
MySQL High Availability_ Tools for Building Rob.. - X-Files
762
-
Upload
khangminh22 -
Category
Documents
-
view
0 -
download
0
Transcript of MySQL High Availability_ Tools for Building Rob.. - X-Files


MySQL High Availability, Second Editionby Charles Bell, Mats Kindahl, and Lars Thalmann
Copyright © 2014 Charles Bell, Mats Kindahl, Lars Thalmann. All rights reserved.
Printed in the United States of America.
Published by O’Reilly Media, Inc., 1005 Gravenstein Highway North, Sebastopol, CA 95472.
O’Reilly books may be purchased for educational, business, or sales promotional use. Online editions arealso available for most titles (http://my.safaribooksonline.com). For more information, contact our corporate/institutional sales department: 800-998-9938 or [email protected].
Editor: Andy OramProduction Editor: Nicole ShelbyCopyeditor: Jasmine KwitynProofreader: Linley Dolby
Indexer: Lucie HaskinsCover Designer: Karen MontgomeryInterior Designer: David FutatoIllustrator: Rebecca Demarest
June 2010: First Edition
April 2014: Second Edition
Revision History for the Second Edition:
2014-04-09: First release
See http://oreilly.com/catalog/errata.csp?isbn=9781449339586 for release details.
Nutshell Handbook, the Nutshell Handbook logo, and the O’Reilly logo are registered trademarks of O’ReillyMedia, Inc. MySQL High Availability, the image of an American robin, and related trade dress are trademarksof O’Reilly Media, Inc.
Many of the designations used by manufacturers and sellers to distinguish their products are claimed astrademarks. Where those designations appear in this book, and O’Reilly Media, Inc. was aware of a trademarkclaim, the designations have been printed in caps or initial caps.
While every precaution has been taken in the preparation of this book, the publisher and authors assumeno responsibility for errors or omissions, or for damages resulting from the use of the information containedherein.
ISBN: 978-1-449-33958-6
[LSI]

Table of Contents
Foreword for the Second Edition. . . . . . . . . . . . . . . . . . . . . . . . . . . . . . . . . . . . . . . . . . . . . . . . . xvForeword for the First Edition. . . . . . . . . . . . . . . . . . . . . . . . . . . . . . . . . . . . . . . . . . . . . . . . . . . xixPreface. . . . . . . . . . . . . . . . . . . . . . . . . . . . . . . . . . . . . . . . . . . . . . . . . . . . . . . . . . . . . . . . . . . . . . xxi
Part I. High Availability and Scalability
1. Introduction. . . . . . . . . . . . . . . . . . . . . . . . . . . . . . . . . . . . . . . . . . . . . . . . . . . . . . . . . . . . . . . . 3What’s This Replication Stuff, Anyway? 5So, Backups Are Not Needed Then? 7What’s With All the Monitoring? 7Is There Anything Else I Can Read? 8Conclusion 9
2. MySQL Replicant Library. . . . . . . . . . . . . . . . . . . . . . . . . . . . . . . . . . . . . . . . . . . . . . . . . . . . . 11Basic Classes and Functions 15Supporting Different Operating Systems 16Servers 17Server Roles 19Conclusion 21
3. MySQL Replication Fundamentals. . . . . . . . . . . . . . . . . . . . . . . . . . . . . . . . . . . . . . . . . . . . . 23Basic Steps in Replication 24
Configuring the Master 25Configuring the Slave 27Connecting the Master and Slave 28
A Brief Introduction to the Binary Log 29What’s Recorded in the Binary Log 30Watching Replication in Action 30The Binary Log’s Structure and Content 33
iii

Adding Slaves 35Cloning the Master 37Cloning a Slave 39Scripting the Clone Operation 41
Performing Common Tasks with Replication 42Reporting 43
Conclusion 49
4. The Binary Log. . . . . . . . . . . . . . . . . . . . . . . . . . . . . . . . . . . . . . . . . . . . . . . . . . . . . . . . . . . . . 51Structure of the Binary Log 52
Binlog Event Structure 54Event Checksums 56
Logging Statements 58Logging Data Manipulation Language Statements 58Logging Data Definition Language Statements 59Logging Queries 59LOAD DATA INFILE Statements 65Binary Log Filters 67Triggers, Events, and Stored Routines 70Stored Procedures 75Stored Functions 78Events 81Special Constructions 82Nontransactional Changes and Error Handling 83
Logging Transactions 86Transaction Cache 87Distributed Transaction Processing Using XA 91Binary Log Group Commit 94
Row-Based Replication 97Enabling Row-based Replication 98Using Mixed Mode 99
Binary Log Management 100The Binary Log and Crash Safety 100Binlog File Rotation 101Incidents 103Purging the Binlog File 104
The mysqlbinlog Utility 105Basic Usage 106Interpreting Events 113
Binary Log Options and Variables 118Options for Row-Based Replication 120
iv | Table of Contents

Conclusion 121
5. Replication for High Availability. . . . . . . . . . . . . . . . . . . . . . . . . . . . . . . . . . . . . . . . . . . . . 123Redundancy 124Planning 126
Slave Failures 127Master Failures 127Relay Failures 127Disaster Recovery 127
Procedures 128Hot Standby 130Dual Masters 135Slave Promotion 144Circular Replication 149
Conclusion 151
6. MySQL Replication for Scale-Out. . . . . . . . . . . . . . . . . . . . . . . . . . . . . . . . . . . . . . . . . . . . . 153Scaling Out Reads, Not Writes 155The Value of Asynchronous Replication 156Managing the Replication Topology 158
Application-Level Load Balancing 162Hierarchical Replication 170
Setting Up a Relay Server 171Adding a Relay in Python 172
Specialized Slaves 173Filtering Replication Events 174Using Filtering to Partition Events to Slaves 176
Managing Consistency of Data 177Consistency in a Nonhierarchical Deployment 178Consistency in a Hierarchical Deployment 180
Conclusion 187
7. Data Sharding. . . . . . . . . . . . . . . . . . . . . . . . . . . . . . . . . . . . . . . . . . . . . . . . . . . . . . . . . . . . 189What Is Sharding? 190
Why Should You Shard? 191Limitations of Sharding 192
Elements of a Sharding Solution 194High-Level Sharding Architecture 196
Partitioning the Data 197Shard Allocation 202
Mapping the Sharding Key 206Sharding Scheme 206
Table of Contents | v

Shard Mapping Functions 210Processing Queries and Dispatching Transactions 215
Handling Transactions 216Dispatching Queries 218
Shard Management 220Moving a Shard to a Different Node 220Splitting Shards 225
Conclusion 225
8. Replication Deep Dive. . . . . . . . . . . . . . . . . . . . . . . . . . . . . . . . . . . . . . . . . . . . . . . . . . . . . . 227Replication Architecture Basics 228
The Structure of the Relay Log 229The Replication Threads 233Starting and Stopping the Slave Threads 234
Running Replication over the Internet 235Setting Up Secure Replication Using Built-in Support 237Setting Up Secure Replication Using Stunnel 238
Finer-Grained Control Over Replication 239Information About Replication Status 239
Options for Handling Broken Connections 248How the Slave Processes Events 249
Housekeeping in the I/O Thread 249SQL Thread Processing 250
Semisynchronous Replication 257Configuring Semisynchronous Replication 258Monitoring Semisynchronous Replication 259
Global Transaction Identifiers 260Setting Up Replication Using GTIDs 261Failover Using GTIDs 263Slave Promotion Using GTIDs 264Replication of GTIDs 266
Slave Safety and Recovery 268Syncing, Transactions, and Problems with Database Crashes 268Transactional Replication 270Rules for Protecting Nontransactional Statements 274
Multisource Replication 275Details of Row-Based Replication 278
Table_map Events 280The Structure of Row Events 282Execution of Row Event 283Events and Triggers 284Filtering in Row-Based Replication 286
vi | Table of Contents

Partial Row Replication 288Conclusion 289
9. MySQL Cluster. . . . . . . . . . . . . . . . . . . . . . . . . . . . . . . . . . . . . . . . . . . . . . . . . . . . . . . . . . . . 291What Is MySQL Cluster? 292
Terminology and Components 292How Does MySQL Cluster Differ from MySQL? 293Typical Configuration 293Features of MySQL Cluster 294Local and Global Redundancy 296Log Handling 297Redundancy and Distributed Data 297
Architecture of MySQL Cluster 298How Data Is Stored 300Partitioning 303Transaction Management 304Online Operations 304
Example Configuration 306Getting Started 306Starting a MySQL Cluster 308Testing the Cluster 313Shutting Down the Cluster 314
Achieving High Availability 314System Recovery 317Node Recovery 318Replication 319
Achieving High Performance 324Considerations for High Performance 325High Performance Best Practices 326
Conclusion 328
Part II. Monitoring and Managing
10. Getting Started with Monitoring. . . . . . . . . . . . . . . . . . . . . . . . . . . . . . . . . . . . . . . . . . . . 333Ways of Monitoring 334Benefits of Monitoring 335System Components to Monitor 335
Processor 336Memory 337Disk 338Network Subsystem 339
Table of Contents | vii

Monitoring Solutions 340Linux and Unix Monitoring 341
Process Activity 342Memory Usage 347Disk Usage 350Network Activity 353General System Statistics 355Automated Monitoring with cron 356
Mac OS X Monitoring 356System Profiler 357Console 359Activity Monitor 361
Microsoft Windows Monitoring 365The Windows Experience 366The System Health Report 367The Event Viewer 369The Reliability Monitor 372The Task Manager 374The Performance Monitor 375
Monitoring as Preventive Maintenance 377Conclusion 377
11. Monitoring MySQL. . . . . . . . . . . . . . . . . . . . . . . . . . . . . . . . . . . . . . . . . . . . . . . . . . . . . . . . . 379What Is Performance? 380MySQL Server Monitoring 381
How MySQL Communicates Performance 381Performance Monitoring 382SQL Commands 383The mysqladmin Utility 389MySQL Workbench 391Third-Party Tools 402The MySQL Benchmark Suite 405
Server Logs 407Performance Schema 409
Concepts 410Getting Started 412Using Performance Schema to Diagnose Performance Problems 420
MySQL Monitoring Taxonomy 421Database Performance 423
Measuring Database Performance 423Best Practices for Database Optimization 435
Best Practices for Improving Performance 444
viii | Table of Contents

Everything Is Slow 444Slow Queries 444Slow Applications 445Slow Replication 445
Conclusion 446
12. Storage Engine Monitoring. . . . . . . . . . . . . . . . . . . . . . . . . . . . . . . . . . . . . . . . . . . . . . . . . 447InnoDB 448
Using the SHOW ENGINE Command 450Using InnoDB Monitors 453Monitoring Logfiles 457Monitoring the Buffer Pool 458Monitoring Tablespaces 460Using INFORMATION_SCHEMA Tables 461Using PERFORMANCE_SCHEMA Tables 462Other Parameters to Consider 463Troubleshooting Tips for InnoDB 464
MyISAM 467Optimizing Disk Storage 467Repairing Your Tables 468Using the MyISAM Utilities 468Storing a Table in Index Order 470Compressing Tables 471Defragmenting Tables 471Monitoring the Key Cache 471Preloading Key Caches 472Using Multiple Key Caches 473Other Parameters to Consider 474
Conclusion 475
13. Replication Monitoring. . . . . . . . . . . . . . . . . . . . . . . . . . . . . . . . . . . . . . . . . . . . . . . . . . . . . 477Getting Started 477Server Setup 478Inclusive and Exclusive Replication 478Replication Threads 481Monitoring the Master 483
Monitoring Commands for the Master 483Master Status Variables 487
Monitoring Slaves 487Monitoring Commands for the Slave 487Slave Status Variables 492
Replication Monitoring with MySQL Workbench 493
Table of Contents | ix

Other Items to Consider 495Networking 495Monitor and Manage Slave Lag 496Causes and Cures for Slave Lag 497Working with GTIDs 498
Conclusion 499
14. Replication Troubleshooting. . . . . . . . . . . . . . . . . . . . . . . . . . . . . . . . . . . . . . . . . . . . . . . . 501What Can Go Wrong 502Problems on the Master 503
Master Crashed and Memory Tables Are in Use 503Master Crashed and Binary Log Events Are Missing 503Query Runs Fine on the Master but Not on the Slave 505Table Corruption After a Crash 505Binary Log Is Corrupt on the Master 506Killing Long-Running Queries for Nontransactional Tables 507Unsafe Statements 507
Problems on the Slave 509Slave Server Crashed and Replication Won’t Start 510Slave Connection Times Out and Reconnects Frequently 510Query Results Are Different on the Slave than on the Master 511Slave Issues Errors when Attempting to Restart with SSL 512Memory Table Data Goes Missing 513Temporary Tables Are Missing After a Slave Crash 513Slave Is Slow and Is Not Synced with the Master 513Data Loss After a Slave Crash 514Table Corruption After a Crash 514Relay Log Is Corrupt on the Slave 515Multiple Errors During Slave Restart 515Consequences of a Failed Transaction on the Slave 515I/O Thread Problems 515SQL Thread Problems: Inconsistencies 516Different Errors on the Slave 517
Advanced Replication Problems 517A Change Is Not Replicated Among the Topology 517Circular Replication Issues 518Multimaster Issues 518The HA_ERR_KEY_NOT_FOUND Error 519GTID Problems 519
Tools for Troubleshooting Replication 520Best Practices 521
Know Your Topology 521
x | Table of Contents

Check the Status of All of Your Servers 523Check Your Logs 523Check Your Configuration 524Conduct Orderly Shutdowns 525Conduct Orderly Restarts After a Failure 525Manually Execute Failed Queries 526Don’t Mix Transactional and Nontransactional Tables 526Common Procedures 526
Reporting Replication Bugs 528Conclusion 529
15. Protecting Your Investment. . . . . . . . . . . . . . . . . . . . . . . . . . . . . . . . . . . . . . . . . . . . . . . . . 531What Is Information Assurance? 532
The Three Practices of Information Assurance 532Why Is Information Assurance Important? 533
Information Integrity, Disaster Recovery, and the Role of Backups 533High Availability Versus Disaster Recovery 534Disaster Recovery 535The Importance of Data Recovery 541Backup and Restore 542
Backup Tools and OS-Level Solutions 547MySQL Enterprise Backup 548MySQL Utilities Database Export and Import 559The mysqldump Utility 560Physical File Copy 562Logical Volume Manager Snapshots 564XtraBackup 569Comparison of Backup Methods 569
Backup and MySQL Replication 570Backup and Recovery with Replication 571PITR 571
Automating Backups 579Conclusion 581
16. MySQL Enterprise Monitor. . . . . . . . . . . . . . . . . . . . . . . . . . . . . . . . . . . . . . . . . . . . . . . . . . 583Getting Started with MySQL Enterprise Monitor 584
Commercial Offerings 585Anatomy of MySQL Enterprise Monitor 585Installation Overview 586
MySQL Enterprise Monitor Components 590Dashboard 591Monitoring Agent 594
Table of Contents | xi

Advisors 594Query Analyzer 595MySQL Production Support 597
Using MySQL Enterprise Monitor 597Monitoring 599Query Analyzer 605Further Information 608
Conclusion 609
17. Managing MySQL Replication with MySQL Utilities. . . . . . . . . . . . . . . . . . . . . . . . . . . . . 611Common MySQL Replication Tasks 612
Checking Status 612Stopping Replication 615Adding Slaves 617
MySQL Utilities 618Getting Started 618Using the Utilities Without Workbench 619Using the Utilities via Workbench 619
General Utilities 621Comparing Databases for Consistency: mysqldbcompare 621Copying Databases: mysqldbcopy 624Exporting Databases: mysqldbexport 625Importing Databases: mysqldbimport 628Discovering Differences: mysqldiff 629Showing Disk Usage: mysqldiskusage 632Checking Tables Indexes: mysqlindexcheck 635Searching Metadata: mysqlmetagrep 636Searching for Processes: mysqlprocgrep 637Cloning Servers: mysqlserverclone 639Showing Server Information: mysqlserverinfo 641Cloning Users: mysqluserclone 642Utilities Client: mysqluc 643
Replication Utilities 644Setting Up Replication: mysqlreplicate 644Checking Replication Setup: mysqlrplcheck 646Showing Topologies: mysqlrplshow 648
High Availability Utilities 650Concepts 650mysqlrpladmin 651mysqlfailover 655
Creating Your Own Utilities 663Architecture of MySQL Utilities 663
xii | Table of Contents

Custom Utility Example 664Conclusion 673
A. Replication Tips and Tricks. . . . . . . . . . . . . . . . . . . . . . . . . . . . . . . . . . . . . . . . . . . . . . . . . . 675
B. A GTID Implementation. . . . . . . . . . . . . . . . . . . . . . . . . . . . . . . . . . . . . . . . . . . . . . . . . . . . . 693
Index. . . . . . . . . . . . . . . . . . . . . . . . . . . . . . . . . . . . . . . . . . . . . . . . . . . . . . . . . . . . . . . . . . . . . . . 705
Table of Contents | xiii


Foreword for the Second Edition
In 2011, Pinterest started growing. Some say we grew faster than any other startup todate. In the earliest days, we were up against a new scalability bottleneck every day thatcould slow down the site or bring it down altogether. We remember having our laptopswith us everywhere. We slept with them, we ate with them, we went on vacation withthem. We even named them. We have the sound of the SMS outage alerts imprinted inour brains.
When the infrastructure is constantly being pushed to its limits, you can’t help but wishfor an easy way out. During our growth, we tried no less than five well-known databasetechnologies that claimed to solve all our problems, but each failed catastrophically.Except MySQL. The time came around September 2011 to throw all the cards in the airand let them resettle. We re-architected everything around MySQL, Memcache, andRedis with just three engineers.
MySQL? Why MySQL? We laid out our biggest concerns with any technology andstarted asking the same questions for each. Here’s how MySQL shaped up:
• Does it address our storage needs? Yes, we needed mappings, indexes, sorting, andblob storage, all available in MySQL.
• Is it commonly used? Can you hire somebody for it? MySQL is one of the mostcommon database choices in production today. It’s so easy to hire people who haveused MySQL that we could walk outside in Palo Alto and yell out for a MySQLengineer and a few would come up. Not kidding.
• Is the community active? Very active. There are great books available and a strongonline community.
• How robust is it to failure? Very robust! We’ve never lost any data even in the mostdire of situations.
• How well does it scale? By itself, it does not scale beyond a single box. We’d need asharding solution layered on top. (That’s a whole other discussion!)
xv

• Will you be the biggest user? Nope, not by far. Bigger users included Facebook,Twitter, and Google. You don’t want to be the biggest user of a technology if youcan help it. If you are, you’ll trip over new scalability problems that nobody has hada chance to debug yet.
• How mature is it? Maturity became the real differentiator. Maturity to us is a meas‐ure of the blood, sweat, and tears that have gone into a program divided by itscomplexity. MySQL is reasonably complex, but not nearly so compared to some ofthe magic autoclustering NoSQL solutions available. Additionally, MySQL has had28 years of the best and the brightest contributing back to it from such companiesas Facebook and Google, who use it at massive scale. Of all the technologies welooked at, by our definition of maturity, MySQL was a clear choice.
• Does it have good debugging tools? As a product matures, you naturally get greatdebugging and profiling tools since people are more likely to have been in a similarsticky situation. You’ll find yourself in trouble at 3 A.M. (multiple times). Beingable to root cause an issue and get back to bed is better than rewriting for anothertechnology by 6 A.M.
Based on our survey of 10 or so database technologies, MySQL was the clear choice.MySQL is great, but it kinda drops you off at your destination with no baggage and youhave to fend for yourself. It works very well and you can connect to it, but as soon asyou start using it and scaling, the questions starting flying:
• My query is running slow, now what?• Should I enable compression? How do I do it?• What are ways of scaling beyond one box?• How do I get replication working? How about master-master replication?• REPLICATION STOPPED! NOW WHAT?!• What are options for durability (fsync speeds)?• How big should my buffers be?• There are a billion fields in mysql.ini. What are they? What should they be set to?• I just accidentally wrote to my slave! How do I prevent that from happening again?• How do I prevent running an UPDATE with no where clause?• What debugging and profiling tools should I be using?• Should I use InnoDB, MyISAM, or one of several other flavors of storage engine?
The online community is helpful for answering specific questions, finding examples,bug fixes, and workarounds, but often lacks a strong cohesive story, and deeper dis‐cussions about architecture are few and far between. We knew how to use MySQL at
xvi | Foreword for the Second Edition

small scale, but this scale and pace were insane. High Availability MySQL providedinsights that allowed us to squeeze more out of MySQL.
One new feature in MySQL 5.6, Global Transaction Handlers, adds a unique identifierto every transaction in a replication tree. This new feature makes failover and slavepromotion far easier. We’ve been waiting for this for a long time and it’s well covered inthis new edition.
During our grand re-architecture to a sharded solution, we referred to this book forarchitectural decisions, such as replication techniques and topologies, data shardingalternatives, monitoring options, tuning, and concerns in the cloud. It gave us a deeperunderstanding of how MySQL works underneath the hood, which allowed us to makebetter informed choices around the high level queries, access patterns, and structureswe’d be using, as well as iterate on our design afterward. The resulting MySQL archi‐tecture still serves Pinterest’s core data needs today.
—Yashwanth Nelapati and Marty WeinerPinterest
February 2014
Foreword for the Second Edition | xvii


Foreword for the First Edition
A lot of research has been done on replication, but most of the resulting concepts arenever put into production. In contrast, MySQL replication is widely deployed but hasnever been adequately explained. This book changes that. Things are explained herethat were previously limited to people willing to read a lot of source code and spend alot of time—including a few late-night sessions—debugging it in production.
Replication enables you to provide highly available data services while enduring theinevitable failures. There are an amazing number of ways for things to fail, includingthe loss of a disk, server, or data center. Even when hardware is perfect or fully redundant,people are not. Database tables will be dropped by mistake. Applications will writeincorrect data. Occasional failure is assured. But with reasonable preparation, recoveryfrom failure can also be assured. The keys to survival are redundancy and backups.Replication in MySQL supports both.
But MySQL replication is not limited to supporting failure recovery. It is frequently usedto support read scale-out. MySQL can efficiently replicate to a large number of servers.For applications that are read-mostly, this is a cost-effective strategy for supporting alarge number of queries on commodity hardware.
And there are other interesting uses for MySQL replication. Online data definition lan‐guage (DDL) is a very complex feature to implement in a relational database manage‐ment system. MySQL does not support online DDL, but through the use of replication,you can implement something that is frequently good enough. You can get a lot donewith replication if you are willing to be creative.
Replication is one of the features that made MySQL wildly popular. It is also the featurethat allows you to convert a popular MySQL prototype into a successful business-criticaldeployment. Like most of MySQL, replication favors simplicity and ease of use. As aconsequence, it is occasionally less than perfect when running in production. This bookexplains what you need to know to successfully use MySQL replication. It will help youto understand how replication has been implemented, what can go wrong, how to pre‐
xix

vent problems, and how to fix them when—despite your best attempts at prevention—they crop up.
MySQL replication is also a work in progress. Change, like failure, is also assured.MySQL is responding to that change, and replication continues to get more efficient,more robust, and more interesting. For instance, row-based replication is new in MySQL5.1.
While MySQL deployments come in all shapes and sizes, I care most about data servicesfor Internet applications and am excited about the potential to replicate from MySQLto distributed storage systems like HBase and Hadoop. This will make MySQL better atsharing the data center.
I have been on teams that support important MySQL deployments at Facebook andGoogle. I’ve encountered many of the problems covered in this book and have had theopportunity and time to learn solutions. The authors of this book are also experts onMySQL replication, and by reading this book you can share their expertise.
—Mark Callaghan
xx | Foreword for the First Edition

Preface
The authors of this book have been creating parts of MySQL and working with it formany years. Dr. Charles Bell is a senior developer leading the MySQL Utilities team. Hehas also worked on replication and backup. His interests include all things MySQL,database theory, software engineering, microcontrollers, and three-dimensional print‐ing. Dr. Mats Kindahl is a principal senior software developer currently leading theMySQL High Availability and Scalability team. He is architect and implementor of sev‐eral MySQL features. Dr. Lars Thalmann is the development director and technical leadof the MySQL Replication, Backup, Connectors, and Utilities teams, and has designedmany of the replication and backup features. He has worked on the development ofMySQL clustering, replication, and backup technologies.
We wrote this book to fill a gap we noticed among the many books on MySQL. Thereare many excellent books on MySQL, but few that concentrate on its advanced featuresand applications, such as high availability, reliability, and maintainability. In this book,you will find all of these topics and more.
We also wanted to make the reading a bit more interesting by including a runningnarrative about a MySQL professional who encounters common requests made by hisboss. In the narrative, you will meet Joel Thomas, who recently decided to take a jobworking for a company that has just started using MySQL. You will observe Joel as helearns his way around MySQL and tackles some of the toughest problems facing MySQLprofessionals. We hope you find this aspect of the book entertaining.
Who This Book Is ForThis book is for MySQL professionals. We expect you to have basic knowledge of SQL,MySQL administration, and the operating system you are running. We provide intro‐ductory information about replication, disaster recovery, system monitoring, and otherkey topics of high availability. See Chapter 1 for other books that offer useful backgroundinformation.
xxi

How This Book Is OrganizedThis book is divided into two parts. Part I encompasses MySQL high availability andscale-out. Because these depend a great deal on replication, a lot of this part focuses onthat topic. Part II examines monitoring and performance concerns for building robustdata centers.
Part I, High Availability and ScalabilityChapter 1, Introduction, explains how this book can help you and gives you a contextfor reading it.
Chapter 2, MySQL Replicant Library, introduces a Python library for working with setsof servers that is used throughout the book.
Chapter 3, MySQL Replication Fundamentals, discusses both manual and automatedprocedures for setting up basic replication.
Chapter 4, The Binary Log, explains the critical file that ties together replication andhelps in disaster recovery, troubleshooting, and other administrative tasks.
Chapter 5, Replication for High Availability, shows a number of ways to recover fromserver failure, including the use of automated scripts.
Chapter 6, MySQL Replication for Scale-Out, shows a number of techniques and top‐ologies for improving the read scalabilility of large data sets.
Chapter 7, Data Sharding, shows techniques for handling very large databases and/orimproving the write scalability of a database through sharding.
Chapter 8, Replication Deep Dive, addresses a number of topics, such as secure datatransfer and row-based replication.
Chapter 9, MySQL Cluster, shows how to use this tool to achieve high availability.
Part II, Monitoring and ManagingChapter 10, Getting Started with Monitoring, presents the main operating system pa‐rameters you have to be aware of, and tools for monitoring them.
Chapter 11, Monitoring MySQL, presents several tools for monitoring database activityand performance.
Chapter 12, Storage Engine Monitoring, explains some of the parameters you need tomonitor on a more detailed level, focusing on issues specific to MyISAM or InnoDB.
Chapter 13, Replication Monitoring, offers details about how to keep track of what mas‐ters and slaves are doing.
xxii | Preface

Chapter 14, Replication Troubleshooting, shows how to deal with failures and restarts,corruption, and other incidents.
Chapter 15, Protecting Your Investment, explains the use of backups and disaster re‐covery techniques.
Chapter 16, MySQL Enterprise Monitor, introduces a suite of tools that simplifies manyof the tasks presented in earlier chapters.
Chapter 17, Managing MySQL Replication with MySQL Utilities, introduces the MySQLUtilities, which are a new set of tools for managing MySQL Servers.
AppendixesAppendix A, Replication Tips and Tricks, offers a grab bag of procedures that are usefulin certain situations.
Appendix B, A GTID Implementation, shows an implementation for handling failoverswith transactions if you are using servers that don’t support GTIDs.
Conventions Used in This BookThe following typographical conventions are used in this book:Plain text
Indicates menu titles, table names, options, and buttons.
ItalicIndicates new terms, database names, URLs, email addresses, filenames, and Unixutilities.
Constant width
Indicates command-line options, variables and other code elements, the contentsof files, and the output from commands.
Constant width bold
Shows commands or other text that should be typed literally by the user.
Constant width italic
Shows text that should be replaced with user-supplied values.
This element signifies a tip or suggestion.
Preface | xxiii

This element signifies a general note.
This element indicates a warning or caution.
Using Code ExamplesSupplemental material (code examples, exercises, etc.) is available for download at athttp://bit.ly/mysqllaunch.
This book is here to help you get your job done. In general, if example code is offeredwith this book, you may use it in your programs and documentation. You do not needto contact us for permission unless you’re reproducing a significant portion of the code.For example, writing a program that uses several chunks of code from this book doesnot require permission. Selling or distributing a CD-ROM of examples from O’Reillybooks does require permission. Answering a question by citing this book and quotingexample code does not require permission. Incorporating a significant amount of ex‐ample code from this book into your product’s documentation does require permission.
We appreciate, but do not require, attribution. An attribution usually includes the title,author, publisher, and ISBN. For example: “MySQL High Availability, by Charles Bell,Mats Kindahl, and Lars Thalmann. Copyright 2014 Charles Bell, Mats Kindahl, andLars Thalmann, 978-1-44933-958-6.”
If you feel your use of code examples falls outside fair use or the permission given above,feel free to contact us at [email protected].
Safari® Books OnlineSafari Books Online (www.safaribooksonline.com) is an on-demand digital library that delivers expert content in bothbook and video form from the world’s leading authors intechnology and business.
Technology professionals, software developers, web designers, and business and crea‐tive professionals use Safari Books Online as their primary resource for research, prob‐lem solving, learning, and certification training.
xxiv | Preface

Safari Books Online offers a range of product mixes and pricing programs for organi‐zations, government agencies, and individuals. Subscribers have access to thousands ofbooks, training videos, and prepublication manuscripts in one fully searchable databasefrom publishers like O’Reilly Media, Prentice Hall Professional, Addison-Wesley Pro‐fessional, Microsoft Press, Sams, Que, Peachpit Press, Focal Press, Cisco Press, JohnWiley & Sons, Syngress, Morgan Kaufmann, IBM Redbooks, Packt, Adobe Press, FTPress, Apress, Manning, New Riders, McGraw-Hill, Jones & Bartlett, Course Technol‐ogy, and dozens more. For more information about Safari Books Online, please visit usonline.
How to Contact UsPlease address comments and questions concerning this book to the publisher:
O’Reilly Media, Inc.1005 Gravenstein Highway NorthSebastopol, CA 95472800-998-9938 (in the United States or Canada)707-829-0515 (international or local)707-829-0104 (fax)
We have a web page for this book, where we list errata, examples, and any additionalinformation. You can access this page at http://bit.ly/mysql_high_availability.
To comment or ask technical questions about this book, send email to: [email protected].
For more information about our books, courses, conferences, and news, see our websiteat: http://www.oreilly.com.
AcknowledgmentsThe authors would like to thank our technical reviewers of this and the previous edition:Mark Callahan, Morgan Tocker, Sveta Smirnova, Luis Soares, Sheeri Kritzer Cabral,Alfie John, and Colin Charles. Your attention to detail and insightful suggestions wereinvaluable. We could not have delivered a quality book without your help.
We also want to thank our extremely talented colleagues on the MySQL team and in theMySQL community who have provided comments, including Alfranio Correia, AndreiElkin, Zhen-Xing He, Serge Kozlov, Sven Sandberg, Luis Soares, Rafal Somla, Li-BingSong, Ingo Strüwing, Dao-Gang Qu, Giuseppe Maxia, and Narayanan Venkateswaranfor their tireless dedication to making MySQL the robust and powerful tool it is today.We especially would like to thank our MySQL customer support professionals, who helpus bridge the gap between our customers’ needs and our own desires to improve the
Preface | xxv

product. We would also like to thank the many community members who so selflesslydevote time and effort to improve MySQL for everyone.
Finally, and most important, we would like to thank our editor, Andy Oram, who helpedus shape this work, for putting up with our sometimes cerebral and sometimes over-the-top enthusiasm for all things MySQL. A most sincere thanks goes out to the entireO’Reilly team and especially our editor for their patience as we struggled to fit so manynew topics into what was already a very large book.
Charles would like to thank his loving wife, Annette, for her patience and understandingwhen he was spending time away from family priorities to work on this book. Charleswould also like to thank his many colleagues on the MySQL team at Oracle who con‐tribute their wisdom freely to everyone on a daily basis. Finally, Charles would like tothank all of his brothers and sisters in Christ who both challenge and support him daily.
Mats would like to thank his wife, Lill, and two sons, Jon and Hannes, for their uncon‐ditional love and understanding in difficult times. You are the loves of his life and hecannot imagine a life without you. Mats would also like to thank his MySQL colleaguesinside and outside Oracle for all the interesting, amusing, and inspiring times together—you are truly some of the sharpest minds in the trade.
Lars would like to thank his amazing girlfriend Claudia; he loves her beyond words. Hewould also like to thank all of his colleagues, current and past, who have made MySQLsuch an interesting place to work. In fact, it is not even a place. The distributed natureof the MySQL development team and the open-mindedness of its many dedicated de‐velopers are truly extraordinary. The MySQL community has a special spirit that makesworking with MySQL an honorable task. What we have created together is remarkable.It is amazing that it started with such a small group of people and managed to build aproduct that services so many of the Fortune 500 companies today.
xxvi | Preface

PART I
High Availability and Scalability
One of the key database features that supports both high availability and scalability inan application is replication. Replication is used to create redundancy in the databaselayer as well as to make copies of the database available for scaling the reads. Part I covershow you can use replication to ensure high availability and how you can scale yoursystem.


CHAPTER 1
Introduction
Joel looked through the classified ads for a new job. His current job was a good one, andthe company had been very accommodating to him while he attended college. But ithad been several years since he graduated, and he wanted to do more with his career.
“This looks promising,” he said, circling an advertisement for a computer science spe‐cialist working with MySQL. He had experience with MySQL and certainly met theacademic requirements for the job. After reading through several other ads, he decidedto call about the MySQL job. After a brief set of cursory questions, the human resourcesmanager granted him an interview in two days’ time.
Two days and three interviews later, he was introduced to the company’s president andchief executive officer, Robert Summerson, for his final technical interview. He waitedwhile Mr. Summerson paused during the questions and referred to his notes. So far, theywere mostly mundane questions about information technology, but Joel knew the hardquestions about MySQL were coming next.
Finally, the interviewer said, “I am impressed with your answers, Mr. Thomas. May Icall you Joel?”
“Yes, sir,” Joel said as he endured another uncomfortable period while the interviewerread over his notes for the third time.
“Tell me what you know about MySQL,” Mr. Summerson said before placing his handson his desk and giving Joel a very penetrating stare.
Joel began explaining what he knew about MySQL, tossing in a generous amount of thematerial he had read the night before. After about 10 minutes, he ran out of things totalk about.
Mr. Summerson waited a couple of minutes, then stood and offered Joel his hand. AsJoel rose and shook Mr. Summerson’s hand, Summerson said, “That’s all I need to hear,Joel. The job is yours.”
3

“Thank you, sir.”
Mr. Summerson motioned for Joel to follow him out of his office. “I’ll take you back tothe HR people so we can get you on the payroll. Can you start two weeks from Monday?”
Joel was elated and couldn’t help but smile. “Yes, sir.”
“Excellent.” Mr. Summerson shook Joel’s hand again and said, “I want you to comeprepared to evaluate the configuration of our MySQL servers. I want a complete reporton their configuration and health.”
Joel’s elation waned as he drove out of the parking lot. He didn’t go home right away.Instead, he drove to the nearest bookstore. “I’m going to need a good book on MySQL,”he thought.
So, you have decided to take on a large installation and take care of its operation. Well,you are up for some very interesting—as well as rewarding—times.
Compared to running a small site, supporting a large venture requires planning, fore‐sight, experience, and even more planning. As a database administrator for a large ven‐ture, you are required to—or will be required to—do things like the following:
• Provide plans for recovery of business-essential data in the event of a disaster. It isalso likely that you will have to execute the procedure at least once.
• Provide plans for handling a large customer/user base and monitoring the load ofeach node in the site in order to optimize it.
• Plan for rapid scale-out in the event the user base grows rapidly.
For all these cases, it is critical to plan for the events in advance and be prepared to actquickly when necessary.
Because not all applications using big sets of servers are websites, we prefer to use theterm deployment—rather than the term site or website—to refer to the server that youare using to support some kind of application. This could be a website, but could justas well be a customer relationship management (CRM) system or an online game. Thebook focuses on the database layer of such a system, but there are some examples thatdemonstrate how the application layer and the database layer integrate.
You need three things to keep a site responsive and available: backups of data, redun‐dancy in the system, and responsiveness. The backups can restore a node to the state itwas in before a crash, redundancy allows the site to continue to operate even if one ormore of the nodes stops functioning, and the responsiveness makes the system usablein practice.
4 | Chapter 1: Introduction

1. You are not restricted to using a single backup method; you can just as well use a mix of different methodsdepending on your needs. For each case, however, you have to make a choice of the most appropriate methodto do the backup.
There are many ways to perform backups, and the method you choose will depend onyour needs.1 Do you need to recover to an exact point in time? In that case, you have toensure that you have all that is necessary for performing a point-in-time recovery(PITR). Do you want to keep the servers up while making a backup? If so, you need toensure that you are using some form of backup that does not disturb the running server,such as an online backup.
Redundancy is handled by duplicating hardware, keeping several instances running inparallel, and using replication to keep multiple copies of the same data available onseveral machines. If one of the machines fails, it is possible to switch over to anothermachine that has a copy of the same data.
Together with replication, backup also plays an important role in scaling your systemand adding new nodes when needed. If done right, it is even possible to automaticallyadd new slaves at the press of a button, at least figuratively.
What’s This Replication Stuff, Anyway?If you’re reading this book, you probably have a pretty good idea of what replication isabout. It is nevertheless a good idea to review the concepts and ideas.
Replication is used to clone all changes made on a server—called the master server orjust master—to another server, which is called the slave server or just slave. This isnormally used to create a faithful copy of the master server, but replication can be usedfor other purposes as well.
The two most common uses of replication are to create a backup of the main server toavoid losing any data if the master crashes and to have a copy of the main server toperform reporting and analysis work without disturbing the rest of the business.
For a small business, this makes a lot of things simpler, but it is possible to do a lot morewith replication, including the following:Support several offices
It is possible to maintain servers at each location and replicate changes to the otheroffices so that the information is available everywhere. This may be necessary toprotect data and also to satisfy legal requirements to keep information about thebusiness available for auditing purposes.
Ensure the business stays operational even if one of the servers goes downAn extra server can be used to handle all the traffic if the original server goes down.
What’s This Replication Stuff, Anyway? | 5

2. There is an extension called semisynchronous replication as well (see “Semisynchronous Replication” on page257), but that is a relatively new addition. Until MySQL 5.7.2 DMR, it externalized the transaction before it wasreplicated, allowing it to be read before it had been replicated and acknowledged requiring some care whenbeing used for high availability.
Ensure the business can operate even in the presence of a disasterReplication can be used to send changes to an alternative data center at a differentgeographic location.
Protect against mistakes (“oopses”)It is possible to create a delayed slave by connecting a slave to a master such thatthe slave is always a fixed period—for example, an hour—behind the master. If amistake is made on the master, it is possible to find the offending statement andremove it before it is executed by the slave.
One of the two most important uses of replication in many modern applications is thatof scaling out. Modern applications are typically very read-intensive; they have a highproportion of reads compared to writes. To reduce the load on the master, you can setup a slave with the sole purpose of answering read queries. By connecting a load balancer,it is possible to direct read queries to a suitable slave, while write queries go to the master.
When using replication in a scale-out scenario, it is important to understand thatMySQL replication traditionally has been asynchronous2 in the sense that transactionsare committed at the master server first, then replicated to the slave and applied there.This means that the master and slave may not be consistent, and if replication is runningcontinuously, the slave will lag behind the master.
The advantage of using asynchronous replication is that it is faster and scales better thansynchronous replication, but in cases where it is important to have current data, theasynchrony must be handled to ensure the information is actually up-to-date.
Scaling out reads is, however, not sufficient to scale all applications. With growing de‐mands on larger databases and higher write load, it is necessary to scale more than justreads. Managing larger databases and improving performance of large database systemscan be accomplished using techniques such as sharding. With sharding, the database issplit into manageable chunks, allowing you to increase the size of the database by dis‐tributing it over as many servers as you need as well as scaling writes efficiently.
Another important application of replication is ensuring high availability by addingredundancy. The most common technique is to use a dual-master setup (i.e., usingreplication to keep a pair of masters available all the time, where each master mirrorsthe other). If one of the masters goes down, the other one is ready to take over imme‐diately.
In addition to the dual-master setup, there are other techniques for achieving highavailability that do not involve replication, such as using shared or replicated disks.
6 | Chapter 1: Introduction

Although they are not specifically tied to MySQL, these techniques are important toolsfor ensuring high availability.
So, Backups Are Not Needed Then?A backup strategy is a critical component of keeping a system available. Regular backupsof the servers provide safety against crashes and disasters, which, to some extent, canbe handled by replication. Even when replication is used correctly and efficiently, how‐ever, there are some things that it cannot handle. You’ll need to have a working backupstrategy for the following cases:Protection against mistakes
If a mistake is discovered, potentially a long time after it actually occurred, repli‐cation will not help. In this case, it is necessary to roll back the system to a timebefore the mistake was introduced and fix the problem. This requires a workingbackup schedule.
Replication provides some protection against mistakes if you are using a time-delayed slave, but if the mistake is discovered after the delay period, the change willhave already taken effect on the slave as well. So, in general, it is not possible toprotect against mistakes using replication only—backups are required as well.
Creating new serversWhen creating new servers—either slaves for scale-out purposes or new masters toact as standbys—it is necessary to make a backup of an existing server and restorethat backup image on the new server. This requires a quick and efficient backupmethod to minimize the downtime and keep the load on the system at an acceptablelevel.
Legal reasonsIn addition to pure business reasons for data preservation, you may have legalrequirements to keep data safe, even in the event of a disaster. Not complying withthese requirements can pose significant problems to operating the business.
In short, a backup strategy is necessary for operating the business, regardless of anyother precautions you have in place to ensure that the data is safe.
What’s With All the Monitoring?Even if you have replication set up correctly, it is necessary to understand the load onyour system and to keep a keen eye on any problems that surface. As business require‐ments shift due to changing customer usage patterns, it is necessary to balance thesystem to use resources as efficiently as possible and to reduce the risk of losing avail‐ability due to sudden changes in resource utilization.
So, Backups Are Not Needed Then? | 7

There are a number of different things that you can monitor, measure, and plan for tohandle these types of changes. Here are some examples:
• You can add indexes to tables that are frequently read.• You can rewrite queries or change the structure of databases to speed up execution
time.• If locks are held for a long time, it is an indication that several connections are using
the same table. It might pay off to switch storage engines.• If some of your scale-out slaves are hot-processing a disproportionate number of
queries, the system might require some rebalancing to ensure that all the scale-outslaves are hit evenly.
• To handle sudden changes in resource usage, it is necessary to determine the normalload of each server and understand when the system will start to respond slowlybecause of a sudden increase in load.
Without monitoring, you have no way of spotting problematic queries, hot slaves, orimproperly utilized tables.
Is There Anything Else I Can Read?There is plenty of literature on using MySQL for various jobs, and also a lot of literatureabout high-availability systems. Here is a list of books that we strongly recommend ifyou are going to work with MySQL:MySQL by Paul DuBois (Addison-Wesley)
This is the reference to MySQL and consists of 1,200 pages (really!) packed witheverything you want to know about MySQL (and probably a lot that you don’t wantto know).
High Performance MySQL, Third Edition by Baron Schwartz, Peter Zaitsev, and Va‐dim Tkachenko (O’Reilly)
This is one of the best books on using MySQL in an enterprise setting. It coversoptimizing queries and ensuring your system is responsive and available.
Scalable Internet Architectures by Theo Schlossnagle (Sams Publishing)Written by one of the most prominent thinkers in the industry, this is a must foranybody working with systems of scale.
The book uses a Python library developed by the authors (called the MySQL PythonReplicant) for many of the administrative tasks. MySQL Python Replicant is availableon Launchpad.
8 | Chapter 1: Introduction

ConclusionIn the next chapter, we will start with the basics of setting up replication, so get a com‐fortable chair, open your computer, and we’ll get started.
Joel was adjusting his chair when a knock sounded from his door.
“Settling in, Joel?” Mr. Summerson asked.
Joel didn’t know what to say. He had been tasked to set up a replication slave on his firstday on the job and while it took him longer than he had expected, he had yet to hear hisboss’s feedback about the job. Joel spoke the first thing on his mind: “Yes, sir, I’m stilltrying to figure out this chair.”
“Nice job with the documentation, Joel. I’d like you to write a report explaining whatyou think we should do to improve our management of the database server.”
Joel nodded. “I can do that.”
“Good. I’ll give you another day to get your office in order. I expect the report by Wed‐nesday, close of business.”
Before Joel could reply, Mr. Summerson walked away.
Joel sat down and flipped another lever on his chair. He heard a distinct click as the backgave way, forcing him to fling his arms wide. “Whoa!” He looked toward his door as heclumsily picked up his chair, thankful no one saw his impromptu gymnastics. “OK, thatlever is now off limits,” he said.
Conclusion | 9


CHAPTER 2
MySQL Replicant Library
Joel opened his handy text file full of common commands and tasks and copied theminto another editor, changing the values for his current need. It was a series of commandsinvolving a number of tools and utilities. “Ah, this is for the birds!” he thought. “Therehas got to be a better way.”
Frustrated, he flipped open his handy MySQL High Availability tome and examined thetable of contents. “Aha! A chapter on a library of replication procedures. Now, this iswhat I need!”
Automating administrative procedures is critical to handling large deployments, so youmight be asking, “Wouldn’t it be neat if we could automate the procedures in this book?”In many cases, you’ll be happy to hear that you can. This chapter introduces the MySQLReplicant library, a simple library written by the authors for managing replication. Wedescribe the basic principles and classes, and will extend the library with new func‐tionality in the coming chapters.
The code is available at Launchpad, where you can find more information and downloadthe source code and documentation.
The Replicant library is based around the idea of creating a model of the connectionsbetween servers on a computer (any computer, such as your laptop), like the model inFigure 2-1. The library is designed so you can manage the connections by changing themodel. For example, to reconnect a slave to another master, just reconnect the slave inthe model, and the library will send the appropriate commands for doing the job.
11

Figure 2-1. A replication topology reflected in a model
Besides the simple replication topology shown in Figure 2-1, two other basic topologiesinclude tree topologies and dual masters (used for providing high availability). Topol‐ogies will be covered in more depth in Chapter 6.
To make the library useful on a wide variety of platforms and for a wide variety ofdeployments, it has been constructed with the following in mind:
• The servers are likely to run on a variety of operating systems, such as Windows,Linux, and flavors of Unix such as Solaris or Mac OS X. Procedures for starting andstopping servers, as well as the names of configuration files, differ depending onthe operating system. The library should therefore support different operating sys‐tems and it should be possible to extend it with new operating systems that are notin the library.
• The deployment is likely to consist of servers running different versions of MySQL.For example, while you are upgrading a deployment to use new versions of theserver, it will consist of a mixture of old and new versions. The library should beable to handle such a deployment.
• A deployment consists of servers with many different roles, so it should be possibleto specify different roles for the servers. In addition, it should be possible to createnew roles that weren’t anticipated at the beginning. Also, servers should be able tochange roles.
• It is necessary to be able to execute SQL queries on each server. This functionalityis needed for configuration as well as for extracting information necessary to man‐age the deployment. This support is also used by other parts of the system to im‐plement their jobs—for example, to implement a slave promotion.
12 | Chapter 2: MySQL Replicant Library


SlaveNotRunningError
This exception is raised when the slave is not running but was expected to run.
NotMasterError
This exception is raised when the server is not a master and the operation is there‐fore illegal.
NotSlaveError
This exception is raised when the server is not a slave and the operation is thereforeillegal.
There is also a set of classes for representing some common concepts that will be usedlater in the book:Position and GTID
These classes represent a binlog position consisting of a filename and a byte offsetwithin the file, or a global transaction identifier (introduced in MySQL 5.6). Arepresentation method prints out a parsable representation of the binlog positionsso that they can be put in secondary storage or if you just want to look at them.
To compare and order the positions, the class defines a comparison operator thatallows the positions to be ordered.
Note that when global transaction identifiers are not used, positions can be differenton different servers, so it is not useful to compare positions from different servers.For that reason, an exception will be thrown if an attempt is made to comparedifferent kinds of positions.
User
This class represents a user with a name and a password. It is used for many typesof accounts: a MySQL user account, a shell user account, and the replication user(which we will introduce later).
Supporting Different Operating SystemsTo work with different operating systems, you can use a set of classes that abstract awaythe differences. The idea is to give each class methods for each of the required tasks thatare implemented differently by different operating systems. At this time, all we need aremethods to stop and start the server:Machine
This class is the base class for a machine and holds all the information that is com‐mon to this kind of machine. It is expected that a machine instance has at least thefollowing members:Machine.defaults_file
The default location of the my.cnf file on this machine
16 | Chapter 2: MySQL Replicant Library

Machine.start_server( server )Method to start the server
Machine.stop_server( server )Method to stop the server
Linux
This class handles a server running on a Linux machine. It uses the init(8) scriptsstored under /etc/init.d to start and stop the server.
Solaris
This class handles servers running on a Solaris machine and uses the svadm(1M)command to start and stop the server.
ServersThe Server class defines all the primitive functions that implement the higher-levelfunctions we want to expose in the interface:Server(name, ...)
The Server class represents a server in the system; there is one object for eachrunning server in the entire system. Here are the most important parameters (fora full list, consult the project page on Launchpad):name
This is the name of the server, and is used to create values for the pid-file,log-bin, and log-bin-index options. If no name parameter is provided, it willbe deduced from the pid-file option, the log-bin option, the log-bin-index option, or as a last resort, using the default.
host, port, and socketThe host where the server resides, the port for connecting to the server as aMySQL client, and the socket through which to connect if on the same host.
ssh_user and sql_userA combination of user and password that can be used for connecting to themachine or the server. These users are used to execute administrative com‐mands, such as starting and stopping the server and reading and writing theconfiguration file, or for executing SQL commands on the server.
machine
An object that holds operating system–specific primitives. We chose the name“machine” instead of “os” to avoid a name conflict with the Python standardlibrary os module. This parameter lets you use different techniques for startingand stopping the server as well as other tasks and operating system–specificparameters. The parameters will be covered later.
Servers | 17

server_id
An optional parameter to hold the server’s identifier, as defined in each server’sconfiguration file. If this option is omitted, the server identifier will be readfrom the configuration file of the server. If there is no server identifier in theconfiguration file either, the server is a vagabond and does not participate inreplication as master or slave.
config_manager
An optional parameter to hold a reference to a configuration manager that canbe queried for information about the configuration for the server.
Server.connect() and Server.disconnect()Use the connect and disconnect methods to establish a connection to the serverbefore executing commands in a session and disconnect from the server after fin‐ishing the session, respectively.
These methods are useful because in some situations it is critical to keep the con‐nection to the server open even after an SQL command has been executed. Other‐wise, for example, when doing a FLUSH TABLES WITH READ LOCK, the lock willautomatically be released when the connection is dropped.
Server.ssh(command, args...) and Server.sql(command, args...)Use these to execute a shell command or an SQL command on the server.
The ssh and sql methods both return an iterable. ssh returns a list of the lines ofoutput from the executed command, whereas sql returns a list of objects of aninternal class named Row. The Row class defines the __iter__ and next methods sothat you iterate over the returned lines or rows, for example:
for row in server.sql("SHOW DATABASES"): print row["Database"]
To handle statements that return a single row, the class also defines a __getitem__method, which will fetch a field from the single row or raise an exception if thereis no row. This means that when you know your return value has only one row(which is guaranteed for many SQL statements), you can avoid the loop shown inthe previous example and write something like:
print server.sql("SHOW MASTER STATUS")["Position"]
Server.fetch_config() and Server.replace_config()The methods fetch_config and replace_config fetch the configuration file intomemory from the remote server to allow the user to add or remove options as wellas change the values of some options. For example, to add a value to the log-binand log-bin-index options, you can use the module as follows:
from my_deployment import master
config = master.fetch_config()
18 | Chapter 2: MySQL Replicant Library

config.set('log-bin', 'capulet-bin')config.set('log-bin-index', 'capulet-bin.index')master.replace_config(config)
Server.start() and Server.stop()The methods start and stop forward information to the machine object to do theirjobs, which depend on the operating system the server is using. The methods willeither start the server or shut down the server, respectively.
Server RolesServers work slightly differently depending on their roles. For example, masters requirea replication user for slaves to use when connecting, but slaves don’t require that useraccount unless they act as a master and have other slaves connecting. To capture theconfiguration of the servers in a flexible manner, classes are introduced for representingdifferent roles.
When you use the imbue method on a server, the appropriate commands are sent to theserver to configure it correctly for that role. Note that a server might change roles in thelifetime of a deployment, so the roles given here just serve to configure the initial de‐ployment. However, a server always has a designated role in the deployment and there‐fore also has an associated role.
When a server changes roles, it might be necessary to remove some of the configurationinformation from the server, so therefore an unimbue method is also defined for a roleand used when switching roles for a server.
In this example, only three roles are defined. Later in the book, you will see more rolesdefined. For example, you will later see how to create nonfinal slaves that can be usedas secondaries or relay servers. The following three roles can be found in the MySQLReplicant library:Role
This is the base class of all the roles. Each derived class needs to define the methodsimbue and (optionally) unimbue to accept a single server to imbue with the role. Toaid derived classes with some common tasks, the Role class defines a number ofhelper functions, including the following:Role.imbue(server)
This method imbues the server with the new role by executing the appropriatecode.
Role.unimbue(server)
This method allows a role to perform cleanup actions before another role isimbued.
Server Roles | 19

Role._set_server_id(server, config)
If there is no server identifier in the configuration, this method sets it toserver.server_id. If the configuration has a server identifier, it will be usedto set the value of server.server_id.
Role._create_repl_user(server, user)
This method creates a replication user on the server and grants it the necessaryrights to act as a replication slave.
Role._enable_binlog(server, config)
This method enables the binary log on the server by setting the log-bin andlog-bin-index options to appropriate values. If the server already has a valuefor log-bin, this method does nothing.
Role._disable_binlog(server, config)
This method disables the binary log by clearing the log-bin and log-bin-index options in the configuration file.
Vagabond
This is the default role assigned to any server that does not participate in the rep‐lication deployment. As such, the server is a “vagabond” and does not have anyresponsibilities whatsoever.
Master
This role is for a server that acts as a master. The role will set the server identifier,enable the binary log, and create a replication user for the slaves. The name andpassword of the replication user will be stored in the server so that when slaves areconnected, the class can look up the replication username.
Final
This is the role for a (final) slave (i.e., a slave that does not have a binary log of itsown). When a server is imbued with this role, it will be given a server identifier, thebinary log will be disabled, and a CHANGE MASTER command will be issued to connectthe slave to a master.
Note that we stop the server before we write the configuration file back to it, and restartthe server after we have written the configuration file. The configuration file is read onlywhen starting the server and closed after the reading is done, but we play it safe andstop the server before modifying the file.
One of the critical design decisions here is not to store any state information about theservers that roles apply to. It might be tempting to keep a list of all the masters by addingthem to the role object, but because roles of the servers change over the lifetime of thedeployment, the roles are used only to set up the system. Because we allow a role tocontain parameters, you can use them to configure several servers with the sameinformation.
20 | Chapter 2: MySQL Replicant Library

import my_deployment
from mysql.replicant.roles import Final
slave_role = Final(master=my_deployment.master)for slave in my_deployment.slaves: slave_role.imbue(slave)
ConclusionIn this chapter you have seen how to build a library for making administration of yourservers easy. You have also seen the beginning of the MySQL Replicant library that wewill be developing throughout this book.
Joel finished testing his script. He was pretty confident he had all of the parts in placeand that the resulting command would save him a lot of time in the future. He clickedEnter.
A few moments later, his script returned the data he expected. He checked his serversthinking this was too easy, but he found everything he wanted to do had been done.“Cool, that was easy!” he said, and locked his screen before heading to lunch.
Conclusion | 21


CHAPTER 3
MySQL Replication Fundamentals
Joel jumped as a sharp rap on his door announced his boss’s unapologetic interruption.Before Joel could say “come in,” the boss stepped into his doorway and said, “Joel, we’regetting complaints that our response time is getting slow. See what you can do to speedthings up. The administrator told me there are too many read operations from theapplications. See what you can do to offload some of that.”
Before Joel could respond, Mr. Summerson was out the door and on his way elsewhere.“I suppose he means we need a bigger server,” Joel thought.
As if he had read Joel’s mind, Mr. Summerson stuck his head back in the doorway andsaid, “Oh, and by the way, the startup we bought all the equipment from had a bunchof servers we haven’t found any use for yet. Can you take a look at those and see whatyou can do with them? OK, Joel?” Then he was gone again.
“I wonder if I’ll ever get used to this,” Joel thought as he pulled his favorite MySQL bookoff the shelf and glanced at the table of contents. He found the chapter on replicationand decided that might fit the bill.
MySQL replication is a very useful tool when used correctly, but it can also be a sourceof considerable headaches when it experiences a failure or when it is configured or usedincorrectly. This chapter will cover the fundamentals of using MySQL replication bybeginning with a simple setup to get you started and then introducing some basic tech‐niques to store in your “replication toolkit.”
This chapter covers the following replication use cases:High availability through hot standby
If a server goes down, everything will stop; it will not be possible to execute (perhapscritical) transactions, get information about customers, or retrieve other importantdata. This is something that you want to avoid at (almost) any cost, because it can
23

severely disrupt your business. The easiest solution is to configure an extra serverwith the sole purpose of acting as a hot standby, ready to take over the job of themain server if it fails.
Report generationCreating reports from data on a server will degrade the server’s performance, insome cases significantly. If you’re running lots of background jobs to generate re‐ports, it’s worth creating an extra server just for this purpose. You can get a snapshotof the database at a certain time by stopping replication on the report server andthen running large queries on it without disturbing the main business server. Forexample, if you stop replication after the last transaction of the day, you can extractyour daily reports while the rest of the business is humming along at its normalpace.
Debugging and auditingYou can also investigate queries that have been executed on the server—for example,to see whether particular queries were executed on servers with performance prob‐lems, or whether a server has gone out of sync because of a bad query.
Basic Steps in ReplicationThis chapter will introduce several sophisticated techniques for maximizing the effi‐ciency and value of replication, but as a first step, we will set up the simple replicationshown in Figure 3-1—a single instance of replication from a master to a slave. This doesnot require any knowledge of the internal architecture or execution details of the rep‐lication process (we’ll explore these before we take on more complicated scenarios).
Figure 3-1. Simple replication
Setting up basic replication can be summarized in three easy steps:
24 | Chapter 3: MySQL Replication Fundamentals

1. On Windows, the command-line prompt (CMD) or PowerShell can be used in place of the Unix “shell.”
1. Configure one server to be a master.2. Configure one server to be a slave.3. Connect the slave to the master.
Unless you plan replication from the start and include the right configuration optionsin the my.cnf files, you will have to restart each server to carry out steps 1 and 2.
To follow the procedures in this section, it is easiest if you have a shellaccount on the machine with privileges to change the my.cnf file aswell as an account on the server with ALL privileges granted.1
You should be very restrictive in granting privileges in a productionenvironment. For precise guidelines, consult “Privileges for the UserConfiguring Replication” on page 27.
Configuring the MasterTo configure a server so that it can act as master, ensure the server has an active binarylog and a unique server ID. We will examine the binary log in greater detail later, butfor now it is sufficient to say that it keeps a record of all the changes the master has madeso that they can be repeated on the slave. The server ID is used to distinguish two serversfrom each other. To set up the binary log and server ID, you have to take the serverdown and add the log-bin, log-bin-index, and server-id options to the my.cnfconfiguration file as shown in Example 3-1. The added options are in boldface.
Example 3-1. Options added to my.cnf to configure a master[mysqld]user = mysqlpid-file = /var/run/mysqld/mysqld.pidsocket = /var/run/mysqld/mysqld.sockport = 3306basedir = /usrdatadir = /var/lib/mysqltmpdir = /tmplog-bin = master-binlog-bin-index = master-bin.indexserver-id = 1
The log-bin option gives the base name for all the files created by the binary log (asyou will see later, the binary log consists of several files). If you create a filename withan extension to log-bin, the extension will be ignored and only the file’s base name willbe used (i.e., the name without the extension).
Basic Steps in Replication | 25

The log-bin-index option gives the name of the binary log index file, which keeps alist of all binlog files.
Strictly speaking, it is not necessary to give a name in the log-bin option. The defaultvalue is hostname-bin. The value for hostname is taken from the option for pid-file,which by default is the name of the host (as given by the gethostname(2) system call).If an administrator later changes the machine’s hostname, the binlog files will changenames as well, but they will be tracked correctly in the index file. However, it is a goodidea to create a name that is unique for the MySQL server and not tied to the machinethe server is running on because it can be confusing to work with a series of binlog filesthat suddenly change name midstream.
If no value is provided for log-bin-index, the default value will be the same base nameas for the binlog files (hostname-bin if you don’t give a default for log-bin). This meansthat if you do not provide a value for log-bin-index, the index file will change its namewhen you change the name of the host. So if you change the name of the host and startthe server, it will not find the index file and therefore assume that it does not exist, andthis will give you an empty binary log.
Each server is identified by a unique server ID, so if a slave connects to the master andhas the same server-id as the master, an error will be generated indicating that themaster and the slave have the same server ID.
Once you have added the options to the configuration file, start the server again andfinish its configuration by adding a replication user.
After you make the change to the master’s configuration file, restart the master for thechanges to take effect.
The slave initiates a normal client connection to the master and requests the master tosend all changes to it. For the slave to connect, a user with special replication privilegesis required on the master. Example 3-2 shows a standard mysql client session on the master server, with commands that add a new user account and give it the properprivilege.
Example 3-2. Creating a replication user on the mastermaster> CREATE USER repl_user;Query OK, 0 rows affected (0.00 sec)master> GRANT REPLICATION SLAVE ON *.* -> TO repl_user IDENTIFIED BY 'xyzzy';Query OK, 0 rows affected (0.00 sec)
26 | Chapter 3: MySQL Replication Fundamentals

There is nothing special about the REPLICATION SLAVE privilege ex‐cept that the user can retrieve the binary log from the master. It isperfectly viable to have a normal user account and grant that user theREPLICATION SLAVE privilege. It is, however, a good idea to keep thereplication slave user separate from the other users. If you do that,you can remove the user if you need to disallow certain slaves fromconnecting later.
Configuring the SlaveAfter configuring the master, you must configure the slave. As with the master server,you need to assign each slave a unique server ID. You may also want to consider addingthe names of the relay log and the relay log index files to the my.cnf file (we will discussthe relay log in more detail in “Replication Architecture Basics” on page 228) using theoptions relay-log and relay-log-index. The recommended configuration optionsare given in Example 3-3, with the added options highlighted.
Example 3-3. Options added to my.cnf to configure a slave[mysqld]user = mysqlpid-file = /var/run/mysqld/mysqld.pidsocket = /var/run/mysqld/mysqld.sockport = 3306basedir = /usrdatadir = /var/lib/mysqltmpdir = /tmpserver-id = 2relay-log-index = slave-relay-bin.indexrelay-log = slave-relay-bin
Like the log-bin and log-bin-index options, the defaults for the relay-log andrelay-log-index options depend on the hostname. The default for relay-log is hostname-relay-bin and the default for relay-log-index is hostname-relay-bin.index.Using the default introduces a problem in that if the hostname of the server changes, itwill not find the relay log index file and will assume there is nothing in the relay logfiles.
After editing the my.cnf file, restart the slave server for the changes to take effect.
Privileges for the User Configuring ReplicationTo configure the connection of the slave to the master for replication, it is necessary tohave an account with certain privileges, in addition to a shell account with access tocritical files. For security reasons, it is usually a good idea to restrict the account usedfor configuring the master and slave to just the necessary privileges. To create and dropusers, the account needs to have the CREATE USER privilege. To grant the REPLICATION
Basic Steps in Replication | 27

SLAVE to the replication account, it is necessary to have the REPLICATION SLAVE privilegewith the GRANT OPTION.
To perform further replication-related procedures (shown later in this chapter), youneed a few more options:
• To execute the FLUSH LOGS command (or any FLUSH command), you need theRELOAD privilege.
• To execute SHOW MASTER STATUS and SHOW SLAVE STATUS, you need either theSUPER or REPLICATION CLIENT privilege.
• To execute CHANGE MASTER TO, you need the SUPER privilege.
For example, to give mats sufficient privileges for all the procedures in this chapter, issuethe following:
server> GRANT REPLICATION SLAVE, RELOAD, CREATE USER, SUPER -> ON *.* -> TO mats@'192.168.2.%' -> WITH GRANT OPTION;
Connecting the Master and SlaveNow you can perform the final step in setting up basic replication: directing the slaveto the master so that it knows where to replicate from. To do this, you need four piecesof information about the master:
• A hostname• A port number• A user account on the master with replication slave privileges• A password for the user account
You already created a user account with the right privileges and a password when con‐figuring the master. The hostname is given by the operating system and can’t be con‐figured in the my.cnf file, but the port number can be assigned in my.cnf (if you do notsupply a port number, the default value of 3306 will be used). The final two steps nec‐essary to get replication up and running are to direct the slave to the master using theCHANGE MASTER TO command and then start replication using START SLAVE:
slave> CHANGE MASTER TO -> MASTER_HOST = 'master-1', -> MASTER_PORT = 3306, -> MASTER_USER = 'repl_user', -> MASTER_PASSWORD = 'xyzzy';Query OK, 0 rows affected (0.00 sec)
28 | Chapter 3: MySQL Replication Fundamentals

slave> START SLAVE;Query OK, 0 rows affected (0.15 sec)
Congratulations! You have now set up your first replication between a master and aslave! If you make some changes to the database on the master, such as adding newtables and filling them in, you will find that they are replicated to the slave. Try it out!Create a test database (if you do not already have one), create some tables, and add somedata to the tables to see that the changes replicate over to the slave.
Observe that either a hostname or an IP address can be given to the MASTER_HOSTparameter. If a hostname is given, the IP address for the hostname is retrieved by callinggethostname(3), which, depending on your configuration, could mean resolving thehostname using a DNS lookup. The steps for configuring such lookups are beyond thescope of this book.
A Brief Introduction to the Binary LogWhat makes replication work is the binary log (or just binlog), which is a record of allchanges made to the database on a server. You need to understand how the binary logworks in order to have control over replication or to fix any problems that arise, so we’llgive you a bit of background in this section.
Figure 3-2 shows a schematic view of the replication architecture, containing a masterwith a binary log and a slave that receives changes from the master via the binary log.We will cover the replication architecture in detail in Chapter 8. When a statement isabout to finish executing, it writes an entry to the end of the binary log and sends thestatement parser a notification that it has completed the statement.
Figure 3-2. Role of the binary log in replication
Usually only the statement that is about to finish executing is written to the binary log,but there are some special cases where other information is written—either in addition
A Brief Introduction to the Binary Log | 29

to the statement or instead of the statement. It will soon be clear why this is so, but forthe time being, you can pretend that only the statements that are being executed arebeing written to the binary log.
What’s Recorded in the Binary LogThe purpose of the binary log is to record changes made to the tables in the database.The binary log can then be used for replication, as well as for point-in-time-recovery(PITR) , discussed in Chapter 15) and in some limited cases for auditing.
Note that the binary log contains only changes made to the database, so for statementsthat do not change any data in the database, no entry is written to the binary log.
Traditionally, MySQL replication records changes by preserving the SQL statement thatmade the change. This is called statement-based replication. Because statement-basedreplication re-executes the statements on the slave, the result on the slave can differ fromthe master if the context of the master and slave are not exactly the same. This is thereason why as of version 5.1, MySQL also offers row-based replication. In contrast tostatement-based replication, row-based replication individually records each change toa row in the binary log. In addition to being more convenient, row-based replicationcan offer some speed advantages in certain situations.
To imagine the difference, consider a complex update that uses a lot of joins or WHEREclauses. Instead of re-executing all the logic on the slave in statement-based replication,all you really need to know is the state of the row after the change. On the other hand,if a single update changes 10,000 rows, you’d rather record just the statement instead of10,000 separate changes as row-based replication does.
We will cover row-based replication in Chapter 8, explaining its implementation andits use. In the examples that follow, we’ll focus on statement-based replication becauseit’s easier to understand with respect to database management activities.
Watching Replication in ActionUsing the replication example from the previous section, let’s take a look at the binlogevents for some simple statements. Let’s start by connecting a command-line client tothe master and executing a few commands to get a binary log:
master> CREATE TABLE tbl (text TEXT);Query OK, 0 rows affected (0.04 sec)
master> INSERT INTO tbl VALUES ("Yeah! Replication!");Query OK, 1 row affected (0.00 sec)
master> SELECT * FROM tbl;+--------------------+| text |
30 | Chapter 3: MySQL Replication Fundamentals

+--------------------+| Yeah! Replication! |+--------------------+1 row in set (0.00 sec)
master> FLUSH LOGS;Query OK, 0 rows affected (0.28 sec)
The FLUSH LOGS command forces the binary log to rotate, which will allow us to see a“complete” binlog file in all its glory. To take a closer look at this file, use the SHOW BINLOGEVENTS command, as shown in Example 3-4.
Example 3-4. Checking what events are in the binary logmaster> SHOW BINLOG EVENTS\G*************************** 1. row *************************** Log_name: mysql-bin.000001 Pos: 4 Event_type: Format_desc Server_id: 1End_log_pos: 107 Info: Server ver: 5.5.34-0ubuntu0.12.04.1-log, Binlog ver: 4*************************** 2. row *************************** Log_name: mysql-bin.000001 Pos: 107 Event_type: Query Server_id: 1End_log_pos: 198 Info: use `test`; CREATE TABLE tbl (text TEXT)*************************** 3. row *************************** Log_name: mysql-bin.000001 Pos: 198 Event_type: Query Server_id: 1End_log_pos: 266 Info: BEGIN*************************** 4. row *************************** Log_name: mysql-bin.000001 Pos: 266 Event_type: Query Server_id: 1End_log_pos: 374 Info: use `test`; INSERT INTO tbl VALUES ("Yeah! Replication!")*************************** 5. row *************************** Log_name: mysql-bin.000001 Pos: 374 Event_type: Xid Server_id: 1End_log_pos: 401 Info: COMMIT /* xid=188 */*************************** 6. row *************************** Log_name: mysql-bin.000001 Pos: 401
A Brief Introduction to the Binary Log | 31

Event_type: Rotate Server_id: 1End_log_pos: 444 Info: mysql-bin.000002;pos=46 rows in set (0.00 sec)
In this binary log, we can now see six events: a format description event, three queryevents, one XID event, and a rotate event. The query event is how statements executedagainst the database are normally written to the binary log, the XID event is used fortransaction management, whereas the format description and rotate events are used bythe server internally to manage the binary log. We will discuss these events in moredetail in Chapter 8, but for now, let’s take a closer look at the columns given for eachevent:Event_type
This is the type of the event. We have seen three different types here, but there aremany more. The type of the event denotes what information is transported to theslave. Currently—in MySQL 5.1.18 to 5.5.33—there are 27 events (several of themare not used, but they are retained for backward compatibility), and in 5.6.12 thereare 35, but this is an extensible range and new events are added as required.
Server_id
This is the server ID of the server that created the event.
Log_name
This is the name of the file that stores the event. An event is always contained in asingle file and will never span two files.
Pos
This is the position of the file where the event starts (i.e., the first byte of the event).
End_log_pos
This gives the position in the file where the event ends and the next event starts.This is one higher than the last byte of the event, so the bytes in the range Pos toEnd_log_pos − 1 are the bytes containing the event and the length of the event canbe computed as End_log_pos − Pos.
Info
This is human-readable text with information about the event. Different informa‐tion is printed for different events, but you can at least count on the query event toprint the statement that it contains.
The first two columns, Log_name and Pos, make up the binlog position of the event andwill be used to indicate the location or position of an event. In addition to what is shownhere, each event contains a lot of other information—for example, a timestamp, whichis the number of seconds since the Epoch (a classic Unix moment in time, 1970-01-0100:00:00 UTC).
32 | Chapter 3: MySQL Replication Fundamentals

The Binary Log’s Structure and ContentAs we explained, the binary log is not actually a single file, but a set of files that allowfor easier management (such as removing old logs without disturbing recent ones). Thebinary log consists of a set of binlog files with the real contents as well as a binlog indexfile, which keeps track of which binlog files exist. Figure 3-3 shows how a binary log isorganized.
Figure 3-3. Structure of the binary log
One binlog file is the active binlog file. This is the file that is currently being written to(and usually read from as well).
Each binlog file starts with a format description event and ends with a rotate event. Theformat description log event contains, among other things, the version of the server thatproduced the file and general information about the server and binary log. The rotateevent tells where the binary log continues by giving the filename of the next file in the sequence.
Each file is organized into binary log events, where each event makes a standalone,atomic piece of the binary log. The format description log event contains a flag thatmarks the file as properly closed. While a binlog file is being written, the flag is set, andwhen the file is closed, the flag is cleared. This way, it is possible to detect corrupt binlogfiles in the event of a crash and allow replication to recover.
If you try to execute additional statements at the master, you will observe somethingstrange—no changes are seen in the binary log:
master> INSERT INTO tbl VALUES ("What's up?");Query OK, 1 row affected (0.00 sec)
master> SELECT * FROM tbl;+--------------------+| text |
A Brief Introduction to the Binary Log | 33

+--------------------+| Yeah! Replication! || What's up? |+--------------------+1 row in set (0.00 sec)
master> SHOW BINLOG EVENTS\Gsame as before
What happened to the new event? Well, as you already know, the binary log consists ofseveral files, and the SHOW BINLOG EVENTS statement shows only the contents of the firstbinlog file. This is contrary to what most users expect, which is to see the contents ofthe active binlog file. If the name of the first binlog file is master-bin.000001 (containingthe events shown previously), you can take a look at the events in the next binlog file,in this case named master-bin.000002, using the following:
master> SHOW BINLOG EVENTS IN 'master-bin.000002'\G*************************** 1. row *************************** Log_name: mysql-bin.000002 Pos: 4 Event_type: Format_desc Server_id: 1End_log_pos: 107 Info: Server ver: 5.5.34-0ubuntu0.12.04.1-log, Binlog ver: 4*************************** 2. row *************************** Log_name: mysql-bin.000002 Pos: 107 Event_type: Query Server_id: 1End_log_pos: 175 Info: BEGIN*************************** 3. row *************************** Log_name: mysql-bin.000002 Pos: 175 Event_type: Query Server_id: 1End_log_pos: 275 Info: use `test`; INSERT INTO tbl VALUES ("What's up?")*************************** 4. row *************************** Log_name: mysql-bin.000002 Pos: 275 Event_type: Xid Server_id: 1End_log_pos: 302 Info: COMMIT /* xid=196 */4 rows in set (0.00 sec)
You might have noticed in Example 3-4 that the binary log ends with a rotate event andthat the Info field contains the name of the next binlog file and position where theevents start. To see which binlog file is currently being written, you can use the SHOWMASTER STATUS command:
34 | Chapter 3: MySQL Replication Fundamentals

master> SHOW MASTER STATUS\G*************************** 1. row *************************** File: master-bin.000002 Position: 205 Binlog_Do_DB:Binlog_Ignore_DB:1 row in set (0.00 sec)
Now that you’ve finished taking a look at the binary log, stop and reset the slave anddrop the table:
master> DROP TABLE tbl;Query OK, 0 rows affected (0.00 sec)
slave> STOP SLAVE;Query OK, 0 rows affected (0.08 sec)
slave> RESET SLAVE;Query OK, 0 rows affected (0.00 sec)
After that, you can drop the table and reset the master to start fresh:master> DROP TABLE tbl;Query OK, 0 rows affected (0.00 sec)
master> RESET MASTER;Query OK, 0 rows affected (0.04 sec)
The RESET MASTER command removes all the binlog files and clears the binlog indexfile. The RESET SLAVE statement removes all files used by replication on the slave to geta clean start.
Neither the RESET MASTER nor the RESET SLAVE command is de‐signed to work when replication is active, so:
• When executing the RESET MASTER command (on the master),make sure that no slaves are attached.
• When executing the RESET SLAVE command (on the slave),make sure that the slave does not have replication active by issuing a STOP SLAVE command.
We will cover the most basic events in this chapter, but for the complete list with all itsgory details, refer to the MySQL Internals Manual.
Adding SlavesNow that you know a little about the binary log, we are ready to tackle one of the basicproblems with the way we created a slave earlier. When we configured the slave, we
Adding Slaves | 35

provided no information about where to start replication, so the slave will start readingthe binary logs on the master from the beginning. That’s clearly not a very good idea ifthe master has been running for some time: in addition to making the slave replay quitea lot of events just to ramp up, you might not be able to obtain the necessary logs, becausethey might have been stored somewhere else for safekeeping and removed from themaster (we’ll discuss that more in Chapter 15 when we talk about backups and PITR).
We need another way to create new slaves—called bootstrapping a slave—without start‐ing replication from the beginning.
The CHANGE MASTER TO command has two parameters that will help us here:MASTER_LOG_FILE and MASTER_LOG_POS. (Starting with MySQL 5.6, there is another,even easier way to specify positions: Global Transaction Identifiers, or GTIDs. Readmore about them in Chapter 8.) You can use these to specify the binlog position at whichthe master should start sending events instead of starting from the beginning.
Using these parameters to CHANGE MASTER TO, we can bootstrap a slave using the fol‐lowing steps:
1. Configure the new slave.2. Make a backup of the master (or of a slave that has been replicating the master).
See Chapter 15 for common backup techniques.3. Write down the binlog position that corresponds to this backup (in other words,
the position following the last event leading up to the master’s current state).4. Restore the backup on the new slave. See Chapter 15 for common restore
techniques.5. Configure the slave to start replication from this position.
Depending on whether you use the master or a slave as a baseline in step 2, the procedurediffers slightly, so we will start by describing how to bootstrap a new slave when youonly have a single server running that you want to use as master—this is called cloningthe master.
Cloning the master means taking a snapshot of the server, which is usually accomplishedby creating a backup. There are various techniques for backing up the server, but in thischapter, we have decided to use one of the simpler techniques: running mysqldump tocreate a logical backup. Other options are to create a physical backup by copying thedatabase files, online backup techniques such as MySQL Enterprise Backup, or evenvolume snapshots using Linux LVM (Logical Volume Manager). The various techniqueswill be described fully in Chapter 15, along with a discussion of their relative merits.
36 | Chapter 3: MySQL Replication Fundamentals

Cloning the MasterThe mysqldump utility has options that allow you to perform all the steps in this sectionin a single step, but to explain the necessary operations, we will perform all the stepshere individually. You will see a more compact version later in this section.
To clone the master, as shown in Figure 3-4, start by creating a backup of the master.Because the master is probably running and has a lot of tables in the cache, it is necessaryto flush all tables and lock the database to prevent changes before checking the binlogposition. You can do this using the FLUSH TABLES WITH READ LOCK command:
master> FLUSH TABLES WITH READ LOCK;Query OK, 0 rows affected (0.02 sec)
Figure 3-4. Cloning a master to create a new slave
Once the database is locked, you are ready to create a backup and note the binlog po‐sition. Note that at this point you should not disconnect mysql from the server as thatwill release the lock that you just took. Because no changes are occurring on the master,the SHOW MASTER STATUS command will correctly reveal the current file and positionin the binary log. We will go through the details of the SHOW MASTER STATUS and theSHOW MASTER LOGS commands in Chapter 8.
master> SHOW MASTER STATUS\G*************************** 1. row *************************** File: master-bin.000042 Position: 456552 Binlog_Do_DB:Binlog_Ignore_DB:1 row in set (0.00 sec)
The position of the next event to write is master-bin.000042, 456552, which is wherereplication should start, given that everything before this point will be in the backup.Once you have jotted down the binlog position, you can create your backup. The easiestway to create a backup of the database is to use mysqldump:
$ mysqldump --all-databases --host=master-1 >backup.sql
Adding Slaves | 37

Because you now have a faithful copy of the master, you can unlock the tables of thedatabase on the master and allow it to continue processing queries:
master> UNLOCK TABLES;Query OK, 0 rows affected (0.23 sec)
Next, restore the backup on the slave using the mysql utility:$ mysql --host=slave-1 <backup.sql
You have now restored the backup of the master on the slave and can start the slave.Recalling the binlog position of the master that you wrote down previously, configurethe slave using CHANGE MASTER TO and start the slave:
slave> CHANGE MASTER TO -> MASTER_HOST = 'master-1', -> MASTER_PORT = 3306, -> MASTER_USER = 'slave-1', -> MASTER_PASSWORD = 'xyzzy', -> MASTER_LOG_FILE = 'master-bin.000042', -> MASTER_LOG_POS = 456552;Query OK, 0 rows affected (0.00 sec)
slave> START SLAVE;Query OK, 0 rows affected (0.25 sec)
It is possible to have mysqldump perform many of the previous steps automatically. Tomake a logical backup of all databases on a server called master, enter:
$ mysqldump --host=master -all-databases \> --master-data=1 >backup-source.sql
The --master-data=1 option makes mysqldump write a CHANGEMASTER TO statementwith the file and position in the binary log, as given by SHOW MASTER STATUS.
You can then restore the backup on a slave using:$ mysql --host=slave-1 <backup-source.sql
Note that you can only use --master-data=1 to get a CHANGE MASTER TO statement forthe master. When cloning the slave later, it is necessary to perform all the steps given inthe following section.
Congratulations! You have now cloned the master and have a new slave up and running.Depending on the load of the master, you might need to allow the slave to catch up fromthe position you jotted down, but that requires far less effort than starting from thebeginning.
Depending on how long the backup took, there might be a lot of data to catch up to, sobefore bringing the slave online, you might want to read through “Managing Consis‐tency of Data” on page 177.
38 | Chapter 3: MySQL Replication Fundamentals

Cloning a SlaveOnce you have a slave connected to the master, you can use the slave instead of themaster to create new slaves. That way, you can create a new slave without bringing themaster offline. If you have a large or high-traffic database, the downtime could be con‐siderable, considering both the time to create the backup and the time for the slaves tocatch up.
The process of cloning a slave is illustrated in Figure 3-5 and is basically the same as fora master, but it differs in how you find the binlog position. You also need to take intoconsideration that the slave you are cloning from is replicating a master.
Figure 3-5. Cloning a slave to create a new slave
The first thing you have to do before starting a backup is to stop the slave so that nomore changes occur on it. If replication is running while you create the backup, you willhave an inconsistent backup image if changes are made to the database while it is beingbacked up. The exception is if you use some form of online backup method—such as MySQL Enterprise Backup—in which case you do not need to stop the slave beforecreating the backup. Here is what you will see when you stop the slave:
original-slave> STOP SLAVE;Query OK, 0 rows affected (0.20 sec)
After the slave is stopped, you can flush the tables as before and create the backup.Because you created a backup of the slave (not the master), use the SHOW SLAVE STATUS command instead of SHOW MASTER STATUS to determine where to start replication.The output from this command is considerable, and it will be covered in detail inChapter 8, but to get the position of the next event in the binary log of the master thatthe slave will execute, note the value of the fields Relay_Master_Log_File and Exec_Master_Log_Pos:
Adding Slaves | 39

original-slave> SHOW SLAVE STATUS\G ...Relay_Master_Log_File: master-bin.000042 ... Exec_Master_Log_Pos: 546632
After creating the backup and restoring it on the new slave, configure replication to startfrom this position and start the new slave:
new-slave> CHANGE MASTER TO -> MASTER_HOST = 'master-1', -> MASTER_PORT = 3306, -> MASTER_USER = 'slave-1', -> MASTER_PASSWORD = 'xyzzy', -> MASTER_LOG_FILE = 'master-bin.000042', -> MASTER_LOG_POS = 546632;Query OK, 0 rows affected (0.19 sec)
new-slave> START SLAVE;Query OK, 0 rows affected (0.24 sec)
Cloning the master and cloning the slave differ only on some minor points, which meansthat our Python library will be able to combine the two into a single procedure forcreating new slaves by creating the backup at a source server and connecting the newslave to a master.
A common technique for making backups is to call FLUSH TABLES WITH READ LOCKand then to create a copy of the database files while the MySQL server is locked withthe read lock. This is usually much faster than using mysqldump, but FLUSH TABLESWITH READ LOCK is not safe for use with InnoDB!
FLUSH TABLES WITH READ LOCK does lock the tables, preventing any new transactionsfrom starting, but there are several activities going on in the background that FLUSHTABLES WITH READ LOCK does not prevent.
Use one of the following techniques to create a backup of InnoDB tables safely:
• Shut down the server and copy the files. This can be an advantage if the databaseis big, as restoring data with mysqldump can be slow.
• Use mysqldump after performing FLUSH TABLES WITH READ LOCK (as we did ear‐lier). The read lock is preventing changes while the data is read. The database maybe locked for a long time if there is a lot of data to be read. Note, however, that it ispossible to take a consistent snapshot using the --single-transaction option, butthis is only possible when using InnoDB tables. For more information, see “Themysqldump Utility” on page 560.
• Use a snapshot solution such as LVM (on Linux) or ZFS (on Solaris) while lockingthe database with FLUSH TABLES WITH READ LOCK.
40 | Chapter 3: MySQL Replication Fundamentals

• Use MySQL Enterprise Backup (or XtraBackup) to do an online backup of MySQL.
Scripting the Clone OperationThe Python library clones a master simply by copying the database from the masterusing the Server object that represents the master. To do this, it uses a clone function,which you will see in Example 3-6.
Cloning a slave is similar, but the backup is taken from one server, while the new slaveconnects to another server to perform replication. It is easy to support cloning both amaster and a slave by using two different parameters: a source parameter that specifieswhere the backup should be created and a use_master parameter that indicates wherethe slave should connect after the backup is restored. A call to the clone method lookslike the following:
clone(slave = slave[1], source = slave[0], use_master = master)
The next step is to write some utility functions to implement the cloning function, whichwill also come in handy for other activities. Example 3-5 shows the following functions:fetch_master_pos
Fetches the binlog position from a master (i.e., the position of the next event themaster will write to the binary log).
fetch_slave_pos
Fetches the binlog position from a slave (i.e., the position of the next event to readfrom the master).
replicate_from
Accepts as arguments a slave, a master, and a binlog position, and directs the slaveto replicate from the master starting with the given position.
The replicate_from function reads the field repl_user from the master to get thename and password of the replication user. If you look at the definition of the Serverclass, you’ll find that there is no such field. It is added by the Master role when the serveris imbued.
Example 3-5. Utility functions to fetch the master and slave positions of a server_CHANGE_MASTER_TO = """CHANGE MASTER TO MASTER_HOST=%s, MASTER_PORT=%s, MASTER_USER=%s, MASTER_PASSWORD=%s, MASTER_LOG_FILE=%s, MASTER_LOG_POS=%s"""
def replicate_from(slave, master, position): slave.sql(_CHANGE_MASTER_TO, (master.host, master.port, master.repl_user.name, master.repl_user.passwd, position.file, position.pos))
Adding Slaves | 41

def fetch_master_pos(server): result = server.sql("SHOW MASTER STATUS") return Position(server.server_id, result["File"], result["Position"])
def fetch_slave_pos(server): result = server.sql("SHOW SLAVE STATUS") return Position(server.server_id, result["Relay_Master_Log_File"], result["Exec_Master_Log_Pos"])
These are all the functions needed to create the clone function. To clone a slave, thecalling application passes a separate use_master argument, causing clone to direct thenew slave to that master for replication. To clone a master, the calling application omitsthe separate use_master argument, causing the function to use the “source” server as amaster.
Because there are many ways to create a backup of a server, Example 3-6 restricts themethod to one choice, using mysqldump to create a logical backup of the server. Later,we will demonstrate how to generalize the backup procedure so that you can use thesame basic code to bootstrap new slaves using arbitrary backup methods.
Example 3-6. Function to clone either the master or the slavedef clone(slave, source, use_master = None): from subprocess import call backup_file = open(server.host + "-backup.sql", "w+") if master is not None: source.sql("STOP SLAVE") lock_database(source) if master is None: position = fetch_master_position(source) else: position = fetch_slave_position(source) call(["mysqldump", "--all-databases", "--host='%s'" % source.host], stdout=backup_file) if master is not None: start_slave(source) backup_file.seek() # Rewind to beginning call(["mysql", "--host='%s'" % slave.host], stdin=backup_file) if master is None: replicate_from(slave, source, position) else: replicate_from(slave, master, position) start_slave(slave)
Performing Common Tasks with ReplicationEach of the common use cases for replication—scale-out, hot standbys, and so forth—involve their own implementation details and possible pitfalls. We’ll show you how toperform some of these tasks and how to enhance the Python library to support them.
42 | Chapter 3: MySQL Replication Fundamentals

Passwords are omitted from the examples in this section. When con‐figuring the accounts to control the servers, you can either allowaccess only from certain hosts that control the deployment (by cre‐ating accounts such as mats@'192.168.2.136'), or you can supplypasswords to the commands.
ReportingMost businesses need a lot of routine reports: weekly reports on the items sold, monthlyreports on expenses and revenues, and various kinds of heavy data mining to spot trendsor identify focus groups for the marketing department.
Running these queries on the master can prove to be troublesome. Data-mining queriescan require a lot of computing resources and can slow down normal operations only tofind out that, say, a focus group for left handed scissors might not be worthwhile toconduct. In addition, these reports are typically not very urgent (compared to processingnormal transactions), so there is no need to create them as quickly as possible. In otherwords, because these reports are not time-critical, it does not matter much if they taketwo hours to complete instead of one.
A better idea is to dust off a spare server (or two, if you have enough reporting require‐ments) and set it up to replicate from the master. When you need to do the reporting,you can stop replication, run your reporting applications, then start replication again,all without disturbing the master.
Reporting often needs to cover a precise interval, such as a summary of all sales for theday, so it is necessary to stop replication at the right moment so you don’t get any salesfor the following day in the report. Because there is no way to stop the slave when it seesan event with a certain date or time, it has to be done some other way.
Let’s pretend that reports are needed once each day, and that all transactions from mid‐night to midnight shall be included. It is necessary to stop the reporting slave at midnightso that no events from after midnight are executed on the slave and all events frombefore midnight are executed on the slave. The intention is not to do this manually, solet’s consider how we can automate the procedure. The following steps will accomplishwhat we want:
1. Just before midnight, perhaps five minutes before midnight, stop the reporting slaveso that no events come from the master.
2. After midnight, check the binary log on the master and find the last event that wasrecorded before midnight. Obviously, if you do this before midnight, you might nothave seen all events for the day yet.
3. Record the binlog position of this event and start the slave to run until this position.
Performing Common Tasks with Replication | 43

4. Wait until the slave has reached this position and stopped.
The first issue is how to schedule the jobs correctly. There are different ways to do this,depending on the operating system. Although we won’t go into all the details here, youcan see how to schedule tasks for Unix-like operating systems, such as Linux, in “Sched‐uling tasks on Unix” on page 48.
Stopping the slave is as simple as executing STOP SLAVE and noting the binlog positionafter the slave is stopped:
slave> STOP SLAVE;Query OK, 0 rows affected (0.25 sec)
slave> SHOW SLAVE STATUS\G ...Relay_Master_Log_File: capulet-bin.000004 ... Exec_Master_Log_Pos: 24561 row in set (0.00 sec)
The remaining three steps are executed before the actual reporting starts and usually aspart of the script that does the actual reporting. Before outlining the script, let’s considerhow to perform each step.
To read the contents of the binary log, invoke a utility called mysqlbinlog. This will beintroduced in detail later, but this utility is used in the second step. The mysqlbinlogutility has the two handy options, --start-datetime and --stop-datetime, which youcan use to read only a portion of the binary log. So to get all events from the time thatyou stopped the slave to just before midnight, use the following command:
$ mysqlbinlog --force --read-from-remote-server --host=reporting.bigcorp.com \> --start-datetime='2009-09-25 23:55:00' > --stop-datetime='2009-09-25 23:59:59' \> binlog files
The timestamp stored in each event is the timestamp when the statement started exe‐cuting, not the timestamp when it was written to the binary log. The --stop-datetime option will stop emitting events on the first timestamp after the date/timesupplied, so it is possible that there is an event that started executing before the date/time but was written to the binary log after the date/time. Such an event is not includedin the range given.
Because the master is writing to the binary logs at this time, it is necessary to supply the--force option. Otherwise, mysqlbinlog will refuse to read the open binary log. Toexecute this command, it is necessary to supply a set of binlog files to read. Since thenames of these files are dependent on configuration options, the names of these fileshave to be fetched from the server. After that, it is necessary to figure out the range ofbinlog files that needs to be supplied to the mysqlbinlog command. Getting the list ofbinlog filenames is easy to do with the SHOW BINARY LOGS command:
44 | Chapter 3: MySQL Replication Fundamentals

master> SHOW BINARY LOGS;+--------------------+-----------+| Log_name | File_size |+--------------------+-----------+| capulet-bin.000001 | 24316 || capulet-bin.000002 | 1565 || capulet-bin.000003 | 125 || capulet-bin.000004 | 2749 |+--------------------+-----------+4 rows in set (0.00 sec)
In this case, there are only four files, but there could potentially be quite a lot more.Scanning a large list of files that were written before the slave was stopped is just a wasteof time, so it is a good idea to try to reduce the number of files to read in order to findthe correct position to stop at. Because you recorded the binlog position in the first step,when the slave was stopped, it is an easy matter to find the name of the file where theslave stopped and then take that name and all the following names as input to themysqlbinlog utility. Typically, this will only be one file (or two in the event that the binarylog was rotated between stopping the slave and starting the reporting).
When executing the mysqlbinlog command with just a few binlog files, you will get atextual output for each with some information about the event:
$ mysqlbinlog --force --read-from-remote-server --host=reporting.bigcorp.com \> --start-datetime='2009-09-25 23:55:00' > --stop-datetime='2009-09-25 23:59:59' \> capulet-bin.000004/*!40019 SET @@session.max_insert_delayed_threads=0*/;/*!50003 SET @OLD_COMPLETION_TYPE=@@COMPLETION_TYPE,COMPLETION_TYPE=0*/;DELIMITER /*!*/;# at 4#090909 22:16:25 server id 1 end_log_pos 106 Start: binlog v 4, server v...ROLLBACK/*!*/; . . .# at 2495#090929 23:58:36 server id 1 end_log_pos 2650 Query thread_id=27 exe...SET TIMESTAMP=1254213690/*!*/;SET /*!*/;INSERT INTO message_board(user, message) VALUES ('[email protected]', 'Midnight, and I'm bored')/*!*/;
The interesting part here is the end_log_pos of the last event in the sequence (in thiscase, 2650), because this is where the next event after midnight will be written.
If you were paying attention to the output from the previous command, you saw thatthere is no information about which binlog file this byte position is referring to, and itis necessary to have a file to find the event. If a single file is supplied to the mysqlbin
Performing Common Tasks with Replication | 45

log command, the filename is obvious, but if two files are supplied, it is necessary tofigure out if the last event for the day is in the first or the second file.
If you look at the line containing the end_log_pos, you will also see that the event typeis there. Because every binlog file starts with a format description event—a line for suchan event appears in the previous output—you can check these events to determine thelocation of the event you want. If there are two format description events in the output,the event is in the second file, and if there is just one, it is in the first file.
The final step before starting the reporting work is to start replication and stop it atexactly the position where the event after midnight will be written (or has already beenwritten, should that be the case). To do this, you can use the lesser-known syntax STARTSLAVE UNTIL. This command accepts a master logfile and a master log position wherethe slave should stop, and then starts the slave. When the slave reaches the given position,it will automatically stop:
report> START SLAVE UNTIL -> MASTER_LOG_POS='capulet-bin.000004', -> MASTER_LOG_POS=2650;Query OK, 0 rows affected (0.18 sec)
Like the STOP SLAVE command (without the UNTIL), the START SLAVE UNTIL commandwill return immediately—not, as could be expected, when the slave has reached theposition where it should stop. So commands issued after START SLAVE UNTIL continueto be executed as long as the slave is running. To wait for the slave to reach the positionyou want it to stop at, use the MASTER_POS_WAIT function, which will block while waitingfor the slave to reach the given position:
report> SELECT MASTER_POS_WAIT('capulet-bin.000004', 2650);Query OK, 0 rows affected (231.15 sec)
At this point, the slave has stopped at the last event for the day, and the reporting processcan start analyzing the data and generating reports.
Handling reporting in Python
Automating this in Python is quite straightforward; Example 3-7 shows the code forstopping reporting at the right time.
The fetch_remote_binlog function reads a binary log from a remote server using themysqlbinlog command. The contents of the file(s) will be returned as an iterator overthe lines of the file. To optimize the fetches, you can optionally provide a list of files toscan. You can also pass a start date/time and a stop date/time to limit the date/time rangeof the result. These will be passed to the mysqlbinlog program.
The find_datetime_position function does the work of scanning the binlog lines tofind the last end_log_pos as well as keeping track of how many start events have beenobserved. It also contacts the reporting server to find out where it stopped reading the
46 | Chapter 3: MySQL Replication Fundamentals

binlog file and then contacts the master to get the binlog files and find the right one tostart the scan from.
Example 3-7. Python code for running replication to a datetimedef fetch_remote_binlog(server, binlog_files=None, start_datetime=None, stop_datetime=None): from subprocess import Popen, PIPE if not binlog_files: binlog_files = [ row["Log_name"] for row in server.sql("SHOW BINARY LOGS")]
command = ["mysqlbinlog", "--read-from-remote-server", "--force", "--host=%s" % (server.host), "--user=%s" % (server.sql_user.name)] if server.sql_user.passwd: command.append("--password=%s" % (server.sql_user.passwd)) if start_datetime: command.append("--start-datetime=%s" % (start_datetime)) if stop_datetime: command.append("--stop-datetime=%s" % (stop_datetime)) return iter(Popen(command + binlog_files, stdout=PIPE).stdout)
def find_datetime_position(master, report, start_datetime, stop_datetime): from itertools import dropwhile from mysql.replicant import Position import re
all_files = [row["Log_name"] for row in master.sql("SHOW BINARY LOGS")] stop_file = report.sql("SHOW SLAVE STATUS")["Relay_Master_Log_File"] files = list(dropwhile(lambda file: file != stop_file, all_files)) lines = fetch_remote_binlog(server, binlog_files=files, start_datetime=start_datetime, stop_datetime=stop_datetime) binlog_files = 0 last_epos = None for line in lines: m = re.match(r"#\d{6}\s+\d?\d:\d\d:\d\d\s+" r"server id\s+(?P<sid>\d+)\s+" r"end_log_pos\s+(?P<epos>\d+)\s+" r"(?P<type>\w+)", line) if m: if m.group("type") == "Start": binlog_files += 1 if m.group("type") == "Query": last_epos = m.group("epos") return Position(files[binlog_files-1], last_epos)
You can now use these functions to synchronize the reporting server before the actualreporting job:
Performing Common Tasks with Replication | 47

master.connect()report.connect()pos = find_datetime_position(master, report, start_datetime="2009-09-14 23:55:00", stop_datetime="2009-09-14 23:59:59")report.sql("START SLAVE UNTIL MASTER_LOG_FILE=%s, MASTER_LOG_POS=%s", (pos.file, pos.pos))report.sql("DO MASTER_POS_WAIT(%s,%s)", (pos.file, pos.pos))
. .code for reporting . .
As you can see, working with replication is pretty straightforward. This particular ex‐ample introduces several of the critical concepts that we will be using later when talkingabout scale-out: how to start and stop the slave at the right time, how to get informationabout binlog positions or figure it out using the standard tools, and how to integrate itall into an automated solution for your particular needs.
Scheduling tasks on Unix
To easiest way ensure the slave is stopped just before midnight and the reporting isstarted after midnight is to set up a job for cron(8) that sends a stop slave command tothe slave and starts the reporting script.
For example, the following crontab(5) entries would ensure that the slave is stoppedbefore midnight, and that the reporting script to roll the slave forward is executed, say,five minutes after midnight. Here we assume that the stop_slave script will stop theslave, and the daily_report will run the daily report (starting with the synchronizationdescribed earlier):
# stop reporting slave five minutes before midnight, every day55 23 * * * $HOME/mysql_control/stop_slave
# Run reporting script five minutes after midnight, every day5 0 * * * $HOME/mysql_control/daily_report
Assuming that you put this in a crontab file, reporttab, you can install the crontab fileusing the crontab reporttab command.
Scheduling tasks on Windows
To start the Task Scheduler in Windows, open the search feature (Windows key+R) andenter taskschd.msc. Depending on your security settings and version of Windows, youmay need to respond to the User Account Control (UAC) dialog box to continue. Tocreate a new task trigger by time, choose Create Basic Task from the Action pane. Thisopens the Create Basic Task Wizard, which will guide you through the steps to create a
48 | Chapter 3: MySQL Replication Fundamentals

simple task. On the first pane of the wizard, name the task and provide an optionaldescription, then click Next.
The second pane allows you to specify the frequency of the firing of the task. There aremany options here for controlling when the task runs: a single run, daily, weekly, andeven when you log on or when a specific event occurs. Click Next once you’ve madeyour choice. Depending on the frequency you chose, the third pane will allow you tospecify the details (e.g., date and time) of when the task fires. Click Next once you haveconfigured the trigger timing options.
The fourth pane is where you specify the task or action to occur when the task eventoccurs (when the task fires). You can choose to start a program, send an email message,or display a message to the user. Make your selection and click Next to move to the nextpane. Depending on the action you chose on the previous pane, here you can specifywhat happens when the task fires. For example, if you chose to run an application, youenter the name of the application or script, any arguments, and which folder the taskstarts in.
Once you have entered all of this information, click Next to review the task on the finalpane. If you’re satisfied all is set correctly, click Finish to schedule the task. You can clickBack to return to any of the previous screens and make changes. Finally, you have theoption to open the Properties page after you click Finish if you want to make additionalchanges to the task.
ConclusionIn this chapter, we have presented an introduction to MySQL replication, including alook at why replication is used and how to set it up. We also took a quick look into thebinary log. In the next chapter, we examine the binary log in greater detail.
Joel finished giving Mr. Summerson his report on how he was going to balance the loadacross four new slaves, along with plans for how the topology could be expanded tohandle future needs.
“That’s fine work, Joel. Now explain to me again what this slave thing is.”
Joel suppressed a sigh and said, “A slave is a copy of the data on the database server thatgets its changes from the original database server called the master…”
Conclusion | 49


CHAPTER 4
The Binary Log
“Joel?”
Joel jumped, nearly banging his head as he crawled out from under his desk. “I was justrerouting a few cables,” he said by way of an explanation.
Mr. Summerson merely nodded and said in a very authoritative manner, “I need you tolook into a problem the marketing people are having with the new server. They need toroll back the data to a certain point.”
“Well, that depends…” Joel started, worried about whether he had snapshots of old statesof the system.
“I told them you’d be right down.”
With that, Mr. Summerson turned and walked away. A moment later a woman stoppedin front of his door and said, “He’s always like that. Don’t take it personally. Most of uscall it a drive-by tasking.” She laughed and introduced herself. “My name’s Amy. I’m oneof the developers here.”
Joel walked around his desk and met her at the door. “I’m Joel.”
After a moment of awkward silence Joel said, “I, er, better get on that thing.”
Amy smiled and said, “See you around.”
“Just focus on what you have to do to succeed,” Joel thought as he returned to his deskto search for that MySQL book he bought last week.
The previous chapter included a very brief introduction to the binary log. In this chapter,we will fill in more details and give a more thorough description of the binary logstructure, the replication event format, and how to use the mysqlbinlog tool to investigateand work with the contents of binary logs.
51

The binary log records changes made to the database. It is usually used for replication,and the binary log then allows the same changes to be made on the slaves as well. Becausethe binary log normally keeps a record of all changes, you can also use it for auditingpurposes to see what happened in the database, and for point-in-time recovery (PITR)by playing back the binary log to a server, repeating changes that were recorded in thebinary log. (This is what we did in “Reporting” on page 43, where we played back allchanges done between 23:55:00 and 23:59:59.)
The binary log contains information that could change the database. Note that state‐ments that could potentially change the database are also logged, even if they don’tactually do change the database. The most notable cases are those statements that op‐tionally make a change, such as DROP TABLE IF EXISTS or CREATE TABLE IF NOTEXISTS, along with statements such as DELETE and UPDATE that have WHERE conditions that don’t happen to match any rows on the master.
SELECT statements are not normally logged because they do not make any changes toany database. There are, however, exceptions.
The binary log records each transaction in the order that the commit took place on themaster. Although transactions may be interleaved on the master, each appears as anuninterrupted sequence in the binary log, the order determined by the time of thecommit.
Structure of the Binary LogConceptually, the binary log is a sequence of binary log events (also called binlogevents or even just events when there is no risk of confusion). As you saw in Chap‐ter 3, the binary log actually consists of several files, as shown in Figure 4-1, that togetherform the binary log.
Figure 4-1. The structure of the binary log
52 | Chapter 4: The Binary Log

1. In some special cases, covered in “How nontransactional statements are logged” on page 88, nontransactionalstatements can be part of a group.
The actual events are stored in a series of files called binlog files with names in the formhost-bin.000001, accompanied by a binlog index file that is usually named host-bin.index and keeps track of the existing binlog files. The binlog file that is currentlybeing written to by the server is called the active binlog file. If no slaves are lagging, thisis also the file that is being read by the slaves. The names of the binlog files and thebinlog index file can be controlled using the log-bin and log-bin-index options, whichyou are familiar with from “Configuring the Master” on page 25. The options are cov‐ered in more detail later in this chapter.
The index file keeps track of all the binlog files used by the server so that the server cancorrectly create new binlog files when necessary, even after server restarts. Each line inthe index file contains the name of a binlog file that is part of the binary log. Dependingon the MySQL version, it can either be the full name or a name relative to the datadirectory. Commands that affect the binlog files, such as PURGE BINARY LOGS, RESETMASTER, and FLUSH LOGS, also affect the index file by adding or removing lines to matchthe files that were added or removed by the command.
As shown in Figure 4-1, each binlog file is made up of binlog events, with theFormat_description event serving as the file’s header and the Rotate event as its footer.Note that a binlog file might not end with a rotate event if the server was interrupted orcrashed.
The Format_description event contains information about the server that wrote thebinlog file as well as some critical information about the file’s status. If the server isstopped and restarted, it creates a new binlog file and writes a new Format_description event to it. This is necessary because changes can potentially occur between bring‐ing a server down and bringing it up again. For example, the server could be upgraded,in which case a new Format_description event would have to be written.
When the server has finished writing a binlog file, a Rotate event is added to end thefile. The event points to the next binlog file in sequence by giving the name of the fileas well as the position to start reading from.
The Format_description event and the Rotate event will be described in detail in thenext section.
With the exception of control events (e.g., Format_description, Rotate, and Incident), events of a binlog file are grouped into units called groups, as seen inFigure 4-2. In transactional storage engines, each group is roughly equivalent to atransaction, but for nontransactional storage engines or statements that cannot be partof a transaction, such as CREATE or ALTER, each statement is a group by itself.1
Structure of the Binary Log | 53

In short, each group of events in the binlog file contains either a single statement notin a transaction or a transaction consisting of several statements.
Figure 4-2. A single binlog file with groups of events
Each group is executed entirely or not at all (with the exception of a few well-definedcases). If, for some reason, the slave stops in the middle of a group, replication will startfrom the beginning of the group and not from the last statement executed. Chapter 8describes in detail how the slave executes events.
Binlog Event StructureMySQL 5.0 introduced a new binlog format: binlog format 4. The preceding formatswere not easy to extend with additional fields if the need were to arise, so binlog format4 was designed specifically to be extensible. This is still the event format used in everyserver version since 5.0, even though each version of the server has extended the binlogformat with new events and some events with new fields. Binlog format 4 is the eventformat described in this chapter.
Each binlog event consists of four parts:Common header
The common header is—as the name suggests—common to all events in the binlogfile.
The common header contains basic information about the event, the most impor‐tant fields being the event type and the size of the event.
54 | Chapter 4: The Binary Log

Post headerThe post header is specific to each event type; in other words, each event type storesdifferent information in this field. But the size of this header, just as with the com‐mon header, is the same throughout a given binlog file. The size of each event typeis given by the Format_description event.
Event bodyAfter the headers comes the event body, which is the variable-sized part of the event.The size and the end position is listed in the common header for the event. Theevent body stores the main data of the event, which is different for different eventtypes. For the Query event, for instance, the body stores the query, and for theUser_var event, the body stores the name and value of a user variable that was justset by a statement.
ChecksumStarting with MySQL 5.6, there is a checksum at the end of the event, if the serveris configured to generate one. The checksum is a 32-bit integer that is used to checkthat the event has not been corrupted since it was written.
A complete listing of the formats of all events is beyond the scope of this book, butbecause the Format_description and Rotate events are critical to how the other eventsare interpreted, we will briefly cover them here. If you are interested in the details of theevents, you can find them in the MySQL Internals Manual.
As already noted, the Format_description event starts every binlog file and containscommon information about the events in the file. The result is that the Format_description event can be different between different files; this typically occurs when a serveris upgraded and restarted. The Format_description_log_event contains the followingfields:Binlog file format version
This is the version of the binlog file, which should not be confused with the versionof the server. MySQL versions 3.23, 4.0, and 4.1 use version 3 of the binary log,while MySQL versions 5.0 and later use version 4 of the binary log.
The binlog file format version changes when developers make significant changesin the overall structure of the file or the events. In MySQL version 5.0, the startevent for a binlog file was changed to use a different format and the common headersfor all events were also changed, which prompted the change in the binlog fileformat version.
Server versionThis is a version string denoting the server that created the file. This includes theversion of the server as well as additional information if special builds are made.The format is normally the three-position version number, followed by a hyphen
Structure of the Binary Log | 55

and any additional build options. For example, “5.5.10-debug-log” means debugbuild version 5.5.10 of the server.
Common header lengthThis field stores the length of the common header. Because it’s here in the Format_description, this length can be different for different binlog files. This holdsfor all events except the Format_description and Rotate events, which cannotvary.
Post-header lengthsThe post-header length for each event is fixed within a binlog file, and this fieldstores an array of the post-header length for each event that can occur in the binlogfile. Because the number of event types can vary between servers, the number ofdifferent event types that the server can produce is stored before this field.
The Rotate and Format_description log events have a fixed lengthbecause the server needs them before it knows the size of the com‐mon header length. When connecting to the server, it first sends aFormat_description event. Because the length of the common head‐er is stored in the Format_description event, there is no way for theserver to know what the size of the common header is for the Rotate event unless it has a fixed size. So for these two events, the sizeof the common header is fixed and will never change between serv‐er versions, even if the size of the common header changes for oth‐er events.
Because both the size of the common header and the size of the post header for eachevent type are given in the Format_description event, extending the format with newevents or even increasing the size of the post headers by adding new fields is supportedby this format and will therefore not require a change in the binlog file format.
With each extension, particular care is taken to ensure that the extension does not affectinterpretation of events that were already in earlier versions. For example, the commonheader can be extended with an additional field to indicate that the event is compressedand the type of compression used, but if this field is missing—which would be the caseif a slave is reading events from an old master—the server should still be able to fall backon its default behavior.
Event ChecksumsBecause hardware can fail and software can contain bugs, it is necessary to have someway to ensure that data corrupted by such events is not applied on the slave. Randomfailures can occur anywhere, and if they occur inside a statement, they often lead to asyntax error causing the slave to stop. However, relying on this to prevent corrupt events
56 | Chapter 4: The Binary Log

from being replicated is a poor way to ensure integrity of events in the binary log. Thispolicy would not catch many types of corruptions, such as in timestamps, nor would itwork for row-based events where the data is encoded in binary form and random cor‐ruptions are more likely to lead to incorrect data.
To ensure the integrity of each event, MySQL 5.6 introduced replication event check‐sums. When events are written, a checksum is added, and when the events are read, thechecksum is computed for the event and compared against the checksum written withthe event. If the checksums do not match, execution can be aborted before any attemptis made to apply the event on the slave. The computation of checksums can potentiallyimpact performance, but benchmarking has demonstrated no noticeable performancedegradation from the addition and checking of checksums, so they are enabled by de‐fault in MySQL 5.6. They can, however, be turned off if necessary.
In MySQL 5.6, checksums can be generated when changes are written either to thebinary log or to the relay log, and verified when reading events back from one of theselogs.
Replication event checksums are controlled using three options:binlog-checksum=type
This option enables checksums and tells the server what checksum computation touse. Currently there are only two choices: CRC32 uses ISO-3309 CRC-32 checksums,whereas NONE turns off checksumming. The default is CRC32, meaning that check‐sums are generated.
master-verify-checksum=boolean
This option controls whether the master verifies the checksum when reading it fromthe binary log. This means that the event checksum is verified when it is read fromthe binary log by the dump thread (see “Replication Architecture Basics” on page228), but before it is sent out, and also when using SHOW BINLOG EVENTS. If any of theevents shown is corrupt, the command will throw an error. This option is off bydefault.
slave-sql-verify-checksum=boolean
This option controls whether the slave verifies the event checksum after reading itfrom the relay log and before applying it to the slave database. This option is off bydefault.
If you get a corrupt binary log or relay log, mysqlbinlog can be used to find the badchecksum using the --verify-binlog-checksum option. This option causes mysqlbin‐log to verify the checksum of each event read and stop when a corrupt event is found,which the following example demonstrates:
$ client/mysqlbinlog --verify-binlog-checksum master-bin.000001 . .
Structure of the Binary Log | 57

.# at 261#110406 8:35:28 server id 1 end_log_pos 333 CRC32 0xed927ef2...SET TIMESTAMP=1302071728/*!*/;BEGIN/*!*/;# at 333#110406 8:35:28 server id 1 end_log_pos 365 CRC32 0x01ed254d IntvarSET INSERT_ID=1/*!*/;ERROR: Error in Log_event::read_log_event(): 'Event crc check failed!...DELIMITER ;# End of log fileROLLBACK /* added by mysqlbinlog */;/*!50003 SET COMPLETION_TYPE=@OLD_COMPLETION_TYPE*/;
Logging StatementsStarting with MySQL 5.1, row-based replication is also available, which will be coveredin “Row-Based Replication” on page 97.
In statement-based replication, the actual executed statement is written to the binarylog together with some execution information, and the statement is re-executed on theslave. Because not all events can be logged as statements, there are some exceptions thatyou should be aware of. This section will describe the process of logging individualstatements as well as the important caveats.
Because the binary log is a common resource—all threads write to it—it is critical toprevent two threads from updating the binary log at the same time. To handle this, alock for the binary log—called the LOCK_log mutex—is acquired just before each groupis written to the binary log and released just after the group has been written. Becauseall session threads for the server can potentially log transactions to the binary log, it isquite common for several session threads to block on this lock.
Logging Data Manipulation Language StatementsData manipulation are usuallylanguage (DML) statements are usually DELETE, INSERT,and UPDATE statements. To support logging changes in a consistent manner, MySQLwrites the binary log while transaction-level locks are held, and releases them after thebinary log has been written.
To ensure that the binary log is updated consistently with the tables that the statementmodifies, each statement is logged to the binary log during statement commit, just beforethe table locks are released. If the logging were not made as part of the statement, anotherstatement could be “injected” between the changes that the statement introduces to thedatabase and the logging of the statement to the binary log. This would mean that thestatements would be logged in a different order than the order in which they took effectin the database, which could lead to inconsistencies between master and slave. For in‐
58 | Chapter 4: The Binary Log

stance, an UPDATE statement with a WHERE clause could update different rows on the slavebecause the values in those rows might be different if the statement order changed.
Logging Data Definition Language StatementsData definition language (DDL) statements affect a schema, such as CREATE TABLE andALTER TABLE statements. These create or change objects in the filesystem—for example,table definitions are stored in .frm files and databases are represented as filesystemdirectories—so the server keeps information about these available in internal datastructures. To protect the update of the internal data structure, it is necessary to acquirean internal lock (called LOCK_open) before altering the table definition.
Because a single lock is used to protect these data structures, the creation, alteration,and destruction of database objects can be a considerable source of performance prob‐lems. This includes the creation and destruction of temporary tables, which is quitecommon as a technique to create an intermediate result set to perform computationson.
If you are creating and destroying a lot of temporary tables, it is often possible to boostperformance by reducing the creation (and subsequent destruction) of temporarytables.
Logging QueriesFor statement-based replication, the most common binlog event is the Query event,which is used to write a statement executed on the master to the binary log. In additionto the actual statement executed, the event contains some additional information nec‐essary to execute the statement.
Recall that the binary log can be used for many purposes and contains statements in apotentially different order from that in which they were executed on the master. In somecases, part of the binary log may be played back to a server to perform PITR, and insome cases, replication may start in the middle of a sequence of events because a backuphas been restored on a slave before starting replication.
In all these cases, the events are executing in different contexts (i.e., there is informationthat is implicit when the server executes the statement but that has to be known toexecute the statement correctly). Examples include:Current database
If the statement refers to a table, function, or procedure without qualifying it withthe database, the current database is implicit for the statement.
Value of user-defined variableIf a statement refers to a user-defined variable, the value of the variable is implicitfor the statement.
Logging Statements | 59

Seed for the RAND functionThe RAND function is based on a pseudorandom number function, meaning that itcan generate a sequence of numbers that are reproducible but appear random inthe sense that they are evenly distributed. The function is not really random, butstarts from a seed number and applies a pseudorandom function to generate adeterministic sequence of numbers. This means that given the same seed, the RANDfunction will always return the same number. However, this makes the seed implicitfor the statement.
The current timeObviously, the time the statement started executing is implicit. Having a correcttime is important when calling functions that are dependent on the current time—such as NOW and UNIX_TIMESTAMP—because otherwise they will return different re‐sults if there is a delay between the statement execution on the master and on theslave.
Value used when inserting into an AUTO_INCREMENT columnIf a statement inserts a row into a table with a column defined with the AUTO_INCREMENT attribute, the value used for that row is implicit for the statementbecause it depends on the rows inserted before it.
Value returned by a call to LAST_INSERT_IDIf the LAST_INSERT_ID function is used in a statement, it depends on the valueinserted by a previous statement, which makes this value implicit for the statement.
Thread IDFor some statements, the thread ID is implicit. For example, if the statement refersto a temporary table or uses the CURRENT_ID function, the thread ID is implicit forthe statement.
Because the context for executing the statements cannot be known when they’re re‐played—either on a slave or on the master after a crash and restart—it is necessary tomake the implicit information explicit by adding it to the binary log. This is done inslightly different ways for different kinds of information.
In addition to the previous list, some information is implicit to the execution of triggersand stored routines, but we will cover that separately in “Triggers, Events, and StoredRoutines” on page 70.
Let’s consider each of the cases of implicit information individually, demonstrate theproblem with each one, and examine how the server handles it.
Current database
The log records the current database by adding it to a special field of the Query event.This field also exists for the events used to handle the LOAD DATA INFILE statement,
60 | Chapter 4: The Binary Log

discussed in “LOAD DATA INFILE Statements” on page 65, so the description hereapplies to that statement as well. The current database also plays an important role infiltering on the database and is described later in this chapter.
Current time
Five functions use the current time to compute their values: NOW, CURDATE, CURTIME,UNIX_TIMESTAMP, and SYSDATE. The first four functions return a value based on the timewhen the statement started to execute. In contrast, SYSDATE returns the value when thefunction is executed. The difference can best be demonstrated by comparing the exe‐cution of NOW and SYSDATE with an intermediate sleep:
mysql> SELECT SYSDATE(), NOW(), SLEEP(2), SYSDATE(), NOW()\G*************************** 1. row ***************************SYSDATE(): 2013-06-08 23:24:08 NOW(): 2013-06-08 23:24:08 SLEEP(2): 0SYSDATE(): 2013-06-08 23:24:10 NOW(): 2013-06-08 23:24:081 row in set (2.00 sec)
Both functions are evaluated when they are encountered, but NOW returns the time thatthe statement started executing, whereas SYSDATE returns the time when the functionwas executed.
To handle these time functions correctly, the timestamp indicating when the eventstarted executing is stored in the event. This value is then copied from the event to theslave execution thread and used as if it were the time the event started executing whencomputing the value of the time functions.
Because SYSDATE gets the time from the operating system directly, it is not safe forstatement-based replication and will return different values on the master and slavewhen executed. So unless you really want to have the actual time inserted into yourtables, it is prudent to stay away from this function.
Context events
Some implicit information is associated with statements that meet certain conditions:
• If the statement contains a reference to a user-defined variable (as in Example 4-1),it is necessary to add the value of the user-defined variable to the binary log.
• If the statement contains a call to the RAND function, it is necessary to add thepseudorandom seed to the binary log.
• If the statement contains a call to the LAST_INSERT_ID function, it is necessary toadd the last inserted ID to the binary log.
Logging Statements | 61

• If the statement performs an insert into a table with an AUTO_INCREMENT column,it is necessary to add the value that was used for the column (or columns) to thebinary log.
Example 4-1. Statements with user-defined variablesSET @value = 45;INSERT INTO t1 VALUES (@value);
In each of these cases, one or more context events are added to the binary log before theevent containing the query is written. Because there can be several context events pre‐ceding a Query event, the binary log can handle multiple user-defined variables togetherwith the RAND function, or (almost) any combination of the previously listed conditions.The binary log stores the necessary context information through the following events:User_var
Each such event records the name and value of a single user-defined variable.
Rand
Records the random number seed used by the RAND function. The seed is fetchedinternally from the session’s state.
Intvar
If the statement is inserting into an autoincrement column, this event records thevalue of the internal autoincrement counter for the table before the statement starts.
If the statement contains a call to LAST_INSERT_ID, this event records the value thatthis function returned in the statement.
Example 4-2 shows some statements that generate all of the context events and how theevents appear when displayed using SHOW BINLOG EVENTS. Note that there can be severalcontext events before each statement.
Example 4-2. Query events with context eventsmaster> SET @foo = 12;Query OK, 0 rows affected (0.00 sec)
master> SET @bar = 'Smoothnoodlemaps';Query OK, 0 rows affected (0.00 sec)
master> INSERT INTO t1(b,c) VALUES -> (@foo,@bar), (RAND(), 'random');Query OK, 2 rows affected (0.00 sec)Records: 2 Duplicates: 0 Warnings: 0
master> INSERT INTO t1(b) VALUES (LAST_INSERT_ID());Query OK, 1 row affected (0.00 sec)
master> SHOW BINLOG EVENTS FROM 238\G
62 | Chapter 4: The Binary Log

*************************** 1. row *************************** Log_name: mysqld1-bin.000001 Pos: 238 Event_type: Query Server_id: 1End_log_pos: 306 Info: BEGIN*************************** 2. row *************************** Log_name: mysqld1-bin.000001 Pos: 306 Event_type: Intvar Server_id: 1End_log_pos: 334 Info: INSERT_ID=1*************************** 3. row *************************** Log_name: mysqld1-bin.000001 Pos: 334 Event_type: RAND Server_id: 1End_log_pos: 369 Info: rand_seed1=952494611,rand_seed2=949641547*************************** 4. row *************************** Log_name: mysqld1-bin.000001 Pos: 369 Event_type: User var Server_id: 1End_log_pos: 413 Info: @`foo`=12*************************** 5. row *************************** Log_name: mysqld1-bin.000001 Pos: 413 Event_type: User var Server_id: 1End_log_pos: 465 Info: @`bar`=_utf8 0x536D6F6F74686E6F6F6...*************************** 6. row *************************** Log_name: mysqld1-bin.000001 Pos: 465 Event_type: Query Server_id: 1End_log_pos: 586 Info: use `test`; INSERT INTO t1(b,c) VALUES (@foo,@bar)...*************************** 7. row *************************** Log_name: mysqld1-bin.000001 Pos: 586 Event_type: Xid Server_id: 1End_log_pos: 613 Info: COMMIT /* xid=44 */*************************** 8. row *************************** Log_name: mysqld1-bin.000001 Pos: 613
Logging Statements | 63

Event_type: Query Server_id: 1End_log_pos: 681 Info: BEGIN*************************** 9. row *************************** Log_name: mysqld1-bin.000001 Pos: 681 Event_type: Intvar Server_id: 1End_log_pos: 709 Info: LAST_INSERT_ID=1*************************** 10. row *************************** Log_name: mysqld1-bin.000001 Pos: 709 Event_type: Intvar Server_id: 1End_log_pos: 737 Info: INSERT_ID=3*************************** 11. row *************************** Log_name: mysqld1-bin.000001 Pos: 737 Event_type: Query Server_id: 1End_log_pos: 843 Info: use `test`; INSERT INTO t1(b) VALUES (LAST_INSERT_ID())*************************** 12. row *************************** Log_name: mysqld1-bin.000001 Pos: 843 Event_type: Xid Server_id: 1End_log_pos: 870 Info: COMMIT /* xid=45 */12 rows in set (0.00 sec)
Thread ID
The last implicit piece of information that the binary log sometimes needs is the threadID of the MySQL session handling the statement. The thread ID is necessary when afunction is dependent on the thread ID—such as when it refers to CONNECTION_ID—butmost importantly for handling temporary tables.
Temporary tables are specific to each thread, meaning that two temporary tables withthe same name are allowed to coexist, provided they are defined in different sessions.Temporary tables can provide an effective means to improve the performance of certainoperations, but they require special handling to work with the binary log.
Internally in the server, temporary tables are handled by creating obscure names forstoring the table definitions. The names are based on the process ID of the server, thethread ID that creates the table, and a thread-specific counter to distinguish betweendifferent instances of the table from the same thread. This naming scheme allows tables
64 | Chapter 4: The Binary Log

from different threads to be distinguished from each other, but each statement can accessits proper table only if the thread ID is stored in the binary log.
Similar to how the current database is handled in the binary log, the thread ID is storedas a separate field in every Query event and can therefore be used to compute thread-specific data and handle temporary tables correctly.
When writing the Query event, the thread ID to store in the event is read from thepseudo_thread_id server variable. This means that it can be set before executing astatement, but only if you have SUPER privileges. This server variable is intended to beused by mysqlbinlog to emit statements correctly and should not normally be used.
For a statement that contains a call to the CONNECTION_ID function or that uses or createsa temporary table, the Query event is marked as thread-specific in the binary log. Becausethe thread ID is always present in the Query event, this flag is not necessary but is mainlyused to allow mysqlbinlog to avoid printing unnecessary assignments to the pseudo_thread_id variable.
LOAD DATA INFILE StatementsThe LOAD DATA INFILE statement makes it easy to fill tables quickly from a file. Un‐fortunately, it is dependent on a certain kind of context that cannot be covered by thecontext events we have discussed: files that need to be read from the filesystem.
To handle LOAD DATA INFILE, the MySQL server uses a special set of events to handlethe transfer of the file using the binary log. In addition to solving the problem for LOADDATA INFILE, this makes the statement a very convenient tool for transferring largeamounts of data from the master to the slave, as you will see soon. To correctly transferand execute a LOAD DATA INFILE statement, several new events are introduced into thebinary log:Begin_load_query
This event signals the start of data transfer in the file.
Append_block
A sequence of one or more of these events follows the Begin_load_query event tocontain the rest of the file’s data, if the file was larger than the maximum allowedpacket size on the connection.
Execute_load_query
This event is a specialized variant of the Query event that contains the LOAD DATAINFILE statement executed on the master.
Even though the statement contained in this event contains the name of the file thatwas used on the master, this file will not be sought by the slave. Instead, the contentsprovided by the preceding Begin_load_query and Append_block events will beused.
Logging Statements | 65

For each LOAD DATA INFILE statement executed on the master, the file to read is mappedto an internal file-backed buffer, which is used in the following processing. In addition,a unique file ID is assigned to the execution of the statement and is used to refer to thefile read by the statement.
While the statement is executing, the file contents are written to the binary log as asequence of events starting with a Begin_load_query event—which indicates the be‐ginning of a new file—followed by zero or more Append_block events. Each event writ‐ten to the binary log is no larger than the maximum allowed packet size, as specified bythe max-allowed-packet option.
After the entire file is read and applied to the table, the execution of the statementterminates by writing the Execute_load_query event to the binary log. This event con‐tains the statement executed together with the file ID assigned to the execution of thestatement. Note that the statement is not the original statement as the user wrote it, butrather a recreated version of the statement.
If you are reading an old binary log, you might instead findLoad_log_event, Execute_log_event, and Create_file_log_event.These were the events used to replicate LOAD DATA INFILE prior toMySQL version 5.0.3 and were replaced by the implementation justdescribed.
Example 4-3 shows the events written to the binary log by a successful execution of aLOAD DATA INFILE statement. In the Info field, you can see the assigned file ID—1, inthis case—and see that it is used for all the events that are part of the execution of thestatement. You can also see that the file foo.dat used by the statement contains morethan the maximum allowed packet size of 16384, so it is split into three events.
Example 4-3. Successful execution of LOAD DATA INFILEmaster> SHOW BINLOG EVENTS IN 'master-bin.000042' FROM 269\G*************************** 1. row *************************** Log_name: master-bin.000042 Pos: 269 Event_type: Begin_load_query Server_id: 1End_log_pos: 16676 Info: ;file_id=1;block_len=16384*************************** 2. row *************************** Log_name: master-bin.000042 Pos: 16676 Event_type: Append_block Server_id: 1End_log_pos: 33083 Info: ;file_id=1;block_len=16384*************************** 3. row ***************************
66 | Chapter 4: The Binary Log

Log_name: master-bin.000042 Pos: 33083 Event_type: Append_block Server_id: 1End_log_pos: 33633 Info: ;file_id=1;block_len=527*************************** 4. row *************************** Log_name: master-bin.000042 Pos: 33633 Event_type: Execute_load_query Server_id: 1End_log_pos: 33756 Info: use `test`; LOAD DATA INFILE 'foo.dat' INTO...;file_id=14 rows in set (0.00 sec)
Binary Log FiltersIt is possible to filter out statements from the binary log using two options: binlog-do-db and binlog-ignore-db (which we will call binlog-*-db, collectively). The binlog-do-db option is used when you want to filter only statements belonging to a certaindatabase, and binlog-ignore-db is used when you want to ignore a certain databasebut replicate all other databases.
These options can be given multiple times, so to filter out both the database one_db andthe database two_db, you must give both options in the my.cnf file. For example:
[mysqld]binlog-ignore-db=one_dbbinlog-ignore-db=two_db
The way MySQL filters events can be quite a surprise to unfamiliar users, so we’ll explainhow filtering works and make some recommendations on how to avoid some of themajor headaches.
Figure 4-3 shows how MySQL determines whether the statement is filtered. The filteringis done on a statement level—either the entire statement is filtered out or the entirestatement is written to the binary log—and the binlog-*-db options use the currentdatabase to decide whether the statement should be filtered, not the database of thetables affected by the statement.
To help you understand the behavior, consider the statements in Example 4-4. Each lineuses bad as the current database and changes tables in different databases.
Logging Statements | 67


To avoid mistakes when executing statements that can potentially befiltered out, make it a habit not to write statements so they qualifytable, function, or procedure names with the database name. In‐stead, whenever you want to access a table in a different database,issue a USE statement to make that database the current database. Inother words, instead of writing:
INSERT INTO other.book VALUES ('MySQL', 'Paul DuBois');
write:USE other; INSERT INTO book VALUES ('MySQL', 'Paul DuBois');
Using this practice, it is easy to see by inspection that the statementdoes not update multiple databases simply because no tables shouldbe qualified with a database name.
This behavior does not apply when row-based replication is used. The filtering em‐ployed in row-based replication will be discussed in “Filtering in Row-Based Replica‐tion” on page 286, but since row-based replication can work with each individual rowchange, it is able to filter on the actual table that the row is targeted for and does notuse the current database.
So, what happens when both binlog-do-db and binlog-ignore-db are used at the sametime? For example, consider a configuration file containing the following two rules:
[mysqld]binlog-do-db=goodbinlog-ignore-db=bad
In this case, will the following statement be filtered out or not?USE ugly; INSERT INTO t1 VALUES (1);
Following the diagram in Figure 4-3, you can see that if there is at least a binlog-do-db rule, all binlog-ignore-db rules are ignored completely, and since only the gooddatabase is included, the previous statement will be filtered out.
Because of the way that the binlog-*-db rules are evaluated, it ispointless to have both binlog-do-db and binlog-ignore-db rulesat the same time. Since the binary log can be used for recovery aswell as replication, the recommendation is not to use the binlog-*-db options and instead filter out the event on the slave by usingreplicate-* options (these are described in “Filtering and skip‐ping events” on page 255). Using the binlog-*-db option would fil‐ter out statements from the binary log and you will not be able torestore the database from the binary log in the event of a crash.
Logging Statements | 69

Triggers, Events, and Stored RoutinesA few other constructions that are treated specially when logged are stored programs—that is, triggers, events, and stored routines (the last is a collective name for storedprocedures and stored functions). Their treatment with respect to the binary log con‐tains some elements in common, so they will be covered together in this section. Theexplanation distinguishes statements of two types: statements that define, destroy, oralter stored programs and statements that invoke them.
Statements that define or destroy stored programs
The following discussion shows triggers in the examples, but the same principles applyto definition of events and stored routines. To understand why the server needs to handlethese features specially when writing them to the binary log, consider the code inExample 4-5.
In the example, a table named employee keeps information about all employees of animagined system and a table named log keeps a log of interesting information. Notethat the log table has a timestamp column that notes the time of a change and that thename column in the employee table is the primary key for the table. There is also a statuscolumn to tell whether the addition succeeded or failed.
To track information about employee information changes—for example, for auditingpurposes—three triggers are created so that whenever an employee is added, removed,or changed, a log entry of the change is added to a log table.
Notice that the triggers are after triggers, which means that entries are added only if theexecuted statement is successful. Failed statements will not be logged. We will laterextend the example so that unsuccessful attempts are also logged.
Example 4-5. Definitions of tables and triggers for employee administrationCREATE TABLE employee ( name CHAR(64) NOT NULL, email CHAR(64), password CHAR(64), PRIMARY KEY (name));
CREATE TABLE log ( id INT AUTO_INCREMENT, email CHAR(64), status CHAR(10), message TEXT, ts TIMESTAMP, PRIMARY KEY (id));
CREATE TRIGGER tr_employee_insert_after AFTER INSERT ON employee
70 | Chapter 4: The Binary Log

FOR EACH ROW INSERT INTO log(email, status, message) VALUES (NEW.email, 'OK', CONCAT('Adding employee ', NEW.name));
CREATE TRIGGER tr_employee_delete_after AFTER DELETE ON employeeFOR EACH ROW INSERT INTO log(email, status, message) VALUES (OLD.email, 'OK', 'Removing employee');
delimiter $$CREATE TRIGGER tr_employee_update_after AFTER UPDATE ON employeeFOR EACH ROWBEGIN IF OLD.name != NEW.name THEN INSERT INTO log(email, status, message) VALUES (OLD.email, 'OK', CONCAT('Name change from ', OLD.name, ' to ', NEW.name)); END IF; IF OLD.password != NEW.password THEN INSERT INTO log(email, status, message) VALUES (OLD.email, 'OK', 'Password change'); END IF; IF OLD.email != NEW.email THEN INSERT INTO log(email, status, message) VALUES (OLD.email, 'OK', CONCAT('E-mail change to ', NEW.email)); END IF;END $$delimiter ;
With these trigger definitions, it is now possible to add and remove employees as shownin Example 4-6. Here an employee is added, modified, and removed, and as you cansee, each of the operations is logged to the log table.
The operations of adding, removing, and modifying employees may be done by a userwho has access to the employee table, but what about access to the log table? In thiscase, a user who can manipulate the employee table should not be able to make changesto the log table. There are many reasons for this, but they all boil down to trusting thecontents of the log table for purposes of maintenance, auditing, disclosure to legalauthorities, and so on. So the DBA may choose to make access to the employee tableavailable to many users while keeping access to the log table very restricted.
Example 4-6. Adding, removing, and modifying usersmaster> SET @pass = PASSWORD('xyzzy');Query OK, 0 rows affected (0.00 sec)
master> INSERT INTO employee VALUES ('mats', '[email protected]', @pass);
Query OK, 1 row affected (0.00 sec)
master> UPDATE employee SET name = 'matz'
Logging Statements | 71

-> WHERE email = '[email protected]';Query OK, 1 row affected (0.00 sec)Rows matched: 1 Changed: 1 Warnings: 0
master> SET @pass = PASSWORD('foobar');Query OK, 0 rows affected (0.00 sec)
master> UPDATE employee SET password = @pass -> WHERE email = '[email protected]';Query OK, 1 row affected (0.00 sec)Rows matched: 1 Changed: 1 Warnings: 0
master> DELETE FROM employee WHERE email = '[email protected]';Query OK, 1 row affected (0.00 sec)
master> SELECT * FROM log;+----+------------------+-------------------------------+---------------------+| id | email | message | ts |+----+------------------+-------------------------------+---------------------+| 1 | [email protected] | Adding employee mats | 2012-11-14 18:56:08 || 2 | [email protected] | Name change from mats to matz | 2012-11-14 18:56:11 || 3 | [email protected] | Password change | 2012-11-14 18:56:41 || 4 | [email protected] | Removing employee | 2012-11-14 18:57:11 |+----+------------------+-------------------------------+---------------------+4 rows in set (0.00 sec)
The INSERT, UPDATE, and DELETE in the example can generate a warning that it is unsafeto log when statement mode is used. This is because it invokes a trigger that inserts intoan autoincrement column. In general, such warnings should be investigated.
To make sure the triggers can execute successfully against a highly protected table, theyare executed as the user who defined the trigger, not as the user who changed the con‐tents of the employee table. So the CREATE TRIGGER statements in Example 4-5 areexecuted by the DBA, who has privileges to make additions to the log table, whereasthe statements altering employee information in Example 4-6 are executed through auser management account that only has privileges to change the employee table.
When the statements in Example 4-6 are executed, the employee management accountis used for updating entries in the employee table, but the DBA privileges are used tomake additions to the log table. The employee management account cannot be used toadd or remove entries from the log table.
As an aside, Example 4-6 assigns passwords to a user variable before using them in thestatement. This is done to avoid sending sensitive data in plain text to another server.
72 | Chapter 4: The Binary Log

Security and the Binary LogIn general, a user with REPLICATION SLAVE privileges has privileges to read everythingthat occurs on the master and should therefore be secured so that the account cannotbe compromised. Details are beyond the scope of this book, but here are some examplesof precautions you can take:
• Make it impossible to log in to the account from outside the firewall.• Track all login attempts for accounts with REPLICATION SLAVE privileges, and place
the log on a separate secure server.• Encrypt the connection between the master and the slave using, for example,
MySQL’s built-in Secure Sockets Layer (SSL) support.
Even if the account has been secured, there is information that does not have to be inthe binary log, so it makes sense not to store it there in the first place.
One of the more common types of sensitive information is passwords. Events containingpasswords can be written to the binary log when executing statements that change tableson the server and that include the password required for access to the tables.
A typical example is:
UPDATE employee SET pass = PASSWORD('foobar') WHERE email = '[email protected]';
If replication is in place, it is better to rewrite this statement without the password. Thisis done by computing and storing the hashed password into a user-defined variable andthen using that in the expression:
SET @password = PASSWORD('foobar');UPDATE employee SET pass = @password WHERE email = '[email protected]';
Since the SET statement is not replicated, the original password will not be stored in thebinary log, only in the memory of the server while executing the statement.
As long as the password hash, rather than the plain-text password, is stored in the table,this technique works. If the raw password is stored directly in the table, there is no wayto prevent the password from ending up in the binary log. But storing hashes for pass‐words is a standard good practice in any case, to prevent someone who gets his handson the raw data from learning the passwords.
Encrypting the connection between the master and the slave offers some protection,but if the binary log itself is compromised, encrypting the connection doesn’t help.
If you recall the earlier discussion about implicit information, you may already havenoticed that both the user executing a line of code and the user who defines a trigger
Logging Statements | 73

are implicit. As you will see in Chapter 8, neither the definer nor the invoker of thetrigger is critical to executing the trigger on the slave, and the user information is ef‐fectively ignored when the slave executes the statement. However, the information isimportant when the binary log is played back to a server—for instance, when doing a PITR.
To play back a binary log to the server without problems in handling privileges on allthe various tables, it is necessary to execute all the statements as a user with SUPERprivileges. But the triggers may not have been defined using SUPER privileges, so it isimportant to recreate the triggers with the correct user as the trigger’s definer. If a triggeris defined with SUPER privileges instead of by the user who defined the trigger originally,it might cause a privilege escalation.
To permit a DBA to specify the user under which to execute a trigger, the CREATETRIGGER syntax includes an optional DEFINER clause. If a DEFINER is not given to thestatements—as is the case in Example 4-7—the statement will be rewritten for the binarylog to add a DEFINER clause and use the current user as the definer. This means that thedefinition of the insert trigger appears in the binary log, as shown in Example 4-7. Itlists the account that created the trigger (root@localhost) as the definer, which is whatwe want in this case.
Example 4-7. A CREATE TRIGGER statement in the binary logmaster> SHOW BINLOG EVENTS FROM 92236 LIMIT 1\G*************************** 1. row *************************** Log_name: master-bin.000038 Pos: 92236 Event_type: Query Server_id: 1End_log_pos: 92491 Info: use `test`; CREATE DEFINER=`root`@`localhost` TRIGGER ...1 row in set (0.00 sec)
Statements that invoke triggers and stored routines
Moving over from definitions to invocations, we can ask how the master’s triggers arehandled during replication. Well, actually they’re not handled at all.
The statement that invokes the trigger is logged to the binary log, but it is not linked tothe particular trigger. Instead, when the slave executes the statement, it automaticallyexecutes any triggers associated with the tables affected by the statement. This meansthat there can be different triggers on the master and the slave, and the triggers on themaster will be invoked on the master while the triggers on the slave will be invoked onthe slave. For example, if the trigger to add entries to the log table is not necessary onthe slave, performance can be improved by eliminating the trigger from the slave.
Still, any context events necessary for replicating correctly will be written to the binarylog before the statement that invokes the trigger, even if it is just the statements in the
74 | Chapter 4: The Binary Log

trigger that require the context events. Thus, Example 4-8 shows the binary log afterexecuting the INSERT statement in Example 4-5. Note that the first event writes theINSERT ID for the log table’s primary key. This reflects the use of the log table in thetrigger, but it might appear to be redundant because the slave will not use the trigger.
You should, however, note that using different triggers on the master and slave—or notrigger at all on either the master or slave—is the exception and that the INSERT ID isnecessary for replicating the INSERT statement correctly when the trigger is both on themaster and slave.
Example 4-8. Contents of the binary log after executing INSERTmaster> SHOW BINLOG EVENTS FROM 93340\G*************************** 1. row *************************** Log_name: master-bin.000038 Pos: 93340 Event_type: Intvar Server_id: 1End_log_pos: 93368 Info: INSERT_ID=1*************************** 2. row *************************** Log_name: master-bin.000038 Pos: 93368 Event_type: User var Server_id: 1End_log_pos: 93396h Info: @`pass`=_utf8 0x2A3942353030333433424335324...utf8_general_ci*************************** 3. row *************************** Log_name: master-bin.000038 Pos: 93396 Event_type: Query Server_id: 1End_log_pos: 93537 Info: use `test`; INSERT INTO employee VALUES ...3 rows in set (0.00 sec)
Stored ProceduresStored functions and stored procedures are known by the common name stored rou‐tines. Since the server treats stored procedures and stored functions very differently,stored procedures will be covered in this section and stored functions in the next section.
The situation for stored routines is similar to triggers in some aspects, but very differentin others. Like triggers, stored routines offer a DEFINER clause, and it must be explicitlyadded to the binary log whether or not the statement includes it. But the invocation ofstored routines is handled differently from triggers.
To begin, let’s extend Example 4-6, which defines tables for employees and logs, withsome utility routines to work with the employees. Even though this can be handled with
Logging Statements | 75

standard INSERT, DELETE, and UPDATE statements, we’ll use stored procedures to demon‐strate some issues involved in writing them to the binary log. For these purposes, let’sextend the example with the functions in Example 4-9 for adding and removing em‐ployees.
Example 4-9. Stored procedure definitions for managing employeesdelimiter $$CREATE PROCEDURE employee_add(p_name CHAR(64), p_email CHAR(64), p_password CHAR(64)) MODIFIES SQL DATABEGIN DECLARE l_pass CHAR(64); SET l_pass = PASSWORD(p_password); INSERT INTO employee(name, email, password) VALUES (p_name, p_email, l_pass);END $$
CREATE PROCEDURE employee_passwd(p_email CHAR(64), p_password CHAR(64)) MODIFIES SQL DATABEGIN DECLARE l_pass CHAR(64); SET l_pass = PASSWORD(p_password); UPDATE employee SET password = l_pass WHERE email = p_email;END $$
CREATE PROCEDURE employee_del(p_name CHAR(64)) MODIFIES SQL DATABEGIN DELETE FROM employee WHERE name = p_name;END $$delimiter ;
For the employee_add and employee_passwd procedures, we have extracted the en‐crypted password into a separate variable for the reasons already explained, but theemployee_del procedure just contains a DELETE statement, since nothing else is needed.A binlog entry corresponding to one function is:
master> SHOW BINLOG EVENTS FROM 97911 LIMIT 1\G*************************** 1. row *************************** Log_name: master-bin.000038 Pos: 97911 Event_type: Query Server_id: 1End_log_pos: 98275 Info: use `test`; CREATE DEFINER=`root`@`localhost`PROCEDURE ...1 row in set (0.00 sec)
76 | Chapter 4: The Binary Log

As expected, the definition of this procedure is extended with the DEFINER clause beforewriting the definition to the binary log, but apart from that, the body of the procedureis left intact. Notice that the CREATE PROCEDURE statement is replicated as a Query event,as are all DDL statements.
In this regard, stored routines are similar to triggers in the way they are treated by thebinary log. But invocation differs significantly from triggers. Example 4-10 calls theprocedure that adds an employee and shows the resulting contents of the binary log.
Example 4-10. Calling a stored proceduremaster> CALL employee_add('chuck', '[email protected]', 'abrakadabra');Query OK, 1 row affected (0.00 sec)
master> SHOW BINLOG EVENTS FROM 104033\G*************************** 1. row *************************** Log_name: master-bin.000038 Pos: 104033 Event_type: Intvar Server_id: 1End_log_pos: 104061 Info: INSERT_ID=1*************************** 2. row *************************** Log_name: master-bin.000038 Pos: 104061 Event_type: Query Server_id: 1End_log_pos: 104416 Info: use `test`; INSERT INTO employee(name, email, password) VALUES ( NAME_CONST('p_name',_utf8'chuck' COLLATE ...), NAME_CONST('p_email',_utf8'[email protected]' COLLATE ...), NAME_CONST('pass',_utf8'*FEB349C4FDAA307A...' COLLATE ...))2 rows in set (0.00 sec)
In Example 4-10, there are four things that you should note:
• The CALL statement is not written to the binary log. Instead, the statements executedas a result of the call are written to the binary log. In other words, the body of thestored procedure is unrolled into the binary log.
• The statement is rewritten to not contain any references to the parameters of thestored procedure—that is, p_name, p_email, and p_password. Instead, theNAME_CONST function is used for each parameter to create a result set with a singlevalue.
• The locally declared variable pass is also replaced with a NAME_CONST expression,where the second parameter contains the encrypted password.
Logging Statements | 77

• Just as when a statement that invokes a trigger is written to the binary log, thestatement that calls the stored procedure is preceded by an Intvar event holdingthe insert ID used when adding the employee to the log table.
Since neither the parameter names nor the locally declared names are available outsidethe stored routine, NAME_CONST is used to associate the name of the parameter or localvariable with the constant value used when executing the function. This guarantees thatthe value can be used in the same way as the parameter or local variable. However, thischange is not significant; currently it offers no advantages over using the parameters directly.
Stored FunctionsStored functions share many similarities with stored procedures and some similaritieswith triggers. Similar to both stored procedures and triggers, stored functions have aDEFINER clause that is normally (but not always) used when the CREATE FUNCTIONstatement is written to the binary log.
In contrast to stored procedures, stored functions can return scalar values and you cantherefore embed them in various places in SQL statements. For example, consider thedefinition of a stored routine in Example 4-11, which extracts the email address of anemployee given the employee’s name. The function is a little contrived—it is significantlymore efficient to just execute statements directly—but it suits our purposes well.
Example 4-11. A stored function to fetch the name of an employeedelimiter $$CREATE FUNCTION employee_email(p_name CHAR(64)) RETURNS CHAR(64) DETERMINISTICBEGIN DECLARE l_email CHAR(64); SELECT email INTO l_email FROM employee WHERE name = p_name; RETURN l_email;END $$delimiter ;
This stored function can be used conveniently in other statements, as shown inExample 4-12. In contrast to stored procedures, stored functions have to specify a char‐acteristic—such as DETERMINISTIC, NO SQL, or READS SQL DATA—if they are to be writ‐ten to the binary log.
Example 4-12. Examples of using the stored functionmaster> CREATE TABLE collected ( -> name CHAR(32), -> email CHAR(64) -> );
78 | Chapter 4: The Binary Log

Query OK, 0 rows affected (0.09 sec)
master> INSERT INTO collected(name, email) -> VALUES ('chuck', employee_email('chuck'));Query OK, 1 row affected (0.01 sec)
master> SELECT employee_email('chuck');+-------------------------+| employee_email('chuck') |+-------------------------+| [email protected] |+-------------------------+1 row in set (0.00 sec)
When it comes to calls, stored functions are replicated in the same manner as triggers:as part of the statement that executes the function. For instance, the binary log doesn’tneed any events preceding the INSERT statement in Example 4-12, but it will contain thecontext events necessary to replicate the stored function inside the INSERT.
What about SELECT? Normally, SELECT statements are not written to the binary log sincethey don’t change any data, but a SELECT containing a stored function, as inExample 4-13, is an exception.
Example 4-13. Example of stored function that updates a tableCREATE TABLE log(log_id INT AUTO_INCREMENT PRIMARY KEY, msg TEXT);
delimiter $$CREATE FUNCTION log_message(msg TEXT) RETURNS INT DETERMINISTICBEGIN INSERT INTO log(msg) VALUES(msg); RETURN LAST_INSERT_ID();END $$delimiter ;
SELECT log_message('Just a test');
When executing the stored function, the server notices that it adds a row to the logtable and marks the statement as an “updating” statement, which means that it will bewritten to the binary log. So, for the slightly artificial example in Example 4-13, thebinary log will contain the event:
*************************** 7. row *************************** Log_name: mysql-bin.000001 Pos: 845 Event_type: Query Server_id: 1End_log_pos: 913 Info: BEGIN
Logging Statements | 79

*************************** 8. row *************************** Log_name: mysql-bin.000001 Pos: 913 Event_type: Intvar Server_id: 1End_log_pos: 941 Info: LAST_INSERT_ID=1*************************** 9. row *************************** Log_name: mysql-bin.000001 Pos: 941 Event_type: Intvar Server_id: 1End_log_pos: 969 Info: INSERT_ID=1*************************** 10. row *************************** Log_name: mysql-bin.000001 Pos: 969 Event_type: Query Server_id: 1End_log_pos: 1109 Info: use `test`; SELECT `test`.`log_message`(_utf8'Just a test' COLLATE...*************************** 11. row *************************** Log_name: mysql-bin.000001 Pos: 1105 Event_type: Xid Server_id: 1End_log_pos: 1132 Info: COMMIT /* xid=237 */
Stored Functions and PrivilegesThe CREATE ROUTINE privilege is required to define a stored procedure or stored func‐tion. Strictly speaking, no other privileges are needed to create a stored routine, butsince it normally executes under the privileges of the definer, defining a stored routinewould not make much sense if the definer of the procedure didn’t have the necessaryprivileges to read to or write from tables referenced by the stored procedure.
But replication threads on the slave execute without privilege checks. This leaves a se‐rious security hole allowing any user with the CREATE ROUTINE privilege to elevate herprivileges and execute any statement on the slave.
In MySQL versions earlier than 5.0, this does not cause problems, because all paths ofa statement are explored when the statement is executed on the master. A privilegeviolation on the master will prevent a statement from being written to the binary log,so users cannot access objects on the slave that were out of bounds on the master. How‐ever, with the introduction of stored routines, it is possible to create conditional exe‐cution paths, and the server does not explore all paths when executing a stored routine.
Since stored procedures are unrolled, the exact statements executed on the master arealso executed on the slave, and since the statement is logged only if it was successfully
80 | Chapter 4: The Binary Log

executed on the master, it is not possible to get access to other objects. Not so with storedfunctions.
If a stored function is defined with SQL SECURITY INVOKER, a malicious user can crafta function that will execute differently on the master and the slave. The security breachcan then be buried in the branch executed on the slave. This is demonstrated in thefollowing example:
CREATE FUNCTION magic() RETURNS CHAR(64) SQL SECURITY INVOKERBEGIN DECLARE result CHAR(64); IF @@server_id <> 1 THEN SELECT what INTO result FROM secret.agents LIMIT 1; RETURN result; ELSE RETURN 'I am magic!'; END IF;END $$
One piece of code executes on the master (the ELSE branch), whereas a separate pieceof code (the IF branch) executes on the slave where the privilege checks are disabled.The effect is to elevate the user’s privileges from CREATE ROUTINE to the equivalent ofSUPER.
Notice that this problem doesn’t occur if the function is defined with SQL SECURITYDEFINER, because the function executes with the user’s privileges and will be blocked onthe slave.
To prevent privilege escalation on a slave, MySQL requires SUPER privileges by defaultto define stored functions. But because stored functions are very useful, and some da‐tabase administrators trust their users with creating proper functions, this check can bedisabled with the log-bin-trust-function-creators option.
EventsThe events feature is a MySQL extension, not part of standard SQL. Events, which shouldnot be confused with binlog events, are handled by a stored program that is executedregularly by a special event scheduler.
Similar to all other stored programs, definitions of events are also logged with a DEFINER clause. Since events are invoked by the event scheduler, they are always executed asthe definer and do not pose a security risk in the way that stored functions do.
When events are executed, the statements are written to the binary log directly.
Since the events will be executed on the master, they are automatically disabled on the slave and will therefore not be executed there. If the events were not disabled, they would
Logging Statements | 81

be executed twice on the slave: once by the master executing the event and replicatingthe changes to the slave, and once by the slave executing the event directly.
Because the events are disabled on the slave, it is necessary to en‐able these events if the slave, for some reason, should lose the master.So, for example, when promoting a slave as described in Chapter 5,don’t forget to enable the events that were replicated from the mas‐ter. This is easiest to do using the following statement:
UPDATE mysql.events SET Status = ENABLED WHERE Status = SLAVESIDE_DISABLED;
The purpose of the check is to enable only the events that weredisabled when being replicated from the master. There might beevents that are disabled for other reasons.
Special ConstructionsEven though statement-based replication is normally straightforward, some specialconstructions have to be handled with care. Recall that for the statement to be executedcorrectly on the slave, the context has to be correct for the statement. Even though thecontext events discussed earlier handle part of the context, some constructions haveadditional context that is not transferred as part of the replication process.
The LOAD_FILE function
The LOAD_FILE function allows you to fetch a file and use it as part of an expression.Although quite convenient at times, the file has to exist on the slave server to replicatecorrectly since the file is not transferred during replication, as the file to LOAD DATAINFILE is. With some ingenuity, you can rewrite a statement involving the LOAD_FILEfunction either to use the LOAD DATA INFILE statement or to define a user-definedvariable to hold the contents of the file. For example, take the following statement thatinserts a document into a table:
master> INSERT INTO document(author, body) -> VALUES ('Mats Kindahl', LOAD_FILE('go_intro.xml'));
You can rewrite this statement to use LOAD DATA INFILE instead. In this case, you haveto take care to specify character strings that cannot exist in the document as field andline delimiters, since you are going to read the entire file contents as a single column.
master> LOAD DATA INFILE 'go_intro.xml' INTO TABLE document -> FIELDS TERMINATED BY '@*@' LINES TERMINATED BY '&%&' -> (author, body) SET author = 'Mats Kindahl';
An alternative is to store the file contents in a user-defined variable and then use it inthe statement.
82 | Chapter 4: The Binary Log

master> SET @document = LOAD_FILE('go_intro.xml');master> INSERT INTO document(author, body) VALUES -> ('Mats Kindahl, @document);
Nontransactional Changes and Error HandlingSo far we have considered only transactional changes and have not looked at errorhandling at all. For transactional changes, error handling is pretty uncomplicated: astatement that tries to change transactional tables and fails will not have any effect at allon the table. That’s the entire point of having a transactional system—so the changesthat the statement attempts to introduce can be safely ignored. The same applies totransactions that are rolled back: they have no effect on the tables and can thereforesimply be discarded without risking inconsistencies between the master and the slave.
A specialty of MySQL is the provisioning of nontransactional storage engines. This canoffer some speed advantages, because the storage engine does not have to administerthe transactional log that the transactional engines use, and it allows some optimizationson disk access. From a replication perspective, however, nontransactional engines re‐quire special considerations.
The most important aspect to note is that replication cannot handle arbitrary nontran‐sactional engines, but has to make some assumptions about how they behave. Some ofthose limitations are lifted with the introduction of row-based replication in version 5.1—a subject that will be covered in “Row-Based Replication” on page 97—but even in thatcase, it cannot handle arbitrary storage engines.
One of the features that complicates the issue further, from a replication perspective, isthat it is possible to mix transactional and nontransactional engines in the same trans‐action, and even in the same statement.
To continue with the example used earlier, consider Example 4-14, where the log tablefrom Example 4-5 is given a nontransactional storage engine while the employee tableis given a transactional one. We use the nontransactional MyISAM storage engine forthe log table to improve its speed, while keeping the transactional behavior for theemployee table.
We can further extend the example to track unsuccessful attempts to add employees bycreating a pair of insert triggers: a before trigger and an after trigger. If an administratorsees an entry in the log with a status field of FAIL, it means the before trigger ran, butthe after trigger did not, and therefore an attempt to add an employee failed.
Example 4-14. Definition of log and employee tables with storage enginesCREATE TABLE employee ( name CHAR(64) NOT NULL, email CHAR(64), password CHAR(64), PRIMARY KEY (email)
Logging Statements | 83

) ENGINE = InnoDB;
CREATE TABLE log ( id INT AUTO_INCREMENT, email CHAR(64), message TEXT, status ENUM('FAIL', 'OK') DEFAULT 'FAIL', ts TIMESTAMP, PRIMARY KEY (id)) ENGINE = MyISAM;
delimiter $$CREATE TRIGGER tr_employee_insert_before BEFORE INSERT ON employeeFOR EACH ROWBEGIN INSERT INTO log(email, message) VALUES (NEW.email, CONCAT('Adding employee ', NEW.name)); SET @LAST_INSERT_ID = LAST_INSERT_ID();END $$delimiter ;
CREATE TRIGGER tr_employee_insert_after AFTER INSERT ON employeeFOR EACH ROW UPDATE log SET status = 'OK' WHERE id = @LAST_INSERT_ID;
What are the effects of this change on the binary log?
To begin, let’s consider the INSERT statement from Example 4-6. Assuming the statementis not inside a transaction and AUTOCOMMIT is 1, the statement will be a transaction byitself. If the statement executes without errors, everything will proceed as planned andthe statement will be written to the binary log as a Query event.
Now, consider what happens if the INSERT is repeated with the same employee. Sincethe email column is the primary key, this will generate a duplicate key error when theinsertion is attempted, but what will happen with the statement? Is it written to thebinary log or not?
Let’s have a look…master> SET @pass = PASSWORD('xyzzy');Query OK, 0 rows affected (0.00 sec)
master> INSERT INTO employee(name,email,password) -> VALUES ('chuck','[email protected]',@pass);ERROR 1062 (23000): Duplicate entry '[email protected]' for key 'PRIMARY'master> SELECT * FROM employee;+------+--------------------+-------------------------------------------+| name | email | password |+------+--------------------+-------------------------------------------+| chuck | [email protected] | *151AF6B8C3A6AA09CFCCBD34601F2D309ED54888 |+------+--------------------+-------------------------------------------+1 row in set (0.00 sec)
84 | Chapter 4: The Binary Log

master> SHOW BINLOG EVENTS FROM 38493\G*************************** 1. row *************************** Log_name: master-bin.000038 Pos: 38493 Event_type: User var Server_id: 1End_log_pos: 38571 Info: @`pass`=_utf8 0x2A31353141463642384333413641413...*************************** 2. row *************************** Log_name: master-bin.000038 Pos: 38571 Event_type: Query Server_id: 1End_log_pos: 38689 Info: use `test`; INSERT INTO employee(name,email,password)...2 rows in set (0.00 sec)
As you can see, the statement is written to the binary log even though the employeetable is transactional and the statement failed. Looking at the contents of the table usingthe SELECT reveals that there is still a single employee, proving the statement was rolledback—so why is the statement written to the binary log?
Looking into the log table will reveal the reason.master> SELECT * FROM log;+----+------------------+------------------------+--------+---------------------+| id | email | message | status | ts |+----+------------------+------------------------+--------+---------------------+| 1 | [email protected] | Adding employee mats | OK | 2010-01-13 15:50:45 || 2 | [email protected] | Name change from ... | OK | 2010-01-13 15:50:48 || 3 | [email protected] | Password change | OK | 2010-01-13 15:50:50 || 4 | [email protected] | Removing employee | OK | 2010-01-13 15:50:52 || 5 | [email protected] | Adding employee mats | OK | 2010-01-13 16:11:45 || 6 | [email protected] | Adding employee mats | FAIL | 2010-01-13 16:12:00 |+----+--------------+----------------------------+--------+---------------------+6 rows in set (0.00 sec)
Look at the last line, where the status is FAIL. This line was added to the table by thebefore trigger tr_employee_insert_before. For the binary log to faithfully representthe changes made to the database on the master, it is necessary to write the statementto the binary log if there are any nontransactional changes present in the statement orin triggers that are executed as a result of executing the statement. Since the statementfailed, the after trigger tr_employee_insert_after was not executed, and therefore thestatus is still FAIL from the execution of the before trigger.
Since the statement failed on the master, information about the failure needs to bewritten to the binary log as well. The MySQL server handles this by using an error codefield in the Query event to register the exact error code that caused the statement to fail.This field is then written to the binary log together with the event.
Logging Statements | 85

The error code is not visible when using the SHOW BINLOG EVENTS command, but youcan view it using the mysqlbinlog tool, which we will cover later in the chapter.
Logging TransactionsYou have now seen how individual statements are written to the binary log, along withcontext information, but we did not cover how transactions are logged. In this section,we will briefly cover how transactions are logged.
A transaction can start under a few different circumstances:
• When the user issues START TRANSACTION (or BEGIN).• When AUTOCOMMIT=1 and a statement accessing a transactional table starts to exe‐
cute. Note that a statement that writes only to nontransactional tables—for example,only to MyISAM tables—does not start a transaction.
• When AUTOCOMMIT=0 and the previous transaction was committed or aborted eitherimplicitly (by executing a statement that does an implicit commit) or explicitly byusing COMMIT or ROLLBACK.
Not every statement that is executed after the transaction has started is part of thattransaction. The exceptions require special care from the binary log.
Nontransactional statements are by their very definition not part of the transaction.When they are executed, they take effect immediately and do not wait for the transactionto commit. This also means that it is not possible to roll them back. They don’t affectan open transaction: any transactional statement executed after the nontransactionalstatement is still added to the currently open transaction.
In addition, several statements do an implicit commit. These can be separated into threegroups based on the reason they do an implicit commit.Statements that write files
Most DDL statements (CREATE, ALTER, etc.), with some exceptions, do an implicitcommit of any outstanding transaction before starting to execute and an implicitcommit after they have finished. These statements modify files in the filesystemand are for that reason not transactional.
Statements that modify tables in the mysql databaseAll statements that create, drop, or modify user accounts or privileges for users doan implicit commit and cannot be part of a transaction. Internally, these statementsmodify tables in the mysql database, which are all nontransactional.
In MySQL versions earlier than 5.1.3, these statements did not cause an implicitcommit, but because they were writing to nontransactional tables, they were treatedas nontransactional statements. As you will soon see, this caused some inconsis‐
86 | Chapter 4: The Binary Log

tencies, so implicit commits were added for these statements over the course ofseveral versions.
Statements that require implicit commits for pragmatic reasonsStatements that lock tables, statements that are used for administrative purposes,and LOAD DATA INFILE cause implicit commits in various situations because theimplementation requires this to make them work correctly.
Statements that cause an implicit commit are clearly not part of any transaction, becauseany open transaction is committed before execution starts. You can find a complete listof statements that cause an implicit commit in the online MySQL Reference Manual.
Transaction CacheThe binary log can have statements in a different order from their actual execution,because it combines all the statements in each transaction to keep them together. Mul‐tiple sessions can execute simultaneous transactions on a server, and the transactionalstorage engines maintain their own transactional logs to make sure each transactionexecutes correctly. These logs are not visible to the user. In contrast, the binary log showsall transactions from all sessions in the order in which they were committed as if eachexecuted sequentially.
To ensure each transaction is written as a unit to the binary log, the server has to separatestatements that are executing in different threads. When committing a transaction, theserver writes all the statements that are part of the transaction to the binary log as asingle unit. For this purpose, the server keeps a transaction cache for each thread, asillustrated in Figure 4-4. Each statement executed for a transaction is placed in thetransaction cache, and the contents of the transaction cache are then copied to the binarylog and emptied when the transaction commits.
Figure 4-4. Threads with transaction caches and a binary log
Logging Transactions | 87

Statements that contain nontransactional changes require special attention. Recall fromour previous discussion that nontransactional statements do not cause the currenttransaction to terminate, so the changes introduced by the execution of a nontransac‐tional statement have to be recorded somewhere without closing the currently opentransaction. The situation is further complicated by statements that simultaneously af‐fect transactional and nontransactional tables. These statements are considered trans‐actional but include changes that are not part of the transaction.
Statement-based replication cannot handle this correctly in all situations, so a best-effortapproach has been taken. We’ll describe the measures taken by the server, followed bythe issues you have to be aware of in order to avoid the replication problems that areleft over.
How nontransactional statements are logged
When no transaction is open, nontransactional statements are written to the binary logat the end of execution of the statement and do not “transit” in the transaction cachebefore ending up in the binary log. If, however, a transaction is open, the rules for howto handle the statement are as follows:
1. Rule 1: If the statement is marked as transactional, it is written to the transactioncache.
2. Rule 2: If the statement is not marked as transactional and there are no statementsin the transaction cache, the statement is written directly to the binary log.
3. Rule 3: If the statement is not marked as transactional, but there are statements inthe transaction cache, the statement is written to the transaction cache.
The third rule might seem strange, but you can understand the reasoning if you look atExample 4-15. Returning to our employee and log tables, consider the statements inExample 4-15, where a modification of a transactional table comes before modificationof a nontransactional table in the transaction.
Example 4-15. Transaction with nontransactional statement1 START TRANSACTION;2 SET @pass = PASSWORD('xyzzy');3 INSERT INTO employee(name,email,password) VALUES ('mats','[email protected]', @pass);4 INSERT INTO log(email, message) VALUES ('[email protected]', 'This employee was bad');5 COMMIT;
Following rule 3, the statement on line 4 is written to the transaction cache even thoughthe table is nontransactional. If the statement were written directly to the binary log, itwould end up before the statement in line 3 because the statement in line 3 would notend up in the binary log until a successful commit in line 5. In short, the slave’s log would
88 | Chapter 4: The Binary Log

end up containing the comment added by the DBA in line 4 before the actual changeto the employee in line 3, which is clearly inconsistent with the master. Rule 3 avoidssuch situations. The left side of Figure 4-5 shows the undesired effects if rule 3 did notapply, whereas the right side shows what actually happens thanks to rule 3.
Figure 4-5. Alternative binary logs depending on rule 3
Rule 3 involves a trade-off. Because the nontransactional statement is cached while thetransaction executes, there is a risk that two transactions will update a nontransactionaltable on the master in a different order from that in which they are written to the binarylog.
This situation can arise when there is a dependency between the first transactional andthe second nontransactional statement of the transaction, but this cannot generally behandled by the server because it would require parsing each statement completely, in‐cluding code in all triggers invoked, and performing a dependency analysis. Althoughtechnically possible, this would add extra processing to all statements during an opentransaction and would therefore affect performance, perhaps significantly. Because theproblem can almost always be avoided by designing transactions properly and ensuringthat there are no dependencies of this kind in the transaction, the overhead was notadded to MySQL.
How to avoid replication problems with nontransactional statements
The best strategy for avoiding problems is not to use nontransactional tables. However,if they are required by the application, a strategy for avoiding the dependencies discussedin the previous section is to ensure that statements affecting nontransactional tables arewritten first in the transaction. In this case, the statements will be written directly to thebinary log, because the transaction cache is empty (refer to rule 2 in the precedingsection). The statements are known to have no dependencies.
If you need any values from these statements later in the transaction, you can assignthem to temporary tables or variables. After that, the real contents of the transactioncan be executed, referencing the temporary tables or variables.
Logging Transactions | 89

Writing Non-Transactional Statements DirectlyStarting with MySQL 5.6, it is possible to force nontransactional statements to be writtendirectly to the binary log by using the option binlog_direct_non_transactional_updates. When this option is enabled, all nontransactional statements will be written tothe binary log before the transaction where they appear instead of inside the transaction,even when the nontransactional statement appears after a transactional statement. Thisoption changes the behavior only in statement-based replication. In row-based repli‐cation, the rows for the nontransactional statement are always written before the trans‐action. This will work because row-based replication does not execute the statements,but just changes the data in the table. Hence, the nontransactional “statement” will nothave any dependencies at all and can be safely written before the transaction.
As an example, if the transaction in Example 4-15 is executed with binlog_direct_non_transactional_updates disabled (which is the default), statements are writ‐ten to the binary log in the order shown by Figure 4-6.
Figure 4-6. Order of statements from Example 4-15 in natural order
If, instead, binlog_direct_non_transactional_updates is enabled, the sequence ofevents will be in the order shown in Figure 4-7. Here, a separate transaction created forthe write to the log table, which is then written before the transaction containing trans‐actional statements.
Figure 4-7. Order of statements from Example 4-15 in safe order
90 | Chapter 4: The Binary Log

Because the nontransactional statement is written before the transaction, it is criticalthat there are no dependencies on the statements executed before the nontransactionalstatement in the transaction. If this is something that you need, you should considerusing row-based replication instead.
Distributed Transaction Processing Using XAMySQL version 5.0 lets you coordinate transactions involving different resources byusing the X/Open Distributed Transaction Processing model, XA. Although currentlynot very widely used, XA offers attractive opportunities for coordinating all kinds ofresources with transactions.
In version 5.0, the server uses XA internally to coordinate the binary log and the storageengines.
A set of commands allows the client to take advantage of XA synchronization as well.XA allows different statements entered by different users to be treated as a single trans‐action. On the other hand, it imposes some overhead, so some administrators turn itoff globally.
Instructions for working with the XA protocol are beyond the scope of this book, butwe will give a brief introduction to XA here before describing how it affects the binarylog.
XA includes a transaction manager that coordinates a set of resource managers so thatthey commit a global transaction as an atomic unit. Each transaction is assigned a uniqueXID, which is used by the transaction manager and the resource managers. When usedinternally in the MySQL server, the transaction manager is usually the binary log andthe resource managers are the storage engines. The process of committing an XA trans‐action is shown in Figure 4-8 and consists of two phases.
In phase 1, each storage engine is asked to prepare for a commit. When preparing, thestorage engine writes any information it needs to commit correctly to safe storage andthen returns an OK message. If any storage engine replies negatively—meaning that itcannot commit the transaction—the commit is aborted and all engines are instructedto roll back the transaction.
After all storage engines have reported that they have prepared without error, and beforephase 2 begins, the transaction cache is written to the binary log. In contrast to normaltransactions, which are terminated with a normal Query event with a COMMIT, an XAtransaction is terminated with an Xid event containing the XID.
Logging Transactions | 91

Figure 4-8. Distributed transaction commit using XA
In phase 2, all the storage engines that were prepared in phase 1 are asked to committhe transaction. When committing, each storage engine will report that it has committedthe transaction in stable storage. It is important to understand that the commit cannotfail: once phase 1 has passed, the storage engine has guaranteed that the transaction canbe committed and therefore is not allowed to report failure in phase 2. A hardwarefailure can, of course, cause a crash, but since the storage engines have stored the in‐
92 | Chapter 4: The Binary Log

formation in durable storage, they will be able to recover properly when the serverrestarts. The restart procedure is discussed in the section “The Binary Log and CrashSafety” on page 100.
After phase 2, the transaction manager is given a chance to discard any shared resources,should it choose to. The binary log does not need to do any such cleanup actions, so itdoes not do anything special with regard to XA at this step.
In the event that a crash occurs while committing an XA transaction, the recoveryprocedure in Figure 4-9 will take place when the server is restarted. At startup, the serverwill open the last binary log and check the Format_description event. If the binlog-in-use flag is set (described in “Binlog File Rotation” on page 101), it indicates that theserver crashed and XA recovery has to be executed.
Figure 4-9. Procedure for XA recovery
The server starts by walking through the binary log that was just opened and findingthe XIDs of all transactions in the binary log by reading the Xid events. Each storageengine loaded into the server will then be asked to commit the transactions in this list.
Logging Transactions | 93

For each XID in the list, the storage engine will determine whether a transaction withthat XID is prepared but not committed, and commit it if that is the case. If the storageengine has prepared a transaction with an XID that is not in this list, the XID obviouslydid not make it to the binary log before the server crashed, so the transaction shouldbe rolled back.
Binary Log Group CommitWriting data to disk takes time; quite a lot actually. The performance of disk is ordersof magnitude slower than main memory, where disk access times is counted in milli‐seconds, main memory access is counted in nanoseconds. For that reason, operatingsystems have elaborate memory management systems for keeping part of the files inmemory and not performing more writes to disk than necessary. Since database systemshave to be safe from crashes, it is necessary to force the data to be written to disk whena transaction is committed.
To avoid the performance impact resulting if each transaction has to be written to disk,multiple independent transactions can be grouped together and written to disk as asingle unit, which is called group commit. Because the disk write time is mainly a con‐sequence of the time it takes to move the disk head to the correct position on the disk,and not the amount of data written, this improves performance significantly.
It is, however, not sufficient to commit the transaction data in the storage engine effi‐ciently, the binary log also has to be written efficiently. For that reason, binary log groupcommit was added in MySQL 5.6. With this, multiple independent transactions can becommitted as a group to the binary log, improving performance significantly.
In order for online backup tools like MySQL Enterprise Backup to work correctly, it isimportant that transactions are written to the binary log in the same order as they areprepared in the storage engine.
The implementation is built around a set of stages that each transaction has to passthrough before being fully committed, you can see an illustration in Figure 4-10. Eachstage is protected by a mutex so there can never be more than one thread in each stage.
Each stage handles one part of the commit procedure. The first stage flushes the trans‐action caches of the threads to the file pages, the second stage executes a sync to get thefile pages to disk, and the last stage commits all transactions.
94 | Chapter 4: The Binary Log


• For the commit stage, the transactions are committed in the storage engines inthe same order as they registered.
5. The sessions are enqueued to the queue for the next stage in the same order as theywere registered for this stage.Note that the queue might not be empty, which means that a session thread has“caught up” with a preceding leader thread. In this case, the session thread that wasthe leader and did the processing will become a follower for the next stage and letthe leader already queued up handle the processing for the combined sets of ses‐sions. Note that a leader can become a follower, but a follower can never become aleader.
As explained, new leader threads merge their session queues with older threads that arein the middle of commit procedures. This lets the system adapt dynamically to changingsituations. Normally, the sync stage is the most expensive stage, so many batches ofsessions will pass through the flush stage and “pile up” in the sync stage queue, afterwhich a single leader thread will bring all the sessions through that stage. However, ifbattery-backed caches are used, fsync calls are very cheap, so in that case, sessions mightnot pile up at this stage.
Transactions have to be committed in order so that online backup methods (such asXtraBackup or MySQL Enterprise Backup) work correctly. For this reason, the commitstage commits the transactions in the same order as they are written to the binary log.
However, it is also possible to commit transactions in parallel in the commit stage. Thismeans that the commits are done in an arbitrary order. This does not affect correctnessin normal operations, but it means that you should not take an online backup whiledoing parallel commits.
Benchmarks did not show any measurable improvement in performance when com‐mitting transactions in parallel, so the default is to always commit in order. This is alsothe recommended setting, unless you have special needs (or just want to test it).
You can control whether transactions should be ordered using binlog_order_commits. If this is set to OFF, transactions are committed in parallel and the last stage isskipped (the threads commit themselves in an arbitrary order instead of waiting for theleader).
The flush stage includes an optimization when reading sessions from the queue. Insteadof entering the flush stage and taking the entire queue for processing, the leader “skims”one session at a time from the queue, flushes it, and then repeats the procedure. Theidea behind this optimization is that as long as there are sessions enqueueing, there isno point in advancing to the queue stage, and since flushing the transaction to the binarylog takes time, performing it on each session provides an opportunity for more sessionsthat need committing to enqueue themselves. This optimization showed significant
96 | Chapter 4: The Binary Log

performance improvements in throughput. But because it can affect latency, you cancontrol how long the leader thread will keep “skimming” sessions from the flush queueusing the binlog_max_flush_queue_time, which takes the number of microsecondsthat the leader should skim the queue. Once the timer expires, the entire queue will begrabbed and the leader reverts to executing the procedure described in the precedinglist for the stage. This means that the time given is not the maximum latency of a trans‐action: the leader will have to flush all the transactions that are registered for the queuebefore moving to the sync stage.
Row-Based ReplicationThe primary goal of replication is to keep the master and the slave synchronized so theyhave the same data. As you saw earlier, replication offers a number of special featuresto ensure the results are as close as possible to being identical on master and slave:context events, session-specific IDs, etc.
Despite this, there are still some situations that statement-based replication can’t cur‐rently handle correctly:
• If an UPDATE, DELETE, or INSERT statement contains a LIMIT clause, it may causeproblems if a database crashes during execution.
• If there is an error during execution of a nontransactional statement, there is noguarantee that the effects are the same on the master and the slave.
• If a statement contains a call to a UDF, there is no way to ensure the same value isused on the slave.
• If the statement contains any nondeterministic function—such as USER, CURRENT_USER, or CONNECTION_ID—results may differ between master and slave.
• If a statement updates two tables with autoincrement columns, it will not workcorrectly, because only a single last insert ID can be replicated, which will then beused for both tables on the slave, while on the master, the insert ID for each tablewill be used individually.
In these cases, it is better to replicate the actual data being inserted into the tables, whichis what row-based replication does.
Instead of replicating the statement that performs the changes, row-based replicationreplicates each row being inserted, deleted, or updated separately, with the values thatwere used for the operation. Since the row that is sent to the slave is the same row thatis sent to the storage engine, it contains the actual data being inserted into the table.Hence there are no UDFs to consider, no autoincrement counters to keep track of, andno partial execution of statements to take into consideration—just data, plain and sim‐ple.
Row-Based Replication | 97

2. MySQL 5.6 supports logging the statement that generated the rows to the binary log together with the rows.See the note in “Options for Row-Based Replication” on page 120.
Row-based replication opens up an entirely new set of scenarios that you just cannotaccomplish with statement-based replication. However, you must also be aware of somedifferences in behavior.
When choosing between statement-based and row-based replication, consider thefollowing:
• Do you have statements that update a lot of rows, or do the statements usually onlychange or insert a few rows?If the statement changes a lot of rows, statement-based replication will have morecompact statements and may execute faster. But since the statement is executed onthe slave as well, this is not always true. If the statement has a complex optimizationand execution plan, it might be faster to use row-based replication, because the logicfor finding rows is much faster.If the statement changes or inserts only a few rows, row-based replication is po‐tentially faster because there is no parsing involved and all processing goes directlyto the storage engine.
• Do you need to see which statements are executed? The events for handling row-based replication are hard to decode, to say the least. In statement-based replication,the statements are written into the binary log and hence can be read directly.2
• Statement-based replication has a simple replication model: just execute the samestatement on the slave. This has existed for a long time and is familiar to manyDBAs. Row-based replication, on the other hand, is less familiar to many DBAs andcan therefore potentially be harder to fix when replication fails.
• If data is different on master and slave, executing statements can yield differentresults on master and slave. Sometimes this is intentional—in this case, statement-based replication can and should be used—but sometimes this not intentional andcan be prevented through row-based replication.
Enabling Row-based ReplicationYou can control the format to use when writing to the binary log using the optionbinlog-format. This option can take the values STATEMENT, MIXED, or ROW (see “Optionsfor Row-Based Replication” on page 120 for more information), which comes both as aglobal variable and session variable. This makes it possible for a session to temporarilyswitch replication format (but you need SUPER privileges to change this variable, eventhe session version). However, to ensure that row-based replication is used when starting
98 | Chapter 4: The Binary Log

the server, you need to stop the master and update the configuration file. Example 4-16shows the addition needed to enable row-based replication.
Example 4-16. Options to configure row-based replication[mysqld]user = mysqlpid-file = /var/run/mysqld/mysqld.pidsocket = /var/run/mysqld/mysqld.sockport = 3306basedir = /usrdatadir = /var/lib/mysqltmpdir = /tmplog-bin = master-binlog-bin-index = master-bin.indexserver-id = 1binlog-format = ROW
Using Mixed ModeMixed-mode replication is recommended for MySQL version 5.1 and later, but thedefault value for the binlog-format option is STATEMENT. This might seem odd, but thatdecision was made to avoid problems for users who upgrade from versions 5.0 or earlier.Because those versions had no row-based replication and users had to use statement-based replication, the MySQL developers did not want servers to make a sudden switch.If the servers suddenly started sending out row-based replication events when they wereupgraded, the deployment would likely be a mess. To reduce the number of factors thatan upgrading DBA has to consider, the default for this option remains STATEMENT.
However, if you use one of the template files distributed with MySQL version 5.1, youwill notice the binlog-format option has the value MIXED, per the recommendation.
The principles behind mixed-mode replication are simple: use statement-based repli‐cation normally and switch to row-based replication for unsafe statements. We havealready examined the kinds of statements that can lead to problems and why. To sum‐marize, mixed-mode currently switches to row-based replication if:
• The statement calls any of the following:— The UUID function— A user-defined function— The CURRENT_USER or USER function— The LOAD_FILE function
• Two or more tables with an AUTO_INCREMENT column are updated in the samestatement.
• A server variable is used in the statement.
Row-Based Replication | 99

• The storage engine does not allow statement-based replication (e.g., the MySQLCluster engine).
This list is, by necessity, incomplete: it is being extended as new constructions are dis‐covered unsafe. For a complete and accurate list, refer to the online MySQL Reference Manual.
Binary Log ManagementThe events mentioned thus far represent some real change of data that occurred on themaster. However, things can happen that do not represent any change of data on themaster but can affect replication. For example, if the server is stopped, it can potentiallyaffect replication. No events can, of course, be written to the binary log when the serveris not running, but this means that if anything is changed in the datafile, it will not berepresented in the binary log. A typical example of this is restoring a backup, or other‐wise manipulating the datafiles. Such changes are not replicated simply because theserver is not running. However, the fact that the server stopped is sometimes representedin the binary log using a binary log event precisely to be able to recognize that there canbe a “gap” in the binary log where things could have happened.
Events are needed for other purposes as well. Because the binary logs consist of multiplefiles, it is necessary to split the groups at convenient places to form the sequence ofbinlog files. To handle this safely, special events (rotate events) are added to thebinary log.
The Binary Log and Crash SafetyAs you have seen, changes to the binary log do not correspond to changes to the masterdatabases on a one-to-one basis. It is important to keep the databases and the binarylog mutually consistent in case of a crash. In other words, there should be no changescommitted to the storage engine that are not written to the binary log, and vice versa.
Nontransactional engines introduce problems right away. For example, it is not possibleto guarantee consistency between the binary log and a MyISAM table because MyISAMis nontransactional and the storage engine will carry through any requested change longbefore any attempt to log the statement.
But for transactional storage engines, MySQL includes measures to make sure that acrash does not cause the binary log to lose too much information.
As we described in “Logging Statements” on page 58, events are written to the binarylog before releasing the locks on the table, but after all the changes have been given tothe storage engine. So if there is a crash before the storage engine releases the locks, theserver has to ensure that any changes recorded to the binary log are actually in the table
100 | Chapter 4: The Binary Log

on the disk before allowing the statement (or transaction) to commit. This requirescoordination with standard filesystem synchronization.
Because disk accesses are very expensive compared to memory accesses, operating sys‐tems are designed to cache parts of the file in a dedicated part of the main memory—usually called the page cache—and wait to write file data to disk until necessary. Writingto disk becomes necessary when another page must be loaded from disk and the pagecache is full, but it can also be requested by an application by doing an explicit call towrite the pages of a file to disk.
Recall from the earlier description of XA that when the first phase is complete, all datahas to be written to durable storage—that is, to disk—for the protocol to handle crashescorrectly. This means that every time a transaction is committed, the page cache has tobe written to disk. This can be very expensive and, depending on the application, notalways necessary. To control how often the data is written to disk, you can set the sync-binlog option. This option takes an integer specifying how often to write the binarylog to disk. If the option is set to 5, for instance, the binary log will be written to diskon every fifth commit group of statements or transactions. The default value is 0, whichmeans that the binary log is not explicitly written to disk by the server, but happens atthe discretion of the operating system.
Note that since the introduction of binary log group commit inMySQL version 5.6, there is a sync with each commit group and notwith each transaction or statement. This means that with sync-binlog=1 several transactions will be written to disk in a batch. Youcan read more about binary log group commit in “Binary Log GroupCommit” on page 94.
For storage engines that support XA, such as InnoDB, setting the sync-binlog optionto 1 means that you will not lose any transactions under normal crashes. For enginesthat do not support XA, you might lose at most one transaction.
If, however, every group is written to disk, it means that the performance suffers, usuallya lot. Disk accesses are notoriously slow and caches are used for precisely the purposeof improving the performance because they remove the need to always write data todisk. If you are prepared to risk losing a few transactions or statements—either becauseyou can handle the work it takes to recover this manually or because it is not importantfor the application—you can set sync-binlog to a higher value or leave it at the default.
Binlog File RotationMySQL starts a new file to hold binary log events at regular intervals. For practical andadministrative reasons, it wouldn’t work to keep writing to a single file—operating sys‐
Binary Log Management | 101

tems have limits on file sizes. As mentioned earlier, the file to which the server is cur‐rently writing is called the active binlog file.
Switching to a new file is called binary log rotation or binlog file rotation, depending onthe context.
Four main activities cause a rotation:The server stops
Each time the server starts, it begins a new binary log. We’ll discuss why shortly.
The binlog file reaches a maximum sizeIf the binlog file grows too large, it will be automatically rotated. You can controlthe size of the binlog files using the binlog-cache-size server variable.
The binary log is explicitly flushedThe FLUSH LOGS command writes all logs to disk and creates a new file to continuewriting the binary log. This can be useful when administering recovery images forPITR. Reading from an open binlog file can have unexpected results, so it is advis‐able to force an explicit flush before trying to use binlog files for recovery.
An incident occurred on the serverIn addition to stopping altogether, the server can encounter incidents that causethe binary log to be rotated. These incidents sometimes require special manualintervention from the administrator, because they can leave a “gap” in the replicationstream. It is easier for the DBA to handle the incident if the server starts on a freshbinlog file after an incident.
The first event of every binlog file is the Format_description event, which describesthe server that wrote the file along with information about the contents and status ofthe file.
Three items are of particular interest here:The binlog-in-use flag
Because a crash can occur while the server is writing to a binlog file, it is critical toindicate when a file was closed properly. Otherwise, a DBA could replay a corruptedfile on the master or slave and cause more problems. To provide assurance aboutthe file’s integrity, the binlog-in-use flag is set when the file is created and clearedafter the final event (Rotate) has been written to the file. Thus, any program cansee whether the binlog file was properly closed.
Binlog file format versionOver the course of MySQL development, the format for the binary log has changedseveral times, and it will certainly change again. Developers increment the versionnumber for the format when significant changes—notably changes to the commonheaders—render new files unreadable to previous versions of the server. (The cur‐rent format, starting with MySQL version 5.0, is version 4.) The binlog file format
102 | Chapter 4: The Binary Log

version field lists its version number; if a different server cannot handle a file withthat version, it simply refuses to read the file.
Server versionThis is a string denoting the version of the server that wrote the file. The serverversion used to run the examples in this chapter was “5.5.31-0ubuntu0.12.04.1,” forinstance. As you can see, the string is guaranteed to include the MySQL serverversion, but it also contains additional information related to the specific build. Insome situations, this information can help you or the developers figure out andresolve subtle bugs that can occur when replicating between different versions ofthe server.
To rotate the binary log safely even in the presence of crashes, the server uses a write-ahead strategy and records its intention in a temporary file called the purge index file(this name was chosen because the file is used while purging binlog files as well, as youwill see). Its name is based on that of the index file, so for instance if the name of theindex file is master-bin.index, the name of the purge index file is master-bin.~rec~. Aftercreating the new binlog file and updating the index file to point to it, the server removesthe purge index file.
In versions of MySQL earlier than 5.1.43, rotation or binlog file purg‐ing could leave orphaned files; that is, the files might exist in thefilesystem without being mentioned in the index file. Because of this,old files might not be purged correctly, leaving them around andrequiring manual cleaning of the files from the directory.The orphaned files do not cause a problem for replication, but can beconsidered an annoyance. The procedure shown in this section en‐sures that no files are orphaned in the event of a crash.
In the event of a crash, if a purge index file is present on the server, the server cancompare the purge index file and the index file when it restarts and see what was actuallyaccomplished compared to what was intended.
Before MySQL version 5.6 it was possible that the binary log could be left partiallywritten. This could occur if only a part of the cache was written to the binary log beforethe server crashed. With MySQL version 5.6, the binary log will be trimmed and thepartially written transaction removed from the binary log. This is safe because thetransaction is not committed in the storage engine until it was written completely tothe binary log.
IncidentsThe term “incidents” refers to events that don’t change data on a server but must bewritten to the binary log because they have the potential to affect replication. Most
Binary Log Management | 103

incidents don’t require special intervention from the DBA—for instance, servers canstop and restart without changes to database files—but there will inevitably be someincidents that call for special action.
Currently, there are two incident events that you might discover in a binary log:Stop
Indicates that the server was stopped through normal means. If the server crashed,no stop event will be written, even when the server is brought up again. This eventis written in the old binlog file (restarting the server rotates to a new file) andcontains only a common header; no other information is provided in the event.
When the binary log is replayed on the slave, it ignores any Stop events. Normally,the fact that the server stopped does not require special attention and replicationcan proceed as usual. If the server was switched to a new version while it was stop‐ped, this will be indicated in the next binlog file, and the server reading the binlogfile will then stop if it cannot handle the new version of the binlog format. In thissense, the Stop event does not represent a “gap” in the replication stream. However,the event is worth recording because someone might manually restore a backup ormake other changes to files before restarting replication, and the DBA replayingthe file could find this event in order to start or stop the replay at the right time.
Incident
An event type introduced in version 5.1 as a generic incident event. In contrast withthe Stop event, this event contains an identifier to specify what kind of incidentoccurred. It is used to indicate that the server was forced to perform actions thatalmost guarantee that changes are missing from the binary log.
For example, incident events in version 5.1 are written if the database was reloadedor if a nontransactional event was too big to fit in the binlog file. MySQL Clustergenerates this event when one of the nodes had to reload the database and couldtherefore be out of sync.
When the binary log is replayed on the slave, it stops with an error if it encountersan Incident event. In the case of the MySQL Cluster reload event, it indicates aneed to resynchronize the cluster and probably to search for events that are missingfrom the binary log.
Purging the Binlog FileOver time, the server will accumulate binlog files unless old ones are purged from thefilesystem. The server can automatically purge old binary logs from the filesystem, oryou can explicitly tell the server to purge the files.
To make the server automatically purge old binlog files, set the expire-logs-daysoption—which is available as a server variable as well—to the number of days that you
104 | Chapter 4: The Binary Log

want to keep binlog files. Remember that as with all server variables, this setting is notpreserved between restarts of the server. So if you want the automatic purging to keepgoing across restarts, you have to add the setting to the my.cnf file for the server.
To purge the binlog files manually, use the PURGE BINARY LOGS command, which comesin two forms:PURGE BINARY LOGS BEFORE datetime
This form of the command will purge all files that are before the given date. Ifdatetime is in the middle of a logfile (which it usually is), all files before the oneholding datetime will be purged.
PURGE BINARY LOGS TO 'filename'
This form of the command will purge all files that precede the given file. In otherwords, all files before filename in the output from SHOW MASTER LOGS will be re‐moved, leaving filename as the first binlog file.
Binlog files are purged when the server starts or when a binary log rotation is done. Ifthe server discovers files that require purging, either because a file is older than expire-logs-days or because a PURGE BINARY LOGS command was executed, it will start bywriting the files that the server has decided are ripe for purging to the purge index file(for example, master-bin.~rec~). After that, the files are removed from the filesystem,and finally the purge index file is removed.
In the event of a crash, the server can continue removing files by comparing the contentsof the purge index file and the index file and removing all files that were not removedbecause of a crash. As you saw earlier, the purge index file is used when rotating as well,so if a crash occurs before the index file can be properly updated, the new binlog filewill be removed and then re-created when the rotate is repeated.
The mysqlbinlog UtilityOne of the more useful tools available to an administrator is the client program mysql‐binlog. This is a small program that can investigate the contents of binlog files as wellas relay logfiles (we will cover the relay logs in Chapter 8). In addition to reading binlogfiles locally, mysqlbinlog can also fetch binlog files remotely from other servers.
The mysqlbinlog is a very useful tool when investigating problems with replication, butyou can also use it to implement PITR, as demonstrated in Chapter 3.
The mysqlbinlog tool normally outputs the contents of the binary log in a form that canbe executed by sending them to a running server. When statement-based replication isemployed, the statements executed are emitted as SQL statements. For row-based rep‐lication, which will be introduced in Chapter 8, mysqlbinlog generates some additionaldata necessary to handle row-based replication. This chapter focuses entirely on
The mysqlbinlog Utility | 105

statement-based replication, so we will use the command with options to suppress out‐put needed to handle row-based replication.
Some options to mysqlbinlog will be explained in this section, but for a complete list,consult the online MySQL Reference Manual.
Basic UsageLet’s start with a simple example where we create a binlog file and then look at it usingmysqlbinlog. We will start up a client connected to the master and execute the followingcommands to see how they end up in the binary log:
mysqld1> RESET MASTER;Query OK, 0 rows affected (0.01 sec)
mysqld1> CREATE TABLE employee ( -> id INT AUTO_INCREMENT, -> name CHAR(64) NOT NULL, -> email CHAR(64), -> password CHAR(64), -> PRIMARY KEY (id) -> );Query OK, 0 rows affected (0.00 sec)
mysqld1> SET @password = PASSWORD('xyzzy');Query OK, 0 rows affected (0.00 sec)
mysqld1> INSERT INTO employee(name,email,password) -> VALUES ('mats','[email protected]',@password);Query OK, 1 row affected (0.01 sec)
mysqld1> SHOW BINARY LOGS;+--------------------+-----------+| Log_name | File_size |+--------------------+-----------+| mysqld1-bin.000038 | 670 |+--------------------+-----------+1 row in set (0.00 sec)
Let’s now use mysqlbinlog to dump the contents of the binlog file master-bin.000038,which is where all the commands ended up. The output shown in Example 4-17 hasbeen edited slightly to fit the page.
Example 4-17. Output from execution of mysqlbinlog$ sudo mysqlbinlog \> --short-form \> --force-if-open \> --base64-output=never \> /var/lib/mysql1/mysqld1-bin.0000381 /*!40019 SET @@session.max_insert_delayed_threads=0*/;
106 | Chapter 4: The Binary Log

2 /*!50003 SET @OLD_COMPLETION_TYPE=@@COMPLETION_TYPE,COMPLETION_TYPE=0*/;3 DELIMITER /*!*/;4 ROLLBACK/*!*/;5 use test/*!*/;6 SET TIMESTAMP=1264227693/*!*/;7 SET @@session.pseudo_thread_id=999999999/*!*/;8 SET @@session.foreign_key_checks=1, @@session.sql_auto_is_null=1, @@session.unique_checks=1, @@session.autocommit=1/*!*/;9 SET @@session.sql_mode=0/*!*/;10 SET @@session.auto_increment_increment=1, @@session.auto_increment_offset=1/*!*/;11 /*!\C utf8 *//*!*/;12 SET @@session.character_set_client=8,@@session.collation_connection=8, @@session.collation_server=8/*!*/;13 SET @@session.lc_time_names=0/*!*/;14 SET @@session.collation_database=DEFAULT/*!*/;15 CREATE TABLE employee (16 id INT AUTO_INCREMENT,17 name CHAR(64) NOT NULL,18 email CHAR(64),19 password CHAR(64),20 PRIMARY KEY (id)21 ) ENGINE=InnoDB22 /*!*/;23 SET TIMESTAMP=1264227693/*!*/;24 BEGIN25 /*!*/;26 SET INSERT_ID=1/*!*/;27 SET @`password`:=_utf8 0x2A31353141463... COLLATE `utf8_general_ci`/*!*/;28 SET TIMESTAMP=1264227693/*!*/;29 INSERT INTO employee(name,email,password)30 VALUES ('mats','[email protected]',@password)31 /*!*/;32 COMMIT/*!*/;33 DELIMITER ;34 # End of log file35 ROLLBACK /* added by mysqlbinlog */;36 /*!50003 SET COMPLETION_TYPE=@OLD_COMPLETION_TYPE*/;
To get this output, we use three options:short-form
With this option, mysqlbinlog prints only information about the SQL statementsissued, and leaves out comments with information about the events in the binarylog. This option is useful when mysqlbinlog is used only to play back the events toa server. If you want to investigate the binary log for problems, you will need thesecomments and should not use this option.
force-if-open
If the binlog file is not closed properly, either because the binlog file is still beingwritten to or because the server crashed, mysqlbinlog will print a warning that this
The mysqlbinlog Utility | 107

binlog file was not closed properly. This option prevents the printing of that warn‐ing.
base64-output=never
This prevents mysqlbinlog from printing base64-encoded events. If mysqlbinlog hasto print base64-encoded events, it will also print the Format_description event ofthe binary log to show the encoding used. For statement-based replication, this isnot necessary, so this option is used to suppress that event.
In Example 4-17, lines 1–4 contain the preamble printed in every output. Line 3 sets adelimiter that is unlikely to occur elsewhere in the file. The delimiter is also designedto appear as a comment in processing languages that do not recognize the setting of thedelimiter.
The rollback on line 4 is issued to ensure the output is not accidentally put inside atransaction because a transaction was started on the client before the output was fedinto the client.
We can skip momentarily to the end of the output—lines 33–35—to see the counterpartto lines 1–4. They restore the values set in the preamble and roll back any open trans‐action. This is necessary in case the binlog file was truncated in the middle of a trans‐action, to prevent any SQL code following this output from being included in a trans‐action.
The USE statement on line 5 is printed whenever the database is changed. Even thoughthe binary log specifies the current database before each SQL statement, mysqlbinlogshows only the changes to the current database. When a USE statement appears, it is thefirst line of a new event.
The first line that is guaranteed to be in the output for each event is SET TIMESTAMP, asshown on lines 6 and 23. This statement gives the timestamp when the event startedexecuting in seconds since the epoch.
Lines 7–14 contain general settings, but like USE on line 5, they are printed only for thefirst event and whenever their values change.
Because the INSERT statement on lines 29–30 is inserting into a table with an autoin‐crement column using a user-defined variable, the INSERT_ID session variable on line26 and the user-defined variable on line 27 are set before the statement. This is the resultof the Intvar and User_var events in the binary log.
If you omit the short-form option, each event in the output will be preceded by some comments about the event that generated the lines. You can see these comments, whichstart with hash marks (#) in Example 4-18.
108 | Chapter 4: The Binary Log

Example 4-18. Interpreting the comments in mysqlbinlog output$ sudo mysqlbinlog \> --force-if-open \> --base64-output=never \> /var/lib/mysql1/mysqld1-bin.000038 . . .1 # at 3862 #100123 7:21:33 server id 1 end_log_pos 414 Intvar3 SET INSERT_ID=1/*!*/;4 # at 4145 #100123 7:21:33 server id 1 end_log_pos 496 User_var6 SET @`password`:=_utf8 0x2A313531...838 COLLATE `utf8_general_ci`/*!*/;7 # at 4968 #100123 7:21:33 server id 1 end_log_pos 643 Query thread_id=6 exec_time=0 error_code=09 SET TIMESTAMP=1264227693/*!*/;10 INSERT INTO employee(name,email,password)11 VALUES ('mats','[email protected]',@password)12 /*!*/;13 # at 64314 #100123 7:21:33 server id 1 end_log_pos 670 Xid = 21815 COMMIT/*!*/;16 DELIMITER ;17 # End of log file18 ROLLBACK /* added by mysqlbinlog */;19 /*!50003 SET COMPLETION_TYPE=@OLD_COMPLETION_TYPE*/;
The first line of the comment gives the byte position of the event, and the second linecontains other information about the event. Consider, for example, the INSERT state‐ment line:
# at 496#100123 7:21:33 server id 1 end_log_pos 643 Query thread_id=6 exec_time=0 error_code=0
The various parts of the comments have the following meanings:at 496
The byte position where the event starts (i.e., the first byte of the event).
100123 7:21:33
The timestamp of the event as a datetime (date plus time). This is the time whenthe query started executing or when the events were written to the binary log.
server_id 1
The server ID of the server that generated the event. This server ID is used to setthe pseudo_thread_id session variable, and a line setting this variable is printed ifthe event is thread-specific and the server ID is different from the previously printedID.
The mysqlbinlog Utility | 109

end_log_pos 643
The byte position of the event that follows this event. By taking the difference be‐tween this value and the position where the event starts, you can get the length ofthe event.
Query
The type of event. In Example 4-18, you can see several different types of events,such as User_var, Intvar, and Xid.
The fields after these are event-specific, and hence different for each event. For the Queryevent, we can see two additional fields:thread_id=6
The ID of the thread that executed the event. This is used to handle thread-specificqueries, such as queries that access temporary tables.
exec_time=0
The execution time of the query in seconds.
Example 4-17 and Example 4-18 dump the output of a single file, but mysqlbinlog acceptsmultiple files as well. If several binlog files are given, they are processed in order.
The files are printed in the order you request them, and there is no checking that theRotate event ending each file refers to the next file in sequence. The responsibility forensuring that these binlog files make up part of a real binary log lies on the user.
Thanks to the way the binlog files binlog files are given, they will be processed in arenamed, submitting multiple files to mysqlbinlog—such as by using * as a file-globbingwildcard—is usually not a problem. However, let’s look at what happens when the binlogfile counter, which is used as an extension to the filename, goes from 999999 to 1000000:
$ ls mysqld1-bin.[0-9]*mysqld1-bin.000007 mysqld1-bin.000011 mysqld1-bin.000039mysqld1-bin.000008 mysqld1-bin.000035 mysqld1-bin.1000000mysqld1-bin.000009 mysqld1-bin.000037 mysqld1-bin.999998mysqld1-bin.000010 mysqld1-bin.000038 mysqld1-bin.999999
As you can see, the last binlog file to be created is listed before the two binlog files thatare earlier in binary log order. So it is worth checking the names of the files before youuse wildcards.
Since your binlog files are usually pretty large, you won’t want to print the entire contentsof the binlog files and browse them. Instead, there are a few options you can use to limitthe output so that only a range of the events is printed.start-position=bytepos
The byte position of the first event to dump. Note that if several binlog files aresupplied to mysqlbinlog, this position will be interpreted as the position in the firstfile in the sequence.
110 | Chapter 4: The Binary Log

If an event does not start at the position given, mysqlbinlog will still try to interpretthe bytes starting at that position as an event, which usually leads to garbage output.
stop-position=bytepos
The byte position of the last event to print. If no event ends at that position, the lastevent printed will be the event with a position that precedes bytepos. If multiplebinlog files are given, the position will be the position of the last file in the sequence.
start-datetime=datetime
Prints only events that have a timestamp at or after datetime. This will work cor‐rectly when multiple files are given—if all events of a file are before the datetime,all events will be skipped—but there is no checking that the events are printed inorder according to their timestamps.
stop-datetime=datetime
Prints only events that have a timestamp before datetime. This is an exclusive range,meaning that if an event is marked 2010-01-24 07:58:32 and that exact datetimeis given, the event will not be printed.
Note that since the timestamp of the event uses the start time of the statement butevents are ordered in the binary log based on the commit time, it is possible to haveevents with a timestamp that comes before the timestamp of the preceding event.Since mysqlbinlog stops at the first event with a timestamp outside the range, theremight be events that aren’t displayed because they have timestamps before datetime.
Reading remote files
In addition to reading files on a local filesystem, the mysqlbinlog utility can read binlogfiles from a remote server. It does this by using the same mechanism that the slaves useto connect to a master and ask for events. This can be practical in some cases, since itdoes not require a shell account on the machine to read the binlog files, just a user onthe server with REPLICATION SLAVE privileges.
To handle remote reading of binlog files, include the read-from-remote-server optionalong with a host and user for connecting to the server, and optionally a port (if differentfrom the default) and a password.
When reading from a remote server, give just the name of the binlog file, not the fullpath.
So to read the Query event from Example 4-18 remotely, the command would looksomething like the following (the server prompts for a password, but it is not outputwhen you enter it):
$ sudo mysqlbinlog> --read-from-remote-server> --host=master.example.com
The mysqlbinlog Utility | 111

> --base64-output=never> --user=repl_user --password> --start-position=294> mysqld1-bin.000038Enter password:/*!50530 SET @@SESSION.PSEUDO_SLAVE_MODE=1*/;/*!40019 SET @@session.max_insert_delayed_threads=0*/;/*!50003 SET @OLD_COMPLETION_TYPE=@@COMPLETION_TYPE,COMPLETION_TYPE=0*/;DELIMITER /*!*/;# at 294#130608 22:09:19 server id 1 end_log_pos 0 Start: binlog v 4, server v 5.5.31 -0ubuntu0.12.04.1-log created 130608 22:09:19# at 294#130608 22:13:08 server id 1 end_log_pos 362 Query thread_id=53 exec_time=0 error_code=0SET TIMESTAMP=1370722388/*!*/;SET @@session.pseudo_thread_id=53/*!*/;SET @@session.foreign_key_checks=1, @@session.sql_auto_is_null=0...SET @@session.sql_mode=0/*!*/;SET @@session.auto_increment_increment=1, @@session.auto_increment_offset.../*!\C utf8 *//*!*/;SET @@session.character_set_client=33,@@session.collation_connection=33...SET @@session.lc_time_names=0/*!*/;SET @@session.collation_database=DEFAULT/*!*/;BEGIN/*!*/;# at 362#130608 22:13:08 server id 1 end_log_pos 390 IntvarSET INSERT_ID=1/*!*/;# at 390#130608 22:13:08 server id 1 end_log_pos 472 User_varSET @`password`:=_utf8 0x2A31353141463642384333413641413039434643434244333...# at 472#130608 22:13:08 server id 1 end_log_pos 627 Query thread_id=53 exec_time=0use `test`/*!*/;SET TIMESTAMP=1370722388/*!*/;INSERT INTO employee(name, email, password) VALUES ('mats', '[email protected]', @password)/*!*/;# at 627#130608 22:13:08 server id 1 end_log_pos 654 Xid = 175COMMIT/*!*/;DELIMITER ;# End of log fileROLLBACK /* added by mysqlbinlog */;/*!50003 SET COMPLETION_TYPE=@OLD_COMPLETION_TYPE*/;/*!50530 SET @@SESSION.PSEUDO_SLAVE_MODE=0*/;
Reading raw binary logfiles
The mysqlbinlog utility is very useful for investigating binary logs, but it can also be usedfor taking backups of binlog files. This is very useful when you do not have access to
112 | Chapter 4: The Binary Log

the machine using normal shell but have REPLICATION SLAVE privileges. In this case,you can read the binary logfiles from the server, but they should not be parsed and ratherjust saved to files.
The normal way to use mysqlbinlog for taking a backup of binlog files remotely is:mysqlbinlog --raw --read-from-remote-server \ --host=master.example.com --user=repl_user \ master-bin.000012 master-bin.000013 ...
In this example, the binlog files master-bin.000012 and master-bin.000013 will be readand saved in the current directory. Note that you have to use --read-from-remote-server together with --raw. Using --raw without --read-from-remote-server ispointless since that would be the same as using a plain file copy. The most interestingoptions to control the behavior of mysqlbinlog are described below. You can find a de‐tailed description of how to use mysqlbinlog for backups at the MySQL Reference Man‐ual.--result-file=prefix
This option gives the prefix to use when constructing the files to write to. The prefixcan be a directory name (with trailing slash), or any other prefix. It defaults to theempty string, so if this option is not used, files will be written using the same nameas they have on the master.
--to-last-log
Normally, only the files given on the command line are transferred, but if this optionis provided, only the starting binary log file has to be given. After that, mysqlbin‐log will transfer all files after the first one.
--stop-never
Do not stop reading after reaching end of file of the last log: keep waiting for moreinput. This option is useful when taking a backup that is to be used for point-in-time recovery. See “Backup and MySQL Replication” on page 570 for a detailed treat‐ment of backing up for point-in-time recovery.
Interpreting EventsSometimes, the standard information printed by mysqlbinlog is not sufficient for spot‐ting a problem, so it is necessary to go into the details of the event and investigate itscontent. To handle such situations, you can pass the hexdump option to tell mysqlbin‐log to write the actual bytes of the events.
Before going into the details of the events, here are some general rules about the formatof the data in the binary log:
The mysqlbinlog Utility | 113

Integer dataInteger fields in the binary log are printed in little-endian order, so you have to readinteger fields backward. This means that, for example, the 32-bit block 03 01 00 00represents the hexadecimal number 103.
String dataString data is usually stored both with length data and null-terminated. Sometimes,the length data appears just before the string and sometimes it is stored in the postheader.
This section will cover the most common events, but an exhaustive reference concerningthe format of all the events is beyond the scope of this book. Check the Binary Logsection in the MySQL Internals Manual for an exhaustive list of all the events availableand their fields. The most common of all the events is the Query event, so let’s concentrateon it first. Example 4-19 shows the output for such an event.
Example 4-19. Output when using option - -hexdump $ sudo mysqlbinlog \ > --force-if-open \ > --hexdump \ > --base64-output=never \ > /var/lib/mysql1/mysqld1-bin.000038 . . .1 # at 4962 #100123 7:21:33 server id 1 end_log_pos 6433 # Position Timestamp Type Master ID Size Master Pos Flags4 # 1f0 6d 95 5a 4b 02 01 00 00 00 93 00 00 00 83 02 00 00 10 005 # 203 06 00 00 00 00 00 00 00 04 00 00 1a 00 00 00 40 |................|6 # 213 00 00 01 00 00 00 00 00 00 00 00 06 03 73 74 64 |.............std|7 # 223 04 08 00 08 00 08 00 74 65 73 74 00 49 4e 53 45 |.......test.INSE|8 # 233 52 54 20 49 4e 54 4f 20 75 73 65 72 28 6e 61 6d |RT.INTO.employee|9 # 243 65 2c 65 6d 61 69 6c 2c 70 61 73 73 77 6f 72 64 |.name.email.pass|10 # 253 29 0a 20 20 56 41 4c 55 45 53 20 28 27 6d 61 74 |word....VALUES..|11 # 263 73 27 2c 27 6d 61 74 73 40 65 78 61 6d 70 6c 65 |.mats...mats.exa|12 # 273 2e 63 6f 6d 27 2c 40 70 61 73 73 77 6f 72 64 29 |mple.com...passw|13 # 283 6f 72 64 29 |ord.|14 # Query thread_id=6 exec_time=0 error_code=0 SET TIMESTAMP=1264227693/*!*/; INSERT INTO employee(name,email,password) VALUES ('mats','[email protected]',@password)
The first two lines and line 14 are comments listing basic information that we discussedearlier. Notice that when you use the hexdump option, the general information and theevent-specific information are split into two lines, whereas they are merged in the nor‐mal output.
Lines 3 and 4 list the common header:
114 | Chapter 4: The Binary Log

Timestamp
The timestamp of the event as an integer, stored in little-endian format.
Type
A single byte representing the type of the event. Some event types are given in theMySQL Internals Manual but to get the values for your specific server you need tolook in the source code (in the file sql/log_event.h).
Master ID
The server ID of the server that wrote the event, written as an integer. For the eventshown in Example 4-19, the server ID is 1.
Size
The size of the event in bytes, written as an integer.
Master Pos
The same as end_log_pos (i.e., the start of the event following this event).
Flags
This field has 16 bits reserved for general flags concerning the event. The field ismostly unused, but it stores the binlog-in-use flag. As you can see in Example 4-19,the binlog-in-use flag is set, meaning that the binary log is not closed properly(in this case, because we didn’t flush the logs before calling mysqlbinlog).
After the common header come the post header and body for the event. As alreadymentioned, an exhaustive coverage of all the events is beyond the scope of this book,but we will cover the most important and commonly used events: the Query and Format_description log events.
Query event post header and body
The Query event is by far the most used and also the most complicated event issued bythe server. Part of the reason is that it has to carry a lot of information about the contextof the statement when it was executed. As already demonstrated, integer variables, uservariables, and random seeds are covered using specific events, but it is also necessaryto provide other information, which is part of this event.
The post header for the Query event consists of five fields. Recall that these fields are offixed size and that the length of the post header is given in the Format_descriptionevent for the binlog file, meaning that later MySQL versions may add additional fieldsif the need should arise.Thread ID
A four-byte unsigned integer representing the thread ID that executed the state‐ment. Even though the thread ID is not always necessary to execute the statementcorrectly, it is always written into the event.
The mysqlbinlog Utility | 115

Execution timeThe number of seconds from the start of execution of the query to when it waswritten to the binary log, expressed as a four-byte unsigned integer.
Database name lengthThe length of the database name, stored as an unsigned one-byte integer. Thedatabase name is stored in the event body, but the length is given here.
Error codeThe error code resulting from execution of the statement, stored as a two-byteunsigned integer. This field is included because, in some cases, statements have tobe logged to the binary log even when they fail.
Status variables lengthThe length of the block in the event body storing the status variables, stored as atwo-byte unsigned integer. This status block is sometimes used with a Query eventto store various status variables, such as SQL_MODE.
The event body consists of the following fields, which are all of variable length.Status variables
A sequence of status variables. Each status variable is represented by a single integerfollowed by the value of the status variable. The interpretation and length of eachstatus variable value depends on which status variable it concerns. Status variablesare not always present; they are added only when necessary. Some examples of statusvariables follow:Q_SQL_MODE_CODE
The value of SQL_MODE used when executing the statement.
Q_AUTO_INCREMENT
This status variable contains the values of auto_increment_increment andauto_increment_offset used for the statement, assuming that they are notthe default of 1.
Q_CHARSET
This status variable contains the character set code and collation used by theconnection and the server when the statement was executed.
Current databaseThe name of the current database, stored as a null-terminated string. Notice thatthe length of the database name is given in the post header.
Statement textThe statement that was executed. The length of the statement can be computedfrom the information in the common header and the post header. This statementis normally identical to the original statement written, but in some cases, the state‐ment is rewritten before it is stored in the binary log. For instance, as you saw earlier
116 | Chapter 4: The Binary Log

in this chapter, triggers and stored procedures are stored with DEFINER clausesspecified.
Format description event post header and body
The Format_description event records important information about the binlog fileformat, the event format, and the server. Because it has to remain robust betweenversions—it should still be possible to interpret it even if the binlog format changes—there are some restrictions on which changes are allowed.
One of the more important restrictions is that the common header of both the Format_description event and the Rotate event is fixed at 19 bytes. This means that it isnot possible to extend the event with new fields in the common header.
The post header and event body for the Format_description event contain the follow‐ing fields:Binlog file version
The version of the binlog file format used by this file. For MySQL versions 5.0 andlater, this is 4.
Server version stringA 50-byte string storing server version information. This is usually the three-partversion number followed by information about the options used for the build,“5.5.31-0ubuntu0.12.04.1,” for instance.
Creation timeA four-byte integer holding the creation time—the number of seconds since theepoch—of the first binlog file written by the server since startup. For later binlogfiles written by the server, this field will be zero.
This scheme allows a slave to determine that the server was restarted and that theslave should reset state and temporary data—for example, close any open transac‐tions and drop any temporary tables it has created.
Common header lengthThe length of the common header for all events in the binlog file except the Format_description and Rotate events. As described earlier, the length of the com‐mon header for the Format_description and Rotate events is fixed at 19 bytes.
Post-header lengthsThis is the only variable-length field of the Format_description log event. It holdsan array containing the size of the post header for each event in the binlog file as aone-byte integer. The value 255 is reserved as the length for the field, so the maxi‐mum length of a post header is 254 bytes.
The mysqlbinlog Utility | 117

Binary Log Options and VariablesA set of options and variables allow you to configure a vast number of aspects of binarylogging.
Several options control such properties as the name of the binlog files and the indexfile. Most of these options can be manipulated as server variables as well. Some havealready been mentioned earlier in the chapter, but here you will find more details oneach:expire-log-days=days
The number of days that binlog files should be kept. Files that are older than thespecified number will be purged from the filesystem when the binary log is rotatedor the server restarts.
By default this option is 0, meaning that binlog files are never removed.
log-bin[=basename ]The binary log is turned on by adding the log-bin option in the my.cnf file, asexplained in Chapter 3. In addition to turning on the binary log, this option givesa base name for the binlog files; that is, the portion of the filename before the dot.If an extension is provided, it is removed when forming the base name of the binlogfiles.
If the option is specified without a basename, the base name defaults to host-binwhere host is the base name—that is, the filename without directory or extension—of the file given by the pid-file option, which is usually the hostname as given bygethostname(2). For example, if pid-file is /usr/run/mysql/master.pid, the defaultname of the binlog files will be master-bin.000001, master-bin.000002, etc.
Since the default value for the pid-file option includes the hostname, it is stronglyrecommended that you give a value to the log-bin option. Otherwise the binlogfiles will change names when the hostname changes (unless pid-file is given anexplicit value).
log-bin-index[=filename]
Gives a name to the index file. This can be useful if you want to place the index filein a different place from the default.
The default is the same as the base name used for log-bin. For example, if the basename used to create binlog files is master-bin, the index file will be named master-bin.index.
Similar to the situation for the log-bin option, the hostname will be used for con‐structing the index filename, meaning that if the hostname changes, replication willbreak. For this reason, it is strongly recommended that you provide a value for thisoption.
118 | Chapter 4: The Binary Log

log-bin-trust-function-creators
When creating stored functions, it is possible to create specially crafted functionsthat allow arbitrary data to be read and manipulated on the slave. For this reason,creating stored functions requires the SUPER privilege. However, since stored func‐tions are very useful in many circumstances, it might be that the DBA trusts anyonewith CREATE ROUTINE privileges not to write malicious stored functions. For thisreason, it is possible to disable the SUPER privilege requirement for creating storedfunctions (but CREATE ROUTINE is still required).
binlog-cache-size=bytes
The size of the in-memory part of the transaction cache in bytes. The transactioncache is backed by disk, so whenever the size of the transaction cache exceeds thisvalue, the remaining data will go to disk.
This can potentially create a performance problem, so increasing the value of thisoption can improve performance if you use many large transactions.
Note that just allocating a very large buffer might not be a good idea, because thatmeans that other parts of the server get less memory, which might cause perfor‐mance degradation.
max-binlog-cache-size=bytes
Use this option to restrict the size of each transaction in the binary log. Since largetransactions can potentially block the binary log for a long time, they will causeother threads to convoy on the binary log and can therefore create a significantperformance problem. If the size of a transaction exceeds bytes, the statement willbe aborted with an error.
max-binlog-size=bytes
Specifies the size of each binlog file. When writing a statement or transaction wouldexceed this value, the binlog file is rotated and writing proceeds in a new, emptybinlog file.
Notice that if the transaction or statement exceeds max-binlog-size, the binarylog will be rotated, but the transaction will be written to the new file in its entirety,exceeding the specified maximum. This is because transactions are never split be‐tween binlog files.
sync-binlog=period
Specifies how often to write the binary log to disk using fdatasync(2). The valuegiven is the number of transaction commits for each real call to fdatasync(2). Forinstance, if a value of 1 is given, fdatasync(2) will be called for each transactioncommit, and if a value of 10 is given, fdatasync(2) will be called after each 10 trans‐action commits.
Binary Log Options and Variables | 119

A value of zero means that there will be no calls to fdatasync(2) at all and that theserver trusts the operating system to write the binary log to disk as part of the normalfile handling.
read-only
Prevents any client threads—except the slave thread and users with SUPER privileges—from updating any data on the server (this does not include temporary tables,which can still be updated). This is useful on slave servers to allow replication toproceed without data being corrupted by clients that connect to the slave.
Options for Row-Based ReplicationUse the following options to configure row-based replication:binlog-format
The binlog-format option can be set to use one of the following modes:STATEMENT
This will use the traditional statement-based replication for all statements.
ROW
This will use the shiny new row-based replication for all statements that insertor change data (data manipulation language, or DML, statements). However,statement-based replication must still be used for statements that create tablesor otherwise alter the schema (data definition language, or DDL, statements).
MIXED
This is intended to be a safe version of statement-based replication and is therecommended mode to use with MySQL version 5.1 and later. In mixed-modereplication, the server writes the statements to the binary log as statements, butswitches to row-based replication if a statement is considered unsafe throughone of the criteria we have discussed in this chapter.
The variable also exists as a global server variable and as a session variable. Whenstarting a new session, the global value is copied to the session variable and thenthe session variable is used to decide how to write statements to the binary log.
binlog-max-row-event-size
Use this option to specify when to start a new event for holding the rows. Becausethe events are read fully into memory when being processed, this option is a roughway of controlling the size of row-holding events so that not too much memory isused when processing the rows.
binlog-rows-query-log-events (new in MySQL 5.6)This option causes the server to add an informational event to the binary log beforethe the row events. The informational event contains the original query that gen‐erated the rows.
120 | Chapter 4: The Binary Log

Note that, because unrecognized events cause the slave to stop, any slave server beforeMySQL 5.6.2 will not recognize the event and hence stop replicating from the master.This means that if you intend to use an informational event, you need to upgrade allslaves to MySQL 5.6.2 (or later) before enabling binlog-rows-query-log-events.
Starting with MySQL 5.6.2, informational events can be added for other purposes aswell, but they will not cause the slave to stop. They are intended to allow informationto be added to the binary log for those readers (including slaves) that can have use forit, but they should not in any way change the semantics of execution and can thereforebe safely ignored by slaves that do not recognize them.
ConclusionClearly, there is much to the binary log—including its use, composition, and techniques.We presented these concepts and more in this chapter, including how to control thebinary log behavior. The material in this chapter builds a foundation for a greater un‐derstanding of the mechanics of the binary log and its importance in logging changesto data.
Joel opened an email message from his boss that didn’t have a subject. “I hate it whenpeople do that,” he thought. Mr. Summerson’s email messages were like his taskings—straight and to the point. The message read, “Thanks for recovering that data for themarketing people. I’ll expect a report by tomorrow morning. You can send it via email.”
Joel shrugged and opened a new email message, careful to include a meaningful subject.He wondered what level of detail to include and whether he should explain what helearned about the binary log and the mysqlbinlog utility. After a moment of contem‐plation, he included as many details as he could. “He’ll probably tell me to cut it backto a bulleted list,” thought Joel. That seemed like a good idea, so he wrote a two-sentencesummary and a few bullet points and moved them to the top of the message. When hewas finished, he sent it on its way to his boss. “Maybe I should start saving these some‐where in case I have to recount something,” he mused.
Conclusion | 121


CHAPTER 5
Replication for High Availability
Joel was listening to his iPod when he noticed his boss standing directly in front of hisdesk. He took off his headphones and said, “Sorry, sir.”
Mr. Summerson smiled and said, “No problem, Joel. I need you to figure out some wayto ensure we can keep our replicated servers monitored so that we don’t lose data andcan minimize downtime. We’re starting to get some complaints from the developers thatthe system is too inflexible. I can deal with the developers, but the support people tellme that when we have a failure it takes too long to recover. I’d like you to make that yourtop priority.”
Joel nodded. “Sure, I’ll look at load balancing and improving our recovery efforts inreplication.”
“Excellent. Give me a report on what you think we need to do to solve this problem.”
Joel watched his boss leave his office. “OK, let’s find out what this high availability chapterhas to say,” he thought, as he opened his favorite MySQL book.
Buying expensive machines known for their reliability and ensuring that you have areally good UPS in case of power failures should give you a highly available system.Right?
Well, high availability is actually not that easy to achieve. To have a system that is trulyavailable all the time, you have to plan carefully for any contingency and ensure thatyou have redundancy to handle failing components. True high availability—a systemthat does not go down even in the most unexpected circumstances—is hard to achieveand very costly.
123

The basic principles for achieving high availability are simple enough; implementingthe measures is the tricky part. You need to have three things in place for ensuring highavailability:Redundancy
If a component fails, you have to have a replacement for it. The replacement can beeither idly standing by or part of the existing deployment.
Contingency plansIf a component fails, you have to know what to do. This depends on which com‐ponent failed and how it failed.
ProcedureIf a component fails, you have to be able to detect it and then execute your plansswiftly and efficiently.
If the system has a single component whose failure will cause the entire system to fail,the system has a single point of failure. If a system has a single point of failure, it puts asevere limit on your ability to achieve high availability, which means that one of yourfirst goals is to locate these single points of failure and ensure you have redundancy forthem.
RedundancyTo understand where redundancy might be needed, you have to identify every potentialpoint of failure in the deployment. Even though it sounds easy—not to mention a tadtedious and boring—it requires some imagination to ensure that you really have foundthem all. Switches, routers, network cards, and even network cables are single points offailure. Outside of your architecture, but no less important, are power sources andphysical facilities. But what about services needed to keep the deployment up? Supposeall network management is consolidated in a web-based interface? Or what if you haveonly one staff person who knows how to handle some types of failure?
Identifying the points of failure does not necessarily mean that you have to eliminatethem all. Sometimes it is just not possible for economical, technical, or geographicreasons, but being aware of them helps you with planning.
Some things that you should consider, or at least make a conscious decision aboutwhether to consider, are cost of duplicating components, the probability of failure fordifferent components, the time to replace a component, and risk exposure while re‐pairing a component. If repairing a component takes a week and you are running withthe spare as the single point of failure during this time, you are taking a certain risk thatthe spare could be lost as well, which may or may not be acceptable.
Once you have identified where you need redundancy, you have to choose between twofundamental alternatives: you can either keep duplicates around for each
124 | Chapter 5: Replication for High Availability

component—ready to take over immediately if the original component should fail—oryou can ensure you have extra capacity in the system so that if a component fails, youcan still handle the load. This choice does not have to be made in an all-or-nothingfashion: you can combine the two techniques so that you duplicate some componentsand use extra capacity for some other parts of the system.
On the surface, the easiest approach is to duplicate components, but duplication isexpensive. You have to leave a standby around and keep it up-to-date with the maincomponent all the time. The advantages of duplicating components are that you do notlose performance when switching and that switching to the standby is usually fasterthan restructuring the system, which you would have to do if you approached the prob‐lem by creating spare capacity.
Creating spare capacity lets you use all the components for running the business, pos‐sibly allowing you to handle higher peaks in your load. When a component breaks, yourestructure the system so that all remaining components are in use. It is, however, im‐portant to have more capacity than you normally need.
To understand why, consider a simple case where you have a master that handles thewrites—actually, you should have two, because you need to have redundancy—with aset of slaves connected to the master whose only purpose is to serve read requests.
Should one of the slaves fail, the system will still be responding, but the capacity of thesystem will be reduced. If you have 10 slaves, each running at 50% capacity, the failureof one slave will increase the load on each slave to 55%, which is easy to handle. However,if the slaves are running at 95% capacity and one of the slaves fails, each server wouldhave to handle 105% of the original load to handle the same load, which is clearly notpossible. In this case, the read capacity of the system will be reduced and the responsetime will be longer.
And planning for the loss of one server is not sufficient: you have to consider the prob‐ability of losing more than one server and prepare for that situation as well. Continuingwith our previous example, even if each server is running at 80% capacity, the systemwill be able to handle the loss of one server. However, the loss of two servers means thatthe load on each remaining server will increase to 100%, leaving you with no room forunexpected bursts in traffic. If this occurs once a year, it might be manageable, but youhave to know how often it is likely to happen.
Table 5-1 gives example probabilities for losing 1, 2, or 3 servers in a setup of 100 servers,given different probabilities of losing a single server. As you can see, with a 1% proba‐bility of losing a server, you have a 16% risk of losing three or more servers. If you arenot prepared to handle that, you’re in for some problems if it actually happens.
Redundancy | 125


Slave FailuresBy far, the easiest failures to handle are slave failures. Because the slaves are used onlyfor read queries, it is sufficient to inform the load balancer that the slave is missing, andthe load balancer will direct new queries to the functioning slaves. There have to beenough slaves to handle the reduced capacity of the system, but apart from that, a failingslave does not normally affect the replication topology and there are no specific topol‐ogies that you need to consider to make slave failure easier to manage.
When a slave has failed, there are inevitably some queries that have been sent to theslave that are waiting for a reply. Once these connections report an error resulting froma lost server, the queries have to be repeated with a functioning slave.
Master FailuresIf the master fails, it has to be replaced to keep the deployment up, and it has to bereplaced quickly. The moment the master fails, all write queries will be aborted, so thefirst thing to do is to get a new master available and direct all clients to it.
Because the main master failed, all the slaves are now without a master as well, meaningthat all the slaves have stale data, but they are still up and can reply to read queries.
However, some queries may block if they are waiting for changes to arrive at the slave.Some queries may make it into the relay log of the slave and therefore will eventuallybe executed by the slave. No special consideration has to be taken on the behalf of thesequeries.
For queries that are waiting for events that did not leave the master before it crashed,the situation is bleaker. In this case, it is necessary to ensure they are handled. Thisusually means they are reported as failures, so the user will have to reissue the query.
Relay FailuresFor servers acting as relay servers, the situation has to be handled specially. If they fail,the remaining slaves have to be redirected to use some other relay or the master itself.Because the relay has been added to relieve the master of some load, it is likely that themaster will not be able to handle the load of a batch of slaves connected to one of itsrelays.
Disaster RecoveryIn the world of high availability, “disaster” does not have to mean earthquakes or floods;it just means that something went very bad for the computer and it is not local to themachine that failed.
Planning | 127

Typical examples are lost power in the data center—not necessarily because the powerwas lost in the city; just losing power in the building is sufficient.
The nature of a disaster is that many things fail at once, making it impossible to handleredundancy by duplicating servers at a single data center. Instead, it is necessary toensure data is kept safe at another geographic location, and it is quite common forcompanies to ensure high availability by having different components at different offi‐ces, even when the company is relatively small.
ProceduresAfter you have eliminated all single points of failure, ensured you have sufficient re‐dundancy for the system, and made plans for every contingency, you should be readyfor the last step.
All your resources and careful planning are of no use unless you can wield them properly.You can usually manage a small site with a few servers manually with very little planning,but as the number of servers increases, automation becomes a necessity—and if you runa successful business, the number of servers might have to increase quickly.
You’re likely better off if you plan from day one to have automation—if you have togrow, you will be busy handling other matters and will probably not have time to createthe necessary automation support.
Some of the basic procedures have already been discussed, but you need to considerhaving ready-made procedures for at least the following tasks:Adding new slaves
Creating new slaves when you need to scale is the basis for running a big site. Thereare several options for creating new slaves. They all circle around methods for takinga snapshot of an existing server, usually a slave, restoring the snapshot on a newserver, and then starting replication from the correct position.
The time for taking a snapshot will, of course, affect how quickly you can bring thenew slave up; if the backup time is too long, the master may have issued a lot ofchanges, which means that the new slave will take longer to catch up. For this reason,the snapshot time is important. Figure 5-1 shows the snapshot time when the slavehas caught up. You can see that when the slave is stopped to take a snapshot, thechanges will start to accumulate, which will cause the outstanding changes to in‐crease. Once the slave is restarted, it will start to apply the outstanding changes andthe number of outstanding changes will decrease.
128 | Chapter 5: Replication for High Availability

Figure 5-1. Outstanding changes when taking a snapshot
Some different methods of taking a snapshot include the following:Using mysqldump
Using mysqldump is safe but slow. If you use InnoDB tables, mysqldump hasoptions to allow you to take a consistent snapshot, meaning you do not haveto bring the server offline. There are also options that allow you to get the masterand slave positions for the snapshot so that replication will start at the rightposition.
Copying the database filesThis is relatively fast, but requires you to bring the server offline before copyingthe files. It also require you to manage the positions for starting replication atthe right place, something that mysqldump does for you.
Using an online backup methodThere are different methods available, such as the MySQL Enterprise Backupand XtraBackup.
Using LVM to get a snapshotOn Linux, it is possible to take a snapshot of a volume using Logical VolumeManager (LVM). It does require that you prepare beforehand, because a specialLVM volume has to be created. Just like copying the database files, this methodrequires you to manage the replication positions yourself.
Using filesystem snapshot methodsThe Solaris ZFS, for example, has built-in support for taking snapshots. Thisis a very fast technique for creating backups, but it is similar to the other tech‐niques (except for mysqldump). It also requires you to manage the replicationpositions yourself.
Procedures | 129

If it should be necessary to use a different engine when restoring, you have to usemysqldump: all the other methods have to restore to the same engine that was usedfor taking the backup.
Techniques for creating new slaves are covered in Chapter 3, and the differentbackup methods are covered in Chapter 15.
Removing slaves from the topologyRemoving slaves from the setup only requires notifying the load balancer that theslave is absent. An example load balancer—with methods for adding and removingservers—can be found in Chapter 6.
Switching the masterFor routine maintenance, it is common to have to switch all the slaves of a masterover to a secondary master as well as notify load balancers of the master’s absence.This procedure can and should be handled with no downtime at all, so it shouldnot affect normal operations.
Using slave promotion (described later in this chapter) is one way to handle this,but it might be easier to use a hot standby instead (also covered later in this chapter).
Handling slave failuresYour slaves will fail—it is just a matter of how often. Handling slave failures mustbe a routine event in any deployment. It is only necessary to detect that the slave isabsent and remove it from the load balancer’s pool, as described in Chapter 6.
Handling master failuresWhen the master goes down suddenly, you have to detect the failure and move allthe slaves over to a standby, or promote one of the slaves to be the new master.Techniques for this are described later in this chapter.
Upgrading slavesUpgrading slaves to new versions of the server should usually not be a problem.However, bringing the slave out of the system for the upgrade requires removingit from the load balancer and maybe notifying other systems of the slave’s absence.
Upgrading mastersTo upgrade the master, you first need to upgrade all the slaves to ensure that theycan read all the replication events of the master. To upgrade the master, it is usuallynecessary to either use a standby as a master while you are performing the upgradeor promote one of the slaves to be the master for the duration of the upgrade.
Hot StandbyThe easiest topology for duplicating servers is hot standby, shown in Figure 5-2. Thehot standby is a dedicated server that just duplicates the main master. The hot standbyserver is connected to the master as a slave, so that it reads and applies all changes. This
130 | Chapter 5: Replication for High Availability

setup is often called primary-backup configuration, where the primary is the master andthe “backup” is the secondary. There can be multiple hot standbys.
Figure 5-2. Master with a hot standby
Failure is inevitable, at least when you run a large deployment. It is not a question of ifservers fail, but when and how often they fail. The idea in this topology is that when themain master fails, the hot standby provides a faithful replica of the master, and all theclients and slaves can therefore be switched over to the hot standby and continue op‐erating. Operations can proceed with hardly a lapse, and the hot standby gives you achance to fix or replace the main master. After you have repaired the master, you haveto bring it back on track and either set it to be the hot standby, or redirect the slaves tothe original master again. As with many ideas, the reality is not always that rosy.
All these are relevant issues, but for starters, let’s just consider the first case: that ofswitching over to a hot standby when the primary is still running, as illustrated inFigure 5-3.
MySQL 5.6 introduced the concept of global transaction identifiers, which significantlysimplifies this problem of handling failover. However, because MySQL 5.6 is relativelynew, this section demonstrates how to perform failover before MySQL 5.6. For a de‐scription of how to handle failover using global transaction identifiers, have a look in“Global Transaction Identifiers” on page 260, where you will also see how to set the serverup for using global transaction identifiers. If you are using a pre-MySQL 5.6 server andwant to use global transaction identifiers, you have to roll them yourself. An exampleof how to do this can be found in Appendix B.
Procedures | 131

Figure 5-3. Switching over from a running master to a standby
Handling a switchover
The main challenge with switching over to a standby before MySQL 5.6 is to performthe switchover in such a way that the slave starts replicating from the standby at preciselythe position where it stopped replicating from the original master. If the positions wereeasy to translate—for example, if the positions were the same on both the master andthe standby—we would not have a problem. Unfortunately, the positions may be dif‐ferent on the master and the standby for a number of reasons. The most common causeis when a standby was not attached to the master when the master was started. But evenif they were attached from the start, events cannot be guaranteed to be written the sameway to the binary log on the standby as they were written to the binary log on the master.
The basic idea for performing the switchover is to stop the slave and the standby atexactly the same position and then just redirect the slave to the standby. Because thestandby hasn’t made any changes after the position where you stopped it, you can justcheck the binlog position on the standby and direct the slave to start at that position.This task has to be performed manually, because just stopping the slave and the standbywill not guarantee that they are synchronized.
To do this, stop both the slave and the standby and compare the binlog positions. Becauseboth positions refer to positions on the same master—the slave and standby are bothconnected to the same master—you can check the positions just by comparing thefilename and the byte position lexicographically (in that order):
standby> SHOW SLAVE STATUS\G ... Relay_Master_Log_File: master-bin.000096 ... Exec_Master_Log_Pos: 7566481 row in set (0.00 sec)
132 | Chapter 5: Replication for High Availability

slave> SHOW SLAVE STATUS\G ... Relay_Master_Log_File: master-bin.000096 ... Exec_Master_Log_Pos: 743456 1 row in set (0.00 sec)
In this case, the standby is ahead of the slave: they are in the same file, but the standbyis at position 756648 whereas the slave is at 743456. So just write down the slave positionof the standby (756648) and stop the slave from running until it has caught up with thestandby. To have the slave catch up with the standby and stop at the right position, usethe START SLAVE UNTIL command, as we did when stopping the reporting slave earlierin this chapter:
slave> START SLAVE UNTIL -> MASTER_LOG_FILE = 'master-bin.000096', -> MASTER_LOG_POS = 756648;Query OK, 0 rows affected (0.18 sec)
slave> SELECT MASTER_POS_WAIT('master-bin.000096', 756648);Query OK, 0 rows affected (1.12 sec)
The slave and standby have now stopped at exactly the same position, and everythingis ready to do the switchover to the standby using CHANGE MASTER to direct the slave tothe standby and start it. But what position should you specify? Because the file andposition that the master recorded for its stopping point are different from the file andposition recorded by the standby for the same point, it is necessary to fetch the positionthat the standby recorded while recording the changes as a master. To do this, executeSHOW MASTER STATUS on the standby:
standby> SHOW MASTER STATUS\G*************************** 1. row *************************** File: standby-bin.000019 Position: 56447 Binlog_Do_DB:Binlog_Ignore_DB:1 row in set (0.00 sec)
Now you can redirect the slave to the standby using the correct position:slave> CHANGE MASTER TO -> MASTER_HOST = 'standby.example.com', -> MASTER_PORT = 3306, -> MASTER_USER = 'repl_user', -> MASTER_PASSWORD = 'xyzzy', -> MASTER_LOG_FILE = 'standby-bin.000019', -> MASTER_LOG_POS = 56447; Query OK, 0 rows affected (0.18 sec)
Procedures | 133

slave> START SLAVE;Query OK, 0 rows affected (0.25 sec)
If the opposite is true—if the slave is ahead of the standby—you can just switch the rolesof the standby and the slave in the previous steps. This is possible because the master isrunning and can provide either the slave or the standby with the missing changes. Inthe next section, we will consider how to handle the situation in which the master hasstopped unexpectedly and hence cannot provide either the slave or the standby withthe missing changes.
Handling a switchover in Python
Example 5-1 shows the Python code for switching a slave over to another master. Thereplicate_to_position function instructs a server to read from the master only to thegiven position. When the procedure returns, the slave will have stopped at exactly thisposition. The switch_to_master directs a slave to a new master. The procedure assumesthat both the server on which it executes and the new master are connected to the sameoriginal master. If they are not, the positions are not comparable and the procedure willraise an exception. The procedure allows the position on the master to be given explicitlyinstead of computed, which we will use later in the chapter when implementing fail-over.
Example 5-1. Procedure for switching to a new masterfrom mysql.replicant.commands import ( fetch_slave_position, fetch_master_position, change_master,)
def replicate_to_position(server, pos): server.sql("START SLAVE UNTIL MASTER_LOG_FILE=%s, MASTER_LOG_POS=%s", (pos.file, pos.pos)) server.sql("SELECT MASTER_POS_WAIT(%s,%s)", (pos.file, pos.pos))
def switch_to_master(server, standby, master_pos=None): server.sql("STOP SLAVE") server.sql("STOP SLAVE") if master_pos is None: server_pos = fetch_slave_position(server) standby_pos = fetch_slave_position(standby) if server_pos < standby_pos: replicate_to_position(server, standby_pos) elif server_pos > standby_pos: replicate_to_position(standby, server_pos) master_pos = fetch_master_position(standby) change_master(server, standby, master_pos) standby.sql("START SLAVE") server.sql("START SLAVE")
134 | Chapter 5: Replication for High Availability

Dual MastersOne frequently mentioned setup for high availability is the dual masters topology. Inthis setup, two masters replicate each other to keep both current. This setup is verysimple to use because it is symmetric. Failing over to the standby master does not requireany reconfiguration of the main master, and failing back to the main master again whenthe standby master fails in turn is very easy.
Servers can be either active or passive. If a server is active it means that the server acceptswrites, which are likely to be propagated elsewhere using replication. If a server is pas‐sive, it does not accept writes and is just following the active master, usually to be readyto take over when it fails.
When using dual masters, there are two different setups, each serving a different pur‐pose:Active-active
In an active-active setup, writes go to both servers, which then transfer changes tothe other master.
Active-passiveIn this setup, one of the masters, called the active master, handles writes while theother server, called the passive master, just keeps current with the active master.
This is almost identical to the hot standby setup, but because it is symmetric, it iseasy to switch back and forth between the masters, each taking turns being the activemaster.
Note that this setup does not necessarily let the passive master answer queries. Forsome of the solutions that you’ll see in this section, the passive master is a coldstandby.
These setups do not necessarily mean that replication is used to keep the serverssynchronized—there are other techniques that can serve that purpose. Some techniquescan support active-active masters, while other techniques can only support active-passive masters.
The most common use of an active-active dual masters setup is to have the serversgeographically close to different sets of users—for example, in branch offices at differentplaces in the world. The users can then work with the local server, and the changes willbe replicated over to the other master so that both masters are kept in sync. Because thetransactions are committed locally, the system will be perceived as more responsive. Itis important to understand that the transactions are committed locally, meaning thatthe two masters are not consistent (i.e., they might not have the same information). Thechanges committed to one master will be propagated to the other master eventually, butuntil that has been done, the masters have inconsistent data.
Procedures | 135

This has two main consequences that you need to be aware of:
• If the same information is updated on the two masters—for example, a user isaccidentally added to both masters—there will be a conflict between the two updatesand it is likely that replication will stop.
• If a crash occurs while the two masters are inconsistent, some transactions will belost.
To some extent, you can avoid the problem with conflicting changes by allowing writesto only one of the servers, thereby making the other master a passive master. This iscalled an active-passive setup. The active server is called the primary and the passiveserver is called the secondary.
Losing transactions when the server crashes is an inevitable result of using asynchro‐nous replication, but depending on the application, it does not necessarily have to be aserious problem. You can limit the number of transactions that are lost when the servercrashes by using a new feature in MySQL 5.5 called semisynchronous replication. The idea behind semisynchronous replication is that the thread committing a transactionblocks until at least one slave acknowledges that it has received the transaction. Becausethe events for the transaction are sent to the slave after the transaction has been com‐mitted to the storage engine, the number of lost transactions can be kept down to atmost one per thread.
Similar to the active-active approach, the active-passive setup is symmetrical and there‐fore allows you to switch easily from the main master to the standby and back. De‐pending on the way you handle the mirroring, it may also be possible to use the passivemaster for administrative tasks such as upgrading the server and use the upgrade serveras the active master once the upgrade is finished without any downtime at all.
One fundamental problem that has to be resolved when using an active-passive setupis the risk of both servers deciding that they are the primary master. This is called thesplit-brain syndrome. This can occur if network connectivity is lost for a brief period,long enough to have the secondary promote itself to primary, but then the primary isbrought online again. If changes have been made to both servers while they are both inthe role of primary, there may be a conflict. In the case of using a shared disk, simulta‐neous writes to the disks by two servers are likely to cause “interesting” problems withthe database (i.e., problems that are probably disastrous and difficult to pinpoint). Inother words, two running MySQL servers are not allowed to shard the same data di‐rectory, so it is necessary to ensure that at most one MySQL server using the data di‐rectory is active at any time (you can find a more elaborate discussion on this in “Shareddisks” on page 137).
The easiest and most common way to prevent such a situation is to ensure that the serverthat was deemed “dead” is really not active. This is done using a technique called, some‐
136 | Chapter 5: Replication for High Availability

what morbidly, STONITH (Shoot The Other Node In The Head). This can be accom‐plished in several different ways, such as connecting to the server and executing a kill-9 (if the server can be reached), turning of the network card to isolate the server, orturning the power switch on the machine. If the server is truly unreachable (e.g., it endedup on a different partition), you have to use a “poison pill” so that when the server isaccessible again, it will “commit suicide.”
Shared disks
A straightforward dual masters approach is shown in Figure 5-4, where a pair of mastersis connected using a shared disk architecture such as a storage area network (SAN). Inthis approach, both servers are connected to the same SAN and are configured to usethe same files. Because one of the masters is passive, it will not write anything to thefiles while the active master is running as usual. If the main server fails, the standby willbe ready to take over.
The advantage of this approach is that, because the binlog files are on a shared disk,there is no need for translating binlog positions. The two servers are truly mirror imagesof each other, but they are running on two different machines. This means that switchingover from the main master to the standby is very fast. There is no need for the slaves totranslate positions to the new master; all that is necessary is to note the position wherethe slave stopped, issue a CHANGE MASTER command, and start replication again.
When you failover using this technique, you have to perform recovery on the tables,because it is very likely that updates were stopped midstream. Each storage engine be‐haves differently in this situation. For example, InnoDB has to perform a normal re‐covery from the transaction log, as it would in the event of a crash, whereas if you useMyISAM you probably have to repair the tables before being able to continue operation.Of these two choices, InnoDB is preferred because recovery is significantly faster than repairing a MyISAM table.
You should also consider the time it takes to warm up the caches, which can be lengthy.
Notice that the position uses the server ID of the main server, but it represents the sameposition on the standby because it uses the same files and is a mirror image of the mainserver. Because the position contains the server ID as well, this will also catch any mis‐takes made by the user, such as passing a master that is not a mirror image of the mainmaster.
Setting up dual masters using shared disks is dependent on the shared storage solutionused, a discussion that is beyond the scope of this book.
Procedures | 137

Figure 5-4. Dual masters using a shared disk
The problem with using shared storage is that the two masters are using the same filesfor storing data, so you have to be very careful when doing any administrative tasks onthe passive master. Overwriting the configuration files, even by mistake, can be fatal. Itis not sufficient to enforce one server to be read-only because there are files written (e.g.,by InnoDB) even when the server is in read-only mode.
The handling of split-brain syndrome depends on which shared disk solution is usedand is beyond the scope of this book. One example, however, occurs when using SCSI,which has support for reserving disks by servers. This allows a server to detect that it isreally not the primary anymore by noticing that the disks are reserved by another server,and bringing itself offline.
Replicated disks using DRBD
The Linux High Availability project contains a lot of useful tools for maintaining highavailability systems. Most of these tools are beyond the scope of this book, but there isone tool that is interesting for our purposes: Distributed Replicated Block Device(DRBD), which is software for replicating block devices over the network.
Figure 5-5 shows a typical setup of two nodes where DRBD is used to replicate a diskto a secondary server. The setup creates two DRBD block devices, one on each node,which in turn write the data to the real disks. The two DRBD processes communicate
138 | Chapter 5: Replication for High Availability

over the network to ensure any changes made to the primary are replicated over to thesecondary. To the MySQL server, the device replication is transparent. The DRBD de‐vices look and behave like normal disks, so no special configuration is needed for theservers.
You can only use DRBD in an active-passive setup, meaning that the passive disk cannotbe accessed at all. In contrast with the shared disk solution outlined earlier and thebidirectional replication implementation described later in this chapter, the passivemaster cannot be accessed at all.
Similar to the shared disk solution, DRBD has the advantage of not needing to translatepositions between the two masters because they share the same files. However, failingover to the standby master takes longer than in the shared disk setup described earlier.
Figure 5-5. Using DRBD to replicate disks
For both the shared disk and the DRBD setup, it is necessary to perform recovery of thedatabase files before bringing the servers online. Because recovery of MyISAM tables is quite expensive, it is recommended that you use a transactional engine with goodrecovery performance for the database tables. InnoDB is the proven solution in thiscase, but investigating alternative transactional engines might prove to be well-investedtime.
The mysql database contains strictly MyISAM tables so you should, as a general prin‐ciple, avoid unnecessary changes to these tables during normal operations. It is, ofcourse, impossible to avoid when you need to perform administrative tasks.
One advantage of DRBD over shared disks is that for the shared disk solution, the disksactually provide a single point of failure. Should the network to the shared disk arraygo down, it is possible that the server will not work at all. In contrast, replicating the
Procedures | 139

disks means that the data is available on both servers, which reduces the risk of a totalfailure.
DRBD also has support built in to handle split-brain syndrome and can be configuredto automatically recover from it.
Bidirectional replication
When using dual masters in an active-passive setup, there are no significant differencescompared to the hot standby solution outlined earlier. However, in contrast to the otherdual-masters solutions outlined earlier, it is possible to have an active-active setup(shown in Figure 5-6).
Figure 5-6. Bidirectional replication
Although controversial in some circles, an active-active setup does have its uses. Atypical case is when there are two (or more) offices working with local information inthe same database (e.g., sales data or employee data) and each office wants low responsetimes when working with the database, while ensuring the data is available in bothplaces. In this case, the data is naturally local to each office—each salesperson is normallyworking with his own sales and rarely, if ever, makes changes to another salesperson’sdata.
Use the following steps to set up bidirectional replication:
1. Ensure both servers have different server IDs.2. Ensure both servers have the same data (and that no changes are made to either
system until replication has been activated).3. Create a replication user and prepare replication (using the information in Chap‐
ter 1) on both servers.
140 | Chapter 5: Replication for High Availability

4. Start replication on both servers.
When using bidirectional replication, be forewarned that replica‐tion includes no concept of conflict resolution. If both servers up‐date the same piece of data, you will have a conflict that may or maynot be noticed. If you are lucky, replication will stop at the offend‐ing statement, but you shouldn’t count on it. If you intend to have ahigh availability system, you should ensure, at the application level,that two servers do not try to update the same data.Even if data is naturally partitioned—as in the example given previ‐ously with two offices in separate locations—it is critical to put pro‐visions in place to ensure data is not accidentally updated at thewrong server.In this case, the application has to connect to the server responsi‐ble for the employee and update the information there, not justupdate the information locally and hope for the best.
If you want to connect slaves to either of the servers, you have to ensure the log-slave-updates option is enabled. The other master is also connected as a slave, so an obviousquestion is this: what happens to events that the server sends out when they return tothe server?
When replication is running, the server ID of the server that created the event is attachedto each event. This server ID is then propagated further when the slave writes the eventto its binary log. When a server sees an event with the same server ID as its own serverID, that event is simply skipped and replication proceeds with the next event.
Sometimes, you want to process the event anyway. This might be the case if you haveremoved the old server and created a new one with the same server ID and you are inthe process of performing a PITR. In those cases, it is possible to disable this checkingusing the replicate-same-server-id configuration variable. However, to prevent youfrom shooting yourself in the foot, you cannot set this option at the same time that log-slave-updates is set. Otherwise, it would be possible to send events in a circle andquickly thrash all the servers. To prevent that from happening, MySQL prevents eventsfrom being forwarded if replicate-same-server-id is set.
When using an active-active setup, there is a need to handle conflicts in a safe way, andby far the easiest way—and indeed the only recommended way to handle an active-active setup—is to ensure the different active servers write to different areas.
One possible solution is to assign different databases—or different tables—to differentmasters. Example 5-2 shows a setup that uses two different tables, each updated bydifferent masters. To make it easy to view the split data, a view is created that combinesthe two tables.
Procedures | 141

Example 5-2. Different tables for different officesCREATE TABLE Employee_Sweden ( uid INT AUTO_INCREMENT PRIMARY KEY, name VARCHAR(20));
CREATE TABLE Employee_USA ( uid INT AUTO_INCREMENT PRIMARY KEY, name VARCHAR(20));
-- This view is used when reading from the two tables simultaneously.CREATE VIEW Employee AS SELECT 'SWE', uid, name FROM Employee_Sweden UNION SELECT 'USA', uid, name FROM Employee_USA;
This approach is best to use if the split is natural in that, for example, different officeshave different tables for their local data and the data only needs to be combined forreporting purposes. This might seem easy enough, but the following issues can com‐plicate usage and administration of the tables:Reads and writes to different tables
Because of the way the view is defined, you cannot update it. Writes have to bedirected at the real tables, while reads can either use the view or read directly fromthe tables.
It might therefore be necessary to introduce application logic to handle the splitinto reads and writes that go to different tables.
Accurate and current dataBecause the two tables are managed by different sites, simultaneous updates to thetwo tables will cause the system to temporarily enter a state where both servers haveinformation that is not available on the other server. If a snapshot of the informationis taken at this time, it will not be accurate.
If accurate information is required, generate methods for ensuring the informationis accurate. Because such methods are highly application-dependent, they will notbe covered here.
Optimization of viewsWhen using views, two techniques are available to construct a result set. In the firstmethod—called MERGE—the view is expanded in place, optimized, and executed asif it were a SELECT query. In the second method—called TEMPTABLE—a temporarytable is constructed and populated with the data.
142 | Chapter 5: Replication for High Availability

If the server uses a TEMPTABLE view, it performs very poorly, whereas the MERGE viewis close to the corresponding SELECT. MySQL uses TEMPTABLE whenever the viewdefinition does not have a simple one-to-one mapping between the rows of the viewand the rows of the underlying table—for example, if the view definition containsUNION, GROUP BY, subqueries, or aggregate functions—so careful design of the viewsis paramount for getting good performance.
In either case, you have to consider the implications of using a view for reporting,as it might affect performance.
If each server is assigned separate tables, there will be no risk of conflict at all, given thatupdates are completely separated. However, if all the sites have to update the same tables,you will have to use some other scheme.
The MySQL server has special support for handling this situation in the form of twoserver variables:auto_increment_offset
This variable controls the starting value for any AUTO_INCREMENT column in a table(i.e., the value that the first row inserted into the table gets for the AUTO_INCREMENT column). For subsequent rows, the value is calculated using auto_increment_increment.
auto_increment_increment
This is the increment used to compute the next value of an AUTO_INCREMENT column.
There are session and global versions of these two variables and theyaffect all tables on the server, not just the tables created. Whenever anew row is inserted into a table with an AUTO_INCREMENT column, thenext value available in this sequence is used:valueN = auto_increment_offset + N*auto_increment_incrementYou should notice that the next value is not computed by adding theauto_increment_increment to the last value in the table.
Building on the previous example, auto_increment_increment to ensure new rowsadded to a table are assigned numbers from different sequences of numbers dependingon which server is used. The idea is that the first server uses the sequence 1, 3, 5… (oddnumbers), while the second server uses the sequence 2, 4, 6… (even numbers).
Continuing with Example 5-2, Example 5-3 uses these two variables to ensure the twoservers use different IDs when inserting new employees into the Employee table.
Example 5-3. Two servers writing to the same table-- The common table can be created on either serverCREATE TABLE Employee ( uid INT AUTO_INCREMENT PRIMARY KEY,
Procedures | 143

name VARCHAR(20), office VARCHAR(20));
-- Setting for first masterSET GLOBAL AUTO_INCREMENT_INCREMENT = 2;SET GLOBAL AUTO_INCREMENT_OFFSET = 1;
-- Setting for second masterSET GLOBAL AUTO_INCREMENT_INCREMENT = 2;SET GLOBAL AUTO_INCREMENT_OFFSET = 2;
This scheme handles the insertion of new items in the tables, but when entries are beingupdated, it is still critical to ensure the update statements are sent to the correct server(i.e., the server responsible for the employee). Otherwise, data is likely to be inconsistent.If updates are not done correctly, the slaves will normally not stop—they will just rep‐licate the information, which leads to inconsistent values on the two servers.
For example, if the first master executes the statement:master-1> UPDATE Employee SET office = 'Vancouver' WHERE uid = 3;Query OK, 1 rows affected (0.00 sec)
and at the same time, the same row is updated at the second server using the statement:master-2> UPDATE Employee SET office = 'Paris' WHERE uid = 3;Query OK, 1 rows affected (0.00 sec)
the result will be that the first master will place the employee in Paris while the secondmaster will place the employee in Vancouver (note that the order will be swapped be‐cause each server will update the other server’s statement after its own).
Detecting and preventing such inconsistencies is important because they will cascadeand create more inconsistency over time. Statement-based replication executes state‐ments based on the data in the two servers, so one inconsistency can lead to others.
If you take care to separate the changes made by the two servers as outlined previously,the row changes will be replicated and the two masters will therefore be consistent.
If users use different tables on the different servers, the easiest way to prevent suchmistakes is to assign privileges so that a user cannot accidentally change tables on thewrong server. This is, however, not always possible and cannot prevent the case just shown.
Slave PromotionThe procedures described so far work well when you have a master running that youcan use to synchronize the standby and the slave before the switchover, but what happenswhen the master dies all of a sudden? Because replication has stopped in its tracks withall slaves (including the standby), there is no way to know what is on each slave. If the
144 | Chapter 5: Replication for High Availability

standby is ahead of all the slaves that need to be reassigned, there is no problem, becauseyou can run replication on each slave to the place where the standby stopped. You willlose any changes that were made on the master but not yet sent to the standby. We willcover how to handle the recovery of the master in this case separately.
If the standby is behind one of the slaves, you shouldn’t use the standby as the newmaster, because the slave knows more than the standby. As a matter of fact, it would bebetter if the slave that has replicated most events from the common master (which isnow “more knowledgeable”) were the master instead!
This is exactly the approach taken to handle master failures using slave promotion:instead of trying to keep a dedicated standby around (which then might not be the bestcandidate), ensure that any one of the slaves connected to the master can be promotedto master and take over at the point where the master was lost. By selecting the “mostknowledgeable” slave as the new master, you guarantee that none of the other slaves willbe more knowledgeable than the new master, so they can connect to the new masterand read events from it.
There is, however, a critical issue that needs to be resolved: osynchronizing all slaveswith the new master so that no events are lost or repeated. The problem in this situationis that all of the slaves need to read events from the new master.
The traditional method for promoting a slave
Before delving into the final solution, let us first take a look at the traditionally recom‐mended way for handling slave promotion. This will work as a good introduction tothe problem.
Figure 5-7 shows a typical setup with a master and several slaves.
For the traditional method of slave promotion, the following are required:
• Each promotable slave must have a user account for the replication user.• Each promotable slave should run with log-bin with the binary log enabled.• Each promotable slave should run without the log-slave-updates option (the
reason will become obvious shortly).
Procedures | 145

Figure 5-7. Promoting a slave to replace a failed master
Assume you are starting with the original setup shown in Figure 5-7 and that the masterfails. You can promote a slave to be the new master by doing the following:
1. Stop the slave using STOP SLAVE.2. Reset the slave that is going to be the new master using RESET MASTER. This will
ensure the slave starts as the new master and that any connecting slave will startreading events from the time the slave was promoted.
3. Connect the other slaves to the new master using CHANGE MASTER. Because you resetthe new master, you can start replication from the beginning of the binary log, soit is not necessary to provide any position to CHANGE MASTER.
Unfortunately, this approach is based on an assumption that is not generally true—thatthe slaves have received all changes that the master has made. In a typical setup, theslaves will lag behind the master to various degrees. It might be just a few transactions,but nevertheless, they lag behind. This means that each slave needs to fetch the missingtransactions somehow, and if none of the other slaves have a binary log enabled, thereis no way to provide these changes to the slaves. The situation can be handled by figuringout what slave has seen most of the master’s changes (the most knowlegeable slave) andthen synchronize all the other slaves with the most knowledgeable slave by eithercopying the entire database, or using something like the mysqldbcompare to get thechanges to the slaves.
Regardless of that, this approach is so simple that it is useful if you can handle losttransactions or if you are operating under a low load.
146 | Chapter 5: Replication for High Availability

A revised method for promoting a slave
The traditional approach to promoting a slave is inadequate in most cases because slavesusually lag behind the master. Figure 5-8 illustrates the typical situation when the masterdisappears unexpectedly. The box labeled “binary log” in the center is the master’s binarylog and each arrow represents how much of the binary log the slave has executed.
Figure 5-8. Binary log positions of the master and the connected slaves
In the figure, each slave has stopped at a different binlog position, and even the mostknowledgeable slave has not got all the transactions from the now defunct master. Thetransactions that have not been replicated to the new master are lost forever (it willbecome clear why in “Consistency in a Hierarchical Deployment” on page 180), and thetransactions missing from the lagging slaves have to be transferred from the mostknowledgeable slave. The situation is resolved by promoting one slave (the most knowl‐edgeable one) to be the new master and then synchronizing the other slaves to it. InExample 5-4, you can find code to order the slaves based on their master positions. Thisworks if the slaves are connected to the same master, which means that the coordinatesare comparable.
Example 5-4. Python code to find the best slavefrom mysql.replicant.commands import ( fetch_slave_position,)
def fetch_gtid_executed(server): server.connect()
Procedures | 147


Figure 5-9. Circular replication setup
In Figure 5-9, there are four servers named for the cities in which they are located (thenames are arbitrarily picked and do not reflect a real setup). Replication goes in a circle:Stockholm to Moscow to Paris to London and back to Stockholm. This means thatMoscow is upstream of Paris, but downstream of Stockholm. Suppose that Moscow goesdown suddenly and unexpectedly. To allow replication to continue, it is necessary toreconnect the “downstream” server Paris to the “upstream” server Stockholm to ensurethe continuing operation of the system.
Figure 5-10 shows a scenario in which a single server fails and the servers reconnect toallow replication to continue. Sounds simple enough, doesn’t it? Well, it’s not really assimple as it looks. There are basically three potential problems:
• The downstream server—the server that was slave to the failed master—needs toconnect to the upstream server and start replication from what it last saw. How isthat position decided?
• Suppose that the crashed server has managed to send out some events before crash‐ing. What happens with those events?
• We need to consider how we should bring the failed server into the topology again.What if the server applied some transactions of its own that were written to thebinary log but not yet sent out? It is clear that these transactions are lost, so we needto handle this.
As you will see, all of these issues are easy to solve with the global transaction identifiersintroduced in MySQL 5.6. When detecting that one of the servers failed, just use theCHANGE MASTER command to connect the downstream server to the upstream serverusing the MASTER_AUTO_POSITION=1 option:
paris> CHANGE MASTER TO -> MASTER_HOST='stockholm.example.com', -> MASTER_AUTO_POSITION = 1;
150 | Chapter 5: Replication for High Availability

Because each server remembers what transactions were seen, any transactions that wassent out by the failing server will be applied to each remaining server in the ring exactlyonce. This means that it automatically handles the second and third issues from our list.
Figure 5-10. Changing topology in response to a failing server
Because the failed server can be in an alternative future (see Figure 6-8) compared tothe other servers, bringing the server back in the ring will cause the missing transactionto “suddenly appear” (from the perspective of the application using the database), andthis might not be what you want. The safest way to bring it into the circle again is torestore the server from one of the servers in the ring and reconnect the circle so thatthe new server is in the ring again.
ConclusionHigh availability is a nontrivial concept to implement in practice. In this chapter, wepresented a look into high availability and how you can achieve it with MySQL. In thenext chapter, we will look more at high availability as we examine a companion topic:scaling out.
Joel’s email notification chime sounded. He clicked on his email and opened the latestmessage. It was from Mr. Summerson, who made comments about his report. He readit through and at the bottom found what he expected. It read, “I like the redundancyideas and especially the hot standby strategy. Make this happen.”
Joel sighed as he realized his plans for getting to know some of his coworkers were goingto have to wait. He had a lot of work to do.
Conclusion | 151


CHAPTER 6
MySQL Replication for Scale-Out
Joel stood and stretched and figured it was time for a soda. As he walked around hisdesk, headed to the break room, his boss met him at his door. “Good afternoon, sir.”
“Hey, Joel. We just sold a bunch of licenses for our new applications. The marketingpeople tell me we can expect to see an increase in load of at least tenfold on the databaseserver.”
Joel raised his eyebrows. He had added a single slave just last week and that had improvedthe load problem, but not entirely.
“We need to scale out, Joel.”
“Yes, sir. I’ll get right on it.”
Mr. Summerson tapped Joel on the shoulder and smiled, then walked down the hall tohis office.
Joel stood still for a few moments as he pondered what “scale out” meant and formed aplan. “I’ve got to do a little more reading,” he mumbled as he headed to the break room.
When the load starts to increase—and if you are running a successful deployment, it isjust a matter of when it will start to increase—you can handle it in two ways. The firstis to buy larger and more powerful servers to handle the increased load, which is calledscaling up, whereas the second is to add more servers to handle the increased load, whichis called scaling out. Of these two, scaling out is by far the more popular solution becauseit usually involves buying a batch of low-cost standard servers and is much more cost-effective.
In addition to handling an increased load, additional servers can support high availa‐bility and other business requirements. When used effectively, scaling out puts thecombined resources—such as computing power—of all the servers to best use.
153

This chapter doesn’t go into all the hardware, network, and other considerations in‐volved in scaling out—those are beyond the scope of this book and are covered to somedegree in High Performance MySQL, but we will talk about how to set up replication inMySQL to make the best use of scale-out. After some basic instructions for replication,we’ll start to develop a Python library that makes it easy to administer replication overlarge sets of servers, and we’ll examine how replication fits into your organization’sbusiness needs.
All the code in this chapter (as well as the other chapters of the book) can be found inthe MySQL Replicant source code repository at Launchpad.
The most common uses for scaling out and replication are:Load balancing for reads
The master is occupied with updating data, so it can be wise to have separate serversto answer queries. Because queries only need to read data, you can use replicationto send changes on the master to slaves—as many as you feel you need—so thatthey have current data and can process queries.
Load balancing for writesHigh-traffic deployments distribute processing over many computers, sometimesseveral thousand. Here, replication plays a critical role in distributing the informa‐tion to be processed. The information can be distributed in many different waysbased on the business use of your data and the nature of the use:
• Distributed based on the information’s role. Rarely updated tables can be kepton a single server, while frequently updated tables are partitioned over severalservers.
• Partitioned by geographic region so that traffic can be directed to the closestserver.
Disaster avoidance through hot standbyIf the master goes down, everything will stop—it will not be possible to execute(perhaps critical) transactions, get information about customers, or retrieve othercritical data. This is something that you want to avoid at (almost) any cost as it canseverely disrupt your business. The easiest solution is to configure a slave with thesole purpose of acting as a hot standby, ready to take over the job of the master ifit fails.
Disaster avoidance through remote replicationEvery deployment runs the risk of having a data center go down due to a disaster,be it a power failure, an earthquake, or a flood. To mitigate this, use replication totransport information between geographically remote sites.
154 | Chapter 6: MySQL Replication for Scale-Out

Making backupsKeeping an extra server around for making backups is very common. This allowsyou to make your backups without having to disturb the master at all, because youcan take the backup server offline and do whatever you like with it.
Report generationCreating reports from data on a server will degrade the server’s performance, insome cases significantly. If you’re running lots of background jobs to generate re‐ports, it’s worth creating a slave just for this purpose. You can get a snapshot of thedatabase at a certain time by stopping replication on the slave and then runninglarge queries on it without disturbing the main business server. For example, if youstop replication after the last transaction of the day, you can extract your dailyreports while the rest of the business is humming along at its normal pace.
Filtering or partitioning dataIf the network connection is slow, or if some data should not be available to certainclients, you can add a server to handle data filtering. This is also useful when thedata needs to be partitioned and reside on separate servers.
Scaling Out Reads, Not WritesIt is important to understand that scaling out in this manner scales out reads, not writes.Each new slave has to handle the same write load as the master. The average load of thesystem can be described as follows:
AverageLoad =∑ ReadLoad + ∑ WriteLoad
∑ Capacity
So if you have a single server with a total capacity of 10,000 transactions per second,and there is a write load of 4,000 transactions per second on the master, while there isa read load of 6,000 transactions per second, the result will be:
AverageLoad =∑ ReadLoad + ∑ WriteLoad
∑ Capacity =6000 + 4000
10000 = 100 %
Now, if you add three slaves to the master, the total capacity increases to 40,000 trans‐actions per second. Because the write queries are replicated as well, each query is exe‐cuted a total of four times—once on the master and once on each of the three slaves—which means that each slave has to handle 4,000 transactions per second in write load.The total read load does not increase because it is distributed over the slaves. This meansthat the average load now is:
Scaling Out Reads, Not Writes | 155

AverageLoad =∑ ReadLoad + ∑ WriteLoad
∑ Capacity =6000 + 4 * 4000
4 * 10000 = 55 %
Notice that in the formula, the capacity is increased by a factor of 4, as we now have atotal of four servers, and replication causes the write load to increase by a factor of 4 aswell.
It is quite common to forget that replication forwards to each slave all the write queriesthat the master handles. So you cannot use this simple approach to scale writes, onlyreads. In the next chapter, you will see how to scale writes using a technique calledsharding.
The Value of Asynchronous ReplicationMySQL replication is asynchronous, a type of replication particularly suitable formodern applications such as websites.
To handle a large number of reads, sites use replication to create copies of the masterand then let the slaves handle all read requests while the master handles the write re‐quests. This replication is considered asynchronous because the master does not waitfor the slaves to apply the changes, but instead just dispatches each change request tothe slaves and assumes they will catch up eventually and replicate all the changes. Thistechnique for improving performance is usually a good idea when you are scaling out.
In contrast, synchronous replication keeps the master and slaves in sync and does notallow a transaction to be committed on the master unless the slave agrees to commit itas well (i.e., synchronous replication makes the master wait for all the slaves to keep upwith the writes).
Asynchronous replication is a lot faster than synchronous replication, for reasons ourdescription should make obvious. Compared to asynchronous replication, synchronousreplication requires extra synchronizations to guarantee consistency. It is usually im‐plemented through a protocol called two-phase commit, which guarantees consistencybetween the master and slaves, but requires extra messages to ping-pong between them.Typically, it works like this:
1. When a commit statement is executed, the transaction is sent to the slaves and theslave is asked to prepare for a commit.
2. Each slave prepares the transaction so that it can be committed, and then sends anOK (or ABORT) message to the master, indicating that the transaction is prepared (orthat it could not be prepared).
3. The master waits for all slaves to send either an OK or an ABORT message:
156 | Chapter 6: MySQL Replication for Scale-Out

a. If the master receives an OK message from all slaves, it sends a commit messageto all slaves asking them to commit the transaction.
b. If the master receives an ABORT message from any of the slaves, it sends an ABORTmessage to all slaves asking them to abort the transaction.
4. Each slave is then waiting for either an OK or an ABORT message from the master.a. If the slaves receive the commit request, they commit the transaction and send
an acknowledgment to the master that the transaction is committed.b. If the slaves receive an abort request, they abort the transaction by undoing any
changes and releasing any resources they held, then send an acknowledgmentto the master that the transaction was aborted.
5. When the master has received acknowledgments from all slaves, it reports thetransaction as committed (or aborted) and continues with processing the nexttransaction.
What makes this protocol slow is that it requires a total of four messages, including themessages with the transaction and the prepare request. The major problem is not theamount of network traffic required to handle the synchronization, but the latency in‐troduced by the network and by processing the commit on the slave, together with thefact that the commit is blocked on the master until all the slaves have acknowledged thetransaction. In contrast, asynchronous replication requires only a single message to besent with the transaction. As a bonus, the master does not have to wait for the slave, butcan report the transaction as committed immediately, which improves performancesignificantly.
So why is it a problem that synchronous replication blocks each commit while the slavesprocess it? If the slaves are close to the master on the network, the extra messages neededby synchronous replication make little difference, but if the slaves are not nearby—maybe in another town or even on another continent—it makes a big difference.
Table 6-1 shows some examples for a server that can commit 10,000 transactions persecond. This translates to a commit time of 0.1 ms (but note that some implementations,such as MySQL Cluster, are able to process several commits in parallel if they are inde‐pendent). If the network latency is 0.01 ms (a number we’ve chosen as a baseline bypinging one of our own computers), the transaction commit time increases to 0.14 ms,which translates to approximately 7,000 transactions per second. If the network latencyis 10 ms (which we found by pinging a server in a nearby city), the transaction committime increases to 40.1 ms, which translates to about 25 transactions per second! Incontrast, asynchronous replication introduces no delay at all, because the transactionsare reported as committed immediately, so the transaction commit time stays at theoriginal 10,000 per second, just as if there were no slaves.
The Value of Asynchronous Replication | 157


Figure 6-1. Simple, tree, dual-master, and circular replication topologies
The simple and tree topologies are used for scale-out. The use of replication causes thenumber of reads to greatly exceed the number of writes. This places special demandson the deployment in two ways:It requires load balancing
We’re using the term load balancing here to describe any way of dividing queriesamong servers. Replication creates both reasons for load balancing and methodsfor doing so. First, replication imposes a basic division of the load by specifyingwrites to be directed to the masters while reads go to the slaves. Furthermore, yousometimes have to send a particular query to a particular slave.
It requires you to manage the topologyServers crash sooner or later, which makes it necessary to replace them. Replacinga crashed slave might not be urgent, but you’ll have to replace a crashed masterquickly.
In addition to this, if a master crashes, clients have to be redirected to the newmaster. If a slave crashes, it has to be taken out of the pool of load balancers so noqueries are directed to it.
To handle load balancing and management, you should put tools in place to managethe replication topology, specifically tools that monitor the status and performance ofservers and tools to handle the distribution of queries.
For load balancing to be effective, it is necessary to have spare capacity on the servers.There are a few reasons for ensuring you have spare capacity:Peak load handling
You need to have margins to be able to handle peak loads. The load on a system isnever even, but fluctuates up and down. The spare capacity necessary to handle alarge deployment depends a lot on the application, so you need to monitor it closelyto know when the response times start to suffer.
Managing the Replication Topology | 159

Distribution costYou need to have spare capacity for running the replication setup. Replication al‐ways causes a “waste” of some capacity on the overhead of running a distributedsystem. It involves extra queries to manage the distributed system, such as the extraqueries necessary to figure out where to execute a read query.
One item that is easily forgotten is that each slave has to perform the same writesas the master. The queries from the master are executed in an orderly manner (i.e.,serially), with no risk of conflicting updates, but the slave needs extra capacity forrunning replication.
Administrative tasksRestructuring the replication setup requires spare capacity so you can supporttemporary dual use, like when moving data between servers.
Load balancing works in two basic ways: either the application asks for a server basedon the type of query, or an intermediate layer—usually referred to as a proxy—analyzesthe query and sends it to the correct server.
Using an intermediate layer to analyze and distribute the queries (as shown inFigure 6-2) is by far the most flexible approach, but it has two disadvantages:
• There is a performance degradation when using a proxy because of two reasons:processing resources have to be spent on analyzing queries and there is an extrahop introduced for the queries that now have to go through the proxy. Processingthe query may delay it—because it has to be parsed and analyzed twice (once by theproxy and again by the MySQL server)—but the latency introduced by the extrahop is likely to exceed the time for analyzing the query. Depending on the appli‐cation, this may or may not be a problem.
• Correct query analysis can be hard to implement, sometimes even impossible. Aproxy will often hide the internal structure of the deployment from the applicationprogrammer so that it should not be necessary to make the hard choices. For thisreason, the client may send a query that can be very hard to analyze properly andmight require a significant rewrite before being sent to the servers.
One of the tools that you can use for proxy load balancing is MySQL Proxy. It containsa full implementation of the MySQL client protocol, and therefore can act as a serverfor the real client connecting to it and as a client when connecting to the MySQL server.This means that it can be fully transparent: a client can’t distinguish between the proxyand a real server.
160 | Chapter 6: MySQL Replication for Scale-Out

Figure 6-2. Using a proxy to distribute queries
The MySQL Proxy is controlled using the Lua programming language. It has a built-inLua engine that executes small—and sometimes not so small—programs to interceptand manipulate both the queries and the result sets. Because the proxy is controlledusing a real programming language, it can carry out a variety of sophisticated tasks,including query analysis, query filtering, query manipulation, and query distribution.
Configuration and programming of the MySQL Proxy are beyond the scope of thisbook, but there are extensive publications about it online. Some of the ones we finduseful are:Jan Kneschke
Jan Kneschke is the original author of the MySQL Proxy and has several goodpresentations and posts about the Proxy.
The MySQL Reference ManualThe MySQL Proxy section of the MySQL Reference Manual contain the details ofthe implementation as well as an introduction to writing scripts for the MySQLProxy.
The precise methods for using a proxy depend entirely on the type of proxy you use, sowe will not cover that information here. Instead, we’ll focus on using a load balancer inthe application layer. There are a number of load balancers available, including:
• Hardware• Simple software load balancers, such as Balance
Managing the Replication Topology | 161

• Peer-based systems, such as Wackamole• Full-blown clustering solutions, such as the Linux Virtual Server
It is also possible to distribute the load on the DNS level and to handle the distributiondirectly in the application.
Application-Level Load BalancingThe most straightforward approach to load balancing at the application level is to havethe application ask the load balancer for a connection based on the type of query it isgoing to send. In most cases, the application already knows whether the query is goingto be a read or write query, and which tables will be affected. In fact, forcing the appli‐cation developer to consider these issues when designing the queries may produce otherbenefits for the application, usually in the form of improved overall performance of thesystem. Based on this information, a load balancer can provide a connection to the rightserver, which the application can then use to execute the query.
A load balancer on the application layer needs to have a store with information aboutthe servers and what queries they should handle. Functions in the application layer sendqueries to this store, which returns the name or IP address of the MySQL server to query.The lookup procedure can either be placed in the application, or inside the connectorif it supports it. Many connectors support ways for providing information about serverswithout a central store, but then you need to have means for seeding the connectorswith this information, or provide it through the application.
Example of an application-level load balancer
Let’s develop a simple load balancer like the one shown in Figure 6-3 for use by theapplication layer. PHP is being used for the presentation logic because it’s so popular onweb servers. It is necessary to write functions for updating the server pool informationand functions to fetch servers from the pool.
The pool is implemented by creating a table with all the servers in the deployment in acommon database that is shared by all nodes. In this case, we just use the host and portas primary key for the table (instead of creating a host ID) and create a common databaseto contain the tables of the shared data.
162 | Chapter 6: MySQL Replication for Scale-Out

Figure 6-3. Load balancing on the application level
You should duplicate the central store so that it doesn’t create a single point of failure.In addition, because the list of available servers does not often change, load balancinginformation is a perfect candidate for caching.
For the sake of simplicity—and to avoid introducing dependencies on other systems—we demonstrate the application-level load balancer using a pure MySQL implementa‐tion. There are many other techniques that you can use that do not involve MySQL. Themost common technique is to use round-robin DNS; another alternative is usingMemcached, which is a distributed in-memory key/value store.
Also note that the addition of an extra query (to query the common database) is asignificant overhead for high-performing systems and should be avoided. This is tra‐ditionally done using a cache for the information, but we start with an implementationwithout caches. You will see how to add caches in Example 6-5.
The load balancer lists servers in the load balancer pool, separated into categories basedon what kind of queries they can handle. Information about the servers in the pool isstored in a central repository. The implementation consists of a table in the commondatabase given in Example 6-1, the load balancer in Example 6-2 for querying the loadbalancer from the application, and the Python functions in Example 6-3 for updatinginformation about the servers.
Example 6-1. Database tables for the load balancerCREATE TABLE nodes ( host VARCHAR(28) NOT NULL, port INT UNSIGNED NOT NULL, sock VARCHAR(80) type ENUM('OL','RO','RW') NOT NULL DEFAULT '',
Managing the Replication Topology | 163


def pool_add(common, server, types=None): if types is None: types = [] common.use("common") try: common.sql(_INSERT_SERVER, (server.host, server.port, server.socket, ','.join(types))) except IntegrityError: raise AlreadyInPoolError
def pool_del(common, server): common.use("common") common.sql(_DELETE_SERVER, (server.host, server.port))
def pool_set(common, server, types=None): if types is None: types = [] common.use("common") common.sql(_UPDATE_SERVER, (','.join(types), server.host, server.port))
These functions can be used as shown in the following examples:pool_add(common, master, ['READ', 'WRITE'])
for slave in slaves: pool_add(common, slave, ['READ'])
With everything in place, the load balancer can be used as in Example 6-4, where thedictionary is set up to use central.example.com for the central repository. After that,get_connection can be used to get connections to the server based on the hint provided.
Example 6-4. PHP code using the load balancer$DICT = new Dictionary("central.example.com", "mats", "");
$QUERY = <<<END_OF_QUERYSELECT first_name, last_name, dept_nameFROM employees JOIN dept_emp USING (emp_no) JOIN departments USING (dept_no)WHERE emp_no = ?END_OF_QUERY;
$mysql = $DICT->get_connection('mats', 'xyzzy', 'employees', array('type' => DB_RO));$stmt = $mysql->prepare($QUERY);if ($stmt) { $stmt->bind_param("d", $emp_no); $stmt->execute(); $stmt->bind_result($first_name, $last_name, $dept_name); while ($stmt->fetch()) print "$first_name $last_name $dept_name\n";
166 | Chapter 6: MySQL Replication for Scale-Out


you will not see any events in the binlog. The reason for this is that there is no point inwasting disk space by recording the changes; if there is a problem and, say, the slavecrashes, you can always recover by cloning the master or another slave.
On the other hand, the relay server needs to keep a binary log to record all the changes,because the relay passes them on to other slaves. Unlike typical slaves, however, the relaydoesn’t need to actually apply changes to a database of its own, because it doesn’t answerqueries.
In short, a typical slave needs to apply changes to a database, but not to a binary log. Arelay server needs to keep a binary log, but does not apply changes to a database.
To avoid writing changes to the database, it is necessary to keep tables around (so thestatements can be executed), but the changes should just be thrown away. A storageengine named Blackhole was created for purposes just like this one. The Blackholeengine accepts all statements and always reports success in executing them, but anychanges are just thrown away. A relay introduces an extra delay that can cause its slavesto lag further behind the master than slaves that are directly connected to the master.This lag should be balanced against the benefits of removing some load from the master,because managing a hierarchical setup is significantly more difficult than managing asimple setup.
Setting Up a Relay ServerSetting up a relay server is quite easy, but we have to consider what to do with tablesthat are being created on the relay as well as what to do with tables that already exist onthe relay when we change its role. Not keeping data in the databases will make processingevents faster and reduce the lag for the slaves at the end of the replication process,because there is no data to be updated. To set up a relay server, we thus have to:
1. Configure the slave to forward any events executed by the slave thread by writingthem to the binlog of the relay slave.
2. Change the storage engine for all tables on the relay server to use the BLACKHOLEstorage engine to preserve space and improve performance.
3. Ensure that any new tables added to the relay also use the BLACKHOLE engine.
Configuring the relay server to forward events executed by the slave thread is done byadding the log-slave-updates option to my.cnf, as demonstrated earlier.
In addition to setting log-slave-updates, it is necessary to change the default storageengine using the default-storage-engine in the my.cnf file. You can temporarilychange the storage engine on the relay by issuing the command SET STORAGE_ENGINE= 'BLACKHOLE', but that setting will not persist if the server is restarted.
Hierarchical Replication | 171

The final task is to change the storage engine for all tables already on the relay serverto use BLACKHOLE. Do this using the ALTER TABLE statement to change the storage enginefor each table on the server. Because the ALTER TABLE statements shouldn’t be writtento the binary log (the last thing we want is for slaves to discard the changes they receive!),turn off the binary log temporarily while executing the ALTER TABLE statements. Thisis shown in Example 6-8.
Example 6-8. Changing the engine for all tables in database windyrelay> SHOW TABLES FROM windy;+-----------------+| Tables_in_windy |+-----------------+| user_data | . . .| profile |+-----------------+45 row in set (0.15 sec)relay> SET SQL_LOG_BIN = 0;relay> ALTER TABLE user_data ENGINE = 'BLACKHOLE'; . . .relay> ALTER TABLE profile ENGINE = 'BLACKHOLE';relay> SET SQL_BIN_LOG = 1;
This is all you need to turn a server into a relay server. The usual way you come to employa relay is to start with a setup in which all slaves attach directly to a master and discoverafter some time that it is necessary to introduce a relay server. The reason is usually thatthe master has become too loaded, but there could be architectural reasons for makingthe change as well. So how do you handle that?
You can use what you learned in the previous sections and modify the existing deploy‐ment to introduce the new relay server by:
1. Connecting the relay server to the master and configuring it to act as a relay server.2. Switching over the slaves one by one to the relay server.
Adding a Relay in PythonLet’s turn to the task of developing support for administering relays by extending ourlibrary. Because we have a system for creating new roles and imbuing servers with thoseroles, let’s use that by defining a special role for the relay server. This is shown inExample 6-9.
172 | Chapter 6: MySQL Replication for Scale-Out

Example 6-9. Role definition for relayfrom mysql.replicant import roles
class Relay(roles.Role): def __init__(self, master): super(Relay, self).__init__() self.__master = master
def imbue(self, server): config = server.get_config() self._set_server_id(server, config) self._enable_binlog(server) config.set('mysqld', 'log-slave-updates' '1') server.put_config(config) server.sql("SET SQL_LOG_BIN = 0") for db in list of databases: for table in server.sql("SHOW TABLES FROM %s", (db)): server.sql("ALTER TABLE %s.%s ENGINE=BLACKHOLE", (db,table)) server.sql("SET SQL_LOG_BIN = 1")
Specialized SlavesIn the simple scale-out deployment—like the one described thus far—all slaves receiveall data and can therefore handle any kind of query. It is, however, not very common todistribute requests evenly over the different parts of the data. Instead, there is usuallysome data that needs to be accessed very frequently and some that is rarely accessed.For example, consider the needs of an ecommerce site:
• The product catalog is browsed almost all the time.• Data about items in stock may not be requested very often.• User data is not requested very often, because most of the critical information is
recorded using session-specific information stored in the browser as cookies.• On the other hand, if cookies are disabled, the session data will be requested from
the server with almost every page request.• Newly added items are usually accessed more frequently than old items (e.g., “spe‐
cial offers” might be accessed more frequently than other items).
It would clearly be a waste of resources to keep the rarely accessed data on each andevery slave just in case it is requested. It would be much better to use the deploymentshown in Figure 6-5, where a few servers are dedicated to keeping rarely accessed data,while a different set of servers are dedicated to keeping data that is accessed frequently.
Specialized Slaves | 173

Figure 6-5. Replication topology with master and specialized slaves
To do this, it is necessary to separate tables when replicating. MySQL can do this byfiltering the events that leave the master or, alternatively, filtering the events when theycome to the slave.
Filtering Replication EventsThe two different ways of filtering events are called master filters when the events arefiltered on the master and slave filters when the events are filtered on the slave. Themaster filters control what goes into the binary log and therefore what is sent to theslaves, while slave filters control what is executed on the slave. For the master filters,events for filtered-out tables are not stored in the binary log at all, while for slave filters,the events are stored in the binary log and also sent to the slave and not filtered out untiljust before they are going to be executed.
This means that it is not possible to use PITR to recover these databases properly—ifthe databases are stored in the backup image, they will still be restored when restoringthe backup, but any changes made to tables in the database since that moment will notbe recovered, because the changes are not in the binary log.
If slave filters are used, all changes are sent over the network.
This clearly wastes network bandwidth, especially over long-haul network connections.
Later in this chapter, you will see a detailed discussion of the relative merits of masterand slave filtering and an approach that allows the binary log to remain intact while stillsaving network bandwidth.
Master filters
There are two configuration options for creating master filters:
174 | Chapter 6: MySQL Replication for Scale-Out

binlog-do-db=db
If the current database of the statement is db, the statement will be written to thebinary log; otherwise, the statement will be discarded.
binlog-ignore-db=db
If the current database of the statement is db, the statement will be discarded;otherwise, the statement will be written to the binary log.
If you want to replicate everything except a few databases, use binlog-ignore-db. Ifyou want to replicate just a few databases, use binlog-do-db. Combining them is notrecommended, because the logic for deciding whether a database should be replicatedor not is complicated (see Figure 4-3). The options do not accept lists of databases, soif you want to list several databases, you have to repeat an option multiple times.
As an example, to replicate everything except the top and secret databases, add thefollowing options to the configuration file:
[mysqld]...binlog-ignore-db = topbinlog-ignore-db = secret
Using binlog-*-db options to filter events means that the twodatabases will not be stored in the binary log at all, and hence can‐not be recovered using PITR in the event of a crash. For that rea‐son, it is strongly recommended that you use slave filters, not mas‐ter filters, when you want to filter the replication stream. You shoulduse master filters only for data that can be considered volatile andthat you can afford to lose.
Slave filters
Slave filtering offers a longer list of options. In addition to being able to filter the eventsbased on the database, slave filters can filter individual tables and even groups of tablenames by using wildcards.
In the following list of rules, the replicate-wild rules look at the full name of the table,including both the database and table name. The pattern supplied to the option usesthe same patterns as the LIKE string comparison function—that is, an underscore (_)matches a single character, whereas a percent sign (%) matches a string of any length.Note, however, that the pattern must contain a period to be legitimate. This means thatthe database name and table name are matched individually, so each wildcard appliesonly to the database name or table name.replicate-do-db=db
If the current database of the statement is db, execute the statement.
Specialized Slaves | 175

replicate-ignore-db=db
If the current database of the statement is db, discard the statement.
replicate-do-table=db_name.tbl_namereplicate-wild-do-table=db_pattern.tbl_pattern
If the name of the table being updated is table or matches the pattern, executeupdates to the table.
replicate-ignore-table=db_name.tbl_namereplicate-wild-ignore-table=db_pattern.tbl_pattern
If the name of the table being updated is table or matches the pattern, discardupdates to the table.
These filtering rules are evaluated just before the server decides whether to executethem, so all events are sent to the slave before being filtered.
Using Filtering to Partition Events to SlavesSo what are the benefits and drawbacks of filtering on the master versus filtering on theslave? At a brief glance, it might seem like a good idea to structure the databases so thatit is possible to filter events on the master using the binlog-*-db options instead ofusing the replicate-*-db options. That way, the network is not laden with a lot ofuseless events that will be removed by the slave anyway. However, as mentioned earlierin the chapter, there are problems associated with filtering on the master:
• Because the events are filtered from the binary log and there is only a single binarylog, it is not possible to “split” the changes and send different parts of the databaseto different servers.
• The binary log is also used for PITR, so if there are any problems with the server,it will not be possible to restore everything.
• If, for some reason, it becomes necessary to split the data differently, it will no longerbe possible, because the binary log has already been filtered and cannot be “unfil‐tered.”
It would be ideal if the filtering could be on the events sent from the master and not onthe events written to the binary log. It would also be good if the filtering could becontrolled by the slave so that the slave could decide which data to replicate. For MySQLversion 5.1 and later, this is not possible, and instead, it is necessary to filter events usingthe replicate-* options—that is, to filter the events on the slave.
As an example, to dedicate a slave to the user data stored in the two tables users andprofiles in the app database, shut down the server and add the following filteringoptions to the my.cnf file:
176 | Chapter 6: MySQL Replication for Scale-Out

[mysqld]...replicate-wild-do-table=app.usersreplicate-wild-do-table=app.profiles
If you are concerned about network traffic—which could be significant if you replicateover long-haul networks—you can set up a relay server on the same machine as themaster, as shown in Figure 6-6 (or on the same network segment as the master), whoseonly purpose is to produce a filtered version of the master’s binary log.
Figure 6-6. Filtering by putting master and relay on the same machine
Managing Consistency of DataAs discussed earlier in the chapter, one of the problems with asynchronous replicationis managing consistency. To illustrate the problem, let’s imagine you have an ecommercesite where customers can browse products and put items they want to purchase in acart. You’ve set up your servers so that when a user adds an item to the cart, the changerequest goes to the master, but when the web server requests information about thecontents of the cart, the query goes to one of the slaves tasked with answering suchqueries. Because the master is ahead of the slave, it is possible that the change has notreached the slave yet, so a query to the slave will then find the cart empty. This will, ofcourse, come as a big surprise to the customer, who will then promptly add the item tothe cart again only to discover that the cart now contains two items, because this time,the slave managed to catch up and replicate both changes to the cart. This situationclearly needs to be avoided or you will risk a bunch of irritated customers.
To avoid getting data that is too old, it is necessary to somehow ensure that the dataprovided by the slave is recent enough to be useful. As you will see, the problem becomeseven trickier when a relay server is added to the mix. The basic idea of handling this is
Managing Consistency of Data | 177

to somehow mark each transaction committed on the master, and then wait for the slaveto reach that transaction (or later) before trying to execute a query on the slave.
With the introduction of global transaction identifiers (GTID) in MySQL 5.6, failingover slaves and clients has become significantly simpler because most of the techniquesdescribed here are handled automatically. The global transaction IDs are described indetail in “Global Transaction Identifiers” on page 260, but this chapter will to a large extentfocus on the old solution for the benefit of users that have not transitioned to MySQL5.6 yet. The differences between pre-5.6 and 5.6-based solution are highlighted in thereminder of the chapter.
Prior to MySQL 5.6, the problem needed to be handled in different ways depending onwhether there are any relay servers between the master and the slave.
Consistency in a Nonhierarchical DeploymentWhen all the slaves are connected directly to the master, it is very easy to check forconsistency. In this case, it is sufficient to record the binlog position after the transactionhas been committed and then wait for the slave to reach this position using the previ‐ously introduced MASTER_POS_WAIT function. But it is not possible to get the exact po‐sition where a transaction was written in the binlog. Why? Because in the time betweenthe commit of a transaction and the execution of SHOW MASTER STATUS, several eventscan be written to the binlog.
This does not matter, because in this case, it is not necessary to get the exact binlogposition where the transaction was written; it is sufficient to get a position that is at orlater than the position of the transaction. Because the SHOW MASTER STATUS commandwill show the position where replication is currently writing events, executing this afterthe transaction has committed will be sufficient for getting a binlog position that canbe used for checking consistency.
Example 6-10 shows the PHP code for processing an update to guarantee that the datapresented is not stale.
Example 6-10. PHP code for avoiding read of stale datafunction fetch_master_pos($server) { $result = $server->query('SHOW MASTER STATUS'); if ($result == NULL) return NULL; // Execution failed $row = $result->fetch_assoc(); if ($row == NULL) return NULL; // No binlog enabled $pos = array($row['File'], $row['Position']); $result->close(); return $pos;}
178 | Chapter 6: MySQL Replication for Scale-Out

function sync_with_master($master, $slave) { $pos = fetch_master_pos($master); if ($pos == NULL) return FALSE; if (!wait_for_pos($slave, $pos[0], $pos[1])) return FALSE; return TRUE;}
function wait_for_pos($server, $file, $pos) { $result = $server->query( "SELECT MASTER_POS_WAIT('$file', $pos)"); if ($result == NULL) return FALSE; // Execution failed $row = $result->fetch_row(); if ($row == NULL) return FALSE; // Empty result set ?! if ($row[0] == NULL || $row[0] < 0) return FALSE; // Sync failed $result->close(); return TRUE;}
function commit_and_sync($master, $slave) { if ($master->commit()) { if (!sync_with_master($master, $slave)) return NULL; // Synchronization failed return TRUE; // Commit and sync succeeded } return FALSE; // Commit failed (no sync done)}
function start_trans($server) { $server->autocommit(FALSE);}
Example 6-10 contains the functions commit_and_sync and start_trans together withthree support functions, fetch_master_pos, wait_for_pos, and sync_with_master.The commit_and_sync function commits a transaction and waits for it to reach a des‐ignated slave. It accepts two arguments, a connection object to a master and a connectionobject to the slave. The function will return TRUE if the commit and the sync succeeded,FALSE if the commit failed, and NULL if the commit succeeded but the synchronizationfailed (either because there was an error in the slave or because the slave lost the master).
The function works by committing the current transaction and then, if that succeeds,fetching the current master binlog position through SHOW MASTER STATUS. Becauseother threads may have executed updates to the database between the commit and thecall to SHOW MASTER STATUS, it is possible (even likely) that the position returned is notat the end of the transaction, but rather somewhere after where the transaction waswritten in the binlog. As mentioned earlier, this does not matter from an accuracy per‐
Managing Consistency of Data | 179

spective, because the transaction will have been executed anyway when we reach thislater position.
After fetching the binlog position from the master, the function proceeds by connectingto the slave and executing a wait for the master position using the MASTER_POS_WAITfunction. If the slave is running, a call to this function will block and wait for the positionto be reached, but if the slave is not running, NULL will be returned immediately. This isalso what will happen if the slave stops while the function is waiting (like if an erroroccurs when the slave thread executes a statement). In either case, NULL indicates thetransaction has not reached the slave, so it’s important to check the result from the call.If MASTER_POS_WAIT returns 0, it means that the slave had already seen the transactionand therefore synchronization succeeds trivially.
To use these functions, it is sufficient to connect to the server as usual, but then use thefunctions to start, commit, and abort transactions. Example 6-11 shows examples oftheir use in context, but the error checking has been omitted because it is dependent onhow errors are handled.
Example 6-11. Using the start_trans and commit_and_sync functionsrequire_once './database.inc';
start_trans($master);$master->query('INSERT INTO t1 SELECT 2*a FROM t1');commit_and_sync($master, $slave);
PHP scripts have a maximum execution time, which defaults to 30seconds. If the script exceeds this time, execution will be terminat‐ed. You need to keep that in mind when using the code inExample 6-10 by either running in safe mode, or changing the max‐imum execution time.
Consistency in a Hierarchical DeploymentThanks to the global transaction identifiers introduced in MySQL 5.6, managing con‐sistency in a MySQL 5.6 server is just as easy as in “Consistency in a NonhierarchicalDeployment” on page 178. Because the transaction identifier does not change betweenmachines, it does not matter how many relay servers there are between the origin of thetransaction and the server you connect to.
Managing consistency in a hierarchical deployment before MySQL 5.6 is significantlydifferent from managing consistency in a simple replication topology where each slaveis connected directly to the master. Because the positions are changed by every inter‐mediate relay server, it is not possible to wait for a master position at the ultimate slave(the slave at the bottom at the hierarchy). Instead, it is necessary to figure out another
180 | Chapter 6: MySQL Replication for Scale-Out

way to wait for the transactions to reach the ultimate slave. There are basically twoalternatives that you can use to ensure you are not reading stale data.
The first solution is to use the global transaction identifiers shown in Appendix B tohandle slave promotions and to poll the slave repeatedly until it has processed thetransaction. In contrast with the global transaction identifiers in MySQL 5.6, there isno wait function that we can use for these, so it is necessary to poll repeatedly.
The MASTER_POS_WAIT function is quite handy when it comes to handling the wait, soif it were possible to use that function, it would solve a lot of problems. The secondsolution, illustrated in Figure 6-7, uses this function to connect to each of the relayservers in the path from the master to the final slave to ensure the change propagatesto the slave. It is necessary to connect to each relay slave between the master and theslave, because it is not possible to know which binlog position will be used on each ofthe relay servers.
Figure 6-7. Synchronizing with all servers in a relay chain
Both solutions have their merits, so let’s consider the advantages and disadvantages ofeach of them.
If the slaves are normally up-to-date with respect to the master, the first solution willperform a simple check of the final slave only and will usually show that the transaction
Managing Consistency of Data | 181

has been replicated to the slave and that processing can proceed. If the transaction hasnot been processed yet, it is likely that it will be processed before the next check, so thesecond time the final slave is checked, it will show that the transaction has reached theslave. If the checking period is small enough, the delay will not be noticeable forthe user, so a typical consistency check will require one or two extra messages whenpolling the final slave. This approach requires only the final slave to be polled, not anyof the intermediate slaves. This can be an advantage from an administrative point aswell, because it does not require keeping track of the intermediate slaves and how theyare connected.
On the other hand, if the slaves normally lag behind, or if the replication lag varies alot, the second approach is probably better. The first solution will repeatedly poll theslave, and most of the time will report that the transaction has not been committed onthe slave. You can handle this by increasing the polling period, but if the polling periodhas to be so large that the response time is unacceptable, the first solution will not workwell. In this case, it is better to use the second solution and wait for the changes to rippledown the replication tree and then execute the query.
For a tree of size N, the number of extra requests will then be proportional to log N. Forinstance, if you have 50 relay servers and each relay server handles 50 final slaves, youcan handle all 2,500 slaves with exactly two extra requests: one to the relay server andthen one to the final slave.
The disadvantages of the second approach are:
• It requires the application code to have access to the relay slaves so that they canconnect to each relay server in turn and wait for the position to be reached.
• It requires the application code to keep track of the architecture of your replicationso that the relay servers can be queried.
Querying the relay servers will slow them down, because they have to handle more work,but in practice, this might turn out not to be a problem. By introducing a cachingdatabase connection layer, you can avoid some of the traffic. The caching layer willremember the binlog position each time a request is made and query the relay only ifthe binlog position is greater than the cached one. The following is a rough stub for thecaching function:
function wait_for_pos($server, $wait_for_pos) { if (cached position for $server > $wait_for_pos) return TRUE; else { code to wait for position and update cache }}
182 | Chapter 6: MySQL Replication for Scale-Out


if ($master->commit()) { $server = fetch_relay_chain($master, $slave); for ($i = sizeof($server) - 1; $i > 1 ; --$i) { if (!sync_with_master($server[$i], $server[$i-1])) return NULL; // Synchronization failed } }}
function start_trans($server) { $server->autocommit(FALSE);}
To find all the servers between the master and the slave, we use the function fetch_relay_chain. It starts from the slave and uses the function get_master_for to get themaster for a slave. We have deliberately not included the code for this function, as itdoes not add anything to our current discussion. However, this function has to be de‐fined for the code to work.
After the relay chain is fetched, the code synchronizes the master with its slave all theway down the chain. This is done with the sync_with_master function, which wasintroduced in Example 6-10.
One way to fetch the master for a server is to use SHOW SLAVE STATUS and read theMaster_Host and Master_Port fields. If you do this for each transaction you are aboutto commit, however, the system will be very slow.
Because the topology rarely changes, it is better to cache the information on the appli‐cation servers, or somewhere else, to avoid excessive traffic to the database servers.
In Chapter 5, you saw how to handle the failure of a master by, for example, failing overto another master or promoting a slave to be a master. We also mentioned that once themaster is repaired, you need to bring it back to the deployment. The master is a criticalcomponent of a deployment and is likely to be a more powerful machine than the slaves,so you should restore it to the master position when bringing it back. Because the masterstopped unexpectedly, it is very likely to be out of sync with the rest of the deployment.This can happen in two ways:
• If the master has been offline for more than just a short time, the rest of the systemwill have committed many transactions that the master is not aware of. In a sense,the master is in an alternative future compared to the rest of the system. An illus‐tration of this situation is shown in Figure 6-8.
• If the master committed a transaction and wrote it to the binary log, then crashedjust after it acknowledged the transaction, the transaction may not have made it tothe slaves. This means the master has one or more transactions that have not beenseen by the slaves, nor by any other part of the system.
Managing Consistency of Data | 185

If the original master is not too far behind the current master, the easiest solution to thefirst problem is to connect the original master as a slave to the current master, and thenswitch over all slaves to the master once it has caught up. If, however, the original masterhas been offline for a significant period, it is likely to be faster to clone one of the slavesand then switch over all the slaves to the master.
If the master is in an alternative future, it is not likely that its extra transactions shouldbe brought into the deployment. Why? Because the sudden appearance of a new trans‐action is likely to conflict with existing transactions in subtle ways. For example, if thetransaction is a message in a message board, it is likely that a user has already recom‐mitted the message. If a message written earlier but reported as missing—because themaster crashed before the message was sent to a slave—suddenly reappears, it will be‐fuddle the users and definitely be considered an annoyance. In a similar manner, userswill not look kindly on shopping carts suddenly having items added because the masterwas brought back into the system.
Figure 6-8. Original master in an alternative future
In short, you can solve both of the out-of-sync problems—the master in an alternativefuture and the master that needs to catch up—by simply cloning a slave to the originalmaster and then switching over each of the current slaves in turn to the original master.
These problems, however, highlight how important it is to ensure consistency by check‐ing that changes to a master are available on some other system before reporting thetransaction as complete, in the event that the master should crash. The code that wehave discussed in this chapter assumes that a user will try to read the data immediately,and therefore checks that it has reached the slave before a read query is carried out onthe server. From a recovery perspective, this is excessive; it is sufficient to ensure thetransaction is available on at least one other machine (e.g., on one of the slaves or relay
186 | Chapter 6: MySQL Replication for Scale-Out

servers connected to the master). In general, you can tolerate n−1 failures if you havethe change available on n servers.
As of MySQL 5.6, you can use global transaction identifiers to handle this. Simply usethe WAIT_UNTIL_SQL_THREAD_AFTER_GTIDS function instead of the MASTER_POS_WAITin Example 6-10, leading to the definition of wait_for_pos:
function wait_for_pos($server, $gtids) { $result = $server->query( "SELECT WAIT_UNTIL_SQL_THREAD_AFTER_GTIDS($gtids)"); if ($result == NULL) return FALSE; // Execution failed $row = $result->fetch_row(); if ($row == NULL) return FALSE; // Empty result set ?! if ($row[0] == NULL || $row[0] < 0) return FALSE; // Sync failed $result->close(); return TRUE;}
You can find a full description of global transaction identifiers in “Global TransactionIdentifiers” on page 260.
ConclusionIn this chapter, we looked at techniques to increase the throughput of your applicationsby scaling out, whereby we introduced more servers to handle more requests for data.We presented ways to set up MySQL for scaling out using replication and gave practicalexamples of some of the concepts. In the next chapter, we will look at some more ad‐vanced replication concepts.
A rap on Joel’s door drew his attention to Mr. Summerson standing in the doorway. “Ilike your report on scaling out our servers, Joel. I want you to get started on that rightaway. Use some of those surplus servers we have down in the computer room.”
Joel was happy he had decided to send his boss a proposal first. “Yes, sir. When do weneed these online?”
Mr. Summerson smiled and glanced at his watch. “It’s not quitting time yet,” he said andwalked away.
Joel wasn’t sure whether he was joking or not, so he decided to get started right away.He picked up his now-well-thumbed copy of MySQL High Availability and his notesand headed to the computer room. “I hope I set the TiVo,” he muttered, knowing thiswas going to be a late night.
Conclusion | 187


CHAPTER 7
Data Sharding
Joel finished reviewing his server logs and noted a few issues with a couple of queries.He made notes in his engineering notebook to watch these queries so he could learnwhether they are simply long running or queries that need to be refactored to be moreefficient. He was just noting the username for each query when his boss pinged him onthe company’s Jabber channel.
“I wish I’d never suggested we adopt instant messaging,” he thought. Joel typed thenormal response, “pong,” and waited for his boss to fire off another microtask. While itwas nice not to get ambushed in his own office, Joel knew his boss well enough thatsooner or later Mr. Summerson would give up using Jabber and return to his usual drive-by tasking routine.
“J, I need u to wrt a WP on shrdin. Do we need? Hlp new acct?”
Joel took a moment to decipher his boss’s propensity to think instant messaging was thesame as texting, where typing is more difficult and some services charge by the letter.“OK, so he’s discovered sharding. Now, what is a WP?” Joel typed his response, “Sure,I’ll get right on it. Do you mean white paper?”
“Ack” appeared a moment later.
Joel minimized his Jabber window, opened his browser, entered “sharding mysql whitepaper pdf ” in the search box, and pressed Enter. “If it’s out there, I’ll find it.”
In the previous chapter, you learned how to scale reads by attaching slaves to a masterand directing reads to the slaves while writes go to the master. As the load increases, itis easy to add more slaves to the master and serve more read queries. This allows youto easily scale when the read load increases, but what about the write load? All writesstill go to the master, so if the number of writes increases enough, the master will becomethe bottleneck preventing the system from scaling. At this point, you will probably ask
189

1. The MySQL Reference Manual refers to a schema as a database, making that term ambiguous. The SQLstandard actually uses the name schema and the syntax for the create statement is CREATE SCHEMA schemain the SQL standard.
whether there is some way to scale writes as well as reads. We’ll present sharding as asolution in this chapter, but let’s start with a look at some background.
In previous chapters, the data in the database is fully stored in a single server, but in thischapter, you will see the data in the database distributed over several servers. To avoidconfusion, we’ll use the term schema to denote the name that you use with the statementUSE schema or CREATE DATABASE schema.1 We’ll reserve the term database for the col‐lection of all the data that you have stored, regardless of how many machines it is dis‐tributed over.
For example, you can choose to break up a database by placing some tables on differentmachines (also known as functional partitioning), and splitting some tables placingsome of the rows on different machines (called horizontal partitioning, which is whatwe are talking about in this chapter).
What Is Sharding?Most attempts to scale writes start with using the setup in Figure 7-1, consisting of twomasters using bidirectional replication and a set of clients that update different mastersdepending on which data they need to change. Although the architecture appears todouble the capacity for handling writes (because there are two masters), it actuallydoesn’t. Writes are just as expensive as before because each statement has to be executedtwice: once when it is received from the client and once when it is received from theother master. All the writes done by the A clients, as well as the B clients, are replicatedand get executed twice, which leaves you in no better position than before. In short, adual-master setup doesn’t help you scale writes, so it is necessary to find some othermeans to scale the system. The only way forward is to remove replication between theservers so that they are completely separate.
With this architecture, it is possible to scale writes by partitioning the data into twocompletely independent sets and directing the clients to the partition that is responsiblefor each item of data the clients attempt to update. This way, no resources need to bedevoted to processing updates for other partitions. Partitioning the data in this manneris usually referred to as sharding (other common names are splintering or horizontalpartitioning) and each partition in this setup is referred to as a shard.
190 | Chapter 7: Data Sharding

Figure 7-1. Pair of masters with bidirectional replication
Why Should You Shard?Depending on where your application is experiencing strain, you have different reasonsto shard. The biggest advantages of sharding, and the most common reasons to shard,are:Placing data geographically close to the user
By placing bulky data such as pictures or videos close to the user, it is possible toreduce latency. This will improve the perceived performance of the system.
Reducing the size of the working setIf the table is smaller, it is possible that a larger part of the table, maybe even theentire table, can fit into main memory. Searching through a table that is entirely inmain memory is very efficient, so splitting a large table into many small tables mayimprove performance drastically. This means that performance can be improvedby sharding tables, even if multiple shards are stored on a single server.
Another aspect that affects performance is that the algorithms that search the tablesare more efficient if the table is smaller. This can give a performance boost evenwhen multiple shards are stored on the same machine. There are, however, technicallimitations and overheads associated with storing multiple shards on a machine, soit is necessary to strike a balance between the number of shards and the size of theshards.
Deciding the optimal size of the tables requires monitoring the performance of theMySQL server and also monitoring InnoDB (or any other storage engine you use)to learn the average number of I/O operations required on average for each rowscanned and to see if you need to make the shards even smaller. You will learn moreabout monitoring the server using the performance schema in Chapter 11 andmonitoring InnoDB in Chapter 12 (especially getting statistics on the buffer pool,as it is important to optimize the size of the shards).
What Is Sharding? | 191

Distributing the workIf the data is sharded, it is possible to parallelize the work, provided that it is simpleenough. This approach is most efficient when the shards are approximately thesame size. So if you shard your database for this reason, you must find a way tobalance the shards as they grow or shrink over time.
It’s worth noting that you do not have to shard all the data in the database. You can shardsome of the big tables, and duplicate the smaller tables on each shard (these are usuallycalled global tables). You can also combine sharding and functional partitioning andshard bulky data such as posts, comments, pictures, and videos, while keeping direc‐tories and user data in an unsharded central store, similar to the deployment shown inFigure 7-2.
Figure 7-2. Shards with a centralized database
Limitations of ShardingSharding can improve performance, but it is not a panacea and comes with its own setof limitations that may or may not affect you. Many of these can be handled, and youwill in this section learn about the limitations and how to handle them.
The challenge is to ensure that all queries give the same result when executed towardthe unsharded database and the sharded database. If your queries access multiple tables(which is usually the case) you have to be careful to ensure that you get the same result
192 | Chapter 7: Data Sharding

for the unsharded database and the sharded database. This means that you have to picka sharding index that ensures that the queries get the same result on a sharded or un‐sharded database.
In some cases, it is not practical or possible to solve the problem using sharding indexes,and it is necessary to rewrite the query (or eliminate it entirely, if possible). Two commonproblems you need to handle are cross-shard joins and AUTO_INCREMENT columns. We’llbriefly cover them in the following sections.
Cross-shard joins
One of the most critical limitations that might affect you are cross-shard joins. Becausethe tables are partitioned, it is not possible to join two tables that belong to differentshards and get the same result as if you executed the query in an unsharded database.
The most common reason for using cross-shard joins is to create reports. This usuallyrequires collecting information from the entire database, so two approaches are gener‐ally used:
• Execute the query in a map-reduce fashion (i.e., send the query to all shards andcollect the result into a single result set).
• Replicate all the shards to a separate reporting server and run the query there.
The advantage of executing the query in a map-reduce fashion is that you can get asnapshot of the live database, but it means that you take resources from the businessapplication that is using the database. If your query is short and you really need to havea result reflecting the current state of the application database, this might be a usefulapproach. It is probably wise to monitor these queries, though, to make sure that theyare not taking up too many resources and impacting application performance.
The second approach, replication, is easier. It’s usually feasible, as well, because mostreporting is done at specific times, is long-running, and does not depend on the currentstate of the database.
Later, in “Mapping the Sharding Key” on page 206, you will see a technique to automaticallydetect cross-shard joins and raise an error when attempts are made to execute suchqueries.
Using AUTO_INCREMENT
It is quite common to use AUTO_INCREMENT to create a unique identifier for a column.However, this fails in a sharded environment because the shards do not synchronizetheir AUTO_INCREMENT identifiers. This means that if you insert a row in one shard, itmight well happen that the same identifier is used on another shard. If you truly wantto generate a unique identifier, there are basically two approaches:
What Is Sharding? | 193

• Generate a unique UUID. The drawback is that the identifier takes 128 bits (16bytes). There is also a slight possibility that the same UUID is picked independently,but it is so small that you can ignore it.
• Use a composite identifier, as in Figure 7-3, where the first part is the shard identifier(see “Mapping the Sharding Key” on page 206) and the second part is a locally gen‐erated identifier (which can be generated using AUTO_INCREMENT). Note that theshard identifier is used when generating the key, so if a row with this identifier ismoved, the original shard identifier has to move with it. You can solve this bymaintaining, in addition to the column with the AUTO_INCREMENT, an extra columncontaining the shard identifier for the shard where the row was created.
Figure 7-3. A composite key
In case you are interested, the probability of a collision can be com‐puted using the equation that solves the Birthday Problem, where dis the number of “days” and n is the number of “people”:
P2(n, d ) = 1 -d !
(d - n) ! d n
Elements of a Sharding SolutionThe way you shard your database is ultimately determined by the queries that usersintend to execute. For instance, it may make sense to shard sales data by year (2012 inone shard, 2013 in another, etc.), but if users run a lot of queries comparing sales in oneDecember to another December, you will force the queries to cross shards. As we notedbefore, cross-shard joins are notoriously difficult to handle, so this would hamper per‐formance and even force users to rewrite their queries.
In this section, we will cover the issues you need to handle in order to build a goodsharding solution. These decide how you can distribute the data, as well as how you canreshard the data in an efficient manner:
• You have to decide how to partition the application data. What tables should besplit? What tables should be available on all shards? What columns are the tablesgoing to be sharded on?
• You have to decide what sharding metadata (information about the shards) youneed and how to manage it. This covers such issues as how to allocate shards to
194 | Chapter 7: Data Sharding


Figure 7-4. Employee schema
High-Level Sharding ArchitectureFigure 7-5 shows the high-level architecture of a sharding solution. Queries come froman application and are received by a broker. The broker decides where to send the query,possibly with the help of a sharding database that keeps track of sharding information.The query is then sent to one or more shards of the application database and executed.The result set from the executions are collected by the broker, possibly post-processed,and then sent back to the application.
Figure 7-5. High-level sharding architecture
196 | Chapter 7: Data Sharding

Partitioning the DataWriting each item of data to a particular server allows you to scale writes efficiently. Butthat’s not sufficient for scalability: efficient data retrieval is also important, and to achievethat, it is necessary to keep associated data together. For this reason, the biggest challengein efficient sharding is to have a good sharding index so that data commonly requestedtogether is on the same shard. As you will see, a sharding index is defined over columnsin multiple tables; typically you use only a single column from each table, but multiplecolumns are also possible. The sharding index will decide what tables will be shardedand how they will be sharded.
After having picked a sharding index, you will end up with something similar toFigure 7-6.
Figure 7-6. Schema with sharded and global tables
Here you can see several tables that have been sharded and where the rows are dis‐tributed over the shards (employees, salaries, and titles). Identical copies of the
Partitioning the Data | 197

global tables (companies and departments) are present on each shard. We’ll cover howto select columns for the sharding index and show how we came up with this particularsolution for our sample schema.
To split the database over shards, you need to pick one or more of the columns for thesharding index and use them to distribute the rows over the shards. Using multiplesharding columns from a single table for the index can be hard to maintain unless theyare used correctly. For this reason, it is usually best to pick a single column in a tableand use that for the sharding index.
Sharding on a column that is a primary key offers significant advantages. The reasonfor this is that the column should have a unique index, so that each value in the columnuniquely identifies the row.
To illustrate the problem of picking a sharding column that does not contain uniquevalues, suppose that you picked the country of an employee as the sharding key. In thiscase, all rows that belong to Sweden (for example) will go to one shard, and all thatbelong to China (for example) will go to another shard. This can be an appealing choicefor sharding the database if reports or updates are often done on a per-country basis.But even though this might work as long as the size of each shard is relatively small, itwill break down once the shards start to grow and need to be split further. At this point,because all rows in a shard will have the same sharding key, it won’t be possible to splitthe shards further when they have grown to the point where they need to be split again.In the end, the shard for Sweden can contain a maximum of 9 million entries, while theshard for China can contain a maximum of 1.3 billion entries, and these shards cannotbe split further. This is a quite unfair distribution, and the server managing China hasto perform more than 100 times better than the server managing Sweden to achieve thesame performance.
If you instead pick the primary key of the table (in this case, the column with the em‐ployee number), you can group the employees any way you like and create partitionsof arbitrary sizes. This will allow you to distribute the rows into shards of roughly thesame size, hence distributing the workload evenly over the servers.
So how should you pick columns for the sharding index for the schema in Figure 7-4?Well, the first question is what tables need to be sharded. A good starting point fordeciding that is to look at the number of rows in the tables as well as the dependenciesbetween the tables.
Table 7-1 shows the number of rows in each table in the employees schema. Now, thenumbers are nothing like what you would see in a real database in need of sharding—the contents of this database easily fit onto a single server—but it serves as a goodexample to demonstrate how to construct a sharded database from an unsharded one.A good candidate table for sharding is employees. Not only is it a big table, but several
198 | Chapter 7: Data Sharding

other tables are dependent on it, and as you will see later, if there are dependenciesbetween tables, there are opportunities for sharding them as well.
The primary key of the employees table is the emp_no column. Because this is the pri‐mary key, sharding on this column will allow you to distribute the rows of the employees table on the shards evenly and split the tables as you need.
So if we shard on the emp_no column in the employees table, how does that affect thetables that are dependent on employees? Because there is a foreign key reference to theemployees table, this suggests that the intention is to support joining the tables on thatcolumn. Take a look at this query, which could be a typical query for fetching the titleand salary of an employee:
SELECT first_name, last_name, title FROM titles JOIN employees USING (emp_no)WHERE emp_no = employee number AND CURRENT_DATE BETWEEN from_date AND to_date
As previously mentioned, the goal is to make sure the query returns the same result inboth the sharded and unsharded databases. Because employees is sharded on columnemp_no, this query can never reference rows in titles and employees that are on dif‐ferent shards. So after sharding employees, all rows in titles that have an emp_no thatis not in the employees shard you use will never be referenced. To fix this, titles shouldbe sharded on column emp_no as well. The same reasoning holds for all tables that havea foreign key reference into the employees table, so employees, titles, salaries,emp_dep, and dept_manager need to be sharded. In short, even though you picked asingle column to start with, you will shard several tables, each on a column that is relatedto your original sharding of the employees table.
Now that we have sharded almost all the tables in the schema, only the departmentstable remains. Can this also be sharded? The table is so small that it is not necessary toshard it, but what would be the consequence if it was sharded? As noted before, itdepends on the queries used to retrieve information from the database, but becausedept_manager and dept_emp are used to connect departments and employees, it is astrong hint that the schema is designed to execute queries joining these tables. Forexample, consider this query to get the name and department for an employee:
SELECT first_name, last_name, dept_nameFROM employees JOIN dept_emp USING (emp_no) JOIN departments USING (dept_no)WHERE emp_no = employee number
This query puts more stress on your sharding choices than the previous SELECT, becauseit is not dealing with a single column shared by two tables (the primary key of theemployees table) but with two columns that can range anywhere throughout the threetables involved. So how can you ensure that this query returns all the results from asharded database as it would in the unsharded one? Because the employees table is
Partitioning the Data | 199

sharded on the emp_no column, every row where dept_emp.emp_no = employ
ees.emp_no and dept_emp.dept_no = departments.dept_no has to be in the sameshard. If they are in different shards, no rows will match, and the query will return anempty result.
Because employees in the same department can reside on different shards, it is betternot to shard the departments table, but instead to keep it available on all shards as aglobal table. Duplicating a table on multiple shards makes updating the tables a littlemore complicated (this will be covered later) but because the departments table is notexpected to change frequently, this is likely to be a good trade-off.
Automatically Computing Possible Sharding IndexesAs this section has shown, even when you pick a single sharding key, you need to shardall tables that depend on the table that you picked for sharding. Sharding a single tableon one of its columns can force you to shard other tables on the related column. Forexample, because the emp_no column in the employees table is related to the emp_nocolumn in the salaries table, sharding the employees table will allow the salariestable to also be sharded on the same column.
For small schemas, it is easy to follow the foreign key relations, but if you have a schemawith many tables and many relations, it is not as easy to find all the dependencies. If youare careful about using foreign keys to define all your dependencies, you can computeall the possible sharding indexes of dependent columns by using the information schemaavailable in MySQL. The query to find all sets of dependent columns is:
USE information_schema;SELECT GROUP_CONCAT( CONCAT_WS('.', table_schema, table_name, column_name) ) AS indexesFROM key_column_usage JOIN table_constraints USING (table_schema, table_name, constraint_name)WHERE constraint_type = 'FOREIGN KEY'GROUP BY referenced_table_schema, referenced_table_name, referenced_column_nameORDER BY table_schema, table_name, column_name;
If you run this query on the employees schema, the result is two possible shardingindexes:
200 | Chapter 7: Data Sharding

Candidate #1 Candidate #2
salaries.emp_no dept_manager.dept_no
dept_manager.emp_no dept_emp.dept_no
dept_emp.emp_no
titles.emp_no
A single query can compute this because each foreign key has to reference a primarykey in the target table. This means that there will be no further references that have tobe followed, as would be the case if a foreign key could refer to another foreign key.
By counting the number of rows in the tables, you can get an idea of what index wouldgive the best sharding. You can also see that dept_manager and dept_emp are in bothalternatives, so these are conflicting and you can use only one of them.
Usually, you have only one big set of tables that need to be sharded, as in the exampleschema in Figure 7-4. In other cases, however, you have several “sets” of tables that youwant to shard independently. For example, assume that, in addition to the employees ofthe company, you want to keep track of all the publications of each department. Therelation between employees and publications is a many-to-many relationship, which inclassic database schema design is created by a junction table with foreign keys pointingto the employees and publications tables. So tracking publications requires, in additionto the schema shown earlier, a publications table and a dept_pub table to be added tothe schema, as in Figure 7-7.
Figure 7-7. Publication schema added to employees schema
If the publications table is so large that it needs to be sharded as well, you can do so.If you look carefully in Figure 7-7, you’ll see that the departments table is still availableon all nodes, and there are foreign key references from dept_pub to publications anddepartments. This means that you can shard the publications and dept_pub tables,leading to a system where you have multiple independent sharding indexes.
What are the consequences of multiple independent sharding indexes? A single querycan contain references to tables in one of the sets in Table 7-2 plus global tables, but it
Partitioning the Data | 201


shard frequently (to reflect changes in the application or other reasons), a singleshard per server can be a performance bottleneck, so there is always a trade-offbetween having to adapt the application and getting the performance you need.
If you need to re-shard frequently, having multiple shards on each server can bepart of a solution. This allow you to move shards between servers to balance theload. However, you might still have to split shards if a single shard grows too hot.
How can you back up a shard?Apart from being able to easily back up a single shard at a time, you also need to beable to easily create backups to move shards between servers. Most backup methodscan create a backup of an entire server, or one or more schemas. For that reason, itis prudent to ensure that a schema is entirely in a shard (but there can be multipleschemas in each shard).
Single shard per server
The most straightforward approach is to keep a single shard on each server. This allowscross-schema queries, so it is not necessary to rewrite queries. There are two drawbacksto this approach: multiple tables may exceed the size of main memory on the server,which affects performance, and balancing the load between servers becomes more ex‐pensive in case you need to re-shard the tables.
As mentioned earlier, one of the goals of sharding a database is to reduce the size of thetables so that it can fit into memory. Smaller tables take less time to search, both becausethey contain fewer rows and because more of each table can fit in memory.
If the server becomes overloaded and it is necessary to reduce the load, this principlesuggests the solution: split the shard and either create a new shard using a spare server,or move the now extraneous rows to another shard and merge them with the rows there.If the rows are moved to an existing shard, and there is just one shard per server, therows have to be merged with the rows already on that shard. Because merging is verydifficult to do as an online operation, splitting and remerging is expensive when onlyone shard is allowed per server. In the next section, we will consider how to avoid havingto merge shards when moving them.
Multiple shards per server (virtual shards)
As we’ve explained, if you can keep multiple shards on a single machine, the data canbe moved between machines in a more efficient manner because the data is alreadysharded. This offers some flexibility to move shards around to balance the load on themachines, but if you do that, you need to be able to distinguish between the shards thatcoexist on the same server. For example, you need to be able to distinguish table employees.dept_emp in shard 123 from employees.dept_emp in shard 234 even if theyare on the same machine.
Partitioning the Data | 203

2. Many backup techniques can handle individual tables as well, but it is more complicated to manage backupand restore of individual tables. Using databases to structure the database makes the job of managing backupseasier.
A common approach is to attach the shard identifier to the name of the schema. Forexample, the schema employees in shard 123 would then be named employees_123 anda partition of each table is placed in each schema (e.g., the dept_emp table consists ofemployees_1.dept_emp, employees_2.dept_emp, … employees_N.dept_emp).
Because the MySQL server stores each schema in its own directory, most backup meth‐ods can make backups of schemas but have problems backing up individual tables.2 Theapproach just shown separates the tables for different shards into different directories,making it easy to take backups of shards (something that you will need later). Becauseyou can limit replicate-do-db to specific schemas on a server, you can replicatechanges to the individual shards as well, which will prove useful when you move shardsbetween servers.
Keeping multiple shards on each server makes it comparably easy to move one ofthe shards to another server to reduce the load on the server. Because you can havemultiple shards on each server, you can even move the shard to a server that alreadyhas other shards, without having to merge the rows of the shards. Note that this approachis not a replacement for re-sharding, because you need to have techniques in place tosplit a shard anyway.
In addition to adding the schema names with the shard identifier, you can add the shardidentifier to the name of the table. So, with this approach, the names would be employees_123.dept_emp_123, employees_124.dept_emp_124, and so on. Although the shardnumber on the table seems redundant, it can be useful for catching problems where theapplication code mistakenly queries the wrong shard.
The drawback of adding the shard number to the schema names and/or the tables isthat users need to rewrite their queries. If all your queries always go to a single schema,never executing cross-schema queries, it is easy to issue USE employee_identifierbefore sending the query to the server and keep the old table names. But if cross-schemaqueries are allowed, it is necessary to rewrite the query to locate all the schema namesand append the shard identifier to each.
Inserting specific table numbers into queries can be quite error-prone, so if you can,generalize the query and automate the insertion of the right table number. For example,you can use braces to wrap the number in the schema name, and then use a regularexpression to match and replace the schema and table name with the schema and tablename for the shard in question. Example PHP code is shown in Example 7-1.
204 | Chapter 7: Data Sharding

Example 7-1. Replacing table references in queriesclass my_mysqli extends mysqli { public $shard_id;
private function do_replace($query) { return preg_replace(array('/\{(\w+)\.(\w+)\}/', '/\{(\w+)\}/'), array("$1_{$this->shard_id}.$2", "$1"), $query); }
public function __construct($shard_id, $host, $user, $pass, $db, $port) { parent::__construct($host, $user, $pass, "{$db}_{$shard_id}", $port); $this->shard_id = $shard_id; }
public function prepare($query) { return parent::prepare($this->do_replace($query)); }
public function query($query, $resultmode = MYSQLI_STORE_RESULT) { return parent::query($this->do_replace($query), $resultmode); }}
The code creates a subclass of mysqli, overriding the prepare and query functions withspecialized versions that rewrite the names of the databases. Then the original functionis called, passing the correct database name to connect to. Because there are no changesto the mysqli interface, no changes are normally necessary in the application code. Anexample using the class is:
if ($result = $mysqli->query("SELECT * FROM {test.t1}")) { while ($row = $result->fetch_object()) print_r($row); $result->close();}else { echo "Error: " . $mysql->error;}
However, this works only if the application writers are willing (and able) to add thismarkup to the queries. It is also error-prone because application writers can forget toadd the markup.
Partitioning the Data | 205

Mapping the Sharding KeyIn the previous section, you saw how the choice of sharding column decides what tablesneed to be sharded. You also saw how to partition a table by range. In this section,partition functions will be discussed in more depth: you will see what sharding meta-data is needed to compute the right shards as well as how to map the rows of a shardedtable to actual shards.
As explained earlier in the chapter, the goal of mapping the sharding key is to create apartition function that accepts a sharding key value and outputs a shard identifier forthe shard where the row exists. As also noted earlier, there can be several sharding keys,but in that case, we create a separate partition function for each sharding key. For thediscussions in this section, we assume that each shard has a unique shard identifier,which is just an integer and can be used to identify each database or table as shown inthe previous section.
You saw in “Partitioning the Data” on page 197 that each partition function is associatedwith several columns if there are foreign keys relationships between the tables. So whenyou have a sharding key value you want to map (e.g., “20156”) it does not matter whetherit was the employees.emp_no column or the dept_emp.emp_no column: both tables aresharded the same way. This means that when talking about mapping a sharding keyvalue to a shard, the columns are implicitly given by the partition function and it issufficient to provide the key.
Sharding SchemeThe partition function can be implemented using either a static sharding scheme or adynamic sharding scheme (as the names suggest, the schemes just tell whether thesharding can change or is fixed):Static sharding
In a static sharding scheme, the sharding key is mapped to a shard identifier usinga fixed assignment that never changes. The computation of the shard identifier isusually done in the connector or in the application, which means that it can be donevery efficiently.
For example, you could use range-based assignment, such as making the first shardresponsible for users 0 through 9,999, the second shard responsible for users 10,000through 19,999, and so on. Or you could scatter users semirandomly through ahash based on the value of the last four digits of the identifier.
Dynamic sharding schemesIn a dynamic sharding scheme, the sharding key is looked up in a dictionary thatindicates which shard contains the data. This scheme is more flexible than a staticscheme, but requires a centralized store called the sharding database in this chapter.
206 | Chapter 7: Data Sharding


figure out what service instance to contact by joining with the locations table. We’lllook at the sharding types later.
Example 7-4. Tables used for dynamic shardingCREATE TABLE locations ( shard_id INT AUTO_INCREMENT, host VARCHAR(64), port INT UNSIGNED DEFAULT 3306, PRIMARY KEY (shard_id));
CREATE TABLE partition_functions ( func_id INT AUTO_INCREMENT, sharding_type ENUM('RANGE','HASH','LIST'), PRIMARY KEY (func_id));
Now we’ll change the static implementation of the Dictionary class from Example 7-2to use the tables in Example 7-4. In Example 7-5, the class now fetches the shard infor‐mation from a sharding database instead of looking it up statically. It uses the informa‐tion returned to create a connection as before. As you can see, the query for fetchingthe shard information is not filled in. This is dependent on how the mapping is designedand is what we’ll discuss next.
Example 7-5. Implementation of dictionary for dynamic sharding$FETCH_SHARD = <<<END_OF_QUERYquery to fetch sharding keyEND_OF_QUERY;
class Dictionary { private $server;
public function __construct($host, $user, $pass, $port = 3306) { $mysqli = new mysqli($host, $user, $pass, 'sharding', $port); $this->server = $mysqli; }
public function get_connection($key, $user, $pass, $db, $tables) { global $FETCH_SHARD; if ($stmt = $this->server->prepare($FETCH_SHARD)){ $stmt->bind_param('i', $key); $stmt->execute(); $stmt->bind_result($no, $host, $port); if ($stmt->fetch()) { $link = new my_mysqli($no, $host, $user, $pass, $db, $port); $link->shard_id = $no; return $link; } } return null;
Mapping the Sharding Key | 209

}}
Shard Mapping FunctionsOur sharding database in Example 7-4 showed three different sharding types in thepartition_function table. Each partition type, described in the online MySQL docu‐mentation, uses a different kind of mapping between the data in the sharded columnand the shards themselves. Our table includes the three most interesting ones:List mapping
Rows are distributed over the shards based on a set of distinct values in the shardingcolumn. For example, the list could be a list of countries.
Range mappingRows are distributed over the shards based on where the sharding column fallswithin a range. This can be convenient when you shard on an ID column, dates, orother information that falls conveniently into ranges.
Hash mappingRows are distributed over the shards based on a hash value of the sharding keyvalue. This theoretically provides the most even distribution of data over shards.
Of these mappings, the list mapping is the easiest to implement, but is the most difficultto use when you want to distribute the load efficiently. It can be useful when you shardfor locality, because it can ensure that each shard is located close to its users. The rangepartitioning is easy to implement and eliminates some of the problems with distributingthe load, but it can still be difficult to distribute the load evenly over the shards. Thehash mapping is the one that distributes the load best over the shards of all three, but itis also the most complicated to implement in an efficient manner, as you will see in thefollowing sections. The most important mappings are the range mapping and the hashmapping, so let’s concentrate on those.
For each shard mapping, we will consider both how to add a new shard and how toselect the correct shard based on the sharding key chosen.
Range mapping
The most straightforward approach to range mapping is to separate the rows of a tableinto ranges based on the sharding column and to assign one shard for each range. Eventhough ranges are easy to implement, they have the problem of potentially becomingvery fragmented. This solution also calls for a data type that supports ranges efficiently,which you are not always lucky to have. For example, if you are using URIs as keys, “hot”sites will be clustered together when you actually want the opposite, to spread them out.To get a good distribution in that case, you should use a hash mapping, which we coverin “Hash mapping and consistent hashing” on page 212.
210 | Chapter 7: Data Sharding


Fetching the shard. After defining and populating this table, you can fetch the shardnumber, hostname, and port for the shard using the following query, to be used inExample 7-5:
SELECT shard_id, hostname, port FROM ranges JOIN locations USING (shard_id) WHERE func_id = 0 AND ? >= ranges.lower_boundORDER BY ranges.lower_bound DESCLIMIT 1;
The query fetches all rows that have a lower bound below the key provided, orders themby lower bound, and then takes the first one. Note that the code in Example 7-5 preparesthe query before executing it, so the question mark in the query will be replaced withthe sharding key in use. Another option would be to store both the lower and upperbound, but that makes it more complicated to update the sharding database if the num‐ber of shards or the ranges for the shards should change.
Hash mapping and consistent hashing
One of the issues you might run into when using a range mapping is that you do notget a good distribution of the “hot” clusters of data, which means that one shard canbecome overloaded and you have to split it a lot to be able to cope with the increase inload. If you instead use a function that distributes the data points evenly over the range,the load will also be distributed evenly over the shards. A hash function takes someinput and computes a number from it called the hash. A good hash function distributesthe input as evenly as possible, so that a small change in the input string still generatesa very different output number. You saw one very common hash function inExample 7-2, where modulo arithmetic was used to get the number of the shard.
The naïve hash function in common use computes a hash of the input in some manner(e.g., using MD5 or SHA-1 or even some simpler functions) and then uses moduloarithmetic to get a number between 1 and the number of shards. This approach doesnot work well when you need to re-shard to, for example, add a new shard. In this case,you can potentially move a lot of rows between the shards, because computing themodulo of the hashed string can potentially move all the elements to a new shard. Toavoid this problem, you can instead use consistent hashing, which is guaranteed to moverows from just one old shard to the new shard.
To understand how this is possible, look at Figure 7-8. The entire hash range (the outputof the hash function) is shown as a ring. On the hash ring, the shards are assigned topoints on the ring using the hash function (we’ll show you how to do this later). In asimilar manner, the rows (here represented as the red dots) are distributed over the ringusing the same hash function. Each shard is now responsible for the region of the ringthat starts at the shard’s point on the ring and continues to the next shard point. Becausea region may start at the end of the hash range and wrap around to the beginning of the
212 | Chapter 7: Data Sharding

hash range, a ring is used here instead of a flat line. But this cannot happen when usingthe regular hash function shown earlier, as each shard has a slot on the line and thereis no slot that wraps around from the end to the beginning of the range.
Figure 7-8. Hash ring used for consistent hashing
Now suppose that a new shard is added to the ring, say shard-5 in the figure. It will beassigned to a position on the ring. Here it happens to split shard-2, but it could havebeen either of the existing shards. Because it splits shard-2, only the circled rows fromthe old shard-2 will have to be moved to shard-5. This means that the new shard willjust take over the rows that are in one shard and move them to the new shard, whichimproves performance significantly.
So, how do you implement this consistent hashing? Well, the first thing that you needis a good hash function, which will generate values on the hash ring. It must have a verybig range, hence a lot of “points” on the hash ring where rows can be assigned. A goodset of hash functions having the needed properties comes from cryptography.
Cryptography uses hash functions to create “signatures” of messages to detect tamper‐ing. These functions take as input an arbitrary string, and produce a number as output.Cryptography requires a number of complex mathematical properties from its hashfunctions, but for our purpose, the two most important properties are to provide a hashvalue containing a large number of bits and to distribute the input strings evenly overthe output range. Cryptographic hash functions have these properties, so they are agood choice for us.
The most commonly used functions are MD5 and the SHA family of hash functions(i.e., SHA-1, SHA-256/224, and SHA-512/384). Table 7-4 shows the most common hashfunctions and the number of bits in the numbers they produce. These functions aredesigned to be fast and accept any string as input, which makes them perfect for com‐puting a hash of arbitrary values.
Mapping the Sharding Key | 213


update statement. Detecting whether the statement is sent to the right shard can be moretricky. If you rewrite your queries as shown in Example 7-2, you will automatically getan error when you access the wrong shard because the schema name will be wrong. Ifyou do not rewrite the queries, you have to tailor some assert-like functionality to ensurethat the query is executed on the correct shard.
To detect whether a transaction is in progress, the response packet of the MySQL Pro‐tocol contains two flags: SERVER_STATUS_IN_TRANS and SERVER_STATUS_AUTOCOMMIT.The first flag is true if a transaction has been started explicitly using START TRANSACTION, but will not be set when AUTOCOMMIT=0. The flag SERVER_STATUS_AUTOCOMMIT isset if autocommit is on, and is clear otherwise. By combining these two flags, it is possibleto see whether a statement is part of a transaction and the next statement should be sentto the same connection. There is currently no support in the MySQL connectors tocheck these flags, so currently you have to track transaction-starting statements and theautocommit flag in the broker.
Handling the fourth issue (detecting whether a new transaction has started) would beeasy if there were a server flag in the response packet that told you if a new transactionhad started. Unfortunately, this is currently not available in the server, so you just haveto monitor queries as they come in and recognize those that start a new transaction.Remember that some statements cause an implicit commit, so make sure to includethem if you want a generic solution.
Dispatching QueriesAs explained in the discussion in “Handling Transactions” on page 216, handling trans‐actions in a sharded environment is far from transparent, and applications have to takeinto account that they are working with a sharded database. For this reason, the goal forthe sample implementation demonstrated in this chapter is not to make query dispatchtransparent, but rather to make it easy to use for the application developer.
Most of the discussion in this section applies both when using a proxy as a broker andwhen placing the broker close to the application, such as if you implement the brokerin a PHP program on the application server. For the purposes of illustration, we’ll as‐sume a PHP implementation in this section. Let’s continue with the model introducedin Example 7-2 through Example 7-5, and implement a dynamic sharding scheme forrange sharding.
So what kind of information can you reasonably ask the application developer to pro‐vide? As you saw previously, it is necessary to provide the sharding key one way or theother. A typical range mapping, such as shown in Table 7-3, allows you to fetch the shard identifier only if you also provide the function identifier of the function used toshard the tables used in the query. It’s unreasonable to expect the application developerto know the function identifier that is needed for the query, and doing so would not bevery robust either because the partition functions might change. However, because each
218 | Chapter 7: Data Sharding


Moving a shard from one node (the source node) to another node (the target node)without any downtime at all is not possible, but it is possible to keep the downtime toa minimum. The technique is similar to the description in Chapter 3 of creating a slave.The idea is to make a backup of the shard, restore it on the target node, and use repli‐cation to re-execute any changes that happened in between. This is what you’ll need todo:
1. Create a backup of the schemas on the source node that you want to move. Bothonline and offline backup methods can be used.
2. Each backup, as you could see in earlier chapters, backs up data to a particular pointin the binary log. Write this log position down.
3. Bring the target node down by stopping the server.4. While the server is down:
a. Set the option replicate-do-db in the configuration file to replicate only theshard that you want to move:
[mysqld]replicate-do-db=shard_123
b. If you have to restore the backup from the source node while the server is down,do that at this time.
5. Bring the server up again.6. Configure replication to start reading from the position that you noted in step 2
and start replication on the target server. This will read events from the source serverand apply any changes to the shard that you are moving.Plan to have excess capacity on the target node so that you can temporarily handlean increase in the number of writes on it.
7. When the target node is sufficiently close to the source node, lock the shard’s schemaon the source node in order to stop changes. It is not necessary to stop changes tothe shard on the target node, because no writes will go there yet.The easiest way to handle that is to issue LOCK TABLES and lock all the tables in theshard, but other schemes are possible, including just removing the tables (e.g., ifthe application can handle a table that disappears, as outlined next, this is a possiblealternative).
8. Check the log position on the source server. Because the shard is not being updatedanymore, this will be the highest log position you need to restore.
9. Wait for the target server to catch up to this position, such as by using START SLAVEUNTIL and MASTER_POS_WAIT.
10. Turn off replication on the target server by issuing RESET SLAVE. This will removeall replication information, including master.info, relay-log.info, and all relay log‐
Shard Management | 221

files. If you added any replication options to the my.cnf file to configure replication,you have to remove them, preferably in the next step.
11. Optionally bring the target server down, remove the replicate-do-db from themy.cnf file for the target server, and bring the server up again.This step is not strictly necessary, because the replicate-do-db option is used onlyto move shards and does not affect the functioning of the shard after the shard hasbeen moved. When the time comes to move a shard here again, you have to changethe option at that time anyway.
12. Update the shard information so that update requests are directed to the new lo‐cation of the shard.
13. Unlock the schema to restart writes to the shard.14. Drop the shard schema from the source server. Depending on how the shard is
locked, there might still be readers of the shard at this point, so you have to takethat into consideration.
Whew! That took quite a few steps. Fortunately, they can be automated using the MySQLReplicant library. The details for each individual step vary depending on how the ap‐plication is implemented.
Various backup techniques are covered in Chapter 15, so we won’t list them here. Notethat when designing a solution, you don’t want to tie the procedure to any specificbackup method, because it might later turn out that other ways of creating the backupare more suitable.
To implement the backup procedure just described, it is necessary to bring the shardoffline, which means that it is necessary to prevent updates to the shard. You can do thiseither by locking the shard in the application or by locking tables in the schema.
Implementing locking in the application requires coordination of all requests so thatthere are no known conflicts, and because web applications are inherently distributed,lock management can become quite complicated very quickly.
In our case, we simplify the situation by locking a single table—the locations table—instead of spreading out the locks among the various tables accessed by many clients.Basically, all lookups for shard locations go through the locations table, so a singlelock on this table ensures that no new updates to any shard will be started while weperform the move and remap the shards. It is possible that there are updates in pro‐gress that either have started to update the shard or are just about to start updating theshard. So you should also lock the entire server using READ_ONLY. Any updates about tostart will be locked out and be given an error message. Updates in progress will beallowed to finish (or might be killed after a timeout). When the lock on the shard isreleased, the shard will be gone, so the statements doing the update will fail and willhave to be redone on the new shard.
222 | Chapter 7: Data Sharding

Example 7-8 automates the procedures just described. You can also use the Replicantlibrary to do it.
Example 7-8. Procedure for moving a shard between nodes_UPDATE_SHARD_MAP = """UPDATE locations SET host = %s, port = %d WHERE shard_id = %d"""
def lock_shard(server, shard): server.use("common") server.sql("BEGIN") server.sql(("SELECT host, port, sock" " FROM locations" " WHERE shard_id = %d FOR UPDATE"), (shard,))
def unlock_shard(server): server.sql("COMMIT")
def move_shard(common, shard, source, target, backup_method): backup_pos = backup_method.backup_to() config = target.fetch_config() config.set('replicate-do-db', shard) target.stop().replace_config(config).start() replicant.change_master(target, source, backup_pos) replicant.slave_start(target)
# Wait until slave is at most 10 seconds behind master replicant.slave_status_wait_until(target, 'Seconds_Behind_Master', lambda x: x < 10) lock_shard(common, shard) pos = replicant.fetch_master_pos(source) replicant.slave_wait_for_pos(target, pos) source.sql("SET GLOBAL READ_ONLY = 1") kill_connections(source) common.sql(_UPDATE_SHARD_MAP, (target.host, target.port, target.socket, shard)) unlock_shard(common, shard) source.sql("DROP DATABASE shard_%s", (shard)) source.sql("SET GLOBAL READ_ONLY = 1")
As described earlier, you have to keep in mind that even though the table is locked, someclient sessions may be using the table because they have retrieved the node location butare not yet connected to it, or alternatively may have started updating the shard.
The application code has to take this into account. The easiest solution is to have theapplication recompute the node if the query to the shard fails. Example 7-9 shows the
Shard Management | 223


Splitting ShardsWhen a host becomes too loaded, you can move one of the shards on the host to anotherserver, but what do you do when the shard becomes too hot? The answer is: you splitit.
Splitting a shard into multiple smaller shards can be very expensive, but the downtimecan be kept to a minimum if done carefully. Assume that you need to split a shard andmove half of the contents of the shard to a new node. Here’s a step-by-step explanation:
1. Take a backup of all the schemas in the shard. If you use an online backup method,such as MEB, XtraDB, or filesystem snapshots, the shard can be kept online whilethe backup is taken.
2. Write down the binary log position that this backup corresponds to.3. Restore the backup from step 1 on the destination node.4. Start replication from the source node to the destination node. If you want to avoid
copying more changes than necessary, you can use binlog-do-db or replication-do-db to just replicate changes for the schemas that you moved. At this point, allrequests still go to the original shard and the new shard is “dark” and not visible.
5. Wait until replication has caught up and the destination is close enough to thesource. Then lock the source shard so that neither reads nor writes are possible.
6. Wait until the destination host is fully up to date with the source. During this step,all data in the shard will be unavailable.
7. Update the sharding database so that all requests for data in the new shard go tothe new shard.
8. Unlock the source shard. At this point, all data is available, but there is too muchdata on both the source and destination shards. This data is, however, not part ofthe new shard data and queries sent to the server will not access this data.
9. Start two jobs in parallel that remove the superfluous rows on each shard using anormal DELETE. To avoid a large impact on performance, you can remove just a fewrows at a time by adding a LIMIT.
ConclusionThis chapter presented techniques for increasing the throughput of your applicationsby scaling out, whereby we introduced more servers to handle more requests for data.We presented ways to set up MySQL for scaling out using replication and gave practicalexamples of some of the concepts. In the next chapter, we will look at some more ad‐vanced replication concepts.
Conclusion | 225

Joel felt pretty good. He had delivered his first company white paper to Mr. Summersonearlier in the day. He knew the response would come soon. While his boss was a bit onthe “hyper alpha boss” high end, he could count on his work being reviewed promptly.A little while later, on his way to the break room, Joel met his boss in the hall. “I likedyour paper on scaling, Joel. You can get started on that right away; we’ve got some extraservers lying around downstairs.” “Right away,” Joel said with a smile as his boss movedon to deliver another drive-by tasking.
226 | Chapter 7: Data Sharding

CHAPTER 8
Replication Deep Dive
A knock on his door drew Joel’s attention away from reading his email. He wasn’t sur‐prised to see Mr. Summerson standing in his doorway.
“Yes, sir?”
“I am getting a little concerned about all this replication stuff we’ve got now. I’d like youto do some research into what we need to do to improve our knowledge of how it allworks. I want you to put together a document explaining not only the current config‐uration, but also troubleshooting ideas with specific details on what to do when thingsgo wrong and what makes it tick.”
Joel was expecting such a task. He, too, was starting to be concerned that he needed toknow more about replication. “I’ll get right on it, sir.”
“Great. Take your time on this one. I want to get it right.”
Joel nodded as his boss walked away. He sighed and gathered his favorite MySQL bookstogether. He needed to do some reading on the finer points of replication.
Previous chapters introduced the basics of configuring and deploying replication tokeep your site up and available, but to understand replication’s potential pitfalls andhow to use it effectively, you should know something about its operation and the kindsof information it uses to accomplish its tasks. This is the goal of this chapter. We willcover a lot of ground, including:
• How to promote slaves to masters more robustly• Tips for avoiding corrupted databases after a crash• Multisource replication• Row-based replication
227

• Global transaction identifiers• Multithreaded replication
Replication Architecture BasicsChapter 4 discussed the binary log along with some of the tools that are available toinvestigate the events it records. But we didn’t describe how events make it over to theslave and get re-executed there. Once you understand these details, you can exert morecontrol over replication, prevent it from causing corruption after a crash, and investigateproblems by examining the logs.
Figure 8-1 shows a schematic illustration of the internal replication architecture, con‐sisting of the clients connected to the master, the master itself, and several slaves. Foreach client that connects to the master, the server runs a session that is responsible forexecuting all SQL statements and sending results back to the client.
The events flow through the replication system from the master to the slaves in thefollowing manner:
1. The session accepts a statement from the client, executes the statement, and syn‐chronizes with other sessions to ensure each transaction is executed without con‐flicting with other changes made by other sessions.
2. Just before the statement finishes execution, an entry consisting of one or moreevents is written to the binary log. This process is covered in Chapter 3 and will notbe described again in this chapter.
3. After the events have been written to the binary log, a dump thread in the mastertakes over, reads the events from the binary log, and sends them over to the slave’sI/O thread.
4. When the slave I/O thread receives the event, it writes it to the end of the relay log.5. Once in the relay log, a slave SQL thread reads the event from the relay log and
executes the event to apply the changes to the database on the slave.
If the connection to the master is lost, the slave I/O thread will try to reconnect to theserver in the same way that any MySQL client thread does. Some of the options thatwe’ll see in this chapter deal with reconnection attempts.
228 | Chapter 8: Replication Deep Dive

Figure 8-1. Master and several slaves with internal architecture
The Structure of the Relay LogAs the previous section showed, the relay log is the information that ties the master andslave together—the heart of replication. It’s important to be aware of how it is used andhow the slave threads coordinate through it. Therefore, we’ll go through the details hereof how the relay log is structured and how the slave threads use the relay log to handlereplication.
Replication Architecture Basics | 229

As described in the previous section, the events sent from the master are stored in therelay log by the I/O thread. The relay log serves as a buffer so that the master does nothave to wait for the slave execution to finish before sending the next event.
Figure 8-2 shows a schematic view of the relay log. It’s similar in structure to the binlogon the master but has some extra files.
Figure 8-2. Structure of the relay log
In addition to the content files and the index files in the binary log, the relay log main‐tains two files to keep track of replication progress: the relay log information file and themaster log information file. The names of these two files are controlled by two optionsin the my.cnf file:relay-log-info-file=filename
This option sets the name of the relay log information file. It is also available as theread-only server variable relay_log_info_file. Unless an absolute filename isgiven, the filename is relative to the data directory of the server. The default filenameis relay-log.info.
master-info-file=filename
This option sets the name of the master log information file. The default filenameis master.info.
230 | Chapter 8: Replication Deep Dive

The information in the master.info file takes precedence over infor‐mation in the my.cnf file. This means that if you change informa‐tion in the my.cnf file and restart the server, the information will stillbe read from the master.info file instead of from the my.cnf file.For this reason, we recommend not to put any of the options thatcan be specified with the CHANGE MASTER TO command in the my.cnffile, but instead to use the CHANGE MASTER TO command to config‐ure replication. If, for some reason, you want to put any of the rep‐lication options in the my.cnf file and you want to make sure that theoptions are read from it when starting the slave, you have to issueRESET SLAVE before editing the my.cnf file.Beware when executing RESET SLAVE! It will delete the master.infofile, the relay-log.info file, and all the relay logfiles!
For convenience, we will use the default names of the information files in the discussionthat follows.
The master.info file contains the master read position as well as all the informationnecessary to connect to the master and start replication. When the slave I/O threadstarts up, it reads information from this file, if it is available.
Example 8-1 shows a short example of a master.info file. We’ve added a line numberbefore each line and an annotation in italics at the end of each line (the file itself cannotcontain comments). If the server is not compiled with SSL support, lines 9 through 15—which contain all the SSL options—will be missing. Example 8-1 shows what theseoptions look like when SSL is compiled. The SSL fields are covered later in the chapter.
The password is written unencrypted in the master.info file. For thatreason, it is critical to protect the file so it can be read only by theMySQL server. The standard way to ensure this is to define adedicated user on the server to run the server, assign all the filesresponsible for replication and database maintenance to this user,and remove all permissions from the files except read and write bythis user.
Example 8-1. Contents of the master.info file (MySQL version 5.6.12) 1 23 Number of lines in the file 2 master-bin.000001 Current binlog file being read (Master_Log_File) 3 151 Last binlog position read (Read_Master_Log_Pos) 4 localhost Master host connected to (Master_Host) 5 root Replication user (Master_User) 6 Replication password 7 13000 Master port used (Master_Port)
Replication Architecture Basics | 231

8 60 Number of times slave will try to reconnect (Connect_Retry) 9 0 1 if SSL is enabled, otherwise 010 SSL Certification Authority (CA)11 SSL CA Path12 SSL Certificate13 SSL Cipher14 SSL Key15 0 SSL Verify Server Certificate 16 60.000 Heartbeat 17 Bind Address 18 0 Ignore Server IDs 19 Master UUID 8c6d027e-cf38-11e2-84c7-0021cc6850ca20 10 Retry Count 21 SSL CRL 22 SSL CRL Path 23 0 Auto Position
If you have an old server, the format can be slightly different.
In MySQL versions earlier than 4.1, the first line did not appear. Developers added aline count to the file in version 4.1.1 so they could extend the file with new fields anddetect which fields are supported by just checking the line count.
Version 5.1.16 introduced line 15, SSL Verify Server Certificate, and the lines after thatwere introduced in different versions of 5.6.
The relay-log.info file tracks the progress of replication and is updated by the SQL thread.Example 8-2 shows a sample excerpt of a relay-log.info file. These lines correspond tothe beginning of the next event to execute.
Example 8-2. Contents of the relay-log.info file./slave-relay-bin.000003 Relay log file (Relay_Log_File)380 Relay log position (Relay_Log_Pos)master1-bin.000001 Master log file (Relay_Master_Log_File)234 Master log position (Exec_Master_Log_Pos)
If any of the files are not available, they will be created from information in the my.cnffile and the options given to the CHANGE MASTER TO command when the slave is started.
It is not enough to just configure a slave using my.cnf and execute aCHANGE MASTER TO statement. The relay logfiles, the master.info file,and the relay-log.info file are not created until you issue START SLAVE.
232 | Chapter 8: Replication Deep Dive

The Replication ThreadsAs you saw earlier in the chapter, replication requires several specialized threads onboth the master and the slave. The dump thread on the master handles the master’s endof replication. Two slave threads—the I/O thread and the SQL thread—handle repli‐cation on the slave.Master dump thread
This thread is created on the master when a slave I/O thread connects. The dumpthread is responsible for reading entries from the binlog on the master and sendingthem to the slave.
There is one dump thread per connected slave.
Slave I/O threadThis thread connects to the master to request a dump of all the changes that occurand writes them to the relay log for further processing by the SQL thread.
There is one I/O thread on each slave. Once the connection is established, it is keptopen so that any changes on the master are immediately received by the slave.
Slave SQL threadThis thread reads changes from the relay log and applies them to the slave database.The thread is responsible for coordinating with other MySQL threads to ensurechanges do not interfere with the other activities going on in the MySQL server.
From the perspective of the master, the I/O thread is just another client thread and canexecute both dump requests and SQL statements on the master. This means a client canconnect to a server and pretend to be a slave to get the master to dump changes fromthe binary log. This is how the mysqlbinlog program (covered in detail in Chapter 4)operates.
The SQL thread acts as a session when working with the database. This means it main‐tains state information similar to that of a session, but with some differences. Becausethe SQL thread has to process changes from several different threads on the master—the events from all threads on the master are written in commit order to the binary log—the SQL thread keeps some extra information to distinguish events properly. Forexample, temporary tables are session-specific, so to keep temporary tables from dif‐ferent sessions separated, the session ID is added to the events. The SQL thread thenrefers to the session ID to keep actions for different sessions on the master separate.
The details of how the SQL thread executes events are covered later in the chapter.
Replication Architecture Basics | 233

The I/O thread is significantly faster than the SQL thread because theI/O thread merely writes events to a log, whereas the SQL thread hasto figure out how to execute changes against the databases. There‐fore, during replication, several events are usually buffered in the relaylog. If the master crashes, you have to handle these before connect‐ing to a new master.To avoid losing these events, wait for the SQL thread to catch up beforetrying to reconnect the slave to another master.Later in the chapter, you will see several ways of detecting whetherthe relay log is empty or has events left to execute.
Starting and Stopping the Slave ThreadsIn Chapter 3, you saw how to start the slave using the START SLAVE command, but a lotof details were glossed over. We’re now ready for a more thorough description of startingand stopping the slave threads.
When the server starts, it will also start the slave threads if there is a master.info file. Asmentioned earlier in this chapter, the master.info file is created if the server was con‐figured for replication and if START SLAVE commands were issued on the slaves to starttheir I/O and SQL threads. So if the previous session had been used for replication,replication will be resumed from the last position stored in the master.info and relay-log.info files, with slightly different behavior for the two slave threads:Slave I/O thread
The slave I/O thread will resume by reading from the last read position accordingto the master.info file.
For writing the events, the I/O thread will rotate the relay logfile and start writingto a new file, updating the positions accordingly.
Slave SQL threadThe slave SQL thread will resume reading from the relay log position given in relay-log.info.
You can start the slave threads explicitly using the START SLAVE command and stopthem explicitly with the STOP SLAVE command. These commands control the slavethreads and can be used to stop and start the I/O thread or SQL thread separately:START SLAVE and STOP SLAVE
These will start or stop both the I/O and the slave thread.
START SLAVE IO_THREAD and STOP SLAVE IO_THREADThese will start or stop only the I/O thread.
234 | Chapter 8: Replication Deep Dive

START SLAVE SQL_THREAD and STOP SLAVE SQL_THREADThese will start or stop only the SQL thread.
When you stop the slave threads, the current state of replication is saved to the master.info and relay-log.info files. This information is then picked up when the slave threads arestarted again.
If you specify a master host using the master-host option (which canbe either in the my.cnf file or passed as an option when startingmysqld), the slave will also start.Because the recommendation is not to use this option, but instead touse the MASTER_HOST option to the CHANGE MASTER command, themaster-host option will not be covered here.
Running Replication over the InternetThere are many reasons to replicate between two geographically separated data centers.One reason is to ensure you can recover from a disaster such as an earthquake or apower outage. You can also locate a site strategically close to some of your users, suchas content delivery networks, to offer them faster response times. Although organiza‐tions with enough resources can lease dedicated fiber, we will assume you use the openInternet to connect.
The events sent from the master to the slave should never be considered secure in anyway: as a matter of fact, it is easy to decode them to see the information that is replicated.As long as you are behind a firewall and do not replicate over the Internet—for example,replicating between two data centers—this is probably secure enough, but as soon youneed to replicate to another data center in another town or on another continent, it isimportant to protect the information from prying eyes by encrypting it.
The standard method for encrypting data for transfer over the Internet is to use SSL.There are several options for protecting your data, all of which involve SSL in some way:
• Use the support that is built into the server to encrypt the replication from masterto slave.
• Use Stunnel, a program that establishes an SSL tunnel (essentially a virtual privatenetwork) to a program that lacks SSL support.
• Use SSH in tunnel mode.
This last alternative does not appear to really offer any significant advantages over usingStunnel, but can be useful if you are not allowed to install any new programs on amachine and can enable SSH on your servers. In that case, you can use SSH to set up atunnel. We will not cover this option further.
Running Replication over the Internet | 235

When using either the built-in SSL support or stunnel for creating a secure connection,you need:
• A certificate from a certification authority (CA)• A (public) certificate for the server• A (private) key for the server
The details of generating, managing, and using SSL certificates is beyond the scope ofthis book, but for demonstration purposes, Example 8-3 shows how to generate a self-signed public certificate and associated private key. This example assumes you use theconfiguration file for OpenSSL in /etc/ssl/openssl.cnf.
Example 8-3. Generating a self-signed public certificate with a private key$ sudo openssl req -new -x509 -days 365 -nodes \ -config /etc/ssl/openssl.cnf \> -out /etc/ssl/certs/master.pem -keyout /etc/ssl/private/master.keyGenerating a 1024 bit RSA private key.....++++++.++++++writing new private key to '/etc/ssl/private/master.key'-----You are about to be asked to enter information that will be incorporatedinto your certificate request.What you are about to enter is what is called a Distinguished Name or a DN.There are quite a few fields but you can leave some blankFor some fields there will be a default value,If you enter '.', the field will be left blank.-----Country Name (2 letter code) [AU]:SEState or Province Name (full name) [Some-State]:UpplandLocality Name (eg, city) []:StorvretaOrganization Name (eg, company) [Internet Widgits Pty Ltd]:Big Inc.Organizational Unit Name (eg, section) []:Database ManagementCommon Name (eg, YOUR name) []:master-1.example.comEmail Address []:[email protected]
The certificate signing procedure puts a self-signed public certificate in /etc/ssl/certs/master.pem and the private key in /etc/ssl/private/master.key (which is also used to signthe public certificate).
On the slave, you have to create a server key and a server certificate in a similar manner.For the sake of discussion, we’ll use /etc/ssl/certs/slave.pem as the name of the slaveserver’s public certificate and /etc/ssl/private/slave.key as the name of the slave server’sprivate key.
236 | Chapter 8: Replication Deep Dive

Setting Up Secure Replication Using Built-in SupportThe simplest way to encrypt the connection between the master and slave is to use aserver with SSL support. Methods for compiling a server with SSL support are beyondthe scope of this book; if you are interested, consult the online reference manual.
To use the built-in SSL support, it is necessary to do the following:
• Configure the master by making the master keys available.• Configure the slave to encrypt the replication channel.
To configure the master to use SSL support, add the following options to the my.cnf file:
[mysqld]ssl-capath=/etc/ssl/certsssl-cert=/etc/ssl/certs/master.pemssl-key=/etc/ssl/private/master.key
The ssl-capath option contains the name of a directory that holds the certificates oftrusted CAs, the ssl-cert option contains the name of the file that holds the servercertificate, and the ssl-key option contains the name of the file that holds the privatekey for the server. As always, you need to restart the server after you have updated themy.cnf file.
The master is now configured to provide SSL support to any client, and because a slaveuses the normal client protocol, it will allow a slave to use SSL as well.
To configure the slave to use an SSL connection, issue CHANGE MASTER TO with theMASTER_SSL option to turn on SSL for the connection, then issue MASTER_SSL_CAPATH,MASTER_SSL_CERT, and MASTER_SSL_KEY, which function like the ssl-capath, ssl-cert, and ssl-key configuration options just mentioned, but specify the slave’s side ofthe connection to the master:
slave> CHANGE MASTER TO -> MASTER_HOST = 'master-1', -> MASTER_USER = 'repl_user', -> MASTER_PASSWORD = 'xyzzy', -> MASTER_SSL_CAPATH = '/etc/ssl/certs', -> MASTER_SSL_CERT = '/etc/ssl/certs/slave.pem', -> MASTER_SSL_KEY = '/etc/ssl/private/slave.key';Query OK, 0 rows affected (0.00 sec)
slave> START SLAVE;Query OK, 0 rows affected (0.15 sec)
Now you have a slave running with a secure channel to the master.
Running Replication over the Internet | 237

Setting Up Secure Replication Using StunnelStunnel is an easy-to-use SSL tunneling application that you can set up either as an SSLserver or as an SSL client.
Using Stunnel to set up a secure connection is almost as easy as setting up an SSLconnection using the built-in support, but requires some additional configuration. Thisapproach can be useful if the server is not compiled with SSL support or if for somereason you want to offload the extra processing required to encrypt and decrypt datafrom the MySQL server (which makes sense only if you have a multicore CPU).
As with the built-in support, you need to have a certificate from a CA as well as a publiccertificate and a private key for each server. These are then used for the stunnel com‐mand instead of for the server.
Figure 8-3 shows a master, a slave, and two Stunnel instances that communicate overan insecure network. One Stunnel instance on the slave server accepts data over a stan‐dard MySQL client connection from the slave server, encrypts it, and sends it over tothe Stunnel instance on the master server. The Stunnel instance on the master server,in turn, listens on a dedicated SSL port to receive the encrypted data, decrypts it, andsends it over a client connection to the non-SSL port on the master server.
Figure 8-3. Replication over an insecure channel using Stunnel
Example 8-4 shows a configuration file that sets up Stunnel to listen on socket 3508 foran SSL connection, where the master server is listening on the default MySQL socket3306. The example refers to the certificate and key files by the names we used earlier.
Example 8-4. Master server configuration file /etc/stunnel/master.confcert=/etc/ssl/certs/master.pemkey=/etc/ssl/private/master.keyCApath=/etc/ssl/certs[mysqlrepl]accept = 3508connect = 3306
Example 8-5 shows the configuration file that sets up Stunnel on the client side. Theexample assigns port 3408 as the intermediate port—the non-SSL port that the slave
238 | Chapter 8: Replication Deep Dive

will connect to locally—and Stunnel connects to the SSL port 3508 on the master server,as shown in Example 8-4.
Example 8-5. Slave server configuration file /etc/stunnel/slave.confcert=/etc/ssl/certs/slave.pemkey=/etc/ssl/private/slave.keyCApath=/etc/ssl/certs[mysqlrepl]accept = 3408connect = master-1:3508
You can now start the Stunnel program on each server and configure the slave to connectto the Stunnel instance on the slave server. Because the Stunnel instance is on the sameserver as the slave, you should give localhost as the master host to connect to and theport that the Stunnel instance accepts connections on (3408). Stunnel will then takecare of tunneling the connection over to the master server:
slave> CHANGE MASTER TO -> MASTER_HOST = 'localhost', -> MASTER_PORT = 3408, -> MASTER_USER = 'repl_user', -> MASTER_PASSWORD = 'xyzzy';Query OK, 0 rows affected (0.00 sec)
slave> START SLAVE;Query OK, 0 rows affected (0.15 sec)
You now have a secure connection set up over an insecure network.
If you are using Debian-based Linux (e.g., Debian or Ubuntu), youcan start one Stunnel instance for each configuration file in the /etc/stunnel directory by setting ENABLED=1 in /etc/default/stunnel4.So if you create the Stunnel configuration files as given in this sec‐tion, one slave Stunnel and one master Stunnel instance will be start‐ed automatically whenever you start the machine.
Finer-Grained Control Over ReplicationWith an understanding of replication internals and the information replication uses,you can control it more expertly and learn how to avoid some problems that can occur.We’ll give you some useful background in this section.
Information About Replication StatusYou can find most of the information about replication status on the slave, but there issome information available on the master as well. Most of the information on the master
Finer-Grained Control Over Replication | 239

relates to the binlog (covered in Chapter 4), but information relating to the connectedslaves is also available.
The SHOW SLAVE HOSTS command only shows information about slaves that use thereport-host option, which the slave uses to give information to the master about theserver that is connected. The master cannot trust the information about the connectedslaves, because there are routers with NAT between the master and the slave. In additionto the hostname, there are some other options that you can use to provide informationabout the connecting slave:report-host
The name of the connecting slave. This is typically the domain name of the slave,or some other similar identifier, but can in reality be any string. In Example 8-6, weuse the name “Magic Slave.”
report-port
The port on which the slave listens for connections. This default is 3306.
report-user
This is the user for connecting to the master. The value given does not have to matchthe value used in CHANGE MASTER TO. This option is only shown when the show-slave-auth-info option is given to the server.
report-password
This is the password used when connecting to the master. The password given doesnot have to match the password given to CHANGE MASTER TO.
show-slave-auth-info
If this option is enabled, the master will show the additional information about thereported user and password in the output from SHOW SLAVE HOSTS.
Example 8-6 shows sample output from SHOW SLAVE HOSTS where three slaves are con‐nected to the master.
Example 8-6. Sample output from SHOW SLAVE HOSTSmaster> SHOW SLAVE HOSTS;+-----------+-------------+------+-------------------+-----------+| Server_id | Host | Port | Rpl_recovery_rank | Master_id |+-----------+-------------+------+-------------------+-----------+| 2 | slave-1 | 3306 | 0 | 1 || 3 | slave-2 | 3306 | 0 | 1 || 4 | Magic Slave | 3306 | 0 | 1 |+-----------+-------------+------+-------------------+-----------+1 row in set (0.00 sec)
240 | Chapter 8: Replication Deep Dive

The output shows slaves that are connected to the master and some information aboutthe slaves. Notice that this display also shows slaves that are indirectly connected to themaster via relays. There are two additional fields shown when show-slave-auth-info is enabled (which we do not show here).
The following fields are purely informational and do not necessarily show the real slavehost or port, nor the user and password used when configuring the slave in CHANGEMASTER TO:Server_id
This is the server ID of the connected slave.
Host
This is the name of the host as given by report-host.
User
This is the username reported by the slave by using report-user.
Password
This column shows the password reported by the slave using report-password.
Port
This shows the port.
Master_id
This shows the server ID that the slave is replicating from.
Rpl_recovery_rank
This field has never been used and is removed in MySQL version 5.5.
The information about indirectly connected slaves cannot be entire‐ly trusted, because it is possible for the information to be inaccuratein certain situations where slaves are being added.For this reason, there is an effort underway to remove this informa‐tion and show only directly connected slaves, as this information canbe trusted.
You can use the SHOW MASTER LOGS command to see which logs the master is keepingtrack of in the binary log. A typical output from this command can be seen inExample 8-7.
The SHOW MASTER STATUS command (shown in Example 8-8) shows where the nextevent will be written in the binary log. Because a master has only a single binlog file, thetable will always contain only a single line. And because of that, the last line of the outputof SHOW MASTER LOGS will match the output of this command, only with different head‐ers. This means that if you need to execute a SHOW MASTER LOGS to implement some
Finer-Grained Control Over Replication | 241

feature, you do not need to execute a SHOW MASTER STATUS as well but can instead usethe last line of SHOW MASTER LOGS.
Example 8-7. Typical output from SHOW MASTER LOGSmaster> SHOW MASTER LOGS;+-------------------+-----------+| Log_name | File_size |+-------------------+-----------+| master-bin.000011 | 469768 || master-bin.000012 | 1254768 || master-bin.000013 | 474768 || master-bin.000014 | 4768 |+-------------------+-----------+1 row in set (0.00 sec)
Example 8-8. Typical output from SHOW MASTER STATUSmaster> SHOW MASTER STATUS;+--------------------+----------+--------------+------------------+| File | Position | Binlog_Do_DB | Binlog_Ignore_DB |+--------------------+----------+--------------+------------------+| master-bin.000014 | 4768 | | |+--------------------+----------+--------------+------------------+1 row in set (0.00 sec)
To determine the status for the slave threads, use the SHOW SLAVE STATUS command.This command contains almost everything you need to know about the replicationstatus. Let’s go through the output in more detail. A typical output from SHOW SLAVESTATUS is given in Example 8-9.
Example 8-9. Sample output from SHOW SLAVE STATUS Slave_IO_State: Waiting for master to send event Master_Host: master1.example.com Master_User: repl_user Master_Port: 3306 Connect_Retry: 1 Master_Log_File: master-bin.000001 Read_Master_Log_Pos: 192 Relay_Log_File: slave-relay-bin.000006 Relay_Log_Pos: 252 Relay_Master_Log_File: master-bin.000001 Slave_IO_Running: Yes Slave_SQL_Running: Yes Replicate_Do_DB: Replicate_Ignore_DB: Replicate_Do_Table: Replicate_Ignore_Table: Replicate_Wild_Do_Table: Replicate_Wild_Ignore_Table: Last_Errno: 0
242 | Chapter 8: Replication Deep Dive

Last_Error: Skip_Counter: 0 Exec_Master_Log_Pos: 192 Relay_Log_Space: 553 Until_Condition: None Until_Log_File: Until_Log_Pos: 0 Master_SSL_Allowed: No Master_SSL_CA_File: Master_SSL_CA_Path: Master_SSL_Cert: Master_SSL_Cipher: Master_SSL_Key: Seconds_Behind_Master: 0Master_SSL_Verify_Server_Cert: No Last_IO_Errno: 0 Last_IO_Error: Last_SQL_Errno: 0 Last_SQL_Error:
The state of the I/O and SQL threads
The two fields Slave_IO_Running and Slave_SQL_Running indicate whether the slaveI/O thread or the SQL thread, respectively, is running. If the slave threads are not run‐ning, it could be either because they have been stopped or because of an error in thereplication.
If the I/O thread is not running, the fields Last_IO_Errno and Last_IO_Error will showthe reason it stopped. Similarly, Last_SQL_Errno and Last_SQL_Error will show thereason why the SQL thread stopped. If either of the threads stopped without error—forexample, because they were explicitly stopped or reached the until condition—therewill be no error message and the errno field will be 0, similar to the output inExample 8-9. The fields Last_Errno and Last_Error are synonyms for Last_SQL_Errno and Last_SQL_Error, respectively.
The Slave_IO_State shows a description of what the I/O thread is currently doing.Figure 8-4 shows a state diagram of how the message can change depending on the stateof the I/O thread.
Finer-Grained Control Over Replication | 243

Figure 8-4. Slave I/O thread states
The messages have the following meanings:Waiting for master update
This message is shown briefly when the I/O thread is initialized and before it triesto establish a connection with the master.
244 | Chapter 8: Replication Deep Dive

Connecting to masterThis message is shown while the slave is trying to establish a connection with themaster, but has not yet made the connection.
Checking master versionThis message is shown when the slave has managed to connect to the master andis performing a handshake with the master.
Registering slave on masterThis message is shown while the slave is trying to register itself with the master.When registering, it sends the value of the report-host option described earlier tothe master. This usually contains the hostname or the IP number of the slave, butcan contain any string. The master cannot depend simply on checking the IP ad‐dress of the TCP connection, because there might be routers running inetworkaddress translation (NAT) between the master and slave.
Requesting binlog dumpThis message is shown when the slave starts to request a binlog dump by sendingthe binlog file, binlog position, and server ID to the master.
Waiting for master to send eventThis message is printed when the slave has established a connection with the masterand is waiting for the master to send an event.
Queueing master event to the relay logThis message is shown when the master has sent an event and the slave I/O threadis about to write it to the relay log. This message is displayed regardless of whetherthe event is actually written to the relay log or skipped because of the rules outlinedin “Filtering Replication Events” on page 174.
Note the spelling in the previous message (“Queueing” insteadof “Queuing”).When checking for messages using scripts or other tools, it isvery important to check what the message really says and not justwhat you think it should read.
Waiting to reconnect after actionThis message is shown when a previous action failed with a transient error andthe slave will try to reconnect. Possible values for action are:registration on master
When attempting to register with the master
binlog dump request
When requesting a binlog dump from the master
Finer-Grained Control Over Replication | 245

master event read
When waiting for or reading an event from the master
Reconnecting after failed actionThis message is shown when the slave is trying to reconnect to the master aftertrying action but has not yet managed to establish a connection. The possiblevalues for action are the same as for the “Waiting to reconnect after action”message.
Waiting for slave mutex on exitThis message is shown while the I/O thread is shutting down.
Waiting for the slave SQL thread to free enough relay log spaceThis message is shown if the relay log space limit (as set by the relay-log-space-limit option) has been reached and the SQL thread needs to process some of therelay log to write the new events.
The binary log and relay log positions
As replication processes events on the slave, it maintains three positions in parallel.
These positions are shown in the output from SHOW SLAVE STATUS in Example 8-9, asthe following pairs of fields:Master_Log_File, Read_Master_Log_Pos
The master read position: the position in the master’s binary log of the next eventto be read by the I/O thread.
The values of these fields are taken from lines 2 and 3 of master.info, as shown inExample 8-1.
Relay_Master_Log_File, Exec_Master_Log_PosThe master execute position: the position in the master’s binlog of the next event tobe executed by the SQL thread.
The values of these fields are taken from lines 3 and 4 of relay-log.info, as shown inExample 8-2.
Relay_Log_File, Relay_Log_PosThe relay log execute position: the position in the slave’s relay log of the next eventto be executed by the SQL thread.
The values of these fields are taken from lines 1 and 2 of relay-log.info, as shown inExample 8-2.
You can use the positions to gain information about replication progress or to optimizesome of the algorithms developed in Chapter 5.
246 | Chapter 8: Replication Deep Dive

For example, by comparing the master read position and the master execute position,it is possible to determine whether there are any events waiting to be executed. This isparticularly interesting if the I/O thread has stopped, because it allows an easy way towait for the relay log to become empty: once the positions are equal, there is nothingwaiting in the relay log, and the slave can be safely stopped and redirected to anothermaster.
Example 8-10 shows sample code that waits for an empty relay log on a slave. MySQLprovides the convenient MASTER_POS_WAIT function to wait until a slave’s relay log hasprocessed all waiting events. In the event that the slave thread is not running, thenMASTER_POS_WAIT will return NULL, which is caught and generates an exception.
Example 8-10. Python script to wait for an empty relay logfrom mysql.replicant.errors import Error
class SlaveNotRunning(Error): pass
def slave_wait_for_empty_relay_log(server): result = server.sql("SHOW SLAVE STATUS") log_file = result["Master_Log_File"] log_pos = result["Read_Master_Log_Pos"] running = server.sql( "SELECT MASTER_POS_WAIT(%s,%s)", (log_file, log_pos)) if running is None: raise SlaveNotRunning
Using these positions, you can also optimize the scenarios in Chapter 5. For instance,after running Example 8-21, which promotes a slave to master, you will probably haveto process a lot of events in each of the other slaves’ relay logs before switching the slaveto the new master. In addition, ensuring that the promoted slave has executed all eventsbefore allowing any slaves to connect will allow you to lose a minimum of data.
By modifying the function order_slaves_on_position in Example 5-5 to createExample 8-11, you can make the former slaves execute all events they have in their relaylogs before performing the switch. The code uses the slave_wait_for_empty_relay_log function in Example 8-10 to wait for the relay log to become empty beforereading the slave position.
Example 8-11. Minimizing the number of lost events when promoting a slavefrom mysql.replicant.commands import ( fetch_slave_position, slave_wait_for_empty_relay_log, )
def order_slaves_on_position(slaves): entries = [] for slave in slaves:
Finer-Grained Control Over Replication | 247

slave_wait_for_empty_relay_log(slave) pos = fetch_slave_position(slave) gtid = fetch_gtid_executed(slave) entries.append((pos, gtid, slave)) entries.sort(key=lambda x: x[0]) return [ entry[1:2] for entry in entries ]
In addition to the technique demonstrated here, another technique mentioned in someof the literature is to check the status of the SQL thread in the SHOW PROCESSLIST output.If the State field is “Has read all relay log; waiting for the slave I/O thread to update it,”the SQL thread has read the entire relay log. This State message is generated only bythe SQL thread, so you can safely search for it in all threads.
Options for Handling Broken ConnectionsThe I/O thread has the responsibility for maintaining the connection with the masterand, as you have seen in Figure 8-4, includes quite a complicated bit of logic to do so.
If the I/O thread loses the connection with the master, it will attempt to reconnect tothe master a limited number of times. The period of inactivity after which the I/O threadreacts, the retry period, and the number of retries attempted are controlled by threeoptions:--slave-net-timeout
The number of seconds of inactivity accepted before the slave decides that the con‐nection with the master is lost and tries to reconnect. This does not apply to asituation in which a broken connection can be detected explicitly. In these cases,the slave reacts immediately, moves the I/O thread into the reconnection phase,and attempts a reconnect (possibly waiting according to the value of master-connect-retry and only if the number of retries done so far does not exceedmaster-retry-count).
The default is 3,600 seconds.
--master-connect-retry
The number of seconds between retries. You can specify this option as theCONNECT_RETRY parameter for the CHANGE MASTER TO command. Use of the optionin my.cnf is deprecated.
The default is 60 seconds.
--master-retry-count
The number of retries before finally giving up.
The default is 86,400.
These defaults are probably not what you want, so you’re better off supplying your ownvalues.
248 | Chapter 8: Replication Deep Dive

How the Slave Processes EventsCentral to replication are the log events: they are the information carriers of the repli‐cation system and contain all the metadata necessary to ensure replication can executethe changes made on the master to produce a replica of the master. Because the binarylog on the master is in commit order for all the transactions executed on the master,each transaction can be executed in the same order in which it appears in the binarylog to produce the same result on the slave as on the master.
The slave SQL thread executes events from all the sessions on the master in sequence.This has some consequences for how the slave executes the events:The slave reply is single-threaded, whereas the master is multithreaded
The log events are executed in a single thread on the slave, but on multiple threadson the master. This can make it difficult for the slave to keep up with the master ifthe master is committing a lot of transactions.
Some statements are session-specificSome statements on the master are session-specific and will cause different resultswhen executed from the single session on the slave:
• Every user variable is session-specific.• Temporary tables are session-specific.• Some functions are session-specific (e.g., CONNECTION_ID).
The binary log decides execution orderEven though two transactions in the binary log appear to be independent—and intheory could be executed in parallel—they may in reality not be independent. Thismeans that the slave is forced to execute the transactions in sequence to guaranteethe master and the slave are consistent.
Housekeeping in the I/O ThreadAlthough the SQL thread does most of the event processing, the I/O does some house‐keeping before the events even come into the SQL thread’s view. So we’ll look at I/Othread processing before discussing the “real execution” in the SQL thread. To keep upprocessing speed, the I/O thread inspects only certain bytes to determine the type ofthe event, then takes the necessary action to the relay log:Stop events
These events indicate that a slave further up in the chain has been stopped in anorderly manner. This event is ignored by the I/O thread and is not even written tothe relay log.
How the Slave Processes Events | 249

Rotate eventIf the master binary log is rotated, so is the relay log. The relay log might be rotatedmore times than the master, but the relay log is rotated at least each time the master’sbinary log is rotated.
Format description eventsThese events are saved to be written when the relay log is rotated. Recall that theformat between two consecutive binlog files might change, so the I/O thread needsto remember this event to process the files correctly.
If replication is set up to replicate in a circle or through a dual-master setup (which iscircular replication with only two servers), events will be forwarded in the circle untilthey arrive at the server that originally sent them. To avoid having events continue toreplicate around in the circle indefinitely, it is necessary to remove events that have beenexecuted before.
To implement this check, each server determines whether the event has the server’s ownserver ID. If it does, this event was sent from this server previously, and replication onthe slave has come full circle. To avoid an event that circulates infinitely (and hence isapplied infinitely) this event is not written to the relay log, but just ignored. You canturn this behavior off using the replicate-same-server-id option on the server. Ifyou set this option, the server will not carry out the check for an identical server ID andthe event will be written to the relay log regardless of which server ID it has.
SQL Thread ProcessingThe slave SQL thread reads the relay log and re-executes the master’s database state‐ments on the slave. Some of these events require special information that is not part ofthe SQL statement. The special handling includes:Passing master context to the slave server
Sometimes state information needs to be passed to the slave for the statement toexecute correctly. As mentioned in Chapter 4, the master writes one or more contextevents to pass this extra information. Some of the information is thread-specific butdifferent from the information in the next item.
Handling events from different threadsThe master executes transactions from several sessions, so the slave SQL thread hasto decide which thread generated some events. Because the master has the bestknowledge about the statement, it marks any event that it considers thread-specific.For instance, the master will usually mark events that operate on temporary tablesas thread-specific.
Filtering events and tablesThe SQL thread is responsible for doing filtering on the slave. MySQL providesboth database filters, which are set up by replicate-do-db and replicate-
250 | Chapter 8: Replication Deep Dive

ignore-db, and table filters, which are set up by replicate-do-table, replicate-ignore-table, replicate-wild-do-table, and replicate-wild-ignore-table.
Skipping eventsTo recover replication after it has stopped, there are features available to skip eventswhen restarting replication. The SQL thread handles this skipping.
Context events
On the master, some events require a context to execute correctly. The context is usuallythread-specific features such as user-defined variables, but can also include state infor‐mation required to execute correctly, such as autoincrement values for tables with au‐toincrement columns. To pass this context from the master to the slave, the master hasa set of context events that it can write to the binary log.
The master writes each context event before the event that contains the actual change.Currently, context events are associated only with Query events and are added to thebinary log before the Query events.
Context events fall into the following categories:User variable event
This event holds the name and value of a user-defined variable.
This event is generated whenever the statement contains a reference to a user-defined variable.
SET @foo = 'SmoothNoodleMaps';INSERT INTO my_albums(artist, album) VALUES ('Devo', @foo);
Integer variable eventThis event holds an integer value for either the INSERT_ID session variable or theLAST_INSERT_ID session variable.
The INSERT_ID integer variable event is used for statements that insert into tableswith an AUTO_INCREMENT column to transfer the next value to use for theautoincrement column. This information, for example, is required by this tabledefinition and statement:
CREATE TABLE Artist (id INT AUTO_INCREMENT PRIMARY KEY, artist TEXT);INSERT INTO Artist VALUES (DEFAULT, 'The The');
The LAST_INSERT_ID integer variable event is generated when a statement uses theLAST_INSERT_ID function, as in this statement:
INSERT INTO Album VALUES (LAST_INSERT_ID(), 'Mind Bomb');
How the Slave Processes Events | 251

Rand eventIf the statement contains a call to the RAND function, this event will contain therandom seeds, which will allow the slave to reproduce the “random” value generatedon the master:
INSERT INTO my_table VALUES (RAND());
These context events are necessary to produce correct behavior in the situations justdescribed, but there are other situations that cannot be handled using context events.For example, the replication system cannot handle a user-defined function (UDF) unlessthe UDF is deterministic and also exists on the slave. In these cases, the user variableevent can solve the problem.
User variable events can be very useful for avoiding problems with replicating nonde‐terministic functions, for improving performance, and for integrity checks.
As an example, suppose that you enter documents into a database table. Each documentis automatically assigned a number using the AUTO_INCREMENT feature. To maintain theintegrity of the documents, you also add an MD5 checksum of the documents in thesame table. A definition of such a table is shown in Example 8-12.
Example 8-12. Definition of document table with MD5 checksumCREATE TABLE document( id INT UNSIGNED AUTO_INCREMENT PRIMARY KEY, doc BLOB, checksum CHAR(32));
Using this table, you can now add documents to the table together with the checksumand also verify the integrity of the document, as shown in Example 8-13, to ensure ithas not been corrupted. Although the MD5 checksum is currently not considered cryp‐tographically secure, it still offers some protection against random errors such as diskand memory problems.
Example 8-13. Inserting into the table and checking document integritymaster> INSERT INTO document(doc) VALUES (document);Query OK, 1 row affected (0.02 sec)
master> UPDATE document SET checksum = MD5(doc) WHERE id = LAST_INSERT_ID();Query OK, 1 row affected (0.04 sec)
master> SELECT id, -> IF(MD5(doc) = checksum, 'OK', 'CORRUPT!') AS Status -> FROM document;+-----+----------+| id | Status |+-----+----------+| 1 | OK |
252 | Chapter 8: Replication Deep Dive

| 2 | OK || 3 | OK || 4 | OK || 5 | OK || 6 | OK || 7 | CORRUPT! || 8 | OK || 9 | OK || 10 | OK || 11 | OK |+-----+----------+11 row in set (5.75 sec)
But how well does this idea play with replication? Well, it depends on how you use it.When the INSERT statement in Example 8-13 is executed, it is written to the binary logas is, which means the MD5 checksum is recalculated on the slave. So what happens ifthe document is corrupted on the way to the slave? In that case, the MD5 checksum willbe recalculated using the corrupt document, and the corruption will not be detected.So the statement given in Example 8-13 is not replication-safe. We can, however, dobetter than this.
Instead of following Example 8-13, write your code to look like Example 8-14, whichstores the checksum in a user-defined variable and uses it in the INSERT statement. Theuser-defined variable contains the actual value computed by the MD5 function, so it willbe identical on the master and the slave even if the document is corrupted in the transfer(but, of course, not if the checksum is corrupted in the transfer). Either way, a corruptionoccurring when the document is replicated will be noticed.
Example 8-14. Replication-safe method of inserting a document in the tablemaster> INSERT INTO document(doc) VALUES (document);Query OK, 1 row affected (0.02 sec)
master> SELECT MD5(doc) INTO @checksum FROM document WHERE id = LAST_INSERT_ID();Query OK, 0 rows affected (0.00 sec)
master> UPDATE document SET checksum = @checksum WHERE id = LAST_INSERT_ID();Query OK, 1 row affected (0.04 sec)
Thread-specific events
As mentioned earlier, some statements are thread-specific and will yield a different resultwhen executed in another thread. There are several reasons for this:Reading and writing thread-local objects
A thread-local object can potentially clash with an identically named object in an‐other thread. Typical examples of such objects are temporary tables or user-definedvariables.
How the Slave Processes Events | 253

We have already examined how replication handles user-defined variables, so thissection will just concentrate on how replication handles the temporary tables.
Using variables or functions that have thread-specific resultsSome variables and functions have different values depending on which thread theyare running in. A typical example of this is the server variable connection_id.
The server handles these two cases slightly differently. In addition, there are a few casesin which replication does not try to account for differences between the server and client,so results can differ in subtle ways.
To handle thread-local objects, some form of thread-local store (TLS) is required, butbecause the slave is executing from a single thread, it has to manage this storage andkeep the TLSes separate. To handle temporary tables, the slave creates a unique (man‐gled) filename for the table based on the server process ID, the thread ID, and a thread-specific sequence number. This means that the two statements in Example 8-15—eachruns from a different client on the master—create two different filenames on the slaveto represent the temporary tables.
Example 8-15. Two threads, each creating a temporary tablemaster-1> CREATE TEMPORARY TABLE cache (a INT, b INT);Query OK, 0 rows affected (0.01 sec)
master-2> CREATE TEMPORARY TABLE cache (a INT, b INT);Query OK, 0 rows affected (0.01 sec)
All the statements from all threads on the master are stored in sequence in the binarylog, so it is necessary to distinguish the two statements. Otherwise, they will cause anerror when executed on the slave.
To distinguish the statements in the binary log so that they do not conflict, the servertags the Query events containing the statement as thread-specific and also adds thethread ID to the event. (Actually, the thread ID is added to all Query events, but is notreally necessary except for thread-specific statements.)
When the slave receives a thread-specific event, it sets a variable special to the replicationslave thread, called the pseudothread ID, to the thread ID passed with the event. Thepseudothread ID will then be used when constructing the temporary tables. The processID of the slave server—which is the same for all master threads—will be used whenconstructing the filename, but that does not matter as long as there is a distinctionamong tables from different threads.
We also mentioned that thread-specific functions and variables require special treat‐ment to work correctly when replicated. This is not, however, handled by the server.When a server variable is referenced in a statement, the value of the server variable willbe retrieved on the slave. If, for some reason, you want to replicate exactly the same
254 | Chapter 8: Replication Deep Dive

value, you have to store the value in a user-defined variable as shown in Example 8-14,or use row-based replication, which we will cover later in the chapter.
Filtering and skipping events
In some cases, events may be skipped either because they are filtered out using repli‐cation filters or because the slave has been specifically instructed to skip a number ofevents.
The SQL_SLAVE_SKIP_COUNTER variable instructs the slave server to skip a specifiednumber of events. The SQL thread should not be running when you set the variable.This condition is typically easy to satisfy, because the variable is usually used to skipsome events that caused replication to stop already.
An error that stops replication should, of course, be investigated and handled, but if youfix the problem manually, it is necessary to ignore the event that stopped replicationand force replication to continue after the offending event. This variable is provided asa convenience, to keep you from having to use CHANGE MASTER TO. Example 8-16 showsthe feature in use after a bad statement has caused replication to stop.
Example 8-16. Using the SQL_SLAVE_SKIP_COUNTERslave> SET GLOBAL SQL_SLAVE_SKIP_COUNTER = 3;Query OK, 0 rows affected (0.02 sec)
slave> START SLAVE;Query OK, 0 rows affected (0.02 sec)
When you start the slave, three events will be skipped before resuming replication. Ifskipping three events causes the slave to end up in the middle of a transaction, the slavewill continue skipping events until it finds the end of the transaction.
Events can also be filtered by the slave if replication filters are set up. As we discussedin Chapter 4, the master can handle filtering, but if there are slave filters, the events arefiltered in the SQL thread, which means that the events are still sent from the masterand stored in the relay log.
Filtering is done differently depending on whether database filters or table filters are setup. The logic for deciding whether a statement for a certain database should be filteredout from the binary log was detailed in Chapter 4, and the same logic applies to slavefilters, with the addition that here a set of table filters have to be handled as well.
One important aspect of filtering is that a filter applying to a single table causes the entirestatement referring to that filter to be left out of replication. The logic for filtering state‐ments on the slave is shown in Figure 8-5.
Filtering that involves tables can easily become difficult to understand, so we advise thefollowing rules to avoid unwanted results:
How the Slave Processes Events | 255

• Do not qualify table names with the database they’re a part of. Precede the statementwith a USE statement instead to set a new default database.
• Do not update tables in different databases using a single statement.• Avoid updating multiple tables in a statement, unless you know that all tables are
filtered or none of the tables are filtered. Notice that from the logic in Figure 8-5,the whole statement will be filtered if even one of the tables is filtered.
Figure 8-5. Replication filtering rules
256 | Chapter 8: Replication Deep Dive

Semisynchronous ReplicationGoogle has an extensive set of patches for MySQL and InnoDB to tailor the server andthe storage engine. One of the patches that is available for MySQL version 5.0 is thesemisynchronous replication patch. MySQL has since reworked the patch and releasedit with MySQL 5.5.
The idea behind semisynchronous replication is to ensure the changes are written todisk on at least one slave before allowing execution to continue. This means that foreach connection, at most one transaction can be lost due to a master crash.
It is important to understand that the semisynchronous replication patch does not holdoff commits of the transaction; it just avoids sending a reply back to the client until thetransaction has been written to the relay log of at least one slave. Figure 8-6 shows theorder of the calls when committing a transaction. As you can see, the transaction iscommitted to the storage engine before the transaction is sent to the slave, but the returnfrom the client’s commit call occurs after the slave has acknowledged that the transactionis in durable storage.
Figure 8-6. Transaction commit with semisynchronous replication
For each connection, one transaction can be lost if a crash occurs after the transactionhas been committed to the storage engine but before the transaction has been sent tothe slave. However, because the acknowledgment of the transaction goes to the client
Semisynchronous Replication | 257

after the slave has acknowledged that it has the transaction, at most one transaction canbe lost. This usually means that one transaction can be lost per client.
Configuring Semisynchronous ReplicationTo use semisynchronous replication, both the master and the slave need to support it,so both the master and the slave have to be running MySQL version 5.5 or later andhave semisynchronous replication enabled. If either the master or the slave does notsupport semisynchronous replication, it will not be used, but replication works as usual,meaning that more than one transaction can be lost unless special precautions are takento ensure each transaction reaches the slave before a new transaction is started.
Use the following steps to enable semisynchronous replication:
1. Install the master plug-in on the master:master> INSTALL PLUGIN rpl_semi_sync_master SONAME 'semisync_master.so';
2. Install the slave plug-in on each slave:slave> INSTALL PLUGIN rpl_semi_sync_slave SONAME 'semisync_slave.so';
3. Once you have installed the plug-ins, enable them on the master and the slave. Thisis controlled through two server variables that are also available as options, so toensure that the settings take effect even after restart, it is best to bring down theserver and add the options to the my.cnf file of the master:
[mysqld]rpl-semi-sync-master-enabled = 1
and to the slave:[mysqld]rpl-semi-sync-slave-enabled = 1
4. Restart the servers.
If you followed the instructions just given, you now have a semisynchronous replicationsetup and can test it, but consider these cases:
• What happens if all slaves crash and therefore no slave acknowledges that it hasstored the transaction to the relay log? This is not unlikely if you have only a singleserver attached to the master.
• What happens if all slaves disconnect gracefully? In this case, the master has noslave to which the transaction can be sent for safekeeping.
In addition to rpl-semi-sync-master-enabled and rpl-semi-sync-slave-enabled,there are two options that you can use to handle the situations we just laid out:
258 | Chapter 8: Replication Deep Dive

rpl-semi-sync-master-timeout=milliseconds
To prevent semisynchronous replication from blocking if it does not receive anacknowledgment, it is possible to set a timeout using the rpl-semi-sync-master-timeout=milliseconds option.
If the master does not receive any acknowledgment before the timeout expires, itwill revert to normal asynchronous replication and continue operating withoutsemisynchronous replication.
This option is also available as a server variable and can be set without bringing theserver down. Note, however, that as with every server variable, the value will notbe saved between restarts.
rpl-semi-sync-master-wait-no-slave={ON|OFF}
If a transaction is committed but the master does not have any slaves connected, itis not possible for the master to send the transaction anywhere for safekeeping. Bydefault, the master will then wait for a slave to connect—as long as it is within thetimeout limit—and acknowledge that the transaction has been properly written todisk.
You can use the rpl-semi-sync-master-wait-no-slave={ON|OFF} option to turnoff this behavior, in which case the master reverts to asynchronous replication ifthere are no connected slaves.
Note that if the master does not receive any acknowledgment be‐fore the timeout given by rpl-semi-sync-master-timeout expires,or if rpl-semi-sync-master-wait-no-slave=ON, semi-synchronous replication will silently revert to normal asynchro‐nous replication and continue operating without semisynchronousreplication.
Monitoring Semisynchronous ReplicationBoth plug-ins install a number of status variables that allow you to monitor semisyn‐chronous replication. We will cover the most interesting ones here (for a complete list,consult the online reference manual for semisynchronous replication):rpl_semi_sync_master_clients
This status variable reports the number of connected slaves that support and havebeen registered for semisynchronous replication.
rpl_semi_sync_master_status
The status of semisynchronous replication on the master is 1 if it is active, and 0 ifit is inactive—either because it has not been enabled or because it was enabled buthas reverted to asynchronous replication.
Semisynchronous Replication | 259

rpl_semi_sync_slave_status
The status of semisynchronous replication on the slave is 1 if active (i.e., if it hasbeen enabled and the I/O thread is running) and 0 if it is inactive.
You can read the values of these variables either using the SHOW STATUS command orthrough the information schema table GLOBAL_STATUS. If you want to use the values forother purposes, the SHOW STATUS command is hard to use and a query as shown inExample 8-17 uses SELECT on the information schema to extract the value and store itin a user-defined variable.
Example 8-17. Retrieving values using the information schemamaster> SELECT Variable_value INTO @value -> FROM INFORMATION_SCHEMA.GLOBAL_STATUS -> WHERE Variable_name = 'Rpl_semi_sync_master_status'; Query OK, 1 row affected (0.00 sec)
Global Transaction IdentifiersStarting with MySQL 5.6, the concept of global transaction identifiers (GTIDs) wasadded, which means that each transaction is assigned a unique identifier. This sectionintroduces GTIDs and demonstrates how they can be used. For a detailed descriptionof GTIDs, look in “Replication with Global Transaction Identifiers” in the MySQL 5.6Reference Manual.
In MySQL 5.6, each transaction on a server is assigned a transaction identifier, whichis a nonzero 64-bit value assigned to a transaction based on the order in which theycommitted. This number is local to the server (i.e., some other server might assign thesame number to some other transaction). To make this transaction identifier global, theserver UUID is added to form a pair. For example, if the server has a server UUID (asgiven by the server variable @@server_uuid) 2298677f-c24b-11e2-
a68b-0021cc6850ca, the 1477th transaction committed on the server will have GTID2298677f-c24b-11e2-a68b-0021cc6850ca:1477.
When a transaction is replicated from a master to a slave, the binary log position of thetransaction changes because the slave has to write it to the binary logfile on the slave.Because a slave might be configured differently, the positions can be vastly differentfrom the position on the master—but the global transaction identifier will be the same.
When transactions are replicated and global transaction identifiers are enabled, theGTID of the transaction is retained regardless of the number of times that the transac‐tion is propagated. This simple idea makes GTIDs a very powerful concept, as you willsoon see.
While the notation just shown indicates an individual transaction, it is also necessaryto have a notation for a global transaction identifier set (or GTID set). This helps, forexample, when talking about transactions that have been logged on a server. A GTID
260 | Chapter 8: Replication Deep Dive


After updating the options file, you need to restart the server for the changes to takeeffect. Once you’ve done this for all servers that are going to be used in the setup, you’reset for doing a failover. Using the GTID support in MySQL 5.6, switching masters justrequires you to issue the command:
CHANGE MASTER TOMASTER_HOST = host_of_new_master,MASTER_PORT = port_of_new_master,MASTER_USER = replication_user_name,MASTER_PASSWORD = replication_user_password,MASTER_AUTO_POSITION = 1
The MASTER_AUTO_POSITION causes the slave to automatically negotiate what transac‐tions should be sent over when connecting to the master.
To see status of replication in GTID positions, SHOW SLAVE STATUS has been extendedwith a few new columns. You can see an example of those in Example 8-18.
Example 8-18. Output of SHOW SLAVE STATUS with GTID enabled Slave_IO_State: Waiting for master to send event . . . Slave_IO_Running: Yes Slave_SQL_Running: Yes . . . Master_UUID: 4e2018fc-c691-11e2-8c5a-0021cc6850ca . . .Retrieved_Gtid_Set: 4e2018fc-c691-11e2-8c5a-0021cc6850ca:1-1477 Executed_Gtid_Set: 4e2018fc-c691-11e2-8c5a-0021cc6850ca:1-1593 Auto_Position: 1
Master_UUID
This is the server UUID of the master. The field is not strictly tied to the GTIDimplementation (it was added before the GTIDs were introduced), but it is usefulwhen debugging problems.
Retrieved_Gtid_Set
This is the set of GTIDs that have been fetched from the master and stored in therelay log.
Executed_Gtid_Set
This is the set of GTIDs that have been executed on the slave and written to theslave’s binary log.
262 | Chapter 8: Replication Deep Dive

Failover Using GTIDs“Hot Standby” on page 130 described how to switch to a hot standby without usingglobal transaction identifiers. That process used binary log positions, but with globaltransaction identifiers, there is no longer a need to check the positions.
Switching over to a hot standby with global transaction identifiers is very easy (it issufficient to just redirect the slave to the new master using CHANGE MASTER):
CHANGE MASTER TO MASTER_HOST = 'standby.example.com';
As usual, if no other parameters change, it is not necessary to repeat them.
When you enable MASTER_AUTO_POSITION, the master will figure out what transactionsneed to be sent over. The failover procedure is therefore easily defined using the Rep‐licant ilibrary:
_CHANGE_MASTER = ( "CHANGE MASTER TO " "MASTER_HOST = %s, MASTER_PORT = %d, " "MASTER_USER = %s, MASTER_PASSWORD = %s, " "MASTER_AUTO_POSITION = 1" ) def change_master(server, master): server.sql(_CHANGE_MASTER, master.host, master.port, master.user, master.password)
def switch_to_master(server, standby): change_master(server, standby) server.sql("START SLAVE")
By comparing this procedure with the one in Example 5-1, you can see that there are afew things that have been improved by using GTIDs:
• Because you do not need to check the position of the master, it is not necessary tostop it to ensure that it is not changing.
• Because the GTIDs are global (i.e., they never change when replicated), there is noneed for the slave to “align” with the master or the standby to get a good switchoverposition.
• It is not necessary to fetch the position on the standby (which is a slave to the currentprimary) because everything is replicated to the slave.
• It is not necessary to provide a position when changing the master because theservers automatically negotiate positions.
Because the GTIDs are global (i.e., it is not necessary to do any sort of translation of thepositions), the preceding procedure works just as well for switchover and failover, even
Global Transaction Identifiers | 263

when a hierarchical replication is used. This was not the case in “Hot Standby” on page130, where different procedures had to be employed for switchover, non-hierarchicalfailover, and failover in a hierarchy.
In order to avoid losing transactions when the master fails, it is a good habit to emptythe relay log before actually executing the failover. This avoids re-fetching transactionsthat have already been transferred from the master to the slave. The best approach wouldbe to redirect only the I/O thread to the new master, but unfortunately, this is (not yet)possible. To wait for the relay log to become empty, the handy WAIT_UN
TIL_SQL_THREAD_AFTER_GTIDS function will block until all the GTIDs in a GTID sethave been processed by the SQL thread. To use this function, we change the functionin Example 8-19 .
Example 8-19. Python code for failover to a standby using GTIDdef change_master(server, standby): fields = server.sql("SHOW SLAVE STATUS") server.sql("SELECT WAIT_UNTIL_SQL_THREAD_AFTER_GTIDS(%s)", fields['Retrieved_Gtid_Set']) server.sql("STOP SLAVE") change_master(server, standby) server.sql("START SLAVE")
Slave Promotion Using GTIDsThe procedure shown in the previous section for failover works fine when the slave isactually behind the standby. But, as mentioned in “Slave Promotion” on page 144, if theslave knows more transactions than the standby, failing over to the standby does notput you in a better situation. It would actually be better if the slave were the new master.So how can this be implemented using global transaction identifiers?
The actual failover using the procedure in Example 8-19 can still be used, but if thereare multiple slaves to a master, and the master fails, it is necessary to compare the slavesto see what slave is more knowledgable. To help with this, MySQL 5.6 introduced thevariable GTID_EXECUTED. This global variable contains a GTID set consisting of alltransactions that have been written to the binary log on the server. Note that no GTIDis generated unless the transaction is written to the binary log, so only transactions thatwere written to the binary log are represented in this set.
There is also a global variable GTID_PURGED that contains the set of all transactions thathave been purged (i.e., removed) from the binary log and are no longer available toreplicate. This set is always a subset of (or equal to) GTID_EXECUTED.
This variable can be used to check that a candidate master has enough events in thebinary log to act as master to some slave. If there are any events in GTID_PURGED on themaster that are not in GTID_EXECUTED on the slave, the master will not be able to replicatesome events that the slave needs because they are not in the binary log. The relation
264 | Chapter 8: Replication Deep Dive

between these two variables can be seen in Figure 8-7, where each variable represents a“wavefront” through the space of all GTIDs.
Using GTID_EXECUTED, it is easy to compare the slaves and decide which one knows themost transactions. The code in Example 8-20 orders the slaves based on GTID_EXECUTED and picks the “best” one as the new master. Note that GTID sets are not normallytotally ordered (i.e., two GTID sets can differ but have the same size). In this particularcase, however, the GTID sets will be totally ordered, because they were ordered in thebinary log of the master.
Example 8-20. Python code to find the best slavefrom mysql.replicant.server import GTIDSet
def fetch_gtid_executed(server): return GTIDSet(server.sql("SELECT @@GLOBAL.GTID_EXECUTED"))
def fetch_gtid_purged(server): return GTIDSet(server.sql("SELECT @@GLOBAL.GTID_PURGED"))
def order_slaves_on_gtid(slaves): entries = [] for slave in slaves: pos = fetch_gtid_executed(slave) entries.append((pos, slave)) entries.sort(key=lambda x: x[0]) return entries
Figure 8-7. GTID_EXECUTED and GTID_PURGED
Combining the examples in Example 8-19 and Example 8-20 allows the function topromote the best slave to be written as simply as what is shown in Example 8-21.
Example 8-21. Slave promotion with MySQL 5.6 GTIDsdef promote_best_slave_gtid(slaves): entries = order_slaves_on_gtid(slaves) _, master = entries.pop(0) # "Best" slave will be new master for _, slave in entries: switch_to_master(master, slave)
Global Transaction Identifiers | 265

Replication of GTIDsThe previous sections showed how to set up the MySQL server to use global transactionidentifiers and how to handle failover and slave promotion, but one piece of the puzzleis still missing: how are GTIDs propagated between the servers?
A GTID is assigned to every group in the binary log—that is, to each transaction, single-statement DML (whether transactional or nontransactional), and DDL statement. Aspecial GTID event is written before the group and contains the full GTID for thetransaction, as illustrated in Figure 8-8.
Figure 8-8. A binary logfile with GTIDs
To handle the replication of transactions with a GTID assigned, the SQL thread pro‐cesses the GTID event in the following manner:
1. If the GTID is already present in the GTID_EXECUTED, the transaction will be skippedentirely, not even written to the binary log. (Recall that GTID_EXECUTED contains alltransactions already in the binary log, so there is no need to write it again.)
2. Otherwise, the GTID will be assigned to the transaction that follows, and the nexttransaction is executed as normal.
3. When the transaction commits, the GTID assigned to the transaction is used togenerate a new GTID event, which is then written to the binary log before thetransaction.
4. The contents of the transaction cache are then written to the binary log after theGTID event.
266 | Chapter 8: Replication Deep Dive

Note that with GTIDs assigned to every transaction, it is possible to filter out transac‐tions that have already been executed in the first step, which was not possible beforeMySQL 5.6.
You can control what GTID is assigned to a transaction through a new variable namedGTID_NEXT. This variable can either contain a GTID or have the value AUTOMATIC. (Itcan also take the value ANONYMOUS, but this can be used only when GTID_MODE = ON, sowe disregard this case.) When committing a transaction, different actions are takendepending on the value of GTID_NEXT:
• If GTID_NEXT has the value AUTOMATIC, a new GTID is created and assigned to thetransaction.
• If GTID_NEXT has a GTID as a value, that GTID will be used when the transactionis written to the binary log.
The GTID assigned to GTID_NEXT is not changed after the transaction commits. Thismeans you have to set it either to a new GTID or to AUTOMATIC after you have committedthe transaction. If you do not change the value of GTID_NEXT, you will get an error whenyou try to start a new transaction, regardless of whether it is done explicitly or implicitly.
Observe that GTID_NEXT has to be set before the transaction starts. If you try to set thevariable after starting a transaction, you will just get an error.
Once you set GTID_NEXT and start a transaction, the GTID is owned by the transaction.This will be reflected in the variable GTID_OWNED:
mysql> SELECT @@GLOBAL.GTID_OWNED;+-------------------------------------------+| @@GLOBAL.GTID_OWNED |+-------------------------------------------+| 02020202-0202-0202-0202-020202020202:4#42 |+-------------------------------------------+1 row in set (0.00 sec)
In this case, the only owned GTID, which is owned by the session with ID 42, is02020202-0202-0202-0202-020202020202:4.
GTID_OWNED should be considered internal and is intended for testing and debugging.
Replicating from a master to a slave directly is not the only way changes can be replicated.MySQL replication is also designed to work with mysqlbinlog so that SQL statementscan be generated, saved to a file, and applied to a server. To handle propagation of GTIDseven when it is done indirectly through mysqlbinlog, GTID_NEXT is used. Whenevermysqlbinlog encounters a GTID event, it will generate a statement to set GTID_NEXT. InExample 8-22, you can see an example of the output.
Global Transaction Identifiers | 267

Example 8-22. Example output from mysqlbinlog with GTID events# at 410#130603 20:57:54 server id 1 end_log_pos 458 CRC32 0xc6f8a5eb# GTID [commit=yes]SET @@SESSION.GTID_NEXT= '01010101-0101-0101-0101-010101010101:3'/*!*/;# at 458#130603 20:57:54 server id 1 end_log_pos 537 CRC32 0x1e2e40d0# Position Timestamp Type Master ID Size Master Pos Flags# Query thread_id=4 exec_time=0 error_code=0SET TIMESTAMP=1370285874/*!*/;BEGIN/*!*/;# at 537#130603 20:57:54 server id 1 end_log_pos 638 CRC32 0xc16f211d# Query thread_id=4 exec_time=0 error_code=0SET TIMESTAMP=1370285874/*!*/;INSERT INTO t VALUES (1004)/*!*/;# at 638#130603 20:57:54 server id 1 end_log_pos 669 CRC32 0x91980f0bCOMMIT/*!*/;
Slave Safety and RecoverySlave servers can crash too, and when they do, you need to recover them. The first stepin handling a crashed slave is always to investigate why it crashed. This cannot be au‐tomated, because there are so many hard-to-anticipate reasons for crashes. A slave mightbe out of disk space, it may have read a corrupt event, or it might have re-executed astatement that resulted in a duplicate key error for some reason. However, it is possibleto automate some recovery procedures and use this automation to help diagnose aproblem.
Syncing, Transactions, and Problems with Database CrashesTo ensure slaves pick up replication safely after a crash on the master or slave, you needto consider two different aspects:
• Ensuring the slave stores all the necessary data needed for recovery in the event ofa crash
• Executing the recovery of a slave
Slaves do their best to meet the first condition by syncing to disk. To provide acceptableperformance, operating systems keep files in memory while working with them, andwrite them to disk only periodically or when forced to. This means data written to a fileis not necessarily in safe storage. If there is a crash, data left only in memory will be lost.
268 | Chapter 8: Replication Deep Dive

To force a slave to write files to disk, the database server issues an fsync call, whichwrites all data stored in memory to disk. To protect replication data, the MySQL servernormally executes fsync calls for the relay log, the master.info file, and the relay-log.info file at regular intervals.
I/O thread syncing
For the I/O thread, two fsync calls are made whenever an event has been processed:one to flush the relay log to disk and one to flush the master.info file to disk. Doing theflushes in this order ensures that no events will be lost if the slave crashes betweenflushing the relay log and flushing the master.info file. This, however, means that anevent can be duplicated if a crash occurs in any of the following cases:
• The server flushes the relay log and is about to update the master read position inmaster.info.
• The server crashes, which means that the master read position now refers to theposition before the event that was flushed to the relay log.
• The server restarts and gets the master read position from master.info, meaning theposition before the last event written to the relay log.
• Replication resumes from this position, and the event is duplicated.
If the files were flushed in the opposite order—the master.info file first and the relay logsecond—there would be potential for losing an event in the same scenario, because theslave would pick up replication after the event that it was about to write to the relay log.Losing an event is deemed to be worse than duplicating one, hence the relay log is flushedfirst.
SQL thread syncing
The SQL thread processes the groups in the relay log by processing each event in turn.When all the events in the group are processed, the SQL thread commits the transactionusing the following process:
1. It commits the transaction to the storage engine (assuming the storage engine sup‐ports commit).
2. It updates the relay-log.info file with the position of the next event to process, whichis also the beginning of the next group to process.
3. It writes relay-log.info to disk by issuing an fsync call.
While executing inside a group, the thread increments the event position to keep trackof where the SQL thread is reading in the relay log, but if there is a crash, execution willresume from the last recorded position in the relay-log.info file.
Slave Safety and Recovery | 269

This behavior leaves the SQL thread with its own version of the atomic update problemmentioned for the I/O thread, so the slave database and the relay-log.info file can getout of sync in the following scenario:
1. The event is applied to the database and the transaction is committed. The nextstep is to update the relay-log.info file.
2. The slave crashes, which means relay-log.info now points to the beginning of thejust-completed transaction.
3. On recovery, the SQL thread reads the information from the relay-log.info file andstarts replication from the saved position.
4. The last executed transaction is repeated.
What all this boils down to is that committing a transaction on the slave and updatingthe replication information is not atomic: it is possible that relay-log.info does not ac‐curately reflect what has been committed to the database. The next section describeshow transactional replication is implemented in MySQL 5.6 to solve this problem.
Transactional ReplicationAs noted in the previous section, replication is not crash-safe, because the informationabout the progress of replication is not always in sync with what has actually been appliedto the database. Although transactions are not lost if the server crashes, it can requiresome tweaking to bring the slaves up again.
MySQL 5.6 has increased crash safety for the slave by committing the replication in‐formation together with the transaction as shown in Figure 8-9. This means that rep‐lication information will always be consistent with what has been applied to the database,even in the event of a server crash. Also, some fixes were done on the master to ensurethat it recovers correctly.
Figure 8-9. Position information updated after the transaction and inside the transac‐tion
270 | Chapter 8: Replication Deep Dive

Recall that the replication information is stored in two files: master.info and relay-log.info. The files are arranged so that they are updated after the transaction has beenapplied. This means that if you have a crash between the transaction commit and theupdate of the files, as on the left in Figure 8-9, the position information will be wrong.In other words, a transaction cannot be lost this way, but there is a risk that a transactioncould be applied again when the slave recovers.
The usual way to avoid this is to have a primary key on all your tables. In that case, arepeated update of the table would cause the slave to stop, and you would have to useSQL_SLAVE_SKIP_COUNTER to skip the transaction and get the slave up and running again(or GTID_NEXT to commit a dummy transaction). This is better than losing a transaction,but it is nevertheless a nuisance. Removing the primary key to prevent the slave fromstopping will only solve the problem partially: it means that the transaction would beapplied twice, which would both place a burden on the application to handle dual entriesand also require that the tables be cleaned regularly. Both of these approaches requireeither manual intervention or scripting support. This does not affect reliability, butcrashes are much easier to handle if the replication information is committed in thesame transaction as the data being updated.
To implement transactional replication in MySQL 5.6, the replication information canbe stored either in files (as before) or in tables. Even when storing the replication in‐formation in tables, it is necessary either to store the data and the replication informationin the same storage engine (which must be transactional) or to support XA on bothstorage engines. If neither of these steps are taken, the replication information and thedata cannot be committed as a single transaction.
Setting up transactional replication
The default in MySQL 5.6 is to use files for the replication information, so to use trans‐actional replication, it is necessary to reconfigure the server to use tables for the repli‐cation information. To control where the replication information is placed, two newoptions have been added: master_info_repository and relay_log_info_repository. These options take the value FILE or TABLE to use either the file or the table for therespective piece of information.
Thus, to use transactional replication, edit your configuration file, add the options asshown in Example 8-23, and restart the server.
Example 8-23. Adding options to turn on transactional replication[mysqld]...master_info_repository = TABLErelay_log_info_repository = TABLE...
Slave Safety and Recovery | 271

Before MySQL 5.6.6, the default engine for slave_master_info andslave_relay_log_info was MyISAM. For replication to be trans‐actional, you need to change the engine to use a transactional en‐gine, typically InnoDB, using ALTER TABLE:
slave> ALTER TABLE mysql.slave_master_info ENGINE = InnoDB;slave> ALTER TABLE mysql.slave_relay_log_info ENGINE = InnoDB;
Details of transactional replication
Two tables in the mysql database preserve information needed for transactional repli‐cation: slave_master_info, corresponding to the file master.info, and slave_relay_log_info, corresponding to the file relay_log.info.
Just like the master.info file, the slave_master_info table stores information about theconnection to the master. Table 8-1 shows each field of the table, and which row in themaster.info file and SHOW SLAVE STATUS output it corresponds to.
Table 8-1. Fields for slave_master_infoField Line in file Slave status column
Number_of_lines 1
Master_log_name 2 Master_Log_File
Master_log_pos 3 Read_Master_Log_Pos
Host 3 Master_Host
User_name 4 Master_User
User_password 5
Port 6 Master_Port
Connect_retry 7 Connect_Retry
Enabled_ssl 8 Master_SSL_Allowed
Ssl_ca 9 Master_SSL_CA_File
Ssl_capath 10 Master_SSL_CA_Path
Ssl_cert 11 Master_SSL_Cert
Ssl_cipher 12 Master_SSL_Cipher
Ssl_key 13 Master_SSL_Key
Ssl_verify_servert_cert 14 Master_SSL_Verify_Server_Cert
Heartbeat 15
Bind 16 Master_Bind
Ignored_server_ids 17 Replicate_Ignore_Server_Ids
Uuid 18 Master_UUID
Retry_count 19 Master_Retry_Count
Ssl_crl 20 Master_SSL_Crl
272 | Chapter 8: Replication Deep Dive

Field Line in file Slave status column
Ssl_crlpath 21 Master_SSL_Crlpath
Enabled_auto_position 22 Auto_Position
Similarly, Table 8-2 shows the definition of the slave_relay_log_info table corre‐sponding to the relaylog.info file.
Table 8-2. Fields of slave_relay_log_infoField Line in file Slave status column
Number_of_lines 1
Relay_log_name 2 Relay_Log_File
Relay_log_pos 3 Relay_Log_Pos
Master_log_name 4 Relay_Master_Log_File
Master_log_pos 5 Exec_Master_Log_Pos
Sql_delay 6 SQL_Delay
Number_of_workers 7
Id 8
Now, suppose that the following transaction was executed on the master:START TRANSACTION;UPDATE titles, employees SET titles.title = 'Dictator-for-Life' WHERE first_name = 'Calvin' AND last_name IS NULL;UPDATE salaries SET salaries.salary = 1000000 WHERE first_name = 'Calvin' AND last_name IS NULL;COMMIT;
When the transaction reaches the slave and is executed there, it behaves as if it wasexecuted the following way (where Exec_Master_Log_Pos, Relay_Master_Log_File,Relay_Log_File, and Relay_Log_Pos are taken from the SHOW SLAVE STATUS output):
START TRANSACTION;UPDATE titles, employees SET titles.title = 'Dictator-for-Life' WHERE first_name = 'Calvin' AND last_name IS NULL;UPDATE salaries SET salaries.salary = 1000000 WHERE first_name = 'Calvin' AND last_name IS NULL;SET @@SESSION.LOG_BIN = 0;UPDATE mysql.slave_relay_log_info SET Master_log_pos = Exec_Master_Log_Pos, Master_log_name = Relay_Master_Log_File, Relay_log_name = Relay_Log_File, Relay_log_pos = Relay_Log_Pos;SET @@SESSION.LOG_BIN = 1;COMMIT;
Note that the added “statement” is not logged to the binary log on the master, becausethe binary log is temporarily disabled when the “statement” is executed. If both
Slave Safety and Recovery | 273

slave_relay_log_info and the tables are placed in the same engine, this will be com‐mitted as a unit.
The result is to update slave_relay_log_info with each transaction executed on theslave, but note that slave_master_info does not contain information that is critical forensuring that transactional replication works. The only fields that are updated are thepositions of events fetched from the master. On a crash, the slave will pick up from thelast executed position, and not from the last fetched position, so this information isinteresting to have only in the event that the master crashes. In this case, the events inthe relay log can be executed to avoid losing more events than necessary.
Similar to flushing the disk, committing to tables is expensive. Because the slave_master_info table does not contain any information that is critical for ensuring transac‐tional replication, avoiding unnecessary commits to this table improves performance.
For this reason, the sync_master_info option was introduced. The option contains aninteger telling how often the replication information should be committed to theslave_master_info (or flushed to disk, in the event that the information is stored inthe traditional files). If it is nonzero, replication information is flushed each time themaster fetches the number of events indicated by the variable’s value. If it is zero, noexplicit flushing is done at all, but the operating system will flush the information todisk. Note, however, that the information is flushed to disk or committed to the tablewhen the binary log is rotated or the slave starts or stops.
If you are using tables for storing the replication information, this means that if:sync_master_info = 0
the slave_master_info table is updated only when the slave starts or stops, or the binarylog is rotated, so changes to the fetched position are not visible to other threads. If it iscritical for your application that you can view this information, you need to setsync_master_info to a nonzero value.
Rules for Protecting Nontransactional StatementsStatements executed outside of transactions cannot be tracked and protected fromre-execution after a crash. The problem is comparable on masters and slaves. If a state‐ment against a MyISAM table is interrupted by a crash on the master, the statement isnot logged at all, because logging is done after the statement has completed. Upon restart(and successful repair) the MyISAM table will contain a partial update, but the binarylog will not have logged the statement at all.
The situation is similar on the slave: if a crash occurs in the middle of execution of astatement (or a transaction that modifies a nontransactional table), the changes mightremain in the table, but the group position will not be changed. The nontransactionalstatement will be re-executed when the slave starts up replication again.
274 | Chapter 8: Replication Deep Dive

It is not possible to automatically catch problems with crashes in the middle of updatinga nontransactional table, but by obeying a few rules, it is possible to ensure you at leastreceive an error when this situation occurs.INSERT statements
To handle these statements, you need to have a primary key on the tables that youreplicate. In this way, an INSERT that is re-executed will generate a duplicate keyerror and stop the slave so that you can check why the master and the slave are notconsistent.
DELETE statementsTo handle these, you need to stay away from LIMIT clauses. If you do this, thestatement will just delete the same rows again (i.e., the rows that match the WHEREclause), which is fine since it will either pick up where the previous statement leftoff or do nothing if all specified rows are already deleted. However, if the statementhas a LIMIT clause, only a subset of the rows matching the WHERE condition will beexecuted, so when the statement is executed again, another set of rows will be de‐leted.
UPDATE statementsThese are the most problematic statements. To be safe, either the statement has tobe idempotent—executing it twice should lead to the same result—or the occasionaldouble execution of the statement should be acceptable, which could be the case ifthe UPDATE statement is just for maintaining statistics over, say, page accesses.
Multisource ReplicationAs you may have noticed, it is not possible to have a slave connect to multiple mastersand receive changes from all of them. This topology is called multisource and shouldnot be confused with the multimaster topology introduced in Chapter 6. In a multi‐source topology, changes are received from several masters, but in a multimaster top‐ology, the servers form a group that acts as a single master by replicating changes fromeach master to all the other masters.
There have been plans for introducing multisource replication into MySQL for a longtime, but one issue stands in the way of the design: what to do with conflicting updates.These can occur either because different sources make truly conflicting changes, orbecause two intermediate relays are forwarding a change made at a common master.Figure 8-10 illustrates both types of conflicts. In the first, two masters (sources) makechanges to the same data and the slave cannot tell which is the final change. In thesecond, only a single change is made, but it looks to the slave like two changes from twodifferent sources. In both cases, the slave will not be able to distinguish between eventscoming from the two relays, so an event sent from the master will be seen as two differentevents when arriving at the slave.
Multisource Replication | 275

The diamond configuration does not have to be explicitly set up: itcan occur inadvertently as a result of switching from one relay toanother if the replication stream is overlapping during a switchover.For this reason, it is important to ensure all events in queue—on theslave and on all the relays between the master and the slave—havebeen replicated to the slave before switching over to another master.
You can avoid conflicts by making sure you handle switchovers correctly and—in thecase of multiple data sources—ensuring updates are done so that they never have achance of conflicting. The typical way to accomplish this is to update different databases,but it is also possible to assign updates of different rows in the same table to differentservers.
Although MySQL does not currently let you replicate from several sources simultane‐ously, you can come close by switching a slave among several masters, replicating pe‐riodically from each of them in turn. This is called round-robin multisource replica‐tion. It can be useful for certain types of applications, such as when you’re aggregatingdata from different sources for reporting purposes. In these cases, you can separate datanaturally by storing the writes from each master in its own database, table, or partition.There is no risk of conflict, so it should be possible to use multisource replication.
Figure 8-10. True multisource and a diamond configuration
276 | Chapter 8: Replication Deep Dive

Figure 8-11 shows a slave that replicates from three masters in a round-robin fashion,running a client dedicated to handling the switches between the masters. The processfor round-robin multisource replication is as follows:
1. Set the slave up to replicate from one master. We’ll call this the current master.2. Let the slave replicate for a fixed period of time. The slave will then read changes
from the current master and apply them while the client responsible for handlingthe switching just sleeps.
3. Stop the I/O thread of the slave using STOP SLAVE IO_THREAD.4. Wait until the relay log is empty.5. Stop the SQL thread using STOP SLAVE SQL_THREAD. CHANGE MASTER requires that
you stop both threads.6. Save the slave position for the current master by saving the values of the Ex
ec_Master_Log_Pos and Relay_Master_Log_File columns from the SHOW SLAVESTATUS output.
7. Change the slave to replicate from the next master in sequence by taking the pre‐viously saved positions and using CHANGE MASTER to set up replication.
8. Restart the slave threads using START SLAVE.9. Repeat the sequence starting from step 2.
Figure 8-11. Round-robin multisource replication using a client to switch
Note that in steps 3 through 5, we stop first the I/O thread and then the SQL thread.The reason for doing this and not just stopping replication on the slave is that the SQL
Multisource Replication | 277

thread can be lagging behind (and usually is), so if we just stop both threads, there willbe a bunch of outstanding events in the relay log that will just be thrown away. If youare more concerned about executing only, say, one minute’s worth of transactions fromeach master and don’t care about throwing away those additional events, you can simplystop replication instead of performing steps 3 through 5. The procedure will still workcorrectly, because the events that were thrown away will be refetched from the masterin the next round.
This can, of course, be automated using a separate client connection and the MySQLReplicant library, as shown in Example 8-24. By using the cycle function from theitertools module, you can repeatedly read from a list of masters in turn.
Example 8-24. Round-robin multisource replication in Pythonimport itertools
position = {}def round_robin_multi_master(slave, masters): current = masters[0] for master in itertools.cycle(masters): slave.sql("STOP SLAVE IO_THREAD"); slave_wait_for_empty_relay_log(slave) slave.sql("STOP SLAVE SQL_THREAD"); position[current.name] = fetch_slave_position(slave) slave.change_master(position[current.name]) master.sql("START SLAVE") current = master sleep(60) # Sleep 1 minute
Details of Row-Based Replication“Row-Based Replication” on page 97 left out one major subject concerning row-basedreplication: how the rows are executed on the slave. In this section, you will see thedetails of how row-based replication is implemented on the slave side.
In statement-based replication, statements are handled by writing the statement in a single Query event. However, because a significant number of rows can be changed ineach statement, row-based replication handles this differently and therefore requiresmultiple events for each statement.
To handle row-based replication, four new events have been introduced:Table_map
This maps a table ID to a table name (including the database name) and some basicinformation about the columns of the table on the master.
The table information does not include the names of the columns, just the types.This is because row-based replication is positional: each column on the master goesinto the same position in the table on the slave.
278 | Chapter 8: Replication Deep Dive

Write_rows, Delete_rows, and Update_rowsThese events are generated whenever rows are inserted, deleted, or updated, re‐spectively. This means that a single statement can generate multiple events.
In addition to the rows, each event contains a table ID that refers to a table IDintroduced by a preceding Table_map event and one or two column bitmaps spec‐ifying the columns of the table affected by the event. This allows the log to savespace by including only those columns that have changed or that are necessary tolocate the correct row to insert, delete, or update.
Whenever a statement is executed, it is written into the binary log as a sequence ofTable_map events, followed by a sequence of row events. The last row event of thestatement is marked with a special flag indicating it is the last event of the statement.
Example 8-25 shows the execution of a statement and the resulting events. We haveskipped the format description event here, because you have already seen it.
Example 8-25. Execution of an INSERT statement and the resulting eventsmaster> START TRANSACTION;Query OK, 0 rows affected (0.00 sec)
master> INSERT INTO t1 VALUES (1),(2),(3),(4);Query OK, 4 rows affected (0.01 sec)Records: 4 Duplicates: 0 Warnings: 0
master> INSERT INTO t1 VALUES (5),(6),(7),(8);Query OK, 4 rows affected (0.01 sec)Records: 4 Duplicates: 0 Warnings: 0
master> COMMIT;Query OK, 0 rows affected (0.00 sec)
master> SHOW BINLOG EVENTS IN 'master-bin.000053' FROM 106\G*************************** 1. row *************************** Log_name: master-bin.000054 Pos: 106 Event_type: Query Server_id: 1End_log_pos: 174 Info: BEGIN*************************** 2. row *************************** Log_name: master-bin.000054 Pos: 174 Event_type: Table_map Server_id: 1End_log_pos: 215 Info: table_id: 18 (test.t1)*************************** 3. row *************************** Log_name: master-bin.000054 Pos: 215
Details of Row-Based Replication | 279

Event_type: Write_rows Server_id: 1End_log_pos: 264 Info: table_id: 18 flags: STMT_END_F*************************** 4. row *************************** Log_name: master-bin.000054 Pos: 264 Event_type: Table_map Server_id: 1End_log_pos: 305 Info: table_id: 18 (test.t1)*************************** 5. row *************************** Log_name: master-bin.000054 Pos: 305 Event_type: Write_rows Server_id: 1End_log_pos: 354 Info: table_id: 18 flags: STMT_END_F*************************** 6. row *************************** Log_name: master-bin.000054 Pos: 354 Event_type: Xid Server_id: 1End_log_pos: 381 Info: COMMIT /* xid=23 */6 rows in set (0.00 sec)
This example adds two statements to the binary log. Each statement starts with aTable_map event followed by a single Write_rows event holding the four rows of eachstatement.
You can see that each statement is terminated by setting the statement-end flag of therow event. Because the statements are inside a transaction, they are also wrapped withQuery events containing BEGIN and COMMIT statements.
The size of the row events is controlled by the option binlog-row-event-max-size,which gives a threshold for the number of bytes in the binary log. The option does notgive a maximum size for a row event: it is possible to have a binlog row event that hasa larger size if a row contains more bytes than binlog-row-event-max-size.
Table_map EventsAs already mentioned, the Table_map event maps a table name to an identifier so thatit can be used in the row events, but that is not its only role. In addition, it contains somebasic information about the fields of the table on the master. This allows the slave tocheck the basic structure of the table on the slave and compare it to the structure on themaster to make sure they match well enough for replication to proceed.
280 | Chapter 8: Replication Deep Dive

The basic structure of the table map event is shown in Figure 8-12. The commonheader—the header that all replication events have—contains the basic informationabout the event. After the common header, the post header gives information that isspecial for the table map event. Most of the fields in Figure 8-12 are self-explanatory,but the representation of the field types deserves a closer look.
Figure 8-12. Table map event structure
The following fields together represent the column type:Column type array
An array listing the base types for all the columns. It indicates whether this is aninteger, a string type, a decimal type, or any of the other available types, but it doesnot give the parameters for the column type. For example, if the type of a columnis CHAR(5), this array will contain 254 (the constant representing a string), but thelength of the string (in this case, 5) is stored in the column metadata mentionedlater.
Null bit arrayAn array of bits that indicate whether each field can be NULL.
Column metadataAn array of metadata for the fields, fleshing out details left out of the column typearray. The piece of metadata available to each field depends on the type of the field.For example, the DECIMAL field stores the precision and decimals in the metadata,whereas the VARCHAR type stores the maximum length of the field.
By combining the data in these three arrays, it is possible to deduce the type of the field.
Not all type information is stored in the arrays, so in two particular cases, it is not possiblefor the master and the slave to distinguish between two types:
Details of Row-Based Replication | 281

• When there is no information about whether an integer field is signed or unsigned.This means the slave will be unable to distinguish between a signed and unsignedfield when checking the tables.
• When the character sets of string types are not part of the information. This meansthat replicating between different character sets is not supported and may lead tostrange results, because the bytes will just be inserted into the column with nochecking or conversion.
The Structure of Row EventsFigure 8-13 shows the structure of a row event. This structure can vary a little dependingon the type of event (write, delete, or update).
Figure 8-13. Row event header
In addition to the table identifier, which refers to the table ID of a previous table mapevent, the event contains the following fields:Table width
The width of the table on the master. This width is length-encoded in the same wayas for the client protocol, which is why it can be either one or two bytes. Most ofthe time, it will be one byte.
Columns bitmapThe columns that are sent as part of the payload of the event. This informationallows the master to send a selected set of fields with each row. There are two typesof column bitmaps: one for the before image and one for the after image. The beforeimage is needed for deletions and updates, whereas the after image is needed forwrites (inserts) and updates. See Table 8-3 for more information.
282 | Chapter 8: Replication Deep Dive


Primary key lookupIf the table on the slave has a primary key, it is used to perform a primary key lookup.This is the fastest of all the methods.
Index scanIf there is no primary key defined for the table but an index is defined, this will beused to locate the correct row to change. All rows in the index will be scanned andthe columns compared with the row received from the master.
If the rows match, this row will be used for the Delete_rows or Update_rowsoperation. If no rows match, the slave will stop replication with an error indicatingthat it could not locate the correct row.
Table scanIf there is no primary key or index on the table, a full table scan is used to locatethe correct row to delete or update.
In the same way as for the index scan, each row in the scan will be compared withthe row received from the master, and if they match, that row will be used for thedelete or update operation.
Because the index or primary key on the slave rather than the master is used to locatethe correct row to delete or update, you should keep a couple of things in mind:
• If the table has a primary key on the slave, the lookup will be fast. If the table doesnot have a primary key, the slave has to do either a full table scan or an index scanto find the correct row to update, which is slower.
• You can have different indexes on the master and slave.
When replicating a table, it is always wise to have a primary key on the table regardlessof whether row-based or statement-based replication is used.
Because statement-based replication actually executes each statement, a primary key onupdates and deletes speeds up replication significantly for statement-based replicationas well.
Events and TriggersThe execution of events and triggers differs in statement-based replication and row-based replication. The only difference for events is that row-based replication generatesrow events instead of query events.
Triggers, on the other hand, reveal a different and more interesting story.
As discussed in Chapter 4, for statement-based replication, trigger definitions are re‐plicated to the slave so that when a statement is executed that affects a table with a trigger,the trigger will be executed on the slave as well.
284 | Chapter 8: Replication Deep Dive

For row-based replication, it doesn’t matter how the rows change—whether changescome from a trigger, a stored procedure, an event, or directly from the statement. Be‐cause the rows updated by the trigger are replicated to the slave, the trigger does notneed to be executed on the slave. As a matter of fact, executing it on the slave wouldlead to incorrect results.
Consider Example 8-26, which defines a table with a trigger.
Example 8-26. Definition of a table and triggersCREATE TABLE log ( number INT AUTO_INCREMENT PRIMARY KEY, user CHAR(64), brief TEXT);
CREATE TABLE user ( id INT AUTO_INCREMENT PRIMARY KEY, email CHAR(64), password CHAR(64));
CREATE TRIGGER tr_update_user AFTER UPDATE ON user FOR EACH ROW INSERT INTO log SET user = NEW.email, brief = CONCAT("Changed password from '", OLD.password, "' to '", NEW.password, "'");
CREATE TRIGGER tr_insert_user AFTER INSERT ON user FOR EACH ROW INSERT INTO log SET user = NEW.email, brief = CONCAT("User '", NEW.email, "' added");
Given these table and trigger definitions, this sequence of statements can be executed:master> INSERT INTO user(email,password) VALUES ('[email protected]', 'xyzzy');Query OK, 1 row affected (0.05 sec)
master> UPDATE user SET password = 'secret' WHERE email = '[email protected]';Query OK, 1 row affected (0.01 sec)Rows matched: 1 Changed: 1 Warnings: 0
master> SELECT * FROM log;+--------+--------------+-------------------------------------------+| number | user | brief |+--------+--------------+-------------------------------------------+| 1 | [email protected] | User '[email protected]' added || 2 | [email protected] | Changed password from 'xyzzy' to 'secret' |
Details of Row-Based Replication | 285

+--------+--------------+-------------------------------------------+2 rows in set (0.00 sec)
This is, of course, not very secure, but at least it illustrates the situation. So, how do thesechanges appear in the binary log when using row-based replication?
master> SHOW BINLOG EVENTS IN 'mysqld1-bin.000054' FROM 2180;+--------------+----+-----------+---------+-----------+------------------------+|Log_name |Pos |Event_type |Server_id|End_log_pos|Info |+--------------+----+-----------+---------+-----------+------------------------+|master-bin…54|2180|Query | 1| 2248|BEGIN ||master-bin…54|2248|Table_map | 1| 2297|table_id: 24 (test.user)||master-bin…54|2297|Table_map | 1| 2344|table_id: 26 (test.log) ||master-bin…54|2344|Write_rows | 1| 2397|table_id: 24 ||master-bin…54|2397|Write_rows | 1| 2471|table_id: 26 flags: || | | | | | STMT_END_F ||master-bin…54|2471|Query | 1| 2540|COMMIT ||master-bin…54|2540|Query | 1| 2608|BEGIN ||master-bin…54|2608|Table_map | 1| 2657|table_id: 24 (test.user)||master-bin…54|2657|Table_map | 1| 2704|table_id: 26 (test.log) ||master-bin…54|2704|Update_rows| 1| 2783|table_id: 24 ||master-bin…54|2783|Write_rows | 1| 2873|table_id: 26 flags: || | | | | | STMT_END_F ||master-bin…54|2873|Query | 1| 2942|COMMIT |+--------------+----+-----------+---------+-----------+------------------------+12 rows in set (0.00 sec)
As you can see, each statement is treated as a separate transaction containing only asingle statement. The statement changes two tables—the test.user and test.logtables—and therefore there are two table maps at the beginning of the statement in thebinary log. When replicated to the slave, these events are executed directly and theexecution goes “below the trigger radar,” thereby avoiding execution of the triggers forthe tables on the slave.
Filtering in Row-Based ReplicationFiltering also works differently in statement-based and row-based replication. Recallfrom Chapter 4 that statement-based replication filtering is done on the entire statement(i.e., either all of the statement is executed or the statement is not executed at all) becauseit is not possible to execute just part of a statement. For the database filtering options,the current database is used and not the database of the table that is being changed.
Row-based replication offers more choice. Because each row for a specific table is caughtand replicated, it is possible to filter on the actual table being updated and even filterout some rows based on arbitrary conditions. For this reason, row-based replicationalso filters changes based on the actual table updated and is not based on the currentdatabase for the statement.
286 | Chapter 8: Replication Deep Dive

Consider what will happen with filtering on a slave set up to ignore the ignore_medatabase. What will be the result of executing the following statement under statement-based and row-based replication?
USE test; INSERT INTO ignore_me.t1 VALUES (1),(2);
For statement-based replication, the statement will be executed, but for row-based rep‐lication, the changes to table t1 will be ignored, because the ignore_me database is onthe ignore list.
Continuing on this path, what will happen with the following multitable updatestatement?
USE test; UPDATE ignore_me.t1, test.t2 SET t1.a = 3, t2.a = 4 WHERE t1.a = t2.a;
With statement-based replication, the statement will be executed, expecting the tableignore_me.t1 to exist—which it might not, because the database is ignored—and willupdate both the ignore_me.t1 and test.t2 tables. Row-based replication, on the otherhand, will update only the test.t2 table.
Partial Execution of StatementsAs already noted, statement-based replication works pretty well unless you have to ac‐count for failures, crashes, and nondeterministic behavior. Because you can count onthe failure or crash to occur at the worst possible moment, this will almost always leadto partially executed statements.
The same situation occurs when the number of rows affected by an UPDATE, DELETE, orINSERT statement is artificially limited. This may happen explicitly through a LIMITclause or because the table is nontransactional and, say, a duplicate key error abortsexecution and causes the statement to be only partially applied to the table.
In such cases, the changes that the statement describes are applied to only an initial setof rows. The master and the slave can have different opinions of how the rows areordered, which can therefore result in the statement being applied to different sets ofrows on the master and the slave.
MyISAM maintains all the rows in the order in which they were inserted. That may giveyou confidence that the same rows will be affected in case of partial changes. Unfortu‐nately, however, that is not the case. If the slave has been cloned from the master usinga logical backup or restored from a backup, it is possible that the insertion order changed.
Normally, you can solve this problem by adding an ORDER BY clause, but even that doesnot leave you entirely safe, because you are still in danger of having the statement par‐tially executed because of a crash.
Details of Row-Based Replication | 287

Partial Row ReplicationAs mentioned earlier, the events Write_rows, Delete_rows, and Update_rows eachcontain a column bitmap that tells what columns are present in the rows in the body ofthe event. Note that there is one bitmap for the before image and one for the after image.
Prior to MySQL 5.6.2, only the MySQL Cluster engine uses the option of limiting thecolumns written to the log, but starting with MySQL 5.6.2, it is possible to control whatcolums are written to the log using the option binlog-row-image. The option acceptsthree different values: full, noblob, and minimal.full
This is the default for binlog-row-image and will replicate all columns. Prior toMySQL 5.6.2, this is how the rows were always logged.
noblob
With this setting, blobs will be omitted from the row unless they change as part ofthe update.
minimal
With this setting, only the primary key (in the before image) and the columns thatchange values (in the after image) are written to the binary log.
The reason for having full as default is because there might be different indexes on themaster, and the slave and columns that are not part of the primary key on the mastermight be needed to find the correct row on the slave.
If you look at Example 8-27, there are different definitions of the tables on the masterand slave, but the only difference is that there are different indexes. The rationale forthis difference could be that on the master it is necessary for the id column to be aprimary key for autoincrement to work, but on the slave all selects are done using theemail column.
In this case, setting binlog-row-image to minimal will store the values of the id columnin the binary log, but this column cannot be used to find the correct row on the slave.This will cause replication to fail. Because it is expected that replication should workeven if this mistake is made, the default for binlog-row-image is full.
If you are using identical indexes on the master and slave (or at least have indexes onthe slave on the columns that are indexed on the master), you can set binlog-row-image to minimal and save space by reducing the size of the binary log.
So what’s the role of the noblob value then? Well... it acts as a middle ground. Eventhough it is possible to have different indexes on the master and slave, it is very rare forblobs to be part of an index. Because blobs usually take a lot of space, using noblob willbe almost as safe as full, under the assumption that blobs are never indexed.
288 | Chapter 8: Replication Deep Dive

Example 8-27. Table with different indexes on master and slave/* Table definition on the master */CREATE TABLE user ( id INT AUTO_INCREMENT PRIMARY KEY, email CHAR(64), password CHAR(64));
/* Table definition on the slave */CREATE TABLE user ( id INT, email CHAR(64) PRIMARY KEY, password CHAR(64));
ConclusionThis chapter concludes a series of chapters about MySQL replication. We discussedadvanced replication topics such as how to promote slaves to masters more robustly,looked at tips and techniques for avoiding corrupted databases after a crash, examinedmultisource replication configurations and considerations, and finally looked at row-based replication in detail.
In the next chapters, we examine another set of topics for building robust data centers,including monitoring, performance tuning of storage engines, and replication.
Joel met his boss in the hallway on his way back from lunch. “Hello, Mr. Summerson.”
“Hello, Joel.”
“Have you read my report?”
“Yes, I have, Joel. Good work. I’ve passed it around to some of the other departmentsfor comment. I want to add it to our SOP manual.”
Joel imagined SOP meant standard operating procedures.
“I’ve asked the reviewers to send you their comments. It might need some wordsmithingto fit into an SOP, but I know you’re up to the task.”
“Thank you, sir.”
Mr. Summerson nodded, patted Joel on the shoulder, and continued on his way downthe hall.
Conclusion | 289


CHAPTER 9
MySQL Cluster
A subdued knock on his door alerted Joel to his visitor. He looked up to see a worried-looking Mr. Summerson.
“I’ve got to dump on you this time, Joel. We’re in a real bind here.”
Joel remained silent, wondering what his definition of “dump on you” meant. So far, hehad tasked Joel with some pretty intense work.
“We’ve just learned of a new customer who wants to use our latest database applicationin a real-time, five-nines environment.”
“Always up and no downtime?”
“That’s right. Now, I know MySQL is very reliable, but there’s no time to change theapplication to use a fault-tolerant database server.”
Joel remembered skimming a chapter on a special version of MySQL and wondered ifthat would work. He decided to take a chance: “We could use the cluster technology.”
“Cluster?”
“Yes, MySQL has a cluster version that is a fault-tolerant database system. It has workedin some pretty demanding environments, like telecom, as I recall....”
Mr. Summerson’s eyes brightened and he appeared to stand a little straighter as he de‐livered his coup de grâce. “Perfect. Give me a report by tomorrow morning. I want cost,hardware requirements, limitations—the works. Don’t pull any punches. If we can getthis to work, I want to do it, but I don’t want to risk our reputation on a hunch.”
“I’ll get right on it,” Joel said, wondering what he had gotten himself into this time. AfterMr. Summerson left, he sighed and opened his favorite MySQL book. “This may be mygreatest challenge yet,” he said.
291

When high performance, high availability, redundancy, and scalability are paramountconcerns for database planners, they often seek to improve their replication topologieswith commodity high-availability hardware and load-balancing solutions. Althoughthis approach often meets the needs of most organizations, if you need a solution withno single points of failure and extremely high throughput with 99.999% uptime, chancesare the MySQL Cluster technology will meet your needs.
In this chapter, you will be introduced to the concepts of the MySQL Cluster technology.It provides you an example of starting and stopping a simple cluster, and discusses thekey points of using MySQL Cluster, including high availability, distributed data, anddata replication. We begin by describing what MySQL Cluster is and how it differs froma normal MySQL server.
What Is MySQL Cluster?MySQL Cluster is a shared-nothing storage solution with a distributed node architec‐ture designed for fault tolerance and high performance. Data is stored and replicatedon individual data nodes, where each data node runs on a separate server and maintainsa copy of the data. Each cluster also contains management nodes. Updates use read-committed isolation to ensure all nodes have consistent data and a two-phased committo ensure the nodes have the same data (if any one write fails, the update fails).
The original implementation of MySQL Cluster stored all information in main memorywith no persistent storage. Later releases of MySQL Cluster permit storage of the dataon disk. Perhaps the best quality of MySQL Cluster is that it uses the MySQL server asthe query engine via the storage engine layer. Thus, you can migrate applications de‐signed to interact with MySQL to MySQL Cluster transparently.
The shared-nothing, peer node concept permits an update executed on one server tobecome visible immediately on the other servers. The transmission of the updates usesa sophisticated communication mechanism designed for very high throughput acrossnetworks. The goal is to have the highest performance possible by using multiple MySQLservers to distribute the load, and high availability and redundancy by storing data indifferent locations.
Terminology and ComponentsTypical installations of the MySQL Cluster involve installing the components of thecluster on different machines on a network. Hence, MySQL Cluster is also known as anetwork database (NDB). When we use the term “MySQL Cluster,” we refer to theMySQL server plus the NDB components. However, when we use “NDB” or “NDBCluster” we refer specifically to the cluster components.
MySQL Cluster is a database system that uses the MySQL server as the frontend tosupport standard SQL queries. A storage engine named NDBCluster is the interface
292 | Chapter 9: MySQL Cluster

that links the MySQL server with the cluster technology. This relationship is often con‐fused. You cannot use the NDBCluster storage engine without the NDBCluster com‐ponents. However is it is possible to use the NDB Cluster technologies without theMySQL server, but this requires lower-level programming with the NDB API.
The NDB API is object-oriented and implements indexes, scans, transactions, and eventhandling. This allows you to write applications that retrieve, store, and manipulate datain the cluster. The NDB API also provides object-oriented error-handling facilities toallow orderly shutdown or recovery during failures. If you are a developer and want tolearn more about the NDB API, see the MySQL NDB API online documentation.
How Does MySQL Cluster Differ from MySQL?You may be wondering, “What is the difference between a cluster and replication?”There are several definitions of clustering, but it can generally be viewed as somethingthat has membership, messaging, redundancy, and automatic failover capabilities. Rep‐lication, in contrast, is simply a way to send messages (data) from one server to another.We discuss replication within a cluster (also called local replication) and MySQL repli‐cation in more detail later in this chapter.
Typical ConfigurationYou can view the MySQL Cluster as having three layers:
• Applications that communicate with the MySQL server• The MySQL server that processes the SQL commands and communicates to the
NDB storage engine• The NDB Cluster components (i.e., the data nodes) that process the queries and
return the results to the MySQL server
You can scale up each layer independently with more server process‐es to increase performance.
Figure 9-1 shows a conceptual drawing of a typical cluster installation.
The applications connect to the MySQL server, which accesses the NDB Cluster com‐ponents via the storage engine layer (specifically, the NDB storage engine). We willdiscuss the NDB Cluster components in more detail momentarily.
What Is MySQL Cluster? | 293

Figure 9-1. MySQL Cluster
There are many possible configurations. You can use multiple MySQL servers to connectto a single NDB Cluster and even connect multiple NDB Clusters via MySQL replication.We will discuss more of these configurations in later sections.
Features of MySQL ClusterTo satisfy the goals of having the highest achievable performance, high availability, andredundancy, data is replicated inside the cluster among the peer data nodes. The datais stored on multiple data nodes and is replicated synchronously, each data node con‐necting to every other data node.
294 | Chapter 9: MySQL Cluster

It is also possible to replicate data between clusters, but in this case,you use MySQL replication, which is asynchronous rather than syn‐chronous. As we’ve discussed in previous chapters, asynchronousreplication means you must expect a delay in updating the slaves;slaves do not report back the progress in committing changes, andyou cannot expect a consistent view across all servers in the replica‐ted architecture like you can expect within a single MySQL cluster.
MySQL Cluster has several specialized features for creating a highly available system.The most significant ones are:Node recovery
Data node failures can be detected via either communication loss or heartbeat fail‐ure, and you can configure the nodes to restart automatically using copies of thedata from the remaining nodes. Failure and recovery can comprise single or mul‐tiple storage nodes. This is also called local recovery.
LoggingDuring normal data updates, copies of the data change events are written to a logstored on each data node. You can use the logs to restore the data to a point in time.
CheckpointingThe cluster supports two forms of checkpoints, local and global. Local checkpointsremove the tail of the log. Global checkpoints are created when the logs of all datanodes are flushed to disk, creating a transaction-consistent snapshot of all nodedata to disk. In this way, checkpointing permits a complete system restore of allnodes from a known good synchronization point.
System recoveryIn the event the whole system is shut down unexpectedly, you can restore it usingcheckpoints and change logs. Typically, the data is copied from disk into memoryfrom known good synchronization points.
Hot backup and restoreYou can create simultaneous backups of each data node without disturbing exe‐cuting transactions. The backup includes the metadata about the objects in thedatabase, the data itself, and the current transaction log.
No single point of failureThe architecture is designed so that any node can fail without bringing down thedatabase system.
FailoverTo ensure node recovery is possible, all transactions are committed using readcommit isolation and two-phase commits. Transactions are then doubly safe (i.e.,
What Is MySQL Cluster? | 295

they are stored in two separate locations before the user gets acceptance of thetransaction).
PartitioningData is automatically partitioned across the data nodes. Starting with MySQL ver‐sion 5.1, MySQL Cluster supports user-defined partitioning.
Online operationsYou can perform many of the maintenance operations online without the normalinterruptions. These are operations that normally require stopping a server orplacing locks on data. For example, it is possible to add new data nodes online, altertable structures, and even reorganize the data in the cluster.
For more information about MySQL Cluster, see the MySQL Cluster Documentationcontaining reference guides for the different versions of cluster.
Local and Global RedundancyYou can create local redundancy (inside a particular cluster) using a two-phase commitprotocol. In principle, each node goes through a round in which it agrees to make achange, then undergoes a round in which it commits the transaction. During the agree‐ment phase, each node ensures that there are enough resources to commit the changein the second round. In NDB Cluster, the MySQL server commit protocol changes toallow updates to multiple nodes. NDB Cluster also has an optimized version of two-phase commit that reduces the number of messages sent using synchronous replication.The two-phase protocol ensures the data is redundantly stored on multiple data nodes,a state known as local redundancy.
Global redundancy uses MySQL replication between clusters. This establishes two no‐des in a replication topology. As discussed previously, MySQL replication is asynchro‐nous because it does not include an acknowledgment or receipt for arrival or executionof the events replicated. Figure 9-2 illustrates the differences.
296 | Chapter 9: MySQL Cluster

Figure 9-2. Local and global redundancy
Log HandlingMySQL Cluster implements two types of checkpoints: local checkpoints to purge partof the redo log, and a global checkpoint that is mainly for synchronizing between thedifferent data nodes. The global checkpoint becomes important for replication becauseit forms the boundary between sets of transactions known as epochs. Each epoch isreplicated between clusters as a single unit. In fact, MySQL replication treats the set oftransactions between two consecutive global checkpoints as a single transaction.
Redundancy and Distributed DataData redundancy is based on replicas, where each replica has a copy of the data. Thisallows a cluster to be fault tolerant. If any data node fails, you can still access the data.Naturally, the more replicas you allow in a cluster, the more fault tolerant the clusterwill be.
What Is MySQL Cluster? | 297

Split-Brain SyndromeIf one or more data nodes fail, it is possible that the remaining data nodes will be unableto communicate. When this happens, the two sets of data nodes are in a split-brainscenario. This type of situation is undesirable, because each set of data nodes couldtheoretically perform as a separate cluster.
To overcome this, you need a network partitioning algorithm to decide between thecompeting sets of data nodes. The decision is made in each set independently. The setwith the minority of nodes will be restarted and each node of that set will need to jointhe majority set individually.
If the two sets of nodes are exactly the same size, a theoretical problem still exists. If yousplit four nodes into two sets with two nodes in each, how do you know which set is aminority? For this purpose, you can define an arbitrator. In the case that the sets areexactly the same size, the set that first succeeds in contacting the arbitrator wins.
You can designate the arbitrator as either a MySQL server (SQL node) or a managementnode. For best availability, you should locate the arbitrator on a system that does nothost a data node.
The network partitioning algorithm with arbitration is fully automatic in MySQL Clus‐ter, and the minority is defined with respect to node groups to make the system evenmore available than it would be compared to just counting the nodes.
You can specify how many copies of the data (NoOfReplicas) exist in the cluster. Youneed to set up as many data nodes as you want replicas. You can also distribute the dataacross the data nodes using partitioning. In this case, each data node has only a portionof the data, making queries faster. But because you have multiple copies of the data, youcan still query the data in the event that a node fails, and the recovery of the missingnode is assured (because the data exists in the other replicas). To achieve this, you needmultiple data nodes for each replica. For example, if you want two replicas and parti‐tioning, you need to have at least four data nodes (two data nodes for each replica).
Architecture of MySQL ClusterMySQL Cluster is composed of one or more MySQL servers communicating via theNDB storage engine to an NDB cluster. An NDB cluster itself is composed of severalcomponents: data or storage nodes that store and retrieve the data and one or moremanagement nodes that coordinate startup, shutdown, and recovery of data nodes. Mostof the NDB components are implemented as daemon processes, while MySQL Clusteralso offers client utilities to manipulate the daemons’ features. Here is a list of the dae‐mons and utilities (Figure 9-3 depicts how each of these components communicates):
298 | Chapter 9: MySQL Cluster

mysqldThe MySQL server
ndbdA data node
ndbmtdA multithreaded data node
ndb_mgmdThe cluster’s management server
ndb_mgmThe cluster’s management client
Each MySQL server with the executable name mysqld typically supports one or moreapplications that issue SQL queries and receive results from the data nodes. When dis‐cussing MySQL Cluster, the MySQL servers are sometimes called SQL nodes.
The data nodes are NDB daemon processes that store and retrieve the data either inmemory or on disk depending on their configuration. Data nodes are installed on eachserver participating in the cluster. There is also a multithreaded data node daemonnamed ndbmtd that works on platforms that support multiple CPU cores. You can seeimproved data node performance if you use the multithreaded data node on dedicatedservers with modern multiple-core CPUs.
Figure 9-3. The MySQL Cluster components
The management daemon, ndb_mgmd, runs on a server and is responsible for readinga configuration file and distributing the information to all of the nodes in the cluster.ndb_mgm, the NDB management client utility, can check the cluster’s status, start back‐
Architecture of MySQL Cluster | 299

ups, and perform other administrative functions. This client runs on a host convenientto the administrator and communicates with the daemon.
There are also a number of utilities that make maintenance easier. Here are a few of themore popular ones (consult the NDB Cluster documentation for a complete list):ndb_config
Extracts configuration information from existing nodes.
ndb_delete_allDeletes all rows from an NDB table.
ndb_descDescribes NDB tables (like SHOW CREATE TABLE).
ndb_drop_indexDrops an index from an NDB table.
ndb_drop_tableDrops an NDB table.
ndb_error_reporterDiagnoses errors and problems in a cluster.
ndb_redo_log_readerChecks and prints out a cluster redo log.
ndb_restorePerforms a restore of a cluster. Backups are made using the NDB management client.
How Data Is StoredMySQL Cluster keeps all indexed columns in main memory. You can store the remain‐ing nonindexed columns either in memory or on disk with an in-memory page cache.Storing nonindexed columns on disk allows you to store more data than the size ofavailable memory.
When data is changed (via INSERT, UPDATE, DELETE, etc.), MySQL Cluster writes a recordof the change to a redo log, checkpointing data to disk regularly. As described previously,the log and the checkpoints permit recovery from disk after a failure. However, becausethe redo logs are written asynchronously with the commit, it is possible that a limitednumber of transactions can be lost during a failure. To mitigate against this risk, MySQLCluster implements a write delay (with a default of two seconds, but this is configurable).This allows the checkpoint write to complete so that if a failure occurs, the last check‐point is not lost as a result of the failure. Normal failures of individual data nodes donot result in any data loss due to the synchronous data replication within the cluster.
300 | Chapter 9: MySQL Cluster

When a MySQL Cluster table is maintained in memory, the cluster accesses disk storageonly to write records of the changes to the redo log and to execute the requisite check‐points. Because writing the logs and checkpoints is sequential and few random accesspatterns are involved, MySQL Cluster can achieve higher write throughput rates withlimited disk hardware than the traditional disk caching used in relational database sys‐tems.
You can calculate the size of memory you need for a data node using the followingformula. The size of the database is the sum of the size of the rows times the number ofrows for each table. Keep in mind that if you use disk storage for nonindexed columns,you should count only the indexed columns in calculating the necessary memory.
(SizeofDatabase × NumberOfReplicas × 1.1 ) / NumberOfDataNodes
This is a simplified formula for rough calculation. When planning the memory of yourcluster, you should consult the online MySQL Cluster Reference Manual for additionaldetails to consider.
You can also use the Perl script ndb_size.pl found in most distributions. This scriptconnects to a running MySQL server, traverses all the existing tables in a set of databases,and calculates the memory they would require in a MySQL cluster. This is convenient,because it permits you to create and populate the tables on a normal MySQL server first,then check your memory configuration before you set up, configure, and load data intoyour cluster. It is also useful to run periodically to keep ahead of schema changes thatcan result in memory issues and to give you an idea of your memory usage. Example 9-1depicts a sample report for a simple database with a single table. To find the total sizeof the database, multiply the size of the data row from the summary by the number ofrows. In Example 9-1, we have (for MySQL version 5.1) 84 bytes per row for data andindex. If we had 64,000 rows, we would need to have 5,376,000 bytes of memory to storethe table.
If the script generates an error about a missing Class/MethodMaker.pm module, you need to install this class on your system. For ex‐ample, on Ubuntu you can install it with the following command:
sudo apt-get install libclass-methodmaker-perl
Example 9-1. Checking the size of a database with ndb_size.pl$ ./ndb_size.pl \> --database=cluster_test --user=rootndb_size.pl report for database: 'cluster_test' (1 tables)----------------------------------------------------------Connected to: DBI:mysql:host=localhost
Architecture of MySQL Cluster | 301

Including information for versions: 4.1, 5.0, 5.1
cluster_test.City-----------------
DataMemory for Columns (* means varsized DataMemory): Column Name Type Varsized Key 4.1 5.0 5.1 district char(20) 20 20 20 population int(11) 4 4 4 ccode char(3) 4 4 4 name char(35) 36 36 36 id int(11) PRI 4 4 4 -- -- --Fixed Size Columns DM/Row 68 68 68 Varsize Columns DM/Row 0 0 0
DataMemory for Indexes: Index Name Type 4.1 5.0 5.1 PRIMARY BTREE N/A N/A N/A -- -- -- Total Index DM/Row 0 0 0
IndexMemory for Indexes: Index Name 4.1 5.0 5.1 PRIMARY 29 16 16 -- -- -- Indexes IM/Row 29 16 16
Summary (for THIS table): 4.1 5.0 5.1 Fixed Overhead DM/Row 12 12 16 NULL Bytes/Row 0 0 0 DataMemory/Row 80 80 84(Includes overhead, bitmap and indexes)
Varsize Overhead DM/Row 0 0 8 Varsize NULL Bytes/Row 0 0 0 Avg Varside DM/Row 0 0 0
No. Rows 3 3 3
Rows/32kb DM Page 408 408 388Fixedsize DataMemory (KB) 32 32 32
Rows/32kb Varsize DM Page 0 0 0 Varsize DataMemory (KB) 0 0 0
Rows/8kb IM Page 282 512 512 IndexMemory (KB) 8 8 8
Parameter Minimum Requirements------------------------------
302 | Chapter 9: MySQL Cluster

* indicates greater than default
Parameter Default 4.1 5.0 5.1 DataMemory (KB) 81920 32 32 32 NoOfOrderedIndexes 128 1 1 1 NoOfTables 128 1 1 1 IndexMemory (KB) 18432 8 8 8NoOfUniqueHashIndexes 64 0 0 0 NoOfAttributes 1000 5 5 5 NoOfTriggers 768 5 5 5
Although Example 9-1 uses a very simple table, the output shows not only the row size,but also a host of statistics for the tables in the database. The report also shows theindexing statistics, which are the key mechanism the cluster uses for high performance.
The script displays the different memory requirements across MySQL versions. Thisallows you to see any differences if you are working with older versions of MySQLCluster.
PartitioningOne of the most important aspects of MySQL Cluster is data partitioning. MySQLCluster partitions data horizontally (i.e., the rows are automatically divided among thedata nodes using a function to distribute the rows). This is based on a hashing algorithmthat uses the primary key for the table. In early versions of MySQL, the software usesan internal mechanism for partitioning, but MySQL versions 5.1 and later allow you toprovide your own function for partitioning data. If you use your own function forpartitioning, you should create a function that ensures the data is distributed evenlyamong the data nodes.
If a table does not have a primary key, MySQL Cluster adds a surro‐gate primary key.
Partitioning allows the MySQL Cluster to achieve higher performance for queries be‐cause it supports distribution of queries among the data nodes. Thus, a query will returnresults much faster when gathering data across several nodes than from a single node.For example, you can execute the following query on each data node, getting the sumof the column on each one and summing those results:
SELECT SUM(population) FROM cluster_db.city;
Data distributed across the data nodes is protected from failure if you have more thanone replica (copy) of the data. If you want to use partitioning to distribute your data
Architecture of MySQL Cluster | 303

across multiple data nodes to achieve parallel queries, you should also ensure you haveat least two replicas of each row so that your cluster is fault tolerant.
Transaction ManagementAnother aspect of MySQL Cluster’s behavior that differs from MySQL server concernstransactional data operations. As mentioned previously, MySQL Cluster coordinatestransactional changes across the data nodes. This uses two subprocesses called thetransaction coordinator and the local query handler.
The transaction coordinator handles distributed transactions and other data operationson a global level. The local query handler manages data and transactions local to thecluster’s data nodes and acts as a coordinator of two-phase commits at the data node.
Each data node can be a transaction coordinator (you can tune this behavior). Whenan application executes a transaction, the cluster connects to a transaction coordinatoron one of the data nodes. The default behavior is to select the closest data node as definedby the networking layer of the cluster. If there are several connections available withinthe same distance, a round-robin algorithm selects the transaction coordinator.
The selected transaction coordinator then sends the query to each data node, and thelocal query handler executes the query, coordinating the two-phased commit with thetransaction coordinator. Once all data nodes verify the transaction, the transaction co‐ordinator validates (commits) the transaction.
MySQL Cluster supports the read-committed transaction isolation level. This meansthat when there are changes during the execution of the transaction, only committedchanges can be read while the transaction is underway. In this way, MySQL Clusterensures data consistency while transactions are running.
For more information about how transactions work in MySQL Cluster and a list ofimportant limitations on transactions, see the MySQL Cluster chapter in the onlineMySQL Reference Manual.
Online OperationsIn MySQL versions 5.1 and later, you can perform certain operations while a cluster isonline, meaning that you do not have to either take the server down or lock portions ofthe system or database. The following list briefly discusses a few of the online operationsavailable in MySQL Cluster and lists the versions that include each feature:Backup (versions 5.0 and later)
You can use the NDB management console to perform a snapshot backup (a non‐blocking operation) to create a backup of your data in the cluster. This operationincludes a copy of the metadata (names and definitions of all tables), the table data,and the transaction log (a historical record of changes). It differs from a mysql‐
304 | Chapter 9: MySQL Cluster

dump backup in that it does not use a table scan to read the records. You can restorethe data using the special ndb_restore utility.
Adding and dropping indexes (MySQL Cluster version 5.1 and later)You can use the ONLINE keyword to perform the CREATE INDEX or DROP INDEXcommand online. When online operation is requested, the operation is noncopying—it does not make a copy of the data in order to index it—so indexes do not haveto be recreated afterward. One advantage of this is that transactions can continueduring alter table operations, and tables being altered are not locked against accessby other SQL nodes. However, the table is locked against other queries on the SQLnode performing the alter operation.
In MySQL Cluster version 5.1.7 and later, add and drop indexoperations are performed online when the indexes are onvariable-width columns only.
Alter table (MySQL Cluster version 6.2 and later)You can use the ONLINE keyword to execute an ALTER TABLE statement online. It isalso noncopying and has the same advantages as adding indexes online. Addition‐ally, in MySQL Cluster version 7.0 and later, you can reorganize the data acrosspartitions online using the REORGANIZE PARTITION command as long as you don’tuse the INTO (partition_definitions) option.
Changing default column values or data types online is current‐ly not supported.
Add data nodes and node groups (MySQL Cluster version 7.0 and later)You can manage the expansion of your data nodes online, either for scale-out orfor node replacement after a failure. The process is described in great detail in thereference manual. Briefly, it involves changing the configuration file, performing arolling restart of the NDB management daemon, performing a rolling restart of theexisting data nodes, starting the new data nodes, and then reorganizing thepartitions.
For more information about MySQL Cluster, its architecture and features, you can findwhite papers covering MySQL Cluster, but also many other MySQL-related topics.
Architecture of MySQL Cluster | 305

Example ConfigurationIn this section, we present a sample configuration of a MySQL Cluster running two datanodes on two systems, with the MySQL server and NDB management node on a thirdsystem. We present examples of simplified data node setup. Our example system isshown in Figure 9-4.
Figure 9-4. Sample cluster configuration
You can see one node that contains both the NDB management daemon and the SQLnode (the MySQL server). There are also two data nodes, each on its own system. Youneed a minimum of three computers to form a basic MySQL Cluster configuration witheither increased availability or performance.
This is a minimal configuration for MySQL Cluster and, if the number of replicas is setto two, the minimal configuration for fault tolerance. If the number of replicas is set toone, the configuration will support partitioning for better performance but will not befault tolerant.
It is generally permissible to run the NDB management daemon on the same node as aMySQL server, but you may want to move this daemon to another system if you arelikely to have a high number of data nodes or want to ensure the greatest level of faulttolerance.
Getting StartedYou can obtain MySQL Cluster from the MySQL downloads page. It is open source, likethe MySQL server. You can download either a binary distribution or an installation filefor some of the top platforms. You can also download the source code and build the
306 | Chapter 9: MySQL Cluster

cluster on your own platform. Be sure to check the platform notes for specific issues foryour host operating system.
You should follow the normal installation procedures outlined in the MySQL ReferenceManual. Aside from one special directory, the NDB tools are installed in the same lo‐cation as the MySQL server binaries.
Before we dive into our example, let us first review some general concepts concerningconfiguring a MySQL cluster. The cluster configuration is maintained by the NDBmanagement daemon and is read (initially) from a configuration file. There are manyparameters that you can use to tune the various parts of the cluster, but we will con‐centrate on a minimal configuration for now.
There are several sections in the configuration file. At a minimum, you need to includeeach of the following sections:[mysqld]
The familiar section of the configuration file that applies to the MySQL server, theSQL node.
[ndb default]
A default section for global settings. Use this section to specify all of the settingsyou want applied to every node, both data and management. Note that the nameof the section contains a space, not an underscore.
[ndb_mgmd]
A section for the NDB management daemon.
[ndbd]
You must add one section with this name for each data node.
Example 9-2 shows a minimal configuration file that matches the configuration inFigure 9-4.
Example 9-2. Minimal configuration file[ndbd default]NoOfReplicas= 2DataDir= /var/lib/mysql-cluster
[ndb_mgmd]hostname=192.168.0.183datadir= /var/lib/mysql-cluster
[ndbd]hostname=192.168.0.12
[ndbd]hostname=192.168.0.188
Example Configuration | 307

[mysqld]hostname=192.168.0.183
This example includes the minimal variables for a simple two data-node cluster withreplication. Thus, the NoOfReplicas option is set to 2. Notice we have set the datadirvariable to /var/lib/mysql-cluster. You can set it to whatever you want, but most instal‐lations of MySQL Cluster use this directory.
Finally, notice we have specified the hostname of each node. This is important, becausethe NDB management daemon needs to know the location of all of the nodes in thecluster. If you have downloaded and installed MySQL Cluster and want to follow along,make the necessary changes to the hostnames so they match our example.
The MySQL Cluster configuration file is by default placed in /var/lib/mysql-cluster andis named config.ini.
It is not necessary to install the complete MySQL Cluster binarypackage on the data nodes. As you will see later, you need only thendbd daemon on the data nodes.
Starting a MySQL ClusterStarting MySQL Cluster requires a specific order of commands. We will step throughthe procedures for this example, but it is good to briefly examine the general process:
1. Start the management node(s).2. Start the data nodes.3. Start the MySQL servers (SQL nodes).
For our example, we first start the NDB management node on 192.168.0.183. Then westart each of the data nodes (192.168.0.12 and 192.168.0.188, in either order). Once thedata nodes are running, we can start the MySQL server on 192.168.0.183 and, after abrief startup delay, the cluster is ready to use.
Starting the management node
The first node to start is the NDB management daemon named ndb_mgmd. This islocated in the libexec folder of the MySQL installation. For example, on Ubuntu it islocated in /usr/local/mysql/libexec.
Start the NDB management daemon by issuing a superuser launch and specify the --initial and --config-file options. The --initial option tells the cluster that thisis our first time starting and we want to erase any configurations stored from previous
308 | Chapter 9: MySQL Cluster

launches. The --config-file option tells the daemon where to find the configurationfile. Example 9-3 shows how to start the NDB management daemon for our example.
Example 9-3. Starting the NDB management daemon$ sudo ../libexec/ndb_mgmd --initial \--config-file /var/lib/mysql-cluster/config.iniMySQL Cluster Management Server mysql-5.6.11 ndb-7.3.2
It is always a good idea to provide the --config-file option when you start, becausesome installations have different default locations for the configuration file search pat‐tern. You can discover this pattern by issuing the command ndb_mgmd --help andsearching for the phrase “Default options are read from.” It is not necessary to specifythe --config-file option on subsequent starts of the daemon.
Starting the management console
While not absolutely necessary at this point, it is a good idea to now launch the NDBmanagement console and check that the NDB management daemon has correctly readthe configuration. The name of the NDB management console is ndb_mgm and it islocated in the bin directory of the MySQL installation. We can view the configurationby issuing the SHOW command, as shown in Example 9-4.
Example 9-4. Initial start of the NDB management console$ ./ndb_mgm-- NDB Cluster -- Management Client --ndb_mgm> SHOWConnected to Management Server at: 192.168.0.183:1186Cluster Configuration---------------------[NDBd(NDB)] 2 node(s)id=2 (not connected, accepting connect from 192.168.0.188)id=3 (not connected, accepting connect from 192.168.0.12)
[NDB_mgmd(MGM)] 1 node(s)id=1 @192.168.0.183 (mysql-5.5.31 ndb-7.2.13)
[mysqld(API)] 1 node(s)id=4 (not connected, accepting connect from 192.168.0.183)
ndb_mgm>
This command displays the data nodes and their IP addresses as well as the NDB man‐agement daemon and the SQL node. This is a good time to check that all of our nodesare configured with the right IP addresses and that all of the appropriate data nodes areloaded. If you have changed your cluster configuration but see the old values here, it islikely the NDB management daemon has not read the new configuration file.
Example Configuration | 309

This output tells us that the NDB management daemon is loaded and ready. If it werenot, the SHOW command would fail with a communication error. If you see that error,be sure to check that you are running the NDB management client on the same serveras the NDB management daemon. If you are not, use the --ndb-connectstring optionand provide the IP address or hostname of the machine hosting the NDB managementdaemon.
Finally, notice the node IDs of your nodes. You will need this information to issuecommands to a specific node in the cluster from the NDB management console. Issuethe HELP command at any time to see the other commands available. You will also needto know the node ID for your SQL nodes so that they start up correctly.
You can specify the node IDs for each node in your cluster using the--ndb-nodeid parameter in the config.ini file.
You can also use the STATUS command to see the status of your nodes. Issue ALL STATUS to see the status of all nodes or node-id STATUS to see the status of a specific node.This command is handy for watching the cluster start up, because the output reportswhich startup phase the data node is in. If you want to see the details, look in a versionof the online MySQL Reference Manuals containing MySQL Cluster for more detailsabout the phases of data node startup.
Starting data nodes
Now that we have started our NDB management daemon, it is time to start the datanodes. However, before we do that, let’s examine the minimal setup needed for an NDBdata node.
To set up an NDB data node, all you need is the NDB data node daemon (ndbd) compiledfor the targeted host operating system. First, create the folder /var/lib/mysql-cluster,then copy in the ndbd executable, and you’re done! Clearly, this makes it very easy toscript the creation of data nodes (and many have).
You can start the data nodes (ndbd) using the --initial-start option, which signalsthat this is the first time the cluster has been started. You also must provide the --ndb-connectstring option, providing the IP address of the NDB management daemon.Example 9-5 shows starting a data node for the first time. Do this on each data node.
Example 9-5. Starting the data node$ sudo ./ndbd --initial-start --ndb-connectstring=192.168.0.1832013-02-11 06:22:52 [ndbd] INFO -- Angel connected to '192.168.0.183:1186'2013-02-11 06:22:52 [ndbd] INFO -- Angel allocated nodeid: 2
310 | Chapter 9: MySQL Cluster

If you are starting a new data node, have reset a data node, or are recovering from afailure, you can specify the --initial option to force the data node to erase any existingconfiguration and cached data and request a new copy from the NDB managementdaemon.
Be careful when using the --initial options. They really do de‐lete your data!
Return to the management console and check the status (Example 9-6).
Example 9-6. Status of data nodesndb_mgm> SHOWCluster Configuration---------------------[ndbd(NDB)] 2 node(s)id=2 @192.168.0.188 (mysql-5.5.31 ndb-7.2.13, Nodegroup: 0, Master)id=3 @192.168.0.12 (mysql-5.5.31 ndb-7.2.13, Nodegroup: 0, Master)
[ndb_mgmd(MGM)] 1 node(s)id=1 @192.168.0.183 (mysql-5.5.31 ndb-7.2.13)
[mysqld(API)] 1 node(s)id=4 (not connected, accepting connect from 192.168.0.183)
You can see that the data nodes started successfully, because information about theirdaemons is shown. You can also see that one of the nodes has been selected as the masterfor cluster replication. Because we set the number of replicas to 2 in our configurationfile, we have two copies of the data. Don’t confuse this notion of master with a masterin MySQL replication. We discuss the differences in more detail later in the chapter.
Starting the SQL nodes
Once the data nodes are running, we can connect our SQL node. There are severaloptions we must specify that enable a MySQL server to connect to an NDB cluster. Mostpeople specify these in the my.cnf file, but you can also specify them on the startupcommand line if you start the server in that manner:ndbcluster
Tells the server that you want to include the NDB Cluster storage engine.
ndb_connectstring
Tells the server the location of the NDB management daemon.
Example Configuration | 311

ndb_nodeid and server_idNormally set to the node ID. You can find the node ID in the output from the SHOWcommand in the NDB management console.
Example 9-7 shows a correct startup sequence for the SQL node in our clusterexample.
Example 9-7. Starting the SQL node$ sudo ../libexec/mysqld --ndbcluster \--console -umysql130211 9:14:21 [Note] Plugin 'FEDERATED' is disabled.130211 9:14:21 InnoDB: Started; log sequence number 0 1112278176130211 9:14:21 [Note] NDB: NodeID is 4, management server '192.168.0.183:1186'130211 9:14:22 [Note] NDB[0]: NodeID: 4, all storage nodes connected130211 9:14:22 [Note] Starting Cluster Binlog Thread130211 9:14:22 [Note] Event Scheduler: Loaded 0 events130211 9:14:23 [Note] NDB: Creating mysql.NDB_schema130211 9:14:23 [Note] NDB: Flushing mysql.NDB_schema130211 9:14:23 [Note] NDB Binlog: CREATE TABLE Event: REPL$mysql/NDB_schema130211 9:14:23 [Note] NDB Binlog: logging ./mysql/NDB_schema (UPDATED,USE_WRITE)130211 9:14:23 [Note] NDB: Creating mysql.NDB_apply_status130211 9:14:23 [Note] NDB: Flushing mysql.NDB_apply_status130211 9:14:23 [Note] NDB Binlog: CREATE TABLE Event: REPL$mysql/NDB_apply_status130211 9:14:23 [Note] NDB Binlog: logging ./mysql/NDB_apply_status(UPDATED,USE_WRITE)2013-02-11 09:14:23 [NdbApi] INFO -- Flushing incomplete GCI:s < 65/172013-02-11 09:14:23 [NdbApi] INFO -- Flushing incomplete GCI:s < 65/17130211 9:14:23 [Note] NDB Binlog: starting log at epoch 65/17130211 9:14:23 [Note] NDB Binlog: NDB tables writable130211 9:14:23 [Note] ../libexec/mysqld: ready for connections.Version: '5.5.31-ndb-7.2.13-cluster-gpl-log' socket: '/var/lib/mysql/mysqld.sock'port: 3306 Source distribution
The output includes extra comments about the NDB Cluster connection, logs, andstatus. If you do not see these or if you see errors, be sure that you started your SQLnode with the proper options. Of particular importance is the message stating the nodeID and the management server. If you have multiple management servers running, besure your SQL node is communicating with the correct one.
Once the SQL node starts correctly, return to the management console and check thestatus of all of your nodes (Example 9-8).
Example 9-8. Example status of a running clusterndb_mgm> SHOWCluster Configuration---------------------[NDBd(NDB)] 2 node(s)id=2 @192.168.0.188 (mysql-5.5.31 ndb-7.2.13, Nodegroup: 0, Master)id=3 @192.168.0.12 (mysql-5.5.31 ndb-7.2.13, Nodegroup: 0)
312 | Chapter 9: MySQL Cluster

[NDB_mgmd(MGM)] 1 node(s)id=1 @192.168.0.183 (mysql-5.5.31 ndb-7.2.13)
[mysqld(API)] 1 node(s)id=4 @192.168.0.183 (mysql-5.5.31 ndb-7.2.13)
As you can see, all of our nodes are now connected and running. If you see any detailsother than what is shown here, you have a failure in the startup sequence of your nodes.Be sure to check the logs for each node to determine what went wrong. The most com‐mon cause is network connectivity (e.g., firewall issues). The NDB nodes use port 1186by default.
The logfiles for the data nodes and the NDB management daemon are located in thedata directory. The SQL node logs are located in the usual location for a MySQL server.
Testing the ClusterNow that our example cluster is running, let’s perform a simple test (shown inExample 9-9) to ensure we can create a database and tables using the NDB Clusterstorage engine.
Example 9-9. Testing the clustermysql> create database cluster_db;Query OK, 1 row affected (0.06 sec)
mysql> create table cluster_db.t1 (a int) engine=NDBCLUSTER;Query OK, 0 rows affected (0.31 sec)
mysql> show create table cluster_db.t1 \G*************************** 1. row *************************** Table: t1Create Table: CREATE TABLE `t1` ( `a` int(11) DEFAULT NULL) ENGINE=NDBcluster DEFAULT CHARSET=latin11 row in set (0.00 sec)
mysql> insert into cluster_db.t1 VALUES (1), (100), (1000);Query OK, 3 rows affected (0.00 sec)Records: 3 Duplicates: 0 Warnings: 0
mysql> select * from cluster_db.t1 \G*************************** 1. row ***************************a: 1*************************** 2. row ***************************a: 1000*************************** 3. row ***************************a: 1003 rows in set (0.00 sec)
Example Configuration | 313

Now that you have a running cluster, you can experiment by loading data and runningsample queries. We invite you to “fail” one of the data nodes during data updates andrestart it to see that the loss of a single data node does not affect accessibility.
Shutting Down the ClusterJust as there is a specific order for startup, there is a specific order to shutting down yourcluster:
1. If you have replication running between clusters, allow the slaves to catch up, thenstop replication.
2. Shut down your SQL nodes (mysqld).3. Issue SHUTDOWN in the NDB management console.4. Exit the NDB management console.
If you have MySQL replication running among two or more clusters, the first step willensure the replication slaves catch up (synchronize) with the master before you shut theSQL nodes down.
When you issue the SHUTDOWN command in the NDB management console, it will shutdown all of your data nodes and the NDB management daemon.
Achieving High AvailabilityThe main motivation for using high availability is to keep a service accessible. For da‐tabase systems, this means we must always be able to access the data. MySQL Cluster isdesigned to meet this need. MySQL Cluster supports high availability through distri‐bution of data across data nodes (which reduces the risk of data loss from a single node),replication among replicas in the cluster, automatic recovery (failover) of lost data no‐des, detection of data node failures using heartbeats, and data consistency using localand global checkpointing.
Let’s examine some of the qualities of a high-availability database system. To be con‐sidered highly available, a database system (or any system) must meet the followingrequirements:
• 99.999% uptime• No single point of failure• Failover• Fault tolerance
A 99.999% uptime means the data is, for practical purposes, always available. In otherwords, the database server is considered a nonstop, continuous service. The assumption
314 | Chapter 9: MySQL Cluster


And you can employ the normal high availability solutions discussed in previous chap‐ters, including replication and automated failover between whole clusters. We discusscluster replication in more detail later in this chapter.
Fault tolerance is normally associated with hardware such as backup power suppliesand redundant network channels. For software systems, fault tolerance is a by-productof how well failover is handled. For MySQL Cluster, this means it can tolerate a certainnumber of failures and continue to provide access to the data. Much like a hardwareRAID system that loses two drives on the same RAID array, loss of multiple data nodesacross replicas can result in an unrecoverable failure. However, with careful planning,you can configure MySQL Cluster to reduce this risk. A healthy dose of monitoring andactive maintenance can also reduce risk.
MySQL Cluster achieves fault tolerance by actively managing the nodes in the cluster.MySQL Cluster uses a heartbeat to check that services are alive, and when it detects afailed node, it takes action to perform a recovery.
The logging mechanisms in MySQL Cluster also provide a level of recovery for failoverand fault tolerance. Local and global checkpointing ensures data is consistent across thecluster. This information is critical for rapid recovery of data node failures. Not onlydoes it allow you to recover the data, but the unique properties of the checkpointingalso allow for rapid recovery of nodes. We discuss this feature in more detail later.
Figure 9-5 depicts a MySQL cluster configured for high availability in a web servicescenario.
The dotted boxes in the figure denote system boundaries. These components shouldreside on separate hardware to ensure redundancy. Also, you should configure the fourdata nodes as two replicas. Not shown in this drawing are additional components thatinteract with the application, such as a load balancer to divide the load across the weband MySQL servers.
When configuring a MySQL cluster for high availability, you should consider employingall of the following best practices (we discuss these in more detail later in this chapterwhen we examine high performance MySQL Cluster techniques):
• Use multiple replicas with data nodes on different hardware.• Use redundant network links to guard against network failures.• Use multiple SQL nodes.• Use multiple data nodes to improve performance and decentralize the data.
316 | Chapter 9: MySQL Cluster

Figure 9-5. A highly available MySQL cluster
System RecoveryThere are two types of system recovery. In one type, you shut down the server formaintenance or similar planned events. The other is an unanticipated loss of systemcapability. Fortunately, MySQL Cluster provides a mechanism to recover functionalityeven if the worst should occur.
When MySQL Cluster is shut down properly, it restarts from the checkpoints in thelogs. This is largely automatic and a normal phase of the startup sequence. The systemloads the most recent data from the local checkpoints for each data node, thereby re‐covering the data to the latest snapshot on restart. Once the data nodes have loaded thedata from their local checkpoints, the system executes the redo log up to the most recentglobal checkpoint, thereby synchronizing the data to the last change made prior to theshutdown. The process is the same for either a restart following an intentional shutdownor a full system restart after a failure.
You may not think a startup is something that would “recover,” but remember thatMySQL Cluster is an in-memory database and, as such, the data must be reloaded fromdisk on startup. Loading the data up to the most recent checkpoint accomplishes this.
Achieving High Availability | 317

When recovering a system from a catastrophic failure or as a corrective measure, youcan also recover from a backup of the data. As mentioned previously, you can restoredata by invoking the ndb_restore utility from the NDB management console and usingthe output of a recent online backup.
To perform a complete system restore from backup, you should first place the clusterin single-user mode using the following command in the NDB management console:
ENTER SINGLE USER MODE node-id
The node-id is the node ID of the data node you want to use for the ndb_restore utility.See the online MySQL Reference Manual for more details about single-user mode andconnecting API-based utilities.
You then run restore on each data node in the cluster. Once you have restored the dataon each data node, you can exit single-user mode and the cluster will be ready for use.To exit single-user mode, issue the following command in the NDB managementconsole:
EXIT SINGLE USER MODE
For more information about MySQL Cluster backup and restore, see the “Using theMySQL Cluster Management Client to Create a Backup” and “Restore a MySQL ClusterBackup” sections of the online MySQL Reference Manual.
Do not use the --initial option when restarting your server aftera failure or scheduled takedown.
Node RecoveryThere can be several reasons for a node failure, including network, hardware, memory,or operating system issues or failures. Here, we discuss the most common causes ofthese failures and how MySQL Cluster handles node recovery. In this section, we con‐centrate on data nodes, as they are the most important nodes with respect to data ac‐cessibility:Hardware
In the event the host computer hardware fails, clearly the data node running onthat system will fail. In this case, MySQL Cluster will fail over to the other replicas.To recover from this failure, replace the failed hardware and restart the data node.
NetworkIf the data node becomes isolated from the network due to some form of networkhardware or software failure, the node may continue to execute, but because itcannot contact the other nodes (via heartbeating), MySQL Cluster will mark the
318 | Chapter 9: MySQL Cluster

node as “down” and fail over to another replica until the node returns and can berecovered. To recover from this failure, replace the failed network hardware andrestart the data node.
MemoryIf there is insufficient memory on the host system, the cluster can essentially runout of space for data. This will result in that data node failing. To solve the problem,add more memory or increase the values of the configuration parameters for mem‐ory allocation and perform a rolling restart of the data node.
Operating systemIf the operating system configuration interferes with the execution of the data node,resolve the problems and restart the data node.
For more information about database high availability and MySQL high availabilityusing MySQL Cluster, see the white papers on the MySQL website.
ReplicationWe have already briefly discussed how MySQL replication and replication inside thecluster differ. MySQL Cluster replication is sometimes called internal cluster replica‐tion or simply internal replication to clarify that it is not MySQL replication. MySQLreplication is sometimes called external replication.
In this section, we discuss MySQL Cluster internal replication. We will also look at howMySQL replication (external replication) replicates data between MySQL clusters in‐stead of between individual MySQL servers.
Replication inside the cluster versus MySQL replication
We mentioned earlier that MySQL Cluster uses synchronous replication inside thecluster. This is done to support the two-phase commit protocol for data integrity. Con‐versely, MySQL replication uses asynchronous replication, which is a one-way transferof data that relies on the stable delivery and execution of events without verificationthat the data has been received before the commit.
Replicating inside the cluster
Internal MySQL Cluster replication provides redundancy by storing multiple copies ofthe data (which are called replicas). The process ensures data is written to multiple nodesbefore the query is acknowledged as complete (committed). This is done using a two-phase commit.
This form of replication is synchronous in that the data is guaranteed to be consistentat the point at which the query is acknowledged or that the commit has completed.
Achieving High Availability | 319

Data is replicated as fragments, where a fragment is defined as a subset of rows in a table.Fragments are distributed across the data nodes as a result of partitioning, and a copyof the fragment exists on another data node in each replica. One of the fragments isdesignated as the primary and is used for query execution. All other copies of the samedata are considered secondary fragments. During an update, the primary fragment isupdated first.
MySQL replication between clusters
Replication between clusters is very easy to do. If you can set up replication betweentwo MySQL servers, you can set up replication between two MySQL clusters. This isbecause there are no special configuration steps or extra commands or parametersneeded to start replication between clusters. MySQL replication works just as it doesbetween individual servers. It just so happens that in this case, the data is stored in NDBclusters. However, there are some limitations to external replication. We list a few herefor your consideration when planning external replication (consult the “MySQL ClusterReplication” section of the online MySQL Reference Manual for the latest details con‐cerning external replication):
• External replication must be row-based.• External replication cannot be circular.• External replication does not support the auto_increment_* options.• The size of the binary log may be larger than for normal MySQL replication.
MySQL replication to replicate data from one cluster to another permits you to leveragethe advantages of MySQL Cluster at each site and still replicate the data to other sites.
Can MySQL Replication Be Used with MySQL Cluster?You can replicate from a MySQL Cluster server to a non-MySQL Cluster server (or viceversa). No special configuration is necessary other than to accommodate some potentialstorage engine conflicts, which is similar to replicating among MySQL servers withdifferent storage engines. In this case, use default storage engine assignment and forgospecifying the storage engine in your CREATE statements.
Replicating from a MySQL cluster to a non-MySQL cluster requires creating the specialtable called ndb_apply_status to replicate the epochs committed. If this table is missingon the slave, replication will stop with an error reporting that ndb_apply_status doesnot exist. You can create the table with the following command:
CREATE TABLE `mysql`.`ndb_apply_status` ( `server_id` INT(10) UNSIGNED NOT NULL, `epoch` BIGINT(20) UNSIGNED NOT NULL, `log_name` VARCHAR(255) CHARACTER SET latin1
320 | Chapter 9: MySQL Cluster

COLLATE latin1_bin NOT NULL, `start_pos` BIGINT(20) UNSIGNED NOT NULL, `end_pos` BIGINT(20) UNSIGNED NOT NULL, PRIMARY KEY (`server_id`) USING HASH) ENGINE=NDBCLUSTER DEFAULT CHARSET=latin1;
Replication of the MySQL cluster using external replication requires row-based MySQLreplication, and the master SQL node must be started with --binlog-format=ROW or--binlog-format=MIXED. All other requirements for MySQL replication also apply(e.g., unique server IDs for all SQL nodes).
External replication also requires some special additions to the replication process, in‐cluding use of the cluster binary log, the binlog injector thread, and special system tablesto support updates between clusters. External replication also handles transactionalchanges a bit differently. We discuss these concepts in more detail in the next section.
Architecture of MySQL Cluster (external) replication
You can consider the basic concepts of the operations of external replication to be thesame as MySQL replication. Specifically, we define the roles of master and slave forcertain cluster installations. As such, the master contains the original copy of the data,and the slaves receive copies of the data in increments based on the incoming flow ofchanges to the data.
Replication in MySQL Cluster makes use of a number of dedicated tables in the mysqldatabase on each SQL node on the master and the slave (whether the slave is a singleserver or a cluster). These tables are created during the MySQL installation process. Thetwo tables are ndb_binlog_index, which stores index data for the binary log (local tothe SQL node), and ndb_apply_status, which stores a record of the operations thathave been replicated to the slave. The ndb_apply_status table is maintained on all SQLnodes and kept in sync so that is the same throughout the cluster. You can use it toexecute PITR of a failed replicated slave that is part of a MySQL cluster.
These tables are updated by a new thread called the binlog injector thread. This threadkeeps the master updated with any changes performed in the NDB Cluster storageengine by recording the changes made in the cluster. The binlog injector thread is re‐sponsible for capturing all the data events within the cluster as recorded in the binarylog and ensures all events that change, insert, or delete data are recorded in the ndb_binlog_index table. The master’s dump thread sends the events to the slave I/O threadusing MySQL replication.
One important difference in external replication involving MySQL Cluster is that eachepoch is treated as a transaction. Because an epoch is a span of time between checkpoints,and MySQL Cluster ensures consistency at each checkpoint, epochs are consideredatomic and are replicated using the same mechanism as a transaction in MySQL repli‐
Achieving High Availability | 321

cation. The information about the last applied epoch is stored in the NDB system tablesthat support external replication between MySQL clusters.
Single-channel and multichannel replication
The MySQL replication connection between a master and slave is called a channel. Achannel is, in effect, the networking protocol and medium used to connect the masterto its slaves. Normally, there is only a single channel, but to ensure maximum availability,you can set up a secondary channel for fault tolerance. This is called multichannel rep‐lication. Figure 9-6 shows multichannel external replication.
Figure 9-6. Multichannel external replication
Multichannel replication enhances recovery of a network link failure dramatically. Ide‐ally, you would use active monitoring to trigger a potential failure of the network linkto signal when the link is down. This can be accomplished in a variety of ways, fromscripts that use simple heartbeat mechanisms to alerts and advisors such as those avail‐able in the MySQL Enterprise Monitor.
Notice that the setup in Figure 9-6 has a total of four SQL nodes (i.e., MySQL servers).The cluster acting as the master cluster has two SQL nodes acting as masters, one pri‐mary and one secondary. Likewise, the cluster acting as a slave cluster has two SQLnodes acting as primary and secondary slaves. The primary master/slave pair commu‐
322 | Chapter 9: MySQL Cluster

nicates over one network connection, and the secondary master/slave pair communi‐cates over a different network connection.
Don’t take your networking components for granted. Even a switchcan fail. Using different cabling on the same switched network gainsvery little. It is best to use a completely separate set of redundantconnections and intermediary networking components to achievetrue network redundancy.
Setup of multichannel replication does not differ much from single-channel (normal)MySQL replication. However, the replication failover is a little different. The idea is thatyou do not start the slave on the secondary channel. Failover to the secondary channelrequires some special steps.
Use the following procedure to start multichannel external replication with the primarychannel active and the second channel in standby mode (we assume the redundantnetworking communication and hardware is in place and working properly):
1. Start the primary master.2. Start the secondary master.3. Connect the primary slave to the primary master.4. Connect the secondary slave to the secondary master.5. Start the primary slave.
Do not start the secondary slave (using START SLAVE). If you do, yourisk primary key conflicts and duplicate data issues. You should,however, configure the secondary slave with information about thesecondary master (using CHANGE MASTER) so the secondary chan‐nel can be started quickly if the primary channel fails.
Failover to the secondary channel requires a different procedure. It is not enough tojust start the secondary slave. To avoid having the same data replicated twice, you mustfirst establish the last replicated epoch and use it to start replication. The procedure isas follows (notice that we use variables to store intermediate results):
1. Find the time of the most recent global checkpoint the slave received. This requiresfinding the most recent epoch from the ndb_apply_status table on the primaryslave:
SELECT @latest := MAX(epoch) FROM mysql.ndb_apply_status;
Achieving High Availability | 323

2. Get the rows that appear in the ndb_binlog_index table on the primary masterfollowing the failure. You can find these rows from the primary master with thefollowing query:
SELECT @file := SUBSTRING_INDEX(File, '/', −1), @pos := PositionFROM mysql.ndb_binlog_indexWHERE epoch > @latest ORDER BY ASC LIMIT 1;
3. Synchronize the secondary channel. Run this command on the secondary slave,where file is the actual filename and pos is the position:
CHANGE MASTER TO MASTER_LOG_FILE = 'file', MASTER_LOG_POS = pos;
4. Start replication on the secondary channel by running this command on the sec‐ondary slave:
START SLAVE;
This failover procedure will switch the replication channel. If you have failures of anyof the SQL nodes, you must deal with those issues and repair them before executing thisprocedure.
It is a good idea to ensure the primary channel is indeed offline. Youmay want to consider stopping the primary slave just in case.
Achieving High PerformanceMySQL Cluster is designed not only for high availability, but also for high performance.We have already reviewed many of these features, as they are often beneficial for highavailability. In this section, we examine a few features that provide high performance.We conclude with a list of best practices for tuning your system for high performance.
The following features support high performance in MySQL Cluster; we have examinedmany of these in previous sections:Replication between clusters (global redundancy)
All data is replicated to a remote site that can be used to offload the primary site.
Replication inside a cluster (local redundancy)Multiple data nodes can be used to read data in parallel.
Main memory storageNot needing to wait for disk writes ensures quick processing of updates to data.
324 | Chapter 9: MySQL Cluster

Considerations for High PerformanceThere are three main considerations when tuning your system to support highperformance.
• Ensure your applications are as efficient as they can be. Sometimes this requiresmodification of your database servers (e.g., optimizing the configuration of theservers or modifying the database schema), but often the application itself can bedesigned or refactored for higher performance.
• Maximize access to your databases. This includes having enough MySQL serversfor the number of connections (scale-out) and distributing the data for availability,such as through replication.
• Consider making performance enhancements to your MySQL Cluster, for instance,by adding more data nodes.
Queries with joins can often be very time-consuming. The mainsource is the distributed nature of MySQL Cluster and that the MySQLserver did not have good support for handling MySQL Cluster joins.Before MySQL Cluster 7.2, a JOIN operation was executed by fetch‐ing data from the data nodes and performing the join inside the SQLnode, requiring the data to be transferred several times over the net‐work. With MySQL Cluster 7.2, MySQL Server 5.5 has added sup‐port to allowing the join to be “pushed down” into the engine, whichthen performs the actual join. This reduces the amount of data thatneeds to be sent over the network and also allows increased parallel‐ism by executing the join on multiple data nodes.
You may need to make certain trade offs between the level of high availability you desireand high performance. For example, adding more replicas increases availability. How‐ever, while more replicas protect against loss of data nodes, they require more processingpower and you may see lower performance during updates. The reads are still quick,because multiple replicas do not need to be read for the same data. Having a greaternumber of data nodes (scale out) while keeping the number of replicas low leads tohigher write performance.
Another primary consideration is the distributed nature of MySQL Cluster. Becauseeach node performs best when run on a separate server, the performance of each serveris critical, but so are the networking components. Coordination commands and dataare being transported from node to node, so the performance of the networking inter‐connect must be tuned for high performance. You should also consider parameters suchas selection of transport (e.g., TCP/IP, SHM, and SCI), latency, bandwidth, and geo‐graphic proximity.
Achieving High Performance | 325

You can set up and run MySQL Cluster in a cloud environment. One advantage of doingso is that the network interconnections are very fast and optimized. Because the datanodes require mainly a fast processor, adequate memory, and a fast network, virtualserver technology is more than adequate for using MySQL Cluster in the cloud. Note,however, that MySQL Cluster is not officially supported in virtual server environments.
You can find a complete list of all of the considerations for high performance in the“MySQL Cluster” section of the online MySQL Reference Manual. For general MySQLperformance improvements, see High Performance MySQL.
High Performance Best PracticesThere are a number of things you can do to ensure your MySQL Cluster is running atpeak performance. We list a few of the top performance enhancement practices here,along with a brief discussion of each. Some of these are more general in nature, but wedo not want to overlook these in our quest for the highest performance possible.Tune for access patterns
Consider the methods your applications use to access data. Because MySQL Clusterstores indexed columns in memory, accesses referencing these columns show aneven greater speed-up over nonindexed columns than you get on single MySQLservers. MySQL Cluster requires a primary key in every table, so applications thatretrieve data by primary key are almost guaranteed to be fast.
Make your applications distribution-awareThe best-case scenario for accessing data on a partitioned data store is to isolate aquery to a single node in the cluster. By default, MySQL Cluster uses the primarykey for hashing the rows across the partitions. Unfortunately, this isn’t always op‐timal if you consider the behavior of master/detail queries (common applicationsthat consult a master table followed by details in other tables that refer back to themaster table). In this case, you should alter the hashing function to ensure themaster row and the detail rows are on the same node. One way to accomplish thisis partition pruning, whereby you drop the secondary field used in the detail tablepartition hash and partition the detail rows with only the master’s primary key(which is the foreign key in the detail table). This allows both the master and detailrows to be allocated to the same node in the partition tree.
Use batch operationsEach round trip of a query has significant overhead. For certain operations likeinserts, you can save some of that overhead by using a multiple insert query (anINSERT statement that inserts multiple rows). You can also batch operations byturning on the transaction_allow_batching parameter and including multipleoperations within a transaction (within the BEGIN and END blocks). This lets you listmultiple data manipulation queries (INSERT, UPDATE, etc.) and reduce overhead.
326 | Chapter 9: MySQL Cluster

The transaction_allow_batching option does not work withSELECT statements or UPDATE statements that include variables.
Optimize schemasOptimizing your database schemas has the same effect for MySQL Cluster as it doesfor normal database systems. For MySQL Cluster, consider using efficient data types(e.g., the minimum size needed to save memory; 30 bytes per row in a million-rowtable can save you a significant amount of memory). You should also considerdenormalization for certain schemas to take advantage of MySQL Cluster’s paralleldata access methods (partitioning).
Optimize queriesClearly, the more optimized the query, the faster the query performance. This is apractice common to all databases and should be one of the first things you do toimprove the performance of your application. For MySQL Cluster, consider queryoptimization from the standpoint of how the data is retrieved. Specifically, joins areparticularly sensitive to performance in MySQL Cluster. Poorly performing queriescan sometimes cause anomalies that are easily mistaken for inefficiencies in otherparts of your system.
Optimize server parametersOptimize your cluster configuration to ensure it is running as efficiently as possible.This may mean spending some time to understand the many configuration optionsas well as securing the correct hardware to exploit. There is no magic potion forthis task—each installation becomes more and more unique as you change moreparameters. Use this practice with care, tune one parameter at a time, and alwayscompare the results to known baselines before instituting a change.
Use connection poolsBy default, SQL nodes use only a single thread to connect to the NDB cluster. Withmore threads to connect, the SQL nodes can execute several queries at once. To useconnection pooling for your SQL nodes, add the ndb-cluster-connection-pooloption in your configuration file. Set the value to be greater than 1 (say, 4) and placeit in the [mysqld] section. You should experiment with this setting because it isfrequently too high for the application or hardware.
Use multithreaded data nodesIf your data node has multiple CPU cores or multiple CPUs, you will gain additionalperformance by running the multithreaded data node daemon named ndbmtd. Thisdaemon can make use of up to eight CPU cores or threads. Using multiple threadsallows the data node to run many operations in parallel, such as the local queryhandler (LQH) and communication processes, to achieve even higher throughput.
Achieving High Performance | 327

Use the NDB API for custom applicationsWhile the MySQL server (the SQL node) offers a fast query processor frontend,MySQL has built a direct-access C++ mechanism called the NDB API. For someoperations, such as interfacing MySQL Cluster with LDAP, this may be the onlyway to connect the MySQL cluster (in this case just the NDB cluster) to your ap‐plication. If performance is critical to your application and you have the necessarydevelopment resources to devote to a custom NDB API solution, you can see sig‐nificant improvements in performance.
Use the right hardwareNaturally, faster hardware results in faster performance (generally speaking). How‐ever, you should consider every aspect of the cluster configuration. Consider notonly faster CPUs and more and faster memory, but also high-speed interconnectsolutions such as SCI and high-speed, hardware-redundant network connections.In many cases, these hardware solutions are built as turnkey commodities and donot require reconfiguring the cluster.
Do not use swap spaceMake sure your data nodes are using real memory and not swap space. You willnotice a dramatic performance drop when the data nodes start using swap space.This affects not only performance, but also possibly the stability of the cluster.
Use processor affinity for data nodesIn multiple-CPU machines, lock your data node processes to CPUs that are notinvolved in network communications. You can do this on some platforms (e.g., SunCMT processor systems) using the LockExecuteThreadToCPU and LockMaintThreadsToCPU parameters in the [ndbd] section of the configuration file.
If you follow these best practices, you will be well on your way to making MySQL Clusterthe best high-performance, high-availability solution for your organization. For moreinformation about optimizing MySQL Cluster, see the white paper “Optimizing Per‐formance of the MySQL Cluster Database.”
ConclusionIn this chapter, we discussed the unique high availability solution for MySQL usingMySQL Cluster. The strengths of MySQL Cluster include partitioning tables and dis‐tributing them across separate nodes and the parallel architecture of MySQL Cluster asa multimaster database. This allows the system to execute high volumes of both readand write operations concurrently. All updates are instantly available to all applicationnodes (via SQL commands or the NDB API) accessing data stored in the data nodes.
Because write loads are distributed across all of the data nodes, you can achieve veryhigh levels of write throughput and scalability for transactional workloads. Finally, withthe implementation of multiple MySQL server nodes (SQL nodes) running in parallel,
328 | Chapter 9: MySQL Cluster

where each server shares the load with multiple connections, and the use of MySQLreplication to ensure data shipping among geographic sites, you can build highly effi‐cient, high-concurrency transactional applications.
Although few applications may have such stringent needs, MySQL Cluster is a greatsolution for those applications that demand the ultimate form of MySQL highavailability.
“Joel!”
Joel smiled as his boss backtracked to stand in his doorway.
“Yes, Bob?” Joel asked.
Mr. Summerson stepped into the office and closed the door, then pulled up a chair andsat down directly across from Joel.
Momentarily taken off-guard, Joel merely smiled and said, “What can I do for you, Bob?”
“It’s what you have done for me, Joel. You’ve come up to speed on this MySQL stuff veryquickly. You have kept pace with our ramp-up and recent acquisitions. And now you’vehelped make us a lot of money on this last deal. I know I’ve thrown a lot at you and youdeserve something in return.” After an uncomfortable pause, he asked, “Do you playgolf, Joel?”
Joel shrugged. “I haven’t played since college, and I was never very good at it.”
“That won’t be a problem. I love the game, but the feeling isn’t mutual. I lose half a boxof balls every time I play. Are you free Saturday for a game of nine holes?”
Joel wasn’t sure where this was going, but something told him he should accept. “Sure,I’m free.”
“Good. Meet me at the Fair Oaks course at 1000 hours. We’ll play nine holes, then discussyour future over lunch.”
“OK. See you there, Bob.”
Mr. Summerson stood, opened the door, and paused. “I’ve told the accounting office tocreate a budget for you to manage, including enough to cover the cost of the MySQLEnterprise subscription and funding for two full-time assistants.”
“Thanks,” Joel said, stunned. He wasn’t prepared for outright acceptance of his proposal,much less more responsibility.
As Mr. Summerson disappeared down the hall, Joel’s friend Amy came in and stood nextto him. “Are you OK?” she asked with concern.
“Yeah, why?”
Conclusion | 329

“I’ve never seen him close the door to talk to someone. If you don’t mind me asking,what was that all about?”
With a wave of his hand over the documentation on his desk, Joel said, “He asked meto play golf and then said I had my own budget and could buy the MySQL Enterprisesubscription.”
Amy smiled and touched his arm. “That’s good, Joel—really good.”
Joel was confused. He didn’t think the responsibility of managing money or the approvalfor a purchase order was worthy of such a reaction. “What?”
“The last person who played golf with Mr. Summerson got a promotion and a raise. Mr.Summerson may be tough on the outside, but he rewards loyalty and determination.”
“Really?” Joel stared at the papers on his desk. He told himself not to get his hopes up.
“Are you free for lunch?” Amy asked with a light squeeze of his arm.
Joel looked at her hand on his arm and smiled. “Sure. Let’s go somewhere nice.” But inaccepting her offer, Joel knew he would be up late working on a plan for their next date.
330 | Chapter 9: MySQL Cluster

PART II
Monitoring and Managing
Now that you have a sophisticated, multiserver system that hopefully meets your site’sneeds, you must keep on top of it. This part of the book explains monitoring, with sometopics in performance, and covers backups and other aspects of handling the inevitablefailures that sometimes occur.


CHAPTER 10
Getting Started with Monitoring
Joel placed his nonfat half-caf latte, fruit cup, and cheese pastry on his desk and smiledat the parody of nutrition awaiting him. Ever since he found the upscale shopping centeron his walk to work, his breakfasts had gotten rather creative.
He turned on his monitor and waited for his email application to retrieve his messageswhile he opened the top of his latte. Scanning the message subjects and hoping therewasn’t yet another message from his boss, he noticed several messages from users withsubjects that hinted at performance issues.
Joel clicked through them, scanning the text. “Well, I guess something must be wrong,”he mumbled, as he read complaints about how applications that queried the databasesystem were taking too long to respond.
He unwrapped his pastry and pondered what could be causing the problems. “Thingswere just fine yesterday,” he reasoned. After a few sips of his latte he remembered some‐thing he read about performance monitoring while working on the lab machines atcollege.
Joel finished his pastry and reached for his MySQL High Availability book. “There hasgot to be something in here,” he said.
How do you know when your servers are performing poorly? If you wait for your usersto tell you something is wrong, chances are there has been something wrong for sometime. Leaving problems unaddressed for an extended period complicates the diagnosisand repair process.
In this chapter, we will begin our examination of monitoring MySQL at the operatingsystem level, using the basic tools available on various systems. We look here first be‐cause a system service or application always relies on the performance of the operating
333

system and its hardware. If the operating system is performing poorly, so will the da‐tabase system or application.
We will first examine the reasons for monitoring systems, then we’ll look at basic mon‐itoring tasks for popular operating systems and discuss how monitoring can make yourpreventive maintenance tasks easier. Once you’ve mastered these skills, you can beginto look more closely at your database system. In the next chapter, we will look in greaterdetail at monitoring a MySQL server, along with some practical guides to solving com‐mon performance problems.
Ways of MonitoringWhen we think of monitoring, we normally think about some form of early warningsystem that detects problems. However, the definition of monitor (as a verb) is “toobserve, record, or detect an operation or condition with instruments that do not affectthe operation or condition.” This early warning system uses a combination of automatedsampling and an alert system.
The Linux and Unix operating systems are very complex and have many parametersthat affect all manner of minor and major system activities. Tuning these systems forperformance can be more art than science. Unlike some desktop operating systems,Linux and Unix (and their variants) do not hide the tuning tools nor do they restrictwhat you can tune. Some systems, such as Mac OS X and Windows, hide many of theunderlying mechanics of the system behind a very user-friendly visual interface.
The Mac OS X operating system, for example, is a very elegant and smoothly runningoperating system that needs little or no attention from the user under normal conditions.However, as you will see in the following sections, the Mac OS X system provides aplethora of advanced monitoring tools that can help you tune your system if you knowwhere to look for them.
The Windows operating system has many variants, the newest at the time of this writingbeing Windows 8. Fortunately, most of these variants include the same set of monitoringtools, which allow the user to tune the system to meet specific needs. While not con‐sidered as suave as Mac OS X, Windows offers a greater range of user-accessible tuningoptions.
There are three primary categories of system monitoring: system performance, appli‐cation performance, and security. You may commence monitoring for more specificreasons, but in general, the task falls into one of these categories.
Each category uses a different set of tools (with some overlap) and has a different ob‐jective. For instance, you should monitor system performance to ensure the system isoperating at peak efficiency. Application performance monitoring ensures a single
334 | Chapter 10: Getting Started with Monitoring

application is performing at peak efficiency, and security monitoring helps you ensurethe systems are protected in the most secure manner.
Monitoring a MySQL server is akin to monitoring an application. This is becauseMySQL, like most database systems, lets you measure a number of variables and statusindicators that have little or nothing to do with the operating system. However, a data‐base system is very susceptible to the performance of the host operating system, so it isimportant to ensure your operating system is performing well before trying to diagnoseproblems with the database system.
Because the goal is to monitor a MySQL system to ensure the database system is per‐forming at peak efficiency, the following sections discuss monitoring the operating sys‐tem for performance. We leave monitoring for security to other texts that specialize inthe details and nuances of security monitoring.
Benefits of MonitoringThere are two approaches to monitoring. You may want to ensure nothing has changed(no degradation of performance and no security breaches) or to investigate what haschanged or gone wrong. Monitoring the system to ensure nothing has changed is calledproactive monitoring, whereas monitoring to see what went wrong is called reactivemonitoring. Sadly, most monitoring occurs in a reactive manner. Very few IT profes‐sionals have the time or resources to conduct proactive monitoring. Reactive monitor‐ing is therefore the only form of monitoring some professionals understand.
However, if you take the time to monitor your system proactively, you can eliminate alot of reactive work. For example, if your users complain about poor performance (thenumber one trigger for reactive monitoring), you have no way of knowing how muchthe system has degraded unless you have previous monitoring results with which tocompare. Recording such results is called forming a baseline of your system (i.e., youmonitor the performance of your system under low, normal, and high loads over aperiod of time). If you do the sampling frequently and consistently, you can determinethe typical performance of the system under various loads. Thus, when users reportperformance problems, you can sample the system and compare the results to yourbaseline. If you include enough detail in your historical data, you can normally see, ata glance, which part of the system has changed.
System Components to MonitorYou should examine four basic parts of the system when monitoring performance:Processor
Check to see how much of it is utilized and what peaks are reached by utilization.
Benefits of Monitoring | 335

MemoryCheck to see how much is being used and how much is still available to runprograms.
DiskCheck to see how much disk space is available, how disk space is used, and whatdemand there is for it and how fast it delivers content (response time).
NetworkCheck for hroughput, latency, and error rates when communicating with othersystems on the network.
ProcessorMonitor the system’s CPU to ensure there are no runaway processes and that the CPUcycles are being shared equally among the running programs. One way to do this is tocall up a list of the programs running and determine what percentage of the CPU eachis using. Another method is to examine the load average of the system processes. Mostoperating systems provide several views of the performance of the CPU.
A process is a unit of work in a Linux or Unix system. A program mayhave one or more processes running at a time. Multithreaded appli‐cations, such as MySQL, generally appear on the system as multipleprocesses.
When a CPU is under a performance load and contention is high, the system can exhibitvery slow performance and even periods of seeming inactivity. When this occurs, youmust either reduce the number of processes or reduce the CPU usage of processes thatseem to be consuming more CPU time. You can find which processes are consumingmore CPU by using the top utility for Linux and Unix systems, Activity Monitor on MacOS X, or the Task Manager Performance tab on Windows. But be sure to monitor theCPUs to make sure that high CPU utilization is really the cause of the problem—slow‐ness is even more likely to occur because of memory contention, discussed in the nextsection.
Some of the common solutions to CPU overloading include:Provision a new server to run some processes
This is, of course, the best method, but requires money for new systems. Experi‐enced system administrators can often find other ways to reduce CPU usage, es‐pecially when the organization is more willing to spend your time than to spendmoney.
336 | Chapter 10: Getting Started with Monitoring

Remove unnecessary processesAn enormous number of systems run background processes that may be useful forcertain occasions but just bog down the system most of the time. However, anadministrator must know the system very well to identify which processes are non‐essential.
Kill runaway processesThese probably stem from buggy applications, and they are often the culprit whenperformance problems are intermittent or rare. In the event that you cannot stopa runaway process using a controlled or orderly method, you may need to terminatethe process abruptly using a force quit dialog or the command line.
Optimize applicationsSome applications routinely take up more CPU time or other resources than theyreally need. Poorly designed SQL statements are often a drag on the databasesystem.
Lower process prioritiesSome processes run as background jobs, such as report generators, and can be runmore slowly to make room for interactive processes.
Reschedule processesMaybe some of those report generators can run at night when system load is lower.
Processes that consume too much CPU time are called CPU-bound or processor-bound, meaning they do not suspend themselves for I/O and cannot be swapped out ofmemory.
If you find the CPU is not under contention and there are either few processes runningor no processes consuming large amounts of CPU time, the problem with performanceis likely to be elsewhere (waiting on disk I/O, insufficient memory, excessive page swapping, etc.).
MemoryMonitor memory to ensure your applications are not requesting so much memory thatthey waste system time on memory management. From the very first days of limitedrandom access memory (RAM, or main memory), operating systems have evolved toemploy a sophisticated method of using disk memory to store unused portions or pagesof main memory. This technique, called paging or swapping, allows a system to run moreprocesses than main memory can load at one time, by storing the memory for suspendedprocesses and later retrieving the memory when the process is reactivated. While thecost of moving a page of memory from memory to disk and back again is relatively high(it is time-consuming compared to accessing main memory directly), modern operatingsystems can do it so quickly that the penalty isn’t normally an issue unless it reachessuch a high level that the processor and disk cannot keep up with the demands.
System Components to Monitor | 337

However, the operating system may perform some swapping at a high level periodicallyto reclaim memory. Be sure to measure memory usage over a period of time to ensureyou are not observing a normal cleanup operation.
When periods of high paging occur, it is likely that low memory availability may be theresult of a runaway process consuming too much memory or too many processes re‐questing too much memory. This kind of high paging, called thrashing, can be treatedthe same way as a CPU under contention. Processes that consume too much memoryare called memory-bound.
When treating memory performance problems, the natural tendency is to add morememory. While that may indeed solve the problem, it is also possible that the memoryis not allocated correctly among the various subsystems.
There are several things you can do in this situation. You can allocate different amountsof memory to parts of the system—such as the kernel or filesystem—or to various ap‐plications that permit such tweaking, including MySQL. You can also change the priorityof the paging subsystem so the operating system begins paging earlier.
Be very careful when tweaking memory subsystems on your serv‐er. Be sure to consult your documentation or a book dedicated toimproving performance for your specific operating system.
If you monitor memory and find that the system is not paging too frequently, but per‐formance is still an issue, the problem is likely related to one of the other subsystems.
DiskMonitor disk usage to ensure there is enough free disk space available, as well as suffi‐cient I/O bandwidth to allow processes to execute without significant delay. You canmeasure this using either a per-process or overall transfer rate to and from disk. The per-process rate is the amount of data a single process can read or write. The overall transferrate is the maximum bandwidth available for reading and writing data on disk. Somesystems have multiple disk controllers; in these cases, overall transfer rate may be meas‐ured per disk controller.
Performance issues can arise if one or more processes are consuming too much of themaximum disk transfer rate. This can have very detrimental effects on the rest of thesystem in much the same way as a process that consumes too many CPU cycles: it“starves” other processes, forcing them to wait longer for disk access.
Processes that consume too much of the disk transfer rate are called disk-bound, mean‐ing they are trying to access the disk at a frequency greater than the available share of
338 | Chapter 10: Getting Started with Monitoring

the disk transfer rate. If you can reduce the pressure placed on your I/O system by adisk-bound process, you’ll free up more bandwidth for other processes.
You may hear the terms I/O-bound or I/O-starved when referring toprocesses. This normally means the process is consuming too muchdisk.
One way to meet the needs of a process performing a lot of I/O to disk is to increase theblock size of the filesystem, thus making large transfers more efficient and reducing theoverhead imposed by a disk-bound process. However, this may cause other processesto run more slowly.
Be careful when tuning filesystems on servers that have only a sin‐gle controller or disk. Be sure to consult your documentation or abook dedicated to improving performance for your specific operat‐ing system.
If you have the resources, one strategy for dealing with disk contention is to add anotherdisk controller and disk array and move the data for one of the disk-bound processesto the new disk controller. Another strategy is to move a disk-bound process to another,less utilized server. Finally, in some cases it may be possible to increase the bandwidthof the disk by upgrading the disk system to a faster technology.
There are differing opinions as to where to optimize first or even which is the best choice.We believe:
• If you need to run a lot of processes, maximize the disk transfer rate or split theprocesses among different disk arrays or systems.
• If you need to run a few processes that access large amounts of data, maximize theper-process transfer rate by increasing the block size of the filesystem.
You may also need to strike a balance between the two solutions to meet your uniquemix of processes by moving some of the processes to other systems.
Network SubsystemMonitor network interfaces to ensure there is enough bandwidth and that the data beingsent or received is of sufficient quality.
Processes that consume too much network bandwidth, because they are attempting toread or write more data than the network configuration or hardware make possible, are
System Components to Monitor | 339

called network-bound. These processes keep other processes from accessing sufficientnetwork bandwidth to avoid delays.
Network bandwidth issues are normally indicated by utilization of a percentage of themaximum bandwidth of the network interface. You can solve these issues with processesby assigning the processes to specific ports on a network interface.
Network data quality issues are normally indicated by a high number of errors encoun‐tered on the network interface. Luckily, the operating system and data transfer appli‐cations usually employ checksumming or some other algorithm to detect errors, butretransmissions place a heavy load on the network and operating system. Solving theproblem may require moving some applications to other systems on the network orinstalling additional network cards, which normally requires a diagnosis followed bychanging the network hardware, reconfiguring the network protocols, or moving thesystem to a different subnet on the network.
When referring to a process that is taking too much time accessingnetworking subsystems, we say it is network-bound.
Monitoring SolutionsFor each of the four subsystems just discussed, a modern operating system offers itsown specific tools that you can use to get information about the subsystem’s status. Thesetools are largely standalone applications that do not correlate (at least directly) with theother tools. As you will see in the next sections, the tools are powerful in their own right,but it requires a fair amount of effort to record and analyze all of the data they produce.
Fortunately, a number of third-party monitoring solutions are available for most op‐erating and database systems. It is often best to contact your systems providers forrecommendations on the best solution to meet your needs and maintain compatibilitywith your infrastructure. Most vendors offer system monitoring tools as an option. Thefollowing are a few of the more notable offerings:up.time
An integrated system for monitoring and reporting performance for servers. Itsupports multiple platforms.
CactiA graphical reporting solution for graphing data from the RRDtool. RRDtool is anopen source data logging system and can be tailored using Perl, Python, Ruby, LUA,or TCL.
340 | Chapter 10: Getting Started with Monitoring


Figure 10-1. The top command
Below the summary comes the list of processes, in descending order (which is fromwhere the name of the command derives) based on how much CPU time is being used.In this example, a Bash shell is currently the task leader followed by one or severalinstallations of MySQL.
NicenessYou can change the priority of a process on a Linux or Unix system. You may want todo this to lower the priorities of processes that require too much CPU power, are oflower urgency, or could run for an extended period but that you do not want to cancelor reschedule. You can use the commands nice, ionice, and renice to alter the priorityof a process.
Most distributions of Linux and Unix now group processes that have had their prioritieschanged into a group called nice. This allows you to get statistics about these modifiedprocesses without having to remember or collate the information yourself. Havingcommands that report the CPU time for nice processes gives you the opportunity to seehow much CPU these processes are consuming with respect to the rest of the system.For example, a high value on this parameter may indicate there is at least one processwith too high of a priority.
Perhaps the best use of the top command is to allow it to run and refresh every threeseconds. If you check the display at intervals over time, you will begin to see whichprocesses are consuming the most CPU time. This can help you determine at a glancewhether there is a runaway process.
Linux and Unix Monitoring | 343

You can change the refresh rate of the command by specifying thedelay on the command. For example, top -d 3 sets the delay to threeseconds.
Most Linux and Unix variants have a top command that works like we have described.Some have interesting interactive hot keys that allow you to toggle information on oroff, sort the list, and even change to a colored display. You should consult the manualpage for the top command specific to your operating system, because the special hotkeys and interactive features differ among operating systems.
The iostat command
The iostat command gives you different sets of information about your system, in‐cluding statistics about CPU time, device I/O, and even partitions and network filesys‐tems (NFS). The command is useful for monitoring processes because it gives you apicture of how the system is doing overall related to processes and the amount of timethe system is waiting for I/O. Figure 10-2 shows an example of running the iostatcommand on a system with moderate load.
Figure 10-2. The iostat command
The iostat, mpstat, and sar commands might not be installed onyour system by default, but they can be installed as an option. Forexample, they are part of the sysstat package in Ubuntu distribu‐tions. Consult your operating system documentation for informa‐tion about installation and setup.
Figure 10-2 shows the percentages for CPU usage from the time the system was started.These are calculated as averages among all processors. As you can see, the system isrunning on a dual-core CPU, but only one row of values is given. This data includes thepercentage of CPU utilization:
344 | Chapter 10: Getting Started with Monitoring

• Executing at the user level (running applications)• Executing at the user level with nice priority• Executing at the system level (kernel processes)• Waiting on I/O• Waiting for virtual processes• Idle time
A report like this can give you an idea of how your system has been performing sinceit was started. While this means that you might not notice periods of poor performance(because they are averaged over time), it does offer a unique perspective on how theprocesses have been consuming available processing time or waiting on I/O. For ex‐ample, if %idle is very low, you can determine that the system was kept very busy.Similarly, a high value for %iowait can indicate a problem with the disk. If %system or%nice is much higher than %user, it can indicate an imbalance of system and prioritizedprocesses that are keeping normal processes from running.
The mpstat command
The mpstat command presents much of the same information as iostat for processortime, but splits the information out by processor. If you run this command on a multi‐processor system, you will see the percentage of data per processor as well as the totalsfor all processors. Figure 10-3 shows an example of the mpstat command.
Figure 10-3. The mpstat command
There is an option to tell the mpstat command to refresh the information based on aninterval passed. This can be helpful if you want to watch how your processors are per‐forming with respect to the processes over a period of time. For instance, you can seewhether your processor affinity is unbalanced (too many processes are assigned to onespecific processor).
Linux and Unix Monitoring | 345

Some implementations of mpstat provide an option to see a morecomprehensive display including show statistics for all processors.This may be -A or -P ALL depending on your operating system.
To find out more about the mpstat command, consult the manual page for your oper‐ating system.
The ps command
The ps command is one of those commands we use on a daily basis but never take thetime to consider its power and utility. This command gives you a snapshot of the pro‐cesses running on your system. It displays the process ID, the terminal the process isrunning from, the amount of time it has been running, and the command used to startthe process. It can be used to find out how much memory a process uses, how muchCPU a process uses, and more. You can also pipe the output to grep to more easily findprocesses. For example, the command ps -A | grep mysqld is a popular command tofind information about all of the MySQL processes running on your system. This willsend the list of all processes to the grep command, which will in turn only show thoserows with “mysqld” in them. You can use this technique to find a process ID so you canget detailed information about that process using other commands.
What makes the ps command so versatile is the number of options available for dis‐playing data. You can display the processes for a specific user, get related processes fora specific process by showing its process tree, and even change the format of the output.Consult your documentation for information about the options available on your op‐erating system.
One of the ways you can use this output to diagnose problems is to look for processesthat have been running for a long time or check process status (e.g., check those thatare stuck in a suspicious state or sleeping). Unless they are known applications likeMySQL, you might want to investigate why they have been running for so long.
Figure 10-4 shows an abbreviated example of the ps command run on a system undermoderate load.
346 | Chapter 10: Getting Started with Monitoring

Figure 10-4. The ps command
Another use for the output is to see whether there are processes that you do not recognizeor a lot of processes run by a single user. Many times this indicates a script that is spawning processes, perhaps because it has been set up improperly, and can even indi‐cate a dangerous security practice.
There are many other utilities built into operating systems to display information aboutprocesses. As always, a good reference on performance tuning for your specific oper‐ating system will be the best source for more in-depth information about monitoring processes.
Memory UsageSeveral commands provide information about memory usage on your system. The mostpopular ones include free and pmap.
The free command
The free command shows you the amount of physical memory available. It displaysthe total amount of memory, the amount used, and the amount free for physical mem‐ory, and it displays the same statistics for your swap space. It also shows the memorybuffers used by the kernel and the size of the cache. Figure 10-5 shows an example offree run on a system with a moderate load.
Linux and Unix Monitoring | 347

Figure 10-5. The free command
In the output from an Ubuntu system, shown in Figure 10-5, theshared column is obsolete.
There is a switch that puts the command into a polling mode where the statistics areupdated for the number of seconds provided. For example, to poll memory every fiveseconds, issue free -t -s 5.
The pmap command
The pmap command gives you a detailed map of the memory used for a process. To usethis command, you must first find the process ID for the process you want to explore.You can get this information using the ps command, or even the top command if youare looking at a process that is consuming lots of CPU time.
You can also get the memory map of multiple processes by listing the process IDs onthe command line. For example, pmap 12578 12579 will show the memory map forprocess IDs 12578 and 12579.
The output shows a detailed map of all of the memory addresses and the sizes of theportions of memory used by the process at the instant the report was created. It displaysthe command used to launch the process, including the full path and parameters, whichcan be very useful for determining where the process was started and what options it isusing. You’d be amazed how handy that is when trying to figure out why a process isbehaving abnormally. The display also shows the mode (access rights) for the memoryblock. This can be useful in diagnosing interprocess issues. Figures 10-6 and 10-7 showan example of a mysqld process map when running on a system with moderate load.
348 | Chapter 10: Getting Started with Monitoring

Figure 10-6. The pmap command—part 1
Figure 10-7. The pmap command—part 2
Notice that the listing chosen is the device output format (selected by issuing the -dparameter on startup) as well as where the memory is being mapped or used. This canbe handy in diagnosing why a particular process is consuming lots of memory and whichpart (e.g., a library) is consuming the most.
Figure 10-7 shows the final line of the pmap output, which displays some useful summaryinformation.
The final line shows how much memory is mapped to files, the amount of privatememory space, and the amount shared with other processes. This information may bea key piece of data needed to solve memory allocation and sharing issues.
There are several other commands and utilities that display information about memoryusage (e.g., dmesg, which can display messages from bootup); consult a good referenceon performance tuning for your operating system.
Linux and Unix Monitoring | 349

Disk UsageA number of commands can reveal the disk usage statistics on your system. This sectiondescribes and demonstrates the iostat and sar commands.
The iostat command
As you have already seen in “Process Activity” on page 342, the iostat command showsthe CPU time used and a list of all of the disks and their statistics. Specifically, iostatlists each device, its transfer speed, the number of blocks read and written per second,and the total number of blocks read and written. For easy consultation, Figure 10-8repeats Figure 10-2, which is an example of the iostat command run on a system witha moderate load.
Figure 10-8. The iostat command
This report can be very important when diagnosing disk problems. At a glance, it cantell you whether some devices are being used more than others. If this is the case, youcan move some processes to other devices to reduce demand for a single disk. The outputcan also tell you which disk is experiencing the most reads or writes—this can help youdetermine whether a particular device needs to be upgraded to a faster one. Conversely,you can learn which devices are underutilized. For example, if you see that your shinynew super-fast disk is not being accessed much, it is likely that you have not configuredthe high-volume processes to use the new disk. On the other hand, it could be that yourprogram is using memory caches that I/O is seldom performed on.
The sar command
The sar command is a very powerful utility that displays all sorts of information aboutyour system. It records data over time and can be configured in a variety of ways, so itcan be a little tricky to set up. Consult your operating system’s documentation to ensureyou have it set up correctly. Like most of the system utilization commands we show, youcan also configure sar to generate reports at regular intervals.
350 | Chapter 10: Getting Started with Monitoring

The sar command can also display CPU usage, memory, cache, anda host of other data similar to that shown by the other commands.Some administrators set up sar to run periodically to cull the dataand form a benchmark for their system. A complete tutorial on saris beyond the scope of this book. For a more detailed examination,see System Performance Tuning by Gian-Paolo D. Musumeci andMike Loukides (O’Reilly).
In this section, we will look at how to use the sar command to display informationabout disk usage. We do this by combining displays of the I/O transfer rates, swap spaceand paging statistics, and block device usage. Figure 10-9 shows an example of the sarcommand used to display disk usage statistics.
Figure 10-9. The sar command for disk usage
The report displays so much information that it seems overwhelming at first glance.Notice the first section after the header. This is the paging information that displays theperformance of the paging subsystem. Below that is a report of the I/O transfer rates,followed by the swap space report and then a list of the devices with their statistics. Thelast portion of the report displays averages calculated for all parameters sampled.
The paging report shows the rate of pages paged in or out of memory, the number ofpage faults per second that did not require disk access, the number of major faultsrequiring disk access, and additional statistics about the performance of the pagingsystem. This information can be helpful if you are seeing a high number of page faults(major page faults are more costly), which could indicate too many processes running.
Linux and Unix Monitoring | 351

Large numbers of major page faults can cause disk usage problems (i.e., if this value isvery high and disk usage is high, poor performance may not be located in the disksubsystems). It is possible the observation is just a symptom of something going wrongin the application or operating system.
The I/O transfer report shows the number of transactions per second (tps), the readand write requests, and the totals for blocks read and written. In this example, the systemis not using I/O but is under heavy CPU load. This is a sign of a healthy system. If theI/O values were very high, we would suspect one or more processes of being stuck inan I/O-bound state. For MySQL, a query generating a lot of random disk accesses ortables that reside across a fragmented disk could cause such a problem.
The swap space report shows the amount of swap space available, how much is used,the percentage used, and how much cache memory is used. This can be helpful in in‐dicating a problem with swapping out too many processes and, like the other reports,can help you determine whether the problem lies in your disks and other devices orwith memory or too many processes.
The block device (any area of the system that moves data in blocks like disk, memory,etc.) report shows the transfer rate (tps), the reads and writes per second, and averagewait times. This information can be helpful in diagnosing problems with your blockdevices. If these values are all very high (unlike this example, which shows almost nodevice activity), it could mean you have reached the maximum bandwidth of your de‐vices. However, this information should be weighed against the other reports on thispage to rule out a thrashing system, a system with too many processes, or a systemwithout enough memory (or a combination of such problems).
This composite report can be helpful in determining where your disk usage problemslie. If the paging report shows an unusually high rate of faults, it’s an indication you mayhave too many applications running or not enough memory. However, if these valuesare low or average, you need to look to the swap space; if that is normal, you can examinethe device usage report for anomalies.
Disk usage analyzer
In addition to operating system utilities, the GNOME desktop project has created agraphical application called the Disk Usage Analyzer. This tool gives you an in-depthlook at how your storage devices are being used. It also gives you a graphic that depictsdisk usage. The utility is available in most distributions of Linux.
Figure 10-10 shows a sample report from the Disk Usage Analyzer.
352 | Chapter 10: Getting Started with Monitoring

Figure 10-10. Disk Usage Analyzer
Basically, this report gives you a look at how the devices are performing alongside thepaging and swap systems. Naturally, if a system is swapping a lot of processes in and outof memory, the disk usage will be unusual. This is why it is valuable to look at theseitems together on the same report.
Diagnosing disk problems can be challenging, and only a few commands give you thekind of detailed statistics about disk usage we’ve described. However, some operatingsystems provide more detailed and specific tools for examining disk usage. Don’t forgetthat you can also determine available space, what is mounted, which filesystems eachdisk has, and much more from more general commands such as ls, df, and fdisk.Consult your operating system documentation for a list and description of all disk-related commands, as well as for disk usage and monitoring commands.
The vmstat command, shown later in this chapter, can also show thisdata. Use the vmstat -d command to get a text-based representa‐tion of the data.
Network ActivityDiagnosing network activity problems may require specialized knowledge of hardwareand networking protocols. Detailed diagnostics are normally left to the networkingspecialists, but there are two commands you, as a MySQL administrator, can use to getan initial picture of the problem.
Linux and Unix Monitoring | 353

The netstat command
The netstat command allows you to see network connections, routing tables, interfacestatistics, and additional networking-related information. The command provides a lotof the information that a network specialist would use to diagnose and configure com‐plex networking problems. However, it can be helpful to see how much traffic is passingthrough your network interfaces and which interfaces are being accessed the most.Figure 10-11 shows a sample report of all of the network interfaces and how much datahas been transmitted over each one.
Figure 10-11. The netstat command
In systems that have multiple network interfaces, it may be helpful to determine whetherany interface is being overutilized or if the wrong interfaces are active.
The ifconfig command
The ifconfig command, an essential tool for any network diagnostics, displays a listof the network interfaces on your system, including the status and settings for each.Figure 10-12 shows an example of the ifconfig command.
Figure 10-12. The ifconfig command
The output lists each interface, whether it is up or down, along with its configurationinformation. This can be very helpful in determining how an interface is configuredand can tell you, for example, that instead of communicating over your super-fastEthernet adapter, your network has failed over to a much slower interface. The root of
354 | Chapter 10: Getting Started with Monitoring

networking problems is often not the traffic on the network, but rather the networkinterface choice or setup.
If you produce the reports shown here for your system and still need help diagnosingthe problem, having this data ahead of time can help your networking specialist zero inon the problem more quickly. Once you have eliminated any processes consuming toomuch network bandwidth and determined where you have a viable network interface,the networking specialist can then configure the interface for optimal performance.
General System StatisticsAlong with the subsystem-specific commands we’ve discussed, and grouped statisticalreporting commands, Linux and Unix offer additional commands that give you moregeneral information about your system. These include commands such as uptime andvmstat.
The uptime command
The uptime command displays how long a system has been running. It displays thecurrent time; how long the system has been running; how many users have been usingthe system (logged on); and load averages for the past 1, 5, and 15 minutes. Figure 10-13shows an example of the command.
Figure 10-13. The uptime command
This information can be helpful if you want to see how the system has been performingon average in the recent past. The load averages given are for processes in an active state(not waiting on I/O or the CPU). Therefore, this information has limited use for de‐termining performance issues, but can give you a general sense of the health of thesystem.
The vmstat command
The vmstat command is a general reporting tool that gives you information aboutprocesses, memory, the paging system, block I/O, disk, and CPU activity. It is sometimesused as a first stop on a quest for locating performance issues. High values in some fieldsmay lead you to examine those areas more closely using other commands discussed inthis chapter.
Figure 10-14 shows an example of the vmstat command run on a system with low load.
Linux and Unix Monitoring | 355

The data shown here includes the number of processes, where r indicates those waitingto run and b indicates those in an uninterruptible state. The next set of columns showsthe swap space totals including amount of memory swapped in (si) or out (so). Thenext area shows the I/O reports for blocks received (bi) or sent (bo). The next area showsthe number of interrupts per second (in), number of context switches per second (cs),time spent running processes in user space (us), time spent running processes in kernelspace (sy), idle time (id), and time waiting for I/O (wa). These times are all in seconds.
There are more parameters and options for the vmstat command. Check your operatingsystem manual for more details on the options available for your operating system.
Figure 10-14. The vmstat command
Automated Monitoring with cronPerhaps the most important tool to consider is the cron facility. You can use cron toschedule a process to run at a specific time. This allows you to run commands and savethe output for later analysis. It can be a very powerful strategy, allowing you to takesnapshots of the system over time. You can then use the data to form averages of thesystem parameters, which you can use as a benchmark to compare to when the systemperforms poorly in the future. This is important because it allows you to see at a glancewhat has changed, saving you considerable time when diagnosing performance prob‐lems.
If you run your performance monitoring tools daily, and then examine the results andcompare them to your benchmark, you may be able to detect problems before yourusers start complaining. Indeed, this is the basic premise behind the active monitoringtools we’ve described.
Mac OS X MonitoringBecause the Mac OS X operating system is built on the Unix Mac kernel, you can usemost of the tools described earlier to monitor your operating system. However, thereare other tools specific to the Mac. These include the following graphical administrationtools:
356 | Chapter 10: Getting Started with Monitoring

• System Profiler• Console• Activity Monitor
This section will present an overview of each of these tools for the purposes of moni‐toring a Mac OS X system. These tools form the core monitoring and reporting facilitiesfor Mac OS X. In good Mac fashion, they are all well-written and well-behaved graphicaluser interfaces (GUIs). The GUIs even show the portions of the tools that report infor‐mation from files. As you will see, each has a very important use and can be very helpfulin diagnosing performance issues on a Mac.
System ProfilerThe System Profiler gives you a snapshot of the status of your system. It provides anincredible amount of detail about just about everything in your system, including all ofthe hardware, the network, and the software installed. Figure 10-15 shows an exampleof the System Profiler.
Figure 10-15. The System Profiler
You can find the System Profiler in the Applications/Utilities folder on your hard drive.You can also launch the System Profiler via Spotlight. As Figure 10-15 shows, the tooloffers a tree pane on the left and a detail pane on the right. You can use the tree pane todive into the various components of your system.
If you would prefer a console-based report, the System Profiler has acommand-line-equivalent application in /usr/sbin/system_profiler.There are many parameters and options that allow you to restrict theview to certain reports. To find out more, open a terminal and typeman system_profiler.
Mac OS X Monitoring | 357

If you open the Hardware tree, you will see a listing of all of the hardware on your system.For example, if you want to see what type of memory is installed on your system, youcan click the Memory item in the Hardware tree.
System Profiler provides a network report, which we have seen in another form onLinux. Click the Network tree to get a basic report of all of the network interfaces onyour system. Select one of the network interfaces in the tree or in the detail pane to seeall of the same (and more) information that the network information commands inLinux and Unix generate. You can also find out information about firewalls, locationsyou’ve defined, and even which volumes are shared on the network.
Another very useful report displays the applications installed on your system. ClickSoftware→Applications report to see a list of all of the software on your system, includingthe name, version, when it was updated, whether it is a 64-bit application, and whatkind of application it is—for instance, whether it’s a universal or a native Intel binary.This last detail can be very important. For example, you can expect a universal binaryto run slower than an Intel binary. It is good to know these things in advance, as theycan set certain expectations for performance.
Figure 10-16 shows an example of this report.
Figure 10-16. Memory report from System Profiler
358 | Chapter 10: Getting Started with Monitoring

As you can see, this is a lot of detail. You can see how many memory cards are installed,their speed, and even the manufacturer code and part number. Wow!
We call each detail pane a report because it’s essentially a detailedreport for a given category. Some people may refer to all of the dataas a report, which is not incorrect, but we think it’s better to consid‐er the whole thing a collection of reports.
If you are intrigued with the power of this tool, feel free to experiment and dig aroundin the tree for more information about your system. You will find just about any factabout it here.
The System Profiler can be very valuable during diagnostics of system problems. Manytimes AppleCare representatives and Apple-trained technicians will ask for a report ofyour system. Generate the report from the System Profiler by using the File→Save com‐mand. This saves an XML file that Apple professionals can use. You can also export thereport to RTF using the File→Export command. Finally, you can print the report aftersaving it as a PDF file.
You can also change the level of detail reported using the View menu. It has options forMini, Basic, and Full, which change the level of detail from very minimal to a completereport. Apple professionals usually ask for the full report.
A System Profiler report is the best way to determine what is on your system withoutopening the box. It should be your first source to determine your system configuration.
ConsoleThe Console application displays the logfiles on your system, and is located inthe /Applications/Utilities folder or via Spotlight. Unlike the System Profiler, this toolprovides you not only a data dump, but also the ability to search the logs for vital in‐formation. When diagnosing problems, it is sometimes helpful to see whether there areany messages in the logs that give more information about an event. Figure 10-17 showsan example of the Console application.
When you launch the Console application, it reads all of the system logs and categorizesthem into console diagnostic messages. As you can see in Figure 10-17, the displayfeatures a log search pane on the left and a log view on the right. You can also click theindividual logfiles in the Files tree to see the contents of each log. The logfiles includethe following:~/Library/Logs
Stores all messages related to user applications. Check here for messages aboutapplications that crash while logged in, information about iDisk activity, and otheruser-related tasks.
Mac OS X Monitoring | 359

/Library/LogsStores all system messages. Check here for information generated at the system levelfor crashes and other unusual events.
/private/var/logStores all Unix BSD process-related messages. Check here for information aboutthe system daemon or BSD utility.
Logs are sequential text files where data is always appended,never updated in the middle, and rarely deleted.
The most powerful feature of Console is its search capability. You can create reportscontaining messages for a given phrase or keyword and view them later. To create a newsearch, select File→New Database Search in the menu. You will be presented with ageneralized search builder that you can use to create your query. When you are finished,you can name and save the report for later processing. This can be a very handy way tokeep an eye on troublesome applications.
Another really cool feature is the capability to mark a spot in a log that indicates thecurrent date and time—you can use this to determine the last time you looked at thelog. If your experience is like ours, you often find interesting messages in several placesin the logs and need to review them later, but don’t know where you found them orwhere you left off reviewing the log. Having the ability to mark a log is a real help inthis case. To mark a log, highlight a location in the file and click the Mark button on thetoolbar.
Although the data reported is a static snapshot of the logs upon launch and any reportsyou run are limited to this snapshot, you can also set up alerts for new messages in thelogs. Use Console→Preferences to turn on notifications, which are delivered to youeither via a bouncing icon on the Dock or by bringing the Console application to theforefront after a delay.
The Console application can be very helpful for seeing how various aspects of yoursystem work by monitoring the events that occur and for finding errors from applica‐tions or hardware. When you are faced with a performance issue or another troublesomeevent, be sure to search the logs for information about the application or event. Some‐times the cure for the problem is presented to you in the form of a message generatedby the application itself.
360 | Chapter 10: Getting Started with Monitoring

Figure 10-17. The Console application
Activity MonitorUnlike the static nature of the previously described tools, the Activity Monitor is adynamic tool that gives you information about the system as it is running. The bulk ofthe data you will need to treat performance issues can be found in the Activity Monitor.Indeed, you will see information comparable to every tool presented in the Linux andUnix section as you explore the Activity Monitor: information about the CPU, systemmemory, disk activity, disk usage, and network interfaces.
With the Activity Monitor, for example, you can find out which processes are runningand how much memory they are using as well as the percentage of CPU time each isconsuming. In this case, the use is analogous to the top command from Linux.
The CPU display shows useful data such as the percentage of time spent executing inuser space (user time), the percentage spent in system space (system time), and thepercentage of time spent idle. This screen also displays the number of threads and pro‐cesses running, along with a color-coded graph displaying an aggregate of the user andsystem time. Combined with the top-like display, this can be an excellent tool if you areinvestigating problems related to CPU-bound processes.
Figure 10-18 shows the Activity Monitor displaying a CPU report.
Mac OS X Monitoring | 361

Figure 10-18. The Activity Monitor’s CPU display
Notice that there is a Python script that, at the time of the sampling, was consuming aconsiderable portion of the CPU time. In this case, the system was running a Bazaarbranch in a terminal window. The Activity Monitor shows why my system gets sluggishwhen branching a code tree.
You can double-click a process to get more information about it. You can also cancel aprocess either in a controlled manner or by forcing it to quit. Figure 10-19 shows anexample of the process inspection dialog.
You can export the list of processes by selecting File→Save. You cansave the list of processes either as a text file or as an XML file. SomeApple professionals may ask for the process list in addition to theSystem Profiler report when diagnosing problems.
362 | Chapter 10: Getting Started with Monitoring

Figure 10-19. The Activity Monitor’s process inspection dialog
The System Memory display (Figure 10-20) shows information about the distributionof memory. It shows how much memory is free, how much memory cannot be cachedand must stay in RAM (in other words, the wired memory), how much is being used,and how much is inactive. With this report, you can see at a glance whether you have amemory issue.
Figure 10-20. The Activity Monitor’s System Memory display
The Disk Activity display (Figure 10-21) shows the disk activity for all of your disks.Shown in the first column are the total number of data transfers from (reads in) and to(writes out) disk along with disk performance for reads and writes per second. The nextcolumn shows the total size of the data read from and written to disk along with thethroughput for each. Included is a graph that displays reads and writes over time in acolor-coded graph.
Mac OS X Monitoring | 363

Figure 10-21. The Activity Monitor’s Disk Activity display
The Disk Activity data can tell you whether you invoke a lot of disk accesses and whetherthe number of reads and writes (and total amount of data) is unusually high. An un‐usually high value could indicate you may have to run processes at different times sothey do not compete for the disk or you may have to add another disk to balance theload.
The Disk Usage display (Figure 10-22) shows the used and free space for each of yourdrives. It also shows a color-coded pie chart to give you a quick view of the disk uti‐lization. You can view another disk by selecting the disk in the drop-down list.
Figure 10-22. The Activity Monitor’s Disk Usage display
This display allows you to monitor the free space on your disk so you know when toadd more disks and/or extend partitions to add more space when you run low.
The Network display (Figure 10-23) shows a lot of information about how your systemis communicating with the network. Shown in the first column is how many packetswere read or received (packets in) and written or sent (packets out) over the network.There are also performance statistics measured in packets per second for reads andwrites. The next column shows the size of the data read and written on the networkalong with the transfer rate for each direction. A color-coded chart shows the relativeperformance of the network. Note the peak value over the chart. You can use the dataon this display to determine whether a process is consuming the maximum bandwidthof your system’s network interfaces.
364 | Chapter 10: Getting Started with Monitoring

Figure 10-23. The Activity Monitor’s Network display
This section has given you a window into the powerful monitoring tools available onMac OS X. It’s not a complete tutorial, but it will get you started with monitoring a MacOS X system. For complete details about each of the applications shown, be sure toconsult the documentation provided by Apple on the Help menu of each application.
Microsoft Windows MonitoringWindows is saddled with the reputation of lacking tools; some have called its monitoringcounterintuitive. The good news is the barriers to monitoring a Windows system are amyth. In fact, Windows comes with some very powerful tools, including a scheduler forrunning tasks. You can take performance snapshots, examine errors in the Event Viewer(the Windows equivalent of logs), and monitor performance in real time.
The images shown in this section were taken from several Windowsmachines. The tools do not differ much in Windows XP or newerversions, including Windows Server 2008 and Windows 8. Howev‐er, there are differences in accessing the tools in Windows 7 and later,and these differences are noted for each tool.
Indeed, there are a great many tools available to the Windows administrator. We won’ttry to cover them all here, but instead we’ll focus on tools that let you monitor a Windowssystem in real time. Let’s examine some of the basic reporting tools first.
The following are the most popular tools you can use to diagnose and monitor perfor‐mance issues in Windows:
• Windows Experience Index• System Health Report• Event Viewer• Task Manager• Reliability Monitor
Microsoft Windows Monitoring | 365

• Performance Monitor
An excellent source for information about Microsoft Windows performance, tools,techniques, and documentation can be found at the Microsoft Technet website.
The Windows ExperienceIf you want a quick glance at how your system is performing compared to the expect‐ations of Microsoft’s hardware performance indexes, you can run the Windows Expe‐rience report.
To launch the report, click Start, then select Control Panel→System and Mainte‐nance→Performance Information and Tools. You will have to acknowledge the UserAccount Control (UAC) to continue.
You can also access the System Health Report using the search feature on the Start menu.Click Start and enter “performance” in the search box, then click Performance Infor‐mation and Tools. Click Advanced Tools and then click the link “Generate a systemhealth report” at the bottom of the dialog. You will have to acknowledge the UAC tocontinue.
Microsoft has changed the Windows Experience in Windows 7. Thereport is very similar to that of earlier Windows versions, but it sup‐plies more information that you can use to judge the performance ofyour system.
The report is run once after installation, but you can regenerate the report by clickingUpdate My Score.
This report rates five areas of your system’s performance: processor (CPU), memory,video controller (graphics), video graphics accelerator (gaming graphics), and the pri‐mary hard drive. Figure 10-24 shows an example of the Windows Experience report.
There is a little-known feature of this report you may find valuable—click on the link“Learn how you can improve your computer’s performance” to get a list of best practicesfor improving each of these scores.
You should run this report and regenerate the metrics every time youchange the configuration of your system. This will help you identifysituations where configuration changes affect the performance ofyour server.
366 | Chapter 10: Getting Started with Monitoring

Figure 10-24. The Windows Experience report
The best use for this tool is to get a general impression of how your system is performingwithout analyzing a ton of metrics. A low score in any of the categories can indicate aperformance issue. If you examine the report in Figure 10-24, for instance, you will seethat the system has a very low graphics and gaming graphics score. This is not unex‐pected for a Windows system running as a virtual machine or a headless server, but itmight be alarming to someone who just shelled out several thousand dollars for a high-end gaming system.
The System Health ReportOne of the unique features and diagnostic improvements in Windows Vista and lateris the ability to generate a report that takes a snapshot of all of the software, hardware,and performance metrics for your system. It is analogous to the System Profiler of MacOS X, but also contains performance counters.
To launch the System Health Report, click Start, then select Control Panel→System andMaintenance→Performance Information and Tools. Next, select Advanced Tools, thenclick the link “Generate a system health report” at the bottom of the dialog. You willhave to acknowledge the UAC to continue.
You can also access the System Health Report using the search feature on the Start menu.Click Start and enter “performance” in the search box, then click Performance Infor‐mation and Tools. Click Advanced Tools and select the link “Generate a system healthreport” at the bottom of the dialog. Another way to access the System Health Report isto use the search feature on the Start menu. Click Start and enter “system health report”in the search box, then click the link in the Start menu. You will have to acknowledgethe UAC to continue. Figure 10-25 shows an example of the System Health Report.
Microsoft Windows Monitoring | 367

Figure 10-25. The System Health Report
This report has everything—all of the hardware, software, and many other aspects ofyour system are documented here. Notice the report is divided into sections that youcan expand or collapse for easier viewing. The following list briefly describes the infor‐mation displayed by each section:System Diagnostics Report
The system name and the date the report was generated.
Diagnostic ResultsWarning messages generated while the report was being run, identifying potentialproblem areas on your computer. Also included is a brief overview of the perfor‐mance of your system at the time the report was run.
Software ConfigurationA list of all of the software installed on your system, including system securitysettings, system services, and startup programs.
Hardware ConfigurationA list of the important metadata for disk, CPU performance counters, BIOS infor‐mation, and devices.
368 | Chapter 10: Getting Started with Monitoring

CPUA list of the processes running at report time and metadata about system compo‐nents and services.
NetworkMetadata about the network interfaces and protocols on your system.
DiskPerformance counters and metadata about all of the disk devices.
MemoryPerformance counters for memory, including the process list and memory usage.
Report StatisticsGeneral information about the system when the report was run, such as processorspeed and the amount of memory installed.
The System Health Report is your key to understanding how your system is configuredand is performing at a glance. It is a static report, representing a snapshot of the system.
There is a lot of detailed information in the Hardware Configuration, CPU, Network,Disk, and Memory sections. Feel free to explore those areas for greater details aboutyour system.
The best use of this tool, beyond examining the performance counters, is to save thereport for later comparison to other reports when your system is performing poorly.You can save an HTML version of the report by selecting File→Save As.
You can use the saved report as a baseline for performance of your system. If you generatethe report several times over the course of low, medium, and high usage, you should beable to put together a general expectation for performance. These expectations are im‐portant because you can use them to determine whether your performance issues arewithin the bounds of expectations. When a system enters a period of unusually highload during a time when it is expected to have a low load, the users’ experience maygenerate complaints. If you have these reports to compare to, you can save yourself alot of time investigating the exact source of the slowdown.
The Event ViewerThe Windows Event Viewer shows all the messages logged for application, security, andsystem events. It is a great source of information about events that have occurred (orcontinue to occur) and should be one of the primary tools you use to diagnose andmonitor your system.
You can accomplish a great deal with the Event Viewer. For example, you can generatecustom views of any of the logs, save the logs for later diagnosis, and set up alerts forspecific events in the future. We will concentrate on viewing the logs. For more infor‐
Microsoft Windows Monitoring | 369

mation about the Event Viewer and how you can set up custom reports and subscribeto events, consult your Windows help files.
To launch the Event Viewer, click the Start button, then right-click Computer and chooseManage. You will have to acknowledge the UAC to continue. You can then click theEvent Viewer link in the left panel. You can also launch the Event Viewer by clickingStart, typing “event viewer,” and pressing Enter.
The dialog has three panes by default. The left pane is a tree view of the custom views, logfiles, and applications and services logs. The logs are displayed in the center pane,and the right pane contains the Action menu items. The log entries are sorted, by default,in descending order by date and time. This allows you to see the most recent messagesfirst.
You can customize the Event Viewer views however you like. You caneven group and sort events by clicking on the columns in the logheader.
Open the tree for the Windows logs to see the base logfiles for the applications, security,and system (among others). Figure 10-26 shows the Event Viewer open and the log treeexpanded.
The logs available to view and search include:Application
All messages generated from user applications as well as operating system services.This is a good place to look when diagnosing problems with applications.
SecurityMessages related to access and privileges exercised, as well as failed attempts toaccess any secure object. This can be a good place to look for application failuresrelated to username and password issues.
SetupMessages related to application installation. This is the best place to look for infor‐mation about failures to install or remove software.
SystemMessages about device drivers and Windows components. This can be the mostuseful set of logs for diagnosing problems with devices or the system as a whole. Itcontains information about all manner of devices running at the system level.
Forwarded EventsMessages forwarded from other computers. Consult the Windows documentationabout working with remote event logging.
370 | Chapter 10: Getting Started with Monitoring

Figure 10-26. The Windows Event Viewer
Digging through these logs can be challenging, because many of them display infor‐mation that is interesting to developers and not readable by mere mortals. To makethings easier, you can search any of the logs by clicking the Find operation in the Actionspane and entering a text string. For example, if you are concerned about memory issues,you can enter “memory” to filter all of the log entries for ones containing the string“memory,” which will then be shown in the center pane.
You can also click the Details tab to make things easier to read.
Each log message falls into one of the following three categories (these apply to userprocesses, system components, and applications alike):Error
Indicates a failure of some magnitude, such as a failed process, out-of-memoryproblem, or system fault.
Microsoft Windows Monitoring | 371

WarningIndicates a less serious condition or event of note, such as low memory or low diskspace.
InformationConveys data about an event. This is generally not a problem, but it could provideadditional information when diagnosing problems, such as when a USB drive wasremoved.
To view a log, open the corresponding tree in the left pane. To view the details aboutany message, click on the message. The message will be displayed below the log entries,as shown in Figure 10-26. In the lower part of the center pane, you can click the Generaltab to see general information about the message, such as the statement logged, whenit occurred, what log it is in, and the user who was running the process or application.You can click the Details tab to see a report of the data logged. You can view the infor‐mation as text (Friendly View) or XML (XML View). You can also save the informationfor later review; the XML View is useful to pass the report to tools that recognize the format.
The Reliability MonitorThe most interesting monitoring tool in Windows is the Reliability Monitor. This is aspecialized tool that plots the significant performance and error events that have oc‐curred over time in a graph.
A vertical bar represents each day over a period of time. The horizontal bar is an ag‐gregate of the performance index for that day. If there are errors or other significantevents, you will see a red X on the graph. Below the bar is a set of drop-down lists thatcontain the software installations and removals, any application failures, hardware fail‐ures, Windows failures, and any additional failures.
This tool is great for checking the performance of the system over a period of time. Itcan help diagnose situations when an application or system service has performed cor‐rectly in the past but has started performing poorly, or when a system starts generatingerror messages. The tool can help locate the day the event first turned up, as well as giveyou an idea of how the system was performing when it was running well.
Another advantage of this tool is that it gives you a set of daily baselines of your systemover time. This can help you diagnose problems related to changing device drivers (oneof the banes of Windows administration), which could go unnoticed until the systemdegrades significantly.
In short, the Reliability Monitor gives you the opportunity to go back in time and seehow your system was performing. The best part of all? You don’t have to turn it on—itruns automatically, gleaning much of its data from the logs, and therefore automaticallyknowing your system’s history.
372 | Chapter 10: Getting Started with Monitoring

One big source of problems on Windows is connecting and config‐uring hardware. We will not discuss this subject here, as it can easi‐ly fill a book in its own right. The good news is there is a plethora ofinformation about Windows on the Internet. Try googling for yourspecific driver or hardware to see the most popular hits. You can alsocheck out the Microsoft support forums. Another excellent resourceand host of some popular Windows tools is Sysinternals.
You can access the Reliability Monitor by clicking Start, typing “reliability,” and pressingEnter or clicking on Reliability and Performance Monitor. You will have to acknowledgethe UAC. Click Reliability Monitor in the tree pane on the left. Figure 10-27 shows anexample of the Reliability Monitor.
Figure 10-27. The Reliability Monitor
In Windows 7, you can launch the Reliability Monitor by clicking Start, typing “actioncenter” in the search box, and pressing Enter. You can then select Maintenance → Viewreliability report. The report differs from previous versions of Windows, but offers thesame information in a tidier package. For example, instead of the drop-down lists, thenew Reliability Monitor report lists known incidents in a single list.
Microsoft Windows Monitoring | 373

The Task ManagerThe Windows Task Manager (shown in Figure 10-28) displays a dynamic list of runningprocesses. It has been around for a long time and has been improved over variousversions of Windows.
The Task Manager offers a tabbed dialog with displays for running applications, pro‐cesses (this is most similar to the Linux top command), services active on the system,a CPU performance meter, a network performance meter, and a list of users. Unlikesome other reports, this tool generates its data dynamically, refreshing periodically. Thismakes the tool a bit more useful in observing the system during periods of low perfor‐mance.
The reports display the same information as the System Health Report, but in a muchmore compact form, and are updated continuously. You can find all of the critical metricsneeded to diagnose performance issues with CPU, resource-hogging processes, mem‐ory, and the network. Conspicuously missing is a report on disk performance.
Figure 10-28. The Task Manager
One of the interesting features of the Task Manager is that it shows a miniature perfor‐mance meter in the notification area on the Start bar that gives you a chance to watchfor peaks in usage. You can launch the Task Manager any time by pressing Ctrl+Alt+Deland choosing Task Manager from the menu.
374 | Chapter 10: Getting Started with Monitoring

Running a dynamic performance monitoring tool consumes resour‐ces and can affect a system that already suffers poor performance.
The Performance MonitorThe Performance Monitor is the premier tool for tracking performance in a Windowssystem. It allows you to select key metrics and plot their values over time. It can alsostore the session so you can later review it and create a baseline for your system.
The Performance Monitor has metrics for just about everything in your system. Thereare counters for many of the smaller details having to do with the basic areas of per‐formance: CPU, memory, disk, and network. There are a great many other categoriesas well.
To launch the Performance Monitor, click Start, then select Control Panel→System andMaintenance→Performance Information and Tools. Click Advanced Tools and thenclick the link Open Reliability and Performance Monitor near the middle of the dialog.You will have to acknowledge the UAC to continue. Click Reliability Monitor in the treepane on the left to access the Performance Monitor feature.
You can also launch the Performance Monitor by clicking Start, typing “reliability,” andpressing Enter or clicking on Reliability and Performance Monitor. You will have toacknowledge the UAC. Click Reliability Monitor in the tree pane on the left to accessthe Performance Monitor feature. Figure 10-29 shows an example of the PerformanceMonitor.
Microsoft has two levels of metrics: objects that offer a high-level view of an area suchas the processor or memory, and counters that represent a specific detail of the system.Thus, you can monitor the CPU’s performance as a whole or watch the finer details,such as percentage of time idle or the number of user processes running. Add theseobjects or counters to the main chart by clicking the green plus sign on the toolbar. Thisopens a dialog that allows you to choose from a long list of items to add to the chart.Adding the items is a simple matter of selecting the object and expanding the drop-down list on the left, then dragging the desired object to the list on the right.
Microsoft Windows Monitoring | 375
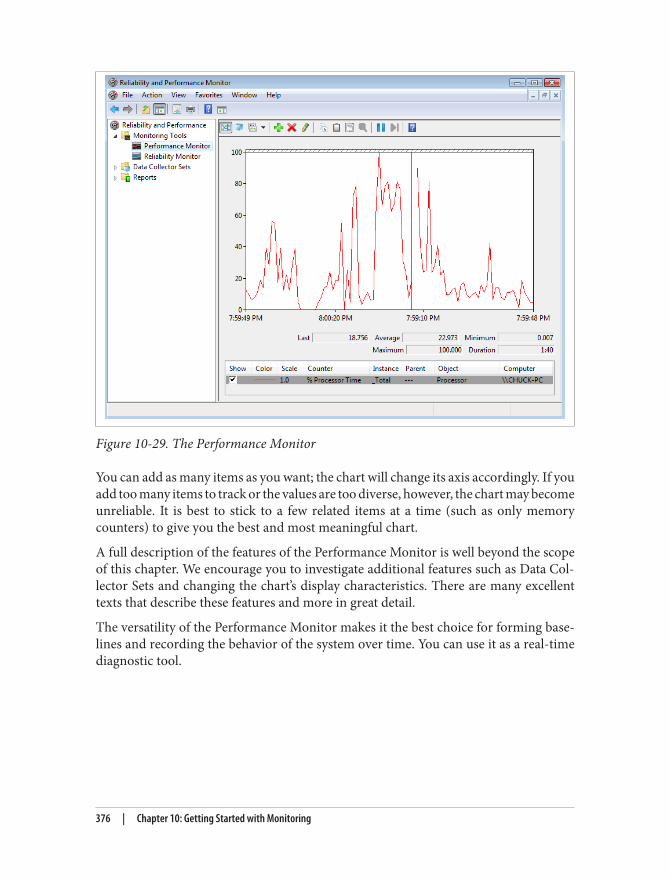
Figure 10-29. The Performance Monitor
You can add as many items as you want; the chart will change its axis accordingly. If youadd too many items to track or the values are too diverse, however, the chart may becomeunreliable. It is best to stick to a few related items at a time (such as only memorycounters) to give you the best and most meaningful chart.
A full description of the features of the Performance Monitor is well beyond the scopeof this chapter. We encourage you to investigate additional features such as Data Col‐lector Sets and changing the chart’s display characteristics. There are many excellenttexts that describe these features and more in great detail.
The versatility of the Performance Monitor makes it the best choice for forming base‐lines and recording the behavior of the system over time. You can use it as a real-timediagnostic tool.
376 | Chapter 10: Getting Started with Monitoring

If you have used the Reliability or Performance Monitor, you mayhave noticed a seldom-commented-on feature called the ResourceOverview. This is the default view of the Reliability and Perfor‐mance Monitor. It provides four dynamic performance graphs forCPU, disk, network, and memory. Below the graphs are drop-downdetail panes containing information about these areas. This report isan expanded form of the Task Manager performance graphs andprovides yet another point of reference for performance monitoringand diagnosis on Microsoft Windows.
This brief introduction to monitoring performance on Microsoft Windows should per‐suade you that the belief that Microsoft’s Windows platform is difficult to monitor andlacks sophisticated tools is a myth. The tools are very extensive (some could argue toomuch so) and provide a variety of views of your system’s data.
Monitoring as Preventive MaintenanceThe techniques discussed so far give you a snapshot of the status of the system. However,most would agree that monitoring is normally an automated task that samples theavailable statistics for anomalies. When an anomaly is found, an alert is sent to anadministrator (or group of administrators) to let someone know there may be a problem.This turns the reactive task of checking the system status into a proactive task.
A number of third-party utilities combine monitoring, reporting, and alerts into easy-to-use interfaces. There are even monitoring and alert systems for an entire infrastruc‐ture. For example, Nagios can monitor an entire IT infrastructure and set up alerts foranomalies.
There are also monitoring and alert systems available either as part of or an add-on foroperating systems and database systems. We will examine the Enterprise Monitor forMySQL in Chapter 16.
ConclusionThere are a great many references on both performance tuning and security monitoring.This chapter provides a general introduction to system monitoring. While it is notcomprehensive, the material presented is an introduction to the tools, techniques, andconcepts of monitoring your operating system and server performance. In the nextchapter, we will take on the task of monitoring a MySQL system and discuss somecommon practices to help keep your MySQL system running at peak performance.
Monitoring as Preventive Maintenance | 377

“Joel!”
He knew that voice and that tone. Joel’s boss was headed his way and about to conductanother drive-by tasking. He turned to face his office door as his boss stepped throughit. “Did you read Sally’s email about the slowdown?”
Joel recalled that Sally was one of the employees who sent him a message asking whyher application was running slowly. He had just finished checking the low-hangingfruit—there was plenty of memory and disk space wasn’t an issue.
“Yes, I was just looking into the problem now.”
“Make it your top priority. Marketing has a deadline to produce their quarterly salesprojections. Let me know what you find.” His boss nodded once and stepped away.
Joel sighed and returned to examining the reports on CPU usage while wondering howto describe technology to the nontechnical.
378 | Chapter 10: Getting Started with Monitoring

CHAPTER 11
Monitoring MySQL
Joel had a feeling today was going to be a better day. Everything was going well: theperformance measurements for the servers were looking good and the user complaintswere down. He had successfully reconfigured the server and improved performancegreatly. There was only one application still performing poorly, but he was sure it wasn’ta hardware- or operating-system-related problem; more likely, it was an issue with apoorly written query. Nevertheless, he had sent his boss an email message explaininghis findings and that he was working on the remaining problems.
Joel heard quickened footsteps approaching his office. He instinctively looked towardhis door, awaiting the now-routine appearance of his boss. He was shocked as Mr. Sum‐merson zipped by without so much as a nod in his direction.
He shrugged his shoulders and returned to reading his email messages. Just then a newmessage appeared with “HIGH PRIORITY” in the subject line in capital letters. It wasfrom his boss. Chiding himself for holding his breath, Joel relaxed and opened themessage. He could hear his boss’s voice in his mind as he read through the message.
“Joel, good work on those reports. I especially like the details you included about mem‐ory and disk performance. I’d like you to generate a similar report about the databaseserver. I’d also like you to look into a problem one of the developers is having with aquery. Susan will send you the details.”
With a deep sigh, Joel once again opened his favorite MySQL book to learn more aboutmonitoring the database system. “I hope it has something about drilling down intoindividual components,” he mumbled, knowing he needed to get up to speed quicklyon an advanced feature of MySQL.
Now that you understand how monitoring works and how to keep your host’s operatingsystems at peak efficiency, how do you know whether your MySQL servers are per‐forming at their peak efficiency? Better still, how do you know when they aren’t?
379

In this chapter, we begin with a look at monitoring MySQL, a brief discussion of mon‐itoring techniques for MySQL, and the taxonomy of monitoring MySQL, and then moveon to monitoring and improving performance in your databases. We conclude with alook into best practices for improving database performance.
What Is Performance?Before we begin discussions about database performance and general best practices formonitoring and tuning a MySQL server, it is important to define what we mean by performance. For the purposes of this chapter, good performance is defined as meetingthe needs of the user such that the system performs as expediently as the user expects,whereas poor performance is defined as anything less. Typically, good performancemeans that response time and throughput meet the users’ expectations. While this maynot seem very scientific, savvy administrators know the best gauge of how well thingsare going is the happiness of the users.
That doesn’t mean we don’t measure performance. On the contrary, we can and mustmeasure performance in order to know what to fix, when, and how. Furthermore, if youmeasure performance regularly, you can even predict when your users will begin to beunhappy. Your users won’t care if you reduce your cache hit rate by 3%, beating yourbest score to date. You may take pride in such things, but metrics and numbers aremeaningless when compared to the user’s experience at the keyboard.
There is a very important philosophy that you should adopt when dealing with perfor‐mance. Essentially, you should never adjust the parameters of your server, database, orstorage engine unless you have a deliberate plan and a full understanding of the ex‐pectations of the change as well as the consequences. More important, never adjustwithout measuring the effects of the change over time. It is entirely possible that youcan improve the performance of the server in the short run but negatively impact per‐formance in the long run. Finally, you should always consult references from severalsources, including the reference manuals.
Now that we’ve issued that stern warning, let’s turn our attention to monitoring andimproving performance of the MySQL server and databases.
Administrators monitoring MySQL almost always focus on improv‐ing performance. Certainly performance is important, in terms ofhow long the user must wait for a query to execute. But monitoringcan also check for the exhaustion of resources, or a high demand forthose resources which can cause timeouts or other failures to getaccess to your server.
380 | Chapter 11: Monitoring MySQL

MySQL Server MonitoringManaging the MySQL server falls in the category of application monitoring. This isbecause most of the performance parameters are generated by the MySQL software andare not part of the host operating system. As mentioned previously, you should alwaysmonitor your base operating system in tandem with monitoring MySQL becauseMySQL is very sensitive to performance issues in the host operating system.
There is an entire chapter in the online MySQL Reference Manual that covers all aspectsof monitoring and performance improvement, intriguingly titled “Optimization.” Rath‐er than repeat the facts and rhetoric of that excellent reference, we will discuss a generalapproach to monitoring the MySQL server and examine the various tools available.
This section is an introduction to the finer details of monitoring the MySQL server.We’ll start with a short discussion of how to change and monitor the behavior of thesystem, then discuss monitoring primarily for the purposes of diagnosing performanceissues and forming a performance benchmark. We will also discuss best practices fordiagnosing performance issues and take a look at monitoring the storage engine sub‐layer in MySQL—an area not well understood or covered by other reference sources.
How MySQL Communicates PerformanceThere are two mechanisms you can use to govern and monitor behavior in the MySQLserver. You use server variables to control behavior and status variables to read behaviorconfiguration and statistical information regarding features and performance.
There are many variables you can use to configure the server. Some can be set only atstartup (called startup options, which can also be set in option files). Others can be setat the global level (across all connections), the session level (for a single connection), orboth the global and session levels.
You can read server variables using the following commands:SHOW [GLOBAL | SESSION] VARIABLES;
You can change those variables that are not static (read-only) using the following com‐mands (you can include multiple settings on a single line using a comma separator):
SET [GLOBAL | SESSION] variable_name = value;SET [@@global. | @@session. | @@]variable_name = value;
Session variable settings are not persistent beyond the current con‐nection and are reset when the connection is closed.
MySQL Server Monitoring | 381

You can read status variables using the following commands—the first two commandsdisplay the value of all local or session scope variables (the default is session) and thethird command displays those variables that are global in scope:
SHOW STATUS;SHOW SESSION STATUS;SHOW GLOBAL STATUS;
We discuss how and when to use these commands in the next section.
Two of the most important commands for discovering information about the serverand how it is performing are SHOW VARIABLES and SHOW STATUS. There are a great manyvariables (over 290 status variables alone). The variable lists are generally in alphabeticalorder and are often grouped by feature. However, sometimes the variables are not neatlyarranged. Filtering the command by a keyword through the LIKE clause can produceinformation about the specific aspects of the system you want to monitor. For example,SHOW STATUS LIKE '%thread%' shows all of the status variables related to thread exe‐cution.
Performance MonitoringPerformance monitoring in MySQL is the application of the previous commands—specifically, setting and reading system variables and reading status variables. The SHOWand SET commands are only two of the possible tools you can use to accomplish thetask of monitoring the MySQL server.
Indeed, there are several tools you can use to monitor your MySQL server. The toolsavailable in the standard distributions are somewhat limited in that they are consoletools and include special commands you can execute from a MySQL client (e.g., SHOWSTATUS) and utilities you can run from a command line (e.g., mysqladmin).
The MySQL client tool is sometimes called the MySQL monitor, butshould not be confused with a monitoring tool.
There are also GUI tools available that make things a little easier if you prefer or requiresuch options. In particular, you can download the MySQL GUI tools, which includeadvanced tools that you can use to monitor your system, manage queries, and migrateyour data from other database systems.
We begin by examining how to use the SQL commands and then discuss the MySQLWorkbench tool. We also take a look at one of the most overlooked tools available tothe administrator: the server logs.
382 | Chapter 11: Monitoring MySQL

Some savvy administrators may consider the server logs the first and primary tool foradministering the server. Although they are not nearly as vital for performance moni‐toring, they can be an important asset in diagnosing performance issues.
SQL CommandsAll of the SQL monitoring commands could be considered variants of the SHOW com‐mand, which displays internal information about the system and its subsystems. Forexample, one pair of commands that can be very useful in monitoring replication isSHOW MASTER STATUS and SHOW SLAVE STATUS. We will examine these in more detaillater in this chapter.
Many of these commands can be achieved by querying the INFORMATION_SCHEMA tables directly. See the online MySQL Reference Man‐ual for more details about the INFORMATION_SCHEMA database and itsfeatures.
While there are many forms of the SHOW command, the following are the most commonSQL commands you can use to monitor the MySQL server:SHOW INDEX FROM table
Describes the indexes in the table. This can let you know whether you have the rightindexes for the way your data is used.
SHOW PLUGINS
Displays the list of all known plug-ins. It shows the name of the plug-in and itscurrent status. The storage engines in newer releases of MySQL are implementedas plug-ins. Use this command to get a snapshot of the currently available plug-insand their status. While not directly related to monitoring peformance, some plug-ins supply system variables. Knowing which plug-ins are installed can help deter‐mine whether you can access plug-in−specific variables.
SHOW [FULL] PROCESSLIST
Displays data for all threads (including those handling connections to clients) run‐ning on the system. This command resembles the process commands of the hostoperating system. The information displayed includes connection data along withthe command executing, how long it has been executing, and its current state. Likethe operating system command it resembles, it can diagnose poor response (toomany threads), a zombie process (long running or nonresponding), or even con‐nection issues. When dealing with poor performance or unresponsive threads, usethe KILL command to terminate them. The default behavior is to show the processesfor the current user. The FULL keyword displays all processes.
MySQL Server Monitoring | 383

You must have the SUPER privilege to see all processes runningon the system.
SHOW [GLOBAL | SESSION] STATUS
Displays the values of all of the system variables. You will probably use this com‐mand more frequently than any other. Use this command to read all of the statisticalinformation available on the server. Combined with the GLOBAL or SESSION key‐word, you can limit the display to those statistics that are global- or session-only.
SHOW TABLE [FROM db ] STATUS
Displays detailed information about the tables in a given database. This includesthe storage engine, collation, creation data, index data, and row statistics. You canuse this command along with the SHOW INDEX command to examine tables whendiagnosing poorly performing queries.
SHOW [GLOBAL | SESSION] VARIABLES
Displays the system variables. These are typically configuration options for theserver. Although they do not display statistical information, viewing the variablescan be very important when determining whether the current configuration haschanged or if certain options are set. Some variables are read-only and can bechanged only via the configuration file or the command line on startup, while otherscan be changed globally or set locally. You can combine this command with theGLOBAL or SESSION keyword to limit the display to those variables that are global-or session-only.
Limiting the Output of SHOW CommandsThe SHOW commands in MySQL are very powerful. However, they often display too muchinformation. This is especially true for the SHOW STATUS and SHOW VARIABLES
commands.
To see less information, you can use the LIKE pattern clause, which limits the outputto rows matching the pattern specified. The most common example is using the LIKEclause to see only variables for a certain subset, such as replication or logging. You canuse the standard MySQL pattern symbols and controls in the LIKE clause in the samemanner as a SELECT query.
For example, the following displays the status variables that include the name “log”:
mysql> SHOW SESSION STATUS LIKE '%log%';+--------------------------+-------+| Variable_name | Value |+--------------------------+-------+
384 | Chapter 11: Monitoring MySQL

| Binlog_cache_disk_use | 0 || Binlog_cache_use | 0 || Com_binlog | 0 || Com_purge_bup_log | 0 || Com_show_binlog_events | 0 || Com_show_binlogs | 0 || Com_show_engine_logs | 0 || Com_show_relaylog_events | 0 || Tc_log_max_pages_used | 0 || Tc_log_page_size | 0 || Tc_log_page_waits | 0 |+--------------------------+-------+11 rows in set (0.11 sec)
The commands specifically related to storage engines include the following:SHOW ENGINE engine_name LOGS
Displays the log information for the specified storage engine. The information dis‐played is dependent on the storage engine. This can be very helpful in tuning storageengines. Some storage engines do not provide this information.
SHOW ENGINE engine_name STATUS
Displays the status information for the specified storage engine. The informationdisplayed depends on the storage engine. Some storage engines display more in‐formation than others. For example, the InnoDB storage engine displays dozens ofstatus variables, while the NDB storage engine shows a few, and the MyISAM stor‐age engine displays no information. This command is the primary mechanism forviewing statistical information about a given storage engine and can be vital fortuning certain storage engines (e.g., InnoDB).
Older synonyms for the SHOW ENGINE commands (SHOW engine LOGS and SHOW engine STATUS) have been deprecated.Also, these commands can display information only on certainengines, including InnoDB and Performance_Schema.
SHOW ENGINES
Displays a list of all known storage engines for the MySQL release and their status(i.e., whether the storage engine is enabled). This can be helpful when decidingwhich storage engine to use for a given database or in replication to determine ifthe same storage engines exist on both the master and the slave.
The commands specifically related to MySQL replication include:SHOW BINLOG EVENTS [IN log_file] [FROM pos] [LIMIT offset row_count]
Displays the events as they were recorded to the binary log. You can specify a logfileto examine (omitting the IN clause tells the system to use the current logfile), and
MySQL Server Monitoring | 385

limit output to the last events from a particular position or to the first number ofrows after an offset into the file. This command is the primary command used indiagnosing replication problems. It comes in very handy when an event occurs thatdisrupts replication or causes an error during replication.
If you do not use a LIMIT clause and your server has been run‐ning and logging events for some time, you could get a verylengthy output. If you need to examine a large number of events,you should consider using the mysqlbinlog utility instead.
SHOW BINARY LOGS
Displays the list of the binary logs on the server. Use this command to get infor‐mation about past and current binlog filenames. The size of each file is alsodisplayed. This is another useful command for diagnosing replication problemsbecause it will permit you to specify the binlog file for the SHOW BINLOG EVENTScommand, thereby reducing the amount of data you must explore to determine theproblem. The SHOW MASTER LOGS command is a synonym.
SHOW RELAYLOG EVENTS [IN log_file] [FROM pos] [LIMIT offset row_count]
Available in MySQL version 5.5.0, this command does the same thing as SHOW BINLOG EVENTS, only with relay logs on the slave. If you do not supply a filename forthe log, events from the first relay log are shown. This command has no effect whenrun on the master.
SHOW MASTER STATUS
Displays the current configuration of the master. It shows the current binlog file,the current position in the file, and all inclusive or exclusive replication settings.Use this command when connecting or reconnecting slaves.
SHOW SLAVE HOSTS
Displays the list of slaves connected to the master that used the --report-hostoption. Use this information to determine which slaves are connected toyour master.
SHOW SLAVE STATUS
Displays the status information for the system acting as a slave in replication. Thisis the primary command for tracking the performance and status of your slaves. Aconsiderable amount of information is displayed that is vital to maintaining ahealthy slave. See Chapter 3 for more information about this command.
Example 11-1 shows the SHOW VARIABLES command and its output from a recent beta release of MySQL.
386 | Chapter 11: Monitoring MySQL

Example 11-1. Showing thread status variablesmysql> SHOW VARIABLES LIKE '%thread%';+----------------------------+---------------------------+| Variable_name | Value |+----------------------------+---------------------------+| innodb_file_io_threads | 4 || innodb_read_io_threads | 4 || innodb_thread_concurrency | 0 || innodb_thread_sleep_delay | 10000 || innodb_write_io_threads | 4 || max_delayed_threads | 20 || max_insert_delayed_threads | 20 || myisam_repair_threads | 1 || pseudo_thread_id | 1 || thread_cache_size | 0 || thread_handling | one-thread-per-connection || thread_stack | 262144 |+----------------------------+---------------------------+12 rows in set (0.00 sec)
This example shows not only those status variables for thread management, but alsothe thread control for the InnoDB storage engine. Although you sometimes get moreinformation than you expected, a keyword-based LIKE clause is sure to help you findthe specific variable you need.
Knowing which variables to change and which variables to monitor can be the mostchallenging part of monitoring a MySQL server. As mentioned, a great deal of valuableinformation on this topic is included in the online MySQL Reference Manual.
To illustrate the kinds of features you can monitor in a MySQL server, let us examinethe variables that control the query cache. The query cache is one of the most importantperformance features in MySQL if you use the MyISAM storage engine for your appli‐cation data. It allows the server to buffer frequently used queries and their results inmemory. Thus, the more often a query is run, the more likely it is that the results canbe read from the cache rather than reexamining the index structures and tables to re‐trieve the data. Clearly, reading the results from memory is much faster than readingthem from disk every time. This can be a performance improvement if your data is readmuch more frequently than it is written (updated).
Each time you run a query, it is entered into the cache and has a lifetime governed byhow recently it was used (old queries are dumped first) and how much memory thereis available for the query cache. Additionally, there are a number of events that caninvalidate (remove) queries from the cache.
We include a partial list of these events here:
• Changes to data or indexes.
MySQL Server Monitoring | 387

• Subtle differences of the same query that have a different result set, which can causemissed cache hits. Thus, it is important to use standardized queries for commonlyaccessed data. You will see later in this chapter how views can help in this area.
• When a query derives data from temporary tables (not cached).• Transaction events that can invalidate queries in the cache (e.g., COMMIT).
You can determine whether the query cache is configured and available in your MySQLinstallation by examining the have_query_cache variable. This is a system variable withglobal scope, but it is read-only. You control the query cache using one of several vari‐ables. Example 11-2 shows the server variables for the query cache.
Example 11-2. Query cache server variablesmysql> SHOW VARIABLES LIKE '%query_cache%';+------------------------------+----------+| Variable_name | Value |+------------------------------+----------+| have_query_cache | YES || query_cache_limit | 1048576 || query_cache_min_res_unit | 4096 || query_cache_size | 33554432 || query_cache_type | ON || query_cache_wlock_invalidate | OFF |+------------------------------+----------+6 rows in set (0.00 sec)
As you can see, there are several things you can change to affect the query cache. Mostnotable is the ability to temporarily turn off the query cache by setting thequery_cache_size variable, which sets the amount of memory available for the querycache. If you set this variable to 0, it effectively turns off the query cache and removesall queries from the cache. This is not related to the have_query_cache variable, whichmerely indicates that the feature is available. Furthermore, it is not sufficient to setquery_cache_type = OFF because it does not deallocate the query cache buffer. Youmust also set the size to completely turn off the query cache. For more informationabout configuring the query cache, see the section titled “Query Cache Configuration”in the online MySQL Reference Manual.
You can observe the performance of the query cache by examining several status vari‐ables, as shown in Example 11-3.
Example 11-3. Query cache status variablesmysql> SHOW STATUS LIKE '%Qcache%';+-------------------------+-------+| Variable_name | Value |+-------------------------+-------+| Qcache_free_blocks | 0 || Qcache_free_memory | 0 |
388 | Chapter 11: Monitoring MySQL

| Qcache_hits | 0 || Qcache_inserts | 0 || Qcache_lowmem_prunes | 0 || Qcache_not_cached | 0 || Qcache_queries_in_cache | 0 || Qcache_total_blocks | 0 |+-------------------------+-------+8 rows in set (0.00 sec)
Here we see one of the more subtle inconsistencies in the MySQL server. You can controlthe query cache using variables that start with query_cache, but the status variablesstart with Qcache. While the inconsistency was intentional (to help distinguish a servervariable from a status variable), oddities like this can make searching for the right itemsa challenge.
There are many nuances to the query cache that allow you to manage and configure itand monitor its performance. This makes the query cache an excellent example todemonstrate the complexity of monitoring the MySQL server.
For example, you can and should periodically defragment the query cache with theFLUSH QUERY CACHE command. This does not remove results from the cache, but insteadallows for internal reorganization to better utilize memory.
While no single volume (or chapter in a broader work) can cover all such topics andnuances of the query cache, the practices described in this chapter therefore are generaland are designed to be used with any feature in the MySQL server. However, the specificdetails may require additional research and a good read through the online MySQLReference Manual.
The mysqladmin UtilityThe mysqladmin command-line utility is the workhorse of the suite of command-linetools. There are many options and tools (called “commands”) this utility can perform.The online MySQL Reference Manual discusses the mysqladmin utility briefly. In thissection, we examine the options and tools for monitoring a MySQL server.
The utility runs from the command line, so it allows administrators to script sets ofoperations much more easily than they can process SQL commands. Indeed, some ofthe third-party monitoring tools use a combination of the mysqladmin and SQL com‐mands to gather information for display in other forms.
You must specify connection information (user, password, host, etc.) to connect to arunning server. The following is a list of commonly used commands (as you will see,most of these have equivalent SQL commands that produce the same information):
MySQL Server Monitoring | 389

status
Displays a concise description of the status of the server, including uptime, numberof threads (connections), number of queries, and general statistical data. This com‐mand provides a quick snapshot of the server’s health.
extended-status
Displays the entire list of system statistics and is similar to the SQL SHOW STATUScommand.
processlist
Displays the list of current processes and works the same way as the SQL SHOWPROCESSLIST command.
kill thread id
Allows you to kill a specified thread. Use this in conjunction with processlist tohelp manage runaway or hung processes.
variables
Displays the system server variables and values. This is equivalent to the SQL SHOWVARIABLES command.
There are many options and other commands not listed here, including commands tostart and stop a slave during replication and manage the various system logs.
One of the best features of the mysqladmin utility is its comparison of information overtime. The --sleep n option tells the utility to execute the specified command onceevery n seconds. For example, to see the process list refreshed every three seconds onthe local host, use the following command:
mysqladmin -uroot --password processlist --sleep 3
This command will execute until you cancel the utility using Ctrl-C.
Perhaps the most powerful option is the comparative results for the extended statuscommand. Use the --relative option to compare the previous execution values withthe current values. For example, to see the previous and current values for the systemstatus variables, use this command:
mysqladmin -uroot --password extended-status --relative --sleep 3
You can also combine commands to get several reports at the same time. For example,to see the process list and status information together, issue the following command:
mysqladmin --root … processlist status
mysqladmin has many other uses. You can use it to shut down the server, flush the logs,ping a server, start and stop slaves in replication, and refresh the privilege tables. Formore information about the mysqladmin tool, see the section titled “mysqladmin—Client for Administering a MySQL Server” in the online MySQL Reference Manual.Figure 11-1 shows the sample output of a system with no load.
390 | Chapter 11: Monitoring MySQL

Figure 11-1. Sample mysqladmin process and status report
MySQL WorkbenchThe MySQL Workbench application is a GUI tool designed as a workstation-basedadministration tool. MySQL Workbench, which we’ll just call Workbench henceforth,is available for download on the MySQL website and is offered as a community edition(GPL) and a commercial version called the Standard Edition. The Standard Edition isbundled with the MySQL Enterprise offerings.
The major features of Workbench include:
• Server administration• SQL development• Data modeling• Database Migration Wizard
We will discuss server administration in more detail and briefly introduce SQL devel‐opment in the following sections. Data modeling is beyond the scope of this chapter,but if you want to implement configuration management for your database schemas,we encourage you to explore the feature presented in the Workbench documentation.The database migration wizard is designed to automate the migration of database sche‐ma and data from other database systems. These include Microsoft SQL Server 2000,2005, 2008, and 2012, PostgreSQL 8.0 and later, and Sybase Adaptive Server Enterprise15.x and greater. It can be a really handy tool to make adoption of MySQL easier andfaster.
MySQL Workbench replaces the older MySQL GUI Tools, includingMySQL Administrator, MySQL Query Browser, and MySQL Migra‐tion Toolkit.
When you launch Workbench, the main screen displays three distinct sections repre‐senting SQL development, data modeling, and server administration (Figure 11-2). The
MySQL Server Monitoring | 391

links below each section permit you to start working with each of these features. Thedatabase migration feature is accessed via the “Database Migrate…” menu option.
Figure 11-2. MySQL Workbench home window
You can use Workbench on any platform and can access one or more servers connectedto the client. This makes the tool much more convenient when monitoring severalservers on the network.
For more information and details about installation and setup, refer to the onlineMySQL Workbench documentation.
MySQL server administration
The server administration feature provides facilities for viewing and changing systemvariables, managing configuration files, examining the server logs, monitoring statusvariables, and even viewing graphical representations of performance for some of themore important features. It also has a full set of administration options that allow youto manage users and view database configurations. While it was originally intended toreplace the mysqladmin tool, popular demand ensures we will have both for the fore‐seeable future.
392 | Chapter 11: Monitoring MySQL

To use the server administration feature, you must first define an instance of a MySQLserver to administer. Click the New Server Instance link and follow the steps to createa new instance (connection) to your server. The process will connect to and validate theparameters you entered to ensure it has a valid instance. Once the instance is created,it will be displayed in the box under the Server Administration section of the homewindow.
To administer your server, choose the server instance from the list then click ServerAdministration. You will see a new window like Figure 11-3.
Figure 11-3. Server Administration window
Notice on the left side of the window there are four sections: management, configura‐tion, security, and data export/restore. We discuss each of these briefly.
Management. The management group of tools permits you to see an overview of theserver status, start and stop the server, view system and status variables, and view theserver logs.
MySQL Server Monitoring | 393

In the first edition of this book, we presented the MySQL Adminis‐trator application that contained a feature to produce detailed graphsof memory usage, connections, and more. This feature is not presentin MySQL Workbench but is included in the MySQL EnterpriseMonitor application that contains advanced monitoring tools for en‐terprises. The graphing feature is vastly superior to the features in thedeprecated MySQL Administrator tool.
We see an example of the server status in Figure 11-3. Notice we see a small graph ofthe server load and its memory usage. To the right of that, we see graphs for connectionusage, network traffic, query cache hits, and key efficiency. You can use these graphs asa quick look at your server status. If any of the graphs show unusually high (or, in rarecases, unusually low) values, you can use that as a clue to start looking for performanceproblems before they become critical.
If you would like a tool that offers finer granularity in graphing system status, health,and so on, you may want to explore the MySQL Enterprise Monitor application. Wediscuss the MySQL Enterprise Monitor in Chapter 16.
The startup and shutdown tool lets you start or stop the server instance. It also showsthe most recent messages from the server, should you start or stop the server with thetool.
The status and system variable tool is one of the handiest of the management group.Figure 11-4 shows an example screenshot of this tool. You can choose to explore statusvariables by category or search for any status variable matching a phrase (similar toLIKE '%test%').
The system variable tab has the same search feature. Figure 11-5 is an example screenshot of the system variables tool. As you can see, a lot of categories are defined. Thecategories allow you to quickly zoom to the area you are most interested in viewing.Any variable prefixed by [rw] is read/write and therefore can be changed by the ad‐ministrator at runtime.
The administrator account must have the SUPER privilege.
394 | Chapter 11: Monitoring MySQL

Figure 11-4. Status variables
Figure 11-5. System variables
MySQL Server Monitoring | 395

Once you start using Workbench, you should find yourself using these tools frequently.The ability to search and quickly navigate to a status or system variable will save you alot of typing or reentering SQL SHOW commands. If that isn’t enough to convince you,the tools also allow you to copy the variables to the clipboard for use in reports andsimilar efforts. You can copy all of the global variables or just those that are shown inthe result list.
The last tool in the management group allows you to explore the server logs. Figure 11-6shows an example screenshot of the server logs tool. It displays a tab for each type oflog that is enabled. In the example, we have the slow query, general, and error logsenabled. You can view each log in turn, paging through the log entries. You can alsoselect portions of the logs and copy them to the clipboard for reporting and similarefforts.
You may be prompted to enter elevated privileges for reading the logfiles. Also, if you are connected to a remote server (other than local‐host), you must use a SSH instance connection with appropriate cre‐dentials.
Figure 11-6. Server logs
396 | Chapter 11: Monitoring MySQL

As you can see, the graphical tools for managing MySQL servers are designed to makerudimentary and repetitive tasks easier.
Configuration. The next group includes a powerful tool for managing your configurationfile. Figure 11-7 shows a sample screenshot of the options file tool. Not only can youview what options are set in your configuration file, but you can change their valuesand save the new values. More on that in a moment.
The user account used must have write privileges at the OS-level forthis file.
Figure 11-7. Options file
There are several categories listed in tabs across the top. These include general, ad‐vanced, MyISAM, performance, logfiles, security, InnoDB, NDB, transactions, net‐working, replication, and miscellaneous. The tool includes all of the server optionsknown for the version of your server. The use of categories makes finding and settingconfiguration file entries easier. A short help text is provided to the right of each option.
MySQL Server Monitoring | 397

Setting options requires first checking the tick box to indicate the option should appearin the file. In addition, if the option takes a value, enter or change the value in theprovided text box. Once you have all of the options set the way you want, you can makethem take effect by clicking Apply. When you click Apply, a dialog opens that displaysa summary of the changes to the file. You can cancel or apply the changes or you cansee the complete contents of the file from this dialog. When you click Apply, the toolsaves the changes to the file, which will take effect on the next start of the server.
There is one other powerful feature to this tool. Notice the drop-down box labeled“mysqld” near the bottom. This allows you to set the section of the configuration fileyou are editing, and thereby use the tool to modify options for certain applications.Combined with the ability to restart the server, you can use this tool to help tune yourserver. You may find this easier and faster to use than traditional command-line tools.
Security. The next group contains a permissions tool that allows you to quickly see thepermissions for any user from a list of all users defined on the server. Figure 11-8 showsa sample screenshot of the tool.
Figure 11-8. Privileges
You can use this tool to help diagnose access issues and to help prune your permissionsets to minimal access for your users. The tool also permits you to change permissions
398 | Chapter 11: Monitoring MySQL

for a given user by clicking the tick box to toggle access (no checkmark means the userdoes not have the permission). Once you’ve made changes to one or more users, youcan click Apply to issue the appropriate changes on the server.
Data export/restore. The last group of tools encapsulate the basic data export and importfeatures of mysqldump. While not strictly devoted to monitoring, you would do well toinclude such features in your collection of tools. For example, it may be necessary tomake copies or export data from one server to another for further analysis of aperformance-related query issue.
You can select entire databases or any combination of objects to export. Figure 11-9shows a sample screenshot of the export feature.
Figure 11-9. Data export
You can dump all the objects and data to a single file, or specify a project folder whereeach table is saved as a separate .sql file that contains the table creation and data insertSQL statements. After you select either option, along with the databases and tables youwant to export, and then click Start Export, the associated mysqldump commands willrun. A summary dialog is opened to display progress of the operation and the exactcommands used to issue the export. You can save these commands for use in scripts.
MySQL Server Monitoring | 399

You can also choose to export procedures and functions, events, or not export any dataat all (exporting only the table structure). If your database uses InnoDB, you can alsotell the tool to use a single transaction to avoid prolonged locking of the tables. In thiscase, the tool tells mysqldump to use the consistent snapshot feature of InnoDB to lockthe tables.
Importing data is done via the data import/restore tool (Figure 11-10). It allows you toselect an export folder or file to import, a target default database (schema).
Figure 11-10. Data import
If you elected to export to a project folder, you can also select which files (tables) youwant to import, allowing you to perform a selective restore. Like the export tool, exe‐cuting the import will open a dialog that shows you the progress of the import as well as the mysqldump commands.
SQL development
The SQL Editor is another of the GUI tools available in Workbench. It also is not amonitoring tool in and of itself, but, as you shall see, provides a robust environment forconstructing complex SQL statements.
400 | Chapter 11: Monitoring MySQL

You can access the tool from the home window. Here you select an instance, then clickOpen Connection to Start Querying. Figure 11-11 shows a sample screenshot.
You can use the SQL Editor to build queries and execute them in a graphical form. Resultsets are returned and displayed in a spreadsheet-like display. The SQL Editor allows forvertical scrolling through all of the results as well as changing the size of the columnsand horizontally scrolling to better view the data. Many users find this tool more con‐venient and easier to use than the traditional mysql command-line client.
Figure 11-11. SQL Editor
The performance-related functionality and the value added for administrators is thegraphical display of the results of the EXPLAIN command for any given query.Figure 11-12 shows a sample explanation of a query from the world (InnoDB) database.We will discuss this in greater detail later in the chapter.
The SQL Editor example shown here should give you an indication of the utilitarianvalue of the GUI. You can enter any query and see the explanation of the query executionby first executing the query, then selecting Explain Query from the Query menu.
MySQL Server Monitoring | 401

Figure 11-12. SQL Editor: Results view
Notice there are two parts to the results. The bottom part shows the results of theEXPLAIN command as well as the actual rows returned. You can use the scroll bars toview more data without having to reissue the query.
This is a valuable performance tuning tool because you can write the query once, usethe Explain Query feature, observe the results, either rewrite the query or adjust theindexes, then reissue the query and observe the changes in the GUI. And you thoughtquery tools were for users only—not so with this tool.
But wait, there’s more. The SQL Editor has enhanced editing tools, such as color-coding.To see all of the advanced features and uses for the SQL Editor, check the online MySQLWorkbench documentation.
Third-Party ToolsSome third-party tools are also useful. Some of the more popular are MySAR, mytop,InnoTop, and MONyog. Except for MONyog, they are all text-based (command-line)tools that you can run in any console window and connect to any MySQL server reach‐able across the network. We discuss each of these briefly in the following sections.
402 | Chapter 11: Monitoring MySQL

MySAR
MySAR is a system activity report that resembles the output of the Linux sar command.MySAR accumulates the output of the SHOW STATUS, SHOW VARIABLES, and SHOW FULLPROCESSLIST commands and stores them in a database on the server named mysar. Youcan configure the data collection in a variety of ways, including limiting the data col‐lected. You can delete older data in order to continue to run MySAR indefinitely andnot worry about filling up your disk with status dumps.
MySAR is open source and licensed under the GNU Public License version 2 (GPL v2).
If you use sar to gather a lot of data, you may want to check out theksar tool. The ksar tool is a graphical presentation tool that oper‐ates on the output of sar.
mytop
The mytop utility monitors the thread statistics and general performance statistics ofMySQL. It lists common statistics like hostname, version of the server, how many querieshave run, the average times of queries, total threads, and other key statistics. It runs theSHOW PROCESSLIST and SHOW STATUS commands periodically and displays the infor‐mation in a listing like the top command found on Linux. Figure 11-13 shows an ex‐ample.
Figure 11-13. The mytop utility
Jeremy D. Zawodny wrote mytop, and it is still maintained by him along with the MySQLcommunity. It is open source and licensed under the GNU Public License version 2(GPL v2).
MySQL Server Monitoring | 403

InnoTop
InnoTop is another system activity report that resembles the top command. Inspiredby the mytop utility, InnoTop has many of the same tools as mytop, but is specificallydesigned to monitor InnoDB performance as well as the MySQL server. You can monitorcritical statistics concerning transactions, deadlocks, foreign keys, query activity, rep‐lication activity, system variables, and a host of other details.
InnoTop is widely used and considered by some to be a general performance monitoringtool. It has many features that allow you to monitor the system dynamically. If you areusing InnoDB primarily as your default (or standard) storage engine and want a well-rounded monitoring tool you can run in text mode, look no further than InnoTop.Figure 11-14 shows an example of the InnoTop utility.
Figure 11-14. The InnoTop utility
The InnoTop utility is licensed under the GNU Public License version 2 (GPL v2).
MONyog
MySQL Monitor and Advisor (MONyog) is another good MySQL monitoring tool. Itallows you to set parameters for key components for security and performance, andincludes tools to help tune your servers for maximum performance. You can set eventsto monitor specific parameters and get alerts when the system reaches the specifiedthresholds. The major features of MONyog are:
404 | Chapter 11: Monitoring MySQL

• Server resource monitoring• Identification of poorly executing SQL statements• Server log monitoring (e.g., the error log)• Real-time query performance monitoring and identification of long-running
queries• Alerting for significant events
MONyog also provides a GUI component if you prefer to graph the output.
The MySQL Benchmark SuiteBenchmarking is the process of determining how a system performs under certain loads.The act of benchmarking varies greatly and is somewhat of an art form. The goal is tomeasure and record statistics about the system while running a well-defined set of testswhereby the statistics are recorded under light, medium, and heavy load on the server.In effect, benchmarking sets the expectations for the performance of the system.
This is important because it gives you a hint if your server isn’t performing as well asexpected. For example, if you encounter a period during which users are reportingslower performance on the server, how do you know the server is performing poorly?Let’s say you’ve checked all of the usual things—memory, disk, etc.—and all are per‐forming within tolerance and without error or other anomalies. How, then, do you knowif things are running more slowly?
Enter the benchmarks. You can rerun the benchmark test and if the values producedare much larger (or smaller, depending on what you are measuring), you know thesystem is performing below expectations.
You can use the MySQL benchmark suite to establish your own benchmarks. Thebenchmark tool is located in the sql-bench folder and is normally included in the sourcecode distribution. The benchmarks are written in Perl and use the Perl DBI module foraccess to the server. If you do not have Perl or the Perl DBI module, see the section titled“Installing Perl on Unix” in the online MySQL Reference Manual.
Use the following command to run the benchmark suite:./run-all-tests --server=mysql --cmp=mysql --user=root
This command will run the entire set of standard benchmark tests, recording the currentresults and comparing them with known results of running the tests on a MySQL server.Example 11-4 shows an excerpt of the results of running this command on a systemwith limited resources.
MySQL Server Monitoring | 405

Example 11-4. The MySQL benchmark suite resultscbell@cbell-mini:~/source/bzr/mysql-6.0-review/sql-bench$Benchmark DBD suite: 2.15Date of test: 2009-12-01 19:54:19Running tests on: Linux 2.6.28-16-generic i686Comments:Limits from: mysqlServer version: MySQL 6.0.14 alpha debug logOptimization: NoneHardware:
alter-table: Total time: 77 wallclock secs ( 0.12 usr 0.05 sys + 0.00 cusr 0.00 csys = 0.17 CPU)ATIS: Total time: 150 wallclock secs (20.22 usr 0.56 sys + 0.00 cusr 0.00 csys = 20.78 CPU)big-tables: Total time: 135 wallclock secs (45.73 usr 1.16 sys + 0.00 cusr 0.00 csys = 46.89 CPU)connect: Total time: 1359 wallclock secs (200.70 usr 30.51 sys + 0.00 cusr 0.00 csys = 231.21 CPU)…
Although the output of this command isn’t immediately valuable, recall that bench‐marking is used to track changes in performance over time. Whenever you run thebenchmark suite, you should compare it to your known baseline and your last severalbenchmark checks. Because load can influence the benchmarks, taking the benchmarkdata over several increments can help mitigate the influence of load for systems that run24-7.
For example, if you see the wallclock times jump considerably from one run to another,this may not be an indication of a performance slowdown. You should also compare thedetailed values, such as user and system time. Of course, an increase in the majority ofthese values can be an indication that the system is experiencing a heavy load. In thiscase, you should check the process list to see whether there are indeed a lot of users andqueries running. If that is the case, run the benchmark suite again when the load is lessand compare the values. If they decrease, you can deduce it was due to sporadic load.On the other hand, if the values remain larger (hence, the system is slower), you shouldbegin investigation as to why the system is taking longer to execute the benchmark tests.
The Benchmark FunctionMySQL contains a built-in function called benchmark() that you can use to execute asimple expression and obtain a benchmark result. It is best used when testing otherfunctions or expressions to determine if they are causing delays. The function takes twoparameters: a counter for looping and the expression you want to test. The followingexample shows the results of running 10,000,000 iterations of the CONCAT function:
406 | Chapter 11: Monitoring MySQL

mysql> SELECT BENCHMARK(10000000, "SELECT CONCAT('te','s',' t')");+-----------------------------------------------------+| BENCHMARK(10000000, "SELECT CONCAT('te','s',' t')") |+-----------------------------------------------------+| 0 |+-----------------------------------------------------+1 row in set (0.06 sec)
The diagnostic output of this function is the time it takes to run the benchmark function.In this example, it took 0.06 seconds to run the iterations. If you are exploring a complexquery, consider testing portions of it using this command. You may find the problem isrelated to only one part of the query. For more information about the benchmark suite,see the online MySQL Reference Manual.
Now that we have discussed the various tools available for monitoring MySQL and havelooked at some best practices, we turn our attention to capturing and preserving op‐erational and diagnostic information using logfiles.
Server LogsIf you are a seasoned Linux or Unix administrator, you are familiar with the conceptsand importance of logging. The MySQL server was born of this same environment.Consequently, MySQL creates several logs that contain vital information about errors,events, and data changes.
This section examines the various logs in a MySQL server, including the role each logplays in monitoring and performance improvement. Logfiles can provide a lot of in‐formation about past events.
There are several types of logs in the MySQL server:
• General query log• Slow query log• Error log• Binary log
You can turn any of the logs on or off using startup options. Most installations have atleast the error log enabled.
The general query log, as its name implies, contains information about what the serveris doing, such as connections from clients, as well as a copy of the commands sent tothe server. As you can imagine, this log grows very quickly. Examine the general querylog whenever you are trying to diagnose client-related errors or to determine whichclients are issuing certain types of commands.
Server Logs | 407

Commands in the general query log appear in the same order in whichthey were received from the clients and may not reflect the actual orderof execution.
Turn on the general query log by specifying the --general-log startup option. You canalso specify the name of the logfile using the --log-output startup option. These op‐tions have dynamic variable equivalents. For example, SET GLOBAL log_output =FILE; sets the log output for a running server to write to a file. Finally, you can read thevalues of either of these variables using the SHOW VARIABLES command.
The slow query log stores a copy of long-running queries. It is in the same format as thegeneral log, and you can control it in the same manner with the --log-slow-queriesstartup option. The server variable that controls which queries go into the slow querylog is log_query_time (in seconds). You should tune this variable to meet the expect‐ations for your server and applications to help track times when queries perform slowerthan desired. You can send log entries to a file, a table, or both using the FILE, TABLE,or BOTH option, respectively.
The slow query log can be a very effective tool for tracking problems with queries beforethe users complain. The goal, of course, is to keep this log small or, better still, emptyat all times. That is not to say you should set the variable very high; on the contrary, youshould set it to your expectations and adjust the value as your expectations or circum‐stances change.
The slave does not log slow queries by default. However, if you usethe --log-slow-slave-statements option, it will write slow-running events to its slow log.
The error log contains information gathered when the MySQL server starts or stops. Italso contains the errors generated while the server is running. The error log is your firststop when analyzing a failed or impaired MySQL server. On some operating systems,the error log can also contain a stack trace (or core dump).
You can turn the error log on or off using the --log-error startup option. The defaultname for the error log is the hostname appended by the extension .err. It is saved in thebase directory (the same location as the host of the data directory) by default but canbe overridden by setting the path with the general_log_file option.
If you start your server with --console, errors are written to standard error output aswell as to the error log.
408 | Chapter 11: Monitoring MySQL

The binary log stores all of the changes made to the data on the server as well as statisticalinformation about the execution of the original command on the server.
The online MySQL Reference Manual states that the binary logs are used for backup;however, practice shows that replication is a more popular use of the binary log.
The unique format of the binary log allows you to use the log for incremental backups,where you store the binlog file created between each backup. You do this by flushingand rotating the binary logs (closing the log and opening a new log); this allows you tosave a set of changes since your last backup. This same technique lets you perform PITR,where you restore data from a backup and apply the binary log up to a specific point ordate. For more information about the binary log, see Chapter 4. For more informationabout PITR, see Chapter 15.
Because the binary log makes copies of every data change, it does add a small amountof overhead to the server, but the performance penalty is well worth the benefits. How‐ever, system configuration such as disk setup and storage engine choice can greatly affectthe overhead of the binary log. For example, there is no concurrent commit when usingthe InnoDB storage engine. This may be a concern in high-write scenarios with binarylogging and InnoDB.
Turn on the binary log using the --log-bin startup option, specifying the root filenameof the binary log. The server appends a numeric sequence to the end of the filename,allowing for automatic and manual rotations of the log. While not normally necessary,you can also change the name of the index for the binary logs by specifying the --log-bin-index startup option. Perform log rotations using the FLUSH LOGS command.
You can also control what is logged (inclusive logging) or what is excluded (exclusivelogging) using --binlog-do-db and --binlog-ignore-db, respectively.
Performance SchemaIn this section, we present the Performance Schema feature as a technique for measuringthe internal execution of the server, which can help you diagnose performance prob‐lems. While this section introduces the feature and contains a brief startup guide, it doesnot contain all of the possible configuration and setup parameters and options nor doesit contain a complete guide to using the Performance Schema views. For a completedetailed explanation of how to set up and use the Performance Schema tables, see theonline reference manual under the heading “MySQL Performance Schema.”
A recent addition to the MySQL Server, the Performance Schema feature is presentedas a database named performance_schema (sometimes shown in all capitals). It containsa set of dynamic tables (stored in memory) that enable you to see very low-level metricsof server execution. This feature was added to the server in version 5.5.3. The Perfor‐mance Schema feature provides metadata on the execution of the server, right down to
Performance Schema | 409

the line of code being executed. Indeed, it is possible to monitor precisely a mechanismin a particular source file.
For this reason, the Performance Schema is often considered a developer tool for diag‐nosing execution of the server code itself. This is because it is most often used to diagnosedeadlocks, mutex, and thread problems. However, it is much more than that! You canget metrics for stages of query optimization, file I/O, connections, and much more. Yes,it is very low level and will indeed show you references to source code. But althoughmost metrics target specific code components, the tool also provides historical data aswell as current values for a metric. This can be particularly useful if you are diagnosinga difficult performance problem that you can isolate to a specific use case.
You may be thinking that this would create a tremendous load on the server and incura severe penalty on performance. For some external monitoring solutions, this is true,but the Performance Schema is designed to have little or no measurable impact on serverperformance. This is possible because of the way the feature is intertwined with theserver: it takes advantage of many of the optimizations in the server that external toolssimply cannot.
The following section presents a terse introduction to the terms and concepts used inPerformance Schema. Later sections will show you how to use the feature to diagnoseperformance problems.
ConceptsThis section presents the basic concepts of the Performance Schema in an effort to makeit easier for you to get started using it to gather metrics.
The Performance Schema appears in your list of databases (SHOW DATABASES) as performance_schema and contains a number of dynamic tables that you can see with SHOWTABLES. Example 11-5 lists the available tables in an early release candidate for theMySQL 5.6 server.
The number of tables is likely to expand with future releases of the server.
Example 11-5. performance_schema tablesmysql> SHOW TABLES;;+----------------------------------------------------+| Tables_in_Performance Schema |+----------------------------------------------------+| accounts || cond_instances || events_stages_current || events_stages_history || events_stages_history_long || events_stages_summary_by_account_by_event_name || events_stages_summary_by_host_by_event_name || events_stages_summary_by_thread_by_event_name |
410 | Chapter 11: Monitoring MySQL

| events_stages_summary_by_user_by_event_name || events_stages_summary_global_by_event_name || events_statements_current || events_statements_history || events_statements_history_long || events_statements_summary_by_account_by_event_name || events_statements_summary_by_digest || events_statements_summary_by_host_by_event_name || events_statements_summary_by_thread_by_event_name || events_statements_summary_by_user_by_event_name || events_statements_summary_global_by_event_name || events_waits_current || events_waits_history || events_waits_history_long || events_waits_summary_by_account_by_event_name || events_waits_summary_by_host_by_event_name || events_waits_summary_by_instance || events_waits_summary_by_thread_by_event_name || events_waits_summary_by_user_by_event_name || events_waits_summary_global_by_event_name || file_instances || file_summary_by_event_name || file_summary_by_instance || host_cache || hosts || mutex_instances || objects_summary_global_by_type || performance_timers || rwlock_instances || session_account_connect_attrs || session_connect_attrs || setup_actors || setup_consumers || setup_instruments || setup_objects || setup_timers || socket_instances || socket_summary_by_event_name || socket_summary_by_instance || table_io_waits_summary_by_index_usage || table_io_waits_summary_by_table || table_lock_waits_summary_by_table || threads || users |+----------------------------------------------------+52 rows in set (0.01 sec)
Performance Schema monitors events, where an event is any discrete execution that hasbeen instrumented (enabled in code and called “instrument points”) and has a meas‐urable duration. For example, the event could be a method call, a mutex lock/unlock,
Performance Schema | 411

or a file I/O. Events are stored as a current event (the most recent value), historical values,and summaries (aggregates).
Performance Schema events are not the same as binary log events.
An instrument, therefore, consists of the instrument points in the server (source) thatproduce events when they execute. An instrument must be enabled in order to fire anevent.
You can monitor specific users (threads) using the setup_actors table. You can monitorspecific tables or all tables in certain databases using the setup_objects table. Currently,only table objects are supported.
A timer is a type of execution that is measured by a time duration. Timers include idle,wait, stage, and statement. You can change the duration of timers to change the fre‐quency of the measurement. Values include CYCLE, NANOSECOND, MICROSECOND, MILLISECOND, and TICK. You can see the available timers by examining the rows in the performance_timers table.
Setup tables are used to enable or disable actors, instruments, objects (tables), and timers.
Getting StartedPerformance Schema can be enabled at startup or at runtime. You can check to seewhether your server supports Performance Schema and whether it is turned on byexamining the performance_schema variable. A value of ON indicates the feature is en‐abled. To enable Performance Schema at startup, use the --performance-schema startupoption:
[mysqld]…performance_schema=ON…
Enabling Performance Schema and configuring events to monitor at startup requiresthe use of several startup options. Depending on the level of detail you want to collect,enabling Performance Schema at startup can become complicated. Fortunately, all ofthe required and voluntary options and their values can be stored in your configurationfile. If you want to collect all available events for a specific server under controlledconditions, it may be easier to enable Performance Schema at startup.
412 | Chapter 11: Monitoring MySQL

However, most administrators will want to enable Performance Schema at runtime. Youmust enable Performance Schema either via the --performance-schema startup vari‐able or via your configuration file. Once enabled, you must configure the events youwant to record. This involves modifying the rows in the setup and configuration tables.This section will demonstrate the process you use to enable events and instruments forpreparing to collect data for diagnosing performance problems.
To enable monitoring with Performance Schema, begin by setting the timers you wantto use, setting the events you want to enable, and enabling the instruments you want tomonitor.
For example, if you want to monitor all SHOW GRANTS events, begin by setting the timerfor the statement object. In this case, we will use the standard NANOSECOND timing. Youcan check the current setting by examining the setup_timers table:
mysql> select * from setup_timers;+-----------+-------------+| NAME | TIMER_NAME |+-----------+-------------+| idle | MICROSECOND || wait | CYCLE || stage | NANOSECOND || statement | NANOSECOND |+-----------+-------------+4 rows in set (0.01 sec)
Next, enable the instrument for the SQL statement as follows. In this case, we set somecolumns in the setup_instruments table to YES for the specific command (SHOWGRANTS). More specifically, we enable the instrumentation of the metric and enable thetimer property for the metric:
mysql> UPDATE setup_instruments SET enabled='YES', timed='YES' WHERE name = 'statement/sql/show_grants';Query OK, 1 row affected (0.00 sec)Rows matched: 1 Changed: 1 Warnings: 0
Next, enable the consumers for the events_statements_current and events_statements_history statements:
mysql> UPDATE setup_consumers SET enabled='YES' WHERE name = 'events_statements_current';Query OK, 0 rows affected (0.00 sec)Rows matched: 1 Changed: 1 Warnings: 0
mysql> UPDATE setup_consumers SET enabled='YES' WHERE name = 'events_statements_history';Query OK, 1 row affected (0.00 sec)Rows matched: 1 Changed: 1 Warnings: 0
Now execute the SHOW GRANTS command and examine the events_statements_current and events_statements_history tables:
Performance Schema | 413

mysql> show grants \G*************************** 1. row ***************************Grants for root@localhost: GRANT ALL PRIVILEGES ON *.* TO 'root'@'localhost' IDENTIFIED BY PASSWORD '*81F5E21E35407D884A6CD4A731AEBFB6AF209E1B' WITH GRANT OPTION*************************** 2. row ***************************Grants for root@localhost: GRANT PROXY ON ''@'' TO 'root'@'localhost' WITH GRANT OPTION2 rows in set (0.01 sec)
mysql> select * from events_statements_current \G*************************** 1. row *************************** THREAD_ID: 22 EVENT_ID: 80 END_EVENT_ID: NULL EVENT_NAME: statement/sql/select SOURCE: mysqld.cc:903 TIMER_START: 13104624563678000 TIMER_END: NULL TIMER_WAIT: NULL LOCK_TIME: 136000000 SQL_TEXT: select * from events_statements_current DIGEST: NULL DIGEST_TEXT: NULL CURRENT_SCHEMA: performance_schema OBJECT_TYPE: NULL OBJECT_SCHEMA: NULL OBJECT_NAME: NULL OBJECT_INSTANCE_BEGIN: NULL MYSQL_ERRNO: 0 RETURNED_SQLSTATE: NULL MESSAGE_TEXT: NULL ERRORS: 0 WARNINGS: 0 ROWS_AFFECTED: 0 ROWS_SENT: 0 ROWS_EXAMINED: 0CREATED_TMP_DISK_TABLES: 0 CREATED_TMP_TABLES: 0 SELECT_FULL_JOIN: 0 SELECT_FULL_RANGE_JOIN: 0 SELECT_RANGE: 0 SELECT_RANGE_CHECK: 0 SELECT_SCAN: 1 SORT_MERGE_PASSES: 0 SORT_RANGE: 0 SORT_ROWS: 0 SORT_SCAN: 0 NO_INDEX_USED: 1 NO_GOOD_INDEX_USED: 0 NESTING_EVENT_ID: NULL NESTING_EVENT_TYPE: NULL
414 | Chapter 11: Monitoring MySQL

1 row in set (0.00 sec)
mysql> select * from events_statements_history \G*************************** 1. row *************************** THREAD_ID: 22 EVENT_ID: 77 END_EVENT_ID: 77 EVENT_NAME: statement/sql/select SOURCE: mysqld.cc:903 TIMER_START: 12919040536455000 TIMER_END: 12919040870255000 TIMER_WAIT: 333800000 LOCK_TIME: 143000000 SQL_TEXT: select * from events_statements_history DIGEST: 77d3399ea8360ffc7b8d584c0fac948a DIGEST_TEXT: SELECT * FROM `events_statements_history` CURRENT_SCHEMA: performance_schema OBJECT_TYPE: NULL OBJECT_SCHEMA: NULL OBJECT_NAME: NULL OBJECT_INSTANCE_BEGIN: NULL MYSQL_ERRNO: 0 RETURNED_SQLSTATE: NULL MESSAGE_TEXT: NULL ERRORS: 0 WARNINGS: 0 ROWS_AFFECTED: 0 ROWS_SENT: 1 ROWS_EXAMINED: 1CREATED_TMP_DISK_TABLES: 0 CREATED_TMP_TABLES: 0 SELECT_FULL_JOIN: 0 SELECT_FULL_RANGE_JOIN: 0 SELECT_RANGE: 0 SELECT_RANGE_CHECK: 0 SELECT_SCAN: 1 SORT_MERGE_PASSES: 0 SORT_RANGE: 0 SORT_ROWS: 0 SORT_SCAN: 0 NO_INDEX_USED: 1 NO_GOOD_INDEX_USED: 0 NESTING_EVENT_ID: NULL NESTING_EVENT_TYPE: NULL*************************** 2. row *************************** THREAD_ID: 22 EVENT_ID: 78 END_EVENT_ID: 78 EVENT_NAME: statement/sql/show_grants SOURCE: mysqld.cc:903 TIMER_START: 12922392541028000 TIMER_END: 12922392657515000
Performance Schema | 415

TIMER_WAIT: 116487000 LOCK_TIME: 0 SQL_TEXT: show grants DIGEST: 63ca75101f4bfc9925082c9a8b06503b DIGEST_TEXT: SHOW GRANTS CURRENT_SCHEMA: performance_schema OBJECT_TYPE: NULL OBJECT_SCHEMA: NULL OBJECT_NAME: NULL OBJECT_INSTANCE_BEGIN: NULL MYSQL_ERRNO: 0 RETURNED_SQLSTATE: NULL MESSAGE_TEXT: NULL ERRORS: 0 WARNINGS: 0 ROWS_AFFECTED: 0 ROWS_SENT: 0 ROWS_EXAMINED: 0CREATED_TMP_DISK_TABLES: 0 CREATED_TMP_TABLES: 0 SELECT_FULL_JOIN: 0 SELECT_FULL_RANGE_JOIN: 0 SELECT_RANGE: 0 SELECT_RANGE_CHECK: 0 SELECT_SCAN: 0 SORT_MERGE_PASSES: 0 SORT_RANGE: 0 SORT_ROWS: 0 SORT_SCAN: 0 NO_INDEX_USED: 0 NO_GOOD_INDEX_USED: 0 NESTING_EVENT_ID: NULL NESTING_EVENT_TYPE: NULL*************************** 3. row *************************** THREAD_ID: 22 EVENT_ID: 74 END_EVENT_ID: 74 EVENT_NAME: statement/sql/show_grants SOURCE: mysqld.cc:903 TIMER_START: 12887992696398000 TIMER_END: 12887992796352000 TIMER_WAIT: 99954000 LOCK_TIME: 0 SQL_TEXT: show grants DIGEST: 63ca75101f4bfc9925082c9a8b06503b DIGEST_TEXT: SHOW GRANTS CURRENT_SCHEMA: performance_schema OBJECT_TYPE: NULL OBJECT_SCHEMA: NULL OBJECT_NAME: NULL OBJECT_INSTANCE_BEGIN: NULL MYSQL_ERRNO: 0
416 | Chapter 11: Monitoring MySQL

RETURNED_SQLSTATE: NULL MESSAGE_TEXT: NULL ERRORS: 0 WARNINGS: 0 ROWS_AFFECTED: 0 ROWS_SENT: 0 ROWS_EXAMINED: 0CREATED_TMP_DISK_TABLES: 0 CREATED_TMP_TABLES: 0 SELECT_FULL_JOIN: 0 SELECT_FULL_RANGE_JOIN: 0 SELECT_RANGE: 0 SELECT_RANGE_CHECK: 0 SELECT_SCAN: 0 SORT_MERGE_PASSES: 0 SORT_RANGE: 0 SORT_ROWS: 0 SORT_SCAN: 0 NO_INDEX_USED: 0 NO_GOOD_INDEX_USED: 0 NESTING_EVENT_ID: NULL NESTING_EVENT_TYPE: NULL*************************** 4. row *************************** THREAD_ID: 22 EVENT_ID: 75 END_EVENT_ID: 75 EVENT_NAME: statement/sql/select SOURCE: mysqld.cc:903 TIMER_START: 12890520653158000 TIMER_END: 12890521011318000 TIMER_WAIT: 358160000 LOCK_TIME: 148000000 SQL_TEXT: select * from events_statements_current DIGEST: f06ce227c4519dd9d9604a3f1cfe3ad9 DIGEST_TEXT: SELECT * FROM `events_statements_current` CURRENT_SCHEMA: performance_schema OBJECT_TYPE: NULL OBJECT_SCHEMA: NULL OBJECT_NAME: NULL OBJECT_INSTANCE_BEGIN: NULL MYSQL_ERRNO: 0 RETURNED_SQLSTATE: NULL MESSAGE_TEXT: NULL ERRORS: 0 WARNINGS: 0 ROWS_AFFECTED: 0 ROWS_SENT: 1 ROWS_EXAMINED: 1CREATED_TMP_DISK_TABLES: 0 CREATED_TMP_TABLES: 0 SELECT_FULL_JOIN: 0 SELECT_FULL_RANGE_JOIN: 0
Performance Schema | 417

SELECT_RANGE: 0 SELECT_RANGE_CHECK: 0 SELECT_SCAN: 1 SORT_MERGE_PASSES: 0 SORT_RANGE: 0 SORT_ROWS: 0 SORT_SCAN: 0 NO_INDEX_USED: 1 NO_GOOD_INDEX_USED: 0 NESTING_EVENT_ID: NULL NESTING_EVENT_TYPE: NULL*************************** 5. row *************************** THREAD_ID: 22 EVENT_ID: 76 END_EVENT_ID: 76 EVENT_NAME: statement/sql/select SOURCE: mysqld.cc:903 TIMER_START: 12895480384972000 TIMER_END: 12895480736605000 TIMER_WAIT: 351633000 LOCK_TIME: 144000000 SQL_TEXT: select * from events_statements_history DIGEST: 77d3399ea8360ffc7b8d584c0fac948a DIGEST_TEXT: SELECT * FROM `events_statements_history` CURRENT_SCHEMA: performance_schema OBJECT_TYPE: NULL OBJECT_SCHEMA: NULL OBJECT_NAME: NULL OBJECT_INSTANCE_BEGIN: NULL MYSQL_ERRNO: 0 RETURNED_SQLSTATE: NULL MESSAGE_TEXT: NULL ERRORS: 0 WARNINGS: 0 ROWS_AFFECTED: 0 ROWS_SENT: 1 ROWS_EXAMINED: 1CREATED_TMP_DISK_TABLES: 0 CREATED_TMP_TABLES: 0 SELECT_FULL_JOIN: 0 SELECT_FULL_RANGE_JOIN: 0 SELECT_RANGE: 0 SELECT_RANGE_CHECK: 0 SELECT_SCAN: 1 SORT_MERGE_PASSES: 0 SORT_RANGE: 0 SORT_ROWS: 0 SORT_SCAN: 0 NO_INDEX_USED: 1 NO_GOOD_INDEX_USED: 0 NESTING_EVENT_ID: NULL
418 | Chapter 11: Monitoring MySQL

NESTING_EVENT_TYPE: NULL5 rows in set (0.00 sec)
Notice that the output for the events_statements_table shows only the last recordedstatement executed, whereas the output for events_statements_history shows recentqueries from those events enabled. We enabled both the statement/sql/select andstatement/sql/show_grants instruments in this example, so events of both types areshown.
While the example is rather simplistic, there is a wealth of information we can gain fromusing this technique. For example, we see the output includes timing information, suchas when the query started and ended as well as lock time. We also see warning and errorcounts, information about how the query was optimized, and indications of whetherindexes were used.
The steps in this example are representative of the steps you would use to enable otherinstruments and events. In summary, you should do the following to enable monitoringusing the Performance Schema:
1. Set the timer (applies to instruments with a timing element).2. Enable the instrument.3. Enable the consumer.
Filtering EventsThere are two techniques for filtering events: prefiltering and postfiltering.
Prefiltering is accomplished by modifying the Performance Schema setup configurationto turn on only those events you want to collect from certain producers and collectedby certain consumers. Prefiltering reduces overhead and avoids filling the history tableswith metrics that you don’t need, and avoid filling tables that are not needed (by notmaintaining consumers). The drawback of prefiltering is that it requires you to predictwhich events you want to check before you run your test.
Postfiltering is typically done by enabling a host of producers and consumers to collectas much information as possible. Filtering is done after the data is collected by usingWHERE clauses on the Performance Schema tables. Postfiltering is done on a per-userbasis (in the WHERE clause). You would use postfiltering in cases where you are not certainwhich events you need to collect: for example, when there is no repeatable use case.
Which to use depends on your preference for the amount of data to collect. If you knowwhat you are looking for (the metrics to measure) and you want only to record thoseevents, prefiltering will be the technique to use. On the other hand, if you are unsure ofwhat you are looking for or you need to generate data metrics over time, you may want
Performance Schema | 419

to consider postfiltering and explore the Performance Schema tables using SELECTstatements to narrow the scope of your search.
Using Performance Schema to Diagnose Performance ProblemsThis section presents an alternative to the methodology listed in the online referencemanual for diagnosing problems using the Performance Schema. It includes a muchimproved process that ensures your server is returned to its original state.
Like the example in the reference manual, the methodology assumes you have a set ofoperations that exhibit a repeatable problem over several databases.
One word of caution: it is likely your use case will not be so cut and dry and you mayneed to be able to reproduce more than just the data and the queries. For example, ifyour diagnosis involves problems associated with load or certain other conditions (anumber of connections, a certain application, etc.), you may need to be able to reproducethe load and similar conditions.
Another condition you should sort out before using Performance Schema is what pa‐rameters, variables, and options you will use to tune your server. It does little good totinker with your server if you are not certain what you need to tune. You may not beable to know precisely what to tune, but you should have a good idea at this point. Also,be sure to record the current value before you change it. The normal course of tuningis to change one and only one thing at a time, and to compare the performance beforeand after the change. If no positive change occurs, you should restore the original valuebefore moving on to another parameter or option.
The following lists the steps you can use to diagnose your performance problem withPerformance Schema:
1. Query the setup_instruments table to identify all related instruments and enablethem.
2. Set up the timers for the frequency that you need to record. Most times, the defaultsare the correct timer values. If you change the timers, record their original values.
3. Identify the consumers (event tables) associated with the instruments and enablethem. Be sure to enable the current, history, and history_long variants.
4. Truncate the *history and *history_long tables to ensure you start with a “clean”state.
5. Reproduce the problem.6. Query the Performance Schema tables. If your server has multiple clients running,
you can isolate the rows by thread ID.7. Observe the values and record them.
420 | Chapter 11: Monitoring MySQL


Database PerformanceMonitoring the performance of an individual database is one of the few areas in theMySQL feature set where community and third-party developers have improved theMySQL experience. MySQL includes some basic tools you can use to improve perfor‐mance, but they do not have the sophistication of some other system-tuning tools. Dueto this limitation, most MySQL DBAs earn their pay through experience in relationalquery optimization techniques. We recognize there are several excellent references thatcover database performance in great detail and many readers are likely to be well versedin basic database optimization. Here are a few resources for you to turn to:
• Refactoring SQL Applications by Stephane Faroult and Pascal L’Hermite (O’Reilly)• SQL and Relational Theory: How to Write Accurate SQL Code by C.J. Date
(O’Reilly)• SQL Cookbook by Anthony Mollinaro (O’Reilly)
Rather than reintroducing query optimization techniques, we will concentrate on howyou can work with the tools available in MySQL to assist in optimizing databases. Wewill use a simple example and a known sample database to illustrate the use of the queryperformance command in MySQL. In the next section, we list best practices for im‐proving database performance.
Measuring Database PerformanceTraditionally, database management systems have provided profiling tools and indexingtools that report statistics you can use to fine-tune indexes. Although there are somebasic elements that can help you improve database performance in MySQL, there is noadvanced profiling tool available as open source.
Although the basic MySQL installation does not include formal tools for monitoringdatabase improvement, the MySQL Enterprise Manager suite offers a host of perfor‐mance monitoring features. We will discuss this tool in more detail in Chapter 16.
Fortunately, MySQL provides a few simple tools to help you determine whether yourtables and queries are optimal. They are all SQL commands and include EXPLAIN,ANALYZE TABLE, and OPTIMIZE TABLE. The following sections describe each of thesecommands in greater detail.
Using EXPLAIN
The EXPLAIN command gives information about how a SELECT statement (EXPLAINworks only for SELECT statements) can be executed. Here is the syntax for EXPLAIN (notethat EXPLAIN is a synonym for the DESCRIBE command found in other database systems):
[EXPLAIN | DESCRIBE] [EXTENDED] SELECT select options
Database Performance | 423

You can also use the EXPLAIN and DESCRIBE commands to view details about the columnsor partitions of a table. The syntax for this version of the command is:
[EXPLAIN | DESCRIBE] [PARTITIONS SELECT * FROM] table_name
A synonym for EXPLAIN table_name is SHOW COLUMNS FROM
table_name.
We will discuss the first use of the EXPLAIN command, examining a SELECT commandto see how the MySQL optimizer executes the statement. The results of this contain astep-by-step list of join operations that the optimizer predicts it would require to executethe statement.
The best use of this command is to determine whether you have the best indexes onyour tables to allow for more precise targeting of candidate rows. You can also use theresults to test the various optimizer override options. While this is an advanced tech‐nique and generally discouraged, under the right circumstances you may encounter aquery that runs faster with certain optimizer options. We will see an example of thislater in this section.
Now let’s look at some examples of the EXPLAIN command in action. The followingexamples are queries executed on the sakila sample database provided for MySQL de‐velopment and experimentation.
Let’s begin with a simple and seemingly harmless query. Let’s say we want to see all ofthe films rated higher than a PG rating. The result set contains a single row with thefollowing columns:id
Sequence number of the statement in order of execution
select_type
The type of statement executed
table
The table operated on for this step
type
The type of join to be used
possible_keys
A list of columns available if there are indexes that include the primary key
key
The key selected by the optimizer
424 | Chapter 11: Monitoring MySQL

key_len
The length of the key or portion of the key used
ref
Constraints or columns to be compared
rows
An estimate of the number of rows to process
extra
Additional information from the optimizer
If the type column shows ALL, you are doing a full table scan. Youshould strive to avoid that by adding indexes or rewriting your query.Similarly, if this column shows INDEX, you are doing a full index scan,which is very inefficient. See the online MySQL Reference Manual formore details on the types of joins and their consequences.
Example 11-6 shows how the MySQL optimizer executes this statement. We use the \Gto request a vertical display format for clarity.
The table we are using in the example contains a field (column) that is defined as anenumerated type. Enumerated types permit you to provide a list of possible values. Ifyou did not use the enumerated type and defined a lookup table, you would have toperform a join to select results with the value of the field. Thus, enumerated values canreplace small lookup tables and therefore enumerated values can be used to improveperformance.
This is because the text for the enumerated values is stored only once—in the tableheader structures. What is saved in the rows is a numeric reference value that forms anindex (array index) of the enumerated value. Enumerated value lists can save space andcan make traversing the data a bit more efficient. An enumerated field type allows oneand only one value.
In the following example, the film table in the sakila database has an enumerated fieldnamed rating taking the values G, PG, PG-13, R, and NC-17. In the examples that follow,we will see how this enumerated value field can be used (and misused) in queries.
Example 11-6. A simple SELECT statementmysql> EXPLAIN SELECT * FROM film WHERE rating > 'PG' \G*************************** 1. row *************************** id: 1 select_type: SIMPLE table: film type: ALLpossible_keys: NULL key: NULL
Database Performance | 425

key_len: NULL ref: NULL rows: 892 Extra: Using where1 row in set (0.01 sec)
You can see from this output that the optimizer has only one step to execute and that itis not using any indexes. This makes sense because we are not using any columns withindexes. Furthermore, even though there is a WHERE clause, the optimizer will still haveto do a full table scan. This may be the right choice when you consider the columns usedand the lack of indexes. However, if we ran this query hundreds of thousands of times,the full table scan would be a very poor use of time. In this case, we know from lookingat the results that adding an index should improve execution (Example 11-7).
Example 11-7. Adding an index to improve query performancemysql> ALTER TABLE film ADD INDEX film_rating (rating);Query OK, 0 rows affected (0.42 sec)Records: 0 Duplicates: 0 Warnings: 0
Let’s add an index to the table and try again. Example 11-8 shows the improved queryplan.
Example 11-8. Improved query planmysql> EXPLAIN SELECT * FROM film WHERE rating > 'PG' \G*************************** 1. row *************************** id: 1 select_type: SIMPLE table: film type: ALLpossible_keys: film_rating key: NULL key_len: NULL ref: NULL rows: 892 Extra: Using where1 row in set (0.00 sec)
For those of you with sharp eyes who have already spotted the prob‐lem, bear with us as we work through it.
Here we see that the query has now identified an index (possible_keys) but is still notusing the index, because the key field is NULL. So what can we do? For this simple ex‐ample, you may note that only 892 rows are expected to be read. The actual row count
426 | Chapter 11: Monitoring MySQL

is 1,000 rows and the result set would contain only 418 rows. Clearly, it would be a muchfaster query if it read only 42% of the rows!
Now let’s see whether we can get any additional information from the optimizer by using the EXTENDED keyword. This keyword allows us to see extra information via theSHOW WARNINGS command. You should issue the command immediately after the EXPLAIN command. The warning text describes how the optimizer identifies table andcolumn names in the statement, the internal rewrite of the query, any optimizer rulesapplied, and any additional notes about the execution. Example 11-9 shows the resultsof using the EXTENDED keyword.
Example 11-9. Using the EXTENDED keyword for more informationmysql> EXPLAIN EXTENDED SELECT * FROM film WHERE rating > 'PG' \G*************************** 1. row *************************** id: 1 select_type: SIMPLE table: film type: ALLpossible_keys: film_rating key: NULL key_len: NULL ref: NULL rows: 892 filtered: 100.00 Extra: Using where1 row in set, 1 warning (0.00 sec)
mysql> SHOW WARNINGS \G*************************** 1. row *************************** Level: Note Code: 1003Message: select `sakila`.`film`.`film_id` AS `film_id`,`sakila`.`film`.`title` AS `title`,`sakila`.`film`.`description` AS `description`,`sakila`.`film`.`release_year` AS `release_year`,`sakila`.`film`.`language_id` AS `language_id`,`sakila`.`film`.`original_language_id` AS `original_language_id`,`sakila`.`film`.`rental_duration` AS `rental_duration`,`sakila`.`film`.`rental_rate` AS `rental_rate`,`sakila`.`film`.`length` AS `length`,`sakila`.`film`.`replacement_cost` AS `replacement_cost`,`sakila`.`film`.`rating` AS `rating`,`sakila`.`film`.`special_features` AS `special_features`,`sakila`.`film`.`last_update` AS `last_update`from `sakila`.`film` where (`sakila`.`film`.`rating` > 'PG')1 row in set (0.00 sec)
This time, there is one warning that contains information from the optimizer, displayinga rewritten form of the query to include all columns and explicitly reference the column
Database Performance | 427

in the WHERE clause. While this has told us the query can be written a bit better, it doesn’tsuggest any performance improvements. Fortunately, we can make it more efficient.
Let’s see what happens when we issue a query for a specific rating rather than using arange query. We will see the optimization with the index and without. Example 11-10shows the results.
Example 11-10. Removing the range querymysql> EXPLAIN SELECT * FROM film WHERE rating = 'R' \G*************************** 1. row *************************** id: 1 select_type: SIMPLE table: film type: refpossible_keys: film_rating key: film_rating key_len: 2 ref: const rows: 195 Extra: Using where1 row in set (0.00 sec)
mysql> ALTER TABLE film DROP INDEX film_rating;Query OK, 0 rows affected (0.37 sec)Records: 0 Duplicates: 0 Warnings: 0
mysql> EXPLAIN SELECT * FROM film WHERE rating = 'R' \G*************************** 1. row *************************** id: 1 select_type: SIMPLE table: film type: ALLpossible_keys: NULL key: NULL key_len: NULL ref: NULL rows: 892 Extra: Using where1 row in set (0.00 sec)
Now we see a little improvement. Notice that the first query plan does indeed use theindex and results in a much improved plan. The question then remains, why doesn’t theoptimizer use the index? In this case, we’ve used a nonunique index on an enumeratedfield. What sounded like a really good idea is actually not much help at all for a rangequery of enumerated values. However, we could rewrite the query differently (in severalways, actually) to produce better performance. Let’s look at the query again.
We know we want all films rated higher than PG. We assumed that the rating is orderedand that the enumerated field reflects the order. Thus, it appears the order is maintained
428 | Chapter 11: Monitoring MySQL

if we accept the enumeration index for each value that corresponds to the order (e.g.,G = 1, PG = 2, etc.). But what if the order is incorrect or if (like in this example) the listof values is incomplete?
In the example we’ve chosen, where we want all of the films that have a rating higherthan PG, we know from our list of ratings that this includes films with a rating of R orNC-17. Rather than using a range query, let’s examine what the optimizer would do ifwe listed these values.
Recall that we removed the index, so we will try the query first without the index, thenadd the index and see if we have an improvement. Example 11-11 shows the improvedquery.
Example 11-11. Improved query without rangemysql> EXPLAIN SELECT * FROM film WHERE rating = 'R' OR rating = 'NC-17' \G*************************** 1. row *************************** id: 1 select_type: SIMPLE table: film type: ALLpossible_keys: NULL key: NULL key_len: NULL ref: NULL rows: 892 Extra: Using where1 row in set (0.00 sec)
mysql> ALTER TABLE film ADD INDEX film_rating (rating);Query OK, 0 rows affected (0.40 sec)Records: 0 Duplicates: 0 Warnings: 0
mysql> EXPLAIN SELECT * FROM film WHERE rating = 'R' OR rating = 'NC-17' \G*************************** 1. row *************************** id: 1 select_type: SIMPLE table: film type: ALLpossible_keys: film_rating key: NULL key_len: NULL ref: NULL rows: 892 Extra: Using where1 row in set (0.00 sec)
Alas, that didn’t work either. Again, we have chosen to query on a column that has anindex but is not an index the optimizer can use. However, the optimizer can use theindex for a simple equality comparison because the values being compared are stored
Database Performance | 429

in the index. We can exploit this by rewriting the query as the union of two queries.Example 11-12 shows the rewritten query.
Example 11-12. Query rewritten using UNIONmysql> EXPLAIN SELECT * FROM film WHERE rating = 'R' UNIONSELECT * FROM film WHERE rating = 'NC-17' \G*************************** 1. row *************************** id: 1 select_type: PRIMARY table: film type: refpossible_keys: film_rating key: film_rating key_len: 2 ref: const rows: 195 Extra: Using where*************************** 2. row *************************** id: 2 select_type: UNION table: film type: refpossible_keys: film_rating key: film_rating key_len: 2 ref: const rows: 210 Extra: Using where*************************** 3. row *************************** id: NULL select_type: UNION RESULT table: <union1,2> type: ALLpossible_keys: NULL key: NULL key_len: NULL ref: NULL rows: NULL Extra:3 rows in set (0.00 sec)
Success! Now we can see we have a query plan that is using the index and processingfar fewer rows. We can see from the result of the EXPLAIN command that the optimizeris running each query individually (steps execute from row 1 down to row n) and com‐bines the result in the last step.
430 | Chapter 11: Monitoring MySQL

MySQL has a session status variable named last_query_cost thatstores the cost of the most recent query executed. Use this variable tocompare two query plans for the same query. For example, after eachEXPLAIN, check the value of the variable. The query with the lowestcost value is considered the more efficient (less time-consuming)query. A value of 0 indicates that no query has been submitted forcompilation.
While this exercise may seem to be a lot of work for a little gain, consider that there aremany such queries being executed in applications without anyone noticing the ineffi‐ciency. Normally we encounter these types of queries only when the row count gets largeenough to notice. In the sakila database, there are only 1,000 rows, but what if therewere a million or tens of millions of rows?
EXPLAIN is the only tool in a standard MySQL distribution that you can use by itself toprofile a query in MySQL. The “Optimization” chapter in the online MySQL ReferenceManual has a host of tips and tricks to help an experienced DBA improve the perfor‐mance of various query forms.
Using ANALYZE TABLE
The MySQL optimizer, like most traditional optimizers, uses statistical informationabout tables to perform its analysis of the optimal query execution plan. These statisticsinclude information about indexes, distribution of values, and table structure, amongmany items.
The ANALYZE TABLE command recalculates the key distribution for one or more tables.This information determines the table order for a join operation. The syntax for theANALYZE TABLE command is:
ANALYZE [LOCAL | NO_WRITE_TO_BINLOG] TABLE table_list
You should run this command whenever there have been significant updates to the table(e.g., bulk-loaded data). The system must have a read lock on the table for the durationof the operation.
You can update the key distribution only for MyISAM and InnoDB tables. Other storageengines don’t support this tool, but all storage engines must report index cardinalitystatistics to the optimizer if they support indexes. Some storage engines, particularlythird-party engines, have their own specific built-in statistics. A typical execution of thecommand is shown in Example 11-13. Running the command on a table with no indexeshas no effect, but will not result in an error.
Database Performance | 431

Example 11-13. Analyzing a table to update key distributionmysql> ANALYZE TABLE film;+-------------+---------+----------+----------+| Table | Op | Msg_type | Msg_text |+-------------+---------+----------+----------+| sakila.film | analyze | status | OK |+-------------+---------+----------+----------+1 row in set (0.00 sec)
If you are using InnoDB, there are some cases when you should notuse this command. See innodb_stats_persistent in the online ref‐erence manual for more details.
In this example, we see that the analysis is complete and there are no unusual conditions.Should there be any unusual events during the execution of the command, the Msg_typefield can indicate info, Error, or warning. In these cases, the Msg_text field will giveyou additional information about the event. You should always investigate the situationif you get any result other than status and OK.
For example, if the .frm file for your table is corrupt or missing, you could see thefollowing messages. In other cases, the output may indicate the table is unreadable (e.g.,permission/access issues). Also, the command performs checks specific to the storageengine. In the case of InnoDB, the checks are more thorough and when there are errors,you are likely to see InnoDB-specific errors.
Example 11-14. Analyze table errorsmysql> ANALYZE TABLE test.t1;+---------+---------+----------+-------------------------------+| Table | Op | Msg_type | Msg_text |+---------+---------+----------+-------------------------------+| test.t1 | analyze | Error | Table 'test.t1' doesn't exist || test.t1 | analyze | status | Operation failed |+---------+---------+----------+-------------------------------+2 rows in set (0.00 sec)
You can see the status of your indexes using the SHOW INDEX command. A sample of theoutput of the film table is shown in Example 11-15. In this case, we’re interested in thecardinality of each index, which is an estimate of the number of unique values in it. Weomit the other columns from the display for brevity. For more information about SHOWINDEX, see the online MySQL Reference Manual.
Example 11-15. The indexes for the film tablemysql> SHOW INDEX FROM film \G*************************** 1. row *************************** Table: film
432 | Chapter 11: Monitoring MySQL

Non_unique: 0 Key_name: PRIMARYSeq_in_index: 1 Column_name: film_id Collation: A Cardinality: 1028…*************************** 2. row *************************** Table: film Non_unique: 1 Key_name: idx_titleSeq_in_index: 1 Column_name: title Collation: A Cardinality: 1028…*************************** 3. row *************************** Table: film Non_unique: 1 Key_name: idx_fk_language_idSeq_in_index: 1 Column_name: language_id Collation: A Cardinality: 2…*************************** 4. row *************************** Table: film Non_unique: 1 Key_name: idx_fk_original_language_idSeq_in_index: 1 Column_name: original_language_id Collation: A Cardinality: 2…*************************** 5. row *************************** Table: film Non_unique: 1 Key_name: film_ratingSeq_in_index: 1 Column_name: rating Collation: A Cardinality: 11 Sub_part: NULL Packed: NULL Null: YES Index_type: BTREE Comment:5 rows in set (0.00 sec)
Database Performance | 433

Using OPTIMIZE TABLE
Tables that are updated frequently with new data and deletions can become fragmentedquickly and, depending on the storage engine, can have gaps of unused space or sub‐optimal storage structures. A badly fragmented table can result in slower performance,especially during table scans.
The OPTIMIZE TABLE command restructures the data structures for one or more tables.This is especially beneficial for row formats with variable length fields (rows). It can beused only for MyISAM and InnoDB tables. The syntax is:
OPTIMIZE [LOCAL | NO_WRITE_TO_BINLOG] TABLE table_list
The LOCAL or NO_WRITE_TO_BINLOG keyword prevents the commandfrom being written to the binary log (and thereby from being repli‐cated in a replication topology). This can be very useful if you wantto experiment or tune while replicating data or if you want to omitthis step from your binary log and not replay it during PITR.
You should run this command whenever there have been significant updates to the table(e.g., a large number of deletes and inserts). This operation is designed to rearrange dataelements into a more optimal structure and could run for quite a long time (holdingwrite locks on the table). So this is one operation that is best run during times of lowloads.
If the table cannot be reorganized (perhaps because there are no variable length recordsor there is no fragmentation), the command will recreate the table and update the sta‐tistics. A sample output from this operation is shown in Example 11-16.
Example 11-16. The optimize table commandmysql> OPTIMIZE TABLE film \G*************************** 1. row *************************** Table: sakila.film Op: optimizeMsg_type: noteMsg_text: Table does not support optimize, doing recreate + analyze instead*************************** 2. row *************************** Table: sakila.film Op: optimizeMsg_type: statusMsg_text: OK2 rows in set (0.44 sec)
Here we see two rows in the result set. The first row tells us that the OPTIMIZE TABLEcommand could not be run and that the command will instead recreate the table andrun the ANALYZE TABLE command. The second row is the result of the ANALYZETABLE step.
434 | Chapter 11: Monitoring MySQL

Like the ANALYZE TABLE command, any unusual events during the execution of thecommand are indicated in the Msg_type field by info, Error, or warning. In these cases,the Msg_text field will give you additional information about the event. You shouldalways investigate the situation if you get any result other than status and OK.
When using InnoDB, especially when there are secondary indexes(which usually get fragmented), you may not see any improvementor may encounter long processing times for the operation unless youuse the InnoDB “fast index create” option, but this depends on howthe index was constructed. It may not apply to all indexes.
Best Practices for Database OptimizationAs mentioned previously, there are many great examples, techniques, and practicesconcerning optimization that come highly recommended by the world’s best databaseperformance experts. Because monitoring is used to detect and diagnose performanceissues, we include these best practices as a summary for the lessons learned about mon‐itoring MySQL.
For brevity, and to avoid controversial techniques, we will discuss a few commonlyagreed-upon best practices for improving database performance. We encourage you toexamine some of the texts referenced earlier for more detail on each of these practices.
Use indexes sparingly but effectively
Most database professionals understand the importance of indexes and how they im‐prove performance. Using the EXPLAIN command is often the best way to determinewhich indexes are needed. While the problem of not having enough indexes is under‐stood, having too much of a good thing can also cause a performance issue.
As you saw when exploring the EXPLAIN command, it is possible to create too manyindexes or indexes that are of little or no use. Each index adds overhead for every in‐sertion and deletion against the table. In some cases, having too many indexes with wide(as in many values) distributions can slow insert and delete performance considerably.It can also lead to slower replication and restore operations.
You should periodically check your indexes to ensure they are all meaningful and uti‐lized. Remove any indexes that are not used, have limited use, or have wide distributions.You can often use normalization to overcome some of the problems with wide distri‐butions.
Use normalization, but don’t overdo it
Many database experts who studied computer science or a related discipline may havefond memories (or nightmares) of learning the normal forms as described by C.J. Date
Database Performance | 435

and others. We won’t revisit the material here; rather, we will discuss the impacts oftaking those lessons too far.
Normalization (at least to third normal form) is a well-understood and standard prac‐tice. However, there are situations in which you may want to violate these rules.
The use of lookup tables is often a by-product of normalization (i.e., you create a specialtable that contains a list of related information that is used frequently in other tables).However, you can impede performance when you use lookup tables with limited dis‐tributions (only a few rows or a limited number of rows with small values) that areaccessed frequently. In this case, every time your users query information, they mustuse a join to get the complete data. Joins are expensive, and frequently accessed datacan add up over time. To mitigate this potential performance problem, you can useenumerated fields to store the data rather than a lookup table. For example, rather thancreating a table for hair color (despite what some subcultures may insist upon, therereally are only a limited number of hair color types), you can use an enumerated fieldand avoid the join altogether.
For example, if you created a child table to contain the possible values of hair color, themaster table would contain a field whose value is an index into the hair color table.When you execute a query to get results from the master table, you would have to do ajoin to get the values for the hair color field. If you used an enumerated field, you caneliminate the need for the join and thus improve performance.
Another potential issue concerns calculated fields. Typically, we do not store data thatis formed from other data (such as sales tax or the sum of several columns). Rather, thecalculated data is performed either during data retrieval via a view or in the application.This may not be a problem if the calculations are simple or are seldom performed, butwhat if the calculations are complex and are performed many times? In this case, youare potentially wasting a lot of time performing these calculations. One way to mitigatethis problem is to use a trigger to calculate the value and store it in the table. While thistechnically duplicates data (a big no-no for normalization theorists), it can improveperformance when a lot of calculations are being performed.
Use the right storage engine for the task
One of the most powerful features of MySQL is its support for different storage engines.Storage engines govern how data is stored and retrieved. MySQL supports a number ofthem, each with unique features and uses. This allows database designers to tune theirdatabase performance by selecting the storage engine that best meets their applicationneeds. For example, if you have an environment that requires transaction control forhighly active databases, choose a storage engine best suited for this task. You may alsohave identified a view or table that is often queried but almost never updated (e.g., alookup table). In this case, you may want to use a storage engine that keeps the data inmemory for faster access.
436 | Chapter 11: Monitoring MySQL

Recent changes to MySQL have permitted some storage engines to become plug-ins,and some distributions of MySQL have only certain storage engines enabled by default.To find out which storage engines are enabled, issue the SHOW ENGINES command.Example 11-17 shows the storage engines on a typical installation.
Example 11-17. Storage enginesmysql> SHOW ENGINES \G*************************** 1. row *************************** Engine: InnoDB Support: YES Comment: Supports transactions, row-level locking, and foreign keysTransactions: YES XA: YES Savepoints: YES*************************** 2. row *************************** Engine: MyISAM Support: DEFAULT Comment: Default engine as of MySQL 3.23 with great performanceTransactions: NO XA: NO Savepoints: NO*************************** 3. row *************************** Engine: BLACKHOLE Support: YES Comment: /dev/null storage engine (anything you write to it disappears)Transactions: NO XA: NO Savepoints: NO*************************** 4. row *************************** Engine: CSV Support: YES Comment: CSV storage engineTransactions: NO XA: NO Savepoints: NO*************************** 5. row *************************** Engine: MEMORY Support: YES Comment: Hash based, stored in memory, useful for temporary tablesTransactions: NO XA: NO Savepoints: NO*************************** 6. row *************************** Engine: FEDERATED Support: NO Comment: Federated MySQL storage engineTransactions: NULL XA: NULL Savepoints: NULL*************************** 7. row *************************** Engine: ARCHIVE
Database Performance | 437
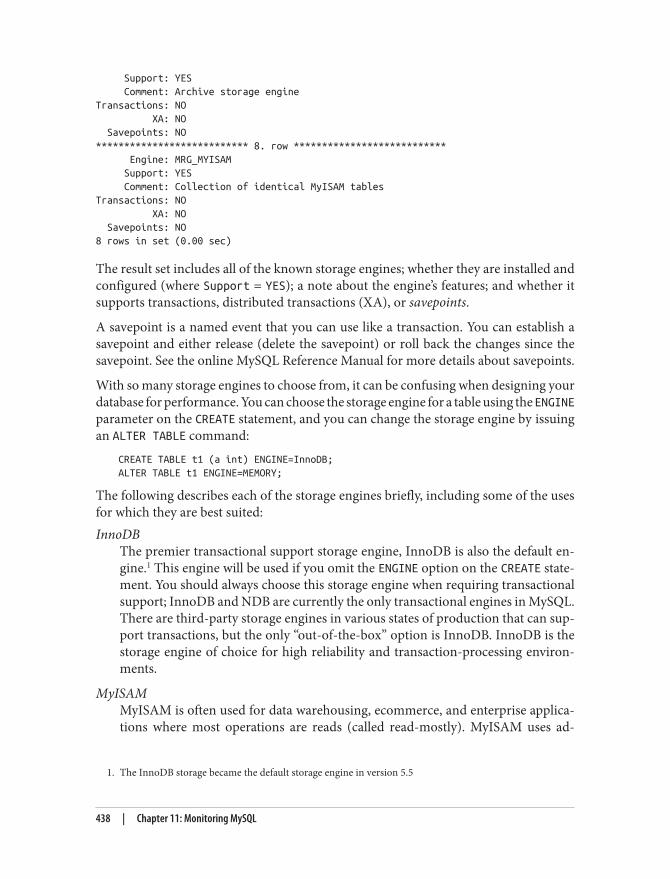
1. The InnoDB storage became the default storage engine in version 5.5
Support: YES Comment: Archive storage engineTransactions: NO XA: NO Savepoints: NO*************************** 8. row *************************** Engine: MRG_MYISAM Support: YES Comment: Collection of identical MyISAM tablesTransactions: NO XA: NO Savepoints: NO8 rows in set (0.00 sec)
The result set includes all of the known storage engines; whether they are installed andconfigured (where Support = YES); a note about the engine’s features; and whether itsupports transactions, distributed transactions (XA), or savepoints.
A savepoint is a named event that you can use like a transaction. You can establish asavepoint and either release (delete the savepoint) or roll back the changes since thesavepoint. See the online MySQL Reference Manual for more details about savepoints.
With so many storage engines to choose from, it can be confusing when designing yourdatabase for performance. You can choose the storage engine for a table using the ENGINEparameter on the CREATE statement, and you can change the storage engine by issuingan ALTER TABLE command:
CREATE TABLE t1 (a int) ENGINE=InnoDB;ALTER TABLE t1 ENGINE=MEMORY;
The following describes each of the storage engines briefly, including some of the usesfor which they are best suited:InnoDB
The premier transactional support storage engine, InnoDB is also the default en‐gine.1 This engine will be used if you omit the ENGINE option on the CREATE state‐ment. You should always choose this storage engine when requiring transactionalsupport; InnoDB and NDB are currently the only transactional engines in MySQL.There are third-party storage engines in various states of production that can sup‐port transactions, but the only “out-of-the-box” option is InnoDB. InnoDB is thestorage engine of choice for high reliability and transaction-processing environ‐ments.
MyISAMMyISAM is often used for data warehousing, ecommerce, and enterprise applica‐tions where most operations are reads (called read-mostly). MyISAM uses ad‐
438 | Chapter 11: Monitoring MySQL

vanced caching and indexing mechanisms to improve data retrieval and indexing.MyISAM is an excellent choice when you need storage in a wide variety of appli‐cations requiring fast retrieval of data without the need for transactions.
BlackholeThis storage engine is very interesting. It doesn’t store anything at all. In fact, it iswhat its name suggests—data goes in but never returns. All jocularity aside, theBlackhole storage engine fills a very special need. If binary logging is enabled, SQLstatements are written to the logs, and Blackhole is used as a relay agent (or proxy)in a replication topology. In this case, the relay agent processes data from the masterand passes it on to its slaves but does not actually store any data. The Blackholestorage engine can be handy in situations where you want to test an application toensure it is writing data, but you don’t want to store anything on disk.
CSVThis storage engine can create, read, and write comma-separated value (CSV) filesas tables. The CSV storage engine is best used to rapidly export structured businessdata to spreadsheets. The CSV storage engine does not provide any indexing mech‐anisms and has certain issues in storing and converting date/time values (they donot obey locality during queries). The CSV storage engine is best used when youwant to permit other applications to share or exchange data in a common format.Given that it is not as efficient for storing data, you should use the CSV storageengine sparingly.
The CSV storage engine is used for writing logfiles. For exam‐ple, the backup logs are CSV files and can be opened by otherapplications that use the CSV protocol (but not while the serv‐er is running).
MemoryThis storage engine (sometimes called HEAP) is an in-memory storage that uses ahashing mechanism to retrieve frequently used data. This allows for much fasterretrieval. Data is accessed in the same manner as with the other storage engines,but the data is stored in memory and is valid only during the MySQL session—thedata is flushed and deleted on shutdown. Memory storage engines are typicallygood for situations in which static data is accessed frequently and rarely ever altered(e.g., lookup tables). Examples include zip code listings, state and county names,category listings, and other data that is accessed frequently and seldom updated.You can also use the Memory storage engine for databases that utilize snapshottechniques for distributed or historical data access.
Database Performance | 439

FederatedCreates a single table reference from multiple database systems. The Federatedstorage engine allows you to link tables together across database servers. Thismechanism is similar in purpose to the linked data tables available in other databasesystems. The Federated storage engine is best suited for distributed or data martenvironments. The most interesting feature of the Federated storage engine is thatit does not move data, nor does it require the remote tables to use the same storageengine.
The Federated storage engine is currently disabled in most dis‐tributions of MySQL. Consult the online MySQL ReferenceManual for more details.
ArchiveThis storage engine can store large amounts of data in a compressed format. TheArchive storage engine is best suited for storing and retrieving large amounts ofseldom-accessed archival or historical data. Indexes are not supported and the onlyaccess method is via a table scan. Thus, you should not use the Archive storageengine for normal database storage and retrieval.
MergeThis storage engine (MRG_MYISAM) can encapsulate a set of MyISAM tables with thesame structure (table layout or schema) referenced as a single table. Thus, the tablesare partitioned by the location of the individual tables, but no additional partition‐ing mechanisms are used. All tables must reside on the same server (but not nec‐essarily the same database).
When a DROP command is issued on a merged table, only theMerge specification is removed. The original tables are notaltered.
The best attribute of the Merge storage engine is speed. It permits you to split alarge table into several smaller tables on different disks, combine them using amerge table specification, and access them simultaneously. Searches and sorts willexecute more quickly, because there is less data in each table to manipulate. Also,repairs on tables are more efficient because it is faster and easier to repair severalsmaller individual tables than a single large table. Unfortunately, this configurationhas several disadvantages:
• You must use identical MyISAM tables to form a single merge table.
440 | Chapter 11: Monitoring MySQL

• The replace operation is not allowed.• Indexes are less efficient than for a single table.
The Merge storage engine is best suited for very large database (VLDB) applications,like data warehousing, where data resides in more than one table in one or moredatabases. You can also use it to help solve some partitioning problems where youwant to partition horizontally but do not want to add the complexity of setting upthe partition table options.
Clearly, with so many choices of storage engines, it is possible to choose engines thatcan hamper performance or, in some cases, prohibit certain solutions. For example, ifyou never specify a storage engine when the table is created, MySQL uses the defaultstorage engine. If not set manually, the default storage engine reverts to the platform-specific default, which may be MyISAM on some platforms. This may mean you aremissing out on optimizing lookup tables or limiting features of your application by nothaving transactional support. It is well worth the extra time to include an analysis ofstorage engine choices when designing or tuning your databases.
Use views for faster results via the query cache
Views are a very handy way to encapsulate complex queries to make it easier to workwith the data. You can use views to limit data both vertically (fewer columns) or hori‐zontally (a WHERE clause on the underlying SELECT statement). Both uses are very handy,and of course, the more complex views use both practices to limit the result set returnedto the user or to hide certain base tables or to ensure an efficient join is executed.
Using views to limit the columns returned can help you in ways you may not haveconsidered. It not only reduces the amount of data processed, but can also help youavoid costly SELECT * operations that users tend to do without much thought. Whenmany of these types of operations are run, your applications are processing far too muchdata and this can affect performance of not only the application, but also the server, andmore important, can decrease available bandwidth on your network. It’s always a goodidea to use views to limit data in this manner and hide access to the base table(s) toremove any temptation users may have to access the base table directly.
Views that limit the number of rows returned also help reduce network bandwidth andcan improve the performance of your applications. These types of views also protectagainst proliferation of SELECT * queries. Using views in this manner requires a bitmore planning, because your goal is to create meaningful subsets of the data. You willhave to examine the requirements for your database and understand the queries issuedto form the correct WHERE clauses for these queries.
With a little effort, you may find you can create combinations of vertically and hori‐zontally restrictive views, thereby ensuring your applications operate on only the data
Database Performance | 441

that is needed. The less data moving around, the more data your applications can processin the same amount of time.
Perhaps the best way to use views is to eliminate poorly formed joins. This is especiallytrue when you have a complex normalized schema. It may not be obvious to users howto combine the tables to form a meaningful result set. Indeed, most of the work doneby DBAs when striving for better performance is focused on correcting poorly formedjoins. Sometimes this can be trivial—for example, fewer rows processed during the joinoperation—but most of the time the improved response time is significant.
Views can also be helpful when using the query cache in MySQL. The query cache storesthe results of frequently used (accessed) queries. Using views that provide a standardizedresult set can improve the likelihood that the results will be cached and, therefore, re‐trieved more efficiently.
You can improve performance with a little design work and the judicious use of viewsin your databases. Take the time to examine how much data is being moved around(both the number of columns and rows) and examine your application for any querythat uses joins. Spend some time forming views that limit the data and identify the mostefficient joins and wrap them in a view as well. Imagine how much easier you’ll restknowing your users are executing efficient joins.
Use constraints
The use of constraints provides another tool in your arsenal for combating performanceproblems. Rather than proselytizing about limitations on using constraints, we encour‐age you to consider constraints a standard practice and not an afterthought.
There are several types of constraints available in MySQL, including the following:
• Unique indexes• Primary keys• Enumerated values• Sets• Default values• NOT NULL option
We’ve discussed using indexes and overusing indexes. Indexes help improve data re‐trieval by allowing the system to store and find data more quickly.
442 | Chapter 11: Monitoring MySQL

Foreign keys are another form of constraint but are not directly re‐lated to performance. Rather, foreign keys can be used to protectreferential integrity. However, it should be noted that updating tableswith a lot of foreign keys or executing cascade operations can havesome affect on performance. Currently, only InnoDB supports for‐eign keys. For more information about foreign keys, see the onlineMySQL Reference Manual.
Sets in MySQL are similar to enumerated values, allowing you to constrain the valuesin a field. You can use sets to store information that represents attributes of the data,instead of using a master/detail relationship. This not only saves space in the table (setvalues are bitwise combinations), but also eliminates the need to access another tablefor the values.
The use of the DEFAULT option to supply default values is an excellent way to prohibitproblems associated with poorly constructed data. For example, if you have a numericfield that represents values used for calculations, you may want to ensure that when thefield is unknown, a default value is stored for it. You can set defaults on most data types.You can also use defaults for date and time fields to avoid problems processing invaliddate and time values. More important, default values can save your application fromhaving to supply the values (or using the less reliable method of asking the user toprovide them), thereby reducing the amount of data sent to the server during data entry.
You should also consider using the NOT NULL option when specifying fields that musthave a value. If an entry is attempted where there are NOT NULL columns and no datavalues are provided, the INSERT statement will fail. This prevents data integrity issuesby ensuring all important fields have values. Null values can also make certain querieson these fields take longer.
Use EXPLAIN, ANALYZE, and OPTIMIZE
We have already discussed the benefits of these commands. We list them here as a bestpractice to remind you that these tools are vital for diagnostic and tuning efforts. Usethem often and with impunity, but follow their use carefully. Specifically, use ANALYZEand OPTIMIZE when it makes sense and not as a regular, scheduled event. We haveencountered administrators who run these commands nightly, and in some cases thatmay be warranted, but in the general case it is not warranted and can lead to unnecessarytable copies (like we saw in the earlier examples). Thus, forcing the system to copy dataregularly can be a waste of time and could lead to limited access during the operation.
Now that we’ve discussed how to monitor and improve MySQL query performance, letus look at some best practices that you can use to help focus your investigation of performance.
Database Performance | 443

Best Practices for Improving PerformanceThe details of diagnosing and improving performance of databases are covered by worksdevoted to the subject and indeed, the information fills many pages.
For completeness and as a general reference, we include in this section a set of bestpractices for combating performance anomalies; this is meant to be a checklist for youto use as a guide. We have grouped the practices by common problems.
Everything Is SlowWhen the system as a whole is performing poorly, you must focus your efforts on howthe system is running, starting with the operating system. You can use one or more ofthe following techniques to identify and improve the performance of your system:
• Check hardware for problems.• Improve hardware (e.g., add memory).• Consider moving data to isolated disks.• Check the operating system for proper configuration.• Consider moving some applications to other servers.• Consider replication for scale-out.• Tune the server for performance.
Slow QueriesAny query that appears in the slow query log or those identified as problematic by yourusers or developers can be improved using one or more of the following techniques:
• Normalize your database schema.• Use EXPLAIN to identify missing or incorrect indexes.• Use the benchmark() function to test parts of queries.• Consider rewriting the query.• Use views to standardize queries.• Test using the query cache (this may not work for all queries or the frequency of
your access patterns).
444 | Chapter 11: Monitoring MySQL

A replication slave does not write replicated queries to the slow querylog, regardless of whether the query was written to the slow query logon the master.
Slow ApplicationsIf an application is showing signs of performance issues, you should examine the ap‐plication components to determine where the problem is located. Perhaps you will findonly one module is causing the problem, but sometimes it may be more serious. Thefollowing techniques can help you identify and solve application performance problems:
• Turn on the query cache.• In cases where the query cache is already enabled, turning it off may improve some
queries. Consider using the query cache on demand using DEMAND mode and SELECTSQL_CACHE.
• Consider and optimize your storage engine choices.• Verify the problem isn’t in the server or operating system.• Define benchmarks for your applications and compare to known baselines.• Examine internalized (written in the application) queries and maximize their
performance.• Divide and conquer—examine one part at a time.• Use partitioning to spread out the data.• Examine your indexes for fragmentation.
Slow ReplicationThe performance problems related to replication, as discussed earlier, are normallyisolated to problems with the database and server performance. Use the following tech‐niques when diagnosing performance issues for replication:
• Ensure your network is operating at peak performance.• Ensure your servers are configured correctly.• Optimize your databases.• Limit updates to the master.• Divide reads across several slaves.• Check the slaves for replication lag.
Best Practices for Improving Performance | 445

• Perform regular maintenance on your logs (binary and relay logs).• Use compression over your network if bandwidth is limited.• Use inclusive and exclusive logging options to minimize what is replicated.
ConclusionThere are a lot of things to monitor on a MySQL server. We’ve discussed the basic SQLcommands available for monitoring the server, the mysqladmin command-line utility,the benchmark suite, and MySQL Workbench. We have also examined some best prac‐tices for improving database performance.
Now that you know the basics of operating system monitoring, database performance,MySQL monitoring, and benchmarking, you have the tools and knowledge to success‐fully tune your server for optimal performance.
Joel smiled as he compiled his report about Susan’s nested query problem. It had takena few hours of digging through logfiles to find the problem, but after he explained theoverhead of the query to the developers, they agreed to change the query to use a lookuptable stored in a memory table. Joel felt his boss was going to be excited to learn abouthis ingenuity. He clicked Send just as his boss appeared in his door frame.
“Joel!”
Joel jumped, despite knowing Mr. Summerson was there. “I’ve got the marketing ap‐plication problem solved, sir,” he said quickly.
“Great! I look forward to reading about your solution.”
Joel wasn’t sure his boss would understand the technical parts of his message, but healso knew his boss would keep asking if he didn’t explain everything.
Mr. Summerson nodded once and went on his way. Joel opened an email message fromPhil in Seattle complaining about replication problems and soon realized the problemsextended much further than the server he had been working with.
446 | Chapter 11: Monitoring MySQL

CHAPTER 12
Storage Engine Monitoring
Joel was enjoying his morning latte when his office phone rang. It startled him becauseuntil now he had never heard it ring. He lifted the receiver and heard engine noises.Expecting the call was a wrong number, he said hesitantly, “Hello?”
“Joel! Glad I caught you.” It was Mr. Summerson, calling from his car.
“Yes, sir.”
“I’m on my way to the airport to meet with the sales staff in the Seattle office. I wantedto ask you to look into the new application database. The developers in Seattle tell methey think we need to figure out a better configuration for performance.”
Joel had expected something like this. He knew a little about InnoDB and MyISAM, buthe wasn’t familiar with monitoring, much less tuning their performance. “I can lookinto it, sir.”
“Great. Thanks, Joel. I’ll email you.” The connection was severed before Joel could reply.Joel finished the last of his latte and started reading about storage engines in MySQL.
Now that you know when your servers are performing well (and when they aren’t), howdo you know how well your storage engines are performing? If you are hosting one ormore transactional databases or need your storage engine to perform at its peak for fastqueries, you will need to monitor your storage engines. In this chapter, we discuss ad‐vanced storage engine monitoring, focusing on improving storage engine performance,by examining the two most popular storage engines: InnoDB and MyISAM. We willdiscuss how to monitor each and offer some practical advice on how to improveperformance.
447

InnoDBThe InnoDB storage engine is the default storage engine for MySQL (as of version 5.5).InnoDB provides high reliability and high performance transactional operations thatsupport full ACID compliance. InnoDB has been proven to be very reliable and con‐tinues to be improved. The latest improvements include multicore processor support,improved memory allocation, and finer grain performance tuning capabilities. The on‐line reference manual contains a detailed explanation of all of the features of the InnoDBstorage engine.
There are many tuning options for the InnoDB storage engine, and a thorough exami‐nation of all of them and the techniques that go along with each can fill an entire volume.For example, there are 50 variables that control the behavior of InnoDB and over 40status variables to communicate metadata about performance and status. In this section,we discuss how to monitor the InnoDB storage engine and focus on some key areas forimproving performance.
Rather than discussing the broader aspects of these areas, we provide a strategy or‐ganized into the following areas of performance improvement:
• Using the SHOW ENGINE command• Using InnoDB monitors• Monitoring logfiles• Monitoring the buffer pool• Monitoring tablespaces• Using INFORMATION_SCHEMA tables• Using PERFORMANCE_SCHEMA tables• Other parameters to consider• Troubleshooting InnoDB
We will discuss each of these briefly in the sections that follow. However, before we getstarted, let’s take a brief look at the InnoDB architectural features.
The InnoDB storage engine uses a very sophisticated architecture that is designed forhigh concurrency and heavy transactional activity. It has a number of advanced featuresthat you should consider prior to attempting to improve performance. We focus on thefeatures we can monitor and improve. These include indexes, the buffer pool, logfiles,and tablespaces.
The indexes in an InnoDB table use clustered indexes. Even if no index is specified,InnoDB assigns an internal value to each row so that it can use a clustered index. Aclustered index is a data structure that stores not only the index, but also the data itself.
448 | Chapter 12: Storage Engine Monitoring

This means once you’ve located the value in the index, you can retrieve the data withoutadditional disk seeks. Naturally, the primary key index or first unique index on a tableis built as a clustered index.
When you create a secondary index, the key from the clustered index (primary key,unique key, or row ID) is stored along with the value for the secondary index. Thisallows very fast search by key and fast retrieval of the original data in the clustered index.It also means you can use the primary key columns when scanning the secondary indexto allow the query to use only the secondary index to retrieve data.
The buffer pool is a caching mechanism for managing transactions and writing andreading data to or from disks and, properly configured, can reduce disk access. Thebuffer pool is also a vital component for crash recovery, as the buffer pool is written todisk periodically (e.g., during shutdown). By default, the buffer pool state is saved in afile named ib_buffer_pool in the same directory as the InnoDB datafiles. Because thestate is an in-memory component, you must monitor the effectiveness of the buffer poolto ensure it is configured correctly.
InnoDB also uses the buffer pool to store data changes and transactions. InnoDB cacheschanges by saving them to a page (block) of data in the buffer pool. Each time a page isreferenced, it is placed in the buffer pool and when changed, it is marked as “dirty.” Thechanges are then written to disk to update the data and a copy is written into a redo log.These logfiles are stored as files named ib_logfile0 or ib_logfile1. You can see these filesin the data directory of the MySQL server.
For more information about configuring and controlling the flush‐ing of the buffer pool, see the section entitled “Improvements toBuffer Pool Flushing” in the online MySQL Reference Manual.
The InnoDB storage engine uses two disk-based mechanisms for storing data: logfilesand tablespaces. InnoDB also uses the logs to rebuild (or redo) data changes made priorto a shutdown or crash. On startup, InnoDB reads the logs and automatically writes thedirty pages to disk, thereby recovering buffered changes made before the crash.
Separate TablespacesOne of the newest performance features permits the storage of undo logs as separatetablespaces. Because the undo logs can consume a lot of space during long-runningtransactions, placing the undo logs in separate or even multiple tablespaces reduces thesize of the system tablespace. To place the undo logs in separate tablespaces, set the--innodb_undo_tablespaces configuration option to a value greater than zero. You canalso specify the location of the undo log tablespaces by using the
InnoDB | 449

--innodb_undo_directory option. MySQL assigns names to the undo log tablespacesusing the form innodbn, where n is a sequential integer with leading zeros.
Tablespaces are an organizational tool InnoDB uses as machine-independent files thatcontain both data and indexes as well as a rollback mechanism (to roll back transac‐tions). By default, all tables share one tablespace (called a shared tablespace). Sharedtablespaces do not automatically extend across multiple files. By default, a tablespacetakes up a single file that grows as the data grows. You can specify the autoextend optionto allow the tablespace to create new files.
You can also store tables in their own tablespaces (called file-per-table). File-per-tabletablespaces contain both the data and the indexes for your tables. While there is still acentral InnoDB file that is maintained, file-per-table permits you to segregate the datato different files (tablespaces). These tablespaces automatically extend across multiplefiles, thereby allowing you to store more data in your tables than what the operatingsystem can handle. You can divide your tablespace into multiple files to place on differentdisks.
Use innodb_file_per_table to create a separate tablespace for eachtable. Any tables created prior to setting this option will remain in theshared tablespace. Using this command affects only new tables. It doesnot reduce or otherwise save space already allocated in the sharedtablespace. To apply the change to existing tables, use the ALTERTABLE ... ENGINE=INNODB command. Do this after you have turnedon the innodb_file_per_table feature.
Using the SHOW ENGINE CommandThe SHOW ENGINE INNODB STATUS command (also known as the InnoDB monitor)displays statistical and configuration information concerning the state of the InnoDBstorage engine. This is the standard way to see information about InnoDB. The list ofstatistical data displayed is long and very comprehensive. Example 12-1 shows an ex‐cerpt of the command run on a standard installation of MySQL.
Example 12-1. The SHOW ENGINE INNODB STATUS commandmysql> SHOW ENGINE INNODB STATUS \G*************************** 1. row *************************** Type: InnoDB Name:Status:=====================================2013-01-08 20:50:16 11abaa000 INNODB MONITOR OUTPUT=====================================Per second averages calculated from the last 3 seconds-----------------
450 | Chapter 12: Storage Engine Monitoring

BACKGROUND THREAD-----------------srv_master_thread loops: 1 srv_active, 0 srv_shutdown, 733 srv_idlesrv_master_thread log flush and writes: 734----------SEMAPHORES----------OS WAIT ARRAY INFO: reservation count 2OS WAIT ARRAY INFO: signal count 2Mutex spin waits 1, rounds 19, OS waits 0RW-shared spins 2, rounds 60, OS waits 2RW-excl spins 0, rounds 0, OS waits 0Spin rounds per wait: 19.00 mutex, 30.00 RW-shared, 0.00 RW-excl------------TRANSACTIONS------------Trx id counter 1285Purge done for trx's n:o < 0 undo n:o < 0 state: running but idleHistory list length 0LIST OF TRANSACTIONS FOR EACH SESSION:---TRANSACTION 0, not startedMySQL thread id 3, OS thread handle 0x11abaa000, query id 32 localhost 127.0.0.1 root initSHOW ENGINE INNODB STATUS--------FILE I/O--------I/O thread 0 state: waiting for i/o request (insert buffer thread)I/O thread 1 state: waiting for i/o request (log thread)I/O thread 2 state: waiting for i/o request (read thread)I/O thread 3 state: waiting for i/o request (read thread)I/O thread 4 state: waiting for i/o request (read thread)I/O thread 5 state: waiting for i/o request (read thread)I/O thread 6 state: waiting for i/o request (write thread)I/O thread 7 state: waiting for i/o request (write thread)I/O thread 8 state: waiting for i/o request (write thread)I/O thread 9 state: waiting for i/o request (write thread)Pending normal aio reads: 0 [0, 0, 0, 0] , aio writes: 0 [0, 0, 0, 0] , ibuf aio reads: 0, log i/o's: 0, sync i/o's: 0Pending flushes (fsync) log: 0; buffer pool: 0171 OS file reads, 5 OS file writes, 5 OS fsyncs0.00 reads/s, 0 avg bytes/read, 0.00 writes/s, 0.00 fsyncs/s-------------------------------------INSERT BUFFER AND ADAPTIVE HASH INDEX-------------------------------------Ibuf: size 1, free list len 0, seg size 2, 0 mergesmerged operations: insert 0, delete mark 0, delete 0discarded operations: insert 0, delete mark 0, delete 0Hash table size 276671, node heap has 0 buffer(s)0.00 hash searches/s, 0.00 non-hash searches/s
InnoDB | 451

---LOG---Log sequence number 1625987Log flushed up to 1625987Pages flushed up to 1625987Last checkpoint at 16259870 pending log writes, 0 pending chkp writes8 log i/o's done, 0.00 log i/o's/second----------------------BUFFER POOL AND MEMORY----------------------Total memory allocated 137363456; in additional pool allocated 0Dictionary memory allocated 55491Buffer pool size 8191Free buffers 8034Database pages 157Old database pages 0Modified db pages 0Pending reads 0Pending writes: LRU 0, flush list 0 single page 0Pages made young 0, not young 00.00 youngs/s, 0.00 non-youngs/sPages read 157, created 0, written 10.00 reads/s, 0.00 creates/s, 0.00 writes/sNo buffer pool page gets since the last printoutPages read ahead 0.00/s, evicted without access 0.00/s, Random read ahead 0.00/sLRU len: 157, unzip_LRU len: 0I/O sum[0]:cur[0], unzip sum[0]:cur[0]--------------ROW OPERATIONS--------------0 queries inside InnoDB, 0 queries in queue0 read views open inside InnoDBMain thread id 4718366720, state: sleepingNumber of rows inserted 0, updated 0, deleted 0, read 00.00 inserts/s, 0.00 updates/s, 0.00 deletes/s, 0.00 reads/s----------------------------END OF INNODB MONITOR OUTPUT============================
1 row in set (0.00 sec)
The SHOW ENGINE INNODB MUTEX command displays mutex information about InnoDBand can be very helpful when tuning threading in the storage engine. Example 12-2shows an excerpt of the command run on a standard installation of MySQL.
452 | Chapter 12: Storage Engine Monitoring

Example 12-2. The SHOW ENGINE INNODB MUTEX commandmysql> SHOW ENGINE INNODB MUTEX;+--------+--------------------+---------------+| Type | Name | Status |+--------+--------------------+---------------+| InnoDB | trx/trx0rseg.c:167 | os_waits=1 || InnoDB | trx/trx0sys.c:181 | os_waits=7 || InnoDB | log/log0log.c:777 | os_waits=1003 || InnoDB | buf/buf0buf.c:936 | os_waits=8 || InnoDB | fil/fil0fil.c:1487 | os_waits=2 || InnoDB | srv/srv0srv.c:953 | os_waits=101 || InnoDB | log/log0log.c:833 | os_waits=323 |+--------+--------------------+---------------+7 rows in set (0.00 sec)
The Name column displays the source file and line number where the mutex was created.The Status column displays the number of times the mutex waited for the operatingsystem (e.g., os_waits=5). If the source code was compiled with the UNIV_DEBUG direc‐tive, the column can display one of the following values:count
The number of times the mutex was requested
spin_waits
The number of times a spinlock operation was run
os_waits
The number of times the mutex waited on the operating system
os_yields
The number of times a thread abandoned its time slice and returned to the operatingsystem
os_wait_times
The amount of time the mutex waited for the operating system
The SHOW ENGINE INNODB STATUS command displays a lot of information directly fromthe InnoDB storage engine. While it is unformatted (it isn’t displayed in neat rows andcolumns), there are several tools that use this information and redisplay it. For example,the InnoTop (see “InnoTop” on page 404) command communicates data this way.
Using InnoDB MonitorsThe InnoDB storage engine is the only native storage engine that supports monitoringdirectly. Under the hood of InnoDB is a special mechanism called a monitor that gathersand reports statistical information to the server and client utilities. All of the following(and most third-party tools) interact with the monitoring facility in InnoDB, henceInnoDB monitors the following items via the MySQL server:
InnoDB | 453

• Table and record locks• Lock waits• Semaphore waits• File I/O requests• Buffer pool• Purge and insert buffer merge activity
The InnoDB monitors are engaged automatically via the SHOW ENGINE INNODB STATUS command, and the information displayed is generated by the monitors. However,you can also get this information directly from the InnoDB monitors by creating aspecial set of tables in MySQL. The actual schema of the tables and where they resideare not important (provided you use the ENGINE = INNODB clause). Once they are cre‐ated, each of the tables tells InnoDB to dump the data to stderr. You can see thisinformation via the MySQL error log. For example, a default install of MySQL on MacOS X has an error log named /usr/local/mysql/data/localhost.err. On Windows, you canalso display the output in a console by starting MySQL with the --console option. Toturn on the InnoDB monitors, create the following tables in a database of your choice:
mysql> SHOW TABLES LIKE 'innodb%';+---------------------------+| Tables_in_test (innodb%) |+---------------------------+| innodb_lock_monitor || innodb_monitor || innodb_table_monitor || innodb_tablespace_monitor |+---------------------------+4 rows in set (0.00 sec)
To turn off the monitors, simply delete the table. The monitors automatically regeneratedata every 15 seconds.
The tables are deleted on reboot. To continue monitoring after areboot, you must recreate the tables.
Each monitor presents the following data:innodb_monitor
The standard monitor that prints the same information as the status SQL command.See Example 12-1 for an example of the output of this monitor. The only differencebetween the SQL command and the output of the innodb_monitor is that the output
454 | Chapter 12: Storage Engine Monitoring

to stderr is formatted the same way as if you used the vertical display option in theMySQL client.
innodb_lock_monitor
The lock monitor also displays the same information as the SQL command, butincludes additional information about locks. Use this report to detect deadlocksand explore concurrency issues.
Example 12-3. The InnoDB lock monitor report------------TRANSACTIONS------------Trx id counter 2E07Purge done for trx's n:o < 2C02 undo n:o < 0History list length 36LIST OF TRANSACTIONS FOR EACH SESSION:---TRANSACTION 2E06, not startedmysql tables in use 1, locked 1MySQL thread id 3, OS thread handle 0x10b2f3000, query id 30 localhost rootshow engine innodb status
innodb_table_monitor
The table monitor produces a detailed report of the internal data dictionary.Example 12-4 shows an excerpt of the report generated (formatted for readability).Notice the extensive data provided about each table, including the column defini‐tions, indexes, approximate number of rows, foreign keys, and more. Use this reportwhen diagnosing problems with tables or if you want to know the details of indexes.
Example 12-4. The InnoDB table monitor report===========================================2013-01-08 21:11:00 11dc5f000 INNODB TABLE MONITOR OUTPUT===========================================--------------------------------------TABLE: name SYS_DATAFILES, id 14, flags 0, columns 5, indexes 1, appr.rows 9 COLUMNS: SPACE: DATA_INT len 4; PATH: DATA_VARCHAR prtype 524292 len 0; DB_ROW_ID: DATA_SYS prtype 256 len 6; DB_TRX_ID: DATA_SYS prtype 257 len 6; DB_ROLL_PTR: DATA_SYS prtype 258 len 7; INDEX: name SYS_DATAFILES_SPACE, id 16, fields 1/4, uniq 1, type 3 root page 308, appr.key vals 9, leaf pages 1, size pages 1 FIELDS: SPACE DB_TRX_ID DB_ROLL_PTR PATH--------------------------------------...-----------------------------------END OF INNODB TABLE MONITOR OUTPUT==================================
InnoDB | 455

innodb_tablespace_monitor
Displays extended information about the shared tablespace, including a list of filesegments. It also validates the tablespace allocation data structures. The report canbe quite detailed and very long, as it lists all of the details about your tablespace.Example 12-5 shows an excerpt of this report.
Example 12-5. The InnoDB tablespace monitor report================================================2013-01-08 21:11:00 11dc5f000 INNODB TABLESPACE MONITOR OUTPUT================================================FILE SPACE INFO: id 0size 768, free limit 576, free extents 3not full frag extents 1: used pages 13, full frag extents 3first seg id not used 180SEGMENT id 1 space 0; page 2; res 2 used 2; full ext 0fragm pages 2; free extents 0; not full extents 0: pages 0SEGMENT id 2 space 0; page 2; res 1 used 1; full ext 0fragm pages 1; free extents 0; not full extents 0: pages 0SEGMENT id 3 space 0; page 2; res 1 used 1; full ext 0fragm pages 1; free extents 0; not full extents 0: pages 0SEGMENT id 4 space 0; page 2; res 1 used 1; full ext 0fragm pages 1; free extents 0; not full extents 0: pages 0SEGMENT id 5 space 0; page 2; res 1 used 1; full ext 0fragm pages 1; free extents 0; not full extents 0: pages 0SEGMENT id 6 space 0; page 2; res 0 used 0; full ext 0fragm pages 0; free extents 0; not full extents 0: pages 0SEGMENT id 7 space 0; page 2; res 1 used 1; full ext 0fragm pages 1; free extents 0; not full extents 0: pages 0SEGMENT id 8 space 0; page 2; res 0 used 0; full ext 0fragm pages 0; free extents 0; not full extents 0: pages 0SEGMENT id 9 space 0; page 2; res 1 used 1; full ext 0fragm pages 1; free extents 0; not full extents 0: pages 0SEGMENT id 10 space 0; page 2; res 0 used 0; full ext 0fragm pages 0; free extents 0; not full extents 0: pages 0SEGMENT id 11 space 0; page 2; res 1 used 1; full ext 0fragm pages 1; free extents 0; not full extents 0: pages 0SEGMENT id 12 space 0; page 2; res 0 used 0; full ext 0fragm pages 0; free extents 0; not full extents 0: pages 0SEGMENT id 13 space 0; page 2; res 1 used 1; full ext 0fragm pages 1; free extents 0; not full extents 0: pages 0SEGMENT id 14 space 0; page 2; res 0 used 0; full ext 0fragm pages 0; free extents 0; not full extents 0: pages 0SEGMENT id 15 space 0; page 2; res 160 used 160; full ext 2fragm pages 32; free extents 0; not full extents 0: pages 0SEGMENT id 16 space 0; page 2; res 1 used 1; full ext 0fragm pages 1; free extents 0; not full extents 0: pages 0SEGMENT id 17 space 0; page 2; res 1 used 1; full ext 0fragm pages 1; free extents 0; not full extents 0: pages 0SEGMENT id 18 space 0; page 2; res 1 used 1; full ext 0fragm pages 1; free extents 0; not full extents 0: pages 0SEGMENT id 19 space 0; page 2; res 1 used 1; full ext 0
456 | Chapter 12: Storage Engine Monitoring

fragm pages 1; free extents 0; not full extents 0: pages 0SEGMENT id 20 space 0; page 2; res 1 used 1; full ext 0fragm pages 1; free extents 0; not full extents 0: pages 0
...
NUMBER of file segments: 179Validating tablespaceValidation ok---------------------------------------END OF INNODB TABLESPACE MONITOR OUTPUT=======================================
As you can see, the InnoDB monitor reports quite a lot of detail. Keeping these turnedon for extended periods could add a substantial amount of data to your logfiles.
Monitoring LogfilesBecause the InnoDB logfiles buffer data between your data and the operating system,keeping these files running well will ensure good performance. You can monitor thelogfiles directly by watching the following system status variables:
mysql> SHOW STATUS LIKE 'InnoDB%log%';+------------------------------+-------+| Variable_name | Value |+------------------------------+-------+| InnoDB_log_waits | 0 || InnoDB_log_write_requests | 0 || InnoDB_log_writes | 2 || InnoDB_os_log_fsyncs | 5 || InnoDB_os_log_pending_fsyncs | 0 || InnoDB_os_log_pending_writes | 0 || InnoDB_os_log_written | 1024 |+------------------------------+-------+
We saw some of this information presented by the InnoDB monitors, but you can alsoget detailed information about the logfiles using the following status variables:InnoDB_log_waits
A count of the number of times the log was too small (i.e., did not have enoughroom for all of the data) and the operation had to wait for the log to be flushed. Ifthis value begins to increase and remains higher than zero for long periods (exceptperhaps during bulk operations), you may want to increase the size of the logfiles.
InnoDB_log_write_requests
The number of log write requests.
InnoDB_log_writes
The number of times data was written to the log.
InnoDB | 457

InnoDB_os_log_fsyncs
The number of operating system file syncs (i.e., fsync() method calls).
InnoDB_os_log_pending_fsyncs
The number of pending file sync requests. If this value begins to increase and staysabove zero for an extended period of time, you may want to investigate possibledisk access issues.
InnoDB_os_log_pending_writes
The number of pending log write requests. If this value begins to increase and stayshigher than zero for an extended period of time, you may want to investigate pos‐sible disk access issues.
InnoDB_os_log_written
The total number of bytes written to the log.
Because all of these options present numerical information, you can build your owncustom graphs in MySQL Workbench to display the information in graphical form.
Monitoring the Buffer PoolThe buffer pool is where InnoDB caches frequently accessed data. Any changes youmake to the data in the buffer pool are also cached. The buffer pool also stores infor‐mation about current transactions. Thus, the buffer pool is a critical mechanism usedfor performance.
You can view information about the behavior of the buffer pool using the SHOW ENGINEINNODB STATUS command, as shown in Example 12-1. We repeat the buffer pool andmemory section here for your convenience:
----------------------BUFFER POOL AND MEMORY----------------------Total memory allocated 138805248; in additional pool allocated 0Dictionary memory allocated 70560Buffer pool size 8192Free buffers 760Database pages 6988Modified db pages 113Pending reads 0Pending writes: LRU 0, flush list 0, single page 0Pages read 21, created 6968, written 100430.00 reads/s, 89.91 creates/s, 125.87 writes/sBuffer pool hit rate 1000 / 1000LRU len: 6988, unzip_LRU len: 0I/O sum[9786]:cur[259], unzip sum[0]:cur[0]
The critical items to watch for in this report are listed here (we discuss more specificstatus variables later):
458 | Chapter 12: Storage Engine Monitoring

Free buffersThe number of buffer segments that are empty and available for buffering data.
Modified pagesThe number of pages that have changes (dirty).
Pending readsThe number of reads waiting. This value should remain low.
Pending writesThe number of writes waiting. This value should remain low.
Hit rateA ratio of the number of successful buffer hits to the number of all requests. Youwant this value to remain as close as possible to 1:1.
There are a number of status variables you can use to see this information in greaterdetail. The following shows the InnoDB buffer pool status variables:
mysql> SHOW STATUS LIKE 'InnoDB%buf%';+-----------------------------------+-------+| Variable_name | Value |+-----------------------------------+-------+| InnoDB_buffer_pool_pages_data | 21 || InnoDB_buffer_pool_pages_dirty | 0 || InnoDB_buffer_pool_pages_flushed | 1 || InnoDB_buffer_pool_pages_free | 8171 || InnoDB_buffer_pool_pages_misc | 0 || InnoDB_buffer_pool_pages_total | 8192 || InnoDB_buffer_pool_read_ahead_rnd | 0 || InnoDB_buffer_pool_read_ahead_seq | 0 || InnoDB_buffer_pool_read_requests | 558 || InnoDB_buffer_pool_reads | 22 || InnoDB_buffer_pool_wait_free | 0 || InnoDB_buffer_pool_write_requests | 1 |+-----------------------------------+-------+
There are a number of status variables for the buffer pool that display key statisticalinformation about the performance of the buffer pool. You can monitor such detailedinformation as the status of the pages in the buffer pool, the reads and writes from andto the buffer pool, and how often the buffer pool causes a wait for reads or writes. Thefollowing explains each status variable in more detail:InnoDB_buffer_pool_pages_data
The number of pages containing data, including both unchanged and changed(dirty) pages.
InnoDB_buffer_pool_pages_dirty
The number of pages that have changes (dirty).
InnoDB | 459

InnoDB_buffer_pool_pages_flushed
The number of times the buffer pool pages have been flushed.
InnoDB_buffer_pool_pages_free
The number of empty (free) pages.
InnoDB_buffer_pool_pages_misc
The number of pages that are being used for administrative work by the InnoDBengine itself. This is calculated as:
X = InnoDB_buffer_pool_pages_total – InnoDB_buffer_pool_pages_free – InnoDB_buffer_pool_pages_data
InnoDB_buffer_pool_pages_total
The total number of pages in the buffer pool.
InnoDB_buffer_pool_read_ahead_rnd
The number of random read-aheads that have occurred by InnoDB scanning for alarge block of data.
InnoDB_buffer_pool_read_ahead_seq
The number of sequential read-aheads that have occurred as a result of a sequentialfull table scan.
InnoDB_buffer_pool_read_requests
The number of logical read requests.
InnoDB_buffer_pool_reads
The number of logical reads that were not found in the buffer pool and were readdirectly from the disk.
InnoDB_buffer_pool_wait_free
If the buffer pool is busy or there are no free pages, InnoDB may need to wait forpages to be flushed. This value is the number of times the wait occurred. If this valuegrows and stays higher than zero, you may have either an issue with the size of thebuffer pool or a disk access issue.
InnoDB_buffer_pool_write_requests
The number of writes to the InnoDB buffer pool.
Because all of these options present numerical data, you can build your own customgraphs in MySQL Workbench to display the information in graphical form.
Monitoring TablespacesInnoDB tablespaces are basically self-sufficient, provided you have allowed InnoDB toextend them when they run low on space. You can configure tablespaces to automaticallygrow using the autoextend option for the innodb_data_file_path variable. For ex‐
460 | Chapter 12: Storage Engine Monitoring

ample, the default configuration of a MySQL installation sets the shared tablespace to10 megabytes and can automatically extend to more files:
--innodb_data_file_path=ibdata1:10M:autoextend
See the “InnoDB Configuration” section in the online MySQL Reference Manual formore details.
You can see the current configuration of your tablespaces using the SHOW ENGINE INNODBSTATUS command, and you can see the details of the tablespaces by turning on theInnoDB tablespace monitor (see the “Using Tablespace Monitors” section in the onlineMySQL Reference Manual for more details).
Using INFORMATION_SCHEMA TablesThe INFORMATION_SCHEMA database includes a number of tables devoted to In‐noDB. These tables are technically views, in the sense that the data they present is notstored on disk; rather, the data is generated when the table is queried. The tables provideanother way to monitor InnoDB and provide performance information to administra‐tors. These tables are present by default in version 5.5 and later.
There are tables for monitoring compression, transactions, locks, and more. Here we’lldescribe some of the available tables briefly:INNODB_CMP
Displays details and statistics for compressed tables.
INNODB_CMP_RESETDisplays the same information as INNODB_CMP, but has the side effect thatquerying the table resets the statistics. This allows you to track statistics periodically(e.g., hourly, daily, etc.).
INNODB_CMPMEMDisplays details and statistics about compression use in the buffer pool.
INNODB_CMPMEM_RESETDisplays the same information as INNODB_CMPMEM, but has the side effect thatquerying the table resets the statistics. This allows you to track statistics periodically(e.g., hourly, daily, etc.).
INNODB_TRXDisplays details and statistics about all transactions, including the state and querycurrently being processed.
INNODB_LOCKSDisplays details and statistics about all locks requested by transactions. It describeseach lock, including the state, mode, type, and more.
InnoDB | 461

INNODB_LOCK_WAITSDisplays details and statistics about all locks requested by transactions that are beingblocked. It describes each lock, including the state, mode, type, and the blockingtransaction.
A complete description of each table, including the columns andexamples of how to use each, is presented in the online referencemanual.
You can use the compression tables to monitor the compression of your tables, includingsuch details as the page size, pages used, time spent in compression and decompression,and much more. This can be important information to monitor if you are using com‐pression and want to ensure the overhead is not affecting the performance of yourdatabase server.
You can use the transaction and locking tables to monitor your transactions. This is avery valuable tool in keeping your transactional databases running smoothly. Most im‐portant, you can determine precisely which state each transaction is in, as well as whichtransactions are blocked and which are in a locked state. This information can also becritical in diagnosing complex transaction problems such as deadlock or poor perfor‐mance.
Older versions of InnoDB, specifically during the MySQL version 5.1era, were built as a plug-in storage engine. If you are using the olderInnoDB storage engine plug-in, you also have access to seven spe‐cial tables in the INFORMATION_SCHEMA database. You must install theINFORMATION_SCHEMA tables separately. For more details, see the In‐noDB plug-in documentation.
Using PERFORMANCE_SCHEMA TablesAs of MySQL version 5.5, InnoDB now supports the PERFORMANCE_SCHEMA feature ofthe MySQL server. The PERFORMANCE_SCHEMA feature was introduced in Chapter 11. ForInnoDB, this means you can monitor the internal behavior of the InnoDB subsystems.This enables you to tune InnoDB using a general knowledge of the source code. Whileit is not strictly necessary to read the InnoDB source code to use the PERFORMANCE_SCHEMA tables to tune InnoDB, expert users with this knowledge can obtain more preciseperformance tuning. But that comes at a price. It is possible to over tune such that thesystem performs well for certain complex queries at the expense of other queries thatmay not see the same performance improvements.
462 | Chapter 12: Storage Engine Monitoring

To use PERFORMANCE_SCHEMA with InnoDB, you must have MySQL version 5.5 or later,InnoDB 1.1 or later, and have PERFORMANCE_SCHEMA enabled in the server. All InnoDB-specific instances, objects, consumers, and so on are prefixed with “innodb” in the name.For example, the following shows a list of the active InnoDB threads (you can use thisto help isolate and monitor how InnoDB threads are performing):
mysql> SELECT thread_id, name, type FROM threads WHERE NAME LIKE '%innodb%';+-----------+----------------------------------------+------------+| thread_id | name | type |+-----------+----------------------------------------+------------+| 2 | thread/innodb/io_handler_thread | BACKGROUND || 3 | thread/innodb/io_handler_thread | BACKGROUND || 4 | thread/innodb/io_handler_thread | BACKGROUND || 5 | thread/innodb/io_handler_thread | BACKGROUND || 6 | thread/innodb/io_handler_thread | BACKGROUND || 7 | thread/innodb/io_handler_thread | BACKGROUND || 8 | thread/innodb/io_handler_thread | BACKGROUND || 9 | thread/innodb/io_handler_thread | BACKGROUND || 10 | thread/innodb/io_handler_thread | BACKGROUND || 11 | thread/innodb/io_handler_thread | BACKGROUND || 13 | thread/innodb/srv_lock_timeout_thread | BACKGROUND || 14 | thread/innodb/srv_error_monitor_thread | BACKGROUND || 15 | thread/innodb/srv_monitor_thread | BACKGROUND || 16 | thread/innodb/srv_purge_thread | BACKGROUND || 17 | thread/innodb/srv_master_thread | BACKGROUND || 18 | thread/innodb/page_cleaner_thread | BACKGROUND |+-----------+----------------------------------------+------------+16 rows in set (0.00 sec)
You can find InnoDB-specific items in the rwlock_instances, mutex_instances,file_instances, file_summary_by_event_name, and file_summary_by_instancestables as well.
Other Parameters to ConsiderThere are many things to monitor and tune in the InnoDB storage engine. We havediscussed only a portion of those and focused mainly on monitoring the various sub‐systems and improving performance. However, there are a few other items you maywant to consider.
Thread performance can be improved under certain circumstances by adjusting theinnodb_thread_concurrency option. The default value is zero in MySQL version 5.5and later (8 in prior versions), meaning that there is infinite concurrency or manythreads executing in the storage engine. This is usually sufficient, but if you are runningMySQL on a server with many processors and many independent disks (and heavy useof InnoDB), you may see a performance increase by setting this value equal to thenumber of processors plus independent disks. This ensures InnoDB will use enoughthreads to allow maximum concurrent operations. Setting this value to a value greater
InnoDB | 463

than what your server can support has little or no effect—if there aren’t any availablethreads, the limit will never be reached.
If your MySQL server is part of a system that is shut down frequently or even periodically(e.g., you run MySQL at startup on your Linux laptop), you may notice when usingInnoDB that shutdown can take a long time to complete. Fortunately, InnoDB can beshut down quickly by setting the innodb_fast_shutdown option. This does not affectdata integrity nor will it result in a loss of memory (buffer) management. It simply skipsthe potentially expensive operations of purging the internal caches and merging insertbuffers. It still performs a controlled shutdown, storing the buffer pools on disk.
By setting the innodb_lock_wait_timeout variable, you can control how InnoDB dealswith deadlocks. This variable exists at both the global and session level, and controlshow long InnoDB will allow a transaction to wait for a row lock before aborting. Thedefault value is 50 seconds. If you are seeing a lot of lock-wait timeouts, you can decreasethe value to decrease the amount of time your locks wait. This may help diagnose someof your concurrency problems or at least allow your queries to time out sooner.
If you are importing lots of data, you can improve load time by making sure your in‐coming datafiles are sorted in primary key order. In addition, you can turn off theautomatic commit by setting AUTOCOMMIT to 0. This ensures the entire load is committedonly once. You can also improve bulk load by turning off foreign key and uniqueconstraints.
Remember, you should approach tuning InnoDB with great care.With so many things to tweak and adjust, it can be very easy forthings to go wrong quickly. Be sure to follow the practice of chang‐ing one variable at a time (and only with a purpose) and measure,measure, measure.
Troubleshooting Tips for InnoDBThe best tools to use are those listed earlier, including the InnoDB monitors, the SHOWENGINE INNODB STATUS command (another way to display the data from the InnoDBmonitors), and the PERFORMANCE_SCHEMA features. However, there are additional strate‐gies that you may find helpful in dealing with errors using InnoDB. This section providessome general best practices for troubleshooting InnoDB problems. Use these practiceswhen faced with trying to solve errors, warnings, and data corruption issues.
Errors
When encountering errors related to InnoDB, find the error information in the errorlog. To turn on the error log, use the --log-error startup option.
464 | Chapter 12: Storage Engine Monitoring

Deadlocks
If you encounter multiple deadlock failures, you can use the option--innodb_print_all_deadlocks (available in version 5.5 and later) to write all dead‐lock messages to the error log. This allows you to see more than the last deadlock asshown in the SHOW ENGINE INNODB STATUS and may be informative if your applicationdoes not have its own error handlers to deal with deadlocks.
Data dictionary problems
Table definitions are stored in the .frm files having the same name as the table and storedunder folders by database name. Definitions are also stored in the InnoDB data dictio‐nary. If there is a storage corruption or file broken, you can encounter errors related toa mismatched data dictionary. Here are some of the more common symptoms andsolutions:Orphaned temporary table
If an ALTER TABLE operation fails, the server may not clean up correctly, leaving atemporary table in the InnoDB tablespace. When this occurs, you can use the tablemonitor to identify the table name (temporary tables are named starting with#sql). You can then issue a DROP TABLE to drop this table to eliminate the orphanedtable.
Cannot open a tableIf you see an error like Can't open file: 'somename.innodb' along with an errormessage in the error log like Cannot find table somedb/somename..., it meansthere is an orphaned file named somename.frm inside the database folder. In thiscase, deleting the orphaned .frm file will correct the problem.
Tablespace does not existIf you are using the --innodb_file_per_table option and encounter an errorsimilar to InnoDB data dictionary has tablespace id N, but tablespacewith the id or name does not exist..., you must drop the table and recreateit. However, it is not that simple. You must first recreate the table in another data‐base, locate the .frm there and copy it to the original database, then drop the table.This may generate a warning about a missing .ibd file but it will correct the datadictionary. From there, you can recreate the table and restore the data from backup.
Cannot create a tableIf you encounter an error in the error log that tells you the table already exists inthe data dictionary, you may have a case where there is no corresponding .frm filefor the table in question. When this occurs, follow the directions in the error log.
InnoDB | 465

Observe console messages
Some errors and warnings are only printed to the console (e.g., stdout, stderr). Whentroubleshooting errors or warnings, it is sometimes best to launch MySQL via the com‐mand line instead of using the mysqld_safe script. On Windows, you can use the--console option to prevent suppression of console messages.
I/O problems
I/O problems are generally encountered on startup or when new objects are created ordropped. These types of errors are associated with the InnoDB files and vary in severity.Unfortunately, these problems are normally very specific to the platform or OS andtherefore may require specific steps to correct. As a general strategy, always check yourerror log or console for errors, checking particularly for OS-specific errors because thesecan indicate why I/O errors are occurring. Also check for missing or corrupt folders inthe data directory along with properly named InnoDB files.
You can also experience I/O problems when there are problems with the data disks.These normally appear at startup but can occur anytime there are disk read or writeerrors. Hardware errors can sometimes be mistaken for performance problems. Be sureto check your operating system’s disk diagnosis as part of your troubleshooting routine.
Sometimes the problem is a configuration issue. In this case, you should double-checkyour configuration file to ensure InnoDB is properly configured. For example, check toensure the innodb_data_* options are set correctly.
Corrupted databases
If you encounter severe or critical errors in your databases that cause InnoDB to crashor keep the server from starting, you can launch the server with the innodb_force_recovery recovery option in your configuration file, assigning it an integer value rangingfrom 1 to 6 that causes InnoDB to skip certain operations during startup.
This option is considered a last resort option and should be usedonly in the most extreme cases where all other attempts to start theserver have failed. You should also export the data prior to attempt‐ing the procedure.
Here’s a brief description of each option (more information can be found in the onlinereference manual):
1. Skip corrupt pages when select statements are issued. Allows partial data recovery.2. Do not start the master or purge thread.3. Do not execute rollbacks after crash recovery.
466 | Chapter 12: Storage Engine Monitoring

4. Do not execute insert buffer operations. Do not calculate table statistics.5. Ignore undo logs on startup.6. Do not execute the redo log when running recovery.
MyISAMThere are very few things to monitor on the MyISAM storage engine. This is becausethe MyISAM storage engine was built for web applications with a focus on fast queriesand, as such, has only one feature in the server that you can tune—the key cache. Thatdoesn’t mean there is nothing else that you can do to improve performance. On thecontrary, there are many things you can do, including using options like low priorityand concurrent inserts. Most fall into one of three areas: optimizing storage on disk,using memory efficiently by monitoring and tuning the key cache, and tuning yourtables for maximum performance.
Rather than discussing the broader aspects of these areas, we provide a strategy or‐ganized into the following areas of performance improvement:
• Optimizing disk storage• Tuning your tables for performance• Using the MyISAM utilities• Storing a table in index order• Compressing tables• Defragmenting tables• Monitoring the key cache• Preloading key caches• Using multiple key caches• Other parameters to consider
We will discuss each of these briefly in the sections that follow.
Optimizing Disk StorageOptimizing disk space for MyISAM is more of a system configuration option than aMyISAM-specific tuning parameter. MyISAM stores each table as its own .myd (data‐file) and one or more .myi (index) files. They are stored with the .frm file in the folderunder the name of the database in the data directory specified by the --datadir startupoption. Thus, optimizing disk space for MyISAM is the same as optimizing disk spacefor the server (i.e., you can see performance improvements by moving the data directory
MyISAM | 467

to its own disk, and you can further improve performance of the disk with RAID orother high availability storage options).
The latest release of MySQL Utilities includes a new utility namedthe .frm reader (mysqlfrm), which allows you to read .frm files andproduce the CREATE statement for the table. You can use this utilitywhenever you need to diagnose problems with .frm files. See theMySQL Utilities documentation for more information about the .frmreader.
Repairing Your TablesThere are a couple of SQL commands that you can use to keep your tables in optimalcondition. These include the ANALYZE TABLE, OPTIMIZE TABLE, and REPAIR TABLEcommands.
The ANALYZE TABLE command examines and reorganizes the key distribution for a table.The MySQL server uses the key distribution to determine the join order when joiningon a field other than a constant. Key distributions also determine which indexes to usefor a query. We discuss this command in more detail in “Using ANALYZE TABLE” onpage 431.
The REPAIR TABLE command is not really a performance tool—you can use it to fix acorrupted table for the MyISAM, Archive, and CSV storage engines. Use this commandto try to recover tables that have become corrupt or are performing very poorly (whichis usually a sign that a table has degraded and needs reorganizing or repair).
Use the OPTIMIZE TABLE command to recover deleted blocks and reorganize the tablefor better performance. You can use this command for MyISAM and InnoDB tables.
While these commands are useful, there are a number of more advanced tools you canuse to further manage your MyISAM tables.
Using the MyISAM UtilitiesThere are a number of special utilities included in the MySQL distribution that aredesigned for use with the MyISAM storage engine (tables):
• myisam_ftdump allows you to display information about full-text indexes.• myisamchk allows you to perform analysis on a MyISAM table.• myisamlog allows you to view the change logs of a MyISAM table.• myisampack allows you to compress a table to minimize storage.
468 | Chapter 12: Storage Engine Monitoring

myisamchk is the workhorse utility for MyISAM. It can display information about yourMyISAM tables or analyze, repair, and optimize them. You can run the command forone or more tables, but you can only use it when the server is running if you flush thetables and lock them. Alternatively, you can shut down the server.
Be sure to make a backup of your tables before running this utilityin case the repair or optimization steps fail. In rare cases, this hasbeen known to leave tables corrupted and irreparable.
The following list describes options related to performance improvement, recovery, andreport status (see the online MySQL Reference Manual for a complete description ofthe available options):analyze
Analyzes the key distribution of indexes to improve query performance.
backup
Makes a copy of the tables (the .myd file) prior to altering them.
check
Checks the table for errors (report only).
extended-check
Does a thorough check of the table for errors, including all indexes (report only).
force
Performs a repair if any errors are found.
information
Shows statistical information about the table. Use this command first to see thecondition of your table before running recover.
medium-check
Performs a more thorough check of the table (repair only). This does less checkingthan extended-check.
recover
Performs a comprehensive repair of the table, repairing the data structures. Repairseverything except duplicate unique keys.
safe-recover
Performs an older form of repair that reads through all rows in order and updatesall of the indexes.
MyISAM | 469

sort index
Sorts the index tree in high-low order. This can reduce seek time to index structuresand make accessing the index faster.
sort records
Sorts the records in the order of a specified index. This can improve performancefor certain index-based queries.
Example 12-6 shows the results of running the myisamchk command to display infor‐mation about a MyISAM table.
Example 12-6. The myisamchk utilityMyISAM file: /usr/local/mysql/data/employees/employeesRecord format: PackedCharacter set: latin1_swedish_ci (8)File-version: 1Creation time: 2012-12-03 08:13:03Status: changedData records: 297024 Deleted blocks: 3000Datafile parts: 300024 Deleted data: 95712Datafile pointer (bytes): 6 Keyfile pointer (bytes): 6Datafile length: 9561268 Keyfile length: 3086336Max datafile length: 281474976710654Max keyfile length: 288230376151710719Recordlength: 44
table description:Key Start Len Index Type Rec/key Root Blocksize1 1 4 unique long 1 2931712 1024
Storing a Table in Index OrderYou can improve the efficiency of large data retrieval for range queries (e.g., WHERE a > 5AND a < 15) by storing table data in the same order as it is stored in the index. Thistype of ordering allows the query to access data in order, without having to search thedisk pages for the data. To sort a table in index order, use the myisamchk utility sort records option (-R) and specify which index you want to use, starting with number 1for the first index. The following command sorts table1 from the test database in theorder of the second index:
myisamchk -R 2 /usr/local/mysql/data/test/table1
You can accomplish the same effect using ALTER TABLE and ORDER BY.
Sorting the table like this does not ensure the order will remain by index when new rowsare added. Deletions do not disturb the order, but as new rows are added the table canbecome less ordered and cause your performance advantages to dwindle. If you use thistechnique for tables that change frequently, you may want to consider running thecommand periodically to ensure optimal ordering.
470 | Chapter 12: Storage Engine Monitoring

Compressing TablesCompressing data saves space. While there are methods to compress data in MySQL,the MyISAM storage engine allows you to compress (pack) read-only tables to savespace. They must be read-only because MyISAM does not have the capability to de‐compress, reorder, or compress additions (or deletions). To compress a table, use themyisampack utility as follows:
myisampack -b /usr/local/mysql/data/test/table1
Always use the backup (-b) option to create a backup of your table prior to compressingit. This will allow you to make the table writable without having to rerun the myisampack command.
There are two reasons for compressing a read-only table. First and foremost, it can savea lot of space for tables that include data that is easy to compress (e.g., text). Second,when a compressed table is read and the query uses the primary key or unique index tofind a row, only the single-row data is decompressed prior to additional comparisons.
There are a great many options to the myisampack command. If you are interested incompressing your read-only tables for space, see the online MySQL Reference Manualfor more details about how to control the compression features.
Defragmenting TablesWhen MyISAM tables have had a lot of changes in the form of deletions and insertions,the physical storage can become fragmented. Often there are small gaps in the physicalstore representing deleted data, or there are records stored out of the original order, orboth. To optimize the table and reorganize it back to the desired order and form, useeither the OPTIMIZE TABLE command or the myisamchk utility.
You should run these commands periodically for tables where you have specified a sortorder to ensure they are stored in the most optimal manner. You should also run oneof these commands when data has undergone many changes over a period of time.
Monitoring the Key CacheThe key cache in MySQL is a very efficient structure designed to store frequently usedindex data. It is used exclusively for MyISAM and stores the keys using a fast lookupmechanism (usually a B-tree). The indexes are stored internally (in memory) as linkedlists and can be searched very quickly. The key cache is created automatically when thefirst MyISAM table is opened for reading. Each time a query is issued for a MyISAMtable, the key cache is examined first. If the index is found there, it performs the indexsearch in memory rather than reading the index from disk first. The key cache is thesecret weapon that makes MyISAM so much faster for rapid queries than some otherstorage engines.
MyISAM | 471

A number of variables control the key cache, and you can monitor each using the SHOWVARIABLES and SHOW STATUS commands. The variables you can monitor with the SHOWcommands are shown in Example 12-7.
Example 12-7. The key cache status and system variablesmysql> SHOW STATUS LIKE 'Key%';+------------------------+-------+| Variable_name | Value |+------------------------+-------+| Key_blocks_not_flushed | 0 || Key_blocks_unused | 6694 || Key_blocks_used | 0 || Key_read_requests | 0 || Key_reads | 0 || Key_write_requests | 0 || Key_writes | 0 |+------------------------+-------+7 rows in set (0.00 sec)
mysql> SHOW VARIABLES LIKE 'key%';+--------------------------+---------+| Variable_name | Value |+--------------------------+---------+| key_buffer_size | 8384512 || key_cache_age_threshold | 300 || key_cache_block_size | 1024 || key_cache_division_limit | 100 |+--------------------------+---------+4 rows in set (0.01 sec)
As you can imagine, the key cache can be a very complicated mechanism. Tuning thekey cache can therefore be a challenge. We recommend monitoring usage and makingchanges to the size of the key cache rather than changing how it performs, as it performsvery well in the default configuration.
If you want to improve cache hit behavior, use one of the two techniques discussed next:preloading the cache and using multiple key caches along with adding more memoryto the default key cache.
Preloading Key CachesYou can preload your indexes into the key cache. This ensures your queries will be faster,because the index is already loaded in the key cache and the index is loaded sequentially(rather than randomly, as would occur when the key cache is loaded under concurrentoperation, for example). However, you must ensure there is enough room in the cacheto hold the index. Preloading can be a very effective way to speed up your queries forcertain applications or modes of use. For example, if you know there will be a lot ofqueries against a particular table during the execution of an application (e.g., a typical
472 | Chapter 12: Storage Engine Monitoring

payroll audit), you can preload the associated table indexes into the key cache, therebyimproving performance during this activity. To preload the key cache for a table, use the LOAD INDEX command as shown in Example 12-8.
Example 12-8. Preloading indexes into the key cachemysql> LOAD INDEX INTO CACHE salaries IGNORE LEAVES;+--------------------+--------------+----------+----------+| Table | Op | Msg_type | Msg_text |+--------------------+--------------+----------+----------+| employees.salaries | preload_keys | status | OK |+--------------------+--------------+----------+----------+1 row in set (1.49 sec)
This example loads the index for the salary table into the key cache. The IGNORELEAVES clause preloads only the blocks for the nonleaf nodes of the index. While thereis no special command to flush the key cache, you can forcibly remove an index fromthe key cache by modifying the table—for example, by reorganizing the index or simplydropping and recreating the index.
Using Multiple Key CachesOne of the little-known advanced features of MySQL is the creation of multiple keycaches or custom key caches to reduce contention for the default key cache. This featureallows you to load the index of one or more tables into a special cache that you configureyourself. As you can imagine, this means allocating memory to the task and as suchrequires careful planning. However, the performance benefits may be substantial if thereare periods in which you are executing many queries against a set of tables where theindexes are frequently referenced.
To create a secondary key cache, first define it with the SET command by allocatingmemory, then issue one or more CACHE INDEX commands to load the indexes for oneor more tables. Unlike the default key cache, you can flush or remove a secondary keycache by setting its size to 0. Example 12-9 shows how to create a secondary key cacheand add the index for a table to the cache.
Example 12-9. Using secondary key cachesmysql> SET GLOBAL emp_cache.key_buffer_size=128*1024;Query OK, 0 rows affected (0.00 sec)
mysql> CACHE INDEX salaries IN emp_cache;+--------------------+--------------------+----------+----------+| Table | Op | Msg_type | Msg_text |+--------------------+--------------------+----------+----------+| employees.salaries | assign_to_keycache | status | OK |+--------------------+--------------------+----------+----------+1 row in set (0.00 sec)
MyISAM | 473

mysql> SET GLOBAL emp_cache.key_buffer_size=0;Query OK, 0 rows affected (0.00 sec)
Notice that the secondary cache involves defining a new variable named emp_cache andsetting its size to 128 KB. This is a special syntax of the SET command and while itappears to create a new system variable, it is actually creating a new global user variable.You can discover the existence or size of a secondary key cache as follows:
mysql> select @@global.emp_cache.key_buffer_size;+------------------------------------+| @@global.emp_cache.key_buffer_size |+------------------------------------+| 131072 |+------------------------------------+1 row in set (0.00 sec)
Secondary key caches are global and thus exist until you flush them by setting their sizeto 0 or when the server is restarted.
You can save the configuration of multiple key caches by storing thestatements in a file and using the init-file=path_to_file com‐mand in the [mysqld] section of the MySQL option file to executethe statements on startup.
Other Parameters to ConsiderThere are a number of other parameters to consider (remember that you should changeonly one thing at a time and only if you have a good reason to do so; you should neverchange the configuration of a complex feature like a storage engine without a goodreason and reasonable expectations for the outcome):myisam_data_pointer_size
The default pointer size in bytes (2–7) used by CREATE TABLE if there is no valuespecified for MAX_ROWS (the maximum number of rows to store in the table). It hasa default value of 6.
myisam_max_sort_file_size
Maximum size of a temporary file used when sorting data. Increasing this valuemay make repairs and reorganization of index operations faster.
myisam_recover_options
The recovery mode for MyISAM. You can use this for OPTIMIZE TABLE as well. Themodes include default, backup, force, and quick, and can take any combination ofthese options. Default means recovery is performed without a backup, force, orquick checking. Backup means a backup will be created before recovery. Forcemeans recovery continues even if data is lost (more than one row). Quick means
474 | Chapter 12: Storage Engine Monitoring

the rows in the table are not checked if there are no blocks marked as deleted.Consider the severity of the recovery when determining which options to use.
myisam_repair_threads
If set to a value greater than 1, repair and sorting operations are done in paralleland can make the operations a bit faster. Otherwise, they are done sequentially.
myisam_sort_buffer_size
The size of the buffer for sorting operations. Increasing this value can help withsorting indexes. However, values greater than 4 GB work only on 64-bit machines.
myisam_stats_method
Controls how the server counts NULL values in index value distribution for statisticaloperations. This can also affect the optimizer, so use with care.
myisam_use_mmap
Turns the memory map option on for reading and writing MyISAM tables. Can behelpful in situations where there are a lot of small writes that contend with readqueries that return large data sets.
We have discussed a number of strategies for monitoring and improving MyISAM per‐formance. While the discussion is brief, it covers the most important aspects of usingMyISAM effectively. For more information about the key cache and the MyISAM stor‐age engine, see the online MySQL Reference Manual.
MySQL, Replication, and High AvailabilityThere is a higher probability of corruption of MyISAM data than InnoDB data and, asa result, MyISAM requires longer recovery times. Also, because MyISAM does not sup‐port transactions, events are executed one at a time, which could lead to partial statementexecution and therefore an incomplete transaction. Add to this the fact that the slaveexecutes as a single thread, which could allow the slave to fall behind when processinglong-running queries. Thus, using MyISAM on a slave in a high-availability solutionwith transactions can be problematic.
ConclusionThis chapter examined how to monitor and improve the performance of storage enginesin the MySQL server. We have discussed the specifics of two of the most popular storageengines, and in the next chapter, we turn our attention to the more advanced topic ofmonitoring and improving the performance of replication.
Conclusion | 475

Joel paused with his mouse over the Send button. He had prepared a report on theInnoDB monitoring data he collected and had written some recommendations in anemail message to his boss. But he wasn’t sure he should send it without being asked.Shrugging, he figured it couldn’t hurt, so he hit Send.
About two minutes later, his email application popped up a box from his system trayproclaiming a new email message. Joel clicked on the message. It was from his boss.
“Joel, nice work on the InnoDB stuff. I want you to call a meeting with the developersand the IT folks. Have a sit-down and get everyone on board with your recommenda‐tions. Make it happen. I’ll be in the office on Monday.”
“OK,” Joel said, as he felt the burden of responsibility slip onto his shoulders. He realizedthis was his first meeting since being hired. He was a little nervous, so he decided to gofor a walk before making an agenda and sending out an email message inviting peopleto attend. “Well, it can’t be any worse than my thesis defense.”
476 | Chapter 12: Storage Engine Monitoring

CHAPTER 13
Replication Monitoring
Joel spent a few moments logging into the Seattle replication slave and determined thatreplication was still running.
A familiar voice spoke from his doorway. “What about that Seattle thing, Joel? Are youon it?”
“I’m still working on that one, sir. I need to figure out the replication configuration andmonitor the problem.” Joel thought to himself, “… and read more about replicationmonitoring.”
“All right, Joel. I’ll let you work. I’ll check on you again after lunch.”
As his boss left, Joel looked at his watch. “OK, so I’ve got about an hour to figure outhow to monitor replication.”
With a deep sigh, Joel once again opened his MySQL book to learn more about moni‐toring MySQL. “I didn’t think replication could lead to so many problems of its own,”he muttered.
Now that you know when your servers are performing well (and when they aren’t), howdo you know how well your replication is performing? Things may be going smoothly,but how do you know that?
In this chapter, we discuss advanced monitoring, focusing on monitoring and improv‐ing replication performance.
Getting StartedThere are two areas that can affect the performance of your replication topology. Youmust ensure both are optimized to avoid affecting replication.
477

First, ensure your network has the bandwidth to handle the replicated data. As we’vediscussed, the master makes a copy of the changes and sends it to the slaves via a networkconnection. If the network connection is slow or is suffering from contention, so toowill your replicated data. We discuss some ways to tune your network and ways you cantune replication to make the best of certain networking environments.
Second, and most important, ensure the databases you are replicating are optimized.This is vital because any inefficiency in the database on the master will be compoundedby the same poor database performance on the slaves. This is especially true concerningindexing and normalization. However, a well-tuned database is only half of the equation.You must also ensure your queries are optimized. For example, a poorly tuned queryrun on the master will run just as poorly on your slaves.
Once you have your network performing well and your databases and queries opti‐mized, you can focus on configuring your servers for optimal performance.
Server SetupAnother very important thing you can do to create the best platform for your replicationtopology is make sure your servers are configured for optimal performance. A poorlyperforming replication topology can often be traced back to poorly performing servers.Ensure your servers are operating with enough memory and that the storage devicesand storage engine choices are optimal for your databases.
Some recommend using lower-performing machines for slaves, noting that the slavedoes not have as much running on it (typically, slaves only process SELECT queries, whilethe master handles updates to data). However, this is incorrect. In a typical single masterand single slave where all databases are being replicated, both machines have about thesame load, but because the slave is executing the events in a single thread versus manythreads on the master, even though the workload is the same, the slave may take moretime to process and execute the events.
Perhaps the best way to view this issue is to consider that one of the best uses of repli‐cation is failover. If your slaves are slower than your master and if you must fail over inthe event that your master suffers a failure, the expectation is that your promoted slaveshould have the same performance as your demoted master.
Inclusive and Exclusive ReplicationYou can configure your replication to replicate all data (the default); log only some dataor exclude certain data on the master, thereby limiting what is written to the binary logand what is replicated; or you can configure your slave to act on only certain data. Usinginclusive or exclusive replication (or both) can help resolve complex load balancing orscale-out issues, making replication more powerful and more flexible. Another name
478 | Chapter 13: Replication Monitoring

for this process is filtering data, where the combination of the inclusive and exclusivelists form the filter criteria.
On the master, use the --binlog-do-db startup option to specify that you want onlyevents for a certain database to be written to the binary log. You can specify one or moreof these options, specifying one database per option, on the command line or in yourconfiguration file.
You can also specify that you want to exclude (ignore) events for a certain database usingthe --binlog-ignore-db startup option. You can specify one or more of these options,specifying one database per option, on the command line or in your configuration file.This option tells the master to not log any events that act on the database(s) listed.
You can use the --binlog-do-db and --binlog-ignore-db optionstogether, provided the databases listed do not overlap. If a databasename appears on both lists, the database in the --binlog-ignore-db list is ignored. Be sure to check the values of these variables whendiagnosing data replication issues (e.g., missing data on the slave).Additionally, when you use the --binlog-do-db or --binlog-ignore-db options, you are filtering what goes into the binary log.This severely limits the use of PITR, because you can only recoverwhat was written to the binary log.
There are several options you can use to control which data is replicated on the slave.There are companion options for the binlog options on the master, options to restrictat the table level, and even a command to do a transformation (rename).
Performing inclusive or exclusive replication on the slave may not improve performanceof replication across the topology. While the slaves may store less data, the same amountof data is transmitted by the master, and the overhead of doing the filter on the slavemay not gain much if the inclusive and exclusive lists are complex. If you are worriedabout transmitting too much data over the network, it is best to perform the filteringon the master.
On the slave, you can specify that you want to include only those events for a certaindatabase to be read and executed from the relay log with the --replicate-do-db start‐up option. You can specify one or more of these options, specifying one database peroption, on the command line or in your configuration file. This option tells the slave toexecute only those events that act on the database(s) listed.
You can also specify that you want to exclude (ignore) events for a certain database usingthe --replicate-ignore-db startup option. You can specify one or more of these op‐tions, specifying one database per option, on the command line or in your configurationfile. This option tells the slave to not execute any events that act on the database(s) listed.
Inclusive and Exclusive Replication | 479

The replicate options on the slave behave differently depending onwhich format you use. This is especially important for statement-based replication and could lead to data loss. For example, if you areusing statement-based replication and you use the --replicate-do-db option, the slave restricts events to only those statements follow‐ing the USE <db> command. If you issue a statement for a differentdatabase without a change of database, the statement is ignored. Seethe online MySQL Reference Manual for additional details aboutthese limitations.
You can perform inclusive and exclusive replication on the slave at the table level. Usethe --replicate-do-table and --replicate-ignore-table options to execute or ig‐nore only those events for a specific table. These commands are very handy if you havea table with sensitive data that isn’t used by your application but is critical to adminis‐tration or other special functions. For example, if you have an application that includespricing information from your vendors (what you pay for something), you may wantto hide that information if you employ or contract out sales services. Rather than build‐ing a special application for your contractors, you can deploy your existing applicationso that it uses a slave that replicates everything, excluding the tables that contain thesensitive information.
There are also forms of the last two options that permit the use of wildcard patterns.These options, replicate-wild-do-table and replicate-wild-ignore-table, per‐form the same functionality as their namesakes, but support the use of wildcards. Forexample, --replicate-wild-do-table=db1.tbl% executes events for any tables thatstart with “tbl” in db1 (e.g., tbl, tbl1, tbl_test). Similarly, you can use --replicate-wild-do-table=db1.% to execute events for any object in the db1 database. These wild‐card versions of the slave-side filtering can be another asset when solving complexreplication scenarios.
There is also a transformation option you can use on the slave to rename or change thename of a database for table operations on the slave. It applies only to tables. You cando this using the --replicate-rewrite-db="<from>-><to>" option (you must use thequotes). This option only changes the name of the database for table events; it does notchange the names for commands like CREATE DATABASE, ALTER DATABASE, and so on.It only affects events for which a database is specified (or to redirect the default databasefor statement-based replication). You can use this option more than once for multipledatabase name transformations.
While not strictly an inclusive or exclusive replication option,--replicate-same-server-id prevents infinite loops in circular rep‐lication. If set to 0, it tells the slave to skip events that have the sameserver_id. If you set it to 1, the slave will process all events.
480 | Chapter 13: Replication Monitoring

Replication ThreadsBefore we explore monitoring of the master and slave, we should reexamine the threadsinvolved in replication. We present these again here from the perspective of monitoringand diagnosing problems.
There are three threads that control replication. Each performs a specific role. On themaster, there is a single thread per connected slave called the Binlog Dump thread. It isresponsible for sending the binlog events to the connected slaves. On the slave, thereare two threads, the Slave IO thread and the Slave SQL thread. The I/O thread isresponsible for reading the incoming binlog events from the master and writing themto the slave’s relay log. The SQL thread is responsible for reading the events in the relaylog and executing them.
You can monitor the current state of the Binlog Dump thread using the SHOW PROCESSLIST command:
mysql> SHOW PROCESSLIST \G*************************** 1. row *************************** Id: 1 User: rpl Host: localhost:54197 db: NULLCommand: Binlog Dump Time: 25 State: Master has sent all binlog to slave; waiting for binlog to be updated Info: NULL
Notice the State column. The data presented here is a description of what the masteris doing with respect to the binary log and the slaves. This example is a typical result fora well-running replication topology. The display shows the following columns:Id
Displays the connection ID.
User
Displays the user who ran the statement.
Host
The host where the statement originated.
db
The default database if specified; otherwise, NULL is displayed, indicating no defaultdatabase was specified.
Command
The type of command the thread is running. See the online MySQL ReferenceManual for more information.
Replication Threads | 481

Time
The time (in seconds) that the thread has been in the reported state.
State
The description of the current action or state (e.g., waiting). This is normally adescriptive text message.
Info
The statement the thread is executing. NULL indicates no statement is in progress.This is the case for the replication threads when they are in waiting states.
You can also see the thread status on the slave. You can monitor the I/O and SQL threadsusing the SHOW PROCESSLIST command:
mysql> SHOW PROCESSLIST \G*************************** 1. row *************************** Id: 2 User: system user Host: db: NULLCommand: Connect Time: 127 State: Waiting for master to send event Info: NULL*************************** 2. row *************************** Id: 3 User: system user Host: db: NULLCommand: Connect Time: 10 State: Slave has read all relay log; waiting for the slave I/O thread to update it Info: NULL
Again, the State column contains the most important information. If you are havingproblems with replication on your slave, be sure to issue the SHOW PROCESSLIST com‐mand on the slave and take note of the I/O and SQL thread states. In this example, wesee the normal states of a slave waiting for information from the master (I/O thread)and having executed all events in the relay log (SQL thread).
It is always a good idea to use the SHOW PROCESSLIST command tocheck the status of the replication when troubleshooting.
482 | Chapter 13: Replication Monitoring

Monitoring the MasterThere are several ways to monitor your master. You can issue SHOW commands to seestatus information and status variables or use MySQL Workbench. The primary SQLcommands include SHOW MASTER STATUS, SHOW BINARY LOGS, and SHOW BINLOGEVENTS.
In this section, we will examine the SQL commands available for monitoring the masterand provide a brief summary of the available status variables you can monitor either byusing the SHOW STATUS command or by creating custom graphs.
Monitoring Commands for the MasterThe SHOW MASTER STATUS command displays information about the master’s binarylog, including the name and offset position of the current binlog file. This informationis vital in connecting slaves, as we have discussed in previous chapters. It also providesinformation about logging constraints. Example 13-1 shows the result of a typical SHOWMASTER STATUS command.
Example 13-1. The SHOW MASTER STATUS commandmysql> SHOW MASTER STATUS \G*************************** 1. row *************************** File: mysql-bin.000002 Position: 156058362 Binlog_Do_DB: Inventory Binlog_Ignore_DB: Vendor_salesExecuted_Gtid_Set: 87e02a46-5363-11e2-9d4a-ed25ee3d65421 row in set (0.00 sec)
The data is displayed in the following columns:File
This column lists the name of the current binlog file.
Position
This column lists the current position (next write) in the binary log.
Binlog_Do_DB
This column lists any databases specified by the --binlog-do-db startup optiondiscussed earlier.
Binlog_Ignore_DB
This column lists any databases specified by the --binlog-ignore-db startup op‐tion discussed earlier.
Monitoring the Master | 483

Executed_Gtid_Set
This column lists the GTIDs that have been executed on the master. This columnis valid on servers that have GTIDs enabled. It displays the same values as thegtid_executed server variable.
The SHOW BINARY LOGS command (also known by its alias, SHOW MASTER LOGS) dis‐plays the list of binlog files available on the master and their sizes in bytes. This commandis useful for comparing the information on the slave concerning where the slave is withrespect to the master (i.e., which binary log the slave is currently reading from on themaster). Example 13-2 shows the results of a typical SHOW MASTER LOGS command.
You can rotate the binary log on the master with the FLUSH LOGScommand. This command closes and reopens all logs and opens anew log with an incremented file extension. You should periodicallyflush the log to help manage the growth of logs over time. It also helpswith diagnosing replication problems.
Example 13-2. The SHOW MASTER LOGS command on the mastermysql> SHOW MASTER LOGS;+-------------------+-----------+| Log_name | File_size |+-------------------+-----------+| master-bin.000001 | 103648205 || master-bin.000002 | 2045693 || master-bin.000003 | 1022910 || master-bin.000004 | 3068436 |+-------------------+-----------+4 rows in set (0.00 sec)
You can also use the SHOW BINLOG EVENTS command to show events in the binary log.The syntax of the command is as follows:
SHOW BINLOG EVENTS [IN <log>] [FROM <pos>] [LIMIT [<offset>,] <rows>]
Take care when using this command, as it can produce a lot of data. It is best used tocompare events on the master with events on the slave read from its relay log.Example 13-3 shows the binlog events from a typical replication configuration.
Example 13-3. The SHOW BINLOG EVENTS command (statement-based)mysql> SHOW BINLOG EVENTS IN 'master-bin.000001' FROM 2571 LIMIT 4 \G*************************** 1. row *************************** Log_name: master-bin.000001 Pos: 2571 Event_type: Query Server_id: 1End_log_pos: 2968 Info: use `employees`; CREATE TABLE salaries (
484 | Chapter 13: Replication Monitoring

emp_no INT NOT NULL, salary INT NOT NULL, from_date DATE NOT NULL, to_date DATE NOT NULL, KEY (emp_no), FOREIGN KEY (emp_no) REFERENCES employees (emp_no) ON DELETE CASCADE, PRIMARY KEY (emp_no, from_date))*************************** 2. row *************************** Log_name: master-bin.000001 Pos: 2968 Event_type: Query Server_id: 1End_log_pos: 3041 Info: BEGIN*************************** 3. row *************************** Log_name: master-bin.000001 Pos: 3041 Event_type: Query Server_id: 1End_log_pos: 3348 Info: use `employees`; INSERT INTO `departments` VALUES ('d001','Marketing'),('d002','Finance'),('d003','Human Resources'), ('d004','Production'),('d005','Development'),('d006','Quality Management'),('d007','Sales'),('d008','Research'),('d009', 'Customer Service')*************************** 4. row *************************** Log_name: master-bin.000001 Pos: 3348 Event_type: Xid Server_id: 1End_log_pos: 3375 Info: COMMIT /* xid=17 */4 rows in set (0.01 sec)
In this example, we are using statement-based replication. Had we used row-based rep‐lication, the binlog events would have looked very different. You can see the differencein Example 13-4.
Example 13-4. The SHOW BINLOG EVENTS command (row-based)mysql> SHOW BINLOG EVENTS IN 'master-bin.000001' FROM 2571 LIMIT 4 \G*************************** 1. row *************************** Log_name: master-bin.000001 Pos: 2571 Event_type: Query Server_id: 1End_log_pos: 2968 Info: use `employees`; CREATE TABLE salaries ( emp_no INT NOT NULL, salary INT NOT NULL,
Monitoring the Master | 485

from_date DATE NOT NULL, to_date DATE NOT NULL, KEY (emp_no), FOREIGN KEY (emp_no) REFERENCES employees (emp_no) ON DELETE CASCADE, PRIMARY KEY (emp_no, from_date))*************************** 2. row *************************** Log_name: master-bin.000001 Pos: 2968 Event_type: Query Server_id: 1End_log_pos: 3041 Info: BEGIN*************************** 3. row *************************** Log_name: master-bin.000001 Pos: 3041 Event_type: Table_map Server_id: 1End_log_pos: 3101 Info: table_id: 15 (employees.departments)*************************** 4. row *************************** Log_name: master-bin.000001 Pos: 3101 Event_type: Write_rows Server_id: 1End_log_pos: 3292 Info: table_id: 15 flags: STMT_END_F4 rows in set (0.01 sec)
Notice there is far less information to see in the binary log of a row-based format. It cansometimes be beneficial to switch to a statement-based row format when diagnosingcomplex problems with data corruption or intermittent failures. For example, it may behelpful to see exactly what is written to the binary log on the master and compare thatto what is read from the relay log on the slave. If there are differences, they could beeasier to find in a statement-based format than in a row-based format where the data isin a machine-readable format. See Chapter 3 for more details about the formats of thebinary log and the advantages and trade-offs of using one versus the other.
The mysqlbinlog tool includes the --verbose option, which con‐structs SQL commands from row events. Use this option when ex‐ploring row-based log events to discover more information abouteach event. Note that the reconstructed SQL statements are not com‐plete in the sense that they are identical to the original query. Thus,the use of this option is not a complete reconstruction of the eventsfrom row format to SQL.
486 | Chapter 13: Replication Monitoring

Master Status VariablesThere are only a couple status variables for monitoring the master (these are limited tocounters that indicate how many times a master-related command has been issued onthe master):Com_change_master
Shows the number of times the CHANGE MASTER command was issued. If this valuechanges frequently or is significantly higher than the number of your servers timesthe number of scheduled restarts on your slaves, you may have a situation whereadditional slaves are being restarted too frequently; this can be an indication ofunstable connectivity.
Com_show_master_status
Shows the number of times the SHOW MASTER STATUS command was issued. As withCom_change_master, high values of this counter can indicate an unusual numberof inquiries for reconnecting slaves.
Monitoring SlavesThere are several ways to monitor your slaves. You can issue SHOW commands to seestatus information and status variables or use MySQL Workbench. The primary SQLcommands include SHOW SLAVE STATUS, SHOW BINARY LOGS, and SHOW BINLOG EVENTS.
In this section, we will examine the SQL commands available for monitoring a slaveand give a brief summary of the available status variables that you can monitor witheither the SHOW STATUS command or by creating custom graphs with the MySQL Work‐bench. We will look at the MySQL Workbench in “Replication Monitoring with MySQLWorkbench” on page 493.
Monitoring Commands for the SlaveThe SHOW SLAVE STATUS command displays information about the slave’s binary log,its connection to the server, and replication activity, including the name and offsetposition of the current binlog file. This information is vital in diagnosing slave perfor‐mance, as we have seen in previous chapters. Example 13-5 shows the result of a typicalSHOW SLAVE STATUS command executed on a server running MySQL version 5.6.
Example 13-5. The SHOW SLAVE STATUS commandmysql> SHOW SLAVE STATUS \G*************************** 1. row *************************** Slave_IO_State: Waiting for master to send event Master_Host: localhost Master_User: rpl Master_Port: 3306 Connect_Retry: 60
Monitoring Slaves | 487

Master_Log_File: mysql-bin.000002 Read_Master_Log_Pos: 39016226 Relay_Log_File: relay-bin.000004 Relay_Log_Pos: 9353715 Relay_Master_Log_File: mysql-bin.000002 Slave_IO_Running: Yes Slave_SQL_Running: Yes Replicate_Do_DB: Replicate_Ignore_DB: Replicate_Do_Table: Replicate_Ignore_Table: Replicate_Wild_Do_Table: Replicate_Wild_Ignore_Table: Last_Errno: 0 Last_Error: Skip_Counter: 0 Exec_Master_Log_Pos: 594 Relay_Log_Space: 1008 Until_Condition: None Until_Log_File: Until_Log_Pos: 0 Master_SSL_Allowed: No Master_SSL_CA_File: Master_SSL_CA_Path: Master_SSL_Cert: Master_SSL_Cipher: Master_SSL_Key: Seconds_Behind_Master: 0Master_SSL_Verify_Server_Cert: No Last_IO_Errno: 0 Last_IO_Error: Last_SQL_Errno: 0 Last_SQL_Error: Replicate_Ignore_Server_Ids: Master_Server_Id: 2 Master_UUID: 87e02a46-5363-11e2-9d4a-ed25ee3d6542 Master_Info_File: /Users/cbell/source/temp_13002/master.info SQL_Delay: 0 SQL_Remaining_Delay: NULL Slave_SQL_Running_State: Slave has read all relay log; waiting for the slave I/O thread to update it Master_Retry_Count: 86400 Master_Bind: Last_IO_Error_Timestamp: Last_SQL_Error_Timestamp: Master_SSL_Crl: Master_SSL_Crlpath: Retrieved_Gtid_Set: 87e02a46-5363-11e2-9d4a-ed25ee3d6542:1-2 Executed_Gtid_Set: 87e02a46-5363-11e2-9d4a-ed25ee3d6542:1-2, d28c2ea6-5362-11e2-9d45-c78c6761ae47:1 Auto_Position: 11 row in set (0.00 sec)
488 | Chapter 13: Replication Monitoring

There is a lot of information here. This is the most important command for replication.It is a good idea to study the details of each item presented. Rather than listing theinformation item by item, we present the information from the perspective of an ad‐ministrator (i.e., the information is normally inspected with a specific goal in mind).Thus, we group the information into categories for easier reference. These categoriesinclude master connection information, slave performance, log information, filtering,log performance, and error conditions.
The first row contains the most important information: the current status of the I/Othread. The status can be connecting to the master, waiting for events from the master,reconnecting to the master, and so on.
The information displayed about the master connection includes the current hostnameof the master, the user account used to connect, and the port the slave is connected toon the master. Toward the bottom of the listing is the SSL connection information (ifyou are using an SSL connection).
The next category includes information about the binary log on the master and the relaylog on the slave. The filename and position of each are displayed. It is important to notethese values whenever you diagnose replication problems. Of particular note is Relay_Master_Log_File, which shows the filename of the master binary log where themost recent event from the relay log has been executed.
Replication filtering configuration lists all of the slave-side replication filters. Checkhere if you are uncertain how your filters are set up.
Also included is the last error number and text for the slave and the I/O and SQL threads.Beyond the state values for the slave threads, this information is most often examinedwhen there is an error. It can be helpful to check this information first when encoun‐tering errors on the slave, before examining the error log, as this information is the mostcurrent and normally gives you the reason for the failure.
There is also information about the configuration of the slave, including the settings forthe skip counter and the until conditions. See the MySQL Reference Manual for moreinformation about these fields.
Near the bottom of the list is the current error information. This includes errors for theslave’s I/O and SQL threads. These values should always be 0 for a properly functioningslave.
Some of the more important performance columns are discussed in more detail here:Connect_Retry
The number of seconds that expire between retry connect attempts. This valueshould always be low, but you may want to set it higher if you have a case where theslave is having issues connecting to the master.
Monitoring Slaves | 489

Exec_Master_Log_Pos
This shows the position of the last event executed from the master’s binary log.
Relay_Log_Space
The total size of all of the relay logfiles. You can use this to determine if you needto purge the relay logs in the event you are running low on disk space.
Seconds_Behind_Master
The number of seconds between the time an event was executed and the time theevent was written in the master’s binary log. A high value here can indicate signif‐icant replication lag. We discuss replication lag in an upcoming section.
The value for Seconds_Behind_Master could become stale whenreplication stops due to network failures, loss of heartbeat fromthe master, and so on. It is most meaningful when replication isrunning.
Retrieved_Gtid_Set
The list of GTIDs (transactions) received by this slave. If the list of GTIDs receiveddoes not match the executed GTIDs on the master, the slave may be lagging behindreading events from the master. This value is empty when GTIDs are turned off.
Executed_Gtid_Set
The list of GTIDs (transactions) executed on the slave. If the list does not matchRetrieved_Gtid_Set, it may indicate that the slave has not executed all of thetransactions or there are transactions that originated on the slave. This value isempty when GTIDs are turned off.
If your replication topology is using GTIDs, Retrieved_Gtid and Execut
ed_Gtid_Set can be very important when determining missing transactions or signif‐icant slave lag. See the online MySQL Reference Manual section titled “Replication withGlobal Transaction Identifiers” for more information about GTIDs and how to managetransactions among servers in the topology.
If your slave has binary logging enabled, the SHOW BINARY LOGS command displays thelist of binlog files available on the slave and their sizes in bytes. Example 13-6 shows theresults of a typical SHOW BINARY LOGS command.
You can rotate the relay log on the slave by using the FLUSH LOGScommand.
490 | Chapter 13: Replication Monitoring

Example 13-6. The SHOW BINARY LOGS command on the slavemysql> SHOW BINARY LOGS;+------------------+-----------+| Log_name | File_size |+------------------+-----------+| slave-bin.000001 | 5151604 || slave-bin.000002 | 1030108 || slave-bin.000003 | 1030044 |+------------------+-----------+3 rows in set (0.00 sec)
You can also use the SHOW BINLOG EVENTS command to show events in the binary logon the slave, if the slave has binary logging enabled and the log_slave_updates optionis specified. Example 13-7 shows the binlog events from a typical replication configu‐ration.
In MySQL versions 5.5 and later, you can also inspect the slave’s relay log with SHOWRELAYLOG EVENTS.
Example 13-7. The SHOW BINLOG EVENTS command (statement-based)mysql> SHOW BINLOG EVENTS IN 'slave-bin.000001' FROM 2701 LIMIT 2 \G*************************** 1. row *************************** Log_name: slave-bin.000001 Pos: 2701 Event_type: Query Server_id: 1End_log_pos: 3098 Info: use `employees`; CREATE TABLE salaries ( emp_no INT NOT NULL, salary INT NOT NULL, from_date DATE NOT NULL, to_date DATE NOT NULL, KEY (emp_no), FOREIGN KEY (emp_no) REFERENCES employees (emp_no) ON DELETE CASCADE, PRIMARY KEY (emp_no, from_date))*************************** 2. row *************************** Log_name: slave-bin.000001 Pos: 3098 Event_type: Query Server_id: 1End_log_pos: 3405 Info: use `employees`; INSERT INTO `departments` VALUES ('d001','Marketing'),('d002','Finance'), ('d003','Human Resources'),('d004','Production'), ('d005','Development'),('d006','Quality Management'), ('d007','Sales'),('d008','Research'), ('d009','Customer Service')2 rows in set (0.01 sec)
Monitoring Slaves | 491

Slave Status VariablesThere are only a few status variables for monitoring the slave. These include countersthat indicate how many times a slave-related command was issued on the master andstatistics for key slave operations. The first four listed here are simply counters of thevarious slave-related commands. The values should correspond with the frequency ofthe maintenance of your slaves. If they do not, you may want to investigate the possibilitythat there are more slaves in your topology than you expected or that a particular slaveis being restarted too frequently. The variables include the following:Com_show_slave_hosts
The number of times the SHOW SLAVE HOSTS command was issued.
Com_show_slave_status
The number of times the SHOW SLAVE STATUS command was issued.
Com_slave_start
The number of times the SLAVE START command was issued.
Com_slave_stop
The number of times the SLAVE STOP command was issued.
Slave_heartbeat_period
The current configuration for the number of seconds that elapse between heartbeatchecks of the master.
Slave_last_heartbeat
The most recent heartbeat event received. It is displayed as a timestamp value. Ifthe current value is less than the current value plus Slave_heartbeat_period, theheartbeat event may be delayed. Significant lag can indicate a possible connectionproblem with the master.
Slave_open_temp_tables
The number of temporary tables the slave’s SQL thread is using. A high value canindicate the slave is overburdened.
Slave_received_heartbeats
The count of heartbeat replies from the master. This value should correspondroughly to the elapsed time since the slave was restarted divided by the heartbeatinterval.
Slave_retried_transactions
The number of times the SQL thread has retried transactions since the slave wasstarted.
Slave_running
Simply displays ON if the slave is connected to the master and the I/O and SQLthreads are executing without error. Otherwise displays OFF.
492 | Chapter 13: Replication Monitoring

Replication Monitoring with MySQL WorkbenchYou have seen how you can use MySQL Workbench to monitor network traffic andstorage engines. MySQL Workbench can display the status variables and system vari‐ables using an easy to navigate set of lists. Figure 13-1 shows the MySQL Workbenchsystem administration status and system variables page highlighting the replicationstatus variables. You can use this page to quickly see how your replication is reportingstatus.
Figure 13-1. Replication status variables
MySQL Workbench also permits you to see the replication system variables and theirvalues. If you click on the System Variables tab, you will see a long list of categories onthe left. Choosing any of the replication categories will show the associated system vari‐ables. Figure 13-2 shows the replication slave system variables. Notice the [rw] prefixon some of the variables. This indicates the variables are read/write and therefore onesyou can change at runtime.
Replication Monitoring with MySQL Workbench | 493

Figure 13-2. Replication system variables
The system administration feature also allows you to search for status and variables.Currently, MySQL Workbench version 5.2.45 does not group the GTID variables underthe replication categories. But you can search for the GTID variables as shown inFigure 13-3. In this way, regardless of which version of MySQL Workbench you areusing, you can access any status or system variable that may have been added to thesystem or that Workbench does not group as you expect.
Chapter 11 has a brief tutorial on the use of MySQL Workbench. To learn more abouthow to use the system administration features of MySQL Workbench, see the onlinereference manual.
494 | Chapter 13: Replication Monitoring

Figure 13-3. GTID system variables
Other Items to ConsiderThis section discusses some additional considerations for monitoring replication. Itincludes special networking considerations and monitoring lag (delays in replication).
NetworkingIf you have limited networking bandwidth, high contention for the bandwidth, or simplya very slow connection, you can improve replication performance by using compres‐sion. You can configure compression using the slave_compressed_protocol variable.
In cases where network bandwidth is not a problem but you have data that you want toprotect while in transit from the master to the slaves, you can use an SSL connection.You can configure the SSL connection using the CHANGE MASTER command. See thesection titled “Setting Up Replication Using SSL” in the online MySQL Reference Man‐ual for details on using SSL connections in replication.
Another networking configuration you may want to consider is using master heartbeats.You have seen where this information is shown on the SHOW SLAVE STATUS command.A heartbeat is a mechanism to automatically check connection status between a masterand a slave. It can detect levels of connectivity in milliseconds. Master heartbeat is used
Other Items to Consider | 495

in replication scenarios where the slave must be kept in sync with the master with littleor no delay. Having the capability to detect when a threshold expires ensures the delayis identified before replication is halted on the slave.
You can configure master heartbeat using a parameter in the CHANGE MASTER commandwith the master_heartbeat_period=<value> setting, where the value is the number ofseconds at which you want the heartbeat to occur. You can monitor the status of theheartbeat with the following commands:
SHOW STATUS like 'slave_heartbeat period'SHOW STATUS like 'slave_received_heartbeats'
Monitor and Manage Slave LagPeriods of massive updates, overburdened slaves, or other significant network perfor‐mance events can cause your slaves to lag behind the master. When this happens, theslaves are not processing the events in their relay logs fast enough to keep up with thechanges sent from the master.
As you saw with the SHOW SLAVE STATUS command, Seconds_Behind_Master can showindications that the slave is running behind the master. This field tells you by how manyseconds the slave’s SQL thread is behind the slave’s I/O thread (i.e., how far behind theslave is in processing the incoming events from the master). The slave uses the time‐stamps of the events to calculate this value. When the SQL thread on the slave reads anevent from the master, it calculates the difference in the timestamp. The following ex‐cerpt shows a condition in which the slave is 146 seconds behind the master (in thiscase, the slave is more than two minutes behind, which can be a problem if your appli‐cation is relying on the slaves to provide timely information):
mysql> SHOW SLAVE STATUS \G... Seconds_Behind_Master: 146...
The SHOW PROCESSLIST command (run on the slave) can also provide an indication ofhow far behind the slave is. Here, we see the number of seconds that the SQL thread isbehind, measured using the difference between the timestamp of the last replicatedevent and the real time of the slave. For example, if your slaves have been offline for 30minutes and have reconnected to the master, you would expect to see a value of ap‐proximately 1,800 seconds in the Time field of the SHOW PROCESSLIST results. The fol‐lowing excerpt shows this condition (large values in this field are indicative of significantdelays that can result in stale data on the slaves):
mysql> SHOW PROCESSLIST \G... Time: 1814...
496 | Chapter 13: Replication Monitoring

Depending on how your replication topology is designed, you may be replicating datafor load balancing. In this case, you typically use multiple slaves, directing a portion ofthe application or users to the slaves for SELECT queries, thereby reducing the burdenon the master.
Causes and Cures for Slave LagSlave lag can be a nuisance for some replication users. The main reason for lag is thesingle-threaded nature of the slave (actually, there are two threads, but only one executesevents and this is the main culprit in slave lag). For example, a master with a multiple-core CPU can run multiple transactions in parallel and will be faster than a slave that isexecuting transactions (events from the binary log) in a single thread. We have alreadydiscussed some ways to detect slave lag. In this section, we discuss some common causesand solutions for reducing slave lag.
These issues can be mitigated by using the multithreaded slavefeature.
There are several causes for slave lag (e.g., network latency). It is possible the slave I/Othread is delayed in reading events from the logs. The most common reason for slavelag is simply that the slave has a single thread to execute all events, whereas the masterhas potentially many threads executing in parallel. Some other causes include long-running queries with inefficient joins, I/O-bound reads from disk, lock contention, andInnoDB thread concurrency issues.
Now that you know more about what causes slave lag, let us examine some things youcan do to minimize it:Organize your data
You can see performance improvements by normalizing your data and by usingsharding to distribute your data. This helps eliminate duplication of data, but asyou saw in Chapter 11, duplication of some data (such as lookup text) can actuallyimprove performance. The idea here is to use just enough normalization andsharding to improve performance without going too far. This is something onlyyou, the owner of the data, can determine either through experience or experi‐mentation.
Divide and conquerWe know that adding more slaves to handle the queries (scale-out) is a good wayto improve performance, but not scaling out enough could still result in slave lagif the slaves are processing a much greater number of queries. In extreme cases, you
Other Items to Consider | 497

can see slave lag on all of the slaves. To combat this, consider segregating your datausing replication filtering to replicate different databases among your slaves. Youcan still use scale-out, but in this case you use an intermediary slave for each groupof databases you filter, then scale from there.
Identify long-running queries and refactor themIf long-running queries are the source of slave lag, consider refactoring the queryor the operation or application to issue shorter queries or more compact transac‐tions. However, if you use this technique combined with replication filtering, youmust use care when issuing transactions that span the replication filter groups. Onceyou divide a long-running query that should be an atomic operation (a transaction)across slaves, you run the risk of causing data integrity problems.
Load balancingYou can also use load balancing to redirect your queries to different slaves. Thismay reduce the amount of time each slave spends on answering queries, therebyleaving more computational time to process replication events.
Ensure you are using the latest hardwareClearly, having the best hardware for the job normally equates to better perfor‐mance. At the very least, you should ensure your slave servers are configured totheir optimal hardware capabilities and are at least as powerful as the master.
Reduce lock contentionTable locks for MyISAM and row-level locks for InnoDB can cause slave lag. If youhave queries that result in a lot of locks on MyISAM or InnoDB tables, considerrefactoring the queries to avoid as many locks as possible.
Working with GTIDsIf you are using GTIDs, you can use the GTID system variables on the master and slaveto verify that transactions have been executed on the master, received by the slave, andexecuted on the slave. Let us review the system variables associated with GTIDs. Thefollowing lists the system variables, their uses, and notes on how to use them in moni‐toring and troubleshooting GTID enabled servers:enforce_gtid_consistency
When enabled, the server prohibits unsafe transactions from executing includingusing the CREATE TABLE ... SELECT statements and CREATE TEMPORARY TABLEinside transactions. This variable is not a dynamic variable. It is disabled by default,read only, and global in scope.
gtid_executed
The variable can be read in either session or global scope. When used in sessionscope, it shows the set of transactions that are written to the cache in the current
498 | Chapter 13: Replication Monitoring

session. When used in global scope, it shows the set of all transactions that arelogged in the binary log.
Issuing a RESET MASTER command clears this variable in theglobal scope. You may need to execute the reset command whencopying or restoring data on a slave from the master.
gtid_mode
Shows whether GTIDs are being used (value = ON). Note that future releases of theserver may have additional values for this variable as new GTID features are in‐troduced.
gtid_next
Determines how GTIDs are created. A value of AUTOMATIC indicates GTIDs arecreated using the standard globally unique mechanism. A value of ANONYMOUSmeans the GTIDs are generated using file and position and therefore are not unique.
gtid_owned
This variable also depends on its scope. When used in session scope, the list holdsall GTIDs that are owned by this server. When used in global scope, it displays alist of all GTIDS along with the owner of each GTID.
gtid_purged
This shows those transactions that have been purged from the binary log. You canuse this variable to keep the slave from executing transactions that were executedon the master. For example, if you were copying or restoring data from the master,you would not want any transactions that have already been applied to the data tobe executed on the slave when the GTIDs are received then executed. Thus, youcan set this variable to include those GTIDs that been applied to the data.
It is not possible to isolate specific GTIDs for specific databases. Thus, when you do abackup on the master for restoring on the slave and you read the GTID set on the master,you will get the entire GTID set. When applied to the slave using this variable, youtherefore tell the slave that all transactions in the GTID list have been executed. Thus,partial restore of data must be executed with care. The best solution is always do a fullbackup on the master and restore it on the slave, after populating gtid_purged with theGTID list from the master.
ConclusionThis chapter concludes our discussion of the many ways you can monitor MySQL, andprovides a foundation for you to implement your own schedules for monitoring virtu‐ally every aspect of the MySQL server.
Conclusion | 499

Now that you know the basics of operating system monitoring, database performance,and MySQL monitoring and benchmarking, you have the tools and knowledge to suc‐cessfully tune your server for optimal performance.
Joel smiled as he compiled his report about the replication issue. He paused and glancedat his doorway. He could almost sense it coming.
“Joel!”
Joel jumped, unable to believe his prediction. “I’ve got the replication problem solved,sir,” he said quickly.
“Great! Send me the details when you get a moment.”
“I also discovered some interesting things about the order processing system.” He no‐ticed Mr. Summerson’s eyebrow raise slightly in anticipation. Joel continued, “It seemswe have sized the buffer pool incorrectly. I think I can make some improvements in thatarea as well.”
Mr. Summerson said, “Monitoring again?”
“Yes, sir. I’ve got some reports on the InnoDB storage engine. I’ll include that in myemail, too.”
“Good work. Good work, indeed.”
Joel knew that look. His boss was thinking again, and that always led to more work. Joelwas surprised when his boss simply walked away slowly. “Well, it seems I finally stumpedhim.”
500 | Chapter 13: Replication Monitoring

CHAPTER 14
Replication Troubleshooting
The message subject was simply “Fix the Seattle server.” Joel knew such cryptic subjectlines came from only one person. A quick scan of the message header confirmed theemail was from Mr. Summerson. Joel opened the message and read the contents.
“The Seattle server is acting up again. I think the replication thingy is hosed. Make thisyour top priority.”
“OK,” Joel muttered to himself. Because the monitoring reports he had produced lastweek showed no anomalies and he was sure the replication setup was correct the lasttime he checked, Joel wasn’t sure how to attack the problem. But he knew where to findthe answers. “It looks like I need to read that replication troubleshooting chapter afterall.”
A familiar head appeared in his doorway. Joel decided to perform a preemptive ma‐neuver by saying, “I’m on it.” This resulted in a nod and a casual salute as his bosscontinued down the hall.
MySQL replication is usually trouble-free and rarely needs tuning or tweaking once thetopology is active and properly configured. However, there are times when things cango wrong. Sometimes an error is manifested, and you have clear evidence with whichto start your investigations. Other times the condition or problem is easily understood,but the causes of the more difficult problems that can arise are not so obvious. Fortu‐nately, you can resolve these problems if you follow some simple guidelines and practicesfor troubleshooting replication.
This chapter presents these ideas by focusing on techniques to resolve replication prob‐lems. We begin with a description of what can go wrong, then we discuss the basic toolsavailable to help troubleshoot problems, and we conclude with some strategies for solv‐ing and preventing replication problems.
501

Troubleshooting replication problems involving the MySQL Clusterfollows the same procedures presented in this chapter. If you arehaving problems with MySQL Cluster, see Chapter 9 for trouble‐shooting cluster failures and startup issues.
Seasoned computer users understand that computing systems are prone to occasionalfailures. Information technology professionals make it part of their creed to preventfailures and ensure reliable access and data to users. However, even properly managedsystems can have issues.
MySQL replication is no exception. In particular, the slave state is not crash-safe. Thismeans that if the MySQL instance on the slave crashes, it is possible the slave will stopin an undefined state. In the worst case, the relay log or the master.info file could becorrupt.
Indeed, the more complex the topology (including load and database complexity) andthe more diverse the roles are among the nodes in the topology, the more likely some‐thing will go wrong. That doesn’t mean replication cannot scale—on the contrary, youhave seen how replication can easily scale to massive replication topologies. What weare saying is that when replication problems occur, they are usually the result of anunexpected action or configuration change.
What Can Go WrongThere are many things that can go wrong to disrupt replication. MySQL replication ismost susceptible to problems with data, be it data corruption or unintended interrup‐tions in the replication stream. System crashes that result in an unsafe and uncontrolledtermination of MySQL can also cause replication restarting issues.
You should always prepare a backup of your data before changing anything to fix theproblem. In some cases, the backup will contain data that is corrupt or missing, but thebenefits are still valid—specifically, that no matter what you do, you can at least returnthe data to the state at the time of the error. You’d be surprised how easy it is to make abad situation worse.
In the following sections, we begin exploring replication troubleshooting by describingthe most common failures in MySQL replication. These are some of the more frequentlyencountered replication problems. While the list can’t include all possible replicationproblems, it does give you an idea of the types of things that can go wrong. We includea brief statement of some likely causes for each.
502 | Chapter 14: Replication Troubleshooting

Problems on the MasterWhile most errors will manifest on the slave, look to this section for potential solutionsfor problems originating on the master. Administrators sometimes automaticallysuspect the slave. You should take a look at both the master and the slave when diag‐nosing replication problems.
Master Crashed and Memory Tables Are in UseWhen the master is restarted, any data for memory tables is purged, as is normal forthe memory storage engine. However, if a table that uses the memory storage engine isbeing replicated and the slave was not restarted, the slave may have outdated data.
Fortunately, when the first access to the memory table occurs after a restart, a specialdelete event is sent to the slaves to signal the slaves to purge the data, thereby synchro‐nizing the data. However, the interval between when the table is referenced and whenthe replication event is transmitted can result in the slave having outdated data. To avoidthis problem, use a script to first purge the data, then repopulate it on the master atstartup using the init_file option.
For example, if you have a memory table that stores frequently used data, create a filelike the following and reference it with the init_file option:
# Force slaves to purge dataDELETE FROM db1.mem_zip;# Repopulate the dataINSERT INTO ...
The first command is a delete query, which will be replicated to the slaves when repli‐cation is restarted. Following that are statements to repopulate the data. In this way, youcan ensure there is no gap where the slave could have out-of-date information in amemory table.
Master Crashed and Binary Log Events Are MissingIt is possible for the master to fail and not write recent events to the binary log on disk.In other words, if the server crashes before MySQL flushes its binary events cache todisk (in the binary log), those cached events can be lost.
This is usually indicated by an error on the slave stating that the binary log offset eventis missing or does not exist. In this case, the slave is attempting to reconnect on restartusing the last known binlog file and position of the master, and while the binlog file mayexist, the offset does not, because the events that incremented the offset were not writtento disk.
Unfortunately, there is no way to retrieve the lost binlog events. To solve this problem,you must check the current binlog position on the master and use this information to
Problems on the Master | 503

tell the slave to start at the next known event on the master. Be sure to check the dataon both your master and slave once the slave is synchronized. It should be noted thatthe next event may be the first event in the next binary logfile, so be sure to check to seewhether the log spans multiple files.
It is also possible that some of the events that were lost on the master were applied tothe data prior to the crash. You should always compare the tables in question on themaster to determine if there are differences between the master and the slave. Thissituation is rare, but it can cause problems later on if an update for a row is executed onthe master against one of these missing events, which then causes a failure when run onthe slave. In this case, the slave is attempting to run an update on rows that do not exist.
For example, consider a scenario of a fictional, simplified database for an auto dealerwhere information about cars for sale is stored in tables corresponding to new and usedcars. The tables are set up with autoincrement keys.
On the master, the following happens:INSERT INTO auto.used_cars VALUES (2004, 'Porsche', 'Cayman', 23100, 'blue');
A crash occurs after the following statement is executed but before it is written to thebinary log:
UPDATE auto.used_cars SET color = 'white' WHERE id = 17;
In this case, the update query was lost during the crash on the master. When the slaveattempts to restart, an error is generated. You can resolve the problem using the sug‐gestion just shown. A check on the number of rows on the master and slave shows thesame row count. Notice the update that corrected the color of the 2004 Porsche to whiteinstead of blue. Now consider what will happen when a salesperson tries to help a cus‐tomer find the blue Porsche of her dreams by executing this query on the slave:
SELECT * FROM auto.used_carsWHERE make = 'Porsche' AND model = 'Cayman' AND color = 'blue';
Will the salesperson who runs the query discover he has a blue Porsche Cayman forsale? A good auto salesperson always ensures he has the car on the lot by visual inspec‐tion, but for argument’s sake, let us assume he is too busy to do so and tells his customerhe has the car of her dreams. Imagine his embarrassment (and loss of a sale) when hiscustomer arrives to test-drive the car only to discover that it is white.
To prevent loss of data should the master crash, turn on sync_binlog (set to 1) at startup or in your configuration file. This will tell themaster to flush an event to the binary log immediately. While this maycause a noticeable performance drop for InnoDB, the protection af‐forded could be great if you cannot afford to lose any changes to thedata (but you may lose the last event, depending on when the crashoccurred).
504 | Chapter 14: Replication Troubleshooting

While this academic example may not seem too bad, consider the possibilities of amissing update to a medical database or a database that contains scientific data. Clearly,a missing update, even a seemingly simple one, can cause problems for your users.Indeed, this scenario can be considered a form of data corruption. Always check thecontents of your tables when encountering this problem. In this case, crash recoveryensures the binary log and InnoDB are consistent when sync_binlog=1, but it otherwisehas no effect for MyISAM tables.
Query Runs Fine on the Master but Not on the SlaveWhile not strictly a problem on the master, it is sometimes possible that a query (e.g.,an update or insert command) will run properly on the master but not on the slave.There are many causes of this type of error, but most point to a referential integrity issueor a configuration problem on the slave or the database.
The most common cause of this error is updating rows on the master that do not existon the slave. It can also happen when a query refers to a table that does not exist on theslave or that has a different signature (different columns or column types). In this case,you must change the slave to match the server in order to properly execute the query.If you want to use tables that have different signatures, take care in designing the tablesso that data that exists only on the master is not accessed by queries (reads) on the slaves.
In some cases, it is possible the query is referencing a table that is not replicated. Forexample, if you are using any of the replication filtering startup options (a quick checkof the master and slave status will confirm this), it is possible that the database the queryis referencing is not on the slave. In this situation, you must either adjust your filtersaccordingly or manually add the missing tables to the missing database on the slave.
In other cases, the cause of a failed query can be more complex, such as character setissues, corrupt tables, or even corrupt data. If you confirm your slave is configured thesame as your master, you may need to diagnose the query manually. If you cannot correctthe problem on the slave, you may need to perform the update manually and tell theslave to skip the event that contains the failed query.
To skip an event on a slave, use the sql_slave_skip_counter vari‐able and specify the number of events from the master you want toskip. Sometimes this is the fastest way to restart replication.
Table Corruption After a CrashIf your master or slave crashes and, after restarting them both, you find one or moretables are corrupt or find that they are marked as crashed by MyISAM, you will needto fix these problems before restarting replication.
Problems on the Master | 505

You can detect which tables are corrupt by examining the server’s logfiles, looking forerrors like the following:
... [ERROR] /usr/bin/mysqld: Table 'db1.t1' is markedas crashed and should be repaired ...
You can use the following command to perform optimization and repair in one step allof the tables for a given database (in this case, db1):
mysqlcheck -u <user> -p --check --optimize --auto-repair db1
For MyISAM tables, you can use the myisam-recover option to turnon automatic recovery. There are four modes of recovery. See theonline MySQL Reference Manual for more details.
Once you have repaired the affected tables, you must also determine if the tables on theslave have been corrupted. This is necessary if the master and slave share the same datacenter and the failure was environmental (e.g., they were connected to the same powersource).
Always perform a backup on a table before repairing it. In somecases, a repair operation can result in data loss or leave the table inan unknown state.
It is also possible that a repair can leave the master and slave out of sync, especially ifthere is data loss as a result of the repair. You may need to compare the data in theaffected table to ensure the master and slave are synchronized. If they are not, you mayneed to reload the data for the affected table on the slave if the slave is missing data, orcopy data from the slave if the master is missing data.
Binary Log Is Corrupt on the MasterIf a server crash or disk problem results in a corrupt binary log on the master, you cannotrestart replication. There are many causes and types of corruption that can occur in thebinary log, but all result in the inability to execute one or more events on the slave, oftenresulting in errors such as “could not parse relay log event.”
In this case, you must carefully examine the binary log for recoverable events and rotatethe logs on the master with the FLUSH LOGS command. There may be data loss on theslave as a result, and the slave will most definitely fail in this scenario. The best recoverymethod is to resynchronize the slave with the master using a reliable backup and re‐
506 | Chapter 14: Replication Troubleshooting

covery tool. In addition to rotating the logs, you can ensure any data loss is minimizedand get replication restarted without errors.
In some cases, if it is easy to determine how many events were corrupted or missing, itmay be possible to skip the corrupted events by using the sql_slave_skip_counteroption on the slave. You can determine this by comparing the master’s binlog referenceon the slave to the current binlog position on the master and computing the number ofevents to skip. One way to do this is to use the mysqlbinlog tool to read the binary logof the master and count the events.
Killing Long-Running Queries for Nontransactional TablesIf you are forced to terminate a query that is modifying a nontransactional table, it ispossible the query has been replicated to and executed on the slave. When this occurs,it is likely that the changes on the master will be different than on the slave.
For example, if you terminate a query that would have updated 400 out of the 600 rowsin a table, allowing only 200 of the 400 changes to complete on the master, it is possiblethat the slave completed all 400 updates.
Thus, whenever you terminate a query that updates data on the master, you need toconfirm that the change has not executed on the slave. If it has (or even as a precaution),you should resynchronize the data on the slave once you’ve corrected the table on themaster. Usually in this case, you will fix the master and then make a backup of the dataon the master and restore it on the slave.
Unsafe StatementsIf you have databases that use both transactional and nontransactional tables, you maynot encounter any problems so long as changes to the databases or tables do not occurin the same transaction. However, combining transactional and nontransactional tablesis likely to cause problems. This is especially true when using unsafe statements. Al‐though some unsafe statements may execute without errors, it is best to avoid them.
The online reference manual lists a number of unsafe statements. Essentially, these in‐clude any statement or clause that can result in a different result on the master and slave.Unsafe statements and functions include UUID(), FOUND_ROWS(), INSERT DELAYED, andLIMIT. For example, using LIMIT without an ORDER BY clause can result in differentresults. If you use the ORDER BY clause and the tables are the same, the results will bepredictable.
For a complete list of unsafe statements, see the section “Determination of Safe andUnsafe Statements in Binary Logging” in the online reference manual.
Problems on the Master | 507

Although it is possible to detect when these statements are used by monitoring warningsclosely, you could have a situation where you encounter these statements through usernaïveté. For example, consider the following table:
CREATE TABLE test.t1 (a int, b char(20)) ENGINE=InnoDB;
Now suppose the following updates are occurring on different clients writing to themaster and that statement-based binary logging is enabled. The clients are identified bydifferent mysql prompts. Assume that the order the statements are executed representsthe order in which the statements were executed:
client_1> BEGIN;client_1> INSERT INTO test.t1 VALUES (1, 'client_1'), (2, 'client_1'), (3, 'client_1');client_2> BEGIN;client_2> INSERT INTO test.t1 VALUES (4, 'client_2'), (5, 'client_2'), (6, 'client_2');client_2> COMMIT;client_1> COMMIT;
Notice that although client 1 started its transaction first, client 2 completed (committed)its transaction first. Because InnoDB preserves the order of insert based on when thetransacton started, the resulting table will look like the following (in this case, the rowsare in the order in which they were inserted in the InnoDB caching mechanism; this ishow it would appear in a SELECT without using indexes on the master):
mysql> SELECT * FROM test.t1;+------+----------+| a | b |+------+----------+| 1 | client_1 || 2 | client_1 || 3 | client_1 || 4 | client_2 || 5 | client_2 || 6 | client_2 |+------+----------+6 rows in set (0.00 sec)
However, because the transaction on client 2 actually executed first, that is the orderreflected in the binary log and therefore the order read by a slave. Thus, on a connectedslave, the same table will have a slightly different original, unindexed order (but thesame data):
mysql> SELECT * FROM test.t1;+------+----------+| a | b |+------+----------+| 4 | client_2 || 5 | client_2 || 6 | client_2 |
508 | Chapter 14: Replication Troubleshooting

| 1 | client_1 || 2 | client_1 || 3 | client_1 |+------+----------+6 rows in set (0.00 sec)
Now let’s consider an unsafe statement executed on the master like the following:UPDATE test.t1 SET b='this_client' LIMIT 3;
Here, the intention is to change only the first three rows correcting column b. On themaster, this works as expected:
mysql> SELECT * FROM test.t1;+------+-------------+| a | b |+------+-------------+| 1 | this_client || 2 | this_client || 3 | this_client || 4 | client_2 || 5 | client_2 || 6 | client_2 |+------+-------------+6 rows in set (0.00 sec)
However, on the slave, we get an entirely different result when the statement is replicated.As you can see, this sort of unsafe statement can lead to some really interesting andfrustrating data inconsistencies:
mysql> SELECT * FROM test.t1;+------+-------------+| a | b |+------+-------------+| 4 | this_client || 5 | this_client || 6 | this_client || 1 | client_1 || 2 | client_1 || 3 | client_1 |+------+-------------+6 rows in set (0.00 sec)
Clearly, unsafe statements should be avoided. One of the best ways to do so is to educateusers as to which statements are unsafe, monitor your replication warnings, and con‐sider using all transactional tables and row-based binary logging.
Problems on the SlaveMost problems you will encounter will be the result of some error on the slave. In somesituations, like those described in the previous section, it may be a problem that origi‐
Problems on the Slave | 509

nated on the master, but it almost always will be seen on the slave in one form or another.The following sections list some of the common problems on the slave.
Use Binary Logging on the SlaveOne way to ensure a more robust slave is to turn on binary logging using the log-slave-updates option. This will cause the slave to log the events it executes from its relay log,thereby creating a binary log that you can use to replay events on the slave in the eventthat the relay log (or the data) becomes corrupt.
Slave Server Crashed and Replication Won’t StartWhen a slave server crashes, it is usually easy to reestablish replication with the masteronce you determine the last known good event executed on the slave. You can see thisby examining the SHOW SLAVE STATUS output.
However, when you encounter errors regarding account access, it may become impos‐sible to restart replication. This can be the result of authentication problems, such as ifthe slave had to be rebuilt and the replication account (the account used in the CHANGEMASTER command) was not created or the password is incorrect. Replication may alsonot be able to start due to corrupted tables on the master or slave(s). In these cases, youare likely to see connection errors in the console and logs for the slave MySQL server.
When this occurs, always check the permissions of the replication user on the master.Ensure the proper privileges are granted to the user defined in either your configurationfile or on your CHANGE MASTER command. The privileges should be similar to thefollowing:
GRANT REPLICATION SLAVE ON *.*TO 'rpl_user'@'192.168.1.%' IDENTIFIED BY 'password_here';
You can change this command to suit your needs as a means to solve this problem.
Slave Connection Times Out and Reconnects FrequentlyIf you have multiple slaves in your topology and have either not set the server_id optionor have the same value for server_id for two or more of your slaves, you may haveconflicting server IDs. When this happens, one of the slaves may exhibit frequent time‐outs or drop and reconnect sequences.
This problem is simply due to the nonunique IDs among your slaves. But it can bedifficult to diagnose (or, we should say, it’s easy to misdiagnose as a connection problem).You should always check the error log of the master and slave for error messages. In thiscase, it is likely the error will contain the nature of the timeout.
510 | Chapter 14: Replication Troubleshooting

To prevent this type of problem, always ensure that all of your servers have a server_id option set either in the configuration file or in the startup command line.
Query Results Are Different on the Slave than on the MasterOne of the more difficult problems to detect occurs when the results of a query per‐formed on one or more slaves do not match that of the master. It is possible you maynever notice the problem. The problem could be as simple or innocuous as sort orderissues, or as severe as missing or extra rows in the result set.
The main causes of this type of error are the execution of unsafe statements, writes sentto the slave, mixing transactional and nontransactional storage engines, and differentquery options set on the master and slave (e.g., SQL_MODE).
A less common cause for this problem is differing character sets between the masterand slave. For example, the master can be configured with one character set and collationdefaults, while one or more slaves are configured with another. In most cases, this isfine so long as the character sets are compatible (same number of bytes for characterstorage). However, if your users start complaining of extra or missing rows or differingresult orders, you should check the data carefully for rows that differ between the masterand slaves.
Another possible cause of this problem is using different default storage engines on themaster and slave (e.g., using the MyISAM storage engine on the master and the InnoDBstorage engine on the slave). In this case, it is entirely likely that the query results willbe in different orders if there are no primary key or any indexes to ensure correct order(and no ORDER BY clause).
Perhaps a more subtle cause of this type of problem is differing table definitions on themaster and slave. For example, it is possible to leave some initial columns or endingcolumns missing on the slave. A solution to this problem is to ensure you always includethe columns in each SELECT statement. For example, if the slave has more columns thanthe master, a SELECT * query executed on the slave will result in more data than whatis on the master. This can be complicated if the slave has extra initial columns. In thiscase, the results of a SELECT * query will not align to the same query executed on themaster.
Similar, and perhaps more serious, is the case where you execute an INSERT INTO queryon the master without specifying the columns. Again, if the slave has more initial col‐umns, the data may not align and the query may fail. It is best to write the query asINSERT INTO <table> (a, b, c) …, explicitly listing the columns.
Problems on the Slave | 511

Column order is important. Tables with different structures on themaster and slave must have a common set of columns that appear atthe beginning or end of the table.
There are many potential errors when you use this feature. For example, if the masterhas more columns than the slave, users could expect that the data for all columns isreplicated but only those columns present on the slave are replicated. Sometimes youactually want fewer columns on the slave, and can make it work by careful querying.But a careless user can achieve this accidentally by dropping columns in such a way thatreplication can still proceed. In some cases, the SELECT queries executed on the slavewill fail when referencing the missing columns, thereby giving you a clue to the problem.Other times, you can simply be missing data in your applications.
A common user error, which can result in different results from queries delivered tothe master and to the slave, is making other types of changes to the tables or databasesexecuted on the slave but not executed on the master (i.e., a user performs some non-replicated data manipulation on the slave that changes a table signature but does notexecute the same statement on the master). When this occurs, queries can return wrongresults, wrong columns, wrong order, or extra data, or simply fail due to referencingmissing columns. It is always a good precaution to check the layout of a table involvedin these types of problems to ensure it is the same on the master and slave. If it is not,resynchronize the table and retry the query.
Slave Issues Errors when Attempting to Restart with SSLProblems related to SSL connections are typically the usual permission issues describedpreviously. In this case, the privileges granted must also include the REQUIRE SSL option,as shown here (be sure to check that the replication user exists and has the correctprivileges):
GRANT REPLICATION SLAVE ON *.*TO 'rpl_user'@'%' IDENTIFIED BY 'password_here' REQUIRE SSL;
Other issues related to restarting replication when SSL connections are used are missingcertificate files or incorrect values for the SSL-related options in the configuration file(e.g., ssl-ca, ssl-cert, and ssl-key) or the related options in the CHANGE MASTERcommand (e.g., MASTER_SSL_CA, MASTER_SSL_CAPATH, MASTER_SSL_CERT, and MASTER_SSL_KEY). Be sure to check your settings and paths to ensure nothing has changedsince the last time replication was started.
512 | Chapter 14: Replication Troubleshooting

Memory Table Data Goes MissingIf one or more of your databases uses the memory storage engine, the data containedin these tables will be lost when a slave server is restarted (the server, not the slavethreads). This is expected, as data in memory tables does not survive a restart. The tableconfiguration still exists and the table can be accessed, but the data has been purged.
It is possible that when a slave server is restarted, queries directed to the memory tablefail (e.g., UPDATE) or query results are inaccurate (e.g., SELECT). Thus, the error may notoccur right away and could be as simple as missing rows in a query result.
To avoid this problem, you should carefully consider the use of memory tables in yourdatabases. You should not create memory tables on the master to be updated on theslaves via replication without procedures in place to recover the data for the tables inthe event of a crash or planned restart of the server. For example, you can execute ascript before you start replication that copies the data for the table from the master. Ifthe data is derived, use a script to repopulate the data on the slave.
Other things to consider are filtering out the table during replication or possibly notusing the memory storage engine for any replicated table.
Temporary Tables Are Missing After a Slave CrashIf your replicated databases and queries make use of temporary tables, you should con‐sider some important facts about temporary tables. When a slave is restarted, its tem‐porary tables are lost. If any temporary tables were replicated from the master and youcannot restart the slave from that point, you may have to manually create the tables orskip the queries that reference the temporary tables.
This scenario often results in the case where a query will not execute on one or moreslaves. The resolution to this problem is similar to missing memory tables. Specifically,in order to get the query to execute, you may have to manually recreate the temporarytables or resynchronize the data on the slave with the data on the master and skip thequery when restarting the slave.
Slave Is Slow and Is Not Synced with the MasterIn slave lag, also called excessive lag, the slave cannot process all of the events from themaster fast enough to avoid delays in updates of the data. In the most extreme cases,the updates to the data on the slave become out of date and cause incorrect results. Forexample, if a slave server in a ticketing agency is many minutes behind the master, it ispossible the ticketing agency can sell seats that are no longer available (i.e., they havebeen marked as “sold” on the master but the slave did not get the updates until too late).
We discussed this problem in previous chapters, but a summary of the resolution is stillrelevant here. To detect the problem, monitor the slave’s SHOW SLAVE STATUS output
Problems on the Slave | 513

and examine the Seconds_Behind_Master column to ensure the value is within toler‐ance for your application. To solve the problem, consider moving some of the databasesto other slaves, reducing the number of databases being replicated to the slave, improv‐ing network delays (if any), and making data storage improvements.
For example, you can relieve the slave of processing extraneous events by using anadditional slave for bulk or expensive data updates. You can relieve the replication loadby making updates on a separate slave and applying the changes using a reliable backupand restore method on all of the other machines in the topology.
Data Loss After a Slave CrashIt is possible that a slave server may crash and not record the last known master binlogposition. This information is saved in the relay_log.info file. When this occurs, the slavewill attempt to restart at the wrong (older) position and therefore attempt to executesome queries that may have already been executed. This normally results in query errors;you can handle this by skipping the duplicate events.
However, it is also possible these duplicate events can cause the data to be changed(corrupted) so that the slave is no longer in sync with the master. Unfortunately, thesetypes of problems are not that easy to detect. Careful examination of the logfiles mayreveal that some events have been executed, but you may need to examine the binlogevents and the master’s binary log to determine which ones were duplicated.
There is a set of Python-based tools called MySQL Utilities for work‐ing with MySQL servers. They include a utility that can be used toidentify differences in data and structure. MySQL Utilities are dis‐cussed in more detail in Chapter 17.
Table Corruption After a CrashWhen you restart a master following a crash, you may find one or more tables are corruptor marked as crashed by MyISAM. You need to resolve these issues before restartingreplication. Once you have repaired the affected tables, ensure the tables on the slavehave not suffered any data loss as a result of the repair. It is very unusual for this to occur,but it is something that you should check. When in doubt, always manually resynchron‐ize these tables with the master using a backup and restore or similar procedure beforerestarting replication.
Data loss after a repair operation is a very real possibilityfor MyISAM when a partial page write occurs during a hardware orserver crash. Unfortunately, it is not always easy to determine if thedata has been lost.
514 | Chapter 14: Replication Troubleshooting

Relay Log Is Corrupt on the SlaveIf a server crash or disk problem results in a corrupt relay log on the slave, replicationwill stop with one of several errors related to the relay log. There are many causes andtypes of corruption that can occur in the relay log, but all result in the inability to executeone or more events on the slave.
When this occurs, your best choice for recovery is identifying where the last knowngood event was executed from the master’s binary log and restarting replication usingthe CHANGE MASTER command, providing the master’s binlog information. This willforce the slave to recreate a new relay log. Unfortunately, this means any recovery fromthe old relay log can be compromised.
Multiple Errors During Slave RestartOne of the more difficult problems to detect and fix is multiple errors on the slave duringinitial start or a later restart. There are a variety of errors that occur and sometimes theyoccur at random or without a clearly identifiable cause.
When this occurs, check the error log and the output of SHOW SLAVE STATUS, lookingfor messages concerning errors reported during slave connection and replication start‐up. You can also check the size of the max_allowed_packet on both the master and theslave. If the size is larger on the master than on the slave, it is possible the master haslogged an event that exceeds the slave’s size. This can cause random and seeminglyillogical errors.
Consequences of a Failed Transaction on the SlaveNormally when there is a failed transaction, the changes are rolled back to avoid prob‐lems associated with partial updates. However, this is complicated when you mix trans‐actional and nontransactional tables—the transactional changes are rolled back, but thenontransactional changes are not. This can lead to problems such as data loss or du‐plicated, redundant, or unwanted changes to the nontransactional tables.
The best way to avoid this problem is to avoid mixing transactional andnontransactional table relationships in your database and to always use transactionalstorage engines.
I/O Thread ProblemsThere are three common issues related to the I/O thread:
• Dropped connection to the master• Intermittent connection to the master
Problems on the Slave | 515

• Slave lagging severely behind the master
You will find master connection errors in the slave status output in the Last_IO_Errno and Last_IO_Error fields. It is also likely that the state of the Slave_IO_Running willbe No. The causes for these errors should be apparent in the error description. If theerror is not easily understood, you should follow these steps to isolate the problem:
• Check the CHANGE MASTER command to ensure the correct user credentials are used.• Check the replication user’s credentials on the master.• Check the network to ensure the master is reachable by using ping hostname on a
client, where hostname is the hostname of the master.• Check that the port used on the server is reachable using telnet hostname n, wheren is the master’s port.
If the connection to the master drops but the slave is able to reestablish the connection,you most likely are encountering problems with network bandwidth. In this case, useyour network testing tools to ensure there is sufficient bandwidth and take appropriatesteps to reduce excessive bandwidth use.
If the slave is very far behind the master, you should ensure there is no corruption inthe relay log, there are no errors or warnings on the slave, and the slave is performingcorrectly (a common problem is that the system is burdened with another process). Ifall of these check out, you can consider using a multithreaded slave or replication fil‐tering to isolate databases among groups of slaves.
SQL Thread Problems: InconsistenciesThe most common problem found with the SQL thread is a statement that has failed toexecute on the slave. In this case, the slave’s SQL thread will stop and the error will bepresented in the slave status. You should look there for clues to why the statement failedand take corrective action.
Causes for statement errors on the slave but not the master were addressed earlier. Theyare often caused by key collisions, inadvertent writes to the slave, or by different dataon the slave and master. Whenever you encounter these issues, you should trace thecause of the problem if possible to try and prevent it from happening in the future. Onekey step is to identify an application or user that issued data changes to a slave.
The cure for most of these problems is bringing the slave back into synchronizationwith the master. A nifty tool for checking consistency between the master and slave isthe MySQL Utilities mysqldbcompare script. This utility is an offline tool that you canrun on your slave during periods of low activity or when it is safe to lock the tables fora period of time. The utility will not only identify which objects differ in structure orare missing, it will also identify the data rows that differ and permit you to generate
516 | Chapter 14: Replication Troubleshooting

transformation statements that you can use to bring the slave into consistency with themaster. This utility and several other replication utilities are discussed in more detail inChapter 17.
Different Errors on the SlaveAlthough rare, it is possible you could encounter a situation where a statement resultsin a different error presented on the slave than the master. This is normally manifestedas an error that reads, “Query X caused different errors on master and slave…” Themessage will present the error, but it might appear simply as something like “Error 0,”which indicates that the statement succeeded on the slave but that there was an erroron the master.
The most likely cause of this problem is an error during a trigger or event on the master.For example, if a trigger on the master failed but either the equivalent trigger succeededon the slave or the trigger was missing on the slave (a common practice). In this case,the best way to solve the problem is to correct the error on the master, then tell the slaveto skip the statement.
However, it is also possible the problem is related to a deadlock in the trigger broughton by data inconsistencies. If this occurs, you may need to correct the inconsistenciesfirst and retry or skip the statement.
Advanced Replication ProblemsThere are some natural complications with some of the more advanced replicationtopologies. In this section, we examine some of the common problems you might en‐counter while using an advanced feature of replication.
A Change Is Not Replicated Among the TopologyIn some cases, changes to a database object are not replicated. For example, ALTERTABLE may be replicated, while FLUSH, REPAIR TABLE, and similar maintenance com‐mands are not. Whenever this happens, consult the limitations of data manipulation(DML) commands and maintenance commands.
This problem is typically the result of an inexperienced administrator or developerattempting database administration on the master, expecting the changes to replicateto the slaves.
Whenever there are profound changes to a database object that change its structure ata file level or you use a maintenance command, execute the command or procedure onall of the slaves to ensure the changes are propagated throughout your topology.
Advanced Replication Problems | 517

Savvy administrators often use scripts to accomplish this as routine scheduled mainte‐nance. Typically, the scripts stop replication in an orderly manner, apply the changes,and restart replication automatically.
Circular Replication IssuesIf you are using circular replication and you have recovered from a replication failurewhereby one or more servers were taken out of the topology, you can encounter aproblem in which an event is executed more than once on some of the servers. This cancause replication to fail if the query fails (e.g., a key violation). This occurs because theoriginating server was among those servers that were removed from the topology.
When this happens, the server designated as the originating server has failed to termi‐nate the replication of the event. You can solve this problem by using the IGNORE_SERVER_IDS option (available in MySQL versions 5.5.2 and later) with the CHANGE MASTERcommand, supplying a list of server IDs to ignore for an event. When the missing serversare restored, you must adjust this setting so that events from the replaced servers arenot ignored.
Multimaster IssuesAs with circular replication (which is a specific form of multimaster topology), if youare recovering from a replication failure, you may encounter events that are executedmore than once. These events are typically events from a removed server. You can solvethis problem the same way as you would with circular replication—by placing the serverIDs of the removed servers in the list of the IGNORE_SERVER_IDS option with the CHANGEMASTER command.
Another possible problem with multimaster replication crops up when changes to thesame table occur on both masters and the table has an autoincrement column for theprimary key. In this case, you can encounter duplicate key errors. If you must insert newrows on more than one master, use the auto_increment_increment and auto_increment_offset options to stagger the increments. For example, you can allow one serverto use only even numbers while the other uses only odd numbers. It can be even morecomplicated to get more than two masters to update the same table with an autoincre‐ment primary key. Not only does it make it more difficult to stagger the increments, itbecomes an administrative problem if you need to replace a server in the topology thatis updating the table. If you make the increment too large (and you have massiveamounts of data), you could exceed the maximum values of the data type for the key ina large table.
518 | Chapter 14: Replication Troubleshooting

The HA_ERR_KEY_NOT_FOUND ErrorThis is a familiar error encountered in a row-based replication topology. The most likelycause of this error is a conflict whereby the row to be updated or deleted is not presentor has changed, so the storage engine cannot find it. This can be the result of an errorduring circular replication or changes made directly to a slave on replicated data. Whenthis occurs, you must determine the source of the conflict and repair the data or skipthe offending event.
GTID ProblemsThe addition of Globally Unique Transaction Identifiers (GTID) is a recent feature forreplication. As we discussed earlier in the book, GTIDs can solve the problem of failoverfor the loss of the master in a topology. Fortunately, there are few cases where replicationencounters problems with GTIDs. Their very nature makes them stable. However, it isstill possible to run into problems when working with slaves on topologies that haveGTID enabled.
Most often you will not encounter errors but will find that the slave has an incompleteset of transactions. In this case, you will use the techniques discussed previously toidentify which GTIDs have been executed on the slave. If it is not possible to wait forthe slave to catch up to the master, you can use the new replication protocol to catch aslave up by making it a slave of another up-to-date slave. This will make the slave thatis behind request those missing GTIDs from its new master. Once the slave is up-to-date, you can return it to its original master.
The one situation where you may encounter an error related to GTIDs is when youattempt to provision a slave. If you have a slave that is behind or does not have all of thedata on the master, you would ordinarily perform a restore on the slave of a most recentbackup of the master. You can still do this, but you also need to set the gtid_purgedvariable on the slave to include all of the GTIDs executed on the master (the value ofthe masters gtid_executed system variable).
If you use mysqldump or the mysqldbcopy, mysqldbexport, and mysqldbimport com‐mands from MySQL Utilities, the correct GTID statements will be generated for you.However, if you attempt to set the gtid_purged variable on the slave, you may encounteran error similar to "GTID_PURGED can only be set when GTID_EXECUTED is empty.” Thisoccurs because the destination server is not in a clean replication state. To correct theerror, you must first issue the RESET MASTER command on the slave to clear thegtid_purged variable, then set the gtid_purged variable.
Advanced Replication Problems | 519

Never issue RESET MASTER on your master for an active replicationtopology using GTIDs. Be very careful when using this command.
Tools for Troubleshooting ReplicationIf you have used or set up replication or performed maintenance, many of the tools youneed to successfully diagnose and repair replication problems are familiar to you.
In this section, we discuss the tools required to diagnose replication problems alongwith a few suggestions about how and when to use each:SHOW PROCESSLIST
When encountering problems, it is always a good idea to see what else is running.This command tells you the current state of each of the threads involved in repli‐cation. Check here first when examining the problem.
SHOW MASTER STATUS and SHOW SLAVE STATUSThese SQL commands are your primary tool for diagnosing replication problems.Along with the SHOW PROCESSLIST command, you should execute these commandson the master and then on the slave, then examine the output. The slave commandhas an extended set of parameters that are invaluable in diagnosing replicationproblems.
SHOW GRANTS FOR < replication user >Whenever you encounter slave user access problems, you should first examine thegrants for the slave user to ensure they have not changed.
CHANGE MASTER
Sometimes the configuration files have been changed, either knowingly or acci‐dentally. Use this SQL command to override the last known connection parameters,which can correct slave connection problems.
STOP/START SLAVE
Use these SQL commands to start and stop replication. It is sometimes a good ideato stop a slave if it is in an error state.
Examine the configuration filesSometimes the problem occurs as a result of an unsanctioned or forgotten config‐uration change. Check your configuration files routinely when diagnosing con‐nection problems.
520 | Chapter 14: Replication Troubleshooting

Examine the server logsYou should make this a habit whenever diagnosing problems. Checking the serverlogs can sometimes reveal errors that are not visible elsewhere. As cryptic as theycan sometimes be, the error and warning messages can be helpful.
SHOW SLAVE HOSTS
Use this command to identify the connected slaves on the master if they use thereport-host option.
SHOW BINLOG EVENTS
This SQL command displays the events in the binary log. If you use statement-basedreplication, this command will display the changes using SQL statements.
mysqlbinlogThis utility allows you to read events in the binary or relay logs, often indicatingwhen there are corrupt events. Don’t hesitate to use this tool frequently when di‐agnosing problems related to events and the binary log.
PURGE BINARY LOGS
This SQL command allows you to remove certain events from the binary log, suchas those that occur after a specific time or after a given event ID. Your routinemaintenance plan should include the use of this command for purging older binarylogs that are no longer needed. You should use a specific time duration to preventpurging binary logs accidentally or too frequently.
Now that we have reviewed the problems you can encounter in replication and haveseen a list of the tools available in a typical MySQL release, we turn our attention tostrategies for attacking replication problems.
Best PracticesReviewing the potential problems that can occur in replication and listing the toolsavailable for fixing the problems is only part of the complete solution. There are someproven strategies and best practices for resolving replication problems quickly.
This section describes the strategies and best practices you should cultivate when di‐agnosing and repairing replication problems. We present these in no particular order—depending on the problem you are trying to solve, one or more may be helpful.
Know Your TopologyIf you are using MySQL replication on a small number of servers, it may not be thatdifficult to commit the topology configuration to memory. It may be as simple as a singlemaster and one or more slaves, or as complex as two servers in a multimaster topology.However, there is a point at which memorizing the topology and all of its configurationparameters becomes impossible.
Best Practices | 521

The more complex the topology and the configuration, the harder it is to determine thecause of a problem and where to begin your repair operations. It would be very easy toforget a lone slave in a topology of hundreds of slave servers.
It is always a good idea to have a map of your topology and the current configurationsettings. You should keep a record of your replication setup in a notebook or file andplace it where you and your colleagues or subordinates can find it easily. This informa‐tion will be invaluable to someone who understands replication administration but mayhave never worked with your installation.
You should include a textual or graphical drawing of your topology and indicate anyfilters (master and slave), as well as the role of each server in the topology. You shouldalso consider including the CHANGE MASTER command, complete with options, and thecontents of the configuration files for all of your servers.
A drawing of your topology need not be sophisticated or an artistic wonder. A simpleline drawing will do nicely. Figure 14-1 shows a hybrid topology, complete with nota‐tions for filters and roles.
Note that the production relay slave (192.168.1.105) has two masters (192.168.1.100 and192.168.1.101). This is strange, because no slave can have more than one master. Toachieve this level of integration—consuming data from a third party—you would needa second instance of a MySQL server on the production relay slave to replicate the datafrom the strategic partner (192.168.1.101) and use a script to conduct periodic transfersof the data from the second MySQL instance to the primary MySQL instance on theproduction relay slave. This would achieve the integration depicted in Figure 14-1 withsome manual labor and a time-delayed update of the strategic partner data.
There are certain problems inherent in certain topologies. We have already discussedmany of these in this and previous chapters. What follows is a list of the types of top‐ologies, including a short description and some common issues to be aware ofconcerning known vulnerabilities:Star (also called single master)
This is the typical single master, many slaves topology. There are no special limi‐tations or problems other than those that apply to replication as a whole. However,the process of promoting a slave to a master can be complicated in that you mustuse the slave that is most up-to-date with the master. This can be difficult to deter‐mine and may require examination of the state of every slave.
ChainIn this configuration, a server is a master to one slave, which is in turn a master toanother slave, and so on, with the end point being a simple slave. Other than theserver ID issue mentioned earlier, there is also the problem of determining whichposition an intermediate master/slave was at when it failed. Promoting a new mas‐ter/slave node can require additional work to ensure consistency.
522 | Chapter 14: Replication Troubleshooting

Circular (also called ring)This is the same as the chain topology except there is no end point. This topologyrequires careful setup so that events are terminated at the originating server.
MultimasterThis is similar to a circular topology, but in this case, each master is a slave of everyother master. This topology has all of the limitations and problems of circular rep‐lication as well as being one of the most complex topologies to manage due to thepossibility of conflicting changes. To avoid this problem, you must ensure you makechanges using only one of the masters. If a conflicting change occurs, say an UPDATE on one master and a DELETE statement on the other master, it is possible theDELETE statement will execute before the UPDATE, which will prevent the UPDATEfrom updating any rows.
HybridA hybrid topology uses elements of some or all of the other topologies. You typicallysee this topology in a large organization that has compartmentalized functions ordivisions that require similar but often isolated elements of the infrastructure. Iso‐lation is accomplished using filtering whereby data is divided among several slavesfrom an original master (sometimes called the prime or master master) that containsall of the data sent to the slaves, which become masters to their own star topologies.This is by far the most complex topology and requires careful notation and diligenceto keep your documentation updated.
Check the Status of All of Your ServersOne of the best preventive tasks you can perform is to regularly check the status of allof the servers in your topology. This need not be complicated. For instance, you can setup a scheduled task that launches the MySQL client and issues a SHOW MASTER STATUS or SHOW SLAVE STATUS and prints out or emails the results.
Keeping a close eye on your server status is a good way to stay informed when there isa potential problem. It also gives you a chance to react more quickly when errors occur.
You should look for errors, monitor the slave lag, check your filters to see that theymatch your records, and ensure all of your slaves are running and not reporting warn‐ings or connection errors.
Check Your LogsAlong with checking your server status regularly, you should also consider checking thelogs of your servers periodically. You can accomplish this easily using the MySQLWorkbench GUI to connect to each server in turn and look at the most recent entriesin the logs.
Best Practices | 523

Figure 14-1. Sample topology map
If you are diligent in this effort, it will pay dividends in the form of early problemdetection. Sometimes errors or warnings—which, at the time, do not manifest in any‐thing detectable—are written to the log. Catching these telltale signs early can makeyour repair work much easier.
We recommend examining your logs at the same time you examine the status of yourservers.
Check Your ConfigurationAlong with the servers and logfiles, you should also routinely examine your configu‐ration files to ensure your documentation is up-to-date. This isn’t as critical as checkingthe logs, but it is often overlooked. We recommend checking your configuration filesand updating your documentation at least once a week if you have a lot of changes, and
524 | Chapter 14: Replication Troubleshooting

at least once a month if you have few changes to the topology or servers. If you have anenvironment in which there is more than one administrator, you may want to considerdoing this more frequently.
Conduct Orderly ShutdownsSometimes it is necessary to stop replication while you diagnose and repair a problem.If replication has already stopped, you may not need to do anything, but if you have acomplex topology and the error is related to data loss, it may be safer to stop replicationacross the topology. But you should do so in a controlled and safe manner.
There are several strategies for doing a controlled shutdown of your replication topol‐ogy. If data loss is an issue and slave lag is not, you may want to lock the tables on yourmaster and flush the binary logs, then wait for all of the (remaining) slaves to catch upand then shut the slaves down. This will ensure all events are replicated and executedon the slaves that are operational.
On the other hand, if the problem is severe, you may want to start with the slaves onthe leaves of your topology and work your way up the topology, leaving the masterrunning. However, if you leave the master running (i.e., you don’t lock all of the tables)and you have a heavy load of updates running and your diagnostic and repair takes along time, your slaves will be lagging behind your master when you restart replication.It is better to stop updates on the master if you think your repair will take a long time.
If you are faced with a difficult problem or (worse) a problem that appears randomlyor without warning, you may want to consider shutting down replication completely.This is especially true if you have a problem with only one of your slaves. Shutting downreplication will allow you to isolate the server while you diagnose the problem.
Conduct Orderly Restarts After a FailureIt is also important to restart replication in an orderly manner. It is often best to restartthe replication topology under controlled conditions, such as on only one master andone slave. Even if your topology is more complex, having the most basic building blocksof replication started initially will allow you to test and ensure the problem is fixed beforerestarting all of your servers.
Isolation is essential when dealing with problems that are confined to a single slave ora set of events. It is also helpful to start with a single master and a single slave so that ifyou cannot fix the problem, you can get help from MySQL professionals more easilybecause you have isolated the problem to the smallest set of parameters as possible. See“Reporting Replication Bugs” on page 528 for more details.
Best Practices | 525

Manually Execute Failed QueriesOne of the most frequently overlooked strategies is examining the queries in the relaylog or binary log for clues as to what has gone wrong. It is easy to get stuck on researchingthe error on the slave and diagnosing all of the many things that can go wrong, butsometimes (especially when there is a query involved) you can gain far more informa‐tion about the problem by isolating the slave server in question and attempting the querymanually.
If you are using statement-based replication, this is an easy task because the query ishuman-readable in the binary or relay log. If you use row-based replication, you canstill execute the query, but you cannot read the query itself. In this case, a malformedquery or a query that uses a missing, incorrect, or corrupt reference may not be obviousuntil you execute the query manually.
Remember, you should always make a backup of your data before attempting diagnosticsthat could result in changes to the data. Running a broken query is definitely one ofthose cases. We have seen queries that cause replication errors but sometimes succeedwhen run manually. When this occurs, it is usually indicative of a slave configurationerror or binary or relay log issue rather than a problem with the query itself.
Don’t Mix Transactional and Nontransactional TablesThis may be an obvious best practice to many, but it is good to remind ourselves none‐theless. Mixing transactional and nontransactional table updates in a transaction canlead to a host of problems, not the least of which is the inability to rollback changes toa nontransactional table. You should avoid this practice entirely.
That being said, it is possible that some mixing of nontransactional statements can beconsidered safe. For example, if your nontransactional tables are lookup tables thatrarely get updated and, more important, are not updated in the course of the transaction,it may be safe to execute these statements.
The best way to avoid problems associated with mixing transactional andnontransactional tables is to convert all of your tables to InnoDB, thereby making themtransactional. In most cases, this is perfectly reasonable and you will notice no ill effects.However, if your data requires a different storage engine (e.g., the Archive or CSVstorage engines), it may not be convenient or even possible to convert them.
Common ProceduresThere are also some common procedures you can use to execute the practices justdiscussed. These include troubleshooting replication and pausing replication on themaster.
526 | Chapter 14: Replication Troubleshooting

Troubleshooting replication failures
The following is a stepwise procedure you can use when attacking replication problems(most of these steps have been described elsewhere in this book or may already befamiliar to you):
1. Check the status on the master. Record any anomalies.2. Check the status on each slave. Record any anomalies.3. Read the error logs on all of your servers.4. Examine the process list on each server. Look for anomalies in status.5. If no errors are reported, attempt to restart the slave. Record any errors presented.6. Check the configuration of the server in question to ensure nothing has changed.7. Examine your notes and form a plan to research and fix the problem.
This procedure is oversimplified, but it should help you diagnose the replication prob‐lem more quickly than chasing the errors presented will (if there are any errors to chase).
You should write down or electronically record all observations whileyou conduct this procedure. Seeing the information consolidated inone place can sometimes present a much clearer body of evidence.
Pausing replication
To pause replication, execute the following steps on each of your master servers, startingwith the prime master (the first master):
On the master:
1. Run the FLUSH TABLES WITH READ LOCK command.2. Run the SHOW MASTER STATUS command.3. Record the master binary log and position.
On the slaves:
1. Run SELECT MASTER_POS_WAIT (binary_log_name, position).
On each remaining active slave connected to this master, examine the results of SHOWSLAVE STATUS until the slave has synchronized with the master. Once the slave reachesthis state, it is safe to shut down the slave.
Best Practices | 527

When you restart your replication topology, all slaves will automatically start withoutany lag. This procedure is useful in cases where there has been a disruption and youwant to get things going again to avoid a prolonged slave lag.
Reporting Replication BugsOnce in a while you may encounter a replication problem that you cannot solve or thereis no solution. In this case, you should report the problem to the MySQL developers,who may be better equipped to diagnose the problem (and correct it if it is a defect).Even if you do not have a support agreement in place, you can report a bug for theMySQL release you are using.
That is not to say that the bug database is a “free help” resource. It is reserved for reportingand tracking defects. The best advice for tricky problems is to check all MySQL databaseforums for ideas and solutions first. Only when it is clear that the problem is uniqueand unrelated to your environment or application should you report it as a defect.
The best bug reports are those that describe errors that can be demonstrated or repeatedusing an isolated test case (e.g., a replication problem that can be demonstrated on atest master and slave), and that have a minimal set of data needed for the problem. Oftenthis is nothing more than a complete and accurate report of the configuration and eventin question.
To report a bug, visit http://bugs.mysql.com and (if you have not done so already) registerfor an account. When you enter your bug report, be sure to describe the problem ascompletely as possible. For fastest results and a quick resolution, include as many of thefollowing details as possible:
• Record all error messages verbatim.• Include the binary log (in full or an excerpt).• Include the relay log (in full or an excerpt).• Record the configuration of the master and slave.• Copy the results of the SHOW MASTER STATUS and SHOW SLAVE STATUS commands.• Provide copies of all error logs.
Be sure to exhaust all of these techniques and explore the problemusing all of the available tools.
528 | Chapter 14: Replication Troubleshooting

The MySQL bug tracking tool will keep you apprised of your bug submission by sendingyou email alerts whenever the bug report is updated.
ConclusionThis chapter includes suggestions for solving some of the common problems that canarise when using replication. We examined some of the ways replication can fail anddiscussed how to solve the problems and prevent them in the future. We also examinedsome tools and best practices for troubleshooting MySQL replication.
One resource that is often overlooked is the section titled “Replication Features andIssues” in the online reference manual. This section includes very important informa‐tion about limitations with replication and how it interacts with certain server features,settings, and the design and implementation choices of your databases. You may wantto read this section whenever a new version of the server is released to ensure you areinformed about how new features may affect replication.
Joel smiled as he heard his boss coming toward his door. He was ready this time andstarted speaking as soon as he saw Mr. Summerson’s polished wingtips. “I’ve got theSeattle server back online, sir. It was a problem with a couple of queries that failed becausethe tables were changed on the slave. I have advised the Seattle office to direct all schemachanges and table maintenance to the master here. I will keep a watch on it from nowon and let you know if the problem returns.”
Mr. Summerson smiled. Joel could feel perspiration beading on his forehead. “Great!Good work.”
Joel was relieved. “Thank you, sir.”
His boss started to leave, but performed one of his now-routine pause, turn, and taskmaneuvers. “One more thing.”
“Sir?” Joel said a little too quickly.
“It’s Bob.”
Joel was confused. Mr. Summerson’s tasking usually involved a complete sentence. “Sir?”he said hesitantly.
“You can call me Bob. I think we’re well past the ‘sir’ stuff.”
Joel sat for a few moments until he realized he was staring into the middle distance ofspace. He blinked and realized his friend Amy from the development staff was standingin front of his desk.
“Are you OK, Joel?”
“What?”
Conclusion | 529

“You were zoned out there. What were you thinking about?”
Joel smiled and reclined his chair. “I think I finally got to him.”
“Who? Mr. Summerson?”
“Yeah, he just told me to call him Bob.”
Amy smiled and crossed her arms, then jokingly said, “Well, I suppose we’ll be callingyou Mr. Joel from now on.”
Joel laughed and said, “Have you had lunch yet?”
530 | Chapter 14: Replication Troubleshooting

CHAPTER 15
Protecting Your Investment
Joel pulled open the middle drawer of his desk and was rummaging for a working penwhen he heard a familiar staccato rap on his door frame. “Joel, I need you to talk withthe information assurance auditors and tell them what our recovery plans are. Oh, andbe sure you order your tapes so they’ll know we’re prepared.”
“Auditors? Tapes?” Joel asked as he made eye contact with Mr. Summerson.
“Be sure to start working on whatever disaster recovery planning document they’reasking about. And tell the procurement office what kind of media you need to get startedwith your archives. They will show you what forms to fill out. Get some extras just incase,” Joel’s manager said as he disappeared from view.
Joel pushed his drawer closed and stood up. The boss must mean media for backups,he thought. But what was all that about auditors and planning? Joel pulled his chair overto his workstation and sat down. “Well, I guess I’ll have to figure out what informationassurance is and how to do a backup,” he mumbled as he opened his browser.
Mr. Summerson popped his head back into the doorway and said, “Oh, and Joel, I’d liketo see your recovery plan on my desk by tomorrow morning before the continuity ofoperations planning session at 1400.”
Joel sighed as he realized his manager had asked for far more than he originally thought.Joel reached for his handy MySQL book. “Money well spent,” he said as he opened thebook to the chapter titled “Protecting Your Investment.”
This chapter focuses on protecting data and providing data recovery. Practical topics inthe chapter include backup planning, data recovery, and the procedures for backing upand restoring in MySQL. Any discussion of these topics would be incomplete withoutan introduction to the concepts of information assurance, information integrity, disasterrecovery, and related terms. Indeed, once you have read through these sections you will
531

see there is much more to protecting your investment than simply being able to backup and restore data.
What Is Information Assurance?This section introduces the concept of information assurance, what it means to an or‐ganization, and how to get started practicing good information assurance. Although wedo not intend to include a full description of all areas, we’ll make sure to present thebasics so you can begin your study of the subject well prepared. Oh, and so you canexplain it to your boss too!
Information assurance (IA) is the management of technologies designed to administer,monitor, ensure the availability of, and control security in information systems. Thegoals of IA are to ensure the control and protection of the data and systems, the au‐thenticity of access, and the confidentiality and availability of the information. Whilethis book focuses on the database system, IA applies to all aspects of information tech‐nology. The following sites include useful background about IA:
• The NSA website’s section on IA• The Wikipedia page for IA
The Three Practices of Information AssuranceSome researchers break down the field of IA into three related practices:Information security
The protection of computing systems from damage by managing the risk of threats,both internal and external
Information integrityThe assurance of continued availability and continuity of the system and its data(sometimes called data protection)
Information significanceThe assessment of the value of the system to the user
Information security is the most common and most well documented of the three prac‐tices. There are countless references on how best to maintain an expected level of pro‐tection for computing systems. There are also many references for physical securitymeasures.
Information integrity is, however, the most important but also the most often over‐looked practice. This chapter focuses on the importance of best practices for informa‐tion integrity.
532 | Chapter 15: Protecting Your Investment

Information significance is the least commonly understood practice. Organizations thatpractice total quality management and related disciplines are familiar with assessing thevalue of the system, but generally consider only the financial aspects of the businessinstead of the value of information to employees in the course of doing their work. Whileone can argue that what is good for the company is good for the employees, we haveencountered policies that seem well intended but may frustrate the employees.
When you consider information integrity and significance, IA comes to include disasterplanning and disaster recovery, which otherwise are often left out of the calculations.
Well-planned IA includes both nonphysical (data, access codes, etc.) and physical (com‐puters, access cards, keys, etc.) aspects. This chapter focuses on the physical aspect insome detail because database systems can be one of the most important resources to anorganization.
Why Is Information Assurance Important?With the increasing importance of computing systems to organizations and the risingcosts of technology, conserving revenue and planning for the unexpected become pri‐orities. As a result, the field of IA has grown beyond the scope of sequestered researchersand government agencies (two of the most interested groups). As these concepts becomemore popular, they are finding their way into many corporate auditors’ toolboxes.
As an information technology leader, you need to be prepared to address the needs ofyour business to protect it from the unknown, including physical, nonphysical, andfinancial threats. One common place to turn is IA. If your organization has or is planningto initiate its own IA program, you owe it to yourself to learn how IA affects you.
Information Integrity, Disaster Recovery, and the Role ofBackupsInformation integrity is sometimes referred to as business continuity. The term under‐lines the importance of ensuring that an organization can continue its mission withoutinterruption, and that you can carry out a controlled restore in the event of an unex‐pected catastrophic event. The effects of such an event can range from a minor problemto a devastating loss of operations or data that you cannot solve quickly (e.g., recoveringfrom a power outage) or without considerable expense (e.g., replacing the informationtechnology systems). It is important to acknowledge that there is no single solution thatcan help you prevent or recover from all events.
Information Integrity, Disaster Recovery, and the Role of Backups | 533

Remember, hardware can and will eventually fail; be prepared.
The areas of responsibility for information integrity include:Data integrity
Ensures data will never be lost and that it is up to date and not corrupted
Communication integrityEnsures that communication links are always available, are recoverable in the caseof an outage, and can initiate a trusted connection
System integrityEnsures you can restart the system in case of a malfunction, that you can recoverthe data and server state in case of loss or damage, and that the system maintains alevel of continuity
As businesses grow more dependent on their information systems, the systems becomemore and more critical to business operations. Indeed, most modern businesses thatutilize information technology have become so dependent on these systems that thebusiness and its information technology become one (i.e., the business cannot existwithout it).
When this becomes true, an organization must recognize that it cannot operate effec‐tively (or perhaps at all) if its information technology becomes disabled. Businesses inthis situation place a great deal of importance on being able to recover the system asquickly as possible. The ability to recover operational capability or data in the event ofa sudden unplanned event is called disaster recovery.
Businesses that fall under the scrutiny of regulatory organizations are aware (or soonwill be made so) that there are several legal decisions and standards that may requirethe company to adopt IA and disaster recovery. More importantly, there are effortsunderway to ensure the protection of certain forms of data. In the United States, theseinclude the , the Patriot Act, and the Health Insurance Portability and AccountabilityAct of 1996 (HIPAA), the Patriot Act, and the Sarbanes-Oxley Act of 2002 (SOX).
High Availability Versus Disaster RecoveryMost businesses recognize they must invest in technologies that allow their systems torecover quickly from minor to moderate events. Technologies such as replication, re‐dundant array of inexpensive disks (RAID) and redundant power supplies are all sol‐utions to these needs. These are considered high availability options because they are
534 | Chapter 15: Protecting Your Investment

all intended to permit real-time or near real-time recovery without loss of any data (orto minimize the data loss to very small segments, such as the last changed record).
Unfortunately, few businesses take the extra step to ensure their investments are pro‐tected from devastating (and expensive) loss. Those that do are protecting their invest‐ments with the ultimate form of risk analysis: disaster recovery.
Certainly there is some overlap between the practices of high availability and disasterrecovery. High availability solutions can address the minor disasters and even form onelayer of defense for major disasters. However, each provides a different type of protec‐tion. High availability protects against the known or expected, while disaster recoveryallows you to plan for the unexpected.
Disaster RecoveryDisaster recovery involves the process, policies, and planning for the continuation ofinformation integrity after a catastrophic event. The most important aspect is creatingand maintaining a document that contains this information: a disaster recovery plan.
Entire texts have been devoted to each aspect of disaster recovery. This section presentsan overview of each so you can justify the importance of disaster recovery to yourmanagement team.
We have already discussed one form of disaster recovery in Chapter 3. These are some‐times the frontline tools that organizations use to recover from small disasters, but whathappens if something really bad happens, like a RAID array fails beyond recovery oryour server is destroyed by fire?
Before you can plan for the worst, you need to answer a series of questions that willform the premise or goals of the disaster recovery plan. These questions also form thecriteria you can use to determine the effectiveness of the plan:
• What are the physical and nonphysical threats to your organization?• What level of operational capability is needed or desired to maintain your business?• How long can your business wait until operations are restored?• What resources are available to plan and execute disaster recovery?
The first step of disaster recovery is acknowledging the worst-case scenario: the loss ofthe entire data center due to a catastrophic event. This includes not only the loss of thetechnology (servers, workstations, network equipment, etc.), but also the loss of thecomputing facility itself—and let’s not forget the loss of personnel to operate the systems(this is seldom considered, but should be).
Information Integrity, Disaster Recovery, and the Role of Backups | 535

While that may seem like a doomsday story, real events have happened and may happenagain that could result in just such a level of disruption. It could be as simple as awidespread power outage or as catastrophic as a hurricane, earthquake, or even war.
Imagine that the building that houses your information technology falls victim to asevere storm that damages the building beyond repair. The roof is torn away and 90%of the physical resources are damaged by water and falling debris. Let us also supposeyour company is in the middle of a very lucrative and time-sensitive businesstransaction.
How will your company recover from this disaster? Were there any plans for such anevent? How much will a prolonged loss of operations affect the revenue of the company?How quickly can you reestablish operations? This scenario may spur your managementto invest in disaster recovery.
As another incentive, consider that if you plan for the worst and have procedures forrecovering your systems, mundane outages become that much easier to endure. Theplanning aspect is the most important part of disaster recovery and offers the assuranceof continuity of operations.
No One Is Exempt from DisasterDisasters such as flood or fire can occur almost anywhere and to any organization. Someareas are more susceptible to natural disasters than others. However, no matter whereyour organization is located, there exists some element of risk. There is, however, onetype of disaster that can strike anywhere and at any time: the man-made kind.
All organizations are responsible for preparing against malicious human activities, in‐cluding those carried out by internal staff. And even if some parts of your operationsare fully protected, some parts are likely to be distributed across less secure sites.
For example, suppose your company is located where natural disasters rarely happen.You are located far from earthquake fault lines and flooding is not a measurable risk.The building has an excellent fire suppression system, is protected physically, and ismonitored 24-7 by trained responders. Overall, there is very low risk of physical lossdue to natural disasters. Your predecessor had thought of everything, and managementis not convinced of the need for a disaster recovery plan.
Now suppose an employee wants to damage the organization from within. When de‐signing a disaster recovery plan, ask yourself, “What damage could an otherwise trustedemployee do to the systems, data, or infrastructure?” While it may seem disconcertingand even paranoid to think like this, a glance through the reports of organizations vic‐timized by sabotage from within should make you consider the unthinkable—that oneof your employees could be a saboteur.
536 | Chapter 15: Protecting Your Investment

A good disaster recovery plan will include measures to reduce the risk of sabotage byidentifying potential vulnerabilities, such as physical access to the building and equip‐ment, as well as a review of all administrative rights to sensitive systems and data.
The goal of disaster recovery is to reestablish the operational capability of an organi‐zation as quickly as possible, which means its information technology must be restored.Best practices of disaster recovery include assessing the risk and planning recovery ofall aspects of the information technology—both the physical and electronic. Gooddisaster planners include provisions for reestablishing a physical location for the orga‐nization as well as reconstructing the information technology from scratch. This shouldinclude the ability to acquire any equipment needed in an expedient manner by havinga standby ready, by replacing a failed site with equipment taken from remaining sites,or by purchasing new equipment.
Rebuilding the network and the data from scratch includes acquiring a minimal set ofcomputing and networking equipment to restore the data and applications to a statewhere the organization can operate at an acceptable level of reduced operations. There‐fore, you need to determine the minimal set of technology that will allow the organi‐zation to continue its mission with little or no loss of revenue.
Personnel are also a key asset that your plan must consider. Thus, one recovery proce‐dure is notifying all personnel in the case of an emergency. This may be as simple as aphone tree, where each employee is responsible for calling a set of her peers to pass oncritical information. It may also be a sophisticated automated contact system that tele‐phones all employees with a prerecorded message. Most automated systems provide alevel of assessment by requiring each employee to acknowledge the message. The bestnotification systems include multiple point escalation. For example, the home phonenumbers of employees are called first, followed by email, mobile, and text messages.
Disaster recovery also has a policy aspect, which includes the assessment of risks duringemergencies (what assets are in danger, and how important is each one?) and who is tomake decisions in the case of unavailability (or death) of members in the chain of com‐mand. For example, if the employee in charge of the networking systems is unavailable,his subordinate is designated to assume his responsibilities (and make any necessarydecisions).
Disaster recovery planning
Planning is a much larger area and consists of making contingencies in the case of allknown or expected scenarios. For example, a good disaster recovery plan has writtenprocedures for establishing an alternative site and step-by-step instructions on how tobuild the information systems from scratch.
Information Integrity, Disaster Recovery, and the Role of Backups | 537

This is a good time to point out one fatal flaw in some disaster recovery plans. Little canbe gained by expending countless hours and resources developing a disaster recoveryplan if it is then stored on the hard drives of the systems it is designed to recover. Takethe time to secure a copy of your disaster recovery plan in an offsite fireproof safe.
Disaster recovery workflow
You may have several questions by now. How do you get started with disaster recovery?How do you go from surveying your inventory of information technology to handingyour boss a disaster recovery plan? It all begins with an examination of your goals. Fromthere, you can proceed to planning and eventually evolve your own disaster recoveryplan document.
If this sounds like a lot of work, it is. Most organizations form a team of experts fromacross the organization. The most successful teams are staffed by individuals who un‐derstand what is at stake (the organization could go bankrupt and everyone could losetheir jobs), and who understand their areas of expertise well enough to identify criticalsystems.
It might seem obvious, but you must also plan for the possibility that those who create,test, and author a disaster recovery plan may not be the people who execute it. Thisconsideration underscores the importance of comprehensive and unambiguous docu‐mentation, as well as clear assignment of responsibilities with some built-inredundancy.
The following describes the steps in typical disaster recovery planning. These stepsprovide an overview (later sections offer a more in-depth look):
1. Establish your disaster recovery team. Assuming your organization consists ofmore than a handful of employees, you should inform your manager now that youneed to form a team to accomplish the goal of delivering a disaster recovery plan.Identify key roles you think will be needed to staff the team. Be sure to includepersonnel from all aspects of the organization and avoid the temptation to staff thegroup with only technology-savvy people. You need a complete perspective up anddown the organization, and the only way to get that is to diversify.
2. Develop a mission statement. Conduct a study of your current state of operations,identify the acceptable minimal level of operations for your organization, and statethe goals of your disaster recovery process.
3. Get management buy-in. Unless management initiated the task, it is your respon‐sibility to persuade your management personnel that disaster recovery will requiretheir support in order to succeed. It may be the only way you can get the neededresources (time, budget, personnel) to accomplish your goals.
4. Plan for the worst. This is the part that many people find the most fun. You shouldstart recording scenarios that describe the types of catastrophic events that could
538 | Chapter 15: Protecting Your Investment

occur in your region. Include everything from theft, sabotage, weather events, andfire to disease and even worse. Be sure to start a file for these scenarios, as you willneed them later when developing your recovery plans.
5. Assess your inventory and organizational resources. Make a list of all of the infor‐mation technology in your organization. Be sure to include everything needed foroperational success, including employee workstations and network connectivity.You should list things that exist now, not what you deem the minimal set. Reducingthe assets to the minimum acceptable set will come later. You should also recordthe current organizational chart and the chain of command, complete with primaryand secondary decision makers. Remember to write all of this down and save it forlater.
6. Conduct risk assessment. Determine the effects that the loss of each of your re‐sources could have on your organization. This will form your minimal level ofoperations. You should establish a priority for each resource and even establishmore than one acceptable level of operations. Be sure to include a careful study ofthe applications and data needed. This will be used to help you decide which pro‐cedure to use when responding to events. You may be able to recover from partiallosses, for instance, by redeploying your remaining systems instead of bringing upnew systems, at a savings of critical time and money. It may be that you can operatefor a short period of time with lower operational capability.
7. Develop contingency plans. Now that you have the disaster scenarios, your assess‐ment of your inventory, and your risk assessment, you can begin writing the firstdraft of your disaster recovery plan. These contingency plans can take any formyou find useful, but most planners start making procedures using lists and narra‐tion. Use whatever format makes sense to your team.
8. Create verification procedures. No plan is useful if it falls apart during execution.Now is the time to develop procedures to verify your disaster recovery plan. Startby having mock exercises in which you walk through your list of contingencies andmake any adjustments needed. Go back to step 4 and cycle through the steps as yourefine your disaster recovery plan.
9. Practice makes perfect. After refining your disaster recovery plan, start real-lifeexercises to ensure the plan works. The ultimate goal is to demonstrate to man‐agement that you can achieve each acceptable level of operations. If you can’t, goback to step 6 and cycle through the remaining steps until you reach a completeand repeatable set of procedures.
Your disaster recovery plan should have at least one full operational test yearly or when‐ever a major element in the organization or information technology changes.
Information Integrity, Disaster Recovery, and the Role of Backups | 539

Tools for disaster recovery
Although disaster recovery involves more than just your data and computers, the focusof disaster recovery is always the data and the information technology capabilities. Thereare numerous tools and strategies that you can use in your disaster recovery plans. Thefollowing are a few of the more popular tools and strategies:Backup power
Always include some form of uninterruptible power supply. The durability and costof such equipment are largely dependent on how much downtime your companycan permit. If you must have continuous operational capability, you will need asystem capable of powering your equipment for extended periods of time.
Network connectivityDepending on your need to reach customers and business partners electronically,you may need to consider redundant or alternative network access. This could beas simple as different media (say, an extra fiber trunk line to your access point) oras complex as alternative connection points (like satellite or cellular carriers).
Alternative siteIf your company must have full capability and as little downtime as possible, youmay need to ensure rapid recovery with no data or operational loss. The ultimatestrategy is to secure an alternative site to house your information technology oreven your entire company. This can take the form of a mobile office (a temporaryoffice trailer or similar platform) that contains a replica of your informationtechnology.
Supplemental personnelDisaster recovery planners often overlook this component. One possible disasteryou must consider is the loss of part or all of your staff in critical roles. This couldtake the form of infectious disease, a hostile takeover by a rival firm, or even massloss of life. Whatever the possible cause, you should include an analysis of the criticalroles in your organization and have contingencies for filling them in the event of adisaster. One obvious choice is to cross-train personnel. This will increase yourtalent pool, with the added benefit of making your employees more valuable.
Backup hardwarePerhaps the most obvious aspect of continued operations is the need to have addi‐tional hardware. Your high availability technology can partially fulfill this need, butthe ultimate strategy is to store replacement hardware off site (or at your alternativesite) so that you can place it into service quickly. This hardware must not simply beleft to gather dust, but should be up to date with your latest software and exercisedregularly.
540 | Chapter 15: Protecting Your Investment

Secure vaultAnother aspect that planners often overlook is a secure place to store backups ofcritical data. You should acquire a storage space at a secure facility (the level ofsecurity will depend on the value and sensitivity of your data) that matches yourdowntime needs. If you have a very low downtime threshold, a bank or similarrepository may not be able to retrieve the data fast enough. In contrast, storingbackups of critical data in your basement or in a public place may not be safe enough.
High availabilityAs mentioned earlier, high availability options form the first layer of defense in adisaster recovery plan. The ability to fail over to alternative data repositories canhelp you to overcome minor events.
Always keep copies of your data and your disaster recovery plan in asecure offsite location.
One rule of thumb applies to all disaster recovery tools and strategies: the faster youneed to recover from a disaster and the greater operational capability you need to restore,the higher the cost will be. This is why it is important to develop several levels of op‐erational capability—so that you can adapt your plan and management will have optionsfor different levels of loss and circumstances. It may be that your company is sufferingfrom a recession or other financial limitation and may have to sacrifice operationalcapability. The more options you have, the stronger your disaster recovery plan will be.
The Importance of Data RecoveryBecause most businesses consider their data their most valuable asset (outside of theirpersonnel, the most difficult asset to replace), the primary focus of most disaster re‐covery plans is restoring the data and making it accessible. Yes, it is all about the data.
Data recovery is defined as the planning, policies, and procedures for restoring theorganization’s data to an acceptable operating state. The most important part of datarecovery is the ability to back up and restore data. The success of a backup and recoverycapability is sometimes called resiliency or recoverability.
The key aspects of data recovery are the ability to plan, execute, and audit data backupand to restore operations. The one aspect that is most often overlooked is auditing. Agood backup and restore service should be one that you can rely on. Too often, backupsystems fail without any indication that the data is absent, is corrupted in the archive,or has been destroyed. This is usually discovered the moment something goes wrong
Information Integrity, Disaster Recovery, and the Role of Backups | 541

and a restore is attempted. Clearly, learning that data doesn’t exist or has been corruptedduring the moment of crisis can make data recovery very difficult.
Terminology
Two terms are found in almost all references to data recovery and backup solutions, soit’s important to understand them:Recovery Point Objective (RPO)
The state of the system that is acceptable for use. Thus, RPO represents the maxi‐mum acceptable degradation of services (operational capability) or maximum ac‐ceptable data loss. Use these goals for measuring the success of a recovery action.
Recovery Time Objective (RTO)The maximum amount of time permitted to endure a loss of capability (also calleddowntime).
The RTO is affected a great deal by the RPO. If you need to recover all data (or almostall data, such as all transactions that were replicated), you will need work harder torecover it, so achieving a fast recovery—a low RTO—will be more costly. A higher RPOor lower RTO requires a bigger investment in hardware and software as well as trainingadministrators to use systems that guarantee higher RTO and RPO, because they tendto be complex solutions. For example, if your RTO is less than three seconds and yourRPO is full capability with no data loss, you must invest in an extensive high availabilitysolution that can tolerate the complete loss of a server, data or repository without lossof data (or time).
Backup and RestoreThis section describes the two most important tools in data recovery. It drills down intothe concepts of backup and restore, the planning you need to do, and the backup andrestore solutions available.
For database systems like MySQL, backup and restore capability means making copiesof the data that you can store and later reload so that the state of the data returns to thepoint at which the backup was made.
The following sections are provided for those who may not be familiar with backup andrecovery systems and the available solutions for MySQL. We’ll explore the benefits ofthe various solutions and how to create an archival plan that you can use to recoveryour data with minimal loss.
Why back up?
Some might think that a backup is not necessary if you use replication or some form ofhardware redundancy. While that may be true for recovering data quickly in the event
542 | Chapter 15: Protecting Your Investment


Losing more than one disk of a hardware arrayIf multiple disks of a single hardware RAID fail, it is likely that recovery will fail. Ifthis happens (and it happens more often than you may think), you may have nochoice but to restore the data in the array from backups.
Disk failure on both master and slaveIf both your master and slave systems fail (particularly if it’s a disk failure), you maybe without your hot standby. This can manifest in a variety of ways. For example,it is possible for a particular table (or shard) to become corrupt or for the disk it isstored on to fail on both the master and slave. Again, a restore of the data may bethe only solution.
Backup power failureThis is perhaps one of the most humiliating scenarios. Your high-value powerbackup system fails the moment you need it—during a power outage. If poweroutages are a possibility you need to prepare for, consider installing a backup planin case your primary power backup fails.
The point is that having routine backups of your data is a basic and sound data recoverypractice. High availability options such as replication or RAID hardware are clearly abetter choice for up-to-the-second recovery, but none of these technologies can helpyou in the event of a catastrophic loss. You have seen that replication can help preventdata loss, but what happens, for example, if the disaster is such that both your mastersand slaves are damaged beyond repair? In this case, only a good and recent backup cansave you.
The following sections discuss backup in more detail and show you how you can beginmaking backups of your MySQL data right away.
Expectations for backups
A backup operation must have the capability to make copies of the data in a form thatyou can restore later. Furthermore, the backup copy must be consistent. For a transac‐tional database, this means that the backup contains only transactions committed priorto the start of the copy, not partial or uncommitted data. Backups must also supportmonitoring so that you can validate the performance of the backup and the state of thedata.
There are several forms of backup:Full backup
Makes a full backup of everything stored by the server. Nothing is omitted. Thisform requires the most time and storage space.
544 | Chapter 15: Protecting Your Investment

Differential backupBacks up just the data that changed since the last full backup. The backup containsthe actual data (rows) at the time of backup. This typically requires less space thanthe full backup and is much faster.
Incremental backupBacks up just the data that changed since the last incremental or full backup. Thisnormally takes the form of a change log (e.g., the binary log in MySQL). This backuptypically takes much less time than a differential or full backup and, depending onthe number of changes since the last backup, may require very little space.
Both differential and incremental backups record the differences between a previousbackup and the current state of the data. But a differential backup includes the actualdata, whereas the incremental backup refers to the log, from which it can reconstructthe data. Thus, when you restore a differential backup, the data is imported from thebackup into the restored database. When you apply an incremental backup, it appliesthe changes to the data from the log.
When developing your data recovery plan, pick a naming convention for your backuparchives (also called a backup image or simply backup file). For example, you mightname each file with a date and any other pertinent information such as full_backup_2013_09_09 or incr_backup_week_3_september. There is no right or wrong here, sofeel free to use something that makes sense to you and meets your needs.
Expectations for the restore process
A restore operation must have the capability to replace the data on the system with datathat is in an archive such that the data replaced is identical to that in the archive. Likebackups, the restore process must support monitoring so that you can validate the per‐formance of the restore and the state of the data.
Unfortunately, few backup systems meet all of these criteria for backup and restore.Those that do are often proprietary platforms (installations of customized hardwareand software) that are expensive and difficult to maintain. This chapter includes eco‐nomical options to back up and restore your MySQL data.
Logical versus physical backup
One misunderstood concept of backup is the difference between logical and physicalmodes; the choice you make can have significant effects on both the efficiency of yourbackups and options for restoring data.
A logical backup is simply a collection of normal SQL SELECT queries. The backup isusually built through a table scan, which is a record-by-record traversal of the data.
A physical backup is a copy of the original binary data (files) and it often makes a copyof the files at the operating-system level. Any backup method that involves copying the
Information Integrity, Disaster Recovery, and the Role of Backups | 545

data, index, and buffer memory (files) that does not use record-by-record access isconsidered a physical backup.
As you might imagine, logical backups can be considerably slower than physical back‐ups. This is because the system must use the normal SQL internal mechanisms to readone record at a time. Physical backups normally use operating system functions and donot have nearly as much overhead. Conversely, physical backups may require lockingthe tables associated with the binary files until the binary copy is complete, while someforms of logical backups do not lock or block access to the tables while the backup isrunning.
Deciding which method to use may be harder than you think. For example, if you wantto make a copy of a MySQL database server that includes all of its data, you can simplytake it offline, shut down the server, and copy the entire mysql directory to anothercomputer. You must also include the data directories for the InnoDB files if you havechanged their default locations. This will create a second instance of the server identicalto the first. This may be a great way to build your replication topology, but it is veryinconvenient for backing up a few important databases that cannot be taken offline. Inthis case, a logical backup may be your best (and only) choice. However, if your databasesare all stored in InnoDB, MEB may be a possible solution instead of the logical backup,because you can backup InnoDB without blocking activity on the databases.
Forming an archival plan
Getting what you need from backup and restore tools requires discipline and somethought. The most overlooked step is developing what is called an archival plan. Thisis the analysis that determines how frequently you need to make copies of your data.
The first thing you must ask yourself is, “How much data can I afford to lose in the eventthat I need to recover from scratch?” In other words, how much data can you afford toskip or perhaps never recover in the event of a total loss of your data? This becomesyour RPO, or the level of operational capability that your company must have in orderto conduct business.
Clearly, any loss of data is bad. You must consider the value of the data itself when youplan your RPOs. You may find some data is more valuable than other data. Some datamay be critical to the well-being and stability of your company while other data may beless valuable. Clearly, if you identify data that is critical to your organization, it must berecovered without loss. Thus, you may come up with a few different RPOs. It is alwaysa good practice to define several levels, then determine which one fits the recovery needsat hand.
This is important because the archival plan determines how often you must perform abackup and at what capacity (how much is backed up). If you cannot tolerate any lossof data whatsoever, you are more than likely going to have to extend your high availa‐bility options to include replication of some sort to an offsite location. But even that is
546 | Chapter 15: Protecting Your Investment

not 100% foolproof. For instance, corruption or sabotage in the master may propagateto the replicas and go undiscovered for some time.
You are more likely to measure your tolerance for data loss by the maximum amountof time you can allow for the recovery of lost data. In other words, how long can youafford to have the data unavailable while it is being recovered? This directly translatesto how much money your organization can stand to lose during the downtime. Forsome organizations, every second that passes without access to the data is very costly.It may also be true that some data is more valuable to the company’s income than otherdata and as such you can afford to spend more time recovering that data.
Again, you should determine several time frames, each of which is acceptable dependingon the state of the business at the time. This forms your RTO options and you can matchthem with your RPO levels to get a picture of how much time each level of recoveryrequires. Determining your RTO levels can mean reentry of the data into the system orredoing some work to reacquire the data (e.g., performing another download of data oran update from a business partner).
Once you determine the amount of data loss you can tolerate (RPO) and how long youcan tolerate for the recovery (RTO), you should examine the capabilities of your backupsystem and choose the frequency and method that meets your needs. But don’t stopthere. You should set up automated tasks that perform the backup during times whenit is most beneficial (or least disruptive).
Finally, you should test the backups periodically by practicing data recovery (i.e., re‐storing the data). This will ensure you have good, viable backups free of defects, therebyensuring safe data recovery with low risk.
Backup Tools and OS-Level SolutionsOracle provides several solutions for backup and restore ranging from an advanced,commercial grade physical backup (MySQL Enterprise Backup) to GPL solutions forlogical backups (MySQL Utilities and mysqldump). Additionally, there are several third-party solutions for performing backups on MySQL. You can also perform some unso‐phisticated but effective backups at the operating system level.
The final section of this chapter briefly discusses the most popular alternatives. Thereare other options for backups as well, but most are similar in purpose to the followingmethods:
• MySQL Enterprise Backup• MySQL Utilities• Physical file copy• The mysqldump utility
Backup Tools and OS-Level Solutions | 547

• Logical Volume Manager snapshots• XtraBackup
MySQL Enterprise BackupIf you are looking for a backup solution that permits you to make non-blocking,physical-level backups of your data and you have used the InnoDB storage engine asyour primary data storage, you will want to examine the MySQL Enterprise Backupproduct from Oracle. MySQL Enterprise Backup is part of the MySQL Enterprise Edi‐tion product offering. More information about the MySQL Enterprise offerings can befound at MySQL Enterprise Documentation.
With MySQL Enterprise Backup, hence MEB, you can make full backups of your data‐bases while MySQL is online without interrupting data access. MEB also supports in‐cremental and partial backups. When restoring data, MEB supports point-in-time re‐covery (PITR), enabling restores to a specific point in time. When combined with thebinary log features, MEB permits roll-forward recovery to a specific transaction, pro‐vided you have a backup capable of supporting a partial restoration. You can also usetransportable tablespaces (supported in version 5.6 and later) to facilitate partial re‐stores, but that requires the --innodb_file_per_table=ON option.
Two other valuable features of MEB including performing a partial restore for specifictables or tablespaces, and creating compressed backup files, which greatly reducing theirsizes.
MEB can also back up MyISAM, Merge, Partition, and Archive tables,but it blocks updates to these tables while the backup is running.
MEB supports MySQL version 4.0 and later and is supported on a wide variety of plat‐forms including Linux, Mac OS X, and Windows. If you are interested in learning moreabout MySQL Enterprise Backup, visit the MySQL Enterprise Backup documentationwebsite. The MEB utility has many additional features, many of which will be familiarto users of Oracle Backup tools. We list a few of the more interesting and importantfeatures here:
• Integration with external backup products (e.g., Oracle Secure backup, Netbackup,and Tivoli Storage Manager) using serial backup tape (SBT). This helps you inte‐grate your MySQL Backup into your existing enterprise backup and recovery sol‐ution.
548 | Chapter 15: Protecting Your Investment

• Backup to a single file, which permits streaming across pipes and is also used withSBT.
• Parallel backup that permits splitting each of the files to be backed up into a separatebuffer. The buffers are then processed in parallel for read, write, and compressionoperations. This feature can often improve backup duration times by a factor of 10.Note that the serial integrity of the backup is maintained via the use of multiplethreads. In other words, you can still restore the file without using special optionsor procedures to put the streams back together. MEB does all that for you.
• In the latest release, MEB does full-instance backups. This means all datafiles, logfiles, and the state of global variables and plug-in configurations are stored in thebackup image. Cool! If you examine the meta directory in your backup directory,you will see backup_variables.txt, which stores the settings of all global variables,backup_content.xml, which lists all files included, and backup_create.xml, whichcontains the manifest for the backup operation.
• Support for all of the features of the latest server release, including using differentInnoDB page sizes, different InnoDB CRC calculation algorithms, and relocatingInnoDB pages for optimization on solid state devices.
• Integration with MySQL Workbench. MEB can now be used from within the com‐mercial version of MySQL Workbench.
You can download a trial version of MySQL Enterprise Backup forevaluation purposes via Oracle’s eDelivery system. You must have anOracle Web account. If you do not have such an account, you cancreate one on the site.
Using mysqlbackup is very easy. You can initiate a number of commands by specifyingthe command name as one of the parameters. An overview of the available commandsfollows, broken out by the basic operations (see the online MEB documentation formore details on each command, along with examples on how to use them):Backup commands
backup
Make a backup to a specified backup directory. The resulting files contain araw backup image and must have the log applied before it can be restored.
backup-and-apply-log
Make a backup to a specified backup directory and apply the log operation onthe snapshot. This makes the backup viable for a complete restore. Note thatthe resulting file cannot be compressed with the compression option and typ‐ically can consume more space than a backup without the log.
Backup Tools and OS-Level Solutions | 549

backup-dir-to-image
Make a backup to a single file (called an image) in a specific backup directory.
backup-to-image
Make a backup to a single file. The result file is a raw backup image and musthave the log applied before it can be restored.
Restore/recovery commandsapply-incremental-backup
This operation uses an incremental backup and applies it to a full backup forpreparing a backup image for restoring. Note that this works only for InnoDBtables.
apply-log
This operation uses an existing backup directory and applies the InnoDB logsso that the resulting InnoDB data and log files are the correct size for restoringdata to the server. Note that in order to do apply-log on a backup image file,it must be extracted to a backup directory first.
copy-back
The restore command. In this case, the server is offline and the operation copiesall files to the specific data directory. This is an offline restore. Note that youshould never use this command on a server that is running. Also note that thisdoes not apply the log.
copy-back-and-apply-log
The restore command. In this case, the server is offline and the operation copiesall files to the specific data directory and applies the log. Effectively, this is acomplete offline restore. Note that you should never use this command on aserver that is running.
Utility commands (which manipulate the images)extract
Extract the items in a backup image using relative paths. If you use the --backup-dir option, you can specify a directory to place the files being extrac‐ted. You can use the --src-entry to filter the extract to a specific file or direc‐tory.
image-to-backup-dir
Extract a backup image to a backup directory.
list-image
List the items in the image. The --src-entry option can be used to filter theoutput to list a specific file or directory.
validate
Compare the checksums in the file to detect corruption.
550 | Chapter 15: Protecting Your Investment

How MEB works
As we stated, MEB is a physical-level backup tool. As such, it makes binary copies ofthe actual disk files where the data is stored. It also makes direct copies of the InnoDBengine files, including the logs. Finally, MEB also makes copies of all other pertinentfiles (.frm files, MyISAM files, etc.). With the release of MEB 3.9.0, full instance backupis enabled, which also saves the global variable settings.
Because MEB copies the InnoDB files, it does so as a snapshot operation (thereby al‐lowing hot backups). When this occurs, the state of the pointers inside the InnoDBstorage engine may not match the data that is actually stored in the backup image. Thus,backups require two steps; first backup the data, and then apply the logs to the InnoDBfiles in the backup directory so that they are set to the correct pointers. In other words,you must make the backup files match the state of the InnoDB files by applying anychanges to InnoDB tables that happened while the backup was in progress. Once youhave done this, the backup image is in a state to be restored. Fortunately, you can doboth of these in one pass by using the backup-and-apply-log command (described inthe next section).
Restoring a full backup requires the server to be offline. This is because the backupperforms a complete overwrite of all files and sets the global variables to their staterecorded at the time of the backup (for MEB 3.9.0 and later).
The following sections demonstrate the three basic operations: full backup, incrementalbackup, and full restore. You can find examples of all commands in the MEB onlinereference manual.
Performing a full backup
To create a full backup, you simply specify the user, password, and port options (asappropriate—mysqlbackup follows the standard MySQL client practices for accessingservers by host, port, or socket). You also specify the backup command of your choice(here we will use backup-and-apply-log) and a backup directory to store the resultingfile(s):
$ sudo ./mysqlbackup backup-and-apply-log --port=3306 \ --backup-dir=./initial-backup --user=root --password --show-progressPassword:MySQL Enterprise Backup version 3.9.0 [2013/08/23]Copyright (c) 2003, 2013, Oracle and/or its affiliates. All Rights Reserved.
mysqlbackup: INFO: Starting with following command line ... ./mysqlbackup backup --port=3306 --backup-dir=./initial-backup --user=root --password --show-progress
Enter password: mysqlbackup: INFO: MySQL server version is '5.5.23-log'. mysqlbackup: INFO: Got server configuration information from running server.
Backup Tools and OS-Level Solutions | 551

IMPORTANT: Please check that mysqlbackup run completes successfully. At the end of a successful 'backup' run mysqlbackup prints "mysqlbackup completed OK!".
130826 15:48:29 mysqlbackup: INFO: MEB logfile created at /backups/initial-backup/meta/MEB_2013-08-26.15-48-29_backup.log
-------------------------------------------------------------------- Server Repository Options:-------------------------------------------------------------------- datadir = /usr/local/mysql/data/ innodb_data_home_dir = innodb_data_file_path = ibdata1:10M:autoextend innodb_log_group_home_dir = /usr/local/mysql/data/ innodb_log_files_in_group = 2 innodb_log_file_size = 5242880 innodb_page_size = Null innodb_checksum_algorithm = innodb
-------------------------------------------------------------------- Backup Config Options:-------------------------------------------------------------------- datadir = /backups/initial-backup/datadir innodb_data_home_dir = /backups/initial-backup/datadir innodb_data_file_path = ibdata1:10M:autoextend innodb_log_group_home_dir = /backups/initial-backup/datadir innodb_log_files_in_group = 2 innodb_log_file_size = 5242880 innodb_page_size = 16384 innodb_checksum_algorithm = innodb
mysqlbackup: INFO: Unique generated backup id for this is 13775524146819070
mysqlbackup: INFO: Creating 14 buffers each of size 16777216.130826 17:26:56 mysqlbackup: INFO: Full Backup operation starts with following threads 1 read-threads 6 process-threads 1 write-threads130826 17:26:56 mysqlbackup: INFO: System tablespace file format is Antelope.130826 17:26:56 mysqlbackup: INFO: Starting to copy all innodb files...130826 17:26:56 mysqlbackup: INFO: Progress: 0 of 27 MB; state: Copying system tablespace130826 17:26:56 mysqlbackup: INFO: Copying /usr/local/mysql/data/ibdata1 (Antelope file format).130826 17:26:56 mysqlbackup: INFO: Found checkpoint at lsn 20121160.130826 17:26:56 mysqlbackup: INFO: Starting log scan from lsn 20121088.130826 17:26:56 mysqlbackup: INFO: Copying log...130826 17:26:56 mysqlbackup: INFO: Log copied, lsn 20121160.130826 17:26:56 mysqlbackup: INFO: Completing the copy of innodb files.130826 17:26:57 mysqlbackup: INFO: Preparing to lock tables: Connected to mysqld server.130826 17:26:57 mysqlbackup: INFO: Starting to lock all the tables...130826 17:26:57 mysqlbackup: INFO: All tables are locked and flushed to disk
552 | Chapter 15: Protecting Your Investment

130826 17:26:57 mysqlbackup: INFO: Opening backup source directory '/usr/local/mysql/data/'130826 17:26:57 mysqlbackup: INFO: Starting to backup all non-innodb files insubdirectories of '/usr/local/mysql/data/'130826 17:26:57 mysqlbackup: INFO: Copying the database directory 'menagerie'130826 17:26:57 mysqlbackup: INFO: Copying the database directory 'my_sensor_network'130826 17:26:57 mysqlbackup: INFO: Copying the database directory 'mysql'130826 17:26:57 mysqlbackup: INFO: Copying the database directory 'newschema'130826 17:26:57 mysqlbackup: INFO: Copying the database directory 'performance_schema'130826 17:26:57 mysqlbackup: INFO: Copying the database directory 'test_arduino'130826 17:26:57 mysqlbackup: INFO: Copying the database directory 'world'130826 17:26:57 mysqlbackup: INFO: Copying the database directory 'world_innodb'130826 17:26:57 mysqlbackup: INFO: Completing the copy of all non-innodb files.130826 17:26:58 mysqlbackup: INFO: Progress: 27 of 27 MB; state: Copying metadata to image130826 17:26:58 mysqlbackup: INFO: A copied database page was modified at 20121160. (This is the highest lsn found on page) Scanned log up to lsn 20123788. Was able to parse the log up to lsn 20123788. Maximum page number for a log record 776130826 17:26:58 mysqlbackup: INFO: All tables unlocked130826 17:26:58 mysqlbackup: INFO: All MySQL tables were locked for 0.913 seconds.130826 17:26:58 mysqlbackup: INFO: Reading all global variables from the server.130826 17:26:58 mysqlbackup: INFO: Completed reading of all global variables from the server.130826 17:26:58 mysqlbackup: INFO: Creating server config files server-my.cnf and server-all.cnf in /Users/cbell/source/meb-3.9.0-osx10.6-universal/bin/initial-backup130826 17:26:58 mysqlbackup: INFO: Full Backup operation completed successfully.130826 17:26:58 mysqlbackup: INFO: Backup created in directory '/Users/cbell/source/meb-3.9.0-osx10.6-universal/bin/initial-backup'130826 17:26:58 mysqlbackup: INFO: MySQL binlog position: filename mysql-bin.000026, position 20734
------------------------------------------------------------- Parameters Summary------------------------------------------------------------- Start LSN : 20121088 End LSN : 20123788-------------------------------------------------------------
mysqlbackup: INFO: Creating 14 buffers each of size 65536.130826 17:26:58 mysqlbackup: INFO: Apply-log operation starts with following threads 1 read-threads 1 process-threads130826 17:26:58 mysqlbackup: INFO: ibbackup_logfile's creation parameters: start lsn 20121088, end lsn 20123788, start checkpoint 20121160.
Backup Tools and OS-Level Solutions | 553

mysqlbackup: INFO: InnoDB: Starting an apply batch of log records to the database...InnoDB: Progress in percent: 0 1 2 3 4 5 6 7 8 9 10 11 12 13 14 15 16 17 18 19 20 21 22 23 24 25 26 27 28 29 30 31 32 33 34 35 36 37 38 39 40 41 42 43 44 45 46 47 48 49 50 51 52 53 54 55 56 57 58 59 60 61 62 63 64 65 66 67 68 69 70 71 72 73 74 75 76 77 78 79 80 81 82 83 84 85 86 87 88 89 90 91 92 93 94 95 96 97 98 99 mysqlbackup: INFO: InnoDB: Setting log file size to 5242880 mysqlbackup: INFO: InnoDB: Setting log file size to 5242880130826 17:26:58 mysqlbackup: INFO: We were able to parse ibbackup_logfile up to lsn 20123788. mysqlbackup: INFO: Last MySQL binlog file position 0 20653, file name ./mysql-bin.000026130826 17:26:58 mysqlbackup: INFO: The first datafile is '/backups/initial-backup/datadir/ibdata1' and the new created log files are at '/backups/initial-backup/datadir'130826 17:26:59 mysqlbackup: INFO: Progress: 27 of 27 MB; state: Completed130826 17:26:59 mysqlbackup: INFO: Apply-log operation completed successfully.130826 17:26:59 mysqlbackup: INFO: Full backup prepared for recovery successfully.
mysqlbackup completed OK!
You can use the --show-progress option to track progress by per‐cent to stdout, a file, or a table. This option can also show the phaseof the operation. See the online MEB reference manual for moredetails.
You can also make a compressed backup using the --compress option. But you cannotdo this with the backup-and-apply-log operation. To create a compressed full backupthat is viable for restore, you must do it in two steps, as follows (note that we must usethe --uncompress option with the apply-log command):
$ sudo ./mysqlbackup backup --compress --port=3306 \ --backup-dir=/backups/initial-backup --user=root \ --password --show-progress$ sudo ./mysqlbackup apply-log --port=3306 \ --backup-dir=/backups/initial-backup --user=root \ --password --show-progress --uncompress
Performing an incremental backup
An incremental backup is performed by specifying an existing backup image (full orprevious incremental backup image) to which you want to compare the current state ofthe databases, using the --incremental-base option to specify the backup directory.Use --backup-dir to specify the directory for the incremental backup image. Here wedemonstrate how to create the first incremental backup image from the most recent fullbackup (see the online MEB reference manual for more details about performing in‐
554 | Chapter 15: Protecting Your Investment

cremental backups including specifying the logical sequence number, or LSN, manuallyto control the incremental backup):
$ sudo ./mysqlbackup backup --port=3306 \ --backup-dir=/backups/incremental-backup-Monday \ --incremental-base=dir:/backups/initial-backup-1 --user=root --passwordMySQL Enterprise Backup version 3.9.0 [2013/08/23]Copyright (c) 2003, 2013, Oracle and/or its affiliates. All Rights Reserved.
mysqlbackup: INFO: Starting with following command line ... ./mysqlbackup backup --port=3306 --backup-dir=/backups/incremental-backup-Monday --incremental-base=/backups/initial-backup-1 --user=root --password
Enter password: mysqlbackup: INFO: MySQL server version is '5.5.23-log'. mysqlbackup: INFO: Got some server configuration information from running server.
IMPORTANT: Please check that mysqlbackup run completes successfully. At the end of a successful 'backup' run mysqlbackup prints "mysqlbackup completed OK!".
130826 19:02:43 mysqlbackup: INFO: MEB logfile created at /backups/incremental-backup-Monday/meta/MEB_2013-08-26.19-02-43_backup.log
-------------------------------------------------------------------- Server Repository Options:-------------------------------------------------------------------- datadir = /usr/local/mysql/data/ innodb_data_home_dir = innodb_data_file_path = ibdata1:10M:autoextend innodb_log_group_home_dir = /usr/local/mysql/data/ innodb_log_files_in_group = 2 innodb_log_file_size = 5242880 innodb_page_size = Null innodb_checksum_algorithm = innodb
-------------------------------------------------------------------- Backup Config Options:-------------------------------------------------------------------- datadir = /backups/incremental-backup-Monday/datadir innodb_data_home_dir = /backups/incremental-backup-Monday/datadir innodb_data_file_path = ibdata1:10M:autoextend innodb_log_group_home_dir = /backups/incremental-backup-Monday/datadir innodb_log_files_in_group = 2 innodb_log_file_size = 5242880 innodb_page_size = 16384 innodb_checksum_algorithm = innodb
mysqlbackup: INFO: Unique generated backup id for this is 13775581632965290
Backup Tools and OS-Level Solutions | 555

mysqlbackup: INFO: Creating 14 buffers each of size 16777216.130826 19:02:45 mysqlbackup: INFO: Full Backup operation starts with following threads1 read-threads 6 process-threads 1 write-threads130826 19:02:45 mysqlbackup: INFO: System tablespace file format is Antelope.130826 19:02:45 mysqlbackup: INFO: Starting to copy all innodb files...130826 19:02:45 mysqlbackup: INFO: Found checkpoint at lsn 20135490.130826 19:02:45 mysqlbackup: INFO: Starting log scan from lsn 20135424.130826 19:02:45 mysqlbackup: INFO: Copying /usr/local/mysql/data/ibdata1 (Antelope file format).130826 19:02:45 mysqlbackup: INFO: Copying log...130826 19:02:45 mysqlbackup: INFO: Log copied, lsn 20135490.130826 19:02:45 mysqlbackup: INFO: Completing the copy of innodb files.130826 19:02:46 mysqlbackup: INFO: Preparing to lock tables: Connected to mysqld server.130826 19:02:46 mysqlbackup: INFO: Starting to lock all the tables...130826 19:02:46 mysqlbackup: INFO: All tables are locked and flushed to disk130826 19:02:46 mysqlbackup: INFO: Opening backup source directory '/usr/local/mysql/data/'130826 19:02:46 mysqlbackup: INFO: Starting to backup all non-innodb files insubdirectories of '/usr/local/mysql/data/'130826 19:02:46 mysqlbackup: INFO: Copying the database directory 'menagerie'130826 19:02:46 mysqlbackup: INFO: Copying the database directory 'my_sensor_network'130826 19:02:46 mysqlbackup: INFO: Copying the database directory 'mysql'130826 19:02:46 mysqlbackup: INFO: Copying the database directory 'newschema'130826 19:02:46 mysqlbackup: INFO: Copying the database directory 'performance_schema'130826 19:02:46 mysqlbackup: INFO: Copying the database directory 'test_arduino'130826 19:02:46 mysqlbackup: INFO: Copying the database directory 'world'130826 19:02:46 mysqlbackup: INFO: Copying the database directory 'world_innodb'130826 19:02:46 mysqlbackup: INFO: Completing the copy of all non-innodb files.130826 19:02:47 mysqlbackup: INFO: A copied database page was modified at 20135490. (This is the highest lsn found on page) Scanned log up to lsn 20137372. Was able to parse the log up to lsn 20137372. Maximum page number for a log record 724130826 19:02:47 mysqlbackup: INFO: All tables unlocked130826 19:02:47 mysqlbackup: INFO: All MySQL tables were locked for 0.954 seconds.130826 19:02:47 mysqlbackup: INFO: Reading all global variables from the server.130826 19:02:47 mysqlbackup: INFO: Completed reading of all global variables from the server.130826 19:02:47 mysqlbackup: INFO: Creating server config files server-my.cnf and server-all.cnf in /backups/incremental-backup-Monday130826 19:02:47 mysqlbackup: INFO: Full Backup operation completed successfully.130826 19:02:47 mysqlbackup: INFO: Backup created in directory '/backups/incremental-backup-Monday'130826 19:02:47 mysqlbackup: INFO: MySQL binlog position: filename mysql-bin.000026, position 71731
556 | Chapter 15: Protecting Your Investment

------------------------------------------------------------- Parameters Summary------------------------------------------------------------- Start LSN : 20135424 End LSN : 20137372-------------------------------------------------------------
mysqlbackup completed OK!
In MEB, incremental backups are performed by using the InnoDBredo log, thus capturing changes made since the last recorded posi‐tion. The incremental backup feature targets InnoDB tables. For non-InnoDB tables, incremental backup includes the entire datafile rath‐er than just the changes.
Restoring data
Data is restored by applying the log described in the previous section. This operationessentially points the MySQL instance to the backup copies of the database. It does notcopy the files to the normal MySQL datadir location. If you want to do this, you mustcopy the files manually. The reason for this is that the mysqlbackup utility is designedto refuse to overwrite any data. To start a MySQL instance and use a backup of yourdata, execute a command like the following:
$ sudo ./mysqlbackup --defaults-file=/etc/my.cnf copy-back \ --datadir=/usr/local/mysql/data --backup-dir=/backups/initial-backupMySQL Enterprise Backup version 3.9.0 [2013/08/23]Copyright (c) 2003, 2013, Oracle and/or its affiliates. All Rights Reserved.
mysqlbackup: INFO: Starting with following command line ... ./mysqlbackup --defaults-file=/etc/my.cnf copy-back --datadir=/usr/local/mysql/data --backup-dir=/backups/initial-backup
IMPORTANT: Please check that mysqlbackup run completes successfully. At the end of a successful 'copy-back' run mysqlbackup prints "mysqlbackup completed OK!".
130826 19:52:46 mysqlbackup: INFO: MEB logfile created at /backups/initial-backup/meta/MEB_2013-08-26.19-52-46_copy_back.log
-------------------------------------------------------------------- Server Repository Options:-------------------------------------------------------------------- datadir = /usr/local/mysql/data innodb_data_home_dir = /usr/local/mysql/data innodb_data_file_path = ibdata1:10M:autoextend innodb_log_group_home_dir = /usr/local/mysql/data innodb_log_files_in_group = 2
Backup Tools and OS-Level Solutions | 557

innodb_log_file_size = 5M innodb_page_size = Null innodb_checksum_algorithm = innodb
-------------------------------------------------------------------- Backup Config Options:-------------------------------------------------------------------- datadir = /backups/initial-backup/datadir innodb_data_home_dir = /backups/initial-backup/datadir innodb_data_file_path = ibdata1:10M:autoextend innodb_log_group_home_dir = /backups/initial-backup/datadir innodb_log_files_in_group = 2 innodb_log_file_size = 5242880 innodb_page_size = 16384 innodb_checksum_algorithm = innodb
mysqlbackup: INFO: Creating 14 buffers each of size 16777216.130826 19:52:46 mysqlbackup: INFO: Copy-back operation starts with following threads 1 read-threads 1 write-threads130826 19:52:46 mysqlbackup: INFO: Copying /backups/initial-backup/datadir/ibdata1.130826 19:52:46 mysqlbackup: INFO: Copying the database directory 'menagerie'130826 19:52:46 mysqlbackup: INFO: Copying the database directory 'my_sensor_network'130826 19:52:46 mysqlbackup: INFO: Copying the database directory 'mysql'130826 19:52:46 mysqlbackup: INFO: Copying the database directory 'newschema'130826 19:52:46 mysqlbackup: INFO: Copying the database directory 'performance_schema'130826 19:52:46 mysqlbackup: INFO: Copying the database directory 'test_arduino'130826 19:52:46 mysqlbackup: INFO: Copying the database directory 'world'130826 19:52:46 mysqlbackup: INFO: Copying the database directory 'world_innodb'130826 19:52:46 mysqlbackup: INFO: Completing the copy of all non-innodb files.130826 19:52:46 mysqlbackup: INFO: Copying the log file 'ib_logfile0'130826 19:52:46 mysqlbackup: INFO: Copying the log file 'ib_logfile1'130826 19:52:47 mysqlbackup: INFO: Creating server config files server-my.cnf and server-all.cnf in /usr/local/mysql/data130826 19:52:47 mysqlbackup: INFO: Copy-back operation completed successfully.130826 19:52:47 mysqlbackup: INFO: Finished copying backup files to '/usr/local/mysql/data'
mysqlbackup completed OK!
You must specify the --defaults-file as the first option after thecommand. If you do not, an error message similar to mysqlbackup:unknown variable ‘defaults-file=/etc/my.cnf’ may be displayed.
558 | Chapter 15: Protecting Your Investment

Backing up a downed server
One of the tasks that is essential to good forensic recovery work is backing up the dataof a downed server. Why would you do this? If the server is down due to hardware issuesor some other non-database file (or MySQL) related problem, the data is most likelyOK and you may not think a backup is necessary. But what if, during the course ofrestarting the server, something goes wrong? If you have a good backup and recoveryplan in place you can always restore from the last backup, or from a backup plus thelast incremental backups. However, having a full backup of the server—with all of itssettings—is much more secure. Not only will you be able to restore the data shouldsomething go wrong during the repair, but you will also have a backup to which youcan return if the problem is recurring or you want to attempt to re-create it.
This is one area where MEB shines. MEB can perform what it calls a “cold backup”: abackup of a server that is not running. To accomplish this, execute a full backup spec‐ifying the --no-connection and the --defaults-file options. You also need to specifythe --datadir. The following shows a sample command to run a cold backup (we omitthe messages generated for brevity; they are the same sort of messages generated for a hot backup):
$ sudo ./mysqlbackup --defaults-file=/etc/my.cnf backup-and-apply-log \ --no-connection --datadir=/usr/local/mysql/data \ --backup-dir=/backups/emergency-cold-backupMySQL Enterprise Backup version 3.9.0 [2013/08/23]Copyright (c) 2003, 2013, Oracle and/or its affiliates. All Rights Reserved.
mysqlbackup: INFO: Starting with following command line ... ./mysqlbackup --defaults-file=/etc/my.cnf backup-and-apply-log --no-connection --datadir=/usr/local/mysql/data --backup-dir=/Users/cbell/source/emergency-cold-backup
IMPORTANT: Please check that mysqlbackup run completes successfully. At the end of a successful 'backup-and-apply-log' run mysqlbackup prints "mysqlbackup completed OK!".[...]
130826 20:09:09 mysqlbackup: INFO: Full backup prepared for recovery successfully.
mysqlbackup completed OK!
MySQL Utilities Database Export and ImportMySQL Utilities is a subcomponent of the MySQL Workbench Tool. We cover the topicin more detail in Chapter 17, but this section introduces two utilities that you can useto help backup and restore your data. They may be helpful when you need to make acopy of your data either for transformation (bulk or targeted changes to your data) orto make a human-readable copy of the data.
Backup Tools and OS-Level Solutions | 559

The first utility is mysqldbexport. This utility permits you to read your databases (aselected list or all databases) and produces output in one of several forms, includingSQL statements, comma- or tab-separated lists, and grid or vertical output, similar tohow the mysql client displays data. You can redirect this to a file for later use.
The second utility is mysqldbimport. This utility reads the output produced by themysqldbexport utility.
Both utilities allow you to import only the object definitions, only the data, or both.This may sound similar to mysqldump, and in many ways that it is true, but these utilitieshave simplified options (one criticism of mysqldump is the vast array of options avail‐able) and is written in Python, which permits database professionals to tailor the exportand import to their own needs.
A more in-depth examination of mysqldbexport and mysqldbimport can be found inChapter 17.
The mysqldump UtilityThe most popular alternative to the physical file copy feature is the mysqldump clientapplication. It has been part of the MySQL installation for some time and was originallydonated to MySQL by Igor Romanenko. mysqldump creates a set of SQL statements thatre-create the databases when you rerun them. For example, when you run a backup, theoutput contains all of the CREATE statements needed to create the databases and thetables they contain, as well as all the INSERT statements needed to re-create the data inthose tables.
This can be very handy if you need to do a search-and-replace operation in the text ofyour data. Simply back up your database, edit the resulting file with a text editor, thenrestore the database to effect the changes. Many MySQL users use this technique tocorrect all sorts of errors caused by making batch edits to the data. You will find thismuch easier than writing, say, 1,000 UPDATE statements with complicated WHERE clauses.
There are two drawbacks to using mysqldump. It takes a lot more time than the binarycopies made by file-level (physical) backups like MySQL Enterprise Backup, LVM, or asimple offline file copy, and it requires a lot more storage space. The cost in time can besignificant if you make frequent backups, want to restore a database quickly after asystem failure, or need to transfer the backup file across a network.
You can use mysqldump to back up all your databases, a specific subset of databases, oreven particular tables within a given database. The following examples show each ofthese options:
mysqldump -uroot -all-databasesmysqldump -uroot db1, db2mysqldump -uroot my_db t1
560 | Chapter 15: Protecting Your Investment


The backup_2013_09_09.tar.gz file must reside on a directory shared by the two servers(or you must physically copy it to the new server). Now, on the server where you wantto restore the data, change to the root installation of your new installation of MySQL.Delete the existing data directory, if it exists, then execute the following:
tar -xvf ../backup_2013_09_09.tar.gz
As mentioned earlier, it is always a good idea to use meaningful file‐names for your backup images.
As you can see from this example, it is very easy to back up your data at the operatingsystem level. Not only can you get a single compressed archive file that you can movearound easily, you also get the benefit of fast file copy. You can even do a selective backupby simply copying individual files or subdirectories from your data directory.
Unfortunately, the tar command is available only on Linux and Unix platforms. If youhave Cygwin installed on a Windows system and have included its version of the com‐mand, you can also use tar there. You can also use 7zip to create tar archives onWindows.
Other than Cygwin or another Unix-on-Windows package, the closest equivalent tothis command on Windows is the handy folder archive feature of the Explorer or anarchive program such as WinZip. To create a WinZip file, open Windows Explorer andnavigate to your data directory. But instead of opening the directory, right-click the datadirectory and choose an option that compresses the data, which will have a label suchas Send To→Compressed (zipped) Folder, then provide a name for the .zip file.
Although a physical file copy is the quickest and easiest form of backup, it does requirethat you shut down the server. But that isn’t necessary if you are careful to ensure noupdates occur during the file copy, by locking all tables and performing a flushtables command. However, this practice is not recommended and you should alwaystake your server offline (shutdown) before making the file copy.
This is similar to the process for cloning a slave. See Chapter 3 formore details and an example of cloning a slave using file copy.
Additionally, depending on the size of the data, your server must be offline not only forthe time to copy the files, but also for any additional data loads like cache entries or the
Backup Tools and OS-Level Solutions | 563

use of memory tables for fast lookups. For this reason, physical copy backup may notbe feasible for some installations.
Fortunately, there is a Perl script, created by Tim Bunce, to automate this process. Thescript is named mysqlhotcopy.sh and it is located in the ./scripts folder of your MySQLinstallation. It allows you to make hot copies of databases. However, you can use it onlyto back up MyISAM or Archive storage engines and it works only on Unix and Netwareoperating systems.
The mysqlhotcopy.sh utility also includes customization features. You can find moreinformation about it at the mysqlhotcopy documentation.
Logical Volume Manager SnapshotsMost Linux and some Unix systems provide another powerful method of backing upyour MySQL database. It makes use of a technology called the logical volume manager(LVM).
Microsoft Windows has a similar technology called Volume Shadow Copy. Unfortu‐nately, there are no generic utilities to make a snapshot of a random partition or folderstructure as there are for LVM. You can, however, make snapshots of an entire drive,which can be useful if your database directory is the only thing on that drive. See theMicrosoft online documentation for more information.
An LVM is a disk subsystem that gives you a lot of administrative power to create,remove, and resize volumes easily and quickly without using the older, often compli‐cated and unforgiving disk tools.
The added benefit for backup is the concept of taking a snapshot (i.e., a copy of an activevolume) without disrupting the applications that access the data on that volume. Theidea is to take a snapshot, which is a relatively fast operation, and then back up thesnapshot instead of the original volume. Deep inside LVM, a snapshot is managed usinga mechanism that keeps track of the changes since you took the snapshot, so that itstores only the disk segments that have changed. Thus, a snapshot takes up less spacethan a complete copy of the volume and when the backup is made, the LVM copies thefiles as they existed at the time of the snapshot. Snapshots effectively freeze the data.
Another benefit of using LVM and snapshots for backing up database systems lies inhow you use the volumes. The best practice is to use a separate volume for each of yourMySQL installations so that all of the data is on the same volume, allowing you to createa backup quickly using a snapshot. Of course, it is also possible to use multiple logicalvolumes in some situations, such as using one logical volume for each tablespace oreven different logical volumes for MyISAM and InnoDB tables.
564 | Chapter 15: Protecting Your Investment

Getting started with LVM
If your Linux installation does not have LVM installed, you can install it using yourpackage manager. For example, on Ubuntu you can install LVM using the followingcommand:
sudo apt-get install lvm2
Although not all LVM systems are the same, the following procedure is based on a typicalDebian distribution and works well on systems like Ubuntu. We don’t mean to write acomplete tutorial on LVM but just to give you an idea of the complexity of using LVMfor making database backups. Consult your operating system documentation forspecifics about the type of LVM your system supports, or simply browse the many how-to documents available on the Web.
Before we get started with the details, let’s take a moment to understand the basic con‐cepts of LVM. There is a hierarchy of levels to the LVM implementation. At the lowestlevel is the disk itself. On top of that are partitions, which allow us to communicate withthe disk. On top of the partition we create a physical volume, which is the control mech‐anism that the LVM provides. You can add a physical volume to a volume group (whichcan contain multiple physical volumes), and a volume group can contain one or morelogical volumes. Figure 15-1 depicts the relationship among filesystems, volume groups,physical volumes, and block devices.
Figure 15-1. Anatomy of LVM
Backup Tools and OS-Level Solutions | 565

A logical volume can act as either a normal mounted filesystem or a snapshot. Thecreation of a snapshot logical volume is the key to using snapshots for backup. Thefollowing sections describe how you can get started experimenting with LVM and mak‐ing backups of your data.
There are several useful commands that you should become familiar with. The followinglist contains the most frequently used commands and their uses. Be sure to consult thedocumentation for more information about these commands:pvcreate
Creates a physical volume
pvscan
Shows details about the physical volumes
vgcreate
Creates volume groups
vgscan
Shows details about volume groups
lvcreate
Creates a logical volume
lvscan
Shows details about logical volumes
lvremove
Removes a logical volume
mount
Mounts a logical volume
umount
Unmounts a logical volume
To use LVM, you need to have either a new disk or a disk device that you can logicallyunmount. The process is as follows (the output here was generated on a laptop runningUbuntu version 9.04):
1. Create a backup of an existing MySQL data directory:tar -czf ~/my_backups/backup.tar.gz /dev/mysql/datadir
2. Partition the drive:sudo partedselect /dev/sdbmklabel msdosmkpart testquit
566 | Chapter 15: Protecting Your Investment

3. Create a physical volume for the drive:sudo pvcreate /dev/sdb
4. Create a volume group:sudo vgcreate /dev/sdb mysql
5. Create a logical volume for your data (here we create a 20 GB volume):sudo lvcreate -L20G -ndatadir mysql
6. Create a filesystem on the logical volume:mke2fs /dev/mysql/datadir
7. Mount the logical volume:sudo mkdir /mntsudo mount /dev/mysql/datadir /mnt
8. Copy the archive and restore your data to the logical volume:sudo cp ~/my_backups/backup.tar.gzsudo tar -xvf backup.tar.gz
9. Create an instance of a MySQL server and use --datadir to point to the folder onthe logical volume:
./mysqld --console -uroot --datadir=/mnt
If you want to experiment with LVM, we recommend you use a diskwhose data you can afford to lose. A good, cheap option is a smallUSB hard drive.
That’s all you need to get started with a logical volume. Take some time to experimentwith the LVM tools, until you are certain you can work with them effectively, beforeyou start using them for your production systems.
LVM in a backup and restore
To do your backup, you need to flush and temporarily lock all of the tables, take thesnapshot, and then unlock the tables. The lock is necessary to ensure all of your ongoingtransactions are finished. The process is shown here along with the shell-level com‐mands that perform the operations:
1. Issue a FLUSH TABLES WITH READ LOCK command in a MySQL client.2. Create a snapshot of your logical volume (the -s option specifies a snapshot):
sudo lvcreate -L20M -s -n backup /dev/mysql/datadir
Backup Tools and OS-Level Solutions | 567

3. Issue an UNLOCK TABLES command in a MySQL client (your server can now resumeits operations).
4. Mount the snapshot:sudo mkdir /mntssudo mount /dev/mysql/backup /mnts
5. Perform a backup of the snapshot:tar -[FIXTHIS]f snapshot.tar.gz /mnts
Of course, the best use of the snapshot is to initiate a copy periodically so that you cando another backup. There are scripts available from volunteers on the Web to automatethis process, but the tried-and-true mechanism is to remove the snapshot and re-createit using the following procedure:
1. Unmount the snapshot:sudo umount /mnts
2. Remove the snapshot (logical volume):sudo lvremove /dev/mysql/backup
You can then re-create the snapshot and perform your backup. If you create your ownscript, we recommend adding the snapshot removal after you have verified the backuparchive was created. This will ensure your script performs proper cleanup.
If you need to restore the snapshot, simply restore the data. The real benefit of LVM isthat all of the operations for creating the snapshot and the backup using the tar utilityallow you to create a customized script that you can run periodically (such as a cronjob), which can help you automate your backups.
LVM in ZFSThe procedure for performing a backup using Sun Microsystems’ ZFS filesystem (avail‐able in Solaris 10) is very similar to the Linux LVM procedure. We describe the differ‐ences here for those of you using Solaris.
In ZFS, you store your logical volumes (which Sun calls filesystems for read/write andsnapshots for read-only copies) in a pool (similar to the volume group). To make a copyor backup, simply create a snapshot of a filesystem.
Issue the following commands to create a ZFS filesystem that you can manage:
zpool create -f mypool c0d0s5zfs create mypool/mydata
Use the following command to make a backup (take a snapshot of the new filesystem):
zfs snapshot mypool/mydata@backup_12_Dec_2013
568 | Chapter 15: Protecting Your Investment


Backup and Recovery with ReplicationOne shortcoming of backups in general is that they are created at a specific time (usuallylate at night to avoid disturbing other operations). If there is a problem that requiresyou to restore the master to some point after you created the backup, you will be out ofluck, right? Nope! As it turns out, this is indeed not only possible, but quite easy if youcombine the backups with the binary logs.
The binary log records all changes that are made to the database while the database isrunning, so by restoring the correct backup and playing back the binary log up to theappropriate second, you can actually restore a server to a precise moment in time.
The most important step in a recovery procedure is, of course, recovery. So let’s focuson performing recovery before outlining the procedure for performing a backup.
PITRThe most frequent use for backup in replication is PITR, the ability to recover from anerror (such as data loss or hardware failure) by restoring the system to a state as closeas possible to the most recent correct state, thus minimizing the loss of data. For this towork, you must have performed at least one backup.
Once you repair the server, you can restore the latest backup image and apply the binarylog using that binary log name and position as the starting point.
The following describes one procedure you can use to perform PITR using the backupsystem:
1. Return your server to an operational state after the event.2. Find the latest backup for the databases you need to restore.3. Restore the latest backup image.4. Apply the binary log using the mysqlbinlog utility using the starting position (or
starting date/time) from the last backup.
At this point, you may be wondering, “Which binary log do I use for PITR after abackup?” The answer depends on how you performed the backup. If you flushed thebinary log prior to running the backup, you need to use the name and position of thecurrent log (the newly opened logfile). If you did not flush the binary log prior to runningthe backup, use the name and position of the previous log.
For easier PITR, always flush the logs prior to a backup. The start‐ing point is then at the start of the file.
Backup and MySQL Replication | 571

Restoring after an error is replicated
Now let’s see how a backup can help you recover unintentional changes in a replicationtopology. Suppose one of your users has made a catastrophic (yet valid) change that isreplicated to all of your slaves. Replication cannot help you here, but the backup systemcan come to the rescue.
Perform the following steps to recover from unintentional changes to data in a repli‐cation topology:
1. Drop the databases on the master.2. Stop replication.3. Restore the latest backup image before the event on the master.4. Record the master’s current binlog position.5. Restore the latest backup image before the event on the slaves.6. Perform a PITR on the master, as described in the previous section.7. Restart replication from the recorded position and allow the slaves to sync.
In short, a good backup strategy is not only a necessary protection against data loss, butan important tool in your replication toolbox.
Recovery example
Now, let’s look at a concrete example. Assume you’re creating backups regularly everymorning at 2:00 A.M. and save the backup images away somewhere for later usage. Forthis example, let’s assume all binary logs are available and that none are removed. Inreality, you will prune the binlog files regularly to keep the disk space down, but let’sconsider how to handle that later.
You have been tasked with recovering the database to its state at 2013-12-19 12:54:23,because that’s when the manager’s favorite pictures were accidentally deleted by hisoverzealous assistant, who took his “Could you please clean my desk?” request to includethe computer desktop as well. Here are the steps you need to follow to recover thepicture:
1. Locate the backup image that was taken before 2013-12-19 12:54:23.It does not actually make any difference which one you pick, but to save on therecovery time, you should probably pick the one closest, which would then be thebackup image dated in the morning of the same day.
2. Restore the backup image on the machine to create an exact copy of the databaseat 2013-12-19 02:00:00.
572 | Chapter 15: Protecting Your Investment

3. Locate all the binlog files that include the entire range from 2013-12-19 02:00:00 to2013-12-19 12:54:23. It does not matter if there are events from before the start timeor after the end time, but it is critical that the binlog files cover the entire range youwant.
4. Play the binlog files back using the mysqlbinlog utility and give a start time of2013-12-19 02:00:00 and an end time of 2013-12-19 12:54:23.
You can now tell your manager that his favorite pictures are back.
To automate this, it is necessary to do some bookkeeping. This will give you an indicationof what you need to save when doing the backup, so let’s go through the informationthat you will require when doing a recovery.
• To use the backup images correctly, it is critical to label each with the start and endtime it represents. This will help you determine which image to pick.
• You also need the binlog position of the backup. This is necessary because the timeis not sufficiently precise in deciding where to start playing back the binlog files.
• You also need to keep information about what range each binlog file represents.Strictly speaking, this is not required, but it can be quite helpful because it helpsyou avoid processing all binlog files of a recovery image. This is not something thatthe MySQL server does automatically, so you have to handle it yourself.
• You cannot keep these files around forever, so it is important to sort all the infor‐mation, backup images, and binlog files in such a way that you can easily archivethem when you need to free up some disk space.
Recovery images
To help you administer all the information about your backups in manageable chunks,we introduce the concept of a recovery image. The recovery image is just a virtual con‐tainer and is not a physical entity: it contains only information about where all thenecessary pieces are to be able to perform recovery.
Figure 15-2 shows a sequence of recovery images and the contents of each. The finalrecovery image in the sequence is special and is called the open recovery image. This isthe recovery image that you are still adding changes to, hence it does not have an endtime yet. The other recovery images are called closed recovery images and these have anend time.
Backup and MySQL Replication | 573

Figure 15-2. A sequence of recovery images and contents
Each recovery image has some pieces of information that are necessary to perform arecovery:A backup image
The backup image is required for restoring the database.
A set of binlog filesBinlog files must cover the entire range for the recovery image.
Start time and an optional end timeThese are the start and end time that the recovery image represents. If this is theopen recovery image, it does not have an end time. This recovery image is notpractical to archive, so for our purposes, the end time of this recovery image is thecurrent time.
The binlog files usually contain events outside the range of startand end times, but all events in that range should be in the re‐covery image.
A list of the name and start time for each binlog fileTo extract the correct binlog files from, say, an archive, you need the names and thestart and end times for each file. You can extract the start time for the binlog fileusing mysqlbinlog.
574 | Chapter 15: Protecting Your Investment

Backup procedure
The backup procedure gathers all the information required and structures it so that wecan use it for both archiving and recovery (for this procedure, assume that we are goingto create recovery image n and that we have a sequence of recovery images, Image1 toImagen–1):
1. Create a backup using your favorite method and note the name of the backup imageand the binlog position it represents. The binlog position also contains the binlogfilename.If you used an offline backup tool, the backup time is the time when you locked thetables, and the binlog position is the position given by SHOW MASTER STATUS afteryou locked the database.
2. Create a new open recovery Imagen with the following parameters:
• Backup(Imagen) is now the backup image from step 1.• Position(Imagen) is the position from step 1.• BinlogFiles(Imagen) is unknown, but it starts with the filename from the position
from step 1.• StartTime(Imagen) is the start time of the image, which is taken from the event
at the binlog position from step 1.
3. Close Imagen–1, noting the following:
• BinlogFiles(Imagen–1) is now the binlog files from Position(Imagen–1) to Posi‐tion(Imagen).
• EndTime(Imagen–1) is now the same as StartTime(Imagen).
PITR in Python
To manage the various sorts of backup methods in a consistent manner, we’ve createdthe class PhysicalBackup in Example 15-1. The class holds three methods:class PhysicalBackup.PhysicalBackup(image_name)
The constructor for the class takes the name of an image that it will use when backingup or restoring a server.
PhysicalBackup.backup_from(server)
This method will create a backup of the server and store it under the image namegiven to the constructor.
PhysicalBackup.restore_on(server)
This method will use the backup image for the backup and restore it on server.
Backup and MySQL Replication | 575

By using a class to represent a backup method in this manner, it is easy to replace thebackup method with any other method as long as it has these methods.
Example 15-1. Class for representing the physical backup methodclass BackupImage(object): "Class for representing a backup image"
def __init__(self, backup_url): self.url = urlparse.urlparse(backup_url)
def backup_server(self, server, db): "Backup databases from a server and add them to the backup image." pass
def restore_server(self, server): "Restore the databases in an image on the server" pass
class PhysicalBackup(BackupImage): "A physical backup of a database"
def backup_server(self, server, db="*"): datadir = server.fetch_config().get('datadir') if db == "*": db = [d for d in os.listdir(datadir) if os.path.isdir(os.path.join(datadir, d))] server.sql("FLUSH TABLES WITH READ LOCK") position = replicant.fetch_master_pos(server) if server.host != "localhost": path = basename(self.url.path) else: path = self.url.path server.ssh(["tar", "zpscf", path, "-C", datadir] + db) if server.host != "localhost": subprocess.call(["scp", server.host + ":" + path, self.url.path]) server.sql("UNLOCK TABLES") return position
def restore_server(self, server): if server.host == "localhost": path = self.url.path else: path = basename(self.url.path)
datadir = server.fetch_config().get('datadir')
try: server.stop() if server.host != "localhost": call(["scp", self.url.path, server.host + ":" + path]) server.ssh(["tar", "zxf", path, "-C", datadir])
576 | Chapter 15: Protecting Your Investment

finally: server.start()
The next step is to introduce a representation of the recovery image, as shown inExample 15-2. The recovery image stores the pieces of information as five fields:RecoveryImage.backup_image
The backup image to use.
RecoveryImage.start_time
The start time of the recovery image.
RecoveryImage.start_position
The binlog position that the backup image represents. Use this instead of the starttime as the starting point for playing back the binlog files, because it will be accurate.There can be a lot of transactions executed during a second, and using the starttime will fail because it will pick the first event with the start time, while the realstart position may be somewhere else.
RecoveryImage.binlog_files
A list of the binlog files that are part of this recovery image.
RecoveryImage.binlog_datetime
A dictionary mapping binlog filenames to date/times, which are the date/time ofthe first event of the binlog file.
In addition, the recovery image must have the following utility methods:RecoveryImage.contains(datetime)
Decides whether datetime is contained in the recovery image. Because the binlogfile may have been rotated mid-second, the end_time is inclusive.
RecoveryImage.backup_from(server)
Creates a new open recovery image by creating a backup of server and collectsinformation about the backup.
RecoveryImage.restore_to(server, datetime)
Restores the recovery image on the server so that all changes up to and includingdatetime are applied. This assumes datetime is in the range for the recovery image.If datetime is before the recovery image’s start time, nothing will be applied, andif it is after the recovery image’s end time, all will be applied.
Example 15-2. A representation of a recovery imageclass RecoveryImage(object): def __init__(self, backup_method): self.backup_method = backup_method self.backup_position = None self.start_time = None self.end_time = None
Backup and MySQL Replication | 577

self.binlog_files = [] self.binlog_datetime = {}
def backup_from(self, server, datetime): self.backup_position = backup_method.backup_from(server)
def restore_to(self, server): backup_method.restore_on(server)
def contains(self, datetime): if self.end_time: return self.start_time <= datetime < self.end_time else: return self.start_time <= datetime
Because managing the recovery images requires manipulating several images, we in‐troduce the RecoveryImageManager class in Example 15-3. The class contains twomethods in addition to the constructor:RecoveryImageManager.point_in_time_recovery(server, datetime)
A method to perform PITR of server to datetime
RecoveryImageManager.point_in_time_backup(server)
A method to perform a backup of the server for PITR
The recovery image manager keeps track of all recovery images and the backup methodused. Here we assume that the same backup method is used for all the recovery images,but that is not strictly required.
Example 15-3. RecoveryImageManager classclass RecoveryImageManager(object): def __init__(self, backup_method): self.__images = [] self.__backup_method = backup_method
def point_in_time_recovery(server, datetime): from itertools import takewhile from subprocess import Popen, PIPE
for im in images: if im.contains(datetime): image = im break image.restore_on(server)
def before(file): return image.binlog_datetime(file) < datetime
files = takewhile(before, image.binlog_files) command = ["mysqlbinlog", "--start-position=%s" % (image.backup_position.pos),
578 | Chapter 15: Protecting Your Investment

"--stop-datetime=%s" % (datetime)] mysqlbinlog_proc = Popen(mysqlbinlog_command + files, stdout=PIPE)
mysql_command = ["mysql", "--host=%s" % (server.host), "--user=%s" % (server.sql_user.name), "--password=%s" % (server.sql_user.password)] mysql_proc = Popen(mysql_command, stdin=mysqlbinlog_proc.stdout) output = mysql_proc.communicate()[0]
def point_in_time_backup(self, server): new_image = RecoveryImage(self.__backup_method) new_image.backup_position = image.backup_from(server) new_image.start_time = event_datetime(new_image.backup_position)
prev_image = self.__images[-1].binlog_files prev_image.binlog_files = binlog_range(prev_image.backup_position.file, new_image.backup_position.file) prev_image.end_time = new_image.start_time
self.__images.append(new_image)
Automating BackupsIt is fairly easy to automate backups. In the previous section, we demonstrated how todo a backup and recovery with replication. In this section, we generalize the procedureto make it easier to do nonreplication-related backup and restore.
The only issue you may encounter is providing a mechanism to automatically name thebackup image file. There are many ways to do this, and Example 15-4 shows a methodthat names the file using the backup time. You can add this backup method to the Pythonlibrary to complement your replication methods. This is the same library shown inprevious chapters. Substitute the executable command for your backup solution for[BACKUP COMMAND].
Example 15-4. Backup script#!/usr/bin/python
import MySQLdb, optparse
# --# Parse arguments and read Configuration# --parser = optparse.OptionParser()parser.add_option("-u", "--user", dest="user", help="User to connect to server with")parser.add_option("-p", "--password", dest="password", help="Password to use when connecting to server")parser.add_option("-d", "--database", dest="database",
Automating Backups | 579

help="Database to connect to")(opts, args) = parser.parse_args()
if not opts.password or not opts.user or not opts.database: parser.error("You have to supply user, password, and database")
try: print "Connecting to server..." # # Connect to server # dbh = MySQLdb.connect(host="localhost", port=3306, unix_socket="/tmp/mysql.sock", user=opts.user, passwd=opts.password, db=opts.database)
# # Perform the restore # from datetime import datetime
filename = datetime.time().strftime("backup_%Y-%m-%d_%H-%M-%S.bak") dbh.cursor().execute("[BACKUP COMMAND]%s'" % filename) print "\nBACKUP complete."
except MySQLdb.Error, (n, e): print 'CRITICAL: Connect failed with reason:', e
Automating restores is a bit easier if you consider that there is no need to create a backupimage name. However, depending on your installation, usage, and configuration, youmay need to add commands to ensure there is no destructive interaction with activitiesby other applications or users. Example 15-5 shows a typical restore method that youcan add to the Python library to complement your replication methods. Substitute theexecutable command for your backup solution for [RESTORE COMMAND].
Example 15-5. Restore script#!/usr/bin/python
import MySQLdb, optparse
# --# Parse arguments and read Configuration# --parser = optparse.OptionParser()parser.add_option("-u", "--user", dest="user", help="User to connect to server with")parser.add_option("-p", "--password", dest="password", help="Password to use when connecting to server")parser.add_option("-d", "--database", dest="database", help="Database to connect to")(opts, args) = parser.parse_args()
580 | Chapter 15: Protecting Your Investment

if not opts.password or not opts.user or not opts.database: parser.error("You have to supply user, password, and database")
try: print "Connecting to server..." # # Connect to server # dbh = MySQLdb.connect(host="localhost", port=3306, unix_socket="/tmp/mysql.sock", user=opts.user, passwd=opts.password, db=opts.database)
# # Perform the restore # from datetime import datetime
filename = datetime.time().strftime("backup_%Y-%m-%d_%H-%M-%S.bak") dbh.cursor().execute("[RESTORE COMMAND]%S'", (database, filename)) print "\nRestore complete."except MySQLdb.Error, (n, e): print 'CRITICAL: Connect failed with reason:', e
As you can see in Example 15-5, you can automate a restore. However, most peopleprefer to execute the restore manually. One scenario in which an automated restoremight be helpful is in a testing environment where you want to start with a baseline andrestore a database to a known state. Another use is in a development system where youwant to preserve a certain environment for each project.
ConclusionIn this chapter, we studied IA and drilled down to the aspects that most affect you as anIT professional. We saw the importance of disaster recovery planning and how to makeyour own disaster recovery plan, and we saw how the database system is an integral partof disaster recovery. Finally, we examined several ways you can protect your MySQLdata by making regular backups.
In the next few chapters, we will examine more advanced MySQL topics, includingMySQL Enterprise and MySQL Cluster.
Joel glanced at his terminal window and issued another command to check on hisdatabase backups. He had set up a recurring backup script to back up all of his databasesand felt confident this simple operation was working. He lamented that it was only asmall start toward getting his disaster recovery plan written. He looked forward to ex‐
Conclusion | 581

perimenting with more scripts and scheduling his first disaster planning meeting. Healready had several of his new colleagues in mind for the team. A sharp rap on his doorstartled him from his thoughts.
“Did you get that media order in yet, Joel? What about that plan thing?” Mr. Summersonasked.
Joel smiled and said, “Yes, and I’ve determined I can back up the entire database withjust a…”
“Hey, that’s great, Joel. I don’t need the details; just keep us off of the auditor’s radar.OK?”
Joel smiled and nodded as his boss disappeared on his way to execute a drive-by taskingon another employee. He wondered if his boss really understood the amount of work itwould take to reach that goal. He opened his email application and started composinga message to request more personnel and resources.
582 | Chapter 15: Protecting Your Investment

CHAPTER 16
MySQL Enterprise Monitor
Joel clicked open another terminal window and read the output. He rubbed his eyesuntil his vision cleared. The numbers were beginning to run together as he tried to keeptabs on all of his servers spread out over three sites. His report was overdue.
He had tried using a spreadsheet to tabulate the data, which had worked when he hadonly a few servers, but it was getting tedious now that he had more than 30 to monitor.His friends had tried to convince him to buy an enterprise monitoring suite, but his bosshad a reputation of vetoing any purchases that didn’t immediately contribute to thecompany’s ability to produce revenue.
“Hey, Joel.”
Joel looked up to see his friend Doug from customer support standing at his door witha stained coffee cup in hand. “Hey,” Joel replied.
“You look like you could use a break.”
“No time. I’ve got to get a report together that shows the status of all of the servers andI can’t write it until I finish checking each server.”
“Wow, that’s a real hands-on approach.”
“I know. I’ve read about these enterprise suites that make this all easier to do, but I don’tknow which one to buy or even if Mr. Summerson will sign off on it.”
“Well, if you could show him how much time it takes you to do all this…” Doug said,with a dangerous wave of his mug.
Joel thought for a moment. “If only I could show him the difference between what I’vehad to slog through and what it would be like to use a good tool…”
“Good plan. Now how about a cup? My treat.”
583

Joel followed Doug to the break room and chatted with him about a recent Dave Mat‐thews Band concert they’d attended.
When Joel returned to his office, he started reading about the MySQL Enterprise Editionoffering from Oracle.
Monitoring a group of servers can be a lot of work. The tools needed to properly monitora server are numerous and while most are easy to use once you understand what theydo, they still require a bit of work to get going. Scripting and even some creative webhosting can help manage the execution of the various tools and the collection of thedata, but as the number of servers to monitor grows, the task of collecting and analyzingall of the data can become time consuming.
The monitoring techniques discussed so far in this book can become unmanageable forinstallations with more than a few servers. Indeed, manual monitoring and reportingcan turn into a full-time job for one or more technicians in an organization with dozensof servers.
We focus on monitoring in this chapter, but the same can be said about administration.Specifically, administrators often see time savings when they use administration toolsthat permit automation of common tasks, such as running scripts to populate tables orperforming table maintenance.
Fortunately, this problem isn’t new, nor is it insurmountable. Indeed, there are severalenterprise monitoring suites that can make life in a sea of servers much easier.
One of the most underestimated tools available for monitoring MySQL is the MySQLEnterprise Monitor (MEM), which comes with the MySQL Enterprise Edition license.The MEM tools can greatly enhance monitoring and preventive maintenance and candramatically reduce diagnostic time and downtime. While it is a fee-based tool, thesavings of having a well-maintained data center will more than cover the cost.
This chapter introduces the MySQL Enterprise Monitor version 3.0 and shows you howthey will save you time while keeping your MySQL servers running at the highest levelsof performance and availability. We also include an example of the monitoring toolsrunning on a complex replication topology.
Getting Started with MySQL Enterprise MonitorMEM is one component of the MySQL Enterprise Edition. When you purchase a com‐mercial license for MySQL Enterprise Edition, you get all of the enterprise tools as well.
The MySQL Enterprise Edition was launched in 2006 and comprises the EnterpriseMySQL server release, a set of monitoring tools, auditing, backup, and product supportservices. MySQL Enterprise Edition is intended for customers who use MySQL for data
584 | Chapter 16: MySQL Enterprise Monitor

management. Early on, MySQL recognized the need organizations have for stability andreliability. MySQL Enterprise Edition was the answer to this need.
If you are not ready to purchase a MySQL Enterprise Edition or youwant to try it out for a while before deciding, you can get a trial licenseand download a copy of the software under a trial license on theOracle Software Delivery Cloud. If you are an Oracle customer, youcan also find MySQL products for download on the Oracle supportsite.
The following sections describe the available options for purchasing commercial ver‐sions of MySQL. We also include an overview of the installation process. Later sectionsdescribe the features and benefits in more detail.
Commercial OfferingsMySQL is available for purchase in one of four editions. At the top of the heap is thefull featured MySQL Enterprise Edition which includes a host of tools and productsdesigned to help organizations manage large installations of MySQL. You can also pur‐chase commercial licenses of the MySQL server, called the MySQL Standard Editionwhich provides the MySQL server as well as professional support. For specialized needs,Oracle offers two solutions. The MySQL Cluster Carrier Grade Edition for organizationsthat require large, redundant, high speed in memory database solutions. The MySQLClassic Edition is configured and licensed for use by ISVs/OEMs.
With so many options to choose from, you can add more support as your businessgrows. For more information about purchasing licenses for your MySQL servers or ifyou want to obtain professional support as well as advanced tools such as MEM, contactthe Oracle MySQL Sales Team. Visit the MySQL Products and Services site for moreinformation about contacting the sales team either by phone or electronically.
Anatomy of MySQL Enterprise MonitorMySQL Enterprise Monitor includes a web-based MEM application hosted by its ownweb server (Tomcat), along with a separate MySQL server instance to be a repositoryfor the metrics collected by other applications installed on your MySQL servers, calledagents. MEM combines the metrics into reports that you can enhance with heuristics called advisors that help you enforce best practices based on MySQL research and ex‐pertise. The reports are displayed on a web page called a dashboard. We’ll discuss laterin this chapter how to install and use these components.
Thus, MEM is made up of two components. The web server and MySQL server instanceis called the MEM Service Manager (sometimes referred to as the MySQL EnterpriseMonitor or simply monitor). The component you install on the MySQL server to mon‐
Getting Started with MySQL Enterprise Monitor | 585

itor the MySQL instances and collect data is called the MEM Agent (or simply MySQLAgent). Although not part of MEM specifically (but is a prerequisite) is one or moreMySQL server instances. A pictorial representation of these components and the flowof information is shown in Figure 16-1. We discuss each of these components in moredetail in a later section.
Figure 16-1. Anatomy of MySQL Enterprise Monitor
Now that we understand the components of MEM, let’s see how we can install thecomponents and get MEM running.
Installation OverviewWhile complete, detailed installation instructions are beyond the scope of this book, webriefly describe the steps necessary to install and configure the MySQL EnterpriseMonitor. Fortunately, the install process is streamlined and very easy.
For example, if you’re doing a new installation, the basic steps include the following:
1. Download, install and launch the Service Manager. To install the MySQL EnterpriseMonitor Service Manager component, including the metrics repository (a separateinstallation of MySQL), which is operating system–specific. For example, youwould install the file named mysqlmonitor-3.0.0.2887-osx-installer.app on a MacOS X system.
2. Open the service manager using your browser (starts automatically for a new install)and configure your system using the first-time setup screen. You can also accessthe dashboard at http://localhost:18443.
586 | Chapter 16: MySQL Enterprise Monitor

3. Install the monitoring agent on your MySQL servers. This is also operating system–specific. For example, on Linux systems you would install an agent such asmysqlmonitoragent-3.0.0.2887-linux-glibc2.3-x86-64bit-installer.bin.
4. Configure the dashboard to reflect your environment. You can group servers andgive each server a more descriptive name.
You can find additional information about installing MEM in theonline MEM reference manual.
Installing the MEM Service Manager
The installation of the MEM Service Manager component includes a self-contained webserver and MySQL instance that you install on the system where you want to host theDashboard and metrics collection. This system is the destination for the data from eachof the monitoring agents. This process is very easy to perform and does not require anyweb administration expertise.
During the installation of the service manager component, you will have to make de‐cisions about the names of certain accounts and the location (e.g., IP address) of yourserver. You will need this information when installing the monitoring agents. The Get‐ting Started chapter in the online MEM reference manual discusses all of these items.It may be helpful to print out the guide and use it to write down the information yousupply during the installation for later reference.
Installing the MEM Agent
Installation of the monitoring agents is also very easy. Once your monitoring server isup and running, you can install one agent on each of your servers where your MySQLserver instances reside. Some systems may require manually starting the agent, whichis explained in detail in the guide.
While it is possible to install the monitor agent on any server and monitor MySQLinstances running on other servers, it is best to install the agent on the server with theMySQL instances you wish to monitor. This permits the agent to send operating systemstatistics, performance data, and configuration parameters to the Dashboard. If youinstall the agent on another system, the system section of the Dashboard report for theMySQL server will be blank.
You can use your existing MySQL server installations, but for the best return on yourinvestment, you should be using the versions provided by your MySQL Enterprise Ed‐
Getting Started with MySQL Enterprise Monitor | 587

ition license purchase. Once your database servers are configured and running properly,you can begin the installation of the Enterprise Monitor and monitoring agents.
You should begin by installing the MEM service on a machine on your network thathas connectivity to all of the servers you want to monitor (we recommend always usingMEM to monitor your MySQL servers). During the installation process, be sure to writedown the hostname or IP address of this server and the username and password youspecified for the agent access. The installation process is very easy and is well docu‐mented on the MySQL Enterprise Edition documentation site.
Several user accounts are involved in the installation of MEM: a MEMadministrator account, an agent access account to your MEM serv‐er, and two agent access accounts for the monitoring agent runningon each MySQL server. Getting these confused can lead to a failedinstallation.
Once the MEM service is up and running on your monitoring server, you can begininstalling the monitoring agent on each of your MySQL servers. When you install themonitoring agent, you will need to provide a user account and password for a connec‐tion from the monitoring agent to your MySQL server. It is best to use the same user‐name and password for all of your servers. Like the MEM services installation, installingthe monitoring agent is very easy. Just be sure to record all of the user accounts andpasswords used. Once again, you should use the same accounts and passwords for allof your monitoring agents. Once installation is complete, the server should show up inthe MEM within a few moments depending on your refresh settings.
Repeat the installation on each of your servers and observe the results in the Dashboard.Figure 16-2 shows the Dashboard for the example information infrastructure with allmonitoring agents reporting. You will see several graphs and sections in the interface.These include database availability, connection status to each server, aggregate databaseactivity, query response times, and a list of critical issues identified among the servers.
Fixing monitoring agent problems
Although the installation process for the monitoring agent is very streamlined, thereare times when things can go wrong. If you are careful to supply the correct information,everything should work correctly.
The following are some basic procedures for diagnosing and correcting problems ingetting the monitoring agent to report to the MEM:
• Check the mysql-monitor-agent.log file if your monitoring agent starts but the serveris not shown on the Dashboard, or if the agent or service status indicates an error(a red dot) in the heat chart. This file contains a wealth of information that can helpyou solve most problems. You can find the logfiles in the following locations:
588 | Chapter 16: MySQL Enterprise Monitor

Mac OS X/Applications/mysql/enterprise/agent/
Linux/Unix/opt/mysql/enterprise/agent
WindowsC:\Program Files\MySQL\Enterprise\Agent
• Check the user account and permissions specified for the monitoring agent on theMySQL server.
• Verify the port and hostname of your local MySQL server. Be sure the informationmatches what is in the \etc\bootstrap.profile file.
If you feel you have used the wrong usernames and passwords, you can use the \bin\agent.sh script to change any of the parameters for the agent. The following shows thecommands available (see the online MEM reference manual for more details):
$ ./agent.sh --helpUsage: java com.mysql.etools.agent.runtime.Main [options], where options are:
Option Description------ ------------D, --agent-instance-dir Path to the directory that contains per agent instance configuration and runtime data. Only used for multiple agent instances running from the same base directory.-G, --agent-group MEM Group to use for all MySQL connections from this agent-I, --uuid MEM Agent UUID-M, --migrate-agent Migrate agent connections-P, --port Port for the MySQL instance (Actions: Create, Modify)-S, --socket Socket for the MySQL instance (Actions: Create, Modify)-T, --test-credentials Test MySQL connection credentials-U, --url MEM Service Manager URL-c, --create-connection Create or Modify a MySQL connection-d, --delete-connection Close and Delete a MySQL connection (must also specify --connection-id)-f, --force-plain-stdin Force the use of plain standard input (clear password input)-g, --connection-group MEM Group to use for created/modified connection (Actions: Create, Modify)-h, --host Host for the MySQL instance (Actions: Create, Modify)--help Prints this usage message-i, --connection-id Connection ID (Actions: Modify, Delete)-j, --admin-user Admin level username (Actions: Create, Modify)
Getting Started with MySQL Enterprise Monitor | 589

-k, --general-user General level username (Actions: Create, Modify)-l, --limited-user Limited level username (Actions: Create, Modify)-m, --auto-manage-extra-users Auto-create general / limited users (Actions: Create, Modify)-s, --show Show information about all MySQL connections on this agent-t, --run-collection-tests Discover, and attempt to collect OS related assets and dump them to STDOUT (for debugging)-u, --agent-user MEM Service Manager agent username-v, --version Displays the version of the agent and components
Configuring the dashboard
After at least one agent is installed and started, you can return to the Dashboard andstart configuring it to fit your needs. For example, you can create groups to organizeyour servers into logical units. For instance, you may want to define some servers asproduction servers and others as development servers.
You can rename the servers using the Manage Servers option on the Settings page. Thisallows you to use more meaningful names on the Dashboard while leaving the actualhostnames of the servers unaltered. You can also create groups to combine relatedservers. This can be very handy, because the group is displayed on the various controls,allowing you to collapse the group and alter the display as needed.
MySQL Enterprise Monitor ComponentsThe MEM forms the core of the continuous server monitoring and alerts. The MySQLwebsite states it best: “It’s like having a ‘Virtual DBA Assistant’ at your side to recommendbest practices to eliminate security vulnerabilities, improve replication, optimize per‐formance and more.” Despite the marketing angle, the MEM gives you professional-level tools to meet the growing needs of your business’s data center.
The MEM includes the following key features:
• A single web-based display to monitor the health of all of your servers• Over 600 metrics, including the MySQL server and its host operating system• The ability to monitor performance, replication, schema, and security• The ability to monitor operating system statistics of the servers where the agent is
installed• Immediate health status via an easy-to-read heat chart• Notification of metric threshold violations
590 | Chapter 16: MySQL Enterprise Monitor

• Implementation of the best practices ruleset from the creators of MySQL• Compliance with all of the latest features of the MySQL including UUIDs, GTIDs,
and more• Automatic adaptive measures to detect changes to servers such as replication roles,
detecting new server instances, and more.• Detection and ranking of the most critical issues on each server• Trends, projections, and forecasting features added to all graphs and events to help
identify potential problems• The 3.0 version introduces many changes to the user interfaces for the Dashboard
making it even easier to monitor your servers
Recall that MEM is composed of a distributed web-based application that you run onyour internal network. A monitoring agent is installed on each MySQL server that sendsmetrics to the web server component, called the Dashboard. It is here that you can seeall of the statistics and graphs that depict the status of your servers. There are alsoadvisors that implement the best practices for ensuring your installations are properlyconfigured and running at peak efficiency.
DashboardThe face of the MySQL Enterprise Monitoring tools is the Dashboard, the web appli‐cation running on your monitoring server. The Dashboard provides a single locationwhere you can monitor all of your servers, either individually or in groups. You can seethe availability, security, and performance data for all of your servers in one place. Youcan check the relative health of each, examine graphs of performance and memory use,and see vital operating system statistics for each server.
The Dashboard presents monitoring and alert information to you in an easy-to-readformat. An example of a simple installation is shown in Figure 16-2. As you can see, theDashboard provides all of the critical information on a single screen. There are tabs forvarious dashboard views (overview graphs, MySQL instances, and replication), events,the Query Analyzer, reports and graphs, and configuration settings. The “What’s New?”tab contains links to news and events concerning the tools and your Enterprise licensesand products.
MySQL Enterprise Monitor Components | 591

Figure 16-2. The MySQL Enterprise Monitor Dashboard
Notice the “Emergency & Critical Events” secton in the lower right of the page. Thisarea shows you all of the critical issues detected for each server. In this case, we havepurposely included servers with some issues to demonstrate the power of the automaticcritical issue detection. However, it should be noted that these servers are developmentservers and not used for production. Had it been a production server, the issues iden‐tified would be most serious. Nevertheless, MEM treats all servers with the highest levelof expectations and scrutiny. Here we see that MEM has detected several critical prob‐lems that need to be addressed.
Among these issues are a suboptimal setting for the table cache, several issues with useraccounts, and a prediction about disk space. Let’s look at one of the account issues. Ifyou click on the alter, you will see a detailed explanation of the problem along with howto correct the problem, as shown in Figure 16-3.
592 | Chapter 16: MySQL Enterprise Monitor

Figure 16-3. The MySQL Enterprise Monitor Dashboard
As you can see from the explanation, there exists at least one account named “root”without a password. A quick query on the server reveals this to be true and the recom‐mended actions most prudent. Clearly, this is something that must be fixed to ensurestronger security.
mysql> SELECT user, host, password FROM mysql.user WHERE user = 'root';+------+----------------------------+-------------------------------------------+| user | host | password |+------+----------------------------+-------------------------------------------+| root | localhost | *[...] || root | 127.0.0.1 | || root | ::1 | || root | 192.168.1.15 | *[...] || root | 192.168.1.102 | *[...] || root | % | *[...] |+------+----------------------------+-------------------------------------------+6 rows in set (0.00 sec)
MySQL Enterprise Monitor Components | 593

We have masked out the passwords in the previous ouput. An ac‐tual query would show the digest value for the password column.
As each critical issue is corrected and the interface refreshed, the issue is removed fromthe list. You can also clear the issues if you feel they are not applicable. For example, youmay have a development or test server that is configured intentionally to have issues foruse in testing. You can also add your own notes about the conditions for future reference.In this way, you can quickly see those servers in your network that needs attention.
Monitoring AgentThe monitoring agent is a special lightweight application that gathers information abouta MySQL server, including statistics about the host operating system. The monitoringagent is therefore the key component in the monitoring tools. Designed to be installedon each server you want to monitor, the agent is not only lightweight, but almost trans‐parent, with no noticeable performance degradation.
AdvisorsThe MEM tools include one feature that departs from typical enterprise monitoringsolutions: a mechanism that monitors specific areas of system performance and con‐figuration and sends alerts when a server diverges from the best practices defined bythe designers of MySQL. This means you can get immediate feedback on anything thatcan cause your system to become suboptimal in configuration, security, or performance.This mechanism is called an advisor, and there are many of them monitoring and re‐porting on a wide variety of areas. The advisors supplied are extensive:Administration
Monitors general database administration and performance.
AgentChecks the status of the agents installed on your network.
AvailabilityMonitor MySQL connections and process health.
BackupChecks status of backup jobs, resources, and tasks for MySQL Enterprise Backup.
ClusterAdvisors for the MySQL Cluster product.
594 | Chapter 16: MySQL Enterprise Monitor

GraphingIdentifies issues for the graphing elements.
Memory UsageIdentifies changes in memory usage and sends alerts when suboptimal conditionsarise.
Monitoring and Support ServicesAdvisors for the MEM services themselves. Yes, it even advises you on how to makeit better!
Operating SystemIdentifies potential problems about the operating system of the hosts for the MySQLservers.
PerformanceIdentifies differences in performance based on MySQL performance best practicerules.
Query AnalysisIdentifies issues related to the Query Analyzer.
ReplicationIdentifies replication-specific conditions related to configuration, health, synchro‐nization (delays), and performance issues.
SchemaIdentifies changes to database and schema objects. Can monitor changes and pro‐vide alerts when unwanted or unexpected changes occur.
SecurityIdentifies potential security vulnerabilities and sends alerts.
Each advisor provides comprehensive coverage of a specific area of the server using aset of rules based on best practices. The advisors help you identify where your serversneed attention and give you advice on how to improve or correct the situation. If theset of advisors isn’t broad enough, you can create your own advisors to meet your needs.
Query AnalyzerComplex databases and the complex applications that they tend to support can resultin the execution of complex queries. Given the expressiveness of SQL, queries are oftennot written to execute as efficiently as possible. Furthermore, poorly written queries canoften be the source of poor performance on other levels. Savvy DBAs acknowledge thisand often look to the queries first for database performance diagnostics.
You can normally find a poorly performing query by watching the slow query log orthe process list (i.e., issuing a SHOW PROCESSLIST command). Once you have identified
MySQL Enterprise Monitor Components | 595

a query that needs your attention, you can use the EXPLAIN command to see how MySQLwill execute the query. Although this process is well known and has been used by DBAsfor some time, it is a labor-intensive task that does not easily lend itself to scripting. Asthe complexity of the database grows, so too does the labor involved in diagnosing poorlyperforming queries.
You can examine user queries with this method, but what do you do when investigatingapplication performance where the SQL statements are included in the application codeitself? This situation is among the hardest to diagnose and repair, as it requires changingthe application. Assuming that is possible, how do you advise the developers to improvetheir queries?
Unfortunately, the SQL statements in the application code are rarely suspected of beingthe source of performance problems. DBAs and developers are all too quick to blamethe server or system instead of application code or embedded SQL queries. Worse still,the MySQL system does not support robust performance metric collection and there islittle support for finding troublesome queries.
As a partial solution to these difficulties, you may find it useful to pull up a list of all ofthe long-running queries on your server and examine the slowest ones. The QueryAnalyzer component of the Enterprise Monitor tools provides this help.
You can enable the Query Analyzer via the Dashboard. Installation and configurationrequire a little work, so be sure to consult the Getting Started guide for details.
The Query Analyzer provides an aggregate display showing performance statistics forqueries in real time. It shows all of your queries from all of your servers in one place soyou don’t need to go from server to server looking for poorly performing queries. Thissame list maintains a history of the queries so you don’t have to worry about the addi‐tional space for logs.
You can get two different views for each query: a canonical view (no numeric data) tosee a pictorial version of the query, and a version that shows specific timing and accessdata for the query. Best of all, the advisor can even alert you when a given query wasexecuted and on which server.
The Query Analyzer allows you to see which queries are performing poorly and toidentify a solution by examining the suspected query’s execution plan. Clearly, thisfeature alone can provide huge time savings, especially for situations in which you aredeveloping or tuning an application for deployment or need to optimize your queriesfor improved performance.
596 | Chapter 16: MySQL Enterprise Monitor

MySQL Production SupportThe MySQL Enterprise Edition license includes access to support professionals whocan help you with development, deployment, and management of your MySQL servers.Support includes problem resolution, consulting, access to an online knowledge baseof common solutions, and a technical account manager who will be your point of con‐tact, helping you with all of your support needs.
Depending on how you purchased the MySQL Enterprise Edition,consultation and extended assistance may incur additional costs.
Using MySQL Enterprise MonitorNow that we have described the features of MEM and its components, let’s take a lookat an example of how the tools can truly benefit an organization. In this example, weuse a hypothetical—albeit not uncommon—information infrastructure for a web-basedcompany. This example is representative of the types of replication models seen in in‐dustry. It includes a complex multiple-tier replication setup that replicates some data‐bases but not others.
This scenario, shown in Figure 16-4, consists of two data centers connected via repli‐cation for high availability and load balancing. These data centers host the company’sdatabases. The production data center in San Francisco is used for hosting their day-to-day operations. Connected to this master server is a slave for the development de‐partments located in Seattle and responsible for building and enhancing the productlines.
Each of the slaves beneath the data centers can (and typically do) host additional data‐bases that are not replicated. For example, the production server typically hosts a humanresources database that is not replicated to most of its slaves (e.g., it is not replicated tothe development center). Similarly, the development server has various incarnations ofthe product line databases in various states of development.
A topology such as this can be visualized easily with the MySQL Enterprise MonitorDashboard. Figure 16-5 shows how the example topology would look in the dashboard.
Using MySQL Enterprise Monitor | 597

Figure 16-4. Sample information infrastructure
The topology of servers displayed in the following images is a basic replication setupwith a single master and few slaves at each site. The master in the satellite office (Seattle)is connected as a slave to the master in the main office (San Francisco). The servers havenot been configured in an optimal state to demonstrate the features and power of MEMto identify sub optimal configurations and critical issues.
598 | Chapter 16: MySQL Enterprise Monitor

Figure 16-5. Dashboard
This is the default display mode for the dashboard. As we can see, each of the servers isreporting its availability, categorical database activity, query response times, and a longlist of potential issues. There are additional views available in the dashboard that includea view of the servers participating in replication topologies and a detailed list of allMySQL servers monitored. We will see examples of these views in later sections.
As you can surmise, this page presents all of the pertinent information about yourservers so that you can, at a glance, see the overall health of your information infra‐structure, including all potential and critical issues identified by the monitoring agents.Clearly, monitoring can’t get any easier than that!
MonitoringThere are several areas in which MEM makes monitoring much easier for the admin‐istrators of a complex infrastructure. These areas include:
• Critical issues details• Consolidated server graphs• Server details• Replication details• Advisors
Using MySQL Enterprise Monitor | 599

We will examine each of these in greater detail in the following sections.
Critical issues details
The best thing about the critical issues list, which may not be obvious, is that you canclick on any one of the entries to get more information. For example, if you click on oneof the servers in the Current Problem Hosts, you will see a list of all of the alerts for thatsystem, as shown in Figure 16-6. You can then click one of the most recent alerts andget a detailed report like the one shown in Figure 16-7.
Figure 16-6. Sample alerts list
600 | Chapter 16: MySQL Enterprise Monitor

Figure 16-7. Sample alert report
This report indicates the server on which the alert occurred, the time it occurred, andadvice following the established best practices including any pertinent links to docu‐mentation. The alert reports make the MEM stand alone among the monitoring options.This is what is meant by having a “virtual DBA assistant.” The alerts will make your lifemuch easier by trapping the problems from servers all over your organization and re‐porting them in a single place. This saves you the time and tedium of costly diagnosticefforts or active monitoring and gives you tips on how to solve problems quickly.
Consolidated server graphs
At the left of the Dashboard display is a consolidated set of graphs that show aggregatedata from the servers being monitored (Figure 16-8), including database activity, con‐nection status of all servers, and query response times.
Using MySQL Enterprise Monitor | 601

Figure 16-8. Sample consolidated server graphs
The database activity graph shows statistics concerning availability. Like all of thegraphs, the data is aggregated from all servers monitored.
The connections graph shows the connection times for all of the servers monitored overtime.
The database activity shows you a relative count of the most frequent queries based oncategory.
The query response time shows the average response time of queries executed.
You can see many more reports including reports for specific met‐rics from the Reports and Graphs tab.
Server details
Another nice feature of the Dashboard is that it lets you click on a specific server in thelist of servers to see more details about the system. The server details report shows theversion of the MySQL server; when it was last started (uptime); where the data is located;
602 | Chapter 16: MySQL Enterprise Monitor

the host operating system; and CPU, memory size, disk space, and networkinformation.
You can use this information for inventory purposes (determining what hardware is onyour network) as well as for a quick look at what operating system is running to giveyou a clue about how to fix a problem. For example, you can remotely log into a serverto fix something and know its hostname, IP address, MySQL version, and most impor‐tantly, the host operating system before you log in—all critical information that mostadministrators memorize or write down in a notebook. Figure 16-9 shows an excerptof the server details portion of the Dashboard.
Figure 16-9. Server details
Replication details
The Replication tab of the Dashboard includes a list of all of your servers participatingin replication. The information is presented in a list form and, like all lists in MEM, youcan click on each item to get more information. Figure 16-10 shows a sample replicationdetails report.
Using MySQL Enterprise Monitor | 603

Figure 16-10. Replication details
Notice that items in the list are grouped by topology (e.g., “Wesayso Corporation,” whichyou can rename), including the type of topology, what role(s) the server is performing,and critical statistics about replication, including status of the threads, time behindmaster, current binary log, log position, master log information, and the most recenterrors.
This is an excellent example of how you can get a quick picture of your replicationtopology. The list shows the masters and slaves grouped hierarchically (i.e., a master islisted at a level directly under the group and its slaves under each master). InFigure 16-10, it is easy to see the development server has two slaves, dev_slave1 anddev_slave2, and the development server is a slave to the production server. Having all theinformation about replication in one location makes the tedious task of monitoringreplication on each server obsolete.
Advisors
What makes all of the alerts and pretty charts so informative are the best practicesimplemented in the advisors. You can see all of the active advisors (and create your own)on the Advisors tab in the Dashboard.
Figure 16-11 shows the advisors that are active for a specific server on your network.You can enable, disable, or unschedule any of the advisors (unscheduling removes thedata collected).
604 | Chapter 16: MySQL Enterprise Monitor

Figure 16-11. Advisors
Perhaps the most useful feature of this page is adding your own advisors. This featureallows you to expand the MEM to meet your specific needs. It also gives you the onething you need most when migrating from a manual monitoring solution: the ability topreserve your hard work.
For example, if you create a reporting mechanism that monitors a custom application,you can create an advisor for it and add alerts to the Dashboard. The specific details ofhow to add new advisors and alerts are covered in the MySQL Enterprise Monitormanual on the MySQL Enterprise Edition documentation site. This customization fea‐ture is one the most powerful and underutilized features of MySQL Enterprise Edition.
Query AnalyzerOne of the most powerful features of MEM is the Query Analyzer. The Query Analyzerworks by intercepting SQL commands using MySQL Proxy and processing them, thenpassing them on to the local server for execution. This allows it to record statistics sothat you can view them at any time. The Query Analyzer also supports advisors that firealerts for slow queries. Figure 16-12 shows a conceptual drawing of how MySQL Proxyintercepts queries and reports the statistics to the MEM.
Using MySQL Enterprise Monitor | 605

Newer versions of the Query Analyzer can use the Performance Sche‐ma database instead of the MySQL Proxy to gather statistics.
Figure 16-12. Using MySQL Proxy to collect data for Query Analyzer
The Query Analyzer runs over the user-defined port 6446 (by de‐fault) and can introduce some performance delay. Thus, you shouldenable it only when you are searching for problems.
One nice thing about the Query Analyzer and the Dashboard is the tight integrationamong the tools. If you have an alert about a slow query or drill down into a CPUutilization report or other MySQL-based statistic, you will see the Query Analyzer page(which you can also access directly by clicking the Query Analyzer tab). Figure 16-13shows an example of the Query Analyzer page on the Dashboard.
The Query Analyzer page displays a list of servers on the left. You can click a specificserver to see a list of queries executed on that server, sorted by longest running query.You can also use the chart at the top to narrow the time window to see queries duringa specific time period.
606 | Chapter 16: MySQL Enterprise Monitor

Figure 16-13. Query Analyzer display
You can sort the list on any column by clicking the column heading. This makes it a biteasier to see repetitive queries and diagnostics by sorting the rows with the longest-running queries at the top, showing the query statement, the amount of data manipu‐lated, and more.
You can click any row to get a more detailed report on the query. Figure 16-14 shows asample canonical query report. As with the other reports, you can get more detailedinformation, including the actual query on the Example Query tab, the output of theEXPLAIN command on the Explain Query tab (if you enabled that option), and graphsfor execution time, number of executions, and number of rows returned on theGraphs tab.
MEM and Cloud ComputingMEM can also function well in a cloud computing environment. The same rules apply,however, regarding the persistence of the data and server instances. Just be sure to re‐quest a persistent IP address for your MEM server. Repeatedly starting and stoppingyour instances will cause no ill effects, but changing hostnames and some types of re‐configuration can cause the monitoring agents to stop reporting. The unique ID foreach server is stored in the mysql.inventory table. Even though you change the IP ad‐dress, it won’t be re-added to the table because a previous incarnation (with the sameunique ID) is already in the table. Thus, MEM may not be able to contact the serverbecause it may be using stale data (the old IP address). Truncating the table typicallysolves this (because the server will be added to the table again), but it is best to use thesame hostnames and IP addresses for all of your servers.
There is one excellent benefit of running MEM in a commercial provider’s cloud: youpay only for computation and storage space. Data transfer within the cloud is usuallyfree or much less than shipping data in and out of the cloud.
Using MySQL Enterprise Monitor | 607

Figure 16-14. Canonical query report
This report presents details of the query captured, such as the canonical form of thequery (a pictorial representation of the query as it was written), details of its execution(including time taken), and rows returned or affected.
Once again, the Query Analyzer component of MEM provides a monitoring tool thatwill save you a considerable amount of time diagnosing problems with MySQL. Thiscomponent is a vital monitoring tool that will help you keep your servers running welland your queries executing efficiently.
Further InformationA complete and thorough description of the MEM and its many features is beyond thescope of this book. However, there is a great deal of information available on the Web.For more information about custom advisors and more, see the MySQL EnterpriseMonitoring manual located on the MySQL Enterprise Edition documentation site. Ifyou are an Oracle customer, you can check the knowledge base on the Oracle supportwebsite (https://support.oracle.com) for answers to common problems.
608 | Chapter 16: MySQL Enterprise Monitor

ConclusionThe MySQL server is the most popular open source database system for good reason.It is so versatile that any organization can use it, from a single self-contained web serverproviding content to users to online transaction processing systems (OLTPs) to highlyavailable massively scaled-out data center infrastructures. MySQL can handle all of thisand more. The MEM makes it possible to extend MySQL to large installations whilepreserving peak performance and reliability.
If you need high availability and want to build the best and most reliable data centerbased on MySQL, you should consider purchasing the appropriate MySQL EnterpriseEdition licenses. Other solutions exist, but none have the depth of expertise for bestpractices offered by MySQL Enterprise Edition and none give you the sophistication ofthe advisors and Query Analyzer for a bargain price.
Joel was ready. He had sent his proposal to purchase the much-needed MySQL Enter‐prise Edition licenses to cover all of the company’s servers. Mr. Summerson had a rep‐utation for spending as little as possible, so Joel was ready to defend his proposal andhad decided not to give up until Mr. Summerson had at least heard him out.
Each time he heard footsteps approaching, Joel would look up at his doorway. He knewhis boss would stop by any moment. Another set of footsteps approached and he steeledhimself once more. Mr. Summerson whisked by without a glance. “Wait for it,” Joelwhispered.
“Joel, I like this MEM thing. I want you to put together a cost estimate and…”
Joel interrupted his boss. “I already have a report for you, Bob.”
Mr. Summerson raised his eyebrows and said, “Send it to me, and I’ll get the beancounters to see if we can work it into the budget for next year.” With that, Mr. Summersonwas gone, on his way to his next victim.
Joel eased back in his desk chair and crossed his arms in satisfaction. “I’ll take that asan ‘attaboy,’” he said.
Conclusion | 609


CHAPTER 17
Managing MySQL Replicationwith MySQL Utilities
Joel was feeling pretty good about his job. Over the last few months he had conqueredmany tasks, including setting up replication and tuning MySQL. Most recently, his bossagreed to allow Joel to hire another MySQL administrator. Yes, Joel had finally madethe job his own.
A familiar knock followed by an equally familiar intrusion by his boss broke Joel’s revelry.
“Joel, I’ve got a few candidates I’d like to interview. Before you do that, I’d like you towrite up a training manual. Make sure you include all of the tricks and tips as well as allof your administrative trickery so that our new employee can come up to speed quickly.Start with that replication thing. That worries me.”
Not waiting for a reply, Joel’s boss disappeared on his way to the next drive-by tasking.Joel chuckled as he considered his latest challenge.
Suddenly, Joel’s boss thrust his head back into the doorway and said, “Be sure to use thatDocBook format the documentation guys like so much.”
“Great!” Joel said with a mock smile as his boss once again disappeared. “I guess I’ll govisit the documentation team to see what tools they use to compile their DocBook files.”
MySQL replication is a very sound and reliable server feature. As you have seen inprevious chapters, initiating and configuring replication requires a certain amount ofknowledge as well as a set of procedures tailored to your needs. Knowing what to dowhen is the key to managing MySQL replication well.
Many of the best practices for managing MySQL replication have been presented inprevious chapters. Most have been presented in the context of learning replication andapplying replication features for high availability solutions. However, we felt the book
611


In the example, we see one entry for the binlog dump thread for each slave attached.This master has two slaves attached and they are both healthy, because there’s no indi‐cation of an error in the state field.
These commands are very good at giving all of the details about the slave and its con‐nection with the master and are easy to issue from a mysql client. However, what if youhave dozens of slaves or even hundreds of slaves, or better still a tiered topology withintermediate masters and thousands of slaves? Running these commands on each slavecan get very tedious.
Fortunately, there are tools you can use to make life easier. For installations of manyslaves and complex topologies, the MySQL Enterprise Monitor solution is most likelyyour tool of choice for its one-stop monitoring capabilities.
However, there is an alternative. Even if you have many slaves, you may want to checka few of them or perhaps check only the slaves for a particular master. In this case, youcan use the health command of the mysqlrpladmin utility to generate a health reportfor a master and its slaves. We will see this utility in action later in this chapter.
Stopping ReplicationThe next most common replication administration task is stopping and restarting rep‐lication. We recommend doing these operations any time you need to do something tothe slave: for maintenance reasons, to correct errors in the data, or perhaps for appli‐cation specific changes.
The commands for starting and stopping replication include commands for resettingthe replication configurations on the master or slave. We have seen these commands inprevious chapters but summarize them here for convenience (we also include variantsas separate entries for clarity):STOP SLAVE
Stops the replication threads (SQL, IO) on the slave. Use this command when youwish to disconnect the slave from the master and stop receiving updates.
STOP SLAVE IO_THREAD
Stops the replication IO thread only. Use this command when you wish to stopreceiving updates from the master but still want to process any events in the slave’srelay log.
STOP SLAVE SQL_THREAD
Stops the replication SQL thread only. Use this command when you wish to stopprocessing events in the relay log but do not want to stop receiving updates fromthe master.
START SLAVE
Starts the slave’s replication threads.
Common MySQL Replication Tasks | 615

START SLAVE UNTIL SQL_BEFORE_GTIDS gtid_set
Start the replication threads until both have reached the first GTID before the GTIDin gtid_set is encountered, at which time the threads are stopped.
START SLAVE UNTIL SQL_AFTER_GTIDS gtid_set
Start the replication threads until both have reached the last GTID before the GTIDin gtid_set is encountered at which time the threads are stopped.
START SLAVE UNTIL MASTER_LOG_FILE='file', MASTER_LOG_POS=position
Start the replication slaves until the master’s log file and position are reached, afterwhich the slave threads are stopped.
START SLAVE UNTIL RELAY_LOG_FILE='file', RELAY_LOG_POS=position
Start the replication slaves until the slave’s relay log file and position are reached,after which the slave threads are stopped.
RESET SLAVE
This command causes the slave to delete the settings for connecting to the master.It is designed to be used for making a clean start of replication (e.g., when movinga slave from one master to another—also called pruning). The command also startsa new relay log ceasing any reads to existing relay logs.
RESET MASTER
This command is issued on the master. It is used to delete all of the binary log filesand the binary log index creating a new binary log and index. Clearly, this commandis one you will want to use very sparingly and never in the normal course of repli‐cation management. For example, it will disrupt slaves (perhaps with data loss orinconsistency) when run on a master with active slaves connected. A case whereyou may use it is if you have a master that has been taken offline (or has failed) andyou later wish to return it to service as a slave for another master.
You can specify a thread type for the START SLAVE UNTIL commandwhen used with SQL_BEFORE_GTIDS or SQL_AFTER_GTIDS. You can alsospecify only the SQL_THREAD option for the other START SLAVE UNTIL forms to act only on the SQL thread. See the online referencemanual for a complete list of the options for the START SLAVE com‐mand.
If you need to stop, start, or reset a lot of slaves, connecting to each and every one maybecome time consuming if you haven’t the time to write a script to repeat the commandon a list (or something similar). Fortunately, there is a tool you can use to issue thesecommands to a list of slaves. We will see the mysqlrpladmin utility in more detail laterin this chapter.
616 | Chapter 17: Managing MySQL Replication with MySQL Utilities

Adding SlavesAside from checking on the health of your slaves and the routine starting and stoppingreplication on slaves, the next most common replication administrative task is addingslaves to a topology. The purpose of doing so may be for scale out, making the dataaccessible to remote areas, or the normal maintenance process of removing a slave,making system changes, then returning it to the topology.
The most important element for this operation, and indeed the one that trips up mostnovice administrators, is getting the slave in sync with the master. This is particularlycomplicated when working with a slave that has older states of the databases. While theprocess is essentially the same, the case where you are adding a new slave with no datais a bit easer (only one data loading option to consider).
Before you add a slave to the topology, you must consider whether the slave has an olderstate of the data on the master. If this is true, you have several options.
• You can overwrite the data with a copy from the master. This would normally beapplying a backup file taken from the master to the slave.
• You can attempt to roll forward the master’s binary log from the last known master’sbinary log and position. This technique, called point-in-time recovery (PITR), hasbeen mentioned elsewhere in this book. Depending on how far behind the slave is,this may be a faster option than waiting for the slave to catch up. Note that thisrequires you know the master’s binary log file and position at the time the slave wastaken out of the topology.
• You can connect to the master and let the slave catch up.
You can discover the slave’s last known master binary log file andposition from the master information stored in the master.info file, forslaves started with the --master-info-repo=FILE option. You canalso query the mysql.slave_master_infotable for slaves started withthe --master-info-repo=TABLE option.
The process of adding a slave involves deciding how to set up the data on the slave andthen executing the plan using backups, file copies, or some other form of data recovery.Once the slave has data that is close to or the same as the master, you can then set upreplication in the usual manner, as described in Chapter 3. The following list summarizesthe steps for completeness:
1. If you’re not using GTIDs, be sure the new slave’s --server-id is set to a value thatis unique among your master and its slaves.
2. Prepare the data on the slave.
Common MySQL Replication Tasks | 617

3. Issue the CHANGE MASTER command on the slave. If using GTIDs, use MASTER_AUTO_POSITION=1 instead of the master log file and position
4. Issue the START SLAVE command on the slave.5. Check the slave’s SHOW SLAVE STATUS for errors.
The preceding process is called slave provisioning. Although you can’t perform all ofthese steps with a single command, there are helper utilities to make each of the stepseasier. We will see these utilities in action later in this chapter.
MySQL UtilitiesOracle has included a set of very useful administrative tools called MySQL Utilities,which is a subproduct of MySQL Workbench. The utilities are written purely in Pythonand are all command-line based.
Included in MySQL Utilities are a number of helpful utilities for managing replication.Many of the tasks discussed in the previous section can be accomplished using theseutilities. In addition to replication-specific utilities, there are a number of utilities thatcan be used in a variety of scenarios involving replication.
The following sections will present the utilities available. Rather than present an option-by-option discussion of each feature for each utility, we present the goals of the utilitiesalong with discussions on how best to use them with replication. If you need morespecific information about the utilities—the available options, features, and limitations—consult the online documentation for MySQL Utilities. The documentation containsa number of additional example scenarios and in-depth description of all options.
Most utilities provide a verbosity option, --verbose or just -v, that can be specifiedmultiple times to increase the amount of information printed. The highest level of ver‐bosity is usually --verbose --verbose --verbose or -vvv, to indicate a verbosity ofthree.
Getting StartedMySQL Utilities are available via a direct download from the MySQL download site. Todownload from that site, visit the MySQL Developers’ Zone download page. You willfind downloads for most popular platforms, including .tar and .zip files for those whowish to install the utilities using the traditional python ./setup.py install command.
The only installation requirements for installing and using MySQL Utilities are Python2.7 or higher and the Connector/Python database connector. Connector/Python canalso be found on the download site. The connector must be installed before running autility but may be installed after MySQL Utilities.
618 | Chapter 17: Managing MySQL Replication with MySQL Utilities

Using the Utilities Without WorkbenchTo use MySQL Utilities outside of MySQL Workbench, you can open any terminal(console) and, if it is not already specified in your environment or profile, set thePYTHONPATH environment variable. It must include the locations of both MySQL Utilitiesand Connector/Python. If you installed both using a platform-specific installer or viathe standard Python install command, both products were installed in your PythonXXfolder.
Using the Utilities via WorkbenchIf you download and install Workbench version 6 and later, and you have installedMySQL Utilities, you can access MySQL Utilities from within Workbench. Versionsof MySQL Workbench prior to version 6 include MySQL Utilities in the installation.MySQL Workbench version 6 and later do not.
To access MySQL Utilities from Workbench, open Workbench, then either click on thePlugins menu item and choose “Start Shell for MySQL Utilities” or click on the multi-tool icon. You may need to widen the display or click on the right arrow icon to see theUtilities plug-in icon. Figure 17-1 highlights both methods of accessing MySQL Utilities.
When the plug-in is launched, it will open a terminal (console) and print a list of theutilities available. Figure 17-2 demonstrates the results of launching the utilities plug-in.
The development of MySQL Utilities and Workbench often result innew versions available several times a year. Be sure to check thedownloads page for the latest version of MySQL Utilities and MySQLWorkbench.
MySQL Utilities | 619

Figure 17-1. Accessing MySQL Utilities from Workbench
Figure 17-2. The MySQL Utilities Plugin Console
620 | Chapter 17: Managing MySQL Replication with MySQL Utilities

General UtilitiesThis section includes a brief overview of those utilities that are general purpose in nature.We describe each utility and present a brief example of its execution along with someideas for how the utility can be used to help manage replication.
While some utilities provide shortcuts such as -s for certain op‐tions, all utilities have the ability to use prefixes for option namesprovided the prefix matches a single option. For example, supposethere is a utility with an option named --discover-slaves-loginand there are no other options that have similar prefixes. You can use--discover= or --disco instead of typing the entire option name.Clearly, this can be a huge time saver when entering many options.
Comparing Databases for Consistency: mysqldbcompareAlthough data inconsistency is rare in a well-managed infrastructure, it is possible datacan become corrupt. But it is not just data that could be inconsistent—the object defi‐nitions themselves can be inconsistent. Fortunately, the compare database utility is de‐signed to compare both definitions as well as data.
In replication, it is less likely to encounter object definition differences. Most of the time,this is a result of user error but can be the result of errors occurring during the replicationprocess. What is needed is a utility that allows you to compare two tables to determineany differences in the data.
Accidental or misdirected changes can cause data on a slave to become out of sync withthe master. For example, if a user (or an application) writes to a slave, it has effectivelyintroduced inconsistencies. Depending on the type of change, the inconsistency can goundetected for some time.
Data inconsistency can also occur if there are errors during transport of the changesfrom the master to the slave, or as a result of an unrelated failure of the slave duringexecution of events. In most cases, the error is detected right away, but it may be difficultto determine what inconsistencies exist or if any exist at all. Rather than take a chancethat the data remains consistent after the slave is repaired, it is always a good idea tocheck for inconsistencies.
Checking for inconsistency is a non-trivial endeavor. There are also many ways one candetermine inconsistencies. The mysqldbcompare utility builds checksums on a row-by-row basis, grouping them into chunks that are later compared to determine which chunkcontains inconsistencies. While effective in identifying the exact rows that differ, dueto the overhead involved in generating the checksums, running the utility against mul‐tiple databases or multiple tables with many rows may result in extended run times.
General Utilities | 621

This utility is considered an offline utility due to the overhead re‐quired to execute it, which includes a potentially long lock on thetables. If you decide to run the utility while the database is availableto users, try to do so when response time is not critical and you canhold up the database with the resource-intensive utility.
Use with replication
mysqldbcompare can be used during recovery from data corruption problems on theslave. Because the utility requires locking of the tables to be compared, it is consideredan offline utility.
To minimize impacts to production applications and users, the best use case is to choosea slave among the active, viable slaves and compare the databases between the knowngood slave and the recovered slave. You don’t have to take the servers offline, but it isbest to suspend replication before running the compare to avoid the possibility of up‐dates being blocked by the lock taken during the compare.
There are two uses of the utility for recovery. First, you can use the utility to comparethe slave with the data issues with another slave to discover what has changed. Second,you can use the utility to determine whether the data recovery attempts were successful.
Once you have identified the rows that differ, you can begin efforts to correct the dif‐ferences. There are many ways to go about this, from manual changes to the rows onthe slave to running a data recovery process like backup or point-in-time recovery.
One feature makes this utility especially useful for recovery of data inconsistencies. Itcan generate the SQL commands needed to bring the databases into synchronization.This generates statements you can use on your slave to correct data inconsistencies.
Examples of mysqldbcompare
The following examples compare a database on two servers: two slaves in a replicationtopology. The first example detects missing views on server2. This may be OK for aslave. Some administrators will create views for application-specific features. Notice thedata differences identified. Because we are running the utility on two slaves, we wouldexpect the slaves to be identical, but clearly the row for the supplier table with id 2 waschanged differently between the slaves. The good news is you now know which row tofocus your attention to determine what changes are needed to bring the slaves intoconsistency.
$ mysqldbcompare --server1=root@slave1 --server2=root@slave2 \ inventory:inventory --run-all-tests# server1 on slave1: ... connected.# server2 on slave2: ... connected.# Checking databases inventory on server1 and inventory on server2
622 | Chapter 17: Managing MySQL Replication with MySQL Utilities

WARNING: Objects in server1:inventory but not in server2:inventory: VIEW: finishing_up VIEW: cleaning Defn Row DataType Object Name Diff Count Check---------------------------------------------------------------------------TABLE supplier pass FAIL FAIL
Data differences found among rows:--- inventory.supplier+++ inventory.supplier@@ -1,2 +1,2 @@ code,name-2,Never Enough Inc.+2,Wesayso Corporation
In the next example, we run the same command, only this time we generate the datatransformation statements needed to synchronize the databases and correct the datainconsistency. Compare this to the previous example. Notice the statements presentedat the end of the listing. These are statements that can make your job of recovering fromdata inconsistency on a slave.
$ mysqldbcompare --server1=root@slave1 --server2=root@slave2 \ inventory:inventory --run-all-tests --difftype=sql# server1 on slave1: ... connected.# server2 on slave2: ... connected.# Checking databases inventory on server1 and inventory on server2
WARNING: Objects in server1:inventory but not in server2:inventory: VIEW: finishing_up VIEW: cleaning Defn Row DataType Object Name Diff Count Check---------------------------------------------------------------------------TABLE supplier pass FAIL FAIL
Data differences found among rows:--- inventory.supplier+++ inventory.supplier@@ -1,2 +1,2 @@ code,name-2,Never Enough Inc.+2,Wesayso Corporation
## Transformation for --changes-for=server1:#
UPDATE `inventory`.`supplier` SET name = 'Wesayso Corporation' WHERE code = 2;
General Utilities | 623

Copying Databases: mysqldbcopyThere are times when you need to copy data from one server to another. Depending onthe sizes of the databases you need to copy and the urgency or expediency of the copy,common offline solutions—a backup, file copy, or logical volume image—may be in‐convenient to set up and execute. In these times, it would be easier to simply tell a utilityto copy the databases. That is what the copy database utility, mysqldbcopy, is designedto do. mysqldbcopy copies all objects and the data in each database listed.
The copy database utility allows you to specify one or more databases to be copied fromone server to another. There are options for renaming the databases on the destinationserver. You can also copy a database on the same server by specifying a different namefor the database, thereby permitting you to rename databases without taking the originaldatabase offline.
Use with replication
One of the steps needed when adding a new slave is to load the slave with the data fromthe master, so you can then start replication without forcing the slave to read and executemany events from the master. Although it is often more efficient and faster to restore abackup from the master (or another up-to-date slave), it is sometimes necessary orconvenient to copy a small amount of data. In this case, mysqldbcopy may be easier toexecute than a partial restore.
Example of mysqldbcopy
The following example copies a single database from one server to another. Notice themessages printed as the copy executes. Not only are the objects and data copied, but thedatabase-level grants are copied as well. Depending on your backup application, thislast feature may make using this utility easier and faster than copying the data and thenapplying the grants manually.
$ mysqldbcopy --source=root@slave1 --destination=root@slave2 \ util_test:util_test# Source on slave1: ... connected.# Destination on slave2: ... connected.# Copying TABLE util_test.t1# Copying table data.# Copying TABLE util_test.t2# Copying table data.# Copying TABLE util_test.t3# Copying table data.# Copying TABLE util_test.t4# Copying table data.# Copying VIEW util_test.v1# Copying TRIGGER util_test.trg# Copying PROCEDURE util_test.p1# Copying FUNCTION util_test.f1
624 | Chapter 17: Managing MySQL Replication with MySQL Utilities

# Copying EVENT util_test.e1# Copying GRANTS from util_test#...done.
Exporting Databases: mysqldbexportCopying data using MySQL’s database copy utilities involves two operations; readingthe data from one server and writing the data to another server. There are times whenyou want or need to have copies of your data in a file for manipulation (correcting errorsto many rows manually), for safekeeping, or for ingestion into analytical tools.
To meet these use cases, the copy operation was made into two utilities: mysqldbex‐port for exporting the data and mysqldbimport for importing it. The export and importdatabase utilities are designed to perform a logical copy of the data. This means theutility will read tables one row at a time rather than reading the table data in binaryform like a physical copy.
The export database utility is designed to copy object definitions, data, or both usingthe --export option. You can also specify which object types you want to include withthe --skip option. Thus it is possible to export only the events for a given list of data‐bases, only the data for a specific table, or all of the objects and data from a server.
Although the utility generates its output at the console (standard out), you can redirectthe output to a file for use in other tools or for use by the import database utility.
One of the most powerful features of this utility is the ability to produce the output inone of several forms:SQL
Produce SQL statements for object creation (CREATE) and data (INSERT). This is thedefault output format.
GRID
Display output in grid or table format like that of the mysql client.
CSV
Display output in comma-separated values format.
TAB
Display output in tab-separated format.
VERTICAL
Display output in single-column format like that of the \G command option in themysql client.
General Utilities | 625

These formats are supported by a number of utilities, enablingyou to pass the formats through further filtering to make theoutput easier to read or easier to use with external tools.
The export database utility is designed to support replication by adding the appropriatereplication commands in the output stream. This permits you to use the output of theexport as an import to a slave or a master depending on the option you specify. Use the--rpl option to instruct the utilty to add STOP SLAVE , CHANGE MASTER, START SLAVEcommands to the output. For example, you can instruct the utility to include the rep‐lication commands for controlling a slave during import. To do so, use the --rpl=SLAVE option to copy data off of one slave with the goal of updating another slavethat has fallen behind. The --rpl=SLAVE option adds a CHANGE MASTER command to theend of the output. When you import this file on another slave, the slave will connect tothe same master as the slave where the export was run.
The --rpl=MASTER option also adds a CHANGE MASTER command to the end of the output.But this time, the master is the server where the export was run. This means when youimport this file on another slave, the slave will connect to the slave where the export wasrun.
You can even tell the utility to generate both statements with the --rpl=BOTH option,allowing you to edit the import for use in different levels in your topology (slaves of thecurrent server and peer slaves).
When replication statements are generated, they are always generated as SQL statements(regardless of the format chosen) and are written in the order they would be used duringan import operation. The following shows the order of statements generated (the state‐ments generated by use of the --rpl option are shown in bold):
1. STOP SLAVE2. Object definitions3. Data4. CHANGE MASTER ...5. START SLAVE
The utility also permits you to specify a separate file containing the replication com‐mands. This lets you use the replication commands separately from the export. Thismay be most helpful when you use the replication mode to generate both forms of theCHANGE MASTER (current server as master or current servers master).
If you recall, the CHANGE MASTER command includes the replication user and password.You can specify this using the --rpl-user option in the form of username:password.
626 | Chapter 17: Managing MySQL Replication with MySQL Utilities

For example, the --rpl-user=rpl:secret option instructs the mysqldbexport com‐mand to use rpl as the replication user and secret as the replication user password inthe CHANGE MASTER command as shown here:
CHANGE MASTER TO MASTER_HOST = 'localhost', MASTER_USER = 'rpl', MASTER_PASSWORD = 'secret', MASTER_PORT = 13001, MASTER_LOG_FILE = 'clone-bin.000001', MASTER_LOG_POS = 920;
If you omit the --rpl-user option, the CHANGE MASTER command will be generatedwith commented-out sections for the master user and password. This is because theinformation may not be known at the time the export is running. We show this in anupcoming example.
Another use for this utility with replication, perhaps the most useful, is during recoveryof a slave from data corruption. When used together with the mysqldbcompare databaseconsistency utility, mysqldbexport can be used to export the data from the known goodslave. You then import it on the recovered slave to restore consistency.
The latest versions of both mysqldbcopy and mysqldbexport permit you to generate thecorrect GTID statements setting the GTID_PURGED list for use in importing the data onslaves. See the online reference manual for MySQL Utilities for more information.
Example of mysqldbexport
The following example shows an export of a database with replication statements andGTID statements. The format used is a comma separated file, but the replication com‐mands are all SQL commands. Notice also the CHANGE MASTER command. To use thiscommand, you need to provide the correct user and password for the replication useron the master.
Although the database in the example is trivial, the example illustrates the replicationcommands that enable the use of the utility in replication:
$ mysqldbexport --server=root:pass@localhost:13001 --export=both --rpl=master --format=csv test_125# Source on localhost: ... connected.-- STOP SLAVE;# Exporting metadata from test_125# TABLES in test_125:TABLE_SCHEMA,TABLE_NAME,ENGINE,ORDINAL_POSITION,COLUMN_NAME,COLUMN_TYPE,IS_NULLABLE,COLUMN_DEFAULT,COLUMN_KEY,TABLE_COLLATION,CREATE_OPTIONS,CONSTRAINT_NAME,REFERENCED_TABLE_NAME,UNIQUE_CONSTRAINT_NAME,UPDATE_RULE,DELETE_RULE,CONSTRAINT_NAME,COL_NAME,REFERENCED_TABLE_SCHEMA,REFERENCED_COLUMN_NAMEtest_125,t1,InnoDB,1,a,int(11),YES,,,latin1_swedish_ci,,,,,,,,,,test_125,t1,InnoDB,2,b,char(30),YES,,,latin1_swedish_ci,,,,,,,,,,# VIEWS in test_125: (none found)# TRIGGERS in test_125: (none found)# PROCEDURES in test_125: (none found)# FUNCTIONS in test_125: (none found)
General Utilities | 627

# EVENTS in test_125: (none found)# GRANTS in test_125: (none found)#...done.# Exporting data from test_125# Data for table test_125.t1:a,b1,one2,two3,three#...done.# Connecting to the current server as master# WARNING: No --rpl-user specified and multiple users found with replication privileges.-- CHANGE MASTER TO MASTER_HOST = 'localhost', # MASTER_USER = '', # MASTER_PASSWORD = '', MASTER_PORT = 13001, MASTER_LOG_FILE = 'clone-bin.000001', MASTER_LOG_POS = 920;-- START SLAVE;
Notice the -- prefix for the replication commands. These are addedto permit the mysqldbimport to import the file and identify the rowswith replication commands.
Importing Databases: mysqldbimportThe import database utility, mysqldbimport, is designed to read a file formatted in anyof the formats generated by the export database utility. This permits you to store or usecopies of your data in the form most convenient to the task at hand and import the datawithout having to convert it.
The import database utility simply reads the file, parsing formats other than the SQLformat by converting them to SQL statements, and executes the commands on theserver.
You can use mysqldbimport to import your own files if they are for‐matted in one of mysqldbexport’s output formats.
One of the best features of this utility is the ability to import only the object definitionsor the data. Use the --import option to tell the utility to import the object definitions,the data, or both.
Another feature is the ability to change the storage engine of the tables when importing,thereby performing two operations in one pass. This can be very handy when importingdata on servers that do not support the storage engines of the originating server. For
628 | Chapter 17: Managing MySQL Replication with MySQL Utilities

example, you can use this feature to restore MyISAM tables, changing the storage engineto InnoDB in a single step.
Lastly, you can use the --dryrun option to validate the file but not actually execute thestatements generated.
Use with replication
mysqldbimport is a key companion to mysqleximport, which we discussed previously,to support the use cases for replication. The import operation is the natural follow-upto an export: you read from one server and write to another. If the file to be importedcontains replication commands, they are executed as they are encountered.
Examples of mysqldbimport
The following example shows the result of importing the data from the database exportexample shown in “Example of mysqldbexport” on page 627. In this case, we tell theimport database utility to include both object definitions and data:
$ mysqldbimport --server=root:pass@localhost:13001 test_125.sql --import=both# Source on localhost: ... connected.# Importing definitions and data from test_125.sql.#...done.
When you use the mysqldbimport utility to import output from the mysqldbexport utilitythat contains replication commands (via the --rpl option), you need do nothing extrato make these commands execute. The mysqldbimport utility is designed to identifythese commands even if the format of the file is not SQL and execute them.
However, you can disable these commands by using the --skip-rpl option. You maywant to do this if the export was saved to a file and you are using the file to import to aserver that isn’t or is not intended to be part of the topology. For example, if you wantto generate a test server to test some application, you can use an export from a viableslave and skip the replication commands when importing the file on the test server.
Discovering Differences: mysqldiffThe database difference utility, mysqldiff, performs the object definition differencecheck required by mysqldbcompare data consistency utility and described in “Compar‐ing Databases for Consistency: mysqldbcompare” on page 621. In fact, mysqldiff pre‐dates mysqldbcompare, which includes all its functionality. This shows an interestingconsequence of the high degree of reuse in the MySQL Utilities supporting library.
Rather than replace the difference utility with the data consistency utility, it was decidedto leave the utility for cases where users want to check object definitions only.
The output of mysqldiff is a difference report in one of several forms of your choice,including unified, context, differ, or SQL. The default is unified. The SQL mode can be
General Utilities | 629

valuable because it generates the transformation statements (ALTER statements) that canbe used to transform the tables so that they are the same structure.
Use with replication
mysqldiff is very helpful with replication for detecting when objects have diverged. Forexample, one of your servers may fail to update data because one or more of the tablesor dependent tables have changed in structure.
MySQL replication permits you to have different columns on themaster and slave. There are many legitimate use cases for these fea‐tures. But mysqldiff does not currently recognize the valid forms ofdifferences and instead identifies these cases as errors.
Example of mysqldiff
The following example demonstrates the use of the utility to detect differences in objectson two servers:
$ mysqldiff --server1=root:pass@localhost:13001 --server2=root:pass@localhost:13002 diff_db:diff_db# server1 on localhost: ... connected.# server2 on localhost: ... connected.# Comparing diff_db to diff_db [PASS]# Comparing diff_db.table1 to diff_db.table1 [FAIL]# Object definitions differ. (--changes-for=server1)#
--- diff_db.table1+++ diff_db.table1@@ -1,4 +1,5 @@ CREATE TABLE `table1` ( `a` int(11) DEFAULT NULL,- `b` char(30) DEFAULT NULL+ `b` char(30) DEFAULT NULL,+ `c` timestamp NOT NULL DEFAULT CURRENT_TIMESTAMP ) ENGINE=InnoDB DEFAULT CHARSET=latin1Compare failed. One or more differences found.
Detecting Misdirected WritesOne of the ways that replication can go wrong is if updates to data are misdirected toslaves instead of the master. If your slaves are not running in read-only mode, a usercould issue an update to the wrong server. When this happens, it may go undetected forsome time and can cause some frustrating side effects.
630 | Chapter 17: Managing MySQL Replication with MySQL Utilities

This could manifest as a slave that stops unexpectedly for queries that run correctly onother slaves or different data displayed by applications on some slaves and not others.
There is a trick that you can use to help identify the rogue updates. If your tables do nothave any restrictions on using timestamps, add a timestamp column to the tables onyour slave. By default, this value will not be updated for any replicated event but will beupdated for a data change issued on the slave directly.
The following transcript demonstrates how to set up this configuration and how to usethe data to identify the rows changed (we have annotated the listing, removing extra‐neous output for brevity; the commands were run on a simple replication topology ofa master and a single slave):
# Executed on the master:mysql> CREATE DATABASE diff_db;mysql> CREATE TABLE diff_db.table1 (a int, b char(30));mysql> INSERT INTO diff_db.table1 VALUES (1, 'one'), (2, 'two'), (3, 'three');mysql> SELECT * FROM diff_db.table1;+------+-------+| a | b |+------+-------+| 1 | one || 2 | two || 3 | three |+------+-------+
# Executed on the slave:mysql> SELECT * FROM diff_db.table1;+------+-------+| a | b |+------+-------+| 1 | one || 2 | two || 3 | three |+------+-------+
# Alter the table on the slave:mysql> ALTER TABLE diff_db.table1 add column c timestamp default NOW() after b;
### Enter the rogue update ###mysql> INSERT INTO diff_db.table1 VALUES (4, 'four', NULL);
mysql> SELECT * FROM diff_db.table1;+------+-------+---------------------+| a | b | c |+------+-------+---------------------+| 1 | one | 0000-00-00 00:00:00 || 2 | two | 0000-00-00 00:00:00 || 3 | three | 0000-00-00 00:00:00 || 4 | four | 2012-11-14 15:34:08 |+------+-------+---------------------+
General Utilities | 631

# Executed on the master:mysql> INSERT INTO diff_db.table1 VALUES (7, 'seven'), (8, 'eight');mysql> SELECT * FROM diff_db.table1;+------+-------+| a | b |+------+-------+| 1 | one || 2 | two || 3 | three || 7 | seven || 8 | eight |+------+-------+
# Executed on the slave:mysql> SELECT * FROM diff_db.table1;+------+-------+---------------------+| a | b | c |+------+-------+---------------------+| 1 | one | 0000-00-00 00:00:00 || 2 | two | 0000-00-00 00:00:00 || 3 | three | 0000-00-00 00:00:00 || 4 | four | 2012-11-14 15:34:08 || 7 | seven | 0000-00-00 00:00:00 || 8 | eight | 0000-00-00 00:00:00 |+------+-------+---------------------+
# Query for detecting rogue updates:mysql> SELECT * FROM diff_db.table1 WHERE c > 0;+------+------+---------------------+| a | b | c |+------+------+---------------------+| 4 | four | 2012-11-14 15:34:08 |+------+------+---------------------+
Notice the last two queries issued on the slave. We see that the timestamp column wasnot updated by any row from the master (we show new rows being added for validation),but the row update on the slave is given a timestamp value. If you have reason to notmake your slaves read only, you may want to consider a similar solution.
Showing Disk Usage: mysqldiskusageThe disk usage utility, mysqldiskusage, is one of several diagnostic utilities that reportinformation about a MySQL server. This utility is designed to display the total size ofeach database as well as other file related information, such as names and sizes of logsand InnoDB configuration parameters.
Database sizes are calculated in one of two ways. If the user account has read access tothe data directory, the sizes displayed reflect the total size of the files in the directory. If
632 | Chapter 17: Managing MySQL Replication with MySQL Utilities

the user does not have read access to the data directory, the sizes are calculated basedon metadata information about the tables, including row size and average row length.By default, the utility shows only the total size of the database, but the --verbose optionshows the database size broken out by data and miscellaneous files.
The utility can also display the existing and number of binary logs with the --binlogoption, relay logs with the --relaylog option, and slow and query logs with the --logs option. You can turn on all options with the --all option.
The output can be formatted in the GRID, CSV, TAB, or VERTICAL formats described in“Exporting Databases: mysqldbexport” on page 625.
The utility must be run on the server hosting MySQL. You will alsoneed read access to the data directory in order to display all of theinformation about logs and InnoDB data. As a result, you may needelevated privileges to run the utility.
Use with replication
Although mysqldiskusage does not apply directly to replication, it is useful when plan‐ning upgrades to replication servers to make sure you have sufficient disk space. Youcan also use the utility to check on the size of the log files and InnoDB files.
Example of mysqldiskusage
The following example shows a detailed list of the sizes of all databases on a server. Wealso show all information with all of the options enabled. Notice the information dis‐played for InnoDB. This could be helpful in diagnosing InnoDB configuration issues:
$ mysqldiskusage --server=root:root@localhost --binlog --logs --innodb --all --empty -vvv# Source on localhost: ... connected.# Database totals:+--------------------+--------------+--------------+-------------+--------------+| db_name | db_dir_size | data_size | misc_files | total |+--------------------+--------------+--------------+-------------+--------------+| oltp2 | 472,785 | 445,728 | 27,057 | 472,785 || frm_test | 472,785 | 445,728 | 27,057 | 472,785 || compare_util_test | 472,785 | 445,728 | 27,057 | 472,785 || bvm | 15,129 | 6,080 | 9,049 | 15,129 || compare | 97,924,346 | 97,897,677 | 26,669 | 97,924,346 || compare_employees | 554,176,356 | 554,166,900 | 9,456 | 554,176,356 || db1 | 11,035 | 2,188 | 8,847 | 11,035 || db2 | 11,035 | 2,188 | 8,847 | 11,035 || emp1 | 17,517 | 81,920 | 17,517 | 99,437 || emp2 | 88,877 | 206,029,917 | 87,760 | 206,117,677 || emp3 | 27,989 | 33,885 | 26,872 | 60,757 || employees | 88,892 | 206,029,917 | 87,775 | 206,117,692 || griots | 14,415 | 5,288 | 9,127 | 14,415 |
General Utilities | 633

| groits | 9,045 | 16,384 | 9,045 | 25,429 || mysql | 903,022 | 693,480 | 191,720 | 885,200 || oltp1 | 62,705 | 114,688 | 62,705 | 177,393 || sak1 | 411,538 | 6,887,232 | 143,442 | 7,030,674 || sakila | 510,111 | 6,944,576 | 184,671 | 7,129,247 || test | 580,636 | 74,029 | 506,607 | 580,636 || test123 | 17,343 | 32,768 | 17,343 | 50,111 || test_1 | 48,730 | 5,225 | 43,505 | 48,730 || test_cache | 9,868 | 1,045 | 8,823 | 9,868 || test_trig | 9,871 | 1,024 | 8,847 | 9,871 || util_test_clone2 | 36,709 | 50,269 | 35,592 | 85,861 || welford_kindle | 59,058 | 48,896 | 10,162 | 59,058 || world | 472,785 | 445,728 | 27,057 | 472,785 |+--------------------+--------------+--------------+-------------+--------------+
Total database disk usage = 1,081,112,742 bytes or 1.00 GB
# Log information.+------------------------+--------------+| log_name | size |+------------------------+--------------+| Chucks-iMac.log | 829,601,162 || Chucks-iMac-slow.log | 97,783 || Chucks-iMac.local.err | 234,028 |+------------------------+--------------+
Total size of logs = 829,932,973 bytes or 791.00 MB
# binary log information:Current binary log file = my_log.000171+----------------+----------+| log_file | size |+----------------+----------+| my_log.000001 | 3527 || my_log.000002 | 785115 || my_log.000003 | 569 |...| my_log.000169 | 348 || my_log.000170 | 258 || my_log.000171 | 722 || my_log.index | 2736 |+----------------+----------+
Total size of binary logs = 21,883,426 bytes or 20.00 MB
# Server is not an active slave - no relay log information.# InnoDB tablespace information:+--------------+------------+--------------------+-------------------------+| innodb_file | size | type | specification |+--------------+------------+--------------------+-------------------------+| ib_logfile0 | 5242880 | log file | || ib_logfile1 | 5242880 | log file | |
634 | Chapter 17: Managing MySQL Replication with MySQL Utilities

| ibdata1 | 815792128 | shared tablespace | ibdata1:778M || ibdata2 | 52428800 | shared tablespace | ibdata2:50M:autoextend |+--------------+------------+--------------------+-------------------------+
Total size of InnoDB files = 889,192,448 bytes or 848.00 MB
Tablespace ibdata2:50M:autoextend can be extended by using ibdata2:50M[...]
InnoDB freespace = 427,819,008 bytes or 408.00 MB
#...done.
Notice the list of binary logs. We have cut a long section of the results for brevity, but itis clear from the listing that the server has never had its binary logs purged. This is onearea that may be a concern for servers that have been running for extended periods.
Checking Tables Indexes: mysqlindexcheckOne of the most highly scrutinized areas for improving queries is indexing. The indexcheck utility mysqlindexcheck examines tables to determine whether there are duplicateor redundant indexes. Duplicate indexes are those that match exactly, while redundantindexes are those that are subsets of others. For example, if you have one index on theid and title columns (in that exact order) and another index on just the id column,the index on the single column is not needed. You would be surprised to see how oftenthis occurs.
mysqlindexcheck can generate SQL statements for the DROP command for all indexesidentified. You can also show the statistics of the indexes identified. This may be helpfulin performance tuning specific index parameters.
Perhaps the most useful options display a list of the worst (or best) performing indexes.This can be invaluable when tuning your databases for better query performance.
Use with replication
Although this utility has no direct application to replication other than improving theperformance of queries, you would do well to use the utility to help you improve theperformance of your applications that run on a replication system.
Example of mysqlindexcheck
The following example shows the result of checking for duplicate and redundant indexeson the sample Sakila database (while no duplicate or redundant indexes are found, weincluded the --worst option to show the worst performing index for each table; weomit some of the data for brevity):
$ mysqlindexcheck --stats -d -s --server=root:pass@localhost sakila --worst=1 --format=vertical# Source on localhost: ... connected.
General Utilities | 635

## Showing the top 1 worst performing indexes from sakila.actor:#************************* 1. row ************************* database: sakila table: actor name: idx_actor_last_name column: last_name sequence: 1 num columns: 1 cardinality: 200 est. rows: 200 percent: 100.001 rows....## Showing the top 1 worst performing indexes from sakila.rental:#************************* 1. row ************************* database: sakila table: rental name: idx_fk_staff_id column: staff_id sequence: 1 num columns: 1 cardinality: 1 est. rows: 16305 percent: 0.011 rows.
Searching Metadata: mysqlmetagrepThe metadata search utility, mysqlmetagrep, is another diagnostic tool that can aid infinding objects that match a given pattern. This can be helpful any time you need tolocate an object that matches a name or partial name.
The utility has unique search capabilities that permit you to search using POSIX regularexpressions (REGEX) or SQL patterns (e.g., LIKE). You can restrict the search to specificobject types using the --object-types option, which accepts a comma-separated listof one or more of the following: database, trigger, user, routine, column, table,partition, event, and view. The default is to search all object types. Although thedefault is to search by name, you can also instruct the utility to search the body ofprocedures using the --body option.
You can also generate a SQL statement for the search that you can use inside otherroutines or scripts.
The output can be formatted in the GRID, CSV, TAB, or VERTICAL formats described in“Exporting Databases: mysqldbexport” on page 625.
636 | Chapter 17: Managing MySQL Replication with MySQL Utilities

Use with replication
You may need to find objects by name if you encounter errors in your application orbinary log that result in partial statements or errors and warnings with partial infor‐mation.
Example of mysqlmetagrep
The following example shows a metadata search for objects with that start with the letter“t” (we signify this by providing the underscore characer after the t):
$ mysqlmetagrep --server=root:pass@localhost --pattern="t_" --format=vertical************************* 1. row ************************* Connection: root:*@localhost:3306 Object Type: TABLE Object Name: t1 Database: example1 Field Type: TABLE Matches: t1************************* 2. row ************************* Connection: root:*@localhost:3306 Object Type: TABLE Object Name: t1 Database: test Field Type: TABLE Matches: t12 rows.
Searching for Processes: mysqlprocgrepThe process search utility, mysqlprocgrep permits you to search the running processeson a server via the same search capabilities as the metadata search utility, mysqlmeta‐grep. In this case, you can match the user, host, database, command, info, and state fieldsof the SHOW PROCESSLIST output. You can also query for processes by age, permittingyou to identify long-running queries or long-term connections. Once you have identi‐fied the processes you are interested in, the utility will also permit you to kill either thequery or the connection matching the search terms.
Run the utility with general search terms until you identify the ex‐act processes you want. You can then run the utility again, specify‐ing the --kill-query or --kill-connection option to kill either thequery or the connection for processes that match.
Like the metadata grep utility, you can use the --sql option to generate SQL statementsfor use in procedures or scripts.
General Utilities | 637

Use with replication
The process search utility can be helpful with replication by identifying the connectionsfor each slave or for a specific slave by user or host. We will see a unique use of this utilityin the example.
Example of mysqlprocgrep
The following example shows a topology map generated by one of the replication util‐ities we will discuss later (see “Showing Topologies: mysqlrplshow” on page 648). In thiscase, there is a slave that was started without the --report-host and --report-portoptions (required by all replication utilities). We first show the topology map, whichdepicts a master and three slaves. Notice the warning. The utility has detected morethan the three slaves. Using the process search utility we can find the fourth slave.
$ mysqlrplshow --master=root:pass@localhost:13002 --disco=root:pass# master on localhost: ... connected.# Finding slaves for master: localhost:13002WARNING: There are slaves that have not been registered with --report-host or --report-port.
# Replication Topology Graphlocalhost:13002 (MASTER) | +--- slavehost1:13001 - (SLAVE) | +--- slavehost3:13003 - (SLAVE) | +--- slavehost4:13004 - (SLAVE)
$ mysqlprocgrep --server=root:pass@localhost:13002 --match-command="Bin%" --format=vertical************************* 1. row ************************* Connection: root:*@localhost:13002 Id: 10 User: rpl Host: slavehost1:56901 Db: None Command: Binlog Dump Time: 258 State: Master has sent all binlog to slave; waiting for binlog to be up Info: None************************* 2. row ************************* Connection: root:*@localhost:13002 Id: 8 User: rpl Host: slavehost3:56898 Db: None Command: Binlog Dump Time: 261 State: Master has sent all binlog to slave; waiting for binlog to be up Info: None
638 | Chapter 17: Managing MySQL Replication with MySQL Utilities

************************* 3. row ************************* Connection: root:*@localhost:13002 Id: 6 User: rpl Host: slavehost4:56894 Db: None Command: Binlog Dump Time: 264 State: Master has sent all binlog to slave; waiting for binlog to be up Info: None************************* 4. row ************************* Connection: root:*@localhost:13002 Id: 19 User: rpl Host: localhost:56942 Db: None Command: Binlog Dump Time: 18 State: Master has sent all binlog to slave; waiting for binlog to be up Info: None4 rows.
Cloning Servers: mysqlservercloneThe server clone utility, mysqlserverclone, is the workhorse of the bunch. It provides theability to create a new instance of a server, either by connecting to a running server orby launching a server from a MySQL installation (via the --basedir option).
When you use this utility, you specify a new data directory and a new port. You can alsospecify a server ID and a password for the root user, and pass any special options to themysqld process that will be started. If you use the --verbose option, the utility will printthe server messages on startup; otherwise these are suppressed.
The new server will be started with a new database with only defaults set. For example,you will only see the mysql database (along with the INFORMATION_SCHEMA andPERFORMANCE_SCHEMA). If you want to copy data to the new server, you can usethe database copy or the database export and import utilities.
Use with replication
This utility is very handy when you need to create a new slave in a hurry. On mostsystems, the utility takes only a few seconds to create the new data directory and launchthe server. This makes it very easy to quickly set up a new replication slave or even anentire topology on a single server.
When you are faced with difficult diagnostics of binary logs, replication errors, and dataconsistency issues, you can use mysqlserverclone to create and test a master and slavequickly. You can then use them to conduct a forensic investigation of problems by du‐
General Utilities | 639

plicating the server instances and re-creating the error on the instances. This in turnsaves you from risking harm to your existing servers.
Example of mysqlserverclone
The following example shows how to start a new instance of a server that may be offlineor unreachable. Run this command on the host where MySQL was installed. The optionspassed include a new data directory, the new port, the new server_id, and a root pass‐word:
$ mysqlserverclone --basedir=/usr/local/mysql-5.6 --new-data=../temp_13001 \ --new-port=13001 --new-id=101 --root=pass123 \ --mysqld="--log-bin --gtid-mode=on --log-slave-updates --enforce-gtid-consistency"# Cloning the MySQL server located at ../mysql-5.6.# Creating new data directory...# Configuring new instance...# Locating mysql tools...# Setting up empty database and mysql tables...# Starting new instance of the server...# Testing connection to new instance...# Success!# Setting the root password...# Connection Information:# -uroot -ppass123 --socket=../temp_13001/mysql.sock#...done.
The following example shows how easy it is to launch a new instance of a running server.Notice the options passed to the server process (mysqld) using the --mysqld option.Notice as well that we used the --delete-data option to delete the data directory if itexists. The utility will not start unless the data directory is empty or this option is present:
$ mysqlserverclone --server=root:root@localhost:13001 --new-data=../temp_13002 \ --new-port=13002 --new-id=102 --root=pass123 \ --mysqld="--log-bin --gtid-mode=on --log-slave-updates --enforce-gtid-consistency" \ --delete-data# Cloning the MySQL server running on localhost.# Creating new data directory...# Configuring new instance...# Locating mysql tools...# Setting up empty database and mysql tables...# Starting new instance of the server...# Testing connection to new instance...# Success!# Setting the root password...# Connection Information:# -uroot -ppass123 --socket=/Volumes/Source/source/temp_13002/mysql.sock#...done.
640 | Chapter 17: Managing MySQL Replication with MySQL Utilities

Showing Server Information: mysqlserverinfoThe show server information command, mysqlserverinfo, is another diagnostic utility.It is used to present the basic information about a server. It displays the major settingsfor the server, such as the base directory, data directory, configuration file, and more.
There are options for displaying the defaults read from the configuration file as well asan option to display a list of any MySQL servers running on the host where the utilityis running. The command can display the information in a variety of formats, as de‐scribed in “Exporting Databases: mysqldbexport” on page 625: GRID, CSV, TAB, andVERTICAL.
Use with replication
Like any diagnostic tool, this utility is applicable to all forms of problem investigationin replication. If used in conjunction with the server clone utility, you can quickly dis‐cover any cloned server instances.
Example of mysqlserverinfo
The following example shows this utility running on a server installed on the local host.The chosen options output the servers running on this host along with the defaults fromthe configuration file:
$ mysqlserverinfo --server=root:root@localhost:13001 --show-servers --show-defaults --format=VERTICAL## The following MySQL servers are active on this host:# Process id: 236, Data path: /Users/cbell/source/temp_13001# Process id: 331, Data path: /Users/cbell/source/temp_13002# Process id: 426, Data path: /Users/cbell/source/temp_13003# Process id: 431, Data path: /Users/cbell/source/temp_13004## Source on localhost: ... connected.************************* 1. row ************************* server: localhost:13001 version: 5.6.6-m9-log datadir: /Users/cbell/source/temp_13001/ basedir: /Users/cbell/source/mysql-5.6/ plugin_dir: /Users/cbell/source/mysql-5.6/lib/plugin/ config_file: /etc/my.cnf binary_log: clone-bin.000001 binary_log_pos: 853 relay_log: None relay_log_pos: None1 rows.
Defaults for server localhost:13001 --port=13001 --basedir=/usr/local/mysql
General Utilities | 641

--datadir=/usr/local/mysql/data --server_id=5 --log-bin=my_log --general_log --slow_query_log --innodb_data_file_path=ibdata1:778M;ibdata2:50M:autoextend#...done
You must be running on the localhost (the server) to use the --show-defaults option.
Cloning Users: mysqlusercloneDatabase administrators working on MySQL have often commented on the inconven‐ience of creating multiple users with the same set of privileges. Savvy administratorsoften write scripts to do this, usually including the actual GRANT statements and justsubstituting the username and host for each user they need to create.
This can be error prone especially when the privileges change over time. If security is atop priority, the location and access to the script may require special handling.
This seems like a lot of extra work. Fortunately, there is a utility to make it easier to copy(clone) users privileges. The user clone utility, mysqluserclone, copies all of the privilegesfor one user to one or more users, either on the same system or on another system. Youcan even set the password for each user you create.
The utility has a number of interesting features, including the ability to include theactual SQL statements during the clone operation and the ability to include global priv‐ileges that match the user@host specified. You can also list all of the users and theirprivileges on the server with the --list option. The output can be formatted in GRID,CSV, TAB, or VERTICAL formats described in “Exporting Databases: mysqldbexport” onpage 625.
Use with replication
One area where this utility can be helpful is during the provisioning of a slave. In thiscase, you may have a new slave that you need to re-create the accounts that exist on themaster. The user clone utility makes this as easy as specifying the user on the master (oranother active slave) you want to clone and providing the connection information forthe master and the new slave. You can even use an option to clone all users. Thus, thisutility is another convenience utility to make slave provisioning easier.
642 | Chapter 17: Managing MySQL Replication with MySQL Utilities

Example of mysqluserclone
The following example clones a user account and her grants from one server to another.The first command prints (dumps) the GRANT statements for the user. The second per‐forms the clone operation. Notice that we specify the user twice in the second command.This is because the utility allows you to clone other users from a single user account. Soin this command, the first instance is the one you want to copy and the second is thenew user you wish to create with the same privileges. You may specify as many newusers as you want, each one a clone of the existing one that you are copying:
$ mysqluserclone --source=root:root@localhost:13002 joe@localhost --dump# Source on localhost: ... connected.Dumping grants for user joe@localhostGRANT SELECT ON *.* TO 'joe'@'localhost'
$ mysqluserclone --source=root:root@localhost:13002 --destination=root:root@localhost:13003 joe@localhost joe@localhost# Source on localhost: ... connected.# Destination on localhost: ... connected.# Cloning 1 users...# Cloning joe@localhost to user joe@localhost# ...done.
Utilities Client: mysqlucThe MySQL Utilities client, mysqluc, is not a utility in and of itself. Rather, it is a wrapperthat provides type completion for utility commands, options, and parameters. It alsolets you specify user-defined variables that enable repeated reuse of a single value.
Perhaps the best feature of the utilities client is the ability to get help for any utility,including itself. This makes using any of the utilities much easier and more convenient.
Use with replication
While the client offers no administrative features related directly to replication, it canbe a very handy tool for running replication utilities. This is especially true when user-defined variables are used to represent the master and slave connections. Type com‐pletion will also help you to remember the various options and is especially helpful forseldom used options.
Example of mysqluc
The following example executes several commands inside the utilities console. Thecommands demonstrate how to display the health of a simple replication topology. Wewill discuss the replication administration (mysqlrpladmin) utility in more detail in alater section:
$ mysqlucLaunching console ...
General Utilities | 643

Welcome to the MySQL Utilities Client (mysqluc) version 1.1.0 - MySQL Workbench Distribution 5.2.44Copyright (c) 2000, 2012, Oracle and/or its affiliates. All rights reserved.
Oracle is a registered trademark of Oracle Corporation and/or its affiliates.Other names may be trademarks of their respective owners.
Type 'help' for a list of commands or press TAB twice for list of utilities.
mysqluc> help rpladminUsage: mysqlrpladmin.py --slaves=root@localhost:3306 <command>
mysqluc> set $MASTER=root:root@localhost:13001mysqluc> set $DISCOVER=root:rootmysqluc> rpladmin --master=$MASTER --disco=$DISCOVER health# Discovering slaves for master at localhost:13001# Checking privileges.## Replication Topology Health:+------------+--------+---------+--------+------------+---------+| host | port | role | state | gtid_mode | health |+------------+--------+---------+--------+------------+---------+| localhost | 13001 | MASTER | UP | ON | OK || localhost | 13002 | SLAVE | UP | ON | OK || localhost | 13003 | SLAVE | UP | ON | OK || localhost | 13004 | SLAVE | UP | ON | OK |+------------+--------+---------+--------+------------+---------+# ...done.
mysqluc>
Notice the commands issued in the client. Another very convenient feature of the clientis you don’t have to type the mysql prefix in the utility commands. Notice also the useof the user-defined variables, $MASTER and $DISCOVER, and detailed help for the repli‐cation administration utility. Clearly, this is a very handy tool.
Replication UtilitiesThis section includes a brief overview of the MySQL Utilities that were designed spe‐cially for replicated environments.
Setting Up Replication: mysqlreplicateWe have discussed setting up replication in detail in Chapter 3. In summary, once thereplication prerequisites are met, the steps involve the following general operations:
1. Create the replication user on the master.
644 | Chapter 17: Managing MySQL Replication with MySQL Utilities

2. If not using GTIDs, check the master’s SHOW MASTER STATUS view and record thevalues.
3. Issue the CHANGE MASTER TO command on the slave.4. Issue the START SLAVE command on the slave.5. Check for errors on the slave with SHOW SLAVE STATUS.
While this is not a long list of operations, it does involve at least one trip to the masterto issue at least two commands and at least three commands on the slave. If you considerneeding to do this many times for a large scale out effort, the operations can becometedious.
This is where the replicate utility mysqlreplicate makes life much easier. Instead of is‐suing five commands over the master and its slave, the replicate command permits youto issue a single command where, at a minimum, you list the master and the slave. Theutility takes care of the rest. There are options for setting the replication user, testingthe replication setup, and most importantly, controlling how replication starts.
Replication can start from the beginning (where the slave requests all events from themaster), start from the first event in a particular binary log file, or start from a specificbinary log file and position. The utility provides sufficient options to cover many sce‐narios where you want to start replication.
Best of all, because this is a single command, you can script it for use in a large scale outoperation where you simply use a variable populated by a list of values for the slave (oreven the master).
Example of mysqlreplicate
The following example shows a simple replication setup using the default options:$ mysqlreplicate --master=root:root@localhost:13001 --slave=root:root@localhost:13002# master on localhost: ... connected.# slave on localhost: ... connected.# Checking for binary logging on master...# Setting up replication...# ...done.
The following example shows the previous command executed with the -vvv option torequest a high level of verbosity. Notice that all of the commands needed for replicationconfiguration are performed by the utility, as well as key prerequisite checks. If some‐thing goes wrong setting up replication with this utility, try rerunning it with verbosityand check the output for errors:
$ mysqlreplicate --master=root:root@localhost:13001 --slave=root:root@localhost:13002 -vvv --test-db=test_rpl# master on localhost: ... connected.
Replication Utilities | 645

# slave on localhost: ... connected.# master id = 101# slave id = 102# master uuid = 8e1903fa-2de4-11e2-a8c9-59dc46c8181e# slave uuid = 8a40ec3a-2ded-11e2-a903-0ca829d3a6c5# Checking InnoDB statistics for type and version conflicts.# Checking storage engines...# Checking for binary logging on master...# Setting up replication...# Connecting slave to master...# CHANGE MASTER TO MASTER_HOST = 'localhost', MASTER_USER = 'rpl', MASTER_PASSWORD = 'rpl', MASTER_PORT = 13001, MASTER_AUTO_POSITION=1# Starting slave from master's last position...# status: Waiting for master to send event# error: 0:# Testing replication setup...# Creating a test database on master named test_rpl...# Success! Replication is running.# ...done.
Notice that we also used the --test-db option to test replication between the masterand slave. This feature creates a new database specified by the option and ensures theslave receives the update. Thus, the utility permits you to ensure replication is workingonce the slave is started.
This utility is the most useful replication utility for configuring your replication topol‐ogy. However, for situations where you may not know the full configuration of the slaveor have many masters and many more slaves, it can be tedious to check whether repli‐cation is configured correctly or whether two servers can be made master and slave.Fortunately, the next replication utility fills this need.
Checking Replication Setup: mysqlrplcheckOne of the challenges for setting up replication is knowing when a master and slavehave all of the prerequisites for replication and are compatible. “Compatible,” in thiscase, means the slave has the correct settings so that it can either rejoin the master orconnect to the master for the first time.
The replication check utility, mysqlrplcheck, examines the master and slave to determinewhether each is configured properly for replication (e.g., the master has binary loggingenabled), whether they are compatible, and whether the slave has been connected or isconnected to this master. This last feature can be very handy if you are uncertain towhich master your slave is connected—especially if you have recovered the slave froman error condition.
Because the utility accepts one master and one slave, it is well suited to diagnostic andadministrative work on replication. If you run the utility with verbosity turned on atthe -vvv level, you will see additional details including the actual values for the UUIDs,
646 | Chapter 17: Managing MySQL Replication with MySQL Utilities

slave status, and more. Verbosity also gives you more information about error condi‐tions.
Example of mysqlrplcheck
Let’s see an example where a master and slave are not connected and there are config‐uration conflicts. The following output shows a number of issues with replication be‐tween the chose master and slave (we use the verbosity option to see the additionaldetails):
$ mysqlrplcheck --master=root:root@localhost:13001 --slave=root:root@localhost:13002 -vvv# master on localhost: ... connected.# slave on localhost: ... connected.Test Description Status---------------------------------------------------------------------------Checking for binary logging on master [pass]Are there binlog exceptions? [pass]Replication user exists? [FAIL]
Slave is not connected to a master.
Checking server_id values [FAIL]
The slave's server_id is the same as the master.
Checking server_uuid values [pass]
master uuid = 8e1903fa-2de4-11e2-a8c9-59dc46c8181e slave uuid = d722e59c-2de5-11e2-a8d1-3f758e665783
Is slave connected to master? [FAIL]
Slave is stopped.
Check master information file [pass]
## Master information file:## Reading master information from a table.
Checking InnoDB compatibility [pass]Checking storage engines compatibility [pass]Checking lower_case_table_names settings [pass]
Master lower_case_table_names: 2 Slave lower_case_table_names: 2
Checking slave delay (seconds behind master) [FAIL]
Replication Utilities | 647

The server specified as the slave is not configured as a replication slave.
# ...done.
Notice the problems revealed in the output. Because the slave is not connected to themaster, a number of checks or tests fail, including the replication use check, whetherthe slave is connected, and the slave delay. But most importantly, we see that the serv‐er_ids are the same on the master and slave: a common problem that makes it impossibleto set up replication.
If the slave were connected to the master and there were errors, theverbosity option would display the output of the SHOW SLAVE STATUS view.
The following example shows a successful execution of the utility (now we know thatthe master and slave are configured correctly, and that replication between them isworking correctly):
$ mysqlrplcheck --master=root:root@localhost:13001 --slave=root:root@localhost:13002# master on localhost: ... connected.# slave on localhost: ... connected.Test Description Status---------------------------------------------------------------------------Checking for binary logging on master [pass]Are there binlog exceptions? [pass]Replication user exists? [pass]Checking server_id values [pass]Checking server_uuid values [pass]Is slave connected to master? [pass]Check master information file [pass]Checking InnoDB compatibility [pass]Checking storage engines compatibility [pass]Checking lower_case_table_names settings [pass]Checking slave delay (seconds behind master) [pass]# ...done.
Now that we have a nice replication setup and checking utility, it would be great if wecould see our topology in a graph. The next utility was designed to allow you to discoveryour topology. Its core functionality is essential for the HA utilities, which we will discussin the next section.
Showing Topologies: mysqlrplshowAnother useful utility for replication is the ability to see a graph of your topology. Theshow replication utility, mysqlrplshow, shows the slaves attached to a given master. Slaves
648 | Chapter 17: Managing MySQL Replication with MySQL Utilities

must be started with --report-host and --report-port so that they show in the SHOWSLAVE HOSTS view.
If you provide the --recurse option, the utility will attempt to connect to each slaveand display its slaves. In this manner, the utility can discover the topology for as manyservers as can be reached with the credentials provided by the --discover-slaves-login option.
You can use the --prompt option to prompt for the username andpassword for each slave that fails to connect with the default creden‐tials provided.
The utility can also identify circular replication topologies. If you use the --show-list option, the utility displays a list of the servers in a variety of formats. The formatsare the familiar GRID, CSV, TAB, and VERTICAL options. The output could be importedinto another script of application for further analysis or reports.
Example of mysqlrplshow
The following example demonstrates the utility running on a simple tiered replicationtopology. Notice that there is an intermediate master on slavehost2.
$ mysqlrplshow --master=root:pass@masterhost:13001 --recurse \ --discover-slaves-login=root:root --format=grid --show-list# master on masterhost: ... connected.# Finding slaves for master: localhost:13001# master on slavehost1: ... connected.# Finding slaves for master: localhost:13002# master on slavehost2: ... connected.# Finding slaves for master: localhost:13003# master on slavehost3: ... connected.# Finding slaves for master: localhost:13004
# Replication Topology Graphmasterhost:13001 (MASTER) | +--- slavehost1:13002 - (SLAVE) | +--- slavehost2:13003 - (SLAVE + MASTER) | +--- slavehost3:13004 - (SLAVE)
+-------------------+-------------------+| Master | Slave |+-------------------+-------------------+| masterhost:13001 | slavehost1:13002 || masterhost:13001 | slavehost2:13003 |
Replication Utilities | 649

| slavelhost:13002 | slavehost3:13004 |+-------------------+-------------------+
High Availability UtilitiesThe MySQL Utilities project includes two utilities that are designed specifically for HAsolutions. There is a general utility for performing routine, on-demand operations(mysqlrpladmin), and another designed to run continuously to monitor a master andits slaves (mysqlfailover).
The following sections present details of these utilities along with examples of their useand a discussion of scenarios for using the utilities.
ConceptsWe begin with a discussion of the concepts used in the HA utilities. As with manyspecialized tools, there are often ideas or concepts that the user is expected to understandprior to using the tool. For example, the HA utilities are designed to perform two basicoperations: switchover and failover. The following will help you understand the modes,commands, and output of the utilities and make your experience using them better.Some of these may be familiar but are included for review.
We assume you have read the previous chapters on replication andhigh availability, including Chapters 4, 5, and 6, and have a goodunderstanding of replication terminology.
Global Transaction Identifiers
A Global Transaction Identifier (GTID) is a special marker added to the binary log thatincludes a unique value to identify the origin of the event. These marks are added beforeeach group of events (transactions) in the binary log and are composed of the UniqueUniversal Identifier (UUID) of the server and a sequence number. The sequence numberis ordinal starting from 1.
GTIDs therefore enable a new replication protocol that permits the slave to request anyGTIDs it has not executed from the master. The calculation of what GTIDs have or havenot been applied is simplified and made accurate by the uniqueness of the GTID.
This new concept and the new protocol make it possible to take any slave of a downedmaster and make it the new master by collecting the GTIDs from the other slaves. Thus,for the first time, MySQL has a native mechanism to enable failover.
GTIDs must be enabled (the gtid_mode=ON option to mysqld) if you plan to run themysqlfailover utility and to execute the failover command for the mysqlrpladmin utility.
650 | Chapter 17: Managing MySQL Replication with MySQL Utilities

Candidate slave
A candidate slave is a slave that has been chosen to replace the master when the masterhas gone down or is unreachable. The candidate slave can be chosen automatically fromthose meeting all the following criteria:
• The slave is running and reachable.• GTIDs are enabled.• The slave is not lagging behind the master.• The slave’s replication filters do not conflict. More specifically, the list of databases
in the filters have matches. For example, if the master has db1 and db3 listed in --binlog-do-db and a slave had db1 and db2 listed in --replicate-do-db, thesefilters conflict because the data replicated to the slave is different from what theslave is filtering from the master.
• The replication user exists on the slave.• Binary logging is enabled on the slave.
Slave election
This is the process of selecting a candidate slave for use in replacing the master. Theutilities have a feature that includes this step as a precursor to failover.
Failover
Failover is the process of replacing the role of the master when the master is down orhas become unreachable.
Switchover
Switchover is the purposeful switching of the master role from a live master to anotherslave. It is different from failover because in this case, the master is available and thenew slave can be brought up to date with all events from the master. You may performswitchover, for instance, when you have to take the master offline for maintenance.
mysqlrpladminThe mysqlrpladmin utility permits administrators to execute operations on MySQLreplication resources on-demand (i.e., it executes a command and then exits). Availablecommands include:elect
Elect the best slave and report the winner.
High Availability Utilities | 651

failover
Conduct a failover from the master to the best slave.
gtid
Show the status of Global Transaction Identifier variables, and display UUIDs forall servers.
health
Display the replication health for the master and its slaves.
reset
Issue the STOP SLAVE and RESET SLAVE commands to each slave.
start
Start all slaves.
stop
Stop all slaves.
switchover
Perform slave promotion.
The next section presents examples of the more frequently used commands and practicalways they can be used.
Examples of mysqlrpladmin
Let us begin the tour of the replication administration utility with the health command.This displays a list of the slaves connected to the master and a summary of the statusfor slave and replication health. The following example shows a master and its slaves.Notice we used the discovery option (-disco), passing the user and password to be usedto connect to each slave. If you want to see more details for the health report, use the--verbose option:
$ mysqlrpladmin --master=root:pass@localhost:13002 --disco=root:pass health# Discovering slaves for master at localhost:13002# Checking privileges.## Replication Topology Health:+------------+--------+---------+--------+------------+---------+| host | port | role | state | gtid_mode | health |+------------+--------+---------+--------+------------+---------+| localhost | 13002 | MASTER | UP | ON | OK || localhost | 13003 | SLAVE | UP | ON | OK || localhost | 13004 | SLAVE | UP | ON | OK || localhost | 13005 | SLAVE | UP | ON | OK |+------------+--------+---------+--------+------------+---------+# ...done.
652 | Chapter 17: Managing MySQL Replication with MySQL Utilities

Remember that you must start your slaves with the --report-hostand --report-port options to use the discover slaves feature.
If you want to use the failover command rather than the failover utility to conductmanual failover, the elect command permits you to look ahead to see which slave willbe chosen for failover. This can be helpful when building a fault-tolerant applicationwhere you need to know specifics of the new master. The following example shows howto find out which slave will be chosen:
$ mysqlrpladmin --master=root:pass@localhost:13002 --disco=root:pass elect# Discovering slaves for master at localhost:13002# Checking privileges.# Electing candidate slave from known slaves.# Best slave found is located on localhost:13003.# ...done.
The GTID command displays a list of all of the GTIDs in the topology. This can be avery long list if your master and slaves have been running for a long period with manytransactions. You can use this report to help diagnose problems with transactions. Thefollowing shows an excerpt of the output of the GTID command:
$ mysqlrpladmin --master=root:pass@localhost:13002 --disco=root:pass gtid# Discovering slaves for master at localhost:13002# Checking privileges.## UUIDS for all servers:+------------+--------+---------+---------------------------------------+| host | port | role | uuid |+------------+--------+---------+---------------------------------------+| localhost | 13002 | MASTER | 673d40e4-32ac-11e2-87f6-419d4fb292c5 || localhost | 13003 | SLAVE | 7cb05e3e-32ac-11e2-87f6-336560b463d4 || localhost | 13004 | SLAVE | 940abcdc-32ac-11e2-87f7-9f158c80ded6 || localhost | 13005 | SLAVE | a680695c-32ac-11e2-87f7-797d07ab4557 |+------------+--------+---------+---------------------------------------+## Transactions executed on the server:+------------+--------+---------+-------------------------------------------+| host | port | role | gtid |+------------+--------+---------+-------------------------------------------+| localhost | 13002 | MASTER | 0035A78A-32AF-11E2-8807-6F5662E76235:1-2 || localhost | 13002 | MASTER | 42077312-32AC-11E2-87F5-4FD43CAEB376:1-2 || localhost | 13002 | MASTER | 498880AE-32B1-11E2-8815-C19FD75A3D21:1-2 || localhost | 13002 | MASTER | 4AA055C2-32AF-11E2-8808-366E88604744:1-2 || localhost | 13002 | MASTER | 59D25A04-32AF-11E2-8809-6D4E4056F0AF:1-2 || localhost | 13002 | MASTER | 5D3211AC-32B0-11E2-880F-F6735C743197:1-2 || localhost | 13002 | MASTER | 673D40E4-32AC-11E2-87F6-419D4FB292C5:1-3 || localhost | 13002 | MASTER | 74151132-32AE-11E2-8803-E93E7AABEB97:1-2 |
High Availability Utilities | 653

| localhost | 13002 | MASTER | 7CB05E3E-32AC-11E2-87F6-336560B463D4:1-3 |...| localhost | 13005 | SLAVE | 7CB05E3E-32AC-11E2-87F6-336560B463D4:1-3 || localhost | 13005 | SLAVE | 940ABCDC-32AC-11E2-87F7-9F158C80DED6:1-3 || localhost | 13005 | SLAVE | 9E6957E4-32AF-11E2-880B-C19ED44E0636:1-2 || localhost | 13005 | SLAVE | A680695C-32AC-11E2-87F7-797D07AB4557:1-3 || localhost | 13005 | SLAVE | C903D9AC-32AF-11E2-880C-6D4F415B0402:1-2 || localhost | 13005 | SLAVE | F37C4048-32AF-11E2-880D-CFD6C34C3629:1-2 |+------------+--------+---------+-------------------------------------------+# ...done.
The most popular command of the replication administration utility is the switchovercommand. This permits you to perform a controlled switch of the master role from thecurrent master to a specified slave. We say “controlled” because the slave is allowed tocatch up to the master before the change of role occurs.
A very handy option for this command is the --demote-master option. This tells theswitchover command to make the old master a slave of the new master once the changeof role is complete. This permits you to rotate the role of master among a set of slaves.The following example shows this command in action. Notice the health report at theend of the execution. You can use this to verify the change of role. Compare this to thehealth report from the earlier examples.
Take a moment and look through the output; all of the steps in the switchover processare documented with brief status statements.
$ mysqlrpladmin --master=root:pass@localhost:13003 --disco=root:pass failover# Discovering slaves for master at localhost:13003# Checking privileges.# Performing failover.# Candidate slave localhost:13002 will become the new master.# Preparing candidate for failover.# Creating replication user if it does not exist.# Stopping slaves.# Performing STOP on all slaves.# Switching slaves to new master.# Starting slaves.# Performing START on all slaves.# Checking slaves for errors.# Failover complete.## Replication Topology Health:+------------+--------+---------+--------+------------+---------+| host | port | role | state | gtid_mode | health |+------------+--------+---------+--------+------------+---------+| localhost | 13002 | MASTER | UP | ON | OK || localhost | 13004 | SLAVE | UP | ON | OK || localhost | 13005 | SLAVE | UP | ON | OK |+------------+--------+---------+--------+------------+---------+# ...done.
654 | Chapter 17: Managing MySQL Replication with MySQL Utilities

We save the failover command for last to show you how it can be used manually in placeof the failover utility, which is designed to support automatic failover. The followingshows the results of running the failover command. Notice that this command alsoprints a health report at the end to confirm the operation.
Take a moment and look through the output; all of the steps in the failover process aredocumented with brief status statements.
$ mysqlrpladmin --master=root:pass@localhost:13003 --disco=root:pass failover# Discovering slaves for master at localhost:13003# Checking privileges.# Performing failover.# Candidate slave localhost:13002 will become the new master.# Preparing candidate for failover.# Creating replication user if it does not exist.# Stopping slaves.# Performing STOP on all slaves.# Switching slaves to new master.# Starting slaves.# Performing START on all slaves.# Checking slaves for errors.# Failover complete.## Replication Topology Health:+------------+--------+---------+--------+------------+---------+| host | port | role | state | gtid_mode | health |+------------+--------+---------+--------+------------+---------+| localhost | 13002 | MASTER | UP | ON | OK || localhost | 13004 | SLAVE | UP | ON | OK || localhost | 13005 | SLAVE | UP | ON | OK |+------------+--------+---------+--------+------------+---------+# ...done.
mysqlfailoverThe failover utility is not a run-once type of utility. Rather, it is a utility designed to runinteractively. The failover utility is also called the failover console, but it is a command-line tool and purely text based.
The console can be run on any system but should be run on a system that can be moni‐tored closely. It would not fare well for your failover strategy if the server on which theautomatic failover utility runs happens to be offline should the master fail. Also, if youhave multiple masters in your topology, you will need to run one (and only one) instanceof the utility and connect each to one and only one master.
The console is also designed to be used with GTID-enabled servers and will not workwith non-GTID enabled servers.
High Availability Utilities | 655

Because it is an interactive utility, there are a number of menu commands you can chooseonce the console is started. Let’s take a look at what the console looks like when con‐nected to master with four slaves:
$ mysqlfailover --master=root:pass@localhost:13001 --disco=root:pass --log=failover_log.txt# Discovering slaves for master at localhost:13001# Checking privileges.[...]MySQL Replication Failover UtilityFailover Mode = auto Next Interval = Mon Nov 19 20:00:49 2012
Master Information------------------Binary Log File Position Binlog_Do_DB Binlog_Ignore_DBclone-bin.000001 574
GTID Executed Set42077312-32AC-11E2-87F5-4FD43CAEB376:1-2
Replication Health Status+------------+--------+---------+--------+------------+---------+| host | port | role | state | gtid_mode | health |+------------+--------+---------+--------+------------+---------+| localhost | 13001 | MASTER | UP | ON | OK || localhost | 13002 | SLAVE | UP | ON | OK || localhost | 13003 | SLAVE | UP | ON | OK || localhost | 13004 | SLAVE | UP | ON | OK || localhost | 13005 | SLAVE | UP | ON | OK |+------------+--------+---------+--------+------------+---------+
Q-quit R-refresh H-health G-GTID Lists U-UUIDs L-log entries
The [...] in the preceding listing represents a screen refresh. The fail‐over console is designed to fill a text command window (terminal).Thus, the line that reads, “MySQL Replication Failover Utility” ap‐pears on the top line of the window.
The console displays the master information at the top, including the current log fileand position as well as the GTID executed set. Below that is a health report—the sameas the replication administration utility, mysqlrpladmin.
At the bottom of the screen is the menu. Select from the following items using the keyspecified as the capital letter preceding the label:Quit
Exit the console.
656 | Chapter 17: Managing MySQL Replication with MySQL Utilities

RefreshRefreshes the health report. Use this command while viewing the health report torefresh the data before the next interval.
HealthDisplays the health report. Use this command to switch the view to the health report.
GTID ListsShows the GTIDs for the master’s executed set, the slave’s executed GTIDs, slave’spurged GTIDs, and slave’s owned GTIDs. Pressing G repeatedly will cycle throughall of the lists. Use this command to switch the view to the list of UUIDs.
UUIDsShows the UUIDs for all servers. Use this command to switch the view to the listof UUIDs.
Log EntriesRead and display the rows in the failover log file. This item is displayed only if thislog file is enabled.
The failover console is designed to check the status of the master at fixed intervals. Thedefault is every 15 seconds. You can change this frequency using the --interval option.
One of the interesting features of the failover console is the ability to generate a log ofthe operations taking place. Each statement and status item is saved in the log. You canturn on the log with the --log-file option, specifying a path and filename for the logfile. The log file is appended rather than rewritten by default, but you can use the --log-age=N option to tell the utility to overwrite entries older than N number of days.
The log file can be very useful in situations where you need to keep a permanent recordof events or if you desire a higher level of audit capability.
Another useful option is the --rediscover option. This instructs the utility to rerunthe slave discovery feature on each interval. Use this option if you want the failoverconsole to detect when new slaves are added.
Failover modes
The failover console permits several modes of operation. This permits you to run thefailover console in the manner most appropriate to your environment or requirements.The following describes each mode (the default mode is AUTO):AUTO
Execute automatic failover to the list of candidates first. If no candidate slaves areviable, continue to locate a viable candidate from the list of slaves. If no slaves arefound to be a viable candidate, generate an error and exit.
High Availability Utilities | 657

Once a candidate is found, the utility will conduct a failover to the best slave. Thecommand will test each candidate slave listed for the prerequisites. Once a candidateslave is elected, it is made a slave of each of the other slaves, thereby collecting anytransactions that were executed on other slaves but not the candidate. In this way,the candidate becomes the most up-to-date slave.
ELECT
This mode is the same as AUTO except that, if no candidates specified in the list ofcandidate slaves are viable, it does not check the remaining slaves, but generates anerror and exits. Use this mode if you have a subset of slaves you want to use forfailover, where the remaining slaves are not eligible. For example, you may want toexclude slaves with older or inferior hardware.
FAIL
Produces an error and does not failover when the master is down. This mode isused to provide periodic health monitoring without taking a failover action.
The failover event
A failover event occurs when the master can neither be reached via a database connec‐tion nor pinged. This check occurs once per interval. When both tests fail, the failoverevent is initiated.
The failover detection is also tunable. You can use the --ping option to tell the utilityhow many ping attempts to use before considering the master offline. You can use anexternal script to control the failover detection. “Extension points” on page 663 explainshow to use an external script to initiate the failover event.
The following process summarizes the steps executed during the failover event. This isa generalized list based on the default failover mode. The process is slightly different forslave election depending on the mode (see “Failover modes” on page 657):
• A new candidate slave is elected as follows. If the --candidate-slaves option isspecified, the slaves are tested in the order they appear. If none of these slaves meetthe prerequisites in “Candidate slave” on page 651, and the --slaves option isspecified, the slaves are tested in the order they appear. If none of these slaves areelected, the utility will test each slave it can discover. Because the prerequisites arenot stringent, it is likely that the first candidate slave will be the first slave listed inthe --candidate-slaves option.
• Once the candidate slave is elected, it is made a slave of every other slave. Thisutilizes the new replication protocol that ensures that the candidate slave retrievesany transactions that have executed on another slave but not this candidate slave.
• Now that the candidate slave is up to date with all transactions, it is made the newmaster.
658 | Chapter 17: Managing MySQL Replication with MySQL Utilities

• Lastly, the remaining slaves are connected to the new master and replication isrestarted.
When this process runs, the failover console switches temporarily into a list mode whereit lists status statements for each step of the process. If you use the --verbose option,the utility will display all of the details of the operations.
The following example shows a failover event in progress. Notice that you can see all ofthe GTIDs involved and even the CHANGE MASTER commands as they are run. If youturned on the log feature, all of these statements would appear in the log file as well:
Failover starting in 'auto' mode...# Checking eligibility of slave localhost:13002 for candidate.# GTID_MODE=ON ... Ok# Replication user exists ... Ok# Candidate slave localhost:13002 will become the new master.# Preparing candidate for failover.# LOCK STRING: FLUSH TABLES WITH READ LOCK# Connecting candidate to localhost:13003 as a master to retrieve unprocessed GTIDs.# Change master command for localhost:13002# CHANGE MASTER TO MASTER_HOST = 'localhost', MASTER_USER = 'rpl', MASTER_PASSWORD = 'rpl', MASTER_PORT = 13003, MASTER_AUTO_POSITION=1# UNLOCK STRING: UNLOCK TABLES# Waiting for candidate to catch up to slave localhost:13003.# Slave localhost:13002:# QUERY = SELECT SQL_THREAD_WAIT_AFTER_GTIDS('0035A78A-32AF-11E2-8807-6F5662E76235:1-2', 3)# Return Code = 0# Slave localhost:13002:# QUERY = SELECT SQL_THREAD_WAIT_AFTER_GTIDS('42077312-32AC-11E2-87F5-4FD43CAEB376:1-2', 3)# Return Code = 0# Slave localhost:13002:# QUERY = SELECT SQL_THREAD_WAIT_AFTER_GTIDS('498880AE-32B1-11E2-8815-C19FD75A3D21:1-2', 3)# Return Code = 0# Slave localhost:13002:# QUERY = SELECT SQL_THREAD_WAIT_AFTER_GTIDS('74151132-32AE-11E2-8803-E93E7AABEB97:1-2', 3)# Return Code = 0# Slave localhost:13002:# QUERY = SELECT SQL_THREAD_WAIT_AFTER_GTIDS('7CB05E3E-32AC-11E2-87F6-336560B463D4:1-3', 3)# Return Code = 0# Slave localhost:13002:# QUERY = SELECT SQL_THREAD_WAIT_AFTER_GTIDS('9E6957E4-32AF-11E2-880B-C19ED44E0636:1-2', 3)# Return Code = 0# Slave localhost:13002:# QUERY = SELECT SQL_THREAD_WAIT_AFTER_GTIDS('F37C4048-32AF-11E2-880D-
High Availability Utilities | 659

CFD6C34C3629:1-2', 3)# Return Code = 0# LOCK STRING: FLUSH TABLES WITH READ LOCK# Connecting candidate to localhost:13004 as a master to retrieve unprocessed GTIDs.# Change master command for localhost:13002# CHANGE MASTER TO MASTER_HOST = 'localhost', MASTER_USER = 'rpl', MASTER_PASSWORD = 'rpl', MASTER_PORT = 13004, MASTER_AUTO_POSITION=1# UNLOCK STRING: UNLOCK TABLES# Waiting for candidate to catch up to slave localhost:13004.# Slave localhost:13002:# QUERY = SELECT SQL_THREAD_WAIT_AFTER_GTIDS('0035A78A-32AF-11E2-8807-6F5662E76235:1-2', 3)# Return Code = 0# Slave localhost:13002:# QUERY = SELECT SQL_THREAD_WAIT_AFTER_GTIDS('42077312-32AC-11E2-87F5-4FD43CAEB376:1-2', 3)# Return Code = 0# Slave localhost:13002:# QUERY = SELECT SQL_THREAD_WAIT_AFTER_GTIDS('498880AE-32B1-11E2-8815-C19FD75A3D21:1-2', 3)# Return Code = 0# Slave localhost:13002:# QUERY = SELECT SQL_THREAD_WAIT_AFTER_GTIDS('74151132-32AE-11E2-8803-E93E7AABEB97:1-2', 3)# Return Code = 0# Slave localhost:13002:# QUERY = SELECT SQL_THREAD_WAIT_AFTER_GTIDS('940ABCDC-32AC-11E2-87F7-9F158C80DED6:1-3', 3)# Return Code = 5# Slave localhost:13002:# QUERY = SELECT SQL_THREAD_WAIT_AFTER_GTIDS('9E6957E4-32AF-11E2-880B-C19ED44E0636:1-2', 3)# Return Code = 0# Slave localhost:13002:# QUERY = SELECT SQL_THREAD_WAIT_AFTER_GTIDS('F37C4048-32AF-11E2-880D-CFD6C34C3629:1-2', 3)# Return Code = 0# LOCK STRING: FLUSH TABLES WITH READ LOCK# Connecting candidate to localhost:13005 as a master to retrieve unprocessed GTIDs.# Change master command for localhost:13002# CHANGE MASTER TO MASTER_HOST = 'localhost', MASTER_USER = 'rpl', MASTER_PASSWORD = 'rpl', MASTER_PORT = 13005, MASTER_AUTO_POSITION=1# UNLOCK STRING: UNLOCK TABLES# Waiting for candidate to catch up to slave localhost:13005.# Slave localhost:13002:# QUERY = SELECT SQL_THREAD_WAIT_AFTER_GTIDS('0035A78A-32AF-11E2-8807-6F5662E76235:1-2', 3)# Return Code = 0# Slave localhost:13002:# QUERY = SELECT SQL_THREAD_WAIT_AFTER_GTIDS('42077312-32AC-11E2-87F5-
660 | Chapter 17: Managing MySQL Replication with MySQL Utilities

4FD43CAEB376:1-2', 3)# Return Code = 0# Slave localhost:13002:# QUERY = SELECT SQL_THREAD_WAIT_AFTER_GTIDS('498880AE-32B1-11E2-8815-C19FD75A3D21:1-2', 3)# Return Code = 0# Slave localhost:13002:# QUERY = SELECT SQL_THREAD_WAIT_AFTER_GTIDS('4AA055C2-32AF-11E2-8808-366E88604744:1-2', 3)# Return Code = 5# Slave localhost:13002:# QUERY = SELECT SQL_THREAD_WAIT_AFTER_GTIDS('59D25A04-32AF-11E2-8809-6D4E4056F0AF:1-2', 3)# Return Code = 0# Slave localhost:13002:# QUERY = SELECT SQL_THREAD_WAIT_AFTER_GTIDS('5D3211AC-32B0-11E2-880F-F6735C743197:1-2', 3)# Return Code = 0# Slave localhost:13002:# QUERY = SELECT SQL_THREAD_WAIT_AFTER_GTIDS('74151132-32AE-11E2-8803-E93E7AABEB97:1-2', 3)# Return Code = 0# Slave localhost:13002:# QUERY = SELECT SQL_THREAD_WAIT_AFTER_GTIDS('9E6957E4-32AF-11E2-880B-C19ED44E0636:1-2', 3)# Return Code = 0# Slave localhost:13002:# QUERY = SELECT SQL_THREAD_WAIT_AFTER_GTIDS('A680695C-32AC-11E2-87F7-797D07AB4557:1-3', 3)# Return Code = 0# Slave localhost:13002:# QUERY = SELECT SQL_THREAD_WAIT_AFTER_GTIDS('C903D9AC-32AF-11E2-880C-6D4F415B0402:1-2', 3)# Return Code = 0# Slave localhost:13002:# QUERY = SELECT SQL_THREAD_WAIT_AFTER_GTIDS('F37C4048-32AF-11E2-880D-CFD6C34C3629:1-2', 3)# Return Code = 0# Creating replication user if it does not exist.# Stopping slaves.# Performing STOP on all slaves.# Executing stop on slave localhost:13002 Ok# Executing stop on slave localhost:13003 Ok# Executing stop on slave localhost:13004 Ok# Executing stop on slave localhost:13005 Ok# Switching slaves to new master.# Change master command for localhost:13002# CHANGE MASTER TO MASTER_HOST = 'localhost', MASTER_USER = 'rpl', MASTER_PASSWORD = 'rpl', MASTER_PORT = 13002, MASTER_AUTO_POSITION=1# Change master command for localhost:13003# CHANGE MASTER TO MASTER_HOST = 'localhost', MASTER_USER = 'rpl', MASTER_PASSWORD = 'rpl', MASTER_PORT = 13002, MASTER_AUTO_POSITION=1
High Availability Utilities | 661

# Change master command for localhost:13004# CHANGE MASTER TO MASTER_HOST = 'localhost', MASTER_USER = 'rpl', MASTER_PASSWORD = 'rpl', MASTER_PORT = 13002, MASTER_AUTO_POSITION=1# Change master command for localhost:13005# CHANGE MASTER TO MASTER_HOST = 'localhost', MASTER_USER = 'rpl', MASTER_PASSWORD = 'rpl', MASTER_PORT = 13002, MASTER_AUTO_POSITION=1# Starting slaves.# Performing START on all slaves.# Executing start on slave localhost:13003 Ok# Executing start on slave localhost:13004 Ok# Executing start on slave localhost:13005 Ok# Checking slaves for errors.# localhost:13003 status: Ok# localhost:13004 status: Ok# localhost:13005 status: Ok# Failover complete.# Discovering slaves for master at localhost:13002
Failover console will restart in 5 seconds.
Once the failover event is complete, the console is redrawn with the new master infor‐mation and the updated list of slaves in the health report. Based on the previous exam‐ples, the resulting health report after failover follows:
MySQL Replication Failover UtilityFailover Mode = auto Next Interval = Mon Nov 19 20:28:03 2012
Master Information------------------Binary Log File Position Binlog_Do_DB Binlog_Ignore_DBclone-bin.000001 7073
GTID Executed Set0035A78A-32AF-11E2-8807-6F5662E76235:1-2 [...]
Replication Health Status+------------+--------+---------+--------+------------+---------+| host | port | role | state | gtid_mode | health |+------------+--------+---------+--------+------------+---------+| localhost | 13002 | MASTER | UP | ON | OK || localhost | 13003 | SLAVE | UP | ON | OK || localhost | 13004 | SLAVE | UP | ON | OK || localhost | 13005 | SLAVE | UP | ON | OK |+------------+--------+---------+--------+------------+---------+
Q-quit R-refresh H-health G-GTID Lists U-UUIDs L-log entries
Notice that the original master on port 13001 is no longer displayed and the electedslave has become the new master with all slaves connected.
662 | Chapter 17: Managing MySQL Replication with MySQL Utilities

Extension points
To make the failover utility more flexible, it supports four extension points that you canuse to call your own scripts. This can be very helpful in tailoring your fault tolerantapplication to interact with the failover console. The following lists the extension pointsavailable and how each can be used (they are listed in the order in which they occurduring a failover event):--exec-fail-check
This option permits you to provide an application-specific failover event. This re‐places the default failover detection criteria (master cannot be reached and cannotbe pinged) with your own event detection. A return code of 0 indicates that failovershould not take place. A return code other than 0 indicates that failover should takeplace. The script is run at the start of each interval. The timeout option is not usedin this case.
--exec-before
The utility runs this script before the failover event occurs. You can use this to tellyour application to halt all writes and prepare for changing the master.
--exec-after
The utility runs this script after the failover event occurs but before the slaves areswitched to the new master. You can use this to inform your application that thenew master is ready.
--exec-post-failover
The utility runs this utility after the slaves are redirected to the new master and thehealth report is generated. You can use this to inform your application that it canread from the slaves again.
Creating Your Own UtilitiesNow that you know what the MySQL Utilities are and how they are used with replication,you may have ideas for new uses of these utilities or even new utilities that you wouldlike to have that are specific to your environment. Fortunately, MySQL Utilities wasdesigned with this kind of major extension in mind. This section covers the architectureand organization of the MySQL Utilities. We will also discuss an example of a customutility that you can create yourself or use as a template for custom replication utilities.
Architecture of MySQL UtilitiesUtilities are built using a single script responsible for defining and validating optionsand arguments. The script (also referred to by the name of the utility) references a seriesof modules that contain Python classes and methods for the operations they perform.These are called command modules. These are the interface to a larger set of Python
Creating Your Own Utilities | 663

classes and methods that are designed to model specific components or behaviors ofthe server. We call the files that contain these classes and methods common modules.Both command and common modules use the Connector/Python connector to connectto a MySQL Server.
The MySQL Utilities library therefore is the collection of all of the command and com‐mon modules. These files are stored together under the same folder. If you were todownload the MySQL Utilities source code, you would see folders named /scripts, /mysql/utilities/command, and /mysql/utilities/common.
Figure 17-3 shows the relationships between the parts of MySQL Utilities and thereforehow each utility is built. For example, the mysqldbcopy script is implemented in the /scripts/mysqldbcopy.py file and calls a command module named /mysql/utilities/command/dbcopy.py, which calls several modules such as server.py, options.py, anddatabase.py located in the /mysql/utilities/common folder.
Figure 17-3. Architecture of MySQL Utilities
Custom Utility ExampleThis section contains an example of a custom utility built by combining features fromexisting utilities. Suppose you want a utility that copies all of the databases and usersfrom one server to another. Furthermore, you want the utility to create a new instanceof the server and use that as the destination for the copy. This utility can be very handyfor creating test environments for development and diagnosis of data problems.
We will begin with a brief list of operations needed and a detailed look at the code foreach operation. We conclude with a complete listing of the resulting source code.
Operations
If we skip the housekeeping operations, such as defining options and validating pa‐rameters and values, we can create a simple list of operations for the new utility. Thesecan be combined into three major sections. First, we need to connect to the server anddiscover what needs to be copied. Second, we need to create a clone of that server. Lastly,
664 | Chapter 17: Managing MySQL Replication with MySQL Utilities

we need to perform the copy to the new server. We can expand this list of operationsinto the following eight steps:
1. Set up the parameters.2. Connect to the original server.3. Find all of the databases.4. Find all of the users.5. Make a clone of the original server.6. Connect to the new server.7. Copy all of the databases.8. Copy all of the users.
If you consider the available utilities, you’ll find a utility that can copy databases, a utilitythat can copy (clone) users, and a server that can clone a running or offline server. Onceyou consider the architecture of the utilities, it is easy to see that our solution is a mash-up of these three utilities. In fact, we can study those utilities and discover the commandmodules they use, then re-create the same calls in our new utility.
The following section explains each of the operations in more detail.
Sample code
We begin with setting up the parameters for the utility. Because we are reusing parts ofother utilities, we can identify the options we need to use from studying how the utilitiesare created.
If you set aside those options that are provided for additional elective features, we findwe need only a few options. If we minimize the list, we find that not many options areneeded. From the server clone utility, we see we need --new-data, --new-port, and --new-id. From the database copy utility, we need to list the databases with --databases. All of the utilities have the --server option in common, which we need inorder to connect to the original server for the copy and clone operations. We also needthe --users option to identify the users we want to copy.
Now that we have a list of options, we can start a new file named cloneserver.py and copythe options from the other utilities. The following shows the options needed:
parser = optparse.OptionParser( version=VERSION_FRM.format(program=os.path.basename(sys.argv[0])), description=DESCRIPTION, usage=USAGE, add_help_option=False)parser.add_option("--help", action="help")
# Set up utility-specific options:
Creating Your Own Utilities | 665

# Connection information for the source serverparser.add_option("--server", action="store", dest="server", type="string", default="root@localhost:3306", help="connection information for original server in " + \ "the form: user:password@host:port:socket")
# Data directory for new instanceparser.add_option("--new-data", action="store", dest="new_data", type="string", help="the full path to the location " "of the data directory for the new instance")
# Port for the new instanceparser.add_option("--new-port", action="store", dest="new_port", type="string", default="3307", help="the new port " "for the new instance - default=%default")
# Server id for the new instanceparser.add_option("--new-id", action="store", dest="new_id", type="string", default="2", help="the server_id for " "the new instance - default=%default")
# List of databasesparser.add_option("-d", "--databases", action="store", dest="dbs_to_copy", type="string", help="comma-separated list of databases " "to include in the copy (omit for all databases)", default=None)
# List of usersparser.add_option("-u", "--users", action="store", dest="users_to_copy", type="string", help="comma-separated list of users " "to include in the copy (omit for all users)", default=None)
The current release of MySQL Utilities uses a module named opt‐parse, which will eventually be replaced by argparse.
The next operation, connecting to the server, can be accomplished as follows. Noticewe must import a helper method to parse the server option value, then import the Serverclass, build a dictionary of the options, and finally call the connect() method. The useof a Python dictionary to contain options is a common practice in all utilities:
# Parse the connection informationfrom mysql.utilities.common.options import parse_connection try: conn = parse_connection(opt.server) except: parser.error("Server connection values invalid or"
666 | Chapter 17: Managing MySQL Replication with MySQL Utilities

" cannot be parsed.")
# Connect to original server from mysql.utilities.common.server import Server
server_options = {'conn_info’ : conn, 'role’ : "source"} srv1 = Server(server_options) srv1.connect()
Now that we have a connection to a MySQL server, we can build a list of databases. Ifwe consider the case where the user may want to copy all of the databases, we can checkthe database option and, if none are listed, get a list of all of the databases on the server.We can do the same for users. The following shows one example of how we can ac‐complish this:
# Get list of databases from the server if not specified in optionsprint "# Getting databases..."db_list = []if opt.dbs_to_copy is None: for db in server1.get_all_databases(): db_list.append((db[0], None))else: for db in opt.dbs_to_copy.split(","): db_list.append((db, None))
# Get list of all users from the serverprint "# Getting users..."user_list=[]if opt.users_to_copy is None: users = server1.exec_query("SELECT user, host " "FROM mysql.user " "WHERE user != 'root' and user != ''") for user in users: user_list.append(user[0]+'@'+user[1])else: for user in opt.users_to_copy.split(","): user_list.append(user)
The next major operation is to clone the server. Because we have minimized the options,we’ll make a few with specific defaults. It would not be difficult to make these intooptions if desired. The following shows the code needed to make the clone. Because thisis the first operation that calls the command modules, we would expect a bit of com‐plexity. However, the opposite is true. Utility command modules are a very high level(sometimes called macro-level) of encapsulation, making the command modules verypowerful and the script file very simple.
As you may suspect, this code is very similar to the connection code for the originalserver. The following shows the code for this operation:
# Parse source connection valuestry:
Creating Your Own Utilities | 667

conn = parse_connection(opt.server)except: parser.error("Server connection values invalid or cannot be parsed.")
# Get a server class instanceprint "# Connecting to server..."server_options = { 'conn_info' : conn, 'role' : "source",}server1 = Server(server_options)try: server1.connect()except UtilError, e: print "ERROR:", e.errmsg
You might be wondering how we handle errors. The utilities make extensive use ofexceptions. For normal operations that have known errors, command modules returntypical return codes of False or True, but when a catastrophic error occurs, like invaliduser credentials, the library modules throw an exception.
Now we are ready to copy the database and users identified previously. As you mayexpect, there are command modules for each of these operations that accept a serverconnection:
print "# Copying databases..."try: dbcopy.copy_db(conn, dest_values, db_list, options)except exception.UtilError, e: print "ERROR:", e.errmsg exit(1)
# Build dictionary of optionsoptions = { "overwrite" : True, "quiet" : True, "globals" : True}
print "# Cloning the users..."for user in user_list: try: res = userclone.clone_user(conn, dest_values, user, (user,), options) except exception.UtilError, e: print "ERROR:", e.errmsg exit(1)
And that’s all of the code for the new utility! Lets take a look at the completed code andsee an example of its execution.
668 | Chapter 17: Managing MySQL Replication with MySQL Utilities

Putting it all together
Now that you have seen the code involved with each operation, let’s take a look at thecompleted source code. Example 17-3 shows all of the sample code plus the typicalhousekeeping and setup code for managing a typical utility.
Example 17-3. Completed source codeimport optparseimport osimport sys
from mysql.utilities import VERSION_FRMfrom mysql.utilities.command import dbcopyfrom mysql.utilities.command import serverclonefrom mysql.utilities.command import userclonefrom mysql.utilities.common.server import Serverfrom mysql.utilities.common.options import parse_connectionfrom mysql.utilities import exception
# ConstantsNAME = "example - copy_server "DESCRIPTION = "copy_server - copy an existing server"USAGE = "%prog --server=user:pass@host:port:socket " \ "--new-dir=path --new-id=server_id " \ "--new-port=port --databases=db list " \ "--users=user list"
# Setup the command parserparser = optparse.OptionParser( version=VERSION_FRM.format(program=os.path.basename(sys.argv[0])), description=DESCRIPTION, usage=USAGE, add_help_option=False)parser.add_option("--help", action="help")
# Setup utility-specific options:
# Connection information for the source serverparser.add_option("--server", action="store", dest="server", type="string", default="root@localhost:3306", help="connection information for original server in " + \ "the form: user:password@host:port:socket")
# Data directory for new instanceparser.add_option("--new-data", action="store", dest="new_data", type="string", help="the full path to the location " "of the data directory for the new instance")
# Port for the new instanceparser.add_option("--new-port", action="store", dest="new_port", type="string", default="3307", help="the new port " "for the new instance - default=%default")
Creating Your Own Utilities | 669

# Server id for the new instanceparser.add_option("--new-id", action="store", dest="new_id", type="string", default="2", help="the server_id for " "the new instance - default=%default")
# List of databasesparser.add_option("-d", "--databases", action="store", dest="dbs_to_copy", type="string", help="comma-separated list of databases " "to include in the copy (omit for all databases)", default=None)
# List of usersparser.add_option("-u", "--users", action="store", dest="users_to_copy", type="string", help="comma-separated list of users " "to include in the copy (omit for all users)", default=None)
# Now we process the rest of the arguments.opt, args = parser.parse_args()
# Parse source connection valuestry: conn = parse_connection(opt.server)except: parser.error("Server connection values invalid or cannot be parsed.")
# Get a server class instanceprint "# Connecting to server..."server_options = { 'conn_info' : conn, 'role' : "source",}server1 = Server(server_options)try: server1.connect()except UtilError, e: print "ERROR:", e.errmsg
# Get list of databases from the server if not specified in optionsprint "# Getting databases..."db_list = []if opt.dbs_to_copy is None: for db in server1.get_all_databases(): db_list.append((db[0], None))else: for db in opt.dbs_to_copy.split(","): db_list.append((db, None))
# Get list of all users from the serverprint "# Getting users..."user_list=[]
670 | Chapter 17: Managing MySQL Replication with MySQL Utilities

if opt.users_to_copy is None: users = server1.exec_query("SELECT user, host " "FROM mysql.user " "WHERE user != 'root' and user != ''") for user in users: user_list.append(user[0]+'@'+user[1])else: for user in opt.users_to_copy.split(","): user_list.append(user)
# Clone the serverprint "# Cloning server instance..."try: res = serverclone.clone_server(conn, opt.new_data, opt.new_port, opt.new_id, "root", None, False, True)except exception.UtilError, e: print "ERROR:", e.errmsg exit(1)
# Set connection valuesdest_values = { "user" : conn.get("user"), "passwd" : "root", "host" : conn.get("host"), "port" : opt.new_port, "unix_socket" : os.path.join(opt.new_data, "mysql.sock")}
# Build dictionary of optionsoptions = { "quiet" : True, "force" : True}
print "# Copying databases..."try: dbcopy.copy_db(conn, dest_values, db_list, options)except exception.UtilError, e: print "ERROR:", e.errmsg exit(1)
# Build dictionary of optionsoptions = { "overwrite" : True, "quiet" : True, "globals" : True}
print "# Cloning the users..."for user in user_list: try: res = userclone.clone_user(conn, dest_values, user,
Creating Your Own Utilities | 671

(user,), options) except exception.UtilError, e: print "ERROR:", e.errmsg exit(1)
print "# ...done."
Example 17-4 shows the output of this example. Here we see the new utility is used tocopy two databases, all of the users, and create a new server.
Example 17-4. Example execution$ copy_server --new-port=3307 --server=root:pass@localhost \ --new-data=/Volumes/Source/testabc -d db1,db2# Connecting to server...# Getting databases...# Getting users...# Cloning server instance...# Cloning the MySQL server running on localhost.# Creating new data directory...# Configuring new instance...# Locating mysql tools...# Setting up empty database and mysql tables...# Starting new instance of the server...# Testing connection to new instance...# Success!# Setting the root password...# Connection Information:# -uroot -proot --socket=/Volumes/Source/testabc/mysql.sock#...done.# Copying databases...# Cloning the users...# ...done.
Suggestions
The example project is very helpful in producing a running clone of an existing server.However, if we consider how this can be used in replication, we may consider it wouldbe more useful if it had the ability to optionally make the new server a clone of theoriginal server. This would, in effect, create a new utility that can be used to provisionslaves. How cool is that?
To do this, you would need to use the command module for the replication utilitydescribed in “Architecture of MySQL Utilities” on page 663. The following example givesa hint of the code you will need to use. We leave this modification for you to explore asan exercise. Start by identifying the required options and adding them to the file:
from mysql.utilities.command.setup_rpl import setup_replication
...
672 | Chapter 17: Managing MySQL Replication with MySQL Utilities

res = setup_replication(m_values, s_values, opt.rpl_user, options, opt.test_db)
ConclusionMySQL replication is a powerful feature that is easy to set up and administer for a smallnumber of servers. When the topology grows to many servers or acquires complexitysuch as tiered servers, geographically remote sites, or configuration for data segregationvia filtering, managing replication can become a challenge.
In this chapter, we presented a set of utilities you can use to manage your replicationservers for operations like copying databases, cloning users, and setting up and checkingreplication. We also presented two powerful utilities designed to make switchover in asingle command and to provide automatic failover.
Now that you know how to achieve high availability with MySQL, you can use MySQLUtilities to further enhance your MySQL installation.
Joel clicked the key sequence to save his latest version of his manifesto of managingMySQL replication. “That’s done,” he said with the satisfaction of a job completed.
Joel’s new email tone chimed. With some trepidation, he glanced at his inbox. As hesuspected, his boss was asking about the status of his writing project. He clicked onReply and composed a simple response, then attached the new file.
A knock on his doorjamb distracted him before he could hit Send. “Joel, I’ve got acandidate on line 4 who knows MySQL. Why don’t you check him out and quiz him onreplication with that new document you’ve written?” As his boss hurried off, Joel sentthe email and then reached for his phone. “How does he do that?” Joel wondered.
Conclusion | 673


APPENDIX A
Replication Tips and Tricks
This appendix is a collection of useful tips and tricks for running, diagnosing, repairing,and improving MySQL replication. They are supplemental material and, as such, maynot contain all of the details needed for a full tutorial. Consult the online MySQL Ref‐erence Manual for more details about MySQL replication.
The last few sections of this appendix describe features that will be offered by MySQLsoon, but are not officially available at the time of this writing.
Examining the Binary Log with VerboseIf you are using row-based logging, you can use the --verbose option to see a recon‐struction of the queries in the event. The following shows what this looks like when runon a binary log with row-based logging:
$ mysqlbinlog --verbose master-bin.000001BINLOG 'qZnvSRMBAAAAKQAAAAYCAAAAABAAAAAAAAAABHRlc3QAAnQxAAEDAAE=qZnvSRcBAAAAJwAAAC0CAAAQABAAAAAAAAEAAf/+AwAAAP4EAAAA '/*!*/;### INSERT INTO test.t1### SET### @1=3### INSERT INTO test.t1### SET### @1=4
Notice that the values are given using @n-style names for the columns. This is becauserow-based replication is transferring the record and applying it by column position, butignores the names of the columns.
675

Using Replication to Repopulate a TableIf a table on your slave becomes corrupt either through error or accident (e.g., a userdeletes the data), you can use replication to recover the data. Do so by creating a tem‐porary table on the master that is a copy of the original table, dropping the originaltable, and then re-creating it from the copy. This works very well as long as you do nothave any column data types that this could affect (e.g., autoincrement). You are usingthe power of replication to reproduce the table on the slaves. There are two forms ofthis process, based on which form of logging you are using.
Statement-Based LoggingIf you are using statement-based logging, run the following for each table:
SELECT * INTO OUTFILE 't1.txt' FROM t1;DROP TABLE IF EXISTS t1;CREATE TABLE t1 ...;LOAD DATA INFILE 't1.txt' INTO TABLE t1;
Row-Based LoggingIf you are using row-based logging, the temporary table is not transferred to the slave.Therefore, send only the data that is necessary to bootstrap the table using the INSERTINTO command as follows:
CREATE TEMPORARY TABLE t1_tmp LIKE t1;INSERT INTO t1_tmp SELECT * FROM t1;DROP TABLE IF EXISTS t1;CREATE TABLE t1 SELECT * FROM t1_tmp;
Using MySQL Proxy to Perform Multimaster ReplicationNo slave can have more than one master, but a master can have many slaves. This isn’tan issue for most installations, but what if you need to combine data from two differentmasters and replicate the combined data to your slaves?
One way to do this is to use MySQL Proxy as an intermediate slave. Figure A-1 showsa conceptual drawing of this configuration.
676 | Appendix A: Replication Tips and Tricks

Figure A-1. Using MySQL Proxy to handle multiple masters
MySQL Proxy will receive changes (events) from both masters and write a new binarylog without saving the data (writing it to a database). Your slaves use MySQL Proxy asa master. This has the effect of combining data from two masters and replicating to aset of slaves. This effectively implements multimaster replication.
For more information about MySQL Proxy, see the section on MySQL Proxy in theonline MySQL Reference Manual.
Using a Default Storage EngineIf you use a default storage engine on your master by issuing the SET GLOBAL STORAGEENGINE command, this command is not replicated. Therefore, any CREATE statementthat does not specify a storage engine will get the default storage engine as it was set onthe slaves. Thus, it is possible that your InnoDB tables will be replicated to MyISAMtables. If you ignore the warnings when this occurs, you can encounter a scenario inwhich replication stops due to some incompatibility.
One solution is to ensure the global storage engine is set on each slave by including thedefault-storage-engine option in the configuration file. However, the best practiceis to specify the storage engine on the CREATE statement.
This does not prevent issues in which a storage engine used on the master does not existon the slave. In this case, you may encounter problems that can be solved only by in‐stalling the missing storage engine on the slave.
Using a Default Storage Engine | 677

MySQL Cluster Multisource ReplicationYou can set up multisource replication using MySQL Cluster (Figure A-2). To do so, setup the masters to replicate different data. By keeping the data on different masters, youavoid cross-contamination of keys and similar context-dependent values.
Figure A-2. Multisource replication
Multichannel Replication with FailoverFor greater reliability and rapid recovery, you can use a dual replication setup(Figure A-3), in which two sets of replication topologies replicate from one cluster toanother. If one stream goes down, you can fail over to the other stream quickly.
Notice that server names are of the form mysql.X and saved positions are of the formmysql.X.savepos.
678 | Appendix A: Replication Tips and Tricks

Figure A-3. Multichannel replication
Using the Current Database to FilterThe binlog filters can be quite convenient for eliminating statements for particular pur‐poses.
For example, some statements may be meant only for the server, such as setting theengine of a table where you want the engines to be different on the master and the slave.There are many reasons to use a different engine on the slave, including the following:
• MyISAM is more suitable for reporting, and because the binary log contains com‐plete transactions, you can use InnoDB on the master for transactional processingand MyISAM on slaves for reporting and analytical processing.
• To save memory, you can eliminate some tables on a slave used for analytical pro‐cessing by replacing the engine with Blackhole.
You can suspend writing to the binary log by setting the SQL_LOG_BIN server variableto 0. For instance, Example A-1 turns off logging (SQL_LOG_BIN = 0) before changinga table to the MyISAM engine, so that it takes place only on the master, then turnslogging back on (SQL_LOG_BIN = 1). However, setting SQL_LOG_BIN requires SUPERprivileges, which you probably don’t want to grant to regular database users. Therefore,Example 6-8 shows an alternative way to change an engine on the master without log‐ging it. (In the example, it is assumed that the table my_table resides in a databasemy_db.) Create a dedicated database (in this case, we use the name no_write_db). Then,any user who wants to execute a statement that should not be replicated can USE theno_write_db database, and the statement will be filtered out. Because using a databaserequires access privileges, you can control who has the privileges to hide statementswithout providing the SUPER privilege to an untrusted user.
Example A-1. Two different ways to filter a statement from the binary logmaster> SET SQL_LOG_BIN = 0;Query OK, 0 rows affected (0.00 sec)
master> ALTER TABLE my_table ENGINE=MyISAM;Query OK, 92 row affected (0.90 sec)
Using the Current Database to Filter | 679

Records: 92 Duplicates: 0 Warnings: 0
master> SET SQL_LOG_BIN = 1;Query OK, 0 rows affected (0.00 sec)
master> USE no_write_db;Reading table information for completion of table and column namesYou can turn off this feature to get a quicker startup with -A
Database changedmaster> ALTER TABLE my_db.my_table ENGINE=MyISAM;Query OK, 92 row affected (0.90 sec)Records: 92 Duplicates: 0 Warnings: 0
More Columns on Slave Than MasterIf you need to include additional columns on the slave that the master doesn’t have—for example, to record timestamps or add routing or other localized data—you can addcolumns to a table on a slave without having to add the columns on the master. MySQLreplication supports this scenario by ignoring the additional columns. To actually insertdata into the extra columns on the slave, define them to accept default values (an easyway to insert timestamps, for instance) or use a trigger defined on the slave to providethe values.
For statement-based logging, you can create the columns as follows:
1. Create the table on the master:CREATE TABLE t1 (a INT, b INT);
2. Alter the table on the slave:ALTER TABLE t1 ADD ts TIMESTAMP;
3. Sample insert on the master:INSERT INTO t1(a,b) VALUES (10,20);
For row-based logging, you must make the new columns appear at the end of the rowand have default values. Row-based replication will fail if you add columns in the middleor at the front of the row. As long as you add columns at the end of the table and givethem default values, no special consideration needs to be taken regarding which state‐ments to use when replicating, because row-based replication will extract the columnsdirectly from the row being updated, inserted, or deleted.
Fewer Columns on Slave Than MasterIf you need to have fewer columns on the slave than the master—for example, to protectsensitive data or to reduce the amount of data replicated—you can remove columns
680 | Appendix A: Replication Tips and Tricks

from a table on a slave without having to remove the columns on the master. MySQLrow-based replication supports this scenario by ignoring the missing columns. How‐ever, the missing columns on the slave must be from the end of the master’s row.
For row-based replication, you can drop the columns as follows:
1. Create the table on the master:CREATE TABLE t1 (a INT, b INT, comments TEXT);
2. Alter the table on the slave:ALTER TABLE t1 DROP comments;
3. Sample insert on the master:INSERT INTO t1 VALUES (1,2,"Do not store this on slave");
For row-based replication, you can replicate an arbitrary set of columns of a tablewithout regard to whether they are at the end or not by using a trigger on the master toupdate the table from a base table in a separate database so that only the columns in theslave’s database are replicated. Figure A-4 shows a conceptual drawing of this solution.Here, a table with three columns is transformed using a trigger to a table in the replicateddatabase.
Figure A-4. Replicating a subset of columns
An example follows of how you can use a trigger to update the table in the replicateddatabase. On the master, execute the following:
Fewer Columns on Slave Than Master | 681

CREATE DATABASE rpl_db;USE test;CREATE TABLE t1 (a INT, b BLOB, c INT);CREATE TRIGGER tr_t1 AFTER INSERT ON test.t1 FOR EACH ROWINSERT INTO rpl_db.t1_v(a,c) VALUES(NEW.a,NEW.c);USE rpl_db;CREATE TABLE t1_v (a INT, c INT);
When executing a normal insert, the trigger will extract a subset of the columns andwrite it to the table in the rpl_db database. This database will then be replicated, butthe original table will not:
USE test;SET @blob = REPEAT('beef',100);INSERT INTO t1 VALUES (1,@blob,3), (2,@blob,9);
Replicate Selected Rows to SlaveYou can also segment replication so that only rows satisfying a certain condition arereplicated. This technique uses a special database that is replicated from the master tothe slave (this is accomplished by setting up a filter) and a trigger to determine whichrows are to be replicated. The trigger determines which rows are to be replicated byinserting them into the replicated table (Figure A-5).
Figure A-5. Replicating a subset of rows
An example follows of how you can use a trigger to update the table in the replicateddatabase with only rows having an odd value in column a inserted:
682 | Appendix A: Replication Tips and Tricks

# Just replicate rows that have odd numbers in the first column.USE rpl_db;CREATE TABLE t1_h (a INT, b BLOB, c INT);--delimiter //CREATE TRIGGER slice_t1_horiz AFTER INSERT ON test.t1FOR EACH ROWBEGIN IF NEW.a MOD 2 = 1 THEN INSERT INTO rpl_db.t1_h VALUES (NEW.a, NEW.b, NEW.c); END IF;END//--delimiter ;
Replication Heartbeat (5.4.4 or Later)It is possible to improve the reliability of replication and improve failover using thereplication heartbeat mechanism. When the heartbeat is turned on, the slave will peri‐odically challenge the master. As long as the slave gets a response, it will continue asusual and challenge the master again at the next interval. The server maintains statisticsof the number of heartbeats received, which can help to determine whether the masteris offline or not responding. Figure A-6 shows a conceptual drawing of the heartbeatmechanism.
Figure A-6. Heartbeat during replication
The heartbeat mechanism allows the slave to detect when the master is still responding,and has the following advantages and capabilities:
• Automatic checking of connection status• No more relay log rotates when the master is idle• Detection of master/slave disconnect, configurable in milliseconds
Thus, you can use the heartbeat mechanism to perform automatic failover and similarhigh availability operations. Use the following command to set the heartbeat intervalon the slave:
Replication Heartbeat (5.4.4 or Later) | 683

CHANGE MASTER SET master_heartbeat_period= val;
The following commands allow you to check the settings and statistics of the heartbeatmechanism:
SHOW STATUS like 'slave_heartbeat period';SHOW STATUS like 'slave_received_heartbeats';
Ignoring Servers in Circular Replication (5.5 or Later)If you have a circular replication topology and one of the servers fails, you must changethe topology to exclude the failed server. In Figure A-7, server A has failed and you mustremove it from the circle. In this case, you can set server B to terminate server A’s eventsin the new circle.
Figure A-7. Replacing a server in circular replication
You can do this by issuing the following command on server B:CHANGE MASTER TO MASTER_HOST=C ... IGNORE_SERVER_IDS=(A)
This feature was introduced in MySQL version 5.5.
Time-Delayed Replication (5.6 or Later)There is sometimes a need to delay replication—for example, when you want to ensureslaves are not overloaded with changes. This feature provides the ability to executereplication events on a slave so that it is n seconds behind the master at all times. Youcan set this parameter as shown:
CHANGE MASTER TO MASTER_DELAY= seconds
seconds is a nonnegative integer less than MAX_ULONG number of seconds for the slaveto wait (attempts to set the number higher will be rejected with an error).
You can verify the delayed setup by running the SHOW SLAVE STATUS command andexamining the Seconds_behind_master column of the output.
684 | Appendix A: Replication Tips and Tricks


Implementing Multisource Replication in Pure SQL (5.6 orLater)As you saw in the section “Multisource Replication in a Shell Script” on page 687, a slavecan currently not replicate from multiple master (multisource replication) at the sametime, but it is possible to replicate from multiple masters by using a time-sharing schemewhere the current master is switched at regular intervals.
The solution in “Multisource Replication in a Shell Script” on page 687 used a separateclient—implemented there in the Bourne shell—to work as scheduler and change themaster for the server regularly. Wouldn’t it be neat if there were a way to have the serverchange master itself? The good news is that it is possible... if you are using MySQL 5.6.By using the tables that were introduced in MySQL 5.6 to handle transactional replica‐tion (see “Transactional Replication” on page 270) it is possible to implement a time-share multisource entirely in SQL by creating an event (as in CREATE EVENT) to performthe master change.
To implement this, it is necessary to have a list of masters to traverse. The list need tocontain all the necessary connection information, as well as the position where repli‐cation left off before switching to the next master. To keep track of the masters easily,there is also a column containing a server number (it is not the server ID, just a numberused in the algorithm). In addition, it would be convenient if masters could be addedand removed from the from the list without having to stop the event scheduler.
Table A-1. Definition of Table My_MastersField Type Null Key Default
server_id int(10) unsigned NO PRI NULL
host varchar(50) YES NULL
port int(10) unsigned YES 3306
user varchar(50) YES NULL
passwd varchar(50) YES NULL
The table described in Table A-1 suits the purpose well. In order to keep track of thecurrent master, a Current_Master table is introduced as well, holding the index of thecurrently active master. To be able to support addition and removal of masters, bothtables have to be transactional because we will update the information in both tables asa single transaction. In this case, it would have been convenient if a session variablecould be used to keep track of the index of the current server, but each time an event isstarted, a new sessions is spawned, so the value of the session variable is not kept betweeninvocations of the event; therefore we have to store the value in a table.
Here is the complete definition of the event that switches the master (followed by a step-by-step explanation):
690 | Appendix A: Replication Tips and Tricks


APPENDIX B
A GTID Implementation
With MySQL 5.6, global transaction identifiers were introduced to provide a way touniquely identify a transaction regardless of what server it is executed on. Handlingfailovers with a 5.6 server is very easy, and you can find a description of that in “FailoverUsing GTIDs” on page 263. But if you do not have a 5.6 server and still need to performfailover, you can use the methods described in this appendix, basically by implementingyour own global transaction identifiers and writing them to the binary log. The goal isto implement the features necessary to perform slave promotion.
Adding GTIDs to a ServerTo match the latest transaction on each of the slaves with the corresponding event inthe binary log of the promoted slave, you need to tag each transaction. The content andstructure of the tags don’t matter; they just need to be uniquely identifiable no matterwho executed the transaction so each transaction on the master can be found in thepromoted slave’s binary log. These tags are the global transaction identifiers that we aregoing to implement in this appendix.
The easiest way to accomplish this is to insert a statement at the end of each transactionthat updates a special table and use that to keep track of where each slave is. Just beforecommitting each transaction, a statement updates the table with a number that is uniquefor the transaction.
Tagging can be handled in two main ways:
• Extending the application code to perform the necessary statements• Calling a stored procedure to perform each commit and writing the tag in the
procedure
693

Because the first approach is easier to follow, it will be demonstrated here. If you areinterested in the second approach, see “Stored Procedures to Commit Transactions” onpage 698 later in this appendix.
To implement global transaction identifiers (GTIDs), create two tables as inExample B-1: one table named Global_Trans_ID to generate sequence numbers and aseparate table named Last_Exec_Trans to record the GTID.
The server identifier is added to the definition of Last_Exec_Trans to distinguishtransactions committed on different servers. If, for example, the promoted slave failsbefore all the slaves have managed to connect, it is very important to distinguish betweenthe transaction identifier of the original master and the transaction identifier of thepromoted slave. Otherwise, the slaves that didn’t manage to connect to the promotedslave might start to execute from a position that is wrong when they are redirected tothe second promoted slave. This example uses MyISAM to define the counter table, butit is possible to use InnoDB for this as well.
In this section, to keep code simple and familiar, we show the operations as plain SQL.In later sections, we show sample code that illustrates how to automate the operationsas part of your applications.
Example B-1. Tables used for generating and tracking global transaction identifiersCREATE TABLE Global_Trans_ID ( number INT UNSIGNED AUTO_INCREMENT PRIMARY KEY) ENGINE = MyISAM;
CREATE TABLE Last_Exec_Trans ( server_id INT UNSIGNED, trans_id INT UNSIGNED) ENGINE = InnoDB;
-- Insert a single row with NULLs to be updated.INSERT INTO Last_Exec_Trans() VALUES ();
The next step is to construct a procedure for adding a global transaction identifier tothe binary log so that a program promoting a slave can read the identifier from the log.The following procedure is suitable for our purposes:
1. Insert an item into the transaction counter table, making sure to turn off the binarylog before doing so, because the insert should not be replicated to the slaves:
master> SET SQL_LOG_BIN = 0;Query OK, 0 rows affected (0.00 sec)
master> INSERT INTO Global_Trans_ID() VALUES ();Query OK, 1 row affected (0.00 sec)
694 | Appendix B: A GTID Implementation

2. Fetch the global transaction identifier using the function LAST_INSERT_ID. To sim‐plify the logic, the server identifier is fetched from the server variable server_id atthe same time:
master> SELECT @@server_id as server_id, LAST_INSERT_ID() as trans_id;+-----------+----------+| server_id | trans_id |+-----------+----------+| 0 | 235 |+-----------+----------+1 row in set (0.00 sec)
3. Before inserting the global transaction identifier into the Last_Exec_Trans track‐ing table, you can remove its row from the transaction counter table to save space.This optional step works only for a MyISAM table, because it internally tracks thelatest autoincrement value and keeps autoincrementing from the value of the re‐moved row. If you use InnoDB, you have to be careful about leaving the last usedglobal transaction identifier in the table. InnoDB determines the next number fromthe maximum value in the autoincrement column currently in the table.
master> DELETE FROM Global_Trans_ID WHERE number < 235;Query OK, 1 row affected (0.00 sec)
4. Turn on the binary log:master> SET SQL_LOG_BIN = 1;Query OK, 0 rows affected (0.00 sec)
5. Update the Last_Exec_Trans tracking table with the server identifier and thetransaction identifier you got in step 2. This is the last step before committing thetransaction through a COMMIT:
master> UPDATE Last_Exec_Trans SET server_id = 0, trans_id = 235;Query OK, 1 row affected (0.00 sec)
master> COMMIT;Query OK, 0 rows affected (0.00 sec)
Each global transaction identifier represents a point where replication can be resumed.Therefore, you must carry out this procedure for every transaction. If it is not used forsome transaction, the transaction will not be tagged properly and it will not be possibleto start from that position.
To define these tables and configure a server to use these GTIDs, you can use thePromotable class (shown in Example B-2) to handle the new kind of server. As you cansee, this example reuses the _enable_binlog helper method introduced in “ServerRoles” on page 19, and adds a method to set the log-slave-updates option. Because apromotable slave requires the special tables we showed earlier for the master, the addi‐tion of a promotable slave requires you to add these tables as well. To do this, we writea function named _add_global_id_tables. The function assumes that if the tables
Adding GTIDs to a Server | 695

already exist, they have the correct definition, so no attempt is made to re-create them.However, the Last_Exec_Trans table needs to start with one row for the update to workcorrectly, so if no warning was produced to indicate that a table already exists, we createthe table and add a row with NULL.
Example B-2. The definition of a promotable slave role_GLOBAL_TRANS_ID_DEF = """CREATE TABLE IF NOT EXISTS Global_Trans_ID ( number INT UNSIGNED NOT NULL AUTO_INCREMENT, PRIMARY KEY (number)) ENGINE=MyISAM"""
_LAST_EXEC_TRANS_DEF = """CREATE TABLE IF NOT EXISTS Last_Exec_Trans ( server_id INT UNSIGNED DEFAULT NULL, trans_id INT UNSIGNED DEFAULT NULL) ENGINE=InnoDB"""
class Promotable(Role): def __init__(self, repl_user, master): self.__master = master self.__user = repl_user
def _add_global_id_tables(self, master): master.sql(_GLOBAL_TRANS_ID_DEF) master.sql(_LAST_EXEC_TRANS_DEF) if not master.sql("SELECT @@warning_count"): master.sql("INSERT INTO Last_Exec_Trans() VALUES ()")
def _relay_events(self, server, config): config.set('mysqld', 'log-slave-updates')
def imbue(self, server): # Fetch and update the configuration config = server.get_config() self._set_server_id(server, config) self._enable_binlog(server, config) self._relay_event(server, config)
# Put the new configuration in place server.stop() server.put_config(config) server.start()
# Add tables to master self._add_global_id_tables(self.__master)
server.repl_user = self.__master.repl_user
696 | Appendix B: A GTID Implementation

This routine configures the slaves and the master correctly for using global transactionidentifiers.
Transaction Handling Using GTIDsYou still have to update the Last_Exec_Trans table when committing each transaction.In Example B-3 you can see an example implementation in PHP for committing trans‐actions. The code is written using PHP, because this is part of the application code andnot part of the code for managing the deployment.
Example B-3. Code for starting, committing, and aborting transactionsfunction start_trans($link) { mysql_query("START TRANSACTION", $link);}
function rollback_trans($link) { mysql_query("ROLLBACK", $link);}
function commit_trans($link) { mysql_select_db("common", $link); mysql_query("SET SQL_LOG_BIN = 0", $link); mysql_query("INSERT INTO Global_Trans_ID() VALUES ()", $link); $trans_id = mysql_insert_id($link); $result = mysql_query("SELECT @@server_id as server_id", $link); $row = mysql_fetch_row($result); $server_id = $row[0];
$delete_query = "DELETE FROM Global_Trans_ID WHERE number = %d"; mysql_query(sprintf($delete_query, $trans_id), $link); mysql_query("SET SQL_LOG_BIN = 1", $link);
$update_query = "UPDATE Last_Exec_Trans SET server_id = %d, trans_id = %d"; mysql_query(sprintf($update_query, $server_id, $trans_id), $link); mysql_query("COMMIT", $link);}
We can then use this code to commit transactions by calling the functions instead ofthe usual COMMIT and ROLLBACK. For example, we could write a PHP function to add amessage to a database and update a message counter for the user:
function add_message($email, $message, $link) { start_trans($link); mysql_select_db("common", $link); $query = sprintf("SELECT user_id FROM user WHERE email = '%s'", $email); $result = mysql_query($query, $link); $row = mysql_fetch_row($result); $user_id = $row[0];
Transaction Handling Using GTIDs | 697

$update_user = "UPDATE user SET messages = messages + 1 WHERE user_id = %d"; mysql_query(sprintf($update_user, $user_id), $link);
$insert_message = "INSERT INTO message VALUES (%d,'%s')"; mysql_query(sprintf($insert_message, $user_id, $message), $link); commit_trans($link);}
$conn = mysql_connect(":/var/run/mysqld/mysqld1.sock", "root");add_message('[email protected]', "MySQL Python Replicant rules!", $conn);
Stored Procedures to Commit TransactionsThe main approach shown here to sync servers is to implement the transaction commitprocedure in the application, meaning that the application code needs to know tablenames and the intricacies of how to produce and manipulate the global transactionidentifier. Once you understand them, the complexities are not as much of a barrier asthey might seem at first. Often, you can handle them with relative ease by creatingfunctions in the application code that the application writer can call without having toknow the details.
Another approach is to put the transaction commit logic in the database server by usingstored procedures. Depending on the situation, this can sometimes be a better alterna‐tive. For example, the commit procedure can be changed without having to change theapplication code.
For this technique to work, it is necessary to put the transaction identifier from theGlobal_Trans_ID table and the server identifier into either a user-defined variable or alocal variable in the stored routine. Depending on which approach you select, the queryin the binary log will look a little different.
Using local variables is less likely to interfere with surrounding code because user-defined variables can be viewed or changed outside the stored procedure. This is knownas “leaking”.
The procedure for committing a transaction will then be:
CREATE PROCEDURE commit_trans () SQL SECURITY DEFINERBEGIN DECLARE trans_id, server_id INT UNSIGNED; SET SQL_LOG_BIN = 0; INSERT INTO Global_Trans_ID() values (); SELECT LAST_INSERT_ID() INTO trans_id, @@server_id INTO server_id; SET SQL_LOG_BIN = 1; INSERT INTO Last_Exec_Trans(server_id, trans_id) VALUES (server_id, trans_id);
698 | Appendix B: A GTID Implementation

COMMIT;END
Committing a transaction from the application code is then simple:
CALL Commit_Trans();
Now the task remains of changing the procedure for scanning the binary log for theglobal transaction identifier. So, how will a call to this function appear in the binary log?Well, a quick call to mysqlbinlog shows:
# at 1724#091129 18:35:11 server id 1 end_log_pos 1899 Query thread_id=75 exec_time=0 error_code=0SET TIMESTAMP=1259516111/*!*/;INSERT INTO Last_Exec_Trans(server_id, trans_id) VALUES ( NAME_CONST('server_id',1), NAME_CONST('trans_id',13))/*!*/;# at 1899#091129 18:35:11 server id 1 end_log_pos 1926 Xid = 1444COMMIT/*!*/;
As you can see, both the server identifier and the transaction identifier are clearly visiblein the output. How to match this statement using a regular expression is left as an exercisefor the reader.
Finding Positions of GTIDsWhen connecting a slave to the promoted slave and start replication at the right position,it is necessary to find out what position on the promoted slave has the last executedtransaction of the slave. This is done by scanning the binary log of the promoted slaveto find the GTID.
The logs of the promoted slave can be retrieved using SHOW MASTER LOGS, so you canscan them for global transaction identifiers. For instance, when you read the slave-3-bin.000005 file using mysqlbinlog, part of the output will look like that shown inExample B-4. The transaction received by slave-3 starting at position 596 (highlightedin the first line of the output) has the global transaction identifier received by slave-1,as shown by an UPDATE of the Last_Exec_Trans table.
Example B-4. Output from the mysqlbinlog command for one transaction# at 596#091018 18:35:42 server id 1 end_log_pos 664 Query thread_id=952 ...SET TIMESTAMP=1255883742/*!*/;BEGIN/*!*/;# at 664#091018 18:35:42 server id 1 end_log_pos 779 Query thread_id=952 ...SET TIMESTAMP=1255883742/*!*/;
Finding Positions of GTIDs | 699

UPDATE user SET messages = messages + 1 WHERE id = 1/*!*/;# at 779#091018 18:35:42 server id 1 end_log_pos 904 Query thread_id=952 ...SET TIMESTAMP=1255883742/*!*/;INSERT INTO message VALUES (1,'MySQL Python Replicant rules!')/*!*/;# at 904#091018 18:35:42 server id 1 end_log_pos 1021 Query thread_id=952 ...SET TIMESTAMP=1255883742/*!*/;UPDATE Last_Exec_Trans SET server_id = 1, trans_id = 245/*!*/;# at 1021#091018 18:35:42 server id 1 end_log_pos 1048 Xid = 1433COMMIT/*!*/;
Example B-4 shows that the trans_id 245 is the last transaction seen by slave-1, so nowyou know that the start position for slave-1 is in file slave-3-bin.000005 at byte position1048. So to start slave-1 at the correct position, you can now execute CHANGE MASTERand START SLAVE:
slave-1> CHANGE MASTER TO -> MASTER_HOST = 'slave-3', -> MASTER_LOG_FILE = 'slave-3-bin.000005', -> MASTER_LOG_POS = 1048;Query OK, 0 rows affected (0.04 sec)
slave-1> START SLAVE;Query OK, 0 rows affected (0.17 sec)
By going backward in this manner you can connect the slaves one by one to the newmaster at exactly the right position.
This technique works well if the update statement is added to every transaction commit.Unfortunately, there are statements that perform an implicit commit before and afterthe statement. Typical examples include CREATE TABLE, DROP TABLE, and ALTERTABLE. Because these statements do an implicit commit, they cannot be tagged properly,hence it is not possible to restart just after them. Suppose that the following sequenceof statements is executed and there is a crash:
INSERT INTO message_board VALUES ('[email protected]', 'Hello World!');CREATE TABLE admin_table (a INT UNSIGNED);INSERT INTO message_board VALUES ('', '');
If a slave has just executed the CREATE TABLE and then loses the master, the last seenglobal transaction identifier is for the INSERT INTO—that is, just before the CREATETABLE statement. Therefore, the slave will try to reconnect to the promoted slave withthe transaction identifier of the INSERT INTO statement. Because it will find the positionin the binary log of the promoted slave, it will start by replicating the CREATE TABLEstatement again, causing the slave to stop with an error.
700 | Appendix B: A GTID Implementation

You can avoid these problems through careful design and use of statements that performimplicit commits. For example, if CREATE TABLE is replaced with CREATE TABLE IF NOTEXISTS, the slave will notice that the table already exists and skip execution of the state‐ment.
The first step is to fetch the binlog files remotely, similar to the method used in Chap‐ter 3. In this case, we need to fetch the entire binlog file, as we do not know where tostart reading. The fetch_remote_binlog function in Example B-5 fetches a binary logfrom a server and returns an iterator to the lines of the binary log.
Example B-5. Fetching a remote binary logimport subprocess
def fetch_remote_binlog(server, binlog_file): command = ["mysqlbinlog", "--read-from-remote-server", "--force", "--host=%s" % (server.host), "--user=%s" % (server.sql_user.name)] if server.sql_user.passwd: command.append("--password=%s" % (server.sql_user.passwd)) command.append(binlog_file) return iter(subprocess.Popen(command, stdout=subprocess.PIPE).stdout)
The iterator returns the lines of the binary log one by one, so the lines have to be furtherseparated into transactions and events to make the binary log easier to work with.Example B-6 shows a function named group_by_event that groups lines belonging tothe same event into a single string, and a function named group_by_trans that groupsa stream of events (as returned by group_by_event) into lists, where each list representsa transaction.
Example B-6. Parsing the mysqlbinlog output to extract transactionsdelimiter = "/*!*/;"
def group_by_event(lines): event_lines = [] for line in lines: if line.startswith('#'): if line.startswith("# End of log file"): del event_lines[-1] yield ''.join(event_lines) return if line.startswith("# at"): yield ''.join(event_lines) event_lines = [] event_lines.append(line)
def group_by_trans(lines): group = []
Finding Positions of GTIDs | 701

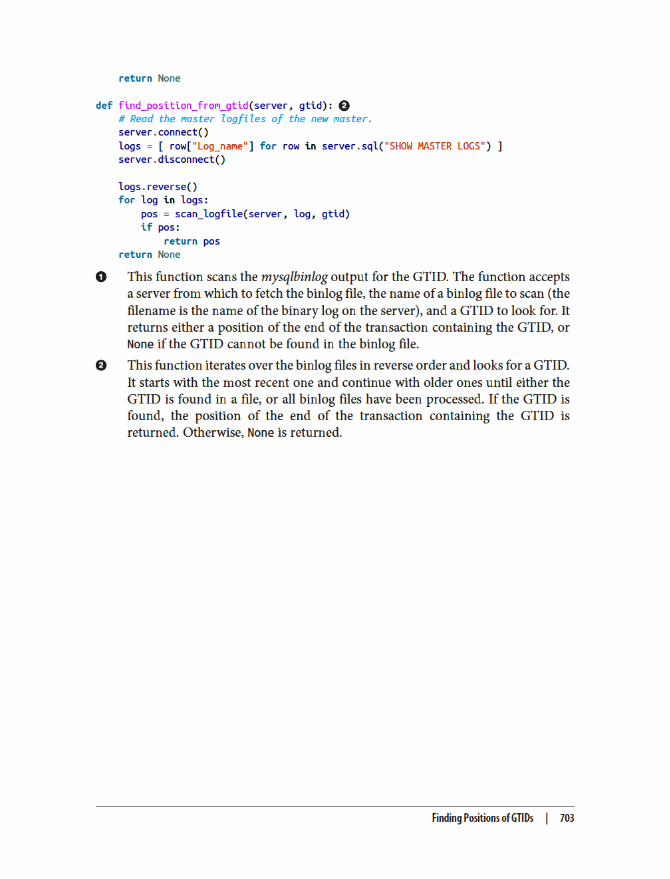


About the AuthorsDr. Charles A. Bell is a Senior Software Engineer at Oracle. He is currently the leaddeveloper for backup and a member of the MySQL Backup and Replication team. Helives in a small town in rural Virginia with his loving wife. He received his Doctor ofPhilosophy in Engineering from Virginia Commonwealth University in 2005. His re‐search interests include database systems, versioning systems, semantic web, and agilesoftware development.
Dr. Mats Kindahl is principal senior software developer in the MySQL team at Oracle.He is the main architect and implementor of MySQL’s row-based replication and severalother replication features and is currently architect and project lead for the MySQL HighAvailability team that is developing MySQL Fabric. Before starting at MySQL, he didresearch in formal methods, program analysis, and distributed systems, the area wherehe earned his doctoral degree in computer science. He has also spent several years de‐veloping C/C++ compilers.
Dr. Lars Thalmann is the development manager for MySQL replication and backup.He is responsible for the strategy and development of these features and leads the cor‐responding engineering teams. Thalmann has worked with MySQL development since2001, when he was a software developer working on MySQL Cluster. More recently, hehas driven the creation and development of the MySQL backup feature, has guided theevolution of MySQL replication since 2004, and has been a key player in the developmentof MySQL Cluster replication. Thalmann holds a doctorate in computer science fromUppsala University, Sweden.
ColophonThe animal on the cover of MySQL High Availability is an American robin (Turdusmigratorius). Instantly recognizable by its distinctive appearance–dark head, reddish-orange breast, and brown back–this member of the thrush family is among the mostcommon American birds. (Though it shares its name with the European robin, whichalso has a reddish breast, the two species are not closely related.)
The American robin inhabits a range of six million square miles in North America andis resident year-round through much of the United States. Commonly considered aharbinger of spring, robins are early to sing in the morning and among the last birdssinging at night. Their diets consist of invertebrates (often earthworms) and fruit andberries. Robins favor open ground and short grass, so they are frequent backyard visi‐tors, and they are often found in parks, in gardens, and on lawns.
The cover image is from Johnson’s Natural History, Volume II. The cover fonts are URWTypewriter and Guardian Sans. The text font is Adobe Minion Pro; the heading font isAdobe Myriad Condensed; and the code font is Dalton Maag’s Ubuntu Mono.