Risk Shifts in the Market for Audits: An Examination of Changes in Risk for “Second Tier” Audit...
26
93 AUDITING: A JOURNAL OF PRACTICE & THEORY American Accounting Association Vol. 28, No. 2 DOI: 10.2308 / aud.2009.28.2.93 November 2009 pp. 93–118 Risk Shifts in the Market for Audits: An Examination of Changes in Risk for ‘‘Second Tier’’ Audit Firms Chris E. Hogan and Roger D. Martin SUMMARY: The market for audit services has been affected in recent years by signif- icant changes like the demise of Andersen and the implementation of the Sarbanes- Oxley Act of 2002. One impact of these market changes has been an increase in the frequency of auditor switches, and in particular, the frequency of clients switching from Big 4 auditors to smaller audit firms. We examine whether this switching activity has resulted in changes in the risk characteristics of publicly traded clients of Second Tier audit firms. This analysis is important as regulators are concerned about audit market concentration and would like to see the Second Tier audit firms expand their share of the publicly traded client market. Results indicate that Second Tier firms are accepting clients with potentially increased audit and client business risk characteristics relative to their existing client base, but they also appear to be ‘‘shedding’’ clients that have increased audit and client business risk characteristics relative to their existing client base. Some of the differences in risk characteristics for those departing clients are more pronounced in the period after 2000, when we expect the most significant changes in the audit market occurred. Second Tier auditors are increasingly exposed to more business risk as they accept larger clients coming from Big 4 predecessor auditors, which may increase their exposure to litigation. Keywords: auditor switching; second tier audit firms; national audit firms; risk characteristics. Data Availability: The data used in this study are available from public sources. Chris E. Hogan is an Associate Professor at Michigan State University, and Roger D. Martin is an Associate Professor at the University of Virginia. We have benefited from discussions with Jeanette Franzel and the staff at the GAO related to this topic. We also appreciate the comments by an anonymous reviewer, Dan Simunic (editor), Bob Allen, workshop participants at The University of Kansas, and participants at the 2008 Joint Auditing: A Journal of Practice & Theory and Journal of Contemporary Accounting and Economics Symposium, and in particular the discussant at that Symposium, Charles Chen. Editor’s note: Accepted by Dan Simunic. Submitted: August 2007 Accepted: April 2009 Published Online: November 2009
-
Upload
independent -
Category
Documents
-
view
1 -
download
0
Transcript of Risk Shifts in the Market for Audits: An Examination of Changes in Risk for “Second Tier” Audit...
93
AUDITING: A JOURNAL OF PRACTICE & THEORY American Accounting AssociationVol. 28, No. 2 DOI: 10.2308/aud.2009.28.2.93November 2009pp. 93–118
Risk Shifts in the Market for Audits:An Examination of Changes in Risk
for ‘‘Second Tier’’ Audit FirmsChris E. Hogan and Roger D. Martin
SUMMARY: The market for audit services has been affected in recent years by signif-icant changes like the demise of Andersen and the implementation of the Sarbanes-Oxley Act of 2002. One impact of these market changes has been an increase in thefrequency of auditor switches, and in particular, the frequency of clients switching fromBig 4 auditors to smaller audit firms. We examine whether this switching activity hasresulted in changes in the risk characteristics of publicly traded clients of Second Tieraudit firms. This analysis is important as regulators are concerned about audit marketconcentration and would like to see the Second Tier audit firms expand their share ofthe publicly traded client market. Results indicate that Second Tier firms are acceptingclients with potentially increased audit and client business risk characteristics relativeto their existing client base, but they also appear to be ‘‘shedding’’ clients that haveincreased audit and client business risk characteristics relative to their existing clientbase. Some of the differences in risk characteristics for those departing clients aremore pronounced in the period after 2000, when we expect the most significantchanges in the audit market occurred. Second Tier auditors are increasingly exposedto more business risk as they accept larger clients coming from Big 4 predecessorauditors, which may increase their exposure to litigation.
Keywords: auditor switching; second tier audit firms; national audit firms; riskcharacteristics.
Data Availability: The data used in this study are available from public sources.
Chris E. Hogan is an Associate Professor at Michigan State University, and Roger D.Martin is an Associate Professor at the University of Virginia.
We have benefited from discussions with Jeanette Franzel and the staff at the GAO related to this topic. We alsoappreciate the comments by an anonymous reviewer, Dan Simunic (editor), Bob Allen, workshop participants atThe University of Kansas, and participants at the 2008 Joint Auditing: A Journal of Practice & Theory and Journalof Contemporary Accounting and Economics Symposium, and in particular the discussant at that Symposium,Charles Chen.
Editor’s note: Accepted by Dan Simunic.
Submitted: August 2007Accepted: April 2009
Published Online: November 2009
94 Hogan and Martin
Auditing: A Journal of Practice & Theory November 2009American Accounting Association
INTRODUCTION
Publicly traded companies have been increasingly willing to switch to non-Big 4 auditfirms in recent years (Reilly 2006; Governmental Accountability Office [GAO] 2006;Byrnes 2005; Public Accounting Report 2004). While this shift to smaller audit firms
has led to recent research about related audit fee changes and stock price reactions, weexamine the possible changes in overall audit client portfolio risks for smaller audit firms.In particular we examine whether the changes in the audit market have resulted in a shiftin the risk characteristics of publicly traded clients served by the large national firms—‘‘Second Tier’’ firms—over recent years.1
Significant forces have changed the market for audit services in recent years. Auditfirms face limited resources to provide expanded (and required) assurance services de-manded by audit clients, and auditors are subject to increased regulatory and public scrutinyfor their involvement with clients with low quality financial reporting. New restrictions onservices allowed to be provided by auditors to attestation clients have also been enacted inrecent years. Audit firms are reportedly responding to changes in the audit market by morevigorously pursuing and retaining clients with lower risks that provide profitable returns onthe firms’ limited resources. Upward fee pressures and service provision issues (e.g., morerestricted services) have also caused audit clients to reassess their independent auditoraffiliations (GAO 2006).
The resulting changes in the market for audit services lead to the possibility that ad-justments in portfolios of audit clients result in certain audit firms assuming more risk thanin the past. Smaller firms in particular might face more business risk with an increase inthe frequency of audit clients ‘‘moving down’’ from the Big 4 firms, since those clientsmoving down might be doing so because they pose relatively more audit risk or providelower profitability to the audit firm. From a public policy perspective, one concern is thatsmaller firms might now be providing attestation services to a different—and in particular,riskier—clientele. While regulators are concerned about audit market concentration and areencouraging small audit firms to more actively participate in the market for audit servicesfor publicly traded client firms (Advisory Committee on the Auditing Profession 2008; Cox2005), this potential for riskier client portfolios could lead to eventual shocks to the capitalmarkets if the smaller firms are ill-equipped to manage increased risks of their client baseand face subsequent threats to their continued existence.
We examine whether the level of audit and financial risks of clients have changed inrecent years. While recent studies have examined client-switching issues among the Big 4firms and between the Big 4 firms and non-Big 4 firms as a group (e.g., Landsman et al.2007), we specifically address whether Second Tier firms might be affected by a redistri-bution of audit clients and their associated risks. The movement of risky clients has notnecessarily been solely a shift of risky clients from the Big 4 firms to the Second Tier auditfirms, however. Second Tier firms have likely evaluated their own client portfolios in thecontext of the changes in the audit market, and might well have chosen to shed some oftheir own risky clients to even smaller firms. Clients of Second Tier firms might also haverecognized the resource constraints faced by their auditors and resulting fee pressures anddecided to move to audit firms that can provide more personalized service at acceptablefee levels. It is also possible that audit clients who were reluctant to shift away from a Big4 auditor in prior years decided the tumultuous conditions in the early 2000s provided an
1 Our classification of ‘‘Second Tier’’ audit firms includes BDO Seidman; Crowe, Chizek and Company; GrantThornton LLP; and McGladrey & Pullen. We will describe the rationale for this classification in a subsequentsection of the paper.
Risk Shifts in the Market for Audits 95
Auditing: A Journal of Practice & Theory November 2009American Accounting Association
opportunity to ‘‘move down’’ in auditor size without significant scrutiny from shareholders.Thus the level of risks associated with the client portfolios of Second Tier firms is notnecessarily higher in recent years.
We identify portfolios of publicly traded audit clients for the Second Tier firms foreach year 2001–2004 and identify the source (e.g., either new or continuing from the prioryear) and the continuance status (e.g., either continuing or departing before the next year)for all clients in those portfolios. We examine changes in risk for Second Tier firms bycomparing risk characteristics of publicly traded client portfolios in 2000 versus 2004 andby comparing audit and financial risks of publicly traded clients that are new to or departingfrom a Second Tier firm to the continuing portfolio of publicly traded clients in eachyear from 2001 to 2004. We also compare clients coming from Big 4 firms versus smalleraudit firms, and clients departing to smaller firms versus those departing to Big 4 firms togain further insight into the changes in the Second Tier’s portfolio of clients.
We find a significant amount of switching activity both to and away from the SecondTier firms with new clients representing approximately 20 percent of their publicly tradedclient portfolios each year. The majority of new clients came from Big 4 firms whereas themajority of departing clients subsequently engaged smaller audit firms (or delisted). As aresult of these changes, auditor business risk seems to have increased for Second Tier firmsbased on the consistent pattern of accepting larger clients during the period while disas-sociating from relatively smaller clients. To the degree that larger clients are associatedwith increased risk of auditor litigation, these results imply that Second Tier firms becameexposed to higher business risk as a result of the switching activity.
Profitability (measured as return on assets) for new clients was lower than for contin-uing and departing clients. New clients from Big 4 firms were more likely to have hadprior losses than continuing clients of the Second Tier firms, but in turn the clients whodeparted from Second Tier firms to smaller firms were also more likely to have had priorlosses than continuing clients. This would seem to be evidence that the Second Tier firmswere disassociating from clients with higher financial risk characteristics at the same timethey were accepting new clients with greater financial risk characteristics relative to therest of their client portfolios.
Changes to characteristics associated with audit risk were also not in a consistent di-rection. Growth rates (measured as change in sales) were higher for new and departingclients relative to continuing clients. Restatements and disclosure control weaknesses weremore frequent for new clients relative to continuing clients, while the same two character-istics were less frequent for departing clients relative to continuing clients. All else equal,this would imply that Second Tier firms were increasing the riskiness of their audit port-folios based on these characteristics. In contrast, however, when comparing matters dis-closed in 8-Ks associated with auditor realignments, departing clients had higher occurrencerates of reportable conditions and accounting concerns relative to new clients throughoutthe study period.
Overall, our findings suggest that the Second Tier firms were rebalancing their clientportfolios over this period. As they took on larger and more risky clients, predominantlyclients coming from the Big 4 audit firms, they also seemed to be shedding clients thatwere less profitable and more likely to have riskier reporting issues such as going-concernopinions, accounting concerns, and reportable conditions.
The remainder of the paper is as follows. We discuss prior research on auditor switchingand why an examination of switching results for Second Tier firms is particularly importantin recent years. Following, we describe data used in our analyses, and we present results.Finally, we offer a summary and conclusion based on our findings.
96 Hogan and Martin
Auditing: A Journal of Practice & Theory November 2009American Accounting Association
BACKGROUND AND MOTIVATIONThe market for financial statement auditing services has typically been analyzed in the
context of being in a state of equilibrium, with specific auditor realignments among andbetween Big 4, Second Tier and smaller audit firms occurring because of changing con-ditions for individual clients and/or audit firms (e.g., Schwartz and Menon 1985; Johnsonand Lys 1990; Shu 2000; Johnstone and Bedard 2004). For example, audit clients mightinitiate auditor changes as they grow and/or demand a different bundle of services fromtheir audit firm. Alternatively, as audit firms face risk-return trade-offs, they may resignfrom clients where the audit fee the client is willing to pay is not sufficient to cover thepotential costs of being associated with the client.2 Allowing for these auditor-client re-alignments as auditor-specific and client-specific circumstances change, during any giventime period it is reasonable to assume that the audit market is close to a state of equilibriumin which Big 4, Second Tier and smaller audit firms are associated with acceptable port-folios of clients that balance costs and benefits.
For auditor realignments that do occur during a given period, prior research has foundthat audit firms tend to resign from clients with higher litigation risk (e.g., Shu 2000;Krishnan and Krishnan 1997), clients with financial distress (Krishnan and Krishnan 1997),and clients with higher audit risk characteristics (Johnstone and Bedard 2004), but thisresearch does not document whether the client is able to engage a similar audit firm or isforced to move to a smaller audit firm. To address this issue, Landsman et al. (2007)examine client firms that switch from a Big N audit firm (where Big N refers to the varyingnumber of top tier accounting firms over time) and note that even though audit clients thatswitch auditors exhibit higher audit and financial risk, the majority of those clients are ableto engage another Big N firm in the pre-Enron period. Clients that do move down to asmaller audit firm are smaller and more likely to receive a going-concern audit opinion.Their findings suggest that Big N audit firms were still willing to accept larger clientsdespite higher levels of audit and financial risk during the pre-Enron period.
Thus, research has documented that auditor-client alignments in the pre-Sarbanes-Oxleyperiod were determined by client characteristics and changes in those characteristics, andby auditors realigning their client portfolios through resignations and the acceptance of newclients within the context of their overall portfolio. The Big N firms were willing to ac-cept clients with higher levels of audit and financial risk, and thus it was not necessarilythe case that riskier clients were forced to move to smaller audit firms.
Clearly, though, the events surrounding the demise of Andersen and the passage andimplementation of the Sarbanes-Oxley Act introduced industry-wide ‘‘shocks’’ to the marketfor audit services for all audit firms—Big 4, Second Tier and smaller firms. Audit firmshad to respond to several changes that likely affected their ability and willingness to servecertain clients and the fees that would be charged for audit services. In particular, auditmarket changes that affected audit firms included:
● increased public and political scrutiny resulting from highly publicized audit andcorporate failures;
● Sarbanes-Oxley Act provisions, most notably the required changes to the audit pro-duction process (including internal control attestation responsibilities);
● increased demand on resources given the additional attestation requirements (i.e.,internal control attestations);
2 Audit firms typically increase audit effort and audit fees in the presence of increased audit risk (Bell et al. 2001;Bedard and Johnstone 2006); however, clients may not be willing to pay a higher fee and would instead bewilling to switch auditors.
Risk Shifts in the Market for Audits 97
Auditing: A Journal of Practice & Theory November 2009American Accounting Association
● restriction of provision of some services to audit clients;● required disclosure of fees for publicly traded clients; and● increased level of regulation and oversight by the Public Company Accounting Over-
sight Board (PCAOB).
Audit clients were also affected by many of the same changes in the audit market as theyevaluated their external auditor affiliations:
● increased reporting requirements and liability risk for executives;● new demand for internal control attestation and subsequent attestation by indepen-
dent auditors;● restriction of certain services from independent auditors; and● increased focus on the role and qualifications of the audit committee.
These audit market changes likely motivated firms and clients to examine their rela-tionships in a different light than that in the pre-existing ‘‘equilibrium’’ state describedearlier. For example, the additional audit work required to provide attestation on internalcontrols led to higher audit fees that audit firms could charge to clients, but that additionalwork also imposed resource constraints on audit firms that limited their ability to retain allof their prior clients and perform the additional audit work. In this setting audit firms hadthe choice to disassociate from clients who did not provide the requisite combination ofrisk and return (i.e., fees or fee potential). All else being equal, in such cases it is likelythat the large firms would have resigned from riskier clients who would then have beenforced to find successor auditors.
A less direct result might have been observed if an audit firm simply proposed to raisefees to a level that would compensate the firm for the increased audit work and the asso-ciated risk, but the audit client decided the increased audit fee was too high. In this casethe separation could have taken the form of a resignation or dismissal, but the essenceof the switch was that the audit firm and client essentially ‘‘agreed’’ to not remain togetherbecause of the changed environment. This type of switch—for which the external observerwould see that the auditor and client simply agreed to part ways—would be indistinguish-able from other cases of auditor switching that are not necessarily related to a risk realign-ment motivation. For example, clients might have realigned because they thought theirability to command adequate attention and service from resource-constrained large firmswas diminished. Clients might also have shifted away from Big 4 auditors at this timebecause they thought they could do so in that environment without the historically negativeconnotation of ‘‘moving down’’ to a lower-tier audit firm.
The result of these varying changes in the audit market is that it is not clear to theexternal observer what specific changes in the audit market led to a particular auditor-clientrealignment. Resource constraints, audit fee responses, client risk characteristics, clientpreferences (e.g., for auditor attention or for auditor reputation), and auditor independenceconstraints all could have contributed in varying and combined ways to motivate auditorsand clients to change their affiliations. Importantly, however, one clear result of these nu-merous motivations for auditor realignments was increased volatility in the audit market asauditors and clients re-assessed market conditions and their effects.
Evidence Related to Switching Activity from Prior ResearchThe frequency of auditor switches increased in the 2000s (Sullivan 2006; Audit Ana-
lytics 2006), and popular press articles attribute this switching activity to risk management
98 Hogan and Martin
Auditing: A Journal of Practice & Theory November 2009American Accounting Association
practices by audit firms (Bryan-Low 2003; Byrnes 2003; Hindo 2003) or resource con-straints for large audit firms (Plitch and Wei 2004; Taub 2004). Several academic studiesexamine the conditions and effects of this switching activity.
For example, researchers have examined specific dimensions of recent switching be-havior by identifying which clients switch and whom they select as successor auditors. Asstated above, Landsman et al. (2007) examine Big N switches and document that for thepre-Enron period most auditor switches from Big N auditors resulted in successor Big Nauditors since other large auditors were willing to accept those new engagements, andalthough companies that select non-Big N successor auditors tended to be smaller and havegoing-concern audit opinions, there were not significant differences in other client-relatedrisks between lateral and downward switches. In the post-Enron period (i.e., 2002–2004),however, lateral Big N switches occur with lower frequency than in the earlier period andrisky companies are less likely to switch laterally to another Big N auditor. Landsman etal. (2007) conclude that Big N auditors are more sensitive to risky clients in the post-Enronperiod.
Schloetzer (2006), Rama and Read (2006), and Doogar et al. (2007) present similarevidence of an increase in client switching from Big N to smaller auditors due to recentaudit market changes, and also generally provide evidence that Big N audit firms tend toretain clients with lower audit risk. Most studies—those addressing periods both pre- andpost early 2000s—tend to focus most heavily on ‘‘Big N’’ activity, however, and partitionall non-Big 4 firms together. Given the dominance of the Big N firms this is reasonable interms of understanding the biggest component of the audit market, but a limitation is thatwe learn little about the specific accumulation of risks at the next level of audit firms (i.e.,the Second Tier).
Results from recent studies on audit fees also corroborate the conjecture that Big 4firms might be ‘‘filtering out’’ riskier clients through audit fee increases. Ettredge et al.(2007) find that clients paying higher fees after the implementation of Section 404 reportingtend to dismiss their auditors, and dismissals are associated with a higher rate of engagingnon-Big 4 successor auditors. Ho and Wang (2006) report that non-Big 4 auditors appearto charge an audit fee premium to clients switching from Big 4 auditors to compensate forthe higher audit risk associated with those clients. The combined evidence from thesestudies is consistent with larger audit firms managing resource constraints by focusing onclients that generate higher audit fees, and being willing to separate from smaller, risk-ier clients that might ‘‘move down’’ from the Big 4 audit market. As with the recentswitching studies discussed above, though, these audit fee papers do not consider the im-plications of risk accumulation at the next smaller level of audit firms.
The combined findings from these recent studies indicate there is a higher likelihoodof downward switches in recent years, and the relative riskiness of companies switchingdownward has likely increased at the same time, but it is not known whether this increasedauditor realignment activity has necessarily led to an increase in the accumulation of riskyclients in Second Tier firms’ client portfolios. A logical response by these firms, of course,is to manage risks of their own client portfolios. Second Tier firms had the opportunity toevaluate their own portfolios of clients in terms of business risk and profitability. Consistentwith the prior discussion of recent research results that imply an increased rate of downwardswitches and an increased level of risk of those clients switching downward, Second Tierfirms could be adjusting their own portfolios by accepting more clients that are shiftingdownward from Big 4 firms but in turn pushing some of their own riskiest or least profitableclients to even smaller firms. In that case, the relative risk level of the portfolios of clients
Risk Shifts in the Market for Audits 99
Auditing: A Journal of Practice & Theory November 2009American Accounting Association
served by the Second Tier firms may not necessarily be changing significantly in recentyears.
Research QuestionThe GAO has completed two reports that address issues regarding consolidation and
competitiveness within the auditing profession (General Accounting Office [GAO] 2003;GAO 2006). These reports identify four national firms—Grant Thornton LLP, BDOSeidman, McGladrey & Pullen, and Crowe, Chizek and Company—as a ‘‘next tier’’ offirms (GAO 2003, 47; GAO 2006, 2). That designation is also used by Audit Analytics intheir analyses and the same four firms are subject to the annual inspections prescribed bythe PCAOB.
The long-term financial health of these Second Tier firms is an important element inthe ongoing debate about concentration of the audit market. While the health of the Big 4draws the most attention in this debate (see, for example, American Assembly 2005), theviability of the Second Tier is also important because of the numbers of publicly tradedclients they serve. Given their growth in recent years (see, for example, Reilly 2006), theirrole in the audit market is critical because they provide alternatives to Big 4 auditors(Advisory Committee on the Auditing Profession 2008, Cox 2005) and they serve a sig-nificant number of publicly traded clients. An example of the potentially catastrophic riskfaced by these Second Tier firms is provided by a recent lawsuit against BDO Seidman,which resulted in a guilty verdict against the firm for negligence; potential punitive damagescould be as much as $510 million. BDO Seidman reports ‘‘a judgment of that size certainlywould have a severe impact on any firm’’ and could lead to significant layoffs at BDOSeidman (Leone and Taub 2007).
We examine risk characteristics of clients of Second Tier audit firms in recent years.In particular, we identify the publicly traded clients served by Second Tier firms for theyears 2001 through 2004 and test for changes in audit and financial risks of those clientsby comparing risk characteristics of (1) client portfolios for Second Tier firms at the be-ginning versus end of the time period; (2) new clients in each year to clients continuingfrom the prior year; and (3) continuing clients in a given year to clients that depart to otherfirms before the next year’s audit. These comparisons identify possible changes in the levelof risk in the portfolios of publicly traded clients during this time period for the SecondTier firms.
Similar to prior research, we rely on a variety of measures to proxy for risks faced byaudit firms. We generally consider three sources of risk for an audit firm: audit risk (therisk that the auditor will issue an unqualified audit opinion in error), client’s business risk(the risk that the client experiences declining performance in the future), and auditor busi-ness risk (the risk the auditor will suffer reputation or economic damage because of asso-ciation with a client) (Kinney 2000). Measures typically linked with audit risk include clientgrowth rates, the ratio of inventory and receivables to total assets, prior ‘‘abnormal’’ auditopinions and the presence of unusual audit-related conditions (e.g., presence of controlproblems or other accounting-related concerns identified in company reports). Client’s busi-ness risk measures include financial performance measures such as return on assets, lev-erage, and the existence of losses that indicate the potential for declines in future economicperformance by the client. Auditor business risk is usually characterized as indicators thatthe audit firm is more likely to be involved in litigation as a result of their association witha particular client, so the other two client risks are expected to be related to auditor businessrisk, along with factors such as client size (since a broader set of stakeholders might be
100 Hogan and Martin
Auditing: A Journal of Practice & Theory November 2009American Accounting Association
expected to be more likely to seek legal recourse in the event of improper financial reportingor poor financial performance by a client).
We also use characteristics of the auditor realignments to consider risk implications.For example, realignments can be the result of auditor resignations from clients or of clientdismissals of their prior auditors. Though resignations and dismissals do not necessarilyreveal all of the motivations leading to specific auditor realignments, we use these desig-nations to consider whether client movements are more commonly associated with one orthe other of these actions.3 We also consider sources of new audit clients and destinationsof departing audit clients to examine whether we can identify differences within thesegroups that might inform us about prevailing trends during this period that might alsoindicate changes in riskiness of client portfolios.
DATAWe primarily use Compustat and Audit Analytics auditor information to identify client
portfolios for Second Tier firms. This coordination is important since we found the twosources to often have conflicting and erroneous data. We started with companies identifiedin Compustat as being audited by any of the Second Tier firms in Compustat years 2000through 2004, then compared those companies to audit clients identified by Audit Analyticsas having audit reports issued by Second Tier firms for the corresponding dates. If thesedata sources had conflicting information for a given company we established data accuracyby examining source documents (e.g., specific audit opinion language and data in AuditAnalytics, public filings included in the SEC’s EDGAR database, or company websites).Identifying the combination of data from Compustat and Audit Analytics allows us to findas many publicly traded clients of the Second Tier firms as possible during this time period.4
We identify a parsimonious set of variables used in prior auditor switching studies tomeasure client’s business risk, audit risk and auditor business risk associated with a specificclient (see, for example, Landsman et al. 2007; Johnstone and Bedard 2004; Krishnan andKrishnan 1997; Johnson and Lys 1990). We use Compustat data for financial statementitems and Audit Analytics to identify financial statement restatements and internal controlweaknesses. The specific variables examined include:
Assets � total assets, in millions (Data6);Sales � sales, in millions (Data12);
(AR�Inv) /Assets � ratio of accounts receivable and inventory to total assets((DATA2 � DATA3)/DATA6);
3 We argue that resignations and dismissals are likely even more ‘‘noisy’’ during this period because of the varyingmotivations discussed earlier. For example, prior research (e.g., Krishnan and Krishnan 1997) indicates thatresignations are more likely to be associated with audit firms wishing to separate from risky clients, but duringthis period firms might have been more likely to simply resign due to known resource constraints, which wouldnot necessarily be associated with a specific client’s risk characteristics. We leave it to future research to examinewhether the nature of the dismissal versus resignation realignments occurred with unusual frequencies or underunusual circumstances during this period relative to prior periods.
4 The number of data corrections identified was substantial. Roughly 33 percent (n � 324) of the 979 companiesidentified in Compustat as being clients of a Second Tier firm during this time period had at least one year ofauditor information that needed to be corrected. The most common data disagreement between the sources wasin the year of a switch to or from a Second Tier auditor—a critical piece of information as we classify eachclient as new or continuing from the prior year and as continuing or departing before the next year’s audit.Correcting this annual data also included deleting some firms that turned out to be erroneously listed as SecondTier clients. Fifty-four companies were added to the list of Second Tier clients from Compustat based on ourdata searches; these additional companies were identified in Audit Analytics as being clients of Second Tierfirms during the study period (these companies existed in Compustat but were not identified as clients of SecondTier firms because of incorrect auditor codes in Compustat).
Risk Shifts in the Market for Audits 101
Auditing: A Journal of Practice & Theory November 2009American Accounting Association
ROA � return on assets (DATA18/DATA6);Loss � dichotomous variable � 1 if ROA � 0, � 0 otherwise;
Leverage � ratio of total liabilities to total assets (DATA181/DATA6);LtDebt to Assets � ratio of long-term debt to total assets (DATA 9/DATA6);
Change in sales (%) � percentage change in sales from prior year;OCF � cash flows from operating activities scaled by total assets
(DATA 308/DATA6);Change in assets (%) � percentage change in assets from prior year;
Restate � 1 if the financial statements of the current year were eventuallyrestated (per Audit Analytics Restatement data set), 0 otherwise;and
DCWeakness � 1 if the company reported a disclosure controls weakness in aSection 302 report at some point during our sample period (datafrom Audit Analytics Disclosure Controls data set), 0 otherwise.
Our study is largely descriptive as we do not have a satisfactory measure of the overall‘‘risk’’ of a client portfolio or a ‘‘best’’ way to capture or measure audit risk or auditorbusiness risk. We first examine descriptive data for the overall portfolio of publicly tradedclients of the Second Tier firms in 2000 versus 2004 to document whether client firmcharacteristics significantly changed over this time period in the overall portfolio. In thenext section, we examine descriptive data on all of the variables listed above for new clients,continuing clients and departing clients by year to provide a more detailed view of shiftsin these measures over our sample time period, which spans both the demise of ArthurAndersen and the passage of the Sarbanes-Oxley Act of 2002. Then, we also conduct amultivariate analysis comparing new to continuing clients, and continuing to departingclients, using these same measures. In additional multivariate analyses, we separately ex-amine clients that are coming from Big 4 firms versus clients coming from smaller auditfirms, and clients departing to Big 4 firms versus clients departing to smaller audit firms,as these are likely clients with differing risk characteristics. Finally, we directly comparenew and departing clients supplementing with data available from 8-K disclosures of auditorchanges where we can examine additional measures of audit and business risk due to the8-K disclosure requirements that are not available for continuing clients.
RESULTSSecond Tier Client Portfolios
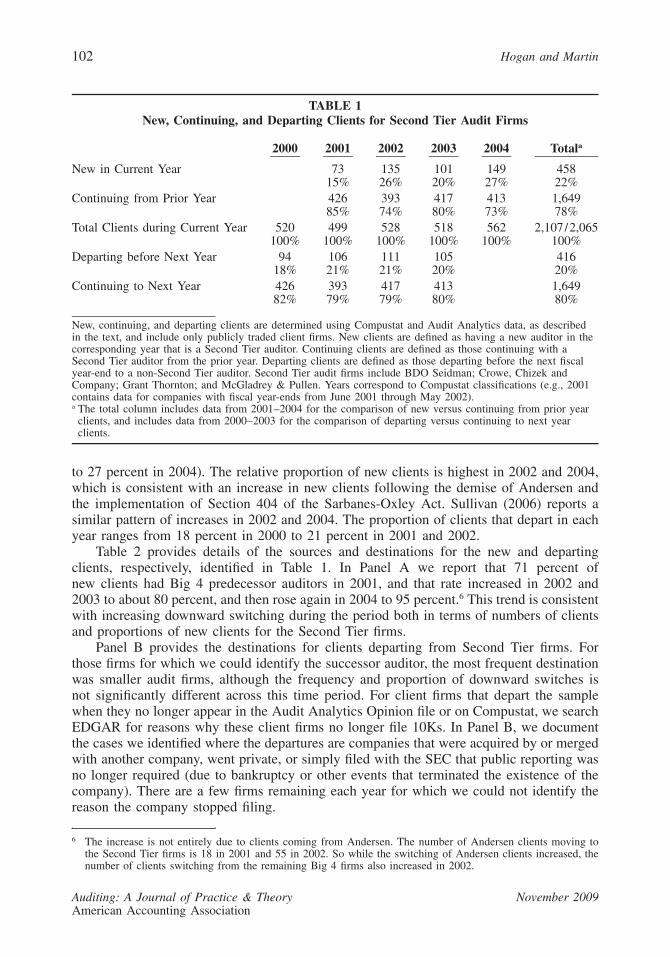
Table 1 presents client counts for the Second Tier firms for 2000 through 2004. It isimportant to reiterate that we only include data for publicly traded client firms. For years2000 through 2003 we report what happens to the clients for the next year. For example,for the 520 clients identified as Second Tier clients in 2000, 94 departed before the nextyear’s audit, while 426 continued with a Second Tier auditor. We do not count moveswithin the Second Tier audit firms as departures or new clients.5 Similar summary statisticsare provided to describe the sources of clients for each year 2001–2004. For example, ofthe 499 Second Tier clients identified in 2001, 73 were new in that year while 426 continuedfrom the prior year.
What is surprising is the amount of turnover. Approximately 20 percent of the publiclytraded client portfolio represents new clients in each year (ranging from 15 percent in 2001
5 There are 19 auditor changes within the Second Tier firms over our sample period.
102 Hogan and Martin
Auditing: A Journal of Practice & Theory November 2009American Accounting Association
TABLE 1New, Continuing, and Departing Clients for Second Tier Audit Firms
2000 2001 2002 2003 2004 Totala
New in Current Year 7315%
13526%
10120%
14927%
45822%
Continuing from Prior Year 42685%
39374%
41780%
41373%
1,64978%
Total Clients during Current Year 520100%
499100%
528100%
518100%
562100%
2,107/2,065100%
Departing before Next Year 9418%
10621%
11121%
10520%
41620%
Continuing to Next Year 42682%
39379%
41779%
41380%
1,64980%
New, continuing, and departing clients are determined using Compustat and Audit Analytics data, as describedin the text, and include only publicly traded client firms. New clients are defined as having a new auditor in thecorresponding year that is a Second Tier auditor. Continuing clients are defined as those continuing with aSecond Tier auditor from the prior year. Departing clients are defined as those departing before the next fiscalyear-end to a non-Second Tier auditor. Second Tier audit firms include BDO Seidman; Crowe, Chizek andCompany; Grant Thornton; and McGladrey & Pullen. Years correspond to Compustat classifications (e.g., 2001contains data for companies with fiscal year-ends from June 2001 through May 2002).a The total column includes data from 2001–2004 for the comparison of new versus continuing from prior year
clients, and includes data from 2000–2003 for the comparison of departing versus continuing to next yearclients.
to 27 percent in 2004). The relative proportion of new clients is highest in 2002 and 2004,which is consistent with an increase in new clients following the demise of Andersen andthe implementation of Section 404 of the Sarbanes-Oxley Act. Sullivan (2006) reports asimilar pattern of increases in 2002 and 2004. The proportion of clients that depart in eachyear ranges from 18 percent in 2000 to 21 percent in 2001 and 2002.
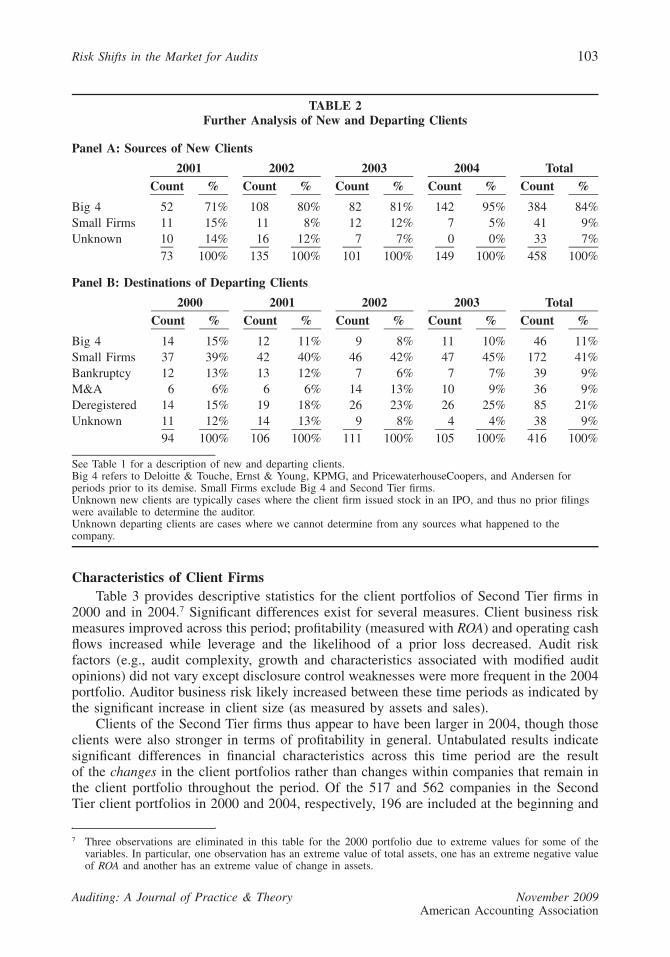
Table 2 provides details of the sources and destinations for the new and departingclients, respectively, identified in Table 1. In Panel A we report that 71 percent ofnew clients had Big 4 predecessor auditors in 2001, and that rate increased in 2002 and2003 to about 80 percent, and then rose again in 2004 to 95 percent.6 This trend is consistentwith increasing downward switching during the period both in terms of numbers of clientsand proportions of new clients for the Second Tier firms.
Panel B provides the destinations for clients departing from Second Tier firms. Forthose firms for which we could identify the successor auditor, the most frequent destinationwas smaller audit firms, although the frequency and proportion of downward switches isnot significantly different across this time period. For client firms that depart the samplewhen they no longer appear in the Audit Analytics Opinion file or on Compustat, we searchEDGAR for reasons why these client firms no longer file 10Ks. In Panel B, we documentthe cases we identified where the departures are companies that were acquired by or mergedwith another company, went private, or simply filed with the SEC that public reporting wasno longer required (due to bankruptcy or other events that terminated the existence of thecompany). There are a few firms remaining each year for which we could not identify thereason the company stopped filing.
6 The increase is not entirely due to clients coming from Andersen. The number of Andersen clients moving tothe Second Tier firms is 18 in 2001 and 55 in 2002. So while the switching of Andersen clients increased, thenumber of clients switching from the remaining Big 4 firms also increased in 2002.
Risk Shifts in the Market for Audits 103
Auditing: A Journal of Practice & Theory November 2009American Accounting Association
TABLE 2Further Analysis of New and Departing Clients
Panel A: Sources of New Clients
2001Count %
2002Count %
2003Count %
2004Count %
TotalCount %
Big 4 52 71% 108 80% 82 81% 142 95% 384 84%Small Firms 11 15% 11 8% 12 12% 7 5% 41 9%Unknown 10 14% 16 12% 7 7% 0 0% 33 7%
73 100% 135 100% 101 100% 149 100% 458 100%
Panel B: Destinations of Departing Clients
2000Count %
2001Count %
2002Count %
2003Count %
TotalCount %
Big 4 14 15% 12 11% 9 8% 11 10% 46 11%Small Firms 37 39% 42 40% 46 42% 47 45% 172 41%Bankruptcy 12 13% 13 12% 7 6% 7 7% 39 9%M&A 6 6% 6 6% 14 13% 10 9% 36 9%Deregistered 14 15% 19 18% 26 23% 26 25% 85 21%Unknown 11 12% 14 13% 9 8% 4 4% 38 9%
94 100% 106 100% 111 100% 105 100% 416 100%
See Table 1 for a description of new and departing clients.Big 4 refers to Deloitte & Touche, Ernst & Young, KPMG, and PricewaterhouseCoopers, and Andersen forperiods prior to its demise. Small Firms exclude Big 4 and Second Tier firms.Unknown new clients are typically cases where the client firm issued stock in an IPO, and thus no prior filingswere available to determine the auditor.Unknown departing clients are cases where we cannot determine from any sources what happened to thecompany.
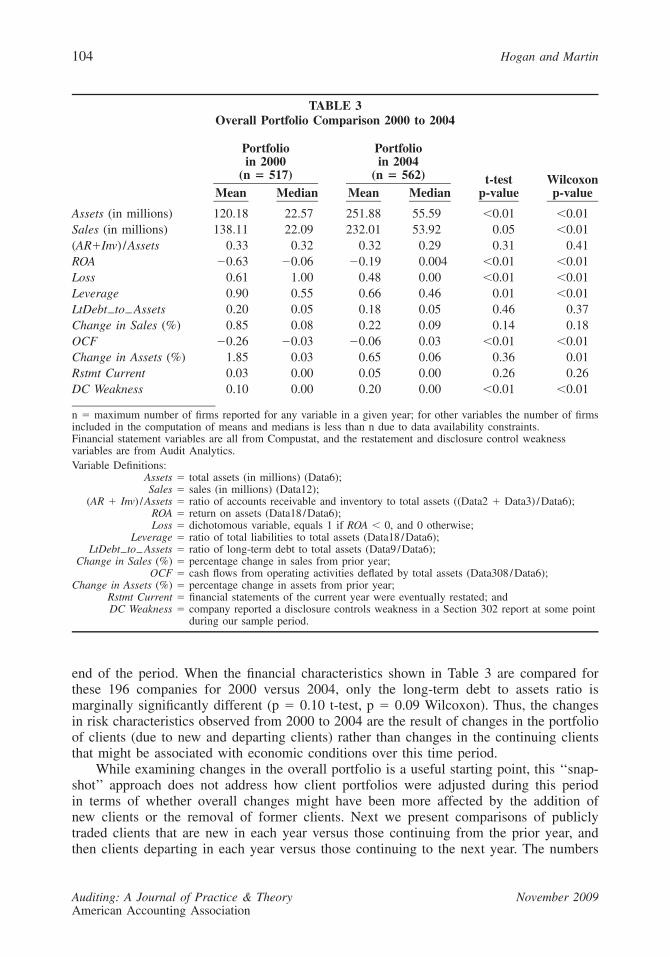
Characteristics of Client FirmsTable 3 provides descriptive statistics for the client portfolios of Second Tier firms in
2000 and in 2004.7 Significant differences exist for several measures. Client business riskmeasures improved across this period; profitability (measured with ROA) and operating cashflows increased while leverage and the likelihood of a prior loss decreased. Audit riskfactors (e.g., audit complexity, growth and characteristics associated with modified auditopinions) did not vary except disclosure control weaknesses were more frequent in the 2004portfolio. Auditor business risk likely increased between these time periods as indicated bythe significant increase in client size (as measured by assets and sales).
Clients of the Second Tier firms thus appear to have been larger in 2004, though thoseclients were also stronger in terms of profitability in general. Untabulated results indicatesignificant differences in financial characteristics across this time period are the resultof the changes in the client portfolios rather than changes within companies that remain inthe client portfolio throughout the period. Of the 517 and 562 companies in the SecondTier client portfolios in 2000 and 2004, respectively, 196 are included at the beginning and
7 Three observations are eliminated in this table for the 2000 portfolio due to extreme values for some of thevariables. In particular, one observation has an extreme value of total assets, one has an extreme negative valueof ROA and another has an extreme value of change in assets.
104 Hogan and Martin
Auditing: A Journal of Practice & Theory November 2009American Accounting Association
TABLE 3Overall Portfolio Comparison 2000 to 2004
Portfolioin 2000
(n � 517)Mean Median
Portfolioin 2004
(n � 562)Mean Median
t-testp-value
Wilcoxonp-value
Assets (in millions) 120.18 22.57 251.88 55.59 �0.01 �0.01Sales (in millions) 138.11 22.09 232.01 53.92 0.05 �0.01(AR�Inv) /Assets 0.33 0.32 0.32 0.29 0.31 0.41ROA �0.63 �0.06 �0.19 0.004 �0.01 �0.01Loss 0.61 1.00 0.48 0.00 �0.01 �0.01Leverage 0.90 0.55 0.66 0.46 0.01 �0.01LtDebt to Assets 0.20 0.05 0.18 0.05 0.46 0.37Change in Sales (%) 0.85 0.08 0.22 0.09 0.14 0.18OCF �0.26 �0.03 �0.06 0.03 �0.01 �0.01Change in Assets (%) 1.85 0.03 0.65 0.06 0.36 0.01Rstmt Current 0.03 0.00 0.05 0.00 0.26 0.26DC Weakness 0.10 0.00 0.20 0.00 �0.01 �0.01
n � maximum number of firms reported for any variable in a given year; for other variables the number of firmsincluded in the computation of means and medians is less than n due to data availability constraints.Financial statement variables are all from Compustat, and the restatement and disclosure control weaknessvariables are from Audit Analytics.Variable Definitions:
Assets � total assets (in millions) (Data6);Sales � sales (in millions) (Data12);
(AR � Inv) /Assets � ratio of accounts receivable and inventory to total assets ((Data2 � Data3) /Data6);ROA � return on assets (Data18 /Data6);Loss � dichotomous variable, equals 1 if ROA � 0, and 0 otherwise;
Leverage � ratio of total liabilities to total assets (Data18 /Data6);LtDebt to Assets � ratio of long-term debt to total assets (Data9 /Data6);
Change in Sales (%) � percentage change in sales from prior year;OCF � cash flows from operating activities deflated by total assets (Data308 /Data6);
Change in Assets (%) � percentage change in assets from prior year;Rstmt Current � financial statements of the current year were eventually restated; andDC Weakness � company reported a disclosure controls weakness in a Section 302 report at some point
during our sample period.
end of the period. When the financial characteristics shown in Table 3 are compared forthese 196 companies for 2000 versus 2004, only the long-term debt to assets ratio ismarginally significantly different (p � 0.10 t-test, p � 0.09 Wilcoxon). Thus, the changesin risk characteristics observed from 2000 to 2004 are the result of changes in the portfolioof clients (due to new and departing clients) rather than changes in the continuing clientsthat might be associated with economic conditions over this time period.
While examining changes in the overall portfolio is a useful starting point, this ‘‘snap-shot’’ approach does not address how client portfolios were adjusted during this periodin terms of whether overall changes might have been more affected by the addition ofnew clients or the removal of former clients. Next we present comparisons of publiclytraded clients that are new in each year versus those continuing from the prior year, andthen clients departing in each year versus those continuing to the next year. The numbers
Risk Shifts in the Market for Audits 105
Auditing: A Journal of Practice & Theory November 2009American Accounting Association
of firms in each of these analyses are slightly less than what is presented in Tables 1 and2 due to missing Compustat data.
Comparing new and departing clients to the base of continuing clients is important asthe acceptance and dismissal decisions are made with portfolio management in mind, whichmeans these clients are assessed relative to the existing client base (Johnstone and Bedard2004). At this point, we pool all new clients regardless of whether they are coming froma Big 4 firm or a small firm and all departing clients regardless of where they are departingto, so that we can examine the overall portfolio effect. In later tests, we analyze the sourcesand destinations of the clients to further analyze the source of changes in risk.
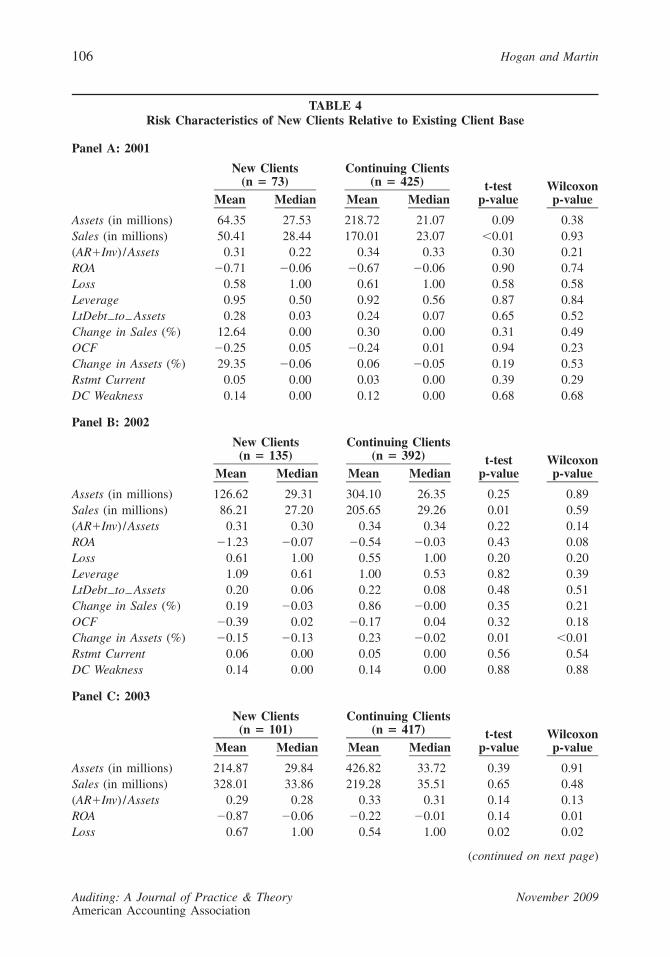
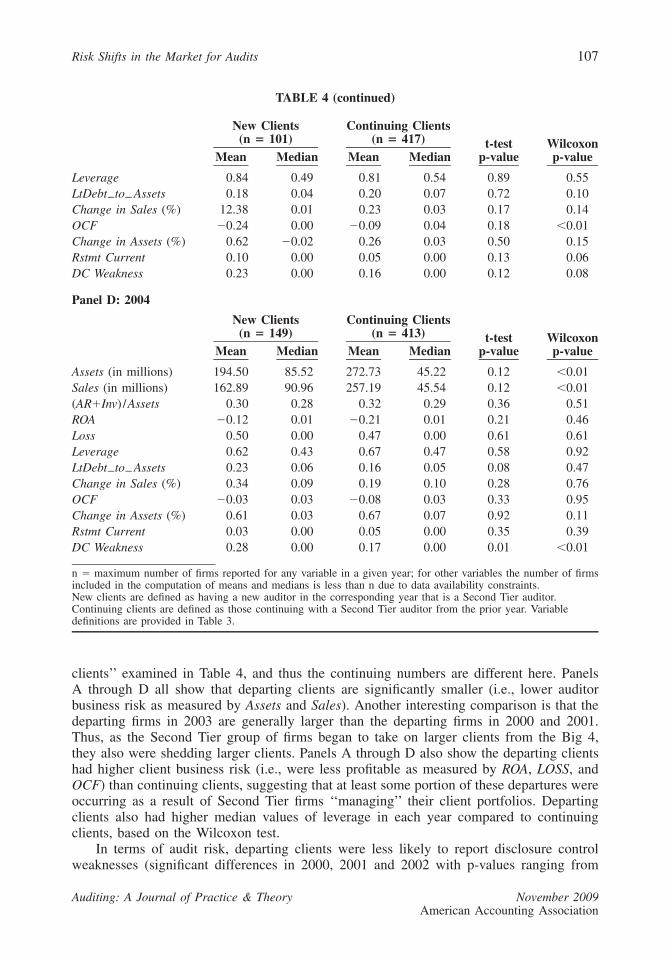
New Clients versus Clients Continuing from Prior Year—UnivariateTable 4 presents descriptive statistics for new clients versus those clients that continued
from the prior year, for each of the years 2001 through 2004. The data is skewed, and thuswe present both means and medians.8 Auditor business risk is initially lower for new clientsrelative to continuing clients, but this reverses in the later years. For 2001 (Panel A), theonly significant differences are between the average sales of new versus continuing clients(t-test p-value � 0.01) with new clients having a lower level of sales and the average totalassets of new versus continuing clients (t-test p-value � 0.09) with new clients havinglower total assets. Sales is also significantly lower for new clients in 2002 (Panel B, t-testp-value � 0.01). In 2004 (Panel D), it appears that the Second Tier audit firms are pickingup larger clients, as indicated by significantly larger median total assets and median salesvalues per the Wilcoxon two-sample test for a difference in medians. This finding is con-sistent with the findings in Table 2 that the Second Tier group of audit firms is picking upa large number of clients in 2004 from the Big 4 audit firms. The only significant differencesin terms of client business risk are in 2002 and 2003 (Panels B and C), where new clientsare marginally less profitable (have significantly lower ROA and/or OCF, and in 2003 havea significantly higher percentage of firms reporting a loss).
In terms of audit risk factors, the comparisons in Panels C and D suggest that newclients in these years were more likely to have financial statement restatements and disclo-sure control weaknesses relative to continuing clients, although the significance of thisdifference varies. The percentage of financial statements eventually restated for new clientsvaries from 3 percent in 2004 to 10 percent in 2003, while for continuing clients thepercentage ranges from 3 percent in 2001 to 5 percent in the other three years. For restate-ments, 2003 is the only year that shows a significant difference (Wilcoxon p-value � 0.06).The percentage of new clients reporting disclosure control weaknesses varies from 14 per-cent in 2001 to 28 percent in 2004, while for continuing clients the percentage ranges from12 percent to 17 percent. Disclosure control weaknesses are significantly more likely fornew clients in 2003 (Wilcoxon p-value � 0.08) and in 2004 (t-test and Wilcoxon p-value� 0.01) relative to continuing clients.
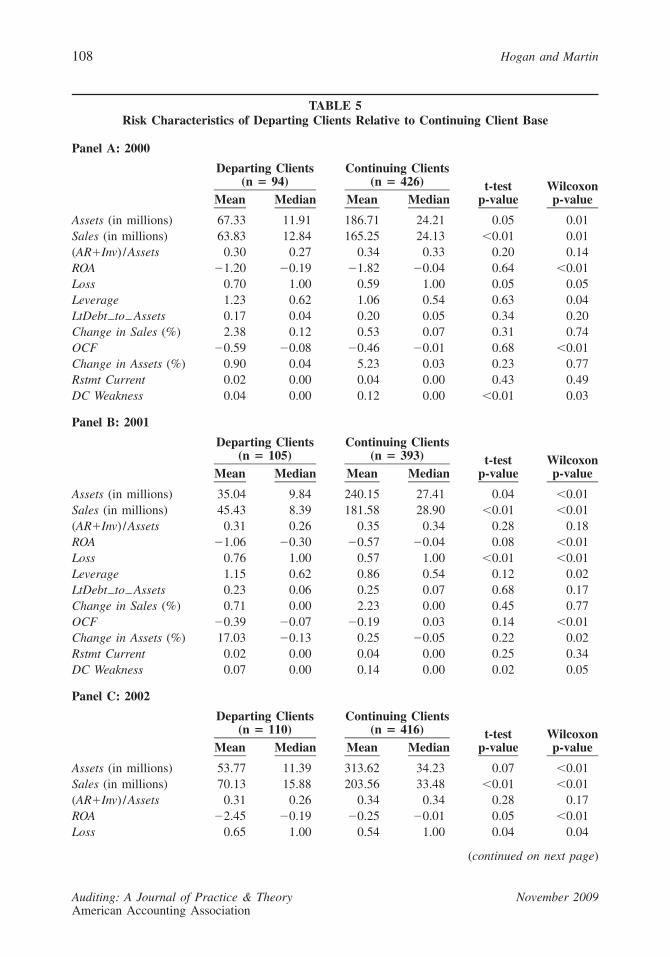
Departing Clients versus Clients Continuing to the Next Year—UnivariateTable 5 presents data for clients departing in each year versus clients continuing on to
the next year. Note that this definition is different from the ‘‘continuing from prior year
8 We eliminate four observations with extreme values in this and all subsequent tables. One observation is adeparting client in 2001 with an extreme positive value of change in sales. Two other observations, a continuingclient in 2001 and a departing client in 2002, have extreme negative values of ROA (and also an extreme positivevalue of leverage and an extreme negative value of OCF for one of the firms). The fourth observation has anextreme positive value of leverage in 2003.
106 Hogan and Martin
Auditing: A Journal of Practice & Theory November 2009American Accounting Association
TABLE 4Risk Characteristics of New Clients Relative to Existing Client Base
Panel A: 2001
New Clients(n � 73)
Mean Median
Continuing Clients(n � 425)
Mean Mediant-test
p-valueWilcoxonp-value
Assets (in millions) 64.35 27.53 218.72 21.07 0.09 0.38Sales (in millions) 50.41 28.44 170.01 23.07 �0.01 0.93(AR�Inv) /Assets 0.31 0.22 0.34 0.33 0.30 0.21ROA �0.71 �0.06 �0.67 �0.06 0.90 0.74Loss 0.58 1.00 0.61 1.00 0.58 0.58Leverage 0.95 0.50 0.92 0.56 0.87 0.84LtDebt to Assets 0.28 0.03 0.24 0.07 0.65 0.52Change in Sales (%) 12.64 0.00 0.30 0.00 0.31 0.49OCF �0.25 0.05 �0.24 0.01 0.94 0.23Change in Assets (%) 29.35 �0.06 0.06 �0.05 0.19 0.53Rstmt Current 0.05 0.00 0.03 0.00 0.39 0.29DC Weakness 0.14 0.00 0.12 0.00 0.68 0.68
Panel B: 2002
New Clients(n � 135)
Mean Median
Continuing Clients(n � 392)
Mean Mediant-test
p-valueWilcoxonp-value
Assets (in millions) 126.62 29.31 304.10 26.35 0.25 0.89Sales (in millions) 86.21 27.20 205.65 29.26 0.01 0.59(AR�Inv) /Assets 0.31 0.30 0.34 0.34 0.22 0.14ROA �1.23 �0.07 �0.54 �0.03 0.43 0.08Loss 0.61 1.00 0.55 1.00 0.20 0.20Leverage 1.09 0.61 1.00 0.53 0.82 0.39LtDebt to Assets 0.20 0.06 0.22 0.08 0.48 0.51Change in Sales (%) 0.19 �0.03 0.86 �0.00 0.35 0.21OCF �0.39 0.02 �0.17 0.04 0.32 0.18Change in Assets (%) �0.15 �0.13 0.23 �0.02 0.01 �0.01Rstmt Current 0.06 0.00 0.05 0.00 0.56 0.54DC Weakness 0.14 0.00 0.14 0.00 0.88 0.88
Panel C: 2003
New Clients(n � 101)
Mean Median
Continuing Clients(n � 417)
Mean Mediant-test
p-valueWilcoxonp-value
Assets (in millions) 214.87 29.84 426.82 33.72 0.39 0.91Sales (in millions) 328.01 33.86 219.28 35.51 0.65 0.48(AR�Inv) /Assets 0.29 0.28 0.33 0.31 0.14 0.13ROA �0.87 �0.06 �0.22 �0.01 0.14 0.01Loss 0.67 1.00 0.54 1.00 0.02 0.02
(continued on next page)
Risk Shifts in the Market for Audits 107
Auditing: A Journal of Practice & Theory November 2009American Accounting Association
TABLE 4 (continued)
New Clients(n � 101)
Mean Median
Continuing Clients(n � 417)
Mean Mediant-test
p-valueWilcoxonp-value
Leverage 0.84 0.49 0.81 0.54 0.89 0.55LtDebt to Assets 0.18 0.04 0.20 0.07 0.72 0.10Change in Sales (%) 12.38 0.01 0.23 0.03 0.17 0.14OCF �0.24 0.00 �0.09 0.04 0.18 �0.01Change in Assets (%) 0.62 �0.02 0.26 0.03 0.50 0.15Rstmt Current 0.10 0.00 0.05 0.00 0.13 0.06DC Weakness 0.23 0.00 0.16 0.00 0.12 0.08
Panel D: 2004
New Clients(n � 149)
Mean Median
Continuing Clients(n � 413)
Mean Mediant-test
p-valueWilcoxonp-value
Assets (in millions) 194.50 85.52 272.73 45.22 0.12 �0.01Sales (in millions) 162.89 90.96 257.19 45.54 0.12 �0.01(AR�Inv) /Assets 0.30 0.28 0.32 0.29 0.36 0.51ROA �0.12 0.01 �0.21 0.01 0.21 0.46Loss 0.50 0.00 0.47 0.00 0.61 0.61Leverage 0.62 0.43 0.67 0.47 0.58 0.92LtDebt to Assets 0.23 0.06 0.16 0.05 0.08 0.47Change in Sales (%) 0.34 0.09 0.19 0.10 0.28 0.76OCF �0.03 0.03 �0.08 0.03 0.33 0.95Change in Assets (%) 0.61 0.03 0.67 0.07 0.92 0.11Rstmt Current 0.03 0.00 0.05 0.00 0.35 0.39DC Weakness 0.28 0.00 0.17 0.00 0.01 �0.01
n � maximum number of firms reported for any variable in a given year; for other variables the number of firmsincluded in the computation of means and medians is less than n due to data availability constraints.New clients are defined as having a new auditor in the corresponding year that is a Second Tier auditor.Continuing clients are defined as those continuing with a Second Tier auditor from the prior year. Variabledefinitions are provided in Table 3.
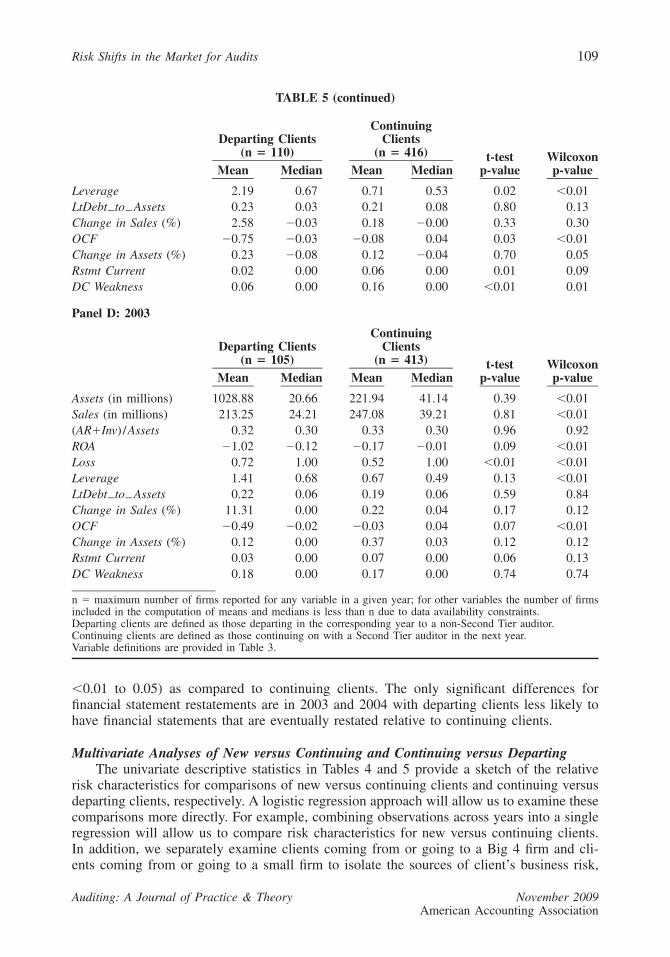
clients’’ examined in Table 4, and thus the continuing numbers are different here. PanelsA through D all show that departing clients are significantly smaller (i.e., lower auditorbusiness risk as measured by Assets and Sales). Another interesting comparison is that thedeparting firms in 2003 are generally larger than the departing firms in 2000 and 2001.Thus, as the Second Tier group of firms began to take on larger clients from the Big 4,they also were shedding larger clients. Panels A through D also show the departing clientshad higher client business risk (i.e., were less profitable as measured by ROA, LOSS, andOCF) than continuing clients, suggesting that at least some portion of these departures wereoccurring as a result of Second Tier firms ‘‘managing’’ their client portfolios. Departingclients also had higher median values of leverage in each year compared to continuingclients, based on the Wilcoxon test.
In terms of audit risk, departing clients were less likely to report disclosure controlweaknesses (significant differences in 2000, 2001 and 2002 with p-values ranging from
108 Hogan and Martin
Auditing: A Journal of Practice & Theory November 2009American Accounting Association
TABLE 5Risk Characteristics of Departing Clients Relative to Continuing Client Base
Panel A: 2000
Departing Clients(n � 94)
Mean Median
Continuing Clients(n � 426)
Mean Mediant-test
p-valueWilcoxonp-value
Assets (in millions) 67.33 11.91 186.71 24.21 0.05 0.01Sales (in millions) 63.83 12.84 165.25 24.13 �0.01 0.01(AR�Inv) /Assets 0.30 0.27 0.34 0.33 0.20 0.14ROA �1.20 �0.19 �1.82 �0.04 0.64 �0.01Loss 0.70 1.00 0.59 1.00 0.05 0.05Leverage 1.23 0.62 1.06 0.54 0.63 0.04LtDebt to Assets 0.17 0.04 0.20 0.05 0.34 0.20Change in Sales (%) 2.38 0.12 0.53 0.07 0.31 0.74OCF �0.59 �0.08 �0.46 �0.01 0.68 �0.01Change in Assets (%) 0.90 0.04 5.23 0.03 0.23 0.77Rstmt Current 0.02 0.00 0.04 0.00 0.43 0.49DC Weakness 0.04 0.00 0.12 0.00 �0.01 0.03
Panel B: 2001
Departing Clients(n � 105)
Mean Median
Continuing Clients(n � 393)
Mean Mediant-test
p-valueWilcoxonp-value
Assets (in millions) 35.04 9.84 240.15 27.41 0.04 �0.01Sales (in millions) 45.43 8.39 181.58 28.90 �0.01 �0.01(AR�Inv) /Assets 0.31 0.26 0.35 0.34 0.28 0.18ROA �1.06 �0.30 �0.57 �0.04 0.08 �0.01Loss 0.76 1.00 0.57 1.00 �0.01 �0.01Leverage 1.15 0.62 0.86 0.54 0.12 0.02LtDebt to Assets 0.23 0.06 0.25 0.07 0.68 0.17Change in Sales (%) 0.71 0.00 2.23 0.00 0.45 0.77OCF �0.39 �0.07 �0.19 0.03 0.14 �0.01Change in Assets (%) 17.03 �0.13 0.25 �0.05 0.22 0.02Rstmt Current 0.02 0.00 0.04 0.00 0.25 0.34DC Weakness 0.07 0.00 0.14 0.00 0.02 0.05
Panel C: 2002
Departing Clients(n � 110)
Mean Median
Continuing Clients(n � 416)
Mean Mediant-test
p-valueWilcoxonp-value
Assets (in millions) 53.77 11.39 313.62 34.23 0.07 �0.01Sales (in millions) 70.13 15.88 203.56 33.48 �0.01 �0.01(AR�Inv) /Assets 0.31 0.26 0.34 0.34 0.28 0.17ROA �2.45 �0.19 �0.25 �0.01 0.05 �0.01Loss 0.65 1.00 0.54 1.00 0.04 0.04
(continued on next page)
Risk Shifts in the Market for Audits 109
Auditing: A Journal of Practice & Theory November 2009American Accounting Association
TABLE 5 (continued)
Departing Clients(n � 110)
Mean Median
ContinuingClients
(n � 416)Mean Median
t-testp-value
Wilcoxonp-value
Leverage 2.19 0.67 0.71 0.53 0.02 �0.01LtDebt to Assets 0.23 0.03 0.21 0.08 0.80 0.13Change in Sales (%) 2.58 �0.03 0.18 �0.00 0.33 0.30OCF �0.75 �0.03 �0.08 0.04 0.03 �0.01Change in Assets (%) 0.23 �0.08 0.12 �0.04 0.70 0.05Rstmt Current 0.02 0.00 0.06 0.00 0.01 0.09DC Weakness 0.06 0.00 0.16 0.00 �0.01 0.01
Panel D: 2003
Departing Clients(n � 105)
Mean Median
ContinuingClients
(n � 413)Mean Median
t-testp-value
Wilcoxonp-value
Assets (in millions) 1028.88 20.66 221.94 41.14 0.39 �0.01Sales (in millions) 213.25 24.21 247.08 39.21 0.81 �0.01(AR�Inv) /Assets 0.32 0.30 0.33 0.30 0.96 0.92ROA �1.02 �0.12 �0.17 �0.01 0.09 �0.01Loss 0.72 1.00 0.52 1.00 �0.01 �0.01Leverage 1.41 0.68 0.67 0.49 0.13 �0.01LtDebt to Assets 0.22 0.06 0.19 0.06 0.59 0.84Change in Sales (%) 11.31 0.00 0.22 0.04 0.17 0.12OCF �0.49 �0.02 �0.03 0.04 0.07 �0.01Change in Assets (%) 0.12 0.00 0.37 0.03 0.12 0.12Rstmt Current 0.03 0.00 0.07 0.00 0.06 0.13DC Weakness 0.18 0.00 0.17 0.00 0.74 0.74
n � maximum number of firms reported for any variable in a given year; for other variables the number of firmsincluded in the computation of means and medians is less than n due to data availability constraints.Departing clients are defined as those departing in the corresponding year to a non-Second Tier auditor.Continuing clients are defined as those continuing on with a Second Tier auditor in the next year.Variable definitions are provided in Table 3.
�0.01 to 0.05) as compared to continuing clients. The only significant differences forfinancial statement restatements are in 2003 and 2004 with departing clients less likely tohave financial statements that are eventually restated relative to continuing clients.
Multivariate Analyses of New versus Continuing and Continuing versus DepartingThe univariate descriptive statistics in Tables 4 and 5 provide a sketch of the relative
risk characteristics for comparisons of new versus continuing clients and continuing versusdeparting clients, respectively. A logistic regression approach will allow us to examine thesecomparisons more directly. For example, combining observations across years into a singleregression will allow us to compare risk characteristics for new versus continuing clients.In addition, we separately examine clients coming from or going to a Big 4 firm and cli-ents coming from or going to a small firm to isolate the sources of client’s business risk,
110 Hogan and Martin
Auditing: A Journal of Practice & Theory November 2009American Accounting Association
auditor’ business risk, and audit risk. We select a subset of the variables listed in Tables 4and 5 since many of them are highly correlated. Specifically, we estimate the followinglogistic regression for new versus continuing clients:
CONTINUE/NEW � a � a (ln Assets) � a ((AR�Inv) /Assets) � a (ROA)0 1 2 3
� a (Loss) � a (Leverage) � a (Change in sales)4 5 6
� a (OCF)� a (RstmtCurrent) � a (DCWeakness). (1)7 8 9
CONTINUE/NEW is 0 for clients continuing from the prior year, and CONTINUE/NEWis 1 for clients new to a Second Tier firm in a given year.
Similarly, we estimate the following logistic regression to compare continuing withdeparting clients:
CONTINUE/DEPART � b � b (ln Assets) � b ((AR�Inv) /Assets)0 1 2
� b (ROA) � b (Loss) � b (Leverage)3 4 5
� b (Change in sales) � b (OCF)6 7
� b (RstmtCurrent) � b (DCWeakness). (2)8 9
CONTINUE/DEPART � 0 for clients continuing to the next year, and � 1 for clientsdeparting to a non-Second Tier firm in a given year.
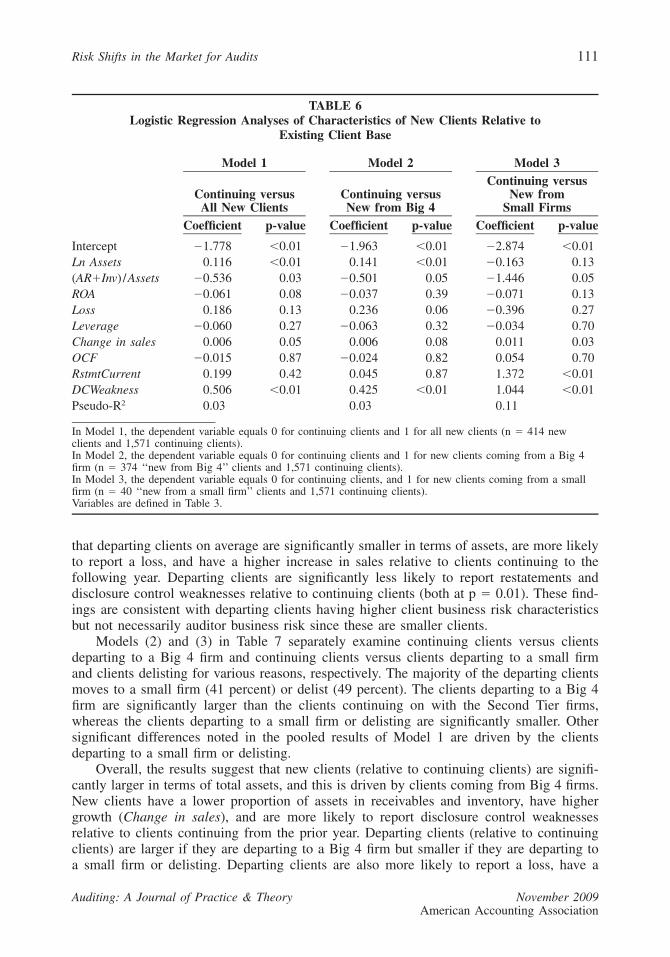
Table 6 presents the results of estimating the logistic regression Equation (1) for thecomparison of new versus continuing clients.9 The results estimated including data for allthe years 2001–2004 and pooling all new clients together regardless of the source (Model1 in Table 6) suggest that new clients are significantly larger in terms of total assets, havea lower proportion of assets in receivables and inventory, have lower ROA, and have highergrowth (Change in sales). New clients are also more likely to report disclosure controlweaknesses. These inferences are consistent with those discussed from the univariate com-parisons and suggest that new clients have at least a few indicators of higher client businessrisk, auditor business risk, and audit risk relative to continuing clients.10
Models (2) and (3) in Table 6 separately examine continuing clients versus new clientscoming from a Big 4 firm and continuing clients versus new clients coming from a smallfirm, respectively. The majority of new clients (90 percent overall) come from a Big 4 firm.The new clients coming from a Big 4 firm increase auditor business risk (i.e., are signifi-cantly larger clients), whereas new clients coming from a small firm are not significantlydifferent in terms of total assets than the continuing group of clients. Results on audit riskare mixed in that both new groups of clients have a lower proportion of assets in receivablesand inventory, a higher increase in sales, and are more likely to report disclosure controlweaknesses. The new clients coming from a small firm are also more likely to have financialstatement restatements, while this is not the case for clients coming from a Big 4 firm.
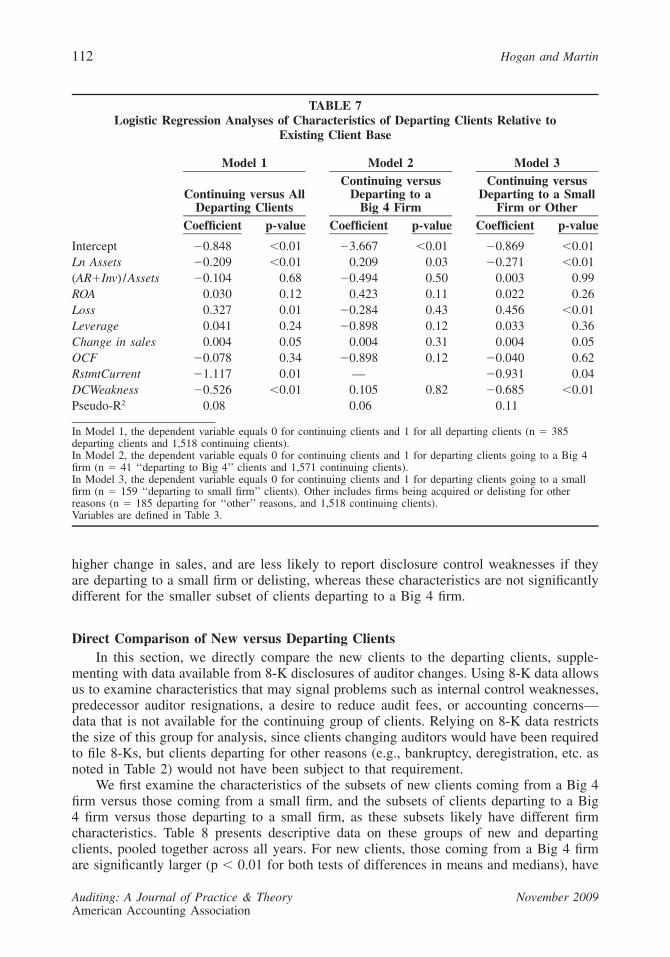
The results of estimating regression Equation (2) above comparing continuing versusdeparting clients, presented as Model 1 in Table 7, confirm our observations from Table 5
9 Note there are fewer observations in Tables 6 and 7 as compared to Tables 4 and 5 due to requiring completedata for the regressions. As noted in Tables 4 and 5, some data items are missing for firm-year observationsresulting in a smaller overall sample size for the regressions.
10 For all of the logistic regression models estimated in the paper, we estimate the area under the Receiver OperatingCharacteristic (ROC) curve as a measure of goodness-of-fit. The area under the ROC curve ranges from 0.60to 0.76, which is considered acceptable discrimination according to Hosmer and Lemeshow (2000).
Risk Shifts in the Market for Audits 111
Auditing: A Journal of Practice & Theory November 2009American Accounting Association
TABLE 6Logistic Regression Analyses of Characteristics of New Clients Relative to
Existing Client Base
Model 1
Continuing versusAll New Clients
Coefficient p-value
Model 2
Continuing versusNew from Big 4
Coefficient p-value
Model 3Continuing versus
New fromSmall Firms
Coefficient p-value
Intercept �1.778 �0.01 �1.963 �0.01 �2.874 �0.01Ln Assets 0.116 �0.01 0.141 �0.01 �0.163 0.13(AR�Inv) /Assets �0.536 0.03 �0.501 0.05 �1.446 0.05ROA �0.061 0.08 �0.037 0.39 �0.071 0.13Loss 0.186 0.13 0.236 0.06 �0.396 0.27Leverage �0.060 0.27 �0.063 0.32 �0.034 0.70Change in sales 0.006 0.05 0.006 0.08 0.011 0.03OCF �0.015 0.87 �0.024 0.82 0.054 0.70RstmtCurrent 0.199 0.42 0.045 0.87 1.372 �0.01DCWeakness 0.506 �0.01 0.425 �0.01 1.044 �0.01Pseudo-R2 0.03 0.03 0.11
In Model 1, the dependent variable equals 0 for continuing clients and 1 for all new clients (n � 414 newclients and 1,571 continuing clients).In Model 2, the dependent variable equals 0 for continuing clients and 1 for new clients coming from a Big 4firm (n � 374 ‘‘new from Big 4’’ clients and 1,571 continuing clients).In Model 3, the dependent variable equals 0 for continuing clients, and 1 for new clients coming from a smallfirm (n � 40 ‘‘new from a small firm’’ clients and 1,571 continuing clients).Variables are defined in Table 3.
that departing clients on average are significantly smaller in terms of assets, are more likelyto report a loss, and have a higher increase in sales relative to clients continuing to thefollowing year. Departing clients are significantly less likely to report restatements anddisclosure control weaknesses relative to continuing clients (both at p � 0.01). These find-ings are consistent with departing clients having higher client business risk characteristicsbut not necessarily auditor business risk since these are smaller clients.
Models (2) and (3) in Table 7 separately examine continuing clients versus clientsdeparting to a Big 4 firm and continuing clients versus clients departing to a small firmand clients delisting for various reasons, respectively. The majority of the departing clientsmoves to a small firm (41 percent) or delist (49 percent). The clients departing to a Big 4firm are significantly larger than the clients continuing on with the Second Tier firms,whereas the clients departing to a small firm or delisting are significantly smaller. Othersignificant differences noted in the pooled results of Model 1 are driven by the clientsdeparting to a small firm or delisting.
Overall, the results suggest that new clients (relative to continuing clients) are signifi-cantly larger in terms of total assets, and this is driven by clients coming from Big 4 firms.New clients have a lower proportion of assets in receivables and inventory, have highergrowth (Change in sales), and are more likely to report disclosure control weaknessesrelative to clients continuing from the prior year. Departing clients (relative to continuingclients) are larger if they are departing to a Big 4 firm but smaller if they are departing toa small firm or delisting. Departing clients are also more likely to report a loss, have a
112 Hogan and Martin
Auditing: A Journal of Practice & Theory November 2009American Accounting Association
TABLE 7Logistic Regression Analyses of Characteristics of Departing Clients Relative to
Existing Client Base
Model 1
Continuing versus AllDeparting Clients
Coefficient p-value
Model 2Continuing versus
Departing to aBig 4 Firm
Coefficient p-value
Model 3Continuing versus
Departing to a SmallFirm or Other
Coefficient p-value
Intercept �0.848 �0.01 �3.667 �0.01 �0.869 �0.01Ln Assets �0.209 �0.01 0.209 0.03 �0.271 �0.01(AR�Inv) /Assets �0.104 0.68 �0.494 0.50 0.003 0.99ROA 0.030 0.12 0.423 0.11 0.022 0.26Loss 0.327 0.01 �0.284 0.43 0.456 �0.01Leverage 0.041 0.24 �0.898 0.12 0.033 0.36Change in sales 0.004 0.05 0.004 0.31 0.004 0.05OCF �0.078 0.34 �0.898 0.12 �0.040 0.62RstmtCurrent �1.117 0.01 — �0.931 0.04DCWeakness �0.526 �0.01 0.105 0.82 �0.685 �0.01Pseudo-R2 0.08 0.06 0.11
In Model 1, the dependent variable equals 0 for continuing clients and 1 for all departing clients (n � 385departing clients and 1,518 continuing clients).In Model 2, the dependent variable equals 0 for continuing clients and 1 for departing clients going to a Big 4firm (n � 41 ‘‘departing to Big 4’’ clients and 1,571 continuing clients).In Model 3, the dependent variable equals 0 for continuing clients and 1 for departing clients going to a smallfirm (n � 159 ‘‘departing to small firm’’ clients). Other includes firms being acquired or delisting for otherreasons (n � 185 departing for ‘‘other’’ reasons, and 1,518 continuing clients).Variables are defined in Table 3.
higher change in sales, and are less likely to report disclosure control weaknesses if theyare departing to a small firm or delisting, whereas these characteristics are not significantlydifferent for the smaller subset of clients departing to a Big 4 firm.
Direct Comparison of New versus Departing ClientsIn this section, we directly compare the new clients to the departing clients, supple-
menting with data available from 8-K disclosures of auditor changes. Using 8-K data allowsus to examine characteristics that may signal problems such as internal control weaknesses,predecessor auditor resignations, a desire to reduce audit fees, or accounting concerns—data that is not available for the continuing group of clients. Relying on 8-K data restrictsthe size of this group for analysis, since clients changing auditors would have been requiredto file 8-Ks, but clients departing for other reasons (e.g., bankruptcy, deregistration, etc. asnoted in Table 2) would not have been subject to that requirement.
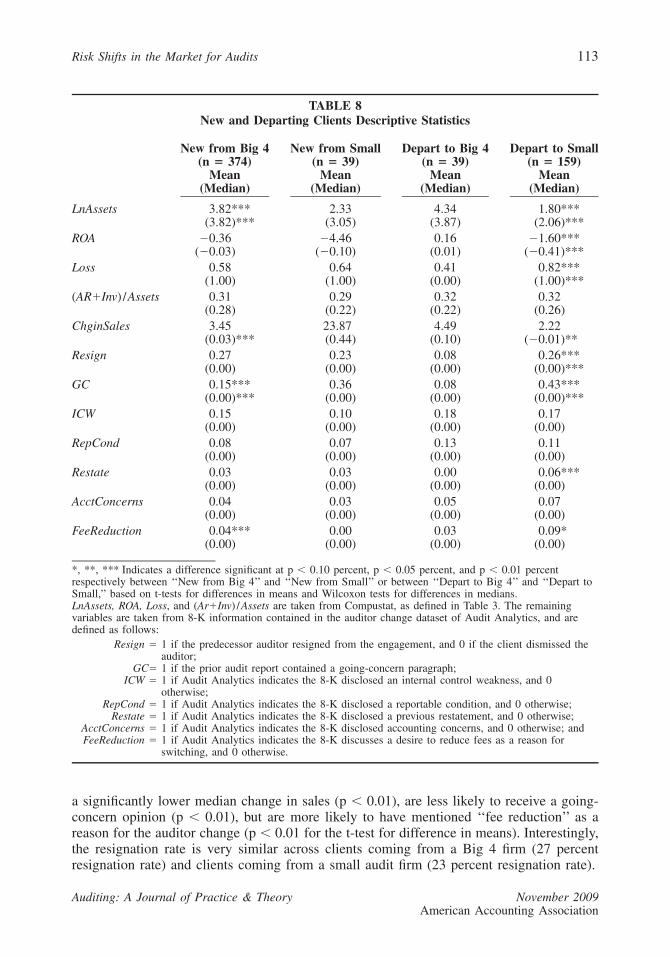
We first examine the characteristics of the subsets of new clients coming from a Big 4firm versus those coming from a small firm, and the subsets of clients departing to a Big4 firm versus those departing to a small firm, as these subsets likely have different firmcharacteristics. Table 8 presents descriptive data on these groups of new and departingclients, pooled together across all years. For new clients, those coming from a Big 4 firmare significantly larger (p � 0.01 for both tests of differences in means and medians), have
Risk Shifts in the Market for Audits 113
Auditing: A Journal of Practice & Theory November 2009American Accounting Association
TABLE 8New and Departing Clients Descriptive Statistics
New from Big 4(n � 374)
Mean(Median)
New from Small(n � 39)
Mean(Median)
Depart to Big 4(n � 39)
Mean(Median)
Depart to Small(n � 159)
Mean(Median)
LnAssets 3.82***(3.82)***
2.33(3.05)
4.34(3.87)
1.80***(2.06)***
ROA �0.36(�0.03)
�4.46(�0.10)
0.16(0.01)
�1.60***(�0.41)***
Loss 0.58(1.00)
0.64(1.00)
0.41(0.00)
0.82***(1.00)***
(AR�Inv) /Assets 0.31(0.28)
0.29(0.22)
0.32(0.22)
0.32(0.26)
ChginSales 3.45(0.03)***
23.87(0.44)
4.49(0.10)
2.22(�0.01)**
Resign 0.27(0.00)
0.23(0.00)
0.08(0.00)
0.26***(0.00)***
GC 0.15***(0.00)***
0.36(0.00)
0.08(0.00)
0.43***(0.00)***
ICW 0.15(0.00)
0.10(0.00)
0.18(0.00)
0.17(0.00)
RepCond 0.08(0.00)
0.07(0.00)
0.13(0.00)
0.11(0.00)
Restate 0.03(0.00)
0.03(0.00)
0.00(0.00)
0.06***(0.00)
AcctConcerns 0.04(0.00)
0.03(0.00)
0.05(0.00)
0.07(0.00)
FeeReduction 0.04***(0.00)
0.00(0.00)
0.03(0.00)
0.09*(0.00)
*, **, *** Indicates a difference significant at p � 0.10 percent, p � 0.05 percent, and p � 0.01 percentrespectively between ‘‘New from Big 4’’ and ‘‘New from Small’’ or between ‘‘Depart to Big 4’’ and ‘‘Depart toSmall,’’ based on t-tests for differences in means and Wilcoxon tests for differences in medians.LnAssets, ROA, Loss, and (Ar�Inv) /Assets are taken from Compustat, as defined in Table 3. The remainingvariables are taken from 8-K information contained in the auditor change dataset of Audit Analytics, and aredefined as follows:
Resign � 1 if the predecessor auditor resigned from the engagement, and 0 if the client dismissed theauditor;
GC� 1 if the prior audit report contained a going-concern paragraph;ICW � 1 if Audit Analytics indicates the 8-K disclosed an internal control weakness, and 0
otherwise;RepCond � 1 if Audit Analytics indicates the 8-K disclosed a reportable condition, and 0 otherwise;
Restate � 1 if Audit Analytics indicates the 8-K disclosed a previous restatement, and 0 otherwise;AcctConcerns � 1 if Audit Analytics indicates the 8-K disclosed accounting concerns, and 0 otherwise; andFeeReduction � 1 if Audit Analytics indicates the 8-K discusses a desire to reduce fees as a reason for
switching, and 0 otherwise.
a significantly lower median change in sales (p � 0.01), are less likely to receive a going-concern opinion (p � 0.01), but are more likely to have mentioned ‘‘fee reduction’’ as areason for the auditor change (p � 0.01 for the t-test for difference in means). Interestingly,the resignation rate is very similar across clients coming from a Big 4 firm (27 percentresignation rate) and clients coming from a small audit firm (23 percent resignation rate).
114 Hogan and Martin
Auditing: A Journal of Practice & Theory November 2009American Accounting Association
TABLE 9New versus Departing Clients Logistic Regression Model
Pooled 2000–2004n � 615 Changes
(413 new, 198 departing)Coefficient(p-value)
2000–2001n � 156 Changes
(60 new, 95 departing)Coefficient(p-value)
2002–2004n � 459 Changes
(353 new, 103 departing)
Coefficient(p-value)
Intercept 0.321(0.36)
1.129(0.09)
�0.168(0.71)
LnAssets �0.435(�0.01)
�0.326(0.01)
�0.455(�0.01)
ROA 0.061(0.04)
0.143(0.17)
0.054(0.07)
Loss 0.070(0.76)
0.403(0.36)
0.010(0.97)
(AR�Inv) /Assets 0.059(0.88)
�0.034(0.96)
�0.047(0.93)
Resign �0.302(0.18)
�0.509(0.32)
0.010(0.97)
GC 0.572(0.01)
0.323(0.47)
0.622(0.04)
ICW �0.121(0.76)
�1.324(0.07)
0.361(0.48)
RepCond 0.834(0.06)
0.998(0.28)
0.783(0.16)
Restate 0.255(0.61)
1.663(0.19)
�0.033(0.96)
AcctConcerns 0.830(0.06)
0.975(0.29)
0.573(0.32)
FeeReduction 0.918(0.02)
2.079(0.06)
0.660(0.23)
Pseudo-R2 0.20 0.18 0.21
The dependent variable, NeworDepart, equals 1 if the client firm is departing one of the Second Tier audit firmsin the current year, and 0 if the client is new to the Second Tier audit firms in the current year.Variables are defined in Table 8.
For the departing clients, clients departing to a small firm are significantly smaller, areless profitable and more likely to report a loss, are more likely to have received a going-concern opinion, and are more likely to have had a financial statement restatement. Con-sistent with the higher client business risk and audit risk profile of these clients, SecondTier audit firms are more likely to have resigned from the clients departing to a small firm(i.e., the Second Tier firms only resign from 8 percent of the firms departing to a Big 4but resign from 26 percent of the clients departing to a small auditor). The clients departingto a Big 4 firm are relatively larger, more profitable firms that the Second Tier auditorswould probably prefer to retain, all else being equal.
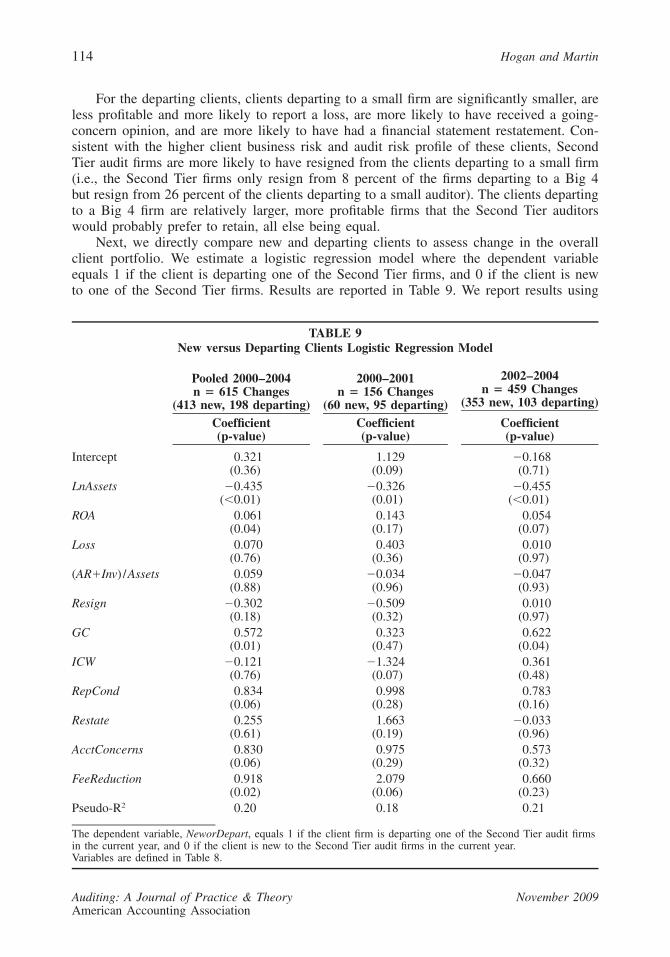
Next, we directly compare new and departing clients to assess change in the overallclient portfolio. We estimate a logistic regression model where the dependent variableequals 1 if the client is departing one of the Second Tier firms, and 0 if the client is newto one of the Second Tier firms. Results are reported in Table 9. We report results using
Risk Shifts in the Market for Audits 115
Auditing: A Journal of Practice & Theory November 2009American Accounting Association
all years pooled, and also for the pre-Sarbanes-Oxley (and Andersen demise) time periodversus the post-Sarbanes-Oxley (and Andersen demise) time period. The results are con-sistent with an increase in auditor business risk. Newer clients are larger, as measured intotal assets, as compared to departing clients, consistent with our earlier findings and con-sistent with the Second Tier firms picking up clients from the Big 4 during this time period.Interestingly, the pooled results suggest departing clients are more profitable than newclients as measured by ROA, although this difference is driven by the post-Sarbanes-Oxleytime period (and also note that the group of firms departing due to delistings or mergers isnot included here, whereas they were included in earlier analyses that did not require 8-Kdata). The ratio of accounts receivable and inventory to total assets is not significant either.11
Interestingly, the negative coefficient on the Resign variable suggests that the Second Tierfirms are less likely to have resigned from their departing clients (as compared to the newclients they are gaining from predominantly the Big 4); however, the coefficients are notsignificant in either the pooled results or the pre- or post-Sarbanes-Oxley period.
Several of the measures capturing audit risk are more likely for the departing clientsas compared to the new clients. Going-concern opinions (GC) are significantly more likelyfor the departing clients in the pooled results (p � 0.01), but this seems to be driven bythe post-Sarbanes-Oxley time period as the coefficient is not significant in the pre-Sarbanes-Oxley period. Both reportable conditions (RepCond) and accounting concerns (Acct-Concerns) are more likely for the departing clients in the pooled results (p � 0.06 for bothcoefficients), although the coefficients are not significant in the pre- or post-Sarbanes-Oxleyperiods individually. The occurrence of restatements (Restate) does not appear to differacross new and departing clients, and there also does not seem to be a difference in thereporting of internal control weaknesses although they are marginally significantly morelikely for new clients in the pre-Sarbanes-Oxley period only (p � 0.07). Finally, departingclients are more likely to have identified fee reductions as causes for switching auditorsduring the period, particularly in the pre-Sarbanes-Oxley period.12
Overall, the results are consistent with the Second Tier firms taking on more auditorbusiness risk as a result of new clients being significantly larger than departing clients. Thisresult is driven by the fact that the new clients are coming predominantly from Big 4 firmswhereas departing clients are going predominantly to smaller audit firms. The Second Tierfirms are shedding clients with some characteristics that are consistent with greater levelsof audit risk (more likely to have disclosed reportable conditions and accounting concernsin the 8-K announcing the auditor change), and this is driven by the clients departing to asmaller audit firm. However, many other measures of audit risk and client business risk arenot significantly different across new and departing clients.13
11 We also estimate the model including the change in sales variable; however, we do not report those results inthe paper as we lose an additional 45 observations that do not have a value for change in sales. The coefficienton change in sales is not significant (p � 0.72) and other results are qualitatively similar.
12 We conducted Chow tests across the two periods noted in Table 9, and the only significant difference betweenestimated coefficients across the two periods is for the ICW variable. Thus our discussion above that refers tosignificant results apparently being driven by one period or the other is based on the observation that theestimated coefficient for a given variable is significant in one period but not the other, but differences betweenthe two periods are not necessarily statistically significant.
13 The incidence of reporting losses, the ratio of inventory and receivables to total assets, the occurrence of auditorresignations from the predecessor auditor, and financial statement restatements are not significantly differentacross new and departing clients either in the pooled results or in the separate periods.

116 Hogan and Martin
Auditing: A Journal of Practice & Theory November 2009American Accounting Association
DISCUSSION AND CONCLUSIONThe evidence and analysis indicate a significant amount of switching activity for the
Second Tier audit firms, with approximately 20 percent of their publicly traded client port-folio being comprised of new clients each year over the 2001–2004 time period. This periodof increased realignment activity for Second Tier firms clearly provided an opportunity forrisk characteristics of Second Tier client portfolios to change during the period, whichwould be important to consider as clients and regulators evaluate the viability of this setof audit firms as providers of audits to more and more publicly traded companies
Client business risk characteristics did change during the period, but not in a consis-tently clear upward or downward direction. In comparing the overall portfolio from 2000to 2004, client profitability (measured with ROA) increased. Profitability for new clientswas lower than for continuing clients and clients departing to another audit firm (as opposedto delisting), implying that new clients might be more likely to encounter financial problemsgoing forward relative to the comparison groups. At the same time, in analyses that includeclients departing due to delisting and other reasons, the departing clients were less profitableand more likely to report a loss relative to continuing clients. New clients from Big 4 firmswere more likely to have had prior losses than continuing clients of the Second Tierfirms, but in turn the clients who departed from Second Tier firms to smaller firms werealso more likely to have had prior losses. Overall, the evidence suggests the Second Tierfirms were disassociating from some risky firms at the same time they were accepting newclients with riskier characteristics than the rest of their client portfolios.
Changes to audit risk characteristics were also not in a consistent direction. Growthrates (measured as change in sales) were higher for new and departing clients relative tocontinuing clients. Restatements and disclosure control weaknesses were more frequent fornew clients relative to continuing clients, while the same two characteristics were lessfrequent for departing clients relative to continuing clients. All else equal, this would implythat Second Tier firms were increasing the riskiness of their audit portfolios based on thesecharacteristics. In contrast, however, when comparing matters disclosed in 8-Ks associatedwith auditor realignments, departing clients had higher occurrence rates of reportable con-ditions and accounting concerns relative to new clients throughout the study period.
Auditor business risk, which is typically considered to be associated with client businessrisk and audit risk as well as indicators that an audit firm is more likely to suffer economicor reputational losses, seems to have increased for Second Tier firms based on the consistentpattern of accepting larger clients during the period while disassociating from relativelysmaller clients. New clients were larger than continuing clients during the period, withformer Big 4 clients explaining that difference. Departing clients were smaller than contin-uing clients overall, but for the smaller set of clients (compared to the number of clientsmoving to smaller firms) moving ‘‘up’’ to Big 4 firms, the departing clients were relativelylarger. Direct comparisons of new versus departing clients show that new clients were largerthroughout the study period. To the degree that larger clients are associated with increasedrisks of auditor litigation, these results imply that the exposure of the Second Tier firms tohigher business risk has increased.
Overall, our findings suggest that the Second Tier firms are clearly rebalancing theirclient portfolios over this period, but there is not a marked shift in risk characteristics thatindicate either significantly more or less risk to the firms as a result. As they take on largerand more risky clientele, predominantly clients coming from the Big 4 audit firms, theyalso seem to be shedding clients that are less profitable and more likely to have higher riskreporting issues such as accounting concerns and reportable conditions.
Risk Shifts in the Market for Audits 117
Auditing: A Journal of Practice & Theory November 2009American Accounting Association
REFERENCESAdvisory Committee on the Auditing Profession. 2008. Preliminary Recommendations of the Sub-
committee on Concentration and Competition. Washington, D.C.: U.S. Department of theTreasury.
American Assembly. 2005. The future of the accounting profession: Auditor concentration. Availableat: http: / /www.americanassembly.org/programs.dir / report file.dir /AUDIT report report filereport final.pdf.
Audit Analytics. 2006. Auditor change—Departures analysis. IVES Group. Available at: http: / /www.AuditAnalytics.com.
Bedard, J. C., and K. M. Johnstone. 2006. A longitudinal comparison of auditors’ response to clientrisk in the Sarbanes-Oxley era. Working paper, Bentley College.
Bell, R. B., W. Landsman, and D. A. Shackelford. 2001. Auditors’ perceived business risk and auditfees: Analysis and evidence. Journal of Accounting Research 39 (June): 35–43.
Bryan-Low, C. 2003. Accounting firms aim to dispel cloud of corporate fraud. The Wall Street Journal(May 27): C1.
Byrnes, N. 2003. Reform: Who’s making the grade. BusinessWeek (September 22): 80.———. 2005. The little guys doing large audits. BusinessWeek (August 22/29): 39.Cox, C. 2005. Speech by SEC Chairman: Remarks delivered before the 2005 AICPA National Con-
ference on Current SEC and PCAOB Developments. Washington, D.C.: Securities and ExchangeCommission. Available at: http: / /www.sec.gov/news/speech/spch120505cc.htm.
Doogar, R., N. Fargher, and K. P. Hong. 2007. Audit market contestability in the post-Enron era.Working paper, University of Illinois.
Ettredge, M., C. Li, and S. Scholz. 2007. Audit fees and auditor dismissals in the Sarbanes-Oxleyera. Accounting Horizons 21 (4): 371–386.
Hindo, B. 2003. Audit clients get the heave-ho. BusinessWeek (December 1): 7.Ho, J. L. Y., and J. Wang. 2006. Examination of audit fee premiums and auditor switching pre and
post the demise of Arthur Andersen and Sarbanes-Oxley Act of 2002. Working paper, Universityof California, Irvine, and Norwegian School of Economics and Business Administration.
Hosmer, D. W., and S. Lemeshow. 2000. Applied Logistic Regression. 2nd edition. New York, NY:John Wiley and Sons.
Johnson, W. B., and T. Lys. 1990. The market for audit services: Evidence from voluntary auditorchanges. Journal of Accounting and Economics 12 (January): 281–308.
Johnstone, K. M., and J. C. Bedard. 2004. Audit firm portfolio management decisions. Journal ofAccounting Research 42 (September): 659–690.
Kinney, W. R., Jr. 2000. Information Quality Assurance and Internal Control for Management De-cision Making. New York, N.Y.: Irwin McGraw-Hill.
Krishnan, J., and J. Krishnan. 1997. Litigation risk and auditor resignations. The Accounting Review72 (October): 539–560.
Landsman, W. R., K. K. Nelson, and B. R. Rountree. 2007. Auditor switches in the pre- and post-Enron eras: Risk or realignment? Working paper, The University of North Carolina and RiceUniversity.
Leone, M., and S. Taub. 2007. BDO found guilty, but how guilty? CFO.com (June 18). Available at:http: / /www.cfo.com/article.cfm/9355392?f�related.
Plitch, P., and L. Wei. 2004. Moving the market: Auditor-client breakups risk, while disclosure oftenlags. The Wall Street Journal (August 3): C3.
Public Accounting Report. 2004. Big 4 shed smaller clients in big numbers. Public Accounting Report(September 30).
Rama, D. V., and W. J. Read. 2006. Resignations by the Big 4 and the market for audit services.Accounting Horizons 20 (June): 97–109.
Reilly, D. 2006. Midtier auditors gain traction in quest for large-cap clients. The Wall Street Journal(November 14): C3.
Schloetzer, J. D. 2006. Arthur Andersen, SOX Section 404 and auditor turnover: Theory and evidence.Working paper, Georgetown University.

118 Hogan and Martin
Auditing: A Journal of Practice & Theory November 2009American Accounting Association
Schwartz, K., and K. Menon. 1985. Auditor switches by failing firms. The Accounting Review 60(April): 248–261.
Shu, S. 2000. Auditor resignations: Clientele effects and legal liability. Journal of Accounting andEconomics 29 (April): 173–205.
Sullivan, M. 2006. Great migration: How recent events changed the switching behavior of top-tieraudit clients. Working paper, The George Washington University.
Taub, S. 2004. Big 4 seen shedding small clients. CFO.com (September 21). Available at: http: / /www1.cfo.com/article.cfm/3217664/c 3217674?f�TodayInFinance Inside.
U.S. General Accounting Office (GAO). 2003. Public accounting firms: Mandated study on consoli-dation and competition. Available at: http: / /www.gao.gov/new.items/d03864.pdf.
———. 2006. Sarbanes-Oxley Act: Consideration of key principles needed in addressing implemen-tation for smaller public companies. Available at: http: / /www.gao.gov/products /GAO-06-361.