RISK-ON AMID RETURN TO NORMALITY INVESTMENT ...
35
RISK-ON AMID RETURN TO NORMALITY SECOND QUARTER 2021 FLORENCE BARJOU JEANNE ASSERAF-BITTON CIO for Active Investment Strategies Global Head of Market Research JEAN-BAPTISTE BERTHON PHILIPPE FERREIRA Senior Strategist Senior Strategist VACCINATION TO DICTATE RETURN TO NORMALITY LOOMING U.S. BOOM EMU SLOW CATCH-UP CONDUCIVE POLICY BACKDROP O/W DM EQUITIES UNATTRACTIVE FIXED-INCOME FAVOR SHORT DURATION O/W U.S. BREAKEVEN TACTICAL BUY COMMIDITIES NEUTRAL CORPORATE CREDIT TACTICAL BUY EM O/W EVENT-DRIVEN U/W MARKET NEUTRAL L/S O/W CTA N GLOBAL MACRO INVESTMENT STRATEGY LYXOR CROSS ASSET RESEARCH
-
Upload
khangminh22 -
Category
Documents
-
view
1 -
download
0
Transcript of RISK-ON AMID RETURN TO NORMALITY INVESTMENT ...

R I S K- O N A M I D R E TU R N TO
N O R M A L ITY
S E C O N D Q U A R T E R 2 0 2 1
FLORENCE BARJOU JEANNE ASSERAF-BITTON
CIO for Active Investment Strategies Global Head of Market Research
JEAN-BAPTISTE BERTHON PHILIPPE FERREIRA
Senior Strategist Senior Strategist
VACCINATION TO DICTATE
RETURN TO NORMALITY
LOOMING U.S. BOOM
EMU SLOW CATCH-UP
CONDUCIVE POLICY BACKDROP
O/W DM EQUITIES
UNATTRACTIVE FIXED-INCOME FAVOR SHORT DURATION
O/W U.S. BREAKEVEN TACTICAL BUY COMMIDITIES
NEUTRAL CORPORATE CREDIT
TACTICAL BUY EM
O/W EVENT-DRIVEN U/W MARKET NEUTRAL L/S
O/W CTA N GLOBAL MACRO
I N V E ST M E N T ST RAT E G Y
LYXOR CROSS ASSET RESEARCH


INVESTMENT STRATEGY INVESTMENT STRATEGY
By LYXOR CROSS ASSET RESEARCH SECOND QUARTER 2021
Contact: [email protected] +33 (0) 1 42 13 31 31
Completed April 7th, 2021. Data as of March 31st, 2021 unless otherwise specified.
Important Notice: For investors in the European Economic Area, this material is intended for clients
(current or potential) who meet the definition of “Professional Counterparty” or “Eligible
Counterparty” under the Markets in Financial Instruments Directive (“MiFID”), and any products or
services described falling within the scope of the MiFID are only available to such clients. This
document is considered marketing communication within the meaning of the MiFID.
CONTENTS
EXECUTIVE SUMMARY 3
MACRO & MARKET VIEWS 4
Markets hesitating between Reflation and Inflation 4
Pandemic trends and policy response to continue dictate growth prospects 5
The looming U.S. economic boom 7
Will the U.S. economy overheat and yield unwanted inflation? 8
Fed, Taper, AIT and U.S. Yields 9
U.S. Fixed-income markets’ unattractive risk-return profile 10
Strong earnings prospects keep us O/W on U.S. Equities 10
Addressing U.S. Value and Growth themes through sectors 11
EURUSD, not a no-brainer! 12
Europe: near term challenges; mid-term opportunities 13
O/W EMU equities to leverage global growth; Neutral UK equities 15
EMU sectors: cyclicals vs. defensives 16
Japan Economy: The fundamental story remains intact 17
Japan Equities: Not taking profit yet (O/W) 18
EM Economies: Brightening outlook 19
EM Equities: Tactical Buy, but strategic Neutrality 20
EM HC Debt: Modest spread tightening in sight, but U.S. rates risk (N) 22
Commodities: Supercycle and sentivity to U.S. rates 23
Brent: Waltz in three-quarter time 23
Copper: shortage in 2021 (O/W) 25
Gold: Mixed fundamentals, tactical opportunity (N+) 25
ALTERNATIVE STRATEGIES 26
KEY VIEWS 26
UPGRADE CTA (O/W) AT THE EXPENSE OF GLOBAL MACRO (N) 27
DOWNGRADE L/S CREDIT TO NEUTRAL 27
STAY O/W EVENT-DRIVEN 28
L/S EQUITY: PREFER DIRECTIONAL TO MARKET NEUTRAL L/S (U/W) 28
Methodological appendix on Lyxor Alternative UCITs Peer Groups 29
DISCLAIMER 31
INVESTMENT STRATEGY INVESTMENT STRATEGY
By LYXOR CROSS ASSET RESEARCH SECOND QUARTER 2021
2
back to the top
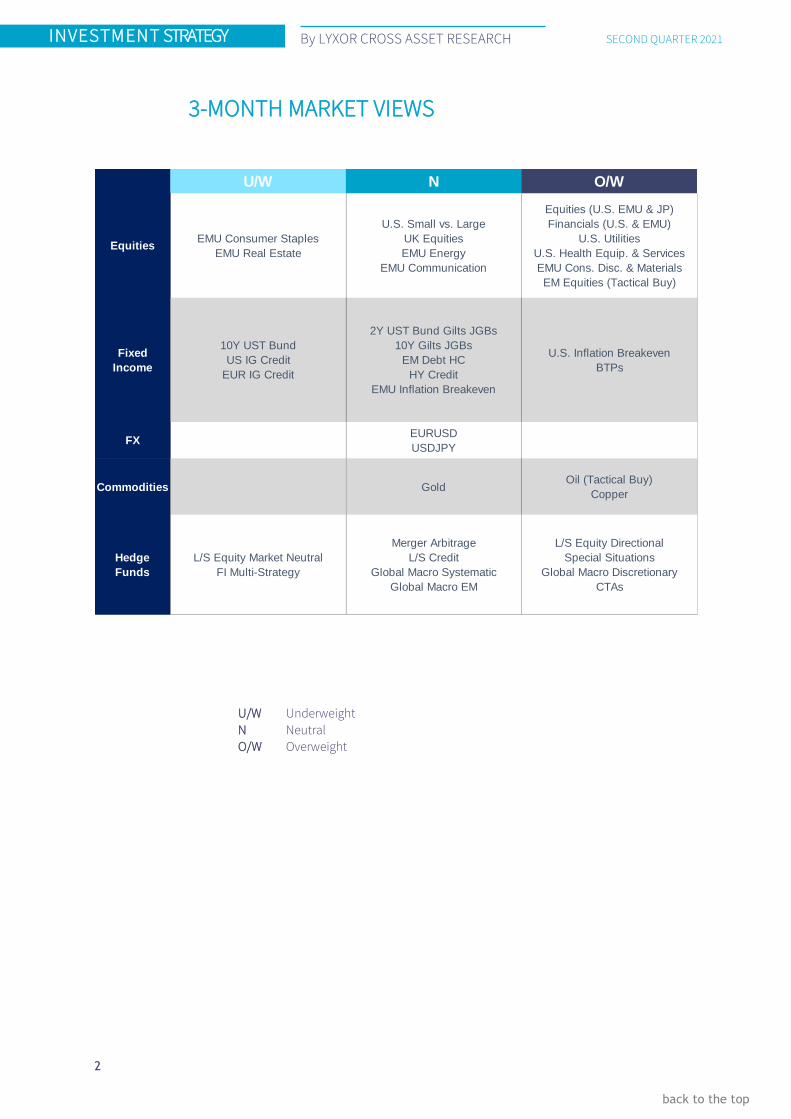
3-MONTH MARKET VIEWS
U/W Underweight
N Neutral
O/W Overweight
U/W N O/W
EquitiesEMU Consumer Staples
EMU Real Estate
U.S. Small vs. Large
UK Equities
EMU Energy
EMU Communication
Equities (U.S. EMU & JP)
Financials (U.S. & EMU)
U.S. Utilities
U.S. Health Equip. & Services
EMU Cons. Disc. & Materials
EM Equities (Tactical Buy)
Fixed
Income
10Y UST Bund
US IG Credit
EUR IG Credit
2Y UST Bund Gilts JGBs
10Y Gilts JGBs
EM Debt HC
HY Credit
EMU Inflation Breakeven
U.S. Inflation Breakeven
BTPs
FXEURUSD
USDJPY
Commodities GoldOil (Tactical Buy)
Copper
Hedge
Funds
L/S Equity Market Neutral
FI Multi-Strategy
Merger Arbitrage
L/S Credit
Global Macro Systematic
Global Macro EM
L/S Equity Directional
Special Situations
Global Macro Discretionary
CTAs

INVESTMENT STRATEGY INVESTMENT STRATEGY
By LYXOR CROSS ASSET RESEARCH SECOND QUARTER 2021
3
back to the top
EXECUTIVE SUMMARY
Macro & Market Views
The recovery is not over yet. The vaccination rollout and global stimulus point to a faster
recovery in H2, justifying a bullish bias on risky assets.
Yet, the recovery will likely be unequal and uneven. The U.S. would be a major global growth
driver, boosted by aggressive policy support. Chinese growth would moderate and remain
imbalanced. Europe could lag, slowed by renewed mobility restrictions. The path of the gradual
but steady Japanese recovery would depend on consumer confidence. The progress of EM
countries would remain uneven, a function of their access to vaccinations and exposure to U.S.
reflation.
The laborious services recovery still calls for continued fiscal and monetary support, inducing
recurrent inflation fears and rate volatility, amplified by intense supply-chain pressures. While
U.S. inflation has not reached its peak yet, other developed economies seem unlikely to
overheat. Inflation hedges would remain in demand, keeping us O/W on U.S. breakeven and
bullish on cyclical commodities - especially copper.
Highly abundant macro and market liquidity may result in trading anomalies, requiring tactical
monitoring. While Covid-19 developments should remain a significant market differentiator,
sequencing regional, sectors and factors recoveries would be challenging, unsettled by rate and
inflation uncertainties. Exposure to U.S. reflation will likely be a major theme in Q2, in particular
for Japan, UK, Germany, Asia and China, and Mexico.
We maintain our risk-on positioning. Our O/W on DM equities seeks to leverage on U.S. reflation,
on lagging valuations in Europe and on Japanese efforts to exit deflation. We combine value and
growth styles through sectors, looking for similar drivers. More affordable valuations in EM and
China open tactical opportunities. In contrast, we are U/W govies and have neutralized our
stance on HY credit.
Alternative Strategies
We have adjusted our views on alternative strategies given the changing environment discussed
above. In this context, carry strategies, on which we were constructive until now, are less
appealing with Treasury yields heading to 2-2.5%. We downgraded L/S Credit and EM Global
Macro to N. We don’t expect the conditions to be met for such strategies to outperform.
With regards to other strategies, we remain O/W Event-Driven and Neutral L/S Equity (Directional
L/S at O/W and Market Neutral L/S at U/W). Event-Driven strategies should continue to benefit
from robust corporate activity in the post-Covid world. Special Situations are more directional
than Merger Arbitrage and have a value bias which is likely to be rewarded. Merger Arbitrage
remains attractive as deal spreads fluctuate in the 6-7% range at present and SPACs have
become a new engine of performance. Finally, we upgraded CTAs to O/W. Their portfolios are
well-balanced and positioned for a cyclical upswing. Overall, we have a slight preference for
Event-Driven vs. L/S Equity and now favor CTAs to Global Macro strategies due to the EM bias of
the latter.

INVESTMENT STRATEGY INVESTMENT STRATEGY
By LYXOR CROSS ASSET RESEARCH SECOND QUARTER 2021
4
back to the top
MACRO & MARKET VIEWS
MARKETS HESITATING BETWEEN REFLATION
AND INFLATION
The quarter ended on a positive note for risk assets.
Improvement on the Covid-19 front, global growth
momentum gaining traction, the passing of a massive
policy stimulus bill in the U.S. and ample liquidity
pushed cyclical commodities and equity markets
higher. Oil (Brent generic first Future) and Copper (LME
generic first Future) led the way, surging +21.1% and
+13.3%, respectively. The MSCI World Index gained
+5.7% in local currency terms over the period.
While financial conditions (as measured by the Chicago
Fed ANFCI) continued to improve, risk asset volatility
remained elevated, signaling sustained investor
nervousness on the bumpy road to normality. Also,
markets started to show signs of froth. In the U.S., the
short squeeze on the video game retailer GameStop
triggered by Reddit users agitated markets. It only had a
transitory impact on financial stability but will likely lead
to new regulations to address the gamification of retail
investing. Other signs of frothiness include non or hardly
profitable companies (Tesla, Airbnb, etc.) trading at
extreme price to sales ratios. U.S. margin debt soared to
$814 bn by the end of February. Yet, relative to market
performance, this new record might be seen as a
recovery rather than a sign of uncontrolled speculation.
In China, asset bubbles in the stock and property
markets prompted the PBoC to adjust its monetary
policy, triggering a correction.
Better growth prospects triggered a sharp widespread
revival in inflation expectations. Inflation breakeven
jumped more than 60 bps (five-year maturity) in the U.S.
and United Kingdom. Implicit measures of Eurozone
inflation expectations rose as well, though the move was
shallower (+25 bps on five-year EUR inflation swap). The
U.S. 10-year government bond yield gained +83 bps,
ending March 2021 at 1.74%, thereby recouping its pre-
Covid level. Eurozone yields moved up as well, though
to a lesser extent.
Firmer USD and higher bond yields precipitated a major
Growth to Value rotation. In terms of geographies, the
shift favored Eurozone equities (EuroStoxx 300 +8.7%)
over U.S. equities (S&P 500 +5.8%) while hindering
emerging markets advance (MSCI EM +3.6%).
Typical safe-havens struggled in a period when reflation
trades occupied center stage. Gold prices lost about
10% as U.S. real yields gradually recovered from deeply
negative levels. Long-dated U.S. Treasuries and German
Bunds (Bloomberg-Barclays 7-10-year indices) yielded
Q1 2021 Asset Class Performance
Source: Macrobond, Lyxor AM
Persistent volatility
Source: Macrobond, Lyxor AM
U.S. Margin debt soaring
Source: Macrobond, Lyxor AM
INVESTMENT STRATEGY INVESTMENT STRATEGY
By LYXOR CROSS ASSET RESEARCH SECOND QUARTER 2021
5
back to the top
negative returns of -5.7% and -1.6% returns,
respectively. Credit spread compression in the high yield
segment more than offset base yield increases, allowing
U.S. and Europe high-yield credit to offer thin but
positive total returns over the quarter.
Heading into Q2, pressing questions on investors’ minds
and ours include: do reflation trades continue to offer
attractive risk-return profiles? Will the economic
recovery affirm itself and spread to Europe? What are
the risks that U.S. growth overheats, leading to
unwanted inflation? When will central banks start
normalizing monetary policy?
PANDEMIC TRENDS AND POLICY RESPONSE
TO CONTINUE DICTATE GROWTH PROSPECTS
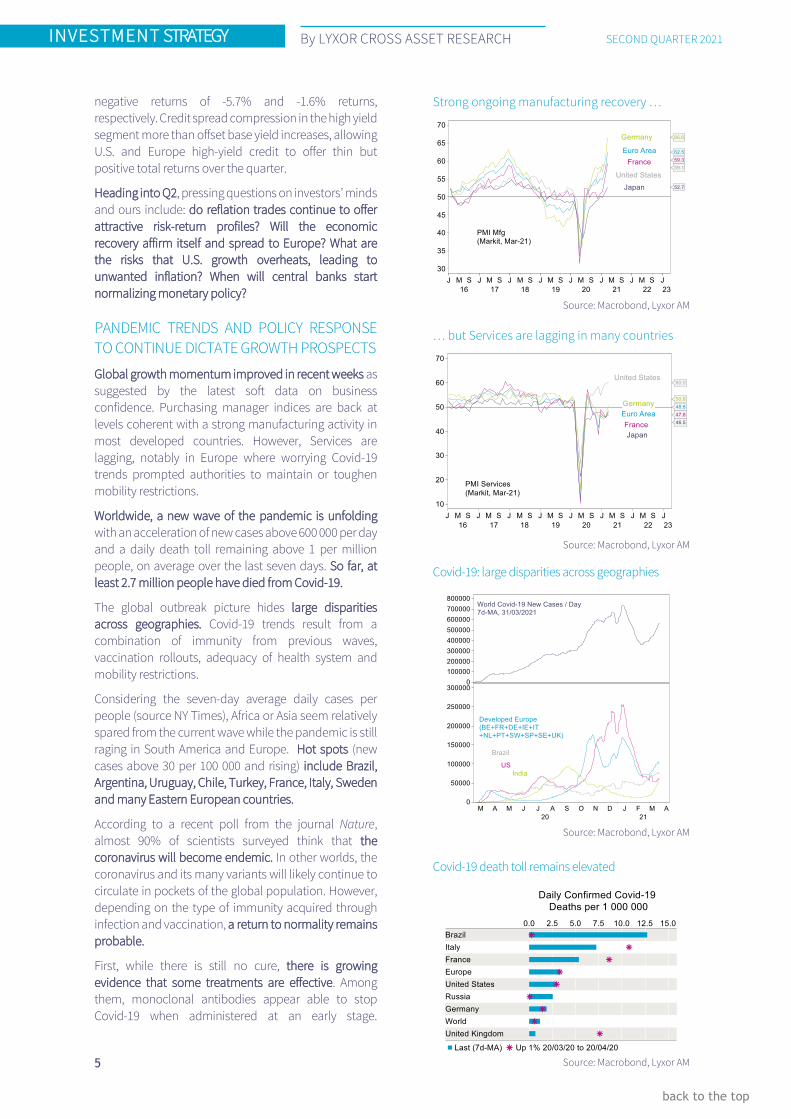
Global growth momentum improved in recent weeks as
suggested by the latest soft data on business
confidence. Purchasing manager indices are back at
levels coherent with a strong manufacturing activity in
most developed countries. However, Services are
lagging, notably in Europe where worrying Covid-19
trends prompted authorities to maintain or toughen
mobility restrictions.
Worldwide, a new wave of the pandemic is unfolding
with an acceleration of new cases above 600 000 per day
and a daily death toll remaining above 1 per million
people, on average over the last seven days. So far, at
least 2.7 million people have died from Covid-19.
The global outbreak picture hides large disparities
across geographies. Covid-19 trends result from a
combination of immunity from previous waves,
vaccination rollouts, adequacy of health system and
mobility restrictions.
Considering the seven-day average daily cases per
people (source NY Times), Africa or Asia seem relatively
spared from the current wave while the pandemic is still
raging in South America and Europe. Hot spots (new
cases above 30 per 100 000 and rising) include Brazil,
Argentina, Uruguay, Chile, Turkey, France, Italy, Sweden
and many Eastern European countries.
According to a recent poll from the journal Nature,
almost 90% of scientists surveyed think that the
coronavirus will become endemic. In other worlds, the
coronavirus and its many variants will likely continue to
circulate in pockets of the global population. However,
depending on the type of immunity acquired through
infection and vaccination, a return to normality remains
probable.
First, while there is still no cure, there is growing
evidence that some treatments are effective. Among
them, monoclonal antibodies appear able to stop
Covid-19 when administered at an early stage.
Strong ongoing manufacturing recovery …
Source: Macrobond, Lyxor AM
… but Services are lagging in many countries
Source: Macrobond, Lyxor AM
Covid-19: large disparities across geographies
Source: Macrobond, Lyxor AM
Covid-19 death toll remains elevated
Source: Macrobond, Lyxor AM

INVESTMENT STRATEGY INVESTMENT STRATEGY
By LYXOR CROSS ASSET RESEARCH SECOND QUARTER 2021
6
back to the top
Unfortunately, they could lose their efficacy against new
variants, leading researchers to tailor them against
those variants. Second and more importantly in our
view, vaccination is key for a return to normality.
So far, accumulated evidence on available vaccines
suggest that they are less effective against new virus
variants, notably the so-called “United Kingdom”
variant that presents increased transmissibility. Also, it is
not yet clear whether vaccinated people could be
asymptomatic and contagious. However, on a more
positive note, most vaccines seem to prevent severe
symptoms from variants. Extended vaccination should
help preserve health systems and contain fatalities,
thereby allowing authorities to reopen economies.
While Covid-19 vaccine developments have been
acclaimed as unparalleled achievements, the
vaccination ramp-up looks hesitant and slow with only
3.5% of the world population fully vaccinated so far.
Overall, developed economies are more advanced than
most emerging countries but there are striking
differences. Despite logistics hurdles, the U.S.
vaccination rollout is accelerating, and already 16.2% of
the population are fully vaccinated and an additional
13.6% have received a first dose. The Eurozone is far
behind with vaccination levels at about a third of U.S.
ones. Despite newly released vaccine supply plans (with
an acceleration of deliveries in Q2 and Q3), Europe may
not succeed to provide full protection (2 doses) to 70%
of its population before September, probably few
months after the U.S.
The contrasting Covid-19 picture on both sides of the
Atlantic translates into contrasted policy response. In
the U.S., many states are already easing restrictions
whereas authorities in the Eurozone are maintaining or
strengthening anti-Covid-19 measures such as
lockdowns and curfews. Unsurprisingly, mobility
remains impaired in major Eurozone countries while it
is recovering quickly in the U.S.
We believe that the vaccination timeline will be critical
in assessing growth prospects. Over the last three
months, Bloomberg consensus on 2021 growth showed
continuous upward revisions for the U.S. and downward
revisions for the Eurozone. As detailed in later sections,
we think that risks remain skewed to the upside for the
U.S. and to the downside for Continental Europe.
As the pandemic enters its second year, many
epidemiologists doubt that herd immunity could be
achieved because of uneven and partial vaccination
efforts (children being left out), risks that vaccines may
not prevent transmission, the emergence of new
variants and the uncertainty over how long immunity
lasts (whether acquired through infection or
vaccination).
Yet, a new normal without herd immunity remains
probable when authorities reopen economies.
Pent-up demand combined with policy stimulus
would trigger a sharp rebound in activity. We believe
that the U.S. will return to normal over the coming
quarter while the Eurozone may have to wait until
Q3 2021.
Covid-19 Vaccination tracker
Source: Macrobond, Lyxor AM
Contrasted mobility trends…
Source: Macrobond, Lyxor AM
… should be pivotal for growth prospects
Source: Macrobond, Lyxor AM

INVESTMENT STRATEGY INVESTMENT STRATEGY
By LYXOR CROSS ASSET RESEARCH SECOND QUARTER 2021
7
back to the top
THE LOOMING U.S. ECONOMIC BOOM
Recent soft and hard data suggest that the U.S.
economic reflation is already gaining traction. ISM
purchasing manager indices for manufacturing and
services are back to levels coherent with a strong
expansion. Our weekly GDP tracker designed to follow
U.S. macro momentum has picked up sharply over the
last few days. Based on consumer sentiment, rail
shipments, raw steel production and initial jobless
claims, the tracker that shows a strong correlation to
real GDP growth (R² above 80%) signaled that activity
was already accelerating mid-March. The latest update
of the Atlanta Fed’s GDPNow estimate points to 6%
annualized quarter-over-quarter real GDP growth in Q1,
above the current Bloomberg consensus of 4.7%.
Those estimates do not necessarily take into account
the new stimulus payments that Americans have started
to receive as part of the American Rescue Plan, a $1.9tn
stimulus bill signed into law by President Biden on
March 11, 2021. Key elements of the American Rescue
Plan include $300 per week supplement jobless benefits
until Labor Day, $1400 direct payments to individuals
and $350bn to help state and local governments
mitigate the Covid-19 related fiscal shock.
The minimum wage hike was left out but other
measures such as tax credits, subsidies and extended
health access will likely benefit low- and middle-income
households. The pace of support to consumers is
accelerating by about $1tn (annualized) in March and
Q2 compared to the previous six months.
Households have accumulated massive savings since
the start of the Covid-19 crisis resulting from both
lockdown measures preventing them from spending
and from stimulus checks and subsidies granted by the
government. Savings that jumped to 35% of personal
consumption in Q2 2020 and decreased to 15% in Q4
will likely firm-up to about 20% of personal spending
over the next two quarters.
Propensity to consume is typically a function of
confidence, which in turn depends on the employment
outlook. To that regard, consumer confidence is already
rebounding and March payroll data that showed over
900 000 job creations bodes well for the coming months.
To be sure, we do not expect that households will
immediately catch-up entirely on their consumption
and spend the total savings accumulated over the past
four quarters but part of it will likely be spent as the
economy reopens, boosting consumption and driving
Q2 real growth to double-digits levels.
U.S. activity is already gaining traction
Source: Macrobond, Lyxor AM
Massive savings waiting to be spent
Source: Macrobond, Lyxor AM
Consumer confidence rebounding
Source: Macrobond, Lyxor AM
Sizeable labor slack likely to contract quickly
Source: Macrobond, Lyxor AM
INVESTMENT STRATEGY INVESTMENT STRATEGY
By LYXOR CROSS ASSET RESEARCH SECOND QUARTER 2021
8
back to the top
WILL THE U.S. ECONOMY OVERHEAT AND
YIELD UNWANTED INFLATION?
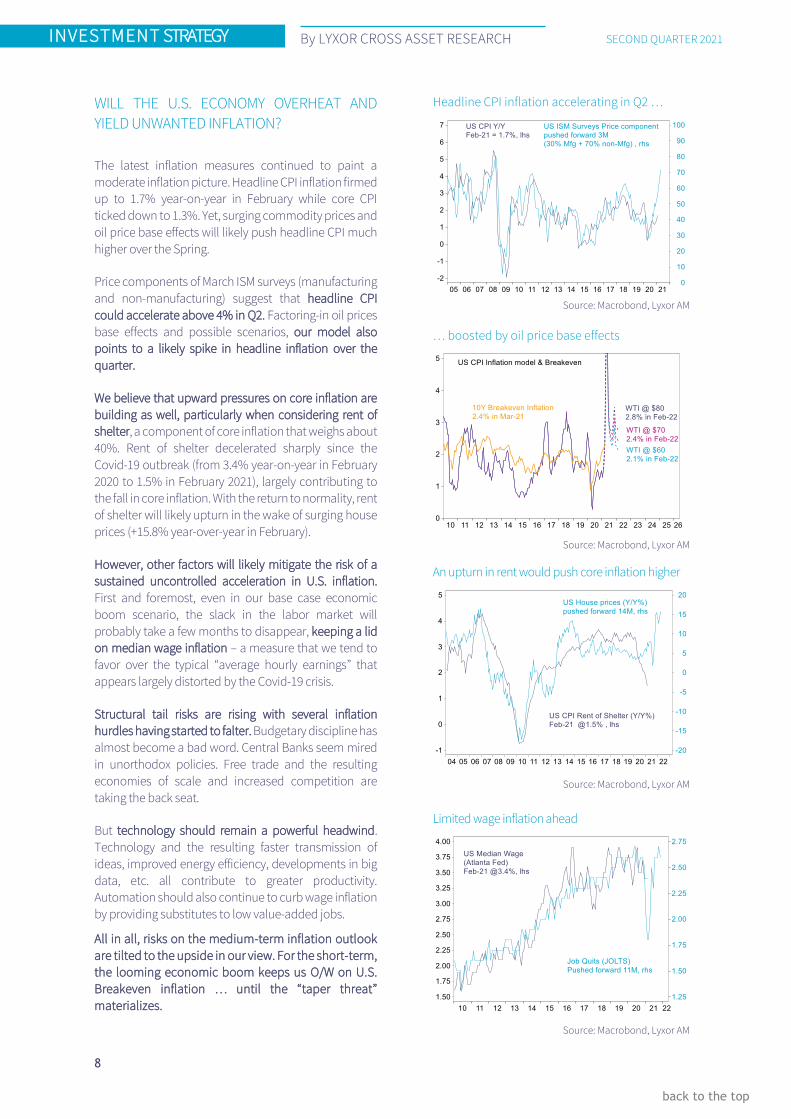
The latest inflation measures continued to paint a
moderate inflation picture. Headline CPI inflation firmed
up to 1.7% year-on-year in February while core CPI
ticked down to 1.3%. Yet, surging commodity prices and
oil price base effects will likely push headline CPI much
higher over the Spring.
Price components of March ISM surveys (manufacturing
and non-manufacturing) suggest that headline CPI
could accelerate above 4% in Q2. Factoring-in oil prices
base effects and possible scenarios, our model also
points to a likely spike in headline inflation over the
quarter.
We believe that upward pressures on core inflation are
building as well, particularly when considering rent of
shelter, a component of core inflation that weighs about
40%. Rent of shelter decelerated sharply since the
Covid-19 outbreak (from 3.4% year-on-year in February
2020 to 1.5% in February 2021), largely contributing to
the fall in core inflation. With the return to normality, rent
of shelter will likely upturn in the wake of surging house
prices (+15.8% year-over-year in February).
However, other factors will likely mitigate the risk of a
sustained uncontrolled acceleration in U.S. inflation.
First and foremost, even in our base case economic
boom scenario, the slack in the labor market will
probably take a few months to disappear, keeping a lid
on median wage inflation – a measure that we tend to
favor over the typical “average hourly earnings” that
appears largely distorted by the Covid-19 crisis.
Structural tail risks are rising with several inflation
hurdles having started to falter. Budgetary discipline has
almost become a bad word. Central Banks seem mired
in unorthodox policies. Free trade and the resulting
economies of scale and increased competition are
taking the back seat.
But technology should remain a powerful headwind.
Technology and the resulting faster transmission of
ideas, improved energy efficiency, developments in big
data, etc. all contribute to greater productivity.
Automation should also continue to curb wage inflation
by providing substitutes to low value-added jobs.
All in all, risks on the medium-term inflation outlook
are tilted to the upside in our view. For the short-term,
the looming economic boom keeps us O/W on U.S.
Breakeven inflation … until the “taper threat”
materializes.
Headline CPI inflation accelerating in Q2 …
Source: Macrobond, Lyxor AM
… boosted by oil price base effects
Source: Macrobond, Lyxor AM
An upturn in rent would push core inflation higher
Source: Macrobond, Lyxor AM
Limited wage inflation ahead
Source: Macrobond, Lyxor AM

INVESTMENT STRATEGY INVESTMENT STRATEGY
By LYXOR CROSS ASSET RESEARCH SECOND QUARTER 2021
9
back to the top
FED, TAPER, AIT AND U.S. YIELDS
In early May 2013, the Federal Reserve alluded to a
possible tapering of its quantitative easing (‘QE’) that
was confirmed by Ben Bernanke on 19 June 2013.
Bond markets sold off in a move often referred to as
the “Taper Tantrum”. U.S. Treasury 10-year yields
spiked +85 bps over May-June 2013 buoyed by rising
term premiums (+60 bps) and higher average implicit
real short-term rates (+60 bps) that more than offset
the 35-bps compression in Breakeven inflation.
Notably, the recent “taperless” spike in yields was of
similar magnitude (+81 bps year-to-date) but was
primarily driven by rising inflation expectations and
higher term premiums. When the Fed will start
signaling a possible scaling down of its monthly QE
purchases (currently $80bn U.S. Treasuries and
$40bn MBS), a switch between implicit inflation and
real short-term rates will likely happen, abruptly
compressing breakevens. We believe that Fed’s QE
Taper is a major risk to our long call on U.S.
breakevens but not an immediate threat.
The latest FOMC meeting showed the Fed committed
to its average inflation targeting (‘AIT’) framework.
Fed Chair Jerome Powell insisted that the Fed will not
act preemptively and will react to actual data rather
than forecasts. A change in interest policy could be
considered when three features are met: 1) labor
conditions should be consistent with maximum
employment, 2) inflation should be at 2% and not on
a transitory basis and, 3) inflation should be on track
to exceed 2%. The Fed’s summary of economic
projections displayed no rate hike through 2023
despite higher growth and inflation estimates
showed few FOMC participants judging that
conditions for a rate hike would be met before the
end of 2023 and four of them considering a rate hike
was warranted before the end of next year.
The Fed seemed eager to maintain a strict control
over the short end of the yield curve (up to three
years) but does not seem overly concerned by the
recent rise in longer maturity yields. We concur that
10-year yields approaching 2% or even higher are
unlikely to derail the looming economic boom.
With nominal GDP growth likely to reach 10% in 2021,
fundamentals could call for much higher yields.
However, we think that the Fed’s dedication to
anchor short maturities will limit the normalization.
We revised up our forecasts and foresee a further
steepening of the two-to-ten-year slope towards 2%,
which would translate into 10-year yields rising to
1.90% over Q2 and 2.25% over the coming year. In our
opinion, risks are skewed to the upside.
Beware of the Taper threat for Breakevens
Source: Macrobond, Lyxor AM
The Fed revised up its macro projections …
Source: Macrobond, Lyxor AM
… but appeared committed to its AIT framework
Source: Macrobond, Lyxor AM
Further curve steepening ahead
Source: Macrobond, Lyxor AM
Change in bps YTDTaper Impact
May-June 2013
US 10YY 81 85
US 10Y Break-Even Inflation 38 -35
US 10YY Term Premium (Fed, Kim-Wright) 52 60
US 10Y Average Implicit Real ST Rate (K-W) -13 60
US 3YY 18 36
US 3Y Break-Even Inflation 65 -40
US 3YY Term Premium (Fed, Kim-Wright) 18 27
US 3Y Average Implicit Real ST Rate (K-W) -69 50

INVESTMENT STRATEGY INVESTMENT STRATEGY
By LYXOR CROSS ASSET RESEARCH SECOND QUARTER 2021
10
back to the top
U.S. FIXED-INCOME MARKETS’ UNATTRACTIVE
RISK-RETURN PROFILE
We continue to rank short-dated U.S. Treasuries at
Neutral for the next three months. The Fed’s
dedication to its AIT framework will likely keep a lid
on the short end of the curve for at least the coming
12 to 18 months.
Our new higher three-month and one-year targets on
U.S. 10-year yields of 1.90% and 2.25%, respectively,
translate into negative expected returns and prompt
us to prefer an U/W stance on long maturities.
Corporate spreads have fallen to historical lows,
leaving little room for further compression.
In the investment-grade (‘IG’) segment, spreads have
reached lows last seen in early 2018 or before 2008,
leaving little room for compression over the coming
quarter despite the booming economic outlook. We
find that IG risk-return profile has deteriorated and
we downgrade U.S investment grade to U/W.
We downgrade U.S. high-yield (‘HY’) credit to Neutral.
We estimate that the default probability implied in HY
current option adjusted spreads is 1.2% for next
November, about a fourth of Moody’s bottom-up
forecasts that have been revised down to reflect
improved macro prospects. Also, the recovery in oil
prices seems well advanced and is unlikely to
contribute much further to lowering default
probabilities in the HY energy segment. We find that
HY spreads are fully discounting our bullish macro
scenario at a time when base risks are increasing.
STRONG EARNINGS PROSPECTS KEEP US O/W
ON U.S. EQUITIES
After a milder contraction (-3%) in 2020 than
originally anticipated, Bloomberg bottom-up
consensus estimates point to a sharp rebound for
S&P 500 sales this year (+8%) and next (+6.7%).
Notably, our top-down model reaches similar results
when factoring-in nominal GDP forecasts from the
Congressional Budget Office, a stable dollar and WTI
prices at $65 per barrel for the next 18 months.
Moreover, if we factor in our base case scenario with
U.S. nominal GDP growth reaching 10% in 2021, we
find that sales growth could surprise on the upside.
Profit margins will likely benefit from the operating
leverage and stay firm at current high levels in 2021 or
even further recover. Combining booming sales
growth and solid profit margins should warrant eye-
catching EPS growth this year.
The Q1 earnings season is about to start, probably on
a strong footing, as suggested by the record-high
Corporate spreads at historical lows …
Source: Macrobond, Lyxor AM
… discounting a bullish macro scenario
Source: Macrobond, Lyxor AM
S&P 500 sales growth could surprise on the upside
Source: Macrobond, Lyxor AM
Margins likely to benefit from operating leverage
Source: Macrobond, Lyxor AM

INVESTMENT STRATEGY INVESTMENT STRATEGY
By LYXOR CROSS ASSET RESEARCH SECOND QUARTER 2021
11
back to the top
number of S&P 500 companies having issued positive
sales and EPS guidance for the quarter.
Regarding 2021, I/B/E/S and Bloomberg bottom-up
consensus estimates for S&P 500 EPS have been
markedly revised up since the beginning of the year
and currently show EPS growth exceeding 25%.
Alongside Bloomberg top-down consensus, we reach
a similar conclusion and believe risks remain skewed
to the upside.
Prospects for 2022 are more moderate with about
10% expected EPS growth and more uncertain as U.S.
corporate profitability could be clouded by Biden’s
corporate tax agenda. We doubt that Democrats will
seek to raise the tax rate to 28%, a level proposed by
the candidate but exceeding the average OECD
corporate tax rate. A more modest phased-in
increase seems likely in our opinion, which may not
constitute a large drag on 2023 EPS.
U.S. Equity valuations look stretched on various
metrics. In Q4 2020, the Tobin’s Q that represents the
market value of equity related to the market value of
net worth for U.S. nonfinancial corporate business
staged a new 70-year record above 2.5. End of March,
the S&P 500 price to sales ratio stood at 2.8, a level
last seen during the Tech bubble. And the 12-month
forward PE ratio was still hovering at about two
standard deviations above its 30-year mean.
Yet, equity risk premia, a measure relative to U.S.
yields, remained close to its 30-year mean,
suggesting that valuations are supported by the Fed’s
unorthodox policies and its impact on the bond
market. Will the rise in yields compress equity
multiples and undermine the bull market?
As detailed in previous sections, we believe that the
U.S. return to normality will continue to pressure
yields higher but the Fed’s dedication to its AIT
framework should limit the potential upside over the
coming months. We anticipate that the acceleration
in macro and EPS growth will constitute a strong
tailwind for U.S. equities, prompting large inflows
(partly from stimulus payments) and dwarfing
valuation-related risks. We maintain an O/W stance
on U.S. equities.
ADDRESSING U.S. VALUE AND GROWTH
THEMES THROUGH SECTORS
Late February, we closed our O/W call on Small
versus Large caps initiated last November.
The impressive Small caps rally pushed their relative
valuations to overstretched territory, prompting us to
take some profits and to neutralize the size theme.
Strong S&P 500 EPS prospects
Source: Macrobond, Lyxor AM
Typical valuation metrics look stretched …
Source: Macrobond, Lyxor AM
… but not relative to the bond market
Source: Macrobond, Lyxor AM
Back to Neutral on Size
Source: Macrobond, Lyxor AM

INVESTMENT STRATEGY INVESTMENT STRATEGY
By LYXOR CROSS ASSET RESEARCH SECOND QUARTER 2021
12
back to the top
While the Growth theme is usually represented by
similar definitions, the Value theme can be
interpreted quite differently depending on the
investor approach. Therefore, we prefer to address
the Growth versus Value rotation through sectors.
Considering the S&P 500 pure Value and pure Growth
indices, we find large differences concentrated in few
sectors. Growth is heavily weighted on 1) Information
Technology (45%) that we rank Neutral, 2) Media &
Entertainment (31%), a group dominated by
Facebook, Google, Netflix and Twitter, which calls for
a bottom-up approach in our view and, 3) Retailing
(12%), essentially representing Amazon, and
therefore also ranked Neutral from a top-down
perspective.
We favor three sectors, heavily weighted in the S&P
500 Pure Value index, and therefore O/W the Value
theme.
We remain O/W on U.S. Banks for their cyclicality and
attractive valuations. The sector should continue to
benefit from the yield curve steepening. We also favor
Healthcare Equipment and Services despite the
sector’s rich valuation. The Covid-19 crisis and
related policy response should lift earnings growth
potential in 2021 above current (+9%) expectations.
Finally, we are constructive on Utilities that will likely
be supported by green capex, offer about 3.5%
dividend yield and present little downside risks in the
early phases of a recovery.
EURUSD, NOT A NO-BRAINER!
Last quarter we refrained from joining the crowded
long EURUSD as we thought the pair would stay in a
narrow range around 1.20. Examining the main
drivers anew, we find conflicting forces and no strong
rationale for a long call on either side.
As of the end of March, short speculative positions on
USD have closed and long positions on EUR have
receded, leaving no major excesses to correct. Short-
term interest rate differentials are expected to
change little as the Fed and the ECB pledged to
maintain policy rates at current levels for the next 12
to 18 months. However, the more advanced reflation
in the U.S. could lead to a further widening of the
long-term yield gap between U.S. and Germany,
pressuring USD up. On the other side, the Eurozone is
expected to catch-up in terms of vaccination, return
to normality and macro momentum. Such a shift
would likely trigger renewed interest on Eurozone
assets, tilting risks on EUR to the upside.
On a longer-term horizon (1 to 3 years), we keep in
mind the U.S. ballooning twin deficits that could be
detrimental to the greenback.
S&P 500 Growth & Value Sector breakdowns
Source: Macrobond, Lyxor AM
S&P 500 Sector Rotation
Source: Macrobond, Lyxor AM
EURUSD under conflicting drivers
Source: Macrobond, Lyxor AM
Pure Growth Pure Value
Industry GroupsEnergy 0% 11%
Materials 0% 2%
Capital Goods 0% 6%
Commercial & Professional Serv 0% 0%
Transportation 0% 0%
Automobiles & Components 4% 2%
Consumer Durables & Apparel 0% 1%
Consumer Services 0% 0%
Retailing 12% 1%
Food & Staples Retailing 0% 4%
Food, Beverage & Tobacco 0% 2%
Household & Personal Products 0% 0%
Health Care Equipment & Servic 1% 7%
Pharmaceuticals, Biotechnology 3% 0%
Banks 0% 26%
Diversified Financials 1% 17%
Insurance 0% 7%
Real Estate 0% 1%
Software & Services 23% 0%
Technology Hardware & Equipmen 15% 2%
Semiconductors & Semiconductor 7% 0%
Telecommunication Services 0% 4%
Media & Entertainment 31% 4%
Utilities 0% 3%

INVESTMENT STRATEGY INVESTMENT STRATEGY
By LYXOR CROSS ASSET RESEARCH SECOND QUARTER 2021
13
back to the top
EUROPE: NEAR TERM CHALLENGES; MID-TERM
OPPORTUNITIES
The EMU recovery faces hurdles in the very near term.
France and Italy tightened mobility restrictions at the
turn of the quarter and the reopening will probably take
more time than what the consensus currently expects.
Vaccination campaigns in the EU continue to lag vs. the
U.S. and the U.K. and the difficulties faced by the
AstraZeneca vaccine could delay herd immunity.
A rebound in EMU activity looms nonetheless towards
late Q2 and Q3 as the economies reopen. Business and
consumer sentiment surveys improved in March despite
the Covid-19 headwinds and the industrial sector
bounced back markedly in recent months. Pent up
demand in services could show to be supportive, while
international firms are likely to be less constrained than
domestic ones thanks to their ability to capture external
growth.
The policy mix is supportive. The monetary stance is set
to remain highly accommodative as inflation stays
muted. Policy rates may remain unchanged in 2021/
2022 while the ECB announced asset purchases under
the Pandemic Emergency Purchase Program (“PEPP”)
will be frontloaded in Q2. The overall PEPP envelope
remains at EUR 1850bn until March 2022, of which
approximately half has already been purchased as of
end-March. In parallel, the ECB will also continue to
purchase EUR 20bn/ month under the Asset Purchase
Program (“APP”). The ECB will continue reinvesting
principal payments from maturing securities for “an
extended period of time” past the date when it starts
raising rates. Frequent refinancing operations
contribute to ample liquidity conditions. The ECB’s
January bank lending survey signaled a tightening of
credit standards for firms and households, related to
adverse economic prospects, and not with banks’ cost
of funds & balance sheet constraints.
On the other hand, the fiscal stance, albeit less
accommodative than in the U.S., will remain supportive.
EU fiscal rules have been suspended in 2021 and
possibly 2022, to prevent fiscal consolidation too early in
the cycle and allow for a reform of the framework. EU
fiscal rules are nonetheless unlikely to be reformed
before German (26/09) and possibly French (April 2022)
elections. Concurrently, fiscal stimulus at the level of the
EU is backloaded, the institutional set-up is complex,
and disbursements will only gain traction in 2022.
Our stance on EMU inflation breakevens stands at N.
Upside risks in service prices, which represent 40% of
the consumer price index, and potential spillovers from
higher inflation expectations in the U.S., suggest some
exposure to the asset class is deserved despite mixed
economic prospects and elevated unemployment
(8.1% in January according to Eurostat).
The expected shape of the European recovery
Bloomberg consensus forecasts. Source: Macrobond,
Bloomberg, Lyxor AM
Inflation pressures to remain muted in Europe,
with some upside risks
Source: Macrobond, Lyxor AM
The fiscal stance is less accommodative in
Europe than in the U.S.
General Government. Source: OECD, Macrobond, Lyxor AM
EU fiscal support is backloaded
Source: ECB, Lyxor AM

INVESTMENT STRATEGY INVESTMENT STRATEGY
By LYXOR CROSS ASSET RESEARCH SECOND QUARTER 2021
14
back to the top
In the UK, a strong recovery is likely to take shape as
early as Q2 on the back of the economic reopening, after
a sharp contraction in Q1-21 due to tight lockdowns.
The U.K. has started the gradual reopening of the
economy in March and will accelerate the pace of
normalization in April. We expect the BoE to stay put
over the next two years even if the vaccine rollout leads
to a stronger and earlier recovery than elsewhere in
Europe. On the fiscal front, support measures were
extended until the end of September 2021. Capex is
likely to get boosted by the two-year super-deduction
for capital allowances. The increase in the corporate tax
rate will start in FY 2023-24 (from 19% to 25%). Longer
term, the Brexit should also translate into welfare losses,
because of higher trade costs with the EU.
U/W Bunds and Guilts on spillovers from rising Treasury
yields. Elevated ECB purchases, which will result in
strongly negative net-net supply of mid-to-long term
sovereign bonds (c. EUR -350bn in the 10 largest
Eurozone countries until end-2021) and challenging
near term economic conditions will likely cap the rise in
German yields. But spillovers from higher Treasury
yields might push 10-year Bunds towards -20bps in Q2
and towards 0% in twelve months, in our view. We
estimate 10-year Bund yields rise 50bps when Treasury
yields rise 100bps, based on weekly data over the last
twenty years. Meanwhile, UK Gilts could be fueled by
their higher beta to U.S. Treasuries and by the faster
pace of economic reopening.
Concurrently, our stance on BTPs (Italy) remains at O/W.
Credit risks rose as public debt jumped significantly, but
near-term funding needs will be fully addressed by the
ECB. The new administration, under Prime Minister
Mario Draghi, benefits from a positive market
appreciation given the solid track record of the former
ECB governor during the euro zone sovereign crisis a
decade ago. Italian yields trade higher than peers
among large euro zone countries and, considering the
manageable risks, appear attractive. 10-year BTP yields
trade at 0.63%, almost 20bps above all-time lows
reached earlier in February 2021.
The upside in credit markets appears limited with Euro
Investment Grade (IG) and High Yield (HY) spreads below
pre-Covid-19 crisis levels. Risks are broadly neutral
thanks to state guarantee schemes which have been
extended until June 2021 in several European countries.
The French State-guaranteed loan is a one-year treasury
loan and will have a grace period over this period for
instance. In the medium term, there are question marks
over a potential rise in default rates. In the UK, IG
spreads, near 100 bps currently, are more attractive but
involve currency hedging costs that remove that
advantage. Overall, near the trough of the business cycle
we prefer getting exposure to equities over credit.
A strong rebound looms in the UK
Source: Macrobond, Lyxor AM
O/W Italy in Eurozone sovereign debt markets
Source: Macrobond, Lyxor AM
A slight preference for IG Credit (N) vs. Govies
Source: Macrobond, Lyxor AM
HY default rates are expected to have peaked
Source: Moody’s, Macrobond, Lyxor AM

INVESTMENT STRATEGY INVESTMENT STRATEGY
By LYXOR CROSS ASSET RESEARCH SECOND QUARTER 2021
15
back to the top
O/W EMU EQUITIES TO LEVERAGE GLOBAL
GROWTH; NEUTRAL UK EQUITIES
At this preliminary stage of the business cycle and in
order to position portfolios for a global cyclical upswing,
we believe European equities are attractive. Domestic
fundamentals are unlikely to be highly supportive in the
very near term due to renewed mobility restrictions. But
large caps are in a good position to leverage global
growth, in a similar fashion than EMU equities delivered
upbeat returns in Q1 despite renewed lockdowns
domestically. Based on Bloomberg data we estimate
that more than half of the earnings (EBITDA) of
EuroStoxx 300 members is generated outside Europe, of
which half comes from the U.S. which is likely to
experience a healthy recovery.
The valuation of EMU equities is rich but less so than in
the U.S. The 12-months forward P/E ratio is near record
highs, at 17.8x. This is more than 20% above the average
valuation of the past five years. EMU equities are
nonetheless attractive vs. the U.S. market from a
valuation standpoint. U.S. equities trade at almost 23x
future earnings (25% above the 5-year average). Low
bond yields in the EMU reinforce the attractiveness of
equities, while upward revisions to earnings growth
expectations might temper rich valuations.
The expected (total) return of EMU equities, in the range
of 8-10% over the next twelve months, leads us to
upgrade our stance to O/W. Our model, based on lagged
industrial production, Brent oil prices and the consumer
price index helps to explain 75% of the sales p/ share
annual change over the past 15 years. Going forward, we
use our own forecasts and assume conservative profit
margin expansion (+200bps to 4.5%) and dividend yield
normalization (3.2%). Both would remain 50 bps below
the long-term average (5% profit margin and 3.7%
dividend yield) according to Bloomberg data.
Quantitative approaches are nonetheless challenged by
the huge disturbances caused by the Covid-19 in data
releases and must be handled with care. Having said
that, we believe our estimate is conservative.
Our stance on UK equities stands at N. From a valuation
standpoint, UK equities are more attractive than EMU
equities. The 12-months forward P/E ratio is below the
5-year average, at 13.3x, and below the valuation of U.S.
and EMU equity markets. Also, considering the vaccine
rollout, the recovery is likely to start earlier than in the
EMU. Yet, the composition of benchmarks such as the
FTSE 100 is quite defensive, resulting in a systematic
underperformance vs. the EuroStoxx 300 in expansion
cycles. The latter is biased towards Consumer
Discretionary stocks (16% weight) while the UK
benchmark is biased towards Consumer Staples (18%
weight) which underperform in recoveries. We expect
the underperformance of the FTSE 100 to continue.
Upward revisions to EPS expectations bode well
Source: I/B/E/S, Lyxor AM
Valuation is rich in the EMU compared to history
Source: Bloomberg, Macrobond, Lyxor AM
Our model explains 75% of sales p/share changes
Based on 3-months lagged EMU IP, current CPI and Brent oil
prices. R2: 75%. Source: Bloomberg, Macrobond, Lyxor AM
EMU outperformed UK equities in expansions
Source: Macrobond, Lyxor AM

INVESTMENT STRATEGY INVESTMENT STRATEGY
By LYXOR CROSS ASSET RESEARCH SECOND QUARTER 2021
16
back to the top
EMU SECTORS: CYCLICALS VS. DEFENSIVES
From a top down perspective, our sector
recommendations are grounded in two
considerations. First, a recovery looms, which should
be supportive for cyclical sectors versus defensive
ones. In that regard, we maintain Consumer
Discretionary and Materials at O/W. Second, policy
risks eased and bond yields, albeit low, are set to
experience upward pressures. As a result, we upgrade
Financials to O/W. Concurrently, we downgrade Real
Estate and maintain Consumer Staples at U/W.
Financials are expected to benefit from three factors.
First, the looming recovery should be supportive for
value and cyclical stocks. The sector has been the
most attractively valued for some time. We expect
this value potential to be unlocked in the coming
quarters. Second, the sector should benefit from the
rise in bond yields. ECB purchases will put a cap on
yields but better economic prospects in the U.S.
should put upward pressure on Bund yields. Third,
the regulatory pressure is expected to have peaked
and dividend distribution should normalize partially.
One source of risk is the elevated volatility of the
sector and the possibility that bond yields remain
extremely low.
Consumer discretionary should benefit from the
economic reopening and pent-up demand for such
products. Dispersion is high within this sector and we
prefer Automobiles & Components and Consumer
Durables & Apparel at the industry group level (vs.
Consumer Services and Retailing). In terms of market
capitalization, they represent the bulk of the sector.
Meanwhile, Materials are expected to be bolstered by
increased infrastructure spending. Both sectors are
not particularly attractive from a valuation
perspective, but there is room for additional upward
revisions in earnings expectations.
U/W Real Estate and Consumer Staples. The former is
one of the most vulnerable sectors to the rise in bond
yields, along with Utilities. Over the past three years,
a 100bps rise in Bund yields has translated into a -
8.6% underperformance of the sector vs. the MSCI
EMU. Then, the valuation of Consumer Staples is
close to record highs. Its defensive features are less
appealing as we head towards a recovery and it is
also sensitive to rising bond yields.
Finally, we upgraded Communication Services to N.
Within the sector, Media & Entertainment are
expected to outperform. The environment for
Communication Services remains highly competitive
and regulations are tough. Elevated capex and
topline trends remain challenging. Pricing is
improving but continues to lag inflation.
EMU sectors: maintain a bias towards cyclicals
(+) upgrade; (-) downgrade vs. last quarter. Source: Lyxor AM
Cyclical sectors outperform during recoveries
Source: Macrobond, Lyxor AM
Upgrade Financials to O/W on valuation
Source: I/B/E/S, Macrobond, Lyxor AM
Real Estate and Consumer Staples are
vulnerable to rising bond yields
Source: Macrobond, Lyxor AM
U/W N O/W
Utilities
Consumer Staples Health CareConsumer
Discretionary
Real estate (-)Communication Services
(+)Materials
Energy Financials (+)
Industrials
IT

INVESTMENT STRATEGY INVESTMENT STRATEGY
By LYXOR CROSS ASSET RESEARCH SECOND QUARTER 2021
17
back to the top
JAPAN ECONOMY: THE FUNDAMENTAL STORY
REMAINS INTACT
Covid outperformance and cyclical exposure
We expect Japan to remain less impacted by the
pandemic than in the rest of the world. It is facing a
much milder fourth wave, even though some large cities
are instating some new mobility restrictions.
As a result, high frequency indicators of activity are close
to cruise level and outpacing most of its peers. Japan’s
relative isolation from the pandemic is all the more
remarkable that its vaccination is only beginning,
strongly lagging most DM countries.
Japan is also highly geared to external activity. Japan is
very sensitive to the economic pulse China, the U.S. and
the rest of Asia, which account for 80% of its exports.
These regions are leading in the way out of the
pandemic recession. Moreover, Japanese export
products tend to have an extra cyclical bias: machinery,
auto, tech, and cyclical services are their key exports.
Unsurprisingly, Japanese equity indices are sensitive to
foreign activity. About 40% of Topix stocks revenues are
generate abroad, 15/20% of which in the U.S. and China.
While Japanese exports face short-term downside risks
in the U.S., where tighter mobility restrictions are
probable, 2021 bodes well for Japan.
Meanwhile, we still see upside potential from Japanese
consumption, though progress remain slow for now.
The virus fear-factor was the last straw for consumer
confidence after a stream of shocks, including a major
typhoon and the rise in sales tax. Should confidence
revive in 2021, boosted by the end of the pandemic,
massive accumulated savings could boost household
spending.
In the medium-term, positive impacts from Suganomics
would also boost corporate demand through greater
investment on tech and M&A.
U.S. rate isolation but U.S. reflation exposure
Japanese long and short-term sovereign yields display a
low beta to U.S. rates (on average 0.1). Japanese
inflation trends are also softer than in the U.S.
reinforcing its isolation from U.S. rate volatility. A greater
sensitivity of Japanese assets to U.S. monetary policy is
through the currency. A weaker JPY due to a higher U.S.-
Japan rate differential would overall be supportive for
Japanese equities, which are highly exposed to foreign
revenues.
Meanwhile, Japan is primarily exposed to the U.S.
reflation. Through its exports of vehicle, chips,
machinery, services, Japan stand as a prime beneficiary
from a boom in U.S. consumption demand and greater
infrastructure spending.
Slow but steady economic progress
Japanese economic prints are steadily improving.
Orders remain driven by external demand, but pulse
in domestic orders is gaining traction. Orders are
pointing to increased manufacturing activity, amid
lows intermediary and finished goods inventories.
Unlike the U.S. and Europe, Japan is not facing
particularly severe supply chain disruptions, though
companies are struggling to fully pass higher
commodity prices. Hiring pressure is also improving
in the manufacturing sector.
Exports remain the main driver in Japan
Source: Bloomberg, Lyxor AM
The manufacturing recovery is not over yet
Source: Bloomberg, Lyxor AM
High Japanese exposure to the world recovery
Source: Macrobond, Lyxor AM

INVESTMENT STRATEGY INVESTMENT STRATEGY
By LYXOR CROSS ASSET RESEARCH SECOND QUARTER 2021
18
back to the top
In nuance, the pulse looks weaker in services, which
remains in recovery mode, not being yet in full steam
expansion. It is evidencing progress yet to be achieved
in domestic demand.
The BoJ only a tad more hawkish
Japanese equities would also benefit from continued
monetary and fiscal support. The latest BoJ move, a tad
more hawkish, doesn’t question the highly
accommodative environment. It recently raised its daily
long-term rate trading range by 5bp to 25bp and
removed its explicit annual ETF purchase target (now
focusing on Topix instead of Nikkei underlying). We see
JPY remaining rangy.
JAPAN EQUITIES: NOT TAKING PROFIT YET
(O/W)
Japanese equities ranked amongst the top performers
in Q1, but we are not taking profits just yet.
We expect the asset class to remain supported by a
strong alignment of planets, benefitting from a deep
exposure to the U.S. reflation, a high gear to the world
recovery, especially through revenue exposure to
regions which are leading in the way out of the
pandemic recession.
With continued monetary and fiscal support, we expect
the slow but steady economic progress to translate into
greater domestic confidence and demand. The amount
of savings put back to work and renewed traction in
domestic investment will likely be pivotal for Japanese
equity returns.
The outperformance of Japanese equities has been
largely driven by export sensitive segments. So far
progress in domestic demand and prospects from
Suganomics are both loosely priced in, implying
significant re-rating potential.
The breakdown of Japanese total-return indices shows
that much of the performance year-to-date has been
driven by improving margins, not by valuation multiples
expansion.
We find that Japanese companies’ greatest room for
improvement lies with their gross margin, weaker than
in other developed markets. In contrast, years of
deflation have led Japanese companies to maintain
elevated control of their operational and non-operation
fixed costs. This leaves them with strong operational
leverage in this early cycle.
The profit backdrop for Q1 remains healthy, and
earnings are being firmly revised up.
Furthermore, despite the recent bull run, Japanese
stocks remain under-owned, while they can provide
diversification benefits. The tactical environment is
neutral, with technicals remaining stretched, but with
greater fundamental support.
Strong Japan exposure to the U.S. Reflation
Source: Macrobond, Lyxor AM
Consumption potential if confidence returns
Source: Macrobond, Lyxor AM
Continued fiscal and monetary support
Source: Macrobond, Lyxor AM
Japanese equities remain under-owned
Source: Macrobond, Lyxor AM

INVESTMENT STRATEGY INVESTMENT STRATEGY
By LYXOR CROSS ASSET RESEARCH SECOND QUARTER 2021
19
back to the top
Key themes in this market include positioning around
companies’ U.S. reflation exposures (at the expense of
those rather exposed to Asia which already
outperformed). Value and cyclical stocks would remain
in demand. The worsening saturation global trade
would also be a positive for industrial and services
companies sensitive to shipping and naval
construction. The Japanese semi sector would remain
appealing, increasingly used as alternative amid supply
chain reshuffling.
We remain O/W for now.
EM ECONOMIES: BRIGHTENING OUTLOOK
A transitory and mild Q1 soft patch
New Covid-19 infections are picking up in several EM
countries, while vaccination programs are rolling out
at a much slower pace than in DM, making herd
immunity improbable until next year.
Yet, sensitivity of real activity in EM countries to
mobility restrictions has receded. The soft patch in
Q1 has been mild and high frequency indicators have
slowed less than in DM countries.
We expect EM countries to experience a meaningful
rebound in Q2, driven by the rebound in the rest of
the world and by the acceleration of the global
recovery. Eastern Europe, more sensitive to the pulse
in Western Europe, might lag other regions.
However, the EM economic upside would be capped
by the economic moderating in China as stimulus are
gradually unwound and as its manufacturing
recovery nears its completion. Moreover, we expect a
further erosion in the EM vs. DM growth differential
due to the ongoing deglobalization (which sees
concentrated supply chains, DM ageing, and more
protectionism) and due to EM countries’ uneven
ability to boost domestic consumption. Finally, a
heavy election calendar in EM countries would imply
a higher relative political risk. Main elections concern
Chile in April 11, Mexico in June 6, Iran in June 18,
Taiwan in August 28, Russia in September 19, the
Czech Republic in October 8, Iraq in October 10,
Argentina in October 24, Chile in November 21 and
Libya in December 24.
US Reflation becomes pivotal for EM, net positive
With its ambitious spending package, the U.S. will
likely be a key driver for global growth. The U.S.
buoyant economy will likely attract some investors’
flows at the expense of EM’s.
However, the US. Reflation will boost those most
connected to its supply chain. This includes China
and the largest Asia countries (including India, South
Korea, and Taiwan), as well as Mexico. In contrast,
EM and world trade recoveries are not over yet
Source: Bloomberg, Lyxor AM
Uneven EM recovery progress
Source: Markit, Lyxor AM
Uneven EM exposure to the U.S. reflation
Source: OECD, Lyxor AM
PMI Manuf
(SA) Aug Sep Oct Nov Dec Jan Feb Mar Apr May Jun Jul Aug Sep Oct Nov Dec Jan Feb Mar
US 49.9 51.0 51.5 52.2 52.5 51.7 50.8 49.2 36.9 39.8 49.6 51.3 53.6 53.5 53.3 56.7 56.5 59.1 58.5 59.0
Euro Area 47.0 45.7 45.9 46.9 46.3 47.9 49.2 44.5 33.4 39.4 47.4 51.8 51.7 53.7 54.8 53.8 55.2 54.8 57.9 62.5
Germany 43.5 41.7 42.1 44.1 43.7 45.3 48.0 45.4 34.5 36.6 45.2 51.0 52.2 56.4 58.2 57.8 58.3 57.1 60.7 66.6
France 51.1 50.1 50.7 51.7 50.4 51.1 49.8 43.2 31.5 40.6 52.3 52.4 49.8 51.2 51.3 49.6 51.1 51.6 56.1 59.3
Italy 48.7 47.8 47.7 47.6 46.2 48.9 48.7 40.3 31.1 45.4 47.5 51.9 53.1 53.2 53.8 51.5 52.8 55.1 56.9 59.8
Spain 48.8 47.7 46.8 47.5 47.4 48.5 50.4 45.7 30.8 38.3 49.0 53.5 49.9 50.8 52.5 49.8 51.0 49.3 52.9 56.9
UK 47.4 48.3 49.6 48.9 47.5 50.0 51.7 47.8 32.6 40.7 50.1 53.3 55.2 54.1 53.7 55.6 57.5 54.1 55.1 58.9
Japan 49.3 48.9 48.4 48.9 48.4 48.8 47.8 44.8 41.9 38.4 40.1 45.2 47.2 47.7 48.7 49.0 50.0 49.8 51.4 52.7
China 50.4 51.4 51.7 51.8 51.5 51.1 40.3 50.1 49.4 50.7 51.2 52.8 53.1 53.0 53.6 54.9 53.0 51.5 50.9 50.6
Asia ex-China & Japan49.6 49.6 49.2 49.9 50.8 51.6 51.0 46.6 33.4 36.1 44.8 46.8 50.0 51.7 52.8 53.1 53.7 54.4 54.2 54.1
India 51.4 51.4 50.6 51.2 52.7 55.3 54.5 51.8 27.4 30.8 47.2 46.0 52.0 56.8 58.9 56.3 56.4 57.7 57.5 55.4
South Korea 49.0 48.0 48.4 49.4 50.1 49.8 48.7 44.2 41.6 41.3 43.4 46.9 48.5 49.8 51.2 52.9 52.9 53.2 55.3 55.3
Taiwan 47.9 50.0 49.8 49.8 50.8 51.8 49.9 50.4 42.2 41.9 46.2 50.6 52.2 55.2 55.1 56.9 59.4 60.2 60.4 60.8
Indonesia 49.0 49.1 47.7 48.2 49.5 49.3 51.9 45.3 27.5 28.6 39.1 46.9 50.8 47.2 47.8 50.6 51.3 52.2 50.9 53.2
Malaysia 47.4 47.9 49.3 49.5 50.0 48.8 48.5 48.4 31.3 45.6 51.0 50.0 49.3 49.0 48.5 48.4 49.1 48.9 47.7 49.9
Philippines 51.9 51.8 52.1 51.4 51.7 52.1 52.3 39.7 31.6 40.1 49.7 48.4 47.3 50.1 48.5 49.9 49.2 52.5 52.5 52.2
Thailand 50.0 50.6 50.0 49.3 50.1 49.9 49.5 46.7 36.8 41.6 43.5 45.9 49.7 49.9 50.8 50.4 50.8 49.0 47.2 48.8
Vietnam 51.4 50.5 50.0 51.0 50.8 50.6 49.0 41.9 32.7 42.7 51.1 47.6 45.7 52.2 51.8 49.9 51.7 51.3 51.6 53.6
Brazil 52.5 53.4 52.2 52.9 50.2 51.0 52.3 48.4 36.0 38.3 51.6 58.2 64.7 64.9 66.7 64.0 61.5 56.5 58.4 52.8
Mexico 49.0 49.1 50.4 48.0 47.1 49.0 50.0 47.9 35.0 38.3 38.6 40.4 41.3 42.1 43.6 43.7 42.4 43.0 44.2 45.6
Russia 49.1 46.3 47.2 45.6 47.5 47.9 48.2 47.5 31.3 36.2 49.4 48.4 51.1 48.9 46.9 46.3 49.7 50.9 51.5 51.1
Poland 48.8 47.8 45.6 46.7 48.0 47.4 48.2 42.4 31.9 40.6 47.2 52.8 50.6 50.8 50.8 50.8 51.7 51.9 53.4 54.3
Czech Rep. 44.9 44.9 45.0 43.5 43.6 45.2 46.5 41.3 35.1 39.6 44.9 47.0 49.1 50.7 51.9 53.9 57.0 57.0 56.5 58.0
Turkey 48.0 50.0 49.0 49.5 49.5 51.3 52.4 48.1 33.4 40.9 53.9 56.9 54.3 52.8 53.9 51.4 50.8 54.4 51.7 52.6
2020 20212019

INVESTMENT STRATEGY INVESTMENT STRATEGY
By LYXOR CROSS ASSET RESEARCH SECOND QUARTER 2021
20
back to the top
Eastern European countries will be far less exposed
to rising U.S. spending in climate, infrastructure, and
housing.
Fundamental EM risks have receded
Heightened EM countries macro risk after several
years of trade war, global trade erosion, and the
pandemic, have now normalized. We also observe
that the countries that have structurally been the
most vulnerable to capital outflows, are more
dispersed.
This should limit risk contagion within the EM world.
Moreover, this should support greater investors’ risk
taking, who will rather focus on improving growth
and profit prospects as macro risks abate. Finally, this
would also help EM countries better navigate higher
US rate and USD volatility.
As a result, we expect the EM risk premium to return
to average.
Inflation (and the virus) remains the key risk
Inflation surprises are intensifying in many EM
countries. It is mainly due to soaring commodity
prices. In some countries, core CPI (which excludes
the most volatile inflation components) are catching
up with trends in headline inflation. These countries
look more at risk.
This will force several major central banks to tighten
their policy at an inopportune time, or to delay more
dovish policies. Turkey, Brazil, Russia, and to some
extent Mexico have or will soon have to alter their
policies.
EM EQUITIES: TACTICAL BUY, BUT STRATEGIC
NEUTRALITY
The correction is over, tactical buy
The stellar outperformance early this year has been
nearly erased during the correction that started by
mid-February. Over the process stretched technicals
and investors positioning along with overly rich
valuations have been clean up.
We believe this is opening a tactical window for a 5%
to 10% upside.
Brighter EM backdrop, but not brighter than the rest
of the world: strategically neutral EM
The EM equity backdrop has arguably improved.
Receding macro risk are allowing investors to focus
less on EM vulnerabilities, and more on growth and
profit prospects, which particularly opportune at
early cycle stage.
We also expect EM assets to navigate higher U.S.
rates as long as they remain driven by better
growth, not by a Fed policy shift.
Moreover, the ambitious U.S. reflation will provide
tailwind for a number of EM countries (especially
EM risk premium should converge to average
Source: Bloomber, Lyxor AM
EM countries prepare to hike rates next year
Source: Bloomberg, Lyxor AM
Multiple expansion is now more reasonable
Source: Macrobond, Lyxor AM
Target
Rate (%) CPI y/y M2 y/y
Target Rate Chg
Last 12M (bps)
Market-expected Rate
Chg Next 12M (bps)
China 2.2 -0.2 10.1 0 70
Sth Korea 0.5 1.5 10.1 -75 28
India 4.0 5.0 17.9 -40 69
Malaysia 1.8 0.1 5.5 -75 40
Philippines 2.0 4.5 10.8 -125 222
Thailand 0.5 -0.1 10.0 -37 29
Indonesia 3.5 1.4 11.4 -111 0
Brazil 2.8 5.2 27.1 -100 504
Mexico 4.0 3.8 12.8 -200 72
Chile 0.5 2.9 61.5 0 124
Russia 4.5 5.8 13.4 -100 138
Poland 0.1 3.2 16.6 -90 24
Hungary 0.6 3.1 20.8 -30 79
Turkey 19.0 16.2 29.8 871 -214
Sth Africa 3.5 2.9 13.1 -75 90
Aggr. (xTK) 2.6 2.9 15.5 -70 130

INVESTMENT STRATEGY INVESTMENT STRATEGY
By LYXOR CROSS ASSET RESEARCH SECOND QUARTER 2021
21
back to the top
China/Asia and Mexico), though some of the flow will
be diverted away from EM back into U.S. markets.
However, economic prospects have also improved in
DM countries, reducing the EM-DM differential. Also,
inflationary pressures will force several central banks
to hike rates or reduce their liquidity injection earlier
than in DM (in aggregate, about +130bps is priced for
the next 12M). Finally, the main EM growth driver
(China) is losing some traction as it tries to unwind
some of its stimulus.
So, beyond post-correction tactical opportunities, we
do not see a sustained period of EM outperformance
vs. DM equities.
EM countries’ sensitivity to higher inflation, to
commodity prices, and to the US reflation are likely to
be key differentiators in Q2. We also expect rotation
towards laggards to continue, though with volatility
until U.S. rates stabilize.
China: Tactical buying opportunity, strategically
neutral
The Chinese recovery is losing some traction, as
authorities unwind some of their stimulus, and is still
skewed towards the manufacturing sector. Questions
regarding the reliability of growth measures also start
to raise eyebrows.
We remain of the view that the USDCNY at 6.6 would
gradually rise towards 6.3, driven by a very solid
international position.
U.S. pressures have only changed in means. We
expect less initiatives on tariffs (though the existing
one are likely to remain for the foreseeable future),
more multilateral pressures, non-tariff barriers and a
focus on tech. The U.S.-China meeting in Alaska led to
limited change in this current stressed relationship. It
was likely more about setting the tone and aimed at
domestic and allies’ ears than to one another.
The steep correction confirmed our cautiousness in
the previous quarter. With excess valuation largely
cleaned up, we see tactical opportunity with a
+5/10% upside potential.
Brazil: Delayed recovery amid political mess (N)
A concerning rise in virus infections will likely lead to
new mobility restrictions. As a result, a longer soft
patch is probable, while inflationary trends are
delaying new stimulus packages.
Inflation is passing through to core CPI, leading the
central bank to tighten rate. An additional 25bp is
likely.
Moreover, President Bolsonaro’s eroding political
support would limit reforms.
The main current upside risk comes from low
absolute and relative valuations.
India: Strong U.S. reflation exposure (OW)
Reforms were validated and are boosting
sentiment, though the devil will be in the
implementation details.
India is undergoing a strong recovery. Its strong
exposure to the U.S. reflation provides powerful
tailwinds. Supply chain diversification also favors
India.
We remain O/W, though we acknowledge three
key downside risks. First, the rise in virus
infections is flagging orange and is leading several
states to set new mobility restrictions. Second,
elevated inflation could cap the leeway for
stimulus. Third, valuation is rich.
Russia: Capped recovery (N)
Rising inflation is anchoring in core CPI, calling for
tighter monetary policy.
Oil activity would gain further traction as output
normalizes amid firm oil prices. However, the rest
of the economy relies on still sluggish demand
and budget stimulus.
Chinese data smoothing?
Source: Bloomberg, Lyxor AM
Eroding Chinese stimulus
Source: Macrobond, Lyxor AM

INVESTMENT STRATEGY INVESTMENT STRATEGY
By LYXOR CROSS ASSET RESEARCH SECOND QUARTER 2021
22
back to the top
Western sanctions risk remains live but would not
substantially alter the current risk premium.
We are neutral. The main upside risk come from oil
prices creeping higher in 2021 and cheap relative
valuations.
Turkey: Monetary U-turn and political ambitions
(U/W)
The replacement of the central bank governor Ağbal
with Kavcioğlu, after only 5 months of a more hawkish
policy designed to tame the runaway inflation, is
shaking investors’ confidence. Since then, the Turkish
lira and equity markets dropped more than -10% and
sovereign CDS returned closer to their highs. After the
second dovish U-turn (governor Cetinkaya was fired
mid-2019 after hiking rates aggressively in 2018):
confidence might not return quickly.
The new governor, a loyal support of President
Erdogan and his unorthodox economic policies, will
have limited means to curb inflation without the lever
of higher rates. Capital control would also be tricky
given the elevated share of foreign debt.
We expect investor flows, which had returned since
mid-last year, to bleed again. Small FX reserves (only
7% of GDP), a current account deficit of more than
5%, and inflation showing no signs of moderation
(both for domestic and external reasons) will leave
the Lira highly vulnerable. It could also lead Turkey to
struggle meeting its more than $200bn funding needs
within the next 12 months. What the new central bank
managing team will do in its April and May meeting
(hold or rate cut?) will be closely monitored.
In perspective, the ruling party AKP came to power in
the early 2000’s, with the economic expansion by
then largely contributing to its popularity. By
encouraging an overheating economy, President
Erdogan might aim for more popular support to crush
a stronger opposition ahead of the 2023 elections,
unless he’s planning to gamble on early elections…
EM HC DEBT: MODEST SPREAD TIGHTENING IN
SIGHT, BUT U.S. RATES RISK (N)
Reasonable isolation from U.S. rates, but less than in
equities
The asset class has tended in line with DM credit year-
to-date, in line with our neutral positioning so far.
Historically, EM HC debt has managed to navigate
episodes of higher U.S. rates, provided the driver was
better growth, not a Fed policy shift. Weakness in the
asset class has so far been without panic.
However, correlation with U.S. rates and with the U.S.
dollar rose, pointing to higher volatility and risks.
Modest and selective spread tightening
opportunities
The macro backdrop has arguably improved, and
the asset class remains appealing to hold in
portfolios. EM macro risk have receded and there
are no pending major default situations –
Argentina and Turkey are the current weakest
links. The asset class also continues to offer
diversification within credit.
Inflation remains a downside risk in India
Source: Macrobond, Lyxor AM
Flows in Turkey will likely take another U-turn
Source: Macrobond, Lyxor AM
EM HC debt navigated episodes of higher U.S. rates
Source: Bloomberg, Lyxor AM
(in bps) (in % )
US rates
impact on EM
assets
US 10YUS Bkvn
10Y
US Real
10Y
Episodes of Rising
Yields
MSCI EM
Loc
EM HC
TR
EM Local
TR
JPM EM
FX
Sep20-Apr21 101 70 31 25.9 1.8 4.0 4.6
Mar20 43 -70 113 -22.2 -13.7 -8.1 -8.3
Sep17-Feb18 85 33 51 11.7 -0.7 3.1 -0.3
Jul-Dec16 121 46 75 3.8 -2.0 -4.8 -3.2
Jan-Jun15 73 26 48 0.5 1.6 -5.0 -2.5
May-Sep13 136 -22 159 -8.7 -7.9 -10.6 -8.6
Sep-Oct11 54 32 22 5.7 1.1 4.2 3.8
Oct-Dec10 113 39 75 1.2 -2.4 -3.2 -1.8
Dec08-Jun09 185 197 -13 41.6 17.5 4.3 -
Sep-Oct08 36 -90 126 -21.2 -16.0 -8.3 -
Mar-Jun08 80 9 71 3.7 0.2 - -
Mar-Jun07 76 14 62 17.3 -0.6 - -
Jan-Jun06 89 20 69 -7.0 -2.0 - -
Aug-Nov05 57 21 36 6.2 0.6 - -
Feb-Mar05 63 32 31 1.4 -1.7 - -
Mar-May04 109 38 71 -10.2 -7.8 - -
Jun-Sep03 144 51 93 15.1 -3.6 - -
-50 0 50 100 150 200
NominalYield
INVESTMENT STRATEGY INVESTMENT STRATEGY
By LYXOR CROSS ASSET RESEARCH SECOND QUARTER 2021
23
back to the top
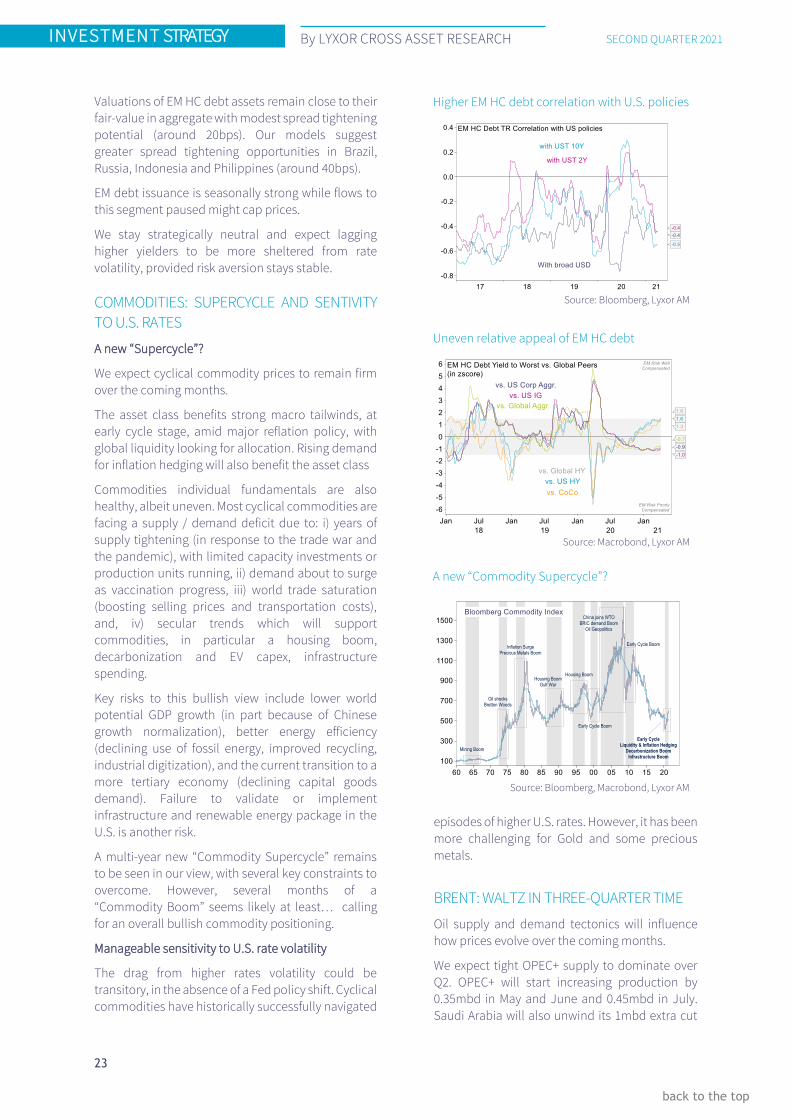
Valuations of EM HC debt assets remain close to their
fair-value in aggregate with modest spread tightening
potential (around 20bps). Our models suggest
greater spread tightening opportunities in Brazil,
Russia, Indonesia and Philippines (around 40bps).
EM debt issuance is seasonally strong while flows to
this segment paused might cap prices.
We stay strategically neutral and expect lagging
higher yielders to be more sheltered from rate
volatility, provided risk aversion stays stable.
COMMODITIES: SUPERCYCLE AND SENTIVITY
TO U.S. RATES
A new “Supercycle”?
We expect cyclical commodity prices to remain firm
over the coming months.
The asset class benefits strong macro tailwinds, at
early cycle stage, amid major reflation policy, with
global liquidity looking for allocation. Rising demand
for inflation hedging will also benefit the asset class
Commodities individual fundamentals are also
healthy, albeit uneven. Most cyclical commodities are
facing a supply / demand deficit due to: i) years of
supply tightening (in response to the trade war and
the pandemic), with limited capacity investments or
production units running, ii) demand about to surge
as vaccination progress, iii) world trade saturation
(boosting selling prices and transportation costs),
and, iv) secular trends which will support
commodities, in particular a housing boom,
decarbonization and EV capex, infrastructure
spending.
Key risks to this bullish view include lower world
potential GDP growth (in part because of Chinese
growth normalization), better energy efficiency
(declining use of fossil energy, improved recycling,
industrial digitization), and the current transition to a
more tertiary economy (declining capital goods
demand). Failure to validate or implement
infrastructure and renewable energy package in the
U.S. is another risk.
A multi-year new “Commodity Supercycle” remains
to be seen in our view, with several key constraints to
overcome. However, several months of a
“Commodity Boom” seems likely at least… calling
for an overall bullish commodity positioning.
Manageable sensitivity to U.S. rate volatility
The drag from higher rates volatility could be
transitory, in the absence of a Fed policy shift. Cyclical
commodities have historically successfully navigated
episodes of higher U.S. rates. However, it has been
more challenging for Gold and some precious
metals.
BRENT: WALTZ IN THREE-QUARTER TIME
Oil supply and demand tectonics will influence
how prices evolve over the coming months.
We expect tight OPEC+ supply to dominate over
Q2. OPEC+ will start increasing production by
0.35mbd in May and June and 0.45mbd in July.
Saudi Arabia will also unwind its 1mbd extra cut
Higher EM HC debt correlation with U.S. policies
Source: Bloomberg, Lyxor AM
Uneven relative appeal of EM HC debt
Source: Macrobond, Lyxor AM
A new “Commodity Supercycle”?
Source: Bloomberg, Macrobond, Lyxor AM

INVESTMENT STRATEGY INVESTMENT STRATEGY
By LYXOR CROSS ASSET RESEARCH SECOND QUARTER 2021
24
back to the top
over three months. While this would represent a total
2.15mbd supply addition by end of July, higher
demand by then would absorb most of it. It suggests,
OPEC+ still intends to maintain tight market
conditions.
Meanwhile, U.S. producers would not materially
change their output, still focusing on shale gas
profitability after years of losses. Over the quarter,
demand would only gradually rise, unevenly across
regions: higher in the U.S., disappointing in Europe,
stable in China and the rest of Asia. Higher demand
for inflation hedges and hopes from the ambitious
U.S. reflation plan would also support prices.
Technical factors, including bank hedging flows, oil
anchoring in backwardation, attractive roll yields,
and top-down strategies flows (including CTAs flows)
could add upside risks. As investors factor in greater
demand in H2 and discipline among producers, risk
for oil prices would be on the upside, possibly flirting
with $75/b for Brent. Volatility would stay elevated
ahead of each monthly OPEC+ meetings, pointing to
tactical/opportunistic positioning in Q2.
By the summer, we expect the OPEC+ discipline to
ease, driven by higher prices and diverging Saudi
Arabia vs. Russia targets. Non-OPEC producers would
also start ramping up their production. Fear that
producers might prematurely normalize their
production would turn investors more cautious and
watchful of spare capacities (currently leveling
around 6.5mbd for OPEC). Demand would materially
improve by the summer, with evidence of some
normalization in transport and greater industrial
demand, at time of high seasonal demand. However,
this progress would have been factored in prices
earlier. All in all, we see oil prices moderating in the
second part of the year.
With excess oil inventories cleaned up by year-end,
we see oil markets returning to “normal” next year. A
balanced market and a business cycle gradually
shifting to a mid-cycle stage would keep prices on a
firm footing, but without exuberance.
Geopolitics might be a negative factor in Q2, with the
U.S. attempting to restart nuclear talks with Iran.
Such talks will probably fail to a meaningful
breakthrough ahead of the June 18 presidential
elections in Iran. Some sanctions easing is plausible
in exchange for reduced nuclear activities, but a more
comprehensive agreement looks unlikely before
H2. Meanwhile, Iran might continue to expand its
nuclear program to gain further negotiating
leverage.
All in all, we see Brent prices nearing $75/b in Q2.
We revise our 12M target to $75/b too. We are
tactically buyers.
Q2
Tight OPEC+ overall Supply
marginal non-OPEC Output rise
Stable Demand
Price Spike
H2
Greater OPEC+ Supply
Moderate non-OPEC Output
Surging Demand
Price Moderation
2022
Balance S/D
Broadening Demand Recovery
OPEC+ / non-OPEC Supply Competition
Firm prices
Cyclical Commodities navigated higher U.S. IR
Source: Bloomberg, Lyxor AM
Oil excess inventories washed out by yearend
Source: Bloomberg, Lyxor AM
Crude output and demand dynamics (m/m)
Source: Macrobond, Lyxor AM
(in bps) (in % )
US rates
impact on
Commodities
US 10YUS Bkvn
10Y
US Real
10YEpisodes of Rising Yields Brent Copper Gold
Comdty
BBG
Sep20-Apr21 101 70 31 45.5 38.0 -7.3 17.8
Mar20 43 -70 113 -50.7 -15.4 -11.2 -16.0
Sep17-Feb18 85 33 51 25.5 2.9 -0.7 3.0
Jul-Dec16 121 46 75 12.8 22.5 -17.0 1.5
Jan-Jun15 73 26 48 38.0 10.9 -5.7 4.0
May-Sep13 136 -22 159 19.0 4.7 -6.2 -1.2
Sep-Oct11 54 32 22 9.4 -1.6 -2.1 -2.0
Oct-Dec10 113 39 75 6.5 10.9 2.4 9.3
Dec08-Jun09 185 197 -13 78.2 79.6 8.4 13.1
Sep-Oct08 36 -90 126 -22.3 -25.0 9.3 -17.6
Mar-Jun08 80 9 71 22.1 -2.3 -12.0 5.6
Mar-Jun07 76 14 62 7.7 21.7 0.1 2.3
Jan-Jun06 89 20 69 12.9 48.7 3.2 0.2
Aug-Nov05 57 21 36 -13.2 6.6 5.9 -3.4
Feb-Mar05 63 32 31 23.4 8.1 3.5 12.7
Mar-May04 109 38 71 9.7 -9.9 -6.2 1.2
Jun-Sep03 144 51 93 -6.7 5.4 5.2 0.2
-50 0 50 100 150 200
Nominal Yield
Real Yield

INVESTMENT STRATEGY INVESTMENT STRATEGY
By LYXOR CROSS ASSET RESEARCH SECOND QUARTER 2021
25
back to the top
COPPER: SHORTAGE IN 2021 (O/W)
There’s no question copper is enjoying a strong
alignment of planets, driven by global growth
improvements, an ambitious U.S. reflation (with
other packages in other regions), the rebound in
construction and in auto sales, higher demand for
inflation hedges and strong market liquidity.
We expect a copper shortage this year. Chinese
demand is moderating but will be relayed by the rest
of the world. Structural trends in electronics, EV, and
decarbonization will provide lasting tailwinds. In
particular, subsequent reflation packages in DM will
likely be focusing on green investment, in favor of
copper and rare earth.
Meanwhile copper supply would resume at a slow
rate. Current mine outage will take time to overcome.
Most new supply projects are for 2022 and following.
Finally, with world trade saturation and supply chain
stress on the one hand, and already tight global
copper inventories, prices could breach previous
record highs, north of $10 000/t.
Investors positioning is already high in futures
markets, but such concern would ease when
evidence of physical shortage emerges. Besides, we
see hedging activity in options.
GOLD: MIXED FUNDAMENTALS, TACTICAL
OPPORTUNITY (N+)
Gold fundamentals remain mixed. The share of global
debt still trading in negative territories remains
elevated, keeping gold as an appealing alternative to
cash. The physical market has also improved, with a
normalizing demand in jewelry and electronics, albeit
partially offset by output restart. Trends in inflation
are marginally positive: though we do not expect
inflation to overshoot, investors might use gold as a
hedge.
On the negative side, lower world tail risk due as
vaccination roll out and the ongoing economic
recovery (though with delays in Europe) is cutting
financial demand. ETF flows, which have been pivotal
for prices in 2020 and highly sensitive to the dollar
and U.S. rates, are now less active.
In perspective, we might be experiencing a shift in
gold allegiance. Demand from the physical and
central banks (which trashed gold in H2 20 and are
now rebuilding their reserves) might have become
more decisive than financial demand.
We are strategically neutral. Much healthier
technicals after the correction would soon provide
tactical entry point. We see gold prices trading in
a range opening short-term tactical
opportunities and maintain our 12M target at
$1800/oz.
Chinese Copper demand to be relayed abroad
Source: Bloomberg, Lyxor AM
Manageable concerns from stretched positions
Source: Bloomberg, Lyxor AM
Central banks might rebuild their gold reserves
Source: Macrobond, Lyxor AM

INVESTMENT STRATEGY INVESTMENT STRATEGY
By LYXOR CROSS ASSET RESEARCH SECOND QUARTER 2021
26
back to the top
ALTERNATIVE STRATEGIES
KEY VIEWS
Alternative strategies saw exciting developments in Q1,
in a context where equities and bonds experienced
opposite fates. We estimate alternative strategies were
up +1.1% quarter-to-date (as of March 26th), while the
MSCI World was up +6.1% and the Barclays Global
Aggregate was down -2.3%. The reverberations of rising
bond yields were a hurdle for some strategies such as
Global Macro (-0.5%) and L/S Credit (-0.2%).
Overall, L/S Equity strategies navigated rotations quite
well (+1.5%) and CTAs outperformed (+2%) despite the
trend reversal in fixed income. Event-Driven also
managed to deliver healthy returns (+2.5%), with Special
Situations outperforming Merger Arbitrage. The latter
reassured investors, demonstrating its ability to
discriminate between SPACs as an overabundance of
SPAC IPOs and excess leverage triggered a correction in
February without concrete implications on Merger
Arbitrage performance.
Going forward, we have adjusted our views given the
changing market environment. We assume 10-year
Treasury yields will continue their ascent towards 2%-
2.5% in the next twelve months on the back of ambitious
fiscal stimulus plans and solid economic prospects.
In this context, carry strategies, on which we were
constructive until now, are less appealing. We
downgraded L/S Credit and EM Global Macro to N.
Historically, High Yield credit has proved resilient to a
selloff at the long end of the Treasury curve. But L/S
Credit is negatively impacted by rising implied volatility
in rates, which is a source of risk as market concerns over
inflation could grow. All in all, we don’t expect the
conditions to be met for L/S Credit to outperform. With
regards to EM Macro, the underlying asset class is more
directly impacted by rising Treasury yields and the
appreciation of the USD, which has led several central
banks to hike policy rates lately (i.e. Brazil, Russia,
Turkey).
With regards to the remaining strategies, we remain
O/W Event-Driven and Neutral L/S Equity (Directional
L/S at O/W and Market Neutral L/S at U/W). Event-Driven
strategies should continue to benefit from robust
corporate activity. Special Situations are more
directional than Merger Arbitrage and have a value bias
which is likely to be rewarded. Concurrently, SPACs have
become a new engine of performance for Merger
Arbitrage. We upgraded CTAs to O/W in February and
stick to that view. CTA portfolios are well-balanced and
positioned for a cyclical upswing. Overall, we have a
slight preference for Event-Driven vs. L/S Equity and
now prefer CTAs to Global Macro strategies.
KEY VIEWS
L/S Equity (N)
U/W L/S Market Neutral
O/W Directional L/S
Event-Driven (Overweight)
N Merger Arbitrage
O/W Special Situations
L/S Credit/ Fixed Income Arbitrage (N)
N L/S Credit (downgraded)
N Multi-Credit FI Arbitrage
Global Macro (N)
O/W Discretionary Macro
N EM Macro (downgraded)
N Systematic Macro
CTAs (O/W)
Event-Driven & CTAs outperformed in Q1
See methodology of Lyxor Peer Groups in the appendix.
Indices in total return in USD. Source: Bloomberg, Lyxor AM
Investment views on hedge-fund strategies
(+) upgrade; (-) downgrade vs. last quarter. Source: Lyxor AM
U/W N O/W
Hedge
Funds
L/S Equity Market Neutral
FI Multi-Strategy
Merger Arbitrage
L/S Credit (-)
Global Macro Systematic
Global Macro EM (-)
L/S Equity Directional
Special Situations
Global Macro
Discretionary
CTAs (+)

INVESTMENT STRATEGY INVESTMENT STRATEGY
By LYXOR CROSS ASSET RESEARCH SECOND QUARTER 2021
27
back to the top
UPGRADE CTA (O/W) AT THE EXPENSE OF
GLOBAL MACRO (N)
We downgrade Global Macro to N on the back of the
potential difficulties faced by EM strategies
(downgraded to N). EM currencies and sovereign credit
face structural challenges as Treasury yields move
higher. Considering our expectation that 10-year
Treasuries will rise beyond 2% in the next twelve
months, we believe EM Macro strategies are unlikely to
outperform. Yet, we refrain from downgrading to U/W as
external headwinds cause dispersion in EM assets that
can be supportive. Current conditions open the door for
arbitrage opportunities between countries with strong
vs. weak external balance sheets; or commodity
exporters vs. importers.
Our stance on Discretionary (O/W) and Systematic (N)
Macro strategies remains unchanged. The former tends
to have a tactical bias which appears relevant at present,
as asset prices adjust to renewed growth expectations
until a new equilibrium in rates, commodities and
equity valuations is met.
We upgrade our stance on CTAs to O/W and believe they
can benefit from surging inflation expectations and/ or
real bond yields via their FX and commodity exposures.
Their sharp deleveraging in fixed income suggests the
strategy could be well prepared for any tapering of asset
purchases from the Fed later this year. Finally, CTAs
currently provide exposure to equities in moderate
proportions and are not sensitive to sector rotations, a
hurdle at present.
DOWNGRADE L/S CREDIT TO NEUTRAL
We downgrade L/S Credit strategies to N for similar
reasons than EM Global Macro. The rise in U.S.
Treasury yields can be challenging for HY credit as debt
servicing becomes more expensive for corporates. Yet,
to the extent that rising bond yields reflect better
economic prospects, HY benchmarks have historically
shown to be resilient when a selloff at the long end of
the Treasury curve occurs.
L/S Credit is nonetheless negatively impacted by rising
implied volatility in rates, which is a source of risk as
market concerns over inflation grow. Bond markets
could overshoot as market participants test the Fed
willingness to tolerate higher inflation. All in all, we
don’t expect the conditions to be met for L/S Credit to
outperform.
We also refrain from downgrading to U/W as L/S Credit
strategies are exposed to market segments that benefit
from the economic recovery. Liquidity conditions,
whose deterioration cause hurdles to L/S Credit and
Fixed Income Arbitrage strategies, are expected to
remain stable as central banks continue to provide
ample funding to financial sectors.
Discretionary Macro are tactical and diversified
*** Significant at 99% confidence level. ** Significant at 95%
confidence level. Source: Bloomberg, Macrobond, Lyxor AM
CTAs have turned short fixed income
In total return and FX hedged. Normalized series (mean zero
and standard deviation 1). Source: Macrobond, Lyxor AM
HY Credit: resilient vs. sell off in long dated Treasuries
Source: Bloomberg, Macrobond, Lyxor AM
L/S Credit: rising implied vol in rates is a hurdle
USD Swaption ATM NVOL 3M (OIS) 3Mx10Y. Source: HFR,
Bloomberg, Macrobond, Lyxor AM

INVESTMENT STRATEGY INVESTMENT STRATEGY
By LYXOR CROSS ASSET RESEARCH SECOND QUARTER 2021
28
back to the top
STAY O/W EVENT-DRIVEN
Our stance on Event-Driven strategies remains
constructive on the back of robust corporate activity
globally and their ability to capture the cyclical upswing.
The strategy also brings elevated diversification
benefits, having no exposure to the momentum risk
factor structurally, at the difference of many L/S Equity
strategies for instance.
We maintain a slight preference for Special Situations
(O/W) vs. Merger Arbitrage (N) thanks to its higher equity
market beta and exposure to Value stocks. Yet, Merger
Arbitrage reassured investors in Q1, as an
overabundance of SPAC IPOs and excess leverage
triggered a correction in February, without concrete
implications on Merger Arbitrage performance. SPACs
now form part of the engines of performance of the
strategy for the medium term.
In terms of M&A activity, Technology, Financials and
Industrials continue to experience large volumes in the
U.S. and Europe. M&A activity in the U.S. Health Care
sector also remains strong. Deal spreads have widened
in the U.S. towards the end of March and stand at 7% as
of March 26th, above the average of recent quarters.
L/S EQUITY: PREFER DIRECTIONAL TO MARKET
NEUTRAL L/S (U/W)
Our views on L/S Equity strategies remain unchanged,
with a preference for Directional L/S vs. Market Neutral
L/S strategies. The former benefitted from the market
rebound lately, with an equity market beta that we
estimate at 33%, a record since early 2018. Apart from a
slight short Quality bias, we do not find major factor
biases from an aggregate perspective at present. This
helped such strategies avoiding factor rotation pitfalls in
recent months. Our stance on the strategy remains O/W.
Stock dispersion remains elevated, which is a support
for alpha generation. We prefer strategies that can adopt
a value bias in their portfolio. Yet, value rebounds have
been short lived in recent decades and it is unclear
whether the risk factor can outperform over the long
run.
Finally, our stance on Market Neutral L/S remains U/W.
The strategy maintains a long Momentum bias, but to
the extent that Value stocks have rebounded, the
Momentum equity style increasingly reflects positive
developments in Value stocks. Overall, the prospects for
the strategy have improved and alpha generation has
turned positive and significant statistically. Yet, ahead of
a cyclical upswing, we prefer Directional L/S over Market
Neutral L/S, which are more defensive, by construction.
Corporate activity has swiftly recovered
Megadeals are deals above USD 5bn. Source: Eikon,
Macrobond, Lyxor AM
O/W Special Situations to leverage the cyclical upswing
U.S. Market Neutral risk factors. *** Significant at 99%
confidence level. Source: Dow Jones, Macrobond, Lyxor AM
Dispersion in stock returns remains elevated
Based on daily returns of the components of the S&P 500.
Source: Macrobond, Lyxor AM
Market Neutral L/S remains long Momentum.
But Momentum is increasingly Value
Source: Bloomberg, Macrobond, Lyxor AM

INVESTMENT STRATEGY INVESTMENT STRATEGY
By LYXOR CROSS ASSET RESEARCH SECOND QUARTER 2021
29
back to the top
METHODOLOGICAL APPENDIX ON LYXOR
ALTERNATIVE UCITS PEER GROUPS
The information contained in this section on the
performance of hedge funds is based on publicly
available information. The universe of underlying
funds is relatively stable but varies depending on the
criteria of inclusion presented below. It is based on an
unbiased selection from our team of hedge fund
analysts.
Performance is calculated on a daily basis, using an
arithmetic average (equally weighted average).
Regarding share classes used in these peer groups, we
selected the primary share class as referenced in
Bloomberg. Non-USD share classes are hedged in USD
based on hedging costs available on Bloomberg.
As of March 2021, there are 224 strategies across the
main categories in the industry, representing USD182
bn of assets under management.
The criteria of inclusion are fourfold:
- We only include UCITS strategies;
- Assessment by Lyxor’s Hedge Fund selection team
based on funds’ materials or manager interaction;
- We only include strategies with assets under
management of at least USD 50 million; and
- We only include strategies with at least a one-year
track record.
Lyxor Alternative UCITs Peer Groups: number of
funds by strategy
Source: Lyxor AM
Lyxor CTA ; 24
Lyxor L/S Credit ; 26
Lyxor Risk Premia ; 14
Lyxor Event Driven ; 26
Lyxor Global Macro ; 56
Lyxor L/S Equity; 78
# of funds by strategy

INVESTMENT STRATEGY INVESTMENT STRATEGY
By LYXOR CROSS ASSET RESEARCH SECOND QUARTER 2021
30
back to the top

DISCLAIMER The circumstances in which this publication has been produced are such that it is not appropriate to characterize
it as independent investment research as referred to in MiFID. As such, it should be treated as a marketing
communication even if it contains research recommendations. This publication is also not subject to any
prohibition on dealing ahead of the dissemination of investment research. However, Lyxor is required to have
policies to manage the conflicts which might arise in the production of its research, including preventing dealing
ahead of investment research.
This material has been prepared solely for information purposes and does not constitute an offer or a solicitation
of an offer to buy or sell any security or financial instrument or to participate in any investment strategy. This
material does not purport to summarize or contain all of the provisions that would be set forth in any offering
memorandum. Any purchase or sale of any securities may be made only pursuant to a final offering memorandum.
No advisory relationship is created by the receipt of this material. This material should not be construed as legal,
business or tax advice. A more robust discussion of the risks and tax considerations involved in investing in a fund
is available from the more complete disclosures incorporated into the offering documentation for such fund.
This material has not been prepared in regard to specific investment objectives, financial situations, or the
particular needs of any specific entity or person. Investors should make their own appraisal of the risks and should
seek their own financial advice regarding the appropriateness of investing in any securities or financial instrument
or participating in any investment strategy. Before you decide to invest in any account or fund, you should carefully
read the relevant client agreements and offering documentation. No representation is made that your investment
objectives will be achieved. This material is not intended for use by retail customers.
Any descriptions involving investment process, risk management, portfolio characteristics or statistical analysis
are provided for illustrative purposes only; they will not apply in all situations, and may be changed without notice.
Past performance is not indicative of future results, and it is impossible to predict whether the value of any fund
or index will rise or fall over time.
While the information in this material has been obtained from sources deemed reliable, neither Société Générale
(“SG”), Lyxor Asset Management S.A.S. (“Lyxor AM”) nor their affiliates guarantee its accuracy, timeliness or
completeness. We are under no obligation to update or otherwise revise such information if and when it changes.
Any opinions expressed herein are statements of our judgment on this date and are subject to change without
notice. SG, Lyxor AM and their affiliates assume no fiduciary responsibility or liability for any consequences,
financial or otherwise, arising from an investment in any security or financial instrument described herein or in any
other security, or from the implementation of any investment strategy. Lyxor AM and its affiliates may from time to
time deal in, profit from the trading of, hold, have positions in, or act as market-makers, advisers, brokers or
otherwise in relation to the securities and financial instruments described herein. Service marks appearing herein
are the exclusive property of SG and its affiliates, as the case may be.
Hedge funds may invest in futures and other derivative instruments. Futures trading and other derivatives may
permit extremely high degrees of leverage and expose the funds to, among other things, volatility, market
illiquidity, market risks, legal risks and operational risks. Hedge funds may be exposed to risks relating to non-
domestic markets, including, but not limited to, risks relating to currency exchange, tax, lack of liquidity, market
manipulation, political instability and transaction costs. An investment in a hedge fund can be subject to total loss.
This presentation contains the views of Lyxor AM analysts and/or strategies. The views espoused in this
presentation may differ from opinions and recommendations produced by other departments of SG.
Note about Indices: Indices are not available for direct investment. A comparison to an index is not meant to imply
that an investment in a fund is comparable to an investment in the funds or securities represented by such index.
A fund is actively managed while an index is a passive index of securities. Indices are not investable themselves,
and thus do not include the deduction of fees and other expenses associated with an investment in a fund. Not all
the funds that comprise indices cited herein are suitable for U.S. Investors as a result of, among other things, the
implementation of the Volcker Rule. Please see the offering documentation for these funds for more details.
Notice to U.S. Investors: Any potential investment in any securities or financial instruments, the categories of which
are described herein, may not be suitable for all investors. Any prospective investment will require you to represent
that you are an “accredited investor,” as defined in Regulation D under the Securities Act of 1933, as amended, and
a “qualified purchaser,” as defined in Section 2(a)(51) of the Investment Company Act of 1940, as amended (the
“40 Act”). The securities and financial instruments described herein may not be available in all jurisdictions.
Investments in or linked to hedge funds are highly speculative and may be adversely affected by the unregulated
nature of hedge funds and the use of trading strategies and techniques that are typically prohibited for funds
registered under the ’40 Act. Also, hedge funds are typically less transparent in terms of information and pricing
and have much higher fees than registered funds. Investors in hedge funds may not be afforded the same
protections as investors in funds registered under the ’40 Act including limitations on fees, controls over
investment policies and reporting requirements.
Notice to Canadian Investors: Any potential investment in any securities or financial instruments, the categories
of which are described herein, may not be suitable for all investors. Any prospective investment will require you to
represent that you are a “permitted client,” as defined in Canadian Regulation National Instrument 31-103, and an
“accredited investor,” as defined in National Instrument 45-106. The securities and financial instruments described
herein may not be available in all jurisdictions of Canada.
For more information, U.S. and Canadian investors and recipients should contact Lyxor Asset Management Inc.,
1251 Avenue of the Americas, New York, NY 10020 or [email protected].
Notice to U.K. Investors: This communication is issued in the UK by Lyxor Asset Management UK LLP, which is
authorised and regulated by the Financial Conduct Authority in the UK under Registration Number 435658.
Source: This document has been prepared by Lyxor Asset Management S.A.S., 17 cours Valmy, 92800 Puteaux.
Lyxor AM is a French management company authorized by the Autorité des marchés financiers and placed under
the regulations of the UCITS (2014/91/UE) and AIFM (2011/61/EU) Directives. Lyxor AM is also registered with the
U.S. Commodity Futures Trading Commission as a registered commodity pool operator and a commodity trading
advisor.

Lyxor Asset Management
Tours Société Générale - 17 Cours Valmy 92987 Paris La Défense Cedex - France
www.lyxor.com [email protected]