Risk of Climate-Induced Damage in Historic Textiles
11
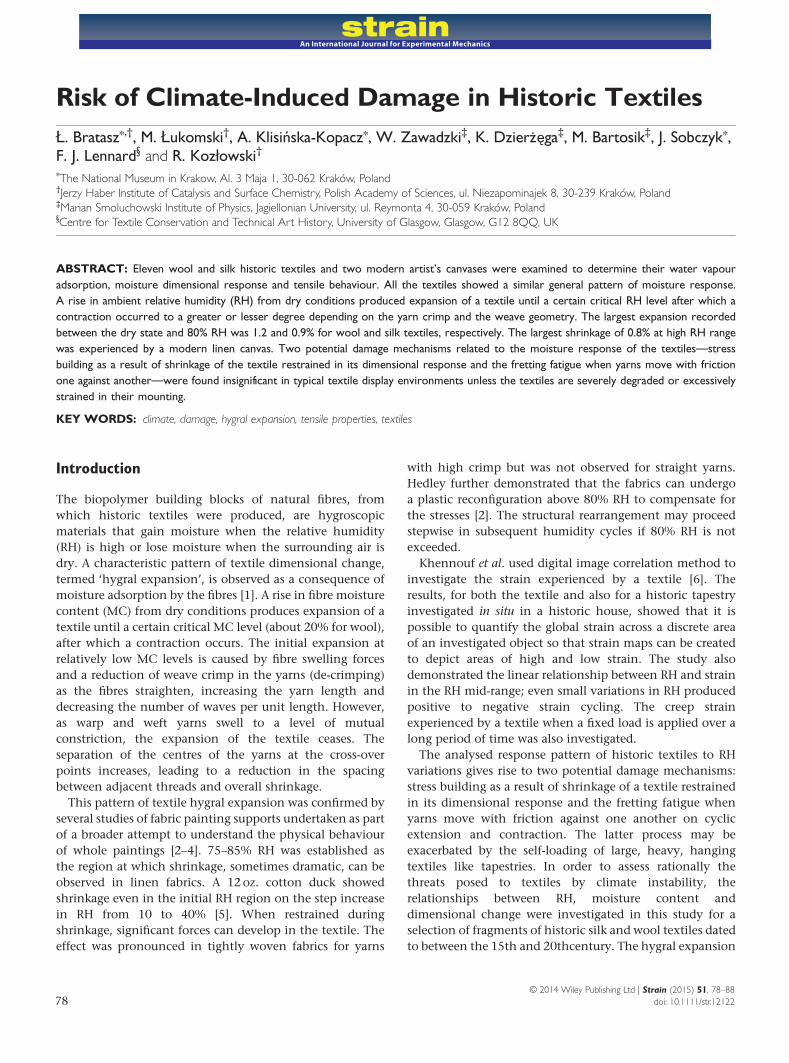
Risk of Climate-Induced Damage in Historic Textiles Ł. Bratasz * ,† , M. Łukomski † , A. Klisińska-Kopacz * , W. Zawadzki ‡ , K. Dzierżęga ‡ , M. Bartosik ‡ , J. Sobczyk * , F. J. Lennard § and R. Kozłowski † * The National Museum in Krakow, Al. 3 Maja 1, 30-062 Kraków, Poland † Jerzy Haber Institute of Catalysis and Surface Chemistry, Polish Academy of Sciences, ul. Niezapominajek 8, 30-239 Kraków, Poland ‡ Marian Smoluchowski Institute of Physics, Jagiellonian University, ul. Reymonta 4, 30-059 Kraków, Poland § Centre for Textile Conservation and Technical Art History, University of Glasgow, Glasgow, G12 8QQ, UK ABSTRACT: Eleven wool and silk historic textiles and two modern artist’s canvases were examined to determine their water vapour adsorption, moisture dimensional response and tensile behaviour. All the textiles showed a similar general pattern of moisture response. A rise in ambient relative humidity (RH) from dry conditions produced expansion of a textile until a certain critical RH level after which a contraction occurred to a greater or lesser degree depending on the yarn crimp and the weave geometry. The largest expansion recorded between the dry state and 80% RH was 1.2 and 0.9% for wool and silk textiles, respectively. The largest shrinkage of 0.8% at high RH range was experienced by a modern linen canvas. Two potential damage mechanisms related to the moisture response of the textiles—stress building as a result of shrinkage of the textile restrained in its dimensional response and the fretting fatigue when yarns move with friction one against another—were found insignificant in typical textile display environments unless the textiles are severely degraded or excessively strained in their mounting. KEY WORDS: climate, damage, hygral expansion, tensile properties, textiles Introduction The biopolymer building blocks of natural fibres, from which historic textiles were produced, are hygroscopic materials that gain moisture when the relative humidity (RH) is high or lose moisture when the surrounding air is dry. A characteristic pattern of textile dimensional change, termed ‘hygral expansion’, is observed as a consequence of moisture adsorption by the fibres [1]. A rise in fibre moisture content (MC) from dry conditions produces expansion of a textile until a certain critical MC level (about 20% for wool), after which a contraction occurs. The initial expansion at relatively low MC levels is caused by fibre swelling forces and a reduction of weave crimp in the yarns (de-crimping) as the fibres straighten, increasing the yarn length and decreasing the number of waves per unit length. However, as warp and weft yarns swell to a level of mutual constriction, the expansion of the textile ceases. The separation of the centres of the yarns at the cross-over points increases, leading to a reduction in the spacing between adjacent threads and overall shrinkage. This pattern of textile hygral expansion was confirmed by several studies of fabric painting supports undertaken as part of a broader attempt to understand the physical behaviour of whole paintings [2–4]. 75–85% RH was established as the region at which shrinkage, sometimes dramatic, can be observed in linen fabrics. A 12 oz. cotton duck showed shrinkage even in the initial RH region on the step increase in RH from 10 to 40% [5]. When restrained during shrinkage, significant forces can develop in the textile. The effect was pronounced in tightly woven fabrics for yarns with high crimp but was not observed for straight yarns. Hedley further demonstrated that the fabrics can undergo a plastic reconfiguration above 80% RH to compensate for the stresses [2]. The structural rearrangement may proceed stepwise in subsequent humidity cycles if 80% RH is not exceeded. Khennouf et al. used digital image correlation method to investigate the strain experienced by a textile [6]. The results, for both the textile and also for a historic tapestry investigated in situ in a historic house, showed that it is possible to quantify the global strain across a discrete area of an investigated object so that strain maps can be created to depict areas of high and low strain. The study also demonstrated the linear relationship between RH and strain in the RH mid-range; even small variations in RH produced positive to negative strain cycling. The creep strain experienced by a textile when a fixed load is applied over a long period of time was also investigated. The analysed response pattern of historic textiles to RH variations gives rise to two potential damage mechanisms: stress building as a result of shrinkage of a textile restrained in its dimensional response and the fretting fatigue when yarns move with friction against one another on cyclic extension and contraction. The latter process may be exacerbated by the self-loading of large, heavy, hanging textiles like tapestries. In order to assess rationally the threats posed to textiles by climate instability, the relationships between RH, moisture content and dimensional change were investigated in this study for a selection of fragments of historic silk and wool textiles dated to between the 15th and 20thcentury. The hygral expansion © 2014 Wiley Publishing Ltd | Strain (2015) 51, 78–88 78 doi: 10.1111/str.12122 An International Journal for Experimental Mechanics
Transcript of Risk of Climate-Induced Damage in Historic Textiles
Risk of Climate-Induced Damage in Historic TextilesŁ. Bratasz*,†, M. Łukomski†, A. Klisińska-Kopacz*, W. Zawadzki‡, K. Dzierżęga‡, M. Bartosik‡, J. Sobczyk*,F. J. Lennard§ and R. Kozłowski†*The National Museum in Krakow, Al. 3 Maja 1, 30-062 Kraków, Poland†Jerzy Haber Institute of Catalysis and Surface Chemistry, Polish Academy of Sciences, ul. Niezapominajek 8, 30-239 Kraków, Poland‡Marian Smoluchowski Institute of Physics, Jagiellonian University, ul. Reymonta 4, 30-059 Kraków, Poland§Centre for Textile Conservation and Technical Art History, University of Glasgow, Glasgow, G12 8QQ, UK
ABSTRACT: Eleven wool and silk historic textiles and two modern artist’s canvases were examined to determine their water vapouradsorption, moisture dimensional response and tensile behaviour. All the textiles showed a similar general pattern of moisture response.A rise in ambient relative humidity (RH) from dry conditions produced expansion of a textile until a certain critical RH level after which acontraction occurred to a greater or lesser degree depending on the yarn crimp and the weave geometry. The largest expansion recordedbetween the dry state and 80% RH was 1.2 and 0.9% for wool and silk textiles, respectively. The largest shrinkage of 0.8% at high RH rangewas experienced by a modern linen canvas. Two potential damage mechanisms related to the moisture response of the textiles—stressbuilding as a result of shrinkage of the textile restrained in its dimensional response and the fretting fatigue when yarns move with frictionone against another—were found insignificant in typical textile display environments unless the textiles are severely degraded or excessivelystrained in their mounting.
KEY WORDS: climate, damage, hygral expansion, tensile properties, textiles
Introduction
The biopolymer building blocks of natural fibres, fromwhich historic textiles were produced, are hygroscopicmaterials that gain moisture when the relative humidity(RH) is high or lose moisture when the surrounding air isdry. A characteristic pattern of textile dimensional change,termed ‘hygral expansion’, is observed as a consequence ofmoisture adsorption by the fibres [1]. A rise in fibre moisturecontent (MC) from dry conditions produces expansion of atextile until a certain critical MC level (about 20% for wool),after which a contraction occurs. The initial expansion atrelatively low MC levels is caused by fibre swelling forcesand a reduction of weave crimp in the yarns (de-crimping)as the fibres straighten, increasing the yarn length anddecreasing the number of waves per unit length. However,as warp and weft yarns swell to a level of mutualconstriction, the expansion of the textile ceases. Theseparation of the centres of the yarns at the cross-overpoints increases, leading to a reduction in the spacingbetween adjacent threads and overall shrinkage.
This pattern of textile hygral expansion was confirmed byseveral studies of fabric painting supports undertaken as partof a broader attempt to understand the physical behaviourof whole paintings [2–4]. 75–85% RH was established asthe region at which shrinkage, sometimes dramatic, can beobserved in linen fabrics. A 12oz. cotton duck showedshrinkage even in the initial RH region on the step increasein RH from 10 to 40% [5]. When restrained duringshrinkage, significant forces can develop in the textile. Theeffect was pronounced in tightly woven fabrics for yarns
with high crimp but was not observed for straight yarns.Hedley further demonstrated that the fabrics can undergoa plastic reconfiguration above 80% RH to compensate forthe stresses [2]. The structural rearrangement may proceedstepwise in subsequent humidity cycles if 80% RH is notexceeded.
Khennouf et al. used digital image correlation method toinvestigate the strain experienced by a textile [6]. Theresults, for both the textile and also for a historic tapestryinvestigated in situ in a historic house, showed that it ispossible to quantify the global strain across a discrete areaof an investigated object so that strain maps can be createdto depict areas of high and low strain. The study alsodemonstrated the linear relationship between RH and strainin the RH mid-range; even small variations in RH producedpositive to negative strain cycling. The creep strainexperienced by a textile when a fixed load is applied over along period of time was also investigated.
The analysed response pattern of historic textiles to RHvariations gives rise to two potential damage mechanisms:stress building as a result of shrinkage of a textile restrainedin its dimensional response and the fretting fatigue whenyarns move with friction against one another on cyclicextension and contraction. The latter process may beexacerbated by the self-loading of large, heavy, hangingtextiles like tapestries. In order to assess rationally thethreats posed to textiles by climate instability, therelationships between RH, moisture content anddimensional change were investigated in this study for aselection of fragments of historic silk and wool textiles datedto between the 15th and 20thcentury. The hygral expansion
© 2014 Wiley Publishing Ltd | Strain (2015) 51, 78–8878 doi: 10.1111/str.12122
An International Journal for Experimental Mechanics
results were compared with critical extensions obtained intensile tests. Furthermore, the impact of a large number ofextension cycles on textile performance was assessed.
Materials and MethodsSeveral samples of historic textiles made of wool and silkwere used in the testing programme. Two modern artistcanvases were also investigated. Details of the textiles aregiven in Table 1.
Water vapour adsorption and desorption isotherms weredetermined at 24 °C and for an RH range between 0 and80%. The measurements were performed gravimetricallywith the use of a vacuum microbalance from CI ElectronicsLtd (Salisbury, UK). Typically, a piece of textile (0.05–0.1 g)was weighed and outgassed prior to a measurement under avacuum of a residual pressure less than 0.1 Pa. The aim wasto move air out of the textile and to eliminate most of thespecies physisorbed during the storage of the sample,especially adsorbed water. A vacuum was maintained until
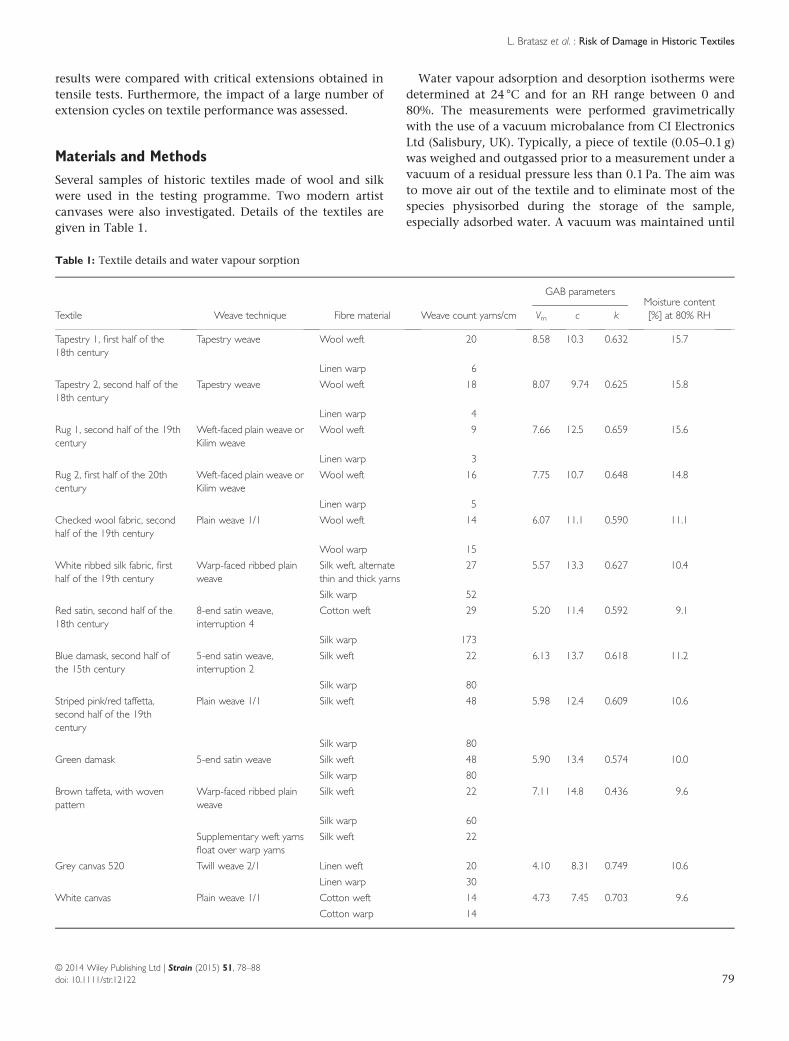
Table 1: Textile details and water vapour sorption
Textile Weave technique Fibre material Weave count yarns/cm
GAB parametersMoisture content[%] at 80% RHVm c k
Tapestry 1, first half of the18th century
Tapestry weave Wool weft 20 8.58 10.3 0.632 15.7
Linen warp 6
Tapestry 2, second half of the18th century
Tapestry weave Wool weft 18 8.07 9.74 0.625 15.8
Linen warp 4
Rug 1, second half of the 19thcentury
Weft-faced plain weave orKilim weave
Wool weft 9 7.66 12.5 0.659 15.6
Linen warp 3
Rug 2, first half of the 20thcentury
Weft-faced plain weave orKilim weave
Wool weft 16 7.75 10.7 0.648 14.8
Linen warp 5
Checked wool fabric, secondhalf of the 19th century
Plain weave 1/1 Wool weft 14 6.07 11.1 0.590 11.1
Wool warp 15
White ribbed silk fabric, firsthalf of the 19th century
Warp-faced ribbed plainweave
Silk weft, alternatethin and thick yarns
27 5.57 13.3 0.627 10.4
Silk warp 52
Red satin, second half of the18th century
8-end satin weave,interruption 4
Cotton weft 29 5.20 11.4 0.592 9.1
Silk warp 173
Blue damask, second half ofthe 15th century
5-end satin weave,interruption 2
Silk weft 22 6.13 13.7 0.618 11.2
Silk warp 80
Striped pink/red taffetta,second half of the 19thcentury
Plain weave 1/1 Silk weft 48 5.98 12.4 0.609 10.6
Silk warp 80
Green damask 5-end satin weave Silk weft 48 5.90 13.4 0.574 10.0
Silk warp 80
Brown taffeta, with wovenpattern
Warp-faced ribbed plainweave
Silk weft 22 7.11 14.8 0.436 9.6
Silk warp 60
Supplementary weft yarnsfloat over warp yarns
Silk weft 22
Grey canvas 520 Twill weave 2/1 Linen weft 20 4.10 8.31 0.749 10.6
Linen warp 30
White canvas Plain weave 1/1 Cotton weft 14 4.73 7.45 0.703 9.6
Cotton warp 14
© 2014 Wiley Publishing Ltd | Strain (2015) 51, 78–8879doi: 10.1111/str.12122
L. Bratasz et al. : Risk of Damage in Historic Textiles
a constant weight was obtained; then, subsequent quantitiesof water vapour were introduced, and the respective massincreases because of the sorption, and the equilibriumpressures were recorded. At each adsorption point, a textileattained a constant level of the moisture content termedthe equilibrium moisture content (EMC). Samples wereconsidered to have reached ‘equilibrium’ when the weightchanges were less than 0.01% in 10min. The EMC valueswere calculated on the basis of the initial weight of theoutgassed sample. Similarly, the desorption branches of theisotherms were obtained by reducing the water vapourpressure and determining the EMC. The process was fullyautomated and rapid; attaining equilibrium at eachadsorption or desorption point took between 0.5 and 1h.The tensile properties were determined using a
universal testing machine (UTM) from Hegewald &Peschke MPT GMBH (Nossen, Germany) for textilespecimens 80–100mm long and 50mm wide. All measure-ments were taken under laboratory conditions at RH valuesranging between 30 and 50% and at temperatures rangingbetween 22 and 24 °C. The rate of tension loading wasbetween 1 and 2mmmin�1. For some specimens, additionaltests were carried out at a low loading rate of0.003mmmin�1 to measure the effect of creep.Using the UTM, cycles of strain were produced by
mechanical stretching of the specimens with an amplitudeof 1%, that is, exceeding the maximum dimensionalchanges of unrestrained textiles induced by fluctuations ofRH as determined in the hygral expansion measurements.After each cycle, the position of zero strain was reinitialisedto compensate for incomplete strain recovery when thestress was removed. The frequency of the strain cycles wasapproximately 0.3Hz, which was low enough to preventthe specimen from heating. The specimens were subjectedto up to 100 000 cycles. The tensile properties of each testedsample were determined after the cycling to assess thepossible impact of the fretting process. All the experimentswere conducted at ambient RH ranging from 30 to 50%and at room temperature.The dimensional change of textiles accompanying water
vapour adsorption and desorption was measured using strips80×20mm2. The measurements were taken in a speciallybuilt sample holder placed in a vacuum vessel connected tothe same outgassing and water vapour dosing system usedto determine the water vapour sorption isotherms; in fact,the two measurements were taken simultaneously. Thespecimen was vertically oriented in the holder, and its upperend was firmly stabilised. The lower end was free to move inthe vertical direction, and changes of its position weremeasured with 2μm accuracy using an inductive transducerfrom RDP Electronics Ltd (Wolverhampton, UK). Thespecimenwas loadedwith force of 0.8N (40Nm�1) sufficientto keep it in a vertical plane. Both expansion and shrinkagebranches of the dimensional change isothermwere recorded.
On-site monitoring of the dimensional responseof a historic textile
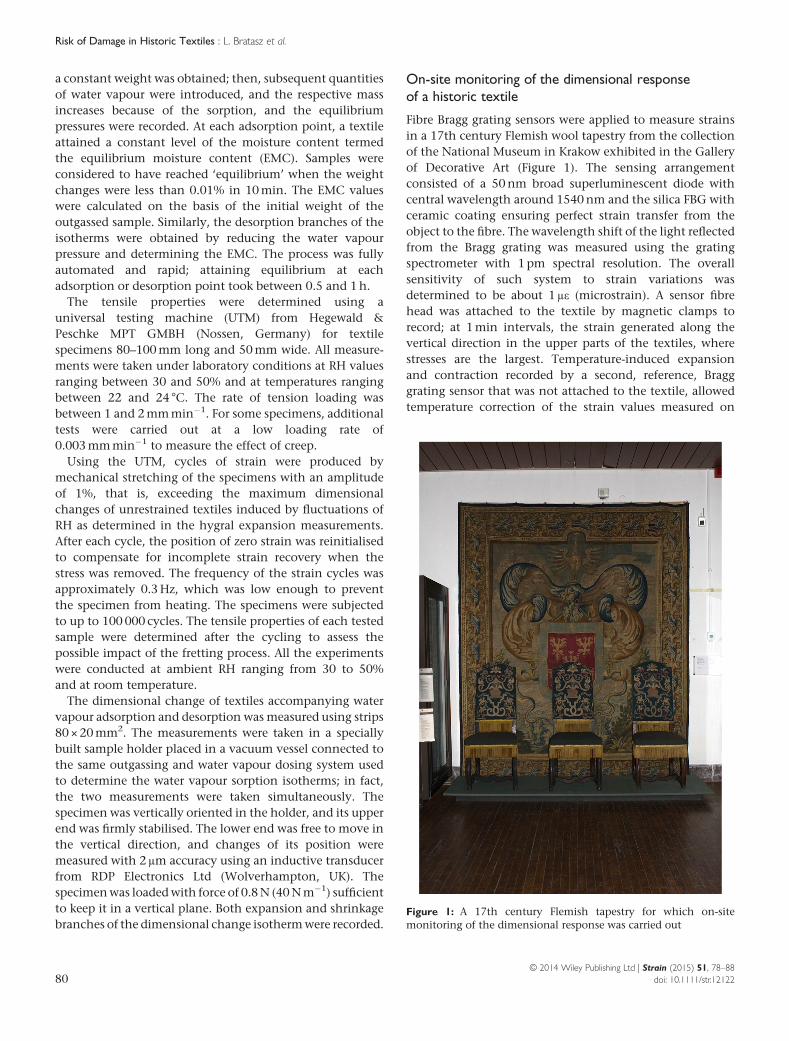
Fibre Bragg grating sensors were applied to measure strainsin a 17th century Flemish wool tapestry from the collectionof the National Museum in Krakow exhibited in the Galleryof Decorative Art (Figure 1). The sensing arrangementconsisted of a 50nm broad superluminescent diode withcentral wavelength around 1540nm and the silica FBG withceramic coating ensuring perfect strain transfer from theobject to the fibre. The wavelength shift of the light reflectedfrom the Bragg grating was measured using the gratingspectrometer with 1pm spectral resolution. The overallsensitivity of such system to strain variations wasdetermined to be about 1με (microstrain). A sensor fibrehead was attached to the textile by magnetic clamps torecord; at 1min intervals, the strain generated along thevertical direction in the upper parts of the textiles, wherestresses are the largest. Temperature-induced expansionand contraction recorded by a second, reference, Bragggrating sensor that was not attached to the textile, allowedtemperature correction of the strain values measured on
Figure 1: A 17th century Flemish tapestry for which on-sitemonitoring of the dimensional response was carried out
© 2014 Wiley Publishing Ltd | Strain (2015) 51, 78–8880 doi: 10.1111/str.12122
Risk of Damage in Historic Textiles : L. Bratasz et al.
the textile. Ambient temperature and RH were alsomeasured using a radio monitoring system from IMC GroupLtd (Letchworth, Hertfordshire, UK). The sensor, the dataacquisition system and the method of strain calculationwere described in detail in Ref. [7].
Results and DiscussionSorption isotherms
By way of example, the adsorption and desorptionisotherms for one wool and one silk specimen investigatedare shown in Figure 2. Hysteresis loops appear between theadsorption and desorption branches; these show the highermoisture content during desorption when compared withthat during adsorption at any given RH value. Thisphenomenon is associated with the swelling of a non-rigidtextile structure in the course of adsorption, so that theeffect is in fact a manifestation of elastic hysteresis [8].The three-parameter Guggenheim–Andersen–de Boer
(GAB) sorption equation was used to interpret the sorptiondata for textile materials by expressing the EMC as afunction of RH [9]:
EMC RH; T ¼ const:ð Þ ¼ Vm*c*k*RH=1001� k*RH=100ð Þ 1þ c � 1ð Þk*RH=100ð Þ
(1)
where EMC is the equilibrium moisture content in per centof dry material, RH is the relative humidity in per cent, Vm isthe the monolayer capacity in the same units as EMC, c is anenergy constant related to the difference of free enthalpy(standard chemical potential) of water molecules in theupper sorption layers and in the monolayer, and k is the
third parameter, related, in turn, to the difference of freeenthalpy of water molecules in the pure liquid and theupper sorption layers.
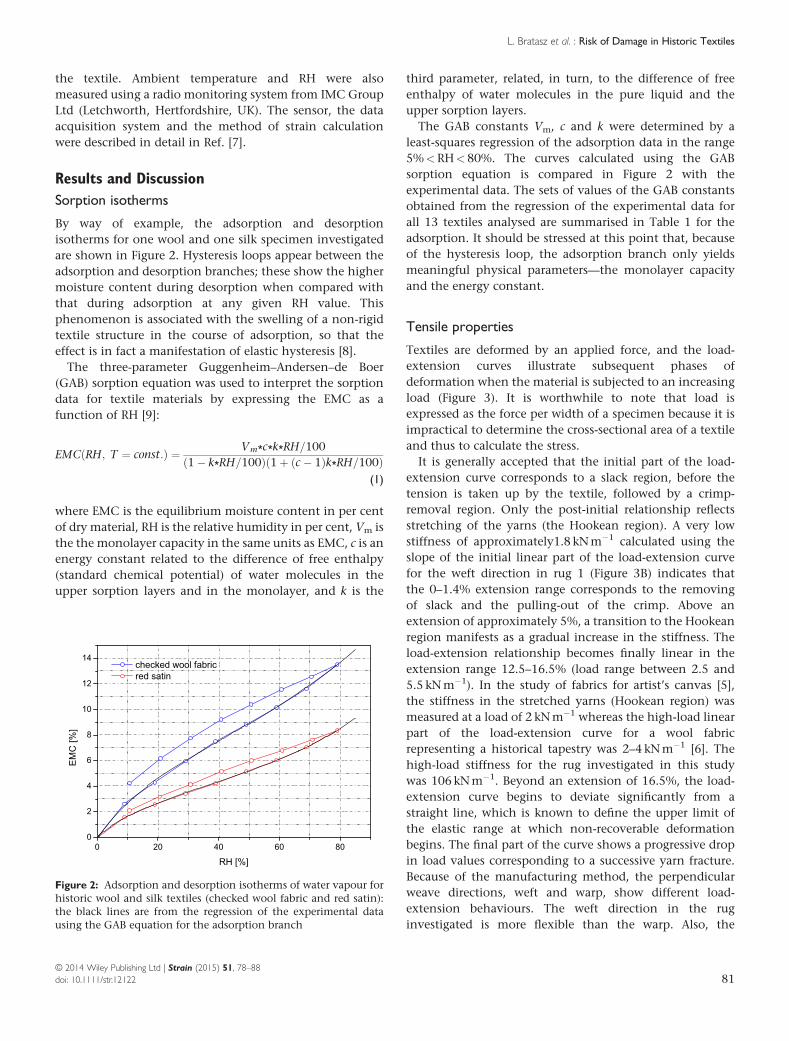
The GAB constants Vm, c and k were determined by aleast-squares regression of the adsorption data in the range5%<RH<80%. The curves calculated using the GABsorption equation is compared in Figure 2 with theexperimental data. The sets of values of the GAB constantsobtained from the regression of the experimental data forall 13 textiles analysed are summarised in Table 1 for theadsorption. It should be stressed at this point that, becauseof the hysteresis loop, the adsorption branch only yieldsmeaningful physical parameters—the monolayer capacityand the energy constant.
Tensile properties
Textiles are deformed by an applied force, and the load-extension curves illustrate subsequent phases ofdeformation when the material is subjected to an increasingload (Figure 3). It is worthwhile to note that load isexpressed as the force per width of a specimen because it isimpractical to determine the cross-sectional area of a textileand thus to calculate the stress.
It is generally accepted that the initial part of the load-extension curve corresponds to a slack region, before thetension is taken up by the textile, followed by a crimp-removal region. Only the post-initial relationship reflectsstretching of the yarns (the Hookean region). A very lowstiffness of approximately1.8 kNm�1 calculated using theslope of the initial linear part of the load-extension curvefor the weft direction in rug 1 (Figure 3B) indicates thatthe 0–1.4% extension range corresponds to the removingof slack and the pulling-out of the crimp. Above anextension of approximately 5%, a transition to the Hookeanregion manifests as a gradual increase in the stiffness. Theload-extension relationship becomes finally linear in theextension range 12.5–16.5% (load range between 2.5 and5.5 kNm�1). In the study of fabrics for artist’s canvas [5],the stiffness in the stretched yarns (Hookean region) wasmeasured at a load of 2 kNm�1 whereas the high-load linearpart of the load-extension curve for a wool fabricrepresenting a historical tapestry was 2–4kNm�1 [6]. Thehigh-load stiffness for the rug investigated in this studywas 106 kNm�1. Beyond an extension of 16.5%, the load-extension curve begins to deviate significantly from astraight line, which is known to define the upper limit ofthe elastic range at which non-recoverable deformationbegins. The final part of the curve shows a progressive dropin load values corresponding to a successive yarn fracture.Because of the manufacturing method, the perpendicularweave directions, weft and warp, show different load-extension behaviours. The weft direction in the ruginvestigated is more flexible than the warp. Also, the
Figure 2: Adsorption and desorption isotherms of water vapour forhistoric wool and silk textiles (checked wool fabric and red satin):the black lines are from the regression of the experimental datausing the GAB equation for the adsorption branch
© 2014 Wiley Publishing Ltd | Strain (2015) 51, 78–8881doi: 10.1111/str.12122
L. Bratasz et al. : Risk of Damage in Historic Textiles
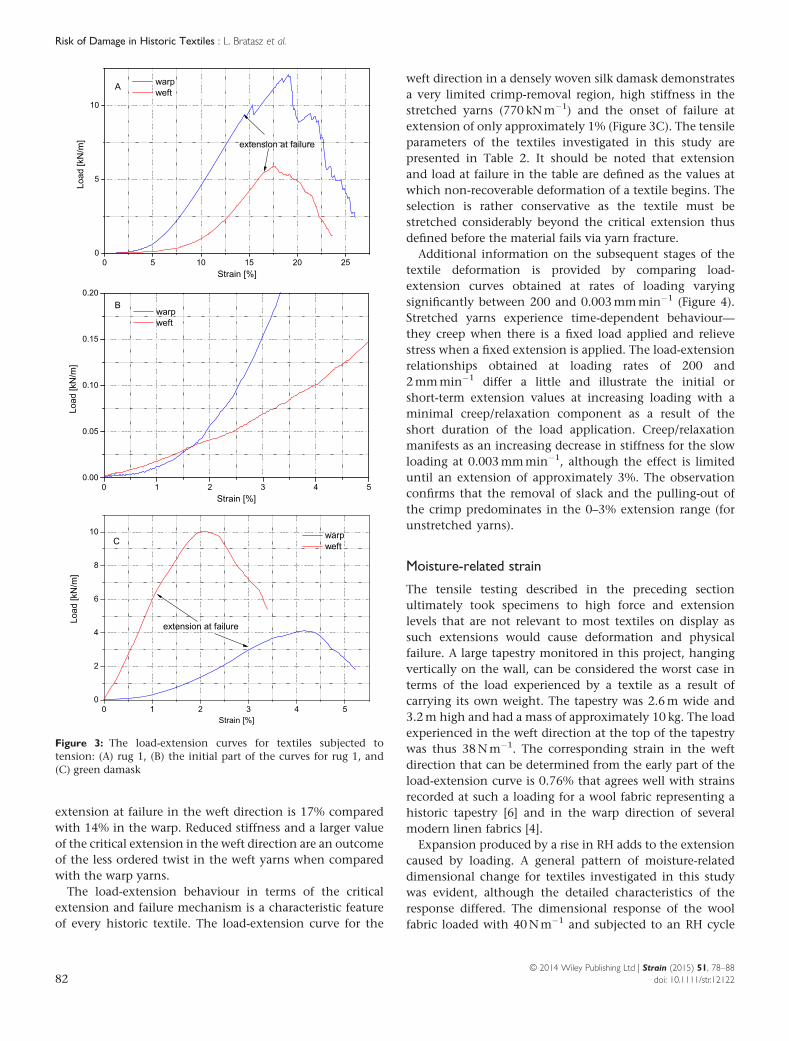
extension at failure in the weft direction is 17% comparedwith 14% in the warp. Reduced stiffness and a larger valueof the critical extension in the weft direction are an outcomeof the less ordered twist in the weft yarns when comparedwith the warp yarns.The load-extension behaviour in terms of the critical
extension and failure mechanism is a characteristic featureof every historic textile. The load-extension curve for the
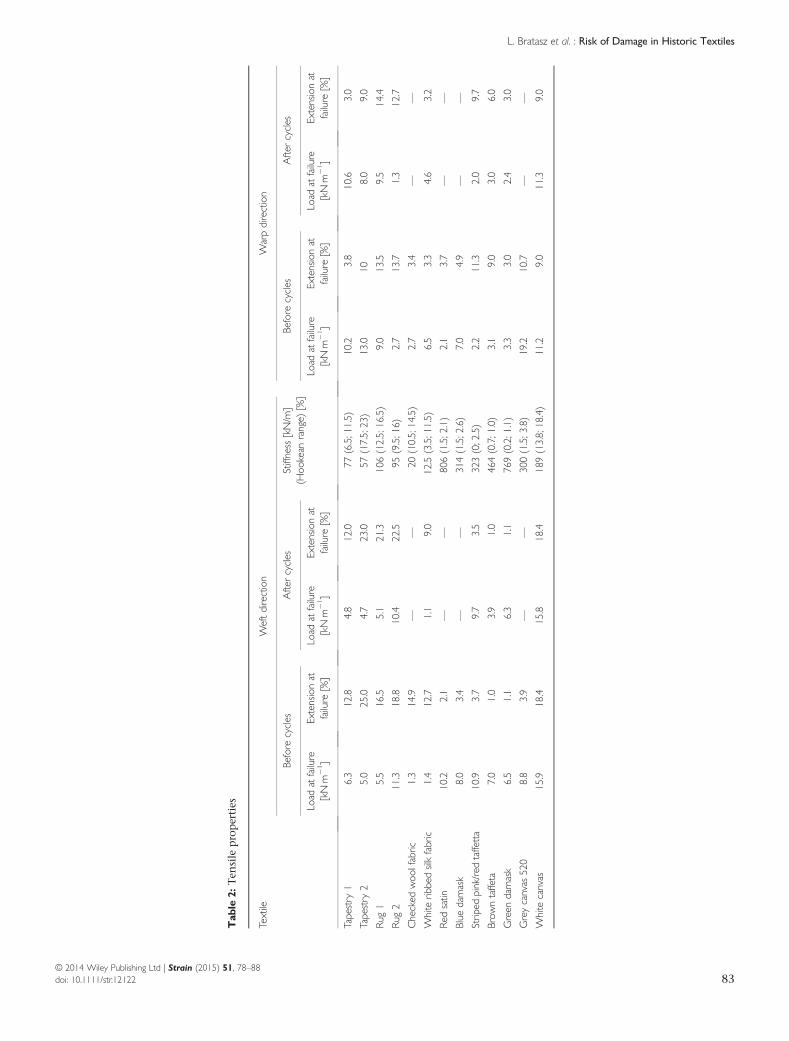
weft direction in a densely woven silk damask demonstratesa very limited crimp-removal region, high stiffness in thestretched yarns (770 kNm�1) and the onset of failure atextension of only approximately 1% (Figure 3C). The tensileparameters of the textiles investigated in this study arepresented in Table 2. It should be noted that extensionand load at failure in the table are defined as the values atwhich non-recoverable deformation of a textile begins. Theselection is rather conservative as the textile must bestretched considerably beyond the critical extension thusdefined before the material fails via yarn fracture.
Additional information on the subsequent stages of thetextile deformation is provided by comparing load-extension curves obtained at rates of loading varyingsignificantly between 200 and 0.003mmmin�1 (Figure 4).Stretched yarns experience time-dependent behaviour—they creep when there is a fixed load applied and relievestress when a fixed extension is applied. The load-extensionrelationships obtained at loading rates of 200 and2mmmin�1 differ a little and illustrate the initial orshort-term extension values at increasing loading with aminimal creep/relaxation component as a result of theshort duration of the load application. Creep/relaxationmanifests as an increasing decrease in stiffness for the slowloading at 0.003mmmin�1, although the effect is limiteduntil an extension of approximately 3%. The observationconfirms that the removal of slack and the pulling-out ofthe crimp predominates in the 0–3% extension range (forunstretched yarns).
Moisture-related strain
The tensile testing described in the preceding sectionultimately took specimens to high force and extensionlevels that are not relevant to most textiles on display assuch extensions would cause deformation and physicalfailure. A large tapestry monitored in this project, hangingvertically on the wall, can be considered the worst case interms of the load experienced by a textile as a result ofcarrying its own weight. The tapestry was 2.6m wide and3.2m high and had a mass of approximately 10 kg. The loadexperienced in the weft direction at the top of the tapestrywas thus 38Nm�1. The corresponding strain in the weftdirection that can be determined from the early part of theload-extension curve is 0.76% that agrees well with strainsrecorded at such a loading for a wool fabric representing ahistoric tapestry [6] and in the warp direction of severalmodern linen fabrics [4].
Expansion produced by a rise in RH adds to the extensioncaused by loading. A general pattern of moisture-relateddimensional change for textiles investigated in this studywas evident, although the detailed characteristics of theresponse differed. The dimensional response of the woolfabric loaded with 40Nm�1 and subjected to an RH cycle
Figure 3: The load-extension curves for textiles subjected totension: (A) rug 1, (B) the initial part of the curves for rug 1, and(C) green damask
© 2014 Wiley Publishing Ltd | Strain (2015) 51, 78–8882 doi: 10.1111/str.12122
Risk of Damage in Historic Textiles : L. Bratasz et al.
Tab
le2:
Ten
sile
properties
Textile
Weftdirection
Warpdirection
Before
cycles
Aftercycles
Stiffness[kN/m
](H
ookean
range)
[%]
Before
cycles
Aftercycles
Load
atfailure
[kNm
�1]
Extensionat
failure
[%]
Load
atfailure
[kNm
�1 ]
Extensionat
failure
[%]
Load
atfailure
[kNm
�1 ]
Extensionat
failure
[%]
Load
atfailure
[kNm
�1]
Extensionat
failure
[%]
Tapestry
16.3
12.8
4.8
12.0
77(6.5;11.5)
10.2
3.8
10.6
3.0
Tapestry
25.0
25.0
4.7
23.0
57(17.5;23)
13.0
108.0
9.0
Rug1
5.5
16.5
5.1
21.3
106(12.5;16.5)
9.0
13.5
9.5
14.4
Rug2
11.3
18.8
10.4
22.5
95(9.5;16)
2.7
13.7
1.3
12.7
Checked
woo
lfabric
1.3
14.9
——
20(10.5;14.5)
2.7
3.4
——
White
ribbedsilkfabric
1.4
12.7
1.1
9.0
12.5(3.5;11.5)
6.5
3.3
4.6
3.2
Redsatin
10.2
2.1
——
806(1.5;2.1)
2.1
3.7
——
Blue
damask
8.0
3.4
——
314(1.5;2.6)
7.0
4.9
——
Strip
edpink/red
taffetta
10.9
3.7
9.7
3.5
323(0;2.5)
2.2
11.3
2.0
9.7
Brow
ntaffeta
7.0
1.0
3.9
1.0
464(0.7;1.0)
3.1
9.0
3.0
6.0
Green
damask
6.5
1.1
6.3
1.1
769(0.2;1.1)
3.3
3.0
2.4
3.0
Greycanvas
520
8.8
3.9
——
300(1.5;3.8)
19.2
10.7
——
White
canvas
15.9
18.4
15.8
18.4
189(13.8;18.4)
11.2
9.0
11.3
9.0
© 2014 Wiley Publishing Ltd | Strain (2015) 51, 78–8883doi: 10.1111/str.12122
L. Bratasz et al. : Risk of Damage in Historic Textiles
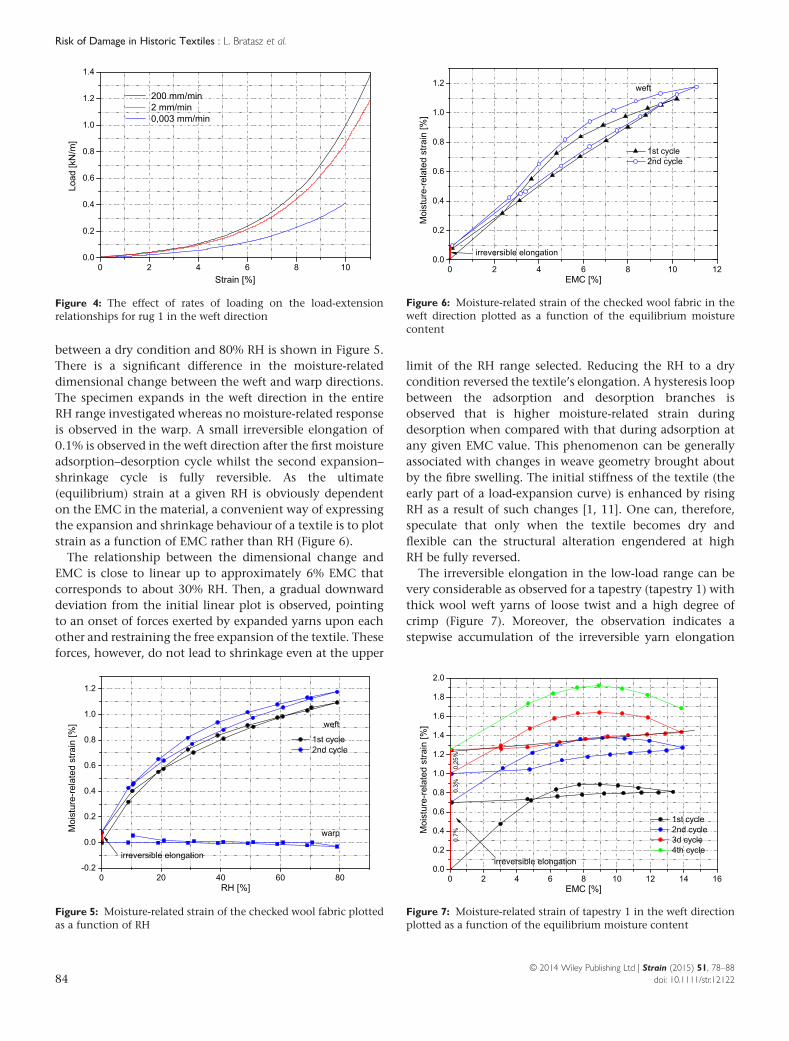
between a dry condition and 80% RH is shown in Figure 5.There is a significant difference in the moisture-relateddimensional change between the weft and warp directions.The specimen expands in the weft direction in the entireRH range investigated whereas no moisture-related responseis observed in the warp. A small irreversible elongation of0.1% is observed in the weft direction after the first moistureadsorption–desorption cycle whilst the second expansion–shrinkage cycle is fully reversible. As the ultimate(equilibrium) strain at a given RH is obviously dependenton the EMC in the material, a convenient way of expressingthe expansion and shrinkage behaviour of a textile is to plotstrain as a function of EMC rather than RH (Figure 6).The relationship between the dimensional change and
EMC is close to linear up to approximately 6% EMC thatcorresponds to about 30% RH. Then, a gradual downwarddeviation from the initial linear plot is observed, pointingto an onset of forces exerted by expanded yarns upon eachother and restraining the free expansion of the textile. Theseforces, however, do not lead to shrinkage even at the upper
limit of the RH range selected. Reducing the RH to a drycondition reversed the textile’s elongation. A hysteresis loopbetween the adsorption and desorption branches isobserved that is higher moisture-related strain duringdesorption when compared with that during adsorption atany given EMC value. This phenomenon can be generallyassociated with changes in weave geometry brought aboutby the fibre swelling. The initial stiffness of the textile (theearly part of a load-expansion curve) is enhanced by risingRH as a result of such changes [1, 11]. One can, therefore,speculate that only when the textile becomes dry andflexible can the structural alteration engendered at highRH be fully reversed.
The irreversible elongation in the low-load range can bevery considerable as observed for a tapestry (tapestry 1) withthick wool weft yarns of loose twist and a high degree ofcrimp (Figure 7). Moreover, the observation indicates astepwise accumulation of the irreversible yarn elongation
Figure 5: Moisture-related strain of the checked wool fabric plottedas a function of RH
Figure 4: The effect of rates of loading on the load-extensionrelationships for rug 1 in the weft direction
Figure 6: Moisture-related strain of the checked wool fabric in theweft direction plotted as a function of the equilibrium moisturecontent
Figure 7: Moisture-related strain of tapestry 1 in the weft directionplotted as a function of the equilibrium moisture content
© 2014 Wiley Publishing Ltd | Strain (2015) 51, 78–8884 doi: 10.1111/str.12122
Risk of Damage in Historic Textiles : L. Bratasz et al.
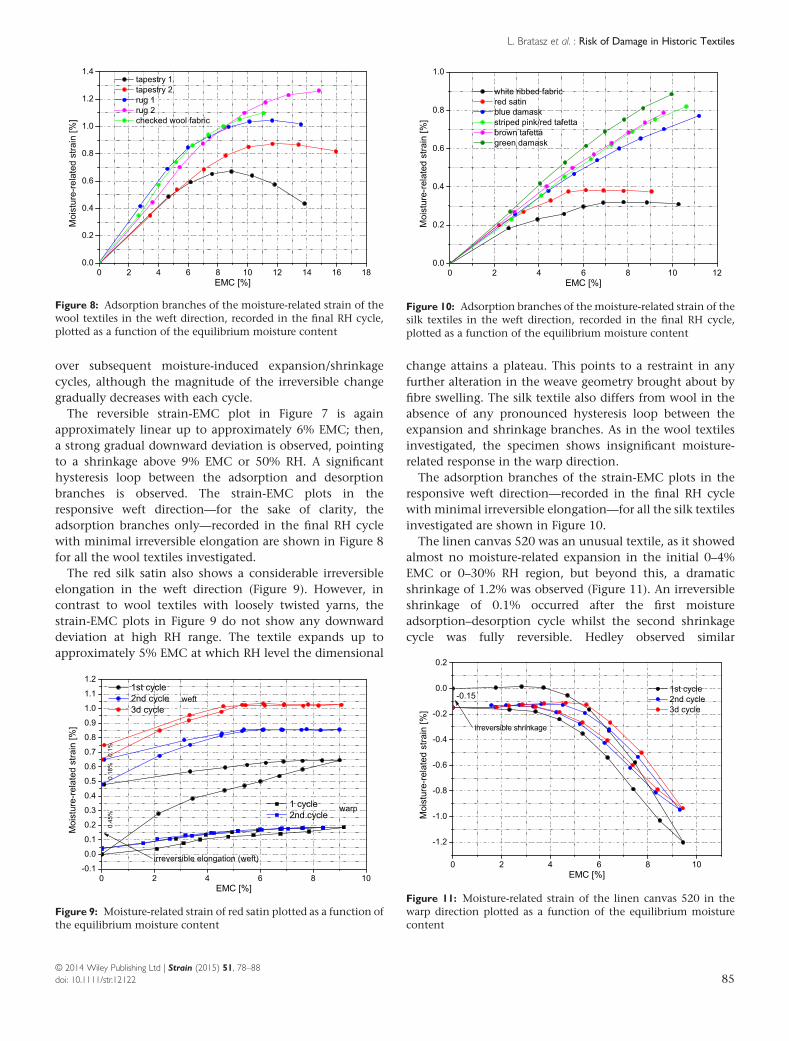
over subsequent moisture-induced expansion/shrinkagecycles, although the magnitude of the irreversible changegradually decreases with each cycle.The reversible strain-EMC plot in Figure 7 is again
approximately linear up to approximately 6% EMC; then,a strong gradual downward deviation is observed, pointingto a shrinkage above 9% EMC or 50% RH. A significanthysteresis loop between the adsorption and desorptionbranches is observed. The strain-EMC plots in theresponsive weft direction—for the sake of clarity, theadsorption branches only—recorded in the final RH cyclewith minimal irreversible elongation are shown in Figure 8for all the wool textiles investigated.The red silk satin also shows a considerable irreversible
elongation in the weft direction (Figure 9). However, incontrast to wool textiles with loosely twisted yarns, thestrain-EMC plots in Figure 9 do not show any downwarddeviation at high RH range. The textile expands up toapproximately 5% EMC at which RH level the dimensional
change attains a plateau. This points to a restraint in anyfurther alteration in the weave geometry brought about byfibre swelling. The silk textile also differs from wool in theabsence of any pronounced hysteresis loop between theexpansion and shrinkage branches. As in the wool textilesinvestigated, the specimen shows insignificant moisture-related response in the warp direction.
The adsorption branches of the strain-EMC plots in theresponsive weft direction—recorded in the final RH cyclewith minimal irreversible elongation—for all the silk textilesinvestigated are shown in Figure 10.
The linen canvas 520 was an unusual textile, as it showedalmost no moisture-related expansion in the initial 0–4%EMC or 0–30% RH region, but beyond this, a dramaticshrinkage of 1.2% was observed (Figure 11). An irreversibleshrinkage of 0.1% occurred after the first moistureadsorption–desorption cycle whilst the second shrinkagecycle was fully reversible. Hedley observed similar
Figure 8: Adsorption branches of the moisture-related strain of thewool textiles in the weft direction, recorded in the final RH cycle,plotted as a function of the equilibrium moisture content
Figure 9: Moisture-related strain of red satin plotted as a function ofthe equilibrium moisture content
Figure 10: Adsorption branches of the moisture-related strain of thesilk textiles in the weft direction, recorded in the final RH cycle,plotted as a function of the equilibrium moisture content
Figure 11: Moisture-related strain of the linen canvas 520 in thewarp direction plotted as a function of the equilibrium moisturecontent
© 2014 Wiley Publishing Ltd | Strain (2015) 51, 78–8885doi: 10.1111/str.12122
L. Bratasz et al. : Risk of Damage in Historic Textiles

irreversible dimensional changes in linen canvases which heexplained as a plastic behaviour [2].The adsorption branches of the strain-EMC plots in the
warp direction for the two canvases—the linen canvas 520and the cotton canvas investigated—are shown in Figure 12.The latter textile does not show any shrinkage force at ahigh RH range because its yarns are quite straight and havelittle crimp.The moisture response plots make it possible to derive the
cyclic dimensional changes that the textiles experience intheir display environments in response to RH fluctuations.One wool and one silk textile (rug 2 and green damask) thatshowed the highest moisture-related dimensional responsewere selected for the calculations as these represented theworst cases of the study in terms of the susceptibility ofthe textile to humidity cycles (Figure 13). When the textiles
experience RH variations between 25 and 75% RH,corresponding to RH variations of the highest amplituderecorded during a year in the display environment of thetextile monitored in this study (refer to the succeedingtexts), the dimensional response is 0.45 and 0.4% for wooland silk respectively.
Moisture-related strains of the Flemish tapestry in itsdisplay environment
The on-site monitoring of strains generated by RH variationswas carried out during 1year for a Flemish wool tapestry fromthe collection of the National Museum in Krakow hung fromthe weft yarns as described in the preceding texts (Figure 14).The analysis of the recorded data indicated a significantlynon-linear relationship between strain and RH (Figure 15).
Figure 12: Adsorption branches of the moisture-related strain in thecanvases in the warp direction, recorded in the final RH cycle,plotted as a function of the equilibrium moisture content
Figure 13: Moisture-related strain of wool rug 2 and green silkdamask in the weft direction, plotted as a function of RH.Dimensional responses for RH variations between 25 and 75% aremarked
Figure 14: RH and strain along the weft yarns of the Flemishtapestry monitored over 1 year
Figure 15: The relationship between strain along the wool weftyarns of the Flemish tapestry and RH
© 2014 Wiley Publishing Ltd | Strain (2015) 51, 78–8886 doi: 10.1111/str.12122
Risk of Damage in Historic Textiles : L. Bratasz et al.
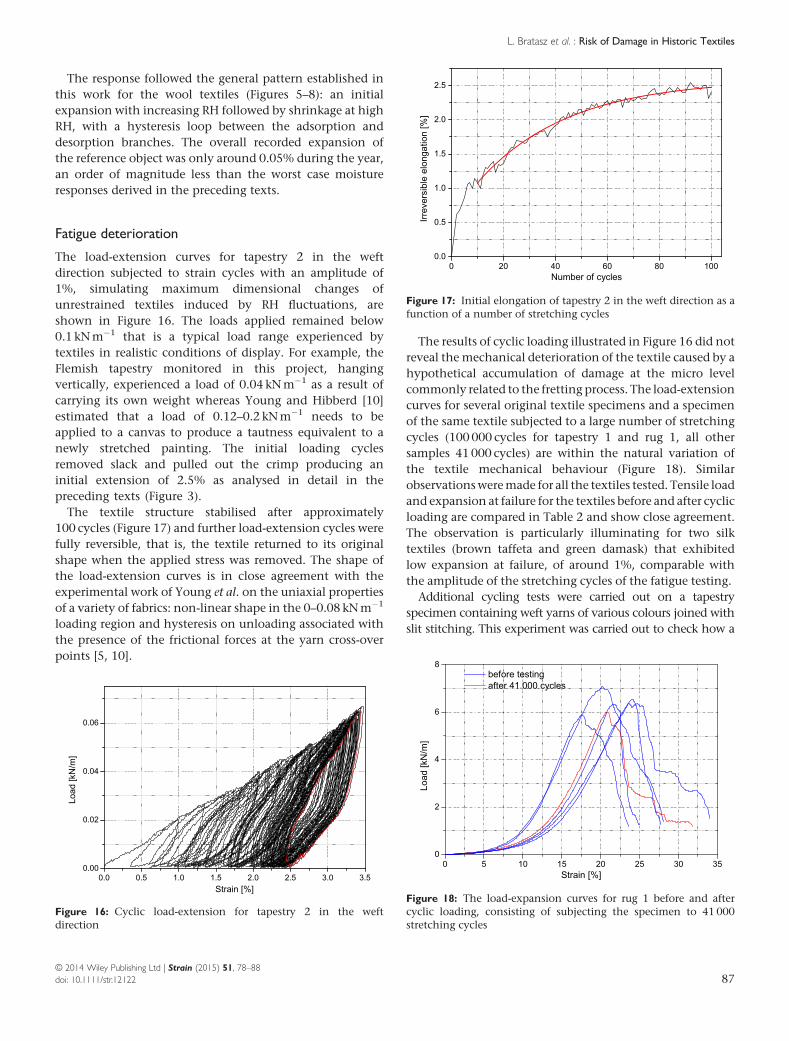
The response followed the general pattern established inthis work for the wool textiles (Figures 5–8): an initialexpansion with increasing RH followed by shrinkage at highRH, with a hysteresis loop between the adsorption anddesorption branches. The overall recorded expansion ofthe reference object was only around 0.05% during the year,an order of magnitude less than the worst case moistureresponses derived in the preceding texts.
Fatigue deterioration
The load-extension curves for tapestry 2 in the weftdirection subjected to strain cycles with an amplitude of1%, simulating maximum dimensional changes ofunrestrained textiles induced by RH fluctuations, areshown in Figure 16. The loads applied remained below0.1 kNm�1 that is a typical load range experienced bytextiles in realistic conditions of display. For example, theFlemish tapestry monitored in this project, hangingvertically, experienced a load of 0.04 kNm�1 as a result ofcarrying its own weight whereas Young and Hibberd [10]estimated that a load of 0.12–0.2 kNm�1 needs to beapplied to a canvas to produce a tautness equivalent to anewly stretched painting. The initial loading cyclesremoved slack and pulled out the crimp producing aninitial extension of 2.5% as analysed in detail in thepreceding texts (Figure 3).The textile structure stabilised after approximately
100 cycles (Figure 17) and further load-extension cycles werefully reversible, that is, the textile returned to its originalshape when the applied stress was removed. The shape ofthe load-extension curves is in close agreement with theexperimental work of Young et al. on the uniaxial propertiesof a variety of fabrics: non-linear shape in the 0–0.08 kNm�1
loading region and hysteresis on unloading associated withthe presence of the frictional forces at the yarn cross-overpoints [5, 10].
The results of cyclic loading illustrated in Figure 16 did notreveal the mechanical deterioration of the textile caused by ahypothetical accumulation of damage at the micro levelcommonly related to the fretting process. The load-extensioncurves for several original textile specimens and a specimenof the same textile subjected to a large number of stretchingcycles (100000 cycles for tapestry 1 and rug 1, all othersamples 41000 cycles) are within the natural variation ofthe textile mechanical behaviour (Figure 18). Similarobservationsweremade for all the textiles tested. Tensile loadand expansion at failure for the textiles before and after cyclicloading are compared in Table 2 and show close agreement.The observation is particularly illuminating for two silktextiles (brown taffeta and green damask) that exhibitedlow expansion at failure, of around 1%, comparable withthe amplitude of the stretching cycles of the fatigue testing.
Additional cycling tests were carried out on a tapestryspecimen containing weft yarns of various colours joined withslit stitching. This experiment was carried out to check how a
Figure 17: Initial elongation of tapestry 2 in the weft direction as afunction of a number of stretching cycles
Figure 18: The load-expansion curves for rug 1 before and aftercyclic loading, consisting of subjecting the specimen to 41 000stretching cycles
Figure 16: Cyclic load-extension for tapestry 2 in the weftdirection
© 2014 Wiley Publishing Ltd | Strain (2015) 51, 78–8887doi: 10.1111/str.12122
L. Bratasz et al. : Risk of Damage in Historic Textiles
large number of cycles affect areas of stress accumulation.Similarly to the homogeneous samples, the results showed nosignificant change in either the reversibility of the loading-extension cycles or the mechanical properties. This confirmedthat the historical samples were not significantly affected bythousands of cycles.
ConclusionsThe dimensional response of a range of textiles to changes inRH, and the critical levels of strain at which thematerials begin to fail physically, were systematicallyexamined, providing insight into potential textile damagemechanisms: stress building as a result of shrinkage of a textilerestrained in its dimensional response and the fretting fatiguewhen friction causes yarns to move against each other oncyclic extension and contraction. It was assumed that thehistoric textiles would have undergone irreversible loadingcycles in the past. This study aimed to assess whether museumdisplay conditions contributed accumulating irreversibledeformation reflecting deteriorationof yarns caused by fatigue.Decreasing RH produces shrinkage in a textile that induces
tensile stress when the textile is restrained in its dimensionalresponse. The restraint may result from fixing the textile in arigid construction that restricts movement, in upholsteredfurniture or in frames to decorate walls, or by supporting ahistoric textile with another textile that responds differently toRH changes. The investigations carried out in this study indicatethat if a wool textile that is highly responsive to moisture islightly stretched and equilibrated at an average RH of 50% inits display environment, then even the fall of the parameter inwinter to a very low level of 10% will reduce the moisturecontent of the wool from 11 to 4% and produce a shrinkage of0.6%. For a silk textile that is highly responsive to moisture,the same RH fall would produce a moisture content drop from5.5 to 2% and a shrinkage of 0.35%. The calculated dimensionalchanges are insignificant in termsof failure risk unless the textilewas initially excessively strained in its mounting.The risk of climate-induced fretting fatigue was assessed,
assuming reasonably that the expansion and shrinkagecycles induced by RH variations can be simulated by cyclicmechanical stretching of a textile. Even in the worst casescenario when diurnal RH variations in a museum are aspronounced as to produce a strain of 1% for a wool tapestry,274 years of object storage in such conditions would notcause significant damage as a result of fretting fatigue.The established relationships between RH, moisture content
and dimensional change also allow the self-loading of largehanging textiles like tapestries to be assessed rationally. Theload experienced in the weft direction at the top end of a largetapestry, monitored in this project, was 38Nm�1 as a result ofcarrying its ownweight. For a yearly RH variation ranging from25% in winter to 75% in summer, the gain in textile mass andthe resulting load is 7%, that is, 2.7Nm�1. The increased load
produces an insignificant increase in strain of the order of0.02% that is still far from the critical strain at which the textilefails physically. Therefore, the textiles sustain increases inweight as a result of sorption of moisture without damageunless they are so degraded that the extension produced byself-loading is close to the critical level.
ACKNOWLEDGEMENTS
This research was supported by a grant from Iceland.Lichtenstein and Norway through the European EconomicArea (EEA) Financial Mechanism within the research projectDirect monitoring of strain for protection of historic textiles and
paintings on canvas implemented in 2008–2011.
REFERENCES1. Ballard, M. (1997) More on moisture: cohesive, temporary, or
permanent set and hygral expansion. Text. Conserv. Newsletter32, 5–20.
2. Hedley,G.(1988)Relativehumidityandthestress/strainresponseof canvas paintings: uniaxial measurements of naturally agedsamples. Stud. Conserv.33, 133–48.
3. Mecklenburg, M. F. (2007) Determining the Acceptable Ranges ofRelative Humidity and Temperature in Museums and Galleries.Part 1, Structural Response to Relative Humidity. MuseumConservation Institute, The Smithsonian Institution,Washington[accessed 4 April 2014]. Available at: http://si-pddr.si.edu/handle/10088/7056
4. Krarup Andersen, C. (2013) Lined Canvas Paintings.PhD Thesis, Royal Academy of Fine Arts, Schools forArchitecture, Design and Conservation, Copenhagen.
5. Young, C. and Jardine, S. (2012) Fabrics for the twenty-firstcentury: as artist canvas and for the structural reinforcement ofeasel paintings on canvas. Stud. Conserv. 57, 237–53.
6. Khennouf, D., Dulieu-Barton, J. M., Chambers A. R., Lennard,F. J. and Eastop, D. D. (2010) Assessing the feasibility ofmonitoring strain in historical tapestries using digital imagecorrelation. Strain 46, 19–42.
7. Zawadzki, W., Bartosik, M., Dzierżęga, K., Bratasz, Ł., Łukomski,M. and Peacock, E. (2012) Application of fibre Bragg gratings forstrain measurement in historic textiles and paintings oncanvas. Optica Applicata XLII, 503–517.
8. Sing, K. S. W., Everett, D. H., Haul, R. A. W., Moscou, L.,Pierotti, R. A., Rouquerol, J. and Siemieniewska, T. (1985)Reporting physisorption data for gas solid systems with specialreference to the determination of surface area and porosity. PureAppl. Chem. 57, 603–619.
9. Timmermann, E. O. (2003) Multilayer sorption parameters: BETor GAB values? Colloids and Surf. A: Physicochem. Eng. Aspects220, 235–260.
10. Young, C. R. T. and Hibberd, R. D. (1999) Biaxial testing ofpaintings on canvas. Stud. Conserv. 44, 129–141.
11. Mecklenburg, M. F. (2005) The structure of canvas supportedpaintings. In: Preprints of the International Conference onPainting Conservation. Canvases: Behavior, Deterioration andTreatment (V. Guerola Blay, M. Castell Augusti, S. Martin Reyand L. Fuster López, Eds). Universitat Politècnica de València,Valencia: 119–155.
© 2014 Wiley Publishing Ltd | Strain (2015) 51, 78–8888 doi: 10.1111/str.12122
Risk of Damage in Historic Textiles : L. Bratasz et al.