pressure ulcer: prevalence, incidence, risk factors, and the ...
Upload
khangminh22Category
view
1download
0
RISK FACTORS AND CONTEMPORARY MANAGEMENT OF
LOW BACK PAIN
Gustavo de Carvalho Machado, BPhty (Hons)
A thesis submitted in fulfilment of the requirements for the degree of
Doctor of Philosophy
School of Public Health, Sydney Medical School
The University of Sydney
November 2016

Supervisors’ Statement
As supervisors of Gustavo de Carvalho Machado’s doctoral work, we certify that we consider
his thesis “Risk Factors and Contemporary Management of Low Back Pain” sufficiently well
presented to be examined, and certify that it does not exceed the prescribed word limit or any
extended word limit for which prior approval has been granted.
Associate Professor Manuela Ferreira
Institute of Bone and Joint Research
The University of Sydney
_______________________________________ Date: 30 November 2016
Professor Christopher Maher
The University of Sydney
_______________________________________ Date: 30 November 2016
Associate Professor Paulo Ferreira
Faculty of Health Sciences
The University of Sydney
_______________________________________ Date: 30 November 2016
ii

Candidate’s Statement
I, Gustavo de Carvalho Machado, hereby declare that this submission is my own work and that
it contains no material previously published or written by another person except where
acknowledged in the text. Nor does it contain material which has been accepted for the award
of another degree.
I, Gustavo de Carvalho Machado, understand that if I am awarded a higher degree for my thesis
entitled “Risk Factors and Contemporary Management of Low Back Pain” being lodged
herewith for examination, the thesis will be lodged in the University library and be available
immediately for use. I agree that the University Librarian (or in the case of a department, the
Head of the Department) may supply a photocopy or microform of the thesis to an individual
for research or study or to a library.
_____________________________________
Date: 30 November 2016
iii

Table of Contents
Supervisors’ Statement .............................................................................................................. ii
Candidate’s Statement .............................................................................................................. iii
Table of Contents ..................................................................................................................... iv
Acknowledgements ................................................................................................................. vii
Publications and Presentations ................................................................................................. ix
Preface ..................................................................................................................................... xii
Abstract .................................................................................................................................. xiv
Chapter One: Introduction ...................................................................................................... 1
1.1 Introduction to low back pain .......................................................................................... 2
1.2 The prevalence of low back pain ..................................................................................... 2
1.3 The socioeconomic burden of low back .......................................................................... 3
1.4 The definition and classification of low back pain .......................................................... 3
1.5 The mechanisms and risk factors for low back pain ....................................................... 6
1.6 Pharmacological interventions for low back pain ........................................................... 9
1.7 The clinical prognosis of low back pain ........................................................................ 11
1.8 Surgical interventions for low back pain ....................................................................... 12
1.9 The rates of surgical procedures for low back pain ....................................................... 13
1.10 Aims of the thesis ........................................................................................................ 14
1.11 References ................................................................................................................... 16
Chapter Two: Transient physical and psychosocial activities increase the risk of non-
persistent and persistent low back pain: a case-crossover study with 12 months follow-up .. 24
Abstract ................................................................................................................................ 26
Introduction ......................................................................................................................... 27
Materials and methods ......................................................................................................... 27
Results ................................................................................................................................. 29
Discussion ............................................................................................................................ 31
Acknowledgments ............................................................................................................... 33References ........................................................................................................................... 33
Chapter Three: An
inception cohort study ............................................................................................................. 34
Abstract ................................................................................................................................ 37
Introduction ......................................................................................................................... 38
Methods ............................................................................................................................... 39
Results ................................................................................................................................. 42
Discussion ............................................................................................................................ 44Acknowledgments .............................................................................................................. 49References ........................................................................................................................... 50
iv

Tables .................................................................................................................................. 53
Appendix ............................................................................................................................. 57Figure .................................................................................................................................. 59
Chapter Four: Efficacy and safety of paracetamol for spinal pain and osteoarthritis:
systematic review and meta-analysis of randomised placebo controlled trials ....................... 60Abstract ................................................................................................................................ 62Introduction ......................................................................................................................... 62Methods ............................................................................................................................... 63Results ................................................................................................................................. 65Discussion ............................................................................................................................ 70References ........................................................................................................................... 73Appendix ............................................................................................................................. 75
Chapter Five: Nonsteroidal anti-inflammatory drugs for spinal pain: systematic review
and meta-analysis .................................................................................................................... 82Abstract ................................................................................................................................ 84
Introduction ......................................................................................................................... 84Methods ............................................................................................................................... 84Results ................................................................................................................................. 86Discussion ............................................................................................................................ 88Acknowledgments ............................................................................................................... 91References ........................................................................................................................... 91Search Strategy .................................................................................................................... 94Supplementary Tables ......................................................................................................... 95Supplementary Figures ...................................................................................................... 103
Chapter Six: Patients with sciatica still experience pain and disability 5 years after surgery:
systematic review with meta-analysis of cohort studies .................................................... 106Abstract .............................................................................................................................. 108Introduction ....................................................................................................................... 109Methods ............................................................................................................................. 109Results ............................................................................................................................... 110Discussion and conclusions ............................................................................................... 112Acknowledgments ............................................................................................................. 115References ......................................................................................................................... 115Appendix ........................................................................................................................... 118
Chapter Seven: Effectiveness of surgery for lumbar spinal stenosis: a systematic review and
meta-analysis ......................................................................................................................... 126Abstract .............................................................................................................................. 128Introduction ....................................................................................................................... 129Materials and methods ....................................................................................................... 130Results ............................................................................................................................... 131
v

Discussion .......................................................................................................................... 140Conclusions ....................................................................................................................... 141References ......................................................................................................................... 142Appendix ........................................................................................................................... 146
Chapter Eight: Trends, complications, and costs for hospital admission and surgery for lumbar spinal stenosis ............................................................................................................ 149
Abstract .............................................................................................................................. 151Introduction ....................................................................................................................... 151Methods ............................................................................................................................. 152Results ............................................................................................................................... 153Discussion .......................................................................................................................... 154Key Points.......................................................................................................................... 157References ......................................................................................................................... 157
Chapter Nine: Conclusions .................................................................................................. 1589.1 Overview of principal findings .................................................................................... 1599.2 Implications and directions for future research ........................................................... 1609.3 Concluding remarks ..................................................................................................... 1669.4 References ................................................................................................................... 167
Appendix A .......................................................................................................................... 169
Appendix B .......................................................................................................................... 172
Appendix C .......................................................................................................................... 176
Appendix D .......................................................................................................................... 178
Appendix E .......................................................................................................................... 181
Appendix F........................................................................................................................... 185
vi

Acknowledgements
Ma, I could not have done this without you. Thank you so much for all your support and
patience during the last four years. I truly admire you in so many ways and you inspire me to
work harder every day. You make me a better person and I am grateful that you chose me as
your husband. You are my best friend, as a team we will grow stronger, and together we will
have a beautiful family. I love you forever. This thesis is dedicated to you.
Mum and Dad, you are my greatest examples in life. Thank you for always believing in me and
for the many sacrifices you have made to support my decisions. Vi, you are the best brother one
could ever ask for, and you really inspire me. I will be eternally grateful for all your support
and for always motivating me to pursue my dreams. Despite the huge distance between us, the
three of you have always been in my heart and very close to me, and I thought of you every
single day. I love you and hope I have made you proud.
Manuela, Paulo and Chris, I am appreciative of your guidance during my PhD candidature.
Manuela and Paulo, you are my great examples of perseverance and success. I could not thank
you enough for your mentorship and all the opportunities you gave me since the early stages of
my career. Chris, you are a great leader and I have learnt a lot from you. For all this, I will be
forever grateful.
Steve and Chris Williams, a huge thanks for your mentorship and priceless advice, accompanied
with so much fun and, of course, beer. Anne Moseley, thank you for the opportunity to work
with PEDro and for the amazing bushwalks we did in the Blue Mountains. Colleen, Martin and
Debra, thank you for your support and supervision during my teaching experience in the
vii

Discipline of Physiotherapy at the Faculty of Health Sciences. Jose Liberato Jr, thank you for
being a remarkable teacher, you have shown me the value of our profession in helping people
get better and stay well.
This journey would not have been the same without my fellow PhD students Zambelli and
Marcinha, Daniel and Paula, Bruno and Tie, Patricia, Juliana, Steph, Mike, Matt, Aron, and
Tarci. You guys have made my candidature so much more enjoyable and I will miss you!
Marilie, Jen, Marnee, Matt, Amabile, and Anita, thank you for adding some fun in to my
teaching days at the Faculty of Health Sciences.
To my Brazilian Jiu-jitsu coaches at Gracie Barra Belo Horizonte (Claudio Mattos, Marcelo
Azevedo, Vinicius Draculino) and students at Zeus Martial Arts Academy, and Costa Prasoulas,
you kept my mind in place and reminded me about important aspects of life: discipline, focus,
determination, and loyalty. To my friends, Marcelo and Mayumi, Bernardo and Nadia, Matheus
and Marcela, Igor and Mariana, Rafael, Damien and Larissa, Paul and Imelda, thank you for
your friendship and for sharing with me some great moments in this great country.
viii

Publications and Presentations
Parts of the work presented in this thesis have been published or accepted for publication in
peer-reviewed journals and/ or presented in conferences.
Published or accepted papers
Machado GC, Maher CG, Ferreira PH, et al. Can recurrence after an acute episode of low back
pain be predicted? Phys Ther 2017;[In press].
Machado GC, Ferreira PH, Maher CG, et al. Nonsteroidal anti-inflammatory drugs for spinal
pain: a systematic review and meta-analysis. Ann Rheum Dis 2017;76:1269-78.
Machado GC, Maher CG, Ferreira PH, et al. Trends, complications, and costs for hospital
admission and surgery for lumbar spinal stenosis. Spine 2017;[Epub ahead of print].
Machado GC, Ferreira ML. No clinical benefits of surgery over rehabilitation for lumbar spinal
stenosis (PEDro synthesis). Br J Sports Med 2017;51:541-42.
Machado GC, Ferreira PH, Yoo RIJ, et al. Surgical options for lumbar spinal stenosis. Cochrane
Database Syst Rev 2016;11:CD012421.
Machado GC, Ferreira PH, Maher CG, et al. Transient physical and psychosocial activities
increase the risk of non-persistent and persistent low back pain: a case-crossover study with 12
months follow-up. Spine J 2016;16:1445-52.
ix

Machado GC, Witzleb AJ, Fritsch C, et al. Patients with sciatica still experience pain and
disability 5 years after surgery: a systematic review with meta-analysis of cohort studies. Eur J
Pain 2016;20:1700-09.
Machado GC, Maher CG, Ferreira PH, et al. Efficacy and safety of paracetamol for spinal pain
and osteoarthritis: systematic review and meta-analysis of randomised placebo controlled trials.
BMJ 2015;350:h1225.
Machado GC, Maher CG, Ferreira ML. Paracetamol, spinal pain, and osteoarthritis: Authors'
reply to Adam and to Veal and Thompson. BMJ 2015;350:h2223.
Machado GC, Maher CG, Ferreira ML. Lack of efficacy of paracetamol for low back pain and
osteoarthritis. J Pioneer Med Sci 2015;5:142-43.
Machado GC, Ferreira PH, Harris IA, et al. Effectiveness of surgery for lumbar spinal stenosis:
a systematic review and meta-analysis. PLoS ONE 2015;10:e0122800.
Machado GC, Ferreira ML. Physiotherapy improves eating disorders and quality of life in
bulimia and anorexia nervosa. Br J Sports Med 2014;48:1519-20.
Presentations
Machado GC, Ferreira PH, Maher CG, Hunter DJ, Day RO, Pinheiro MB, Ferreira ML. Safety
and efficacy of nonsteroidal anti-inflammatory drugs for spinal pain: a systematic review with
meta-analysis of randomised placebo-controlled trials. In: Proceedings of XIV International
x

Forum for Back & Neck Pain Research in Primary Care, June 2016. Buxton, United Kingdom.
Poster Presentation.
Machado GC, Witzleb AJ, Fritsch C, Maher CG, Ferreira PH, Ferreira ML. The clinical course
of patients with sciatica treated surgically: a systematic review with meta-analysis of cohort
studies. In: Proceedings of Australian Physiotherapy Association Conference, October 2015.
Gold Coast, Australia. Oral Presentation.
Machado GC, Ferreira PH, Maher CG, Latimer J, Steffens D, Koes BW, Li Q, Ferreira ML.
Triggers for an episode of persistent low back pain: 12-month follow-up of a case-crossover
study. In: Proceedings of Australian Physiotherapy Association Conference, October 2015.
Gold Coast, Australia. Oral Presentation.
Machado GC, Maher CG, Ferreira PH, Pinheiro MB, Lin CWC, Day RO, McLachlan AJ,
Ferreira ML. Efficacy and safety of paracetamol for spinal pain and osteoarthritis: a systematic
review and meta-analysis. In: Proceedings of III Population Health Congress, September 2015.
Hobart, Australia. Poster Presentation.
Machado GC, Ferreira PH, Harris IA, Pinheiro MB, Koes BW, van Tulder M, Rzewuska M,
Maher CG, Ferreira ML. Decompression techniques in the management of lumbar spinal
stenosis: a systematic review and meta-analysis of randomised controlled trials. In: Proceedings
of XIII International Forum for Back Pain Research in Primary Care, October 2014. Campos
do Jordao, Brazil. Poster Presentation.
xi

Preface
This thesis is arranged in nine chapters, written so that each chapter can be read independently.
The studies in this thesis involve two topics: risk factors (Chapter Two and Chapter Three),
and contemporary management of low back pain (Chapter Four to Chapter Eight). The
University of Sydney allows published papers that arose from the candidature to be included in
the thesis.
Chapter One is an introduction to the thesis and provides an overview of the definitions,
epidemiology, and economic burden of low back pain, as well as a background related to the
risk factors, prognosis, and contemporary management associated with this condition. Chapter
Two is a case-crossover study with 12-month follow-up identifying transient physical and
psychosocial risk factors for an episode of persistent low back pain in primary care settings.
This study is presented as published in The Spine Journal. Chapter Three is an inception
cohort study conducted to estimate the 1-year incidence of recurrence of low back pain and to
investigate predictors associated with future recurrences within one year. This study is
presented in the format required by Physical Therapy where it was accepted for publication.
Chapter Four consists of a systematic review investigating the safety and efficacy of
paracetamol in patients with low back or neck pain, or osteoarthritis. This study is presented as
published in BMJ. Chapter Five is a systematic review investigating the safety and efficacy of
nonsteroidal anti-inflammatory drugs in patients with low back or neck pain, with or without
radicular symptoms. This study is presented as published in Annals of the Rheumatic Diseases.
Chapter Six is a systematic review investigating the long-term prognosis in terms of pain and
disability in patients who received surgery for sciatica. This study is presented as published in
European Journal of Pain. Chapter Seven investigates the safety and efficacy of various
xii

surgical options for patients with lumbar spinal stenosis through a systematic review. This study
is presented as published in PLoS ONE. Chapter Eight is a population-based data linkage study
conducted to identify the trends, complications, and costs of hospital admission and surgery for
lumbar spinal stenosis. This study is presented as published in Spine. Chapter Nine is an
overview of the thesis, and discusses the clinical implications of the findings and directions for
future research.
Each chapter contains its own reference list. Appendices that were published as online
supplementary material, and other relevant outputs are included at the end of the relevant
chapter. Additional appendices unrelated to individual chapters are included at the end of the
thesis. Ethical approval was obtained from the Human Research Ethics Committee of the
University of Sydney for the studies reported in Chapter Two and Chapter Three prior to
commencement. Ethical approval was obtained from the New South Wales Population and
Health Services Research Ethics Committee for the study reported in Chapter Eight prior to
commencement. The remaining chapters did not require ethical approval.
xiii
Abstract
Low back pain is common and causes more burden in terms of years lived with disability than
any other health condition globally. In most cases, the patho-anatomical cause of low back
pain cannot be determined. Less commonly, specific spinal pathologies can be identified as
the cause of low back pain, including conditions involving neurologic compromise, such as
sciatica and lumbar spinal stenosis. Despite extensive research over the past decades,
questions remain in terms of the underlying mechanisms, risk factors, and current treatment
options for these conditions. The broad aim of this thesis, therefore, is to contribute to a better
understanding of factors associated with low back pain onset and the safety and efficacy of
contemporary management strategies.
Risk factors associated with the onset of a new episode of low back pain can be divided into
those involving long-term exposure (e.g., smoking) and those involving transient or brief
exposure to the risk factor (e.g., a fall). A recent case-crossover study identified that
commonly endorsed physical and psychosocial triggers (e.g., awkward postures, distracted
during an activity) increase substantially the risk of sudden onset low back pain, with odds
ratios ranging from 2.7 to 25.0. This study focussed on triggers for an acute episode of low
back pain and did not consider the triggers that increased the risk of an episode of longer
duration. This is an important issue as most of the costs of low back pain are associated with
persistent cases. The study presented in Chapter Two includes the 12-month follow-up of
this case-crossover study and examined the association between the previously identified
triggers and the risk of a low back pain episode that persisted for greater than six weeks. This
study was based on data from 782 patients presenting to primary care clinics for a new
episode of low back pain, who were successfully followed-up. Conditional logistic regression
xiv

models suggested that previously identified psychosocial and physical triggers, such as being
fatigued or tired during an activity or manual tasks involving awkward postures, increased the
risk of persistent episodes of low back pain, with odds ratios (OR) ranging from 2.9 (95%
confidence interval [CI]: 1.3–6.4) to 11.7 (95% CI: 5.4–25.3). The results were similar to
those for acute episodes of low back pain, suggesting that controlling exposures to these
triggers may prevent not only the cases of low back that resolve within six weeks, but also the
cases that persist, which are believed to cause the greatest burden of this condition.
While a great proportion of patients with low back pain experience recovery within six weeks,
recurrence of low back pain is common. However, estimates of recurrence within one year
range from 26% to 84%. Part of this variability can be attributed to different definitions of
episodes of low back pain used across studies. Moreover, only a few studies have used
appropriate methodology to investigate predictors of recurrence. The study presented in
Chapter Three determined the 1-year incidence of recurrence in participants who had
recently recovered from an acute episode of low back pain, and identified predictors of future
recurrences. This was an inception cohort study with 12 months follow-up. Recurrence was
defined based on a 12-month recall of a new episode of pain or a new episode of care seeking
with data from 469 participants. The 1-year incidence of recurrence of low back pain was
33%, and the recurrence rate for a new episode of care seeking for low back pain was 18%.
Multivariable regression analysis revealed that having more than two previous episodes of
low back pain increased the odds of a future recurrence by 3.2 (95% CI: 2.1–4.8). This factor
was also associated with recurrent episodes of care seeking (OR: 2.9, 95% CI: 1.7–4.8). No
other factors were associated with recurrence. This study contributes to the lack of research on
recurrence of low back pain.
xv

Patients with low back pain seeking primary health care are often recommended paracetamol
as the first line analgesic medication. This medicine is also widely used to treat osteoarthritis.
However, a randomised trial published in 2014 concluded that paracetamol was ineffective
for acute low back pain, and there was also conflicting evidence for its use in osteoarthritis.
The systematic review with meta-analysis of randomised placebo-controlled trials presented
in Chapter Four investigated the safety and efficacy of paracetamol in patients with low
back pain, as well as neck pain, or osteoarthritis. Searching eight databases revealed 13 trials
that met the inclusion criteria. Pain and disability scores were converted to a 0 to 100 scale,
and a 9-point threshold was used to define smallest worthwhile effect. Pooling showed no
effects of paracetamol on pain (mean difference [MD]: –0.5, 95% CI: –2.9 to 1.9) or disability
(MD: 0.4, 95% CI: –0.9 to 1.7) for acute low back pain. No trials investigated the effects of
paracetamol for patients with neck pain. Paracetamol had small and not clinically important
effects for osteoarthritis in pain relief (MD: –3.7, 95% CI: –5.5 to –1.9) or disability reduction
(MD: –2.9, 95% CI: –4.9 to –0.9). Patients taking paracetamol were 3.8 times (95% CI: 1.9–
7.4) more likely to have abnormal test results of liver function compared with placebo. The
results of this systematic review support the reconsideration of recommendations to use
paracetamol for these conditions. The study was published with an editorial and has received
various prizes, including the BMJ 1st prize for the most accesses in 2015.
The impact of withdrawing recommendations for paracetamol from clinical guidelines of low
back pain is that the use of nonsteroidal anti-inflammatory drugs (NSAIDs), second line
analgesic, is set to increase. A comprehensive review and appraisal of the literature on the
efficacy and safety of NSAIDs was therefore paramount. Moreover, the effects of NSAIDs for
some forms of spinal pain, such as acute low back pain and neck pain, remain uncertain.
Chapter Five, therefore, presents a systematic review with meta-analysis of randomised
xvi

placebo-controlled trials that aimed to determine the efficacy and safety of NSAIDs for low
back pain, as well as neck pain, with or without radicular pain. Systematic searches were
conducted in five large databases and 35 randomised trials were included in the review. Pain
and disability outcomes were converted to a 0 to 100 scale, and a between-group difference of
10 points was used as the smallest worthwhile effect. Numbers needed to treat were also
calculated providing the number of participants treated with NSAIDs who would achieve a
clinically important pain reduction compared with placebo. Pooling revealed that for every six
participants (95% CI: 4 to 10) treated with NSAIDs, only one would benefit from it,
considering a between-group difference of 10 points (i.e., compared with placebo) for clinical
importance in the short-term. Moreover, only in three of the 14 analyses looking at different
types of spinal pain, outcomes, or time points were the pooled treatment effects marginally
above our threshold for clinical importance. Additionally, taking NSAIDs increased the risk
of developing gastrointestinal adverse events by 2.5 times (95% CI: 1.2–5.2).
The initial management of low back pain usually focuses on conservative treatments,
including analgesic medications. When conservative treatments are unsuccessful, surgery may
be considered. Sciatica is a common indication for spine surgery, but at present the clinical
course of this condition following surgery remains largely unknown. Therefore, the
systematic review with meta-analysis of cohort studies presented in Chapter Six investigated
the clinical course of pain and disability in patients who had surgery for sciatica. The searches
were conducted in three large databases and 40 publications (39 cohort studies) were
included. Pain and disability scores were converted to a common 0 to 100 scale and modelled
as a function of time. Generalised estimating equations revealed that the pooled mean leg pain
intensity before surgery was 75.2 (95% CI: 68.1 to 82.4) and the mean disability was 55.1
(95% CI: 52.3 to 58.0). Pooled mean leg pain (15.3, 95% CI: 8.5 to 22.1) and disability (15.5,
xvii

95% CI: 13.3 to 17.6) reduced substantially after three months. At five years, patients still
reported moderate levels of leg pain (21.0, 95% CI: 12.5 to 29.5) and disability (13.1, 95%
CI: 10.6 to 15.5). These findings suggest that patients with sciatica experience rapid
improvements in the first three months after surgery, but are not likely to experience full
recovery (i.e., absence of pain or disability) in the long-term.
Lumbar spinal stenosis is the fastest-growing indication for spine surgery among older
people. However, surgeons usually rely on their own preferences to decide on the best
surgical technique for their patient. The systematic review and meta-analysis presented in
Chapter Seven investigated the efficacy of surgery for lumbar spinal stenosis, and the
effectiveness of various surgical options for this condition. The searches conducted on seven
databases revealed limited evidence, as no surgical placebo-controlled trials were found. The
24 randomised trials included in the review compared various surgical options for lumbar
spinal stenosis. Pain and disability scores were converted to a 0 to 100 scale. Pooling
suggested that fusion offered no additional benefits over decompression surgery alone on pain
(MD: –0.3, 95% CI: –7.3 to 6.7) or disability (MD: 3.3, 95% CI: –6.1 to 12.6). The
interspinous process spacers alone were not more effective than conventional decompression
in pain relief (MD: –0.6, 95% CI: –8.1 to 7.0) or disability reduction (MD: 1.3, 95% CI: –4.5
to 7.0), but showed small effects when compared with decompression plus fusion on
disability (MD: 5.7, 95% CI: 1.3 to 10.0). This review was originally published in PLoS ONE
in 2015, but has since then been updated and published in the Cochrane Database of
Systematic Reviews, presented in this thesis as an appendix. The updated results provide
current evidence on the surgical options for lumbar spinal stenosis, and could be used to guide
clinical decision-making in this contentious area.
xviii

Even though the effects of surgical procedures for patients with lumbar spinal stenosis remain
unclear, the rates of fusion procedures have increased in the United States in recent times. It is
unknown, however, whether these trends are happening elsewhere. Moreover, further
information on complications could better inform surgeons, referring physicians, and patients
about risks of surgical procedures. The population-based health record linkage study
presented in Chapter Eight determined the trends in hospital admission and surgery for
lumbar spinal stenosis in Australia, and investigated associated complications and health care
use. The Centre for Health Record Linkage was used to link data of admissions, discharges,
and transfers records from all public and private hospitals in New South Wales between 2003
and 2013. In one decade, the age-standardised rate of hospital admissions for lumbar spinal
stenosis increased from 34.8 to 39.3 per 100,000 people. In 2013, the total costs for lumbar
spinal stenosis were AU $46.1 million. Decompression rates increased from 19.0 to 22.1 per
100,000 people during 2003–2013, while the rates of simple fusion doubled, from 1.3 to 2.8
per 100,000 people. The most significant increase, however, occurred for complex fusion,
from 0.6 to 2.4 per 100,000 people – a 4-fold increase in the same 10-year period. Mean
hospital costs with decompression surgery were AU $12,168, while simple and complex
fusion cost AU $30,811 and AU $32,350, respectively. Complex fusion procedures increased
the odds of major complications by 4.1 (95% CI: 1.7–10.1) compared with decompression
alone. This study confirms that in Australia the number of complex fusion procedures is
increasing at a much faster rate than any other surgical procedure for lumbar spinal stenosis,
though it is associated with increased risk of major complications and resource use.
Overall, the studies presented in this thesis provide a substantial contribution to the
understanding of the mechanisms and risk factors of low back pain. The identification of
transient risk factors for persistent low back pain could help develop better preventive
xix

strategies. Although a great proportion of patients experience recovery within six weeks, it is
now clear that a third is expected to have a recurrence, with multiple previous episodes being
the only significant predictor of future recurrences. This thesis also contributes to a better
understanding of current management strategies for low back pain. Paracetamol is ineffective
for acute low back pain, but NSAIDs provide small effects in pain relief and disability
reduction. Recommendations in clinical practice guidelines on pharmacological interventions
should be reviewed. Although patients refractory to conservative treatments are frequently
referred to surgery, the postoperative clinical course of sciatica is not as favourable as
previously thought. Furthermore, despite the lack of evidence on surgical options for lumbar
spinal stenosis, fusion surgery is increasing at an alarming rate in Australia.
xx

CHAPTER ONE
Introduction
1

1.1 Introduction to low back pain
Low back pain is a common condition affecting millions of people and is associated with a
major socioeconomic burden globally.1 In Australia, low back pain is the second most common
symptom for a primary care consultation.2 Low back pain also accounts for 2.3% of all
physician consultations in the United States.3,4 The burden to the patient is also substantial and
low back pain is still the main cause of disability and work loss in many countries.5 While
serious spinal pathologies leading to low back pain (e.g., vertebral fracture and malignancy)
are uncommon in primary care, about 9% of patients will have some type of neurologic
compromise, where sciatica and lumbar spinal stenosis are the most common diagnoses.6 The
remaining 90% will present with non-specific low back pain, when the anatomical structure
causing the pain cannot be identified.1 A better understanding of risk factors and mechanisms
of low back pain is crucial in order to prevent this burdesome condition.
The initial management of low back pain usually involves the use of simple analgesics.
However, the safety and efficacy of commonly used analgesics (e.g., paracetamol) for low back
pain have been questioned by a recent randomised trial.7 Likewise, the safety and efficacy of
complex interventions, including surgery for lower back conditions is still controversial and
the focus of much debate.8 This thesis will contribute to a better understanding of factors
associated with low back pain onset and the safety and efficacy of contemporary management
strategies.
1.2 The prevalence of low back pain
Every year, about 6% of the population develops a first-ever episode of low back pain.9 Most
people, however, will experience multiple episodes of low back pain throughout their lives,
resulting in a lifetime prevalence of 84%.10 A systematic review of 165 studies yielded an
2

estimate of the point-prevalence of low back pain of 12%, while the 1-month prevalence was
estimated at 23%.11 Low back pain associated with neurologic compromise, on the other hand,
is less prevalent. For instance, while the annual prevalence of non-specific low back pain is
38%,11 sciatica affects about 10% of the population annually.12 Another less common cause of
low back pain is lumbar spinal stenosis, which affects only 4% of the general adult population
every year,13 though the prevalence can be much higher in those older than 60 years of age.14
1.3 The socioeconomic burden of low back pain
Globally, low back pain causes more disease burden than any other health condition, where
burden is measured as years lived with disability.15 The burden of low back pain has increased
by 57% between 1990 and 2013, from 46.1 million to 72.3 million years lived with disability.16
This condition continues to be the leading cause of disability in most countries according to
the 2015 Global Burden of Diseases study.5 The direct (health care) and indirect (reduction of
work or household productivity) costs associated with low back pain are large and seem to be
growing.17 However, estimates of economic costs vary greatly between different countries.4
For example, indirect costs in the United States are as high as US $28.2 billion, while the direct
costs are estimated at US $90.6 billion.4 In Australia, the estimated costs associated with
productivity loss are AU $8.2 billion (US $6.2 billion), whereas annual costs of health care are
AU $1.0 billion (US $800 million).18
1.4 The definition and classification of low back pain
Low back pain is usually defined as a primary complaint of pain between the costal margin and
the inferior gluteal folds, with or without leg pain.19 An episode of low back pain is defined as
low back pain lasting at least 24 hours in duration.19 A recurrent episode is the return of low
back pain with minimum pain intensity following a period of least one month without pain (0
3

or 1, 0–10 scale).20 Such definitions are commonly used in international clinical practice
guidelines and will be used in the work presented in this thesis.21,22
Low back pain is also classified according to its duration, though time frames are inconsistently
reported in the literature.21 For instance, the duration of symptoms used to define the transition
from an acute (or non-persistent) to chronic (or persistent) episode of low pain has been
reported as 72 hours,23 while others have used a cut off of three months.24 Given that patients
with low back pain improve markedly in the first six weeks,25 this thesis defines a non-
persistent episode of low back pain as that lasting less than six weeks. Hence, persistent low
back pain is defined as an episode lasting six weeks or longer.19
1.4.1 Using a diagnostic triage to classify low back pain
Another classification of low back pain consists of using a diagnostic triage to identify non-
specific low back pain episodes from cases of neurologic compromise or serious spinal
pathology.21,22 Non-specific low back pain is used to define those cases without clear specific
cause, and comprises 90% of patients with low back pain presenting to primary care.1,26
Neurologic compromise affects about 9% of patients with low back pain,27 whereas serious
spinal pathologies, such as vertebral fracture or malignancy, affect ~1% of patients presenting
to primary care with low back pain.6
Sciatica is the most common type of neurologic compromise affecting the lumbar spine.27 This
condition is defined as radiating pain into the leg that may present with neurological symptoms,
such as paraesthesia, weakness and reduction of reflexes.28 Sciatica is a commonly used term
but reflects an out of date view of the mechanism of the condition.29 A more contemporary
term is lumbosacral radicular syndrome or radiculopathy. However, given the common use of
4

the term sciatica in the literature, this thesis uses this term to define patients with unilateral
radiating pain below the knee with or without low back pain or neurological symptoms.
Another form of neurologic compromise, more common in the older population, is lumbar
spinal stenosis. This condition is defined as the narrowing of the central spinal canal, lateral
recesses, or intervertebral foramen, causing compression of neurovascular tissues.13 Central
lumbar spinal stenosis causes compression of the spinal cord or cauda equina by hypertrophy
of bony or ligamentous tissues.30 The most common symptom of central lumbar spinal stenosis
is intermittent neurogenic claudication – radiating bilateral leg pain exacerbated by standing,
walking, or lumbar extension, and relieved by forward flexion or sitting.31 Lateral or foraminal
lumbar spinal stenosis, on the other hand, compromises nerve roots, and symptoms may
resemble those of unilateral radiculopathy.13 Often these subgroups are lumped together to
create heterogeneous cohorts simply defined as lumbar spinal stenosis.
Serious pathologies of the lumbar spine include infection, inflammatory diseases, cauda equina
syndrome, axial spondyloarthritis, vertebral fracture and malignancy. These conditions,
however, only affect a small minority (~1%) of patients with low back pain presenting to
primary care.6 Vertebral fracture and malignancy are the most common serious pathologies
affecting the lumbar spine,32,33 and screening for red flags is endorsed in most clinical
guidelines in order to identify patients more likely to have these conditions.21 However, only a
small subset of red flags (older age, prolonged corticosteroid use, severe trauma, presence of a
contusion, or history of malignancy) have been found to be associated with increased likelihood
of vertebral fracture or malignancy.34
5

The focus of the work presented in this thesis is on the risk factors and current management
strategies for non-specific low back pain, sciatica and lumbar spinal stenosis, which together,
comprise the most prevalent and burdensome conditions that affect the lumbar spine.
1.5 The mechanisms and risk factors for low back pain
There is an unclear understanding of the underlying mechanisms associated with low back pain.
Low back pain may originate from various spinal structures including intervertebral discs,
muscles, bones, ligaments or neural tissues. The identification of the exact anatomical source
of pain, however, is impractical in clinical practice, given the weak association between clinical
tests and reference tests for each diagnosis (e.g., facet joint or sacroiliac joint pain).35,36
The factors currently known to increase the risk of low back pain onset have not helped the
development of effective preventive strategies.37 One possible explanation is that most of these
factors are related to long-term exposures (e.g., smoking) or are non-modifiable factors (e.g.,
age, gender, comorbidities).9,26,38 A well-conducted systematic review of 41 cohort studies
revealed 21 significant risk factors for low back pain, but most cohorts used pain of any
duration to ascertain future low back pain.38 Moreover, cohorts studies are often vulnerable to
confounding issues. The Triggers for Low Back Pain was the first study to overcome these
common limitations by investigating transient exposure to modifiable factors likely to trigger
a new episode of low back pain using a case-crossover design.39 The findings revealed that
manual and psychological factors, such vigorous physical activity or being distracted during a
task, significantly increased the risk of a new onset of low back pain, with odds ratio ranging
from 2.7 (95% CI: 2.0–3.6) to 25.0 (95% CI: 3.4–184.5).39 However, the link between these
triggers and persistent cases of low back pain remained unclear, given the Triggers study
focused on acute episodes.
6

Identifying triggers for persistent low back pain is particularly important, since these cases
account for 75% of the socioeconomic burden of this condition.40 Therefore, Chapter Two
presents a 12-month follow-up of the Triggers for Low Back Pain study that identified the
triggers associated with onset of an episode of low back pain that persisted greater than six
weeks in duration. The study also compared the risk estimates for persistent low back pain with
those linked to non-persistent cases. Findings from this study are likely to aid understanding of
the mechanisms of low back pain, and facilitate the development of effective preventive
interventions for this condition.
Patients with a new episode of low back pain experience large improvements in the first few
weeks after the onset of symptoms.25 In fact, about two thirds of these patients recover
completely within six weeks,41 a finding confirmed by the study presented in Chapter Two.
However, our understanding of predictors of recovery is still poor.42 Furthermore, we know
that once recovered, patients will often report recurrent episodes.43 There are, however,
inconsistent estimates of recurrence of low back pain reported in the literature, and a lack of
large high quality cohort studies investigating predictors of recurrence.43
To date only one large inception cohort study has investigated recurrence of low back pain
using an appropriate methodology.44 Stanton et al. suggested that 33% (95% CI: 28–38) of
those who recover from an acute episode would have a recurrence of low back pain within the
next 12 months.44 Other studies have failed to include a representative sample45 or to use
standardised definitions of recovery or recurrence.46 This resulted in misleading estimates of
recurrence ranging from 26% to 84%.43 Furthermore, previous studies investigating recurrence
of low back pain have included participants with persistent pain who are less likely to recover,
7

and thus ineligible to have a recurrence.43 Therefore, there is a lack of agreement on incidence
estimates of recurrence of low back pain.
Previous studies have important methodological flaws and do not provide sufficient
information on potential risk factors for the recurrence of low back pain.43 For instance, Van
den Heuvel et al. have shown that certain work-related physical movements are associated with
recurrence (odds ranged from 1.4 to 4.1). However, they have used a non-standardised
definition of recurrence of low back pain (i.e., regular or prolonged low back pain in the
previous 12 months).44 Only two cohort studies have investigated risk factors for recurrence of
low back pain using appropriate methodology.45,46 These studies have found that having
previous episodes of low back pain doubled the odds (95% CI: 1.2–3.4) of future
recurrences.45,46 Although other factors have been investigated, including pain intensity,
smoking, perceived global health or risk of recurrence, red flags, and physical activity; no other
risk factors for recurrent low back pain have been identified.45 Imaging findings have been
identified as potentially relevant factors to consider for the risk of recurrence of low back
pain.46 Other relevant factors likely to increase the risk of recurrence have never been studied,
such as presence of radiculopathy, use of medications, and anxiety. Therefore, the risk factors
for a recurrent episode of low back pain remain largely unknown.
The inconsistent incidence estimates, and the largely unknown risk factors for recurrence of
low back pain hamper the effective management of this condition. For instance, most
interventions aiming to reduce incidence of low back pain are ineffective.37 There is indeed a
paucity of research in this area, thus Chapter Three presents a prospective inception cohort
study that investigated the incidence of recurrence of low back pain within one year, and
predictors (not previously studied) of recurrence. The study included a large sample of patients
8

who had recovered from an acute episode of low back pain in primary care settings. The results
of this study will inform patients and clinicians about the incidence of recurrence of low back
pain, and the factors associated with future recurrences.
1.6 Pharmacological interventions for low back pain
Patients with low back pain seeking primary care are often managed with simple analgesics,
such as paracetamol and NSAIDs.48 Despite the wide use of these analgesics in clinical
practice, there are still uncertainties about their safety and efficacy. Clinical guidelines often
recommend paracetamol as the first line analgesic medication for low back pain, whereas
NSAIDs are often considered the second choice.21,22 Paracetamol is the most widely used over-
the-counter medicine for low back pain, mainly because of the common belief that it is a safe
medicine. NSAIDs, on the other hand, are one of the most frequently prescribed analgesic in
primary care to treat low back pain.49,50
The safety of paracetamol has been recently challenged by a systematic review of long-term
cohort studies including data for 665,000 adults.51 Roberts et al. revealed that the use of
paracetamol increases the relative rate of mortality by 1.63 (95% CI: 1.58–1.68) compared with
not taking paracetamol.51 The study also showed that standard-dose paracetamol therapy (i.e.,
500–1000 mg every 4–6 hours; maximum, 4000 mg daily) is associated with an increased risk
of cardiovascular, gastrointestinal, and renal adverse effects.51 Therapeutic doses of
paracetamol are also known to increase alanine aminotransferase activity (ALT), a commonly
used biomarker for liver injury (i.e., ALT more than three times the upper limit of the reference
value).52 Although there are uncertainties about the clinical implication of the transient
elevations of ALT, a systematic review of 30,865 patients taking therapeutic doses of
paracetamol has reported no cases of acute liver failure.53 However, the evidence on ALT
9

activity in specific populations treated with paracetamol, such as musculoskeletal pain, has
never been summarised.
The clinical benefits of paracetamol for common musculoskeletal conditions have been
questioned recently. For instance, a large randomised trial including 1,652 participants showed
that paracetamol is no more effective than placebo for acute low back pain.7 Furthermore, there
have been discussions on whether paracetamol should be kept in the most recent NICE
guidance for the management of osteoarthritis,54 due to its questionable efficacy. In this
context, Chapter Four presents a systematic review with meta-analysis of randomised
placebo-controlled trials investigating the efficacy and safety of paracetamol for low back pain,
neck pain, and osteoarthritis.55
The use of NSAIDs for low back pain has decreased in the last decade,56 though it is expected
to rise since paracetamol seems to offer no clinical benefits over placebo.7 Furthermore, there
has been an increased awareness of risks associated with opioid use,57 which is recommended
as third choice analgesic for low back pain. Additionally, the NICE clinical guidelines, for
instance, are now recommending NSAIDs as the first choice analgesic for low back pain and
sciatica.58 However, there are still concerns about the safety of this drug, given its association
with cardiovascular and serious gastrointestinal adverse effects.59
The clinical benefits of NSAIDs seem to be small for patients with chronic low back pain or
sciatica, according to the latest Cochrane reviews.60,61 However, its effects on other forms of
spinal pain, such as neck pain or acute low back pain, remain unclear. Therefore, there is a need
to understand the effects and safety of NSAIDs in the management of spinal pain. In Chapter
Five a systematic review with meta-analysis of randomised placebo-controlled trials
10

investigated the efficacy and associated adverse effects of NSAIDs for lower back or neck pain,
with or without radicular symptoms. Given topical and injection formulations are often used
for these patients, the review also included trials testing various delivery routes of NSAIDs.
Although the use of simple analgesics is extremely popular for low back pain, surgery is often
recommended for cases of neurologic compromise (i.e., lumbar spinal stenosis and sciatica)
that is refractory to conservative treatments, which are believed to have a worse prognosis.62
1.7 The clinical prognosis of low back pain
Clinical guidelines21,22 often report a favourable course of low back pain managed in primary
care that is not consistent with the most recent evidence. Data for 15 cohorts with acute low
back pain revealed a rapid reduction of pain in the first weeks.63 Pooled mean pain score was
52 (95% CI: 48 to 57; 0–100 scale) at baseline, and 23 (95% CI: 21 to 25) at six weeks.63
However, improvements seem to slow beyond this point,25 and about a third of patients never
fully recover within 12 months.41 The clinical course of persistent low back pain is slightly less
favourable. About 60% of patients with low back pain still report moderate levels of pain and
disability by 12 months.25,63 Patients who fail to improve with conservative treatment are often
referred to surgery. In fact, this is more often the case for patients with sciatica, who are 3.9
times (95% CI: 1.3–11.4) more likely to be referred to surgery compared with those reporting
low back pain alone.62
Surgery for sciatica usually involves the removal of the herniated disc via discectomy – the
most common surgical procedure for this condition.28 With advances in surgical technologies,
minimally invasive procedures for sciatica have been developed, such as microdiscectomy and
endoscopic procedures.64 Despite the popularity of these surgical procedures, recent
randomised trials have shown that surgery does not lead to better long-term clinical outcomes
11

compared with conservative treatments for sciatica.65,66 Moreover, one trial reported that
intraoperative complications (e.g., dural tear) occurred in 4% of patients.58 This same trial also
reported a postoperative complication rate of 5%, and a 12-month reoperation rate of 4%,
whereas no adverse effects were noted in the conservative treatment group.58
There is not clear consensus on the long-term prognosis of patients with sciatica after surgery.
As a result, surgeons often provide their own opinions and expectations about the course of
pain and disability following a surgical procedure. The problem is that surgeons’ predictions
are often overly optimistic and poorly correlate (kappa = 0.03) with patients’ outcomes after
surgery.67 The unclear understanding of the postoperative course of sciatica hampers clinical
decision-making and the communication between patients and surgeons. Thus, Chapter Six
presents a systematic review with meta-analysis of large prospective cohort studies
investigating the course of pain and disability of patients with sciatica up to five years after
surgery. The study also investigates whether different surgical procedures lead to different
clinical courses. The results of this study will better inform surgeons and patients about the
most likely long-term prognosis of sciatica after surgery, despite the lack of robust evidence in
terms of its safety and efficacy.
1.8 Surgical interventions for low back pain
Surgery for lumbar spinal stenosis is the fastest growing spine surgery worldwide in older
people.68 Despite the increasing number of surgical procedures for lumbar spinal stenosis, there
is no clear consensus on its indications, especially on whether or not to add fusion to
decompression surgery.69 There is also a range of surgical decompression techniques available,
such as spinous process-splitting laminectomy, endoscopic laminectomy, and unilateral or
12

bilateral laminotomy. However, the decision of the most appropriate surgical decompression
procedure seems to be based on surgeons’ own preferences and opinions.70
The specific efficacy of surgery (i.e., excluding improvement due to natural history and
placebo) for lumbar spinal stenosis remains unclear. Moreover, there is uncertainty about the
effectiveness (i.e., extent to which an intervention achieves its intended effect in the usual
clinical setting) of newer surgical techniques or devices compared with conventional surgical
procedures. Therefore, Chapter Seven presents a systematic review and meta-analysis of
randomised controlled-trials investigating the efficacy and safety of surgery compared with no
treatment, sham or placebo surgery, as well as the comparative effectiveness of various surgical
options for lumbar spinal stenosis. After this systematic review was published, the Cochrane
Back and Neck Group invited the authors to update and transform the review into a Cochrane
review, which is presented in Appendix F in this thesis.
1.9 The rates of surgical procedures for low back pain
Although surgery for low back pain seems to offer similar clinical outcomes as conservative
treatments,8 the rates of surgical procedures have been increasing.71 In the United States, the
most dramatic increase was noted for fusion procedures,72 and similar trends have also been
observed in other countries.73 In Australia, there has been an increase of surgical fusion for low
back pain. However, the number of publicly performed fusion procedures increased by only
2% compared with a 167% increase in private facilities over the same 10-year period.74
There are several factors that could explain the reasons why lumbar fusion surgery is increasing
at a much faster rate than other surgical procedures for low back pain. These reasons include
surgical technological advances, financial incentives, and marketing of surgical devices.
13

Studies investigating trends in surgery for low back pain have consistently reported a marked
increase in the rates of fusion surgery in older people,72-74 among whom lumbar spinal stenosis
is the most frequent indication for spine surgery.68
To date very few studies have investigated the trends in hospital admission and surgery for
lumbar spinal stenosis,68,75,76 and the majority were conducted in the United States.68,75 The
trends in the United States are for decreased use of decompression alone and increased use of
decompression plus fusion.68,75 It is still unclear, however, whether these trends are also
happening elsewhere, thus limiting the global understanding of changes in surgical rates for
this condition.
The use of more complex surgical procedures for lumbar spinal stenosis has been associated
with an increased risk of complications and mortality.68 Deyo et al. reported that the addition
of complex fusion (i.e., fusion of three or more spinal levels, or a combined anterior and
posterior approach) tripled the risk (95% CI 2.50–3.49) of life-threatening complications
compared with decompression alone. Complex fusion was also more costly (US $80,888) than
conventional decompression alone (US $23,724). These figures are largely unknown in
Australia. Therefore, Chapter Eight presents a population-based health record linkage study
investigating the trends in hospital admission and surgical procedures for lumbar spinal
stenosis, as well as complications and resource use, in New South Wales Australia.
1.10 Aims of the thesis
The aims of this thesis were to:
1. Investigate the association between physical and psychosocial triggers and the risk of
persistent low back pain episodes in primary care (Chapter Two).
14

2. Determine the 12-month incidence of recurrence after an acute episode of low back
pain, and to identify predictors of recurrences (Chapter Three).
3. Systematically review and appraise the literature on the efficacy and safety of
commonly used medications for low back pain, including paracetamol (Chapter Four)
and NSAIDs (Chapter Five).
4. Systematically review and appraise the literature on the clinical course of pain and
disability in patients with sciatica undergoing surgery (Chapter Six).
5. Systematically review and appraise the literature on the efficacy and safety of surgery
for lumbar spinal stenosis, as well as the effectiveness of various surgical options for
this condition (Chapter Seven).
6. Determine the trends in hospital admission and surgery for lumbar spinal stenosis, as
well as investigate associated complications and resource use in New South Wales
Australia (Chapter Eight).
15

1.11 References
1. Maher C, Underwood M, Buchbinder R. Non-specific low back pain. Lancet 2016;
18;389:736-47.
2. Britt H, Miller GC, Henderson J, et al. General practice activity in Australia 2014-15.
Sydney: Sydney University Press, 2015.
3. Deyo RA, Mirza SK, Martin BI. Back pain prevalence and visit rates: estimates from
U.S. national surveys, 2002. Spine 2006;31:2724-27.
4. Dagenais S, Caro J, Haldeman S. A systematic review of low back pain cost of illness
studies in the United States and internationally. Spine J 2008;8:8-20.
5. GBD 2015 Disease and Injury Incidence and Prevalence Collaborators. Global,
regional, and national incidence, prevalence, and years lived with disability for 310
diseases and injuries, 1990-2015: a systematic analysis for the Global Burden of
Disease Study 2015. Lancet 2016;388:1545-602.
6. Henschke N, Maher CG, Refshauge KM, et al. Prevalence of and screening for serious
spinal pathology in patients presenting to primary care settings with acute low back
pain. Arthritis Rheum 2009;60:3072-80.
7. Williams CM, Maher CG, Latimer J, et al. Efficacy of paracetamol for acute low-back
pain: a double-blind, randomised controlled trial. Lancet 2014;384:1586-96.
8. Peul WC, Bredenoord AL, Jacobs WC. Avoid surgery as first line treatment for non-
specific low back pain. BMJ 2014;349:g4214.
9. Hoy D, Brooks P, Blyth F, et al. The Epidemiology of low back pain. Best Pract Res
Clin Rheumatol 2010;24:769-81.
10. Balague F, Mannion AF, Pellise F, et al. Non-specific low back pain. Lancet
2012;379:482-91.
16

11. Hoy D, Bain C, Williams G, et al. A systematic review of the global prevalence of low
back pain. Arthritis Rheum 2012;64:2028-37.
12. Konstantinou K, Dunn KM. Sciatica: review of epidemiological studies and prevalence
estimates. Spine 2008;33:2464-72.
13. Lurie J, Tomkins-Lane C. Management of lumbar spinal stenosis. BMJ
2016;352:h6234.
14. Ishimoto Y, Yoshimura N, Muraki S, et al. Associations between radiographic lumbar
spinal stenosis and clinical symptoms in the general population: the Wakayama Spine
Study. Osteoarthritis Cartilage 2013;21:783-88.
15. Hoy D, March L, Brooks P, et al. The global burden of low back pain: estimates from
the Global Burden of Disease 2010 study. Ann Rheum Dis 2014;73:968-74.
16. GBD Study 2013 Collaborators. Global, regional, and national incidence, prevalence,
and years lived with disability for 301 acute and chronic diseases and injuries in 188
countries, 1990-2013: a systematic analysis for the Global Burden of Disease Study
2013. Lancet 2015;386:743-800.
17. Asche CV, Kirkness CS, McAdam-Marx C, et al. The societal costs of low back pain:
data published between 2001 and 2007. J Pain Palliat Care Pharmacother 2007;21:25-
33.
18. Walker BF, Muller R, Grant WD. Low back pain in Australian adults: the economic
burden. Asia Pac J Public Health 2003;15:79-87.
19. de Vet HC, Heymans MW, Dunn KM, et al. Episodes of low back pain: a proposal for
uniform definitions to be used in research. Spine 2002;27:2409-16.
20. Stanton TR, Latimer J, Maher CG, et al. A modified Delphi approach to standardize
low back pain recurrence terminology. Eur Spine J 2011;20:744-52.
17

21. Koes BW, van Tulder M, Lin CW, et al. An updated overview of clinical guidelines for
the management of non-specific low back pain in primary care. Eur Spine J
2010;19:2075-94.
22. Wong JJ, Cote P, Sutton DA, et al. Clinical practice guidelines for the noninvasive
management of low back pain: A systematic review by the Ontario Protocol for Traffic
Injury Management (OPTIMa) Collaboration. Eur J Pain 2016; 21:201-16.
23. Coste J, Delecoeuillerie G, Cohen de Lara A, et al. Clinical course and prognostic
factors in acute low back pain: an inception cohort study in primary care practice. BMJ
1994;308:577-80.
24. Von Korff M. Studying the natural history of back pain. Spine 1994;19:2041S-46S.
25. da CMCL, Maher CG, Hancock MJ, et al. The prognosis of acute and persistent low-
back pain: a meta-analysis. CMAJ 2012;184:E613-24.
26. van Tulder M, Koes B, Bombardier C. Low back pain. Best Pract Res Clin Rheumatol
2002;16:761-75.
27. Deyo RA, Rainville J, Kent DL. What can the history and physical examination tell us
about low back pain? JAMA 1992;268:760-65.
28. Ropper AH, Zafonte RD. Sciatica. N Engl J Med 2015;372:1240-48.
29. Fairbank JC. Sciatic: An archaic term. BMJ 2007;335:112.
30. Bailey P, Casamajor L. Osteo-arthritis of the spine as a cause of compression of the
spinal cord and its roots: With reports of five cases. J Nerv Ment Dis 1911;38:588-609.
31. Verbiest H. A radicular syndrome from developmental narrowing of the lumbar
vertebral canal. J Bone Joint Surg Br 1954;36-B:230-37.
32. Williams CM, Henschke N, Maher CG, et al. Red flags to screen for vertebral fracture
in patients presenting with low-back pain. Cochrane Database Syst Rev
2013;1:CD008643.
18

33. Henschke N, Maher CG, Ostelo RW, et al. Red flags to screen for malignancy in
patients with low-back pain. Cochrane Database Syst Rev 2013;2:CD008686.
34. Downie A, Williams CM, Henschke N, et al. Red flags to screen for malignancy and
fracture in patients with low back pain: systematic review. BMJ 2013;347:f7095.
35. Hancock MJ, Maher CG, Latimer J, et al. Systematic review of tests to identify the disc,
SIJ or facet joint as the source of low back pain. Eur Spine J 2007;16:1539-50.
36. Brinjikji W, Luetmer PH, Comstock B, et al. Systematic literature review of imaging
features of spinal degeneration in asymptomatic populations. AJNR Am J Neuroradiol
2015;36:811-16.
37. Steffens D, Maher CG, Pereira LS, et al. Prevention of low back pain: a systematic
review and meta-analysis. JAMA Intern Med 2016;176:199-208.
38. Taylor JB, Goode AP, George SZ, et al. Incidence and risk factors for first-time incident
low back pain: a systematic review and meta-analysis. Spine J 2014;14:2299-319.
39. Steffens D, Ferreira ML, Latimer J, et al. What triggers an episode of acute low back
pain? A case-crossover study. Arthritis Care Res 2015;67:403-10.
40. Frymoyer JW, Cats-Baril WL. An overview of the incidences and costs of low back
pain. Orthop Clin North Am 1991;22:263-71.
41. Henschke N, Maher CG, Refshauge KM, et al. Prognosis in patients with recent onset
low back pain in Australian primary care: inception cohort study. BMJ 2008;337:a171.
42. George SZ, Beneciuk JM. Psychological predictors of recovery from low back pain: a
prospective study. BMC Musculoskelet Disord 2015;16:49.
43. Pengel LH, Herbert RD, Maher CG, et al. Acute low back pain: systematic review of
its prognosis. BMJ 2003;327:323.
19

44. van den Heuvel SG, Ariens GA, Boshuizen HC, et al. Prognostic factors related to
recurrent low-back pain and sickness absence. Scand J Work Environ Health
2004;30:459–67.
45. Stanton TR, Henschke N, Maher CG, et al. After an episode of acute low back pain,
recurrence is unpredictable and not as common as previously thought. Spine
2008;33:2923-28.
46. Hancock MJ, Maher CM, Petocz P, et al. Risk factors for a recurrence of low back pain.
Spine J 2015;15:2360-68.
47. Stanton TR, Latimer J, Maher CG, et al. Definitions of recurrence of an episode of low
back pain: a systematic review. Spine 2009;34:E316-22.
48. Williams CM, Maher CG, Hancock MJ, et al. Low back pain and best practice care: A
survey of general practice physicians. Arch Intern Med 2010;170:271-77.
49. Gore M, Tai KS, Sadosky A, et al. Use and costs of prescription medications and
alternative treatments in patients with osteoarthritis and chronic low back pain in
community-based settings. Pain Pract 2012;12:550-60.
50. Piccoliori G, Engl A, Gatterer D, et al. Management of low back pain in general practice
- is it of acceptable quality: an observational study among 25 general practices in South
Tyrol (Italy). BMC Fam Pract 2013;14:148.
51. Roberts E, Delgado Nunes V, Buckner S, et al. Paracetamol: not as safe as we thought?
A systematic literature review of observational studies. Ann Rheum Dis 2016;75:552-
59.
52. Watkins PB, Kaplowitz N, Slattery JT, et al. Aminotransferase elevations in healthy
adults receiving 4 grams of acetaminophen daily: a randomized controlled trial. JAMA
2006;296:87-93.
20

53. Dart RC, Bailey E. Does therapeutic use of acetaminophen cause acute liver failure?
Pharmacotherapy 2007;27:1219-30.
54. Wise J. NICE keeps paracetamol in UK guidelines on osteoarthritis. BMJ
2014;348:g1545.
55. McAlindon TE, Bannuru RR, Sullivan MC, et al. OARSI guidelines for the non-
surgical management of knee osteoarthritis. Osteoarthritis Cartilage 2014;22:363-88.
56. Mafi JN, McCarthy EP, Davis RB, et al. Worsening trends in the management and
treatment of back pain. JAMA Intern Med 2013;173:1573-81.
57. Dowell D, Haegerich TM, Chou R. CDC Guideline for Prescribing Opioids for Chronic
Pain--United States, 2016. JAMA 2016;315:1624-45.
58. National Institute for Health and Care Excellence. Low back pain and sciatica. 2016,
London. Available from: www.nice.org.uk, accessed 24/08/2016.
59. van der Linden MW, van der Bij S, Welsing P, et al. The balance between severe
cardiovascular and gastrointestinal events among users of selective and non-selective
non-steroidal anti-inflammatory drugs. Ann Rheum Dis 2009;68:668-73.
60. Enthoven WT, Roelofs PD, Deyo RA, et al. Non-steroidal anti-inflammatory drugs for
chronic low back pain. Cochrane Database Syst Rev 2016;2:CD012087.
61. Rasmussen-Barr E, Held U, Grooten WJ, et al. Non-steroidal anti-inflammatory drugs
for sciatica. Cochrane Database Syst Rev 2016;10:CD012382.
62. Selim AJ, Ren XS, Fincke G, et al. The importance of radiating leg pain in assessing
health outcomes among patients with low back pain. Results from the Veterans Health
Study. Spine 1998;23:470-74.
63. Costa Lda C, Maher CG, McAuley JH, et al. Prognosis for patients with chronic low
back pain: inception cohort study. BMJ 2009;339:b3829.
21

64. Gibson JN, Waddell G. Surgical interventions for lumbar disc prolapse. Cochrane
Database Syst Rev 2007:CD001350.
65. Weinstein JN, Tosteson TD, Lurie JD, et al. Surgical vs nonoperative treatment for
lumbar disk herniation: the Spine Patient Outcomes Research Trial (SPORT): a
randomized trial. JAMA 2006;296:2441-50.
66. Lequin MB, Verbaan D, Jacobs WC, et al. Surgery versus prolonged conservative
treatment for sciatica: 5-year results of a randomised controlled trial. BMJ Open 2013;3:
e002534.
67. Graz B, Wietlisbach V, Porchet F, et al. Prognosis or "curabo effect?": physician
prediction and patient outcome of surgery for low back pain and sciatica. Spine
2005;30:1448-52.
68. Deyo RA, Mirza SK, Martin BI, et al. Trends, major medical complications, and
charges associated with surgery for lumbar spinal stenosis in older adults. JAMA
2010;303:1259-65.
69. Knaub MA, Won DS, McGuire R, et al. Lumbar spinal stenosis: indications for
arthrodesis and spinal instrumentation. Instr Course Lect 2005;54:313-19.
70. Katz JN, Lipson SJ, Lew RA, et al. Lumbar laminectomy alone or with instrumented
or noninstrumented arthrodesis in degenerative lumbar spinal stenosis. Patient
selection, costs, and surgical outcomes. Spine 1997;22:1123-31.
71. Deyo RA, Mirza SK. Trends and variations in the use of spine surgery. Clin Orthop
Relat Res 2006;443:139-46.
72. Weinstein JN, Lurie JD, Olson PR, et al. United States' trends and regional variations
in lumbar spine surgery: 1992-2003. Spine 2006;31:2707-14.
22

73. Sivasubramaniam V, Patel HC, Ozdemir BA, et al. Trends in hospital admissions and
surgical procedures for degenerative lumbar spine disease in England: a 15-year time-
series study. BMJ Open 2015;5:e009011.
74. Harris IA, Dao AT. Trends of spinal fusion surgery in Australia: 1997 to 2006. ANZ J
Surg 2009;79:783-88.
75. Bae HW, Rajaee SS, Kanim LE. Nationwide trends in the surgical management of
lumbar spinal stenosis. Spine 2013;38:916-26.
76. Jansson KA, Blomqvist P, Granath F, et al. Spinal stenosis surgery in Sweden 1987-
1999. Eur Spine J 2003;12:535-41.
23

CHAPTER TWO
Transient physical and psychosocial activities increase the risk of non-persistent and
persistent low back pain: a case-crossover study with 12 months follow-up
Chapter Two has been published as:
Machado GC, Ferreira PH, Maher CG, et al. Transient physical and psychosocial activities
increase the risk of non-persistent and persistent low back pain: a case-crossover study with 12
months follow-up. Spine J 2016;16:1445-52. Copyright © 2016, North American Spine
Society. Reprinted with permission from Elsevier Inc.
24

Statement from co-authors confirming authorship contribution of
the PhD candidate
The co-authors of the paper “Transient physical and psychosocial activities increase the risk of
non-persistent and persistent low back pain: a case-crossover study with 12 months follow-up”
confirm that Gustavo de Carvalho Machado has made the following contributions:
Conception and design of the research
Analysis and interpretation of the findings
Writing of the manuscript and critical appraisal of the content
In addition to the statements above, in cases where I am not the corresponding author of a
published item, permission to include the published material has been granted by the
corresponding author.
Gustavo de Carvalho Machado _________________________ Date: 30 November 2016
As supervisor for the candidature upon which this thesis is based, I can confirm that the
authorship attribution statements above are correct.
Manuela Loureiro Ferreira _________________________ Date: 30 November 2016
25

Clinical Study
Transient physical and psychosocial activities increase the risk ofnonpersistent and persistent low back pain: a case-crossover study
with 12 months follow-up
Gustavo C. Machado, PhD Studenta,*, Paulo H. Ferreira, PhDb, Chris G. Maher, PhDa,Jane Latimer, PhDa, Daniel Steffens, PhDa, Bart W. Koes, PhDc, Qiang Li, MBiostata,
Manuela L. Ferreira, PhDa,daThe George Institute for Global Health, Sydney Medical School, The University of Sydney, Sydney, NSW, Australia
bFaculty of Health Sciences, The University of Sydney, Sydney, NSW, AustraliacDepartment of General Practice, Erasmus Medical Centre, Rotterdam, The Netherlands
dInstitute of Bone and Joint Research, The Kolling Institute, Sydney Medical School, The University of Sydney, Sydney, NSW, Australia
Received 26 November 2015; revised 27 June 2016; accepted 2 August 2016
Abstract BACKGROUND CONTEXT: A previous study has shown that transient physical and psychoso-
cial activities increased the risk of developing low back pain. However, the link between these factors
in triggering nonpersistent or persistent episodes remains unclear.
PURPOSE: We aimed to investigate the association of transient exposures to physical and psycho-
social activities with the development of nonpersistent or persistent low back pain.
STUDY DESIGN: This was a case-crossover study with 12 months follow-up.
PATIENT SAMPLE: We included 999 consecutive participants seeking care for a sudden onset
of low back pain.
OUTCOME MEASURES: Development of low back pain was the outcome measure.
MATERIALS AND METHODS: At baseline, participants reported transient exposures to 12 pre-
defined activities over the 4 days preceding pain onset. After 12 months, participants were asked
whether they had recovered and the date of recovery. Exposures in the 2-hour period preceding pain
onset (case window) were compared with the 2-hour period, 24 hours before pain onset (control window)
in a case-crossover design for all participants. Conditional logistic regression was used to calculate
odds ratios (ORs) and 95% confidence intervals (CI), and interaction analyses were used to compare
estimates of nonpersistent (i.e., <6 weeks duration) and persistent cases. This study received funding
from Australia’s National Health and Medical Research Council (APP1003608).
RESULTS: There were 832 participants (83%) who completed the 12 months follow-up success-
fully. Of these, 430 participants had nonpersistent low back pain (<6 weeks duration), whereas 352
reported persistent symptoms (≥6 weeks duration). Exposure to several transient activities, such as
manual tasks involving heavy loads, awkward postures, live people or animals, moderate or vigor-
ous physical activity, and being fatigued or tired during a task or activity, significantly increased the
risk of both nonpersistent and persistent low back pain, with ORs ranging from 2.9 to 11.7. Overall,
the risk of developing a persistent or a nonpersistent episode of low back pain associated with the
included physical factors did not differ significantly.
FDA device/drug status: Not applicable.
Author disclosures: GCM: Nothing to disclose. PHF: Grant: NHMRC
(G, Paid directly to institution/employer), pertaining to the submitted work.
CGM: Grant: NHMRC (G, Paid directly to institution/employer),
pertaining to the submitted work. JL: Grant: NHMRC (G, Paid directly to
institution/employer), pertaining to the submitted work. DS: Nothing to dis-
close. BWK: Grant: NHMRC (G, Paid directly to institution/employer),
pertaining to the submitted work. QL: Nothing to disclose. MLF: Nothing
to disclose.
The disclosure key can be found on the Table of Contents and at
www.TheSpineJournalOnline.com.
* Corresponding author. The George Institute for Global Health, PO Box
M201, Missenden Rd, Camperdown, Sydney, NSW 2050, Australia. Tel.:
+61 2 8052 4300.
E-mail address: [email protected] (G.C. Machado)
http://dx.doi.org/10.1016/j.spinee.2016.08.010
1529-9430/© 2016 Elsevier Inc. All rights reserved.
The Spine Journal 16 (2016) 1445–1452
26

CONCLUSIONS: Our results revealed that previously identified triggers contribute equally to the
development of both nonpersistent and persistent low back pain. Future prevention strategies should
focus on controlling exposure to these triggers as they have the potential to decrease the burden as-
sociated with both acute and chronic low back pain. © 2016 Elsevier Inc. All rights reserved.
Keywords: Case-crossover; Cohort; Epidemiology; Low back pain; Primary care; Risk factors; Triggers
Introduction
Low back pain is the leading contributor to global dis-
ability [1]. An acute episode typically improves considerably
in the first 6 weeks after presentation to primary care [2], but
over 60% of patients do not experience complete recovery
(defined as return to work, no disability, and no pain) [3]. Pa-
tients with persistent low back pain contribute substantially
to disease burden and treatment costs. For instance, 75% of
direct and indirect low back pain costs are attributed to pa-
tients with persistent pain, and it is estimated to be as high
as USD$80 billion annually [4,5].
One way to potentially reduce this burden is to control ex-
posure to risk factors in the hope of preventing episodes of
low back pain. Most of the current prevention approaches aim
to control exposure to long-term risk factors [6,7]. An example
would be redesigning the workplace to reduce exposure to
prolonged sitting or repeated lifting [8]. However, not all risk
factors involve prolonged exposure, but rather transient ex-
posure. We have demonstrated in a case-crossover study,
that transient exposure to physical and psychosocial activi-
ties, such as manual tasks involving heavy loads or being
distracted or fatigued during an activity, significantly in-
creases the odds of developing an episode of low back pain
in the few hours following activity [9].
Our previous results, however, were limited to identifying
the risk associated with the onset of a new episode of low back
pain, regardless of the duration of the episode. Given that we
recruited participants within the first week from pain onset, we
were unaware of howmany of those participants would in fact
develop persistent, troublesome pain and how many would
recover rapidly. Therefore, no information on the transient risks
for low back pain was provided in terms of the duration of the
low back pain episode. To address this limitation we have con-
ducted a 12-month follow-up to the original Triggers for low
back pain study [9] and present the results in this paper.
The aim of the current study, therefore, was to investi-
gate the increased risk of transient exposures to a range of
physical and psychosocial activities in triggering episodes of
low back pain that are short-lived or those that persist. We
also aimed to compare if nonpersistent and persistent cases
share the same triggers.
Materials and methods
Study design
This study is a follow-up of the Triggers for low back pain
study [9]. The Triggers for low back pain study used a case-
crossover design to evaluate the increase in risk of a sudden
episode of low back pain associated with transient exposure
to 12 standard physical and psychosocial activities. These stan-
dard transient activities were selected based on a list of
the most hazardous tasks in the workplace, provided in the
Australian National Code of Practice [10].
Transient physical activities:
• Manual tasks involving:
o Heavy loads
o Awkward postures
o Objects not close to the body
o Handling of people or animals
o Unstable or unbalanced or difficult to grasp or hold
loads
• Moderate physical activity
• Vigorous physical activity
• A slip, trip, or fall
• Sexual activity
Transient psychosocial activities:
• Alcohol consumption
• Distracted during an activity or task
• Fatigued or tired during an activity or task
The Triggers for low back pain study employed a case-
crossover design. Case-crossover studies enable controlling
for potential confounders, such as genetic and lifestyle in-
fluences, as each participant acts as his or her own control
[11]. Therefore, no further statistical adjustments for con-
founders are necessary, which makes this design ideal for
quantifying the increased risk caused by transient expo-
sures to putative risk factors.
Briefly, in the Triggers for low back pain study, the base-
line characteristics of participants and exposureswere collected
from a telephone interview within 7 days of the onset of the
low back pain episode. Participants were asked to report ex-
posures to the 12 predefined putative triggers over the 96 hours
preceding pain onset. The increase in risk was investigated by
comparing exposure to these standard triggers in the 2-hour
period before pain onset (case window) with exposure in the
2-hour period 24 hours before pain onset (control window).
In the present study, participants were interviewed by tele-
phone 12 months after the baseline interview. At this time
point, participants were asked if they had recovered from the
original episode, and if so the date of recovery. Recovery was
defined as being pain-free for at least one month within the
1446 G.C. Machado et al. / The Spine Journal 16 (2016) 1445–1452
27

course of the episode [12]. We then selected participants who
reported experiencing rapid recovery (low back pain lasting
up to 6 weeks), and those who had persistent symptoms greater
than 6 weeks. We selected 6 weeks as a cutoff time point ac-
cording to current guidelines of low back pain [13]. In addition,
we performed secondary exploratory analyses using 3 and
12 months as a cutoff to define our groups of nonpersistent
and persistent low back pain.
Setting and participants
Consecutive adult patients presenting to 300 primary care
clinics for a new episode of sudden onset low back pain were
recruited inNewSouthWales,Australia betweenOctober 2011
andNovember 2012.Anewepisodeof lowbackpainwasdefined
as a primary complaint of pain between the 12th rib and the
buttock crease, with or without leg pain, causing the patient to
seek health care or take medication, and preceded by a period
of at least 1 month without low back pain [12]. Patients were
included in the study if they comprehended English,
presented within 7 days from pain onset, and reported pain of
at least moderate intensity (measured using item 7 of the Short-
Form 36 [SF-36] questionnaire) [14] in the first 24 hours of
the current episode. Patients were excluded from the study if
they presented with serious spinal pathology (e.g., metastatic,
inflammatory, or infectious diseases of the spine, cauda equina
syndrome, or spinal fracture).All participants providedwritten
informed consent for participation in the study. This study was
approved by theHumanResearchEthics Committee of theUni-
versity of Sydney (protocol number 05–2011/ 13742).
Baseline and follow-up assessments
At baseline, trained research staff conducted telephone in-
terviews using a standardized questionnaire to collect
sociodemographic and clinical characteristics of the current
low back pain episode. Low back pain severity and interfer-
ence with work were based on modified items 7 and 8 from
the SF-36 questionnaire [14]. Tension or anxiety and feel-
ings of depression were measured based on the Orebro
Musculoskeletal Pain Questionnaire [15]. The participants were
then asked to identify the date and time of pain onset. Also
during this interview, data on exposures to a variety of tran-
sient activities were collected, and patients reported being
exposed or not exposed to the 12 predefined putative trig-
gers, as well as the time of occurrence and duration, over the
96 hours preceding the onset of low back pain. At this stage,
attempts were made to minimize recall bias by asking par-
ticipants to refer to their agenda, calendar, and or smartphones
to enhance their memory of the activities they have per-
formed before pain onset. The baseline interview script was
piloted with 20 participants with low back pain and adjust-
ments were made to improve clarity and participant recall.
At 12 months, a second telephone interview was con-
ducted. Participants were called up to four times and voicemails
or emails were sent as a reminder of the interview. We asked
participants if they had low back pain at the moment, how
severe it was, and how much pain interfered with normal work
during the previous week. These questions were based on
modified items 7 and 8 from the SF-36 questionnaire [14].
If participants experienced recovery from the original episode,
we then asked how long they took to recover, and from this
we calculated the duration of the episode for each partici-
pant. Recovery was defined as being pain-free for at least 1
month, and this information was provided to participants during
the interview [12].
Data synthesis
Data were entered in an electronic database using FileMaker
Pro version 12 (FileMaker Inc, Santa Clara, CA, USA).Where
time to recover was reported as weeks or months, these were
transformed into days. Participants (n=14) who reported im-
precise recovery dates (e.g., responses such as “few months”
and “several weeks”) were treated as missing data. Check-
ing of data was performed by randomly selecting a subsample
Context
Back pain is a prevalent medical issue affecting the ma-
jority of individuals in society at one time or another.While
a number of triggers for back pain have been described,
their role in leading to persistent episodes of back pain has
not been sufficiently explored. In this context, the authors
sought to evaluate the role of transient physical and
psychosocial activities as triggers for persistent or
nonpersistent episodes of back pain.
Contribution
This study include close to 1,000 patients seeking care for
an epidosde of low back pain. Of these, 430 participants
had nonpersistent back pain while 352 had persistent
pain. The authors conclude that previously identified
triggers equally contribute to the development of both
nonpersistent and persistent low back pain.
Implications
The results of this study may not necessarily be translat-
able given the clinical context and methodological design.
While the authors maintain that their findings have clin-
ical utility, the fact remains that the study only involved
patients who developed back pain and chose to present for
evaluation. This then represents an incomplete population-
based study as no effective controls who did not develop
back pain, or chose to seek care, are included in this anal-
ysis. Further confirmatory work in other clinical contexts
are likely necessary as a result.
—The Editors
1447G.C. Machado et al. / The Spine Journal 16 (2016) 1445–1452
28

(20%) of the sample and independently double-checking it
for inconsistencies. No significant inconsistencies (0.8% of
disagreement) were found during this stage.
Statistical analysis
Descriptive statistics were used to report the characteris-
tics of participants, including means and standard deviations
(SDs) for continuous variables, and frequencies and propor-
tions (%) for categorical variables. Differences between
baseline characteristics of participants with nonpersistent and
those with persistent low back pain were analyzed using in-
dependent t test for continuous variables and chi-square test
for categorical variables. A positive significance level was
assumed at a p<.05.
Participants who recovered within 6 weeks were catego-
rized as nonpersistent cases, and those who reported low back
pain lasting greater than 6 weeks were categorized as per-
sistent cases [13]. In these two subsets of participants, the
frequency of exposure to each putative trigger was calcu-
lated for the case (0–2 hours before the pain onset) and control
windows (24–26 hours before the pain onset). Conditional
logistic regression models were constructed to quantify the
risk of low back pain onset associated with each trigger, where
each participant represented a matched set of data for case
and control exposures. Odds ratios (OR) and 95% confi-
dence intervals (CIs) were calculated by comparing exposure
in the case window with the control window. Interaction anal-
yses were then conducted to assess the difference in estimates
between patients with nonpersistent low back pain and those
with persistent pain. STATA13 (StataCorp LP, College Station,
TX, USA) was used for all analyses.
Secondary exploratory analyses
Because there is no consensus view on the duration of
pain required for an episode to be considered persistent, we
conducted sensitivity analyses using cutoffs of (1) 3 months
and (2) 12 months as the start point for persistent low back
pain.
Results
A total of 1,639 patients from 300 clinics in New South
Wales, Australia were screened by trained clinicians between
October 2011 and November 2012. Of these, 999 patients
(mean age 45.3, 54% men) had non-specific low back pain
of at least moderate intensity for less than 7 days and were
thus eligible to participate. In total, 832 participants (83%)
were followed-up successfully at 12 months (Figure). The main
reasons for lost to follow-up were participants being unavail-
able to respond (n=139) or declining to participate (n=28).
As one participant had missing data on recovery and 49 did
not report sufficient data to calculate the duration of the
episode, our total sample comprised 782 participants report-
ing complete data. Only gender and employment status were
statistically different between participants included in the final
analysis (n=782) compared with those not included (n=217).
A higher proportion of men (57% vs. 43%, p<.001) and em-
ployed participants (85% vs. 78%, p=.009) were included in
the final analysis.All other baseline characteristics were similar
between these two subgroups.
Of our total sample of 782 participants, 430 (55%) had
recovered within 6 weeks, whereas 352 (45%) had persis-
tent symptoms lasting greater than 6 weeks. The baseline
characteristics of these two subgroups were compared,
and we found that the characteristics with statistical and
clinical significance between the two groups were gender and
compensable low back pain. The baseline characteristics for
the two groups of participants are shown in Table 1.
Risk of developing nonpersistent low back pain
The exposure frequency and ORs with 95% CI quantify-
ing the increase in risk of developing nonpersistent low back
pain associated with exposure to the 12 standard putative trig-
gers are shown in Table 2. Exposure to 8 of the 12 transient
activities significantly increased the risk of developing non-
persistent low back pain.
In terms of physical triggers, manual tasks involving objects
not close to body, live people or animal, heavy loads, and
awkward postures resulted in ORs ranging from 3.0 (95% CI
1.1 to 8.3) to 5.6 (95% CI 3.4 to 9.1). However, tasks in-
volving unstable or difficult to hold loads were not associated
with nonpersistent low back pain (OR 2.3, 95% CI 0.9 to 5.6).
Exposure to vigorous physical activity was slightly more risky
than exposure to moderate or vigorous physical activity. We
could not calculate the ORs for exposures to a slip, trial, or
Figure. Flowchart of participants through the study.
1448 G.C. Machado et al. / The Spine Journal 16 (2016) 1445–1452
29

fall because of absence of events in the control window. Sexual
activity was not associated with nonpersistent low back pain
(OR 1.7, 95% CI 0.4 to 7.0).
In regard to psychosocial triggers, alcohol consumption
was not a risk factor for nonpersistent low back pain (OR 1.7,
95% CI 0.4 to 7.0). On the other hand, being distracted (OR
9.0, 95% CI 1.1 to 71.0) or fatigued or tired (OR 7.3, 95%
CI 2.5 to 20.6) during a task or activity were strongly asso-
ciated in triggering a nonpersistent episode.
Risk of developing persistent low back pain
The exposure frequency and ORs with 95% CI quantify-
ing the increase in risk of developing persistent low back pain
associated with exposure to the 12 standard putative trig-
gers are shown in Table 3. Exposure to 6 of the 12 transient
activities significantly increased the risk of developing low
back pain lasting equal or greater than 6 weeks.
For physical triggers, manual tasks involving live people
or animals, heavy loads, and awkward postures were highly
associated with persistent pain, with OR up to 11.7 (95% CI
5.4 to 25.3). Exposure to vigorous physical activity was as
risky as exposure to moderate or vigorous physical activity.
Sexual activity was not associated with persistent low back
pain (OR 0.5, 95% CI 0.1 to 2.7).
In regard to psychosocial triggers, alcohol consumption
was not a risk factor for persistent low back pain (OR 0.7,
95% CI 0.1 to 4.0), and being fatigue or tired during a
task or activity showed a slight association (OR 2.9, 95% CI
1.3 to 6.4).We could not calculate the ORs for the remaining
triggers because of few events in the case or control windows.
Differences between nonpersistent and persistent low
back pain
Overall, our results revealed that in general, physical trig-
gers were more largely associated with persistent low back
pain, whereas psychosocial factors were more strongly as-
sociated with nonpersistent cases. For example, the odds of
developing persistent low back pain when exposed to manual
tasks involving awkward postures (OR 11.7) were twice the
odds of developing a short-lived episode (OR 5.6). More-
over, the odds of developing nonpersistent low back pain when
fatigued or tired during an activity (OR 7.3) was 2.5 times
greater than the odds for persistent low back pain (OR 2.9).
However, our interaction analysis revealed no statistically sig-
nificant differences between these estimates.
Secondary exploratory analyses
Table 4 shows the results of our second exploratory anal-
yses according to our different definitions of persistent low
back pain. In our fist exploratory analysis, we defined per-
sistent low back pain as episodes lasting greater than 3 months.
Using this definition, 563 (72%) participants had recovered
and 219 (28%) experienced persistent low back pain. In the
interaction analysis, our results confirmed that the triggers
identified are similarly associated with the development of
nonpersistent or persistent episodes of low back pain, with
no statistically significant difference between the estimates.
The only statistically significant difference was for being fa-
tigued or tired during an activity, which was only associated
with an episode of nonpersistent low back pain (OR 9.7 95%
CI 3.5 to 27.3).
In our second sensitivity analysis, we defined persistent
cases as low back pain lasting 12 months or more. Of our
total sample, 733 (88%) participants had recovered by 12
Table 1
Baseline characteristics of the participants with nonpersistent (<6 weeks)
and those with persistent low back pain (≥6 weeks)
Patients’ characteristics
Nonpersistent
pain
(<6 w,
n=430*)
Persistent
pain
(≥6 w,
n=352*)
Age, mean (SD), y 45.8 (13.3) 44.5 (13.4)
Male, no. (%) 267 (62.1) 181 (51.4)
Body-mass index, mean (SD), kg/m2 26.1 (4.5) 26.6 (5.1)
Duration of current episode, mean (SD), d 4.7 (2.7) 5.1 (2.7)
Number of previous episodes, mean (SD) 5.6 (9.3) 6.5 (20.1)
Days to seek care, mean (SD) 2.8 (2.0) 3.2 (2.2)
Pain scores (0–10), mean (SD) 5.0 (2.2) 5.6 (2.1)
Currently taking medication, no. (%) 175 (40.7) 179 (50.9)
Currently employed, no. (%) 372 (86.5) 295 (83.8)
Workers compensation, no. (%) 23 (5.3) 46 (13.1)
Occupation
Not employed, no. (%) 58 (13.5) 57 (16.2)
Clerical and administrative worker,
no. (%)
36 (8.4) 42 (11.9)
Community and personal service
worker, no. (%)
14 (3.1) 19 (5.4)
Labourer, no. (%) 16 (3.7) 7 (2.0)
Machinery operator and driver,
no. (%)
12 (2.8) 11 (3.1)
Manager, no. (%) 70 (15.9) 57 (16.2)
Professional, no. (%) 168 (16.3) 112 (31.8)
Sales worker, no. (%) 18 (4.2) 19 (5.4)
Technician and trade worker, no. (%) 38 (8.8) 28 (7.9)
Pain severity in first 24 h†
Moderate, no. (%) 166 (38.6) 112 (31.8)
Severe, No. (%) 215 (50.0) 186 (52.8)
Very severe, no. (%) 49 (11.4) 54 (15.3)
Pain interfering work first 24 h†
Not at all, no. (%) 10 (2.3) 5 (1.4)
A little bit, no. (%) 48 (11.2) 28 (8.0)
Moderately, no. (%) 109 (25.3) 88 (25.0)
Quite a bit, no. (%) 174 (40.5) 128 (36.4)
Extremely, no. (%) 89 (20.7) 103 (29.3)
Tense/anxious scores, mean (SD)‡ 3.7 (2.6) 4.4 (2.5)
Depression scores, mean (SD)‡ 2.4 (2.6) 3.0 (2.8)
SD, standard deviation. SF, Short-Form.
Note: Values in bold indicate statistically significant differences (p<.05)
in baseline characteristics between participants with persistent pain and those
with nonpersistent pain.
* Missing data for 50 patients, therefore only 782 participants were in-
cluded in the final analyses.† Based on modified items 7 and 8 from SF-36: “How much low back
pain have you had in the past week?” and “During the past week, how much
did low back pain interfere with your normal work (including work outside
the home and housework)?”‡ Based on the Orebro Musculoskeletal Pain Questionnaire.
1449G.C. Machado et al. / The Spine Journal 16 (2016) 1445–1452
30

months and only 98 (12%) still experienced persistent symp-
toms. Similarly, we found no statistically significant differences
between the estimates in our interaction analysis, revealing
that the triggers we identified are equally associated with non-
persistent and persistent low back pain.
Discussion
This study is the first to provide estimates of the in-
creased risk in developing persistent low back pain associated
with transient exposures to physical and psychosocial
activities. Moreover, we show for the first time a compari-
son in the risk of developing nonpersistent or persistent low
back pain associated with these factors. Our results re-
vealed that these triggers are important factors to be controlled,
as they can contribute to the development of both non-
persistent and persistent episodes of low back pain.
We identified eight triggers that are highly associated with
the development of nonpersistent low back pain, and six factors
that are strongly associated in triggering persistent epi-
sodes. Overall, participants experiencing a short-lived episode
and those having persistent symptoms share the same trig-
Table 2
Exposure frequency and odds ratios (ORs) with its 95% confidence interval (CI) for each trigger in the case (0–2 hours) and control (24–26 hours) windows
for participants with nonpersistent low back pain (<6 weeks)
Triggers
Nonpersistent low back pain (<6 w, n=430)
Case no. (%) Control no. (%) OR (95% CI)
Physical factors
Manual tasks involving
Heavy loads 76 (17.7) 29 (6.7) 3.9 (2.3–6.8)†
Awkward posture 123 (28.6) 36 (8.37) 5.6 (3.4–9.1)†
Objects not close to the body 17 (4.0) 7 (1.6) 3.0 (1.1–8.3)†
Live people or animals 34 (7.9) 25 (5.8) 4.0 (1.1–14.2)†
Unstable or difficult to hold loads 18 (4.2) 9 (2.1) 2.3 (0.9–5.6)
Moderate or vigorous physical activity 111 (25.8) 67 (15.6) 2.4 (1.6–3.7)
Vigorous physical activity only 45 (10.5) 18 (4.2) 3.5 (1.8–6.8)†
Slip or trip or fall* 14 (3.3) 0.0 (0.0) –
Sexual activity 5 (1.2) 3 (0.7) 1.7 (0.4–7.0)
Psychosocial factors
Consumption of alcohol 5 (1.2) 3 (0.7) 1.7 (0.4–7.0)
Distracted during an activity or task 11 (2.6) 3 (0.7) 9.0 (1.1–71.0)†
Fatigue or tired during an activity or task 55 (12.8) 30 (7.0) 7.3 (2.5–20.6)†
* Due to small frequencies of exposures in either case or control windows, this trigger could not be included in the conditional logistic regression
analysis.† Indicates statistically significant results.
Table 3
Exposure frequency and odds ratios (ORs) with its 95% confidence interval (CI) for each trigger in the case (0–2 hours) and control (24–26 hours) windows
for participants with persistent low back pain (≥6 weeks)
Triggers
Persistent low back pain (≥6 w, n=352)
Case no. (%) Control no. (%) OR (95% CI)
Physical factors
Manual tasks involving
Heavy loads 70 (19.9) 25 (7.1) 6.6 (3.2–13.9)†
Awkward posture 94 (26.7) 19 (5.4) 11.7 (5.4–25.3)†
Objects not close to the body* 17 (4.8) 6 (1.7) –
Live people or animals 35 (9.9) 27 (7.7) 5.0 (1.1–22.8)†
Unstable or difficult to hold loads* 25 (7.1) 8 (2.3) –
Moderate or vigorous physical activity 82 (23.3) 44 (12.5) 3.2 (1.9–5.6)†
Vigorous physical activity only 43 (12.2) 23 (6.5) 3.5 (1.6–7.7)†
Slip or trip or fall* 12 (3.4) 1 (0.3) –
Sexual activity 2 (0.6) 4 (1.1) 0.5 (0.1–2.7)
Psychosocial factors
Consumption of alcohol 2 (0.6) 3 (0.9) 0.7 (0.1–4.0)
Distracted during an activity or task* 13 (3.7) 1 (0.3) –
Fatigue or tired during an activity or task 39 (11.1) 24 (6.8) 2.9 (1.3–6.4)†
* Due to small frequencies of exposures in both case and control windows, this trigger could not be included in the conditional logistic regression
analysis.† Indicates statistically significant results.
1450 G.C. Machado et al. / The Spine Journal 16 (2016) 1445–1452
31

gers (manual tasks involving heavy loads, awkward posture,
live people or animal, moderate or vigorous physical activ-
ity, and being fatigued during a task or activity). This result
could be used for developing future prevention programs, and
could potentially prevent not only the cases of low back pain
that are short-lived, but also persistent cases. Specifically, edu-
cating people in the potentially hazardous activities that can
trigger both persistent and nonpersistent low back pain would
be important, as these triggers are readily modifiable risk
factors.
Our study included a total sample of 999 consecutive pa-
tients with low back pain who presented to primary care within
7 days from pain onset. A key strength of the current study
was our ability to include 83% of the original participants
in the 12-month follow-up. Among those who refused to par-
ticipate in the follow-up or were lost to follow-up, there were
less men and less employed people. It is not clear if these
characteristics are predictors of recovery, and whether these
participants developed persistent pain. Therefore, it is unclear
if our results might have been different if they were in-
cluded. Another strength of this study is the low risk of bias
achieved by the use of a case-crossover study design, where
the participant acts as his or her own control. In this study
design, the chance of bias due to confounding is reduced,
and no further adjustments were necessary in our analyses
[11].
An acknowledged limitation of our study is the potential
for recall bias.At 12 months follow-up, participants were asked
to report whether they had recovered from low back pain and
also the date of their recovery, and some participants had dif-
ficulty reporting dates precisely. However, a previous study
has shown that recall of past low back pain experience was
fairly reproducible over a 12-month period (k=0.82) [16].
Another component that could have affected recovery is the
type of treatment participants received; however, no data on
types of treatment or referrals were collected during the in-
terviews. Nevertheless, in a case-crossover design, participants
are compared to themselves, therefore between-patient dif-
ferences, such as treatment received, are unlikely to change
our results. Furthermore, our study was limited by the number
of participants with persistent low back pain in the analysis.
For example, only 98 participants had persistent symptoms
in our secondary sensitivity analysis. Our estimates, there-
fore, resulted in relatively wide confidence intervals. Also,
because of the time required to interview participants about
exposures over a 96-hour period we were only able to collect
data on exposure to 12 preselected triggers.
This is the first study to investigate the effects of short-
term exposure to physical and psychosocial factors,
experienced before pain onset, on the risk of developing an
episode of low back pain that will persist. It is also the first
study to compare short-lived with persistent cases. Our study
differs conceptually from prognostic studies that usually in-
vestigate characteristics post onset of low back pain on the
risk of developing a persistent episode of low back pain. Prog-
nostic factors identified in these studies may help in
prognostication and treatment selection, whereas the trig-
gers for persistent low back pain we identified have a role
in prevention of the original episode.
The key finding of this study was that most triggers that
increased the risk of a new onset of low back pain also in-
creased the risk in developing episodes that go on to become
persistent. This finding increases substantially the potential
of having knowledge of triggers to make a difference to the
burden of low back pain. By controlling exposure to these
triggers it might be possible to prevent not only the cases of
Table 4
Odds ratios (ORs) with its 95% confidence interval (CI) for each trigger from the secondary exploratory analyses for our different definitions of persistent
low back pain
Triggers
3 Mo as definition of persistent low back pain 12 Mo as definition of persistent low back pain
Nonpersistent pain
(<3 mo, n=563)
Persistent pain
(≥3 mo, n=219)
Nonpersistent pain
(<12 mo, n=733)
Persistent pain
(≥12 mo, n=98)
Physical factors OR (95% CI) OR (95% CI) OR (95% CI) OR (95% CI)
Manual tasks involving
Heavy loads 4.2 (2.6–6.8)† 8.0 (2.8–22.6)† 4.7 (3.0–7.5)† 8.5 (2.0–36.8)†
Awkward posture 6.1 (3.9–9.5)† 16.0 (5.0–51.4)† 7.2 (4.7–11.0)† 13.0 (3.1–54.8)†
Objects not close to the body 4.2 (1.6–11.1)† –* 5.0 (1.9–13.1)† 4.2 (1.6–11.1)†
Live people or animals 5.0 (1.4–17.3)† 3.5 (0.7–16.8) 5.5 (1.9–16.0)† 4.0 (0.4–35.8)
Unstable or difficult to hold loads 3.3 (1.4–7.7)† –* 4.1 (1.8–9.5)† –*
Moderate or vigorous physical activity 2.8 (1.9–4.1)† 2.4 (1.2–4.8)† 2.6 (1.9–3.6)† 4.0 (1.1–14.2)†
Vigorous physical activity only 3.7 (2.1–6.7)† 2.8 (1.0–7.8)† 3.1 (1.8–5.1)† –*
Slip or trip or fall – –* –* –*
Sexual activity 1.4 (0.4–4.4) –* 1.0 (0.4–2.9) –*
Psychosocial factors
Consumption of alcohol 2.3 (0.6–9.0) –* 1.6 (0.5–4.9) –*
Distracted during an activity or task 14 (1.8–106.5)† –* 16.0 (2.1–120.6)† –*
Fatigue or tired 9.7 (3.5–27.3)† 1.6 (0.7–3.9) 4.2 (2.2–7.8)† 2.0 (0.5–8.0)
* Due to small frequencies of exposures or patients overlapping both case and control windows, this trigger could not be included in the conditional
logistic regression analysis.† Indicates statistically significant results.
1451G.C. Machado et al. / The Spine Journal 16 (2016) 1445–1452
32

low back pain that are short-lived but most importantly the
cases that typically go on to be become persistent and account
for the major burden of the disease [4,5].
The triggers that did not increase odds of an acute episode
(sexual activity and alcohol consumption) also did not in-
crease the odds of persistent low back pain. The estimates for
persistent low back pain, however, were less precise as a con-
sequenceof having fewer participants in the analyses, particularly
for the strictest definition of persistent pain (pain ≥12months),
where there were only 98 participants.Althoughwe found that
some triggers, such as manual tasks involving heavy loads or
awkward postures, were more strongly associated with per-
sistent low back pain rather than with episodes that were short-
lived, there were no overall statistically significant differences
between these estimates. This means that persistent and non-
persistent cases of low back pain share the same triggers.
We acknowledge that there are other potential triggers that
would be worth evaluating in future studies. Further re-
search should also investigate the effectiveness of prevention
strategies that control exposure to the harmful triggers we iden-
tified in this study.
Acknowledgments
The Triggers for low back pain study received funding from
Australia’s National Health and Medical Research Council
(application ID APP1003608). The funder had no involve-
ment in the study design, data collection, data analysis,
manuscript preparation, and publication decisions. MLF is
supported by a Sydney Medical Foundation Fellowship. CGM
is supported by a research fellowship from Australia’s Na-
tional Health and Medical Research Council. GCM is
supported by an Australian Postgraduate Award from
Australia’s Department of Education and Training.We declare
no conflicts of interest.
References
[1] Global Burden of Disease Study 2013 Collaborators. Global, regional,
and national incidence, prevalence, and years lived with disability for
301 acute and chronic diseases and injuries in 188 countries, 1990–2013:
a systematic analysis for the Global Burden of Disease Study 2013.
Lancet 2015;386:743–800.
[2] da C. Menezes Costa L, Maher CG, Hancock MJ, McAuley JH, Herbert
RD, Costa LO. The prognosis of acute and persistent low-back pain:
a meta-analysis. CMAJ 2012;184:E613–24.
[3] Henschke N, Maher CG, Refshauge KM, Herbert RD, Cumming RG,
Bleasel J, et al. Prognosis in patients with recent onset low back
pain inAustralian primary care: inception cohort study. BMJ 2008;337:
a171.
[4] Frymoyer JW, Cats-Baril WL. An overview of the incidences and costs
of low back pain. Orthop Clin North Am 1991;22:263–71.
[5] Juniper M, Le TK, Mladsi D. The epidemiology, economic burden, and
pharmacological treatment of chronic low back pain in France, Germany,
Italy, Spain and the UK: a literature-based review. Expert Opin
Pharmacother 2009;10:2581–92.
[6] O’Sullivan K, O’Keeffe M, O’Sullivan L, O’Sullivan P, Dankaerts W.
The effect of dynamic sitting on the prevention and management of
low back pain and low back discomfort: a systematic review.
Ergonomics 2012;55:898–908.
[7] van Duijvenbode IC, Jellema P, van Poppel MN, van Tulder MW.
Lumbar supports for prevention and treatment of low back pain.
Cochrane Database Syst Rev 2008;(2):CD001823.
[8] Bernardes JM, Wanderck C, Moro AR. Participatory ergonomic
intervention for prevention of low back pain: assembly line redesign
case. Work 2012;41(Suppl. 1):5993–8.
[9] Steffens D, Ferreira ML, Latimer J, Ferreira PH, Koes BW, Blyth F,
et al. What triggers an episode of acute low back pain?A case-crossover
study. Arthritis Care Res 2015;67:403–10.
[10] Australian Safety and Compensation Council. National code of practice
for the prevention of musculoskeletal disorders from performing manual
tasks at work. Canberra, Commonwealth of Australia; 2007.
[11] Maclure M. The case-crossover design: a method for studying transient
effects on the risk of acute events. Am J Epidemiol 1991;133:144–
53.
[12] de Vet HC, Heymans MW, Dunn KM, Pope DP, van der Beek AJ,
Macfarlane GJ, et al. Episodes of low back pain: a proposal for uniform
definitions to be used in research. Spine 2002;27:2409–16.
[13] Savigny P, Watson P, Underwood M, Guideline Development Group.
Early management of persistent non-specific low back pain: summary
of NICE guidance. BMJ 2009;338:b1805.
[14] Ware JE Jr, Sherbourne CD. The MOS 36-item short-form health survey
(SF-36). I. Conceptual framework and item selection. Med Care
1992;30:473–83.
[15] Linton SJ, Boersma K. Early identification of patients at risk of
developing a persistent back problem: the predictive validity of the
Orebro Musculoskeletal Pain Questionnaire. Clin J Pain 2003;19:80–86.
[16] Walsh K, Coggon D. Reproducibility of histories of low-back pain
obtained by self-administered questionnaire. Spine 1991;16:1075–
7.
1452 G.C. Machado et al. / The Spine Journal 16 (2016) 1445–1452
33

CHAPTER THREE
Can recurrence after an acute episode of low back pain be predicted?
Chapter Three has been accepted for publication as:
Machado GC, Maher CG, Ferreira PH, et al. Can recurrence after an acute episode of low back
pain be predicted? Phys Ther 2017;[In press]. Copyright © 2017, American Physical Therapy
Association. Reprinted with permission from Oxford University Press.
34

Statement from co-authors confirming authorship contribution of
the PhD candidate
The co-authors of the paper “Can recurrence after an acute episode of low back pain be
predicted?” confirm that Gustavo de Carvalho Machado has made the following contributions:
Conception and design of the research
Analysis and interpretation of the findings
Writing of the manuscript and critical appraisal of the content
In addition to the statements above, in cases where I am not the corresponding author of a
published item, permission to include the published material has been granted by the
corresponding author.
Gustavo de Carvalho Machado __________________________ Date: 30 November 2016
As supervisor for the candidature upon which this thesis is based, I can confirm that the
authorship attribution statements above are correct.
Manuela Loureiro Ferreira _________________________ Date: 30 November 2016
35

Can recurrence after an acute episode of low back pain be predicted?
Gustavo C. Machado,1 Chris G. Maher,1 Paulo H. Ferreira,2 Jane Latimer,1 Bart W. Koes,3
Daniel Steffens,4 Manuela L. Ferreira5
1 School of Public Health, The University of Sydney, Sydney, Australia
2 Faculty of Health Sciences, University of Sydney, Sydney, Australia
3 Department of General Practice, Erasmus Medical Centre, Rotterdam, the Netherlands
4 Surgical Outcomes Research Centre, Royal Prince Alfred Hospital, Sydney, Australia
5 Institute of Bone and Joint Research, Sydney Medical School, The University of Sydney,
Sydney, Australia
Corresponding author: Gustavo C. Machado. Level 10, King George V Building, Royal
Prince Alfred Hospital, 83-117 Missenden Road, Camperdown NSW 2050 Australia. Email:
36

Abstract
Background: Although recurrence is common after an acute episode of low back pain,
recurrence rates vary widely and predictors of recurrence remain largely unknown.
Objective: To determine the 1-year incidence of recurrence in participants that recovered from
an acute episode of low back pain, and to identify predictors of recurrence.
Design: Inception cohort nested in a case-crossover study.
Methods: We followed for 12 months, 832 of the 999 participants who initially presented to
primary care within the first seven days of an episode of low back pain. Of these, 469 recovered
(1-month pain free) from the index episode within six weeks and were included in this study.
Recurrence was defined as a new episode lasting more than one day, or as an episode of care
seeking. Putative predictors were assessed at baseline and chosen a priori. Multivariable
regression analysis was used to calculate odds ratios (OR) and 95% confidence intervals (CI).
Results: The 1-year incidence of recurrence of low back pain was 33%, and the 1-year
incidence of recurrence of low back pain with care seeking was 18%. Participants reporting
more than two previous episodes of low back pain had increased odds of future recurrences
(OR: 3.18, CI: 2.11–4.78). This factor was also associated with recurrent episodes that led to
care seeking (OR: 2.87, CI: 1.73–4.78). No other factors were associated with recurrences.
Limitations: Reliance on recall.
Conclusions: After an acute episode of low back pain, one third of patients will experience a
recurrent episode, and approximately half of those will seek care. Having experienced more
than two previous episodes of low back pain triples the odds of a recurrence within one year.
Word count: 3,115.
37

Introduction
Low back pain is the leading cause of disability according to the 2015 Burden of Disease
Study,1 and affects 9.4% of the global population.2 Although a great proportion of individuals
with acute low back pain improve considerably in the first six weeks,3 there is evidence showing
that rates of recurrence range widely from 15% to 84% within one year.4-6 This large variation
may be explained by how recurrence is defined, with only a few studies using standardised
definitions of episodes of low back pain, including both onset and recovery.7 Further, only a
few studies have investigated predictors of recurrence.5, 6
Most studies that investigated recurrence of low back pain have focused on participants with
persistent pain, therefore, unlikely to recover or have a recurrence.8 There are few studies using
inception cohorts to investigate recurrence of low back pain.5, 6 Stanton et al reported recurrence
rates of 24% and 33% (depending upon the analytic method used),5 while Hancock et al
reported rates ranging from 26% to 54%, depending on how recurrence was defined (episode
of care or 12-month recall).6 These two studies similarly found that only one factor, namely
previous episodes of low back pain, was significantly associated with future recurrences. Other
factors not showing an association included smoking, perceived global health, perceived risk
of recurrence, red flags, physical activity,5 and imaging findings.6 Both studies used single
items, rather than a validated questionnaire to assess physical activity so may have under-
estimated the risk associated with physical activity. Moreover, other factors such as leg pain,
pain and disability levels in the first 24 hours of the episode, use of medications, and anxiety
have not yet been investigated. There is, therefore a paucity of research in this area, leading to
limited understanding of the risk factors for recurrence and the development of effective
preventive management strategies for low back pain.9-11
38

In the current inception cohort study we aimed to investigate the 1-year incidence of recurrence
of low back pain in a large representative sample of patients who had recently recovered from
an acute episode of low back pain presenting to primary care. We also investigated the risk
factors associated with recurrences within one year including novel factors not considered in
previous studies.
Methods
This study is reported according to recommendations of the Strengthening the Reporting of
Observational Studies in Epidemiology (STROBE) statement.12
Participants
This is an inception cohort study with a 1-year follow-up nested in the case-crossover study
Triggers for Low Back Pain.13 This study was approved by the Human Research Ethics
Committee of The University of Sydney (protocol number 05-2011/ 13742), and obtained
informed consent of participants. In brief, Triggers included 999 consecutive patients,
years who presented to one of 300 primary care clinics (general practitioners, physiotherapists
and chiropractors) in New South Wales, Australia between October 2011 and November 2012
with a new episode of sudden onset low back pain. To be included, patients needed to have
presented for care within seven days from pain onset and report moderate pain intensity (item
7 of the SF-36 questionnaire) in the first 24 hours.14 All patients were assessed within seven
days of seeking health care for low back pain. Low back pain was defined as a primary
complaint of pain between the 12th rib and the buttock crease, with or without leg pain, causing
the patient to seek health care or take medication.15 Patients presenting with serious spinal
pathology (e.g., metastatic, inflammatory or infective diseases of the spine) were excluded. In
39

this inception cohort study, we only included patients who had recovered after an acute episode
of low back pain (i.e., within 6 weeks).
Predictors of recurrence
A baseline assessment was conducted through telephone interviews. Factors related to
participants’ socio-demographics (age, gender, body mass index), current history (duration of
episode, days to seek care, number of previous episodes, pain intensity, interference with
function, pain beyond knee), general health (use of medications, physical activity level), work
status (in paid employment, compensable case), and presence of yellow flags (depression,
tension/ anxiety) were collected. These variables, chosen a priori, have been associated with
poorer prognosis,16-18 and were included in this study as putative predictors of recurrence of
low back pain. We hypothesised that older age, female gender, higher body mass index, greater
number of previous episodes, greater duration of current episode, greater days to seek care,
higher pain and/or disability, presence of pain beyond knee, lower habitual physical activity,
higher depression/tension/anxiety, being out of work, and presence of compensation would be
associated with worse prognosis.
Given most participants in our study have reported previous episodes of low back pain, we
decided to use the median number of previous episodes as a cut-off to define previous low back
in previous studies investigating history of low back pain as a predictor of outcomes.19,20
Low back pain intensity was assessed using a numeric rating scale (range, 0–10), and through
modification of item 7 from the SF-36 questionnaire: “how much back pain have you had during
the first 24 hours of this episode”. Interference with function was similarly measured using a
40

modification of item 8 from the SF-36 questionnaire: “during the first 24 hours of this episode
how much did back pain interfere with your normal work”.14 Habitual physical activity was
assessed using the Active Australia questionnaire, which estimates the amount of light,
moderate, and vigorous physical activity in the week before pain onset.21 The proportion of
people doing “sufficient” activity was calculated, defined as a minimum of 150 minutes (sum
of time spent walking plus time spent in moderate and vigorous activity [weighted by two]) and
five sessions of activity per week. We used items 13 and 14 of the Orebro Musculoskeletal Pain
Questionnaire to evaluate anxiety (“how tense or anxious have you felt in the past week”) and
depression (“how much have you been bothered by feeling depressed in the past week”),
respectively.22 Medication use was assessed by asking participants whether they were taking
any medications during the current episode of low back pain. Work status was simply measured
by asking participants if they were in paid employment. Table 1 shows previously investigated
factors associated with recurrence in other studies,5, 6 and those included in our analysis.
Outcome measures
The primary outcome for the study was recurrence of low back pain. Our primary definition of
recurrence was an episode of low back pain that was still present 24 hours after the onset of
symptoms, of at least mild pain intensity,23 and followed a period of at least 30 days pain-free
(pain intensity 0 or 1).15 Trained research assistants made a clear distinction between pain that
was still present 24 hours after the onset of low back pain (which was our outcome) and pain
that lasted continuously for 24 hours. These data were obtained at 1-year follow-up interviews
conducted via telephone and participants responded whether they had recovered from the
original episode of low back pain. If participants had recovered, we then asked how long they
took to recover, and from this we calculated the duration of the episode for each participant.
Thereafter, participants were asked whether they had experienced a recurrent episode, based on
41

the above definitions. Our secondary definition of recurrence required participants to also seek
care for their new episode of low back pain. We also asked about the intensity of pain and
interference with function associated with the recurrent episode, based on modified questions
from the SF-36 questionnaire.14
Statistical analysis
We calculated the 1-year incidence of recurrence of low back pain as the proportion of
participants who reported recurrence divided by the total number of people who had recovered
within six weeks. Descriptive statistics were used to report the characteristics of participants,
including means and standard deviations (SD) for continuous variables, and frequencies and
proportions for categorical variables.
Univariate regression analyses were used to select putative factors with a p
multivariable regression analysis in a single step. Multivariable logistic regression analysis was
conducted for our main definition of recurrence and used to identify associations between
baseline characteristics of participants and recurrence of low back pain within one year follow-
up. In a sensitivity analysis, we used our second definition of recurrence (episode of care) as
the outcome. STATA 13 (StataCorp LP., College Station, Texas) was used for all analyses.
Results
Of the 999 participants presenting to primary care clinics for an acute episode of low back pain,
832 were successfully contacted at 1-year follow-up. Reasons for loss to follow up include
participants refusing to participate or unavailable to answer the telephone. Within one year, 469
participants had recovered from the original episode within six weeks and comprised our
sample (Figure 1). The mean age of those who recovered was 45.8 (SD: 13.3) years and 57%
42

were men. See Table 2 for other baseline characteristics of participants. The incidence of
recurrence after an acute episode of low back pain based on 12-month recall was 33% (n =
157). Most participants reported having at least moderate pain intensity for the recurrent episode
(n = 92, 60%), and nearly half (n = 74, 47%) had moderate to extreme interference with
function. For our second definition, where participants were required to have sought care for
their new episode, the 1-year incidence of recurrence of low back pain was 18% (n = 83).
Five factors (duration of episode, pain intensity, previous episodes of low back pain, depression
and physical activity) showed associations (p
(eAppendix available at academic.oup.com/ptj) and were entered into our multivariable
regression model. The results of our multivariable regression analysis showed that only one
factor, multiple
a recurrence within one year. Using this definition of recurrence, participants who reported
three or more previous episodes of low back pain had 3.18 times (95% CI 2.11–4.78; p <0.001)
the odds of having a recurrence than those who reported less than three previous episodes.
Nearly half (105/224, 47%) of those with multiple previous episodes of low back pain had a
recurrence. No other factors were associated with recurrences. Table 3 shows odds ratios and p
values for the variables that entered into our multivariable regression analysis.
In our sensitivity analysis, where the outcome was recurrence and care seeking, we found that
multiple
future recurrences (OR: 2.87, 95% CI: 1.73–4.78; p <0.001). One-quarter of participants
(57/223, 25%) reporting more than two previous episodes of low back pain had a recurrence
associated with care seeking. No other factors were associated with recurrences that required
care seeking in our sensitivity analysis (Table 3). A post hoc analysis comparing any prior
43

history of low back pain with no prior history revealed similar results. Having any prior history
of low back pain more than tripled the odds of recurrence (OR: 3.45, 95% CI: 1.90–6.23;
p<0.001). Similarly, when we used care seeking as the definition of recurrence, any prior history
of low back pain was also associated with future recurrences (OR: 2.29, 95% CI: 1.12–4.65; p
<0.001).
Discussion
Our inception cohort study revealed that 33% of participants had a recurrence after an acute
episode of low back pain, and about half of those sought care. Although we investigated other
factors not included in previous studies, we confirm that only one factor, having multiple
previous episodes of low back pain, was associated with future recurrences. This factor
remained associated with recurrence of low back pain when we used a second, and stricter,
definition of recurrence, where participants needed to also seek care for the new episode.
Our study included a large sample (n = 469) of patients seeking primary care clinics for a
sudden, onset of low back pain who recovered within six weeks. We used an inception cohort
study design with minimal loss to follow-up (83% response rate), where participants were
included within one week of the onset of the original episode of low back pain. Moreover, a
range of factors not previously investigated were chosen a priori as putative risk factors for
recurrence of low back pain, including factors related to socio-demographics, current history,
general health, work status, and presence of yellow flags. We have also used previously
recommended definitions of episodes of pain, for both recovery and recurrence of low back
pain. Recovery was defined as experience of a period of at least one month without low back
pain (pain intensity 0 or 1, on an 11-point scale),15 while a recurrent episode consisted of a new
episode of at least mild intensity that lasted more than 24 hours.23 Given previous research has
44

shown that individuals who seek care because of low back pain are those with higher levels of
disability and pain intensity,24 we used a second, and stricter, definition of recurrence, including
only those who sought care for the recurrent episode.
A limitation of this study is the reliance on recall, as participants were asked to report recovery
and recurrence information one year after the original episode of low back pain. Memory of
painful events, such as an episode of low back pain, may be distorted by time. Some studies
have reported that low back pain episodes tend to be underreported as the recall period
increases,25, 26 while others have found that pain episodes is often overestimated.22, 27-29
Therefore, it is uncertain whether the dates reported by study participants were accurate and
truly reflected the duration of the episode of low back pain. However, it seems that patients
experiencing recurrent low back pain tend to have greater recall accuracy compared with
patients with chronic pain.30
Despite our attempt to include different putative predictors of recurrence, other relevant factors
not included in our study might have contributed to the onset of the recurrent episode. Previous
studies investigating recurrence of low back pain have either failed to include habitual physical
activity as a putative predictor,6 or have only included a single item to assess physical activity
(“do you participate in at least 30 minutes of moderate intensity physical activity each day?”).5
Although we used a validated questionnaire to assess the level of habitual physical activity of
participants at baseline,21 this factor was not associated with future recurrences of low back
pain. We acknowledge, however, that self-reported measures of physical activity participation
tend to yield overestimated results, and suggest therefore that future studies measure physical
activity using accelerometers. To ensure the baseline interview was feasible and the duration of
the interview acceptable to participants, we only included single questions (depression and
45

anxiety) from the Orebro Questionnaire rather than administering the entire questionnaire.
Therefore, in our regression model we used the responses to a subset of questions rather than
the entire questionnaire as one possible predictor of recurrence.
Another limitation of our study is the lack of data on the type of interventions participants
received during the course of the low back pain episode, and whether this may have influenced
our results. Further, our sample may not represent the general population, given we only
included people who sought care for the original episode of low back pain. Although recruiting
clinicians indicated whether patients presented radiating pain below the knee, we did not assess
for signs of nerve root compression, such as by testing lower limb reflexes, muscle function or
using the straight leg raise test. Therefore, these data were not available to be included in our
analysis as potential predictors of recurrence.
Most studies investigating the incidence of recurrence of low back pain have not used
standardised definitions of episodes as suggested by de Vet et al.15 Recurrence rates are highly
reliant on how recovery and recurrence are defined, and as a result these studies have reported
a wide range of incidence estimates.4, 5 For instance, the incidence of recurrence for an episode
of work absence (10%) is usually much lower compared with estimates for an episode of pain.31
Another explanation for the high variability is the calculation of estimates of recurrence based
on the total sample rather than using only those who recovered from the original episode, and
thus were eligible for recurrence. Stanton et al. have used previously recommended definitions
of episodes of low back pain and have included only participants who recovered within six
weeks from the original episode, reporting recurrence rates similar to ours, ranging from 24%
to 33%.5 Another recent study, however, reported higher recurrence rates for an episode of pain
(54%) and for an episode of care (26%) compared with ours (33% and 18%, respectively).6 We
46

recommend future studies investigating recurrence of low back pain use a large inception cohort
of participants recovered following an acute episode of low back pain, and use previously
proposed definitions of episodes of low back pain, including onset, recovery and recurrence.15,
23
Our multivariable regression analysis showed results similar to those found in a previous
inception cohort study,5 which also reported that previous history of low back pain
(dichotomised yes/no variable) was consistently predictive of recurrence of low back pain
within one year (OR: 1.8, 95% CI: 1.0–3.2). Another cohort study using similar methodology
has also revealed that previous episodes of low back pain (continuous variable) was the only
significant factor associated with future recurrences (hazard ratio: 1.04, 95% CI: 1.02–1.07).6
Although we investigated various other factors not included in these two studies, we confirm
that the only factor consistently associated with future recurrences was multiple previous
episodes of low back pain. Hancock et al. also used a similar definition of recurrence related to
an episode of care, though no estimates were reported due to limited number of events.6 Thus,
to date previous episodes of low back pain is the only known factor associated with recurrence
of low back pain. This is an important factor, given the strong association with cases of health
care utilisation, which are usually the ones likely to be more disabling and account for the major
burden of the condition.32, 33 Other factors investigated in our study but with no significant
association with future recurrences included duration of the episode, pain intensity, and
depression.
In conclusion, our results revealed that about one third of patients who recover from an acute
episode of low back pain will have a recurrence within one year, with half of those requiring
further care. Having three or more episodes of low back pain triples the odds of having a
47

recurrence within one year. Further research is required in this field, with a particular focus on
including potential predictors of recurrence not investigated in our study, such as objective
measures of physical activity participation.
48

Acknowledgements
Professor Chris Maher is supported by a Principal Research Fellowship from the National
Health and Medical Research Council. Associate Professor Manuela Ferreira holds a Sydney
Medical Foundation Fellowship, Sydney Medical School. Gustavo Machado is supported by an
Australian Postgraduate Award from the Department of Education and Training of Australia.
Funding: This study received funding from the National Health and Medical Research Council
(application ID APP1003608). The funder had no involvement in the study design, data
collection, data analysis, manuscript preparation, and/ or publication decisions.
Conflict of Interest: none declared.
49

References
1. GBD 2015 Disease and Injury Incidence and Prevalence Collaborators. Global,
regional, and national incidence, prevalence, and years lived with disability for 310
diseases and injuries, 1990-2015: a systematic analysis for the Global Burden of Disease
Study 2015. Lancet. Oct 08 2016;388(10053):1545-1602.
2. Hoy D, March L, Brooks P, et al. The global burden of low back pain: estimates from
the Global Burden of Disease 2010 study. Ann Rheum Dis. Jun 2014;73(6):968-974.
3. da CMCL, Maher CG, Hancock MJ, McAuley JH, Herbert RD, Costa LO. The
prognosis of acute and persistent low-back pain: a meta-analysis. CMAJ. Aug 7
2012;184(11):E613-624.
4. Pengel LH, Herbert RD, Maher CG, Refshauge KM. Acute low back pain: systematic
review of its prognosis. BMJ. Aug 9 2003;327(7410):323.
5. Stanton TR, Henschke N, Maher CG, Refshauge KM, Latimer J, McAuley JH. After an
episode of acute low back pain, recurrence is unpredictable and not as common as
previously thought. Spine (Phila Pa 1976). Dec 15 2008;33(26):2923-2928.
6. Hancock MJ, Maher CM, Petocz P, et al. Risk factors for a recurrence of low back pain.
Spine J. Nov 1 2015;15(11):2360-2368.
7. Stanton TR, Latimer J, Maher CG, Hancock M. Definitions of recurrence of an episode
of low back pain: a systematic review. Spine (Phila Pa 1976). Apr 20 2009;34(9):E316-
322.
8. Hoy D, Brooks P, Blyth F, Buchbinder R. The Epidemiology of low back pain. Best
Pract Res Clin Rheumatol. Dec 2010;24(6):769-781.
9. Aleksiev AR. Ten-year follow-up of strengthening versus flexibility exercises with or
without abdominal bracing in recurrent low back pain. Spine (Phila Pa 1976). Jun 1
2014;39(13):997-1003.
50

10. Ciriello VM, Shaw WS, Rivard AJ, Woiszwillo MJ. Dynamic training of the lumbar
musculature to prevent recurrence of acute low back pain: a randomized controlled trial
using a daily pain recall for 1 year. Disabil Rehabil. 2012;34(19):1648-1656.
11. Choi BK, Verbeek JH, Tam WW, Jiang JY. Exercises for prevention of recurrences of
low-back pain. Cochrane Database Syst Rev. 2010(1):CD006555.
12. von Elm E, Altman DG, Egger M, et al. The Strengthening the Reporting of
Observational Studies in Epidemiology (STROBE) statement: guidelines for reporting
observational studies. Lancet. Oct 20 2007;370(9596):1453-1457.
13. Steffens D, Ferreira ML, Latimer J, et al. What triggers an episode of acute low back
pain? A case-crossover study. Arthritis Care & Research. 2015;In press.
14. Ware JE, Jr., Sherbourne CD. The MOS 36-item short-form health survey (SF-36). I.
Conceptual framework and item selection. Med Care. Jun 1992;30(6):473-483.
15. de Vet HC, Heymans MW, Dunn KM, et al. Episodes of low back pain: a proposal for
uniform definitions to be used in research. Spine (Phila Pa 1976). Nov 1
2002;27(21):2409-2416.
16. Bekkering GE, Hendriks HJ, van Tulder MW, et al. Prognostic factors for low back pain
in patients referred for physiotherapy: comparing outcomes and varying modeling
techniques. Spine (Phila Pa 1976). Aug 15 2005;30(16):1881-1886.
17. Pincus T, Burton AK, Vogel S, Field AP. A systematic review of psychological factors
as predictors of chronicity/disability in prospective cohorts of low back pain. Spine
(Phila Pa 1976). Mar 1 2002;27(5):E109-120.
18. Steenstra IA, Verbeek JH, Heymans MW, Bongers PM. Prognostic factors for duration
of sick leave in patients sick listed with acute low back pain: a systematic review of the
literature. Occup Environ Med. Dec 2005;62(12):851-860.
51

19. Axen I, Bodin L. The Nordic maintenance care program: the clinical use of identified
indications for preventive care. Chiropr Man Therap. Mar 06 2013;21(1):10.
20. Lopez WO, Vialle EN, Anillo CC, Guzmao M, Vialle LR. Clinical and radiological
association with positive lumbar discography in patients with chronic low back pain.
Evid Based Spine Care J. Feb 2012;3(1):27-34.
21. Armstrong T, Bauman A, Davies J. Physical activity patterns of Australian adults.
Results of the 1999 National Physical Activity Survey. Canberra: Australian Institute of
Health and Welfare; 2000.
22. Linton SJ, Boersma K. Early identification of patients at risk of developing a persistent
back problem: the predictive validity of the Orebro Musculoskeletal Pain Questionnaire.
Clin J Pain. Mar-Apr 2003;19(2):80-86.
23. Stanton TR, Latimer J, Maher CG, Hancock MJ. A modified Delphi approach to
standardize low back pain recurrence terminology. Eur Spine J. May 2011;20(5):744-
752.
24. Ferreira ML, Machado G, Latimer J, Maher C, Ferreira PH, Smeets RJ. Factors defining
care-seeking in low back pain--a meta-analysis of population based surveys. Eur J Pain.
Aug 2010;14(7):747 e741-747.
25. Biering-Sorensen F, Hilden J. Reproducibility of the history of low-back trouble. Spine
(Phila Pa 1976). Apr 1984;9(3):280-286.
26. Roche PA, Gijsbers K. A comparison of memory for induced ischaemic pain and
chronic rheumatoid pain. Pain. Jun 1986;25(3):337-343.
27. Eich E, Reeves JL, Jaeger B, Graff-Radford SB. Memory for pain: relation between past
and present pain intensity. Pain. Dec 1985;23(4):375-380.
28. Jamison RN, Sbrocco T, Parris WC. The influence of physical and psychosocial factors
on accuracy of memory for pain in chronic pain patients. Pain. Jun 1989;37(3):289-294.
52

29. Linton SJ. Memory for chronic pain intensity: correlates of accuracy. Percept Mot
Skills. Jun 1991;72(3 Pt 2):1091-1095.
30. McGorry RW, Webster BS, Snook SH, Hsiang SM. Accuracy of pain recall in chronic
and recurrent low back pain. Journal of Occupational Rehabilitation. 1999;9(3):169-
178.
31. Marras WS, Ferguson SA, Burr D, Schabo P, Maronitis A. Low back pain recurrence
in occupational environments. Spine (Phila Pa 1976). Oct 1 2007;32(21):2387-2397.
32. Frymoyer JW, Cats-Baril WL. An overview of the incidences and costs of low back
pain. Orthop Clin North Am. Apr 1991;22(2):263-271.
33. Wasiak R, Kim J, Pransky G. Work disability and costs caused by recurrence of low
back pain: longer and more costly than in first episodes. Spine (Phila Pa 1976). Jan 15
2006;31(2):219-225.
53

Table 1 Putative predictors of recurrence of low back pain
Predictors Stanton et al (n = 353)5 Hancock et al (n = 76)6 Machado et al (n = 469)
Sociodemographics - Age, body mass index,
educational level
Age, gender, body mass
index
Current history Previous episodes,
number of red flags
Previous episodes Previous episodes, duration
of episode, days to seek
care, pain and disability
levels, leg pain
General health Smoking, habitual
physical activity,
perceived general health
Smoking Habitual physical activity,
use of medications
Psychosocial Perceived risk of
recurrence
Perceived risk of
recurrence, depression
Depression, tension/
anxiety
Work-related - Involvement in heavy
lifting/ awkward positions,
job satisfaction
Work status, occupation,
compensable case
Others Qualification of
practitioner
MRI findings -
n number, MRI magnetic resonance imaging
54

Table 2 Baseline characteristics of participants (n = 469)
Characteristics Value
Age, mean (SD), years 45.8 (13.3)
Male sex, No. (%) 291 (57)
Body-mass index, mean (SD), kg/m2 26.1 (4.5)
Duration of current episode, mean (SD), days 4.7 (2.7)
Number of previous episodes, mean (SD) 5.5 (9.4)
3 previous episodes of low back pain, No. (%) 226 (48)
Days to seek care, mean (SD) 2.8 (2.1)
Pain scores (0–10), mean (SD) 5.0 (2.1)
Leg pain below knee, No. (%) 27 (6)
Currently taking medication, No. (%) 193 (41)
Currently employed, No. (%) 405 (86)
Workers compensation, No. (%) 26 (6)
If in paid employment, what is done for a living
Not employed, No. (%) 64 (14)
Clerical and Administrative Worker, No. (%) 38 (8)
Community and Personal Service Worker, No. (%) 15 (3)
Labourer, No. (%) 17 (4)
Machinery Operator and Driver, No. (%) 12 (3)
Manager, No. (%) 76 (16)
Professional, No. (%) 180 (38)
Sales Worker, No. (%) 23 (5)
Technician and Trade Worker, No. (%) 44 (9)
Pain severity in first 24 hours*
Moderate, No. (%) 182 (39)
Severe, No. (%) 234 (50)
Very severe, No. (%) 53 (11)
Pain interfering with work in first 24 hours*
Not at all, No. (%) 10 (2)
A little bit, No. (%) 52 (11)
Moderately, No. (%) 119 (25)
Quite a bit, No. (%) 189 (40)
Extremely, No. (%) 99 (21)
Habitual physical activity in last week†
Insufficient activity, No. (%) 114 (24)
Sufficient activity, No. (%) 355 (76)
Tense/ anxious scores, mean (SD)‡ 2.5 (2.6)
Depression scores, mean (SD)‡ 3.8 (2.5)
n number, SD standard deviation* Based on modified items 7 and 8 from SF-36† Sufficient activity is defined as 150 minutes (using the sum of walking, moderate activity and vigorous activity [weighted by two]) and five sessions of activity per week‡ Based on items 13 and 14 from the Orebro Musculoskeletal Pain Questionnaire
55

Table 3 Risk factors for recurrence of low back pain
Recurrence of low back pain
>1 day duration
Recurrence of low back pain
& care seeking
Factors OR (95% CI) Sig. OR (95% CI) Sig.
Duration of episode 0.94 (0.87–1.02) 0.15 1.04 (0.95–1.14) 0.38
LBP intensity 1.29 (0.95–1.76) 0.10 1.31 (0.91–1.90) 0.15
Previous LBP* 3.18 (2.11–4.78)† 0.00 2.87 (1.73–4.78)† 0.00
Depression 1.05 (0.97–1.14) 0.21 0.95 (0.86–1.04) 0.28
Habitual physical activity 0.98 (0.95–1.01) 0.14 0.99 (0.95–1.02) 0.41
OR odds ratio, CI confidence interval, Sig p-values, LBP low back pain
* v <3 previous episodes of low back pain
† Indicates statistically significant results
56

eAppendix Results of univariate regression analyses
Recurrence of low back pain
>1 day duration
Factors (by domains) OR (95% CI) Sig.
Sociodemographics
Age 0.99 (0.97–1.01) 0.21
Gender 0.96 (0.65–1.42) 0.86
BMI 1.01 (0.97–1.06) 0.59
Current history
Duration of episode 0.95 (0.88–1.02) 0.13†
Previous LBP* 3.19 (2.13–4.78) 0.00†
LBP intensity 1.34 (1.00–1.80) 0.05†
Interference with work 0.95 (0.83–1.08) 0.40
Leg pain 1.61 (0.73–3.53) 0.23
General health
Medication use 1.10 (0.74–1.62) 0.64
Habitual physical activity 0.98 (0.95–1.01) 0.13†
Work-related
Employed 1.09 (0.61–1.92) 0.78
Worker’s compensation 0.86 (0.37–2.03) 0.73
Psychosocial
Depression 1.06 (0.99–1.14) 0.10†
Anxiety 1.04 (0.97–1.12) 0.30
OR odds ratio, CI confidence interval, Sig p-values, LBP low back pain, BMI body mass index
* v <3 previous episodes of low back pain
† Indicates statistically significant results
57

Figure captions
Fig. 1 Flowchart of study participants
58

Figure 1
59

CHAPTER FOUR
Efficacy and safety of paracetamol for spinal pain and osteoarthritis: systematic review
and meta-analysis of randomised placebo controlled trials
Chapter Four has been published as:
Machado GC, Maher CG, Ferreira PH, et al. Efficacy and safety of paracetamol for spinal pain
and osteoarthritis: systematic review and meta-analysis of randomised placebo controlled trials.
BMJ 2015;350:h1225. Copyright © 2015, British Medical Association. Reprinted with
permission from BMJ Publishing Group.
60

Statement from co-authors confirming authorship contribution of
the PhD candidate
The co-authors of the paper “Efficacy and safety of paracetamol for spinal pain and
osteoarthritis: systematic review and meta-analysis of randomised placebo controlled trials”
confirm that Gustavo de Carvalho Machado has made the following contributions:
Conception and design of the research
Analysis and interpretation of the findings
Writing of the manuscript and critical appraisal of the content
In addition to the statements above, in cases where I am not the corresponding author of a
published item, permission to include the published material has been granted by the
corresponding author.
Gustavo de Carvalho Machado _________________________ Date: 30 November 2016
As supervisor for the candidature upon which this thesis is based, I can confirm that the
authorship attribution statements above are correct.
Manuela Loureiro Ferreira _________________________ Date: 30 November 2016
61

RESEARCH
1
OPEN ACCESS
the bmj | BMJ 2015;350:h1225 | doi: 10.1136/bmj.h1225
1The George Institute for Global Health, Sydney Medical School, University of Sydney, Sydney, NSW 2000, Australia2Faculty of Health Sciences, University of Sydney, Sydney, NSW 2141, Australia3Department of Clinical Pharmacology, St Vincent’s Hospital and University of New South Wales, Sydney, NSW 2010, Australia4School of Medical Sciences, Department of Medicine, University of New South Wales, Sydney, NSW 2033, Australia5Faculty of Pharmacy, University of Sydney, Sydney, NSW 2050, Australia 6Centre for Education and Research on Ageing, Concord Hospital, Sydney, NSW 2139, Australia7Institute of Bone and Joint Research, The Kolling Institute, Sydney Medical School, University of Sydney, Sydney, NSW 2065, Australia
Correspondence to: G C Machado [email protected]
Additional material is published online only. To view please visit the journal online (http://dx.doi.org/10.1136/bmj.h1225)
Cite this as: BMJ 2014;350:h1225 doi: 10.1136/bmj.h1225
Accepted: 04 February 2015
E"cacy and safety of paracetamol for spinal pain and
osteoarthritis: systematic review and meta-analysis
of randomised placebo controlled trials
Gustavo C Machado,1 Chris G Maher,1 Paulo H Ferreira,2 Marina B Pinheiro,2 Chung-Wei Christine Lin,1 Richard O Day,3, 4 Andrew J McLachlan,5, 6 Manuela L Ferreira1, 7
ABSTRACT
OBJECTIVE
To investigate the e3cacy and safety of paracetamol
(acetaminophen) in the management of spinal pain
and osteoarthritis of the hip or knee.
DESIGN
Systematic review and meta-analysis.
DATA SOURCES
Medline, Embase, AMED, CINAHL, Web of Science,
LILACS, International Pharmaceutical Abstracts, and
Cochrane Central Register of Controlled Trials from
inception to December 2014.
ELIGIBILITY CRITERIA FOR SELECTING STUDIES
Randomised controlled trials comparing the e3cacy
and safety of paracetamol with placebo for spinal pain
(neck or low back pain) and osteoarthritis of the hip or
knee.
DATA EXTRACTION
Two independent reviewers extracted data on pain,
disability, and quality of life. Secondary outcomes
were adverse eRects, patient adherence, and use of
rescue medication. Pain and disability scores were
converted to a scale of 0 (no pain or disability) to 100
(worst possible pain or disability). We calculated
weighted mean diRerences or risk ratios and 95%
conVdence intervals using a random eRects model.
The Cochrane Collaboration’s tool was used for
assessing risk of bias, and the GRADE approach was
used to evaluate the quality of evidence and
summarise conclusions.
RESULTS
12 reports (13 randomised trials) were included. There
was “high quality” evidence that paracetamol is
ineRective for reducing pain intensity (weighted mean
diRerence −0.5, 95% conVdence interval −2.9 to 1.9)
and disability (0.4, −1.7 to 2.5) or improving quality of
life (0.4, −0.9 to 1.7) in the short term in people with
low back pain. For hip or knee osteoarthritis there was
“high quality” evidence that paracetamol provides a
signiVcant, although not clinically important, eRect on
pain (−3.7, −5.5 to −1.9) and disability (−2.9, −4.9 to
−0.9) in the short term. The number of patients
reporting any adverse event (risk ratio 1.0, 95%
conVdence interval 0.9 to 1.1), any serious adverse
event (1.2, 0.7 to 2.1), or withdrawn from the study
because of adverse events (1.2, 0.9 to 1.5) was similar
in the paracetamol and placebo groups. Patient
adherence to treatment (1.0, 0.9 to 1.1) and use of
rescue medication (0.7, 0.4 to 1.3) was also similar
between groups. “High quality” evidence showed that
patients taking paracetamol are nearly four times more
likely to have abnormal results on liver function tests
(3.8, 1.9 to 7.4), but the clinical importance of this
eRect is uncertain.
CONCLUSIONS
Paracetamol is ineRective in the treatment of low back
pain and provides minimal short term beneVt for
people with osteoarthritis. These results support the
reconsideration of recommendations to use
paracetamol for patients with low back pain and
osteoarthritis of the hip or knee in clinical practice
guidelines.
SYSTEMATIC REVIEW REGISTRATION
PROSPERO registration number CRD42013006367.
Introduction
Low back and neck pain (spinal pain) are leading
causes of disability worldwide, and osteoarthritis of the
hip or knee is the 11th highest contributor to global dis-
ability, when disability is measured by years lived with
disability.1 The point prevalence of spinal pain is 9.4%,
and osteoarthritis aCects nearly 4% of the global popu-
lation.2–4 The increasing healthcare expenditure for
these conditions is mostly attributed to the increasing
cost of prescription medicines, accounting for about
20% of the total cost.5
Prescription of drugs is the most common approach
to treatment used by general practitioners for spinal
pain and osteoarthritis,6 and guidelines consistently
recommend the prescription of paracetamol (acetamin-
ophen) as the Krst line analgesic for these conditions.7–11
There has, however, been controversy about keeping
paracetamol in the most recent guidance on osteoar-
thritis from the National Institute for Health and Care
WHAT IS ALREADY KNOWN ON THIS TOPIC
Clinical guidelines recommend paracetamol as Vrst line analgesic drug for both
spinal pain (neck and low back pain) and osteoarthritis of the hip and knee
The evidence base supporting these recommendations has recently been called
into question
WHAT THIS STUDY ADDS
High quality evidence suggests that paracetamol is ineRective in reducing pain and
disability or improving quality of life in patients with low back pain
There is high quality evidence that paracetamol oRers a small but not clinically
important beneVt for pain and disability reduction in patients with hip or knee
osteoarthritis
Though high quality evidence shows that patients taking paracetamol are nearly
four times more likely to have abnormal results on liver function tests compared
with those taking oral placebo, the clinical relevance of this is unclear
62

RESEARCH
2 doi: 10.1136/bmj.h1225 | BMJ 2015;350:h1225 | the bmj
Excellence,12 mainly because of previous studies report-
ing small eCects of paracetamol compared with pla-
cebo.13–15 Moreover, optimal therapeutic beneKts of
paracetamol might require regular doses of up to
4000 mg/day.16 There are some concerns regarding
safety of the full recommended dose,17 18 although the
evidence on safety is still debatable.19 Potential adverse
eCects and treatment schedule seem to also have a con-
siderable eCect on patient adherence20 as taking anal-
gesics constantly and regularly three or four times a day
is inconvenient at least.
New randomised controlled trials15 21 have been con-
ducted since the last meta-analyses of paracetamol for
spinal pain and osteoarthritis of the hip or knee were
published. There is still uncertainty, however, whether
consideration of new data changes the conclusions
regarding the eWcacy and safety of paracetamol for
these conditions. In this systematic review we investi-
gated the eWcacy and safety of paracetamol in patients
with spinal pain or osteoarthritis of the hip or knee by
including data from placebo controlled trials only, as
these represent the highest standard of evidence to
inform the optimal use of drugs.22
Methods
Data sources and searches
We conducted a systematic review following the
PRISMA statement23 and prospectively registered the
review on PROSPERO. We carried out a systematic elec-
tronic search in Medline, Embase, AMED, CINAHL, Web
of Science, LILACS, International Pharmaceutical
Abstracts, and Cochrane Central Register of Controlled
Trials from inception to 8 December 2014. We used a
combination of relevant keywords to construct the
search strategy including paracetamol, acetamino-
phen, back pain, neck pain, osteoarthritis, osteoarthro-
sis, placebo, randomised, and controlled trial (see
appendix 1). One author (GCM) conducted the Krst
screening of potentially relevant records based on titles
and abstract, and two authors (GCM and MBP) inde-
pendently performed the Knal selection of included
trials based on full text evaluation. Citation tracking
was also performed on included studies and relevant
systematic reviews, and relevant websites and clinical
trials registries were searched for unpublished studies.
Consensus between the two reviewers was used to
resolve any disagreement.
Study selection
We included only randomised controlled trials compar-
ing the eWcacy of paracetamol versus placebo. To be
eligible, trials had to include participants with non-
speciKc spinal pain (neck or low back pain) or osteoar-
thritis of the hip or knee. We did not exclude trials in
mixed populations of patients with spinal pain and
osteoarthritis. The intensity and duration of symptoms
were not restricted. There were also no restrictions for
languages or publication date. Studies that included
patients with a serious spinal pathology (such as cauda
equina syndrome, tumour, or infection) were excluded.
Studies with mixed populations of patients with
rheumatoid arthritis and osteoarthritis were also
excluded, unless separate data were reported for osteo-
arthritis. Studies in which participants had previous
spinal, hip, or knee surgery remained eligible, but trials
evaluating analgesia in the immediate postoperative
period were not included. We included only full reports
in this systematic review (that is, no abstracts).
Trials were eligible for inclusion when they reported
at least one of the following primary outcome measures:
pain intensity, disability status, and quality of life. Sec-
ondary outcome measures were safety (adverse eCects),
patient adherence, and use of rescue medication.
Data extraction and quality assessment
Using a standardised data extraction form, two review-
ers (GCM and MBP) independently extracted study
characteristics (details of participants, interventions,
and outcomes) from the included trials, and a third
author (MLF) resolved any disagreement. We extracted
means, standard deviations, and sample sizes for our
primary outcome measures. Mean estimates were
extracted in the following hierarchical order: mean dif-
ferences, change scores, and Knal values. For our sec-
ondary outcomes, we extracted the number of cases
and the total sample size. The safety outcomes extracted
from included trials were the number of patients report-
ing any adverse event, the number of patients reporting
any serious adverse event (as deKned by each study),
the number of patients withdrawn from study because
of adverse events, and the number of patients with
abnormal results on liver function tests (hepatic
enzyme activity ≥1.5 times the upper limit of the refer-
ence range). We contacted authors to provide further
information when there were insuWcient data reported
in the paper. When authors were unavailable we esti-
mated data using the recommendations in the Cochrane
Handbook for Systematic Reviews of Interventions.24
Two reviewers (GCM and MBP) independently
assessed the risk of bias of the included studies using
the Cochrane Collaboration’s tool.24 25 Consensus was
used to resolve any disagreement. RevMan version 5.3.5
was used to generate Kgures and summaries. The qual-
ity of evidence was rated for each pooled analysis with
the GRADE (grading of recommendations assessment,
development and evaluation) system,26 with outcomes
of interest being ranked according to their relevance for
clinical decision making as of limited importance,
important, or critical.27 The quality of evidence was
downgraded by one level according to the following cri-
teria: limitation of study design, inconsistency of
results, imprecision, and publication bias. We did not
consider the indirectness criterion in this review
because we included a speciKc population with rele-
vant outcomes and direct comparisons.28 Briefly,
GRADE was downgraded by one level for limitation of
study design when more than a quarter of the studies
included in an analysis were considered at high risk of
bias (that is, one or more bias domains were judged as
high risk) according to the Cochrane Handbook and
thus plausible to affect the interpretation of our
results.24 29 Results were considered inconsistent if there
63

RESEARCH
3the bmj | BMJ 2015;350:h1225 | doi: 10.1136/bmj.h1225
was a wide variance of point estimates across studies or
if the heterogeneity between trials was large (I2>50%).30
Imprecision was identiKed when the upper or lower
limits of the 95% conKdence interval crossed the mini-
mal clinically important diCerence of 9 points (range
0–100).31 32 We visually judged a funnel plot (scatterplot
of the eCect of estimates from individual studies against
its standard error) and used Egger’s test to investigate
publication bias (small study eCects).33 We included a
total of 11 trials in the assessment of small study eCects
(nine trials including patients with osteoarthritis and
two trials including patients with back pain, reporting
data on immediate or short term pain intensity). If the
Egger’s test result was signiKcant (two tailed P<0.1) we
would downgrade the quality of evidence (GRADE) by
one level for all meta-analyses.34 The quality of evi-
dence was deKned as “high quality,” “moderate qual-
ity,” “low quality,” and “very low quality.”26
Data synthesis and analysis
We grouped the outcomes into four time points of
assessment: immediate term (≤2 weeks), short term (>2
weeks but ≤3 months), intermediate term (>3 months
but ≤12 months), and long term (>12 months). If studies
reported multiple time points within each category, we
used the time point closest to one week for immediate
term, eight weeks for short term, six months for inter-
mediate term, and 12 months for long term. When stud-
ies reported more than one scale to measure pain we
extracted the more severe estimate reported at baseline.
Scores for pain and disability were converted to a com-
mon 0 (no pain or disability) to 100 (worse pain or dis-
ability) scale. Pain intensity measures to calculate
treatment eCects were numerical rating scale scores
(range 0–10) or visual analogue scale scores (range
0–100). These two pain measures are highly correlated
and can be used interchangeably when transformed.35
Other measures of pain were also obtained from visual
analogue scale scores included in the Western Ontario
and McMaster Universities osteoarthritis index
(WOMAC) pain subscale (VA3 series range 0–100)36 and
from the multi-dimensional health assessment ques-
tionnaire (MDHAQ) pain subscale (range 0–100).37
Disability measures in the meta-analyses were WOMAC
function subscale or WOMAC total scores.38 One study
reported pain and disability measures from the WOMAC
Likert version (LK series), and the scores were also nor-
malised to a scale of 0 to 100.
To facilitate the interpretation of our pooled esti-
mates, we deKned the eCects of paracetamol compared
with placebo as ineCective when the 95% conKdence
interval crossed the no eCect line, showing no signiK-
cant diCerence between groups. We considered the
minimal clinically important diCerence as a diCerence
of 9 mm in a 0–100 mm visual analogue scale. This esti-
mate has been used in past systematic reviews32 to
investigate the eWcacy of medicines compared with
placebo for osteoarthritis and corresponds to the
median minimal clinically important diCerence found
in trials investigating patients with osteoarthritis. When
our treatment eCects were smaller than 9 mm, although
signiKcant, we considered the eCect as small and not
clinically important.
We used the I2 statistic to assess heterogeneity
between trials, and values higher than 50% were deKned
to identify high heterogeneity.39 We calculated weighted
mean diCerences or risk ratios and 95% conKdence
intervals and used the random eCects model to pool esti-
mates for each analysis obtained with Comprehensive
Meta-Analysis version 2.2.064 (Englewood, NJ, 011).
Secondary exploratory analysis
We performed sensitivity analyses to explore the inlu-
ence of each risk of bias domain on pooled treatment
eCects. These stratiKed analyses were accompanied by
meta-regression to generate a P value for interaction
between the bias domain and estimate of treatment
eCect. For these analyses we used data from all osteoar-
thritis trials included in the meta-analysis on short term
pain (seven trials). As a previous study reported that
small trials in osteoarthritis tend to report more beneK-
cial treatment eCects than large trials,40 we also con-
ducted a sensitivity analysis between large trials (sample
size ≥100 per group) versus small trials (sample size
<100 per group) for all trials investigating patients with
osteoarthritis at immediate or short term follow-up. Neg-
ative diCerences in treatment eCects indicate that small
trials have more beneKcial eCects than large trials.
Post hoc analysis
We carried out a post hoc analysis to assess the poten-
tial impact of a new trial on the current evidence and
thus to determine if a further new trial is justiKed. We
used extended funnel plots (graphical augmentations
of the funnel plots commonly used to investigate publi-
cation bias in meta-analyses)41 to assess the impact of a
new trial in our meta-analysis. The extended funnel
plots provide shaded contours that represent the contri-
bution of a new trial to existing evidence based on sta-
tistical simulations.42 Addition of data from a new trial
of a certain sample size and treatment eCect could
Potentially relevant records a�er excluding duplicates (n=4037): Medline (n=1183) AMED (n=208) Embase (n=1812)
CINAHL (n=1007)Web of Science (n=575)CENTRAL (n=376)
LILACS (n=85)IPA (n=252)
Potentially relevant studies identi"edfor full text evaluation (n=116)
Records included in review(n=12; 13 randomised controlled trials)
Excluded a�er screening titles and abstracts (n=3921)
Studies excluded (n=104): Not appropriate intervention (n=42) Not appropriate population (n=10) Not appropriate data (n=4) Not randomised controlled trial (n=48)
Fig 1 | Flow chart of trials investigating eVcacy of
paracetamol in spinal pain and osteoarthritis. Numbers of
records from each database include duplicates.
IPA=International Pharmaceuticals Abstracts,
CENTRAL=Cochrane Register of Controlled Trials
64

RESEARCH
4 doi: 10.1136/bmj.h1225 | BMJ 2015;350:h1225 | the bmj
result in the new conclusion that the eCect of interven-
tion is clearly worthwhile or clearly not worthwhile, for
instance. We conducted extended funnel plots to assess
the impact a further trial of paracetamol for spinal pain
and hip or knee osteoarthritis would have on the current
evidence presented in this meta-analysis. Stata 13
(StataCorp, College Station, TX) was used for this analysis.
Results
Our search results yielded 5498 records, and aner
excluding duplicates we screened 4037 titles and
abstracts. Two independent reviewers evaluated 116
potentially relevant studies, and 12 records (13 ran-
domised controlled trials) met the criteria to be
included in this review, with one article reporting
results of two trials (Kg 1).43–54 Ten trials reporting data
from 3541 patients evaluated the efficacy of
paracetamol in patients with osteoarthritis of the hip
or knee,43 44 46–51 54 and three trials (1825 patients) inves-
tigated the eWcacy of paracetamol in people with low
back pain.45 52 53 We did not identify any trials in
patients with neck pain. Overall, the included trials
assessed 5366 patients. We identiKed two randomised
trials published as abstracts and excluded them from
this review.55 56 One randomised trial investigating the
eWcacy of paracetamol for low back pain did not report
results for the placebo group, and attempts to access
these data from the authors and the company that
funded the study were unsuccessful.45 This trial was
included in the review but not in the meta-analysis.
In the included studies paracetamol was primarily
administered orally (as tablets/capsules). One trial,
however, reported the use of intravenous paracetamol
in participants with chronic low back pain.52 The total
oral dose and dose regimens for paracetamol varied
across trials, with 10 trials using a total dose of 3900–
4000 mg/day and three trials using 3000 mg/day
(table 1). Two trials used a three arm design, one
Table 1 | Characteristics of randomised placebo controlled trials included in review of eVcacy and safety of paracetamol for spinal pain and osteoarthritis
Study Details of participants Interventions (Dose regimens) Outcomes and time points
Spinal pain
Nadler, 200245 133 patients (group 1=113, group 2=20); mean age (SD) group 1=34.9 (11.3), group 2=38.0 (9.1); duration: acute (NR)
Group 1: paracetamol 500 mg, 2 tablets, 4 times daily, 4000 mg total. Group 2: oral placebo
Pain (VRS, 0–5); Roland Morris questionnaire (0–24); adverse events; on days 2 and 4
Wetzel, 201452 (cross over)
40 patients on chronic opioid therapy, mean age (SD)=57.2 (12.8); duration: chronic (>6 months)
Group 1: single intravenous paracetamol 1000 mg dose. Group 2: intravenous placebo
Pain (VAS, 0–10); Roland Morris questionnaire (0–24); immediately aher infusion
Williams, 201453 1652 patients (group 1=550, group 2=549, group 3=553); mean age (SD) group 1=44.1 (14.8), group 2=45.4 (16.7), group 3=45.4 (16.7); duration: acute (<6 weeks)
Group 1: paracetamol 665 mg, 2 tablets, 3 times daily, 3990 mg total. Group 2: paracetamol 500 mg, 1–2 tablets as required, 4–6 hours apart, maximum 8 tablets per day. Group 3: oral placebo. Rescue medication allowed
Pain (NRS, 0–10); Roland Morris questionnaire (0–24); SF-12 physical score (0–100); patient adherence; rescue medication; adverse events; at 1, 2, 4, and 12 weeks
Osteoarthritis
Amadio, 198343 (cross over)
25 patients; median age (range)=64 (43–80); duration: NR
Group 1: paracetamol 500 mg, 2 tablets, 4 times daily, 4000 mg total. Group 2: oral placebo
50 h (15 m) walking test; adverse events; at 4 weeks
Zoppi, 199544 60 patients (group 1=30, group 2=30); mean age (SD) group 1=57.6 (11.2), group 2=55.3 (11.9); duration: group 1=75.0 (98.2) months, group 2=45.8 (58.6) months
Group 1: ekervescent paracetamol 500 mg, 2 tablets, 3 times daily, 3000 mg total. Group 2: ekervescent placebo
Pain (VAS, 0–100); adverse events; at 1 week
Case, 200346 57 patients (group 1=29, group 2=28); mean age (SD) group 1=62.1 (11.4), group 2=61.7 (9.0); duration: NR
Group 1: paracetamol 500 mg, 2 tablets, 4 times daily, 4000 mg total. Group 2: Oral placebo
WOMAC pain (VAS, 0–500); WOMAC function (0–1700); adverse events; at 2 and 12 weeks
Golden, 200447 303 patients (group 1=148, group 2=155); mean age (SD) group 1=61.1 (13.1), group 2=60.3 (13.0); duration: NR
Group 1: paracetamol 1000 mg, 1 tablet, 4 times daily, 4000 mg total. Group 2: Oral placebo
Pain intensity on weight bearing (0–4); 50 h (15 m) walking test; adverse events; at 1 week
Miceli-Richard, 200448 779 patients (group 1=405, group 2=374); mean age (SD)=70 (11); duration: 46 (47) months
Group 1: paracetamol 1000 mg, 1 tablet, 4 times daily, 4000 mg total. Group 2: oral placebo. Rescue medication not allowed
Pain (VAS, 0–100); WOMAC function (0–100); adverse events; patient adherence; at 1 and 6 weeks
Pincus, 2004a (PACES-A cross over trial)49
524 patients; mean age (SE) group 1=63.7 (1.2), group 2=62.8 (1.3); duration group 1: 8.5 (1.0) years, group 2: 8.1 (1.1) years
Group 1: Paracetamol 1000 mg, 1 tablet, 4 times daily, 4000 mg total. Group 2: Oral placebo. Rescue medication allowed
MDHAQ pain (VAS, 0–100); WOMAC (0–100); adverse events; at 6 weeks
Pincus, 2004b (PACES-B cross over trial)49
556 patients; mean age (SE) group 1=64.8 (1.3), group 2=63.4 (1.3); duration group 1: 10.4 (1.3) years, group 2: 9.5 (1.1) years
Group 1: paracetamol 1000 mg, 1 tablet, 4 times daily, 4000 mg total. Group 2: oral placebo. Rescue medication allowed
MDHAQ pain (VAS, 0–100); WOMAC (0–100); adverse events; at 6 weeks
Herrero-Beaumont, 200751
212 patients (group 1=108, group 2=104); mean age (SD) group 1=63.8 (7.2), group 2=64.5 (6.9); duration: group 1: 6.5 (5.3) years, group 2: 7.2 (5.8) years
Group 1: paracetamol 1000 mg, 1 tablet, 3 times daily, 3000 mg total. Group 2: oral placebo. Rescue medication allowed
WOMAC pain (Likert, 0–20); WOMAC function (0–68); rescue medication; adverse events; at 6 months
Altman, 200750 483 patients (group 1=160, group 2=158, group 3=165); mean age (range)=62.2 (40–90); duration: NR
Group 1: paracetamol ER 1300 mg, 3 times daily, 3900 mg total. Group 2: paracetamol 650 mg, 3 times daily, 1950 mg total. Group 3: oral placebo. Rescue medication allowed
WOMAC pain (VAS, 0–100); WOMAC function (0–100); adverse events; at 12 weeks
Prior, 201454 542 patients (group 1=267, group 2=275); mean age (SD) group 1=61.7 (10.2), group 2=61.7 (10.1); duration: NR
Group 1: paracetamol ER 650 mg, 2 tablets, 3 times daily, 3900 mg total. Group 2: oral placebo. Rescue medication allowed, but limited
WOMAC pain (VAS, 0–100); WOMAC function (0–100); adverse events; at 2 and 12 weeks
VRS=verbal rating scale, VAS=visual analogue scale, NRS=numeric rating scale, NR=not reported, WOMAC=Western Ontario and McMaster Universities arthritis index, MDHAQ=multi-
dimensional health assessment questionnaire, SF-12=12-item short form health survey, Duration=duration of condition, ER=extended release.
65

RESEARCH
5the bmj | BMJ 2015;350:h1225 | doi: 10.1136/bmj.h1225
included a third group that received paracetamol as
required,53 and another included a third group that
received a lower dose of paracetamol (650 mg, one tab-
let, three times/day, 1950 mg total).50 All three treat-
ment groups were included in the meta-analyses
following the recommendation in the Cochrane Hand-
book for Systematic Reviews of Interventions.24 The
washout period before treatment started varied across
trials, ranging from one day to six months. The wash-
out periods were 12 weeks for corticosteroids,51 six
weeks for intra-articular steroids,43 and ranged from
three days to two weeks for non-steroidal anti-inlam-
matories.43 46–48 Patients stopped taking simple analge-
sics from one to 10 days.43 46 48 52 One trial reported that
the washout for glucosamine drugs was six months,51
and two trials used “Kve half lives” to deKne this
period.50 54
We included six trials that reported data from people
with chronic pain,44 48 49 51 52 and two studies that
included people with acute pain only.45 53 The remaining
studies did not report the duration of pain or disability.
Nine trials used the diagnosis of osteoarthritis based on
image evidence and clinical assessment,43 46–51 54
whereas one trial based the diagnosis solely on image
evidence.44 Two trials used a clear deKnition of low
back pain,52 53 and one trial used a simple question to
deKne patients (“do the muscles of your low back
hurt?”).45 Table 1 includes more detailed information on
included trials.
Figure 2 summarises the assessment of risk of bias
for individual trials. Twelve trials had at least one
domain judged as unclear risk of bias. Four trials had
at least one domain considered as high risk of bias, and
only one trial had all bias domains judged as low risk of
bias. Most trials (nine) failed to report the method used
to generate the sequence allocation, though all
reported being randomised studies. Three trials
adopted an appropriate method of concealment of allo-
cation, and only one trial failed to report blinding of
patients, personnel, and outcome assessors. Eight tri-
als were funded by companies that produce parac-
etamol and were considered as having unclear risk of
bias for the other sources of bias domain. As only one
study reported data for intermediate term follow-up, its
results were pooled with trials reporting data for short
term follow-up. None of the included trials reported
data for long term follow-up. The inspection of the fun-
nel plot and the lack of signiKcance of the Egger’s test
(P=0.21) suggested no serious small study eCects (see
appendix 2, Kg A). We therefore considered that no
meta-analysis presented serious publication bias
according to the GRADE approach. Figure 3 sum-
marises pooled eCect sizes for pain and disability at
immediate and short term follow-up. Tables 2 and 3
present individual trial results and calculations of
eCect sizes.
Spinal pain
Immediate term follow-up
Two trials including 1692 patients with low back pain
tested the eCect of paracetamol compared with placebo
in pain reduction.52 53 Pooling showed no eCect of parac-
etamol on pain (weighted mean diCerence 1.4, 95% con-
fidence interval −1.3 to 4.1; “moderate quality”
evidence, downgraded for limitation of study design).
For disability, one trial evaluating 1652 patients found
no diCerence between paracetamol and placebo (−1.9,
−4.8 to 1.0).53 The quality of evidence for disability in
the immediate term was rated “high quality” according
to the GRADE approach.
Short term follow-up
Only one trial investigated the short term eWcacy of
paracetamol in 1652 patients with low back pain.53
This trial showed no eCect of paracetamol on pain
intensity (weighted mean diCerence −0.5, 95% conK-
dence interval −2.9 to 1.9), disability (0.4, −1.7 to 2.5), or
quality of life measured by the 12-item short form
health survey (SF-12 version 2) (0.4, −0.9 to 1.7) at short
term follow-up. The quality of evidence (GRADE) for
Altman 2007
Amadio & Cummings 1983
Case 2003
Golden 2004
Herrero-Beaumont 2007
Miceli-Richard 2004
Nadler 2002
Pincus 2004a
Pincus 2004b
Prior 2014
Wetzel 2014
Williams 2014
Zoppi 1995
Ra
nd
om
se
qu
en
ce g
en
era
tio
n (
sele
ctio
n b
ias)
All
oca
tio
n c
on
cea
lme
nt
(se
lect
ion
bia
s)
Bli
nd
ing
of
pa
rtic
ipa
nts
an
d p
ers
on
ne
l (p
erf
orm
an
ce b
ias)
Bli
nd
ing
of
ou
tco
me
ass
ess
me
nt
(de
tect
ion
bia
s)
Inco
mp
lete
ou
tco
me
da
ta (
att
riti
on
bia
s)
Se
lect
ive
re
po
rtin
g (
rep
ort
ing
bia
s)
Oth
er
bia
s
Fig 2 | Risk of bias summary showing review authors’
judgments about each risk of bias domain in placebo
controlled trials on eVcacy of paracetamol for spinal pain
and osteoarthritis. Randomised clinical trials are listed
alphabetically by author name
66

RESEARCH
6 doi: 10.1136/bmj.h1225 | BMJ 2015;350:h1225 | the bmj
all three outcomes was rated as “high quality.” Tables 4
and 5 summarise the Kndings and quality assessment
(GRADE) for outcomes ranked as critical for decision
making.
Osteoarthritis
Immediate term follow-up
Five trials reported data from 1741 patients with hip or
knee osteoarthritis and were included in a meta-analysis
Spinal pain (pain/immediate term)
Wetzel 2014
Williams 2014a
Williams 2014b
Pooled E�ect: I2=0%
Spinal pain (pain/short term)
Williams 2014a
Williams 2014b
Pooled e�ect: I2=0%
Spinal pain (disability/immediate term)
Williams 2014a
Williams 2014b
Pooled e�ect: I2=0%
Spinal pain (disability/short term)
Williams 2014a
Williams 2014b
Pooled e�ect: I2=0%
Osteoarthritis (pain/immediate term)
Zoppi 1995
Case 2003
Golden 2004
Miceli-Richard 2004
Prior 2014
Pooled e�ect: I2=33%
Osteoarthritis (pain/short term)
Case 2003
Miceli-Richard 2004
Pincus 2004a
Pincus 2004b
Herrero-Beaumont 2007
Altman 2007a
Altman 2007b
Prior 2014
Pooled E�ect: I2=0%
Osteoarthritis (disability/immediate term)
Case 2003
Miceli-Richard 2004
Prior 2014
Pooled e�ect: I2=84%
Osteoarthritis (disability/short term)
Case 2003
Miceli-Richard 2004
Pincus 2004a
Pincus 2004b
Herrero-Beaumont 2007
Altman 2007a
Altman 2007b
Prior 2014
Pooled e�ect: I2=33%
0.0 (-9.7 to 9.7)
1.0 (-2.9 to 4.9)
2.0 (-2.0 to 6.0)
1.4 (-1.3 to 4.1)
-1.0 (-4.4 to 2.4)
0.0 (-3.4 to 3.4)
-0.5 (-2.9 to 1.9)
-2.5 (-6.6 to 1.6)
-1.3 (-5.4 to 2.9)
-1.9 (-4.8 to 1.0)
0.0 (-2.9 to 2.9)
0.8 (-2.2 to 3.8)
0.4 (-1.7 to 2.5)
-9.2 (-19.6 to 1.2)
-0.6 (-6.6 to 5.3)
-4.2 (-8.2 to -0.2)
-1.0 (-4.0 to 2.0)
-5.9 (-10.0 to -1.8)
-3.3 (-5.8 to -0.8)
-1.7 (-12.8 to 9.4)
-0.8 (-4.4 to 2.8)
-6.9 (-12.3 to -1.5)
-6.2 (-11.4 to -1.0)
-2.5 (-7.7 to 2.7)
-6.9 (-13.4 to -0.4)
-3.2 (-9.0 to 2.6)
-4.2 (-8.5 to 0.1)
-3.7 (-5.5 to -1.9)
2.6 (-1.5 to 6.6)
-1.0 (-2.7 to 0.7)
-6.5 (-10.0 to -3.0)
-1.7 (-6.0 to 2.6)
2.6 (-5.1 to 10.3)
0.0 (-2.7 to 2.7)
-3.6 (-8.0 to 0.8)
-3.8 (-7.7 to 0.1)
-4.7 (-9.5 to -0.1)
-7.1 (-13.4 to -0.8)
-1.0 (-6.9 to 4.9)
-5.4 (-9.5 to -1.2)
-2.9 (-4.9 to -0.9)
8
48
44
50
50
50
50
51
49
5
14
25
33
23
3
26
11
12
12
8
10
18
30
38
32
6
23
13
16
12
8
9
13
-20 -10 0 10 20
Author, year
Favours paracetamol Favours placebo
Mean difference(95% CI)
Mean difference(95% CI)
Weight(%)
51.0 (21.0)
37.0 (26.0)
38.0 (27.0)
12.0 (22.0)
13.0 (22.0)
32.1 (27.1)
33.3 (27.1)
10.0 (19.6)
10.8 (20.4)
-20.0 (21.5)
-0.9 (11.7)
-22.2 (18.1)
-16.0 (21.0)
-26.4 (24.2)
-4.8 (16.6)
–
-17.4 (26.0)
-13.8 (23.7)
–
-26.5 (25.5)
-22.8 (21.6)
-30.0 (20.9)
0.5 (7.2)
-8.0 (12.0)
-23.1 (21.7)
-2.5 (12.1)
-12.0 (17.0)
-8.4 (19.9)
-8.4 (17.7)
–
-24.9 (24.6)
-18.8 (21.9)
-26.6 (20.0)
Mean (SD)
36
517
499
506
514
513
498
504
514
28
27
145
385
267
22
298
171
185
108
160
158
177
27
385
267
22
298
171
185
108
160
158
177
Total
51.0 (21.0)
36.0 (26.0)
36.0 (26.0)
13.0 (23.0)
13.0 (23.0)
34.6 (27.1)
34.6 (27.1)
10.0 (18.8)
10.0 (18.8)
-10.8 (18.0)
-0.3 (10.5)
-18.0 (16.5)
-15.0 (21.0)
-20.5 (24.5)
-3.1 (19.7)
–
-10.5 (25.2)
-7.6 (26.9)
–
-19.6 (22.5)
-19.6 (22.5)
-25.8 (20.3)
-2.1 (7.6)
-7.0 (12.0)
-16.1 (19.9)
-5.0 (13.1)
-12.0 (16.0)
-4.8 (21.8)
-4.6 (20.2)
–
-17.8 (22.3)
-17.8 (22.3)
-21.3 (19.5)
Mean (SD)
Paracetamol Placebo
36
252
252
253
253
250
250
252
252
28
26
149
356
275
19
262
172
182
104
83
82
172
26
356
275
19
262
172
182
104
82
82
172
Total
Fig 3 | Weighted mean di_erences for pain and disability in placebo controlled trials on eVcacy of paracetamol for spinal
pain and hip or knee osteoarthritis. Pain and disability are expressed on scale of 0–100. Immediate term=follow-up ≤2
weeks; short term=follow-up evaluations >2 weeks but ≤3 months. Studies ordered chronologically within subgroups
67

RESEARCH
7the bmj | BMJ 2015;350:h1225 | doi: 10.1136/bmj.h1225
to evaluate the immediate eCect of paracetamol in pain
reduction.44 46–48 54 Pooling showed that paracetamol
has a small beneKt when compared with placebo in
reducing pain (weighted mean diCerence −3.3, 95% con-
Kdence interval −5.8 to −0.8; “high quality” evidence).
For disability, pooling of three trials with 1378 patients
showed no immediate eCect of paracetamol (−1.7, −6.0 to
2.6; “moderate quality” evidence, downgraded for
inconsistency).46 48 54
Short term follow-up
At short term follow-up, seven trials including 3153
patients with hip or knee osteoarthritis were pooled to
estimate the eWcacy of paracetamol in reducing pain
and disability.46 48–51 54 Pooling showed a signiKcant
small eCect favouring paracetamol for pain (weighted
mean diCerence −3.7, 95% conKdence interval −5.5 to
−1.9). Similarly, a signiKcant but small beneKt of parac-
etamol was found for short term reduction in disability
(−2.9, −4.9 to −0.9). The quality of evidence (GRADE) for
both pooling was rated as “high quality.”
Secondary outcomes
Our secondary outcomes included adverse eCects,
patient adherence, and use of rescue medication. Fig 4
summarises the results.
Adverse e6ects
The type of adverse events reported by patients varied
substantially between trials. Nine trials investigated the
number of participants reporting any adverse
event.43 44 47–50 53 54 There was no diCerence in the number
of patients reporting adverse events between the parac-
etamol and placebo groups (risk ratio 1.0, 95% conK-
dence interval 0.9 to 1.1; “moderate quality” evidence).
The number of patients reporting any serious adverse
event (as deKned by each study) was also similar in both
paracetamol and placebo groups (1.2, 0.7 to 2.1; “moder-
ate quality” evidence).48–51 53 54 Ten trials reported data
on the number of patients withdrawn from the study
because of adverse events, with three of these trials
reporting no drop outs from adverse events. We found
no signiKcant diCerence between groups for this out-
come (1.2, 0.9 to 1.5; “high quality” evidence).44 46 48–51
Three trials evaluated the results of liver function tests to
detect adverse eCects of paracetamol (activities of ala-
nine aminotransferase, and/or aspartate aminotransfer-
ase) in participants with osteoarthritis,50 51 54 where an
abnormal test was deKned as hepatic enzyme activity 1.5
times the upper limit of the reference range or over. Pool-
ing showed that participants taking paracetamol are
nearly four times more likely to have abnormal results
on liver function tests than participants taking placebo
(3.8, 1.9 to 7.4; “high quality” evidence).
Patient adherence
Two trials in patients with low back pain and osteoar-
thritis investigated adherence to study treatments,
deKned as the number of patients reporting consump-
tion of more than 70%53 or 85%48 of the recommended
dose. We found no diCerence in the number of partici-
pants adhering to study treatments between parac-
etamol and placebo groups from the pooling of two trials
(risk ratio 1.0, 95% conKdence interval 0.9 to 1.1; “mod-
erate quality” evidence, downgraded for inconsistency).
Use of rescue medication
This was measured as the number of patients using a
rescue medication (naproxen 250 mg, two tablets ini-
tially then one tablet every six to eight hours as
needed,53 or ibuprofen 400 mg, one tablet every eight
hours for a maximum of three days51) during the trial.
Pooled analysis of two trials in low back pain and osteo-
arthritis showed no diCerence between the paracetamol
and placebo groups (risk ratio 0.7, 95% conKdence
interval 0.4 to 1.3; “high quality” evidence).
Secondary exploratory analysis
The results from our secondary analyses on the poten-
tial impact of individual risk of bias domains on our
Table 2 | Calculation of e_ect sizes for immediate and short term pain and disability outcome measures in people with spinal pain randomised to
paracetamol or placebo
Outcome scale Range
Mean (SD or SE), extracted Mean (SD), converted* No of patients Mean di_erence (95% CI)
Analytic method*Paracetamol Placebo Paracetamol Placebo Paracetamol Placebo
Pain/immediate term
Wetzel, 201452 VAS 0–10 5.1 (2.1) 5.1 (2.1) 51.0 (21.0) 51.0 (21.0) 36 36 0.0 (−9.7 to 9.7) FV
Williams, 2014a53† NRS 0–10 3.7 (2.6) 3.6 (2.6) 37.0 (26.0) 36.0 (26.0) 517 252 1.0 (−2.9 to 4.9) FV
Williams, 2014b53‡ NRS 0–10 3.8 (2.7) 3.6 (2.6) 38.0 (27.0) 36.0 (26.0) 499 252 2.0 (−2.0 to 6.0) FV
Pain/short term
Williams, 2014a53† NRS 0–10 1.2 (2.2) 1.3 (2.3) 12.0 (22.0) 13.0 (23.0) 506 253 −1.0 (−4.4 to 2.4) FV
Williams, 2014b53‡ NRS 0–10 1.3 (2.2) 1.3 (2.3) 13.0 (22.0) 13.0 (23.0) 514 253 0.0 (−3.4 to 3.4) FV
Disability/immediate term
Williams, 2014a53† RMQ 0–24 7.7 (6.5) 8.3 (6.5) 32.1 (27.1) 34.6 (27.1) 513 250 −2.5 (−6.6 to 1.6) FV
Williams, 2014b53‡ RMQ 0–24 8.0 (6.5) 8.3 (6.5) 33.3 (27.1) 34.6 (27.1) 498 250 −1.3 (−5.4 to 2.9) FV
Disability/short term
Williams, 2014a53† RMQ 0–24 2.4 (4.7) 2.4 (4.5) 10.0 (19.6) 10.0 (18.8) 504 252 0.0 (−2.9 to 2.9) FV
Williams, 2014b53‡ RMQ 0–24 2.6 (4.9) 2.4 (4.5) 10.8 (20.4) 10.0 (18.8) 514 252 0.8 (−2.2 to 3.8) FV
NRS=numerical rating scale, VAS=visual analogue scale, RMQ=Roland-Morris questionnaire, FV=pnal value,
*Used to calculate treatment ekect.
†Paracetamol (as recommended; paracetamol 665 mg, 2 tablets, 3 times daily, 3990 mg total) v placebo. Placebo group sample size was divided by 2.
‡Paracetamol (as required; paracetamol 500 mg, 1–2 tablets as required, 4–6 hours apart, maximum 8 tablets per day) v placebo. Placebo group sample size was divided by 2.
68

RESEARCH
8 doi: 10.1136/bmj.h1225 | BMJ 2015;350:h1225 | the bmj
Tab
le 3
| C
alc
ula
tio
n o
f e
_e
ct s
ize
s fo
r im
me
dia
te a
nd
sh
ort
te
rm p
ain
an
d d
isa
bil
ity
ou
tco
me
me
asu
res
in p
eo
ple
wit
h o
ste
oa
rth
riti
s ra
nd
om
ise
d t
o p
ara
ceta
mo
l or
pla
ceb
o
Ou
tco
me
sca
leR
an
ge
Me
an
(S
D o
r S
E),
ex
tra
cte
dM
ea
n (
SD
), c
on
vert
ed
*N
o o
f p
ati
en
ts
MD
(9
5%
CI)
An
aly
tica
l m
eth
od
*P
ara
ceta
mo
lP
lace
bo
Pa
race
tam
ol
Pla
ceb
oP
ara
ceta
mo
lP
lace
bo
Pa
in/i
mm
ed
iate
te
rm
Zo
pp
i, 19
95
44
VA
S0
–10
0−
20
.0†
(21.
5‡)
−10
. 8†
(18
‡)−
20
.0 (
21.
5)
−10
.8 (
18.0
)2
82
8−
9.2
(−
19.6
to
1.2
)C
S
Ca
se, 2
00
34
6W
OM
AC
pa
in (
VA
S)
0–
50
0−
4.7
(5
8.4
)−
1.5
(5
2.3
)−
0.9
(11
.7)
−0
.3 (
10.5
)2
72
6−
0.6
(−
6.6
to
5.3
)C
S
Go
lde
n, 2
00
44
7P
ain
on
WB
0–
4−
0.9
† (1
8.1
§)
−0
.7†
(16
.5§
)−
22
.2 (
18.1
)−
18.0
(16
.5)
145
149
−4
.2 (
−8
.2 t
o −
0.2
)C
S
Mic
eli
-Ric
ha
rd, 2
00
44
8V
AS
0–
100
−16
.0 (
21.
0)
−15
.0 (
21)
−16
.0 (
21.
0)
−15
.0 (
21.
0)
38
53
56
−1.
0 (
−4
.0 t
o 2
.0)
CS
Pri
or,
20
145
4W
OM
AC
pa
in (
VA
S)
0–
100
−2
6.4
(1.
5)
−2
0.5
(1.
5)
−2
6.4
(2
4.2
¶)
−2
0.5
(2
4.5
¶)
26
72
75−
5.9
(−
10.0
to
−1.
8)
CS
Pa
in/s
ho
rt t
erm
Ca
se, 2
00
34
6W
OM
AC
pa
in (
VA
S)
0–
50
0−
23
.8 (
83
.2)
−15
.3 (
98
.7)
−4
.8 (
16.6
)−
3.1
(19
.7)
22
19−
1.7
(−12
.8 t
o 9
.4)
CS
Mic
eli
-Ric
ha
rd, 2
00
44
8V
AS
0–
100
NA
**N
A**
NA
**N
A**
29
82
62
−0
.8 (
−4
.4 t
o 2
.8)
AN
CO
VA
Pin
cus,
20
04
a4
9M
DH
AQ
pa
in (
VA
S)
0–
100
−17
.4 (
2.0
)−
10.5
(1.
9)
−17
.4 (
26
.0¶
)−
10.5
(2
5.2
¶)
171
172
−6
.9 (
−12
.3 t
o −
1.5
)C
S
Pin
cus,
20
04
b4
9M
DH
AQ
pa
in (
VA
S)
0–
100
−13
.8 (
1.7
)−
7.6
(2
.0)
−13
.8 (
23
.7¶
)−
7.6
(2
6.9
¶)
185
182
−6
.2 (
−11
.4 t
o −
1.0
)C
S
He
rre
ro-B
ea
um
on
t, 2
00
751W
OM
AC
pa
in (
LK3
)0
–2
0N
A**
NA
**N
A**
NA
**10
810
4−
2.5
(−
7.7
to 2
.7)
AN
CO
VA
Alt
ma
n, 2
00
7a5
0††
WO
MA
C p
ain
(V
AS
)0
–10
0−
26
.5 (
25
.5)
−19
.6 (
22
.5)
−2
6.5
(2
5.5
)−
19.6
(2
2.5
)16
08
3−
6.9
(−
13.4
to
−0
.4)
CS
Alt
ma
n, 2
00
7b5
0‡
‡W
OM
AC
pa
in (
VA
S)
0–
100
−2
2.8
(2
1.6
)−
19.6
(2
2.5
)−
22
.8 (
21.
6)
−19
.6 (
22
.5)
158
82
−3
.2 (
−9
.0 t
o 2
.6)
CS
Pri
or,
20
145
4W
OM
AC
pa
in (
VA
S)
0–
100
−3
0.0
(1.
6)
−2
5.8
( 1
.5)
−3
0.0
(2
0.9
¶)
−2
5.8
(2
0.3
¶)
177
172
−4
.2 (
−8
.5 t
o 0
.1)
CS
Dis
ab
ilit
y/im
me
dia
te t
erm
Ca
se, 2
00
34
6W
OM
AC
fu
nct
ion
0–
170
07.
8 (
123
.1)
−3
5.6
(12
9.9
)0
.5 (
7.2
)−
2.1
(7.
6)
27
26
2.6
(−
1.5
to
6.6
)C
S
Mic
eli
-Ric
ha
rd, 2
00
44
8W
OM
AC
fu
nct
ion
0–
100
−8
.0 (
12.0
)−
7.0
(12
.0)
−8
.0 (
12.0
)−
7.0
(12
.0)
38
53
56
−1.
0 (
−2
.7 t
o 0
.7)
CS
Pri
or,
20
145
4W
OM
AC
fu
nct
ion
0–
100
−2
3.1
(1.
3)
−16
.6 (
1.2
)−
23
.1 (
21.
7¶
)−
16.1
(19
.9¶
)2
67
275
−6
.5 (
−10
.0 t
o −
3.0
)C
S
Dis
ab
ilit
y/sh
ort
te
rm
Ca
se, 2
00
34
6W
OM
AC
fu
nct
ion
0–
170
0−
41.
8 (
20
5.6
)−
85
.6 (
22
3.2
)−
2.5
(12
.1)
−5
.0 (
13.1
)2
219
2.6
(−
5.1
to
10
.3)
CS
Mic
eli
-Ric
ha
rd, 2
00
44
8W
OM
AC
fu
nct
ion
0–
100
−12
.0 (
17.0
)−
12.0
(16
.0)
−12
.0 (
17.0
)−
12.0
(16
.0)
29
82
62
0.0
(−
2.7
to
2.7
)C
S
Pin
cus,
20
04
a4
9W
OM
AC
to
tal
0–
100
−8
.4 (
1.5
)−
4.8
(1.
7)
−8
.4 (
19.9
¶)
−4
.8 (
21.
8¶
)17
117
2−
3.6
(−
8.0
to
0.8
)C
S
Pin
cus,
20
04
b4
9W
OM
AC
to
tal
0–
100
−8
.4 (
1.3
)−
4.6
(1.
5)
−8
.4 (
17.7
¶)
−4
.6 (
20
.2¶
)18
518
2−
3.8
(−
7.7
to 0
.1)
CS
He
rre
ro-B
ea
um
on
t, 2
00
751W
OM
AC
fu
nct
ion
0–
68
NA
**N
A**
NA
**N
A**
108
104
−4
.7 (
−9
.5 t
o −
0.1
)A
NC
OV
A
Alt
ma
n, 2
00
7a5
0††
WO
MA
C f
un
ctio
n0
–10
0−
24
.9 (
24
.6)
−17
.8 (
22
.3)
−2
4.9
(2
4.6
)−
17.8
(2
2.3
)16
08
2−
7.1
(−13
.4 t
o −
0.8
)C
S
Alt
ma
n, 2
00
7b5
0‡
‡W
OM
AC
fu
nct
ion
0–
100
−18
.8 (
21.
9)
−17
.8 (
22
.3)
−18
.8 (
21.
9)
−17
.8 (
22
.3)
158
82
−1.
0 (
−6
.9 t
o 4
.9)
CS
Pri
or,
20
145
4W
OM
AC
fu
nct
ion
0–
100
−2
6.6
(1.
5)
−2
1.3
(1.
5)
−2
6.6
(2
0.0
¶)
−2
1.3
(19
.5¶
)17
717
2−
5.4
(−
9.5
to
−1.
2)
CS
MD=
me
an
dik
ere
nce
, SD=
sta
nd
ard
de
via
tio
n, S
E=
sta
nd
ard
err
or,
VA
S=
visu
al a
na
log
ue
sca
le, L
K3=
Like
rt s
cale
, CS=
cha
ng
e sc
ore
, AN
CO
VA=
an
aly
sis
of
cova
ria
nce
, NA=
no
t a
pp
lica
ble
, MD
HA
Q=
mu
ltid
ime
nsi
on
al h
ea
lth
ass
ess
me
nt
qu
est
ion
na
ire
, WO
MA
C=
We
ste
rn O
nta
rio
McM
ast
er
ost
eo
art
hri
tis
ind
ex.
*Use
d t
o c
alc
ula
te t
rea
tme
nt
ek
ect
.
†Me
an
ca
lcu
late
d f
rom
gra
ph
s.
‡SD
fro
m b
ase
lin
e.
§A
vera
ge
SD
ad
op
ted
fro
m s
imil
ar
stu
die
s, Z
op
pi,
Ca
se, a
nd
Mic
eli
-Ric
ha
rd.
¶S
D c
alc
ula
ted
usi
ng
SE
an
d s
am
ple
siz
e.
**W
eig
hte
d m
ea
n d
ike
ren
ce a
nd
95
% C
I pro
vid
ed
.
††P
ara
ceta
mo
l (p
ara
ceta
mo
l ext
en
de
d r
ele
ase
13
00
mg
, 3 t
ime
s d
ail
y, 3
90
0 m
g t
ota
l) v
pla
ceb
o. P
lace
bo
sa
mp
le s
ize
wa
s d
ivid
ed
by
2.
‡‡P
ara
ceta
mo
l (p
ara
ceta
mo
l 65
0 m
g, 3
tim
es
da
ily,
19
50
mg
to
tal)
v p
lace
bo
. Pla
ceb
o s
am
ple
siz
e w
as
div
ide
d b
y 2
.
69

RESEARCH
9the bmj | BMJ 2015;350:h1225 | doi: 10.1136/bmj.h1225
treatment eCects are presented in Kg B in appendix 2.
None of the individual domains had a signiKcant inlu-
ence on the estimated treatment eCect. Our stratiKed
analysis between small and large trials showed a diCer-
ence of eCects of 1.4 (95% conKdence interval −2.8 to
5.6), indicating that smaller trials tend to report less
beneKcial eCects, though this diCerence was not signif-
icant (P=0.51).
Extended funnel plot assessment
Aner consideration of the results we carried out a post
hoc analysis to assess the eCect of a new trial in our
meta-analysis using extended funnel plots. Our results
conKrm that the results of a new trial added to current
evidence would not change the conclusion that parac-
etamol does not deliver a clinically important beneKt
(at least 9 points out of a 0–100 range) for spinal pain
and osteoarthritis (see Kg C in appendix 2).
Discussion
There is “high quality” evidence that paracetamol has
a signiKcant but small eCect in patients with hip or
knee osteoarthritis compared with placebo in the short
term. The small eCects, <4 points on a 0–100 point
scale, are not likely to be meaningful for clinicians or
patients. “High quality” evidence shows that parac-
etamol is ineCective for low back pain, but we found no
trials investigating neck pain. We also found “high
quality” evidence that paracetamol increases the risk
of having an abnormal result on liver function tests by
nearly fourfold, although the impact of this on clini-
cally relevant patient outcomes is unclear. Adherence
to the treatment protocol was similar in both parac-
etamol and placebo groups, and there was also no dif-
ference in the use of rescue medication. Overall, our
results are based on “high quality” evidence (GRADE),
and therefore further research is unlikely to change
this evidence. This systematic review should inform
clinical practice and policy with regard to Krst line care
of these patients.
Strengths and weaknesses of the study
This systematic review was prospectively registered,
and we followed the protocol thoroughly. We included
only placebo controlled trials in the review as they pro-
vide the best evidence on the eWcacy of pharmacologi-
cal treatment.22 We included 13 randomised trials, 10 in
people with hip or knee osteoarthritis, and three inves-
tigating people with low back pain. We included two
more trials than the last meta-analysis investigating
people with osteoarthritis,15 and three more than the
last review on people with spinal pain.21 To facilitate the
Table 5 | Summary of fndings and quality of evidence assessment for outcomes classifed as critical for clinical decision
making in patients with osteoarthritis randomised to paracetamol or placebo
Time point
Summary of fndings Quality of evidence assessment (GRADE)
No of patients (trials)
E_ect size* (95% CI)
Study limitation Inconsistency Imprecision Quality Importance
Pain
Immediate term 1686 (5) −3.3 (−5.8 to −0.8) None None None High Critical
Short term 2355 (7) −3.7 (−5.5 to −1.9) None None None High Critical
Disability
Immediate term 1336 (3) −1.7 (−6.0 to 2.6) None −1† None Moderate Critical
Short term 2354 (7) −2.9 (−4.9 to −0.9) None None None High Critical
Adverse events (all short term)‡
Any 4846 (9) 1.0 (0.9 to 1.1) None −1† None Moderate Critical
Serious§ 4852 (7) 1.2 (0.7 to 2.1) None −1† None Moderate Critical
Drop out¶ 3023 (7) 1.2 (0.9 to 1.5) None None None High Critical
Liver** 1237 (3) 3.8 (1.9 to 7.4) None None None High Critical
*Weighted mean dikerence (negative value favours paracetamol) for pain and disability; risk ratio for adverse events.
†Wide variance of point estimates across studies or large heterogeneity between trials (I2>50%).
‡Includes patients with hip/knee osteoarthritis and low back pain.
§As depned by each study.
¶Patients withdrawn from study because of adverse events.
**No of patients with abnormal results on liver function test (AST/ALN >1.5 ULN).
Table 4 | Summary of fndings and quality of evidence assessment for outcomes classifed as critical for clinical decision
making in patients with spinal pain randomised to paracetamol or placebo
Time point
Summary of fndings Quality of evidence assessment (GRADE)
No of patients E_ect size* (95% CI) Study limitation Inconsistency Imprecision Quality Importance
Pain
Immediate term 1592 (2 trials) 1.4 (−1.3 to 4.1) −1 None None Moderate Critical
Short term 1526 (1 trial) −0.5 (−2.9 to 1.9) None None None High Critical
Disability
Immediate term 1511 (1 trial) −1.9 (−4.8 to 1.0) None None None High Critical
Short term 1522 (1 trial) 0.4 (−1.7 to 2.5) None None None High Critical
*Weighted mean dikerence. Negative value favours paracetamol.
†>25% of studies included in analysis had at least one bias domain judged as high risk of bias according to Cochrane Collaboration’s tool.
70

RESEARCH
10 doi: 10.1136/bmj.h1225 | BMJ 2015;350:h1225 | the bmj
interpretation of our results, we provide precise esti-
mates and clinically interpretable scores on 0–100
point scales of pain and disability. Overall, the quality
of evidence for our outcomes considered critical for
clinical decision making was ranked “high” according
to the GRADE system. Moreover, this is the Krst review
to report evidence of changes in hepatic enzyme activity
associated with paracetamol, patient adherence, and
use of rescue medication in patients with osteoarthritis
and spinal pain. Other strengths of our review included
lack of restrictions to publication language or date and
use of hand search of clinical trial registries (for exam-
ple, ClinicalTrials.gov) and relevant websites for
unpublished trials.
The number of studies in each meta-analysis was rel-
atively small because of small number of trials avail-
able on this topic (paracetamol versus placebo for
spinal pain and osteoarthritis). For instance, in the
meta-analyses investigating the efficacy of parac-
etamol on pain reduction for back pain we have
Adverse e'ects (any)
Amadio 1983
Zoppi 1995
Golden 2004
Miceli-Richard 2004
Pincus 2004a
Pincus 2004b
Altman 2007
Prior 2014
Williams 2014
Pooled E�ect: I2=68%
Adverse e'ects (serious)
Miceli-Richard 2004
Pincus 2004a
Pincus 2004b
Herrero-Beaumont 2007
Altman 2007
Prior 2014
Williams 2014
Pooled e�ect: I2=0%
Adverse e'ects (withdrawals)
Zoppi 1995
Miceli-Richard 2004
Pincus 2004a
Pincus 2004b
Herrero-Beaumont 2007
Altman 2007
Prior 2014
Pooled e�ect: I2=0%
Adverse e'ects (liver)
Herrero-Beaumont 2007
Altman 2007
Prior 2014
Pooled e�ect: I2=0%
Patient adherence
Miceli-Richard 2004
Williams 2014
Pooled E�ect: I2=0%
Use of rescue medication
Herrero-Beaumont 2007
Williams 2014
Pooled e�ect: I2=47%
1.3 (0.6 to 2.6)
0.6 (0.2 to 1.8)
1.0 (0.7 to 1.4)
0.9 (0.7 to 1.2)
1.1 (0.8 to 1.4)
1.1 (0.9 to 1.5)
1.1 (0.9 to 1.4)
1.0 (0.8 to 1.1)
1.0 (0.8 to 1.3)
1.0 (0.9 to 1.1)
1.5 (0.4 to 6.4)
0.7 (0.2 to 3.2)
0.8 (0.1 to 13.1)
1.0 (0.3 to 3.2)
1.6 (0.3 to 7.6)
4.1 (0.9 to 19.2)
0.9 (03 to 2.7)
1.2 (0.7 to 2.1)
1.0 (0.2 to 6.6)
1.1 (0.7 to 1.8)
1.3 (0.7 to 2.7)
1.3 (0.5 to 3.3)
1.3 (0.6 to 2.9)
1.2 (0.5 to 2.6)
1.1 (0.7 to 1.9)
1.2 (0.9 to 1.5)
3.4 (1.4 to 8.0)
2.3 (0.5 to 10.7)
8.2 (1.9 to 35.5)
3.8 (1.9 to 7.4)
0.9 (0.9 to 1.0)
1.1 (1.0 to 1.2)
1.0 (0.9 to 1.1)
0.9 (0.8 to 1.0)
0.4 (0.2 to 1.1)
0.7 (0.4 to 1.3)
1
1
7
11
11
9
11
34
15
14
13
4
20
12
12
25
2
32
13
8
10
11
24
60
19
21
56
44
76
24
0.01 0.1 1 10 100
Author, year
Favours paracetamol Favours placebo
Risk ratio(95% CI)
Risk ratio(95% CI)
Weight(%)
10/25
4/30
47/148
85/405
85/300
87/331
71/160
148/267
198/1063
5/405
3/300
1/331
5/108
6/318
8/267
9/1096
2/30
36/405
16/171
11/331
12/108
18/318
25/267
21/108
9/318
16/267
292/405
459/897
85/108
8/1031
Paracetamol
8/25
7/30
50/155
86/374
76/289
63/273
66/165
159/275
98/531
3/374
4/289
1/273
5/104
2/165
2/275
5/547
2/30
29/374
12/172
7/273
9/104
8/165
23/275
6/104
2/165
2/275
284/374
196/414
95/104
9/516
Placebo
No of events/total
Fig 4 | Risk ratio for safety outcome measures, patient adherence, and use of rescue medication in placebo controlled
trials on eVcacy of paracetamol compared with placebo. Any=No of patients reporting any adverse event; serious=No of
patients reporting any serious adverse event (as defned by each study); withdrawals=No of patients withdrawn from
study because of adverse events; liver=No of patients with abnormal results on liver function tests. Studies are ordered
chronologically within subgroups
71

RESEARCH
11the bmj | BMJ 2015;350:h1225 | doi: 10.1136/bmj.h1225
included a maximum number of two trials, and for
osteoarthritis we included a maximum number of
seven trials in a meta-analysis. Moreover, none of the
trials reported data for long term follow-up, and our
results are limited to the immediate and short term eW-
cacy of paracetamol. Although we included three trials
investigating spinal pain, none of these trials included
patients with neck pain. In addition, one of the
included trials did not report results for the placebo
group,45 and attempts to gain access to these data
were unsuccessful. Most of the included trials used
the maximum dose of 4000 mg/day recommended by
the US Food and Drug Administration: seven trials used
4000 mg/day as the maximum dose, two trials used
3990 mg as the maximum dose, and two trials
used 3900 mg as the maximum dose. Only two trials
used 3000 mg/day as the maximum dose.
Strengths and weaknesses in relation to other studies
Previous meta-analyses have concluded that parac-
etamol signiKcantly reduces pain in people with hip or
knee osteoarthritis.13–15 One of these reviews reported no
diCerence in toxicity, deKned by the number of patients
reporting any adverse event.14 All endorsed the use of
paracetamol for pain reduction in such patients. Our
review included two trials not previously identiKed in
the most recent previous meta-analysis, and our results
show only a small clinically irrelevant beneKt of parac-
etamol for pain and disability at short term follow-up.
Supratherapeutic doses of paracetamol can over-
whelm the normal metabolic pathways and protective
mechanisms in the liver and produce dangerous
amounts of a toxic metabolite, N-acetyl-p-benzoqui-
noneimine.57 Most commonly this is seen in intentional
overdoses, and the consequence can be liver failure.
However, the drug has been used extensively for
decades for chronic musculoskeletal conditions, and
there is scant evidence for clinically signiKcant toxicity
with regular doses of up to 4000 mg/day in otherwise
healthy adults, although some researchers contest
this.17 The signiKcant eCect on hepatic enzymes that we
show is well known,58 but a link with clinically import-
ant toxicity is still uncertain.
Implications for clinicians and policymakers
Interventions such as drugs that aim to provide symp-
tomatic relief have been associated with improvement
of physical function in people with osteoarthritis.59 60
Similarly, there is a high correlation of changes in pain
scores and function scores in people with low back
pain.61 62 This evidence supports the use of drugs for
pain relief to improve function in these conditions, and,
overall, we have shown consistent results across pain
and disability outcome measures. We found that parac-
etamol is ineCective on both pain and disability out-
comes for low back pain in the immediate and short
term and is not clinically superior to placebo on both
pain and disability outcomes for osteoarthritis.
Although thresholds for clinically important diCer-
ences between groups are unknown for osteoarthritis, a
recent study has used a minimal clinically important
diCerence of 0.9 on a 0–10 scale (or 9 on a 0 to 100 scale)
based on the median diCerence found in previous large
trials including patients with osteoarthritis.32 Our larg-
est observed eCect size of −3.7 points on a 0–100 pain
scale, favouring paracetamol, is unlikely to be consid-
ered clinically important by patients or clinicians.
Moreover, the lower boundary of the 95% conKdence
interval of this eCect size was −5.5 and still did not reach
the minimal clinically important difference of −9
deKned in this review. Our results therefore provide an
argument to reconsider the endorsement of parac-
etamol in clinical practice guidelines for low back pain
and hip or knee osteoarthritis.
Recent evidence on lower limb osteoarthritis shows
that exercises (such as strengthening exercise) com-
pared with no exercise control result in large treatment
eCects for pain reduction (mean diCerence −2.3, 95%
conKdence interval −2.8 to −1.26; on a 10 cm visual ana-
logue scale).63 This eCect size is much larger than the
largest eCect size from our pooled analyses on short
term eCects of paracetamol for hip or knee osteoarthri-
tis. Paracetamol alone therefore might not be suWcient
to treat hip or knee osteoarthritis and might need to be
accompanied by other management strategies, such as
exercises and advice/education. Future trials, however,
are needed to assess the combined eCect of these inter-
ventions in patients with osteoarthritis.
Unanswered questions and future research
This systematic review shows precise and clinically
interpretable estimates of the size of the eCect of parac-
etamol compared with placebo in the management of
spinal pain and osteoarthritis of the hip or knee.
Although our results provide “high quality” evidence
that paracetamol does not provide a clinically
important eCect in the short term, the long term eCect of
this drug in the treatment of spinal pain and osteoar-
thritis remains unknown. Moreover, we found higher
risk of abnormal results on liver function tests in
patients taking paracetamol, though the clinical impli-
cations of this are uncertain. The eCects of paracetamol
for neck pain are unknown as we found no trials includ-
ing participants with this condition.
Contributors: GCM, MLF, CGM, PHF, C-WCL, ROD, and AJMcL were involved in the conception and design of the review. GCM, MLF, and MBP developed the search strategy and performed study selection. GCM and MBP extracted data from included studies. GCM and MLF were involved in the data analysis. GCM, MLF, CGM, PHF, C-WCL, ROD, and AJMcL were involved in the interpretation and discussion of results. GCM drahed the manuscript, and MLF, CGM, and PHF contributed to the drahing of the review. CCL, ROD, MBP, and AJMcL revised it critically for important intellectual content. All authors approved the pnal version of the article. All authors had access to all of the data in the study and can take responsibility for the integrity of the data and the accuracy of the data analysis. MLF is guarantor.
Funding: This research received no specipc grant from any funding agency in the public, commercial, or not-for-propt sectors. GCM and MBP hold an international postgraduate research scholarship/postgraduate award from the Australian Government. CGM is supported by a research fellowship from the National Health and Medical Research Council. MLF holds a fellowship from Sydney Medical Foundation/Sydney Medical School. CCL holds a career development fellowship from the National Health and Medical Research Council, Australia. RD is a chief investigator on NH&MRC Programme Grant No 1054146. AJM is an investigator on the NHMRC Centre for Research Excellence in Medicines and Ageing.
72

RESEARCH
12 doi: 10.1136/bmj.h1225 | BMJ 2015;350:h1225 | the bmj
Competing interests: All authors have completed the ICMJE uniform disclosure form at www.icmje.org/coi_disclosure.pdf and declare: AJM received support from GlaxoSmithKline for a PhD scholarship, and AJM, ROD, CGM, and C-WCL received support from GlaxoSmithKline for the PACE trial.
Ethical approval: Not required.
Data sharing: No additional data available.
Transparency: The lead author (GCM) awrms that the manuscript is an honest, accurate, and transparent account of the study being reported; no important aspects of the study have been omitted.
This is an Open Access article distributed in accordance with the Creative Commons Attribution Non Commercial (CC BY-NC 4.0) license, which permits others to distribute, remix, adapt, build upon this work non-commercially, and license their derivative works on dikerent terms, provided the original work is properly cited and the use is non-commercial. See: http://creativecommons.org/licenses/by-nc/4.0/.
1 Vos T, Flaxman AD, Naghavi M, et al. Years lived with disability (YLDs) for 1160 sequelae of 289 diseases and injuries 1990–2010: a systematic analysis for the Global Burden of Disease Study 2010. Lancet 2012;380:2163–96.
2 Cross M, Smith E, Hoy D, et al. The global burden of hip and knee osteoarthritis: estimates from the Global Burden of Disease 2010 study. Ann Rheum Dis 2014;73:1323–30.
3 Hoy D, March L, Brooks P, et al. The global burden of low back pain: estimates from the Global Burden of Disease 2010 study. Ann Rheum Dis 2014;73:968–74.
4 Hoy D, March L, Woolf A, et al. The global burden of neck pain: estimates from the Global Burden of Disease 2010 study. Ann Rheum Dis 2014;73:1309–15.
5 United States Bone and Joint Initiative. The burden of musculoskeletal diseases in the United States. 3rd ed. American Academy of Orthopaedic Surgeons, 2014. www.boneandjointburden.org.
6 Bertin P, Becquemont L, Corruble E, et al. The therapeutic management of chronic pain in ambulatory care patients aged 65 and over in France: the S.AGES Cohort. Baseline data. J Nutr Health Aging 2013;17:681–6.
7 Chou R, Qaseem A, Snow V, et al. Diagnosis and treatment of low back pain: a joint clinical practice guideline from the American College of Physicians and the American Pain Society. Ann Intern Med 2007;147:478–91.
8 Zhang W, Doherty M, Arden N, et al. EULAR evidence based recommendations for the management of hip osteoarthritis: report of a task force of the EULAR Standing Committee for International Clinical Studies Including Therapeutics (ESCISIT). Ann Rheum Dis 2005;64:669–81.
9 Jordan KM, Arden NK, Doherty M, et al. EULAR Recommendations 2003: an evidence based approach to the management of knee osteoarthritis: Report of a Task Force of the Standing Committee for International Clinical Studies Including Therapeutic Trials (ESCISIT). Ann Rheum Dis 2003;62:1145–55.
10 Hochberg MC, Altman RD, April KT, et al. American College of Rheumatology 2012 recommendations for the use of nonpharmacologic and pharmacologic therapies in osteoarthritis of the hand, hip, and knee. Arthritis Care Res 2012;64:465–74.
11 McAlindon TE, Bannuru RR, Sullivan MC, et al. OARSI guidelines for the non-surgical management of knee osteoarthritis. Osteoarthritis Cartilage 2014;22:363–88.
12 Wise J. NICE keeps paracetamol in UK guidelines on osteoarthritis. BMJ 2014;348:g1545.
13 Zhang W, Jones A, Doherty M. Does paracetamol (acetaminophen) reduce the pain of osteoarthritis? A meta-analysis of randomised controlled trials. Ann Rheum Dis 2004;63:901–7.
14 Towheed TE, Maxwell L, Judd MG, et al. Acetaminophen for osteoarthritis. Cochrane Database Syst Rev 2006;1:CD004257.
15 Zhang W, Nuki G, Moskowitz RW, et al. OARSI recommendations for the management of hip and knee osteoarthritis: part III: Changes in evidence following systematic cumulative update of research published through January 2009. Osteoarthritis Cartilage 2010;18:476–99.
16 Tylenol (acetaminophen) professional product information. McNeil Consumer Healthcare, 2010.
17 Jalan R, Williams R, Bernuau J. Paracetamol: are therapeutic doses entirely safe? Lancet 2006;368:2195–6.
18 Graham GG, Davies MJ, Day RO, et al. The modern pharmacology of paracetamol: therapeutic actions, mechanism of action, metabolism, toxicity and recent pharmacological pndings. Inflammopharmacology 2013;21:201–32.
19 Graham GG, Day RO, Graudins A, et al. FDA proposals to limit the hepatotoxicity of paracetamol (acetaminophen): are they reasonable? Inflammopharmacology 2010;18:47–55.
20 Laba TL, Brien JA, Fransen M, et al. Patient preferences for adherence to treatment for osteoarthritis: the MEdication Decisions in
Osteoarthritis Study (MEDOS). BMC Musculoskelet Disord 2013;14:160.
21 Davies RA, Maher CG, Hancock MJ. A systematic review of paracetamol for non-specipc low back pain. Eur Spine J 2008;17:1423–30.
22 Freedman B. Placebo-controlled trials and the logic of clinical purpose. IRB 1990;12:1–6.
23 Liberati A, Altman DG, Tetzlak J, et al. The PRISMA statement for reporting systematic reviews and meta-analyses of studies that evaluate healthcare interventions: explanation and elaboration. BMJ 2009;339:b2700.
24 Higgins JPT, Green S. Cochrane handbook for systematic reviews of interventions. Version 5.1.0. Cochrane Collaboration, 2009.
25 Higgins JP, Altman DG, Gotzsche PC, et al. The Cochrane Collaboration’s tool for assessing risk of bias in randomised trials. BMJ 2011;343:d5928.
26 Guyatt GH, Oxman AD, Vist GE, et al. GRADE: an emerging consensus on rating quality of evidence and strength of recommendations. BMJ 2008;336:924–6.
27 Guyatt GH, Oxman AD, Kunz R, et al. GRADE guidelines: 2. Framing the question and deciding on important outcomes. J Clin Epidemiol 2011;64:395–400.
28 Guyatt GH, Oxman AD, Kunz R, et al. GRADE guidelines: 8. Rating the quality of evidence—indirectness. J Clin Epidemiol 2011;64:1303–10.
29 Guyatt GH, Oxman AD, Vist G, et al. GRADE guidelines: 4. Rating the quality of evidence—study limitations (risk of bias). J Clin Epidemiol 2011;64:407–15.
30 Guyatt GH, Oxman AD, Kunz R, et al. GRADE guidelines: 7. Rating the quality of evidence—inconsistency. J Clin Epidemiol 2011;64:1294–302.
31 Guyatt GH, Oxman AD, Kunz R, et al. GRADE guidelines 6. Rating the quality of evidence—imprecision. J Clin Epidemiol 2011;64:1283–93.
32 Wandel S, Juni P, Tendal B, et al. Ekects of glucosamine, chondroitin, or placebo in patients with osteoarthritis of hip or knee: network meta-analysis. BMJ 2010;341:c4675.
33 Egger M, Davey Smith G, Schneider M, et al. Bias in meta-analysis detected by a simple, graphical test. BMJ 1997;315:629–34.
34 Guyatt GH, Oxman AD, Montori V, et al. GRADE guidelines: 5. Rating the quality of evidence—publication bias. J Clin Epidemiol 2011;64:1277–82.
35 Hjermstad MJ, Fayers PM, Haugen DF, et al. Studies comparing numerical rating scales, verbal rating scales, and visual analogue scales for assessment of pain intensity in adults: a systematic literature review. J Pain Symptom Manage 2011;41:1073–93.
36 Kersten P, White PJ, Tennant A. The visual analogue WOMAC 3.0 scale—internal validity and responsiveness of the VAS version. BMC Musculoskelet Disord 2010;11:80.
37 Pincus T, Yazici Y, Bergman M. Development of a multi-dimensional health assessment questionnaire (MDHAQ) for the infrastructure of standard clinical care. Clin Exp Rheumatol 2005;23:S19–28.
38 Bellamy N. WOMAC osteoarthritis index user guide IV. University of Queensland, 2000.
39 Higgins JP, Thompson SG. Quantifying heterogeneity in a meta-analysis. Stat Med 2002;21:1539–58.
40 Nuesch E, Trelle S, Reichenbach S, et al. Small study ekects in meta-analyses of osteoarthritis trials: meta-epidemiological study. BMJ 2010;341:241.
41 Langan D, Higgins JP, Gregory W, et al. Graphical augmentations to the funnel plot assess the impact of additional evidence on a meta-analysis. J Clin Epidemiol 2012;65:511–9.
42 Ferreira ML, Herbert RD, Crowther MJ, et al. When is a further clinical trial justiped? BMJ 2012;345:e5913.
43 Amadio P Jr, Cummings DM. Evaluation of acetaminophen in the management of osteoarthritis of the knee. Curr Ther Res Clin Exp 1983;34:59–66.
44 Zoppi M, Peretti G, Boccard E. Placebo-controlled study of the analgesic ewcacy of an ekervescent formulation of 500 mg paracetamol in arthritis of the knee or the hip. Eur J Pain 1995;16:42–48.
45 Nadler SF, Steiner DJ, Erasala GN, et al. Continuous low-level heat wrap therapy provides more ewcacy than Ibuprofen and acetaminophen for acute low back pain. Spine 2002;27:1012–7.
46 Case JP, Baliunas AJ, Block JA. Lack of ewcacy of acetaminophen in treating symptomatic knee osteoarthritis: a randomized, double-blind, placebo-controlled comparison trial with diclofenac sodium. Arch Intern Med 2003;163:169–78.
47 Golden HE, Moskowitz RW, Minic M. Analgesic ewcacy and safety of nonprescription doses of naproxen sodium compared with acetaminophen in the treatment of osteoarthritis of the knee. Am J Ther 2004;11:85–94.
48 Miceli-Richard C, Le Bars M, Schmidely N, et al. Paracetamol in osteoarthritis of the knee. Ann Rheum Dis 2004;63:923–30.
49 Pincus T, Koch G, Lei H, et al. Patient preference for placebo, acetaminophen (paracetamol) or celecoxib ewcacy studies (PACES): two randomised, double blind, placedo controlled, crossover clinical trials in patients with knee or hip osteoarthritis. Ann Rheum Dis 2004;63:931–39.
73

RESEARCH
No commercial reuse: See rights and reprints http://www.bmj.com/permissions Subscribe: http://www.bmj.com/subscribe
50 Altman RD, Zinsenheim JR, Temple AR, et al. Three-month ewcacy and safety of acetaminophen extended-release for osteoarthritis pain of the hip or knee: a randomized, double-blind, placebo-controlled study. Osteoarthritis Cartilage 2007;15:454–61.
51 Herrero-Beaumont G, Ivorra JA, Del Carmen Trabado M, et al. Glucosamine sulfate in the treatment of knee osteoarthritis symptoms: a randomized, double-blind, placebo-controlled study using acetaminophen as a side comparator. Arthritis Rheum 2007;56:555–67.
52 Wetzel L, Zadrazil M, Paternostro-Sluga T, et al. Intravenous nonopioid analgesic drugs in chronic low back pain patients on chronic opioid treatment: a crossover, randomised, double-blinded, placebo-controlled study. Eur J Anaesthesiol 2014;31:35–40.
53 Williams C, Maher C, Latimer J, et al. Ewcacy of paracetamol for acute low-back pain: a double-blind, randomised controlled trial. Lancet 2014;384:1586–96.
54 Prior MJ, Harrison DD, Frustaci ME. A randomized, double-blind, placebo-controlled 12 week trial of acetaminophen extended release for the treatment of signs and symptoms of osteoarthritis. Curr Med Res Opin 2014;30:2377–87.
55 Glimet TJ, Lermusiaux JL, Masse C, et al. Etude controlee de l’action antalgique du paracetamol ekervescent dans la gonarthrose. Rev Rhum 1989;56:269.
56 Altman RD. Ibuprofen, acetaminophen and placebo in osteoarthritis of the knee: a six-day double-blind study. Arthritis Rheum 1999;42:S403.
57 Amar PJ, Schik ER. Acetaminophen safety and hepatotoxicity—where do we go from here? Expert Opin Drug Saf 2007;6:341–55.
58 Watkins PB, Kaplowitz N, Slattery JT, et al. Aminotransferase elevations in healthy adults receiving 4 grams of acetaminophen daily—a randomized controlled trial. JAMA 2006;296:87–93.
59 Barthel HR, Peniston JH, Clark MB, et al. Correlation of pain relief with physical function in hand osteoarthritis: randomized controlled trial post hoc analysis. Arthritis Res Ther 2010;12:R7.
60 Schein JR, Kosinski MR, Janagap-Benson C, et al. Functionality and health-status benepts associated with reduction of osteoarthritis pain. Curr Med Res Opin 2008;24:1255–65.
61 Gronblad M, Hupli M, Wennerstrand P, et al. Intercorrelation and test-retest reliability of the pain disability index (PDI) and the Oswestry disability questionnaire (ODQ) and their correlation with pain intensity in low back pain patients. Clin J Pain 1993;9:189–95.
62 Sheldon EA, Bird SR, Smugar SS, et al. Correlation of measures of pain, function, and overall response: results pooled from two identical studies of etoricoxib in chronic low back pain. Spine 2008;33:533–8.
63 Uthman OA, van der Windt DA, Jordan JL, et al. Exercise for lower limb osteoarthritis: systematic review incorporating trial sequential analysis and network meta-analysis. BMJ 2013;347:f5555.
© BMJ Publishing Group Ltd 2015
Appendix 1: Search strategies
Appendix 2: Supplementary Kgures A-C
74

Appendix 1
Medline
1. acetaminophen.mp. OR exp acetaminophen/
2. *Analgesics, Non-Narcotic/tu, th [Therapeutic Use, Therapy]
3. analgesic*.ab,ti.
4. (aceta OR actimin OR anacin OR apacet OR "aspirin free anacin" OR acamol OR acetalgin OR adol OR aldolOR
OR alvedon OR apiretal OR atamel OR atasol OR benuron OR biogesic OR "biogesic kiddielets" OR buscapina
OR banesin OR "ben u ron" OR calpol OR captin OR cemol OR coldex OR cotibin OR crocin OR dafalgan
OR daleron OR "dawa ya magi" OR depon OR dexamol OR dolex OR dolgesic OR doliprane OR dolorol OR
dolprone OR "duiyixian anjifen pian" OR dapa OR dolo OR datril OR duatrol OR dayquil OR efferalgan OR
enelfa OR europain OR febrectal OR febricet OR febridol OR fensum OR feverall OR fibi OR "fibi plus" OR
gelocatil OR gripin OR gesic OR genapap OR genebs OR hedex OR hedanol OR herron OR influbene OR
kafa OR kitadol OR lekadol OR lupocet OR lemsip OR liquiprin OR pyrigesic OR mexalen OR milidon OR
minoset OR momentum OR napa OR "neo kiddielets" OR neopap OR "oraphen pd" OR pyrigesic OR pacol
OR pamol OR parol OR panado OR panadol OR panamax OR panda OR panodil OR pyrigesic OR paracet
OR paracetamol OR paracitol OR paralen OR paramed OR paramol OR parol OR perdolan OR perfalgan OR
pinex OR "pyongsu cetamol" OR pyrenol OR pyrigesic OR plicet OR panadrex OR paratabs OR paralgin OR
phenaphen OR revanin OR rokamol OR rubophen OR redutemp OR sara OR scanol OR "sinpro n" OR
"snaplets fr" OR suppap OR tachipirin OR tachipirina OR tafirol OR tapsin OR termalgin OR tempra OR
thomapyrin OR tipol OR "togal classic duo" OR treuphadol OR triaminic OR tylenol OR tamen OR tapanol
OR tipol OR uphamol OR vermidon OR vitamol OR valorin OR xumadol OR zolben).tw.
5. OR (1-4)
6. osteoarthritis.mp. OR exp osteoarthritis/
7. exp low back pain/
8. exp back pain/
9. exp neck pain/
10. ("low back pain" OR "back pain" OR "neck pain" OR backache OR lumbago OR "neck ache" OR "spin* pain"
OR "knee pain" OR "hip pain").mp.
11. OR (6-10)
12. 5 AND 11
13. randomized controlled trial.pt. OR exp randomized controlled trial/
14. "randomized controlled trial".mp.
15. exp random allocation/
16. placebo.mp. OR exp placebos/ OR exp placebo effect/
17. (random* adj3 trial).ab,ti.
18. "controlled clinical trial".mp. OR exp controlled clinical trial/
19. Random*.ab,ti.
20. OR (13-19)
21. 12 AND 20
22. limit 21 to humans
AMED
1. exp Acetaminophen/ OR acetaminophen.mp.
2. exp Analgesics/ OR Analgesics.mp.
3. exp Drug therapy/ OR drug therapy.mp.
4. analgesic*.ab,ti.
5. (aceta OR actimin OR anacin OR apacet OR "aspirin free anacin" OR acamol OR acetalgin OR adol OR aldolor
OR alvedon OR apiretal OR atamel OR atasol OR benuron OR biogesic OR "biogesic kiddielets" OR buscapina
OR banesin OR "ben u ron" OR calpol OR captin OR cemol OR coldex OR cotibin OR crocin OR dafalgan
OR daleron OR "dawa ya magi" OR depon OR dexamol OR dolex OR dolgesic OR doliprane OR dolorol OR
dolprone OR "duiyixian anjifen pian" OR dapa OR dolo OR datril OR duatrol OR dayquil OR efferalgan OR
75

enelfa OR europain OR febrectal OR febricet OR febridol OR fensum OR feverall OR fibi OR "fibi plus" OR
gelocatil OR gripin OR gesic OR genapap OR genebs OR hedex OR hedanol OR herron OR influbene OR
kafa OR kitadol OR lekadol OR lupocet OR lemsip OR liquiprin OR pyrigesic OR mexalen OR milidon OR
minoset OR momentum OR napa OR "neo kiddielets" OR neopap OR "oraphen pd" OR pyrigesic OR pacol
OR pamol OR parol OR panado OR panadol OR panamax OR panda OR panodil OR pyrigesic OR paracet
OR paracetamol OR paracitol OR paralen OR paramed OR paramol OR parol OR perdolan OR perfalgan OR
pinex OR "pyongsu cetamol" OR pyrenol OR pyrigesic OR plicet OR panadrex OR paratabs OR paralgin OR
phenaphen OR revanin OR rokamol OR rubophen OR redutemp OR sara OR scanol OR "sinpro n" OR
"snaplets fr" OR suppap OR tachipirin OR tachipirina OR tafirol OR tapsin OR termalgin OR tempra OR
thomapyrin OR tipol OR "togal classic duo" OR treuphadol OR triaminic OR tylenol OR tamen OR tapanol
OR tipol OR uphamol OR vermidon OR vitamol OR valorin OR xumadol OR zolben).tw.
6. OR (1-5)
7. exp Osteoarthritis/ OR osteoarthritis.mp.
8. exp Low back pain/ OR low back pain.mp.
9. back pain.mp. OR exp Backache/
10. exp Neck pain/ OR neck pain.mp.
11. ("low back pain" OR "back pain" OR "neck pain" OR backache OR lumbago OR "neck ache" OR "spin* pain"
OR "knee pain" OR "hip pain").mp.
12. OR (7-11)
13. 6 AND 12
14. exp Randomized controlled trials/ OR randomized controlled trial.mp.
15. randomized controlled trial.pt.
16. exp Random allocation/ OR random allocation.mp.
17. exp Placebos/ OR placebo.mp.
18. (random* adj3 trial).ab,ti.
19. Random*.ab,ti.
20. OR (14-19)
21. 13 AND 20
Embase
1. 'acetaminophen'/exp OR 'acetaminophen'
2. (aceta OR actimin OR anacin OR apacet OR "aspirin free anacin" OR acamol OR acetalgin OR adol OR
aldolOR OR alvedon OR apiretal OR atamel OR atasol OR benuron OR biogesic OR "biogesic kiddielets"
OR buscapina OR banesin OR "ben u ron" OR calpol OR captin OR cemol OR coldex OR cotibin OR crocin
OR dafalgan OR daleron OR "dawa ya magi" OR depon OR dexamol OR dolex OR dolgesic OR doliprane
OR dolorol OR dolprone OR "duiyixian anjifen pian" OR dapa OR dolo OR datril OR duatrol OR dayquil
OR efferalgan OR enelfa OR europain OR febrectal OR febricet OR febridol OR fensum OR feverall OR
fibi OR "fibi plus" OR gelocatil OR gripin OR gesic OR genapap OR genebs OR hedex OR hedanol OR
herron OR influbene OR kafa OR kitadol OR lekadol OR lupocet OR lemsip OR liquiprin OR pyrigesic OR
mexalen OR milidon OR minoset OR momentum OR napa OR "neo kiddielets" OR neopap OR "oraphen
pd" OR pyrigesic OR pacol OR pamol OR parol OR panado OR panadol OR panamax OR panda OR panodil
OR pyrigesic OR paracet OR paracetamol OR paracitol OR paralen OR paramed OR paramol OR parol OR
perdolan OR perfalgan OR pinex OR "pyongsu cetamol" OR pyrenol OR pyrigesic OR plicet OR panadrex
OR paratabs OR paralgin OR phenaphen OR revanin OR rokamol OR rubophen OR redutemp OR sara OR
scanol OR "sinpro n" OR "snaplets fr" OR suppap OR tachipirin OR tachipirina OR tafirol OR tapsin OR
termalgin OR tempra OR thomapyrin OR tipol OR "togal classic duo" OR treuphadol OR triaminic OR
tylenol OR tamen OR tapanol OR tipol OR uphamol OR vermidon OR vitamol OR valorin OR xumadol OR
zolben)
3. 1 OR 2
4. 'osteoarthritis'/exp OR 'osteoarthritis'
5. 'low back pain'/exp OR 'low back pain'
6. 'backache'/exp OR 'backache'
76

7. 'neck pain'/exp OR 'neck pain'
8. 'low back pain' OR 'back pain' OR 'neck pain' OR backache OR lumbago OR 'neck ache' OR 'spin$ pain' OR
'knee pain' OR 'hip pain'
9. OR (4-8)
10. 3 AND 9
11. 'randomized controlled trial (topic)'/exp OR 'randomized controlled trial (topic)'
12. 'randomization'/exp OR 'randomization'
13. 'placebo'/exp OR 'placebo'
14. randomized:ab
15. placebo:ab
16. randomly:ab
17. OR (11-16)
18. 10 AND 17
CINAHL
1. (MH "Acetaminophen") OR "acetaminophen"
2. (MH "Analgesics+/TU")
3. "analgesic$"
4. "paracetamol"
5. "tylenol"
6. "panadol"
7. OR (1-6)
8. (MH "Osteoarthritis+") OR "osteoarthritis" OR (MH "Osteoarthritis, Spine+") OR (MH "Osteoarthritis, Knee")
OR (MH "Osteoarthritis, Hip")
9. (MH "Low Back Pain") OR "low back pain" OR (MH "Back Pain+")
10. (MH "Neck Pain") OR "neck pain"
11. (MH "Knee Pain+") OR "knee pain"
12. "hip pain"
13. "backache"
14. OR (8-13)
15. 7 AND 14
Web of Science
1. acetaminophen
2. Paracetamol OR tylenol OR panadol
3. OR (1-2)
4. osteoarthritis
5. back pain
6. neck pain
7. (spin* pain" OR "knee pain" OR "hip pain")
8. OR (4-7)
9. 3 AND 8
10. randomized controlled trial
11. random allocation
12. placebo
13. controlled clinical trial
14. Random*
15. OR (10-14)
16. 9 AND 15
LILACS
77

((Acetaminophen OR paracetamol OR tylenol OR panadol) AND (osteoarthritis OR back pain OR lumbago OR
backache OR neck pain OR knee pain OR hip pain))
International Pharmaceutical Abstracts
1. acetaminophen.mp.
2. (aceta or actimin or anacin or apacet or "aspirin free anacin" or acamol or acetalgin or adol or aldolOR or alvedon
or apiretal or atamel or atasol or benuron or biogesic or "biogesic kiddielets" or buscapina or banesin or "ben
u ron" or calpol or captin or cemol or coldex or cotibin or crocin or dafalgan or daleron or "dawa ya magi" or
depon or dexamol or dolex or dolgesic or doliprane or dolorol or dolprone or "duiyixian anjifen pian" or dapa
or dolo or datril or duatrol or dayquil or efferalgan or enelfa or europain or febrectal or febricet or febridol or
fensum or feverall or fibi or "fibi plus" or gelocatil or gripin or gesic or genapap or genebs or hedex or hedanol
or herron or influbene or kafa or kitadol or lekadol or lupocet or lemsip or liquiprin or pyrigesic or mexalen or
milidon or minoset or momentum or napa or "neo kiddielets" or neopap or "oraphen pd" or pyrigesic or pacol
or pamol or parol or panado or panadol or panamax or panda or panodil or pyrigesic or paracet or paracetamol
or paracitol or paralen or paramed or paramol or parol or perdolan or perfalgan or pinex or "pyongsu cetamol"
or pyrenol or pyrigesic or plicet or panadrex or paratabs or paralgin or phenaphen or revanin or rokamol or
rubophen or redutemp or sara or scanol or "sinpro n" or "snaplets fr" or suppap or tachipirin or tachipirina or
tafirol or tapsin or termalgin or tempra or thomapyrin or tipol or "togal classic duo" or treuphadol or triaminic
or tylenol or tamen or tapanol or tipol or uphamol or vermidon or vitamol or valorin or xumadol or zolben).tw.
3. 1 OR 2
4. osteoarthritis.mp.
5. low back pain.mp.
6. back pain.mp.
7. neck pain.mp.
8. ("low back pain" or "back pain" or "neck pain" or backache or lumbago or "neck ache" or "spin* pain" or "knee
pain" or "hip pain").mp.
9. OR (4-8)
10. 3 AND 9
CENTRAL
1. acetaminophen.mp. or exp Acetaminophen/
2. Analgesics, Non-Narcotic/tu [Therapeutic Use]
3. (paracetamol or tylenol or panadol).mp.
4. 1 or 2 or 3
5. exp Osteoarthritis, Hip/ or exp Osteoarthritis/ or exp Osteoarthritis, Spine/ or exp Osteoarthritis, Knee/
6. Low back pain.mp. or exp Low Back Pain/
7. Neck pain.mp. or exp Neck Pain/
8. ("low back pain" or "back pain" or "neck pain" or backache or lumbago or "neck ache" or "spin* pain" or "knee
pain" or "hip pain").mp.
9. 5 or 6 or 7 or 8
10. 4 and 9
78

Appendix 2 (Figure A)
79

Appendix 2 (Figure B)
80

Appendix 2 (Figure C)
81

CHAPTER FIVE
Nonsteroidal anti-inflammatory drugs for spinal pain: a systematic review and meta-
analysis
Chapter Five has been published as:
Machado GC, Ferreira PH, Maher CG, et al. Nonsteroidal anti-inflammatory drugs for spinal
pain: a systematic review and meta-analysis. Ann Rheum Dis 2017;76:1269-78. Copyright ©
2017, British Medical Association. Reprinted with permission from BMJ Publishing Group.
82

Statement from co-authors confirming authorship contribution of
the PhD candidate
The co-authors of the paper “Nonsteroidal anti-inflammatory drugs for spinal pain: a systematic
review and meta-analysis” confirm that Gustavo de Carvalho Machado has made the following
contributions:
Conception and design of the research
Analysis and interpretation of the findings
Writing of the manuscript and critical appraisal of the content
In addition to the statements above, in cases where I am not the corresponding author of a
published item, permission to include the published material has been granted by the
corresponding author.
Gustavo de Carvalho Machado _________________________ Date: 30 November 2016
As supervisor for the candidature upon which this thesis is based, I can confirm that the
authorship attribution statements above are correct.
Manuela Loureiro Ferreira _________________________ Date: 30 November 2016
83

EXTENDED REPORT
Non-steroidal anti-inflammatory drugs for spinalpain: a systematic review and meta-analysis
Gustavo C Machado,1 Chris G Maher,1 Paulo H Ferreira,2 Richard O Day,3
Marina B Pinheiro,2 Manuela L Ferreira1,4
ABSTRACTBackground While it is now clear that paracetamol isineffective for spinal pain, there is not consensus on theefficacy of non-steroidal anti-inflammatory drugs(NSAIDs) for this condition. We performed a systematicreview with meta-analysis to determine the efficacy andsafety of NSAIDs for spinal pain.Methods We searched MEDLINE, EMBASE, CINAHL,CENTRAL and LILACS for randomised controlled trialscomparing the efficacy and safety of NSAIDs withplacebo for spinal pain. Reviewers extracted data,assessed risk of bias and evaluated the quality ofevidence using the Grade of RecommendationsAssessment, Development and Evaluation approach.A between-group difference of 10 points (on a 0–100scale) was used for pain and disability as the smallestworthwhile effect, as well as to calculate numbersneeded to treat. Random-effects models were used tocalculate mean differences or risk ratios with 95% CIs.Results We included 35 randomised placebo-controlledtrials. NSAIDs reduced pain and disability, but providedclinically unimportant effects over placebo. Sixparticipants (95% CI 4 to 10) needed to be treated withNSAIDs, rather than placebo, for one additionalparticipant to achieve clinically important pain reduction.When looking at different types of spinal pain, outcomesor time points, in only 3 of the 14 analyses were thepooled treatment effects marginally above our thresholdfor clinical importance. NSAIDs increased the risk ofgastrointestinal reactions by 2.5 times (95% CI 1.2 to5.2), although the median duration of included trialswas 7 days.Conclusions NSAIDs are effective for spinal pain, butthe magnitude of the difference in outcomes betweenthe intervention and placebo groups is not clinicallyimportant. At present, there are no simple analgesicsthat provide clinically important effects for spinal painover placebo. There is an urgent need to develop newdrug therapies for this condition.
INTRODUCTIONSpinal pain (neck or low back pain) is the leadingcause of disability worldwide,1 2 and commonlymanaged in general practice by prescription ofmedicines.3 4 Clinical guidelines recommend non-steroidal anti-inflammatory drugs (NSAIDs) as asecond-line analgesic after paracetamol, with thirdchoice being opioids.5 However, recentmeta-analyses have shown that paracetamol is inef-fective,6 7 and opioids appear only to offer smallbenefits for this condition.8 Thus, although the useof NSAIDs has fallen in the past decade,9 their use
could rapidly rise, given the lack of efficacy of para-cetamol and increased awareness of risks associatedwith opioid use.10 11
There is still not consensus on the efficacy ofNSAIDs for spinal pain. The most recentmeta-analysis excluded participants with acute lowback pain or neck pain,12 and to date no reviewshave investigated NSAID injections or topical for-mulations in this population. Furthermore, previousmeta-analyses have reported standardised mean dif-ferences (MD) as effect sizes, which are non-intuitive and difficult to interpret;13 thus bettermeasures of treatment effects, such as numbersneeded to treat (NNT), are likely to enhance inter-pretability for the clinician. There is also concernabout the cardiovascular safety of cyclo-oxygenase-2(COX-2) inhibitors, while serious gastrointestinaladverse reactions are more closely linked to non-selective NSAIDs,14 although all NSAIDs have beenassociated with cardiovascular and gastrointestinalrisks.15 Thus, there is far greater need to understandthe efficacy and safety of this medicine for spinalpain.Therefore, the aim of this systematic review was
to investigate the efficacy and safety of NSAIDscompared with placebo in patients with spinal pain,with or without radicular pain. We also aimed toevaluate whether trial characteristics or methodsare associated with estimates of treatment effect.
METHODSLiterature searchWe followed the Preferred Reporting Items forSystematic Reviews and Meta-analyses (PRISMA)statement,16 and prospectively registered the reviewprotocol on the International Prospective Registerof Systematic Reviews (CRD42015023746). Wesearched MEDLINE, EMBASE, CINAHL,CENTRAL and LILACS from their inception toFebruary 2016. The search strategy was constructedbased on a combination of the following keywordsand their variations: neck pain, back pain,lumbago, sciatica, anti-inflammatory, placebo andrandomised controlled trial. There were no restric-tions of language or publication period.Translations were obtained for non-English studies(two trials). The complete search strategy is shownin online supplementary table S1. One author(GCM) performed the first selection of studiesbased on titles and abstracts, and two authors(GCM and MBP) independently screened full texts.We also searched for potentially eligible trials in thereference lists of included studies and relevant
1269Machado GC, et al. Ann Rheum Dis 2017;76:1269–1278. doi:10.1136/annrheumdis-2016-210597
Clinical and epidemiological research
To cite: Machado GC, Maher CG, Ferreira PH, et al. Ann Rheum Dis 2017;76:1269–1278.
Handling editor Tore K Kvien
Additional material is published online only. To view please visit the journal online (http://dx.doi.org/10.1136/annrheumdis-2016-210597).
1The George Institute for Global Health, Sydney Medical School, University of Sydney, Sydney, New South Wales, Australia2Arthritis and Musculoskeletal Research Group, Faculty of Health Sciences, University of Sydney, Sydney, New South Wales, Australia3Department of Clinical Pharmacology, St Vincent’s Hospital & University of New South Wales, Sydney, New South Wales, Australia4Institute of Bone and Joint Research, The Kolling Institute, Sydney Medical School, University of Sydney, Sydney, New South Wales, Australia
Correspondence toGustavo C Machado, The George Institute for Global Health, PO Box M201, Missenden Road, Camperdown, Sydney, NSW 2050, Australia; [email protected]
Received 27 September 2016Revised 20 December 2016Accepted 27 December 2016Published Online First 20 January 2017
84

systematic reviews. We used consensus to resolve anydisagreement.
Study selectionOnly randomised placebo-controlled trials published in peer-reviewed journals and investigating the effects and safety ofNSAIDs for spinal pain were included in this review. Trials hadto include participants with neck or low back pain, with orwithout radicular pain. Trials that included mixed populationswere included if they reported separate data for participantswith spinal pain. We included trials investigating acute orchronic spinal pain of any intensity and eligible trials had tocompare any class, formulation or route of administration(topical, oral or injection) of NSAIDs with a matching placebo.Only trials that reported patient-relevant outcomes, such as painintensity, disability status, quality-of-life or adverse events wereincluded. The dose and frequency of NSAIDs intake were notrestricted, and we investigated the effects of both non-selectiveNSAIDs (eg, acetic acids, enolic acids, propionic acids, salicy-lates) and COX-2 inhibitors. We excluded trials of participantswith serious spinal pathology (cancer, infectious diseases orcauda equina syndrome). Trials evaluating postoperative anal-gesia using NSAIDs in participants with spinal pain wereexcluded, as were non-randomised controlled trials, review arti-cles, guidelines and observational studies.
Data extraction and quality assessmentWe used a standardised data extraction form to record thecharacteristics of included participants, NSAID class and dose,route of administration, outcomes and duration of follow-up.Two reviewers (GCM and MBP) independently recordedthe sample size, means and SDs for pain, disability andquality-of-life measures. We extracted these data following ahierarchical order: mean difference (MD), change scores andpost-treatment scores. When medians, IQRs, ranges or SEs werereported, we used previously reported formulae to estimatemeans and SDs.17 According to recommendations in theCochrane Handbook,18 we extracted data from the first periodof crossover randomised trials, and in multi-arm trials weextracted data from all groups and divided the number of parti-cipants in the control group by the number of comparisons.
For the safety outcomes, we extracted the number of partici-pants reporting any adverse event, any serious adverse event (asdefined by each trial or events including myocardial infarctionand/or stroke), the number of dropouts due to adverse eventsand the number of participants reporting gastrointestinaladverse reactions. We also extracted the number of participantstaking additional analgesics and the number of tablets consumedper day. We contacted authors of included trials to clarify anyrelevant information or to request additional data in case ofincomplete reporting. Consensus or a third reviewer (MLF) wasused to resolve any disagreement.
The Cochrane Collaboration’s tool was used to assess the riskof bias of included studies by two independent reviewers (GCMand MBP).19 The quality of the evidence from each pooled ana-lysis was evaluated using the Grade of RecommendationsAssessment, Development and Evaluation (GRADE) approach.20
The quality of evidence was downgraded by one level accordingto the following criteria: limitation of study design (more than aquarter of studies considered at serious risk of bias), inconsist-ency of results (substantial heterogeneity, I2>50%), imprecision(pooled sample size <300), indirectness (dissimilar population,intervention, outcomes and time points) and publication bias(funnel plot assessment and Egger’s test two-tailed p<0.1).
Consensus was used to resolve any disagreement. The quality ofevidence was then judged as high, moderate, low or very low.
Data synthesis and analysisTrials were pooled for common outcomes and time points. Asour primary analysis we present overall pooled estimates includ-ing all available trials, and as a secondary analysis we presentseparate pooled effects for neck pain, acute/chronic low backpain and sciatica. We defined a follow-up period <2 weeks asimmediate-term, and a follow-up between 2 weeks and3 months as short-term. When more than one time point wasavailable for the same definition, we extracted data at 1 weekfor immediate-term, or at 8 weeks for short-term. Although weattempted to extract data for medium (>3 months but<12 months) and long-term (≥12 months) follow-ups, no trialsreported data for these time points.
Pain outcome measures reported in included trials were visualanalogue scales (range, 0–100), or numerical rating scales(range, 0–10). These two pain measures are highly correlatedand can be used interchangeably when transformed.21 The dis-ability scale used in trials was the Roland-Morris DisabilityQuestionnaire (range, 0–24). Pain and disability scores were con-verted to a common 0-point (no pain or disability) to 100-point(worst possible pain or disability) scale to facilitate the interpret-ation of our results, and because smallest worthwhile effects forpain and disability in this population are often reported in a 0–100 scale.22–24 Quality-of-life measures included the 12-item orthe 36-item Short Form (SF) Health Survey (range, 0–100); noscore conversion was needed for this outcome.
A between-group difference of 10 points (on a 0–100 scale)for pain, disability and quality-of-life was considered as the smal-lest worthwhile effect;22 the mean effect sizes below this thresh-old were considered clinically unimportant. The smallestworthwhile effect describes the smallest effect of intervention(compared with placebo) that patients perceive as important,and is critical for clinical decision-making.25 We usedrandom-effects models to calculate MD or risk ratios (RR) and95% CIs. We also present the results for the pain intensity ana-lyses as numbers needed to treat (NNT), using the method pro-posed by Norman.26 This expresses the number of patients whoneed to be treated with an NSAID rather than placebo, for oneadditional person to benefit (based on a clinically importantchange of 10 points on a 0–100 pain scale; and allowing for theproportion of patients who were improved, the same and dete-riorated in NSAID and placebo groups). All analyses were con-ducted using Comprehensive Meta-Analysis V.2 (Biostat,Englewood, New Jersey, USA).
Secondary exploratory analysisWe conducted subgroup analyses to explore the influence of dif-ferent factors on our estimates of treatment effects. We usedmeta-regression to generate the difference in effect sizes (with95% CI) and p values between subgroups for pain at immediate-term. Subgroups were defined in terms of risk of bias judge-ments (low, unclear or high), form of drug administration(topical, oral or injection) and type of NSAID (COX-2 inhibi-tors or non-selective NSAIDs). We also investigated the differ-ence of effect sizes of discontinued drugs (eg, rofecoxib andvaldecoxib) and currently marketed NSAIDs, given the aim ofthis review in informing current best practice.
1270 Machado GC, et al. Ann Rheum Dis 2017;76:1269–1278. doi:10.1136/annrheumdis-2016-210597
Clinical and epidemiological research
85

RESULTSInitial search and resultsOur search resulted in a total of 5208 individual records. Afterthe screening of titles and abstracts, two independent reviewersassessed 302 full-text articles. We included 35 randomised trialsafter full-text examination with data for 6065 participants withspinal pain (figure 1).27–61 Twenty-two trials investigated theeffects of NSAIDs for low back pain, of which 11 included par-ticipants with acute back pain and 11 (10 published reports)included participants with chronic low back pain. Eleven trialsinvestigated participants with sciatica and two included neckpain only. The median treatment duration in included trials was7 (IQR, 5–7) days. NSAIDs were mostly administered orally, butfive trials used intravenous or intramuscular injection,35 37–39 59
and three used a topical formulation, such as a gel, patch orcream.51 53 56 Nine trials had a three-arm parallel design andtwo were randomised crossover trials. These trials comparedtwo different drugs, or two different dosages of the same drugwith a matching placebo. Online supplementary table S2 pro-vides more detail on the characteristics of included trials andthe medications evaluated.
The risk of bias assessment (see online supplementary figureS1) shows that overall, studies had no serious risk of bias.However, about half of the trials had at least one bias domainjudged as high risk. A third of included trials reported an appro-priate method of randomisation, and only four reported suitableallocation concealment. Nearly all trials were therapist andassessor-blinded, but 20% of trials had high dropout rates(>15%). Seven trials did not report relevant outcomes or failedto report results previously described in their methods and werejudged at high risk of reporting bias. Eleven trials were judgedat high risk for the ‘other’ bias domain as they reported thatpharmaceutical companies that funded the trial were involved inrunning the study, analysing the data or writing the manuscript.
The risk of bias assessment for each individual trial is shown inonline supplementary figure S2. The inspection of the funnelplot including all trials reporting data for immediate pain reduc-tion and the non-significant Egger’s test (p=0.86) revealed nopublication bias (see online supplementary figure S3).Therefore, none of our meta-analyses was downgraded for pub-lication bias according to the GRADE approach. Data extractedfrom individual trials and calculations of effect sizes are shownin online supplementary tables S3 and S4.
Efficacy of NSAIDs for spinal painPooling of all included trials revealed moderate-quality evidencethat NSAIDs reduced pain in the immediate (MD −9.2, 95% CI−11.1 to −7.3) and short-term (MD −7.7, 95% CI −11.4 to−4.1) compared with placebo (figure 2). The NNT to achieve aclinically significant effect of NSAIDs over placebo on painreduction in the immediate-term was 5 (95% CI 4 to 6) and 6(95% CI 4 to 10) in the short-term. The effects of NSAIDs ondisability were slightly smaller than for pain, with effect atimmediate-term follow-up being −8.1 (95% CI −11.6 to −4.6),and at short-term −6.1 (95% CI −9.5 to −2.8) (figure 3). Themagnitude of the difference in outcomes between the interven-tion and placebo groups, however, was less than the 10-pointthreshold for clinical importance.
There was high-quality evidence of clinically unimportanteffects of NSAIDs compared with placebo for the physicalcomponent of the SF-12 (MD −2.9, 95% CI −3.7 to −2.1),and no effects over placebo were found for the mental compo-nent (MD −0.3, 95% CI −1.2 to 0.6). None of the includedstudies used the SF-36 to measure quality-of-life. Table 1 pro-vides more detailed information on the summary of findingsand the GRADE assessment. None of the included trialsreported medium-term or long-term effects of NSAIDs.
Safety of NSAIDs for spinal painFor the safety analyses, we included up to 21 trials (5153 parti-cipants) with median treatment duration of 7 (IQR, 5–7) days(figure 4). No difference in any event rate between NSAIDs andplacebo was found (RR 1.1, 95% CI 1.0 to 1.2). Only two trialsincluding 635 participants reported serious adverse event dataand again there was no difference between groups (RR 1.5,95% CI 0.4 to 5.2). Similarly, nine trials with 3283 participantsrevealed no difference in the number of dropouts due toadverse events (RR 1.0, 95% CI 0.6 to 1.6). However, wefound a significantly higher number of participants in theNSAIDs group reporting gastrointestinal adverse events com-pared with placebo (RR 2.5, 95% CI 1.2 to 5.2); 28/702 partici-pants taking NSAIDs had gastrointestinal adverse reactionscompared with 9/465 in the placebo groups. Overall, theseresults were based on high-quality evidence according to theGRADE evaluation.
Use of rescue medicationThe use of rescue medication was measured in a variety of waysin eight trials, such as the number of participants taking add-itional analgesics and the number of tablets taken per day. Fourtrials revealed moderate-quality evidence of no difference in thenumber of participants taking an additional analgesic (RR 1.0,95% CI 0.6 to 1.4). However, pooling of four trials showedhigh-quality evidence that participants taking NSAIDs requiredless tablets/day of a rescue medication (MD –0.4, 95% CI −0.5to −0.3), a difference that is arguably not clinically important.
Figure 1 Study selection. CENTRAL, Cochrane Central Register ofControlled Trials. *Number of citations listed for each database includesduplicates.
1271Machado GC, et al. Ann Rheum Dis 2017;76:1269–1278. doi:10.1136/annrheumdis-2016-210597
Clinical and epidemiological research
86

Secondary exploratory analysisResults from our meta-regression analyses showed that trialswith low risk of selection bias had larger effects (MD −11.2,95% CI −13.9 to −8.5) than trials judged at unclear risk (MD
−6.7, 95% CI −8.6 to −4.9). The difference between these sub-groups (MD −4.2, 95% CI −7.7 to −0.8) was statistically sig-nificant (p=0.02). COX-2 inhibitors had larger effects (MD−13.4, 95% CI −15.7 to −11.1) compared with non-selectiveNSAIDs (MD −7.7, 95% CI −9.8 to −5.6). This difference was
Figure 2 Mean differences for pain in placebo-controlled trials on efficacy of non-steroidal anti-inflammatory drugs (NSAIDs) for spinal pain. Painis expressed on scale of 0–100. Immediate-term=follow-up ≤2 weeks; short-term=follow-up >2 weeks but ≤3 months; LBP, low back pain. Studiesordered chronologically within subgroups.
1272 Machado GC, et al. Ann Rheum Dis 2017;76:1269–1278. doi:10.1136/annrheumdis-2016-210597
Downloaded from http://ard.bmj.com/ on June 14, 2017 - Published by group.bmj.com
Clinical and epidemiological research
87

also statistically significant (MD −5.7, 95% CI −9.4 to −1.9;p=0.003), but of questionable clinical relevance. There was nodifference between the effect sizes of discontinued drugs com-pared with currently marketed NSAIDs (MD 0.3, 95% CI −3.7to 4.3; p=0.88), although no trials investigating celecoxib werefound (table 2). Different delivery routes resulted in similareffects compared with a matching placebo: topical (MD −13.2,95% CI −18.5 to −7.9), oral (MD −8.5, 95% CI −10.4 to−6.6) and injection (MD −9.5, 95% CI −14.7 to −4.4).
DISCUSSIONOur review of 35 randomised placebo-controlled trials demon-strates that NSAIDs are effective in reducing pain and disability inpatients with spinal pain, although treatment effects above thoseof placebo are small and arguably not clinically important. Forevery six patients treated with NSAIDs, rather than placebo, onlyone additional patient would benefit considering a between-groupdifference of 10 points for clinical importance in the short-term.Furthermore, when looking at different spinal pain, outcomes ortime points in only 3 of the 14 analyses were the pooled effectsonly marginally above our 10-point threshold for clinical rele-vance. NSAIDs were associated with higher number of patientsreporting gastrointestinal adverse effects in the short-termfollow-up (ie, <14 days). No data on safety at medium-term orlong-term follow-ups were provided by included trials.
The strengths of our review include that it was prospectivelyregistered and followed the PRISMA recommendations, includ-ing the use of GRADE to appraise the quality of the evidence.
We were able to identify a significantly larger number of trialsthan past reviews,12 62–70 which have often limited their inclu-sion criteria to a specific language, population or type ofNSAID. Including more studies (35 randomised placebo-controlled trials) enabled us to conduct a more thorough evalu-ation of the effects of NSAIDs for various forms of spinal pain,and to include a range of forms of drug administration. We havealso provided valuable information on pooled treatment effectsfor specific populations, including neck pain, acute/chronic lowback pain and sciatica. Furthermore, we have provided clinicallyinterpretable estimates on a 0–100 scale, and compared oureffect sizes with a predetermined smallest worthwhile effect of10 points, which reflects the smallest effect of the interventionon outcomes compared with placebo that patients would con-sider meaningful or important.22 Given physicians often findthe interpretation of effect sizes reported in meta-analysis chal-lenging,71 we have also presented our results on pain reductionas the NNT for a clinically significant effect of NSAIDs overplacebo. Moreover, potential factors that could have influencedour treatment effects, such as risk of bias judegments, class ofNSAIDs and route of administration, were investigated throughmeta-regression analyses. Although COX-2 inhibitors showedlarger effects than non-selective NSAIDs on pain reduction, thesize of the difference is of arguable clinical relevance. COX-2inhibitors trials included in our review were fairly recent (allwere conducted after 2003) and substantially larger (meansample size of 280). They were also more likely to report safetyoutcomes than older trials.
Figure 3 Mean differences for disability in placebo-controlled trials on efficacy of non-steroidal anti-inflammatory drugs (NSAIDs) for spinal pain.Disability is expressed on scale of 0–100. Immediate-term=follow-up ≤2 weeks; short-term=follow-up >2 weeks but ≤3 months; LBP, low backpain. Studies ordered chronologically within subgroups.
1273Machado GC, et al. Ann Rheum Dis 2017;76:1269–1278. doi:10.1136/annrheumdis-2016-210597
Clinical and epidemiological research
88

Our review has some limitations. First, we did not find anytrials investigating the efficacy and safety of celecoxib versusplacebo, a commonly used COX-2 selective drug. Second,some of the trials included in our meta-analysis used drugs thatare discontinued or are no longer commercialised in majormarkets (eg, rofecoxib and valdecoxib), but ourmeta-regression revealed that this was not a factor that influ-enced our estimates; discontinued drugs (MD −8.9, 95% CI−10.8 to −7.0) had similar effects as currently marketedNSAIDs (MD −9.3, 95% CI −12.1 to −6.5). Third, there is no
evidence on the long-term effects and safety of NSAIDs, as themedian follow-up time was 1 week in included trials, withsome treatment schedules lasting <1 day. Fourth, our overallpooled estimates resulted in substantial between-trial hetero-geneity (I2 ranged from 59% to 87%), which, however, wasfound considerably reduced in the stratified meta-analysesaccording to the type of spinal pain (ie, neck pain, acute/chronic low back pain, or sciatica). Finally, another limitationof our study is that there were very few trials on neck pain,and none on whiplash.
Table 1 Summary of findings and quality of evidence assessment
Summary of findings Quality of evidence assessment (GRADE)
Overall Trials Participants I2, % MD (95% CI) Study limitation Inconsistency Imprecision Quality
Immediate-term
Pain 23 5217 59 –9.2 (−11.1 to −7.3) None –1 None Moderate
Disability 12 2667 87 −8.1 (−11.6 to −4.6) None –1 None Moderate
Short-term
Pain 9 2611 81 −7.7 (−11.4 to −4.1) None –1 None Moderate
Disability 8 2086 85 −6.1 (−9.5 to −2.8) None –1 None Moderate
Quality-of-life (PC) 4 1330 0 −2.9 (−3.7 to −2.1) None None None High
Quality-of-life (MC) 4 1330 15 −0.3 (−1.2 to 0.6) None None None High
Neck pain
Immediate-term
Pain 2 225 36 −16.3 (−20.6 to −12.0) None None –1 Moderate
Disability 2 225 98 −12.2 (−34.3 to 10.0) None –1 –1 Low
Acute low back pain
Immediate-term
Pain 5 814 26 −6.4 (−10.3 to −2.5) None None None High
Disability 3 476 43 −7.1 (−12.4 to −1.9) None None None High
Short-term
Pain 1 120 0 −1.0 (−5.9 to 3.9) None None –1 Moderate
Disability 1 120 0 −0.4 (−5.4 to 4.5) None None –1 Moderate
Chronic low back pain
Immediate-term
Pain 9 2537 52 −11.1 (−13.8 to −8.4) None –1 None Moderate
Disability 6 1752 30 −8.4 (−10.6 to −6.3) None None None High
Short-term
Pain 7 2277 60 −9.8 (−12.7 to −7.0) None –1 None Moderate
Disability 6 1752 87 −7.9 (−11.8 to −4.0) None –1 None Moderate
Sciatica
Immediate-term
Pain 7 1641 0 −6.2 (−8.2 to −4.2) None None None High
Disability 1 214 0 1.2 (−3.8 to 6.1) None None –1 Moderate
Short-term
Pain 1 214 0 3.3 (−1.5 to 8.1) None None –1 Moderate
Disability 1 214 0 2.4 (−2.6 to 7.3) None None –1 Moderate
Safety outcomes
All time points
Adverse events (any)* 21 5153 16 1.1 (1.0 to 1.2) None None None High
Adverse events (serious)† 2 635 56 1.5 (0.4 to 5.2) None –1 None Moderate
Adverse events (dropout)‡ 9 3283 38 1.0 (0.6 to 1.6) None None None High
Adverse events (gastro)§ 3 1167 0 2.5 (1.2 to 5.2) None None None High
Negative values favours NSAIDs.*Number of patients reporting any adverse effect.†Number of patients reporting any serious adverse effect (as defined by each study).‡Number of patients withdrawn from study due to adverse effects.§Number of patients reporting gastrointestinal adverse effects.MC, mental component; MD, mean differences; NSAIDs, non-steroidal anti-inflammatory drugs; PC, physical component.
1274 Machado GC, et al. Ann Rheum Dis 2017;76:1269–1278. doi:10.1136/annrheumdis-2016-210597
Downloaded from http://ard.bmj.com/ on June 14, 2017 - Published by group.bmj.com
Clinical and epidemiological research
89

We provide sound evidence that NSAIDs are effective, but donot offer clinically important benefits for spinal pain abovethose attributable to placebo, given overall pooled estimated dif-ferences were <10 points. This is crucially important becausewe now know paracetamol is ineffective,6 7 and opioids onlyoffer small benefits for spinal pain.8 Thus, given our results andevidence from these recent high-quality meta-analyses, it seemsthat there are no analgesics with clinically important effects overplacebo for spinal pain. This is a problem, as current guidelines
for spinal pain endorse these three medicines.5 For instance, theNational Institute for Health and Care Excellence (NICE) guid-ance on low back pain and sciatica now recommends NSAIDs asfirst analgesic option and suggests the use of opioids with para-cetamol to treat spinal pain. In our review, even when theeffects of NSAIDs were analysed for different spinal pain strata(ie, neck pain, acute/chronic low back pain or sciatica), only 3of the 14 analyses revealed effects that were marginally aboveour threshold for clinical relevance. The effects observed in
Figure 4 Risk ratio for safety outcome measures in placebo-controlled trials on efficacy of non-steroidal anti-inflammatory drugs (NSAIDs)compared with placebo. Any adverse event=no. of patients reporting any adverse event; serious adverse events=no. of patients reporting any seriousadverse event (as defined by each study); GI adverse events=no. of patients reporting gastrointestinal adverse events; withdrawals=no. of patientswithdrawn from study because of adverse events. Studies are ordered chronologically within subgroups.
1275Machado GC, et al. Ann Rheum Dis 2017;76:1269–1278. doi:10.1136/annrheumdis-2016-210597
Clinical and epidemiological research
90

trials including participants with neck pain were unexpected,particularly because these trials investigated topical NSAIDsonly. Our safety analysis revealed that NSAIDs increased the riskof gastrointestinal adverse effects by 2.5 times compared withplacebo, although safety data were limited to trials that usednon-selective NSAIDs. However, it is established that allNSAIDs, including COX-2 inhibitors, have been linked togastrointestinal harms.15 72 Our safety results should be inter-preted with caution given the short duration of exposure toNSAIDs in included trials.
In summary, compared with placebo, NSAIDs do not providea clinically important effect on spinal pain, and six patientsmust be treated with NSAIDs for one patient to achieve a clinic-ally important benefit in the short-term. When this result istaken together with those from recent reviews on paracetamoland opioids, it is now clear that the three most widely used, andguideline-recommended medicines for spinal pain do notprovide clinically important effects over placebo. There is anurgent need to develop new analgesics for spinal pain.
Twitter Follow Gustavo Machado @gustavocmachado
Contributors All authors made substantial contributions to the study conceptionand design or analysis and interpretation of data and were involved in drafting themanuscript and approved the final version.
Funding GCM and MBP are supported by an Australian Postgraduate Award fromthe Department of Education and Training of Australia. CGM is supported by aPrincipal Research Fellowship from the National Health and Medical ResearchCouncil. MLF holds a Sydney Medical Foundation Fellowship, Sydney Medical School.
Competing interests None declared.
Provenance and peer review Not commissioned; externally peer reviewed.
REFERENCES1 Hoy D, March L, Brooks P, et al. The global burden of low back pain: estimates
from the Global Burden of Disease 2010 study. Ann Rheum Dis 2014;73:968–74.
2 Hoy D, March L, Woolf A, et al. The global burden of neck pain: estimatesfrom the Global Burden of Disease 2010 study. Ann Rheum Dis 2014;73:1309–15.
3 Cherkin DC, Wheeler KJ, Barlow W, et al. Medication use for low back pain inprimary care. Spine 1998;23:607–14.
4 Michaleff ZA, Harrison C, Britt H, et al. Ten-year survey reveals differences in GPmanagement of neck and back pain. Eur Spine J 2012;21:1283–9.
5 Koes BW, van Tulder M, Lin CW, et al. An updated overview of clinical guidelinesfor the management of non-specific low back pain in primary care. Eur Spine J2010;19:2075–94.
6 Machado GC, Maher CG, Ferreira PH, et al. Efficacy and safety of paracetamol forspinal pain and osteoarthritis: systematic review and meta-analysis of randomisedplacebo controlled trials. BMJ 2015;350:h1225.
7 Australian Institute of Health and Welfare 2010. Medication use for arthritis andosteoporosis. Canberra: AIHW, 2010.
Table 2 Secondary exploratory analyses for pain at immediate-term
Variable
Summary of findings Meta-regression
Studies Participants I2, % MD (95% CI) MD (95% CI) p Value
Sequence generation
Low 12 2594 65 −11.2 (−13.9 to −8.5)
Unclear 11 2623 13 −6.7 (−8.6 to −4.9) −4.2 (−7.7 to −0.8) 0.02
Allocation concealment
Low 4 680 25 −5.9 (−9.3 to −2.4)
Unclear 19 4537 60 −9.8 (−11.9 to −7.8) −3.6 (−8.4 to 1.2) 0.14
Blinding
Low 22 5037 62 −9.3 (−11.2 to −7.4)
Unclear 1 180 0 −7.1 (−14.8 to 0.6) 2.1 (−7.5 to 11.8) 0.70
Incomplete data
Low 12 2384 72 −9.0 (−12.2 to −5.8)
Unclear 6 1641 0 −7.3 (−9.3 to −5.2) 1.0 (−3.3 to 5.3) 0.65
High 5 1192 32 −11.8 (−15.1 to −8.5) −2.5 (−7.5 to 2.4) 0.31
Selective reporting
Low 18 4592 64 −9.4 (−11.4 to −7.3)
Unclear 4 545 34 −9.0 (−14.3 to −3.7) 0.7 (−5.6 to 6.9) 0.83
High 1 80 0 −6.0 (−15.0 to 3.0) 3.4 (−8.6 to 15.6) 0.59
Other (funding)
Low 2 300 0 −3.5 (−7.7 to 0.7)
Unclear 13 2309 51 −9.4 (−11.9 to −6.9) −4.9 (−11.9 to 2.1) 0.17
High 8 2608 69 −9.9 (−13.1 to −6.8) −5.4 (−12.6 to 1.7) 0.13
NSAIDs class
COX-2 inhibitors 6 1703 0 −13.4 (−15.7 to −11.1)
Non-selective 17 3514 57 −7.7 (−9.8 to −5.6) −5.7 (−9.4 to −1.9) 0.003
Administration form
Oral 18 4493 50 −8.5 (−10.4 to −6.6)
Topical 3 405 55 −13.2 (−18.5 to −7.9) −4.9 (−10.2 to 0.3) 0.06
Injection 2 319 29 −9.5 (−14.7 to −4.4) −1.3 (−7.9 to 5.4) 0.71
Discontinued drug
Yes 8 1774 0 −8.9 (−10.8 to −7.0)
No 15 3443 71 −9.3 (−12.1 to −6.5) 0.3 (−3.7 to 4.3) 0.88
COX-2, cyclo-oxygenase-2; MD, mean difference; NSAIDs, non-steroidal anti-inflammatory drugs.
1276 Machado GC, et al. Ann Rheum Dis 2017;76:1269–1278. doi:10.1136/annrheumdis-2016-210597
Downloaded from http://ard.bmj.com/ on June 14, 2017 - Published by group.bmj.com
Clinical and epidemiological research
91

8 Abdel Shaheed C, Maher CG, Williams KA, et al. Efficacy, tolerability, anddose-dependent effects of opioid analgesics for low back pain: a systematic reviewand meta-analysis. JAMA Intern Med 2016;176:958–68.
9 Mafi JN, McCarthy EP, Davis RB, et al. Worsening trends in the management andtreatment of back pain. JAMA Intern Med 2013;173:1573–81.
10 Dunn KM, Saunders KW, Rutter CM, et al. Opioid prescriptions for chronic pain andoverdose: a cohort study. Ann Intern Med 2010;152:85–92.
11 Dowell D, Haegerich TM, Chou R. CDC guideline for prescribing opioids for chronicpain—United States, 2016. JAMA 2016;315:1624–45.
12 Enthoven WT, Roelofs PD, Deyo RA, et al. Non-steroidal anti-inflammatorydrugs for chronic low back pain. Cochrane Database Syst Rev 2016;2:CD012087.
13 Thorlund K, Walter SD, Johnston BC, et al. Pooling health-related quality of lifeoutcomes in meta-analysis—a tutorial and review of methods for enhancinginterpretability. Res Synth Methods 2011;2:188–203.
14 van der Linden MW, van der Bij S, Welsing P, et al. The balance between severecardiovascular and gastrointestinal events among users of selective andnon-selective non-steroidal anti-inflammatory drugs. Ann Rheum Dis2009;68:668–73.
15 Trelle S, Reichenbach S, Wandel S, et al. Cardiovascular safety of non-steroidalanti-inflammatory drugs: network meta-analysis. BMJ 2011;342:c7086.
16 Liberati A, Altman DG, Tetzlaff J, et al. The PRISMA statement for reportingsystematic reviews and meta-analyses of studies that evaluate healthcareinterventions: explanation and elaboration. BMJ 2009;339:b2700.
17 Wan X, Wang W, Liu J, et al. Estimating the sample mean and standard deviationfrom the sample size, median, range and/or interquartile range. BMC Med ResMethodol 2014;14:135.
18 Higgins JPT, Green S, (eds). Cochrane Handbook for Systematic Reviews ofInterventions. Version. 5.1.0 [updated March 2011]. The Cochrane Collaboration,2011. Available from http://handbook.cochrane.org.
19 Higgins JP, Altman DG, Gøtzsche PC, et al. The Cochrane Collaboration’s tool forassessing risk of bias in randomised trials. BMJ 2011;343:d5928.
20 Guyatt GH, Oxman AD, Vist GE, et al. GRADE: an emerging consensus on ratingquality of evidence and strength of recommendations. BMJ 2008;336:924–6.
21 Hjermstad MJ, Fayers PM, Haugen DF, et al. Studies comparing numerical ratingscales, verbal rating scales, and visual analogue scales for assessment of painintensity in adults: a systematic literature review. J Pain Symptom Manage2011;41:1073–93.
22 Ferreira ML, Herbert RD, Ferreira PH, et al. The smallest worthwhile effect ofnonsteroidal anti-inflammatory drugs and physiotherapy for chronic low back pain:a benefit-harm trade-off study. J Clin Epidemiol 2013;66:1397–404.
23 Dworkin RH, Turk DC, Wyrwich KW, et al. Interpreting the clinical importance oftreatment outcomes in chronic pain clinical trials: IMMPACT recommendations.J Pain 2008;9:105–21.
24 Ostelo RW, Deyo RA, Stratford P, et al. Interpreting change scores for pain andfunctional status in low back pain: towards international consensus regardingminimal important change. Spine 2008;33:90–4.
25 Copay AG, Subach BR, Glassman SD, et al. Understanding the minimum clinicallyimportant difference: a review of concepts and methods. Spine J 2007;7:541–6.
26 Norman GR, Sridhar FG, Guyatt GH, et al. Relation of distribution- andanchor-based approaches in interpretation of changes in health-related quality oflife. Med Care 2001;39:1039–47.
27 Goldie I. A clinical trial with indomethacin (indomee(R)) in low back pain andsciatica. Acta Orthop Scand 1968;39:117–28.
28 Jacobs JH, Grayson MF. Trial of an anti-inflammatory agent (indomethacin) in lowback pain with and without radicular involvement. Br Med J 1968;3:158–60.
29 Goldie I. Anti-inflammatory treatment of lumbago? Lakartidningen1970;67:1197–204.
30 Weber H, Aasand G. The effect of phenylbutazone on patients with acutelumbago-sciatica. A double blind trial. J Oslo City Hosp 1980;30:69–72.
31 Berry H, Bloom B, Hamilton EB, et al. Naproxen sodium, diflunisal, and placebo inthe treatment of chronic back pain. Ann Rheum Dis 1982;41:129–32.
32 Jagemann V. [Treatment of acute lumbago with diflunisal. Controlled double-blindstudy with placebos]. MMW Munch Med Wochenschr 1983;125:29–31.
33 Amlie E, Weber H, Holme I. Treatment of acute low-back pain with piroxicam:results of a double-blind placebo-controlled trial. Spine 1987;12:473–6.
34 Bontoux D. Lombo-radiculalgies: efficacite, tolerance et benefice therapeutiquecompares de l’etodolac (600mg/j), du diclofenac (150 mg/j) et du placebo.Rhumatologie 1990;42:201–6.
35 Gendrault P, Barat JL, Legras B, et al. Etude comparative en double aveugle Feldène20 mg versus placebo IM dans les radiculalgies résiduelles après intervention sur lacolonne vertébrale lombaire. Abstract Rhumato 1992;88:17–22.
36 Weber H, Holme I, Amlie E. The natural course of acute sciatica with nerve rootsymptoms in a double-blind placebo-controlled trial evaluating the effect ofpiroxicam. Spine 1993;18:1433–8.
37 Babej-Dölle R, Freytag S, Eckmeyer J, et al. Parenteral dipyrone versus diclofenacand placebo in patients with acute lumbago or sciatic pain: randomizedobserver-blind multicenter study. Int J Clin Pharmacol Ther 1994;32:204–9.
38 Szpalski M, Hayez JP. Objective functional assessment of the efficacy of tenoxicamin the treatment of acute low back pain. A double-blind placebo-controlled study.Br J Rheumatol 1994;33:74–8.
39 Ghozlan R, Dropsy R. Study of analgesic activity (single dose) of etodolac p.o.,tenoxicam i.m. and placebo in acute sciatica. Rhumatologie 1996;48:83–90.
40 Dreiser RL, Le Parc JM, Vélicitat P, et al. Oral meloxicam is effective in acutesciatica: two randomised, double-blind trials versus placebo or diclofenac. InflammRes 2001;50(Suppl 1):S17–23.
41 Nadler SF, Steiner DJ, Erasala GN, et al. Continuous low-level heat wrap therapyprovides more efficacy than Ibuprofen and acetaminophen for acute low back pain.Spine 2002;27:1012–7.
42 Birbara CA, Puopolo AD, Munoz DR, et al. Treatment of chronic low back pain withetoricoxib, a new cyclo-oxygenase-2 selective inhibitor: improvement in pain anddisability—a randomized, placebo-controlled, 3-month trial. J Pain 2003;4:307–15.
43 Dreiser RL, Marty M, Ionescu E, et al. Relief of acute low back pain withdiclofenac-K 12.5 mg tablets: a flexible dose, ibuprofen 200 mg andplacebo-controlled clinical trial. Int J Clin Pharmacol Ther 2003;41:375–85.
44 Katz N, Ju WD, Krupa DA, et al. Efficacy and safety of rofecoxib in patients withchronic low back pain: results from two 4-week, randomized, placebo-controlled,parallel-group, double-blind trials. Spine 2003;28:851–8.
45 Nadler SF, Steiner DJ, Erasala GN, et al. Continuous low-level heatwrap therapy fortreating acute nonspecific low back pain. Arch Phys Med Rehabil 2003;84:329–34.
46 Nadler SF, Steiner DJ, Petty SR, et al. Overnight use of continuous low-levelheatwrap therapy for relief of low back pain. Arch Phys Med Rehabil2003;84:335–42.
47 Coats TL, Borenstein DG, Nangia NK, et al. Effects of valdecoxib in the treatment ofchronic low back pain: results of a randomized, placebo-controlled trial. Clin Ther2004;26:1249–60.
48 Katz N, Rodgers DB, Krupa D, et al. Onset of pain relief with rofecoxib in chroniclow back pain: results of two four-week, randomized, placebo-controlled trials.Curr Med Res Opin 2004;20:651–8.
49 Pallay RM, Seger W, Adler JL, et al. Etoricoxib reduced pain and disability andimproved quality of life in patients with chronic low back pain: a 3 month,randomized, controlled trial. Scand J Rheumatol 2004;33:257–66.
50 Hancock MJ, Maher CG, Latimer J, et al. Assessment of diclofenac or spinalmanipulative therapy, or both, in addition to recommended first-line treatment foracute low back pain: a randomised controlled trial. Lancet 2007;370:1638–43.
51 Allegrini A, Nuzzo L, Pavone D, et al. Efficacy and safety of piroxicam patch versuspiroxicam cream in patients with lumbar osteoarthritis. A randomized,placebo-controlled study. Arzneimittelforschung 2009;59:403–9.
52 Herrmann WA, Geertsen MS. Efficacy and safety of lornoxicam compared with placeboand diclofenac in acute sciatica/lumbo-sciatica: an analysis from a randomised,double-blind, multicentre, parallel-group study. Int J Clin Pract 2009;63:1613–21.
53 Hsieh LF, Hong CZ, Chern SH, et al. Efficacy and side effects of diclofenac patch intreatment of patients with myofascial pain syndrome of the upper trapezius. J PainSymptom Manage 2010;39:116–25.
54 Katz N, Borenstein DG, Birbara C, et al. Efficacy and safety of tanezumab in thetreatment of chronic low back pain. Pain 2011;152:2248–58.
55 Kivitz AJ, Gimbel JS, Bramson C, et al. Efficacy and safety of tanezumabversus naproxen in the treatment of chronic low back pain. Pain 2013;154:1009–21.
56 Predel HG, Giannetti B, Pabst H, et al. Efficacy and safety of diclofenac diethylamine1.16% gel in acute neck pain: a randomized, double-blind, placebo-controlledstudy. BMC Musculoskelet Disord 2013;14:250.
57 von Heymann WJ, Schloemer P, Timm J, et al. Spinal high-velocity low amplitudemanipulation in acute nonspecific low back pain: a double-blindedrandomized controlled trial in comparison with diclofenac and placebo. Spine2013;38:540–8.
58 Stark J, Petrofsky J, Berk L, et al. Continuous low-level heatwrap therapy relieveslow back pain and reduces muscle stiffness. Phys Sportsmed 2014;42:39–48.
59 Wetzel L, Zadrazil M, Paternostro-Sluga T, et al. Intravenous nonopioid analgesic drugs inchronic low back pain patients on chronic opioid treatment: a crossover, randomised,double-blinded, placebo-controlled study. Eur J Anaesthesiol 2014;31:35–40.
60 Basmajian JV. Acute back pain and spasm. A controlled multicenter trial ofcombined analgesic and antispasm agents. Spine 1989;14:438–9.
61 Radin EL, Bryan RS. Phenylbutazone for prolapsed discs? Lancet 1968;292:736.62 Wong JJ, Cote P, Ameis A, et al. Are non-steroidal anti-inflammatory drugs effective
for the management of neck pain and associated disorders, whiplash-associateddisorders, or non-specific low back pain? A systematic review of systematic reviewsby the Ontario Protocol for Traffic Injury Management (OPTIMa) Collaboration.Eur Spine J 2016;25:34–61.
63 Abdel Shaheed C, Maher CG, Williams KA, et al. Interventions available over thecounter and advice for acute low back pain: systematic review and meta-analysis.J Pain 2014;15:2–15.
64 Pinto RZ, Maher CG, Ferreira ML, et al. Drugs for relief of pain in patients withsciatica: systematic review and meta-analysis. BMJ 2012;344:e497.
65 Kuijpers T, van Middelkoop M, Rubinstein SM, et al. A systematic review on theeffectiveness of pharmacological interventions for chronic non-specific low-backpain. Eur Spine J 2011;20:40–50.
1277Machado GC, et al. Ann Rheum Dis 2017;76:1269–1278. doi:10.1136/annrheumdis-2016-210597
Clinical and epidemiological research
92

66 Chou R, Huffman LH, American Pain Society, American College of Physicians.Medications for acute and chronic low back pain: a review of the evidence for anAmerican Pain Society/American College of Physicians clinical practice guideline.Ann Intern Med 2007;147:505–14.
67 Leaver AM, Refshauge KM, Maher CG, et al. Conservative interventions provideshort-term relief for non-specific neck pain: a systematic review. J Physiother2010;56:73–85.
68 Machado LA, Kamper SJ, Herbert RD, et al. Analgesic effects of treatments fornon-specific low back pain: a meta-analysis of placebo-controlled randomized trials.Rheumatology (Oxford) 2009;48:520–7.
69 Mason L, Moore RA, Edwards JE, et al. Topical NSAIDs for chronic musculoskeletalpain: systematic review and meta-analysis. BMC Musculoskelet Disord 2004;5:28.
70 Roelofs PD, Deyo RA, Koes BW, et al. Non-steroidal anti-inflammatory drugs for lowback pain. Cochrane Database Syst Rev 2008;(1):CD000396.
71 Krouss M, Croft L, Morgan DJ. Physician Understanding and Ability to CommunicateHarms and Benefits of Common Medical Treatments. JAMA Intern Med2016;176:1565–7.
72 Bhala N, Emberson J, Merhi A, et al. Vascular and upper gastrointestinal effects ofnon-steroidal anti-inflammatory drugs: meta-analyses of individual participant datafrom randomised trials. Lancet 2013;382:769–79.
1278 Machado GC, et al. Ann Rheum Dis 2017;76:1269–1278. doi:10.1136/annrheumdis-2016-210597
Clinical and epidemiological research
93

Table S1. Search Strategy
MEDLINE (up to February 2016)
1. randomized controlled trial/ or controlled clinical trial.pt. or comparative study.pt or clinical trial.pt. or
randomized.ab. or randomised.ab or randomly.ab,ti. or trial.ab,ti.
2. placebos/ or placebo effect/ or placebo.tw or anti-inflammatory agents, non-steroidal/ or anti-inflammator*.tw
or nsaid*.tw. or acetylsalicyl* or diflunisal or aceclofenac or alclofenac or diclofenac or indometacin or
sulindac or meloxicam or piroxicam or dexibuprofen or dexketoprofen or fenoprofen or flurbiprofen or
ibuprofen or ketoprofen or naproxen or tiapro* or metamizol or phenylbutazone or phenazone or
propyphenazone or celecoxib or etoricoxib or nabumeton or parecoxib.tw
3. 1 and 2
4. back pain/ or low back pain/ or dorsalgia.ti,ab. or backache.ti,ab. or (lumbar adj pain).tw. or lumbago.tw or
back disorder*.tw. or neck pain/ or neck pain.tw.
5. 3 and 4
6. limit 5 to humans
EMBASE (up to February 2016)
1. 'randomized controlled trial (topic)' or randomized:ab or randomised:ab or randomly:ab
2. 'placebo'/exp or placebo:ti or placebo:ab
3. #1 and #2
4. 'nonsteroidal antiinflammatory agent'/exp or 'anti inflammatory':ti or 'anti inflammatory':ab or nsaid*:ti or
nsaid*:ab
5. #3 and #4
6. 'low back pain'/exp or 'low back pain' or 'backache'/exp or 'backache' or 'neck pain'/exp or 'neck pain'
7. #5 and #6
8. #7 and [embase]/lim
9. #8 and [humans]/lim
10. #9 and ([article]/lim or [article in press]/lim or [review]/lim)
CINAHL (up to February 2016)
1. (MH "Clinical Trials+") or (MH "Comparative Studies") or (MH "Randomized Controlled Trials") or (MH"Clinical Trials+") or ti random* or ab random*
2. (MH "Antiinflammatory Agents, Non-Steroidal+") or (MH "Antiinflammatory Agents, Topical+") or"Antiinflammatory" or "Anti-inflammatory" or ti nsaid* or ab nsaid*
3. 1 and 24. (MH "Low Back Pain") or (MH "Back Pain+") or "dorsalgia" or "backache" or "lumbago" or (MH "Neck Pain")5. 3 and 46. 5 limited to humans
CENTRAL (up to February 2016)
1. MeSH descriptor: [Back Pain] explode all trees or MeSH descriptor: [Low Back Pain] explode all trees or
(lumbar next pain) or (coccyx) or (coccydynia) or (sciatica) or (spondylosis) or MeSH descriptor: [Spinal
Diseases] explode all trees or (lumbago) or (discitis) or (disc near degeneration) or (disc near prolapse) or
(disc near herniation) or back disorder* or back near pain or MeSH descriptor: [Neck Pain] explode all trees or
neck pain or neck disorder*
2. MeSH descriptor: [Anti-Inflammatory Agents, Non-Steroidal] explode all trees or nsaid*
3. 1 and 2
4. 3 limited to trials
LILACS (up to February 2016)
1. (anti-inflammatory or antiinflamatorio or anti-inflamatorio or anti-inflammatories or antiinflamatorios or anti-
inflamatorios or NSAIDs or AINEs) and (osteoarthritis or osteoartrite or back pain or dor lombar or lumbago
or lombalgia or backache or neck pain or dor cervical or knee pain or hip pain)
94

Table
S2.
Ch
ara
cte
risti
cs o
f in
clu
ded
stu
die
s
Stu
dy
Co
un
try
Deta
ils o
f p
art
icip
an
tsIn
terv
en
tio
ns (
do
se r
eg
imen
s)
NS
AID
cla
ss
Ou
tco
mes a
nd
tim
e p
oin
ts
Gold
ie 1
968
Sw
eden
50 s
cia
tica p
atients
(gro
up 1
=25,
gro
up 2
=25);
mean a
ge
(SD
)=N
R;
52%
male
Gro
up 1
: In
dom
eth
acin
25 m
g, 1 c
apsule
, 3 tim
es d
aily
, 75 m
g tota
l;
Gro
up 2
: O
ral pla
cebo
Acetic a
cid
Advers
e e
ffects
; at
2 w
eeks
Jacobs 1
968
United
Kin
gdom
110
back p
ain
with o
r w
ithout
scia
tica p
atients
(gro
up 1
=55,
gro
up 2
=55);
mean a
ge (
SD
)=N
R
Gro
up 1
: In
dom
eth
acin
25 m
g, 1 c
apsule
, 3 tim
es d
aily
, 75 m
g tota
l fo
r 2 d
ays, th
en 1
capsule
4 t
imes d
aily
, 100 m
g t
ota
l fo
r 5 d
ays;
Gro
up 2
: O
ral pla
cebo
Acetic a
cid
Advers
e e
ffects
; at
1 w
eek
Radin
1968
United
Sta
tes
23 s
cia
tica p
atients
(gro
up 1
=12,
gro
up 2
=11);
mean a
ge (
SD
)=N
R
Gro
up 1
: P
henylb
uta
zone 1
00 m
g, 1 t
able
ts,
6 t
imes d
aily
, 600 m
g t
ota
l fo
r 2 d
ays, th
en 1
table
t, 3
tim
es d
aily
, 300 m
g t
ota
l fo
r 8 d
ays; G
roup
2:
Ora
l pla
cebo
Enolic
acid
Advers
e e
ffects
; at
1 w
eek
Gold
ie 1
970
Sw
eden
90 a
cute
back p
ain
patients
(g
roup 1
=30,
gro
up 2
=30,
gro
up
3=
30);
age (
range)=
15 t
o 6
9
years
; 56 %
male
Gro
up 1
: In
dom
eth
acin
25 m
g, 2 c
apsule
s,
3 t
imes d
aily
, 150 m
g t
ota
l;
Gro
up 2
: A
spirin
500 m
g,
2 c
apsule
s, 3 tim
es d
aily
, 3000 m
g t
ota
l;
Gro
up 3
: O
ral pla
cebo
Acetic a
cid
; S
alic
yla
tes
Advers
e e
ffects
; at
1 w
eek
Weber
1980
Norw
ay
57 s
cia
tica p
atients
(gro
up 1
=28,
gro
up 2
=29);
mean a
ge
(SD
)=41.0
(13.3
) years
; 54%
m
ale
Gro
up 1
: P
henylb
uta
zone 2
00 m
g, 2 t
able
ts,
3 t
imes d
aily
, 1200 m
g
tota
l fo
r 3 d
ays, th
en 1
table
t, 3
tim
es d
aily
, 600 m
g t
ota
l fo
r 2 d
ays;
Gro
up 2
: O
ral pla
cebo
Enolic
acid
Use o
f re
scue m
edic
ation; at 1
week
Berr
y 1
982
(cro
ss-o
ver)
United
Kin
gdom
37 a
cute
back p
ain
patients
; m
ean a
ge (
SD
)=55.0
(11.8
) years
; 35%
male
Gro
up 1
: N
apro
xen S
odiu
m 2
75 m
g,
2 c
apsule
s,
2 tim
es d
aily
, 1100
mg t
ota
l; G
roup 2
: D
iflu
nis
al 250 m
g,
2 t
able
ts,
2 t
imes d
aily
, 1000 m
g
tota
l; G
roup 3
: O
ral pla
cebo
Pro
pio
nic
acid
; S
alic
yla
tes
Pain
(10 c
m V
AS
); A
dvers
e
eff
ects
; at
1 w
eek
Jagem
ann
1983
Germ
any
30 a
cute
back p
ain
patients
(g
roup 1
=15,
gro
up 2
=15);
age
(range)=
18 t
o 5
7 y
ears
; 47 %
m
ale
Gro
up 1
: D
iflu
nis
al 500 m
g, 2 t
able
ts,
once d
aily
, 1000 m
g t
ota
l; G
roup
2:
Ora
l pla
cebo
Salic
yla
tes
Pain
(4-p
oin
t scale
); D
isabili
ty (
4-
poin
t scale
); a
t 1 w
eek
Am
lie 1
987
Norw
ay
282 a
cute
back p
ain
patients
(g
roup 1
=140,
gro
up 2
=142);
m
ean a
ge=
37.9
years
; 60%
male
Gro
up 1
: P
iroxic
am
20 m
g, 2 c
apsule
s, once d
aily
for
2 d
ays,
40 m
g
tota
l, t
hen 1
capsule
, once d
aily
for
5 d
ays,20 m
g t
ota
l; G
roup 2
: O
ral
pla
cebo
Enolic
acid
Pain
(100 m
m V
AS
); A
dvers
e
eff
ects
; U
se o
f re
scue
medic
ation; at
1 w
eek
95

Basm
ajia
n
1989
Canada
89 a
cute
back p
ain
patients
(g
roup 1
=44,
gro
up 2
=45);
mean
age (
SD
)=N
R
Gro
up 1
: D
iflu
nis
al 500 m
g, 1 t
able
ts,
twic
e d
aily
, 1000 m
g tota
l; G
roup
2:
Ora
l pla
cebo
Salic
yla
tes
Advers
e e
ffects
; at
1 w
eek
Bonto
ux 1
990
Fra
nce
204 s
cia
tica p
atients
(gro
up
1=
74,
gro
up 2
=69, gro
up 3
=71);
m
ean a
ge (
SD
)=45.7
(13.2
) years
; 59%
male
Gro
up 1
: E
todola
c 2
00 m
g, 1 table
t, 3
tim
es d
aily
, 600 m
g t
ota
l; G
roup
2:
Dic
lofe
nac 5
0 m
g, 1 table
t, 3
tim
es d
aily
, 150 m
g tota
l; G
roup 3
: O
ral
pla
cebo
Acetic a
cid
Pain
(100 m
m V
AS
); A
dvers
e
eff
ects
; at
1 a
nd 5
days
Gendra
ult
1992
Fra
nce
147 s
cia
tica p
atients
(gro
up
1=
75,
gro
up 2
=72);
mean
age=
44.0
years
; 58%
male
Gro
up 1
: P
iroxic
am
40 m
g, in
tram
uscula
r in
jection, once d
aily
, 40 m
g
tota
l; G
roup 2
: P
lacebo s
alin
e inje
ction
Enolic
acid
Pain
(100 m
m V
AS
); A
dvers
e
eff
ects
; at
5 d
ays
Weber
1993
Norw
ay
214 s
cia
tica p
atients
(gro
up
1=
120,
gro
up 2
=94);
mean
age=
48.0
years
Gro
up 1
: P
iroxic
am
20 m
g, 2 c
apsule
s, once d
aily
, 40 m
g t
ota
l fo
r 2
days, th
en 1
capsule
, once d
aily
, 20 m
g tota
l fo
r 12 d
ays; G
roup 2
: O
ral
pla
cebo
Enolic
acid
Pain
(100 m
m V
AS
); D
isabili
ty
(RM
DQ
); A
dvers
e e
ffects
; U
se o
f re
scue m
edic
ation; at 1 a
nd 4
w
eeks
Babej-D
olle
1994
Germ
any
172
back p
ain
with o
r w
ithout
scia
tica p
atients
(gro
up 1
=86,
gro
up 2
=86);
mean a
ge
(SD
)=50.6
(16.3
) years
; 54%
m
ale
Gro
up 1
: D
iclo
fenac S
odiu
m 7
5 m
g,
intr
am
uscula
r in
jection, once d
aily
, 75 m
g tota
l; G
roup 2
: P
lacebo s
alin
e inje
ction
Acetic a
cid
Pain
(100 m
m V
AS
); A
dvers
e
eff
ects
; at
1 d
ay
Szpals
ki 1994
Belg
ium
73 a
cute
back p
ain
patients
(g
roup 1
=37,
gro
up 2
=36);
mean
age (
SD
)=38.2
(9.8
) years
; 64%
m
ale
Gro
up 1
: T
enoxic
am
20 m
g,
intr
am
uscula
r in
jection o
n d
ay 1
, th
en 1
ta
ble
t, o
nce d
aily
for
14 d
ays,
20 m
g t
ota
l; G
roup 2
: M
atc
hin
g
intr
am
uscula
r in
jection o
r ora
l pla
cebo
Enolic
acid
Pain
(10 c
m V
AS
); a
t 1 w
eek
Ghozla
n 1
996
Fra
nce
194 s
cia
tica p
atients
(gro
up
1=
67,
gro
up 2
=66, gro
up 3
=61);
m
ean a
ge (
SD
)=42.0
(12.4
) years
; 63%
male
Gro
up 1
: E
todola
c 3
00 m
g, 1 table
t, s
ingle
dose,
300 m
g tota
l; G
roup 2
: T
enoxic
am
20 m
g,
intr
am
uscula
r in
jection, sin
gle
dose, 20 m
g t
ota
l;
Gro
up 3
: P
lacebo s
alin
e inje
ction
Acetic a
cid
; E
nolic
acid
Pain
(100 m
m V
AS
); A
dvers
e
eff
ects
; U
se o
f re
scue
medic
ation; at
4 a
nd 1
2 h
ours
Dre
iser
2001
Six
countr
ies
532 s
cia
tica p
atients
(gro
up
1=
171,
gro
up 2
=181,
gro
up
3=
180);
mean a
ge (
SD
)=47.0
(1
4.3
) years
; 44%
male
Gro
up 1
: M
elo
xic
am
15 m
g, 1 t
able
t, o
nce d
aily
, 15 m
g tota
l; G
roup 2
: M
elo
xic
am
7.5
mg,
1 table
t, o
nce d
aily
, 7.5
mg tota
l; G
roup 3
: O
ral
pla
cebo
Enolic
acid
Pain
(100 m
m V
AS
); A
dvers
e
eff
ects
; at
1 w
eek
Nadle
r 2002
United
Sta
tes
126 a
cute
back p
ain
patients
(g
roup 1
=106,
gro
up 2
=20);
m
ean a
ge (
SD
)=N
R; 40%
male
Gro
up 1
: Ib
upro
fen 2
00 m
g,
2 t
able
ts,
3 tim
es d
aily
, 1200 m
g tota
l;
Gro
up 2
: O
ral pla
cebo
Pro
pio
nic
acid
Pain
(6-p
oin
t scale
); A
dvers
e
eff
ects
; at
2 d
ays
96

Birbara
2003
United
Sta
tes
319 c
hro
nic
back p
ain
patients
(g
roup 1
=107,
gro
up 2
=103,
gro
up 3
=109);
mean a
ge
(SD
)=52.0
(13.0
) years
; 39%
m
ale
Gro
up 1
: E
toricoxib
90 m
g,
1 c
apsule
, once d
aily
, 90 m
g t
ota
l; G
roup 2
: E
toricoxib
60 m
g,
1 c
apsule
, once d
aily
, 60 m
g t
ota
l; G
roup 3
: O
ral
pla
cebo
CO
X-2
inhib
itor
Pain
(100 m
m V
AS
); D
isabili
ty
(RM
DQ
); Q
ualit
y o
f lif
e (
SF
-12);
A
dvers
e e
ffects
; U
se o
f re
scue
medic
ation; at
1 a
nd 1
2 w
eeks
Dre
iser
2003
Fra
nce
372 a
cute
back p
ain
patients
(g
roup 1
=124,
gro
up 2
=122,
gro
up 3
=126);
mean a
ge
(SD
)=40.9
(11.2
) years
; 49%
m
ale
Gro
up 1
: D
iclo
fenac 1
2.5
mg,
1 o
r 2 t
able
ts, 4 to 6
tim
es d
aily
, 150 m
g
maxim
um
; G
roup 2
: Ib
upro
fen 2
00 m
g, 1 o
r 2 t
able
ts,
4 t
o 6
tim
es d
aily
, 1200 m
g m
axim
um
; G
roup 3
: O
ral pla
cebo
Acetic a
cid
; P
ropio
nic
acid
Pain
(100 m
m V
AS
); D
isabili
ty
(RM
DQ
); Q
ualit
y o
f lif
e (
SF
-12);
A
dvers
e e
ffects
; at
1 w
eek
Katz
2003 (
2tr
ials
)U
nited
Sta
tes
690 c
hro
nic
back p
ain
patients
(g
roup 1
=229,
gro
up 2
=233,
gro
up 3
=228);
mean a
ge
(SD
)=53.4
(13.1
) years
; 38%
m
ale
Gro
up 1
: R
ofe
coxib
50 m
g, 1 table
t, o
nce d
aily
, 50 m
g tota
l; G
roup 2
: R
ofe
coxib
25 m
g, 1 table
t, o
nce d
aily
, 25 m
g tota
l; G
roup 3
: O
ral
pla
cebo
CO
X-2
inhib
itor
Pain
(100 m
m V
AS
); D
isabili
ty
(RM
DQ
); Q
ualit
y o
f lif
e (
SF
-12);
A
dvers
e e
ffects
; at
1 a
nd 4
w
eeks
Nadle
r 2003-a
United
Sta
tes
108 a
cute
back p
ain
patients
(g
roup 1
=12,
gro
up 2
=96);
mean
age (
SD
)=36.7
(10.8
) years
Gro
up 1
: Ib
upro
fen 2
00 m
g,
2 t
able
ts,
3 tim
es d
aily
, 1200 m
g tota
l;
Gro
up 2
: O
ral pla
cebo
Pro
pio
nic
acid
Pain
(6-p
oin
t scale
); A
dvers
e
eff
ects
; at
5 d
ays
Nadle
r 2003-b
United
Sta
tes
38 a
cute
back p
ain
patients
(g
roup 1
=34,
gro
up 2
=4);
mean
age (
SD
)=N
R
Gro
up 1
: Ib
upro
fen 2
00 m
g,
2 t
able
ts,
3 tim
es d
aily
, 1200 m
g tota
l;
Gro
up 2
: O
ral pla
cebo
Pro
pio
nic
acid
Pain
(6-p
oin
t scale
); A
dvers
e
eff
ects
; at
5 d
ays
Coats
2004
United
Sta
tes &
C
anada
293 c
hro
nic
back p
ain
patients
(g
roup 1
=148,
gro
up 2
=145);
m
ean a
ge (
SD
)=48.6
(12.9
) years
; 43%
male
Gro
up 1
: V
ald
ecoxib
40 m
g,
1 table
t, o
nce d
aily
, 40 m
g tota
l; G
roup 2
: O
ral pla
cebo
CO
X-2
inhib
itor
Pain
(10 c
m V
AS
); D
isabili
ty
(RM
DQ
); A
dvers
e e
ffects
; at
1
and 4
weeks
Palla
y 2
004
United
Sta
tes
325 c
hro
nic
back p
ain
patients
(g
roup 1
=106,
gro
up 2
=109,
gro
up 3
=110);
mean a
ge
(SD
)=52.8
(13.0
) years
; 38%
m
ale
Gro
up 1
: E
toricoxib
90 m
g,
1 t
able
t, o
nce d
aily
, 90 m
g tota
l; G
roup 2
: E
toricoxib
60 m
g,
1 t
able
t, o
nce d
aily
, 60 m
g tota
l; G
roup 3
: O
ral
pla
cebo
CO
X-2
inhib
itor
Pain
(100 m
m V
AS
); D
isabili
ty
(RM
DQ
); Q
ualit
y o
f lif
e (
SF
-12);
A
dvers
e e
ffects
; U
se o
f re
scue
medic
ation; at
1 a
nd 1
2 w
eeks
Hancock 2
007
Austr
alia
120 a
cute
back p
ain
patients
(g
roup 1
=60,
gro
up 2
=60);
mean
age (
SD
)=40.7
(15.6
) years
; 56%
m
ale
Gro
up 1
: D
iclo
fenac 5
0 m
g, 1 table
t, 2
tim
es d
aily
, 100 m
g t
ota
l; G
roup
2:
Ora
l pla
cebo
Acetic a
cid
Pain
(10-p
oin
t N
RS
); D
isabili
ty
(RM
DQ
); A
dvers
e e
ffects
; at
1
and 1
2 w
eeks
Alle
grini 2009
Italy
180 c
hro
nic
back p
ain
patients
(g
roup 1
=60,
gro
up 2
=60,
gro
up
3=
60);
mean a
ge (
SD
)=51.0
(1
4.8
) years
; 43%
male
Gro
up 1
: P
iroxic
am
patc
h 1
4 m
g d
aily
; G
roup 2
: P
iroxic
am
1%
cre
am
, 1.4
g d
aily
; G
roup 3
: P
lacebo p
atc
hE
nolic
acid
Pain
(100 m
m V
AS
); A
dvers
e
eff
ects
; at
9 d
ays
97

Herr
mann
2009
Germ
any
171 s
cia
tica p
atients
(gro
up
1=
57,
gro
up 2
=57, gro
up 3
=57);
m
ean a
ge (
SD
)=49.7
(13.4
) years
; 44%
male
Gro
up 1
: Lorn
oxic
am
8 m
g, 2 c
apsule
s, once d
aily
plu
s 1
capsule
after
8 h
ours
, 24 m
g t
ota
l fo
r 1 d
ay, th
en 2
capsule
s, once d
aily
, 16 m
g t
ota
l fo
r 3 d
ays;
Gro
up 2
: D
iclo
fenac 5
0 m
g, 1 table
t, o
nce d
aily
, 50 m
g t
ota
l fo
r 1 d
ay, th
en 1
table
t, 3
tim
es d
aily
, 150 m
g t
ota
l fo
r 3 d
ays; G
roup 3
: O
ral pla
cebo
Enolic
acid
; A
cetic a
cid
Pain
(100 m
m V
AS
); A
dvers
e
eff
ects
; at
4 d
ays
Hsie
h 2
010
Taiw
an
153 n
eck p
ain
patients
(gro
up
1=
97,
gro
up 2
=56);
mean a
ge
(SD
)=38.4
(10.7
) years
; 17%
m
ale
Gro
up 1
: D
iclo
fenac p
atc
h 6
0 m
g, hydro
phili
c a
dhesiv
e, 3 tim
es d
aily
, 180 m
g tota
l; G
roup 2
: P
lacebo p
atc
hes
Acetic a
cid
Pain
(10 c
m V
AS
); D
isabili
ty
(ND
I);
Advers
e e
ffects
; at
1 w
eek
Katz
2011
United
Sta
tes
129 c
hro
nic
back p
ain
patients
(g
roup 1
=88,
gro
up 2
=41);
mean
age (
SD
)=52.1
(14.8
) years
; 50%
m
ale
Gro
up 1
: N
apro
xen 5
00 m
g,
1 table
t, 2
tim
es d
aily
, 1000 m
g t
ota
l;
Gro
up 2
: O
ral pla
cebo
Pro
pio
nic
acid
Pain
(10 c
m V
AS
); D
isabili
ty
(RM
DQ
); A
dvers
e e
ffects
; at
1
and 8
weeks
Kiv
itz 2
013
United
Sta
tes
525 c
hro
nic
back p
ain
patients
(g
roup 1
=295,
gro
up 2
=230);
m
ean a
ge (
SD
)=51.8
(17.0
) years
; 47%
male
Gro
up 1
: N
apro
xen 5
00 m
g,
1 table
t, 2
tim
es d
aily
, 1000 m
g t
ota
l;
Gro
up 2
: O
ral pla
cebo
Pro
pio
nic
acid
Pain
(10
cm
VA
S);
Dis
abili
ty
(RM
DQ
); A
dvers
e e
ffects
; at
2
and 8
weeks
Pre
del 2013
Germ
any
72 n
eck p
ain
patients
(gro
up
1=
36,
gro
up 2
=36);
mean
age=
33.8
(10.7
) years
; 46%
male
Gro
up 1
: D
iclo
fenac d
ieth
yla
min
e 1
.16%
gel (2
g),
applie
d topic
ally
, 4
tim
es d
aily
; G
roup 2
: P
lacebo g
el
Acetic a
cid
Pain
(10 c
m V
AS
); D
isabili
ty
(ND
I);
Advers
e e
ffects
; at
5 d
ays
Von H
eym
ann
2013
Germ
any
62 c
hro
nic
back p
ain
patients
(g
roup 1
=37,
gro
up 2
=25);
mean
age (
SD
)=38.2
(10.1
) years
; 54%
m
ale
Gro
up 1
: D
iclo
fenac 5
0 m
g, 1 table
t, 3
tim
es d
aily
, 150 m
g t
ota
l; G
roup
2:
Ora
l pla
cebo
Acetic a
cid
Pain
(100 m
m V
AS
); D
isabili
ty
(RM
DQ
); a
t 1 w
eek
Sta
rk 2
014
United
Sta
tes
30 c
hro
nic
back p
ain
patients
(g
roup 1
=5,
gro
up 2
=25);
mean
age (
SD
)=29.8
(7.2
) years
; 43%
m
ale
Gro
up 1
: Ib
upro
fen 2
00 m
g,
2 t
able
ts,
3 tim
es d
aily
, 1200 m
g tota
l;
Gro
up 2
: O
ral pla
cebo
CO
X-2
inhib
itor
Pain
(6-p
oin
t scale
); D
isabili
ty
(RM
DQ
); a
t 8 h
ours
Wetz
el 2014
(cro
ss-o
ver)
Austr
ia
40 c
hro
nic
back p
ain
patients
on
opio
id t
hera
py; m
ean a
ge
(SD
)=57.2
(12.8
) years
; 35%
m
ale
Gro
up 1
: P
are
coxib
40 m
g, in
travenous inje
ction,
once d
aily
, 40 m
g
tota
l; G
roup 2
: In
travenous p
lacebo
Acetic a
cid
Pain
(10 c
m V
AS
); D
isabili
ty
(RM
DQ
); a
t 30 m
inute
s
VA
S =
Vis
ual A
nalo
gue S
cale
, N
RS
= N
um
eric R
ating S
cale
, N
R =
Not
Report
ed, S
D =
Sta
ndard
Devia
tion,
RM
DQ
= R
ola
nd-M
orr
is D
isabili
ty Q
uestionnaire, S
F-1
2 =
12-ite
m S
hort
Form
Health
Surv
ey,
ND
I =
Neck D
isabili
ty I
ndex
98

Table
S3.
Calc
ula
tio
n o
f E
ffect
Siz
es f
or
Imm
ed
iate
an
d S
ho
rt-t
erm
Pain
Ou
tco
mes
Au
tho
r, Y
ear
Ou
tco
me S
cale
Ran
ge
Mean
(S
D),
Extr
acte
dM
ean
(S
D),
Co
nvert
ed
†N
SA
IDs
Gro
up
, n
Pla
ceb
o
Gro
up
, n
MD
(95%
CI)
An
aly
tic
Meth
od
NS
AID
sP
laceb
oN
SA
IDs
Pla
ceb
o
Imm
edia
te-t
erm
Am
lie 1
987
VA
S0–100
–76.0
(35.0
)–68.0
(35.0
)–76.0
(35.0
)–68.0
(35.0
)134
132
–8.0
(–16.4
to 0
.4)
CS
Bonto
ux 1
990-a
VA
S0–100
–24.2
(20.8
)–15.5
(20.0
)–24.2
(20.8
)–15.5
(20.0
)62
30
–8.7
(–17.7
to 0
.3)
CS
Bonto
ux 1
990-b
VA
S0–100
–21.8
(21.0
)–15.5
(20.0
)–21.8
(21.0
)–15.5
(20.0
)59
31
–6.3
(–15.3
to 2
.7)
CS
Gendra
ult 1
992
VA
S0–100
9.7
(15.1
**)
17.3
(15.1
**)
9.7
(15.1
)17.3
(15.1
)75
72
–7.6
(–12.5
to –
2.7
)F
V
Weber
1993
VA
S0–100
40.6
§(2
1.9
**)
40.6
§(1
9.4
**)
40.6
(2
1.9
)40.6
(19.4
)120
94
0.0
(–5.6
to 5
.6)
FV
Babej-D
olle
1994
VA
S0–100
41.7
(25.9
)54.8
(25.3
)41.7
(25.9
)54.8
(25.3
)86
86
–13.1
(–20.8
to –
5.4
)F
V
Szpals
ki 1994
VA
S0–10
1.9
(2.0
)2.8
(1.9
)19.4
(20.3
)28.1
(19.6
)33
35
–8.7
(–18.2
to 0
.8)
FV
Ghozla
n 1
996-a
VA
S0–100
45.9
§(2
0.8
**)
53.8
§(2
0.0
**)
45.9
(20.8
)53.8
(20.0
)67
30
–7.9
(–16.8
to 1
.0)
FV
Ghozla
n 1
996-b
VA
S0–100
47.6
§(1
5.1
**)
53.8
§(1
5.1
**)
47.6
(15.1
)53.8
(15.1
)66
31
–6.2
(–12.6
to 0
.2)
FV
Dre
iser
2001-a
VA
S0–100
–46.0
(26.2
)–40.0
(26.8
)–46.0
(26.2
)–40.0
(26.8
)171
90
–6.0
(–12.7
to 0
.7)
CS
Dre
iser
2001-b
VA
S0–100
–45.0
(26.9
)–40.0
(26.8
)–45.0
(26.9
)–40.0
(26.8
)181
90
–5.0
(–11.8
to 1
.8)
CS
Birbara
2003-a
VA
S0–100
–31.5
(23.8
)§–17.7
(16.9
)§–31
.5 (
23.8
)–17.7
(16.9
)107
54
–13.8
(–20.9
to –
6.7
)C
S
Birbara
2003-b
VA
S0–100
–33.1
(23.1
)§–17.7
(16.7
)§–33
.1 (
23.1
)–17.7
(16.7
)101
53
–15.4
(–22.4
to –
8.4
)C
S
Dre
iser
2003-a
VA
S0–100
–48.4
(26.1
)–37.5
(26.9
)–48.4
(26.1
)–37.5
(26.9
)107
46
–10.9
(–20.0
to –
1.8
)C
S
Dre
iser
2003-b
VA
S0–100
–48.8
(24.0
)–37.5
(26.9
)–48.8
(24.0
)–37.5
(26.9
)103
46
–11.3
(–20.0
to –
2.6
)C
S
Katz
2003-a
VA
S0–100
–33.6
(27.4
††)
–20.4
(19.1
††)
–33.6
(27.4
)–20.4
(19.1
)229
114
–13.2
(–18.8
to –
7.6
)C
S
Katz
2003-b
VA
S0–100
–33.8
(26.5
††)
–20.4
(19.1
††)
–33.8
(26.5
)–20.4
(19.1
)233
114
–13.4
(–18.8
to –
8.0
)C
S
Coats
2004
VA
S0–100
47.0
§(2
7.4
¶)
58.0
§(2
6.9
¶)
47.0
(27.4
)58.0
(26.9
)148
145
–11.0
(–17.2
to –
4.8
)F
V
Palla
y 2
004-a
VA
S0–100
–29.6
§(2
2.3
¶)
–13.9
§(1
6.1
¶)
–29.6
(22.3
)–13.9
(16.1
)106
55
–15.7
(–22.3
to –
9.0
)C
S
Palla
y 2
004-b
VA
S0–100
–30.4
§(2
2.7
¶)
–13.9
§(1
6.1
¶)
–30.4
(22.7
)–13.9
(16.1
)109
55
–16.5
(–23.2
to –
9.8
)C
S
Hancock 2
007
VA
S0–10
NA
||N
A||
NA
||N
A||
60
60
–2.0
(–6.9
to 2
.9)†
AN
CO
VA
Alle
grini-a 2
009
VA
S0–100
38.3
(26.6
)47.6
(26.6
)38.3
(26.6
)47.6
(26.6
)60
30
–9.3
(–21.0
to 2
.4)
FV
Alle
grini-b 2
009
VA
S0–100
42.2
(21.7
)47.6
(26.6
)42.2
(21.7
)47.6
(26.6
)60
30
–5.4
(–15.7
to 4
.9)
FV
Herr
mann 2
009-a
VA
S0–100
–20.5
(12.3
)–14.9
(12.3
)–20.5
(12.3
)–14.9
(12.3
)57
57
–5.6
(–10.0
to –
1.2
)C
S
99

Herr
mann 2
009-b
VA
S0–100
–24.1
(25.9
**)
–13.7
(25.3
**)
–24.1
(25.9
)–13.7
(25.3
)57
29
–10.4
(–21.9
to 1
.1)
CS
Hsie
h 2
010
VA
S0–10
2.6
(1.8
)3.9
(1.8
)25.7
(17.5
)39.2
(18.0
)97
56
–13.5
(–19.3
to –
7.7
)F
V
Katz
2011
VA
S0–10
–2.1
§(2
.0‡)
–1.3
§(1
.4‡)
–21.0
(20.3
)–13.0
(13.9
)88
41
–8.0
(–13.9
to –
2.1
)C
S
Kiv
itz 2
013
NR
S0–10
–1.8
§(2
.0¶)
–1.3
§(1
.9¶)
–18.1
(20.1
)–13.1
(19.3
)295
230
–5.0
(–8.4
to –
1.6
)C
S
Pre
del 2013
VA
S0–100
1.2
(2.9
)19.2
(11.9
)1.2
(2.9
)19.2
(11.9
)36
36
–18.0
(–22.0
to –
14.0
)F
V
Von H
eym
ann 2
013
VA
S0–100
34.0
§(2
2.3
††)
33.2
§(2
5.3
††)
34.0
(22.3
)33.2
(25.3
)36
22
0.8
(–11.7
to 1
3.2
)F
V
Wetz
el 2014
VA
S0–10
4.5
(2.0
)5.1
(2.1
)45.0
(20.0
)51.0
(21.0
)40
40
–6.0
(–15.0
to 3
.0)
FV
Short
-term
Weber
1993
VA
S0–100
20.9
§(1
8.6
**)
17.6
§(1
6.5
**)
20.9
(1
8.6
)17.6
(16.5
)120
94
3.3
(–1.5
to 8
.1)
FV
Birbara
2003-a
VA
S0–100
NA
||N
A||
NA
||N
A||
107
54
–7.5
(–13.7
to –
1.3
)A
NC
OV
A
Birbara
2003-b
VA
S0–100
NA
||N
A||
NA
||N
A||
101
53
–10.5
(–16.7
to –
4.2
)A
NC
OV
A
Katz
2003-a
VA
S0–100
NA
||N
A||
NA
||N
A||
229
114
–13.8
(–18.4
to –
9.2
)A
NC
OV
A
Katz
2003-b
VA
S0–100
NA
||N
A||
NA
||N
A||
233
114
–13.5
(–18.1
to –
8.9
)A
NC
OV
A
Coats
2004
VA
S0–100
34.0
(27.4
¶)
44.5
(26.9
¶)
34.0
(27.4
)44.5
(26.9
)148
145
–10.5
(–16.7
to –
4.3
)F
V
Palla
y 2
004-a
VA
S0–100
NA
||N
A||
NA
||N
A||
106
55
–12.7
(–18.6
to –
6.8
)A
NC
OV
A
Palla
y 2
004-b
VA
S0–100
NA
||N
A||
NA
||N
A||
109
55
–12.1
(–18.0
to –
6.2
)A
NC
OV
A
Hancock 2
007
VA
S0–10
NA
||N
A||
NA
||N
A||
60
60
–1.0
(–5.9
to 3
.9)
AN
CO
VA
Katz
2011
VA
S0–10
–2.6
§(2
.0‡)
–2.2
§(1
.4‡)
–26.0
(20.9
)–22.0
(14.3
)88
41
–4.0
(–11.1
to 3
.1)
CS
Kiv
itz 2
013
NR
S0–10
–1.7
§(2
.2¶)
–1.4
§(2
.2¶)
–17.7
(21.8
)–14.0
(22.1
)295
230
–3.7
(–7.5
to 0
.1)
CS
SD
=S
tandard
Devia
tion,
NR
S=
Num
erical R
ating S
cale
, V
AS
=V
isual A
nalo
gue S
cale
, F
V=
Fin
al V
alu
e,
CS
=C
hange S
core
, A
NC
OV
A=
Analy
sis
of
Covariance, N
A=
Not A
pplic
able
, C
I=
Confidence
Inte
rval
*S
D fro
m b
aselin
e† C
onvert
ed t
o a
com
mon 0
to 1
00 s
cale
when n
ecessary
, and u
sed t
o c
alc
ula
te t
reatm
ent eff
ect
‡ S
D c
alc
ula
ted f
rom
the s
am
ple
siz
e, m
ean a
nd p
-valu
e§
Mean a
nd/
or
SD
calc
ula
ted fro
m g
raphs
|| M
ean d
iffe
rence a
nd 9
5%
CI
were
pro
vid
ed
¶ S
D c
alc
ula
ted u
sin
g S
E a
nd s
am
ple
siz
e**
SD
adopte
d f
rom
sim
ilar
stu
die
s,
or
from
all
gro
ups w
ithin
the s
am
e s
tudy
†† S
D c
alc
ula
ted u
sin
g 9
5%
CI
100

Table
S4.
Calc
ula
tio
n o
f E
ffect
Siz
es f
or
Imm
ed
iate
an
d S
ho
rt-t
erm
Dis
ab
ilit
yO
utc
om
es
Au
tho
r, Y
ear
Ou
tco
me S
cale
Ran
ge
Mean
(S
D),
Extr
acte
dM
ean
(S
D),
Co
nvert
ed
†N
SA
IDs
Gro
up
, n
Pla
ceb
o
Gro
up
, n
MD
(95%
CI)
An
aly
tic
Meth
od
NS
AID
sP
laceb
oN
SA
IDs
Pla
ceb
o
Imm
edia
te-t
erm
Weber
1993
RM
DQ
0–17
8.7
§(3
.3**
)8.5
§(2
.9**
)51.2
(19.3
)50.0
(17.1
)120
94
1.2
(–3.8
to 6
.1)
FV
Birbara
2003-a
RM
DQ
0–24
–5.6
§(3
.3¶)
–3.1
§(3
.7¶)
–23.4
(13.8
)–12.9
(15.3
)107
54
–10.4
(–15.1
to –
5.7
)C
S
Birbara
2003-b
RM
DQ
0–24
–5.4
§(3
.8¶)
–3.1
§(3
.6¶)
–22.5
(15.9
)–12.9
(15.3
)101
53
–9.6
(–14.8
to –
4.4
)C
S
Dre
iser
2003-a
RM
DQ
0–24
–8.6
(5.7
)–5.7
(5.3
)–35.9
(23.8
)–23.8
(22.1
)106
45
–12.1
(–20.2
to –
4.0
)C
S
Dre
iser
2003-b
RM
DQ
0–24
–8.1
(5.2
)–5.7
(5.3
)–33.8
(21.7
)–23.8
(22.1
)102
45
–10.0
(–17.7
to –
2.4
)C
S
Katz
2003-a
RM
DQ
0–24
9.1
§(6
.1¶)
11.7
§(4
.3¶)
37.9
(25.2
)48.8
(17.8
)229
114
–10.8
(–16.0
to –
5.7
)F
V
Katz
2003-b
RM
DQ
0–24
9.1
§(6
.1¶)
11.7
§(4
.3¶)
37.9
(25.5
)48.8
(17.8
)233
114
–10.8
(–16.0
to –
5.6
)F
V
Coats
2004
RM
DQ
0–24
8.8
§(5
.5¶)
10.2
§(5
.4¶)
36.5
(22.8
)42.5
(22.4
)148
145
–6.0
(–11.2
to –
0.9
)F
V
Palla
y 2
004-a
RM
DQ
0–24
–4.9
§(3
.9¶)
–2.7
§(3
.3¶)
–20.2
(16
.3)
–11.4
(13.9
)106
55
–8.8
(–13.9
to –
3.8
)C
S
Palla
y 2
004-b
RM
DQ
0–24
–5.0
§(4
.7¶)
–2.7
§(3
.3¶)
–20.9
(1
9.6
)–11.4
(13.9
)109
55
–9.5
(–15.3
to –
3.7
)C
S
Hancock 2
007
RM
DQ
0–24
NA
||N
A||
NA
||N
A||
60
60
–2.1
(–7.5
to 3
.3)
AN
CO
VA
Hsie
h 2
010
ND
I0–50
11.3
(2.8
)11.7
(2.9
)22.5
(5.5
)23.5
(5.7
)97
56
–1.0
(–2.8
to 0
.9)
FV
Katz
2011
RM
DQ
0–24
–3.9
§(3
.7‡)
–3.3
§(2
.6‡)
–16.3
(15.6
)–13.8
(10.6
)88
41
–2.5
(–7.1
to 2
.1)
CS
Pre
del 2013
ND
I0–50
2.8
(3.0
)14.6
(6.8
)5.6
(6.0
)29.2
(13.6
)36
36
–23.6
(–28.5
to –
18.7
)F
V
Von H
eym
ann 2
013
RM
DQ
0–24
8.8
§(9
.5††)
10.8
§(6
.9††)
–23.6
(7.4
)–17.4
(7.4
)36
22
–6.2
(–20.3
to 7
.9)
CS
Short
-term
Weber
1993
RM
DQ
0–17
4.8
§(3
.3**
)4.4
§(2
.9**
)28.2
(19.3
)25.9
(17.1
)120
94
2.4
(–2.6
to 7
.3)
FV
Birbara
2003-a
RM
DQ
0–24
NA
||N
A||
NA
||N
A||
107
54
–8.6
(–14.4
to –
2.8
)A
NC
OV
A
Birbara
2003-b
RM
DQ
0–24
NA
||N
A||
NA
||N
A||
101
53
–10.1
(–16.1
to –
4.1
)A
NC
OV
A
Katz
2003-a
RM
DQ
0–24
NA
||N
A||
NA
||N
A||
229
114
–9.6
(–13.7
to –
5.4
)A
NC
OV
A
Katz
2003-b
RM
DQ
0–24
NA
||N
A||
NA
||N
A||
233
114
–9.2
(–13.2
to –
5.1
)A
NC
OV
A
Coats
2004
RM
DQ
0–24
7.3
§(5
.5¶)
8.5
§(5
.4¶)
30.4
(22.8
)35.3
(22.4
)148
145
–4.9
(–10.1
to 0
.3)
FV
Palla
y 2
004-a
RM
DQ
0–24
NA
||N
A||
NA
||N
A||
106
55
–9.9
(–15.4
to –
4.4
)A
NC
OV
A
Palla
y 2
004-b
RM
DQ
0–24
NA
||N
A||
NA
||N
A||
109
55
–11.8
(-1
7.2
to –
6.4
)A
NC
OV
A
101

Hancock 2
007
RM
DQ
0–24
NA
||N
A||
NA
||N
A||
60
60
–0.4
(–5.4
to 4
.5)
AN
CO
VA
Katz
2011
RM
DQ
0–24
–4.8
§(1
.1‡)
–4.6
§(0
.8‡)
–20.0
(4.7
)–19.2
(3.2
)88
41
–0.8
(–2.2
to 0
.5)
CS
SD
=S
tandard
Devia
tion,
RM
DQ
= R
ola
nd-M
orr
is D
isabili
ty Q
uestionnaire,
ND
I =
Neck D
isabili
ty Index,
FV
=F
inal V
alu
e, C
S=
Change S
core
, A
NC
OV
A=
Analy
sis
of
Covariance,
NA
=N
ot A
pplic
able
, C
I=
Confidence Inte
rval,
*S
D fro
m b
aselin
e† C
onvert
ed t
o a
com
mon 0
to 1
00 s
cale
when n
ecessary
, and u
sed t
o c
alc
ula
te t
reatm
ent eff
ect
‡ S
D c
alc
ula
ted f
rom
the s
am
ple
siz
e, m
ean a
nd p
-valu
e§
Mean a
nd/o
r S
D c
alc
ula
ted f
rom
gra
phs
|| M
ean d
iffe
rence a
nd 9
5%
CI
were
pro
vid
ed
¶ S
D c
alc
ula
ted u
sin
g S
E a
nd s
am
ple
siz
e**
SD
adopte
d f
rom
sim
ilar
stu
die
s,
from
all
gro
ups w
ithin
the s
am
e s
tudy
†† S
D c
alc
ula
ted u
sin
g 9
5%
CI
102

Figure S1. Risk of bias graph showing review authors' judgments about each risk of bias domain
presented as percentages across placebo-controlled trials on efficacy of NSAIDs for spinal pain
103

Figure S2. Risk of bias summary showing review authors' judgements about each risk of bias domain
in placebo-controlled trials on efficacy of NSAIDs for spinal pain. Randomized trials are listed
alphabetically by author name
104

Figure S3. Funnel plot. Plot of effect size between NSAIDs and placebo versus their respective
standard error. Each circle represents one trial
105

CHAPTER SIX
Patients with sciatica still experience pain and disability 5 years after surgery: a
systematic review with meta-analysis of cohort studies
Chapter Six has been published as:
Machado GC, Witzleb AJ, Fritsch C, et al. Patients with sciatica still experience pain and
disability 5 years after surgery: a systematic review with meta-analysis of cohort studies. Eur J
Pain 2016;20:1700-09. Copyright © 2016, European Pain Federation. Reprinted with
permission from John Wiley and Sons.
106

Statement from co-authors confirming authorship contribution of
the PhD candidate
The co-authors of the paper “Patients with sciatica still experience pain and disability 5 years
after surgery: a systematic review with meta-analysis of cohort studies” confirm that Gustavo
de Carvalho Machado has made the following contributions:
Conception and design of the research
Analysis and interpretation of the findings
Writing of the manuscript and critical appraisal of the content
In addition to the statements above, in cases where I am not the corresponding author of a
published item, permission to include the published material has been granted by the
corresponding author.
Gustavo de Carvalho Machado _________________________ Date: 30 November 2016
As supervisor for the candidature upon which this thesis is based, I can confirm that the
authorship attribution statements above are correct.
Manuela Loureiro Ferreira _________________________ Date: 30 November 2016
107

REVIEW ARTICLE
Patients with sciatica still experience pain and disability5 years after surgery: A systematic review with meta-analysisof cohort studiesG.C. Machado1, A.J. Witzleb1, C. Fritsch2, C.G. Maher1, P.H. Ferreira3, M.L. Ferreira1,4
1 The George Institute for Global Health, Sydney Medical School, The University of Sydney, NSW, Australia
2 Department of Physiotherapy, Universidade Federal de Ciencias da Sa"ude de Porto Alegre, Brazil
3 Faculty of Health Sciences, The University of Sydney, NSW, Australia
4 Institute of Bone and Joint Research, The Kolling Institute, Sydney Medical School, The University of Sydney, NSW, Australia
Correspondence
Gustavo C. Machado
E-mail: [email protected]
Funding sources
This research received no specific grant
from any funding agency in the public, com-
mercial, or not-for-profit sectors. CG Maher’s
fellowship is funded by Australia’s National
Health and Medical Research Council. GC
Machado hold an international postgraduate
research scholarship/postgraduate award
from the Australian Government. ML Ferreira
holds a Sydney Medical Foundation
Fellowship.
Conflicts of interest
None declared.
Systematic review registration
PROSPERO registration number
CRD42014015225.
Accepted for publication
30 March 2016
doi:10.1002/ejp.893
Abstract
Background and objective: The clinical course of patients with
sciatica is believed to be favourable, but there is conflicting evidence on
the postoperative course of this condition. We aimed to investigate the
clinical course of sciatica following surgery.
Databases and data treatment: An electronic search was conducted
on MEDLINE, EMBASE and CINAHL from inception to April 2015. We
screened for prospective cohort studies investigating pain or disability
outcomes for patients with sciatica treated surgically.
Fractional polynomial regression analysis was used to generate pooled
means and 95% confidence intervals (CI) of pain and disability up to
5 years after surgery. Estimates of pain and disability (converted to a
0–100 scale) were plotted over time, from inception to last available
follow-up time.
Results: Forty records (39 cohort studies) were included with a total of
13,883 patients with sciatica. Before surgery, the pooled mean leg pain
score was 75.2 (95% CI 68.1–82.4) which reduced to 15.3 (95% CI 8.5–
22.1) at 3 months. Patients were never fully recovered in the long-term
and pain increased to 21.0 (95% CI 12.5–29.5) at 5 years. The pooled
mean disability score before surgery was 55.1 (95% CI 52.3–58.0) and
this decreased to 15.5 (95% CI 13.3–17.6) at 3 months, and further
reduced to 13.1 (95% CI 10.6–15.5) at 5 years.
Conclusions: Although surgery is followed by a rapid decrease in pain
and disability by 3 months, patients still experience mild to moderate
pain and disability 5 years after surgery.
What does this review add?: This review provides a quantitative
summary of the postoperative course of patients with sciatica. Patients
with sciatica experienced a rapid reduction in pain and disability in
the first 3 months, but still had mild to moderate symptoms 5 years
after surgery. Although no significant differences were found,
microdiscectomy showed larger improvements compared to other
surgical techniques.
1700 Eur J Pain 20 (2016) 1700--1709 © 2016 European Pain Federation - EFIC!
108

1. Introduction
The term sciatica, although considered controversial
(Fairbank, 2007), is widely used to define
lumbosacral radicular syndrome or radiating pain
below the knee (Koes et al., 2007). Sciatica affects
10–25% of the general population every year
(Konstantinou and Dunn, 2008), and compared to
patients with low back pain, sciatica is characterized
by more intense pain and disability, and worse
symptoms in the lower limb than the spine
(Frymoyer, 1988). As a result, patients with sciat-
ica consume more health care resources than
patients with low back pain alone, most of which is
used to cover its surgical management (Selim et al.,
1998).
Surgical procedures for sciatica generally focus on
removal of disc herniation, the most common
procedure being discectomy, performed with or
without magnifying tools, or minimally invasive
techniques (Gibson and Waddell, 2007). Discec-
tomy is the most common neurosurgical procedure
in the United States, where nearly 300,000 proce-
dures are performed each year (Bruske-Hohlfeld
et al., 1990). Although a favourable prognosis has
been attributed to sciatica (van Tulder et al., 2010),
to date there are no meta-analyses investigating the
course of this condition in surgically treated
patients.
The favourable prognosis attributed to sciatica is
largely based on data from randomized controlled
trials (Koes et al., 2007), which have strict inclusion
criteria and aim to evaluate the efficacy of
interventions, thus are rarely designed to investi-
gate the long-term clinical course of a condition.
Current systematic reviews of cohort studies
specifically designed to assess the prognosis of
sciatica have been limited to identifying the prog-
nostic factors associated with outcomes of interest
in non-surgically treated sciatica (Ashworth et al.,
2011; Verwoerd et al., 2013). These reviews
usually fail to provide any quantitative summary
of the clinical course of sciatica in terms of pain
or disability and therefore are in general
inconclusive.
The aim of this systematic review was to investi-
gate the clinical course of pain and disability in
patients that underwent surgery for sciatica and
were included in prospective cohort studies. We also
investigated whether different surgical techniques
showed similar courses.
2. Methods
2.1 Literature search
This review was prospectively registered with PROS-
PERO (registration number CRD42014015225), and
we followed the MOOSE statement for reporting sys-
tematic reviews of observational studies (Stroup
et al., 2000). We performed a systematic search of
MEDLINE, CINAHL and EMBASE databases from
inception to April 2015. A combination of relevant
keywords was used to construct our search strategy
and included terms such as sciatica, radiculopathy,
ischialgia, disc herniation, disc hernia, course, prog-
nosis, and cohort. The full search strategy is pre-
sented in Appendix S1. One author (CF) conducted
the first screening based on titles and abstract, and
two authors (GCM and AJW) selected relevant stud-
ies based on full text evaluation. We also performed
citation tracking of relevant systematic reviews and
of the reference list from included studies. Consen-
sus was used to resolve any disagreements.
2.2 Selection of studies
We included only cohort studies investigating the
course of patients with sciatica treated surgically in
terms of pain and disability with a minimum of
three months follow-up. To be eligible, the study
had to explicitly report that participants had sciatica
or leg pain below the knee or other synonym for sci-
atica. Sciatica could be caused by disc herniation or
degenerative disc diseases. The following synonyms
were considered: radiculopathy, radicular pain, nerve
root compromise, nerve root compression, lum-
bosacral radicular syndrome, nerve root pain, and
nerve root entrapment. Cohorts of mixed groups of
patients with low back pain were eligible when it
was possible to clearly identify a subgroup with sciat-
ica, and data only from these participants were
included in the analysis. Studies analysing acute,
subacute and/or chronic sciatica were also included
in the review. There was no restriction related to the
source of patients, intensity or duration of symp-
toms. Studies were included only if reporting pain or
disability outcomes as continuous variables, and
were a full report. We included only studies pub-
lished in English, German, Spanish and Portuguese
in this review. Studies including patients with seri-
ous spinal conditions (e.g. cancer, infectious diseases,
cauda equina syndrome), cervical radiculopathy,
© 2016 European Pain Federation - EFIC! Eur J Pain 20 (2016) 1700--1709 1701
G.C. Machado et al. The postoperative course of sciatica
109

spondylolisthesis or spinal canal stenosis were
excluded as these conditions present different clinical
courses. Prospective cohorts nested in randomized
clinical trials were also excluded, as well as case
reports or case series. Studies investigating patients
undergoing repeat surgery for sciatica were not
included in this review.
2.3 Data extraction and quality assessment
Using a standardized data extraction form, two
reviewers (GCM and AJW) extracted study charac-
teristics (details of participants, sample source, type
of surgery, outcomes, follow-up times, and inception
time) and a third author (MLF) resolved any dis-
agreement. For pain and disability outcomes, mea-
sures of central tendency (mean or median) and
dispersion (standard deviation, standard error, or
95% confidence intervals) were extracted for each
assessment, including baseline and all available fol-
low-ups. Authors of included studies were contacted
by email when included studies reported incomplete
or missing data. We only used data reported in the
included studies, i.e. no imputation was performed.
For most studies, pain intensity was defined as leg
pain or radicular pain. When these outcomes were
not reported, we included measures of lower back
and leg pain, or overall pain. Pain scores were
reported in numerical rating scales (range, 0–10) or
visual analogue scales (range, 0–100). Disability
scales included the Oswestry Disability Index (range,
0–100) and the Roland–Morris Disability Question-
naire (range, 0–24). Both pain and disability scores
were converted to a common 0 (no pain or disabil-
ity) to 100 (maximum pain or disability) scale.
Methodological quality of the included studies was
assessed by two independent reviewers using an
adaptation of the methodological criteria suggested
by Altman (2001). These criteria relate to sampling
(2 items), completeness of follow-up (1 item), and
description of prognostic outcomes (1 item). These
criteria have been used by other systematic reviews
of observational studies (Pengel et al., 2003; Kamper
et al., 2008; da C Menezes Costa et al., 2012). Stud-
ies were considered at low risk of bias when they
fulfilled at least three of the criteria.
2.4 Data synthesis and analysis
Pain and disability were modelled as a function of
time, and time was defined as time since surgery.
Each study received a weight corresponding to the
inverse of the mean-squared standard error of the
estimates from the included studies. Fractional poly-
nomial analysis using generalized estimating equa-
tions was used to calculate pooled mean and 95%
confidence interval estimates for pain and disability
at baseline and at 1, 3, 6, 12, 24, and 60-month fol-
low-ups. (Royston and Sauerbrei, 2008). STATA ver-
sion 13 (StataCorp LP, College Station, TX, USA)
was used for all analyses.
2.5 Secondary exploratory analysis
A secondary exploratory analysis including only
studies that were classified as low risk of bias (stud-
ies that fulfilled at least three quality criteria) was
conducted. To identify if different surgical techniques
had similar clinical courses, we stratified our main
analysis based on the types of surgical technique.
For this, we conducted a subgroup analysis of studies
that used open discectomy, microdiscectomy, endo-
scopic discectomy, or nucleoplasty. An interaction
analysis was performed to test for statistically signifi-
cant differences between the courses of different sur-
gical techniques, and also to generate p-values for
interaction.
3. Results
We screened a total of 10,525 records, and after
excluding irrelevant studies based on titles and
abstracts we assessed 259 full text articles (Fig. 1).
Forty publications reporting on 39 cohort studies
were included in our review (Astrand et al., 2000;
Asch et al., 2002; Putzier et al., 2005; den Boer
et al., 2006; Carragee et al., 2006; Floman et al.,
2007; Guilfoyle et al., 2007; Hakkinen et al., 2007;
Mirzai et al., 2007; Sasani et al., 2007; Al-Zain et al.,
2008; Schaufele, 2008; Wu et al., 2008; Ahn et al.,
2009; Lierz et al., 2009; Schick and Elhabony, 2009;
Ebrahim et al., 2010; Johansson et al., 2010; Moran-
jkic et al., 2010; Ohtori et al., 2010; Peng et al.,
2010; Azzazi et al., 2011; Casal-Moro et al., 2011;
Cho et al., 2011; Choi et al., 2011; Chumnanvej
et al., 2011; Lebow et al., 2011a,b; Lee and Lee,
2011; Lee et al., 2011, 2015; Nie et al., 2011; Wang
et al., 2011; Dedering, 2012; Righesso et al., 2012;
Shabat et al., 2012; Crockett et al., 2014; Ratsep
et al., 2014; Sencer et al., 2014; Lagerback et al.,
2015). One cohort study reported the 12- and 24-
month follow-up results after surgery in two publi-
cations (Lebow et al., 2011a,b). Overall, the included
cohort studies investigated the prognosis of 13,883
patients with sciatica from 19 countries and included
follow-ups for up to 5 years. Patients were mainly
1702 Eur J Pain 20 (2016) 1700--1709 © 2016 European Pain Federation - EFIC!
The postoperative course of sciatica G.C. Machado et al.
110

diagnosed with lumbar disc herniation (36 studies,
92%) and three studies included patients with disco-
genic pain (no disc herniation present on imaging)
or lumbosacral radicular syndrome. Types of surgical
procedures varied across studies and were classified
as open discectomy (13 studies, 33%), microdiscec-
tomy (eight studies, 21%), endoscopic discectomy
(10 studies, 25%), and nucleoplasty (eight studies,
21%). Only two studies did not report inception
time (i.e. time when participants were assessed
before surgery). In 34 studies (87%), baseline assess-
ments were performed preoperatively, and two stud-
ies used 2 and 6 weeks prior to surgery as the
inception. The characteristics of included studies and
participants are described in Table S1.
3.1 Methodological quality
Only 17 studies fulfilled at least three quality criteria
and were considered as low risk of bias. Twenty-four
studies (62%) reported the source of participants
and described the inclusion and exclusion criteria.
Only 36% of the included studies clearly reported
selecting a representative sample of participants with
sciatica, i.e. consecutive or random sampling at a
common point in the course of the disease. About
three quarters of the cohorts had data available for
over 80% of participants at any one time point, and
62% reported an appropriate analysis (including
statistical adjustments for important prognostic fac-
tors). Fig. 2 summarizes the number of studies
Figure 1 Flow diagram of studies included in the systematic review.
© 2016 European Pain Federation - EFIC! Eur J Pain 20 (2016) 1700--1709 1703
G.C. Machado et al. The postoperative course of sciatica
111

fulfilling each quality criterion. The risk of bias
assessment for each study is presented in Table S1.
3.2 The clinical course of sciatica after surgery
We included 27 studies with complete data (i.e.
studies reporting means and standard deviations) in
the meta-analysis on the course of leg pain intensity.
Overall, patients experienced a large reduction in leg
pain intensity in the first 3 months. Before surgery,
the pooled mean leg pain was 75.2 (95% CI 68.1–
82.4) and this became reduced to 15.3 (95% CI 8.5–
22.1) at 3 months. After 3 months, leg pain
remained stable till 6 months post-surgery (15.1,
95% CI 8.6–21.6), however, it increased progres-
sively after that, to 16.2 (95% CI 9.7–22.7) at
12 months, 18.0 (95% CI 11.0–25.1) at 24 months,
and 21.0 (95% CI 12.5–29.5) at 5 years follow-up
(Fig. 3C).
A total of 24 studies were included in the meta-ana-
lysis for disability. A marked improvement occurred
in the first 3 months. On average, patients had severe
disability at inception with a pooled mean disability
score of 55.1 (95% CI 52.3–58.0). Disability scores
reduced to 15.5 (95% CI 13.3–17.6) at 3 months
(15.5, 95% CI 13.3–17.6), with a further reduction to
14.2 (95% CI 12.0–16.5) at 6 months, 13.6 (95% CI
11.3–16.0) at 12 months, 13.3 (95% CI 10.8–15.7) at
24 months, reaching 13.1 (95% CI 10.6–15.5) at
5 years follow-up (Fig. 3D).
3.3 Secondary exploratory analyses
In our secondary exploratory analyses, we found
that studies with low risk of bias (n = 17) showed
lower pain scores throughout the course of the con-
dition compared to all studies, and a similar course
for disability (Fig. 4). We also investigated whether
different surgical techniques would result in similar
prognosis. We could not model the disability data for
endoscopic discectomy studies because of converge
problems. Overall, microdiscectomy showed lower
pain and disability scores overtime compared to
other surgical techniques. At 1 month after surgery,
microdiscectomy reduced leg pain to 12.7 (95% CI
5.1–20.4) and disability to 13.3 (95% CI 10.7–15.8),
with scores continuing to reduce up to 24 months
(Fig. 4). On average, we found a difference of 3.6
points across different surgical techniques in terms of
pain intensity; however, our interaction analysis
showed that this difference is not statistically signifi-
cant (p = 0.60). Similarly, no difference was found
for disability status between surgical techniques
(p = 0.24), confirming different techniques have a
similar prognosis in terms of disability.
4. Discussion and Conclusions
In this systematic review, we quantified the clinical
course of pain and disability over time based upon
39 prospective cohort studies (n = 13,883) enrolling
patients with sciatica managed by surgery. Our
meta-analyses showed that symptoms decrease
markedly in the first 3 months after surgery, but
patients never experienced full resolution of pain or
disability in the long-term. Patients treated with
microdiscectomy showed lower scores for pain and
disability over time compared to other surgical tech-
niques, though this difference was not statistically
significant.
This is the first systematic review to quantitatively
synthesize the course of pain and disability outcomes
after surgery for sciatica by including only prospec-
tive cohort studies with long-term follow-up. We
included 39 cohort studies in our review, of which
27 provided data to be included in the meta-analysis,
totalling nearly 14,000 patients with sciatica. Most of
Figure 2 Methodological quality and number of studies in each category.
1704 Eur J Pain 20 (2016) 1700--1709 © 2016 European Pain Federation - EFIC!
The postoperative course of sciatica G.C. Machado et al.
112

the studies excluded from the analyses did not pro-
vide measures of variability (standard deviation or
standard error), and attempts to have access to these
data from authors were unsuccessful. Previous sys-
tematic reviews investigating the prognosis of sciatica
have included patients treated non-surgically and
mainly focused on summarizing the role of prognos-
tic factors (e.g. age, gender, smoking, previous his-
tory of sciatica) on outcomes of interest (Ashworth
et al., 2011; Verwoerd et al., 2013). Our systematic
review adds important information on the prognosis
of patients with sciatica treated surgically, and can
be used to guide clinical decision making by sur-
geons and patients.
Our review reports pooled scores of pain and dis-
ability on scales of 0–100 points to provide easily
interpretable results for clinicians and patients. Pain
outcomes were generally reported in individual stud-
ies on numeric rating scales (range, 0–10) or visual
analogue scales (range, 0–100). Most of the included
studies (n = 36, 90%) reported leg pain intensity
measures as the outcome. Two studies assessed lower
back with radicular/leg pain (Putzier et al., 2005;
Peng et al., 2010). One study reported measuring
discogenic pain (Lee et al., 2015), but it was not
clear if this was a measure of leg or low back pain.
Another study including only patients with sciatica
used the body pain subscale of the SF-36 scale as the
outcome measure (Dedering, 2012). Disability out-
comes were usually reported as Oswestry Disability
Index (range, 0–100) or the Roland–Morris Disability
Questionnaire (range, 0–24) scores. Previous studies
Figure 3 Postoperative course of patients with sciatica. The raw data for (A) pain and (B) disability from studies included in the meta-analysis.
Each line joins data from a single study, and point estimates and its 95% confidence interval are also shown. Same raw data with filled circles rep-
resenting mean (C) pain and (D) disability scores reported at a specific time point. The regression line represents pooled mean and the shaded
area circumscribes its 95% confidence intervals. Fractional polynomial regression modelling was used to fit the data.
© 2016 European Pain Federation - EFIC! Eur J Pain 20 (2016) 1700--1709 1705
G.C. Machado et al. The postoperative course of sciatica
113

have shown that these scales are highly correlated
and can be used interchangeably when transformed
(Leclaire et al., 1997; Hjermstad et al., 2011).
Our review also presents limitations. Only 17 stud-
ies (44%) met at least three quality assessment crite-
ria and were considered low risk of bias. Our
sensitivity analysis, however, showed that studies
with low risk of bias reported slight less pain scores
following surgery, compared to all studies, and a
similar course for disability. Differences on pain
scores were, however, not statistically significant.
The main methodological flaw in the included stud-
ies was failure to recruit a representative sample,
with only about a third of the studies reporting
appropriate sampling methods. About 30% of
included studies had very small sample sizes (50 par-
ticipants or less), and around 35% did not report an
appropriate analysis or defined the sample by clearly
stating the inclusion and exclusion criteria. Further-
more, none of the included studies reported if partic-
ipants had neuropathic pain characteristics, such as
dysaesthesia (impaired sensation) and allodynia
(pain resulting from a stimulus which would not
normally provoke pain). Previous research has
shown that higher scores of neuropathic pain and
the presence of neuropathic pain features are associ-
ated with persistent postoperative leg pain (Shamji
and Shcharinsky, 2016). It is unclear if included
studies are screened for these characteristics, and
could have potentially included participants more
likely to develop failed back surgery syndrome.
Another limitation of this review includes the impos-
sibility of evaluating the role of patient-level predic-
tors on pain and disability outcomes after surgery, as
we could not access individual patient data.
Open discectomy is commonly performed in
patients with sciatica, and consists of the surgical
removal of herniated disc material responsible for
nerve root or spinal cord compression (Mixter and
Barr, 1934). Although no significant differences in
the course of pain and disability for different surgical
techniques were found, patients treated with open
discectomy showed the least improvement (58%) in
pain intensity in the first 6 months, and still experi-
enced moderate disability after 2 years (ODI disabil-
ity score > 20 points). Microdiscectomy is considered
as a technical modification of open discectomy, but
with a smaller incision and less dissection, and
involves the use of an operating microscope or other
magnifying tools (Williams, 1978). In our review,
this technique showed the largest improvement in
pain (89%) and disability (77%) 6 months after sur-
gery, but no further significant improvements
occurred after that. Endoscopic discectomy has been
originally proposed to further decrease surgical com-
plications and speed recovery (Kambin and Savitz,
2000). Endoscopic surgery studies showed on aver-
age 83% pain reduction at 6-month follow-up, but
pain increased 45% after this and patients still expe-
rienced mild to moderate pain intensity at 5 years
follow-up (19.5, 95% CI 11.0–28.0). Nucleoplasty is
an alternative to open surgery and uses bipolar
radiofrequency energy to reduce intradiscal pressure
(Sharps and Isaac, 2002). Our meta-analysis showed
that patients treated with nucleoplasty had an aver-
age 66% reduction in pain and 50% reduction in
disability in the first month, but plateau after this.
Figure 4 Secondary exploratory analyses. The line of best fit for each
surgical technique (open discectomy in red, microdiscectomy in blue,
endoscopic discectomy in orange, and nucleoplasty in green) is
shown. The line of best fit derived from the primary meta-analysis
(grey line) and its 95% confidence interval (shaded grey), as well as the
line of best fit derived from studies with low risk of bias (RoB, dashed
line), are also shown.
1706 Eur J Pain 20 (2016) 1700--1709 © 2016 European Pain Federation - EFIC!
The postoperative course of sciatica G.C. Machado et al.
114

The evidence for the effectiveness of surgery for
sciatica over its natural course is still limited – no
surgical placebo-controlled trials have ever been
conducted in patients with sciatica and previous ran-
domized trials have shown no significant differences
in pain intensity between surgery and usual conser-
vative care at 2-year (mean difference 3.2, !2.0 to
8.4) or at 5-year follow-up (mean difference !2.7,
95% CI !8.4 to 2.9) (Weinstein et al., 2006; Lequin
et al., 2013). It is unclear, therefore, whether the
changes in pain and disability observed in our
review are associated with treatment itself or if a
result of surgery-associated placebo effects, or even
the condition’s natural course.
In conclusion, this review investigated the course
of pain and disability after surgery in patients with
sciatica. The results from our meta-analyses revealed
that on average patients experience rapid improve-
ments in the first 3 months following surgery, but
still report mild to moderate pain and disability at
5 years. Microdiscectomy showed larger improve-
ments compared to other surgical techniques,
though no significant differences were found. This
review is paramount for planning surgical interven-
tions in this population and should be used to
inform patients and clinicians of likely long-term
prognosis of sciatica in terms of pain and disability.
Acknowledgements
None.
Author contributions
C.F. conducted the first search and screening of records.
G.C.M. and A.J.W. performed the main data collection,
and G.C.M. drafted the first version of the manuscript. All
authors contributed substantially to conception and design,
acquisition, analysis and interpretation of the data. Fur-
thermore, all authors participated in the revision of the
manuscript and gave their final approval of this version.
References
Ahn, Y., Lee, S.H., Lee, J.H., Kim, J.U., Liu, W.C. (2009).
Transforaminal percutaneous endoscopic lumbar discectomy for
upper lumbar disc herniation: Clinical outcome, prognostic factors,
and technical consideration. Acta Neurochir (Wien) 151, 199–206.
Altman, D.G. (2001). Systematic reviews of evaluations of prognostic
variables. BMJ 323, 224–228.
Al-Zain, F., Lemcke, J., Killeen, T., Meier, U., Eisenschenk, A. (2008).
Minimally invasive spinal surgery using nucleoplasty: A 1-year
follow-up study. Acta Neurochir (Wien) 150, 1257–1262.
Asch, H.L., Lewis, P.J., Moreland, D.B., Egnatchik, J.G., Yu, Y.J.,
Clabeaux, D.E., Hyland, A.H. (2002). Prospective multiple outcomes
study of outpatient lumbar microdiscectomy: Should 75 to 80%
success rates be the norm? J Neurosurg 96, 34–44.
Ashworth, J., Konstantinou, K., Dunn, K.M. (2011). Prognostic factors
in non-surgically treated sciatica: A systematic review. BMC
Musculoskelet Disord 12, 208.
Astrand, P., Maattanen, H., Vucetic, N. and Svensson, O. (2000). Pain
and orthopaedic and neurologic signs after lumbar discectomy: A 2-
year followup. Clin Orthop Relat Res 379, 154–160.
Azzazi, A., AlMekawi, S., Zein, M. (2011). Lumbar disc nucleoplasty
using coblation technology: Clinical outcome. J Neurointerv Surg 3,
288–292.
den Boer, J.J., Oostendorp, R.A., Beems, T., Munneke, M., Evers, A.W.
(2006). Continued disability and pain after lumbar disc surgery: The
role of cognitive-behavioral factors. Pain 123, 45–52.
Bruske-Hohlfeld, I., Merritt, J.L., Onofrio, B.M., Stonnington, H.H.,
Offord, K.P., Bergstralh, E.J., Beard, C.M., Melton, L.J. 3rd, Kurland,
L.T. (1990). Incidence of lumbar disc surgery. A population-based
study in Olmsted County, Minnesota, 1950–1979. Spine 15, 31–35.
da C Menezes Costa, L., Maher, C.G., Hancock, M.J., McAuley, J.H.,
Herbert, R.D. and Costa, L.O. (2012). The prognosis of acute and
persistent low-back pain: A meta-analysis. CMAJ 184, E613–E624.
Carragee, E.J., Spinnickie, A.O., Alamin, T.F., Paragioudakis, S. (2006).
A prospective controlled study of limited versus subtotal posterior
discectomy: Short-term outcomes in patients with herniated lumbar
intervertebral discs and large posterior anular defect. Spine 31,
653–657.
Casal-Moro, R., Castro-Menendez, M., Hernandez-Blanco, M., Bravo-
Ricoy, J.A. and Jorge-Barreiro, F.J. (2011). Long-term outcome after
microendoscopic diskectomy for lumbar disk herniation: A
prospective clinical study with a 5-year follow-up. Neurosurgery 68,
1568–1575; discussion 1575.
Cho, J.Y., Lee, S.H., Lee, H.Y. (2011). Prevention of development of
postoperative dysesthesia in transforaminal percutaneous endoscopic
lumbar discectomy for intracanalicular lumbar disc herniation:
Floating retraction technique. Minim Invasive Neurosurg 54, 214–218.
Choi, K.C., Kim, J.S., Kang, B.U., Lee, C.D., Lee, S.H. (2011). Changes
in back pain after percutaneous endoscopic lumbar discectomy and
annuloplasty for lumbar disc herniation: A prospective study. Pain
Med 12, 1615–1621.
Chumnanvej, S., Kesornsak, W., Sarnvivad, P., Kuansongthum, V.
(2011). Full endoscopic lumbar discectomy via interlaminar
approach: 2-year results in Ramathibodi Hospital. J Med Assoc Thai 94,
1465–1470.
Crockett, M.T., Moynagh, M., Long, N., Kilcoyne, A., Dicker, P.,
Synnott, K., Eustace, S.J. (2014). Ozone-augmented percutaneous
discectomy: A novel treatment option for refractory discogenic
sciatica. Clin Radiol 69, 1280–1286.
Dedering, A. (2012). Lumbar muscle fatigue and subjective health
measurements in patients with lumbar disc herniation 2 years after
surgery. Eur Spine J 21, 646–654.
Ebrahim, K.S., AlShehaby, A., AlWardany, M.A., Darwish, A. and
Awad, M. (2010). Percutaneous image guided lumbar disc
nucleoplasty: A minimal invasive technique for lumbar disc
decompression. Pan Arab J Neurosurg 14, 51–55+138.
Fairbank, J.C. (2007). Sciatica: An archaic term. BMJ 335, 112.
Floman, Y., Millgram, M.A., Smorgick, Y., Rand, N., Ashkenazi, E.
(2007). Failure of the Wallis interspinous implant to lower the
incidence of recurrent lumbar disc herniations in patients undergoing
primary disc excision. J Spinal Disord Tech 20, 337–341.
Frymoyer, J.W. (1988). Back pain and sciatica. N Engl J Med 318,
291–300.
Gibson, J.N. and Waddell, G. (2007). Surgical interventions for lumbar
disc prolapse. Cochrane Database Syst Rev CD001350.
Guilfoyle, M.R., Ganesan, D., Seeley, H., Laing, R.J. (2007). Prospective
study of outcomes in lumbar discectomy. Br J Neurosurg 21, 389–395.
Hakkinen, A., Kautiainen, H., Jarvenpaa, S., Arkela-Kautiainen, M.,
Ylinen, J. (2007). Changes in the total Oswestry Index and its ten
items in females and males pre- and post-surgery for lumbar disc
herniation: A 1-year follow-up. Eur Spine J 16, 347–352.
© 2016 European Pain Federation - EFIC! Eur J Pain 20 (2016) 1700--1709 1707
G.C. Machado et al. The postoperative course of sciatica
115

Hjermstad, M.J., Fayers, P.M., Haugen, D.F., Caraceni, A., Hanks, G.W.,
Loge, J.H., Fainsinger, R., Aass, N., Kaasa, S., and European Palliative
Care Research, C. (2011). Studies comparing Numerical Rating
Scales, Verbal Rating Scales, and Visual Analogue Scales for
assessment of pain intensity in adults: A systematic literature review.
J Pain Symptom Manage 41, 1073–1093.
Johansson, A.C., Linton, S.J., Rosenblad, A., Bergkvist, L., Nilsson, O.
(2010). A prospective study of cognitive behavioural factors as
predictors of pain, disability and quality of life one year after lumbar
disc surgery. Disabil Rehabil 32, 521–529.
Kambin, P., Savitz, M.H. (2000). Arthroscopic microdiscectomy: An
alternative to open disc surgery. Mt Sinai J Med 67, 283–287.
Kamper, S.J., Rebbeck, T.J., Maher, C.G., McAuley, J.H., Sterling, M.
(2008). Course and prognostic factors of whiplash: A systematic
review and meta-analysis. Pain 138, 617–629.
Koes, B.W., van Tulder, M.W., Peul, W.C. (2007). Diagnosis and
treatment of sciatica. BMJ 334, 1313–1317.
Konstantinou, K., Dunn, K.M. (2008). Sciatica: Review of
epidemiological studies and prevalence estimates. Spine 33, 2464–
2472.
Lagerback, T., Elkan, P., Moller, H., Grauers, A., Diarbakerli, E. and
Gerdhem, P. (2015). An observational study on the outcome after
surgery for lumbar disc herniation in adolescents compared with
adults based on the Swedish Spine Register. Spine J 15, 1241–1247 In
press.
Lebow, R., Parker, S.L., Adogwa, O., Reig, A., Cheng, J., Bydon, A. and
McGirt, M.J. (2011a). Microdiscectomy improves pain-associated
depression, somatic anxiety, and mental well being in patients with
herniated lumbar disc. Neurosurgery 70, 306–311.
Lebow, R.L., Adogwa, O., Parker, S.L., Sharma, A., Cheng, J., McGirt,
M.J. (2011b). Asymptomatic same-site recurrent disc herniation after
lumbar discectomy: Results of a prospective longitudinal study with
2-year serial imaging. Spine 36, 2147–2151.
Leclaire, R., Blier, F., Fortin, L., Proulx, R. (1997). A cross-sectional
study comparing the Oswestry and Roland-Morris Functional
Disability scales in two populations of patients with low back pain of
different levels of severity. Spine 22, 68–71.
Lee, D.Y., Lee, S.H. (2011). Carbon dioxide (CO2) laser-assisted
microdiscectomy for extraforaminal lumbar disc herniation at the L5-
S1 level. Photomed Laser Surg 29, 531–535.
Lee, S.H., Derby, R., Sul, D., Hong, J., Kim, G.H., Kang, S., Kim, N.H.,
Yoo, S.H., Lee, S.J., Hong, Y.K., Lee, J.E. (2011). Efficacy of a new
navigable percutaneous disc decompression device (L’DISQ) in
patients with herniated nucleus pulposus related to radicular pain.
Pain Med 12, 370–376.
Lee, S.H., Derby, R., Sul, D., Hong, Y.K., Ha, K.W., Suh, D., Lee, S.H.,
Yoon, H.S., Yoo, S.H., Lee, S.J., Park, H.J., Jung, Y.J., Lee, J.E., Kim,
N.H. (2015). Effectiveness of a new navigable percutaneous disc
decompression device (L’DISQ) in patients with lumbar discogenic
pain. Pain Med 16, 266–273.
Lequin, M.B., Verbaan, D., Jacobs, W.C., Brand, R., Bouma, G.J.,
Vandertop, W.P., Peul, W.C., for the Leiden-The Hague Spine
Intervention Prognostic Study Group. (2013). Surgery versus
prolonged conservative treatment for sciatica: 5-year results of a
randomised controlled trial. BMJ Open 3, e002534.
Lierz, P., Alo, K.M., Felleiter, P. (2009). Percutaneous lumbar
discectomy using the Dekompressor system under CT-control. Pain
Pract 9, 216–220.
Mirzai, H., Tekin, I., Yaman, O. and Bursali, A. (2007). The results of
nucleoplasty in patients with lumbar herniated disc: A prospective
clinical study of 52 consecutive patients. Spine J 7, 88–92; discussion
92-83.
Mixter, W.J., Barr, J.S. (1934). Rupture of the intervertebral disc with
involvement of the spinal canal. N Engl J Med 211, 210–215.
Moranjkic, M., Ercegovic, Z., Hodzic, M., Brkic, H. (2010). Outcome
prediction in lumbar disc herniation surgery. Acta Med Salin 39, 75–
80.
Nie, H., Jiang, D., Ou, Y., Quan, Z., Bai, C., An, H. (2011). Efficacy and
safety of surgery for lumbar disc herniation in patients aged 80 and
older. Turk Neurosurg 21, 172–176.
Ohtori, S., Yamashita, M., Yamauchi, K., Inoue, G., Koshi, T., Suzuki,
M., Orita, S., Eguchi, Y., Ochiai, N., Kishida, S., Takaso, M., Aoki, Y.,
Ishikawa, T., Arai, G., Miyagi, M., Kamoda, H., Nakamura, J.,
Takahashi, K. (2010). Low back pain after lumbar discectomy in
patients showing endplate modic type 1 change. Spine 35, E596–
E600.
Peng, C.W.B., Yeo, W., Tan, S.B. (2010). Percutaneous endoscopic
discectomy: Clinical results and how it affects the quality of life. J
Spinal Disord Tech 23, 425–430.
Pengel, L.H., Herbert, R.D., Maher, C.G., Refshauge, K.M. (2003).
Acute low back pain: Systematic review of its prognosis. BMJ 327,
323.
Putzier, M., Schneider, S.V., Funk, J.F., Tohtz, S.W., Perka, C. (2005).
The surgical treatment of the lumbar disc prolapse: Nucleotomy with
additional transpedicular dynamic stabilization versus nucleotomy
alone. Spine 30, E109–E114.
Ratsep, T., Abel, A., Linnamagi, U. (2014). Patient involvement in
surgical treatment decisions and satisfaction with the treatment
results after lumbar intervertebral discectomy. Eur Spine J 23, 873–
881.
Righesso, O., Falavigna, A. and Avanzi, O. (2012). Correlation between
persistent neurological impairment and clinical outcome after
microdiscectomy for treatment of lumbar disc herniation.
Neurosurgery 70, 390–396; discussion 396-397.
Royston, P., Sauerbrei, W. (2008). Multivariable Model-Building: A
Pragmatic Approach to Regression Analysis Based on Fractional
Polynomials for Modelling Continuous Variables. (Chichester: John
Wiley).
Sasani, M., Ozer, A.F., Oktenoglu, T., Canbulat, N., Sarioglu, A.C.
(2007). Percutaneous endoscopic discectomy for far lateral lumbar
disc herniations: Prospective study and outcome of 66 patients. Minim
Invasive Neurosurg 50, 91–97.
Schaufele, M.K. (2008). Single level lumbar disc herniations resulting
in radicular pain: Pain and functional outcomes after treatment with
targeted disc decompression. Pain Med 9, 835–843.
Schick, U., Elhabony, R. (2009). Prospective comparative study of
lumbar sequestrectomy and microdiscectomy. Minim Invasive
Neurosurg 52, 180–185.
Selim, A.J., Ren, X.S., Fincke, G., Deyo, R.A., Rogers, W., Miller, D.,
Linzer, M., Kazis, L. (1998). The importance of radiating leg pain in
assessing health outcomes among patients with low back pain.
Results from the Veterans Health Study. Spine 23, 470–474.
Sencer, A., Yorukoglu, A.G., Akcakaya, M.O., Aras, Y., Aydoseli, A.,
Boyali, O., Sencan, F., Sabanci, P.A., Gomleksiz, C., Imer, M., Kiris,
T., Hepgul, K., Unal, O.F., Izgi, N., Canbolat, A.T. (2014). Fully
endoscopic interlaminar and transforaminal lumbar discectomy:
Short-term clinical results of 163 surgically treated patients. World
Neurosurg 82, 884–890.
Shabat, S., David, R., Folman, Y. (2012). Nucleoplasty is effective in
reducing both mechanical and radicular low back pain: A prospective
study in 87 patients. J Spinal Disord Tech 25, 329–332.
Shamji, M.F., Shcharinsky, A. (2016). Use of neuropathic pain
questionnaires in predicting persistent postoperative neuropathic pain
following lumbar discectomy for radiculopathy. J Neurosurg Spine 24,
256–262.
Sharps, L.S., Isaac, Z. (2002). Percutaneous disc decompression using
nucleoplasty. Pain Physician 5, 121–126.
Stroup, D.F., Berlin, J.A., Morton, S.C., Olkin, I., Williamson, G.D.,
Rennie, D., Moher, D., Becker, B.J., Sipe, T.A., Thacker, S.B. (2000).
Meta-analysis of observational studies in epidemiology: A proposal
for reporting. Meta-analysis Of Observational Studies in
Epidemiology (MOOSE) group. JAMA 283, 2008–2012.
van Tulder, M., Peul, W., Koes, B. (2010). Sciatica: What the
rheumatologist needs to know. Nat Rev Rheumatol 6, 139–145.
Verwoerd, A.J., Luijsterburg, P.A., Lin, C.W., Jacobs, W.C., Koes, B.W.,
Verhagen, A.P. (2013). Systematic review of prognostic factors
predicting outcome in non-surgically treated patients with sciatica.
Eur J Pain 17, 1126–1137.
Wang, B., Lu, G., Patel, A.A., Ren, P., Cheng, I. (2011). An evaluation
of the learning curve for a complex surgical technique: The full
1708 Eur J Pain 20 (2016) 1700--1709 © 2016 European Pain Federation - EFIC!
The postoperative course of sciatica G.C. Machado et al.
116

endoscopic interlaminar approach for lumbar disc herniations. Spine J
11, 122–130.
Weinstein, J.N., Tosteson, T.D., Lurie, J.D., Tosteson, A.N., Hanscom,
B., Skinner, J.S., Abdu, W.A., Hilibrand, A.S., Boden, S.D., Deyo,
R.A. (2006). Surgical vs nonoperative treatment for lumbar disk
herniation: The Spine Patient Outcomes Research Trial (SPORT): A
randomized trial. JAMA 296, 2441–2450.
Williams, R.W. (1978). Microlumbar discectomy: A conservative surgical
approach to the virgin herniated lumbar disc. Spine 3, 175–182.
Wu, C.G., Li, Y.D., Li, M.H., Gu, Y.F., Li, M. (2008). Prospective
evaluation of transabdominal percutaneous lumbar discectomy for
L5-S1 disc herniation: Initial clinical experience. J Neurosurg Spine 8,
321–326.
Supporting Information
Additional Supporting Information may be found online in
the supporting information tab for this article:
Table S1. Characteristics of studies included in the review.
Table S2. Risk-of-bias assessment of the included studies.
Appendix S1. Search strategy.
© 2016 European Pain Federation - EFIC! Eur J Pain 20 (2016) 1700--1709 1709
G.C. Machado et al. The postoperative course of sciatica
117

Appendix S1
Medline
1. exp sciatic neuropathy/
2. sciatic neuropath$.mp.
3. sciatic neuralgi$.mp.
4. sciatic pain$.mp.
5. sciatic hernia$.mp.
6. sciatic paraly$.mp.
7. sciatica/
8. sciatic$.mp.
9. ischialg$.mp.
10. piriformis.mp.
11. intervertebral disk displac$.mp.
12. herniated disk$.mp.
13. slipped disk.mp.
14. prolapsed disk.mp.
15. disk prolap$.mp.
16. disk hernia$.mp.
17. intervertebral disc displac$.mp.
18. herniated disc$.mp.
19. slipped disc.mp.
20. prolapsed disc$.mp.
21. disc prolap$.mp.
22. disc hernia.mp.
23. radicular syndr$.mp.
24. radiculopathy$.mp.
25. OR (1–24)
26. lumbosacral.mp.
27. lumbal.mp.
28. lumbar.mp.
29. OR (26–28)
30. 29 AND 25
31. exp cohort studies/
32. incidence/
33. follow-up study.mp.
34. prognos$.mp.
35. predict$.mp.
36. course.mp.
37. survival.mp.
38. logistic.mp.
39. Cox.mp.
40. life tables.mp.
41. log rank.mp.
42. OR (31–41)
43. 30 AND 42
44. human/ not animal/
45. 43 AND 44
46. editorial/
47. case report/
48. letter/
49. OR (46–48)
118

49. 45 NOT 49
CINAHL
1. sciatic neuropath*
2. sciatic neural*
3. sciatic pain*
4. sciatic hernia*
5. sciatic paraly*
6. sciatica
7. sciatic*
8. ischial*
9. piriformis
10. intervertebral disk displac*
11. herniated disk*
12. slipped disk*
13. prolapsed disk*
14. disk prolap*
15. disk hernia*
16. intervertebral disc displac*
17. herniated disc*
18. slipped disc*
19. prolapsed disc*
20. disc prolap*
21. disc hernia*
22. radicular syndr*
23. radiculopath*
24. OR (1–23)
25. lumbosacral
26. lumbal
27. lumbar
28. OR (25–27)
29. 24 AND 28
30. (MH "Prospective Studies+")
31. mh incidence OR "predic*"
32. (MH "prognosis+")
33. "course"
34. (MH "Survival Analysis+")
35. (MH "Cox Proportional Hazards Model")
36. (MH "Logistic Regression+")
37. (MH "Log-Rank Test")
38. OR (30–37)
39. 38 and 29
40. MH human NOT MH animals
41. 39 and 40
42. prospective* NOT case report* letter* editorial*
43. 41 AND 42
Embase
1. sciatic NEAR/1 neuropath*
2. sciatic* NEAR/3 (neuralgi* OR pain* OR hernia* OR paraly* OR paresthe* OR paraesthe*)
3. ‘sciatica’/exp OR sciatica
4. ‘sciatics’ OR sciatics
119

5. ischialg*
6. piriformis
7. lumbar AND disk AND hernia*
8. 'intervertebral disk hernia'/syn OR ‘intervertebral disk hernia’
9. (hernia* OR slipped OR prolaps*) NEAR/3 (disk* OR disc*)
10. radicular NEAR/1 syndr*
11. radiculopath*
12. lumbosacral OR lumba*
13. OR (1–11)
14. 12 AND 13
15. ('cohort analysis'/exp AND [embase]/lim)
16. ('incidence'/exp AND [embase]/lim)
17. ('follow up'/exp OR 'follow up' AND [embase]/lim)
18. ('prognosis'/exp OR prognos* AND [embase]/lim)
19. ('prediction'/exp OR predict* AND [embase]/lim)
20. ('disease course'/exp OR 'course' AND [embase]/lim)
21. ('survival'/exp OR 'survival' AND [embase]/lim)
22. ('logistic regression analysis'/exp OR 'logistic' AND [embase]/lim)
23. ('proportional hazards model'/exp OR 'cox' AND [embase]/lim)
24. ('life table'/exp OR 'life table' OR 'life tables'/exp OR 'life tables' AND [embase]/lim)
25. ('log rank test'/exp OR 'log rank' AND [embase]/lim)
26. OR (15–25)
27. 14 AND 26
28. 'animals'/exp OR animals NOT ('humans'/exp OR humans)
29. 27 NOT 28
30. case NEAR/1 report*
31. editorial*
32. letter*
33. OR (30–32)
33. 29 NOT 33
120

Tab
le S
1 C
har
acte
rist
ics
of
studie
s in
cluded
in t
he
revie
w
Stu
dy
So
urc
e, C
ou
ntr
yIn
cep
tio
n
Sa
mp
le C
ha
ra
cte
ris
tics
Su
rg
ica
l In
terv
en
tio
nO
utc
om
es,
Fo
llo
w-u
p
Ah
n 2
00
9W
oo
rid
ul
Sp
ine
Ho
spit
al,
So
uth
Ko
rea
Pre
op
erat
ive
45
pat
ients
wit
h l
um
bar
dis
c her
nia
tio
n,
73
% m
ale
Per
cuta
neo
us
end
osc
op
ic
dis
cect
om
yR
adic
ula
r p
ain;
at 3
9
mo
nth
s
Al-
Zai
n 2
00
8U
nfa
llkra
nken
hau
s B
erli
n
Neu
rosu
rger
y C
linic
, G
erm
any
Six
wee
ks
bef
ore
surg
ery
69
pat
ients
wit
h d
isco
gen
ic p
ain,
mea
n a
ge
42
(1
4)
yea
rs,
61
% m
ale,
N
ucl
eop
last
yR
adic
ula
r p
ain;
at 1
2
mo
nth
s
Asc
h 2
00
2U
nit
ed S
tate
sT
wo
wee
ks
bef
ore
surg
ery
21
2 p
atie
nts
wit
h l
um
bar
dis
c her
nia
tio
n,
mea
n a
ge
41
(1
1)
yea
rs,
62
% m
ale
Mic
rosc
op
ic d
isce
cto
my
Leg
pai
n,
OD
I; a
t 2
4
mo
nth
s
Ast
rand
20
00
Hud
din
ge
Un
iver
sity
H
osp
ital
, S
wed
enN
R1
61
pat
ients
wit
h l
um
bar
dis
c her
nia
tio
n,
mea
n a
ge
43
(1
2)
yea
rsD
isce
cto
my
Sci
atic
pai
n;
at 2
4 m
on
ths
Azz
azi
20
11
Eg
yp
tP
reop
erat
ive
50
pat
ients
wit
h l
um
bar
dis
c her
nia
tio
n,
mea
n a
ge
41
(9
) yea
rs,
64
% m
ale
Nucl
eop
last
yR
adic
ula
r p
ain,
OD
I; a
t 1
2
mo
nth
s
Car
ragee
20
06
Div
isio
n o
f O
rtho
ped
icS
urg
ery,
Sta
nfo
rd
Univ
ersi
ty,
Un
ited
Sta
tes
NR
30
pat
ients
wit
h l
um
bar
dis
c her
nia
tio
n,
mea
n a
ge
38
(9
) yea
rs,
53
% m
ale
Sub
tota
l d
isce
cto
my
Leg
pai
n,
OD
I; a
t 2
4
mo
nth
s
Cas
al-M
oro
20
11
Univ
ersi
ty H
osp
ital
of
Vig
o,
Sp
ain
Pre
op
erat
ive
12
0 p
atie
nts
wit
h l
um
bar
dis
c her
nia
tio
n,
mea
n a
ge
41
(1
3)
yea
rs,
54
% m
ale
Mic
roen
do
sco
pic
dis
cect
om
yL
eg p
ain,
OD
I; a
t 6
0
mo
nth
s
Cho
20
11
Wo
ori
dul
Sp
ine
Ho
spit
al,
So
uth
Ko
rea
Pre
op
erat
ive
15
4 p
atie
nts
wit
h l
um
bar
dis
c her
nia
tio
n,
mea
n a
ge
45
(6
6)
yea
rs,
55
% m
ale
Tra
nsf
ora
min
al p
ercu
taneo
us
end
osc
op
ic d
isce
cto
mty
Rad
icula
r p
ain,
OD
I; a
t 8
m
onth
s
Cho
i 2
01
1W
oo
rid
ul
Sp
ine
Ho
spit
al,
So
uth
Ko
rea
Pre
op
erat
ive
58
pat
ients
wit
h l
um
bar
dis
c her
nia
tio
n,
mea
n a
ge
36
(1
3)
yea
rs,
64
% m
ale
Per
cuta
neo
us
end
osc
op
ic
dis
cect
om
y a
nd
an
nulo
pla
sty
Leg
pai
n,
OD
I; a
t 2
4
mo
nth
s
Ch
um
nan
vej
20
11
Ram
athib
od
i H
osp
ital
, T
hai
land
Pre
op
erat
ive
60
pat
ients
wit
h l
um
bar
dis
c her
nia
tio
n,
mea
n a
ge
46
(1
1)
yea
rs,
45
% m
ale
End
osc
op
ic d
isce
cto
my
Rad
icula
r p
ain,
OD
I; a
t 2
3
mo
nth
s
Cro
cket
t 2
01
4C
app
agh N
atio
nal
O
rtho
pae
dic
Ho
spit
al,
Irel
and
Pre
op
erat
ive
14
7 p
atie
nts
wit
h l
um
bar
dis
c her
nia
tio
n,
mea
n a
ge
50
yea
rs,
58
%
mal
e
Auto
mat
ed p
ercu
taneo
us
dis
cect
om
y p
lus
intr
a-d
isca
l o
zone
inje
ctio
nS
ciat
ic p
ain;
at 6
mo
nth
s
Ded
erin
g 2
01
2S
wed
enP
reop
erat
ive
36
pat
ients
lu
mb
ar d
isc
her
nia
tio
n,
mea
n a
ge
42
(1
1)
yea
rs,
61
% m
ale
Mic
rod
isce
cto
my
Bo
dy p
ain S
F-3
6;
at 2
4
mo
nth
s
121

den
Bo
er 2
00
64
Dutc
h H
osp
ital
s,
Net
her
land
sP
reop
erat
ive
31
0 p
atie
nts
wit
h l
um
bo
sacr
al
rad
icula
r sy
nd
rom
e, m
ean a
ge
43
(1
5)
yea
rs,
50
% m
ale
Lu
mb
ar d
isc
surg
ery
Leg
pai
n,
RM
DQ
; at
6
mo
nth
s
Eb
rahim
20
10
Eg
yp
tP
reop
erat
ive
29
pat
ients
wit
h l
um
bar
dis
c p
rola
pse
, m
ean a
ge
39
yea
rs,
79
%
mal
e N
ucl
eop
last
yL
eg p
ain;
at 1
2 m
onth
s
Flo
man
20
07
Isra
el S
pin
e C
ente
r at
Ass
uta
H
osp
ital
, Is
rael
Pre
op
erat
ive
37
pat
ients
wit
h l
um
bar
dis
c her
nia
tio
n,
mea
n a
ge
36
(1
0)
yea
rs,
62
% m
ale)
Dis
cect
om
y f
oll
ow
ed b
y
fixat
ion o
f th
e se
gm
ent
wit
h
the
Wal
lis
imp
lan
t
Leg
pai
n,
OD
I; a
t 1
6
mo
nth
s
Guil
foyle
20
07
Ad
den
bro
oks'
s H
osp
ital
, U
nit
ed K
ingd
om
Pre
op
erat
ive
20
3 p
atie
nts
wit
h l
um
bar
dis
c p
rola
pse
, m
ean a
ge
41
(1
7)
yea
rs,
53
% m
ale
Dis
cect
om
yL
eg p
ain,
RM
DQ
; at
24
m
onth
s
Hak
kin
en 2
00
7Jy
väs
kylä
Cre
ntr
al H
osp
ital
, F
inla
nd
Pre
op
erat
ive
98
pat
ients
wit
h l
um
bar
dis
c her
nia
tio
n,
mea
n a
ge
43
(1
3)
yea
rs,
61
% m
ale
Lu
mb
ar d
isc
her
nia
tio
n s
urg
ery
Leg
pai
n,
OD
I; a
t 1
2
mo
nth
s
Johan
sso
n 2
01
0C
om
mu
nit
y a
nd
Univ
ersi
ty
Ho
spit
al,
Sw
eden
Pre
op
erat
ive
59
pat
ients
wit
h l
um
bar
dis
c her
nia
tio
n,
mea
n a
ge
40
(8
) yea
rs,
60
% m
ale
Dis
cect
om
y w
ith m
agnif
yin
g
gla
sses
, b
ut
no
mic
rosc
op
eL
eg p
ain,
OD
I; a
t 1
2
mo
nth
s
Lag
erb
ack 2
01
5S
weS
pin
e R
egis
ter,
Sw
eden
Pre
op
erat
ive
10
,464
pat
ients
wit
h l
um
bar
dis
c her
nia
tio
n,
mea
n a
ge
42
yea
rs,
55
%
mal
eD
isce
cto
my
Leg
pai
n,
OD
I; a
t 2
2
mo
nth
s
Leb
ow
20
11
5 M
edic
al I
nst
itu
tio
ns,
U
nit
ed S
tate
sP
reop
erat
ive
10
0 p
atie
nts
wit
h l
um
bar
dis
c her
nia
tio
n,
mea
n a
ge
40
(9
) yea
rs,
66
% m
ale
Dis
cect
om
yL
eg p
ain;
at 1
2 m
onth
s
Leb
ow
20
11
5M
edic
al I
nst
itu
tio
ns,
U
nit
ed S
tate
sP
reop
erat
ive
10
8 p
atie
nts
wit
h l
um
bar
dis
c her
nia
tio
n,
mea
n a
ge
42
(1
0)
yea
rs,
67
% m
ale
Dis
cect
om
yL
eg p
ain,
OD
I; a
t 2
5
mo
nth
s
Lee
20
11
-aS
outh
Ko
rea
Pre
op
erat
ive
31
pat
ients
wit
h e
xtr
afo
ram
inal
lum
bar
dis
c her
nia
tio
n,
mea
n a
ge
62
(1
1)
yea
rs,
32
% m
ale
Co
2 l
aser
-ass
iste
d
mic
rod
isce
cto
my
Leg
pai
n;
at 1
2 m
onth
s
Lee
20
11
-bU
niv
ersi
ty S
pin
alP
ain O
utp
atie
nt
Cli
nic
, S
outh
Ko
rea
Pre
op
erat
ive
27
pat
ients
wit
h l
um
bar
dis
c her
nia
tio
n,
mea
n a
ge
41
(1
5)
yea
rs,
70
% m
ale
Dis
c d
eco
mp
ress
ion u
sin
g
L’D
ISQ
Leg
pai
n,
OD
I; a
t 6
m
onth
s
Lee
20
15
Univ
ersi
ty S
pin
alP
ain O
utp
atie
nt
Cli
nic
, S
outh
Ko
rea
Pre
op
erat
ive
20
pat
ients
wit
h d
isco
gen
ic p
ain,
mea
n a
ge
41
(11
) yea
rs,
70
% m
ale
Dis
c d
eco
mp
ress
ion u
sin
g
L’D
ISQ
Dis
cogen
ic p
ain,
OD
I; a
t 1
2 m
onth
s
122

Lie
rz 2
00
9M
arie
nkra
nken
hau
s S
oes
t,
Ger
man
yP
reop
erat
ive
64
pat
ients
wit
h c
onta
ined
lu
mb
ar
dis
c her
nia
tio
n,
mea
n a
ge
53
(1
1)
yea
rs,
53
% m
ale
Per
cuta
neo
us
dis
cect
om
yR
adic
ula
r p
ain;
at 1
2
mo
nth
s
Mir
zai
20
07
Turk
eyP
reop
erat
ive
52
pat
ients
wit
h l
um
bar
dis
c her
nia
tio
n,
mea
n a
ge
45
(9
) yea
rs,
42
% m
ale
Nucl
eop
last
yR
adic
ula
r p
ain,
OD
I; a
t 1
2
mo
nth
s
Mo
ranjk
ic 2
01
0N
R,
Bo
snia
-Her
zego
vin
aP
reop
erat
ive
70
pat
ients
wit
h l
um
bar
dis
c her
nia
tio
n,
mea
n 4
6 (
9),
51
% m
ale
Mic
rod
isce
cto
my
Leg
pai
n,
RM
DQ
; at
6
mo
nth
s
Nie
20
11
Chin
aP
reop
erat
ive
90
pat
ients
wit
h l
um
bar
dis
c her
nia
tio
n,
mea
n a
ge
67
(1
8)
yea
rs,
56
% m
ale
Dis
cect
om
yL
eg p
ain,
OD
I; a
t 2
0
mo
nth
s
Ohto
ri 2
01
0Ja
pan
Pre
op
erat
ive
45
pat
ients
wit
h L
um
bar
Dis
c H
ernia
tio
n,
mea
n a
ge
35
yea
rs,
58
%
mal
eD
isce
cto
my
Leg
pai
n,
OD
I; a
t 2
4
mo
nth
s
Pen
g 2
01
0S
ingap
ore
Gen
eral
Ho
spit
al,
Sin
gap
ore
Pre
op
erat
ive
55
pat
ients
wit
h l
um
bar
dis
c her
nia
tio
n,
mea
n a
ge
36
(1
3)
yea
rs,
58
% m
ale
End
osc
op
ic d
isce
cto
my
Lo
wer
-lim
b p
ain
; at
41
m
onth
s
Putz
ier
20
05
Ger
man
yP
reop
erat
ive
84
pat
ients
wit
h s
ym
pto
mat
ic d
isc
pro
lap
se,
mea
n a
ge
37
(1
0)
yea
rs,
61
% m
ale
Nucl
eoto
my w
ith o
r w
itho
ut
dynam
ic s
tab
iliz
atio
n
Lo
w b
ack a
nd
leg
pai
n,
OD
I; a
t 3
4 m
on
ths
Rat
sep
20
14
Tar
tu U
niv
ersi
ty H
osp
ital
, E
sto
nia
Pre
op
erat
ive
15
0 p
atie
nts
wit
h l
um
bar
dis
c her
nia
tio
n,
mea
n a
ge
47
(1
3)
yea
rs,
44
% m
ale
Mic
rod
isce
cto
my
Rad
icula
r o
r lu
mb
ar p
ain,
OD
I; a
t 1
2 m
on
ths
Rig
hes
so 2
01
2B
razi
lP
reop
erat
ive
15
0 p
atie
nts
wit
h l
um
bar
dis
c her
nia
tio
n,
mea
n a
ge
48
yea
rs,
53
%
mal
eM
icro
dis
cect
om
yS
ciat
ic p
ain,
OD
I; a
t 2
4
mo
nth
s
Sas
ani
20
07
Turk
eyP
reop
erat
ive
66
pat
ients
wit
h e
xtr
afo
ram
inal
lu
mb
ar d
isc
her
nia
tio
n,
mea
n a
ge
52
(2
8)
yea
rs,
46
% m
ale
Per
cuta
neo
us
end
osc
op
ic
dis
cect
om
yL
eg p
ain,
OD
I; a
t 1
2
mo
nth
s
Sch
aufe
le 2
00
83
lar
ge
spin
e p
ract
ices
, U
nit
ed S
tate
sP
reop
erat
ive
19
pat
ients
wit
h l
um
bar
dis
c p
rotr
usi
on,
mea
n a
ge
38
(9
) yea
rs,
79
% m
ale
Dis
c d
eco
mp
ress
ion u
sin
g a
n
intr
adis
cal
cath
eter
Leg
pai
n;
at 1
2 m
onth
s
Sch
ick 2
00
9W
edau
Ho
spit
al i
n
Duis
burg
, G
erm
any
Pre
op
erat
ive
10
0 p
atie
nts
wit
h l
um
bar
dis
c her
nia
tio
n,
mea
n a
ge
52
(1
4)
yea
rs,
64
% m
ale
Mic
rosu
rgic
al d
isc
op
erat
ion
(seq
ues
trec
tom
y o
r m
icro
dis
cect
om
y)
Rad
icula
r p
ain,
OD
I; a
t 3
4
mo
nth
s
123

Sen
cer
20
14
Turk
eyP
reop
erat
ive
16
3 p
atie
nts
wit
h l
um
bar
dis
c her
nia
tio
n,
mea
n a
ge
47
(1
5)
yea
rs,
45
% m
ale
End
osc
op
ic i
nte
rlam
inar
and
tr
ansf
ora
min
al d
isce
cto
my
Leg
pai
n,
OD
I; a
t 1
2
mo
nth
s
Shab
at 2
01
2Is
rael
Pre
op
erat
ive
87
pat
ients
wit
h l
um
bar
dis
c her
nia
tio
n,
mea
n a
ge
49
(1
1)
yea
rs,
57
% m
ale
Nucl
eop
last
yR
adic
ula
r p
ain,
OD
I; a
t 2
4
mo
nth
s
Wan
g 2
01
1S
eco
nd
Xia
ng
ya
Ho
spit
al o
f C
entr
al S
outh
Univ
ersi
ty,
Chin
aP
reop
erat
ive
30
pat
ients
wit
h l
um
bar
dis
c her
nia
tio
n,
mea
n a
ge
36
yea
rs,
57
%
mal
e
Full
end
osc
op
ic i
nte
rlam
inar
d
isce
cto
my
Leg
pai
n;
at 1
9 m
onth
s
Wu 2
00
8T
he
Six
th A
ffil
iate
d
Peo
ple
’s H
osp
ital
, C
hin
aP
reop
erat
ive
30
pat
ients
wit
h e
xtr
ud
ed d
isc
frag
men
ts,
mea
n a
ge
41
(9
) yea
rs,
73
% m
ale
Tra
nsa
bd
om
inal
per
cuta
neo
us
dis
cect
om
yL
eg p
ain,
OD
I; a
t 2
1
mo
nth
s
OD
I, O
swes
try D
isab
ilit
y I
nd
ex;
RM
DQ
, R
ola
nd
-Mo
rris
Dis
abil
ity Q
ues
tio
nnai
re;
L’D
ISQ
, N
avig
able
Per
cuta
neo
us
Dis
c D
eco
mp
ress
ion D
evic
e
124

Table S2 Risk-of-bias assessment of the included studies
StudyDefined
Samplea
Representative
Sampleb
Adequate
Follow-upc Appropriate Analysisd
Ahn, 2009 Yes No No No
Al-Zain, 2008 No No Yes No
Asch, 2002 Yes No No Yes
Astrand, 2000 No Yes Yes No
Azzazi, 2011 No No Yes Yes
Carragee, 2006 Yes Yes Yes Yes
Casal-Moro, 2011 Yes Yes Yes Yes
Cho, 2011 No No Yes Yes
Choi, 2011 No No Yes Yes
Chumnanvej, 2011 Yes Yes Yes No
Crockett, 2014 Yes Yes Yes No
Dedering, 2012 No Yes Yes Yes
den Boer, 2006 Yes No Yes No
Ebrahim, 2010 No No Yes No
Floman, 2007 Yes No No No
Guilfoyle, 2007 Yes No No Yes
Hakkinen, 2007 Yes No Yes Yes
Johansson, 2010 Yes No Yes Yes
Lagerback, 2015 Yes Yes No Yes
Lebow, 2011 No No No Yes
Lebow, 2011 No No Yes Yes
Lee, 2011 Yes Yes Yes Yes
Lee-a, 2015 Yes No No No
Lee-b, 2011 Yes Yes Yes Yes
Lierz, 2009 Yes Yes No No
Mirzai, 2007 Yes Yes Yes Yes
Moranjkic, 2010 Yes No Yes Yes
Nie, 2011 Yes No Yes Yes
Ohtori, 2010 No No Yes Yes
Peng, 2010 No No No No
Putzier, 2005 No No Yes No
Ratsep, 2014 Yes Yes Yes No
Righesso, 2012 Yes No Yes Yes
Sasani, 2007 No No Yes Yes
Schaufele, 2008 Yes No Yes Yes
Schick, 2009 No No Yes No
Sencer, 2014 Yes Yes No Yes
Shabat, 2012 No No Yes No
Wang, 2011 No No Yes No
Wu, 2008 Yes Yes Yes Yes
aSource of participants and sample selection described.bConsecutive or random sampling of participants gathered at a common point in the course of the disease.cOutcome data available for at least 80% of participants at 1 follow-up point.dIncluding statistical adjustments for important prognostic factors.
125

CHAPTER SEVEN
Effectiveness of surgery for lumbar spinal stenosis: a systematic review and meta-
analysis
Chapter Seven has been published as:
Machado GC, Ferreira PH, Harris IA, et al. Effectiveness of surgery for lumbar spinal stenosis:
a systematic review and meta-analysis. PLoS ONE 2015;10:e0122800. Copyright © 2015,
Machado et al. This is an open access article.
126

Statement from co-authors confirming authorship contribution of
the PhD candidate
The co-authors of the paper “Effectiveness of surgery for lumbar spinal stenosis: a systematic
review and meta-analysis” confirm that Gustavo de Carvalho Machado has made the following
contributions:
Conception and design of the research
Analysis and interpretation of the findings
Writing of the manuscript and critical appraisal of the content
In addition to the statements above, in cases where I am not the corresponding author of a
published item, permission to include the published material has been granted by the
corresponding author.
Gustavo de Carvalho Machado _________________________ Date: 30 November 2016
As supervisor for the candidature upon which this thesis is based, I can confirm that the
authorship attribution statements above are correct.
Manuela Loureiro Ferreira _________________________ Date: 30 November 2016
127

RESEARCH ARTICLE
Effectiveness of Surgery for Lumbar Spinal
Stenosis: A Systematic Review and Meta-
Analysis
Gustavo C. Machado1*, Paulo H. Ferreira2, Ian A. Harris3, Marina B. Pinheiro2, Bart
W. Koes4, Maurits van Tulder5, Magdalena Rzewuska1, Chris G. Maher1, Manuela
L. Ferreira1,6
1 The George Institute for Global Health, Sydney Medical School, University of Sydney, Sydney, NSW,
Australia, 2 Faculty of Health Sciences, University of Sydney, Sydney, NSW, Australia, 3 South WesternSydney Clinical School, Ingham Institute for Applied Medical Research, University of New South Wales,Sydney, NSW, Australia, 4 Department of General Practice, Erasmus Medical Centre, Rotterdam, The
Netherlands, 5 Department of Health Sciences, VU University, Amsterdam, The Netherlands, 6 Institute ofBone and Joint Research, Sydney Medical School, University of Sydney, Sydney, NSW, Australia
Abstract
Background
The management of spinal stenosis by surgery has increased rapidly in the past two de-
cades, however, there is still controversy regarding the efficacy of surgery for this condition.
Our aim was to investigate the efficacy and comparative effectiveness of surgery in the
management of patients with lumbar spinal stenosis.
Methods
Electronic searches were performed on MEDLINE, EMBASE, AMED, CINAHL, Web of Sci-
ence, LILACS and Cochrane Library from inception to November 2014. Hand searches
were conducted on included articles and relevant reviews. We included randomised con-
trolled trials evaluating surgery compared to no treatment, placebo/sham, or to another sur-
gical technique in patients with lumbar spinal stenosis. Primary outcome measures were
pain, disability, recovery and quality of life. The PEDro scale was used for risk of bias as-
sessment. Data were pooled with a random-effects model, and the GRADE approach was
used to summarise conclusions.
Results
Nineteen published reports (17 trials) were included. No trials were identified comparing
surgery to no treatment or placebo/sham. Pooling revealed that decompression plus fusion
is not superior to decompression alone for pain (mean difference –3.7, 95% confidence in-
terval –15.6 to 8.1), disability (mean difference 9.8, 95% confidence interval –9.4 to 28.9), or
walking ability (risk ratio 0.9, 95% confidence interval 0.4 to 1.9). Interspinous process spac-
er devices are slightly more effective than decompression plus fusion for disability (mean
PLOSONE | DOI:10.1371/journal.pone.0122800 March 30, 2015 1 / 18
OPEN ACCESS
Citation: Machado GC, Ferreira PH, Harris IA,
Pinheiro MB, Koes BW, van Tulder M, et al. (2015)
Effectiveness of Surgery for Lumbar Spinal Stenosis:
A Systematic Review and Meta-Analysis. PLoS ONE
10(3): e0122800. doi:10.1371/journal.pone.0122800
Academic Editor: Mohammed Shamji, Toronto
Western Hospital, CANADA
Received: November 10, 2014
Accepted: February 13, 2015
Published: March 30, 2015
Copyright: © 2015 Machado et al. This is an open
access article distributed under the terms of the
Creative Commons Attribution License, which permits
unrestricted use, distribution, and reproduction in any
medium, provided the original author and source are
credited.
Data Availability Statement: All relevant data are
within the paper and its Supporting Information files.
Funding: The authors have no support or funding to
report.
Competing Interests: The authors have declared
that no competing interests exist.
128
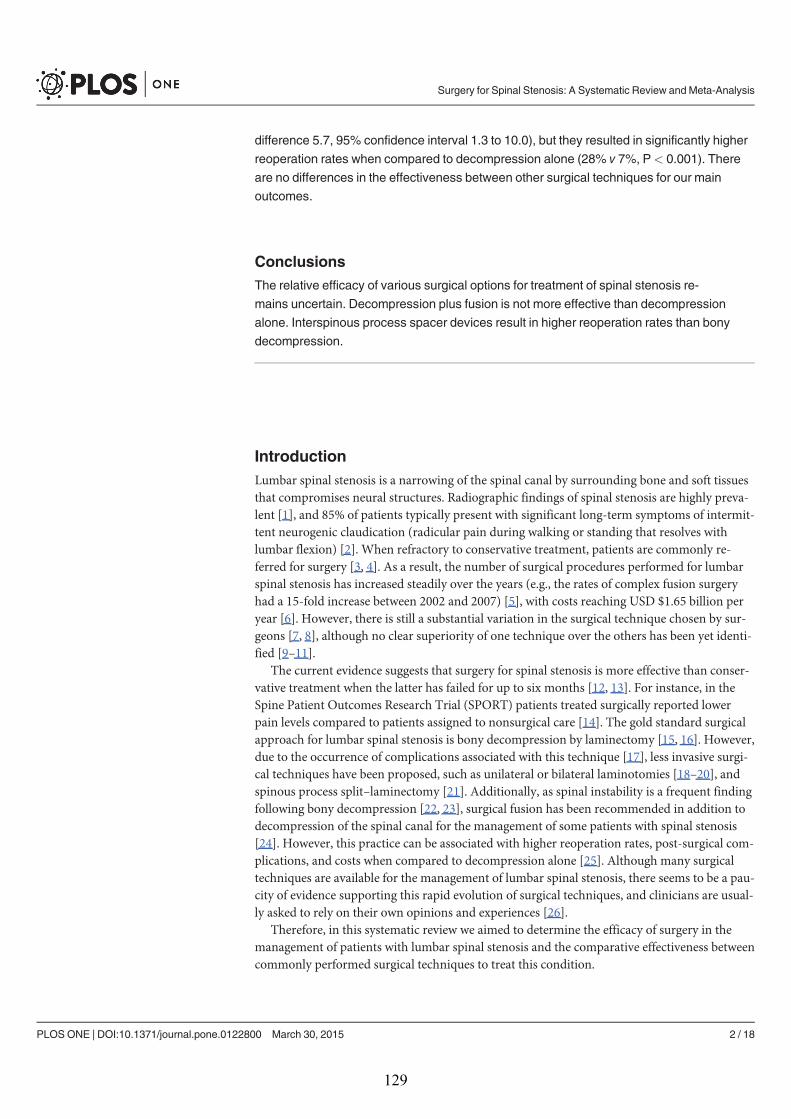
difference 5.7, 95% confidence interval 1.3 to 10.0), but they resulted in significantly higher
reoperation rates when compared to decompression alone (28% v 7%, P< 0.001). There
are no differences in the effectiveness between other surgical techniques for our main
outcomes.
Conclusions
The relative efficacy of various surgical options for treatment of spinal stenosis re-
mains uncertain. Decompression plus fusion is not more effective than decompression
alone. Interspinous process spacer devices result in higher reoperation rates than bony
decompression.
Introduction
Lumbar spinal stenosis is a narrowing of the spinal canal by surrounding bone and soft tissues
that compromises neural structures. Radiographic findings of spinal stenosis are highly preva-
lent [1], and 85% of patients typically present with significant long-term symptoms of intermit-
tent neurogenic claudication (radicular pain during walking or standing that resolves with
lumbar flexion) [2]. When refractory to conservative treatment, patients are commonly re-
ferred for surgery [3, 4]. As a result, the number of surgical procedures performed for lumbar
spinal stenosis has increased steadily over the years (e.g., the rates of complex fusion surgery
had a 15-fold increase between 2002 and 2007) [5], with costs reaching USD $1.65 billion per
year [6]. However, there is still a substantial variation in the surgical technique chosen by sur-
geons [7, 8], although no clear superiority of one technique over the others has been yet identi-
fied [9–11].
The current evidence suggests that surgery for spinal stenosis is more effective than conser-
vative treatment when the latter has failed for up to six months [12, 13]. For instance, in the
Spine Patient Outcomes Research Trial (SPORT) patients treated surgically reported lower
pain levels compared to patients assigned to nonsurgical care [14]. The gold standard surgical
approach for lumbar spinal stenosis is bony decompression by laminectomy [15, 16]. However,
due to the occurrence of complications associated with this technique [17], less invasive surgi-
cal techniques have been proposed, such as unilateral or bilateral laminotomies [18–20], and
spinous process split–laminectomy [21]. Additionally, as spinal instability is a frequent finding
following bony decompression [22, 23], surgical fusion has been recommended in addition to
decompression of the spinal canal for the management of some patients with spinal stenosis
[24]. However, this practice can be associated with higher reoperation rates, post-surgical com-
plications, and costs when compared to decompression alone [25]. Although many surgical
techniques are available for the management of lumbar spinal stenosis, there seems to be a pau-
city of evidence supporting this rapid evolution of surgical techniques, and clinicians are usual-
ly asked to rely on their own opinions and experiences [26].
Therefore, in this systematic review we aimed to determine the efficacy of surgery in the
management of patients with lumbar spinal stenosis and the comparative effectiveness between
commonly performed surgical techniques to treat this condition.
Surgery for Spinal Stenosis: A Systematic Review and Meta-Analysis
PLOS ONE | DOI:10.1371/journal.pone.0122800 March 30, 2015 2 / 18
129

Material and Methods
Data sources and search
We conducted a systematic review and meta-analysis following the recommendations of the
PRISMA statement [27]. The methods of this review have been previously registered with
PROSPERO, number CRD42013005901. We performed a systematic electronic search on
MEDLINE, EMBASE, AMED, CINAHL, Web of Science, LILACS and Cochrane Central Reg-
ister of Controlled Trials from the date of inception until 2014. The search strategy
is in S1 Table. Hand searches of references were also conducted on relevant reviews and
Study selection
Two independent reviewers (GM and MP/MR) performed the selection of studies and consen-
sus was used to resolve any disagreement. To be included, studies needed to be full published
randomised controlled trials comparing the efficacy of surgery to no treatment, placebo/sham,
or comparing the effectiveness of different types of surgical procedures. Trials were included if
they explicitly reported that subjects were treated for lumbar spinal stenosis, despite its ana-
tomical classification (central, foraminal or lateral), or diagnostic criteria. There were no re-
strictions regarding intensity or duration of symptoms, language or publication date. Studies of
patients with trauma, tumour, and previous spine surgery were excluded. As degenerative
spondylolisthesis is a common finding in patients with lumbar spinal stenosis, only trials in-
cluding patients with spondylolisthesis greater than grade I were excluded. Review articles,
guidelines, observational studies, trials comparing different types of fusion techniques, and sur-
gery for cervical spine stenosis were also excluded.
Data extraction and quality assessment
Using a standardised extraction form, data from each included study were independently ex-
tracted by two reviewers (GM and MP) and consensus used to resolve any disagreement. The
following information from each study was extracted: participants’ characteristics (age, stenosis
duration and diagnosis criteria), type of surgery and outcome measure. Primary outcomes of
interest were pain (e.g., back pain, leg pain, overall pain), disability (e.g., Oswestry Disability
Index, walking ability), quality of life, and recovery. Quality of life measures of our interest in-
cluded for example total scores of the 36-item short-form health survey (SF-36) or from the
EuroQol questionnaire. However, none of the trials included in our review reported the total
scores of these measures. Instead, they reported scores for the sub-items (e.g., Physical Func-
tion or Physical Component Scores) and therefore could not be included in our analyses. Re-
covery was measured using the differences between preoperative and postoperative Japanese
Orthopaedic Association (JOA) scores and reported in the included trials. Secondary outcomes
included perioperative surgical data (e.g., blood loss, operation time, length of hospitalisation),
complications, reoperations, and costs. To enable cross-trial comparisons, terms used to de-
scribe surgical complications were coded based on previously established standard definitions
for common complications post spine surgery [28]. We extracted sample sizes, means (final
values) and standard deviations for continuous outcomes, and number of cases for dichoto-
mous outcomes. If trials reported incomplete data, authors were contacted for further informa-
tion. If authors were unavailable, missing data were imputed according to recommendations in
the Cochrane Handbook for Systematic Reviews of Interventions [29].
We used the Physiotherapy Evidence Database (PEDro) scale to assess the methodological
quality of the included studies. The PEDro scale is widely used to assess the quality of clinical
Surgery for Spinal Stenosis: A Systematic Review and Meta-Analysis
PLOS ONE | DOI:10.1371/journal.pone.0122800 March 30, 2015 3 / 18
130

trials in various areas of medicine [30], and consists of an 11-item checklist that has been
shown to be a valid and reliable tool [31, 32]. Two raters (GM and MR) independently assessed
the methodological quality of each included study and a third author resolved any disagree-
ment. Trials were considered to be of high methodological quality when the PEDro final score
was!6 points.
Data synthesis and analysis
All data on leg pain, back pain or overall pain were extracted from included trials. If trials re-
ported more than one measure of pain intensity (e.g., back and leg pain), the more severe mea-
sure at baseline was included in the analyses. Pain and disability outcome measures were
converted to scales from 0 (no pain or disability) to 100 (worst possible pain or disability). For
data synthesis, follow-up times were categorized as short-term (less than 12 months) and long-
term (12 months or more). If studies reported multiple time points within each category, the
time point closest to three months for the short-term, and 12 months for the long-term were
used. When more than one scale to measure pain or disability was reported, the one cited by
the authors as the primary outcome was used. When studies reported results for more than
two intervention groups, we combined similar groups according to the recommendations in
the Cochrane Handbook [29].
Trials were grouped according to type of surgery comparison, outcomes, and assessment
time points. We used a random-effects model to calculate mean differences (MD) and 95%
confidence intervals (CI) for continuous measures. For dichotomous outcomes, risk ratio (RR)
and 95% CI was used. Descriptive and inferential statistics were used to present complication
and reoperation rates, with a significance level at 5%. The I2 statistic was used to assess hetero-
geneity between trials, and values higher than 50% were defined to identify high heterogeneity
[33]. Comprehensive Meta-Analysis version 2.2.064 (Englewood, NJ, USA, 2011) was used for
all analyses.
Grading the evidence and applicability
The GRADE (Grading of Recommendations Assessment, Development and Evaluation) sys-
tem was used to assess the overall quality of the evidence and strength of recommendations for
each outcome measure [34]. The quality of evidence was downgraded by one level according to
the following criteria: limitation of study design (> 25% of the studies with low methodological
quality [PEDro score< 6]), inconsistency of results (statistically significant heterogeneity [I2>
50%] or" 75% of trials with findings in the same direction), and imprecision (wide confidence
intervals or total number of participants< 300 for each pooled analysis). The indirectness cri-
terion was not considered in this review because we included a specific population with rele-
vant outcomes and direct comparisons. Where only single trials were available, evidence from
studies with< 300 participants was downgraded for inconsistency and imprecision and rated
as “low quality” evidence. They could be further downgraded to “very low quality” evidence if
limitations of study design were found. The quality of evidence was defined as: “high quality”,
“moderate quality”, “low quality”, and “very low quality” [34].
Results
Study characteristics
A total of 7,284 records were identified. After excluding duplicates 5,148 titles and abstracts
were reviewed, and 168 full text records were assessed. Of these, 19 published reports (17 ran-
domised controlled trials) remained eligible for inclusion in our review [9–11, 35–50]. Flow
Surgery for Spinal Stenosis: A Systematic Review and Meta-Analysis
PLOS ONE | DOI:10.1371/journal.pone.0122800 March 30, 2015 4 / 18
131

chart diagram of included studies with the main reasons for exclusion are shown in Fig 1. Two
records reported results from the same trial, a subgroup analysis and overall results [48, 49].
Therefore, only the full report was included in our analysis. One trial was published in English
as well as in German [9, 50], and as they reported similar results we included the English publi-
cation in our analyses. All remaining trials included in this review were published in English
and therefore no translation was required.
Participant characteristics
The 17 included trials investigated a total of 1,554 patients and most studies defined lumbar
spinal stenosis based on clinical assessment with a concordant imaging diagnosis [9–11, 36–38,
40–47, 49]. One study included patients based solely on imaging diagnosis [35], and another
study used clinical assessment only [39]. Fourteen out of 17 trials (82%) explicitly reported in-
cluding only patients who had failed to improve with conservative treatment [9–11, 36–38, 40–
43, 45–47, 49]. The characteristics of included studies and participants are described in
Table 1.
Quality assessment
The methodological quality of the included trials revealed a mean score of 5.5 (standard devia-
tion 1.8) using the PEDro scale (range, 0 to 10 score). The most common methodological flaws
were lack of blinding (therapist, patient and assessor) and failure to use an intention-to-treat
analysis. The three studies that blinded the patients reported that all patients gave informed
consent and only one trial described that patients were informed about the operation, timing,
Fig 1. Flow Diagram of Studies Included in the Systematic Review. RCT = randomised controlled trial.*Number of citations includes duplicates.
doi:10.1371/journal.pone.0122800.g001
Surgery for Spinal Stenosis: A Systematic Review and Meta-Analysis
PLOS ONE | DOI:10.1371/journal.pone.0122800 March 30, 2015 5 / 18
132

Table 1. Characteristics of Included Studies.
Study Details of Participants Surgery Type Outcomes (Time Point)
Decompression v Decompression+Fusion
Bridwell et al,1993
44 patients (G1 = 10, G2 and G3combined = 34); Mean age (range): 66.1(46–79) years; Stenosis duration: NR
G1: Decompression; G2: Decompressionplus fusion; G3: As G2 with instrumentation
Walking ability, complications,reoperations; at mean follow-up of 3.1years
Grob et al,1995
45 patients (G1 = 15, G2 and G3combined = 30); Mean age (range): 67 (48–87) years; Stenosis duration: NR
G1: Decompression; G2: Decompressionplus fusion (most stenotic segment); G3: AsG2 (all stenotic segments)
VAS (overall pain), walking ability,operation time, blood loss, complications,reoperations; at 24 months
Hallet et al,2007
44 patients (G1 = 14, G2 and G3combined = 30); Mean age (range): 57 (34–75) years; Stenosis duration: NR
G1: Decompression; G2: Decompressionplus instrumented postero-lateral fusion; G3:As G2 plus transforaminal interbody fusion
VAS (back pain), RMDQ, operation time,blood loss, reoperations, costs; at 24months
Laminectomy v Laminotomy
Postacchiniet al, 1992
67 patients (G1 = 35, G2 = 32); Mean age(range): 57 (43–79) years; Stenosisduration: NR
G1: Multiple laminotomy; G2: Laminectomy VAS (leg pain, radicular symptoms),operating time, blood loss, complications;at mean follow-up of 3.7 years
Thome et al,2005
120 patients (G1 and G2 combined = 80,G3 = 40); Mean age (SD): 68 (9) years;Mean stenosis duration (SD): 20.2 (29.7)months
G1: Bilateral laminotomy; G2: Unilaterallaminotomy; G3: Laminectomy
VAS (overall pain), RMDQ, walkingdistance, duration of operation, bloodloss, complications, reoperations; at 3and 12 months
Cavusogluet al, 2007
100 patients (G1 = 50, G2 = 50); Mean age(SD): 69.2 (12.2) years; Stenosis duration: 8to 60 months
G1: Unilateral laminectomy; G2: Unilaterallaminotomy
SF-36 body pain, ODI, complications; at3 months and 4 to 7 years
Celik et al,2010
80 patients (G1 = 40, G2 = 40); Mean age(SD): G1 = 61 (13), G2 = 59 (14) years;Stenosis duration: NR
G1: Total laminectomy; G2: Bilateralmicrodecompressive laminotomy
VAS (leg pain), ODI, walking distance,operation time, blood loss, complications,reoperations; at 3 and 12 months
Gurelik et al,2012
52 patients (G1 = 26, G2 = 26); Mean age(SD): G1 = 60.7 (10), G2 = 57.5 (8.5) years;Stenosis duration: NR
G1: Unilateral laminotomy; G2:Laminectomy
ODI, walking distance; at 6 months
Laminectomy v Split-laminectomy/laminotomy
Watanabeet al, 2011
41 patients (G1 = 22, G2 = 19); Mean age(SD): G1 = 69 (10), G2 = 71 (8) years;Stenosis duration: NR
G1: Spinous process-splitting laminectomy;G2: Laminectomy
JOA, recovery, operation time, bloodloss, reoperations; at 12 months
Liu et al, 2013 56 patients (G1 = 27, G2 = 29); Mean age(SD): G1 = 59.4 (4.7), G2 = 61.1 (3.1) years;Mean stenosis duration: G1 = 6.5, G2 = 5.9years
G1: Modified unilateral laminotomy; G2:Laminectomy
VAS (leg pain), JOA, operation time,blood loss; at 24 months
Rajasekaranet al, 2013
51 patients (G1 = 28, G2 = 23); Mean age(SD): G1 = 57.3 (11.2), G2 = 54.5 (8.2)years; Stenosis duration: NR
G1: Spinous process-splitting laminectomy;G2: Laminectomy
VAS (leg pain), JOA, recovery, operationtime, blood loss, hospitalisation,complications, reoperations; at 6 and 12months
Laminectomy/laminotomy v Endoscopic-laminectomy/laminotomy
Ruetten et al,2009
192 patients (G1 = 100, G2 = 92); Mean age(range): 64 (38–86) years; Mean stenosisduration (range): 19 (2–78) months
G1: Laminotomy; G2: Full endoscopiclaminotomy
ODI, operation time, complications,reoperations; at 3 and 12 months
Yagi et al,2009
41 patients (G1 = 20, G2 = 21); Mean age(range): G1 = 73.3 (63–79), G2 = 70.8 (66–73) years; Stenosis duration: NR
G1: Microendoscopic laminectomy; G2:Laminectomy
JOA, operation time, blood loss,hospitalisation; at 3 and 12 months
Laminectomy/laminotomy v Interspinous process spacer device
Stromqvistet al, 2013
100 (G1 = 50, G2 = 50); Mean age (range):69 (49–89) years; Stenosis duration: NR
G1: Laminectomy/laminotomy; G2: X-Stopdevice
VAS (leg pain), ZCQ (physical function),operation time, complications,reoperations; at 6 and 12 months
Moojen et al,2013
159 patients (G1 = 79; G2 = 80); Medianage (range): G1 = 64 (47–83), G2 = 66 (45–83) years; Mean stenosis duration: G1 = 22,G2 = 23 months
G1: Laminotomy/fecetectomy; G2: CoflexDevice
VAS (leg pain), ZCQ (physical function),walking ability, operation time,hospitalisation, complications,reoperations; at 6 and 12 months
Decompression+Fusion v Interspinous process spacer device
(Continued)
Surgery for Spinal Stenosis: A Systematic Review and Meta-Analysis
PLOS ONE | DOI:10.1371/journal.pone.0122800 March 30, 2015 6 / 18
133

and potential complications before the procedure [37, 46, 49]. Only half of the included trials
reported concealed allocation (Fig 2). Full details of the final PEDro score for each trial is pre-
sented in S2 Table. Given the small number of trials included in each meta-analysis, small
study bias analysis was not possible.
Interventions
No trials comparing surgery to no treatment or placebo/sham were identified. Therefore, all in-
cluded trials compared different types of surgical techniques for lumbar spinal stenosis. Quality
of evidence assessment and summary of findings, as well as the results of perioperative surgical
outcomes (operation time, blood loss, and hospitalisation) are shown in Table 2. Pooled effect
sizes for pain and disability at both short and long-term follow-up are presented in Figs 3 and
4.
Decompression v Decompression plus fusion
The addition of fusion to bony decompression was investigated in three randomised trials re-
porting data from 133 patients at long-term follow-up [9, 44, 45]. Pooled analysis showed
Table 1. (Continued)
Study Details of Participants Surgery Type Outcomes (Time Point)
Azzazi et al,2010
60 patients (G1 = 30, G2 = 30); Mean age(range): 56.3 (27–79) years; Mean stenosisduration: 5.3 (0.2–36.9) years
G1: Decompression plus transpedicularscrew fixation; G2: X-Stop device
VAS (leg pain), ODI, operation time,hospitalisation, complications; at 24months
Davis et al,2013
322 patients (G1 = 107, G2 = 215); Meanage (SD): G1 = 64.1 (9); G2 = 62.1 (9.2);Stenosis duration: NR
G1: Decompression plus transpedicularscrew fixation; G2: Coflex device
VAS (leg pain), ODI, operation time,blood loss, hospital length of stay,complications, reoperations; at 24months
SD = standard deviation; NR = not reported; VAS = visual analogue scale; RMDQ = Roland Morris Disability questionnaire; ODI = Oswestry Disability
Index; SF-36 = 36-item short-form health survey; JOA = Japanese Orthopaedic Association Score; ZCQ = Zurich Claudication Questionnaire
doi:10.1371/journal.pone.0122800.t001
Fig 2. Risk of Bias (PEDro) Criteria and Number of Trials in Each Category. PEDro = PhysiotherapyEvidence Database.
doi:10.1371/journal.pone.0122800.g002
Surgery for Spinal Stenosis: A Systematic Review and Meta-Analysis
PLOS ONE | DOI:10.1371/journal.pone.0122800 March 30, 2015 7 / 18
134

Table 2. Summary of Findings and Quality of Evidence Assessment (GRADE).
Summary of Findings Quality of Evidence Assessment (GRADE)
Outcomes Time Point No. Patients Effect Sizea (95% CI) Studylimitation
Consistency Precision Quality
Decompression v Decompression+Fusion
Pain Long-term 86[9, 45] –3.7 (–15.6 to 8.1) Limitation (–1) Inconsistency (–1)
Imprecision (–1)
Very low
Disability Long-term 41[45] 9.8 (–9.4 to 28.9) No limitation One study (–1) One study (–1) Low
Walking abilityb Long-term 88[9, 44] RR: 0.9 (0.4 to 1.9) Limitation (–1) Inconsistency (–1)
Imprecision (–1)
Very low
Operation time (min) Perioperative 89[9, 45] –105.2 (–227.6 to 17.3) Limitation (–1) No inconsistency Imprecision (–1)
Low
Blood loss (mL) Perioperative 89[9, 45] –826.5 (–1582.7 to—70.2)
Limitation (–1) Inconsistency (–1)
Imprecision (–1)
Very low
Laminectomy v Laminotomy
Pain Short-term 281[10, 36, 37] –0.4 (–4.3 to 3.5) No limitation Inconsistency (–1)
Imprecision (–1)
Low
Pain Long-term 393[10, 35–37,39]
1.7 (–4.4 to 7.8) Limitation (–1) Inconsistency (–1)
No imprecision Low
Disability Short-term 333[10, 36–38] 1.6 (–1.0 to 4.2) No limitation No inconsistency No imprecision High
Disability Long-term 335[10, 36, 37,39]
1.1 (–1.7 to 3.8) No limitation Inconsistency (–1)
No imprecision Moderate
Walking ability (m) Short-term 233[36–38] –7.6 (–37.4 to 22.3) Limitation (–1) Inconsistency (–1)
Imprecision (–1)
Very low
Walking ability (m) Long-term 181[36, 37] –3.0 (–32.7 to 26.7) No limitation No inconsistency Imprecision (–1)
Moderate
Operation time (min) Perioperative 279[35–37, 39] –3.6 (–30.0 to 22.9) Limitation (–1) No inconsistency Imprecision (–1)
Low
Blood loss (mL) Perioperative 302[35–37, 39] 34.1 (15.1 to 53.0) Limitation (–1) No inconsistency No imprecision Moderate
Laminectomy v Split–laminectomy/laminotomy
Pain Long-term 105[39, 41] 2.3 (–3.8 to 8.4) Limitation (–1) Inconsistency (–1)
Imprecision (–1)
Very low
Disability Long-term 148[39–41] –1.0 (–4.8 to 2.9) Limitation (–1) Inconsistency (–1)
Imprecision (–1)
Very low
Recovery Long-term 137[39–41] 2.1 (–5.7 to 9.8) Limitation (–1) Inconsistency (–1)
Imprecision (–1)
Very low
Operation time (min) Perioperative 146[39–41] –2.8 (–19.2 to 13.5) Limitation (–1) Inconsistency (–1)
Imprecision (–1)
Very low
Blood loss (mL) Perioperative 146[39–41] 21.8 (16.4 to 27.2) Limitation (–1) No inconsistency Imprecision (–1)
Low
Hospitalisation(days)
Perioperative 51[41] –0.1 (–0.6 to 0.4) No limitation One study (–1) One study (–1) Low
Laminectomy/laminotomy v Endoscopic–laminectomy/laminotomy
Disability Short-term 202[42, 43] 5.2 (–2.2 to 12.5) Limitation (–1) No inconsistency Imprecision (–1)
Low
Disability Long-term 202[42, 43] 3.1 (–0.7 to 7.0) Limitation (–1) No inconsistency Imprecision (–1)
Low
Operation time (min) Perioperative 233[42, 43] 3.5 (–17.6 to 24.6) Limitation (–1) Inconsistency (–1)
Imprecision (–1)
Very low
Blood loss (mL) Perioperative 41[43] 34.0 (30.4 to 37.6) Limitation (–1) One study (–1) One study (–1) Very low
Hospitalisation(days)
Perioperative 41[43] 8.6 (6.8 to 10.3) Limitation (–1) One study (–1) One study (–1) Very low
Laminectomy/laminotomy v Interspinous process spacer device
(Continued)
Surgery for Spinal Stenosis: A Systematic Review and Meta-Analysis
PLOS ONE | DOI:10.1371/journal.pone.0122800 March 30, 2015 8 / 18
135

“very low quality” evidence of nonsignificant difference between treatment groups on pain re-
duction (MD—3.7, 95% CI—15.6 to 8.1). One trial revealed “low quality” evidence of no be-
tween-group difference for disability (MD 9.8, 95% CI—9.4 to 28.9). Two trials evaluated the
effectiveness of decompression plus fusion compared to decompression alone on walking abili-
ty (i.e., patients were considered improved when able to increase their walking distance by 50%
at follow-up). The analysis provided “very low quality” evidence of no difference on walking
ability between groups (RR 0.9, 95% CI 0.4 to 1.9). Mean direct surgery costs was higher for pa-
tients treated by decompression plus fusion (USD $16,115) compared to decompression alone
(USD $10,392). However, no inferential statistics were reported for this outcome.
Laminectomy v Laminotomy
Six randomised controlled trials reporting data from 475 patients compared laminectomy to
unilateral [10, 36, 38, 39], and bilateral laminotomies [35–37]. For pain, we found “low quality”
evidence that laminotomy is not superior to laminectomy at short-term (MD—0.4, 95% CI—
4.3 to 3.5) and long-term follow-up (MD 1.7, 95% CI—4.4 to 7.8). Likewise, “high” to “moder-
ate quality” evidence revealed that laminotomy failed to show disability reduction when com-
pared to laminectomy at short-term (MD 1.6, 95% CI—1.0 to 4.2) and long-term follow-up
(MD 1.1, 95% CI—1.7 to 3.8). For short-term walking ability (i.e., walking distance in metres
Table 2. (Continued)
Summary of Findings Quality of Evidence Assessment (GRADE)
Outcomes Time Point No. Patients Effect Sizea (95% CI) Studylimitation
Consistency Precision Quality
Pain Short-term 247[11, 46] –4.8 (–11.1 to 1.5) No limitation No inconsistency Imprecision (–1)
Moderate
Pain Long-term 247[11, 46] –2.4 (–13.6 to 8.9) No limitation Inconsistency (–1)
Imprecision (–1)
Low
Disability Short-term 248[11, 46] –0.4 (–6.9 to 6.2) No limitation Inconsistency (–1)
Imprecision (–1)
Low
Disability Long-term 246[11, 46] –0.8 (–8.4 to 6.7) No limitation Inconsistency (–1)
Imprecision (–1)
Low
Walking abilityb Short-term 145[46] OR: 0.8 (0.4 to 1.3) No limitation One study (–1) One study (–1) Low
Walking abilityb Long-term 136[46] OR: 1.3 (0.9 to 1.8) No limitation One study (–1) One study (–1) Low
Operation time (min) Perioperative 259[11, 46] 27.4 (10.8 to 44.1) No limitation Inconsistency (–1)
Imprecision (–1)
Low
Hospitalisation(days)
Perioperative 159[46] 0.1 (–0.3 to 0.4) No limitation One study (–1) One study (–1) Low
Decompression+Fusion v Interspinous process spacer device
Pain Long-term 308[47, 49] 5.3 (–1.1 to 11.6) Limitation (–1) No inconsistency No imprecision Moderate
Disability Long-term 308[47, 49] 5.7 (1.3 to 10.0) Limitation (–1) No inconsistency No imprecision Moderate
Operation time (min) Perioperative 381[47, 49] 78.8 (30.1 to 127.6) Limitation (–1) No inconsistency No imprecision Moderate
Blood loss (mL) Perioperative 320[49] 238.9 (194.8 to 283.0) No limitation One study (–1) One study (–1) Low
Hospitalisation(days)
Perioperative 382[47, 49] 1.6 (0.9 to 2.3) Limitation (–1) No inconsistency No imprecision Moderate
RR = risk ratio; OR = odds ratio; CI = confidence interval; m = metres; mL = millilitres; min = minutes.aEffect size is mean difference, unless otherwise specified. Negative value favours first comparator. Effect sizes (95% CI) in bold indicate statistically
significant results.bDichotomous data: Walking ability better (ability to walk 50% farther or increase of 80 m in the walking distance postoperatively) or same/worse, effect
size reported as risk ratio or odds ratio.
doi:10.1371/journal.pone.0122800.t002
Surgery for Spinal Stenosis: A Systematic Review and Meta-Analysis
PLOS ONE | DOI:10.1371/journal.pone.0122800 March 30, 2015 9 / 18
136

without radicular pain), there is “very low quality” evidence that laminotomy is not superior to
laminectomy (MD—7.6, 95% CI—37.4 to 22.3), and “moderate quality” evidence of no differ-
ence at long-term follow-up (MD—3.0, 95% CI—32.7 to 26.7).
Laminectomy v Split–laminectomy/laminotomy
Three trials reported data of 148 patients treated with bony decompression by laminectomy or
with spinous process split–laminectomy/laminotomy at long-term follow-up [39–41]. Pooling
showed no statistically significant difference between treatments for pain (MD 2.3, 95% CI—
3.8 to 8.4) and disability (MD—1.0, 95% CI—4.8 to 2.9). We also found no difference on long-
term recovery rate (MD 2.1, 95% CI—5.7 to 9.8) assessed by the Japanese Association Score
(range, 0 to 100). The overall quality of evidence was rated as “very low quality” for all three
outcomes, according to the GRADE criteria.
Laminectomy/laminotomy v Endoscopic–laminectomy/laminotomy
The effectiveness of endoscopic–assisted laminectomy/laminotomy was investigated in two
randomised trials including 233 patients [42, 43]. Pooling revealed “low quality” evidence of
no significant effect of endoscopic approaches compared to conventional laminectomy/lami-
notomy on disability at short-term (MD 5.2, 95% CI—2.2 to 12.5), and long-term follow-up
(MD 3.1, 95% CI—0.7 to 7.0). Pain intensity was not reported in these two studies.
Fig 3. Mean Difference for Pain and Disability at Short-term Follow-up (less than 12months). *Decompression technique is laminectomyor laminotomy.
doi:10.1371/journal.pone.0122800.g003
Surgery for Spinal Stenosis: A Systematic Review and Meta-Analysis
PLOS ONE | DOI:10.1371/journal.pone.0122800 March 30, 2015 10 / 18
137

Fig 4. Mean Difference for Pain and Disability at Long-term Follow-up (12 months or more).*Decompression technique is laminectomy or laminotomy
doi:10.1371/journal.pone.0122800.g004
Surgery for Spinal Stenosis: A Systematic Review and Meta-Analysis
PLOS ONE | DOI:10.1371/journal.pone.0122800 March 30, 2015 11 / 18
138

Laminectomy/laminotomy v Interspinous process spacer device
Two high methodological quality trials reported data of 259 patients comparing bony decom-
pression by laminectomy or laminotomies to the X-Stop and Coflex interspinous process spac-
er devices [11, 46]. At short-term follow-up, “moderate quality” evidence showed no difference
on pain reduction (MD—4.8, 95% CI—11.1 to 1.5). Likewise, “low quality” evidence revealed
no long-term difference on pain between groups (MD—2.4, 95% CI—13.6 to 8.9). For disabili-
ty, “low quality evidence” did not reveal any difference at short-term (MD—0.4, 95% CI—6.9
to 6.2) and long-term follow-up (MD—0.8, 95% CI—8.4 to 6.7). Additionally, one study
showed “low quality” evidence of no benefit of interspinous spacers compared to decompres-
sion on walking ability (i.e., ability to walk 1200 m within 15 minutes or increase of 80 m com-
pared to baseline walking distance) at short-term (OR 0.8, 95% CI 0.4 to 1.3) and long-term
follow-up (OR 1.3, 95% CI 0.9 to 1.8).
Decompression plus fusion v Interspinous process spacer device
Two trials compared decompression plus fusion to the X-Stop and Coflex devices [47, 49], in-
cluding a total of 382 patients analysed at long-term follow-up only. There is “moderate quali-
ty” evidence of no difference between groups on pain reduction (MD 5.3, 95% CI—1.1 to 11.6).
However, we found “moderate quality” evidence that interspinous spacers are slightly superior
to decompression plus fusion on disability outcomes in the long-term (MD 5.7, 95% CI 1.3 to
10.0).
Adverse events and reoperations
We found high variability in the number of reported adverse events across surgical techniques,
with rates ranging from 4% to 45%. Trials reported a wide variety of minor and major surgical
adverse events, ranging from transient urinary retention to cerebrovascular accident. Overall,
reoperation rates ranged from 3% to 28%, with the interspinous process spacer devices reveal-
ing the highest rates.
“Very low” and “low quality” evidence revealed that patients undergoing decompression
plus fusion had an overall higher rate of adverse events (20/64, 31% v 3/24, 13%; P = 0.07) and
reoperations (9/92, 10% v 1/37, 3%; P = 0.47) when compared to decompression alone. This
difference was not statistically significant, however. “Moderate quality” evidence showed that
laminectomy had nonsignificant higher adverse events (23/154, 15% v 19/192, 10%; P = 0.60)
and reoperations rates (6/68, 9% v 4/114, 4%; P = 0.12) than the minimally invasive lamino-
tomies. We found “low” and “very low quality” evidence that conventional laminectomy re-
vealed nonsignificant higher adverse event (3/23, 13% v 1/28, 4%, P = 0.25) and reoperation
rates (1/38, 3% v 1/45, 2%, P = 0.90) than the spinous process splitting techniques. There is
“very low quality” evidence that laminectomy/laminotomy result in significantly higher ad-
verse event rates (16/100, 16% v 5/92, 5%; P = 0.03) than the endoscopic techniques. However,
no difference in reoperation rates was observed (2/80, 3% v 3/81, 4%; P = 0.66). In trials investi-
gating the effectiveness of interspinous process spacer devices, we found “moderate quality” ev-
idence that bony decompression is not associated with higher adverse events (9/129, 7% v 6/
130, 5%; P = 0.74). However, interspinous process spacers revealed a significantly higher reop-
eration rate (34/123, 28% v 9/122, 7%; P< 0.001). Trials comparing decompression plus fusion
to interspinous process spacer devices reported similar rates of adverse events for both tech-
niques (45%), and “low quality” evidence revealed no difference in rates of revision surgery
(23/215, 11% v 8/107, 7%; P = 0.36).
Surgery for Spinal Stenosis: A Systematic Review and Meta-Analysis
PLOS ONE | DOI:10.1371/journal.pone.0122800 March 30, 2015 12 / 18
139

Discussion
The results of this systematic review have revealed a paucity of evidence on the efficacy of sur-
gery for lumbar spinal stenosis, to date there are no published randomised controlled trials
comparing surgery to no treatment or placebo/sham surgery. Placebo-controlled trials in sur-
gery are feasible and powerful to show the efficacy of surgical procedures [51]. Therefore, we
identified 17 published randomised trials that reported the comparative effectiveness of differ-
ent surgical techniques. Our results show that overall there is no difference in the effectiveness
among the most commonly used surgical techniques for lumbar spinal stenosis. More impor-
tantly, we have demonstrated that the addition of fusion to traditional decompression for the
treatment of lumbar spinal stenosis adds no benefit in terms of pain or disability. We found
that the interspinous process spacer devices showed better outcomes (disability, operation
time, blood loss, and hospitalisation) compared to decompression plus fusion. However, inter-
spinous spacers have significantly higher reoperation rates than bony decompression.
There are several strengths to our review. We have used a prespecified registered protocol,
performed a sensitive electronic search on seven different databases, and selected studies with
no restrictions for language or publication date. To our knowledge, this is the first review to ob-
jectively estimate the effectiveness amongst all surgical techniques for lumbar spinal stenosis
focusing on patient-related outcomes, whereas past reviews performed pooled analysis based
on surgeon-related outcomes (i.e., the effectiveness of a surgical technique was rated by the sur-
geon) [16]. Our review included only randomised clinical trials, as causal inference of treat-
ment on clinical outcomes can only be made when patients are truly randomised to treatment
groups [52]. A further limitation of past reviews is that many have drawn conclusions based on
non-randomised trials (i.e., indirect comparisons, observational studies and case series) [53–
55]. Although it is debatable whether meta-analysis from randomised trials can provide accu-
rate estimates about harms of medical interventions [56, 57], this is the first review to assess
the safety of all surgical techniques for lumbar spinal stenosis by investigating reported
adverse events, reoperation rates, perioperative blood loss, operation time, and length
of hospitalisation.
Our review has identified important weaknesses in the literature. Overall, the methodologi-
cal quality of included studies was poor. Whereas blinding of the caregiver in surgical trials is
typically not possible, only six trials reported blinding of outcome assessors and three studies
reported that patients were blinded. The reporting of data was also poor among some included
studies, and we had to estimate the treatment effect from graphs or by adopting data (e.g., stan-
dard deviation) from similar studies. We recommend that future trials follow the CONSORT
statement when reporting randomised controlled trials [58]. The safety of surgical interven-
tions also varied largely across studies and not all trials have reported the numbers of adverse
events or reoperations. Therefore, it is possible we have underestimated the rates of complica-
tions and reoperations and alert that our conclusions on harms of included interventions
should be interpreted with caution. Future studies should be more thorough in reporting these
surgical outcomes [59]. Another limitation of our study is the inclusion of few studies in each
meta-analysis and the variability of techniques used by surgeons.
We found no trials investigating the efficacy of surgery for lumbar spinal stenosis compared
to placebo/sham surgery. Therefore its true efficacy rather than the effect of the patient's expec-
tation of the surgical intervention (placebo effect) remains unknown. Given the amount of sur-
gical techniques for the treatment of lumbar spinal stenosis the need for placebo/sham-
controlled trials has never been greater. Previous work has proposed the appropriate ethical
considerations for sham surgery [60], and demonstrated that placebo/sham-controlled trials in
surgery are feasible [51]. For instance, sham-controlled trials have been recently published in
Surgery for Spinal Stenosis: A Systematic Review and Meta-Analysis
PLOS ONE | DOI:10.1371/journal.pone.0122800 March 30, 2015 13 / 18
140

investigating the efficacy of vertebroplasty for painful osteoporotic vertebral fractures [61]. In
these trials, sham surgery was performed by inserting a blunt stylet and gently tapping the ver-
tebral body. Likewise, Flum has suggested performing minimally invasive approaches to the
spine, simulating the decompressive technique, but without actually removing any bone tissue
[62]. The addition of fusion to decompression for spinal stenosis has been previously investi-
gated in systematic reviews with conflicting conclusions [63, 64]. We have identified three ran-
domised trials comparing decompression alone to decompression plus fusion, and our results
revealed no significant differences between treatment groups on clinical outcomes. In fact, de-
compression plus fusion revealed significantly higher intraoperative blood loss when compared
to decompression alone. These findings are based on “low” to “very low” quality evidence,
however. One high quality trial revealed a cost difference of approximately USD $6,290 per pa-
tient for an additional fusion implant [45]. Therefore, the superiority of decompression plus fu-
sion to decompression alone is still uncertain and surgeons should choose between these
techniques with caution, especially considering the associated costs and perioperative compli-
cations of fusion. A systematic review has also investigated the effectiveness of interspinous
process spacer devices for spinal stenosis, suggesting that spacer devices are superior to bony
decompression [54]. However, this result was based on indirect comparisons through a net-
work meta-analysis. Similarly, a second systematic review has failed to identify trials directly
comparing these two techniques [53]. More recently, Wu et al reported results from meta-anal-
yses that included both randomised and non-randomised studies [65]. In our review, pooling
of two high methodological quality randomised trials has revealed no difference between treat-
ments on pain, disability, or walking ability. Although the spacer devices showed significantly
less operation time, they resulted in higher numbers of revision surgeries. Therefore, due to
lack of effectiveness and higher reoperation rates of interspinous process devices compared to
bony decompression, the recommendation for the use of decompressive devices is debatable.
Conclusions
In conclusion, there is relatively limited evidence to guide the use of surgery for the manage-
ment of lumbar spinal stenosis. Overall, the quality of the available evidence ranged from
“high” to “very low” revealing nonsignificant differences across surgical techniques for lumbar
spinal stenosis, and a small, but clinically debatable, benefit of interspinous spacer devices com-
pared to decompression plus fusion. The addition of fusion to decompression is more costly,
leads to more intraoperative blood loss, and fails to promote superior outcomes if compared to
decompression alone. Although the operation using interspinous spacers is quicker, these de-
vices are more expensive than conventional bony decompression and are associated with
higher revision surgeries. We, therefore, question the use of decompression plus fusion and the
safety of interspinous spacers in the management of patients with lumbar spinal stenosis. More
high quality trials comparing the effectiveness between techniques are needed to support our
findings. Patients and clinicians could use this review as an evidence-based tool to help decide
the best surgical option for this condition.
Supporting Information
S1 Checklist. PRISMA Checklist.
(DOC)
S1 Table. Search Strategy.
(DOCX)
Surgery for Spinal Stenosis: A Systematic Review and Meta-Analysis
PLOS ONE | DOI:10.1371/journal.pone.0122800 March 30, 2015 14 / 18
141

S2 Table. Risk of Bias (PEDro) of Included Studies. PEDro = Physiotherapy Evidence Data-
base.
(DOCX)
Author Contributions
Conceived and designed the experiments: GCMMLF CGM PHF IAH. Performed the experi-
ments: GCMMLFMBP MR. Analyzed the data: GCMMLF CGM IAH. Contributed reagents/
materials/analysis tools: MvT BWKMBPMR. Wrote the paper: GCMMLF CGM PHF IAH.
Critical revision of the manuscript for important intellectual content: MvT BWK.
References1. Ishimoto Y, Yoshimura N, Muraki S, Yamada H, Nagata K, Hashizume H, et al. Associations between
radiographic lumbar spinal stenosis and clinical symptoms in the general population: the WakayamaSpine Study. Osteoarthritis Cartilage. 2013; 21: 783–788. doi: 10.1016/j.joca.2013.02.656 PMID:23473979
2. Benoist M. The natural history of lumbar degenerative spinal stenosis. Joint Bone Spine. 2002; 69:450–457. PMID: 12477228
3. Johnsson KE, Rosen I, Uden A. The natural course of lumbar spinal stenosis. Clin Orthop Relat Res.1992: 82–86.
4. You JJ, Bederman SS, Symons S, Bell CM, Yun L, Laupacis A, et al. Patterns of care after magneticresonance imaging of the spine in primary care. Spine. 2013; 38: 51–59. doi: 10.1097/BRS.0b013e3182611182 PMID: 22652596
5. Deyo RA, Gray DT, Kreuter W, Mirza S, Martin BI. United States trends in lumbar fusion surgery for de-generative conditions. Spine. 2005; 30: 1441–1445; discussion 1446–1447. PMID: 15959375
6. Deyo RA, Mirza SK, Martin BI, Kreuter W, Goodman DC, Jarvik JG. Trends, major medical complica-tions, and charges associated with surgery for lumbar spinal stenosis in older adults. JAMA. 2010;303: 1259–1265. doi: 10.1001/jama.2010.338 PMID: 20371784
7. Davis H. Increasing rates of cervical and lumbar spine surgery in the United States, 1979–1990. Spine.1994; 19: 1117–1123; discussion 1123–1114. PMID: 8059266
8. Ciol MA, Deyo RA, Howell E, Kreif S. An assessment of surgery for spinal stenosis: time trends, geo-graphic variations, complications, and reoperations. J AmGeriatr Soc. 1996; 44: 285–290. PMID:8600197
9. Grob D, Humke T, Dvorak J. Degenerative lumbar spinal stenosis. Decompression with and without ar-throdesis. J Bone Joint Surg Am 1995; 77: 1036–1041. PMID: 7608225
10. Cavusoglu H, Turkmenoglu O, Kaya RA, Tuncer C, Colak I, Sahin Y, et al. Efficacy of unilateral lami-nectomy for bilateral decompression in lumbar spinal stenosis. Turk Neurosurg. 2007; 17: 100–108.PMID: 17935024
11. Stromqvist BH, Berg S, Gerdhem P, Johnsson R, Moller A, Sahlstrand T, et al. X-stop versus decom-pressive surgery for lumbar neurogenic intermittent claudication: Randomized controlled trial with 2-year follow-up. Spine. 2013; 38: 1436–1442. doi: 10.1097/BRS.0b013e31828ba413 PMID: 23403549
12. Kovacs FM, Urrútia G, Alarcón JD. Surgery versus conservative treatment for symptomatic lumbar spi-nal stenosis: a systematic review of randomized controlled trials. Spine. 2011; 36: E1335–1351. doi:10.1097/BRS.0b013e31820c97b1 PMID: 21311394
13. May S, Comer C. Is surgery more effective than non-surgical treatment for spinal stenosis, and whichnon-surgical treatment is more effective? A systematic review. Physiotherapy. 2013; 99: 12–20. doi:10.1016/j.physio.2011.12.004 PMID: 23219644
14. Weinstein JN, Tosteson TD, Lurie JD, Tosteson ANA, Blood E, Hanscom B, et al. Surgical versus non-surgical therapy for lumbar spinal stenosis. N Engl J Med. 2008; 358: 794–810. doi: 10.1056/NEJMoa0707136 PMID: 18287602
15. Jansson KA, Blomqvist P, Granath F, Nemeth G. Spinal stenosis surgery in Sweden 1987–1999. EurSpine J. 2003; 12: 535–541. PMID: 12768381
16. Gibson JN, Waddell G. Surgery for degenerative lumbar spondylosis: updated Cochrane Review.Spine. 2005; 30: 2312–2320. PMID: 16227895
Surgery for Spinal Stenosis: A Systematic Review and Meta-Analysis
PLOS ONE | DOI:10.1371/journal.pone.0122800 March 30, 2015 15 / 18
142

17. Stromqvist F, Jonsson B, Stromqvist B, Swedish Society of Spinal Surgeons. Dural lesions in decom-pression for lumbar spinal stenosis: incidence, risk factors and effect on outcome. Eur Spine J. 2012;21: 825–828. doi: 10.1007/s00586-011-2101-2 PMID: 22146791
18. Aryanpur J, Ducker T. Multilevel lumbar laminotomies for focal spinal stenosis: case report. Neurosur-gery. 1988; 23: 111–115. PMID: 2971890
19. Spetzger U, Bertalanffy H, Reinges MHT, Gilsbach JM. Unilateral laminotomy for bilateral decompres-sion of lumbar spinal stenosis. Part II: Clinical experiences. Acta Neurochir (Wien). 1997; 139: 397–403. PMID: 9204107
20. Spetzger U, Bertalanffy H, Naujokat C, von Keyserlingk DG, Gilsbach JM. Unilateral laminotomy for bi-lateral decompression of lumbar spinal stenosis. Part I: Anatomical and surgical considerations. ActaNeurochir (Wien). 1997; 139: 392–396. PMID: 9204106
21. Watanabe K, Hosoya T, Shiraishi T, Matsumoto M, Chiba K, Toyama Y. Lumbar spinous process-split-ting laminectomy for lumbar canal stenosis. Technical note. J Neurosurg Spine. 2005; 3: 405–408.PMID: 16302638
22. Johnsson KE, Redlund-Johnell I, Uden A, Willner S. Preoperative and postoperative instability in lum-bar spinal stenosis. Spine. 1989; 14: 591–593. PMID: 2749373
23. Nasca RJ. Rationale for spinal fusion in lumbar spinal stenosis. Spine. 1989; 14: 451–454. PMID:2718051
24. Taylor VM, Deyo RA, Cherkin DC, Kreuter W. Low back pain hospitalization. Recent United Statestrends and regional variations. Spine. 1994; 19: 1207–1212; discussion 1213. PMID: 8073311
25. Deyo RA, Martin BI, Ching A, Tosteson AN, Jarvik JG, Kreuter W, et al. Interspinous spacers comparedwith decompression or fusion for lumbar stenosis: complications and repeat operations in the medicarepopulation. Spine. 2013; 38: 865–872. doi: 10.1097/BRS.0b013e31828631b8 PMID: 23324936
26. Katz JN, Lipson SJ, Lew RA, Grobler LJ, Weinstein JN, Brick GW, et al. Lumbar laminectomy alone orwith instrumented or noninstrumented arthrodesis in degenerative lumbar spinal stenosis. Patient se-lection, costs, and surgical outcomes. Spine. 1997; 22: 1123–1131. PMID: 9160471
27. Liberati A, Altman DG, Tetzlaff J, Mulrow C, Gotzsche PC, Ioannidis JP, et al. The PRISMA statementfor reporting systematic reviews and meta-analyses of studies that evaluate healthcare interventions:explanation and elaboration. BMJ. 2009; 339: b2700. doi: 10.1136/bmj.b2700 PMID: 19622552
28. Mirza SK, Deyo RA, Heagerty PJ, Turner JA, Lee LA, Goodkin R. Towards standardized measurementof adverse events in spine surgery: conceptual model and pilot evaluation. BMCMusculoskelet Disord.2006; 7: 53. PMID: 16787537
29. Higgins JPT, Green S. Cochrane Handbook for Systematic Reviews of Interventions Version 5.1.0 [up-dated March 2011]. The Cochrane Collaboration, 2011. Available from www.cochrane-handbook.org.:The Cochrane Collaboration.
30. Elkins MR, Moseley AM, Sherrington C, Herbert RD, Maher CG. Growth in the Physiotherapy EvidenceDatabase (PEDro) and use of the PEDro scale. Br J Sports Med. 2013; 47: 188–189. doi: 10.1136/bjsports-2012-091804 PMID: 23134761
31. Maher CG, Sherrington C, Herbert RD, Moseley AM, Elkins M. Reliability of the PEDro scale for ratingquality of randomized controlled trials. Phys Ther. 2003; 83: 713–721. PMID: 12882612
32. de Morton NA. The PEDro scale is a valid measure of the methodological quality of clinical trials: a de-mographic study. Aust J Physiother. 2009; 55: 129–133. PMID: 19463084
33. Higgins JP, Thompson SG. Quantifying heterogeneity in a meta-analysis. Stat Med. 2002; 21: 1539–1558. PMID: 12111919
34. Guyatt GH, Oxman AD, Vist GE, Kunz R, Falck-Ytter Y, Alonso-Coello P, et al. GRADE: an emergingconsensus on rating quality of evidence and strength of recommendations. BMJ. 2008; 336: 924–926.doi: 10.1136/bmj.39489.470347.AD PMID: 18436948
35. Postacchini F, Cinotti G, Perugia D, Gumina S. The surgical treatment of central lumbar stenosis. Multi-ple laminotomy compared with total laminectomy. J Bone Joint Surg Br. 1993; 75: 386–392. PMID:8496205
36. Thome C, Zevgaridis D, Leheta O, Bazner H, Pockler-Schoniger C, Wohrle J, et al. Outcome after less-invasive decompression of lumbar spinal stenosis: a randomized comparison of unilateral laminotomy,bilateral laminotomy, and laminectomy. J Neurosurg Spine. 2005; 3: 129–141. PMID: 16370302
37. Celik SE, Celik S, Goksu K, Kara A, Ince I. Microdecompressive laminatomy with a 5-year follow-up pe-riod for severe lumbar spinal stenosis. J Spinal Disord Tech. 2010; 23: 229–235. doi: 10.1097/BSD.0b013e3181a3d889 PMID: 20526152
38. Gurelik M, Bozkina C, Kars Z, Karadag O, Unal O, Bayrakli F. Unilateral laminotomy for decompressionof lumbar stenosis is effective and safe: A prospective randomized comparative study. J Neurol Sci.2012; 29: 744–753.
Surgery for Spinal Stenosis: A Systematic Review and Meta-Analysis
PLOS ONE | DOI:10.1371/journal.pone.0122800 March 30, 2015 16 / 18
143

39. Liu X, Yuan S, Tian Y. Modified unilateral laminotomy for bilateral decompression for lumbar spinal ste-nosis: Technical note. Spine. 2013; 38: E732–E737. doi: 10.1097/BRS.0b013e31828fc84c PMID:23466507
40. Watanabe K, Matsumoto M, Ikegami T, Nishiwaki Y, Tsuji T, Ishii K, et al. Reduced postoperativewound pain after lumbar spinous process-splitting laminectomy for lumbar canal stenosis: A random-ized controlled study. Clinical article. J Neurosurg Spine. 2011; 14: 51–58. doi: 10.3171/2010.9.SPINE09933 PMID: 21142464
41. Rajasekaran S, Thomas A, Kanna RM, Shetty AP. Lumbar spinous process splitting decompressionprovides equivalent outcomes to conventional midline decompression in degenerative lumbar canalstenosis: A prospective, randomised controlled study of 51 patients. Spine. 2013; 38: 1737–1743. doi:10.1097/BRS.0b013e3182a056c1 PMID: 23797498
42. Ruetten S, KompM, Merk H, Godolias G. Surgical treatment for lumbar lateral recess stenosis with thefull-endoscopic interlaminar approach versus conventional microsurgical technique: A prospective, ran-domized, controlled study—Clinical article. J Neurosurg Spine. 2009; 10: 476–485. doi: 10.3171/2008.7.17634 PMID: 19442011
43. Yagi M, Okada E, Ninomiya K, Kihara M. Postoperative outcome after modified unilateral-approachmicroendoscopic midline decompression for degenerative spinal stenosis: Clinical article. J NeurosurgSpine. 2009; 10: 293–299. doi: 10.3171/2009.1.SPINE08288 PMID: 19441985
44. Bridwell KH, Sedgewick TA, O'Brien MF, Lenke LG, Baldus C. The role of fusion and instrumentation inthe treatment of degenerative spondylolisthesis with spinal stenosis. J Spinal Disord. 1993; 6: 461–472. PMID: 8130395
45. Hallett A, Huntley JS, Gibson JN. Foraminal stenosis and single-level degenerative disc disease: a ran-domized controlled trial comparing decompression with decompression and instrumented fusion.Spine. 2007; 32: 1375–1380. PMID: 17545903
46. MoojenWA, Arts MP, JacobsWC, van Zwet EW, van den Akker-van Marle ME, Koes BW, et al. Inter-spinous process device versus standard conventional surgical decompression for lumbar spinal steno-sis: randomized controlled trial. BMJ. 2013; 347: f6415. doi: 10.1136/bmj.f6415 PMID: 24231273
47. Azzazi A, Elhawary Y. Dynamic stabilization using X-stop versus transpedicular screw fixation in thetreatment of lumbar canal stenosis: comparative study of the clinical outcome. Neurosurg Q. 2010; 20:165–169.
48. Davis R, Auerbach JD, Bae H, Errico TJ. Can low-grade spondylolisthesis be effectively treated by ei-ther coflex interlaminar stabilization or laminectomy and posterior spinal fusion Two-year clinical and ra-diographic results from the randomized, prospective, multicenter US investigational device exemptiontrial: Clinical article. J Neurosurg Spine. 2013; 19: 174–184. doi: 10.3171/2013.4.SPINE12636 PMID:23725394
49. Davis RJ, Errico TJ, Bae H, Auerbach JD. Decompression and coflex interlaminar stabilization com-pared with decompression and instrumented spinal fusion for spinal stenosis and low-grade degenera-tive spondylolisthesis: Two-year results from the prospective, randomized, multicenter, food and drugadministration investigational device exemption trial. Spine. 2013; 38: 1529–1539. doi: 10.1097/BRS.0b013e31829a6d0a PMID: 23680830
50. Grob D, Humke T, Dvorak J. Surgical decompression of degenerative lumbar spinal stenosis with andwithout fusion. Orthopade. 1993; 22: 243–249. PMID: 8414481
51. Wartolowska K, Judge A, Hopewell S, Collins GS, Dean BJ, Rombach I, et al. Use of placebo controlsin the evaluation of surgery: systematic review. BMJ. 2014; 348: g3253. doi: 10.1136/bmj.g3253 PMID:24850821
52. Rubin DB. Formal modes of statistical inference for causal effects. Journal of Statistical Planning andInference. 1990; 25: 279–292.
53. MoojenWA, Arts MP, Bartels RH, JacobsWC, Peul WC. Effectiveness of interspinous implant surgeryin patients with intermittent neurogenic claudication: a systematic review and meta-analysis. Eur SpineJ. 2011; 20: 1596–1606. doi: 10.1007/s00586-011-1873-8 PMID: 21667130
54. Chou D, Lau D, Hermsmeyer J, Norvell D. Efficacy of interspinous device versus surgical decompres-sion in the treatment of lumbar spinal stenosis: a modified network analysis. Evid Based Spine Care J.2011; 2: 45–56. doi: 10.1055/s-0031-1274756 PMID: 23230405
55. Turner JA, Ersek M, Herron L, Deyo R. Surgery for lumbar spinal stenosis. Attempted meta-analysis ofthe literature. Spine. 1992; 17: 1–8. PMID: 1531550
56. Golder S, Loke YK, Bland M. Meta-analyses of adverse effects data derived from randomised con-trolled trials as compared to observational studies: methodological overview. PLoSMed. 2011; 8:e1001026. doi: 10.1371/journal.pmed.1001026 PMID: 21559325
57. Papanikolaou PN, Christidi GD, Ioannidis JP. Comparison of evidence on harms of medical interven-tions in randomized and nonrandomized studies. CMAJ. 2006; 174: 635–641. PMID: 16505459
Surgery for Spinal Stenosis: A Systematic Review and Meta-Analysis
PLOS ONE | DOI:10.1371/journal.pone.0122800 March 30, 2015 17 / 18
144

58. Schulz KF, Altman DG, Moher D. CONSORT 2010 statement: updated guidelines for reporting parallelgroup randomised trials. BMJ. 2010; 340: c332. doi: 10.1136/bmj.c332 PMID: 20332509
59. Ioannidis JP, Evans SJ, Gotzsche PC, O'Neill RT, Altman DG, Schulz K, et al. Better reporting of harmsin randomized trials: an extension of the CONSORT statement. Ann Intern Med. 2004; 141: 781–788.PMID: 15545678
60. Horng S, Miller FG. Ethical framework for the use of sham procedures in clinical trials. Crit Care Med.2003; 31: S126–130. PMID: 12626957
61. Buchbinder R, Osborne RH, Ebeling PR, Wark JD, Mitchell P, Wriedt C, et al. A randomized trial of ver-tebroplasty for painful osteoporotic vertebral fractures. N Engl J Med. 2009; 361: 557–568. doi: 10.1056/NEJMoa0900429 PMID: 19657121
62. Flum DR. Interpreting surgical trials with subjective outcomes: avoiding UnSPORTsmanlike conduct.JAMA. 2006; 296: 2483–2485. PMID: 17119146
63. Martin CR, Gruszczynski AT, Braunsfurth HA, Fallatah SM, O'Neil J, Wai EK. The surgical manage-ment of degenerative lumbar spondylolisthesis: a systematic review. Spine. 2007; 32: 1791–1798.PMID: 17632401
64. Resnick DK, Choudhri TF, Dailey AT, Groff MW, Khoo L, Matz PG, et al. Guidelines for the performanceof fusion procedures for degenerative disease of the lumbar spine. Part 9: fusion in patients with steno-sis and spondylolisthesis. Journal of Neurosurgery Spine. 2005; 2: 679–685. PMID: 16028737
65. Wu AM, Zhou Y, Li QL, Wu XL, Jin YL, Luo P, et al. Interspinous spacer versus traditional decompres-sive surgery for lumbar spinal stenosis: a systematic review and meta-analysis. PLoS One. 2014; 9:e97142. doi: 10.1371/journal.pone.0097142 PMID: 24809680
Surgery for Spinal Stenosis: A Systematic Review and Meta-Analysis
PLOS ONE | DOI:10.1371/journal.pone.0122800 March 30, 2015 18 / 18
145

Ap
pen
dix
S1
Tab
le S
1.S
earc
h S
trat
egy
ME
DL
INE
, A
ME
D a
nd
Coch
ran
e C
entr
al
Reg
iste
r of
Con
troll
ed T
rials
(u
p t
o N
ovem
ber
2014
)1
.(s
pin
al s
teno
sis
or
canal
ste
no
sis
or
(sp
in* a
dj3
ste
no
sis)
or
(lu
mb
ar a
dj3
ste
no
sis)
or
(lat
eral
ad
j3 s
teno
sis)
or
(cen
tral
ad
j3 s
teno
sis)
or
(fo
ram
in* a
dj3
sten
osi
s) o
r neu
rogen
ic c
laud
icat
ion o
r ra
dic
ulo
pat
hy o
r ra
dic
ula
r p
ain o
r lu
mb
ar r
adic
ula
r p
ain o
r sp
ond
ylo
list
hes
is o
r (l
um
b* a
dj5
sp
ond
yl*
) o
rsp
ond
ylo
sis)
.mp
. [m
p=
titl
e, s
ub
ject
hea
din
g w
ord
, re
gis
try w
ord
, ab
stra
ct,
trad
e nam
e/gen
eric
nam
e]2
.(g
ener
al s
urg
ery o
r su
rger
y o
r d
eco
mp
ress
ion o
r d
eco
mp
res*
surg
ery o
r (s
pin
* a
dj3
dec
om
pre
ss*)
or
lam
inec
tom
y o
r la
min
ecto
m*
or
lam
ino
tom
* o
rla
min
op
last
y o
r sp
inal
fusi
on o
r (s
pin
* a
dj3
fusi
on)
or
(ped
icle
ad
j3 s
crew
) o
r lu
mb
ar f
usi
on o
r ver
teb
rae
fusi
on
or
ver
teb
ral
fixat
ion o
r sp
inal
fix
atio
n o
rsp
ond
ylo
des
is o
r sp
ond
ylo
syn
des
is o
r ar
thro
des
is o
r ar
thro
des
is o
r (p
ost
ero
late
ral
adj3
fusi
on)
or
(inte
rbo
dy a
dj3
fusi
on)
or
(ante
rio
r ad
j3 f
usi
on)
or
(po
ster
ior
adj3
fusi
on)
or
(tra
nsf
ora
min
al a
dj3
fusi
on)
or
(tra
nsp
soas
ad
j3 f
usi
on)
or
(fac
et a
dj3
fusi
on)
or
(bo
ne
adj3
gra
ft)
or
(fix
atio
n a
dj3
sp
in*)
or
(ped
icle
adj3
fusi
on)
or
gra
ft o
r (c
age
adj3
fusi
on)
or
(scr
ew a
dj3
fusi
on)
or
fora
min
oto
my o
r fo
ram
inec
tom
y o
r su
rgic
al p
roce
dure
s, m
inim
ally
in
vas
ive
or
min
im*
invas
ive)
.mp
. [m
p=
titl
e, s
ub
ject
hea
din
g w
ord
, re
gis
try w
ord
, ab
stra
ct,
trad
e nam
e/gen
eric
nam
e]3
.1
and
24
.(r
and
om
ized
co
ntr
oll
ed t
rial
or
(ran
do
m* a
dj3
tri
al)
or
contr
oll
ed c
linic
al t
rial
or
rand
om
ized
or
pla
ceb
o o
r ra
nd
om
ly o
r ra
nd
om
* o
r tr
ial
or
clin
ical
tri
al o
rcl
inic
al s
tud
y).
mp
. [m
p=
titl
e, s
ub
ject
hea
din
g w
ord
, re
gis
try w
ord
, ab
stra
ct,
trad
e nam
e/gen
eric
nam
e]5
.3
and
46
.L
imit
5 t
o h
um
ans
EM
BA
SE
(u
p t
o N
ovem
ber
2014)
1.
'ver
teb
ral
canal
ste
no
sis'
/exp
OR
'ver
teb
ral
canal
ste
no
sis'
OR
'sp
ine
NE
AR
/3 s
teno
sis'
OR
'lu
mb
ar N
EA
R/3
ste
no
sis'
OR
'lat
eral
NE
AR
/3 s
teno
sis'
OR
'cen
tral
ste
no
sis'
OR
'fo
ram
inal
ste
no
sis'
OR
'neu
rogen
ic c
laud
icat
ion
' OR
'rad
iculo
pat
hy'/ex
p O
R r
adic
ulo
pat
hy O
R 'r
adic
ula
r p
ain
'/exp
OR
'rad
icula
r p
ain
'O
R 'l
um
bar
rad
icula
r p
ain
' OR
'sp
ond
ylo
list
hes
is'/e
xp
OR
sp
ond
ylo
list
hes
is O
R 's
po
nd
ylo
sis'
/exp
OR
sp
ond
ylo
sis
2.
'surg
ery'/e
xp
OR
surg
ery O
R 'd
eco
mp
ress
ion s
urg
ery'/e
xp
OR
'dec
om
pre
ssio
n s
urg
ery' O
R 'd
eco
mp
ress
ion s
pin
al c
ord
'/exp
OR
'dec
om
pre
ssio
n s
pin
al c
ord
'O
R 'd
eco
mp
ress
ion
'/exp
OR
dec
om
pre
ssio
n O
R 'l
amin
ecto
my
'/exp
OR
lam
inec
tom
y O
R l
amin
oto
my O
R 'l
amin
op
last
y'/ex
p O
R l
amin
op
last
y O
R 's
pin
efu
sio
n'/e
xp
OR
'sp
ine
fusi
on
' OR
'sp
inal
fusi
on
'/exp
OR
'sp
inal
fu
sio
n' O
R 'l
um
bar
NE
AR
/3 f
usi
on
' OR
'ver
teb
rae
fusi
on
' OR
'ver
teb
ral
fixat
ion
' OR
'sp
ond
ylo
des
is'/e
xp
OR
sp
ond
ylo
des
is O
R 's
pin
al f
ixat
ion
' OR
'sp
inal
fix
atio
n d
evic
e'/e
xp
OR
'sp
inal
fix
atio
n d
evic
e' O
R 's
po
nd
ylo
synd
esis
'/exp
OR
spo
nd
ylo
synd
esis
OR
po
ster
ola
tera
l N
EA
R/3
fusi
on O
R i
nte
rbo
dy N
EA
R/3
fu
sio
n O
R a
nte
rio
r N
EA
R/3
fu
sio
n O
R p
ost
erio
r N
EA
R/3
fu
sio
n O
Rtr
ansf
ora
min
al N
EA
R/3
fusi
on O
R 't
ransp
soas
fusi
on
' OR
fac
et N
EA
R/3
fusi
on O
R 'a
rthro
des
is'/e
xp
OR
art
hro
des
is O
R b
one
NE
AR
/5gra
ft O
R f
ixat
ion
NE
AR
/5 s
pin
* O
R p
edic
le N
EA
R/5
fusi
on O
R c
age
NE
AR
/5 f
usi
on O
R s
crew
NE
AR
/5 f
usi
on O
R p
edic
le N
EA
R/5
scr
ew O
R 'f
ora
min
oto
my'/ex
p O
Rfo
ram
ino
tom
y O
R f
ora
min
ecto
my O
R 'm
inim
ally
in
vas
ive
pro
ced
ure
s'/e
xp
OR
'min
imal
ly i
nvas
ive
pro
ced
ure
s' O
R 'm
inim
$ i
nvas
ive'
3.
#1
AN
D #
24
.'r
and
om
ized
co
ntr
oll
ed t
rial
'/exp
OR
'ran
do
miz
ed c
ontr
oll
ed t
rial
' OR
'co
ntr
oll
ed c
linic
al t
rial
'/exp
OR
'co
ntr
oll
ed c
linic
al t
rial
' OR
'cli
nic
al t
rial
'/exp
OR
'cli
nic
al t
rial
' OR
ran
do
miz
ed:a
b O
R p
lace
bo
:ab
OR
ran
do
mly
:ab
OR
tri
al:a
b O
R 'c
linic
al s
tud
y':a
b5
.#
3 A
ND
#4
6.
5A
ND
'hu
man
'/de
146
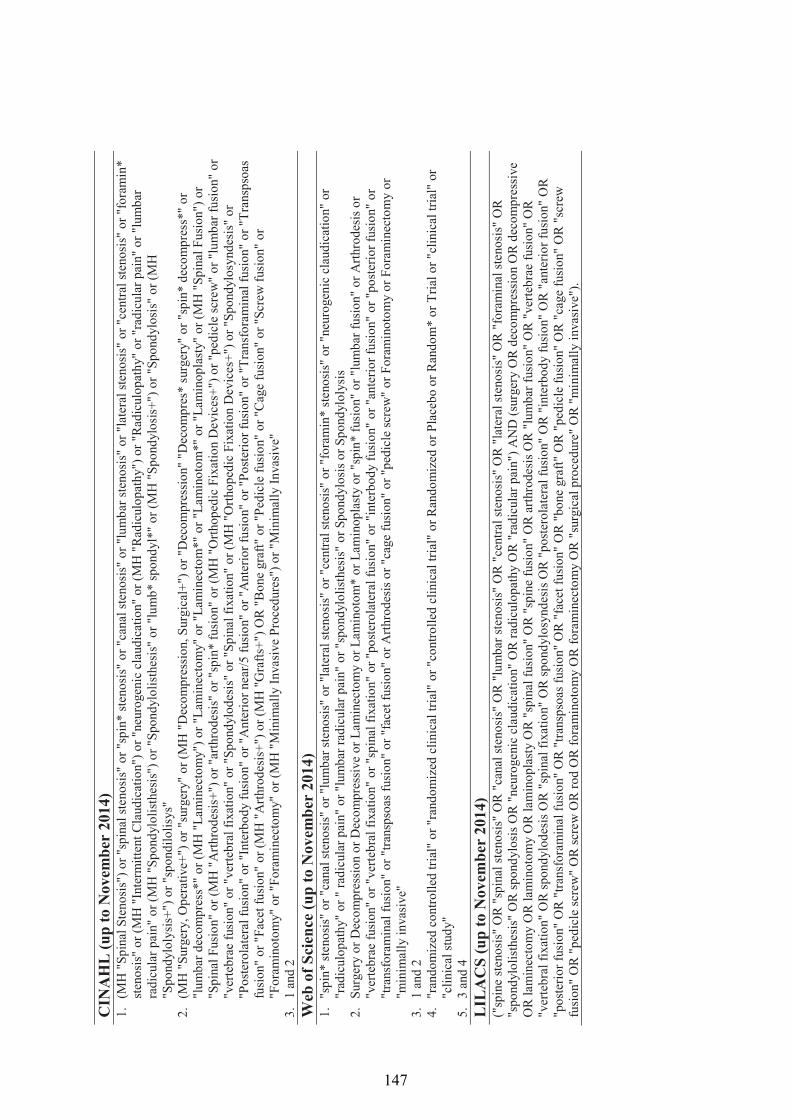
CIN
AH
L (
up
to N
ovem
ber
2014)
1.
(MH
"Sp
inal
Ste
no
sis"
)o
r"s
pin
alst
eno
sis"
or
"sp
in*
sten
osi
s"o
r"c
anal
sten
osi
s"o
r"l
um
bar
sten
osi
s"o
r"l
ater
alst
eno
sis"
or
"cen
tral
sten
osi
s"o
r"f
ora
min
*st
eno
sis"
or
(MH
"Inte
rmit
tent
Cla
ud
icat
ion")
or
"neu
rogen
iccl
aud
icat
ion"
or
(MH
"Rad
iculo
pat
hy")
or
"Rad
iculo
pat
hy"
or
"rad
icula
rp
ain"
or
"lum
bar
rad
icula
rp
ain"
or
(MH
"Sp
ond
ylo
list
hes
is")
or
"Spo
nd
ylo
list
hes
is"
or
"lu
mb
*sp
ond
yl*
"o
r(M
H"S
po
nd
ylo
sis+
")o
r"S
po
nd
ylo
sis"
or
(MH
"Sp
ond
ylo
lysi
s+")
or
"sp
ond
ilo
lisy
s"2
.(M
H"S
urg
ery,
Op
erat
ive+
")or
"surg
ery"
or
(MH
"Dec
om
pre
ssio
n,
Surg
ical
+")
or
"Dec
om
pre
ssio
n"
"Dec
om
pre
s*su
rger
y"
or
"sp
in*
dec
om
pre
ss*"
or
"lu
mb
ard
eco
mp
ress
*"
or
(MH
"Lam
inec
tom
y")
or
"Lam
inec
tom
y"
or
"Lam
inec
tom
*"
or
"Lam
ino
tom
*"
or
"Lam
ino
pla
sty"
or
(MH
"Sp
inal
Fu
sio
n")
or
"Sp
inal
Fusi
on"
or
(MH
"Art
hro
des
is+
")o
r"a
rthro
des
is"
or
"sp
in*
fusi
on"
or
(MH
"Ort
hop
edic
Fix
atio
nD
evic
es+
")o
r"p
edic
lesc
rew
"o
r"l
um
bar
fusi
on"
or
"ver
teb
rae
fusi
on"
or
"ver
teb
ral
fixat
ion"
or
"Sp
ond
ylo
des
is"
or
"Sp
inal
fixat
ion"
or
(MH
"Ort
ho
ped
icF
ixat
ion
Dev
ices
+")
or
"Sp
ond
ylo
synd
esis
"o
r"P
ost
ero
late
ral
fusi
on"
or
"Inte
rbo
dy
fusi
on"
or
"Ante
rio
rnea
r/5
fusi
on"
or
"Ante
rio
rfu
sio
n"
or
"Po
ster
ior
fusi
on"
or
"Tra
nsf
ora
min
alfu
sio
n"
or
"Tra
nsp
soas
fusi
on"
or
"Fac
etfu
sio
n"
or
(MH
"Art
hro
des
is+
")o
r(M
H"G
raft
s+")
OR
"Bo
ne
gra
ft"
or
"Ped
icle
fusi
on"
or
"Cag
efu
sio
n"
or
"Scr
ewfu
sio
n"
or
"Fo
ram
ino
tom
y"
or
"Fo
ram
inec
tom
y"
or
(MH
"Min
imal
lyIn
vas
ive
Pro
ced
ure
s")
or
"Min
imal
lyIn
vas
ive"
3.
1an
d2
Web
of
Sci
ence
(u
p t
o N
ovem
ber
2014
)1
."s
pin
* s
teno
sis"
or
"can
al s
teno
sis"
or
"lum
bar
ste
no
sis"
or
"lat
eral
ste
no
sis"
or
"cen
tral
ste
no
sis"
or
"fo
ram
in* s
teno
sis"
or
"neu
rogen
ic c
laud
icat
ion"
or
"rad
iculo
pat
hy"
or
" ra
dic
ula
r p
ain"
or
"lum
bar
rad
icula
r p
ain"
or
"sp
ond
ylo
list
hes
is"
or
Sp
ond
ylo
sis
or
Sp
ond
ylo
lysi
s2
.S
urg
ery
or
Dec
om
pre
ssio
n o
r D
eco
mp
ress
ive
or
Lam
inec
tom
y o
r L
amin
oto
m* o
r L
amin
op
last
y o
r "s
pin
* f
usi
on"
or
"lum
bar
fu
sio
n"
or
Art
hro
des
is o
r"v
erte
bra
e fu
sio
n"
or
"ver
teb
ral
fixat
ion"
or
"sp
inal
fix
atio
n"
or
"po
ster
ola
tera
l fu
sio
n"
or
"inte
rbo
dy f
usi
on"
or
"ante
rio
r fu
sio
n"
or
"po
ster
ior
fusi
on"
or
"tra
nsf
ora
min
al f
usi
on"
or
"tra
nsp
soas
fusi
on"
or
"fac
et f
usi
on"
or
Art
hro
des
is o
r "c
age
fusi
on"
or
"ped
icle
scr
ew"
or
Fo
ram
ino
tom
y o
r F
ora
min
ecto
my o
r"m
inim
ally
in
vas
ive"
3.
1 a
nd
24
."r
and
om
ized
co
ntr
oll
ed t
rial
" o
r "r
and
om
ized
cli
nic
al t
rial
" o
r "c
ontr
oll
ed c
linic
al t
rial
" o
r R
and
om
ized
or
Pla
ceb
o o
r R
and
om
* o
r T
rial
or
"cli
nic
al t
rial
" or
"cli
nic
al s
tud
y"
5.
3 a
nd
4
LIL
AC
S (
up
to N
ovem
ber
2014)
("sp
ine
sten
osi
s" O
R "
spin
al s
teno
sis"
OR
"ca
nal
ste
no
sis"
OR
"lu
mb
ar s
teno
sis"
OR
"ce
ntr
al s
teno
sis"
OR
"la
tera
l st
eno
sis"
OR
"fo
ram
inal
ste
no
sis"
OR
"s
po
nd
ylo
list
hes
is"
OR
sp
ond
ylo
sis
OR
"neu
rogen
ic c
laud
icat
ion"
OR
rad
iculo
pat
hy O
R "
rad
icula
r p
ain")
AN
D (
surg
ery O
R d
eco
mp
ress
ion O
R d
eco
mp
ress
ive
OR
lam
inec
tom
y O
R l
amin
oto
my O
R l
amin
op
last
y O
R "
spin
al f
usi
on"
OR
"sp
ine
fusi
on"
OR
art
hro
des
is O
R "
lum
bar
fusi
on"
OR
"ver
teb
rae
fusi
on"
OR
"v
erte
bra
l fi
xat
ion"
OR
sp
ond
ylo
des
is O
R "
spin
al f
ixat
ion"
OR
sp
ond
ylo
synd
esis
OR
"p
ost
ero
late
ral
fusi
on"
OR
"in
terb
od
y f
usi
on"
OR
"an
teri
or
fusi
on"
OR
"p
ost
erio
r fu
sio
n"
OR
"tr
ansf
ora
min
al f
usi
on"
OR
"tr
ansp
soas
fusi
on"
OR
"fa
cet
fusi
on"
OR
"b
one
gra
ft"
OR
"p
edic
le f
usi
on"
OR
"cag
e fu
sio
n"
OR
"sc
rew
fu
sio
n"
OR
"p
edic
le s
crew
" O
R s
crew
OR
ro
d O
R f
ora
min
oto
my O
R f
ora
min
ecto
my O
R "
surg
ical
pro
ced
ure
" O
R "
min
imal
ly i
nvas
ive"
).
147

Ap
pen
dix
S2
Tab
le S
2. R
isk o
f B
ias
(PE
Dro
) of
Incl
uded
Stu
die
s
Stu
dy
Item
1It
em
2It
em
3It
em
4It
em
5It
em
6It
em
7It
em
8It
em
9It
em
10
To
tal
Po
stac
chin
i et
al,
19
92
Yes
No
No
No
No
Yes
Yes
No
Yes
No
4
Tho
me
et a
l, 2
00
5Y
esY
esY
esN
oN
oN
oY
esN
oY
esY
es6
Cav
uso
glu
et
al,
20
07
Yes
Yes
Yes
Yes
No
Yes
Yes
No
Yes
Yes
8
Cel
ik e
t al
, 2
01
0Y
esY
esY
esN
oN
oN
oY
esN
oY
esY
es6
Gure
lik e
t al
, 2
01
2Y
esN
oN
oN
oN
oN
oY
esN
oY
esY
es4
Liu
et
al,
20
13
Yes
No
Yes
No
No
No
Yes
No
Yes
Yes
5
Wat
anab
e et
al,
20
11
Yes
No
Yes
No
No
No
No
No
Yes
Yes
4
Raj
asek
aran
et
al,
20
13
Yes
Yes
Yes
No
No
Yes
Yes
No
Yes
No
6
Ruet
ten e
t al
, 2
00
9Y
esY
esY
esN
oN
oN
oY
esN
oY
esN
o5
Yag
i et
al,
20
09
Yes
No
Yes
No
No
No
No
No
Yes
Yes
4
Bri
dw
ell
et a
l, 1
99
3Y
esN
oN
oN
oN
oN
oY
esN
oY
esN
o3
Gro
b e
t al
, 19
95
Yes
No
No
No
No
Yes
Yes
No
Yes
No
4
Hal
let
et a
l, 2
00
7Y
esY
esY
esN
oN
oY
esY
esY
esY
esY
es8
Str
om
qvis
t et
al,
20
13
Yes
Yes
Yes
No
No
No
Yes
Yes
Yes
Yes
7
Mo
oje
n e
t al
, 20
13
Yes
Yes
Yes
Yes
No
Yes
Yes
Yes
Yes
Yes
9
Azz
azi
et a
l, 2
01
0Y
esN
oY
esN
oN
oN
oY
esN
oY
esN
o4
Dav
is e
t al
, 2
01
3Y
esY
esY
esY
esN
oN
oY
esN
oY
esY
es7
PE
Dro
= P
hysi
oth
erap
y E
vid
ence
Dat
abas
e; I
tem
1 =
ran
do
m a
llo
cati
on;
Item
2 =
co
nce
aled
all
oca
tio
n;
Item
3 =
bas
elin
e co
mp
arab
ilit
y;
Item
4 =
bli
nd
ing o
f su
bje
cts;
Ite
m
5 =
bli
nd
ing o
f th
erap
ists
; It
em 6
= b
lind
ing o
f as
sess
ors
; It
em 7
= a
deq
uat
e fo
llo
w-u
p;
Item
8 =
inte
nti
on
-to
-tre
at a
nal
ysi
s; I
tem
9 =
bet
wee
n-g
roup
co
mp
aris
ons;
Ite
m 1
0 =
p
oin
t es
tim
ates
and
var
iab
ilit
y.
148

CHAPTER EIGHT
Trends, complications, and costs for hospital admission and surgery for lumbar spinal
stenosis
Chapter Eight has published as:
Machado GC, Maher CG, Ferreira PH, et al. Trends, complications, and costs for hospital
admission and surgery for lumbar spinal stenosis. Spine 2017;[Epub ahead of print]. Copyright
© 2017, Wolters Kluwer Health, Inc. Reprinted with permission from Lippincott Williams &
Wilkins.
149

Statement from co-authors confirming authorship contribution of
the PhD candidate
The co-authors of the paper “Trends, complications, and costs for hospital admission and
surgery for lumbar spinal stenosis” confirm that Gustavo de Carvalho Machado has made the
following contributions:
Conception and design of the research
Analysis and interpretation of the findings
Writing of the manuscript and critical appraisal of the content
In addition to the statements above, in cases where I am not the corresponding author of a
published item, permission to include the published material has been granted by the
corresponding author.
Gustavo de Carvalho Machado _________________________ Date: 30 November 2016
As supervisor for the candidature upon which this thesis is based, I can confirm that the
authorship attribution statements above are correct.
Manuela Loureiro Ferreira _________________________ Date: 30 November 2016
150

Trends, Complications, and Costs for HospitalAdmission and Surgery for Lumbar Spinal Stenosis
Gustavo C. Machado, PhD student,�Chris G. Maher, PhD,� Paulo H. Ferreira, PhD,y
Ian A. Harris, MBBS, MMed (Clin Epi), PhD,zRichard A. Deyo, MD, MPH,§Damien McKay, MBBS,{,jj
Qiang Li, MBiostat,� and Manuela L. Ferreira, PhD�,��
Study Design. Population-based health record linkage study.Objective. The aim of this study was to determine trends in
hospital admissions and surgery for lumbar spinal stenosis, as
well as complications and resource use in Australia.Summary of Background Data. In the United States, rates of
decompression surgery have declined, whereas those of fusion
have increased. It is unclear whether this trend is also happening
elsewhere.Methods. We included patients 18 years and older admitted to
a hospital in New South Wales between 2003 and 2013 who
were diagnosed with lumbar spinal stenosis. We investigated the
rates of hospital admission and surgical procedures, as well as
hospital costs, length of hospital stay, and complications.
Surgical procedures were: decompression alone, simple fusion
(one to two disc levels, single approach), and complex fusion
(three or more disc levels or a combined posterior and anterior
approach).
Results. The rates of decompression surgery increased from
19.0 to 22.1 per 100,000 people. Simple fusion rates increased
from 1.3 to 2.8 per 100,000 people, whereas complex fusion
increased from 0.6 to 2.4 per 100,000 people. The odds of
major complications for complex fusion compared with decom-
pression alone was 4.1 (95% confidence interval [CI]: 1.7–
10.1), although no difference was found for simple fusion (odds
ratio 2.0, 95% CI: 0.7–6.1). Mean hospital costs with decom-
pression surgery were AU $12,168, whereas simple and com-
plex fusion cost AU $30,811 and AU $32,350, respectively.Conclusion. In Australia, decompression rates for lumbar spinal
stenosis increased from 2003 to 2013. The fastest increasing
surgical procedure was complex fusion. This procedure
increased the risk of major complications and resource, although
recent evidence suggest fusion provides no additional benefits to
the traditional decompression surgery.Key words: complications, costs, data linkage, decompression,fusion, hospital admission, low back pain, mortality, spinalstenosis, surgery.Level of Evidence: 3Spine 2017;42:xxx-xxx
Lumbar spinal stenosis is narrowing of the spinal canalor vertebral foramen from degenerative changes ofbony or ligamentous structures, often resulting in
symptoms of neurogenic claudication.1 In older adults,lumbar spinal stenosis is the most common indication forspine surgery,2 and decompression without fusion is usuallythe surgical procedure of choice. However, some surgeonsdecide to include a fusion procedure, although indicationsremain unclear.3,4 It appears that the decision to performfusion is largely based on surgeons’ preferences,5 leading tolarge practice variations across different regions.2,6,7
Surgery for lumbar spinal stenosis has questionablebenefits over nonsurgical interventions,8 and different sur-gical techniques have been shown to deliver similar clinicaloutcomes in a recent Cochrane review.9 However, theaddition of fusion results in longer operation time and moreperioperative blood loss compared with decompressionsurgery alone,9 and increases the risk of complications.10
From the �The George Institute for Global Health, Sydney Medical School,The University of Sydney, Sydney, NSW, Australia; yFaculty of HealthSciences, The University of Sydney, Sydney, NSW, Australia; zSouth West-ern Sydney Clinical School, Ingham Institute for Applied Medical Research,University of New South Wales, Sydney, NSW, Australia; §Department ofFamily Medicine, Oregon Health and Science University, Portland, OR;{Department of Rheumatology, Liverpool Hospital, Sydney, NSW, Aus-tralia; jjChildren’s Hospital Institute of Sports Medicine, Sydney Children’sHospital Network, Sydney, NSW, Australia; and ��Institute of Bone and JointResearch, The Kolling Institute, Sydney Medical School, The University of
Acknowledgment date: December 20, 2016. First revision date: March 2,2017. Second revision date: March 21, 2017. Acceptance date: April 14,2017.
The manuscript submitted does not contain information about medicaldevice(s)/drug(s).
Arthritis Australia and State & Territory Affiliate Project Grant from ArthritisSouth Australia, 2014 grant funds were received in support of this work.
Relevant financial activities outside the submitted work: grants, travel/accommodations/meeting expenses.
Address correspondence and reprint requests to Gustavo C. Machado, PhDstudent, The George Institute for Global Health, Sydney Medical School,The University of Sydney, PO Box M201, Missenden Road, Camperdown,
AQ5 NSW 2050, Australia; E-mail: [email protected]
DOI: 10.1097/BRS.0000000000002207
Spine
AQ4 Sydney, Sydney, NSW, Australia.
SPINE Volume 42, Number 00, pp 000–000ß 2017 Wolters Kluwer Health, Inc. All rights reserved
SURGERY
www.spinejournal.com 1
Copyright ß 2017 Wolters Kluwer Health, Inc. Unauthorized reproduction of this article is prohibited.
151

Rates of inpatient decompression surgery for lumbar spinalstenosis have declined during the last decade in the UnitedStates, whereas fusion rates have increased.11,12 Complexfusion procedures three or more disc levels or a combinedposterior and anterior approach) showed the highestincrease,12 although this procedure tripled the risk of life-threatening complications and had higher hospital costscompared with decompression surgery.12 Although trendsin the surgical management of lumbar spinal stenosis havecome under close scrutiny, most data come from the UnitedStates.11–13 It is unclear whether similar trends are occur-ring elsewhere. Population-based studies outside the UnitedStates would help elucidate whether similar trends areoccurring in health systems with different insurancearrangements, financial incentives, surgical rates, andcultural expectations.
We therefore investigated the trends in hospital admissionand surgical procedures for lumbar spinal stenosis and itsassociated complications and health care use inAustralia.Weused data from themost populous state,NewSouthWales, toexamine trends in a 10-year period between 2003 and 2013.
MATERIALS AND METHODS
Study PopulationThis study sourced data from New South Wales where 7.3million people, or one-third of the country’s population,live. Data were derived from 226 public and 173 privatehospitals (30% of all hospitals in Australia). We used theCentre for Health Record Linkage to link data from theAdmitted Patient Data Collection (APDC) to the New SouthWales Registry of Births, Deaths andMarriages (BDM). TheAPDC includes admissions, discharges, and transfer recordsfor all public and private sector hospitals and day-procedurecenters in New South Wales. The BDM includes infor-mation on date, cause, and contributing cause of death.Our sample included adults aged 18 years or older and whowere admitted between January 2003 and December 2013,with a diagnosis of lumbar spinal stenosis. We used theInternational Statistical Classification of Diseases andRelated Health Problems, 10th Revision, Australian Modi-fication (ICD-10-AM) to identify patients with a diagnosisof lumbar spinal stenosis (codes M48.05, M48.06, andM48.07). Patients with primary diagnosis codes of seriousspinal disease (i.e., cancer, spinal infection, spinal cordinjury, or inflammatory diseases), or codes for cervical/thoracic spinal stenosis were excluded. Patients with diag-nosis codes for spinal stenosis in the sacral and sacrococcy-geal region were also excluded, as were those coded withspinal stenosis of multiple sites in the spine (i.e., cervical andlumbar) or unspecified location. This study was approved bythe NSW Population and Health Services Research EthicsCommittee (HREC/14/CIPHS/65).
Surgical ProceduresThe codes from the Australian Classification of HealthInterventions (ACHI) 8th edition were used to identify
surgical procedures for lumbar spinal stenosis. We onlyincluded cases in which the surgical procedure codes wereused for the principal procedure. We categorized surgicalinterventions into 3 broad categories: decompression alone,simple fusion, and complex fusion. These categories havebeen used in previous studies, which showed an increasedrisk of life-threatening complications and resource use withincreasing surgical complexity.11,12 Decompression aloneconsisted of principal procedure codes for laminectomy(90024–00, 90024–01), with or without discectomy(40300–00, 40300–01) or rhizolysis (40330–00, 40330–01), and no concomitant fusion. Simple fusion involvedsingle anterior (48660–00), posterior (48642–00,48654–00), or posterolateral (48648–00, 48654–01)fusion of one or two spinal disc levels, with or withoutadditional codes for decompression. Complex fusion wasdefined as codes for anterior (48669–00), posterior(48645–00, 48657–00), or posterolateral (48651–00,48657–01) fusion of three or more disc levels, or a combi-nation of anterior and posterior approaches with or withoutadditional codes for decompression.
ComplicationsComplications were categorized into major complications,wound complications, and mortality. Major complicationsincluded ICD-10-AM diagnosis codes for cardiorespiratoryarrest (R09.2, I46), acute respiratory failure (J96.0, J96.9),pulmonary embolism (I26, I26.0, I26.9), pneumonia (J12–J18), acute myocardial infarction (I21), and stroke (I60–I64). To optimize the identification of more serious com-plications,14 we also used additional ACHI procedure codesfor cardiopulmonary resuscitation (92052–00), postopera-tive endotracheal intubation (22007–00), and mechanicalventilation (13857–00, 13879–00). Wound complicationswere diagnosis codes for hemorrhage (T81.0), postoperativeinfection (T81.4), or additional procedure codes for wounddebridement (30023–00). Only complications occurringduring the course of the episode of care were considered.Mortality was defined as deaths occurring within 30 daysafter the surgical procedure.
Health Care OutcomesThe APDC also includes data on length of hospital stayand rehospitalization. We defined rehospitalization as asecond hospital admission within 28 days of dischargefrom the index admission.15 A revision surgery wasdefined as reoperations within 24 months after indexprocedure, and was identified using ACHI procedurecodes for revision of spinal procedure (90025–00,90025–01, 90025–03) or postoperative reopening oflaminotomy or laminectomy site (90009–00), as well asusing codes for any lumbar spine surgery. The AustralianRefined Diagnosis Related Groups (AR-DRG 7.0) wasused to estimate total hospital admission costs, meanadmission cost per patient, and admission costs relatedto different types of surgical procedures.
SURGERY Trends, Complications, and Costs Regarding Lumbar Spinal Stenosis � Machado et al
2 www.spinejournal.com Month 2017
152

Statistical AnalysisThe rates of hospital admission and surgery, age-standar-dized by the direct method to the 2003 New South Walespopulation, were calculated and reported as per 100,000people. Hospital costs were adjusted for inflation to 2011AU dollars using the consumer price index, as published bythe Australian Bureau of Statistics. Descriptive statisticswere used to report rates of hospital admission and surgeryfor lumbar spinal stenosis over time.
In our bivariate analyses, we used a logit link functionwith binomial distribution to compare the proportion ofpatients with complications (wound, major, and death) andreadmissions among subgroups (age categories, sex, type ofsurgery, hospital type, and health insurance status). Logisticregression was used for multivariable analyses, adjusted forage categories (5-year groups), sex, and previous spinesurgery, or presence of comorbidities in the 12 monthsbefore surgery. The results are reported as odds ratio(OR) and 95% confidence intervals (CIs). Comorbiditieswere defined using coding algorithms when using ICD-10administrative data as proposed by Quan et al,16 and ACHIcodes were used to identify spine surgical procedures in theprevious year.
We used a logit link functionwith gamma distribution forhospital costs and a log linear model for length of hospitalstay to compare subgroups. Results of this analysis arereported as adjusted rate ratio and 95% CI, which reflectsa relative mean difference between the subgroups. Decom-pression alone was used as the reference group in allregression analyses. We considered statistically significantresults when P<0.05. All the statistical analyses wereperformed in SAS 9.4 (SAS Institute, Cary, NC).
RESULTS
Trends in Hospital AdmissionBetween 2003 and 2013, there were 30,680 hospital admis-sions for lumbar spinal stenosis in New South Wales, ofwhich 19,628 patients underwent a surgical procedure. Themean age of admitted patients was 69.3 (standard deviation[SD]: 12.4) years and 52% were female. Nearly 70% ofhospitalized patients were 65 years or older (n¼18,888). Inone decade, the age-standardized rate of hospital admissionfor lumbar spinal stenosis increased from 34.8 per 100,000to 39.3 per 100,000 people (Figure 1).
Trends in Surgical ProceduresDuring the years 2003 to 2013, there were 17,123 decom-pression-alone operations, 1458 simple fusions, and 1047complex fusion procedures. The age-standardized rate ofdecompression alone increased from 19.0 per 100,000people to 22.1 per 100,000 people during this period(Figure 2). The rate of simple fusion doubled in one decade,from 1.3 per 100,000 people to 2.8 per 100,000 people,whereas the rate of complex fusion procedures increasedfrom 0.6 per 100,000 people to 2.4 per 100,000 people(Figure 3). From 2003 to 2011, 1166 of 18,449 patients
(6.3%) underwent revision surgery (i.e., any lumbar spinesurgery) within 2 years from index surgery.
Health Care UtilizationIn2013alone, theaverage lengthofhospital staywas 6.2days(SD: 6.4), with a significant difference observed across differ-ent age categories (Table 1). Most hospital admissionsoccurred in private hospitals (n¼2213, 69%), and among
Figure 1. Hospital admissions for lumbar spinal stenosis per 100,000people in New South Wales, Australia. Adjusted for age and sex bythe direct method to the 2003 population.
Figure 2. Decompression procedures for lumbar spinal stenosis per100,000 people in New South Wales, Australia. Adjusted for ageand sex by the direct method to the 2003 population.
SURGERY Trends, Complications, and Costs Regarding Lumbar Spinal Stenosis � Machado et al
Spine www.spinejournal.com 3
153

patients holding private health insurance (n¼2063, 64%).Hospital admission costs for lumbar spinal stenosis totaledAUD $46.1 million (2011 dollars), with a mean cost perpatient of AUD $15,216 (SD: 10,832). Hospital costs relatedto surgical admissions were AUD $33.2 million, accountingfor 72% of the aggregate hospital bill. Other in-hospitalprocedures included spinal injections, administration ofpharmacological agents, and allied health care interventions.
Patients who received complex fusion required longerhospital stay (10 days, SD: 5) than those who receivedsimple fusion (8 days, SD: 4), or decompression surgery(5 days, SD: 5). The mean hospital admission cost for acomplex fusion procedure was AUD $32,350 (SD: 8279),whereas cost for simple fusion was AUD $30,811 (SD:6823). The mean cost for decompression surgery was sig-nificantly lower (AUD $12,168, SD: 4984) compared withfusion procedures. Mean hospital costs for insured patientswere higher (AUD $16,670) than those for uninsuredpatients (AUD $12,702), probably because of higher ratesof fusion procedures in the insured group (21%) comparedwith patients without health insurance (9%). Table 2 pro-vides results from the multivariable regression analysesshowing that the length of hospital stay of fusion procedureswas nearly twice as long compared with decompressionalone, whereas hospital costs were about 2.5 times greater.Readmission rate within 28 days of discharge was 2%, but itwas significantly greater for patients in public facilities orfor those not insured (3.3%) compared with patients inprivate hospitals or those holding private health insurance,respectively (Table 1).
ComplicationsIn 2013, 1.7% of admitted patients for lumbar spinalstenosis had major complications within the episode of care,
0.2% had wound complications, and the 30-day mortalityrate was 0.4% (Table 1). Major complications and 30-daymortality rates were significantly higher in patients aged 80years or older (n¼705); nearly 4% had major compli-cations, and mortality was around 1%. A substantial differ-ence in complication rates was also noted for different typesof surgical procedures. Complex fusion proceduresincreased the odds of major complications by 4.1 times(95% CI: 1.7–10.1) compared with decompression alone.Simple fusion was associated with a doubling of odds forcomplications compared with decompression surgery alone(OR 2.0, 95% CI: 0.7–6.1), a difference that was notstatistically significant (Table 2).
DISCUSSIONIn this population-based study, we found that the rates ofhospital admission for lumbar spinal stenosis increased by13% during the years 2003 to 2013, from 34.8 to 39.3 per100,000 people. Although rates of all types of surgicalprocedures for lumbar spinal stenosis increased during thisperiod, the rates of complex fusion procedures increasedfour-fold, from 0.6 to 2.4 per 100,000 people. More com-plex procedures, however, were associated with longerlength of hospital stay, increased risk of major compli-cations, and greater hospital costs.
Few studies have addressed trends in surgical procedures,associated complications, and resource use for lumbar spi-nal stenosis outside the United States. A Swedish study13
reported no data for specific surgical procedures (i.e.,decompression alone, simple fusion, or complex fusion),and previous studies investigating trends in spine surgery inAustralia did not report separate data for patients withlumbar spinal stenosis.7,17 We have defined complexity ofsurgical procedures similarly to previous reports from theUnited States,11,12 allowing a direct comparison of ourresults. Furthermore, our regression analyses were adjustednot only for age categories and sex, but also for previousspinal surgery and comorbidities, according to coding algor-ithms defined by Quan et al.16
Our study has some limitations. First, there may be errorsin the diagnosis and procedure codes used to identify ourpopulation and the types of surgery. Second, it is likely thatour complication rates are underestimated, as some com-plications may have not been coded or may have occurredpost-discharge. Third, the lack of information on associateddiagnoses, including spondylolisthesis or scoliosis, also pre-vented us from identifying the number of fusion procedures,associated complications, and hospital costs for these sub-groups. Finally, our data are restricted to admissions in NewSouth Wales hospitals, so patients living near the borders ofthe state but hospitalized in other states or territories ofAustralia were not included. This may have been, however,counterbalanced by hospital admissions of patients comingin from adjacent states or territories.
Other studies that have investigated trends in surgery forlumbar spinal stenosis have shown an increase in surgicalrates over time.2,11–13 However, only two studies from the
Figure 3. Fusion procedures for lumbar spinal stenosis per 100,000people in New South Wales, Australia.
SURGERY Trends, Complications, and Costs Regarding Lumbar Spinal Stenosis � Machado et al
4 www.spinejournal.com Month 2017
154

TABLE
1.LengthofHospital
Stay,Hospital
Costs,
andComplica
tionsforLu
mbar
Spinal
Sten
osisin
NSW
Australia,
2013
Mea
n(SD)
Rate%
(No.ofPatients)
No.ofHospital
Admissions
Lengthof
Hospital
Stay
,d
Mea
nHospital
Costs,
AU
$Major
Complica
tions
Wound
Complica
tions
28-day
Rea
dmission
30-day
Mortality
Ove
rall
3215
6.2
(6.4)
15,216(10,832)
1.7
(55)
0.2
(7)
2.0
(65)
0.4
(12)
Age
,y
<60
575
4.5
(3.9)
13,609(9565)
0.5
(3)
0.0
(0)
1.7
(10)
0.0
(0)
60–69
847
5.8
(6.7)
16,093(10,449)
1.1
(9)
0.1
(1)
1.8
(15)
0.1
(1)
70–79
1088
6.1
(5.4)
16,228(11,456)
1.5
(16)
0.2
(2)
2.4
(26)
0.5
(5)
�80
705
8.1
(8.1)�
13,911(10,997)�
3.8
(27)�
0.6
(4)
2.0
(14)
0.9
(6)�
Sex Women
1619
7.0
(7.2)
15,605(11,209)
1.6
(26)
0.4
(6)
1.9
(30)
0.3
(4)
Men
1596
5.4
(5.2)�
14,821(10,425)�
1.8
(29)
0.1
(1)�
2.2
(35)
0.5
(8)
Typ
eofsurgical
proce
dure
Dec
ompression
1800
4.9
(4.8)
12,168(4984)
1.0
(18)
0.2
(3)
1.5
(27)
0.1
(2)
Simple
fusion
226
8.0
(4.1)
30,811(6823)
1.8
(4)
0.0
(0)
1.8
(4)
0.0
(0)
Complexfusion
193
9.7
(5.4)�
32,350(8279)�
3.6
(7)�
0.5
(1)
2.6
(5)
0.5
(1)
Hospital
type
Public
1002
6.4
(7.8)
12,192(9256)
1.3
(13)
0.2
(2)
3.3
(33)
0.6
(6)
Priva
te2213
6.1
(5.6)
16,585(11,212)�
1.9
(42)
0.2
(5)
1.5
(32)�
0.3
(6)
Hea
lthinsurance
Insured
2063
6.3
(5.6)
16,670(11,475)
1.8
(36)
0.2
(4)
1.6
(32)
0.3
(6)
Notinsured
976
6.2
(7.9)
12,702(9440)�
1.7
(17)
0.2
(2)
3.3
(32)�
0.6
(6)
SDindicates
stan
darddeviation.
�Differencesam
ongsubgroupssign
ifican
tat
P<0.05.Tests
weredoneusinggeneralized
linearmodel
(loglin
kfunctionwithgammadistributionforco
st;loglin
earmodel
forlengthofstay
;logitlin
kfunction
withbinomialdistributionforbinaryoutcomes.
SURGERY Trends, Complications, and Costs Regarding Lumbar Spinal Stenosis � Machado et al
Spine www.spinejournal.com 5
Copyright ß 2017 Wolters Kluwer Health, Inc. Unauthorized reproduction of this article is prohibited.
155

United States have examined these trends according todifferent surgical procedures revealing that decompressionrates have declined, whereas the rates of fusion procedureshave increased,11,12with themost significant increase occur-ring for complex fusion.12 Our study confirms that inAustralia complex fusion is the fastest growing surgicalprocedure for lumbar spinal stenosis, although we have alsoobserved a slight increase in the rates of decompressionsurgery from 2003 to 2013. Our study, therefore, contrib-utes to a global understanding of changes in surgical ratesfor lumbar spinal stenosis.
A large study found an increased risk of life-threateningcomplications and resource use with increasing surgicalcomplexity.12 Fusion procedures require longer operationtime and involve extensive dissection of spinal tissues,factors that contribute to higher complication rates. Theimplants usually placed during a fusion operation are alsoresponsible for increased tissue injury and costs involvedwith the procedure. The costs with equipment for spinalfusion, such as screws, rods, and plates might explain thehigher costs found for insured patients, as a greater pro-portion of these patients (21%) received fusion procedurescompared with noninsured patients (9%). The additionalcosts with equipment for spinal fusion allow surgeons to usecodes for fusion procedures for the billing of a higheramount than that for decompression-alone procedures.We have also found that complex fusion procedures notonly require longer hospital stay, but also increased the riskof major complications, whereas the hospital costs were 2.5times higher than conventional decompression surgery.
Despite the increase in fusion procedures in recent times,it seems that there is no clear consensus regarding indica-tions for fusion surgery in the presence of lumbar spinestenosis among spine surgeons.3,4 The decision to performfusion is largely based on surgeons’ preferences andopinions.5 This may reflect a paucity of evidence and lackof evidence-based decision making when selecting the mostappropriate surgical procedure in this population. A recentCochrane review9 highlighted the paucity of randomized
clinical trials in this important area, and revealed no clinicalbenefits of adding fusion to decompression surgery. How-ever, it is important to note that the trends observed in thepresent study, as well as in previous reports,11,12 precededthis recent finding.
The increase in use of potentially harmful interventionswith questionable clinical effectiveness is a major healthpolicy concern and efforts to address this issue deserve ahigh priority. A review of guidelines18 for the surgicalmanagement of lumbar spinal stenosis is needed to informcurrent best-practice evidence.9 However, more specificstrategies are required to change clinical practice, such asreviewing funding of nonevidence-based procedures, so thatcare delivered to patients more closely aligns with currentevidence. It is unclear why more complex surgical pro-cedures for lumbar spinal stenosis are increasing at a muchfaster rate. The ageing of the population is not a plausibleexplanation for this trend, as our study and previous reportsadjusted the analyses for age categories and populationgrowth. Other possible explanations of the trends weobserved are the increasing number of spine specialiststrained to perform fusion, financial incentives to performmore complex procedures, and advancements in surgicaltechnology19 allowing fusion procedures to be performedmore efficiently.
Further studies are required to determine whether thetrends we observed in decompression surgery for lumbarspinal stenosis in New SouthWales, Australia, are occurringelsewhere. Future research should particularly investigatethe reason why complex fusion is increasing at a faster rate,including patients’ beliefs and preferences, their reasons forundergoing surgery, and marketing of new surgical implantsand techniques. More prospective cohort studies are alsoneeded to investigate complication and mortality rates byincluding a large sample of patients with lumbar spinalstenosis receiving either decompression alone or fusionprocedures.
In conclusion, there was an increase in rates of hospitaladmission for lumbar spinal stenosis between 2003 and
TABLE 2. Complications and Health Care Use as a Function of Type of Surgical Procedure
Simple Fusion Complex Fusion
Odds ratio (95% CI)�
Wound complications No output 2.88 (0.29–28.30)
Major complications 2.04 (0.68–6.12) 4.09 (1.66–10.07)
28-day Rehospitalization 1.24 (0.43–3.61) 1.88 (0.71–4.97)
30-day Mortality No output 5.56 (0.47–65.49)
Adjusted rate ratio (95% CI)y
Length of hospital stay, d 1.58 (1.45–1.73)z 1.91 (1.76–2.06)
Hospital costs, AU$ 2.53 (2.43–2.64) 2.65 (2.53–2.78)
CI indicates confidence interval.�Adjusted for age group, sex, previous spine surgery, and comorbidity (excluding myocardial infarction and stroke). Decompression alone used as thereference group with estimates presented as odds ratio using logistic regression.yAdjusted estimates based on generalized linear model with log link function using decompression alone as the reference group.zSignificant difference between complex and simple fusion (P<0.05).
SURGERY Trends, Complications, and Costs Regarding Lumbar Spinal Stenosis � Machado et al
6 www.spinejournal.com Month 2017
156

2013 in New South Wales, Australia. The rates of decom-pression surgery have also increased, a trend not observed inthe United States. Our study confirms that the number ofcomplex fusion procedures is increasing at a much fasterrate than any other surgical procedure for this condition—afour-fold increase in 10 years. Complex fusion procedureswere associated with an increased risk of major compli-cations, longer length of hospital stay, and greater hospitalcosts compared with decompression alone. The increasinguse of fusion surgery should be reassessed in light of recenttrials that fail to demonstrate the benefit of adding fusionprocedures to decompression surgery.
Key Points
In Australia, the rates of inpatient decompressionsurgery for lumbar spinal stenosis have increasedslightly during the last decade, whereas fusionrates have increased by four-fold.
Decompression surgery costs AU $12,168,whereas simple and complex fusion costs AU$30,811 and AU $32,350, respectively.
Complex fusion procedures increased the odds ofmajor complications by 4.1 times compared withdecompression alone.
References1. Katz JN, Harris MB. Clinical practice. Lumbar spinal stenosis. N
Engl J Med 2008;358:818–25.2. Ciol MA, Deyo RA, Howell E, et al. An assessment of surgery for
spinal stenosis: time trends, geographic variations, complications,and reoperations. J Am Geriatr Soc 1996;44:285–90.
3. Knaub MA, Won DS, McGuire R, et al. Lumbar spinal stenosis:indications for arthrodesis and spinal instrumentation. InstrCourse Lect 2005;54:313–9.
4. Krismer M. Fusion of the lumbar spine. A consideration of theindications. J Bone Joint Surg Br 2002;84:783–94.
5. Katz JN, Lipson SJ, Lew RA, et al. Lumbar laminectomy alone orwith instrumented or noninstrumented arthrodesis in degenerativelumbar spinal stenosis. Patient selection, costs, and surgical out-comes. Spine (Phila Pa 1976) 1997;22:1123–31.
6. Australian Commission on Safety and Quality in Health Care andNational Health Performance Authority. Australian Atlas ofHealthcare Variation. Sydney: ACSQHC, 2015.
7. Loeser JD, Van Konkelenberg R, Volinn E, et al. Small areaanalysis of lumbar spine surgery in South Australia. Aust N Z JSurg 1993;63:14–9.
8. Machado GC, Ferreira ML. No clinically important benefits ofsurgery over rehabilitation for lumbar spinal stenosis (PEDrosynthesis). Br J Sports Med 2017;51:541–2.
9. Machado GC, Ferreira PH, Yoo RI, et al. Surgical options forlumbar spinal stenosis. Cochrane Database Syst Rev2016;11:CD012421.
10. Deyo RA, Ciol MA, Cherkin DC, et al. Lumbar spinal fusion. Acohort study of complications, reoperations, and resource usein the Medicare population. Spine (Phila Pa 1976) 1993;18:1463–70.
11. Bae HW, Rajaee SS, Kanim LE. Nationwide trends in the surgicalmanagement of lumbar spinal stenosis. Spine (Phila Pa 1976)2013;38:916–26.
12. Deyo RA, Mirza SK, Martin BI, et al. Trends, major medicalcomplications, and charges associated with surgery forlumbar spinal stenosis in older adults. JAMA 2010;303:1259–65.
13. Jansson KA, Blomqvist P, Granath F, et al. Spinal stenosis surgeryin Sweden 1987-1999. Eur Spine J 2003;12:535–41.
14. Michel J, Nghiem HD, Jackson TJ. Using ICD-10-AM codesto characterise hospital-acquired complications. HIM J 2009;38:18–25.
15. Jencks SF, Williams MV, Coleman EA. Rehospitalizations amongpatients in the Medicare fee-for-service program. N Engl J Med2009;360:1418–28.
16. Quan H, Sundararajan V, Halfon P, et al. Coding algorithms fordefining comorbidities in ICD-9-CM and ICD-10 administrativedata. Med Care 2005;43:1130–9.
17. Harris IA, Dao AT. Trends of spinal fusion surgery in Australia:1997 to 2006. ANZ J Surg 2009;79:783–8.
18. Kreiner DS, Shaffer WO, Baisden JL, et al. An evidence-basedclinical guideline for the diagnosis and treatment of degenerativelumbar spinal stenosis (update). Spine J 2013;13:734–43.
19. Kazemi N, Crew LK, Tredway TL. The future of spine surgery:new horizons in the treatment of spinal disorders. Surg Neurol Int2013;4:S15–21.
SURGERY Trends, Complications, and Costs Regarding Lumbar Spinal Stenosis � Machado et al
Spine www.spinejournal.com 7
Copyright ß 2017 Wolters Kluwer Health, Inc. Unauthorized reproduction of this article is prohibited.
157

CHAPTER NINE
Conclusions
158

9.1 Overview of principal findings
The first aim of this thesis was to investigate the role of selected physical and psychosocial risk
factors for new and recurrent episodes of low back pain. Chapter Two revealed that transient
exposure to many of these factors, such as manual tasks involving heavy loads or being fatigued
or tired during a manual task, significantly increased the risk of developing a new episode of
persistent low back pain, defined as an episode of greater than six weeks in duration. For those
who recovered within six weeks, Chapter Three showed that one third experienced recurrence
of low back pain within one year, with half of those recurrences involving health care. The
study also suggested that having three or more previous episodes of low back pain tripled the
odds of future recurrent episodes.
The second aim of this thesis was to investigate the effects of analgesics for low back pain, a
common treatment approach in primary care settings. Chapter Four revealed that, compared
with placebo, paracetamol was ineffective in relieving pain and reducing disability for acute
low back pain. This medication was also found to provide clinically unimportant benefits for
patients with osteoarthritis, and increased the risk of liver toxicity. Chapter Five showed that
NSAIDs, whilst increasing the risk of gastrointestinal adverse reactions, provided no clinically
important benefits in terms of pain and disability reduction over placebo for low back pain,
neck pain or sciatica.
Patients with sciatica or lumbar spinal stenosis who do not respond to conservative treatments,
including analgesics, are often referred to surgery.1 Thus the following chapters investigated
the effectiveness and long-term prognosis associated with the surgical management of these
conditions. Chapter Six revealed that the prognosis of patients with sciatica following surgery
is not as favourable as previously thought. Patients improved rapidly in the first three months
159

after surgery, but they were likely to experience incomplete recovery even when followed for
up to five years. For lumbar spinal stenosis, Chapter Seven showed that the addition of fusion
to decompression surgery does not lead to better outcomes compared with decompression
alone. Furthermore, minimally invasive techniques were not clinically superior to conventional
decompression. Despite the lack of evidence supporting surgery for lumbar spinal stenosis,
Chapter Eight demonstrated that rates of surgical procedures for this condition have increased
between 2003 and 2013 in Australia. Complex fusion showed the highest increase, though this
procedure was associated with an increased risk of major complications and resource use.
This thesis addresses important gaps in the literature about the risk factors and common
management strategies for low back pain. The work it encompasses reveals the importance of
removing the focus on pharmacological treatments for low back pain, and highlights the
potential for the development and evaluation of preventive approaches. Low back pain is an
endemic condition, and further research on its prevention is urgently needed. This thesis also
provides advanced understanding of the most common specific pathologies affecting the lumbar
spine (i.e., sciatica and spinal stenosis), which are often overlooked in research. The findings
of the work presented in this thesis, therefore, have important implications for clinical practice
and future research in the management of low back pain, including sciatica and lumbar spinal
stenosis.
9.2 Implications and directions for future research
9.2.1 Risk factors for new and recurrent episodes of low back pain
The case-crossover study with 12 months follow-up presented in Chapter Two provides the
first investigation of transient risk factors for persistent low back pain. The triggers identified
in this study (e.g., exposure to manual tasks involving heavy loads, live people or animals, and
160

awkward postures) are likely to be modifiable and therefore potential targets for prevention
interventions. Furthermore, a comparison of these results with the parent study2 revealed that
there was no difference in the results, which means that both persistent and non-persistent cases
of low back pain seem to share similar triggers.
Clinicians could use these results to advise patients about potential triggers to avoid in order to
reduce the risk for developing low back pain. Controlling the exposure to these triggers could
help to not only prevent the cases of low back pain that are short-lived but also those that
become persistent, which are often linked to the greatest burden of this condition.1 Previous
research has also confirmed that patients can, in most cases, accurately nominate the activities
that have triggered their low back pain episode when these are related to physical loading of
the spine, such as performing work with heavy loads.3 Psychosocial triggers are, however,
largely overlooked by patients. Therefore, it is important that clinicians provide additional
advice on how to reduce exposure to the triggers that patients recognise but, most importantly,
to the triggers that are not typically recognised as risky, such as distraction and fatigue and more
complex forms of activities involving manual handling. Interestingly, consumption of alcohol
and sexual activity were the only triggers not associated with onset of persistent symptoms, but
they were also not associated with development of non-persistent low back pain.
It is possible that other transient factors not included in this study may also increase the risk for
onset of persistent low back pain. Therefore, additional factors would be worth evaluating in
future studies, including stress and anxiety. Furthermore, future research should investigate the
effects of prevention strategies that control exposure to the harmful triggers for persistent low
back pain identified in this study.
161

Although we are in the infancy of understanding the mechanisms and risk factors related to new
or recurrent episodes of low back pain, these steps are essential in the development of
preventative strategies. Chapter Two revealed that about two thirds of patients with low back
pain will have recovered within six weeks after its onset. Patients who recovered were then
followed-up for 12 months in a separate study to establish the prevalence and determinants of
recurrence of low back pain. The results from the large inception cohort study presented in
Chapter Three indicated that one third of participants who recover within six weeks from pain
onset will have a recurrence within the first year. Moreover, nearly one in five participants
reported a recurrence of low back pain that required care seeking. The analyses revealed only
one predictor of recurrence: having three or more previous episodes of low back pain. Other
factors (i.e., gender, duration of episode, days to seek care, pain and disability levels, use of
medication, depression, tension or anxiety, work status, and compensable case) were not
associated with recurrence of low back pain.
Although only previous episodes of low back pain increased the risk of recurrence, this factor
remained strongly associated with cases that required health care. Further research is required
in this field, given to date only two large inception cohort studies (including the study presented
in this thesis) have investigated recurrence of low back pain.4 A particular focus should be made
in including potential predictors of recurrence not investigated in this study, such as physical
activity measured by accelerometers.
9.2.2 Management of low back pain: pharmacological interventions
Simple analgesics are often prescribed for patients with low back pain in primary care settings,5
where paracetamol is recommended as the first line treatment.6 Chapter Four, however,
showed that paracetamol is not superior to placebo in reducing pain and disability for people
162

with acute low back pain. Since this study was published, there have been changes in
recommendations in some best practice guidelines. For instance, the most recent National
Institute for Health and Care Excellence (NICE) guideline no longer recommend paracetamol
alone for low back pain and sciatica.
The study presented in Chapter Four was published with an editorial4 and reopened the
discussion on the effects of paracetamol. The BMJ published two letters to the editor,5 6 and a
response from authors (Appendix A). The review was summarised with commentary in leading
medical journals, such as the New England Journal of Medicine7 and Annals of Internal
Medicine,8 and accompanied by an editorial (Appendix B). A number of prizes have been
awarded to this study (Appendix C), including the BMJ 1st prize for the most accesses in 2015.
Moreover, this study was ranked in the top 20 studies with potential to change clinical practice
of primary care physicians in American Family Physician.9 The study also generated great
media interest (Appendix D), being ranked in the top 100 studies of 2015 by Altmetric. A
revision of all guidelines for the management of low back pain is urgently needed,10 and future
studies should monitor whether changes in practice occur.
Given the recent evidence that paracetamol is ineffective for low back pain, the prescription of
NSAIDs is likely to increase, despite concerns about its safety. The study presented in Chapter
Five revealed that NSAIDs are effective but do not provide clinically important effects on pain
and disability for patients with low back pain, as well as neck pain and sciatica. Most patients
who were given an NSAID (6 out of 7) fared no better than if they were given a placebo, when
considering a threshold of smallest worthwhile effect of 10-points (0–100 scale) as a between-
group difference. The findings also suggested an increased risk of gastrointestinal adverse
events with NSAIDs compared with placebo.
163

The thesis contributes to the body of evidence on the effects of pharmacological interventions
for low back pain. Since a recent systematic review has also found small effects of opioids over
placebo for chronic low back pain,11 it seems that current analgesics only offer trivial effects
for this condition. The ethical implications of using placebo pills in clinical practice, the small
effects of simple analgesics, and the increasing concerns on the risk of harm associated with
opioid use highlight the important role of non-pharmacological treatments. Guidelines for the
management of acute low back pain recommend that patients should receive reassurance and
advice to stay active or increase physical activity levels.10 For chronic low back pain, exercise
therapy12 or multidisciplinary biopsychosocial rehabilitation13 are recommended as treatment
options.
9.2.3 Management of low back pain: surgical interventions
For patients with sciatica or lumbar spinal stenosis who show a lack of improvement after
conservative treatments, surgery may be considered.1 Chapter Six revealed that despite the
rapid improvement of symptoms in the first three months after surgery, many patients with
sciatica never fully recover even when followed up to five years. It is unclear whether changes
in symptoms observed in this study were associated with surgery itself or if it was a result of
the condition’s natural course, or even surgery-associated placebo effects, given the
observational nature of the included studies. Another systematic review has shown similar
trends for patients with lumbar spinal stenosis,14 a condition that is the fastest increasing
indication for spine surgery in older people.15
Most of the evidence supporting the use of surgery for lumbar spinal stenosis comes from trials
comparing surgery with non-surgical treatments.16 A summary of the current evidence
(Appendix E), however, revealed that surgery has no clinically important benefits over non-
164

surgical treatments. Moreover, Chapter Seven revealed that to date there are no trials
comparing surgery with no treatment, sham or placebo surgery for lumbar spinal stenosis. The
findings also suggested that adding fusion to decompression surgery does not lead to better
clinical outcomes compared with decompression alone. Adding fusion to decompression was
associated with more blood loss and longer length of hospital stay. Furthermore, new surgical
devices, such as the interspinous process spacers X-Stop and Coflex, were not superior to
conventional decompression surgery and increased the risk of reoperations. Finally, minimally
invasive decompression surgery, such as spinous process-splitting laminectomy or unilateral or
bilateral laminotomy, resulted in similar clinical outcomes compared with conventional
decompression. The study reported in this chapter has been updated and converted into a
Cochrane review, which is presented in Appendix F.
Despite the lack of evidence supporting the use of surgery for lumbar spinal stenosis, Chapter
Eight revealed that rates of all surgical procedures for this condition have increased in the last
posterior and anterior approach) have increased at a much faster rate than any other surgical
procedure. Despite the rapid increase of complex fusion surgery, this procedure increased the
risks of major complications, such as myocardial infarction and stroke, and led to longer length
of hospital stay and greater hospital costs compared with decompression alone.
Collectively, the studies in Chapters Six to Eight have shown important findings on the
surgical management of sciatica and lumbar spinal stenosis. The study reported in Chapter Six
may help inform surgeons and patients with sciatica about the most likely long-term prognosis
after surgery. Although surgeons could use the results of the study presented in Chapter Seven
to decide the best surgical option for their patients, there is an urgent need for a placebo-
165

controlled trial evaluating surgery for lumbar spinal stenosis. Future studies should also
investigate the reason why the use of fusion procedures is increasing so fast, as shown in
Chapter Eight. Only recently conducted high quality studies showed the lack of clinical benefit
of fusion procedures over decompression surgery.17,18 Therefore, there is need for further
research monitoring the trends in surgical procedures rates in order to investigate whether
changes are occurring in light of recently published evidence.
9.3 Concluding Remarks
Previously identified triggers, including transient physical and psychosocial activities,
are associated with onset of persistent low back pain. Whilst about 70% of patients with
a new onset of low back pain will recover within six weeks, one third of those will
experience future recurrences, with half of these seeking health care again.
Paracetamol is ineffective for acute low back pain and only offers non-clinically
important benefits for osteoarthritis. NSAIDs are effective, but the magnitude of the
effects over placebo is arguably clinically irrelevant.
The prognosis of sciatica after surgery is not as good as previously thought, and patients
are likely to not fully recover in the long-term. For lumbar spinal stenosis, despite the
lack of evidence on the effects of surgery, surgical rates are increasing in Australia.
166

9.4 References
1. Selim AJ, Ren XS, Fincke G, et al. The importance of radiating leg pain in assessing
health outcomes among patients with low back pain. Results from the Veterans Health
Study. Spine 1998;23:470-74.
2. Steffens D, Ferreira ML, Latimer J, et al. What triggers an episode of acute low back
pain? A case-crossover study. Arthritis Care & Research 2015;67:403-10.
3. Parreira Pdo C, Maher CG, Latimer J, et al. Can patients identify what triggers their
back pain? Secondary analysis of a case-crossover study. Pain 2015;156:1913-19.
4. Mallen C, Hay E. Managing back pain and osteoarthritis without paracetamol. BMJ
2015;350:h1352.
5. Veal FC, Thompson AJ. Paracetamol should remain the first line option for persistent
pain. BMJ 2015;350:h2221.
6. Adam R. Danger of generalising findings on paracetamol for low back pain. BMJ
2015;350:h2220.
7. Mueller PS. Acetaminophen is ineffective for low back pain. NEJM Journal Watch
2015;35:69-70.
8. Chou R. ACP Journal Club. Review: Acetaminophen reduces pain in hip or knee
osteoarthritis by a small amount, but not low back pain. Ann Intern Med 2015;163:JC10.
9. Ebell MH, Grad R. Top 20 Research Studies of 2015 for Primary Care Physicians. Am
Fam Physician 2016;93:756-62.
10. Wong JJ, Cote P, Sutton DA, et al. Clinical practice guidelines for the noninvasive
management of low back pain: A systematic review by the Ontario Protocol for Traffic
Injury Management (OPTIMa) Collaboration. Eur J Pain 2016;21:201-16.
167

11. Abdel Shaheed C, Maher CG, Williams KA, et al. Efficacy, tolerability, and dose-
dependent effects of opioid analgesics for low back pain: a systematic review and meta-
analysis. JAMA Intern Med 2016;176:958-68.
12. Hayden JA, van Tulder MW, Malmivaara AV, et al. Meta-analysis: exercise therapy for
nonspecific low back pain. Ann Intern Med 2005;142:765-75.
13. Kamper SJ, Apeldoorn AT, Chiarotto A, et al. Multidisciplinary biopsychosocial
rehabilitation for chronic low back pain: Cochrane systematic review and meta-analysis.
BMJ 2015;350:h444.
14. Fritsch CG, Ferreira ML, Maher CG, et al. The clinical course of pain and disability
following surgery for spinal stenosis: a systematic review and meta-analysis of cohort
studies. Eur Spine J 2016;26:324-35.
15. Deyo RA, Mirza SK, Martin BI, et al. Trends, major medical complications, and charges
associated with surgery for lumbar spinal stenosis in older adults. JAMA
2010;303:1259-65.
16. Zaina F, Tomkins-Lane C, Carragee E, et al. Surgical versus non-surgical treatment for
lumbar spinal stenosis. Cochrane Database Syst Rev 2016;1:CD010264.
17. Ghogawala Z, Dziura J, Butler WE, et al. Laminectomy plus fusion versus laminectomy
alone for lumbar spondylolisthesis. N Engl J Med 2016;374:1424-34.
18. Forsth P, Olafsson G, Carlsson T, et al. A randomized, controlled trial of fusion surgery
for lumbar spinal stenosis. N Engl J Med 2016;374:1413-23.
168

APPENDIX A
Paracetamol, spinal pain, and osteoarthritis: Authors’ reply to Adam and to Veal and
Thompson
Appendix A has been published as:
Machado GC, Maher CG, Ferreira ML. Paracetamol, spinal pain, and osteoarthritis: Authors’
reply to Adam and to Veal and Thompson. BMJ 2015;350:h22235. Copyright © 2015, British
Medical Association. Reprinted with permission from BMJ Publishing Group.
169

Statement from co-authors confirming authorship contribution of
the PhD candidate
The co-authors of the paper “Paracetamol, spinal pain, and osteoarthritis: Authors’ reply to
Adam and to Veal and Thompson” confirm that Gustavo de Carvalho Machado has made the
following contributions:
Conception and design of the research
Analysis and interpretation of the findings
Writing of the manuscript and critical appraisal of the content
In addition to the statements above, in cases where I am not the corresponding author of a
published item, permission to include the published material has been granted by the
corresponding author.
Gustavo de Carvalho Machado _________________________ Date: 30 November 2016
As supervisor for the candidature upon which this thesis is based, I can confirm that the
authorship attribution statements above are correct.
Manuela Loureiro Ferreira _________________________ Date: 30 November 2016
170

PARACETAMOL, SPINAL PAIN, AND OSTEOARTHRITIS
Authors� reply to Adam and to Veal and Thompson
PhD student director associate professor
BMJ
BMJ
BMJ
BMJ
BMJ
LETTERS
171

APPENDIX B
Lack of efficacy of paracetamol (acetaminophen) for low back pain and osteoarthritis
Appendix B has been published as:
Machado GC, Maher CG, Ferreira ML. Lack of efficacy of paracetamol (acetaminophen) for
low back pain and osteoarthritis. J Pioneer Med Sci 2015;5:142-43. Copyright © 2015, Journal
of Pioneering Medical Sciences. Reprinted with permission.
172

Statement from co-authors confirming authorship contribution of
the PhD candidate
The co-authors of the paper “Lack of efficacy of paracetamol (acetaminophen) for low back
pain and osteoarthritis” confirm that Gustavo de Carvalho Machado has made the following
contributions:
Conception and design of the research
Analysis and interpretation of the findings
Writing of the manuscript and critical appraisal of the content
In addition to the statements above, in cases where I am not the corresponding author of a
published item, permission to include the published material has been granted by the
corresponding author.
Gustavo de Carvalho Machado _________________________ Date: 30 November 2016
As supervisor for the candidature upon which this thesis is based, I can confirm that the
authorship attribution statements above are correct.
Manuela Loureiro Ferreira _________________________ Date: 30 November 2016
173

© J PIONEER MED SCI.www.jpmsonline.com Volume 5, Issue 4. October-November, 2015. Page | 142
Lack of Efficacy of Paracetamol (Acetaminophen)
for Low Back Pain and Osteoarthritis
Gustavo C Machado1, Chris G Maher2, Manuela L Ferreira3
1PhD Student, The George Institute for Global Health, Sydney Medical School, University of Sydney, Sydney, Australia 2Professor, The George Institute for Global Health, Sydney Medical School, University of Sydney, Sydney, Australia 3Associate Professor, The George Institute for Global Health and Institute of Bone and Joint Research, Sydney Medical
School, University of Sydney, Sydney, Australia
Conflict of Interest: None
declared
This article has been
peer-reviewed
Article Submitted on: 31st
May 2015
Article Accepted on: 20th
June 2015
Funding Sources: None
declared
Correspondence to: Mr
Gustavo C Machado
Address: The George
Institute for Global
Health, PO Box M201,
Missenden Road,
Camperdown, Sydney,
NSW 2050, Australia
Email:
gmachado@georgeinstitu
te.org.au
Cite this article: Machado
GC, Maher CG, Ferreira
ML. Lack of efficacy of
paracetamol
(acetaminophen) for low
back pain and
osteoarthritis. J Pioneer
Med Sci 2015; 5(4):142-
143
Paracetamol, also known as acetaminophen, is
the most widely used over-the-counter
medication to treat back pain and osteoarthritis
[1]. Clinical guidelines consistently recommend
it as first line analgesic medication due to its
safety, effectiveness and low cost [2, 3]. A
recently published systematic review and meta-
analysis questions the efficacy of paracetamol
and calls for a revision of clinical guidelines [4].
The systematic review included 13 randomized
placebo-controlled trials investigating the safety
and efficacy of paracetamol in 5,366 patients
with low back pain (3 trials) or with hip or knee
osteoarthritis (10 trials) [4]. No trial enrolling
patients with neck pain were identified. The
meta-analysis suggested that paracetamol is not
effective in reducing pain and disability, or in
improving quality of life in patients with low
back pain. For hip and knee osteoarthritis,
paracetamol has a statistically significant effect
on pain and disability, but the effect is too small
to be clinically worthwhile. These results were
based on high quality evidence, and therefore
further research is unlikely to change this
conclusion [4].
The safety of paracetamol was recently
questioned in a systematic review of long-term
observational evidence, which showed an overall
28% increased risk of mortality and up to 2 times
greater risk of cardiovascular adverse events,
gastrointestinal bleeds and impaired kidney
function with the use of paracetamol in the
general adult population [5]. Paracetamol is also
associated with serious liver toxicity, including
liver failure, at doses of more than 4 g/day [1].
The above noted systematic review also found
that paracetamol at regular doses of up to 4 g/day
can increase the risk of abnormal results on liver
function tests up to four times (an abnormal test
was defined as hepatic enzyme activity 1.5 times
or more than the upper reference range) [4].
However, this result is based on the short-term
use of paracetamol, and the clinical meaning of
this transient alteration is unknown. The review
also revealed that adverse side effects varied
across trials, but no differences were found in
terms of the number of patients using
paracetamol reporting any adverse event, or to
adverse events, compared to those using a
placebo. Similarly, adherence to treatment
schedule rates was similar between those taking
paracetamol compared with those using a
placebo [4].
Low back pain and osteoarthritis are the leading
causes of global disability, and account for 10-
20% of all consultations with a general
practitioner [6]. This systematic review
contributes to the recent research that has
highlighted opportunities to improve the health
care provided for both conditions. Primary care
patients with osteoarthritis typically skip the first
line therapy with exercise and weight control [7],
and instead rapidly progress to referral for
imaging or surgery. Patients with low back pain
often get referrals for opioid medicines and
imaging [8]. A more liberal policy of imaging for
patients with back pain does not provide better
clinical outcomes, but the over-reporting of
incidental findings may cause unnecessary
concern to the patient and trigger unnecessary
tests and treatments. Clinicians should carefully
weigh benefits and harms when making
treatment decisions.
Paracetamol has minimal or no benefit for
patients with low back pain or osteoarthritis, but
may cause harm. In this context, its continued
use for these prevalent musculoskeletal diseases
may seem hard to justify. There are other
effective treatment options for patients with low
back pain and osteoarthritis. Reassurance of the
benign nature of low back pain, together with
advice and educational programs are known to be
effective and help reduce recovery time [9].
Other treatments include physical therapies such
as spinal manipulation and exercise as well as
psychological therapies, such as cognitive
behavioral therapy. Intra-articular corticosteroids
are effective in short-term pain reduction for
knee osteoarthritis, and land-based or water-
based aerobic exercises, strength training, weight
management and oral or topical anti-
inflammatory medicines have also been shown to
174

© J PIONEER MED SCI.www.jpmsonline.com Volume 5, Issue 4. October-November, 2015. Page | 143
provide benefits for patients with lower limb
osteoarthritis [3].
The editorial that accompanied this systematic
review in The BMJ emphasized the importance of
non-pharmacological options for musculoskeletal
conditions but warns that adherence to exercise
and access to physiotherapy are still poor in the
United Kingdom National Health Service [10]. In
the United States, same is also true, and only
about 60% of patients with osteoarthritis report
receiving needed rehabilitation services, common
barriers being lack of service coverage by the
health plan and high costs. Musculoskeletal
conditions, such as low back pain and
osteoarthritis, are still largely under-recognized
as a health priority. Thus, it is necessary to take
stock of the evidence for these common
conditions, and make sure people are receiving
appropriate care.
REFERENCES
1. Blieden M, Paramore LC, Shah D, et al. A perspective
on the epidemiology of acetaminophen exposure and toxicity in the United States. Expert Rev Clin
Pharmacol 2014; 7:341-8.
2. Chou R, Qaseem A, Snow V, et al. Diagnosis and treatment of low back pain: a joint clinical practice
guideline from the American College of Physicians and
the American Pain Society. Ann Intern Med 2007; 147:478-91.
3. McAlindon TE, Bannuru RR, Sullivan MC, et al.
OARSI guidelines for the non-surgical management of knee osteoarthritis. Osteoarthritis Cartilage 2014;
22:363-88.
4. Machado GC, Maher CG, Ferreira PH, et al. Efficacy and safety of paracetamol for spinal pain and
osteoarthritis: systematic review and meta-analysis of
randomised placebo controlled trials. BMJ 2015; 350:h1225.
5. Roberts E, Delgado Nunes V, Buckner S, et al.
Paracetamol: not as safe as we thought? A systematic
literature review of observational studies. Ann Rheum
Dis 2015; [Epub ahead of print].
6. Badley EM, Rasooly I, Webster GK. Relative importance of musculoskeletal disorders as a cause of
chronic health problems, disability, and health care
utilization: findings from the 1990 Ontario Health Survey. J Rheumatol 1994; 21:505-14.
7. Brand CA, Harrison C, Tropea J, et al. Management of
osteoarthritis in general practice in Australia. Arthritis Care Res (Hoboken) 2014; 66:551-8.
8. Williams CM, Maher CG, Hancock MJ, et al. Low back
pain and best practice care: A survey of general practice physicians. Arch Intern Med 2010; 170:271-7.
9. Williams CM, Maher CG, Latimer J, et al. Efficacy of
paracetamol for acute low-back pain: a double-blind, randomised controlled trial. Lancet 2014; 384:1586-96.
10. Mallen C, Hay E. Managing back pain and osteoarthritis
without paracetamol. BMJ 2015; 350:h1352.
175

APPENDIX C
Prizes and awards received for the study presented in Chapter Four
176

1. 1st Place Research Paper for the Most Number of Accesses, The British Medical Journal
(BMJ), London, UK.
The publication BMJ 2015;350:h1225 had over 80,000 downloads in 2015 and was awarded
a prize at the BMJ’s yearly Friends of the Journal event.
2. Research Student 2015 Publication Award, School of Public Health, Sydney Medical
School, The University of Sydney, Sydney, Australia.
The publication BMJ 2015;350:h1225 was awarded the best research paper by a higher
degree research student in terms of originality, quality and the significance.
3. Altmetric 2015 Top 100 Research Study, Altmetric, London, UK.
The publication BMJ 2015;350:h1225 was ranked in the top 1% of all articles ever tracked
by Altmetric with a current score of 1,038 for media attraction in 2015.
4. Top 20 Research Studies of 2015 for Primary Care Physicians, American Family Physician,
Leawood, USA.
The publication BMJ 2015;350:h1225 was ranked in the top 20 among approximately
20,000 research studies published during 2015 for greatest clinical relevance for family
physicians likely to change clinical practice.
177

APPENDIX D
Media coverage for the study presented in Chapter Four
178

Television
1. Channel ONE News. Interviewees: Manuela Ferreira, David Hunter
2. Channel 7 News. Interviewees: Manuela Ferreira, Chris Maher
3. Channel 9 News. Interviewee: David Hunter
4. Channel 10 Eyewitness News. Interviewees: Chris Maher, Manuela Ferreira
5. NBN News. Interviewee: David Hunter
Radio
1. ABC Radio National. Interviewee: Gustavo Machado
2. Triple J. Interviewee: Gustavo Machado
3. 4CRB. Interviewee: Manuela Ferreira
4. 3BA, Mixx FM, Coast FM, and Light FM. Interviewee: Manuela Ferreira
5. 2NURFM and Sunshine FM. Interviewee: Chris Maher
6. Spirit 96.5 FM and MIX 94.5. Interviewee: Chris Maher
7. 2MAX, 2YOU FM, Coast FM, and Great Lakes FM
Newspaper
1. Sydney Morning Herald
2. The Australian
3. Herald Sun
4. Adelaide Advertiser
5. Courier Mail
6. Geelong Advertiser
7. Gold Coast Bulletin
8. Townsville Bulletin
179

Top 10 Online News
1. The New York Times: http://nyti.ms/1DeaCji
2. The Guardian: http://bit.ly/1I3v49A
3. The Telegraph: http://bit.ly/1NBjJvM
4. The Times: http://bit.ly/1Dp7VNP
5. BBC News: http://bbc.in/1IP1Zwk
6. Daily Mail: http://dailym.ai/2faSDmv
7. The Mirror: http://bit.ly/2f7QhHq
8. Wall Street OTC: http://bit.ly/2exDcDI
9. CBS News: http://cbsn.ws/1C8OEcl
10. The Australian: http://bit.ly/2faMeHY
180

APPENDIX E
No clinically important benefits of surgery over rehabilitation for lumbar spinal stenosis
(PEDro synthesis)
Appendix E has been published as:
Machado GC, Ferreira ML. No clinically important benefits of surgery over rehabilitation for
lumbar spinal stenosis (PEDro synthesis). Br J Sports Med 2017;51:541-42. Copyright ©
2017, British Medical Association. Reprinted with permission from BMJ Publishing Group.
181

Statement from co-authors confirming authorship contribution of
the PhD candidate
The co-author of the paper “No clinically important benefits of surgery over rehabilitation for
lumbar spinal stenosis (PEDro synthesis)” confirm that Gustavo de Carvalho Machado has
made the following contributions:
Conception and design of the research
Analysis and interpretation of the findings
Writing of the manuscript and critical appraisal of the content
In addition to the statements above, in cases where I am not the corresponding author of a
published item, permission to include the published material has been granted by the
corresponding author.
Gustavo de Carvalho Machado _________________________ Date: 30 November 2016
As supervisor for the candidature upon which this thesis is based, I can confirm that the
authorship attribution statements above are correct.
Manuela Loureiro Ferreira _________________________ Date: 30 November 2016
182

This section features a recent systematic review that is indexed onPEDro, the Physiotherapy Evidence Database (http://www.pedro.org.au). PEDro is a free, web-based database of evidence relevantto physiotherapy.
No clinically important benefitsof surgery over rehabilitationfor lumbar spinal stenosis(PEDro synthesis)
▸ Zaina F, Tomkins-Lane C, Carragee E, et al. Surgical versus non-surgical treatment forlumbar spinal stenosis. Cochrane Database Syst Rev 2016;(1):CD010264.
BACKGROUNDLumbar spinal stenosis affects over 200 000 people in the USAand is the most common indication for spine surgery in olderadults.1 Nearly 38 000 surgical procedures are performed everyyear, and decompression is often the surgical procedure ofchoice.2 Some surgeons, however, decide to perform fusion,though this procedure has been associated with an increasedrisk of complications and resource use.2 We currently lackplacebo-controlled trials of surgery for lumbar spinal stenosis,3
thus the evidence to support surgery for this population comeslargely from trials comparing surgery with non-surgicaltreatments.4
AIMThe aim of the review was to investigate the effects of surgery forlumbar spinal stenosis compared with non-surgical treatments.For this PEDro synthesis, we updated the pooled analyses byincluding data of a recently published randomised trial.5
SEARCHES AND INCLUSION CRITERIASearches were conducted on CENTRAL, MEDLINE, Embase,CINAHL, PEDro and ICL up to February 2015. Studies wereincluded if they were: (1) randomised or quasi-randomised con-trolled trials, (2) compared surgery with conservative treat-ments, (3) evaluated pain, function and/or disability, quality oflife or adverse effects and (4) included adult patients withlumbar spinal stenosis.
INTERVENTIONSSurgical procedures included decompression with or withoutfusion. Non-surgical treatments consisted of rehabilitation (exer-cises, physiotherapy, manipulation, mobilisation, acupuncture,bracing), cognitive–behavioural treatments, drugs or steroidinjections.
MAIN OUTCOME MEASURESThe review included only studies that reported measures of painintensity, functional and/or disability status, health-relatedquality of life or safety outcomes.
STATISTICAL METHODSLength of follow-up was defined as short term (<6 months),intermediate term (6–24 months) and long term (≥24 months).
Pooled mean differences (MD), standardised mean differences(SMD), risk ratios and associated 95% CIs were calculated usingrandom-effects meta-analysis. Heterogeneity was evaluatedusing the χ
2 test and the I2 statistic. A MD <10 (0–100 scale)or SMD <0.4 was defined as a small and not clinically import-ant effect. Data from a large randomised controlled trial5 notincluded in the meta-analysis were extracted and pooled follow-ing the methods described in the review using ComprehensiveMeta-Analysis V.2.02.
RESULTSThe review included 5 randomised trials with a total of 643participants. The overall quality of the evidence was assessedusing the GRADE approach. Three trials compared surgerywith rehabilitation modalities, and two trials comparedsurgery with steroid injection. The additional trial notincluded in the meta-analysis had 169 participants (mean age68 years, 52% men) who received surgical decompression orphysiotherapy.5
The review found that surgery had similar effects on disabil-ity reduction as rehabilitation at short (MD −3.66, 95%CI −10.12 to 2.80) or intermediate term (MD −6.18, 95%CI −15.03 to 2.66). Non-clinically important effects werefound at long term (MD −4.43, 95% CI −7.91 to −0.96).Adding data from the most recent randomised trial to themeta-analyses did not change the conclusions, confirming thatsurgery is not superior to rehabilitation on disability at short(SMD −0.12, 95% CI −0.41 to 0.16) or intermediate term(SMD −0.23, 95% CI −0.56 to 0.10). Small and not clinicallyimportant effects were observed at long term (SMD −0.21,95% CI −0.39 to −0.03). The review did not report pooledeffects for pain outcomes measured in a continuous scale. Ourpooled analyses revealed no differences between surgery andrehabilitation on pain at short term (SMD −0.21, 95%CI −0.58 to 0.15). A small and not clinically important effectwas found at intermediate term (SMD −0.25, 95% CI −0.48 to−0.03), but no difference was observed at long term (SMD−0.26, 95% CI −0.53 to 0.01).
The review showed that surgery resulted in small but not clin-ically important pain (MD −2.40, 95% CI −2.88 to 1.92) anddisability (MD −5.70, 95% CI −10.83 to 0.57) reduction com-pared with epidural steroid injection. No long term data wereavailable for this comparison. Complication rates ranged from11% to 24% in the surgical group, and reoperation rate was13%. There were no side effects reported for any of the non-surgical treatments.
LIMITATIONSThere was substantial heterogeneity in some pooled analyses,with I2 values ranging from 17% to 81%. The review did notreport pooled effects for pain outcomes measured in a continu-ous scale. A large randomised trial was included in the review,5
but not in the pooled analyses. Adding data from this new trial,however, has not changed the final conclusions.
CLINICAL IMPLICATIONSOur updated pooled analyses confirmed that there are at bestsmall and not clinically important effects of surgery comparedwith rehabilitation on pain and disability. Furthermore, thereare no clinically important effects of surgery compared withsteroid injection on pain and disability. Surgery is associatedwith high complication and reoperation rates, while no sideeffects are reported for any of the conservative treatment
PEDro systematic review update
541Machado GC, Ferreira ML. Br J Sports Med 2017;51:541–542. doi:10.1136/bjsports-2016-097238
183

options. The included trials provide low-quality evidence;therefore, high-quality evidence is still needed to confirmwhether surgery is superior to non-surgical treatments forthese patients.
Gustavo C Machado,1 Manuela L Ferreira1,2
1The George Institute for Global Health, Sydney Medical School, The University of
Sydney, Sydney, New South Wales, Australia2Institute of Bone and Joint Research, The Kolling Institute, Sydney Medical School,
The University of Sydney, Sydney, New South Wales, Australia
Correspondence to Gustavo C Machado, The George Institute for Global Health,
Sydney Medical School, The University of Sydney. P.O. Box M201, Missenden Road,
Sydney, NSW 2050, Australia; [email protected]
Contributors GCM selected the systematic review. GCM wrote the first draft of themanuscript. MLF contributed to interpretation of the data and revision of the finalmanuscript.
Competing interests GCM is supported by an international postgraduate researchscholarship from the Australian Department of Education and Training. MLF issupported by a Sydney Medical Foundation Fellowship from the Sydney MedicalSchool.
Provenance and peer review Not commissioned; externally peer reviewed.
REFERENCES1 Deyo RA, Gray DT, Kreuter W, et al. United States trends in lumbar fusion surgery for
degenerative conditions. Spine 2005;30:1441–5.2 Deyo RA, Mirza SK, Martin BI, et al. Trends, major medical complications, and
charges associated with surgery for lumbar spinal stenosis in older adults. JAMA2010;303:1259–65.
3 Machado GC, Ferreira PH, Harris IA, et al. Effectiveness of surgery for lumbar spinalstenosis: a systematic review and meta-analysis. PLoS ONE 2015;10:e0122800.
4 Lurie J, Tomkins-Lane C. Management of lumbar spinal stenosis. BMJ 2016;352:h6234.
5 Delitto A, Piva SR, Moore CG, et al. Surgery versus nonsurgical treatment of lumbarspinal stenosis: a randomized trial. Ann Intern Med 2015;162:465–73.
PEDro systematic review update
To cite Machado GC, Ferreira ML. Br J Sports Med 2017;51:541–542.
Accepted 26 November 2016Published Online First 16 December 2016
Br J Sports Med 2017;51:541–542. doi:10.1136/bjsports-2016-097238
542 Machado GC, Ferreira ML. Br J Sports Med 2017;51:541–542. doi:10.1136/bjsports-2016-097238
184

APPENDIX F
Surgical options for lumbar spinal stenosis
Appendix F has been published as:
Machado GC, Ferreira PH, Yoo RIJ, et al. Surgical options for lumbar spinal stenosis.
Cochrane Database Syst Rev 2016;11:CD012421. Copyright © 2016, The Cochrane
Collaboration. Reprinted with permission from John Wiley & Sons Ltd.
185

Statement from co-authors confirming authorship contribution of
the PhD candidate
The co-authors of the paper “Surgical options for lumbar spinal stenosis” confirm that
Gustavo de Carvalho Machado has made the following contributions:
Conception and design of the research
Analysis and interpretation of the findings
Writing of the manuscript and critical appraisal of the content
In addition to the statements above, in cases where I am not the corresponding author of a
published item, permission to include the published material has been granted by the
corresponding author.
Gustavo de Carvalho Machado _________________________ Date: 30 November 2016
As supervisor for the candidature upon which this thesis is based, I can confirm that the
authorship attribution statements above are correct.
Manuela Loureiro Ferreira _________________________ Date: 30 November 2016
186

Cochrane Database of Systematic Reviews
Surgical options for lumbar spinal stenosis (Review)
Machado GC, Ferreira PH, Yoo RIJ, Harris IA, Pinheiro MB, Koes BW, van Tulder MW, Rzewuska M,
Maher CG, Ferreira ML
Machado GC, Ferreira PH, Yoo RIJ, Harris IA, Pinheiro MB, Koes BW, van Tulder MW, Rzewuska M, Maher CG, Ferreira ML.
Surgical options for lumbar spinal stenosis.
Cochrane Database of Systematic Reviews 2016, Issue 11. Art. No.: CD012421.
DOI: 10.1002/14651858.CD012421.
www.cochranelibrary.com
Surgical options for lumbar spinal stenosis (Review)
Copyright © 2016 The Cochrane Collaboration. Published by John Wiley & Sons, Ltd.
187

T A B L E O F C O N T E N T S
1HEADER . . . . . . . . . . . . . . . . . . . . . . . . . . . . . . . . . . . . . . .
1ABSTRACT . . . . . . . . . . . . . . . . . . . . . . . . . . . . . . . . . . . . . .
2PLAIN LANGUAGE SUMMARY . . . . . . . . . . . . . . . . . . . . . . . . . . . . . .
4SUMMARY OF FINDINGS FOR THE MAIN COMPARISON . . . . . . . . . . . . . . . . . . .
6BACKGROUND . . . . . . . . . . . . . . . . . . . . . . . . . . . . . . . . . . . .
7OBJECTIVES . . . . . . . . . . . . . . . . . . . . . . . . . . . . . . . . . . . . .
7METHODS . . . . . . . . . . . . . . . . . . . . . . . . . . . . . . . . . . . . . .
9RESULTS . . . . . . . . . . . . . . . . . . . . . . . . . . . . . . . . . . . . . . .
Figure 1. . . . . . . . . . . . . . . . . . . . . . . . . . . . . . . . . . . . . . 10
Figure 2. . . . . . . . . . . . . . . . . . . . . . . . . . . . . . . . . . . . . . 12
Figure 3. . . . . . . . . . . . . . . . . . . . . . . . . . . . . . . . . . . . . . 14
Figure 4. . . . . . . . . . . . . . . . . . . . . . . . . . . . . . . . . . . . . . 15
Figure 5. . . . . . . . . . . . . . . . . . . . . . . . . . . . . . . . . . . . . . 16
Figure 6. . . . . . . . . . . . . . . . . . . . . . . . . . . . . . . . . . . . . . 16
17ADDITIONAL SUMMARY OF FINDINGS . . . . . . . . . . . . . . . . . . . . . . . . . .
22DISCUSSION . . . . . . . . . . . . . . . . . . . . . . . . . . . . . . . . . . . . .
23AUTHORS’ CONCLUSIONS . . . . . . . . . . . . . . . . . . . . . . . . . . . . . . .
24ACKNOWLEDGEMENTS . . . . . . . . . . . . . . . . . . . . . . . . . . . . . . . .
24REFERENCES . . . . . . . . . . . . . . . . . . . . . . . . . . . . . . . . . . . . .
33CHARACTERISTICS OF STUDIES . . . . . . . . . . . . . . . . . . . . . . . . . . . . .
82DATA AND ANALYSES . . . . . . . . . . . . . . . . . . . . . . . . . . . . . . . . . .
Analysis 1.1. Comparison 1 Decompression alone versus decompression plus fusion, Outcome 1 Pain. . . . . . 85
Analysis 1.2. Comparison 1 Decompression alone versus decompression plus fusion, Outcome 2 Disability. . . . 86
Analysis 1.3. Comparison 1 Decompression alone versus decompression plus fusion, Outcome 3 Walking ability. . . 87
Analysis 1.4. Comparison 1 Decompression alone versus decompression plus fusion, Outcome 4 Operation time. . 88
Analysis 1.5. Comparison 1 Decompression alone versus decompression plus fusion, Outcome 5 Blood loss. . . . 89
Analysis 1.6. Comparison 1 Decompression alone versus decompression plus fusion, Outcome 6 Reoperations. . . 90
Analysis 1.7. Comparison 1 Decompression alone versus decompression plus fusion, Outcome 7 Hospitalisation. . . 91
Analysis 2.1. Comparison 2 Decompression versus interspinous spacer, Outcome 1 Pain. . . . . . . . . . . 92
Analysis 2.2. Comparison 2 Decompression versus interspinous spacer, Outcome 2 Disability. . . . . . . . . 93
Analysis 2.3. Comparison 2 Decompression versus interspinous spacer, Outcome 3 Function. . . . . . . . . 94
Analysis 2.4. Comparison 2 Decompression versus interspinous spacer, Outcome 4 Quality of life. . . . . . . . 95
Analysis 2.5. Comparison 2 Decompression versus interspinous spacer, Outcome 5 Costs. . . . . . . . . . . 96
Analysis 2.6. Comparison 2 Decompression versus interspinous spacer, Outcome 6 Operation time. . . . . . . 96
Analysis 2.7. Comparison 2 Decompression versus interspinous spacer, Outcome 7 Blood loss. . . . . . . . . 97
Analysis 2.8. Comparison 2 Decompression versus interspinous spacer, Outcome 8 Reoperations. . . . . . . . 98
Analysis 2.9. Comparison 2 Decompression versus interspinous spacer, Outcome 9 Hospitalisation. . . . . . . 98
Analysis 3.1. Comparison 3 Decompression plus fusion versus interspinous spacer, Outcome 1 Pain. . . . . . . 99
Analysis 3.2. Comparison 3 Decompression plus fusion versus interspinous spacer, Outcome 2 Disability. . . . . 100
Analysis 3.3. Comparison 3 Decompression plus fusion versus interspinous spacer, Outcome 3 Quality of life. . . . 100
Analysis 3.4. Comparison 3 Decompression plus fusion versus interspinous spacer, Outcome 4 Operation time. . . 101
Analysis 3.5. Comparison 3 Decompression plus fusion versus interspinous spacer, Outcome 5 Blood loss. . . . . 102
Analysis 3.6. Comparison 3 Decompression plus fusion versus interspinous spacer, Outcome 6 Reoperations. . . . 102
Analysis 3.7. Comparison 3 Decompression plus fusion versus interspinous spacer, Outcome 7 Hospitalisation. . . 103
Analysis 4.1. Comparison 4 Laminectomy versus laminotomy, Outcome 1 Pain. . . . . . . . . . . . . . 104
Analysis 4.2. Comparison 4 Laminectomy versus laminotomy, Outcome 2 Disability. . . . . . . . . . . . 105
Analysis 4.3. Comparison 4 Laminectomy versus laminotomy, Outcome 3 Walking ability. . . . . . . . . . 106
Analysis 4.4. Comparison 4 Laminectomy versus laminotomy, Outcome 4 Operation time. . . . . . . . . . 107
Analysis 4.5. Comparison 4 Laminectomy versus laminotomy, Outcome 5 Blood loss. . . . . . . . . . . . 108
Analysis 4.6. Comparison 4 Laminectomy versus laminotomy, Outcome 6 Reoperations. . . . . . . . . . . 109
Analysis 4.7. Comparison 4 Laminectomy versus laminotomy, Outcome 7 Hospitalisation. . . . . . . . . . 109
iSurgical options for lumbar spinal stenosis (Review)
Copyright © 2016 The Cochrane Collaboration. Published by John Wiley & Sons, Ltd.
188

Analysis 5.1. Comparison 5 Decompression versus split-decompression, Outcome 1 Pain. . . . . . . . . . . 110
Analysis 5.2. Comparison 5 Decompression versus split-decompression, Outcome 2 Disability. . . . . . . . . 111
Analysis 5.3. Comparison 5 Decompression versus split-decompression, Outcome 3 Recovery. . . . . . . . . 112
Analysis 5.4. Comparison 5 Decompression versus split-decompression, Outcome 4 Operation time. . . . . . . 113
Analysis 5.5. Comparison 5 Decompression versus split-decompression, Outcome 5 Blood loss. . . . . . . . . 114
Analysis 5.6. Comparison 5 Decompression versus split-decompression, Outcome 6 Reoperations. . . . . . . . 115
Analysis 5.7. Comparison 5 Decompression versus split-decompression, Outcome 7 Hospitalisation. . . . . . . 115
Analysis 6.1. Comparison 6 Decompression versus endoscopic decompression, Outcome 1 Disability. . . . . . . 116
Analysis 6.2. Comparison 6 Decompression versus endoscopic decompression, Outcome 2 Operation time. . . . 117
Analysis 6.3. Comparison 6 Decompression versus endoscopic decompression, Outcome 3 Blood loss. . . . . . 117
Analysis 6.4. Comparison 6 Decompression versus endoscopic decompression, Outcome 4 Reoperations. . . . . 118
Analysis 6.5. Comparison 6 Decompression versus endoscopic decompression, Outcome 5 Hospitalisation. . . . . 118
119ADDITIONAL TABLES . . . . . . . . . . . . . . . . . . . . . . . . . . . . . . . . . .
121APPENDICES . . . . . . . . . . . . . . . . . . . . . . . . . . . . . . . . . . . . .
129CONTRIBUTIONS OF AUTHORS . . . . . . . . . . . . . . . . . . . . . . . . . . . . .
129DECLARATIONS OF INTEREST . . . . . . . . . . . . . . . . . . . . . . . . . . . . . .
129SOURCES OF SUPPORT . . . . . . . . . . . . . . . . . . . . . . . . . . . . . . . . .
130DIFFERENCES BETWEEN PROTOCOL AND REVIEW . . . . . . . . . . . . . . . . . . . . .
130INDEX TERMS . . . . . . . . . . . . . . . . . . . . . . . . . . . . . . . . . . . .
iiSurgical options for lumbar spinal stenosis (Review)
Copyright © 2016 The Cochrane Collaboration. Published by John Wiley & Sons, Ltd.
189

[Intervention Review]
Surgical options for lumbar spinal stenosis
Gustavo C Machado1, Paulo H Ferreira2, Rafael IJ Yoo1, Ian A Harris3, Marina B Pinheiro2, Bart W Koes4, Maurits W van Tulder5,
Magdalena Rzewuska6 , Christopher G Maher1, Manuela L Ferreira7
1The George Institute for Global Health, Sydney Medical School, The University of Sydney, Sydney, Australia. 2Discipline of Physio-
therapy, Faculty of Health Sciences, The University of Sydney, Sydney, Australia. 3Ingham Institute for Applied Medical Research, South
Western Sydney Clinical School, UNSW Australia, Liverpool, Australia. 4Department of General Practice, Erasmus Medical Center,
Rotterdam, Netherlands. 5Department of Health Sciences, Faculty of Earth and Life Sciences, VU University Amsterdam, Amsterdam,
Netherlands. 6Department of Social Medicine, Faculty of Medicine, University of São Paulo, Ribeirão Preto, Brazil. 7The George
Institute for Global Health & Institute of Bone and Joint Research, The Kolling Institute, Sydney Medical School, The University of
Sydney, Sydney, Australia
Contact address: Gustavo C Machado, The George Institute for Global Health, Sydney Medical School, The University of Sydney,
PO Box M201, Sydney, NSW 2050, Australia. [email protected].
Editorial group: Cochrane Back and Neck Group.
Publication status and date: New, published in Issue 11, 2016.
Citation: Machado GC, Ferreira PH, Yoo RIJ, Harris IA, Pinheiro MB, Koes BW, van Tulder MW, Rzewuska M, Maher CG, Ferreira
ML. Surgical options for lumbar spinal stenosis. Cochrane Database of Systematic Reviews 2016, Issue 11. Art. No.: CD012421. DOI:
10.1002/14651858.CD012421.
Copyright © 2016 The Cochrane Collaboration. Published by John Wiley & Sons, Ltd.
A B S T R A C T
Background
Hospital charges for lumbar spinal stenosis have increased significantly worldwide in recent times, with great variation in the costs and
rates of different surgical procedures. There have also been significant increases in the rate of complex fusion and the use of spinal
spacer implants compared to that of traditional decompression surgery, even though the former is known to incur costs up to three
times higher. Moreover, the superiority of these new surgical procedures over traditional decompression surgery is still unclear.
Objectives
To determine the efficacy of surgery in the management of patients with symptomatic lumbar spinal stenosis and the comparative
effectiveness between commonly performed surgical techniques to treat this condition on patient-related outcomes. We also aimed to
investigate the safety of these surgical interventions by including perioperative surgical data and reoperation rates.
Search methods
Review authors performed electronic searches of the Cochrane Central Register of Controlled Trials (CENTRAL), MEDLINE, Embase,
CINAHL, AMED, Web of Science, LILACS and three trials registries from their inception to 16 June 2016. Authors also conducted
citation tracking on the reference lists of included trials and relevant systematic reviews.
Selection criteria
This review included only randomised controlled trials that investigated the efficacy and safety of surgery compared with no treatment,
placebo or sham surgery, or with another surgical technique in patients with lumbar spinal stenosis.
1Surgical options for lumbar spinal stenosis (Review)
Copyright © 2016 The Cochrane Collaboration. Published by John Wiley & Sons, Ltd.
190

Data collection and analysis
Two reviewers independently assessed the studies for inclusion and performed the ’Risk of bias’ assessment, using the Cochrane Back and
Neck Review Group criteria. Reviewers also extracted demographics, surgery details, and types of outcomes to describe the characteristics
of included studies. Primary outcomes were pain intensity, physical function or disability status, quality of life, and recovery. The
secondary outcomes included measurements related to surgery, such as perioperative blood loss, operation time, length of hospital stay,
reoperation rates, and costs. We grouped trials according to the types of surgical interventions being compared and categorised follow-
up times as short-term when less than 12 months and long-term when 12 months or more. Pain and disability scores were converted
to a common 0 to 100 scale. We calculated mean differences for continuous outcomes and relative risks for dichotomous outcomes.
We pooled data using the random-effects model in Review Manager 5.3, and used the GRADE approach to assess the quality of the
evidence.
Main results
We included a total of 24 randomised controlled trials (reported in 39 published research articles or abstracts) in this review. The trials
included 2352 participants with lumbar spinal stenosis with symptoms of neurogenic claudication. None of the included trials compared
surgery with no treatment, placebo or sham surgery. Therefore, all included studies compared two or more surgical techniques. We
judged all trials to be at high risk of bias for the blinding of care provider domain, and most of the trials failed to adequately conceal the
randomisation process, blind the participants or use intention-to-treat analysis. Five trials compared the effects of fusion in addition
to decompression surgery. Our results showed no significant differences in pain relief at long-term (mean difference (MD) -0.29, 95%
confidence interval (CI) -7.32 to 6.74). Similarly, we found no between-group differences in disability reduction in the long-term (MD
3.26, 95% CI -6.12 to 12.63). Participants who received decompression alone had significantly less perioperative blood loss (MD -0.52
L, 95% CI -0.70 L to -0.34 L) and required shorter operations (MD -107.94 minutes, 95% CI -161.65 minutes to -54.23 minutes)
compared with those treated with decompression plus fusion, though we found no difference in the number of reoperations (risk ratio
(RR) 1.25, 95% CI 0.81 to 1.92). Another three trials investigated the effects of interspinous process spacer devices compared with
conventional bony decompression. These spacer devices resulted in similar reductions in pain (MD -0.55, 95% CI -8.08 to 6.99)
and disability (MD 1.25, 95% CI -4.48 to 6.98). The spacer devices required longer operation time (MD 39.11 minutes, 95% CI
19.43 minutes to 58.78 minutes) and were associated with higher risk of reoperation (RR 3.95, 95% CI 2.12 to 7.37), but we found
no difference in perioperative blood loss (MD 144.00 mL, 95% CI -209.74 mL to 497.74 mL). Two trials compared interspinous
spacer devices with decompression plus fusion. Although we found no difference in pain relief (MD 5.35, 95% CI -1.18 to 11.88),
the spacer devices revealed a small but significant effect in disability reduction (MD 5.72, 95% CI 1.28 to 10.15). They were also
superior to decompression plus fusion in terms of operation time (MD 78.91 minutes, 95% CI 30.16 minutes to 127.65 minutes) and
perioperative blood loss (MD 238.90 mL, 95% CI 182.66 mL to 295.14 mL), however, there was no difference in rate of reoperation
(RR 0.70, 95% CI 0.32 to 1.51). Overall there were no differences for the primary or secondary outcomes when different types of
surgical decompression techniques were compared among each other. The quality of evidence varied from ’very low quality’ to ’high
quality’.
Authors’ conclusions
The results of this Cochrane review show a paucity of evidence on the efficacy of surgery for lumbar spinal stenosis, as to date no trials
have compared surgery with no treatment, placebo or sham surgery. Placebo-controlled trials in surgery are feasible and needed in the
field of lumbar spinal stenosis. Our results demonstrate that at present, decompression plus fusion and interspinous process spacers
have not been shown to be superior to conventional decompression alone. More methodologically rigorous studies are needed in this
field to confirm our results.
P L A I N L A N G U A G E S U M M A R Y
Effectiveness of surgery for people with leg or back pain due to symptomatic spinal stenosis
Review question
How well do different types of surgery work for lumbar spinal stenosis?
Background
Spinal stenosis is the narrowing of the spinal canal in the lower back region caused by thickening of the soft tissues and bones. It
is a common condition for which surgery is usually performed after non-surgical treatments (such as physiotherapy) have failed to
2Surgical options for lumbar spinal stenosis (Review)
Copyright © 2016 The Cochrane Collaboration. Published by John Wiley & Sons, Ltd.
191

bring sufficient relief to patients. Spinal stenosis is a common cause of low back pain that radiates to the legs, and it is more common
in older adults. Surgery for lumbar spinal stenosis normally involves taking pressure off the spinal cord or spinal nerves (known as
decompression) by removing bone and soft tissues from around the spinal canal. Another common surgical approach is to fuse two or
more vertebrae together after decompression in the patient whose spine seems to be unstable. The usefulness of some types of surgery
for lumbar spinal stenosis, however, has been questioned, and previous studies have reported that patients who receive fusion are more
likely to have major complications and higher costs when compared with patients who undergo decompression only. More recently,
spinal implants were created to help indirectly reduce pressure in the spinal canal and at the same time stabilise the bones. However,
these implants have also been linked to worse outcomes (e.g., higher reoperation rates) when compared to conventional decompression.
Search date
This review includes all trials published up to June 2016.
Study characteristics
We included all trials that compared any surgical technique with no surgery or placebo surgery, and also trials comparing different
surgical techniques with each other, including fusion and spinal implants. All the patients included in these studies were diagnosed
with lumbar spinal stenosis and had symptoms in the leg or thigh that worsened by walking or standing and were generally relieved by
a change in position, such as bending forward or sitting. The main measure we used to compare how well the different types of surgery
worked was how much less pain people felt as they went about their daily lives. We also looked at whether their leg pain improved,
how much blood they lost during surgery, how long the surgery took, how long they had to stay in hospital, how many patients had
to have another operation for the problem and how much the treatment cost.
Key results and quality of the evidence
Twenty-four randomised controlled trials were included with a total of 2352 people. We did not find trials that compared surgery
with no treatment or placebo surgery, so all included trials compared different surgical techniques. The quality of the evidence from
these studies varied from very low quality to high quality. This large variation was mainly due to different study protocols, surgical
techniques and quality of reporting according to the ’Risk of bias’ assessment. We found that patients who had decompression plus
fusion fared no better than those who underwent decompression surgery alone. In fact, decompression plus fusion resulted in more
blood loss during surgery than decompression alone. Although the spinal spacers were slightly better than decompression plus fusion
in terms of improvements on daily activities, there were no differences when they were compared with decompression alone. Finally,
we found no differences between different forms of decompression.
3Surgical options for lumbar spinal stenosis (Review)
Copyright © 2016 The Cochrane Collaboration. Published by John Wiley & Sons, Ltd.
192

SU
MM
AR
YO
FF
IN
DI
NG
SF
OR
TH
EM
AI
NC
OM
PA
RI
SO
N[E
xpla
nati
on]
De
co
mp
res
sio
na
lon
ec
om
pa
red
wit
hd
ec
om
pre
ss
ion
plu
sfu
sio
nfo
rlu
mb
ar
sp
ina
ls
ten
os
is
Pa
tie
nt
or
po
pu
lati
on
:p
ati
en
tsw
ith
lum
ba
rs
pin
al
ste
no
sis
Se
ttin
gs
:in
pa
tie
nt
ca
re
Inte
rve
nti
on
:d
ec
om
pre
ss
ion
alo
ne
Co
mp
ari
so
n:
de
co
mp
res
sio
np
lus
fus
ion
Ou
tco
me
sC
om
pa
ris
on
sR
ela
tive
eff
ec
t
(95
%C
I)
Nu
mb
er
of
pa
rtic
ipa
nts
(stu
die
s)
Qu
ali
tyo
fth
ee
vid
en
ce
(GR
AD
E)
Co
mm
en
ts
As
su
me
dri
sk
Co
rre
sp
on
din
gri
sk
De
co
mp
res
sio
nD
ec
om
pre
ss
ion
wit
h
fus
ion
Pa
in
Lo
ng
-te
rm(≥
12
mo
nth
s)
Pa
ins
co
res
co
nve
rte
d
to0
to1
00
sc
ale
to
all
ow
for
co
mp
ari
so
n
of
dif
fere
nt
dis
ab
ilit
y
sc
ale
s(V
AS
,NR
S)
Th
em
ea
np
ain
sc
ore
ran
ge
da
cro
ss
de
co
m-
pre
ss
ion
gro
up
sfr
om
9.5
0to
48
.10
po
ints
Th
em
ea
np
ain
inth
e
de
co
mp
res
sio
nw
ith
fu-
sio
ng
rou
ps
wa
s0
.29
hig
he
r(6
.74
low
er
to7
.
32
hig
he
r)
Me
an
dif
fere
nc
e-0
.29
(-7
.32
,6.7
4)
38
0(4
)⊕
©©
©
Ve
rylo
w
Th
ed
iffe
ren
ce
isn
ot
sta
tis
tic
all
y
or
cli
nic
all
ys
ign
ific
an
t
Dis
ab
ilit
y
Lo
ng
-te
rm(≥
12
mo
nth
s)
Dis
ab
ilit
ys
co
res
co
n-
vert
ed
to0
to1
00
sc
ale
toa
llo
wfo
rc
om
pa
ri-
so
no
fd
iffe
ren
td
isa
bil
-
ity
sc
ale
s(R
MD
Q,
OD
I,
JO
A)
Th
em
ea
np
ain
sc
ore
ran
ge
da
cro
ss
de
co
m-
pre
ss
ion
gro
up
sfr
om
17
.90
to5
6.2
9p
oin
ts
Th
em
ea
nd
isa
bil
ity
sc
ore
inth
ed
ec
om
-
pre
ss
ion
wit
hfu
sio
n
gro
up
wa
s3
.26
low
er
(6.1
2lo
we
rto
12
.63
hig
he
r)
Me
an
dif
fere
nc
e3
.26
(-
6.1
2,1
2.6
3)
33
5(3
)⊕
©©
©
Ve
rylo
w
Th
ed
iffe
ren
ce
isn
ot
sta
tis
tic
all
y
or
cli
nic
all
ys
ign
ific
an
t
4Surgical options for lumbar spinal stenosis (Review)
Copyright © 2016 The Cochrane Collaboration. Published by John Wiley & Sons, Ltd.
193

Op
era
tio
nti
me
Du
rati
on
of
op
era
tio
n
rep
ort
ed
inm
inu
tes
Th
em
ea
no
pe
rati
on
tim
era
ng
ed
ac
ros
s
de
co
mp
res
sio
ng
rou
ps
fro
m8
8.4
6m
inu
tes
to
12
4.4
0m
inu
tes
Th
em
ea
no
pe
rati
on
tim
ein
the
de
co
mp
res
-
sio
nw
ith
fus
ion
gro
up
s
wa
s1
07
.94
hig
he
r(5
4.
23
to1
61
.65
hig
he
r)
Me
an
dif
fere
nc
e-1
07
.
94
(-1
61
.65
,-5
4.2
3)
38
1(4
)⊕
©©
©
Ve
rylo
w
Th
ed
iffe
ren
ce
isc
lin
i-
ca
lly
sig
nif
ica
nt
Blo
od
los
s
Am
ou
nt
of
pe
rio
pe
ra-
tive
blo
od
los
sre
po
rte
d
inL
Th
em
ea
np
eri
op
era
-
tive
blo
od
los
sra
ng
ed
ac
ros
sd
ec
om
pre
ss
ion
gro
up
sfr
om
0.0
8to
0.
34
L
Th
em
ea
np
eri
op
era
tive
blo
od
los
sin
the
de
-
co
mp
res
sio
nw
ith
fu-
sio
ng
rou
ps
wa
s0
.52
L
hig
he
r(0
.34
Lto
0.7
0L
hig
he
r)
Me
an
dif
fere
nc
e-0
.52
(-0
.70
,-0
.34
)
38
3(4
)⊕
©©
©
Ve
rylo
w
Th
ed
iffe
ren
ce
isc
lin
i-
ca
lly
sig
nif
ica
nt
Re
op
era
tio
ns
Nu
mb
er
of
pa
tie
nts
req
uir
ing
are
vis
ion
su
rge
ry
36
of
18
5(1
9p
er
10
0)
pa
rtic
ipa
nts
ha
dre
op
-
era
tio
n
38
of
25
8(1
5p
er
10
0)
pa
rtic
ipa
nts
ha
dre
op
-
era
tio
n
Ris
kra
tio
1.2
5(0
.81
,1.
92
)
44
3(5
)⊕
⊕⊕
©
Mo
de
rate
Th
ed
iffe
ren
ce
isn
ot
sta
tis
tic
all
y
or
cli
nic
all
ys
ign
ific
an
t
CI:
co
nfi
de
nc
ein
terv
al;
VA
S:
vis
ua
lan
alo
gu
es
ca
le;N
RS
:n
um
eri
ca
lra
tin
gs
ca
le;
RM
DQ
:R
ola
nd
-Mo
rris
Dis
ab
ilit
yQ
ue
sti
on
na
ire
;OD
I:O
sw
es
try
Dis
ab
ilit
yIn
de
x;J
OA
:J
ap
an
es
e
Ort
ho
pe
dic
As
so
cia
tio
n
GR
AD
EW
ork
ing
Gro
up
gra
de
so
fe
vid
en
ce
Hig
hq
ua
lity
:F
urt
he
rre
se
arc
his
very
un
like
lyto
ch
an
ge
ou
rc
on
fid
en
ce
inth
ee
sti
ma
teo
fe
ffe
ct.
Mo
de
rate
qu
ali
ty:
Fu
rth
er
res
ea
rch
isli
kely
toh
ave
an
imp
ort
an
tim
pa
ct
on
ou
rc
on
fid
en
ce
inth
ee
sti
ma
teo
fe
ffe
ct
an
dm
ay
ch
an
ge
the
es
tim
ate
.
Lo
wq
ua
lity
:F
urt
he
rre
se
arc
his
very
like
lyto
ha
vea
nim
po
rta
nt
imp
ac
to
no
ur
co
nfi
de
nc
ein
the
es
tim
ate
of
eff
ec
ta
nd
isli
kely
toc
ha
ng
eth
ee
sti
ma
te.
Ve
rylo
wq
ua
lity
:W
ea
reve
ryu
nc
ert
ain
ab
ou
tth
ee
sti
ma
te.
5Surgical options for lumbar spinal stenosis (Review)
Copyright © 2016 The Cochrane Collaboration. Published by John Wiley & Sons, Ltd.
194

B A C K G R O U N D
Description of the condition
Lumbar spinal stenosis is a narrowing of the spinal canal or the
intervertebral foramina by surrounding bone and soft tissues that
compromises neural structures (Bailey 1911; Portal 1803). Al-
though it can be an incidental finding (Boden 1990), lumbar
spinal stenosis may cause leg or lower back symptoms and disabil-
ity, particularly in the older population (Kalichman 2009; Katz
2008). Radiographic findings of spinal stenosis are highly preva-
lent among those older than 60 years of age and can be as high as
80% in specific populations (Ishimoto 2013). Only 30%, how-
ever, present severe lumbar stenosis and about 17% have long-
term symptoms of intermittent neurogenic claudication. Neuro-
genic claudication is the most important feature of lumbar spinal
stenosis as it limits patients’ walking ability and causes a major
impact on their quality of life. Intermittent neurogenic claudica-
tion is defined as uni- or bilateral radicular pain during walking
or standing that is relieved by sitting down or flexing the lumbar
spine (Blau 1961).
The differential diagnosis from vascular intermittent claudication
is sometimes challenging as poor circulation in the muscles of the
legs might mimic neurogenic claudication. Pain sensation while
standing and pain relief with lumbar flexion are important char-
acteristics of neurogenic claudication that may help distinguish
between these conditions. Lumbar spinal stenosis can be classified
as primary (congenital) or secondary stenosis (degenerative, ia-
trogenic, spondylotic, post-traumatic and miscellaneous; Arnoldi
1976; Katz 2008; Siebert 2009). It is also anatomically classified
as central, lateral or foraminal and it can be a result of multiple
factors, such as intervertebral disc protrusion, loss of intervertebral
space height, hypertrophy of joint capsules and ligaments, and os-
teophytes (Siebert 2009).
Description of the intervention
Bony decompression by laminectomy was first described by Alban
Smith (Smith 1829), and first reported in a patient with spinal
stenosis in 1893 (Lane 1893). This surgical procedure is still con-
sidered the gold standard of surgery and the most common tech-
nique for lumbar spinal stenosis (Gibson 2005; Jansson 2003).
After intubation and anaesthesia the patient is positioned prone
on the operating table, and imaging techniques guide a midline
or posterolateral muscle splitting incision. The paraspinal muscles
are stripped to expose the lamina and retracted laterally. The sur-
geon performs partial removal of both osseous (vertebrae lamina,
spinous process, facet joints) and soft tissue elements (posterior
ligamentous complex), but at least 50% of each facet joint com-
plex is preserved to avoid iatrogenic instability. In cases of instabil-
ity, lumbar fusion may be necessary in addition to decompression
(Taylor 1994), which usually involves the use of spinal implants to
stabilise the fused segments, though recent trials have questioned
this view (Forsth 2016; Ghogawala 2016). In the United States, the
rate of fusion for lumbar spinal stenosis has increased significantly
in recent times (Deyo 2010). However, this procedure is associ-
ated with higher reoperation rates, post-surgical complications,
and costs when compared with decompression alone (Deyo 2013).
Furthermore, it is still debatable whether the addition of fusion is
more effective than decompression alone. To overcome the com-
plications associated with fusion, less invasive surgical techniques
have been developed, such as the interspinous process spacer de-
vices (Coflex, Paradigm Spine USA and X-Stop, Medtronic Spine
USA). These spacer devices were created to promote an indirect
decompression and provide stabilisation while preserving the bony
structures of the spinal column (Senegas 1991). However, the most
recent evidence on this topic has shown that these spacer devices
alone are not only more costly than conventional decompression,
but are also associated with higher reoperation rates (Deyo 2013).
Alternatives to conventional decompression by laminectomy have
been developed to minimise the damage on posterior structures
of the lumbar spine. Minimally invasive decompressive tech-
niques used to treat lumbar spinal stenosis include uni- or bilat-
eral laminotomies and spinal process-splitting laminectomy. These
techniques are also frequently performed with the use of an en-
doscope or microscope. The bilateral laminotomy technique pre-
serves the neural arch of the vertebrae and protects the dura. In
multisegmental stenosis this technique allows the reattachment
of the paravertebral muscles to the spinous processes. The sur-
geon partially removes the laminae and ligamentum flavum but
preserves the facet joint complex and the muscles attached to it
(Aryanpur 1988). Unilateral laminotomy refers to partial resection
of the facets and the medial portion of the lamina, and complete
removal of the ligamentum flavum (Spetzger 1997). This tech-
nique was developed to overcome the disadvantage of surgically
induced instability (Spetzger 1997a). More recently, the spinous
process-splitting laminectomy was developed (Watanabe 2005).
In this technique, the lamina is exposed by longitudinally splitting
the spinous process into halves, allowing muscles and ligamentous
attachments to be left intact. Recently, another Cochrane review
showed that these posterior decompression techniques delivered
no different results in terms of leg pain or disability reduction
compared to conventional laminectomy (Overdevest 2015).
How the intervention might work
Increasing the cross-sectional area of the spinal canal at the level of
stenosis (decompression) may decrease pain that is generated from
increased pressure on the nerves within the stenosed segment. The
complete removal of the vertebrae lamina and spinal process in an
extensive conventional laminectomy is, however, linked to post-
surgical spinal instability (Abumi 1990; Hopp 1988; Lee 1983).
Therefore, techniques that increase spinal stability after decom-
6Surgical options for lumbar spinal stenosis (Review)
Copyright © 2016 The Cochrane Collaboration. Published by John Wiley & Sons, Ltd.
195

pression, such as fusion, might have an advantage compared with
decompression alone. In a conventional laminectomy procedure,
the paraspinal muscles are detached extensively from the spinal
processes, vertebrae lamina and facets. Such muscle damage is asso-
ciated with significant atrophy of paraspinal muscles (Kawaguchi
1996; See 1975), and the spinal process-splitting decompression
technique has been proposed to preserve muscle integrity. In ad-
dition, other minimally invasive decompression techniques (e.g.,
uni- or bilateral laminotomies) preserve spinal integrity and are po-
tentially capable of reducing postoperative complications such as
muscle atrophy, weakness, postoperative pain, perioperative blood
loss, operation time and length of hospital stay. Endoscopic as-
sisted decompressive surgery has also been proposed to avoid scar-
ing of the epidural space (Cooper 1991).
Why it is important to do this review
Surgery for lumbar spinal stenosis is believed to be more effective
than conservative treatment when the latter has failed for up to
six months (Kovacs 2011; May 2013). However, the most recent
evidence does not confirm this belief. For instance, in the Spine
Patient Outcomes Research Trial (SPORT) patients treated sur-
gically did not report any difference in outcomes compared with
those treated non-surgically in the intention-to-treat analyses, al-
though the as-treated analyses showed statistically significant but
small differences in terms of pain and function favouring surgery
(Weinstein 2008). Further, a recent trial has also shown that surgi-
cal decompression yielded similar effects to a physiotherapy pro-
gramme (Delitto 2015). In this review we did not include trials
comparing surgery with non-surgical interventions, because this is
covered in another Cochrane review (Zaina 2016). Given most of
the evidence supporting the use of surgery for lumbar spinal steno-
sis comes largely from trials comparing surgery with non-surgical
interventions, it is not possible to distinguish the specific effects of
surgery from the effects of time, regression to the mean, or placebo
effects (Flum 2006). Moreover, many surgical techniques are avail-
able for the management of lumbar spinal stenosis, and the lack
of evidence to support the rapid evolution of surgical techniques
has led clinicians to rely on their own opinions and experiences
to choose the surgical technique for their patients (Katz 1997),
which leads to practice variation. The conflicting results from cur-
rent randomised trials (Cavusoglu 2007; Grob 1995; Stromqvist
2013), and the emerging evidence on this topic (Forsth 2016;
Ghogawala 2016) demand a synthesis of the available evidence.
O B J E C T I V E S
To determine the efficacy of surgery (i.e., surgery versus no treat-
ment, or placebo/sham surgery) in the management of patients
with symptomatic lumbar spinal stenosis and the comparative ef-
fectiveness of commonly performed surgical techniques to treat
this condition on patient-related outcomes. We also aimed to in-
vestigate the safety of these surgical interventions by including pe-
rioperative surgical data and reoperation rates.
M E T H O D S
Criteria for considering studies for this review
Types of studies
We only included published randomised controlled trials.
Types of participants
The participants included in our review consisted of adults
with symptomatic degenerative lumbar spinal stenosis, despite its
anatomical classification (central, foraminal or lateral) or diagnos-
tic criteria (physical examination or radiographic imaging). There
were no restrictions regarding intensity or duration of symptoms.
Studies of participants with trauma, tumour and previous spine
surgery were excluded. As degenerative spondylolisthesis is a com-
mon finding in patients with lumbar spinal stenosis, only trials in-
cluding participants with spondylolisthesis up to Meyerding grade
I (translation of the cranial vertebra of up to 25%) were included
(Meyerding 1932).
Types of interventions
We considered studies that compared the efficacy of surgery with
no treatment, placebo or sham surgery. We also included trials
that compared the effectiveness of different surgical techniques
for lumbar spinal stenosis. However, trials comparing different
fusion techniques or interspinous spacer devices, and surgery for
cervical spinal stenosis, were excluded. We also excluded trials
that compared surgery with non-surgical interventions, as this is
covered in another recent Cochrane review (Zaina 2016).
Types of outcome measures
We included patient-centred outcomes of clinical relevance, as well
as safety and perioperative surgical outcomes. We did not consider
radiographic and biomechanical outcomes.
Primary outcomes
The primary outcomes of this review comprised:
• pain intensity;
• physical function or disability status;
• quality of life; and
7Surgical options for lumbar spinal stenosis (Review)
Copyright © 2016 The Cochrane Collaboration. Published by John Wiley & Sons, Ltd.
196

• recovery.
Pain intensity outcomes were back pain, leg pain or overall pain
reported in visual analogue scales or numeric rating scales. Disabil-
ity outcomes measures included Roland-Morris Disability Ques-
tionnaire (RMDQ), Owestry Disability Index (ODI) or any other
disability instrument used in low back pain research, and walk-
ing ability. Physical function was included if measured using the
Zurich Claudication Questionnaire (ZCQ). Quality of life out-
comes were, for example, total scores of the 36-item or 12-item
Short Form Health Survey (SF-36, SF-12), or the EuroQol ques-
tionnaire (EQ-5D). Trials that reported individual item scores,
rather than the total scores, of the quality of life scales were not
included in the meta-analysis. Recovery was measured using the
differences between preoperative and postoperative Japanese Or-
thopaedic Association (JOA) scores as reported by the included
trials.
Secondary outcomes
Secondary outcomes were:
• perioperative blood loss;
• operation time;
• length of hospital stay;
• reoperation rate; and
• costs.
Search methods for identification of studies
Electronic searches
Review authors developed the search strategy based on the Back
and Neck Review Group methods guidelines and a specialist was
consulted to revise it. Electronic searches of the following databases
were performed up to 16 June 2016:
• Cochrane Back and Neck Review Group Trials Register
(OvidSP, 1991 to May 2016).
• Cochrane Central Register of Controlled Trials
(CENTRAL; OvidSP, Issue 5, 2016).
• MEDLINE (OvidSP, 1946 to June Week 2 2016).
• Embase (Embase.com, 1947 to 16 June 2016).
• CINAHL (EBSCO, 1981 to 16 June 2016).
• AMED (OvidSP, 1985 to 16 June 2016).
• Web of Science (Thomson Reuters, 1900 to 16 June 2016).
• Latin American and Caribbean Health Sciences Literature (
LILACS; 1967 to 16 June 2016).
There were no restrictions on language or publication date. The
search strategy for each database can be found in Appendix 1.
Searching other resources
Authors also searched ClinicalTrials.gov, Australian New Zealand
Clinical Trials Registry (ANZCTR), and World Health Organi-
zation (WHO) International Clinical Trials Registry Platform (
ICTRP) for registered, ongoing or completed trials and contacted
the main investigators of the relevant trials to identify any publi-
cation of the study. The keywords used for these searches included
spinal stenosis, surgery and decompression.
Data collection and analysis
Selection of studies
One reviewer (GM) performed the first screening for relevant
records based on titles and abstracts. Two independent reviewers
(GM and MP/MR/RY) performed the screening of full texts, used
consensus to resolve any disagreement and consulted a third re-
viewer (MF) when consensus could not be reached.
Data extraction and management
Using a standardised data extraction form, two reviewers (GM and
MP/RY) independently extracted data from each included study
and used consensus to resolve any disagreement. From each study,
the reviewers extracted participants’ characteristics (age, disease
duration and diagnostic criteria), type of surgery, type of compar-
ison and outcomes. Pain and disability outcome measures were
converted to scales from 0 (no pain or disability) to 100 (worst
possible pain or disability).
Assessment of risk of bias in included studies
Reviewers evaluated the risk of bias in the included trials using
the ’Risk of bias’ assessment tool as recommended in the CochraneHandbook for Systematic Reviews of Interventions (Higgins 2011)
and the Cochrane Back and Neck Review Group (Furlan 2015).
Two reviewers (GM and MP/RY) independently performed the
’Risk of bias’ assessment of the included trials, used consensus if
there was any disagreement and consulted a third reviewer (MF)
when consensus could not be reached. We scored each study as
having ’high’, ’low’ or ’unclear’ risk of bias for each criterion (see
Table 1 and Table 2).
Measures of treatment effect
Trials were grouped according to the types of surgical interven-
tions being compared, outcomes and assessment time points. We
extracted sample sizes, means (final values) and standard devia-
tions (SD) for continuous outcomes and quantified the treatment
effects as mean differences (MD), or standardised mean differ-
ences (SMD) when trials used different methods to assess the same
outcome. For dichotomous outcomes, the number of cases and
8Surgical options for lumbar spinal stenosis (Review)
Copyright © 2016 The Cochrane Collaboration. Published by John Wiley & Sons, Ltd.
197

the total sample size were used to estimate risk ratios (RR). We,
therefore, used MD, SMD or RR and 95% confidence intervals
(CI) as measures of treatment effects.
Unit of analysis issues
We did not include cluster-randomised trials or cross-over trials.
When multiple pain measures were reported we extracted the most
severe measure at baseline. For disability, we chose the scale defined
in the study as the primary outcome. For data synthesis, follow-
up times were categorised as short-term (closest to three months)
and long-term (closest to 12 months). When studies reported re-
sults for more than two intervention groups, we combined similar
groups according to the recommendations in the Cochrane Hand-book for Systematic Reviews of Interventions (Higgins 2011).
Dealing with missing data
If trials reported incomplete data, we contacted authors to request
further information. If authors were unavailable or when authors
refused to provided data, we imputed data according to recom-
mendations in the Cochrane Handbook for Systematic Reviews ofInterventions (Higgins 2011). For example, we calculated missing
SDs from reported standard errors or 95% CIs and sample size, or
we imputed missing SDs from the average SD reported in similar
studies. We also estimated SDs from graphs when these estimates
were missing in tables or not reported in the text of included trials.
When studies reported medians and interquartile ranges (IQR),
we considered that the median was equivalent to the mean and
the IQR was 1.35 times the SD (Higgins 2011).
Assessment of heterogeneity
We grouped similar trials (e.g., similar types of surgical compari-
son, outcomes, and assessment time points) into clusters and per-
formed a separate analysis for each cluster. To assess heterogeneity
for each pooled analysis we used the I² statistic to estimate the total
variation across studies that was due to heterogeneity, and consid-
ered heterogeneity values greater than 50% to be high (Higgins
2002).
Assessment of reporting biases
We planned to assess reporting bias for each meta-analysis with a
minimum of 10 trials using visual inspection of funnel plots and
Egger’s test. However, the number of studies in each meta-analysis
was insufficient for assessing this type of bias.
Data synthesis
Treatment effects were calculated using random-effects models
with inverse variance weighting for all meta-analyses. A summary
of findings table was created in Review Manager 5.3 and we used
the Grading of Recommendations Assessment, Development and
Evaluation (GRADE, see Appendix 2) to assess the quality of the
evidence for each outcome measure (Guyatt 2008). The quality of
evidence was downgraded by one level according to the following
criteria: limitation of study design (> 25% of the studies with high
risk of bias (at least one of the bias domain judged as high risk)),
inconsistency of results (statistically significant heterogeneity (I²
> 50%) or ≤ 75% of trials with findings in the same direction),
and imprecision (wide confidence intervals or the total number of
participants was fewer than 400 participants in the comparison for
continuous data or fewer than 300 events for dichotomous data
for each pooled analysis). The indirectness criterion was not con-
sidered in this review because we included a specific population
with relevant outcomes and direct comparisons. Where only sin-
gle trials were available, evidence from studies with less than 400
participants was downgraded for imprecision and rated as ’moder-
ate quality’ evidence. The quality of the evidence could be further
downgraded to ’low quality’ evidence if limitations of study design
were found. The quality of evidence was defined as: ’high qual-
ity’, ’moderate quality’, ’low quality’ or ’very low quality’ (Guyatt
2008).
Subgroup analysis and investigation of heterogeneity
Subgroup analysis was planned according to type of surgical in-
tervention (e.g., decompression alone versus decompression plus
fusion) for all outcomes and duration of follow-up (e.g., short-
term and long-term). Although we planned analyses of sources of
heterogeneity according to different factors (e.g., surgeon’s expe-
rience) we did not have enough studies in each meta-analysis to
report accurate results.
Sensitivity analysis
We aimed to perform sensitivity analysis to investigate whether
our judgment of risk of bias of individual studies and time point
definition would affect our conclusions. However, this analysis was
not possible due to the limited number of studies in each meta-
analysis.
R E S U L T S
Description of studies
The description of included studies is summarised in
Characteristics of included studies.
Results of the search
Our search identified a total of 7494 records. After excluding du-
plicates, we screened 5358 titles and abstracts, and assessed 145
9Surgical options for lumbar spinal stenosis (Review)
Copyright © 2016 The Cochrane Collaboration. Published by John Wiley & Sons, Ltd.
198

full text records. Of these, 24 randomised controlled trials (re-
ported in 39 published research articles or abstracts) remained el-
igible for inclusion in our review (Azzazi 2010; Bridwell 1993;
Cavusoglu 2007; Celik 2010; Cho 2007; Davis 2013; Forsth
2016; Ghogawala 2016; Grob 1995; Gurelik 2012; Hallett 2007;
Komp 2015; Liu 2013; Lonne 2015; Mobbs 2014; Moojen 2013;
Postacchini 1993; Rajasekaran 2013; Ruetten 2009; Stromqvist
2013; Thome 2005; Usman 2013; Watanabe 2011; Yagi 2009).
The flow chart of studies with the main reasons for exclusion are
shown in Figure 1. All trials included in this review were published
in English and therefore no translation was required.
Figure 1. Study flow diagram.
10Surgical options for lumbar spinal stenosis (Review)
Copyright © 2016 The Cochrane Collaboration. Published by John Wiley & Sons, Ltd.
199

Included studies
The 24 included trials investigated a total of 2352 participants and
most studies defined lumbar spinal stenosis based on clinical assess-
ment with a concordant imaging diagnosis (Azzazi 2010; Bridwell
1993; Cavusoglu 2007; Celik 2010; Cho 2007; Davis 2013; Grob
1995; Gurelik 2012; Forsth 2016; Ghogawala 2016; Hallett 2007;
Lonne 2015; Mobbs 2014; Moojen 2013; Rajasekaran 2013;
Ruetten 2009; Stromqvist 2013; Thome 2005; Usman 2013;
Watanabe 2011; Yagi 2009). One study included participants
based solely on imaging diagnosis (Postacchini 1993), and two
studies used clinical assessment only (Komp 2015; Liu 2013).
Nineteen out of 24 trials (80%) explicitly reported including only
participants who had failed to improve with conservative treatment
(Azzazi 2010; Bridwell 1993; Cavusoglu 2007; Celik 2010; Cho
2007; Davis 2013; Grob 1995; Gurelik 2012; Hallett 2007; Komp
2015; Lonne 2015; Moojen 2013; Rajasekaran 2013; Ruetten
2009; Stromqvist 2013; Thome 2005; Usman 2013; Watanabe
2011; Yagi 2009). The mean age of participants in included trials
ranged from 56 to 73 years, and trials were conducted in a range
of countries, including the United States, Australia, Turkey, Pak-
istan, Switzerland, Sweden, the United Kingdom, and Japan. See
Characteristics of included studies for additional information.
Excluded studies
We excluded 106 reports from our review; see Characteristics of
excluded studies. The reasons for exclusion were:
• not a randomised controlled trial (67): Abdu 2009;
Anderson 2011; Asazuma 2004; Bazan 2002; Blumenthal 2013;
Bresnahan 2009; Cakir 2009; Cannone 2010; Carrasco 1986;
Cassinelli 2007; Choi 2009; Dantas 2007; Delank 2002; Desai
2012; Epstein 2006; Escobar 2003; Fan 2009; Fast 1985;
Fitzgerald 1976; Försth 2013; Fu 2008; Fujiya 1990;
Ghahreman 2010; González 1992; Gotfryd 2012; Gotfryd
2012a; Gu 2009; Halm 2010; Herkowitz 1991; Hong 2010;
Hong 2011; Ikuta 2005; Imagama 2009; Ito 2010; Katz 1997;
Kawaguchi 2004; Kim 2007; Kim 2007a; Konno 2000;
Kornblum 2004; Lee 2009; Liao 2011; Pappas 1994; Parker
2013; Radcliff 2012; Rapp 2009; Rapp 2011; Richter 2010;
Rompe 1995; Rosa 2012; Rowland 2009; Satomi 1992; Schnake
2006; Sengupta 2006; Skidmore 2011; Smoljanovic 2010;
Smorgick 2013; Steffee 1993; Tani 2002; Tenhula 2000;
Tsutsumimoto 2009; Valesin 2009; Wang 1998; Willén 2008;
Yamada 2012; Yang 2011; Yu 2008;
• not lumbar spinal stenosis (23): Andersen 2008; Aoki
2012; Arriagada 2000; Benli 2006; Bjarke 2002; Carragee 1997;
Carreon 2009; Chen 2010; Cheng 2009; Dahdaleh 2013;
Delawi 2010; Dimar 2009; Feng 2011; Hwang 2010; Kim 2006;
Korovessis 2004; Lian 2010; Ledonio 2012; Michielsen 2013;
Videbaek 2010; Xiao 2007; Xiao 2007a; Zdeblick 1993; and
• inappropriate comparison (16): Auerbach 2012; Altaf
2011; Auerbach 2011; Dirisio 2011; Dryer 2012; Haley 2012;
Haley 2012a; Mahir 2012; McConnell 2011; Radcliff 2011;
Repantis 2009; Sears 2012; Shapiro 2005; Weinstein 2007;
Whang 2013; Zucherman 2004.
Risk of bias in included studies
As blinding of the therapist in surgical trials is not possible, we
judged all studies to be at high risk of bias for this domain. We
judged half of the included trials to be at low or unclear risk for all
of the remaining domains of the ’Risk of bias’ assessment. Only
one trial (Moojen 2013) had all bias domains (except therapist
blinding) judged as low risk. Most of the trials failed to adequately
conceal the randomisation process, blind the participants or use
an intention-to-treat analysis. The results from the risk of bias
assessments for the included studies are summarised in Figure 2.
11Surgical options for lumbar spinal stenosis (Review)
Copyright © 2016 The Cochrane Collaboration. Published by John Wiley & Sons, Ltd.
200

Figure 2. ’Risk of bias’ summary: review authors’ judgements about each risk of bias item for each included
study.
12Surgical options for lumbar spinal stenosis (Review)
Copyright © 2016 The Cochrane Collaboration. Published by John Wiley & Sons, Ltd.
201

Allocation
Only seven trials reported an appropriate method of randomisa-
tion, such as a computer-generated randomisation list. Although
13 trials mentioned that study participants were randomised, they
failed to describe the method used for randomisation and we there-
fore judged them to be at unclear risk of bias. Two trials reported
that participants were randomly allocated according to the se-
quence of presentation to study site and we therefore considered
them to be at high risk of bias (Mobbs 2014; Yagi 2009). In two
trials, the authors reported that the randomisation protocol was
broken and we also considered these trials at high risk of selection
bias (Bridwell 1993; Postacchini 1993). Only six trials reported
an appropriate method of allocation concealment, and 18 failed
to report the method (Figure 2).
Blinding
In surgical clinical trials, it is not possible to blind care providers
(i.e., surgeons), therefore we judged all included studies to be
at high risk of bias for this domain. Only three studies blinded
participants (Celik 2010; Davis 2013; Moojen 2013), while three
trials reported not blinding participants leading us to judge them
as being at high risk of bias (Gurelik 2012; Komp 2015; Ruetten
2009). The remaining 18 trials failed to provide information on
blinding of participants, so we considered them to be at unclear risk
for this bias domain. Eleven trials reported blinding of outcome
assessors; 12 did not report this information and so we judged
them as being at unclear risk of bias. Only one trial mentioned that
outcome assessors were not blinded and we therefore considered
it to be at high risk of bias (Hallett 2007).
Incomplete outcome data
We considered most of the trials (n = 17) to be at low risk of bias
as they reported less than 15% drop-out. One study reported that
nearly 22% of participants were lost, but the number of drop-outs
and reasons were similar between the groups, therefore we judged
this trial as being at low risk of bias for this outcome (Mobbs 2014).
Six trials did not mention the number of participants withdrawn
from the study and we thus judged them as being at unclear risk.
Selective reporting
We judged three trials as being at high risk of bias for selective
reporting. Azzazi 2010 mentioned collecting short-term follow-
up data in the methods section, but failed to report results. Also,
although the authors mentioned measuring the amount of blood
lost during surgery, these data were not reported in the published
manuscript. Bridwell 1993 failed to report relevant patient-related
outcome measures (i.e., pain, disability), and Usman 2013 re-
ported that recovery rate was one of the outcome measures of the
trial, but it was not reported in the results section. We attempted
to contact authors in order to have access to these data, but none
replied.
Other potential sources of bias
Eleven trials reported not receiving funds for conducting the trial
or disclosed any conflicts of interest; we therefore judged them as
being at low risk of bias. The remaining trials did not provide a
conflict of interest or funding statement so we considered them to
be at unclear risk for other sources of bias.
Effects of interventions
See:
Summary of findings for the main comparison SUMMARY
OF FINDINGS FOR DECOMPRESSION VERSUS FUSION;
Summary of findings 2 SUMMARY OF FINDINGS FOR
DECOMPRESSION VERSUS INTERSPINOUS SPACERS;
Summary of findings 3 SUMMARY OF FINDINGS FOR
FUSION VERSUS INTERSPINOUS SPACERS
We did not identify trials comparing surgery with no treatment,
placebo or sham surgery. Therefore, all trials included in this re-
view compared different types of surgical interventions for lumbar
spinal stenosis. We divided the included trials into six comparisons
according to the surgical techniques being compared.
Decompression alone versus decompression plus
fusion
The addition of fusion to bony decompression by either con-
ventional laminectomy (Bridwell 1993; Forsth 2016; Ghogawala
2016; Grob 1995) or foraminotomy (Hallett 2007) was investi-
gated in five randomised trials reporting data from 446 partici-
pants. Overall, the studies included in this review were fairly ho-
mogeneous, thus most of our meta-analyses revealed no important
heterogeneity (I² < 50%). A few pooled analyses resulted in con-
siderable heterogeneity however (I² > 75%), especially the analy-
sis on operation time, where a great variability of estimates were
reported in included trials.
Primary outcomes
Our analyses showed no difference between groups on pain reduc-
tion in the short- (MD 4.50, 95% CI -0.70 to 9.70; Ghogawala
2016) and long-term (MD -0.29, 95% CI -7.32 to 6.74; see Figure
3). Similarly, we found that decompression plus fusion was not
superior to decompression alone on disability reduction at both
13Surgical options for lumbar spinal stenosis (Review)
Copyright © 2016 The Cochrane Collaboration. Published by John Wiley & Sons, Ltd.
202
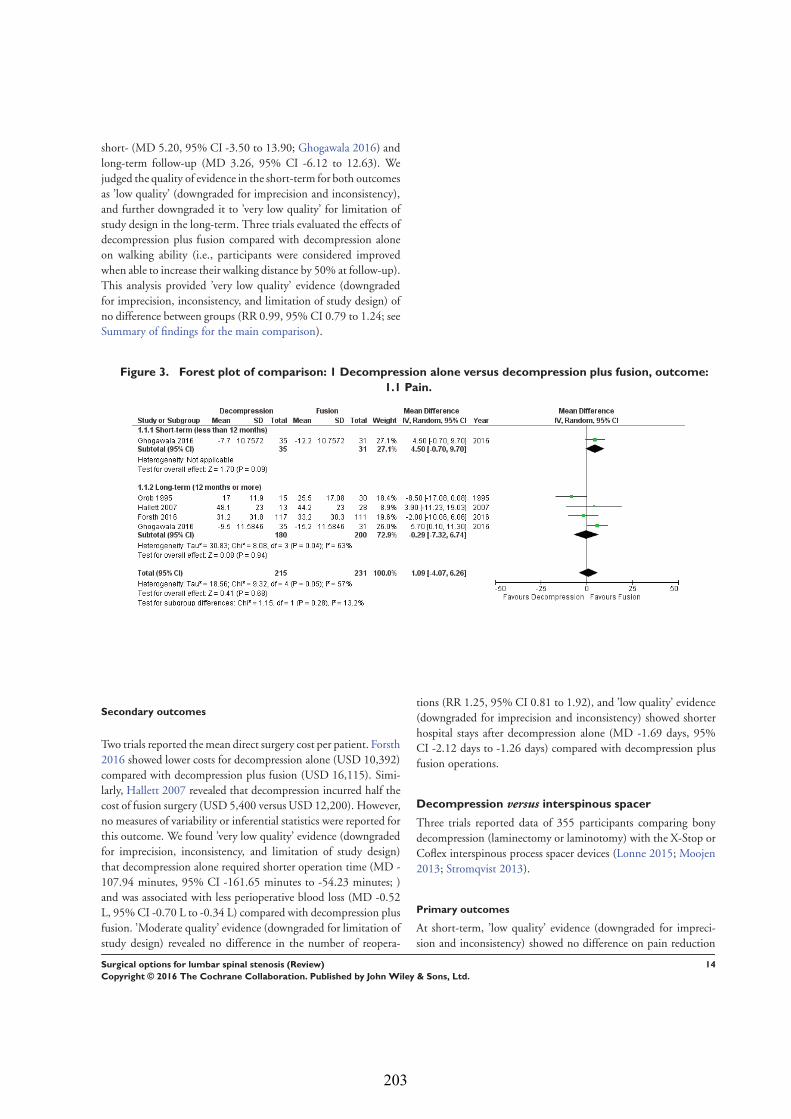
short- (MD 5.20, 95% CI -3.50 to 13.90; Ghogawala 2016) and
long-term follow-up (MD 3.26, 95% CI -6.12 to 12.63). We
judged the quality of evidence in the short-term for both outcomes
as ’low quality’ (downgraded for imprecision and inconsistency),
and further downgraded it to ’very low quality’ for limitation of
study design in the long-term. Three trials evaluated the effects of
decompression plus fusion compared with decompression alone
on walking ability (i.e., participants were considered improved
when able to increase their walking distance by 50% at follow-up).
This analysis provided ’very low quality’ evidence (downgraded
for imprecision, inconsistency, and limitation of study design) of
no difference between groups (RR 0.99, 95% CI 0.79 to 1.24; see
Summary of findings for the main comparison).
Figure 3. Forest plot of comparison: 1 Decompression alone versus decompression plus fusion, outcome:
1.1 Pain.
Secondary outcomes
Two trials reported the mean direct surgery cost per patient. Forsth
2016 showed lower costs for decompression alone (USD 10,392)
compared with decompression plus fusion (USD 16,115). Simi-
larly, Hallett 2007 revealed that decompression incurred half the
cost of fusion surgery (USD 5,400 versus USD 12,200). However,
no measures of variability or inferential statistics were reported for
this outcome. We found ’very low quality’ evidence (downgraded
for imprecision, inconsistency, and limitation of study design)
that decompression alone required shorter operation time (MD -
107.94 minutes, 95% CI -161.65 minutes to -54.23 minutes; )
and was associated with less perioperative blood loss (MD -0.52
L, 95% CI -0.70 L to -0.34 L) compared with decompression plus
fusion. ’Moderate quality’ evidence (downgraded for limitation of
study design) revealed no difference in the number of reopera-
tions (RR 1.25, 95% CI 0.81 to 1.92), and ’low quality’ evidence
(downgraded for imprecision and inconsistency) showed shorter
hospital stays after decompression alone (MD -1.69 days, 95%
CI -2.12 days to -1.26 days) compared with decompression plus
fusion operations.
Decompression versus interspinous spacer
Three trials reported data of 355 participants comparing bony
decompression (laminectomy or laminotomy) with the X-Stop or
Coflex interspinous process spacer devices (Lonne 2015; Moojen
2013; Stromqvist 2013).
Primary outcomes
At short-term, ’low quality’ evidence (downgraded for impreci-
sion and inconsistency) showed no difference on pain reduction
14Surgical options for lumbar spinal stenosis (Review)
Copyright © 2016 The Cochrane Collaboration. Published by John Wiley & Sons, Ltd.
203

(MD -0.93, 95% CI -9.86 to 8.00). Likewise, ’moderate quality’
evidence (downgraded for imprecision) revealed no long-term dif-
ference on pain between the groups (MD -0.55, 95% CI -8.08
to 6.99; see Figure 4). For disability, ’moderate quality evidence’
(downgraded for imprecision) did not reveal any difference in the
short-term (MD 1.30, 95% CI -3.64 to 6.25), and ’low qual-
ity’ evidence (downgraded for imprecision and inconsistency) also
showed no superior benefits of interspinous spacers in the long-
term (MD 1.25, 95% CI -4.48 to 6.98). Pooling revealed ’moder-
ate quality’ evidence (downgraded for imprecision) that improve-
ment of function (as measured by the ZCQ function sub scale)
was similar in the two groups at short- (MD -0.06, 95% CI -0.27
to 0.14) and long-term follow-up (MD -0.00, 95% CI -0.30 to
0.29). One study (Lonne 2015) provided ’moderate quality’ evi-
dence (downgraded for imprecision) that there were no differences
between decompression and interspinous spacers for quality of life
improvement in the short- (MD -0.12, 95% CI -0.25 to 0.01)
and long-term (MD -0.05, 95% CI -0.18 to 0.07; see Summary
of findings 2).
Figure 4. Forest plot of comparison: 2 Decompression versus interspinous spacer, outcome: 2.1 Pain.
Secondary outcomes
Results from ’low quality’ evidence (downgraded for imprecision
and inconsistency) showed that participants receiving interspinous
spacers required longer operation time (MD 39.11 minutes, 95%
CI 19.43 minutes to 58.78 minutes), but there were no differ-
ences in terms of length of hospital stay (MD 0.51 days, 95%
CI -0.58 days to 1.60 days) and perioperative blood loss (MD
144.00 mL, 95% CI -209.74 mL to 497.74 mL). However, ’high
quality’ evidence demonstrated higher reoperation rates after in-
terspinous spacers (RR 3.95, 95% CI 2.12 to 7.37) compared with
conventional decompression. Two trials (Lonne 2015; Moojen
2013) providing ’moderate quality’ evidence (downgraded for im-
precision) reported the total health care cost associated with surgi-
cal procedures, and revealed a significantly higher cost associated
with the interspinous spacers; the incremental cost for an implant
was estimated at EUR 2,856.34 (95% CI EUR 1,970.40 to EUR
3,742.28) or USD 3,103.84 (95% CI USD 2,141.14 to USD
4,066.55).
Decompression plus fusion versus interspinous spacer
Two trials compared decompression plus fusion with the X-Stop
or Coflex interspinous spacer devices (Azzazi 2010; Davis 2013),
including a total of 382 participants analysed at long-term follow-
up only.
Primary outcomes
There was ’low quality’ evidence (downgraded for imprecision and
limitation of study design) of no difference between groups on
pain reduction (MD 5.35, 95% CI -1.18 to 11.88; see Figure
5), and ’moderate quality’ evidence (downgraded for imprecision)
also showed no superior benefit of interspinous spacers in terms
of quality of life (MD -3.10, 95% CI -6.30 to 0.10). However,
we found ’low quality’ evidence (downgraded for imprecision and
limitation of study design) that interspinous spacers were slightly
more effective than fusion on disability reduction (MD 5.72, 95%
CI 1.28 to 10.15; see Summary of findings 3).
15Surgical options for lumbar spinal stenosis (Review)
Copyright © 2016 The Cochrane Collaboration. Published by John Wiley & Sons, Ltd.
204

Figure 5. Forest plot of comparison: 3 Decompression plus fusion versus interspinous spacer, outcome: 3.1
Pain.
Secondary outcomes
We found ’moderate quality’ evidence (downgraded for impreci-
sion) that decompression plus fusion resulted in more periopera-
tive blood loss (MD 238.90 mL, 95% CI 182.66 mL to 295.14
mL; Davis 2013) compared with interspinous spacers. ’Very low
quality’ evidence (downgraded for imprecision, inconsistency and
limitation of study design) revealed longer operation time (MD
78.91 minutes, 95% CI 30.16 minutes to 127.65 minutes) and
length of hospital stay (MD 1.58 days, 95% CI 0.90 days to 2.27
days) for decompression plus fusion. However, there was no differ-
ence in reoperation rates between the two groups (RR 0.70, 95%
CI 0.32 to 1.51; Davis 2013) from ’high quality’ evidence.
Laminectomy versus laminotomy
Six randomised controlled trials reporting data from 475 par-
ticipants compared laminectomy to unilateral (Cavusoglu 2007;
Gurelik 2012; Liu 2013; Thome 2005) or bilateral laminotomy
(Celik 2010; Postacchini 1993; Thome 2005). Data from unilat-
eral and bilateral laminotomy groups were combined according
to recommendations in the Cochrane Handbook for Systematic Re-views of Interventions (Higgins 2011).
Primary outcomes
We found ’moderate quality’ evidence (downgraded for impreci-
sion) that laminotomy is not superior to laminectomy in reducing
pain in the short-term (MD 0.32, 95% CI -2.39 to 3.04), and ’low
quality’ evidence (downgraded for inconsistency and limitation of
study design) of no difference in the long-term (MD -1.92, 95%
CI -8.19 to 4.35; see Figure 6). Likewise, ’moderate quality’ ev-
idence (downgraded for imprecision) revealed no between-group
differences on disability reduction at short- (MD 1.56, 95% CI -
1.02 to 4.13) and long-term follow-up (MD -0.43, 95% CI -4.37
to 3.52). For walking ability (i.e., walking distance in metres with-
out radicular pain), we found ’low quality’ evidence (downgraded
for imprecision and limitation of study design) of no difference
between these techniques in the short-term (SMD -0.07, 95%
CI -0.33 to 0.20). ’Moderate quality’ evidence (downgraded for
imprecision) also showed no difference in walking ability in the
long-term (SMD -0.02, 95% CI -0.33 to 0.28).
Figure 6. Forest plot of comparison: 4 Laminectomy versus laminotomy, outcome: 4.1 Pain.
16Surgical options for lumbar spinal stenosis (Review)
Copyright © 2016 The Cochrane Collaboration. Published by John Wiley & Sons, Ltd.
205

Secondary outcomes
Our results revealed ’low quality’ evidence (downgraded for im-
precision and limitation of study design) of no difference between
the two surgical procedures on the duration of operation (MD -
6.25 minutes, 95% CI -13.76 minutes to 1.27 minutes). However,
there was significantly more blood loss (MD 38.80 mL, 95% CI
17.81 mL to 59.80 mL) and longer hospital stay (MD 1.55, 95%
CI 0.61 to 2.50) for laminectomy when compared with lamino-
tomy. ’Moderate quality’ evidence (downgraded for imprecision)
demonstrated no difference in the number of participants having
a revision surgery (RR 2.61, 95% CI 0.78 to 8.78).
Decompression versus split-decompression
Four trials reported data of 218 participants comparing decom-
pression (laminectomy) with spinous process split-decompression
(Cho 2007; Liu 2013; Rajasekaran 2013; Watanabe 2011). Only
long-term follow-up data was available in included trials.
Primary outcomes
Pooling showed ’low quality’ evidence (downgraded for inconsis-
tency and imprecision) of no differences between treatments on
pain reduction (MD 6.35, 95% CI -3.35 to 16.04). ’Moderate
quality’ evidence (downgraded for imprecision) also revealed no
differences between the two groups on disability reduction (MD
1.87, 95% CI -2.82 to 6.57). ’Low quality’ evidence (downgraded
for inconsistency and imprecision) suggested no superior benefits
of split-decompression on long-term recovery (MD -5.18, 95%
CI -19.81 to 9.45), as assessed by the JOA recovery score (range
0 to 100), compared with conventional decompression.
Secondary outcomes
We found no differences between the two groups based on ’low
quality’ evidence (downgraded for inconsistency and imprecision)
in terms of operation time (MD -10.57 minutes, 95% CI -34.39
minutes to 13.25 minutes), perioperative blood loss (MD -1.83
mL, 95% CI -27.65 mL to 23.98 mL), and length of hospital
stay (MD 1.49 days, 95% CI -1.70 days to 4.67 days). ’Moderate
quality’ evidence (downgraded for imprecision) also demonstrated
that the number of participants requiring reoperation was similar
between the groups (RR 1.22, 95% CI 0.22 to 6.85).
Decompression versus endoscopic decompression
The efficacy of endoscopic-assisted decompression was investi-
gated in three randomised trials including 393 participants (Komp
2015; Ruetten 2009; Yagi 2009).
Primary outcomes
Our meta-analysis revealed ’low quality evidence’ (downgraded
for imprecision and limitation of study design) of a small but sig-
nificant short-term disability reduction of endoscopic approaches
compared with conventional decompression (MD 4.12, 95% CI
0.91 to 7.33). However, ’very low quality evidence’ (downgraded
for inconsistency, imprecision and limitation of study design)
showed no difference between these surgical interventions for dis-
ability in the long-term (MD 1.44, 95% CI -2.66 to 5.54). Komp
2015 did not report estimates of between-group differences or
measures of variability for each treatment group, therefore we
could not calculate a treatment effect for this trial.
Secondary outcomes
’Very low quality’ evidence (downgraded for inconsistency, im-
precision, and limitation of study design) showed no between-
group difference on operation time (MD 10.05 minutes, 95% CI
-2.09 minutes to 22.18 minutes). However, Yagi 2009 provided
’low quality’ evidence (downgraded for imprecision and limitation
of study design) that conventional decompression was associated
with more perioperative blood loss (MD 34.00 mL, 95% CI 30.40
mL to 37.60 mL) and longer hospital stay (MD 8.56 days, 95%
CI 6.78 days to 10.34 days) compared with endoscopic decom-
pression. ’Moderate quality’ evidence (downgraded for limitation
of study design) suggested that the number of participants having
a revision surgery was similar between the surgical interventions
(RR 0.81, 95% CI 0.22 to 2.97).
17Surgical options for lumbar spinal stenosis (Review)
Copyright © 2016 The Cochrane Collaboration. Published by John Wiley & Sons, Ltd.
206

AD
DI
TI
ON
AL
SU
MM
AR
YO
FF
IN
DI
NG
S[E
xpla
nati
on]
De
co
mp
res
sio
nc
om
pa
red
wit
hin
ters
pin
ou
ss
pa
ce
rsfo
rlu
mb
ar
sp
ina
ls
ten
os
is
Pa
tie
nt
or
po
pu
lati
on
:p
ati
en
tsw
ith
lum
ba
rs
pin
al
ste
no
sis
Se
ttin
gs
:in
pa
tie
nt
ca
re
Inte
rve
nti
on
:d
ec
om
pre
ss
ion
Co
mp
ari
so
n:
inte
rsp
ino
us
pro
ce
ss
sp
ac
er
de
vic
es
Ou
tco
me
sC
om
pa
ris
on
sR
ela
tive
eff
ec
t
(95
%C
I)
Nu
mb
er
of
pa
rtic
ipa
nts
(stu
die
s)
Qu
ali
tyo
fth
ee
vid
en
ce
(GR
AD
E)
Co
mm
en
ts
As
su
me
dri
sk
Co
rre
sp
on
din
gri
sk
De
co
mp
res
sio
nIn
ters
pin
ou
ss
pa
ce
rs
Pa
in
Lo
ng
-te
rm(≥
12
mo
nth
s)
Pa
ins
co
res
co
nve
rte
d
to0
to1
00
sc
ale
to
all
ow
for
co
mp
ari
so
n
of
dif
fere
nt
dis
ab
ilit
y
sc
ale
s(V
AS
,NR
S)
Th
em
ea
np
ain
sc
ore
ran
ge
da
cro
ss
de
co
m-
pre
ss
ion
gro
up
sfr
om
21
.65
to3
2.0
0p
oin
ts
Th
em
ea
np
ain
sc
ore
in
the
inte
rsp
ino
us
sp
ac
-
ers
gro
up
sw
as
0.5
5
hig
he
r(6
.99
low
er
to8
.
08
hig
he
r)
Me
an
dif
fere
nc
e-0
.55
(-8
.08
,6.9
9)
32
8(3
)⊕
⊕⊕
©
Mo
de
rate
Th
ed
iffe
ren
ce
isn
ot
sta
tis
tic
all
y
or
cli
nic
all
ys
ign
ific
an
t
Dis
ab
ilit
y
Lo
ng
-te
rm(≥
12
mo
nth
s)
Dis
ab
ilit
ys
co
res
co
n-
vert
ed
to0
to1
00
sc
ale
toa
llo
wfo
rc
om
pa
ri-
so
no
fd
iffe
ren
td
isa
bil
-
ity
sc
ale
s(R
MD
Q,
OD
I,
JO
A)
Th
em
ea
nd
isa
bil
ity
sc
ore
ran
ge
da
cro
ss
de
co
mp
res
sio
ng
rou
ps
fro
m1
8.3
0to
45
.00
po
ints
Th
em
ea
nd
isa
bil
-
ity
sc
ore
inth
e
inte
rsp
ino
us
sp
ac
ers
gro
up
sw
as
1.2
5lo
we
r
(6.9
8lo
we
rto
4.4
8
hig
he
r)
Me
an
dif
fere
nc
e1
.25
(-
4.4
8,6
.98
)
32
7(3
)⊕
⊕©
©
Lo
w
Th
ed
iffe
ren
ce
isn
ot
sta
tis
tic
all
y
or
cli
nic
all
ys
ign
ific
an
t
18Surgical options for lumbar spinal stenosis (Review)
Copyright © 2016 The Cochrane Collaboration. Published by John Wiley & Sons, Ltd.
207

Op
era
tio
nti
me
Du
rati
on
of
op
era
tio
n
rep
ort
ed
inm
inu
tes
Th
em
ea
no
pe
rati
on
tim
era
ng
ed
ac
ros
s
de
co
mp
res
sio
ng
rou
ps
fro
m4
3.0
0to
11
2.9
0
min
ute
s
Th
em
ea
no
pe
rati
on
tim
ein
the
inte
rsp
ino
us
sp
ac
ers
gro
up
sw
as
39
.
11
min
ute
slo
we
r(1
9.
43
to5
8.7
8lo
we
r)
Me
an
dif
fere
nc
e3
9.1
1
(19
.43
,58
.78
)
34
0(3
)⊕
⊕©
©
Lo
w
Th
ed
iffe
ren
ce
isc
lin
i-
ca
lly
sig
nif
ica
nt
Blo
od
los
s
Am
ou
nt
of
pe
rio
pe
ra-
tive
blo
od
los
sre
po
rte
d
inm
L
Th
em
ea
np
eri
op
era
-
tive
blo
od
los
sin
the
de
co
mp
res
sio
ng
rou
p
wa
s1
84
mL
Th
em
ea
np
eri
op
era
tive
blo
od
los
sin
the
inte
r-
sp
ino
us
sp
ac
ers
gro
up
wa
s1
44
mL
low
er
(20
9.
74
mL
low
er
to4
97
.74
mL
hig
he
r)
Me
an
dif
fere
nc
e1
44
.
00
(-2
09
.74
,49
7.7
4)
81
(1)
⊕⊕
©©
Lo
w
Th
ed
iffe
ren
ce
isn
ot
sta
tis
tic
all
y
or
cli
nic
all
ys
ign
ific
an
t
Re
op
era
tio
ns
Nu
mb
er
of
pa
tie
nts
req
uir
ing
are
vis
ion
su
rge
ry
11
of
16
3(7
pe
r1
00
)
pa
rtic
ipa
nts
ha
dre
op
-
era
tio
n
44
of
16
3(2
7p
er
10
0)
pa
rtic
ipa
nts
ha
dre
op
-
era
tio
n
Ris
kra
tio
0.2
5(0
.14
,0.
47
)
32
6(3
)⊕
⊕⊕
⊕
Hig
h
Th
ed
iffe
ren
ce
isc
lin
i-
ca
lly
sig
nif
ica
nt
CI:
co
nfi
de
nc
ein
terv
al;
VA
S:
vis
ua
lan
alo
gu
es
ca
le;N
RS
:n
um
eri
ca
lra
tin
gs
ca
le;
RM
DQ
:R
ola
nd
-Mo
rris
Dis
ab
ilit
yQ
ue
sti
on
na
ire
;OD
I:O
sw
es
try
Dis
ab
ilit
yIn
de
x;J
OA
:J
ap
an
es
e
Ort
ho
pe
dic
As
so
cia
tio
n
GR
AD
EW
ork
ing
Gro
up
gra
de
so
fe
vid
en
ce
Hig
hq
ua
lity
:F
urt
he
rre
se
arc
his
very
un
like
lyto
ch
an
ge
ou
rc
on
fid
en
ce
inth
ee
sti
ma
teo
fe
ffe
ct.
Mo
de
rate
qu
ali
ty:
Fu
rth
er
res
ea
rch
isli
kely
toh
ave
an
imp
ort
an
tim
pa
ct
on
ou
rc
on
fid
en
ce
inth
ee
sti
ma
teo
fe
ffe
ct
an
dm
ay
ch
an
ge
the
es
tim
ate
.
Lo
wq
ua
lity
:F
urt
he
rre
se
arc
his
very
like
lyto
ha
vea
nim
po
rta
nt
imp
ac
to
no
ur
co
nfi
de
nc
ein
the
es
tim
ate
of
eff
ec
ta
nd
isli
kely
toc
ha
ng
eth
ee
sti
ma
te.
Ve
rylo
wq
ua
lity
:W
ea
reve
ryu
nc
ert
ain
ab
ou
tth
ee
sti
ma
te.
19Surgical options for lumbar spinal stenosis (Review)
Copyright © 2016 The Cochrane Collaboration. Published by John Wiley & Sons, Ltd.
208

De
co
mp
res
sio
np
lus
fus
ion
co
mp
are
dw
ith
inte
rsp
ino
us
sp
ac
ers
for
lum
ba
rs
pin
al
ste
no
sis
Pa
tie
nt
or
po
pu
lati
on
:p
ati
en
tsw
ith
lum
ba
rs
pin
al
ste
no
sis
Se
ttin
gs
:in
pa
tie
nt
ca
re
Inte
rve
nti
on
:d
ec
om
pre
ss
ion
plu
sfu
sio
n
Co
mp
ari
so
n:
inte
rsp
ino
us
pro
ce
ss
sp
ac
er
de
vic
es
Ou
tco
me
sC
om
pa
ris
on
sR
ela
tive
eff
ec
t
(95
%C
I)
Nu
mb
er
of
pa
rtic
ipa
nts
(stu
die
s)
Qu
ali
tyo
fth
ee
vid
en
ce
(GR
AD
E)
Co
mm
en
ts
As
su
me
dri
sk
Co
rre
sp
on
din
gri
sk
De
co
mp
res
sio
na
nd
fu-
sio
n
Inte
rsp
ino
us
sp
ac
er
de
vic
es
Pa
in
Lo
ng
-te
rm(≥
12
mo
nth
s)
Pa
ins
co
res
co
nve
rte
d
to0
to1
00
sc
ale
to
all
ow
for
co
mp
ari
so
n
of
dif
fere
nt
dis
ab
ilit
y
sc
ale
s(V
AS
,NR
S)
Th
em
ea
np
ain
sc
ore
ran
ge
da
cro
ss
fus
ion
gro
up
sfr
om
24
.10
to
35
.50
po
ints
Th
em
ea
np
ain
sc
ore
in
the
inte
rsp
ino
us
sp
ac
-
ers
gro
up
sw
as
5.3
5
low
er
(11
.88
low
er
to1
.
18
hig
he
r)
Me
an
dif
fere
nc
e5
.35
(-
1.1
8,1
1.8
8)
30
8(2
)⊕
⊕©
©
Lo
w
Th
ed
iffe
ren
ce
isn
ot
sta
tis
tic
all
y
or
cli
nic
all
ys
ign
ific
an
t
Dis
ab
ilit
y
Lo
ng
-te
rm(≥
12
mo
nth
s)
Dis
ab
ilit
ys
co
res
co
n-
vert
ed
to0
to1
00
sc
ale
toa
llo
wfo
rc
om
pa
ri-
so
no
fd
iffe
ren
td
isa
bil
-
ity
sc
ale
s(R
MD
Q,
OD
I,
JO
A)
Th
em
ea
nd
isa
bil
ity
sc
ore
ran
ge
da
cro
ss
fu-
sio
ng
rou
ps
fro
m2
6.7
0
to3
4.5
0p
oin
ts
Th
em
ea
nd
isa
bil
-
ity
sc
ore
inth
e
inte
rsp
ino
us
sp
ac
ers
gro
up
sw
as
5.7
2lo
we
r
(1.2
8to
10
.15
low
er)
Me
an
dif
fere
nc
e5
.72
(1.2
8,1
0.1
5)
30
8(2
)⊕
⊕©
©
Lo
w
Th
ed
iffe
ren
ce
isn
ot
cli
nic
all
ys
ign
ific
an
t
Op
era
tio
nti
me
Du
rati
on
of
op
era
tio
n
rep
ort
ed
inm
inu
tes
Th
em
ea
no
pe
rati
on
tim
era
ng
ed
ac
ros
sfu
-
sio
ng
rou
ps
fro
m1
50
.
00
to1
53
.20
min
ute
s
Th
em
ea
no
pe
rati
on
tim
ein
the
inte
rsp
ino
us
sp
ac
ers
gro
up
sw
as
78
.
91
low
er
(30
.16
to1
27
.
Me
an
dif
fere
nc
e7
8.9
1
(30
.16
,12
7.6
5)
38
1(2
)⊕
©©
©
Ve
rylo
w
Th
ed
iffe
ren
ce
isc
lin
i-
ca
lly
sig
nif
ica
nt
20Surgical options for lumbar spinal stenosis (Review)
Copyright © 2016 The Cochrane Collaboration. Published by John Wiley & Sons, Ltd.
209

65
low
er)
Blo
od
los
s
Am
ou
nt
of
pe
rio
pe
ra-
tive
blo
od
los
sre
po
rte
d
inm
L
Th
em
ea
np
eri
op
era
tive
blo
od
los
sin
the
fus
ion
gro
up
wa
s3
48
.60
mL
Th
em
ea
np
eri
op
er-
ati
veb
loo
dlo
ss
in
the
inte
rsp
ino
us
sp
ac
-
ers
gro
up
sw
as
23
8.
90
mL
low
er
(18
2.6
6to
29
5.1
4m
Llo
we
r)
Me
an
dif
fere
nc
e2
38
.
90
(18
2.6
6,2
95
.14
)
32
0(1
)⊕
⊕⊕
©
Mo
de
rate
Th
ed
iffe
ren
ce
isc
lin
i-
ca
lly
sig
nif
ica
nt
Re
op
era
tio
ns
Nu
mb
er
of
pa
tie
nts
req
uir
ing
are
vis
ion
su
rge
ry
8o
f1
07
(7p
er
10
0)
pa
rtic
ipa
nts
ha
dre
op
-
era
tio
n
23
of
21
5(1
1p
er
10
0)
pa
rtic
ipa
nts
ha
dre
op
-
era
tio
n
Ris
kra
tio
0.7
0(0
.32
,1.
51
)
32
2(1
)⊕
⊕⊕
⊕
Hig
h
Th
ed
iffe
ren
ce
isn
ot
sta
tis
tic
all
y
or
cli
nic
all
ys
ign
ific
an
t
CI:
co
nfi
de
nc
ein
terv
al;
RR
:ri
sk
rati
o;V
AS
:vi
su
al
an
alo
gu
es
ca
le;N
RS
:n
um
eri
ca
lra
tin
gs
ca
le;
RM
DQ
:R
ola
nd
-Mo
rris
Dis
ab
ilit
yQ
ue
sti
on
na
ire
;OD
I:O
sw
es
try
Dis
ab
ilit
yIn
de
x;
JO
A:
Ja
pa
ne
se
Ort
ho
pe
dic
As
so
cia
tio
n
GR
AD
EW
ork
ing
Gro
up
gra
de
so
fe
vid
en
ce
Hig
hq
ua
lity
:F
urt
he
rre
se
arc
his
very
un
like
lyto
ch
an
ge
ou
rc
on
fid
en
ce
inth
ee
sti
ma
teo
fe
ffe
ct.
Mo
de
rate
qu
ali
ty:
Fu
rth
er
res
ea
rch
isli
kely
toh
ave
an
imp
ort
an
tim
pa
ct
on
ou
rc
on
fid
en
ce
inth
ee
sti
ma
teo
fe
ffe
ct
an
dm
ay
ch
an
ge
the
es
tim
ate
.
Lo
wq
ua
lity
:F
urt
he
rre
se
arc
his
very
like
lyto
ha
vea
nim
po
rta
nt
imp
ac
to
no
ur
co
nfi
de
nc
ein
the
es
tim
ate
of
eff
ec
ta
nd
isli
kely
toc
ha
ng
eth
ee
sti
ma
te.
Ve
rylo
wq
ua
lity
:W
ea
reve
ryu
nc
ert
ain
ab
ou
tth
ee
sti
ma
te.
21Surgical options for lumbar spinal stenosis (Review)
Copyright © 2016 The Cochrane Collaboration. Published by John Wiley & Sons, Ltd.
210

D I S C U S S I O N
Summary of main results
Our results revealed a paucity of evidence on the efficacy of surgery
for lumbar spinal stenosis. We found no trials investigating the
efficacy of surgery for lumbar spinal stenosis compared with no
treatment, placebo or sham surgery. Therefore, the effects of time,
regression to the mean, and patients’ expectations (placebo effect)
regarding surgery remain unknown. Previous research has shown
that placebo-controlled trials in surgery are feasible and a powerful
tool to show the efficacy of surgical interventions (Wartolowska
2014). We identified 24 published randomised trials that com-
pared the effects of different surgical techniques for this condi-
tion. In our main comparison, we found that fusion does not add
benefits in terms of pain or disability reduction compared with
decompression alone for the treatment of lumbar spinal stenosis.
In addition, we found no differences on pain, disability and qual-
ity of life between interspinous process spacer devices and con-
ventional bony decompression. However, the interspinous spac-
ers resulted in significantly higher reoperation rates. We found no
further differences in outcomes among the other surgical decom-
pression techniques for lumbar spinal stenosis. In sum, at present,
newer surgical techniques have not proven superior to conven-
tional decompression for patients with lumbar spinal stenosis.
Overall completeness and applicability ofevidence
Given the number of surgical techniques for the treatment of lum-
bar spinal stenosis, the need for placebo-controlled trials has never
been greater. Through our search, we could not find published
placebo-controlled surgical trials in patients with lumbar spinal
stenosis. Previous studies have demonstrated the appropriate eth-
ical considerations for placebo surgery (Horng 2003), and con-
firmed their feasibility (Wartolowska 2014). Such trials, investi-
gating the efficacy of surgery compared with placebo for other
spinal conditions, such as painful osteoporotic vertebral fractures,
have been conducted and recently published. Buchbinder 2009
performed sham surgery by inserting a blunt stylet and gently tap-
ping the vertebral body and compared this with conventional ver-
tebroplasty. Likewise, Flum 2006 has suggested performing mini-
mally invasive approaches simulating the decompressive technique
to the spine for patients with lumbar spinal stenosis, but without
actually removing any bone tissue.
The addition of fusion to decompression is commonly performed
in this population, although a recent study has shown that fusion
is not only more costly but highly associated with major com-
plications and deaths when compared with decompression alone
(Deyo 2010). Our review provides relevant information on this
topic, showing that the addition of fusion was not associated with
better outcomes (pain or disability) compared with decompres-
sion alone. In fact, fusion was significantly associated with longer
operation time (nearly two hours difference) and more blood loss
during operation (over 500 mL difference), confirming the higher
risk for complications when performing this type of surgery. How-
ever, more studies are needed as we only included five trials pro-
viding ’very low quality’ to ’moderate quality’ evidence. For pa-
tients who present spinal instability and thus require stabilisation
of spinal segments after decompression, the interspinous spacer
devices might be an alternative as they were linked to less perioper-
ative blood loss and shorter operation time and hospital length of
stay. The interspinous spacer devices, however, should not replace
conventional decompression surgery when only decompression of
the spinal canal is warranted (i.e., no further fusion). These devices
failed to be superior to conventional decompression on patient-
relevant outcomes, and resulted in significantly higher reopera-
tion rates. Moreover, our results showed that these implants can
cost on average 1.5 times more than conventional decompression.
Considering the higher risks and costs, we would not recommend
the spacer devices as an alternative to conventional decompression
surgery for lumbar spinal stenosis.
One may argue that differences in the proportion of patients with
mild spondylolisthesis included in the trials may affect the re-
sults. In trials that investigated fusion compared with interspinous
spacers, both Davis 2013 and Azzazi 2010 included only partici-
pants with up to grade I stable degenerative spondylolisthesis. In
Davis 2013, the proportion of participants with spondylolisthesis
was 47%; however, Azzazi 2010 did not report the proportion of
these participants. In the other included trials, the proportion of
participants with up to grade I spondylolisthesis varied. For ex-
ample, Ghogawala 2016 included only participants with lumbar
spinal stenosis and grade I spondylolisthesis, whereas Forsth 2016
stratified the randomisation process to the presence or absence
of degenerative spondylolisthesis, and Cavusoglu 2007 reported
that 15% of included participants had mild spondylolisthesis. Al-
though the differences between groups for some outcomes were
not statistically significant, some might be considered clinically
relevant. As most studies were very small, they were likely under-
powered. Larger studies are needed to confirm these findings, for
example the difference in revision rates between laminectomy and
laminotomy.
This review provides valuable information for clinical decision
making regarding the best surgical technique for patients with
lumbar spinal stenosis, and should be used to inform clinical prac-
tice guidelines about the benefits and harms of different surgical
options for this condition.
Quality of the evidence
Overall, the methodological quality of included studies was poor.
Whereas blinding of the caregiver in surgical trials is typically not
possible, eleven trials reported blinding of outcome assessors and
only three studies reported that participants were blinded. The
22Surgical options for lumbar spinal stenosis (Review)
Copyright © 2016 The Cochrane Collaboration. Published by John Wiley & Sons, Ltd.
211

quality of the available evidence (GRADE) ranged from ’high
quality’ to ’very low quality’. In most cases where the evidence
was downgraded, this was done because we found inconsistency
of findings (I² > 50%) or imprecision (pooled sample size < 300
or 400), hence the evidence was judged as ’moderate quality’. In
some pooled analyses, the evidence was downgraded for both in-
consistency and imprecision, being judged as ’low quality’. In a
few cases, evidence was further downgraded by one level because of
limitation of study design, resulting in ’very low quality’ evidence.
More high quality trials comparing the effects between surgical
techniques are needed to support our findings.
Potential biases in the review process
Although we tried to minimise various biases during the review
process, the reporting of data was poor among some included stud-
ies, and in some circumstances we had to estimate data of treat-
ment effects from graphs or use imputation of data from similar
included trials. To overcome this issue, we recommend that future
clinical trial authors adequately follow the instructions outlined in
the CONSORT statement (Schulz 2010). It is also possible that
we have underestimated the rates of reoperation, and our conclu-
sions on harms of included interventions should be interpreted
with caution. This is because safety reporting across included trials
varied largely and not all trials have reported this outcome. Infor-
mation on safety of surgical procedures is paramount for clinical
decision making, therefore future trials should include complica-
tions and reoperations as outcomes and report them appropriately
(Ioannidis 2004). We acknowledge the limited number of trials
in each comparison, which also limited our ability to perform ad-
ditional subgroup or sensitivity analyses. The search strategy was
limited to humans in some of the databases (MEDLINE, EM-
BASE), so it is possible that we missed potentially relevant studies
not indexed as humans. However, we searched a variety of sources
as a way of trying to capture all relevant studies.
Agreements and disagreements with otherstudies or reviews
This review is an update of a recently published systematic review
(Machado 2015), and included an additional seven randomised
trials (10 records). A recent Cochrane review has also investigated
the effects of decompression techniques for lumbar spinal steno-
sis, but limited the inclusion criteria to posterior decompression
techniques that did not involve fusion or the use of interspinous
process spacer devices (Overdevest 2015). Our results agree with
those from this recent publication showing that different decom-
pression techniques have similar effects on functional disability
and leg pain.
Another systematic review has also investigated the effectiveness
of interspinous process spacer devices for lumbar spinal stenosis,
suggesting that spacer devices are superior to bony decompression
(Chou 2011). However, this review could not find randomised
trials that made a direct comparison between spacer devices and
conventional decompression, therefore its conclusions were based
on indirect comparisons through a network meta-analysis. Sim-
ilarly, a second systematic review failed to identify trials directly
comparing these two techniques (Moojen 2011). As the first ran-
domised trial comparing these techniques was published in 2013,
these older systematic reviews did not include any randomised
studies. More recently, a systematic review of direct comparisons
was published (Wu 2014), but included both randomised and
non-randomised studies in their meta-analysis. Results of this re-
view also found higher reoperation rates and costs associated with
spacer devices when compared with conventional decompression.
A U T H O R S ’ C O N C L U S I O N S
Implications for practice
There is relatively limited evidence to guide the use of surgery for
the management of lumbar spinal stenosis, as there are no pub-
lished placebo-controlled trials investigating the effects of surgery
for this condition. Most of the evidence supporting the use of
surgery comes from randomised trials comparing surgery with
non-surgical interventions, with conflicting conclusions. The ad-
dition of fusion to decompression is not only more costly, but also
leads to more intraoperative blood loss and longer operation time,
and fails to result in superior clinical outcomes when compared
with decompression alone. Operation using interspinous spacer
devices is quicker, and results in less blood loss and shorter hos-
pital length of stay than fusion. These devices, however, do not
provide better outcomes than conventional decompression, and
are associated with higher reoperation rates. This review provides
valuable information for patients and clinicians to help decide the
best surgical option for this condition.
Implications for research
Future research should include high quality randomised placebo-
controlled trials, and trials comparing surgery with conservative
care in order to investigate the specific effects of surgery for lum-
bar spinal stenosis. More methodologically rigorous studies are
needed to compare the effects of the addition of fusion to decom-
pression as we only identified five trials. Trials should incorporate
a double-blinded (patient and assessors) design and include an ad-
equate randomisation process. The standardisation of outcomes is
also crucial and trials should report patient-related outcome mea-
sures, such as leg pain intensity using a visual analogue pain scale;
function measured by the ZCQ or the ODI; walking ability using
accelerometers; quality of life as reported using the SF-36 or the
EQ-5D; as well as surgically relevant outcomes (i.e., perioperative
23Surgical options for lumbar spinal stenosis (Review)
Copyright © 2016 The Cochrane Collaboration. Published by John Wiley & Sons, Ltd.
212

blood loss, operation time, length of hospital stay), and reopera-
tion rates. Also, future trials should include and report clinically
important complications, such as infections, blood transfusions,
and dural tears. Most included trials in this review reported one-
or two-year follow-up, so future research should focus on longer
follow-up times (i.e., five years) to establish the long-term effects
of surgery in this population.
A C K N O W L E D G E M E N T S
This research received no specific grant from any funding agency in
the public, commercial, or not-for-profit sectors. GCM and MBP
are supported by an international postgraduate research scholar-
ship/postgraduate award from the Australian Department of Edu-
cation and Training. CGM is supported by a principal research fel-
lowship from the National Health and Medical Research Council.
MLF is supported by a Sydney Medical Foundation Fellowship
from the Sydney Medical School, The University of Sydney.
R E F E R E N C E S
References to studies included in this review
Azzazi 2010 {published data only}
Azzazi A, Elhawary Y. Dynamic stabilization using X-stop
versus transpedicular screw fixation in the treatment of
lumbar canal stenosis: comparative study of the clinical
outcome. Neurosurgery Quartely 2010; Vol. 20:165–9.
Bridwell 1993 {published data only}
Bridwell KH, Sedgewick TA, O’Brien MF, Lenke LG,
Baldus C. The role of fusion and instrumentation in the
treatment of degenerative spondylolisthesis with spinal
stenosis. Journal of Spinal Disorders 1993;6:461–72.
Cavusoglu 2007 {published data only}
Cavusoglu H, Turkmenoglu O, Kaya RA, Tuncer C, Colak
I, Sahin Y, et al. Efficacy of unilateral laminectomy for
bilateral decompression in lumbar spinal stenosis. Turkish
Neurosurgery 2007;17:100–8.
Celik 2010 {published and unpublished data}
Celik SE, Celik S, Goksu K, Kara A, Ince I.
Microdecompressive laminatomy with a 5-year follow-up
period for severe lumbar spinal stenosis. Journal of Spinal
Disorders & Techniques 2010;23:229–35.
Cho 2007 {published data only}
Cho DY, Lin HL, Lee WY, Lee HC. Split-spinous process
laminotomy and discectomy for degenerative lumbar spinal
stenosis: a preliminary report. Journal of Neurosurgery:Spine 2007;6:229–39.
Davis 2013 {published data only}
Auerbach J, Davis R, Errico T, Bae H. Direct decompression
and coflex interlaminar stabilization compared with
laminectomy and posterior spinal fusion with pedicle screw
instrumentation for spinal stenosis with back pain or
degenerative spondylolisthesis: two-year results from the
prospective, randomized, multicenter FDA IDE trial. SpineJournal 2011;11:86S–7S.
Auerbach J, Zigler J, Davis R, Pettine K, Yeung
A. Comparative cost-effectiveness analysis of coflex
interlaminar stabilization versus posterolateral fusion for
lumbar stenosis and lowgrade spondylolisthesis. European
Spine Journal 2012;21:S311–2.
Auerbach JD, Field JS. Two-level Coflex interlaminar
stabilization compared to two-level lumbar spinal fusion
for the treatment of spinal stenosis with low-grade
spondylolisthesis. Spine Journal 2013;13:155S–6S.
Auerbach JD, Schmier J, Ong KL, Lau E. Cost-
effectiveness of interlaminar stabilization compared with
instrumented posterior spinal fusion for spinal stenosis and
spondylolisthesis. Spine Journal 2012;12:13S.
Cano WG, Block JE, Haley T, Kuznits S, Miller LE.
Lumbar spinal stenosis treatment with an interspinous
spacer: preliminary results of a multicenter, randomized,
controlled FDA-IDE trial. PM&R 2011;3:S213.
Davis R, Auerbach JD, Bae H, Errico TJ. Can low-grade
spondylolisthesis be effectively treated by either coflex
interlaminar stabilization or laminectomy and posterior
spinal fusion: two-year clinical and radiographic results from
the randomized, prospective, multicenter US investigational
device exemption trial. Journal of Neurosurgery: Spine 2013;
19:174–84.
Davis RJ, Auerbach JD, Bae H, Errico TJ. Low-grade
spondylolisthesis can be effectively treated by either coflex
interlaminar stabilization or laminectomy and posterior
spinal fusion: 2-year clinical and radiographic results from
the US IDE trial. European Spine Journal 2012;21:S257–8.
Davis RJ, Errico TJ, Bae H, Auerbach JD. Decompression
and coflex interlaminar stabilization compared with
decompression and instrumented spinal fusion for spinal
stenosis and low-grade degenerative spondylolisthesis: two-
year results from the prospective, randomized, multicenter,
food and drug administration investigational device
exemption trial. Spine 2013;38:1529–39.
Pettine KA. Lumbar decompression followed by coflex
interlaminar implant vs. pedicle screw posterior lateral
fusion for treatment of stenosis. The Spine Journal 2010;
Vol. 10:S11.
Schmier JK, Ong KL, Lau E, Zigler JD, Auerbach JD. Cost-
effectiveness of coflex interlaminar stabilization compared
with instrumented posterior spinal fusion for spinal stenosis
and spondylolisthesis. Value in Health 2012;15:A69.
Forsth 2016 {published data only}
Forsth P, Olafsson G, Carlsson T, Frost A, Borgstrom F,
Fritzell P, et al. A randomized, controlled trial of fusion
surgery for lumbar spinal stenosis. New England Journal of
Medicine 2016;374:1413–23.
24Surgical options for lumbar spinal stenosis (Review)
Copyright © 2016 The Cochrane Collaboration. Published by John Wiley & Sons, Ltd.
213

Ghogawala 2016 {published data only}
Ghogawala Z, Benzel EC, Magge SN, Coumans JV,
Harrington JF, Barker FG. Lumbar spinal fusion reduces risk
of re-operation after laminectomy for lumbar spinal stenosis
associated with grade I degenerative spondylolisthesis:
initial results from the SLIP trial. Neurosurgery 2010;67:
542–3.
Ghogawala Z, Dziura J, Butler WE, Dai F, Terrin N, Magge
SN, et al. Laminectomy plus fusion versus laminectomy
alone for lumbar spondylolisthesis. New England Journal ofMedicine 2016;374:1424–34.
Grob 1995 {published data only}
Grob D, Humke T, Dvorak J. Degenerative lumbar spinal
stenosis. Decompression with and without arthrodesis.
Journal of Bone & Joint Surgery - American Volume 1995;77:
1036–41.
Grob D, Humke T, Dvorak J. [Significance of simultaneous
fusion and surgical decompression in lumbar spinal
stenosis]. Orthopade 1993;22:243–9.
Gurelik 2012 {published data only}
Gurelik M, Bozkina C, Kars Z, Karadag O, Unal O, Bayrakli
F. Unilateral laminotomy for decompression of lumbar
stenosis is effective and safe: a prospective randomized
comparative study. Journal of Neurological Sciences 2012;29:
744–53.
Hallett 2007 {published data only}
Hallett A, Huntley JS, Gibson JN. Foraminal stenosis
and single-level degenerative disc disease: a randomized
controlled trial comparing decompression with
decompression and instrumented fusion. Spine 2007;32:
1375–80.
Komp 2015 {published data only}
Komp M, Hahn P, Oezdemir S, Giannakopoulos A,
Heikenfeld R, Kasch R, et al. Bilateral spinal decompression
of lumbar central stenosis with the full-endoscopic
interlaminar versus microsurgical laminotomy technique: a
prospective, randomized, controlled study. Pain Physician2015;18:61–70.
Liu 2013 {published data only}
Liu X, Yuan S, Tian Y. Modified unilateral laminotomy for
bilateral decompression for lumbar spinal stenosis: technical
note. Spine 2013;38:E732–7.
Lonne 2015 {published data only}
Lonne G, Johnsen LG, Aas E, Lydersen S, Andresen H,
Ronning R, et al. Comparing cost-effectiveness of X-stop to
minimally invasive decompression in lumbar spinal stenosis:
a randomized controlled trial. Spine (Phila Pa 1976) 2015;
40:514–20.
Lonne G, Johnsen LG, Rossvoll I, Andresen H, Storheim K,
Zwart JA, et al. Minimally invasive decompression versus
x-stop in lumbar spinal stenosis: a randomized controlled
multicenter study. Spine (Phila Pa 1976) 2015;40:77–85.
Mobbs 2014 {published data only}
Mobbs RJ, Li J, Sivabalan P, Raley D, Rao PJ. Outcomes
after decompressive laminectomy for lumbar spinal
stenosis: comparison between minimally invasive unilateral
laminectomy for bilateral decompression and open
laminectomy. Journal of Neurosurgery: Spine 2014;21:
179–86.
Moojen 2013 {published and unpublished data}
Moojen W A, Arts M P, Jacobs W C, van Zwet E W, van den
Akker-van Marle M E, Koes B W, et al. Interspinous process
device versus standard conventional surgical decompression
for lumbar spinal stenosis: randomized controlled trial.
BMJ 2013;347:f6415.
Moojen WA, Arts MP, Jacobs WC, van Zwet EW, van den
Akker-van Marle ME, Koes BW, et al. IPD without bony
decompression versus conventional surgical decompression
for lumbar spinal stenosis: 2-year results of a double-blind
randomized controlled trial. European Spine Journal 2015;
24:2295–305.
van den Akker-van Marle ME, Moojen WA, Arts MP,
Vleggeert-Lankamp CL, Peul WC, Leiden-The Hague
Spine Intervention Prognostic Study Group. Interspinous
process devices versus standard conventional surgical
decompression for lumbar spinal stenosis: cost utility
analysis. Spine Journal 2016;16(6):702–10.
Postacchini 1993 {published data only}
Postacchini F, Cinotti G, Perugia D, Gumina S. The surgical
treatment of central lumbar stenosis. Multiple laminotomy
compared with total laminectomy. Journal of Bone & JointSurgery - British Volume 1993;75:386–92.
Rajasekaran 2013 {published data only}
Rajasekaran S, Thomas A, Kanna R M, Shetty AP. Lumbar
spinous process splitting decompression provides equivalent
outcomes to conventional midline decompression in
degenerative lumbar canal stenosis: a prospective,
randomised controlled study of 51 patients. Spine 2013;38:
1737–43.
Ruetten 2009 {published data only}
Ruetten S, Komp M, Merk H, Godolias G. Surgical
treatment for lumbar lateral recess stenosis with the full-
endoscopic interlaminar approach versus conventional
microsurgical technique: a prospective, randomized,
controlled study. Journal of Neurosurgery: Spine 2009;10:
476–85.
Stromqvist 2013 {published and unpublished data}
Stromqvist BH, Berg S, Gerdhem P, Johnsson R, Moller A,
Sahlstrand T, et al. X-stop versus decompressive surgery for
lumbar neurogenic intermittent claudication: randomized
controlled trial with 2-year follow-up. Spine 2013;38:
1436–42.
Thome 2005 {published data only}
Thome C, Schubert GA, Stier R, Hegewald AA, Schmiedek
P. Long-term outcome after less invasive surgery for
decompression of lumbar stenosis - a randomized
comparison of unilateral laminotomy, bilateral laminotomy
and laminectomy. Journal of Neurosurgery: Spine 2010;113:
A432–3.
Thome C, Zevgaridis D, Leheta O, Bazner H, Pockler-
Schoniger C, Wohrle J, et al. Outcome after less-invasive
decompression of lumbar spinal stenosis: a randomized
25Surgical options for lumbar spinal stenosis (Review)
Copyright © 2016 The Cochrane Collaboration. Published by John Wiley & Sons, Ltd.
214

comparison of unilateral laminotomy, bilateral laminotomy,
and laminectomy. Journal of Neurosurgery: Spine 2005;3:
129–41.
Usman 2013 {published data only}
Usman M, Ali M, Khanzada K, Ishaq M, Naeem ul
Haq, Aman R, et al. Unilateral approach for bilateral
decompression of lumbar spinal stenosis: a minimal invasive
surgery. Journal of the College of Physicians & Surgeons
Pakistan 2013;23:852–6.
Watanabe 2011 {published data only}
Watanabe K, Matsumoto M, Ikegami T, Nishiwaki Y, Tsuji
T, Ishii K, et al. Reduced postoperative wound pain after
lumbar spinous process-splitting laminectomy for lumbar
canal stenosis: a randomized controlled study. Journal of
Neurosurgery: Spine 2011;14:51–8.
Yagi 2009 {published data only}
Yagi M, Okada E, Ninomiya K, Kihara M.
Postoperative outcome after modified unilateral-approach
microendoscopic midline decompression for degenerative
spinal stenosis. Journal of Neurosurgery: Spine 2009;10:
293–9.
References to studies excluded from this review
Abdu 2009 {published data only}
Abdu WA, Lurie JD, Spratt KF, Tosteson AN, Zhao W,
Tosteson TD, et al. Degenerative spondylolisthesis: does
fusion method influence outcome? Four-year results of
the spine patient outcomes research trial. Spine 2009;34:
2351–60.
Altaf 2011 {published data only}
Altaf F, Jalgaonkar A, Raman SA. Prospective study of
posterior lumbar interbody fusion and posterolateral fusion
for degenerative spondylolisthesis. Spine Journal 2011;11:
112S–3S.
Andersen 2008 {published data only}
Andersen T, Videbaek TS, Hansen ES, Bunger C,
Christensen FB. The positive effect of posterolateral lumbar
spinal fusion is preserved at long-term follow-up: a RCT
with 11-13 year follow-up. European Spine Journal 2008;
17:272–80.
Anderson 2011 {published data only}
Anderson DG, Patel A, Maltenfort M, Vaccaro AR, Ratliff
J, Hilibrand A, et al. Lumbar decompression using a
traditional midline Approach versus a tubular retractor
system: comparison of patient-based clinical outcomes.
Spine 2011;36:E320–5.
Aoki 2012 {published data only}
Aoki Y, Yamagata M, Ikeda Y, Nakajima F, Ohtori S,
Nakagawa K, et al. A prospective randomized controlled
study comparing transforaminal lumbar interbody fusion
techniques for degenerative spondylolisthesis: unilateral
pedicle screw and 1 cage versus bilateral pedicle screws and
2 cages. Journal of Neurosurgery: Spine 2012;17:153–9.
Arriagada 2000 {published data only}
Arriagada LO. Manejo quirúrgico con instrumentación
transpedicular de la espondilolistesis. Revista Chilena de
Neurocirugía 2000;15:29–36.
Asazuma 2004 {published data only}
Asazuma T, Yamugishi M, Sato M, Ichimura S, Fujikawa K,
Crock HV. Posterior spinal fusion for lumbar degenerative
diseases using the Crock-Yamagishi (C-Y) spinal fixation
system. Journal of Spinal Disorders and Techniques 2004;17:
174–7.
Auerbach 2011 {published data only}
Auerbach J, Davis R. Direct versus indirect decompression
and stabilization: a comparison of clinical outcomes with
coflex interlaminar stabilization, laminectomy and spinal
fusion, and X-STOP to treat spinal stenosis and low-grade
degenerative spondylolisthesis. Spine Journal 2011;11:
104S–5S.
Auerbach 2012 {published data only}
Auerbach J, McGowan K, Halevi M, Maislin G. Mitigating
the potential for adverse event reporting bias: utilization of
an independent clinical events committee. European Spine
Journal 2012;21:S284.
Bazan 2002 {published data only}
Bazan O. Estenosis del conducto raquideo lumbar:
artrodesis posterolateral. Revista de la Asociacion Argentinade Ortopedia y Traumatologia 2002;67:296.
Benli 2006 {published data only}
Benli I T, Cicek H, Kaya A. Comparison of sagittal plane
realignment and reduction with posterior instrumentation
in developmental low or high dysplastic spondylolisthesis.
Kobe Journal of Medical Sciences 2006;52:151–69.
Bjarke 2002 {published data only}
Bjarke Christensen F, Stender Hansen E, Laursen M,
Thomsen K, Bunger CE. Long-term functional outcome of
pedicle screw instrumentation as a support for posterolateral
spinal fusion: randomized clinical study with a 5-year
follow-up. Spine 2002;27:1269–77.
Blumenthal 2013 {published data only}
Blumenthal C, Curran J, Benzel EC, Potter R, Magge SN,
Harrington Jr JF, et al. Radiographic predictors of delayed
instability following decompression without fusion for
degenerative Grade I lumbar spondylolisthesis: clinical
article. Journal of Neurosurgery: Spine 2013;18:340–6.
Bresnahan 2009 {published data only}
Bresnahan L, Ogden AT, Natarajan RN, Fessler RG. A
biomechanical evaluation of graded posterior element
removal for treatment of lumbar stenosis: comparison
of a minimally invasive approach with two standard
laminectomy techniques. Spine 2009;34:17–23.
Cakir 2009 {published data only}
Cakir B, Carazzo C, Schmidt R, Mattes T, Reichel H, Käfer
W. Adjacent segment mobility after rigid and semirigid
instrumentation of the lumbar spine. Spine 2009;34:
1287–91.
26Surgical options for lumbar spinal stenosis (Review)
Copyright © 2016 The Cochrane Collaboration. Published by John Wiley & Sons, Ltd.
215

Cannone 2010 {published data only}
Cannone J. Spinal Stenosis and Fusion Surgery. PositiveHealth 2010;175:1.
Carragee 1997 {published data only}
Carragee EJ. Single-level posterolateral arthrodesis, with
or without posterior decompression, for the treatment
of isthmic spondylolisthesis in adults. A prospective,
randomized study. The Journal of Bone and Joint Surgery.
American volume 1997; Vol. 79:1175–80.
Carrasco 1986 {published data only}
Carrasco M, Simonovich Z. Conducto raquídeo
estrechado. Revista de la Asociación Argentina de Ortopedia y
Traumatología 1986;51:349–62.
Carreon 2009 {published data only}
Carreon LY, Glassman SD, Djurasovic M, Campbell MJ,
Puno RM, Johnson JR, et al. RhBMP-2 versus iliac crest
bone graft for lumbar spine fusion in patients over 60 years
of age: a cost-utility study. Spine 2009;34:238–43.
Cassinelli 2007 {published data only}
Cassinelli EH, Eubanks J, Vogt M, Furey C, Yoo J, Bohlman
HH. Risk factors for the development of perioperative
complications in elderly patients undergoing lumbar
decompression and arthrodesis for spinal stenosis: an
analysis of 166 patients. Spine 2007;32:230–5.
Chen 2010 {published data only}
Chen KX, Yang QY, Liu XC, Li HJ. [Treatment of
degenerative lumbar spondylolisthesis through posterolateral
fusion and fixation with pedicle screws]. Zhongguo Gu
Shang. 2010; Vol. 23:254–6.
Cheng 2009 {published data only}
Cheng L, Nie L, Zhang L. Posterior lumbar interbody
fusion versus posterolateral fusion in spondylolisthesis:
a prospective controlled study in the Han nationality.
International Orthopaedics 2009; Vol. 33:1043–7.
Choi 2009 {published data only}
Choi Y, Kim K, So K. Adjacent segment instability after
treatment with a Graf ligament at minimum 8 years’
followup. Clinical Orthopaedics & Related Research 2009;
467:1740–6.
Dahdaleh 2013 {published data only}
Dahdaleh NS, Nixon AT, Lawton CD, Wong AP, Smith ZA,
Fessler RG. Outcome following unilateral versus bilateral
instrumentation in patients undergoing minimally invasive
transforaminal lumbar interbody fusion: a single-center
randomized prospective study. Neurosurgical Focus 2013;
35:E13.
Dantas 2007 {published data only}
Dantas FL, Prandini MN, Ferreira MA. Comparison
between posterior lumbar fusion with pedicle screws and
posterior lumbar interbody fusion with pedicle screws in
adult spondylolisthesis. Arquivos de Neuropsiquiatria 2007;
Vol. 65:764–70.
Delank 2002 {published data only}
Delank KS, Eysel P, Zollner J, Drees P, Nafe B, Rompe JD.
Undercutting decompression versus laminectomy. Clinical
and radiological results of a prospective controlled trial.
Orthopade 2002;31:1048–56.
Delawi 2010 {published data only}
Delawi D, Dhert WJ, Rillardon L, Gay E, Prestamburgo
D, Garcia-Fernandez C, et al. A prospective, randomized,
controlled, multicenter study of osteogenic protein-1 in
instrumented posterolateral fusions: report on safety and
feasibility. Spine 2010;35:1185–91.
Desai 2012 {published data only}
Desai A, Bekelis K, Ball P, Lurie J, Mirza S, Tosteson TD, et
al. Variability in outcomes after surgery for spinal stenosis
and degenerative spondylolisthesis. Neurosurgery 2012;71:
E545.
Dimar 2009 {published data only}
Dimar Ii JR, Glassman SD, Burkus JK, Pryor PW,
Hardacker JW, Carreon LY. Clinical and radiographic
analysis of an optimized rhBMP-2 formulation as an
autograft replacement in posterolateral lumbar spine
arthrodesis. Journal of Bone and Joint Surgery - AmericanVolume 2009;91:1377–86.
Dirisio 2011 {published data only}
Dirisio DJ, Regan JJ, Hartjen CA, Dryer RF, Rodgers WB,
Pettine K, et al. Treatment of 110 symptomatic lumbar
stenosis patients at 16 centers in an FDA IDE study. Journal
of Neurosurgery 2011;115:A408–9.
Dryer 2012 {published data only}
Dryer R, Youssef JA, Lorio MP, DiRisio DJ, Myer J,
Baker K. Acadia facet replacement system ide clinical trial:
preliminary two-year outcomes. Spine Journal 2012;12:
140S–1S.
Epstein 2006 {published data only}
Epstein NE. A preliminary study of the efficacy of Beta
Tricalcium Phosphate as a bone expander for instrumented
posterolateral lumbar fusions. Journal of Spinal Disorders &
Techniques 2006;19:424–9.
Escobar 2003 {published data only}
Escobar E, Transfeldt E, Garvey T, Ogilvie J, Graber J,
Schultz L. Video-assisted versus open anterior lumbar
spine fusion surgery: a comparison of four techniques and
complications in 135 patients. Spine 2003;28:729–32.
Fan 2009 {published data only}
Fan J, Yu GR, Liu F, Zhao J, Zhao WD. Biomechanical
changes of modified Scott wiring fixation in treating 12
young patients with lumbar spondylolysis. Journal of
Clinical Rehabilitative Tissue Engineering Research 2009;13:
4245–8.
Fast 1985 {published data only}
Fast A, Robin GC, Floman Y. Surgical treatment of lumbar
spinal stenosis in the elderly. Archives of Physical Medicine &
Rehabilitation 1985;66:149–51.
Feng 2011 {published data only}
Feng ZZ, Cao YW, Jiang C, Jiang XX. Short-term outcome
of bilateral decompression via a unilateral paramedian
approach for transforaminal lumbar interbody fusion with
unilateral pedicle screw fixation. Orthopedics 2011;34:364.
27Surgical options for lumbar spinal stenosis (Review)
Copyright © 2016 The Cochrane Collaboration. Published by John Wiley & Sons, Ltd.
216

Fitzgerald 1976 {published data only}
Fitzgerald JA, Newman PH. Degenerative spondylolisthesis.
Journal of Bone & Joint Surgery - British Volume 1976;58:
184–92.
Försth 2013 {published data only}
Försth P, Michaëlsson K, Sandén B. Does fusion improve
the outcome after decompressive surgery for lumbar spinal
stenosis?: A two-year follow-up study involving 5390
patients. Bone & Joint Journal 2013;95-B:960–5.
Fu 2008 {published data only}
Fu YS, Zeng BF, Xu JG. Long-term outcomes of two
different decompressive techniques for lumbar spinal
stenosis. Spine 2008;33:514–8.
Fujiya 1990 {published data only}
Fujiya M, Saita M, Kaneda K, Abumi K. Clinical study
on stability of combined distraction and compression rod
instrumentation with posterolateral fusion for unstable
degenerative spondylolisthesis. Spine 1990;15:1216–22.
Ghahreman 2010 {published data only}
Ghahreman A, Ferch RD, Rao PJ, Bogduk N. Minimal
access versus open posterior lumbar interbody fusion in the
treatment of spondylolisthesis. Neurosurgery 2010; Vol.
66:296–304.
González 1992 {published data only}
González AG, Espinosa ES. Tratamiento quirúrgico del
conducto lumbar estrecho degenerativo. Revista Mexicanade Ortopedia y Traumatología 1992;6:214–6.
Gotfryd 2012 {published data only}
Gotfryd AO, Henriques GG, Poletto PR. Influência da
extensão da artrodese lombossacra nos resultados clínicos e
funcionais. Coluna/Columna 2012;11:13–6.
Gotfryd 2012a {published data only}
Gotfryd AO, Spolidoro DR, Poletto PR. Descompressão
neural isolada ou associada à fusão póstero-lateral nas
afecções degenerativas lombossacras: avaliação da qualidade
de vida e incapacidade funcional pós-operatória. Coluna/
Columna 2012;11:17–20.
Gu 2009 {published data only}
Gu Y, Chen L, Yang HL, Chen XQ, Dong RB, Han GS, et
al. Efficacy of surgery and type of fusion in patients with
degenerative lumbar spinal stenosis. Journal of Clinical
Neuroscience 2009;16:1291–5.
Haley 2012 {published data only}
Haley TR, Dankmyer C, Miller LE, Block J. Novel
interspinous spacer for treatment of moderate lumbar spinal
stenosis: 1-year results of a randomized controlled IDE
trial. Pain Medicine 2012;13:305–6.
Haley 2012a {published data only}
Haley TR, Lichten D, Miller LE. Prospective randomized
controlled trial of interspinous spacer treatment for
moderate lumbar spinal stenosis. Pain Medicine 2012;13:
1101.
Halm 2010 {published data only}
Halm HFH, Richter A. Microsurgical decompression vs.
microsurgical decompression plus interspinous stabilization
in lumbar spinal stenosis. A prospective comparison of 60
patients. Spine Journal 2010; Vol. 10:S66.
Herkowitz 1991 {published data only}
Herkowitz HN, Kurz LT. Degenerative lumbar
spondylolisthesis with spinal stenosis. A prospective
study comparing decompression with decompression and
intertransverse process arthrodesis. Journal of Bone and
Joint Surgery. American Volume 1991; Vol. 73:802–8.
Hong 2010 {published data only}
Hong SW, Lee HY, Kim KH, Lee SH. Interspinous
ligamentoplasty in the treatment of degenerative
spondylolisthesis: Midterm clinical results. Journal ofNeurosurgery: Spine 2010;13:27–35.
Hong 2011 {published data only}
Hong SW, Choi KY, Ahn Y, Baek OK, Wang JC, Lee SH,
et al. A comparison of unilateral and bilateral laminotomies
for decompression of L4-L5 spinal stenosis. Spine 2011;36:
E172–8.
Hwang 2010 {published data only}
Hwang CJ, Vaccaro AR, Hong J, Lawrence JP, Fischgrund
JS, Alaoui-Ismaili MH, et al. Immunogenicity of osteogenic
protein 1: results from a prospective, randomized,
controlled, multicenter pivotal study of uninstrumented
lumbar posterolateral fusion. Journal of Neurosurgery: Spine2010;13:484–93.
Ikuta 2005 {published data only}
Ikuta K, Arima J, Tanaka T, Oga M, Nakano S, Sasaki
K, et al. Short-term results of microendoscopic posterior
decompression for lumbar spinal stenosis. Technical note.
Journal of Neurosurgery Spine 2005;2:624–33.
Imagama 2009 {published data only}
Imagama S, Kawakami N, Matsubara Y, Kanemura T,
Tsuji T, Ohara T. Preventive effect of artificial ligamentous
stabilization on the upper adjacent segment impairment
following posterior lumbar interbody fusion. Spine 2009;
34:2775–81.
Ito 2010 {published data only}
Ito Z, Matsuyama Y, Sakai Y, Imagama S, Wakao N, Ando
K, et al. Bone union rate with autologous iliac bone versus
local bone graft in posterior lumbar interbody fusion. Spine
2010;35:E1101–5.
Katz 1997 {published data only}
Katz JN, Lipson SJ, Lew RA, Grobler LJ, Weinstein
JN, Brick GW, et al. Lumbar laminectomy alone or
with instrumented or noninstrumented arthrodesis in
degenerative lumbar spinal stenosis. Patient selection, costs,
and surgical outcomes. Spine 1997;22:1123–31.
Kawaguchi 2004 {published data only}
Kawaguchi Y, Kanamori M, Ishihara H, Kikkawa T, Matsui
H, Tsuji H, et al. Clinical and radiographic results of
expansive lumbar laminoplasty in patients with spinal
stenosis. Journal of Bone & Joint Surgery - American Volume
2004;86A:292–9.
28Surgical options for lumbar spinal stenosis (Review)
Copyright © 2016 The Cochrane Collaboration. Published by John Wiley & Sons, Ltd.
217

Kim 2006 {published data only}
Kim KT, Lee SH, Lee YH, Bae SC, Suk KS. Clinical
outcomes of 3 fusion methods through the posterior
approach in the lumbar spine. Spine 2006;31:1351–7.
Kim 2007 {published data only}
Kim JW, Park HC, Yoon SH, Oh SH, Roh SW, Rim DC,
et al. A multi-center clinical study of posterior lumbar
interbody fusion with the expandable stand-alone cage
(Tychea cage) for degenerative lumbar spinal disorders.
Journal of Korean Neurosurgical Society 2007;42:251–7.
Kim 2007a {published data only}
Kim SW, Ju CI, Kim CG, Lee SM, Shin H. Minimally
invasive lumbar spinal decompression: A comparative study
between bilateral laminotomy and unilateral laminotomy
for bilateral decompression. Journal of Korean Neurosurgical
Society 2007;42:195–9.
Konno 2000 {published data only}
Konno S, Kikuchi S. Prospective study of surgical treatment
of degenerative spondylolisthesis: comparison between
decompression alone and decompression with Graf system
stabilization. Spine 2000;25:1533–7.
Kornblum 2004 {published data only}
Kornblum MB, Fischgrund JS, Herkowitz HN, Abraham
DA, Berkower DL, Ditkoff JS. Degenerative lumbar
spondylolisthesis with spinal stenosis: a prospective long-
term study comparing fusion and pseudarthrosis. Spine
2004;29:726-33; discussion 733-4.
Korovessis 2004 {published data only}
Korovessis P, Papazisis Z, Koureas G, Lambiris E. Rigid,
semirigid versus dynamic instrumentation for degenerative
lumbar spinal stenosis: a correlative radiological and clinical
analysis of short-term results. Spine 2004; Vol. 29:735–42.
Ledonio 2012 {published data only}
Ledonio CGT, Polly DW, Ghogawala Z, Rampersaud RY,
Santos ERG, Sembrano JN, et al. Societal cost impact
of decompression alone versus decompression and fusion
for degenerative spondylolisthesis. Spine Journal 2012;12:
125S–6S.
Lee 2009 {published data only}
Lee SC, Chen JF, Wu CT, Lee ST. In situ local autograft for
instrumented lower lumbar or lumbosacral posterolateral
fusion. Journal of Clinical Neuroscience 2009;16:37–43.
Lian 2010 {published data only}
Lian XF, Xu JG, Zeng BF, Zhou W, Kong WQ, Hou TS.
Noncontiguous anterior decompression and fusion for
multilevel cervical spondylotic myelopathy: a prospective
randomized control clinical study. European Spine Journal2010;19:713–9.
Liao 2011 {published data only}
Liao JC, Chen WJ, Chen LH, Niu CC, Keorochana G.
Surgical outcomes of degenerative spondylolisthesis with
L5-S1 disc degeneration: comparison between lumbar
floating fusion and lumbosacral fusion at a minimum 5-year
follow-up. Spine 2011;36:1600–7.
Mahir 2012 {published data only}
Mahir S, Marsh G. The 3 year results of a prospective
randomized controlled trial to assess the efficacy with the
dynamic stabilisation of Wallis ligament as an interspinus
implant in lumbar spine decompression. European Spine
Journal 2012;21:S262.
McConnell 2011 {published data only}
McConnell J. A comparison of ß-TCP+BMA versus
RhBMP-2 in anterior lumbar interbody fusion: a
prospective, randomized trial with two-year clinical and
radiographic outcomes. Spine Journal 2011;11:64S–5S.
Michielsen 2013 {published data only}
Michielsen J, Sys J, Rigaux A, Bertrand C. The effect of
recombinant human bone morphogenetic protein-2 in
single-level posterior lumbar interbody arthrodesis. Journal
of Bone & Joint Surgery - American Volume 2013;95:873–80.
Pappas 1994 {published data only}
Pappas CTE, Sonntag VKH. Lumbar stenosis in the elderly.
Neurosurgery Quarterly 1994;4:102–12.
Parker 2013 {published data only}
Parker SL, Adogwa O, Davis BJ, Fulchiero E, Aaronson O,
Cheng J, et al. Cost-utility analysis of minimally invasive
versus open multilevel hemilaminectomy for lumbar
stenosis. Journal of Spinal Disorders & Techniques 2013;26:
42–7.
Radcliff 2011 {published data only}
Radcliff K, Hwang R, Hilibrand A, Smith HE, Gruskay J,
Lurie JD, et al. Does iliac crest autograft affect the outcome
of fusion in the setting of degenerative spondylolisthesis? A
subgroup analysis of the SPORT study. Spine Journal 2011;
11:60S.
Radcliff 2012 {published data only}
Radcliff K, Hwang R, Hilibrand A, Smith HE, Gruskay
J, Lurie JD, et al. The effect of iliac crest autograft on
the outcome of fusion in the setting of degenerative
spondylolisthesis: a subgroup analysis of the Spine Patient
Outcomes Research Trial (SPORT). Journal of Bone andJoint Surgery - Series A 2012;94:1685–92.
Rapp 2009 {published data only}
Rapp SM. Decompression for stenosis less costly than
fusion, especially when instrumented. Orthopedics Today2009;29:38.
Rapp 2011 {published data only}
Rapp SM. Greater spondylolisthesis pain relief found with
bilateral vs. unilateral pedicle screws. Orthopedics Today2011;31:61.
Repantis 2009 {published data only}
Repantis T, Korovessis P, Papazisis Z. Effect of sagittal
spinal alignment on low back pain following decompression
and stabilisation with dynamic, semirigid and rigid
instrumentation. A multifactorial analysis. Journal of Bone
& Joint Surgery - British Volume 2009; Vol. 91:149.
Richter 2010 {published data only}
Richter A, Schutz C, Hauck M, Halm H. Does an
interspinous device (coflex) improve the outcome of
29Surgical options for lumbar spinal stenosis (Review)
Copyright © 2016 The Cochrane Collaboration. Published by John Wiley & Sons, Ltd.
218

decompressive surgery in lumbar spinal stenosis? One-year
follow up of a prospective case control study of 60 patients.
European Spine Journal 2010;19:283–9.
Rompe 1995 {published data only}
Rompe JD, Eysel P, Hopf C, Heine J. Surgical management
of central lumbar spinal stenosis - results with decompressive
laminectomy only and with concomitant instrumented
fusion with the Cotrel-Dubousset-instrumentation. Neuro-
Orthopedics 1995; Vol. 19:17–31.
Rosa 2012 {published data only}
da Rosa FWF, Foizer GA, Yoshino CV, Yonezaki AM,
Ueno FH, Valesin Filho ES, et al. Avaliação dos pacientes
submetidos à descompressão e artrodese póstero-lateral
devido à espondilolistese degenerativa com dois anos de
acompanhamento. Coluna/Columna 2012;11:200–3.
Rowland 2009 {published data only}
Rowland KA. Spinal stenosis: new study purports to show
surgery better than medical management. Evidence-BasedPractice 2009;12:1–3.
Satomi 1992 {published data only}
Satomi K, Hirabayashi K, Toyama Y, Fujimura Y. A clinical
study of degenerative spondylolisthesis. Radiographic
analysis and choice of treatment. Spine 1992;17:1329–36.
Schnake 2006 {published data only}
Schnake KJ, Schaeren S, Jeanneret B. Dynamic stabilization
in addition to decompression for lumbar spinal stenosis
with degenerative spondylolisthesis. Spine 2006;31:442–9.
Sears 2012 {published data only}
Sears WR, Davis RJ, Auerbach JD. The Coflex versus
fusion US FDA IDE trial: an in vivo biomechanical study
of adjacent segment motion following fusion. Spine Journal2012;12:29S.
Sengupta 2006 {published data only}
Sengupta DK, Truumees E, Patel CK, Kazmierczak C,
Hughes B, Elders G, et al. Outcome of local bone versus
autogenous iliac crest bone graft in the instrumented
posterolateral fusion of the lumbar spine. Spine 2006;31:
985–91.
Shapiro 2005 {published data only}
Shapiro S, Rodgers RB, Sloan R, Altstadt T, Miller J.
A randomized trial of instrumented posterior lumbar
interbody fusion using machined cortical wedges/local bone
with or without rhBMP2 in the treatment of degenerative
lumbar spondylolisthesis with stenosis. Neurosurgery 2005;
57:398.
Skidmore 2011 {published data only}
Skidmore G, Ackerman SJ, Bergin C, Ross D, Butler
J, Suthar M, et al. Cost-effectiveness of the X-STOP
interspinous spacer for lumbar spinal stenosis: a comparison
with conservative care and laminectomy. Spine 2011;36:
E345–56.
Smoljanovic 2010 {published data only}
Burkus JK, Gornet MF, Schuler TC, Kleeman TJ,
Zdeblick TA. Six-year outcomes of anterior lumbar
interbody arthrodesis with use of interbody fusion cages
and recombinant human bone morphogenetic protein-2.
Journal of Bone & Joint Surgery - American Volume 2009;91:
1181–9.
Smorgick 2013 {published data only}
Smorgick Y, Park DK, Baker KC, Lurie JD, Tosteson TD,
Zhao W, et al. Single-versus multilevel fusion for single-
level degenerative spondylolisthesis and multilevel lumbar
stenosis: four-year results of the spine patient outcomes
research trial. Spine 2013;38:797–805.
Steffee 1993 {published data only}
Steffee AD, Brantigan JW. The variable screw placement
spinal fixation system. Report of a prospective study of 250
patients enrolled in Food and Drug Administration clinical
trials. Spine 1993;18:1160–72.
Tani 2002 {published data only}
Tani T, Ushida T, Ishida K, Iai H, Noguchi T, Yamamoto
H. Relative safety of anterior microsurgical decompression
versus laminoplasty for cervical myelopathy with a massive
ossified posterior longitudinal ligament. Spine 2002;27:
2491–8.
Tenhula 2000 {published data only}
Tenhula J, Lenke LG, Bridwell KH, Gupta P, Riew D.
Prospective functional evaluation of the surgical treatment
of neurogenic claudication in patients with lumbar spinal
stenosis. Journal of Spinal Disorders 2000;13:276–82.
Tsutsumimoto 2009 {published data only}
Tsutsumimoto T, Shimogata M, Ohta H, Misawa H.
Mini-open versus conventional open posterior lumbar
interbody fusion for the treatment of lumbar degenerative
spondylolisthesis: comparison of paraspinal muscle damage
and slip reduction. Spine 2009;34:1923–8.
Valesin 2009 {published data only}
Valesin Filho ES, Ueno FH, Cabral LTB, Yonezaki AM,
Nicolau RJ, Rodrigues LMR. Estudo prospectivo de
avaliação de dor e incapacidade de pacientes operados de
estenose de canal lombar com seguimento mínimo de dois
anos. Coluna/Columna 2009;8:390–4.
Videbaek 2010 {published data only}
Videbaek TS, Egund N, Christensen FB, Grethe Jurik A,
Bunger CE. Adjacent segment degeneration after lumbar
spinal fusion: the impact of anterior column support: a
randomized clinical trial with an eight- to thirteen-year
magnetic resonance imaging follow-up. Spine 2010;35:
1955–64.
Wang 1998 {published data only}
Wang PJ, Chen WJ, Chen LH, Niu CC. Spinal fusion
and pedicle screw instrumentation in the treatment of
spondylolisthesis over the age of 60. Changgeng Yi Xue Za
Zhi 1998;21:436–41.
Weinstein 2007 {published data only}
Weinstein JN, Lurie JD, Tosteson TD, Hanscom B,
Tosteson ANA, Blood EA, et al. Surgical versus nonsurgical
treatment for lumbar degenerative spondylolisthesis. New
England Journal of Medicine 2007;356:2257–70.
30Surgical options for lumbar spinal stenosis (Review)
Copyright © 2016 The Cochrane Collaboration. Published by John Wiley & Sons, Ltd.
219

Whang 2013 {published data only}
Whang PG, Patel VV, Bradley WD, Block JE. Midterm
outcomes of a prospective multicenter randomized
controlled trial comparing the clinical efficacy of
interspinous spacers as a treatment for moderate lumbar
spinal stenosis. Spine Journal 2013;13:136S–7S.
Willén 2008 {published data only}
Willén J, Wessberg PJ, Danielsson B. Surgical results in
hidden lumbar spinal stenosis detected by axial loaded
computed tomography and magnetic resonance imaging:
an outcome study. Spine 2008;33:E109–15.
Xiao 2007 {published data only}
Xiao R, Li Q, Tang Z. [Comparative study of lumbar
spondylolisthesis treated by three different materials].
Chinese Journal of Reparative and Reconstructive Surgery
2007; Vol. 21:453–6.
Xiao 2007a {published data only}
Xiao RC, Xiao ZM, Li Q, Tang ZH, Hu JZ, Zou GY. Bone
morphogenetic protein and interbody fusion cage change
the height of intervertebral space in patients with lumbar
spondylolisthesis. Journal of Clinical Rehabilitative Tissue
Engineering Research 2007;11:1443–6.
Yamada 2012 {published data only}
Yamada T, Yoshii T, Sotome S, Yuasa M, Kato T, Arai Y, et
al. Hybrid grafting using bone marrow aspirate combined
with porous β-tricalcium phosphate and trephine bone
for lumbar posterolateral spinal fusion: a prospective,
comparative study versus local bone grafting. Spine 2012;
37:E174–9.
Yang 2011 {published data only}
Yang B, Chen R, Xie P, Liu B, Dong J, Rong L.
[Microendoscopic decompression via unilateral approach
for lumbar spinal stenosis]. Chung-Kuo Hsiu Fu ChungChien Wai Ko Tsa Chih/Chinese Journal of Reparative &
Reconstructive Surgery 2011;25:1158–63.
Yu 2008 {published data only}
Yu CH, Wang CT, Chen PQ. Instrumented posterior
lumbar interbody fusion in adult spondylolisthesis. ClinicalOrthopaedics & Related Research 2008;466:3034–43.
Zdeblick 1993 {published data only}
Zdeblick TA. A prospective, randomized study of lumbar
fusion. Preliminary results. Spine 1993;18:983–91.
Zucherman 2004 {published data only}
Zucherman JF, Hsu KY, Hartjen CA, Mehalic TF, Implicito
DA, Martin MJ, et al. A prospective randomized multi-
center study for the treatment of lumbar spinal stenosis with
the X STOP interspinous implant: 1-year results. EuropeanSpine Journal 2004;13:22–31.
Additional references
Abumi 1990
Abumi K, Panjabi MM, Kramer KM, Duranceau J, Oxland
T, Crisco JJ. Biomechanical evaluation of lumbar spinal
stability after graded facetectomies. Spine (Phila Pa 1976)
1990;15:1142–7.
Arnoldi 1976
Arnoldi CC, Brodsky AE, Cauchoix J, Crock HV,
Dommisse GF, Edgar MA, et al. Lumbar spinal stenosis
and nerve root entrapment syndromes. Definition and
classification. Clinical Orthopaedics and Related Research
1976;115:4–5.
Aryanpur 1988
Aryanpur J, Ducker T. Multilevel lumbar laminotomies for
focal spinal stenosis: case report. Neurosurgery 1988;23:
111–5.
Bailey 1911
Bailey P, Casamajor L. Osteo-arthritis of the spine as a cause
of compression of the spinal cord and its roots: with report
of five cases. The Journal of Nervous and Mental Disease1911;38:588–609.
Blau 1961
Blau JN, Logue V. Intermittent claudication of the cauda
equina: an unusual syndrome resulting from central
protrusion of a lumbar intervertebral disc. Lancet 1961;
277:1081–6.
Boden 1990
Boden SD, Davis DO, Dina TS, Patronas NJ, Wiesel SW.
Abnormal magnetic-resonance scans of the lumbar spine in
asymptomatic subjects. A prospective investigation. The
Journal of Bone & Joint Surgery - American Edition 1990;72:
403–8.
Buchbinder 2009
Buchbinder R, Osborne RH, Ebeling PR, Wark JD,
Mitchell P, Wriedt C, et al. A randomized trial of
vertebroplasty for painful osteoporotic vertebral fractures.
New England Journal of Medicine 2009;361:557–68.
Chou 2011
Chou D, Lau D, Hermsmeyer J, Norvell D. Efficacy of
interspinous device versus surgical decompression in the
treatment of lumbar spinal stenosis: a modified network
analysis. Evidence-Based Spine-Care Journal 2011;2:45–56.
Cooper 1991
Cooper RG, Mitchell WS, Illingworth KJ, Forbes WS,
Gillespie JE, Jayson MI. The role of epidural fibrosis and
defective fibrinolysis in the persistence of postlaminectomy
back pain. Spine (Phila Pa 1976) 1991;16:1044–8.
Delitto 2015
Delitto A, Piva SR, Moore CG, Fritz JM, Wisniewski SR,
Josbeno DA, et al. Surgery versus nonsurgical treatment
of lumbar spinal stenosis: a randomized trial. Annals ofInternernal Medicine 2015;162:465–73.
Deyo 2010
Deyo RA, Mirza SK, Martin BI, Kreuter W, Goodman
DC, Jarvik JG. Trends, major medical complications, and
charges associated with surgery for lumbar spinal stenosis in
older adults. JAMA 2010;303:1259–65.
Deyo 2013
Deyo RA, Martin BI, Ching A, Tosteson AN, Jarvik JG,
Kreuter W, et al. Interspinous spacers compared with
decompression or fusion for lumbar stenosis: complications
31Surgical options for lumbar spinal stenosis (Review)
Copyright © 2016 The Cochrane Collaboration. Published by John Wiley & Sons, Ltd.
220

and repeat operations in the medicare population. Spine
(Phila Pa 1976) 2013;38:865–72.
Flum 2006
Flum DR. Interpreting surgical trials with subjective
outcomes: avoiding UnSPORTsmanlike conduct. JAMA
2006;296:2483–5.
Furlan 2015
Furlan AD, Malmivaara A, Chou R, Maher CG, Deyo RA,
Schoene M, et al. 2015 Updated Method Guideline for
Systematic Reviews in the Cochrane Back and Neck Group.
Spine 2015; Vol. 40, issue 21:1660–73.
Gibson 2005
Gibson JN, Waddell G. Surgery for degenerative lumbar
spondylosis: updated Cochrane Review. Spine 2005;30:
2312–20.
Guyatt 2008
Guyatt GH, Oxman AD, Vist GE, Kunz R, Falck-Ytter Y,
Alonso-Coello P, et al. GRADE: an emerging consensus on
rating quality of evidence and strength of recommendations.
BMJ 2008;336:924–6.
Guyatt 2011
Guyatt GH, Oxman AD, Kunz R, Brozek J, Alonso-
Coello P, Rind D, et al. GRADE guidelines: 6. Rating the
quality of evidence--imprecision. J Clin Epidemiol 2011;64:
1283–93.
Higgins 2002
Higgins JP, Thompson SG. Quantifying heterogeneity in a
meta-analysis. Statistics in Medicine 2002;21:1539–58.
Higgins 2011
Higgins JPT, Green S. Cochrane Handbook for Systematic
Reviews of Interventions Version 5.1.0 (updated March
2011). The Cochrane Collaboration, 2011. Available
from www.cochrane-handbook.org. The Cochrane
Collaboration.
Hopp 1988
Hopp E, Tsou PM. Postdecompression lumbar instability.
Clinical Orthopaedics and Related Research 1988;227:
143–51.
Horng 2003
Horng S, Miller FG. Ethical framework for the use of sham
procedures in clinical trials. Critical Care Medicine 2003;
31:S126–30.
Ioannidis 2004
Ioannidis JP, Evans SJ, Gotzsche PC, O’Neill RT,
Altman DG, Schulz K, et al. Better reporting of harms
in randomized trials: an extension of the CONSORT
statement. Annals of Internal Medicine 2004;141:781–8.
Ishimoto 2013
Ishimoto Y, Yoshimura N, Muraki S, Yamada H, Nagata K,
Hashizume H, et al. Associations between radiographic
lumbar spinal stenosis and clinical symptoms in the general
population: the Wakayama Spine Study. OsteoarthritisCartilage 2013;21:783–8.
Jansson 2003
Jansson KA, Blomqvist P, Granath F, Nemeth G. Spinal
stenosis surgery in Sweden 1987-1999. European Spine
Journal 2003;12:535–41.
Kalichman 2009
Kalichman L, Cole R, Kim DH, Li L, Suri P, Guermazi
A, et al. Spinal stenosis prevalence and association with
symptoms: the Framingham Study. Spine Journal 2009;9:
545–50.
Katz 2008
Katz JN, Harris MB. Clinical practice. Lumbar spinal
stenosis. New England Journal of Medicine 2008;358:
818–25.
Kawaguchi 1996
Kawaguchi Y, Matsui H, Tsuji H. Back muscle injury after
posterior lumbar spine surgery. A histologic and enzymatic
analysis. Spine (Phila Pa 1976) 1996;21:941–4.
Kovacs 2011
Kovacs FM, Urrútia G, Alarcón JD. Surgery versus
conservative treatment for symptomatic lumbar spinal
stenosis: a systematic review of randomized controlled trials.
Spine 2011;36:E1335–51.
Lane 1893
Lane A. Case of spondylolisthesis associated with progressive
paraplegia; laminectomy. Lancet 1893;1:991–2.
Lee 1983
Lee CK. Lumbar spinal instability (olisthesis) after extensive
posterior spinal decompression. Spine (Phila Pa 1976)1983;8:429–33.
Machado 2015
Machado GC, Ferreira PH, Harris IA, Pinheiro MB, Koes
BW, van Tulder M, et al. Effectiveness of surgery for lumbar
spinal stenosis: a systematic review and meta-analysis. PLoSOne 2015;10:e0122800.
May 2013
May S, Comer C. Is surgery more effective than non-
surgical treatment for spinal stenosis, and which non-
surgical treatment is more effective? A systematic review.
Physiotherapy 2013;99:12–20.
Meyerding 1932
Meyerding HW. Spondylolisthesis. Surgery, Gynecology &Obstetrics 1932;54:37–377.
Moojen 2011
Moojen WA, Arts MP, Bartels RH, Jacobs WC, Peul WC.
Effectiveness of interspinous implant surgery in patients
with intermittent neurogenic claudication: a systematic
review and meta-analysis. European Spine Journal 2011;20:
1596–606.
Overdevest 2015
Overdevest GM, Jacobs W, Vleggeert-Lankamp C,
Thome C, Gunzburg R, Peul W. Effectiveness of posterior
decompression techniques compared with conventional
laminectomy for lumbar stenosis. Cochrane Database
of Systematic Reviews 2015, Issue 3. [DOI: 10.1002/
14651858.CD010036.pub2]
32Surgical options for lumbar spinal stenosis (Review)
Copyright © 2016 The Cochrane Collaboration. Published by John Wiley & Sons, Ltd.
221

Portal 1803
Portal A. Cours d’anatomie médicale, ou éléments del’anatomie de l’homme. 1. Paris: Baudouin, 1803.
Review Manager [Computer program]
The Nordic Cochrane Centre, The Cochrane Collaboration.
Review Manager (RevMan). Version Version 5.3.
Copenhagen: The Nordic Cochrane Centre, The Cochrane
Collaboration, 2014.
Schulz 2010
Schulz KF, Altman DG, Moher D. CONSORT 2010
statement: updated guidelines for reporting parallel group
randomised trials. BMJ 2010;340:c332.
See 1975
See DH, Kraft GH. Electromyography in paraspinal
muscles following surgery for root compression. Archives ofPhysical Medicine and Rehabilitation 1975;56:80–3.
Senegas 1991
Senegas J. [Surgery of the intervertebral ligaments,
alternative to arthrodesis in the treatment of degenerative
instabilities]. Acta Orthopaedica Belgica 1991;57 Suppl 1:
221–6.
Siebert 2009
Siebert E, Pruss H, Klingebiel R, Failli V, Einhaupl KM,
Schwab JM. Lumbar spinal stenosis: syndrome, diagnostics
and treatment. Nature Reviews Neurology 2009;5:392–403.
Smith 1829
Smith AG. Account of a case in which portions of three
dorsal vertebrae were removed for the relief of paralysis from
fracture, with partial success. North American Medical and
Surgical Journal 1829;8:94–7.
Spetzger 1997
Spetzger U, Bertalanffy H, Naujokat C, von Keyserlingk
DG, Gilsbach JM. Unilateral laminotomy for bilateral
decompression of lumbar spinal stenosis. Part I: Anatomical
and surgical considerations. Acta Neurochirurgica 1997;
139:392–6.
Spetzger 1997a
Spetzger U, Bertalanffy H, Reinges MHT, Gilsbach JM.
Unilateral laminotomy for bilateral decompression of
lumbar spinal stenosis. Part II: Clinical experiences. ActaNeurochirurgica 1997;139:397–403.
Taylor 1994
Taylor VM, Deyo RA, Cherkin DC, Kreuter W. Low back
pain hospitalization. Recent United States trends and
regional variations. Spine (Phila Pa 1976) 1994;19:1207-
12; discussion 13.
Wartolowska 2014
Wartolowska K, Judge A, Hopewell S, Collins GS, Dean BJ,
Rombach I, et al. Use of placebo controls in the evaluation
of surgery: systematic review. BMJ 2014;348:g3253.
Watanabe 2005
Watanabe K, Hosoya T, Shiraishi T, Matsumoto M,
Chiba K, Toyama Y. Lumbar spinous process-splitting
laminectomy for lumbar canal stenosis. Technical note.
Journal of Neurosurgery Spine 2005;3:405–8.
Weinstein 2008
Weinstein JN, Tosteson TD, Lurie JD, Tosteson ANA,
Blood E, Hanscom B, et al. Surgical versus nonsurgical
therapy for lumbar spinal stenosis. New England Journal of
Medicine 2008;358:794–810.
Wu 2014
Wu AM, Zhou Y, Li QL, Wu XL, Jin YL, Luo P, et al.
Interspinous spacer versus traditional decompressive surgery
for lumbar spinal stenosis: a systematic review and meta-
analysis. PLoS One 2014;9:e97142.
Zaina 2016
Zaina F, Tomkins-Lane C, Carragee E, Negrini S. Surgical
versus non-surgical treatment for lumbar spinal stenosis.
Cochrane Database of Systematic Reviews 2016, Issue 1.
[DOI: 10.1002/14651858.CD010264.pub2]∗ Indicates the major publication for the study
33Surgical options for lumbar spinal stenosis (Review)
Copyright © 2016 The Cochrane Collaboration. Published by John Wiley & Sons, Ltd.
222

C H A R A C T E R I S T I C S O F S T U D I E S
Characteristics of included studies [ordered by study ID]
Azzazi 2010
Methods Single-centre RCT
Setting: not reported
Country: Egypt
Period: March 2005 to May 2007
Participants Number: 60 patients (30/30)
Diagnosis: physical and neurological examinations and assessment of imaging studies
(computerized tomography and magnetic resonance imaging)
Included: degenerative spondylolisthesis up to grade I; lateral or central spinal stenosis;
predominant component of leg pain (preoperative score of 40 mm on a 100 mm VAS)
rather than back pain symptoms; moderate disability; unresponsive to conservative treat-
ment for a minimum of three months
Excluded: previous lumbar fusion, decompression or total facetectomy; trauma; diseases
that preclude surgical management; patients younger than 20 years or older than 80
years of age; BMI greater than 40
Age (years): mean (range) 56.3 (27-79)
BMI (kg/m²): mean 27/29
Lumbar stenosis duration (years): mean (range) 5.3 (0.2-36.9)
Interventions Group 1: decompression plus transpedicular screw fixation
Group 2: interspinous process spacer device (X-Stop)
Follow-up: 24 months
Outcomes Pain: 100 mm visual analogue scale leg pain
Disability: ODI
Operation time
Complications
Length of hospital stay
Notes Surgeon’s experience: not reported
Funding: Conflict of interest and financial support were not reported in this study
Risk of bias Risk of bias
Bias Authors’ judgement Support for judgement
Random sequence generation (selection
bias)
Unclear risk Quote: “60 patients enrolled and random-
ized to be treated with either...”
Allocation concealment (selection bias) Unclear risk Not mentioned.
Blinding of participants (performance
bias)
All outcomes
Unclear risk No mention of any attempts to blind the
participants.
34Surgical options for lumbar spinal stenosis (Review)
Copyright © 2016 The Cochrane Collaboration. Published by John Wiley & Sons, Ltd.
223

Azzazi 2010 (Continued)
Bliding of personnel/ care providers (per-
formance bias)
High risk The surgeon could not have been blinded
to the intervention.
Blinding of outcome assessment (detection
bias)
All outcomes
Unclear risk No mention of any attempts to blind the
assessors.
Incomplete outcome data (attrition bias)
All outcomes
Unclear risk No information about drop-outs.
Intention-to-treat analysis (attrition bias) Unclear risk No information about intention-to-treat
analysis.
Selective reporting (reporting bias) High risk The authors report in the methods that pe-
rioperative blood loss was recorded and pa-
tients returned for follow-up evaluations 3
weeks, then 3, 6, 12 and 24 months after
surgery. The results for blood loss were not
reported and only 24-month data were re-
ported. Attempts to access these data from
the authors was unsuccessful
Group similarity at baseline (selection bias) Low risk Patients did not differ in their baseline char-
acteristics, based on Table 1
Co-interventions (performance bias) Unclear risk Not mentioned.
Compliance (performance bias) Low risk Compliance in both treatment groups:
100% (surgery).
Timing of outcome assessment (detection
bias)
Low risk All important outcome assessments for
both groups were measured at the same
time
Other bias Unclear risk Conflict of interest and financial support
were not reported in this study
Bridwell 1993
Methods Single-centre RCT
Setting: Barnes-Jewish Hospital, St. Louis Missouri
Country: USA
Period: February 1985 to March 1990
Participants Number: 44 patients (9/11/24)
Diagnosis: magnetic resonance and computed tomographic imaging. Spinal claudica-
tion caused by spinal stenosis at the spondylolisthesis level
Included: no previous spine surgery
35Surgical options for lumbar spinal stenosis (Review)
Copyright © 2016 The Cochrane Collaboration. Published by John Wiley & Sons, Ltd.
224

Bridwell 1993 (Continued)
Excluded: not reported
Age (years): mean (range) 66.1 (46-79)
Interventions Group 1: decompression alone. Surgical decompression comprised of laminectomy with
preservation of bilateral facet joints without discectomy or extensive foraminotomy
Group 2: decompression plus posterolateral (transverse processes) fusion without in-
strumentation or posterolateral (facets and transverse processes) fusion with instrumen-
tation. All fusions were performed with autogenous iliac bone graft
Follow-up: 37.2 months
Outcomes Disability: Walking ability: worse, same or significantly better after surgery
Complications
Reoperations
Notes Surgeon’s experience: not reported
Funding: Conflict of interest and financial support were not reported in this study
Risk of bias Risk of bias
Bias Authors’ judgement Support for judgement
Random sequence generation (selection
bias)
High risk Quote: “the patients were randomized so
that”. The authors report an error in the
randomisation process
Allocation concealment (selection bias) Unclear risk Not mentioned.
Blinding of participants (performance
bias)
All outcomes
Unclear risk No mention of any attempts to blind the
participants.
Bliding of personnel/ care providers (per-
formance bias)
High risk The surgeon could not have been blinded
to the intervention.
Blinding of outcome assessment (detection
bias)
All outcomes
Unclear risk No mention of any attempts to blind the
assessors.
Incomplete outcome data (attrition bias)
All outcomes
Low risk 43/44=97.7% of the patients completed
the follow-up. The number of drop-outs is
unlikely to affect the results
Intention-to-treat analysis (attrition bias) Unclear risk No information about intention-to-treat
analysis.
Selective reporting (reporting bias) High risk Protocol not available, and relevant out-
comes were not reported
36Surgical options for lumbar spinal stenosis (Review)
Copyright © 2016 The Cochrane Collaboration. Published by John Wiley & Sons, Ltd.
225

Bridwell 1993 (Continued)
Group similarity at baseline (selection bias) Unclear risk No information about patient characteris-
tics at baseline.
Co-interventions (performance bias) Unclear risk Only the surgical technique differed be-
tween treatment groups. No concomitant
discectomy, but foraminotomy was per-
formed in some patients
Compliance (performance bias) Low risk Compliance in both treatment groups:
100% (surgery).
Timing of outcome assessment (detection
bias)
Low risk All important outcome assessments for
both groups were measured at the same
time
Other bias Unclear risk Conflict of interest not reported. Financial
support was not reported in this study
Cavusoglu 2007
Methods Single-centre RCT
Setting: Sisli Etfal State Hospital, Istanbul
Country: Turkey
Period: January 2000 to January 2002
Participants Number: 100 patients (50/50)
Diagnosis: physical examination, preoperative radiological investigations with plain
roentgenogram, magnetic resonance and computed tomographic images
Included: symptoms of neurogenic claudication or radiculopathy; radiological/neu-
roimaging evidence of lumbar stenosis; absence of associated pathology; no history of
spinal surgery; non-respondents to minimal 3 months of conservative care
Excluded: not reported
Age (years): mean (SD) 69.2 (12.2)
Lumbar stenosis duration (years): range 0.7 to 5.0
Interventions Group 1: hemi-laminectomy with preservation of posterior midline structures
Group 2: unilateral laminotomy for bilateral decompression. Decompression of the
lateral recess was performed in the unilateral laminectomy group preserving the facet
joints, and discectomy was performed if necessary
Follow-up: 64.8 months
Outcomes Pain: 100-point SF-36 body pain
Disability: ODI
Complications
Notes Surgeon’s experience: not reported
Funding: Conflict of interest and financial support were not reported in this study
37Surgical options for lumbar spinal stenosis (Review)
Copyright © 2016 The Cochrane Collaboration. Published by John Wiley & Sons, Ltd.
226

Cavusoglu 2007 (Continued)
Risk of bias Risk of bias
Bias Authors’ judgement Support for judgement
Random sequence generation (selection
bias)
Low risk Quote: “a concealed computer-generated
randomization list was used to assign the
patient to one of the two treatment groups”
Allocation concealment (selection bias) Low risk Quote: “a concealed computer-generated
randomization list...”
Blinding of participants (performance
bias)
All outcomes
Unclear risk No mention of any attempts to blind the
participants.
Bliding of personnel/ care providers (per-
formance bias)
High risk The surgeon could not have been blinded
to the intervention.
Blinding of outcome assessment (detection
bias)
All outcomes
Low risk Quote: “a single radiologist blinded to the
clinical results of decompression reviewed
all pre and postoperative studies”
Incomplete outcome data (attrition bias)
All outcomes
Low risk 97/100 = 97% of the patients completed
the follow-up. The number of drop-outs is
unlikely to affect the results
Intention-to-treat analysis (attrition bias) Unclear risk No information about intention-to-treat
analysis.
Selective reporting (reporting bias) Low risk It was clear that the published report in-
cluded all expected outcomes
Group similarity at baseline (selection bias) Low risk Patients did not differ in their baseline char-
acteristics, based on Table 1
Co-interventions (performance bias) Low risk Only the surgical technique differed be-
tween treatment groups
Compliance (performance bias) Low risk Compliance in both treatment groups:
100% (surgery).
Timing of outcome assessment (detection
bias)
Unclear risk All important outcome assessments for
both groups were measured at the same
time
Other bias Unclear risk Conflict of interest and financial support
were not reported in this study
38Surgical options for lumbar spinal stenosis (Review)
Copyright © 2016 The Cochrane Collaboration. Published by John Wiley & Sons, Ltd.
227

Celik 2010
Methods Single-centre RCT
Setting: Department of Neurosurgery, Beyoglu State Hospital, Istanbul
Country: Turkey
Period: July 2001 to May 2003
Participants Number: 80 patients (40/40)
Diagnosis: dynamic x-rays, thin-sliced CT and MRI; severe back/leg pain and neuro-
genic claudication; anteroposterior diameter less than 10 mm of the lumbar spinal canal
by CT scan and MRI
Included: patients who had not responded to conservative medical therapy and physical
therapy; more than 41% in ODI; more than 7 in VAS pain; walking distance less than
30 meters; severe lumbar spinal stenosis clinically
Excluded: patients requiring discectomy or showing any kind of instability before the
surgery
Age (years): mean (SD) 61 (13)/59 (14)
Interventions Group 1: total laminectomy
Group 2: bilateral micro decompressive laminotomy. Medial facetectomy and wide
foraminotomies were performed at the level of stenosis, preserving the lateral aspect of
the facet joints. No patient received discectomy
Follow-up: 60 months
Outcomes Pain: 10 cm VAS leg pain
Disability: ODI, walking distance
Operation time
Perioperative blood loss
Complications
Reoperations
Notes Surgeon’s experience: “both groups of patients were operated by the same senior surgeon
in the same time period”
Funding: Conflict of interest and financial support were not reported in this study
Risk of bias Risk of bias
Bias Authors’ judgement Support for judgement
Random sequence generation (selection
bias)
Unclear risk Quote: “a chart system was used to process
randomizaton”.
Allocation concealment (selection bias) Low risk Quote: “a registered nurse informed sur-
geons about the type of surgery before the
operation”
Blinding of participants (performance
bias)
All outcomes
Low risk Quote: “patients were not informed as
which group they would be placed”
39Surgical options for lumbar spinal stenosis (Review)
Copyright © 2016 The Cochrane Collaboration. Published by John Wiley & Sons, Ltd.
228

Celik 2010 (Continued)
Bliding of personnel/ care providers (per-
formance bias)
High risk The surgeon could not have been blinded
to the intervention.
Blinding of outcome assessment (detection
bias)
All outcomes
Low risk Quote: “the patients were preoperative ex-
amined and followed at regular intervals by
the operating neurosurgeons and by a neu-
rology specialist blinded to the study pro-
tocol.”
Incomplete outcome data (attrition bias)
All outcomes
Low risk 71/80 = 89% of the patients completed the
follow-up. The number of drop-outs is un-
likely to affect the results
Intention-to-treat analysis (attrition bias) Unclear risk No information about intention-to-treat
analysis.
Selective reporting (reporting bias) Low risk It was clear that the published report in-
cluded all expected outcomes
Group similarity at baseline (selection bias) Low risk There were no preoperative differences be-
tween groups, based on Tables 1 to 3
Co-interventions (performance bias) Low risk Only the surgical technique differed be-
tween treatment groups
Compliance (performance bias) Low risk Compliance in both treatment groups:
100% (surgery).
Timing of outcome assessment (detection
bias)
Unclear risk All important outcome assessments for
both groups were measured at the same
time
Other bias Unclear risk Conflict of interest and financial support
were not reported in this study
Cho 2007
Methods Single-centre RCT
Setting: China Medical University and Hospital
Country: China
Period: May 2005 to January 2006
Participants Number: 70 patients (30/40)
Diagnosis: CT and MRI: antero-posterior diameter of the spinal canal less than 11 mm,
an interpediculate distance of less than 16 mm, and a lateral recess distance of less than
3 mm; clinical symptoms of lumbago and intermittent claudication
Included: patients with lumbar stenosis with surgical indication for repair
Excluded: patients > 80 years of age with high anaesthetic risks or severe co-morbidity;
40Surgical options for lumbar spinal stenosis (Review)
Copyright © 2016 The Cochrane Collaboration. Published by John Wiley & Sons, Ltd.
229

Cho 2007 (Continued)
patients requiring concomitant fusion
Age (years): mean (SD) 61 (11)/59 (15)
Lumbar stenosis duration (years): mean (SD) 4.0 (0.7)/5.3 (0.7)
Interventions Group 1: laminectomy
Group 2: split-spinous process laminotomy
Follow-up: 15 months
Outcomes Disability: JOA
Operation time
Perioperative blood loss
Complications
Length of hospital stay
Notes Surgeon’s experience: not reported
Funding: Conflict of interest and financial support were not reported in this study
Risk of bias Risk of bias
Bias Authors’ judgement Support for judgement
Random sequence generation (selection
bias)
Unclear risk Not mentioned.
Allocation concealment (selection bias) Unclear risk Not mentioned.
Blinding of participants (performance
bias)
All outcomes
Unclear risk No mention of any attempts to blind the
participants.
Bliding of personnel/ care providers (per-
formance bias)
High risk The surgeon could not have been blinded
to the intervention.
Blinding of outcome assessment (detection
bias)
All outcomes
Unclear risk No mention of any attempts to blind the
assessors.
Incomplete outcome data (attrition bias)
All outcomes
Unclear risk No information about drop-outs.
Intention-to-treat analysis (attrition bias) Unclear risk No information about intention-to-treat
analysis.
Selective reporting (reporting bias) Low risk It was clear that the published report in-
cluded all expected outcomes
Group similarity at baseline (selection bias) Low risk Patients did not differ in their baseline char-
acteristics, based on the Table 3
41Surgical options for lumbar spinal stenosis (Review)
Copyright © 2016 The Cochrane Collaboration. Published by John Wiley & Sons, Ltd.
230

Cho 2007 (Continued)
Co-interventions (performance bias) Low risk Only the surgical technique differed be-
tween treatment groups. Similar percent-
age of concomitant discectomy. All partic-
ipants received the same postoperative care
Compliance (performance bias) Low risk Compliance in both treatment groups:
100% (surgery).
Timing of outcome assessment (detection
bias)
Low risk All important outcome assessments for
both groups were measured at the same
time
Other bias Unclear risk Conflict of interest and financial support
were not reported in this study
Davis 2013
Methods Multi-centre RCT
Setting: 21 sites in the United States
Country: USA
Period: 2006 to 2010
Participants Number: 322 patients (215/107)
Diagnosis: central, foraminal or lateral stenosis; more than 25% reduction of the an-
teroposterior dimension compared with the next adjacent normal level, with nerve root
crowding compared with the normal level, as determined by the investigator on CT or
MRI
Included: patients with moderate radiographical diagnosis of spinal stenosis with low
back pain; spondylolisthesis up to Meyerding grade I; minimum ODI of 20 (0-50), and
VAS back pain score of 50 or more (0-100); minimum 6 months of conservative care
Excluded: prior lumbar surgery; trauma or tumour; isthmic spondylolisthesis; spondy-
lolysis; scoliosis > 25 degrees; disc herniation; serious disease
Age (years): mean (SD) 64.1 (9.0)/62.1 (9.2)
Interventions Group 1: decompression plus transpedicular screw fixation
Group 2: Coflex interspinous process spacer device (Paradigm spine, LLC, New York,
NY)
Follow-up: 24 months
Outcomes Pain: 100 mm VAS leg pain
Disability: ODI
Operation time
Perioperative blood loss
Complications
Reoperations
Length of hospital stay
42Surgical options for lumbar spinal stenosis (Review)
Copyright © 2016 The Cochrane Collaboration. Published by John Wiley & Sons, Ltd.
231

Davis 2013 (Continued)
Notes Surgeon’s experience: not reported
Funding: “Paradigm Spine, LLC (New York, NY) funds were received in support of this
work. Relevant financial activities outside the submitted work: consultancy, royalties,
payment for lecture, payment for manuscript preparation, patents, payment for devel-
opment of educational presentations”
Risk of bias Risk of bias
Bias Authors’ judgement Support for judgement
Random sequence generation (selection
bias)
Low risk Quote: “computer generated randomiza-
tion codes”
Allocation concealment (selection bias) Low risk Quote: “centralized by the study sponsor”
Blinding of participants (performance
bias)
All outcomes
Low risk Quote: “study subjects were blinded until
after surgery”
Bliding of personnel/ care providers (per-
formance bias)
High risk The surgeon could not have been blinded
to the intervention.
Blinding of outcome assessment (detection
bias)
All outcomes
Low risk Quote: “site study personnel were blinded
to the treatment assignment up until 5 days
prior to surgery”
Incomplete outcome data (attrition bias)
All outcomes
Low risk 89% of the patients completed the follow-
up. The number of drop-outs is unlikely to
affect the results
Intention-to-treat analysis (attrition bias) Unclear risk No information about intention-to-treat
analysis.
Selective reporting (reporting bias) Low risk All expected outcomes were reported.
Group similarity at baseline (selection bias) Low risk Patients did not differ in their baseline char-
acteristics, based on Tables 4 to 9
Co-interventions (performance bias) Low risk Only the surgical technique differed be-
tween treatment groups
Compliance (performance bias) Low risk Compliance in both treatment groups:
100% (surgery).
Timing of outcome assessment (detection
bias)
Low risk All important outcome assessments for
both groups were measured at the same
time
43Surgical options for lumbar spinal stenosis (Review)
Copyright © 2016 The Cochrane Collaboration. Published by John Wiley & Sons, Ltd.
232

Davis 2013 (Continued)
Other bias Unclear risk Quote: “Paradigm Spine, LLC (New York,
NY) funds were received in support of
this work. Relevant financial activities out-
side the submitted work: consultancy, roy-
alties, payment for lecture, payment for
manuscript preparation, patents, payment
for development of educational presenta-
tions.”
Forsth 2016
Methods Multi-centre RCT
Setting: 7 Swedish hospitals
Country: Sweden
Period: October 2006 to June 2012
Participants Number: 247 patients (124/123)
Diagnosis: pseudoclaudication and image findings as per inclusion criteria
Included: pseudoclaudication in one or both legs and back pain (score on VAS > 30), 1
or 2 adjacent stenotic segments (cross-section area of the dural sac ≤ 75 mm²) between
L2 and the sacrum on MRI, duration of symptoms > 6 months
Excluded: spondylolysis, degenerative lumbar scoliosis, history of lumbar spinal surgery
for spinal stenosis or instability, stenosis not caused by degenerative changes, stenosis
caused by a herniated disk, other specific spinal conditions, history of vertebral compres-
sion fractures in affected segments, psychological disorders
Age (years): mean (SD) 66.0 (8.0)/66.0 (9.0)
Interventions Group 1: decompression alone
Group 2: decompression plus fusion. The surgical technique was determined solely by
the surgeon
Follow-up: 24 months
Outcomes Pain: 100 mm VAS leg pain
Disability: ODI
Operation time
Perioperative blood loss
Complications
Reoperations
Length of hospital stay
Costs
Notes Surgeon’s experience: all the trial surgeons were senior consultants and were highly
experienced in performing the two trial interventions
Funding: funded by an Uppsala institutional Avtal om Läkarutbildning och Forskning
Risk of bias Risk of bias
Bias Authors’ judgement Support for judgement
44Surgical options for lumbar spinal stenosis (Review)
Copyright © 2016 The Cochrane Collaboration. Published by John Wiley & Sons, Ltd.
233

Forsth 2016 (Continued)
Random sequence generation (selection
bias)
Low risk Quote: “Simple randomization was per-
formed with the use of a Web-based system
that enabled computer-generated random
treatment assignment”
Allocation concealment (selection bias) Unclear risk Not mentioned.
Blinding of participants (performance
bias)
All outcomes
Unclear risk No mention of any attempts to blind the
participants.
Bliding of personnel/ care providers (per-
formance bias)
High risk The surgeon could not have been blinded
to the intervention.
Blinding of outcome assessment (detection
bias)
All outcomes
Unclear risk No mention of any attempts to blind the
assessors.
Incomplete outcome data (attrition bias)
All outcomes
Low risk 92% of the patients completed the follow-
up. The number of drop-outs is unlikely to
affect the results
Intention-to-treat analysis (attrition bias) Low risk Authors used a modified intention-to-treat
analysis that included 9 patients who did
not initially receive the assigned treatment
but did undergo subsequent surgery
Selective reporting (reporting bias) Low risk All expected outcomes were reported.
Group similarity at baseline (selection bias) Low risk Patients did not differ in their baseline char-
acteristics, based on Table 2
Co-interventions (performance bias) Low risk Only the surgical technique differed be-
tween treatment groups
Compliance (performance bias) Low risk Compliance in both treatment groups:
100% (surgery).
Timing of outcome assessment (detection
bias)
Low risk All important outcome assessments for
both groups were measured at the same
time
Other bias Low risk Quote: “No institution or company had a
role in the data analysis, the preparation of
the manuscript, or the decision to submit
the manuscript for publication.”
45Surgical options for lumbar spinal stenosis (Review)
Copyright © 2016 The Cochrane Collaboration. Published by John Wiley & Sons, Ltd.
234

Ghogawala 2016
Methods Multi-centre RCT
Setting: 5 hospitals
Country: USA
Period: March 2002 to August 2009
Participants Number: 66 patients (35/31)
Diagnosis: standardized radiographic and magnetic resonance images
Included: patients with grade I lumbar spondylolisthesis (degree of spondylolisthesis: 3
to 14 mm) with lumbar stenosis and neurogenic claudication with or without lumbar
radiculopathy
Excluded: radiography revealed lumbar instability (motion of > 3 mm at the level of
listhesis, as measured on flexion-extension radiographs of the lumbar spine), previous
lumbar spinal surgery, severe systemic disease
Age (years): mean (SD) 66.5 (8.0)/66.7 (7.2)
Interventions Group 1: decompression alone by a complete laminectomy with partial removal of the
medial facet joint
Group 2: decompression plus fusion. Patients in the fusion group underwent a lumbar
laminectomy as well as implantation of pedicle screws and titanium alloy rods across the
level of listhesis, with a bone graft harvested from the iliac crest
Follow-up: 24 months
Outcomes Pain: SF-36 bodily pain subscale
Disability: ODI
Operation time
Perioperative blood loss
Reoperations
Length of hospital stay
Notes Surgeon’s experience: all surgeons routinely performed both operations tested in the
trial; each of the surgeons had performed at
least 100 laminectomies and 100 posterolateral fusions for lumbar spondylolisthesis
before joining the trial
Funding: There was no industry funding or any other industry involvement in the trial
Risk of bias Risk of bias
Bias Authors’ judgement Support for judgement
Random sequence generation (selection
bias)
Unclear risk Not mentioned.
Allocation concealment (selection bias) Unclear risk Not mentioned.
Blinding of participants (performance
bias)
All outcomes
Unclear risk No mention of any attempts to blind the
participants.
46Surgical options for lumbar spinal stenosis (Review)
Copyright © 2016 The Cochrane Collaboration. Published by John Wiley & Sons, Ltd.
235

Ghogawala 2016 (Continued)
Bliding of personnel/ care providers (per-
formance bias)
High risk The surgeon could not have been blinded
to the intervention.
Blinding of outcome assessment (detection
bias)
All outcomes
Low risk Quote: “independent study coordinator
who was not aware of the study hypothesis”
Incomplete outcome data (attrition bias)
All outcomes
Low risk 88% of the patients completed the follow-
up. The number of drop-outs is unlikely to
affect the results
Intention-to-treat analysis (attrition bias) Unclear risk No information about intention-to-treat
analysis.
Selective reporting (reporting bias) Low risk All expected outcomes were reported.
Group similarity at baseline (selection bias) Low risk Patients did not differ in their baseline char-
acteristics, based on Table 1
Co-interventions (performance bias) Low risk Only the surgical technique differed be-
tween treatment groups
Compliance (performance bias) Low risk Compliance in both treatment groups:
100% (surgery).
Timing of outcome assessment (detection
bias)
Low risk All important outcome assessments for
both groups were measured at the same
time
Other bias Low risk Quote: “There was no industry funding or
any other industry involvement in the SLIP
trial.”
Grob 1995
Methods Single-centre RCT
Setting: Schutthess Hospital, Zurich
Country: Switzerland
Period: November 1989 to November 1990
Participants Number: 45 patients (15/15/15)
Diagnosis: history and clinical examination; CT and MRI (mid-sagittal diameter of the
spinal canal of less than 11 mm)
Included: degenerative spinal stenosis
Excluded: systemic disease; instability of the spine; previous operation
Age (years): mean (range) 67 (48-87)
Lumbar stenosis duration (years): mean (range) 1.3 (0.5-3.1)
47Surgical options for lumbar spinal stenosis (Review)
Copyright © 2016 The Cochrane Collaboration. Published by John Wiley & Sons, Ltd.
236

Grob 1995 (Continued)
Interventions Group 1: decompression alone. Decompression involved widening of the lateral recess,
undercut of lamina, and discectomy or foraminotomy in some patients
Group 2: decompression plus arthrodesis of the most stenotic segment
Group 3: decompression plus arthrodesis of all of the decompressed vertebral segments
Follow-up: 28 months
Outcomes Pain: 10 cm VAS overall pain
Disability: walking ability
Operation time
Perioperative blood loss:
Complications
Reoperations
Notes Surgeon’s experience: All the operations were performed by the same surgeon
Funding: “no funds were received in support to this study”
Risk of bias Risk of bias
Bias Authors’ judgement Support for judgement
Random sequence generation (selection
bias)
Unclear risk Quote: “the patients were randomly as-
signed to the three treatment groups.”
Allocation concealment (selection bias) Unclear risk Not mentioned.
Blinding of participants (performance
bias)
All outcomes
Unclear risk No mention of any attempts to blind the
participants.
Bliding of personnel/ care providers (per-
formance bias)
High risk The surgeon could not have been blinded
to the intervention.
Blinding of outcome assessment (detection
bias)
All outcomes
Unclear risk No mention of any attempts to blind the
assessors.
Incomplete outcome data (attrition bias)
All outcomes
Low risk 100% of the patients completed the follow-
up.
Intention-to-treat analysis (attrition bias) Unclear risk No information about intention-to-treat
analysis.
Selective reporting (reporting bias) Low risk All expected outcomes were reported.
Group similarity at baseline (selection bias) Unclear risk No information about patients characteris-
tics at baseline.
48Surgical options for lumbar spinal stenosis (Review)
Copyright © 2016 The Cochrane Collaboration. Published by John Wiley & Sons, Ltd.
237

Grob 1995 (Continued)
Co-interventions (performance bias) Low risk Only the surgical technique differed be-
tween treatment groups. Similar percent-
age of concomitant discectomy. All partic-
ipants received the same postoperative care
Compliance (performance bias) Low risk Compliance in both treatment groups:
100% (surgery).
Timing of outcome assessment (detection
bias)
High risk Patients were assessed at different time
points. The average duration of follow-up
was 38 months (range: 24 to 32)
Other bias Low risk Quote: “no funds were received in support
to this study”
Gurelik 2012
Methods Single-centre RCT
Setting: Department of Neurosurgery, Van Training and Research Hospital, Van
Country: Turkey
Period: January 2006 to February 2009
Participants Number: 52 patients (26/26)
Diagnosis: MRI of degenerative lumbar spinal stenosis with symptoms of neurogenic
claudication or radiculopathy
Included: symptoms of neurogenic claudication or radiculopathy; radiological evidence
of degenerative lumbar stenosis; absence of associated pathological entities such as in-
stability and significant disc herniation; absence of previous surgery for lumbar spine
disorder; non-respondents to conservative care
Excluded: not reported
Age (years): mean (SD) 57.5 (8.5)/60.7 (10.0)
Interventions Group 1: laminectomy
Group 2: unilateral laminotomy. Unilateral laminotomy was performed followed by
ipsilateral medial facetectomy and foraminotomy, and the ligamentum flavum were
resected partially. For both procedures, the medial aspects of the contralateral facet joints
were resected partially
Follow-up: 6 months
Outcomes Disability: ODI, walking distance
Notes Surgeon’s experience: “all operations were performed by one author”
Funding: Conflict of interest and financial support were not reported in this study
Risk of bias Risk of bias
Bias Authors’ judgement Support for judgement
49Surgical options for lumbar spinal stenosis (Review)
Copyright © 2016 The Cochrane Collaboration. Published by John Wiley & Sons, Ltd.
238

Gurelik 2012 (Continued)
Random sequence generation (selection
bias)
Unclear risk Quote: “patients were randomly assigned
to one of the following groups”
Allocation concealment (selection bias) Unclear risk Not mentioned.
Blinding of participants (performance
bias)
All outcomes
High risk Quote: “patients were made aware of the
method” and “told which operative proce-
dure they were going to have”
Bliding of personnel/ care providers (per-
formance bias)
High risk The surgeon could not have been blinded
to the intervention.
Blinding of outcome assessment (detection
bias)
All outcomes
Unclear risk No mention of any attempts to blind the
assessors.
Incomplete outcome data (attrition bias)
All outcomes
Low risk 100% of the patients completed the follow-
up.
Intention-to-treat analysis (attrition bias) Unclear risk No information about intention-to-treat
analysis.
Selective reporting (reporting bias) Low risk All expected outcomes were reported.
Group similarity at baseline (selection bias) Low risk Patients did not differ in their baseline char-
acteristics, based on Table 1
Co-interventions (performance bias) Low risk Only the surgical technique differed be-
tween treatment groups
Compliance (performance bias) Low risk Compliance in both treatment groups:
100% (surgery).
Timing of outcome assessment (detection
bias)
Low risk All important outcome assessments for
both groups were measured at the same
time
Other bias Unclear risk Conflict of interest and financial support
were not reported in this study
50Surgical options for lumbar spinal stenosis (Review)
Copyright © 2016 The Cochrane Collaboration. Published by John Wiley & Sons, Ltd.
239

Hallett 2007
Methods Single-centre RCT
Setting: Spinal Unit, Royal Infirmary of Edinburgh, Edinburgh
Country: Scotland, UK
Period: January 1998 to August 2001
Participants Number: 44 patients (14/15/15)
Diagnosis: plain radiographs and magnetic resonance images
Included: foraminal stenosis; single-level degenerative disc disease; uni or bilateral leg
pain, with or without positive root tension sign, muscle weakness and/or sensory loss;
minimum 3 months of conservative care
Excluded: spondylolisthesis Grade II or greater; vertebral translocation > 1 cm (insta-
bility); disc space narrowing of greater than 50%; serious disease
Age (years): mean (range) 57 (34-75)
Interventions Group 1: decompression (single or bilateral foraminotomy)
Group 2: decompression plus instrumented pedicular postero-lateral fusion
Group 3: decompression plus fusion with pedicular screw instrumentation with titanium
interbody cages filled with autologous bone. Minimal microdiscectomy was performed
if necessary
Follow-up: 60 months
Outcomes Pain: 10 cm VAS from the Low Back Outcome Score
Disability: RMDQ
Costs
Operation time
Perioperative blood loss
Reoperations
Notes Surgeon’s experience: All surgery was performed by the same surgeon in a laminar
ventilated theatre
Funding: “supported by a grant from DePuy Ltd., U.K. Corporate/Industry funds were
received in support of this work. No benefits in any form have been or will be received
from a commercial party related directly or indirectly to the subject of this manuscript”
Risk of bias Risk of bias
Bias Authors’ judgement Support for judgement
Random sequence generation (selection
bias)
Unclear risk Quote: “type of treatment was randomly
allocated immediately before surgery.”
Allocation concealment (selection bias) Low risk Quote: “shuffled, closed, opaque en-
velopes, that were numbered 1 to 150 and
opened in sequence.”
Blinding of participants (performance
bias)
All outcomes
Unclear risk No mention of any attempts to blind the
participants.
51Surgical options for lumbar spinal stenosis (Review)
Copyright © 2016 The Cochrane Collaboration. Published by John Wiley & Sons, Ltd.
240

Hallett 2007 (Continued)
Bliding of personnel/ care providers (per-
formance bias)
High risk The surgeon could not have been blinded
to the intervention.
Blinding of outcome assessment (detection
bias)
All outcomes
High risk Quote: “the 3 observers were not blinded
and any dispute was resolved by discussion.
”
Incomplete outcome data (attrition bias)
All outcomes
Low risk 93.1% of the patients completed the fol-
low-up. The number of drop-outs is un-
likely to affect the results
Intention-to-treat analysis (attrition bias) Low risk Quote: “analysis of the results was by in-
tention to treat.”
Selective reporting (reporting bias) Low risk All expected outcomes were reported.
Group similarity at baseline (selection bias) Unclear risk No information about patient characteris-
tics at baseline.
Co-interventions (performance bias) Low risk Only the surgical technique differed be-
tween treatment groups. Similar percent-
age of concomitant discectomy
Compliance (performance bias) Low risk Compliance in both treatment groups:
100% (surgery).
Timing of outcome assessment (detection
bias)
Low risk All important outcome assessments for
both groups were measured at the same
time
Other bias Unclear risk Quote: “supported by a grant from DePuy
Ltd., U.K. Corporate/ Industry funds were
received in support of this work. No bene-
fits in any form have been or will be received
from a commercial party related directly or
indirectly to the subject of this manuscript.
”
Komp 2015
Methods Single-centre RCT
Setting: not reported
Country: Germany
Period: not reported
Participants Number: 160 patients (80/ 80)
Diagnosis: clinical assessment
Included: predominant leg symptoms; neurogenic claudication with or without paresis;
52Surgical options for lumbar spinal stenosis (Review)
Copyright © 2016 The Cochrane Collaboration. Published by John Wiley & Sons, Ltd.
241

Komp 2015 (Continued)
back pain maximum 30/100 on the VAS; conservative therapy exhausted or no longer
indicated due to the symptoms; mono segmental central stenosis caused by facet hyper-
trophy; hypertrophy of the ligamentum flavum; and disc protrusions or a combination
of those
Excluded: predominant back pain, foraminal stenosis in the lower level, fresh soft disc
herniations with bony stenosis; degenerative spondylolisthesis more than Meyerding
Grade I; multidirectional rotation slide; scoliosis more than 20°; prior surgery in the
same segment; and cauda equina syndrome
Age (years): mean (SD) 62 (41-84)
Lumbar stenosis duration (months): mean 17
Interventions Group 1: conventional microsurgical interlaminar decompression. The conventional
decompression operation was performed using the bilateral laminotomy technique with
partial facetectomy and flavum resection
Group 2: full-endoscopic interlaminar decompression.
Follow-up: 24 months
Outcomes Pain: 100 mm VAS leg pain
Disability: ODI
Operation time
Perioperative blood loss
Complications
Reoperations
Notes Surgeon’s experience: All operations were performed by 2 surgeons with many years of
experience in both techniques
Funding: “there was no external funding in the preparation of this manuscript”. The
authors declared no conflicts of interest
Risk of bias Risk of bias
Bias Authors’ judgement Support for judgement
Random sequence generation (selection
bias)
Unclear risk Quote: “the randomization was carried out
as a block randomization.”
Allocation concealment (selection bias) Low risk Quote: “the secretary provided scheduling
in a closed envelope.”
Blinding of participants (performance
bias)
All outcomes
High risk Quote: “randomization was not blinded,
since the patients may identify the opera-
tion procedure.”
Bliding of personnel/ care providers (per-
formance bias)
High risk The surgeon could not have been blinded
to the intervention.
Blinding of outcome assessment (detection
bias)
All outcomes
Low risk Quote: “the follow-up investigators were
not informed of which surgical procedure
had been carried out.”
53Surgical options for lumbar spinal stenosis (Review)
Copyright © 2016 The Cochrane Collaboration. Published by John Wiley & Sons, Ltd.
242

Komp 2015 (Continued)
Incomplete outcome data (attrition bias)
All outcomes
Low risk 153/160 = 96% of the patients completed
the 3-month follow-up and 84% com-
pleted the 24-month follow-up. The num-
ber of drop-outs was similar in each group
and the reasons for drop-out are also re-
ported and are unlikely to affect the results
Intention-to-treat analysis (attrition bias) Unclear risk No information about intention-to-treat
analysis.
Selective reporting (reporting bias) Low risk All expected outcomes were reported.
Group similarity at baseline (selection bias) Unclear risk No information about patient characteris-
tics at baseline
Co-interventions (performance bias) Low risk Only the surgical technique differed be-
tween treatment groups. Similar percent-
age of concomitant discectomy. All partic-
ipants received the same postoperative care
Compliance (performance bias) Low risk Compliance in both treatment groups:
100% (surgery).
Timing of outcome assessment (detection
bias)
Low risk All important outcome assessments for
both groups were measured at the same
time
Other bias Low risk Quote: “there was no external funding in
the preparation of this manuscript”. The
authors declared no conflicts of interest
Liu 2013
Methods Single-centre RCT
Setting: Department of Orthopedic Surgery, Qilu Hospital of Shandong University,
Jinan, Shandong
Country: China
Period: not reported
Participants Number: 56 patients (27/29)
Diagnosis: lumbar spinal stenosis diagnosis by an experienced spine specialist
Included: patients with lumbar spinal stenosis without degenerative spondylolisthesis
or interbody instability
Excluded: not reported
Age (years): mean (SD) 59.4 (4.7)/61.1 (3.1)
Lumbar stenosis duration (years): mean (range) 6.5/5.9 (0.6-13)
54Surgical options for lumbar spinal stenosis (Review)
Copyright © 2016 The Cochrane Collaboration. Published by John Wiley & Sons, Ltd.
243

Liu 2013 (Continued)
Interventions Group 1: conventional laminectomy
Group 2: spinous process-splitting unilateral laminotomy. The spinous process and the
interspinous ligaments were split longitudinally, preserving the paraspinal muscles. Then
unilateral laminotomy was conducted for bilateral decompression with removal of the
cranial and the caudal portion of the ipsilateral lamina, ligamentum flavum, and medial
part of the facet
Follow-up: 24 months
Outcomes Pain: 10 cm VAS leg pain
Disability: JOA
Operation time
Perioperative blood loss
Notes Surgeon’s experience: all patients were diagnosed and assessed by experienced spine
specialists
Funding: “no funds were received in support of this work. No relevant financial activities
outside the submitted work”
Risk of bias Risk of bias
Bias Authors’ judgement Support for judgement
Random sequence generation (selection
bias)
Unclear risk Quote: “the patients were randomly cate-
gorized into 2 groups.”
Allocation concealment (selection bias) Unclear risk Not mentioned.
Blinding of participants (performance
bias)
All outcomes
Unclear risk No mention of any attempts to blind the
participants.
Bliding of personnel/ care providers (per-
formance bias)
High risk The surgeon could not have been blinded
to the intervention.
Blinding of outcome assessment (detection
bias)
All outcomes
Unclear risk No mention of any attempts to blind the
assessors.
Incomplete outcome data (attrition bias)
All outcomes
Low risk 54/57=94.7% of the patients completed
the follow-up. The number of drop-outs is
unlikely to affect the results
Intention-to-treat analysis (attrition bias) Unclear risk No information about intention-to-treat
analysis.
Selective reporting (reporting bias) Low risk All expected outcomes were reported.
55Surgical options for lumbar spinal stenosis (Review)
Copyright © 2016 The Cochrane Collaboration. Published by John Wiley & Sons, Ltd.
244

Liu 2013 (Continued)
Group similarity at baseline (selection bias) Low risk Patients did not differ in their baseline char-
acteristics, based on Tables 1 and 2
Co-interventions (performance bias) Low risk Only the surgical technique differed be-
tween treatment groups
Compliance (performance bias) Low risk Compliance in both treatment groups:
100% (surgery).
Timing of outcome assessment (detection
bias)
Low risk All important outcome assessments for
both groups were measured at the same
time
Other bias Low risk Quote: “no funds were received in support
of this work. No relevant financial activities
outside the submitted work.”
Lonne 2015
Methods Multi-centre RCT
Setting: 6 different Norwegian hospitals
Country: Norway
Period: June 2007 to September 2011
Participants Number: 96 patients (49/47)
Diagnosis: symptoms of neurogenic intermittent claudication and magnetic resonance
images and radiographs
Included: patients with 1 or 2 stenotic levels (from L2 to L5) and with minor spondy-
lolisthesis (Meyerding, grade 1)
Excluded: spinal stenosis at more than 2 levels; previous low back surgery; unilateral
radiculopathy; severe paresis; cauda equina syndrome; degenerative spondylolisthesis >
grade 1; isthmic spondylolisthesis; severe scoliosis, idiopathic or degenerative (Cobb angle
> 10° or sagittally imbalanced); osteoporosis or suspected osteoporotic fractures in lumbar
spine; symptomatic coxarthrosis; vascular intermittent claudication; polyneuropathy;
malignant disease
Age (years): mean (SD) 67 (8.7)/67 (8.8)
BMI (kg/m²): mean (SD) 28 (3.8)/28 (4.7)
Lumbar stenosis duration (years): more than 2 years for the majority of patients in
both groups
Interventions Group 1: minimally invasive decompression (bilateral laminotomy). Decompression
was performed by a partial excision of the lower part of the lamina and the medial aspects
of the facet joint
Group 2: interspinous process spacer device (X-Stop). The X-Stop was inserted be-
tween the spinous processes through the interspinous ligament and was secured by the
supraspinous ligament posteriorly and by the lamina anteriorly
Follow-up: 24 months
56Surgical options for lumbar spinal stenosis (Review)
Copyright © 2016 The Cochrane Collaboration. Published by John Wiley & Sons, Ltd.
245

Lonne 2015 (Continued)
Outcomes Pain: 11-point numerical rating scale leg pain
Disability: ODI
Quality of life: EQ-5D
Costs
Operation time
Perioperative blood loss
Complications
Reoperations
Length of hospital stay
Notes Surgeon’s experience: not reported
Funding: “the study was supported by non-commercial organisations (South-East Re-
gional Health Authority, Norway and the National Advisory Unit on Spinal Surgery, St.
Olavs Hospital, Norway)”
Risk of bias Risk of bias
Bias Authors’ judgement Support for judgement
Random sequence generation (selection
bias)
Low risk Quote: “patients were randomized with
randomly selected block sizes by a com-
puter-based web solution.”
Allocation concealment (selection bias) Unclear risk Not mentioned.
Blinding of participants (performance
bias)
All outcomes
Unclear risk No mention of any attempts to blind the
participants.
Bliding of personnel/ care providers (per-
formance bias)
High risk The surgeon could not have been blinded
to the intervention.
Blinding of outcome assessment (detection
bias)
All outcomes
Unclear risk No mention of any attempts to blind the
assessors.
Incomplete outcome data (attrition bias)
All outcomes
Low risk 81/96 = 84% of the patients completed the
follow-up. The number of drop-outs was
similar in each group and the reasons for
drop-out are also reported and are unlikely
to affect the results
Intention-to-treat analysis (attrition bias) Low risk Quote: “in the main evaluation, not only
was an intention-to-treat analysis per-
formed...”
Selective reporting (reporting bias) Low risk All expected outcomes were reported.
57Surgical options for lumbar spinal stenosis (Review)
Copyright © 2016 The Cochrane Collaboration. Published by John Wiley & Sons, Ltd.
246

Lonne 2015 (Continued)
Group similarity at baseline (selection bias) Low risk Patients did not differ in their baseline char-
acteristics, based on Tables 2 and 4
Co-interventions (performance bias) Low risk Only the surgical technique differed be-
tween treatment groups
Compliance (performance bias) Low risk Compliance in both treatment groups:
100% (surgery).
Timing of outcome assessment (detection
bias)
Low risk All important outcome assessments for
both groups were measured at the same
time
Other bias Low risk Quote: “the study was supported by non-
commercial organisations (South-East Re-
gional Health Authority, Norway and the
National Advisory Unit on Spinal Surgery,
St. Olavs Hospital, Norway).”
Mobbs 2014
Methods Single-centre RCT
Setting: Prince of Wales Hospital, Randwick, Sydney
Country: Australia
Period: 2007 to 2009
Participants Number: 79 patients (40/39)
Diagnosis: clinical assessment, MRI and CT myelogram
Included: symptomatic lumbar spinal stenosis with radiculopathy, neurogenic claudi-
cation, urinary dysfunction; radiologically confirmed spinal stenosis caused by degener-
ative changes; canal stenosis at a maximum of 2 levels
Excluded: concomitant fusion, instrumentation placement or lumbar laminectomy in-
volving discectomy; previous lumbar surgeries at the same level; spondylolisthesis of any
grade or degenerative scoliosis; evidence of instability on dynamic radiographs
Age (years): mean (SD) 65.8 (14.3)/72.7 (10.4)
Interventions Group 1: conventional laminectomy. In the laminectomy group, the spinous process,
lamina, ligamentum flavum and portion of the facet joints were removed
Group 2: microscopic unilateral laminectomy for bilateral decompression. In the uni-
lateral laminectomy group, a medial ipsilateral facetectomy was performed, and if nec-
essary, a contralateral foraminotomy
Follow-up: 44.3 (15)/36.9 (4.3) months
Outcomes Pain: 10 cm VAS leg pain
Disability: ODI
Perioperative blood loss
Complications
Length of hospital stay
58Surgical options for lumbar spinal stenosis (Review)
Copyright © 2016 The Cochrane Collaboration. Published by John Wiley & Sons, Ltd.
247

Mobbs 2014 (Continued)
Notes Surgeon’s experience: surgery performed by a single senior neurosurgeon with extensive
experience in lumbar spine surgery and minimally invasive spine surgery
Funding: The authors reported no conflict of interest
Risk of bias Risk of bias
Bias Authors’ judgement Support for judgement
Random sequence generation (selection
bias)
High risk Quote: “assigned to either open de-
compressive laminectomy or microscopic
ULBD in a 1:1 split according to their se-
quence of presentation.”
Allocation concealment (selection bias) Unclear risk Not mentioned.
Blinding of participants (performance
bias)
All outcomes
Unclear risk No mention of any attempts to blind the
participants.
Bliding of personnel/ care providers (per-
formance bias)
High risk The surgeon could not have been blinded
to the intervention.
Blinding of outcome assessment (detection
bias)
All outcomes
Low risk Quote: “the observer and statistician were
blinded to treatment group by the use of
reference numbers.”
Incomplete outcome data (attrition bias)
All outcomes
Unclear risk 54/79 = 68.4%. Similar and proportional
number of drop-outs in each group and
similar reasons for withdraw
Intention-to-treat analysis (attrition bias) Unclear risk No information about intention-to-treat
analysis.
Selective reporting (reporting bias) Low risk All expected outcomes were reported.
Group similarity at baseline (selection bias) High risk Patiant characteristics varied substantially
for important variables, based on Table 3
Co-interventions (performance bias) Low risk Only the surgical technique differed be-
tween treatment groups
Compliance (performance bias) Low risk Compliance in both treatment groups:
100% (surgery).
Timing of outcome assessment (detection
bias)
High risk Quote: “the mean duration of follow-up
was higher in the open-surgery group than
in the ULBD group.”
59Surgical options for lumbar spinal stenosis (Review)
Copyright © 2016 The Cochrane Collaboration. Published by John Wiley & Sons, Ltd.
248

Mobbs 2014 (Continued)
Other bias Low risk The authors reported no conflict of inter-
est.
Moojen 2013
Methods Multi-centre double blinded RCT
Setting: 5 neurosurgical centres in the Netherlands
Country: Netherlands
Period: October 2008 to September 2011
Participants Number: 159 patients (79/80)
Diagnosis: clinical diagnosis of neurogenic claudication by a neurologist with MRI
findings of spinal canal stenosis
Included: patients between 40 and 85 years; 3 months of neurogenic claudication; single
or 2-level degenerative lumbar canal stenosis; indication for surgery
Excluded: cauda equina syndrome; herniated disc needing discectomy; history of
surgery; significant scoliosis
Age (years): mean 64/66
BMI (kg/m²): mean (range) 28 (20-37)/27 (20-48)
Lumbar stenosis duration (years): mean (range) 1.9 (0.1-17)
Interventions Group 1: decompression (laminotomy, flavectomy, facetectomy). In the decompression
group, a partial resection of the adjacent laminas was executed, followed by a flavectomy
with bilateral opening of the lateral recess and, if necessary, a medial facetectomy was
done
Group 2: interspinous process spacer device (Paradigm Spine, USA). In the experimen-
tal group, no bony decompression was done and the interspinous process device was
implanted by a posterior midline approach
Follow-up: 12 months
Outcomes Pain: 100 mm VAS leg pain
Disability: RMDQ
Function: ZCQ (physical function)
Costs
Operation time
Perioperative blood loss
Complications
Reoperations
Length of hospital stay
Notes Surgeon’s experience: not reported
Funding: “Paradigm Spine funded this trial. Paradigm Spine had no role in data col-
lection, design of the study, data analysis, interpretation of data, or writing the report
and had no influence over whether to submit the manuscript. All the researchers were
individually independent from funders”
Risk of bias Risk of bias
60Surgical options for lumbar spinal stenosis (Review)
Copyright © 2016 The Cochrane Collaboration. Published by John Wiley & Sons, Ltd.
249

Moojen 2013 (Continued)
Bias Authors’ judgement Support for judgement
Random sequence generation (selection
bias)
Low risk Quote: “randomized design with variable
block sizes, with allocations stratified ac-
cording to center.”
Allocation concealment (selection bias) Low risk Quote: “opaque, coded and sealed en-
velopes”. “After induction of anaesthesia,
the prepared envelope was opened and the
patient allocated to one of the treatment
arms.”
Blinding of participants (performance
bias)
All outcomes
Low risk Quote: “patients, nurses on the hospital
wards, and research nurses remained blind
to the allocated treatment during the fol-
low-up period of one year.”
Bliding of personnel/ care providers (per-
formance bias)
High risk The surgeon could not have been blinded
to the intervention.
Blinding of outcome assessment (detection
bias)
All outcomes
Low risk Quote: “all caregivers blind to the allocated
treatment.”
Incomplete outcome data (attrition bias)
All outcomes
Low risk 151/159 = 95% of the patients completed
the follow-up. The number of drop-outs is
unlikely to affect the results
Intention-to-treat analysis (attrition bias) Low risk Quote: “we compared groups on the basis
of an intention to treat analysis.”
Selective reporting (reporting bias) Low risk All expected outcomes were reported.
Group similarity at baseline (selection bias) Low risk Patients did not differ in their baseline char-
acteristics, based on Table 1
Co-interventions (performance bias) Low risk Only the surgical technique differed be-
tween treatment groups. All participants re-
ceived the same postoperative care
Compliance (performance bias) Low risk Compliance in both treatment groups:
100% (surgery).
Timing of outcome assessment (detection
bias)
Low risk All important outcome assessments for
both groups were measured at the same
time
61Surgical options for lumbar spinal stenosis (Review)
Copyright © 2016 The Cochrane Collaboration. Published by John Wiley & Sons, Ltd.
250

Moojen 2013 (Continued)
Other bias Low risk Quote: “Paradigm Spine funded this trial.
Paradigm Spine had no role in data collec-
tion, design of the study, data analysis, in-
terpretation of data, or writing the report
and had no influence over whether to sub-
mit the manuscript. All the researchers were
individually independent from funders.”
Postacchini 1993
Methods RCT
Setting: not reported
Country: Italy
Period: not reported
Participants Number: 67 patients (26/9/32)
Diagnosis: all patients had plain and flexion-extension radiographs of the lumbar spine
with one or more of myelography, plain or contrast-enhanced computed tomographic,
and magnetic resonance imaging
Included: patients with central lumbar stenosis who required surgery
Excluded: not reported
Age (years): mean (range) 57 (43-79)
Interventions Group 1: multiple laminotomies
Group 2: scheduled multiple laminotomies converted to total laminectomy
Group 3: total laminectomy. Disc excision was performed at a single level in four pa-
tients. A unilateral or bilateral intertransverse fusion was performed in four patients with
degenerative spondylolisthesis
Follow-up: 3.7 years (2.2-5.3)
Outcomes Pain: 100 mm VAS leg pain (radicular symptoms)
Operation time
Perioperative blood loss
Complications
Notes Surgeon’s experience: all the patients were operated on by the senior author.
Funding: Conflict of interest and financial support were not reported in this study
Risk of bias Risk of bias
Bias Authors’ judgement Support for judgement
Random sequence generation (selection
bias)
High risk Quote: “we aimed to randomise the choice
of surgical procedure, but had to allow
the protocol to be broken when multiple
laminotomy appeared to be inadequate to
obtain sufficient decompression.”
62Surgical options for lumbar spinal stenosis (Review)
Copyright © 2016 The Cochrane Collaboration. Published by John Wiley & Sons, Ltd.
251

Postacchini 1993 (Continued)
Allocation concealment (selection bias) Unclear risk Not mentioned.
Blinding of participants (performance
bias)
All outcomes
Unclear risk No mention of any attempts to blind the
participants.
Bliding of personnel/ care providers (per-
formance bias)
High risk The surgeon could not have been blinded
to the intervention.
Blinding of outcome assessment (detection
bias)
All outcomes
Low risk Quote: “at the latest follow-up, each patient
was interviewed and examined by one of
the authors, who was unaware of the type
of decompression performed.”
Incomplete outcome data (attrition bias)
All outcomes
Unclear risk 67/70 = 95.7% of the patients completed
the follow-up. The number of drop-outs is
unlikely to affect the results
Intention-to-treat analysis (attrition bias) Unclear risk No information about intention-to-treat
analysis.
Selective reporting (reporting bias) Low risk All expected outcomes were reported.
Group similarity at baseline (selection bias) Unclear risk No information about patient characteris-
tics at baseline.
Co-interventions (performance bias) High risk Concomitant discectomy and fusion were
performed at different rates between the
groups
Compliance (performance bias) Low risk Compliance in both treatment groups:
100% (surgery).
Timing of outcome assessment (detection
bias)
High risk Quote: “the mean follow-up was 3.7 years
(2.2 to 5.3).”
Other bias Unclear risk Conflict of interest and financial support
were not reported in this study
63Surgical options for lumbar spinal stenosis (Review)
Copyright © 2016 The Cochrane Collaboration. Published by John Wiley & Sons, Ltd.
252

Rajasekaran 2013
Methods Singe-centre RCT
Setting: Department of Orthopaedics and Spine Surgery, Ganga Hospital, Coimbatore,
Tamil Nadu
Country: India
Period: not reported
Participants Number: 51 patients (28/23)
Diagnosis: MRI exam correlating with typical neurogenic claudication symptoms due
to degenerative lumbar canal stenosis
Included: degenerative lumbar canal stenosis affecting 3 or less levels; typical neurogenic
claudication symptoms; MRI demonstrating good clinical correlation; and failure of
conservative methods of treatment for a minimum period of 6 months
Excluded: spondylolisthesis with slip Meyerding grade 2 or greater; instability at the
level of stenosis (as defined by > 3 mm translation or > 10° angular change on flexion
extension lateral radiographs); concomitant symptomatic cervical or thoracic stenosis;
comorbidities such as cardiopulmonary insufficiency; peripheral neuropathy; peripheral
vascular disease, prior lumbar spine surgery; severe hip or knee disease
Age (years): mean (SD) 57.3 (11.2)/54.5 (8.2)
Interventions Group 1: lumbar spinous process splitting decompression. In the experimental group,
the interspinous and supra spinous ligaments were cut longitudinally in line with the
spinous processes, then decompression proceeded according to the conventional method
Group 2: conventional midline decompression. In the conventional decompression
group the overhanging portion of the proximal spinous process, the interspinous and the
supraspinous ligaments were removed, and the ligamentum flavum and the distal half
of the proximal lamina were excised. Facetal undercutting was performed as needed
Follow-up: 16 months
Outcomes Pain: 10 cm VAS leg pain (neurogenic claudication)
Disability: JOA
Recovery
Operation time
Perioperative blood loss
Complications
Reoperations
Length of hospital stay
Notes Surgeon’s experience: not reported
Funding: “AO Spine India research grant and the Ganga Orthopaedic Research and
Education Foundation funds were received in support of this work”
Risk of bias Risk of bias
Bias Authors’ judgement Support for judgement
Random sequence generation (selection
bias)
Low risk Quote: “the study was a prospective ran-
domized controlled study” and “surgical
treatment method for the patients was de-
termined by an automated computer-gen-
64Surgical options for lumbar spinal stenosis (Review)
Copyright © 2016 The Cochrane Collaboration. Published by John Wiley & Sons, Ltd.
253

Rajasekaran 2013 (Continued)
erated block randomization chart.”
Allocation concealment (selection bias) Unclear risk Not mentioned.
Blinding of participants (performance
bias)
All outcomes
Unclear risk No mention of any attempts to blind the
participants.
Bliding of personnel/ care providers (per-
formance bias)
High risk The surgeon could not have been blinded
to the intervention.
Blinding of outcome assessment (detection
bias)
All outcomes
Low risk Quote: “patients outcomes were assessed by
an independent observer who was blinded
to the type of surgery that a particular pa-
tient has undergone.”
Incomplete outcome data (attrition bias)
All outcomes
Low risk 100% of the patients completed the follow-
up.
Intention-to-treat analysis (attrition bias) Unclear risk No information about intention-to-treat
analysis.
Selective reporting (reporting bias) Low risk All expected outcomes were reported.
Group similarity at baseline (selection bias) Low risk Patients did not differ in their baseline char-
acteristics, based on Tables 1, 2 and 4
Co-interventions (performance bias) Low risk Only the surgical technique differed be-
tween treatment groups
Compliance (performance bias) Low risk Compliance in both treatment groups:
100% (surgery).
Timing of outcome assessment (detection
bias)
Unclear risk Quote: “the mean duration of follow-up
was 14.2 ± 2.9 months (12-16 mo).”
Other bias Unclear risk Quote: “AO Spine India research grant and
the Ganga Orthopaedic Research and Ed-
ucation Foundation funds were received in
support of this work.”
65Surgical options for lumbar spinal stenosis (Review)
Copyright © 2016 The Cochrane Collaboration. Published by John Wiley & Sons, Ltd.
254

Ruetten 2009
Methods Single-centre RCT
Setting: Centre for Orthopaedics and Traumatology, St. Anna-Hospital Herne, Univer-
sity of Witten/Herdecke, Herne
Country: Germany
Period: 2003 to 2005
Participants Number: 192 patients (100/92)
Diagnosis: MRI and CT
Included: neurogenic claudication with unilateral leg pain with or without paresis;
back pain with maximum score of 20/100 points on the VAS; and conservative therapy
exhausted or no longer indicated due to the symptoms; monosegmental recess stenosis;
no foraminal stenosis in the lower level; no disc herniation; degenerative spondylolisthesis
with maximum Meyerding Grade I; no multidirectional rotation slide; scoliosis with
maximum curvature of 20°; no prior surgery in the same segment
Excluded: not reported
Age (years): mean (range) 64 (38-86)
Lumbar stenosis duration (years): mean (range) 1.6 (0.17-6.5)
Interventions Group 1: conventional microsurgical decompression. Decompression was accomplished
by cranial and caudal laminotomy, partial facetectomy, and ligamentum flavum resection
Group 2: full-endoscopic transforaminal decompression. The operating instruments
and optics were products supplied by Richard Wolf GmbH
Follow-up: 24 months
Outcomes Disability: ODI
Operation time
Complications
Reoperations
Notes Surgeon’s experience: all operations were performed by 2 surgeons who have many years
of experience in both techniques
Funding: “the authors report no conflict of interest concerning the materials or methods
used in this study or the findings specified in this paper”. Financial support was not
reported in this study
Risk of bias Risk of bias
Bias Authors’ judgement Support for judgement
Random sequence generation (selection
bias)
Unclear risk Quote: “randomized assignment was made
by nonphysician study staff. This was ac-
complished using balanced block random-
ization.”
Allocation concealment (selection bias) Unclear risk Not mentioned.
Blinding of participants (performance
bias)
All outcomes
High risk Quote: “the patients are able to identify the
surgical procedure.”
66Surgical options for lumbar spinal stenosis (Review)
Copyright © 2016 The Cochrane Collaboration. Published by John Wiley & Sons, Ltd.
255

Ruetten 2009 (Continued)
Bliding of personnel/ care providers (per-
formance bias)
High risk The surgeon could not have been blinded
to the intervention.
Blinding of outcome assessment (detection
bias)
All outcomes
Low risk “The later examiners were not informed
about which operative procedure was ap-
plied.”
Incomplete outcome data (attrition bias)
All outcomes
Low risk 184/192 = 95.8% of the patients com-
pleted the follow-up. The number of drop-
outs is unlikely to affect the results
Intention-to-treat analysis (attrition bias) Unclear risk No information about intention-to-treat
analysis.
Selective reporting (reporting bias) Low risk All expected outcomes were reported.
Group similarity at baseline (selection bias) Unclear risk No information about patients characteris-
tics at baseline.
Co-interventions (performance bias) Low risk Only the surgical technique differed be-
tween treatment groups
Compliance (performance bias) Low risk Compliance in both treatment groups:
100% (surgery).
Timing of outcome assessment (detection
bias)
Low risk All important outcome assessments for
both groups were measured at the same
time
Other bias Low risk Quote: “the authors report no conflict of
interest concerning the materials or meth-
ods used in this study or the findings spec-
ified in this paper”. Financial support was
not reported in this study
Stromqvist 2013
Methods Multi-centre RCT
Setting: 3 Swedish spine centres
Country: Sweden
Period: not reported
Participants Number: 100 patients (50/50)
Diagnosis: MRI verified spinal stenosis on 1 or 2 levels in the lumbar spine
Included: symptoms of neurogenic claudication for minimum 6 months elicited by
walking and relieved by flexion of the spine or sitting down; age 40 years or more was
required; spinal stenosis was allowed to be present at maximum 2 levels and minor
spondylolisthesis (Meyerding, grade 1) was accepted
67Surgical options for lumbar spinal stenosis (Review)
Copyright © 2016 The Cochrane Collaboration. Published by John Wiley & Sons, Ltd.
256

Stromqvist 2013 (Continued)
Excluded: Previous spine surgery (except for successful disc surgery); infection or malig-
nant disorder; osteoporosis diagnosed before referral for surgery and subjected to medical
treatment; stenosis of the L5-S1-level due to the small spinous process of S1
Age (years): mean (range) 69 (49-89)
Interventions Group 1: decompression alone. The decompressive procedures were performed using
laminectomy or laminotomies with facet-joint sparing techniques
Group 2: interspinous process spacer device (X-Stop)
All operations included open procedures
Follow-up: 24 months
Outcomes Pain: 100 mm VAS leg pain
Disability: ZCQ (physical function)
Operation time
Complications
Reoperations
Notes Surgeon’s experience: not reported
Funding: “no funds were received in support of this work”
Risk of bias Risk of bias
Bias Authors’ judgement Support for judgement
Random sequence generation (selection
bias)
Unclear risk Quote: “randomization was performed by
using envelopes.”
Allocation concealment (selection bias) Unclear risk Quote: “randomization was performed by
using envelopes.”
Blinding of participants (performance
bias)
All outcomes
Unclear risk No mention of any attempts to blind the
participants.
Bliding of personnel/ care providers (per-
formance bias)
High risk The surgeon could not have been blinded
to the intervention.
Blinding of outcome assessment (detection
bias)
All outcomes
Unclear risk No mention of any attempts to blind the
assessors.
Incomplete outcome data (attrition bias)
All outcomes
Low risk 96/100 = 96% of the patients completed
the follow-up. The number of drop-outs is
unlikely to affect the results
Intention-to-treat analysis (attrition bias) Low risk Quote: “in the main evaluation, not only
was intention-to-treat analysis used, but
also as-treated analysis was performed.”
68Surgical options for lumbar spinal stenosis (Review)
Copyright © 2016 The Cochrane Collaboration. Published by John Wiley & Sons, Ltd.
257

Stromqvist 2013 (Continued)
Selective reporting (reporting bias) Low risk All expected outcomes were reported.
Group similarity at baseline (selection bias) Low risk Patients did not differ in their baseline char-
acteristics, based on Table 1
Co-interventions (performance bias) Low risk Only the surgical technique differed be-
tween treatment groups
Compliance (performance bias) Low risk Compliance in both treatment groups:
100% (surgery).
Timing of outcome assessment (detection
bias)
Low risk All important outcome assessments for
both groups were measured at the same
time
Other bias Low risk Quote: “no funds were received in support
of this work.”
Thome 2005
Methods Single-centre RCT
Setting: Departments of Neurosurgery, Neurology, and Neuroradiology, University Hos-
pital Mannheim
Country: Germany
Period: not reported
Participants Number: 120 patients (40/40/40)
Diagnosis: Radiological/neuroimaging evidence of lumbar stenosis
Included: symptoms of neurogenic claudication or radiculopathy; radiological/neu-
roimaging evidence of degenerative lumbar stenosis; absence of associated pathological
entities such as disc herniations or instability; no history of surgery for lumbar stenosis
or lumbar fusion
Excluded: patients who required discectomy
Age (years): mean (range) 68 (44-86)
BMI (kg/m²): mean (SD) 28 (4)/29 (6)/29 (4)
Lumbar stenosis duration (years): mean (SD) 1.7 (2.5)
Interventions Group 1: laminectomy
Group 2: unilateral laminotomy
Group 3: bilateral laminotomy
An operating microscope and high-speed burrs and Kerrison rongeurs were used in all
procedures. Special care was taken in all three groups to minimize facet joint resection
by using an undercutting technique
Follow-up: 12 months
Outcomes Pain: 10 cm VAS overall pain
Disability: RMDQ
Operation time
69Surgical options for lumbar spinal stenosis (Review)
Copyright © 2016 The Cochrane Collaboration. Published by John Wiley & Sons, Ltd.
258

Thome 2005 (Continued)
Perioperative blood loss
Complications
Reoperations
Notes Surgeon’s experience: not reported
Funding: Conflict of interest and financial support were not reported in this study
Risk of bias Risk of bias
Bias Authors’ judgement Support for judgement
Random sequence generation (selection
bias)
Low risk Quote: “computer-generated randomiza-
tion list was used to assign the patient to
one of the treatment groups.”
Allocation concealment (selection bias) Unclear risk Not mentioned.
Blinding of participants (performance
bias)
All outcomes
Unclear risk No mention of any attempts to blind the
participants.
Bliding of personnel/ care providers (per-
formance bias)
High risk The surgeon could not have been blinded
to the intervention.
Blinding of outcome assessment (detection
bias)
All outcomes
Unclear risk No mention of any attempts to blind the
assessors.
Incomplete outcome data (attrition bias)
All outcomes
Low risk 110/120=91.6% of the patients completed
the follow-up. The number of drop-outs is
unlikely to affect the results
Intention-to-treat analysis (attrition bias) Unclear risk No information about intention-to-treat
analysis.
Selective reporting (reporting bias) Low risk All expected outcomes were reported.
Group similarity at baseline (selection bias) Low risk Patients did not differ in their baseline char-
acteristics, based on the Table 1
Co-interventions (performance bias) Low risk Only the surgical technique differed be-
tween treatment groups
Compliance (performance bias) Low risk Compliance in both treatment groups:
100% (surgery).
Timing of outcome assessment (detection
bias)
Low risk All important outcome assessments for
both groups were measured at the same
time
70Surgical options for lumbar spinal stenosis (Review)
Copyright © 2016 The Cochrane Collaboration. Published by John Wiley & Sons, Ltd.
259

Thome 2005 (Continued)
Other bias Unclear risk Conflict of interest not reported. Financial
support was not reported in this study
Usman 2013
Methods Single-centre RCT
Setting: Neurosurgery department of PGMI, Lady Reading Hospital, Peshawar
Country: Pakistan
Period: January 2010 to December 2010
Participants Number: 60 patients (30/30)
Diagnosis: physical examination and radiological/neuroimaging evidence
Included: patients with symptoms of radiculopathy or neurogenic claudication; radio-
logical/neuroimaging evidence of lumbar spinal stenosis involving the central canal and/
or foraminal stenosis; failure of conservative treatment with medication and physiother-
apy for a minimum of three months
Excluded: Patients with spondylolisthesis; associated co-morbid conditions; recurrent
lumbar spinal stenosis
Age (years): 73.4% between 31-50 years old
Interventions Group 1: conventional laminectomy
Group 2: unilateral approach for bilateral decompression. Unilateral laminotomy was
performed with partial resection of the inferior aspect of the cranial hemilamina and the
superior aspect of the caudal hemilamina. Bilateral flavectomy was performed, and the
lateral recess and neural foramina were decompressed contralaterally
Follow-up: minimum 3 months
Outcomes Operation time
Length of hospital stay
Notes Surgeon’s experience: not reported
Funding: Conflict of interest and financial support were not reported in this study
Risk of bias Risk of bias
Bias Authors’ judgement Support for judgement
Random sequence generation (selection
bias)
Unclear risk Quote: “A total of 60 patients with lum-
bar stenosis were randomly assigned to un-
dergo either a conventional laminectomy,
or a unilateral approach.”
Allocation concealment (selection bias) Unclear risk Not mentioned.
Blinding of participants (performance
bias)
All outcomes
Unclear risk No mention of any attempts to blind the
participants.
71Surgical options for lumbar spinal stenosis (Review)
Copyright © 2016 The Cochrane Collaboration. Published by John Wiley & Sons, Ltd.
260

Usman 2013 (Continued)
Bliding of personnel/ care providers (per-
formance bias)
High risk The surgeon could not have been blinded
to the intervention.
Blinding of outcome assessment (detection
bias)
All outcomes
Low risk Quote: “a database was compiled using in-
patients and outpatients medical records by
an independent observer who was not part
of the operative team and/or in patient care.
”
Incomplete outcome data (attrition bias)
All outcomes
Low risk 100% of the patients completed the follow-
up.
Intention-to-treat analysis (attrition bias) Unclear risk No information about intention-to-treat
analysis.
Selective reporting (reporting bias) High risk In the methods the authors reported that
recovery rate was assessed as an outcomes
measure. However, in the results the au-
thors do not report data for this outcome
Group similarity at baseline (selection bias) Unclear risk No information about patients characteris-
tics at baseline.
Co-interventions (performance bias) Low risk Only the surgical technique differed be-
tween treatment groups
Compliance (performance bias) Low risk Compliance in both treatment groups:
100% (surgery).
Timing of outcome assessment (detection
bias)
Unclear risk Not mentioned.
Other bias Unclear risk Conflict of interest and financial support
were not reported in this study
Watanabe 2011
Methods Single-centre RCT
Setting: Department of Orthopaedic Surgery, National Hospital Organization, Mu-
rayama Medical Center, Tokyo
Country: Japan
Period: December 2004 to December 2005
Participants Number: 41 (22/19)
Diagnosis: radiography of the lumbar spine, myelography, CT and MRI
Included: presence of neurogenic claudication; non-respondents to minimum 6 months
of conservative care; clinical symptoms corresponding to MRI or myelography results;
1-2 level decompression necessary
72Surgical options for lumbar spinal stenosis (Review)
Copyright © 2016 The Cochrane Collaboration. Published by John Wiley & Sons, Ltd.
261

Watanabe 2011 (Continued)
Excluded: spinal stenosis due to congenital, spondylolytic, traumatic and iatrogenic
causes; previous surgery; presence of specific disorders; intermittent claudication due to
arterial disease; severe osteoarthrosis or arthritis in the lower limbs; neurological disease
causing impaired lower limb function; psychiatric disorders; 3 or more level requiring
decompression
Age (years): mean (SD) 69 (10)/71 (8)
Interventions Group 1: conventional laminectomy. In the conventional laminectomy group, the
spinous processes were detached from the lamina
Group 2: lumbar spinous process-splitting laminectomy. The cortex of the tip of the
spinous process is removed at the midline using a high-speed drill with a fine 2 mm
diamond-tipped bur, and then, using an osteotome, the spinous process is divided to
the base and detached from the lamina. The supra- and interspinous ligaments were also
split longitudinally with a scalpel
Follow-up: 12 months
Outcomes Disability: JOA
Recovery
Operation time
Perioperative blood loss
Reoperations
Notes Surgeon’s experience: not reported
Funding: “The authors report no conflict of interest concerning the materials or methods
used in this study or the findings specified in this paper”. Financial support was not
reported in this study
Risk of bias Risk of bias
Bias Authors’ judgement Support for judgement
Random sequence generation (selection
bias)
Unclear risk Quote: “prospective, randomized, con-
trolled study.”
Allocation concealment (selection bias) Unclear risk Not mentioned.
Blinding of participants (performance
bias)
All outcomes
Unclear risk No mention of any attempts to blind the
participants.
Bliding of personnel/ care providers (per-
formance bias)
High risk The surgeon could not have been blinded
to the intervention.
Blinding of outcome assessment (detection
bias)
All outcomes
Unclear risk No mention of any attempts to blind the
assessors.
73Surgical options for lumbar spinal stenosis (Review)
Copyright © 2016 The Cochrane Collaboration. Published by John Wiley & Sons, Ltd.
262

Watanabe 2011 (Continued)
Incomplete outcome data (attrition bias)
All outcomes
Unclear risk 34/41 = 82.9%. “The reasons for the with-
drawal were the extension of decompres-
sion levels or the conversion of the pro-
cedure from decompression to fusion after
randomization. However, we do not think
that these withdrawals had a major impact
on the results.”
Intention-to-treat analysis (attrition bias) Unclear risk No information about intention-to-treat
analysis.
Selective reporting (reporting bias) Low risk All expected outcomes were reported.
Group similarity at baseline (selection bias) Unclear risk No information about patients characteris-
tics at baseline.
Co-interventions (performance bias) Low risk Only the surgical technique differed be-
tween treatment groups
Compliance (performance bias) Low risk Compliance in both treatment groups:
100% (surgery).
Timing of outcome assessment (detection
bias)
Low risk All important outcome assessments for
both groups were measured at the same
time
Other bias Unclear risk Quote: “The authors report no conflict of
interest concerning the materials or meth-
ods used in this study or the findings spec-
ified in this paper”. Financial support was
not reported in this study
Yagi 2009
Methods Single-centre RCT
Setting: Department of Orthopedic Surgery, Kawasaki Municipal Hospital, Kawasaki
city
Country: Japan
Period: not reported
Participants Number: 41 patients (21/20)
Diagnosis: computed tomographic myelography and MRI
Included: symptoms of neurogenic claudication referable to the lumbar spine; failure of
conservative treatments; absence of associated pathological condition; 1-level spondylosis
Excluded: not reported
Age (years): mean (range) 73.3 (63-79)/70.8 (66-73)
74Surgical options for lumbar spinal stenosis (Review)
Copyright © 2016 The Cochrane Collaboration. Published by John Wiley & Sons, Ltd.
263

Yagi 2009 (Continued)
Interventions Group 1: conventional laminectomy
Group 2: median approach microendoscopic laminectomy. The operating microscope
was moved into the field and centralized on the laminar base. An osteotomy of the
spinous process at the involved level was performed
Follow-up: 24 months
Outcomes Disability: JOA
Operation time
Perioperative blood loss
Length of hospital stay
Notes Surgeon’s experience: not reported
Funding: “The authors received technical support from Medtronic Sofamor Danek. The
authors report no conflict of interest concerning the materials or methods used in this
study or the findings specified in this paper”
Risk of bias Risk of bias
Bias Authors’ judgement Support for judgement
Random sequence generation (selection
bias)
High risk Quote: “patients were divided into 2 groups
by turns when they came to our hospital.”
Allocation concealment (selection bias) Unclear risk Not mentioned.
Blinding of participants (performance
bias)
All outcomes
Unclear risk No mention of any attempts to blind the
participants.
Bliding of personnel/ care providers (per-
formance bias)
High risk The surgeon could not have been blinded
to the intervention.
Blinding of outcome assessment (detection
bias)
All outcomes
Unclear risk No mention of any attempts to blind the
assessors.
Incomplete outcome data (attrition bias)
All outcomes
Unclear risk Not mentioned.
Intention-to-treat analysis (attrition bias) Unclear risk No information about intention-to-treat
analysis.
Selective reporting (reporting bias) Low risk All expected outcomes were reported.
Group similarity at baseline (selection bias) Unclear risk No information about patient characteris-
tics at baseline.
75Surgical options for lumbar spinal stenosis (Review)
Copyright © 2016 The Cochrane Collaboration. Published by John Wiley & Sons, Ltd.
264

Yagi 2009 (Continued)
Co-interventions (performance bias) Low risk Only the surgical technique differed be-
tween treatment groups
Compliance (performance bias) Low risk Compliance in both treatment groups:
100% (surgery).
Timing of outcome assessment (detection
bias)
Low risk All important outcome assessments for
both groups were measured at the same
time
Other bias Low risk Quote: “The authors received technical
support from Medtronic Sofamor Danek.
The authors report no conflict of interest
concerning the materials or methods used
in this study or the findings specified in this
paper.”
RCT: randomized controlled trial
VAS: visual analogue scale
BMI: body mass index
ODI: Oswestry Disability Index
EQ-5D: EuroQol
SD: standard deviation
SF-36: Short Form (36-item) Health Survey
CT: computerized tomography
MRI: magnetic resonance imaging
JOA: Japanese Orthopedic Association scale
RMDQ: Roland-Morris Disability questionnaire
ZDQ: Zurich Claudication Questionnaire
Characteristics of excluded studies [ordered by study ID]
Study Reason for exclusion
Abdu 2009 Not a randomised controlled trial
Altaf 2011 Not appropriate comparison
Andersen 2008 Not lumbar spinal stenosis
Anderson 2011 Not a randomised controlled trial
Aoki 2012 Not lumbar spinal stenosis
76Surgical options for lumbar spinal stenosis (Review)
Copyright © 2016 The Cochrane Collaboration. Published by John Wiley & Sons, Ltd.
265

(Continued)
Arriagada 2000 Not lumbar spinal stenosis
Asazuma 2004 Not a randomised controlled trial
Auerbach 2011 Not appropriate comparison
Auerbach 2012 Not appropriate comparison
Bazan 2002 Not a randomised controlled trial
Benli 2006 Not lumbar spinal stenosis
Bjarke 2002 Not lumbar spinal stenosis
Blumenthal 2013 Not a randomised controlled trial
Bresnahan 2009 Not a randomised controlled trial
Cakir 2009 Not a randomised controlled trial
Cannone 2010 Not a randomised controlled trial
Carragee 1997 Not lumbar spinal stenosis
Carrasco 1986 Not a randomised controlled trial
Carreon 2009 Not lumbar spinal stenosis
Cassinelli 2007 Not a randomised controlled trial
Chen 2010 Not lumbar spinal stenosis
Cheng 2009 Not lumbar spinal stenosis
Choi 2009 Not a randomised controlled trial
Dahdaleh 2013 Not lumbar spinal stenosis
Dantas 2007 Not a randomised controlled trial
Delank 2002 Not a randomised controlled trial
Delawi 2010 Not lumbar spinal stenosis
Desai 2012 Not a randomised controlled trial
Dimar 2009 Not lumbar spinal stenosis
77Surgical options for lumbar spinal stenosis (Review)
Copyright © 2016 The Cochrane Collaboration. Published by John Wiley & Sons, Ltd.
266

(Continued)
Dirisio 2011 Not appropriate comparison
Dryer 2012 Not appropriate comparison
Epstein 2006 Not a randomised controlled trial
Escobar 2003 Not a randomised controlled trial
Fan 2009 Not a randomised controlled trial
Fast 1985 Not a randomised controlled trial
Feng 2011 Not lumbar spinal stenosis
Fitzgerald 1976 Not a randomised controlled trial
Fu 2008 Not a randomised controlled trial
Fujiya 1990 Not a randomised controlled trial
Försth 2013 Not a randomised controlled trial
Ghahreman 2010 Not a randomised controlled trial
González 1992 Not a randomised controlled trial
Gotfryd 2012 Not a randomised controlled trial
Gotfryd 2012a Not a randomised controlled trial
Gu 2009 Not a randomised controlled trial
Haley 2012 Not appropriate comparison
Haley 2012a Not appropriate comparison
Halm 2010 Not a randomised controlled trial
Herkowitz 1991 Not a randomised controlled trial
Hong 2010 Not a randomised controlled trial
Hong 2011 Not a randomised controlled trial
Hwang 2010 Not lumbar spinal stenosis
Ikuta 2005 Not a randomised controlled trial
78Surgical options for lumbar spinal stenosis (Review)
Copyright © 2016 The Cochrane Collaboration. Published by John Wiley & Sons, Ltd.
267

(Continued)
Imagama 2009 Not a randomised controlled trial
Ito 2010 Not a randomised controlled trial
Katz 1997 Not a randomised controlled trial
Kawaguchi 2004 Not a randomised controlled trial
Kim 2006 Not lumbar spinal stenosis
Kim 2007 Not a randomised controlled trial
Kim 2007a Not a randomised controlled trial
Konno 2000 Not a randomised controlled trial
Kornblum 2004 Not a randomised controlled trial
Korovessis 2004 Not lumbar spinal stenosis
Ledonio 2012 Not lumbar spinal stenosis
Lee 2009 Not a randomised controlled trial
Lian 2010 Not lumbar spinal stenosis
Liao 2011 Not a randomised controlled trial
Mahir 2012 Not appropriate comparison
McConnell 2011 Not appropriate comparison
Michielsen 2013 Not lumbar spinal stenosis
Pappas 1994 Not a randomised controlled trial
Parker 2013 Not a randomised controlled trial
Radcliff 2011 Not appropriate comparison
Radcliff 2012 Not a randomised controlled trial
Rapp 2009 Not a randomised controlled trial
Rapp 2011 Not a randomised controlled trial
Repantis 2009 Not appropriate comparison
79Surgical options for lumbar spinal stenosis (Review)
Copyright © 2016 The Cochrane Collaboration. Published by John Wiley & Sons, Ltd.
268

(Continued)
Richter 2010 Not a randomised controlled trial
Rompe 1995 Not a randomised controlled trial
Rosa 2012 Not a randomised controlled trial
Rowland 2009 Not a randomised controlled trial
Satomi 1992 Not a randomised controlled trial
Schnake 2006 Not a randomised controlled trial
Sears 2012 Not appropriate comparison
Sengupta 2006 Not a randomised controlled trial
Shapiro 2005 Not appropriate comparison
Skidmore 2011 Not a randomised controlled trial
Smoljanovic 2010 Not a randomised controlled trial
Smorgick 2013 Not a randomised controlled trial
Steffee 1993 Not a randomised controlled trial
Tani 2002 Not a randomised controlled trial
Tenhula 2000 Not a randomised controlled trial
Tsutsumimoto 2009 Not a randomised controlled trial
Valesin 2009 Not a randomised controlled trial
Videbaek 2010 Not lumbar spinal stenosis
Wang 1998 Not a randomised controlled trial
Weinstein 2007 Not surgical comparison
Whang 2013 Not appropriate comparison
Willén 2008 Not a randomised controlled trial
Xiao 2007 Not lumbar spinal stenosis
Xiao 2007a Not lumbar spinal stenosis
80Surgical options for lumbar spinal stenosis (Review)
Copyright © 2016 The Cochrane Collaboration. Published by John Wiley & Sons, Ltd.
269

(Continued)
Yamada 2012 Not a randomised controlled trial
Yang 2011 Not a randomised controlled trial
Yu 2008 Not a randomised controlled trial
Zdeblick 1993 Not lumbar spinal stenosis
Zucherman 2004 Not surgical comparison
81Surgical options for lumbar spinal stenosis (Review)
Copyright © 2016 The Cochrane Collaboration. Published by John Wiley & Sons, Ltd.
270

D A T A A N D A N A L Y S E S
Comparison 1. Decompression alone versus decompression plus fusion
Outcome or subgroup titleNo. of
studies
No. of
participants Statistical method Effect size
1 Pain 4 446 Mean Difference (IV, Random, 95% CI) 1.09 [-4.07, 6.26]
1.1 Short-term (less than 12
months)
1 66 Mean Difference (IV, Random, 95% CI) 4.50 [-0.70, 9.70]
1.2 Long-term (12 months or
more)
4 380 Mean Difference (IV, Random, 95% CI) -0.29 [-7.32, 6.74]
2 Disability 3 401 Mean Difference (IV, Random, 95% CI) 3.37 [-3.37, 10.11]
2.1 Short-term (less than 12
months)
1 66 Mean Difference (IV, Random, 95% CI) 5.2 [-3.50, 13.90]
2.2 Long-term (12 months or
more)
3 335 Mean Difference (IV, Random, 95% CI) 3.26 [-6.12, 12.63]
3 Walking ability 3 316 Risk Ratio (IV, Random, 95% CI) 0.99 [0.79, 1.24]
3.1 Long-term (12 months or
more)
3 316 Risk Ratio (IV, Random, 95% CI) 0.99 [0.79, 1.24]
4 Operation time 4 381 Mean Difference (IV, Random, 95% CI) -107.94 [-161.65, -
54.23]
5 Blood loss 4 383 Mean Difference (IV, Random, 95% CI) -0.52 [-0.70, -0.34]
6 Reoperations 5 443 Risk Ratio (IV, Random, 95% CI) 1.25 [0.81, 1.92]
7 Hospitalisation 2 295 Mean Difference (IV, Fixed, 95% CI) -1.69 [-2.12, -1.26]
Comparison 2. Decompression versus interspinous spacer
Outcome or subgroup titleNo. of
studies
No. of
participants Statistical method Effect size
1 Pain 3 656 Mean Difference (IV, Random, 95% CI) -0.89 [-6.08, 4.31]
1.1 Short-term (less than 12
months)
3 328 Mean Difference (IV, Random, 95% CI) -0.93 [-9.86, 8.00]
1.2 Long-term (12 months or
more)
3 328 Mean Difference (IV, Random, 95% CI) -0.55 [-8.08, 6.99]
2 Disability 3 656 Mean Difference (IV, Random, 95% CI) 1.34 [-2.01, 4.69]
2.1 Short-term (less than 12
months)
3 329 Mean Difference (IV, Random, 95% CI) 1.30 [-3.64, 6.25]
2.2 Long-term (12 months or
more)
3 327 Mean Difference (IV, Random, 95% CI) 1.25 [-4.48, 6.98]
3 Function 2 360 Mean Difference (IV, Random, 95% CI) -0.03 [-0.19, 0.12]
3.1 Short-term (less than 12
months)
2 185 Mean Difference (IV, Random, 95% CI) -0.06 [-0.27, 0.14]
3.2 Long-term (12 months or
more)
2 175 Mean Difference (IV, Random, 95% CI) -0.00 [-0.30, 0.29]
4 Quality of life 1 162 Mean Difference (IV, Random, 95% CI) -0.09 [-0.18, 0.00]
82Surgical options for lumbar spinal stenosis (Review)
Copyright © 2016 The Cochrane Collaboration. Published by John Wiley & Sons, Ltd.
271

4.1 Short-term (less than 12
months)
1 81 Mean Difference (IV, Random, 95% CI) -0.12 [-0.25, 0.01]
4.2 Long-term (12 months or
more)
1 81 Mean Difference (IV, Random, 95% CI) -0.05 [-0.18, 0.07]
5 Costs 2 240 Mean Difference (IV, Random, 95% CI) 2856.34 [1970.40,
3742.28]
6 Operation time 3 340 Mean Difference (IV, Random, 95% CI) 39.11 [19.43, 58.78]
7 Blood loss 1 81 Mean Difference (IV, Random, 95% CI) 144.0 [-209.74, 497.
74]
8 Reoperations 3 326 Risk Ratio (IV, Random, 95% CI) 3.95 [2.12, 7.37]
9 Hospitalisation 2 240 Mean Difference (IV, Random, 95% CI) 0.51 [-0.58, 1.60]
Comparison 3. Decompression plus fusion versus interspinous spacer
Outcome or subgroup titleNo. of
studies
No. of
participants Statistical method Effect size
1 Pain 2 308 Mean Difference (IV, Random, 95% CI) 5.35 [-1.18, 11.88]
1.1 Long-term (12 months or
more)
2 308 Mean Difference (IV, Random, 95% CI) 5.35 [-1.18, 11.88]
2 Disability 2 308 Mean Difference (IV, Random, 95% CI) 5.72 [1.28, 10.15]
2.1 Long-term (12 months or
more)
2 308 Mean Difference (IV, Random, 95% CI) 5.72 [1.28, 10.15]
3 Quality of life 1 226 Mean Difference (IV, Random, 95% CI) -3.10 [-6.30, 0.10]
3.1 Long-term (12 months or
more)
1 226 Mean Difference (IV, Random, 95% CI) -3.10 [-6.30, 0.10]
4 Operation time 2 381 Mean Difference (IV, Random, 95% CI) 78.91 [30.16, 127.
65]
5 Blood loss 1 320 Mean Difference (IV, Random, 95% CI) 238.90 [182.66,
295.14]
6 Reoperations 1 322 Risk Ratio (IV, Random, 95% CI) 0.70 [0.32, 1.51]
7 Hospitalisation 2 382 Mean Difference (IV, Random, 95% CI) 1.58 [0.90, 2.27]
Comparison 4. Laminectomy versus laminotomy
Outcome or subgroup titleNo. of
studies
No. of
participants Statistical method Effect size
1 Pain 6 728 Mean Difference (IV, Random, 95% CI) -0.67 [-4.36, 3.02]
1.1 Short-term (less than 12
months)
3 281 Mean Difference (IV, Random, 95% CI) 0.32 [-2.39, 3.04]
1.2 Long-term (12 months or
more)
6 447 Mean Difference (IV, Random, 95% CI) -1.92 [-8.19, 4.35]
2 Disability 6 722 Mean Difference (IV, Random, 95% CI) 1.05 [-0.81, 2.90]
2.1 Short-term (less than 12
months)
4 333 Mean Difference (IV, Random, 95% CI) 1.56 [-1.02, 4.13]
83Surgical options for lumbar spinal stenosis (Review)
Copyright © 2016 The Cochrane Collaboration. Published by John Wiley & Sons, Ltd.
272

2.2 Long-term (12 months or
more)
5 389 Mean Difference (IV, Random, 95% CI) -0.43 [-4.37, 3.52]
3 Walking ability 3 414 Std. Mean Difference (IV, Random, 95% CI) -0.05 [-0.25, 0.15]
3.1 Short-term (less than 12
months)
3 233 Std. Mean Difference (IV, Random, 95% CI) -0.07 [-0.33, 0.20]
3.2 Long-term (12 months or
more)
2 181 Std. Mean Difference (IV, Random, 95% CI) -0.02 [-0.33, 0.28]
4 Operation time 5 339 Mean Difference (IV, Random, 95% CI) -6.25 [-13.76, 1.27]
5 Blood loss 5 381 Mean Difference (IV, Random, 95% CI) 38.80 [17.81, 59.80]
6 Reoperations 2 182 Risk Ratio (IV, Random, 95% CI) 2.61 [0.78, 8.78]
7 Hospitalisation 2 139 Mean Difference (IV, Random, 95% CI) 1.55 [0.61, 2.50]
Comparison 5. Decompression versus split-decompression
Outcome or subgroup titleNo. of
studies
No. of
participants Statistical method Effect size
1 Pain 3 175 Mean Difference (IV, Random, 95% CI) 6.35 [-3.35, 16.04]
1.1 Long-term (12 months or
more)
3 175 Mean Difference (IV, Random, 95% CI) 6.35 [-3.35, 16.04]
2 Disability 4 207 Mean Difference (IV, Random, 95% CI) 1.87 [-2.82, 6.57]
2.1 Long-term (12 months or
more)
4 207 Mean Difference (IV, Random, 95% CI) 1.87 [-2.82, 6.57]
3 Recovery 4 207 Mean Difference (IV, Random, 95% CI) -5.18 [-19.81, 9.45]
4 Operation time 4 211 Mean Difference (IV, Random, 95% CI) -10.57 [-34.39, 13.
25]
5 Blood loss 4 211 Mean Difference (IV, Random, 95% CI) -1.83 [-27.65, 23.
98]
6 Reoperations 3 153 Risk Ratio (IV, Random, 95% CI) 1.22 [0.22, 6.85]
7 Hospitalisation 2 121 Mean Difference (IV, Random, 95% CI) 1.49 [-1.70, 4.67]
Comparison 6. Decompression versus endoscopic decompression
Outcome or subgroup titleNo. of
studies
No. of
participants Statistical method Effect size
1 Disability 3 724 Mean Difference (IV, Random, 95% CI) 2.86 [0.26, 5.45]
1.1 Short-term (less than 12
months)
3 362 Mean Difference (IV, Random, 95% CI) 4.12 [0.91, 7.33]
1.2 Long-term (12 months or
more)
3 362 Mean Difference (IV, Random, 95% CI) 1.44 [-2.66, 5.54]
2 Operation time 3 393 Mean Difference (IV, Random, 95% CI) 10.05 [-2.09, 22.18]
3 Blood loss 1 41 Mean Difference (IV, Random, 95% CI) 34.0 [30.40, 37.60]
4 Reoperations 2 321 Risk Ratio (IV, Random, 95% CI) 0.81 [0.22, 2.97]
5 Hospitalisation 1 41 Mean Difference (IV, Random, 95% CI) 8.56 [6.78, 10.34]
84Surgical options for lumbar spinal stenosis (Review)
Copyright © 2016 The Cochrane Collaboration. Published by John Wiley & Sons, Ltd.
273

Analysis 1.1. Comparison 1 Decompression alone versus decompression plus fusion, Outcome 1 Pain.
Review: Surgical options for lumbar spinal stenosis
Comparison: 1 Decompression alone versus decompression plus fusion
Outcome: 1 Pain
Study or subgroup Decompression FusionMean
Difference WeightMean
Difference
N Mean(SD) N Mean(SD) IV,Random,95% CI IV,Random,95% CI
1 Short-term (less than 12 months)
Ghogawala 2016 35 -7.7 (10.7572) 31 -12.2 (10.7572) 27.1 % 4.50 [ -0.70, 9.70 ]
Subtotal (95% CI) 35 31 27.1 % 4.50 [ -0.70, 9.70 ]
Heterogeneity: not applicable
Test for overall effect: Z = 1.70 (P = 0.090)
2 Long-term (12 months or more)
Grob 1995 15 17 (11.9) 30 25.5 (17.08) 18.4 % -8.50 [ -17.08, 0.08 ]
Hallett 2007 13 48.1 (23) 28 44.2 (23) 8.9 % 3.90 [ -11.23, 19.03 ]
Forsth 2016 117 31.2 (31.8) 111 33.2 (30.3) 19.6 % -2.00 [ -10.06, 6.06 ]
Ghogawala 2016 35 -9.5 (11.5846) 31 -15.2 (11.5846) 26.0 % 5.70 [ 0.10, 11.30 ]
Subtotal (95% CI) 180 200 72.9 % -0.29 [ -7.32, 6.74 ]
Heterogeneity: Tau2 = 30.83; Chi2 = 8.08, df = 3 (P = 0.04); I2 =63%
Test for overall effect: Z = 0.08 (P = 0.94)
Total (95% CI) 215 231 100.0 % 1.09 [ -4.07, 6.26 ]
Heterogeneity: Tau2 = 18.56; Chi2 = 9.32, df = 4 (P = 0.05); I2 =57%
Test for overall effect: Z = 0.41 (P = 0.68)
Test for subgroup differences: Chi2 = 1.15, df = 1 (P = 0.28), I2 =13%
-50 -25 0 25 50
Favours Decompression Favours Fusion
85Surgical options for lumbar spinal stenosis (Review)
Copyright © 2016 The Cochrane Collaboration. Published by John Wiley & Sons, Ltd.
274

Analysis 1.2. Comparison 1 Decompression alone versus decompression plus fusion, Outcome 2 Disability.
Review: Surgical options for lumbar spinal stenosis
Comparison: 1 Decompression alone versus decompression plus fusion
Outcome: 2 Disability
Study or subgroup Decompression FusionMean
Difference WeightMean
Difference
N Mean(SD) N Mean(SD) IV,Random,95% CI IV,Random,95% CI
1 Short-term (less than 12 months)
Ghogawala 2016 35 -17 (17.9976) 31 -22.2 (17.9976) 26.4 % 5.20 [ -3.50, 13.90 ]
Subtotal (95% CI) 35 31 26.4 % 5.20 [ -3.50, 13.90 ]
Heterogeneity: not applicable
Test for overall effect: Z = 1.17 (P = 0.24)
2 Long-term (12 months or more)
Hallett 2007 13 56.29 (29.17) 28 46.54 (29.17) 9.8 % 9.75 [ -9.44, 28.94 ]
Ghogawala 2016 31 -17.9 (18.4113) 35 -26.3 (18.4113) 25.9 % 8.40 [ -0.50, 17.30 ]
Forsth 2016 117 23.61 (18.2) 111 26.6 (19.4) 37.9 % -2.99 [ -7.88, 1.90 ]
Subtotal (95% CI) 161 174 73.6 % 3.26 [ -6.12, 12.63 ]
Heterogeneity: Tau2 = 42.35; Chi2 = 5.85, df = 2 (P = 0.05); I2 =66%
Test for overall effect: Z = 0.68 (P = 0.50)
Total (95% CI) 196 205 100.0 % 3.37 [ -3.37, 10.11 ]
Heterogeneity: Tau2 = 25.00; Chi2 = 6.91, df = 3 (P = 0.07); I2 =57%
Test for overall effect: Z = 0.98 (P = 0.33)
Test for subgroup differences: Chi2 = 0.09, df = 1 (P = 0.77), I2 =0.0%
-50 -25 0 25 50
Favours Decompression Favours Fusion
86Surgical options for lumbar spinal stenosis (Review)
Copyright © 2016 The Cochrane Collaboration. Published by John Wiley & Sons, Ltd.
275

Analysis 1.3. Comparison 1 Decompression alone versus decompression plus fusion, Outcome 3 Walking
ability.
Review: Surgical options for lumbar spinal stenosis
Comparison: 1 Decompression alone versus decompression plus fusion
Outcome: 3 Walking ability
Study or subgroup Decompression Fusion Risk Ratio Weight Risk Ratio
n/N n/N IV,Random,95% CI IV,Random,95% CI
1 Long-term (12 months or more)
Bridwell 1993 3/9 23/34 5.3 % 0.49 [ 0.19, 1.28 ]
Grob 1995 14/15 24/30 39.1 % 1.17 [ 0.93, 1.46 ]
Forsth 2016 98/117 99/111 55.6 % 0.94 [ 0.85, 1.04 ]
Total (95% CI) 141 175 100.0 % 0.99 [ 0.79, 1.24 ]
Total events: 115 (Decompression), 146 (Fusion)
Heterogeneity: Tau2 = 0.02; Chi2 = 4.92, df = 2 (P = 0.09); I2 =59%
Test for overall effect: Z = 0.10 (P = 0.92)
Test for subgroup differences: Not applicable
0.1 0.2 0.5 1 2 5 10
Favours Decompression Favours Fusion
87Surgical options for lumbar spinal stenosis (Review)
Copyright © 2016 The Cochrane Collaboration. Published by John Wiley & Sons, Ltd.
276

Analysis 1.4. Comparison 1 Decompression alone versus decompression plus fusion, Outcome 4 Operation
time.
Review: Surgical options for lumbar spinal stenosis
Comparison: 1 Decompression alone versus decompression plus fusion
Outcome: 4 Operation time
Study or subgroup Decompression FusionMean
Difference WeightMean
Difference
N Mean(SD) N Mean(SD) IV,Random,95% CI IV,Random,95% CI
Grob 1995 15 104 (22.5) 30 147 (22.35) 25.5 % -43.00 [ -56.91, -29.09 ]
Hallett 2007 14 120 (30) 30 288 (60) 24.4 % -168.00 [ -194.61, -141.39 ]
Ghogawala 2016 34 124.4 (34.2) 30 289.6 (66.3) 24.4 % -165.20 [ -191.56, -138.84 ]
Forsth 2016 117 88.46 (35.92) 111 149.4 (45) 25.7 % -60.94 [ -71.54, -50.34 ]
Total (95% CI) 180 201 100.0 % -107.94 [ -161.65, -54.23 ]
Heterogeneity: Tau2 = 2894.02; Chi2 = 118.78, df = 3 (P<0.00001); I2 =97%
Test for overall effect: Z = 3.94 (P = 0.000082)
Test for subgroup differences: Not applicable
-200 -100 0 100 200
Favours Decompression Favours Fusion
88Surgical options for lumbar spinal stenosis (Review)
Copyright © 2016 The Cochrane Collaboration. Published by John Wiley & Sons, Ltd.
277

Analysis 1.5. Comparison 1 Decompression alone versus decompression plus fusion, Outcome 5 Blood loss.
Review: Surgical options for lumbar spinal stenosis
Comparison: 1 Decompression alone versus decompression plus fusion
Outcome: 5 Blood loss
Study or subgroup Decompression FusionMean
Difference WeightMean
Difference
N Mean(SD) N Mean(SD) IV,Random,95% CI IV,Random,95% CI
Forsth 2016 117 0.3 (0.315) 111 0.67 (0.458) 30.8 % -0.37 [ -0.47, -0.27 ]
Ghogawala 2016 35 0.0834 (0.0635) 31 0.51 (0.3344) 29.7 % -0.43 [ -0.55, -0.31 ]
Grob 1995 15 0.3 (0.15) 30 0.76 (0.373) 27.3 % -0.46 [ -0.62, -0.31 ]
Hallett 2007 14 0.34 (0.348) 30 1.58 (1.032) 12.2 % -1.23 [ -1.65, -0.82 ]
Total (95% CI) 181 202 100.0 % -0.52 [ -0.70, -0.34 ]
Heterogeneity: Tau2 = 0.02; Chi2 = 16.16, df = 3 (P = 0.001); I2 =81%
Test for overall effect: Z = 5.66 (P < 0.00001)
Test for subgroup differences: Not applicable
-2 -1 0 1 2
Favours Decompression Favours Fusion
89Surgical options for lumbar spinal stenosis (Review)
Copyright © 2016 The Cochrane Collaboration. Published by John Wiley & Sons, Ltd.
278

Analysis 1.6. Comparison 1 Decompression alone versus decompression plus fusion, Outcome 6
Reoperations.
Review: Surgical options for lumbar spinal stenosis
Comparison: 1 Decompression alone versus decompression plus fusion
Outcome: 6 Reoperations
Study or subgroup Decompression Fusion Risk Ratio Weight Risk Ratio
n/N n/N IV,Random,95% CI IV,Random,95% CI
Bridwell 1993 0/9 2/34 2.1 % 0.70 [ 0.04, 13.43 ]
Grob 1995 0/15 5/30 2.3 % 0.18 [ 0.01, 2.99 ]
Hallett 2007 1/13 2/28 3.5 % 1.08 [ 0.11, 10.83 ]
Ghogawala 2016 10/35 4/31 16.6 % 2.21 [ 0.77, 6.35 ]
Forsth 2016 25/113 25/135 75.5 % 1.19 [ 0.73, 1.96 ]
Total (95% CI) 185 258 100.0 % 1.25 [ 0.81, 1.92 ]
Total events: 36 (Decompression), 38 (Fusion)
Heterogeneity: Tau2 = 0.0; Chi2 = 3.17, df = 4 (P = 0.53); I2 =0.0%
Test for overall effect: Z = 1.01 (P = 0.31)
Test for subgroup differences: Not applicable
0.005 0.1 1 10 200
Favours Decompression Favours Fusion
90Surgical options for lumbar spinal stenosis (Review)
Copyright © 2016 The Cochrane Collaboration. Published by John Wiley & Sons, Ltd.
279
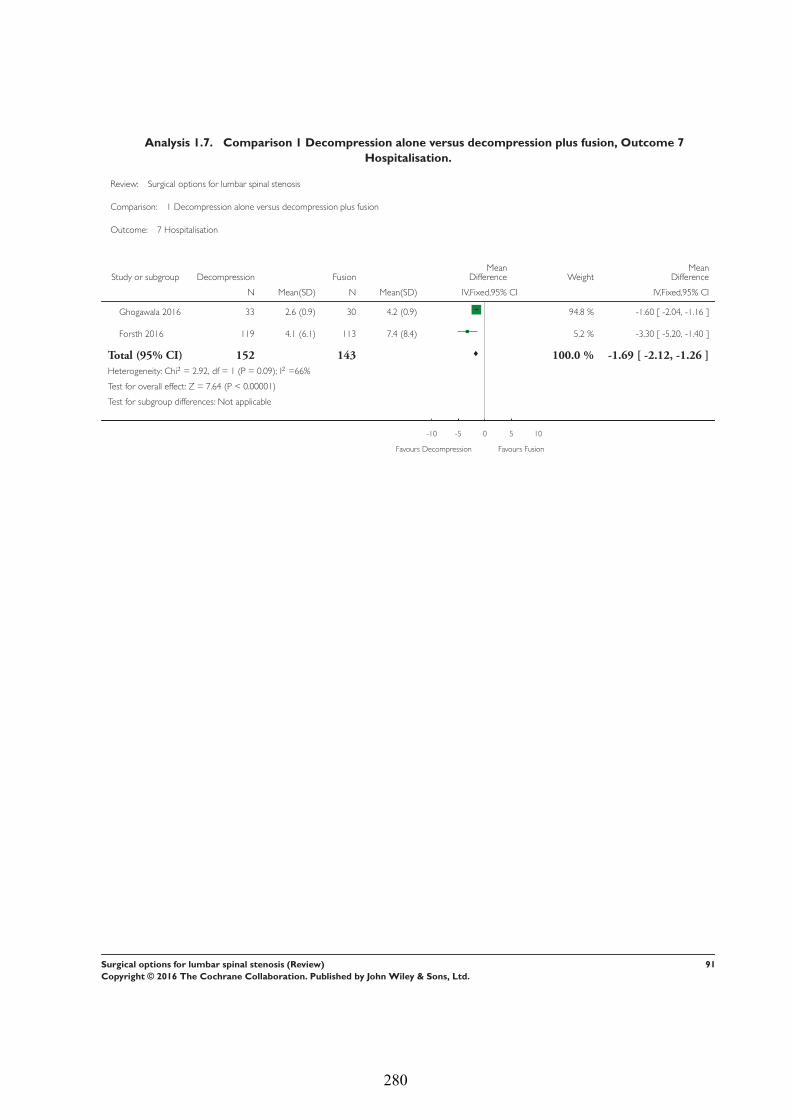
Analysis 1.7. Comparison 1 Decompression alone versus decompression plus fusion, Outcome 7
Hospitalisation.
Review: Surgical options for lumbar spinal stenosis
Comparison: 1 Decompression alone versus decompression plus fusion
Outcome: 7 Hospitalisation
Study or subgroup Decompression FusionMean
Difference WeightMean
Difference
N Mean(SD) N Mean(SD) IV,Fixed,95% CI IV,Fixed,95% CI
Ghogawala 2016 33 2.6 (0.9) 30 4.2 (0.9) 94.8 % -1.60 [ -2.04, -1.16 ]
Forsth 2016 119 4.1 (6.1) 113 7.4 (8.4) 5.2 % -3.30 [ -5.20, -1.40 ]
Total (95% CI) 152 143 100.0 % -1.69 [ -2.12, -1.26 ]
Heterogeneity: Chi2 = 2.92, df = 1 (P = 0.09); I2 =66%
Test for overall effect: Z = 7.64 (P < 0.00001)
Test for subgroup differences: Not applicable
-10 -5 0 5 10
Favours Decompression Favours Fusion
91Surgical options for lumbar spinal stenosis (Review)
Copyright © 2016 The Cochrane Collaboration. Published by John Wiley & Sons, Ltd.
280

Analysis 2.1. Comparison 2 Decompression versus interspinous spacer, Outcome 1 Pain.
Review: Surgical options for lumbar spinal stenosis
Comparison: 2 Decompression versus interspinous spacer
Outcome: 1 Pain
Study or subgroup Decompression Interspinous SpacerMean
Difference WeightMean
Difference
N Mean(SD) N Mean(SD) IV,Random,95% CI IV,Random,95% CI
1 Short-term (less than 12 months)
Stromqvist 2013 48 22.9 (27.36) 48 29.8 (31.51) 13.9 % -6.90 [ -18.71, 4.91 ]
Moojen 2013 78 22 (20.28) 73 26 (26.16) 24.3 % -4.00 [ -11.50, 3.50 ]
Lonne 2015 41 35.8 (27.5) 40 26.2 (27.5) 13.6 % 9.60 [ -2.38, 21.58 ]
Subtotal (95% CI) 167 161 51.8 % -0.93 [ -9.86, 8.00 ]
Heterogeneity: Tau2 = 34.80; Chi2 = 4.53, df = 2 (P = 0.10); I2 =56%
Test for overall effect: Z = 0.20 (P = 0.84)
2 Long-term (12 months or more)
Moojen 2013 78 26 (29.29) 73 23 (28.34) 19.4 % 3.00 [ -6.19, 12.19 ]
Stromqvist 2013 48 21.65 (24.91) 48 30.2 (30.04) 15.3 % -8.55 [ -19.59, 2.49 ]
Lonne 2015 41 32 (27.5) 40 28.6 (27.5) 13.6 % 3.40 [ -8.58, 15.38 ]
Subtotal (95% CI) 167 161 48.2 % -0.55 [ -8.08, 6.99 ]
Heterogeneity: Tau2 = 14.93; Chi2 = 3.01, df = 2 (P = 0.22); I2 =33%
Test for overall effect: Z = 0.14 (P = 0.89)
Total (95% CI) 334 322 100.0 % -0.89 [ -6.08, 4.31 ]
Heterogeneity: Tau2 = 14.36; Chi2 = 7.62, df = 5 (P = 0.18); I2 =34%
Test for overall effect: Z = 0.33 (P = 0.74)
Test for subgroup differences: Chi2 = 0.00, df = 1 (P = 0.95), I2 =0.0%
-50 -25 0 25 50
Favours Decompression Favours Interspinous Spacer
92Surgical options for lumbar spinal stenosis (Review)
Copyright © 2016 The Cochrane Collaboration. Published by John Wiley & Sons, Ltd.
281

Analysis 2.2. Comparison 2 Decompression versus interspinous spacer, Outcome 2 Disability.
Review: Surgical options for lumbar spinal stenosis
Comparison: 2 Decompression versus interspinous spacer
Outcome: 2 Disability
Study or subgroup Decompression Interspinous SpacerMean
Difference WeightMean
Difference
N Mean(SD) N Mean(SD) IV,Random,95% CI IV,Random,95% CI
1 Short-term (less than 12 months)
Stromqvist 2013 48 42.5 (16.75) 48 46.75 (20.75) 14.4 % -4.25 [ -11.79, 3.29 ]
Moojen 2013 78 45 (17.5) 74 42.5 (17.5) 21.5 % 2.50 [ -3.07, 8.07 ]
Lonne 2015 41 19.4 (16.6481) 40 14.4 (17.0763) 14.9 % 5.00 [ -2.35, 12.35 ]
Subtotal (95% CI) 167 162 50.8 % 1.30 [ -3.64, 6.25 ]
Heterogeneity: Tau2 = 7.32; Chi2 = 3.23, df = 2 (P = 0.20); I2 =38%
Test for overall effect: Z = 0.52 (P = 0.61)
2 Long-term (12 months or more)
Moojen 2013 79 45 (17.5) 73 42.5 (17.5) 21.5 % 2.50 [ -3.07, 8.07 ]
Stromqvist 2013 48 41.5 (18.5) 46 46.75 (20.75) 13.3 % -5.25 [ -13.21, 2.71 ]
Lonne 2015 41 18.3 (16.6481) 40 12.6 (17.7088) 14.5 % 5.70 [ -1.79, 13.19 ]
Subtotal (95% CI) 168 159 49.2 % 1.25 [ -4.48, 6.98 ]
Heterogeneity: Tau2 = 13.15; Chi2 = 4.10, df = 2 (P = 0.13); I2 =51%
Test for overall effect: Z = 0.43 (P = 0.67)
Total (95% CI) 335 321 100.0 % 1.34 [ -2.01, 4.69 ]
Heterogeneity: Tau2 = 5.51; Chi2 = 7.32, df = 5 (P = 0.20); I2 =32%
Test for overall effect: Z = 0.78 (P = 0.43)
Test for subgroup differences: Chi2 = 0.00, df = 1 (P = 0.99), I2 =0.0%
-50 -25 0 25 50
Favours Decompression Favours Interspinous Spacer
93Surgical options for lumbar spinal stenosis (Review)
Copyright © 2016 The Cochrane Collaboration. Published by John Wiley & Sons, Ltd.
282

Analysis 2.3. Comparison 2 Decompression versus interspinous spacer, Outcome 3 Function.
Review: Surgical options for lumbar spinal stenosis
Comparison: 2 Decompression versus interspinous spacer
Outcome: 3 Function
Study or subgroup Decompression Interspinous SpacerMean
Difference WeightMean
Difference
N Mean(SD) N Mean(SD) IV,Random,95% CI IV,Random,95% CI
1 Short-term (less than 12 months)
Stromqvist 2013 48 1.7 (0.7577) 48 1.88 (0.7577) 25.9 % -0.18 [ -0.48, 0.12 ]
Lonne 2015 41 1.73 (0.6403) 48 1.7 (0.6325) 33.8 % 0.03 [ -0.24, 0.30 ]
Subtotal (95% CI) 89 96 59.7 % -0.06 [ -0.27, 0.14 ]
Heterogeneity: Tau2 = 0.00; Chi2 = 1.04, df = 1 (P = 0.31); I2 =4%
Test for overall effect: Z = 0.59 (P = 0.55)
2 Long-term (12 months or more)
Stromqvist 2013 48 1.66 (1.5842) 46 1.9 (0.8082) 9.3 % -0.24 [ -0.75, 0.27 ]
Lonne 2015 41 1.7 (0.6403) 40 1.61 (0.6325) 31.0 % 0.09 [ -0.19, 0.37 ]
Subtotal (95% CI) 89 86 40.3 % 0.00 [ -0.30, 0.29 ]
Heterogeneity: Tau2 = 0.01; Chi2 = 1.26, df = 1 (P = 0.26); I2 =21%
Test for overall effect: Z = 0.03 (P = 0.98)
Total (95% CI) 178 182 100.0 % -0.03 [ -0.19, 0.12 ]
Heterogeneity: Tau2 = 0.0; Chi2 = 2.52, df = 3 (P = 0.47); I2 =0.0%
Test for overall effect: Z = 0.39 (P = 0.69)
Test for subgroup differences: Chi2 = 0.10, df = 1 (P = 0.75), I2 =0.0%
-1 -0.5 0 0.5 1
Favours Decompression Favours Interspinous Spacer
94Surgical options for lumbar spinal stenosis (Review)
Copyright © 2016 The Cochrane Collaboration. Published by John Wiley & Sons, Ltd.
283

Analysis 2.4. Comparison 2 Decompression versus interspinous spacer, Outcome 4 Quality of life.
Review: Surgical options for lumbar spinal stenosis
Comparison: 2 Decompression versus interspinous spacer
Outcome: 4 Quality of life
Study or subgroup Decompression Interspinous SpacerMean
Difference WeightMean
Difference
N Mean(SD) N Mean(SD) IV,Random,95% CI IV,Random,95% CI
1 Short-term (less than 12 months)
Lonne 2015 41 0.623 (0.2945) 40 0.74 (0.2846) 50.0 % -0.12 [ -0.25, 0.01 ]
Subtotal (95% CI) 41 40 50.0 % -0.12 [ -0.25, 0.01 ]
Heterogeneity: not applicable
Test for overall effect: Z = 1.85 (P = 0.064)
2 Long-term (12 months or more)
Lonne 2015 41 0.673 (0.2881) 40 0.73 (0.2909) 50.0 % -0.05 [ -0.18, 0.07 ]
Subtotal (95% CI) 41 40 50.0 % -0.05 [ -0.18, 0.07 ]
Heterogeneity: not applicable
Test for overall effect: Z = 0.85 (P = 0.39)
Total (95% CI) 82 80 100.0 % -0.09 [ -0.18, 0.00 ]
Heterogeneity: Tau2 = 0.0; Chi2 = 0.49, df = 1 (P = 0.48); I2 =0.0%
Test for overall effect: Z = 1.91 (P = 0.056)
Test for subgroup differences: Chi2 = 0.49, df = 1 (P = 0.48), I2 =0.0%
-0.5 -0.25 0 0.25 0.5
Favours Decompression Favours Interspinous Spacer
95Surgical options for lumbar spinal stenosis (Review)
Copyright © 2016 The Cochrane Collaboration. Published by John Wiley & Sons, Ltd.
284

Analysis 2.5. Comparison 2 Decompression versus interspinous spacer, Outcome 5 Costs.
Review: Surgical options for lumbar spinal stenosis
Comparison: 2 Decompression versus interspinous spacer
Outcome: 5 Costs
Study or subgroup Interspinous Spacer DecompressionMean
Difference WeightMean
Difference
N Mean(SD) N Mean(SD) IV,Random,95% CI IV,Random,95% CI
Moojen 2013 80 10210 (8127.804) 79 7180 (8127.804) 12.3 % 3030.00 [ 503.26, 5556.74 ]
Lonne 2015 40 8247 (2171.8) 41 5415 (2171.8) 87.7 % 2832.00 [ 1886.01, 3777.99 ]
Total (95% CI) 120 120 100.0 % 2856.34 [ 1970.40, 3742.28 ]
Heterogeneity: Tau2 = 0.0; Chi2 = 0.02, df = 1 (P = 0.89); I2 =0.0%
Test for overall effect: Z = 6.32 (P < 0.00001)
Test for subgroup differences: Not applicable
-1000 -500 0 500 1000
Favours Interspinous Spacer Favours Decompression
Analysis 2.6. Comparison 2 Decompression versus interspinous spacer, Outcome 6 Operation time.
Review: Surgical options for lumbar spinal stenosis
Comparison: 2 Decompression versus interspinous spacer
Outcome: 6 Operation time
Study or subgroup Decompression Interspinous SpacerMean
Difference WeightMean
Difference
N Mean(SD) N Mean(SD) IV,Random,95% CI IV,Random,95% CI
Moojen 2013 79 43 (19) 80 24 (10) 35.0 % 19.00 [ 14.27, 23.73 ]
Stromqvist 2013 50 98 (14.5) 50 62 (14.5) 34.7 % 36.00 [ 30.32, 41.68 ]
Lonne 2015 41 112.9 (41) 40 46.9 (20.8) 30.2 % 66.00 [ 51.89, 80.11 ]
Total (95% CI) 170 170 100.0 % 39.11 [ 19.43, 58.78 ]
Heterogeneity: Tau2 = 281.76; Chi2 = 49.33, df = 2 (P<0.00001); I2 =96%
Test for overall effect: Z = 3.90 (P = 0.000098)
Test for subgroup differences: Not applicable
-100 -50 0 50 100
Favours Decompression Favours Interspinous Spacer
96Surgical options for lumbar spinal stenosis (Review)
Copyright © 2016 The Cochrane Collaboration. Published by John Wiley & Sons, Ltd.
285

Analysis 2.7. Comparison 2 Decompression versus interspinous spacer, Outcome 7 Blood loss.
Review: Surgical options for lumbar spinal stenosis
Comparison: 2 Decompression versus interspinous spacer
Outcome: 7 Blood loss
Study or subgroup Decompression Interspinous SpacerMean
Difference WeightMean
Difference
N Mean(SD) N Mean(SD) IV,Random,95% CI IV,Random,95% CI
Lonne 2015 41 184 (1100) 40 40 (350) 100.0 % 144.00 [ -209.74, 497.74 ]
Total (95% CI) 41 40 100.0 % 144.00 [ -209.74, 497.74 ]
Heterogeneity: not applicable
Test for overall effect: Z = 0.80 (P = 0.42)
Test for subgroup differences: Not applicable
-1000 -500 0 500 1000
Favours Decompression Favours Interspinous Spacer
97Surgical options for lumbar spinal stenosis (Review)
Copyright © 2016 The Cochrane Collaboration. Published by John Wiley & Sons, Ltd.
286

Analysis 2.8. Comparison 2 Decompression versus interspinous spacer, Outcome 8 Reoperations.
Review: Surgical options for lumbar spinal stenosis
Comparison: 2 Decompression versus interspinous spacer
Outcome: 8 Reoperations
Study or subgroup Interspinous Spacer Decompression Risk Ratio Weight Risk Ratio
n/N n/N IV,Random,95% CI IV,Random,95% CI
Moojen 2013 21/73 6/72 54.3 % 3.45 [ 1.48, 8.05 ]
Stromqvist 2013 13/50 3/50 27.4 % 4.33 [ 1.31, 14.28 ]
Lonne 2015 10/40 2/41 18.4 % 5.13 [ 1.20, 21.94 ]
Total (95% CI) 163 163 100.0 % 3.95 [ 2.12, 7.37 ]
Total events: 44 (Interspinous Spacer), 11 (Decompression)
Heterogeneity: Tau2 = 0.0; Chi2 = 0.24, df = 2 (P = 0.89); I2 =0.0%
Test for overall effect: Z = 4.32 (P = 0.000016)
Test for subgroup differences: Not applicable
0.01 0.1 1 10 100
Favours Interspinous Spacer Favours Decompression
Analysis 2.9. Comparison 2 Decompression versus interspinous spacer, Outcome 9 Hospitalisation.
Review: Surgical options for lumbar spinal stenosis
Comparison: 2 Decompression versus interspinous spacer
Outcome: 9 Hospitalisation
Study or subgroup Decompression Interspinous SpacerMean
Difference WeightMean
Difference
N Mean(SD) N Mean(SD) IV,Random,95% CI IV,Random,95% CI
Moojen 2013 79 1.89 (1.2) 80 1.83 (0.9) 60.7 % 0.06 [ -0.27, 0.39 ]
Lonne 2015 41 3.4 (3.1) 40 2.2 (1.7) 39.3 % 1.20 [ 0.11, 2.29 ]
Total (95% CI) 120 120 100.0 % 0.51 [ -0.58, 1.60 ]
Heterogeneity: Tau2 = 0.48; Chi2 = 3.88, df = 1 (P = 0.05); I2 =74%
Test for overall effect: Z = 0.91 (P = 0.36)
Test for subgroup differences: Not applicable
-4 -2 0 2 4
Favours Decompression Favours Interspinous Spacer
98Surgical options for lumbar spinal stenosis (Review)
Copyright © 2016 The Cochrane Collaboration. Published by John Wiley & Sons, Ltd.
287

Analysis 3.1. Comparison 3 Decompression plus fusion versus interspinous spacer, Outcome 1 Pain.
Review: Surgical options for lumbar spinal stenosis
Comparison: 3 Decompression plus fusion versus interspinous spacer
Outcome: 1 Pain
Study or subgroup Fusion Interspinous SpacerMean
Difference WeightMean
Difference
N Mean(SD) N Mean(SD) IV,Random,95% CI IV,Random,95% CI
1 Long-term (12 months or more)
Azzazi 2010 30 35.5 (24.2) 30 25.5 (24.2) 28.4 % 10.00 [ -2.25, 22.25 ]
Davis 2013 86 24.1 (30.6) 162 20.6 (27.4) 71.6 % 3.50 [ -4.22, 11.22 ]
Total (95% CI) 116 192 100.0 % 5.35 [ -1.18, 11.88 ]
Heterogeneity: Tau2 = 0.0; Chi2 = 0.77, df = 1 (P = 0.38); I2 =0.0%
Test for overall effect: Z = 1.61 (P = 0.11)
Test for subgroup differences: Not applicable
-50 -25 0 25 50
Favours Fusion Favours Interspinous Spacer
99Surgical options for lumbar spinal stenosis (Review)
Copyright © 2016 The Cochrane Collaboration. Published by John Wiley & Sons, Ltd.
288

Analysis 3.2. Comparison 3 Decompression plus fusion versus interspinous spacer, Outcome 2 Disability.
Review: Surgical options for lumbar spinal stenosis
Comparison: 3 Decompression plus fusion versus interspinous spacer
Outcome: 2 Disability
Study or subgroup Fusion Interspinous SpacerMean
Difference WeightMean
Difference
N Mean(SD) N Mean(SD) IV,Random,95% CI IV,Random,95% CI
1 Long-term (12 months or more)
Azzazi 2010 30 34.5 (15.8) 30 26.5 (15.8) 30.8 % 8.00 [ 0.00, 16.00 ]
Davis 2013 86 26.7 (21.3) 162 22 (18.6) 69.2 % 4.70 [ -0.64, 10.04 ]
Total (95% CI) 116 192 100.0 % 5.72 [ 1.28, 10.15 ]
Heterogeneity: Tau2 = 0.0; Chi2 = 0.45, df = 1 (P = 0.50); I2 =0.0%
Test for overall effect: Z = 2.52 (P = 0.012)
Test for subgroup differences: Not applicable
-50 -25 0 25 50
Favours Fusion Favours Interspinous Spacer
Analysis 3.3. Comparison 3 Decompression plus fusion versus interspinous spacer, Outcome 3 Quality of
life.
Review: Surgical options for lumbar spinal stenosis
Comparison: 3 Decompression plus fusion versus interspinous spacer
Outcome: 3 Quality of life
Study or subgroup Fusion Interspinous SpacerMean
Difference WeightMean
Difference
N Mean(SD) N Mean(SD) IV,Random,95% CI IV,Random,95% CI
1 Long-term (12 months or more)
Davis 2013 78 40.7 (12.2) 148 43.8 (10.6) 100.0 % -3.10 [ -6.30, 0.10 ]
Total (95% CI) 78 148 100.0 % -3.10 [ -6.30, 0.10 ]
Heterogeneity: not applicable
Test for overall effect: Z = 1.90 (P = 0.058)
Test for subgroup differences: Not applicable
-10 -5 0 5 10
Favours Fusion Favours Interspinous Spacer
100Surgical options for lumbar spinal stenosis (Review)
Copyright © 2016 The Cochrane Collaboration. Published by John Wiley & Sons, Ltd.
289

Analysis 3.4. Comparison 3 Decompression plus fusion versus interspinous spacer, Outcome 4 Operation
time.
Review: Surgical options for lumbar spinal stenosis
Comparison: 3 Decompression plus fusion versus interspinous spacer
Outcome: 4 Operation time
Study or subgroup Fusion Interspinous SpacerMean
Difference WeightMean
Difference
N Mean(SD) N Mean(SD) IV,Random,95% CI IV,Random,95% CI
Azzazi 2010 30 150 (48.3) 30 45 (48.3) 47.6 % 105.00 [ 80.56, 129.44 ]
Davis 2013 107 153.2 (55.5) 214 98 (41.1) 52.4 % 55.20 [ 43.33, 67.07 ]
Total (95% CI) 137 244 100.0 % 78.91 [ 30.16, 127.65 ]
Heterogeneity: Tau2 = 1143.92; Chi2 = 12.90, df = 1 (P = 0.00033); I2 =92%
Test for overall effect: Z = 3.17 (P = 0.0015)
Test for subgroup differences: Not applicable
-200 -100 0 100 200
Favours Fusion Favours Interspinous Spacer
101Surgical options for lumbar spinal stenosis (Review)
Copyright © 2016 The Cochrane Collaboration. Published by John Wiley & Sons, Ltd.
290

Analysis 3.5. Comparison 3 Decompression plus fusion versus interspinous spacer, Outcome 5 Blood loss.
Review: Surgical options for lumbar spinal stenosis
Comparison: 3 Decompression plus fusion versus interspinous spacer
Outcome: 5 Blood loss
Study or subgroup Fusion Interspinous SpacerMean
Difference WeightMean
Difference
N Mean(SD) N Mean(SD) IV,Random,95% CI IV,Random,95% CI
Davis 2013 105 348.6 (281.8) 215 109.7 (120) 100.0 % 238.90 [ 182.66, 295.14 ]
Total (95% CI) 105 215 100.0 % 238.90 [ 182.66, 295.14 ]
Heterogeneity: not applicable
Test for overall effect: Z = 8.33 (P < 0.00001)
Test for subgroup differences: Not applicable
-500 -250 0 250 500
Favours Fusion Favours Interspinous Spacer
Analysis 3.6. Comparison 3 Decompression plus fusion versus interspinous spacer, Outcome 6
Reoperations.
Review: Surgical options for lumbar spinal stenosis
Comparison: 3 Decompression plus fusion versus interspinous spacer
Outcome: 6 Reoperations
Study or subgroup Fusion Interspinous Spacer Risk Ratio Weight Risk Ratio
n/N n/N IV,Random,95% CI IV,Random,95% CI
Davis 2013 8/107 23/215 100.0 % 0.70 [ 0.32, 1.51 ]
Total (95% CI) 107 215 100.0 % 0.70 [ 0.32, 1.51 ]
Total events: 8 (Fusion), 23 (Interspinous Spacer)
Heterogeneity: not applicable
Test for overall effect: Z = 0.91 (P = 0.36)
Test for subgroup differences: Not applicable
0.1 0.2 0.5 1 2 5 10
Favours Fusion Favours Interspinous Spacer
102Surgical options for lumbar spinal stenosis (Review)
Copyright © 2016 The Cochrane Collaboration. Published by John Wiley & Sons, Ltd.
291

Analysis 3.7. Comparison 3 Decompression plus fusion versus interspinous spacer, Outcome 7
Hospitalisation.
Review: Surgical options for lumbar spinal stenosis
Comparison: 3 Decompression plus fusion versus interspinous spacer
Outcome: 7 Hospitalisation
Study or subgroup Fusion Interspinous SpacerMean
Difference WeightMean
Difference
N Mean(SD) N Mean(SD) IV,Random,95% CI IV,Random,95% CI
Azzazi 2010 30 3 (1.345) 30 1 (1.345) 41.0 % 2.00 [ 1.32, 2.68 ]
Davis 2013 107 3.19 (1.61) 215 1.9 (1.08) 59.0 % 1.29 [ 0.95, 1.63 ]
Total (95% CI) 137 245 100.0 % 1.58 [ 0.90, 2.27 ]
Heterogeneity: Tau2 = 0.18; Chi2 = 3.36, df = 1 (P = 0.07); I2 =70%
Test for overall effect: Z = 4.53 (P < 0.00001)
Test for subgroup differences: Not applicable
-4 -2 0 2 4
Favours Fusion Favours Interspinous Spacer
103Surgical options for lumbar spinal stenosis (Review)
Copyright © 2016 The Cochrane Collaboration. Published by John Wiley & Sons, Ltd.
292

Analysis 4.1. Comparison 4 Laminectomy versus laminotomy, Outcome 1 Pain.
Review: Surgical options for lumbar spinal stenosis
Comparison: 4 Laminectomy versus laminotomy
Outcome: 1 Pain
Study or subgroup Laminectomy LaminotomyMean
Difference WeightMean
Difference
N Mean(SD) N Mean(SD) IV,Random,95% CI IV,Random,95% CI
1 Short-term (less than 12 months)
Thome 2005 34 30.5 (27.3) 76 27.94 (28.87) 6.7 % 2.56 [ -8.68, 13.80 ]
Cavusoglu 2007 50 -62.64 (9.52) 50 -61.78 (11.92) 14.6 % -0.86 [ -5.09, 3.37 ]
Celik 2010 34 26 (7) 37 25 (9) 15.2 % 1.00 [ -2.73, 4.73 ]
Subtotal (95% CI) 118 163 36.6 % 0.32 [ -2.39, 3.04 ]
Heterogeneity: Tau2 = 0.0; Chi2 = 0.58, df = 2 (P = 0.75); I2 =0.0%
Test for overall effect: Z = 0.23 (P = 0.82)
2 Long-term (12 months or more)
Postacchini 1993 32 -84 (15.34) 26 -71 (17.11) 9.3 % -13.00 [ -21.46, -4.54 ]
Thome 2005 34 40 (10) 76 29.67 (26.24) 11.2 % 10.33 [ 3.54, 17.12 ]
Cavusoglu 2007 50 -69.64 (10.52) 50 -68.32 (9.92) 14.9 % -1.32 [ -5.33, 2.69 ]
Celik 2010 34 23 (11) 37 25 (14) 12.4 % -2.00 [ -7.83, 3.83 ]
Liu 2013 27 17 (15.5885) 27 13 (10.3923) 10.9 % 4.00 [ -3.07, 11.07 ]
Mobbs 2014 27 39 (29) 27 56 (25) 4.8 % -17.00 [ -31.44, -2.56 ]
Subtotal (95% CI) 204 243 63.4 % -1.92 [ -8.19, 4.35 ]
Heterogeneity: Tau2 = 46.06; Chi2 = 25.14, df = 5 (P = 0.00013); I2 =80%
Test for overall effect: Z = 0.60 (P = 0.55)
Total (95% CI) 322 406 100.0 % -0.67 [ -4.36, 3.02 ]
Heterogeneity: Tau2 = 19.63; Chi2 = 25.98, df = 8 (P = 0.001); I2 =69%
Test for overall effect: Z = 0.36 (P = 0.72)
Test for subgroup differences: Chi2 = 0.41, df = 1 (P = 0.52), I2 =0.0%
-50 -25 0 25 50
Favours Laminectomy Favours Laminotomy
104Surgical options for lumbar spinal stenosis (Review)
Copyright © 2016 The Cochrane Collaboration. Published by John Wiley & Sons, Ltd.
293

Analysis 4.2. Comparison 4 Laminectomy versus laminotomy, Outcome 2 Disability.
Review: Surgical options for lumbar spinal stenosis
Comparison: 4 Laminectomy versus laminotomy
Outcome: 2 Disability
Study or subgroup Laminectomy LaminotomyMean
Difference WeightMean
Difference
N Mean(SD) N Mean(SD) IV,Random,95% CI IV,Random,95% CI
1 Short-term (less than 12 months)
Thome 2005 34 35.67 (28.21) 76 37.97 (31.04) 2.5 % -2.30 [ -14.07, 9.47 ]
Cavusoglu 2007 50 14.22 (9.88) 50 12.22 (6.46) 32.2 % 2.00 [ -1.27, 5.27 ]
Celik 2010 34 21.2 (9.3295) 37 20.5 (10.949) 15.5 % 0.70 [ -4.02, 5.42 ]
Gurelik 2012 26 32.15 (28.94) 26 25.92 (20.43) 1.9 % 6.23 [ -7.39, 19.85 ]
Subtotal (95% CI) 144 189 52.0 % 1.56 [ -1.02, 4.13 ]
Heterogeneity: Tau2 = 0.0; Chi2 = 1.06, df = 3 (P = 0.79); I2 =0.0%
Test for overall effect: Z = 1.19 (P = 0.24)
2 Long-term (12 months or more)
Thome 2005 34 35.42 (30.42) 76 39.74 (30.62) 2.3 % -4.32 [ -16.65, 8.01 ]
Cavusoglu 2007 50 14.02 (9.27) 50 12.4 (6.3) 35.7 % 1.62 [ -1.49, 4.73 ]
Celik 2010 34 21.7 (13.9943) 37 22.3 (16.4235) 6.9 % -0.60 [ -7.68, 6.48 ]
Liu 2013 27 -83.79 (46.41) 27 -92.07 (37.62) 0.7 % 8.28 [ -14.25, 30.81 ]
Mobbs 2014 27 17.8 (15.4) 27 28.6 (27.7) 2.4 % -10.80 [ -22.75, 1.15 ]
Subtotal (95% CI) 172 217 48.0 % -0.43 [ -4.37, 3.52 ]
Heterogeneity: Tau2 = 4.77; Chi2 = 5.07, df = 4 (P = 0.28); I2 =21%
Test for overall effect: Z = 0.21 (P = 0.83)
Total (95% CI) 316 406 100.0 % 1.05 [ -0.81, 2.90 ]
Heterogeneity: Tau2 = 0.0; Chi2 = 6.45, df = 8 (P = 0.60); I2 =0.0%
Test for overall effect: Z = 1.10 (P = 0.27)
Test for subgroup differences: Chi2 = 0.68, df = 1 (P = 0.41), I2 =0.0%
-50 -25 0 25 50
Favours Laminectomy Favours Laminotomy
105Surgical options for lumbar spinal stenosis (Review)
Copyright © 2016 The Cochrane Collaboration. Published by John Wiley & Sons, Ltd.
294

Analysis 4.3. Comparison 4 Laminectomy versus laminotomy, Outcome 3 Walking ability.
Review: Surgical options for lumbar spinal stenosis
Comparison: 4 Laminectomy versus laminotomy
Outcome: 3 Walking ability
Study or subgroup Laminectomy Laminotomy
Std.Mean
Difference Weight
Std.Mean
Difference
N Mean(SD) N Mean(SD) IV,Random,95% CI IV,Random,95% CI
1 Short-term (less than 12 months)
Thome 2005 34 2958 (3561) 76 2744.36 (3427.729) 24.7 % 0.06 [ -0.34, 0.47 ]
Celik 2010 34 85.5 (60.64) 37 90 (69.34) 18.6 % -0.07 [ -0.53, 0.40 ]
Gurelik 2012 26 203.65 (283.04) 26 288.65 (278.05) 13.5 % -0.30 [ -0.85, 0.25 ]
Subtotal (95% CI) 94 139 56.7 % -0.07 [ -0.33, 0.20 ]
Heterogeneity: Tau2 = 0.0; Chi2 = 1.07, df = 2 (P = 0.58); I2 =0.0%
Test for overall effect: Z = 0.49 (P = 0.62)
2 Long-term (12 months or more)
Thome 2005 34 2958 (3561) 76 2972.8 (3428.883) 24.7 % 0.00 [ -0.41, 0.40 ]
Celik 2010 34 94.4 (54.81) 37 97.4 (71.17) 18.6 % -0.05 [ -0.51, 0.42 ]
Subtotal (95% CI) 68 113 43.3 % -0.02 [ -0.33, 0.28 ]
Heterogeneity: Tau2 = 0.0; Chi2 = 0.02, df = 1 (P = 0.89); I2 =0.0%
Test for overall effect: Z = 0.14 (P = 0.89)
Total (95% CI) 162 252 100.0 % -0.05 [ -0.25, 0.15 ]
Heterogeneity: Tau2 = 0.0; Chi2 = 1.14, df = 4 (P = 0.89); I2 =0.0%
Test for overall effect: Z = 0.46 (P = 0.64)
Test for subgroup differences: Chi2 = 0.05, df = 1 (P = 0.83), I2 =0.0%
-1 -0.5 0 0.5 1
Favours Laminectomy Favours Laminotomy
106Surgical options for lumbar spinal stenosis (Review)
Copyright © 2016 The Cochrane Collaboration. Published by John Wiley & Sons, Ltd.
295

Analysis 4.4. Comparison 4 Laminectomy versus laminotomy, Outcome 4 Operation time.
Review: Surgical options for lumbar spinal stenosis
Comparison: 4 Laminectomy versus laminotomy
Outcome: 4 Operation time
Study or subgroup Laminectomy LaminotomyMean
Difference WeightMean
Difference
N Mean(SD) N Mean(SD) IV,Random,95% CI IV,Random,95% CI
Postacchini 1993 32 85.937 (41.88) 26 109.42 (50.22) 8.4 % -23.48 [ -47.63, 0.67 ]
Thome 2005 38 73 (32) 79 83.42 (30.049) 23.6 % -10.42 [ -22.56, 1.72 ]
Celik 2010 22 107 (70.3562) 26 83 (61.1882) 3.7 % 24.00 [ -13.65, 61.65 ]
Liu 2013 29 57 (64.622) 27 67 (109.1192) 2.4 % -10.00 [ -57.41, 37.41 ]
Usman 2013 30 65 (0.5477) 30 69 (0.5477) 61.8 % -4.00 [ -4.28, -3.72 ]
Total (95% CI) 151 188 100.0 % -6.25 [ -13.76, 1.27 ]
Heterogeneity: Tau2 = 23.74; Chi2 = 5.76, df = 4 (P = 0.22); I2 =31%
Test for overall effect: Z = 1.63 (P = 0.10)
Test for subgroup differences: Not applicable
-100 -50 0 50 100
Favours Laminectomy Favours Laminotomy
107Surgical options for lumbar spinal stenosis (Review)
Copyright © 2016 The Cochrane Collaboration. Published by John Wiley & Sons, Ltd.
296

Analysis 4.5. Comparison 4 Laminectomy versus laminotomy, Outcome 5 Blood loss.
Review: Surgical options for lumbar spinal stenosis
Comparison: 4 Laminectomy versus laminotomy
Outcome: 5 Blood loss
Study or subgroup Laminectomy LaminotomyMean
Difference WeightMean
Difference
N Mean(SD) N Mean(SD) IV,Random,95% CI IV,Random,95% CI
Postacchini 1993 32 188.75 (79.4) 26 174.62 (63.15) 19.1 % 14.13 [ -22.55, 50.82 ]
Thome 2005 38 227 (154) 79 194.28 (125.451) 10.7 % 32.72 [ -23.52, 88.96 ]
Celik 2010 34 227 (74) 37 178 (53) 23.6 % 49.00 [ 18.83, 79.17 ]
Liu 2013 29 78 (54.9287) 27 56 (57.1577) 24.1 % 22.00 [ -7.40, 51.40 ]
Mobbs 2014 40 110 (79.4) 39 40 (63.15) 22.5 % 70.00 [ 38.40, 101.60 ]
Total (95% CI) 173 208 100.0 % 38.80 [ 17.81, 59.80 ]
Heterogeneity: Tau2 = 250.23; Chi2 = 7.21, df = 4 (P = 0.13); I2 =45%
Test for overall effect: Z = 3.62 (P = 0.00029)
Test for subgroup differences: Not applicable
-200 -100 0 100 200
Favours Laminectomy Favours Laminotomy
108Surgical options for lumbar spinal stenosis (Review)
Copyright © 2016 The Cochrane Collaboration. Published by John Wiley & Sons, Ltd.
297

Analysis 4.6. Comparison 4 Laminectomy versus laminotomy, Outcome 6 Reoperations.
Review: Surgical options for lumbar spinal stenosis
Comparison: 4 Laminectomy versus laminotomy
Outcome: 6 Reoperations
Study or subgroup Laminectomy Laminotomy Risk Ratio Weight Risk Ratio
n/N n/N IV,Random,95% CI IV,Random,95% CI
Thome 2005 4/34 4/77 83.7 % 2.26 [ 0.60, 8.53 ]
Celik 2010 2/34 0/37 16.3 % 5.43 [ 0.27, 109.19 ]
Total (95% CI) 68 114 100.0 % 2.61 [ 0.78, 8.78 ]
Total events: 6 (Laminectomy), 4 (Laminotomy)
Heterogeneity: Tau2 = 0.0; Chi2 = 0.27, df = 1 (P = 0.60); I2 =0.0%
Test for overall effect: Z = 1.55 (P = 0.12)
Test for subgroup differences: Not applicable
0.005 0.1 1 10 200
Favours Laminectomy Favours Laminotomy
Analysis 4.7. Comparison 4 Laminectomy versus laminotomy, Outcome 7 Hospitalisation.
Review: Surgical options for lumbar spinal stenosis
Comparison: 4 Laminectomy versus laminotomy
Outcome: 7 Hospitalisation
Study or subgroup Laminectomy LaminotomyMean
Difference WeightMean
Difference
N Mean(SD) N Mean(SD) IV,Random,95% CI IV,Random,95% CI
Usman 2013 30 4.67 (2.6236) 30 3.5 (2.7879) 47.4 % 1.17 [ -0.20, 2.54 ]
Mobbs 2014 40 4.2 (2.97) 39 2.3 (2.93) 52.6 % 1.90 [ 0.60, 3.20 ]
Total (95% CI) 70 69 100.0 % 1.55 [ 0.61, 2.50 ]
Heterogeneity: Tau2 = 0.0; Chi2 = 0.57, df = 1 (P = 0.45); I2 =0.0%
Test for overall effect: Z = 3.23 (P = 0.0012)
Test for subgroup differences: Not applicable
-4 -2 0 2 4
Favours Laminectomy Favours Laminotomy
109Surgical options for lumbar spinal stenosis (Review)
Copyright © 2016 The Cochrane Collaboration. Published by John Wiley & Sons, Ltd.
298

Analysis 5.1. Comparison 5 Decompression versus split-decompression, Outcome 1 Pain.
Review: Surgical options for lumbar spinal stenosis
Comparison: 5 Decompression versus split-decompression
Outcome: 1 Pain
Study or subgroup Decompression Split-decompressionMean
Difference WeightMean
Difference
N Mean(SD) N Mean(SD) IV,Random,95% CI IV,Random,95% CI
1 Long-term (12 months or more)
Cho 2007 30 40 (20) 40 23.8 (18.9) 33.2 % 16.20 [ 6.95, 25.45 ]
Rajasekaran 2013 23 17.4 (21.4) 28 19.3 (19.4) 28.9 % -1.90 [ -13.22, 9.42 ]
Liu 2013 27 17 (15.5885) 27 13 (10.3923) 38.0 % 4.00 [ -3.07, 11.07 ]
Total (95% CI) 80 95 100.0 % 6.35 [ -3.35, 16.04 ]
Heterogeneity: Tau2 = 51.50; Chi2 = 6.82, df = 2 (P = 0.03); I2 =71%
Test for overall effect: Z = 1.28 (P = 0.20)
Test for subgroup differences: Not applicable
-50 -25 0 25 50
Favours Decompression Favours Split-decompression
110Surgical options for lumbar spinal stenosis (Review)
Copyright © 2016 The Cochrane Collaboration. Published by John Wiley & Sons, Ltd.
299

Analysis 5.2. Comparison 5 Decompression versus split-decompression, Outcome 2 Disability.
Review: Surgical options for lumbar spinal stenosis
Comparison: 5 Decompression versus split-decompression
Outcome: 2 Disability
Study or subgroup Decompression Split-decompressionMean
Difference WeightMean
Difference
N Mean(SD) N Mean(SD) IV,Random,95% CI IV,Random,95% CI
1 Long-term (12 months or more)
Cho 2007 30 -39.31 (11.03) 40 -44.83 (6.79) 36.8 % 5.52 [ 1.05, 9.99 ]
Liu 2013 27 -83.79 (46.41) 27 -92.07 (37.62) 4.0 % 8.28 [ -14.25, 30.81 ]
Rajasekaran 2013 23 -39.28 (7.83) 28 -37.07 (8.72) 36.4 % -2.21 [ -6.76, 2.34 ]
Watanabe 2011 15 -87.59 (10) 17 -88.97 (11.72) 22.8 % 1.38 [ -6.15, 8.91 ]
Total (95% CI) 95 112 100.0 % 1.87 [ -2.82, 6.57 ]
Heterogeneity: Tau2 = 10.42; Chi2 = 5.97, df = 3 (P = 0.11); I2 =50%
Test for overall effect: Z = 0.78 (P = 0.43)
Test for subgroup differences: Not applicable
-50 -25 0 25 50
Favours Decompression Favours Split-decompression
111Surgical options for lumbar spinal stenosis (Review)
Copyright © 2016 The Cochrane Collaboration. Published by John Wiley & Sons, Ltd.
300

Analysis 5.3. Comparison 5 Decompression versus split-decompression, Outcome 3 Recovery.
Review: Surgical options for lumbar spinal stenosis
Comparison: 5 Decompression versus split-decompression
Outcome: 3 Recovery
Study or subgroup Decompression Split-decompressionMean
Difference WeightMean
Difference
N Mean(SD) N Mean(SD) IV,Random,95% CI IV,Random,95% CI
Cho 2007 30 48.1 (31.1) 40 73.9 (22.4) 25.2 % -25.80 [ -38.92, -12.68 ]
Watanabe 2011 15 74 (17) 17 75 (21) 25.1 % -1.00 [ -14.18, 12.18 ]
Rajasekaran 2013 23 56.7 (22) 28 48.2 (23.9) 25.5 % 8.50 [ -4.12, 21.12 ]
Liu 2013 27 83.6 (34.47) 27 86.1 (16.11) 24.2 % -2.50 [ -16.85, 11.85 ]
Total (95% CI) 95 112 100.0 % -5.18 [ -19.81, 9.45 ]
Heterogeneity: Tau2 = 176.70; Chi2 = 14.53, df = 3 (P = 0.002); I2 =79%
Test for overall effect: Z = 0.69 (P = 0.49)
Test for subgroup differences: Not applicable
-100 -50 0 50 100
Favours Decompression Favours Split-decompression
112Surgical options for lumbar spinal stenosis (Review)
Copyright © 2016 The Cochrane Collaboration. Published by John Wiley & Sons, Ltd.
301

Analysis 5.4. Comparison 5 Decompression versus split-decompression, Outcome 4 Operation time.
Review: Surgical options for lumbar spinal stenosis
Comparison: 5 Decompression versus split-decompression
Outcome: 4 Operation time
Study or subgroup Decompression Split-decompressionMean
Difference WeightMean
Difference
N Mean(SD) N Mean(SD) IV,Random,95% CI IV,Random,95% CI
Cho 2007 30 193 (68) 40 259 (122) 16.6 % -66.00 [ -110.96, -21.04 ]
Watanabe 2011 16 82 (36) 18 69 (29) 30.2 % 13.00 [ -9.15, 35.15 ]
Liu 2013 29 57 (64.62) 27 67 (109.12) 15.6 % -10.00 [ -57.41, 37.41 ]
Rajasekaran 2013 23 57.1 (17.4) 28 62.3 (22.1) 37.6 % -5.20 [ -16.04, 5.64 ]
Total (95% CI) 98 113 100.0 % -10.57 [ -34.39, 13.25 ]
Heterogeneity: Tau2 = 361.90; Chi2 = 9.65, df = 3 (P = 0.02); I2 =69%
Test for overall effect: Z = 0.87 (P = 0.38)
Test for subgroup differences: Not applicable
-200 -100 0 100 200
Favours Decompression Favours Split-decompression
113Surgical options for lumbar spinal stenosis (Review)
Copyright © 2016 The Cochrane Collaboration. Published by John Wiley & Sons, Ltd.
302

Analysis 5.5. Comparison 5 Decompression versus split-decompression, Outcome 5 Blood loss.
Review: Surgical options for lumbar spinal stenosis
Comparison: 5 Decompression versus split-decompression
Outcome: 5 Blood loss
Study or subgroup Decompression Split-decompressionMean
Difference WeightMean
Difference
N Mean(SD) N Mean(SD) IV,Random,95% CI IV,Random,95% CI
Cho 2007 30 132 (128) 40 154 (135) 12.9 % -22.00 [ -84.03, 40.03 ]
Watanabe 2011 16 51.9 (45.3) 18 41.5 (70.8) 23.2 % 10.40 [ -29.13, 49.93 ]
Rajasekaran 2013 23 61.3 (38.94) 28 85.7 (56.1) 33.3 % -24.40 [ -50.57, 1.77 ]
Liu 2013 29 78 (54.93) 27 56 (57.16) 30.6 % 22.00 [ -7.40, 51.40 ]
Total (95% CI) 98 113 100.0 % -1.83 [ -27.65, 23.98 ]
Heterogeneity: Tau2 = 341.97; Chi2 = 6.15, df = 3 (P = 0.10); I2 =51%
Test for overall effect: Z = 0.14 (P = 0.89)
Test for subgroup differences: Not applicable
-100 -50 0 50 100
Favours Decompression Favours Split-decompression
114Surgical options for lumbar spinal stenosis (Review)
Copyright © 2016 The Cochrane Collaboration. Published by John Wiley & Sons, Ltd.
303

Analysis 5.6. Comparison 5 Decompression versus split-decompression, Outcome 6 Reoperations.
Review: Surgical options for lumbar spinal stenosis
Comparison: 5 Decompression versus split-decompression
Outcome: 6 Reoperations
Study or subgroup Decompression Split-decompression Risk Ratio Weight Risk Ratio
n/N n/N IV,Random,95% CI IV,Random,95% CI
Cho 2007 1/30 1/40 39.8 % 1.33 [ 0.09, 20.47 ]
Watanabe 2011 0/15 1/17 30.3 % 0.38 [ 0.02, 8.57 ]
Rajasekaran 2013 1/23 0/28 29.8 % 3.63 [ 0.15, 84.98 ]
Total (95% CI) 68 85 100.0 % 1.22 [ 0.22, 6.85 ]
Total events: 2 (Decompression), 2 (Split-decompression)
Heterogeneity: Tau2 = 0.0; Chi2 = 1.01, df = 2 (P = 0.60); I2 =0.0%
Test for overall effect: Z = 0.23 (P = 0.82)
Test for subgroup differences: Not applicable
0.01 0.1 1 10 100
Favours Decompression Favours Split-decompression
Analysis 5.7. Comparison 5 Decompression versus split-decompression, Outcome 7 Hospitalisation.
Review: Surgical options for lumbar spinal stenosis
Comparison: 5 Decompression versus split-decompression
Outcome: 7 Hospitalisation
Study or subgroup Decompression Split-decompressionMean
Difference WeightMean
Difference
N Mean(SD) N Mean(SD) IV,Random,95% CI IV,Random,95% CI
Cho 2007 30 7.18 (2.89) 40 4.03 (1.56) 48.8 % 3.15 [ 2.01, 4.29 ]
Rajasekaran 2013 23 4.4 (1.1) 28 4.5 (0.9) 51.2 % -0.10 [ -0.66, 0.46 ]
Total (95% CI) 53 68 100.0 % 1.49 [ -1.70, 4.67 ]
Heterogeneity: Tau2 = 5.07; Chi2 = 25.10, df = 1 (P<0.00001); I2 =96%
Test for overall effect: Z = 0.91 (P = 0.36)
Test for subgroup differences: Not applicable
-10 -5 0 5 10
Favours Decompression Favours Split-decompression
115Surgical options for lumbar spinal stenosis (Review)
Copyright © 2016 The Cochrane Collaboration. Published by John Wiley & Sons, Ltd.
304

Analysis 6.1. Comparison 6 Decompression versus endoscopic decompression, Outcome 1 Disability.
Review: Surgical options for lumbar spinal stenosis
Comparison: 6 Decompression versus endoscopic decompression
Outcome: 1 Disability
Study or subgroup Decompression
EndoscopicDecompres-
sionMean
Difference WeightMean
Difference
N Mean(SD) N Mean(SD) IV,Random,95% CI IV,Random,95% CI
1 Short-term (less than 12 months)
Ruetten 2009 80 22 (11.16) 81 20 (11.16) 20.3 % 2.00 [ -1.45, 5.45 ]
Yagi 2009 21 -69.55 (8.69) 20 -79.14 (13.48) 9.6 % 9.59 [ 2.61, 16.57 ]
Komp 2015 80 28 (9.93) 80 24 (9.93) 21.9 % 4.00 [ 0.92, 7.08 ]
Subtotal (95% CI) 181 181 51.8 % 4.12 [ 0.91, 7.33 ]
Heterogeneity: Tau2 = 3.65; Chi2 = 3.70, df = 2 (P = 0.16); I2 =46%
Test for overall effect: Z = 2.52 (P = 0.012)
2 Long-term (12 months or more)
Ruetten 2009 80 22 (11.16) 81 20 (11.16) 20.3 % 2.00 [ -1.45, 5.45 ]
Yagi 2009 21 -77.83 (13.9) 20 -84.34 (8.69) 9.5 % 6.51 [ -0.55, 13.57 ]
Komp 2015 80 27 (12.53) 80 29 (12.53) 18.5 % -2.00 [ -5.88, 1.88 ]
Subtotal (95% CI) 181 181 48.2 % 1.44 [ -2.66, 5.54 ]
Heterogeneity: Tau2 = 7.63; Chi2 = 4.96, df = 2 (P = 0.08); I2 =60%
Test for overall effect: Z = 0.69 (P = 0.49)
Total (95% CI) 362 362 100.0 % 2.86 [ 0.26, 5.45 ]
Heterogeneity: Tau2 = 5.57; Chi2 = 11.44, df = 5 (P = 0.04); I2 =56%
Test for overall effect: Z = 2.15 (P = 0.031)
Test for subgroup differences: Chi2 = 1.02, df = 1 (P = 0.31), I2 =2%
-50 -25 0 25 50
Favours Decompression Favours Endoscopic decompression
116Surgical options for lumbar spinal stenosis (Review)
Copyright © 2016 The Cochrane Collaboration. Published by John Wiley & Sons, Ltd.
305

Analysis 6.2. Comparison 6 Decompression versus endoscopic decompression, Outcome 2 Operation time.
Review: Surgical options for lumbar spinal stenosis
Comparison: 6 Decompression versus endoscopic decompression
Outcome: 2 Operation time
Study or subgroup Decompression
EndoscopicDecompres-
sionMean
Difference WeightMean
Difference
N Mean(SD) N Mean(SD) IV,Random,95% CI IV,Random,95% CI
Ruetten 2009 100 48 (11.97) 92 34 (10.16) 34.4 % 14.00 [ 10.87, 17.13 ]
Yagi 2009 21 63.6 (11.43) 20 71.1 (12.57) 31.2 % -7.50 [ -14.87, -0.13 ]
Komp 2015 80 64 (12.5) 80 42 (7.75) 34.4 % 22.00 [ 18.78, 25.22 ]
Total (95% CI) 201 192 100.0 % 10.05 [ -2.09, 22.18 ]
Heterogeneity: Tau2 = 108.74; Chi2 = 53.92, df = 2 (P<0.00001); I2 =96%
Test for overall effect: Z = 1.62 (P = 0.10)
Test for subgroup differences: Not applicable
-50 -25 0 25 50
Favours Decompression Favours Endoscopic decompression
Analysis 6.3. Comparison 6 Decompression versus endoscopic decompression, Outcome 3 Blood loss.
Review: Surgical options for lumbar spinal stenosis
Comparison: 6 Decompression versus endoscopic decompression
Outcome: 3 Blood loss
Study or subgroup Decompression
EndoscopicDecompres-
sionMean
Difference WeightMean
Difference
N Mean(SD) N Mean(SD) IV,Random,95% CI IV,Random,95% CI
Yagi 2009 21 71 (5.88) 20 37 (5.88) 100.0 % 34.00 [ 30.40, 37.60 ]
Total (95% CI) 21 20 100.0 % 34.00 [ 30.40, 37.60 ]
Heterogeneity: not applicable
Test for overall effect: Z = 18.51 (P < 0.00001)
Test for subgroup differences: Not applicable
-50 -25 0 25 50
Favours Decompression Favours Endoscopic decompression
117Surgical options for lumbar spinal stenosis (Review)
Copyright © 2016 The Cochrane Collaboration. Published by John Wiley & Sons, Ltd.
306

Analysis 6.4. Comparison 6 Decompression versus endoscopic decompression, Outcome 4 Reoperations.
Review: Surgical options for lumbar spinal stenosis
Comparison: 6 Decompression versus endoscopic decompression
Outcome: 4 Reoperations
Study or subgroup Decompression
EndoscopicDecompres-
sion Risk Ratio Weight Risk Ratio
n/N n/N IV,Random,95% CI IV,Random,95% CI
Ruetten 2009 2/80 3/81 54.7 % 0.68 [ 0.12, 3.93 ]
Komp 2015 2/80 2/80 45.3 % 1.00 [ 0.14, 6.93 ]
Total (95% CI) 160 161 100.0 % 0.81 [ 0.22, 2.97 ]
Total events: 4 (Decompression), 5 (Endoscopic Decompression)
Heterogeneity: Tau2 = 0.0; Chi2 = 0.09, df = 1 (P = 0.77); I2 =0.0%
Test for overall effect: Z = 0.32 (P = 0.75)
Test for subgroup differences: Not applicable
0.01 0.1 1 10 100
Favours Decompression Favours Endoscopic decompression
Analysis 6.5. Comparison 6 Decompression versus endoscopic decompression, Outcome 5 Hospitalisation.
Review: Surgical options for lumbar spinal stenosis
Comparison: 6 Decompression versus endoscopic decompression
Outcome: 5 Hospitalisation
Study or subgroup Decompression
EndoscopicDecompres-
sionMean
Difference WeightMean
Difference
N Mean(SD) N Mean(SD) IV,Random,95% CI IV,Random,95% CI
Yagi 2009 21 12.62 (3.21) 20 4.06 (2.57) 100.0 % 8.56 [ 6.78, 10.34 ]
Total (95% CI) 21 20 100.0 % 8.56 [ 6.78, 10.34 ]
Heterogeneity: not applicable
Test for overall effect: Z = 9.45 (P < 0.00001)
Test for subgroup differences: Not applicable
-20 -10 0 10 20
Favours Decompression Favours Endoscopic decompression
118Surgical options for lumbar spinal stenosis (Review)
Copyright © 2016 The Cochrane Collaboration. Published by John Wiley & Sons, Ltd.
307

A D D I T I O N A L T A B L E S
Table 1. Sources of Risk of Bias
Bias Domain Source of Bias PossibleAnswers
Selection (1) Was the method of randomization adequate? Yes/No/Unsure
Selection (2) Was the treatment allocation concealed? Yes/No/Unsure
Performance (3) Was the patient blinded to the intervention? Yes/No/Unsure
Performance (4) Was the care provider blinded to the intervention? Yes/No/Unsure
Detection (5) Was the outcome assessor blinded to the intervention? Yes/No/Unsure
Attrition (6) Was the drop-out rate described and acceptable? Yes/No/Unsure
Attrition (7) Were all randomized participants analysed in the
group to which they were allocated?
Yes/No/Unsure
Reporting (8) Are reports of the study free of suggestion of selective
outcome reporting?
Yes/No/Unsure
Selection (9) Were the groups similar at baseline regarding the most
important prognostic indicators?
Yes/No/Unsure
Performance (10) Were cointerventions avoided or similar? Yes/No/Unsure
Performance (11) Was the compliance acceptable in all groups? Yes/No/Unsure
Detection (12) Was the timing of the outcome assessment similar
in all groups?
Yes/No/Unsure
Other (13) Are other sources of potential bias unlikely? Yes/No/Unsure
Furlan 2015
Table 2. Criteria for a Judgment of “Yes” for the Sources of Risk of Bias
1 A random (unpredictable) assignment sequence. Examples of adequate methods are coin toss (for studies with 2
groups), rolling a dice (for studies with 2 or more groups), drawing of balls of different colours, drawing of
ballots with the study group labels from a dark bag, computer-generated random sequence, preordered
sealed envelopes, sequentially-ordered vials, telephone call to a central office, and preordered list of
treatment assignments.Examples of inadequate methods are: alternation, birth date, social insurance/security number,
date in which they are invited to participate in the study, and hospital registration number
2 Assignment generated by an independent person not responsible for determining the eligibility of the patients.
This person has no information about the persons included in the trial and has no influence on the
assignment sequence or on the decision about eligibility of the patient
119Surgical options for lumbar spinal stenosis (Review)
Copyright © 2016 The Cochrane Collaboration. Published by John Wiley & Sons, Ltd.
308

Table 2. Criteria for a Judgment of “Yes” for the Sources of Risk of Bias (Continued)
3 Index and control groups are indistinguishable for the patients or if the success of blinding was tested among
the patients and it was successful.
4 Index and control groups are indistinguishable for the care providers or if the success of blinding was tested
among the care providers and it was successful.
5 Adequacy of blinding should be assessed for each primary outcome separately. This item should be scored
“yes” if the success of blinding was tested among the outcome assessors and it was successful or:
-for patient-reported outcomes in which the patient is the outcome assessor (e.g., pain, disability): the blinding
procedure is adequate for outcome assessors if participant blinding is scored “yes”
-for outcome criteria assessed during scheduled visit and that supposes a contact between participants and
outcome assessors (e.g., clinical examination): the blinding procedure is adequate if patients are blinded, and
the treatment or adverse effects of the treatment cannot be noticed during clinical examination
-for outcome criteria that do not suppose a contact with participants (e.g., radiography, magnetic resonance
imaging): the blinding procedure is adequate if the treatment or adverse effects of the treatment cannot be
noticed when assessing the main outcome
-for outcome criteria that are clinical or therapeutic events that will be determined by the interaction between
patients and care providers (e.g., cointerventions, hospitalisation length, treatment failure), in which the care
provider is the outcome assessor: the blinding procedure is adequate for outcome assessors if item “4”
(caregivers) is scored “yes”
-for outcome criteria that are assessed from data of the medical forms: the blinding procedure is adequate if
the treatment or adverse effects of the treatment cannot be noticed on the extracted data
6 The number of participants who were included in the study but did not complete the observation period or
were not included in the analysis must be described and reasons given. If the percentage of withdrawals and
drop-outs does not exceed 20% for short-term follow-up and 30% for long-term follow-up and does not lead
to substantial bias a “yes” is scored. (N.B. these percentages are arbitrary, not supported by literature)
7 All randomized patients are reported/analysed in the group they were allocated to by randomization for the
most important moments of effect measurement (minus missing values) irrespective of noncompliance and
cointerventions.
8 All the results from all prespecified outcomes have been adequately reported in the published report of the
trial. This information is either obtained by comparing the protocol and the report, or in the absence of the
protocol, assessing that the published report includes enough information to make this judgment
9 Groups have to be similar at baseline regarding demographic factors, duration and severity of complaints,
percentage of patients with neurological symptoms, and value of main outcome measure(s)
10 If there were no cointerventions or they were similar between the index and control groups
11 The reviewer determines if the compliance with the interventions is acceptable, based on the reported
intensity, duration, number and frequency of sessions for both the index intervention and control
intervention(s). For example, physiotherapy treatment is usually administered for several sessions; therefore it
is necessary to assess how many sessions each patient attended. For single-session interventions (e.g.,
surgery), this item is irrelevant.
120Surgical options for lumbar spinal stenosis (Review)
Copyright © 2016 The Cochrane Collaboration. Published by John Wiley & Sons, Ltd.
309

Table 2. Criteria for a Judgment of “Yes” for the Sources of Risk of Bias (Continued)
12 Timing of outcome assessment should be identical for all intervention groups and for all primary outcome
measures.
13 Other types of biases. For example:
-When the outcome measures were not valid. There should be evidence from a previous or present scientific
study that the primary outcome can be considered valid in the context of the present.
-Industry-sponsored trials. The conflict of interest (COI) statement should explicitly state that the researchers
have had full possession of the trial process from planning to reporting without funders with potential COI
having any possibility to interfere in the process. If, for example, the statistical analyses have been done by a
funder with a potential COI, usually “unsure” is scored.
Furlan 2015
A P P E N D I C E S
Appendix 1. Search strategy
CENTRAL
Last searched 16 June 2016
1. spinal stenosis.mp. or Spinal Stenosis/
2. canal stenosis.mp.
3. lumbar stenosis.mp.
4. 1 or 2 or 3
5. neurosurgery/ or orthopedics/
6. decompression.mp. or Decompression, Surgical/
7. Spinal Fusion/
8. surgery.mp.
9. 5 or 6 or 7 or 8
10. 4 and 9
MEDLINE
Last searched 16 June 2016
1. Exp spinal stenosis/
2. “canal stenosis”.mp.
3. (spin* adj3 stenosis).mp.
4. (lumbar adj3 stenosis).mp.
5. (lateral adj3 stenosis).mp.
6. (central adj3 stenosis).mp.
7. (foramin* adj3 stenosis).mp.
8. “neurogenic claudication”.mp.
9. Exp radiculopathy/
10. Radiculopathy.mp.
121Surgical options for lumbar spinal stenosis (Review)
Copyright © 2016 The Cochrane Collaboration. Published by John Wiley & Sons, Ltd.
310

11. “radicular pain”.mp.
12. “lumbar radicular pain”.mp.
13. Exp spondylolisthesis/
14. Spondylolisthesis.mp.
15. (lumb* adj5 spondyl*).mp.
16. Exp spondylosis/
17. Spondylosis.mp
18. 1 or 2 or 3 or 4 or 5 or 6 or 7 or 8 or 9 or 10 or 11 or 12 or 13 or 14 or 15 or 16 or 17
19. Exp general surgery/
20. Surgery.mp.
21. Exp decompression, surgical/
22. “decompres* surgery”.mp.
23. Decompression.mp
24. (spin* adj3 decompress*).mp.
25. Exp laminectomy/
26. Laminectom*.mp.
27. Laminotom*.mp.
28. Laminoplasty.mp.
29. Exp spinal fusion/
30. (spin* adj3 fusion).mp.
31. (pedicle adj3 screw).mp.
32. “lumbar fusion”.mp.
33. “vertebrae fusion”.mp.
34. “vertebral fixation”.mp.
35. “spinal fixation”.mp.
36. Spondylodesis.mp
37. Spondylosyndesis.mp
38. Arthrodesis.mp. Or exp arthrodesis/
39. (posterolateral adj3 fusion).mp
40. (interbody adj3 fusion).mp
41. (anterior adj3 fusion).mp
42. (posterior adj3 fusion).mp
43. (transforaminal adj3 fusion).mp
44. (transpsoas adj3 fusion).mp
45. (facet adj3 fusion).mp
46. (bone adj3 graft).mp
47. (fixation adj3 spin*).mp
48. (pedicle adj3 fusion).mp
49. Graft.mp
50. (cage adj3 fusion).mp
51. (screw adj3 fusion).mp
52. Foraminotomy.mp. Or exp foraminotomy/
53. Foraminectomy.mp
54. Exp surgical procedures, minimally invasive/
55. “minim* invasive”.mp.
56. 19 or 20 or 21 or 22 or 23 or 24 or 25 or 26 or 27 or 28 or 29 or 30 or 31 or 32 or 33 or 34 or 35 or 36 or 37 or 38 or 39 or 40
or 41 or 42 or 43 or 44 or 45 or 46 or 47 or 48 or 49 or 50 or 51 or 52 or 53 or 54 or 55
57. 18 and 56
58. Exp randomized controlled trial/
59. Randomized controlled trial.pt.
60. “randomized controlled trial”.mp.
61. (random* adj3 trial).ab,ti.
62. Exp controlled clinical trial/
122Surgical options for lumbar spinal stenosis (Review)
Copyright © 2016 The Cochrane Collaboration. Published by John Wiley & Sons, Ltd.
311

63. “controlled clinical trial”.mp.
64. Randomized.ab,ti.
65. Placebo.ab,ti.
66. Randomly.ab,ti.
67. Random*.ab,ti.
68. Trial.ab,ti.
69. Exp clinical trial/
70. “clinical trial”.pt.
71. “clinical trial”.mp.
72. “clinical study”.ab,ti.
73. 58 or 59 or 60 or 61 or 62 or 63 or 64 or 65 or 66 or 67 or 68 or 69 or 70 or 71 or 72
74. 57 and 73
75. Limit 74 to humans
EMBASE
Last searched 16 June 2016
1. ’vertebral canal stenosis’/exp OR ’vertebral canal stenosis’
2. ’spine NEAR/3 stenosis’
3. ’lumbar NEAR/3 stenosis’
4. ’lateral NEAR/3 stenosis’
5. ’central stenosis’
6. ’foraminal stenosis’
7. ’neurogenic claudication’
8. ’radiculopathy’/exp OR radiculopathy
9. ’radicular pain’/exp OR ’radicular pain’
10. ’lumbar radicular pain’
11. ’spondylolisthesis’/exp OR spondylolisthesis
12. ’spondylosis’/exp OR spondylosis
13. 1 OR 2 OR 3 OR 4 OR 5 OR 6 OR 7 OR 8 OR 9 OR 10 OR 11 OR 12
14. ’surgery’/exp OR surgery
15. ’decompression surgery’/exp OR ’decompression surgery’
16. ’decompression spinal cord’/exp OR ’decompression spinal cord’
17. ’decompression’/exp OR decompression
18. ’laminectomy’/exp OR laminectomy
19. laminotomy
20. ’laminoplasty’/exp OR laminoplasty
21. ’spine fusion’/exp OR ’spine fusion’
22. ’spinal fusion’/exp OR ’spinal fusion’
23. ’lumbar NEAR/3 fusion’
24. ’vertebrae fusion’
25. ’vertebral fixation’
26. ’spondylodesis’/exp OR spondylodesis
27. ’spinal fixation’
28. ’spinal fixation device’/exp OR ’spinal fixation device’
29. ’spondylosyndesis’/exp OR spondylosyndesis
30. posterolateral NEAR/3 fusion
31. interbody NEAR/3 fusion
32. anterior NEAR/3 fusion
33. posterior NEAR/3 fusion
34. transforaminal NEAR/3 fusion
35. ’transpsoas fusion’
36. facet NEAR/3 fusion
123Surgical options for lumbar spinal stenosis (Review)
Copyright © 2016 The Cochrane Collaboration. Published by John Wiley & Sons, Ltd.
312

37. ’arthrodesis’/exp OR arthrodesis
38. bone NEAR/5 graft
39. fixation NEAR/5 spin*
40. pedicle NEAR/5 fusion
41. cage NEAR/5 fusion
42. screw NEAR/5 fusion
43. pedicle NEAR/5 screw
44. ’foraminotomy’/exp OR foraminotomy
45. foraminectomy
46. ’minimally invasive procedures’/exp OR ’minimally invasive procedures’
47. ’minim$ invasive’
48. 14 OR 15 OR 16 OR 17 OR 18 OR 19 OR 20 OR 21 OR 22 OR 23 OR 24 OR 25 OR 26 OR 27 OR 28 OR 29 OR 30 OR
31 OR 32 OR 33 OR 34 OR 35 OR 36 OR 37 OR 38 OR 39 OR 40 OR 41 OR 42 OR 43 OR 44 OR 45 OR 46 OR 47
49. 13 AND 48
50. ’randomized controlled trial’/exp OR ’randomized controlled trial’
51. ’controlled clinical trial’/exp OR ’controlled clinical trial’
52. ’clinical trial’/exp OR ’clinical trial’
53. randomized:ab
54. placebo:ab
55. randomly:ab
56. trial:ab
57. ’clinical study’:ab
58. 27 OR 28 OR 29 OR 30 OR 31 OR 32 OR 33 OR 34
59. 26 AND 35
60. 59 AND ’human’/de
CINAHL
Last searched 16 June 2016
57. 19 AND 56
56. 20 OR 21 OR 22 OR 23 OR 24 OR 25 OR 26 OR 27 OR 28 OR 29 OR 30 OR 31 OR 32 OR 33 OR 34 OR 35 OR 36 OR
37 OR 38 OR 39 OR 40 OR 41 OR 42 OR 43 OR 44 OR 45 OR 46 OR 47 OR 48 OR 49 OR 50 OR 51 OR 52 OR 53 OR 54
OR 55
55. (MH “Minimally Invasive Procedures”) OR “Minimally Invasive”
54. “Foraminectomy”
53. “Foraminotomy”
52. “Screw fusion”
51. “Cage fusion”
50. “Pedicle fusion”
49. (MH “Grafts+”) OR “Bone graft”
48. (MH “Arthrodesis+”)
47. “Facet fusion”
46. “Transpsoas fusion”
45. “Transforaminal fusion”
44. “Posterior fusion”
43. “Anterior fusion”
42. “Anterior near/5 fusion”
41. “Interbody fusion”
40. “Posterolateral fusion”
39. “Spondylosyndesis”
38. “Spinal fixation” OR (MH “Orthopedic Fixation Devices+”)
37. “Spondylodesis”
36. “vertebral fixation”
124Surgical options for lumbar spinal stenosis (Review)
Copyright © 2016 The Cochrane Collaboration. Published by John Wiley & Sons, Ltd.
313

35. “vertebrae fusion”
34. “lumbar fusion”
33. (MH “Orthopedic Fixation Devices+”) OR “pedicle screw”
32. “spin* fusion”
31. (MH “Arthrodesis+”) OR “arthrodesis”
30. (MH “Spinal Fusion”) OR “Spinal Fusion”
29. “Laminoplasty”
28. “Laminotom*”
27. “Laminectom*”
26. (MH “Laminectomy”) OR “Laminectomy”
25. “lumbar decompress*”
24. “spin* decompress*”
23. “Decompres* surgery”
22. (MH “Decompression, Surgical+”) OR “Decompression”
21. “surgery”
20. (MH “Surgery, Operative+”)
19. 1 OR 2 OR 3 OR 4 OR 5 OR 6 OR 7 OR 8 OR 9 OR 10 OR 11 OR 12 OR 13 OR 14 OR 15 OR 16 OR 17 OR 18
18. (MH “Spondylolysis+”) OR “spondilolisys”
17. “Spondylosis”
16. (MH “Spondylosis+”)
15. “lumb* spondyl*”
14. (MH “Spondylolisthesis”) OR “Spondylolisthesis”
13. “lumbar radicular pain”
12. “radicular pain”
11. (MH “Radiculopathy”) OR “Radiculopathy”
10. “neurogenic claudication”
9. (MH “Intermittent Claudication”)
8. “foramin* stenosis”
7. “central stenosis”
6. “lateral stenosis”
5. “lumbar stenosis”
4. “Canal stenosis”
3. “spin* stenosis”
2. “spinal stenosis”
1. (MH “Spinal Stenosis”)
AMED
Last searched 16 June 2016
1. Exp Spinal stenosis/
2. Canal stenosis.mp.
3. (spin* adj3 stenosis).mp.
4. (lumbar adj3 stenosis).mp.
5. (lateral adj3 stenosis).mp.
6. (central adj3 stenosis).mp.
7. (foramin* adj3 stenosis).mp.
8. “neurogenic claudication”.mp.
9. Radiculopathy.mp.
10. “radicular pain”.mp.
11. “lumbar radicular pain”.mp.
12. Exp Spondylolisthesis/
13. Spondylolisthesis.mp.
14. (lumb* adj5 spondyl*).mp.
125Surgical options for lumbar spinal stenosis (Review)
Copyright © 2016 The Cochrane Collaboration. Published by John Wiley & Sons, Ltd.
314

15. Spondylosis.mp.
16. 1 or 2 or 3 or 4 or 5 or 6 or 7 or 8 or 9 or 10 or 11 or 12 or 13 or 14 or 15
17. Exp surgery/
18. Surgery.mp.
19. Surgery operative.mp.
20. Decompression.mp.
21. “Decompres* surgery”.mp.
22. (spin* adj3 decompress*).mp.
23. Exp Laminectomy/
24. Laminectom*.mp.
25. Laminotomy.mp.
26. Laminoplasty.mp.
27. Exp arthrodesis/
28. (spin* adj3 fusion).mp.
29. (pedicle adj3 screw).mp.
30. “lumbar fusion”.mp.
31. “vertebrae fusion”.mp.
32. “Vertebral fixation”.mp.
33. “Spinal fixation”.mp.
34. Spondylodesis.mp.
35. Spondylosyndesis.mp.
36. Exp Arthrodesis/ or Arthrodesis.mp.
37. (Posterolateral adj3 fusion).mp.
38. (Interbody adj3 fusion).mp.
39. (Anterior adj3 fusion).mp.
40. (Posterior adj3 fusion).mp.
41. (Transforaminal adj3 fusion).mp.
42. (Transpsoas adj3 fusion).mp.
43. (Facet adj3 fusion).mp.
44. (Bone adj3 graft).mp.
45. (Fixation adj3 spin*).mp.
46. (Pedicle adj3 fusion).mp.
47. Graft.mp.
48. (Cage adj3 fusion).mp.
49. (Screw adj3 fusion).mp.
50. Foraminotomy.mp.
51. “Minim* invasive”.mp.
52. 17 or 18 or 19 or 20 or 21 or 22 or 23 or 24 or 25 or 26 or 27 or 28 or 29 or 30 or 31 or 32 or 33 or 34 or 35 or 36 or 37 or 38
or 39 or 40 or 41 or 42 or 43 or 44 or 45 or 46 or 47 or 48 or 49 or 50 or 51
53. 16 and 52
Web of Science
Last searched 16 June 2016
54. 53 and 43
53. 52 or 51 or 50 or 49 or 48 or 47 or 46 or 45 or 44
52. “clinical study”
51. “clinical trial”
50. Trial)
49. Random*
48. Placebo
47. Randomized
46. “controlled clinical trial”
126Surgical options for lumbar spinal stenosis (Review)
Copyright © 2016 The Cochrane Collaboration. Published by John Wiley & Sons, Ltd.
315

45. “randomized clinical trial”
44. “randomized controlled trial”
43. 42 and 14
42.41 or 40 or 39 or 38 or 37 or 36 or 35 or 34 or 33 or 32 or 31 or 30 or 29 or 28 or 27 or 26 or 25 or 24 or 23 or 22 or 21 or 20 or
19 or 18 or 17 or 16 or 15
41. “minimally invasive”
40. Foraminectomy
39. Foraminotomy
38. “pedicle screw”
37. “cage fusion”
36. Arthrodesis
35. ”facet fusion“
34. ”transpsoas fusion“
33. ”transforaminal fusion“
32. ”posterior fusion“
31. ”anterior fusion“
30. ”interbody fusion“
29. ”posterolateral fusion“
28. Spondylosyndesis
27. ”spinal fixation“
26. Spondylodesis
25. ”vertebral fixation“
24. ”vertebrae fusion“
23. Arthrodesis
22. ”lumbar fusion“
21. ”spin* fusion“
20. Laminoplasty
19. Laminotom*
18. Laminectomy
17. Decompressive
16. Decompression
15. Surgery
14. 13 or 12 or 11 or 10 or 9 or 8 or 7 or 6 or 5 or 4 or 3 or 2 or 1
13. Spondylolysis
12. Spondylosis
11. ”spondylolisthesis“
10. ”lumbar radicular pain“
9.” radicular pain“
8. ”radiculopathy“
7. ”neurogenic claudication“
6. ”foramin* stenosis“
5. ”central stenosis“
4. ”lateral stenosis“
3. ”lumbar stenosis“
2. ”canal stenosis“
1. ”spin* stenosis“
LILACS
Last searched 16 June 2016
(”spine stenosis“ OR ”spinal stenosis“ OR ”canal stenosis“ OR ”lumbar stenosis“ OR ”central stenosis“ OR ”lateral stenosis“ OR
”foraminal stenosis“ OR ”spondylolisthesis“ OR spondylosis OR ”neurogenic claudication“ OR radiculopathy OR ”radicular pain“)
AND (surgery OR decompression OR decompressive OR laminectomy OR laminotomy OR laminoplasty OR ”spinal fusion“ OR
127Surgical options for lumbar spinal stenosis (Review)
Copyright © 2016 The Cochrane Collaboration. Published by John Wiley & Sons, Ltd.
316

”spine fusion“ OR arthrodesis OR ”lumbar fusion“ OR ”vertebrae fusion“ OR ”vertebral fixation“ OR spondylodesis OR ”spinal
fixation“ OR spondylosyndesis OR ”posterolateral fusion“ OR ”interbody fusion“ OR ”anterior fusion“ OR ”posterior fusion“ OR
”transforaminal fusion“ OR ”transpsoas fusion“ OR ”facet fusion“ OR ”bone graft“ OR ”pedicle fusion“ OR ”cage fusion“ OR ”screw
fusion“ OR ”pedicle screw“ OR screw OR rod OR foraminotomy OR foraminectomy OR ”surgical procedure“ OR ”minimally
invasive“)
ClinicalTrials.gov, WHO ICTRP and ANZCTR
Last searched 16 June 2016
ClinicalTrials.gov: Search: (surgery OR decompression) AND Condition: spinal stenosis
WHO ICTRP: Title: (surgery OR decompression) AND Condition: spinal stenosis
ANZCTR: Search terms: (surgery OR decompression) AND Health condition(s) or problem(s) studied: spinal stenosis
Appendix 2. The GRADE approach to evidence synthesis
The quality of evidence will be categorised as follows:
• High (⊕⊕⊕⊕): further research is very unlikely to change the confidence in the estimate of effect.
• Moderate (⊕⊕⊕©): further research is likely to have an important impact in the confidence in the estimate of effect.
• Low (⊕⊕©©): further research is very likely to have an important impact on our confidence in the estimate of effect and is
likely to change the estimate.
• Very Low (⊕©©©): any estimate of effect is very uncertain.
The evidence available to answer each sub-question will be graded on the domains in the following manner:
1. Risk of bias
Limitations in the study design and implementation may bias the estimates of the treatment effect. Our confidence in the estimate of
the effect and in the following recommendation decreases if studies suffer from major limitations. We will examine all studies on five
types of biases:
a) Selection (random sequence generation, allocation concealment, group similarities at baseline)
b) Performance (blinding of participants, blinding of healthcare providers)
c) Attrition (dropouts and intention-to-treat analysis)
d) Measurement (blinding of the outcome assessors and timing of outcome assessment)
e) Reporting bias (selective reporting)
The quality of evidence will be downgraded as follows:
• by one level: when most of the evidence comes from individual studies either with a crucial limitation for one criterion, or with
some limitations for multiple criteria
• by two levels: when most of the evidence comes from individual studies with crucial limitations for multiple criteria
2. Inconsistency
Inconsistency refers to an unexplained heterogeneity of results. Widely differing estimates of the treatment effect (i.e. heterogeneity or
variability in results) across studies suggest true differences in underlying treatment effect. Inconsistency may arise from differences in:
populations (e.g. drugs may have larger relative effects in sicker populations), interventions (e.g. larger effects with higher drug doses),
or outcomes (e.g. diminishing treatment effect with time).
The quality of evidence will be downgraded as follows:
• by one level: when the heterogeneity or variability in results is large.
• by two levels: when the heterogeneity or variability in results is large AND there was inconsistency arising from populations,
interventions, or outcomes.
3. Indirectness
Indirect population, intervention, comparator, or outcome: the question being addressed in this systematic review is different from the
available evidence regarding the population, intervention, comparator, or an outcome in the included randomised trial.
The quality of evidence will be downgraded as follows:
• by one level: when there is indirectness in only one area
• by two levels: when there is indirectness in two or more areas
4. Imprecision
128Surgical options for lumbar spinal stenosis (Review)
Copyright © 2016 The Cochrane Collaboration. Published by John Wiley & Sons, Ltd.
317

Results are imprecise when studies include relatively few participants and few events and thus have wide confidence intervals around the
estimate of the effect. In such a case we judge the quality of the evidence to be lower than it otherwise would be because of uncertainty
in the results. Each outcome is considered separately.
For dichotomous outcomesWe will consider imprecision for either of the following two reasons:
1. There is only one study (unless the study provide data from more than 300 participants). When there is more than one study, the
total number of events is less than 300 (a threshold rule-of-thumb value) (Guyatt 2011).
2. 95% confidence interval around the pooled or best estimate of effect includes both 1) no effect and 2) appreciable benefit or
appreciable harm. The threshold for ’appreciable benefit’ or ’appreciable harm’ is a relative risk reduction (RRR) or relative risk increase
(RRI) greater than 25%.
The quality of the evidence will be downgraded as follows:
• by one level: when there is imprecision due to (1) or (2)
• by two levels: when there is imprecision due to (1) and (2)
For continuous outcomesWe will consider imprecision for either of the following two reasons:
1. There is only one study (unless the study provide data from more than 400 participants). When there is more than one study, total
population size is less than 400 (a threshold rule-of-thumb value; using the usual α and β , and an effect size of 0.2 standard deviations,
representing a small effect).
2. 95% confidence interval includes no effect and the upper or lower confidence limit crosses an effect size (standardised mean difference)
of 0.5 in either direction.
The quality of the evidence will be downgraded as follows:
• by one level: when there is imprecision due to (1) or (2)
• by two levels: when there is imprecision due to (1) and (2)
5. Publication bias
Publication bias is a systematic underestimate or an overestimate of the underlying beneficial or harmful effect due to the selective
publication of studies.
The quality of evidence will be downgraded as follows:
• by one level: when the funnel plot suggests publication bias
C O N T R I B U T I O N S O F A U T H O R S
GCM drafted the manuscript. GCM, MBP, MR and RIY selected eligible studies from the systematic search and performed data
extraction. GCM, MBP and RIY performed the ’Risk of bias’ assessments. MLF, CGM, PHF and IAH are responsible for the concept
and design of the review. BWK and MvT contributed with critical revision of the review for important intellectual content. All review
authors participated in reading and approving the final manuscript.
D E C L A R A T I O N S O F I N T E R E S T
The review authors declare that they have no competing interests and received no external funding to perform this systematic review.
GCM and MBP are supported by an international postgraduate research scholarship/postgraduate award from the Australian Depart-
ment of Education and Training. CGM is supported by a principal research fellowship from the National Health and Medical Research
Council. MLF is supported by a Sydney Medical Foundation Fellowship from the Sydney Medical School, The University of Sydney.
BWK is co-author of one of the included trials (Moojen 2013), but was not involved in the quality assessment or data extraction of
this trial. The remaining authors have noting to declare.
129Surgical options for lumbar spinal stenosis (Review)
Copyright © 2016 The Cochrane Collaboration. Published by John Wiley & Sons, Ltd.
318

S O U R C E S O F S U P P O R T
Internal sources
• None, Other.
External sources
• None, Other.
D I F F E R E N C E S B E T W E E N P R O T O C O L A N D R E V I E W
This is an update of a review published in PLoS One (Machado 2015). The study protocol was previously registered on PROSPERO
(registration number CRD42013005901). We followed the new recommendations of the Cochrane Back and Neck Group in this
review (Furlan 2015), which was not stated in the protocol or previous version of this review as it was not yet published. There were
no substantial changes from the protocol or the previous version of this review.
I N D E X T E R M S
Medical Subject Headings (MeSH)
∗Lumbar Vertebrae; Back Pain [surgery]; Blood Loss, Surgical [statistics & numerical data]; Decompression, Surgical [∗methods]; Leg;
Operative Time; Pain Management; Randomized Controlled Trials as Topic; Reoperation [statistics & numerical data]; Spinal Stenosis
[∗surgery]; Treatment Outcome
MeSH check words
Humans
130Surgical options for lumbar spinal stenosis (Review)
Copyright © 2016 The Cochrane Collaboration. Published by John Wiley & Sons, Ltd.
319
Copyright © 2022 FDOKUMEN