RIGA TECHNICAL UNIVERSITY
97
RIGA TECHNICAL UNIVERSITY FACULTY OF ENGINEERING ECONOMICS AND MANAGEMENT BUSINESS PLAN FOR THE INTRODUCTION OF A SMARTPHONE APPLICATION OF TRANSPORT IN THE LATVIAN MARKET BACHELOR THESIS Degree in Management Engineering Academic Course 2016-2017 Author: Ana Cristina Santervás Garrido Supervisor: Elina Gaile-Sarkane
-
Upload
khangminh22 -
Category
Documents
-
view
3 -
download
0
Transcript of RIGA TECHNICAL UNIVERSITY
RIGA TECHNICAL UNIVERSITY
FACULTY OF ENGINEERING ECONOMICS
AND MANAGEMENT
BUSINESS PLAN FOR THE INTRODUCTION OF A
SMARTPHONE APPLICATION OF TRANSPORT IN
THE LATVIAN MARKET
BACHELOR THESIS
Degree in Management Engineering
Academic Course 2016-2017
Author: Ana Cristina Santervás Garrido
Supervisor: Elina Gaile-Sarkane

BUSINESS PLAN FOR THE INTRODUCTION OF A SMARTPHONE APPLICATION OF TRANSPORT
IN THE LATVIAN MARKET
ACKNOWLEDGMENT
First I would like to sincerely thank my tutor Elina Gaile-Sarkane for her effort and dedication.
Her knowledge, her orientations, her way of working, her patience and her support have been
fundamental during these months that I have been doing my bachelor thesis.
Thanks to Pedro Sanz Angulo, the responsible of the Erasmus at my home university, for his
availability at all times, his great help and his selfless work.
Thanks to my family, my parents and my sister for always support me, both from a distance
and during these wonderful Christmas together.
And finally thanks to Carmen, my partner from the beginning, in the university and life,
because without her these months would not have been the same.

BUSINESS PLAN FOR THE INTRODUCTION OF A SMARTPHONE APPLICATION OF TRANSPORT
IN THE LATVIAN MARKET
I declare that I have worked on my thesis on my own and that I have used only the sources
listed in the Bibliography section and internet sources.
………………………………………………………………………………………………………..
Ana Cristina Santervás Garrido

BUSINESS PLAN FOR THE INTRODUCTION OF A SMARTPHONE APPLICATION OF TRANSPORT
IN THE LATVIAN MARKET
INDEX
1. INTRODUCTION ............................................................................................................... 1
1.1. TOPICALITY ................................................................................................................ 1
1.2. TASKS AND AIM OF RESEARCH ........................................................................................ 1
1.3. LIMITATIONS .............................................................................................................. 1
1.4. DESCRIPTION OF METHODOLOGY .................................................................................... 2
1.5. SOURCES OF INFORMATION ........................................................................................... 2
1.6. DESCRIPTION OF EACH CHAPTER ..................................................................................... 2
2. TEORETHICAL PART .......................................................................................................... 3
2.1. DESCRIPTION OF THE PRODUCT ...................................................................................... 3
2.2. ANALYSIS OF STAKEHOLDERS ......................................................................................... 5
2.2.1. INTERNAL CHANGES .................................................................................................................. 8
2.2.2. EXTERNAL CHANGES .................................................................................................................. 9
2.3. MARKET STUDY ........................................................................................................ 11
2.4. BENCHMARKING........................................................................................................ 12
2.4.1. ANALYSIS OF COMPETITORS .................................................................................................... 12
2.4.2. ANALYSIS OF MARKETING ........................................................................................................ 14
2.5. TECHNICAL STUDY ..................................................................................................... 17
2.6. BUSINESS ORGANIZATION ........................................................................................... 18
2.6.1. LEGAL STRUCTURE ................................................................................................................... 18
2.6.2. ORGANIZATIONAL STRUCTURE ................................................................................................ 21
2.7. STUDY OF INVESTMENT ............................................................................................... 22
2.7.1. FINANCIAL SOURCES ................................................................................................................ 22
2.7.2. BREAKDOWN OF INVESTMENT ................................................................................................ 23
2.8. FINANCIAL STUDY ...................................................................................................... 24
2.8.1. STUDY OF INCOMES AND OUTCOMES ..................................................................................... 24
- Sales/Consumption Forecast ................................................................................................ 24
- Operating costs ..................................................................................................................... 25
- Cash flow or Profit and Loss Statement. ............................................................................... 25
2.8.2. STUDY OF FINANCIAL FEASIBILITY OF THE PROJECT ................................................................ 28
BUSINESS PLAN FOR THE INTRODUCTION OF A SMARTPHONE APPLICATION OF TRANSPORT
IN THE LATVIAN MARKET
3. PRACTICAL PART ............................................................................................................ 29
3.1. DESCRIPTION OF THE PRODUCT .................................................................................... 29
3.2. STAKEHOLDERS ANALYSIS ............................................................................................ 30
3.3. MARKET STUDY ......................................................................................................... 32
3.3.1. ANALYSIS OF INDUSTRY AND ASPECTS RELATED TO THE PROJECT ......................................... 32
3.3.2. ANALYSIS OF THE TARGET MARKET ......................................................................................... 37
3.3.3. ANALYSIS AND DEMAND FORECAST ........................................................................................ 39
3.4. BENCHMARKING........................................................................................................ 40
3.4.1. ANALYSIS OF COMPETITORS .................................................................................................... 40
3.4.2. ANALYSIS OF MARKETING ........................................................................................................ 48
3.5. TECHNICAL STUDY ..................................................................................................... 49
3.5.1. PROJECT REQUIREMENTS ........................................................................................................ 49
3.5.2. ERGONOMICS........................................................................................................................... 50
3.6. BUSINESS ORGANIZATION ........................................................................................... 54
3.6.1. LEGAL STRUCTURE ................................................................................................................... 54
3.6.2. ORGANIZATIONAL STRUCTURE ................................................................................................ 54
3.7. STUDY OF INVESTMENT ............................................................................................... 57
3.7.1. FINANCIAL SOURCES ................................................................................................................ 57
3.7.2. BREAKDOWN OF INVESTMENT ................................................................................................ 58
3.8. FINANCIAL STUDY ...................................................................................................... 60
3.8.1. STUDY OF INCOMES AND OUTCOMES ..................................................................................... 60
- Sales/Consumption forecast ................................................................................................. 60
- Operating costs ..................................................................................................................... 61
- Profit and Loss Statement .................................................................................................... 62
3.8.2. STUDY OF FINANCIAL FEASIBILITY OF THE PROJECT ................................................................ 64
4. CONCLUSIONS ............................................................................................................... 67
5. RECOMENDATIONS ........................................................................................................ 68
6. BIBLIOGRAPHY ............................................................................................................... 69
7. APPENDICES .................................................................................................................... 2
1
BUSINESS PLAN FOR THE INTRODUCTION OF A SMARTPHONE APPLICATION OF TRANSPORT
IN THE LATVIAN MARKET
1. INTRODUCTION
1.1. Topicality
The Project respond to the need for users of public transport to have a mobile application that
combines all the transport media that exists in the city of Riga, since there are many
applications, (such as Satiksme or Taxify) but all are focused only on a part of this sector, none
of it covers it completely.
It is therefore important for both Latvians and Russians who do not live in Riga but visit it
frequently, or for those who live in the city but do not always carry the same routes and
therefore do not know exactly which transport media best meets their Needs; As for the
tourists who come to this city and do not know anything about it, to have a platform that
combines all the transport media and to which they can access with total speed and ease of
use, through their smartphones.
1.2. Tasks and Aim of research
The aim of this Project is to cover the market niche of the Mobile Applications of Transport in
Riga, since as we have said before there are many of these, but none of them combines all
existing transport media in the city, namely: tram, trolley bus, bus, minibus, night bus, taxi
(with information about all the existing companies) and even in a future train, boat or bicycle.
Therefore, the overall objective of the project will be to carry out a business plan for a mobile
transport application in the city of Riga and the specific objectives will be as follows:
Study the market and demonstrate the real user’s need of this type of application.
Analyze the competitors, verifying that they do not adequately cover the market and
compare them, detecting their strengths and weaknesses.
Define the requirements of the application, in both design and software factors; and
those of the company that will need to be built to develop the activity.
Perform all financial calculations, and demonstrate the feasibility of the project.
1.3. Limitations
The main limitations identified during the development of the Project are those related to the
project itself, since it is a business plan for a new activity and not for one already developed,
the calculations have to be based on forecasts.

2
BUSINESS PLAN FOR THE INTRODUCTION OF A SMARTPHONE APPLICATION OF TRANSPORT
IN THE LATVIAN MARKET
We also find limitations on the availability of information to conduct the market study, due to
some statistics of the last few years are not yet available.
1.4. Description of methodology
The methods named below are those selected to carry out this project, specifically in the
analytical field of the business plan:
Stakeholder’s analysis according to Freeman’s method.
Benchmarking: Analysis of competitors using multicriteria methods of decision-
making, specifically Weighted Product and Linear Mapping methods.
Analysis of marketing through Balanced Scorecard.
Financial analysis using the Cash Flow method.
1.5. Sources of information
The main sources of information used are four: Scientific publications and books as
"Stakeholder's Analysis" by Freeman; Stacked data and Statistics, widely used for analytical
studies, namely the market study; Digital Content through web pages, with the availability of a
large amount of information, but with the need to be constrained; and Studies and Projects
previously performed.
1.6. Description of each chapter
The project consists of seven differentiated chapters: introduction, theoretical part, practical
part, conclusions, recommendations, bibliography and appendices. The main chapters are 2
and 3, theoretical part and practical part.
The theoretical part describes the fundamentals of each step to be performed or analyzed in
the practical part, i.e., if we are using a specific methodology in the practical part, that
methodology will be described in detail in the theoretical part.
In the practical part the actual study of the Project object is carried out, i.e., the analysis,
comparisons, calculations, forecasts, etc. are performed. It works with data and it is the
specific and differentiating part of the Project. This part gathers the verbal and graphic
information of what the business is. It is the synthesis of how the owners, administrators or
entrepreneurs will organize the business, carrying out the necessary and sufficient activities to
be successful.
3
BUSINESS PLAN FOR THE INTRODUCTION OF A SMARTPHONE APPLICATION OF TRANSPORT
IN THE LATVIAN MARKET
2. TEORETHICAL PART
2.1. Description of the product
A Business Plan is a document where all the information about a project is detailed, evaluating
all aspects of the feasibility of a commercial initiative, including the description and analysis of
business expectations. It is created, or usually made, by a person who has an innovative idea
or who want to start a business, that is to say, it embodies the entrepreneur ideas and how to
carry them out.
Making a Business Plan is important in any project, regardless of its size or sector. However,
this does not guarantee its success, it will just be not only a useful tool to guide the project
development but also a financial tool.
Therefore, it is a script or a memory in a broad sense, which serves as the basis and the
starting point of any business development.
It will contain the information needed to make an assessment of the content of the project
and its technical, commercial (market analysis, product marketing, etc.), economic
(investments, budgets, funding sources, etc.) and human (structure, organization, training,
etc.) feasibility. To achieve this, we need to identify, describe and analyse the business
opportunity (critical issues which initially we did not repair on may appear at this stage),
compare with its competitors and develop procedures and strategies to turn this business
opportunity into a business project, due to the fact that it is a prior definition of marketing,
human resources, procurement, financial policies, etc., all of them based on the market study.
A Business Plan does not have a fixed structure, but which is commonly used and which is
going to be held in this Project is as follows:
Description of the product.
- Objective of the project.
- Description of the project.
- Distinguishing features.
- The idea of necessity or business opportunity.
Analysis of Stakeholders, that could be included in the Market study.
Market Study.
- Analysis of the industry and aspects related to the project.
- Definition and analysis of the target market.
- Analysis and demand forecast.

4
BUSINESS PLAN FOR THE INTRODUCTION OF A SMARTPHONE APPLICATION OF TRANSPORT
IN THE LATVIAN MARKET
Benchmarking, that could be included in Market study.
- Analysis of competitors.
- Analysis of marketing.
Technical Study
- Project requirements.
- Ergonomics.
Business Organization.
- Legal structure.
- Organizational structure.
Study of investment.
- Financial Sources.
- Breakdown of investment.
Financial Study.
- Study of incomes and outcomes.
- Study of financial feasibility of the project.
Conclusions.
Figure 1: Parts of a Business Project.
Source: userscontent2.emaze.com
5
BUSINESS PLAN FOR THE INTRODUCTION OF A SMARTPHONE APPLICATION OF TRANSPORT
IN THE LATVIAN MARKET
2.2. Analysis of Stakeholders
So far, business environment and marketing techniques were only based on our past or
present experience but without thinking about the future or the business environment of
today. This is the critical aspect why current approaches are out-dated. “Current approaches to
understanding the business environment fail to take account of a wide range of groups who
can affect or are affected by the corporation, its stakeholders”.
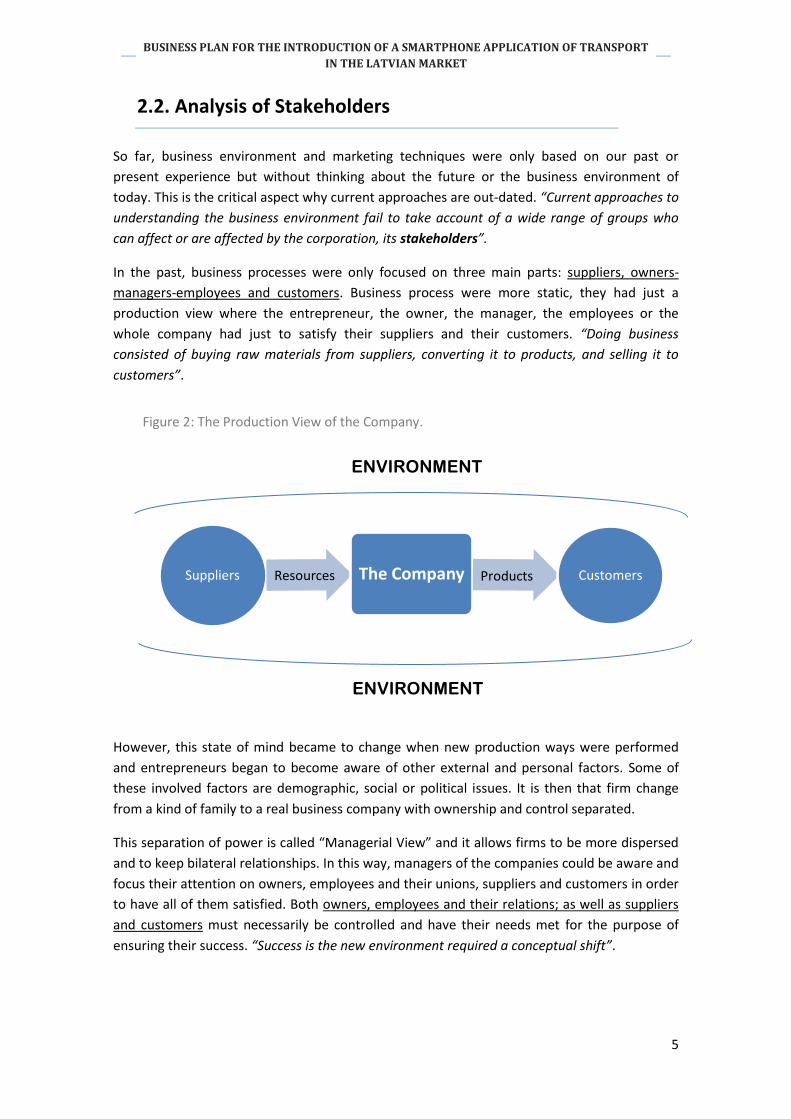
In the past, business processes were only focused on three main parts: suppliers, owners-
managers-employees and customers. Business process were more static, they had just a
production view where the entrepreneur, the owner, the manager, the employees or the
whole company had just to satisfy their suppliers and their customers. “Doing business
consisted of buying raw materials from suppliers, converting it to products, and selling it to
customers”.
However, this state of mind became to change when new production ways were performed
and entrepreneurs began to become aware of other external and personal factors. Some of
these involved factors are demographic, social or political issues. It is then that firm change
from a kind of family to a real business company with ownership and control separated.
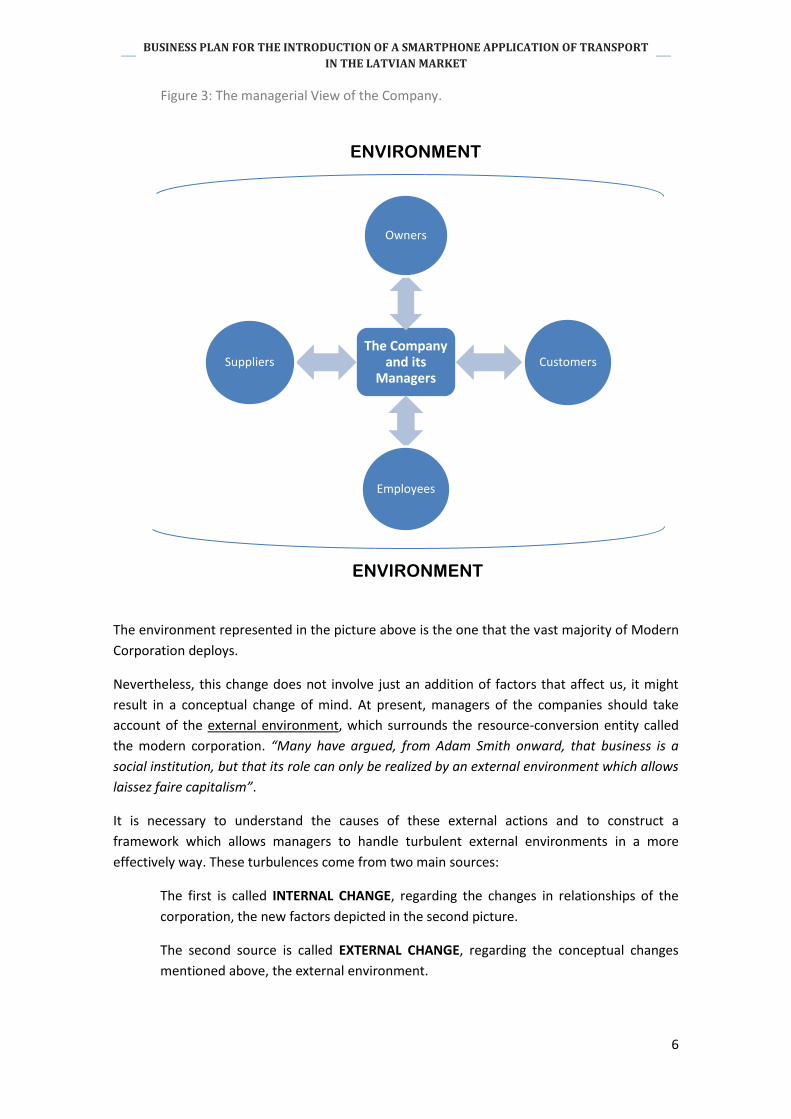
This separation of power is called “Managerial View” and it allows firms to be more dispersed
and to keep bilateral relationships. In this way, managers of the companies could be aware and
focus their attention on owners, employees and their unions, suppliers and customers in order
to have all of them satisfied. Both owners, employees and their relations; as well as suppliers
and customers must necessarily be controlled and have their needs met for the purpose of
ensuring their success. “Success is the new environment required a conceptual shift”.
Figure 2: The Production View of the Company.
Resources Products
Suppliers The Company Customers
ENVIRONMENT
ENVIRONMENT
Resources Products
6
BUSINESS PLAN FOR THE INTRODUCTION OF A SMARTPHONE APPLICATION OF TRANSPORT
IN THE LATVIAN MARKET
The environment represented in the picture above is the one that the vast majority of Modern
Corporation deploys.
Nevertheless, this change does not involve just an addition of factors that affect us, it might
result in a conceptual change of mind. At present, managers of the companies should take
account of the external environment, which surrounds the resource-conversion entity called
the modern corporation. “Many have argued, from Adam Smith onward, that business is a
social institution, but that its role can only be realized by an external environment which allows
laissez faire capitalism”.
It is necessary to understand the causes of these external actions and to construct a
framework which allows managers to handle turbulent external environments in a more
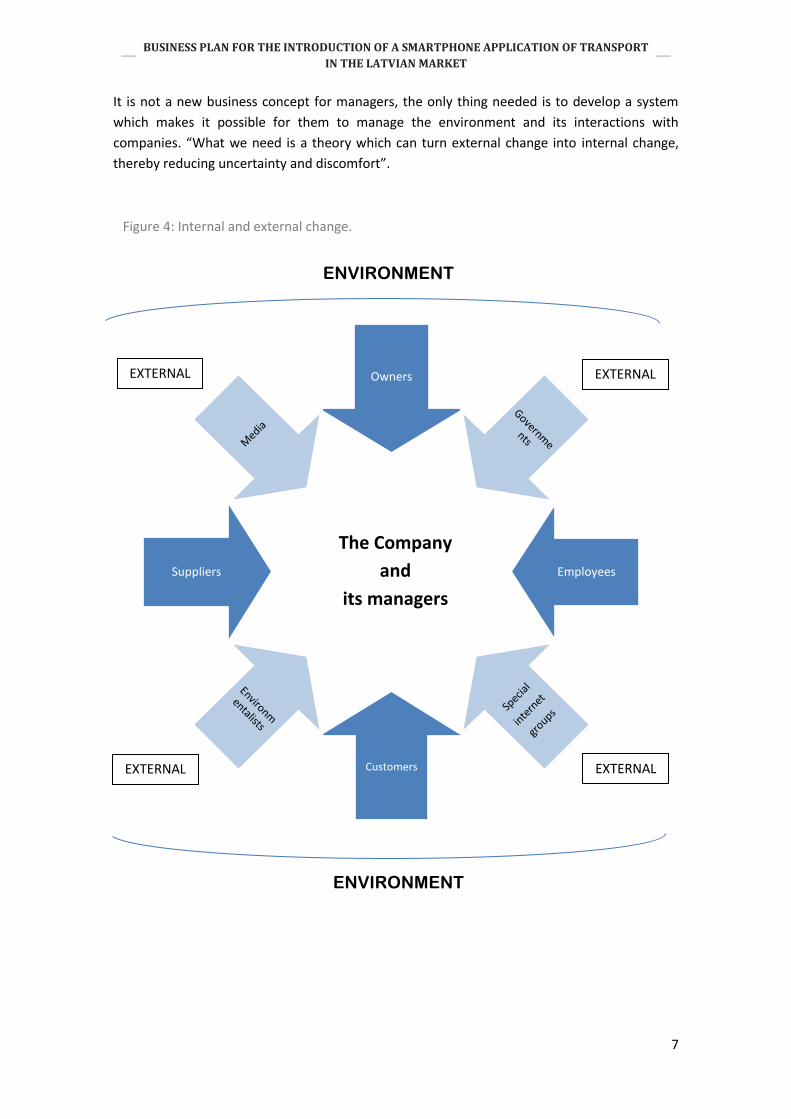
effectively way. These turbulences come from two main sources:
The first is called INTERNAL CHANGE, regarding the changes in relationships of the
corporation, the new factors depicted in the second picture.
The second source is called EXTERNAL CHANGE, regarding the conceptual changes
mentioned above, the external environment.
Figure 3: The managerial View of the Company.
The Company and its
Managers
Owners
Customers
Employees
Suppliers
ENVIRONMENT
ENVIRONMENT
7
BUSINESS PLAN FOR THE INTRODUCTION OF A SMARTPHONE APPLICATION OF TRANSPORT
IN THE LATVIAN MARKET
It is not a new business concept for managers, the only thing needed is to develop a system
which makes it possible for them to manage the environment and its interactions with
companies. “What we need is a theory which can turn external change into internal change,
thereby reducing uncertainty and discomfort”.
Owners
Employees
Customers
Suppliers
The Company
and
its managers
Figure 4: Internal and external change.
ENVIRONMENT
ENVIRONMENT
EXTERNAL EXTERNAL
EXTERNAL EXTERNAL
8
BUSINESS PLAN FOR THE INTRODUCTION OF A SMARTPHONE APPLICATION OF TRANSPORT
IN THE LATVIAN MARKET
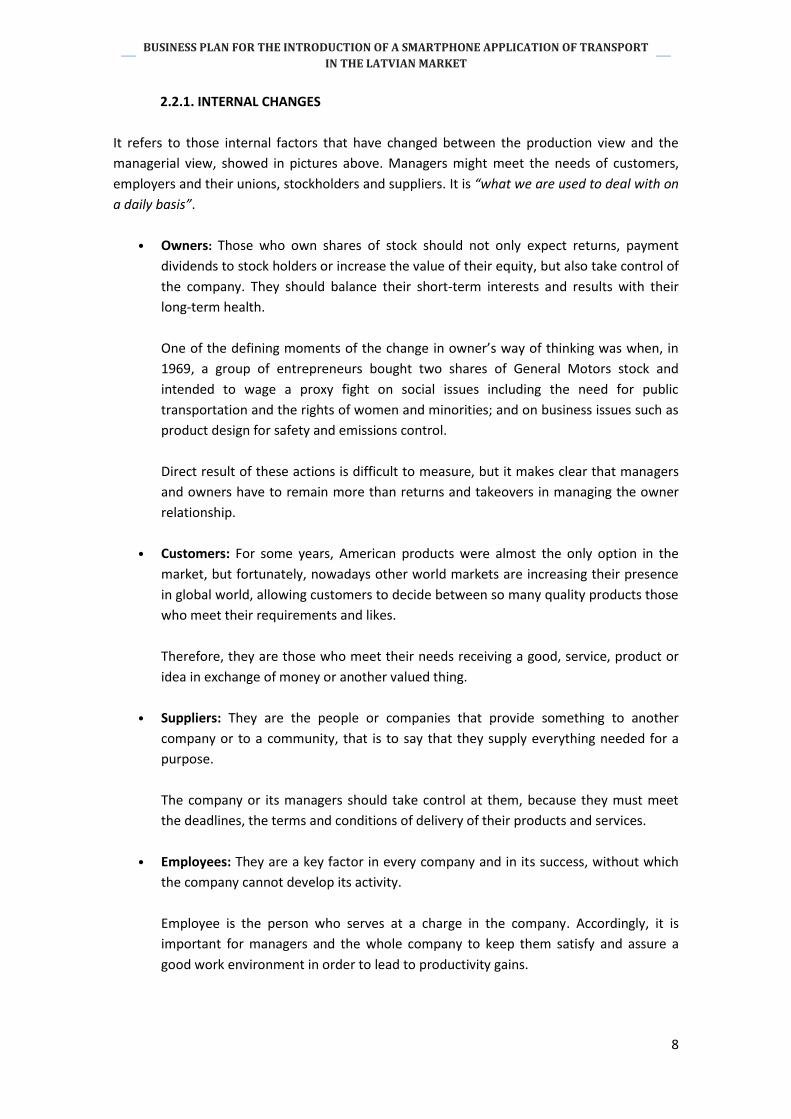
2.2.1. INTERNAL CHANGES
It refers to those internal factors that have changed between the production view and the
managerial view, showed in pictures above. Managers might meet the needs of customers,
employers and their unions, stockholders and suppliers. It is “what we are used to deal with on
a daily basis”.
• Owners: Those who own shares of stock should not only expect returns, payment
dividends to stock holders or increase the value of their equity, but also take control of
the company. They should balance their short-term interests and results with their
long-term health.
One of the defining moments of the change in owner’s way of thinking was when, in
1969, a group of entrepreneurs bought two shares of General Motors stock and
intended to wage a proxy fight on social issues including the need for public
transportation and the rights of women and minorities; and on business issues such as
product design for safety and emissions control.
Direct result of these actions is difficult to measure, but it makes clear that managers
and owners have to remain more than returns and takeovers in managing the owner
relationship.
• Customers: For some years, American products were almost the only option in the
market, but fortunately, nowadays other world markets are increasing their presence
in global world, allowing customers to decide between so many quality products those
who meet their requirements and likes.
Therefore, they are those who meet their needs receiving a good, service, product or
idea in exchange of money or another valued thing.
• Suppliers: They are the people or companies that provide something to another
company or to a community, that is to say that they supply everything needed for a
purpose.
The company or its managers should take control at them, because they must meet
the deadlines, the terms and conditions of delivery of their products and services.
• Employees: They are a key factor in every company and in its success, without which
the company cannot develop its activity.
Employee is the person who serves at a charge in the company. Accordingly, it is
important for managers and the whole company to keep them satisfy and assure a
good work environment in order to lead to productivity gains.
9
BUSINESS PLAN FOR THE INTRODUCTION OF A SMARTPHONE APPLICATION OF TRANSPORT
IN THE LATVIAN MARKET
2.2.2. EXTERNAL CHANGES
It refers to all of those factors who are external to the company. “It is depicted as a set of
arrows from the environment that affect our confortable relationships with suppliers, owners,
customers and employees”. It is an abstruse area that forecasts, among others, regulatory
changes, increases in inflation and interest rates and changes in demographics.
“External changes could be understood in terms of the emergence of several new groups and
the restructuring of old relationships of lesser importance, which have come to a stake in the
actions or inactions of the corporation”.
• Governments: In last years, the influence and presence of government in business
enterprises has increased. That is why its pervasive influence requires a closer
examination. This could be staged by a couple of lawyers or lobbyists who will be able
to ensure compliance with regulations, respond to legal challenges or represent the
firm before Congress and state legislatures.
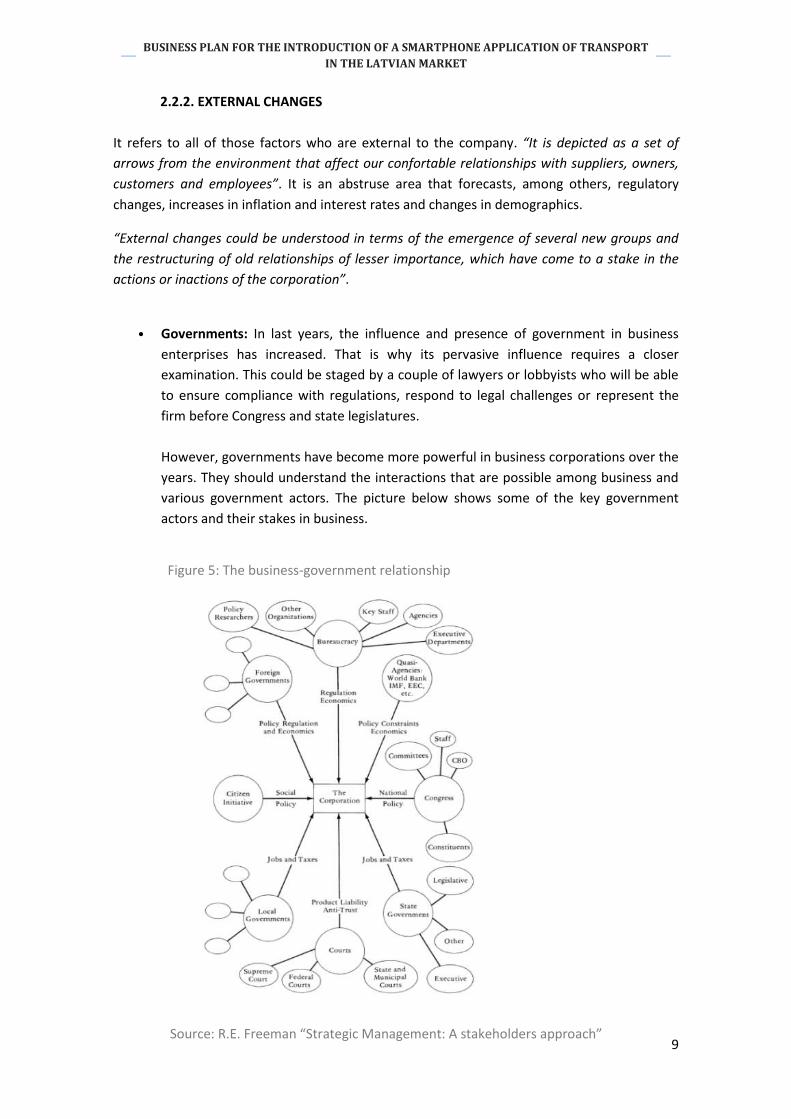
However, governments have become more powerful in business corporations over the
years. They should understand the interactions that are possible among business and
various government actors. The picture below shows some of the key government
actors and their stakes in business.
Figure 5: The business-government relationship
Source: R.E. Freeman “Strategic Management: A stakeholders approach”
10
BUSINESS PLAN FOR THE INTRODUCTION OF A SMARTPHONE APPLICATION OF TRANSPORT
IN THE LATVIAN MARKET
“In addition, national policy changes, such as tax and depreciation schedules, capital
formation incentives, and the creation of new forms of regulation affect the business
community as a whole, even if the marginal effect on a single firm is slight. Hence,
CEOs must spend a good deal of time and resources worrying about proposed public
policy legislation from Congress”.
State governments offer a different set of issues for management, depending on the
region where the company operates.
Environmentalists: This issue, the awareness and value of the environment, has been
contentious and analysed from 1960 granting different grades of importance, but not
agreed yet. “The need to take this external change into account is still with us, despite
recent political shifts to the right”.
• Special Interest Groups: A group of special interest is a group or an individual that
underlies the shifts in the business environment engendered by the government,
foreign competition, consumer advocates and environmentalists. They can use the
political process to further a position on a particular issue, therefore managers must
control them in order to avoid their opposition.
“Special interest group is not a new phenomenon. However, changes in modern
communications technology and the financing of elections make them especially
important for managers to be aware of the agendas of interest groups”.
Media: This is a critical part of present and future business, because mass media have
been increasing its importance more and more over recent decades. If a manager
wants his or her company to succeed, he or she has definitely to take control and have
an impact in this area (mass media), even if the image of the company provided by the
media is not good, the important thing is to have an impact on these media
Nowadays, being known is the most important and useful way to be successful in
business.
11
BUSINESS PLAN FOR THE INTRODUCTION OF A SMARTPHONE APPLICATION OF TRANSPORT
IN THE LATVIAN MARKET
2.3. Market Study
Carrying out a Market Study consist of investigate and conduct a systematic search of
information in support of decision making. It is a basic study about a business idea, a particular
problem or a market opportunity which involves an analysis of the target market’s needs for
solving a problem or covering a requirement.
A detailed analysis of all factors involved or related to the business idea is conducted in order
to know exactly where we are planning to develop our activity; what are the needs, the
strengths and the weak points of the market.
Certain investigations can be very useful, helping us to avoid or weigh up more accurately the
risks inherent in the engagement of any new activity. Therefore, many other utilities of a
market study are: understanding the problems and solutions, identify new opportunities and
plan its marketing or selling points.
In conclusion, the aim of the Market Study is to analyse all factors affecting our business idea
and demonstrate its commercial feasibility.
The main steps of conducting a Market Study are those described below:
1. Understand the market conditions.
Conduct a research about all factors that are related to our project, those that must be
considered before starting a business.
2. Define our target group.
First of all we should take into account the whole market but then we should carry out
market segmentation, identifying, defining and specifying who are going to be our
future customers, also called the “Target group”.
3. Identify market opportunities.
It provides us with more specific information regarding potential problems or
opportunities in our target market. This includes information about market growing,
actual and future trends, external factors and, perhaps, also information about our
competitors.
4. Conclusions.
To sum up, in order to perform a Market Study, we should determine the geographical field,
quantify the potential market, bring the market together in homogeneous groups or segments
with the same customer profile, divide these segments in subgroups called niches, select those
niches where we should take place and calculate their potential and sales demand.
Motivations, customer’s buying behaviours and their necessities will be analysed. Finally, if it is
possible, a consideration of the expected market future evolution should be included.
12
BUSINESS PLAN FOR THE INTRODUCTION OF A SMARTPHONE APPLICATION OF TRANSPORT
IN THE LATVIAN MARKET
2.4. Benchmarking
This section could be included in the Market Study, but it has been decided to study apart from
it. Benchmarking consist of analysing all those competitors operating in the same market or
developing a similar activity to ours.
First of all, we have to identify all of our competitors. Subsequently we have to study them
thoroughly in order to know what activities that they develop are different from our and which
ones are similar to ours.
Once the competitors have been known, we should carry out two processes. It makes no
difference if we first make one or another because both are going to be necessary.
These processes are: Comparison of Competitors, in order to know which is the strongest
competitor and which one is the best option (taking ourselves also into account); and Analysis
of Marketing, that means the best competitor’s features should have been considered and
according to them and with new marketing ideas, we set up strategies that allow our company
to grow up or position itself in the desired market.
2.4.1. ANALYSIS OF COMPETITORS
There are multiple ways to conduct this analysis, but in this project Decision-making
techniques and matrices have been chosen.
Since it is important to succeed, we must ensure that we are taking the right decisions. Its
utility, comprehensibility and user-friendliness are the reasons why we have chosen the
decision-making matrices.
“While there are a wide variety of decision-making techniques and tools, many tend to revolve
around the same key principles of figuring out the decision that needs to be made, in this case,
the alternative that is the best, considering and researching the options and reviewing the
decision once it's been made.”
Therefore, the exact steps required to make a decision-making matrix are as follows:
1. Identify all options, alternatives or competitors, and put them as the row labels of the
table.
2. List the factors that affect the decision or those you need to examine and compare of
those alternatives and put them as the column headings. We shall call them “criteria”.
3. Work your way down the columns of your table, scoring each option for each of the
factors in your decision.
13
BUSINESS PLAN FOR THE INTRODUCTION OF A SMARTPHONE APPLICATION OF TRANSPORT
IN THE LATVIAN MARKET
4. Note if your criteria are increasing or decreasing, classifying all of them. Being
increasing is that the worst score is the lowest and best score is the highest, and being
decreasing is exactly the opposite (the best is the lowest and the worst is the highest).
5. If you are making a weighted assessment (using a weighted method), work out the
relative importance of each criterion. These numbers mean the importance that
customers attached to each criterion in their decisions, from 0 to 10, in order of
increasing importance where (0 means that the factor is absolutely unimportant in the
final decision, and 5 means that it is very important).
If you are making an unweighted method, this step is not necessary.
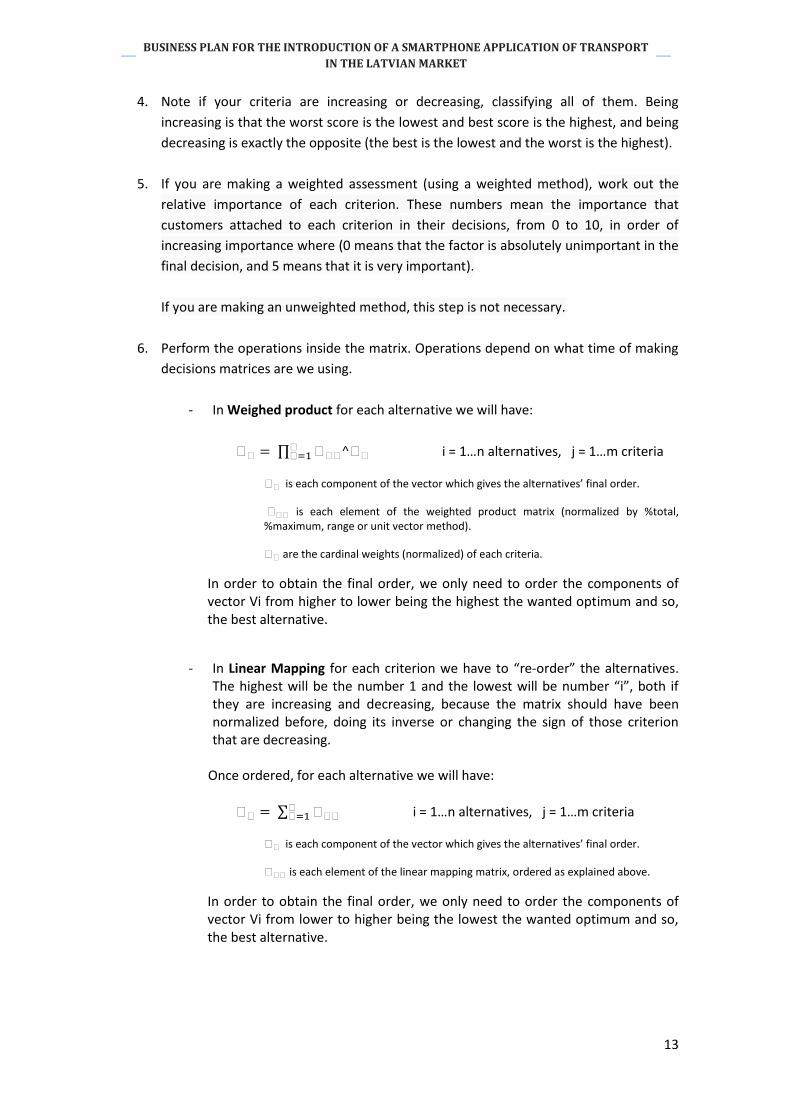
6. Perform the operations inside the matrix. Operations depend on what time of making
decisions matrices are we using.
- In Weighed product for each alternative we will have:
∏ i = 1…n alternatives, j = 1…m criteria
is each component of the vector which gives the alternatives’ final order.
is each element of the weighted product matrix (normalized by %total, %maximum, range or unit vector method).
are the cardinal weights (normalized) of each criteria.
In order to obtain the final order, we only need to order the components of vector Vi from higher to lower being the highest the wanted optimum and so, the best alternative.
- In Linear Mapping for each criterion we have to “re-order” the alternatives.
The highest will be the number 1 and the lowest will be number “i”, both if they are increasing and decreasing, because the matrix should have been normalized before, doing its inverse or changing the sign of those criterion that are decreasing.
Once ordered, for each alternative we will have:
∑ i = 1…n alternatives, j = 1…m criteria
is each component of the vector which gives the alternatives’ final order.
is each element of the linear mapping matrix, ordered as explained above.
In order to obtain the final order, we only need to order the components of vector Vi from lower to higher being the lowest the wanted optimum and so, the best alternative.
14
BUSINESS PLAN FOR THE INTRODUCTION OF A SMARTPHONE APPLICATION OF TRANSPORT
IN THE LATVIAN MARKET
2.4.2. ANALYSIS OF MARKETING
Once competitors have been analysed, we move to perform what is commonly known as
Benchmarking. It is the study and analysis of competitors, understanding their best practices in
order to raise our strategies. Looking at these best practices together with our new marketing
ideas, we can develop our strategic plan which will allow us to get a foothold in the Latvian
Market and then continue growing up.
There are many varied ways to understand Benchmarking. The most common and used
methods are PESTLE analysis, General Electric Model and Balanced Scorecard.
In this project the method chosen has been the “Balanced Scorecard”.
In 1992, Kaplan and Norton of Harvard University revolutionized business administration by
introducing a quite effective concept to align the company toward achieving business
strategies through objective and tangible indicators. The main innovation of this method was
the introduction of measurements on intangibles as specifications for achieving financial goals.
Balanced Scorecard (hereinafter, “BSC”) is the main methodological tool that translates the
vision and strategy into a set of performance measures, which provide the necessary structure
for management and measurement system. This transformation of vision into action is done
through a coherent set of indicators grouped into 4 categories of business-critical in any
business; that will be explained later.
The vision and business strategy dictate the way which individual and collective efforts of a
company should be directed. The definition of strategies by nature is complicated, and the
implementation of it represents the biggest obstacle in most cases. The challenge corresponds
to identify exactly what should be monitored, to communicate at all levels of the company if
the strategies are being achieved through very specific actions.
Therefore, we can say that BSC helps to balance in an integrated and strategically way, the
current progress and provides the future direction of a company, that is to say that we can link
up with strategies and key performance objectives and results.
The balance between indicators is what gives name to the methodology, because we present a
balance between external indicators relating to shareholders and customers; and internal
processes, training, innovation and growth; also there is a balance between performance
indicators, which are past efforts (mainly economic) and indicators that drive future action
(training, innovation, learning, etc.).
However, it is more than a new measurement system. Innovative companies use the BSC as
the framework and organizational and central structure for their processes. Companies can
develop a BSC with fairly limited objectives: get clear, get consensus and focus on its strategy,
and then communicate that strategy throughout the organization. Although, as we have seen
before, the real power of the BSC appears when transformed from a system of indicators in a
management system.
As more and more companies work with the Balanced Scorecard, they realize that it can be
used to:
15
BUSINESS PLAN FOR THE INTRODUCTION OF A SMARTPHONE APPLICATION OF TRANSPORT
IN THE LATVIAN MARKET
Clarify strategy and achieve consensus on it.
Communicate the strategy throughout the organization, communication to all
staff and compliance objectives.
Align personal and departmental goals with strategy.
Link strategic objectives with long-term goals and annual budgets.
Identify and align strategic initiatives.
Conduct periodic and systematic strategic reviews
Get feedback to learn about and improve strategy.
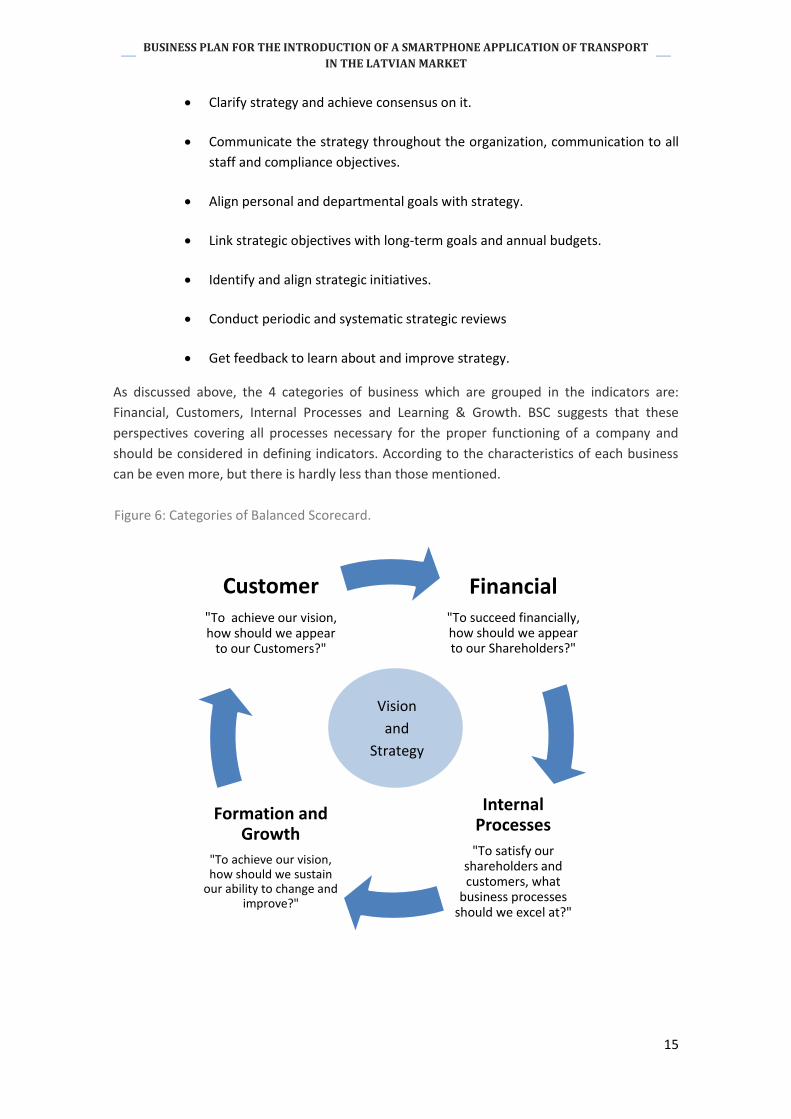
As discussed above, the 4 categories of business which are grouped in the indicators are:
Financial, Customers, Internal Processes and Learning & Growth. BSC suggests that these
perspectives covering all processes necessary for the proper functioning of a company and
should be considered in defining indicators. According to the characteristics of each business
can be even more, but there is hardly less than those mentioned.
Figure 6: Categories of Balanced Scorecard.
Vision
and
Strategy
Financial "To succeed financially, how should we appear to our Shareholders?"
Internal Processes
"To satisfy our shareholders and customers, what
business processes should we excel at?"
Formation and Growth
"To achieve our vision, how should we sustain
our ability to change and improve?"
Customer
"To achieve our vision, how should we appear
to our Customers?"
16
BUSINESS PLAN FOR THE INTRODUCTION OF A SMARTPHONE APPLICATION OF TRANSPORT
IN THE LATVIAN MARKET
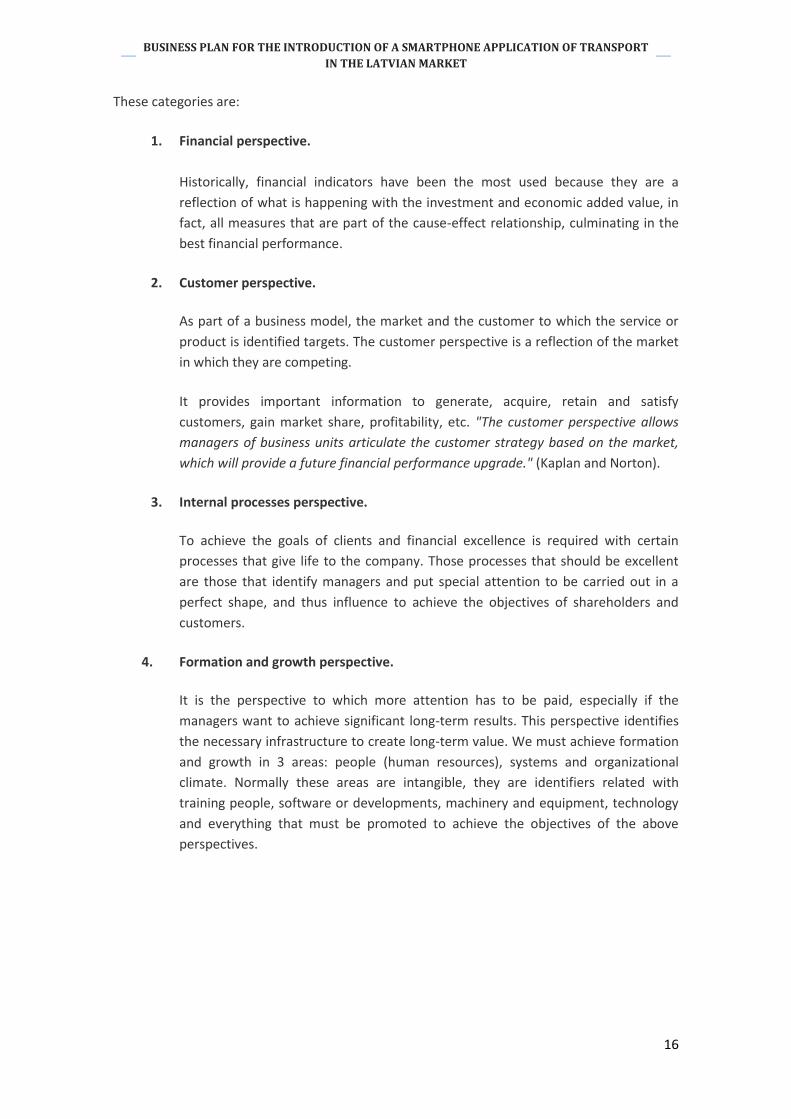
These categories are:
1. Financial perspective.
Historically, financial indicators have been the most used because they are a
reflection of what is happening with the investment and economic added value, in
fact, all measures that are part of the cause-effect relationship, culminating in the
best financial performance.
2. Customer perspective.
As part of a business model, the market and the customer to which the service or
product is identified targets. The customer perspective is a reflection of the market
in which they are competing.
It provides important information to generate, acquire, retain and satisfy
customers, gain market share, profitability, etc. "The customer perspective allows
managers of business units articulate the customer strategy based on the market,
which will provide a future financial performance upgrade." (Kaplan and Norton).
3. Internal processes perspective.
To achieve the goals of clients and financial excellence is required with certain
processes that give life to the company. Those processes that should be excellent
are those that identify managers and put special attention to be carried out in a
perfect shape, and thus influence to achieve the objectives of shareholders and
customers.
4. Formation and growth perspective.
It is the perspective to which more attention has to be paid, especially if the
managers want to achieve significant long-term results. This perspective identifies
the necessary infrastructure to create long-term value. We must achieve formation
and growth in 3 areas: people (human resources), systems and organizational
climate. Normally these areas are intangible, they are identifiers related with
training people, software or developments, machinery and equipment, technology
and everything that must be promoted to achieve the objectives of the above
perspectives.
17
BUSINESS PLAN FOR THE INTRODUCTION OF A SMARTPHONE APPLICATION OF TRANSPORT
IN THE LATVIAN MARKET
2.5. Technical Study
In the technical study, the requirements for running the business, its production process and
infrastructure and other characteristics of the premises where the company works are
described.
Since this case it is all about a computer business whose main element is the programming
software, conducting a technical study itself will not be necessary, at least at the beginning of
the company activity, since, in order to save costs, instead of buying or renting a place where
developing the activity; it could take place at the office of any of its partners’ domicile.
The technical study in this case will comprise the following elements:
Project requirements: It means the aspects and requirements which are necessary for
the operation of the business. Due to the information technology approach of this
business, these requirements will be focused on software, communications, tools,
mobile phone equipment, etc. not in physical requirements.
Ergonomics.
In this case, due to the stated above, the technical study will focus on the performance
requirements of the application.
Moreover, it is important to analyse ergonomics. This is a concept that has been gaining
presence and importance in all products and jobs, until becoming today, an indispensable
factor in each of these.
According to the International Association of Ergonomics, ergonomics is the set of scientific
knowledge applied to work, systems, products and environments are adapted to the capacities
and physical and mental limitations of the person. The goal of ergonomics is to adapt the work
to the capabilities and possibilities of the human being. All ergonomic work items are designed
with the user in mind who will use them
In this case, due to the fact that our product is a mobile application, we are considering
computer ergonomics, that is to say, ergonomics at software and hardware.
Smart software application design has nothing to do with skinning your software with flashy
graphics or weighing down the interface with this week’s “must have” functionality. Rather,
software applications are most successful when programmers streamline features in a way
that balance the ergonomics of user interaction against the impact of user’s environment on
the use of the application. Therefore, as developers, we want to take an ergonomic approach
to design the mobile application in order to ensure its success. This means considering not only
what it takes to ensure that the user’s interaction with the software is as natural as possible in
relation to the device being used, but also how a user’s environment will affect the usage of
the software.
18
BUSINESS PLAN FOR THE INTRODUCTION OF A SMARTPHONE APPLICATION OF TRANSPORT
IN THE LATVIAN MARKET
2.6. Business Organization
Business organization consists of the legal and organizational structure of the business, the
different areas or departments that make up, and other elements related to these.
Business organization usually includes the following elements:
The legal structure: The legal form under which the business is legally constituted
(natural person or legal entity), the type of business (E.I.R.L., S.C., S.A., etc.), etc.
The organizational structure: The type of organization that will have the business
(functional, by product, matrix, etc.), the different areas or departments that make up
and the hierarchical relationships that will occur between them.
Charges and functions: The positions that will have each area or department of the
business and their functions, tasks, responsibilities, bosses and subordinates.
The staff requirements for each department or line of business, and the profile that a
person should have to apply for them (experience, knowledge, skills, etc.).
In our project, this section will be divided in two main parts: Legal Structure and Organizational
Structure.
2.6.1. LEGAL STRUCTURE
One of the first things that should be decided when face a business is to decide which is the
most appropriate legal form for the development of it.
Of course, the key factor is the business idea, i.e. the business planning, study and analysis of
the initial costs and the development of the activity, but the choice of the legal form of the
company will mark from the beginning of the activity throughout the life of the company and
the decisions that will be made.
Issues such as liability limits, the commitment before the start of the activity goods, taxation of
business, the need for external financing, compliance and regulatory requirements, etc. are
some of the factors to be taken into account when making this choice.
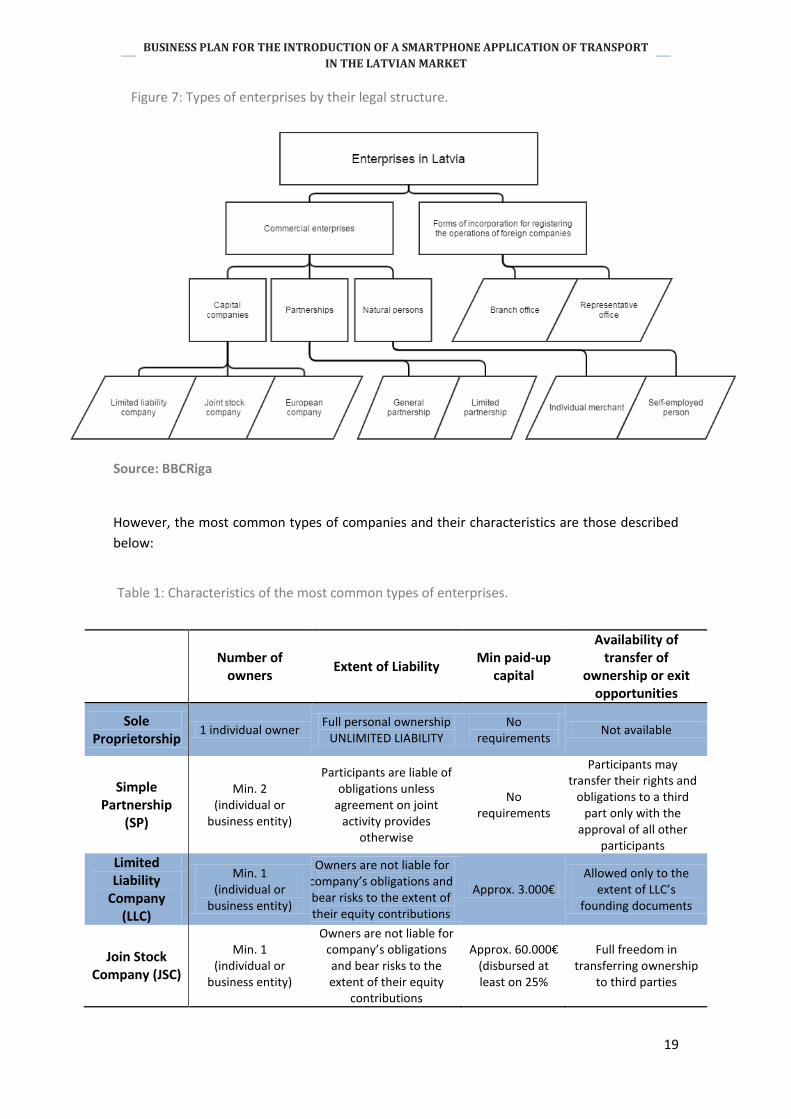
The different types of companies according to their characteristics are as follow:
19
BUSINESS PLAN FOR THE INTRODUCTION OF A SMARTPHONE APPLICATION OF TRANSPORT
IN THE LATVIAN MARKET
However, the most common types of companies and their characteristics are those described
below:
Number of
owners Extent of Liability
Min paid-up capital
Availability of transfer of
ownership or exit opportunities
Sole Proprietorship
1 individual owner Full personal ownership
UNLIMITED LIABILITY No
requirements Not available
Simple Partnership
(SP)
Min. 2 (individual or
business entity)
Participants are liable of obligations unless
agreement on joint activity provides
otherwise
No requirements
Participants may transfer their rights and
obligations to a third part only with the
approval of all other participants
Limited Liability
Company (LLC)
Min. 1 (individual or
business entity)
Owners are not liable for company’s obligations and bear risks to the extent of their equity contributions
Approx. 3.000€ Allowed only to the
extent of LLC’s founding documents
Join Stock Company (JSC)
Min. 1 (individual or
business entity)
Owners are not liable for company’s obligations and bear risks to the extent of their equity
contributions
Approx. 60.000€ (disbursed at least on 25%
Full freedom in transferring ownership
to third parties
Source: BBCRiga
Figure 7: Types of enterprises by their legal structure.
Table 1: Characteristics of the most common types of enterprises.
20
BUSINESS PLAN FOR THE INTRODUCTION OF A SMARTPHONE APPLICATION OF TRANSPORT
IN THE LATVIAN MARKET
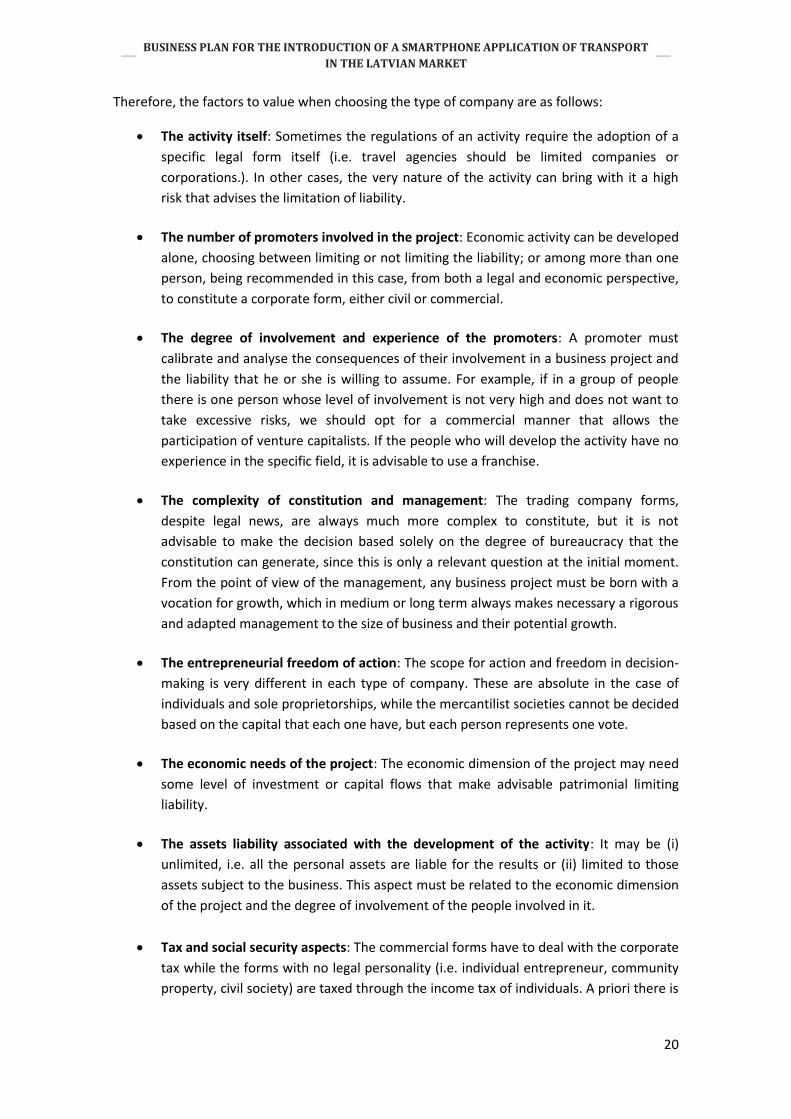
Therefore, the factors to value when choosing the type of company are as follows:
The activity itself: Sometimes the regulations of an activity require the adoption of a
specific legal form itself (i.e. travel agencies should be limited companies or
corporations.). In other cases, the very nature of the activity can bring with it a high
risk that advises the limitation of liability.
The number of promoters involved in the project: Economic activity can be developed
alone, choosing between limiting or not limiting the liability; or among more than one
person, being recommended in this case, from both a legal and economic perspective,
to constitute a corporate form, either civil or commercial.
The degree of involvement and experience of the promoters: A promoter must
calibrate and analyse the consequences of their involvement in a business project and
the liability that he or she is willing to assume. For example, if in a group of people
there is one person whose level of involvement is not very high and does not want to
take excessive risks, we should opt for a commercial manner that allows the
participation of venture capitalists. If the people who will develop the activity have no
experience in the specific field, it is advisable to use a franchise.
The complexity of constitution and management: The trading company forms,
despite legal news, are always much more complex to constitute, but it is not
advisable to make the decision based solely on the degree of bureaucracy that the
constitution can generate, since this is only a relevant question at the initial moment.
From the point of view of the management, any business project must be born with a
vocation for growth, which in medium or long term always makes necessary a rigorous
and adapted management to the size of business and their potential growth.
The entrepreneurial freedom of action: The scope for action and freedom in decision-
making is very different in each type of company. These are absolute in the case of
individuals and sole proprietorships, while the mercantilist societies cannot be decided
based on the capital that each one have, but each person represents one vote.
The economic needs of the project: The economic dimension of the project may need
some level of investment or capital flows that make advisable patrimonial limiting
liability.
The assets liability associated with the development of the activity: It may be (i)
unlimited, i.e. all the personal assets are liable for the results or (ii) limited to those
assets subject to the business. This aspect must be related to the economic dimension
of the project and the degree of involvement of the people involved in it.
Tax and social security aspects: The commercial forms have to deal with the corporate
tax while the forms with no legal personality (i.e. individual entrepreneur, community
property, civil society) are taxed through the income tax of individuals. A priori there is
21
BUSINESS PLAN FOR THE INTRODUCTION OF A SMARTPHONE APPLICATION OF TRANSPORT
IN THE LATVIAN MARKET
no more or less favourable tax regime, but it depends on the actual or potential
business economic performance.
Speed and simplicity of the process: If circumstances or preferences of the promoters
point to a quick and large bureaucratic complications processing, the possibilities are
reduced to formulas without legal personality (Sole Proprietorship, Goods Partnership
or Civil Society) or Limited Liability Company in its telematics version.
The access to public aid: Although it is not a recommended approach itself when
choosing the legal form, it is a variable to take into consideration, so it will be
necessary to address the specific circumstances of each project
2.6.2. ORGANIZATIONAL STRUCTURE
The organizational structure is fundamental to all businesses since it defines how them will be
organized. It has the main function of establishing authority, hierarchy, chain of command,
organizational charts and departmentalisations, among others.
All organizations must have an organizational structure according to all activities or tasks they
intend to perform, through a proper structure on which to establish their functions and
departments in order to produce their services or products through an order and proper
control to achieve their goals and objectives.
This is the foundation of the company, where divisions of activities performed to form
departments and then define the authority in order to achieve the objectives; but also
everything that arises spontaneously from the interaction between members. Taking into
account these two aspects the structure is mainly divided into forms and informal structure.
Formal structure: As a need for a division of activities within an organization to allow
them primarily to achieve the objectives through organizational charts, manuals and
interaction of the principles of the organization and the division of labour, authority
and responsibility, delegation, control unit , hierarchy, span of control and equity in
the workload, among others.
Informal structure: Reflects the social order and emerges formal but is usually more
dynamic than them. It integrates through relationships between people according to a
mix of factors that they form informal groups are represented verbally publicly.
The organizational structure is usually represented by a flow or organization chart.
Organization charts are graphical representations, where the division of labour, the lines of
authority and communication are represented graphically.
In this project, due to the simplicity of relations between charges and the small number of
people involved, making a general flowchart will be enough.
22
BUSINESS PLAN FOR THE INTRODUCTION OF A SMARTPHONE APPLICATION OF TRANSPORT
IN THE LATVIAN MARKET
2.7. Study of investment
An investment refers to the commitment of funds at present, in anticipation of some positive
rate of return in future. Today the spectrum of investment is indeed wide. An investment is
confronted with array of investment avenues. Among all investment, investment in equity is in
best high proportion, and will be the one that we will try from now on since it is the one that
we need for our project.
2.7.1. FINANCIAL SOURCES
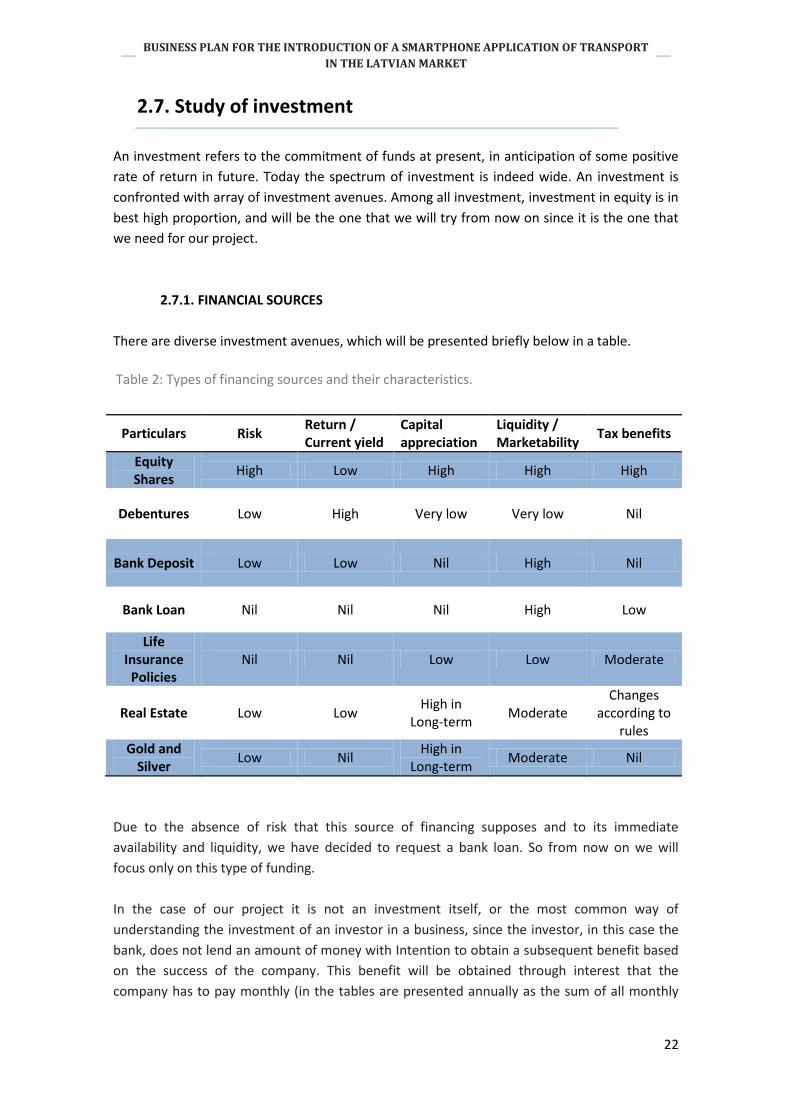
There are diverse investment avenues, which will be presented briefly below in a table.
Particulars Risk Return / Current yield
Capital appreciation
Liquidity / Marketability
Tax benefits
Equity Shares
High Low High High High
Debentures Low High Very low Very low Nil
Bank Deposit Low Low Nil High Nil
Bank Loan Nil Nil Nil High Low
Life Insurance
Policies Nil Nil Low Low Moderate
Real Estate Low Low High in
Long-term Moderate
Changes according to
rules Gold and
Silver Low Nil
High in Long-term
Moderate Nil
Due to the absence of risk that this source of financing supposes and to its immediate
availability and liquidity, we have decided to request a bank loan. So from now on we will
focus only on this type of funding.
In the case of our project it is not an investment itself, or the most common way of
understanding the investment of an investor in a business, since the investor, in this case the
bank, does not lend an amount of money with Intention to obtain a subsequent benefit based
on the success of the company. This benefit will be obtained through interest that the
company has to pay monthly (in the tables are presented annually as the sum of all monthly
Table 2: Types of financing sources and their characteristics.
23
BUSINESS PLAN FOR THE INTRODUCTION OF A SMARTPHONE APPLICATION OF TRANSPORT
IN THE LATVIAN MARKET
interest for a year) for the money borrowed, along with the return, also monthly or annual of
this for dues.
Loan stock is long-term debt capital raised by a company for which interest is paid, usually half
yearly and at a fixed rate. Holders of loan stock are therefore long-term creditors of the
company.
2.7.2. BREAKDOWN OF INVESTMENT
Once the route through which the investment will be obtained is selected, a breakdown of all
that will be used in this investment will be made. That is, the areas in which this money will be
used, and the disaggregated costs of each of its parts.
Generally, the breakdown of an investment bank includes the following areas:
Corporate Finance (equity and debt).
Mergers & Acquisitions (M&A).
Equity Sales.
Fixed Income Sales.
Syndicate (equity and debt).
Equity Trading.
Fixed Income Trading.
Equity Research.
Fixed Income Research.
In this case, since it is the beginning of a business, there will be no mergers or acquisitions, and
the shares will be equally divided between the two partners (in principle only among these,
without possibility of sale), the investment will be mainly for corporate Finance.
Therefore, in this section in the practical part we will disaggregate all the assets, both fixed and
current, necessary for the development of the activity, most of them acquired at the beginning
of this.
24
BUSINESS PLAN FOR THE INTRODUCTION OF A SMARTPHONE APPLICATION OF TRANSPORT
IN THE LATVIAN MARKET
2.8. Financial Study
Financial study is the section that determines whether or not our business idea is viable, and is
a key component in determining whether or not our plan is going to be able to attract any
investment in our business idea.
More in detail, a financial study projects how much start-up capital is needed, sources of
capital, returns on investment, incomes, expenses and other financial considerations. It looks
at how much cash is needed, where it will come from, and how it will be spent. A financial
feasibility study is an assessment of the financial aspects, in this case, for starting and running
a business.
2.8.1. STUDY OF INCOMES AND OUTCOMES
Basically, the financial plan section consists of three main financial statements: the income
statement, also called sales or consumption forecast; the operating costs; and the cash flow or
the profit and loss statement; and even finally a brief explanation or analysis of these three
statements.
Sales/Consumption Forecast
The Sales or Consumption Forecast is basically the first financial statement to come across in
an annual report or financial plan section of the business plan. Due to the fact that our
company is about a product-based business, revenues will be called sales, therefore addressing
in this section the sales forecast and income obtained.
The sales or/and Consumption Forecast is a projection of achievable sales revenue, based on
historical sales data, analysis of market surveys and trends, and salespersons' estimates. Also
called sales budget, it forms the basis of a business plan because the level of sales revenue
affects practically every aspect of a business.
It is usually directly linked with income statement. Basically, the income statement shows how
much money the company generates, the revenue, in this case sales and also forecast of
companies that hire our advertising services or are simply sponsors; which will be then
compared in the following section with how much our company spends (expenses) and
obtaining thus the profit, the difference between these two over a certain time period.
Revenue, also commonly known as sales, is generally the most straightforward part of the
income statement. Often, there is just a single number that represents all the money a
company brought in during a specific time period, although big companies sometimes break
down revenue by business segment or geography.
The categories included in the income statement template and in the computation of incomes
depend on the type of business.
25
BUSINESS PLAN FOR THE INTRODUCTION OF A SMARTPHONE APPLICATION OF TRANSPORT
IN THE LATVIAN MARKET
Operating costs
The next important part to register in a company is their costs. Operating costs are expenses
associated with the maintenance and administration of a business on a day-to-day basis. In
other words, operating costs or expenses are the costs of keeping a business running, those
things a company have to pay each month. The list of operating expenses may include:
Rent or mortgage payments.
Loan payments.
Telecommunications.
Utilities.
Raw materials.
Storage.
Promotion.
Office supplies.
Maintenance.
The operating cost is a component of operating income and is usually reflected on a
company’s income statement. While operating costs generally do not include capital outlays,
they can include many components of operating a business salaries (ours and staff salaries)
Once again, the categories in the operating cost considered depend on the type of business.
Once we have our operating expenses list complete, the total will show what it will cost us to
keep our business running each month. Multiplying this number by 12 we will have an annual
estimate of our operating expenses. Then we should add this to the total of our company
expenses list, and we will have a ballpark figure for our complete company costs.
Cash flow or Profit and Loss Statement.
The Profit and Loss Statement, also called Income Statement shows the Revenues, Expenses,
and Profit of the company for a particular period. It's a snapshot of the business that shows
whether or not the business is profitable at that point in time.
Revenue - Expenses = Profit/Loss.
26
BUSINESS PLAN FOR THE INTRODUCTION OF A SMARTPHONE APPLICATION OF TRANSPORT
IN THE LATVIAN MARKET
When it comes to analysing fundamentals, the income statement lets investors know how well
the company's business is performing; or, basically, whether or not the company is making
money. Generally speaking, companies ought to be able to bring in more money than they
spend or they do not stay in business for long. Those companies with low expenses relative to
revenue or high profits relative to revenue, signal strong fundamentals to investors.
The Cash Flow Projection shows how cash is expected to flow in and out of the business. It is
an important tool for cash flow management, letting know when the expenditures are too high
or when the company might want to arrange short term investments to deal with a cash flow
surplus. As part of the business plan, a Cash Flow Projection will give the company a much
better idea of how much capital investment the business idea needs.
For a bank loans officer, the Cash Flow Projection offers evidence that the business is a good
credit risk and that there will be enough cash on hand to make that business a good candidate
for a line of credit or short term loan.
It is important not to confuse a Cash Flow Projection with a Cash Flow Statement. The Cash
Flow Statement shows how cash has flowed in and out of the business. In other words, it
describes the cash flow that has occurred in the past. The Cash Flow Projection shows the cash
that is anticipated to be generated or expended over a chosen period of time in the future.
While both types of Cash Flow reports are important business decision-making tools for
businesses, we are only concerned with the Cash Flow Projection in the business plan, since it
is a business that has not yet been developed, it is all based on forecasts.
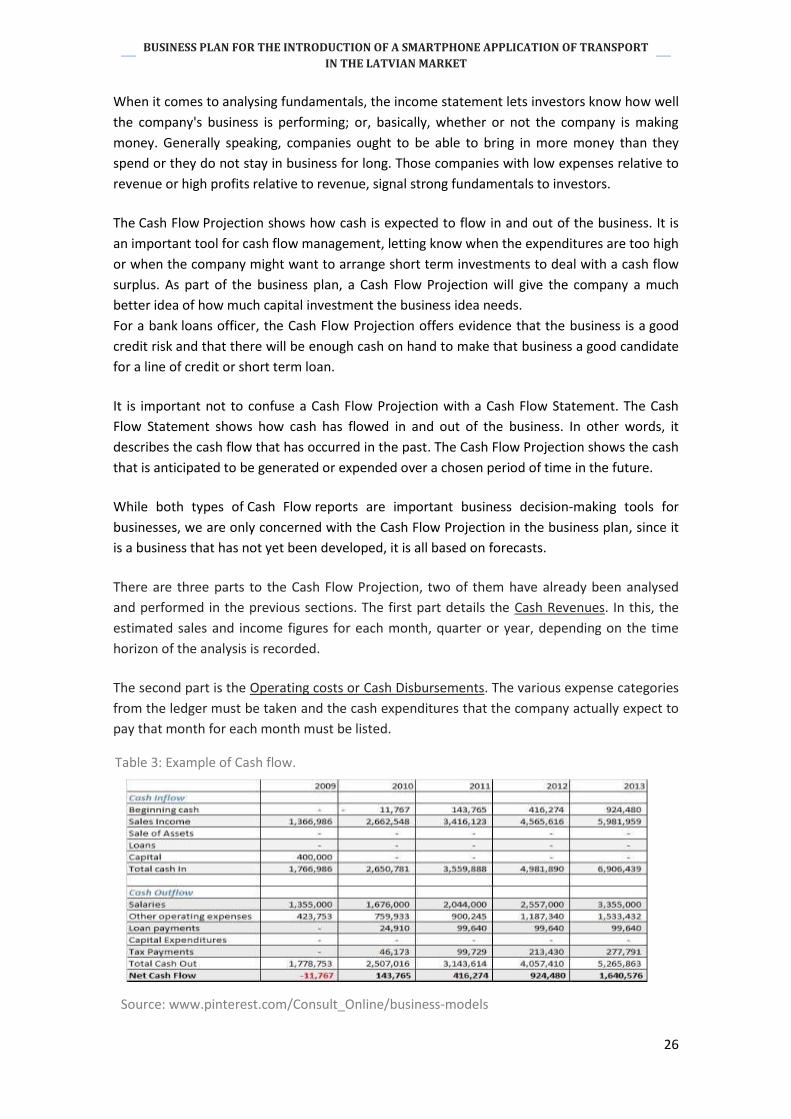
There are three parts to the Cash Flow Projection, two of them have already been analysed
and performed in the previous sections. The first part details the Cash Revenues. In this, the
estimated sales and income figures for each month, quarter or year, depending on the time
horizon of the analysis is recorded.
The second part is the Operating costs or Cash Disbursements. The various expense categories
from the ledger must be taken and the cash expenditures that the company actually expect to
pay that month for each month must be listed.
Table 3: Example of Cash flow.
Source: www.pinterest.com/Consult_Online/business-models
27
BUSINESS PLAN FOR THE INTRODUCTION OF A SMARTPHONE APPLICATION OF TRANSPORT
IN THE LATVIAN MARKET
The third part of the Cash Flow Projection is the Reconciliation of Cash Revenues to Cash
Disbursements, the Profit and Loss Statement or the actual Cash Flow. Cash flow is the net
amount of cash and cash-equivalents moving into and out of a business. Positive cash flow
indicates that a company's liquid assets are increasing, enabling it to settle debts, reinvest in
its business, return money to shareholders, pay expenses and provide a buffer against future
financial challenges. Negative cash flow indicates that a company's liquid assets are
decreasing. Net cash flow is distinguished from net income, which includes accounts
receivable and other items for which payment has not actually been received. Cash flow is
used to assess the quality of a company's income, that is, how liquid it is, which can indicate
whether the company is positioned to remain solvent.
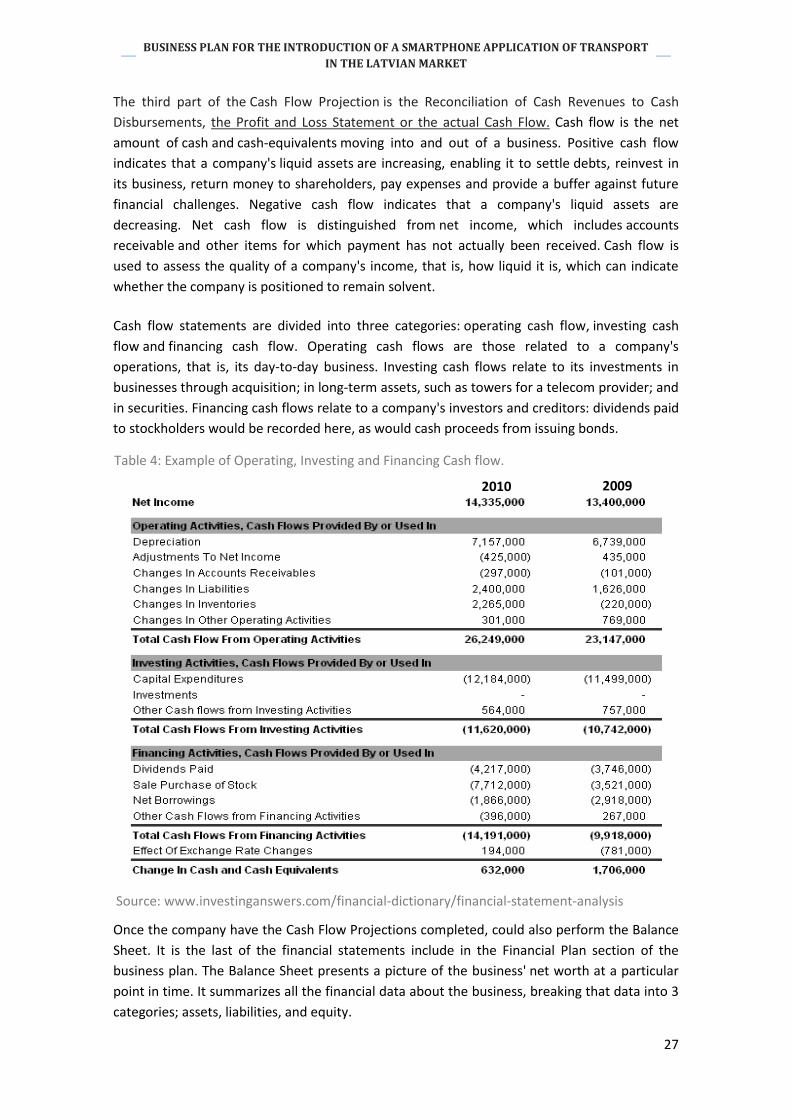
Cash flow statements are divided into three categories: operating cash flow, investing cash
flow and financing cash flow. Operating cash flows are those related to a company's
operations, that is, its day-to-day business. Investing cash flows relate to its investments in
businesses through acquisition; in long-term assets, such as towers for a telecom provider; and
in securities. Financing cash flows relate to a company's investors and creditors: dividends paid
to stockholders would be recorded here, as would cash proceeds from issuing bonds.
Once the company have the Cash Flow Projections completed, could also perform the Balance
Sheet. It is the last of the financial statements include in the Financial Plan section of the
business plan. The Balance Sheet presents a picture of the business' net worth at a particular
point in time. It summarizes all the financial data about the business, breaking that data into 3
categories; assets, liabilities, and equity.
Table 4: Example of Operating, Investing and Financing Cash flow.
Source: www.investinganswers.com/financial-dictionary/financial-statement-analysis
2010 2009

28
BUSINESS PLAN FOR THE INTRODUCTION OF A SMARTPHONE APPLICATION OF TRANSPORT
IN THE LATVIAN MARKET
2.8.2. STUDY OF FINANCIAL FEASIBILITY OF THE PROJECT
In this case, the study of financial feasibility is considered for a project optimization study.
The correct planning of the personal finances allows optimizing financial resources of the
company to reach different objectives. But it is not only important the correct planning, but
also the direct optimization of these. For this reason it is frequent in making a business plan, to
present two financial scenarios, which are called the pessimistic scenario and optimistic or
optimized scenario.
In the pessimistic scenario the initial situation is presented, with the revenues and costs
initially estimated. It is not studied how to increase the former or reduce the latter, since both
owners and investors can see what will happen to the company in the worst case scenario.
A financial feasibility study, this is how to perform the optimistic scenario, can focus on one
particular project or area, or on a group of projects (such as advertising campaigns to improve
brand image or increase revenue, reduce costs, etc.). However, for the purpose of establishing
a business or attracting investors, at least these three key things should be included in the
comprehensive financial feasibility study:
Start-Up Capital Requirements.
Start-Up Capital Sources.
Potential Returns for Investors, this is, the difference between income and expenses.
Investors can be friends, family members, professional associates, client, partners,
shareholders, or investment institutions. They give the companies money with the
understanding that they will receive "returns" on their investment, that is, in addition to the
amount that is invested they will get a percentage of profits.
In order to entice investors the company need to show how its business will make profits,
when it will begin to make profits, how much profit it will make, and what investors will gain
from their investment. The investment return section should offer both a description of how
investors will be involved and discuss different variables that will affect the profitability of the
business, offering more than one scenario.
In our case the financing is done through a microcredit granted by the bank, but even so it will
be essential to carry out this cash flow with these two scenarios. So that the bank can verify
that the company will be profitable and thus can repay the loan installments plus interest
Accrued, due to the fact that the bank will not grant the loan if the company repayment is not
assured.
29
BUSINESS PLAN FOR THE INTRODUCTION OF A SMARTPHONE APPLICATION OF TRANSPORT
IN THE LATVIAN MARKET
3. PRACTICAL PART
3.1. Description of the Product
The object of this Business Plan is the creation and introduction of a new mobile phone
transport application in The Latvian’s Market, specifically in Riga. Accordingly, we are going to
analyse the feasibility and the marketing aspects of the product launch.
Mobile applications are growing up and increasing their popularity, especially among young
and middle-aged people. That is because they are always carrying their mobile phones and it is
easier and faster for them to check any doubt or information in their mobiles, without
requiring more than a simple touch of a finger.
This application will cover the public transport niche, helping people who arrive in a city that
they do not know or those who are in a known place but they are not sure whether they
should take a bus, a minibus, a trolleybus, a tram or a taxi.
It uses the location provided by the mobile phone in order to know exactly where the users
are. These should enter their destination and the application provides them with the following
information:
- They can know how far they are from the nearest bus stop, taxi stop or tram stop.
- They can know how long it would take the taxi ride, the tram ride and the bus drive.
- Also they know how much each way of transport would cost.
At the beginning of the activity, the application is focused on buses, trams, trolleybuses,
minibuses and taxis, but a possible improvement of this, once the application will be
established in the market, is to take into consideration all transport media available.
Therefore, if the journey could be also made by train or boat, the application will provide the
users with all the information listed above of these two transport media. How far it is the
nearest boat or train stop, how long it takes to make the journey and how much it costs.
Therefore, users of this breakthrough and useful application could compare these five - or six
or seven - transport media in order to decide which one they prefer. They would also have
information about the taxi availability and capacity, being able to access directly from the
application to the taxi telephone number in case they decide not going to a stop. Due to the
fact that there is no shortage of taxi companies operating in Riga, this application has all the
taxi fares registered in order to calculate the price of each one taxi company and all of their
telephone numbers as well.
This Project stems from the need of the entrepreneurs themselves for a service which they
could obtain quick and accurate information about the location of taxi stops, availability, fares
and the approximately price of the journey; in order to compare these with the other
transport media, such as tram, trolleybus, bus and minibus.
30
BUSINESS PLAN FOR THE INTRODUCTION OF A SMARTPHONE APPLICATION OF TRANSPORT
IN THE LATVIAN MARKET
3.2. Analysis of Stakeholders
When it comes to putting on the market any breakthrough idea, all factors involved and those
who have an impact in that idea must be considered. These factors, both voluntary and
involuntary, are called Stakeholders and they must be thoroughly analysed and treated in
order to ensure the success of the project and also to anticipate the consequences of any
change in the organisation’s activities.
This discipline, Stakeholder Management, is an important field used by successful people to
win support from others.
Stakeholders could be classified by various means. In this Business Plan they are going to be
categorized according to R.E. Freeman in his stakeholder theory book “Strategic Management:
A Stakeholder Approach”.
INTERNAL STAKEHOLDERS: Those internal factors with whom managers are used to dealing
with on a daily basis.
- Owners: They are those who own shares of stock. In addition to be responsible of
paying dividends to stock holders or increase the value of their equity, they should
manage and control the company.
o The entrepreneur who had the main idea and is convinced to develop it.
o A venture partner that contributes capital allowing the development of the
main idea and obtaining in return some shares of stock.
- Customers: They are those people who access to our product or service. The company
has to satisfy their needs in order to keep them and assure the success.
o Our potential customers are young and middle-aged people that use their
mobile phones, i.e. those who arrive in Riga for the first time and those who
live there or who have been there before but they do not know for sure what
is the best transport media for each trip.
According to the Technology Acceptance Model (hereinafter “TAM”), our
customers will be around of 5% of total population in Riga, this is 35.000
people, but we have to add them those tourists who arrive in Riga and
download our application; resulting in a total of over 50.000 users.
o Transport media: Bus, Minibus, Tram and Trolleybus Company, i.e. Satiksme
and most especially, Taxi Companies, because there are more than five taxi
companies in Riga and consequently, one or some of them could have an
advantage over the others.
Also bike companies, train, boats and shuttles from the airport could be
considered in the future.
31
BUSINESS PLAN FOR THE INTRODUCTION OF A SMARTPHONE APPLICATION OF TRANSPORT
IN THE LATVIAN MARKET
• Suppliers: They are the people or companies that provide something to our company
for a particular purpose. We will have suppliers of materials (software) and suppliers of
services.
o Software companies or mobile operating systems such as IOS and Android.
o Software developers who are able to design and develop the application with
all crucial information, precision and straightforward handling.
• Employees: In this business or company there will not be employees, just owners and
suppliers, because software developers are subcontracted, so we are not considering
them as employees (they will be outsourcing employees, considered as suppliers).
EXTERNAL STAKEHOLDERS: Those factors, who are external to the company, i.e. its
“environment”. It is a set of arrows from the environment that affect our confortable
relationships with suppliers, owners, customers and employees.
• Governments: They are any public organism that acts at local, regional, national or
international level.
o Municipality.
o Ministry of transport.
o Regulations of Latvian Government.
o Regulations for international companies.
• Environmentalists: In this type of external stakeholders they are included all factors
that relate to the environment and awareness of caring it.
o Green thinking. Although our activity has not a direct impact in the
environment, the importance of keeping an environmentally responsible way
of thinking is crucial in all business area.
o Social responsibility, merged also with green thinking.
• Special Interest Groups: It is a group or an individual that underlies the shifts in the
business environment engendered by government, foreign competition, consumer
advocates and environmentalists.
• Media: They are all media in which the company can advertise itself or have any
impact on them.
o Mass Media and Social Media: Public campaign presentations, conferences
and seminars, workshops, webpage or printed materials such as flyers.
o Banners in job fairs or advertising panels.

32
BUSINESS PLAN FOR THE INTRODUCTION OF A SMARTPHONE APPLICATION OF TRANSPORT
IN THE LATVIAN MARKET
3.3. Market study
3.3.1. ANALYSIS OF INDUSTRY AND ASPECTS RELATED TO THE PROJECT
NEED OF THE APPLICATION
Subject to data published in Census Bureau, Riga is the largest and most populous city in the
Baltic Region and one of the most important cities in Europe. It occupies the 54th position in
the ranking of the more populous cities in Europe.
Number City Country Number of inhabitants 1 Istanbul Turkey 13.710.512 2 Moscow Russia 10.382.754 3 London United Kingdom 8.308.369 4 San Petersburg Russia 4.661.219 5 Madrid Spain 3.575.429 6 Berlin Germany 3.375.222 7 Kiev Ukraine 2.845.023 8 Rome Italy 2.768.415 9 Paris France 2.243.833
10 Baku Azerbaijan 2.122.300 11 Bucharest Romania 1.883.425 12 Minsk Belarus 1.834.200 13 Vienna Austria 1.741.246 14 Budapest Hungary 1.740.041 16 Warsaw Poland 1.706.624 21 Stockholm Sweden 1.372.565 25 Prague Czech Republic 1.241.664 30 Brussels Belgium 1.154.635 33 Athens Greece 1.029.520 41 Oslo Norway 951.581 48 Amsterdam The Netherlands 779.808
54 Riga Latvia 710.703
57 Frankfurt Germany 698.775 58 Zagreb Croatia 686.568 60 Skopje Macedonia 668.518 66 Wroclaw Poland 632.930 69 Helsinki Finland 610.601 80 Copenhagen Denmark 559.440 86 Vilna Lithuania 535.631
122 Tallinn Estonia 411.980
Of the cities with over 500.000 inhabitants, according to Eurostat data, there are only three of
them where nationals accounted for less than 75% of the population. These are Brussels,
Zurich and Riga. In Riga, Russians made up the group of non-Latvian citizens living there,
followed by smaller proportions of citizens from Belarus, Ukraine and the other Baltic States.
Table 5: Number of inhabitants in capital cities in Europe.
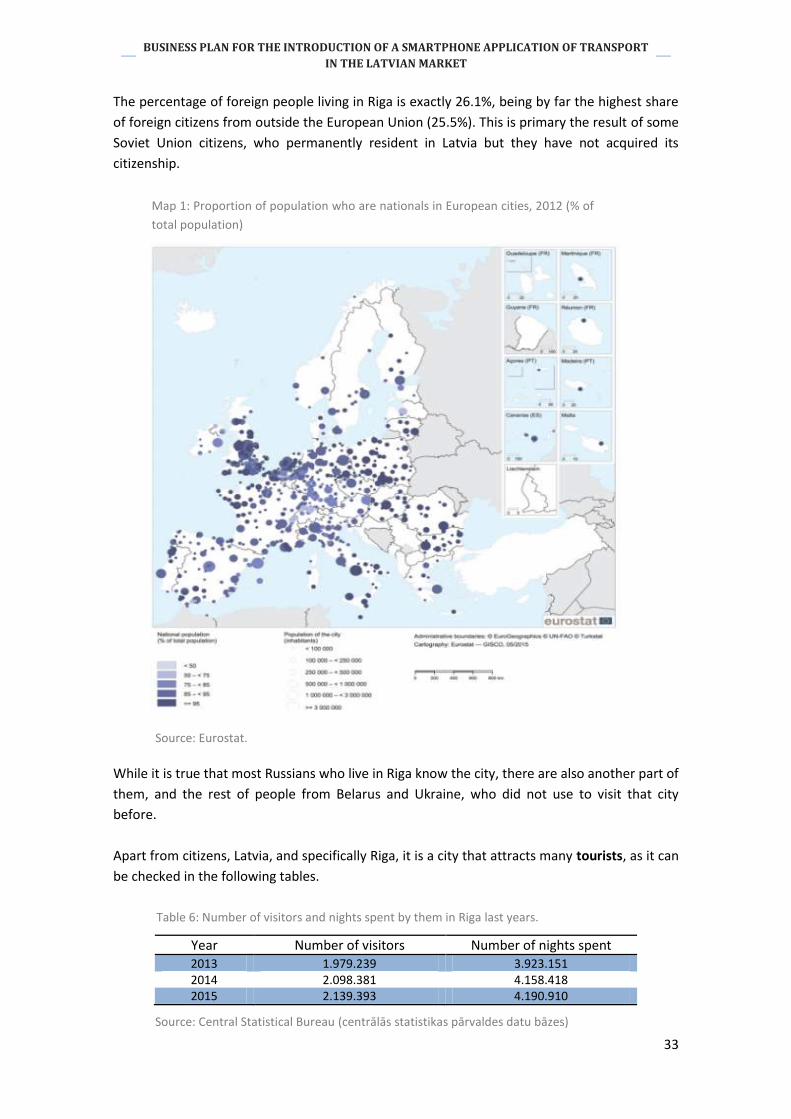
33
BUSINESS PLAN FOR THE INTRODUCTION OF A SMARTPHONE APPLICATION OF TRANSPORT
IN THE LATVIAN MARKET
The percentage of foreign people living in Riga is exactly 26.1%, being by far the highest share
of foreign citizens from outside the European Union (25.5%). This is primary the result of some
Soviet Union citizens, who permanently resident in Latvia but they have not acquired its
citizenship.
While it is true that most Russians who live in Riga know the city, there are also another part of
them, and the rest of people from Belarus and Ukraine, who did not use to visit that city
before.
Apart from citizens, Latvia, and specifically Riga, it is a city that attracts many tourists, as it can
be checked in the following tables.
Year Number of visitors Number of nights spent 2013 1.979.239 3.923.151 2014 2.098.381 4.158.418 2015 2.139.393 4.190.910
Map 1: Proportion of population who are nationals in European cities, 2012 (% of
total population)
Table 6: Number of visitors and nights spent by them in Riga last years.
Source: Eurostat.
Source: Central Statistical Bureau (centrālās statistikas pārvaldes datu bāzes)
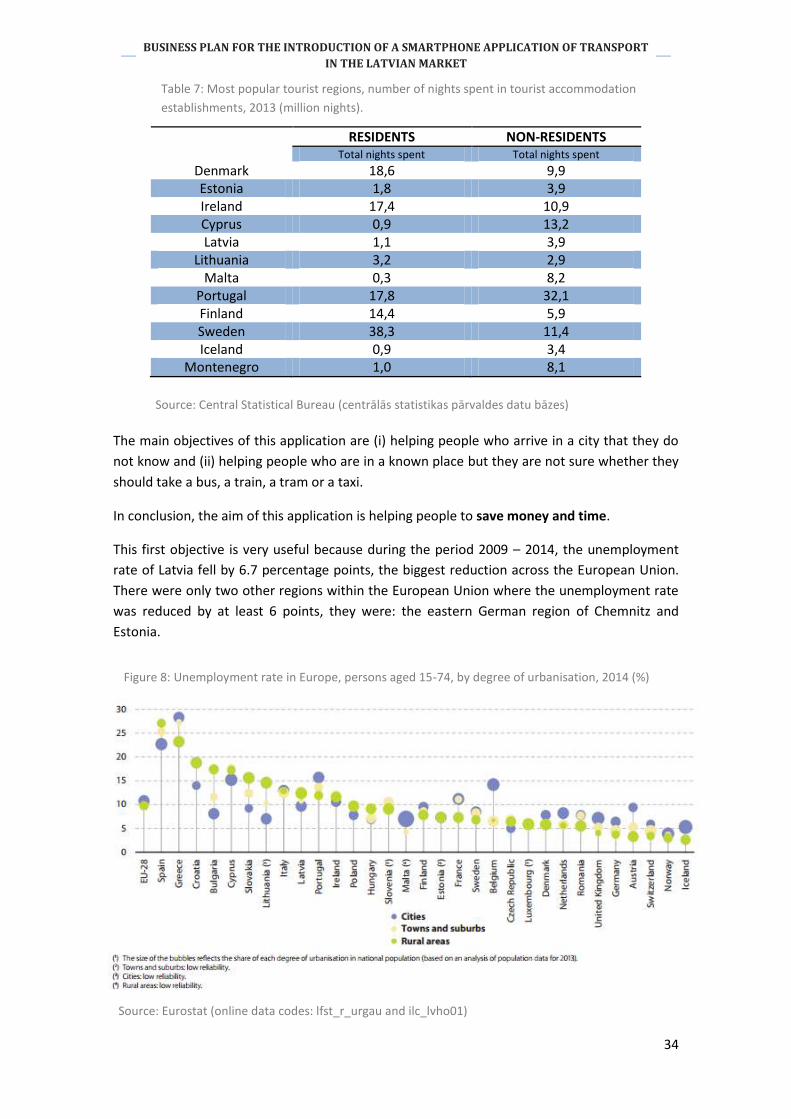
34
BUSINESS PLAN FOR THE INTRODUCTION OF A SMARTPHONE APPLICATION OF TRANSPORT
IN THE LATVIAN MARKET
RESIDENTS NON-RESIDENTS Total nights spent Total nights spent
Denmark 18,6 9,9 Estonia 1,8 3,9 Ireland 17,4 10,9 Cyprus 0,9 13,2 Latvia 1,1 3,9
Lithuania 3,2 2,9 Malta 0,3 8,2
Portugal 17,8 32,1 Finland 14,4 5,9 Sweden 38,3 11,4 Iceland 0,9 3,4
Montenegro 1,0 8,1
The main objectives of this application are (i) helping people who arrive in a city that they do
not know and (ii) helping people who are in a known place but they are not sure whether they
should take a bus, a train, a tram or a taxi.
In conclusion, the aim of this application is helping people to save money and time.
This first objective is very useful because during the period 2009 – 2014, the unemployment
rate of Latvia fell by 6.7 percentage points, the biggest reduction across the European Union.
There were only two other regions within the European Union where the unemployment rate
was reduced by at least 6 points, they were: the eastern German region of Chemnitz and
Estonia.
Table 7: Most popular tourist regions, number of nights spent in tourist accommodation
establishments, 2013 (million nights).
Figure 8: Unemployment rate in Europe, persons aged 15-74, by degree of urbanisation, 2014 (%)
Source: Eurostat (online data codes: lfst_r_urgau and ilc_lvho01)
Source: Eurostat (online data codes: lfst_r_urgau and ilc_lvho01)
Source: Central Statistical Bureau (centrālās statistikas pārvaldes datu bāzes)
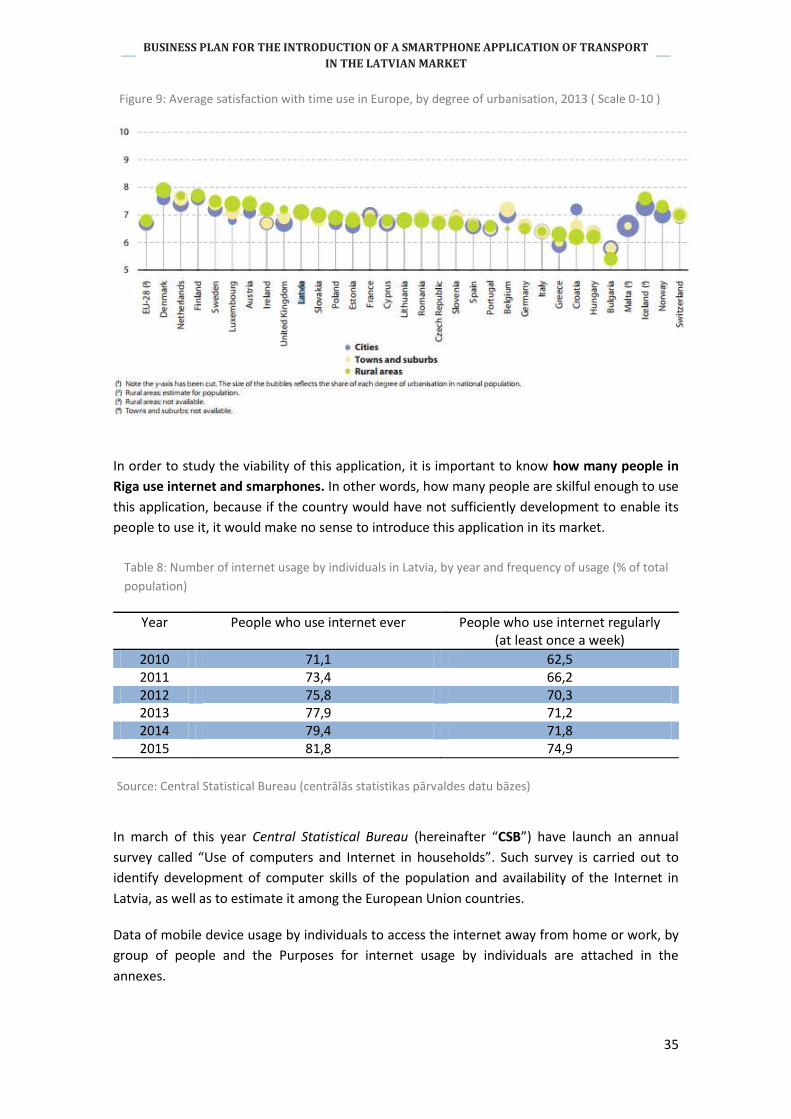
35
BUSINESS PLAN FOR THE INTRODUCTION OF A SMARTPHONE APPLICATION OF TRANSPORT
IN THE LATVIAN MARKET
In order to study the viability of this application, it is important to know how many people in
Riga use internet and smarphones. In other words, how many people are skilful enough to use
this application, because if the country would have not sufficiently development to enable its
people to use it, it would make no sense to introduce this application in its market.
Year People who use internet ever People who use internet regularly (at least once a week)
2010 71,1 62,5 2011 73,4 66,2 2012 75,8 70,3 2013 77,9 71,2 2014 79,4 71,8 2015 81,8 74,9
In march of this year Central Statistical Bureau (hereinafter “CSB”) have launch an annual
survey called “Use of computers and Internet in households”. Such survey is carried out to
identify development of computer skills of the population and availability of the Internet in
Latvia, as well as to estimate it among the European Union countries.
Data of mobile device usage by individuals to access the internet away from home or work, by
group of people and the Purposes for internet usage by individuals are attached in the
annexes.
Figure 9: Average satisfaction with time use in Europe, by degree of urbanisation, 2013 ( Scale 0-10 )
Table 8: Number of internet usage by individuals in Latvia, by year and frequency of usage (% of total
population)
Source: Central Statistical Bureau (centrālās statistikas pārvaldes datu bāzes)
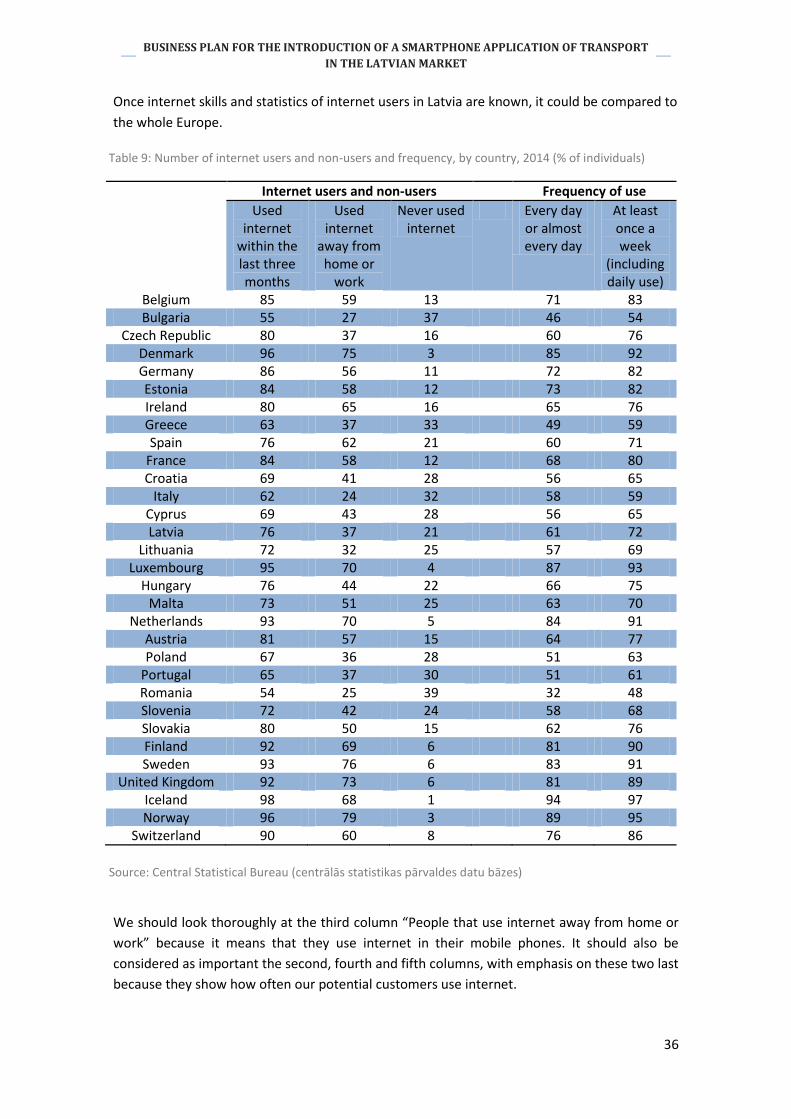
36
BUSINESS PLAN FOR THE INTRODUCTION OF A SMARTPHONE APPLICATION OF TRANSPORT
IN THE LATVIAN MARKET
Once internet skills and statistics of internet users in Latvia are known, it could be compared to
the whole Europe.
Internet users and non-users Frequency of use
Used internet
within the last three months
Used internet
away from home or
work
Never used internet
Every day or almost every day
At least once a week
(including daily use)
Belgium 85 59 13 71 83 Bulgaria 55 27 37 46 54
Czech Republic 80 37 16 60 76 Denmark 96 75 3 85 92 Germany 86 56 11 72 82 Estonia 84 58 12 73 82 Ireland 80 65 16 65 76 Greece 63 37 33 49 59 Spain 76 62 21 60 71
France 84 58 12 68 80 Croatia 69 41 28 56 65
Italy 62 24 32 58 59 Cyprus 69 43 28 56 65 Latvia 76 37 21 61 72
Lithuania 72 32 25 57 69 Luxembourg 95 70 4 87 93
Hungary 76 44 22 66 75 Malta 73 51 25 63 70
Netherlands 93 70 5 84 91 Austria 81 57 15 64 77 Poland 67 36 28 51 63
Portugal 65 37 30 51 61 Romania 54 25 39 32 48 Slovenia 72 42 24 58 68 Slovakia 80 50 15 62 76 Finland 92 69 6 81 90 Sweden 93 76 6 83 91
United Kingdom 92 73 6 81 89 Iceland 98 68 1 94 97 Norway 96 79 3 89 95
Switzerland 90 60 8 76 86
We should look thoroughly at the third column “People that use internet away from home or
work” because it means that they use internet in their mobile phones. It should also be
considered as important the second, fourth and fifth columns, with emphasis on these two last
because they show how often our potential customers use internet.
Table 9: Number of internet users and non-users and frequency, by country, 2014 (% of individuals)
Source: Central Statistical Bureau (centrālās statistikas pārvaldes datu bāzes)
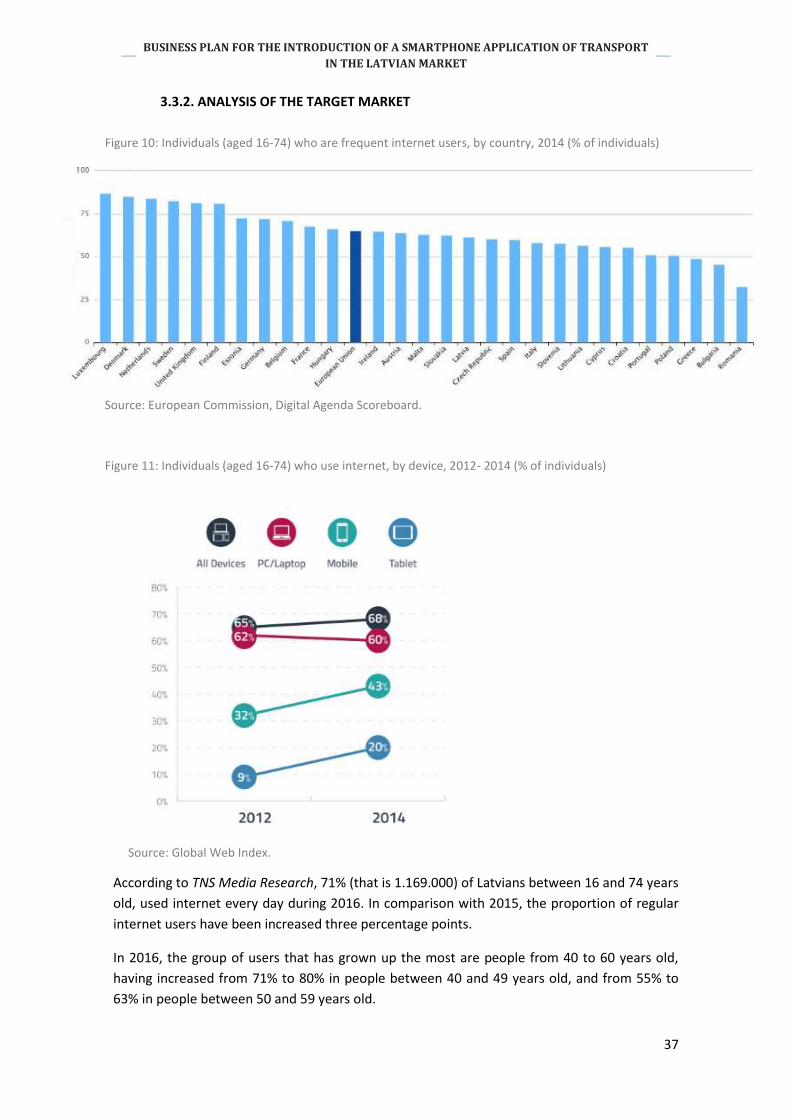
37
BUSINESS PLAN FOR THE INTRODUCTION OF A SMARTPHONE APPLICATION OF TRANSPORT
IN THE LATVIAN MARKET
3.3.2. ANALYSIS OF THE TARGET MARKET
According to TNS Media Research, 71% (that is 1.169.000) of Latvians between 16 and 74 years
old, used internet every day during 2016. In comparison with 2015, the proportion of regular
internet users have been increased three percentage points.
In 2016, the group of users that has grown up the most are people from 40 to 60 years old,
having increased from 71% to 80% in people between 40 and 49 years old, and from 55% to
63% in people between 50 and 59 years old.
Figure 10: Individuals (aged 16-74) who are frequent internet users, by country, 2014 (% of individuals)
Source: European Commission, Digital Agenda Scoreboard.
Source: Global Web Index.
Figure 11: Individuals (aged 16-74) who use internet, by device, 2012- 2014 (% of individuals)

38
BUSINESS PLAN FOR THE INTRODUCTION OF A SMARTPHONE APPLICATION OF TRANSPORT
IN THE LATVIAN MARKET
According to the latest results of this source, Latvian population that use smartphones
continues to grow. More than a half of Latvians, exactly 55%, use smartphone and 22% of
them use tablet. It should be noted that not all smartphone users use internet, they are the
48% those who use internet, and 37% those who use it every day.
Following this analysis, we can assure that internet is frequently used by Latvians, placed in the
sixteen position in the European framework.
Moreover, this number of internet users has been increasing during recent years, and most
importantly, the number of mobile phone users, who are the subject of our research.
Therefore this number of smartphone users is expected to be continuing growing up, ensuring
the sustainability of this project.
Figure 13: Users of tablets and smartphones, by year, 2013- 2016 (% of individuals)
2013 2014 2015 2016
Source: TNS Latvia Digital.
Figure 12: Regular Rate of Internet users, by target group and year, 2015- 2016 (% of individuals)
Source: TNS Latvia Digital.
39
BUSINESS PLAN FOR THE INTRODUCTION OF A SMARTPHONE APPLICATION OF TRANSPORT
IN THE LATVIAN MARKET
3.3.3. ANALYSIS AND DEMAND FORECAST
This new application fills a niche in the market for those lower-middle class people who want
to reap the highest possible cost and time savings.
- Potential market:
All those people who have a Smartphone and perform transfers or trips throughout
the day. Also tourists arriving in Riga.
- Objective market:
This covers those people who frequently use public transportation and include the
ages of 16-49 years.
- Real market:
Those people who do not know very well bus lines, tram lines, trolleybus lines, minibus
lines, and the price of different taxi companies. It is just because of these particular
people that we have decided to create this application.
According to the TAM, this target group represent 5% or even less of Riga total
population, but we should keep in mind that we have to add a high percentage of
tourists to that number of potential customers.
This application is focused on the Real or Objective Target, i.e. those people who are in Riga
whether they know the city or if it is their first time there. It gathers the information about all
bus lines, tram lines, trolley-bus lines, microbus lines and taxis in operation. It would be also
consider train lines if the journey can take place by train. Thanks to all of that information, this
new application will save so much time to its users.
The market where we are introducing ourselves is a growing market since more and more
people are using public transport due to new policies to reduce pollution. Moreover, this
application will be developed in Riga but our Project is to expand it from all over the country in
the future.
It should be kept in mind that we are creating a new sector because the service provided by
this application it is not exactly given by any other company. Consequently, due to we are
acting as “first mover” it is critical to create an excellent application to achieve prestige and
consolidate ourselves before the emergence of competitors.
That is why we have chosen to start just with Riga, in order to learn from mistakes and failures
and subsequently, expand ourselves from all over the country with higher quality.
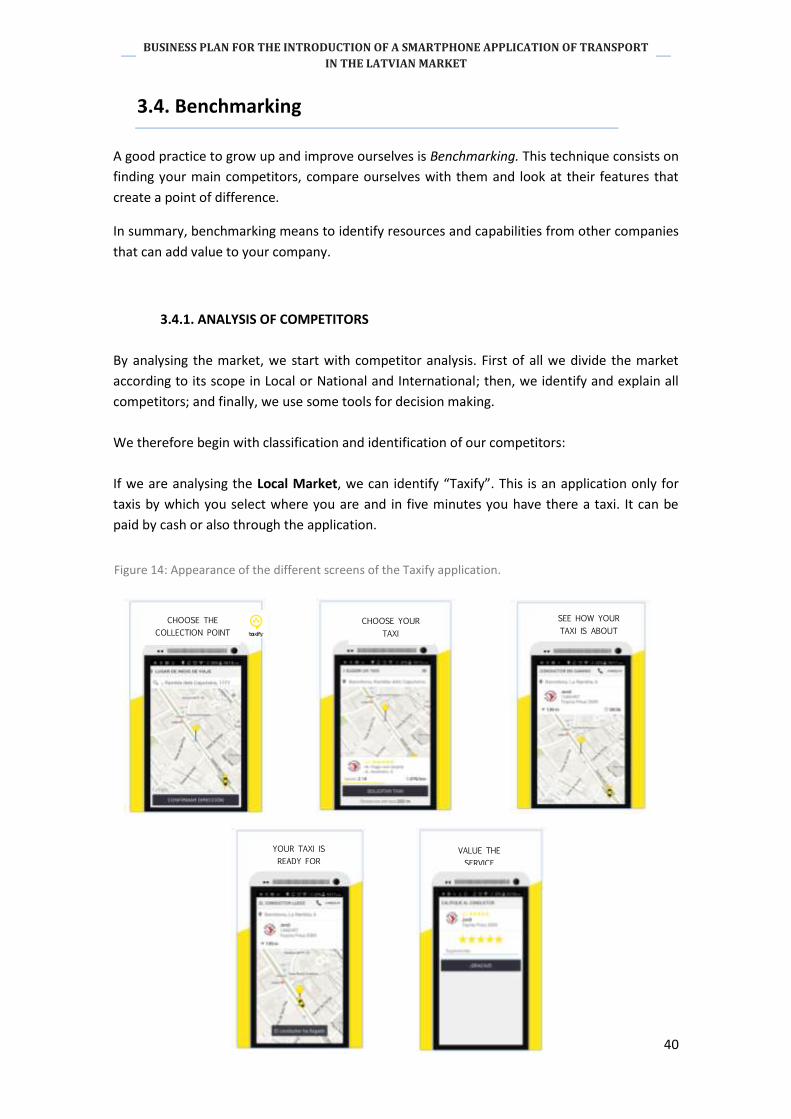
40
BUSINESS PLAN FOR THE INTRODUCTION OF A SMARTPHONE APPLICATION OF TRANSPORT
IN THE LATVIAN MARKET
3.4. Benchmarking
A good practice to grow up and improve ourselves is Benchmarking. This technique consists on
finding your main competitors, compare ourselves with them and look at their features that
create a point of difference.
In summary, benchmarking means to identify resources and capabilities from other companies
that can add value to your company.
3.4.1. ANALYSIS OF COMPETITORS
By analysing the market, we start with competitor analysis. First of all we divide the market
according to its scope in Local or National and International; then, we identify and explain all
competitors; and finally, we use some tools for decision making.
We therefore begin with classification and identification of our competitors:
If we are analysing the Local Market, we can identify “Taxify”. This is an application only for
taxis by which you select where you are and in five minutes you have there a taxi. It can be
paid by cash or also through the application.
CHOOSE THE
COLLECTION POINT
CHOOSE YOUR
TAXI
SEE HOW YOUR
TAXI IS ABOUT
YOUR TAXI IS
READY FOR
VALUE THE
SERVICE
Figure 14: Appearance of the different screens of the Taxify application.
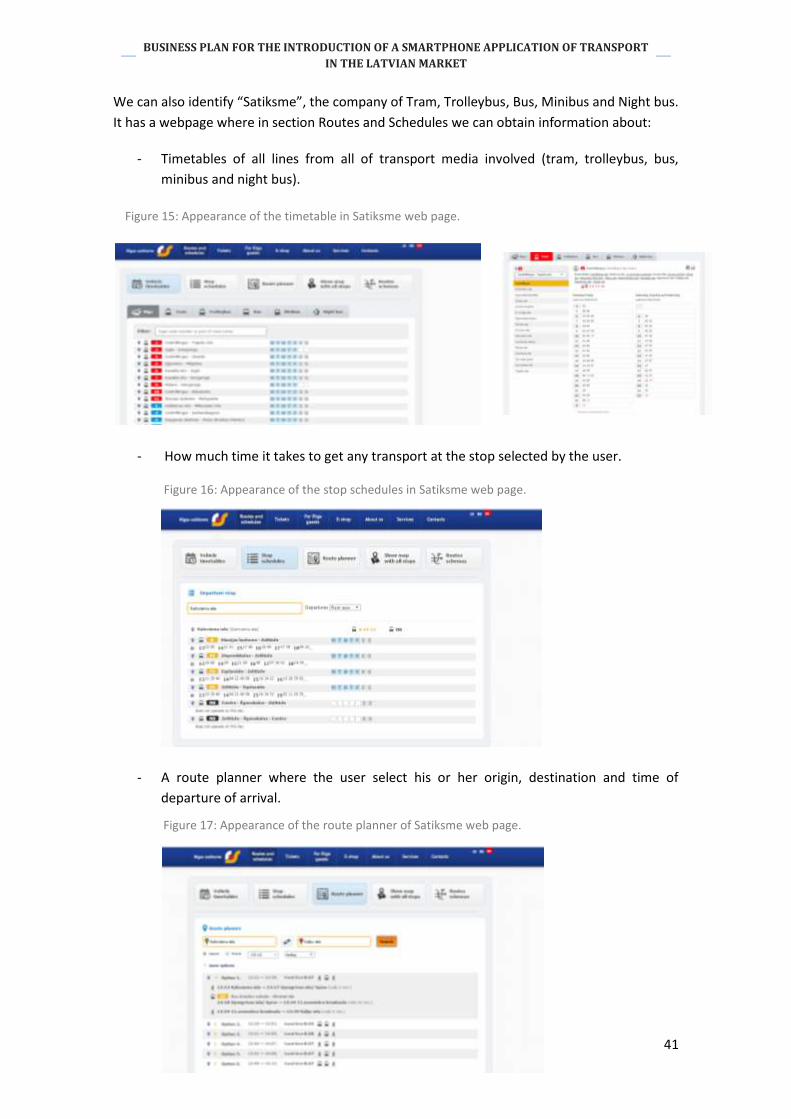
41
BUSINESS PLAN FOR THE INTRODUCTION OF A SMARTPHONE APPLICATION OF TRANSPORT
IN THE LATVIAN MARKET
We can also identify “Satiksme”, the company of Tram, Trolleybus, Bus, Minibus and Night bus.
It has a webpage where in section Routes and Schedules we can obtain information about:
- Timetables of all lines from all of transport media involved (tram, trolleybus, bus,
minibus and night bus).
- The exact schedule and
- How much time it takes to get any transport at the stop selected by the user.
- A route planner where the user select his or her origin, destination and time of
departure of arrival.
Figure 15: Appearance of the timetable in Satiksme web page.
Figure 16: Appearance of the stop schedules in Satiksme web page.
Figure 17: Appearance of the route planner of Satiksme web page.
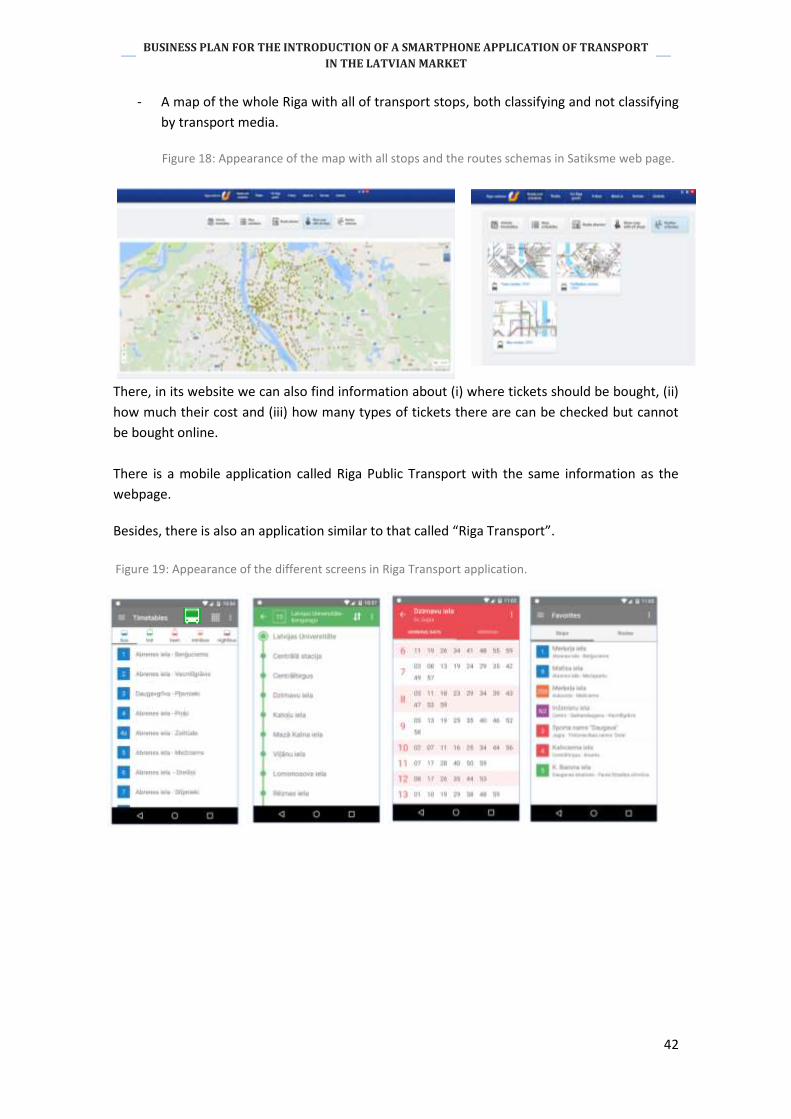
42
BUSINESS PLAN FOR THE INTRODUCTION OF A SMARTPHONE APPLICATION OF TRANSPORT
IN THE LATVIAN MARKET
- A map of the whole Riga with all of transport stops, both classifying and not classifying
by transport media.
There, in its website we can also find information about (i) where tickets should be bought, (ii)
how much their cost and (iii) how many types of tickets there are can be checked but cannot
be bought online.
There is a mobile application called Riga Public Transport with the same information as the
webpage.
Besides, there is also an application similar to that called “Riga Transport”.
Figure 18: Appearance of the map with all stops and the routes schemas in Satiksme web page.
Figure 19: Appearance of the different screens in Riga Transport application.
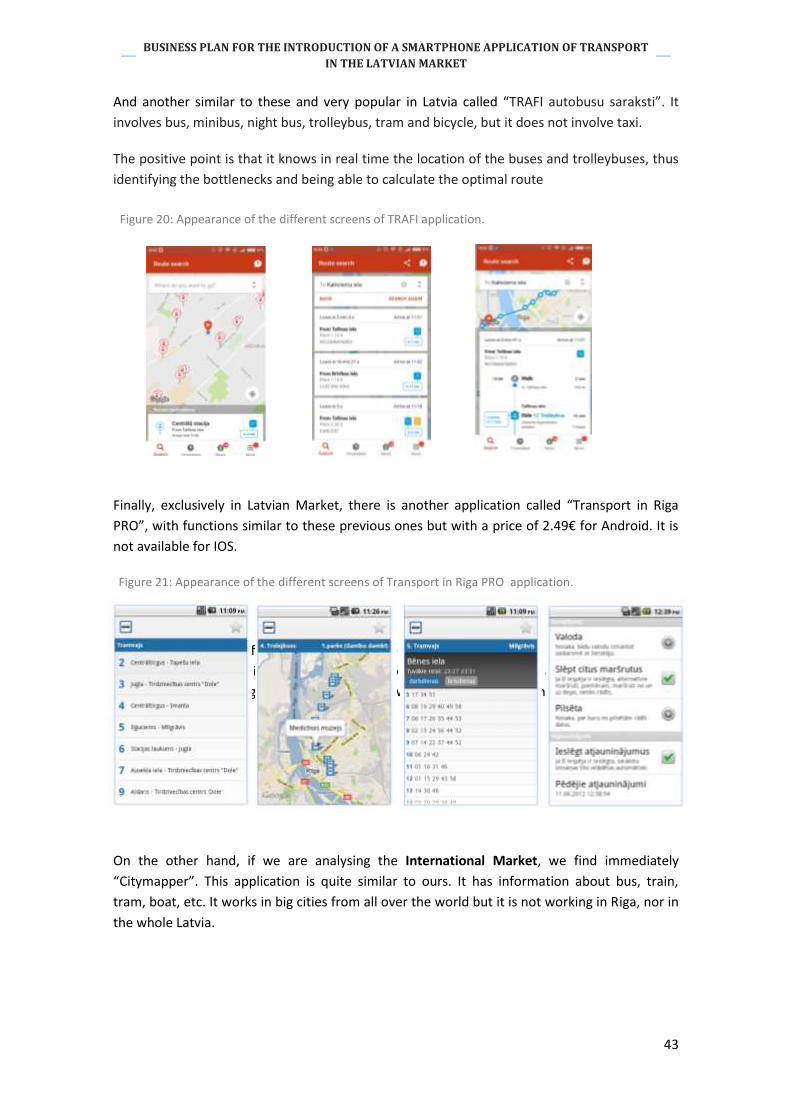
43
BUSINESS PLAN FOR THE INTRODUCTION OF A SMARTPHONE APPLICATION OF TRANSPORT
IN THE LATVIAN MARKET
And another similar to these and very popular in Latvia called “TRAFI autobusu saraksti”. It
involves bus, minibus, night bus, trolleybus, tram and bicycle, but it does not involve taxi.
The positive point is that it knows in real time the location of the buses and trolleybuses, thus
identifying the bottlenecks and being able to calculate the optimal route
Finally, exclusively in Latvian Market, there is another application called “Transport in Riga
PRO”, with functions similar to these previous ones but with a price of 2.49€ for Android. It is
not available for IOS.
On the other hand, if we are analysing the International Market, we find immediately
“citymapper”. This application is quite similar to ours. It has information about bus, train, tram,
boat, etc. It works in big cities from all over the world but it is not working in Riga.
On the other hand, if we are analysing the International Market, we find immediately
“Citymapper”. This application is quite similar to ours. It has information about bus, train,
tram, boat, etc. It works in big cities from all over the world but it is not working in Riga, nor in
the whole Latvia.
Figure 21: Appearance of the different screens of Transport in Riga PRO application.
Figure 20: Appearance of the different screens of TRAFI application.
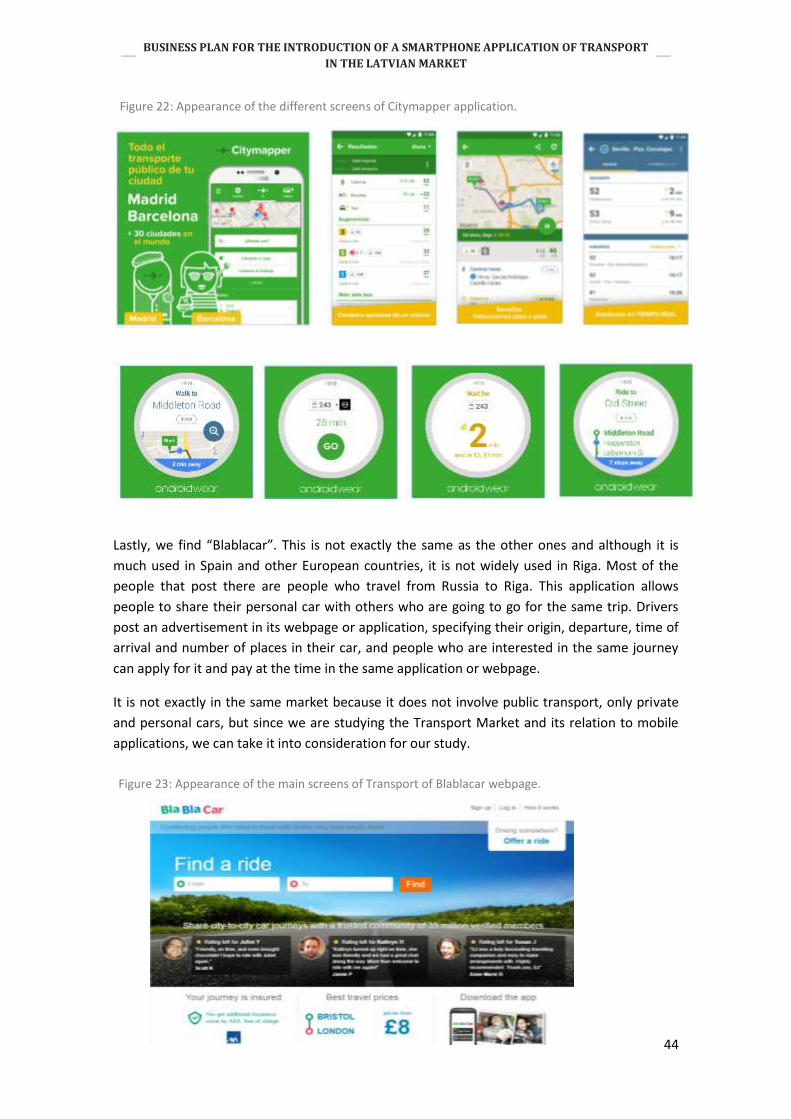
44
BUSINESS PLAN FOR THE INTRODUCTION OF A SMARTPHONE APPLICATION OF TRANSPORT
IN THE LATVIAN MARKET
Lastly, we find “Blablacar”. This is not exactly the same as the other ones and although it is
much used in Spain and other European countries, it is not widely used in Riga. Most of the
people that post there are people who travel from Russia to Riga. This application allows
people to share their personal car with others who are going to go for the same trip. Drivers
post an advertisement in its webpage or application, specifying their origin, departure, time of
arrival and number of places in their car, and people who are interested in the same journey
can apply for it and pay at the time in the same application or webpage.
It is not exactly in the same market because it does not involve public transport, only private
and personal cars, but since we are studying the Transport Market and its relation to mobile
applications, we can take it into consideration for our study.
Figure 22: Appearance of the different screens of Citymapper application.
Figure 23: Appearance of the main screens of Transport of Blablacar webpage.
45
BUSINESS PLAN FOR THE INTRODUCTION OF A SMARTPHONE APPLICATION OF TRANSPORT
IN THE LATVIAN MARKET
Once described all of our competitors, it is time to compare them. In order to know exactly
how important and strong are our competitors, and also which one is the most direct or
dangerous competitor, we will use a series of tools that consist of some matrixes of decission
making.
There are a lot of methods for decission making but in this project we have selected, by its
easy implementation and user-friendlyness, weighted product and linear mapping. We have
chosen Decision Matrix Analysis, one of them about unweighted assessment and the other
about weighted assessment, linear mapping and weighted product, respectively.
Both are described in this same section into teorethical part.
Once we have our competitors identified and known, if we want to use a decision making
matrix, we should decide which criteria we are going to analyse. In this case, those criteria are
as follow:
- Number of transport media involved. In Riga there are Train, Tram, Trolleybus, Bus,
Minibus, night bus, Shuttle and taxi. There are a lot of taxi companies but in this
section taxi will be considered as one transport media. It will be better that which
involves the greatest number of transport media.
- Number of downloads. We are going to use a scope from 0 to 10, being 0 if it does not
have a mobile application and 10 if it has the highest number of dowloads registered.
The best one will be also the one which has the greatest number.
- Geographical scope. It refers to the geographical area covered by the application,
being 1 if it only works in Riga; 2 if it works in the whole country and 3 if it works all
over Europe.
- Difficulty in use, measured from 1 to 10, being 1 the easiest in use and 10 the most
difficult to use. In this case, 1 will be the best, so it is a decreasing criterion.
- Reputation, that means people perception or also if it is known by many people in
Latvia or if it is almost unknown. We will measure it from 1 to 10, being 1 almost
unknown and 10 known by everyone.
- Cost. It is the downloading cost. We will assign a high number to those alternatives
that do not have a mobile application. In this criterion, 0, that means “for free”, is the
best so it is decreasing.
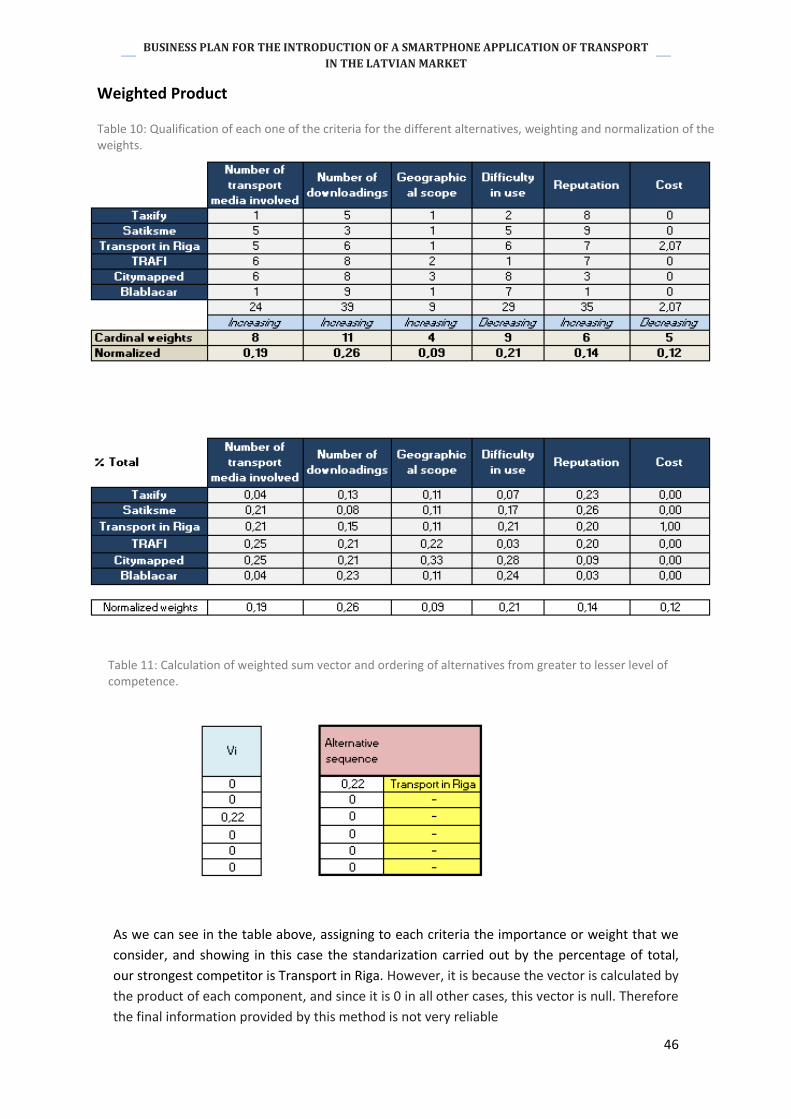
46
BUSINESS PLAN FOR THE INTRODUCTION OF A SMARTPHONE APPLICATION OF TRANSPORT
IN THE LATVIAN MARKET
As we can see in the table above, assigning to each criteria the importance or weight that we
consider, and showing in this case the standarization carried out by the percentage of total,
our strongest competitor is Transport in Riga. However, it is because the vector is calculated by
the product of each component, and since it is 0 in all other cases, this vector is null. Therefore
the final information provided by this method is not very reliable
Weighted Product
Table 10: Qualification of each one of the criteria for the different alternatives, weighting and normalization of the weights.
Table 7: Normalization of the previous data using the total percentage method.
Table 11: Calculation of weighted sum vector and ordering of alternatives from greater to lesser level of competence.
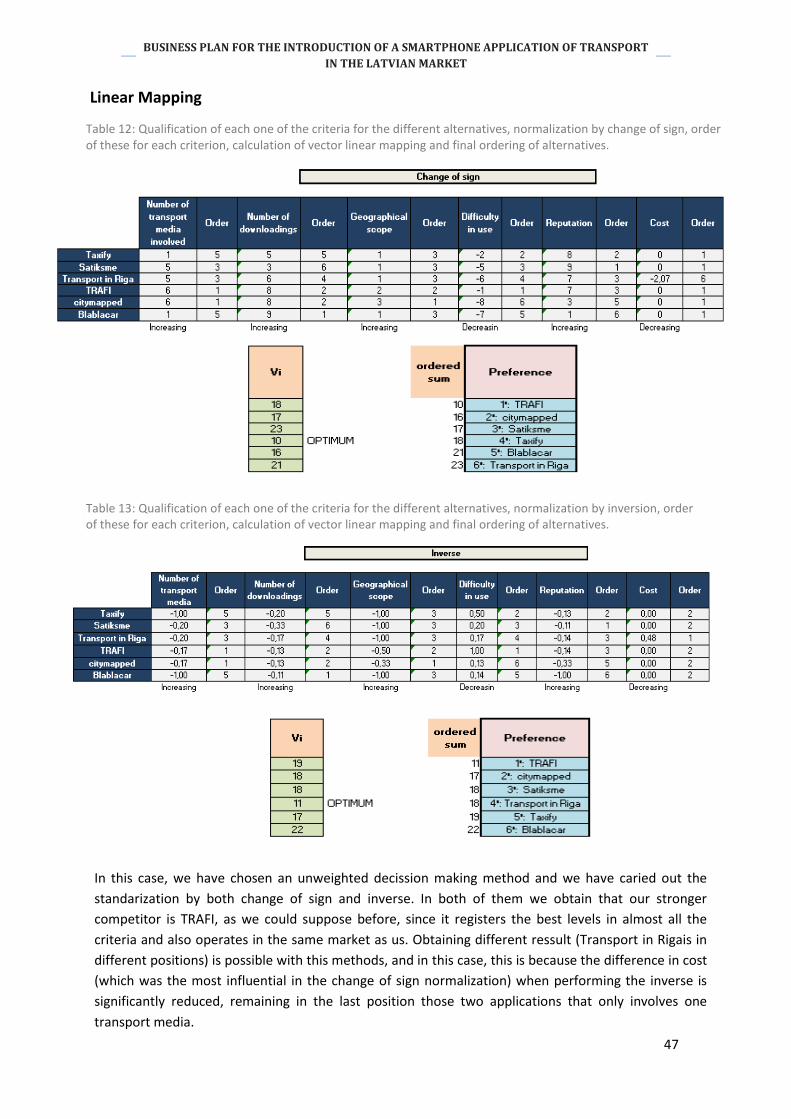
47
BUSINESS PLAN FOR THE INTRODUCTION OF A SMARTPHONE APPLICATION OF TRANSPORT
IN THE LATVIAN MARKET
In this case, we have chosen an unweighted decission making method and we have caried out the
standarization by both change of sign and inverse. In both of them we obtain that our stronger
competitor is TRAFI, as we could suppose before, since it registers the best levels in almost all the
criteria and also operates in the same market as us. Obtaining different ressult (Transport in Rigais in
different positions) is possible with this methods, and in this case, this is because the difference in cost
(which was the most influential in the change of sign normalization) when performing the inverse is
significantly reduced, remaining in the last position those two applications that only involves one
transport media.
Linear Mapping
Table 12: Qualification of each one of the criteria for the different alternatives, normalization by change of sign, order of these for each criterion, calculation of vector linear mapping and final ordering of alternatives. .
Table 13: Qualification of each one of the criteria for the different alternatives, normalization by inversion, order of these for each criterion, calculation of vector linear mapping and final ordering of alternatives. .
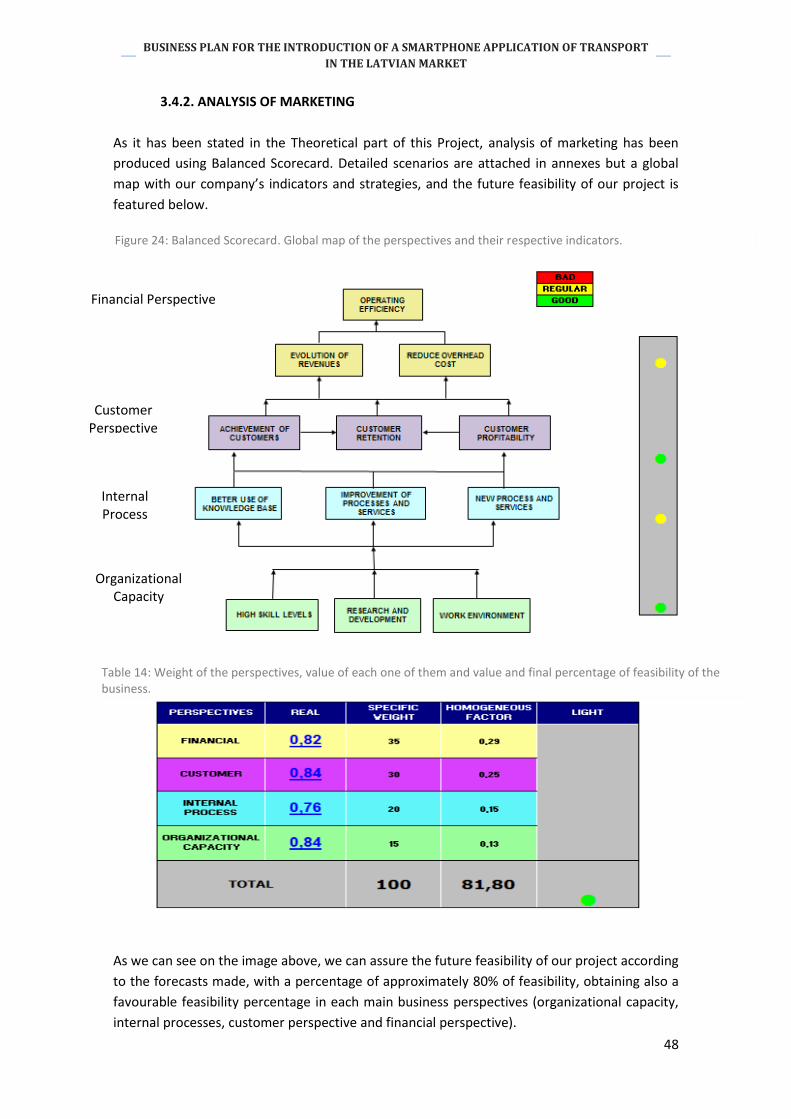
48
BUSINESS PLAN FOR THE INTRODUCTION OF A SMARTPHONE APPLICATION OF TRANSPORT
IN THE LATVIAN MARKET
3.4.2. ANALYSIS OF MARKETING
As it has been stated in the Theoretical part of this Project, analysis of marketing has been
produced using Balanced Scorecard. Detailed scenarios are attached in annexes but a global
map with our company’s indicators and strategies, and the future feasibility of our project is
featured below.
As we can see on the image above, we can assure the future feasibility of our project according
to the forecasts made, with a percentage of approximately 80% of feasibility, obtaining also a
favourable feasibility percentage in each main business perspectives (organizational capacity,
internal processes, customer perspective and financial perspective).
Financial Perspective
Customer Perspective
Internal Process
Organizational Capacity
Figure 24: Balanced Scorecard. Global map of the perspectives and their respective indicators.
Table 14: Weight of the perspectives, value of each one of them and value and final percentage of feasibility of the business.
49
BUSINESS PLAN FOR THE INTRODUCTION OF A SMARTPHONE APPLICATION OF TRANSPORT
IN THE LATVIAN MARKET
3.5. Technical Study
3.5.1. PROJECT REQUIREMENTS
This application must be able to be used at least on mobile devices of the two platforms most
widely today, namely Google’s Android and Apple’s Ios.
Consequently, the proper functioning of the application must be ensured in the following
environments:
iPhone: The latest versions supported by Apple (Ios5, Ios6, Ios7, IOS8, IOS9, IOS10).
Android 2.3 gingerbread OS onwards, taking into account at least the following
resolutions: hdpi, xhdpi and IPRA.
ONLINE AND OFFLINE BEHAVIOR
Use of this application may be done in two ways:
Online: The application requires a data connection and query data directly to the
server.
Offline: The application does not need or does not have a data connection, it is
necessary to have a local copy of the data.
Since this application is also directed to foreign tourists, the limitations in the data connection
of such users should be taken into account. It is possible that a visitor or tourist do not have
Internet access (unless assume roaming charges or is in a place with WiFi connection), to which
must be added low connectivity scenarios. Therefore, to ensure maximum application
functionality, it dumps data on the area and the data storage issue, waiting to find a
connection will be included.
To enable this mode offline, the application must be installed with a database initialized by a
previous dump data to the device.
It is important for us to know the application users in order to anticipate their needs and to
offer them a better service. This makes it necessary to study their behaviour patterns and how
they will use the developed application.
It is necessary to integrate the application with a tool that controls user actions that allow
reporting and analysis of the data collected.
50
BUSINESS PLAN FOR THE INTRODUCTION OF A SMARTPHONE APPLICATION OF TRANSPORT
IN THE LATVIAN MARKET
It will be used for Google Analytics, having the set and the app provider Google Analytics
account so that:
Gaze native Apps shares, i.e. Android and Ios.
Follow-up actions with social networks.
Information such as the number of users using the application every day, created
users, device types, duration of sessions or the type of actions that are performed at
each visit.
Access data: Number of unique users, sessions, access times and duration of sessions
etc.
Technical data: Device models, versions of the installed application, firmware versions.
Data use and application conversion: It should integrate a tool in which the number of
clicks in each section of the application transmits relative information to the user
through push notifications
The content management platform must be accessible from any device, both connected to the
Internet and without data service, and all maintenance that may cause system unavailability
should be advised at least 24 hours in advance.
You will also need geo-positioning services of the device, because the user will have the option
to filter content based on their position.
The iPhone and Android applications will be accessible from the App Store and Google Play.
3.5.2. ERGONOMICS
Following the technical requirements it is also necessary to analyse ergonomics, i.e. the
discipline that deals with the design of workplaces, tools and tasks, to coincide with the
physiological, anatomical, psychological characteristics and capabilities of the worker.
Since our product is a mobile application, with intangible nature, we cannot affect the shape,
dimensions, textures or what device they are working, we can influence the design of it and
how people use them.
Most mobile applications present some level of difficulty from a usability standpoint, because
of the way buttons are laid out on the screen. Tab bars, which are used to navigate between
main sections of the app, limit the tap area of its buttons to the bottom of the screen.
While much of this is obvious to experts, it is not obvious to everybody. User Interface
designers have the chance to create better apps by thinking about ergonomics. As more and
51
BUSINESS PLAN FOR THE INTRODUCTION OF A SMARTPHONE APPLICATION OF TRANSPORT
IN THE LATVIAN MARKET
more people use mobile devices, we will have to consider comfort as a larger part of the user
experience.
That is why we will focus on ergonomics and user-friendliness.
Starting with ergonomics in the design and use of our application, we should think about the
human hand and where we should place buttons so that they are easy to press.
1. Create an app that uses the thumb’s rotation and tendency to move circularly. The
thumb works in arcs not lines, designing our interface to work well for either
interaction.
2. Allow for diagonal gestures. Similar to designing for the thumb we should consider
how users will swipe along diagonal not just vertical or horizontal ones.
3. Limit corner buttons. Consider navigation buttons that do not sit at the corners of the
screen.
4. Make content king. Create gestures/actions that enhance the content, not the ones
that take away from it.
5. Consider our audience. I.e. the different types of people that will be using our app. The
elderly or disabled will have fumbling hands and are likely to place it on a surface or
hold the phone with two hands.
All these aspects considered, the final design and the location of buttons will be determined by
the graphic designer, advised by software developers.
We should also be dynamic, and design our app to act dynamically. Hardware and software
platforms are constantly changing.
Once we have planned all of our technical requirements for ergonomics, we should think
about the actual visual design, that is to say, its colours and its visual identity. In designing apps
we should not only take into account usability, effectiveness or style, but also the font and the
treatment of colour, instantly and involuntarily causing an emotional and subjective reaction in
the mobile user.
The use of bright colours, large images and types of clear and concise source is on the rise.
With the settlement of the big screens in our devices, designers have in mind typography in
order to transmit this beauty and expression to design applications. However the goal is not
only to make it more beautiful, but seeking to improve readability and the user experience
while maintaining the professionalism of the brand.
There are countless studies that talk about how the cold or warm colours of mobile
applications could influence the consumer. If we want to track trends in development of
52
BUSINESS PLAN FOR THE INTRODUCTION OF A SMARTPHONE APPLICATION OF TRANSPORT
IN THE LATVIAN MARKET
applications, we should go for blue, red or even green. However, if we want to differentiate
ourselves, studies advise lean toward the pink or purple hues minority in stores.
Definitely, our company policy is to differentiate ourselves; therefore, before choosing a
colour, we should analyse our competence.
- Taxify is associated with yellow and black.
- Satiksme is associated with blue (with a logo in yellow and red), as well as Transport in
Riga PRO (with a bus logo in blue, black and white).
- Riga transport is associated with green (with a bus logo in green and white) , as well as
citymapper.
- Blablacar is associated with blue, green and red.
Furthermore, due to the fact that our application involves transport media and, thus, the large
number of taxi companies, we do not want to be confused or related with any of them. So
that, we should also analyse their colour code and eliminate them of our list of candidates.
- Red cab is associated with red, as well as Lady Taxi (less known).
- Baltic Taxi is associated with green.
- Panda Taxi is associated with yellow and grey. Smile taxi is associated with yellow and
Alviksa and Riga Taxi are associated with grey.
- Classic Taxi is associated with black, as well as Allo Taxi.
- Avoiss, SOS Taxi and Taxi.lv are associated with white.
All these colours eliminated and trying to be differentiated and easily recognisable, we have
decided to design our application and its logo in garnet and white. Another main reason for
our election is the relationship of these colours with the country where we are developing our
activity, because they are the ones which form the Latvian flat. Red-white-red flag design will
be highly present in the application.
The last point of ergonomic design is Typography. Since our main colours will be garnet, white
and also black, our font should be a different colour depending on the background. We want a
base range of colours so we will use black font in white background and white font in black and
garnet background. The font will be Neue Helvetica Light because it is easily legible and also
users could be accustomed to it due to it is used by IOS.
Therefore, all these things considered, the proposing design for this application will be as
follows:
TRANSPORT
ALL
RIGA
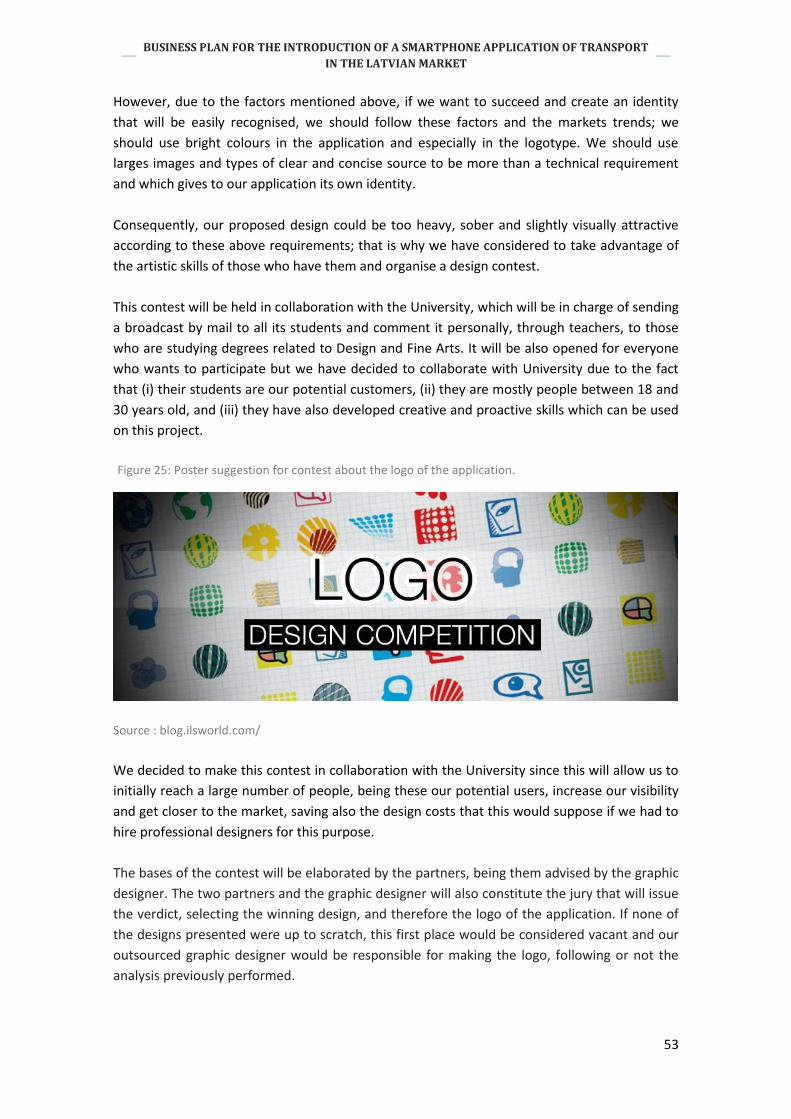
53
BUSINESS PLAN FOR THE INTRODUCTION OF A SMARTPHONE APPLICATION OF TRANSPORT
IN THE LATVIAN MARKET
However, due to the factors mentioned above, if we want to succeed and create an identity
that will be easily recognised, we should follow these factors and the markets trends; we
should use bright colours in the application and especially in the logotype. We should use
larges images and types of clear and concise source to be more than a technical requirement
and which gives to our application its own identity.
Consequently, our proposed design could be too heavy, sober and slightly visually attractive
according to these above requirements; that is why we have considered to take advantage of
the artistic skills of those who have them and organise a design contest.
This contest will be held in collaboration with the University, which will be in charge of sending
a broadcast by mail to all its students and comment it personally, through teachers, to those
who are studying degrees related to Design and Fine Arts. It will be also opened for everyone
who wants to participate but we have decided to collaborate with University due to the fact
that (i) their students are our potential customers, (ii) they are mostly people between 18 and
30 years old, and (iii) they have also developed creative and proactive skills which can be used
on this project.
Source : blog.ilsworld.com/
We decided to make this contest in collaboration with the University since this will allow us to
initially reach a large number of people, being these our potential users, increase our visibility
and get closer to the market, saving also the design costs that this would suppose if we had to
hire professional designers for this purpose.
The bases of the contest will be elaborated by the partners, being them advised by the graphic
designer. The two partners and the graphic designer will also constitute the jury that will issue
the verdict, selecting the winning design, and therefore the logo of the application. If none of
the designs presented were up to scratch, this first place would be considered vacant and our
outsourced graphic designer would be responsible for making the logo, following or not the
analysis previously performed.
Figure 25: Poster suggestion for contest about the logo of the application.
54
BUSINESS PLAN FOR THE INTRODUCTION OF A SMARTPHONE APPLICATION OF TRANSPORT
IN THE LATVIAN MARKET
3.6. Business Organization
3.6.1. LEGAL STRUCTURE
This Project will develop its activity (as long as possible) without setting up a company. This will
work because in Latvia it is not compulsory to be registered as a company below a certain level
of incomes (10.000 € per year); and also because of company creation formalities take only
one hour approximately. After setting up the enterprise register, we should enter in the tax
register.
Therefore, we will start developing our activity by our own, but it is important to plan our
future legal structure because we expect rapid growth in our activity whereby the constitution
of a company becomes necessary.
Due to the advantages and characteristics of our Project, the company will be a Limited
Partnership (SIA), characterized by:
It is the most common type of company in Latvia.
The minimum share capital is 3.090 € and, at least half of it must be paid up in the
start of the business activity.
The minimum number of Shareholders is one. There may be one or more founders of a
limited partnership and may be individuals or legal entities (in this case we have two
owners or founders). The founder may be resident or non-resident in the Republic of
Latvia.
Capital is divided into equal partitions, owing half of the company each owner.
Partners do not respond to social debts.
Owners will put in common money and goods in order to work together and divide up
profits.
The accounts must be kept in line with legal requirements.
3.6.2. ORGANIZATIONAL STRUCTURE
The company is composed by the owners, who will (i) take the decisions, (ii) be responsible of
any problem, if occurs, (iii) and are in charge of marketing and advertisement campaigns; and
the team responsible of the software.
55
BUSINESS PLAN FOR THE INTRODUCTION OF A SMARTPHONE APPLICATION OF TRANSPORT
IN THE LATVIAN MARKET
There will be two owners:
Me, who will be the CEO making the final decision in case of lack of agreement
between Managers, and who will cover the roles of Marketing Manager and Human
Resources Manager; and
Another partner or shareholder who will cover the roles of Logistics Manager, Finance
and Account Manager and also Operations Manager, overseeing the outsourced
Software team.
The software team, as we have previously said, it will be outsourced, but we should clearly
define the specifications and requirements of each charge. This team shall consist of the
following profiles:
Project Manager and Team Leader, with experience in project management and
application development, especially in the field of the tourism sector. It will also assist
in the analysis of the solution, work in collaboration with the graphic designer and
must meet the following requirements:
- Minimum qualifications required: Superior qualifications related to ICT.
- Soft skills such as leadership, team management, organising skills, strategic
thinking skills, etc.
- Provable knowledge in similar projects.
- Minimum 5-year experienced in project management. In this period there
should be targeted projects related to the contract.
Programmers. Profiles responsible for the development and application programming
must comply with the following requirements:
- Minimum qualifications required: Medium qualifications related to ICT.
- Net Programming environments; Programming languages Visual Basic .Net,
HTML, CSS, JavaScripty C +; SQL Server database.
- Minimum 2-year experienced in similar tasks.
Graphic designer. It will coordinate all actions with the project coordinator/team
leader and will be responsible for all graphics aspects and the appearance of the
application. We must comply with the following requirements:
- Minimum qualifications required: Medium degree Graphic Design related
applications.
- Minimum 3-year experienced in similar tasks.
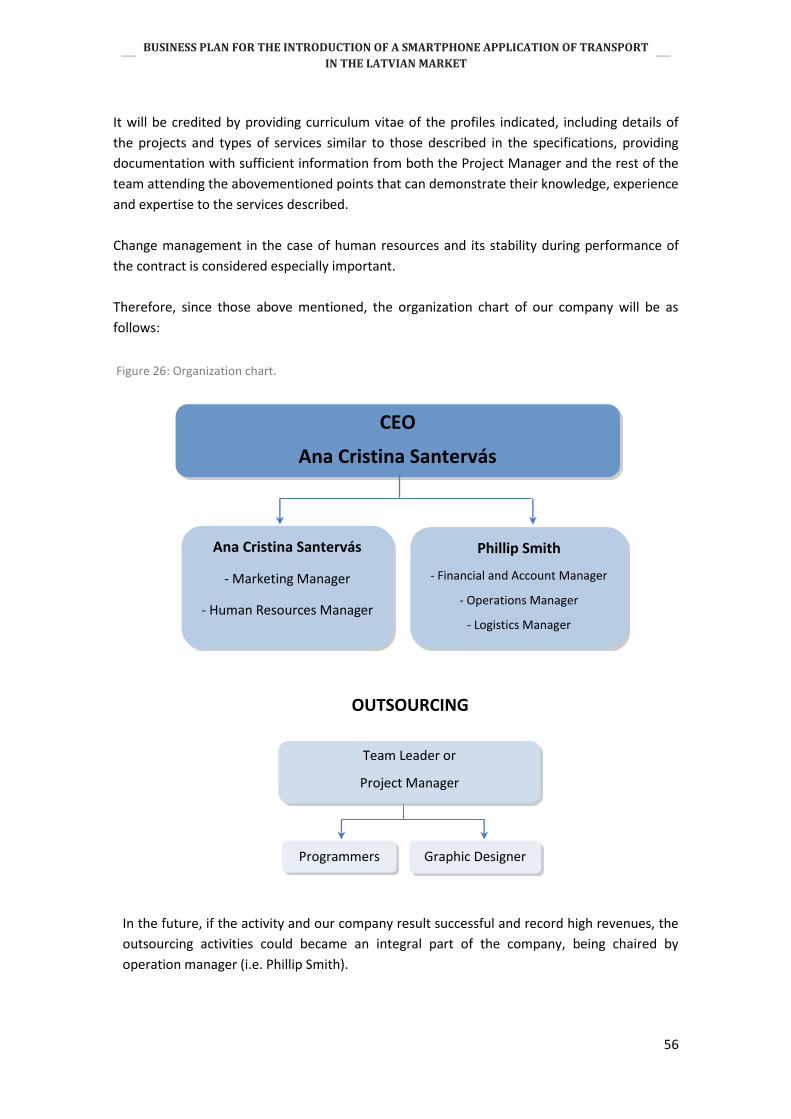
56
BUSINESS PLAN FOR THE INTRODUCTION OF A SMARTPHONE APPLICATION OF TRANSPORT
IN THE LATVIAN MARKET
It will be credited by providing curriculum vitae of the profiles indicated, including details of
the projects and types of services similar to those described in the specifications, providing
documentation with sufficient information from both the Project Manager and the rest of the
team attending the abovementioned points that can demonstrate their knowledge, experience
and expertise to the services described.
Change management in the case of human resources and its stability during performance of
the contract is considered especially important.
Therefore, since those above mentioned, the organization chart of our company will be as
follows:
In the future, if the activity and our company result successful and record high revenues, the
outsourcing activities could became an integral part of the company, being chaired by
operation manager (i.e. Phillip Smith).
Ana Cristina Santervás
- Marketing Manager
- Human Resources Manager
Programmers Graphic Designer
Phillip Smith
- Financial and Account Manager
- Operations Manager
- Logistics Manager
CEO
Ana Cristina Santervás
Team Leader or
Project Manager
OUTSOURCING
Figure 26: Organization chart.

57
BUSINESS PLAN FOR THE INTRODUCTION OF A SMARTPHONE APPLICATION OF TRANSPORT
IN THE LATVIAN MARKET
3.7. Study of Investment
3.7.1. FINANCIAL SOURCES
The budget with which the partners have started the activity has been a total of 30.000 €,
15.000 € of which have been contributed by the two founding partners in equal parts (each
contributing 7.500 €) and the remaining 15.000 € provided by a microcredit for young
entrepreneurs signed with the Spanish bank entity CaixaBank (hereinafter, “La Caixa”).
These European credits from La Caixa are aimed at entrepreneurs and self-employed, as well
as micro-enterprises with less than 10 employees and a turnover not exceeding 2.000.000 €
per year. The characteristics of these microcredits are as follows:
Maximum amount: 25.000 €.
Up to 100% of the project.
Fixed interest rate throughout the life of the operation.
Amortization period: 6 years (without deficiency or with up to 6 months of grace
period).
No real guarantee
The projects eligible under this program are:
Tangible assets: Acquisition, renovation or extension of facilities and material, except
for the purchase of land.
Intangible assets: Development costs, R&D expenditure, creation or acquisition of
distribution networks in national or other markets within the European Union,
obtaining or buying patents, etc.
The intergenerational succession or the transfer of companies to staff members in
order to ensure the continuity of the economic activity of the company. For this, the
entity and the buyer must be SMEs and the amount should not exceed 1.000.000 €.
It will only be necessary to present the business plan in a La Caixa office with the funding
needs in order to qualify for this loan.
Since (i) our company and business forecasts satisfy the number of employees and incomes’
conditions (i.e. it will be aimed at the acquisition of tangible assets and development costs), (ii)
the other characteristics seem appropriate and (iii) we consider that our business plan and
financing conditions would be accepted, we have chosen this form of financing to star our
economic activity.
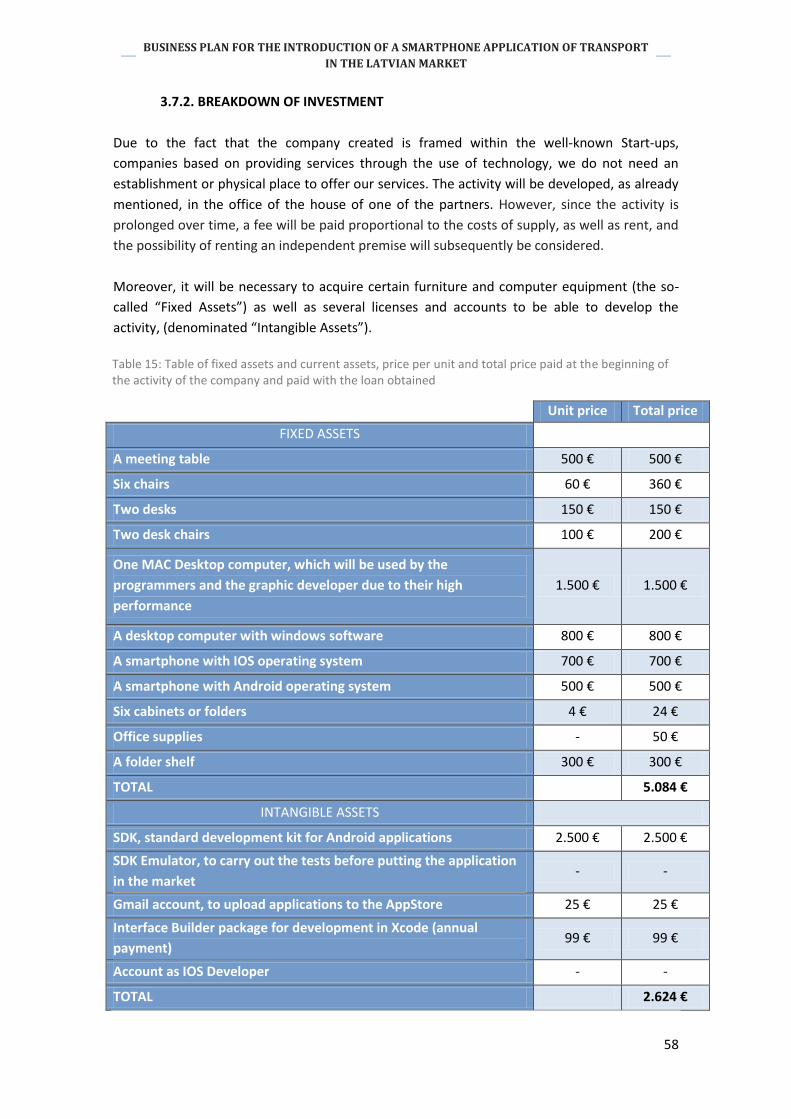
58
BUSINESS PLAN FOR THE INTRODUCTION OF A SMARTPHONE APPLICATION OF TRANSPORT
IN THE LATVIAN MARKET
3.7.2. BREAKDOWN OF INVESTMENT
Due to the fact that the company created is framed within the well-known Start-ups,
companies based on providing services through the use of technology, we do not need an
establishment or physical place to offer our services. The activity will be developed, as already
mentioned, in the office of the house of one of the partners. However, since the activity is
prolonged over time, a fee will be paid proportional to the costs of supply, as well as rent, and
the possibility of renting an independent premise will subsequently be considered.
Moreover, it will be necessary to acquire certain furniture and computer equipment (the so-
called “Fixed Assets”) as well as several licenses and accounts to be able to develop the
activity, (denominated “Intangible Assets”).
Unit price Total price
FIXED ASSETS
A meeting table 500 € 500 €
Six chairs 60 € 360 €
Two desks 150 € 150 €
Two desk chairs 100 € 200 €
One MAC Desktop computer, which will be used by the
programmers and the graphic developer due to their high
performance
1.500 € 1.500 €
A desktop computer with windows software 800 € 800 €
A smartphone with IOS operating system 700 € 700 €
A smartphone with Android operating system 500 € 500 €
Six cabinets or folders 4 € 24 €
Office supplies - 50 €
A folder shelf 300 € 300 €
TOTAL 5.084 €
INTANGIBLE ASSETS
SDK, standard development kit for Android applications 2.500 € 2.500 €
SDK Emulator, to carry out the tests before putting the application
in the market - -
Gmail account, to upload applications to the AppStore 25 € 25 €
Interface Builder package for development in Xcode (annual
payment) 99 € 99 €
Account as IOS Developer - -
TOTAL 2.624 €
Table 15: Table of fixed assets and current assets, price per unit and total price paid at the beginning of the activity of the company and paid with the loan obtained
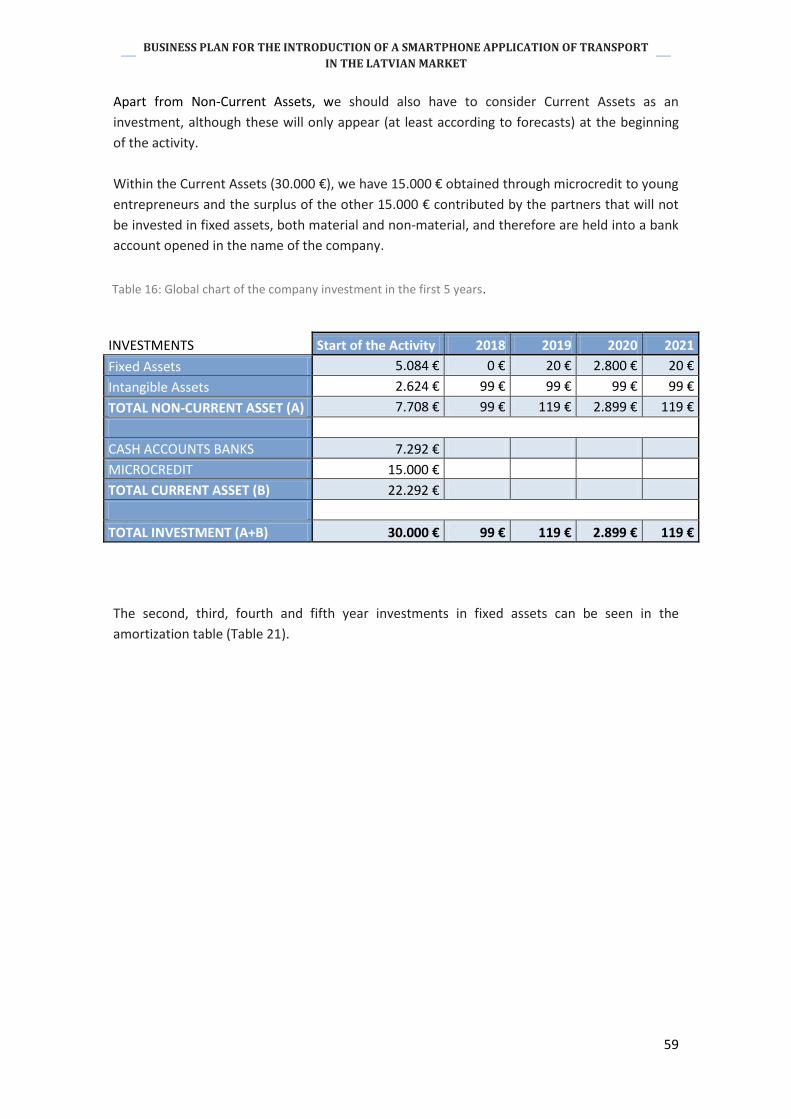
59
BUSINESS PLAN FOR THE INTRODUCTION OF A SMARTPHONE APPLICATION OF TRANSPORT
IN THE LATVIAN MARKET
Apart from Non-Current Assets, we should also have to consider Current Assets as an
investment, although these will only appear (at least according to forecasts) at the beginning
of the activity.
Within the Current Assets (30.000 €), we have 15.000 € obtained through microcredit to young
entrepreneurs and the surplus of the other 15.000 € contributed by the partners that will not
be invested in fixed assets, both material and non-material, and therefore are held into a bank
account opened in the name of the company.
INVESTMENTS Start of the Activity 2018 2019 2020 2021
Fixed Assets 5.084 € 0 € 20 € 2.800 € 20 €
Intangible Assets 2.624 € 99 € 99 € 99 € 99 €
TOTAL NON-CURRENT ASSET (A) 7.708 € 99 € 119 € 2.899 € 119 €
CASH ACCOUNTS BANKS 7.292 €
MICROCREDIT 15.000 €
TOTAL CURRENT ASSET (B) 22.292 €
TOTAL INVESTMENT (A+B) 30.000 € 99 € 119 € 2.899 € 119 €
The second, third, fourth and fifth year investments in fixed assets can be seen in the
amortization table (Table 21).
Table 16: Global chart of the company investment in the first 5 years.
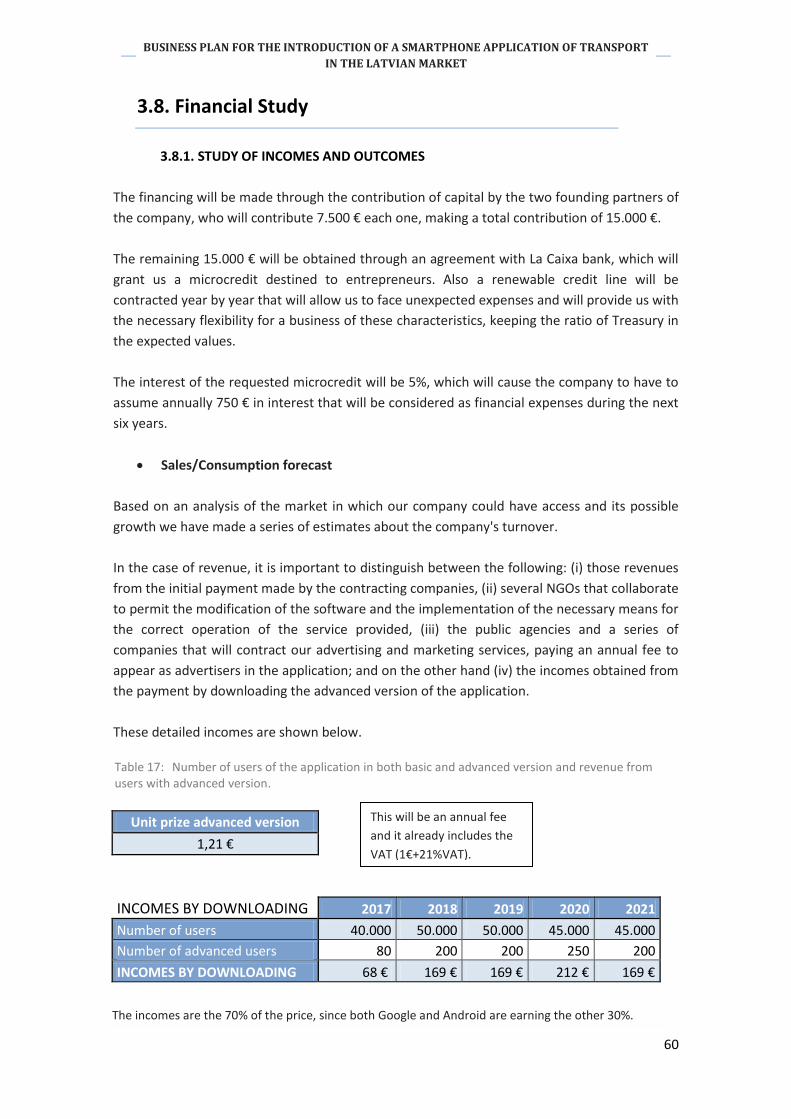
60
BUSINESS PLAN FOR THE INTRODUCTION OF A SMARTPHONE APPLICATION OF TRANSPORT
IN THE LATVIAN MARKET
3.8. Financial Study
3.8.1. STUDY OF INCOMES AND OUTCOMES
The financing will be made through the contribution of capital by the two founding partners of
the company, who will contribute 7.500 € each one, making a total contribution of 15.000 €.
The remaining 15.000 € will be obtained through an agreement with La Caixa bank, which will
grant us a microcredit destined to entrepreneurs. Also a renewable credit line will be
contracted year by year that will allow us to face unexpected expenses and will provide us with
the necessary flexibility for a business of these characteristics, keeping the ratio of Treasury in
the expected values.
The interest of the requested microcredit will be 5%, which will cause the company to have to
assume annually 750 € in interest that will be considered as financial expenses during the next
six years.
Sales/Consumption forecast
Based on an analysis of the market in which our company could have access and its possible
growth we have made a series of estimates about the company's turnover.
In the case of revenue, it is important to distinguish between the following: (i) those revenues
from the initial payment made by the contracting companies, (ii) several NGOs that collaborate
to permit the modification of the software and the implementation of the necessary means for
the correct operation of the service provided, (iii) the public agencies and a series of
companies that will contract our advertising and marketing services, paying an annual fee to
appear as advertisers in the application; and on the other hand (iv) the incomes obtained from
the payment by downloading the advanced version of the application.
These detailed incomes are shown below.
Unit prize advanced version
1,21 €
INCOMES BY DOWNLOADING 2017 2018 2019 2020 2021
Number of users 40.000 50.000 50.000 45.000 45.000
Number of advanced users 80 200 200 250 200
INCOMES BY DOWNLOADING 68 € 169 € 169 € 212 € 169 €
This will be an annual fee
and it already includes the
VAT (1€+21%VAT).
Table 17: Number of users of the application in both basic and advanced version and revenue from users with advanced version.
The incomes are the 70% of the price, since both Google and Android are earning the other 30%.
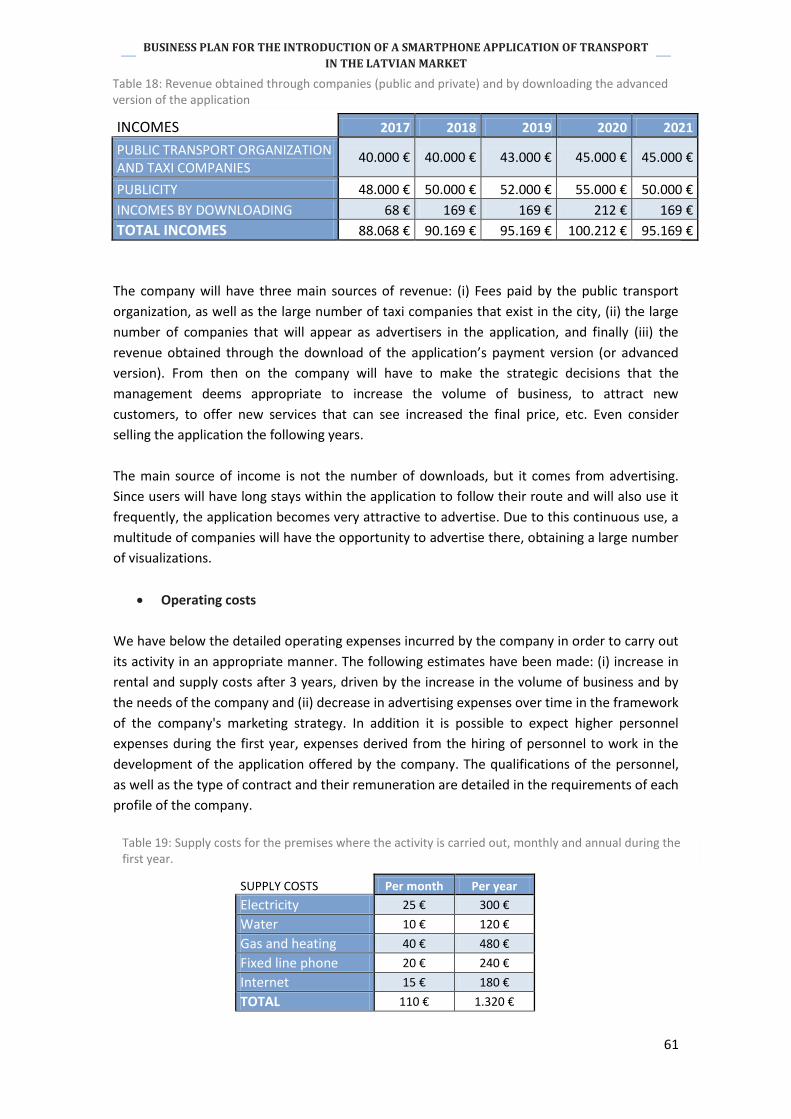
61
BUSINESS PLAN FOR THE INTRODUCTION OF A SMARTPHONE APPLICATION OF TRANSPORT
IN THE LATVIAN MARKET
INCOMES 2017 2018 2019 2020 2021
PUBLIC TRANSPORT ORGANIZATION AND TAXI COMPANIES
40.000 € 40.000 € 43.000 € 45.000 € 45.000 €
PUBLICITY 48.000 € 50.000 € 52.000 € 55.000 € 50.000 €
INCOMES BY DOWNLOADING 68 € 169 € 169 € 212 € 169 €
TOTAL INCOMES 88.068 € 90.169 € 95.169 € 100.212 € 95.169 €
The company will have three main sources of revenue: (i) Fees paid by the public transport
organization, as well as the large number of taxi companies that exist in the city, (ii) the large
number of companies that will appear as advertisers in the application, and finally (iii) the
revenue obtained through the download of the application’s payment version (or advanced
version). From then on the company will have to make the strategic decisions that the
management deems appropriate to increase the volume of business, to attract new
customers, to offer new services that can see increased the final price, etc. Even consider
selling the application the following years.
The main source of income is not the number of downloads, but it comes from advertising.
Since users will have long stays within the application to follow their route and will also use it
frequently, the application becomes very attractive to advertise. Due to this continuous use, a
multitude of companies will have the opportunity to advertise there, obtaining a large number
of visualizations.
Operating costs
We have below the detailed operating expenses incurred by the company in order to carry out
its activity in an appropriate manner. The following estimates have been made: (i) increase in
rental and supply costs after 3 years, driven by the increase in the volume of business and by
the needs of the company and (ii) decrease in advertising expenses over time in the framework
of the company's marketing strategy. In addition it is possible to expect higher personnel
expenses during the first year, expenses derived from the hiring of personnel to work in the
development of the application offered by the company. The qualifications of the personnel,
as well as the type of contract and their remuneration are detailed in the requirements of each
profile of the company.
SUPPLY COSTS Per month Per year
Electricity 25 € 300 €
Water 10 € 120 €
Gas and heating 40 € 480 €
Fixed line phone 20 € 240 €
Internet 15 € 180 €
TOTAL 110 € 1.320 €
Table 19: Supply costs for the premises where the activity is carried out, monthly and annual during the first year.
Table 18: Revenue obtained through companies (public and private) and by downloading the advanced version of the application

62
BUSINESS PLAN FOR THE INTRODUCTION OF A SMARTPHONE APPLICATION OF TRANSPORT
IN THE LATVIAN MARKET
COSTS 2017 2018 2019 2020 2021
PERSONNEL 124.000 € 106.000 € 106.000 € 106.000 € 106.000 €
PROMOTION 3.000 € 3.000 € 2.500 € 2.000 € 2.000 €
COMPUTER MAINTENANCE 200 € 150 € 150 € 150 € 150 €
RENTING 300 € 300 € 350 € 350 € 350 €
SUPPLY 1.320 € 1.320 € 1.400 € 1.400 € 1.400 €
TOTAL 128.820 € 110.770 € 110.400 € 109.900 € 109.900 €
Profit and Loss Statement
In this profit and loss statement we reflect the situation of the company based on the
estimates previously made, and looking for information from companies in the same segment
of the sector in which we want to introduce ourselves. We have applied the following criteria
at the time of amortization:
c 2017 Deprec
2017 2018
Deprec 2018
2019 Deprec
2019 2020
Deprec 2020
2021 Deprec
2021 Service
life Residual
value
Meeting table
500 € 50 € 50 € 50 € 50 € 50 € 10 250 €
Six chairs 360 € 36 € 36 € 36 € 36 € 36 € 10 180 €
Two desks 150 € 15 € 15 € 15 € 15 € 15 € 10 75 €
Two desk chairs
200 € 29 € 29 € 29 € 29 € 29 € 7 57 €
MAC Desktop computer
1.500 € 500 € 500 € 500 € 1.200 € 400 € 400 € 3 400 €
Desktop computer with windows software
800 € 267 € 267 € 267 € 700 € 233 € 233 € 3 233 €
Smartphone with IOS operating system
700 € 233 € 233 € 233 € 600 € 200 € 200 € 3 200 €
Smartphone with Android operating system
500 € 167 € 167 € 167 € 300 € 100 € 100 € 3 100 €
Six cabinets or folders
24 € 2 € 2 € 2 € 2 € 2 € 10 12 €
Office supplies
50 € 25 € 25 € 20 € 10 € 10 € 20 € 10 € 2 10 €
Folder shelf 300 € 30 € 30 € 30 € 30 € 30 € 10 150 €
TOTAL 5.084 € 1.354 € 0 € 1.354 € 20 € 1.339 € 2.800 € 1.105 € 20 € 1.105 € 1.667 €
Table 20: Total annual costs.
Table 21: Annual investment in fixed and current assets, amortization of each of them according to their life time and residual value of the assets after the fifth year of activity.
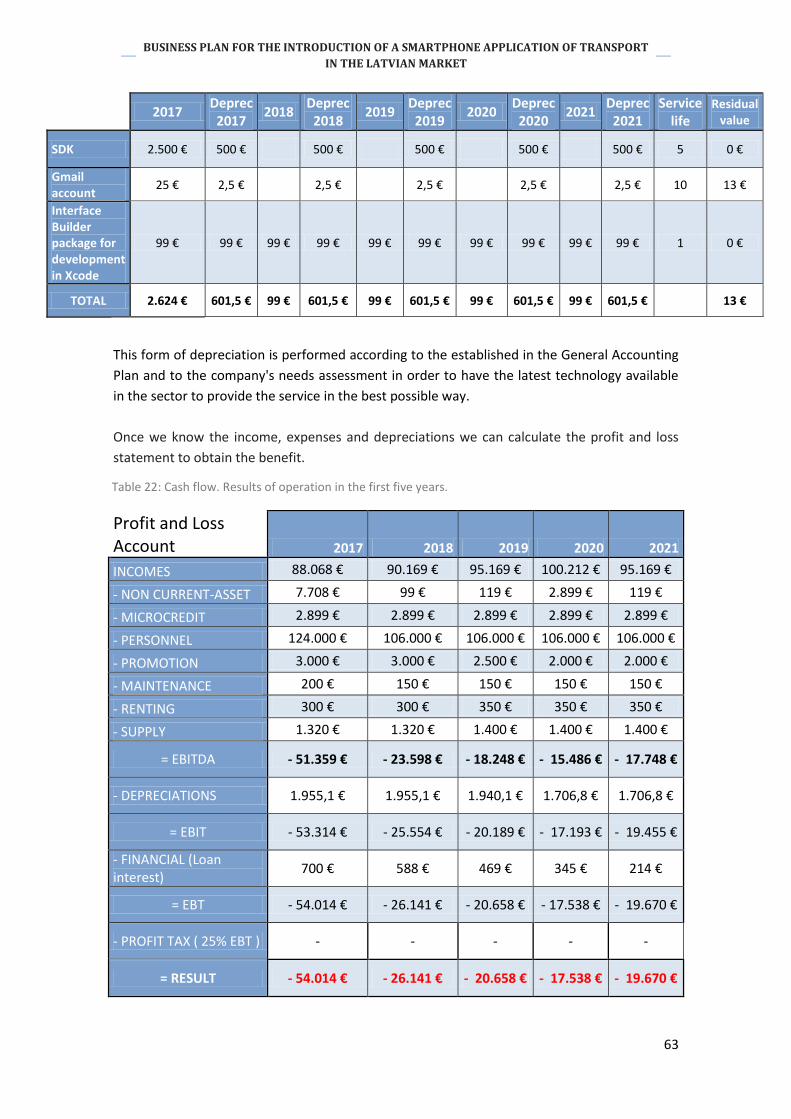
63
BUSINESS PLAN FOR THE INTRODUCTION OF A SMARTPHONE APPLICATION OF TRANSPORT
IN THE LATVIAN MARKET
c 2017 Deprec
2017 2018
Deprec 2018
2019 Deprec
2019 2020
Deprec 2020
2021 Deprec
2021 Service
life Residual
value
SDK 2.500 € 500 € 500 € 500 € 500 € 500 € 5 0 €
Gmail account
25 € 2,5 € 2,5 € 2,5 € 2,5 € 2,5 € 10 13 €
Interface Builder package for development in Xcode
99 € 99 € 99 € 99 € 99 € 99 € 99 € 99 € 99 € 99 € 1 0 €
TOTAL 2.624 € 601,5 € 99 € 601,5 € 99 € 601,5 € 99 € 601,5 € 99 € 601,5 € 13 €
This form of depreciation is performed according to the established in the General Accounting
Plan and to the company's needs assessment in order to have the latest technology available
in the sector to provide the service in the best possible way.
Once we know the income, expenses and depreciations we can calculate the profit and loss
statement to obtain the benefit.
Profit and Loss Account 2017 2018 2019 2020 2021
INCOMES 88.068 € 90.169 € 95.169 € 100.212 € 95.169 €
- NON CURRENT-ASSET 7.708 € 99 € 119 € 2.899 € 119 €
- MICROCREDIT 2.899 € 2.899 € 2.899 € 2.899 € 2.899 €
- PERSONNEL 124.000 € 106.000 € 106.000 € 106.000 € 106.000 €
- PROMOTION 3.000 € 3.000 € 2.500 € 2.000 € 2.000 €
- MAINTENANCE 200 € 150 € 150 € 150 € 150 €
- RENTING 300 € 300 € 350 € 350 € 350 €
- SUPPLY 1.320 € 1.320 € 1.400 € 1.400 € 1.400 €
= EBITDA - 51.359 € - 23.598 € - 18.248 € - 15.486 € - 17.748 €
- DEPRECIATIONS 1.955,1 € 1.955,1 € 1.940,1 € 1.706,8 € 1.706,8 €
= EBIT - 53.314 € - 25.554 € - 20.189 € - 17.193 € - 19.455 €
- FINANCIAL (Loan interest)
700 € 588 € 469 € 345 € 214 €
= EBT - 54.014 € - 26.141 € - 20.658 € - 17.538 € - 19.670 €
- PROFIT TAX ( 25% EBT ) - - - - -
= RESULT - 54.014 € - 26.141 € - 20.658 € - 17.538 € - 19.670 €
Table 22: Cash flow. Results of operation in the first five years.
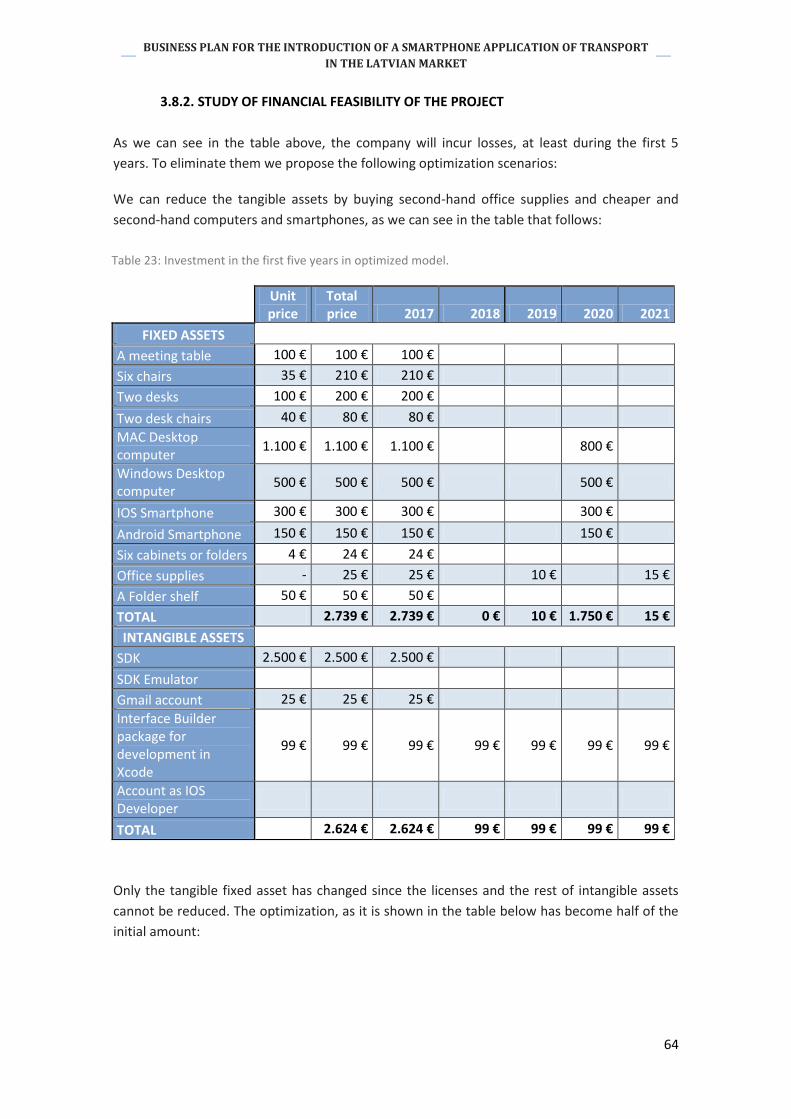
64
BUSINESS PLAN FOR THE INTRODUCTION OF A SMARTPHONE APPLICATION OF TRANSPORT
IN THE LATVIAN MARKET
3.8.2. STUDY OF FINANCIAL FEASIBILITY OF THE PROJECT
As we can see in the table above, the company will incur losses, at least during the first 5
years. To eliminate them we propose the following optimization scenarios:
We can reduce the tangible assets by buying second-hand office supplies and cheaper and
second-hand computers and smartphones, as we can see in the table that follows:
Unit price
Total price 2017 2018 2019 2020 2021
FIXED ASSETS
A meeting table 100 € 100 € 100 €
Six chairs 35 € 210 € 210 €
Two desks 100 € 200 € 200 €
Two desk chairs 40 € 80 € 80 €
MAC Desktop computer
1.100 € 1.100 € 1.100 € 800 €
Windows Desktop computer
500 € 500 € 500 € 500 €
IOS Smartphone 300 € 300 € 300 € 300 €
Android Smartphone 150 € 150 € 150 € 150 €
Six cabinets or folders 4 € 24 € 24 €
Office supplies - 25 € 25 € 10 € 15 €
A Folder shelf 50 € 50 € 50 €
TOTAL 2.739 € 2.739 € 0 € 10 € 1.750 € 15 €
INTANGIBLE ASSETS
SDK 2.500 € 2.500 € 2.500 €
SDK Emulator
Gmail account 25 € 25 € 25 €
Interface Builder package for development in Xcode
99 € 99 € 99 € 99 € 99 € 99 € 99 €
Account as IOS Developer
TOTAL 2.624 € 2.624 € 99 € 99 € 99 € 99 €
Only the tangible fixed asset has changed since the licenses and the rest of intangible assets
cannot be reduced. The optimization, as it is shown in the table below has become half of the
initial amount:
Table 23: Investment in the first five years in optimized model.
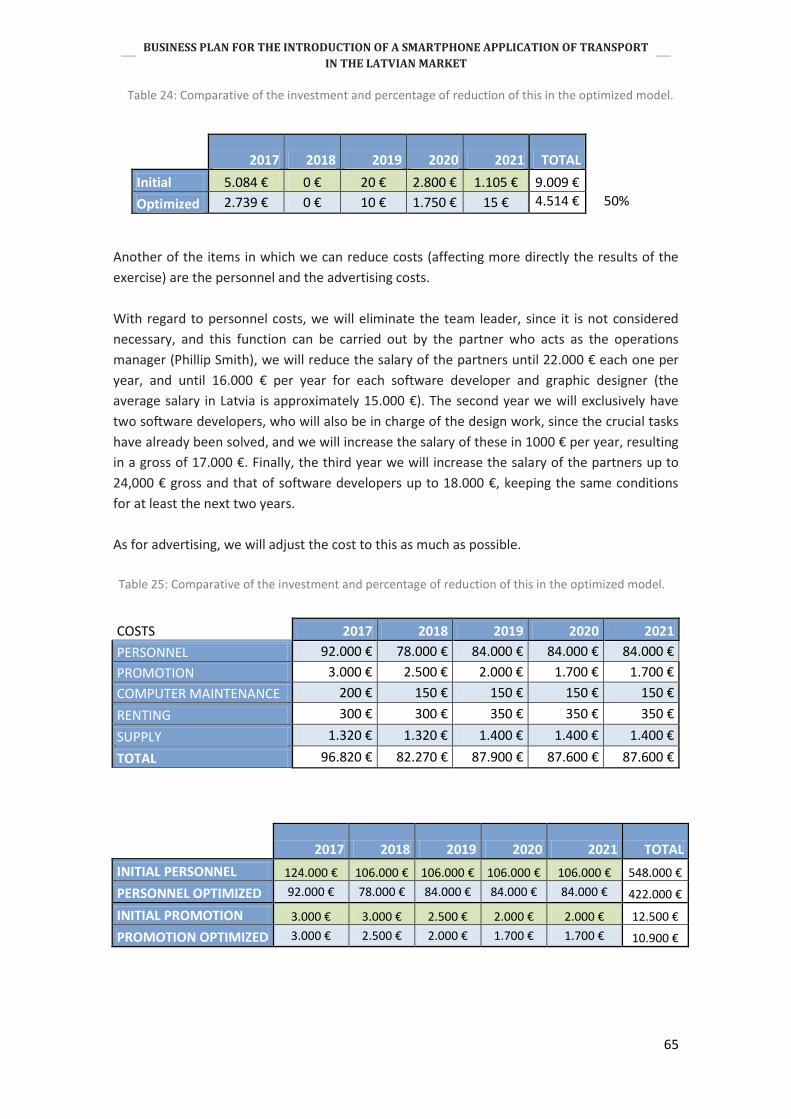
65
BUSINESS PLAN FOR THE INTRODUCTION OF A SMARTPHONE APPLICATION OF TRANSPORT
IN THE LATVIAN MARKET
2017 2018 2019 2020 2021 TOTAL
Initial 5.084 € 0 € 20 € 2.800 € 1.105 € 9.009 €
Optimized 2.739 € 0 € 10 € 1.750 € 15 € 4.514 €
Another of the items in which we can reduce costs (affecting more directly the results of the
exercise) are the personnel and the advertising costs.
With regard to personnel costs, we will eliminate the team leader, since it is not considered
necessary, and this function can be carried out by the partner who acts as the operations
manager (Phillip Smith), we will reduce the salary of the partners until 22.000 € each one per
year, and until 16.000 € per year for each software developer and graphic designer (the
average salary in Latvia is approximately 15.000 €). The second year we will exclusively have
two software developers, who will also be in charge of the design work, since the crucial tasks
have already been solved, and we will increase the salary of these in 1000 € per year, resulting
in a gross of 17.000 €. Finally, the third year we will increase the salary of the partners up to
24,000 € gross and that of software developers up to 18.000 €, keeping the same conditions
for at least the next two years.
As for advertising, we will adjust the cost to this as much as possible.
COSTS 2017 2018 2019 2020 2021
PERSONNEL 92.000 € 78.000 € 84.000 € 84.000 € 84.000 €
PROMOTION 3.000 € 2.500 € 2.000 € 1.700 € 1.700 €
COMPUTER MAINTENANCE 200 € 150 € 150 € 150 € 150 €
RENTING 300 € 300 € 350 € 350 € 350 €
SUPPLY 1.320 € 1.320 € 1.400 € 1.400 € 1.400 €
TOTAL 96.820 € 82.270 € 87.900 € 87.600 € 87.600 €
2017 2018 2019 2020 2021 TOTAL
INITIAL PERSONNEL 124.000 € 106.000 € 106.000 € 106.000 € 106.000 € 548.000 €
PERSONNEL OPTIMIZED 92.000 € 78.000 € 84.000 € 84.000 € 84.000 € 422.000 €
INITIAL PROMOTION 3.000 € 3.000 € 2.500 € 2.000 € 2.000 € 12.500 €
PROMOTION OPTIMIZED 3.000 € 2.500 € 2.000 € 1.700 € 1.700 € 10.900 €
50%
Table 24: Comparative of the investment and percentage of reduction of this in the optimized model.
Table 25: Comparative of the investment and percentage of reduction of this in the optimized model.
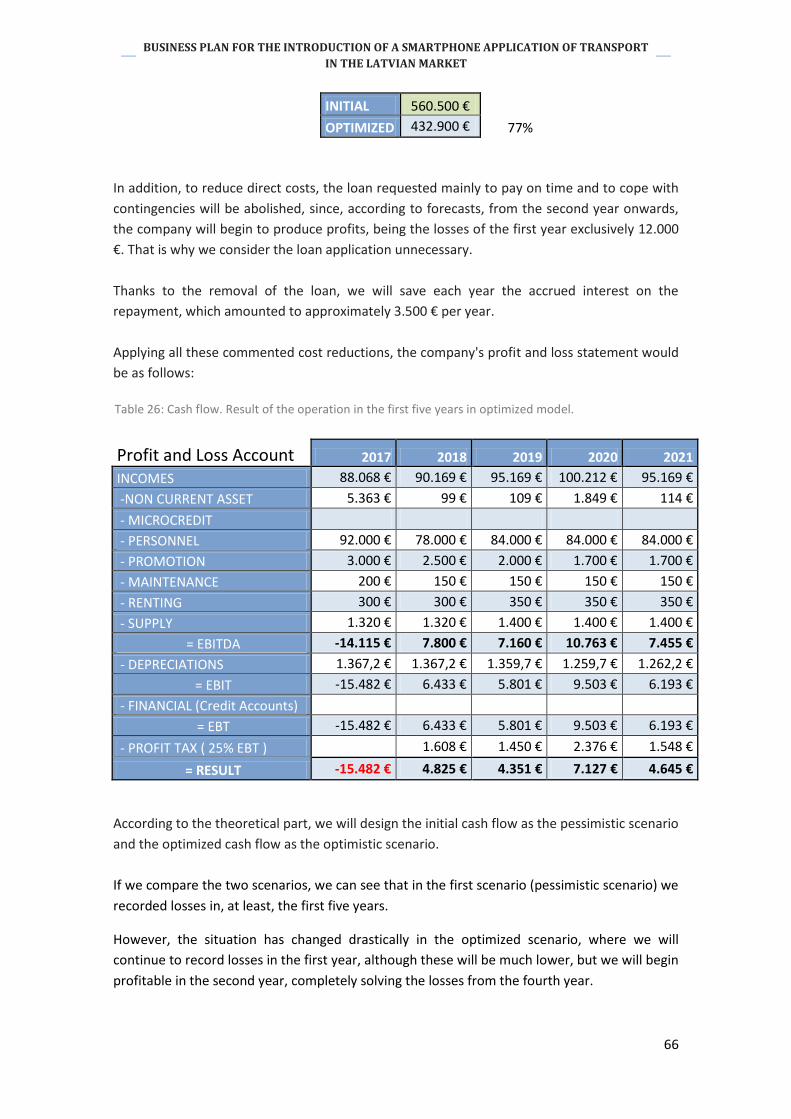
66
BUSINESS PLAN FOR THE INTRODUCTION OF A SMARTPHONE APPLICATION OF TRANSPORT
IN THE LATVIAN MARKET
INITIAL 560.500 €
OPTIMIZED 432.900 € 77%
In addition, to reduce direct costs, the loan requested mainly to pay on time and to cope with
contingencies will be abolished, since, according to forecasts, from the second year onwards,
the company will begin to produce profits, being the losses of the first year exclusively 12.000
€. That is why we consider the loan application unnecessary.
Thanks to the removal of the loan, we will save each year the accrued interest on the
repayment, which amounted to approximately 3.500 € per year.
Applying all these commented cost reductions, the company's profit and loss statement would
be as follows:
Profit and Loss Account 2017 2018 2019 2020 2021
INCOMES 88.068 € 90.169 € 95.169 € 100.212 € 95.169 €
-NON CURRENT ASSET 5.363 € 99 € 109 € 1.849 € 114 €
- MICROCREDIT
- PERSONNEL 92.000 € 78.000 € 84.000 € 84.000 € 84.000 €
- PROMOTION 3.000 € 2.500 € 2.000 € 1.700 € 1.700 €
- MAINTENANCE 200 € 150 € 150 € 150 € 150 €
- RENTING 300 € 300 € 350 € 350 € 350 €
- SUPPLY 1.320 € 1.320 € 1.400 € 1.400 € 1.400 €
= EBITDA -14.115 € 7.800 € 7.160 € 10.763 € 7.455 €
- DEPRECIATIONS 1.367,2 € 1.367,2 € 1.359,7 € 1.259,7 € 1.262,2 €
= EBIT -15.482 € 6.433 € 5.801 € 9.503 € 6.193 €
- FINANCIAL (Credit Accounts)
= EBT -15.482 € 6.433 € 5.801 € 9.503 € 6.193 €
- PROFIT TAX ( 25% EBT ) 1.608 € 1.450 € 2.376 € 1.548 €
= RESULT -15.482 € 4.825 € 4.351 € 7.127 € 4.645 €
According to the theoretical part, we will design the initial cash flow as the pessimistic scenario
and the optimized cash flow as the optimistic scenario.
If we compare the two scenarios, we can see that in the first scenario (pessimistic scenario) we
recorded losses in, at least, the first five years.
However, the situation has changed drastically in the optimized scenario, where we will
continue to record losses in the first year, although these will be much lower, but we will begin
profitable in the second year, completely solving the losses from the fourth year.
Table 26: Cash flow. Result of the operation in the first five years in optimized model.
67
BUSINESS PLAN FOR THE INTRODUCTION OF A SMARTPHONE APPLICATION OF TRANSPORT
IN THE LATVIAN MARKET
4. CONCLUSIONS The initial objective of the project was the creation of a smartphone application of transport
that combines all existing transport media in the city of Riga, Latvia. The project arises after
having observed, through one of the partners, the business opportunity derived from the
increase of tourists and foreigners in the city of Riga, their use of the internet and their need to
save time and money.
Following the Business Plan performed and all forecasts, the main conclusions of the Project
are as follows:
The combination of a novel and necessary idea in this region, but the existence of
similar applications in other areas, together with the qualification of the staff
employed and the most advanced technology, has prepared the company to claim the
first place in the market.
Considering that the general objective of this Project is to study the necessity and
profitability of the application, after the analysis realized it is concluded that the
project is indeed necessary and also feasible since it meets the proposed expectations.
That is, it is demonstrated that the project in its operation is a viable and attractive
business with a successful utility.
Since there are already similar applications, as we can see in the analysis of
competitors (although none bringing together all existing transport media in Riga),
thanks to the qualification of our software developers and graphic designer and the
application of benchmarking techniques, the implementation of the application will be
simple and predictably successful.
The initial paid-in capital from members will be 15.000 €, without recourse to external
financing (in the case of the optimized scenario), foreseeing the growth of the
company, at least during the first 5 years (as can be observed in the forecasts),
increasing its market share and being able to extend its activity to the whole country.
The company will meet its financial targets, starting to record profits from the second
year, recovering its losses and the initial investment in its fourth year of activity and
reaching more than 7.000 € of profits in a year.
The salary of the employees will increase during the second year, and it will continue
growing up during the third year, as well as it will do the salary of the founder
partners, due to the results of the business activity.
68
BUSINESS PLAN FOR THE INTRODUCTION OF A SMARTPHONE APPLICATION OF TRANSPORT
IN THE LATVIAN MARKET
5. RECOMENDATIONS After evaluating the project, and once the conclusions of this are performed, we consider it
appropriate to make the following recommendations:
• The project must have the support of the transport sector, both the public transport
company "Satiksme" and the different private taxi companies, thus ensuring a quality
and complete service for the users of the application.
• Some market researches must be carried out frequently to adequately meet the
changing needs of users, constantly bearing in mind that one of the essential pillars
and one of the tools against the competitors is the quality of service.
• It is also important the efficient organization, in due time and with wide reach of the
promotional activities, especially at the beginning of the activity.
• It should be seriously evaluated the possibility of expanding the business, in terms of
transport media, including in the application the train, boat or bicycle; as well as in the
geographical area, expanding at the national level, once the application is properly
developed and positioned in the market, as it has been commented on during the
project, always taking into consideration the behaviour of the market and the variables
that directly affect it, such as prices, costs, supply and demand.
• It should also be considered the sale of the application, especially from the fifth year
on, when the benefits of the business seems to start to stop growing.
69
BUSINESS PLAN FOR THE INTRODUCTION OF A SMARTPHONE APPLICATION OF TRANSPORT
IN THE LATVIAN MARKET
6. BIBLIOGRAPHY
http://es.slideshare.net/hemanthcrpatna/a-study-on-investment-pattern-of-investors-on-
different-products-conducted-at-asit-c-mehta-investment-intermediates-ltd
R.E. Freeman “Strategic Management: A stakeholders approach”
http://www.bbcriga.lv/en/blog/which_forms_of_company_incorporation_exist_in_latvia.html
http://www.fao.org/docrep/w4343e/w4343e08.htm
https://www.thebalance.com/writing-financial-feasibility-study-3515135
https://www.thebalance.com/writing-the-business-plan-section-8-2947026
http://www.investopedia.com/university/fundamentalanalysis/fundanalysis6.asp
http://www.businessdictionary.com/definition/sales-forecast.html
http://www.investopedia.com/terms/o/operating-cost.asp
https://www.thebalance.com/writing-financial-feasibility-study-3515135
https://www.mindtools.com/pages/article/newPPM_07.htm
http://www.stakeholdermap.com/stakeholder-analysis/stakeholder-analysis-example.html
http://es.slideshare.net/AMARAYYA/benchmarking-ppt
http://ec.europa.eu/eurostat/documents/3217494/7018888/KS-HA-15-001-EN-
N.pdf/6f0d4095-5e7a-4aab-af28-d255e2bcb395
http://www.csb.gov.lv/en/statistikas-temas
http://www.igi-global.com/dictionary/technology-acceptance-model-tam/29485
https://www.raizlabs.com/blog/2013/07/7-essentials-designing-ergonomic-app/
https://www.yeeply.com/blog/diseno-de-apps-color/
http://kaysharbor.com/blog/mobile/pretty-app-you-got-there-but-is-it-comfortable-to-use
https://www.caixabank.com/
https://www.jysk.lv/https://www.thebalance.com/writing-feasibility-study-conclusions-
3515134


BUSINESS PLAN FOR THE INTRODUCTION OF A SMARTPHONE APPLICATION OF TRANSPORT
IN THE LATVIAN MARKET
7. APPENDICES
Year 2014 2015 2016
Mobile phone or
smart phone
Mobile phone network
Mobile phone wireless network
Portable computer
Portable computer wireless network
Other devices
Doesn’t acces the internet away from home or work
Mobile phone
or smart phone
Mobile phone network
Mobile phone wireless network
Portable computer
Portable computer wireless network
Other devices
Doesn’t acces the internet away from home or work
Mobile phone
or smart phone
Mobile phone network
Mobile phone wireless network
Portable computer
Portable computer wireless network
Other devices
Doesn’t acces the internet away from home or work
TOTAL 22,6 16,6 13,6 15,7 11,6 3,4 42,9 28,3 21,5 22,1 15,7 13,0 1,4 40,8 38,5 25,4 31,4 16,2 12,5 0,7 35,6
Men 26,7 20,1 16,1 18,2 13,5 3,4 38,9 31,3 24,3 24,8 18,7 15,4 1,3 37,0 41,7 28,4 33,4 16,9 12,8 0,6 33,7
Women 25.7 19.1 19.8 13.1 10.9 1.5 43.9 35.8 22.9 29.7 15.6 12.3 0.8 37.3 41.6 26.2 34.7 14.8 12.9 0.5 32.1
16-24 years old 67.1 48.0 56.4 30.7 23.9 2.3 23.7 82.5 51.7 69.9 28.0 23.1 1.9 11.2 84.2 51.9 70.0 26.5 23.4 1.8 11.5
25-34 years old 57.0 44.5 44.2 25.8 21.4 2.4 32.0 68.2 44.5 56.2 27.4 21.7 0.9 24.1 76.2 55.9 62.5 25.5 21.3 1.0 16.1
35-44 years old 31.2 23.9 23.5 19.2 17.2 1.6 51.1 48.6 32.1 39.8 21.5 16.6 0.6 37.5 54.7 37.2 43.4 19.9 16.8 0.8 33.4
45-54 years old 15.0 11.6 11.1 12.5 10.2 1.4 54.3 27.2 20.5 20.6 12.3 9.2 0.3 50.7 31.6 20.3 24.2 14.0 11.3 0.6 43.1
55-64 years old 7.2 6.0 5.0 6.0 4.8 0.6 45.7 11.0 6.9 8.3 5.9 3.8 0.4 50.5 14.1 9.5 10.5 10.4 8.3 0.1 43.7
65-74 years old 1.2 0.8 0.5 2.9 2.1 0.3 29.3 3.6 2.4 2.6 4.6 3.1 0.5 28.6 3.5 1.6 2.9 3.0 2.2 0.2 30.2
Pupils, students 73.7 52.4 61.7 33.4 26.7 2.4 18.3 88.9 57.7 73.7 29.3 25.1 1.5 7.1 88.0 49.8 75.0 24.8 22.6 1.1 8.5
Employed 33.7 26.3 26.2 19.6 16.9 1.8 46.7 45.6 30.9 37.0 20.4 15.7 0.8 39.4 52.0 36.6 41.7 20.4 17.1 0.8 33.0
Unemployed 23.2 17.3 17.1 8.0 5.9 0.6 45.6 30.3 15.8 25.7 6.6 5.2 0.5 37.8 38.7 25.3 29.5 13.0 10.5 1.2 28.3
Other inactive 4.3 2.8 2.7 4.5 2.8 0.6 32.1 8.8 5.8 6.9 5.3 3.5 0.4 33.0 9.6 5.5 7.6 5.2 3.8 0.3 31.8
Riga region 37.2 26.1 29.9 20.6 17.6 0.3 370. 48.5 34.5 40.4 22.8 18.9 0.7 31.6 51.9 38.2 42.7 19.4 17.2 0.9 28.6
Table 1: Mobile device usage by individuals to access the internet away from home or work, by group (% of total population within the corresponding group).
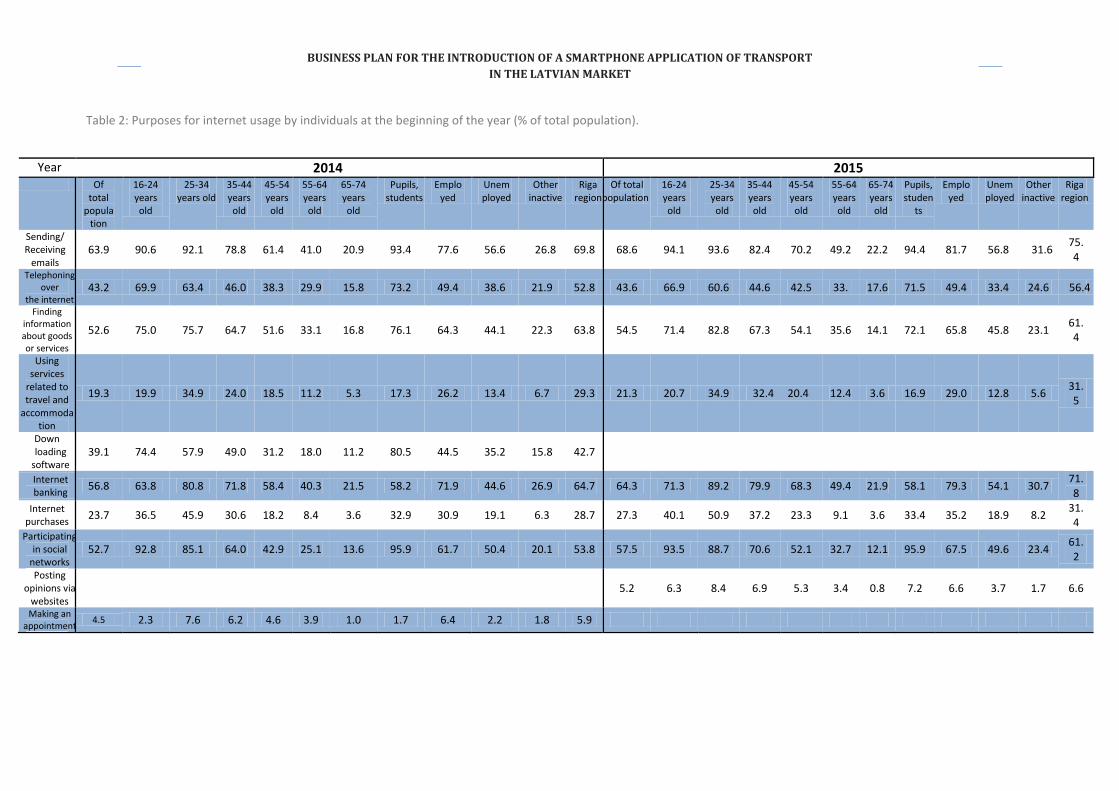
BUSINESS PLAN FOR THE INTRODUCTION OF A SMARTPHONE APPLICATION OF TRANSPORT
IN THE LATVIAN MARKET
Year 2014 2015 Of
total popula
tion
16-24 years old
25-34 years old
35-44 years old
45-54 years old
55-64 years old
65-74 years old
Pupils, students
Emplo yed
Unem ployed
Other inactive
Riga region
Of total population
16-24 years old
25-34 years old
35-44 years old
45-54 years old
55-64 years old
65-74 years old
Pupils, studen
ts
Employed
Unem ployed
Other inactive
Riga region
Sending/ Receiving
emails 63.9 90.6 92.1 78.8 61.4 41.0 20.9 93.4 77.6 56.6 26.8 69.8 68.6 94.1 93.6 82.4 70.2 49.2 22.2 94.4 81.7 56.8 31.6
75.4
Telephoning over
the internet 43.2 69.9 63.4 46.0 38.3 29.9 15.8 73.2 49.4 38.6 21.9 52.8 43.6 66.9 60.6 44.6 42.5 33. 17.6 71.5 49.4 33.4 24.6 56.4
Finding information about goods or services
52.6 75.0 75.7 64.7 51.6 33.1 16.8 76.1 64.3 44.1 22.3 63.8 54.5 71.4 82.8 67.3 54.1 35.6 14.1 72.1 65.8 45.8 23.1 61.4
Using services
related to travel and
accommodation
19.3 19.9 34.9 24.0 18.5 11.2 5.3 17.3 26.2 13.4 6.7 29.3 21.3 20.7 34.9 32.4 20.4 12.4 3.6 16.9 29.0 12.8 5.6 31.5
Down loading
software 39.1 74.4 57.9 49.0 31.2 18.0 11.2 80.5 44.5 35.2 15.8 42.7
Internet banking
56.8 63.8 80.8 71.8 58.4 40.3 21.5 58.2 71.9 44.6 26.9 64.7 64.3 71.3 89.2 79.9 68.3 49.4 21.9 58.1 79.3 54.1 30.7 71.8
Internet purchases
23.7 36.5 45.9 30.6 18.2 8.4 3.6 32.9 30.9 19.1 6.3 28.7 27.3 40.1 50.9 37.2 23.3 9.1 3.6 33.4 35.2 18.9 8.2 31.4
Participating in social
networks 52.7 92.8 85.1 64.0 42.9 25.1 13.6 95.9 61.7 50.4 20.1 53.8 57.5 93.5 88.7 70.6 52.1 32.7 12.1 95.9 67.5 49.6 23.4
61.2
Posting opinions via
websites 5.2 6.3 8.4 6.9 5.3 3.4 0.8 7.2 6.6 3.7 1.7 6.6
Making an appointment
4.5 2.3 7.6 6.2 4.6 3.9 1.0 1.7 6.4 2.2 1.8 5.9
Table 2: Purposes for internet usage by individuals at the beginning of the year (% of total population).
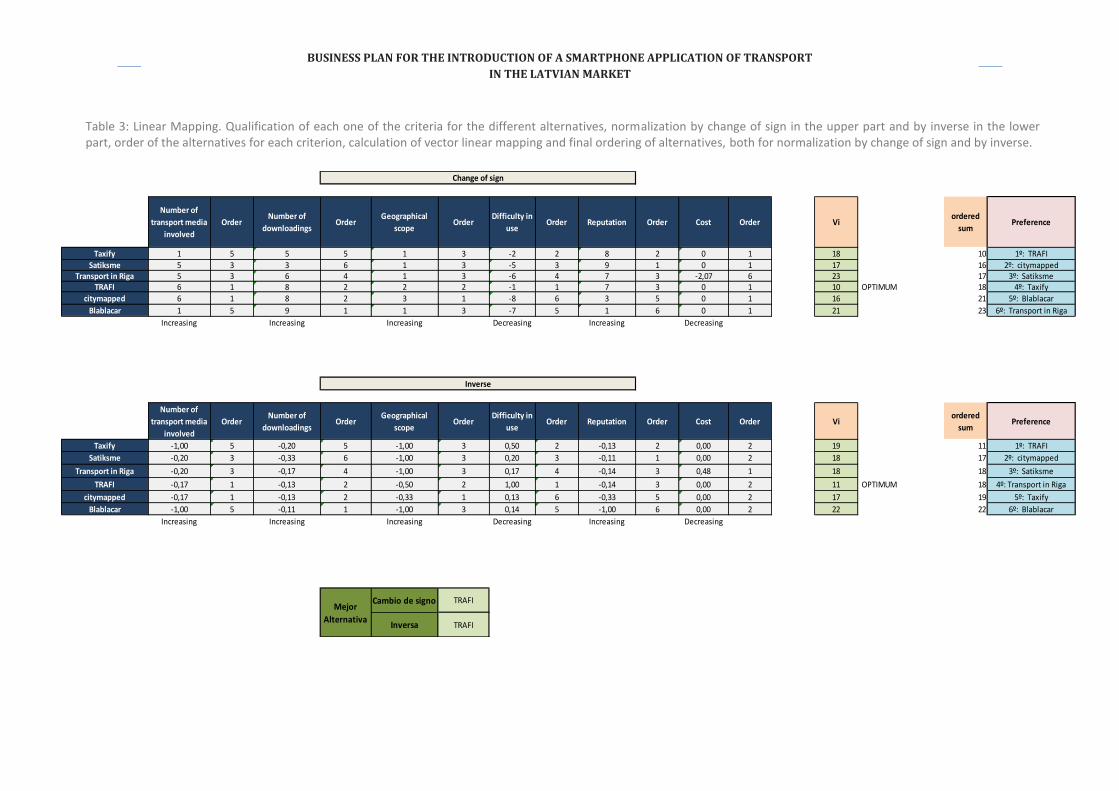
BUSINESS PLAN FOR THE INTRODUCTION OF A SMARTPHONE APPLICATION OF TRANSPORT
IN THE LATVIAN MARKET
Number of
transport media
involved
OrderNumber of
downloadingsOrder
Geographical
scopeOrder
Difficulty in
useOrder Reputation Order Cost Order Vi
ordered
sumPreference
Taxify 1 5 5 5 1 3 -2 2 8 2 0 1 18 10 1º: TRAFI
Satiksme 5 3 3 6 1 3 -5 3 9 1 0 1 17 16 2º: citymappedTransport in Riga 5 3 6 4 1 3 -6 4 7 3 -2,07 6 23 17 3º: Satiksme
TRAFI 6 1 8 2 2 2 -1 1 7 3 0 1 10 OPTIMUM 18 4º: Taxify
citymapped 6 1 8 2 3 1 -8 6 3 5 0 1 16 21 5º: Blablacar
Blablacar 1 5 9 1 1 3 -7 5 1 6 0 1 21 23 6º: Transport in Riga
Increasing Increasing Increasing Decreasing Increasing Decreasing
Number of
transport media
involved
OrderNumber of
downloadingsOrder
Geographical
scopeOrder
Difficulty in
useOrder Reputation Order Cost Order Vi
ordered
sumPreference
Taxify -1,00 5 -0,20 5 -1,00 3 0,50 2 -0,13 2 0,00 2 19 11 1º: TRAFI
Satiksme -0,20 3 -0,33 6 -1,00 3 0,20 3 -0,11 1 0,00 2 18 17 2º: citymapped
Transport in Riga -0,20 3 -0,17 4 -1,00 3 0,17 4 -0,14 3 0,48 1 18 18 3º: Satiksme
TRAFI -0,17 1 -0,13 2 -0,50 2 1,00 1 -0,14 3 0,00 2 11 OPTIMUM 18 4º: Transport in Riga
citymapped -0,17 1 -0,13 2 -0,33 1 0,13 6 -0,33 5 0,00 2 17 19 5º: Taxify
Blablacar -1,00 5 -0,11 1 -1,00 3 0,14 5 -1,00 6 0,00 2 22 22 6º: Blablacar
Increasing Increasing Increasing Decreasing Increasing Decreasing
Change of sign
Inverse
Mejor
Alternativa
Cambio de signo TRAFI
Inversa TRAFI
Table 3: Linear Mapping. Qualification of each one of the criteria for the different alternatives, normalization by change of sign in the upper part and by inverse in the lower part, order of the alternatives for each criterion, calculation of vector linear mapping and final ordering of alternatives, both for normalization by change of sign and by inverse.
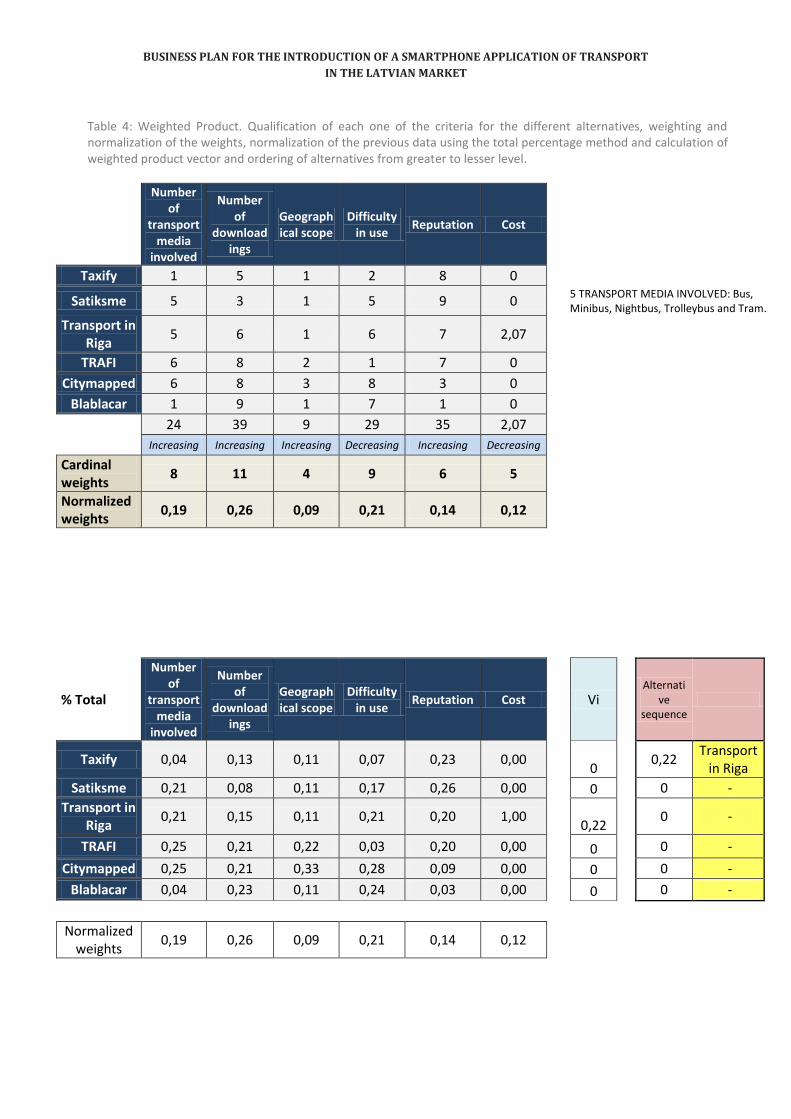
BUSINESS PLAN FOR THE INTRODUCTION OF A SMARTPHONE APPLICATION OF TRANSPORT
IN THE LATVIAN MARKET
Number of
transport media
involved
Number of
downloadings
Geographical scope
Difficulty in use
Reputation Cost
Taxify 1 5 1 2 8 0
Satiksme 5 3 1 5 9 0 5 TRANSPORT MEDIA INVOLVED: Bus, Minibus, Nightbus, Trolleybus and Tram.
Transport in Riga
5 6 1 6 7 2,07
TRAFI 6 8 2 1 7 0
Citymapped 6 8 3 8 3 0
Blablacar 1 9 1 7 1 0
24 39 9 29 35 2,07
Increasing Increasing Increasing Decreasing Increasing Decreasing
Cardinal weights
8 11 4 9 6 5 43
Normalized weights
0,19 0,26 0,09 0,21 0,14 0,12
% Total
Number of
transport media
involved
Number of
downloadings
Geographical scope
Difficulty in use
Reputation Cost
Vi
Alternative
sequence
Taxify 0,04 0,13 0,11 0,07 0,23 0,00 0
0,22 Transport
in Riga
Satiksme 0,21 0,08 0,11 0,17 0,26 0,00 0 0 -
Transport in Riga
0,21 0,15 0,11 0,21 0,20 1,00 0,22
0 -
TRAFI 0,25 0,21 0,22 0,03 0,20 0,00 0 0 -
Citymapped 0,25 0,21 0,33 0,28 0,09 0,00 0 0 -
Blablacar 0,04 0,23 0,11 0,24 0,03 0,00 0 0 -
Normalized weights
0,19 0,26 0,09 0,21 0,14 0,12
Table 4: Weighted Product. Qualification of each one of the criteria for the different alternatives, weighting and normalization of the weights, normalization of the previous data using the total percentage method and calculation of weighted product vector and ordering of alternatives from greater to lesser level.

BUSINESS PLAN FOR THE INTRODUCTION OF A SMARTPHONE APPLICATION OF TRANSPORT
IN THE LATVIAN MARKET
Number of transport
media involved
Number of
downloadings
Geographical scope
Difficulty in use
Reputation Cost
Taxify 1 5 1 2 8 0
Satiksme 5 3 1 5 9 0
5 TRANSPORT MEDIA INVOLVED: Bus, Minibus, Nightbus, Trolleybus and Tram
Transport in Riga
5 6 1 6 7 2,07
TRAFI 6 8 2 1 7 0
Citymapped 6 8 3 8 3 0
Blablacar 1 9 1 7 1 0
24 39 9 29 35 2,07
Increasing Increasing Increasing Decreasing Increasing Decreasi
ng
Cardinal weights
8 11 4 9 6 5 43
Normalized weights
0,19 0,26 0,09 0,21 0,14 0,12
% Total
Number of transport
media involved
Number of
downloadings
Geographical scope
Difficulty in use
Reputation Cost
Vi
Alternative seque
nce
Taxify 0,04 0,13 0,11 0,07 0,23 0,00 0,097
1,159 Transport
in Riga
Satiksme 0,21 0,08 0,11 0,17 0,26 0,00 0,141 0,200 Citymapped
Transport in Riga
0,21 0,15 0,11 0,21 0,20 1,00 1,159
0,154 TRAFI
TRAFI 0,25 0,21 0,22 0,03 0,20 0,00 0,154 0,141 Satiksme
Citymapped 0,25 0,21 0,33 0,28 0,09 0,00 0,200 0,131 Blablacar
Blablacar 0,04 0,23 0,11 0,24 0,03 0,00 0,131 0,097 Taxify
Normalized weights
0,19 0,26 0,09 0,21 0,14 0,12
Table 5: Weighted Sum. Qualification of each one of the criteria for the different alternatives, weighting and normalization of the weights, normalization of the previous data using the total percentage method and calculation of weighted sum vector and ordering of alternatives from greater to lesser level.
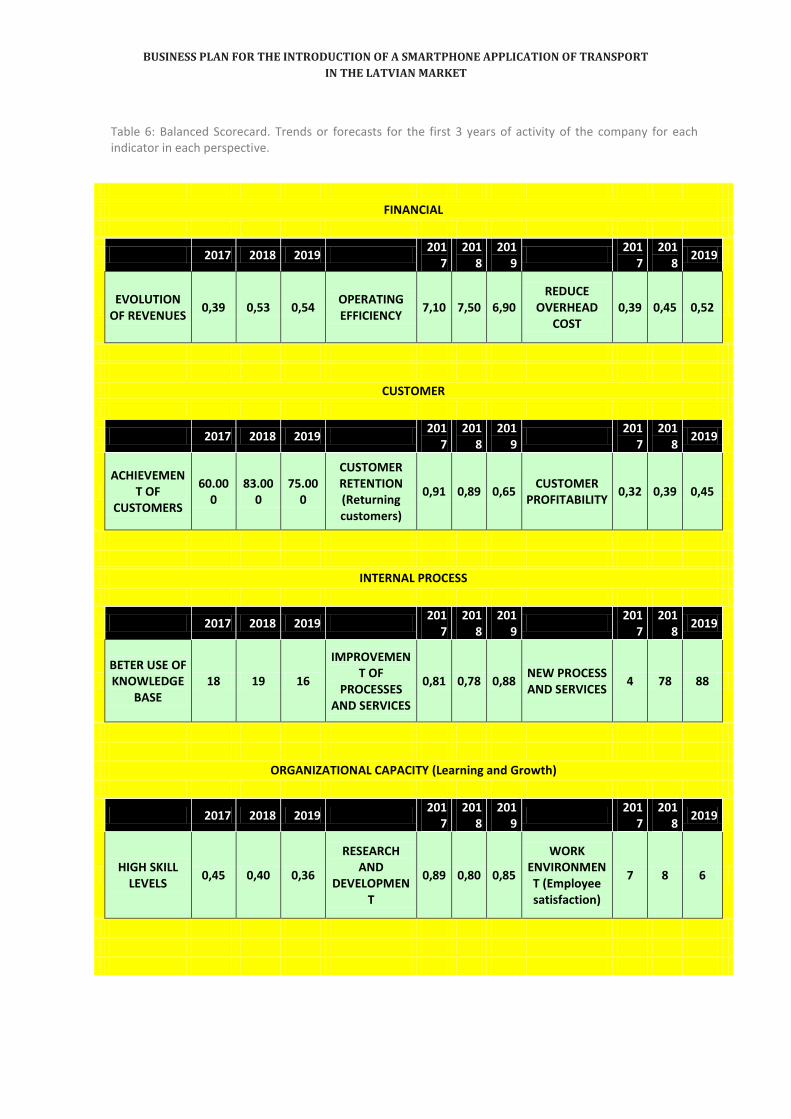
BUSINESS PLAN FOR THE INTRODUCTION OF A SMARTPHONE APPLICATION OF TRANSPORT
IN THE LATVIAN MARKET
FINANCIAL
2017 2018 2019 201
7 201
8 201
9
2017
2018
2019
EVOLUTION
OF REVENUES 0,39 0,53 0,54
OPERATING EFFICIENCY
7,10 7,50 6,90 REDUCE
OVERHEAD COST
0,39 0,45 0,52
CUSTOMER
2017 2018 2019 201
7 201
8 201
9
2017
2018
2019
ACHIEVEMEN
T OF CUSTOMERS
60.000
83.000
75.000
CUSTOMER RETENTION (Returning customers)
0,91 0,89 0,65 CUSTOMER
PROFITABILITY 0,32 0,39 0,45
INTERNAL PROCESS
2017 2018 2019 201
7 201
8 201
9
2017
2018
2019
BETER USE OF KNOWLEDGE
BASE 18 19 16
IMPROVEMENT OF
PROCESSES AND SERVICES
0,81 0,78 0,88 NEW PROCESS AND SERVICES
4 78 88
ORGANIZATIONAL CAPACITY (Learning and Growth)
2017 2018 2019 201
7 201
8 201
9
2017
2018
2019
HIGH SKILL
LEVELS 0,45 0,40 0,36
RESEARCH AND
DEVELOPMENT
0,89 0,80 0,85
WORK ENVIRONMENT (Employee satisfaction)
7 8 6
Table 6: Balanced Scorecard. Trends or forecasts for the first 3 years of activity of the company for each indicator in each perspective.
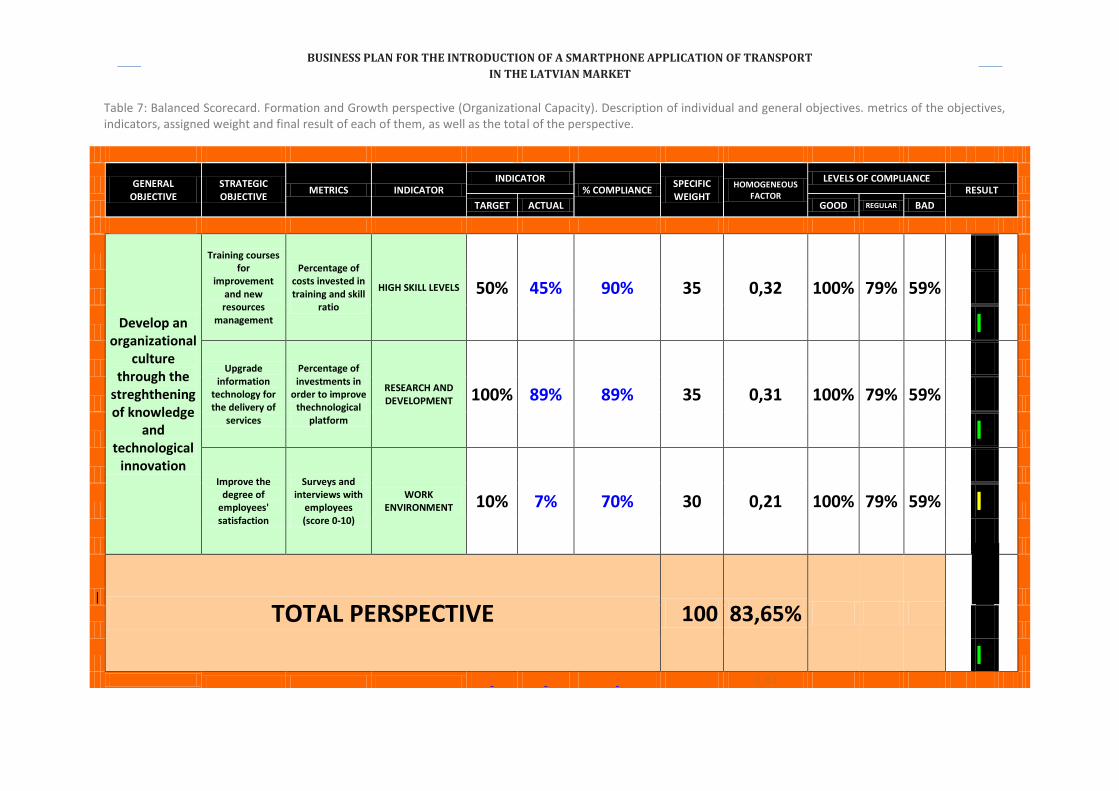
BUSINESS PLAN FOR THE INTRODUCTION OF A SMARTPHONE APPLICATION OF TRANSPORT
IN THE LATVIAN MARKET
Table 7: Balanced Scorecard. Formation and Growth perspective (Organizational Capacity). Description of individual and general objectives. metrics of the objectives, indicators, assigned weight and final result of each of them, as well as the total of the perspective.
GENERAL OBJECTIVE
STRATEGIC OBJECTIVE
METRICS INDICATOR INDICATOR
% COMPLIANCE SPECIFIC WEIGHT
HOMOGENEOUS FACTOR
LEVELS OF COMPLIANCE RESULT
TARGET ACTUAL GOOD REGULAR BAD
Develop an organizational
culture through the
streghthening of knowledge
and technological
innovation
Training courses for
improvement and new resources
management
Percentage of costs invested in training and skill
ratio
HIGH SKILL LEVELS 50% 45% 90% 35 0,32 100% 79% 59%
l
Upgrade information
technology for the delivery of
services
Percentage of investments in
order to improve thechnological
platform
RESEARCH AND DEVELOPMENT 100% 89% 89% 35 0,31 100% 79% 59%
l
Improve the
degree of employees' satisfaction
Surveys and interviews with
employees (score 0-10)
WORK ENVIRONMENT 10% 7% 70% 30 0,21 100% 79% 59%
l
|
TOTAL PERSPECTIVE 100 83,65% 100% 79% 59%
l
0,84
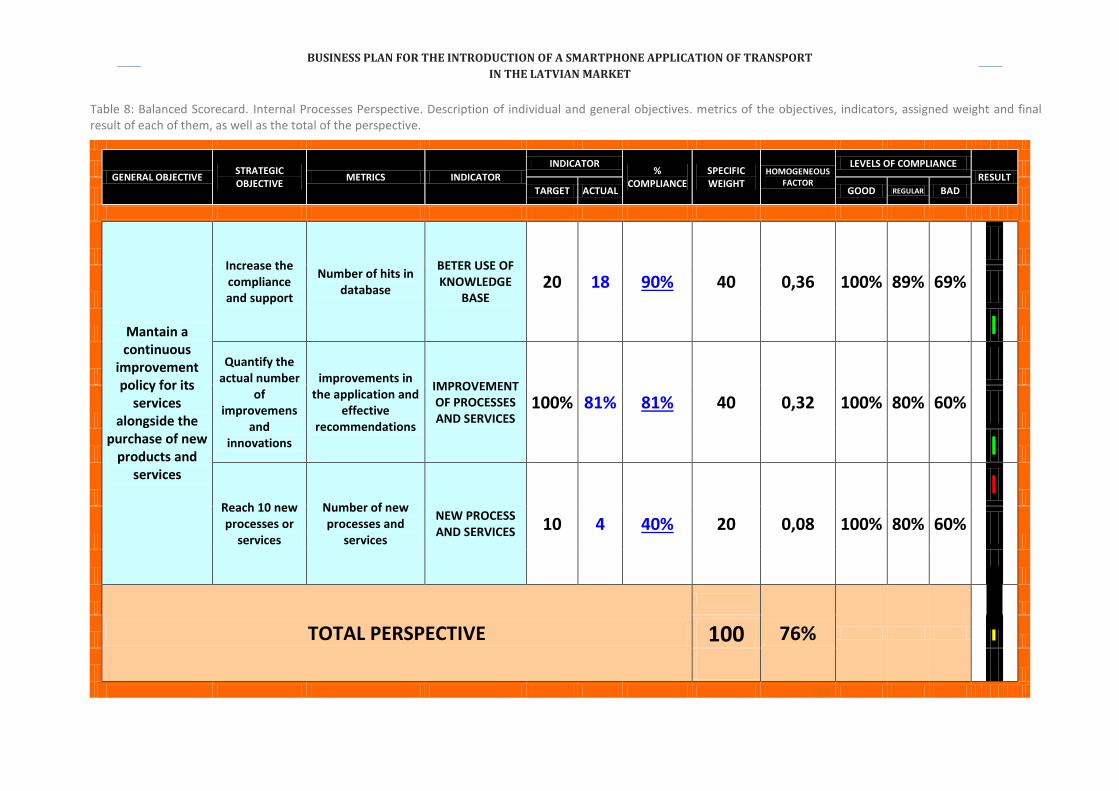
BUSINESS PLAN FOR THE INTRODUCTION OF A SMARTPHONE APPLICATION OF TRANSPORT
IN THE LATVIAN MARKET
GENERAL OBJECTIVE
STRATEGIC OBJECTIVE
METRICS INDICATOR
INDICATOR %
COMPLIANCE SPECIFIC WEIGHT
HOMOGENEOUS FACTOR
LEVELS OF COMPLIANCE
RESULT
TARGET ACTUAL GOOD REGULAR BAD
Mantain a continuous
improvement policy for its
services alongside the
purchase of new products and
services
Increase the compliance and support
Number of hits in database
BETER USE OF KNOWLEDGE
BASE 20 18 90% 40 0,36 100% 89% 69%
l
Quantify the
actual number of
improvemens and
innovations
improvements in the application and
effective recommendations
IMPROVEMENT OF PROCESSES AND SERVICES
100% 81% 81% 40 0,32 100% 80% 60%
l
Reach 10 new processes or
services
Number of new processes and
services
NEW PROCESS AND SERVICES 10 4 40% 20 0,08 100% 80% 60%
l
TOTAL PERSPECTIVE
76% 100,00% 80,00% 60,00%
100 l
76%
Table 8: Balanced Scorecard. Internal Processes Perspective. Description of individual and general objectives. metrics of the objectives, indicators, assigned weight and final result of each of them, as well as the total of the perspective.
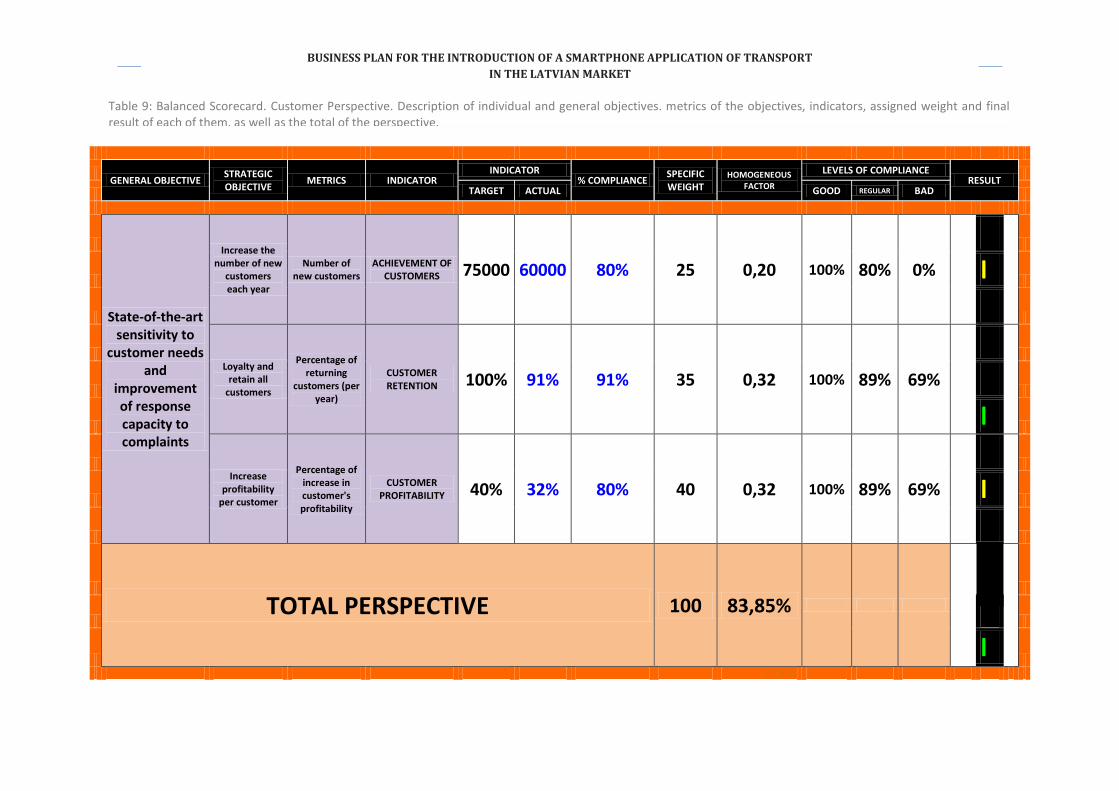
BUSINESS PLAN FOR THE INTRODUCTION OF A SMARTPHONE APPLICATION OF TRANSPORT
IN THE LATVIAN MARKET
GENERAL OBJECTIVE
STRATEGIC OBJECTIVE
METRICS INDICATOR INDICATOR
% COMPLIANCE SPECIFIC WEIGHT
HOMOGENEOUS FACTOR
LEVELS OF COMPLIANCE RESULT
TARGET ACTUAL GOOD REGULAR BAD
State-of-the-art sensitivity to
customer needs and
improvement of response capacity to complaints
Increase the number of new
customers each year
Number of new customers
ACHIEVEMENT OF CUSTOMERS 75000 60000 80% 25 0,20 100% 80% 0%
l
Loyalty and
retain all customers
Percentage of returning
customers (per year)
CUSTOMER RETENTION 100% 91% 91% 35 0,32 100% 89% 69%
l
Increase
profitability per customer
Percentage of increase in customer's profitability
CUSTOMER PROFITABILITY 40% 32% 80% 40 0,32 100% 89% 69%
l
TOTAL PERSPECTIVE 100 83,85% 100% 79% 59%
l
83,85%
Table 9: Balanced Scorecard. Customer Perspective. Description of individual and general objectives. metrics of the objectives, indicators, assigned weight and final result of each of them, as well as the total of the perspective.
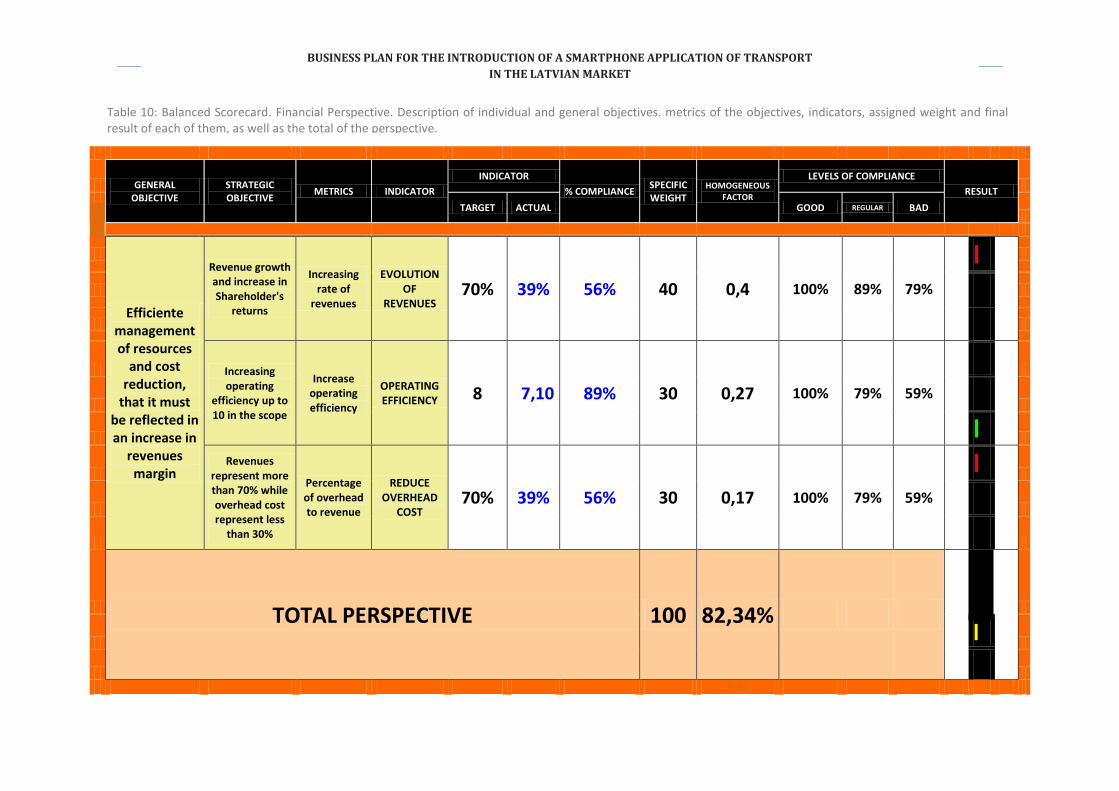
BUSINESS PLAN FOR THE INTRODUCTION OF A SMARTPHONE APPLICATION OF TRANSPORT
IN THE LATVIAN MARKET
GENERAL OBJECTIVE
STRATEGIC OBJECTIVE
METRICS INDICATOR
INDICATOR
% COMPLIANCE SPECIFIC WEIGHT
HOMOGENEOUS FACTOR
LEVELS OF COMPLIANCE
RESULT
TARGET ACTUAL GOOD REGULAR BAD
Efficiente management of resources
and cost reduction,
that it must be reflected in an increase in
revenues margin
Revenue growth and increase in Shareholder's
returns
Increasing rate of
revenues
EVOLUTION OF
REVENUES 70% 39% 56% 40 0,4 100% 89% 79%
l
Increasing operating
efficiency up to 10 in the scope
Increase operating efficiency
OPERATING EFFICIENCY 8 7,10 89% 30 0,27 100% 79% 59%
l
Revenues
represent more than 70% while overhead cost represent less
than 30%
Percentage of overhead to revenue
REDUCE OVERHEAD
COST 70% 39% 56% 30 0,17 100% 79% 59%
l
TOTAL PERSPECTIVE 100 82,34% 100% 89% 59%
l
0,82
Table 10: Balanced Scorecard. Financial Perspective. Description of individual and general objectives. metrics of the objectives, indicators, assigned weight and final result of each of them, as well as the total of the perspective.
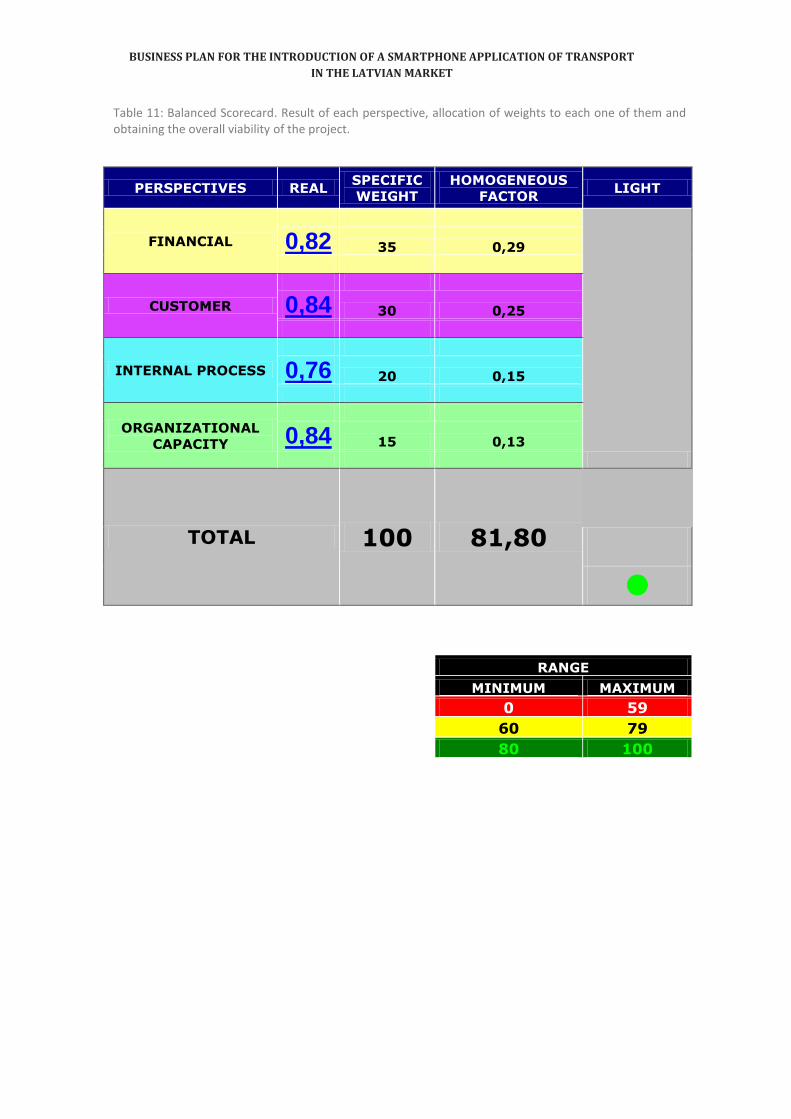
BUSINESS PLAN FOR THE INTRODUCTION OF A SMARTPHONE APPLICATION OF TRANSPORT
IN THE LATVIAN MARKET
PERSPECTIVES REAL SPECIFIC
WEIGHT
HOMOGENEOUS
FACTOR LIGHT
FINANCIAL
0,82 35 0,29
CUSTOMER
0,84 30 0,25
INTERNAL PROCESS
0,76 20 0,15
ORGANIZATIONAL
CAPACITY
0,84 15 0,13
TOTAL 100 81,80
RANGE
MINIMUM MAXIMUM
0 59
60 79
80 100
Table 11: Balanced Scorecard. Result of each perspective, allocation of weights to each one of them and obtaining the overall viability of the project.
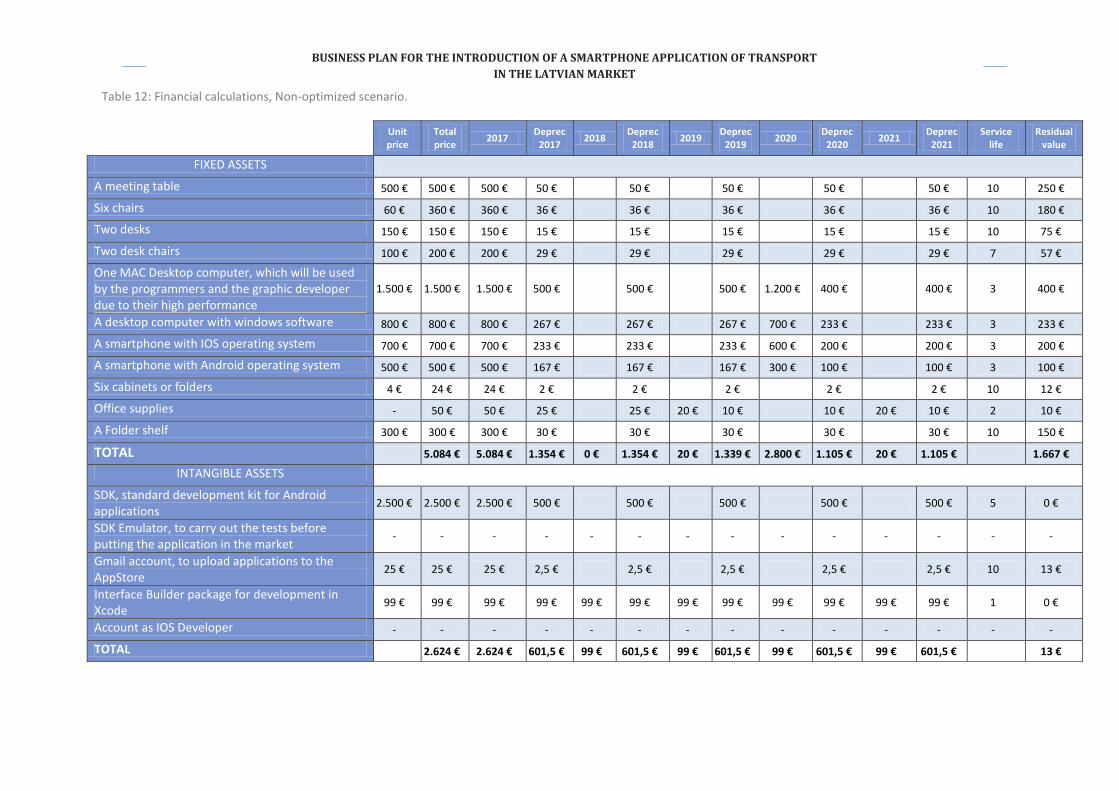
BUSINESS PLAN FOR THE INTRODUCTION OF A SMARTPHONE APPLICATION OF TRANSPORT
IN THE LATVIAN MARKET
Table 12: Financial calculations, Non-optimized scenario.
Unit price
Total price
2017 Deprec
2017 2018
Deprec 2018
2019 Deprec
2019 2020
Deprec 2020
2021 Deprec
2021 Service
life Residual
value
FIXED ASSETS
A meeting table 500 € 500 € 500 € 50 € 50 € 50 € 50 € 50 € 10 250 €
Six chairs 60 € 360 € 360 € 36 € 36 € 36 € 36 € 36 € 10 180 €
Two desks 150 € 150 € 150 € 15 € 15 € 15 € 15 € 15 € 10 75 €
Two desk chairs 100 € 200 € 200 € 29 € 29 € 29 € 29 € 29 € 7 57 €
One MAC Desktop computer, which will be used by the programmers and the graphic developer due to their high performance
1.500 € 1.500 € 1.500 € 500 € 500 € 500 € 1.200 € 400 € 400 € 3 400 €
A desktop computer with windows software 800 € 800 € 800 € 267 € 267 € 267 € 700 € 233 € 233 € 3 233 €
A smartphone with IOS operating system 700 € 700 € 700 € 233 € 233 € 233 € 600 € 200 € 200 € 3 200 €
A smartphone with Android operating system 500 € 500 € 500 € 167 € 167 € 167 € 300 € 100 € 100 € 3 100 €
Six cabinets or folders 4 € 24 € 24 € 2 € 2 € 2 € 2 € 2 € 10 12 €
Office supplies - 50 € 50 € 25 € 25 € 20 € 10 € 10 € 20 € 10 € 2 10 €
A Folder shelf 300 € 300 € 300 € 30 € 30 € 30 € 30 € 30 € 10 150 €
TOTAL 5.084 € 5.084 € 1.354 € 0 € 1.354 € 20 € 1.339 € 2.800 € 1.105 € 20 € 1.105 € 1.667 €
INTANGIBLE ASSETS
SDK, standard development kit for Android applications
2.500 € 2.500 € 2.500 € 500 € 500 € 500 € 500 € 500 € 5 0 €
SDK Emulator, to carry out the tests before putting the application in the market
- - - - - - - - - - - - - -
Gmail account, to upload applications to the AppStore
25 € 25 € 25 € 2,5 € 2,5 € 2,5 € 2,5 € 2,5 € 10 13 €
Interface Builder package for development in Xcode
99 € 99 € 99 € 99 € 99 € 99 € 99 € 99 € 99 € 99 € 99 € 99 € 1 0 €
Account as IOS Developer - - - - - - - - - - - - - -
TOTAL 2.624 € 2.624 € 601,5 € 99 € 601,5 € 99 € 601,5 € 99 € 601,5 € 99 € 601,5 € 13 €
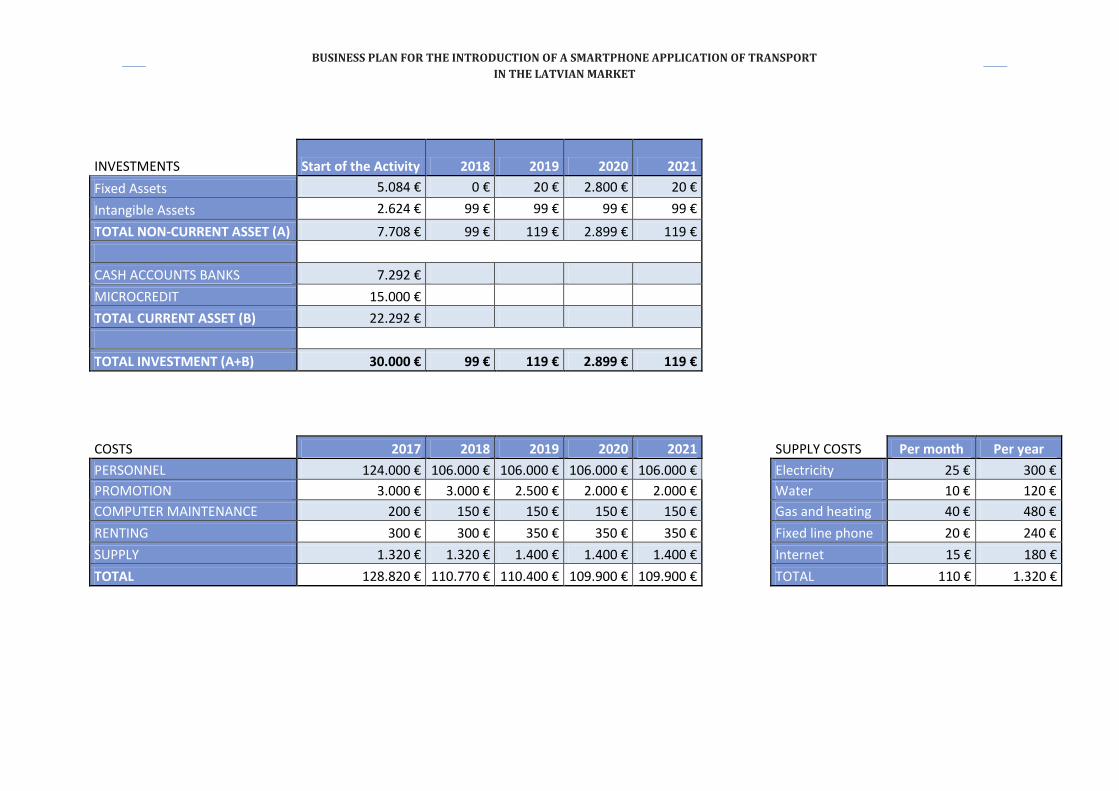
BUSINESS PLAN FOR THE INTRODUCTION OF A SMARTPHONE APPLICATION OF TRANSPORT
IN THE LATVIAN MARKET
INVESTMENTS Start of the Activity 2018 2019 2020 2021
Fixed Assets 5.084 € 0 € 20 € 2.800 € 20 €
Intangible Assets 2.624 € 99 € 99 € 99 € 99 €
TOTAL NON-CURRENT ASSET (A) 7.708 € 99 € 119 € 2.899 € 119 €
CASH ACCOUNTS BANKS 7.292 €
MICROCREDIT 15.000 €
TOTAL CURRENT ASSET (B) 22.292 €
TOTAL INVESTMENT (A+B) 30.000 € 99 € 119 € 2.899 € 119 €
COSTS 2017 2018 2019 2020 2021 SUPPLY COSTS Per month Per year
PERSONNEL 124.000 € 106.000 € 106.000 € 106.000 € 106.000 € Electricity 25 € 300 €
PROMOTION 3.000 € 3.000 € 2.500 € 2.000 € 2.000 € Water 10 € 120 €
COMPUTER MAINTENANCE 200 € 150 € 150 € 150 € 150 € Gas and heating 40 € 480 €
RENTING 300 € 300 € 350 € 350 € 350 € Fixed line phone 20 € 240 €
SUPPLY 1.320 € 1.320 € 1.400 € 1.400 € 1.400 € Internet 15 € 180 €
TOTAL 128.820 € 110.770 € 110.400 € 109.900 € 109.900 € TOTAL 110 € 1.320 €
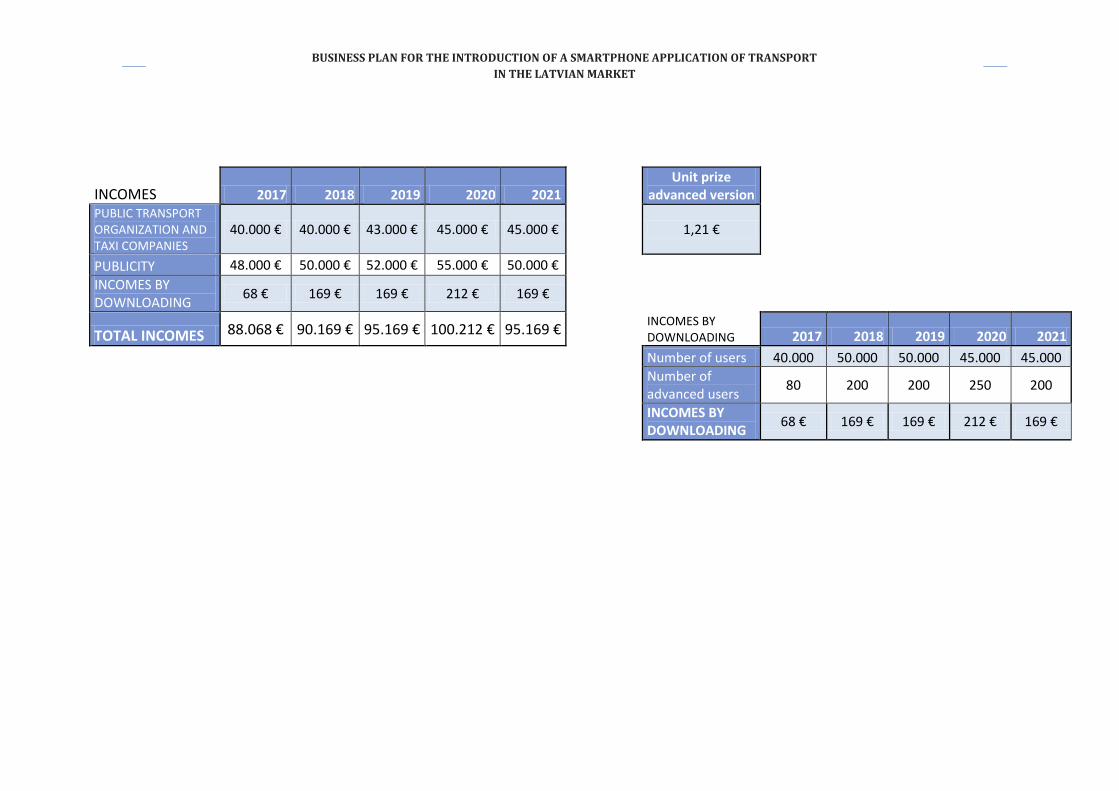
BUSINESS PLAN FOR THE INTRODUCTION OF A SMARTPHONE APPLICATION OF TRANSPORT
IN THE LATVIAN MARKET
INCOMES 2017 2018 2019 2020 2021 Unit prize
advanced version PUBLIC TRANSPORT ORGANIZATION AND TAXI COMPANIES
40.000 € 40.000 € 43.000 € 45.000 € 45.000 €
1,21 €
PUBLICITY 48.000 € 50.000 € 52.000 € 55.000 € 50.000 €
INCOMES BY DOWNLOADING
68 € 169 € 169 € 212 € 169 €
TOTAL INCOMES 88.068 € 90.169 € 95.169 € 100.212 € 95.169 € INCOMES BY DOWNLOADING 2017 2018 2019 2020 2021
Number of users 40.000 50.000 50.000 45.000 45.000
Number of advanced users
80 200 200 250 200
INCOMES BY DOWNLOADING
68 € 169 € 169 € 212 € 169 €
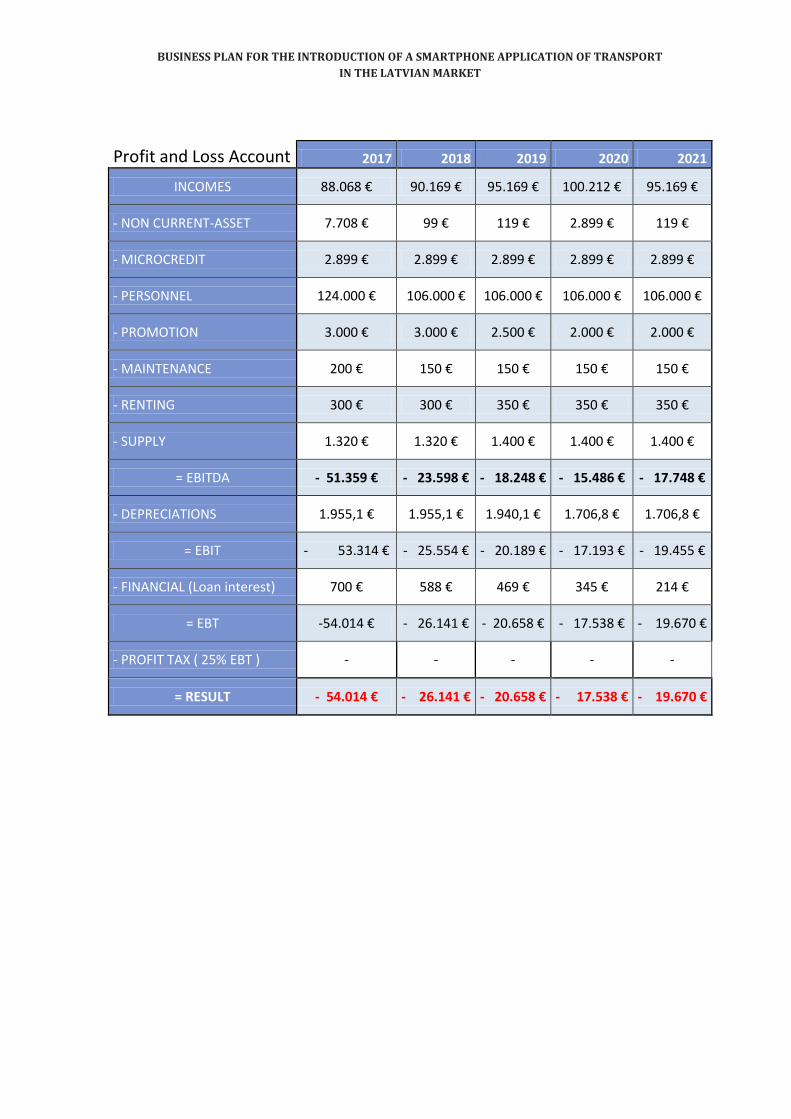
BUSINESS PLAN FOR THE INTRODUCTION OF A SMARTPHONE APPLICATION OF TRANSPORT
IN THE LATVIAN MARKET
Profit and Loss Account 2017 2018 2019 2020 2021
INCOMES 88.068 € 90.169 € 95.169 € 100.212 € 95.169 €
- NON CURRENT-ASSET 7.708 € 99 € 119 € 2.899 € 119 €
- MICROCREDIT 2.899 € 2.899 € 2.899 € 2.899 € 2.899 €
- PERSONNEL 124.000 € 106.000 € 106.000 € 106.000 € 106.000 €
- PROMOTION 3.000 € 3.000 € 2.500 € 2.000 € 2.000 €
- MAINTENANCE 200 € 150 € 150 € 150 € 150 €
- RENTING 300 € 300 € 350 € 350 € 350 €
- SUPPLY 1.320 € 1.320 € 1.400 € 1.400 € 1.400 €
= EBITDA - 51.359 € - 23.598 € - 18.248 € - 15.486 € - 17.748 €
- DEPRECIATIONS 1.955,1 € 1.955,1 € 1.940,1 € 1.706,8 € 1.706,8 €
= EBIT - 53.314 € - 25.554 € - 20.189 € - 17.193 € - 19.455 €
- FINANCIAL (Loan interest) 700 € 588 € 469 € 345 € 214 €
= EBT -54.014 € - 26.141 € - 20.658 € - 17.538 € - 19.670 €
- PROFIT TAX ( 25% EBT ) - - - - -
= RESULT - 54.014 € - 26.141 € - 20.658 € - 17.538 € - 19.670 €
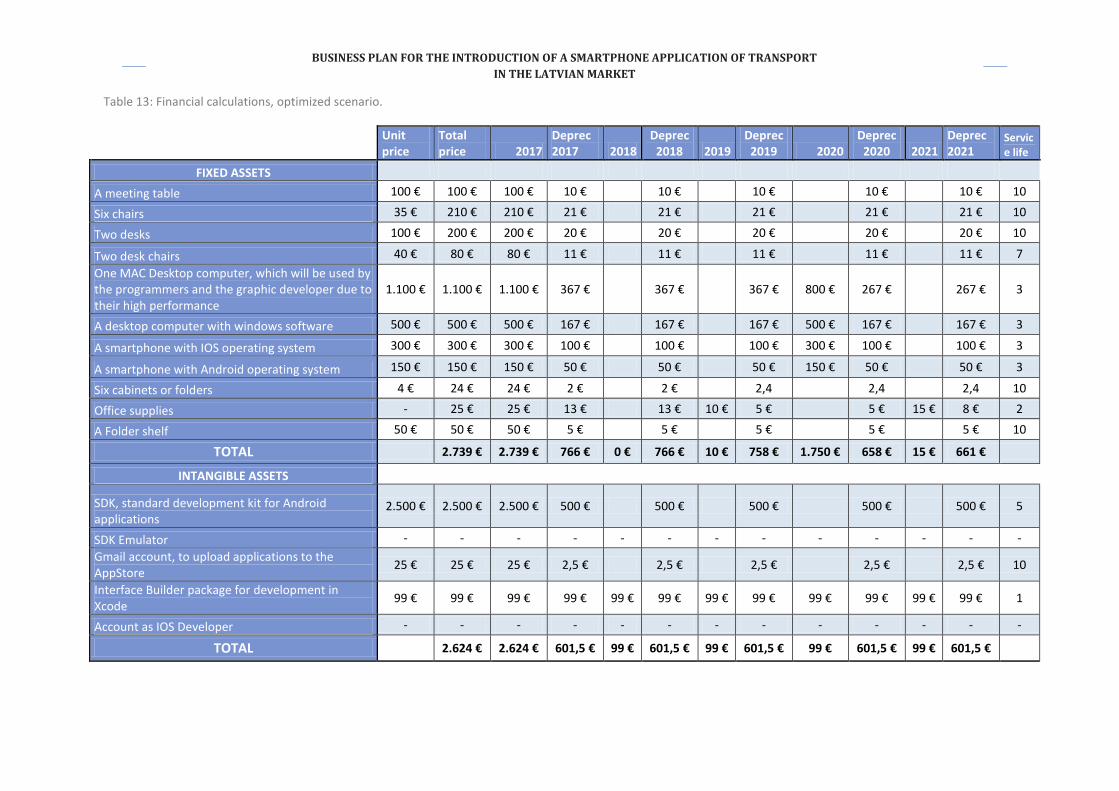
BUSINESS PLAN FOR THE INTRODUCTION OF A SMARTPHONE APPLICATION OF TRANSPORT
IN THE LATVIAN MARKET
Table 13: Financial calculations, optimized scenario.
Unit price
Total price 2017
Deprec 2017 2018
Deprec 2018 2019
Deprec 2019 2020
Deprec 2020 2021
Deprec 2021
Service life
FIXED ASSETS
A meeting table 100 € 100 € 100 € 10 € 10 € 10 € 10 € 10 € 10
Six chairs 35 € 210 € 210 € 21 € 21 € 21 € 21 € 21 € 10
Two desks 100 € 200 € 200 € 20 € 20 € 20 € 20 € 20 € 10
Two desk chairs 40 € 80 € 80 € 11 € 11 € 11 € 11 € 11 € 7
One MAC Desktop computer, which will be used by the programmers and the graphic developer due to their high performance
1.100 € 1.100 € 1.100 € 367 € 367 € 367 € 800 € 267 € 267 € 3
A desktop computer with windows software 500 € 500 € 500 € 167 € 167 € 167 € 500 € 167 € 167 € 3
A smartphone with IOS operating system 300 € 300 € 300 € 100 € 100 € 100 € 300 € 100 € 100 € 3
A smartphone with Android operating system 150 € 150 € 150 € 50 € 50 € 50 € 150 € 50 € 50 € 3
Six cabinets or folders 4 € 24 € 24 € 2 € 2 € 2,4 2,4 2,4 10
Office supplies - 25 € 25 € 13 € 13 € 10 € 5 € 5 € 15 € 8 € 2
A Folder shelf 50 € 50 € 50 € 5 € 5 € 5 € 5 € 5 € 10
TOTAL 2.739 € 2.739 € 766 € 0 € 766 € 10 € 758 € 1.750 € 658 € 15 € 661 €
INTANGIBLE ASSETS
SDK, standard development kit for Android applications
2.500 € 2.500 € 2.500 € 500 € 500 € 500 € 500 € 500 € 5
SDK Emulator - - - - - - - - - - - - -
Gmail account, to upload applications to the AppStore
25 € 25 € 25 € 2,5 € 2,5 € 2,5 € 2,5 € 2,5 € 10
Interface Builder package for development in Xcode
99 € 99 € 99 € 99 € 99 € 99 € 99 € 99 € 99 € 99 € 99 € 99 € 1
Account as IOS Developer - - - - - - - - - - - - -
TOTAL 2.624 € 2.624 € 601,5 € 99 € 601,5 € 99 € 601,5 € 99 € 601,5 € 99 € 601,5 €
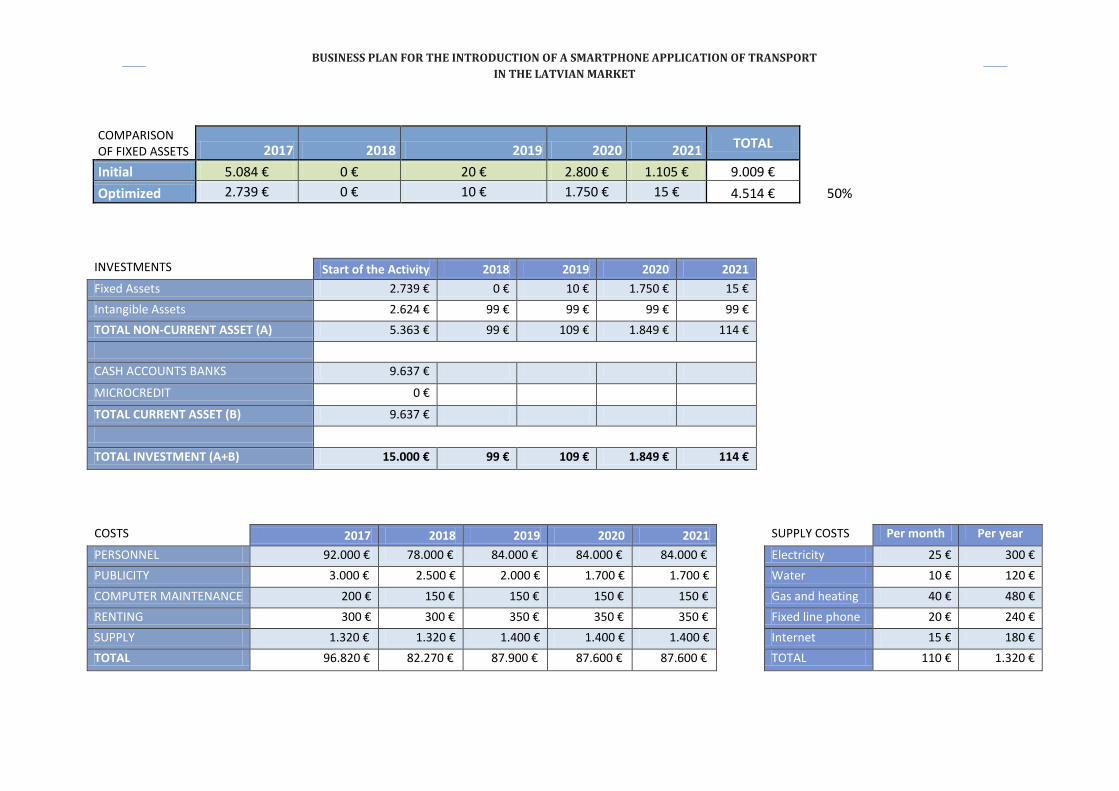
BUSINESS PLAN FOR THE INTRODUCTION OF A SMARTPHONE APPLICATION OF TRANSPORT
IN THE LATVIAN MARKET
COMPARISON OF FIXED ASSETS 2017 2018 2019 2020 2021
TOTAL
Initial 5.084 € 0 € 20 € 2.800 € 1.105 € 9.009 €
Optimized 2.739 € 0 € 10 € 1.750 € 15 € 4.514 € 50%
INVESTMENTS Start of the Activity 2018 2019 2020 2021
Fixed Assets 2.739 € 0 € 10 € 1.750 € 15 €
Intangible Assets 2.624 € 99 € 99 € 99 € 99 €
TOTAL NON-CURRENT ASSET (A) 5.363 € 99 € 109 € 1.849 € 114 €
CASH ACCOUNTS BANKS 9.637 €
MICROCREDIT 0 €
TOTAL CURRENT ASSET (B) 9.637 €
TOTAL INVESTMENT (A+B) 15.000 € 99 € 109 € 1.849 € 114 €
COSTS 2017 2018 2019 2020 2021 SUPPLY COSTS Per month Per year
PERSONNEL 92.000 € 78.000 € 84.000 € 84.000 € 84.000 € Electricity 25 € 300 €
PUBLICITY 3.000 € 2.500 € 2.000 € 1.700 € 1.700 € Water 10 € 120 €
COMPUTER MAINTENANCE 200 € 150 € 150 € 150 € 150 € Gas and heating 40 € 480 €
RENTING 300 € 300 € 350 € 350 € 350 € Fixed line phone 20 € 240 €
SUPPLY 1.320 € 1.320 € 1.400 € 1.400 € 1.400 € Internet 15 € 180 €
TOTAL 96.820 € 82.270 € 87.900 € 87.600 € 87.600 € TOTAL 110 € 1.320 €
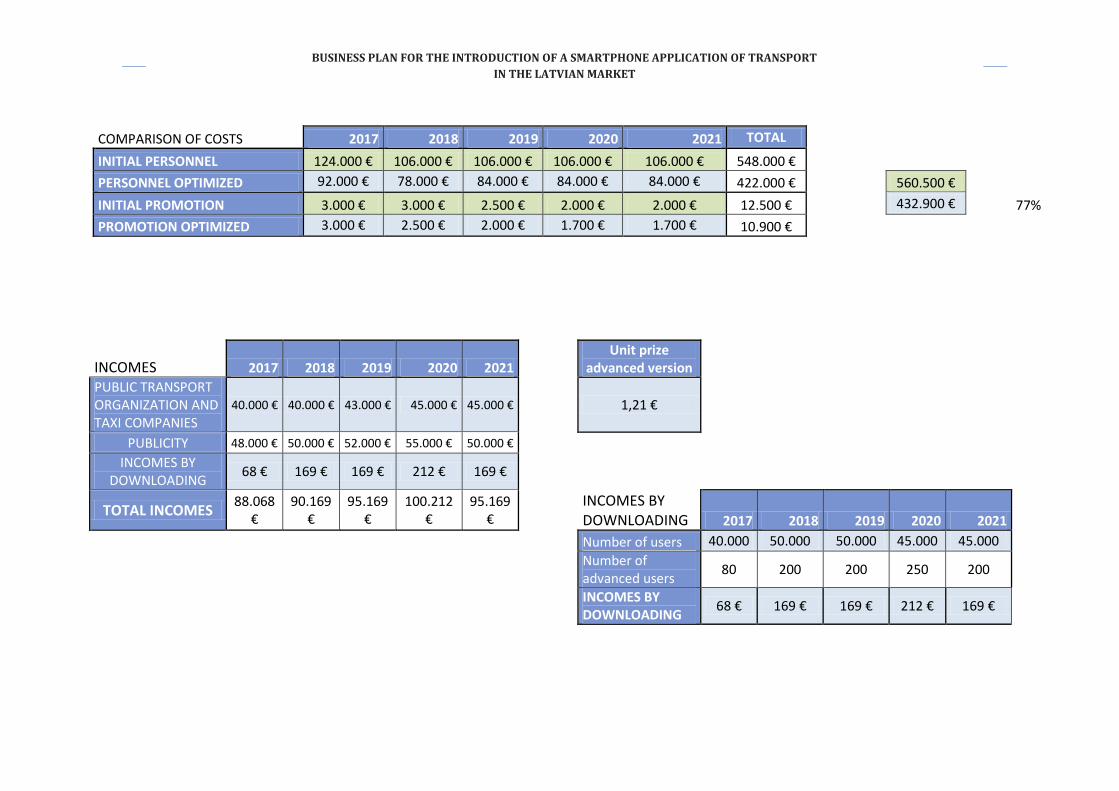
BUSINESS PLAN FOR THE INTRODUCTION OF A SMARTPHONE APPLICATION OF TRANSPORT
IN THE LATVIAN MARKET
COMPARISON OF COSTS 2017 2018 2019 2020 2021 TOTAL
INITIAL PERSONNEL 124.000 € 106.000 € 106.000 € 106.000 € 106.000 € 548.000 €
PERSONNEL OPTIMIZED 92.000 € 78.000 € 84.000 € 84.000 € 84.000 € 422.000 € 560.500 €
INITIAL PROMOTION 3.000 € 3.000 € 2.500 € 2.000 € 2.000 € 12.500 € 432.900 € 77%
PROMOTION OPTIMIZED 3.000 € 2.500 € 2.000 € 1.700 € 1.700 € 10.900 €
INCOMES 2017 2018 2019 2020 2021 Unit prize
advanced version
PUBLIC TRANSPORT ORGANIZATION AND TAXI COMPANIES
40.000 € 40.000 € 43.000 € 45.000 € 45.000 €
1,21 €
PUBLICITY 48.000 € 50.000 € 52.000 € 55.000 € 50.000 €
INCOMES BY DOWNLOADING
68 € 169 € 169 € 212 € 169 €
TOTAL INCOMES 88.068
€ 90.169
€ 95.169
€ 100.212
€ 95.169
€
INCOMES BY DOWNLOADING 2017 2018 2019 2020 2021
Number of users 40.000 50.000 50.000 45.000 45.000
Number of advanced users
80 200 200 250 200
INCOMES BY DOWNLOADING
68 € 169 € 169 € 212 € 169 €
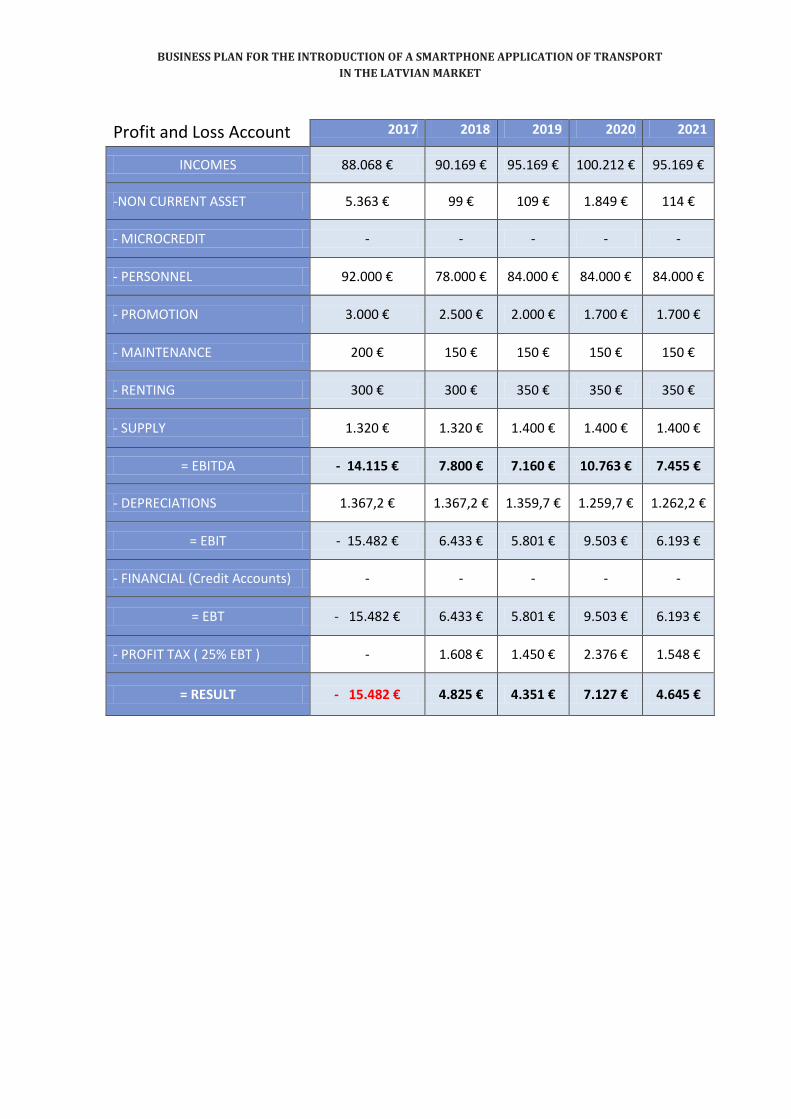
BUSINESS PLAN FOR THE INTRODUCTION OF A SMARTPHONE APPLICATION OF TRANSPORT
IN THE LATVIAN MARKET
Profit and Loss Account 2017 2018 2019 2020 2021
INCOMES 88.068 € 90.169 € 95.169 € 100.212 € 95.169 €
-NON CURRENT ASSET 5.363 € 99 € 109 € 1.849 € 114 €
- MICROCREDIT - - - - -
- PERSONNEL 92.000 € 78.000 € 84.000 € 84.000 € 84.000 €
- PROMOTION 3.000 € 2.500 € 2.000 € 1.700 € 1.700 €
- MAINTENANCE 200 € 150 € 150 € 150 € 150 €
- RENTING 300 € 300 € 350 € 350 € 350 €
- SUPPLY 1.320 € 1.320 € 1.400 € 1.400 € 1.400 €
= EBITDA - 14.115 € 7.800 € 7.160 € 10.763 € 7.455 €
- DEPRECIATIONS 1.367,2 € 1.367,2 € 1.359,7 € 1.259,7 € 1.262,2 €
= EBIT - 15.482 € 6.433 € 5.801 € 9.503 € 6.193 €
- FINANCIAL (Credit Accounts) - - - - -
= EBT - 15.482 € 6.433 € 5.801 € 9.503 € 6.193 €
- PROFIT TAX ( 25% EBT ) - 1.608 € 1.450 € 2.376 € 1.548 €
= RESULT - 15.482 € 4.825 € 4.351 € 7.127 € 4.645 €