South China Sea throughflow as evidenced by satellite images and numerical experiments
Upload
uni-tuebingenCategory
view
1download
0
Drought stress variability in ancient Near Easternagricultural systems evidenced by δ13C in barley grainSimone Riehla,b,1, Konstantin E. Pustovoytovc, Heike Weippertc, Stefan Kletta, and Frank Holed
aInstitute for Archaeological Science and bSenckenberg Center for Human Evolution and Palaeoecology, University of Tübingen, 72070 Tübingen, Germany;cInstitute of Soil Science and Land Evaluation, University of Hohenheim, 70593 Stuttgart, Germany; and dDepartment of Anthropology, Yale University,New Haven, CT 06511
Edited by Kent V. Flannery, University of Michigan, Ann Arbor, MI, and approved July 17, 2014 (received for review May 22, 2014)
The collapse and resilience of political systems in the ancient NearEast and their relationship with agricultural development havebeen of wide interest in archaeology and anthropology. Despiteattempts to link the archaeological evidence to local paleoclimatedata, the precise role of environmental conditions in ancient agricul-tural production remains poorly understood. Recently, stable isotopeanalysis has been used for reconstructing site-specific ancient grow-ing conditions for crop species in semiarid and arid landscapes.To open the discussion of the role of regional diversity in pastagricultural production as a factor in societal development, wepresent 1.037 new stable carbon isotope measurements from 33archaeological sites and modern fields in the geographic area ofthe Fertile Crescent, spanning the Aceramic Neolithic [10,000calibrated years (cal) B.C.] to the later Iron Age (500 cal B.C.), along-side modern data from 13 locations. Our data show that droughtstress was an issue in many agricultural settlements in the ancientNear East, particularly in correlation with the major Holocene cli-matic fluctuations, but its regional impact was diverse and influ-enced by geographic factors. Although cereals growing in thecoastal areas of the northern Levant were relatively unaffectedby Holocene climatic fluctuations, farmers of regions further in-land had to apply irrigation to cope with increased water stress.However, inland agricultural strategies showed a high degree ofvariability. Our findings suggest that regional differences in cli-matic effects led to diversified strategies in ancient subsistenceand economy even within spatially limited cultural units.
Holocene climate change | agricultural societies | aridity stress |Middle East | archaeobotanical crop species
The emergence and decline of early civilizations is intrinsicallytied to agricultural surplus production, either enabling a fo-
cus on technological progress and the accumulation of wealth or,in the case of insufficient yield, leading to hunger, violence,and war.Although the role of agriculture in state building is uniformly
accepted, the role of climate in agricultural production and so-cietal development in the ancient Near East has been explainedin radically different ways, closely related to the scientific back-ground and the humanistic mindset of the individual researchers.Environmental versus cultural determinism are competing ex-planatory models of societal change (1, 2). However, neithermodel adequately accommodates the multicausal structure ofresponses of human societies to high variability in natural andprocess-related effects (3, 4).Local effects of global Holocene climatic fluctuations have
been recognized with diverse magnitudes in paleoclimate proxyarchives in the Near East (5–11). Among these climatic shifts,the 4200 B.P. event has been most intensively discussed byarchaeologists and geographers, who have linked this fluctuationto the decline of state systems at the end of the Early Bronze Age(12–16). Societal collapse has been supported by evidence ofpopulation movements into more favorable regions (17, 18).Agricultural production at the transition from the Early to theMiddle Bronze Age shows regionally limited changes in pre-ferred crop species, which are interpreted as being related to
increased aridity at the end of the third millennium calibratedyears (cal) B.C. (4, 19).Although paleoenvironmental studies and archaeological records
imply that droughts had a major impact on ancient agricul-tural yields (20), these data only indirectly reflect agriculturalproduction. At present, the only way to directly link climaticfluctuations and agricultural productivity in the past is throughstable carbon isotope analysis of archaeological plant remains.This method is an established tool for identifying ancient envi-ronmental conditions for plant growth in arid to semiarid envi-ronments because δ13C values in cereals provide a drought-stresssignal when the amount of water received during the grain-fillingperiod is low (21–26). Carbon fixation during photosynthesisleads to typical ranges of δ13C between −28‰ and −25‰ inmodern barley, which is a C3 plant (27). In case of drought stress,the plants protect themselves from dehydration through closureof the stomata, which leads to a relative enrichment of the heavyvs. the light carbon isotope in the plant tissues (22).Because the δ13C signal reflects seasonal fluctuations in mois-
ture conditions, we undertook stable carbon isotope analysis ofarchaeological and modern barley grains to assess the impactof known Holocene climatic fluctuations on agricultural andeconomic dynamics in ancient societies. Here, we present a re-construction of the effects of past climatic fluctuations on cerealagriculture in the ancient Near East, expressed as chronologicalsequences and spline interpolation maps of isolines of stablecarbon isotope means and minima. Our calculations are basedon 1.037 δ13C measurements from individual barley grains de-rived from 33 archaeological sites and 13 modern locations (Fig.1, Table S1, and Materials and Methods).
Significance
Collapse and resilience of ancient Near Eastern societies is in-trinsically tied to agricultural production. Despite intensivepalaeoclimate research, the role of environmental conditions inancient agricultural production is little understood. Stable car-bon isotope analysis on cereal grains from archaeological sitesprovides a direct evidence for drought stress. This paperdemonstrates that drought stress correlated with major cli-matic fluctuations and affected many agricultural settlementsin the ancient Near East but that its regional impact was di-verse and influenced by geographic factors and human tech-nology. The results lead to a better understanding of howancient agricultural societies performed under fluctuating cli-mate and regionally diverse environmental conditions.
Author contributions: S.R. designed research; S.R. performed research; K.E.P., H.W., S.K.,and F.H. contributed new reagents/analytic tools; S.R. analyzed data; and S.R. wrotethe paper.
The authors declare no conflict of interest.
This article is a PNAS Direct Submission.
Freely available online through the PNAS open access option.1To whom correspondence should be addressed. Email: [email protected].
This article contains supporting information online at www.pnas.org/lookup/suppl/doi:10.1073/pnas.1409516111/-/DCSupplemental.
www.pnas.org/cgi/doi/10.1073/pnas.1409516111 PNAS Early Edition | 1 of 6
ANTH
ROPO
LOGY

Our working hypothesis is that, even with the limitations in thescope of this study (i.e., we do not consider sociocultural issuesthat influenced agricultural decision making), large-scale stablecarbon isotope analysis of ancient cereal grains contributes toour understanding of how agricultural societies performed underfluctuating climate and regionally diverse environmental conditions.
Results and DiscussionDynamics of Regional Drought Stress Within the Framework ofGeneral Climate Trends. Although in arid to semiarid environ-ments other factors, such as crop density and soil salinity, mayplay a role in causing a drought stress signal in the plant, thestrongest correlation of stable carbon isotope data in plantsexists with water availability (27–29). Variability of δ13C mea-surements in archaeobotanical cereal grains occurs at differentlevels. In arid environments the variability of δ13C values may behigher than in semiarid or subhumid regions. Moreover, irriga-tion can lead to locally diverse water availability for cereal cropsand thus to a broad range of values from an individual archae-ological site (30) or between different sites (31). In our study,some samples from where irrigation is known along the Euphratesproduced a comparatively large range of δ13C. This large rangeof δ13C may have resulted from selective irrigation on somefields and not on others (e.g., Emar and Tell el’Abd) (see Fig.3). Intersite or regional variation of δ13C in ancient cerealgrains has also been interpreted as reflecting differences ingrowing conditions, resulting from interannual variation in pre-cipitation or from paleoclimatic fluctuations (29, 32, 33). Amajor problem is that the practice of irrigation remains uncertainfor most archaeological sites. We tried to overcome this problemby including minima values of Δ13C indicating the maximumstress measured. The Δ13C refers to calibrated δ13C values.Calibration is necessary due to changes in the atmospheric CO2concentration (δ13C air) over time (for details see Materials andMethods). The minima values of Δ13C represent those crops thatprobably were not irrigated, even in settlement areas with locallyirrigated fields (see Figs. 3 and 5). However, to unambiguouslyinterpret δ13C values from a Near Eastern Bronze Age site asbeing related to irrigation, additional archaeobotanical (e.g.,weed species), archaeological, and geoarchaeological data andtextual evidence need to be incorporated, which currently is onlyfeasible for a few archaeological sites (30, 34).Our results of accumulated δ13C data document for the first
time, to our knowledge, a generalized trend in water availability
for the area of the Fertile Crescent over a time sequence span-ning from the Neolithic to the Iron Age (Fig. 2). This accumu-lated trend was calculated from the means (Table S1 and Fig. 3)of the 33 archaeological sites depicted (Fig. 1). Fig. 2 shows thechronological course of the Δ13C values fluctuating roughly be-tween 15‰ and 18‰. Values below the reference line of 16‰indicate strong water stress, and values of 16‰ to 17‰ notemoderate stress (see Materials and Methods for the basis of thesereference values).The generalized Δ13C trend is in good agreement with known
Holocene climatic fluctuations, particularly regarding those of5200 B.P., 4200 B.P., and 3200 B.P. (9, 35–38) (Fig. 2). We alsorecognize fluctuations within the sequence of the Early BronzeAge that are in line with opinions on locally variable climaticeffects and settlement patterns during the Early Bronze Age (39–42). During the Neolithic and Chalcolithic periods, water avail-ability seems to have been comparatively more balanced and inagreement with other paleoclimate records (43–45), althoughnot free of fluctuations (9).Bearing in mind the modern differences in Near Eastern cli-
matic geography, deviations in water availability from the gen-eral trend as seen in the accumulated Δ13C record shouldbecome visible at a regional level. For testing this hypothesis, wedefined four geographical regions (Fig. 3): coastal sites, whichreceive relatively stable interannual levels of high precipitation;Euphrates sites, situated in the drier inland but with the optionfor farmers to access the permanent water course of a majorriver; Khabur sites, with a relatively strong north–south decline,the northern sites being close to the Taurus mountains and thesouthern sites having occasional access to irrigation water fromthe Khabur and its tributaries; and sites neither on the coast noralong one of the large rivers.The regional development of the Δ13C record confirms the
expectation of differences according to geographical units (Fig.3). From the coastal sites, the minima rarely plot below the 16‰reference line, and the mean value is in most cases on or abovethe 17‰ line, indicating that drought stress was not a majorproblem to the farmers in this region at any time of the con-sidered sequence. Even during the major climatic fluctuations of4200 B.P. and 3200 B.P., drought stress on barley was onlymoderate in most coastal sites. These patterns are in contrast tothe Euphrates and Khabur river systems, where the minima ofΔ13C reach 13‰ and the mean values are rarely above 17‰.From the Euphrates sites, a particularly large number of Δ13Cvalues are below the 16‰ reference line during the Middle
Fig. 1. Sampling locations in northern Meso-potamia and the Levant and chronology of barleygrains providing δ13C measurements. Note that theonly sites listed are those that appear in the mapsection: (site 1) Abu Hamid, (site 2) Ain Rahub, (site6) Dilkaya Höyük, (site 7) Emar, (site 9) Hirbet ez-Zeraqon, (site 11) Kamid el-Loz, (site 12) KinetHöyük, (site 13) Mashnaqa, (site 14) Mezraa TeleilatHöyük, (site 16) Qubur al-Walayida, (site 17) TellShioukh Faouqani, (site 18) Shir, (site 19) Tell esh-Shuna, (site 20) Tell Atchana, (site 21) Tell Atij, (site22) Tell Beydar III, (site 23) Tell Fadous, (site 24) TellHalaf, (site 25) Tell Kerma, (site 26) Tell Kuran, (site27) Tell Raqa’i, (site 28) Tell Tawila, (site 29) TellTweini, (site 31) Umm Qseir, (site 33) Tell ’el Abd, (site34) Qatna, (site 35) Tell Mozan, (site 36) Ziyade, (site37) Chagar Bazar, (site 38) Zebdani (GPS_152), (site 39)GPS_17, (site 42) Tell Snan (GPS_437), (site 43)Summakiak (GPS_50), (site 44) Membij (GPS_629),(site 45) Tell Abyad (GPS_755), (site 46) Tell Brak(GPS_828), (site 48) Malhat ed Deru, (site 51) TellBderi, (site 52) Tell Leilan, and (site 53) Tel Burna.Please note that some of the archaeological siteshave been sampled only for modern control δ13C.For details on the sites and samples, see Table S1.
2 of 6 | www.pnas.org/cgi/doi/10.1073/pnas.1409516111 Riehl et al.

Bronze Age. All regions at some distance from the coast showa strong to moderate stress signal for the major climate events.The reason for a moderate stress signal at Tell Mozan at the4200 B.P. event is open for debate; it could be because of sea-sonally higher precipitation due to the close vicinity of theTaurus mountains or because irrigation played a role.
Isolines of Δ13C Show Spatial Patterns of Drought Stress in the Past.A significant result of this study is the locally highly variabledrought-stress signals found under continental climate con-ditions, due to comparatively higher aridity inland than along thecoast (Fig. 4). The option of irrigation, particularly along therivers, results in assemblages containing both grains from formerstands that had been irrigated and others that grew without ir-rigation, leading to a broad range of Δ13C values. This relationhas been captured by spline interpolation of the differences be-tween mean and minima Δ13C values from the different loca-tions (Fig. 4). The patterns indicate a high variability of Δ13Cvalues in regions with probable irrigation, inland in the southernLevant and along the rivers, whereas the coastal areas arecharacterized by low intrasample variability in Δ13C values.These relationships are relevant to the interpretation of Δ13Cdata sets from archaeological sites with unknown agriculturalstrategies: i.e., where the archaeological evidence for irrigation ispending. These patterns also support the suggestion that highenvironmental diversity, combined with regionally differing hu-man strategies, are responsible for the heterogeneity of the NearEastern archaeological and geoarchaeological record (4, 46).
Chronological spline interpolation of Δ13C values in barleyshows distinct and regionally variable differences in drought-stress signals throughout time (Fig. 5). In agreement withearlier local studies (44, 47), the mean values for the Early toMid-Holocene (10,000–4000 cal B.C.) are considerably higherthan modern Δ13C signals, indicating good water supply forbarley growth in areas where this crop species experiencesdrought stress today, basically around the modern 300-mm iso-hyet. The differences between the modern and Early to Mid-Holocene Δ13C record are not so strong regarding the minima,which indicate the highest possible drought stress of individualsamples, and are thus generally indicative of the lowermostnatural base line of water supply. However, with both inter-polations, mean and minima, it is obvious that the area betweenthe modern 200-mm and 300-mm isohyets received considerablyhigher precipitation during the growing season of the cereals inthe Early to Mid-Holocene periods than today.The conditions during the first half of the Early Bronze Age
(4000–2500 cal B.C.) seem to have been slightly drier than be-fore, expressed by lower mean Δ13C values in the southern re-gion, the Khabur area, and around the modern 400-mm isohyetwhereas there may have been some beneficial influence from thewaters of the Euphrates at the settlements located along theriver. The presence of a coastal site (Tell Fadous) in the first halfof the Early Bronze Age is responsible for the contrasting pat-tern in this area. A north–south declining precipitation gradientis particularly visible in the minima values.The second half of the Early Bronze Age (2500 to ca. 2000 cal
B.C.) shows an increase in aridity, particularly at the sites ofQatna and Emar: i.e., south of 36° latitude and south of themodern 300-mm isohyet whereas the mean values north of 36° showa much weaker drought stress signal. Although the general trendwas in agreement with the expected effects of the 4200 B.P. event,regional differences in the climatic effects obviously existed (15, 16).The Middle Bronze Age (ca. 1900–1600 cal B.C.) appears to
show a continuation of this process, which is particularly visiblein the minima values indicating extremes of drought stress in theKhabur area, but also at the sites of Emar and Qatna, whereasonly slight changes toward higher aridity occurred along thecoast, at Kinet Höyük and Tell Tweini. This increased inlandaridity correlates with archaeologically observed demographicpatterns in northern Mesopotamia, the Khabur-Balikh steppe,the middle Euphrates (46), and the Aleppo and Hama districts(48). There was a reduction in the number of sites between theend of the Early Bronze Age and the Middle Bronze Age. Themean values for Qatna, which contrast with these patterns, couldbe explained by irrigation or at least cultivation of some barleyfields in the direct vicinity of the paleolake reconstructed for thissite (49).
Fig. 2. Accumulated Δ13C mean record from 1.037 barley grains from 33archaeological sites (black line). Red line, reference line for drought stress at16‰ and below; blue line, reference line for favorable conditions at 17‰and above; red bars, global climatic fluctuations at roughly 5200 B.P. (➀),4200 B.P. (➁), and 3200 B.P. (➂).
Fig. 3. Regional and local Δ13C record from1.037 barley grains from 33 archaeological sites.Each boxplot represents one phase of a site;numbers below the boxplots refer to the ar-chaeological sites in Fig. 1 and Table S1; graycircles are individual measurements; red crossesare outliers; blue diamonds represent means;reference lines and red bars as in Fig. 2. MBA,Middle Bronze Age; LBA, Late Bronze Age.
Riehl et al. PNAS Early Edition | 3 of 6
ANTH
ROPO
LOGY
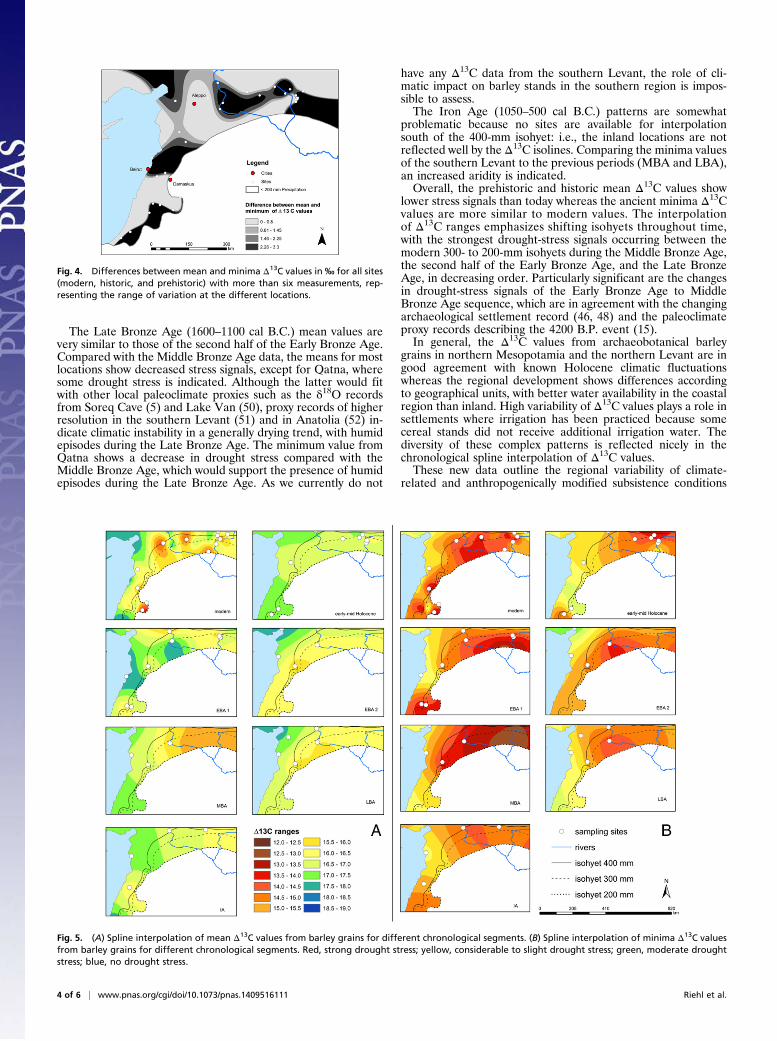
The Late Bronze Age (1600–1100 cal B.C.) mean values arevery similar to those of the second half of the Early Bronze Age.Compared with the Middle Bronze Age data, the means for mostlocations show decreased stress signals, except for Qatna, wheresome drought stress is indicated. Although the latter would fitwith other local paleoclimate proxies such as the δ18O recordsfrom Soreq Cave (5) and Lake Van (50), proxy records of higherresolution in the southern Levant (51) and in Anatolia (52) in-dicate climatic instability in a generally drying trend, with humidepisodes during the Late Bronze Age. The minimum value fromQatna shows a decrease in drought stress compared with theMiddle Bronze Age, which would support the presence of humidepisodes during the Late Bronze Age. As we currently do not
have any Δ13C data from the southern Levant, the role of cli-matic impact on barley stands in the southern region is impos-sible to assess.The Iron Age (1050–500 cal B.C.) patterns are somewhat
problematic because no sites are available for interpolationsouth of the 400-mm isohyet: i.e., the inland locations are notreflected well by the Δ13C isolines. Comparing the minima valuesof the southern Levant to the previous periods (MBA and LBA),an increased aridity is indicated.Overall, the prehistoric and historic mean Δ13C values show
lower stress signals than today whereas the ancient minima Δ13Cvalues are more similar to modern values. The interpolationof Δ13C ranges emphasizes shifting isohyets throughout time,with the strongest drought-stress signals occurring between themodern 300- to 200-mm isohyets during the Middle Bronze Age,the second half of the Early Bronze Age, and the Late BronzeAge, in decreasing order. Particularly significant are the changesin drought-stress signals of the Early Bronze Age to MiddleBronze Age sequence, which are in agreement with the changingarchaeological settlement record (46, 48) and the paleoclimateproxy records describing the 4200 B.P. event (15).In general, the Δ13C values from archaeobotanical barley
grains in northern Mesopotamia and the northern Levant are ingood agreement with known Holocene climatic fluctuationswhereas the regional development shows differences accordingto geographical units, with better water availability in the coastalregion than inland. High variability of Δ13C values plays a role insettlements where irrigation has been practiced because somecereal stands did not receive additional irrigation water. Thediversity of these complex patterns is reflected nicely in thechronological spline interpolation of Δ13C values.These new data outline the regional variability of climate-
related and anthropogenically modified subsistence conditions
Fig. 4. Differences between mean and minima Δ13C values in ‰ for all sites(modern, historic, and prehistoric) with more than six measurements, rep-resenting the range of variation at the different locations.
Fig. 5. (A) Spline interpolation of mean Δ13C values from barley grains for different chronological segments. (B) Spline interpolation of minima Δ13C valuesfrom barley grains for different chronological segments. Red, strong drought stress; yellow, considerable to slight drought stress; green, moderate droughtstress; blue, no drought stress.
4 of 6 | www.pnas.org/cgi/doi/10.1073/pnas.1409516111 Riehl et al.

throughout the Holocene and thus broaden our understanding ofcausal relations between environmental dynamics and societaldevelopment in the ancient Near East. Although we did notspecifically address sociocultural issues that may have influencedagricultural decision making, our results provide a key for an-swering the pivotal question of how agricultural societies per-formed under fluctuating climatic and environmental conditions,which also has implications for risk assessment in regions ofendangered food security today.
ConclusionsOur results show the regional diversity in climatic effects on ancientcrop species in the Near East over the Holocene sequence andsupport one possible causal motivation for societal transformationsin this geographical region.Under specific types of stress, the interplay between humans
and their environment codetermines the resilience, continuity,vulnerability, decline, and regeneration of societies. Althougharchaeology is currently only at the beginning of disentanglingpast human–environment interaction, details of environmentalchange and economic development in ancient societies are nowenhancing our understanding of the reasons for variability offeedback mechanisms in human–environment systems. Essen-tially, the results pinpoint the importance of local variability interms of action planning.
Materials and MethodsStable Carbon Isotope Analysis of Archaeobotanical Cereal Grains. Barleygrains from 33 archaeological sites (Fig. 1) were analyzed for stable carbonisotope ratios, taking into account knowledge of intraspecific and intra-sample variability of δ13C (23, 53). The described high variability requireda target of minimum measurements of six individual grains per archae-obotanical sample, representing a unique contextual unit (Table S1). In somecases, fewer grains per contextual unit were analyzed because of limitedavailability of material. Well-developed grains were chosen to guaranteethe exclusion of δ13C values that would not reflect the mean growing con-ditions: e.g., such as values from immature grains.
The geographical distribution of the archaeological sites is in agreementwith the western and northern part of the Fertile Crescent, the area that hasbeen a focus for studies on the emergence of agriculture in theOldWorld andon the development of ancient civilizations. The chronological distribution ofthe sampled sites is, however, uneven, for reasons of differences in theavailability of archaeobotanical barley grains. Although the distribution ofmodern locations is relatively even, the number of locations for the MiddleBronze Age (ca. 1900–1600 cal B.C.) and the Late Bronze Age (ca. 1600–1200cal B.C.) is limited and restricted to the northwestern part of the area in-vestigated (Figs. 1 and 5).
Measurements of δ13C were carried out at the Institute of Geosciences ofthe University of Tubingen, Germany on a FinniganMAT252 gas source massspectrometer with a ThermoFinnigan GasBench II/CTC Combi-Pal autosam-pler. Before mass-spectrometric measurements, the barley grains werereacted with 5% HCl to eliminate sedimentary carbonate.
The common standard of δ13C VPDB (Vienna Peedee belemnite ‰) wasapplied to the measurements of 13C/12C ratios to calculate δ13C in the barleygrains. Changes in atmospheric CO2 concentration (δ13C air) over timeneeded to be taken into account when comparing cereal grains from dif-ferent archaeological periods. Past δ13C air values are available from ice-coreprojects in Greenland and Antarctica (54–56). We calibrated our δ13C fromancient barley into Δ13C values by using the approximation AIRCO2_LOESS(22, 57).
The reference lines of 16‰ and 17‰ have to be considered as relativeborders (Figs. 2 and 3), depending also on δair when calibrated from thenegative δ13C to the positive Δ13C. Studies on the direct relationship be-tween total water input (TWI) during the grain-filling period and the δ13Cvalue in modern barley relate values below 50 mm TWI during the grain-filling period to a range of δ13C between −24‰ and −20‰ (58). Consideringthe grain-filling period of barley to be shorter than 40 d, a TWI of about40 mm would equal the monthly precipitation of the spring season in the
coastal and hilly regions of our investigation area. In modern barley, 40 mmTWI equals a δ13C value of roughly −23‰, corresponding to a Δ13C ofroughly 16‰. We therefore consider ancient, calibrated values between17‰ and 16‰ and below to indicate increasing drought stress.
Interpolation Methods. Plant stable carbon isotope values correlate withrainfall at global and regional scales, with the regional scale producing thestronger correlation (27) as well as throughout time (23). Because there isa positive spatial autocorrelation for precipitation, we assumed a positivespatiotemporal autocorrelation for the Δ13C values of barley grains (59).Positive spatial autocorrelation postulates correlation between attributevalues (Δ13C) depending on their proximity.
Therefore, we considered interpolation methods as appropriate for cre-ating a continuous model surface and for visualizing local variability fromdiscrete observations. In the present study, the discrete observations arerepresented by the Δ13C values from barley grains.
From the three different local interpolation methods—inverse distanceweighting (IDW), kriging, and spline—we chose the latter for its suitability inretaining small-scale variability in the data. Spline interpolation is a mathe-matical method of smoothing linear features imposing two conditions. First,the surface must pass exactly through the observed points; second, thesurface must have a minimum curvature.
The spline interpolation method estimates values by using piecewisepolynomial functions linked together at break points to form a bicubic spline(the extension of cubic interpolation by interpolating value points on a 2Dregular grid), resulting in a smooth surface that passes through the knownpoint data (60). Conceptually, the interpolator works like bending a sheet ofrubber to pass through a 3D point cloud. In this study, a so-called thin-platespline interpolation, implemented in ArcGIS, was used to replace the exactsurface by a weighted average, producing a minimum-curvature surface.The advantage of the thin-plate spline is that no unnatural breaks caused byexceptionally high or low values will occur. The setting of the weight can beeither tensioning or regularizing. Here, the spline type “regularized” wasapplied, adjusting the third derivative in the curvature minimization ex-pression for a smoother surface (61).
Because the regular spline method disregards geographical barriers, suchas mountain ranges and alterations in precipitation, a spline-with-barriersroutine was applied (62). The spline-with-barriers operator estimates un-known values by curving a surface through known values as well as inter-ruptions by the barriers. In this work, the 200-mm isohyet served as aninterpolation barrier (63). The 200-mm isohyet was chosen because nosample locations occur south of it, and it is generally considered to representthe barrier of rain-fed agriculture (48).
The use of the barrier mapping method links the drought stress indicatedin the Δ13C values to major topographical and precipitation rates and pro-vides results that are more robust than those from regular interpolations.The barriers, as a means of drought-stress border, alter the process of in-terpolation by forcing the trend surface to go around the barrier instead ofcrossing it (64). The final representation can be used to estimate areas withrespectively higher or lower water stress.
The spline-with-barrier interpolation method was performed consistentlyby using the same algorithm for seven time slices ranging from the Neolithicperiod to the present (Fig. 5). For each location, mean and minimum valuesof Δ13C were used (Table S1). The number of sites per time slice varied froma minimum of 4 for the Middle Bronze Age to 13 for the modern locations. Tolimit the processing extent of the interpolated surfaces, a data file was createdincluding all sites from all periods within a surrounding rectangle. Color for-matting of the Δ13C isoline ranges (Fig. 5) was conducted according to thephysiological reaction of the plants, with values between 11.5‰ and 12.5‰ inbrown indicating extreme drought stress, and values between 17.5‰ and 18.5‰shown in blue, indicating good moisture availability for barley growth.
The interpolation results indirectly show climatic fluctuations throughoutthe Holocene by visualizing local spatial surface changes of Δ13C values frombarley grains.
ACKNOWLEDGMENTS. The following researchers contributed by generouslyproviding barley grain: Mark Nesbitt, Joy McCorriston, Reinder Neef, ElenaMarinova, and Reid Bryson. Financial support was obtained through GermanResearch Foundation Grant Ri 1193/6-1.
1. Weiss H, Bradley RS (2001) Archaeology. What drives societal collapse? Science
291(5504):609–610.2. Yoffee N (2010) Collapse in Ancient Mesopotamia. What Happened, What Didn’t?
Questioning Collapse: Human Resilience, Ecological Vulnerability and the Aftermath
of Empire, eds McAnany PA, Yoffee N (Cambridge Univ Press, Cambridge, UK), pp
176–203.3. Geyer B (2002) Expansion and decline of Syria’s arid margin. Arab World Geographer
5(2):73–84.
Riehl et al. PNAS Early Edition | 5 of 6
ANTH
ROPO
LOGY

4. Riehl S (2012) Variability in ancient Near Eastern environmental and agriculturaldevelopment. J Arid Environ 86:113–121.
5. Bar-Matthews M, Ayalon A, Kaufman A (1997) Late Quaternary paleoclimate in theEastern Mediterranean region from stable isotope analysis of speleothems at SoreqCave, Israel. Quat Res 47:155–168.
6. Enzel Y, et al. (2003) Late Holocene climates of the Near East deduced from Dead Sealevel variations and modern regional winter rainfall. Quat Res 60:263–273.
7. Robinson SA, Black S, Sellwood BW, Valdes PJ (2006) A review of palaeoclimates andpalaeoenvironments in the Levant and Eastern Mediterranean from 25000 to 5000 calBP: Setting the environmental background for the evolution of human civilisation.Quat Sci Rev 25:1517–1541.
8. Weninger B, et al. (2006) Climate forcing due to the 8200 cal yr BP event observed atEarly Neolithic sites in the eastern Mediterranean. Quat Res 66(3):401–420.
9. Bar-Matthews M, Ayalon A (2011) Mid-Holocene climate variations revealed by high-resolution speleothem records from Soreq Cave, Israel and their correlation withcultural changes. Holocene 21(1):163–171.
10. Finné M, Holmgren K, Sundqvist HS, Weiberg E, Lindblom M (2011) Climate in theeastern Mediterranean, and adjacent regions, during the past 6000 years: A review.J Archaeol Sci 38(12):3153–3173.
11. Roberts N, Brayshaw D, Kuzucuoglu C, Perez R, Sadori L (2011) The mid-Holoceneclimatic transition in the Mediterranean: Causes and consequences. Holocene 21(1):3–13.
12. Weiss H, et al. (1993) The genesis and collapse of third millennium north meso-potamian civilization. Science 261(5124):995–1004.
13. Dalfes HN (1997) Environmental vulnerability of early societies: some reflections onmodeling issues. Third Millennium BC Climate Change and Old World Collapse, NATOASI Series I, eds Dalfes HN, Kukla G, Weiss H (Springer, Berlin), Vol 49, pp 691–698.
14. Cullen HM, et al. (2000) Climate change and the collapse of the Akkadian empire:Evidence from the deep sea. Geology 28(4):379–382.
15. Staubwasser M, Weiss H (2006) Holocene climate and cultural evolution in late pre-historic-early historic West Asia. Quat Res 66:372–387.
16. Kuzucuoglu C, Marro C, eds (2007) Sociétés Humaines et Changement Climatique à laFin du Troisième Millénaire: Une Crise a-t-Elle eu Lieu en Haute Mésopotamie? (Dif-fusion De Boccard, Paris), Vol XIX.
17. Wilkinson TJ (1997) Environmental fluctuations, agricultural production and collapse:A view from Bronze Age upper Mesopotamia. Third Millennium BC Climate Changeand Old World Collapse, NATO ASI Series I, eds Dalfes HN, Kukla G, Weiss H (Springer,Berlin), Vol 49, pp 67–106.
18. Wilkinson TJ (2004) On the Margin of the Euphrates: Settlement and Land Use at Telles-Sweyhat and the Upper Lake Assad Area, Syria (Oriental Institute, Chicago).
19. Riehl S (2009) Archaeobotanical evidence for the interrelationship of agriculturaldecision-making and climate change in the ancient Near East. Quat Int 197:93–114.
20. Kaniewski D, Van Campo E, Weiss H (2012) Drought is a recurring challenge in theMiddle East. Proc Natl Acad Sci USA 109(10):3862–3867.
21. Araus JL, et al. (1997) Changes in carbon isotope discrimination in grain cereals fromdifferent regions of the western Mediterranean basin during the past seven millenia:Palaeoenvironmental evidence of a differential change in aridity during the lateHolocene. Glob Change Biol 3:107–118.
22. Ferrio JP, Araus JL, Buxó R, Voltas J, Bort J (2005) Water management practices andclimate in ancient agriculture: Inferences from the stable isotope composition of ar-chaeobotanical remains. Veg Hist Archaeobot 14:510–517.
23. Riehl S, Bryson RA, Pustovoytov K (2008) Changing growing conditions for cropsduring the Near Eastern Bronze Age (3000-1200 BC): The stable carbon isotope evi-dence. J Archaeol Sci 35(4):1011–1022.
24. Fiorentino G, et al. (2008) Third millennium B.C. climate change in Syria highlightedby Carbon stable isotope analysis of 14C-AMS dated plant remains from Ebla. Pa-laeogeogr Palaeoclimatol Palaeoecol 266(1-2):51–58.
25. Aguilera M, Ferrio JP, Pérez G, Araus JL, Voltas J (2012) Holocene changes in pre-cipitation seasonality in the western Mediterranean Basin: A multi-species approachusing δ13C of archaeobotanical remains. J Quaternary Sci 27(2):192–202.
26. Caracuta V, Fiorentino G, Martinelli MC (2012) Plant remains and AMS: Dating climatechange in the Aeolian Islands (North Eastern Sicily) during the 2nd millennium BC.Radiocarbon 54(2-3):689–700.
27. Hartman G, Danin A (2010) Isotopic values of plants in relation to water availability inthe Eastern Mediterranean region. Oecologia 162(4):837–852.
28. Stewart GR, Turnbull MH, Schmidt S, Erskine PD (1995) 13C natural abundance inplant communities along a rainfall gradient: A biological intergrator of water avail-ability. Aust J Plant Physiol 22:51–55.
29. Araus JL, et al. (1999) Crop water availability in early agriculture: Evidence fromcarbon isotope discrimination of seeds from a tenth millennium BP sites on the Eu-phrates. Glob Change Biol 5:201–212.
30. Riehl S (2010) Maintenance of agricultural stability in a changing environment: Thearchaeobotanical evidence at Emar. Late Roman and Medieval Cemeteries and En-vironmental Studies. Emar After the Closure of the Tabqa Dam: The Syrian-Germanexcavations 1996–2002, Subartu Book 25, eds Finkbeiner U, Sakal F (Brepols, Turnh-out, Belgium), Vol 1, pp 177–224.
31. Araus JL, et al. (1997) Identification of ancient irrigation practices based on the car-bon isotope discrimination of plant seeds: A case study from the South-East IberianPeninsula. J Archaeol Sci 24(8):729–740.
32. Riehl S (2008) Climate and agriculture in the ancient Near East: A synthesis of the ar-chaeobotanical and stable carbon isotope evidence. Veg Hist Archaeobot 17(1):43–51.
33. Flohr P, Müldner G, Jenkins E (2011) Carbon stable isotope analysis of cereal remains asa way to reconstruct water availability: Preliminary results. Water Hist 3(2):121–144.
34. Kühne H (1990) The effects of irrigation agriculture: Bronze and Iron Age habitationalong the Khabur, Eastern Syria. Man’s Role in the Shaping of the Eastern Mediter-ranean Landscape, eds Bottema S, Entjes-Nieborg G, van Zeist W (Balkema, Rotter-dam), pp 15–30.
35. Bond G, et al. (2001) Persistent solar influence on North Atlantic climate during theHolocene. Science 294(5549):2130–2136.
36. Haug GH, Hughen KA, Sigman DM, Peterson LC, Röhl U (2001) Southward migrationof the intertropical convergence zone through the Holocene. Science 293(5533):1304–1308.
37. Mayewski P, et al. (2004) Holocene climate variability. Quat Res 62:243–255.38. Wanner H, et al. (2008) Mid- to Late Holocene climate change: An overview. Quat Sci
Rev 27(19-20):1791–1828.39. Hole F (1997) Evidence for Mid-Holocene environmental change in the western
Khabur drainage, Northeastern Syria. Third Millennium BC Climate Change and OldWorld Collapse, NATO ASI Series I, eds Dalfes HN, Kukla G, Weiss H (Springer, Berlin),Vol 49, pp 39–66.
40. Vannière B, et al. (2011) Circum-Mediterranean fire activity and climate changesduring the mid-Holocene environmental transition (8500-2500 cal. BP). Holocene21(1):53–73.
41. Ur J (2012) Spatial scale and urban collapse at Tell Brak and Hamoukar at the end ofthe third millennium BC. Looking North: The Socioeconomic Dynamics of NorthernMesopotamian and Anatolian Regions During the Late Third and Early Second Mil-lennium BC, eds Laneri N, Pfälzner P, Valentini S (Harrassovitz, Wiesbaden, Germany),pp 25–35.
42. Höflmayer F, Dee MW, Genz H, Riehl S (2014) Radiocarbon evidence for the EarlyBronze Age Levant: The site of Tell Fadous-Kfarabida (Lebanon) and the end of theEarly Bronze III period. Radiocarbon 56(2):1–14.
43. Sandweiss DH, Maasch KA, Anderson DG (1999) Transitions in the Mid-Holocene.Science 283(5401):499–500.
44. Riehl S, Pustovoytov KE, Hotchkiss S, Bryson RA (2009) Local Holocene environmentalindicators in Upper Mesopotamia: Pedogenic carbonate record vs. archaeobotanicaldata and archaeoclimatological models. Quat Int 209:154–162.
45. Roberts N, Eastwood WJ, Kuzucuoglu C, Fiorentino G, Caracuta V (2011) Climatic,vegetation and cultural change in the eastern Mediterranean during the mid-Holo-cene environmental transition. Holocene 21(1):147–162.
46. Wilkinson TJ, et al. (2014) Contextualizing early urbanization: Settlement cores, earlystates and agro-pastoral strategies in the Fertile Crescent during the fourth and thirdmillennia BC. J World Prehist 27:43–109.
47. Araus JL, Ferrio JP, Buxó R, Voltas J (2007) The historical perspective of dryland ag-riculture: Lessons learned from 10,000 years of wheat cultivation. J Exp Bot 58(2):131–145.
48. Geyer B, et al. (2007) The arid margins of northern Syria: Occupation of the land andmodes of exploitation in the Bronze Age. Urban and Natural Landscapes of an An-cient Syrian Capital: Settlement and Environment at Tell Mishrifeh/Qatna and inCentral-Western Syria, ed Bonacossi DM (Forum, Udine, Italy), pp 269–339.
49. Cremaschi M, Trombino L, Sala A, Valsecchi V (2003) Under fitted streams and theHolocene palaeo-environment in the region of Tell Mishrifeh-Qatna (Central Syria).Akkadica 124(1):71–77.
50. Litt T, et al. (2009) ‘PALEOVAN’, International Continental Scientific Drilling Program(ICDP): Site survey results and perspectives. Quat Sci Rev 28:1555–1567.
51. Langgut D, Finkelstein I, Litt T (2013) Climate and the Late Bronze collapse: Newevidence from the southern Levant. Tel Aviv 40:149–175.
52. Kuzucuo�glu C, Dörfler W, Kunesch S, Goupille F (2011) Mid- to late-Holocene climatechange in central Turkey: The Tecer Lake record. Holocene 21(1):173–188.
53. Heaton THE, Jones G, Halstead P, Tsipropoulos T (2009) Variations in the 13C/12Cratios of modern wheat grain, and implications for interpreting data from BronzeAge Assiros Toumba, Greece. J Archaeol Sci 36(10):2224–2233.
54. Barnola JM, Raynaud D, Korotkevich YS, Lorius C (1987) Vostok ice core provides160,000-year record of atmospheric CO2. Nature 329:408–414.
55. Wagner F, Bohncke SJ, Dilcher DL, Kurschner WM, van Geel B, Visscher H (1999)Century-scale shifts in early holocene atmospheric CO2 concentration. Science284(5422):1971–1973.
56. Indermühle A, Stauffer B, Stocker TF, Raynaud D, Barnola J-M (1999) Early Holoceneatmospheric CO2 concentrations. Science 286(5446):1815.
57. Ferrio JP, Voltas J, Araus JL (2012) A smoothed curve of δ13C of atmospheric CO2 from16.100 BCE to 2.010 CE. Available at http://web.udl.es/usuaris/x3845331/AIRCO2_LOESS.xls.Accessed February 20, 2014.
58. Ferrio JP, Voltas J, Araus JL (2003) Use of carbon isotope composition in monitoringenvironmental changes. Manage Environ Qual 14(1):82–98.
59. Moran PAP (1950) Notes on continuous stochastic phenomena. Biometrika 37(1-2):17–23.
60. Burrough PA, McDonnell R (1998) Principles of Geographic Information Systems(Oxford Univ Press, Oxford).
61. Conolly J, Lake M (2006) Geographical Information Systems in Archaeology (Cam-bridge Univ Press, Cambridge, UK).
62. Terzopoulos D (1988) The computation of visible-surface representations. IEEE TransPattern Anal Mach Intell 10(4):417–438.
63. Burns ER, Morgan DS, Peavler RS, Kahle SC (2011) Three-Dimensional Model of theGeologic Framework for the Columbia Plateau Regional Aquifer System, Idaho, Oregon,and Washington (US Geological Survey, Reston, VA), Scientific Investigations Report2010-5246, p 44.
64. Berenbrock C, Mason RR, Jr, Blanchard SF (2009) Mapping Hurricane Rita inland stormtide. J Flood Risk Manage 2:76–82.
6 of 6 | www.pnas.org/cgi/doi/10.1073/pnas.1409516111 Riehl et al.
Copyright © 2022 FDOKUMEN