Richard H. Lawrence, Jr., CFA Overlook Investments Limited
29
FEBRUARY 2012 GLOBAL VALUE INVESTING Richard H. Lawrence, Jr., CFA Overlook Investments Limited Chinese University of Hong Kong February 2021
-
Upload
khangminh22 -
Category
Documents
-
view
1 -
download
0
Transcript of Richard H. Lawrence, Jr., CFA Overlook Investments Limited

FEBRUARY 2012
GLOBAL VALUE INVESTINGRichard H. Lawrence, Jr., CFAOverlook Investments Limited
Chinese University of Hong KongFebruary 2021

2


Manage Partnership for Bear Markets
Deliver Results to Limited Partners
Overlook’s Tools
Focused & Independent Structure
Cultural DNA
Proven Investment Philosophy
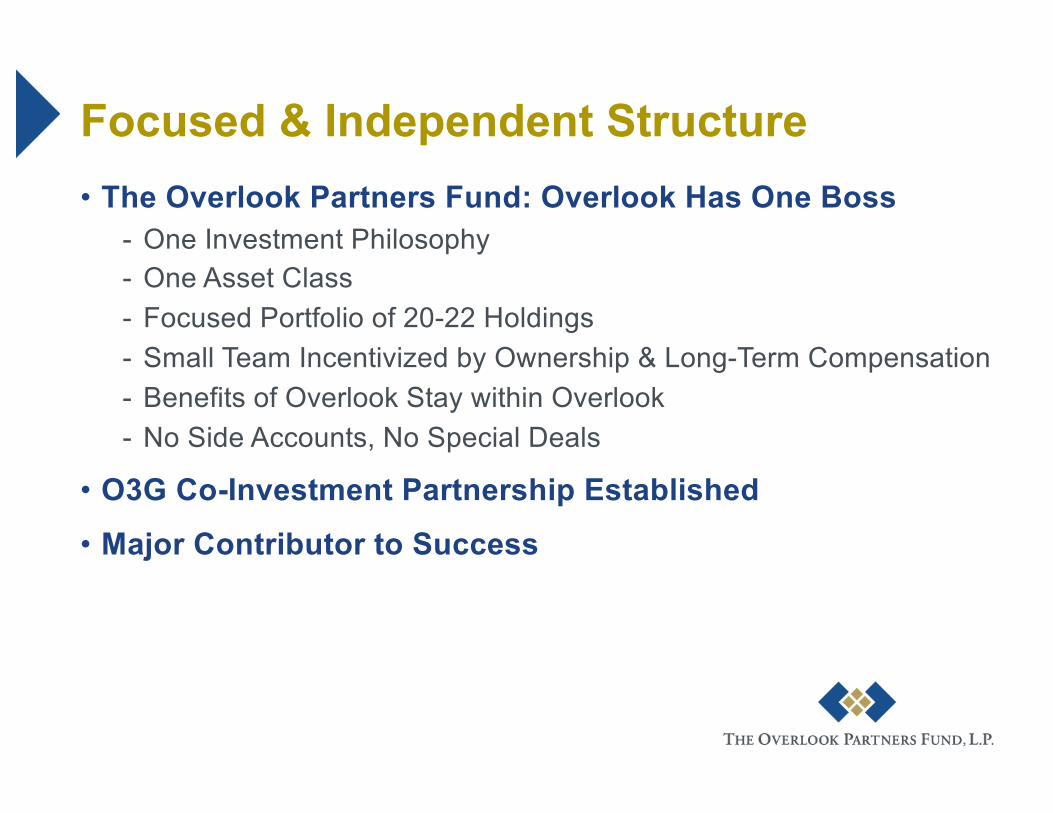
Focused & Independent Structure• The Overlook Partners Fund: Overlook Has One Boss
- One Investment Philosophy- One Asset Class- Focused Portfolio of 20-22 Holdings- Small Team Incentivized by Ownership & Long-Term Compensation- Benefits of Overlook Stay within Overlook- No Side Accounts, No Special Deals
• O3G Co-Investment Partnership Established• Major Contributor to Success

Proven Investment Philosophy• Components Provide Framework for Picking Stocks
- Superior Businesses- Management with Integrity- Bargain Valuation- Long-Term Investment Horizon
• Rigid & Demanding, Yet Flexible• Confluence Creates Value• Past Success Suggests Investment Philosophy Works
- Implementation & Execution Are the Challenge, Not Creation

Cultural DNA• Create an Organization Whose Common Goal Is to Invest
Correctly in Asia- Engage in the Art of Investing
• Culture Formed Around Common Philosophies- Value Investing- Focus on Cash Flow- Engagement with Management- Innovations- Capital-Weighted Returns- Long-Term Perspective- Contrarianism- Aligned Incentives

• Disciplines, Procedures & Processes • Tools Form Basis of Day-to-Day Work
- Extensive List of Applications- Created & Tailored Over 29+ Years- Vary from Simple Reports to Sophisticated Methodologies
• Focus on Issues Critical to Overlook- Profitability, Cash Flow, Drivers, Management, Valuation,
Opportunities & Risks
• Utilize Tools to Gain Insights• MFT Enhances Investment Philosophy
Overlook’s Tools

Deliver Results to Limited Partners• We Measure Success by Capital-Weighted Returns
- Control Growth of Assets Under Management• Capital-Weighted Returns Confirm Value of Model
- Attack Conflicts of Interest• No Soft Dollar Brokerage, No Employee Trading in Asia• No Side Accounts, No Special Deals, MFN
- Share Benefits by Cutting Fees• 22 Times over 29+ Years
• Simply Put: We Aim to Outlaw Greed

Manage Partnership For Bear Markets• Bear Markets, Not Bull Markets, Are Times of Greatest
Value Creation- Actions During Bear Markets Create Years of Outperformance
• Goal Is to Be a Buyer During Bear Markets- Maintain High Quality Investor Base & Backlog- Access to Capital in Bear Market Is Essential
• Commitment Must Start Years Before Bear Market- Fortitude to Underperform During Bull Markets- Returned US$1.0 Bn on January 31, 2018- Returned US$1.0 Bn on January 31, 2021- Unquestioned Commitment to Investment Philosophy
• Not Prediction of, But Preparation for, Bear Markets

Results of The Overlook Model• The Model Is Overlook’s Strongest Asset• 6 Interlocking Components Provide Roadmap & Framework
- Simple Structure, Effective Investment Philosophy, Clear Objective & Long Track Record of Success
• History Suggests Model Delivers Value- Capital Weighted Returns ≥ Time Weighted Returns- 14.3% CAGR Over 29+ Years- Significant Outperformance vs. Fund Benchmark- US$6.8 Bn of Profits Since Inception
• Implementation & Execution Critical Challenges

100
1,000
10,000
1991
1993
1995
1997
1999
2001
2003
2005
2007
2009
2011
2013
2015
2017
2019
2021
Overlook MSCI AXJ S&P 500
Performance vs. Benchmarks (Log Scale)Multiplier CAGR
50.4x 14.4%
10.5x 9.3%
8.0x 7.4%
* Performance Figures are Net of Expenses and Before Performance Allocation** First 7 Years Based on Price Index, Rest of Series Based on MSCI Net Index*** Total Return Index
As of January 31, 2021
* ** ***

Path to Outperformance with Value Investing• Concepts That Have Created Success
1. The Triangle 2. Pricing Power3. Cash Flow 4. High Profitability5. Sustainable EPS Growth6. Valuation Equations
• Goal Is to Secure a Margin of Safety
13
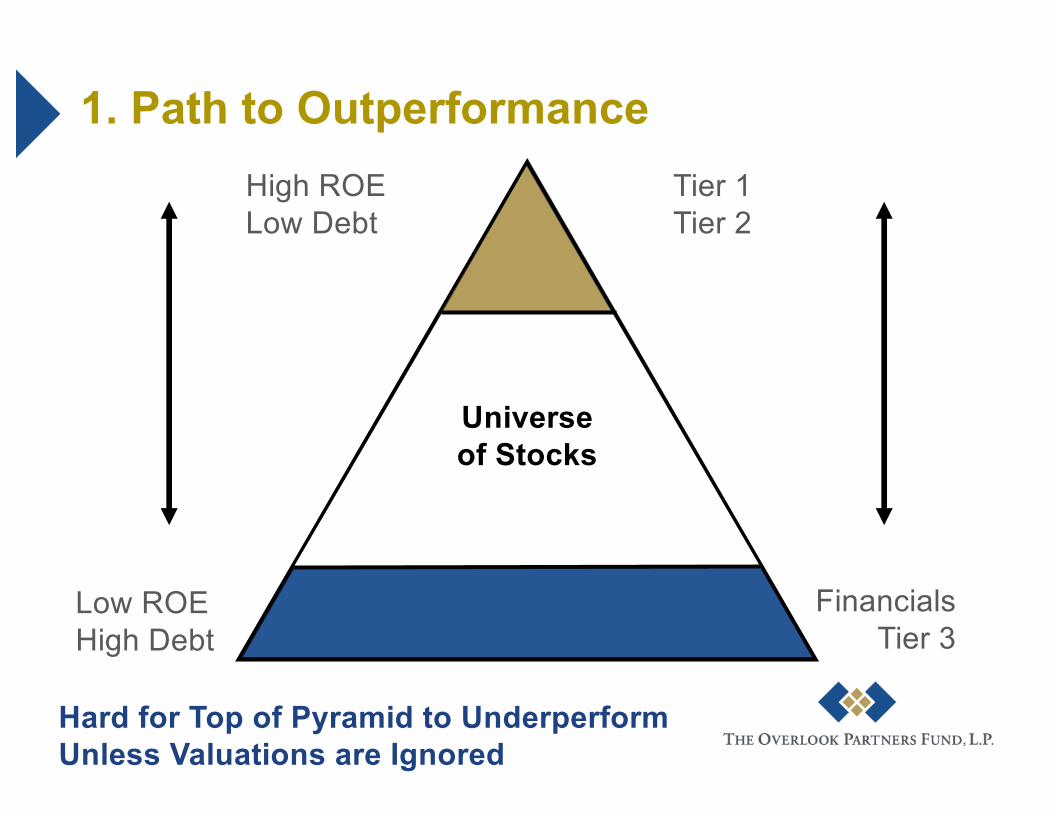
1. Path to OutperformanceHigh ROELow Debt
Low ROEHigh Debt
Tier 1Tier 2
FinancialsTier 3
Hard for Top of Pyramid to Underperform Unless Valuations are Ignored
Universeof Stocks

2. Pricing Power• Importance of Pricing Power Highlighted by All Successful
Value Investors- But How Can We Measure Pricing Power?
• Can You Create One?- Why Should Investors Want Pricing Power?- What are the Components of Pricing Power?- How to Quantify Pricing Power?- Where is Pricing Power Reflected on Income Statement &
Balance Sheet?- How to Index a Pricing Power calculation?
• Four Examples of Pricing Power

Pricing Power In Action
Vitasoy TSMC
16
0%
6%
12%
18%
-
2,000
4,000
6,000
8,000
2010
2011
2012
2013
2014
2015
2016
2017
2018
2019
2020
Revenue EBITDA Margin (RHS)
52%
56%
60%
64%
68%
-
400
800
1,200
1,600
2010
2011
2012
2013
2014
2015
2016
2017
2018
2019
2020
Revenue EBITDA Margin (RHS)
Source: Bloomberg, Overlook Investments
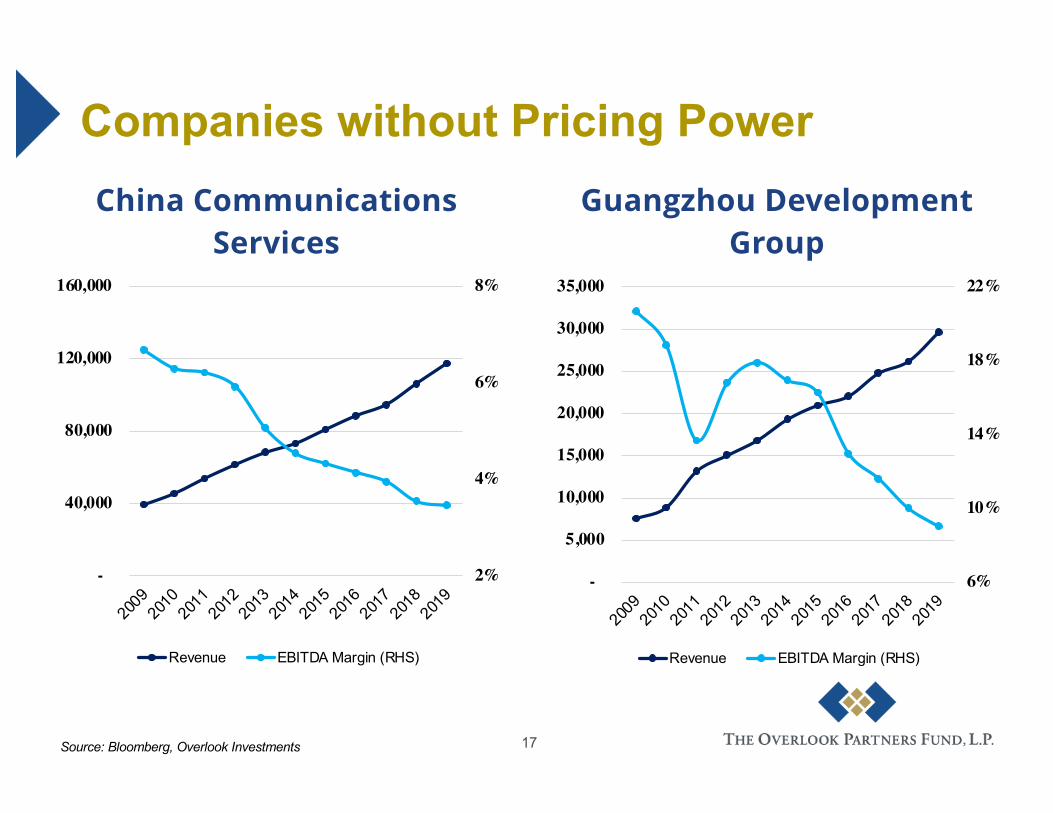
Companies without Pricing PowerChina Communications
ServicesGuangzhou Development
Group
17
2%
4%
6%
8%
-
40,000
80,000
120,000
160,000
2009
2010
2011
2012
2013
2014
2015
2016
2017
2018
2019
Revenue EBITDA Margin (RHS)
6%
10%
14%
18%
22%
-
5,000
10,000
15,000
20,000
25,000
30,000
35,000
2009
2010
2011
2012
2013
2014
2015
2016
2017
2018
2019
Revenue EBITDA Margin (RHS)
Source: Bloomberg, Overlook Investments
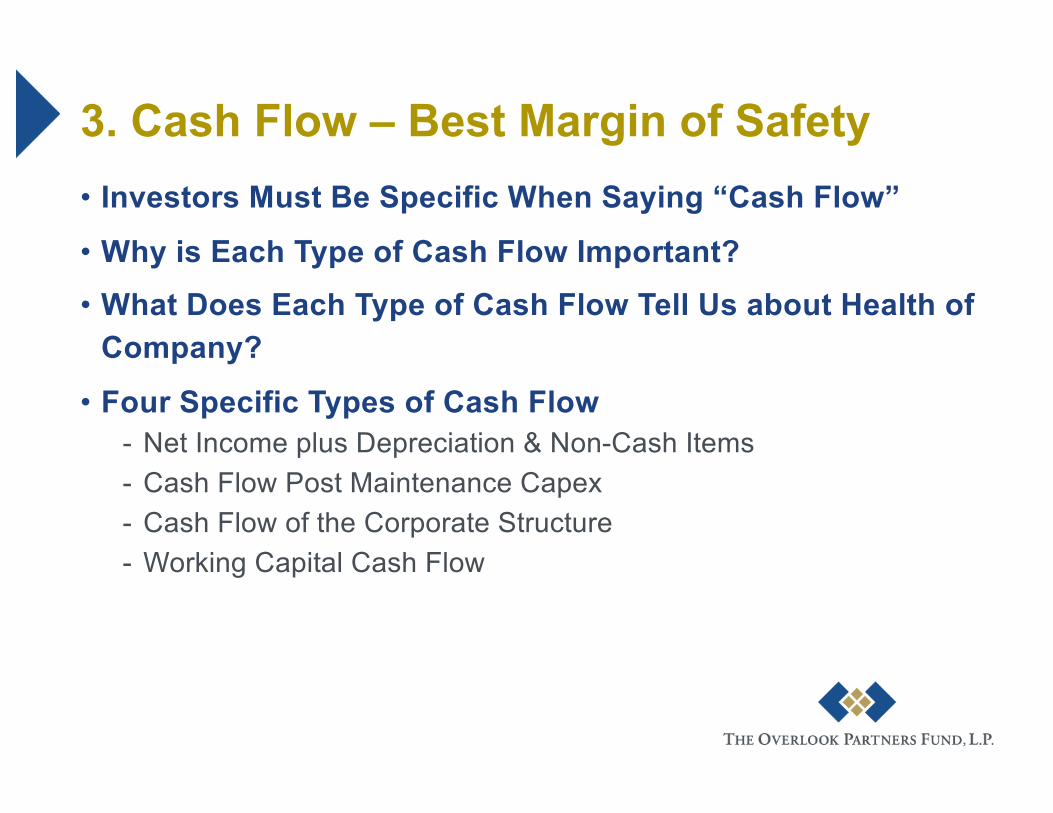
3. Cash Flow – Best Margin of Safety• Investors Must Be Specific When Saying “Cash Flow”• Why is Each Type of Cash Flow Important?• What Does Each Type of Cash Flow Tell Us about Health of
Company?• Four Specific Types of Cash Flow
- Net Income plus Depreciation & Non-Cash Items- Cash Flow Post Maintenance Capex- Cash Flow of the Corporate Structure- Working Capital Cash Flow

Cash Flow – Best Margin of Safety• Places to Look for Attractive Cash Flow
- Low Capital Expenditure- High Operating Returns- Negative Working Capital- Incorrect Depreciation Policies
• Reinvestment of Free Cash Flow is Critical, Particularly Over Long Periods of Time
- Tells Us So Much About Risk/Reward of Management

Cash Flow of the Corporate Structure
Link REIT Group Structure
Source: One Road Research, Company Websites

Different Utilizations of FCF
Advantech TSMC
21
-
100
200
300
400
500
600
700
800
900
2010
2011
2012
2013
2014
2015
2016
2017
2018
2019
2020
Gross Cash Flow Capex Dividends
-
1,000
2,000
3,000
4,000
5,000
6,000
7,000
8,000
9,000
2009
2010
2011
2012
2013
2014
2015
2016
2017
2018
2019
Gross Cash Flow Capex Dividends
Source: Bloomberg, Overlook Investments

Pengdu Agriculture & Animal Husbandry
(100)
-
100
200
300
400
500
600
2009
2010
2011
2012
2013
2014
2015
2016
2017
2018
2019
Gross Cash Flow Capex Dividends
Different Utilizations of FCF (2)
Zhongyu Gas
22Source: Bloomberg, Overlook Investments
-
500
1,000
1,500
2,000
2,500
2009
2010
2011
2012
2013
2014
2015
2016
2017
2018
2019
Gross Cash Flow Capex Dividends

4. High Profitability – DuPont Model• How Do We Measure Profitability? • What are Benchmarks for Profitability?• DuPont Model – Best Structure Available
- Margins - Taxes- Asset Turnover - Leverage

High Profitability – Top of the Pyramid• Return on Equity
- Mistaken Distinction Between High- & Low-Quality ROE - Why Does This Occur?
• Operating Return- Purest Measure of Profitability- EBIT/Average Operation Net Assets
• High Profitability Leads to Quality Governance

5. Sustainable EPS Growth• Earnings Growth Critical to Long-Term Performance
- Last 19 Years at Overlook EPS Growth plus Dividends Contributed 91% of Performance
• Drivers of Sustainable EPS Growth- Low Cyclicality of Business- Ability to Increase Market Share- Large Number of Customers & Suppliers- Proven Low-Cost Status- Management Has Proven Track Record of Growth- Bomb-proof Balance Sheet- Other Ideas?
• Strong Businesses Can Offset Most Risks
25

0
200
400
600
800
1000
1200
1400
1600
1800
2000
2001
2002
2003
2004
2005
2006
2007
2008
2009
2010
2011
2012
2013
2014
2015
2016
2017
2018
2019
2020
Overlook Performance Overlook (EPS + Div Yield)
EPS Growth: Critical to Success
Notes: Overlook Performance and (EPS + Div Yield) are Each Indexed to 100 Starting 2001Note Performance is Net of All Fees and Expenses and Before Profit Participation
Overlook Since 2001 CAGR
EPS Growth 12.5%
DPS Yield 3.2%
Rerating 1.5%
Net Total Performance 17.2%

6. Valuation Equations• Equations – Benefits
- De-emotionalize Valuation Process- Push You in the Right Direction- Help Identify Extremes of Cycles
• Examples of Useful Equations- Ben Graham’s
• Price / Book Value Times P/E < 22.5- John Neff’s
• EPS Growth Rate, Plus Dividend Yield / P/E~ Measures Relative Value within Portfolio
- Overlook’s• Sum of ROE Plus Normalized EPS Growth Rate / 4
~ Example: (30% + 14%) / 4 = Target P/E of 11x

Virtuous Cycle Provides Margin of Safety
Focus on Valuation
Pricing Power
High Profitability
Sustainable EPS Growth
Cash Flow
In Closing, It Helps to Recall This Chart during Confusing Times
FEBRUARY 2012GLOBAL VALUE INVESTINGRichard H. Lawrence, Jr., CFAOverlook Investments Limited
Chinese University of Hong KongFebruary 2021