Rheological and Physical Properties of AP-104 LAW ...
105
PNWD-3465 WTP-RPT-107, Rev 0 Rheological and Physical Properties of AP-104 LAW Pretreated Waste and Melter Feed A.P. Poloski P. R. Bredt R. G. Swoboda June 2004 Prepared for Bechtel National, Inc. under Contract 24590-101-TSA-W000-00004 Performing Organization: Battelle—Pacific Northwest Division Richland, Washington 99352
-
Upload
khangminh22 -
Category
Documents
-
view
0 -
download
0
Transcript of Rheological and Physical Properties of AP-104 LAW ...

PNWD-3465 WTP-RPT-107, Rev 0
Rheological and Physical Properties of AP-104 LAW Pretreated Waste and Melter Feed A.P. Poloski P. R. Bredt R. G. Swoboda June 2004 Prepared for Bechtel National, Inc. under Contract 24590-101-TSA-W000-00004 Performing Organization: Battelle—Pacific Northwest Division Richland, Washington 99352

LEGAL NOTICE
This report was prepared by Battelle Memorial Institute (Battelle) as an account of sponsored research activities. Neither Client nor Battelle nor any person acting on behalf of either: MAKES ANY WARRANTY OR REPRESENTATION, EXPRESS OR IMPLIED, with respect to the accuracy, completeness, or usefulness of the information contained in this report, or that the use of any information, apparatus, process, or composition disclosed in this report may not infringe privately owned rights; or assumes any liabilities with respect to the use of, or for damages resulting from the use of, any information, apparatus, process, or composition disclosed in this report. Reference herein to any specific commercial product, process, or service by trade name, trademark, manufacturer, or otherwise, does not necessarily constitute or imply its endorsement, recommendation, or favoring by Battelle. The views and opinions of authors expressed herein do not necessarily state or reflect those of Battelle.

iii
Summary This document describes work performed under Battelle—Pacific Northwest Division (PNWD) Test
Plan TP-RPP-WTP-189 Rev 0 “AP-104/SY-101 (Envelope A) LAW Melter Feed Rheology Testing”. The objective of this report is to present physical and rheological properties of AP-104 waste that is in a state similar to two streams anticipated in the Waste Treatment and Immobilization Plant (WTP). The first stream considered was the pretreated low-activity waste (LAW) stream that consists of the effluent from the cesium ion exchange column. The second stream is the LAW melter-feed material. This material consists of the pretreated LAW waste stream mixed with a formulation of glass-former chemicals (GFC).
The measurements of physical properties described in this document were performed according to
Guidelines for Performing Chemical, Physical, and Rheological Properties Measurements (24590-WTP-GPG-RTD-001, Rev 0). A sample of AP-104 pretreated LAW(a) was received at a initial sodium concentration of 5.0 M. The sample was concentrated to 6 M, 8 M and 10 M Na concentrations. Physical properties were determined for the 6 M, 8 M, and 10 M Na samples at 25°C and 40°C. The results from the physical properties testing are summarized in Table S-1 and S-2. Lastly, a Haake CV20 rheometer was used to measure the rheological properties of the 6 M, 8 M, and 10 M Na samples at 25°C and 40°C.
The 6 M, 8 M, and 10 M Na pretreated waste samples were then mixed with project-approved glass-
former chemicals in a formulation consistent with “LAWA44.”(b) This material should be considered representative of the LAW melter-feed stream in the WTP. The melter feeds were agitated to suspend the solids, and aliquots were drawn from all three homogenized samples at room temperature. The settling behavior of these 6 M, 8 M, and 10 M Na melter-feed aliquots was measured at 25°C and 40°C. The physical properties of these aliquots were then measured at 25°C and 40°C. Next, the samples were allowed to remain undisturbed for a 48-hour period at a temperature of 40°C. A shear vane was used with a Haake M5 rheometer to determine the 6 M, 8 M, and 10 M Na LAW melter-feed settled-solids shear strength at ambient and 40°C. The rheological properties of the 6 M, 8 M, and 10 M Na LAW melter feeds were measured with a Haake CV20 rheometer at 25°C and 40°C. Rheological measurements were performed on the 8 M Na melter-feed sample based on mixing/aging times of 1 hour, 1 day, and 1 week. Rheological properties of the settled-solids fraction of the 8 M Na melter feed were also measured. Lastly, particle-size distribution was measured on the 6 M Na melter-feed sample.
Physical-properties analysis on these samples indicates a density ranging from 1.26 to 1.43 g/mL with
dissolved-solids contents ranging from 33% to 48%, and pH ranging from 13.8 to 14.2 as the concentration increases from 6 to 10 M Na. It was observed that the material at 5.0 M Na did not contain visible solids. A slight but immeasurable amount of precipitated solids was observed in the 8 M and 10 M Na samples. Flow curves from these samples indicate that the fluid should be characterized as a low-viscosity Newtonian fluid with the maximum measured viscosity of 10 cP.
(a) Note this material is also referred to as AP-104/SY-101 LAW. The contents of SY-101 were placed into the AP-104 tank. This is due to previous tank farm operations to consolidate tank waste. In this document, the AP-104/SY-101 material is referred to as AP-104 LAW.
(b) LAWA44 is a glass formulation developed by Vitreous State Laboratory (VSL) at the Catholic University of America.

iv
Table S.1. Summary of AP-104 Pretreated LAW Measurements at 25°C
Physical Property Units 6 M 8 M 10 M pH n/a 13.8 14.0 14.2 Viscosity cP 3.3 5.8 10 Bulk Density g/mL 1.274 1.360 1.430Vol% Settled Solids % a a a Density of Centrifuged Solids g/mL a a a Vol% Centrifuged Solids % a a a Wt% Centrifuged Solids % a a a Supernatant Density g/mL 1.267 1.358 1.413Density of Settled Solids g/mL a a a Wt% Supernatant with Settled Solids % a a a Wt% Dissolved Solids in Supernatant % 33.3% 41.2% 47.5% Wt% Total Solids in Centrifuged Sludge % a a a Wt% Total Solids % 33.3% 41.3% 47.6% Wt% Undissolved Solids (UDS) % a a a Wt% UDS in Settled Sludge % a a a wt% UDS in Centrifuged Sludge % a a a Average Particle Density g/mL a a a Settled-Solids Density g/mL a a a Centrifuged Solids Density g/mL a a a Wt% Centrifuged Solids % a a a Wt% Settled Solids % a a a Vol% UDS % a a a Vol% UDS in Settled Solids % a a a Vol% UDS in Centrifuged Solids % a a a a—too little solids to quantify.

v
Table S.2. Summary of AP-104 Pretreated LAW Measurements at 40°C
Physical Property Units 6 M 8 M 10 M Viscosity cP 2.2 4.0 6.6 Bulk Density g/mL 1.258 1.352 1.420Vol% Settled Solids % a a a Density of Centrifuged Solids g/mL a a a Vol% Centrifuged Solids % a a a Wt% Centrifuged Solids % a a a Supernatant Density g/mL 1.257 1.348 1.409Density of Settled Solids g/mL a a a Wt% Supernatant with Settled Solids % a a a Wt% Dissolved Solids in Supernatant % 36.0% 41.0% 49.3% Wt% Total Solids in Centrifuged Sludge % a a a Wt% Total Solids % 36.0% 41.0% 49.4% Wt% UDS % a a a Wt% UDS in Settled Sludge % a a a Wt% UDS in Centrifuged Sludge % a a a Average Particle Density g/mL a a a Settled-Solids Density g/mL a a a Centrifuged Solids Density g/mL a a a Wt% Centrifuged Solids % a a a Wt% Settled Solids % a a a Vol% UDS % a a a Vol% UDS in Settled Solids % a a a Vol% UDS in Centrifuged Solids % a a a a—too little solids to quantify. The results from the tests performed on the melter-feed material are summarized in Tables S.3 and
S.4. When glass-former chemicals were added to the AP-104 pretreated LAW, the pH of the solution dropped from the 13.8 to 14.2 range to an 11.1 to 11.6 range as Na concentration increases from 6 M to 10 M. This is most likely due to the relatively large quantity of boric acid in the LAWA44 melter-feed formulation. Such a large change in pH can result in significant solids precipitation. This solids precipitation was observed in the decanted AP-104 supernate that was separated from the settled-solids layer for shear-strength analysis. The separated supernate formed a crust at the air/liquid interface. Shear strength analysis on the settled solids indicate that the shear strength of the sample is minimal with a maximum measured value of 51 Pa at 8 M Na and 25°C. All of the measurements at 6 M, 8 M, and 10 M Na and 40°C possessed shear strengths less than 30 Pa. This value corresponds to the point where the signal noise from the rheometer becomes a significant factor in the analysis (i.e., 1% of the full-scale signal).

vi
Table S.3. Summary of AP-104 Melter-Feed Measurements at 25°C
Physical Property Units 6 M 8 M 10 M Maximum Settled Solids Shear Strength Pa 39 51 <30 pH n/a 11.1 11.5 11.6 Viscosity cP 11 49 98 Bulk Density g/mL 1.591 1.726 1.836 Vol% Settled Solids % 54.7% 69.7% 95.5% Density of Centrifuged Solids g/mL 1.920 2.016 2.001 Vol% Centrifuged Solids % 48.6% 57.7% 72.1% Wt% Centrifuged Solids % 58.7% 67.5% 78.8% Supernatant Density g/mL 1.285 1.339 1.387 Density of Settled Solids g/mL 1.84 1.90 1.86 Wt% Supernatant with Settled Solids % 41.5% 32.8% 21.2% Wt% Dissolved Solids in Supernatant % 34.9% 41.7% 46.8% Wt% Total Solids in Centrifuged Sludge % 70.2% 74.0% 75.2% Wt% Total Solids % 55.7% 63.5% 69.2% Wt % UDS % 31.9% 37.4% 42.0% Wt% UDS in Settled Sludge % 50.2% 49.2% 43.9% Wt% UDS in Centrifuged Sludge % 54.5% 55.7% 53.2% Average Particle Density g/mL 3.24 3.34 3.32 Settled Solids Density g/mL 1.84 1.90 1.86 Centrifuged Solids Density g/mL 1.91 2.01 2.01 Wt% Centrifuged Solids % 58.5% 67.2% 78.9% Wt% Settled Solids % 63.4% 76.0% 95.8% Vol% UDS % 15.6% 19.3% 23.3% Vol% UDS in Settled Solids % 28.6% 28.0% 24.6% Vol% UDS in Centrifuged Solids % 32.2% 33.5% 32.3%

vii
Table S.4. Summary of AP-104 Melter-Feed Measurements at 40°C
Physical Property Units 6 M 8 M 10 M Maximum Settled Solids Shear Strength Pa <30 <30 <30 Viscosity cP 10 35 59 Bulk Density g/mL 1.557 1.691 1.871 Vol% Settled Solids % 50.0% 65.6% 91.4% Density of Centrifuged Solids g/mL 1.812 1.922 2.101 Vol% Centrifuged Solids % 48.5% 56.1% 66.0% Wt% Centrifuged Solids % 57.2% 64.3% 74.7% Supernatant Density g/mL 1.275 1.356 1.348 Density of Settled Solids g/mL 1.81 1.86 1.90 Wt% Supernatant with Settled Solids % 42.5% 35.5% 24.7% Wt% Dissolved Solids in Supernatant % 35.8% 42.7% 50.2% Wt% Total Solids in Centrifuged Sludge % 71.9% 76.1% 77.2% Wt% Total Solids % 56.6% 64.2% 70.6% Wt% UDS % 32.2% 37.4% 40.6% Wt% UDS in Settled Sludge % 55.2% 52.7% 43.3% Wt% UDS in Centrifuged Sludge % 55.7% 57.8% 53.8% Average Particle Density g/mL 2.92 2.88 4.32 Settled-Solids Density g/mL 1.85 1.88 1.92 Centrifuged Solids Density g/mL 1.86 1.95 2.14 Wt% Centrifuged Solids % 57.8% 64.8% 75.5% Wt% Settled Solids % 58.3% 71.0% 93.7% Vol% UDS % 17.2% 22.0% 17.6% Vol% UDS in Settled Solids % 35.0% 34.4% 19.3% Vol% UDS in Centrifuged Solids % 35.5% 39.2% 26.6%
The settling behavior of the AP-104 LAW melter feed can be characterized as “zone” or “hindered”
settling (see Figure S.1). Depending on tank volume in the WTP, settling experiments indicate that a high-solids-loading settled-solids layer can form 24 hours after loss of agitation. This indicates that an operational constraint of several hours is required as the maximum time before evacuation from the unagitated tank to an agitated tank before slurry mobilization becomes extremely difficult. After settling for 72 hours, the volume fraction of settled solids decreases as the temperature increases.
This behavior is most likely due to tighter particle packing as a result of particle dissolution at
elevated temperatures. Physical properties testing reveals that, as expected, the quantity of total and UDS increases with sodium concentration. This is due to the increased quantity of glass-former chemicals (GFC) required for the melter-feed formulation at higher sodium concentrations. When the temperature is increased from 25°C to 40°C, the insoluble GFC appear to dissolve slightly. This is reflected by the increasing dissolved-solids content and decreasing undissolved-solids content as the temperature increases at each sodium concentration.

viii
40%
50%
60%
70%
80%
90%
100%
1 10 100 1,000 10,000
Settling Time (min)
Per
cen
t of
Tot
al S
amp
le H
eigh
t10 M Na AP-104/SY-101 Melter Feed 25°C
8 M Na AP-104/SY-101 Melter Feed 25°C
6 M Na AP-104/SY-101 Melter Feed 25°C
10 M Na AP-104/SY-101 Melter Feed 40°C
8 M Na AP-104/SY-101 Melter Feed 40°C
6 M Na AP-104/SY-101 Melter Feed 40°C
Figure S.1. Summary of AP-104 Melter-Feed Settling Behavior
At low sodium concentrations, AP-104 LAW melter feed exhibits Newtonian rheological behavior.
At 6 M Na at 25°C, the Newtonian viscosity at the low range was approximately 11 cP. At 8 M Na at 25°C, the Newtonian viscosity was approximately 49 cP while the 10 M Na melter feed at 25°C possessed a Newtonian viscosity of approximately 98 cP. A fluid of this viscosity is expected to be difficult to process in the WTP.
Glass-former chemicals were continuously mixed with an AP-104 8 M Na pretreated waste sample.
At intervals of 1 hour, 1 day, and 1 week, the rheology and pH of the sample were measured. Results from these tests are shown in Table S.5. The 8 M Na AP-104 melter feed appears slightly thixotropic. This thixotropy is most likely due to a combination of precipitated solids that formed during the mixing/aging test process and GFC particle erosion. During the mixing/aging test, the steady-state rheology of the fluid remained Newtonian with relatively low viscosities compared to the baseline measurements at the same sodium molarity. Additionally, this sample was allowed to settle for 1 week, and the supernate was decanted from the sample. Shear strength, rheograms, and a limited set of physical properties measurements were performed on this settled solids layer.

ix
Table S.5. Summary of 8 M Na AP-104 LAW Melter-Feed Mixing/Aging Measurements
Description Units 25°C 40°C Viscosity (1-h mixing time) cP 28 17 Viscosity (1-day mixing time) cP 23 14 Viscosity (1-wk mixing time) cP 22 14 Viscosity (settled solids) cP 460 260 pH (1-h mixing time at ambient) -- 11.4 NM pH (1-day mixing time at ambient) -- 11.4 NM pH (1-wk mixing time at ambient) -- 12.3 NM Maximum Settled Solids Shear Strength Pa < 30 < 30 Wt% Total Solids (settled solids) % 74.6 NM Bulk Density (settled solids) g/mL 1.92 A NM NM—Not measured as part of scope. A—Calculated value.
The rheology of the 8 M Na melter-feed settled solids appeared more thixotropic than the
mixing/aging samples. The steady-state flow curve reveals Newtonian behavior that is extremely temperature sensitive. Viscosities were measured at 460 cP at 25°C and 260 cP at 40°C.
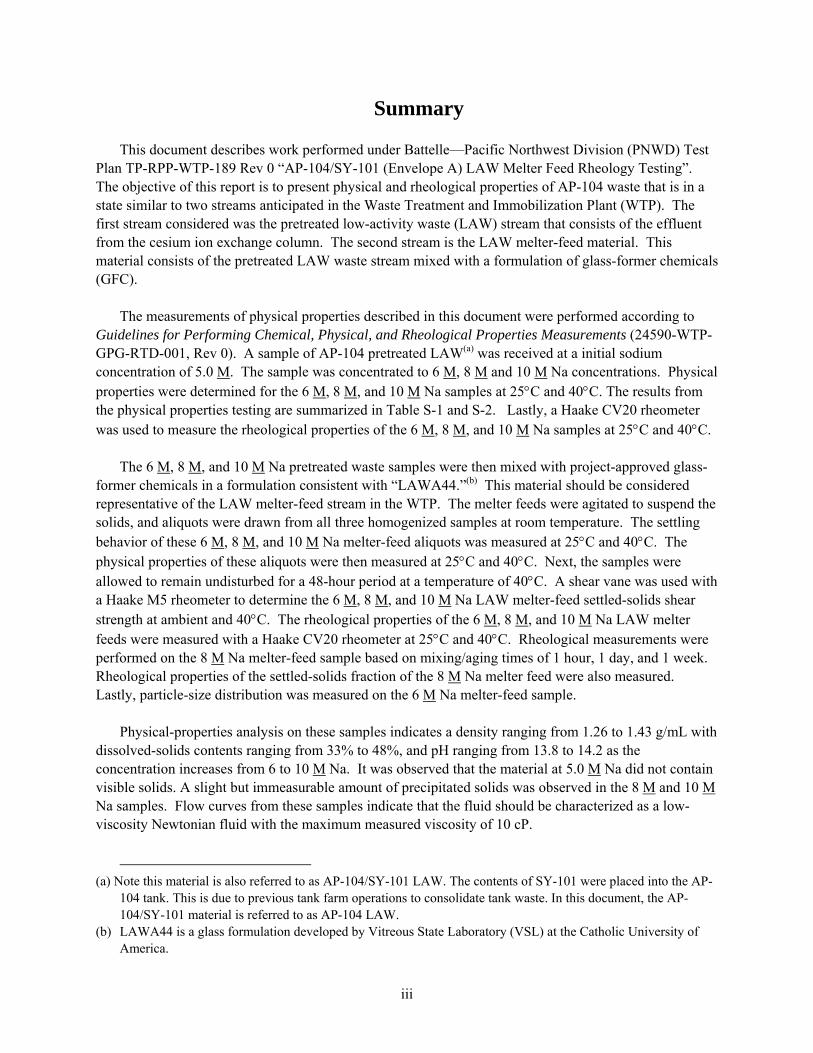
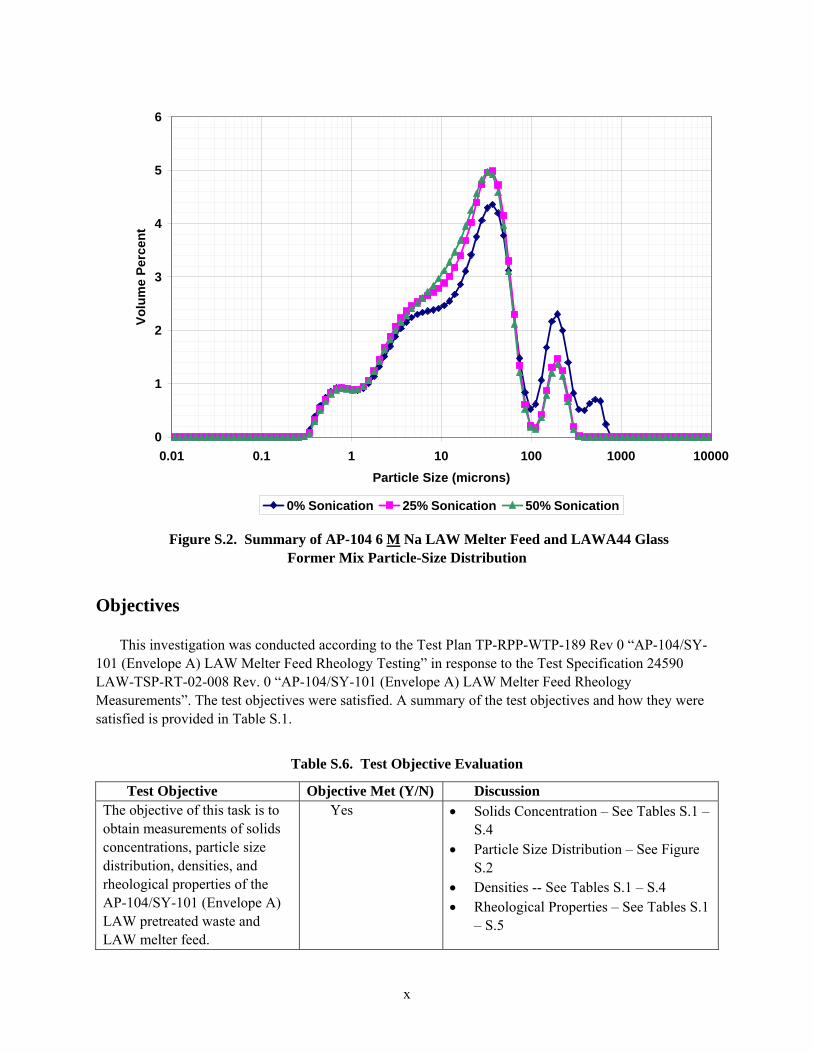
The particle-size distribution (PSD) of a 6 M Na melter feed sample was measured (See Figure S.2). Four modes can be seen in the fundamental PSD. Inflection points indicating relatively small modes dominated by larger modes are seen at approximately 0.7 µm and 5 µm. A large peak is seen at 30 µm. A small fourth peak is observed at approximately 200 µm. Approximately 10 vol% of the particles is below 1.9 µm, 50 vol% (i.e., median value) below 16.8 µm, 90 vol% below 59.8 µm, and 95 vol% below 150 µm. With particle sizes below 200 µm, no significant process challenges with respect to particle settling are anticipated. Ultrasonic waves were applied through the use of a sonication horn with the purpose of breaking apart agglomerates of small particles and measure the primary particle-size distribution of the suspension. The 50% value refers to the percentage of maximum sonication power applied to the samples. The 50% sonication particle-size result should be considered the primary particle-size distribution because of the high repeatability of particle-size results between subsamples.
x
0
1
2
3
4
5
6
0.01 0.1 1 10 100 1000 10000Particle Size (microns)
Volu
me
Perc
ent
0% Sonication 25% Sonication 50% Sonication
Figure S.2. Summary of AP-104 6 M Na LAW Melter Feed and LAWA44 Glass Former Mix Particle-Size Distribution
Objectives
This investigation was conducted according to the Test Plan TP-RPP-WTP-189 Rev 0 “AP-104/SY-
101 (Envelope A) LAW Melter Feed Rheology Testing” in response to the Test Specification 24590 LAW-TSP-RT-02-008 Rev. 0 “AP-104/SY-101 (Envelope A) LAW Melter Feed Rheology Measurements”. The test objectives were satisfied. A summary of the test objectives and how they were satisfied is provided in Table S.1.
Table S.6. Test Objective Evaluation
Test Objective Objective Met (Y/N) Discussion The objective of this task is to obtain measurements of solids concentrations, particle size distribution, densities, and rheological properties of the AP-104/SY-101 (Envelope A) LAW pretreated waste and LAW melter feed.
Yes • Solids Concentration – See Tables S.1 – S.4
• Particle Size Distribution – See Figure S.2
• Densities -- See Tables S.1 – S.4 • Rheological Properties – See Tables S.1
– S.5

xi
Test Exceptions Table S.7 discusses the test exceptions applied to this test.
Table S.7. Test Exceptions
List Test Exceptions Describe Test Exceptions 24590-WTP-TEF-RT-04-00022, Rev. 0
Requires that particle size distribution measurement be made only on the 8 M Na pretreated AP-104 waste sample after the glass formers have been added.
Results and Performance Against Success Criteria Table S.8 discusses the success criteria provided in Test Specification 24590 LAW-TSP-RT-02-008 Rev. 0 “AP-104/SY-101 (Envelope A) LAW Melter Feed Rheology Measurements”.
Table S.8. Discussion of Test Success Criteria
List Success Criteria Explain How the Tests Did or Did Not Meet the Success Criteria
Solids concentration, settling rates, density, and rheology measurements for pretreated waste and melter feed that demonstrate that these waste streams can be processed/transferred at solids concentrations that meet the melter throughput requirements specified in the contract.
Solids concentration, settling rates, density, and rheology measurements for pretreated waste and melter feed at solids concentrations that meet the melter throughput requirements specified in the contract are provided in this report. A summary of these results can be seen in Tables S.1 – S.5 and Figures S.1 – S.2. A comparison of these results to WTP-RPT-098a, indicate that no obvious processing/transferring problems are expected. However, a formal engineering evaluation of these results to the final selected BNI plant design is recommended.
Quality Requirements
PNWD implements the RPP-WTP quality requirements by performing work in accordance with
the PNWD Waste Treatment and Immobilization Plant Support Project quality assurance project plan (QAPjP) approved by the RPP-WTP Quality Assurance (QA) organization. This work will be performed to the quality requirements of NQA-1-1989 Part I, Basic and Supplementary Requirements, and NQA-2a-1990, Part 2.7. These quality requirements are implemented through PNWD's Waste Treatment and
a Poloski A, H Smith, G Smith, and T Calloway. 2004. Technical Basis for LAW Vitrification Stream Physical and Rheological Property Bounding Conditions. WTP-RPT-098, Rev. 0, Battelle—Pacific Northwest Division, Richland, WA.

xii
Immobilization Plant Support Project (WTPSP) Quality Assurance Requirements and Description Manual. The analytical requirements are implemented through WTPSP’s Statement of Work (WTPSP-SOW-005) with the Radiochemical Processing Laboratory (RPL) Analytical Service Operations (ASO).
A matrix that cross-references the NQA-1 and 2a requirements with the PNWD’s procedures for this work is given Test Plan, TP-RPP-WTP-189 Rev 0, AP-104 (Envelope A) Melter Feed Rheology Testing. It includes justification for those requirements not implemented.
Experiments that are not method-specific were performed in accordance with PNWD’s procedures
QA-RPP-WTP-1101 “Scientific Investigations” and QA-RPP-WTP-1201 “Calibration Control System” assuring that sufficient data were taken with properly calibrated measuring and test equipment (M&TE) to obtain quality results.
As specified in Test Specification, 24590-LAW-TSP-RT-02-008 Rev 0, BNI’s QAPjP, PL-
24590-QA00001, is not applicable since the work will not be performed in support of environmental/regulatory testing, and the data will not be used as such.
PNWD addresses internal verification and validation activities by conducting an Independent Technical Review of the final data report in accordance with PNWD’s procedure QA-RPP-WTP-604. This review verifies that the reported results are traceable, that inferences and conclusions are soundly based, and the reported work satisfies the Test Plan objectives. This review procedure is part of PNWD's WTPSP Quality Assurance Requirements and Description Manual. R&T Test Conditions Table S.9 discusses the R&T test conditions provided in Test Specification 24590 LAW-TSP-RT-02-008 Rev. 0 “AP-104/SY-101 (Envelope A) LAW Melter Feed Rheology Measurements”.
Table S.9. Discussion of R&T Test Conditions
List R&T Test Conditions Were Test Conditions Followed? Physical and rheological properties and pH will be measured in accordance with project approved guidelines for the pretreated AP-104/SY-101 (Envelope A) actual waste samples provided by the project.
Yes. All measurements in this document were measured in accordance to the project approved guidelinesa.
Solids concentration, settling rate (if solids are present), density, pH, and shear stress versus shear rate flow curves will be measured on these samples after evaporation to three different sodium concentrations which will be confirmed at a later date and will be clearly specified in the test plan (typically, 6, 8 and
Yes. All measurements including solids concentration, settling rate, density, pH, and shear stress versus shear rate were performed at pretreated waste concentrations of 6, 8, and 10 M. Experimental temperatures of 25°C and 40°C were applied as specified in the approved Test Plan, TP-RPP-WTP-189 Rev 0 “AP-104/SY-101 (Envelope A) LAW
a Smith GL, and K Prindiville. 2002. Guidelines for Performing Chemical, Physical, and Rheological Properties Measurements. 24590-WTP-GPG-RTD-001, Rev 0, Bechtel National, Inc., Richland, WA.
xiii
Table S.9. Discussion of R&T Test Conditions
10 M) at ambient temperature of approximately 25°C and at process temperature of approximately 40°C.
Melter Feed Rheology Testing”.
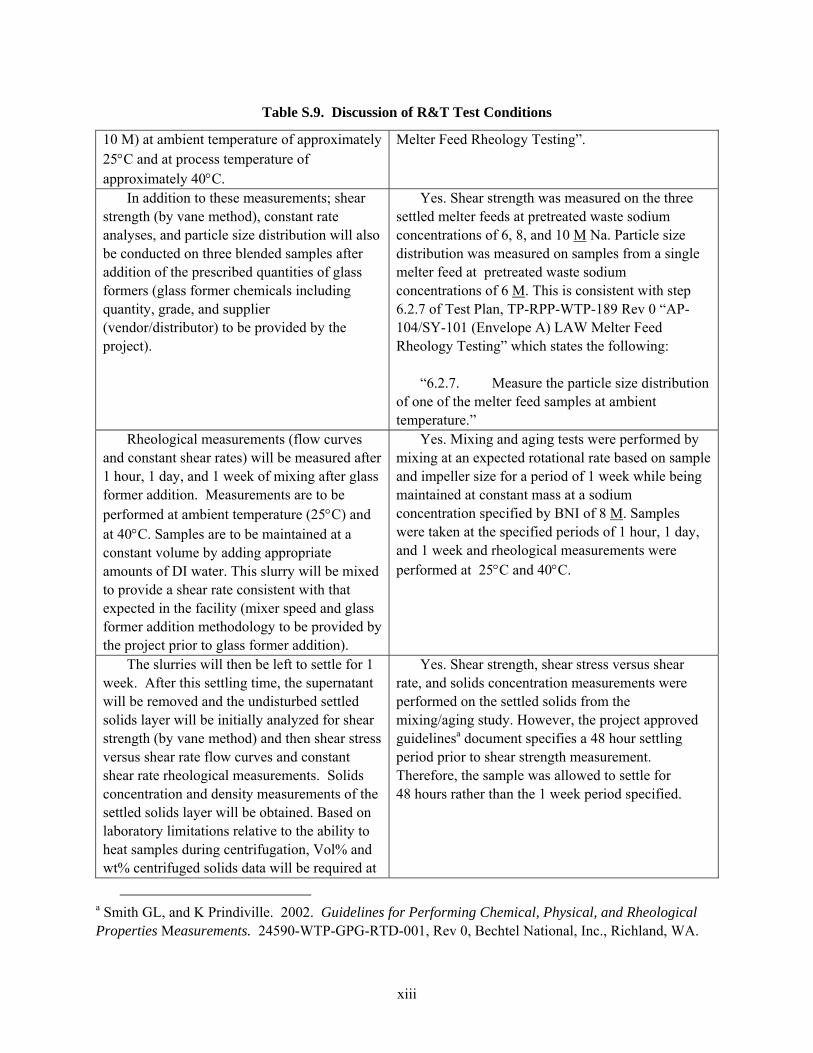
In addition to these measurements; shear strength (by vane method), constant rate analyses, and particle size distribution will also be conducted on three blended samples after addition of the prescribed quantities of glass formers (glass former chemicals including quantity, grade, and supplier (vendor/distributor) to be provided by the project).
Yes. Shear strength was measured on the three settled melter feeds at pretreated waste sodium concentrations of 6, 8, and 10 M Na. Particle size distribution was measured on samples from a single melter feed at pretreated waste sodium concentrations of 6 M. This is consistent with step 6.2.7 of Test Plan, TP-RPP-WTP-189 Rev 0 “AP-104/SY-101 (Envelope A) LAW Melter Feed Rheology Testing” which states the following:
“6.2.7. Measure the particle size distribution
of one of the melter feed samples at ambient temperature.”
Rheological measurements (flow curves and constant shear rates) will be measured after 1 hour, 1 day, and 1 week of mixing after glass former addition. Measurements are to be performed at ambient temperature (25°C) and at 40°C. Samples are to be maintained at a constant volume by adding appropriate amounts of DI water. This slurry will be mixed to provide a shear rate consistent with that expected in the facility (mixer speed and glass former addition methodology to be provided by the project prior to glass former addition).
Yes. Mixing and aging tests were performed by mixing at an expected rotational rate based on sample and impeller size for a period of 1 week while being maintained at constant mass at a sodium concentration specified by BNI of 8 M. Samples were taken at the specified periods of 1 hour, 1 day, and 1 week and rheological measurements were performed at 25°C and 40°C.
The slurries will then be left to settle for 1 week. After this settling time, the supernatant will be removed and the undisturbed settled solids layer will be initially analyzed for shear strength (by vane method) and then shear stress versus shear rate flow curves and constant shear rate rheological measurements. Solids concentration and density measurements of the settled solids layer will be obtained. Based on laboratory limitations relative to the ability to heat samples during centrifugation, Vol% and wt% centrifuged solids data will be required at
Yes. Shear strength, shear stress versus shear rate, and solids concentration measurements were performed on the settled solids from the mixing/aging study. However, the project approved guidelinesa document specifies a 48 hour settling period prior to shear strength measurement. Therefore, the sample was allowed to settle for 48 hours rather than the 1 week period specified.
a Smith GL, and K Prindiville. 2002. Guidelines for Performing Chemical, Physical, and Rheological Properties Measurements. 24590-WTP-GPG-RTD-001, Rev 0, Bechtel National, Inc., Richland, WA.

xiv
Table S.9. Discussion of R&T Test Conditions
ambient temperature only. Simulant Use No simulants were used in this test. All testing was performed with actual Hanford tank waste. Therefore, this section is not applicable. Discrepancies and Follow-on Tests No discrepancies were identified nor remain unresolved. However, the results from this test raise the following issues in regard to processing these materials through the WTP:
• The 10 M Na melter feed suspensions at 40°C exhibited Newtonian behavior with viscosities that are within the LAW melter-feed bounding conditions (Poloski et al. 2004) of a Bingham plastic consistency index between 0.9 to 90 cP and a Bingham plastic yield index not to exceed 15 Pa. This indicates that the material is relatively easy to transport. However, at 25°C, the 10 M Na melter-feed suspension possesses rheological properties that slightly exceed the bounding window and could be difficult to transport.
• The 8 M Na melter-feed settled solids from the mixing/aging testing exhibited Newtonian behavior with viscosities of 460 cP at 25°C and 260 cP at 40°C. These values exceed the LAW melter-feed bounding conditions (Poloski et al. 2004) of a Bingham plastic consistency index between 0.9 to 90 cP and a Bingham plastic yield index not to exceed 15 Pa. This indicates that the material is relatively difficult to transport if the melter feed is allowed to settle significantly.
Follow-on testing involving the use of rheology modifiers with WTP waste simulants should be considered. The objective of the follow-on testing would be to identify materials that when applied at low concentrations lower the rheological properties of the melter feed significantly. Identification of promising rheological modifiers could allow processing at increased solids loading thus increasing plant throughput. Additionally, rheological modifiers should benefit recovery situations from plant upset conditions where remobilization and suspension of the process slurries is required.
xv
Acronyms
GFC Glass-Former Chemicals
HLW High-Level Waste
LAW Low-Activity Waste
M&TE Measuring and Test Equipment
NIST National Institute of Standards and Technology
PNWD Battelle—Pacific Northwest Division
PSD Particle-Size Distribution
QA Quality Assurance
QAPjP Quality Assurance Project Plan
RPP River Protection Project
R&T Research and Technology
UDS Undissolved Solids
VSL Vitreous State Laboratory
WTP Waste Treatment and Immobilization Plant
WTPSP Waste Treatment and Immobilization Plant Support Project

xvi
This page intentionally left blank.

xvii
Definitions Apparent Viscosity – The measured shear stress divided by the measured shear rate. Density – The mass per unit volume. Interstitial Solution – The solution contained between the suspended solid particles of a sludge sample. Newtonian Fluid – A fluid whose apparent viscosity is independent of shear rate. Non-Newtonian Fluid – A fluid whose apparent viscosity varies with shear rate. Rheogram/Flow Curve – A plot of shear stress versus shear rate. Shear Strength – The minimum stress required to initiate fluid movement as determined by the vane method. This definition is different from “yield stress,” which is defined below. Sludge – Wet solids having little or no standing liquid (i.e., mud-like). Slurry – A mixture of solids and solution. Solution – The liquid phase containing dissolved material. Sonication – Application of ultrasonic waves to a sample. Purpose is typically to break apart agglomerates of particles for particle size measurement of the fundamental particles in a sample. Supernatant Liquid – A liquid phase overlying material deposited by settling, precipitation, or centrifugation. Solids Settling Rate – The rate at which solids in an initially homogenized sample settle. This is measured as the change in the settled-solids interface height as a function of time. vol% Settled Solids – The percentage of the volume of the slurry sample that the settled solids occupy after settling for 72 hours under one gravity. These settled solids will contain interstitial solution. vol% Centrifuged Solids – The volume of the solids layer that separates from the bulk slurry after 1 hour of centrifugation at 1000 gravities divided by the total sample volume on a percentage basis. These centrifuged solids will contain interstitial solution. wt% Total Oxides – The percentage of the mass of the bulk sample that remains after converting all non-volatile elements to oxides. Some volatile elements, such as cesium, might be lost in this process. wt% Dissolved Solids – The mass of dissolved species in the supernatant liquid divided by the total mass of the supernatant liquid on a percentage basis. This definition is the same as “wt% Dissolved Solids” from Table 4-2 (a) from the Research and Technology (R&T) plan, document number 24590-WTP-PL-RT-01-002, latest revision, for waste sample slurries. This is also the same as “wt%

xviii
Oven Dried Solids” from Table 4-2 (b) from the R&T plan, document number 24590-WTP-PL-RT-01-002, latest revision, for the liquid-fraction analysis. This is also the same as the “wt% Soluble Solids” from Table 4-2 (c) from the R&T plan, document number 24590-WTP-PL-RT-01-002, latest revision, for the HLW solids analyses. wt% Total Dried Solids – The percentage of the mass of the sample that remains after removing volatiles, including free water, by drying at 105 ± 5°C for 24 hours. This definition is the same as “wt% Total Dried Solids” from Table 4-2 (a) from the R&T plan, document number 24590-WTP-PL-RT-01-002, latest revision, for waste sample slurries. wt% Undissolved Solids – If all of the free standing supernatant liquid and interstitial solution could be removed from a bulk slurry, this is the calculated mass fraction of solids remaining on a percentage basis. Yield Stress – The minimum stress required to initiate fluid movement as determined by a flow curve using a rheological model. This definition is different from “shear strength,” which is defined above. (Note: this is the same value as “Yield Strength” as delineated in Table 4.2a of the WTP R&T Plan, document number 24590-WTP-PL-RT-01-002, latest revision.)

xix
Contents
Summary ...................................................................................................................................................... iii
Acronyms.................................................................................................................................................... xv
Definitions ................................................................................................................................................xvii
1.0 Introduction....................................................................................................................................... 1.1
1.1 Quality Requirements .............................................................................................................. 1.2
2.0 Sample Preparation Details............................................................................................................... 2.1
2.1 Pretreated Feed ........................................................................................................................ 2.1
2.2 Melter Feed.............................................................................................................................. 2.3
3.0 Physical-Properties Testing .............................................................................................................. 3.1
3.1 Methodology for Measuring Physical Properties .................................................................... 3.1
3.2 Analysis of Physical-Properties Uncertainty ........................................................................... 3.4
3.3 Physical Properties of AP-104 Envelope A Pretreated LAW.................................................. 3.4
3.4 Physical Properties of AP-104 Envelope A Melter Feed......................................................... 3.6 3.4.1 pH Measurements.......................................................................................................... 3.9 3.4.2 Settling Behavior........................................................................................................... 3.9
4.0 Rheology........................................................................................................................................... 4.1
4.1 Rheology Measurement Methodology..................................................................................... 4.4
4.2 Pretreated Waste ...................................................................................................................... 4.5
4.3 Melter Feed............................................................................................................................ 4.13
4.4 Mixing/Aging ........................................................................................................................ 4.21 4.4.1 Settled Solids............................................................................................................... 4.29
5.0 Shear Strength................................................................................................................................... 5.1
5.1 Measurement Equipment and Theory...................................................................................... 5.2
5.2 System Validation and Calibration.......................................................................................... 5.4
5.3 Results from Shear-Strength Measurements............................................................................ 5.4

xx
6.0 Particle-Size Distribution.................................................................................................................. 6.1
6.1 Instrument Description ............................................................................................................ 6.1
6.2 Calibration Checks................................................................................................................... 6.1
6.3 Operating Conditions............................................................................................................... 6.2
6.4 Suspending Medium ................................................................................................................ 6.2
6.5 Results ..................................................................................................................................... 6.2
7.0 Conclusions....................................................................................................................................... 7.1
8.0 References......................................................................................................................................... 8.1
Appendix A............................................................................................................................................... A.1
xxi
Figures
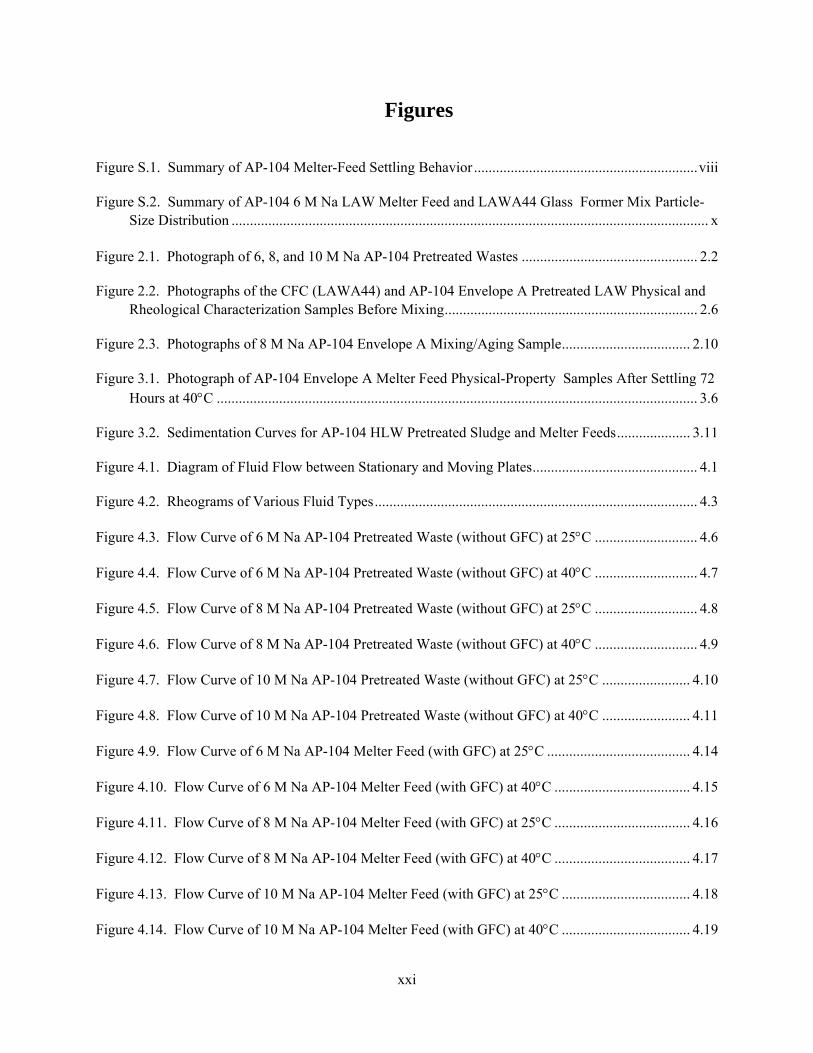
Figure S.1. Summary of AP-104 Melter-Feed Settling Behavior .............................................................viii
Figure S.2. Summary of AP-104 6 M Na LAW Melter Feed and LAWA44 Glass Former Mix Particle-Size Distribution .................................................................................................................................. x
Figure 2.1. Photograph of 6, 8, and 10 M Na AP-104 Pretreated Wastes ................................................ 2.2
Figure 2.2. Photographs of the CFC (LAWA44) and AP-104 Envelope A Pretreated LAW Physical and Rheological Characterization Samples Before Mixing..................................................................... 2.6
Figure 2.3. Photographs of 8 M Na AP-104 Envelope A Mixing/Aging Sample................................... 2.10
Figure 3.1. Photograph of AP-104 Envelope A Melter Feed Physical-Property Samples After Settling 72 Hours at 40°C ................................................................................................................................... 3.6
Figure 3.2. Sedimentation Curves for AP-104 HLW Pretreated Sludge and Melter Feeds.................... 3.11
Figure 4.1. Diagram of Fluid Flow between Stationary and Moving Plates............................................. 4.1
Figure 4.2. Rheograms of Various Fluid Types........................................................................................ 4.3
Figure 4.3. Flow Curve of 6 M Na AP-104 Pretreated Waste (without GFC) at 25°C ............................ 4.6
Figure 4.4. Flow Curve of 6 M Na AP-104 Pretreated Waste (without GFC) at 40°C ............................ 4.7
Figure 4.5. Flow Curve of 8 M Na AP-104 Pretreated Waste (without GFC) at 25°C ............................ 4.8
Figure 4.6. Flow Curve of 8 M Na AP-104 Pretreated Waste (without GFC) at 40°C ............................ 4.9
Figure 4.7. Flow Curve of 10 M Na AP-104 Pretreated Waste (without GFC) at 25°C ........................ 4.10
Figure 4.8. Flow Curve of 10 M Na AP-104 Pretreated Waste (without GFC) at 40°C ........................ 4.11
Figure 4.9. Flow Curve of 6 M Na AP-104 Melter Feed (with GFC) at 25°C ....................................... 4.14
Figure 4.10. Flow Curve of 6 M Na AP-104 Melter Feed (with GFC) at 40°C ..................................... 4.15
Figure 4.11. Flow Curve of 8 M Na AP-104 Melter Feed (with GFC) at 25°C ..................................... 4.16
Figure 4.12. Flow Curve of 8 M Na AP-104 Melter Feed (with GFC) at 40°C ..................................... 4.17
Figure 4.13. Flow Curve of 10 M Na AP-104 Melter Feed (with GFC) at 25°C ................................... 4.18
Figure 4.14. Flow Curve of 10 M Na AP-104 Melter Feed (with GFC) at 40°C ................................... 4.19

xxii
Figure 4.15. Flow Curve of 8 M Na AP-104 Melter Feed (1-hour mixing with GFC) at 25°C ............. 4.22
Figure 4.16. Flow Curve of 8 M Na AP-104 Melter Feed (1-hour mixing with GFC) at 40°C ............. 4.23
Figure 4.17. Flow Curve of 8 M Na AP-104 Melter Feed (1-day mixing with GFC) at 25°C............... 4.24
Figure 4.18. Flow Curve of 8 M Na AP-104 Melter Feed (1-day mixing with GFC) at 40°C............... 4.25
Figure 4.19. Flow Curve of 8 M Na AP-104 Melter Feed (1-week mixing with GFC) at 25°C ............ 4.26
Figure 4.20. Flow Curve of 8 M Na AP-104 Melter Feed (1-week mixing with GFC) at 40°C ............ 4.27
Figure 4.21. Flow Curve of 8 M Na AP-104 Melter Feed Settled Solids (with GFC) at 25°C .............. 4.30
Figure 4.22. Flow Curve of 8 M Na AP-104 Melter Feed Settled Solids (with GFC) at 40°C .............. 4.31
Figure 5.1. Rheogram Illustrating the Concept of Dynamic and Static Yield Stress................................ 5.1
Figure 5.2. Geometrical Requirements of a Shear Vane........................................................................... 5.3
Figure 5.3. Typical Response of a Shear Vane ......................................................................................... 5.4
Figure 5.4. Precipitate Crust Observed from Decanted AP-104 Envelope A Melter Feed Supernate...... 5.6
Figure 6.1. Average PSD of 6 M Na AP-104 Envelope A Melter Feed at Varying Levels of Sonication6.4
Figure 6.2. Average Cumulative PSD of 6 M Na AP-104 Envelope A Melter Feed at Varying Levels of Sonication ......................................................................................................................................... 6.5

xxiii
Tables
Table S.1. Summary of AP-104 Pretreated LAW Measurements at 25°C ................................................. iv
Table S.2. Summary of AP-104 Pretreated LAW Measurements at 40°C .................................................. v
Table S.3. Summary of AP-104 Melter-Feed Measurements at 25°C........................................................ vi
Table S.4. Summary of AP-104 Melter-Feed Measurements at 40°C.......................................................vii
Table S.5. Summary of 8 M Na AP-104 LAW Melter-Feed Mixing/Aging Measurements ...................... ix
Table S.6. Test Objective Evaluation........................................................................................................... x
Table S.7. Test Exceptions.......................................................................................................................... xi
Table S.8. Discussion of Test Success Criteria........................................................................................... xi
Table S.9. Discussion of R&T Test Conditions.........................................................................................xii
Table 2.1. GFC Formulation (LAWA44) for AP-104 Envelope A .......................................................... 2.4
Table 2.2. Quantity of GFC Formulation (LAWA44) Added to AP-104 Envelope A Pretreated LAW Samples............................................................................................................................................. 2.5
Table 2.3. Guideline Reporting Format Mixing Details ........................................................................... 2.9
Table 3.1. Physical Properties of 6 M, 8 M, and 10 M Na AP-104 Envelope A Pretreated Waste at 25°C and 40°C ........................................................................................................................................... 3.5
Table 3.2. Physical Properties of 6 M, 8 M, and 10 M Na AP-104 Envelope A Melter Feed at 25°C and 40°C .................................................................................................................................................. 3.7
Table 3.3. pH of the AP-104 Envelope A Pretreated LAW and Melter Feed........................................... 3.9
Table 3.4. Settling-Model-Fit Parameters of HLW Pretreated Sludge and Melter Feeds....................... 3.12
Table 4.1. Typical Shear Rates in Food-Processing Applications ............................................................ 4.2
Table 4.2. Viscosities of Several Common Newtonian Fluids ................................................................. 4.3
Table 4.3. Rheological Model Fits for AP-104 Pretreated LAW at Various Concentrations and Temperatures .................................................................................................................................. 4.12
Table 4.4. Rheological Model Fits for AP-104 LAW Melter Feed at Various Concentrations and Temperatures .................................................................................................................................. 4.20

xxiv
Table 4.5. Rheological Model Fits for AP-104 LAW Melter Feed at Various Mixing Durations and Temperatures .................................................................................................................................. 4.28
Table 4.6. pH of Mixed/Aged 8 M Na AP-104 Melter Feed .................................................................. 4.29
Table 4.7. Rheological Model Fits for AP-104 LAW Melter Feed at Various Concentrations and Temperatures .................................................................................................................................. 4.32
Table 5.1. Shear Strength of Various Common Materials ........................................................................ 5.2
Table 5.2. Summary of AP-104 Melter Feed Shear Strength Data at Various Temperatures and Waste Loadings ........................................................................................................................................... 5.5
Table 6.1. Particle-Size Analyzer Calibration Data .................................................................................. 6.1
Table 6.2. Summary of Volume PSD Data ............................................................................................... 6.3
Table A.1. Composition of AZ-101 Pretreated LAW Waste and AZ-101 Melter Feed .............................. 1

1.1
1.0 Introduction The objectives of this work were to obtain accurate measurements of solids concentration, densities,
particle size distribution, and rheological properties (in accordance with test plan TP-RPP-WTP-189 Rev 0) on actual AP-104 pretreated low-activity waste (LAW Envelope A) samples and corresponding melter-feed samples. The physical and rheological properties of these process streams are important considerations in selecting flowsheet and processing equipment such as mixers, pumps, piping, and tanks. Measurements on actual waste are also required to verify and validate results obtained with simulants.
Actual samples from Tank AP-104 were used in this testing(a). Multiple AP-104 slurry samples were
received from Hanford’s 222-S laboratory. These slurry samples were composited and characterized by Baldwin et al. (2003). This sample was then processed through cesium and technetium ion exchange columns as described by Fiskum et al. (2003) and Burgeson,(b) respectively. The resulting effluent stream from these ion exchange processes is termed “pretreated” AP-104 LAW and is the focus of this document.
The pretreated AP-104 LAW was received at a concentration of 5.0 M Na. The AP-104 pretreated
LAW was adjusted to various Na concentrations for physical and rheological property measurements. The purpose of adjusting the sodium concentration was to bound the physical and rheological property measurements about a Waste Treatment and Immobilization Plant (WTP) operating point of 8 M Na. The sodium concentrations tested included 6 M, 8 M, and 10 M Na AP-104 pretreated LAW.
The physical and rheological properties were measured according to the WTP project approved
guidelines developed by Smith and Prindiville (2002). Rheological testing was conducted at 25°C and 40°C. Settling and physical-properties testing was conducted at ambient temperature (nominally 23°C to 25°C) and 40°C. For this work, ambient is reported as 25°C.
Project-approved glass-former chemicals (GFC; Schumacher and Hansen 2002) were added to the
6 M, 8 M, and 10 M Na samples to produce a LAW “melter feed” stream consistent with “LAW 44” a representative LAW feed stream in the WTP. Physical and rheological properties of these melter-feed samples were measured. Mixing and aging studies were also conducted on the 8 M Na melter-feed sample. This testing entailed placing an 8 M Na pretreated LAW sample in a mixing vessel at a power-to-volume ratio consistent with that expected in the WTP. Glass formers were added, and the mixing continued for 1 week. During this week, rheograms were obtained after 1 hour, 1 day, and 1 week. At the conclusion of the 1-week mixing period, the pH of the sample was measured and the sample was allowed to settle for 1 week. The supernate was decanted from the settled solids and shear strength measurements were performed on the settled solids fraction 48 hours after being homogenized inside a shear strength suitable container. This 48 hour period is consistent with the WTP project approved guidelines developed by Smith and Prindiville (2002). Next, rheograms on this settled solids fraction were measured at 25°C
(a) Note this material is also referred to as AP-104/SY-101 LAW. The contents of SY-101 were placed into the AP-
104 tank. This is due to previous tank farm operations to consolidate tank waste. In this document, the AP-104/SY-101 material is referred to as AP-104 LAW.
(b) IE Burgeson. 2004. Small Column Testing of Superlig® 639 for Removal of 99Tc from Hanford Tank Waste Envelope A (241-AP-104). Interim Report WTP-RPT-087, Rev 0, Battelle—Pacific Northwest Division, Richland, Washington.

1.2
and 40°C. Lastly, a limited set of physical properties measurements concluded testing with the mixing/aging sample.
This report describes the experimental approach and results of the testing. Specifications for this
work were provided in Test Specification Number 24590-LAW-TSP-RT-02-008 Rev 0. This report also provides the means of communicating results of testing conducted under test plan TP-RPP-WTP-189 Rev 0.
1.1 Quality Requirements
PNWD implemented the RPP-WTP quality requirements by performing work in accordance with
the PNWD Waste Treatment and Immobilization Plant Support Project quality assurance project plan (QAPjP) approved by the RPP-WTP Quality Assurance (QA) organization. This work was be performed to the quality requirements of NQA-1-1989 Part I, Basic and Supplementary Requirements, and NQA-2a-1990, Part 2.7. These quality requirements are implemented through PNWD's Waste Treatment and Immobilization Plant Support Project (WTPSP) Quality Assurance Requirements and Description Manual. The analytical requirements are implemented through WTPSP’s Statement of Work (WTPSP-SOW-005) with the Radiochemical Processing Laboratory (RPL) Analytical Service Operations (ASO).
A matrix that cross-references the NQA-1 and 2a requirements with the PNWD’s procedures for this
work is given Test Plan, TP-RPP-WTP-189 Rev 0, AP-104 (Envelope A) Melter Feed Rheology Testing. It includes justification for those requirements not implemented.
Experiments that are not method-specific were performed in accordance with PNWD’s procedures
QA-RPP-WTP-1101 “Scientific Investigations” and QA-RPP-WTP-1201 “Calibration Control System” assuring that sufficient data were taken with properly calibrated measuring and test equipment (M&TE) to obtain quality results.
As specified in Test Specification, 24590-LAW-TSP-RT-02-008 Rev 0, BNI’s QAPjP,
PL-24590-QA00001, is not applicable since the work will not be performed in support of environmental/regulatory testing, and the data will not be used as such.
PNWD addresses internal verification and validation activities by conducting an Independent
Technical Review of the final data report in accordance with PNWD’s procedure QA-RPP-WTP-604. This review verifies that the reported results are traceable, that inferences and conclusions are soundly based, and the reported work satisfies the Test Plan objectives. This review procedure is part of PNWD's WTPSP Quality Assurance Requirements and Description Manual.

2.1
2.0 Sample Preparation Details This section details preparation of the actual AP-104 samples used for testing. Section 2.1 describes
how the samples were adjusted to achieve the target Na concentrations. Section 2.2 describes the addition of GFC to the pretreated feed to form the melter feed. Unless otherwise stated, all temperatures in this work are reported to ±2°C. Chemical and radiochemical compositions of the LAW and melter feeds are shown in Appendix A.
2.1 Pretreated Feed
The pretreated waste sample was received at a Na concentration of 5.0 M. The 5.0 M Na sample was concentrated by evaporation in a vacuum oven to target Na concentrations of 6 M, 8 M, and 10 M. This was done by measuring the mass of 5.0 M Na sample that was initially placed into each bottle. The density of the 5.0 M Na sample was measured and used to calculate the volume of material in each container. Using the equation 2211 CVCV = , the volume required to reach the target concentrations of 6.0 M, 8.0 M, and 10.0 M Na were calculated. With the assumption that all of the mass loss during evaporation is the result of water loss and 1 g of mass loss = 1 mL of volume loss, the samples were evaporated to the target masses. The final mass of each sample was within +/- 0.03 g of the target values. Using the final measured densities from physical properties testing the final Na molarities were calculated to be 5.6, 7.9, and 9.7 M. These will be referred to as 6, 8, and 10 M Na throughout the report.
Slight precipitation in the 8 M and 10 M Na samples was observed during this concentration-
adjustment step. These samples are shown in Figure 2.1. Throughout this document, samples labeled with an “A” denote a concentration of 6 M Na, “B” denote a concentration of 8 M Na, and “C” denote a concentration of 10 M Na. Sample “D” is a separate 8 M Na sample used for a mixing/aging study.

2.2
6 M Na AP-104 Pretreated LAW
8 M Na AP-104 Pretreated LAW
10 M Na AP-104 Pretreated LAW
8 M Na AP-104 Pretreated LAW (used for
mixing/aging)
Figure 2.1. Photograph of 6, 8, and 10 M Na AP-104 Pretreated Wastes

2.3
2.2 Melter Feed
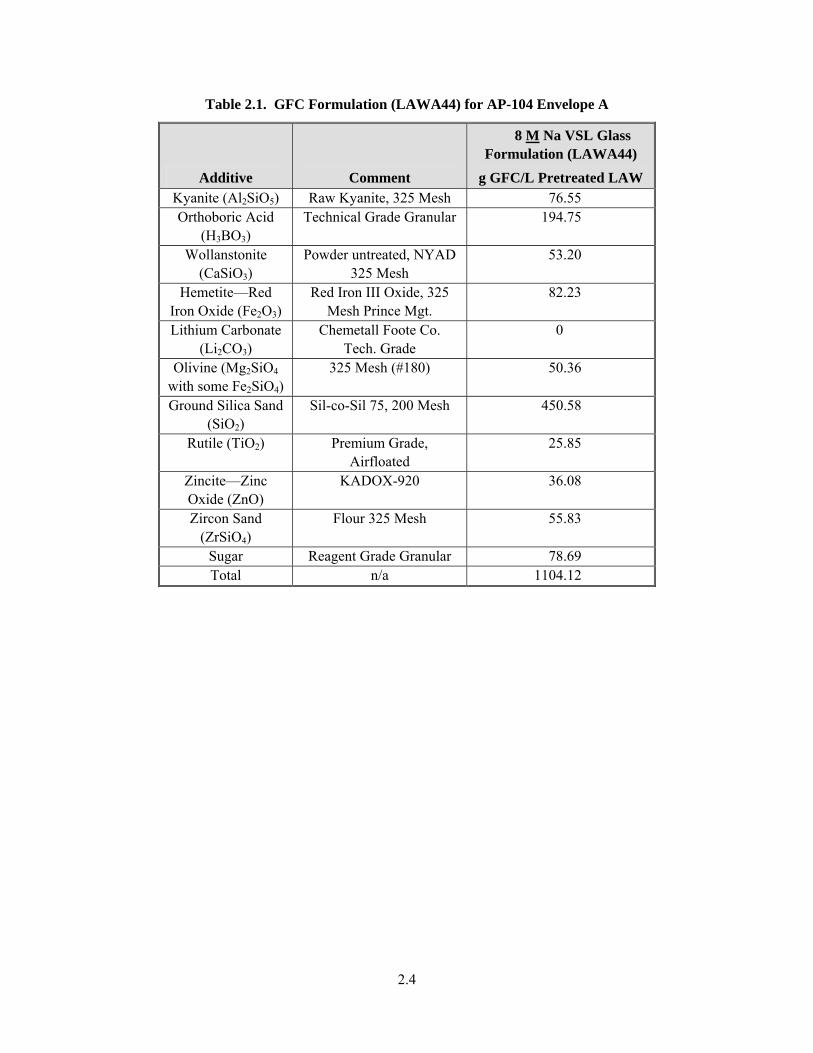
After physical and rheological characterization of the pretreated feed, GFC were added to the 6, 8, and 10 M Na pretreated LAW samples. These samples were used for physical and rheological characterization of the AP-104 Envelope A LAW melter feed. A second 8 M Na sample was prepared as a melter feed for a mixing/aging study that is discussed in Section 4.4. GFC quantities were based on the formulation provided by the Vitreous State Laboratory (VSL) (LAWA44). The VSL formulation was based on a 5 M Na feed on a mass of GFC per liter waste basis. The quantities of GFC were first adjusted on a per liter basis to the target Na concentrations (6 M, 8 M, and 10 M Na). The masses to be added to the 6 M, 8 M, and 10 M Na samples were calculated using adjustment factors of 6/5, 8/5, and 10/5, respectively. These adjusted masses on a liter basis were then multiplied by the volume of sample to calculate how much GFC to add to each sample. Table 2.1 lists the quantity and type of GFC added to added to 8 M Na AP-104 LAW.
Before adding GFC, the individual dry GFC components were weighed into a vessel and mixed
together at the formulation ratio (see Table 2.2). The appropriate mass to add to each of the samples was then weighed into a separate container. The GFC mixtures were then slowly added to the samples while the samples were stirred using a mechanical agitator. Following the GFC addition, the samples were stirred for an additional hour. An initial agitator rotational rate was chosen based on a relationship (see Equation 2.1) designed to keep the level of power input to the mixture per unit volume consistent between WTP mixer designs and the lab-scale mixer. If the calculated rotational rate resulted in poor mixing or a large vortex, the agitator rate was further adjusted to achieve good mixing.
( )5
2393 cmrpm 1096.1iD
VN ⋅⋅×= (2.1)
where N is the impeller speed (rpm), V is the sample volume (mL), and Di is the impeller diameter (cm).
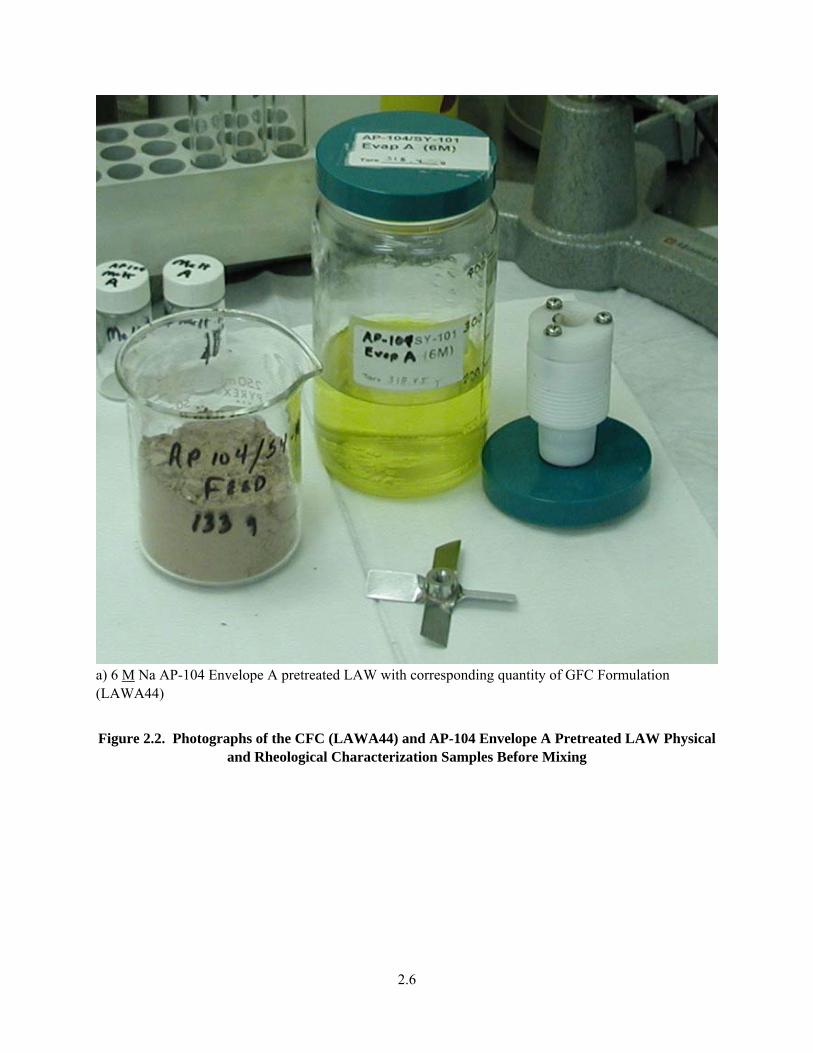
A 2.3-in. diameter impeller in a 2.7-in. diameter glass jar was used for mixing (see Figure 2.2). The
impeller was maintained at approximately 170 to 180 rpm in accordance with Equation 2.1. Mixing details are summarized in Table 2.3.
After stirring for 1 hour, samples were removed for physical and rheological testing. Mixing
continued for a full week with the mixing/aging sample (see Figure 2.3). Samples were drawn and rheologically characterized after 1 hour, 1 day, and 1 week of mixing. Physical properties and rheology results are described in Sections 3 and 4, respectively.
2.4
Table 2.1. GFC Formulation (LAWA44) for AP-104 Envelope A
Additive Comment
8 M Na VSL Glass Formulation (LAWA44)
g GFC/L Pretreated LAW Kyanite (Al2SiO5) Raw Kyanite, 325 Mesh 76.55 Orthoboric Acid
(H3BO3) Technical Grade Granular 194.75
Wollanstonite (CaSiO3)
Powder untreated, NYAD 325 Mesh
53.20
Hemetite—Red Iron Oxide (Fe2O3)
Red Iron III Oxide, 325 Mesh Prince Mgt.
82.23
Lithium Carbonate (Li2CO3)
Chemetall Foote Co. Tech. Grade
0
Olivine (Mg2SiO4 with some Fe2SiO4)
325 Mesh (#180) 50.36
Ground Silica Sand (SiO2)
Sil-co-Sil 75, 200 Mesh 450.58
Rutile (TiO2) Premium Grade, Airfloated
25.85
Zincite—Zinc Oxide (ZnO)
KADOX-920 36.08
Zircon Sand (ZrSiO4)
Flour 325 Mesh 55.83
Sugar Reagent Grade Granular 78.69 Total n/a 1104.12

2.5
Table 2.2. Quantity of GFC Formulation (LAWA44) Added to AP-104 Envelope A Pretreated LAW Samples
Pretreated Feed Sodium
Concentration (M) Description
Initial Mass of
Pretreated Sample (g)
Target Mass of
GFC Added
(g)
Actual Mass of
GFC Added (g)
Percent Deviation
6 Physical and Rheological
Characterization
204.6 133.0
133.0
0%
8 Physical and Rheological
Characterization
215.2 174.7
174.8
0.057%
10 Physical and Rheological
Characterization
228.7 220.7
220.8
0%
8 Mixing/Aging 276.5 224.5 224.5 0%
2.6
a) 6 M Na AP-104 Envelope A pretreated LAW with corresponding quantity of GFC Formulation (LAWA44)
Figure 2.2. Photographs of the CFC (LAWA44) and AP-104 Envelope A Pretreated LAW Physical and Rheological Characterization Samples Before Mixing

2.7
b) 8 M Na AP-104 Envelope A pretreated LAW with corresponding quantity of GFC Formulation (LAWA44)
Figure 2.2 (Contd)

2.8
c) 10 M Na AP-104 Envelope A pretreated LAW with corresponding quantity of GFC Formulation (LAWA44)
Figure 2.2 (Contd)

2.9
Table 2.3. Guideline Reporting Format Mixing Details
Melter Feed ID: LAWA44
Processing Scale (lab/bench, pilot, or full): lab
Activity/Property Data or Explanation
Order of Chemical Additions Dry glass formers combined then added to waste in mixing vessel
Mixing Time 1 hour
Impeller Speed 6 M Na aliquot: ~170–180 rpm 8 M Na aliquot: ~170–180 rpm 10 M Na aliquot: ~170–180 rpm 8 M Na mixing/aging aliquot: ~170-180 rpm
Impeller Diameter 6 M Na aliquot: ~5.8 cm (~2.3 in.) 8 M Na aliquot: ~5.8 cm (~2.3 in.) 10 M Na aliquot: ~5.8 cm (~2.3 in.) 8 M Na mixing/aging aliquot: ~5.8 cm (~2.3 in.)
Tank Diameter 6 M Na aliquot: ~6.9 cm (~2.7 in.) cylindrical 8 M Na aliquot: ~6.9 cm (~2.7 in.) cylindrical 10 M Na aliquot: ~6.9 cm (~2.7 in.) cylindrical 8 M Na mixing/aging aliquot: ~6.9 cm (~2.7 in.) cylindrical
Number of Baffles 0
Size of Baffles NA
Depth of Impeller 6 M Na aliquot: sample midpoint using overhead stirrer 8 M Na aliquot: sample midpoint using overhead stirrer 10 M Na aliquot: sample midpoint using overhead stirrer 8 M Na mixing/aging aliquot: sample midpoint using overhead
stirrer

2.10
a) GFC (LAWA44) and 8 M Na AP-104 Envelope A pretreated LAW mixing/aging sample before mixing
Figure 2.3. Photographs of 8 M Na AP-104 Envelope A Mixing/Aging Sample

2.11
b) 8 M Na AP-104 Envelope A melter feed mixing/aging sample during mixing
Figure 2.3 (Contd)

3.1
3.0 Physical-Properties Testing Samples of the AP-104 pretreated waste and melter feed described in Section 2 were characterized for
selected physical properties according to the methodology defined in Section 4 of 24590-WTP-GPG-RTD-001, Guidelines for Performing Chemical, Physical, and Rheological Properties Measurements. Section 3.1 of this report provides the general protocol, nomenclature, equations, and definitions from the guidelines document. The following physical properties were all measured at 25°C with selected properties measured at 40°C as noted and required by the Test Plan (TP-RPP-WTP-189 Rev 0):
• Density of the bulk slurries, settled solids, centrifuged solids, and centrifuged supernatant.
• The weight percent (wt%) and volume percent (vol%) settled solids, wt% and vol% centrifuged
solids, wt% total solids, wt% total dried solids, and wt% undissolved solids (UDS). Under the guideline methodology, settled solids are defined as the solids layer that separates from the
bulk slurry after 3 days of gravity settling. Centrifuged solids are defined as the solids layer that separates from the bulk slurry after 1 hour of centrifugation at 1000 gravities. Weight percent oven-dried solids is defined as the percent of solids remaining after oven drying the centrifuged solids fraction at 105ºC. Weight percent total dried solids is defined as the percent of solids remaining after drying the bulk sample (solid and liquid fractions) at 105ºC.
3.1 Methodology for Measuring Physical Properties
For this testing, a known mass of each slurry was placed in triplicate in volume-graduated centrifuge cones. The total mass (MB) and volume (VB) of the bulk slurry were recorded, and the density of the bulk slurry calculated (ρB=MB/VB). These results can be biased low due to entrained gas as well as an inability to clearly measure the total sample volume because of material smeared on the sides of the centrifuge tubes. Therefore, the bulk slurry densities were recalculated later in the work using volumes recorded following centrifugation. The samples were then allowed to settle for 3 days while sedimentation measurements were taken. Following settling, the volume of the settled solids (VSS) and volume of the bulk sample (VB) were recorded. The vol% settled solids was then calculated (PVSS = VSS/VB × 100%).
The settled slurries were then centrifuged at approximately 1,000 times the force of gravity for
1 hour. Note that for the 40ºC set of measurements, the aliquots were removed from a temperature-controlled oven at 40ºC before the centrifugation process, which occurred at ambient temperature (~23°C). After centrifugation, the aliquots were returned to the oven where the 40ºC testing temperature was restored. All of the centrifuged supernatant was then transferred to a graduated cylinder, its mass (MCL) and volume (VCL) were recorded, and the density was calculated (ρCL=MCL/VCL). The mass (MCS) and volume (VCS) of the centrifuged solids were also recorded. In addition, the vol% centrifuged solids (PVCS = VCS/VB × 100%) was calculated.
In many cases, centrifugation can result in the release of gas in the form of bubbles or foams.
Therefore, comparison of the bulk-density measurements before and after centrifugation is very important in understanding the rheology of some samples. In addition, it is possible that not all of the gas is

3.2
released from the slurry by centrifugation, so the density results following centrifugation may be biased low.
The centrifuged solids and supernatant aliquots were dried separately at 105°C for 24 hours. The
mass of the dried centrifuged supernatant (MDCL) and the mass of the dried centrifuged solids (MDCS) were then measured. Assuming that all mass lost during the drying process is water and not another volatile component, the wt% total dried solids in the bulk slurry was calculated (PMTS = {[(MDCL × MS)/(MVL × MB)]+[MDCS/MB]} × 100 %), where MVL is the mass of centrifuged liquid before drying. Waters of hydration or volatile organics can lead to low bias in MDCS/MCS. The wt% oven-dried solids was calculated from PODS = MDCS / MCS × 100%.
A calculation was then performed to determine the wt% undissolved solids in the samples, excluding
all interstitial liquid. This is referred to as PMUDS. The following equation was used:
%100MM
MM
1
MM
11P
B
CS
VL
DCL
CS
DCS
MUDS ××⎟⎟⎟⎟
⎠
⎞
⎜⎜⎜⎜
⎝
⎛
−
−−= (3.1)
This calculation assumes that 1) the supernatant and the interstitial liquid had the same composition,
and 2) all mass loss during the drying of the centrifuged solids was water loss from interstitial liquid. The mass percent of UDS (PMUSS) in the settled solids layer can be calculated from Equation 3.2.
( )( ) %100
ρVVMM100P
PCLSSBB
BMUDSMUSS ×
−−⋅
= (3.2)
The mass percent of UDS (PMUCS) in the centrifuged solids layer can be calculated from Equation 3.3.
( )( ) %100
ρVVMM100P
PCLCSBB
BMUDSMUCS ×
−−⋅
= (3.3)
The average particle density ( pρ ) of the UDS can be calculated from Equation 3.4.
( )( )
CL
MUDS
B
MUDSp
ρ100P1
ρ1
100Pρ
−−
= (3.4)
The density of the settled solids ( SSρ ) can be calculated from Equation 3.5.

3.3
( ) ( )CL
MUSS
p
MUSSSS
ρ100P1
ρ100P
1ρ−
+= (3.5)
The density of the centrifuged solids ( CSρ ) can be calculated from Equation 3.6.
( ) ( )CL
MUCS
p
MUCSCS
ρ100P1
ρ100P
1ρ−
+= (3.6)
The mass percent of settled solids (PMSS) in the sample can be calculated from Equation 3.7.
%100PMSS ×
⋅=
B
SSSS
MVρ
(3.7)
The mass percent of centrifuged solids (PMCS) in the sample can be calculated from Equation 3.8.
%100PMCS ×
⋅=
B
CSCS
MVρ
(3.8)
The vol% of UDS (PVUDS) in the sample can be calculated from Equation 3.9.
( )%100
ρρ100P
Pp
BMUDSVUDS ×
⋅= (3.9)
The vol% of UDS (PVUSS) in the settled solids can be calculated from Equation 3.10.
( )%100
ρρ100P
Pp
SSMUSSVUSS ×
⋅= (3.10)
The vol% of UDS (PVUCS) in the centrifuged solids can be calculated from Equation 3.11.
( )%100
ρρ100P
Pp
CSMUCSVUCS ×
⋅= (3.11)

3.4
3.2 Analysis of Physical-Properties Uncertainty
Assuming instrument errors of ±0.002 g for mass measurments and ±0.05 mL for volume measurements, the error propagation assoicated with each of the above equations is reported using a Taylor series expansion approximation.(a) When performing the physical-properties procedure, three alqiouts are taken from the initial bulk sample. The average value from the three subsamples and resulting error propagation value neglects subsampling and procedural errors. The standard deviation from these three measurments is calculated to provide an indication of the overall uncertainty assoicated with these measurments. A large standard deviation relative to the error propogation value and the reported result indicates that errors other than instrument errors (e.g., subsampling and procedural errors) were significant during phyical-properties measurement. A large error-propogation value relative to the reported result indicates that the sample matrix was not suitable for reproducable measurments using the procedure to measure physical properties. When the error propogation value and standard deviation are both small relative to the reported result, high confidence in the reported value is recognized. 3.3 Physical Properties of AP-104 Envelope A Pretreated LAW
Results of the physical-properties measurements on the LAW pretreated wastes at each sodium concentration can be found in Table 3.1. Physical properties were measured at both ambient (25°C) and 40°C. Because the LAW pretreated feed did not contain any significant quantity of UDS, many of the slurry-based physical-property measurements were not applicable to this sample. Consequentially, only the supernatant density and dissolved-solids content were measured. As expected, the density of the supernatant decreases with decreasing sodium concentration and temperature, and the dissolved-solids content increases with increasing sodium concentration. Depending on sodium concentration and temperature, the density of the supernatant ranged from 1.258 g/mL to 1.430 g/mL. The dissolved-solids content was determined to be 33.3, 41.2, and 47.5 wt% for the 6 M, 8 M, and 10 M Na samples, respectively.
(a) Details on this approximation can be found at: http://physics.nist.gov/cuu/Uncertainty/index.html.

3.5
Table 3.1. Physical Properties of 6 M, 8 M, and 10 M Na AP-104 Envelope A Pretreated Waste at 25°C and 40°C
6 M Na 8 M Na 10 M Na
Physical Property Units 25°C ± uncertainty (SD) 40°C ± uncertainty (SD)
25°C ± uncertainty (SD) 40°C ± uncertainty (SD)
25°C ± uncertainty (SD) 40°C ± uncertainty (SD)
Bulk Density g/mL 1.274 ± 0.015 (0.003) 1.258 ± 0.015 (0.003)
1.360 ± 0.015 (0.002) 1.352 ± 0.019 (0.004)
1.430 ± 0.017 (0.014) 1.420 ± 0.016 (0.003)
Vol% Settled Solids % a a a Density of Centrifuged Solids g/mL a a a Vol% Centrifuged Solids % a a a Wt% Centrifuged Solids % a a a
Supernatant Density g/mL 1.267 ± 0.016 (0.003) 1.257 ± 0.015 (0.007)
1.358 ± 0.015 (0.003) 1.348 ± 0.020 (0.009)
1.413 ± 0.017 (0.009) 1.409 ± 0.017 (0.005)
Density of Settled Solids g/mL a a a Wt% Supernatant with Settled Solids %
a a a
Wt% dissolved solids in supernatant % 33.3% ± 0.0% (0.0%) 36.0% ± 0.0% (1.3%)
41.2% ± 0.0% (0.0%) 41.0% ± 0.1% (2.2%)
47.5% ± 0.0% (0.4%) 49.3% ± 0.0% (1.7%)
Wt% total solids in Centrifuged Sludge %
a a a
Wt% Total Solids % 33.3% ± 0.1% (0.0%) 36.0% ± 0.1% (1.3%)
41.3% ± 0.1% (0.1%) 41.0% ± 0.1% (2.2%)
47.6% ± 0.1% (0.4%) 49.4% ± 0.1% (1.7%)
Wt% UDS % a a a Wt % UDS in Settled Sludge % a a a Wt% UDS in Centrifuged Sludge % a a a Average Particle Density g/mL a a a Settled solids Density g/mL a a a Centrifuged Solids Density g/mL a a a Wt% centrifuged solids % a a a Wt% settled solids % a a a
Vol% UDS % a a a
Vol% UDS in settled solids % a a a Vol% UDS in centrifuged solids % a a a a—too little solids to quantify.

3.6
3.4 Physical Properties of AP-104 Envelope A Melter Feed
Physical properties results of the LAW melter feed at each sodium concentration (see Figure 3.1) can be found in Table 3.2. Physical properties measurements were performed at both ambient (25°C) and 40°C. As expected, the quantity of total and UDS increases with sodium concentration because of the increased quantity of GFC required for the melter feed formulation at higher sodium concentrations. When the temperature is increased from 25°C to 40°C, the insoluble GFC appear to dissolve slightly. This is reflected by the increasing dissolved solids content and decreasing UDS content as the temperature increases at each sodium concentration.
The volume fraction of settled solids decreases as the temperature increases, most likely because of
tighter particle packing as a result of particle dissolution at elevated temperatures. Because the settled-solids volume significantly changes before and after centrifugation, maximum packing does not appear to have been reached after settling for 3 days at both 25°C and 40°C. At the conclusion of the mixing/aging study (see Section 2.2) the 1 week mixed sample at 8 M Na was allowed to settle and the resulting supernate was decanted. After shear strength measurements and rheograms were collected on this settled solids layer, the wt% total solids was measured in triplicate at 74.6% ± 0.0% (0.1%). Where the ± 0.0% value is the uncertainty and the (0.1%) value is the standard deviation between the triplicate results. This measurement allows for the calculation of the mixing/aging sample bulk density at 1.92 g/mL. This value compares well with the 1.90 g/mL value shown in Table 3.2 and indicates little change in settled solids behavior due to the 1 week of mixing/aging.
6 M Na 8 M Na 10 M Na
Figure 3.1. Photograph of AP-104 Envelope A Melter Feed Physical-Property Samples After Settling 72 Hours at 40°C

3.7
Table 3.2. Physical Properties of 6 M, 8 M, and 10 M Na AP-104 Envelope A Melter Feed at 25°C and 40°C
6 M Na 8 M Na 10 M Na
Physical Property Units 25°C ± uncertainty (SD) 40°C ± uncertainty (SD)
25°C ± uncertainty (SD) 40°C ± uncertainty (SD)
25°C ± uncertainty (SD) 40°C ± uncertainty (SD)
Bulk Density g/mL 1.591 ± 0.025 (0.018) 1.557 ± 0.022 (0.012)
1.726 ± 0.023 (0.011) 1.691 ± 0.021 (0.019)
1.836 ± 0.022 (0.010) 1.871 ± 0.020 (0.034)
Vol% Settled Solids % 54.7% ± 1.8% (1.0%) 50.0% ± 1.6% (1.5%)
69.7% ± 1.6% (1.2%) 65.6% ± 1.6% (0.8%)
95.5% ± 1.7% (1.8%) 91.4% ± 1.5% (0.8%)
Density of Centrifuged Solids g/mL 1.920 ± 0.062 (0.035) 1.812 ± 0.053 (0.047)
2.016 ± 0.047 (0.020) 1.922 ± 0.043 (0.044)
2.001 ± 0.034 (0.024) 2.101 ± 0.034 (0.011)
Vol% Centrifuged Solids % 48.6% ± 1.8% (1.2%) 48.5% ± 1.6% (2.7%)
57.7% ± 1.5% (1.3%) 56.1% ± 1.4% (1.8%)
72.1% ± 1.5% (1.8%) 66.0% ± 1.3% (0.8%)
Wt% Centrifuged Solids % 58.7% ± 0.0% (0.7%) 57.2% ± 0.1% (2.2%)
67.5% ± 0.0% (0.9%) 64.3% ± 0.0% (1.0%)
78.8% ± 0.0% (1.3%) 74.7% ± 0.0% (0.2%)
Supernatant Density g/mL 1.285 ± 0.040 (0.011) 1.275 ± 0.036 (0.009)
1.339 ± 0.043 (0.018) 1.356 ± 0.039 (0.003)
1.387 ± 0.060 (0.009) 1.348 ± 0.043 (0.003)
Density of Settled Solids g/mL 1.84 ± 0.05 (0.02) 1.81 ± 0.05 (0.03)
1.90 ± 0.03 (0.01) 1.86 ± 0.04 (0.02)
1.86 ± 0.02 (0.02) 1.90 ± 0.02 (0.02)
Wt% Supernatant with Settled Solids %
41.5% ± 0.1% (1.0%) 42.5% ± 0.1% (2.6%)
32.8% ± 0.0% (0.7%) 35.5% ± 0.0% (1.4%)
21.2% ± 0.0% (1.2%) 24.7% ± 0.0% (0.9%)
Wt% dissolved solids in supernatant % 34.9% ± 0.1% (1.1%) 35.8% ± 0.1% (0.6%)
41.7% ± 0.1% (0.3%) 42.7% ± 0.1% (0.6%)
46.8% ± 0.2% (1.8%) 50.2% ± 0.1% (1.3%)
Wt% total solids in Centrifuged Sludge %
70.2% ± 0.1% (0.5%) 71.9% ± 0.1% (0.5%)
74.0% ± 0.1% (0.3%) 76.1% ± 0.1% (0.1%)
75.2% ± 0.0% (0.5%) 77.2% ± 0.0% (1.4%)
Wt% Total Solids % 55.7% ± 0.1% (0.5%) 56.6% ± 0.1% (0.9%)
63.5% ± 0.1% (0.2%) 64.2% ± 0.1% (0.4%)
69.2% ± 0.0% (0.4%) 70.6% ± 0.0% (1.5%)
Wt% UDS % 31.9% ± 0.1% (0.3%) 32.2% ± 0.1% (0.7%)
37.4% ± 0.1% (0.1%) 37.4% ± 0.1% (0.5%)
42.0% ± 0.1% (1.3%) 40.6% ± 0.1% (1.7%)
Wt% UDS in Settled Sludge % 50.2% ± 1.7% (0.7%) 55.2% ± 1.9% (0.1%)
49.2% ± 1.1% (0.7%) 52.7% ± 1.2% (0.1%)
43.9% ± 0.6% (2.0%) 43.3% ± 0.5% (1.7%)
Wt% UDS in Centrifuged Sludge % 54.5% ± 2.1% (0.4%) 55.7% ± 2.0% (1.4%)
55.7% ± 1.5% (0.7%) 57.8% ± 1.6% (0.8%)
53.2% ± 1.1% (2.1%) 53.8% ± 1.0% (1.5%)
Average Particle Density g/mL 3.24 ± 0.63 (0.11) 2.92 ± 0.47 (0.13)
3.34 ± 0.50 (0.11) 2.88 ± 0.34 (0.09)
3.32 ± 0.50 (0.10) 4.32 ± 0.70 (0.08)

3.8
Table 3.2 (Contd)
6 M Na 8 M Na 10 M Na
Physical Property Units 25°C ± uncertainty (SD) 40°C ± uncertainty (SD)
25°C ± uncertainty (SD) 40°C ± uncertainty (SD)
25°C ± uncertainty (SD) 40°C ± uncertainty (SD)
Settled solids Density g/mL 1.84 ± 0.11 (0.02) 1.85 ± 0.11 (0.02)
1.90 ± 0.09 (0.01) 1.88 ± 0.09 (0.02)
1.86 ± 0.09 (0.02) 1.92 ± 0.08 (0.03)
Centrifuged Solids Density g/mL 1.91 ± 0.13 (0.03) 1.86 ± 0.11 (0.00)
2.01 ± 0.11 (0.02) 1.95 ± 0.10 (0.03)
2.01 ± 0.12 (0.02) 2.14 ± 0.11 (0.04)
Wt% centrifuged solids % 58.5% ± 4.4% (1.0%) 57.8% ± 3.9% (2.8%)
67.2% ± 4.1% (0.7%) 64.8% ± 3.6% (1.6%)
78.9% ± 4.8% (1.3%) 75.5% ± 4.0% (1.1%)
Wt% settled solids % 63.4% ± 4.3% (0.9%) 58.3% ± 3.9% (1.2%)
76.0% ± 4.0% (0.8%) 71.0% ± 3.5% (0.9%)
95.8% ± 4.9% (1.4%) 93.7% ± 4.0% (1.5%)
Vol% UDS % 15.6% ± 3.1% (0.5%) 17.2% ± 2.7% (0.3%)
19.3% ± 2.9% (0.6%) 22.0% ± 2.6% (0.3%)
23.2% ± 3.6% (1.5%) 17.6% ± 2.9% (0.8%)
Vol% UDS in settled solids % 28.6% ± 5.9% (1.1%) 35.0% ± 6.1% (1.1%)
28.0% ± 4.4% (0.5%) 34.4% ± 4.4% (0.7%)
24.6% ± 4.0% (2.0%) 19.3% ± 3.2% (0.8%)
Vol% UDS in centrifuged solids % 32.2% ± 6.7% (0.7%) 35.5% ± 6.1% (2.5%)
33.5% ± 5.4% (0.4%) 39.2% ± 5.1% (1.1%)
32.3% ± 5.3% (2.4%) 26.6% ± 4.5% (0.8%)
3.9
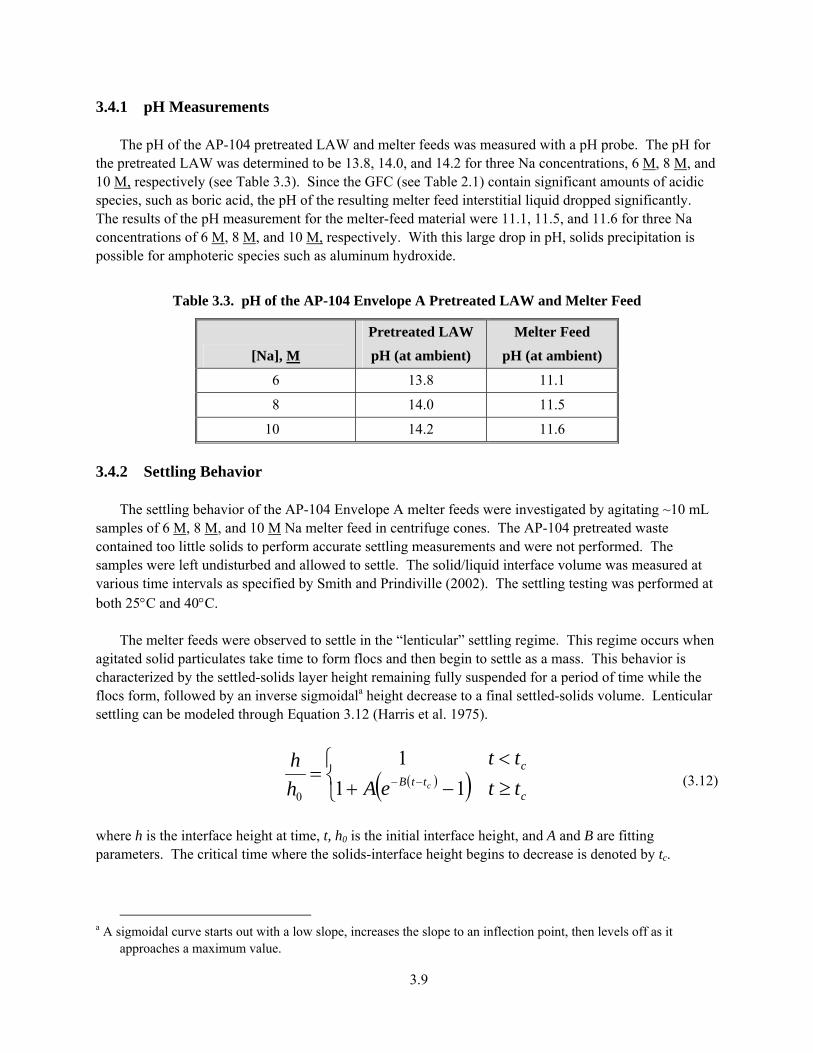
3.4.1 pH Measurements The pH of the AP-104 pretreated LAW and melter feeds was measured with a pH probe. The pH for
the pretreated LAW was determined to be 13.8, 14.0, and 14.2 for three Na concentrations, 6 M, 8 M, and 10 M, respectively (see Table 3.3). Since the GFC (see Table 2.1) contain significant amounts of acidic species, such as boric acid, the pH of the resulting melter feed interstitial liquid dropped significantly. The results of the pH measurement for the melter-feed material were 11.1, 11.5, and 11.6 for three Na concentrations of 6 M, 8 M, and 10 M, respectively. With this large drop in pH, solids precipitation is possible for amphoteric species such as aluminum hydroxide.
Table 3.3. pH of the AP-104 Envelope A Pretreated LAW and Melter Feed
[Na], M Pretreated LAW pH (at ambient)
Melter Feed pH (at ambient)
6 13.8 11.1
8 14.0 11.5
10 14.2 11.6
3.4.2 Settling Behavior The settling behavior of the AP-104 Envelope A melter feeds were investigated by agitating ~10 mL
samples of 6 M, 8 M, and 10 M Na melter feed in centrifuge cones. The AP-104 pretreated waste contained too little solids to perform accurate settling measurements and were not performed. The samples were left undisturbed and allowed to settle. The solid/liquid interface volume was measured at various time intervals as specified by Smith and Prindiville (2002). The settling testing was performed at both 25°C and 40°C.
The melter feeds were observed to settle in the “lenticular” settling regime. This regime occurs when agitated solid particulates take time to form flocs and then begin to settle as a mass. This behavior is characterized by the settled-solids layer height remaining fully suspended for a period of time while the flocs form, followed by an inverse sigmoidala height decrease to a final settled-solids volume. Lenticular settling can be modeled through Equation 3.12 (Harris et al. 1975).
( )( )⎩⎨⎧
≥−+<
= −−c
ttBc
tteAtt
hh
c 111
0 (3.12)
where h is the interface height at time, t, h0 is the initial interface height, and A and B are fitting parameters. The critical time where the solids-interface height begins to decrease is denoted by tc.
a A sigmoidal curve starts out with a low slope, increases the slope to an inflection point, then levels off as it
approaches a maximum value.

3.10
The settling data are presented graphically in Figure 3.2. As expected, the 10 M Na melter feed settled the slowest followed by the 8 M and 6 M Na melter feed. Increasing the temperature from 25°C to 40°C resulted in higher packing efficiency and faster settling rates. Fitting parameters for the line of best fit described by Equation 3.12 are shown in Table 3.4.
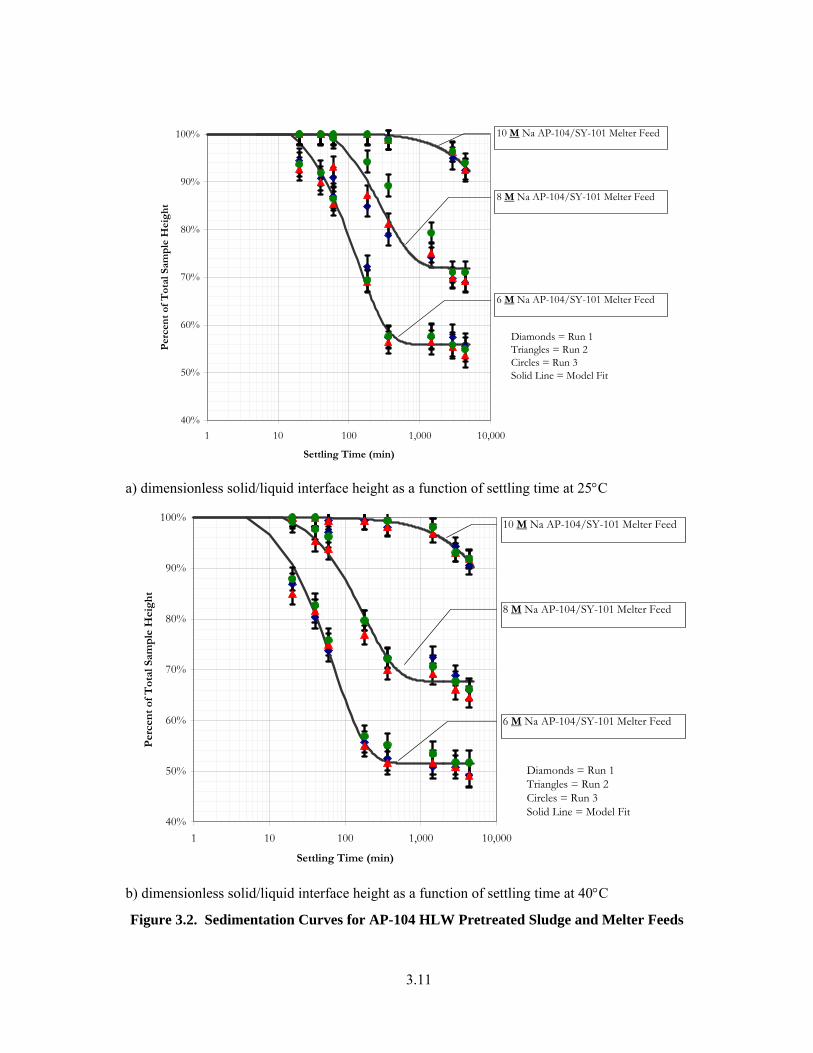
3.11
40%
50%
60%
70%
80%
90%
100%
1 10 100 1,000 10,000
Settling Time (min)
Per
cen
t of
Tot
al S
amp
le H
eigh
t
10 M Na AP-104/SY-101 Melter Feed
8 M Na AP-104/SY-101 Melter Feed
6 M Na AP-104/SY-101 Melter Feed
Diamonds = Run 1Triangles = Run 2Circles = Run 3Solid Line = Model Fit
a) dimensionless solid/liquid interface height as a function of settling time at 25°C
40%
50%
60%
70%
80%
90%
100%
1 10 100 1,000 10,000
Settling Time (min)
Per
cen
t of
Tot
al S
amp
le H
eigh
t
10 M Na AP-104/SY-101 Melter Feed
8 M Na AP-104/SY-101 Melter Feed
6 M Na AP-104/SY-101 Melter Feed
Diamonds = Run 1Triangles = Run 2Circles = Run 3Solid Line = Model Fit
b) dimensionless solid/liquid interface height as a function of settling time at 40°C
Figure 3.2. Sedimentation Curves for AP-104 HLW Pretreated Sludge and Melter Feeds
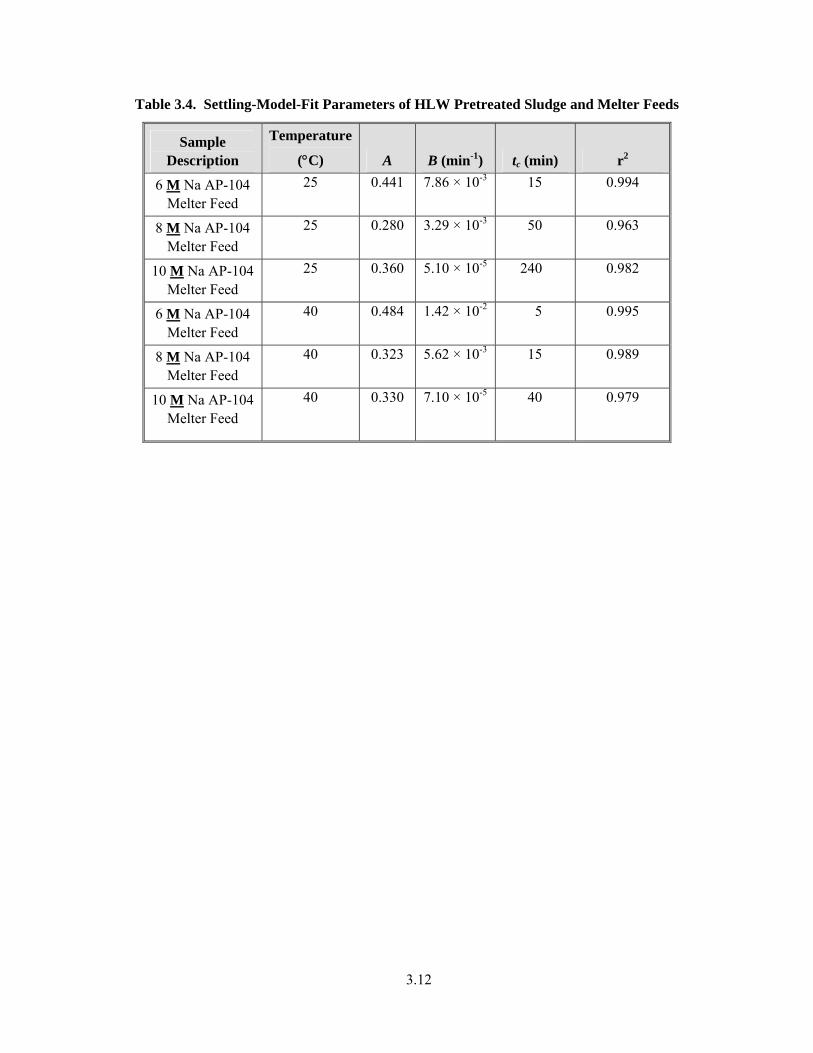
3.12
Table 3.4. Settling-Model-Fit Parameters of HLW Pretreated Sludge and Melter Feeds
Sample Description
Temperature
(°C) A B (min-1) tc (min) r2
6 M Na AP-104 Melter Feed
25 0.441 7.86 × 10⁻³
15
0.994
8 M Na AP-104 Melter Feed
25 0.280
3.29 × 10⁻³
50
0.963
10 M Na AP-104 Melter Feed
25 0.360
5.10 × 10⁻⁵
240
0.982
6 M Na AP-104 Melter Feed
40 0.484
1.42 × 10⁻²
5
0.995
8 M Na AP-104 Melter Feed
40 0.323 5.62 × 10⁻³
15 0.989
10 M Na AP-104 Melter Feed
40 0.330
7.10 × 10⁻⁵
40
0.979
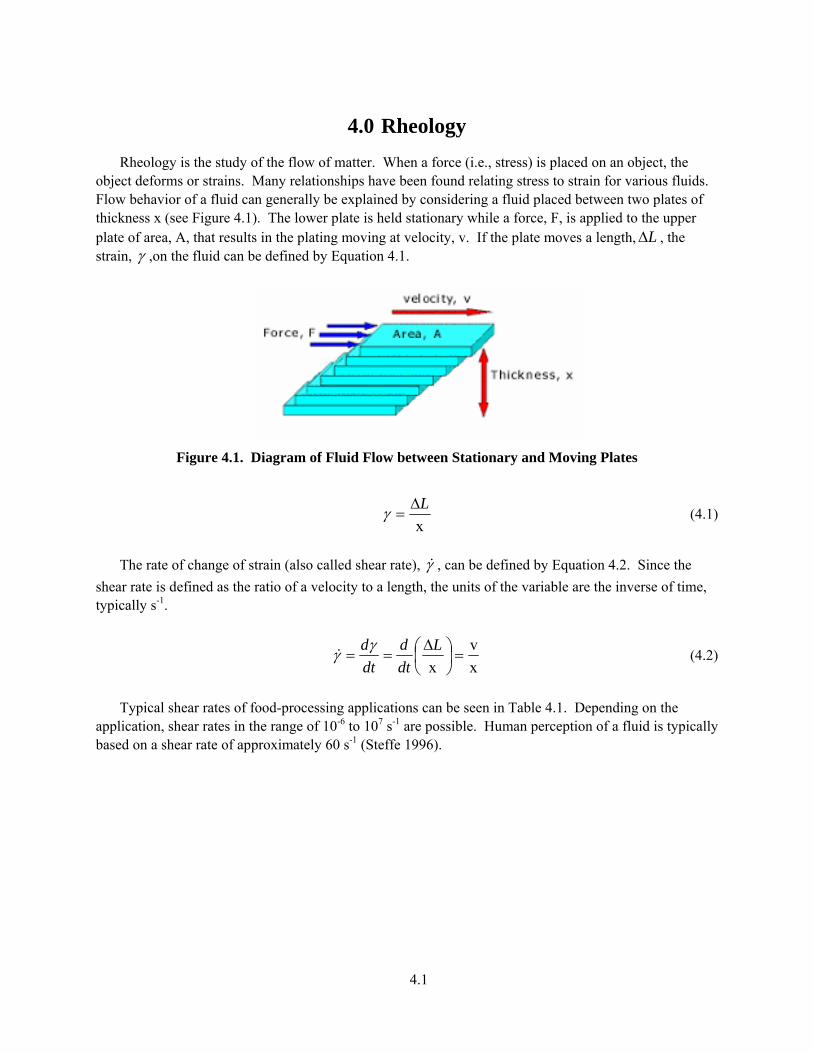
4.1
4.0 Rheology Rheology is the study of the flow of matter. When a force (i.e., stress) is placed on an object, the
object deforms or strains. Many relationships have been found relating stress to strain for various fluids. Flow behavior of a fluid can generally be explained by considering a fluid placed between two plates of thickness x (see Figure 4.1). The lower plate is held stationary while a force, F, is applied to the upper plate of area, A, that results in the plating moving at velocity, v. If the plate moves a length, L∆ , the strain, γ ,on the fluid can be defined by Equation 4.1.
Figure 4.1. Diagram of Fluid Flow between Stationary and Moving Plates
xL∆
=γ (4.1)
The rate of change of strain (also called shear rate), γ& , can be defined by Equation 4.2. Since the
shear rate is defined as the ratio of a velocity to a length, the units of the variable are the inverse of time, typically s-1.
xv
x=⎟
⎠⎞
⎜⎝⎛ ∆
==L
dtd
dtdγγ& (4.2)
Typical shear rates of food-processing applications can be seen in Table 4.1. Depending on the
application, shear rates in the range of 10-6 to 107 s-1 are possible. Human perception of a fluid is typically based on a shear rate of approximately 60 s-1 (Steffe 1996).
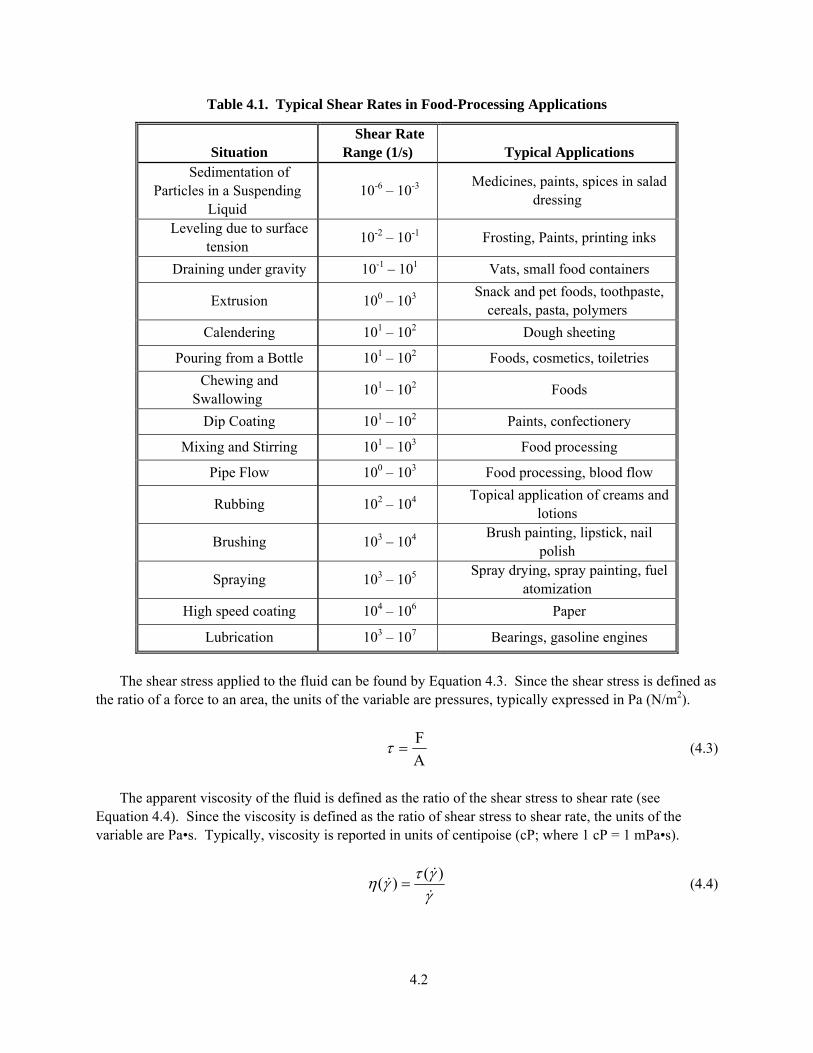
4.2
Table 4.1. Typical Shear Rates in Food-Processing Applications
Situation Shear Rate
Range (1/s) Typical Applications Sedimentation of
Particles in a Suspending Liquid
10-6 – 10-3 Medicines, paints, spices in salad dressing
Leveling due to surface tension 10-2 – 10-1 Frosting, Paints, printing inks
Draining under gravity 10-1 – 101 Vats, small food containers
Extrusion 100 – 103 Snack and pet foods, toothpaste, cereals, pasta, polymers
Calendering 101 – 102 Dough sheeting Pouring from a Bottle 101 – 102 Foods, cosmetics, toiletries
Chewing and Swallowing 101 – 102 Foods
Dip Coating 101 – 102 Paints, confectionery Mixing and Stirring 101 – 103 Food processing
Pipe Flow 100 – 103 Food processing, blood flow
Rubbing 102 – 104 Topical application of creams and lotions
Brushing 103 – 104 Brush painting, lipstick, nail polish
Spraying 103 – 105 Spray drying, spray painting, fuel atomization
High speed coating 104 – 106 Paper Lubrication 103 – 107 Bearings, gasoline engines
The shear stress applied to the fluid can be found by Equation 4.3. Since the shear stress is defined as
the ratio of a force to an area, the units of the variable are pressures, typically expressed in Pa (N/m2).
AF
=τ (4.3)
The apparent viscosity of the fluid is defined as the ratio of the shear stress to shear rate (see
Equation 4.4). Since the viscosity is defined as the ratio of shear stress to shear rate, the units of the variable are Pa•s. Typically, viscosity is reported in units of centipoise (cP; where 1 cP = 1 mPa•s).
γγτγη&
&&
)()( = (4.4)

4.3
For Newtonian fluids, the apparent viscosity is independent of shear rate (see Equation 4.5). Examples of the viscosity of common Newtonian materials can be seen in Table 4.2.
γητ &= (4.5) where τ is the shear stress, η is the Newtonian viscosity, andγ& is the shear rate.
Table 4.2. Viscosities of Several Common Newtonian Fluids
Material Viscosity at 20ºC
(cP) Acetone 0.32 Water 1.0
Ethanol 1.2 Mercury 1.6
Ethylene Glycol 20 Corn Oil 71 Glycerin 1,500
Fluids that do not behave as Newtonian fluids are referred to as non-Newtonian fluids. Rheograms or
plots of shear stress versus shear rate are typically used to characterize non-Newtonian fluids. Examples of typical rheograms can be seen in Figure 4.2.
Shear Rate
She
ar S
tres
s
Bingham Plastic
Yield Pseudoplastic
Newtonian
Shear Thinning
Shear Thickening
Figure 4.2. Rheograms of Various Fluid Types
Shear-thinning and shear-thickening fluids can be modeled by the Ostwald equation (see
Equation 4.6). If n<1, then the material is referred to as pseudoplastic (shear thinning). If n>1, then that material is referred to as dilatant (shear thickening). These fluids exhibit decreasing or increasing apparent viscosities as the shear rate increases, depending on whether the fluid is shear thinning or shear

4.4
thickening, respectively. Since shear-thickening flow behavior is rare, shear-thickening behavior is often an indication of possible secondary flow patterns, solids settling, or other measurement errors.
nmγτ &= (4.6)
where m is the power law consistency coefficient, n is the power law exponent, and γ& is the shear rate.
A rheogram for a Bingham plastic does not pass through the origin. When a rheogram possesses a
non-zero y-intercept, the fluid is said to posses a yield stress. A yield stress is a shear-stress threshold that defines the boundary between solid-like behavior and fluid-like behavior. The fluid will not begin to flow until the yield stress threshold is exceeded. For Bingham plastic materials, once enough force has been applied to exceed the yield stress, the material approaches Newtonian behavior at high shear rates (see Equation 4.7).
γηττ &PBO += (4.7)
where B
Oτ is the Bingham yield stress, ηp is the plastic viscosity, and γ& is the shear rate. Fluids that exhibit a non-linear rheogram with a yield stress are typically modeled by the three-
parameter Herschel-Bulkley equation (see Equation 4.8). Again, shear-thickening behavior is uncommon, and typically the Hershel-Bulkley power law exponent is less than unity.
bH
O kγττ += (4.8)
where HOτ = yield stress k = Herschel-Bulkley consistency coefficientb = Hershel-Bulkley power law exponent
γ = shear rate. 4.1 Rheology Measurement Methodology
A Haake CV20 rheometer was used for the work described in this section. The CV20 system was configured with a temperature-controlled concentric cylinder rotational system. The sensor system consists of an inner cylinder that is placed inside an outer cylinder with a known annular gap distance. When the inner cylinder rotates, the resulting fluid resistance to the flow is measured electronically. When this signal is combined with the rotational rate, it can be mathematically transformed into shear-stress and shear-rate data. The samples analyzed in this report were analyzed with a Haake ZA30 sensor system.
The testing was conducted as follows. The samples were loaded into the sample container, and the
shear rate was increased from 0 to 280 s-1 in 5 minutes (the maximum rotational rate of the instrument). The sample was held at a shear rate of 280 s-1 for 1 minute. Lastly, the shear rate was decreased from 280 to 0 s-1 in 5 minutes. The test was then immediately repeated with the same sample. If the subsequent

4.5
data were in close agreement with the previous run, the testing for that sample was considered complete. If there was noticeable variation in the data, the sample was ramped through this cycle again until two consecutive similar data sets were obtained. The purpose of this repetition was to qualitatively determine if rheological changes occur while under the influence of shear. Shear history is often an important part of determining expected rheological behaviors. Once the previous sample was tested to the point of obtaining consistent data, it was removed, and a new sample was loaded for the next run.
The purpose of this set of testing parameters was to identify the rheological behavior and shear
sensitivity of the materials. The first ramp cycle shows newly loaded or fresh sample behavior, including breakdown of sample structure through hysteresis, if present. Hysteresis is when the ramp-down curve is different from the ramp-up curve. An immediate repeat allows little or no time for the sample to recover. The complete cycle repeat with the used sample shows the effects of a shear history with a short time of recovery for the sample.
National Institute of Standards and Technology (NIST)-traceable Brookfield viscosity standard oils
were used to verify the calibration of the rheometer systems. A verified calibration check requires a deviation between measured and certified values less than 10% for viscosity standards above 10 cP and 15% for viscosity standards below 10 cP. The calibration check is valid for 30 days.
4.2 Pretreated Waste
Rheograms from pretreated waste at various Na concentrations are shown in Figure 4.3 through Figure 4.8. Each figure provides a least-squares rheological model fit (see Section 4.0) for each increasing shear-rate rheogram. These wastes did not contain GFC. Results are summarized in Table 4.3. As expected, the viscosity of the waste increases with increasing Na concentration and decreasing temperature in a range of 2.2 to 10 cP. These wastes have the characteristic linear flow curve of low viscosity Newtonian fluids.
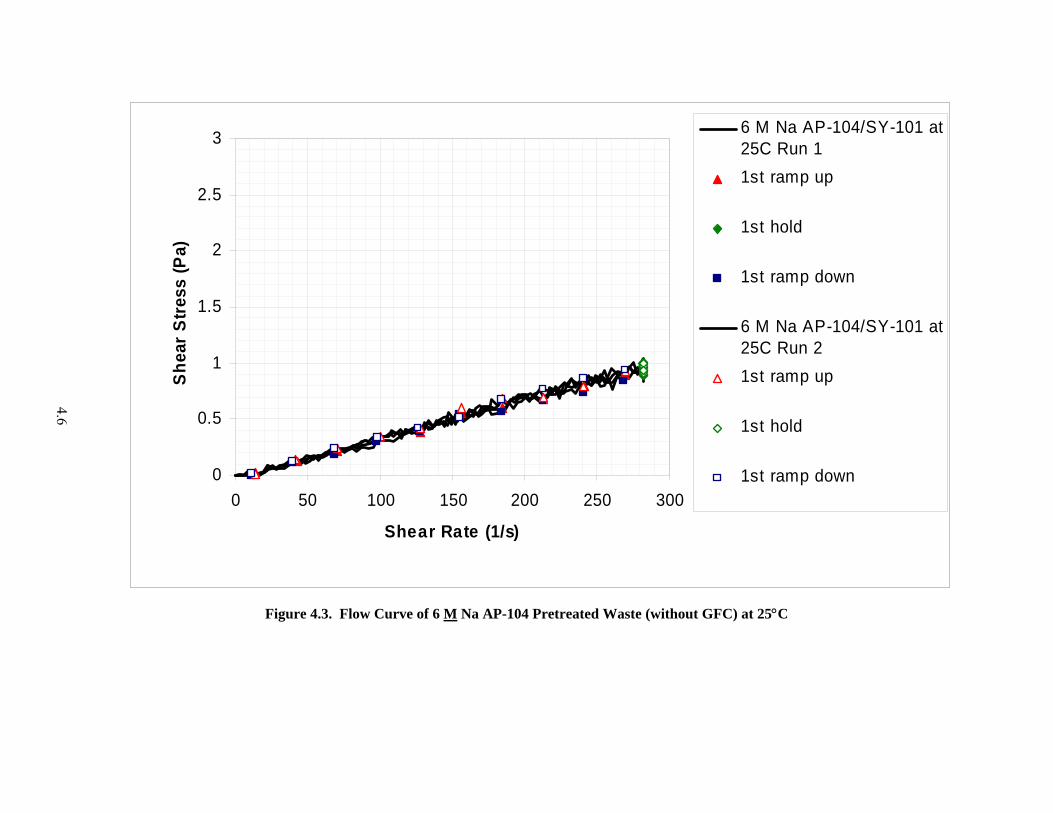
4.6
0
0.5
1
1.5
2
2.5
3
0 50 100 150 200 250 300
Shear Rate (1/s)
She
ar S
tress
(Pa)
6 M Na AP-104/SY-101 at25C Run 11st ramp up
1st hold
1st ramp down
6 M Na AP-104/SY-101 at25C Run 21st ramp up
1st hold
1st ramp down
Figure 4.3. Flow Curve of 6 M Na AP-104 Pretreated Waste (without GFC) at 25°C

4.7
0
0.5
1
1.5
2
2.5
3
0 50 100 150 200 250 300
Shear Rate (1/s)
Shea
r Stre
ss (P
a)
6 M Na AP-104/SY-101 at40C Run 11st ramp up
1st hold
1st ramp down
6 M Na AP-104/SY-101 at40C Run 21st ramp up
1st hold
1st ramp down
Figure 4.4. Flow Curve of 6 M Na AP-104 Pretreated Waste (without GFC) at 40°C
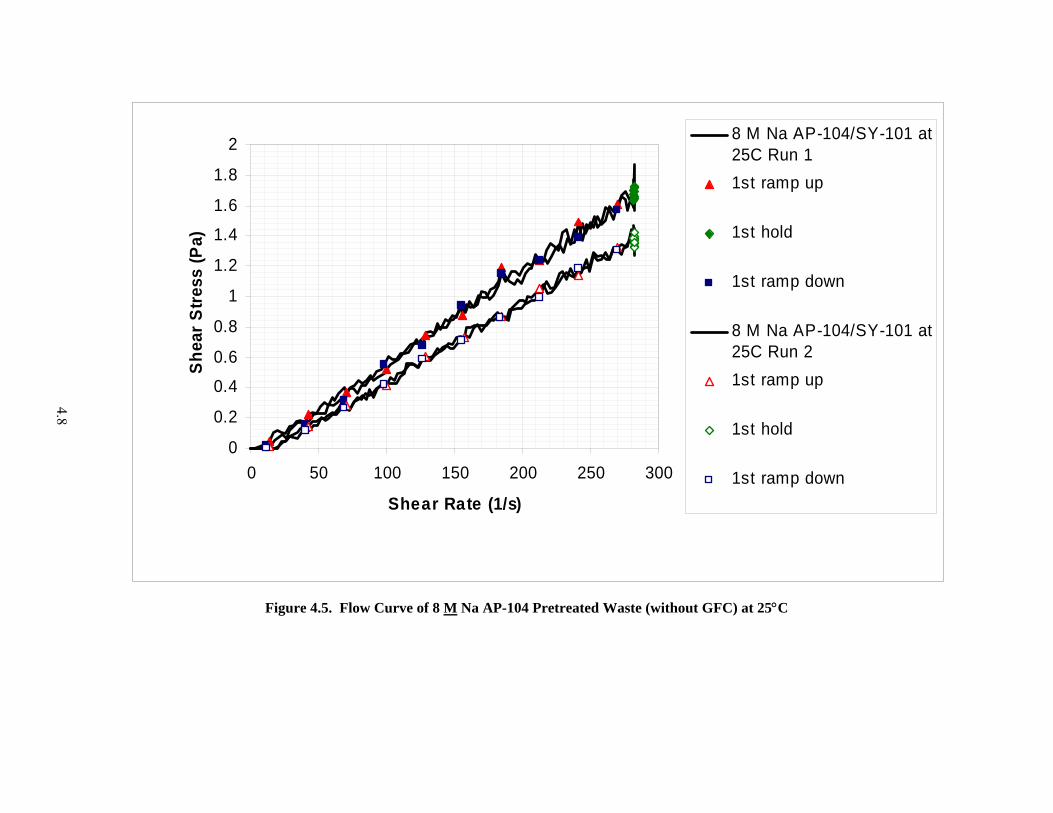
4.8
0
0.2
0.4
0.6
0.8
1
1.2
1.4
1.6
1.8
2
0 50 100 150 200 250 300
Shear Rate (1/s)
Shea
r St
ress
(Pa)
8 M Na AP-104/SY-101 at25C Run 11st ramp up
1st hold
1st ramp down
8 M Na AP-104/SY-101 at25C Run 21st ramp up
1st hold
1st ramp down
Figure 4.5. Flow Curve of 8 M Na AP-104 Pretreated Waste (without GFC) at 25°C

4.9
0
0.2
0.4
0.6
0.8
1
1.2
1.4
0 50 100 150 200 250 300
Shear Rate (1/s)
Shea
r Stre
ss (P
a)
8 M Na AP-104/SY-101 at40C Run 11st ramp up
1st hold
1st ramp down
8 M Na AP-104/SY-101 at40C Run 21st ramp up
1st hold
1st ramp down
Figure 4.6. Flow Curve of 8 M Na AP-104 Pretreated Waste (without GFC) at 40°C

4.10
0
0.5
1
1.5
2
2.5
3
3.5
0 50 100 150 200 250 300
Shear Rate (1/s)
Shea
r Stre
ss (P
a)
10 M Na AP-104/SY-101 at25C Run 11st ramp up
1st hold
1st ramp down
10 M Na AP-104/SY-101 at25C Run 21st ramp up
1st hold
1st ramp down
Figure 4.7. Flow Curve of 10 M Na AP-104 Pretreated Waste (without GFC) at 25°C

4.11
0
0.5
1
1.5
2
2.5
0 50 100 150 200 250 300
Shear Rate (1/s)
Shea
r Stre
ss (P
a)
10 M Na AP-104/SY-101 at40C Run 11st ramp up
1st hold
1st ramp down
10 M Na AP-104/SY-101 at40C Run 21st ramp up
1st hold
1st ramp down
Figure 4.8. Flow Curve of 10 M Na AP-104 Pretreated Waste (without GFC) at 40°C

4.12
Table 4.3. Rheological Model Fits for AP-104 Pretreated LAW at Various Concentrations and Temperatures
Model/model Parameter
6 M Na
at 25°C
6 M Na
at 40°C
8 M Na
at 25°C
8 M Na
at 40°C
10 M Na
at 25°C
10 M Na
at 40°C
Newtonian:
η – Newtonian viscosity (Pa⋅s) 0.003302 0.002178 0.005803 0.003968 0.01041 0.006605
R– correlation coefficient 0.995 0.9958 0.9969 0.9948 0.9993 0.9991
Ostwald (or Power Law):
m – the consistency coefficient (Pa⋅s-n) n/a n/a n/a n/a n/a n/a
n – the power law exponent n/a n/a n/a n/a n/a n/a
R– correlation coefficient n/a n/a n/a n/a n/a n/a
Bingham Plastic: BOτ - the Bingham yield stress (Pa) n/a n/a n/a n/a n/a n/a
ηp - the plastic viscosity (Pa⋅s) n/a n/a n/a n/a n/a n/a
R – correlation coefficient n/a n/a n/a n/a n/a n/a
Herschel-Bulkley: HOτ - the yield stress (Pa) n/a n/a n/a n/a n/a n/a
k - the Herschel-Bulkley consistency coefficient (Pa⋅s-b) n/a n/a n/a n/a n/a n/a
b - the Hershel-Bulkely power law exponent n/a n/a n/a n/a n/a n/a
R– correlation coefficient n/a n/a n/a n/a n/a n/a
n/a = not applicable (model fit has negative yield stress or power law exponent greater than unity)

4.13
4.3 Melter Feed
Rheograms for each of the AP-104 melter-feed samples show strong Newtonian behavior at all temperatures and concentrations (see Figure 4.9 through Figure 4.14). Results are summarized in Table 4.4. As expected, the viscosity of the 6 M Na suspension is significantly less than the viscosity of the 10 M Na suspension. This is caused by the higher concentration of GFC added to the 10 M Na sample and the higher viscosity of the 10 M Na pretreated waste. In addition, all suspensions showed strong temperature dependence. Fortunately, the settling rate for the melter feed suspensions was sufficiently slow during the analyses, and these melter feeds can be adequately modeled as a Newtonian fluid. Due to the observation of a slight degree of thixotropy, the last segment of each run (i.e., ramp-down) was used to determine flow characteristics. The large amount of undissolved solids in these samples results in significant signal noise. This signal noise significantly lowers the calculated correlation coefficients. However, the baseline trend in the flow curves are visually observed to be in good agreement with the calculated model fit values.

4.14
0
0.5
1
1.5
2
2.5
3
0 50 100 150 200 250 300
Shear Rate (1/s)
She
ar S
tres
s (P
a)6 M Na AP-104/SY-101Melter Feed at 25C Run 11st ramp up
1st hold
1st ramp down
6 M Na AP-104/SY-101Melter Feed at 25C Run 21st ramp up
1st hold
1st ramp down
Figure 4.9. Flow Curve of 6 M Na AP-104 Melter Feed (with GFC) at 25°C
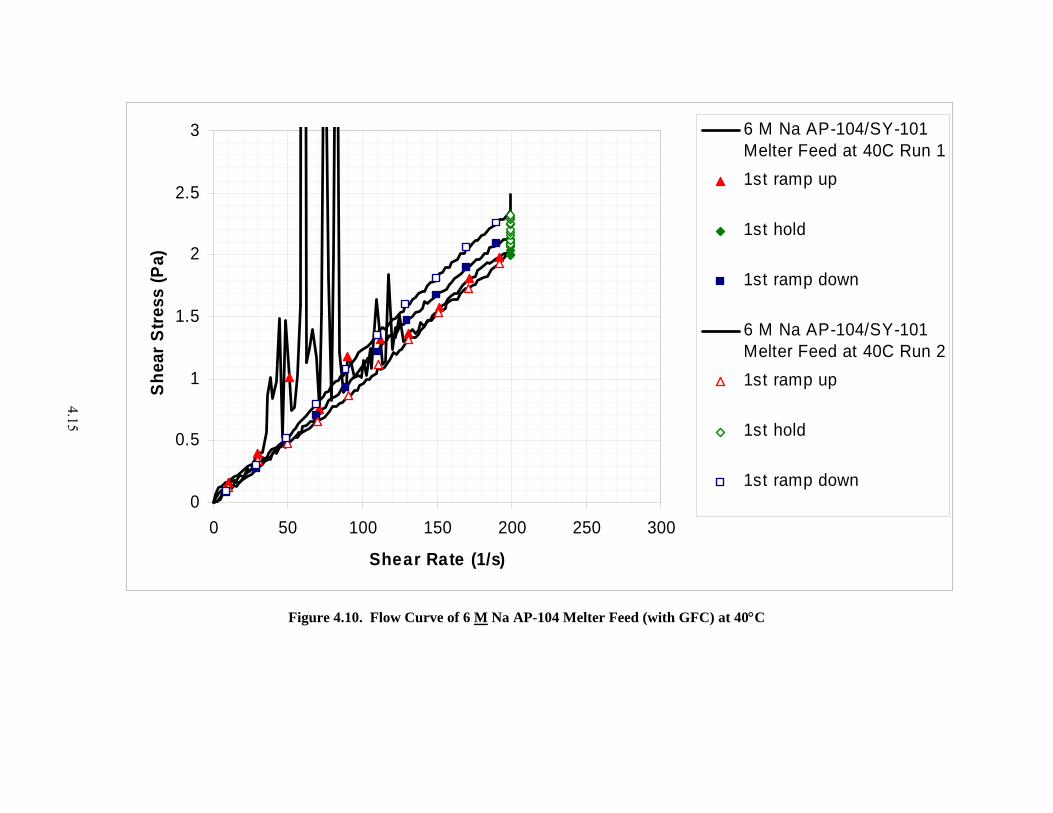
4.15
0
0.5
1
1.5
2
2.5
3
0 50 100 150 200 250 300
Shear Rate (1/s)
Shea
r Stre
ss (P
a)6 M Na AP-104/SY-101Melter Feed at 40C Run 11st ramp up
1st hold
1st ramp down
6 M Na AP-104/SY-101Melter Feed at 40C Run 21st ramp up
1st hold
1st ramp down
Figure 4.10. Flow Curve of 6 M Na AP-104 Melter Feed (with GFC) at 40°C

4.16
0
5
10
15
20
25
30
35
0 50 100 150 200 250 300
Shear Rate (1/s)
She
ar S
tress
(Pa)
8 M Na AP-104/SY-101Melter Feed at 25C Run 11st ramp up
1st hold
1st ramp down
8 M Na AP-104/SY-101Melter Feed at 25C Run 21st ramp up
1st hold
1st ramp down
Figure 4.11. Flow Curve of 8 M Na AP-104 Melter Feed (with GFC) at 25°C

4.17
0
5
10
15
20
25
30
35
0 50 100 150 200 250 300
Shear Rate (1/s)
She
ar S
tress
(Pa)
8 M Na AP-104/SY-101Melter Feed at 40C Run 11st ramp up
1st hold
1st ramp down
8 M Na AP-104/SY-101Melter Feed at 40C Run 21st ramp up
1st hold
1st ramp down
Figure 4.12. Flow Curve of 8 M Na AP-104 Melter Feed (with GFC) at 40°C

4.18
0
10
20
30
40
50
60
70
80
90
100
0 50 100 150 200 250 300
Shear Rate (1/s)
Shea
r Stre
ss (P
a)
10 M Na AP-104/SY-101Melter Feed at 25C Run 11st ramp up
1st hold
1st ramp down
10 M Na AP-104/SY-101Melter Feed at 25C Run 21st ramp up
1st hold
1st ramp down
Figure 4.13. Flow Curve of 10 M Na AP-104 Melter Feed (with GFC) at 25°C

4.19
0
10
20
30
40
50
60
70
80
90
0 50 100 150 200 250 300
Shear Rate (1/s)
Shea
r Str
ess
(Pa)
10 M Na AP-104/SY-101Melter Feed at 40C Run 11st ramp up
1st hold
1st ramp down
10 M Na AP-104/SY-101Melter Feed at 40C Run 21st ramp up
1st hold
1st ramp down
Figure 4.14. Flow Curve of 10 M Na AP-104 Melter Feed (with GFC) at 40°C

4.20
Table 4.4. Rheological Model Fits for AP-104 LAW Melter Feed at Various Concentrations and Temperatures
Model/model Parameter
6 M Na
at 25°C
6 M Na
At 40°C
8 M Na
at 25°C
8 M Na
at 40°C
10 M Na
at 25°C
10 M Na
at 40°C
Newtonian:
η – Newtonian viscosity (Pa⋅s) 0.01141 0.00998 0.04893 0.03499 0.09835 0.05914
R– correlation coefficient 0.9803 0.9986 0.8703 0.8886 0.9982 0.3818
Ostwald (or Power Law):
m – the consistency coefficient (Pa⋅s-n) 0.0116 n/a 0.3069 0.1619 n/a 0.4773
n – the power law exponent 0.9966 n/a 0.6286 0.6904 n/a 0.5765
R– correlation coefficient 0.9804 n/a 0.9318 0.9241 n/a 0.4912
Bingham Plastic:
BOτ - the Bingham yield stress (Pa) 0.071 n/a 1.408 0.9537 n/a 3.211
ηp - the plastic viscosity (Pa⋅s) 0.01088 n/a 0.03838 0.02788 n/a 0.03504
R– correlation coefficient 0.9819 n/a 0.9181 0.9299 n/a 0.6285
Herschel-Bulkley:
HOτ - the yield stress (Pa)
n/a n/a n/a n/a n/a n/a
k - the Herschel-Bulkely consistency coefficient (Pa⋅s -b) n/a n/a n/a n/a n/a n/a
b - the Hershel-Bulkely power law exponent n/a n/a n/a n/a n/a n/a
R– correlation coefficient n/a n/a n/a n/a n/a n/a
n/a = not applicable (model fit has negative yield stress or power law exponent greater than unity)

4.21
4.4 Mixing/Aging
This section describes rheological measurements performed on 8 M AP-104 melter-feed material that was mixed for a week with selected measurements performed after 1 hour, 1 day, and 1 week of mixing. GFC, as formulation LAWA44, were added to an 8 M Na AP-104 pretreated LAW sample with target quantities consistent with Table 2.1. The sample was then mixed with the impeller system discussed in Section 2.2 for a period of 1 hour at ambient temperature (~23°C). The rheology of this sample was then measured at 25°C and 40°C. The remaining sample continued to mix for a period of 1 day. The rheology was again measured at 25°C and 40°C. Finally, the remainder of the sample continued to mix for a period of 6 additional days (total of 1 week). The rheology was then measured a third time. Figure 4.15 through Figure 4.20 present the mixing/aging rheograms at 25ºC and 40ºC over 1-hour, 1-day, and 1-week intervals. Deionized water was added to these samples to keep a constant volume while mixing, thus minimizing changes due to evaporation. The rheological parameters from the mixing/aging phase of the AP-104 melter feed characterization can be found in Table 4.5.
The mixing/aging samples can again be characterized as Newtonian fluids. When compared with the
results presented in Table 4.4, the mixing and aging samples posses significantly lower viscosities. This is likely attributable to sample preparation differences. A small difference in solids loading can result in significant rheological differences. Throughout the mixing/aging study, the rheological properties remained at relatively constant values, indicating good shear stability.

4.22
0
1
2
3
4
5
6
0 50 100 150 200 250 300
Shear Rate (1/s)
Shea
r Stre
ss (P
a)1 hr, 8 M Na AP-104/SY-101 MelterFeed at 25C Run 1
1st ramp up
1st hold
1st ramp dow n
1 hr, 8 M Na AP-104/SY-101 MelterFeed at 25C Run 2
1st ramp up
1st hold
1st ramp dow n
Figure 4.15. Flow Curve of 8 M Na AP-104 Melter Feed (1-hour mixing with GFC) at 25°C

4.23
0
1
2
3
4
5
6
0 50 100 150 200 250 300
Shear Rate (1/s)
She
ar S
tres
s (P
a)1 hr, 8 M Na AP-104/SY-101Melter Feed at 40C Run 11st ramp up
1st hold
1st ramp down
1 hr, 8 M Na AP-104/SY-101Melter Feed at 40C Run 21st ramp up
1st hold
1st ramp down
Figure 4.16. Flow Curve of 8 M Na AP-104 Melter Feed (1-hour mixing with GFC) at 40°C
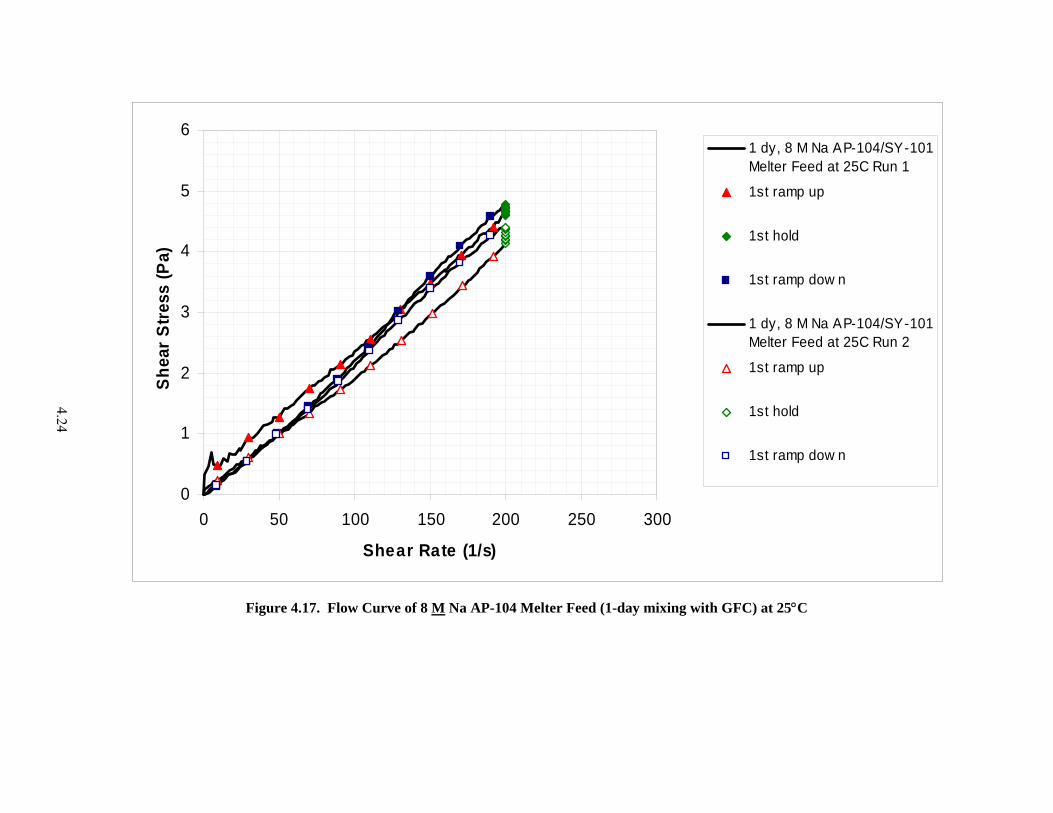
4.24
0
1
2
3
4
5
6
0 50 100 150 200 250 300
Shear Rate (1/s)
Shea
r Stre
ss (P
a)1 dy, 8 M Na AP-104/SY-101Melter Feed at 25C Run 1
1st ramp up
1st hold
1st ramp dow n
1 dy, 8 M Na AP-104/SY-101Melter Feed at 25C Run 2
1st ramp up
1st hold
1st ramp dow n
Figure 4.17. Flow Curve of 8 M Na AP-104 Melter Feed (1-day mixing with GFC) at 25°C
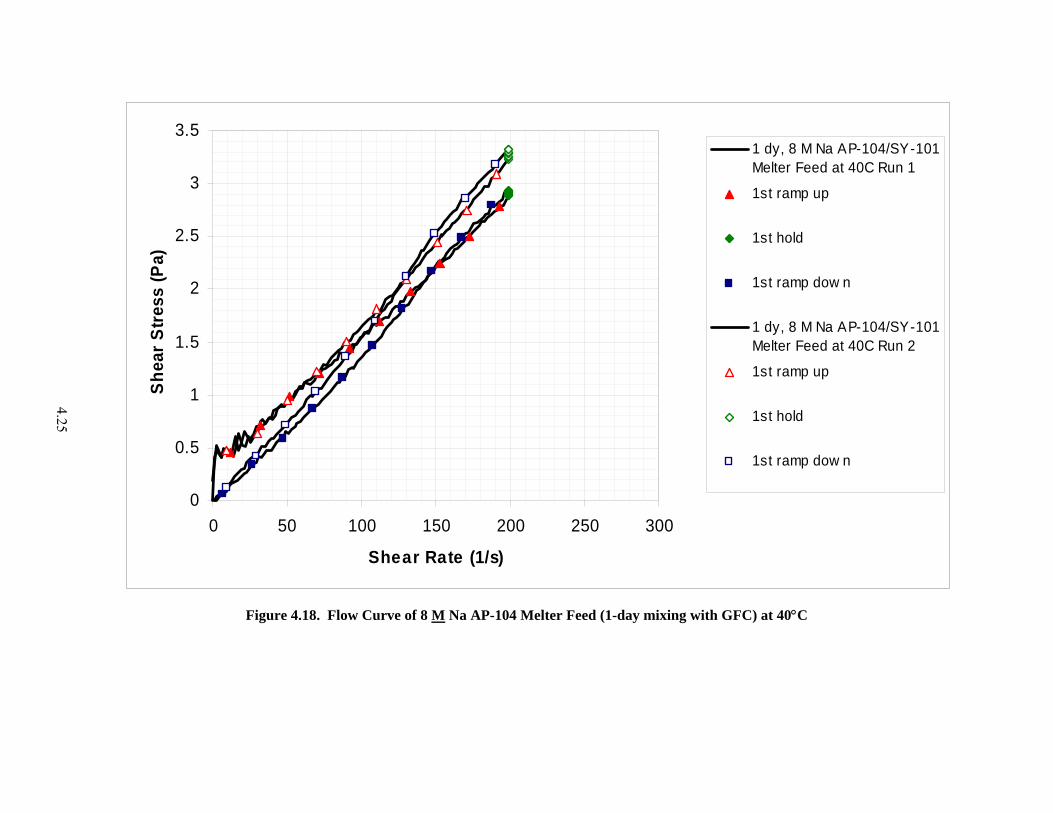
4.25
0
0.5
1
1.5
2
2.5
3
3.5
0 50 100 150 200 250 300
Shear Rate (1/s)
She
ar S
tres
s (P
a)1 dy, 8 M Na AP-104/SY-101Melter Feed at 40C Run 1
1st ramp up
1st hold
1st ramp dow n
1 dy, 8 M Na AP-104/SY-101Melter Feed at 40C Run 2
1st ramp up
1st hold
1st ramp dow n
Figure 4.18. Flow Curve of 8 M Na AP-104 Melter Feed (1-day mixing with GFC) at 40°C

4.26
0
0.5
1
1.5
2
2.5
3
3.5
4
4.5
5
0 50 100 150 200 250 300
Shear Rate (1/s)
Shea
r St
ress
(Pa)
1 w k, 8 M Na AP-104/SY-101Melter Feed at 25C Run 1
1st ramp up
1st hold
1st ramp dow n
1 w k, 8 M Na AP-104/SY-101Melter Feed at 25C Run 2
1st ramp up
1st hold
1st ramp dow n
Figure 4.19. Flow Curve of 8 M Na AP-104 Melter Feed (1-week mixing with GFC) at 25°C

4.27
0
0.5
1
1.5
2
2.5
3
3.5
4
4.5
0 50 100 150 200 250 300
Shear Rate (1/s)
Shea
r Stre
ss (P
a)1 w k, 8 M Na AP-104/SY-101Melter Feed at 40C Run 1
1st ramp up
1st hold
1st ramp dow n
1 w k, 8 M Na AP-104/SY-101Melter Feed at 25C Run 2
1st ramp up
1st hold
1st ramp dow n
Figure 4.20. Flow Curve of 8 M Na AP-104 Melter Feed (1-week mixing with GFC) at 40°C

4.28
Table 4.5. Rheological Model Fits for AP-104 LAW Melter Feed at Various Mixing Durations and Temperatures
Model/model Parameter
8 M Na
at 25°C
1 Hour Mixing
8 M Na
at 40°C
1 Hour Mixing
8 M Na
at 25°C
1 Day Mixing
8 M Na
at 40°C
1 Day Mixing
8 M Na
at 25°C
1 Week Mixing
8 M Na
at 40°C
1 Week Mixing
Newtonian:
η – Newtonian viscosity (Pa⋅s) 0.02769 0.01744 0.02341 0.01442 0.02241 0.01418
R – correlation coefficient 0.9989 0.9992 0.9965 0.9969 0.9985 0.9958
Ostwald (or Power Law):
M – the consistency coefficient (Pa⋅s-n) n/a n/a n/a n/a n/a n/a
N – the power law exponent n/a n/a n/a n/a n/a n/a
R – correlation coefficient n/a n/a n/a n/a n/a n/a
Bingham Plastic:
BOτ - the Bingham yield stress (Pa)
n/a n/a n/a n/a n/a n/a
ηp - the plastic viscosity (Pa⋅s) n/a n/a n/a n/a n/a n/a
R – correlation coefficient n/a n/a n/a n/a n/a n/a
Herschel-Bulkley:
HOτ - the yield stress (Pa)
n/a n/a n/a n/a n/a n/a
K - the Herschel-Bulkely consistency coefficient (Pa⋅s-b) n/a n/a n/a n/a n/a n/a
B - the Hershel-Bulkely power law exponent n/a n/a n/a n/a n/a n/a
R – correlation coefficient n/a n/a n/a n/a n/a n/a
n/a = not applicable (model fit has negative yield stress or power law exponent greater than unity).

4.29
The pH of the melter feed was also measured during the mixing/aging portion of the study. Results of these measurements are shown in Table 4.6. The pH of the 1-hr and 1-day samples are consistent with the reported value of 11.5 (see Section 3.4.1). However, the 1-week mixed sample shows an increase of nearly a full pH unit. This indicates the presence of a slow reaction process occurring over the 1-week time frame. This reaction may have been facilitated by the application of constant stirring. Nonetheless, the rheological parameters appear to be relatively unaffected by this increase in pH.
Table 4.6. pH of Mixed/Aged 8 M Na AP-104 Melter Feed
pH at ambient
1-hour after GFC addition
1-day after GFC addition
1-week after GFC addition
11.4 11.4 12.3
4.4.1 Settled Solids At the conclusion of the mixing/aging study, the sample was allowed to settle for 1 week, and the
supernate was decanted. After an intermediate shear strength measurement (see Section 5.0), the sample was homogenized, and rheological measurements were performed. Several shear-rate ramps were performed on the sample material to assess the degree of thixotropy (or time-dependence) of the material. These measurements exhibit significant thixotropy at both 25ºC and 40ºC. This is seen by the fact that successive runs on the sample material result in significantly lower rheological parameters. Physically, this indicates that a weak structure may have formed in the settled solids sample. As the material is brought to a relatively high shear in the viscometer, the structure breaks down, lowering the initial measured rheological properties (Barnes 1997). As the material is sheared multiple times, the flow curves become repeatable, and a steady-state flow curve can be observed. See Figure 4.21and Figure 4.22 for flow curves at 25°C and 40°C, respectively. Table 4.7 presents the rheological model fits for these data. These data indicate that the settled solids can be characterized as Newtonian or slightly Bingham plastic fluids with measured viscosities in the 250 to 500 cP range. These fluids are relatively viscous and would present processing problems if the melter feed suspensions are allowed to settle in the WTP.

4.30
0
20
40
60
80
100
120
140
160
0 50 100 150 200 250 300
Shear Rate (1/s)
Shea
r St
ress
(Pa)
Settled Solids, 8 M Na AP-104/SY-101 Melter Feed at 25C Run 1
1st ramp up
1st hold
1st ramp dow n
Settled Solids, 8 M Na AP-104/SY-101 Melter Feed at 25C Run 2
1st ramp up
1st hold
1st ramp dow n
Figure 4.21. Flow Curve of 8 M Na AP-104 Melter Feed Settled Solids (with GFC) at 25°C

4.31
0
20
40
60
80
100
120
140
160
0 50 100 150 200 250 300
Shear Rate (1/s)
Shea
r St
ress
(Pa)
Settled Solids, 8 M Na AP-104/SY-101 Melter Feed at 40C Run 1
1st ramp up
1st hold
1st ramp dow n
Settled Solids, 8 M Na AP-104/SY-101 Melter Feed at 40C Run 2
1st ramp up
1st hold
1st ramp dow n
Figure 4.22. Flow Curve of 8 M Na AP-104 Melter Feed Settled Solids (with GFC) at 40°C

4.32
Table 4.7. Rheological Model Fits for AP-104 LAW Melter Feed at Various Concentrations and Temperatures
Model/model Parameter
8 M Na
at 25°C
8 M Na
at 40°C
Newtonian:
η – Newtonian viscosity (Pa⋅s) 0.4617 0.2588
R– correlation coefficient 0.9983 0.9990
Ostwald (or Power Law):
m – the consistency coefficient (Pa⋅s-n) 0.6379 0.3207
n – the power law exponent 0.9389 0.9595
R– correlation coefficient 0.9992 0.9994
Bingham Plastic: BOτ - the Bingham yield stress (Pa) 4.003 1.629
ηp - the plastic viscosity (Pa⋅s) 0.4402 0.25
R– correlation coefficient 0.9999 0.9999
Herschel-Bulkley: HOτ - the yield stress (Pa) n/a n/a
k - the Herschel-Bulkely consistency coefficient (Pa⋅s -b) n/a n/a
b - the Hershel-Bulkely power law exponent n/a n/a
R– correlation coefficient n/a n/a
n/a = not applicable (model fit has negative yield stress or power law exponent greater than unity)

5.1
5.0 Shear Strength According to Guidelines for Performing Chemical, Physical, and Rheological Properties
Measurements (24590-WTP-GPG-RTD-001 Rev 0), the shear strength is defined as the minimum stress required to initiate fluid movement as determined by the vane method. Materials that possess a shear strength exhibit solid-like behavior at low stresses and fluid-like behavior at high stresses. During the solid-like behavior, the material behaves elastically, where a material will strain to a point at a given stress. When the stress is removed in the elastic regime, the material will return to its initial state. The shear strength is regarded as the transition between the elastic behavior and viscous flow.
At sufficiently high solids concentrations, solid/liquid multiphase systems usually exhibit a shear
strength. In these systems, the solid particles are usually attracted to each other through electrostatic forces. This creates a network of attracted particles (e.g., a flocculated structure) that can impede viscous flow at low stresses. Viscous flow is achieved when the applied stress is high enough to break apart the structure. Examples of materials that exhibit shear strength include cements, soils, paints, pastes, and various food products (Liddell and Boger 1996).
Many methods have been developed to evaluate yield stress. These methods produce varying results
based on the rheological technique and assumptions used in the evaluation. To explain these variations, the concept of static and dynamic yield stress is introduced (Figure 5.1). Static and dynamic yield stresses can be explained by assuming that there are two structures present in fluids that exhibit yield stress. One structure is insensitive to shear rate and defines the dynamic yield stress associated with a flow curve. This dynamic yield stress is found by extrapolating data from a conventional rheogram (i.e., shear stress/shear rate) to zero shear rate. The extrapolation can be made with the curve fitted rheological model equations.
Shear Rate
Shea
r Str
ess
Dynamic Yield Stressor "Bingham Plastic Yield Index"
Static Yield Stressor "Shear Strength"
Figure 5.1. Rheogram Illustrating the Concept of Dynamic and Static Yield Stress
However, a secondary weak network structure is also present that forms while the fluid is at rest. The
second structure is sensitive to shear rate and breaks down as the fluid is sheared. Combined, these two stresses define the static yield-stress value. The use of a rheogram to measure this secondary structure

5.2
requires accurate experimental data at low shear rates. Due to slip flow, inertial effects, etc., this is often difficult with conventional viscometers. Consequently, direct measurement of static yield stress or shear strength using a shear vane has been developed.
Use of the static and dynamic yield-stress values varies with application. For instance, the dynamic
yield-stress value extrapolated from a rheogram should be used when performing pipeline head-loss calculations. The static yield stress should be used for process restart applications where the secondary structure could form while the fluid is at rest. Static yield stress or shear strength can be directly measured using a shear-vane technique. Since shear-strength values are discussed in this section, values of shear strength for common food items as measured by the vane method are given in Table 5.1. This table should provide a reference point for the magnitude of shear-strength values discussed in this section.
Table 5.1. Shear Strength of Various Common Materials
Material Shear Strength (Pa) Baby food, peaches 22.9 ± 3.4 Spaghetti sauce, Brand B 24.8 ± 3.4 Spaghetti sauce, Brand A 26.3 ± 4.5 Tomato puree, Brand B 30.0 ± 4.2 Baby food, pears 31.8 ± 5.0 Tomato puree, Brand A 34.4 ± 3.7 Tomato ketchup, Brand B 43.2 ± 3.4 Apple sauce, Brand B 48.2 ± 4.7 Tomato ketchup, Brand A 51.3 ± 5.0 Baby food, carrots 64.0 ± 4.0 Apple sauce, Brand A 77.3 ± 0.0 Mustard, Brand A 82.5 ± 5.3 Mustard, Brand B 103.8 ± 5.0 Mayonnaise, Brand B 163.8 ± 4.2 Mayonnaise, Brand A 204.4 ± 5.0
5.1 Measurement Equipment and Theory
Direct measurement of shear strength can be made by slowly rotating a vane immersed in the sample material and measuring the resulting torque as a function of time. The torque can be converted to a shear stress by making several assumptions (Liddell and Boger 1996). Firstly, the material is assumed to be sheared only along the cylinder defined by the dimensions of the vane. This assumption has been shown to be only a slight oversimplification. The actual diameter of the sheared surface may be up to 5% larger than the vane dimensions (Bowles 1977, p. 99; Keentok 1982; Keentok et al. 1985). Secondly, it is assumed that the stress is distributed uniformly over the cylindrical sheared surface. Although the stress actually peaks sharply at the vane tips (Barnes and Carnali 1990; Keentok et al. 1985), it has been shown that the error due to this assumption is minimal (Alderman et al. 1991; Avramidis and Turain 1991; James

5.3
et al. 1987; Nguyen and Boger 1985a; Nguyen and Boger 1985b; Nguyen and Boger 1983). Therefore, a good approximation of the measured stress can be calculated from Equation 5.1 where K is the vane constant defined in Equation 5.2.
KT /=τ (5.1)
⎟⎠⎞
⎜⎝⎛ +=
31
2
3
DHDK π (5.2)
where τ = calculated shear strength (Pa)
T = Measured maximum torque (Nm)K = shear vane constant (m3) D = shear vane diameter (m) H = shear vane height (m).
In addition, the shear vane must be immersed in the test material such that wall and end effects are
negligible. Figure 5.2 shows an accepted material testing geometry to minimize wall and end effects (Dzuy and Boger 1985). These geometry requirements were confirmed before material testing.
D
DT
Z1
Z2
H
N (rpm)
H/D < 3.5DT/D >2.0
Z1/D >1.0
Z2/D > 0.5
Figure 5.2. Geometrical Requirements of a Shear Vane
A typical stress-time profile is shown in Figure 5.3. The profile shows an initial linear region,
followed by a non-linear region, a stress maximum, and a stress-decay region. The shape of the stress-time profile can be explained from a consideration of the network bonds within the material. The initial linear region represents the elastic deformation of the network bonds. The non-linear region represents

5.4
viscoelastic flow (also called creep flow), where the network bonds are stretched beyond their elastic limit, and some of the bonds begin to break. The linear and non-linear regions are separated by point τy. At the maximum stress, τs, the majority of the bonds are stretched to their limits. When further strain is applied, the bonds are broken and the material begins to flow as a fully viscous fluid. The network typically collapses, and stress decay is observed.
Figure 5.3. Typical Response of a Shear Vane
From this response, two shear strengths can be defined, one corresponding to the transition between
elastic and viscoelastic flow, τy, and the other corresponding to the transition between viscoelastic and fully viscous flow, τs. Most researchers regard the transition between viscoelastic and fully viscous flow as the definitive shear strength of the material. In this report, shear strength will be defined by the transition between viscoelastic and fully viscous flow, τs.
5.2 System Validation and Calibration
Initially, a viscosity standard was measured in a cup/cylinder geometry on the Haake M5 rheometer. While this does not implicitly test the vane geometry, it ensures that the torque detection system used by the viscometer is functioning and calibrated properly. As expected, Newtonian behavior of the standard was observed with a measured viscosity within the allowable 10% value specified in PNWD Test Instruction TI-RPP-WTP-246, “AP-104/SY-101 (Envelope A) LAW Melter Feed and Rheology Testing” and is typical of this particular viscometer model.
5.3 Results from Shear-Strength Measurements
With the calibration of the Haake RS300 rheometer established, shear-strength measurements were taken on the settled solids from the 6, 8, and 10 M Na melter-feed samples. The shear vanes were immersed in the settled solids according to the geometrical requirements outlined in Figure 5.2. The
Time
Shea
r Str
engt
h (P
a) τ s
τ y
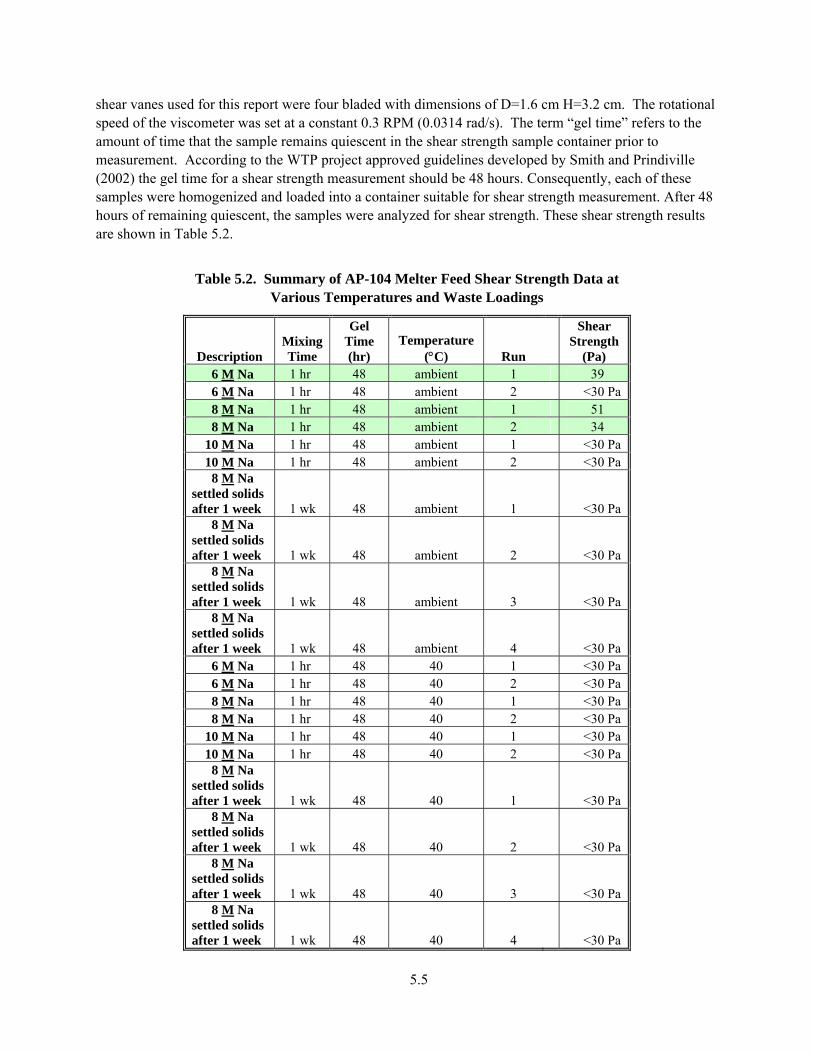
5.5
shear vanes used for this report were four bladed with dimensions of D=1.6 cm H=3.2 cm. The rotational speed of the viscometer was set at a constant 0.3 RPM (0.0314 rad/s). The term “gel time” refers to the amount of time that the sample remains quiescent in the shear strength sample container prior to measurement. According to the WTP project approved guidelines developed by Smith and Prindiville (2002) the gel time for a shear strength measurement should be 48 hours. Consequently, each of these samples were homogenized and loaded into a container suitable for shear strength measurement. After 48 hours of remaining quiescent, the samples were analyzed for shear strength. These shear strength results are shown in Table 5.2.
Table 5.2. Summary of AP-104 Melter Feed Shear Strength Data at Various Temperatures and Waste Loadings
Description Mixing Time
Gel Time (hr)
Temperature (°C) Run
Shear Strength
(Pa) 6 M Na 1 hr 48 ambient 1 39 6 M Na 1 hr 48 ambient 2 <30 Pa 8 M Na 1 hr 48 ambient 1 51 8 M Na 1 hr 48 ambient 2 34
10 M Na 1 hr 48 ambient 1 <30 Pa 10 M Na 1 hr 48 ambient 2 <30 Pa 8 M Na
settled solids after 1 week 1 wk 48 ambient 1 <30 Pa
8 M Na settled solids after 1 week 1 wk 48 ambient 2 <30 Pa
8 M Na settled solids after 1 week 1 wk 48 ambient 3 <30 Pa
8 M Na settled solids after 1 week 1 wk 48 ambient 4 <30 Pa
6 M Na 1 hr 48 40 1 <30 Pa 6 M Na 1 hr 48 40 2 <30 Pa 8 M Na 1 hr 48 40 1 <30 Pa 8 M Na 1 hr 48 40 2 <30 Pa
10 M Na 1 hr 48 40 1 <30 Pa 10 M Na 1 hr 48 40 2 <30 Pa 8 M Na
settled solids after 1 week 1 wk 48 40 1 <30 Pa
8 M Na settled solids after 1 week 1 wk 48 40 2 <30 Pa
8 M Na settled solids after 1 week 1 wk 48 40 3 <30 Pa
8 M Na settled solids after 1 week 1 wk 48 40 4 <30 Pa

5.6
The shear-strength results indicate that the AP-104 melter feed can be characterized as having a small
shear strength at all sodium concentrations and temperatures. The largest shear strength measured was 51 Pa in the 8 M Na sample at ambient temperature. The majority of the other measurements were below 30 Pa. This 30 Pa threshold corresponds to 1% of the torque scale of the M5 rheometer. Measurements below this torque possess a relatively high degree of process noise. For these reasons, the shear strength results are given as “<30 Pa.” when measured less than 30 Pa
A precipitate was observed to be forming during shear-strength sample preparation when free-
standing supernate was decanted from the settled-solids layer. The decanted supernate was placed in individual glass scintillation vials. A precipitate was observed to be forming in the vials of decanted supernate as shown in Figure 5.4. The precipitate appeared to form a crust on the air/liquid interface over a period of several days. The red coloration of the decanted superante in Figure 5.4 is likely colloidal iron oxide from the GFC addition.
Figure 5.4. Precipitate Crust Observed from Decanted AP-104 Envelope A Melter Feed Supernate

6.1
6.0 Particle-Size Distribution The particle-size distributions (PSDs) of the 6 M Na melter feed sample that was mixed for 1 hour
after GFC addition is described in this section. A Malvern MS-2000 particle-size analyzer was used to measure the PSD of this sample.
6.1 Instrument Description
The Malvern MS-2000 particle-size analyzer measures particle diameter by scattered light from a laser beam projected through a stream of the sample particles diluted in a suspending medium. The amount and direction of light scattered by the particles is measured by an optical detector array and then analyzed to determine the size distribution of the particles. This measurement is limited to particles with diameters between 0.02 and 2000 µm.
6.2 Calibration Checks
The performances of both instruments were checked against a NIST traceable standard from Whitehouse Scientific. This standard consists of silica microspheres dispersed in deionized water. This standard was run as a calibration check before the sample was analyzed. Results from these standard tests are presented in Table 6.1. To check the functionality of the instrument, a close fit of the D50 value is typically required (approximately 3% of the certified range of values). The D50 value represents the particle diameter where 50% of the particles are smaller than this value. The D10 and D90 values represent the particle diameter where 10% and 90% of the particles are smaller than these values, respectively, and are used to quantify the edges of the total distribution. The instrument calibration was verified when the measured D50 value was within the range of the NIST-certified values.
Table 6.1. Particle-Size Analyzer Calibration Data
NIST Traceable Particle-Size Standard
(Whitehouse Scientific; Lot No. PS212-0021)
Measured Diameter
(µm) Acceptable Range (µm)
Coefficient of Variation Between Five Runs
D10 25.25 25.37 ± 3.35 0.06%
D50 41.75 41.26 ± 5.50 0.07%
Mal
vern
MS-
2000
D90 68.18 62.93 ± 6.23 0.09%

6.2
6.3 Operating Conditions
The PSD of the 6 M Na melter-feed sample was measured in the Malvern MS-2000 at a pump rotational rate high enough to mobilize the sample but low enough to minimize bubble entrainment. The pump rotational speed has an effect on the resulting PSD by applying shearing forces to agglomerated particles. The shearing forces break apart agglomerates such that the primary PSD can be measured. The higher the pump speed, the more shearing forces are applied. Higher pump speeds also increase the chance for bubble entrainment, which results in erroneous measurements. Further deagglomeration can be achieved through sonication. The samples were sonicated with two progressively increasing levels of ultrasonic waves (25% setting and 50% setting) for a period of 30 seconds. The PSD 30 seconds after sonication was then measured for each level. The ultrasonic energy input is used to determine the shear sensitivity of the slurry to investigate whether flocculation/deagglomeration is occurring. Analyses were repeated on five separate samples under all flow/sonication conditions.
6.4 Suspending Medium
The suspending medium should be chosen such that the PSD is not altered through particle dissolution. An initial attempt was made to use decanted supernate from the melter feed as the suspending medium. However, solids were precipitating in the supernate as discussed in Section 5. These solids coated the glass window and lead to degradation of the signal from the instrument laser. Unfortunately, particle size measurements could not be produced in this suspending medium.
A second suspending medium, 0.01 M NaOH, for the AP-104 analyses was employed. This medium
was selected to keep the pH close to the measured values of 11 to 12 and will lower the chance of the suspending medium altering the particle size distribution of the sample. However, due to the low amount of dissolved solids in this medium, sample dissolution is expected. Sample dissolution can be experimentally observed by changing particle size distribution as a function of time. Fortunately, the particle size measurements presented in this report appeared stable with respect to time.
6.5 Results
The PSD summary of the five samples in the flow cell circulating at sonication levels of 0%, 25%, and 50% are shown in Table 6.2. The D10, D50, and D90 values along with the associated coefficient of variation between these five subsamples are presented. A target value for the coefficient of variation of 15% for the D10 and D90 values and 10% for the D50 value should indicate little variation between subsamples. These target values were achieved at all sonication levels, but the coefficient of variation is smallest at a sonication level of 50%.

6.3
Table 6.2. Summary of Volume PSD Data
Sonication Level D10
(µm) Coefficient
of Variation D50
(µm) Coefficient
of Variation D90
(µm) Coefficient
of Variation 0% 1.9 4.8% 21.2 6.8% 178.7 5.7%
25% 1.9 11.3% 17.3 3.7% 63.3 4.1%
50% 1.9 3.8% 16.8 0.4% 59.8 0.3%
Because of the repeatability between five subsamples, the 50% sonication measurements should be
considered the fundamental PSD. The average PSD for each sonication level is shown in Figure 6.1. From this figure, one can see that as the level of sonication increases, the quantity of large particles decreases, and the quantity of small particles increases. Four modes can be seen in the fundamental PSD. Inflection points indicating relatively small modes dominated by larger modes are seen at approximately 0.7 µm and 5 µm. A large peak is seen at 30 µm. A small fourth peak is observed at approximately 200 µm. The cumulative PSD is shown in Figure 6.2. This representation of the particle-size measurements indicates that the D95 value for the fundamental distribution is approximately 150 µm. The D95 value is commonly used as a conservative value of particle size for various engineering calculations.

6.4
0
1
2
3
4
5
6
0.01 0.1 1 10 100 1000 10000Particle Size (microns)
Volu
me
Perc
ent
0% Sonication 25% Sonication 50% Sonication
Figure 6.1. Average PSD of 6 M Na AP-104 Envelope A Melter Feed at Varying Levels of Sonication

6.5
0
10
20
30
40
50
60
70
80
90
100
0.1 1 10 100 1000Particle Size (microns)
Volu
me
Perc
ent
0% Sonication 25% Sonication 50% Sonication
Figure 6.2. Average Cumulative PSD of 6 M Na AP-104 Envelope A Melter Feed at Varying Levels of Sonication

7.1
7.0 Conclusions A sample of AP-104 pretreated LAW sample was received at an initial sodium concentration of
5.0 M. The sample was concentrated to 6 M, 8 M, and 10 M Na. Physical-properties analyses on these samples indicate a density ranging from 1.26 to 1.43 g/mL with dissolved-solids contents ranging from 33% to 48% and pH ranging from 13.8 to 14.2 as concentration increases from 6 M to 10 M Na. A slight amount of precipitated solids was observed in these samples. Flow curves from these samples indicate that the fluid is characterized as a Newtonian fluid with the maximum measured viscosity of 10.4 cP at 10 M Na and 25°C.
When glass-former chemicals were added to the AP-104 pretreated LAW, the pH of the solution
dropped from the 13.8 to 14.2 range to an 11.1 to 11.6 range as Na concentration increased from 6 M to 10 M. This is most likely caused by the relatively large quantity of boric acid in the LAWA44 melter feed formulation. Such a large change in pH can result in significant solids precipitation. This solids precipitation was observed in a crust that formed on the surface of decanted AP-104 supernate. The supernate was separated from the settled-solids layer for shear-strength analysis. Shear-strength analysis on the solids layer that settled for 2 days revealed a low strength material with a maximum measured shear strength of 51 Pa in the 8 M Na melter feed sample at ambient temperature.
The settling behavior of the AP-104 LAW melter feed can be characterized as “zone” or “hindered”
settling. Depending on tank volume in the WTP, settling experiments indicate that a high-solids-loading settled-solids layer can form 24 hours after loss of agitation. This indicates that an operational constraint of several hours is required as the maximum time before slurry mobilization becomes extremely difficult in an unagitated tank.
After settling for 72 hours, the volume fraction of settled solids decreases as the temperature
increases. This behavior is most likely caused by tighter particle packing as a result of particle dissolution at elevated temperatures. Physical properties testing reveals that, as expected, the quantity of total and UDS increases with sodium concentration. This is caused by the increased quantity of GFC required for the melter-feed formulation at higher sodium concentrations. When the temperature is increased from 25°C to 40°C, the insoluble GFC appear to dissolve slightly. This is reflected by the increasing dissolved-solids content and decreasing undissolved-solids content as the temperature increases at each sodium concentration.
At low sodium concentrations, AP-104 LAW melter feed exhibits Newtonian rheological behavior.
At 6 M Na at 25°C, the Newtonian viscosity at the low range was approximately 11 cP. At 8 M Na at 25°C, the Newtonian viscosity was approximately 49 cP while the 10 M Na melter feed at 25°C possessed a Newtonian viscosity of approximately 98 cP. A fluid of this viscosity is expected to be difficult to process in the WTP.
During the mixing/aging test with the 8 M Na AP-104 melter feed, the fluid appears slightly
thixotropic. This thixotropy is most likely caused by a combination of precipitated solids that formed during the mixing/aging test process and particle erosion. During the mixing/aging test, the steady-state rheology of the fluid remained Newtonian with relatively low viscosities compared to the baseline measurements at the same sodium molarity.

7.2
The rheology of the 8 M Na melter feed settled solids appeared more thixotropic than the mixing/aging samples. The steady state flow curve reveals Newtonian behavior that is extremely temperature sensitive. Viscosities were measured at 460 cP at 25°C and 260 cP at 40°C.
The PSD of a 6 M Na melter feed sample was measured. Four modes can be seen in the fundamental
PSD. Inflection points indicating relatively small modes dominated by larger modes are seen at approximately 0.7 µm and 5 µm. A large peak is seen at 30 µm. A small fourth peak is observed at approximately 200 µm. Approximately 10 vol% of the particles is below 1.9 µm, 50 vol% (i.e., median value) below 16.8 µm, 90 vol% below 59.8 µm, and 95 vol% below 150 µm. With particle sizes below 200 µm, no significant process challenges with respect to particle settling are anticipated.

8.1
8.0 References Alderman NJ, GH Meetenm, and JD Sherwood. 1991. “Vane rheometry of bentonite gels.” J. Non-Newtonian Fluid Mech. 39:291-310. Avramidis KS, and RM Turain. 1991. “Yield Stress of Laterite Suspensions.” J. Colloid Interface Sci. 143:54-68. Baldwin DL, PR Bredt, JA Campbell, OT Farmer, SK Fiskum, LR Greenwood, GM Mong, AP Poloski, RD Scheele, CZ Soderquist, MR Smith, LA Snow, RG Swoboda, MP Thomas, MW Urie, and JJ Wagner. 2003. Chemical Analysis and Physical Property Testing of 241-AP-104 Tank Waste. PNWD-3334, Battelle—Pacific Northwest Division, Richland, WA. Barnes HA. 1997. “Thixotropy - a review.” J. Non-Newtonian Fluid Mech. 70:1-33. Barnes HA, and JO Carnali. 1990. “The vane-in-cup as a novel rheometer geometry for shear-thinning and thixotropic materials.” J. Rheol. 34(6):841-866. Bowles JE. 1977. Foundation, Analysis and Design. 2nd Ed., McGraw-Hill, New York. Dzuy NQ, and DV Boger. 1985. “Direct Yield Stress Measurement with the Vane Method.” J. Rheology 29:335-347. Fiskum SK, DL Blanchard Jr., MJ Steele, and JJ Wagner. 2003. Analysis of SuperLig® 644 Resin Used in Hanford Tank Waste Processing. PNWD-3353, Battelle—Pacific Northwest Division, Richland, WA. Harris CC, P Somasundaran, and RR Jensen. 1975. “Sedimentation of Compressible Materials: Analysis of Batch Sedimentation Curve.” Powder Technology. 11(1975):75-84. James AE, DA Williams, and PR Williams. 1987. “Direct measurement of static yield properties of cohesive suspensions.” Rheol. Acta. 26:437-446. Keentok M. 1982. “The measurement of the yield stress of liquids.” Rheol. Acta 21:325-332. Keentok M, JF Milthorpe, and E O’Donovan. 1985. “On the shearing zone around rotating vanes in plastic liquids: theory and experiment.” J. Non-Newtonian Fluid Mech. 17:23-35. Liddell PV, and DV Boger. 1996. “Yield Stress Measurements With the Vane.” J. Non-Newtonian Fluid Mech., 63:235-261. Nguyen QD, and DV Boger. 1983. “Yield Stress Measurement For Concentrated Suspensions.” Rheol. Acta. 27:321-349. Nguyen QD, and DV Boger. 1985a. “Thixotropic Behavior of Concentrated Bauxite Residue Suspensions.” Rheol. Acta. 24:427-437.

8.2
Nguyen QD, and DV Boger. 1985b. “Direct Yield Stress Measurements With the Vane Method.” Rheol. Acta. 29:335-347. Poloski A, H Smith, G Smith, and T Calloway. 2004. Technical Basis for LAW Vitrification Stream Physical and Rheological Property Bounding Conditions. PNWD-3398, Rev. 0, Battelle—Pacific Northwest Division, Richland, WA. Smith GL, and K Prindiville. 2002. Guidelines for Performing Chemical, Physical, and Rheological Properties Measurements. 24590-WTP-GPG-RTD-001, Rev 0, Bechtel National, Inc., Richland, WA. Schumacher RF, and EK Hansen. 2002. Selection of HLW and LAW Glass Formers. SRT-RPP-2002-00034, Savannah River Technology Center, Aiken, SC. Steffe JF. 1996. Rheological Methods in Food Process Engineering. 2nd Edition, Freeman Press.

A.1
Appendix A
Table A.1 Contains compositional data for analytes listed in 24590-WTP-GPP-RTD-001, “Guidelines for Performing Chemical, Physical, and Rheological Properties Measurements”, Table 12, Sheet 1. With the exception of the 5.046 M Pretreated AP-104 LAW, these compositions have been calculated based on dilution levels and glass former chemical additions. For those components below the detection limit or not analyzed in the 5.046 M Na sample, no values were calculated and cells are indicated by an “NM”. The 5.046 M Na sample was characterized at Battelle under Analytical Sample Requests 6515, 6710, and 6104.
Table A.1. Composition of AZ-101 Pretreated LAW Waste and AZ-101 Melter Feed
Sample 5.046 M
Pretreated AP-104 LAW
6 M Pretreated AP-104 LAW
8 M Pretreated AP-104 LAW
10 M Pretreated AP-104 LAW
6 M AP-104 LAW Melter Feed
8 M AP-104 LAW Melter Feed
10 M AP-104 LAW Melter Feed
Bulk Density (g/ml) 1.242 1.274 1.361 1.43
One liter of Melter Feed made from 6
molar sodium pretreated waste contains
991.8/1274 = 0.7785 liters of the pretreated waste. Density MF
1.591
One liter of Melter Feed made from 8
molar sodium pretreated waste contains
984.0/1361 = 0.723 liters of the pretreated waste. Density MF
1.726
One liter of Melter Feed made
from 10 molar sodium pretreated waste
contains 967.8/1430 = 0.677 liters of the pretreated waste.
Density MF 1.836 Sodium Molarity of
LAW Waste or Pretreated Waste:
5.046 6 8 10
pH at 25°C 14.04a 13.8 14.0 14.2 11.1 11.5 11.6
Analyte: mg/L (LAW) mg/L (LAW)
mg/L (LAW)
mg/L (LAW) mg/L (LAW MF) mg/L (LAW MF) mg/L (LAW MF)
Cations Ag <0.6 NM NM NM NM NM NM Al 10,400 12,400 16,600 21,000 23,800 29,000 34,000 As <6.2 NM NM NM NM NM NM B 40 48 64 80 20,000 25,000 29,000
a Calculated from [OH-]=1.11 M

A.2
Sample 5.046 M
Pretreated AP-104 LAW
6 M Pretreated AP-104 LAW
8 M Pretreated AP-104 LAW
10 M Pretreated AP-104 LAW
6 M AP-104 LAW Melter Feed
8 M AP-104 LAW Melter Feed
10 M AP-104 LAW Melter Feed
Ba <0.5 NM NM NM NM NM NM Be <0.2 NM NM NM NM NM NM Bi <8.0 NM NM NM NM NM NM Ca 70 83 110 138 10,600 13,100 15,400 Cd 4.2 5.0 6.7 8.3 3.9 4.8 5.6 Ce <5.0 NM NM NM NM NM NM Co <1.2 NM NM NM NM NM NM Cr 400 470 630 790 390 480 560 Cs NM NM NM NM NM NM NM Cu <0.6 NM NM NM NM NM NM Dy <1.2 NM NM NM NM NM NM Eu <2.5 NM NM NM NM NM NM Fe [2.5] 3.0 4.0 5.0 35,000 43,000 50,000 Hg NM NM NM NM NM NM NM K 1,700 2,000 2,700 3,400 1,600 1,900 2,300 La <1.2 NM NM NM NM NM NM Li <0.7 NM NM NM NM NM NM Mg <2.5 NM NM NM 8,500 10,600 12,400 Mn <1.2 NM NM NM 24 30 35 Mo 49 59 78 98 46 57 66 Na 116,000 138,000 184,000 230,000 107,000 133,000 156,000 Nd <5.4 NM NM NM NM NM NM Ni 27 32 42 53 117 145 170 P 1,350 1,600 2,100 2,700 1,250 1,550 1810
Pb [7.9] 9.4 13 15.7 7.3 9.1 10.6 Pd <19 NM NM NM NM NM NM Pr <0.5 NM NM NM NM NM NM Pt <0.18 NM NM NM NM NM NM Rb NM NM NM NM NM NM NM Rh <15 NM NM NM NM NM NM Ru <27 NM NM NM NM NM NM S 780 930 1,240 1,500 720 900 1,050

A.3
Sample 5.046 M
Pretreated AP-104 LAW
6 M Pretreated AP-104 LAW
8 M Pretreated AP-104 LAW
10 M Pretreated AP-104 LAW
6 M AP-104 LAW Melter Feed
8 M AP-104 LAW Melter Feed
10 M AP-104 LAW Melter Feed
Sb <12 NM NM NM NM NM NM Se <6.3 NM NM NM NM NM NM Si [55] 65 87 109 150,000 186,000 220,000 Sn [15] 19 25 32 15 18 21 Sr [0.44] 0.52 0.70 0.87 0.41 0.50 0.59 Ta NM NM NM NM NM NM NM Te <12 NM NM NM NM NM NM Th <25 NM NM NM NM NM NM Ti <0.6 NM NM NM 8,700 10,700 12,500 Tl <12 NM NM NM NM NM NM U <50 NM NM NM 11.5 16 18.9 V <1.2 NM NM NM NM NM NM W [69] 82 109 137 64 79 93 Y NM NM NM NM NM NM NM Zn <1.2 NM NM NM 16,900 21,000 25,000 Zr <1.2 NM NM NM 16,200 20,000 23,000
Carbon Analyses
TIC 3,100 3,700 4,900 6,100 2,900 3,500 4,100 TOC 3,400 4,000 5,400 6,700 3,100 3,900 4,600
Anions
F 1,700 2,100 2,700 3,400 1,600 1,980 2,300
Cl 4,500 5,300 7,100 8,800 4,100 5,100 6,000
Br NM NM NM NM NM NM NM NO2 56,000 66,000 88,000 111,000 52,000 64,000 75,000
NO3 92,000 110,000 146,000 183,000 85,000 106,000 124,000 PO4 3,600 4,300 5,800 7,200 3,400 4,200 4,900
SO4 2,300 2,800 3,700 4,600 2,200 2,700 3,100

A.4
Sample 5.046 M
Pretreated AP-104 LAW
6 M Pretreated AP-104 LAW
8 M Pretreated AP-104 LAW
10 M Pretreated AP-104 LAW
6 M AP-104 LAW Melter Feed
8 M AP-104 LAW Melter Feed
10 M AP-104 LAW Melter Feed
CN NM NM NM NM NM NM NM NH3 360 430 570 710 330 410 480
Free OH NM NM NM NM NM NM NM Total OH 19,000 23,000 30,000 38,000 17,600 22,000 25,000
Radioisotopes mCi/L (LAW)
mCi/L (LAW)
mCi/L (LAW)
mCi/L (LAW) mCi/L (LAW) mCi/L (LAW) mCi/L (LAW)
H-3 1.6E-3 1.91E-03 2.55E-03 3.19E-03 1.49E-03 1.85E-03 2.16E-03 C-14 5.84E-4 6.94E-04 9.26E-04 1.16E-03 5.41E-04 6.69E-04 7.84E-04
Cr-51 <4E-4 NM NM NM NM NM NM Fe-59 <7E-5 NM NM NM NM NM NM Ni-59 NM NM NM NM NM NM NM Co-60 1.12E-4 1.33E-04 1.78E-04 2.22E-04 1.04E-04 1.28E-04 1.50E-04
Ni-63 3.68E-2 4.38E-02 5.83E-02 7.29E-02 3.41E-02 4.22E-02 4.94E-02
Se-79 1.15E-4 1.37E-04 1.82E-04 2.28E-04 1.06E-04 1.32E-04 1.54E-04 Y-88 <4E-5 NM NM NM NM NM NM Sr-90 1.92 2.28E+00 3.04E+00 3.80E+00 1.78E+00 2.20E+00 2.58E+00
Sr-90/Y-90 NM NM NM NM NM NM NM Nb-94/95 <4E-5 NM NM NM NM NM NM
Tc-99 5.85E-3 6.96E-03 9.27E-03 1.16E-02 5.42E-03 6.71E-03 7.85E-03
Ru-103 <5E-5 NM NM NM NM NM NM Ru-106 <4E-4 NM NM NM NM NM NM Sn-113 <6E-5 NM NM NM NM NM NM Sb-125 <2E-4 NM NM NM NM NM NM Sn-126 NM NM NM NM NM NM NM
Sb\Sn-126 <1E-4 NM NM NM NM NM NM I-127 NM NM NM NM NM NM NM I-129 1.93E-5 2.29E-05 3.06E-05 3.82E-05 1.79E-05 2.21E-05 2.59E-05
Cs-133 NM NM NM NM NM NM NM Cs-134 <4E-5 NM NM NM NM NM NM

A.5
Sample 5.046 M
Pretreated AP-104 LAW
6 M Pretreated AP-104 LAW
8 M Pretreated AP-104 LAW
10 M Pretreated AP-104 LAW
6 M AP-104 LAW Melter Feed
8 M AP-104 LAW Melter Feed
10 M AP-104 LAW Melter Feed
Cs-135 NM NM NM NM NM NM NM Cs-137 8.17E-4 9.71E-04 1.30E-03 1.62E-03 7.56E-04 9.36E-04 1.10E-03 Ce-144 <5E-4 NM NM NM NM NM NM Sm-151 7.98E-2 9.49E-02 1.27E-01 1.58E-01 7.39E-02 9.15E-02 1.07E-01
Eu-152 <1E-4 NM NM NM NM NM NM Eu-154 <2E-4 NM NM NM NM NM NM Eu-155 <3E-4 NM NM NM NM NM NM Pa-231 NM NM NM NM NM NM NM U-233 <5.1E-6 NM NM NM NM NM NM U-234 <6.9E-7 NM NM NM NM NM NM U-235 2.54E-10 3.02E-10 4.03E-10 5.03E-10 2.35E-10 2.91E-10 3.41E-10 U-236 5.37E-09 6.39E-09 8.51E-09 1.06E-08 4.97E-09 6.16E-09 7.20E-09 U-238 <1.5E-9 NM NM NM NM NM NM
Np-237 6.34E-06 7.54E-06 1.01E-05 1.26E-05 5.87E-06 7.27E-06 8.51E-06
Pu-236 <2E-6 NM NM NM NM NM NM Pu-238 2.34E-5 2.78E-05 3.71E-05 4.64E-05 2.17E-05 2.68E-05 3.14E-05 Pu-239 1.8E-4 2.14E-04 2.85E-04 3.57E-04 1.67E-04 2.06E-04 2.41E-04
Pu-240 NM NM NM NM NM NM NM Pu-239/240 1.67E-4 1.99E-04 2.65E-04 3.31E-04 1.55E-04 1.91E-04 2.24E-04
Pu-241 7.75E-4 9.22E-04 1.23E-03 1.54E-03 7.17E-04 8.88E-04 1.04E-03
Pu-242 <2E-7 NM NM NM NM NM NM Pu-241/Am-241 NM NM NM NM NM NM NM
Am-241 1.96E-3 2.33E-03 3.11E-03 3.88E-03 1.81E-03 2.25E-03 2.63E-03 Am-241, Am-243 NM NM NM NM NM NM NM
Am-242 NM NM NM NM NM NM NM Am-243 <2E-7 NM NM NM NM NM NM Cm-242 6.34E-6 7.54E-06 1.01E-05 1.26E-05 5.87E-06 7.27E-06 8.51E-06
Cm-243 NM NM NM NM NM NM NM Cm-244 NM NM NM NM NM NM NM

A.6
Sample 5.046 M
Pretreated AP-104 LAW
6 M Pretreated AP-104 LAW
8 M Pretreated AP-104 LAW
10 M Pretreated AP-104 LAW
6 M AP-104 LAW Melter Feed
8 M AP-104 LAW Melter Feed
10 M AP-104 LAW Melter Feed
Cm-243/244 4.1E-4 4.88E-04 6.50E-04 8.13E-04 3.80E-04 4.70E-04 5.50E-04
Sum of alpha (TRU) = S (Pu-238, Pu-239,
Pu-240, Am-241) NM
NM NM NM NM NM NM
Total alpha <4E-3 NM NM NM NM NM NM Total beta 4.74 5.64 7.51 9.39 4.39 5.43 6.36
Total gamma NM NM NM NM NM NM NM
[ ] signifies that the analyte was detected within 10 times the instrument detection limit and the uncertainty is estimated to exceed ± 15%.
< indicates the analyte was not observed above the instrument detection limit NM indicates that the value was not measured. If the initial measurement at 5.046 M Na was below detection limit these values were
not calculated at other concentrations in the LAW form or melter feed form.

PNWD-3465 WTP-RPT-107, Rev 0
Distr.1
Distribution
No. of Copies OFFSITE
No. of Copies ONSITE
1 Savannah River National Laboratory Richard Edwards Westinghouse SA
Aiken, South Carolina 29808-0001
8 Battelle—Pacific Northwest Division P.R. Bredt P7-25 D.E. Kurath P7-28 A.P. Poloski P7-25 R.G. Swoboda P7-22 Project Office (2) P7-28 Information Release (2) K1-06
4 Bechtel National, Inc. J. F. Doyle (2) H4-02 D. E. Larson H4-02 C. A. Musick H4-02