
Reward preferences for generations in the information technology industry
47
REWARD PREFERENCES FOR GENERATIONS IN SELECTED ICT COMPANIES ANNETJIE MOORE [email protected] MARK BUSSIN Department of Human Resource Management University of Johannesburg ABSTRACT The focus of this study was to determine whether generations prefer different rewards in the Information and Communication Technology (ICT) industry. The research was completed through a quantitative, structured survey by means of an electronic survey in two ICT companies employing some 4450 people. 164 valid responses were received from sending it to a stratified sample of 1500 employees. The preferences of the generations were compared and categorised in terms of reward categories as described in the literature. To determine the reward preferences of the generations, the Kruskal- Wallis Test was applied. The results show that generations do not display different rewards preferences. Key words: Age, benefits, generations, learning and development, pay, rewards, work environment. Giving employees choices regarding their remuneration packages has become a topical issue in South African organisations - 1 -
-
Upload
johannesburg -
Category
Documents
-
view
0 -
download
0
Transcript of Reward preferences for generations in the information technology industry

REWARD PREFERENCES FOR GENERATIONS IN SELECTED ICT COMPANIES
ANNETJIE MOORE
MARK BUSSIN
Department of Human Resource Management
University of Johannesburg
ABSTRACTThe focus of this study was to determine whether generations prefer
different rewards in the Information and Communication Technology
(ICT) industry. The research was completed through a quantitative,
structured survey by means of an electronic survey in two ICT
companies employing some 4450 people. 164 valid responses were
received from sending it to a stratified sample of 1500 employees. The
preferences of the generations were compared and categorised in
terms of reward categories as described in the literature. To determine
the reward preferences of the generations, the Kruskal- Wallis Test was
applied. The results show that generations do not display different
rewards preferences.
Key words: Age, benefits, generations, learning and development,
pay, rewards, work environment.
Giving employees choices regarding their remuneration packages
has become a topical issue in South African organisations
- 1 -

(Bussin, 2003). This is in terms of rewards to ensure
performance, job satisfaction and retention of the best people
with critical skills to make the company successful. Companies
want high performing individuals and the employees want to be
rewarded in line with performance, value add and personal
choices. The concept of personal differences and personal choice
is not new in the Remuneration sphere, for example Herkenhoff
(2002) did a study called - National Remuneration (Pay)
Preferences: Cultural Analysis Within the Hofstede Model Using
Cultural Values to Untangle the Web of Global Pay.
In an ever-changing, fast moving world, where the only real
differentiator in business lies in people’s competence, it is of
the utmost importance to win the talent war to attract, develop
and retain the best people in the industry. One way of doing
this is to design reward strategies to suit individual choice.
This research is exploratory and a major research question is -
are there in fact reward preferences among generations in the ICT
sector or not? The researcher works in the ICT industry where
resources are scarce and the need for good retention strategies
is imperative.
Table 1, indicates how generations are categorised by identifying
different dates as periods. These periods are linked to key
events which had a major impact on the generations. These dates
or periods are similar, but not exactly the same in all
2

countries, as different events influenced different countries’
generations (Codrington & Grant- Marshall, 2004).
(Insert Table 1 here)
The rationale of this study is to determine whether generations
such as Veterans, Baby Boomers, Generation X and Generation Y,
prefer specific reward schemes, in line with their beliefs,
values, needs, drivers and world views. Generations refer to
categories of people, who are grouped together due to certain
events which had a major impact on their lives, such as World War
ll or 9/11 in New York or the first democratic election in South
Africa in 1994. The aforementioned generations form the bulk of
the South African and other world economies at the moment. The GI
or the Hero Generation will be excluded from this study as most
people in the GI generation have already retired.
Recent research (Giancola, 2008), reports no correlation between
rewards and generations in the USA. It would appear that an
inconsistency exists between generation theory and research.
Definitions
For the purposes of this research, definitions will be linked to
the two main subjects for discussion, namely generations and
rewards.
3

The definition of rewards will include pay, benefits, learning
and development and the work environment (Bussin, 2002a) and
generations will be defined as categories of people who are
grouped in line with major events in their lifetime.
Most companies pay rewards to enhance individual or even team
based performance. Rewards can take many forms and shapes, but
the purpose of this study is to identify specific rewards for
specific generations.
These rewards may have a positive influence on performance, job
satisfaction and retention which are only a few of the
challenging staff issues that companies and management, face on a
daily basis.
Staff turnover becomes a recurring, costly cycle and the root
problem is often not determined. It is not unusual in
organisations, according to a P-E Corporate Survey (September,
2005), to have an average annual staff turnover for 24% of ICT
staff and 10% for general staff. Voluntary terminations comprise
54% of all terminations. Factors listed as reasons for voluntary
terminations for skilled staff are:
better career prospects 46%
higher salary and better employment conditions 44%
emigration 7%
4
job dissatisfaction and/or personality conflict
3%(Source: P-E Corporate Services, 2005)
Apart from the cost and skills shortages, one needs to understand
the core reasons for dissatisfaction, how to address it and
strive to be an employer of choice. This does not necessarily
mean a bigger salary bill. By making use of personal preferences
to structure rewards, some of the problems may be resolved.
Typically, generic reward schemes are implemented in companies
according to job grading systems to pay employees in the
workplace (Bussin, 2002b). Reward preferences in line with
specific generation requirements are not generally considered
yet. According to Karp, Fuller & Sirias, (2002) policies are
often created by Baby Boomers and the needs of Generation X and
Generation Y, are not always catered for. This in return
generates a gap between the reward system and the expectations of
employees. This could lead to dissatisfied staff and high staff
turnover.
The rationale behind this study is to obtain a better
understanding of the reward preferences of Veterans, Baby
Boomers, Generation X and Generation Y, as it may influence the
interaction among these groups in the workplace and more
specifically in the way rewards are structured and implemented.
5
To date, research focused mostly on remuneration and rewards per
job categories and levels within the organisation.
If the main drivers for these generations are different, then
they will have different needs in terms of rewards and
subsequently, businesses need to understand and change
remuneration policies to align with the requirements.
Generations
Margaret Mead was one of the first to have studied generation
theory. She spent most of her life studying tribes in New Guinea,
as she was interested in the way they lived. When these tribes
came in contact with the first world, the transformation was
rapid. She identified three generations in the New Guinea people
(Codrington & Grant – Marshall, 2004).
The first generation is that the grandparent’s past will be the
grandchild’s future. The second generation is that it is normal
that the behaviour of the new generation will be different from
the preceding generation and thirdly, the new generation set the
trends and are expected to be different from the predecessors in
behaviour, attitude and value system (Codrington & Grant –
Marshall, 2004).
The generations identified for the twentieth century are the GI
or Hero Generation, Veterans, Baby Boomers, Generation X and
6

Generation Y. For the purpose of this research, GI will be
excluded as most people who were born before 1920 do not
participate actively in the workplace any more. Shelton and
Shelton (2002), Lammiman and Syrett (2004) and Codrington and
Grant – Marshall, (2004), classified the differences among the
generations. The generation gaps are resultant of cohorts or
defining moments in people’s lives and history. Some defining
moments for each generation, are highlighted in Table 2.
(Insert Table 2 here)
This table illustrates the differences among the generations and
how views and attitudes have changed 180 degrees between the
Veterans and the Generation Y in most aspects of life.
Technology, for example, enabled the generations to communicate
globally at the push of a button, whereas in the 1920’s it took
weeks to get a letter to another country.
Veterans
The Veterans entered the world during World War ll and the Great
Depression. During these difficult years this generation saved
everything and nothing went to waste. They grew up in a time when
“children should be seen and not heard” (Codrington & Grant –
Marshall, 2004). They welcomed stability and consistency as a
result they are withdrawn and unadventurous. From there, the term
Veterans or Silent Generation.
7

During their adult years, this generation worked very hard and
they believe in paying their dues. Women stayed at home and
raised the children. The Veterans saved for a rainy day. As they
retired, they are the wealthiest generation in history. Although
they still do not spend money unless it is absolutely necessary,
it does not mean they do not enjoy life. They are still active
and take hikes, travel, play tennis and bowls and in general keep
busy.
Baby Boomers
The Baby Boomers were born at the end of World War ll. Their
parents indulged them and they were told that they will have
everything the parents never had. These kids were active and grew
up “reckless”. As teenagers their slogan was “Make love, not war”
and the hippie movement was a way to express their anti-
establishment views (Codrington & Grant – Marshall, 2004). As
they grew older, some of the Baby Boomers became very
materialistic, moralistic and domineering, no matter what their
economical status was.
These generations have different views on work. Statements like
“The old-timers won’t change and the kids won’t work,” indicates
that conflict in perceptions between the generations and it is as
a result of the generation gap (Karp, Fuller & Sirias, 2002). The
8

Boomer generation is twice the size of the Generation X.
Generation Y is also twice the size of Generation X.
Karp, Fuller and Sirias (2002), draw attention to the differences
between Baby Boomers and Generation X. Boomers have the ability
to see the world from different angles and are perceived to be
ambiguous. They are also classified as the ‘Schizo-Generation’,
as they would spank their children for unacceptable behaviour and
reward the child for his spirit, where Generation X wants to
stand clear from ambiguity.
The Boomer motto of ‘living to work’ is reversed in the Gen Xer’s
preference of ‘working to live’. This simple but powerful
dichotomy between Boomers and Gen Xers is sufficient in itself to
foster significant levels of unproductive conflict (Karp, Fuller
& Sirias, 2002).
Today, 40 years later, it is the Boomers that are the drivers for
legislation against drugs, smoking and pornography. They are
active and have gymnasium memberships and Mick Jagger of the
Rolling Stones is still having huge rock concerts, although he
does not need to work (Codrington & Grant – Marshall, 2004).
Consequently, it seems that Baby Boomers may prefer rewards in a
cash, recognition and status format.
9
Generation X
Generation X is described by Codrington and Grant – Marshall
(2004) as the “whiners” or the lost generation, who wears baggy
jeans and baseball caps. They grew up in the “anti-child” era, as
the Boomers focused on themselves and children were not
fashionable and often the parents were divorced. Therefore they
flourish in an informal work environment.
As adults, this generation was in the middle of the dot.com burst
bubble. They lost jobs and were left without a sustainable
income. Generation X work to fund their lifestyle and to be able
to share time with family. Loyalty towards companies does not
exist as Generation X observed how their loyal parents were
retrenched.
A Generation X individual enjoys taking risks and have even
invented extreme sports such as bungee jumping, rollerblading,
river rafting and biking.
Although Shelton and Shelton (2002) give an American view, many
of the differences are applicable to the generations in South
Africa. Generation X is fast-paced and high-tech. This generation
takes longer to get married and start families. The most
important values are a work/live balance, to be independent and
pragmatic. They also did research to determine what creates a
10
Generation X friendly work environment and the top four
requirements are:
positive relationship with supervisor;
positive relations with co-workers;
interesting work;
opportunities for learning.
Against this background, it is important to create a work
environment where this generation can built good relationship and
where interesting and challenging work form part of the working
environment.
McNulty (2006) summarises both the behaviours and reward
preference in a nutshell by saying that Generation X is
idealistic, ambitious, flexible, self-sufficient and people
orientated. The flipside of the coin is that they distrust
leadership, juggle busy lives and demand merit-based remuneration
and participative management.
Generation Y
On the opposite side of the spectrum, Generation Y has grown up
with the Internet and therefore, connectivity is a key component
in their lives. Lammiman and Syrett (2004) claim that this
Generation have stronger group bonds than Generation X. Loyalty
to each other in a group, is of paramount importance.
11

The difficulty that employers face is that to Generation Y,
corporate employment is senseless, hypocritical and boring. They
have created their own “language” in their networks and groups
are marked with humour and vivid imagery. They have a huge
influence on the 24/7 living as they want immediate
gratification. This 24/7 living created a lively new evening and
night time economy (Lammiman & Syrett, 2004).
Generation Y is more mobile than Generation X as they do not have
a strong drive for job security or necessary a career with one
employer. Lammiman and Syrett (2004), highlight important factors
to keep this Generation engaged:
introduce ideas-generation and team work methods to
engage them mentally;
managers must make use of the good ideas which are
generated among the staff and measure it;
taking advantage of the strength of technology and
maximise flexibility to perform work and assist with
the 24/7 lives;
communications must be honest and open;
assist individuals to link work with “third party”
activities such as charity.
12

This generation wants to change the world and need time to focus
on community and social issues that are important to them.
Rewards could be simple, but practical such as quality fast food
vouchers or technology. They enjoy fun in the workplace and to be
involved in challenging projects (Codrington & Grant – Marshall,
2004).
Reward systems
“Among the most obvious rewards are pay, promotion, interesting
work, status symbols and fringe benefits. "Giving and withholding
of these rewards can have a tremendous influence on motivation
and satisfaction” (Lawler, 1973 p. 26). People work to be
rewarded and to obtain work satisfaction. Different people will
require different ‘formulas’ in which they want to be rewarded
for work done. There are a number of models to consider, and we
have considered Bussin (2002a) because we believe that it will be
best understood by respondents.
Bussin, (2002a) adapted a remuneration model called Total Reward
Mix. The Reward Mix is structured in four categories namely pay,
benefits, learning and development and the work environment.
Table 3 sets out the Total Reward Mix.
(Insert Table 3 here)
13

The pay component of the model includes a base salary, variable
pay such as incentives, commissions and bonuses. Recognition
could include dinners and award clubs, while shares or share
options are linked to a long term incentive.
The second aspect of this reward model is benefits. It consists of
access to a medical aid, Employee Assistance Programmes (EAP),
health care such as clinics and help lines. Retirement is often
only considered in a serious light when employees are approaching
the silver years. This is an important aspect of benefits where
the employer needs to take the lead role. Savings could include
discounted rates at financial institutes or other similar
agreements with suppliers for improved rates for employees.
Savings could also include company contributions to retirement
vehicles and medical aid. Time off becomes more and more
important for employees to enhance work/life balance and to
contribute to society. Some perks could be identified as
insurance, security, canteens and crèches.
The world and the work environment change at a rapid pace.
Employees want to learn and improve themselves. Companies that
support learning and development are ranked high among the top
companies to work for in South Africa (Corporate Research
Foundation, 2005).
14
The work environment is not always considered as part of the reward
strategy of a company. Technology and work relations are
important aspects of the work environment. Wilson (1999)
discusses the importance of the company culture, leadership,
strategy and the impact on the reward strategy. It is imperative
for the company to provide performance support and constructive
feedback to employees in order to adjust and grow, resulting in
increased productivity and profitability (Milkovich & Newman,
1999). Work/life balance is becoming more and more important in
people’s lives to enable them to juggle the balls of life, and
not to drop any of them.
All companies have access to the four categories of rewards as
per the Bussin (2002a) model, but the success lies in how these
aspects are mixed and matched to address the employees’
preferences.
Bussin (2002b) identified long- and short term incentives. Short
term incentives are profit sharing, gain sharing, bonus schemes
and commission schemes, whereas long term incentives are rolling
incentives, value add schemes and share schemes. Milkovich (1999)
developed a reward system model where the components are clearly
stipulated as shown in Table 4.
(Insert Table 4 here)
15

This model echoes the model which is used by Bussin (2002a). It
is indicative of the fact that reward systems are multi-faceted
and that no simple, single solution exists. From a practical
viewpoint, the challenge is to manage the model in line with the
requirements and expectations of the generations and to maintain
a fair and equitable reward system, aligned to the company’s
strategic objectives.
Although reward models have broad strokes of similarity at a
strategic level, an indicator of a successful reward system is
the way in which it is deployed. For the purpose of this study,
the Total Reward Mix model will be used to facilitate the
research as it is based on a South African context.
In summary, it is important to understand the reasons for the
reward system, as well as the employees’ requirements and needs
to create a win-win situation for both employee and employer. The
most important aspect of this study is to determine whether or
not reward systems are linked to the generations’ preferences in
the ICT Industry.
Research on generations and rewards
As this is a relative new topic in the human resources
environment, very little research has been done with the focus on
the relationship between generations and rewards.
16

Recent research to determine a link between generations and
rewards reveals an interesting twist in the tail of the
theorists. The greater importance of life stage over generation
profiles in understanding employee needs is also indicated in an
analysis of the specific rewards of generational advocates
(Giancola, 2008). He also emphasised that all people are
primarily concerned about their job, career and compensation, no
matter what the generation and therefore concludes that reward
preferences are determined by lifecycle rather than by
generations.
Giancola (2006) expressed his concern as the generation gap has
been overstated by the theorists and that the generation theory
has major gaps. Interesting enough, research found that Baby
Boomers are more interested in retirement planning and Generation
Y prefers career development in terms of rewards. These
differences are linked to life stage rather than to generation
preferences.
To summarise this section, a review of literature revealed that
the Generations have different views, beliefs, values, needs and
drivers. Researchers on the other hand disagree with the
theorists and link reward preferences to the individual’s
lifecycle (Giancola, 2008). The purpose of this research is to
determine whether there is a link between the generations and
reward preferences in the ICT industry, or not.
17

Objectives of the study
The objective of this research is to determine whether
generations prefer different rewards or not. The results are
intended to be helpful to companies with their remuneration
design and offering.
RESEARCH DESIGN
Research Approach
The approach was quantitative research which involved a cross-
sectional survey and correlational techniques for the statistical
analysis. A new questionnaire was developed and a pilot was
conducted on work colleagues and experts who work in the area of
rewards. The questionnaire was forwarded via electronic mail to
Human Resources divisions of two ICT companies, based in
Johannesburg. The contact people in the Human Resources divisions
were asked to distribute the questionnaire to a stratified sample
of staff. The staff complement for both companies combined is
4450.
The research proposition was that generations prefer different
reward systems, even in the ICT industry.
Research Method
The sampling procedure and participants
18
The questionnaire was developed from the literature review and
then piloted with 12 work colleagues and remuneration experts.
Appropriate suggestions were taken into account and the
questionnaire was amended accordingly. The questionnaire was
then sent to the Human Resources representatives in the two ICT
companies. The representatives forwarded the survey to a
stratified sample of 1500 employees to complete the
questionnaire on an anonymous basis. The strata were
proportionate by job level with every third person receiving a
questionnaire. A total of 165 responses were received from the
participants. This represents a response rate of 11%.
The respondents representing the various companies in the survey
are reflected in Table 5.
(Insert Table 5 here)
The level of the participants’ current positions is captured in
Table 5. During the sampling process it is important to report
the sample size, specify the population, consider the dropout,
using methods of correction and not to obscure the response rate
(Gourard, 2004). Therefore, the valid percentage calculated,
took the dropout rate into account. After cleaning the data up,
there were 164 usable responses.
19

Apart from the current level in the organization, the
participants were requested to record their age in the
questionnaire. The responses were categorised into the
generations’ model, discussed earlier.
Measuring instruments
A structured questionnaire was designed to gather the data on
the reward preferences of the participants. The questionnaire
consists of closed-ended and ranking questions to gather the
information. A combination of questions was used. Firstly, a 5-
point Likert Scale was used, ranging from Strongly Agree to
Strongly Disagree and secondly to correlate the views, it was
combined with ranking questions.
Generations
The generations were categorised as follows:
Veterans (1920 – 1940)
Boomers (1941 – 1960)
Generation X (1961 – 1980)
Generation Y (1981 – 2000)
The limitation of this theoretical categorisation is
acknowledged. It is however, based on current literature, and
needs to be validated for South Africa.
20

Reward
The questionnaire was divided into four categories of rewards:
Pay
o Base salary
o Variable pay (Commissions, Incentives, Bonuses,
Profit share, Overtime, Special assignment pay,
Standby allowance)
o Recognition (Status, Prominence due to work
status, work valued in society, Awards, Letters,
Complements, Trophies, Personalised items,
Hobbies)
o Long term incentives (Deferred pay, Shares
schemes)
Benefits
o Health (Medical aid, Life insurance, On-site
health care, HIV/Aids awareness & training, EAP,
Wellness program, 24 hour hotline)
o Retirement (Provident fund, Financial advice)
o Savings (Company contributions to Provident fund)
o Time-off (Leave such as annual, sick,
maternity/paternity, compassionate, family
responsibility, community & charity, in lieu of
overtime)
o Perks (Uniform allowance, travel, Company
arrangements with financial institutes, Concierge
21

services, Crèches, Canteens, Security, Petrol
cards, Cell phone allowances)
Learning and Development
o Career Development (Experience different things,
Challenges, Promotion)
o Performance Management (Feedback, Right amount &
complexity of work)
o Succession Plan (Change to get ahead)
o Training (Knowledge, Skills improvement,
Projects, Experiential learning, Formal
development plans)
Work Environment
o Organisational Climate (Friendly, Secure, Flexi-
time, Flexi-place, Part-time, Fun, Peer and
management relations, Technology, 24/7 Lifestyle,
e-mail, Internet, SMS, VOIP, Shopping, Global
community, Travel )
o Leadership (Ability to influence & inspire,
Values, Participation)
o Performance Support (Create a learning
environment to support and enhance performance)
o Work/Life Balance (Work, Personal (Family,
Friends, Hobbies and Community)
22

Once completed, the Human Resources departments forwarded the
electronic submissions to the researcher, which was delivered to
the Statistical Consultation Service at the University of
Johannesburg for capturing and analysis.
Research procedure
Human Resources representatives for the two organisations were
approached and asked if they would distribute the electronic
survey questionnaire to all employees in the organisation. This
was then emailed to all employees, with a return date and address
to the Human Resources representative. The returns could be
completed and delivered anonymously, faxed or emailed to the
Human Resources representative, who compiled the responses for
the researcher. Once the cut-off date had passed, the researcher
collected the completed questionnaires from the Human Resources
representatives.
Statistical Analysis
In the research, the relationship between the Independent
Variable (Generations) and the Dependent Variable (Rewards) was
clarified. The constructs can be shown schematically as follows:
23
Preferences
Reward System
Generations
Figure 1: Schematic representation of the link between variables
To determine the reward preferences of the generations, the
Kruskal- Wallis Test was applied to determine the mean
descriptives of each category related to the different
generations.
RESULTS
The specific aspects explored in this survey were to determine if
generations prefer different rewards or not. A synopsis of the
biographical data is reflected in Table 5 in the previous
section.
The above data is important in the South African context, to
adjust and measure transformation in the country, as per the
Employment Equity Act. The focus is to increase equally across
races and genders in the country, as well as in the ICT industry.
The item inter-correlation was subjected to a KMO and a
Bartlett’s test and was 0.761 which is higher than 0.7, making
the matrix suitable for being factor analysed. Two factor
analytic methods were used to determine the four factors, which
are used in the research. Firstly, the extraction method was the
24
Principal Axis Factoring and secondly, Varimax with Kaizer
Normalisation was used as a rotation method.
It was determined that the Cronbach alpha was 0.821 and therefore
the scale was reliable.
Table 6 reflects the outcome of the responses on a 5-point
scale, which has been reduced to a three point scale for ease of
reference. The categories of Not important at all and Unimportant
were combined and were named Unimportant in the table below. The
Important category is a combination of Important and Extremely
important categories.
(Insert Table 6 here)
During the analysis, five Eigen values (5,239; 2,148; 1,520;
1,333 and 1.055) were identified, which accounted for 66.4% of
the variance. To compare the empirical research with the theory,
a four factor analysis was forced. The outcome is reflected in
Table 7 below. The communalities of the variables are determined
for the first number of factors. This procedure is repeated until
the sum does not change (Gorsuch, 1983).
The Rotated Factor Matrix is displayed in Table 7, which displays
the different item loadings on the four postulated factors.
(Insert Table 7 here)
25

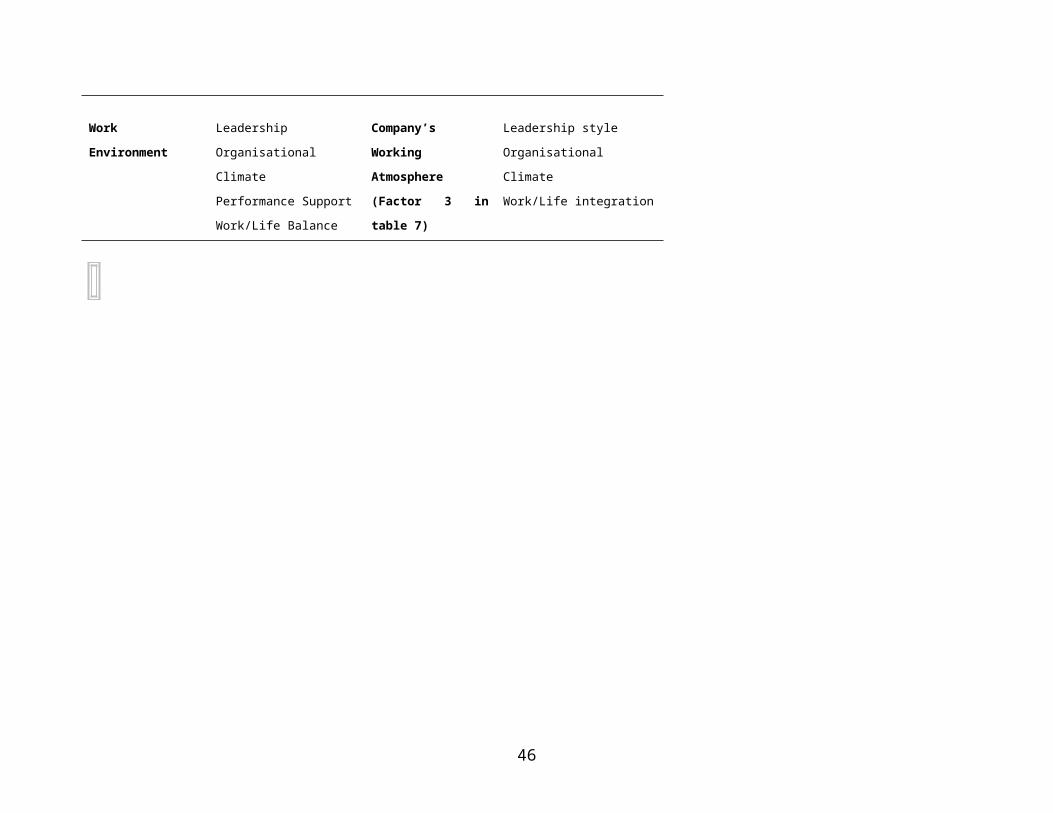
The categories as per the literature research, versus the outcome
of the empirical research are reflected in table 8 below. The
literature research has four categories, namely pay, benefits,
learning and development and work environment. During the
empirical research, the sub-elements did not correlate completely
to the literature research. The researcher named four categories
(Total Cost To Company (TCTC), over and above TCTC, career and
work atmosphere) in the empirical research to categorize the sub-
elements and to compare it with the literature categories.
(Insert Table 8 here)
Although the two clusters of categories are different, the
outcome of the research still provides natural groupings of
different categories or rewards, specific to the ICT industry. To
determine the reward preferences of the generations, the mean
descriptive for each category, is ranked per generations in Table
9.
(Insert Table 9 here)
In this section, statistical analyses were completed on the data
to determine whether a relationship exists between the theory and
the findings of the research. From the summary in Table 9 above,
it is clear from the research that the generations prefer Total
26

Cost to Company (TCTC) to the Over and Above Total Cost to
Company (Over and Above TCTC) rewards.
DISCUSSION
The aim of this research was to determine whether generations in
the ICT industry prefer different rewards or not.
The findings of the research indicate that there is no direct
relationship between rewards preferences and generations in the
ICT industry. All the generations rated Total Cost to Company
(salary, health care, retirement benefits and share options) as
the most important aspect of rewards. This finding supports the
research of Giancola (2008), who states that different
generations do not prefer different rewards.
On the other hand, the lowest rated aspect of rewards for all the
generations participated, was Over and above Total Cost to
Company (perks, savings and variable pay).
It is clear from the research that the older the participant, the
lower the rating of Career (career development, performance
management, performance support, recognition, succession
planning, time off, training) aspect of rewards. Both Generation
Y and X ranked Career as second on their list of reward
27
importance, where it slipped into third position for the Baby
Boomers and in last position for the Veterans. This is the only
category which reports a significant difference of 0.008
(Kruskal- Wallis Non Para Metric), which is smaller than 0.05.
This difference may be subscribed to the lifecycle element as
discussed by Giancola (2008).
The rating of Company Atmosphere (leadership style,
organisational climate and work/life integration) seems to vary
among the generations.
Value add of this research
The research has added insight and value to reward preferences
for generations in the ICT sector. It has become clear that money
matters to all generations, as it was ranked either first or
second by all four generations. Should this reward cocktail be
mixed in line with the likes and dislikes of individuals, ICT
companies may experience a higher retention rate of knowledge
workers, which could result in better customer services and
increased profits.
This research confirms that the main reasons for staff turnover
in the ICT industry as discussed earlier in this article, is
better career prospects and higher salaries. Continuous up-
skilling of staff and providing them with some career prospects
are critical to retain staff members. This may also give staff
28

members the opportunity to better their income in the short to
medium term. The second message which is loud and clear, is to
pay critical staff attractive market related remuneration and
provide challenges and career opportunities.
As the above is critical, the only way to determine staff
members’ aspirations are to talk to the individuals’ on a regular
basis and to build solid and credible relationships, as staff
members leave managers, not their jobs.
Limitations of this research
The following aspects are viewed to be limitations to this study:
Only two ICT companies participated in the survey,
which may not be representative of the industry due to
the core business focuses.
The generation categories used come from global events
and may not be 100% applicable in South Africa.
Future research
As a result of this study, the following research is suggested in
this field:
This study could be completed in a different industry
to determine if generations in different industries
prefer different rewards
29
It is recommended that research is completed focusing
on gender and race, to develop an even better reward
model in the South African context
The study was structured within specific guidelines.
It would be interesting to determine if employees have
different ideas regarding rewards
To measure the impact of a generation’s customized
reward strategy on staff retention and customer
satisfaction, as well as the impact on the bottom line
To determine if rewards are linked to the individual’s
career life cycle
Conclusion
Rewards for generations in the ICT industry is a relative new
concept. This is the first known empirical study of its kind in
South Africa. The trends reflected in this research mirror the
research in the USA, where it is claimed that reward preferences
are linked to lifecycle rather than generations.
The final conclusion is that although rewards are not linked to
generations in the ICT industry, it is clear that one size does
not fit all and companies need to be sensitive and still provide
employees with flexible rewards options.
30

REFERENCES
Bussin, M. (2002a). Choosing the right Incentive Scheme. Randburg:Knowledge Resources Publishing.
Bussin, M. (2002b). Retention Strategies. Randburg: Knowledge ResourcesPublishing.
Bussin, M. (2003). Factors driving changes to remuneration policy andoutcomes. Unpublished Doctor of Commerce dissertation.Johannesburg: University of Johannesburg.
Codrington, G & Grant-Marshall, S. (2004). Mind the Gap!Johannesburg: Penguin Books (Pty) Ltd.
Corporate Research Foundation. (2005). The Best Companies to work for inSouth Africa. (6th Ed.). Paarl: Corporate Research FoundationPublishing
Giancola, F. (2006). The Generation Gap: More myth than Reality.HR. Human Resource Planning, 29, (4): 32-37.
Giancola, F. (2008). Should generation profiles influence rewardsstrategy? Employee Relations Law Journal, 34 (1): 56-68
Gourard, S. (2004). Quantitative Methods in Social Science. Norfolk:Biddles Ltd.
Gorsuch, R. (1983) Factor Analysis. Lawrence Erlebaum Associates
Herkenhoff, L.M. (2002) National Remuneration (Pay) Preferences: CulturalAnalysis Within the Hofstede Model Using Cultural Values to Untangle the Web of GlobalPay. Universal Publishers
Karp, H., Fuller, C., & Sirias, D. (2002). Bridging the Boomer Xer GapCreating Authentic Teams for High Performance Work. California: Davis-BlackPublishing.
31

Kimmel, A.J. (1989). Ethics and Values in Applied Social Research. California: Sage Publications, Inc.
Lammiman, J. & Syrett, M. (2004). Cool Search. Cornwall: TJ International Ltd.
Lawler lll, E.E. (1973). Motivation in Work Organisations. California: Brooks/Cole Publishing Company.
McNulty, E.J. (2006). Can you manage different Generations? Boston: Harvard Business Press.
Milkovich, G.T. & Newman, M.N. (1999). Compensation. (6th Ed.). United States: Irwin/McGraw-Hill.
P-E Corporate Services SA (Pty) Ltd. (September 2005). Human resources practitioner’s handbook. Johannesburg: P-E Corporate Services.
Salls, M. (2004). The Non-profit Boon from Boomers. Boston: Harvard Business School Press.
Shelton, C. & Shelton, L. (2005). The NeXt revolution. California: Davis-Black Publishing.
Wilson, T. (1999). Rewards that drive high performance. New York: AMACOM.
Wilson, T.B. (2003). Innovative Reward Systems for the Changing Workplace. New York: McGraw-Hill.
32

Table 1
Generation timelines in different countries
Generation USA Europe/UK Japan South AfricaGI’s
Veterans
Boomers
Generation X
Generation Y
1900 - 1923
1924 – 1942
1943 – 1962
1963 – 1983
1984 –
1900 - 1918
1919 – 1945
1946 – 1965
1966 – 1984
1985 –
1900 - 1925
1926 – 1945
1946 – 1965
1966 – 1985
1986 –
1900 - 1920
1921 – 1940
1941 – 1960
1961 – 1980
1981 – 2000Reference: (Codrington and Grant- Marshall, 2004).
33

Table 2Differences in the Generations
Defining Values and Characteristics
Attitude
Leadership
Communication
Likes
Dislikes
Defining Events
Veterans(1920– 1940)Reserved,clean-living, gentlemanly
Pay your due, workhard
Formal, hierarchical, loyal, hard working, low key, detail-orientated
Burgeoning airmail, Telephone
Security,stability
Debt, borrowing, upstartyoung people
Discover penicillin, Great Depressio
Boomers(1941 - 1960)
Personal gratification, wellness, success, bossy, stylish, inquisitive, competitive, talkative
If you have it, flash it
Visionary, idealistic, workaholics, energetic, bossy, loud, reward-driven, consensus
Post, courier services, telex,typewriters
Shopping, ostentation, winning, leading, vision
Paying off debt,aging
Mau Mau revolt, Russia launched Sputnik,
Generation X(1961 -1980
Balance, self-reliance, pragmatism, individualistic,arrogant, risk-taking
Whatever…enigmatic
Caution, creative, realistic, low key, innovative,flexible, independent, adaptable, competence
Personal computers, internet, email,web, cellular phones
Sharing, chilling, being individualistic,being with friends, change
Bossiness, corporate culture
Launched microchip,
Generation Y(1981 – 2000)
Respect, independent, loyal, humour, tolerant, caring,honest, balanced,optimistic, clean-cut
Let’s make the world a better place
Civil minded, visionary, confident, optimistic, moralistic, principled, values driven
Email, internet, web, sms, PC withvoice recognition, digital voice,
Shopping, labels,family, friends, the environment, technology
Dishonesty, unbalanced life, ostentation
Internet, virtualcommunities, 24/7lifestyle,
34

Outlook
Work Ethic
Success is a result of
Money is for
Education is
Health
Feedback
n, World War ll, Pearl Harbour, Hiroshima,
Victorian
Work hardbecause it is my duty, life timecareer
Hard work
Security,save for a rainy day
Lucky to have one – we’ll do our very best
Grinned and bore the painNo news is good news
contraceptive pill, Nelson Mandela sentenced to life, cold war, assassinations, feminist movement, Sowetoriots
Optimistic
Driven , self-fulfilling, makes me feel important, job security and career
Political savvy,networking skills
Enjoyment, owe the bank money
A birthright
Doctor must cureme immediately
Regular feedback
Watergate, rightto abortion, test-tube baby, Margaret Thatcher – firstfemale Prime Minister, Working moms, Challenger, latchkey kids, Berlin wall comes down, divorced parents, AIDS
Sceptical
Balanced, fund lifestyle, career rather than security
Holding two jobs
Survival, means to an end
I’ll listen, butI can teach myself
Alternative therapy
Immediate feedback
baggage free, Mandela released,Princess Diana dies, Dolly the clone sheep, Viagra, SMS, 9/11, Iraq war, e-mail spam increases
Opportunity
Enjoy change, entrepreneurial, will help to change the world,parallel career
High energy, fastthinking, quick learning
Immediate gratification andto save the world
There’s more to school than memorising
Obsessed with keeping healthy
Feedback wheneverI need
35

Table 3
Total reward mix
Pay
Base salary
Variable pay
Recognition
Shares
Benefits
Health care
Retirement
Savings
Time off
PerksLearning and Development
Career Development
Performance
management
Succession planning
Training
Work Environment
Organisational climate
Leadership
Performance support
Work/life balance
36
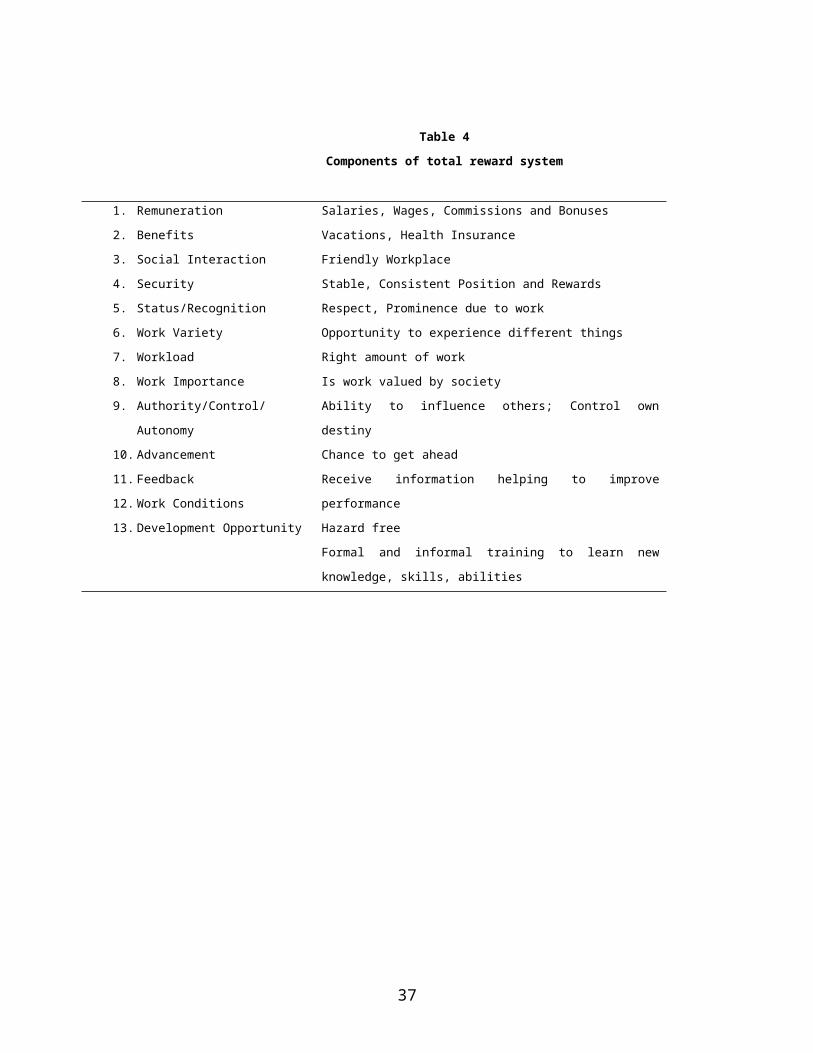
Table 4
Components of total reward system
1. Remuneration
2. Benefits
3. Social Interaction
4. Security
5. Status/Recognition
6. Work Variety
7. Workload
8. Work Importance
9. Authority/Control/
Autonomy
10. Advancement
11. Feedback
12. Work Conditions
13. Development Opportunity
Salaries, Wages, Commissions and Bonuses
Vacations, Health Insurance
Friendly Workplace
Stable, Consistent Position and Rewards
Respect, Prominence due to work
Opportunity to experience different things
Right amount of work
Is work valued by society
Ability to influence others; Control own
destiny
Chance to get ahead
Receive information helping to improve
performance
Hazard free
Formal and informal training to learn new
knowledge, skills, abilities
37

Table 5
Biographical detailsCompany Number of
ParticipantsPercentage
Company A 147 89.10%Company B 18 10.90%Total 165 100%
Level of position
Top management
12 7.30%
Senior management
18 11.10%
Middle management
35 21.30%
Supervisors 46 28%Staff 53 32.30%Total 164 100%
Generations
Veterans 21 12.80%Baby Boomers 53 32.20%
Generation X 52 31.70%Generation Y 38 23.20%Total 164 100%
RaceWhite 129 78.70%Black 27 16.50%Indian 4 2.40%Coloured 4 2.40%Total 164 100%
GenderMale 96 58.50%Female 68 41.50%Total 164 100%
Marital Status
Single, never married
40 24.40%
Co-habituating
6 3.70%
Married 88 53.60%Separated, divorced,
30 18.30%
38

widowed Total 164 100%
39

Table 6
Mean descriptives of categories aligned with generations
Generation Y Generation X Baby Boomers Veterans
Unimportant
Neitherimportant
norunimporta
nt
Important Total Unimporta
nt
Neitherimportant
norunimporta
nt
Important Total Unimporta
nt
Neitherimportant
norunimporta
nt
Important Total Unimporta
nt
Neitherimportant
norunimporta
nt
Important Total
To receive a base salary
Count 0 1 20 21 0 41 41 0 1 47 48 0 18 18
% 0.0% 4.8% 95.3%100.0
% 0.0% 100.0%100.0
% 0.0% 2.1% 98.0%100.0
% 0.0% 100.0%100.0
%
To get career development
Count
0 3 19 22 1 2 39 42 3 6 40 49 3 3 12 18
% 0.0% 13.6% 86.3%100.0
% 2.4% 4.8% 92.8%100.0
% 6.1% 12.2% 81.7%100.0
% 16.7% 16.7% 66.6%100.0
%
To have health carebenefits
Count
1 1 20 22 1 3 38 42 7 4 39 50 1 17 18
% 4.5% 4.5% 90.9%100.0
% 2.4% 7.1% 90.4%100.0
% 14.0% 8.0% 78.0%100.0
% 5.6% 94.4%100.0
%
The leadership style of the organisation
Count
0 4 16 20 0 6 35 41 1 5 42 48 1 2 16 19
% 0.0% 20.0% 80.0%100.0
% 0.0% 14.6% 85.3%100.0
% 2.1% 10.4% 87.5%100.0
% 5.3% 10.5% 84.2%100.0
%
The organisational climatewithin the organisation
Count
1 1 19 21 2 6 33 41 1 3 46 50 0 5 14 19
% 4.8% 4.8% 90.5%100.0
% 4.9% 14.6% 80.5%100.0
% 2.0% 6.0% 92.0%100.0
% 0.0% 26.3% 73.7%100.0
%
- 40 -

The performancemanagement system in the organisation
Count
1 3 17 21 0 3 38 41 2 7 40 49 2 3 14 19
% 4.8% 14.3% 81.0%100.0
% 0.0% 7.3% 92.7%100.0
% 4.0% 14.3% 81.6%100.0
% 10.5% 15.8% 73.7%100.0
%
To receive performancesupport in the organisation
Count
0 4 17 21 0 2 39 41 3 5 42 50 1 3 15 19
% 0.0% 19.0% 81.0%100.0
% 0.0% 4.9% 95.1%100.0
% 6.0% 10.0% 84.0%100.0
% 5.3% 15.8% 79.0%100.0
%
To receive perks
Count 0 5 16 21 2 7 30 39 9 13 27 49 3 4 9 16
% 0.0% 23.8% 76.2%100.0
% 5.2% 17.9% 76.9%100.0
% 18.4% 26.5% 55.1%100.0
% 18.8% 25.0% 56.3%100.0
%
To receive retirement benefits
Count 0 1 18 19 1 2 39 42 5 6 37 48 1 16 17
% 0.0% 5.3% 94.7%100.0
% 2.4% 4.8% 92.9%100.0
% 10.5% 12.5% 77.1%100.0
% 5.9% 94.1%100.0
%
To receive recognitionwithin the organisation
Count
0 6 14 20 1 2 39 42 3 7 40 50 2 3 12 17
% 0.0% 30.0% 70.0%100.0
% 2.4% 4.8% 92.8%100.0
% 6.0% 14.0% 80.0%100.0
% 11.8% 17.6% 70.6%100.0
%
To receive incentives to save
Count 1 5 15 21 4 3 35 42 6 10 34 50 1 3 14 18
% 4.8% 23.8% 71.4%100.0
% 9.5% 7.1% 83.3%100.0
% 12.0% 20.0% 68.0%100.0
% 5.6% 16.7% 77.8%100.0
%
To receive share or share options
Count
1 6 14 21 0 7 34 41 2 6 40 48 0 4 13 17
% 4.8% 28.6% 66.6%100.0
% 0.0% 17.1% 82.9%100.0
% 4.2% 12.5% 83.3%100.0
% 0.0% 23.5% 76.4%100.0
%
To have succession planning within the organisation
Count
0 3 18 21 0 3 38 41 2 7 41 50 2 3 13 18% 0.0% 14.3% 85.7% 100.0 0.0% 7.3% 92.6% 100.0 4.0% 14.0% 82.0% 100.0 11.1% 16.7% 72.2% 100.0
41

% % % %
The have time-off options
Count 0 2 19 21 0 2 41 43 4 11 34 49 1 3 15 19
% 0.0% 9.5% 90.4%100.0
% 0.0% 4.7% 95.4%100.0
% 8.1% 22.4% 69.4%100.0
% 5.3% 15.8% 79.0%100.0
%
To have training opportunities
Count
0 2 18 20 0 2 40 42 1 9 40 50 1 3 14 18
% 0.0% 10.0% 90.0%100.0
% 0.0% 4.8% 95.3%100.0
% 2.0% 18.0% 80.0%100.0
% 5.6% 16.7% 77.7%100.0
%
To have a variable pay component as part of the remuneration plan
Count
0 1 18 19 5 4 30 39 2 8 37 47 1 4 13 18
% 0.0% 5.3% 94.7%100.0
% 12.8% 10.3% 76.9%100.0
% 4.2% 17.0% 78.7%100.0
% 5.6% 22.2% 72.3%100.0
%
To have work/life balance
Count 0 2 17 19 0 1 40 41 1 3 46 50 0 17 17
% 0.0% 10.5% 89.5%100.0
% 0.0% 2.4% 97.5%100.0
% 2.0% 6.0% 92.0%100.0
% 0.0% 100.0%100.0
%
42

Table 7
Rotated factor matrix
Factor
1 2 3 4
To have training opportunities .854 .087 .050 .071
To get career development .766 .227 .013-.07
1
To receive performance support in the organization .605 .256 .375 .235
The performance management system in the organization .506 .046 .474 .151
To have succession planning within the organization .483 .458 .184 .015
To receive recognition within the organization .481 .341 .050 .271
The have time-off options .340 .021 .171 .151
To receive share or share options .040 .617 .158 .025
To have health care benefits .165 .596 .074 .152
To receive retirement benefits .269 .549 .003 .411
To receive a base salary .081 .435 .055 .067
The organisational climate within the organization .136-.02
0.846
-.00
7
The leadership style of the organization .156 .207 .740 -.19
- 43 -

5
To have work/life balance .028 .135 .409 .172
To receive incentives to save .208 .431-.08
5.641
To receive perks .340 .323-.03
7.614
To have a variable pay component as part of the
remuneration plan
-.02
5
-.00
8.104 .572
Extraction Method: Principal Axis Factoring.
Rotation Method: Varimax with Kaiser Normalization.
44

Table 8
Categories according to the literature versus research
Literature
Categories
Sub- elements Empirical
Categories
Sub-elements
Pay Base pay
Long term
incentives
Recognition
Variable pay
Total Cost to
Company (TCTC)
Package (Factor
2 in table 7)
Base salary
Health care
Retirement benefits
Share options
Benefits Health
Perks
Retirement
Savings
Time-off
Over and above
TCTC Package
(Factor 4 in
table 7)
Perks
Savings
Variable pay
Learning and
Development
Career Development
Performance
Management
Succession Planning
Training
Career (Factor 1
in table 7)
Career Development
Performance
Management
Performance Support
Recognition
Succession Planning
Time off options
Training
Opportunities
45
Work
Environment
Leadership
Organisational
Climate
Performance Support
Work/Life Balance
Company’s
Working
Atmosphere
(Factor 3 in
table 7)
Leadership style
Organisational
Climate
Work/Life integration
46

Table 9
Mean descriptive of categories aligned with generations
Research Categories Generation
Y
(1981 –
2000)
Generation
X
(1961 –
1980)
Baby Boomers
(1941 – 1960)
Veterans
(1921-
1940)
TCTC package 4.42 4.59 4.32 4.54Over and Above TCTC
package
4.21 4.23 3.80 4.06
Career 4.33 4.52 4.12 4.06Company’s Working
Atmosphere
4.33 4.44 4.50 4.39
47