Revised GIC A/R02 Covers final
66
Annual Report 2002
-
Upload
khangminh22 -
Category
Documents
-
view
3 -
download
0
Transcript of Revised GIC A/R02 Covers final

Annual Report 2002
Gu
lf Investm
ent C
orporation
An
nu
al Rep
ort 2002
Revised GIC A/R02 Covers final 16/4/03 1:51 pm Page 1

Gulf Investment Corporation Annual Report 2002
1
Financial Highlights
US$ Millions 2002 2001
For the yearNet Interest Income 79.2 48.8 Other Income 43.6 51.7 Operating Expenses 28.0 26.9 Income from Discontinued Operations - 26.7 Net Income 90.3 85.3
At year endTotal Assets 5,804.9 5,541.0 Trading Securities & Managed Funds 308.7 220.6 Investment Securities 3,564.1 3,055.6 Loans & Credit Funds 426.8 487.9
Deposits 1,705.1 1,464.8 Shareholders' Equity 1,178.1 1,151.7
Selected Ratios (%)ProfitabilityReturn on Paid-up Capital 12.0 11.4Return on Adjusted Shareholders' Equity 8.3 7.3
CapitalBIS ratios- Total 35.0 35.9- Tier 1 34.9 35.8
Shareholders' Equity as a % of Total Assets 20.3 20.8
Asset QualityLoans & Credit funds as a % of Total Assets 7.4 8.8Marketable Securities as a % of Total Assets 60.1 55.1GCC & OECD country risk as a % of Total Assets 99.3 95.9
LiquidityLiquid Assets Ratio 76.3 71.7
ProductivityOperating Income as Multiple of Operating Expenses 4.4 3.7
Note: Where necessary, prior years' comparative figures have been adjusted to conform with changes in presentation in the current year.
Shareholders’ Equity (US$ million)
02
01 1,152
1,178
Net Income (US$ million)
02
01 85.3
90.3
Total Assets (US$ million)
02
01 5,541
5,805
GIC π02 Review P.8 Final AW 16/4/03 1:19 pm Page 1

Board of Directors
2
Sultanate of OmanH.E. Ahmed MackiChairmanMinister of National Economy andDeputy Chairman of the Financial Affairs andEnergy Resources Council
Mr. Darwish bin Ismail bin Ali Al-Bulushi §Undersecretary of Financial AffairsMinistry of Finance
State of QatarH.E. Yousef Hussain Kamal*Deputy ChairmanMinister of Finance
H.E. Abdulla Khalid Al-Attiya §Governor, Qatar Central Bank
State of KuwaitH.E. Dr. Mohammed Sabah Al-Salem Al-SabahMinister of State for Foreign Affairs and ActingMinister of Finance and Minister of Planning
Mr. Abdulmohsen Yousef Al-Hunaif §❖
Undersecretary, Ministry of Finance
United Arab EmiratesH.E. Dr. Mohammed Khalfan Bin KhirbashMinister of State for Finance and Industry
Mr. Rashed Ahmed Rasheed §❖
Deputy General ManagerEmirates Management Services Corporation
Kingdom of BahrainH.E. Abdulla H. SaifMinister of Finance and National Economy
Mr. Rashid Ismail Al Meer §❖
Director GeneralThe Pension Fund Commission
Kingdom of Saudi ArabiaH.E. Dr. Ibrahim Al-AssafMinister of Finance and National Economy
H.E. Hamad Al-Sayari §Governor, Saudi Arabian Monetary Agency
Senior ManagementMr. Hisham Abdulrazzaq Al RazzuqiChief Executive Officer
* Chairman of the Executive Committee§ Member of the Executive Committee❖ Member of the Audit Committee
GIC π02 Review P.8 Final AW 16/4/03 1:19 pm Page 2

Gulf Investment Corporation Annual Report 2002
3
Footer
Kingdom of Bahrain
State of Qatar
United Arab Emirates
Sultanate of Oman
State of Kuwait
Kingdom of Saudi Arabia
GIC π02 Review P.8 Final AW 16/4/03 1:19 pm Page 3
Chairman’s Statement
On behalf of the Board of Directors, I have the privilege topresent the Annual Report and Accounts of Gulf InvestmentCorporation for the year 2002.
I am pleased to report that 2002 wasanother good year for GIC, with profits andassets registering solid growth. Operatingincome increased by over 22% to US$ 122.8million and the overall balance sheet sizegrew by approximately 5% to US$ 5,804.9million. At US$ 90.3 million, net income for 2002 was 5.9% higher than that of the prior year, and represented a return onshareholders’ equity of 8.3%. The soundperformance during the year was a result ofstrategic initiatives that reflect clear adherenceby the Corporation to the strategy approvedby the Board of Directors. This performancealso highlights GIC’s ability to continuouslyoptimize its asset mix in line with thechanging operating environment.
During the past year, GIC had initiated severalfocused and well-defined action plans targetedat diversifying and enhancing revenues,increasing efficiency through management ofexpenses, and phased expansion of operatingbusinesses. The rewards of these actions arereflected in the strong performance during2002 and I am confident that the Corporationwill continue to benefit from its diversificationplans in the future. We intend to continuegrowing the balance sheet over the next fewyears, aiming to achieve a suitable leverage, inline with the Corporation’s target ROE andaccepted risk profile.
GIC will continue its efforts to realign itsorganizational resources to meet therequirements of its strategy. It is important torecap that GIC strategy implies an increasedfocus on the GCC region, with principalinvesting in projects playing a central role.Over a third of the Corporation’s total assetsare invested within the GCC countries. The focus implies not only directing moreinvestment resources to the GCC economiesbut also entails revitalizing GIC’s role as apromoter of investment concepts and ideas that enhance and encourage privateenterprise in the region. Our ownership andstanding, strong capital position, efficientand flexible organization structure and clearfocus constitute our principal strengths. I amconfident that the Corporation is now wellpositioned and has the wherewithal toleverage these strengths for continued success.
As at December 31, 2002, total shareholders’equity reached US$ 1,178.1 million. With a capital base in excess of 20% of totalassets, GIC continues to be one of the moststrongly capitalized financial institutions in the region. We view this solid capitalposition as a strategic resource and will strive to deploy this resource in an efficientand disciplined manner to earn competitivereturns. Capital management is fundamentalto GIC’s risk management philosophy, and
4
GIC π02 Review P.8 Final AW 16/4/03 1:19 pm Page 4

takes into account economic and regulatoryrequirements.
I am pleased to welcome to the Board HisExcellency Dr. Mohammed Sabah Al-SalemAl-Sabah, Minister of State for ForeignAffairs and Acting Minister of Finance andPlanning of the State of Kuwait. Dr. Mohammed Al-Sabah replaces Dr. YousefHamad Al-Ebraheem. I take this opportunityto thank Dr. Al-Ebraheem for his valuablecontributions during his tenure as memberof the Board and wish him continued success.
I assumed the chairmanship of the GICBoard in April 2002 and would like to thankmy colleague His Excellency Dr. Ibrahim Al-Assaf for all his efforts and diligence duringhis term as Chairman of the Board in thepreceding two years. Since the posts ofChairman and Deputy Chairman of the Gulf
Investment Corporation are rotated everytwo years among the Ministers of Financerepresenting each of the GCC governments,His Excellency Yousef Hussain Kamal,Minister of Finance of Qatar, has assumedthe position of Deputy Chairman of theBoard following the Corporation’s GeneralAssembly meeting in April 2002. I welcomeHis Excellency and wish him success asDeputy Chairman and Head of the ExecutiveCommittee. I also wish to express myappreciation and gratitude to the membersof the Board and Executive Committee for their strategic guidance and to themanagement and staff at GIC for theircontributions toward the commendableperformance.
Ahmed MackiChairman
Gulf Investment Corporation Annual Report 2002
5
GIC π02 Review P.8 Final AW 16/4/03 1:19 pm Page 5

Chief Executive Officer’s Review
The Gulf Investment Corporation continued its efforts tomanage its main lines of business according to clear strategicguidelines. Emphasis on focused and well-definedapproaches in developing and managing the business resulted in a solid financial performance for the year.
Operating income grew by over 22% to US$ 122.8 million from the US$ 100.5million earned in 2001. The solid performanceonce again demonstrates the ability toidentify opportunities and leveragecompetencies in a challenging operatingenvironment. Subsequent to the divestitureof its principal subsidiary Gulf InternationalBank (GIB) during 2001, this year was thefirst full year of operations on a stand-alonebasis for the Corporation.
Net income at US$ 90.3 million, was 5.9%higher than that of the previous year, in spiteof the US$ 28.3 million provisions madeduring the year under review. Net incomerepresents a return on shareholders’ equityof 8.3% for the year. The record provisionsmade in 2002 reflects the Corporation’sconservative provisioning policy and thestringent criterion for valuation of assets.Despite the difficult operating environment,our two main business lines – the PrincipalInvesting activity and the Global Marketsbusiness – performed well, achieving returntargets set for the year.
During the year under review, GIC receivedUS$ 25 million from the United NationsCompensation Commission (UNCC), whichwas treated as an “extraordinary item” andnot included within operating income. Thisone-off income was in respect of the claimfiled by the Corporation for losses incurredas a result of the Iraqi invasion andoccupation of Kuwait in 1990-91.
In June 2002 Moody’s raised the Long-termand Short-term ratings of Gulf InvestmentCorporation to Baa1 and P-2 respectively,signifying the Corporation’s strong capitalposition, its ownership structure and positionin the Gulf region, clear and well definedstrategy, good profitability, asset quality, and the high level of professionalism of staff and management.
In line with the consistent efforts to diversifyour funding profile, the Corporation issued5-year floating rate notes in July 2002.Increased demand from regional andinternational financial institutions led us toraise the total issue to US$ 300 million andenabled favorable pricing of the issue incomparison to recent issues in the region.
Within the Principal Investing activity, the profitable divestiture of our investmentin Clearstream, the international clearing and settlement organization, conforms with our exit strategy for project investments.In addition to gains generated on this sale,the principal investing activity contributed to operating income through share of profits and dividend income from otherproject investments.
The Corporation continued its task to reviewand restructure its portfolio of GCC projects.As of the end of 2002, GIC’s portfolio ofprojects included 34 businesses covering sixGCC states with total investment ofapproximately US$ 306 million. Thesebusinesses have investment programs totalingUS$ 6 billion in the region’s economy. Ourstrategy in principal investing is to strive toinitiate investment ideas and concepts thatfurther the development of Gulf economies.The thrust will be on project origination andpromotion as against just participation. Oneof the major initiatives under consideration isthe setting up of a stainless steel cold rollingcomplex in Abu Dhabi, at an estimatedinvestment of US$ 200 million, to cater tothe demand for steel coils and sheets in theGCC region and beyond. Sectors or themeswith greater potential for value realizationand investment returns in the Gulf are beingtargeted, such as power generation, financialservices and selected manufacturing niches.
The efforts to restructure the portfolioresulted in GIC playing a key role in the
6
GIC π02 Review P.8 Final AW 16/4/03 1:19 pm Page 6

Gulf Investment Corporation Annual Report and Accounts 2002
7
A commitment to serve the GCC region
GIC π02 Review P.8 Final AW 16/4/03 1:20 pm Page 7

Chief Executive Officer’s Review continued
merger of two companies: Cosmoplast andInterplast; both are based in the UAE andoperate in the same industrial sector. Themerger should result in enhanced economiesof scale, cost-savings and higher efficiency ofoperations, which translates in higher returnto investors. In the same spirit of maximizingvalue, GIC has completed a capital restructuringof one of its subsidiaries, the Gulf IndustrialInvestment Company (GIIC), which resultedin reducing the cost of investment to theCorporation from an initial amount of $94.5million to $52.9 million. The year has alsoseen important developments: Ras LaffanPower in Qatar and A’Saffa Poultry Farms inOman have entered the construction stage;Al Manar Plastics in Saudi Arabia and KuwaitInternational Advanced Industries havecommenced commercial production.
Global Markets investments continued tobe the key driver of overall income growth.Through the dynamic management of its holding structure and the continuousoptimization of its funding profile, theinvestment securities portfolio generatedsuperior spread income, significantlycontributing to the bottom line. Whatdistinguishes the year from previous ones isthe level of involvement by GIC in regionalcapital markets, not only as an investor in itsown right but also as a supplier of productsand services to investors interested in theregion. With the objective of diversifying our sources of revenue, the alternative assetsportfolio was further expanded throughinvestments in a diversified futures program,a high-grade leveraged credit structure, ahigh return hedge fund of funds, and similarstrategies. These investments provided low risk income, while offering benefits of diversification vis-à-vis GIC’s otherconventional asset classes.
GIC is committed to expanding its fee-basedincome source, and in this regard a GCC
equities team was established in early 2002with the objective of attracting third partyfunds for management. In a short span ofless than six months, total funds undermanagement exceeded US$ 200 million,generating steady fee income and entailinglittle risk. In both the proprietary and thirdparty asset management fields, our focus is the GCC region, whose dynamics wecomprehend well and where we have abetter understanding of the inherent risks.With the objective of enhancing GIC’s role inthe GCC capital market, the Corporation is in the advanced stages of launching GCCdebt and equity funds targeted at regionaland international investors.
The Corporation has developed an enhancedinvestment process, with capital and otherresources being allocated based on riskadjusted return criterion. Post-investmentperformance measurement is also based on these measures, enabling continuousoptimization and efficient asset allocation.
Management of expenses remains a prioritywithin the Corporation. The sharp focus anddiscipline we maintain on the cost structureis reflected in the excellent productivity andefficiency ratios. Productivity, expressed interms of total operating income as a multipleof operating expenses, improved to 4.4 in2002 from 3.7 in 2001, and 2.0 in 2000.Standard & Poor’s, in their rating report forGIC, highlighted our cost structure as a keycompetitive advantage, which would bring in benefits in terms of increased efficiencyand improved margins.
With the objective of strengthening theinternal control systems of the Corporation,an Audit Committee of the Board ofDirectors was set up during 2002. Theprimary function of this committee is toassist the Board of Directors in fulfilling itsresponsibility for ensuring that senior
8
GIC π02 Review P.8 Final AW 16/4/03 1:20 pm Page 8
management have established andmaintained an adequate and effective systemof internal controls. Additionally, this boardlevel sub-committee, comprising non-executive directors, will reinforce the internalcontrol system and the internal and externalaudit functions.
GIC’s Regional Role: The Corporationcontinued its efforts to highlight its role inthe regional economies. A GCC equityresearch unit was established with theobjective of providing basic research to theinvestor community in the region. We viewthis newly created function as an integralpart of our strategy to serve the region’seconomies. The research team wasinstrumental in developing and launching aset of equity indices to cover all the six stockmarkets within the GCC region. These GICindices are pioneering in terms of being thefirst regional indices to apply a consistentglobally accepted calculation methodology,and in terms of creating total return GCC
indices including dividends. In the absence of reliable performance benchmarks in theregion, the creation of new indices is seen as an important step in the development of regional capital markets.
I want to emphasize that GIC’s strongperformance is primarily attributed to thededication and commitment of theprofessional staff and our ability to worktogether as a cohesive team. During the yearthe Corporation was successful in attractinghighly qualified professionals from the region,who brought in a diverse yet complementaryset of experiences and skills. I would also liketo take this opportunity to thank our Boardof Directors for their continued support andguidance, which facilitated our work andcontributed to our success.
Hisham Abdulrazzaq Al RazzuqiChief Executive Officer
Gulf Investment Corporation Annual Report 2002
9
GIC π02 Review P.8 Final AW 16/4/03 1:20 pm Page 9

Economic Review
That was not enough, however, to changethe bleak economic picture worldwide. The GCC region, although benefiting fromfirm oil prices in the latter part of the year,had little real GDP growth in view of OPEC’s lowering of production quotas for its members during the year.
The World EconomyThe year started on a good note as the USeconomy grew at 1.4% in the first quarterafter showing negative growth in 4Q 2001.The US avoided the technical definition ofrecession, since it did not have twoconsecutive quarters of negative growth.The hope at the beginning of the year was for a real turnaround in the US, thereforeimpacting positively the rest of the world.Those hopes did not materialize and theunexpected level of corporate malfeasance in the US, coupled with global geopoliticaluncertainties, influenced the mood of investorsand shook confidence in the world markets.The aftershocks of the bursting stock market bubble in the US – especially in thetechnology, telecom and media sectors –continued to influence investor sentiment, notonly in the American markets, but elsewherein the world. As Table 1 shows, all major worldequity markets were negative for the year.
In the US, it was the third year in a row whenall principal market indices declined, which hasnot happened since 1939-1941. The “equityculture”, which analysts were heralding as anew force spreading from the US to Europe,suffered a setback in the year. Indeed, it wasthe first time since 1988 that American equitymutual funds had a net withdrawal.
Equity markets also suffered fromunprecedented volatility. The Europeanmarkets, especially in Germany, sufferedfrom severe volatility during the year, withthe German index XETRA DAX moving bymore than 100% for the closings on March19th and October 9th. Other markets alsohad strong volatility.
The year in which the US is estimated tohave grown by 2.4%, versus 0.8% for theEurozone and -0.3% for Japan,1 was a yearfor reflationary attempts by monetaryauthorities in the US and Europe. TheFederal Reserve in the US kept its low rate of1.75% on federal funds for most of the year,and ended by a 50 bps cut in November2002. The European Central Bank also cutrates during the latter part of the year whenit became obvious that its major economiesin Germany and France were suffering.
10
The turnaround in the world economy did not happen in 2002. The US had a weaker than hoped for growth. The Euro zone hardly had any growth to speak of, and Japan’s growth was negative. The only bright spots wereChina and Australasia.
Table 1Global Stock Market Indices (in local currencies)
31 Dec. 31 Dec. Change
2001 2002 2002
DJIA 10,021.50 8,341.63 -16.76%S&P 500 1,148.08 879.82 -23.37%NASDAQ Composite 1,950.40 1,335.51 -31.53%FTSE 100 5,217.40 3,940.40 -24.48%DAX 5,160.10 2,892.63* -43.94%CAC-40 4,624.58 3,063.91 -33.75%Nikkei 225 10,542.62 8,578.95* -18.63%Hang Seng 11,396.20 9,321.30 -18.21%
* Last trading day was 30 December 2002.Source: Bloomberg
1 Consensus Economics Inc., Consensus Forecasts, 13 January 2003.
GIC π02 Review P.8 Final AW 16/4/03 1:20 pm Page 10

Gulf Investment Corporation Annual Report and Accounts 2002
11
Acting as a catalyst for intra-Gulf investments
GIC π02 Review P.8 Final AW 16/4/03 1:20 pm Page 11

Economic Review continued
This low interest-rate environment hasbenefited bond investors who enjoyedpositive returns. The Salomon Smith BarneyGlobal Corporate Bond Index had totalreturns of 8.77% in local currencies and16.51% in US dollar terms.2 The USTreasuries of 10-year and above had a totalreturn of 16.77%2 while the Merrill LynchMaster index of US Corporate Bondsreturned 10.17%.2 The US dollar, which wasfirm during the first half of the year, sufferedagainst the Euro, especially in the latter partof the year.
Gulf public investors who were overweightin equities suffered more than nationalmonetary authorities that maintain most of their foreign holdings in quasi-cash andgovernment paper. The average high networth GCC investor had mixed resultsdepending on where the assets weredeployed. Since the fortunes of Gulfeconomies are determinedly linked to the oil situation, a brief survey of the oil marketis followed by a review of the maineconomic themes that dominated the GCC economies during the year.
Recent Developments in the Global Oil MarketOPEC cut production targets by 1.5 MM b/d
effective January 1, 2002. The significantfact about it was that it ushered in a newera of cooperation between OPEC and non-OPEC producers, with OPEC’s cut contingentupon non-OPEC countries cutting theirproduction by 500,000 b/d. After lengthynegotiations, Norway, Mexico, Angola andRussia agreed to lower their production andexport targets.
Short Term OutlookIn coming decades, the Atlantic Basin,comprising Brazil, Argentina and countriesfrom Mauritania to Namibia along coastalWest Africa, may emerge as a major non-OPEC supplier. It is estimated that AtlanticBasin non-OPEC production would rise to 10 MM b/d in 2020 from under 4 MM b/d in 2000.3 Another factor that enabled non-OPEC producers to increase their productionwas the steady rise in former Soviet Union(FSU) production, which reached 9.4 MM b/din 20024 after bottoming at around 7 MMb/d in 1996. Most of the additionalproduction has come from Russia, andKazakhstan in the Caspian Sea region. The IEA estimates non-OPEC production toreach 47.92 MM b/d in 2002, with furtherincreases likely in 2003. Oil prices haverebounded as a result of growing fears ofthe breakout of hostilities in the Gulf.
12
Table 2Oil Prices (US$/per barrel)
1998 1999 2000 2001 2002
OPEC Basket 12.28* 17.47 27.60 23.13 24.36Arab Light 12.20 17.45 26.81 23.06 24.32Brent 12.71 17.91 28.44 24.46 25.03WTI 14.36 19.30 30.37 26.00 26.13
* In December 1998 the average price for OPEC Basket was US$ 9.67 per barrel.Source: Middle East Economic Survey (MEES), Volume 46, No. 2 (13 January 2003).
2 Source: Bloomberg 3 Source: International Energy Outlook 2002, Energy InformationAdministration, US Department of Energy.
4 IEA estimate, December 2002.
GIC π02 Review P.8 Final AW 16/4/03 1:20 pm Page 12

There are other factors affecting oilmarkets:- OECD inventories are below the 2%-
3% normal level. OECD inventorieswere drawn down throughout 2002.
- The US is buying oil for its StrategicPetroleum Reserve (SPR). Nearly 30 MMbarrels were added in the first eightmonths of 2002.
- Uncertainty exists about Iraqi exports aswell as the potential for a military conflict.
- The political situation in Venezuela andBolivia remains uncertain.
Long Term OutlookThe supply-demand profile differs significantlyover the long term. The appetite for energy,especially in the emerging economicpowerhouses in South and East Asia, isexpected to remain vigorous over the next10-15 years. Analysts suggest that demandgrowth in China and India will be in excessof 4% per annum over the next 15 years.5
Brazil and the FSU are also expected to showa sharp rise in demand over the sameperiod, albeit at a slower annual rate.
Gulf Investment Corporation Annual Report 2002
13
Table 3GCC Oil Statistics
Quota* Average Actual Production** Oil Export Revenues***
(‘000 b/d) (‘000 b/d) (US$ bn)
1st January 1st January 1st February
2002 2003 2003 2000 2001 2002 2002E 2003F
GCC-OPECKuwait 1,741 1,845 1,966 2,094 2,042 1,853 11.5 11.8Qatar 562 596 635 696 681 640 6.7 7.1Saudi Arabia 7,053 7,475 7,963 8,336 7,961 7,551 52.6 53.8UAE 1,894 2,007 2,138 2,217 2,126 1,952 17.3 17.7GCC Non-OPECBahrain - - - 38 37 37 n/a n/aOman - - - 955 956 897 8.0 n/aTotal 14,336 13,803 12,930
E: US Department of Energy, Energy Information Administration estimates. * www.opec.comF: US Department of Energy, Energy Information Administration forecasts. ** MEES, Volume 46, No. 2 (13 January 2003)
*** MEES, Volume 46, No. 1 (6 January 2003)Oman: Ministry of National Economy, www.moneoman.gov.omBahrain: Bahrain Monetary Agency, Annual Report 2001
Table 4Global Oil Demand (Million b/d)
1999 2000 2001 2002 2003
75.4 76.2 76.5 76.6 77.7
Source: IEA, October 2002
5 International Energy Outlook 2002, Energy InformationAdministration, US Department of Energy.
GIC π02 Review P.8 Final AW 16/4/03 1:20 pm Page 13

Economic Review continued
14
With slow but steady growth in demand inthe industrialized world of just over 1%,demand is seen rising to:85.20 MM b/d in 2005 96.00 MM b/d in 2010 and 118.60 MM b/d in 2020
As demand rises over 85 MM b/d, non-OPECproduction reaches its constraints, whileOPEC production, especially in the Gulf, risesrelatively effortlessly to fill the gap. Therefore, OPEC production is to reach: 38.4 MM b/d in 200544.8 MM b/d in 2010, and 60.2 MM b/d in 2020
The reasons for greater reliance on OPEC areobvious and are easily discernible. In spite ofnew finds in the Caspian and the AtlanticBasin, proven reserves are not of extraordinarymagnitude. Proven reserves in the Caspian at the end of 2000 were around 16 billionbarrels, Angolan reserves stand at 5.4 billionbarrels while Brazil possesses reserves of 8.1billion barrels. This compares with totalMiddle East reserves (including Iraq and Iran)of 684 billion barrels.6 This picture translatesinto an increasing importance for OPEC and the Gulf region in particular during thecoming decades.
The strategic and economic implications arepositive for the region in the long term.
Prospects for the GCC EconomiesGCC economies recorded double digit growthin nominal terms during 2000, as currentaccount balances soared and governmentbudgets showed great improvements, evensurpluses in some cases. The year 2001,however, was disappointing because ofslower world economic growth, the after-effects of the September 11th terrorist attacksin the US, and weak oil markets.
It appears that 2002 is unlikely to havewitnessed significant improvement over2001, with global economic growth stillweak. The usual vigor that is seen in post-recession recoveries is conspicuously absent.With average oil prices of OPEC Basket forthe year at $24.36, and with productioncutbacks in place, the numbers are expectedto show that performance of the GCCeconomies during 2002 was lackluster, withcertain sectors showing some shrinkage in nominal as well as real terms. The IMFestimates negative real GDP growth inKuwait, due to its weaker non-oil sector, andnegligible growth for Saudi Arabia and theUAE. The three countries together account
Table 5Gross Domestic Product for GCC Economies at Current Prices (y/y% change)
Real GDP*
1998 1999 2000 2001 2002e 2002e
Bahrain -2.6 7.1 20.4 -0.4 3.8 4.1Kuwait -16.3 16.1 22.8 -8.4 4.3 -1.0Oman -11.1 11.5 26.2 0.5 1.5 3.3Qatar -9.2 20.8 32.8 -1.8 8.6 3.0Saudi Arabia -11.5 10.4 17.1 -1.2 -0.4 0.7United Arab Emirates -5.5 13.8 19.9 2.6 -0.3 0.3
e: Estimates* IMF World Economic Outlook, September 2002Source : GIC, GCC Economic Statistics Report, 2nd Edition 2002.
6 BP Statistical Review of World Energy 2002.
GIC π02 Review P.8 Final AW 16/4/03 1:20 pm Page 14

for 87% of the total GDP for the region,which means that 2002 had negligibleeconomic growth.
The GCC economies face many challengesfor the future. Rapidly rising populations are lowering per capita income in most GCCcountries. For a long time GCC governmentshave recognized the need for economicdiversification, promoting private enterpriseand reducing dependence on oil. Success inthe areas of petrochemicals, liquefied naturalgas (LNG) production, aluminum smeltingand in running free zones have been obvious.The vital area of financial services is alsobeing opened up for greater private andforeign investment. The important sectors of tourism, retailing, construction and realestate are run by the private sector. It isimperative that private sector investment and participation increase rapidly, as thereare limitations on the ability of governmentsto continue funding development andproviding subsidies. It is also equallyimperative to open up GCC economies tomore competition to enhance the quality ofservices offered and merchandise produced.
The road ahead for the GCC region requirescodification and clarity of tax legislation,contractual laws and corporate laws, greateraccountability and transparency, reduction inlayers of bureaucracy and expediting project
approval process. Reformers call for fullforeign ownership of enterprises as a meansto attract foreign direct investment andforeign technology. An improvement in thejudicial and legal procedures has been urged.
What is critical is that GCC countries must beable to persuade investors, both domesticand foreign, that the region offers a businessfriendly environment, and that the climate formaking investments is continually improving.Vigorous steps are being instituted throughoutthe region to encourage the inflow of foreignprivate capital, and natural gas has clearlyemerged as the mainstay of the diversificationstrategy, as its versatility as feedstock for thepetrochemicals industry and as fuel forvarious uses, including power generation and metallurgy, became known.
Structural ReformsThe last couple of years have seen thepassage of legislation throughout the GCCthat can be described as ground breaking.Saudi Arabia took the lead in ushering theregulatory structural reform process when itintroduced the new Foreign Investment Lawin April 2000, which allows foreign entitiesto own 100% of local businesses as well asreal estate. Foreign holdings of more than49% are now treated in the same fashion aslocal firms in all respects. The Saudi ArabianGeneral Investment Authority (SAGIA) was
Gulf Investment Corporation Annual Report 2002
15
Table 6Consumer Price Index (y/y% change)
1998 1999 2000 2001 2002e
Bahrain -0.4 -1.3 -0.7 -1.2 0.5Kuwait 0.15 3.0 1.8 1.7 2.0Oman -0.5 0.5 -1.4 -0.4 -0.5Qatar 2.9 2.2 1.7 1.4 1.9Saudi Arabia -0.4 -1.6 -0.8 -0.4 -0.5United Arab Emirates 2.0 2.1 1.3 2.2 1.3
e: EstimatesSource : GIC, GCC Economic Statistics Report, 2nd Edition 2002 and EIU Country Reports.
GIC π02 Review P.8 Final AW 16/4/03 1:20 pm Page 15

Economic Review continued
created to facilitate private investment, and1,375 licenses have been issued betweenApril 2000 and August 2002 for possibleinvestments totaling over $12 billion. Taxrates were cut to 30%, and updated mining,taxation and capital markets laws are ontheir way. The capital markets law is expectedto be ratified by the Saudi Cabinet during 2003.
In March 2001 the Kuwaiti NationalAssembly passed a Foreign Investment Lawthat allows foreign investors to establishcompanies in Kuwait without local sponsorsor partners. Bahrain now permits 100%ownership under certain conditions alongwith liberalization of real estate ownershiprules for such companies. Bahrain’s offshorebanking units can be fully foreign owned. By 2005, Bahrain expects to allow foreigners100% ownership of every business. Qatarpassed a new law in 2000, which allowsforeign companies to own more than 50%equity in all projects subject to the approvalof the Ministry of Economy & Trade. Qatarnow permits 100% ownership in the sectorsof education, tourism and healthcare. The
UAE pioneered free zones in the region thatallow 100% ownership, and more zones innewer industries, including high technology,have been established. Oman took the leadin opening up its power, water and transportsectors to domestic and foreign privateparticipation, in addition to LNG andpetrochemicals. Its legislation relating tocapital markets and the opening up of itsstock market to foreign investors has been a trendsetter. All GCC countries are nowmembers of WTO except for Saudi Arabia,which is pushing vigorously for membership.Regulatory bodies to govern sectors such aspower, water and telecommunications arebeing set up everywhere. The legislativeinitiatives summed up above make it manifestlyclear that private enterprise and foreign directinvestment are expected to provide theimpetus for further development efforts inthe GCC region. Competition is expected toincrease and subsidies are being graduallyscaled back. Foreign trade is slated to expandwith the agreement on a GCC customs uniontaking effect on January 1st, 2003.
16
Table 7GCC Government Revenues and Expenditure (US$ Million)
1999 2000 2001 2002 Budget
Revenues Expenditures Deficit/ Revenues Expenditures Deficit/ Revenues Expenditures Deficit/ Revenues Expenditures Deficit/
Surplus Surplus Surplus Surplus
Bahrain 1,756 1,925 (169) 2,786 2,093 693 2,609 2,215 394 1,795 2,781 (986)
Kuwait(a) 17,258 13,169 4,089 16,190 10,395 5,795 17,411 15,486 1,925 11,546 17,796 (6,250)
Oman 4,671 5,901 (1,230) 5,956 6,908 (953) 6,580 7,433 (853) 6,476 7,464 (988)
Qatar(b) 4,191 4,763 (571) 6,436 5,026 1,410 5,307 5,293 14 5,002 5,502 (500)
Saudi Arabia 39,385 49,079 (9,694) 68,892 62,830(c) 6,062 57,410 57,410 0(d) 41,900 53,900 (12,000)
United Arab Emirates(e) 12,182 20,222 (8,040) 20,255 22,891 (2,636) 18,508 25,523 (7,015) n/a n/a n/a
Total GCC 79,443 95,059 (15,615) 120,515 110,143 10,371 107,825 113,360 (5,535) - - -
(a) Kuwait 1999 fiscal year spans from July to June. The 2000 budget covers the period: 1/7/2000 to 31/3/2001. Starting from year 2001, Kuwait fiscal year spans from 1st of April to 31st of March. (b) Qatar fiscal year spans from April to March.(c) 13- months’ salaries were paid during fiscal year 1420/21.(d) Budgeted figures(e) Consolidated budget for the seven emirates as reported in the UAE Central Bank, statistical Bulletin 1Q 2002.Source: GIC, GCC Economic Statistics Report, 2nd Edition 2002.
GIC π02 Review P.8 Final AW 16/4/03 1:20 pm Page 16

Gulf Investment Corporation Annual Report and Accounts 2002
17
A range of global markets investment products
GIC π02 Review P.8 Final AW 16/4/03 1:21 pm Page 17
Economic Review continued
It will be useful to briefly review keydevelopments in important sectors.
Oil and GasObviously, the hydrocarbons sector iseconomically the most important to theregion. Conversely, a healthy and growinghydrocarbons sector is vital to the well beingof the entire energy-consuming world, asproduction capacity in the GCC oil industrymust more than double in the next twenty years.
Among the most important developmentsthat are taking place in the oil and gas sectorare the Gas Initiative in Saudi Arabia andProject Kuwait. Hydrocarbons production inSaudi Arabia and Kuwait, which togetherpossess more than 36% of the global oilreserves, has been off limits to foreigninvestment for more than 25 years. The gasinitiative was launched in 1999. Three coreventures have been formed and preliminaryagreements signed with IOCs. Implementationagreements and project agreements areunder negotiation. The total outlay isexpected to be at least $25 billion; equal to the total direct foreign investment madein Saudi Arabia during the last 25 years.
Project Kuwait aims at raising capacity offour fields in the north of the country to900,000 b/d by 2005 and the capacity of the two western fields to 466,000 b/d overthe same period. Foreign oil companies areexpected to invest more than $7 billion in the development of these fields when the project is implemented. A draft lawregulating proposed arrangements wasapproved by the Cabinet, and is currentlybeing reviewed by the National Assembly.
An important development in the energysector has been the spectacular gas finds in Qatar. In May 2002, SSI-Baker Hughescertified gas reserves of more than 900
trillion cubic feet, ranking Qatar second inthe world in terms of reserves, behindRussia. Qatar’s reserves are equivalent tonearly 200 billion barrels of oil or 20% ofglobal oil reserves.7
Two major projects, Rasgas and Qatargas, arenow operating successfully and have morethan 30% foreign equity investment. Massiveexpansions are ongoing and by 2007 Qatar is estimated to export 35 million tons of LNGannually, which should make Qatar thenumber one LNG exporter in the world.
ADGAS in Abu Dhabi pioneered the LNGindustry in the Gulf as early as 1978, andOman completed a world class facility withthe participation of foreign equity partners in 2000, and a third train will commenceinstallation in early 2003, boosting productionto about 10 million tons annually.
Abu Dhabi continues with the second phaseof its massive $1.2 billion gas reinjectionprogram at the offshore Upper Zakum field,with BP and TotalFinaElf as major shareholdersin the ADNOC subsidiary working on theexpansion of the field.
The Dolphin Gas Pipeline is laying down yetanother milestone, as it would constitute thefirst major cross-border energy deal betweenGCC members. In December 2001, DolphinEnergy Limited (DEL) and Qatar Petroleumsigned a 25-year development andproduction agreement. DEL will drill andextract 2 billion cubic feet of gas per dayand pipe it to Abu Dhabi and then to Dubai.The gas is earmarked for power, water andother industrial uses such as petrochemicalsproduction. The second phase will expandthe pipeline to Oman and then to Pakistan.The first phase involves an outlay of $3.5billion. DEL is 49% owned by IOCs and 51% by the UAE Offsets Group. Efforts are underway to complete the financial
18
7 EIU Qatar Country Report, July 2002.
GIC π02 Review P.8 Final AW 16/4/03 1:21 pm Page 18

arrangements for implementing Dolphin with the appointment of a project financedirector for the project in November 2002.8
Four foreign bidders have been shortlistedfor the engineering, procurement andconstruction contract.
Petrochemicals and FertilizersPetrochemical projects represented the firstmajor step in the diversification policy of the GCC, and are based essentially onexploiting the ethane molecule in natural gas for producing ethylene and numerousother derivates.
Saudi Arabian Basic Industries Corporation(SABIC) has been a pioneer in the GCC in
employing joint ventures with noticeablesuccess. ARAMCO provided inexpensiveethane to the JVs while the partners, major IOCs and global chemicals producers,provided technology and marketingexperience. SABIC today is one of the largestpetrochemicals producers in the world, withover 10% of global production. Since themid-1990s, the Saudi government haspermitted purely private petrochemicalscompanies to operate in Saudi Arabia. Theyinclude Saudi International PetrochemicalsCompany, Saudi Polyolefins Company andJubail Chevron Phillips.
The UAE’s first major petrochemicals plantcame on stream when the $1.2 billion
Gulf Investment Corporation Annual Report 2002
19
8 MEES, Volume 46, No. 3 (20 January 2003).
Table 8GCC Trade & Current Account Balances (US$ Million)
1997 1998 1999 2000 2001*
Bahrain Trade Balance 605 (29) 894 1,801 1,536Current Account (31) (778) (37) 783 157
Kuwait Trade Balance 6,533 1,903 5,568 13,027 9,238Current Account 7,934 2,215 5,062 14,670 8,562
Oman Trade Balance 3,012 307 2,939 6,726 5,763Current Account (78) (2,950) (291) 3,423 2,315
Qatar Trade Balance 863 1,960 4,962 8,664 7,484Current Account (1,679) (455) 2,171 5,474 4,263
Saudi Arabia Trade Balance 34,362 11,287 25,039 49,843 44,387Current Account 305 (13,150) 412 14,336 14,502
U.A.E. Trade Balance 7,399 550 4,754 14,824 10,391Current Account 6,310 (1,114) 3,488 13,751 8,860
Total G.C.C. Trade Balance 52,774 15,979 44,156 94,885 78,799Current Account 12,761 (16,232) 10,805 52,437 38,659
* PreliminarySource : IMF; IFS, January 2003. Qatar Central Bank, Quarterly Statistical Bulletin, June 2002.Central Bank of United Arab Emirates, Statistical Bulletin, April - June 2002.
GIC π02 Review P.8 Final AW 16/4/03 1:21 pm Page 19

Economic Review continued
Borouge Petrochemicals project beganoperation in December 2001. Borouge is a 60:40 JV between ADNOC and Borealis (a Danish firm). Oman is currently the onlyGCC country without a petrochemicals plantbut this is due to change. A joint venturecalled Oman Propylene is in the planningstage. ABB Lummus and LG International are the foreign equity owners along withOman Oil Company, which owns a 60%stake. Other projects are close to theimplementation stage, such as the OmanIndia Fertilizer Company (OIFC), which hasalready awarded construction contracts. This $1.0 billion project will have two 1,750tons/day ammonia trains and two 2,350tons/day urea trains. OIFC is a joint venturebetween Oman Oil Company (50%) and twoIndian Farmers’ Cooperatives (25% each).
The Q-Chem I project was officiallyinaugurated in January 2003. This is a $1.12billion project between Qatar Petroleum(51%) and Chevron Phillips ChemicalCompany (49%). Qatar PetrochemicalsCompany (QAPCO) was the first in the GCCto start petrochemicals (ethylene) productionin 1980; it is a JV with foreign partners andhas undergone several expansions since. In2002, Qatar signed joint venture agreementsto set up three additional petrochemicalsprojects worth $2.1 billion using North Fieldgas, including the setting up of Q-Chem II.
Public UtilitiesElectricity, water and telecommunicationsoffer good opportunities for privatization,both in terms of selling existing assets andbuilding new capacity.
GCC countries would need more than36,000 MW of additional capacity through2010 at a cost of over $44 billion. SaudiArabia alone needs around 2,000 MW ofextra capacity every year for the next twentyyears.9 The power sector needs a huge
amount of new investment, world-classtechnology, greater operating efficiency anda reduction in subsidies, which should leadto competitive but realistic pricing.
Oman was the first GCC country to embarkon privatizing the electricity sector, when itimplemented the Al-Manah IPP (IndependentPower Producer) on a BOOT (build-own-operate-transfer) basis in 1996 with foreignequity partners, and sold a 40% stake in the new concern, United Power Company, to the public. Oman closed three IPPs in 2001, and three existing plants awaitprivatization. Distribution and supplycompanies, as well as transmissioncompanies, are slated for privatization.Comprehensive new legislation is expectedduring 2003 that will outline regulatoryparameters and industry standards. Plans are drawn for an IWPP (Independent Water & Power Producer) at Sohar.
Abu Dhabi commenced a privatizationprogram in 1998 with the establishment of ADWEA (Abu Dhabi Water and ElectricityAuthority) and enactment of enablinglegislation. Abu Dhabi has movedaggressively since, with three new IWPPsthat include a ground breaking project atTaweelah A2, followed by Taweelah A1 andfinally the massive Shuweihat project forwhich financing has been secured. ADWEAhas now commenced work on its fourthIWPP at Umm Al Nar to be followed by thebrown field IWPP at Mirfa. The Shuweihatproject, when completed, will have acapacity of 5000 MW and 300 milliongallons per day. The first phase is beingimplemented with CMS Energy andInternational Power as foreign partners.
Bahrain is planning a new 1,000 MW powerplant using an IPP model. Kuwait isconsidering the 2,400 MW Al Zour NorthScheme as an IWPP. Private investors now
20
9 Source: Economic Intelligence Unit, Saudi Arabia CountryForecast, October 2002.
GIC π02 Review P.8 Final AW 16/4/03 1:21 pm Page 20

Footer
own 57% of the Qatar Electricity & WaterCompany, which is currently implementingits first IWPP at Ras Laffan. AES Corporationof the US owns a 55% stake in Ras Laffanand will be the operator; other shareholdersinclude Gulf Investment Corporation (GIC) at (10%).
Many new developments have taken place in Saudi Arabia since the formation of the Saudi Electricity Company (SEC) in 2000, which incorporated regional powercompanies. SEC is now working onseparating its generation, transmission anddistribution arms in preparation for the saleof certain power generating assets. GIC is advising SEC in this matter.
In 2001, Saudi Arabia created the ElectricityServices Regulatory Authority (ESRA) to actas the regulatory body for the sector with aview for eventual privatization of the sector.ESRA will recommend new tariff structures,promote competition, protect investor andconsumer rights, and establish standards forthe industry. The Governor of ESRA hasstated that the first tenders for IWPPs andIPPs will be released during 2003. Most newprojects will be gas fired and employ moderncombined cycle technology. These IWPPs are likely to be set up under the aegis of the SEC and the Saline Water ConversionCorporation (SWCC) with a joint venturecompany expected to be set up shortly. Theprivate sector and strategic partners areexpected to own 60% of the new JV withthe government owning the remainder.More IWPPs are expected under the GasInitiative. In 2002 Saudi Arabia created aWater Ministry, which will work closely withthe Ministry of Industry and Electricity.
The telecommunications sector in the GCC,unlike other parts of the world, still presentsopportunities for investors. The first initiativewas taken by Qatar when, in December
1998, it sold 45% of its share in QatarTelecommunications Company (Q-Tel) to thepublic, including foreign investors. Oman haspassed legislation for the privatization of thetelecommunications sector and the creationof a regulatory body. A 40% stake in OmanTelecommunications is to be offered to astrategic investor and 9% to local investors. The Kuwaiti government sold anotherportion of its stake in MobileTelecommunications Company (MTC) in2001. The Bahrain TelecommunicationsCompany (Batelco), with a free float of 41%,is the most actively traded issue on theBahrain Stock Exchange. Saudi Arabia hasoffered a 30% stake amounting to $4 billionin the Saudi Telecom Company (STC) to the public in December 2002. The SaudiCommunications Commission is studyingproposals for introducing competition in thesector; the GSM sector could be opened asearly as 2004. Privatization of STC representsthe Kingdom’s first IPO since a 30% stake inSABIC was sold in 1984.
Kuwait became the first country in theregion to privatize wastewater facilities,when it offered a 30-year concession to a joint venture of domestic and foreigninvestors in the Sulaibiya waste watermanagement project, using the BOT model.
Financial ServicesThis is an area with strong potential, otherthan energy and the hydrocarbon sectors. It is imperative to have efficient capitalmarkets to attract investors. Transparencyand maximum rectitude in reporting areessential, and the role of regulators,exchange commissions, arbitration bodiesand monetary authorities is important. In this regard measures are being adoptedthroughout the GCC to increase disclosurerequirements and bolster investorconfidence. Efforts are exerted to developthis crucial sector.
Gulf Investment Corporation Annual Report 2002
21
GIC π02 Review P.8 Final AW 16/4/03 1:21 pm Page 21

Table 9GCC Stock Market Performance (As reflected by GIC Indices)*
(y/y % change)
2000 2001 2002
Composite 7.9 24.1 17.7Bahrain -19.3 0.0 8.1Kuwait 14.4 44.8 26.9Oman -9.9 -37.4 54.7Qatar 1.4 57.0 38.5Saudi Arabia 12.9 14.2 7.0United Arab Emirates -16.2 36.4 20.7
*GIC Indices, which were started on January 1st, 2000, are a group of cap-weighted total return indicies for the GCC equity markets.The flagship index is the GIC Composite Index, which is a market-cap-weighted addition of GIC’s 6 GCC country indices.Source: GIC Equity Research
Economic Review continued
Bahrain commenced its offshore bankingactivities as early as 1975, and today thebanking industry in Bahrain has expandedinto other activities and is thriving,representing more than 20% of the country’sGDP. Bahrain has also grown into a majorregional Islamic banking center, an area thathas great potential for growth worldwide.Kuwait has several Islamic banking andinvestment institutions and the market is expected to grow with the passing oflegislation to regulate Islamic banking. In Kuwait, the Cabinet has drafted a lawallowing access to foreign banks, and theParliament is to review it soon. In March2002, a stake in Kuwait’s Bank of Kuwait & Middle East (BKME) was offered to thepublic and the process resulted in acquisitionby the Bahrain based Ahli United Bank of a major stake in BKME.
Oman’s Capital Market Law came into forcein 1999 and a new supervisory body, theCapital Markets Authority, was created. A grievance committee has also beenestablished. Now all companies seekinglisting must be open to foreign investors and most distinctions between fully ownedOmani companies, and companies with up to 49% foreign holdings, have been
abolished. Oman was the first Gulf exchangeto permit foreigners to trade, which wasshortly followed by Bahrain and KuwaitStock Exchanges. Bahrain has now raised the limit on the stake foreigners may own in Bahraini companies to 49% from 24%.
The Kuwait Stock Exchange has been amongthe best performers in the GCC this year, as Table 9 shows. Compensation paymentsreceived by the United NationsCompensation Committee have been animportant contributor to the improvedperformance of Kuwaiti companies and thestock market. Indeed, Gulf stock markets in general performed better than majormarkets in the US, Europe and Asia, withOman and Qatar on top. This happenedduring a year of uncertainties and uneasinessdue to the situation in Iraq. The year 2001witnessed the launch of two official stockmarkets in the UAE for the first time, theDubai Financial Market (DFM) and the AbuDhabi Securities Market (ADSM). EmaarProperties became the first company listed on the DFM to offer 20% equity toforeigners. In May 2002, Qatar Telecom waslisted on the ADSM, while Q-Tel’s globaldepository receipts (GDR’s) are also listed on the London Stock Exchange.
22
GIC π02 Review P.8 Final AW 16/4/03 1:21 pm Page 22

Dubai announced plans to set up a newfinancial center, Dubai International FinancialCenter (DIFC), and is continuing its efforts to attract foreign banks with more than 25 operating branches there. The Center is expected to concentrate on assetmanagement, Islamic Finance, a regionalexchange and insurance. To attract banksand financial institutions to the Center, manyprivileges and exemptions, like those offeredin the free zones, are provided.
Saudi Arabia launched Tadawul, anelectronic trading system, in October 2001.The new capital markets law, expected soon,will involve the creation of a new regulatorybody and new grievance procedures.
ConclusionsMyriad activities are taking shape across the GCC landscape. New free zones arespringing up, with Kuwait being the latestentrant and Oman poised to follow. Theinnovative Dubai Internet City and DubaiMedia City are attracting business. Newtourist resorts, holiday attractions and hotelsare springing up, especially in Dubai; theseare all in private hands with most havingforeign partners or collaborators. The $3billion Palm Islands project in Dubai, whichwould build two artificial resort islands, isanother ambitious project. Large retail mallsopened in Bahrain during the year andelsewhere in the GCC. Given the variedtopography and the size of the region,tourism could be an industry with potential.
Private healthcare is expanding in allcountries. Port services are being privatized.The Gulf pharmaceutical industry is poisedfor growth with foreign participation.Airlines are expanding along with additionsto airport facilities in Dubai, Doha, Jeddah,Bahrain, Oman and Abu Dhabi. Omanhanded over airport management at Seeband Salalah airports to a consortium led byBritish Airports Authority in January 2002.
Saudi Arabia has earmarked mining as apotential area for diversification, and a newmining law is expected shortly, while theSaudi Arabian Mining Company is slated for privatization.
Summing up, the reform process is gettingmore vigorous throughout the GCC withserious efforts to attract investors. Whereasit may be premature to make a categoricalstatement that the take-off stage has beenreached for the GCC economies in thisregard, it cannot be denied that strongaction is being undertaken to diversify those economies. The actions are morepronounced in some GCC members thanothers. However, a trend is discernible and the changes are becoming more of a necessity than a leisurely option.
Gulf Investment Corporation Annual Report 2002
23
GIC π02 Review P.8 Final AW 16/4/03 1:21 pm Page 23

Financial Review
Net Income AnalysisFor Gulf Investment Corporation (GIC), 2002was a good year with operating revenuesincreasing by 22.2 % to US$ 122.8 millionfrom US$ 100.5 million the prior year. GIC’snet income for 2002, at US$ 90.3 million,registered a growth of 5.9% over the US$85.3 million of the previous year. 2002 wasthe first full year of operations after thedivestiture of Gulf International Bank (GIB).Excluding contributions from GIB in 2001,year on year growth in net income wasapproximately 54.1%. The net income forthe reporting year represented a return on adjusted shareholders’ equity of 8.3%.Despite the difficult global economicenvironment, GIC’s core businessescontinued to perform well, registeringsubstantial earnings growth. The soundperformance during the year was a result of strategic initiatives for expansion takenduring the past year, and reflects theCorporation’s ability to continuously optimizethe asset mix, in line with a rapidly changingoperating environment.
Net Interest and Similar IncomeThe Corporation’s net interest and similarincome for the year grew to US$ 79.2million from US$ 48.8 million the previousyear, an increase of approximately 62.3%.Interest income from the investmentsecurities portfolio was the key contributorto this substantial growth. This wasaugmented by earnings on the outstandingreceivable from shareholders’, income fromloans and credit funds, and net proceedsfrom the money book.
Interest income from the investmentsecurities portfolio increased byapproximately 28.3% relative to prior yearlevels, primarily as a result of improvedspreads. The decision to supplement thisportfolio by acquisition of superior gradedebt securities, in the second quarter of the
2002, further enhanced interest income.Limited exposure to the high yield andemerging markets minimized credit relatedlosses within this portfolio. Given the highlevel of quality maintained within theportfolio and the continuous managementof its funding profile, the investment securitiesportfolio will continue to generate a low riskincome stream in the coming years.
The outstanding due from shareholders’,following the sale of GIB in 2001, earned acompetitive return of approximately 4.2%during 2002. Details of this transaction areprovided in Note 8 of the Financial Statements.
The aggregate interest income from theportfolio of loans and credit funds grew by3.0% year on year. The strategic downsizingof the loan portfolio continued during 2002,resulting in the outstanding balance at thecurrent year end being less than half of thatof the previous year end. The subsequentdecrease in interest income was, however,more than offset by greater yields and highervolumes within the credit funds portfolio.With credit funds offering superior riskadjusted returns, investments in such fundsare being gradually expanded as a substitutefor the loan portfolio.
The Corporation’s interest rate sensitivity gap is set out in Note 23 to the FinancialStatements. Exposure to interest rate risk is restricted due to the limited mismatchbetween the repricing of a majority of the Corporation’s assets and liabilities.
Other Operating Income Other operating income for 2002 totaledUS$ 43.6 million. On a comparative basis,this was 15.7% lower than the US$ 51.7million earned in 2001. The weak globaleconomic environment adversely impactedearnings, particularly with regard toperformance of the portfolio of international
24
Our financial goal To maximize long-term shareholder value through consistently superiorfinancial performance while maintaining strong financial condition.
Our financial performance objective To consistently achieve target earnings growthand return on equity, with an appropriate dividend payout.
Our financial condition objective To efficiently manage the various forms of risksassociated with our business and maintain strong asset quality, capital base and liquidity, whileachieving target balance sheet growth.
GIC π02 Review P.8 Final AW 16/4/03 1:21 pm Page 24

Gulf Investment Corporation Annual Report and Accounts 2002
25
Targeting utilities and selected manufacturing niches for principalinvestments
GIC π02 Review P.8 Final AW 16/4/03 1:22 pm Page 25

Financial Review continued
private equity funds. Fee related income, onthe other hand, registered robust growthover prior year levels. A detailed breakdownis available in Note 17 to the FinancialStatements. The key constituents of otheroperating income are discussed below.
Net gain on trading securities increasedmarginally to US$ 10.3 million from US$ 10.0 million in the previous year.Despite the turmoil in global markets, thesound trading performance can be primarilyattributed to the decision to minimizeexposure to equity markets while shiftingemphasis towards alternative investments.Over the past two years the Corporation has built up a diversified portfolio of market-neutral and hedge fund strategies whichprovide low risk returns, while offeringbenefits of diversification vis-à-vis GIC’s otherconventional asset classes. Investments made during 2002 in a diversified futuresprogram delivered an annualized return of almost 35%, significantly contributing to trading income.
A loss of US$ 5.3 million was realized as a result of sale of holdings within theinvestment securities portfolio for which, it was felt, there had been an irreversibledeterioration in credit quality. These disposalsare in line with the portfolio objective ofmaintaining superior credit quality. Given the large size of the portfolio, and in light of the record number of credit defaults anddowngrades in 2002 globally, the lossesincurred by GIC were relatively modest.
The gain on disposal of available for salesecurities, totaling US$ 5.9 million,represents realizations transferred out ofshareholders’ equity on sale of such assets.Of the US$ 5.9 million, approximately US$ 5.2 million arose from sale of privateequity investments categorized as availablefor sale. Aggregating this with the US$ 3.0
million income from private equity funds,earnings from the international privateequity portfolio totaled US$ 8.2 million for2002. The downturn experienced by theglobal private equity sector during the pasttwo years is expected to reverse with therebounding of the major global economies.
For the year, income from projects andequity participations amounted to US$ 14.4million. Combined with the US$ 4.8 milliongain realized on exit from an internationalproject investment, proceeds from thisbusiness totaled US$ 19.2 million during2002. Income from this activity representsGIC’s share of profits from unconsolidatedsubsidiary and associated companies. Theprincipal investing team continuouslyinteracts with the business sector in theregion, enabling GIC to have first handknowledge of, and take advantage of,opportunities as they appear. It should benoted that some of the project participationsare grass root in nature and still in theirgestation periods. Earnings from suchparticipations are expected to grow with the maturing of these projects.
Dividend income of US$ 5.6 millioncomprises receipts from holdings withinprivate equity participations, equity portfoliosand project investments.
Fees and related income for the yeardoubled to US$ 4.6 million from the US$ 2.3million earned in 2001. The solid growth isindicative of the Corporation’s commitmentto expanding its sources of revenue from feebased businesses, and is a result of initiativestaken over the past year in this regard. AGCC equities team was established in mid2002 with the objective of attracting thirdparty funds for management. By the end of2002, total funds under management grewto US$ 202.6 million, contributing to feeincome. Fee income was also generated by
26
GIC π02 Review P.8 Final AW 16/4/03 1:22 pm Page 26

the financial advisory service, which wasawarded certain prestigious assignmentsduring the year. The marketing team aims todeliver a range of financial products availablein the international markets, to a regionalclientele, in addition to the sale of internallydeveloped GCC investment products toclients in and outside the region. Emphasiswill continue to be on expansion of fee-based revenues, as such income entails lowrisk and puts little pressure on capital.
Operating ExpensesOperating expenses are made up of employeecompensation and benefits, occupancy,information technology, and other expenses.Staff costs, the major component, includeincentive compensation, which varies inaccordance with individual as well as corporateperformance. Information technology costsinclude expenditure relating to ongoingenhancement of computer systems.
As against a 22.2% increase in operatingincome, operating expenses increased by amodest 4.1% over prior year. Productivity,expressed in terms of total operating incomeas a multiple of operating expenses,improved to 4.4 in 2002 from 3.7 in 2001and 2.0 in 2000. Net revenue, after reducingloss provisions for the year, as a multiple of operating expenses also increased to 3.4 in 2002 from 3.2 in the previous year.Amortization of goodwill, excluded from theoperating expenses aggregate in computingthe ratios mentioned above, was marginal.Inclusion of these expenses will not have amaterial impact on the above ratios.
The enhanced productivity ratios reflectmanagement’s commitment to maintain asharp focus and discipline on spending. GICwill continue to derive benefits, in the formof improved efficiency and productivity, fromthe restructuring strategies implemented inthe previous years.
Provisions for Credit LossesWe maintain provisions to absorb lossesinherent in our traditional extensions ofcredit that we believe are probable and thatcan be reasonably estimated. Given thevaried nature of businesses, these may arisefrom our lending, treasury and investmentactivities. Estimating losses is inherentlyuncertain and depends on many factors,including general macroeconomic andpolitical conditions, rating migration, riskconcentrations, structural changes withinindustries, and other external factors such as legal and regulatory requirements. The Corporation periodically reviews suchfactors and reassesses the adequacy of the provisions.
Net charge for the year in provisions forcredit losses amounted to US$ 28.3 millioncompared to US$ 13.8 million during 2001. Provisions for the current yearincluded US$ 13.1 million relating to projects and equity participations, US$ 9.4million pertaining to private equity funds and US$ 5.7 million against diminution in value of debt securities within theinvestment securities portfolio. A detailedbreakdown is provided in Note 18 to theFinancial Statements.
Extraordinary IncomeDuring the year under review, theCorporation received US$ 25.0 million of the US$ 34.3 million awarded to it by theUnited Nations Compensation Commission(“UNCC”) in respect of the claim filed by the Corporation for losses incurred as aresult of the Iraqi invasion and occupation of Kuwait in 1990. Details are provided in Note 19 to the Financial Statements.
Balance Sheet AnalysisTotal assets of the corporation reached US$ 5,804.9 million at the 2002 year end, agrowth of 4.8% relative to the US$ 5,541.0
Gulf Investment Corporation Annual Report 2002
27
02
01
00
Operating Income as a Multiple ofOperating Expenses
02
01
00 2.0
3.7
4.4
Net Revenue as a Multiple of Operating Expenses
02
01
00 2.0
3.2
3.4
GIC π02 Review P.8 Final AW 16/4/03 1:22 pm Page 27

Financial Review continued
million at the previous year end. Expansionof the investment securities portfolio, whichgrew by approximately US$ 508.5 million or16.6% during the year, was the principalcontributor to the overall balance sheetincrease. This was supplemented by increaseswithin the portfolio of trading securities andmanaged funds, and a higher level ofplacements and other liquid assets. Partlyoffsetting these increases, GIC’s investmentsin private equity funds and within projectsand equity participations registered modest decreases during 2002. Further, theoutstanding balance due from shareholdersshrank by 15.6% or US$ 90.2 million as of the 2002 year end.
The Corporation’s strategic focus continuesto be on the GCC states and their majortrading partners in the industrialized world.Note 26 to the Financial Statements sets out the geographic distribution of theCorporation’s assets. The following sectionsprovide details on the key asset categories.
Investment SecuritiesThe portfolio of investment securitiesremained the principal asset category,comprising 61.4% of overall assets, at endof 2002. The investment securities portfoliois composed mostly of investment grademarketable debt securities. The objectives ofthis portfolio include the provision of stablecoupon/spread income, risk diversification,provision of a loan substitute and a reserveof additional liquidity. Investments inequities, at US$ 103.3 million, form less than 2.9% of this portfolio.
Investment securities totaled US$3,564.1million at December 31, 2002 as againstUS$3,055.6 million at end of 2001. Theinvestment securities portfolio includessecurities available for sale of US$ 2,863.0million and securities held to maturity of US$ 701.1 million. Prudently anticipating a
weakening interest rate scenario,approximately US$ 400 million was investedin an AAA rated fixed income portfolioduring the second quarter of 2002. Relativeto invested cost, market value of this high quality available for sale portfolioappreciated by over US$ 10.4 million as at 31 December 2002. In aggregate,approximately US$ 54.6 million in unrealizedgains relating to investment securitiesavailable for sale were included withinshareholders’ equity as at year end 2002.The significant increases in market values are indicative of the superior quality holdingswithin the portfolio. Within the held tomaturity portion, US$ 5.7 million provisionswere made relating to impairment in valueof certain asset backed securities within the portfolio. The held to maturity portion,carried at amortized cost, had a market value of US$ 708.5 million at year end 2002,as against a carrying value after provisions of US$ 701.1 million. A credit risk analysis of the investment securities portfolio isprovided in the risk management section onpage 32, and other details, including ratingsprofile, are contained in Note 6 to theFinancial Statements.
Loans and Credit FundsThis category includes loans and advances ofUS$ 121.8 million and investments in creditfunds of US$ 305.0 million. In line with thestrategic initiatives begun the previous year,the loan book was further downsized during 2002, with the outstanding balanceapproximately half of that of the previousyear end. Investments in credit fundsincreased by 26% year-on-year, reflectingrenewed emphasis in such investmentvehicles. Credit funds, yielding higherspreads vis-à-vis GIC’s loan portfolio, aremanaged by experienced international fundmanagers and offer enhanced risk adjustedreturns. As of 31 December 2002, loans andadvances were entirely to customers within
28
2002 2001 2000
Investment securities 61.4 55.1 54.4
Loans and Credit Funds 7.4 8.8 9.7
Trading Securities and Managed Funds 5.3 4.0 4.3
Project Participations and Equity Funds 6.6 7.6 7.8
Placements and Other Interest Bearing Assets 7.9 10.3 4.3
Other Asset Categories 11.4 14.2 19.5
Asset Mix by Category(percentage)
02
01
00
GIC π02 Review P.8 Final AW 16/4/03 1:22 pm Page 28
Footer
2002 2001 2000
the GCC countries, of which US$ 49.7million were to GCC country governments.There were no significant concentrations byindustrial sector at the year end. Investmentsin credit funds were distributed amongseveral managers within North America.
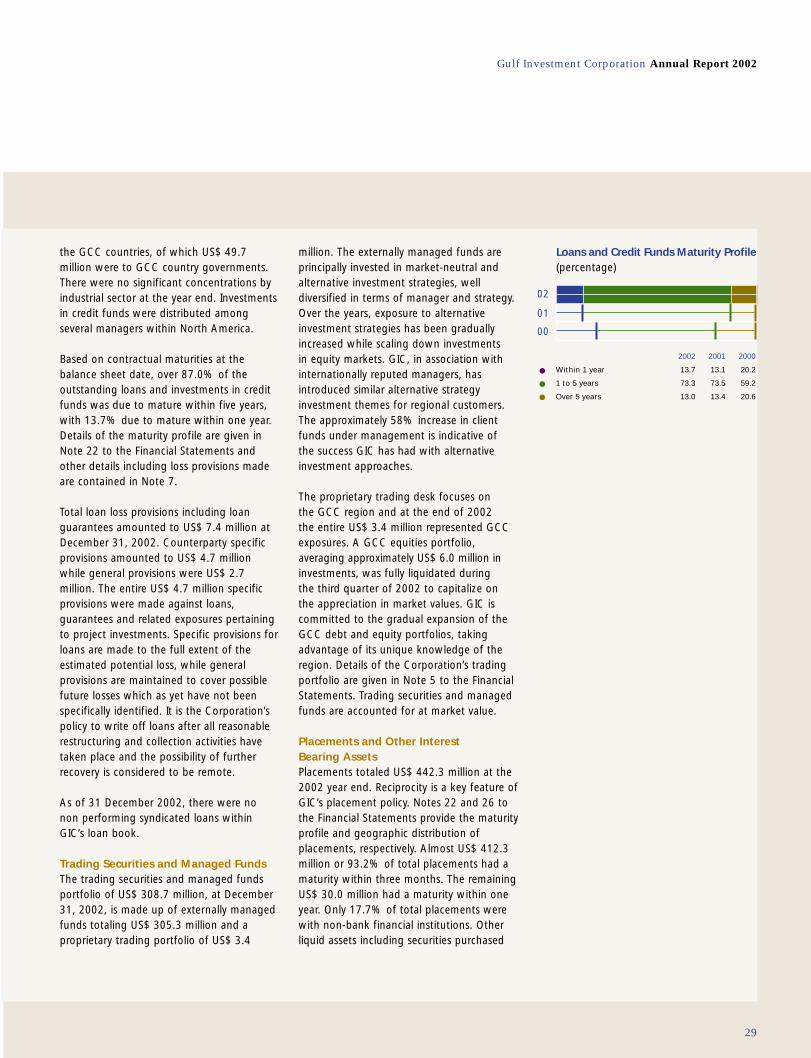
Based on contractual maturities at thebalance sheet date, over 87.0% of theoutstanding loans and investments in creditfunds was due to mature within five years,with 13.7% due to mature within one year.Details of the maturity profile are given inNote 22 to the Financial Statements andother details including loss provisions madeare contained in Note 7.
Total loan loss provisions including loanguarantees amounted to US$ 7.4 million atDecember 31, 2002. Counterparty specificprovisions amounted to US$ 4.7 millionwhile general provisions were US$ 2.7million. The entire US$ 4.7 million specificprovisions were made against loans,guarantees and related exposures pertainingto project investments. Specific provisions forloans are made to the full extent of theestimated potential loss, while generalprovisions are maintained to cover possiblefuture losses which as yet have not beenspecifically identified. It is the Corporation’spolicy to write off loans after all reasonablerestructuring and collection activities havetaken place and the possibility of furtherrecovery is considered to be remote.
As of 31 December 2002, there were no non performing syndicated loans withinGIC’s loan book.
Trading Securities and Managed FundsThe trading securities and managed fundsportfolio of US$ 308.7 million, at December31, 2002, is made up of externally managedfunds totaling US$ 305.3 million and aproprietary trading portfolio of US$ 3.4
million. The externally managed funds areprincipally invested in market-neutral andalternative investment strategies, welldiversified in terms of manager and strategy.Over the years, exposure to alternativeinvestment strategies has been graduallyincreased while scaling down investments in equity markets. GIC, in association withinternationally reputed managers, hasintroduced similar alternative strategyinvestment themes for regional customers.The approximately 58% increase in clientfunds under management is indicative of the success GIC has had with alternativeinvestment approaches.
The proprietary trading desk focuses on the GCC region and at the end of 2002 the entire US$ 3.4 million represented GCCexposures. A GCC equities portfolio,averaging approximately US$ 6.0 million ininvestments, was fully liquidated during the third quarter of 2002 to capitalize on the appreciation in market values. GIC iscommitted to the gradual expansion of theGCC debt and equity portfolios, takingadvantage of its unique knowledge of theregion. Details of the Corporation’s tradingportfolio are given in Note 5 to the FinancialStatements. Trading securities and managedfunds are accounted for at market value.
Placements and Other Interest Bearing AssetsPlacements totaled US$ 442.3 million at the2002 year end. Reciprocity is a key feature ofGIC’s placement policy. Notes 22 and 26 tothe Financial Statements provide the maturityprofile and geographic distribution ofplacements, respectively. Almost US$ 412.3million or 93.2% of total placements had amaturity within three months. The remainingUS$ 30.0 million had a maturity within oneyear. Only 17.7% of total placements werewith non-bank financial institutions. Otherliquid assets including securities purchased
Gulf Investment Corporation Annual Report 2002
29
2002 2001 2000
Within 1 year 13.7 13.1 20.2
1 to 5 years 73.3 73.5 59.2
Over 5 years 13.0 13.4 20.6
Loans and Credit Funds Maturity Profile(percentage)
02
01
00
GIC π02 Review P.8 Final AW 16/4/03 1:22 pm Page 29
Financial Review continued
under resale agreements, cash and bankbalances amounted to US$ 13.7 million atDecember 31, 2002.
Equity FundsEquity funds amounted to US$ 108.0 millionat December 31, 2002. The portfolio isprincipally invested in equity investments of a structured finance nature with a widerange of externally managed private equityfunds. These funds invest in leveraged andunleveraged acquisitions, privatizations,recapitalizations, rapidly growing companies,expansion financings, turnaround situations,and other special equity situations.
With the exception of listed equityinvestments, where fair value is reliablydiscernible, investments in equity funds arecarried at cost. Provisions for other thantemporary decline in value, determined onan individual basis, amounted to US$ 30.7million at the 2002 year end. The US$ 9.4million increase in provisions, during theyear, relates primarily to expected valuediminution pertaining to investments madein the telecom and technology sector. Details on equity funds are provided in Note 9 to the Financial Statements.
Investments in Projects and EquityParticipationsInvestments in projects and equityparticipations amounted to US$ 275.8 millionat the end of 2002, compared to the US$302.3 million at the end of 2001. Thiscategory includes a mix of investments in anunconsolidated GCC subsidiary and equitystakes in GCC companies. During the year GICexited the only international investment withinthe portfolio, which had an original investmentvalue of US$ 12.4 million. A gain of US$ 4.8million was realized on this divestiture.Additional investment of approximately US$5.1 million was made in a power generationproject located in Qatar during 2002.
Net provisions during the year increased byUS$ 8.4 million, resulting from charge forthe year of US$ 13.1 million and utilizationsof US$ 4.7 million. Detailed analysis of theportfolio, including a breakdown ofunconsolidated subsidiary and associatedcompanies, is contained in Note 10 to the Financial Statements. A list of thecorporation’s direct investments is also given on page 64.
Receivable from ShareholdersThe receivable from shareholders’ of US$486.9 million at the end of 2002 representsthe outstanding portion of the proceedsfrom the sale of GIB. The US$ 90.2 millionreduction, relative to 31 December 2001, is the net effect of repayment of US$ 111.2million by shareholders and accrual ofinterest income of US$ 21.0 million for the year. As demonstrated in 2002, theshareholders’ intend to repay this outstandingover the next few years through dividendsreceived from GIB and the Corporation. Note 8 to the Financial Statements providesadditional details.
Property, Plant, Equipment and Other AssetsIncluding property, plant and equipment,total other assets amounted to US$ 178.6million at December 31, 2002. Of this US$28.7 million related to property, plant andequipment. The remaining US$ 149.9 millioncomprised accrued interest receivable,goodwill arising on acquisitions, revaluationgain on derivatives, pension fund, accountsreceivable, prepaid expenses and othermiscellaneous assets. Details are set out inNotes 11 and 12 to the Financial Statements.
A more detailed discussion on liquidity andfunding, the various risks associated with our business activities, and capital strength is included in the risk management section that follows.
30
GIC π02 Review P.8 Final AW 16/4/03 1:22 pm Page 30

Gulf Investment Corporation Annual Report and Accounts 2002
31
Initiating new investment concepts toencourage GCC private enterprise
GIC π02 Review P.8 Final AW 16/4/03 1:23 pm Page 31
Risk Management
The financial goal of the Corporation is to consistently earncompetitive returns, while maintaining risks withinacceptable levels. Recognizing the relationship betweenreturns and risk, the management of risk forms an integralpart of the Corporation’s strategic objective.
The continuous and rapidly changingbusiness environment has increased thecomplexity and diversity of risks. The goalof risk management is not to avoid risks,but to understand and manage them.
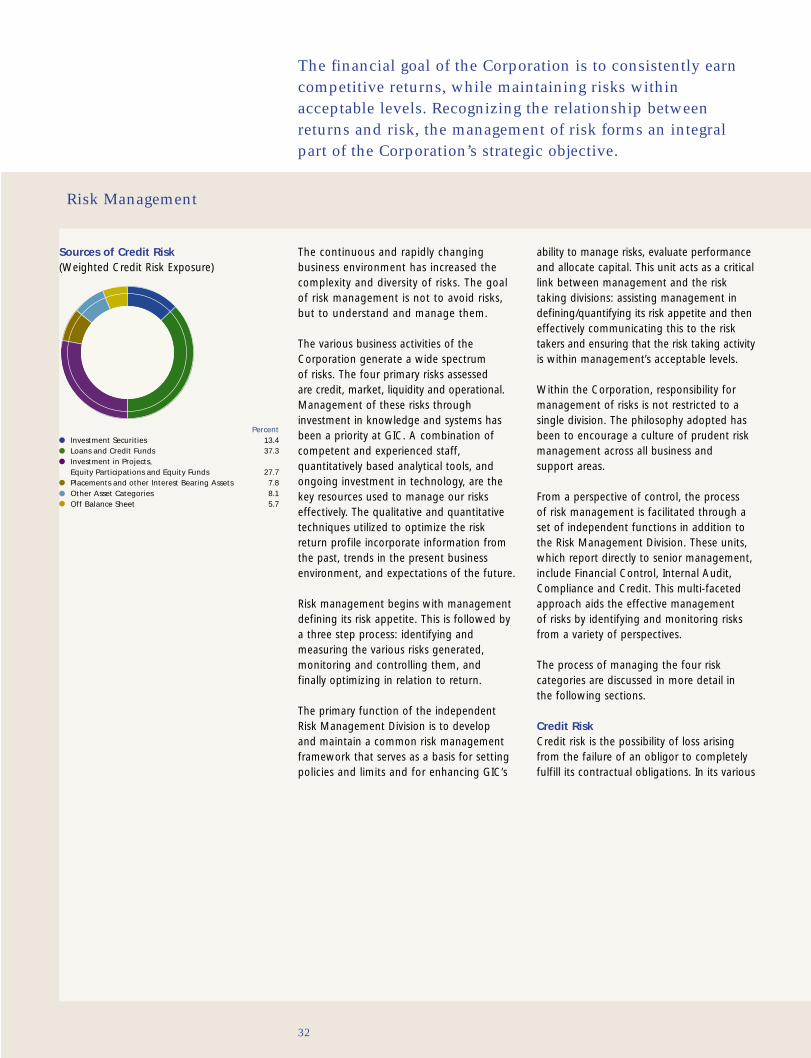
The various business activities of theCorporation generate a wide spectrum of risks. The four primary risks assessed are credit, market, liquidity and operational.Management of these risks throughinvestment in knowledge and systems hasbeen a priority at GIC. A combination ofcompetent and experienced staff,quantitatively based analytical tools, andongoing investment in technology, are thekey resources used to manage our riskseffectively. The qualitative and quantitativetechniques utilized to optimize the riskreturn profile incorporate information fromthe past, trends in the present businessenvironment, and expectations of the future.
Risk management begins with managementdefining its risk appetite. This is followed bya three step process: identifying andmeasuring the various risks generated,monitoring and controlling them, and finally optimizing in relation to return.
The primary function of the independentRisk Management Division is to develop and maintain a common risk managementframework that serves as a basis for settingpolicies and limits and for enhancing GIC’s
ability to manage risks, evaluate performanceand allocate capital. This unit acts as a criticallink between management and the risktaking divisions: assisting management indefining/quantifying its risk appetite and theneffectively communicating this to the risktakers and ensuring that the risk taking activityis within management’s acceptable levels.
Within the Corporation, responsibility formanagement of risks is not restricted to asingle division. The philosophy adopted hasbeen to encourage a culture of prudent riskmanagement across all business and support areas.
From a perspective of control, the process of risk management is facilitated through aset of independent functions in addition tothe Risk Management Division. These units,which report directly to senior management,include Financial Control, Internal Audit,Compliance and Credit. This multi-facetedapproach aids the effective management of risks by identifying and monitoring risksfrom a variety of perspectives.
The process of managing the four riskcategories are discussed in more detail in the following sections.
Credit RiskCredit risk is the possibility of loss arisingfrom the failure of an obligor to completelyfulfill its contractual obligations. In its various
32
PercentInvestment Securities 13.4Loans and Credit Funds 37.3Investment in Projects, Equity Participations and Equity Funds 27.7Placements and other Interest Bearing Assets 7.8Other Asset Categories 8.1Off Balance Sheet 5.7
Sources of Credit Risk (Weighted Credit Risk Exposure)
GIC π02 Review P.8 Final AW 16/4/03 1:23 pm Page 32

on and off-balance sheet business activities,the Corporation seeks opportunities to take credit risk prudently and manage iteffectively to achieve competitive returns.Credit risk is managed concurrently at thetransaction, obligor and portfolio levels.
An activity-wise breakdown of the principalsources of credit risk is illustrated in the piechart opposite. The proportions reflect CreditRisk Weighted Exposure, computed based on BIS capital adequacy guidelines.
The primary tool used in the management of credit risk is a set of well defined creditpolicies and procedures. In addition tocommunicating management’s risk appetitein the form of limits for country, product,industry and obligor, these policies detail theprocess of measurement, monitoring andreporting. The stringent credit approvalframework mandates a rigorous andthorough evaluation of creditworthiness ofeach obligor, after which limits are approvedat the highest levels in the managementhierarchy. A country risk review system isutilized to set country limits. Additionally,limits for product and industry are alsodefined to ensure broad diversification ofcredit risk. Credit policies and procedures are designed to identify, at an early stage,exposures which require more detailedmonitoring and review. The credit riskmanagement process utilizes statisticalmethods as well, to estimate expected and unexpected loss amounts for the various business activities.
Although business units are responsible formaintaining exposures within limits, actualexposures are continuously monitored byindependent control functions including RiskManagement, Financial Control, Complianceand Internal Audit. Technology is a keyelement in the monitoring process and in thisregard, cutting edge systems, capable of close
to real time monitoring and control of risktaking activities, are being effectively utilized.
As of end 2002, the key components of the corporation’s total credit exposure wereloans and credit funds; principal equityinvestments and equity funds; andinvestment securities. Within the portfolioof loans and advances, there has been adeliberate emphasis on GCC countries, aregion whose dynamics GIC comprehendswell and where GIC has a betterunderstanding of the inherent risks. Creditfunds, managed by a range of experiencedand highly rated fund managers, areinvested in superior quality debt securities.
Over the years, the principal investing activityhas reviewed over 350 investment proposalsand as of 31 December 2002 had invested inabout 10% of these. A rigorous evaluationprocess is followed prior to executing anyinvestment. As highlighted in the graph (topright) a healthy diversification across industrysectors is maintained within this portfolio.With regards to the investment securitiesportfolio, the rating profile, illustrated in thegraph (bottom right) highlights the superiorquality of assets held. Debt securities issuedby GCC governments and other investmentgrade issuers constitute over 95.3% of the portfolio.
Off-balance Sheet Financial InstrumentsIn the normal course of its business, theCorporation utilizes derivative and foreignexchange instruments to meet the financialneeds of its customers, to generate tradingrevenues and to manage its exposure tomarket risk.
For derivative and foreign exchangetransactions, procedures similar to on balancesheet products are used for measuring andmonitoring credit risk. Credit risk weightedexposure to off-balance sheet products
Gulf Investment Corporation Annual Report 2002
33
PercentChemicals 29.0Construction Materials 11.5Distributors 8.0Financial Services 1.6Food Products 7.1Metals & Mining 15.6Diversified 10.5Telecommunications 9.5Other 7.2
Principal Investing (Projects) by Industry
PercentAAA / Aaa Rated Debt Securities 21.3GCC Government Securities 13.9Debt Securities of Other Investment Grade Issuers 60.1Other Debt Securities 1.8Equities 2.9
Rating Profile - Investment Securities Portfolio
GIC π02 Review P.8 Final AW 16/4/03 1:23 pm Page 33

Footer
Risk Management continued
amounted to about 6% of total credit riskweighted exposure. This amount representsthe mark-to-market or replacement cost ofthese transactions. In terms of maturity, over 97% of trading foreign exchange andinterest rate contracts were short term with maturities within one year. Credit riskamounts arising from these transactionsrelate to major banks. Off- balance sheettransactions also include credit-relatedcontingent items designed to meet thefinancial requirement of the Corporation’scustomers. A detailed credit risk analysis ofcredit-related contingent items, derivativesand foreign exchange products is set in Notes24 and 25 to the Financial Statements.
Although detailed and thorough analysis is conducted prior to taking on credit risk,unforeseen events could trigger a decline in the creditworthiness associated with atransaction, resulting in loss. Adequate levelsof provisions are set aside to cover such losses.The corporation’s provisioning philosophy isdiscussed in the financial review section onpage 27.
Market RiskMarket risk is the possibility of loss in value of financial instruments, resulting from anadverse change in market factors. Within theCorporation, market risk is made up of threekey risk constituents – interest rate risk, equityrisk and foreign exchange risk. A breakdown,based on risk constituents, is illustrated in thepie chart (left), for the combined mark-to-market and investment activities. Thepercentages reflect average VaR amounts,considered independently, and ignore theeffects of diversification across risk classes.
Market risk is measured, monitored andmanaged, both on a notional basis, andusing a Value at Risk (VaR) concept.Quantitative statistical methods combinedwith judgement and experience are used to
effectively manage market risk. A system of limits and guidelines restrain the risk taking activity with regard to individualtransactions, net positions, volumes,maturities, concentrations, maximumallowable losses, and ensure that risks arewithin the acceptable levels in terms ofnotional amounts. The VaR based systemprovides a more dynamic measure of marketrisk capturing, in a timely manner, theimpact of changes in environment on thevalue of the portfolio of financial instruments.
VaR is calculated and reported to seniormanagement on a daily basis at variouslevels of consolidation including portfolio,business unit and Corporation. The average,minimum and maximum value at riskamounts for the combined mark-to-marketand investment activities are tabulatedopposite. These VaR measures are based ona 95% confidence level, 25 day holdingperiod, and using exponentially weightedhistorical market data. A profile of daily VaRis charted opposite.
At US$ 17.5 million, the average overall VaRfor 2002 was almost 12.6% lower than theaverage overall for 2001. The value at riskassociated with exposures to alternativeinvestment strategies is also quantified andaggregated with risk components of GIC’smore conventional on and off-balance sheetasset classes. The year on year decline inTotal VaR can be primarily attributed to theCorporation’s consistent efforts to optimizethe mix of risk assets, enabling GIC to derive greater benefits from diversification.At year end 2002, the overall VaR was US$ 15.8 million.
Scenario analysis is an essential componentof the market risk management framework.The assumption of normality on which thestatistical models are based may becomeinvalid due to the occurrence of certain
34
PercentInterest Rate Risk 63.9Equity Risk 33.5Foreign Exchange Risk 2.6
Market Risk Constituents – Overall
GIC π02 Review P.8 Final AW 16/4/03 1:23 pm Page 34
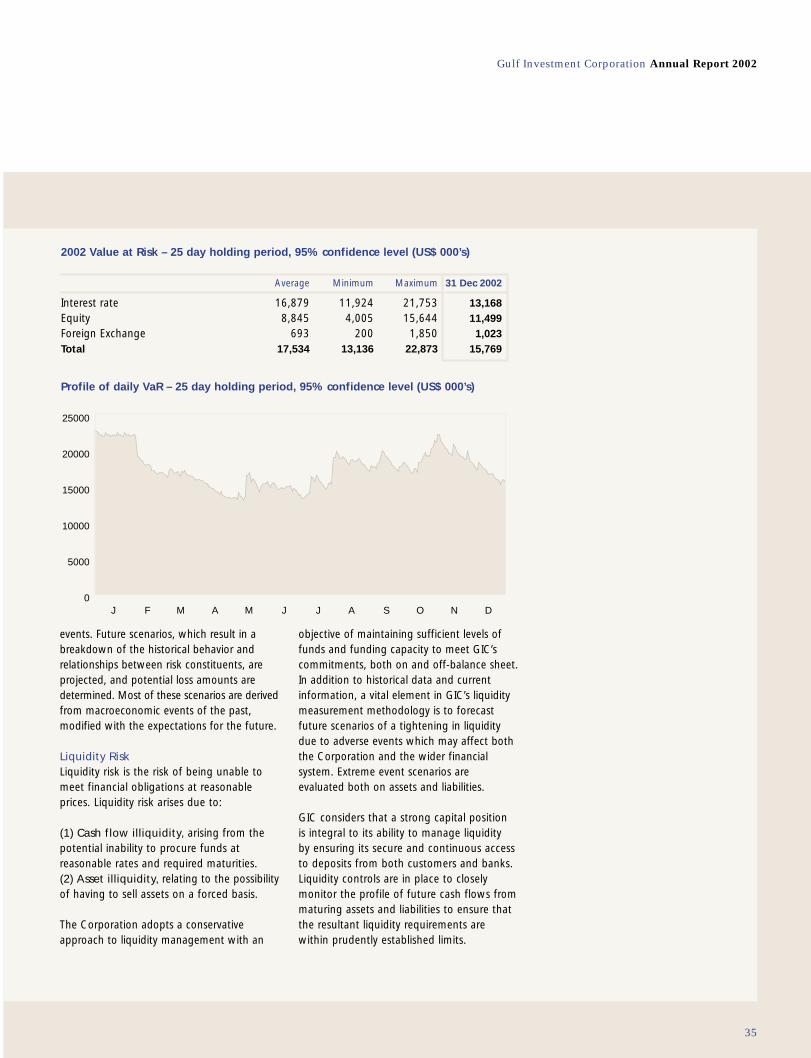
Footer
events. Future scenarios, which result in abreakdown of the historical behavior andrelationships between risk constituents, areprojected, and potential loss amounts aredetermined. Most of these scenarios are derivedfrom macroeconomic events of the past,modified with the expectations for the future.
Liquidity RiskLiquidity risk is the risk of being unable tomeet financial obligations at reasonableprices. Liquidity risk arises due to:
(1) Cash flow illiquidity, arising from thepotential inability to procure funds atreasonable rates and required maturities.(2) Asset illiquidity, relating to the possibilityof having to sell assets on a forced basis.
The Corporation adopts a conservativeapproach to liquidity management with an
objective of maintaining sufficient levels offunds and funding capacity to meet GIC’scommitments, both on and off-balance sheet.In addition to historical data and currentinformation, a vital element in GIC’s liquiditymeasurement methodology is to forecastfuture scenarios of a tightening in liquiditydue to adverse events which may affect boththe Corporation and the wider financialsystem. Extreme event scenarios areevaluated both on assets and liabilities.
GIC considers that a strong capital position is integral to its ability to manage liquidity by ensuring its secure and continuous accessto deposits from both customers and banks.Liquidity controls are in place to closelymonitor the profile of future cash flows frommaturing assets and liabilities to ensure thatthe resultant liquidity requirements arewithin prudently established limits.
Gulf Investment Corporation Annual Report 2002
35
2002 Value at Risk – 25 day holding period, 95% confidence level (US$ 000’s)
Average Minimum Maximum 31 Dec 2002
Interest rate 16,879 11,924 21,753 13,168Equity 8,845 4,005 15,644 11,499Foreign Exchange 693 200 1,850 1,023Total 17,534 13,136 22,873 15,769
J F M A M J J A S O N D0
5000
10000
15000
20000
25000
Profile of daily VaR – 25 day holding period, 95% confidence level (US$ 000’s)
GIC π02 Review P.8 Final AW 16/4/03 1:23 pm Page 35

Risk Management continued
A measure of the Corporation’s liquiditycoverage is highlighted in the followingparagraphs.
Liquid Assets RatioAt 76.3%, the liquid asset ratio reflects thehigh level of liquid assets maintained in thebalance sheet. Comparatively, the ratio atyear end 2001 was 71.7%. The ratio iscomputed by determining the proportion of total assets that can be readily convertedinto cash, without incurring undue capitallosses. Liquid assets include bank balances,money market instruments, securitiespurchased under resale agreements,placements and securities. Investmentsecurities, constituting over 80% of theliquid assets, are primarily made up ofsuperior grade debt securities which are readily realizable.
Diversified sources of fundingGIC consistently endeavors to diversify itsfunding profile and in this regard theCorporation issued US$ 300 million 5-yearfloating rate notes in July 2002. Although the original issue size was US$ 200 million,increased demand from investors led GIC to raise the issue to US$ 300 million. Theupgrade of GIC’s ratings from Baa2 to Baa1by Moody’s is reflected in the favorablepricing of the issue in comparison to recent
issues by regional financial institutions. Detailsof the Corporation’s ratings are provided inthe following sections of this review. TheCorporation’s solid financial condition,augmented by its good standing in theregional and international markets,contributed towards achieving the objectiveof extending and diversifying its funding base.
As the chart (bottom left) illustrates, GIC iscontinuously trying to achieve an optimalmix of sources of funding.
Over the years, the Corporation has appliedits marketing skills to develop a reliablesource of deposits, both regionally and ininternational markets. At December 31st2002, deposits from various sources totaledUS$1,705.1 million, of which deposits fromGCC governments and central banks andother institutions headquartered in the GCCstates amounted to US$ 1,280.0 million.
Maturity profile of assets and liabilitiesA detailed breakdown of the maturity profileby individual asset and liability category isprovided in Note 22 to the FinancialStatements. At December 31st 2002, roughly21.7% of total assets were due to maturewithin 12 months. Approximately to 64.6%of assets with longer maturities were readilyrealizable securities. The maturity profile is
36
2002 2001 2000
Placements & other liquid assets 9.6 12.5 6.3Trading securities and managed funds 5.3 4.1 4.3Investment securities 61.4 55.1 54.4Total 76.3 71.7 65.0
Liquid Assets Ratio(percentage)
02
01
00
2002 2001 2000
GCC deposits 22.1 19.2 16.7International deposits 7.3 7.3 13.0Repo financing 39.8 47.8 41.0Term financing 7.9 2.9 2.9Shareholders' funds and others 22.9 22.8 26.4Total 100.0 100.0 100.0
Diversified Sources of Funding(percentage)
02
01
00
GIC π02 Review P.8 Final AW 16/4/03 1:23 pm Page 36

based on contractual repaymentarrangements and as such does not takeaccount of effective maturities of deposits.The Corporation’s GCC retention recordshows that short maturity deposits fromGCC governments, central banks and otherregional financial institutions have beenregularly renewed over the past decade.
Credit RatingIn June 2002 Moody’s raised the Long-termand Short-term ratings of Gulf InvestmentCorporation to Baa1 and P-2 respectively.Standard & Poor’s confirmed their rating ofBBB+ in their most recent rating review ofthe corporation. Ratings outlook from bothagencies were stable.
These ratings reflect the Corporation’s strongcapital position, its ownership structure andposition in the Gulf region, good profitability,asset quality, loan loss experience, the highlevel of professionalism of staff and effectivemanagement.
Capital StrengthCapital represents the shareholders’investment and is a key strategic resourcewhich supports the Corporation’s risk taking business activities. In line with the Corporation’s financial objective,management strives to deploy this resourcein an efficient and disciplined manner toearn competitive returns. Capital also reflects financial strength and security to the Corporation’s creditors and depositors.Capital management is fundamental to GIC’s risk management philosophy, and takes into account economic andregulatory requirements.
Regulatory CapitalAt the end of the year under review, theTotal and Tier 1 capital ratios were 35.0%and 34.9% respectively. With the divestiturein 2001 of Gulf International Bank, theCorporation’s principal subsidiary, there wasa substantial decrease in aggregate riskweighted exposure. Consequently, thecapital adequacy ratios were significantlyhigher than the minimum regulatoryrequirements. For reasons of comparability,the year 2000 figures provided in the tablereflect ratios on a stand-alone basis for GIC,excluding exposures with the subsidiary GIB.
With the objective of optimizing capitalallocation, GIC has developed a program of phased and gradual growth to beexecuted over the next few years. This build up will be governed predominantly on risk-return objectives.
Economic Capital In addition to maintaining capital reservesbased on regulatory requirements, economiccapital sufficiency based on internal modelsis also determined. The economic capitalcomputation process has three fundamentalobjectives: determine economic capitalsufficiency, in addition to regulatory capitaladequacy; assist in equitable/standardizedperformance measurement of businesses, on a ‘real’ (risk adjusted) basis; and assist in
Gulf Investment Corporation Annual Report 2002
37
Moody’s Standard & Poor’s
Long-term Deposits Baa1 BBB+Short-term Deposits P2 A2Bank Financial Strength (BFSR) C- -
BIS Capital Ratio ComputationsUS$ Million 2002 2001 2000Tier 1 capital (A) 1,155.7 1,128.1 1,302.8Total capital base (B) 1,158.3 1,131.9 1,308.5Risk Weighted Exposure (C) 3,307.9 3,155.0 3,879.6
BIS Capital ratios (%)Tier 1 capital ratio (A/C*100) 34.9 35.8 33.6Total capital ratio (B/C*100) 35.0 35.9 33.7
GIC π02 Review P.8 Final AW 16/4/03 1:23 pm Page 37

Risk Management continued
38
optimizing resource allocation to achievetarget risk adjusted ROE for the Corporation.Economic capital computations are based onextreme scenarios, and cover all types of risks.
Operational RiskOperational risk is the potential for financialand reputational loss arising from abreakdown in internal controls, operationalprocesses or the various systems that supportthem. It also includes human errors, criminalacts and natural disasters. Operational riskfactors can be categorized into internal and external. Internal risk factors aremanaged through the establishment ofeffective infrastructure and controls withinthe Corporation. External risk factors aremanaged by anticipating the occurrence ofadverse events, preparing contingency plansand implementing sound back-up systems.
Internal Audit and ControlThe Internal Audit division plays an importantrole in the risk management process,particularly in managing operational risk.Operational risk is managed through aneffective infrastructure of internal controls
including systems and procedures to monitortransactions, positions, confirmations anddocumentation. The Internal Audit divisionensures that these control mechanisms,which cover the front and back officefunctions, are adhered to and adequatelyfunctioning. In addition to internal audits, theCorporation’s system of internal controls isexamined and evaluated by external auditors,as required by the local regulatory body.
The influence of technology has increasedsubstantially over the recent past and thistrend is likely to accelerate in future. Keepingthis in perspective, considerable resourceshave been allocated to managing the systemside of operational risk. An EDP audit functionwithin the Internal Audit Division works inclose conjunction with the risk managementdivision to oversee system risk issues.
GIC π02 Review P.8 Final AW 16/4/03 1:23 pm Page 38

Gulf Investment Corporation Annual Report 2002
39
Financial Statements
40 Auditors’ Report41 Balance Sheet42 Statement of Income43 Statement of Changes in Shareholders’ Equity44 Statement of Cash Flows 45 Notes to the Financial Statements64 Direct Investments in the GCC Region65 Corporate Directory
GIC π02 Accounts P.7 Final AW 16/4/03 1:55 pm Page 39

40
Independent Auditors’ Report
40
The Shareholders, Gulf Investment Corporation G.S.C., State of KuwaitWe have audited the accompanying balance sheet of Gulf Investment Corporation G.S.C. (“the Corporation”) as at December 31, 2002and the related statements of income, changes in shareholders’ equity and cash flows for the year then ended.
Respective responsibilities of management and auditorsThese financial statements are the responsibility of the Corporation’s management. Our responsibility is to express an opinion on these financial statements based on our audit.
Basis of opinionWe conducted our audit in accordance with the International Standards on Auditing. Those standards require that we plan and perform the audit to obtain reasonable assurance about whether the financial statements are free of material misstatement. An audit includes examining, on a test basis, evidence supporting the amounts and disclosures in the financial statements. An audit also includes assessing the accounting principles used and significant estimates made by management, as well asevaluating the overall financial statement presentation. We believe that our audit provides a reasonable basis for our opinion.
OpinionIn our opinion, the financial statements present fairly, in all material respects, the financial position of the Corporation as at December 31, 2002 and of the results of its operations and its cash flows for the year then ended, in accordance with International Financial Reporting Standards promulgated by the International Accounting Standards Board.
Other regulatory mattersWe further report that we have obtained all the information and explanations that we required for the purpose of our audit and the financial statements include the information required by the Kuwait Commercial Companies Law of 1960, as amended, and theCorporation’s articles and memorandum of association. In our opinion, proper books of account have been kept by the Corporation,an inventory count was carried out in accordance with recognized procedures and the accounting information given in the report ofthe Chairman agrees with the books of account. We have not become aware of any contravention, during the year ended December31, 2002, of the Kuwait Commercial Companies Law of 1960, as amended, or of the Corporation’s articles and memorandum ofassociation, or of Law No. 32 of 1968, as amended, concerning currency, the Central Bank of Kuwait and the Organization ofBanking Business and its related regulations, that would materially affect the Corporation’s activities or its financial position.
KPMGPublic AccountantsKuwaitMarch 15, 2003
GIC π02 Accounts P.7 Final AW 16/4/03 1:55 pm Page 40

41
Gulf Investment Corporation Annual Report 2002
US$ million Note 2002 2001
AssetsCash and bank balances 3.5 2.9Placements 4 442.3 390.7Securities purchased under resale agreements 10.2 176.5Trading securities and managed funds 5 308.7 220.6Investment securities 6 3,564.1 3,055.6Loans and credit funds 7 426.8 487.9Receivable from shareholders 8 486.9 577.1Equity funds 9 108.0 117.9Investment in projects and equity participations 10 275.8 302.3Property and other fixed assets 11 28.7 31.4Other assets 12 149.9 178.1
Total assets 5,804.9 5,541.0
Liabilities and shareholders' equityLiabilitiesSecurities sold under repurchase agreements 2,310.8 2,651.0Deposits 13 1,705.1 1,464.8Term finance 14 460.0 160.0Other liabilities 15 150.9 113.5
Total liabilities 4,626.8 4,389.3
Shareholders' equity Share capital 750.0 750.0Reserves 371.5 356.2Unrealized gain on available-for-sale assets 56.6 45.5
Total shareholders' equity 16 1,178.1 1,151.7
Total liabilities and shareholders' equity 5,804.9 5,541.0
The accompanying notes are an integral part of the financial statements.
Ahmed Abdulnabi Macki Hisham Abdulrazzaq Al RazzuqiChairman Chief Executive Officer
Balance SheetAs at December 31, 2002
41
GIC π02 Accounts P.7 Final AW 16/4/03 1:55 pm Page 41
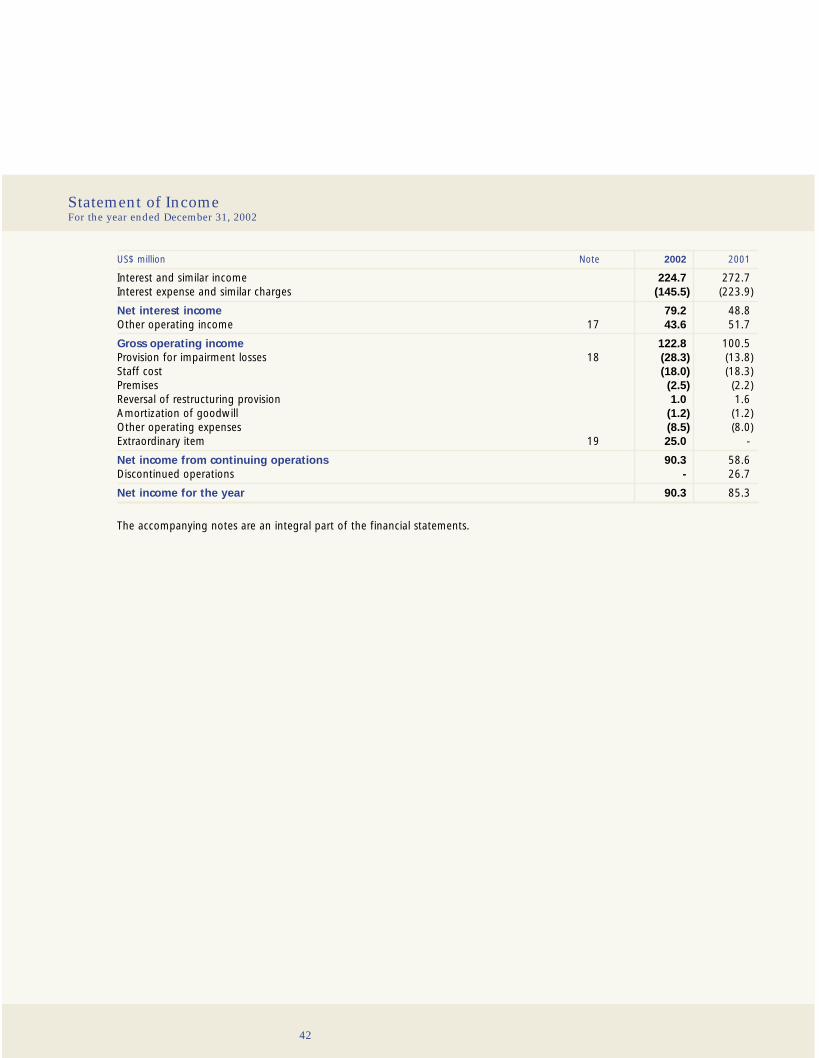
Statement of IncomeFor the year ended December 31, 2002
US$ million Note 2002 2001
Interest and similar income 224.7 272.7Interest expense and similar charges (145.5) (223.9)
Net interest income 79.2 48.8Other operating income 17 43.6 51.7
Gross operating income 122.8 100.5Provision for impairment losses 18 (28.3) (13.8)Staff cost (18.0) (18.3)Premises (2.5) (2.2)Reversal of restructuring provision 1.0 1.6Amortization of goodwill (1.2) (1.2)Other operating expenses (8.5) (8.0)Extraordinary item 19 25.0 -
Net income from continuing operations 90.3 58.6Discontinued operations - 26.7
Net income for the year 90.3 85.3
The accompanying notes are an integral part of the financial statements.
42
GIC π02 Accounts P.7 Final AW 16/4/03 1:55 pm Page 42

Reserves
Unrealizedgain on
Compulsory Voluntary Retained Subtotal available-for-US$ million Capital reserves reserves earnings reserves sale assets Total
Balance as at January 1, 2001 750.0 135.8 135.8 303.2 574.8 - 1,324.8Change in accounting policy (note 3) - - - (0.7) (0.7) 10.0 9.3
Restated balance as at January 1, 2001 750.0 135.8 135.8 302.5 574.1 10.0 1,334.1Change in fair value of
available-for-sale assets - - - - - 41.4 41.4Net gains on disposal of available-for-sale
assets transferred to income statement - - - - - (5.9) (5.9)Transfer to shareholders - - - (303.2) (303.2) - (303.2)Net income for the year - - - 85.3 85.3 - 85.3Transfer to compulsory reserve - 8.5 - (8.5) - - -
Balance as at December 31, 2001 750.0 144.3 135.8 76.1 356.2 45.5 1,151.7
Balance as at January 1, 2002 750.0 144.3 135.8 76.1 356.2 45.5 1,151.7Dividend for 2001 - - - (75.0) (75.0) - (75.0)Net gains on disposal of
available-for-sale assetstransferred to income statement - - - - - (5.9) (5.9)
Change in fair value of available-for-sale assets - - - - - 17.0 17.0
Net income for the year - - - 90.3 90.3 - 90.3Transfer to compulsory reserve - 9.0 - (9.0) - - -
Balance as at December 31, 2002 750.0 153.3 135.8 82.4 371.5 56.6 1,178.1
The accompanying notes are an integral part of the financial statements.
Gulf Investment Corporation Annual Report 2002
43
Statement of Changes in Shareholders’ EquityFor the year ended December 31, 2002
GIC π02 Accounts P.7 Final AW 16/4/03 1:55 pm Page 43

Statement of Cash FlowsFor the year ended December 31, 2002
Introduction Text
US$ million 2002 2001
Cash flows from operating activities:Net income for the year before extraordinary item 65.3 85.3Extraordinary item 25.0 -
Adjustments to reconcile net income to net cash inflow/(outflow) from operating activities:
Income from GIB - (26.7)Income receivable from the shareholders (see note 8) (21.1) (16.2)Provision for impairment losses 28.3 13.8Amortization of goodwill 1.2 1.2Loss/(gain) on sale of investment securities 5.3 (5.6)Gain on sale of investment in equity participation (4.8) -Income from projects and equity participations (14.4) (16.3)Amortization of premium on investment securities 3.1 0.9Depreciation 3.1 3.1Increase in fair value of available-for-sale investments (35.4) (19.3)(Increase)/decrease in trading securities (88.2) 17.7Decrease/(increase) in other assets and other liabilities (net) 64.4 (25.4)
Net cash inflow from operating activities 31.8 12.5
Cash flows from investing activities:Increase in placements (51.6) (169.1)Decrease/(increase) in securities purchased under resale agreements 166.2 (167.4)Decrease in loans and credit funds 61.2 44.5Sale and maturity of investment securities 892.0 432.6Purchase of investment securities (1,354.6) (448.6)Increase in investment in equity funds (7.8) (6.7)Sale of equity participation 17.1 -Decrease in investment in projects and equity participations 10.4 30.8Purchase of property and other fixed assets (0.4) (1.1)Received from shareholders 36.2 -Dividend received - 36.2
Net cash outflow from investing activities (231.3) (248.8)
Cash flows from financing activities:(Decrease)/increase in deposits and repurchase agreements (99.9) 234.5Term finance 300.0 -
Net cash inflow from financing activities 200.1 234.5
Increase/(decrease) in cash and cash equivalents 0.6 (1.8)Cash and cash equivalents at beginning of year 2.9 4.7
Cash and cash equivalents at end of year 3.5 2.9
Cash and cash equivalents comprise of cash and bank balances.
The accompanying notes are an integral part of the financial statements.
44
GIC π02 Accounts P.7 Final AW 16/4/03 1:55 pm Page 44

1 Incorporation and ActivityThe Gulf Investment Corporation G.S.C. (“Corporation”) is an investment company incorporated in Kuwait as a Gulf ShareholdingCompany. It is equally owned by the governments of the six member states of the Gulf Cooperation Council (“GCC”) – Bahrain,Kuwait, Oman, Qatar, Saudi Arabia and the United Arab Emirates. The Corporation is engaged in all aspects of investment banking activities.
The Corporation is domiciled in Kuwait and its registered office is at Jaber Al Mubarak Street, Al Sharq, Kuwait. The total numberof staff employed by the Corporation as at December 31, 2002 was 136 (2001: 136).
The financial statements were authorized for issue by the Board of Directors on March 15, 2003.
2 Statement of Accounting Policies
2.1 Statement of complianceThe financial statements have been prepared in accordance with International Financial Reporting Standards (“IFRSs”) aspromulgated by the International Accounting Standards Board (“IASB”), interpretations issued by the Standing InterpretationsCommittee of the IASB and the requirements of the Kuwait Commercial Companies Law of 1960, as amended, Ministerial OrderNo.18 of 1990, Law No. 32 of 1968 concerning currency, the Central Bank of Kuwait and the Organization of Banking Businessand subsequent amendments thereto and the Corporation’s articles and memorandum of association.
2.2 Basis of presentationThe Corporation’s functional currency is United States Dollars and figures presented in the financial statements are rounded to thenearest million.
The financial statements are prepared on a fair value basis for derivative financial instruments, financial assets and liabilities held fortrading, and available-for-sale assets, except those for which a reliable measure of fair value is not available. Other financial assetsand liabilities and non-financial assets and liabilities are stated at amortized cost or historical cost.
The accounting policies have been consistently applied by the Corporation and are consistent with those used in the previous year.
2.3 SubsidiariesSubsidiaries are those enterprises controlled by the Corporation. Control exists when the Corporation has the power, directly or indirectly, to govern the financial and operating policies of an enterprise so as to obtain benefits from its activities.
Investment in Bitumat Company Limited, a fully owned subsidiary company, is not material to the financial statements of theCorporation. Accordingly, this subsidiary is included under ‘Investment in Projects and Equity Participations’ and is accounted for using the equity method.
2.4 Financial instruments(i) ClassificationTrading instruments are those that the Corporation principally holds for the purpose of short-term profit taking. These includemoney market funds, trading securities and managed funds, derivative contracts that are not designated as effective hedginginstruments, and liabilities from short sales of financial instruments. All trading derivatives in a net receivable position (positive fair value), as well as options purchased, are reported as part of other assets. All trading derivatives in a net payable position (negative fair value), as well as options written, are reported as part of other liabilities.
Originated loans and receivables are loans and receivables created by the Corporation providing money to a debtor other thanthose created with the intention of short-term profit taking. Originated loans and receivables comprise deposits with banks andfinancial institutions, securities purchased under resale agreements, loans and advances to customers (other than purchased loans),receivables from shareholders and debt instruments purchased at original issuance.
Gulf Investment Corporation Annual Report 2002
45
Notes to the Financial StatementsYear ended December 31, 2002
GIC π02 Accounts P.7 Final AW 16/4/03 1:55 pm Page 45

46
Notes to the Financial Statements continuedYear ended December 31, 2002
2.4 Financial instruments continuedHeld-to-maturity assets are financial assets with fixed or determinable payments and fixed maturity that the Corporation has the intent and ability to hold to maturity. These include credit funds and certain debt instruments.
Available-for-sale assets are financial assets that are not held for trading purposes, originated by the Corporation, or held-to-maturity.Available-for-sale instruments include certain investments securities, equity funds and certain investment in projects.
(ii) RecognitionThe Corporation recognizes financial assets held to maturity, held for trading and available-for-sale assets on the trade date i.e. the date it commits to purchase the assets. From this date any gains and losses arising from changes in fair value of the assets are recognized.
Originated loans and receivables are recognized on the settlement date.
(iii) MeasurementFinancial instruments are measured initially at cost, including transaction costs.
Subsequent to initial recognition all trading instruments and all available-for-sale assets are measured at fair value, except that any instrument that does not have a quoted market price in an active market and whose fair value cannot be reliably measured is stated at cost, including transaction costs, less impairment losses (see note 2.14).
All non-trading financial liabilities, originated loans and receivables and held-to-maturity assets are measured at amortized cost lessimpairment losses (see note 2.14). Amortized cost is calculated on the effective interest rate method. Premiums and discounts,including initial transaction costs, are included in the carrying amount of the related instrument and amortized based on theeffective interest rate of the instrument.
(iv) Fair value measurement principlesThe fair value of financial instruments is based on their quoted market price (bid price for assets and offer price for liabilities) atthe balance sheet date without any deduction for transaction costs. If a quoted market price is not available then the fair value ofthe instrument is estimated using pricing models or discounted cash flow techniques or market price of similar financial instruments.
Where discounted cash flow techniques are used, estimated future cash flows are based on management’s best estimates and thediscount rate is a market related rate at the balance sheet date for an instrument with similar terms and conditions. Where pricingmodels are used, inputs are based on market related measures at the balance sheet date.
The fair value of derivatives that are not exchange-traded is estimated at the amount that the Corporation would receive or pay toterminate the contract at the balance sheet date, taking into account current market conditions and the current creditworthiness ofthe counterparties.
(v) Gains and losses on subsequent measurementGains and losses arising from a change in the fair value of available-for-sale assets are recognized directly in shareholders’ equity.When the financial assets are sold, collected or otherwise disposed of, the cumulative gain or loss recognized in shareholders’equity is transferred to the income statement.
Gains and losses arising from a change in the fair value of trading instruments are recognized in the statement of income.
GIC π02 Accounts P.7 Final AW 16/4/03 1:55 pm Page 46

(vi) DerecognitionA financial asset is derecognized when the Corporation loses control over the contractual rights that comprise the asset.This occurs when the rights are realized, expired or are surrendered. A financial liability is derecognized when it is extinguished.
Held-to-maturity, available-for-sale assets and assets held for trading are derecognized using trade date accounting. The Corporation uses the weighted average method to determine the gain or loss on derecognition.
Originated loans and receivables are derecognized on the day they are transferred by the Corporation.
(vii) OffsettingFinancial assets and liabilities are offset and the net amount is reported in the balance sheet when the Corporation has a legallyenforceable right to set off the recognized amounts and the transactions are intended to be settled on a net basis.
2.5 PlacementsPlacements are accounted as originated loans and receivables.
2.6 Repurchase and resale arrangementsThe Corporation enters into purchases (sales) of investments under agreements to resell (repurchase) substantially identicalinvestments at a certain date in the future at a fixed price. The amounts paid are recognized as securities purchased under resaleagreements. Investments sold under repurchase agreements continue to be recognized in the balance sheet and are measured inaccordance with the accounting policy for either assets held for trading or held-to-maturity or available-for-sale, as appropriate. The proceeds from the sale of the investments are reported as part of liabilities as securities sold under repurchase agreements.
The difference between the sale and repurchase considerations is recognized on an accrual basis over the period of the transactionand is included in interest.
2.7 Trading securities and managed fundsTrading securities and managed funds are accounted as trading assets.
2.8 Investment securitiesDebt instruments that the Corporation has the intent and ability to hold to maturity are accounted as held-to-maturity assets.
Debt instruments purchased at original issuance are accounted as original loans and receivables.
Investment securities which are not held-to-maturity investments or debt instruments which are not purchased at original issuanceare classified and accounted as available-for-sale assets.
2.9 Loans and credit fundsLoans and advances to customers originated by the Corporation are carried at amortized cost less specific and general provision for impairment (see note 2.14).
Credit funds are accounted as held-to-maturity assets and are carried at amortized cost less impairment losses (see note 2.14).
2.10 Equity fundsInvestments in equity funds are classified and accounted as available-for-sale investments. Provision is made for any impairmentlosses (see note 2.14) on an individual investment basis and is recognized in the statement of income.
Gulf Investment Corporation Annual Report 2002
47
GIC π02 Accounts P.7 Final AW 16/4/03 1:55 pm Page 47

Notes to the Financial Statements continuedYear ended December 31, 2002
2.11 Investment in projects and equity participationsInvestment in enterprises in which the Corporation holds 20% or more of the voting capital and/or exercises significant control or influence over the financial and operating policies (“associates”) are accounted for using the equity method. Provision is madefor any impairment losses and recognized in the income statement.
Other investments in projects and equity participations are classified as available-for-sale assets. Provision is made for anyimpairment losses (see note 2.14) on an individual investment basis and is recognized as set out in note 2.14.
2.12 Property and other fixed assets Property and other fixed assets are carried at cost less accumulated depreciation and impairment losses (see note 2.14).Depreciation is computed on a straight-line basis over the estimated useful life of each asset category as follows:
Buildings 20 yearsInstallations 5 – 10 yearsOffice equipment 3 – 4 yearsFurniture 4 – 6 yearsMotor vehicles 3 years
2.13 Amortization of goodwill Goodwill arising on acquisition of an associate, jointly controlled entity or subsidiary company represents the excess of the cost ofthe acquisition over the fair value of the net identifiable assets acquired. Goodwill is stated at cost less accumulated amortizationand impairment losses (see note 2.14). Goodwill is amortized over its useful life not exceeding twenty years.
2.14 ImpairmentProperty, other fixed assets, goodwill and financial assets are reviewed at each balance sheet date to determine whether there is objective evidence of impairment. If any such indication exists, the asset’s recoverable amount is estimated.
Property, other fixed assets and goodwillAn impairment loss is recognized whenever the carrying amount of an asset exceeds its recoverable amount. The recoverableamount of assets is the greater of their net selling price and value in use. The impairment losses are recognized in the statement of income.
Originated loans and advances, receivables and held-to-maturity assetsThe recoverable amount of originated loans and advances, receivables and purchased loans that are classified as held-to-maturity, is calculated as the present value of the expected future cash flows, discounted at the instrument’s original effective interest rate.Short-term balances are not discounted.
Loans and advances and receivables are carried at amortized cost less specific and general allowances for uncollectibility. Specificprovision for impairment is established if there is an objective evidence that the Corporation will not be able to collect all amountsdue. The amount of specific provision is determined as the difference between the carrying amount and the recoverable amount of the asset. General provision for impairment is made in accordance with the instructions of the Central Bank of Kuwait datedDecember 18, 1996, as amended.
If in a subsequent period the amount of an impairment loss decreases and the decrease can be linked objectively to an eventoccurring after the write-down, the write-down or allowance is reversed through the income statement.
48
GIC π02 Accounts P.7 Final AW 16/4/03 1:55 pm Page 48

Financial assets remeasured to fair value directly through shareholders’ equityThe recoverable amount of an equity instrument is its fair value. The recoverable amount of debt instruments and purchased loansremeasured to fair value is calculated as the present value of expected future cash flows discounted at the current market rate ofinterest. Where an asset remeasured to fair value directly through shareholders’ equity is impaired, and a write-down of the assetwas previously recognized directly in shareholders’ equity, the write-down is transferred to the income statement and recognized as part of the impairment loss. Where an asset measured to fair value directly through shareholders’ equity is impaired, and anincrease in the fair value of the asset was previously recognized in shareholders’ equity, the increase in fair value of the assetrecognized in shareholders’ equity is reversed to the extent the asset is impaired. Any additional impairment loss is recognized in the income statement.
If in a subsequent period the amount of an impairment loss decreases and the decrease can be linked objectively to an eventoccurring after the write-down, the write-down is reversed through the income statement.
2.15 Other provisionsOther provisions are recognized in the balance sheet when the Corporation has a legal or constructive obligation as a result of a past event, and it is probable that an outflow of economic benefits will be required to settle the obligation.
2.16 Fiduciary activitiesAssets managed for third parties or held in trust or in a fiduciary capacity are not treated as assets of the Corporation andaccordingly are not included in these financial statements.
2.17 Hedge accountingA hedging relationship exists where:• at the inception of the hedge there is formal documentation of the hedge;• the hedge is expected to be highly effective;• the effectiveness of the hedge can be reliably measured;• the hedge is highly effective throughout the reporting period; and• for hedges of a forecasted transaction, the transaction is highly probable and presents an exposure to variations in cash flows
that could ultimately affect net profit or loss.
Where there is a hedging relationship between a derivative instrument and a related item being hedged, the hedging instrument is measured at fair value. The treatment of any resultant gains and losses is set out below.
The fair value of derivative hedging instruments is calculated in the same way as the fair value of trading instruments (refer accounting policy 2.4 (iv)).
Where a derivative financial instrument hedges the exposure to changes in the fair value of a recognized asset or liability, thehedged item is stated at fair value in respect of the risk being hedged. Gains or losses on remeasurement of both the hedginginstrument and the hedged item are recognized in the income statement.
Where a derivative financial instrument hedges the exposure to variability in the cash flows of recognized assets or liabilities (or homogeneous groups/portfolios thereof) or anticipated transactions or firm commitments, the effective part of any gain or loss on remeasurement of the hedging instrument is recognized directly in shareholders’ equity. The ineffective part of any gain or loss is recognized in the income statement.
Gulf Investment Corporation Annual Report 2002
49
GIC π02 Accounts P.7 Final AW 16/4/03 1:55 pm Page 49

Notes to the Financial Statements continuedYear ended December 31, 2002
2.17 Hedge accounting continuedWhen a hedged anticipated transaction or firm commitment results in the recognition of an asset or liability, the cumulative gain or loss on the hedging instrument recognized in shareholders’ equity is removed from shareholders’ equity and included in the initial measurement of the asset or liability. Otherwise the cumulative gain or loss recognized in shareholders’ equity is transferred to the income statement at the same time that the hedged transaction affects net profit or loss and included in the same line item as the hedged transaction.
When a hedging instrument or hedge relationship is terminated but the hedged transaction is still expected to occur, thecumulative gain or loss recognized in shareholders’ equity remains in shareholders’ equity and is recognized in accordance with the above policy. If the hedged transaction is no longer expected to occur, the cumulative gain or loss recognized in shareholders’equity is recognized in the income statement immediately.
2.18 Interest, fee income and dividend incomeInterest income and expense are recognized on an accrual basis taking into account the effective yield of the asset or an applicablefloating rate. Interest income includes the amortization of any discount or premium or other difference between the initial carryingamount of an interest bearing instrument and its amount at maturity calculated on an effective interest rate basis. Fee income isrecognized when earned. Dividend income is recognized when the right to receive payment is established.
2.19 Foreign currencyThe reporting currency of the Corporation is the US Dollar. The share capital of the Corporation is also denominated in US Dollars.Transactions in foreign currencies are converted to US Dollars at the rate of exchange prevailing at the date of the transaction.Foreign currency monetary assets and liabilities are converted into US Dollars at market rates of exchange prevailing on the balancesheet date. Realized and unrealized foreign exchange gains and losses are included in the statement of income. Non-monetaryassets and liabilities denominated in foreign currencies that are stated at fair value are translated to US Dollars at foreign exchangerates ruling at the dates the values were determined. Non-monetary assets and liabilities denominated in foreign currency that arestated at historical cost or amortized cost, are recorded at the exchange rate ruling at the date of transaction.
3 Change in Accounting Policy The adoption of IAS 39 Financial Instruments: Recognition and Measurement in 2001 resulted in a debit adjustment, as at January1, 2001, to retained earnings of US$ 0.7 million and to unrealized gain on available-for-sale assets of US$ 10.0 million. For the yearended December 31, 2001 the net profit decreased by US$ 3.0 million.
4 Placements Placements at December 31, 2002 included placements with non-bank financial institutions amounting to US$ 78.5 million (2001: US$ 35.0 million).
50
GIC π02 Accounts P.7 Final AW 16/4/03 1:55 pm Page 50

5 Trading Securities and Managed Funds
US$ million 2002 2001
Managed funds 305.3 214.9Equities 0.1 5.7Listed debt securities 3.3 -
308.7 220.6
6 Investment SecuritiesDebt and other interest bearing instruments available-for-sale
US$ million 2002 2001
AAA/Aaa rated debt securities 705.9 321.2GCC Government securities 221.5 120.3Debt securities of other investment grade issuers 1,772.2 1,436.2Other debt securities 60.1 39.3
2,759.7 1,917.0
Debt and other interest bearing instruments held-to-maturity
US$ million 2002 2001
AAA/Aaa rated debt securities 52.0 60.9GCC Government securities 275.2 613.7Debt securities of other investment grade issuers 371.6 448.9Other debt securities 2.3 1.5
701.1 1,125.0
Equity investments available-for-sale
US$ million 2002 2001
Listed equity investments 23.6 3.3
Unlisted equity investments 79.7 10.3
103.3 13.6
Total 3,564.1 3,055.6
Investment securities amounting to US$ 2,300.6 million (2001: US$ 2,474.5 million) are pledged as security in respect of borrowingsunder securities sold under repurchase agreements.
During the year, a provision of US$ 5.7 million (2001: US$ nil) was made for the impairment in the value of certain debt and otherinterest bearing securities under held-to-maturity category. The investments shown above are net of this provision.
Gulf Investment Corporation Annual Report 2002
51
GIC π02 Accounts P.7 Final AW 16/4/03 1:55 pm Page 51

Notes to the Financial Statements continuedYear ended December 31, 2002
7 Loans and Credit Funds
US$ million 2002 2001
Loans and advances to customers 121.8 245.8Credit funds 305.0 242.1
426.8 487.9
Loans and advances to customers at December 31, 2002 include lendings to GCC Country Government and Agency of US$ 49.7 million (2001: US$ 120.4 million).
There were no significant concentrations by industrial sector at December 31, 2002 and at December 31, 2001.
a) Provision for loan losses The movements in the provision for loan losses were as follows:
US$ million 2002 2001
Balance at beginning of the year 4.7 4.8Amount utilized (0.8) -Net charge/(write back) for the year 0.1 (0.1)
Balance at end of the year 4.0 4.7
b) Provision for loan guarantees
US$ million 2002 2001
Balance at beginning of the year 3.4 2.6Net charge for the year - 0.8
Balance at end of the year 3.4 3.4
8 Receivable from ShareholdersThis primarily represents the unpaid balance from the sale of Gulf International Bank (“GIB”) to its shareholders on April 7, 2001.Payment of this outstanding balance will be from any future dividends receivable by the shareholders from GIB and from theCorporation. The outstanding balance carries a rate of return to be computed annually. The rate for 2002 was 4.19% (2001: 4.33%).
9 Equity Funds
US$ million 2002 2001
Listed equity investments 9.6 19.9Unlisted equity investments 129.1 119.3
138.7 139.2Provision for impairment (30.7) (21.3)
108.0 117.9
Unlisted equity securities held by the equity funds are carried by the Corporation at cost less any impairment losses, since fair valueof these investments cannot be reliably determined. There is no active market for these investments and there have not been anyrecent transactions that provide evidence of the current fair value.
52
GIC π02 Accounts P.7 Final AW 16/4/03 1:55 pm Page 52
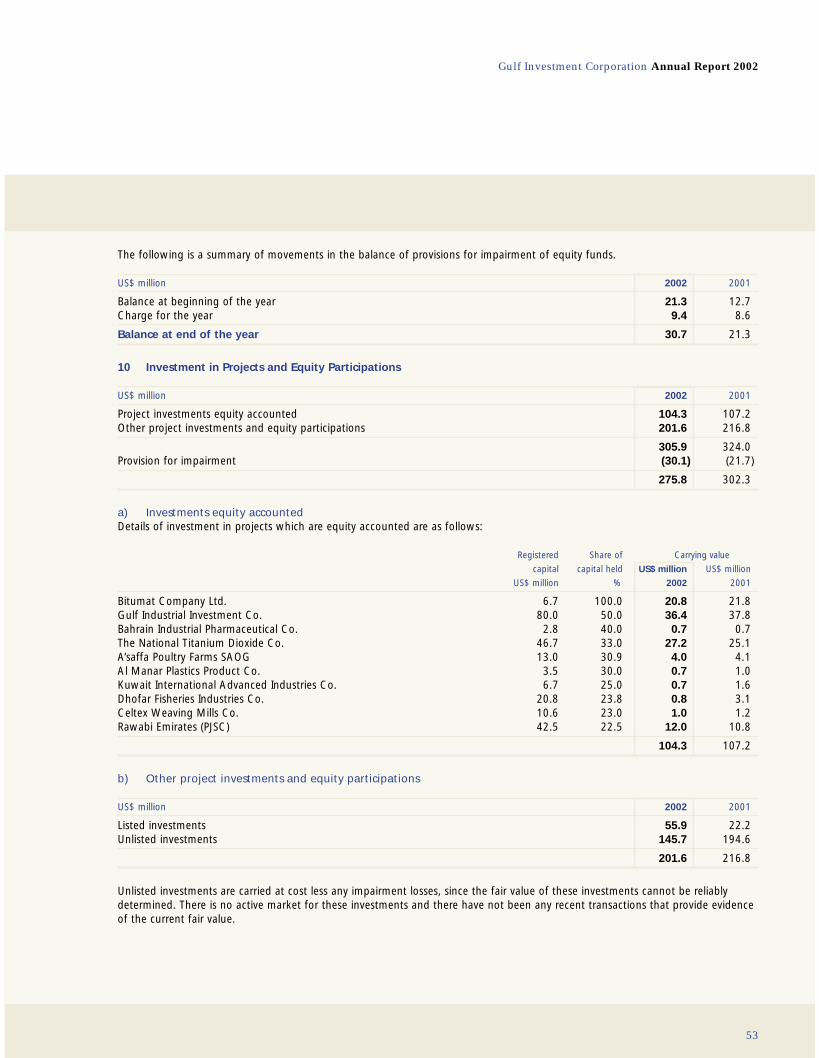
The following is a summary of movements in the balance of provisions for impairment of equity funds.
US$ million 2002 2001
Balance at beginning of the year 21.3 12.7Charge for the year 9.4 8.6
Balance at end of the year 30.7 21.3
10 Investment in Projects and Equity Participations
US$ million 2002 2001
Project investments equity accounted 104.3 107.2Other project investments and equity participations 201.6 216.8
305.9 324.0Provision for impairment (30.1) (21.7)
275.8 302.3
a) Investments equity accounted Details of investment in projects which are equity accounted are as follows:
Registered Share of Carrying value
capital capital held US$ million US$ million
US$ million % 2002 2001
Bitumat Company Ltd. 6.7 100.0 20.8 21.8Gulf Industrial Investment Co. 80.0 50.0 36.4 37.8Bahrain Industrial Pharmaceutical Co. 2.8 40.0 0.7 0.7The National Titanium Dioxide Co. 46.7 33.0 27.2 25.1A’saffa Poultry Farms SAOG 13.0 30.9 4.0 4.1Al Manar Plastics Product Co. 3.5 30.0 0.7 1.0Kuwait International Advanced Industries Co. 6.7 25.0 0.7 1.6Dhofar Fisheries Industries Co. 20.8 23.8 0.8 3.1Celtex Weaving Mills Co. 10.6 23.0 1.0 1.2Rawabi Emirates (PJSC) 42.5 22.5 12.0 10.8
104.3 107.2
b) Other project investments and equity participations
US$ million 2002 2001
Listed investments 55.9 22.2Unlisted investments 145.7 194.6
201.6 216.8
Unlisted investments are carried at cost less any impairment losses, since the fair value of these investments cannot be reliablydetermined. There is no active market for these investments and there have not been any recent transactions that provide evidenceof the current fair value.
Gulf Investment Corporation Annual Report 2002
53
GIC π02 Accounts P.7 Final AW 16/4/03 1:55 pm Page 53

Notes to the Financial Statements continuedYear ended December 31, 2002
10 Investment in Projects and Equity Participations continuedc) Provision for impairment in investment in projects and equity participationsThe movement in the provisions was as follows:
US$ million 2002 2001
Balance at beginning of the year 21.7 17.2Amounts utilized (4.7) -Net charge for the year 13.1 4.5
Balance at end of the year 30.1 21.7
11 Property and Other Fixed Assets
US$ million 2002 2001
Accumulated Net book Net bookCost depreciation value value
Building and installations 24.0 2.4 21.6 22.9Furniture, equipment and motor vehicles 19.6 12.5 7.1 8.5
43.6 14.9 28.7 31.4
There were no significant additions or disposals during the year. The depreciation charge for the year is US$ 3.1 million (2001: US$ 3.1 million).
12 Other Assets
US$ million 2002 2001
Accrued interest, fees and commissions 66.1 68.1Receivable from GIIC - 20.0Derivative assets used for hedging 27.9 0.4Employees’ end of service benefit asset 29.6 29.7Goodwill arising on acquisitions 22.5 23.7Prepayments 1.4 1.0Other, including accounts receivable 2.4 35.2
149.9 178.1
54
GIC π02 Accounts P.7 Final AW 16/4/03 1:55 pm Page 54

13 Deposits
US$ million 2002 2001
Deposits from Central Banks 303.1 303.0Deposits from other banks 755.5 871.5Islamic deposits 437.8 -Other deposits 208.7 290.3
1,705.1 1,464.8
At December 31, 2002 deposits from GCC Country Governments, Central Banks and other institutions headquartered in the GCC States amounted to US$ 1,280.0 million (2001: US$ 1,060.3 million).
14 Term Finance
US$ million 2002 2001
Saudi Riyal Floating rate loan due in 2004 160.0 160.0GIC Floating Rate Note due in 2007 300.0 -
460.0 160.0
During the year, the Corporation issued Floating Rate Notes which are due in 2007 and carry interest at LIBOR plus 40 basis points.
15 Other Liabilities
US$ million 2002 2001
Accrued interest 48.9 48.0Derivative liabilities used for hedging 57.2 20.1Employees’ end of service benefits 32.7 34.3Other provision 3.4 3.4Other, including accounts payable and accrued expenses 8.7 7.7
150.9 113.5
Gulf Investment Corporation Annual Report 2002
55
GIC π02 Accounts P.7 Final AW 16/4/03 1:55 pm Page 55

Notes to the Financial Statements continuedYear ended December 31, 2002
16 Shareholders’ Equity
16.1 The authorized and issued capital comprises 2.1 million shares of US$ 1,000 each (2001: 2.1 million shares of US$ 1,000 each).The paid up capital is US$ 750 million (2001: US$ 750 million).
16.2 In accordance with the Kuwait Commercial Companies’ Law and the Corporation’s Articles of Association, 10 percent of the net income for the year is required to be transferred to the non-distributable compulsory reserve until the reserve reaches aminimum of 50 percent of share capital.
16.3 No transfer has been made to the voluntary reserve for the years ended December 31, 2002 and 2001 based on a resolutionadopted in the General Assembly meeting of the shareholders.
16.4 Unrealized gain on available-for-sale assets comprises the cumulative net change in fair value of available-for-sale assets held by the Corporation.
17 Other Operating Income
US$ million 2002 2001
Net gain on trading securities and managed funds 10.3 10.0Net loss on investment securities (5.3) (0.3)Net gain on sale of investment in projects and equity participations 4.8 0.4Net gain on disposal of available-for-sale investments transferred from shareholders’ equity 5.9 5.9Income from equity funds 3.0 8.6Income from projects and equity participations 14.4 19.1Profit on foreign exchange 0.3 0.2Dividend income 5.6 5.5Fees, commissions and sundry income 4.6 2.3
43.6 51.7
18 Provisions for Impairment Losses
US$ million 2002 2001
Equity funds (9.4) (8.6)Projects and equity participations (13.1) (4.5)Loans and loan guarantees (0.1) (0.7)Investment securities (5.7) -
(28.3) (13.8)
19 Extraordinary ItemThe United Nations Compensation Commission (“UNCC”) completed its review of the claim filed by the Corporation in respect oflosses incurred as a result of the Iraqi invasion and occupation of Kuwait in 1990, and has awarded compensation of US$ 34.3 million.During the year the Corporation received US$ 25.0 million. The balance US$ 9.3 million was received on January 16, 2003.
56
GIC π02 Accounts P.7 Final AW 16/4/03 1:55 pm Page 56

20 Retirement and Other Terminal BenefitsThe Corporation has defined voluntary contribution and end of service indemnity plans which cover all its employees. Contributionto the voluntary plan is based on a percentage of pensionable salary and consists of contribution by employees and a matchedcontribution up to a certain limit by the Corporation. Contribution to the end of service indemnity plan is based on a percentage ofpensionable salary and number of years of service by the employees. The amounts to be paid as the end of service benefits aredetermined by reference to the amounts of the contributions and investment earnings thereon. The Corporation also pays contributionsto a government defined contribution pension plan for certain employees in accordance with the legal requirements in Kuwait.
The total cost of retirement and other end of service benefits included in staff expenses for the year ended December 31, 2002amounted to US$ 2.8 million (2001: US$ 3.0 million).
21 DividendsA dividend of US$ 100 per share for the year ended December 31, 2002 (2001: US$ 100 per share) was approved by the shareholdersin the General Assembly meeting held on March 15, 2003. This will be utilized to settle receivable from shareholders (see note 8 ).
22 Asset and Liability Maturity Profile
Within 3 Mths 1 to 5 Over 5US$ million 3 mths to 1 year years years Total
At December 31, 2002AssetsCash and bank balances 3.5 - - - 3.5Placements 412.3 30.0 - - 442.3Securities purchased under resale agreements 10.2 - - - 10.2Trading securities and managed funds 19.1 - 3.3 286.3 308.7Investment securities 157.2 394.2 2,384.1 628.6 3,564.1Loans and credit funds 14.7 43.9 312.8 55.4 426.8Receivable from shareholders 75.0 - - 411.9 486.9Equity funds 1.4 - 15.4 91.2 108.0Investments in projects and equity participations - - - 275.8 275.8Property and other fixed assets - - - 28.7 28.7Other assets 64.8 33.7 5.7 45.7 149.9
Total assets 758.2 501.8 2,721.3 1,823.6 5,804.9
Liabilities and shareholders' equitySecurities sold under repurchase agreements 1,083.4 1,227.4 - - 2,310.8Deposits 1,465.9 195.7 43.5 - 1,705.1Term finance - - 460.0 - 460.0Other liabilities 36.2 22.3 23.2 69.2 150.9Shareholders' equity - - - 1,178.1 1,178.1
Total liabilities and shareholders' equity 2,585.5 1,445.4 526.7 1,247.3 5,804.9
At December 31, 2001Total assets 963.8 623.6 2,329.7 1,623.9 5,541.0
Total liabilities and shareholders' equity 2,787.6 1,419.1 210.3 1,124.0 5,541.0
The asset and liability maturity profile is based on contractual repayment arrangements and as such does not take account of theeffective maturities of deposits as indicated by the Corporation's deposit retention records and of borrowers’ right to prepayobligations with or without prepayment penalties. Formal liquidity controls are based on contractual asset and liability maturities.
Gulf Investment Corporation Annual Report 2002
57
GIC π02 Accounts P.7 Final AW 16/4/03 1:55 pm Page 57

Notes to the Financial Statements continuedYear ended December 31, 2002
23 Asset and Liability Repricing Profile and Effective Interest Rates
Non-Interest EffectiveWithin 3 3 Mths to Over bearing interest
US$ million mths 1 year 1 year items Total rate %
At December 31, 2002AssetsCash and bank balances 3.5 - - - 3.5 -Placements 412.3 30.0 - - 442.3 2.01Securities purchased under resale agreements 10.2 - - - 10.2 3.40Trading securities and managed funds - - 3.3 305.4 308.7 4.50Investment securities:
Fixed rate 116.5 301.1 1,689.1 - 2,106.7 5.30Floating rate 1,080.7 279.1 - (5.7) 1,354.1 2.97Equities - - - 103.3 103.3 -
Loans and credit funds 333.6 94.5 2.6 (3.9) 426.8 1.77Receivable from shareholders 75.0 - 411.9 - 486.9 4.19Equity funds - - - 108.0 108.0 -Investment in projects and equity participations - - - 275.8 275.8 -Property and other fixed assets - - - 178.6 178.6 -
Total assets 2,031.8 704.7 2,106.9 961.5 5,804.9
Liabilities & shareholders’ equitySecurities sold under repurchase agreements 1,083.4 1,227.4 - - 2,310.8 2.57Deposits 1,465.9 239.2 - - 1,705.1 2.25Term finance 460.0 - - - 460.0 2.56Other liabilities - - - 150.9 150.9 -Shareholders’ equity - - - 1,178.1 1,178.1 -
Total liabilities and shareholders’ equity 3,009.3 1,466.6 - 1,329.0 5,804.9
Derivative instruments 124.8 (124.8) - - -
Interest rate sensitivity gap (852.7) (886.7) 2,106.9 (367.5) -
Cumulative interest rate sensitivity gap (852.7) (1,739.4) 367.5 - -
At December 31, 2001Interest rate sensitivity gap (874.1) (726.4) 1,928.4 (327.9) -
Cumulative interest rate sensitivity gap (874.1) (1,600.5) 327.9 - -
The repricing profile is based on the remaining period to the next interest repricing date. The repricing profiles of floating rateinvestment securities and loans incorporate the effect of interest rate swaps used to modify the interest rate characteristics ofspecific transactions. The general provision for loan losses is deducted from non-interest bearing assets.
58
GIC π02 Accounts P.7 Final AW 16/4/03 1:55 pm Page 58

24 Commitments and Contingent LiabilitiesIn the usual course of meeting the requirements of customers, the Corporation has commitments to extend credit and providefinancial guarantees and letters of credit to guarantee the performance of customers to third parties. The credit risk on thesetransactions is generally less than the contractual amount. The table below sets out the notional principal amounts of outstandingcommitments and the risk-weighted equivalents calculated in accordance with the capital adequacy guidelines of the Bank forInternational Settlements (BIS).
Credit Risk Amounts2002 2001
Notional Risk- Notional Risk-principal weighted principal weighted
US$ million amount equivalent amount equivalent
Transaction-related contingent items 53.8 53.8 59.8 59.8Undrawn loan commitments and underwriting commitments
under note issuance and revolving facilities 24.7 6.2 50.1 12.5
Total 78.5 60.0 109.9 72.3
The above commitments and contingent liabilities have off balance-sheet credit risk because only origination fees and accruals forprobable losses are recognized in the balance sheet until the commitments are fulfilled or expired. Many of the contingent liabilitiesand commitments will expire without being advanced in whole or in part. Therefore, the amounts do not represent expected futurecash flows.
25 Derivatives and Foreign Exchange ProductsDerivatives and foreign exchange instruments are utilized by the Corporation to meet the needs of its customers, to generate tradingrevenues and as part of its asset and liability management (ALM) activity to hedge its own exposure to market, interest rate andcurrency risk.
In the case of derivative transactions the notional principal typically does not change hands. It is simply a quantity which is used tocalculate payments. While notional principal is a volume measure used in the derivatives and foreign exchange markets, it is neither ameasure of market nor credit risk. The Corporation’s measure of credit exposure is the cost of replacing contracts at current marketrates should the counterparty default prior to the settlement date. Credit risk amounts represent the gross unrealized gains ontransactions before taking account of any collateral held or any master netting agreements in place.
Hedge accountingInterest rate swaps under which the Corporation pays a fixed rate and receives a floating rate are used in fair value hedges of fixedinterest securities available-for-sale.
As at the balance sheet date the notional amount of interest rate swaps used to hedge interest rate risk amounted to US$ 560.6 million (2001: US$ 378.3 million) and its net fair value was a swap loss of US$ 57.2 million (2001: US$ 20.1 million). The corresponding gain on the hedged fixed income securities amounted to US$ 54.7 million (2001: US$ 19.3 million).
Gulf Investment Corporation Annual Report 2002
59
GIC π02 Accounts P.7 Final AW 16/4/03 1:55 pm Page 59

Notes to the Financial Statements continuedYear ended December 31, 2002
25 Derivatives and Foreign Exchange Products continuedTrading activitiesThe table below summarizes the aggregate notional, net fair value and credit risk amounts of foreign exchange and derivativefinancial instruments held for trading.
Notional Net fair Credit riskUS$ million amounts values amounts
As at December 31, 2002Foreign exchange contracts:Unmatured spot, forward and futures contracts 833.7 0.7 1.1Options purchased 113.1 (3.6) -Options written 113.1 3.6 3.6
Total 1,059.9 0.7 4.7
Interest rate contracts:Interest rate swaps 51.5 - 0.9
Total 51.5 - 0.9
Grand Total 1,111.4 0.7 5.6
Notional Net fair Credit riskUS$ million amounts values amounts
As at December 31, 2001Foreign exchange contracts:Unmatured spot, forward and futures contracts 268.5 0.1 0.2Options purchased 38.9 - -Options written 38.9 - -
Total 346.3 0.1 0.2
Interest rate contracts:Interest rate swaps 142.7 0.3 1.1
Total 142.7 0.3 1.1
Grand Total 489.0 0.4 1.3
60
GIC π02 Accounts P.7 Final AW 16/4/03 1:55 pm Page 60

Counterparty analysis
US$ million Banks Other Total
At December 31, 2002Credit risk amountsOECD countries 5.4 - 5.4GCC countries 0.2 - 0.2Other countries - - -
Total 5.6 - 5.6
US$ million Banks Other Total
At December 31, 2001Credit risk amountsOECD countries 1.0 - 1.0GCC countries - - -Other countries 0.3 - 0.3
Total 1.3 - 1.3
Credit risk is concentrated on major OECD-based banks.
Maturity analysis
Year Years Years OverUS$ million 1 2 & 3 4 & 5 5 yrs Total
At December 31, 2002Notional amountsForeign exchange contracts 1,059.9 - - - 1,059.9Interest rate contracts 20.0 31.5 - - 51.5
Total 1,079.9 31.5 - - 1,111.4
Year Years Years OverUS$ million 1 2 & 3 4 & 5 5 yrs Total
At December 31, 2001Notional amountsForeign exchange contracts 346.3 - - - 346.3Interest rate contracts 94.6 30.0 18.1 - 142.7
Total 440.9 30.0 18.1 - 489.0
Gulf Investment Corporation Annual Report 2002
61
GIC π02 Accounts P.7 Final AW 16/4/03 1:55 pm Page 61

Notes to the Financial Statements continuedYear ended December 31, 2002
26 Geographic Distribution of Risk Assets
Trading,Cash and Securities investment Loans and
bank purchased securities and advances andbalances and under resale managed receivable from
US$ million placements agreements funds shareholders
GCC 404.5 - 616.1 608.7Other Middle East and North Africa - - 11.3 -Europe 40.3 10.2 1,501.5 30.0North America 0.9 - 1,585.5 275.0Asia 0.1 - 158.4 -
Total 445.8 10.2 3,872.8 913.7
Equity Funds,investment Commitmentsin projects andand equity contingent 2002 2001
US$ million participations liabilities Total Total
GCC 275.8 78.5 1,983.6 2,312.4Other Middle East and North Africa - - 11.3 10.9Europe 23.7 - 1,605.7 1,313.9North America 82.3 - 1,943.7 1,585.9Asia 2.0 - 160.5 218.3
Total 383.8 78.5 5,704.8 5,441.4
An analysis of derivatives and foreign exchange products is set out in note 25.
27 Fair Value InformationAs at the balance sheet date the fair value of financial assets and financial liabilities that are not carried at fair value is notmaterially different from their carrying amounts, except for debt and other interest bearing instruments held-to-maturity (see note 6), whose fair value is US$ 7.4 million higher than its carrying value (2001: US$ 9.5 million higher than its carrying value).
Fair value is the amount at which an asset, liability or financial instrument could be exchanged or settled between knowledgeableparties in an arm’s length transaction. Underlying the definition of fair value is the presumption that the Corporation is a goingconcern without any intention, or need, to liquidate, curtail materially the scale of its operations or undertake a transaction onadverse terms.
62
GIC π02 Accounts P.7 Final AW 16/4/03 1:55 pm Page 62

28 Related Party TransactionsDuring the year certain transactions were conducted with the parties that have a direct or indirect relationship with theCorporation's shareholders. These comprised standard money market, foreign exchange, investment, lending and securitiestransactions and were conducted on an arm's length basis at open market prices. The volume of such transactions are disclosed in respective notes to the financial statements.
29 Fiduciary ActivitiesAt December 31, 2002 third party assets under management amounted to US$ 202.6 million (2001: US$ Nil). These assets are managed in a fiduciary capacity and are therefore excluded from the Balance Sheet.
30 ComparativesWhere necessary, comparative figures have been adjusted to conform with changes in presentation in the current year.
Gulf Investment Corporation Annual Report 2002
63
GIC π02 Accounts P.7 Final AW 16/4/03 1:55 pm Page 63

Direct Investments in the GCC Region
Total GIC’s ShareShareholders’ Equity of Capital
Location (US $ million) (%)
Non-consolidated Subsidiary and Associated CompaniesBitumat Company Saudi Arabia 20.8 100.0Gulf Industrial Investment Company Bahrain 72.8 50.0Bahrain Industrial Pharmaceutical Company Bahrain 1.8 40.0National Titanium Dioxide Company (CRISTAL) Saudi Arabia 82.6 33.0A’saffa Poultry Farms SAOG Oman 12.8 30.9Al Manar Plastics Product Company Saudi Arabia 2.3 30.0Kuwait International Advanced Industries Company Kuwait 3.0 25.0Dhofar Fisheries Industries Company Oman 4.5 23.8Celtex Weaving Mills Company Bahrain 4.2 23.0Rawabi Emirates (PJSC) UAE 53.4 22.5(previously Al Rawabi Dairy Co. & Emirates Modern Poultry Co.)
Equity ParticipationsGulf Stone Company Oman 2.7 19.5Qatar Briquetted Iron Company(QABICO) Qatar 0.6 16.3Advanced Electronics Company (AEC) Saudi Arabia 55.6 15.0National Environmental Services Company (NESCO) Kuwait 2.4 15.3Arab Pesticide Industries Company (MOBEED) Saudi Arabia 4.2 12.5National Petrochemical Industrialization Company Saudi Arabia 179.6 12.0Interplast Company Limited UAE 51.5 17.7Arab Qatari Company for Dairy Products Qatar 14.3 11.2Al-Salam Aircraft Company Saudi Arabia 37.2 10.0Gulf Ferro Alloys Company (Sabayek) Saudi Arabia 10.8 10.0Jarir Marketing Company Saudi Arabia 98.9 10.0National Aluminum Products Company Oman 13.8 10.0Ras Laffan Power Company Qatar 73.4 10.0Zamil Industrial Investment Company (ZIIC) Saudi Arabia 116.0 10.0National Pharmaceutical Industries Company Kuwait 11.7 6.5Securities & Investment Company (SICO) Bahrain 37.7 8.0Al-Jubail Chemical Industrial Company (JANA) Saudi Arabia 49.0 7.5Gulf Aluminum Rolling Mill Company (GARMCO) Bahrain 67.3 5.9Arabian Industrial Fibers Company (Ibn Rushd) Saudi Arabia 639.1 4.7International Fish Farming Company UAE 77.0 4.0United Power Company Oman 132.6 2.3Oasis International Leasing Company (WAHA) UAE 146.2 2.0Thuraya Satellite Telecommunications Company UAE 374.3 1.6Qatar Telecom (Q-TEL) Qatar 581.7 0.6
64
GIC π02 Accounts P.7 Final AW 16/4/03 1:55 pm Page 64

Corporate Directory
Global Markets
Head of Global Markets andProprietary Asset Management Jamal Al-Saeed
Alternative Investments,International Equities & Private EquityRomeo Briones
Equity ResearchOmar Abdallah
GCC EquitiesAbdulrahman Al-Saeed
Head of MarketingHamza Behbehani
Head of TreasuryYacoub Al-Awadi
Fixed IncomeAbdulaziz Al-Mulla
Chief DealerMartin Joy
Money MarketsMathew Abraham
Contact Details
Mailing AddressP.O. Box 3402Safat 13035Kuwait
Telephone(+965) 222 5000
Principal Investing
Head of Corporate Finance & Utilities, and Financial ServicesShafic Ali
Head of Corporate Finance & UtilitiesMahmoud Rateb
Head of Diversified Projects & ManufacturingKhaled Al-Awadi
Head of ManufacturingKhaled Al-Qadeeri
Courier AddressSharqJaber Al Mubarak StreetKuwait
Facsimile(+965) 244 8894
Corporate Office
Head of Economics & StrategyDr. Soliman Demir
Head of Financial Control & Risk ManagementGhassan Tarazi
Head of Internal AuditAnthony W. Ede
Web Site Addresswww.gulfinvestmentcorp.com
Head of Human Resources &AdministrationHani Al-Meer
Head of Shared ServicesMohammed Al-Sanie
Head of Information TechnologyHani Al-Shakhs
Head of OperationsShawki Khalaf
S.W.I.F.T.GCOR KWKW
Senior ManagementChief Executive OfficerHisham Abdulrazzaq Al Razzuqi
Gulf Investment Corporation Annual Report 2002
65
GIC π02 Accounts P.7 Final AW 16/4/03 1:55 pm Page 65