Results of ‘PASt21’ – the Portuguese initiative for performance assessment of water and...
16
Provided for non-commercial research and educational use only. Not for reproduction or distribution or commercial use. This article was originally published by IWA Publishing. IWA Publishing recognizes the retention of the right by the author(s) to photocopy or make single electronic copies of the paper for their own personal use, including for their own classroom use, or the personal use of colleagues, provided the copies are not offered for sale and are not distributed in a systematic way outside of their employing institution. Please note that you are not permitted to post the IWA Publishing PDF version of your paper on your own website or your institution’s website or repository. Please direct any queries regarding use or permissions to [email protected]
Transcript of Results of ‘PASt21’ – the Portuguese initiative for performance assessment of water and...
Provided for non-commercial research and educational use only. Not for reproduction or distribution or commercial use.
This article was originally published by IWA Publishing. IWA Publishing recognizes the retention of the right by the author(s) to photocopy or make single electronic
copies of the paper for their own personal use, including for their own classroom use, or the personal use of colleagues, provided the copies are not offered for sale and
are not distributed in a systematic way outside of their employing institution.
Please note that you are not permitted to post the IWA Publishing PDF version of your paper on your own website or your institution’s website or repository.
Please direct any queries regarding use or permissions to [email protected]
372 © IWA Publishing 2012 Water Science & Technology: Water Supply | 12.3 | 2012
Results of ‘PASt21’ – the Portuguese initiative
for performance assessment of water and wastewater
treatment plants
C. Silva, P. Ramalho, S. Quadros, H. Alegre and M. J. Rosa
ABSTRACT
Performance assessment of water supply and wastewater services is today a major issue. Over the
past six years, the National Civil Engineering Laboratory (Portugal) has been developing performance
assessment systems for drinking water treatment plants (WTPs) and wastewater treatment plants
(WWTPs). In 2009, a national field-test was launched in Portugal, ‘PASt21’, involving 27 plants (10
WTPs and 17 WWTPs). This paper presents an overview of the second generation of the performance
indicator (PI) systems for the overall performance assessment of WTPs and WWTPs, the extent to
which the systems were applied in the 5-year study period (2006–2010), and the aggregated results
(average, median, percentiles 25 and 75, maximum and minimum) of representative PIs in each
assessment group. It was concluded that all indicators are relevant, and the results show the ability
of the proposed PI systems to assess the overall performance of a given treatment plant. The
aggregated results are very important for the continuous improvement of the plant performance
through benchmarking and periodic reassessment of targets.
doi: 10.2166/ws.2012.004
C. Silva (corresponding author)P. RamalhoH. AlegreM. J. RosaUrban Water Division,Hydraulics and Environment Department,LNEC – National Civil Engineering Laboratory,Av. Brasil 101,1700-066 Lisboa,PortugalE-mail: [email protected]
S. QuadrosAzores University,Campus de Angra do Heroísmo,9701-851 Angra do Heroísmo,Portugal
Key words | performance assessment, performance indicators, wastewater treatment plants,
water treatment plants
INTRODUCTION
Performance assessment of water supply and wastewater
services is today a major issue. However, most performance
assessment systems (PASs) do not specifically apply to treat-
ment plants, which are core elements of these services
(Alegre et al. , ; Stahre & Adamsson ; Matos
et al. ; Ofwat ; World Bank ; Stahre et al.
). To our knowledge, exceptions to this situation are
the German initiative ‘Benchmarking water industry’
(DWA ) and the ‘Portuguese initiative for performance
assessment of water and wastewater treatment plants –
PASt21’ (http://past21.lnec.pt/).
Over the past 6 years, LNEC – the National Civil Engin-
eering Laboratory (Portugal) has been developing PASs for
water treatment plants (WTPs) and wastewater treatment
plants (WWTPs) (Vieira et al. , , ; Quadros
et al. ).
These systems comprise two main components, the
Overall Performance Assessment and the Operational Per-
formance Assessment. The former, the subject of this
paper, is based on performance indicators (PIs), which
use historical data and the information produced is aggre-
gated at plant level. The Operational Performance
Assessment is based on performance indices and addresses
the daily performance of each unit operation or process of
the plant.
In 2009, a national field-test was launched, ‘PASt21’,
coordinated by LNEC and involving 27 plants operated by
12 water utilities, publicly owned (10 companies of the
Águas de Portugal holding), private (AGS, S.A.) or munici-
pal (SMAS Almada). The PASt21 project also involves the
Portuguese Water and Waste Services Regulation Authority
and has the support of the Portuguese Association for
373 C. Silva et al. | Results of ‘PASt21’ Water Science & Technology: Water Supply | 12.3 | 2012
Sanitary and Environmental Engineering and the Portu-
guese Water Resources Association.
This paper presents: (i) an overview of the second
generation of the PI systems for the overall performance
assessment of WTPs and WWTPs, (ii) the characterisation
of the 27 case-studies, (iii) the extent to which the
systems were applied in the 5-year study period (2006–
2010), and (iv) the formulation and aggregated results
(average, median, percentiles 25 and 75, maximum and
minimum) of representative indicators in each assessment
group.
THE PI SYSTEM FOR OVERALL PERFORMANCEASSESSMENT OF WTPS AND WWTPS
The developed PASs assumed two general objectives for any
undertaking with regard to a WTP or WWTP performance:
(1) its effectiveness and reliability, i.e. the compliance over
time with the quality requirements of the treated water
and (2) its efficiency (in terms of resources utilisation) and
sustainability (economic and environmental).
These objectives determined the following assessment
groups: Treated water/wastewater quality; Removal effi-
ciency and reliability; Use of natural resources and raw
materials; By-product management; Safety; Personnel;
Economic and financial resources; Planning and design
(the latter only for WWTP) (Vieira et al. , , ;
Quadros et al. ).
Analogous portfolios of PIs for WTP and WWTP were
formulated in these assessment groups according to the
IWA approach (Alegre et al. , ; Matos et al. )
and to the principles established in ISO 24510:2007,
24511:2007, 24512:2007.
The developed PIs are defined as ratios between variables
(of the same or of different nature), and may be therefore
dimensionless (e.g. %, –) or intensive (e.g. kWh/m3). In
the latter case, to allow for comparisons, the denominator
represents one dimension of the system (Alegre et al. ),
e.g. the volume of treated water. The PIs are calculated for
a reference assessment period, preferably a year. PIs
expressed in terms of time are formulated to accommodate
other reference assessment periods. In order to ensure unit
coherence and allow for PI comparison, for these PIs, the
values calculated for other reference assessment periods are
converted into annual values, multiplying by ‘365 (day/
year)/Assessment period (day)’.
The work undertaken in the scope of PASt21 resulted in
the second generation of PI systems for WTP and urban
WWTP. The second generation systems include 94 PIs for
WTPs and 121 PIs for WWTPs, involving 141 and 204 vari-
ables, respectively, i.e. overall ratios of 1.5 and 1.7 variables/
PI. The PI code includes six or eight fields (the last two are
optional) identifying the system (t for WTP and wt for
WWTP), the assessment group and the PI number – e.g.
wtWQ01 is the first indicator (01) of the Treated Wastewater
Quality (WQ) assessment group. Whenever necessary, an
optional numerical field may be used to identify an alterna-
tive processing rule, e.g. wtER35.1 for Pump inspection,
expressed in No./(pump.year), and wtER35.2 for Inspected
pumps, %/year. An optional alphabetical character may be
used for PI speciation. For instance, the consumption of
reagents is assessed for each reagent (or type of reagent)
used in the plant, e.g. wtRU05.0a – Consumption of alu-
minium coagulants, expressed in g Al/m3 of treated
wastewater.
The detailed characterisation of each PI (code
and designation, assessment group, objective, processing
rule, units, data required, results analysis and observations –
for clarification of variables and other relevant aspects to
the PI calculation) is presented in Rosa et al. (a, b).
The proposed PASs deal with a high volume of data, and
an automatic tool for data processing and results visualisa-
tion was therefore developed. PAStool was implemented
in Microsoft Excel® with VBA programming and also
allows for the statistical analysis of results. Whenever stat-
istically feasible, PAStool automatically aggregates in a box
plot (Figure 1) the values obtained for each PI and for
each year, as well as for the overall period under study (to
a maximum of 5 years).
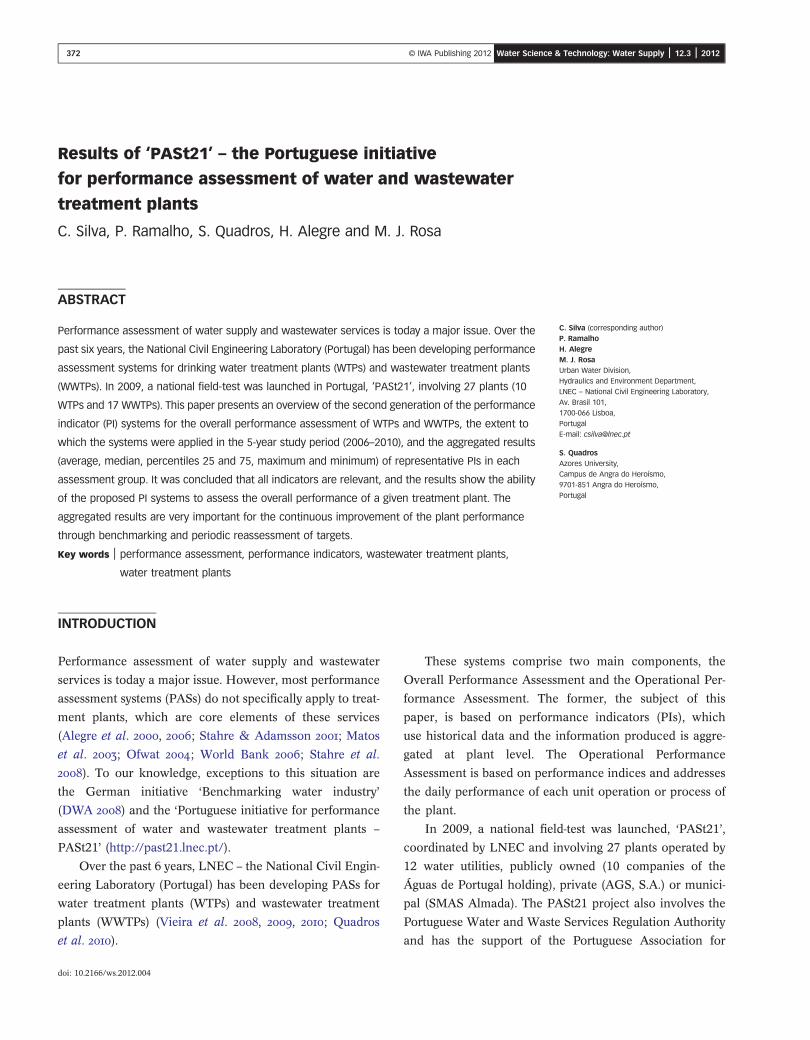
The box plot includes the average, median, percentiles
25 and 75, maximum, minimum and extreme outliers
(values below or above three times the P75-P25 difference).
The percentage of calculation, i.e. the percentage of case-
studies entering the calculation of a given PI, is also
shown. Whenever the latter varies from year to year,
interpretation of PI variations and box plots for the overall
5-year period should be considered with reservation.
Figure 1 | Box plot automatically produced by PAStool.
374 C. Silva et al. | Results of ‘PASt21’ Water Science & Technology: Water Supply | 12.3 | 2012
The number of PIs proposed in each assessment group
and the degree of application of the PI systems in PASt21
case-studies (characterised in ‘The PASt21 Case-studies’,
below) are then presented under the heading ‘Degree of
application of the PI systems during the field test’. The for-
mulation and the aggregated results of representative PIs
are then presented and discussed by assessment group in
sections below headed ‘Treated (waste)water quality’
(WQ), ‘Removal efficiency and reliability’ (ER), ‘Use of natu-
ral resources and raw materials’ (RU), ‘By-product
management’ (BP), ‘Safety’ (Sa), ‘Personnel’ (Pe), ‘Economic
and financial resources’ (Fi) and ‘Planning and design’ (PD).
The PIs shown were selected for their interest, variation
throughout the 5-year period under study and/or higher per-
centage of calculation.
THE PASt21 CASE-STUDIES
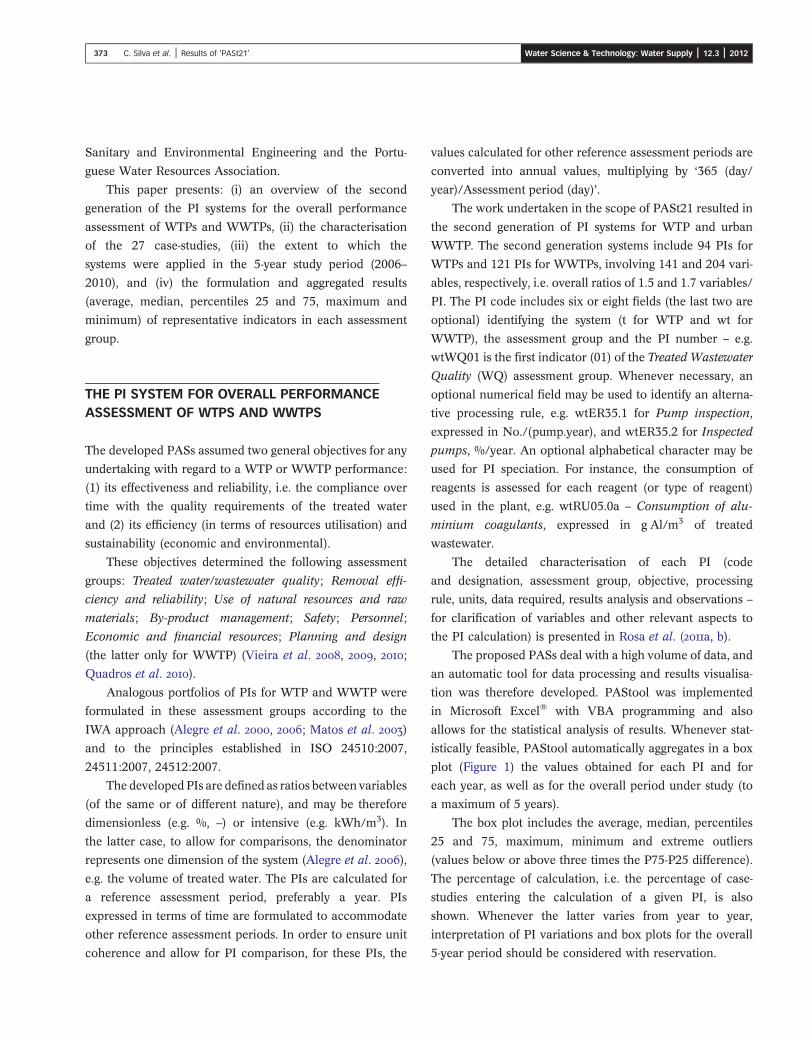
The 27 PASt21 case-studies (10 WTPs and 17 WWTPs) are
spread throughout Portugal (Figure 2) and cover a wide
range of treatment capacities and conventional sequences
(Figures 3 and 4), representative of the national situation
and as commonly found worldwide.
The 10 WTPs range from 3,000 to 400,000 m3/d (yield-
ing a total treatment capacity of 1,160,000 m3/d), have
different raw water sources – surface water only (dam or
river) or surface and groundwater – and different unit oper-
ations or processes for conventional water treatment and
solids processing (Figure 3), typically found worldwide.
The 17 WWTPs cover different capacities (360–
54,500 m3/d) and final disposal of the treated water
(discharge in sensitive, non-sensitive or bathing areas and/
or reuse), involving different unit operations and chemical
and biological processes for wastewater treatment and
solids and biosolids (sludge) processing (Figure 4). Seven
WWTPs are designed for carbon removal, five for biological
carbon and nitrogen removal, and five for carbon, nitrogen
and phosphorus removal by conventional processes –
suspended growth (activated sludge variants) and attached
growth (trickling filters and other biofilters). Twelve
WWTPs include UV disinfection, two have microscreening
and six (mono or dual) filtration prior to water discharge
and/or water reuse (three for 100% of treated flowrate and
three for the water to be reused).
PI RESULTS OF PASt21
Degree of application of the PI systems during the field
test
Figure 5 presents the number of indicators proposed in each
assessment group and the percentage of calculated PIs
during the 5-year (2006–2010) study period – the average
values of the consortium and the maximum percentages
obtained in one (W)WTP.
PAStool was designed for a 5-year period of analysis and
therefore data from 2006 to 2010 were included, even
though the data input is not yet complete for 2010.
All PIs were considered relevant by the consortium
depending on the assessment objectives, although in some
treatment plants the lack of reliable data may limit (for the
time being) the use of a few PIs, e.g. wtBP19 – Greenhouse
gases emission.
The percentage of calculated PIs shown in Figure 5
demonstrates the utilities’ major concern with plant effec-
tiveness and efficiency in terms of personnel and use of
water, energy and raw materials.
The highest percentage of calculation was found for the
assessment groups Treated (waste)water quality and Person-
nel, which were closely followed by the Use of natural
resources and raw materials in the WTPs (Figure 5). In the
WTPs, 39–89% of the PIs of the Treated water quality
group were calculated, on average. In the WWTPs, 23–54%
of the Treated wastewater quality PIs were calculated, the
Figure 2 | Location of PASt21 case-studies in Portugal.
375 C. Silva et al. | Results of ‘PASt21’ Water Science & Technology: Water Supply | 12.3 | 2012
value of 54% corresponding to the total number of the PIs
relating to plant compliance with discharge permits. The
average percentage of calculation for the Personnel indi-
cators ranged from 30 to 90% in the WTPs and from 31 to
85% in the WWTPs, during 2006–2010, whereas the calcu-
lated PIs of Use of natural resources and raw materials in
the WTPs varied from 41 to 80%.
The maximum percentage of PI calculation (also shown
in Figure 5) indicates that for at least one WTP, every PI pro-
posed in the WQ, RU and Pe assessment groups were
calculated, and the same happened for at least one WWTP
in the WQ, Sa, Pe, Fi and PD groups.
The accounting systems of many utilities in the con-
sortium did not allow a reliable and accurate allocation of
the Economic and financial resources (Fi) to a single
plant, and this constraint resulted in low average percen-
tages of PI calculation in this assessment group, in
addition to low data reliability and accuracy. The following
results of Fi indicators should therefore be analysed with
reservation.
The formulation and the results of the selected PIs for
each assessment group are presented in Tables 1–7 (from sec-
tions Treated (waste)water quality, Removal efficiency and
reliability, Use of natural resources and raw materials, By-
product management, Safety, Personnel, Economic and
financial resources, and Planning and design). The results
are aggregated in box plots, which include the average,
median, percentiles 25 and 75,maximum,minimum, extreme
outliers and the percentage of calculation, i.e. the percentage
of case-studies entering this aggregation (Figure 1). A brief
interpretation of the results is also enclosed in the tables.
Treated (waste)water quality
The assessment group Treated water quality evaluates WTP
performance in terms of compliance with water quality cri-
teria established by the utility for the finished water
leaving the plant and at different consumption points. It
also considers the parameters analysed compared to those
established by national legislation for drinking water at the
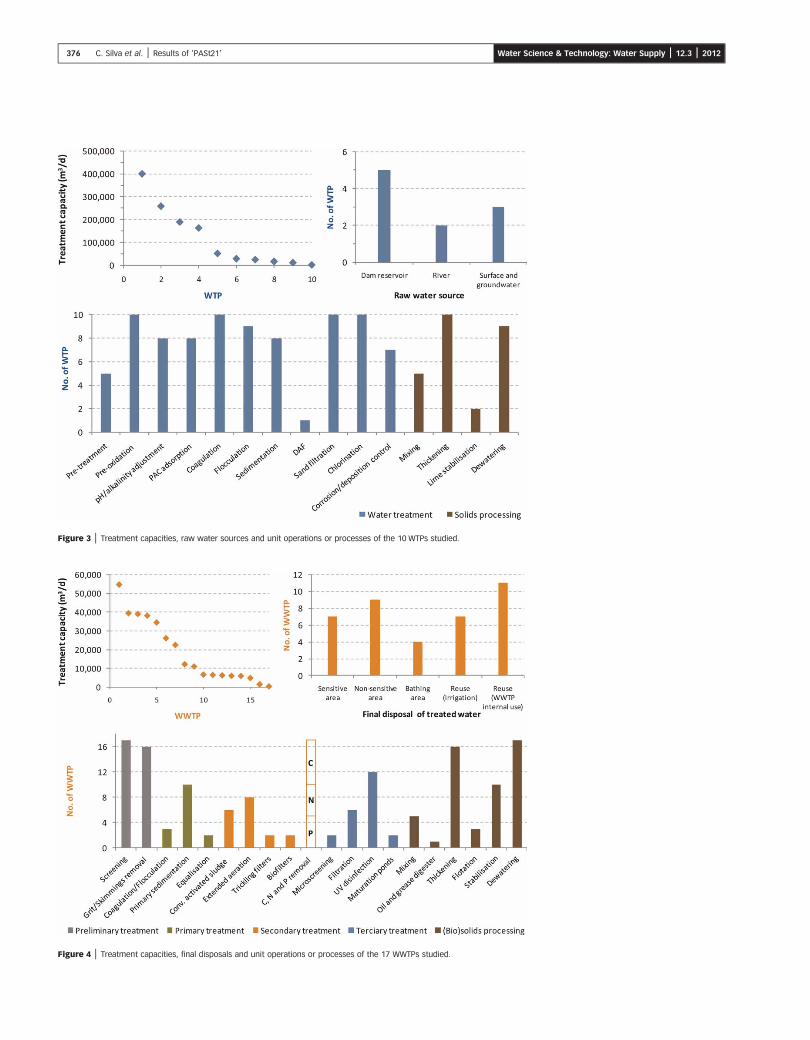
Figure 3 | Treatment capacities, raw water sources and unit operations or processes of the 10 WTPs studied.
Figure 4 | Treatment capacities, final disposals and unit operations or processes of the 17 WWTPs studied.
376 C. Silva et al. | Results of ‘PASt21’ Water Science & Technology: Water Supply | 12.3 | 2012
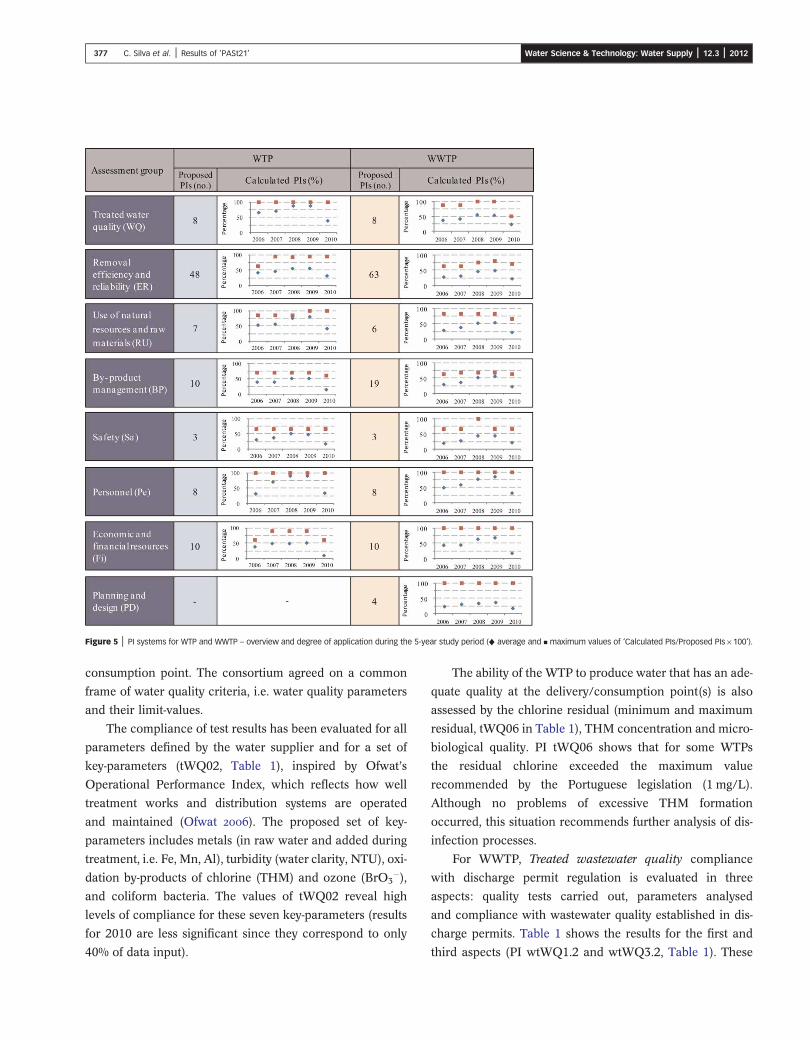
Figure 5 | PI systems for WTP and WWTP – overview and degree of application during the 5-year study period (♦ average and ▪ maximum values of ‘Calculated PIs/Proposed PIs × 100’).
377 C. Silva et al. | Results of ‘PASt21’ Water Science & Technology: Water Supply | 12.3 | 2012
consumption point. The consortium agreed on a common
frame of water quality criteria, i.e. water quality parameters
and their limit-values.
The compliance of test results has been evaluated for all
parameters defined by the water supplier and for a set of
key-parameters (tWQ02, Table 1), inspired by Ofwat’s
Operational Performance Index, which reflects how well
treatment works and distribution systems are operated
and maintained (Ofwat ). The proposed set of key-
parameters includes metals (in raw water and added during
treatment, i.e. Fe, Mn, Al), turbidity (water clarity, NTU), oxi-
dation by-products of chlorine (THM) and ozone (BrO3�),
and coliform bacteria. The values of tWQ02 reveal high
levels of compliance for these seven key-parameters (results
for 2010 are less significant since they correspond to only
40% of data input).
The ability of the WTP to produce water that has an ade-
quate quality at the delivery/consumption point(s) is also
assessed by the chlorine residual (minimum and maximum
residual, tWQ06 in Table 1), THM concentration and micro-
biological quality. PI tWQ06 shows that for some WTPs
the residual chlorine exceeded the maximum value
recommended by the Portuguese legislation (1 mg/L).
Although no problems of excessive THM formation
occurred, this situation recommends further analysis of dis-
infection processes.
For WWTP, Treated wastewater quality compliance
with discharge permit regulation is evaluated in three
aspects: quality tests carried out, parameters analysed
and compliance with wastewater quality established in dis-
charge permits. Table 1 shows the results for the first and
third aspects (PI wtWQ1.2 and wtWQ3.2, Table 1). These
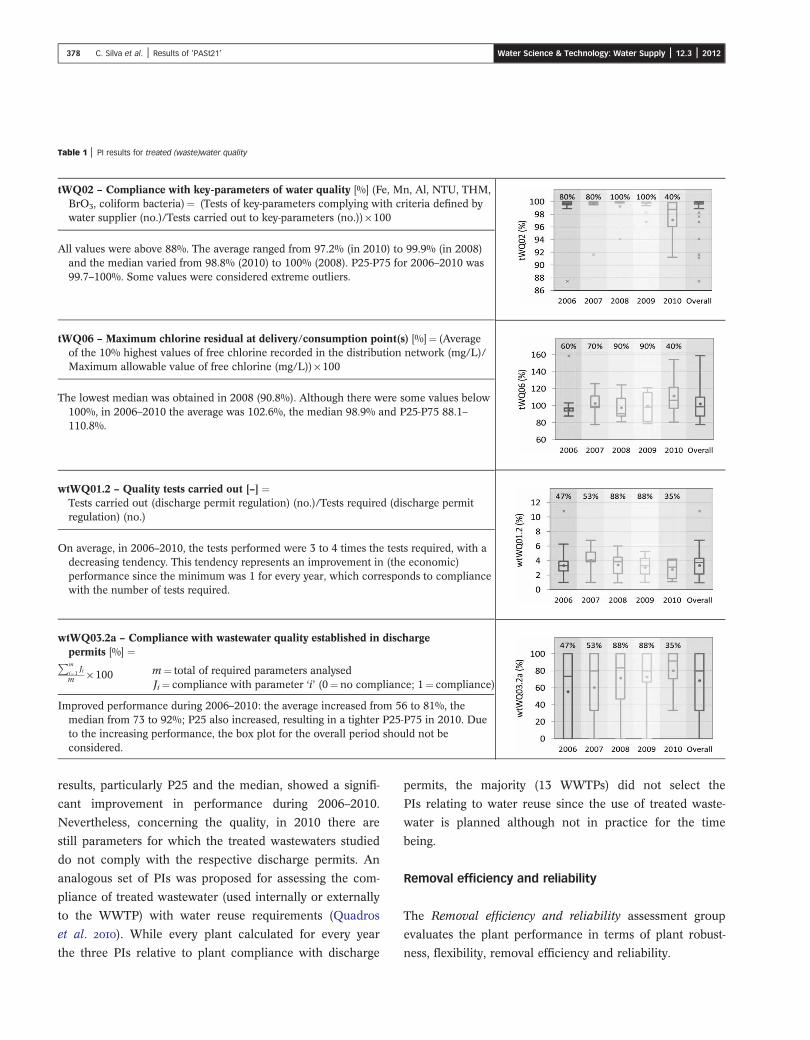
Table 1 | PI results for treated (waste)water quality
tWQ02 – Compliance with key-parameters of water quality [%] (Fe, Mn, Al, NTU, THM,BrO3, coliform bacteria)¼ (Tests of key-parameters complying with criteria defined bywater supplier (no.)/Tests carried out to key-parameters (no.)) × 100
All values were above 88%. The average ranged from 97.2% (in 2010) to 99.9% (in 2008)and the median varied from 98.8% (2010) to 100% (2008). P25-P75 for 2006–2010 was99.7–100%. Some values were considered extreme outliers.
tWQ06 – Maximum chlorine residual at delivery/consumption point(s) [%]¼ (Averageof the 10% highest values of free chlorine recorded in the distribution network (mg/L)/Maximum allowable value of free chlorine (mg/L)) × 100
The lowest median was obtained in 2008 (90.8%). Although there were some values below100%, in 2006–2010 the average was 102.6%, the median 98.9% and P25-P75 88.1–110.8%.
wtWQ01.2 – Quality tests carried out [–] ¼Tests carried out (discharge permit regulation) (no.)/Tests required (discharge permitregulation) (no.)
On average, in 2006–2010, the tests performed were 3 to 4 times the tests required, with adecreasing tendency. This tendency represents an improvement in (the economic)performance since the minimum was 1 for every year, which corresponds to compliancewith the number of tests required.
wtWQ03.2a – Compliance with wastewater quality established in dischargepermits [%] ¼Pm
i¼1Ji
m × 100 m¼ total of required parameters analysedJi¼ compliance with parameter ‘i’ (0¼ no compliance; 1¼ compliance)
Improved performance during 2006–2010: the average increased from 56 to 81%, themedian from 73 to 92%; P25 also increased, resulting in a tighter P25-P75 in 2010. Dueto the increasing performance, the box plot for the overall period should not beconsidered.
378 C. Silva et al. | Results of ‘PASt21’ Water Science & Technology: Water Supply | 12.3 | 2012
results, particularly P25 and the median, showed a signifi-
cant improvement in performance during 2006–2010.
Nevertheless, concerning the quality, in 2010 there are
still parameters for which the treated wastewaters studied
do not comply with the respective discharge permits. An
analogous set of PIs was proposed for assessing the com-
pliance of treated wastewater (used internally or externally
to the WWTP) with water reuse requirements (Quadros
et al. ). While every plant calculated for every year
the three PIs relative to plant compliance with discharge
permits, the majority (13 WWTPs) did not select the
PIs relating to water reuse since the use of treated waste-
water is planned although not in practice for the time
being.
Removal efficiency and reliability
The Removal efficiency and reliability assessment group
evaluates the plant performance in terms of plant robust-
ness, flexibility, removal efficiency and reliability.
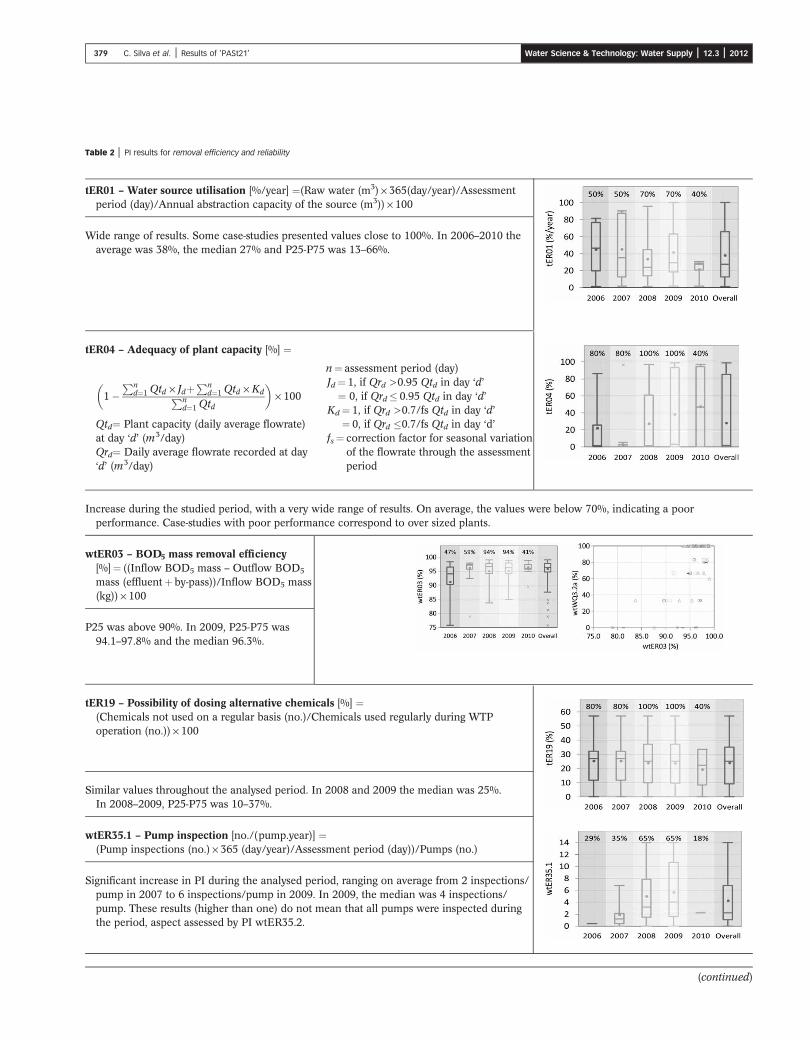
Table 2 | PI results for removal efficiency and reliability
tER01 – Water source utilisation [%/year] ¼(Raw water (m3) × 365(day/year)/Assessmentperiod (day)/Annual abstraction capacity of the source (m3)) × 100
Wide range of results. Some case-studies presented values close to 100%. In 2006–2010 theaverage was 38%, the median 27% and P25-P75 was 13–66%.
tER04 – Adequacy of plant capacity [%] ¼
1�Pn
d¼1 Qtd × JdþPn
d¼1 Qtd ×KdPnd¼1 Qtd
� �× 100
Qtd¼ Plant capacity (daily average flowrate)at day ‘d’ (m3/day)Qrd¼ Daily average flowrate recorded at day‘d’ (m3/day)
n¼ assessment period (day)Jd¼ 1, if Qrd >0.95 Qtd in day ‘d’¼ 0, if Qrd� 0.95 Qtd in day ‘d’
Kd¼ 1, if Qrd >0.7/fs Qtd in day ‘d’¼ 0, if Qrd �0.7/fs Qtd in day ‘d’
fs¼ correction factor for seasonal variationof the flowrate through the assessmentperiod
Increase during the studied period, with a very wide range of results. On average, the values were below 70%, indicating a poorperformance. Case-studies with poor performance correspond to over sized plants.
wtER03 – BOD5 mass removal efficiency[%]¼ ((Inflow BOD5 mass – Outflow BOD5
mass (effluentþ by-pass))/Inflow BOD5 mass(kg)) × 100
P25 was above 90%. In 2009, P25-P75 was94.1–97.8% and the median 96.3%.
tER19 – Possibility of dosing alternative chemicals [%] ¼(Chemicals not used on a regular basis (no.)/Chemicals used regularly during WTPoperation (no.)) × 100
Similar values throughout the analysed period. In 2008 and 2009 the median was 25%.In 2008–2009, P25-P75 was 10–37%.
wtER35.1 – Pump inspection [no./(pump.year)] ¼(Pump inspections (no.) × 365 (day/year)/Assessment period (day))/Pumps (no.)
Significant increase in PI during the analysed period, ranging on average from 2 inspections/pump in 2007 to 6 inspections/pump in 2009. In 2009, the median was 4 inspections/pump. These results (higher than one) do not mean that all pumps were inspected duringthe period, aspect assessed by PI wtER35.2.
(continued)
379 C. Silva et al. | Results of ‘PASt21’ Water Science & Technology: Water Supply | 12.3 | 2012
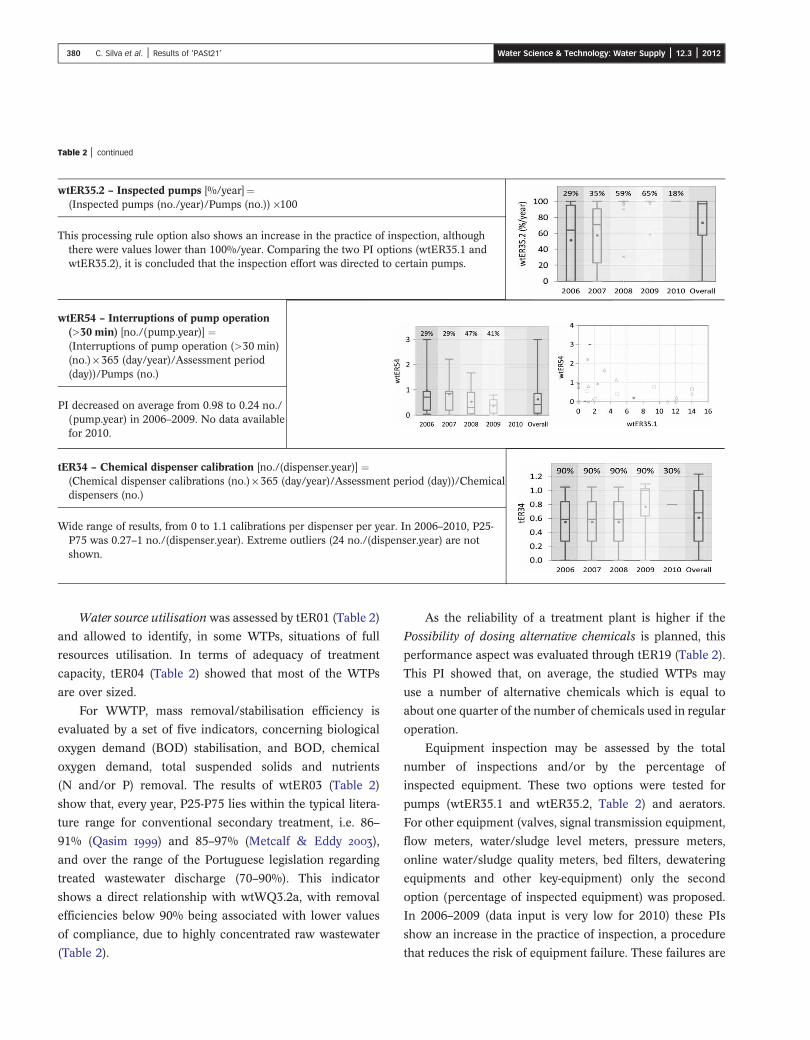
Table 2 | continued
wtER35.2 – Inspected pumps [%/year]¼(Inspected pumps (no./year)/Pumps (no.)) ×100
This processing rule option also shows an increase in the practice of inspection, althoughthere were values lower than 100%/year. Comparing the two PI options (wtER35.1 andwtER35.2), it is concluded that the inspection effort was directed to certain pumps.
wtER54 – Interruptions of pump operation(>30 min) [no./(pump.year)] ¼(Interruptions of pump operation (>30 min)(no.) × 365 (day/year)/Assessment period(day))/Pumps (no.)
PI decreased on average from 0.98 to 0.24 no./(pump.year) in 2006–2009. No data availablefor 2010.
tER34 – Chemical dispenser calibration [no./(dispenser.year)] ¼(Chemical dispenser calibrations (no.) × 365 (day/year)/Assessment period (day))/Chemicaldispensers (no.)
Wide range of results, from 0 to 1.1 calibrations per dispenser per year. In 2006–2010, P25-P75 was 0.27–1 no./(dispenser.year). Extreme outliers (24 no./(dispenser.year) are notshown.
380 C. Silva et al. | Results of ‘PASt21’ Water Science & Technology: Water Supply | 12.3 | 2012
Water source utilisationwas assessed by tER01 (Table 2)
and allowed to identify, in some WTPs, situations of full
resources utilisation. In terms of adequacy of treatment
capacity, tER04 (Table 2) showed that most of the WTPs
are over sized.
For WWTP, mass removal/stabilisation efficiency is
evaluated by a set of five indicators, concerning biological
oxygen demand (BOD) stabilisation, and BOD, chemical
oxygen demand, total suspended solids and nutrients
(N and/or P) removal. The results of wtER03 (Table 2)
show that, every year, P25-P75 lies within the typical litera-
ture range for conventional secondary treatment, i.e. 86–
91% (Qasim ) and 85–97% (Metcalf & Eddy ),
and over the range of the Portuguese legislation regarding
treated wastewater discharge (70–90%). This indicator
shows a direct relationship with wtWQ3.2a, with removal
efficiencies below 90% being associated with lower values
of compliance, due to highly concentrated raw wastewater
(Table 2).
As the reliability of a treatment plant is higher if the
Possibility of dosing alternative chemicals is planned, this
performance aspect was evaluated through tER19 (Table 2).
This PI showed that, on average, the studied WTPs may
use a number of alternative chemicals which is equal to
about one quarter of the number of chemicals used in regular
operation.
Equipment inspection may be assessed by the total
number of inspections and/or by the percentage of
inspected equipment. These two options were tested for
pumps (wtER35.1 and wtER35.2, Table 2) and aerators.
For other equipment (valves, signal transmission equipment,
flow meters, water/sludge level meters, pressure meters,
online water/sludge quality meters, bed filters, dewatering
equipments and other key-equipment) only the second
option (percentage of inspected equipment) was proposed.
In 2006–2009 (data input is very low for 2010) these PIs
show an increase in the practice of inspection, a procedure
that reduces the risk of equipment failure. These failures are
381 C. Silva et al. | Results of ‘PASt21’ Water Science & Technology: Water Supply | 12.3 | 2012
evaluated by PIs of interruption of the operation (>30 min)
of equipment, such as pumps (wtER54, Table 2), valves,
aerators, dewatering equipment and other key-equipment.
As expected, there is an inverse correlation between
wtER35 and wtER54 (Table 2).
Equipment calibration must be verified periodically to
validate the results of the measurements. PIs tER34
to tER38 evaluate the periodic calibration (or verification
of calibration) procedures for chemical dispensers,
flow meters, water/sludge level meters, pressure meters
Table 3 | PI results for use of natural resources and raw materials
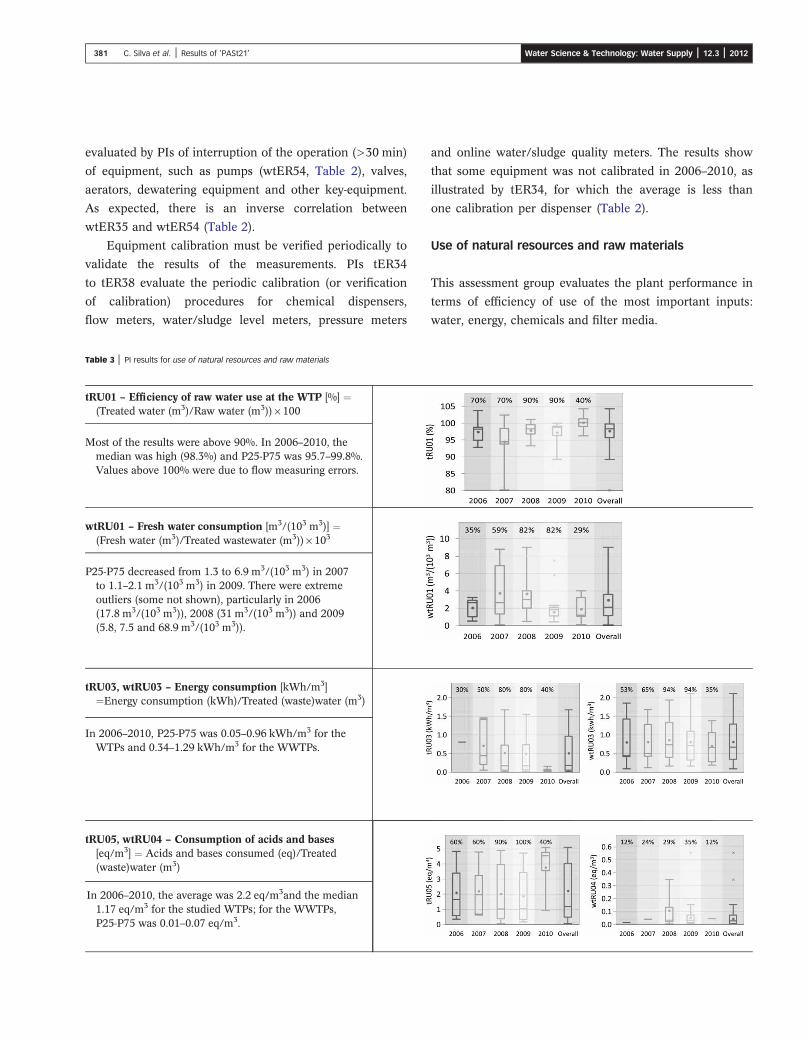
tRU01 – Efficiency of raw water use at the WTP [%] ¼(Treated water (m3)/Raw water (m3)) × 100
Most of the results were above 90%. In 2006–2010, themedian was high (98.3%) and P25-P75 was 95.7–99.8%.Values above 100% were due to flow measuring errors.
wtRU01 – Fresh water consumption [m3/(103 m3)] ¼(Fresh water (m3)/Treated wastewater (m3)) × 103
P25-P75 decreased from 1.3 to 6.9 m3/(103 m3) in 2007to 1.1–2.1 m3/(103 m3) in 2009. There were extremeoutliers (some not shown), particularly in 2006(17.8 m3/(103 m3)), 2008 (31 m3/(103 m3)) and 2009(5.8, 7.5 and 68.9 m3/(103 m3)).
tRU03, wtRU03 – Energy consumption [kWh/m3]¼Energy consumption (kWh)/Treated (waste)water (m3)
In 2006–2010, P25-P75 was 0.05–0.96 kWh/m3 for theWTPs and 0.34–1.29 kWh/m3 for the WWTPs.
tRU05, wtRU04 – Consumption of acids and bases[eq/m3] ¼ Acids and bases consumed (eq)/Treated(waste)water (m3)
In 2006–2010, the average was 2.2 eq/m3and the median1.17 eq/m3 for the studied WTPs; for the WWTPs,P25-P75 was 0.01–0.07 eq/m3.
and online water/sludge quality meters. The results show
that some equipment was not calibrated in 2006–2010, as
illustrated by tER34, for which the average is less than
one calibration per dispenser (Table 2).
Use of natural resources and raw materials
This assessment group evaluates the plant performance in
terms of efficiency of use of the most important inputs:
water, energy, chemicals and filter media.
382 C. Silva et al. | Results of ‘PASt21’ Water Science & Technology: Water Supply | 12.3 | 2012
The Efficiency of raw water use, assessed by tRU01
(Table 3), shows high performance of the studied WTPs.
The Energy consumption in the studied WWTPs
(wtRU03) increased slightly during the studied period
(2006–2010) and the median was four times higher than
the median energy consumption in the WTPs (tRU03).
The median Consumption of acids and bases in the
studied WTPs (tRU05, Table 3) was 1.17 eq/m3, 10 times
higher than in the WWTPs (wtRU04).
By-product management
The By-product management assessment group evaluates
the plant performance in terms of production and disposal/
beneficial use of by-products, including: sludge, filter
media, screenings, grit, skimmings and biogas, and green-
house gases emission.
Sludge production in the studied WWTPs (wtBP01.1,
Table 4) increased from 2006 to 2010. The increase in
Table 4 | PI results for by-product management
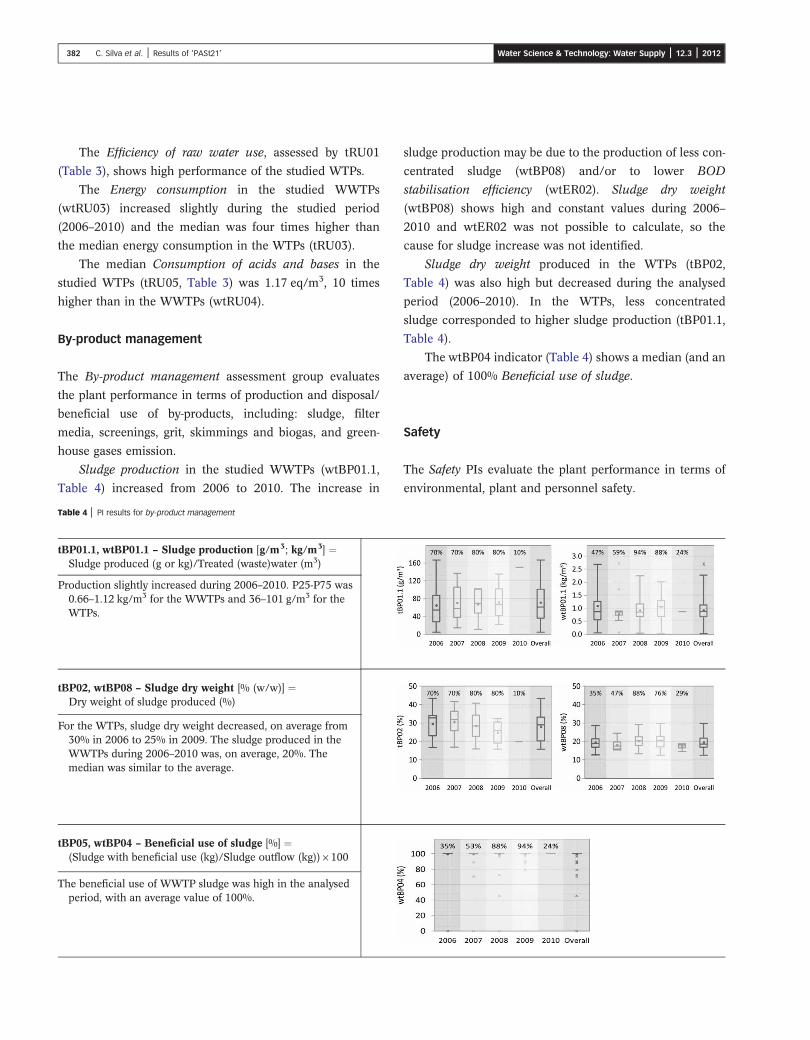
tBP01.1, wtBP01.1 – Sludge production [g/m3; kg/m3] ¼Sludge produced (g or kg)/Treated (waste)water (m3)
Production slightly increased during 2006–2010. P25-P75 was0.66–1.12 kg/m3 for the WWTPs and 36–101 g/m3 for theWTPs.
tBP02, wtBP08 – Sludge dry weight [% (w/w)] ¼Dry weight of sludge produced (%)
For the WTPs, sludge dry weight decreased, on average from30% in 2006 to 25% in 2009. The sludge produced in theWWTPs during 2006–2010 was, on average, 20%. Themedian was similar to the average.
tBP05, wtBP04 – Beneficial use of sludge [%] ¼(Sludge with beneficial use (kg)/Sludge outflow (kg)) × 100
The beneficial use of WWTP sludge was high in the analysedperiod, with an average value of 100%.
sludge production may be due to the production of less con-
centrated sludge (wtBP08) and/or to lower BOD
stabilisation efficiency (wtER02). Sludge dry weight
(wtBP08) shows high and constant values during 2006–
2010 and wtER02 was not possible to calculate, so the
cause for sludge increase was not identified.
Sludge dry weight produced in the WTPs (tBP02,
Table 4) was also high but decreased during the analysed
period (2006–2010). In the WTPs, less concentrated
sludge corresponded to higher sludge production (tBP01.1,
Table 4).
The wtBP04 indicator (Table 4) shows a median (and an
average) of 100% Beneficial use of sludge.
Safety
The Safety PIs evaluate the plant performance in terms of
environmental, plant and personnel safety.
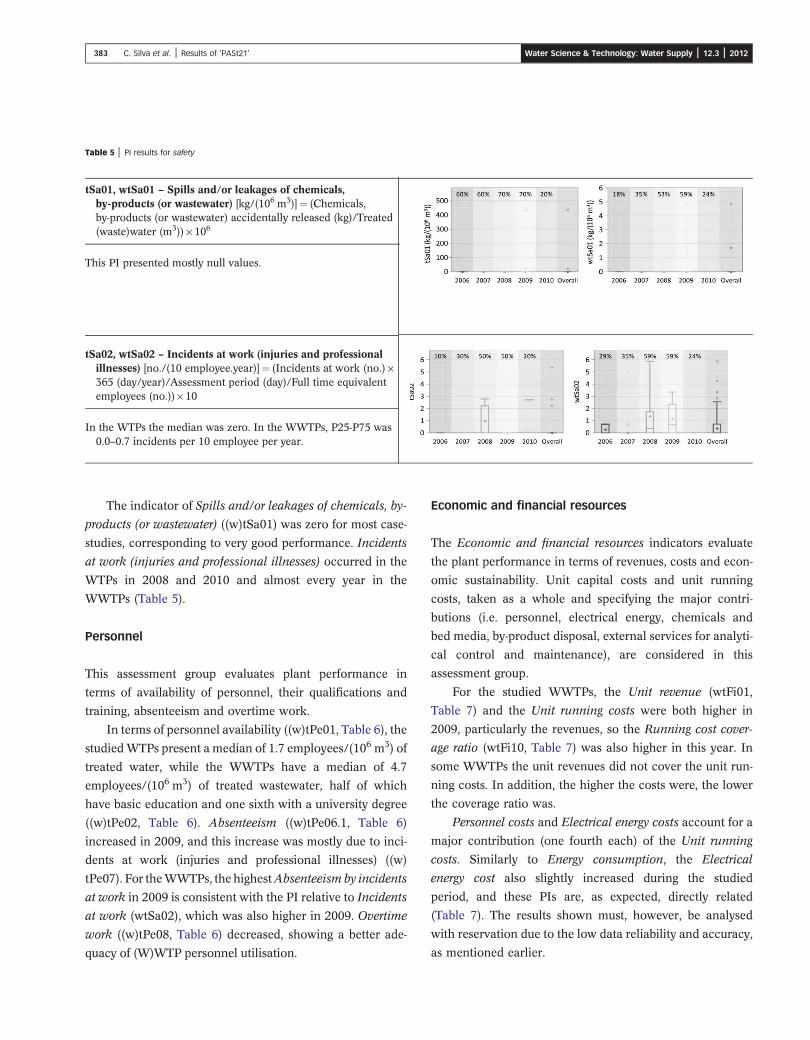
Table 5 | PI results for safety
tSa01, wtSa01 – Spills and/or leakages of chemicals,by-products (or wastewater) [kg/(106 m3)]¼ (Chemicals,by-products (or wastewater) accidentally released (kg)/Treated(waste)water (m3)) × 106
This PI presented mostly null values.
tSa02, wtSa02 – Incidents at work (injuries and professionalillnesses) [no./(10 employee.year)]¼ (Incidents at work (no.) ×365 (day/year)/Assessment period (day)/Full time equivalentemployees (no.)) × 10
In the WTPs the median was zero. In the WWTPs, P25-P75 was0.0–0.7 incidents per 10 employee per year.
383 C. Silva et al. | Results of ‘PASt21’ Water Science & Technology: Water Supply | 12.3 | 2012
The indicator of Spills and/or leakages of chemicals, by-
products (or wastewater) ((w)tSa01) was zero for most case-
studies, corresponding to very good performance. Incidents
at work (injuries and professional illnesses) occurred in the
WTPs in 2008 and 2010 and almost every year in the
WWTPs (Table 5).
Personnel
This assessment group evaluates plant performance in
terms of availability of personnel, their qualifications and
training, absenteeism and overtime work.
In terms of personnel availability ((w)tPe01, Table 6), the
studiedWTPs present a median of 1.7 employees/(106 m3) of
treated water, while the WWTPs have a median of 4.7
employees/(106 m3) of treated wastewater, half of which
have basic education and one sixth with a university degree
((w)tPe02, Table 6). Absenteeism ((w)tPe06.1, Table 6)
increased in 2009, and this increase was mostly due to inci-
dents at work (injuries and professional illnesses) ((w)
tPe07). For theWWTPs, the highestAbsenteeismby incidents
at work in 2009 is consistent with the PI relative to Incidents
at work (wtSa02), which was also higher in 2009. Overtime
work ((w)tPe08, Table 6) decreased, showing a better ade-
quacy of (W)WTP personnel utilisation.
Economic and financial resources
The Economic and financial resources indicators evaluate
the plant performance in terms of revenues, costs and econ-
omic sustainability. Unit capital costs and unit running
costs, taken as a whole and specifying the major contri-
butions (i.e. personnel, electrical energy, chemicals and
bed media, by-product disposal, external services for analyti-
cal control and maintenance), are considered in this
assessment group.
For the studied WWTPs, the Unit revenue (wtFi01,
Table 7) and the Unit running costs were both higher in
2009, particularly the revenues, so the Running cost cover-
age ratio (wtFi10, Table 7) was also higher in this year. In
some WWTPs the unit revenues did not cover the unit run-
ning costs. In addition, the higher the costs were, the lower
the coverage ratio was.
Personnel costs and Electrical energy costs account for a
major contribution (one fourth each) of the Unit running
costs. Similarly to Energy consumption, the Electrical
energy cost also slightly increased during the studied
period, and these PIs are, as expected, directly related
(Table 7). The results shown must, however, be analysed
with reservation due to the low data reliability and accuracy,
as mentioned earlier.
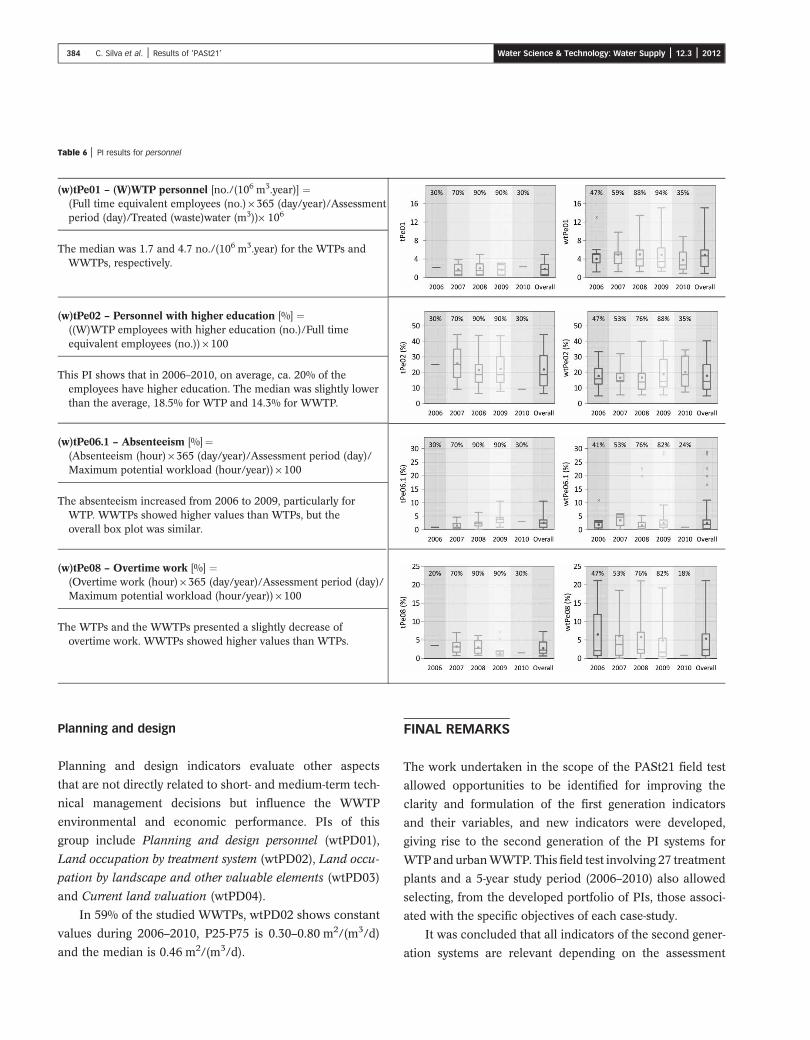
Table 6 | PI results for personnel
(w)tPe01 – (W)WTP personnel [no./(106 m3.year)] ¼(Full time equivalent employees (no.) × 365 (day/year)/Assessmentperiod (day)/Treated (waste)water (m3))× 106
The median was 1.7 and 4.7 no./(106 m3.year) for the WTPs andWWTPs, respectively.
(w)tPe02 – Personnel with higher education [%] ¼((W)WTP employees with higher education (no.)/Full timeequivalent employees (no.)) × 100
This PI shows that in 2006–2010, on average, ca. 20% of theemployees have higher education. The median was slightly lowerthan the average, 18.5% for WTP and 14.3% for WWTP.
(w)tPe06.1 – Absenteeism [%]¼(Absenteeism (hour) × 365 (day/year)/Assessment period (day)/Maximum potential workload (hour/year)) × 100
The absenteeism increased from 2006 to 2009, particularly forWTP. WWTPs showed higher values than WTPs, but theoverall box plot was similar.
(w)tPe08 – Overtime work [%] ¼(Overtime work (hour) × 365 (day/year)/Assessment period (day)/Maximum potential workload (hour/year)) × 100
The WTPs and the WWTPs presented a slightly decrease ofovertime work. WWTPs showed higher values than WTPs.
384 C. Silva et al. | Results of ‘PASt21’ Water Science & Technology: Water Supply | 12.3 | 2012
Planning and design
Planning and design indicators evaluate other aspects
that are not directly related to short- and medium-term tech-
nical management decisions but influence the WWTP
environmental and economic performance. PIs of this
group include Planning and design personnel (wtPD01),
Land occupation by treatment system (wtPD02), Land occu-
pation by landscape and other valuable elements (wtPD03)
and Current land valuation (wtPD04).
In 59% of the studied WWTPs, wtPD02 shows constant
values during 2006–2010, P25-P75 is 0.30–0.80 m2/(m3/d)
and the median is 0.46 m2/(m3/d).
FINAL REMARKS
The work undertaken in the scope of the PASt21 field test
allowed opportunities to be identified for improving the
clarity and formulation of the first generation indicators
and their variables, and new indicators were developed,
giving rise to the second generation of the PI systems for
WTPand urbanWWTP. This field test involving 27 treatment
plants and a 5-year study period (2006–2010) also allowed
selecting, from the developed portfolio of PIs, those associ-
ated with the specific objectives of each case-study.
It was concluded that all indicators of the second gener-
ation systems are relevant depending on the assessment
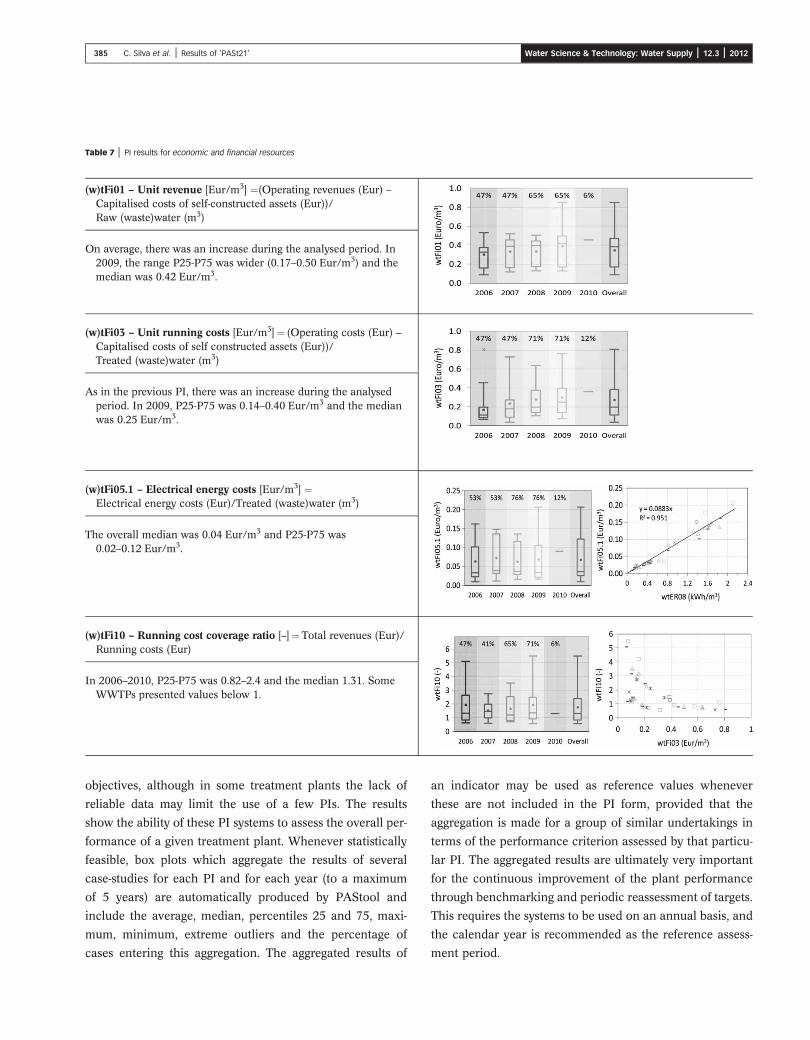
Table 7 | PI results for economic and financial resources
(w)tFi01 – Unit revenue [Eur/m3] ¼(Operating revenues (Eur) –Capitalised costs of self-constructed assets (Eur))/Raw (waste)water (m3)
On average, there was an increase during the analysed period. In2009, the range P25-P75 was wider (0.17–0.50 Eur/m3) and themedian was 0.42 Eur/m3.
(w)tFi03 – Unit running costs [Eur/m3]¼ (Operating costs (Eur) –Capitalised costs of self constructed assets (Eur))/Treated (waste)water (m3)
As in the previous PI, there was an increase during the analysedperiod. In 2009, P25-P75 was 0.14–0.40 Eur/m3 and the medianwas 0.25 Eur/m3.
(w)tFi05.1 – Electrical energy costs [Eur/m3] ¼Electrical energy costs (Eur)/Treated (waste)water (m3)
The overall median was 0.04 Eur/m3 and P25-P75 was0.02–0.12 Eur/m3.
(w)tFi10 – Running cost coverage ratio [–]¼ Total revenues (Eur)/Running costs (Eur)
In 2006–2010, P25-P75 was 0.82–2.4 and the median 1.31. SomeWWTPs presented values below 1.
385 C. Silva et al. | Results of ‘PASt21’ Water Science & Technology: Water Supply | 12.3 | 2012
objectives, although in some treatment plants the lack of
reliable data may limit the use of a few PIs. The results
show the ability of these PI systems to assess the overall per-
formance of a given treatment plant. Whenever statistically
feasible, box plots which aggregate the results of several
case-studies for each PI and for each year (to a maximum
of 5 years) are automatically produced by PAStool and
include the average, median, percentiles 25 and 75, maxi-
mum, minimum, extreme outliers and the percentage of
cases entering this aggregation. The aggregated results of
an indicator may be used as reference values whenever
these are not included in the PI form, provided that the
aggregation is made for a group of similar undertakings in
terms of the performance criterion assessed by that particu-
lar PI. The aggregated results are ultimately very important
for the continuous improvement of the plant performance
through benchmarking and periodic reassessment of targets.
This requires the systems to be used on an annual basis, and
the calendar year is recommended as the reference assess-
ment period.
386 C. Silva et al. | Results of ‘PASt21’ Water Science & Technology: Water Supply | 12.3 | 2012
ACKNOWLEDGEMENTS
The authors acknowledge the PASt21 consortium for the
valuable contribution to this second generation of
performance indicators and their variables, and for
providing the data for testing and implementing the
performance assessment systems.
REFERENCES
Alegre, H., Hirner, W., Melo Baptista, J. & Parena, R. Performance Indicators for Water Supply Services, 1st edition.Manual of Best Practices Series. IWA Publishing, London.
Alegre, H., Melo Baptista, J., Cabrera Jr, E., Cubillo, F., Duarte, P.,Hirner, W., Merkel, W. & Parena, R. PerformanceIndicators for Water Supply Services, 2nd edition. Manual ofBest Practices Series. IWA Publishing, London.
DWA Corporate Benchmarking – Metric Benchmarking asComponent of the Modernisation Strategy – PerformanceIndicators and Evaluation Principles. DWA GermanAssociation for Water, Wastewater and Waste (A. Schulzas Spokesperson of the working group), Germany.
Matos, R., Cardoso, A., Ashley, R., Duarte, P., Molinari, A. &Schulz, A. Performance Indicators for WastewaterServices. Manual of Best Practices Series. IWA Publishing,London.
Metcalf & Eddy Wastewater Engineering – Treatment andReuse, 4th edition (revised by G. Tchobanoglous, F. L.Burton & H. D. Stensel). McGraw-Hill, Inc., New York.
Ofwat Updating the Overall Performance Assessment (OPA)– Conclusions and Methodology for 2004–05 Onwards. UKOffice of Water Services, Birmingham, UK.
Ofwat Levels of service for water industry in England &Wales, 2005–2006 report. UK Office of Water Services.
Qasim, S. R. Wastewater Treatment Plants – Planning,Design and Operation, 2nd edition. Technomic PublishingCo., Lancaster, PA.
Quadros, S., Rosa, M. J., Alegre, H. & Silva, C. Aperformance indicators system for urban wastewatertreatment plants. Water Science and Technology 62 (10),2398–2407.
Rosa, M. J., Quadros, S., Silva, C., Vieira, P., Ramalho, P. &Alegre, H. a Fichas de Indicadores de DesempenhoGlobal de ETAR. Nota Técnica 6/2011_NES(Annex to Final Report of The Portuguese initiativefor performance assessment of water and wastewatertreatment plants). LNEC. Lisbon, June, 126 pp(in Portuguese).
Rosa, M. J., Vieira, P., Silva, C., Quadros, S., Ramalho, P. &Alegre, H. b Fichas de Indicadores de DesempenhoGlobal de ETA. Nota Técnica 5/2011_NES (Annex toFinal Report of The Portuguese initiative for performanceassessment of water and wastewater treatment plants).LNEC. Lisbon, June, 73 pp (in Portuguese).
Stahre, P. & Adamsson, J. Performance benchmarking: Apowerful management instrument for water and wastewaterutilities. Water Technology 12, 47–77.
Stahre, P., Adamsson, J. & Mellstrom, G. A newapproach for assessment of the performance of waterdistribution and sewerage networks. In: InternationalConference on Performance Assessment of UrbanInfrastructure Services. Drinking water, wastewater andsolid waste (E. Cabrera, & M. A. Pardo Jr, eds). IWAPublishing, London. pp. 5–24.
Vieira, P., Alegre, H., Rosa, M. J. & Lucas, H. Drinkingwater treatment plants assessment through performanceindicators. Water Science and Technology – Water Supply8 (3), 245–253.
Vieira, P., Rosa, M. J., Alegre, H., Ramalho, P., Silva, C. & Lucas,H. Avaliação de desempenho de estações de tratamentode água. Águas & Resíduos, série III. No. 9, January/April,pp. 4–17 (in Portuguese).
Vieira, P., Rosa, M. J., Alegre, H. & Lucas, H. Assessing theoperational performance of water treatment plants – focus onwater quality and treatment efficiency. In Proceedings of IWAWorld Water Congress. Montréal.
World Bank IBNET indicator definitions. World Bank,Washington, DC.
First received 8 July 2011; accepted in revised form 5 January 2012