The dynamics underlying pseudo-plateau bursting in a pituitary cell model
Upload
independentCategory
view
1download
0
Responses of a bursting pacemaker to excitation reveal spatialsegregation between bursting and spiking mechanisms
Selva K Maran1, Fred H Sieling2, Kavita Demla3, Astrid A Prinz3, and Carmen C Canavier1,4
1Neuroscience Center of Excellence, LSU Health Sciences Center, New Orleans LA 701122Department of Biomedical Engineering, Georgia Institute of Technology and Emory University,Atlanta GA 303323Department of Biology, Emory University, Atlanta GA 303224Department of Ophthalmology, LSU Health Sciences Center, New Orleans LA 70112
AbstractCentral pattern generators (CPGs) frequently include bursting neurons that serve as pacemakersfor rhythm generation. Phase resetting curves (PRCs) can provide insight into mechanismsunderlying phase locking in such circuits. PRCs were constructed for a pacemaker burstingcomplex in the pyloric circuit in the stomatogastric ganglion of the lobster and crab. This complexis comprised of the Anterior Burster (AB) neuron and two Pyloric Dilator (PD) neurons that are allelectrically coupled. Artificial excitatory synaptic conductance pulses of different strengths anddurations were injected into one of the AB or PD somata using the Dynamic Clamp. Previously,we characterized the inhibitory PRCs by assuming a single slow process that enabled synapticinputs to trigger switches between an up state in which spiking occurs and a down state in which itdoes not. Excitation produced five different PRC shapes, which could not be explained with such asimple model. A separate dendritic compartment was required to separate the mechanism thatgenerates the up and down phases of the bursting envelope (1) from synaptic inputs applied at thesoma, (2) from axonal spike generation and (3) from a slow process with a slower time scale thanburst generation. This study reveals that due to the nonlinear properties and compartmentalizationof ionic channels, the response to excitation is more complex than inhibition.
IntroductionNeurons that fire spontaneously and repetitively can be characterized by their phaseresetting curves (PRCs), which tabulate the length of a cycle perturbed by an input as afunction of when the input is delivered within the cycle. Endogenously bursting neuronshave been shown to be important in well-studied invertebrate central pattern generators(CPGs) (Hartline 1979; Hartline and Gassie 1979; Miller and Selverston 1982; Tazaki andCooke 1990; Arshavsky et al. 1989; Arshavsky et al. 1991; Nargeot et al. 1997; Nargeot etal. 2007), therefore we have focused here on endogenously bursting neurons, specifically inthe pacemaker kernel of the pyloric circuit of the stomatogastric ganglion in crab andlobster.
The usual rationale for studying the phenomenology of phase resetting curves in burstingneurons is that they can be used to predict phase locking within a network (Oprisan et al2004; Sieling et al 2009), with obvious utility to applications to central pattern generating
Address for Correspondence: Carmen C. Canavier, LSU Health Sciences Center, 2020 Gravier Street, Suite D, New Orleans,LA70112, phone: 504-599-0486, fax: 504-568-5801, [email protected].
NIH Public AccessAuthor ManuscriptJ Comput Neurosci. Author manuscript; available in PMC 2012 October 1.
Published in final edited form as:J Comput Neurosci. 2011 October ; 31(2): 419–440. doi:10.1007/s10827-011-0319-y.
NIH
-PA Author Manuscript
NIH
-PA Author Manuscript
NIH
-PA Author Manuscript

circuits containing bursting neurons (Stein et al. 1997) and possibly to pathological networksynchrony among bursting neurons in the case of epilepsy (Huguenard and McCormick2007; Traub and Jefferys 1994) and tremor (Hammond et al. 2007). For bursting neurons,the duration and shape of the burst may change as a result of the feedback within a network,and synaptic strength may be modulated as well, thus it would be useful to understand howthese changes impact the resetting (Demir et al 1997; Oprisan et al 2003), rather thangenerating PRCs for every possible scenario of burst truncation or elongation, and for everypossible synapse strength. The bursting neuron in the study by Oprisan et al. 2003 wastreated as a relaxation oscillator. This type of oscillator shows periodic activity tracing out aclosed path, called a limit cycle, for each cycle in a space composed of voltage and a slowvariable. The limit cycle for a bursting neuron, which can be characterized as a relaxationoscillator, has a depolarized (bursting) and hyperpolarized (silent) branch. Oprisan et al2003 showed that inhibitions applied during the burst produced a switch to thehyperpolarized branch, then prevented a switch back to the depolarized branch until theinhibition was turned off, whereas inhibitions during the silent phase had little effect. Wecharacterized the response of bursting neurons to excitation rather than inhibition, and foundthe responses to excitation at the soma to be a very useful tool in probing the spatiallocalization and dynamics of burst generation. The PRC data was used to determine in verybroad strokes the overarching principles governing how a model that captures the essentialfeatures of the PRC data should be organized. Our methods for understanding thephenomenology underlying observed PRCs should be generally applicable to burstingneurons (or groups of bursting neurons) that incorporate a relaxation oscillation as the burstgenerator.
Most CPGs, including the pyloric circuit, are dominated by inhibition (Calabrese andPeterson 1983; Marder and Calabrese 1996), but some also contain some excitatoryconnections (Cangiano and Grillner 2005; Cheng et al. 1998; McCrea and Rybak 2008). InCPGs such as the pyloric circuit, input perturbations are usually at least as long as thepresynaptic burst duration, and burst durations are variable, so it is reasonable to examinethe effect of input duration. In addition to our stated goal of understanding how the phaseresponse of a bursting neuron to excitation changes as a function of synaptic strength andburst duration, part of the motivation for this work is to determine whether thephenomenology of inhibitory and excitatory phase resetting differs in fundamental ways thatjustify the predominance of inhibition in motor pattern generation. Indeed, in contrast to theprevious work on inhibitory phase resetting, we found that there were five different PRCshapes exhibited in response to excitation, and that a more complex theoretical frameworkwas required in order to interpret them.
METHODSExperimental Methods
Electrophysiology—Somatic intracellular recordings of identified neurons from thepyloric network in the Stomatogastric ganglion of Homarus americanus and Cancerborealis were obtained using standard methods as in Sieling et al. 2009. The pacemaker iscomprised of the anterior burster (AB) and the two pyloric dilator (PD) neurons to which itis electrically coupled. Since the AB/PD complex is electrically coupled and producessynchronous bursting activity (Abbott et al 1991;Miller and Selverston 1982), we treated theAB/PD complex as a single oscillator or neuron. We pharmacologically isolated this groupusing 10−5 M bath application of Picrotoxin to block glutamatergic synapses.
Dynamic clamp used to generate artificial synapses—We recorded the membranepotential from one PD neuron (see Fig. 1A) and used the dynamic clamp (see Fig. 1B)
Maran et al. Page 2
J Comput Neurosci. Author manuscript; available in PMC 2012 October 1.
NIH
-PA Author Manuscript
NIH
-PA Author Manuscript
NIH
-PA Author Manuscript

(Prinz et al., 2004,Sharp et al., 1993a,b) to inject artificial synaptic inputs: the membranepotential V at the PD cell body was amplified, fed into a National Instruments DAQ board(PCI-6051E) and digitized at a rate of 20 kHz. In some experiments (see Table 1), AB ratherthan PD was impaled. The dynamic clamp program was written in C++ and designed to usethe Real Time Linux Dynamic Controller (RTLDC) (Dorval et al. 2001). This programdetected bursts in the ongoing PD rhythm and monitored the instantaneous period. Artificialsynaptic inputs were generated and applied at different phases of the PD rhythm byinstantaneously setting the synaptic conductance to the desired value for the desiredduration. This was accomplished by injecting a current of the form Isyn = gsyns(Vpost − Esyn)where the activation variable s for the artificial synapse was zero before and after the pulse.During input, the program computed the momentary current. To inject this current into thePD neuron, the program computed the corresponding command voltage, which was turnedinto an analog voltage by the DAQ board and sent to the electrode amplifier. In most cases(Table 1), we used either a square pulse in which s=1 for the duration of the pulse, or aslightly rounded square pulse with exponential rise and fall time constants of 10 ms asdescribed in Sieling et al 2009. In other cases (Table 2) we applied ramp inputs in which theconductance increased linearly during the input duration from s = 0 to s = 1, then reached itsmaximum value either at the end of the pulse (full ramp) or halfway through the inputduration (half ramp). Our rationale for using ramps was that we thought that the depolarizingcurrent injected by the dynamic clamp was opening voltage gated sodium channels locatedin between the soma and the burst generator in the dendrites, and we thought that if wedepolarized gradually less of the current would be shunted into the extracellular space bythese channels and more would travel axially toward the dendrites to depolarize them, butthis approach was not successful.
PRC measurement—PRCs were generated by applying pulses of synaptic conductance toa single neuron within the complex, where the pulse was parameterized by conductancestrength (10 to 250 nS, producing a peak in the PRC that can be as large as 100% of theintrinsic period of the isolated neuron) and duration (20 to 1975 ms, ranging from 2% to125% of the network period of the hybrid circuit). An important point is that this type ofPRC does not assume that the magnitude of the PRC scales linearly with the strength of theperturbation, in contrast to the PRCs used in weak coupling theory (Ermentrout and Kopell1991; Netoff et al 2005; Preyer and Butera 2005). Instead, the dependence of the responseon the strength and duration of the pulse is explicitly measured and definitely nonlinear. Thesimplifying assumption in this case is not that the coupling is weak, but that it is pulsatile(see Canavier and Achuthan 2010 for a review of pulse coupled oscillators).
To generate the PRC of a biological neuron in response to a given synaptic input and for agiven synapse strength gsyn, we first determined the intrinsic period P0 of the biologicalneuron. Because the period of rhythm changed as we were recording, we used the average ofthe lengths of the cycles immediately preceding the three most recent inputs as the intrinsicperiod that determines the phase of the latest input (e.g., if the inputs are given during the50th, 55th and 60th cycles, then the intrinsic period for the input given during the 60th cycleis the average of the periods of the 49th, 54th and 59th cycles). If the interspike intervalpreceding a given spike exceeded 50 ms in the case of lobster preparations and 75 ms in thecase of crab preparations, this spike was considered to initiate a new burst, otherwise it wasconsidered to be a continuation of an existing burst.
Once the intrinsic period was determined, the membrane potential of the biological neuronwas recorded in response to conductance pulses of amplitude gsyn multiplied by a savedactivation profile of the artificial synapse. Individual stimuli were delivered 10 s apart toensure that the biological neuron returned to its unperturbed activity between stimuli. Thestimulus interval (ts) was computed by multiplying the desired stimulus phase by the
Maran et al. Page 3
J Comput Neurosci. Author manuscript; available in PMC 2012 October 1.
NIH
-PA Author Manuscript
NIH
-PA Author Manuscript
NIH
-PA Author Manuscript
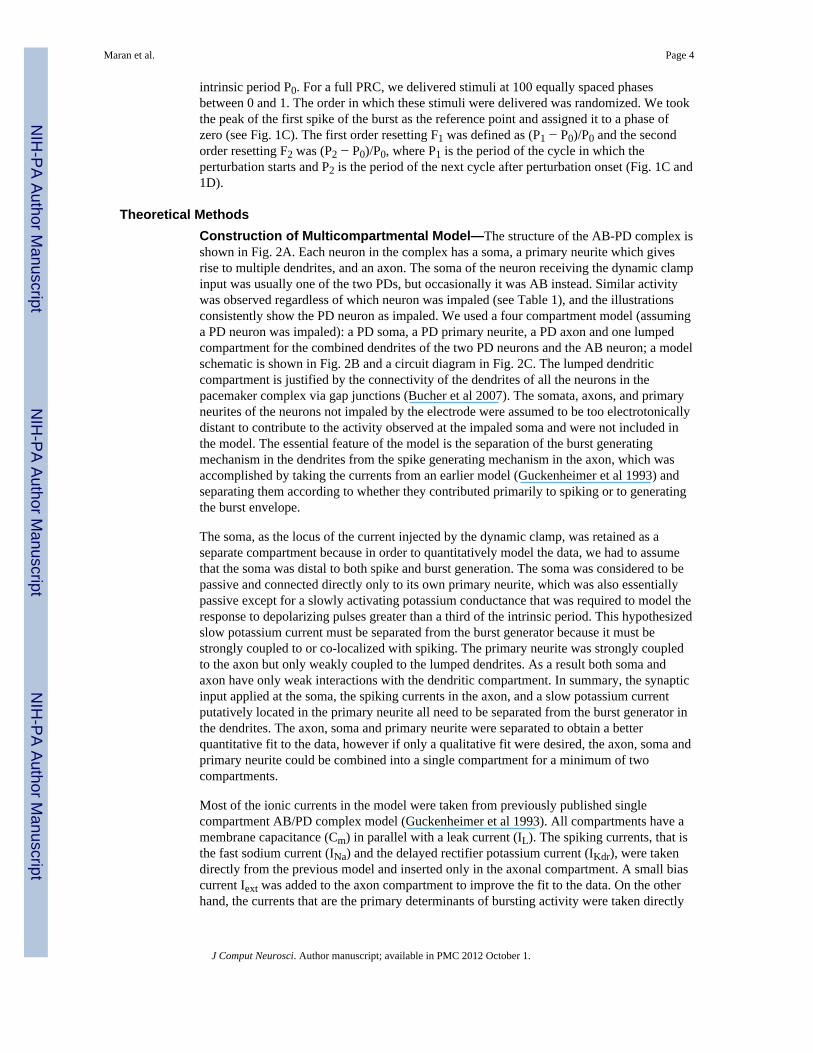
intrinsic period P0. For a full PRC, we delivered stimuli at 100 equally spaced phasesbetween 0 and 1. The order in which these stimuli were delivered was randomized. We tookthe peak of the first spike of the burst as the reference point and assigned it to a phase ofzero (see Fig. 1C). The first order resetting F1 was defined as (P1 − P0)/P0 and the secondorder resetting F2 was (P2 − P0)/P0, where P1 is the period of the cycle in which theperturbation starts and P2 is the period of the next cycle after perturbation onset (Fig. 1C and1D).
Theoretical MethodsConstruction of Multicompartmental Model—The structure of the AB-PD complex isshown in Fig. 2A. Each neuron in the complex has a soma, a primary neurite which givesrise to multiple dendrites, and an axon. The soma of the neuron receiving the dynamic clampinput was usually one of the two PDs, but occasionally it was AB instead. Similar activitywas observed regardless of which neuron was impaled (see Table 1), and the illustrationsconsistently show the PD neuron as impaled. We used a four compartment model (assuminga PD neuron was impaled): a PD soma, a PD primary neurite, a PD axon and one lumpedcompartment for the combined dendrites of the two PD neurons and the AB neuron; a modelschematic is shown in Fig. 2B and a circuit diagram in Fig. 2C. The lumped dendriticcompartment is justified by the connectivity of the dendrites of all the neurons in thepacemaker complex via gap junctions (Bucher et al 2007). The somata, axons, and primaryneurites of the neurons not impaled by the electrode were assumed to be too electrotonicallydistant to contribute to the activity observed at the impaled soma and were not included inthe model. The essential feature of the model is the separation of the burst generatingmechanism in the dendrites from the spike generating mechanism in the axon, which wasaccomplished by taking the currents from an earlier model (Guckenheimer et al 1993) andseparating them according to whether they contributed primarily to spiking or to generatingthe burst envelope.
The soma, as the locus of the current injected by the dynamic clamp, was retained as aseparate compartment because in order to quantitatively model the data, we had to assumethat the soma was distal to both spike and burst generation. The soma was considered to bepassive and connected directly only to its own primary neurite, which was also essentiallypassive except for a slowly activating potassium conductance that was required to model theresponse to depolarizing pulses greater than a third of the intrinsic period. This hypothesizedslow potassium current must be separated from the burst generator because it must bestrongly coupled to or co-localized with spiking. The primary neurite was strongly coupledto the axon but only weakly coupled to the lumped dendrites. As a result both soma andaxon have only weak interactions with the dendritic compartment. In summary, the synapticinput applied at the soma, the spiking currents in the axon, and a slow potassium currentputatively located in the primary neurite all need to be separated from the burst generator inthe dendrites. The axon, soma and primary neurite were separated to obtain a betterquantitative fit to the data, however if only a qualitative fit were desired, the axon, soma andprimary neurite could be combined into a single compartment for a minimum of twocompartments.
Most of the ionic currents in the model were taken from previously published singlecompartment AB/PD complex model (Guckenheimer et al 1993). All compartments have amembrane capacitance (Cm) in parallel with a leak current (IL). The spiking currents, that isthe fast sodium current (INa) and the delayed rectifier potassium current (IKdr), were takendirectly from the previous model and inserted only in the axonal compartment. A small biascurrent Iext was added to the axon compartment to improve the fit to the data. On the otherhand, the currents that are the primary determinants of bursting activity were taken directly
Maran et al. Page 4
J Comput Neurosci. Author manuscript; available in PMC 2012 October 1.
NIH
-PA Author Manuscript
NIH
-PA Author Manuscript
NIH
-PA Author Manuscript

from the earlier model and inserted in the lumped dendritic compartment. These currentswere primarily the slowly voltage-activated and calcium-inactivated calcium current (ICa)and the calcium -activated potassium current (IKCa), with a lesser contribution from the A-type potassium current (IA). A fast potassium current (IKf) was added to the dendriticcompartment to improve the correspondence of the model with the actual PRCs, mostly forthe inhibitory case which was considered for consistency with our previous studies (Oprisanet al 2003). The burst mechanism consists of a slow accumulation of calcium entry via theslow calcium current which is eventually terminated by the calcium-activation of apotassium current as well as by the calcium inactivation of the calcium current, andreinstated after a hyperpolarization in which the calcium concentration decays sufficiently torestart the depolarizing phase. Due to the strong coupling of the axon to the primary neurite,any depolarization of the primary neurite produces spiking in the axon, regardless ofwhether the depolarization originates from the synaptic input applied to the soma or fromthe up state of the burst generator in the soma. Although other currents are known to beexpressed in the AB/PD complex, we present here only the minimal model required toprovide a convincing fit to the experimental data. The most notable omission is thehyperpolarization activated current IH (Tohidi and Nadim, 2009), but the leak current IL hassimilar effects on the resetting curve as IH (Prinz et al 2003b). The full set of modelequations with parameter values is given in Appendix A.
The model PRCs were calculated using the same protocol as for the biological neurons. Themodel is implemented in C and uses a fourth order Runge-Kutta method with a fixed stepsize of 0.02 ms. The simulations were done using a Scyld Beowulf Computational Clusterwith CentOS 4.0 and AMD Opteron 280 processors. The cluster is a 64 bit machine with aPathscale compiler.
Phase plane and nullcline analysis—In order to visualize what happens during theapplication of a pulse, a two-dimensional projection of the 11 dimensional full state space ofthe model was plotted in a phase plane consisting of the rapidly varying dendritic membranepotential Vd and a slow variable, the dendritic calcium concentration c. The voltage nullclinefor an isolated dendritic compartment consists of the pairs of values of dendritic membranepotential and dendritic calcium concentration at which the rate of change of dendriticmembrane potential is zero. The nullcline was calculated by determining at each value ofdendritic potential Vd, the value of Ca2+ that made the following expression equal to zero:IL,d (Vd) + IK,Ca (c, Vd) + ICa(z(Vd), c, Vd) + IA(mA(Vd), hA(Vd) + I Kf(b(Vd), Vd) with allgating variables z, mA, hA and b set to their steady state value (indicated by the dependenceof the gating variable on Vd) at the value of Vd. The isolated dendrite was examined becauseduring a normal bursting cycle, the coupling currents are quite small and brief(Supplemental Figure 1), therefore their inclusion would complicate the analysis but provideno additional insights.
RESULTSThe PRCs recorded from pyloric pacemaker kernels depended upon the strength of thesynaptic conductance as well as upon the duration of the perturbation. With respect to thestrength of the perturbation, we define strong pulses as those that immediately evokedspiking regardless of phase, and weak pulses as those that do not evoke spiking unless theyare applied during a burst when spiking is ongoing in any case. With respect to duration, byour definition a short pulse lasts less than one sixth of the intrinsic period of the neuron, anintermediate pulse lasts one sixth to one third of the period, and a long pulse lasts longerthan a third of the period. For comparison, a burst generally occupies around a third or so ofthe period. Since we varied both the strength and duration of the pulse, the PRCs wereroughly grouped into six categories. The short, weak pulses had no measurable effect. In the
Maran et al. Page 5
J Comput Neurosci. Author manuscript; available in PMC 2012 October 1.
NIH
-PA Author Manuscript
NIH
-PA Author Manuscript
NIH
-PA Author Manuscript
next five sections, we summarize the five characteristic PRC shapes that we observedcorresponding to the other five categories. The model described in the methods producedPRCs that were strikingly similar to the experimentally observed PRCs. This indicates thatthe model captures essential features of the dynamics of the biological oscillator, andallowed us to formulate hypotheses regarding why these characteristic shapes wereobserved.
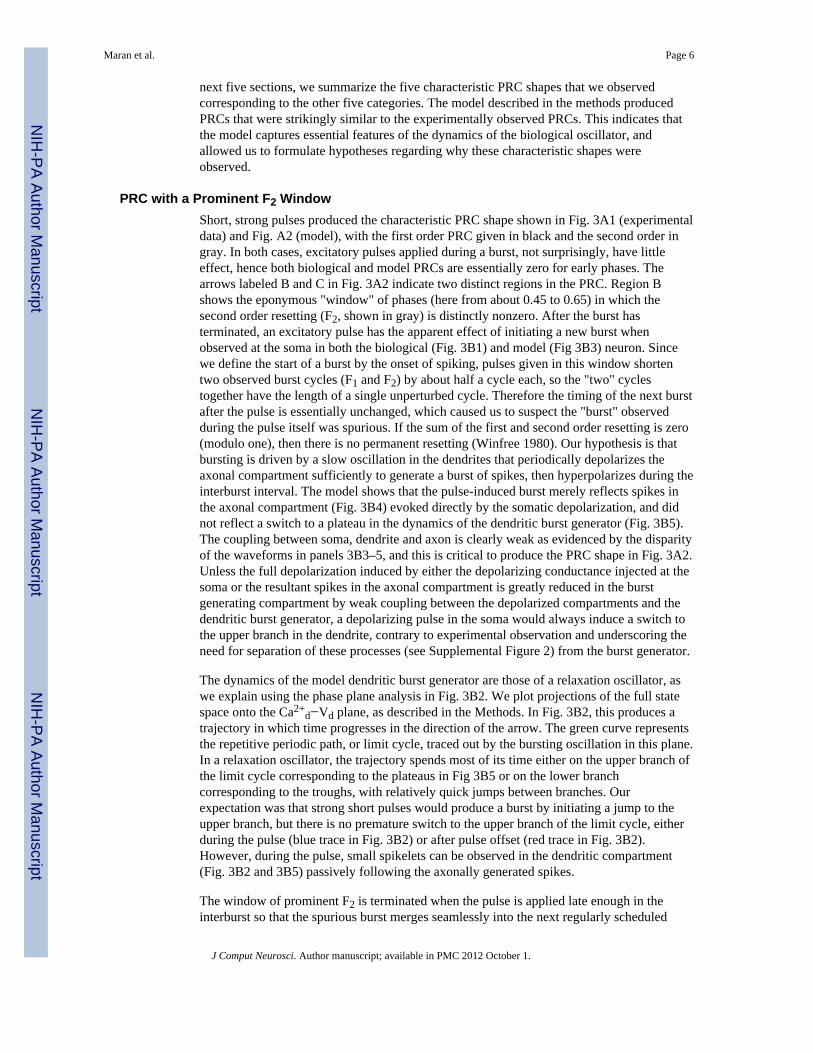
PRC with a Prominent F2 WindowShort, strong pulses produced the characteristic PRC shape shown in Fig. 3A1 (experimentaldata) and Fig. A2 (model), with the first order PRC given in black and the second order ingray. In both cases, excitatory pulses applied during a burst, not surprisingly, have littleeffect, hence both biological and model PRCs are essentially zero for early phases. Thearrows labeled B and C in Fig. 3A2 indicate two distinct regions in the PRC. Region Bshows the eponymous "window" of phases (here from about 0.45 to 0.65) in which thesecond order resetting (F2, shown in gray) is distinctly nonzero. After the burst hasterminated, an excitatory pulse has the apparent effect of initiating a new burst whenobserved at the soma in both the biological (Fig. 3B1) and model (Fig 3B3) neuron. Sincewe define the start of a burst by the onset of spiking, pulses given in this window shortentwo observed burst cycles (F1 and F2) by about half a cycle each, so the "two" cyclestogether have the length of a single unperturbed cycle. Therefore the timing of the next burstafter the pulse is essentially unchanged, which caused us to suspect the "burst" observedduring the pulse itself was spurious. If the sum of the first and second order resetting is zero(modulo one), then there is no permanent resetting (Winfree 1980). Our hypothesis is thatbursting is driven by a slow oscillation in the dendrites that periodically depolarizes theaxonal compartment sufficiently to generate a burst of spikes, then hyperpolarizes during theinterburst interval. The model shows that the pulse-induced burst merely reflects spikes inthe axonal compartment (Fig. 3B4) evoked directly by the somatic depolarization, and didnot reflect a switch to a plateau in the dynamics of the dendritic burst generator (Fig. 3B5).The coupling between soma, dendrite and axon is clearly weak as evidenced by the disparityof the waveforms in panels 3B3–5, and this is critical to produce the PRC shape in Fig. 3A2.Unless the full depolarization induced by either the depolarizing conductance injected at thesoma or the resultant spikes in the axonal compartment is greatly reduced in the burstgenerating compartment by weak coupling between the depolarized compartments and thedendritic burst generator, a depolarizing pulse in the soma would always induce a switch tothe upper branch in the dendrite, contrary to experimental observation and underscoring theneed for separation of these processes (see Supplemental Figure 2) from the burst generator.
The dynamics of the model dendritic burst generator are those of a relaxation oscillator, aswe explain using the phase plane analysis in Fig. 3B2. We plot projections of the full statespace onto the Ca2+
d−Vd plane, as described in the Methods. In Fig. 3B2, this produces atrajectory in which time progresses in the direction of the arrow. The green curve representsthe repetitive periodic path, or limit cycle, traced out by the bursting oscillation in this plane.In a relaxation oscillator, the trajectory spends most of its time either on the upper branch ofthe limit cycle corresponding to the plateaus in Fig 3B5 or on the lower branchcorresponding to the troughs, with relatively quick jumps between branches. Ourexpectation was that strong short pulses would produce a burst by initiating a jump to theupper branch, but there is no premature switch to the upper branch of the limit cycle, eitherduring the pulse (blue trace in Fig. 3B2) or after pulse offset (red trace in Fig. 3B2).However, during the pulse, small spikelets can be observed in the dendritic compartment(Fig. 3B2 and 3B5) passively following the axonally generated spikes.
The window of prominent F2 is terminated when the pulse is applied late enough in theinterburst so that the spurious burst merges seamlessly into the next regularly scheduled
Maran et al. Page 6
J Comput Neurosci. Author manuscript; available in PMC 2012 October 1.
NIH
-PA Author Manuscript
NIH
-PA Author Manuscript
NIH
-PA Author Manuscript

burst (arrow C in Fig. 3A2) corresponding to the voltage traces in the somatic biologicalneuron (Fig. 3C1) and model neuron (Fig. 3C2). Interestingly, this case does show a delayedswitch to the upper branch, but it is not evident without the phase plane analysis shown inFig. 3C3. The voltage nullcline (black curve) was calculated for an isolated dendriticcompartment by setting the gating variables to their steady state values and finding the pairsof values of dendritic membrane potential and dendritic calcium concentration that result inzero net current flow across the dendritic membrane. There are three branches to thisnullcline; the middle branch represents a forbidden zone that repels trajectories (Rinzel andErmentrout 1998) and so crossing this boundary during the pulse (blue trace in Fig. 3C3)forces a branch switch between the lower and upper branches as shown after pulse offset(red trace). There is no F2 in this case because only a single observable cycle is shortened inthis case in contrast to two in the case illustrated by Fig. 3B1 and 3B2. Note that for thebiological neuron, there is a range of phases (~ 0.5–0.7) for which either of these outcomesis possible, depending upon trial to trial variability. The key insight is that the position of thetrajectory relative to the middle branch of the limit cycle at pulse offset determines whetherthe trajectory will decay back to the lower branch (case B) or keep going toward the upperbranch (case C). Thus the middle branch acts as a separatrix between the upper and lowerbranches. The linear segment with an approximate slope of one at late phases for all strongpulse cases reflects the immediate initiation of a burst at a phase of ϕ, resulting in anadvance with a magnitude equal to the remainder of the cycle (1−ϕ), but with opposite sign(ϕ−1). This line segment is known as the causal limit, because an input cannot advance thenext burst time any further, or the burst would occur before the input that caused theadvance, in violation of causality. Analytical expressions for the linear segments of thephase resetting curves are given in the summary section below.
Cubic PRCWeak pulses of intermediate duration given at phases during the burst generally produce afirst order PRC that has the approximate shape of a cubic polynomial with zeros at zero, ϕb,and one, where ϕb is the phase at which burst termination occurs in both biological (blacktrace in Fig. 4A1) and model (black trace in Fig. 4A2) neurons. The arrow B in Fig. 4A2indicates a region of early phases in which delays predominate, and the arrow C a region oflate phases in which advances predominate. Second order resetting (gray traces) is negligiblefor cubic PRCs. Fig. 4B shows an example of delays at early phases, whereas Fig. 4Cillustrates advances at late phases for both the biological (Fig. 4B1, 4C1) and model neuron(Fig. 4B2, 4C2). The phase plane analysis in Fig. 4B3 shows that during the pulse (bluetrace), the trajectory remains on the upper branch for two additional spikes at the end of aburst, resulting in delays for perturbations applied during a burst. The same input appliedduring the interburst advances the time of the next burst by causing a switch from the lowerbranch to the upper branch during the perturbation (Fig. 4C3, blue trace) at an earlier pointon the limit cycle compared to the unperturbed trajectory (green). At intermediate phases,the perturbation both extends the burst and shortens the interburst, so the phase resetting isdetermined by the net effect of the delay and advance, producing a smooth transition fromdelay to advance in the cubic PRC shape. Note that for neurons with cubic PRCs, in contrastto those with prominent F2 windows, the presence of spikes during the perturbation signalsthat the trajectory is on the upper branch and the absence of spikes signals that the trajectoryis on the lower branch. This correlation holds in general only for weak inputs, because weakinputs, unlike strong ones, cannot directly evoke spikes in the axonal compartment.
Bilinear PRCStrong pulses of intermediate duration, like weak ones, also produce early delays and lateadvances for both biological (Fig. 5A1) and model (Fig. 5A2) neurons. Instead of a cubicshape, however, there is an apparent discontinuity (Glass and Winfree 1984) rather than a
Maran et al. Page 7
J Comput Neurosci. Author manuscript; available in PMC 2012 October 1.
NIH
-PA Author Manuscript
NIH
-PA Author Manuscript
NIH
-PA Author Manuscript

smooth transition between the regions of delays (arrow B in Fig. 5A2) and advances (arrowC in Fig. 5A2), resulting in two discontinuous line segments that produce a bilinear shape.For the cubic PRC case described above, transitions between the upper and lower branchesoccurred spontaneously during the input conductance pulse. In contrast, for the bilinear PRCcase, the strong input forces spiking to persist throughout the pulse. For pulses appliedduring the burst, this persistent spiking prolongs the duration of the burst until pulse offset,such that the later the pulse starts, the greater the delay. On the other hand, the time frompulse offset until the next burst is approximately constant. This produces the first linesegment in the bilinear PRC (Fig. 5A) in which the delay varies linearly with phase. Thereason for the constant rebound until the next burst is that the trajectory in the phase plane(Fig. 5B3) converges on a relatively compact region of phase space (black oval) during thetonic spiking induced by the conductance pulse (blue curve). No matter how many spikesare emitted during the burst, the path taken after pulse offset (red trace) is predictablyconstant since the trajectory always starts from approximately the same point and quicklyrelaxes back to the unperturbed limit cycle, producing the next burst in about the sameamount of time from pulse offset each time. If the very slowly activating potassium current(IKs) in the model set to zero, then the model settles into tonic spiking if the pulse is left onindefinitely (Supplemental Figure 3A3 and A5). This compact region of phase space is a"ghost" of this tonically spiking attractor. Although IKs is not set to zero in this example, it isnot significantly activated by an intermediate duration pulse, and the trajectory of the"ghost" spiking limit cycle is very compact compared to a bursting limit cycle, resulting in anearly fixed rebound time, similar to what one would observe if the trajectory wereconsistently released from a fixed point in the phase space. Second order resetting is zero inthis case because the second cycle follows the original limit cycle.
In contrast to pulses given during the burst, pulses given during the interburst (Fig. 5C1biological neuron and Fig. 5C2 model neuron) produce an advance because the pulseinitiates spiking almost immediately, such that the second linear segment of the PRC (Fig.5A1 and 5A2) approaches the causal limit. The input given during the interburst causes atransition to the upper branch to occur sooner (blue trace in Fig. 5C3) than for theunperturbed case (green trace in Fig. 5C3). In this case, the constant rebound (red trace)occurs during the second cycle after the perturbation and produces a constant, generallynonzero, F2 for phases during the interburst (Fig. 5A1 and 5A2). The transition to the upperbranch in Fig. 5C2 (and presumably Fig. 5C1) is obscured because the spiking during thetransition to the upper branch is indistinguishable in the voltage trace from spikes that occuron the upper branch. Therefore the model is an invaluable tool to infer the dynamicsunderlying the observed phase resetting. The distinction between whether spiking prolongsthe existing burst or initiates a new one produces the apparent discontinuity in the bilinearPRC in both the biological neuron (Fig 5A1) and the model neuron (Fig. 5A2). Analyticalexpressions for the linear segments of the phase resetting curves are given in the summarysection below.
U-shaped PRCLong, weak pulses produce a roughly U-shaped first order PRC (Fig. 6A1 and 6A2). Exceptfor very early phases, in general conductance pulses produced only advancement in the firstorder PRC both the biological (Fig. 6A1 black dots) and model neuron (Fig. 6A2 blacktrace, with the region of advances indicated by the arrow labeled B). In both cases, thesecond order PRC consisted mostly of delays (gray dots). In the model, advances wereproduced mostly by shortening the interburst interval as shown in Fig. 6B1 (biologicalneuron) and Fig. 6B2 (model neuron). Especially when applied at late phases, the input alsolengthens the burst in the next cycle, producing delays in F2. The phase plane (Fig. 6B3)shows the advance results because during the pulse (blue trace) there is a premature switch
Maran et al. Page 8
J Comput Neurosci. Author manuscript; available in PMC 2012 October 1.
NIH
-PA Author Manuscript
NIH
-PA Author Manuscript
NIH
-PA Author Manuscript

to the upper branch, shortening the stay on the lower branch and hence the interburst. Alonger burst in the first cycle also results from the three extra spikes at the end of the burst,but this is offset by the shorter interburst. The advance is most pronounced at intermediatephases when the depolarizing pulse extends throughout the interburst interval but does notlengthen the first burst.
Trilinear PRCStrong long pulses produced trilinear PRCs (Figs. 7A1 and 7A2) in contrast to the bilinearPRCs produced by strong intermediate pulses. The salient difference is that longer pulsesactivate a second slow process, simulated in the model as IKs in the primary neurite, whichin contrast to the case for intermediate pulses in Fig. 5, allows the trajectory to escape thecompact area of phase space during tonic spiking at the end of a pulse (blue trace insideblack oval in Fig. 7B3). Because the neuron escapes from the compact space, the recoveryinterval is no longer approximately constant. Furthermore, two line segments result ratherthan a single one for phases during a burst, depending upon whether the trajectory at pulseoffset has crossed the separatix. For inputs given during the early burst (Fig. 7B1 biologicaland Fig. 7B2 model), first order delays are produced by the prolongation of the burst due tocontinued spiking throughout the pulse. In this case, the trajectory of the model neuron (Fig.7B3) is below the separatrix at pulse offset (end of blue trace, start of red). However, forinputs applied later in the burst (Fig. 7C1 biological neuron, Fig. 7C2 model neuron),spiking still prolongs the burst, but the trajectory during the pulse (blue trace in Fig. 7C3)crosses the separatrix, allowing a premature jump (red trace compared to green trace in Fig.7C3) to the upper branch. Moreover, the activation of the slow process is sufficient such thatspiking cannot be maintained after pulse offset even though the trajectory is very close to theupper branch. This results in a "missed cycle" evidenced by a much longer delay in thesecond linear for phases between 0.2 and 0.4 in Fig. 7A1 and A2. The third and final linearsegment has first order resetting at the causal limit and a nonzero F2, similar to the finallinear segment for the bilinear case. Although there were few instances of the trilinear PRC,the close correspondence between the biological (Fig. 7A1) and model (fig. 7A2) PRCs isstriking.
Summary of Excitatory PRCsFigure 8 summarizes schematically how the characteristic shape of the PRC changed as thestrength and duration of the conductance pulse used to generate the PRC was varied. Tables1 and 2 summarize the PRC data as well as the parameters of each experiment. Table 1describes preparations in which synaptic inputs were given either as square pulses orsynaptic conductance waveforms. Table 2 describes preparations that were given synapticinputs as ramps. A total of 85 PRCs were generated in 12 biological neurons. Of the 85PRCs, 24 (28.2%) had a prominent F2 window, 12 (14.11%) were bilinear, 11 (12.94%)were cubic, 6 (7%) were trilinear, 4 (4.7%) were U-shaped, and 21 (24.7%) had negligibleresetting (labeled nil in Fig. 8). There were also PRCs that fell into different categoriesdepending upon which phases were examined. These 7 transitional cases account for 8.23 %of the total PRCs. The transitional cases result because there is a continuum of phaseresetting behavior between the cases indicated in Fig. 8.
Simple equations characterize the PRC for the cases in which strong excitatory pulsesreliably evoke spiking for the short and intermediate pulses, but not for the long pulses inwhich a secondary slow process confounds the analysis. These analyses given below focusonly on explaining the PRC that is based on spiking observed at the soma, without explicitknowledge of the state of the burst generator. An analysis that includes the dynamics of theoften unobservable branch switches in the burst generator and multiple bifurcations requiressophisticated mathematical analyses that will not be attempted here. However, in all cases,
Maran et al. Page 9
J Comput Neurosci. Author manuscript; available in PMC 2012 October 1.
NIH
-PA Author Manuscript
NIH
-PA Author Manuscript
NIH
-PA Author Manuscript

the match between the model and the observed PRCs is so striking we are confident that themodel captures essential features of the dynamics of the AB/PD oscillator kernel.
The equations used to generate the schematic drawings for the prominent F2 window andbilinear in Fig. 8 are given here; all other cases are illustrative and not based upon specificequations tied to the parameters of the dynamics and the stimulation pulse. For theprominent F2 window case, the key insight is that the F2 window arises when a short pulseoccurs in the early part of the interburst interval. In this window alone, the spikes producedduring the pulse are counted as a separate burst, because pulses at earlier phases overlapwith the preceding burst and pulses given at later phases overlap with the next burst. Thetiming of the next burst is unchanged by the spikes during the pulse because the dynamics ofthe dendritic burst generator are unaffected, see Fig. 3. Therefore, the resetting is given byF1(ϕ)= 0 for ϕ<ϕb and F1(ϕ)= ϕ −1 for ϕ>ϕb whereas F2(ϕ)= 0 for ϕ<ϕb, F2(ϕ)= −ϕ for (ϕ>ϕband ϕ < 1−Idur/P0) and F2(ϕ)= 0 for ϕ > 1−Idur/P0). The normalized burst duration is ϕb, theduration of the pulse is Idur and P0 is the intrinsic period. For the bilinear case, F1(ϕ)= ϕ +(Idur+ R −P0)/P0 = ϕ + A for ϕ<ϕb and F1(ϕ)= ϕ −1 for ϕ>ϕb whereas F2(ϕ)=0 for ϕ<ϕb andF2(ϕ) = A = (Idur + R−P0)/P0 for ϕ>ϕb, where the relaxation time back to the original limitcycle was assumed to be of constant duration R. The elapsed time from pulse onset to thenext burst is the pulse duration plus the constant rebound, and the constant A is thenormalized difference between this elapsed time and the intrinsic period. For pulse onsetduring a burst, A is the y-intercept of the linear segment, whereas for pulses given during theinterburst, A is the constant second order resetting.
Inhibitory PRCs RevisitedAs stated in the Introduction, a far simpler conceptual model of branch switching was ableto account for phase resetting of the pyloric pacemaker kernel in response to inhibitoryperturbations (Oprisan et al. 2003). Previously, short strong inhibitory pulses appeared toinduce branch switching such that the amount of resetting could be predicted by assumingthat switches between branches occur along a vertical line in the phase space correspondingto a constant value of the slow variable (Oprisan et al. 2003). The phase plane trajectories inFigs. 3B2 and C3 and 5B3 and C3 show that excitatory perturbations to the model may ormay not switch the trajectory depending upon whether they cross the separatrix, andfurthermore that whether a branch switch has occurred is not evident from examining themembrane potential trace alone. When we examined the response to similarly short, stronginhibitory pulses, we found that the same principles apply. For short inhibitory pulsesapplied early during a burst (Fig. 9A1 biological neuron and Fig. 9A2 model neuron), thetrajectory in the phase plane (Fig. 9A3, blue trace) did not cross the separatrix during thepulse. A brief period of no spiking (beginning of red trace) was followed by a resumption ofspiking on the upper branch. From the phase plane, it is evident that this is the continuationof the same burst. Nevertheless, in the experimental data, we have to be consistent in callingany resumption of spiking after a hyperpolarization a new burst because in the absence ofmeasurements of slow variables we have no way to examine the phase space of the realneuron. For pulses applied later during the burst (Fig. 9B1, biological neuron and Fig. 9B2,model neuron), the trajectory (blue trace in Fig. 9B3) does indeed cross the separatrix,causing burst termination with a switch to the lower branch. Therefore the new model, incontrast to the old interpretation, predicts that the observed F1 for inputs early during a burst(indicated by the arrow labeled A at phases up to about 0.1 in Fig. 9C2) will be qualitativelydifferent than those observed later in a burst. A careful examination of the experimental data(Fig. 9C1) confirms this prediction in that the resetting at very early phases (up to about0.05) appears to form a distinct cluster compared to the resetting observed from phasesbetween 0.05 and 0.25, validating the new model. In order to match the experimental phaseresetting for inhibitory cases, a fast outward current (IKf) that was activated by
Maran et al. Page 10
J Comput Neurosci. Author manuscript; available in PMC 2012 October 1.
NIH
-PA Author Manuscript
NIH
-PA Author Manuscript
NIH
-PA Author Manuscript

depolarization was added to the dendritic compartment. This current flattened the upperbranch of the voltage nullcline to keep it close to the separatrix, facilitating branch switches.The resultant PRCs (Fig 9C1) match the experimental data (Fig. 9C2) better than ourprevious assumptions (Oprisan et al. 2003), and allow us to use a single model to reconcilephase resetting in response to both excitation and inhibition.
Dendritic Versus Somatic Conductance InjectionThe reason that spikes can occur when the dendritic membrane potential is not on the upperbranch is that spiking is initiated in the axon, and a strong depolarization of the soma cancause spiking in the axon without depolarizing the dendritic compartment sufficiently toinduce a transition to the upper branch. We hypothesized that if the excitatory conductancewere to be applied in the dendrites rather than in the soma, that spiking would once againcorrelate with movement on the upper branch of the dendritic potential nullcline. Since weare not able to inject the synaptic conductance in the dendrites of the AB/PD complex, weused the model to simulate this situation instead. A 50 nS conductance pulse was applied tothe dendritic compartment instead of the somatic compartment (Fig. 10A1 and 10B1), andthe trajectories of model neuron during a perturbation (blue traces in Figs. 10A2 and 10B2)became much more nearly vertical at a constant value of the slow variable, as expected for arelaxation oscillator (see Oprisan et al. 2003). For pulses applied both early (Fig. 10A) andlate (Fig. 10B) during the interburst, the PRC (Fig. 10C) became predictable in terms ofobservable switches between branches as we had initially anticipated. Therefore the spatialseparation of the burst generator and conductance injection are critical to the resettingobserved in the model, and likely in the biological neuron as well. Interestingly, small delaysare observed when an excitation is applied during a burst (early phases Fig. 10C), consistentwith experimental data (Benson, 1980, see Discussion).
DISCUSSIONIn this study, PRCs were measured experimentally using the Dynamic Clamp to injectexcitatory conductance pulses of variable strength and duration into a PD soma of thepyloric pacemaker kernel. Based on the observed PRC shapes, five categories wereidentified (in addition to the nil PRC in which no resetting was observed). Of these five, thecubic and bilinear are probably most relevant to resetting that could occur in networks ofbursting neurons, based on the assumption that the duration of a burst is the relevant timescale for synaptic perturbations in these circuits. However, the shorter and longer pulsedurations helped to characterize the nonlinear dynamics of these neurons, and particularly tohighlight the putative spatial segregation of oscillatory mechanisms for spiking versus burstgeneration. A model neuron with more than one compartment was required to reproduce allthe types of PRCs that were observed. Phase plane analysis of the model clearly illustratedthe mechanisms of phase resetting in the model neuron. Mechanisms underlying phaseresetting of the model can be dissected with certainty, and the similarity of observedresetting in the model compared to the biological neuron allows us to infer by analogy thatmechanisms for phase resetting are similar in the biological neuron. The model PRCscaptured the essential trends of all PRC categories; therefore we propose that theinterpretation of observed resetting in the model generalizes to the AB/PD complex andpotentially to other bursting neurons as well, provided the burst generator is essentially arelaxation oscillator.
Interpretive value of model in the presence of spatial segregationHere the beginning of a new burst is defined experimentally as the resumption of spikingafter it has ceased. The presence of spiking would presumably be signaled to thedownstream target, and there is at present no way to determine the status of the burst
Maran et al. Page 11
J Comput Neurosci. Author manuscript; available in PMC 2012 October 1.
NIH
-PA Author Manuscript
NIH
-PA Author Manuscript
NIH
-PA Author Manuscript

generator directly in an experiment. For these reasons, it seems logical and consistent tocount every observable burst as a burst for the purposes of phase resetting, rather thanignoring "bursts" that are not linked to plateaus of the unobservable burst generator. Themodel presented here allows us to separate the spiking and bursting dynamics in a way thatis not possible without it. The model led to a reinterpretation of our previous results forbranch switching observed for short pulses at early phases in inhibitory neurons (Fig. 4 inOprisan et al. 2003). Fig. 9A3 shows that a temporary cessation in spiking as demonstratedin Fig. 9A2 does not always indicate burst termination and a branch switch. The maindeterminant of branch switching was whether the trajectory crossed the separatrix, or middlebranch of the voltage nullcline, during the conductance pulse.
It is likely that the spatial segregation of the spiking mechanism from the burst generatormay be more pronounced for excitation because a depolarizing pulse tends to open voltagegated channels and make the neuron less electrically compact, whereas a hyperpolarizingpulse tends to close channels and make the neuron more compact. Depending upon itslocalization, a depolarizing pulse, but not a hyperpolarizing one, can recruit ectopic spikesthat complicate the interpretation of the data. The absence of clear switches of this nature inthe biological neuron was puzzling until the model suggested that spiking alone was not anindicator of whether a switch to the upper branch was induced. For example, Figs. 3B and5B do not indicate branch switches, whereas Figs. 3C and 5C do indicate such a switch.However, only the phase planes of the model (Figs. 3B2, 3C3 5B3 and 5C3) and not thevoltage traces (Figs. 3B1, 3B3, 3C1, 3C2, 5B1, 5B2, 5C1 and 5C2) reveal whether such aswitch occurs. Since there is in every case an excellent correspondence between the shapesof the model and biological PRCs across all values of coupling strength and duration, we areconfident that we can use this correspondence to infer when a branch switch has occurred inthe biological neuron, even though they do not have the simple form predicted for the casein Fig. 10 in which the input is not spatially segregated from the burst generator. Thus, thephase resetting attributable to an input is strongly dependent upon the spatial localization(somatic vs dendritic) of the input, at least for excitation. This distinction between dendriticand somatic PRCs is based on access to the burst generating mechanism, and is quitedifferent from those previously proposed mechanisms for distinct dendritic PRCs based ondendritic filtering (Goldberg et al 2007) or activation of additional currents due to morerapid calcium accumulation in the dendrites (Schultheiss et al 2010).
Previous models of the AB/PD complex have also included spatial segregation of spikingand burst generation (Soto-Trevino et al. 2005). All three somata in the PD complex (seeFig. 2A) are presumed to be electrically distant from the burst generator in the electricallycoupled dendrites. This interpretation is supported by our observation that direct injection ofthe conductance pulses into the soma of AB (neuron 8 in Table 1) produced similar resultscompared to injection into the soma of PD (all other neurons). A gradual ramp (Table 2) wasno more successful than a square pulse in inducing transitions. Two possible functionalreasons for spatial segregation in general are metabolic efficiency or to give certain inputspreferential access to spiking versus burst generation depending upon the location of thesynapse.
Role of second slow processThe large phase resetting observed during the latter portion of a burst for the trilinear PRCs(Fig. 7 A1, phases from 0.2 to 0.4) required a second slow process (in addition to dendriticcalcium accumulation). In order to simulate such a process, a slow voltage-activatedpotassium current that activates slowly at depolarized potentials, but de-activates morerapidly at hyperpolarized potentials was added to the primary neurite compartment. Rapidde-activation was required to allow full recovery; otherwise, a nonzero F2 was obtained forthe second linear segment of this PRC, in contradiction to the experimental data. The
Maran et al. Page 12
J Comput Neurosci. Author manuscript; available in PMC 2012 October 1.
NIH
-PA Author Manuscript
NIH
-PA Author Manuscript
NIH
-PA Author Manuscript

function of the slow K+ current is to summate temporally during spiking to allow escapefrom the up branch (Fig. 7B) and in some cases to turn spiking off on the up branch (Fig.7C) by countering the negative slope region in the IV curve. Not only did this current allowfor escape from tonic spiking during a long pulse, but also during a very long conductancepulse this current allowed bursting to eventually be re-established in accordance withexperimental observations (see Supplemental Figure 3A2 and 3A4 compared to 3A3 and3A5, but see Soto-Trevino et al. 2005 for a counter-example). If this current is located in thesame compartment as the burst generator then it counters the negative slope region due tothe burst generating calcium current and shuts off bursting (Supplemental Figure 4) insteadof spiking. Therefore in the model it is critical that the slow current must also be separatedfrom bursting but not from spiking. This suggests that in the biological AB/PD complex,there is a strong homeostatic mechanism that favors bursting and acts over relatively shorttime scales (seconds) compared to other homeostatic mechanisms with longer time scales(Turrigiano et al., 1994, 1995). Hooper et (2009) use models and experimental data to arguethat very slow conductances similar to our slow potassium conductance play an importantrole in maintaining phase constancy of bursting neurons in the pyloric circuit.
Inhibition is more reliable and a better choice for CPGsBenson (1980) generated PRCs in the cardiac ganglion of the crab, Portunus, using currentpulses rather than conductance pulses. Four small electrically coupled pacemaker neuronsand five large follower motor neurons were considered as a single oscillatory kernel, andcurrent was injected into the larger motor neurons. The phase resetting observed in responseto inhibition was similar to that observed in our previous study of the AB/PD complex(Oprisan et al. 2003). For phase resetting in response to excitation, Benson found a"distinction between evoking action potentials, which occurred during depolarizing pulses ofany duration of sufficient current intensity, and the induction of a driver potential andassociated action potentials". This distinction seems to parallel the distinction we makebetween evoking action potentials and evoking a switch to the depolarized branch of theburst generator, hence the spatial separation between the two mechanisms may be general.Several cases were described depending upon the strength and timing of the pulse, not all ofwhich correspond to cases that were observed in this study, which argues for the greaterdiversity of resetting in response to excitation compared to inhibition. For example, strongerpulses applied during a burst caused a premature termination of the burst at pulse offset, andthe duration of the subsequent interburst interval was shorter (see Fig. 10C). Bensonobserved three types of responses to excitatory pulses given during the interburst interval: abrief pulse evoked no significant resetting, an intermediate pulse evoked a new burst thatoutlasted the input but was followed by a shortened interburst interval, and a long pulseevoked persistent spiking followed by a constant relaxation interval until the next burst. Theintermediate responses were not observed in our experimental data (but were observed in theAB/PD model when current was injected into the dendrites, Figs. 10A2 and B2). In ourstudy, the longer pulses sometimes evoked a bursting pattern during the pulse rather thancontinuous spiking, and were sometimes but not always followed by a constant relaxationinterval until the next burst.
Ayers and Selverston (1979) measured PRCs in the same bursting neurons utilized in thecurrent study, the AB/PD complex of the lobster, but avoided the confounding effect ofinjecting current or conductance in the soma. Instead, the lateral pyloric (LP) neuron wasstimulated in order to evoke inhibitory postsynaptic potentials and the inferior ventricularnerve (ivn) was stimulated to evoke excitatory postsynaptic potentials (EPSPs). In theirpreparations, neither the LP nor the ivn discharged spontaneously. The inhibitory PRCswere similar to those observed in our previous study (Oprisan et al. 2003), with earlyadvances, an intermediate flat region, and late delays. The excitatory PRCs for a single
Maran et al. Page 13
J Comput Neurosci. Author manuscript; available in PMC 2012 October 1.
NIH
-PA Author Manuscript
NIH
-PA Author Manuscript
NIH
-PA Author Manuscript

EPSP was similar to our cubic PRC, and for twin facilitated EPSPs (a stronger input) thePRC was similar to our bilinear category. These PRCs consisted of early delays and lateadvances, with the caveat that the duration of their perturbations was short (less than 100ms), so the extension of the burst that is responsible for early delays was not very noticeable.These experimentally derived PRCs could be simulated in the model by the injection ofcomparably brief pulses in the dendrites, or by longer pulses in the soma due to the spatialseparation of the soma from the burst generator in the model.
In circuits of bursting neurons, the duration of the inhibition or excitation produced in thetarget of a bursting neuron is on the order of the burst duration, which is a significantfraction of the period. We have shown that the effect of excitation on a bursting neuron ismuch more variable and difficult to predict than that of inhibition, therefore circuits ofbursting neurons constructed using excitation may be less reliable that those based oninhibition (Sieling et al., 2009). This provides a possible explanation for why CPGs relypredominantly on inhibition. Excitation seems to also be more sensitive to the spatiallocation of the input (Fig. 10 and Supplemental Figure 3), which dictates caution in usingthe Dynamic Clamp to simulate synaptic connectivity. The AB/PD complex does not receivephasic excitation from the other components of the pyloric circuit in vivo, but our intent wasto understand phase resetting generally in bursting neurons by using an easily accessible,easily isolated, and robust regular burster to explore the effects of resetting in burstingneurons due to excitatory pulses. Although excitatory synapses are not involved ingenerating the basic triphasic pyloric rhythm, pacemaker neurons do receive excitatoryinputs from command fibers, which could modulate the triphasic rhythm. Dando andSelverston (1972) studied the effect of excitatory inputs on the pyloric rhythm bystimulating the ivn, which presumably activates dendritic synapses. They observed that atlow stimulation frequency there is an increase in pyloric cycle frequency and at highfrequency the endogenous bursting of pacemaker complex ceased, which is in agreementwith our results for long dendritic inputs (Supplemental Figure 3B). For inhibitory pulses ofburst durations in the range of those actually observed in this circuit, injection of theconductance in the soma adequately simulates the effect on phase resetting of a similarperturbation applied in the dendrites.
Effects of Input Strength and DurationA previous study (Prinz et al. 2003b) found that phase resetting in both the AB/PD complexand in an AB/PD model neuron due to both excitation and inhibition was independent ofsynaptic strength above a certain threshold but depended strongly upon duration. Oprisan etal. (2003) explained this dependence for inhibition by showing that longer inputs preventeda jump to the depolarized branch until their offset, at which time the neuron quickly shiftedto the point on the depolarized branch of the limit cycle corresponding to burst initiation at aphase of zero. Here we demonstrated an analogous phenomenon for sufficiently strongexcitatory inputs with intermediate duration. The main effect of input strength was whetheraction potentials were consistently evoked during the pulse or not. If they were, then theeffect of duration was linear because the excitation increased the period by prolonging theburst as in the first segment of the bilinear PRC. However when the duration is furtherprolonged, unlike in the inhibitory case, in the case of excitation the neuron relaxed from thecompact space.
ConclusionIn sum, five shapes of PRCs were observed in the AB/PD complex in response to somaticinjection of artificial excitatory synaptic conductance pulses of different strengths anddurations using the Dynamic Clamp. A four compartment model of the AB/PD complexwith two slow processes produced a good match to all five PRC types, in addition to
Maran et al. Page 14
J Comput Neurosci. Author manuscript; available in PMC 2012 October 1.
NIH
-PA Author Manuscript
NIH
-PA Author Manuscript
NIH
-PA Author Manuscript

previous data on inhibition. In the model, spatial separation of spike and burst generationcombined with a second slow process caused somatic spiking to be independent of the upand down states of the burst generator when the input is given at the soma. Phase planeanalysis of the model allowed us to better understand switches between the upper and lowerbranches of the limit cycle that we propose generated the observed phase resetting. Thesemethods can be generalized to apply to other bursters that rely on a slow process that may bespatially segregated from the point of observation and/or the locus for spike generation.Phase resetting of bursting neurons in response to excitation is much more complex than toinhibition, and the injection of excitatory synaptic conductances in the soma mimicsdendritic activation less accurately than inhibitory. The variability is manifested differentlybut persists whether activation is dendritic or somatic (compare for example Fig. 10A1 andB1 to Fig. 3B1 and C1). The major way in which this study relates to the pyloric circuit is tohelp explain why this circuit and similar circuits have evolved to rely on inhibition as beingmore reliable than excitation (see also Sieling et al 2009).
Supplementary MaterialRefer to Web version on PubMed Central for supplementary material.
AcknowledgmentsThis work was supported by NIH grant NS054281 under the CRCNS program. We thank Ryan Hooper forsupplying some of the PRCs and Rob Butera for comments on an earlier draft.
APPENDIX A
Model DescriptionThe model consists of four compartments. Each compartment obeys the following currentbalance equations,
where Vs,Vpn,Vd and Va correspond to membrane voltage (mV) of soma, primary neurite,dendrite and axon respectively. Cm is the membrane capacitance and Iext is a constant directcurrent.
1) The sodium current (INa) was taken directly from Guckenheimer et al 1993 andis described by INa = GNa m 3h (V−ENa) where ENa is the equilibrium potentialfor sodium and GNa is the conductance strength. The activation variable m is setto the steady state value described by m = αm/(αm+βm).
The inactivation variable h is described by the first order kinetics as follows.
Maran et al. Page 15
J Comput Neurosci. Author manuscript; available in PMC 2012 October 1.
NIH
-PA Author Manuscript
NIH
-PA Author Manuscript
NIH
-PA Author Manuscript

2) The delayed rectifier potassium current (IKdr) was taken directly fromGuckenheimer et al 1993 and is described by IKdr = GKdr n4 (V−EK), whereGKdr is the conductance strength. The activation variable n is described by thefollowing equations.
3) The transient outward potassium current IA was taken directly fromGuckemheimer et al 1993 and is described by IA = GA mA
3 hA (V − EK). Theconductance GA was set within the range studied by Guckenheimer et al 1993.The activation variable mA was set to its steady state value.
The kinetics of the inactivation variable hA are given by
4) The slowly voltage-activated and calcium-inactivated calcium current (ICa) wastaken directly from Guckenheimer et al 1993, except τz was reduced from 23.5to 23 ms, and is described by
where ECa is the equilibrium potential for calcium, GCa is the conductancestrength and c is the dimensionless calcium concentration whose kinetics aredescribed below. The activation variable z is described by the following kineticequations.
5) The calcium-dependent potassium current (IKCa) was taken directly fromGuckenheimer et al 1993 and is described by
where GKCa is the conductance strength, which was set within the range studiedby Guckenheimer et al 1993.
Maran et al. Page 16
J Comput Neurosci. Author manuscript; available in PMC 2012 October 1.
NIH
-PA Author Manuscript
NIH
-PA Author Manuscript
NIH
-PA Author Manuscript

6) The kinetics of the dimensionless activity of the free Ca2+ in the cytosol c weretaken directly from Guckenheimer et al 1993 except that ρ was changed from0.003 ms−1 to 0.0016 ms−1. They are described by the first order equation
7. The leak currents IL,s, IL,pn, IL,d, IL,a in different compartments are given by ILj= GLj (Vj −EL), where GL,j is the leak conductance strength for differentcompartments. The reversal potential for this current was taken fromGuckenheimer et al 1993, but the conductances were adjusted to fit the PRCdata using the compartmental model.
8) Iext is an external bias current also used in the Guckenheimer model.
9) The very slow potassium current (IKs) in the primary neurite was not in theGuckenheimer et al model, but its existence is supported by Hooper et al 2009.We used the following description: IKs = GKs p (V − EK), where Ek is theequilibrium potential for potassium and GKs is the conductance strength. Theactivation variable p is described by the following first order kinetics,
10) The fast potassium current (IKf) was added in the dendrite to better match theshape of the burst envelope. It indicates an incomplete description of theexisting potassium currents in the model and is given by IKf = GKf b (V − EK),with conductance strength given by GKf. The activation variable b is given bythe following first order kinetics,
11) The coupling currents Ipn,d, Ipn,a, and Ipn,s between soma(s), primary neurite(pn), axon (a) and dendrite (d) were introduced as a consequence of themulticompartmental model and are described by the following equations, Ipn,j =Gpn,j (Vj − Vpn), where j=s, d or a for soma, dendrite or axon, respectively,where Gpn,j is the coupling conductance strength between differentcompartments, set in order to separate compartments as required to reproducethe PRC data.
12. The synaptic current that simulates the virtual conductance applied at the somais Isyn = Gsyn (V−Esyn) with synaptic conductance Gsyn and reversal potentialEsyn. Square pulses with Gsyn of different strengths and durations were used toobtain representative PRCs.
All parameters are given in Table 3.
REFERENCESAbbott LF, Marder E, Hooper SL. Oscillating Networks: Control of Burst Duration by Electrically
Coupled Neurons. Neural Computation. 1991; 3:487–497.Arshavsky YI, Deliagina TG, Orlovsky GN, Panchin YV. Control of feeding movements in the
pteropod mollusk, clione-limacina. Exp Brain Res. 1989; 78:387–397. [PubMed: 2599048]
Maran et al. Page 17
J Comput Neurosci. Author manuscript; available in PMC 2012 October 1.
NIH
-PA Author Manuscript
NIH
-PA Author Manuscript
NIH
-PA Author Manuscript
Arshavsky, YI.; Grillner, S.; Orlovsky, GN.; Panchin, YV. Central generators and the spatiotemporalpattern of movements. In: Fagard, J.; Wolff, PH., editors. The development of timing control andtemporal organization in coordinated action: Invariant relative timing, rhythms, and coordination.Amsterdam: Elsevier; 1991. p. 93-115.
Ayers JL, Selverston AI. Monosynaptic entrainment of an endogenous pacemaker network: A cellularmechanism for von Holst's magnet effect. J Comp Physiol. 1979; 129:5–17.
Benson JA. Burst reset and frequency control of the neuronal oscillators in the cardiac ganglion of thecrab, Portunus sanguinolentus. J Exp Biol. 1980; 87:285–313. [PubMed: 6775037]
Bucher D, Johnson CD, Marder E. Neuronal morphology and neuropil structure in the stomatogastricganglion of the lobster, Homarus americanus. J Comp Neurol. 2007; 501(2):185–205. [PubMed:17226763]
Calabrese, RL.; Peterson, EL. Neural control of heartbeat in the leech, hirudo medicinalis. In: Roberts,A.; Roberts, B., editors. Neural origin of rhythmic movements. Cambridge, UK: Cambridge Univ.Press; 1983. p. 195-221.
Canavier CC, Achuthan SA. Pulse Coupled Oscillators and the Phase Resetting Curve. MathematicalBiosciences. 2010; 226-77-96 [Epub ahead of print] PMID: 20460132.
Cangiano L, Grillner S. Mechanisms of rhythm generation in a spinal locomotor network deprived ofcrossed connections: The lamprey hemicord. J Neurosci. 2005; 25:923–935. [PubMed: 15673673]
Cheng J, Stein RB, Jovanovic K, Yoshida K, Bennett DJ, Han Y. Identification, localization, andmodulation of neural networks for walking in the mudpuppy (necturus maculatus) spinal cord. JNeurosci. 1998; 18:4295–4304. [PubMed: 9592106]
Dando, Selverston. Command fibres from the supra-oesophageal ganglion to the stomatogastricganglion in Panulirus argus. J comp Physiol. 1972; 78:138–175.
Demir SS, Butera RJ Jr, DeFranceschi AA, Clark JW Jr, Byrne JH. Phase Sensitivity and Entrainmentin a Modeled Bursting Neuron. Biophysical Journal. 1997; 72:579–594. [PubMed: 9017188]
Dorval AD, Christini DJ, White JA. Real-time linux dynamic clamp: A fast and flexible way toconstruct virtual ion channels in living cells. Annal Biomed Eng. 2001; 29:897–907.
Ermentrout GB, Kopell N. Multiple pulse interactions and averaging in coupled neural oscillators. J.Math Biol. 1991; 29(3):195–217.
Glass L, Winfree AT. Discontinuities in phase resetting experiments. Am. J. Physiol. 1984; 246:R251–R258. (Regulatory Integrative Comp. Physiol. 15). [PubMed: 6696148]
Goldberg JA, Deister CA, Wilson CJ. Response properties and synchronization of rhythmically firingdendritic neurons. J Neurophysiol. 2007 Jan; 97(1):208–219. Epub 2006 Sep 6. [PubMed:16956986]
Guckenheimer J, Gueron S, Harris-Warrick RM. Mapping the dynamics of a bursting neuron. PhilosTrans R Soc Lond B Biol Sci. 1993; 341:345–359. [PubMed: 7504823]
Hammond C, Bergman H, Brown P. Pathological synchronization in Parkinson's disease: networks,models and treatments. Trends Neurosci. 2007; 30:357–364. [PubMed: 17532060]
Hartline DK. Pattern generation in the lobster (panulirus) stomatogastric ganglion. II. Pyloric networksimulation. Biol Cybern. 1979; 33:223–236. [PubMed: 227480]
Hartline DK, Gassie DV. Pattern generation in the lobster (panulirus) stomatogastric ganglion .I.Pyloric neuron kinetics and synaptic interactions. Biol Cybern. 1979; 33:209–222. [PubMed:497265]
Hooper SL, Buchman E, Weaver AL, Thuma JB, Hobbs KH. Slow conductances could underlieintrinsic phase-maintaining properties of isolated lobster (Panulirus interruptus) pyloric neurons. JNeurosci. 2009:1834–1845. [PubMed: 19211890]
Huguenard JR, McCormick DA. Thalamic synchrony and dynamic regulation of global forebrainoscillations. Trends Neurosci. 2007; 30:350–356. [PubMed: 17544519]
Marder E, Calabrese RL. Principles of rhythmic motor pattern generation. Physiol Rev. 1996; 76:687–717. [PubMed: 8757786]
McCrea DA, Rybak IA. Organization of mammalian locomotor rhythm and pattern generation. BrainRes Rev. 2008; 57:134–146. [PubMed: 17936363]
Maran et al. Page 18
J Comput Neurosci. Author manuscript; available in PMC 2012 October 1.
NIH
-PA Author Manuscript
NIH
-PA Author Manuscript
NIH
-PA Author Manuscript

Miller JP, Selverston AI. Mechanisms underlying pattern generation in lobster stomatogastric ganglionas determined by selective inactivation of identified neurons. II. Oscillatory properties of pyloricneurons. J Neurophysiol. 1982; 48:1378–1391. [PubMed: 7153798]
Nargeot R, Baxter DA, Byrne JH. Contingent-dependent enhancement of rhythmic motor patterns: Anin vitro analog of operant conditioning. J Neurosci. 1997; 17:8093–8105. [PubMed: 9334385]
Nargeot R, Petrissans C, Simmers J. Behavioral and in vitro correlates of compulsive-like food seekinginduced by operant conditioning in Aplysia. J Neurosci. 2007; 27:8059–8070. [PubMed:17652597]
Netoff TI, Acker CD, Bettencourt JC, White JA. Beyond two-cell networks: experimentalmeasurement of neuronal responses to multiple synaptic inputs. J. Comput. Neurosci. 2005a;18(3):287–295. [PubMed: 15830165]
Oprisan SA, Prinz AA, Canavier CC. Phase resetting and phase locking in hybrid circuits of one modeland one biological neuron. Biophys J. 2004; 87:2283–2298. [PubMed: 15454430]
Oprisan SA, Thirumalai V, Canavier CC. Dynamics from a time series: can we extract the phaseresetting curve from a time series? Biophys J. 2003; 84:2919–2928. [PubMed: 12719224]
Preyer AJ, Butera RJ. Neuronal oscillators in aplysia californica that demonstrate weak coupling invitro. Phys. Rev. Lett. 2005; 95(13):138103. [PubMed: 16197185]
Prinz AA, Abbott LF, Marder E. The dynamic clamp comes of age. Trends Neurosci. 2004; 27:218–224. [PubMed: 15046881]
Prinz AA, Billimoria CP, Marder E. Alternative to hand-tuning conductance-based models:construction and analysis of databases of model neurons. J Neurophysiol. 2003; 90:3998–4015.[PubMed: 12944532]
Prinz AA, Thirumalai V, Marder E. The functional consequences of changes in the strength andduration of synaptic inputs to oscillatory neurons. J. Neurosci. 2003; 23:943–954. [PubMed:12574423]
Rinzel, J.; Ermentrout, B. Analysis of neural excitability and oscillations. In: Koch, C.; Segev, I.,editors. Methods in Neuronal Modelling: From synapses to Networks". Cambridge, MA, USA:MIT Press; 1989. (revised 1998)
Schultheiss NW, Edgerton JR, Jaeger D. Phase response curve analysis of a full morphological globuspallidus neuron model reveals distinct perisomatic and dendritic modes of synaptic integration. JNeurosci. 2010 Feb 17; 30(7):2767–2782. [PubMed: 20164360]
Sharp AA, O'Neil MB, Abbott LF, Marder E. Dynamic Clamp: computer-generated conductances inreal neurons. J Neurophysiol. 1993a; 69:992–995. [PubMed: 8463821]
Sharp AA, O'Neil MB, Abbott LF, Marder E. The Dynamic Clamp - Artificial conductances inBiological Neurons. Trends Neurosci. 1993b; 16:389–394. [PubMed: 7504352]
Sieling FH, Canavier CC, Prinz AA. Predictions of phase-locking in excitatory hybrid networks:Excitation does not promote phase-locking in pattern generating networks as reliably as inhibition.J Neurophysiol. 2009; 102:69–84. First published. [PubMed: 19357337]
Soto-Treviño C, Rabbah P, Marder E, Nadim F. Computational model of electrically coupled,intrinsically distinct pacemaker neuron. J Neurophysiol. 2005; 94:590–604. [PubMed: 15728775]
Stein, SG.; Grillner, S.; Selverston, AI., editors. Neurons, Networks, and Motor Behavior. MIT Press;1997.
Tazaki K, Cooke IM. Characterization of Ca current underlying burst formation in lobster cardiacganglion motorneurons. J Neurophysiol. 1990; 63:370–384. [PubMed: 2156025]
Tohidi V, Nadim F. Membrane Resonance in Bursting Pacemaker Neurons of an Oscillatory NetworkIs Correlated with Network Frequency. J Neurosci. 2009; 29:6427–6435. [PubMed: 19458214]
Traub RD, Jefferys JG. Are there unifying principles underlying the generation of epilepticafterdischarges in vitro? Prog Brain Res. 1994; 102:383–394. [PubMed: 7800828]
Turrigiano G, Abbott LF, Marder E. Activity-dependent changes in the intrinsic properties of culturedneurons. Science. 1994 May 13; 264(5161):974–977. [PubMed: 8178157]
Turrigiano G, LeMasson G, Marder E. Selective regulation of current densities underlies spontaneouschanges in the activity of cultured neurons. J Neurosci. 1995 May; 15(5 Pt 1):3640–3652.[PubMed: 7538565]
Maran et al. Page 19
J Comput Neurosci. Author manuscript; available in PMC 2012 October 1.
NIH
-PA Author Manuscript
NIH
-PA Author Manuscript
NIH
-PA Author Manuscript

Winfree, AT. The geometry of biological time. New York: Springer; 1980.
Maran et al. Page 20
J Comput Neurosci. Author manuscript; available in PMC 2012 October 1.
NIH
-PA Author Manuscript
NIH
-PA Author Manuscript
NIH
-PA Author Manuscript
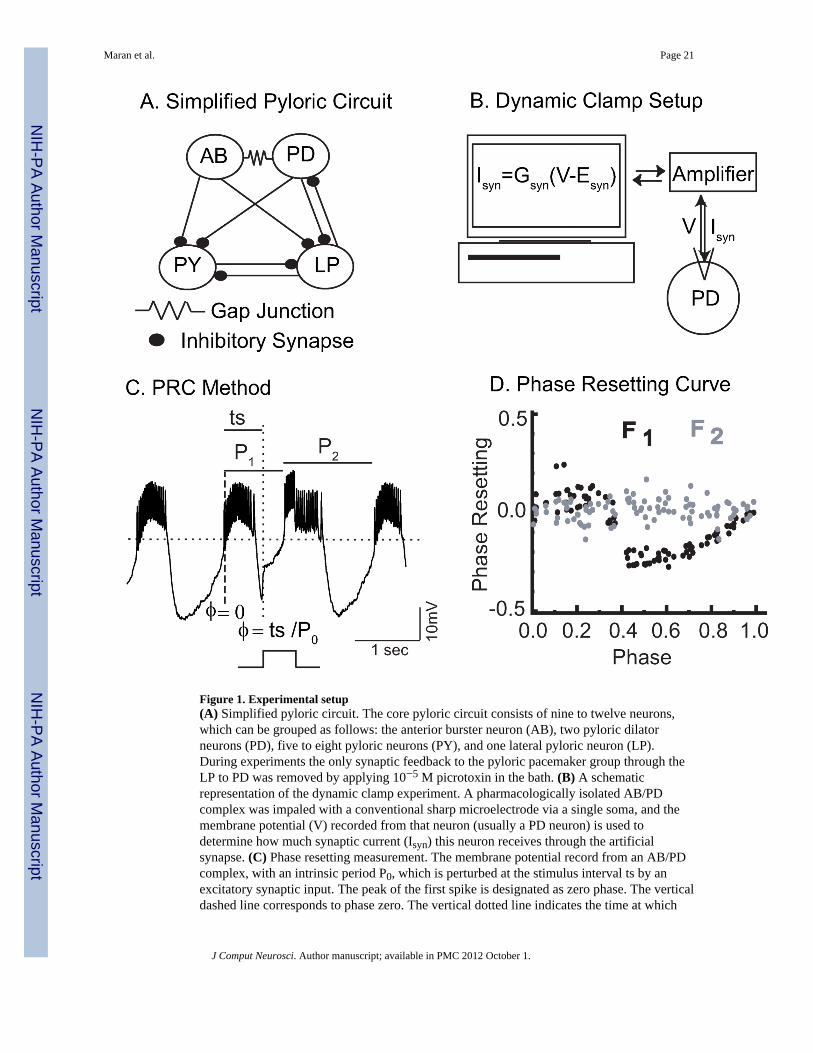
Figure 1. Experimental setup(A) Simplified pyloric circuit. The core pyloric circuit consists of nine to twelve neurons,which can be grouped as follows: the anterior burster neuron (AB), two pyloric dilatorneurons (PD), five to eight pyloric neurons (PY), and one lateral pyloric neuron (LP).During experiments the only synaptic feedback to the pyloric pacemaker group through theLP to PD was removed by applying 10−5 M picrotoxin in the bath. (B) A schematicrepresentation of the dynamic clamp experiment. A pharmacologically isolated AB/PDcomplex was impaled with a conventional sharp microelectrode via a single soma, and themembrane potential (V) recorded from that neuron (usually a PD neuron) is used todetermine how much synaptic current (Isyn) this neuron receives through the artificialsynapse. (C) Phase resetting measurement. The membrane potential record from an AB/PDcomplex, with an intrinsic period P0, which is perturbed at the stimulus interval ts by anexcitatory synaptic input. The peak of the first spike is designated as zero phase. The verticaldashed line corresponds to phase zero. The vertical dotted line indicates the time at which
Maran et al. Page 21
J Comput Neurosci. Author manuscript; available in PMC 2012 October 1.
NIH
-PA Author Manuscript
NIH
-PA Author Manuscript
NIH
-PA Author Manuscript

the input starts. P1 corresponds to the period of the cycle in which the input starts and P2 tothe period of the next cycle. The dotted horizontal line at −45 mV is given for reference. (D)Phase Resetting Curve of a biological neuron (Neuron 6 in Table 1). F1 (black) is first orderresetting and F2 (gray) is second order resetting. gsyn = 20 nS, duration is 595 ms.
Maran et al. Page 22
J Comput Neurosci. Author manuscript; available in PMC 2012 October 1.
NIH
-PA Author Manuscript
NIH
-PA Author Manuscript
NIH
-PA Author Manuscript
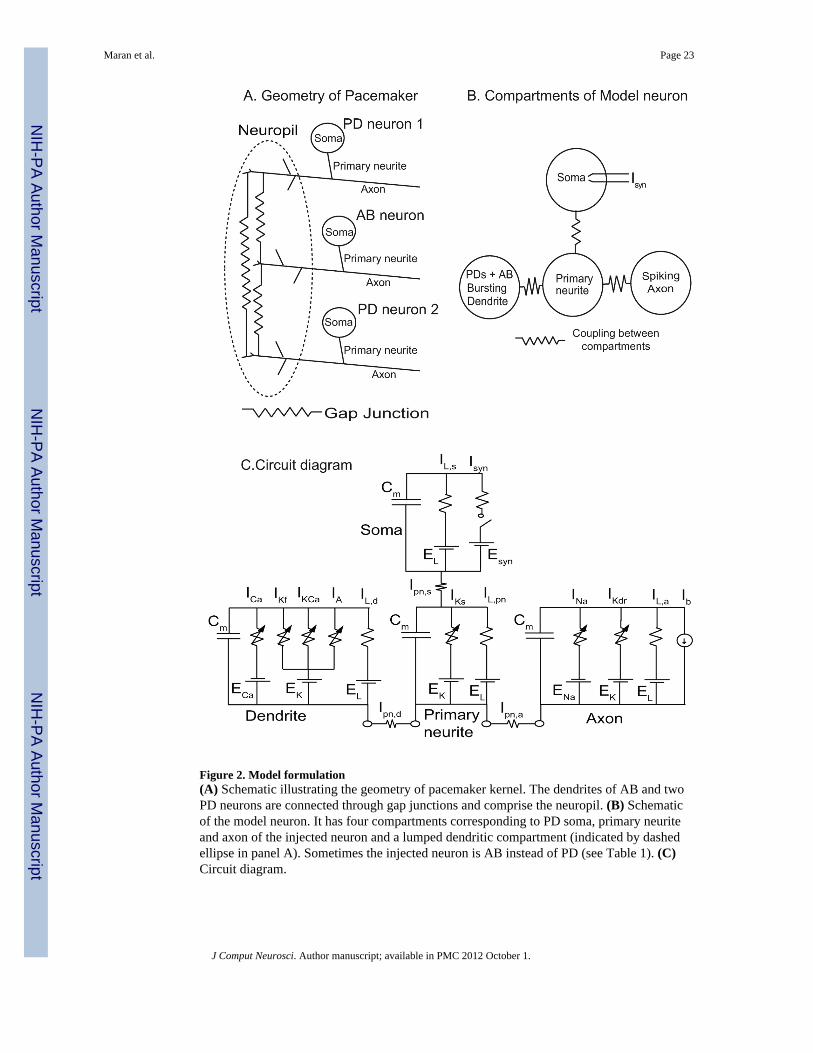
Figure 2. Model formulation(A) Schematic illustrating the geometry of pacemaker kernel. The dendrites of AB and twoPD neurons are connected through gap junctions and comprise the neuropil. (B) Schematicof the model neuron. It has four compartments corresponding to PD soma, primary neuriteand axon of the injected neuron and a lumped dendritic compartment (indicated by dashedellipse in panel A). Sometimes the injected neuron is AB instead of PD (see Table 1). (C)Circuit diagram.
Maran et al. Page 23
J Comput Neurosci. Author manuscript; available in PMC 2012 October 1.
NIH
-PA Author Manuscript
NIH
-PA Author Manuscript
NIH
-PA Author Manuscript

Figure 3. Prominent F2 window PRC for short strong cases explained(A) Biological (A1) and model (A2) PRCs, with first order in black and second order ingray. The arrows indicate the regions of the PRC that correspond to panels B and C. (B)Voltage traces recorded at the soma for a pulse given early in the interburst interval show ashortened cycle initiated by the pulse for the biological (B1) and model (B3) neurons. (A1)The biological neuron is Neuron 3 (Gsyn=50ns, duration=200ms) in Table 1. (B2 and B3) Inthe model neuron, an input strength of 60 nS is applied for 125 ms. The green trace isunperturbed, the blue trace is during the pulse (pulse shown below voltage trace) and redtrace is after pulse offset. Dendritic phase plane analysis (B2) shows that there is notransition to the upper branch. The arrow shows the direction of flow. The membrane
Maran et al. Page 24
J Comput Neurosci. Author manuscript; available in PMC 2012 October 1.
NIH
-PA Author Manuscript
NIH
-PA Author Manuscript
NIH
-PA Author Manuscript

potential in the axonal compartment (A4) shows that axonal spikes are evoked throughoutthe pulse, but do not reflect a new plateau in the dendritic membrane potential (A5), whichis unaffected except for small spikelets that occur during the pulse. (B) Voltage tracesrecorded at the soma for a pulse given applied later in the interburst (B1 and B2) show thatthe cycle initiated by the pulse is not shortened. The phase plane analysis (B3) shows that inthis case, there is nonetheless a premature transition to upper branch. The black curve is thevoltage nullcline.
Maran et al. Page 25
J Comput Neurosci. Author manuscript; available in PMC 2012 October 1.
NIH
-PA Author Manuscript
NIH
-PA Author Manuscript
NIH
-PA Author Manuscript

Figure 4. Cubic PRC for intermediate, weak pulses explained(A) Biological (A1) and model (A2) PRCs, with first order in black and second order ingray. The arrows indicate the regions of the PRC that correspond to panels B and C. (B)Voltage traces recorded at the soma for a pulse given during burst for the biological neuron(B1) and the model neuron (B2). The phase plane analysis (B3) shows that some spikes areadded to the burst, producing a delay. (C) Voltage traces recorded at the soma for a pulsegiven during interburst for the biological neuron (C1) and the model neuron (C2). Thedendritic phase plane analysis (C3) shows that an earlier shift to the upper branch causes theadvance. The colors and curves in model neuron voltage trace and phase plane analysis
Maran et al. Page 26
J Comput Neurosci. Author manuscript; available in PMC 2012 October 1.
NIH
-PA Author Manuscript
NIH
-PA Author Manuscript
NIH
-PA Author Manuscript

correspond to those in Fig. 3. In the model neuron, an input strength of 5nS is applied for400 ms. The biological neuron is neuron 6 (Gsyn=20nS, duration=595ms).
Maran et al. Page 27
J Comput Neurosci. Author manuscript; available in PMC 2012 October 1.
NIH
-PA Author Manuscript
NIH
-PA Author Manuscript
NIH
-PA Author Manuscript

Figure 5. Bilinear PRC for intermediate, strong pulses explained(A) Biological (A1) and model (A2) PRCs, with first order in black and second order ingray. The arrows indicate the regions of the PRC that correspond to panels B and C. (B)Voltage traces recorded at the soma for a pulse given during burst show delays due to burstextension for the biological (B1) and the model (B2) neuron. The black ovals in thedendritic phase plane diagrams (B3) correspond to a compact region of phase space to whichthe trajectory is confined until the end of the input. Spiking continues through the inputpulse. (C) Voltage traces recorded at the soma for a pulse given during the interburst for thebiological neuron (C1) and the model neuron (C2) show advances due to a burst initiated bythe pulse. (C3) The dendritic phase plane analysis shows that a premature shift to the upper
Maran et al. Page 28
J Comput Neurosci. Author manuscript; available in PMC 2012 October 1.
NIH
-PA Author Manuscript
NIH
-PA Author Manuscript
NIH
-PA Author Manuscript

branch is maked by spiking during the pulse. The colors and curves in model neuron voltagetrace and phase plane analysis correspond those in Fig. 3. In the model neuron, an inputstrength of 99 nS is applied for 650 ms. The biological neuron is Neuron 4 (Gsyn=50 nS,duration=200 ms).
Maran et al. Page 29
J Comput Neurosci. Author manuscript; available in PMC 2012 October 1.
NIH
-PA Author Manuscript
NIH
-PA Author Manuscript
NIH
-PA Author Manuscript

Figure 6. ‘U’ shaped PRC for long, weak pulses explained(A) Biological (A1) and model (A2) PRCs, with first order in black and second order ingray. The arrow indicates the regions of the PRC that correspond to panel B. (B) Voltagetraces recorded at the soma for a pulse given during burst for the biological neuron (B1) andthe model neuron (B2). An interburst interval occurs during the input. The biological neuronis Neuron 6 (Gsyn=20 nS, duration=955 ms). In the model neuron, an input strength of 5 nSis applied for 1050 ms. Dendritic phase plane analysis (B3) shows that the transition to thelower branch occurs unimpeded during a weak pulse, followed by an earlier shift to theupper branch that produces an advance.
Maran et al. Page 30
J Comput Neurosci. Author manuscript; available in PMC 2012 October 1.
NIH
-PA Author Manuscript
NIH
-PA Author Manuscript
NIH
-PA Author Manuscript

Figure 7. Trilinear PRCs for long, strong pulses explained(A) Biological (A1) and model (A2) PRCs, with first order in black and second order ingray. The arrows indicate the regions of the PRC that correspond to panels B and C. (B)Voltage traces recorded at the soma for a pulse during the early part of the burst exhibitshort delays in the bio neuron (B1) and the model neuron (B2). The biological neuron isagain Neuron 6 (Gsyn=60 nS, duration=955 ms). For the model neuron, an input strength of50 nS is applied for 1300 ms. (B3) The phase plane analysis shows that the trajectory is notconfined to the upper branch during the pulse as it was for similar shorter inputs (Fig. 5A3)but instead continues spiking during the switch to the lower branch. (C) Voltage tracesrecorded at the soma for a pulse during the late part of the burst exhibit longer delays for the
Maran et al. Page 31
J Comput Neurosci. Author manuscript; available in PMC 2012 October 1.
NIH
-PA Author Manuscript
NIH
-PA Author Manuscript
NIH
-PA Author Manuscript

biological (C1) and model (C2) neuron. Dendritic phase plane analysis (C3) shows a missedcycle with no spiking on the upper branch that is responsible for the sharp increase in delaysalong the line segment labeled C in panel A2. The colors and curves in model neuronvoltage trace and phase plane analysis correspond to those in Fig. 3.
Maran et al. Page 32
J Comput Neurosci. Author manuscript; available in PMC 2012 October 1.
NIH
-PA Author Manuscript
NIH
-PA Author Manuscript
NIH
-PA Author Manuscript

Figure 8. Summary of the variation in observed PRC shapesF1 (black) is first order resetting and F2 (gray) is second order resetting. The dependence ofthe characteristic shapes on the amplitude and duration of the excitatory conductance pulseis illustrated schematically. The prominent F2 window and bilinear PRCs were generatedusing the equations in the text with the following parameters: ϕb=0.45, Idur/P0 = 0.35 and R/P0=0.75.
Maran et al. Page 33
J Comput Neurosci. Author manuscript; available in PMC 2012 October 1.
NIH
-PA Author Manuscript
NIH
-PA Author Manuscript
NIH
-PA Author Manuscript

Figure 9. Re-examination of resetting due to inhibitory inputs(A) Spiking resumes quickly after pulse offset early in a burst for the biological (A1) andmodel (A2) neuron. A 400 nS inhibitory input was applied to the biological neuron for 150ms. A 100 nS inhibitory input was applied to the biological neuron for 100 ms. The phaseplane analysis (A3) shows that the burst after pulse offset is actually a continuation of theoriginal burst, so there is no branch switch. The colors and curves in model neuron voltagetrace and phase plane analysis correspond to those in Fig. 3. (B) Inhibition terminates theburst prematurely at slightly later phases than in A for both bio (B1) and model (B2) neuron.The phase plane analysis (B3) shows that the pulse terminates bursting by inducing a branchswitch. (C) Phase response curves for the biological (C1) and model neuron (C2). F1 (black)
Maran et al. Page 34
J Comput Neurosci. Author manuscript; available in PMC 2012 October 1.
NIH
-PA Author Manuscript
NIH
-PA Author Manuscript
NIH
-PA Author Manuscript

is first order resetting and F2 (gray) is second order resetting. The arrows indicate theregions of large and small advances, respectively, that correspond to panels A and Brespectively.
Maran et al. Page 35
J Comput Neurosci. Author manuscript; available in PMC 2012 October 1.
NIH
-PA Author Manuscript
NIH
-PA Author Manuscript
NIH
-PA Author Manuscript

Figure 10. Dendritic conductance injectionStrong short excitations given at the dendrite always cause branch switching. (A) Inputgiven at the beginning of the interburst interval initiates a drastically shortened burst (A1). A50 nS inhibitory input is applied for 100 ms. The phase plane analysis (A2) shows that animmediate transition to the upper branch results in the short burst. The colors and curves inmodel neuron voltage trace and phase plane analysis correspond to those in Fig. 3. (B) Inputgiven in the middle of the interburst interval initiates a burst that is only slightly shortened(B1). The phase plane analysis (B2) shows why the burst following a branch switch isalways shortened, and shortened more the earlier in the interburst that the input is applied.(C) Phase Response Curve, F1 (black) is first order resetting and F2 (gray) is second orderresetting. The second order advances result from the shortened burst in the cycle followingthe perturbation, with the arrows indicating the regions that correspond to panels A and Brespectively.
Maran et al. Page 36
J Comput Neurosci. Author manuscript; available in PMC 2012 October 1.
NIH
-PA Author Manuscript
NIH
-PA Author Manuscript
NIH
-PA Author Manuscript

NIH
-PA Author Manuscript
NIH
-PA Author Manuscript
NIH
-PA Author Manuscript
Maran et al. Page 37
Tabl
e 1
Sum
mar
y of
PR
Cs g
ener
ated
usi
ng a
squa
re p
ulse
or
slig
htly
rou
nded
squa
re p
ulse
The
PRC
s wer
e di
vide
d in
to th
e fo
llow
ing
cate
gorie
s bas
ed o
n sh
ape:
F in
dica
tes p
rom
inen
t F2 w
indo
w, C
cub
ic, B
bili
near
, U U
-sha
ped,
T tr
iline
ar a
ndN
stan
ds fo
r neg
ligib
le. T
he to
tals
for e
ach
cate
gory
are
as f
ollo
ws,
with
the
num
ber o
f neu
rons
n th
at e
xhib
ited
at le
ast o
ne P
RC
in th
e ca
tego
ry is
giv
enin
par
enth
eses
: F 1
5 (n
=4),
C 8
(n=5
) B 8
(n=3
) U 4
(n=4
) T 6
(n=3
) and
N 1
9 (n
=5).
PRC
s tha
t wer
e tra
nsiti
onal
bet
wee
n tw
o ca
tego
ries t
otal
ed 4
(n=3
)an
d ar
e in
dica
ted
by a
slas
h be
twee
n th
e tw
o ca
tego
ries.
All
reco
rdin
gs w
ere
from
lobs
ter e
xcep
t neu
ron
4 w
hich
was
from
cra
b, a
nd a
ll re
cord
ings
wer
efr
om a
PD
som
a ex
cept
neu
ron
8 w
hich
was
from
AB
. The
inpu
t rev
ersa
l pot
entia
l use
d fo
r Neu
ron
5 an
d N
euro
n 6
was
50
mV
. For
all
othe
r cas
es th
ere
vers
al p
oten
tial u
sed
was
0 m
V. F
or N
euro
ns 5
to 8
the
syna
ptic
inpu
t was
a sl
ight
ly ro
unde
d sq
uare
pul
se w
ith e
xpon
entia
l ris
e an
d fa
ll tim
e co
nsta
nts
of 1
0 m
s as e
xpla
ined
in M
etho
ds, i
n al
l oth
er c
ases
a sq
uare
pul
se w
as g
iven
. Sin
ce th
e pe
riod
of th
e cy
cles
cha
nged
slow
ly d
urin
g re
cord
ings
, the
min
imum
(min
) and
max
imum
(max
) val
ues o
f the
per
iod
are
show
n fo
r som
e ne
uron
s. D
ur c
orre
spon
ds to
dur
atio
n of
the
inpu
t.
Peri
od (m
s)St
reng
th (n
S)
Neu
ron
Dur
(ms)
Min
Mea
nM
ax10
2030
5060
7010
015
020
025
0
150
012
5117
83C
CC
/BB
220
1880
NN
N
50N
NN
100
NF
F
200
NF
350
1490
1702
NN
N
100
NF
F
200
NF
F
4(C
rab)
5059
874
5F
FF
F
100
FF
FF/
B
200
F/B
BB
B
500
CT
TB
595
510
97U
659
512
7115
06C
T
955
UT
T
769
511
4012
04C
B/T
T
955
U
J Comput Neurosci. Author manuscript; available in PMC 2012 October 1.

NIH
-PA Author Manuscript
NIH
-PA Author Manuscript
NIH
-PA Author Manuscript
Maran et al. Page 38
Peri
od (m
s)St
reng
th (n
S)
Neu
ron
Dur
(ms)
Min
Mea
nM
ax10
2030
5060
7010
015
020
025
0
8(A
B)
210
1602
NF
1975
U
910
079
684
7N
500
CC
C
1015
015
2915
63N
NN
N
500
BB
B
J Comput Neurosci. Author manuscript; available in PMC 2012 October 1.

NIH
-PA Author Manuscript
NIH
-PA Author Manuscript
NIH
-PA Author Manuscript
Maran et al. Page 39
Tabl
e 2
Sum
mar
y of
PR
Cs g
ener
ated
usi
ng a
ram
p in
put
The
syna
ptic
inpu
ts w
ere
give
n as
ram
ps e
xpla
ined
in M
etho
ds. B
riefly
, the
ram
p is
eith
er g
iven
for f
ull d
urat
ion
or fo
r the
firs
t hal
f (in
the
seco
nd h
alf
dura
tion
the
neur
on re
ceiv
es fu
ll st
reng
th in
put).
The
cat
egor
ies a
re th
e sa
me
as in
tabl
e 1.
All
reco
rdin
gs a
re fr
om P
D so
mat
a in
lobs
ter.
The
tota
ls a
regi
ven
as in
the
capt
ion
for T
able
1; F
9 (n
=1),
C3
(n=2
) B 4
(n=1
) U 0
, T 0
and
N 2
(n=1
). Th
ree
reco
rdin
gs fr
om n
euro
n 12
wer
e tra
nsiti
onal
bet
wee
ntw
o ca
tego
ries.
The
reve
rsal
pot
entia
l use
d w
as 0
mV
. Stre
ngth
(nS)
Peri
od (m
s)60
8010
015
020
0
Neu
ron
Dur
(ms)
Min
Max
Full
ram
pH
alf
ram
pFu
llra
mp
Hal
fra
mp
Full
ram
pH
alf
ram
pFu
llra
mp
Hal
fra
mp
Full
ram
p
1150
014
5015
31C
C
1250
990
1686
NN
N/F
F
100
N/F
FF
FF
F
200
FF
F
500
CF/
BB
BB
B
J Comput Neurosci. Author manuscript; available in PMC 2012 October 1.

NIH
-PA Author Manuscript
NIH
-PA Author Manuscript
NIH
-PA Author Manuscript
Maran et al. Page 40
Tabl
e 3
Para
met
er v
alue
s
Par
Val
ues
Uni
tsPa
rV
alue
sU
nits
s
ρ0.
0016
ms−
1G
L,d
0.03
54µS
λ n0.
8m
s−1
GL,
pn0.
001
µS
λ h0.
8m
s−1
GL,
s0.
001
µS
KA
1m
s−1
GL,
a0.
001
µS
τ z23
ms
GK
8.0
µS
τ b1
ms
GC
a0.
04µS
KC
a0.
0078
mV−
1G
Na
15.0
µS
z b−50
mV
GsK
0.06
5µS
v a−12
mV
GK
f0.
07µS
v b−62
mV
GA
100
µS
s a−26
mV
GK
Ca
0.27
3µS
s b6
mV
Cm
1.0
nF
E Na
30m
VI ex
t0.
2nA
E Ca
140
mV
Gs,p
n0.
05µS
E K−75
mV
Ga,
pn0.
5µS
E L−40
mV
Gd,
pn0.
04µS
J Comput Neurosci. Author manuscript; available in PMC 2012 October 1.
Copyright © 2022 FDOKUMEN