Response to a postal survey collecting information for fisheries management
12
Aquaculture and Fisheries Management 1990, 21, 479-489 Response to a postal survey collecting information for fisheries management G. W. MAWLE & P. F. RANDERSON* Department of Applied Biology, University of Wales Institute of Science and Technology, Cardiff, Wales Abstract. In a postal survey of 13750 anglers holding licences for a variety of waters in South Wales, a response rate of 51-8% was achieved. Reasons for non-response bias were investigated. Response rates varied throughout the 13-month study, suggesting response was enhanced by prior publicity and in winter, but reduced in the summer holiday period. There was also a progressive loss of potential respondents through deaths and relocation. Salmon anglers provided a higher response rate than trout and coarse anglers. Anglers who had purchased a season licence gave a higher response than those holding a short-term licence. Receipt of questionnaires mid-week produced a lower rate of response. Young and infrequent anglers are likely to be underrepresented in a postal sample. The importance of such non-response bias to parameters estimated by the survey such as catch, expenditure orfishingfrequency is discussed. Recommendations are made for increasing response in future surveys. Introduction With rising pressure on fisheries in the United Kingdom, it is increasingly necessary for managers to obtain information from anglers for use in monitoringfishstocks and in assessing the demand for fisheries. Recent trends in information technology have increased the feasibility of collating and analysing large amounts of such data. Information sought may include details of catches or relate to the anglers themselves, e.g. their attitudes, expenditure, socio-economic characteristics orfishingeffort. There are a variety of methods of contacting anglers to obtain information, including catch return forms distributed with a licence or permit, interviews at the water's edge (e.g. Stabler 1980), and postal survey by which questionnaires are sent to anglers' homes to be completed by the addressee and returned by post (e.g. Randerson, Edwards & Shaw 1978; Radford 1980). A postal survey may be the only practical approach to contacting a large sample of widely dispersed anglers, as other methods can be prohibitively expensive. Whatever method is used to contact anglers, it is important to obtain a high response rate otherwise the results of a survey will be biased if non-respondents differ significantly from respondents. In this paper, the response to a postal survey of anglers is analysed with the objective of indicating how the response by anglers to postal surveys might be improved and also the likely direction of biases which may arise from non-response. * Present address: School of Pure and Applied Biology, University of Wales College of Cardiff, PO Box 915, Cardiff CFl 3TL, Wales, Correspondence: Dr G, W, Mawle, National Rivers Authority, Rivers House, St Mellons Business Park, Cardiff CF3 OLT, Wales, 479
-
Upload
independent -
Category
Documents
-
view
0 -
download
0
Transcript of Response to a postal survey collecting information for fisheries management
Aquaculture and Fisheries Management 1990, 21, 479-489
Response to a postal survey collecting information forfisheries management
G. W. MAWLE & P. F. RANDERSON* Department of Applied Biology, University ofWales Institute of Science and Technology, Cardiff, Wales
Abstract. In a postal survey of 13750 anglers holding licences for a variety of waters in SouthWales, a response rate of 51-8% was achieved. Reasons for non-response bias wereinvestigated.
Response rates varied throughout the 13-month study, suggesting response was enhancedby prior publicity and in winter, but reduced in the summer holiday period. There was also aprogressive loss of potential respondents through deaths and relocation. Salmon anglersprovided a higher response rate than trout and coarse anglers. Anglers who had purchased aseason licence gave a higher response than those holding a short-term licence. Receipt ofquestionnaires mid-week produced a lower rate of response. Young and infrequent anglers arelikely to be underrepresented in a postal sample.
The importance of such non-response bias to parameters estimated by the survey such ascatch, expenditure or fishing frequency is discussed. Recommendations are made for increasingresponse in future surveys.
Introduction
With rising pressure on fisheries in the United Kingdom, it is increasingly necessary formanagers to obtain information from anglers for use in monitoring fish stocks and in assessingthe demand for fisheries. Recent trends in information technology have increased thefeasibility of collating and analysing large amounts of such data. Information sought mayinclude details of catches or relate to the anglers themselves, e.g. their attitudes,expenditure, socio-economic characteristics or fishing effort. There are a variety of methodsof contacting anglers to obtain information, including catch return forms distributed with alicence or permit, interviews at the water's edge (e.g. Stabler 1980), and postal survey bywhich questionnaires are sent to anglers' homes to be completed by the addressee andreturned by post (e.g. Randerson, Edwards & Shaw 1978; Radford 1980). A postal surveymay be the only practical approach to contacting a large sample of widely dispersed anglers,as other methods can be prohibitively expensive. Whatever method is used to contactanglers, it is important to obtain a high response rate otherwise the results of a survey will bebiased if non-respondents differ significantly from respondents.
In this paper, the response to a postal survey of anglers is analysed with the objective ofindicating how the response by anglers to postal surveys might be improved and also the likelydirection of biases which may arise from non-response.
* Present address: School of Pure and Applied Biology, University of Wales College of Cardiff, PO Box 915,Cardiff CFl 3TL, Wales,
Correspondence: Dr G, W, Mawle, National Rivers Authority, Rivers House, St Mellons Business Park, CardiffCF3 OLT, Wales,
479
480 G. W. Mawle & P. F. Randerson
MethodsIn England and Wales, freshwater anglers are legally obliged to purchase a rod licence priorto fishing within the area of each of 10 regional water authorities (now regions of the NationalRivers Authority). The counterfoils of these licences therefore provide a list of the anglersusing the freshwater fisheries within an area, and comprise the sampling frame. In order tocollect data on freshwater angling in South Wales, questionnaires were sent to 13750 anglersselected at random from those who had purchased a Welsh Water Authority (WWA) rodlicence within the area in 1978. The primary purpose of collecting this information was topermit the analysis of supply and demand for freshwater angling within the region (Mawle1984a,b).
An angler could have purchased one of several different classes of WWA rod licence. Theoptions were (1) a salmon licence that allowed the angler to fish for all species, (2) a troutlicence which covered him for all fish except migratory salmonids or (3) a coarse fishinglicence which allowed him to fish for all species except salmonids. For each class of licence,different categories were available, i.e. full season, concessionary season (available toanglers under 16 years of age, in receipt of a state retirement pension, or unemployed whilebeing in receipt of a state disability allowance), and short-term licences which covered theangler for either a day or a week. The class and category of rod licence purchased by eachselected angler were recorded, so creating a stratified series of subsamples.
The questionnaire comprised 35 questions printed on seven differently coloured sheets ofA4 paper (210 x 297mm), with the first sheet being light blue. A multi-colouredquestionnaire was used to aid collation and also to improve response rate (Crapo & Chubb1969). The majority of questions were about the angler's last fishing trip, e.g. the site visited,the catch, the length of time fished and the costs of the trip. Other questions concerned thefrequency of use of site permits and WWA rod licences, the number of trips the angler hadmade in the previous year and the angler's socio-economic characteristics, including incomefor those anglers in employment.
In order to reduce bias towards trips made at any particular time of year, questionnaireswere dispatched at monthly intervals from May 1979 to May 1980 with each month's batchbeing divided between six consecutive posting days; Sundays were excluded as post is neithercollected nor delivered. In May 1979, questionnaires were sent to 625 anglers but from June,when additional resources became available, the number was increased to 1250 per month.Questionnaires were sent to 625 anglers in May 1980 to compensate for the smaller sample inthe previous May. No questionnaires were posted in December because of the disruption tothe post prior to Christmas.
An introductory letter was included with the questionnaire explaining the aims of thesurvey and by whom it was sponsored, i.e. the Water Research Centre. After 9 posting days,a reminder was sent to each non-respondent and, if no reply had been received after a further9 days, a second reminder was sent with a second Copy of the questionnaire. Envelopes,having a Post Office FREEPOST address and indicating that no postage was required, wereincluded with both the initial questionnaire and the second reminder. In order to encourageresponse, anglers' associations in Wales were contacted prior to the start of the survey to gainthe support of their members and articles describing the aims of the survey appeared in thelocal and national angling press. On the return of a questionnaire, the date of return and,where known, the reason for non-completion were recorded.
Weighted least squares regression (Chatterjee & Price 1977) was used to examine trends
Response to a postal survey 481
r6-0
7 0 -
o•o
aia.
a>c
I
-5O6 0 -
50--4-0
4 0 -
-K 30 -
a.
s 10-
O
o
I-3-0 I
--2-0
2 0 - .
-1-0
Remindersent
Remindersent
0 2 4 6 8 |lO 12 14 16 I8t 20 22 24 26 28 30
Number of posting days after questionnoire posted
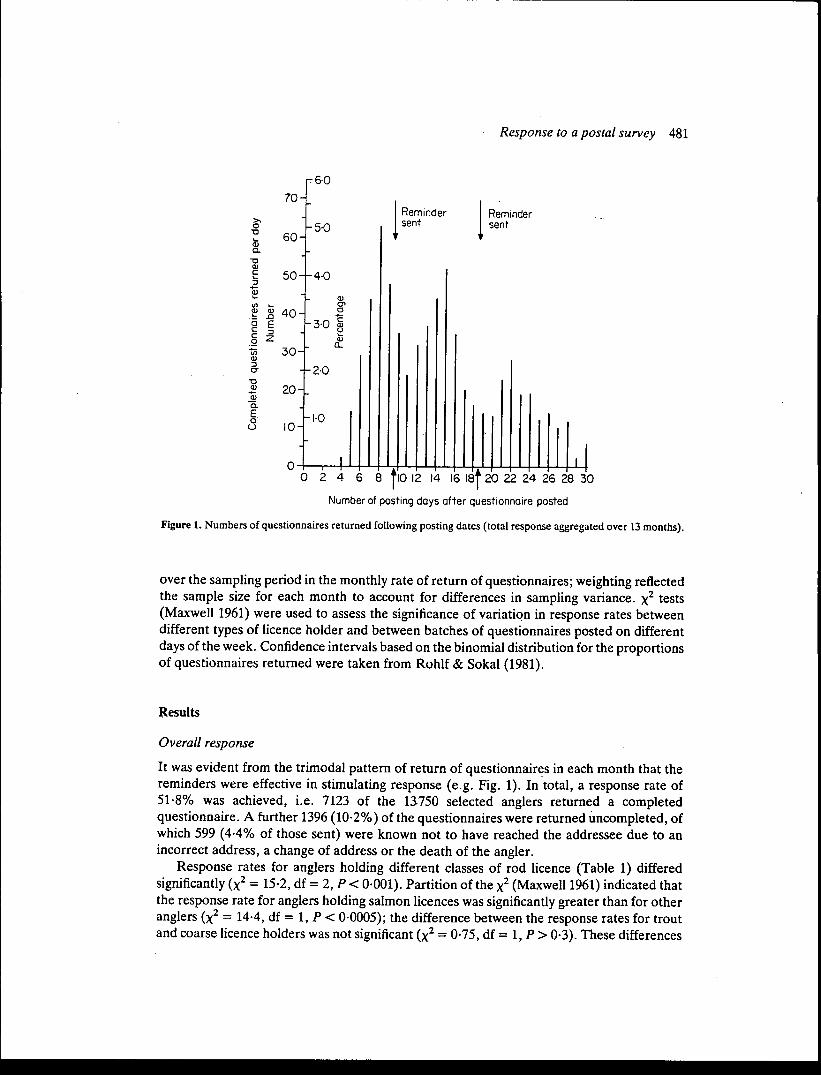
Figure 1. Numbers of questionnaires returned following posting dates (total response aggregated over 13 months).
over the sampling period in the monthly rate of return of questionnaires; weighting reflectedthe sample size for each month to account for differences in sampling variance, x^ tests(Maxwell 1961) were used to assess the significance of variation in response rates betweendifferent types of licence holder and between batches of questionnaires posted on differentdays of the week. Confidence intervals based on the binomial distribution for the proportionsof questionnaires returned were taken from Rohlf & Sokal (1981).
Results
Overall response
It was evident from the trimodal pattern of return of questionnaires in each month that thereminders were effective in stimulating response (e.g. Fig. 1). In total, a response rate of51-8% was achieved, i.e. 7123 of the 1S750 selected anglers returned a completedquestionnaire. A further 1396 (10-2%) of the questionnaires were returned uncompleted, ofwhich 599 (4-4% of those sent) were known not to have reached the addressee due to anincorrect address, a change of address or the death of the angler.
Response rates for anglers holding different classes of rod licence (Table 1) differedsignificantly (x^ = 15-2, df = 2, P < 0-001). Partition of the x^ (Maxwell 1961) indicated thatthe response rate for anglers holding salmon licences was significantly greater than for otheranglers (x^ = 14-4, df=l,P< 0-0005); the difference between the response rates for troutand coarse licence holders was not significant (x^ = 0-75, df = 1, P > 0-3). These differences
482 G. W. Mawle & P. F. Randerson
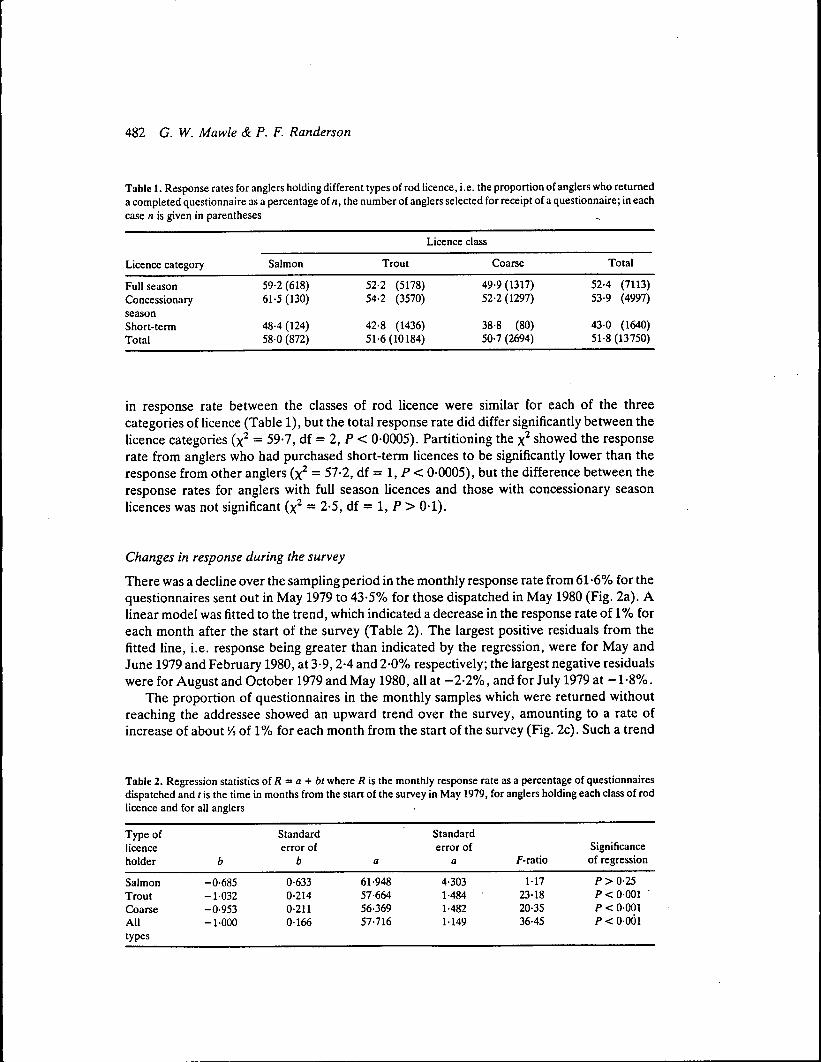
Table 1. Response rates for anglers holding different types of rod licence, i.e. the proportion of anglers who returneda completed questionnaire as a percentage of n, the number of anglers selected for receipt of a questionnaire; in eachcase n is given in parentheses
Licence category
Full seasonConcessionaryseasonShort-termTotal
Salmon
59-2 (618)61-5 (130)
48-4 (124)58-0 (872)
Trout
52-2 (5178)54-2 (3570)
42-8 (1436)51-6(10184)
Licence class
Coarse
49-9 (1317)52-2 (1297)
38-8 (80)50-7 (2694)
Total
52-4 (7113)53-9 (4997)
43-0 (1640)51-8 (13750)
in response rate between the classes of rod licence were similar for each of the threecategories of licence (Table 1), but the total response rate did differ significantly between thelicence categories (x^ = 59-7, df = 2, P < 0-0005). Partitioning the x^ showed the responserate from anglers who had purchased short-term licences to be significantly lower than theresponse from other anglers (x^ = 57-2, df = 1, P < 0-0005), but the difference between theresponse rates for anglers with full season licences and those with concessionary seasonlicences was not significant (x^ = 2-5, df = 1, P > 0-1).
Changes in response during the survey
There was a decline over the sampling period in the monthly response rate from 61-6% for thequestionnaires sent out in May 1979 to 43-5% for those dispatched in May 1980 (Fig. 2a). Alinear model was fitted to the trend, which indicated a decrease in the response rate of 1% foreach month after the start of the survey (Table 2). The largest positive residuals from thefitted line, i.e. response being greater than indicated by the regression, were for May andJune 1979 and February 1980, at 3-9,2-4 and 2-0% respectively; the largest negative residualswere for August and October 1979 and May 1980, all at -2-2%, and for July 1979 at -1-8%.
The proportion of questionnaires in the monthly samples which were returned withoutreaching the addressee showed an upward trend over the survey, amounting to a rate ofincrease of about /s of 1% for each month from the start of the survey (Fig. 2c). Such a trend
Table 2. Regression statistics o{ R = a + bt where R is the monthly response rate as a percentage of questionnairesdispatched and / is the time in months from the start of the survey in May 1979, for anglers holding each class of rodlicence and for all anglers
Type oflicenceholder
SalmonTroutCoarseAlltypes
b
-0-685-1-032-0-953-1-000
Standarderror of
b
0-6330-2140-2110-166
a
61-94857-66456-36957-716
Standarderror of
a
4-3031-4841-4821-149
f-ratio
1-1723-1820-3536-45
Significanceof regression
P>0-25P<QOQlP < 0-001P < 0-001
Response to a postal survey 483
70
occo
oo<u
•5<uo
§a.
I 60Q.
J 50 -
(a)
I I I I I I I I I
8p7 -
6 -
5
45! 3O
5 2
1 I
I I
II
1
(b)
1
uo
ai in
6 -
o 2I
(c
1
1 1
•
0 I 2 3 4 5 6 7 8 9 10 II 12May May1979 1980
Time from start of the survey (months)
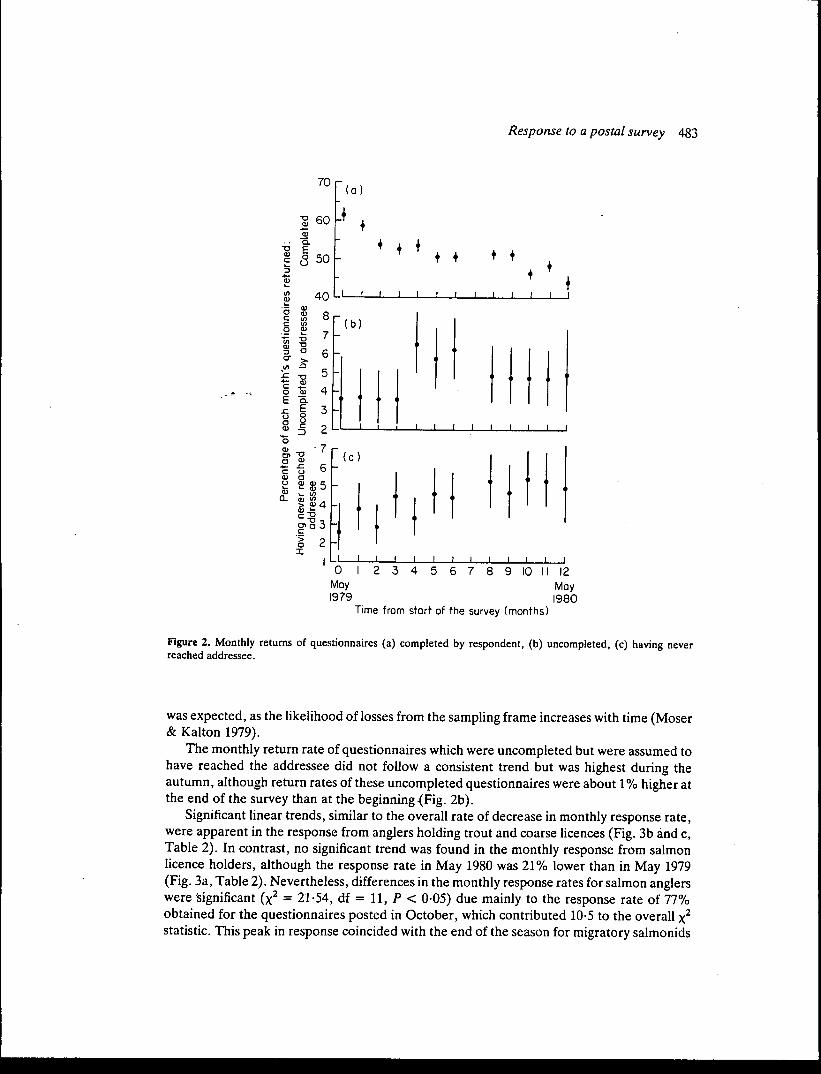
Figure 2. Monthly returns of questionnaires (a) completed by respondent, (b) uncompleted, (c) having neverreached addressee.
was expected, as the likelihood of losses from the sampling frame increases with time (Moser& Kalton 1979).
The monthly return rate of questionnaires which were uncompleted but were assumed tohave reached the addressee did not follow a consistent trend but was highest during theautumn, although return rates of these uncompleted questionnaires were about 1% higher atthe end of the survey than at the beginning {Fig. 2b).
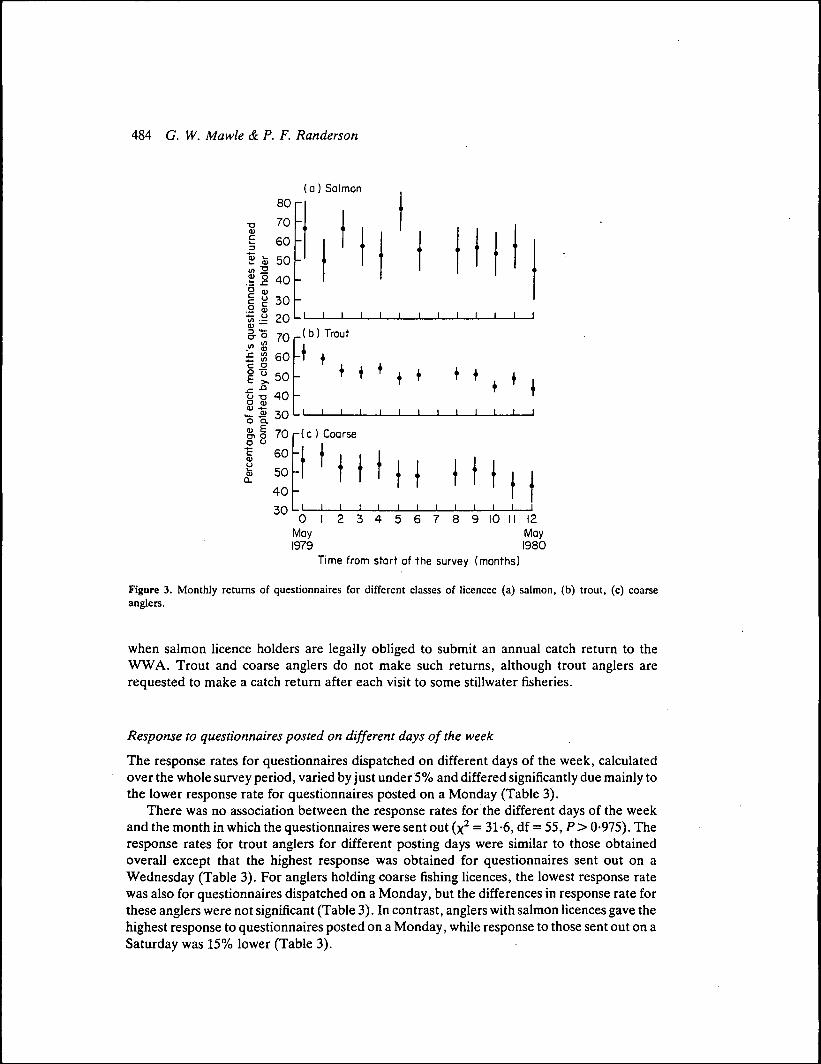
Significant linear trends, similar to the overall rate of decrease in monthly response rate,were apparent in the response from anglers holding trout and coarse licences (Fig. 3b and c.Table 2). In contrast, no significant trend was found in the monthly response from salmonlicence holders, although the response rate in May 1980 was 21% lower than in May 1979(Fig. 3a, Table 2). Nevertheless, differences in the monthly response rates for salmon anglerswere significant (x^ = 21-54, df = 11, P < 0-05) due mainly to the response rate of 77%obtained for the questionnaires posted in October, which contributed 10-5 to the overall x̂statistic. This peak in response coincided with the end of the season for migratory salmonids
484 G. W. Mawle & P. F. Randerson
•ac
S S50) o
. ! : SI
c •"
(a) Salmon80
70
60
50
40
_ 30
I 20. "o 7n ,- (b) Trout
(/)
I 50•° 40O T3
g .£»- .20 Q.01 EOl Oo o
I
307060504030
r ( c ) Coarse
II. I 1 I I I I I I I I I I I
0 I 2 3 4 5 6 7 8 9 10 II 12May May1979 1980
Time from start of the survey (months)
Figure 3. Monthly returns of questionnaires for different classes of licencee (a) salmon, (b) trout, (c) coarseanglers.
when salmon licence holders are legally obliged to submit an annual catch return to theWWA. Trout and coarse anglers do not make such returns, although trout anglers arerequested to make a catch return after each visit to some stillwater fisheries.
Response to questionnaires posted on different days of the week
The response rates for questionnaires dispatched on different days of the week, calculatedover the whole survey period, varied by just under 5% and differed significantly due mainly tothe lower response rate for questionnaires posted on a Monday (Table 3).
There was no association between the response rates for the different days of the weekand the month in which the questionnaires were sent out (x^ = 31 -6, df = 55, P > 0-975). Theresponse rates for trout anglers for different posting days were similar to those obtainedoverall except that the highest response was obtained for questionnaires sent out on aWednesday (Table 3). For anglers holding coarse fishing licences, the lowest response ratewas also for questionnaires dispatched on a Monday, but the differences in response rate forthese anglers were not significant (Table 3). In contrast, anglers with salmon licences gave thehighest response to questionnaires posted on a Monday, while response to those sent out on aSaturday was 15% lower (Table 3).
Response to a postal survey 485
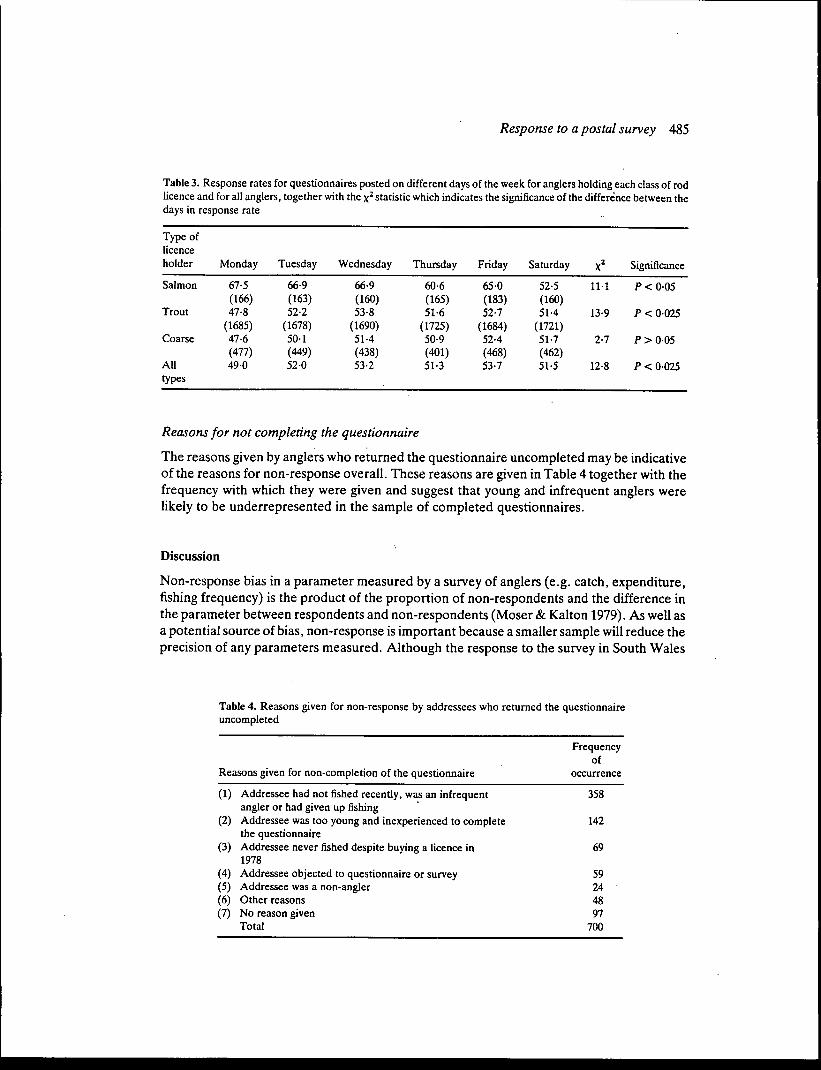
Table 3. Response rates for questionnaires posted on different days of the week for anglers holding each class of rodlicence and for all anglers, together with the x^ statistic which indicates the significance of the difference between thedays in response rate
Type oflicenceholder
Salmon
Trout
Coarse
Alltypes
Monday
67-5(166)47-8
(1685)47-6(477)490
Tuesday
669(163)52-2
(1678)50-1(449)52-0
Wednesday
66-9(160)53-8
(1690)51-4(438)53-2
Thursday
60-6(165)516
(1725)50-9(401)51-3
Friday
65-0(183)52-7
(1684)52-4(468)53-7
Saturday
52-5(160)51-4
(1721)51-7(462)51-5
l M
13-9
2-7
12-8
Significance
P < 0-05
P < 0-025
P > 0-05
? < 0-025
Reasons for not completing the questionnaire
The reasons given by anglers who returned the questionnaire uncompleted may be indicativeof the reasons for non-response overall. These reasons are given in Table 4 together with thefrequency with which they were given and suggest that young and infrequent anglers werelikely to be underrepresented in the sample of completed questionnaires.
Discussion
Non-response bias in a parameter measured by a survey of anglers (e.g. catch, expenditure,fishing frequency) is the product of the proportion of non-respondents and the difference inthe parameter between respondents and non-respondents (Moser & Kalton 1979). As well asa potential source of bias, non-response is important because a smaller sample will reduce theprecision of any parameters measured. Although the response to the survey in South Wales
Table 4. Reasons given for non-response by addressees who returned the questionnaireuncompleted
Frequencyof
Reasons given for non-completion of the questionnaire occurrence
(1) Addressee had not fished recently, was an infrequent 358angler or had given up fishing
(2) Addressee was too young and inexperienced to complete 142the questionnaire
(3) Addressee never fished despite buying a licence in 691978
(4) Addressee objected to questionnaire or survey 59(5) Addressee was a non-angler 24(6) Other reasons 48(7) No reason given 97
Total 700
486 G. W. Mawle & P. F. Randerson
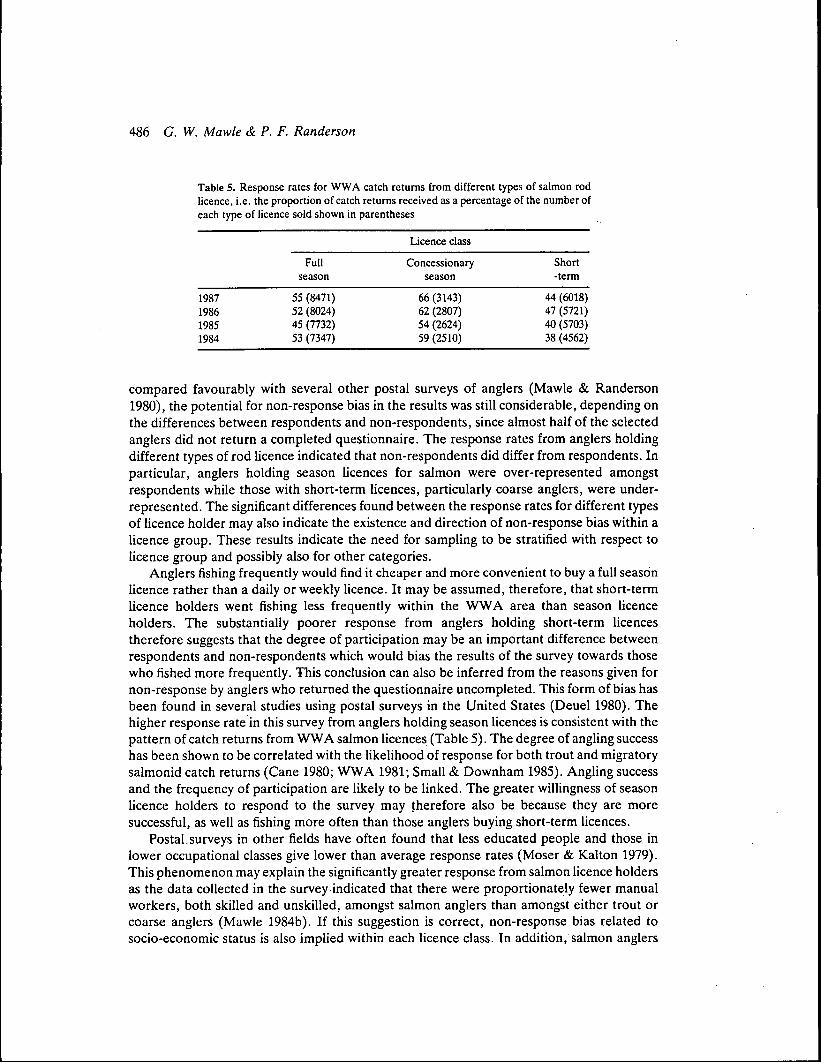
Table 5. Response rates for WWA catch returns from different types of salmon rodlicence, i,e. the proportion of catch returns received as a percentage of the number ofeach type of licence sold shown in parentheses
1987198619851984
Fullseason
55 (8471)52 (8024)45 (7732)53 (7347)
Licence class
Concessionaryseason
66 (3143)62 (2807)54 (2624)59 (2510)
Short-term
44 (6018)47 (5721)40 (5703)38 (4562)
compared favourably with several other postal surveys of anglers (Mawle & Randerson1980), the potential for non-response bias in the results was still considerable, depending onthe differences between respondents and non-respondents, since almost half of the selectedanglers did not return a completed questionnaire. The response rates from anglers holdingdifferent types of rod licence indicated that non-respondents did differ from respondents. Inparticular, anglers holding season licences for salmon were over-represented amongstrespondents while those with short-term licences, particularly coarse anglers, were under-represented. The significant differences found between the response rates for different typesof licence holder may also indicate the existence and direction of non-response bias within alicence group. These results indicate the need for sampling to be stratified with respect tolicence group and possibly also for other categories.
Anglers fishing frequently would find it cheaper and more convenient to buy a full seasonlicence rather than a daily or weekly licence. It may be assumed, therefore, that short-termlicence holders went fishing less frequently within the WWA area than season licenceholders. The substantially poorer response from anglers holding short-term licencestherefore suggests that the degree of participation may be an important difference betweenrespondents and non-respondents which would bias the results of the survey towards thosewho fished more frequently. This conclusion can also be inferred from the reasons given fornon-response by anglers who returned the questionnaire uncompleted. This form of bias hasbeen found in several studies using postal surveys in the United States (Deuel 1980). Thehigher response rate in this survey from anglers holding season licences is consistent with thepattern of catch returns from WWA salmon licences (Table 5). The degree of angling successhas been shown to be correlated with the likelihood of response for both trout and migratorysalmonid catch returns (Cane 1980; WWA 1981; Small & Downham 1985). Angling successand the frequency of participation are likely to be linked. The greater willingness of seasonlicence holders to respond to the survey may therefore also be because they are moresuccessful, as well as fishing more often than those anglers buying short-term licences.
Postal,surveys in other fields have often found that less educated people and those inlower occupational classes give lower than average response rates (Moser & Kalton 1979).This phenomenon may explain the significantly greater response from salmon licence holdersas the data collected in the survey indicated that there were proportionately fewer manualworkers, both skilled and unskilled, amongst salmon anglers than amongst either trout orcoarse anglers (Mawle 1984b). If this suggestion is correct, non-response bias related tosocio-economic status is also implied within each licence class. In addition, salmon anglers
Response to a postal survey 487
may be more receptive to questionnaires because of their obligation to submit annual catchreturns. This supposition is supported by the end-of-season peak in response for salmonanglers and, if valid, suggests that higher response rates might be achieved for other anglerswere information to be collected from them more regularly.
The decline in response over the sampling period highlights a problem of using aretrospective list of anglers. Part of the decline can be attributed to anglers dying or movinghouse but it may also be due to some anglers not having fished since they purchased theirlicences. Therefore, as time passes, anglers may have increasing difficulty in rememberingthe details of their fishing trips and may become progressively less interested in contributingto a survey; Deuel (1980) records that anglers may have difficulty in recalling details of fishingtrips even over a 2-month period. There was little evidence for a decline in response fromsalmon licence holders, perhaps because salmon anglers, who spend more on average per tripthan either trout or coarse anglers (Mawle 1984b), are more committed to their sport.
The propensity for salmon licence holders to respond to the questionnaire and reminderssent in October (Fig. 3) suggests that WWA might attain both a higher rate of catch returnsand more accurate details if reminders were sent immediately after the end of the season.Recent practice by the WWA has been to send out reminders several months later, up toApril the following year.
Other than the peak in October for salmon anglers, there was little evidence for significantseasonal variation in response, and deviations from regression lines may be largelyattributable to sampling variance. Nevertheless, response was lower than expected in Julyand August when many people take their holidays. The impact of the reminders may havebeen lost on anglers returning home from holiday if they opened the initial letter and the tworeminders at the same time. In addition, angling activity was greatest during the summer(Mawle 1984b) and anglers may have considered completing a questionnaire a less desirableactivity than angling itself or some other form of outdoor recreation. Similarly, the higherthan expected response in January and February may have been due to seasonal effects,particularly since the trout fishing season is closed during these months. The high responserate in May 1979 was counteracted by a low response rate in May 1980. One possibleexplanation is that the publicity prior to the survey gave rise to an initially high response.
In general, questionnaires would have reached their destinations on the third day afterposting; for a local address the time may have been shorter, while up to a week may have beenrequired to reach a more distant address (Post Office, personal communication). The lowerresponse rate for questionnaires posted on a Monday therefore implies that anglers are leastlikely to respond to a questionnaire arriving on a Thursday or perhaps a Wednesday since alarge proportion of addressees lived locally. The low response by salmon anglers toquestionnaires posted on a Saturday may be because a smaller proportion of these anglers,who would have received questionnaires midweek, lived locally compared to trout or coarseanglers (Mawle 1984b).
Conclusion
Despite advanced publicity and the use of two reminders, an overall response from 13750anglers to a postal questionnaire of only 51-8% was achieved. Although this comparedfavourably with other such surveys, the likelihood of non-response bias affecting parametersmeasured by the survey was of concern.
488 G. W. Mawle & P. F. Randerson
Response rates declined steadily throughout the 13 months of the survey, indicating theneed for as recent a list of anglers as possible. Higher than expected responses in the first 2months suggested a beneficial effect of prior publicity. Similarly, response was lowest duringthe summer, possibly due to holiday absence, and highest in the winter, perhaps becausefishing activity was lower. The pattern of non-response differed significantly between salmon,trout and coarse anglers, suggesting that each class should be considered separately inseeking to optimize anglers' response to postal survey. Response rates were greatest fromsalmon anglers and lowest from those with short-term licences. For salmon anglers the bestresponse was obtained for October, which coincided with the submission of catch returnsrequired by the Welsh Water Authority. Receipt of questionnaires mid-week resulted in asignificantly lower rate of response.
In order to minimize bias arising from non-response in parameters estimated by postalsurvey sampling, consideration should be given to the time of year and day of the week fordispatch, in relation to the type of angler, especially when only a limited amount of samplingeffort is possible.
Acknowledgments
This work formed part of a study of the demand for angling in South Wales commissioned bythe Water Research Centre (WRC) with funding also by the Sports Council. We are gratefulfor the advice and comments of John Alabaster and John Solbe of WRC, Dr Michael Stablerof Reading University, Dr Graeme Harris of Welsh Water and Prof. R.W. Edwards of theUniversity of Wales Institute of Science and Technology.
References
Cane A, (1980) The use of anglers' returns in the estimation of fishing success. Fisheries Management 11,145-155.Chatterjee S, & Price B, (1977) Regression Analysis by Example. Wiley, New York,Crapo D, & Chubb M, (1969) Recreation area day-use investigation techniques. Part 1: A study of survey
methodology. Technical report No, 6, Recreation Research and Planning Unit, Department of Park andRecreation Resources, College of Agriculture and Natural Resources, Michigan State University,
Deuel D.G, (1980) Special surveys related to data needs for recreational fisheries. In: Allocation of FisheryResources. Proceedings of EIFAC Technical Consultation, Vichy, France, April 1980, pp. 77-81,
Mawle G,W. (1984a) The Demand in South Wales for Trout Fishing on Still Waters, Unpublished report, UWIST,Cardiff,
Mawle G, W, (1984b) Angling.in South Wales and the demand for stillwater trout fisheries. PhD Thesis, University ofWales.
Mawle G,W. & Randerson P,F, (1980) A method for the assessment of demand for recreational fishing in the SouthWales area of the UK. In: Allocation of Fishery Resources. Proceedings of EIFAC Technical Consultation,Vichy, France, April 1980, pp, 265-273.
Maxwell A.E, (1961) Analysing Quantitative Data. Chapman and Hall, London,Moser C,A, & Kalton G, (1979) Survey Methods in Social Investigation, 2nd edn, Heinemann Educational Books,
London,Radford A.F. (1980) Economic survey of the River Wye recreational salmon fishery. Research Paper Series No, 20,
Marine Resources Research Unit Portsmouth Polytechnic,Randerson P,F,, Edwards R,W, & Shaw K, (1978) An economic evaluation of the demand for recreational fishing in
areas of Wales. In: Recreational Freshwater Fisheries (ed. by J, Alabaster), pp, 203-218. Proceedings of theConference of Water Research Centre, Medmenham,
Rohlf F,J, & Sokal R.R, (1981) Statistical Tables, 2nd edn, W,H. Freeman, New York,

Response to a postal survey 489
Small I. & Downham D.Y. (1985) The interpretation of anglers' records (trout and sea trout, Salmo trutta L., andsalmon, Salmo salar L.). Aquaculture and Fisheries Management 16, 151-169.
Stabler M. (1980) Estimation of the benefits of fishing on UK canals: some problems of method.'.In: Allocation ofFishery Resources, pp. 346-355. Proceedings of the EIFAC Technical Consultation, Vichy, France, April 1980.
Welsh Water Authority (1981) Review of commercial fishing for salmon and sea trout. Welsh Water Authority,Brecon, Wales.