Response Styles in Affect Ratings: Making a Mountain Out of a Molehill
23
Response Styles in Affect Ratings: Making a Mountain Out of a Molehill Ulrich Schimmack Department of Psychology University of Toronto, Mississauga Ulf Böckenholt Department of Psychology University of Illinois, Urbana–Champaign Rainer Reisenzein Department of Psychology University of Bielefeld Ratings of affect words are the most commonly used method to assess pleasant affect (PA) and unpleasant affect (UA). The reliance on self-reports would be problematic if affect ratings were heavily influenced by response styles. Several recent publications have indeed suggested (a) that the influence of response styles on affect ratings is per- vasive, (b) that this influence can be controlled by variations of the response format using multitrait-multimethod models, and (c) the discriminant validity of PA and UA is spurious. In this article, we examined the evidence for these claims. We demon- strate that (a) response styles have a negligible effect on affect ratings, (b) multiple re- sponse formats produce the same results as a single response format, and (c) the discriminant validity of PA and UA is not a method artifact. Rather, evidence against discriminant validity is due to the use of inappropriate response formats that respon- dents interpreted as bipolar scales. Measurement error poses a serious problem for investigations of individual differ- ences (Cacioppo & Berntson, 1994; Cacioppo, Gardner, & Berntson, 1999; DeShon, 1998; Diener, 1999; Diener, Sandvik, Pavot, & Gallagher, 1991; Diener, Smith, & Fujita, 1995; Eid, 1995; Green, Goldman, & Salovey, 1993; R. J. Larsen & JOURNAL OF PERSONALITY ASSESSMENT, 78(3), 461–483 Copyright © 2002, Lawrence Erlbaum Associates, Inc.
-
Upload
northwestern -
Category
Documents
-
view
0 -
download
0
Transcript of Response Styles in Affect Ratings: Making a Mountain Out of a Molehill

Response Styles in Affect Ratings:Making a Mountain Out of a Molehill
Ulrich SchimmackDepartment of Psychology
University of Toronto, Mississauga
Ulf BöckenholtDepartment of Psychology
University of Illinois, Urbana–Champaign
Rainer ReisenzeinDepartment of Psychology
University of Bielefeld
Ratings of affect words are the most commonly used method to assess pleasant affect(PA) and unpleasant affect (UA). The reliance on self-reports would be problematic ifaffect ratings were heavily influenced by response styles. Several recent publicationshave indeed suggested (a) that the influence of response styles on affect ratings is per-vasive, (b) that this influence can be controlled by variations of the response formatusing multitrait-multimethod models, and (c) the discriminant validity of PA and UAis spurious. In this article, we examined the evidence for these claims. We demon-strate that (a) response styles have a negligible effect on affect ratings, (b) multiple re-sponse formats produce the same results as a single response format, and (c) thediscriminant validity of PA and UA is not a method artifact. Rather, evidence againstdiscriminant validity is due to the use of inappropriate response formats that respon-dents interpreted as bipolar scales.
Measurement error poses a serious problem for investigations of individual differ-ences (Cacioppo & Berntson, 1994; Cacioppo, Gardner, & Berntson, 1999;DeShon, 1998; Diener, 1999; Diener, Sandvik, Pavot, & Gallagher, 1991; Diener,Smith, & Fujita, 1995; Eid, 1995; Green, Goldman, & Salovey, 1993; R. J. Larsen &
JOURNAL OF PERSONALITY ASSESSMENT, 78(3), 461–483Copyright © 2002, Lawrence Erlbaum Associates, Inc.

Diener, 1987; McCrae, Stone, Fagan, & Costa, 1998; Rorer, 1965; Russell &Carroll, 1999; Schmidt & Hunter, 1996; Watson & Clark, 1997; Watson, Wiese,Vaidya, & Tellegen, 1999). To measure individual differences, individuals have tobe compared on the same dimension, using the same standard of comparison and thesame measurement units. This can be easily achieved with measures of objectivecharacteristics such as height, weight, or frequencies of observable behaviors (Hoyt& Kerns, 1999). However, these requirements are more difficult to meet with regardtoself-reportsof internal states.WhenJohnreports intenseexcitementandJudith re-ports moderate excitement, does John really experience more excitement than Ju-dithdoes?Hence,affect ratingsmaybeespeciallysensitive tomeasurementerror.
At the same time, affect ratings are gaining in importance as indicators of sub-jective well-being (Diener, 1984; Diener, Suh, Lucas, & Smith, 1999; Kahneman,Diener, & Schwarz, 1999). A key assumption in well-being research is that pleas-ant affect (PA) and unpleasant affect (UA) are separate indicators of subjectivewell-being that are determined by different factors (Costa & McCrae, 1980;Diener, 1984; Diener & Lucas, 1999; Lucas, Diener, & Suh, 1996). In support ofthis assumption, many studies have revealed discriminant validity of PA and UA(Diener & Emmons, 1984; Eid, 1995; Lucas et al., 1996; for a review, see Diener etal., 1999).
However, this assumption has been challenged in two publications by Greenand colleagues (Green et al., 1993; Green, Salovey, & Truax, 1999). Green et al.(1993) proposed that “when random and nonrandom measurement error is takeninto account, the independence of positive and negative affect, however defined,proves ephemeral” (p. 1029). Green et al. (1999) argued that evidence fordiscriminant validity of PA and UA is a statistical artifact because these studies didnot control for systematic measurement error.
Tellingly, every one of the aforementioned studies relies on a single method of affect(or attitude) assessment and makes no allowance for the problems associated withrandom and nonrandom response error, a longstanding methodological concern(Bentler, 1969). When one addresses these measurement concerns using amultimethod approach to affect assessment, a largely bipolar structure for affect is re-vealed. (p. 857)
In this article, we reveal two problems with Green et al.’s (1993, 1999) argu-ment. We first demonstrate that there exists practically no evidence that systematicmeasurement error attenuates PA–UA correlations, including Green et al.’s (1993)own data. Second, we present two studies that test an alternative explanation ofGreen et al.’s (1993) evidence against discriminant validity of PA and UA. Wepropose that participants in Green et al.’s (1993) studies interpreted the responseformats as bipolar scales (cf. Russell & Carroll, 1999). If participants rate PA rela-tive to UA and UA relative to PA, then the two ratings are bound to be mirror im-
462 SCHIMMACK, BÖCKENHOLT, REISENZEIN

ages of each other. However, this result does not disprove the conceptualization ofPA and UA as separate dimensions of subjective well-being because this concep-tualization requires the assessment of PA and UA on conceptually independentscales. In short, we demonstrate that evidence for discriminant validity of PA andUA is not an artifact due to response styles. Rather, evidence against discriminantvalidity of PA and UA is an artifact of inappropriate response formats.
NO EVIDENCE FOR RESPONSE STYLES
We follow Rorer’s (1965) distinction between response sets and response styles.Response sets are intentionally faked responses. The most commonly discussed re-sponse set is social desirability—that is, a tendency to endorse higher categories fordesirable moods (typically pleasant moods) and a tendency to endorse lower cate-gories for undesirable categories (typically unpleasant moods). We do not considerresponse sets in this article because previous studies found only negligible influ-ences of social desirability responding in research (Borkenau & Ostendorf, 1992;McCrae & Costa, 1983; Piedmont, McCrae, Rieman, & Angleitner, 2000). In thisarticle, we focus on response styles—that is, individual differences in ratings on aresponse format independent of the content of the question (e.g., acquiescence; cf.Rorer, 1965).
The influence of response styles on personality questionnaires was extensivelystudied in the 1960s and 1970s. A review of this literature by Rorer (1965) con-cluded that response styles have a negligible effect on personality assessments.Several studies in the 1980s also failed to demonstrate response style effects on af-fect ratings (Diener, Larsen, Levine, & Emmons, 1985; Larsen & Diener, 1987).As a result, most researchers at the beginning of the 1990s were no longer worriedthat response styles pose a serious threat to the validity of self-report ratings.
It is well known that there are two opposed points of view regarding the importance ofthe acquiescent response set. One group believes the response set accounts for a largeshare of the content variance. The contrary viewpoint argued by Rorer (1965) and oth-ers is that acquiescence accounts for only a negligible proportion of (…) variance. Infact, the conflict between the opposed groups has subsided because it has becomeclear that stylish tendencies on personality tests are actually negligible. (Lorr, 1989, p.48)
In the early 1990s, however, Green et al. (1993) argued—without reference tothe previous research on response styles—that response styles do have dramaticeffects on the correlation between ratings of PA and UA. In fact, they proposedthat response styles are so strong that they can turn true correlations close to –1 intoobserved correlations close to 0. Green et al. (1993) proposed that previous studies
RESPONSE STYLES 463

failed to control for systematic measurement error because they relied on a singlemethod to assess PA and UA. Hence, both measures were contaminated by methodvariance due to response styles. Presumably, some participants tended to usehigher numbers for ratings of PA and UA than others. The shared method varianceattenuated the negative correlation between PA and UA, leading to false findingsof discriminant validity of PA and UA.
To control for systematic measurement error, Green et al. (1993) proposedmultitrait-multimethod (MTMM) analyses. However, as it is difficult to assess PAand UA with methods other than self-reports, Green et al. (1993) proposed thatmultiformats could serve the same function as multimethods: If a latent trait is as-sessed with different formats, it is possible to separate variance unique to a specificformat from variance that is shared by all formats (cf. Andrews & Withey, 1976).Green et al. (1993) presented several studies that revealed strong negative correla-tions between latent factors of PA and UA that were based on ratings on four dif-ferent formats. This finding was interpreted as evidence that the discriminantvalidity in previous studies with a single format was an artifact because these stud-ies did not control for method variance.
However, several articles that appeared after Green et al.’s (1993) article ob-tained dramatically different results using even more sophisticated MTMM as-sessments. Diener et al. (1995) improved on Green et al.’s (1993) multiformatprocedure by conducting a true multimethod study with three different methods(self-reports, peer reports, and aggregated daily diary data). Diener et al. (1995)published a MTMM matrix (see Table 5). In this matrix, same-trait-different-method correlations ranged from .34 to .68 and different-trait-different-methodcorrelations ranged from –.11 to –.27. The stronger correlations for same-trait cor-relations than for different-trait correlations are evidence for the discriminant va-lidity of PA and UA. We fitted a MTMM structural equation model to Diener etal.’s (1995) correlation matrix. The model (Figure 1) fitted the data moderatelywell, χ2(5, N = 212) = 12, p = .03, comparative fit index (CFI) = .982, Akaike infor-mation criterion (AIC) = 2.49, root mean square error of approximation (RMSEA)= .084. We also tested a model that improved model fit by freeing theoreticallyunpredicted parameters. The theoretically important parameters were practicallyidentical in this model. The results do not support Green et al.’s (1993) hypotheses.First, the error terms of self-reported PA and UA were not positively correlatedwith each other. Hence, there was no evidence of common method variance in self-reports. Second, the latent PA and UA factors were only weakly negatively corre-lated, which supports previous findings of discriminant validity of PA and UA.However, there were positive correlated errors for the daily diary data. This find-ing may reflect weak response style effects, which become more apparent in ag-gregates of repeated ratings (Fisher, Heise, Bohrnstedt, & Lucke, 1985). This bias(.59 × .52 × .63 = .19), however, could only change a true correlation of –.4 into anobserved correlation of –.2, or a true correlation of –.8 into an observed correlation
464 SCHIMMACK, BÖCKENHOLT, REISENZEIN
of –.6. Hence, even this method effect is too weak to lead to substantially differentconclusions about discriminant validity.
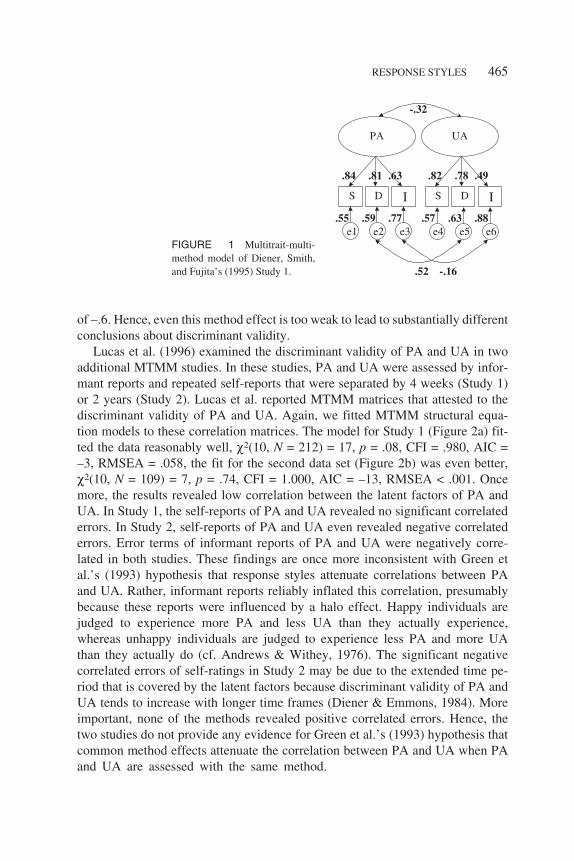
Lucas et al. (1996) examined the discriminant validity of PA and UA in twoadditional MTMM studies. In these studies, PA and UA were assessed by infor-mant reports and repeated self-reports that were separated by 4 weeks (Study 1)or 2 years (Study 2). Lucas et al. reported MTMM matrices that attested to thediscriminant validity of PA and UA. Again, we fitted MTMM structural equa-tion models to these correlation matrices. The model for Study 1 (Figure 2a) fit-ted the data reasonably well, χ2(10, N = 212) = 17, p = .08, CFI = .980, AIC =–3, RMSEA = .058, the fit for the second data set (Figure 2b) was even better,χ2(10, N = 109) = 7, p = .74, CFI = 1.000, AIC = –13, RMSEA < .001. Oncemore, the results revealed low correlation between the latent factors of PA andUA. In Study 1, the self-reports of PA and UA revealed no significant correlatederrors. In Study 2, self-reports of PA and UA even revealed negative correlatederrors. Error terms of informant reports of PA and UA were negatively corre-lated in both studies. These findings are once more inconsistent with Green etal.’s (1993) hypothesis that response styles attenuate correlations between PAand UA. Rather, informant reports reliably inflated this correlation, presumablybecause these reports were influenced by a halo effect. Happy individuals arejudged to experience more PA and less UA than they actually experience,whereas unhappy individuals are judged to experience less PA and more UAthan they actually do (cf. Andrews & Withey, 1976). The significant negativecorrelated errors of self-ratings in Study 2 may be due to the extended time pe-riod that is covered by the latent factors because discriminant validity of PA andUA tends to increase with longer time frames (Diener & Emmons, 1984). Moreimportant, none of the methods revealed positive correlated errors. Hence, thetwo studies do not provide any evidence for Green et al.’s (1993) hypothesis thatcommon method effects attenuate the correlation between PA and UA when PAand UA are assessed with the same method.
RESPONSE STYLES 465
FIGURE 1 Multitrait-multi-method model of Diener, Smith,and Fujita’s (1995) Study 1.

We next reexamined Green et al. (1993) data to explore the reason for the ap-parent discrepancies between Green et al.’s (1993) conclusion and other MTMMstudies. After all, Green et al. (1993) claimed to have found “strong evidence thatour data are contaminated with nonrandom error” (p. 1038). In our analyses, weexcluded the checklist format for two reasons. First, checklists are no longer usedin contemporary affect research, and claims of discriminant validity of PA and UAare no longer based on checklist data (Diener & Emmons, 1984; Diener et al.,1995; Lucas et al., 1996). Second, Warr, Barter, and Brownbridge (1983) alreadydemonstrated that checklists produce weaker negative correlations than ratingscales for reasons other than response styles. As noted by Gotlib and Meyer(1986), for assessments of PA and UA over extended time frames “it is reasonableto expect that an individual would have experienced independent episodes of posi-tive and negative affect” (p. 1163). As Green et al. (1993) used a time frame of atleast a couple of hours, their findings are inconclusive with regard to the influenceof response styles on checklists (Gotlib & Meyer, 1986; Warr et al., 1983). Fur-thermore, Green et al. (1993) did not limit their conclusions to checklists but ratherassumed that any study using a single method produced false evidence fordiscriminant validity of PA and UA. Hence, it is informative and legitimate to ex-amine the influence of response styles on the other formats in Green et al.’s (1993)studies. This way it is possible to examine the influence of response styles on for-mats other than checklists that are more commonly used in contemporary affectresearch.
Green et al.’s (1993) Study 1 allowed for the most powerful analysis because PAand UA were assessed twice, 1 week apart. In this study, participants reported at anunspecified time how they felt “since this morning.” Ratings were made on single-item indicators of PA and UA with three different response formats: a 5-point Likertscale ranging from 1 (agree) to 5 (disagree), a 4-point Describes-Me scale ranging
466 SCHIMMACK, BÖCKENHOLT, REISENZEIN
FIGURE 2 Multitrait-multimethod model of Lucas, Diener, and Suh’s (1996) Study 1 (left)and Study 2 (right).

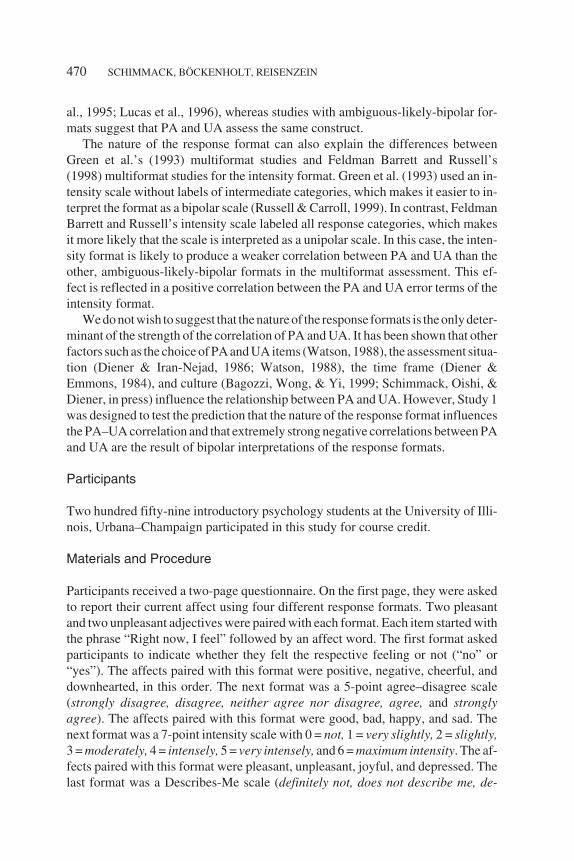
from 1 (definitely not) to 4 (definitely describes me), and a 7-point Intensity scaleranging from1(happy) to7 (nothappy).WefittedaMTMMmodel to thecorrelationmatrixpublished inGreenetal.’s (1993)Table2.Ourmodel (Figure3) fitted thedatareasonably well, χ2(54, N = 139) = 80, p = .01, CFI = .979, AIC = –28, RMSEA =.062. The results reveal a number of remarkable facts. Most important, none of thethree formats showed positive correlated errors that could have attenuated the ob-served correlations between PA and UA. This finding is clearly inconsistent withGreen et al.’s (1993) conclusion that response styles attenuated observed PA–UAcorrelations in their studies. The Likert format even revealed significant negativecorrelated errors, suggesting that ratings on this format inflate the PA–UA correla-tion and thus mask discriminant validity. However, at any one of the two assess-ments, the correlations between PA and UA were close to –1.00 despite the lack ofsubstantial systematic measurement error. This finding is inconsistent with the pre-vious MTMM models that provided clear evidence for discriminant validity of PAand UA. As none of the studies revealed positive correlated errors, something otherthan response styles must be responsible for these dramatic differences. Finally, it isnoteworthy that the correlation between the trait components of PA and UA (i.e., thestable variance across the two assessments) was weaker than the correlation at onemoment in time. This finding is consistent with Diener and Emmons’s (1984) hy-pothesis that the relation between PA and UA becomes weaker over longer timeintervals.
We also reexamined the data of a multiformat study of momentary PA and UA(Feldman Barrett & Russell, 1998). This study did not include a checklist format.Two formats (Likert, Describes Me) were identical to Green et al.’s (1993) for-
RESPONSE STYLES 467
FIGURE 3 Multitrait-multimethod model of Green, Goldman, and Salovey’s (1993) data inStudy 1.

mats. Finally, Feldman Barrett and Russell modified the intensity format. WhereasGreen et al. (1993) used an intensity scale that labeled only the endpoints of thescale (happy–not happy), Feldman Barrett and Russell used the more typical inten-sity format that labels each response category (i.e., 1 = not at all, 2 = a little, 3 =moderately, 4 = quite a bit, and 5 = extremely). Feldman Barrett and Russell alsoused multiple items for each response format, whereas Green et al. (1993) usedsingle-item indicators for each format. Feldman Barrett and Russell published theobserved correlations of two separate samples (Ns = 225, 304). We fitted aMTMM model simultaneously to both data sets and constrained parameters acrossthe two samples. The model fitted the data reasonably well, χ2(28, Ns = 225, 304)= 103, p < .01, CFI = .979, AIC = 47, RMSEA = .071. Once more, model fit couldbe improved by freeing some parameters without changing theoretically relevantparameters. The results again revealed a strong negative correlation between thelatent factors of PA and UA. Also replicated was the significant negative correla-tion between the error terms of the Likert indicators and the absence of methodvariance for the Describes-Me format. In contrast to our model of Green et al.’s(1993) data, the error terms of the intensity format of our model of Feldman Barrettand Russell’s data were positively correlated. However, even this method bias wasnot very strong. According to the parameters in the model, the Likert scale changesa true correlations of –.80 into an observed correlations of –.83 (Likert = .37 × .36× –.22 = –.03), whereas the Intensity format changes a true correlations of –.80into an observed correlation of –.74 (.52 × .45 × .25 = .06). This finding is consis-tent with earlier findings (Jackson, 1967; Rorer, 1965) that response styles have anegligible effect on correlations.
Watson and Clark (1997) also examined the influence of response styles on af-fect ratings and arrived at the same conclusion as we did, using a different ap-proach. Watson and Clark noted that response styles can attenuate between-subject correlations of PA and UA. However, method variance due to responsestyles cannot attenuate within-subject correlations between PA and UA becauseresponse styles have a constant influence on affect ratings of the same individual(see also Schimmack & Grob, 2000). Therefore, response styles can be detected incomparisons of between-subject and within-subject correlations. If affect ratingswere strongly influenced by response styles, between-subject correlations shouldbe much weaker than within-subject correlations of PA and UA. However, Watsonand Clark found similar between-subject and within-subject correlations betweenPA and UA. This finding was also replicated in a meta-analysis of correlations be-tween PA and UA (Russell & Carroll, 1999).
In sum, our brief examination of response style effects on affect ratings re-confirms Rorer’s (1965) conclusion that response styles have only a negligibleeffect on self-report data. None of the MTMM studies supported the hypothesisthat response styles dramatically attenuate the correlation between PA and UA.The only significant method effects were obtained for the daily diary data in
468 SCHIMMACK, BÖCKENHOLT, REISENZEIN

Diener et al.’s (1995) study and for Feldman Barrett and Russell’s (1998) inten-sity format. At the same time, informant reports and the Likert format reliablyinflated the negative correlation between PA and UA. However, these statisti-cally significant effects were too small to be of any practical significance for thediscriminant validity of PA and UA. In fairness, it should be noted that Green etal. (1993) appeared to have noticed that most of their response formats were notseverely influenced by systematic measurement error: “Results for the other for-mats suggest that they vary in their susceptibility to nonrandom error.” (p.1036). However, this important finding was ignored in the Discussion section, inwhich the authors found “strong evidence that our data are contaminated withnonrandom error” (Green et al., 1993, p. 1038).
At the same time, our review revealed dramatic differences in the estimatedcorrelation between PA and UA, ranging from –.19 (Lucas et al., 1996) to –.93(Feldman Barrett & Russell, 1998). Some of these correlations provide strong sup-port for discriminant validity of PA and UA, whereas others show that PA and UAare redundant measures of a single construct. In the following studies, we exam-ined one reason for the inconsistent findings. We hypothesized that the nature of aresponse format influences the correlation between PA and UA. In particular, weproposed that strong negative correlations are obtained only when participants in-terpret a response format as a bipolar scale.
STUDY 1
In Study 1, we tested the hypothesis that the nature of the response format influencesthe correlation between PA and UA. This hypothesis is based on several studies thatdemonstrated different correlations between PA and UA for different response for-mats (Meddis, 1972; Russell & Carroll, 1999; Schimmack, Oishi, Diener, & Suh,2000;Svensson,1977;Warretal., 1983).Russell andCarroll, inparticular,noticedarelationship between the strength of the PA–UA correlation and the polarity of theresponse format. Whereas strictly bipolar formats (happy–sad vs. sad–happy) yieldcorrelations close to –1, strictly unipolar scales often yield much weaker correla-tions around –.50 (Russell & Carroll, 1999; Schimmack, 2001). Russell and Carrollalso noted that some studies used ambiguous formats that can be interpreted as uni-polar or bipolar scales, although one interpretation may be predominant. In particu-lar, ambiguous-likely-bipolar formats are neither strictly unipolar nor strictlybipolar but tend to be interpreted by most participants in a bipolar manner (Russell &Carroll, 1999). Russell and Carroll also classified all formats in Green et al.’s (1993)study with the exception of the checklist as ambiguous-likely-bipolar formats.Hence, the difference between response formats may explain the inconsistent evi-dence regarding discriminant validity. Studies that used unipolar or ambiguous-likely-unipolar formats support the discriminant validity of PA and UA (Diener et
RESPONSE STYLES 469
al., 1995; Lucas et al., 1996), whereas studies with ambiguous-likely-bipolar for-mats suggest that PA and UA assess the same construct.
The nature of the response format can also explain the differences betweenGreen et al.’s (1993) multiformat studies and Feldman Barrett and Russell’s(1998) multiformat studies for the intensity format. Green et al. (1993) used an in-tensity scale without labels of intermediate categories, which makes it easier to in-terpret the format as a bipolar scale (Russell & Carroll, 1999). In contrast, FeldmanBarrett and Russell’s intensity scale labeled all response categories, which makesit more likely that the scale is interpreted as a unipolar scale. In this case, the inten-sity format is likely to produce a weaker correlation between PA and UA than theother, ambiguous-likely-bipolar formats in the multiformat assessment. This ef-fect is reflected in a positive correlation between the PA and UA error terms of theintensity format.
We do not wish to suggest that the nature of the response formats is the only deter-minant of the strength of the correlation of PA and UA. It has been shown that otherfactors such as the choice of PA and UA items (Watson, 1988), the assessment situa-tion (Diener & Iran-Nejad, 1986; Watson, 1988), the time frame (Diener &Emmons, 1984), and culture (Bagozzi, Wong, & Yi, 1999; Schimmack, Oishi, &Diener, in press) influence the relationship between PA and UA. However, Study 1was designed to test the prediction that the nature of the response format influencesthe PA–UA correlation and that extremely strong negative correlations between PAand UA are the result of bipolar interpretations of the response formats.
Participants
Two hundred fifty-nine introductory psychology students at the University of Illi-nois, Urbana–Champaign participated in this study for course credit.
Materials and Procedure
Participants received a two-page questionnaire. On the first page, they were askedto report their current affect using four different response formats. Two pleasantand two unpleasant adjectives were paired with each format. Each item started withthe phrase “Right now, I feel” followed by an affect word. The first format askedparticipants to indicate whether they felt the respective feeling or not (“no” or“yes”). The affects paired with this format were positive, negative, cheerful, anddownhearted, in this order. The next format was a 5-point agree–disagree scale(strongly disagree, disagree, neither agree nor disagree, agree, and stronglyagree). The affects paired with this format were good, bad, happy, and sad. Thenext format was a 7-point intensity scale with 0 = not, 1 = very slightly, 2 = slightly,3 = moderately, 4 = intensely, 5 = very intensely, and 6 = maximum intensity. The af-fects paired with this format were pleasant, unpleasant, joyful, and depressed. Thelast format was a Describes-Me scale (definitely not, does not describe me, de-
470 SCHIMMACK, BÖCKENHOLT, REISENZEIN
scribes me, and definitely describes me). The affects paired with this format weresatisfied, unsatisfied, blue, and pleased.
On the next page, the participants answered questions about how they inter-preted the different response formats. They were instructed to “Imagine that youare in a neutral state in which you do not feel particularly pleasant/good nor un-pleasant/bad. Please check the response category that indicates this neutral state ofthe absence of pleasure and displeasure.” For each of the four response formats,participants had to nominate the category that reflected the neutral state. For re-sponse formats with an odd number of response categories (agree–disagree, inten-sity), participants checked one of the response categories; for formats with an evennumber of response categories (yes–no, Describes-Me), participants could also lo-cate the neutral point between the two middle categories (i.e., between yes and noand between does not describe me and does describe me). These ratings can differ-entiate unipolar and bipolar interpretations of the scales. On bipolar scales (i.e., ex-tremely happy to extremely sad; extremely sad to extremely happy) the neutralpoint is represented by the middle of the scale. In contrast, on unipolar scales (i.e.,not happy to extremely happy; not sad to extremely sad) the neutral point is repre-sented at the lowest point of the scale.
Results
We first analyzed participants’ choices of the neutral scale point. For the yes–noformat, 216 participants (85%) located the neutral point between the yes and nocategory, 24 (9%) opted for no, and 16 (6%) opted for yes. For the agree–dis-agree format, 223 (86%) participants identified the neither agree nor disagreecategory as the neutral point and 23 (9%) chose the agree category, whereas allother categories received less than 3% of the nominations. For the intensityscale, 152 (59%) respondents chose the middle category moderately as the neu-tral point, whereas 69 (27%) interpreted not at all as the neutral point (veryslightly = 4%, slightly = 6%, others below 3%). For the Describes-Me format,179 (69%) participants located the neutral point between describes me not anddescribes me, whereas 40 (15%) chose describes me and 33 (13%) chose doesnot describe me. In short, the vast majority of participants indicated that the neu-tral point is in the middle of the scale for all of the four response formats. Onlyfor the Intensity scale did a sizable minority choose the lowest category, indicat-ing that they interpreted the intensity scale as a unipolar scale.
In the following analyses we examined the influence of the interpretations ofresponse formats on the correlations between PA and UA. We first explored thedata for outliers (more than 3 SDs above or below the mean) and replaced outlierswith less extreme scores (either –3 or 3). Next, we estimated the correlation for asingle response format using structural equation modeling. These models controlfor the influence of random error. Then we tested models with all combinations ofresponse formats. The models included two factors, and the latent correlation be-
RESPONSE STYLES 471

tween the two factors was unconstrained. PA items were constrained to load onone factor and UA items on the other factor. For all models with more than one re-sponse format, error terms between items of the same format were unconstrainedto allow for systematic measurement error.
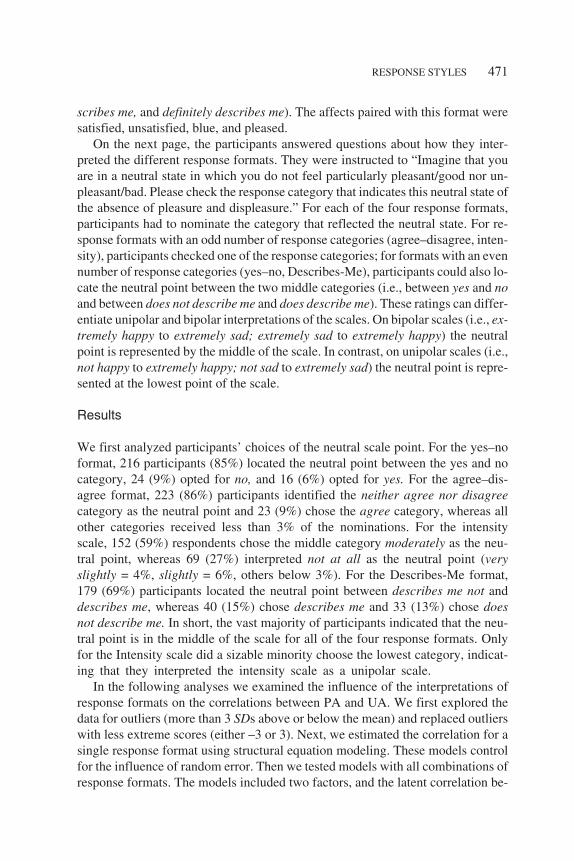
Table 1 shows the fit of the models and the latent correlation between the twofactors. The earlier findings showed that most participants interpreted the yes–no,agree–disagree, and Describes-Me format as bipolar scales. Not surprisingly,these formats produced strong negative correlations (ranging from –.79 to –.83).There was a slight trend for correlations to become stronger when formats that re-ceived bipolar interpretations were combined (range from –.79 to –.95). By con-trast, the intensity format produced a lower correlation and adding the intensityformat to a multiformat model also lowered the estimated correlation between PAand UA at the latent level.
For the model including all four response formats, we also examined the corre-lated error terms and constrained nonsignificant ones to zero (Figure 4). The fit ofthis model was marginal, χ2(104, N = 259) = 297, p < .01, CFI = .930, AIC = 89,RMSEA = .085. Once more, it was possible to free theoretically irrelevant parame-ters to improve model fit while theoretically relevant parameters remained thesame. An inspection of significant correlated errors revealed negative correlatederrors between items of the same format and opposite valence. Only the Intensityscale revealed positive correlated errors.
472 SCHIMMACK, BÖCKENHOLT, REISENZEIN
TABLE 1Model Fit and Correlation between Pleasant Affect and Unpleasant Affect Factors
Measure χ2/df CFI RMSEA r
1a 2 0.995 .074 –.832a 34 0.947 .356 –.813a 0 1.000 .000 –.404a 17 0.965 .252 –.791, 2b 40 0.972 .136 –.951, 3b 47 0.961 .149 –.621, 4b 19 0.988 .082 –.792, 3b 39 0.977 .134 –.862, 4b 10 0.997 .044 –.923, 4b 21 0.988 .089 –.751, 2, 3c 182 0.929 .128 –.881, 2, 4c 88 0.973 .076 –.901, 3, 4c 98 0.966 .084 –.732, 3, 4c 106 0.968 .089 –.891, 2, 3, 4d 257 0.939 .094 –.85
Note. CFI = comparative fit index; RMSEA = root mean square error of approximation; Format 1 =yes–no; Format 2 = agree–disagree; Format 3 = intensity, Format 4 = Describes-Me.
adf = 1. bdf = 7. cdf = 35. ddf = 79.

Discussion
Study 1 tested the prediction that ambiguous formats that are interpreted as bipolarscales produce spurious evidence against discriminant validity of PA and UA. Con-sistent with this prediction, the ambiguous-likely-bipolar formats (Likert and De-scribes-Me) were interpreted by most participants as bipolar formats and yieldedstrong negative correlations between PA and UA. The ambiguous Intensity scalewas interpreted by some participants as bipolar and by others as unipolar. This for-mat yielded a much weaker negative correlation between PA and UA. These find-ings provide direct support for Russell and Carroll’s (1999) prediction that thestrong negative correlations in Green et al.’s (1993) MTMM studies were due to theexclusive reliance on three ambiguous-likely-bipolar formats. Our study also repli-cates Green et al.’s (1993) findings that these formats do not produce positive cor-related errors in MTMM models.
We also replicated Feldman Barrett and Russell’s (1998) finding that the inten-sity format (with labeled response categories) produced positive correlated errors.This finding is consistent with Russell and Carroll’s (1999) hypothesis that thisformat elicits bipolar and unipolar interpretations. As a result, the PA–UA correla-tion is weaker than the correlation for ambiguous-likely-bipolar formats. Hence,the positive correlated errors for intensity ratings do not necessarily reveal thatthese ratings are influenced by response styles. Rather, the positive correlated er-rors reveal differences in the nature of the response formats.
RESPONSE STYLES 473
FIGURE 4 Multitrait-multimethod model of Study 1.

STUDY 2
Study 1 found that previous multiformat studies included mostly formats that par-ticipants interpreted as bipolar scales. Considering this fact, it is not surprising thatthese studies failed to demonstrate discriminant validity of PA and UA. However,this finding does not undermine discriminant validity of PA and UA, which re-quires the assessment of PA and UA on unipolar scales. We conducted Study 2 toexamine discriminant validity of PA and UA in a multiformat study that fulfilledthis basic requirement.
In addition, in Study 2 we examined the influence of response styles by meansof an alternative method. As noted earlier, the multiformat procedure can only de-tect response styles that are unique to each format. Hence, the multiformat proce-dure cannot control response styles that influence responses on all formats in thesame way. For example, if some participants prefer higher response categories onall formats, common method variance to all formats could still attenuate the latentcorrelation between PA and UA. To detect general response styles, we included asecond rating task that employed the same formats as the affect ratings but re-quested ratings of a different construct. For this purpose, participants saw mixedcolors and rated the intensity of red, blue, and yellow in each color. We assumedthat color perception would be independent of participants’ affect. Furthermore,all participants saw the same colors. As a result individual differences in the colorratings were likely to reflect mostly response styles and only some minor individ-ual differences in color perception. We hypothesized that any correlation betweencolor ratings and ratings of current affect are due to response styles (cf. Rorer,1965).
Finally, we obtained amusement ratings to a series of jokes after the assessmentof PA and UA. We reasoned that prior affect should influence amusement in re-sponse to a series of jokes (Schwarz & Clore, 1983). As amusement is a pleasantemotion, we expected that PA should be a stronger predictor of amusement thanUA. This asymmetry would provide further evidence for the discriminant validityof PA and UA.
Participants
Two hundred and seven introductory psychology students at the University of Illi-nois, Urbana–Champaign completed all materials in exchange for course credits.
Materials and Procedure
The materials are presented in the order of the questionnaire.
474 SCHIMMACK, BÖCKENHOLT, REISENZEIN

Affect questionnaires. Participants completed a questionnaire with 84items. Half of the items were paired with a verbal scale and the other half with a nu-merical scale. In the verbal scale, each adjective was embedded in a sentence begin-ning with “I feel … ” and followed by not at all, very slightly, slightly, moderately,intensely, very intensely, and maximum intensity. Participants were instructed tocircle the intensity word that best described their current feelings. For the numericalscale, each adjective was embedded in a sentence “I feel … ” followed by numbersranging from 0 to 15. For both response formats, the participants received instruc-tions (a) to first decide whether they felt the particular affect or not, (b) to use thezero category if they did not feel that affect, and (c) to use the remaining categoriesto indicate the intensity of that affect if they felt it. Previous studies showed thatthese instructions lead to unipolar interpretations of the scale for most participants(e.g., Schimmack, 1997; Schimmack & Diener, 1997). The verbal scale includedcheerful, pleasant, and pleased for PA and downhearted, unpleasant, and unhappyfor UA. The numerical scale included satisfied, positive, and happy for PA and mis-erable, negative, and depressed for UA.
Color ratings. We projected six colors via an overhead projector onto ascreen in front of the participants. They were told that each color comprised the col-ors red, blue, and yellow to various degrees, and they were instructed to rate the in-tensity of red, blue, and yellow in each color. For the first three colors the numericalscale was used. For the last three colors the verbal scale was used. This procedureyielded nine (three red, three yellow, three blue) ratings for the numerical and nineratings for the verbal scale. The red, blue, and yellow ratings of each color were av-eraged to obtain three indicators for each response format.
Amusement ratings. After the affect and color assessment, participants re-ceived 12 written jokes or cartoons. After each joke, they rated how amused theyfelt about it on a 7-point intensity scale with numerical and verbal category labels of0 = not at all, 1 = very slightly, 2 = slightly, 3 = moderately, 4 = strongly, 5 = verystrongly, and 6 = maximum intensity.
Results
Due to missing data, we excluded 17 participants from the following analyses, leav-ing an N of 190 participants. We first examined response styles and the PA–UA cor-relation using standard equation modeling. The first model included six factors,three for PA, UA, and the color ratings on the verbal scale and three for PA, UA, andcolor ratings on the numerical scale. Each latent construct was based on three indi-cators, and the factors were allowed to covary freely with each other. This modelfitted the data reasonably well, χ2(120, N = 190) = 160, p < .01, CFI = .979, AIC =
RESPONSE STYLES 475

–80, RMSEA = .042. To simplify the presentation of the results, we constrainednonsignificant factor correlations to zero. This model (Figure 5) also fitted the data,χ2(126, N = 190) = 165, p = .01, CFI = .979, AIC = –87, RMSEA = .041. The modelrevealed no evidence for response styles that are unique to the numerical or verbalformat: Verbal color ratings were not significantly correlated with verbal PA rat-ings, and numerical color ratings were not significantly correlated with numericalPA ratings. Verbal color ratings were related to verbal UA ratings but so were nu-merical color ratings; these correlations were also very weak. Furthermore, same-format PA–UA correlations were nearly identical to different-format PA–UA cor-relations. This finding is inconsistent with the idea that same-format correlationsare attenuated by common method variance. Finally, verbal and numerical colorratings were highly correlated, suggesting the presence of general response stylesin color ratings that are not detected by manipulations of formats. However, thesestylistic tendencies in color ratings were unrelated to affect ratings. This findingcan be attributed to more valid variance in affect ratings than in the color ratings.All participants rated the same colors. Hence, there is very little substantive vari-ance in these ratings. In contrast, affect ratings reflect actual individual differences,which reduces the influence of stylistic tendencies (Messick, 1967; Rorer, 1965).
The second structural equation model examined influences of prior affect onamusement. In this model, latent factors of PA and UA were based on verbal andnumerical indicators, and the amusement factor was based on three indicators ofamusement about jokes. PA and UA were causally related to amusement. The
476 SCHIMMACK, BÖCKENHOLT, REISENZEIN
FIGURE 5 Mulittrait-multimethod model of affect and color ratings in Study 2.

model fitted the data reasonably well, χ2(87, N = 190) = 163, p < .01, CFI = .955,AIC = –11, RMSEA = .068. The results revealed a significant effect of PA onamusement, whereas UA was unrelated to amusement. Hence, we fitted a secondmodel (Figure 6) that constrained this path to zero. This model fitted the dataequally well, χ2(88, N = 190) = 163, p < .01, CFI = .955, AIC = –13, RMSEA =.068. The model shows that PA was the only predictor of amusement and ex-plained about 10% of the variance in amusement. The asymmetric relations of PAand UA to amusement provide additional evidence for the discriminant validity ofPA and UA.
Discussion
In Study 2, we examined the correlation between PA and UA in a MTMM studywith two unipolar formats. Once more, the study revealed no evidence for responsestyles that could have attenuated the correlation between PA and UA. However, inmarked contrast to previous multiformat studies, this study yielded a much weakercorrelation between PA and UA. This finding supports our hypothesis that the na-ture of the response formats is a major determinant of the strength of the correlation.Studies with ambiguous-likely-bipolar formats yield a strong negative correlation(Feldman Barrett & Russell, 1998; Green et al., 1993). However, studies with am-biguous-likely-unipolar or strict unipolar formats yield much weaker correlationsand clear evidence for the discriminant validity of PA and UA (Diener et al., 1995,1996; Schimmack, 2001).
In Study 2 we also examined another weakness of the multiformat procedure.MTMM analyses can only reveal method variance that is unique to one method.To examine format-unspecific response styles, we included a color-rating task.Our analyses revealed a strong positive correlation between intensity ratings ofcolors on two different formats. This finding suggests that response styles are un-likely to have unique influences on different rating scales. Participants who checkhigher numbers on numerical scales are also likely to check more intensedescriptors on verbal scales. If response styles were mostly format unspecific, theneven a multiformat study would yield biased estimates of the true correlations.Fortunately, the stylistic tendencies in the color ratings were unrelated to the affectratings. There are three explanations for this finding. First, response styles couldbe content specific. Participants who prefer higher response categories for colorsmay not have the same preference for ratings of their own affect. Neither themultiformat procedure nor the color ratings could detect these content-specific andformat-unspecific response styles. However, other evidence that could have de-tected such styles also did not find evidence for response styles (Diener et al.,1995; Lucas et al., 1996; Watson & Clark, 1997). Hence, two other explanations
RESPONSE STYLES 477

appear to be more likely. It is possible that the positive correlation between verbaland numeric color ratings does not reflect response styles. Maybe individuals dodiffer in the intensity of color perceptions, or participants sitting closer to projectorscreen perceived the colors more intensely. It is also possible that color ratings aremuch more heavily influenced by slight response styles than affect ratings. Thereason is that all participants rated the same colors. Hence, there may be very littletrue variance in the color perceptions. In contrast, participants rated different af-fects, and most of the variance in the affect ratings represents true individual dif-ferences in affective experiences.
GENERAL DISCUSSION
In this article, we reexamined the hypotheses that affect ratings are severely biasedby systematic error variance due to response styles and that discriminant validity ofPA and UA is an artifact of measurement error (Green et al., 1993, 1999). A reviewof the evidence, including the seminal study by Green et al. (1993), and two empiri-cal studies lead to a clear conclusion: There is no positive evidence that responsestyles have a notable effect on affect ratings. Most studies did not find positivelycorrelated errors between same-method indicators of PA and UA, which were pre-dicted by the response style hypothesis. When a study did obtain such positive cor-
478 SCHIMMACK, BÖCKENHOLT, REISENZEIN
FIGURE 6 Multitrait-multimethod model of affect and amusement ratings in Study 2.

related errors, the influences on the correlation of PA and UA was negligible.Furthermore, we found several methods that reliably produced negative correlatederrors (informant reports, Likert scales). This finding demonstrates that somemethod effects can inflate the true negative correlation between PA and UA andmask discriminant validity. Hence, MTMM models that include informant reportsneed to model the method variance in informant reports to obtain valid estimates ofstructural relations at the latent level (DeShon, 1998). We also provided clear evi-dence that the correlation between PA and UA depends on the nature of a responseformat. So called ambiguous-likely-bipolar formats (Likert scale, Describe-Me)are interpreted by most participants in a bipolar manner. Not surprisingly, PA andUA appear to be strongly negatively correlated. However, when unipolar formatsare used clear evidence for discriminant validity of PA and UA is obtained. Hence,evidence against discriminant validity of PA and UA is an artifact of inappropriateresponse formats. Subsequently, we discuss the implications of our findings for theconceptualization and measurement of PA and UA.
Are Multiple Response Formats Useful?
To our knowledge, Andrews and Withey (1976) first used multiple-response for-mats in a MTMM model to control for response styles in life-satisfaction judg-ments. They found evidence for format-specific variance that could reflectresponse styles. Hence, our finding that manipulations of the format did not re-veal response styles in affect ratings should not be overgeneralized. Multipleformats may be useful in some domains but not in others. Only empirical datacan determine whether different formats are associated with unique method vari-ance. We only demonstrated that format-specific variance is negligible in affectratings. However, researchers intending to use multiple formats need to paymore attention to the nature of the response formats than was the case in previ-ous multiformat studies. Sometimes subtle changes in a response format can de-termine whether participants interpret a response format in a unipolar or abipolar manner (cf. Schwarz, Knäuper, Hippler, Noelle-Neumann, & Clark,1991). MTMM studies assume that different methods still assess the same con-structs. However, unipolar and bipolar response formats assess different con-structs. Bipolar affect scales ask participants to integrate PA and UA into asingle judgment of hedonic balance, whereas unipolar scales ask participants tomake separate judgments of PA and UA. The question formats assess the sameconstruct, but sometimes the response format can change the nature of an item.Hence, mixing unipolar and bipolar formats in a multiformat assessment violatesthe fundamental assumption of MTMM analyses that different methods still as-sess the same construct.
RESPONSE STYLES 479

Another problem of multiformat studies is that they convey a false sense of se-curity. Researchers may trust the results of these studies because they apparentlycontrolled for response styles. However, multiformat studies can only controlstyles that are unique to each format. Response styles that generalize across differ-ent formats can still bias latent correlations in a positive or negative direction. Forthis reason, MTMM studies that include truly different methods are so important(Diener et al., 1995; Lucas et al., 1996).
A Brief Comment on Bipolarity
Throughout this article, we have consciously avoided the term bipolarity when wereferred to the correlation between PA and UA. Instead, we used the term ofdiscriminant validity. Discriminant validity is a well-defined concept in MTMMstudies. Our results consistently confirmed that different measures of PA or UAwere more highly related among themselves than to each other, unless PA and UAwere assessed with ambiguous-likely-bipolar scales. In this sense, the studies es-tablished discriminant validity of PA and UA as separate indicators of subjectivewell-being. In contrast, the notion of bipolarity has been defined inconsistently inthe literature. Some researchers have defined bipolarity as correlations between PAand UA that approach –1, which implies a lack of discriminant validity (Green etal., 1993, 1999). Our findings clearly refute bipolarity in this sense.
Recently, Russell and Carroll (1999) proposed a different definition of bipo-larity. Accordingly, bipolarity is defined as mutually exclusive experiences ofPA and UA at one moment in time. As noted by the authors, this definition ofbipolarity does not apply to studies that assess PA and UA over extended peri-ods of time, which is typically the case in personality research and assessmentsof subjective well-being (e.g., Costa & McCrae, 1980; Diener et al., 1995,1996). Furthermore, the hypothesis that current PA and UA are bipolar oppo-sites in this sense cannot be tested by means of correlation coefficients (for de-tails, see Schimmack, 2001) because correlations can be close to –1 when PAand UA are not mutually exclusive, and they can be close to 0 when PA and UAare mutually exclusive. However, it should be noted that recent evidence alsocontradicts the hypothesis that momentary feelings of PA and UA are mutuallyexclusive, as people do report concurrent feelings of pleasure and displeasure inconflicting situations (J. T. Larsen, McGraw, & Cacioppo, 2001; Schimmack,2001; Schimmack, Colcombe, & Crites, 2001).
CONCLUSIONS
We examined the claims that affect ratings are heavily influenced by responsestyles and that discriminant validity of PA and UA as separate indicators of subjec-
480 SCHIMMACK, BÖCKENHOLT, REISENZEIN
tive well-being is a method artifact. Contrary to these claims, we demonstrated thatresponse styles have a negligible influence on affect ratings and that evidenceagainst discriminant validity of PA and UA is an artifact due to bipolar interpreta-tions of ambiguous response formats. Personality researchers should assess PA andUA with formats that respondents interpret in a unipolar manner.
REFERENCES
Andrews, F. M., & Withey, S. B. (1976). Social indicators of well-being: America’s perception of lifequality. New York: Plenum.
Bagozzi, R. P., Wong, N., & Yi, Y. (1999). The role of culture and gender in the relationship betweenpositive and negative affect. Cognition and Emotion, 13, 641–672.
Bentler, P. M. (1969). Semantic space is (approximately) bipolar. Journal of Psychology, 71, 33–40.Borkenau, P., & Ostendorf, F. (1992). Social desirability scales as moderator and suppressor variables.
European Journal of Personality, 6, 199–214.Cacioppo, J. T., & Berntson, G. G. (1994). Relationship between attitudes and evaluative space: A criti-
cal review, with emphasis on the separability of positive and negative substrates. Psychological Bul-letin, 115, 401–423.
Cacioppo, J. T., Gardner, W. L., & Berntson, G. G. (1999). The affect system has parallel and integrativeprocessing components: Form follows function. Journal of Personality and Social Psychology, 76,839–855.
Costa, P. T., & McCrae, R. R. (1980). Influence of extraversion and neuroticism on subjective well-be-ing: Happy and unhappy people. Journal of Personality and Social Psychology, 38, 668–678.
DeShon, R. P. (1998). A cautionary note on measurement error corrections in structural equation mod-els. Psychological Methods, 3, 412–423.
Diener, E. (1984). Subjective well-being. Psychological Bulletin, 95, 542–575.Diener, E. (1999). Introduction to the special section on the structure of emotion. Journal of Personality
and Social Psychology, 76, 803–804.Diener, E., & Emmons, R. A. (1984). The independence of positive and negative affect. Journal of Per-
sonality and Social Psychology, 47, 1105–1117.Diener, E., & Iran-Nejad, A. (1986). The relationship in experience between various types of affect.
Journal of Personality and Social Psychology, 50, 1031–1038.Diener, E., Larsen, R. J., Levine, S., & Emmons, R. A. (1985). Intensity and frequency: Dimensions un-
derlying positive and negative affect. Journal of Personality and Social Psychology, 48,1253–1265.
Diener, E., & Lucas, R. E. (1999). Personality and subjective well-being. In D. Kahneman, E. Diener, & N.Schwarz (Eds.), Well-being: The foundations of hedonic psychology (pp.213–229). New York: Sage.
Diener, E., Sandvik, E., Pavot, W., & Gallagher, D. (1991). Response artifacts in the measurement ofsubjective well-being. Social Indicators Research, 24, 35–56.
Diener, E., Smith, H., & Fujita, F. (1995). The personality structure of affect. Journal of Personality andSocial Psychology, 69, 130–141.
Diener, E., Suh, E. M., Lucas, R. E., & Smith, H. L. (1999). Subjective well-being: Three decades ofprogress. Psychological Bulletin, 125, 276–302.
Eid, M. (Ed.). (1995). Modelle der Messung von Personen in Situationen [Measurement models of peo-ple in situations]. Weinheim, Germany: Psychologische Verlagsunion.
Feldman Barrett, L., & Russell, J. A. (1998). Independence and bipolarity in the structure of current af-fect. Journal of Personality and Social Psychology, 74, 967–984.
RESPONSE STYLES 481

Fisher, G. A., Heise, D. R., Bohrnstedt, G. W., & Lucke, J. F. (1985). Evidence for extending thecircumplex model of personality trait language to self-reported affects. Journal of Personality andSocial Psychology, 49, 233–242.
Gotlib, I. H., & Meyer, J. P. (1986). Factor analysis of the multiple affect adjective check list: A separa-tion of positive and negative affect. Journal of Personality and Social Psychology, 50, 1161–1165.
Green, D. P., Goldman, S. L., & Salovey, P. (1993). Measurement error masks bipolarity in affect rat-ings. Journal of Personality and Social Psychology, 64, 1029–1041.
Green, D. P., Salovey, P., & Truax, K. M. (1999). Static, dynamic, and causative bipolarity of affect.Journal of Personality and Social Psychology, 76, 856–867.
Hoyt, W. T., & Kerns, M. (1999). Magnitude and moderators of bias in observer ratings: A meta-analy-sis. Psychological Methods, 4, 403–424.
Jackson, D. N. (1967). Acquiescence response styles: Problems of identification and control. In I. A.Berg (Ed.), Response set in personality assessment (pp.71–114). Chicago: Aldine.
Kahneman, D., Diener, E., & Schwarz, N. (Eds.). (1999). Well-being: The foundations of hedonic psy-chology. New York: Sage.
Larsen, J. T., McGraw, A. P., & Cacioppo, J. T. (2001). Can people feel happy and sad at the same time?Journal of Personality and Social Psychology, 81, 684–696.
Larsen, R. J., & Diener, E. (1987). Affect intensity as an individual difference characteristic: A review.Journal of Research in Personality, 21, 1–39.
Lorr, M. (1989). Models and methods for measurement of affect. In R. Plutchik & H. Kellerman (Eds.),Emotion: The measurement of emotion (Vol.4, pp. 37–53). New York: Academic.
Lucas, R. E., Diener, E., & Suh, E. (1996). Discriminant validity of well-being measures. Journal ofPersonality and Social Psychology, 71, 616–628.
McCrae, R. R., & Costa, P. T. (1983). Social desirability scales: More substance than style. Journal ofConsulting and Clinical Psychology, 51, 882–888.
McCrae, R. R., Stone, S., Fagan, P. J., & Costa, P. T. (1998). Identifying causes of disagreement be-tween self-reports and spouse ratings of personality. Journal of Personality, 66, 285–313.
Meddis, R. (1972). Bipolar factors in affect adjective checklists. British Journal of Social and ClinicalPsychology, 11, 178–184.
Messick, S. J. (1967). The psychology of acquiescence: An interpretation of research evidence. In I. A.Berg (Ed.), Response set in personality assessment (pp.115–145). Chicago: Aldine.
Piedmont, R. L., McCrae, R. R., Rieman, R., & Angleitner, A. (2000). On the invalidity of validityscales: Evidence from self-reports and observer ratings in volunteer samples. Journal of Personalityand Social Psychology, 78, 582–593.
Rorer, L. G. (1965). The great response-style myth. Psychological Bulletin, 63, 129–156.Russell, J. A., & Carroll, J. M. (1999). On the bipolarity of positive affect and negative affect. Psycho-
logical Bulletin, 125, 3–30.Schimmack, U. (1997). Das Berliner-Alltagssprachliche-Stimmungs-Inventar (BASTI): Ein Vorschlag
zur kontentvaliden Erfassung von Stimmungen [The Berlin Everyday Language Mood Inventory(BELMI): Toward the content of valid assessment of moods]. Diagnostica, 43, 150–173.
Schimmack, U. (2001). Pleasure, displeasure, and mixed feelings: Are semantic opposites mutually ex-clusive? Cognition and Emotion, 15, 81–97.
Schimmack, U., Colcombe, S., & Crites, S. J. (2001). Pleasure and displeasure in reaction to conflictingpicture pairs. Manuscript submitted for publication.
Schimmack, U., & Diener, E. (1997). Affect intensity: Separating intensity and frequency in repeatedlymeasured affect. Journal of Personality and Social Psychology, 73, 1313–1329.
Schimmack, U., & Grob, A. (2000). Dimensional models of core affect: A quantitative comparison bymeans of structural equation modeling. European Journal of Personality, 14, 325–345.
482 SCHIMMACK, BÖCKENHOLT, REISENZEIN

Schimmack, U., Oishi, S., & Diener, E. (in press). Cultural influences on the relation between pleasantemotions and unpleasant emotions: Asian dialectic philosophies or individualism-collectivism?Cognition and Emotion.
Schimmack, U., Oishi, S., Diener, E., & Suh, E. (2000). Facets of affective experiences: A new look atthe relation between pleasant and unpleasant affect. Personality and Social Psychology Bulletin, 26,655–668.
Schmidt, F. L., & Hunter, J. E. (1996). Measurement error in psychological research: Lessons from 26research scenarios. Psychological Methods, 1, 199–223.
Schwarz, N., & Clore, G. L. (1983). Affect, misattribution, and judgments of well-being: Informativeand directive functions of affective states. Journal of Personality and Social Psychology, 45,513–523.
Schwarz, N., Knäuper, B., Hippler, H. J., Noelle-Neumann, E., & Clark, F. (1991). Rating scales: Nu-meric values may change the meaning of scale labels. Public Opinion Quarterly, 55, 570–582.
Svensson, E. (1977). Response format and factor structure in affect adjective check lists. ScandinavianJournal of Psychology, 18, 71–78.
Warr, P., Barter, J., & Brownbridge, G. (1983). On the independence of positive and negative affect.Journal of Personality and Social Psychology, 44, 644–651.
Watson, D. (1988). The vicissitudes of mood measurement: Effects of varying descriptors, time frames,and response formats on measures of positive and negative affect. Journal of Personality and SocialPsychology, 55, 128–141.
Watson, D., & Clark, L. A. (1997). Measurement and mismeasurement of affect: Recurrent and emer-gent issues. Journal of Personality Assessment, 68, 267–296.
Watson, D., Wiese, D., Vaidya, J., & Tellegen, A. (1999). The two general activation systems of affect:Structural findings, evolutionary considerations, and psychobiological evidence. Journal of Per-sonality and Social Psychology, 76, 820–838.
Ulrich SchimmackDepartment of PsychologyUniversity of Toronto at MississaugaErindale College3359 Mississauga Road NorthMississauga, Ontario L5L 1C6CanadaE-mail: [email protected]
Received September 5, 2001Revised December 28, 2001
RESPONSE STYLES 483