Residential Wood Burning in British Columbia - Public Behaviour and Opinion
48
Residential Wood Burning in British Columbia - Public Behaviour and Opinion By: Hui Xue and Tony Wakelin British Columbia Ministry of Environment Environmental Protection Division Water, Air and Climate Change Branch Air Protection Section Victoria, British Columbia May 2006
-
Upload
independent -
Category
Documents
-
view
0 -
download
0
Transcript of Residential Wood Burning in British Columbia - Public Behaviour and Opinion

Residential Wood Burning in British Columbia
- Public Behaviour and Opinion
By: Hui Xue and Tony Wakelin
British Columbia Ministry of Environment Environmental Protection Division
Water, Air and Climate Change Branch Air Protection Section
Victoria, British Columbia
May 2006

Library and Archives Canada Cataloguing in Publication Data Xue, Hui Residential wood burning in British Columbia
[electronic resource] : public behaviour and opinion. Available on the Internet. ISBN 0-7726-5577-4 Includes bibliographical references: p. 1. Fuelwood – Burning – Environmental aspects - British
Columbia. 2. Stoves, Wood – Environmental aspects – British Columbia. 3. Air - Pollution - British Columbia 4. Fuelwood – British Columbia – Burning – Public opinion. 5. Public opinion – British Columbia. I. Wakelin, Tony. II. British Columbia. Ministry of Environment. III. British Columbia. Air Protection section.
TD884.5R47 2006 363.739’209711 C2006-960126-7

Abstract
Residential wood heating is a significant source of fine particulate emissions in British Columbia, especially for interior communities where residents have ready access to wood fuel. In June 2003, the Ministry commissioned a telephone survey to study residential wood heating practices. The data obtained were first analyzed to produce the report “Residential Wood Burning Emissions in British Columbia”, which focused on emission estimation. In addition to collecting data for emission estimation, the survey included a number of public behaviour and opinion questions. This report provides further analyses of this data. Emphasis is placed on household energy consumption patterns, future consumption and anticipated switches from the date of survey (2003) to 2006, burning practices, attitudes and opinions, knowledge and awareness concerning air quality, and actions to reduce emission releases. Findings on woodstove changeout and education support a focus on replacing conventional or old technology woodstoves as they account for 58% of total provincial emissions from all residential fuel wood use including open fireplaces. On average, wood heating satisfies between 7 and 14% of household heating requirements. Yet, wood heating is responsible for virtually all the PM2.5 released from residential heating. Anticipated changes between 2003 and 2006 (excluding the Lower Fraser Valley and the Kelowna) indicate that:
• reliance on wood heating could increase between 4 and 11% across B.C., • 1.5% or 10,940 households intend to switch their main heating source to wood, • 1677 households intend to switch away from wood altogether, • of the 59,733 exclusive conventional wood appliances users, 27% or 15,532 are
likely (or very likely) to change to a newer appliance, • 5.7% or 11,465 households intend to install a conventional wood-burning
appliance.
The results of this analysis provide useful insights to determine future actions for reducing emissions from residential fuel wood heating, with an emphasis for running pilot activities in the Highway 16 corridor of the Skeena region.


Table of Contents
1 Introduction 1 2 Questions Posed and Result Analysis 3 3 Results 4
3.1 Fuel Consumption Patterns 5 3.2 Energy consumption pattern (2003) 9
3.2.1 Household energy consumption 9 3.2.2 Classification of energy user groups - province 10 3.2.3 Appliance location by residence type 14
3.3 Future consumption and anticipated switch pattern (2003-06) 15 3.3.1 Future wood user consumption 15 3.3.2 Anticipated energy switch pattern 17 3.3.3 Future wood user appliance choice 18
3.4 Wood burning appliance emissions 22 3.4.1 Wood burning appliances PM2.5 released by region 22 3.4.2 Wood burning appliances PM2.5 released - BVLD 23
3.5 Burning practices 23 3.5.1 Firewood seasoning and storage practices 23 3.5.2 Firewood seasoning and storage practices - province- 25 3.5.3 Non firewood burning practices 25
3.6 Attitudes and opinions 26 3.6.1 Reasons for heating with wood 26 3.6.2 New wood burning appliance installation reasons (2001-06) 28
3.7 Stove and operation awareness 30 3.8 Air quality and pollution sources 31
3.8.1 Chimney smoke and air quality 31 3.8.2 Chimney smoke concern 33 3.8.3 Air pollution sources 34
3.9 Emission reduction actions 35 3.9.1 Groups to involve 35 3.9.2 Support for potential actions 36
4 Summary and Conclusions 37
Appendix A: Statistics 40
Terms 40
Results 41
References 42
Tables Table 1: Wood burning appliance distribution by region and area 5 Table 2: Annual total PM2.5 emissions by region and appliance type 7 Table 3: Household rural and urban energy consumption 9 Table 4: Energy users by fuel type - province 11 Table 5: Energy users by dwelling type - province 14 Table 6: Change in wood users’ consumption profile 16 Table 7: Anticipated switch pattern (2003-06) 17 Table 8: Appliance choice - conventional users (2003-06) 19 Table 9: Woodusers interested in installing new appliances in 2003-06 21 Table 10: Wood users that follow proper firewood seasoning and storage practices 24 Table 11: Degree of importance for heating with wood 27 Table 12: Degree of concern scaling ‘chimney smoke concern’ and ‘% time when air quality is poor’ 31 Table 13: Degree of contribution scale 34 Table 14: Degree of involvement scale 35 Table 15: Correlation table 41 Figures Figure 1: Map of geographic areas sampled in the residential wood burning emission survey 3 Figure 2: Wooduser stratification - province 6 Figure 3: Wooduser stratification - BVLD 6 Figure 4 Wood burning appliances by region 6 Figure 5: Wood burning appliance PM2.5 released by region 7 Figure 6: Regional energy consumption pattern 10 Figure 7: Single energy choice - province 11 Figure 8: Secondary energy choice - province 12 Figure 9: Secondary energy choice - BVLD 13 Figure 10: Wood burning residents in single detached and mobile homes - province 15 Figure 11: Change in wood users’ energy consumption (2003-06) 16 Figure 12: Conventional appliance users likely to install new wood burning appliance (2003-06) 19 Figure 13: Installation of new wood burning appliances appliance users - province 20 Figure 14: Wood burning appliances PM2.5 released by region 22 Figure 15: Wood burning appliances PM2.5 released - BVLD 23 Figure 16: Firewood seasoning and storage practices - province 25 Figure 17: Non firewood burning practices - provincial 26 Figure 18: Reasons for heating with wood - Province, Skeena area and BVLD 27 Figure 19: Reasons for heating with wood by user group 27 Figure 20: Reasons for installing new wood-burning appliances (2001-06) - all wood users 28 Figure 21: New wood-burning appliances installation reasons (2001-06) – province-wide exclusive conventional
appliance users 29 Figure 22: Wood users’ stove and operation awareness 30 Figure 23: The awareness of emission related issues between province-wide appliance user groups 30 Figure 24: The awareness of emission related issues - male and female respondents 31 Figure 25: Air quality and concern for chimney smoke 32 Figure 26: Air quality and concern for chimney smoke - BVLD 32 Figure 27: Air quality and concern for chimney smoke - female versus male respondents and woodusers versus
non users of the province 33 Figure 28: Reasons for chimney smoke concern – gender and wooduser groups 33 Figure 29: Air pollution sources and their effects 34 Figure 30: Groups to involve for improving air quality 35 Figure 31: Support for potential emission reduction actions 36 Figure 32: Support for potential emission reduction actions - wood users versus non-users 37

1
1 Introduction The 2003 Provincial Health Officer’s report indicates that fine particulate (PM2.5) is a health concern throughout British Columbia1. This report states that outdoor air pollution is linked to between 25 and 250 deaths per year in B.C. Although a formal costing exercise has yet to be carried out for the burden of air pollution in B.C., informal estimates place the health burden from outdoor air pollution in B.C. at about $85 million per year.
Various emission estimates for residential wood heating have been made for B.C. Early estimates (1985 to 1995) relied on a number of assumptions from other jurisdictions. To arrive at more reliable emission estimates, the wood burning habits of British Columbia residents were studied in three surveys. One survey focused on the Canadian Lower Fraser Valley (CLFV)2, another focused on the Okanagan Valley3, and the third survey, which is considered further in this report, focused on the remainder of the province. The CLFV and Okanagan surveys were less involved than for the rest of the province since they only concentrated on one geographic area. The provincial survey was done by telephone, using disproportionate sampling of 2100 wood burning appliance users. The survey respondents were interviewed regarding their wood burning habits, and their attitudes toward residential wood heating. Emission estimate data from the surveys were combined with estimates from the CLFV and the Okanagan to produce for a complete emission inventory estimates for the province.4. When considering the results of the Okanagan survey in the context of this report, it should be noted that the provincial survey only excluded the Kelowna portion. Thus, results presented for the Southern Interior region of the province include some parts of the Okanagan.
Residential wood heating accounts for 15% of PM2.5 releases in B.C. It was found that the portion of air emissions contributed by residential wood burning varies between rural and urban settings, as expected. Within some rural locations, residential wood heating can account for the greatest portion of PM2.5 compared to other source sectors. In urban centres the proportional contribution is much smaller. For example, in the CLFV, wood heating contributes to approximately 3% of total fine particulates (PM2.5). While this contribution is relatively low, it should be noted that the quantity of PM2.5 is still large due to the number of residences, and that potential benefits associated with reducing ambient PM2.5 concentrations in the CLFV are an order of magnitude greater than the benefits associated with reducing other contaminants such as ambient ozone5.
The Province has been actively involved in reducing emissions from residential wood heating. In 1994, the Solid Fuel Burning Domestic Appliance Regulation came into effect. This Regulation requires that all new wood burning appliances meet stringent U.S. EPA or equivalent Canadian emission standards. B.C. is still the only Canadian province with such legislation. While the regulation has had a positive effect in reducing PM2.5, there are still a significant number of old technology or conventional woodstoves/fireplace inserts* in operation that emit much more fine particulate than newer wood fired units that meet U.S. EPA or Canadian equivalent emission standards, or appliances burning other fuels such as natural gas or propane.
* Throughout this report the term woodstove applies to freestanding woodstoves and fireplaces inserts unless stated otherwise.

2
In an attempt to further reduce emissions from residential wood heating, the Ministry has supported a number of woodstove changeout programs and has sponsored the Wood Energy Technicians of B.C. (WET BC) to deliver Burn-it-Smart public information workshops.
When these initiatives were evaluated in terms of the number of old appliances changed out or the number of people attending workshops, it became apparent that the return on the invested funding and staff time is relatively low. There are approximately 120,000 old woodstoves in the province - 84,400 of which are outside the CLFV. Fifteen individual changeout programs have resulted in the replacement of approximately 1200 stoves over 10 years, only 1% of the target woodstoves. It is probable that after a decade of these programs, we have reached most of the households that are likely to respond to this approach. In order to evaluate the potential for alternative programs to reduce PM2.5 from residential heating, the Province proposes is now using community based social marketing (CBSM) to improve our understanding of the social aspects of wood heating before enhancing the programs that have been offered.
CBSM is a social science approach which identifies the barriers and benefits to society of societal changes in behaviour and appropriate actions which can effect behavioural changes.6 In this case we want to examine (1) wood appliance changeout, and (2) education to ensure that those who choose to heat their homes with wood apply practices which will minimize emissions. Activities to date include: meeting with the hearth products industry (June 7, 2005), formation of a Residential Wood Heating Working Group, holding a number of Working Group teleconferences (starting October 17, 2005), and commencing question and focus groups within a pilot area comprised of the Highway 16 corridor of the Skeena region of the province.
This report complements the Residential Wood Burning Emissions in British Columbia report4 by analysing data from the same survey for attitudes and opinions regarding residential wood heating. Unlike the emissions report, results from Kelowna and the CLFV have not been combined in this report as it was not possible to integrate independent surveys at the level of detail that would be required to yield consistent results. Where possible this report segregates households by geographic area. Additional steps were also taken to segregate data by household characteristics (such as type of dwelling) and to suggest possible policy instruments (or social marketing strategies) for delivering targeted programs based on public perceptions and attitudes. The statistical techniques used are more advanced than those used in the emissions report, as the intent of this analysis is to draw as much information as possible from the data.
Figure 1 shows the regions and areas the survey used to segregate households geographically. It is theoretically possible to analyse the data for all of these areas, but doing so would add considerably to the volume of material presented. Results are presented first for the province as a whole. From there Ministry regional breakdowns are provided where appropriate. For the regional breakdowns particular emphasis is placed on the Skeena region and the Bulkley Valley/Lakes District (BVLD) airshed. It would be ideal to be able to analyse the data set for the Skeena region Highway 16 corridor. However, since the data set was collected to obtain the minimum number of data points for a acceptable margin of error in the BVLD airshed, it was not possible to consider a smaller number of samples and arrive at meaningful conclusions. Nevertheless, the results for both Skeena and BVLD will imply behaviours for the Highway 16 corridor.

3
Figure 1: Map of geographic areas sampled in the residential wood burning emission survey
Note: The survey did not cover Lower Fraser Valley or Kelowna.
2 Questions Posed and Result Analysis A survey designed to seek information on attitudes and opinions, would normally be carefully vetted to ensure clarity, lack of bias, and meaningful outputs (in this case enough information to satisfy CBSM needs). However, for this survey:
• questions regarding attitudes and opinions were developed by Air Protection staff as an add on to collecting the required emission estimation data, and
• the decision to use CBSM had yet to be made.
As a result, while the questions have value for providing insight into public attitudes and opinions, they were not necessarily optimized for the needs of CBSM. In the sections that follow, the survey questions are presented as appropriate before considering the data. In this way readers can draw their own conclusions regarding the appropriate nature of each question.

4
Results could be presented as simple averages. However, this is problematic as there are theoretical chances that observed differences between the groups can occur as a result of random chance. To ensure that the survey results are statistically significant the following statistical significance tests were used:
• Analysis of Variance (ANOVA)1 • Pearson Chi Square • Pearson Correlation
Since this report has been prepared for a non-technical audience, a detailed discussion of the statistical methods has been moved to the Appendix.
3 Results To comprehend the results of the survey, disproportionate sampling concepts should be understood. The residential wood burning emission survey used disproportionate sampling in selecting the number of wood-burning households.2 Disproportionate sampling was used to keep the number of samples manageable while ensuring adequate representation of wood heating households within each specific region or airshed. The sample size for each survey region was selected to produce statistical results about wood fuel users that would be valid at the 95% confidence level. Non-wood fuel users were surveyed as a control group and as such, only half of the number of non-users was surveyed relative to the users. In the end, the complete responses amounted to a minimum of 100 wood users and 50 non users for each survey region. In effect, wood burning households were over-sampled from a representative population in order to better study variations within this group (for example geographic variations). Therefore, the results generated from the analyses are most appropriate to describe the characteristics of wood users (i.e. fuel consumption pattern) and the distinction between subgroups within the wood users (i.e. conventional stove owners, etc).
Cautions apply for generalizing the survey results to the whole provincial population. The survey only covered 45.2% of the provincial population, with CLFV (52.8% provincial population) and Kelowna (2% provincial population) excluded. The CLFV has distinctive social differences due to its urban nature compared to the rest of the province which is generally more rural. The results of this report could be indicative for Kelowna. However, this report has not been extrapolated to include this. Information on household heating sources and public attitudes towards wood burning in the CLFV can be found in a separate report on a similar 2002 survey for this area. Natural Resources Canada (NRCan) has also conducted a household energy consumption survey7 which covers the whole province (including CLFV). Related statistics are available at the NRCan website (http://oee.nrcan.gc.ca/corporate/statistics/neud/dpa/trends_res_bc.cfm).
1 If we jump ahead to page 8: The ANOVA test indicates that the variation of households heating with wood between regions could be repeated in another survey 95% of the time. Another way of looking at the ANOVA test is that it shows us that the difference between regions is real rather than occurring by random chance. 2 ‘Wood burning households’ and ‘wood users’ in this report include anyone who operates wood burning appliances, except pellet stoves.

5
3.1 Fuel Consumption Patterns Our analysis of the results starts with considering how British Columbia households burn firewood. Table 1 shows the distribution of appliances throughout the province using data from the wood stove emission survey report4.
Table 1: Wood burning appliance distribution by region and area
Note: 1 Source: Canada Post (December 12, 2002 – January 2004). 2 ‘Households burning wood’ also includes pellet stoves. 3 ‘Conventional stove/insert’ includes conventional stoves and fireplace inserts only. 4 ‘Advanced stove/insert’ include the advanced technology stoves/ fireplace inserts and the catalytic stoves/inserts. 5 Includes open hearth, glass door or advanced technology. 6 Wood burning furnaces, typically located in basements. 7 More than one wood burning appliance.
Percent of hhs burning wood in Ministry Region
Air Quality area of interest
Total households
(hhs)1
Percent of hhs
burning wood2
Conventional Stove/ Insert3
Advanced stove
/insert4 Fireplace5 Furnace6 Multiple
appliances7 sum
Capital Regional District
149,324 19.7 28.6 20.4 38.8 0.0 12.2 100 Vancouver Island Other
Vancouver Island
155,076 35.1 30.9 48.9 6.5 4.3 9.4 100
Sunshine Coast 20,050 42.0 31.2 28.0 11.8 9.7 19.4 100 Sunshine
coast Sea-to-Sky 20,958 36.4 29.3 42.4 18.2 2.0 8.1 100 Shuswap 16,631 28.6 25.0 29.2 13.5 14.6 17.7 100 Kamloops 35,181 9.9 21.6 22.7 43.3 3.1 9.3 100 Southern
Interior8 Other Southern Interior
126,857 27.6 31.4 28.6 17.1 9.5 13.3 100
Golden 3,137 42.5 32.3 40.6 2.1 15.6 9.4 100 Cranbrook 15,217 24.8 37.5 33.3 17.7 6.3 5.2 100 Elk Valley 6,236 21.4 35.9 30.4 17.4 6.5 9.8 100 Nelson 7,921 16.5 33.7 33.7 22.4 3.1 7.1 100
Kootenay
Other Kootenay 36,969 41.2 26.8 29.9 11.8 20.5 11.0 100
Williams Lake 9,040 25.4 28.9 36.1 12.4 13.4 9.3 100
Quesnel 10,256 29.4 30.9 27.8 16.5 18.6 6.2 100 Cariboo Other Cariboo 10,544 57.0 23.1 38.5 5.8 15.4 17.3 100
Prince George 33,918 20.5 27.7 26.1 26.1 8.4 11.8 100 Northern
Interior Other Northern 34,767 30.3 20.4 38.8 12.2 14.3 14.3 100
Bulkley Valley/Lakes 13,621 39.8 42.2 24.1 6.0 22.9 4.8 100
Skeena Other Skeena 23,641 20.3 35.8 31.7 12.5 15.8 4.2 100
Weighted provincial average 28.6 29.7 34.3 16.4 8.3 11.3 100

6
Figure 2: Wooduser stratification - province
Multiple 11%Furnace 8%
Fireplace 16%
Advanced 34%
Conventional 30%
Figure 3: Wooduser stratification - BVLD
Multiple 5%
Furnace 23%
Fireplace 6% Advanced 24%
Conventional 42%
Figure 4 Wood burning appliances by region
0%20%40%60%80%
100%
CRD
Other Vancouver is
land
Sunshine Coast
Sea-to-Sky
Shuswap
Kamloops
Other Southern In
terior
Golden
Cranbrook
Elk Valley
Nelson
Other Kooten
ay
William
s Lake
Quesnel
Other Carib
oo
Prince George
Other North
ernBVLD
Other Skeen
a
% o
f woo
duse
rs
Conventional Advanced Fireplace Furnace Multiple
Emissions releases by appliance types are another key starting point for contemplating reduction strategies. The information below was also extracted from the emission survey report.

7
Table 2: Annual total PM2.5 emissions by region and appliance type
Percent of total PM2.5 emission produced from Ministry Region
Air Quality area of interest
Annual emissions (tonnes)
Conventional Stove/ Insert3
Advanced stove
/insert4 Fireplace5 Furnace6 sum
Capital Regional District
2030.8 60.36 14.68 22.21 2.75 100 Vancouver Island Other
Vancouver Island
761.5 65.51 22.05 9.10 3.34 100
Sunshine Coast 333.7 58.80 13.14 10.08 17.98 100 Sunshine
coast Sea-to-Sky 250.5 55.15 21.66 16.52 6.67 100 Shuswap 2232.5 57.14 12.57 7.87 22.43 100 Kamloops 243.3 33.10 12.02 48.47 6.40 100 Southern
Interior8 Other Southern Interior
115.6 62.34 7.03 16.53 14.10 100
Golden 854.4 62.54 12.16 3.87 21.44 100 Cranbrook 84.6 71.99 10.26 9.78 7.97 100 Elk Valley 198.9 60.89 14.11 11.66 13.33 100 Nelson 69.3 63.79 15.72 15.06 5.43 100
Kootenay
Other Kootenay 42.4 51.80 10.01 9.50 28.69 100
Williams Lake 411.0 54.96 14.62 8.55 21.87 100
Quesnel 114.7 50.78 8.63 7.80 32.79 100 Cariboo Other Cariboo 215.7 57.97 14.87 4.68 22.48 100
Prince George 701.9 39.75 15.11 19.22 25.92 100 Northern
Interior Other Northern 308.9 41.87 14.24 13.39 30.50 100
Bulkley Valley/Lakes 343.1 56.04 7.03 6.16 30.77 100
Skeena Other Skeena 535.0 60.36 14.68 22.21 2.75 100
Weighted provincial average 58.0 14.2 15.8 12.0 100
Figure 5: Wood burning appliance PM2.5 released by region
0%20%40%60%80%
100%
CRD
Other VI
Sunshine C
oast
Sea-to
-Sky
Shuswap
Kamloops
Other Southern
Golden
Cranbro
ok
Elk Valley
Nelson
Other Kooten
ay
William
s Lake
Quesnel
Other Cari
boo
Prince G
eorg
e
Other North
ernBVLD
Other Ske
ena
% P
M2.
5 re
leas
ed
Conventional Advanced Fireplace FurnacePM2.5 released from:

8
When considering the need to reduce emissions from residential wood heating, it is logical to focus efforts on conventional free standing stoves and fireplace inserts as they account for 58% of the PM2.5. This statistic is significant when compared to advanced stoves. There are more advanced stoves in the province (34%) compared to conventional units (30%). However, the total emissions from advanced units account for 14% of PM2.5. Therefore, phasing out conventional woodstoves in favour of advanced units would result in a 44% reduction of PM2.5 from the provincial residential fuel wood heating sector. Also, if conventional woodstoves are changed out for cleaner heating options (natural gas, oil, or electricity) the emission reductions will be even greater. When considering a changeout program other appliance types can be excluded at this time due to the following facts:
1. Central wood fired furnaces: • A number of existing units are dual fuel (usually oil and wood). Thus, a change in
fuel would lead to emission reductions without changing out. • Purchase and installation costs are higher than those for new technology
woodstoves. Thus, any kind of monetary incentives required would presumably need to be substantial.
• Units are not covered under the provincial Solid Fuel Burning Domestic Appliance Regulation or U.S. EPA regulations. This has lead to only one wood fired furnace on the market that can meet the U.S. EPA or equivalent Canadian emission standards. Limiting replacement options to one manufacturer would have obvious limitations.
2. Fireplaces:
• Usually result in a net heat loss to a household (except for advanced technology units which are relatively few in number). Therefore, home owners are already encouraged to install a heating appliance to improve energy efficiency.
• BC Hydro and Terasen gas have run programs aimed at converting fireplaces to natural gas http://www.terasengas.com/Promotions/Search/Search.htm Therefore, an changeout program may compete with programs that have already been offered.
• A program to install wood inserts in existing open fireplaces could result in a net increase in emissions. An emission reduction would result from changing from an open fireplace in favour of an advanced technology insert – provided an equal amount of wood is burned. However, insert owners tend to burn more wood as these units offer an efficient heating option. Therefore, the increase in the amount of wood burned could overshadow the emission reduction and lead to a net increase in emissions.
3. Pellet stoves:
• Are much cleaner than advanced technology woodstoves and are therefore not a logical target for replacement.
In addition to the above considerations it should be noted that, to date, every jurisdiction that has run changeout programs only considers removal of conventional stoves and inserts.

9
3.2 Energy consumption pattern (2003) Our analysis starts with looking at household energy consumption as it pertains to the use of wood compared to other options such as electricity, natural gas, and oil. Data is separated into regional statistics and single use or secondary energy choices.
3.2.1 Household energy consumption Question: 11)
Analysis Methods: Disproportionate samples corrected for regional populations, average composition of wood users and non users; ANOVA tests (1) wood users and electricity, gas or oil use, and (2) non users and electricity, gas or oil use. Both demonstrated a confidence interval of 95%. Result:
Table 3: Household rural and urban energy consumption
Energy source Share of hh energy consumption (%) Electricity Gas Oil Wood pellet Other3 Weighted woodusers 22.6 16.0 9.3 47.0 2.7 2.0 Weighted non-users 36.6 53.0 7.2 0.0 0.0 3.1 Weighted rural average1 38.8 35.1 11.3 10.3 0.6 4.5 Weighted urban average1 31.6 53.4 6.5 6.7 0.4 1.4 Weighted provincial average 34.3 46.3 7.4 9.0 0.56 2.8 Provincial average (NRCAN)2 30.8 58.3 5.6 3.3 2.1
Note: 1 Assuming rural and urban communities were equally distributed throughout each region. 2 Source: Natural Resource Canada (2003). http://oee.nrcan.gc.ca/corporate/statistics/neud/dpa/tablestrends2/res_bc_21_e_3.cfm?attr=0 3 ‘Includes propane, coal, hydrothermal, solar energy, Presto/artificial logs, geothermal and wind power.
(Asking all the respondents) 2) Please note that the questions I am going to be asking you refer to the residence you are in right now. Is the residence you are in right now in a rural area, that is, in a country setting? 1 Yes 2 No 9 Don’t know 11) Of all the heat used in your home, approximately what percentage comes from: A Electricity __% B Natural gas __% C Fuel oil or heating oil __% D Wood __% E Wood pellets __% F Other from above __% G Don’t know

10
Figure 6: Regional energy consumption pattern
0%20%40%60%80%
100%
VancouverIsland
SunshineCoast
SouthernInterior
Kootenay Cariboo NorthernInterior
Skeena
% h
h en
ergy
co
nsum
ptio
n
electricity oil pellet gas other wood
In this graph, each bar shows the typical profile of regional energy consumption for households where wood is one of the heat sources. Note: ANOVA test of variance shows that the use of all these fuels varies significantly among wood users and non users
across regions. Discussion: Household heat sources included electricity, heating oil, natural gas, wood, pellet and other (i.e. propane, coal, etc). Among these energy sources, electricity and gas were used most, together meeting more than 76% household heating needs. Note that household energy consumption profile differs considerably between rural and urban regions or households. While urban households depended on natural gas (to meet more than 50% household heating need), rural households tend to use primarily oil (11%) and wood (10%) and thus have a more balanced profile between options. Based on these rural/urban differences, if the CLFV (mostly urban) were included, the provincial household energy consumption would skew to natural gas, accompanied with a drop in the proportional use of other types of energy. This is supported by the NRCan data.
At the regional level, household energy consumption also demonstrated notable variations. For instance, households in Vancouver Island and the Sunshine Coast relied on electricity as the main heat source, while Southern and Northern Interior communities primarily use natural gas. Across the province, wood burning contributes to 7-14% household energy consumption, with the Cariboo area being highest (14%) and Vancouver Island lowest (7%).
The above indicates regional energy consumption, without indicating the number of households using each type of fuel. To understand individual household fuel choices, we must separate the sampled population into two distinct groups—1) those heating with wood alone and 2) those heating with wood in combination with other options.
3.2.2 Classification of energy user groups - province Individual home owners can choose from many heating options. The survey considered this by asking each respondent how much energy use comes from each source.

11
Table 4: Energy users by fuel type - province
% Households Energy source Any1 Single Choice2 Multiple (distinct choices)3 Remainder4 Electricity 51.90 23.04 6.19 22.67 Gas 48.73 33.30 8.79 6.65 Oil 10.14 5.48 1.97 2.7 Wood 27.60 5.24 7.62 14.74 Pellet 1.68 0.30 0.53 0.85 Other 5.48 1.29 0.79 3.4
Note 1 Any – anyone who uses the heat source. 2 Single choice – predominant (90% or more) with other forms of energy each accounting for less than 6% of total energy consumption. 3 Multiple (distinct choices) – identified two or more forms of energy with one energy source preferred by 5%+ margin over any other. 4 Remainder – energy source is used as a part of the heating mix.
The easiest group to classify is of course single choice. This category was assigned if the energy choice was used 90% or more. Exclusive wood users are of interest, as this group is an obvious target for realizing emission reductions. Results were further classified as multiple (distinct choices) when one choice was preferred by a margin of 5% over any other – multiple (distinct choices). The remaining cases (such as multiple not-distinct choices) were assigned to another category.
3.2.2.1 Single Energy Choice - Province Question: 11) Analysis Methods: Weighted average based on regional distribution of population and composition of wood user and non user Result:
Figure 7: Single energy choice - province
0%20%40%60%80%
100%
VancouverIsland
SunshineCoast
SouthernInterior
Kootenay Cariboo NorthernInterior
Skeena
% a
ll ho
useh
olds
electricity oil pellet gas other woodSingle-choice energy user group of:
Discussion: Distribution of the single-choice energy users was distinctive across regions showing agreement with the household energy consumption profile at the regional level. For example, electricity fulfills about half of Vancouver Island needs, the highest within the province (Figure 5). The largest user group exclusively dependent on electricity (single choice-electricity users) was also found on the Island (about 38% of households). Relative to

12
other single choice users (electricity, gas and oil), the distribution of single choice-wood users was relatively uniform across regions (between 4.3% and 8.8%). The Cariboo and Skeena regions are of interest as they had the largest single choice-wood user groups (8-9%) thus suggesting that these areas have a potentially good ‘market share’ for pilot program activities. Since the Highway 16 corridor of the Skeena region has been identified as a pilot program location, the analyses that follow consider the province, the Skeena Region and more specifically the BVLD.
3.2.2.2 Secondary energy choice – province Question: 11) Data analysis: weighted average based on regional distribution of population and composition of wood user and non user Result:
Figure 8: Secondary energy choice - province
0%20%40%60%80%
100%
electricity(6.2%)
gas (8.8%)
oil (2.0%) wood (7.6%)
pellet (0.5%)
other (0.8%)
Primary energy user group
% th
e gr
oup
electricity oil pellet gas other woodPrimary energy user's secondary fuel choice:
Note: The number in brackets stands for the percentage of households using the fuel as a primary choice – for example,
electricity is used as a primary energy source in 6.2% of households – in these households wood is the second fuel choice 54% of the time.
Discussion: When consumers used more than one type of energy, it makes sense to group first by primary use, then by secondary. An interpretive example for the above graph is: 7.6% of provincial households use wood as a primary energy source. Given this, 58% of those households (who use wood as a primary energy source) also use electricity.
Identification of the second fuel choice can be valuable as it sheds light on the interaction between the fuel sources. Electricity and wood were the second fuel choice of all the primary energy user groups except the primary pellet users who were the most diversified in their secondary fuel sources. There is also some asymmetric association in the use of certain types of fuel. For example 32% households who used oil as their primary fuel source, chose electricity as a secondary source. By contrast, no primary electricity users made oil their second fuel choice.
The stratification of energy groups can also provide insights into market shares for alternatives to wood. Although an in-depth analysis is possible from the questionnaire data it is not provided in this report.

13
3.2.2.3 Secondary energy choice - BVLD Question: 11) Data analysis: weighted average based on regional distribution of population and composition of wood user and non user Result:
Figure 9: Secondary energy choice - BVLD
0%20%40%60%80%
100%
electricity(3.7%)
gas (11.2%)
oil (1.4%)
wood (11.6%)
pellet (4.6%)
other (2.3%)
Primary energy user group
% th
e gr
oup
electricity oil pellet gas other woodPrimary energy user's secondary fuel choice:
Note: The number in bracket stands for the percentage of the primary energy user group who had distinctive secondary
fuel choice within households of BVLD.
Discussion: Compared with province-wide choices (Figure 8), the interaction between fuel sources exhibits a different pattern for the BVLD. The number of households choosing wood pellet as their secondary heat source increases significantly in the BVLD; as a matter of fact the use of pellet heat was the highest in the Skeena area among all areas sampled (Figure 9). Unlike province-wide primary energy users, no primary oil users nor the primary ‘other’ energy users of BVLD chose electricity as their secondary fuel source. Recall that 58.6% of the primary wood users made electricity their second-order fuel choice in the province; this number reached 76.0% in BVLD. With respect to the potential market penetration for clean energy, it is even larger in BVLD, up from 20% for the province to about 30.5% (including the single choice-wood users, the primary wood users and the primary other energy users who burned wood as their secondary heat source in the BVLD). The fact that 96% primary wood users chose either electricity (76%) or gas (20%) as their secondary fuel sources, reinforces promotion of these two choices.

14
3.2.3 Appliance location by residence type Question: 4), 10) and 12)
Data analysis: descriptive analysis, weighted average based on regional distribution of population and composition of wood user and non user Result:
Table 5: Energy users by dwelling type - province
Building type Single
Detached5 Semi-
detached Row/town
house Apartments Condominium Mobile Home sum
NRCan provincial average (share %)1 54.3 10.7 30.8 4.2 100
Weighted provincial average (share %) 73.6 5.0 3.8 4.1 6.2 7.3 100
Weighted wood burning residents (%)2,3
71.7 (2.2)
32.14 (0.2)
38.04 (0.6)
14.54 (0.0)
14.74 (0.0)
54.1 (7.5) n/a
Note: 1 Source: Natural Resource Canada (2003). http://oee.nrcan.gc.ca/corporate/statistics/neud/dpa/tablestrends2/res_bc_21_e_3.cfm?attr=0
2 Wood burning residents’ include pellet. 3 Numbers in brackets refer to percentage of resident burning pellet instead of wood. 4 Sample size is less than 70. 5 Except for ‘single detached’ and ‘mobile home’ the survey sample size was insufficient for further analysis (as presented in figure 9). Although a relatively high number of wood users and non users were surveyed, there are few results for user of row/townhouse. In this case, it’s too few to scale up by the number of households by the specific building type.
4) (Asking everyone) what type of residence are you in right now, is it a home, an apartment, condominium, something else? READ IF NECESSARY, CHECK ONE ONLY 1 Detached house 2 Duplex, triplex or semi-detached 3 Apartment building 4 Row-house or townhouse 5 Condominium 6 Manufactured trailer or mobile home 10) (Asking everyone) I am now going to mention some fuels that people burn and/or use to heat their homes. As I mention each one, please tell me if you have burned and/or used this fuel to heat your home over the last 12 months or not. The first type of fuel is: READ a) Electricity 1 YES 2 NO 9 Don’t know b) Natural gas 1 YES 2 NO 9 Don’t know c) Fuel oil or heating oil 1 YES 2 NO 9 Don’t know d) Wood 1 YES 2 NO 9 Don’t know e) Wood pellets 1 YES 2 NO 9 Don’t know e) Any others? SPECIFY: 1 Propane 96 Miscellaneous 12) (Asking wood users) which of the following types of wood burning fixtures or equipment did you use to heat your home in the past 12 months? CHECK ALL THAT APPLY Wood fireplace: 1 YES 2 NO Wood stove: 1 YES 2 NO 9 Don’t know Wood furnace or boiler: 1 YES 2 NO 9 Don’t know Wood pellet stove: 1 YES 2 NO 9 Don’t know

15
Figure 10: Wood burning residents in single detached and mobile homes - province
29%
29%
52%
30% 20%
3%
7%
2%
11% 3%
15%
0% 20% 40% 60% 80% 100%
Mobile home
Single detached
Conventional Advanced Fireplace Furnace Multiple Pellet stove
Discussion: So far, our analysis has considered household heating with wood users as a distinct group. However, it makes sense to divide this group further since wood users produce unequal amounts of PM2.5 depending on the type of appliance used. As mentioned previously, a changeout program would target conventional woodstoves. Thus, it is important to know which building types have these units.
Table 5 provides two pieces of information. First, we have two sets of building type data. The NRCan provincial average provides a means of cross checking the survey results. If a true random provincial woodstove survey was conducted for the entire province, we would expect the housing mix to be similar (or ideally the same). However, this can not occur with these results as our survey did not include the LFV (which is mostly urban). Thus, comparing our survey results with the NRCan survey, one would expect our survey to over-represent single detached houses, and under-represent apartments and condominium (predominant in the LFV) – which is what can be observed from the data.
Figure 10 considers single detached and mobile home firewood use. The other housing categories in Table 5 are excluded due to insufficient sample size. Approximately 70% the detached homes and 80% of mobile homes that use wood use a woodstove (or insert) Of interest is that both dwelling types tend to use a conventional unit 29% of the time.
In the BVLD, 30.1% of residents of single detached houses and 28.4% those of mobile homes burned wood with conventional burning appliances exclusively.
3.3 Future consumption and anticipated switch pattern (2003-06) Our analysis has considered a single point in time snapshot so far. The survey also considered likely future energy uses from 2003 to 2006, and the anticipated appliance switches. The potential value of a cash incentive is also analyzed.
3.3.1 Future wood user consumption Question: 11) and 53)
53) (Asking all the wood users) in all likelihood, what will be the main type of fuel that you will use to heat your home over the next three years? DO NOT READ, ONE ANSWER ONLY 1 ELECTRICITY 2 NATURAL GAS 3 FUEL OIL OR HEATING OIL 4 WOOD 5 SOLAR 6 PROPANE 7 50% WOOD AND 50% ELECTRICITY 8 50% WOOD AND 50% NATURAL GAS 96 MISCELLANEOUS 98 Don’t Know

16
Data analysis: Weighted average based on regional distribution of population. If the respondent did not identify, the extent the fuel would be used to meet the household’s heating need, this analysis assumes that within the next three years, the new energy source would be used 100% of the time. Result:
Table 6: Change in wood users’ consumption profile
Energy source Change in the share (% hh energy consumption) Electricity Gas Oil Wood Other Weighted provincial average -4.27 -0.082 -0.24 4.14 0.45 Weighted rural1 -4.82 -0.63 -0.94 6.26 0.14 Weighted urban1 -3.92 -0.78 0.34 3.80 0.56
Note: 1The calculation assumes rural and urban communities were equally represented throughout each region. 2 The un-weighted provincial average of the change in gas consumption is between that of the un-weighted rural
average and un-weighted urban average. However the weighted provincial average (of the change in gas consumption) is larger in value than the weighted rural and the weighted urban average. This is because 1) the provincial average is heavily weighted towards the more populous regions, and 2) large variation (in the change of gas consumption between rural and urban) occurs in these populous regions.
Figure 11: Change in wood users’ energy consumption (2003-06)
-8%
-4%
0%
4%
8%
12%
Vancouver Island
Sunshine Coast
Southern Interior
KootenayCariboo
Northern Interior
Skeena% h
h en
ergy
co
nsum
ptio
n
electricity gas oil wood other
Note: ‘Other’ includes ‘electricity and natural gas’, ‘wood and oil’, ‘geo-thermo’, ‘wood and propane’, ‘coal’, ‘electricity
and geo-thermo’, ‘electricity and propane’ and ‘oil and natural gas’. Discussion: In question 53 the respondent was only given the option of indicating a complete fuel switch or a 50/50 split. Therefore, caution should be used when interpreting the results. In reality, a fuel switch would likely result in the new source only satisfying a portion of the need (especially when supplementing with wood heat, as someone has to be home to stoke the fire). Given the limitations of this question, it was assumed that when a 50/50 spit was not indicated, the new fuel source would satisfy 100% of household heating need.
With the above assumption, projection to 2006 anticipates that reliance on wood energy could increase by between 4% and 11% of household heating requirements in all regions except the southern interior. The largest increases are anticipated in the Cariboo and Skeena regions, especially within urban neighbourhoods. This increase in wood burning is anticipated to result in a reduction in electricity use. Thus by 2006, wood burning alone could fulfill as much as 52% of the average heating needs for wood-burning households. This can be divided into 39% for urban and 63% for rural.
For completeness it should be noted that those who answered ‘miscellaneous’ options of fuel sources indicated, ‘wood and oil’ is used most frequently (36% of all ‘miscellaneous’ responses); and another 11% indicated they choose the fuel source depending on fuel prices.

17
3.3.2 Anticipated energy switch pattern Question: 11), 53), and 61)
Data analysis: Weighted average based on regional distribution of population and composition of wood user and non user Result:
Table 7: Anticipated switch pattern (2003-06)
Energy switch from/to (% all households) Single energy choice1 User group % households Electricity Gas Oil Wood Other5
Electricity2 23.04 -1.01 0.76 0.01 0.25 Gas2 33.30 0.05 -1.31 0.02 1.25 0.00 Wood 5.24 0.04 0.07 0.00 -0.15 0.03
conventional appliance only 2.06 0.00 0.06 0.00 -0.07 0.01 advanced appliance only 1.80 0.00 0.00 0.00 -0.01 0.01 fireplace only 0.22 0.00 0.005 0.00 0.005 0.00 furnace only 0.54 0.04 0.00 0.00 -0.05 0.01 multiple appliances 0.62 0.00 0.00 0.00 -0.01 0.01
Total 61.58 -0.92 -0.49 0.03 1.35 0.04 Multiple energy wood users 7.56 0.11 0.13 0.05 -0.38 0.08
conventional appliance only 2.11 0.04 0.06 0.05 -0.16 0.00 advanced appliance only 3.66 0.05 0.01 0.00 -0.08 0.02 fireplace only 0.19 0.00 0.06 0.00 -0.06 0.002 furnace only 0.73 0.01 0.00 0.00 -0.03 0.01 multiple appliances 0.86 0.00 0.01 0.00 -0.05 0.04
Note: 1 ‘Oil’ and ‘other’ single choice energy users are not listed here as none of these groups had expressed intention to change their main heat source within the next three years. 2 ‘Single choice-electricity user group’ and ‘single choice-gas user group’ both include the wood users and nonusers. The averages are thus weighted based on the distribution of woodusers and nonusers of the regions. 3 ‘Wood & conventional appliance only’ refers to the group who were solely reliant on wood for heating purpose, at the same time burned wood in the conventional appliances only. 4 The complete fuel switch (from wood to other heat source) doesn’t apply to the primary wood users, as they had managed a more diversified energy profile than the single-choice woodusers. Hence they are more likely to reduce wood burning than giving up wood heat entirely. 5 ‘Other types of fuel’ wasn’t an option as the answer to the question about the likely fuel source to non wood users.
Discussion: The results in Table 7 should also be viewed with caution since the question did not ask how much the new fuel source would be used. Therefore, in the analysis it was assumed that the new fuel source would be used 100% of the time. Keeping this assumption in mind Table 7 ‘single choice user group’ indicates that up to 2.5% of households anticipate switching their main energy source in three years time (to obtain this number, sum each single choice group 1.01 + 1.31 + 0.15), the statistic that is important in this report is the change
61) (Asking non wood users) from what energy source to what other energy source did or might this installation require? DO NOT READ, AS MANY AS APPLY. PROBE B OIL TO GAS C OIL TO ELECTRICITY D OIL TO WOOD E GAS TO OIL F GAS TO ELECTRICITY G GAS TO WOOD H ELECTRICITY TO OIL I ELECTRICITY TO GAS J ELECTRICITY TO WOOD 98 DK

18
from other forms of energy to wood. The survey indicates that 1.5% of all households or 10,940 households are considering switching to wood. At the time of the survey 5.24% of all households were single choice wood users. After accounting for the 0.15% households that are anticipated to move away from wood the provincial single choice wood users will account for 6.57% of all households. While these percentages seem small they account for approximately 48,000 (6.57%) households (excluding CLFV and Kelowna). This translates to a net increase in household wood heating of 25%. Under ‘wood users’ the conventional appliance only users are separated out. It is interesting to note that only 3.4% (0.07/2.06) or 510 (or 1130 including Kelowna) households of the user group are anticipating changing out their appliance over the next three years.
For the multiple energy wood users (that is households that use wood as one of their energy sources), the number of people that are considering changing out conventional woodstoves is higher at 7.6% (0.16/2.11) or 1167 households (again this excludes the CLFV and Kelowna).
When the single and multiple energy users are combined there is an opportunity to change out conventional appliances for 1677 households (note that this number may be conservative as there may be more than one appliance per household in some cases). While this does not seem like much it is more than the number of changeouts achieved from 15 programs offered throughout B.C. in the past 10 years. Therefore, enhancements are required for the exchange programs that have been offered to date.
3.3.3 Future wood user appliance choice
3.3.3.1 Conventional appliance users Question: 48 and 49)
48) (Asking all wood users) How likely do you think you will be to install any new wood or wood pellet burning equipment – either as a replacement for old equipment or as a brand new installation – over the next three years? Will you be very likely, somewhat likely, somewhat unlikely or very unlikely? 1 VERY LIKELY CONTINUE 2 SOMEWHAT LIKELY CONTINUE 3 SOMEWHAT UNLIKELY GO TO QUESTION 52 4 VERY UNLIKELY GO TO QUESTION 52 9 DON’T KNOW GO TO QUESTION 52 49) (Asking wood users who were ‘somewhat likely’ or ‘likely’ to install new appliance in the next three years) Which of the following types of equipment do you think you would most seriously consider installing in the next 3 years? Would it be: READ, CHECK ONE ANSWER ONLY 1) Wood fireplace 2) Woodstove (PROBE) 1 YES 2 NO 9 Don’t Know
1 Conventional woodstove, which is more than 15 years old. 2 Advanced woodstove, which is less than 15 years old and have baffles inside the firebox to burn the smoke. 3 Catalytic woodstove, which is less than 15 years old and have catalysts inside the firebox that burn off the smoke.
3) Fireplace insert (PROBE) 1 YES 2 NO 9 Don’t Know 1 Conventional fireplace insert, which is more than 15 years old. 2 Advanced technology inserts, which is less than 15 years old and have baffles inside the firebox to burn the smoke. 3 Catalytic technology insert, which is less than 15 years old and has a catalyst that burns off the smoke.

19
Data analysis: Weighted average based on regional distribution of population and composition of wood user and non user Result:
Figure 12: Conventional appliance users likely to install new wood burning appliance (2003-06)
23%
18%
14%
14%
12%
13%
20%
14%
10%
43%
54%
62%
0%
2%
1%
0% 20% 40% 60% 80% 100%
BVLD
Skeena
Province
very likely likely somewhat unlikely very unlikely DKConventionalusers:
Table 8: Appliance choice - conventional users (2003-06)
% households Conventional appliance users (% households)
Wood user
Group
Conventional appliance
users
Interested in installing new
appliance
Interested in advanced
stove/insert Interested in furnace
Interested in pellet stove
Unsure about the new
appliance type Province 27.6 8.19 1.96 1.16 0.24 0.41 0.15
Skeena 27.0 10.49 3.05 1.55 0.95 0.44 0.13
BVLD 38.8 16.38 6.01 2.77 2.31 0.92 0.01
Discussion: The data contained in figure 12 considers the 59,733 provincial households that burn wood in a conventional woodstove/insert exclusively (use wood to meet 90% or more of heating demand). Indications are encouraging as 14% or 8363 households are very likely, and an additional 13% or 7,766 are likely to replace their conventional appliance between 2003 and 2006. Most of these would occur in the absence of changeout programs.
In the Skeena region the survey results indicate there are 3910 conventional stove users; 18% or 704 are very likely, and 12% or 469 likely to change. When the BVLD area is considered, there are 2204 stoves 23% or 507 are very likely and 14% or 309 are likely to change between 2003 and 2006. These figures provide perspective for gauging the anticipated number of changes to be achieved from changeout programs in these areas.
49) 4) Wood furnace or boiler (PROBE) 1 YES 2 NO 9 Don’t Know
1 Inside 2 Outside 5) Wood pellet stove 96 MISCELLANEOUS 98 DON’T KNOW

20
In the province, 90% of conventional appliance users who were interested in installing new appliances already had the new-appliance type in mind and the rest remained indecisive about the appliance type (Table 8). 64% of them would choose advanced woodstove/insert; 23% preferred pellet stoves and 13% were interested in a furnace. In Skeena, more than half of the ‘interested’ conventional appliance users would like to install an advanced woodstove/insert and about 30% favoured a furnace. Due to the small sample size of conventional users in the BVLD preference can not be inferred reliably.
It is also important to note that about 5.7% wood-burning households province wide intended to install conventional stoves/fireplace inserts, this number is a bit lower at 4.3% for the BVLD. This is very significant as it means that up to 11,465 provincial and 225 BVLD households could have installed a conventional unit in 2003-06.
Another point to keep in mind is that when a household installs a new advanced technology woodstove, it is likely that the old conventional unit will be resold. The provincial regulation does not preclude this practice and neither do most local bylaws. So, in reality the number of conventional appliance installations could be much higher. This reality raises the need for addressing the resale of conventional appliances.
3.3.3.2 Future appliance choice of appliance user groups Question: 49) Data analysis: weighted average based on regional distribution of population. Result:
Figure 13: Installation of new wood burning appliances appliance users - province
0%20%40%60%80%
100%
Conventional(27%)
Advanced(18%)
Fireplace(21%)
Furnace (13%) Multiple (18%)
Appliance user group interested in installing new appliance
% o
f the
app
lianc
e u
ser g
roup
Advanced Fireplace Furnace Pellet stove OtherType of the new
appliance to install:
Note: 1 ‘Stove/insert’ includes the advanced technology stoves/fireplace inserts and catalytic stoves/fireplace inserts. 2 ‘Other’ as the ‘Type of new appliance’ includes ‘gas heater/fireplaces’, ‘propane stove’, ‘new chimney’, ‘electronic
furnace’, and ‘catalytic converter separate parts’. 3 The number in bracket refers to the percentage of the appliance user group who were ‘somewhat likely’ and ‘very
likely’ to install new wood burning appliance in the next three years.
Discussion: Question 49 can be analysed further to divide current appliance users into their future wood burning appliance choices. Figure 12 shows that 27% of exclusive conventional stove users and 13% furnace users felt ‘somewhat likely’ or ‘very likely’ to have new appliances installed in the next three years. Yet it is unclear whether the new appliance added

21
will be the complete replacement of the old appliance or for additional burning equipment (in which case the conventional stove will likely be retained for use). From the above statistics, it is clear that there is a preferred preference for the type of new appliance to install between appliance user groups: except for the exclusive furnace users, all appliance users made advanced stove their first-choice new appliance. Replacement furnaces were most favoured by the exclusive furnace users. Also, in each appliance user group, there was almost the same percentage of users interested in pellet stoves.
These statistics have implications for the design of strategies that would best serve the emission reduction goal sought by the proposed woodstove changeout program. Presumably for the exclusive fireplace users, adding advanced wood burning inserts would reduce wood smoke and increase combustion efficiency. For multiple appliance users, installing advanced fireplace inserts is likely to encourage wood burning, and could result in a net increase rather than cut PM2.5 emissions. What’s missing from the analysis is the possibility that non wood users might elect to install wood burning inserts into their currently not-in-use fireplaces, of which would give rise to increased emissions. Under such circumstances, the program needs to devise incentives for the multiple appliance users and non wood users to choose clean energy (i.e. gas or electricity) instead of wood-burning fireplace inserts.
3.3.3.3 Cash incentive program response Question: 48) and 52)
Data analysis: weighted average based on regional distribution of population. Result:
Table 9: Woodusers interested in installing new appliances in 2003-06
Uninterested becoming interested if a cash-incentive program offered (% uninterested) Province wide User
group % total
households Households uninterested in installing new appliances*
(% group) Yes No Don’t know Woodusers 27.6 81.9 29.4 58.7 11.9 Conventional appliance users 8.2 73.3 30.8 58.6 10.6 Single energy choice—Wood users 5.2 79.6 31.2 54.8 14.0 Single energy choice—Wood & Conventional appliance users
2.1 76.4 36.9 51.8 11.3
Note: * “Uninterested” households include those who said they were “somewhat unlikely”, “very unlikely” to install new appliance, or ‘Don’t know’.
52) (Asking the woodusers who were ‘very unlikely’, ‘somewhat unlikely’ or unsure to install any new appliance in the next three years) Would you consider replacing your existing wood or wood pellet burning equipment if a cash back incentive program existed? 1 Yes 2 No 9 Don’t know

22
Discussion: A cash incentive would likely have a positive effect on those that indicated they are either very likely or likely to change out a conventional appliance. However, the questionnaire only considered the effect on those who indicated they were ‘very unlikely’ or ‘somewhat unlikely’ to install a new appliance. When we consider only the conventional appliance users, 31% of those who indicated they were uninterested in upgrading became interested if a cash incentive were offered. If we put this into the provincial perspective, 13,502 households that were not interested become interested in changing out. When one considers the lack of effect of the changeout programs offered to date this figure is difficult to accept. In practice, the size of the incentive will no doubt have an effect.
3.4 Wood burning appliance emissions PM2.5 release estimates from wood burning were presented earlier in this report. The analysis that follows provides a graphical interpretation of Table 2 (page 6). Further information is also provided for appliances used in the BVLD.
3.4.1 Wood burning appliances PM2.5 released by region Question: not applicable – data extracted from emission inventory report.4 Data analysis: Conversion rates are used to calculate the emission of PM2.5 from the various appliances. Result:
Figure 14: Wood burning appliances PM2.5 released by region
0%20%40%60%80%
100%
CRD
Other VI
Sunshine C
oast
Sea-to
-Sky
Shuswap
Kamloops
Other Southern
Golden
Cranbro
ok
Elk Valley
Nelson
Other Kooten
ay
William
s Lake
Quesnel
Other Cari
boo
Prince G
eorg
e
Other North
ernBVLD
Other Ske
ena
% P
M2.
5 re
leas
ed
Conventional Advanced Fireplace FurnacePM2.5 released from:
Discussion: Figure 14 is a repeat of figure 5 on page 8. This discussion focuses on differences between regions and the BVLD. Except in Kamloops, conventional stoves were the largest source of PM2.5 among the many types of appliances across the province, as they alone emitted more than 40% of the PM2.5 in each local airshed annually. Combining the results with other statistics obtained from previous surveys of Okanagan and the Lower Fraser Valley, the province-wide PM2.5 emission total is 8183.2 tonnes per year4.
When looking at the emission release estimates, it should be noted that although there are relatively few furnaces and outdoor boilers they account for a disproportionate share of the total emissions. This is due to the fact that these units produce much more pollution than a woodstove when the same amount of fuel is burned.

23
3.4.2 Wood burning appliances PM2.5 released - BVLD Data analysis: descriptive statistics Result:
Figure 15: Wood burning appliances PM2.5 released - BVLD
075
150225300
Advanced Fireplace Furnace Coventional
Tonn
es o
f PM
2.5
01020304050
Num
ber o
f app
s. PM2.5 emission(tonnes per year)
Total number ofeach type ofappliance
Discussion: The benefit of advanced technology units is demonstrated in Figure 15. Although there are a large number of advanced units, they account for a relatively small share of the total emissions.
3.5 Burning practices Burning practices covered in the survey included:
1) firewood seasoning practices (i.e. splitting firewood before seasoning and drying time prior to burning),
2) firewood storage practices (i.e. where to store firewood—outside or inside of the house, and how—having firewood covered when stored outside or keeping it heated when stored inside before burning), and
3) burning of non-firewood material (i.e. how often the household used non-firewood material to start a fire, such as newspaper, manufactured wood products, plastics, etc).
3.5.1 Firewood seasoning and storage practices Question: 33), 34) and 35)
(Asking all the wood users) 33) How long do you typically dry/season your firewood before the heating season? DO NOT READ, ONE ANSWER ONLY 1 NOT AT ALL 2 LESS THAN FIVE MONTHS 3 SIX TO TWELVE MONTHS 4 MORE THAN ONE YEAR 9 Don’t know 34) Do you usually have your firewood split before drying/seasoning it? 1 Yes PROBE: Would that be: READ
1 Hardly ever 2 Some of the time 3 Most of the time 4 All of the time 9 Don’t know
2 No 9 Don’t know

24
Data analysis: Weighted average based on regional distribution of population and composition of wood user and non user, Pearson Chi-square (of the interdependence between wood user’s certain firewood seasoning and storage behaviour, Appendix A: Table 15), ANOVA test of variance. Result:
Table 10: Wood users that follow proper firewood seasoning and storage practices
Firewood seasoning practice (% wood user) Firewood storage practice(% wood user) Splitting firewood for
most/all time before seasoning
Seasoning firewood for 6+moths
Keeping all firewood outside
Keeping all firewood covered/heated
Province 88.67 88.66 84.86 78.42 Skeena 74.23 67.55 81.01 75.57 BVLD 52.68 43.90 80.95 71.43
Discussion: Provincially, 89% of wood burning households split their firewood before seasoning most or all of the time, and season their firewood for more than 6 months before burning; 85% kept all their firewood outside, 15% inside homes; and 78% cover their firewood when stored outside, or inside heated before burning. Compared to the provincial average, fewer BVLD wood users follow these storage practices (52%), particularly when it comes to seasoning (44%). There is a strong relationship between certain firewood treatment practices: 1) those wood users who were more likely to split their firewood before seasoning, also tend to season the firewood for a longer time and were more inclined to keep their firewood dry; and 2) the longer the household had burned wood, the less likely they were to cover their firewood before burning (yet the interdependence isn’t strong).
(Asking all the wood users) 35) How do you store the majority of your wood? Would it be: READ, CHECK ALL THAT APPLY 1 Outside, covered 2 Outside, uncovered 3 Inside, heated 4 Inside, unheated 5 50% outside, covered AND 50% Inside, unheated 6 50% Outside, covered AND 50% Outside, uncovered 7 50% Outside, covered AND 50% Inside, heated 8 50% Outside, uncovered AND 50% Inside, unheated 9 Don’t know

25
3.5.2 Firewood seasoning and storage practices - province- Question: 33), 34) and 35) Data analysis: Weighted average based on regional distribution of population. Result:
Figure 16: Firewood seasoning and storage practices - province
50%60%70%80%90%
100%
FireplaceFurnace
ConventionalMultiple
Advanced
% th
e ap
plia
nce
user
gro
up splitting firewood before seasoningfor most of timeseasoning firewood for 6+ months
all firewood kept outside
firewood covered/heated beforeburning
Firewood seasoning practice:
Firewood storage practice:
Discussion: A significant association is detected between appliance type and firewood preparation behaviour. Households that operate cleaner burning appliances were shown to apply better practices. Among these appliance user groups:
1. exclusive advanced stove users were more likely to split firewood most or all the time, and season firewood for more than 6 months before burning; by contrast;
2. fewer exclusive fireplace users compared to other user groups adopt appropriate firewood seasoning practices; and
3. exclusive advanced woodstove users were also most likely to keep firewood dry.
This information is valuable for delivery of public education programs such as Burn-it-Smart - special emphasis should be given to certain proper burning messages targeted at different appliance user groups. For instance, ‘covering your firewood is especially important to exclusive fireplace users. Also, furnace users should be included in public education programs.
3.5.3 Non firewood burning practices Question: 42)
(Asking all the wood users) 42) How often – always, often, sometimes, rarely or never - do you burn the following materials in your wood or wood pellet burning equipment? READ 1 Always 2 Often 3 Sometimes 4 Rarely 5 Never 9 Don’t know a) Newspapers b) Magazines c) Cardboard d) Coated cartons such as milk or juice containers e) Manufactured wood products such as plywood, chipboard, fibreboard, etc. f) Painted or treated wood g) Plastics

26
Data analysis: descriptive statistics Result:
Figure 17: Non firewood burning practices - provincial
5%15%25%35%45%55%65%
newspapercardboard
coated cartons
manufactured woodmagazines other%
of w
oodu
sers
households who burned the non-firewood material"sometimes", "often" or "always"
Note: ‘Other’ includes a wide variety of material, such as ‘scratch/waste paper/mail’, ‘wax or wax paper’, ‘kitchen
garbage’, ‘kindling’, ‘paper towel’, etc. Discussion: The practice of burning non-firewood material does not seem to be wide spread. However, the impacts from just a few households can be significant. The newspaper category should be excluded since Burn-it-Smart recommends using this to start fires. While more than 80% of wood users ‘never’ or ‘rarely’ burned the listed non-firewood material (magazines, cardboard, etc, see Question 42), over 63% burn more than ‘sometimes’, 19% claimed to have ‘always’ burned newspaper. Within the wood-burning group, almost nobody burned ‘painted or treated wood’ or ‘plastics’ occasionally (1% wood burning households in the province). Non-firewood burning behaviour of BVLD wood users is quite similar to that of the provincial wood users. Significant variation between appliance user groups was not detected.
3.6 Attitudes and opinions Attitudes and opinions are very important for achieving desirable behaviours for wood heating. Reasons for heating with wood, and thoughts motivating those who installed new wood burning appliances were asked as part of the survey.
3.6.1 Reasons for heating with wood Question: 38)
Data analysis: Scaling, weighted average based on regional distribution of population, ANOVA of variance in the ‘degree of importance’ of the wood burning reason between various appliance user groups (un-weighted).
38) (Asking wood users) some people have mentioned to us several reasons for burning wood in their home. As I read each reason, please tell me if this is NOT A REASON, A MINOR REASON OR A MAJOR REASON for burning wood in your home. First…READ a) A wood supply readily available b) It is relatively inexpensive compared to other fuels c) I like the smell or aesthetic beauty of a fire d) Natural gas is not available in my area e) The increasing cost of natural gas 1 NOT A REASON 2 MINOR 3 MAJOR 4, 9 NOT SURE

27
Result: Table 11: Degree of importance for heating with wood
Description Not a reason A minor reason A major reason Degree of importance 1 2 3
Figure 18: Reasons for heating with wood - Province, Skeena area and BVLD
1.01.52.02.53.0
Province Skeena BVLD
Deg
ree
of im
port
ance
steady supply cheap smell/aestheticgas unavailable increasing gas price
Wood burning reasons:
Discussion: Across the province, the most common reasons people heat with wood also highlights the two main characteristics of wood burning—supply being ‘steady’ and price being ‘rather cheap’. Related to cost, some households also cited the ever-rising price of natural gas.
Figure 19: Reasons for heating with wood by user group
1.01.52.02.53.0
Conventional Advanced Fireplace Furnace MultipleAppliance user group
Deg
ree
of im
port
ance
steady supply cheap smell/aestheticgas unavailable increasing gas price
Wood burning reasons:
Note: Significant difference is not found in the rating of ‘increasing gas price’ as wood burning reason by various
appliance users in the province (un-weighted). Motivations for wood burning vary by user group. Exclusive fireplace users enjoy ‘smell and aesthetic beauty of fire/wood burning’, which wasn’t as important to exclusive furnace users. This is to be expected as furnaces are usually in the basement out of sight. For exclusive furnace users, ‘alternative source-gas unavailable’ seems to have a bigger impact. Although the ‘increasing price of gas’ had a rather equal effect on all the appliance user groups, exclusive conventional appliance users found it to be a more important factor underlying their wood burning behaviour. These wood burning reasons are not significantly different across the various appliance users of BVLD, which had a small sample size.

28
3.6.2 New wood burning appliance installation reasons (2001-06) Question: 46) and 50)
Data analysis: Weighted average based on regional distribution of population, Pearson Chi-square (of inter dependence between the reasons for installation and appliance groups) Result:
Figure 20: Reasons for installing new wood-burning appliances (2001-06) - all wood users
0%
10%
20%
30%
increasedfuel
efficiency
price ofalternatives
age aesthetic safety air quality alternativesupply
unreliable
mis
% o
f the
resp
onse
s new installation in the past 2 years (2001-03)new installation in the next 3 years (2003-06)
Note: 1. ‘increased fuel efficiency’ includes ‘the old equipment consuming too much fuel’ as well as the ‘cost saving’
consideration of the households due to the installation of the new burning appliance. 2. ‘price of alternatives’ mainly refers to electricity and natural gas 3. ‘miscellaneous’ includes ‘warmer’, ‘dry heat provided’, ‘more comfortable/healthier’, ‘emergency use’, ‘the house
we recently moved in doesn’t have any burning appliance’, etc. Discussion: The main reasons for installing new wood burning appliances are fuel efficiency, price of alternatives, and old equipment age/failure. Although air quality considerations rank lower it is encouraging that they have a higher ranking for future installations.
Installation of new appliances have is seen differently by respective appliance user groups. Significant difference (from Pearson Chi-square) is observed in the frequency with which different appliance user groups mentioned ‘improved air quality’ as the reason for installation of the new appliance in the past 2 years, and the frequency ‘appliance failure/old age’ was mentioned for both the past 2 years and the next 3 years. ‘Improved air quality’ is cited most by exclusive fireplace users (as a reason for installing new appliance in the past 2 years) and
46) (Asking the wood users who installed new wood burning appliances in the past 2 years) what was the single most important reason you installed this new equipment? 50) (Asking the woodusers who were ‘somehow likely’ or ‘very likely’ to install new wood burning appliances in the next 3 years) What would be the single most important reason why you would install new equipment? 01 AESTHETIC REASONS 02 AGE OF EQUIPMENT 03 ELECTRICITY SUPPLY UNRELIABLE 04 ENVIRONMENTAL/AIR QUALITY CONCERNS 05 EQUIPMENT FAILURE 06 GAS ISN’T AVAILABLE IN MY AREA 07 HIGH ELECTRICAL PRICES 08 HIGH GAS/FUEL PRICES 09 HOME INSURANCE PURPOSES 10 INCONVENIENT TO USE OLD EQUIPMENT 11 OLD EQUIPMENT USES TOO MUCH FUEL 12 SAFETY REASONS 13 FUEL EFFICIENCY 14 COST SAVINGS 96 MISCELLANEOUS 98 Don’t know

29
least by exclusive furnace users. ‘Old equipment failure/age/inconvenient to use’ is the most common reason for exclusive furnace users and exclusive conventional appliance users.
Figure 21: New wood-burning appliances installation reasons (2001-06) – province-wide exclusive conventional appliance users
0%5%
10%15%20%25%30%35%
increasedfuel efficiency
price ofalternatives
age safety aesthetic air quality mis% o
f the
resp
onse
s new installation in the past 2 years (2001-03)new installation in the next 3 years (2003-06)
Discussion: When we look just at the conventional appliance user group, ‘increased fuel efficiency’ of the new appliance, and ‘price of alternative fuel sources too high’ (compared with wood) were most frequently cited as the reasons for installing a new appliance in the past two years by 32 users (5.3% of the user group). By contrast, 30% of future installations are anticipated to result from ‘old equipment age/failure/inconvenient to use’ according to 156 users (26% of the user group). There appears to be a divergence in perception between those who have changed and those who plan to the future. ‘Price of alternatives’ for instance, was less a concern in the past (2001-03). Since 2003, the price of natural gas and oil has undergone dramatic increases, and is projected to keep rising. On the other hand it appears that people have become more aware of ‘air quality’ issues. Advertising for change out programs should focus on the benefits of ‘new’ appliances—compared to old technology specifically, 1) reduced fuel consumption resulting in either less effort to gather wood or potential cost savings (for those who purchase wood), and 2) related air quality benefits with health messaging.
Another important consideration is focusing education on different appliance user groups. Exclusive fireplace users enjoy the ‘smell/aesthetic beauty of fire/wood burning.’ However, those that changed indicated wood smoke and health concerns were motivations. It is encouraging that exclusive fireplace users indicate that they will choose gas/electricity inserts in the future. For wood furnaces, 16% will retire at the end of their anticipated three year remaining service life; yet 6% of the exclusive furnace users would also opt for a new wood furnace as their main heating appliance. For most of these, an important reason for them to keep wood-fired furnaces is the lack of connection with alternative fuel sources, i.e. natural gas. The exclusive wood furnace group didn’t have much concern about air quality, which suggests the education messaging for this group should focus on this along with health effects.

30
3.7 Stove and operation awareness Question: 54) and 55)
Data analysis: Weighted average based on regional distribution of population Result:
Figure 22: Wood users’ stove and operation awareness
50%60%70%80%90%
100%
Province Skeena BVLD
% o
f woo
duse
rs low emissions from new stoves
burning without visible smokeWoodusers being
aware of:
Discussion: More than 70% of provincial wood users knew that new stoves sold in B.C. have lower emission rates. Fewer people were aware that it is possible to burn wood without visible smoke. The Skeena and BVLD wood user groups seem to be more aware of this fact compared to the provincial wood users.
Figure 23: The awareness of emission related issues between province-wide appliance user groups
50%60%70%80%90%
Fireplace Conventional Furnace Multiple Advanced% o
f the
app
lianc
eus
er g
roup
low emissions from new stovesburning without visible smoke
Woodusers being aware of:
Among the various appliance user groups, the fireplace and conventional appliance user groups appear to be relatively unaware of the low emission stove and visible smoke issues. Households who use wood-fired furnaces (exclusive furnace and multiple appliances users) were on average were more aware of these issues than the fireplace and conventional wood appliance groups. The advanced appliance users were most aware.
(Asking wood users) 54) Were you aware that new stoves sold in British Columbia have low emissions rates? 1 YES, AWARE 2 NO, NOT AWARE 9 Don’t Know 55) Were you aware that it is possible to burn wood in a wood stove or fireplace without causing visible smoke? 1 YES, AWARE 2 NO, NOT AWARE 9 Don’t Know

31
Figure 24: The awareness of emission related issues - male and female respondents
50%60%70%80%90%
100%
male respondents female respondents%
of t
he
resp
onse
s low emissions from new stovesburning without visible smoke
Woodusers being aware of:
Between genders, male respondents were seen as more aware of these burning related issues than females. This indicates that within a family it is usually male members who handle household wood heating. Therefore, woodstove changeout and education programs should focus on male family members.
3.8 Air quality and pollution sources
3.8.1 Chimney smoke and air quality Question: 64) and 70)
Data analysis: Scaling, weighted average based on regional distribution of population and make-up of woodusers and non-users, Pearson’s correlation (between the perceived air quality and the degree of chimney concern, Appendix A: Table 15) Result:
Table 12: Degree of concern scaling ‘chimney smoke concern’ and ‘% time when air quality is poor’
Chimney smoke concern % time air quality is ‘poor’
Description Not at all
Not much
Somewhat a concern
A very strong
concern
Almost always good
Good most of the time,
poor on occasion
Good about half of the
time, poor the other half
Poor most of the time,
good on occasion
Almost always poor
Degree of concern 1 2 3 4 10 30 50 70 90
(Asking everyone) 64) To what extent is chimney smoke in your local area a concern to you and your family? 1 Strong concern 2 Somewhat of a concern 3 Not much of a concern 4 Not at all a concern 9 DON’T KNOW 70) Which of the following statements best describes how you feel about the air quality in the area where you live? The air quality in the area where I live is: READ AND ROTATE, ONE ANSWER ONLY 1 Almost always good 2 Good most of the time, poor on occasion 3 Good about half of the time, poor the other half 4 Poor most of the time, good on occasion 5 Almost always poor 9 DON’T KNOW
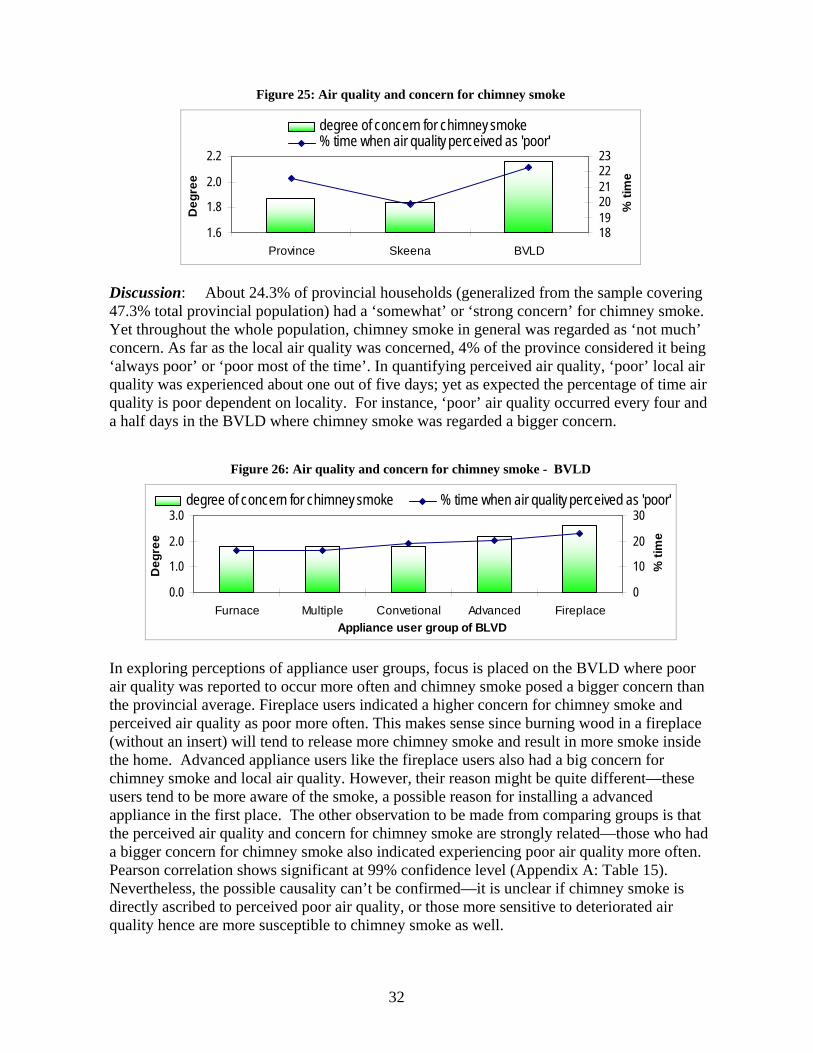
32
Figure 25: Air quality and concern for chimney smoke
1.6
1.8
2.0
2.2
Province Skeena BVLD
Deg
ree
181920212223
% ti
me
degree of concern for chimney smoke% time when air quality perceived as 'poor'
Discussion: About 24.3% of provincial households (generalized from the sample covering 47.3% total provincial population) had a ‘somewhat’ or ‘strong concern’ for chimney smoke. Yet throughout the whole population, chimney smoke in general was regarded as ‘not much’ concern. As far as the local air quality was concerned, 4% of the province considered it being ‘always poor’ or ‘poor most of the time’. In quantifying perceived air quality, ‘poor’ local air quality was experienced about one out of five days; yet as expected the percentage of time air quality is poor dependent on locality. For instance, ‘poor’ air quality occurred every four and a half days in the BVLD where chimney smoke was regarded a bigger concern.
Figure 26: Air quality and concern for chimney smoke - BVLD
0.0
1.0
2.0
3.0
Furnace Multiple Convetional Advanced FireplaceAppliance user group of BLVD
Deg
ree
0
10
20
30
% ti
me
degree of concern for chimney smoke % time when air quality perceived as 'poor'
In exploring perceptions of appliance user groups, focus is placed on the BVLD where poor air quality was reported to occur more often and chimney smoke posed a bigger concern than the provincial average. Fireplace users indicated a higher concern for chimney smoke and perceived air quality as poor more often. This makes sense since burning wood in a fireplace (without an insert) will tend to release more chimney smoke and result in more smoke inside the home. Advanced appliance users like the fireplace users also had a big concern for chimney smoke and local air quality. However, their reason might be quite different—these users tend to be more aware of the smoke, a possible reason for installing a advanced appliance in the first place. The other observation to be made from comparing groups is that the perceived air quality and concern for chimney smoke are strongly related—those who had a bigger concern for chimney smoke also indicated experiencing poor air quality more often. Pearson correlation shows significant at 99% confidence level (Appendix A: Table 15). Nevertheless, the possible causality can’t be confirmed—it is unclear if chimney smoke is directly ascribed to perceived poor air quality, or those more sensitive to deteriorated air quality hence are more susceptible to chimney smoke as well.

33
Figure 27: Air quality and concern for chimney smoke - female versus male respondents and woodusers versus non users of the province
1.601.701.801.902.00
male female Woodusers Nonusers
Deg
ree
0
10
20
30
% o
f the
tim
e
degree of concern for chimney smoke % time air quality perceived as 'poor'
Discussion: Females showed less tolerance for poor air quality and chimney smoke compared to males; one possible explanation is the traditional role of female—they usually take care of the family members and thus become more aware of health risks. Like female respondents, non wood users appeared to be more sensitive to poor air quality and chimney smoke. Similar to the advanced appliance user group, their sensitivity might have caused them to forsake wood burning in the past. Regardless, of one’s gender and wood-user or nonuser some people were more sensitive to ‘chimney smoke’ than the ‘poor’ air quality. This recognition suggests that ‘(the harmful effect of) ‘chimney smoke’, rather than ‘air quality concern’ alone, could be a more persuasive message in the information campaign to encourage the swap of conventional burning appliances.
3.8.2 Chimney smoke concern
Question: 65)
Data analysis: Weighted average based on regional distribution of population and make-up of wood users and non-users Result:
Figure 28: Reasons for chimney smoke concern – gender and wooduser groups
0%20%40%60%80%
male female Woodusers Nonusers
% o
f the
gro
up
health issue air quality smell appearance otherReason why chimney smoke is a concern:
65) (Asking everyone who found chimney smoke ‘somewhat a concern’ or ‘a strong concern’) Why is chimney smoke a concern to you? DO NOT READ, CHECK AS MANY AS APPLY. PROBE 1 HEALTH-RELATED CONCERNS 2 AESTHETIC (APPEARANCE) 3 AESTHETIC (SMELL) 4 ENVIRONMENTAL CONCERNS (POLLUTION, AIR QUALITY, ETC.) 96 MISCELLANEOUS 98 DON’T KNOW

34
Discussion: For chimney smoke, ‘health concerns’ stood out as the number one reason, cited by 59% of respondents. After ‘health concerns’ are ‘air quality’ and ‘smell’. Females once again rated health and air quality concerns higher than males who on the other hand found ‘smell’ and ‘appearance’ of chimney smoke more annoying. ‘Smell’ was most irritating to the non wood user group, while its effects seemed insignificant to the wood users. An information message centered on the ‘smell of chimney smoke’ could thus be less appealing to the targeted wood user group.
3.8.3 Air pollution sources
Question: 67)
Data analysis: scaling, weighted average based on regional distribution of population and make-up of wood users and non-users Result:
Table 13: Degree of contribution scale
Description Low Medium High Scaled value 1 2 3
Figure 29: Air pollution sources and their effects
1.01.21.41.61.82.0
Province Skeena BVLD
Deg
ree
of
cont
ribut
ion
households transportation industry forestry&agriculturePollution source:
Discussion: Among the pollution source categories, ‘transportation’ was considered the number-one source of local air pollution, as about one in four people thought it a ‘high’ contribution to air pollution. ‘Industry’ and ‘forestry, land clearing & agriculture burning’ followed; the perceived impact of these categories depends on location. In the BVLD ‘industry’ was regarded as most responsible for poor air quality, while ‘transportation’ was not indicated to be a problem. In many places throughout the province, ‘households’ were regarded as a rather trivial source of air pollution, except in Golden and Cranbrook where ‘household’ was the second highest group. Households also rated high in the BVLD.
67) (Asking everyone) How would you rank the following sources – Low, Medium or High – for their contribution to air pollution in your area? a) Industry b) Transportation (includes vehicles, trains, aircraft, ships) c) Households (includes woodstoves & backyard burning) d) Forestry, Land Clear, Agricultural Burning 1 LOW 2 MEDIUM 3 HIGH 9 DON’T KNOW

35
3.9 Emission reduction actions
3.9.1 Groups to involve Question: 68)
Data analysis: Weighted average based on regional distribution of population and make-up of wood users and non-users, Pearson correlation between ‘perceived air quality’, ‘degree of concern for chimney smoke’, ‘household contribution to air pollution’, and ‘public involvement in improving air quality’. Result:
Table 14: Degree of involvement scale
Description None Little Some A lot Degree of involvement 0 1 2 3
Figure 30: Groups to involve for improving air quality
1.01.52.02.53.0
Province Skeena BVLD
Deg
ree
of
invo
lvem
ent
senior government local government regional health authoritiesindustry environmental groups public
Partner to involve to improve air quality:
Discussion: Respondents indicated that all the groups listed above should have ‘some’ or more involvement in pollution reduction. Despite the fact that ‘households’ do not perceive they are much of an air pollution source, the general public is regarded as an essential player in emission reductions, as more than half of the respondents thought the public should have ‘a lot’ of involvement. ‘Local government’ and ‘regional health authorities’ were also important players, while ‘senior government’ and ‘environmental groups’ were thought to be somewhat less so. These observations imply that air pollution is perceived as more of a local concern for community action. At the same time, it is closely related to human health; and the hope for reduced emission and health risks relies on oneself and the parties which the public think they have some influence on, i.e. more on local government and the regional authorities than industry.
68) (Asking everyone) I am now going to read a list of six different groups that could be involved in determining ways of improving air quality in your area. As I read each one, please tell me if you think that group should have a lot of involvement, some involvement, little involvement or no involvement in determining ways of improving air quality in your area. a) Senior Government (Provincial and Federal) b) Local Government (Municipal or Regional) c) Regional Health Authorities d) Industry e) Environment Groups f) The Public 1 A LOT 2 SOME 3 LITTLE 4 NONE 9 DON’T KNOW

36
A statistical test (Pearson Correlation) suggests an association between ‘perceived air quality’, ‘degree of concern for chimney smoke’, ‘household contribution to air pollution’, and ‘public involvement in improving air quality’. Those who care more about (or are more sensitive to) air quality or chimney smoke, also tend to think that households have a larger responsibility for air pollution, and thus need to be more closely involved in reducing emissions.
3.9.2 Support for potential actions Question: 66) and 69)
Data analysis: weighted average based on regional distribution of population and make-up of woodusers and non-users Result:
Figure 31: Support for potential emission reduction actions
30%
45%
60%
75%
Province Skeena BVLDsupp
orte
r (%
of a
llho
useh
olds
)
bylaw cash incentive conditional burning suspensionActions to reduce smoke:
Discussion: Among the three proposed policy instruments to cut air pollution, ‘cash incentive’ and ‘conditional burning suspension’ were most welcomed. There were mixed feelings about ‘establishing a bylaw to reduce smoke’, as half of the respondents approved the proposition and the rest opposed it. Compared with the provincial average, fewer people supported a ‘wood burning bylaw’ and ‘burning suspension’ in the BVLD.
(Asking everyone) 66) There are a number of actions that can be taken to reduce the amount of smoke from wood burning equipment. Please tell me if you would generally approve or disapprove of each of the following. First: READ a) Establishing a bylaw to reduce the amount of smoke 1 APPROVE 2 DISAPPROVE 9 NOT SURE b) Providing a cash back incentive for removing old woodstoves and wood inserts 1 APPROVE 2 DISAPPROVE 9 NOT SURE 69) Suppose there is poor air quality in the area where you live. In general would you approve or disapprove of temporarily suspending non-essential woodstove and fireplace burning until the air quality improves? 1 Yes 2 No 9 Don’t know

37
Figure 32: Support for potential emission reduction actions - wood users versus non-users
30%45%60%75%90%
Woodusers Nonusers
supp
orte
r (%
of th
e gr
oup)
bylaw cash incentive conditional burning suspensionActions to reduce smoke:
The divergent preference on certain policy instruments is best manifested in the comparison between woodusers and non users. ‘Wood burning bylaw’ was backed by only 30% of woodusers. In contrast, about half of non woodusers support bylaws. For the woodusers, the ‘cash incentive’ to remove conventional appliances seems most attractive, being supported by 77%. As would be expected, the non woodusers found the ‘cash incentive’ program less appealing but still indicated support of over 60%. The observed distinction in policy preference is a manifestation of the nature that people respond to policy instrument—1) rewards (cash incentives) are generally more favourable than punishment (burning suspension, a means of limitation); and 2) objection rises as the degree of controlling the policy instrument increases and the flexibility decreases (i.e. bylaw or law)8. The non wood users, whose interest is less affected by the proposed policy options, tend to go with the less strict policy alternative—‘conditional burning suspension’.
4 Summary and Conclusions The most significant conclusions have been extracted here to provide a concise summary for woodstove changeouts and public education. Although other information was in the survey and is analysed in this report it is not presented here. To enable the reader to refer back to the more detailed discussion, section numbers are included in parenthesis.
1. It is logical to focus efforts on conventional woodstoves (and fireplace inserts) as they account for 58% of the total provincial PM2.5 from residential wood use (including fireplaces and furnaces). (Section 3.1) This is in contrast to the larger proportion of advanced stoves (34%) that contribute only 14% of PM2.5. Therefore, exchanging conventional woodstoves in favour of advanced units would result in a 44% reduction of PM2.5 from the provincial residential fuel wood heating sector. (3.1)
2. On average wood burning accounts for between 7% and 14% of household heating requirements by region. (3.2.1)
3. The distribution of households that choose to heat exclusively with wood is relatively uniform (between 4 and 9%). The Cariboo and Skeena regions of the province have the highest proportion of households that heat exclusively with wood (8 to 9%). This suggests that changeout programs should concentrate on these two areas. (3.2.2.1)
4. For B.C. households that use two types of energy for heating, 60% of those that heat primarily with electricity or oil, will supplement with wood heat. Unlike other parts of the province, the Skeena region primary electricity and oil users tend to supplement with pellet a relatively high percent of the time (22 and 32% respectively). Thus, a changeout program in this part of the province should promote pellet appliances. (3.2.2.2)

38
5. Single detached houses and mobile homes tend to heat use wood much more often compared to other types of construction (semi detached homes or row/townhouses). (3.2.3)
6. Trends from 2003 to 2006: • Reliance on wood heating can be anticipated to increase from existing levels by
between 4 and 11% of total household heating requirements. The largest increase is anticipated in the Cariboo and Skeena regions, especially within urban neighbourhoods. In reality, the shift could have been much greater than forecast by the survey due to the increased price of natural gas and the abundance of mountain pine beetle wood. (3.3.1)
• 1.5% of provincial households intend to switch their main energy source to wood with electricity being displaced the most. While the percentage switch is relatively low it amounts to 10,940 households (excluding the Kelowna and the CLFV). Another factor to consider is that a number of these changes will likely involve conventional woodstoves. This suggests that there may be a need to simply concentrate on collection and destruction of conventional woodstoves (i.e. offer an incentive for members of the public that turn in a conventional stove). (3.3.2)
• For conventional woodstove users only 3.4 % or 510 exclusive users, and 7.6% or 1167 multiple energy users are intending to switch away from wood altogether. This amounts to a total of 1677 households. While this does not seem like much it is more than the number of changeouts achieved from 15 programs offered throughout B.C. in the past 10 years. Therefore, enhancements are required for the exchange programs that have been offered to date. (3.3.2)
• Survey findings indicate that out of the 59,733 exclusive conventional appliance users 27% or 15,532 are either ‘very likely’ or ‘likely’ to be changed. Most of these would occur in the absence of changeout programs. Of the 3910 exclusive conventional woodstoves in the Skeena region, 30%, or 1173 are very likely or likely to be changed. In the BVLD it is estimated that of the 2204 exclusive conventional appliances, the number of very likely or likely changes amounts to 816. These figures provide perspective for gauging the anticipated effectiveness of changeout programs. (3.3.3.1)
• About 5.7% of wood-burning households province-wide intended to install conventional stoves/fireplace inserts, and 4.3% in the BVLD. This is significant as it means that up to 11,465 provincial and 225 BVLD households could have installed a conventional unit in 2003-06. Another point to keep in mind is that the conventional units that are changed out are likely resold (if a changeout program is not in place). So, in reality the number of conventional appliance installations could be much higher. Thus, there is a need for addressing the resale of conventional appliances. (3.3.3.1)
• The impact of cash incentives was only considered in the questionnaire for cases where respondents indicated they were ‘very unlikely’ or ‘somewhat unlikely’ to replace their equipment. Up to 31% or 13,502 conventional appliance users indicated they would consider replacement if a cash incentive were offered. When one considers the effect of changeout programs offered to date this figure is difficult to accept. In practice, the size of the incentive will no doubt have an effect. (3.3.3.3)

39
7. Provincially 89% of wood burning households split and season their firewood. BVLD residents on average split firewood less often (52%) and even less season it (44%). Thus there is an opportunity for education particularly in the BVLD. (3.5.1)
8. The survey indicates that burning of non firewood material is not all that wide spread. Newspaper is burned fairly often and is a Burn-it-Smart recommended way to start a fire. Almost no-one indicated that they burn ‘painted or treated wood’ or ‘plastics.’ (3.5.3)
9. Key reasons people choose to heat with wood are ‘a wood supply readily available’ and ‘it is relatively inexpensive compared to other fuels.’ This finding is not surprising. However, of interest is that other reasons for burning wood (smell/aesthetic, gas unavailable and increasing gas price) scored on average quite a bit lower. These findings indicate that for changeout programs it will be important to promote the fact that advanced wood burning appliances use less fuel than conventional units. (3.6.1) The importance of cost is reinforced further with reasons that people have either installed or are considering installing new wood burning appliances. The primary reasons were ‘increased fuel efficiency’ and ‘price of alternatives.’ (3.6.2)
10. Another key reason for replacement is ‘old equipment age/failure.’ Of interest is that all wood users indicated more of a tendency to replace appliances compared with exclusive conventional appliance users. The reasons behind this were not explored as part of the survey. (3.6.2)
11. The level of knowledge and awareness of low emission woodstoves and the ability to burn without producing smoke were relatively high. In the Province 72% were aware of low emission woodstoves, and 67% were aware that it is possible to burn without visible smoke. The numbers were about 10% higher in the BVLD. While these findings are encouraging they also indicate that more public education would be beneficial. (3.7)
12. Public support for emission reduction actions showed wide variability between wood users and non-users. The user group showed relatively low support for bylaws (35%) compared to non-users (52%). Also, as one would predict the support for cash incentives was somewhat higher for users (78%) compared to non-users (65%). But, not significantly so. Another interesting finding is that users showed relatively high support for conditional burning exemptions (62%). As expected the support from non-users was higher (68%). (3.9.2)

40
Appendix A: Statistics Terms Results in this report are presented in two major ways:
1) Summary information about the data, such as means, totals, number of cases, maximum value, etc.
2) Statistical techniques to tease out connections between the self reported behaviour of the respondents and their attitudes towards wood fuel use.
“Statistics (including mean, standard deviation, statistics of statistical test, etc) is a branch of applied mathematics concerned with the collection and interpretation of quantitative data and the use of probability theory to estimate population parameters” (ref: wordnet.princeton.edu/perl/webwn)
Normally, simple averages would be enough for describing the overall population and exhibiting differences between groups (such as geographic regions). However, there is a chance that the observed differences between groups occur as a result of sampling error, particularly when the differences are small. Under such circumstances, distinctions between groups can no longer be made and thus, any interpretation of the distinctions is deemed to be neither correct nor necessary.
Statistical significance testing is designed to determine whether the observed differences between groups are real, or merely due to chance. Researchers use statistical significance testing whenever they have a random sample from a population, or a sample that they believe approximates a random, representative sample9. Such tests can help answer the question of whether the discerned relationship between two variables is a genuine one by estimating the probability that the relationship doesn’t exit except by random chance. At the same time, the tests also tell the probability of making an error if we assume that we have found a ‘genuine’ relationship11.
In performing statistical significance testing, there are several steps:
1. calculating the probability of ‘being wrong’ (of making an erroneous prediction) if we assume that our finding of a relationship is true,
2. establishing the critical, predetermined acceptable probability (ranging between 0 and 1.0, usually called ‘alpha’) of making an inferential error caused by the sampling error, and
3. determining the significance by comparing probability of steps 1) and 2).
If the probability of being wrong (from step 1) is smaller than the critical predetermined acceptable probability (from step 2), then our observation of the relationship is accepted as a statistically significant finding10,11. In other words, we are assured that the statistical prediction is accurate. Generally, a confidence level (100% minus the critical acceptable probability is the confidence level) of 95% to 99% is considered acceptable.

41
In the data analysis for this report, statistical significance tests used include ANOVA, and non-parametric tests of measures of association (Pearson Chi Square and Fisher exact test). ANalysis Of VAriance (ANOVA) is a test for significant differences between means3; it can also examine the association between factors such as geographic region, appliance user groups, etc. (called ‘nominal predictor variables’ by statisticians) and a continuous outcome variable (‘scale/interval’ in nature, often called ‘dependent variables’ or ‘responses’, such as % wood heating in meeting household energy consumption, perceived degree of air quality, etc). The Pearson correlation coefficient is also capable in identifying the strength of the relationship between interval variables. If the two variables of interest are categorical in nature (i.e. "male" vs. "female", "wood users" vs. "non-wood users"), Pearson Chi-square is the appropriate nonparametric statistics for testing the relationship between these two variables. When the number of cases is less than 5, the Fisher exact test is used instead of Chi square. Results Correlation
Table 15: Correlation table
Perceived air quality as ‘poor’
Degree of chimney concern
Degree of hhs’ responsibility for pollution
Degree of Involvement of public
Pearson Correlation 1 -.320(**) -.223(**) -.099(**)Sig. (2-tailed) .000 .000 .000Perceived air quality as
‘poor’ N 3136 3125 3088 3076Pearson Correlation -.320(**) 1 .393(**) .151(**)Sig. (2-tailed) .000 .000 .000Degree of chimney concern N 3125 3138 3090 3073Pearson Correlation -.223(**) .393(**) 1 .140(**)Sig. (2-tailed) .000 .000 .000Degree of hhs’ responsibility
for air pollution N 3088 3090 3098 3046Pearson Correlation -.099(**) .151(**) .140(**) 1Sig. (2-tailed) .000 .000 .000
Degree of the public’s involvement in improving air quality N 3076 3073 3046 3081
** Correlation is significant at the 0.01 level (2-tailed).
3 If only comparing two means, ANOVA will give the same results as the t test for independent/dependent samples. However, ANOVA is a much more flexible and powerful technique that can also test for ‘Multiple factors’ and ‘interaction effects’ between the factors. These later sophisticated topics are not explored in the analysis; ANOVA is mainly used to test the significance in means of more than two groups.

42
References 1Provincial Health Officer’s Annual Report 2003, British Columbia Ministry of Health Services Office of the Provincial Health Officer, 2003. http://www.healthservices.gov.bc.ca/pho/pdf/phoannual2003.pdf 2GVRD Residential Wood Burning Survey, Ipsos Reid, April 2002 3Okanagan Indoor Wood Burning Appliance Inventory Survey, A Project of the Okanagan Air Quality Technical Steering Committee, August 29, 2001 4Residential Wood Burning Emissions in British Columbia, British Columbia Ministry or Water, Land and Air Protection, 2004. http://www.env.gov.bc.ca/air/airquality/pdfs/wood_emissions.pdf 5Final Report Health and Air Quality 2005 – Phase 2: Valuation of Health Impacts from Air Quality in the Lower Fraser Valley Airshed, Submitted to: Dr. Menn Biagtan, British Columbia Lung Association by RWDI Air Inc., 2005. 6 Fostering Sustainable Behaviour – An Introduction to Community-Based Social Marketing, Doug McKenzie-Mohr and William Smith, 1999 7 NRCan survey, Natural Resource Canada, 2003. http://oee.nrcan.gc.ca/corporate/statistics/neud/dpa/tablestrends2/res_bc_21_e_3.cfm?attr=0 8Carrots, Sticks, and Promises: A Conceptual Framework for The Management of Public Health and Social Issue Behaviours, Rothschild, Michael L, Journal of Marketing. Vol. 63, October 1999, pp. 24-37 9The concept of statistical significance testing, Thompson, Bruce, Practical Assessment, Research & Evaluation, 4(5), 1999. 10Tests of Significance, Public Policy and Administration Research Methods, Saint-Germain, Michelle A. (n.d.).. Accessed on 21 Nov, 2005 http://www.csulb.edu/~msaintg/ppa696/696stsig.htm 11Elementary Concepts in Statistics. Electronic Text Book, Statsoft.com. (n.d.). Accessed on 21 Nov, 2005 http://www.statsoft.com/textbook/stathome.html