Residential cluster design and potential improvement for ...
12
International Journal of Low-Carbon Technologies 2021, 16, 592–603 © The Author(s) 2020. Published by Oxford University Press. This is an Open Access article distributed under the terms of the Creative Commons Attribution License (http://creativecommons.org/licenses/by/4.0/), which permits unrestricted reuse, distribution, and reproduction in any medium, provided the original work is properly cited. doi:10.1093/ijlct/ctaa091 Advance Access publication 15 December 2020 592 Residential cluster design and potential improvement for maximum energy performance and outdoor thermal comfort on a hot summer in Thailand .............................................................................................................................................................. Daranee Jareemit* and Parintorn Canyookt Faculty of Architecture and Planning, Thammasat University, Pathum Thani, 12120, Thailand ............................................................................................................................................. Abstract Thailand committed to achieving the Sustainable Development Goals to increase urban livability and reduce energy use in the building sector. However, the design information to achieve those challenge goals has been undefined. This study aimed to investigate and examine potential improvements for outdoor thermal comfort and energy efficiency in 136 designs of the two-type residential cluster in Pathum Thani, Thailand, via designs of building orientation, geometry and window-to-wall ratio (WWR). The daily cooling energy consumption in residential clusters was performed using eQuest under the modified weather data from the prior microclimate analysis. The energy-saving scenarios were calculated and compared to the acceptable outdoor thermal comfort hours. It is found that the row house cluster had the potential to be more sustainable than a single house. The row house clusters on orthogonal street orientation offered the highest percentage of hours in outdoor thermal comfort of 46% and energy efficiency below the new standard of Thailand. The cooling energy savings through increasing H/W with lowering WWR was up to 32%. This study’s results could provide urban planners and architects with the new design guidelines and improvement potentials to make cities more energy efficient and environmentally friendly for outdoor living in Thailand. Keywords: urban typology; energy simulation; cooling energy consumption; WWR; urban microclimate *Corresponding author: [email protected] Received 16 July 2020; revised 6 October 2020; editorial decision 19 November 2020; accepted 19 November 2020 ................................................................................................................................................................................. 1. INTRODUCTION Bangkok is ranked as a megacity, being the fiſth largest urban area in East Asia in 2010 [1]. The expansion of urban construction land use and impervious surfaces in Bangkok neighborhoods has led to an increase in air temperature and mean radiant temperature of outdoor urban spaces [2, 3]. With an extreme outdoor air tem- perature, people tend to use air conditioners for indoor cooling. The increase in housing demand and cooling energy use results in a significant increase in the magnitude of energy consumption in the city [4]. Such high energy consumption critically raises the future global temperature, which is not suitable for outdoor living. Thailand is committed to achieving the 2030 Agenda and Sus- tainable Development Goals (SDGs), including mitigation of the global temperature issue. The SDG 7 and 11 were important discussion topics on how the city could improve the quality of life for people, access to affordable sustainable and modern energy, as well as the well-being of the planet [5]. In partnership with United Nations Thailand, Bangkok Metropolitan Administration (BMA) has played a significant role in developing goals and identifying potential livability indicators. In the 20-year development plan for Bangkok Metropolis [6], one of the six-dimension visions was to increase urban livability by increasing accessibility to public areas and green areas and providing pleasant streetscape and better outdoor environmental quality. At the same time, the Energy Policy and Planning Office (EPPO), Ministry of Energy, has sought the energy-savings potential as well as providing renewable energy use to meet the demand. In Thailand’s 20-year development plan [7], EPPO established the outcome of electricity-saving potential in large Downloaded from https://academic.oup.com/ijlct/article/16/2/592/6034915 by guest on 24 July 2022
-
Upload
khangminh22 -
Category
Documents
-
view
3 -
download
0
Transcript of Residential cluster design and potential improvement for ...

International Journal of Low-Carbon Technologies 2021, 16, 592–603© The Author(s) 2020. Published by Oxford University Press.This is an Open Access article distributed under the terms of the Creative Commons Attribution License (http://creativecommons.org/licenses/by/4.0/), whichpermits unrestricted reuse, distribution, and reproduction in any medium, provided the original work is properly cited.doi:10.1093/ijlct/ctaa091 Advance Access publication 15 December 2020 592
Residential cluster design and potentialimprovement for maximum energyperformance and outdoor thermal comfort ona hot summer in Thailand. . . . . . . . . . . . . . . . . . . . . . . . . . . . . . . . . . . . . . . . . . . . . . . . . . . . . . . . . . . . . . . . . . . . . . . . . . . . . . . . . . . . . . . . . . . . . . . . . . . . . . . . . . . . . . . . . . . . . . . . . . . . . . . . . . . . . . . . . . . . . . . . . . . . . . . . . . . . . .
Daranee Jareemit* and Parintorn CanyooktFaculty of Architecture and Planning, Thammasat University, Pathum Thani, 12120,Thailand. . . . . . . . . . . . . . . . . . . . . . . . . . . . . . . . . . . . . . . . . . . . . . . . . . . . . . . . . . . . . . . . . . . . . . . . . . . . . . . . . . . . . . . . . . . . . . . . . . . . . . . . . . . . . . . . . . . . . . . . . . . . . . . . . . . . . . . . . . . . .
AbstractThailand committed to achieving the Sustainable Development Goals to increase urban livability and reduceenergy use in the building sector. However, the design information to achieve those challenge goals hasbeen undefined. This study aimed to investigate and examine potential improvements for outdoor thermalcomfort and energy efficiency in 136 designs of the two-type residential cluster in Pathum Thani, Thailand,via designs of building orientation, geometry and window-to-wall ratio (WWR). The daily cooling energyconsumption in residential clusters was performed using eQuest under the modified weather data from theprior microclimate analysis. The energy-saving scenarios were calculated and compared to the acceptableoutdoor thermal comfort hours. It is found that the row house cluster had the potential to be more sustainablethan a single house. The row house clusters on orthogonal street orientation offered the highest percentageof hours in outdoor thermal comfort of 46% and energy efficiency below the new standard of Thailand. Thecooling energy savings through increasing H/W with lowering WWR was up to 32%. This study’s resultscould provide urban planners and architects with the new design guidelines and improvement potentials tomake cities more energy efficient and environmentally friendly for outdoor living in Thailand.
Keywords: urban typology; energy simulation; cooling energy consumption; WWR; urban microclimate
*Corresponding author:[email protected]
Received 16 July 2020; revised 6 October 2020; editorial decision 19 November 2020; accepted 19 November2020
. . . . . . . . . . . . . . . . . . . . . . . . . . . . . . . . . . . . . . . . . . . . . . . . . . . . . . . . . . . . . . . . . . . . . . . . . . . . . . . . . . . . . . . . . . . . . . . . . . . . . . . . . . . . . . . . . . . . . . . . . . . . . . . . . . . . . . . . . . . . . . . . . . . . . . . . . . . . . . . . . . . . . . . . . . . . . . . . .
1. INTRODUCTIONBangkok is ranked as a megacity, being the fifth largest urban areain East Asia in 2010 [1]. The expansion of urban construction landuse and impervious surfaces in Bangkok neighborhoods has ledto an increase in air temperature and mean radiant temperatureof outdoor urban spaces [2, 3]. With an extreme outdoor air tem-perature, people tend to use air conditioners for indoor cooling.The increase in housing demand and cooling energy use resultsin a significant increase in the magnitude of energy consumptionin the city [4]. Such high energy consumption critically raises thefuture global temperature, which is not suitable for outdoor living.
Thailand is committed to achieving the 2030 Agenda and Sus-tainable Development Goals (SDGs), including mitigation of theglobal temperature issue. The SDG 7 and 11 were important
discussion topics on how the city could improve the quality of lifefor people, access to affordable sustainable and modern energy, aswell as the well-being of the planet [5]. In partnership with UnitedNations Thailand, Bangkok Metropolitan Administration (BMA)has played a significant role in developing goals and identifyingpotential livability indicators. In the 20-year development plan forBangkok Metropolis [6], one of the six-dimension visions was toincrease urban livability by increasing accessibility to public areasand green areas and providing pleasant streetscape and betteroutdoor environmental quality.
At the same time, the Energy Policy and Planning Office(EPPO), Ministry of Energy, has sought the energy-savingspotential as well as providing renewable energy use to meetthe demand. In Thailand’s 20-year development plan [7], EPPOestablished the outcome of electricity-saving potential in large
Dow
nloaded from https://academ
ic.oup.com/ijlct/article/16/2/592/6034915 by guest on 24 July 2022
Residential cluster design and potential improvement for maximum energy performance
commercial buildings in 2030, aiming at 44% lower than thedemand in BAU (business-as-usual) case. The new buildingenergy code (BEC) has been enforced since 2018 to controlenergy consumption in new buildings, where the area is greaterthan 10,000 m2, through building envelope design and usinghigh-performance systems. However, the energy performancestandard for residential buildings has not been determined. TheDepartment of Alternative Energy Development and Efficiency(DEDE) [8] investigated the cooling energy consumption insingle houses and row houses. A new energy efficiency standardwas established that aimed to decrease the cooling energyconsumption below 25 kWh/m2 a year for a single house and44 kWh/m2 a year for a row house. However, the guidelineson building designs achieving the new standard have not beenproposed in that strategic plan.
Urban planning and architectural design can have a significanteffect on outdoor thermal comfort in street canyons. At the sametime, such designs and their effects reflect energy consumptionwithin the buildings. Several outdoor thermal comfort works havepresented that shading effects from nearby buildings and buildingorientation can considerably improve thermal comfort conditionsin outdoor spaces. In Thailand, Srivanit and Jareemit [9] inves-tigated that higher aspect ratio or H/W (as referred to buildingheight (H) to street width (W)) could allow thermal comforthours to be expanded by 4 hours on a hot day (26 April 2016).Regarding the street canyon orientation, N–S oriented canyonscould provide the maximum outdoor thermal comfort hours forhot conditions [10, 11, 12]. In a prior study [9], a maximumcomfort hour occurred in the N–S orientation was 46%.
On the side of building energy analysis, architects have tried tomaximize a building’s energy savings by decreasing heat transferthrough the building envelope. Several techniques have beenaddressed, for example, improving thermal properties of thewall, roof materials and using high-performance glazed windows[13, 14], adding shading devices [13, 15, 16] and reducing glazingwindow areas [17]. However, few studies have explored thecooling effect of the outdoor environment on building energyconsumption by use of such elements as trees and green spaces[18], cool pavement materials [19] and street canyon geometries[20, 21, 22]. Huang and Li [20] presented that an arrangementof building clusters and its geometries could minimize energyconsumption in each building by up to 37.7%.
Several works have mentioned that the N–S delivers themaximum outdoor thermal comfort conditions; however, therectangular-shaped building on this elongated orientation con-sumes the highest cooling energy demand [20, 23]. The maximumenvelope area of the rectangular building on the N–S elongatedorientation could expose the solar heat 33% more than that of thesquare shape [12]. As comprehensive reviews, the design solutionsfor improving energy efficiency and outdoor thermal comfort inThailand’s context have been addressed separately. The cross-disciplinary investigations account for benefits in building energyefficiency, and outdoor thermal comfort is a complex issue thatneeds an examination.
Considering the enforcement in the 20-year development planset by EPPO and BMA, the design guideline integrating bothurban planning and architectural design has not been proposedfor practical applications. This lack of clarity on such designinformation could reduce the effectiveness and performance ofbuilding energy savings and outdoor thermal comfort conditions.It could slow down the progress to meet the strategic plan. Tothis end, this study aimed to understand the relationship betweenresidential planning and architectural design, influencing the out-door thermal comfort and building energy use. The investigationof efficient design, optimizing reductions of energy consumptionand increasing acceptable outdoor thermal comfort conditions,sought to answer the following questions:
(1) How does the planning of residential clusters and buildingdesigns impact the daily cooling energy and outdoor thermalcomfort in that cluster?
(2) How can those cluster designs decrease the residentialcooling energy below the new energy efficiency standard andmaximize outdoor thermal comfort conditions?
2. RESEARCH METHODOLOGYFigure 1 presents the research framework. The first part of thiswork introduces the studied location and defined design param-eters for cooling energy analysis. The second part presents themodel setting in the energy modeling and validation method.Finally, the criteria used to evaluate the performance of coolingenergy consumption and outdoor thermal comfort conditions arepresented.
2.1. Site location and design parametersThis investigation selected Pathum Thani province, located northof Bangkok, as a studied location due to land availability for futurehousing development and easy accessibility from Bangkok. Theexpansion of housing construction in this area shows approxi-mately 12.5% during the past 5 years [24]. In this study, urbantypologies’ design characteristic for the row house cluster referredto the prior work [9, 25]. However, the design characteristics of asingle house and window-to-wall ratios (WWRs) were observedfrom the model homes of four real estate agents. Figure 2 presentsa combination of design parameters of the row house with a totalof 128 design configurations, while the design for a typical singlehouse has only eight configurations. The row houses with aspectratios of 0.5, 0.7, 0.9 and 1.1 represent buildings with two, three,four and five stories, respectively. In contrast, only a two-storybuilding is considered for a single house (H/W = 0.5). There aretwo different building block shapes considered: 1:1 represents asquare shape comprising four housing units per block, while 1:2.5is a rectangular shape with 10 housing units per block. In thisstudy, the WWRs investigated from the row houses and singlehouses range from 20–80% and 20–40%, respectively.
International Journal of Low-Carbon Technologies 2021, 16, 592–603 593
Dow
nloaded from https://academ
ic.oup.com/ijlct/article/16/2/592/6034915 by guest on 24 July 2022

D. Jareemit and P. Canyookt
Figure 1. Research framework.
Figure 2. Summary of the design configurations used to perform the cooling energy consumption.
2.2. Energy simulation and model settingIn this study, the energy simulation software eQUEST 3.64 [26]was used to simulate daily cooling energy consumptions in acluster of row houses and single houses. This software is a user-friendly graphic interface for the DOE-2 engine, widely used forpredicting building energy analysis. Since the sizes of the buildingblocks of the row house and the single house were not equal, the
calculated cooling energy per floor area (Wh/m2-day) for an entireresidential cluster, comprising 40 housing units, was used to assessenergy-savings performance.
2.2.1. Building case studiesThe typical single house had two stories with a living room, diningroom and kitchen on the first floor and three bedrooms on the
594 International Journal of Low-Carbon Technologies 2021, 16, 592–603
Dow
nloaded from https://academ
ic.oup.com/ijlct/article/16/2/592/6034915 by guest on 24 July 2022

Residential cluster design and potential improvement for maximum energy performance
Figure 3. Design characteristics and functions of a single house and row house.
second floor. However, the row house typically had a mixed-usefunction: a commercial function such as merchandise or officespace was typically found on the first floor. The upper floors wereused for residential space, as shown in Figure 3.
Table 1 shows the building materials and operation of air-conditioning units used in the energy model. The wall construc-tion for both building types was masonry systems. The roofof the row house was a flat slab, while the single house had agable roof. Both roof constructions had 8.5 cm. of polyurethaneinstalled. The roof eaves of a single house were typically 1 m. inwidth. The calculation of the cooling load was from the buildingenvelope heat gain. The heat generated from occupants, lightingand equipment did not account in this investigation. The hourlyoperation of air-conditioning units in the commercial area andresidential area were different. The EER of the air-conditioningunit was 8.4, which was surveyed from the houses in 2015–2016.
2.2.2. Modified weather data fileThailand is in a hot and humid climate, where the weather is warmall year round with average temperature ranging from 26 to 31◦C.Prior analysis [25] used the ENVI-met modeling to calculateair temperature and mean radiant temperature in different streetcanyons on 26 April 2016. The energy simulation was extendedfrom the prior work that the simulation was performed underthe same date. On that date, the sun position is at the highestaltitude angle as providing the shortest shadow length. The cal-culated monthly Cooling Degree Hours of this month showed amaximum of approximately 8,800 hours at the base temperatureof 18.5◦C [27]. As a consequence, it has an extreme condition foroutdoor living and energy consumption in buildings.
In the energy simulation, the 24-hour weather data file isrequired in the energy model. This study exported the weatherdata from the ENVI-Met modeling investigated in the priorwork [9]. However, their study’s limitation is that microclimatemodeling was carried out from 6 a.m. to 6 p.m. This study useda trigonometric function shown in Eq. (1) to predict the airtemperature profile from 7 p.m. to 5 a.m. From the microclimateoutput, the air temperatures near four-building envelopes were
measured and averaged to modify the original IWEC weather fileof Pathum Thani. At the same time, relative humidity and solarradiation used the initial values. The temperature fluctuationvalue (Tswing) was adjusted to obtain the curve fitting modelbetween the modified weather data and the weather profilegenerated from the ENVI-met model. A total of 32 sets of hourlyair temperatures were used as input weather data files in theeQUEST model:
Hourly temperature = Tmean − Tswing
(cos2π•
t (sec)86400 (sec)
)
(1)This study followed [28] to create an effect of shading from
nearby buildings in the eQUEST model. The simplified way wasto set the rectangular vertical plates having a setback from eachside of the building block, as presented in Figure 4. The visiblereflectance of nearby building’s shades and ground reflectance was0.5 and 0.2, respectively.
2.2.3. Model validationA two-story row house with 10 housing units per block sur-rounded by similar-sized buildings was selected as the studiedmodel. The actual conditions of the studied house with 40%WWR, including building materials and operation schedules,were set in the model input. In this study, the calculated hourlycooling energy use in the commercial zone of a middle unit wascompared with the data collected from the energy meter installedat the air-conditioning unit operating from 11 a.m.—6 p.m. TheCoefficient of Variation of Root Mean Square Error (CVRMSE)was used to estimate the error between the simulation results andmeasured values. In this study, the calculated CVRMSE valueswere 8.9% errors, which the ability of the simulation model canprovide reliable results. The validated model was then used toperform the daily cooling energy consumption of 136 designconfigurations under 32 local microclimatic conditions.
2.3. Evaluation of the performance of cooling energyconsumption and outdoor thermal comfort conditionsSrivanit and Jareemit [9] investigated microclimate conditions in192 street canyon configurations and used the ENVI-met BioMETpackage to calculate hourly PET value (physiological equivalenttemperature). The calculated hourly PET were determined com-fort hours within the comfortable summer condition rangingfrom 25.1–35.2◦C, as investigated in a previous study [29]. Theyshowed that acceptable comfortable hours ranged from 23–46%.This classified range was then used to access the design solutions,which maximized outdoor thermal comfort conditions. Regard-ing energy efficiency assessment, the cooling energy consumptionin a single house and row house are classified in line with threeperformance levels following DEDE [8], as presented in Table 2.
The performances of cooling energy consumption of 136design configurations were then plotted against the acceptableoutdoor thermal comfort hours. Finally, the optimal designconfigurations, which considerably minimized cooling energy
International Journal of Low-Carbon Technologies 2021, 16, 592–603 595
Dow
nloaded from https://academ
ic.oup.com/ijlct/article/16/2/592/6034915 by guest on 24 July 2022

D. Jareemit and P. Canyookt
Table 1. Initial settings for building construction, envelope materials and air conditioner’s operation schedule used as input in the energy modeling.
Type Parameters Input value Thermal property
Construction Floor to floor 3.0 m (9.8 ft) –Floor to ceiling 2.6 m (8.5 ft) –
Building envelope Roof type (row house) 10.5 cm. concrete slab U-value = 1.7 W/m2.K Roofabsorbance = 0.55
Roof type (single house) Ceramic roof tile U-value = 0.26 W/m2.K Roofabsorbance = 0.55
Roof insulation 8.5 cm. expanded polystyrene foam U-value = 0.32 W/m2.KFloor type 10.5 cm. concrete slab U-value = 1.7 W/m2.K
Wall-paint color Light Absorbance = 0.4Exterior wall 10 cm. brick wall U-value = 2.6 W/m2.KInterior wall 10 cm brick wall U-value = 2.6 W/m2.K
Exterior windows Single clear 6 mm Solar Heat Gain Coefficient(SHGC) = 0.82
Air conditioning system A/C System type Packaged single-zone DX Energy Efficiency Ratio (EER) = 8.4Cooling source DX coils –
A/C operation schedule
Row house Commercial area Weekend 11 am – 6 pmWeekday 11 am – 6 pm
Residential area Weekend 8 pm – 7 amWeekday 8 pm – 6 am
Single house Living room Weekend 11 am – 6 pmWeekday 6 pm – 8 pm
Bedroom Weekend 8 pm – 7 amWeekday 8 pm – 6 am
Figure 4. A model setting of shading effect from nearby buildings in the energy simulation.
consumption while providing the maximum outdoor thermalcomfort condition, were proposed.
3. RESULTS3.1. Modified hourly air temperature profileFigure 5 shows the hourly air temperature (Ta) profile modifiedfrom the microclimate simulation [25]. The simulated air tem-perature in different building’s arrangements varies depending onthe street orientations and aspect ratios. The peak air temperature
obtained from the weather station occurs at 2 p.m., which relatesto the magnitude of solar radiation. In contrast, the highest mag-nitude of local air temperature from the microclimate simulationoccurs at 5 p.m. That shift of the temperature profile might be theeffect of the thermal storage of surface materials.
3.2. The impact of residential cluster designs on thecooling energy and outdoor thermal comfort hours.The simulation of cooling energy of the single house cluster rangesfrom 117 to 140 Wh/m2-day, with an average of 129 Wh/m2-day
596 International Journal of Low-Carbon Technologies 2021, 16, 592–603
Dow
nloaded from https://academ
ic.oup.com/ijlct/article/16/2/592/6034915 by guest on 24 July 2022

Residential cluster design and potential improvement for maximum energy performance
Table 2. Classified groups of scenarios of building cooling energy levels (data are modified from [8]).
Performance Cooling energy consumption
Single house Row house
Above-average performance Above 54 kWh/m2-year (148 Wh/m2-day) Above 54 kWh/m2-year (148 Wh/m2-day)Below-average performance 25–54 kWh/m2-year (68–148 Wh/m2-day) 44–54 kWh/m2-year (121–148 Wh/m2-day)
New energy-efficiency performance Below 25 kWh/m2-year (68 Wh/m2-day) Below 44 kWh/m2-year (121 Wh/m2-day)
Figure 5. Distribution of hourly air temperature used in the energy model.
Figure 6. The calculated daily cooling energy consumption of single houses.
(shown in Figure 6). About 25% of row houses consume less cool-ing energy than those of the single houses (shown in Figure 7).
Figure 8 classifies the performance of calculated cooling energyin residential clusters, as defined by DEDE [8] and the percent-age of outdoor thermal comfort hours obtained from the priorstudy [9]. The extreme cooling energy consumption is seen inthe cases of a square-shaped row house. More than half of thosecases consume the cooling energy above the average performance(148 Wh/m2-day), even when several designs are implemented.Design with a rectangular-shaped cluster (1:2.5) consumes 12%less cooling energy than those of the square shape (1:1). The build-ing shape could considerably reduce the cooling energy in the
residential cluster; however, it does not impact outdoor thermalcomfort in the street canyon.
The cluster orientation induces notable improvements in bothenergy-efficient building and thermal comfort in the street canyonin the reverse direction. The lowest cooling energy consumptions(101.4–120.5 Wh/m2-day), highlighted with the blue color, occurmainly in the row house cluster on E–W elongated orientation.It is 20% lower than those for the N–S street orientation (121 to191 Wh/m2-day). This is because the larger envelope area of therow houses is not exposed to direct solar heat on this arrangement.At the same time, this orientation facilitates the sun rays into thestreet canyon, leading to extreme thermal situations. In contrast,
International Journal of Low-Carbon Technologies 2021, 16, 592–603 597
Dow
nloaded from https://academ
ic.oup.com/ijlct/article/16/2/592/6034915 by guest on 24 July 2022

D. Jareemit and P. Canyookt
Figure 7. The calculated daily cooling energy consumption of row houses.
the N–S orientation delivers the highest degree of comfort hoursat 46%, as seen in the aspect ratio of 0.9 and 1.1 (as seen in thered-dash border), but the cooling energy slightly over the newstandard.
A decrease in WWR notably provides a higher saving degree ofcooling energy use, which correlates to the increment of aspectratio. However, this increment slightly affects the single housecluster, as the single house has only two stories with similar WWRfor all buildings’ facades. For the row house cluster, the design forenhancing the maximum savings, up to 28–32%, could obtain bydecreasing WWR with an increment of aspect ratio, as detailedin Figure 9. Regarding the comfortable outdoor conditions inthe prior study [9], the number of comfort hours increases as
the aspect ratio increases, except for the E–W orientation (seeFigure 10). However, at the N–S and NE–SW orientations, theaspect ratio of 0.9 adequately delivers the maximum comfortablehours, as equal to that of 1.1.
3.3. Design solutions for encouraging outdoor thermalcomfort and energy savings in residential clustersConsidering the effect of designs of residential clusters on coolingenergy and outdoor thermal comfort, the design could be cate-gorized into four scenarios, as seen in Figure 11. By enhancingthe maximum energy performance and outdoor thermal comfort(Scenario 2), it was suggested that the building should elongate
598 International Journal of Low-Carbon Technologies 2021, 16, 592–603
Dow
nloaded from https://academ
ic.oup.com/ijlct/article/16/2/592/6034915 by guest on 24 July 2022

Residential cluster design and potential improvement for maximum energy performance
Figure 8. Calculations of the daily cooling energy consumption and outdoor thermal comfort performance in different residential clusters.
along on the NW–SE oriented street, H/W = 1.1, with a maximumWWR of 40%. This design scenario could deliver the highestenergy-savings by up to 32% and outdoor thermal comfort upto 46%. Although the elongated buildings along with the N–Sorientation consume the highest cooling energy consumption,reducing the glazed-window area and increasing aspect ratiocould minimize the cooling energy nearly the new standard, asdefined by DEDE [8].
The E–W orientation shows the best energy-savings per-formance, while the worst-case outdoor condition as seen inScenario 4. Street tree plantings and building height could notincrease comfort conditions. Overhead shade and canopy could
provide an adequate shaded area to the pedestrian paths [9].Either the lowest or highest cooling energy consumption couldbe seen in the rectangular-shaped row house on orthogonalorientation. Increasing the building height and decreasing glassarea are suggested for minimizing the cooling energy use in thisorientation.
The square-shaped clusters with lower aspect ratios and higherWWRs have the worst of outdoor thermal comfort and energyefficiency (Scenario 3). Additional designs, i.e., using higher per-formance windows, installed wall insulation, and adding externalshading devices, are suggested for improving energy efficiency inthat square-shaped clusters. By enhancing comfortable outdoor
International Journal of Low-Carbon Technologies 2021, 16, 592–603 599
Dow
nloaded from https://academ
ic.oup.com/ijlct/article/16/2/592/6034915 by guest on 24 July 2022

D. Jareemit and P. Canyookt
Figure 9. Energy-savings potentials by the integrated design of WWR and H/W, as compared to the worst situation highlighted with the orange dash line.
Figure 10. Improvement of outdoor thermal comfort hours when increasing theaspect ratio (Data modified from [9])
conditions, planting street trees along the pedestrian paths couldadequately deliver shaded areas.
4. DISCUSSIONTo study an effect of modified weather data on the coolingenergy consumption, one design scenario was selected andperformed energy analysis under two different weather datafiles. In Figure 12, the modified weather data considerably affectsthe cooling energy use when the air-conditioning units wereoperated. From 12 a.m. to 3 p.m., the simulations with modifiedmicroclimate weather data show 0.5–7% lower cooling energyuse than those performed under the original IWEC weather file.However, from 4 p.m. to 11 p.m., the modified weather data showsa higher cooling energy use up to 7%. It is because the modifiedair temperatures of that time are higher than those of the originalweather file.
The single house consumes less cooling energy than the three-story to five-story row house. However, normalized by the totalgross floor area, the row house is more energy efficiency, ascompared to the single house. The five-story row house with arectangular shape potentially provides a higher degree of energyefficiency, owing to the building’s compactness. The rectangular-shaped house has less ‘surface-to-volume ratio’ (S/V) than thesquare-shaped house. The lower S/Vs allow less heat gain throughthe building envelope, as presented in Figure 13. However, theless S/V would help only for buildings with major heat gaincoming from the outside. For building with dominant internalloads, it can be less efficient in the use of daylight and naturalventilation.
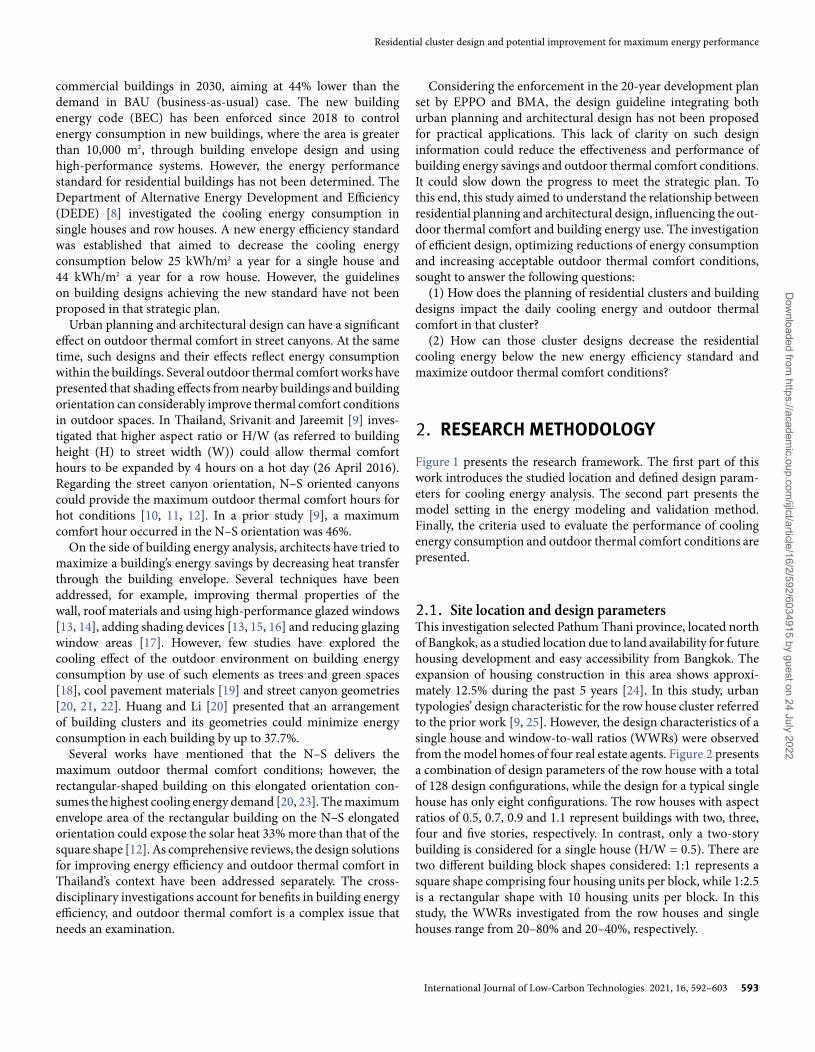
Variations in the building’s geometry and WWR could signif-icantly affect the building’s cooling energy use, as presented inthe previous works [21, 30, 31, 32]. The higher degree of energysavings has a crucial link with the WWR and S/V in this work.At the aspect ratio of 1.1, decreasing WWR to 20% could reducecooling energy up to 22% compared to those of aspect ratio of 0.5(shown in Figure 14(a)). The energy savings increase alongside adecrease in S/V and an increase in WWR, owing to the magnitudereduction in glass areas (see Figure 14(b)). The higher degree ofenergy savings occurs in the rectangular-shaped clusters, as thisshape has lower ratios of glass area to the building volume (seeFigure 14(c)).
Furthermore, in the deep street canyon (higher aspect ratios),nearby buildings’ height could provide shade that reducesheat gain through the building envelope by approximately130 kWh/m2, as mentioned in Martins et al. [33]. The analysisof cooling energy efficiency and outdoor thermal comfortconditions in single house clusters shows a similar performance. Itis because the single house only two stories that deliver insufficientshade for adjacent buildings and outdoor space. Providing shadeis an essential basic design for improving energy efficiency andoutdoor environment for the shallow street canyon lined withsquare-shaped buildings, as similar to the recommendations inprevious works [20, 21, 23, 31, 34].
600 International Journal of Low-Carbon Technologies 2021, 16, 592–603
Dow
nloaded from https://academ
ic.oup.com/ijlct/article/16/2/592/6034915 by guest on 24 July 2022

Residential cluster design and potential improvement for maximum energy performance
Figure 11. Four scenarios matrix of possible situations and potential improvements for outdoor thermal comfort and energy performance in residential clusters.
Figure 12. The percentage error between cooling energy consumptions calculatedusing the modified weather data and original data file.
5. CONCLUSIONSThis study explores and examines the potential improvements ofoutdoor thermal comfort conditions and energy efficiency in low-rise residential clusters in Thailand’s context. The eQuest mod-eling is used to perform the daily cooling energy consumptionin various design configurations of residential clusters, includingorientation, block shape, aspect ratio, and WWR, by integratingmodified weather data from microclimate data generated from the
Figure 13. The distributions of calculated daily cooling energy consumption indifferent ratios of surface area to building volume.
ENVI-met model. The calculations of cooling energy consump-tion per unit of gross floor area are plotted against the acceptableoutdoor thermal comfort hours investigated in prior work [9].With the integrated design of residential planning and architec-tural design, the row house cluster design has more opportunitiesto become sustainable than the single house. By enhancing themaximum outdoor thermal comfort and energy-efficient build-ings in the hot condition of Thailand, the row house should be onthe NW–SE elongated orientations with a maximum WWR of 40and an aspect ratio of 1.1. This recommended design improvesthe cooling energy consumption below Thailand’s new energyefficiency standard and provides the highest number of comfort
International Journal of Low-Carbon Technologies 2021, 16, 592–603 601
Dow
nloaded from https://academ
ic.oup.com/ijlct/article/16/2/592/6034915 by guest on 24 July 2022
D. Jareemit and P. Canyookt
Figure 14. Effect of WWRs and aspect ratios on the energy savings in residential clusters.
hours of 46%. The highest degree of energy savings in residentialclusters correlates to the decrease in glass area and increase inaspect ratio. The energy savings notably increases by up to 28%and 32% for square-shaped and rectangular-shaped row houses,respectively. However, the extreme energy use and thermal situ-ations are seen in the cases of a square-shaped row house and asingle house, which requires further designs of shading elementsand thermal envelopes to prevent incident solar radiation.
The study results provide a better understanding of a rela-tionship between residential planning and architectural design,influencing the cooling energy consumption and outdoor thermalconditions. The potential improvements for sustainable residen-tial clusters via several design techniques for particular situa-tions have been proposed. This new guideline could help urbanplanners and designers successfully utilize the design informationto enhance maximum energy efficiency and outdoor thermalcomfort, especially in the hottest summer month.
Beyond the scope of this study, several parts require furtherinvestigations. Shading significantly contributes to energy savingsand outdoor conditions. The critical factors, including complexurban typology and seasonal sun paths, influence the shaded areaat the pedestrian paths and building envelope. This area, though,needs further investigation.
5. FUNDINGThis work was supported by Thammasat University for LanguageEditing and Research Unit Funds.
5. CONFLICTS OF INTERESTThe authors declare no conflict of interest.
ACKNOWLEDGMENTSThe authors wish to acknowledge the work on the project ‘UrbanPlanning and Environmental Design Strategies for Encouraging
Transit-Oriented Development ’ to inspire our interest in designsfor outdoor thermal comfort on building energy analysis. We aregrateful for special support from Dr. Manat Srivanit, assistantprofessor, from the research cluster of Livable Environment &Architecture Design Lab for providing information and micro-climate data for our study. The authors thank Thammasat Uni-versity for making significant contributions to Thammasat Uni-versity Research Unit in Architecture for Sustainable Living andEnvironment.
REFERENCES[1] World Bank. Urbanization in Thailand is Dominated by the Bangkok
Urban Area. https://www.worldbank.org/en/news/feature/2015/01/26/urbanization-in-thailand-is-dominated-by-the-bangkok-urban-area (21June 2020, date last accessed).
[2] Takkanon P, Chantarangul P. Effects of urban geometry and green areaon thermal condition of urban street canyons in Bangkok. Archit Sci Rev2019;62:35–46. https://doi.org/10.1080/00038628.2018.1534724.
[3] Arifwidodo SD, Tanaka T. The characteristics of urban heat island inBangkok, Thailand. Procedia Soc Behav Sci 2015;195:423–8. https://doi.org/10.1016/j.sbspro.2015.06.484.
[4] Chaisinboon O. Energy efficiency trends for households. http://www.thai-german-cooperation.info/download/20140821_eedp_11_study_resutls_household.pdf (7 November 2020, date last accessed).
[5] Tantiwechwuttikul R. Assgnment #1: Case Study Anlysis. Thailand:Ministry of Energy. https://prospernet.ias.unu.edu/wp-content/uploads/2019/01/20190121-Assignment1_RanapornT_edited.pdf.
[6] Strategy and Evaluation Department, & Bangkok Metropolitan Adminis-tration. 2020. 20-year Development Plan for Bangkok Metropolis [ExecutiveSummary]Faculty of Political Sciences, Chulalongkorn University. http://www.bangkok.go.th/main/backoffice/upload_editor/file/plan20y.pdf.
[7] Energy Policy & Planning Office. 2018. Thailand 20-Year Energy Effi-ciency Development Plan (2018–2038). Bangkok, Thailand: Ministryof Energy.
[8] Department of Alternative Energy Development and Efficiency. Announce-ment of Energy Efficiency Standard for Households, Year 2019 [news]. 2019.https://www.ryt9.com/s/prg/2943811.
[9] Srivanit M, Jareemit D. Modeling the influences of layouts of residen-tial townhouses and tree-planting patterns on outdoor thermal comfortin Bangkok suburb. J Build Eng 2020;101262. https://doi.org/10.1016/j.jobe.2020.101262.
602 International Journal of Low-Carbon Technologies 2021, 16, 592–603
Dow
nloaded from https://academ
ic.oup.com/ijlct/article/16/2/592/6034915 by guest on 24 July 2022

Residential cluster design and potential improvement for maximum energy performance
[10] Ali-Toudert F, Mayer H. Numerical study on the effects of aspect ratioand orientation of an urban street canyon on outdoor thermal comfort inhot and dry climate. Buil Environ 2016;41:94–108. https://doi.org/10.1016/j.buildenv.2005.01.013.
[11] Achour-Younsi S, Kharrat F. Outdoor thermal comfort: Impact of thegeometry of an urban street canyon in a Mediterranean subtropical climate– Case study Tunis, Tunisia. Procedia Soc Behav Sci 2016;216:689–700.https://doi.org/10.1016/j.sbspro.2015.12.062.
[12] Deng J-Y, Wong NH. Impact of urban canyon geometries on outdoor ther-mal comfort in central business districts. Sustain Cities Soc 2020;101966.https://doi.org/10.1016/j.scs.2019.101966.
[13] Sudprasert S. Evaluation of energy savings by retrofitting of the build-ing envelope of air-conditioned row house. J Archit/Plan Res Stud(JARS) 2019;16:83–92. https://www.tci-thaijo.org/index.php/jars/article/view/152099.
[14] Li HX, Li Y, Jiang B et al. Energy performance optimisation of buildingenvelope retrofit through integrated orthogonal arrays with data envel-opment analysis. Renew Energy 2019. https://doi.org/10.1016/j.renene.2019.10.143.
[15] Al-Masrani SM, Al-Obaidi KM, Zalin NA, Aida Isma MI. Design opti-mization of solar shading systems for tropical office buildings: Challengesand future trends. Sol Energy 2018;170:849–72. https://doi.org/10.1016/j.solener.2018.04.047.
[16] Martinopoulos G, Serasidou A, Antoniadou P, Papadopoulos AM. Build-ing integrated shading and building applied photovoltaic system assess-ment in the energy performance and thermal comfort of office buildings.Sustainability 2018;10:4670. https://doi.org/10.3390/su10124670.
[17] Kosir M, Gostisa T, Kristl Z. Influence of architectural building enve-lope characteristics on energy performance in central European cli-matic conditions. J Build Eng 2018;15:278–88. https://doi.org/10.1016/j.jobe.2017.11.023.
[18] Zheng B, Bernard BEDRA, K.; Zheng, J.; Wang, G. Combination of treeconfiguration with street configuration for thermal comfort optimizationunder extreme summer conditions in the Urban Center of Shantou City,China. Sustainability 2018;10:4192. https://doi.org/10.3390/su10114192.
[19] Vallati A, Grignaffini S, Romagna M et al. Influence of street Canyon’smicroclimate on the energy demand for space cooling and heatingof buildings. Energy Procedia 2016;101:941–7. https://doi.org/10.1016/j.egypro.2016.11.119.
[20] Huang K-T, Li Y-J. Impact of street canyon typology on building’speak cooling energy demand: A parametric analysis using orthogo-nal experiment. Energy Build 2017;154:448–64. https://doi.org/10.1016/j.enbuild.2017.08.054.
[21] Lima I, Scalco V, Lamberts R. Estimating the impact of urban den-sification on high-rise office building cooling loads in a hot andhumid climate. Energy Build 2019;182:30–44. https://doi.org/10.1016/j.enbuild.2018.10.019.
[22] Ahmadian E, Byrd H, Sodagar B et al. Energy and the form of cities:The counterintuitive impact of disruptive technologies. Archit Sci Rev2019;62:145–51. https://doi.org/10.1080/00038628.2018.1535422.
[23] Vartholomaios A. A parametric sensitivity analysis of the influence ofurban form on domestic energy consumption for heating and coolingin a Mediterranean city. Sustain Cities Soc 2019;28:135–45. https://doi.org/10.1016/j.scs.2016.09.006.
[24] Real Estate Information Center. 2019. Situation of Number of New Residen-tial Units in Bangkok and Suburb Area [Database]. Real Estate InformationCenter. https://www.reic.or.th/Research/225.
[25] Srivanit M, Jareemit D. Urban planning and environmental designstrategies for encouraging transit-oriented development (TOD). NationalResearch Council of Thailand 2016. https://www.researchgate.net/project/Urban-Planning-and-Environmental-Design-Strategies-for-En-couraging-Transit-Oriented-Development-TOD.
[26] Hirsch, J. EQuest introductory tutorial, version 3.64. James J. Hirsch& Associates. 2010. http://doe2.com/download/equest/eQ-v3-64_Introductory-Tutorial.pdf
[27] Assawamartbunlue K. An investigation of cooling and heating degree-hours in Thailand. J Clean Energy Technol 2013;87–90. https://doi.org/10.7763/JOCET.2013.V1.21.
[28] Farrar-Nagy, S, Anderson, R, Hancock, CE. Impacts of shading and glazingcombinations on residential energy use in a hot dry climate. In Proceedingof 2000 ACEEE Summer Study on Energy Efficiency in Buildings, California,USA. Preprint, 2020.
[29] Srivanit M, Jareemit D. 2016. Human thermal perception and out-door thermal comfort under shaded conditions in summer: a fieldstudy in an institutional campus. In Proceeding of the 6th Interna-tional Conference on Sustainable Energy and Environment (SEE 2016).Thailand.
[30] Ahn Y, Sohn D-W. The effect of neighbourhood-level urban form onresidential building energy use: A GIS-based model using building energybenchmarking data in Seattle. Energy Build 2019;196:124–33. https://doi.org/10.1016/j.enbuild.2019.05.018.
[31] Vallati A, Vollaro ADL, Golasi I et al. On the impact of urban climate microon the energy consumption of buildings. Energy Procedia 2015;82:506–11.https://doi.org/10.1016/j.egypro.2015.11.862.
[32] Yu C, Pan W. Effects of shading on the energy consumption of high-riseoffice buildings in Hong Kong. 2018, 2018;486–93. https://pdfs.semanticscholar.org/aad1/9fa27adcae6733c0317d123d36803c97dae3.pdf.
[33] Martins TA d L, Adolphe L, Bastos LEG, Martins MA d L. Sensitivityanalysis of urban morphology factors regarding solar energy potential ofbuildings in a Brazilian tropical context. Solar Energy 2016;137:11–24.https://doi.org/10.1016/j.solener.2016.07.053.
[34] Hwang R-L, Lin T-P, Matzarakis A. Seasonal effects of urban street shadingon long-term outdoor thermal comfort. Buil Environ 2011;46:863–70.https://doi.org/10.1016/j.buildenv.2010.10.017.
International Journal of Low-Carbon Technologies 2021, 16, 592–603 603
Dow
nloaded from https://academ
ic.oup.com/ijlct/article/16/2/592/6034915 by guest on 24 July 2022