Federal Reserve Bank Operating Circular No. 7 - FRBservices ...
Upload
khangminh22Category
view
0download
0

V F h Governor
LETTER OF TRANSMITTAL
*PC;rd* *m+m
=l=d RESERVE BANK OF INDIA
CENTRAL OFFICE BOMBAY
REF. NO. SYD.1364/02.16.01-92/93 August 29, 1992 C m G o \ Bhadra 7,1914 (L
The Secretary to the Government of India, Ministry of Finance, Department of Economic Affairs, NEW DELHl 110 001.
Dear Sir,
In pursuance of Section 53(2) of the Reserve Bank of India Act, 1934, transmit herewith the following documents:-
(i) A copy of the Annual Accounts for the year ended the 30th June, ,
1992 signed by me, the Deputy Governors and the Chief Accountant and certified by the Bank's Auditors; and
(ii) Two copies of the Annual Report of the Central Board on ihe working of the Bank during the year ended the 30th June, 1992.
Yours faithfully
/ (S. Venkitaramanan)

CENTRAL BOARD OF DIRECTORS
GOVERNOR
S. Venkitararnanan
DEPUTY GOVERNORS
R. Janakiraman
S.S. Tarapore
DIRECTORS NOMINATED UNDER SECTION 8(l)(b) OF THE RBI ACT, 1934
S.S. Marathe
M.V. Arunachalam
Jaharlal Sengupta
S.R. Sen
DIRECTORS NOMINATED UNDER SECTION 8(l)(c) OF THE RBI ACT,1934
Ashok Kumar Jain
R.P. Goenka
A.S. Kahlon
Raghu Raj
Aditya V. Birla
R. Ganesan
P.N. Devarajan
M.S. Patwardhan
DIRECTOR NOMINATED UNDER SECTION 8(l)(d) OF THE RBI ACT, 1934
Montek Singh Ahluwalia
MEMBERS OF LOCAL: BOARDS
WESTERN AREA EASTERN AREA NORTHERN AREA SOUTHERN ARE/: S.S. Marathe Jaharlal Sengupta S.R. Sen M.V. Arunachalam K.N. Chimankar Tombing Jam Khothang R.M. Gupta C. Parvathamma Padma H. Rao Manoj Mohan Ghosh Raghu Nath Rai C. Sri Krishna R.N. Haldipur Saroj Kumar Poddar Bhagat Singh Kadam lsmail M. Kanga
As on June 30,1992

PRINCIPAL OFFICERS (As on June 30,1992)
Executive Directors
Principal Legal Adviser
CENTRAL OFFICE
Department of Administration Credit Planning Cell Department of Banking Operations and Development Department of Currency Management Department of Economic Analysis and Policy Department of Expenditure and Budgetary Control Department of External Investments and Operations Department of Financial Companies Department of Government and Bank Accounts Department of Statistical Analysis and Computer Services Exchange Control Department Financial Institutions Cell Industrial and Export Credit Department Inspection Department Legal Department Management Services Department Personnel Policy Department Premises Department Rural Planning and Credit Department Secretary's Department Urban Banks Department
COLLEGES
Bankers Training College, Bombay College of Agricultural Banking, Pune Reserve Bank Staff College, Madras
OFFICES
Bombay: Calcutta Madras ' New Delhi
Ahrnedabad Ban galore Bhopal Bhubaneswar Byculla, Bombay Chandigarh Guwahati Hyderabad Jaipur Jammu Kanpur Nagpur Patna Thiruvananthapuram
: Kum. I.T. Vaz Kum. V. Visvanathan M.L.T. Fernandes W.S. Saraf
: V.G. Hegde
: A.P. Aiyer Chief Manager : M .V. Raghavachari Adviser-in-Charge : N.D. Parameswaran Chief Officer : B. K. Basu Chief Officer : S.L. Shetty Officer-in-Charge : V. B. Josh i Financial Controller : P.R. Anantharaman Chief Officer : S.S. Karni k Chief Officer : V.G. Athavale Chief Accountant
: R. Nagaraja Rao Officer-in-Charge : O.P. Sodhani Controller : D. N. Samarth Chief Officer : , Jagdish Capoor Chief Officer : S.S. Ranade Chief Inspector : Smt. K.S. Shere Legal Adviser : C,K. Bapiraju Adviser : R.K. Choudhury Chief Officer
-- : R. K. Jalan Chief Officer : V. Subrahmanyam Secretary : N. Hariramani Chief Officer
PRINCIPAL
: S. K. Datta : J.R. Prabhu : T.R. Devarajan
MANAGER
: Y.M. Paranjpe : S.A. Hussain : D.S.R. Raju : R. Venkatesan
MANAGER
: S.J. Thaker : S.N. Razdan : J. Goswami : I.D. Agawal : M.G. Srivastava : R.S. Awasthi : B.S. Sharma : , A. Balarnitran : J. Krishnatrey : C. Harikumar : K.K. Mudgil : R.K. Shetye : A.Q. Siddiqi : S.D. Powar

CONTENTS
PART ONE
- ECONOMIC REVIEW
I. Policy Developments and Perspectives
11. The Real Economy : Performance and Problems 1. Macro-economic Scene 2. Production Trends
Agriculture Industrial Production
Page No.
1
Ill. Government Finances 38
IV. . Monetary and Price Trends Monetary Developments Banking Trends Price Trends
V. Capital Market Developments 63
VI. Developments iq the External Sector 68
VI I. Assessment and Prospects 84
PART TWO - WORKING AND OPERATIONS OF THE RESERVE BANK OF INDIA
VI I I, Introduction 102
IX. Developments Concerning Commercial Banks 104
X. Issues Relating to the Co-operative Credit Structure 116
XI. Deposit Acceptance by Non-banking Financial and Non-financial Companies
XI I. Deposit Insurance and Credit Guarantee Corporation 1 20
XIII. Exchange Management and Exchange Control 121
XIV. Organisational Matters of the Bank 1 27
XV. The Band<'s Accounts for the Year, 1991-92 (JulyJune) 1 40
APPENDIX TABLES 147
THE ANNUAL REPORT ON THE WORKING OF THE. RESERVE BANK OF INDIA
for the Year July 1,1991 to June 30, 1992
PART ONE - ECONOMIC REVIEW
I. POLICY DEVELOPMENTS AND PERSPECTIVES
1.1 The year 1991-92 (July-June) was a landmark period in terms of un- dertaking strong policy measures to quickly stabilise the economy and also introducing a process of basic reforms.
1.2 The preceding decade had seen an acceleration in economic growth but the relatively high rate of growth of GDP was also associated with macro- economic imbalance and the persistence of structural rigidities, a certain degree of' which constrained the sustainability of the growth process. Continuing macro-economic imbalance and a delay in taking corrective action in time accentuated the impact of global economic shock of 1990.
1.3 Large and growing fiscal deficit with a sizeable component of monetised deficit, inevitably resulted in rapid growth of monetacy liquidity far out of alignment with the real economic growth, thereby generating severe demand pressures and accelerating the pace of inflation. These imbalances in turn spilt over onto the external sector in the form of a large and,unsustainable current accouri&deficit. The persistently high levels of fiscal deficit and current account deficit on the balance of payments (BOP) gave rise to a sizeable public debt, both domestic and external. The country was faced by a risk of default on external debt servicing during the early months of the fiscal year 1991-92. The strain on external and internal resources, the threat to monetary stability and the resultant inflationary process, had begun to affect adversely the goals of development. Inflation, which by itself hurts the real income of the poor, had another consequence in that it had also begun to hinder investment plans both in the public and private sectors giving rise to distortions in production and employment generation. The situation called for strong stabilisation measures : fiscal correction, monetary tightening, inflation control, and strengthening of the competitiveness of India's exports.
1.4 To carry forward the benefits of stabilisation measures on an enduring basis, longer-term issues of structural rigidities and impediments to growth have also had to be addressed. First, the myriad of controls and regulations with the consequent growth of bureaucratic intervention inhibited the spurt of enterprise and initiative. Secondly, with the diversification of the domestic market the

comlnunity at large was seeking far more efficient and competitive products. Thirdly, technology was not catching up with that in the outside world espe- cially in those countries which were competing with us. The impetus to tech- nological development in India hitherto originated essentially through public sector projects and a few large private sector investments and all through State- directed planning. Any further development in this area could only be based on a broad-based initiative arising from competition and market efficiency. Fourthly, the absorption of substantial resources in the public sector, to the extent it was in areas which did not provide adequate returns, had begun to crowd out private sector investment. Finally, the world setting uncknvent a major change. Aid availability dwindled; the reduction of aid availability and the arithmetic of balance of payments required that the country had to move towards the goal of earning what it had to pay for its imports of goods and services. Exports demand a higher quality consciousness and competitive tech- nology. Markets abroad, which became highly price sensitive, showed sen- sitivity to quality, service and technology, besides price. Foreign direct investment and foreign tie-ups/collaborations were becoming a major instru- ment of technology transfer and networking in respect of market shares. Unless the country participated in the global market, further accelerated growth of exports, in particular and the economy in general were no longer possible. Studies on country experiences show that entrepreneurs become dynamic and forward-looking in environments of export-orientation, whereas in excessive import-substitution situations, they tend to acquire a dependent psychology and lose dynamism. Above all, the soft option of continuing exemptions from fully participating in the open multi-lateral trading system implied in the General Agreement on Tariffs and Trade (GATT) rules and regulations became difficult. Thus, the logic for liberalisation and structural reforms, for introducing com- petition amongst business enterprises in both domestic and outside markets, was overwhelming.
1.5 It is against this background that since July 1991 the authorities have addressed with utmost speed and determination, the issues of both stabilisation and structural reforms. Fiscal correction, exchange rate adjustment and reform, monetary targets and inflation control constituted the immediate measures for macro-economic stability which were simultaneously supported by structural reforms in the form of industrial deregulation, liberalisation of foreign direct investment, trade liberalisation, overhauling of public enterprises and financial sector reforms. The immediate stabilisation measures and the longer-term struc- tural reforms can pose problems of prioritisation of measures such as, for ex- ample, between the goals of fiscal correction and fiscal consolidation, and between monetary control measures and financial sector reforms.

1.6 Even as the measures of stabilisation and structural adjustment were dominating the economic scene during 1991-92, determined efforts were made to bring the external liquidity crisis under control. As a result, there was a remarkable turnaround achieved in the country's foreign currency assets from less than US $ 1.0 billion in the middle of July 1991 to US $5.6 billion by the end of March 1992 and further to US $ 6.2 billion by the end of June 1992. Drastic import compression measures were combined with efforts to encourage the inflow of resources into the country by non-resident Indians. This was also supplemented by exceptional financing by bilateral and multilateral agencies. The merchandise deficit, on a payment basis, declined from US $ 7.7 billion in 1990-91 to US $ 3.1 billion in 1991-92 and correspondingly,the current account deficit fell steeply from US $ 7.7 billion to US $ 2.8 billion.
FISCAL CORRECTION AND CONSOLIDATION
1.7 The origin of the recent macro-economic crisis is closely linked to the imbalances in the fiscal sector. The Central Government's gross fiscal deficit was equivalent to 8.4 per cent of GDP at current market prices in 1990-91 as against 6 per cent at the beginning of the 1980s and 3 to 4 per cent in the mid-1970s. More significantly, it is the emergence of a persistent and growing deficit on Revenue Account of the Central Government during the 1980s (around 3.5 per cent of GDP in 1990-91) that has been a cause of concern in the fiscal scene Yet another aspect is the large size of the monetised deficit which, apart om generating excess liquidity in the economic system, has rendered diff'cult i' the attainment of the monetary policy objective of price stability. The fiscal deficit has resulted in growing indebtedness - both internal and external - which now constitutes about 57 per cent of GDP. With the onerous burden of debt servicing, interest burden of the Centre alone now forms 4.4 per cent of GDP and over 20 per cent of total expenditure. The continuous increase in Government expenditure, particularly on budgetary subsidies, together with an inadequately elastic response from the tax system and continu- ing losses of the public sector, has contributed to the budgetary gap. Apart from the spill-over of these fiscal imbalances on to the external sector in the form of current account deficit, the disproportionate reliance on Customs revenue for resources (nearly 46 per cent of the Centre's net tax revenue) has tended to result in an excessively protected and sheltered market for Indian industry with its adverse implications for efficiency, technological upgradation and export competitiveness. Finally, the Government's draft on resources on an increasing scale has affected their availability for more productive activities in other sec- tors of the economy.

1.8 Against the above background, Government have in turn, set before themselves the medium-ten objective of substantially reducing the Central Government fiscal deficit (to approximately 3 to 4 per cent of GDP) ;e well as the overall public sector deficit. The fiscal adjustment programme for 1991- 92 visualised :1 sharp reduction in gross fiscal deficit of the Centre from 8.4 per cent in 1990-91 to 6.5 per cent in 1991-92, which was broadly attained. In hct, the adjustment was much sharper in berms of the primary deficit (fisc:ll deficit nlinus net interest payments) from about 6.0 per cent to 3.5 per cent. The reduction in the Centre's fiscal deficit was made possible by reducing expenditure (including net lending) to GDP ratio by about 1.4 percentage points, the reductions being related to non-interest current expenditures like export subsidies, non-Plan grants to States and Union Territories and some moderation in defence expenditure. In addition, capital expenditure was brought down in 1991-92 to achieve the desired reduction in fiscal deficit. So~lle ad- justments were also effected on the resources side, through mobilisation of additional revenue and disinvestment in the equity holdings of public sector enterprises.
1.9 The Centre's Budget for 1992-93 has carried forward the fiscal adjust- ment programme with the overall deficit slated to decline to 5 per cent of GDP. Almost the entire part of the adjustment is to be attained by arresting expendi- ture growth. In fact, according to the Central Budget for the year, the non-in- terest non-Plan expenditure taken together would be lower than that for 1991-92. Thus, again, if the increased interest burden were taken into :iccount,, the estimated primary deficit would recede from 3.5 per cent of GDP in 1991- 92 to less than 2.3 per cent in 1992-93. In order to achieve this, the net market borrowing of the Centre has been pegged at Rs.5,000 crore, a third lower than the level of Rs.7,500 crore during 1991-92. Reduction in interest burden cvill, however, be achieved only over a period as the reduction in Government bor- rowings, as also in monetised deficit, has to be accompanied by reforms to place the debt at market-determined yield rates, transparency in the cost of borrowings by the Government, financial sector reforms, and the importance assigned to monetary management.
1.10 Apart from yet another 1.0 percentage point reduction in the expendi- ture (including net lending) to GDP ratio, the 1992-93 Budget has sought to initiate major changes in the tax structure by drawing upon the recommend:^- tions in the interin2 Report of the Chelliah Committee on tax reforms. The measures proposed in the area of direct taxes aim at simplification and rationalisation of the tax structure, as also widening its base. In the area of indirect taxes, the thrust of the Budget proposals is on encouraging competi- tiveness of Indian industry by bringing the Customs tariff rates in line witti

GRAPH- 1
MACRO- ECONOMIC INDICATORS l o
8
a n' 3 4 - e 0 G a 2 -
0
6DP- W S S DOMESTIC e R O W nGFD- GROSS FISCAL DEFICIT
cno- wRRENT aaXUM DEnaT I.\ - ,*'< * \ . -
GFD /GDP
6'\ ,./* . '\,
-
.' ---* @@dd\,
/ ---- ---- ,A - @&* -- -- 0'
\ ---.. -.-. -.-8 \
I I I I I I I I I I - N B (D t. Q) cn 0 8
- f m - l " 8 g A 8 z 2 Z 2 % P -
a a2 m m d) Q) OD Q) a, 2 a, 0,
S 0,
E - IP a, E a, 92 a,
21 '
1 8 ' t
15
12
// 4 / /t \ " A / \
7 \ /' 1 \
0 \ / // '\ \ -L
\ /
\ \ / /
f /' \ \ '
\ /
$ 1 1 \, I \ v / j V / \ \ \ I 1 /
\ \\ / M3 GROWTH v t \ ' -
' \ / / : \ I v d' - ,/'/
-', / \ \
-
0 1 1 I I 1 I I I I I - r\] Ic) 8 0 1D r- a, Q, 0
- (U
? "P- Z +I Z $ . B r- g 8 8 c?' ?
% -
d) a, OD CD a, OD al 03 CD Q,
E! a, E E 0, !?? 92 E 0, E 2 8

those in competitor countries, reducing the dispenion of tariff rates, rationalis- ing the excise duty structure, and increasing the rates of excise duties selectively on certain non-essential commodities so as to raise additional resources to offset the revenue loss from restructuring of Customs tariffs. The process of structural adjustment and macro-economic stabilisation initiated in 1991-92 is thus being consolidated in 1992-93. The reforms proposed in the Budget, together with a sharp reduction in the fiscal deficit, are expected to lead to a buoyant industrial sector, create additional employment opportunities, reduce external payments problems and simultaneously bring.down inflationary expectations. The Budget has initiated a process by which a sustainable fiscal balance could be brought about in the medium term.
MONETARY POLICY : OBJECTIVES AND INSTRUMENTS
1.11 Since 1989-90, monetary policy has had to contend with a growing fiscal deficit and persistent overhang of liquidity, leading to a resurgence of inflation. Superimposed on it was a deteriorating balance of payments situation, particularly after the Gulf crisis. Thus, containing aggregate demand and, in particular, demand for imports, became an overriding consideration in the policy actions of the Reserve Bank of India during the latter half of 1990-91 and the first part of 1991-92. Despite the major preoccupation with short-term management, the longer-term objectives of promoting operational efficiency of the financial system and developing the money market were pursued. Simul- taneously, the endeavour was to support the cohesive package of measures of macro-economic stabilisation and structural reforms initiated by the Govern- ment since July 1991. In this respect,the recommendations of the Committee on the Financial System (Chairman : Shri M. Narasimham) have had an irn- portant bearing on the formulation of monetary policy.
1.12 There were four major strands of specific credit policy measures during the period under review. The first set of measures aimed at import containment. As opposed to quantitative restrictions on imports, such measures-as i~nposition of cash margins (which for a while ranged between 50 per cent and 200 per cent) and the increase in the cost of import finance through the imposition of a 25 per cent interest rate surcharge, were perceived as non-discretionary ways of containing imports. The second set of measures stemming from the restric- tive monetary policy stance had also been undertaken to contain the current account deficit on the balance of payments. For a given level of income, reduc- ing expenditures, or absorption, essentially means reducing the overall monetary demand and also inflation in the system. The reductions in the overall demand and inflation do not, however, translate themselves irnmedi:~tcly into

an improvement in the balance of payments. They have to work through several links in the system and depend upon such parameters as marginal propensity to import out of income. Combined with the containment of the fiscal deficit, a regime of tight money and credit, apart from facilitating control of intlation, also results in greater economy in the use of resources. 1.13 The third set of measures were a response to an improvement in the foreign exchange situation and some slowing down of the annual rate of intla- tion. These measures included withdrawal of stipulations relating to cash mar- gins on imports and some moderate lowering of lending rates in respect of large borrowers.
1.14 A final set of measures originated in the fiscal adjustment and a com- bination of macro-economic stabilisation and structural reforms undertaken by the Government in the context of which it was considered feasible to moderate the levels of statutory pre-emptions in terms of both the cash reserve ratio (CRR) and the statutory liquidity ratio (SLR). As part of the propcjsals for reforming the financial sector, the Narasimham Committee on the Financi;il System had recommended a reduction in pre-emptions of banks' resources. In response, the Government have agteed to meet their borrowing needs increas- ingly from the market instead of pre-emption of banks' resources. With this end in view and as part of the overall effort to develop the Government securities market which would also provide a major step towards evolving better tools of monetary control, the Government of India introduced three new instruments, viz., 364-day Treasury bills and 5-year and 10-year dated securities, a11 on an auction basis. The further rationalisation of lending rates and substantial freedom given to banks to determine deposit maturities and deposit rates also constitute a part of the above reform programme.
1.15 The key macro-economic assumptions underlying the monetary targets for 1991-92 were a real GDP growth of 3 to 3.5 per cent, an inflation rate of not more than 9 per cent, and a signiticant slowdown in M3 expansion to about 13 per cent. The import compression, credit restriction and fiscal adjustment measures, had an impact on the overall growth rate and in the event, the CDP growth turned out to be a little less than 2.0 per cent and in particular, there was a total stagnation in industrial output. Even so, the M3 expansion ac- celerated to a s high as 18.5 per cent in 1991-92 which was attributable to the domestic expansion of primary liquidity and the larger-than-projected foreign exchange accruals. Since the inflows of foreign exchange were of overriding priority, measures of sterilising the inflow of these resources were not under- taken lest the measures shoulcj dampen such inflows. .
1.16 The monetary policy for the first half of 1992-93 was undertaken against the background of the need to revive industrial and agricul turd produc-

tion and encourage exports while keeping in mind the primacy of the objective of inklation control. Monetary policy was formulated against the Government's declared objective of reducing the gross fiscal deficit from 6.5 per cent of GDP in 1991-92 to 5 per cent of GDP in 1992- 93. The objective of overall policy is to bring down the rate of inflation to 8 per cent. With this end in view, the Central Government has planned to reduce the budget deficit (and the monetised deficit) to Rs.5,389 crore in 1992-93. To realise the full anti-infla- tionary impact of the reduction, it was recognised that the monetised deficit should be moderated throughout the year and not merely at the end of the financial year. If the monetised deficit is moderated over the year it would then be possible to bring monetary expansion (M3) from 18.5 per cent in 1991-92 to less than 11 per cent in 1992-93.
1.17 The rationale of the. important monetary and credit policy measures during the period under review are set out below:
(a) Inte- i) Bank Rate rest Rates 1.18 The Bank Rate as an instrument of monetary policy had been dormant
and had remained unchanged since July 1981. In the context of the inflationary pressures, and the need to evolve a benchmark Reserve Bank rate it was con- sidered apposite to activate the Bank Rate instrument. Accordingly, the Bank Rate was raised from 10.0 per cent to 11.0 per cent pqr annum with effect from the close of business on July 3, 1991, and further raised to 12.0 per cent per annum with effect from the close of business on October 8, 1991.
ii) Lending Rates
1.19 During the period under review, lending rates were modified four times with a view to ensuring that the rates reflected the underlying inflation in the economy and the need for charging positive real rates of interest. First, in tile context of the need to reduce aggregate demand in the economy as also taking into account the increase in deposit rates, effective-July 4, 1991 the lending rate on limits of over Rs.2 lakh was raised by 1.5 percentage points to 18.5 per cent (minimum). Second, perceiving that a number of lending rates had become negative in real terms in the context of the prevailing high inflationary pres- sures, lending rates of scheduled commercial banks were raised across- the- board by 1.5 percentage points, with effect from October 9, 1991. Third, since the minimum lending rate for limits over Rs.2 lakh was raised from 16 per cent to 20 per cent between April 1991 and October 1991, effective March 2, 1992, the lending rate to borrowers with credit limits of over Rs.2 Iakh was reduced by one percentage point as a cautious response to some abatement of the infla- tion rate. Finally, as part of a process of progressive rationalisation of the banks' lending rate structure, effective from April 22, 1992 the existing six categories

of lending rates were reduced to four (Appendix Table 1.1 presents the changes in the structure up to April 22, 1992).
iii) .Deposit Rates
1.20 There were a few revisions in the banks' deposit rate structure during the period under review essentially to provide for positive real rates of interest on bank deposits. First, with a view to ensuring that banks financed their lend- ing operations out of their own resources and to enable banks to compete with alternative savings instruments, the term deposit rates of scheduled commercial banks were raised across-the-board by one percentage point effective July 4, 1991. Secondly, to ensure competitiveness of bank deposits and to provide a better rate of return on short-term surplus funds, as high inflation rates had rendered deposit rates at the short-end unremunerative, interest rate on term deposits (excluding FCNR and NRE deposits) of scheduled commercial banks with a maturity of 46 days to less than one year was raised from 9.0 per cent per annum to 11.0 per cent per annum effective October 9,1991. Simultaneous- ly, for a better alignment of the return on short-term deposits, term deposit rate with maturity of one year to less than 2 years was raised from 10.0 per cent to 12.0 per cent, while that on deposits with maturity of two years to less than three years was increased from 11.0 per cent to the same 12.0 per cent. This resulted in setting the rate for deposits of one year and above but less than three years at 12,O per cent per annum. Deposits with maturity of 3 years and over remained unchanged at 13.0 per cent per annum. At the third stage, as a step towards reform in the regulation of the banks' deposit rate structure, with effect from April 22, 1992, the rates on term deposits (excluding FCNR and NRE deposits) of all maturities of 46 days and over were made subject to a single prescription of 'not exceeding 13,O per cent per annilm'. Banks are now free to determine the maturities and deposit rates within this single ceiling rate of 13.0 per cent per annum (Appendix Table 1.2). Effective April 24, 1992, the interest rate on savings deposits was raised by one percentage point to 6.0 per cent per annurn
(b) Re- 1.21 Upto the first half of 1991-92, when there was the overriding necessity lnxa tion to contain imports, the monetary policy measures were progressively tightened on which culminated in the imposition of cash margins as high as 200 per cent on Imports imports (other than capital goods) under OGL and 150 per cent on imports
(other than capital goods) under specific licences, with effect from April 22, 1991. Furthermore, effective May 9, 1991, an interest surcharge of 25 per cent was levied on bank lendings for all types of import finance.
1.22 Subsequently, as the foreign exchange reserve position showed rapid improvement, gradual relaxations were effected in the general minimum cash

margin requirement from 200 per cent to 150 per cent on October 8, 1991, to 50 per cent on December 9, 1991, to 25 per cent on January 1, 1992 and finally withdrawn effective from February 12, 1992; banks can now .decide the form and size of margin based on their own prudential considerations. Likewise, the 25 per cent interest rate surcharge on import financing was rescinded effective from February 13, 1992.
(c) Incen- i) Export Credit Refinance tives for 1.23 In view of the paramount need to promote exports and also to provide Exports greater incentive to banks to render export credit, the export credit refinance
formula was liberalised and banks' access to funds under this facility was increased. Since July 27, 1991 banks were being provided export credit refinance under a two-tier formula amounting to 50 per cent of the increase in export credit over the monthly average level in 1988-89 plus 100 per cent of the increase over the monthly average level of export credit in 1989-90. With effect from September 4, 1991, refiriance limit under the first tier was raised to 60 per cent while continuing export credit refinance of 100 per cent under the second tier. To provide additional incentive to banks for extending export credit, the refinance under the second tier was raised to 110 per cent effective November 2, 1991 and further to 125 per cent from December 28,.1991. With a view to encouraging banks to continue to provide greater support to the export sector the usual bringing forward-of the base for determining export refinance was not undertaken in April 1992; this has resulted in a very sharp increase i n the export refinance access for banks.
ii) Interest Rates on Export Credit
1.24 In view of the low rates of interest on export credit banks h&e becn finding it unremunerative to lend to the export sector. Moreover, with large interest rate differentials as between export credit and other credit, there was a strong possibility of seepage of credit. To provide greater incentive to banks and to enable them to provide credit support to the export effort, interest rates on pre-shipment and post-shipment export credit were raised. The export credit interest rates were raised i n August 1991 after the interest rate subsidy on export credit was withdrawn and again in October 1991 as part of the general increase in lending rates (Appendix Table 1.3). With the reduction in minimum lending rate for credit limits of over Rs.2 lakh with effect from March 2, 1992, the rates of interest in respect of post-shipment credit beyond 90 days from the date of shipment as also export credit not otherwise specified have also becn reduced by one percentage point from the existing rates.

iii) Relaxatio~t of Cash Margin on Export-re1atc.d Iniporfs
1.25 As part of export promotion measures, a series of relaxations were effected in the prescribed cash margins in respect of imports (other th:m capital goods) related to exports. The stipulated extent of actual export realisations up to which, on certain imports (other than capital goods), manufacturer-exporters were allowed to import goods without cash margins,was enhanced.
il)) Rejnance Scheme for Post-Shipment Export Credit Denominated in US Dollars
1.26 A Scheme of Post-Shipment Export Credit Denominated in Foreign Currency was introduced effective January 1, 1992. The objective of the Scheme is- to provide a facility to exporters to avail of post-shipment export credit denominated in foreign currency and pay interest at rates applicable for the foreign currency concerned. A new refinance facility called 'Refinance Scheme for Post-Shipment Export Credit Denominated in U.S. Dollars' was introduced effective January 4, 1992. Under this Scheme refinance is provided to banks equivalent to 133 113 per cent of the post-shipment export credit denominated in U.S. dollars, provided by banks to the exporters. In order to make dollar-denominated export credit scheme more attractive, the rate of in- terest on refinance under this Scheme was reduced from 7.5 per cent per annum to 5.5 per cent per annum with effect from April 22, 1992, while the rate of interest on post-shipment export credit (dollar-denominated) was retained at 6.5 per cent per annum. The Scheme provides banks with a strong incentive to provide dollar-denominated post-shipment export credit to exporters.
11) Export Credit (Rupee) Refinance
1.27 When pre-shipment and,post-shipment export credit interest rates were raised in August and October 1991, the export refinance rate was not raised so as to enable banks to have some time to phase in the new lending rates on export credit. Hence, effective April 22, 1992, the interest rate on export credit (rupee) refinance was raised from 9.5 per cent per annum to 11.0 per cent per annum.
vi) Delegation of Powers to Bunks to Grant Pre-shipment Credit for' Periods Beyond 180 Days
1.28 With a view to supporting export efforts and giving operational flexibility to banks, Reserve Bank has delegated powers to banks to allow extension of period for pre-shipment credit by 90 days in cases where the exporters have not been able to ship the goods within the permitted period of 180 days for reasons beyond their control. Powers have also been delegated to

banks tosanction pre-shipment credit up to 270 days ab initio in respect of any commodity which would need credit for such a long duration.
(d) Mea- 1.29 Reserve requirements have been a major instrument of control of li- s ures quidity in India. The SLR, though originally conceived as a prudential Relu ting measure, has been partially serving the purpose of meeting the Government's to borrowing requirements at less than market-related rates. With successive in- Reserve creases in reserve requirements,. this instrument was increasingly becoming Require- counter-productive as it affected the profitability of banks. The ~ams imham nients Committee on the Financial System has inter. alia recommended that the SLR
be brought down in a phased manner.
i) Statutory Liquidity Ratio (SLR)
1.30 In the context of fiscal adjustment and macro-economic stabilisation undertaken by the Government, it was considered feasible to moderate the existing levels of statutory pre-emptions. Considering the anticipated decline in 1992-93 in the monetised deficit of the Centre and the reduction in the Centre's market borrowing programme, it was decided to reduce the statutory liquidity ratio on an incremental basis. Accordingly,up to the level of the outstanding net demand and time liabilities (excluding non-resident liabilities) as on April 3, 1992, the SLR will remain unchanged at 38.5 per cent and for any increase in net demand and time liabilities above the April 3, 1992 level, the SLR would be 30 per cent. The SLR of 30 per cent in respect of non-resident liabilities would remain unchanged. It may be mentioned that the deposits mobilised under the Non-Resident (Non-Repatriable) Rupee Deposit Scheme and Foreign Currency Accounts opened under Liberalised Exchange Rate Management Sys- , tern (LERMS) are fully exempted from both CRR and SLR requirements.
ii) Inc~~ernental Cash Reserve Ratio
1.31 The Narasimham Committee had recommended that the cash reserve ratio should continue to be used as an instrument of monetary control though it was recognised that the existing levels were high and needed to be brought down.
1.32 . During the critical period in the first half of 1991, a 10 per cent in- cremental cash reserve ratio was introduced in May 1991. It was recognised that the continuation of a 10 per cent incremental cash reserve ratio (CRR) in addition to the average ratio of 15 per cent would not be feasible for any extended period as it would greatly restrict the flow of credit to the prc)ductive sectors. Moreover, it would not be prudent to continue crisis management measures over a prolonged period. Accc~rdingly, banks were exempted fron~

maintenance of the 10 per cent incremental CRR for any increase in net demand and time liabilities (DTL) over the level as on April 17, 1992.'
iii) in toes t on Banks' Cash Bolances held wirlr the Reserve Bank of India
1.33 Over the years the CRR has been raised and at the same time the interest on cash balances has been raised to shore up bank profitability. Since payment of interest on cash balances attenuates monetary control the cash reserve had to be raised even further. Had interest not been paid on cash balan- ces, the CRR could have been prescribed at a much lower rate to achieve the same level of monetary control. With a view to curtailing the increase in reserve money, it was considered necessary to moderate the total interest payments made by the Reserve Bank of India to banks on their eligible cash balances under the two-tier formula. The modifications were made in two stages during the year. With effect from the fortnight beginning October 19, 1991 (i) on the eligible cash balances based on the net DTL as of March 23, 1990 interest was continued to be paid at a rate of 10.5 per cent per annum, (ii) on the increase in eligible cash balances based on the net DTL maintained after March 23, 1990 under the average 15.0 per cent CRR as well as eligible cash balances under the 10.0 per cent incremental CRR, interest was paid at a reduced rate of 5.0 per cent per annum (as against 8.0 per cent per annum till then). The latter rate was further reduced to 3.0 per cent per annum with effect from the fortnight beginning May 2, 1992.
(e) Gene- i) Incremental Net Non-food Credit (Excluding Expor-t Credit)- Deposit Ratio ral Credit ' 1.34 As part of the credit policy for the first half of the financial. year 1991- Measures 92, banks were required to etlsure that their incremental net non-food credit
(excluding export credit)-deposit ratio did not exceed 45 per cent in 1991-92. To ensure strict compliance, it was decided in October 1991 to automatically reduce refinance limits to banks which exceed this ratio for two successive fortnights for the next four fortnights and to reduce refinance limits for the subsequent two fortnights for banks with excess credit in each subsequent 'fortnight. Banks which persistkntly violated the stipulated ratio faced a total withdrawal of refinance facilities.
1.35 The banking system as a whole observed this guideline in 1991-92 and the continued prescription of an incremental net non-food credit-deposit ratio was not considered necessary for 1992-93. Accordingly, the stipulation of an incremental credit-deposit ratio was withdrawn in April 1992. Banks have been advised to normalise credit facilities to support the revival of productive activity in the agricultural and industrial sectors, in particular the needs of the small
I@ Tlle f~lnds received under the India Developn~en! Bond were, however. already fully exempled front tlre il~cren~en~al cash reserve ratio.

farmers, small-scale industries and exports. They have also been advised to ensure that their lendirig operations are consistent with their own resources and that large and chronic mismatches between sources and uses of hnds are avoided. '
ii) Witl~drawal of ReJnance Facililies to Scheduled Commercial Banks
1.36 In view of the imperative need to contain reserve money expansion in the context of severe inflationary pressures, the following refinance facilities were withdrawn effective October 9, 1991: food credit refinance; standby refinance; 182-day Treasury bill refinance; and discretionary refinance. Thus, except for export credit refinance no other refinance is now available to banks from the Reserve Bank.
iii) Dbcounting/Rediscoilnting of Bills by Banks
1.37 The Reserve Bank's recent inspections/scrutiny of the bills portfolio of banks have revealed a number of disquieting features tending to violate both in letter and spirit the broader objective of the bills discounting/rediscounting facility introduced by the RBI. Fresh instructions have, therefore, been issued in July 1992 to banks to ensure various norms and discipline in providing bill finance including avoidance af financing large borrowers outside the consor- tium arrangement, discounting accommodation bills, and deploying portfolio management funds for discounting bills, and generally restricting bill finance to the working capital needs based on credit norms. As explained below, the instructions also relate to bills portfolio of banks vis-a-vis the finance com- panies. Simultaneously, the Reserve Bank has cautioned the banks that any excess finance obtained by them against ineligible usance bills will be treated as borrowing and accordingly they will be required to recalculate their outside liabilities for the purpose of maintenance of CRR/SLR for the respective periods. Also, any defaults will invite the consequent penalties.
iv) Bills Discounting/Rediscounting Facililies for Finance Companies
1.38 Banks' lending to hire-purchase and equipment leasing companies is subject to a ceiling of three times the net owned funds. While providing facilities to such companies, credit provided by way of bills discounting/ redis- counting should be taken into account. Banks were advised in October 1991 that in the case of finance companies other than hire-purchase and equipment leasing companies also the former should ensure that the total credit accom- modation provided by them, inclusive of bills discounting/rediscounting facilities, did not exceed three times the net owned funds of those companies. Where the lending was above this norm, banks were advised, as a first step, not to allow further drawals and to bring down the outstandings in a phased manner,

1.39 Reinforcing the above instructions, banks have been advised in July 1992 that (a) they should be circumspect in discounting bills drawn by front
'finance companies set up by large industrial houses on other group companies, (b) they should not rediscount the bills discounted by non-bank financial com- panies thus desisting from providing any rediscount facility to finance cBm- panies, and (c) they should ensure that the overall credit limit provided to finance companies including bills discounting did not 'exceed three times the net worth of such companies.
V) Guidelines on Porlfolio Management by B a n b and Subsidiaries
1.40 The Reserve Bank has observed that banks were adopting various devices for accepting funds from their clients for management, offering guaran- teed rates of return on such funds, etc., with a view to avoiding compliance with the guidelines under the Portfolio Management Scheme (PMS). Therefore, the Bank has reiterated the stipulations contained in its circular of January 1991 and emphasised that violations of those stipulations would be viewed seriously and would invite deterrent action against the banks which would include raising of reserve requirements, withdrawal of refinance from the Reserve Bank, and denial of access to money markets, apart from prohibiting the banks froin undertaking such activity. The above stipulations will also apply to the sub- sidiaries of banks except where they are contrary to specific Reserve Bank or SEBI guidelines governing their operations.
vi) Restriction on Credit to Certain Sectors .
1.41 Effective October 9, 1991, banks were required to ensure that there was no increase in the credit outstanding to each of the following sectors : (i) loans for purchases of consumer durables; (ii) other non-priority sector personal loans; (iii) loans to individuals against shares and debentureshonds; and (iv) real estate loans.
1.42 In the context of the 'easing of the pressures on banks' resources and to facilitate recovery of industrial output, the restrictions on the first two categories of loans were withdrawn with effect f rom April 22, 1992 while continuing the restrictions on the latter two. In addition, banks were advised to prescribe a minimum margin ,of 75 per cent on loans to individuals against shares and debenturesbonds effective April 22, 1992.
(0 Mea- i) Cerlificates of Deposit sures 1.43 Effective May 2, 1992, the limits for issue of Certificates of Deposit Relating (CDs) by scheduled commercial banks (excluding regional rural banks) were to the enhanced from 5 per cent to 7 per cent of the fortnightly average outstanding Money aggregate deposits in 1989-90. Consequently, the aggregate limits for the bank- Market ing system for issue of CDs increased from Rs.7,537 crore to Rs.10,531 crore.
(g) Deve- lopmen t 0 f Govern- men t securities Market & Treasury Bills
CDs issued by banks in excess of the earlier limit of 5 per cent will not be subject to CRR.
ii) Cotnmcrcial Paper
1.44 Some significant relaxations were made in the guidelines relating to ~bmmercia l Paper (CP), such as. the reduction in the working capital (fund- based) limit of a company for issue of CP to not less than Rs.5 crore instead of ~ s . 1 6 crore and the minimum credit rating requirement from the Credit Rating Information Services of India Ltd. (CRISIL) and Investment Information and Credit Rating Agency of India Ltd. (IICRA) kept at P2 and A2 instead of P1 and A1 earlier, respectively.
iii) Money Market Mutual Funds (MMMFs)
1.45 A new scheme of Money Market Mutual Funds (MMMFs) was intro- duced. The MMMFs can be set up by scheduled commercial banks and public financial institutions as def'ined under Section 4A of the Companies' Act, 1956. The limit for these funds in the case of MMMFs set up by banks would be equivalent to 2 per cent of the sponsoring bank's fortnightly average aggregate deposits during 1991-92. As MMMFs are primarily intended to be a vehicle for individual investors to participate in the money market, only individuals can subscribe to MMMFs. The minimum lock-in period would be 46 days. The investors cannot be guaranteed a minimum rate of return, Reserve requirements will not apply to MMMFs.
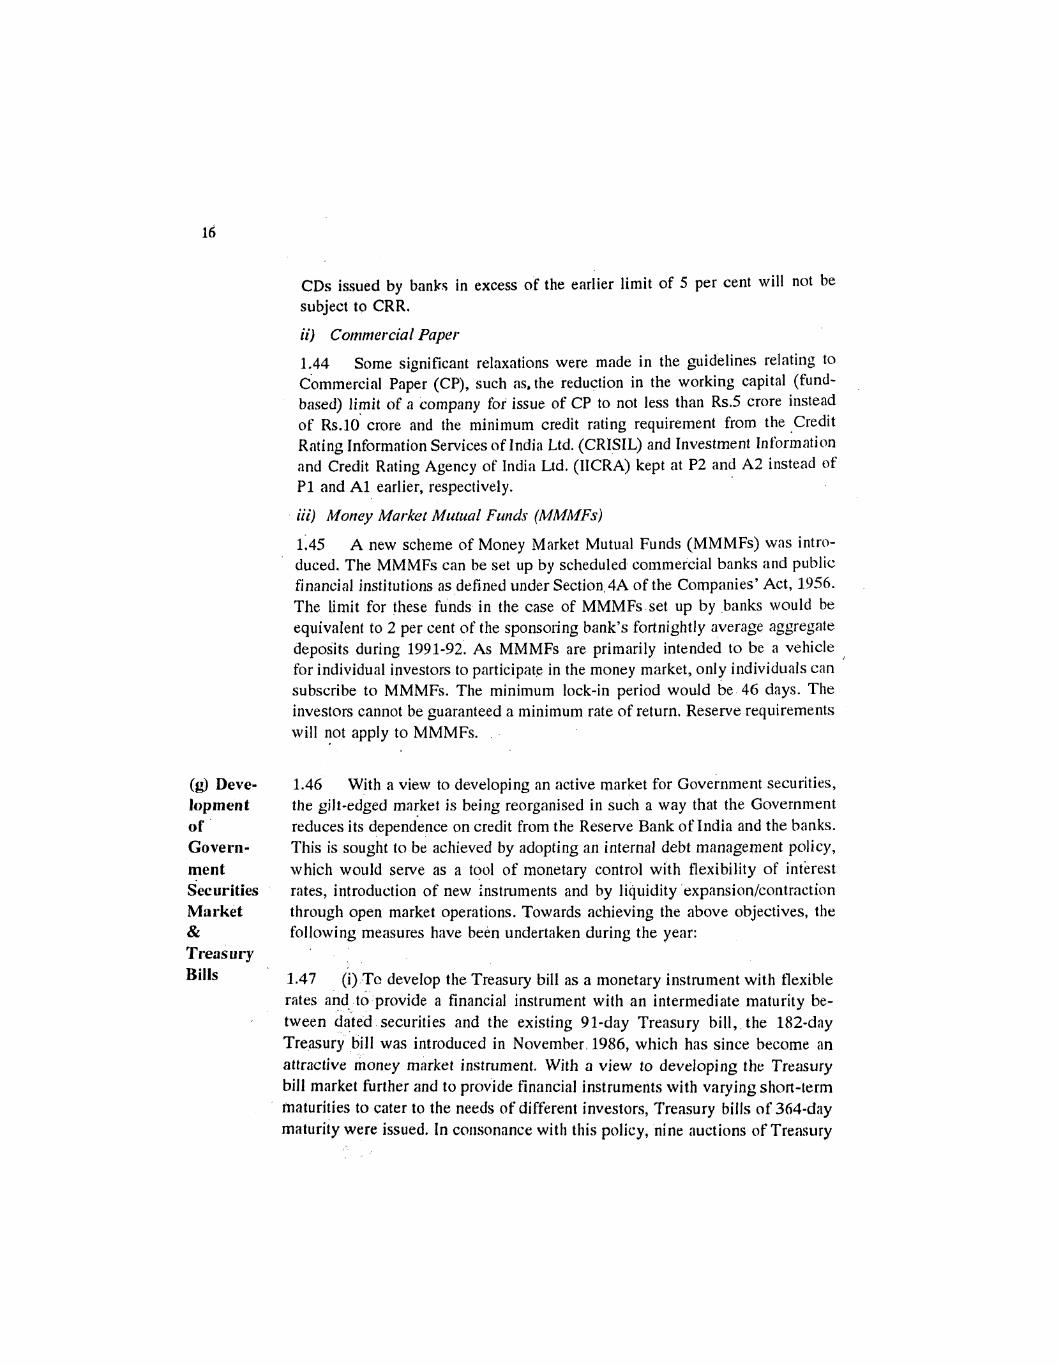
1.46 With a view to developing an active market for Government securities, the gilt-edged market is being reorganised in such a way that the Government reduces its dependence on credit from the Reselve Bank of India and the banks. This is sought to be achieved by adopting an internal debt management policy, which would serve as a tool of monetary control with flexibility of interest rates, introduction of new instruments and by liquidity expansion/contraction through open market operations. Towards achieving the above objectives, the following measures have been undertaken during the year:
1.47 (i) Ta develop the Treasury bill as a monetary instrument with flexible rates and to provide a financial instrument with an intermediate maturity be- tween dated securities and the existing 91-day Treasury bill, the 182-day Treasury bill was introduced in November 1986, which has since become an attractive money market instrument. With a view to developing the Treasury bill market further and to provide financial instruments with varying short-term maturities to cater to the needs of different investors, Treasury bills of 364-day maturity were issued. In consonance with this policy, nine auctions of Treasury

bills of 364-day maturity have so far been held since April 1992 during the current financial year. The response to these auctions up to Auys t 19,'1992has been very encouraging inasmuch a s Rs.7,159.63 crore have been collected within a short span of about five months with a cut-off yield of 11.42 per cent each initially for five auctions and those of 11.36 per cent, 11.27 per cent, 11.20 per cent, and 11.17 per cent, respectively, for the subsequent four auctions.
1.48 (ii) In furtherance of the objective of developing dated'securities of the Government of India as a monetary instrument with flexible yields to s u i t investor expectations, Government of India offered to sell dated securities of 5-year maturity for an aggregate amount of Rs.1,000 crore, as also 10-year security for an equivalent amount, for the first time by auctions on June 3,1992 and August 3, 1992, respectively. At the auction of 5-year security, 21 bids. for Rs. 713 crore at a cut-off yield of 12.0 per cent were accepted and the balance amount of Rs.287 crore was subscribed to by the Reserve Bank. Similarly, at the auction of 10-year security, bids for Rs.647 crore at a cut-off yield of 12.75 per cent were accepted and the balance amount of Rs.353 crore was subscribed to by the Reserve Bank.
1.49 (iii) Since July 1973, Reserve Bank has been allatting banks and in-surance corporations an annual quota for 'switching' Government securities in their portfolios with the Reserve Bank, mainly with a view to enabling them to improve the yields on their investments. The allotment of such quotas to banks and insurance corporations has since k e n dispensed with in the current financial year as the system of switch'quotas merely generated transactions in Government securities between banks/institutions and the Reserve Bank without any effect on the monetary aggregates.
1.50 .(iv) The Discount and Finance House of India Ltd. (DFHI) has started dealing in dated Government securities on a limited scale from April 2, 1992. This is a first step in the direction of developing a secondary market in Govern-ment securities.
(h) New 1.51 With a view to providing further incentives and giving wider options Non-Re: to non-residents, including Overseas Corporate Bodies owned by them, a new sident Non-Resident (Non-Repatriable) Rupee Deposit Scheme was announced. The (Non-Re- salient features of the Scheme are as follows : patriable) Rupee 1.52 Authorised dealers would be permitted to accept deposits under this
Deposit Scheme by way of transfer of foreign exchange funds from outside India 01
Scheme

from the existing NRE/FCNR accounts. The funds transferred to this new non-repatriable rupee Scheme would be converted into rupees at the prevailing exchange rate at the time of placing the deposit and these funds will no longer be repatriable. The deposits under the new Scheme, which can be accepted for maturities of six months to three years, would not be considered as part of net DTL for purposes of reserve requirements and as such these deposits would be free from any reserve requirements. Lendings out of these deposits would not be considered as part of net bank credit for purposes of determining priority sector lending. These deposits, and advances out of them, would not be subject to interest rate regulations and as such banks will be free to determine the deposit and lending rates under this Scheme. Banks would be able to offer attractive deposit rates under this Scheme. While depositors would be free to move from one bank to another, once these deposits are withdrawn from the banking system they would no longer enjoy these facilities even if they return to the banking system. With these attractive features, authorised dealers will be able to mobilise substantial deposits under the Scheme and attract foreign ex-change on a non-repatriable basis without any exchange risk.
EXCHANGE RATE POLICY
1.53 The policy developments in regard to exchange rate of the rupee were influenced by a variety of fundamental considerations : considerations of im-mediate countering of market expectations and also those of longer-term reforms. A reference was made in the last year's Report to the two-step downward adjustment in the exchange value of the rupee on July 1 and 3,1991 with a view to placing it at an appropriate level consistent with the need to maintain the competitiveness of India's exports. A situation of persistent erosion in the country's foreign exchange assets generates destabilising market expectations. In such a milieu, appropriate exchange rate adjustment helps in the immediate period to reverse market expectations and thereby sterns capital outflow in the first instance and later encourages inflow. Simultaneously, very soon and positively in the medium-term, the downward adjustment becomes an instrument to improve the country's international competitiveness a d to correct the imbalances in trade and current account deficits. It raises the relative price of traded goods (by increasing the domestic price of foreign currency) to non-traded (or home) goods, thereby encouraging production of tradeables while discouraging their consumption.
1.54 In India's case, studies have shown that the real effective exchange rate of the rupee (REER) with appropriate adjustments made for export incentives and taxes has served as an important determinant of tile country's export per-formance. Between October 1990 and March 1991 the REER appreciated by

~sPL.cOLLECTIONd RBI - ".I\ rna \\llllllllI\\l\\\\l~lI
59963 _ _ - - _ _ - -
about 2 per cent as a result of widening intlation differenti:lls between India and major industrialised countries. The REER increase took place despite con-tinuing depreciation in the nominal effective exchange rate (NEER) of therupee, by 2.4 per cent against 5 currencies over the same period. In the 5-monthperiod between February 1991 and June 1991, the NEER fell by only 2.5 per cent while inflation differentials continued to widen. All this resulted in an erosion of India's international competitiveness. No doubt India has depreciated the rupee value to a significant extent during the past decade but the country's competitors have resorted to far more depreciation in the values of their cur-rencies in effective terms. To restore the competitiveness of India's exports and to bring about a reduction in trade and current account deficits, it became imperative to make a downward adjustment in the value of the rupee. In deter-mining the extent of adjustment four factors were kept in mind : (i) inflation differentials between India and major industrial countries; (ii) the extent of realdepreciation of the currencies of the countries competing with India; (iii) the degree of correction required in balance of payments; and(iv) the broad in-dicators of market expectations. Taking all these factors into account, the depreciation of the rupee value by 18-19 per cent seemed appropriate.
1.55 Unlike in the recent past when exchange rate adjustments were madegradually in small doses, it was thought necessary to effect a sizeable adjust-ment of the rupee value in the changed circumstances, essentially owing to two reasons: first, to dampen market anticipations so as to offer incentives for reinit-tances and capital inflows; and secondly, to treat the exchange rate adjustment as part of the major stabilisation and structural reform programmes. Besides, such a large adjustment in the exchange rate also made it possible to avoid discretionary export subsidies from the Government budget.
1.56 The stability of the rupee-dollar rate during the year since the exchange rate adjustment of July 1991 together with-the relatively high interest rates more generally and in particular, the raising of interest rates on export credit and the imposition of an interest rate surcharge on import finance, provided a strong impetus to reverse the outflow of foreign exchange.
1.57 The new trade policy of July 1991 introduced a system of EXIM scrip under which exporters earned freely tradeable import entitlements equivalent to30 per cent (or 40 per cent in some cases) of the value of their exports. The premium on the EXIM scrip, when traded, gave an added attraction to exporters to boost their export profitability. The system of EXIM scrip, however, faced many operational and other problems. First, it was limited in scope with in-visible receipts including private remittances being left out of the incentivtscheme. Any extension of it to such large number of transnctir>ns would havt

been cumbersome and difficult to operate. Secondly, EXIM scrip partook the character of yet another licence which needed to be avoided particularly be-cause of administrative work-load involved in the issue and verification of licences. The High-Level Committee on Balance of Payments (Chairman: Dr. C.Rangarajan) appointed by the Government of India in November 1991 was of the view that while retaining the essential elemenis of linking imports with exports and offering incentive to exporters, any new system should avoid the need for issue of licences, cover service and remittance transfers, and should preferably operate through the banking system. On its recommendations, effec-tive March 1, 1992, the Liberalised Exchange Rate Management System (LERMS) has been introduced, the details of which are explained in Section VI.
- 1.58 LERMS should not be viewed as a measure in isolation. It constitutes a part of the totality of liberalisation measures undertaken by the Government of India and the Reserve Bank, including permission to import gold to NRIs.Apart from providing a boost to exports, it aims at efficient import substitution with as little bureaucratic and discretionary controls as possible. It seeks to encourage remittances through banking channels and reduce incentives .forclandestine transactions. LERMS is a system in transition. It subsumes the declared objective of movement into 'hll convertibility on current account in the near future. As the Rangarajan Committee has emphasised, in order to achieve the full benefits of integrating the Indian economy with the world
. economic'system, we need to move step by step towards full convertibility of current account transactions, keeping in view the developments in the macro-economic situation and the world trading environment. It is also envisaged that the proportion of official allocation of foreign exchange for the purposes of public good and other items should be gradually reduced, thus increasing the proportion of foreign exchange that the importers have to buy from the market.
1.59 The experience of LERMS has proved to be encouraging. The spread between the market rate and the official rate has been remarkably stable. Foreign exchange dealings relating to a wide variety of transactions in goods and services including capital account transactions at the market-determined rates, have been conducted smoothly. It has provided an opportunity for the development of market-determined transactions in foreign exchange as a preparatory arrangement for full convertibility on current account.
STRUCTURAL REFORMS
1.60 In the area of structural reforms, industrial deregulation, liberalisation of policies relating to foreign direct investment, public enterprise reform,

reforms of the taxation system, trade liberalisation, and financial sector reforms, constitute a wide set of radical restructuring of the economic system.
1.61 In industrial deregulation, the virtual abolition of the requirement of industrial licensing except for a short list of industries, abolition of the concept of monopoly involving limits on the assets. of large industrial houses for per- mitting industrial investment, restricting the number of industries reserved ex- clusively for the public sector to a short list of industries and permitting competition between the public and private sectors, and alongside, measures to promote small, tiny and village industries, were highlighted in the last year's Report.
1.62 Likewise, the system of automatic approval to be granted by the Reserve Bank for foreign direct investment up to 51 per cent for foreign equity in 34 select areas, as also for foreign technology agreements, was a part of the policy initiative taken in July 1991. Apart from the RBI's automatic approvals, other proposals are considered and approved on merits by the Secretariat for Industrial Approvals and, more significantly, by a Foreign Investment Promo- tion Board (FIPB) specially created to invite, negotiate and facilitate substantial investment by international companies that would provide access to high tech- nology and world markets. The system of automatic approval up to 51 per cent equity has been extended to trading companies primarily engaged in export activities, to hotels and tourism-related industries and also to such critical sec- tors as hydrocarbons and exploration/development, refining and marketing of petroleum oil and gas. Fully-owned foreign enterprises will henceforth be al- lowed to set up giant power projects without the requirement to balance dividend payments with export earnings. NRIs and overseas corporate bodies pre-dominantly owned by them are permitted in high priority areas. The geqeral under the provisions of the Foreign the FERA companies (i.e., those on a par with the Indian to all. The existing 51 per cent equity. goods for sale to the FERA templated.
1.63 According to the information available with 'the Secretariat for In- dustrial Approvals (SIA), foreign collaborations approved during the post- liberalisation period of 1991-92 (August to ~une) have been many times over

that in the corresponding period of the previous year. As against a total of 474 approvals in the previous year, there have been 1,430 approvals up to June 1992 (Appendix Table 1.5). Of these, the break-up of the total number of foreign collaboration approvals involving foreign equity are : RBI (168 for foreign equity wonh Rs.573.4 crore); SIA (332 for foreign equity worth Rs.468.8 crore); and FIPB (19 for foreign equity worth Rs.846.5 crore). Details of actual inflow of direct foreign investment for the recent period are, however, not yet available,
1.64 In regard to the reform of public sector enterprises, apart from the narrowing of their role in setting up industries and inducing competition with the private sector, reductions in budgetary transfers to them and equity disin- vestment of selected enterprises .which began with 20 per cent and which has now been proposed up to 49 per cent, constitute major reform measures. Be- sides, after the passing of amendments to Sick Industrial companies Act, 1985 (SICA), the Government of India have referred 54 Central enterprises to the Board for Industrial and Financial Reconstruction (BIFR) for preparing detailed programmes of restructuring or closure.
J1.65 The Central Budget for 1992-93 has initiated the process of reforming the taxation system based on the interim Report of the Tax Reforms Committee (Chairman: Dr. Raja J. Chelliah). Apart from streamlining the personal income taxation with lower tax rates and reduced exemptions, substantial rationalisation of the capital gains tax and wealth tax as also the widening of the tax base by introducing a presumptive tax scheme, has been effected. A major restructuring of corporate taxation has been deferred until after the detailed recommendations of the Chelliah Committee are received. In indirect taxation some further cuts in Customs tariffs have been implemented (as detailed in a subsequent para-
graph).
1.66 In the tradepolicy area, major structural reforms have been introduced since July 1991, with the avowed objective of liberalising, within the next three to four years, the tightly-controlled and complex .trade regime with high nominal tariffs, quantitative restrictions on imports and also on exports, public sector canalisation, phased manufacturing programme (PMP) for attaining im- pon substitution, and ~ovemrnent purchase preferences for domestic producers. First, after the exchange rate adjustments. of July 1 and 3, 1991, the Cash Compensatory Scheme (CCS) was abolished with effect from July 3, 1991. The Replenishment Licences were replaced by a new instrument called EXlM scrip described earlier. The introduction of EXIM scrip represented a structural change in trade policy which sought to achieve optimal import restraint by linking imports to exports. EXIM scrips which could he sold in the market at

a premium could be utilised for the import of permitted goods. All Supplemen- tary Licences for raw materials and components except for small-scale in- dustries and for manufacturers of specified drugs and equipments, the category of unlisted OGL and additional licences granted to Export Houses, were abolished and all such imports were to be routed through the medium of EXlM scrips. Furthermore, Advance Licensing System a s an instrument of export promotion was strengthened. As the year progressed, the EXIM scrip scheme was administratively found to be cumbersome and, with the introduction of LERMS, it was abolished.
7 Secondly, the export-import policy announced for the five-year period to coincide with the Eighth Plan, April 1, 1992 to March 31, 1997, has made
. a major thrust towards trade liberalisation. The new policy substantially eliminates licensing, quantitative restrictions, and other regulatory and discre- t.': tlonary controls. Exports and imports are allowed freely, subject only to a v .
negative list of imports and a negative list of exports. The list of canalised items imported or exported through public sector agencies has been drasticall y cur- tailed. The negative list of imports consists of only 3 prohibited items, 68 restricted items and 8 canalised items. The restricted items of imports include mainly consumer goods which can be imported only against licences. The canalised items are petroleum products, fertilisers, drugs, vegetable oils and seeds, fatty acids and oils, and cereals. The actual user conditions hitherto obtaining has been dispensed with except in the case of imports regulated by the negative list. Import of capital goods has been further liberslised and there is no longer a negative list of import of capital goods.
1.68 Thirdly, with further reduction in Customs tariffs implernentecl in the Central Government Budget for 1992-93, the maximum tariff rate for raw materials, etc., has been lowered from 150 per cent to 110 per cent, while for capital goods, tariff rates have been lowered by about 10 to 25 per cent to o maximum of about 55 per cent.
FINANCIAL SECTOR REFORM
1.69 Consequent to the submission in November 1991 of the report of the high-level Committee on the Financial System (Chairman: Shri M. Narasirn- ham), follow-up action on a number of recommendations of the Committee was initiated by Government and the Reserve Bank. The Committee made wide- ranging recomlnendations with a view to ensuring that the tinancial sector operates on the basis of operational flexibility and functional autonomy thereby enhancing efficiency, productivity and protitability.

1.70 The Committee was of the view that the statutory liquidity ratio (SLR) instrument should be deployed in conformity with the original intention regarding it as a prudential requirement and should not be viewed as a major instrument for financing the public sector. In line with Government's decision to reduce the fiscal deficit to a level consistent with macro-economic stability, the Committee has recommended that the SLR be brought down in a phased manner to 25 per cent over a period of about five years. Consistent with the anticipsted decline in the monetised deficit of the Centre, and the reduction in the Centre's borrowing programmes and the need for the gradual promotion of a Government securities market, the SLR on an incremental basis has been reduced to 30 per cent. Further reduction in SLR may be thought of in stages.
1.71 As regards the cash reserve ratio (CRR), the Narasimham Committee .had observed that the Reserve Bank should have the flexibility to operate this instrument to serve its monetary policy objectives and that, given Government's resolve to reduce the fiscal deficit, the occasion for its use to control the secon- dary expansion of credit should be less; and the Committee had, therefore, recommended that the Reserve Bank should consider progressively reducing the cash reserve ratio from its high level. Weighing the liquidity situation and the monetary policy considerations, and the need to reduce pre-emptions of banks' resources, the Reserve Bank has discontinued the 10 per cent incremen- tal CRR. Further reduction in CRR is possible once an enduring adjustment in the monetised deficit is attained and open market operations in Government securities with market-related rates of interest become an effective instrument of monetary control.
1.72 The Narasimham Committee had proposed that the interest rate paid to banks on their SLR investments and on CRR in respect of impounded deposits above the basic minimum should be increased. The Government has recognised the need to move towards market-related interest rates on Government bormw- ing. The cash reserve ratio is essentially a monetary instrument for impounding liquidity. The payment of higher interest on CRR by reducing the atnount impounded dilutes the very purpose of imposing a CRR. From the viewpoint of monetary control it is preferable to have a lower CRR with less or no interest paid rather than to have high CRR and pay a high rate of interest.
1.73 Identifying the causes for the deterioration in the financial health of the banking system over time, the Narasimham Committee recommended various remedial measures which include inter alia capital adequacy norms, prudential norms for income recognition and provisioning for bad debts.
I 1.74 in April 1992, the Reserve Bank introduced a risk-assets ratio system for banks (including foreign banks) in India as a capital adequacy measure.

Under the proposed system, the balance sheet assets, non-funded items and other off-balance sheet exposures will be assigned risk weights according to the prescribed percentages and banks will be required to maintain unimpaired minimum capital funds equivalent to the prescribed level of the aggregate of the risk-weighted assets and other exposures, on an ongoing basis. All banks with international presence will have to achieve the norm of 8 per cent as early as possible and in any case by March 31, 1994. Foreign bankq operating in Indiawill have to achieve this norm by March 31,1993.'0ther banks will have w&ieve.a capital adequacy norm of 4 per cent by March 31, 1993 (Tier I or core capital having been set at not less than 50 per cent of total capital) and the 8 per cent norm by March 31, 1996. The total of Tier I1 elements will be limited to a maximum of 100 per cent of total of Tier I elements for the purpose of compliance with the norms. Banks have been advised to review the existing level of capital funds vis-a-vis the prescribed level and plan to increase the capital funds in a phased manner to achieve the prescribed ratio by the end of the period stipulated.
1.75 If the balance sheet of a bank is to reflect actual financial health of that bank, there has to be a proper system of recognition of income, classification of assets and provisioning for bad debts on a prudential basis. The Narasimham~bmmittee had recommended that a policy of income recognition should ha objective and based on record of recovery rather than 01, my subjective con-siderations, that classification of assets of banks should be done on the basis of objective criteria which would ensure a uniform and consistent application of the norms, and that provisioning should be made on the basis of classification of assets into different categories. In April 1992 it was decided to implement the Committee's recommendations, with certain modifications, in a phased manner over a three-year period commencing from the accounting year begin-ning April 1, 1992. Banks have been instructed to treat an amount in respect of term loans, overdrafts and cash credit accounts, bills purchased and dis-counted and other accounts, as "past due" when it has not been paid on the due date. A "non-performing asset" has been defined as a credit facility in respect of which interest has remained unpaid for a period of four quarters during t l~eyear ending March 31, 1993, three quarters during the year ending March 31, 1994 and two quarters during the year ending March 31, 1995 and onwards. Banks have been instructed that they should not charge and take to income account interest on all non-performing assets. As compared with the existing eight health codes, banks are required to classify their advances into four broad groups: (i) standard assets, (ii) sub-standard assets, (iii) doubtful assets, and (iv) loss assets. Broadly, classification of assets into these categories has to be done taking into account the degree of well-defined credit weaknesses and extent of

dependence on collateral security for realisation of dues. The health code sys- tem of classification of assets would, however, continue as a management in- formation tool.
1.76 Taking into account the time-lag between an account becoming doubt- ful of recovery, its recognition as such, the realisation of the security and the erosion over time in the vdlue of security charged to the banks, banks are required to make provision against sub-standard assets, doubtful assets and loss
, assets.
1.77 As regards accounting standards for investments, investments in ap- proved securities have to be bifurcated into 'permanent' and 'current' invest- ments. 'Permanent' investments are those which banks intend to hold till maturity and 'current' investments are those which banks intend to deal in, i.e., buy and sell on a day-to-day basis. To begin with, banks would have to keep not more than 70 per cent of their investments in the 'permanent' category from the accounting year 1992-93 hut this ratio will have to be brought down to 50 per cent in due course. While the depreciation in respect of 'permanent' invest- ment is not likely to affect their realisable value and therefore need not be provided for, depreciation in 'current' investments would have to be fiilly provided for. 'Permanent' investments could be valued at cost unless it is more than face value, in which case the premium has to be amortised over the period remaining for maturity of the security. Banks are not expected to sell securities in the 'permanent' category freely, but if they do so, any loss onsuch transac- tions in securities in this category has to be written off. Besides, any gain should be taken to capital reserve account,
C
1.78 Foreign currency assets and liabilities and unrnatured spot and fonv;ird foreign exchange transactions are required to be revalued on a monthly basis. Spot and fonvard transactions are to be revalued at the then prevailing spot and fonvard foreign exchange rates, respectively.
1.79 In regard to the regulated interest rate structure, a series of reform measures have been put in place :
(a) Considerable rationalisation has been effected in banks' lending rates with the number of concessive slabs reduced and some of the rates have been en- hanced thereby reducing the element of subsidy; (b) The regulated deposit rate structure has been replaced by a single prescription of not exceeding 13.0 per cent per annum for all depo it maturities of 46 days and above; and (c) Rates B of interest on Government securities have been raised and '364-day Tre:~sury bills and 5-year and 10-year securities have been auctioned. It is also pertinent

to note that for a few instruments such as Certificates of Deposit, Money Market Mutual Funds and Non-Resident (Non-Repatriable) Rupee Deposit Scheme, a significant proportion of deposit resources of commercial banks is now at market-related rates of interest.
1.80 The Narasimham Committee had suggested abolition of branch licens- ing policy. Considering that the objective of providing adequate banking in- frastructure throughout the country, particularly in rural areas, had been broadly achieved with the completion of the branch expansion policy for the period W85-90, the Reserve Bank decided to give greater freedom to banks to rationalise their existing branch network by re-locating branches, opening of specialised branches, spinning-off of business at other locations, setting up of controlling offices/administrative units and establishing extension counters, etc. Banks have already been permitted to close down branches other than in rural areas, as well as swap unrernunerative branches or those in remote areas. Under the liberalised'branch licensing policy, only those banks which attain the revised capital adequacy norms and prudential accounting standards have been given freedom to set up new branch offices/upgrade the extension counters into full-fledged new branches without the prior approval of the Reserve Bank. Till such time banks attain the re~ised'ca~ital adequacy norms and until they are specifically advised in this regard, they should continue to obtain prior approval for opening new branches or converting extension counters into full-fledged branches.
1.81 Expansion of branches of foreign banks will be based, as hitherto, on considerations of national advantage from the point of view of facilitating ex- ports and foreign investment. Principles of non-discriminatory recipr,ocal treat- ment and nlutual benefits, besides compliance with prudential and other norms, will be given due weightage.
CAPITAL MARKET
1.82 Recognising the growth during the last decade of the Indian capital market, in terms of both new issue activities and secondary market transac- tions,the Narasimham Committee emphasised that for the business of merchant banking and mutual hnds and such other financial institutions involved in the capital market activities, a s also that of the stock exchanges, to grow on sound lines, a framework of regulations is essential as a measure of investor protec- tion. While recommending that the regulatory functions of the Office of the Controller of Capital Issues (CCI) be transferred to the Securities and Exchange Board of India (SEBI) the Committee perceived the role of SEBI to be not merely one of replacing the restrictive role of CCI but that of undertaking the role of a market regulator to ensure that the market is operated on the basis of
well-laid down principles and guidelines. The Committee was of the view that SEBI should not get involved in the day-to-day functioning of the market or exercise excessive discretionary control of the type practiced by the CCI. In the matter of new capital issues, it is for the merchant bankers and the under- writers to offer professional advice on a particular issue, on the nature of the instrument, its terms and pricing, and for the issuing company to decide its preference.
1.83 Almost all of these capital market reform measures intended to achieve a blending of market freedom and regulation of the market for investor prdtec- tion bised on prudential guidelines have been implemented. A Presidential Ordinance promulgated on January 31, 1992 accorded statutory status as an autonomous body to the SEBI to protect investors' interest in securities, to promote the development of the capital market and to regulate the working of the market including the stock exchanges. Subsequently, the SEBI Bill was passed by the Parliament giving official recognition, effective March 31, 1992, to the organisation as a surveillance body.
1.84 SEBI has been vested with wide-ranging powers to oversee constitution as well as the operations of mutual funds including presentation of accounts, following the decision to allow the entry of private sector and joint sector mutual hnds. Secondly, all stock exchanges in the country have been brought under the annual inspection regime of SEBI for ensuring orderly growth of the stock market and investor protection. Thirdly, with the repealing of the Capital Issues Control Act, 1947 in May 1992, SEBI has been made the regulatory authority in regard to the new issue activities of companies.
1.85 SEBI has issued a series of guidelines covering different aspects of its jurisdiction and responsibility which would have, in their totality, a signiticant bearing on the future development of the capital market. SEBI's guidelines cover: (i) Lead managers/merchant bankers concerned with prospectus issues and portfolio management (including the terms and conditions of the contract), (ii) Mutual funds and each of their constituents, namely, sponsors, trustees, asset management company (AMC) and custodian, including the formation of the AMC, (iii) Stock exchanges including stringent regulations to curb the practice of insider trading, and (iv) Compliance by issuers of capital and inter- mediaries with norms regarding proper disclosure and .investors9 protection which inter alia cover promoters' contribution, pricing of issues, credit rating of debt instruments, monitoring of issue proceeds of large issues and stipuln- tions regarding underwriting and minimum subscription.
1.86 The Over-the-counter (OTC) Exchange of India (OTCEI) protnoted jointly by ICICI, UTI, SBI Capital Markets Ltd., Canbank Financii~l Services

Ltd., GIC and LIC, has been recognised as a stock exchange under the Securities Contracts (Regulation) Act, 1956 with effect from August 23, 1989. The Exchange was incorporated as a company under Section 25 of the Indian Companies' Act,1956, on September 20, 1990. The OTCEI has been set up
' with a view to providing small and medium companies an access to capital arket to raise finance in a cost-effective manner and provide a convenient and
!€ e icient avenue of capital market investment for investors at large. It is a ringless, electronic and national exchange, listing the shares of entirely new companies. It is expected to commence trading operations around the beginning . of August 1992.
1.87 A few other significant liberalisation measures concerning the capital market are :
(i) All restrictions on interest rates on debentures and public sector bonds other than the tax-free PSU bonds were rescinded in August 1991. It was observed that during 1991-92 the issuing companies offered around 17 per cent on non-convertible debentures and around 16 per cent o n partly con- vertible debentures.
(ii) The maximum rate of interest payable by non-banking and non-financial companies on deposits accepted by them was raised from 14 per cent to 15 per cent in January 1992 (For details and other measures on these companies, see Part I1 of this Report).
(iii) In order to impart greater flexibility in the interest rate structure relating to term-lending institutions, the prescription of ceiling rates of interest on lendings by these institutions was replaced by a system of minimum rate prescribed at 15 per cent, effective August 1991. The institutions now generally charge rates of interest in accordance with their perception of creditworthiness of the borrowers.
(iv) Permission has been given to companies with a good track record to issue convertible debentures or equity to investors abroad, in order to enable them to tap investible funds available in international capital markets. These issues would be subject to the same tax treatment as is available to the off-shore mutual funds.
(v) It has been proposed in the Union Budget 1992-93 to allow reputable foreign investors such as Pension Funds to invest in the Indian stock market, with suitable mechanism to ensure that this did not threaten the loss of management control.

(vi) All mutual funds registered with SEBI (public, private or joint sector) would be exempt from the payment of income-tax according to the Union Budget for 1992-93.
(vii)The Government of India issued a comprehensive set of prudential guidelines in February 1992 for the development and regulation of mutual funds (MFs) and for ensuring investor protection. ~ h e ~ e guidelines cover activities of all the mutual funds including those to be set'up in the joint and private sectors. Money Market Mutual Funds would be, however, regu-lated by the RBI on the basis of specified guidelines to be laid down by it, The Government guidelines provide for authorisation of all the MFs by the SEBI, establishment of MFs in the form of trusts under the Indian Trusts Act, 1882 and establishment of Asset Management Companies by the M F ~ . The guidelines,also stipulate the minimum amount to be raised through the open-ended and close-ended schemes, as well as the criteria for investment in securities/companies and income distribution. SEBI will have the right to call for any information regarding the operations of the MFs and any of its schemes from the MFs, Asset Management Company, custodian, sponsor or any others associated with the MFs.
IRREGULARITIES IN THE SECURITIES OPERATIONS OR BANKS AND FINANCIAL INSTITUTIONS
1.88 It is necessary to refer to a recent development of great pubiic concern that has tended to sideline the otherwise far-reaching reform measures and structural changes that are being implemented or underway so as to make the financial system much more competitive, efficient and transparent. On the basis of the information received that some banks were. undertaking large-scale trans-actions in Government securities through the medium of brokers in the course of which they were violating the Reserve Bank of India's detailed guidelines
J issued to them in July 1991, a Committee, with Deputy Governor Shri R.Janakiraman as Chairman, was set up on April 30, 1992 to investigate the irregularities in funds-management by commercial banks and financial institu-tions, in particular, in relation to their dealings in Government securities, public sector bonds, UTI units and similar instruments. The Committee submitted two interim Reports on June 1, and July 5, respectively, and a third Report onAugust25, 1992 which were all released to the public immediately. '
1.89 h he preliminary findings of the Committee have indicated serious deficiencies in the functioning of the banks and financial institutions involved, absence of necessary internal control in various functions, raising money without the backing of genuine securities, diversion of call money to the current

accounts of chosen brokers, and massive collusion between the concerned of- ficials and the brokers involved in dealings in Government securities, public sector bonds and units, etc.'~he Committee has listed the devices adopted for diversion of funds from the banking system to the individual accounts of certain brokers which prima facie constitute evidence of fraudulent misrepresentation. Funds-management operations have been conducted in gross violation and with utter disregard of instructidns and guidelines issued by RBI from time to time. The break-down of essential discipline regarding the issue and recording of Bank Receipts (BRs), the receipt and delivery of securities and the receipt and payment for settlement of the transactions, have been exposed in many of the transactions detailed in the Report. The Committee has also come across in- stances wherein brokers have been financed by banks through the discounting of bills not supported by genuine transactions. Large-scale violations of RBI guidelines on Portfolio Management Services by certain banks have :~lso been pointedly brought out by thecommittee. The total amount of exposure of banks and institutions involved in these transactions aggregated Rs.3,542.79 crore.
J1.90 The Janakiraman Committee has recommended a series of steps so that remedial action is taken to introduce a proper control system, strengthen monitoring, remove lacunae in the existing system and establish procedures so as to prevent recurrence of similar lapses in future.
1.91 The Reserve Bank of India and the Government have taken a number of steps with a view, to unearthing the entire ramifications of the episode, to recover the banking dues, to punish the guilty, and to set in motion enduring measures of a preventive nature.
1.92 The measures include examination of the entire securities transactions of banks and financial institutions for the past one year, placing Bank of Karad Ltd. under liquidation, placing Bank of Madura Ltd. under an RBI observer, starting winding-up proceedings against Metropolitan Co-operative Bank ~ t d ., the de-listing of four brokers from the Reserve Bank's list of approved brokers, entrusting the entire investigation to the Central Bureau of Investigations (CBI), attaching the propekes of all those involved, establishment of a Special Court to exclusively attend to the cases relating to securities transactions of banks and financial institutions, appointment of reputed firms of Chartered Accountants to conduct special audit of the treasury operations of major players in the market under the provisions of section 30(1B) of the Banking Regulation Act, 1949 and issuance of special guidelines including the prohibition of inter-bank ready-forward deals in dated securities and approved/trustee securities except Treasury bills of all maturities and prohibition of double ready-forward deals in .Government securities including Treasury bills.

1.93 The other important aspects of the guidelines are: (i) The existing prohibition on buy-back deals between banks in other securities such as PSU bonds and units will continue; (ii) Banks should ensure that Subsidiary General Ledger (SGL) transfer forms covering their sale transactions in Governmenthp- proved securities are issued only if they have sufficient balance in their respec- tive SGL accounts in the Public Debt Offices of the Reserve Bank of India. In the event of bouncing of SGL transfer forms, banks will render themselves liable to penal action; (iii) BRs should not be issued under any circumstances in respect of transactions in Government securities, for which SGL facility is available. BRs may be issued in the case of other securities for ready transac- tions only, under exceptional circumstances;and (iv) BRs should not be issued covering transactions relating to either portfolio management scheme clients or other constituents including brokers.
1.94 The Committee on Trading in Public Sector Bonds and Units of Mutual Funds (Chairman : S.S. Nadkarni), appointed by the Reserve Bank as
a a follow-up of the Janakiraman Committee, has since submitted its Report, on August 8, 1992 which is under consideration.
1.95 A 30-mem ber Joint Parliamentary . Committee (JPC) comprising t honourable members from both the Houses of Parliament has been constituted
to probe into the entire gamut of issues concerning the securities irregularities.

11. THE REAL ECONOMY : PERFORMANCE AND PROBLEMS
1. MACRO-ECONOMIC SCENE
2.1 After a decade of relatively. high growth which nevertheless was ac- companied by some serious macro-economic imbalances, the Indian economy faced a distinct slowdown during the fiscal year 1991-92. The real GDP growth is expected to be a little less than 2.0 per cent, the lowest since 1980-81; it contrasts with that of 5.6 per cent during 1990-91 and the trend growth of 5.5 per Cent for the decade 1980-81 to 1990-91 (Table 2.1). A dominant factor in this low growth scenario has been the stagnation in industrial output for the first time since 1979-80; agricultural output is also expected to register a decline of about 1.0 per cent.
Table 21 : Growth in Real Gross Domestic Product . .
. (In Per cent Per Annum)
Sector
Decade Seventh Five
(1980-81 to Year-Plan Period
1990-91) (1985-86 to 1989-90)
(Annual Average)
1. Agriculture
2. Manufacturing
3. Services
Total GDP
* RBI estimate. See also Appendix Table 11.1.
2.2 The macro scene concerning domestic saving and investment also remained subdued and somewhat uncertain. The gross domestic saving to GDP ratio, which fell from 22.7 per cent in 1989-90 to 22.2 per cent in 1990-91, is tentatively estimated to register a rise to 23.2 per cent during 1991-92. Simul- taneously, with severe import compression measures, the current account deficit on the balance of payments was drastically cut down and, as a counterpart, the estimated net inflow of foreign resources is estimated to decline from Rs.14,684 crore in 1990-91 to Rs.8,042 crore in 1991-92 or, as percentage of GDP, from 2.8 per cent to 1.3 per cent, respectively. As a result, the ratio of gross domestic investment is estimated to have fallen from 25.0 per cent during 1990-91 to 24.5 per cent during 1991-92 (Table 2.2 and Appendix Tabie 11.2).

Table 2 2 : Saving and Investment Ratios
(In percent)
Ratios to GDP/NDP 1991-92, 1990-91 1989-90 at current market prices
1 2 3 . 4
1. Gross Domestic Saving 23.2 22.2 22.7
2. Gross Aggregate Investment ' 24.5 25.0 25.2
3. Net Domestic Saving 14.3 13.4 13.6
4. Net Aggregate Investment 15.7 16.5 16.4
* Tentative.
2.3 In the co-mposition of gross domestic saving, all the three sectors, name- ly, household, private corporate and public sectors, showed improvement. In the case of the household sector, while the gross financial assets ratio registered a marginal rise from 11.1 per cent in11990-91 to 11.4 per cent in 1991-92, there occurred a significant decline in the household sector's financial liabilities fol- lowing reduced bank borrowings and probably reduced investment activities. It is as a re'sult of this that the ratio of household financial assets (net) showed a more than proportionate increase from 9.8 per cent to 10.6 per cent.
2. PRODUCTION TRENDS
AGRICULTURE
2.4 The sustained progress in agricultural production, witnessed for the last three years in succession, could not be maintained during the year 1991-92 mainly on account of &layed and spatially unfavourable distribution of mon- soon. Preliminary data on agricultural production indicate reduction of about 1.0 per cent in 1991-92.
2.5 The 1991 Kharif foodgrains production has been estimated lower at 94.2 million tonnes against the target of 103.2 million tonnes and the produc- tion of 99.9 million tonnes in the previous Kharifseason. Despite concerted efforts at enhancing the Rabi output, it is expected to be 74.8-76.3 million tonnes which is more or less at the same level as in last year at 76.3 million tonnes. Pulses output did. not show any improvement despite special prod-uction programmes mostly due to water stress in producing areas. Thus, the total foodgrains output in 1991-92 may be placed at 169.0- 170.5 million tonnes against the level of 176.2 million tonnes in the previous year (Appendix Table 11.3).
2.6 Among other crops, production of sugarcane and jutelmestrt showed noticeable improvements over the previous year's level. Cotton production remained at the previous year's level of 98 lakh bales wllile there was a shortfall of 2 lakh tonnes in oilseeds (Appendix Table 11.3).
2.7 The absolute fall in agricultural production has contributed to a sig- nificant extent, to increases in prices of agricultural-commodities and intluenced market expectations.
Procure- 2.8 Reflecting in pan the fall in foodgrains procurement of ment, foodgrains by public sector agencies declined during 1991-92 by 23.4 per cent Off-take to 18.3 million tonnes. The off-take of foodgrains, however, increased to 19.0 and million tonnes as against 16.1 million tonnes during the previous year, reflect- Stocks of ing the supply response of the Public Distribution System (PDS) to increased Foodgrains demand in view of the increased differential between the PDS and open market
prices.
2.9 The stocks of foodgrains with the public sector agencies as at the end of March 1992 were lower at 12.1 million tonnes against 17.3 million tonnes a year ago and the stipulated buffer stock norm of 14.5 million tonnes for the quarter ending March. The stocks of wheat in particular dwindled rather sharply (Appendix Table 11.4). Given the low carry-over of stocks, the need for a u g rnenting supplies to keep agricultural commodity prices in check has become imperative.
INDUSTRIAL PRODUCTION
2.10 During the financial year 1991-92, industrial production registered a fractional rise, the lowest since eleven years ago in 1979-80. During the eighties, annual industrial growth was as high as 7.8 per cent. It was still higher at 8.5 per cent during the Seventh Plan period. In the second half of 1990-91, however, output slowed down eventually culminating in a rise of only 0.1 per cent during 1991-92 (April-March) (Appendix Table 11.5).
2.11 The poor performance in industrial growth during the financial year 1991-92 was particularly in evidence in the output of manufacturing sector which registered a fall of 1.4 per cent as compared with a rise of 9.1 per cent in the previous year. Mining and quarrying outpi~t registered a marginal in- crease of 0.8 per cent as against a rise of 4.5 per cent in the previous year. The output of the electricity sector accelerated to 8.4 per cent as against a rise of 7.8 per cent in 1990-91.
2.12 A vast set of factors contributed to the setback to industrial output :
import compression merisures and rise in import costs affecting not o n l y im-

port-intensive industries but also auwide spectrum of export-oriented and other industries; reduced growth of exports and in particular, exports to rupee pay- ment areas; the increase in cost of credit, as also the limitations on credit availability; erosion in the purchasing power and consumer resistance at higher prices; and above all, the decline in public investment affecting the demand for .capital goods, in particular, and for a series of intermediate and other goods in general. Despite these all-pervasive factors, some of the industries stood the ground rather well. Food processing and manufacturing industries and in: dustries based on agricultural raw materials have generally shown at least posi- tive growth if not acceleration. Secondly, infrastructure industries showed significant expansion in output except for crude petroleum and petroleum products.
Manufac- 2.13 In the manufacturing sector, data in respect of seventeen major in- turing dustrial groups, indicate that during 1991-92, only seven groups with a Sector weightage of 47.75 percentage points recorded positive growth rate as com-
pared with that of 14 groups with a weightage of 71.39 percentage points recording a positive.growth in the previous year. Out of these seven groups, only two groups (viz., beverages, tobacco and tobacco products and non-metal- lic mineral products) with 4.57 per cent weight recorded accelerhion in 1991- 92 as against 8 groups accounting for the weightage of 45.75 points in 1990-91 (Appendix Table 11.6). Among the remaining ten industrial groups, which ex- perienced negative growth rate, electrical machinery group registered the shar- pest fall (-10.3 per cent), followed by metal products (-7.0 per cent), leather & leather products (-7.0 per cent), wood and wood products (-6.7 per cent), textile products (-5.7 per cent), jute, hemp, mesta textiles (-4.1 per cent), machinery and machine tools (-4.0 per cent), transpok equipment (-2.5 per cent) and rubber, plastic & petroleum products (-1.2 per cent). The decline in industrial output is, to a large extent, a reflection of the- import compression and rise in import costs, as may be seen from the decline in-the output of import-intensive industries, such as, electrical goods, transport equipment, etc, This is also evi- dent from trends in production based on the use- based classification (Appendix Table 11.7). The consumer durables segment of the consumer goods industry, which basically represents the 'white goods' industries, recorded a decline of 12.5 per cent during 1991-92 as compared with a rise of 9.1 per cent in the previous year. Besides import compression measures, the restriction on credit for the purchase of consumer goods also appears to have had a dampening impact on the demand for consumer goods.
2.14 Similarly, capital goods production also declined sharply during 199 1- 92, the order of decline being 12.8 per cent (Appendix Table 11.7). The fiscal

restraint and decline in public investment have adversely affected the demand for capital goods, for which the major buyers a* Government or public sector.
Infrirs- 2.15 As already mentioned, the performance of infrastructure industries tructure during the financial year 1991-92 was better than in the previous year, indicat- Industries ing the underlying strength of the supply factors. The growth rate in the com-
posite index of infrastructure industries at 6.0 per cent during 1991-92 has been higher than that in the previous year ( 4.8 per cerit) (Appendix Table 11.8). Among the infrastructure industries, barring petroleum sectoj, crude as well as petroleum products, all the industries - electricity, coal, steel and cement - registered higher rates of growth than in 1990-91. ~roductibn of petroleum crude, however, experienced a larger decline of 8.1 per cent during 1991-92 as compared with the decline of 3.1 per cent in the previous year. Output of petroleum refinery products also declined, though marginally by 0.7 per cent as compared with a decline of 0.3 per cent in the previous year.
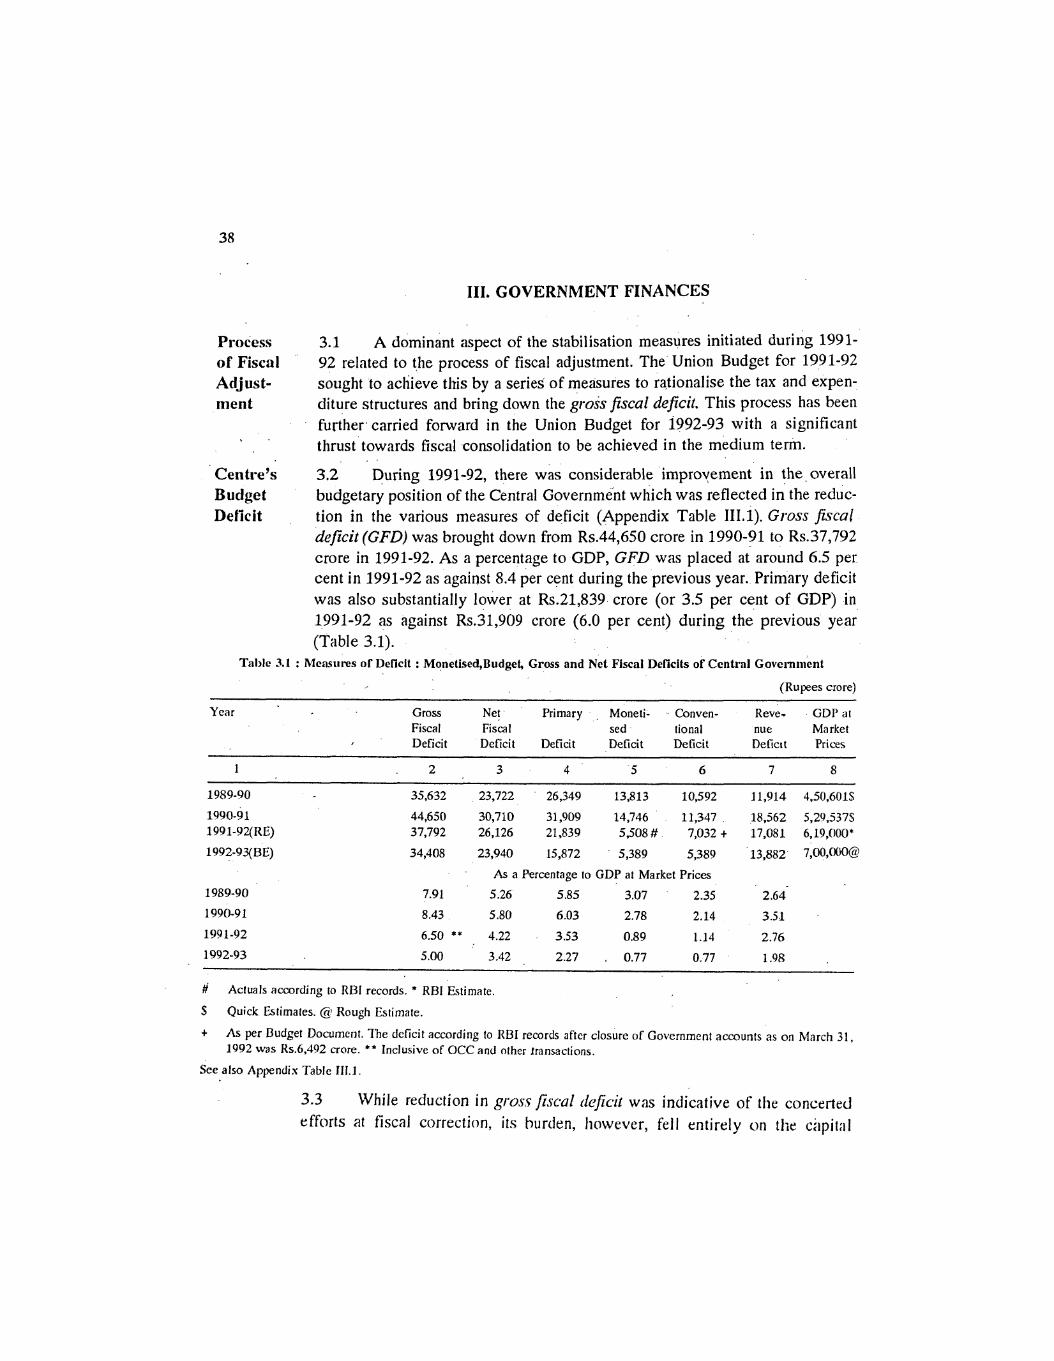
111. GOVERNMENT FINANCES
Process 3.1 A dominant aspect of the stabilisation measures initiated during 1991- of Fiscal 92 related to the process of fiscal adjustment. The Union Budget for 1991-92 Ad.just- sought to achieve this by a series of measures to rationalise the tax and expen- men t diture structures and bring down the gross fiscal deficit. This process has been
further carried forward in the Union Budget for 1992-93 with a significant thrust towards fiscal consolidation to be achieved in the medium term.
Centre's 3.2 During 1991-92, there was considerable improvement in the overall Budget budgetary position of the Central Government which was reflected in the reduc- Deficit tion in the various measures of deficit (Appendix Table 111.1). Gross fiscal
deficit (GFD) was brought down from Rs.44,650 crore in 1990-91 to Rs.37,792 crore in 1991-92. As a percentage to GDP, GFD was placed at- around 6.5 per cent in 1991-92 as against 8.4 per cent during the previous year. Primary deficit was also substantially lower at Rs.21,839 crore (or 3.5 per cent of GDP) in 1991-92 as against Rs.31,909 crore (6.0 per cent) during the previous year (Table 3.1).
Table 3.1 : Measures of Deficit : Monetised,Budget, Gross and Net Fiscal Deficits of Central Gove~m~i~ent
(Rupees crore) - - -- -
Year Gross Net Primary Moneti- Conven- Reve- GDI' at Fiscal Fiscal sed tional nue Market Deficit Deficit Deficit Deficit Deficit Defic~t Prices
As a Percentage to GDP at Market Prices
7.91 5.26 5.85 3.07 2.35 2.64-
d Acruals according to RBI records. * RBI Estimate.
S Quick Estimates. @ Rough Estimate.
t As per Budget Document. ?he deficit according to RBI records after closure of Government accounts as on March 31, 1992 was Rs.6,492 crore. ** Inclusive of OCC and other Iransactions.
See also Appendix Table 111.1.
3.3 While reduction in gross/Sscal (ieficit was indicative of the concerted efforts at fiscal correction, its burden, however, fell entirely on tlie ci~pit:~l

account, as revenue deficit widened from the budgeted level of Rs.13,854 crore to Rs.17,081 crore in the revised estimates for 1991-92. The deterioration in the revenue account was more than offset by the increase in surplus on cilpitalaccount from Rs.6,135 crore to Rs.10,049 crore. Consequently, the convention-al budget deficit stood lower at Rs.7,032 crore (revised estimates) or at Rs.6,492crore (as per RBI records) as against Rs.7,719 crore budgeted earlier; at this level the deficit was considerably lower than the actual deticit ,of Rs.11,347crore during 1990-91. Net RBI credit to the Central Government which indi-cates the monetary impact of budgetary operations (monetised deficit) was also lower at Rs.5,508 crore in 1991-92 as compared with a much larger support of Rs.14,746 crore in 1990-91. These year-end figures are, however, deceptive as the phenomenon of the deficit remaining at unreasonably high levels alvostthroughout the year before the year-end reduction, persisted even more during 1991-92; this is reflected in the fortnightly data which show that the average monetised deficit during 1991-92 was Rs.10,209 crore as against Rs.10,336crore in 1990-91. To have a salutary impact on the growth of liquidity, it is the average monetised deficit which. has to be moderated (Appendix Table 111.2).
3.4 The financing pattern of gross fiscal deficit in 1991-92 indicated in-creased reliance on external borrowings which marked a departure from the trend observed during the previous years. The share of external finance which had steadily declined from 15.4 per cent in 1980-81 to 7.1 per cent in 1990-91,increased significantly to 13.4 per cent in 1991-92. Consequently, the share of internal finance declined from 92.9 per cent to 86.6 per cent during the same period. The share of market borrowings in the financ,ing of the gross fiscal deficit declined from one-third in the early 'eighties to less than one-fifth in 1991-92. Other liabilities comprising small savings, provident funds, special deposits, etc-financed a little less than one-half of the deficit as compared with a .little less than one-fourth in 1980-81 (Appendix Tables 111.3 and 111.4).
3.5 In the revenue account, receipts from corporation tax and income-tax (nei) and royalty on offshore crude were higher than those estimated in the budget. Interest payments on account of discount on treasury bills showed a decline. These favourable outcomes were more than neutralised by a huge shortfall of Rs.3,005 crore in customs collections, a marginal decline in net excise revenue, an increase of Rs.1,895 crore in subsidies, higher provision forgrants to States and increased revenue expenditure on defence. In order to counteract the worsening in the revenue account and thereby to restrict t h emagnitude of the gross fiscal deficit, capital disbursements had to be scalecldown by Rs.2,567 crore which in effect reduced aggregate disbursements by Rs.96 crore. Capital receipts, on the other hand, exceeded the budget estimates
as a result of higher external borrowings (net), and recovery.of loans coupled with a mopping up of Rs.2,000 crore through net sales of 182-day Treasury bills which to a great extent offset the decline of Rs.1,600 crore in small saving collections. Thus, the substantial increase in capital receipts resulted in ag- gregate receipts being in excess of the budgeted estimates by Rs.591 crore.
.3.6 As regards payments, the enforcement of strict expenditure control resulted in a modest increase of only Rs.373 crore in non-Plan expenditure over the budget estimates. Plan expenditure, on the other hand, declined and was lower by 2.1 per cent in the revised estimates. A substantial increase in non- Plan expenditure was in respect of subsidies which went up from Rs.10,395 crore indicated in the budget estimates to Rs.12,290 crore. The fertiliser subsidy increased from Rs.4,000 crore to Rs.4,800 crore following the decision to restrict the actual price increase to 30 per cent as against the average increase of 40 per cent assumed in the budget estimates and also on account of the increase in rupee cost of imported fertilisers. Moreover, an additional provision of Rs.405 crore had to be made in the revised estimates on account of the exemption provided to small and marginal farmers from the price rise. Food subsidy increased by Rs.250 crore notwithstanding the increase in issue prices of rice and wheat in December 1991. In addition, a higher provision of Rs.550 crore was made in respect of export subsidies to meet the residual claims under the Cash Compensatory Scheme.
The 3.7 The Budget for 1992-93 continued to emphasise the need for macro- Budget economic stabilisation through a further reduction of the fiscal deficit. The for Budget has thus projected the conventional budget deficit at Rs.5,389 crore as 1992-93 against Rs.7,032 crore during 1991-92 (revised estimates). The revenue account
would continue to show a gap, though of a substantially lower magnitude at Rs.13,882 crore as against Rs.17,081 crore in 1991-92 ( Appendix Table 111.5). Gross fiscal deficit is expected to come down to Rs.34,408 crore in 1992-93 - a reduction of Rs.3,384 crore as compared with the revised estimates for 1991-92 or a fall from around 6.5 per cent to 5.0 per cent of GDP.
3.8 The envisaged reduction in fiscal deficit is sought to be achieved through a combination of measures, viz., reduction in the non-interest com- ponents of non-Plan expenditure, further disinvestment of equity holdings in public sector enterprises, and non-provision for payment of additional dearness allowance that may fall due in 1992-93. Some of the specific economy measures to contain non-Plan expenditure include cutback in major subsidies to the tune of Rs.1,849 crore, reduction in non-Plan grants to States and Union Territories, cuts in non-Plan loans to public enterprises and foreign govern- ments end a nominal increase of 7 per cent in defence expenditure. Besides the

reduction in non-Plan non-interest expenditure, Plan expenditure would register a smaller increase of 4.8 per cent as against 13.4 per cent in 1991-92.
Centre's 3.9 Keeping in view the objectives and financial targets underlying the Plan Eighth Five-Year Plan which has commenced from April 1,1992, the Central Outlay Plan outlay for 1992-93 has been fixed at Rs.48,407 crore which represents a
- step-up of 20.5 per cent over the revised outlay of Rs.40,172 crore for 1991-92. Budget support for the Plan is expected to be higher at Rs.18,501 crore in 1992-93 as against Rs.17,671 crore in 1991-92; its share in total finance would, however, decline from 44 per cent in 1991-92 to 38.2 per cent. The contribution from Internal and Extra-Budgetary Resources (IEBR) of the public sector enterprises is expected to go up from Rs.22,501 crore in 1991-92 to Rs.29,906 crore in 1992-93 representing a substantial rise of 32.9 per cent. Consequently, the share of IEBR in total finance would increase from 56 per cent in 1991-92 to 61.8 per cent in 1992-93.
Plan and 3.10 The 1992-93 Budget has placed the Plan expenditure during the year Non-Plan at Rs.34,612 crore - an increase of 4.8 per cent as compared with Rs.33,032 Expen- crore in 1991-92. Within the Plan expenditure, the revenue and the capital diture components would account for 53 per cent and 47 per cent, respectively, during
1992-93 as compared with 51.3 per cent and 48.7 per cent, respectively, in 1991-92. An increasing proportion of revenue expenditure would imply that a major share of Plan expenditure would be taken up by current items of expen- diture, thus cutting into the quantum available for the creation of new assets. The proportion of Plan expenditure in the total expenditure is expected to remain unchanged at the 1991-92 level of 29.2 per cent. '
3.11 The Budget for 1992-93 has envisaged containment of overall expen- diture, particularly ncn-interest components of non-Plan expenditure, as part of the strategy to correct the fiscal imbalance. Total non-Plan expenditure es- timated at Rs.84,475 crore in 1992-93 would show an increase of 5.5 per cent over that of Rs.80,070 crore in 1991-92. Among the various components of non-Plan expenditure, interest payments would account for a major share of the increase, absorbing a rising portion of the Central Government income. Total interest payment at Rs.32,000 crore would increase by 17.4 per cent (or Rs.4,750 crore) which would be on top of a substantial increase of 26.9 per cent in 1991-92. In fact, excluding interest payments, the other items of non- Plan expenditure would decline by Rs.345 crore. Adjusted for interest receipts, net interest payments would show a smaller increase of 16.2 per cent in 1992-93 as against 25.2 per cent in 1991-92. Defence expenditure at Rs.17,500 crore would be higher by 7 per cent as against an increase of 6 per cent in 1991-92. The process of fiscal adjustment has necessitated substantial pruning of the

expenditure on subsidies which would be considerably lower a t Rs.10,487 crore in 1992-93 as against Rs. 12,290 crore in 1991-92. .
Chelliu h 3.12 Recognising the need for a comprehensive reform of both the direct Committee and indirect taxes system, the Budget has proposed to give effect to some of on Tux the recommendations of the Chelliah Committee on tax reform. The proposals Reforms for restructuring of personal income-tax involved the raising of the tax exemp- a tld tion limit to Rs.28,000/-, reduction in the number of income-tax rate slabs and Ot11er lowering of tax rates with in entry rate of 20 per cent and the maximum Meusores marginal rate of 40 per cent. In view of the reduction in tax rates, the Budpt
has also announced the withdrawal of deductions available under Section 80 CCA (National Savings Scheme), 80 CCB (Equity-Linked Savings Scheme) and 80L (Income from interest on certain securities, deposits, units of UTI, etc.). The scope of Section 88, which provides for tax rebate in respect of specified savings, has been widened by including within its purview contribu- tions to pension funds set up by National Housing Bank and by inutual funds. A presumptive tax in respect of shopkeepers has been introduced to bring small retail traders with an annual turnover below Rs.5 lakh into the tax net. The Budget also contained proposals to streamline/restructure the existing system in respect of capital gains tax and wealth tax. As regards capital gains, 'the Budget has proposed that taxable capital gains would be computed after allow- ing the cost of acquisition of asset to be adjusted for inflation before deducting it from the sale proceeds. In the sphere of wealth tax, a distinction has been made between productive and non-productive assets and i t is proposed to ex- empt productive assets (bank deposits, shares, securities, bonds, etc.) froin the purview of the tax while non-productive assets like residential houses, urban land, jewellery, bullion, etc., would be taxed at the rate of one per cent of the value in excess of the exemption limit of Rs.15 lakh. The Budget has an- nounced the Government's intention to set up a National Court of Direct Taxes in order to ensure that litigations in direct tax matters are settled expeditiously.
3.13 In the field of excise duties a number of measures have been proposed for rationalisation and simplification of procedures, rules and regulations with a view to eliminating delays in collection and settlement in the system. The Budget has proposed a switch over from specific rates to a system of ad
. valorern rates, wheiever feasible, so as to ensure buoyancy in revenue on ac- count of increase in prices. As regards customs duties, the peak level of tariff was reduced from the existing 150 per cent ta 110 per cent with a few excep- tions. The number of duty slabs in respect of the auxiliary import duty has been reduced to four. Tariff rates in respect of selected capital goods have been reduced from 80 per cent to 60 per cent. Import of 'various raw materials for

the petro-chemical industry would attract a duty ranging between 25 per cent and 80 per cent.
3.14 The net revenue yield from the additional taxation measures is indi- cated in Table 3.2.
Table 3.2 : Revenue Yield f m ~ ~ Additional Taxation
(Rup.!es emre)
Budget , States Net to Tax I-Jead Proposals Share Ccnlre
1 2 3 4
A. Direct Taxes (atbtc)
(a) Corporation Tax
(13) Income Tax
(c) Expenditure Tax
B. Indirect Tilxes (a+b) .
(a) Customs Duties
(b) Union Excise Duties
C. Total (AtB) -
D. Post-Budget Tax Concessions (a+b)
(a) On March 26, 1992
, (b) On April 30, 1992
I. Original Budget
795 435
325
11. Posl-Budget Concessions
-847 -271
-245
-602 -271
111. After Post-Budget Concessions
E. Total Revenue Yield (C+D) 136 1,229 -1,093
3.15 Subsequent to the presentation' of the Budget, the Finance Minister announced post-Budget tax concessions in two stages which included : (i) fur- ther reduction in the import duty on project imports and general machinery, (ii) a partial restoration of the deduction under Section 80L with a reduced ceiling of Rs.7,000 as against Rs.13,000 earlier, (iii) increase in the maximum tax rebate available under Section 88 to Rs.12,000 with a sub-ceiling of Rs.2,000 in respect of Equity-Linked Savings Scheme, (iv) enlargement of the scope of the presumptive tax, (v) reduction in the rate of tax on capital gains, and (vi) reduction in the import duty on gold ti-& Rs.450 per 10 grammes to Rs.220 per 10 grammes. These concessions were expected to result in a total revenue
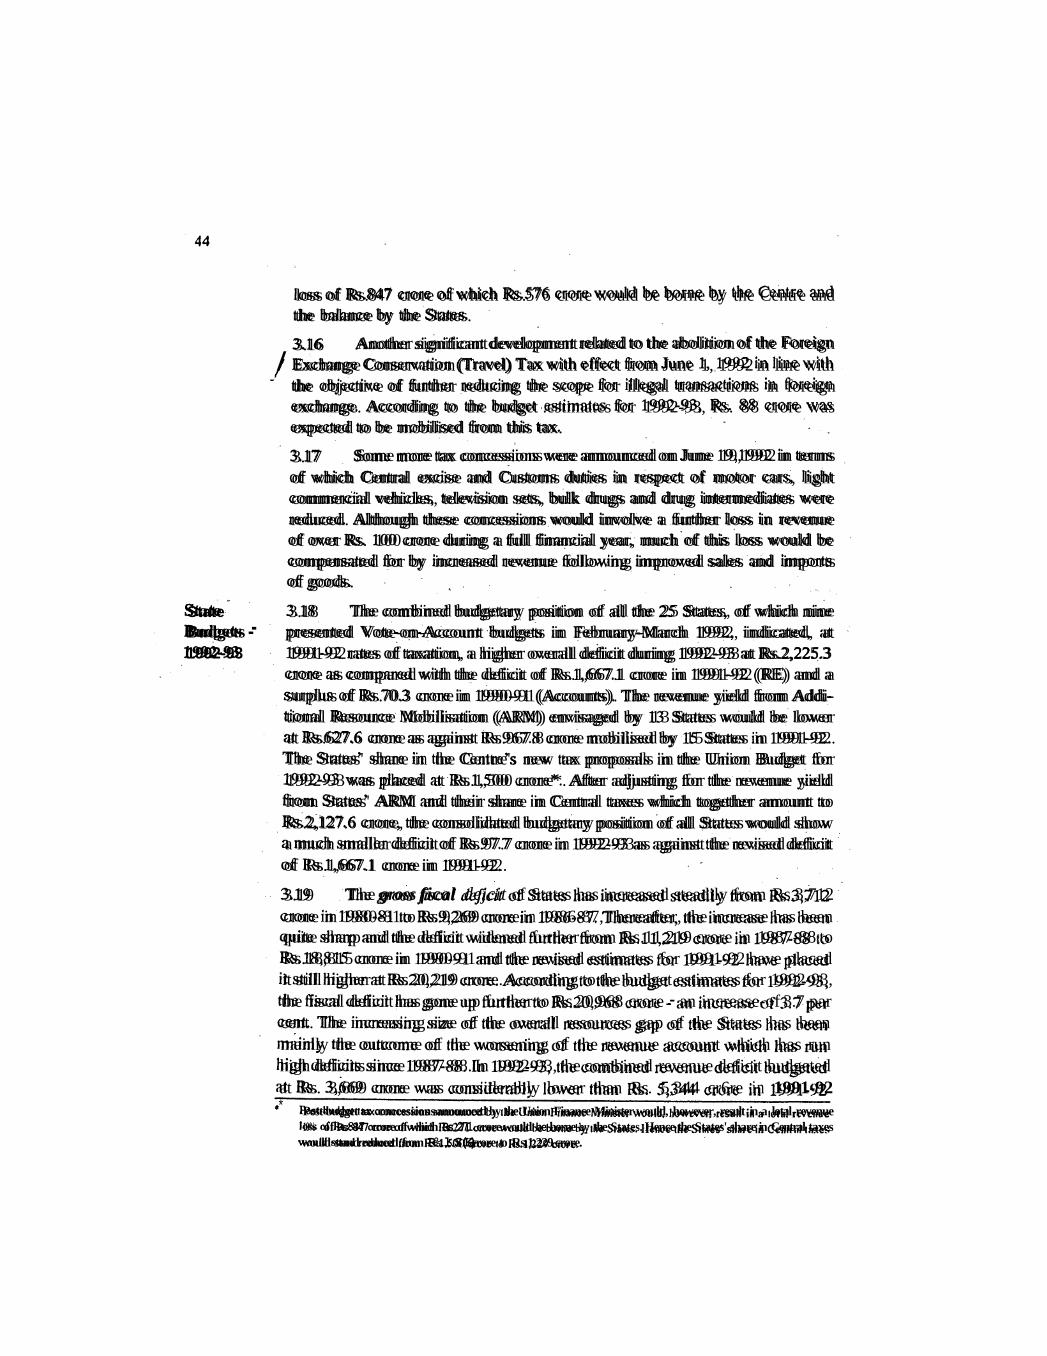
State Budgets - 1992-93
loss of Rs.847 crore of which Rs.576 crore would be borne by the Centre and the balance by the States.
3.16 Another significant development related to the abolition of the Foreign / Exchange Conservation (Travel) Tax with effect from June 1, 1992 in line with
the objective of further reducing the scope for illegal transactions in foreign exchange. According to the budget .estimates for 1992-93, Rs. 88 crore was expected to be mobilised from this tax.
3.17 Some more tax concessions were announced on June 19,1992 in terms of which Central excise and Customs duties in respect of motor cars, light commercial vehicles, television sets, bulk drugs and drug intermediates were reduced. Although these concessions would involve a further loss in revenue of over Rs. 100 crore during a full financial year, much of this loss would be compensated for by increased revenue following improved sales and imports of goods.
3.18 The combined budgetary position of all the 25 States, of which nine presented Vote-on-Account budgets in February-March 1992, indicated, at 1991-92 rates of taxation, a higher overall deficit during 1992-93 at Rs.2,225.3crore as compared with the deficit of Rs.1,667.1 crore in 1991-92 (RE) and a surplus of Rs.70.3 crore in 1990-91 (Accounts). The revenue yield from Addi-tional Resource Mobilisation (ARM) envisaged by 13 States would be lower at Rs.627.6 crore as against Rs.967.8 crore mobilised by 15 States in 1991-92.The States' share in the Centre's new tax proposals in the Union Budget for 1992-93 was placed at Rs.1,500 crore*. After adjusting for the revenue yield from States' ARM and their share in Central taxes which together amount to Rs.2,127.6 crore, the consolidated budgetary position of all States would show a much smaller deficit of Rs.97.7 crore in 1992-93 as against the revised deficit of Rs.1,667.1 crore in 1991-92.
3.19 The gross fical dejcit of States has increased steadily from Rs.3,712crore in 1980-81 to Rs.9,269 crore in 1986-87, Thereafter, the increase has been quite sharp and the deficit widened further from Rs.11,219 crore in 1987-88 to Rs.18,815 crore in 1990-91 and the revised estimates for 1991-92 have placed it still higher at Rs.20,219 crore. According to the budget estimates for 1992-93, the fiscal deficit has gone up further to Rs.20,968 crore - an increase-of 3.7 par cent. The increasing size of the overall resources gap of the States has been mainly the outcome of the worsening of the revenue account which has runhigh deficits since 1987-88. In 1992-93, the combined revenue deficit budgeted at Rs. 3,669 crore was considerably lower than Rs. 5,344 cr6re in 1991-92 * Post-budget tax concessions announced by the Union Finance Minister would, however, result in a lotal revenue
10% of Rs.847 crore of which Rs.271 crore would be borne by the States. Hence the States' share in Central taxes would stand reduced from R%.l.S(K) crore to Rs.1,229 crore.

Ways and Means Advances - and Overdrafts of States
Con- solidated Budgetary Position: Centre and States
(RE). Revenue deficit accounted for 26.4 per cent of the gross fiscal dc/in'r in 1991-92 while the budgeted revenue deficit for 1992-93 accounted for 17.5 per cent. States' ~rosSfzsca1 deficit as percentage of GDP was i1 fraction lower 111
3.3 per cent in 1991-92 as against 3.6 per cent in 1990-91; it is expected to register a further decline to 3.0 per cent in 1992-93 (Appendix Table 111.6).
3.20 The financing pattern of the States' resources gap revealed that on an average half of the gap was financed through loans from the Central Govern- ment while the balance was met through market borrowings, State Provident Funds and others (Appendix Table 111.7).
3.21 The limit for normal Ways and Means Advances (WMA) provided by the Reserve Bank to 23 States to enable them to tide over temporary shortfall in revenues remained unchanged at Rs.744.8 crore. The limit for speci:ll WMASgranted to these States against the pledge of Central Government securities also remained unaltered at Rs.266.0 crore. During 1991-92, all State Governments complied with the Overdraft Regulation Scheme, 1985, under which overdrafts have to be cleared within the stipulated period of,seven consecutive working days.
3.22 According to revised estimates for 1991-92, total receipts of Centre and States were higher at Rs.1,80,665 crore (Rs.2,572 crore) as compared with the budget estimates of Rs.1,78,093 crore. Revenue receipts at Rs.1,27,078crore were lower than the budget figure of Rs.1,27,971 crore while capital receipts at Rs.53,587 crore were considerably in excess of the budget estimates of Rs.50,122 crore. Aggregate disbursements stood at Rs;1,89,364 crore as against Rs.l,87,006 crore in the budget estimates - an increase of Rs.2,358crore. The combined overall deficit was lower at Rs.8'699 crore as comparedwith Rs.8,913 crore indicated in the budget estimates.
3.23 The budget estimates for 1992-93 have placed the overall deficit of the Centre and States at Rs.5'487 crore which is substantially lciwer (36.9 per cent) than Rs.8,699 crore in the previous year (Appendix Table 111.8). The reduced level of the combined deficit is the result of the projected decline in Centre's deficit from Rs.7,032 crore in 1991-92 to Rs.5,389 crore in 1992-93and that of the States from-Rs.1,667 crore to Rs. 98 crore, respectively. Ag- gregate receipts of the Centre and States at Rs. 1,98,617 crore in 1992-93 would show a smaller increase of 9.9 per cent as compared wit11 16.1 per cent in 1991-92. Aggregate disbursements of the Centre and States budgeted atRs.2,04,104 crore in 1992-93 would also increase at a slower rate of 7.8 per cent as against 13.5 per cent in the previous year (Appendix Tables 111.9 and111.10).

Murkct 3.24 Gross market horrclwing by the Central Government amounted to Bornnvings Rs.X.919.O crore during 199 1-92. Net market bormwings \were placed at
Rs.7.50 1 crore as against Rs.8.001 crore i n 1990-9 1; this reflected tlie concerted effort to reduce the reliance on market borrowing for tlnancing Governrilent expenditure. In tlie case of State Governments, as there were no rep:iymtrnt obliga~ions during 1991-92, gross and net market borrowings, amounted to Rs.3,364 crore. The net market borrowings of the Central and State Govern- ments, and of the Central and State-guaranteed institutions amounted to Rs. 14,652 crore in 1991-92 as against Rs.14,097 crore in 1990-91 ( Appendix Table 111.11 ).
C o u ~ ~ o n 3.25 The coupon rates oq C-entral and State Governrilent loans were Rutcs on clii~nged rritller significantly during 1991-92 basically to make Government Cer~t ls I securities no re iittri~ctive for invest~nent considering the economic conditions und State and the prevailing interest rate structure in the country (Appendix Table 111.12)- Govcrn- some of the c1i;lnges have been explained in Section I. Apart from issuing 5- ~ncn t year and 10-year securities on an auction basis, the Government have raised Loans the coupon rates on the Centre's, as also the State securities, of 15-year maturity
to 13.0 per cent.
Reserve 3.26 'The ~ e s e r v e B;ink9s initial subscription io the Central Government Bank's loans during 1991-92 at Rs.4,822 crclre (54.1 per cent of the gross market Support borrowings) was substantially higher than Rs. 4,432 crore (49.3 per cent of the to gross market borrowings) during the previous year. During 1991-92, Reserve Ccn t i . ;~ i Bank's holdings of Central Goverrlment dilted securities decreased by Rs. 295 Loa 11s crore as comp:ired with an increase of Rs.3,481 crore during 1990-91. Apart
from this, the Central Government issued special securities to the Reserve Bank of India towards funding of ad hoe Treasury bills to the tune of Rs.5,000 cr-ore during 199 1-92 as against Rs.30,OOQ crore in 1990-91.
3.27 The gross and net market borrowings by the Central Government budgeted at Rs.6,151 crore and Rs.5,000 crore, respectively, during 1992-93 are substantially lower than the amounts mobilised during 1991-92. This mainly reflects the reduction in the SLR for banks from 38.5 per cent to 30.0 per cent on incremental domestic liabilities over the April 3, 1992 level.
Bonds of 3.28 During the year, a large number of Central public sector undertakings, Puhlic according to the budget documents, were to raise resources through the issue Sectol- of bonds/debentures in the domestic market amounting to Rs.5,722 crore Under- (revised estimates) and they also resorted to external commercial borrow- takings ingslsuppliers' credit to the tune of Rs.1,854 crore. These undertakings :Ire (PS Us) being increasingly encouraged to borrow at market-related rates and in this

context the interest rate ceiling on such bonds was removed i n July 199 1. According to the Union Budget for 1992-93, a total amount of Rs.11,980 crort: ( Rs.6,058 crore through issue of bonds/ debentures in the domestic market and a substantially higher amount of Rs.5,922 crore by way of commercial borrow- ings/ suppliers' credit ) is sought to be mobilised.
3.29 On the basis of provisional information available so far, public sector bonds issued during 1991-92 helped raise Rs.4,227.82 crore. In 1990-91, total realisation from the issue of PSU bonds was as much 'as Rs.5,463.15 crore. Between 1985-86 and 1991-92, the total amount thus raised amounted to about Rs.20,630 crore. A large proportion of this amount was on account of amounts . raised through tax-free PSU bonds (Table 3.3).
Table 3.3 : Public Sector ~ n d e r t a k l n ~ s Issue of Bonds During 1985-86 to 11991-92
(Rupees cmn)
Year Tax Free Bonds Taxable Bonds Total (2+3)
Source : Returns received from the respective public sector undcr(akings.
IV. MONETARY AND PRICE TRENDS
BANKING AND MONETARY TRENDS
4.1 Monetary developments during the financial year 1991-92 were charac-' terised by a striking acceleration in liquidity growth primarily due to large accretion of foreign exchange assets of the banking sector in sharp contrast to a - massive loss of such assets in 1990-91 that had resulted in subdued monetary growth in'that year; there was in addition the expansionary impact arising from the growth of domestic primary liquidity. Both net bank credit to Government and bank 'credit to the comm&cial sector expanded at a much slower pace in 1991-92. This can be attributed to various measures of macro-economic stabilisation initiated by the Government towards fiscal correction and the tight monetary policy measures against the background of high inflation and difficult
, external payments position. There was an acceleration in bank deposit growth during 1991-92 and a slowdown in credit expansion of scheduled commercial banks. - .
MONETARY DEVELOPMENTS
4.2 Monetary expansion during 1991-92, in terms of both broad money (M3) and narrow money (Mi), was considerably higher. M3 registered an in- crease of Rs.4qF256 crore (18.5 per cent) as compared with ~s.34,878 crore (15.1 per cent) in the previous year. The expansion of M3 in 1991-92 was markedly higher than the desired expansion of 13 per cent set out at the time of formulating the macro-economic objectives for the year. The overriding need to attract inflows from non-residents,to enable a build back of foreign exchange reserves,which had earlier dipped to dangerously low levels, weighed as a major factor which dissuaded the authorities from sterilising the growing liquidity associated with such foreign exchange reserve build-up. 4.3 All the components of M3 experienced higher pace8 of expansion in 1991-92 as compared with 1990-91, the most striking being the case of demand deposits (an increase of 32.7 per cent as against 14.7 per cent in the previous year) reflecting the margin money deposits kept by the canalising agencies, and the volatility in money flows associated with the stock market boom (Appendix Table IV.1). The pace of currency expansion at 15.4 per cent was somewhat higher than the increase of 14.6 pgr cent in the previous year. In the additional accruals of.time deposits of Rs.28,037 crore, about Rs.9,500 crore represented
. foreign currency deposits including those under the India Development Bonds.

Table 4.1: Variation In M3 : Conlponents and Sources
(Rupeaq crore)
1991-92P 1990-91 (April - June)
Item 1992-93P 1991-92 P
Currency
Aggregate deposits
of which
External ~ e p o s i ts*
All foreign currency deposits
2.' NRE deposits
Demand deposits
Time deposits
Net bank credit to Government
RBYs net credit to Government
of which:
to Centre
Bank credit to .corhmercial
sector (+11.2) (+13.2) (t4.4) (t0.1)
Nei forekn exchange assets +10,855 t 1,854 +849 d.225
-(t 125.2) (+27.2) (t4.3) (-14.1)
Net non-monetary liabilities -929 +10,149 - -2,510 -3,204 of the banking sector (-1.6) (+21.9) (-4.5) (-5.7)
1 , I
RBI's net non-monetary + 381 t9,486 -2,195 t 257 liabilities (t1.4) (+54.1) (-8 .O) (t 1 .O)
Note :Figures in brackets a r e percentage variations.
P : Provisional. * Relate to scheduled commercial banks only.

Reserve Money a
and, Net Do111es tic Assets of the Reserve Bank
Monetary Programme for 1992-93
4.4 ' Among the sources, net bank credit to Government registered a much
lower expansion of Rs.18,101 crore (12.9 per cent) as against Rs. 23,042 crore (19.7 per cent). This trend of a lower expansion is more noticeable in net Reserve Bank credit to Central Government (Rs.5,508 crore or 6.3 per cent as compared with Rs.14,745 crore or 20.5 per cent in 1990-91). However, the tlgures of net Reserve Bank credit tocentral Government ruled far above this level for most part of the year before dropping sharply in the last week of the financial year and as already indicated in Section 111, the fortnightly average net RBI credit to Central Government was high in 1991-92. Bank credit to commercial sector, too, recorded a lower increase of Rs.19,296 crore (11.2 per cent) as against Rs.20,065 crore (13.2 per cent) in the previous year: Net foreign exchange assets of the banking sector, excluding the revaluation in the value of gold, registered a sizeable expansion of Rs.9,141 crore (105.4 per cent) as against a reduction of Rs.4,694 crore (-68.8 per cent) during 1990-91. A substantial expansionary impulse in monetary growth in 1991-92 also originated in the reduced expansion in the net non-monetary liabilities of the Reserve Bank. An important factor contributing to this had been the exchange loss incurred by the Reserve Bank, placed at Rs.5,233 crore, due to withdrawal/renewal of FCNR deposits.
4.5 The expansion of reserve money was Rs.11,730 crore or 13.4 per cent in 1991-92 as against Rs.10,188 crore or 13.1 per cent in 1990-91 (Appendix Table IV.2). The Reserve Bank of India's net domestic assets(NDA)* showed a very small increase of Rs.875 crore or 1.1 per cent in 1991-92 as against Rs.8,273 crore or 11.6 per cent in the previous year. The targets on expansion of NDA and net RBI credit to the Central Government during 1991-92 were fully met (Table 4.2). As observed earlier, the continued volatility in these indicators has implied that the underlying growth of primary liquidity has been much larger than indicated by the end-of-period numbers.
4.6 The monetary programme for 1992-93 includes inter alia quarterly ceil- ings on net domestic assets (NDA) of the RBI and a sub-ceiling on net RBI credit to the Centre; there is also a quarterly indicative ceiling on total net bank credit to general Government (i.e., Central and State Governments). These are circumscribed by the overall monetary gr3wth target of about 10.4 per cent over the year. The quarterly NDA ceilings are to be adjusted for (i) changes in official exchange rate, (ii) changes in the valuation of gold, (iii) changes in reserve requirements, and (iv) changes in net international reserves (i.e., foreign exchange reserves net of the use of IMF credit and RBI short-term liabilities, i f any). Compliance wit11 the ceilings on RBI variables, i.e., NDA and net RBI credit to Central Government, will be determined by taking a simple average
* Nct domestic asscts cqual mcrvc money minus nct foreign cxchilngc nsscts of RI3I.

Tnblc 4.2: Ceillng on Net Uon~cslic Assets nnd Actunl Perfoni~nnce
(Rul'cles crorc)
Item Outsran- Targeted Expansion over Targeted Actual Perfornlance : Exl3nnsinn Actual ding March 31. 1991 Outst?t~- over Marc11 31. 1991 OUISIRII-
March 31 - ding di;ip 1991 End- End-Oct. End- End- as on End; End-Oct. End: Ilad- :IS 011
Sep- (Nover- Decenr- March Marc11 Sep1.20 (Nyvenl- Dec. Marclt March tember b q 1) ber ~ 9 9 2 3 i . 1991 ber 1) 27 31 31. 1991 1991 1991 1992 1991' '1991 1 9 9 9 19921'
1 2 3 4 5 6 7 8 9 10 11 12
Reserve Money (RM)* 87.779 3,921 9.340 9,340' 13.682 1.01,430 2.063 3.437 8.331 11.730 99.509
Net Donrestic A s e t s 79.796 5,094 10.140 10,140 14.584 94,350 2.176 1.583 1.921 875 80.671
(NDA) (8,023)- (8.023) (12,870) (92,636)
RBI Credit to Govt 88.818 10.012 10,040 10.110 7.712 96.560 7,061 7.SCW 8.146 5.168 91.016
of wl~ich : Credit to Centre 86,758 12,002 12.00 12.000 8.802 95,560 8.891 9.565 9,812 5.508 92,2(6
RBI Clainrs on otl~ers 16,319 - 2,418 - 590 3,030 10.372 26.720 - 3.436 - 5.913 - 6.218 - 3.987 12.362
of which :
(i) Banks 10,007 - 2.527 - 5,027 . 5,408 - 4,NIS 5,101
(ii) Con~n~ercial
sector 6,312 - 909 - 886 - 810 918 7,2(i)
Other items (net) 25.401 2,499 2.670 3.01'0 3.499 28.930 1.450 38.1 4 306 25.707
Net Foreign Assets 7.983 - 1,173 ' - 1.010. - 8(K) - 903 7.030 - 113 1.854 , 6.407 10.855 18.838
* RM Con~ponents :
Currency - - - - - 775 3.274 6,347 8.119; 63.731 Bankers' Deposits - - - - - 91 8 -95 1.753 3.059 34.882
Figures in brackets are net of the incrcase in gold value'over the amount of Rs.6.548 crore valued at the base price of Rs.6,388 per ounce as on March 31, 1991.
P: Provisional.
of four Fridays leading up to and'including the last reporting Fridily of June, September and December quarters; for the March 1993 quarter it would be the average of the four Fridays and March 31 after the closure of Government accounts.
4.7 As set out in Table 4.3, the performance criteria during the first quarter (April-June 1992) in respect of NDA and net RBI credit to the Centre, as also the net bank credit to the geheral Government, have been met. The broad

Table 43: Monetary Programme for 1992-93 (Rupees Crore)
Item Outstan- Targeted Expansion over March 31,1992 Targeted Actual
ding as Outstan- Perfor- on March End- End- End- End- ding as mance :
31, 1992. June September December March on March Expansign
1992 1992 1992 1993 31, 1993 at End-
June.1992 over' March 31,1992 P
1. Reserve Money
Reserve Money
Net Domestic ~ s s e t s i ~ ~ ~ )
RBI Credit to Government '
. O/W Credit to Centre
RBI claims on others
of which:
(i) ' banks
(ii) commercial sector
Other items (net) 25,707 25,100 -2,195
Net Foreign Assets 18,838' -3,800 -3,400 -2,700 -2,500 16 $00 849
2. Indicative Targets
Net Bank credit to 1,58,2940 9,400 10,600 11,400 10,400 16,870 6,391 g eneral Government (4.0) (Ceiling)
Broad Money (M3) 3,15,084 9,600 11,700. 25,200 32,7Od 3,47,800 18,243
(3.0) . (3.7) (8.0) (10.4) (5.8)
@ Net of the revalustion of Rs.200 crore in gold value up to June 1992 over the amount of ~s:8,894 crore valued a t the base price of Rs.8,011 per,ounce as on March 31; 1992. Other adjustments have not been made. Figures ili brackets represent percentages.
P Provisional.
Monetary 4.8 The pace of monetary expansion during the first quarter (AprilJune) of Trends the financial year 1992-93 was faster than that in the previous year. - Broad during money (M3) increased by Rs.18,243 crore (5.8 per cent) as compared with
.: the First Rs.12,535 crore (4.7 per cent). Among the components,agiregate deposits Quarter: registered higher increases while currency with the public recorded a lower pace 1992-93- of expansion. On the sources side, net bank credit to Government was lower.
while bank credit to the commercial sector was higher as compared with th.e corresponding period of 1991-92. Net foreign exchange assets of the banking

Some Monetal-y Relation- ships
sector experienced a substantial accretion (Appendix Table IV. 1). Reserve money also registered a higher expansion of Rs.6,027 crore (6.1 per cent) in this period against Rs.4,725 crore (5.4 per cent) in the previous year. The higher expansion was mainly due to substantial rise in RBI credit to commercial sector and also larger accretion to net foreign exchange assets of the RBI due t? some special transactions.
4.9 The year 1991-92 experienced certain peculiarities in the monetary relationships reflecting short-term responses to policy impulses and impulses from real and monetary sector developments. First, the fiscal and monetary instruments were used actively to contain the reserve money growth. Secondly, M3 grew at a fast pace essentially due to the sizeable foreign-exchange inflow and also the large average growth of primary liquidity from domestic soukes. Thirdly, real GDP growth, targeted at 4.0 per cent, actually turned out to be lower at a little less than 2.0 per cent and the inflationary pressures strengthened. As a result of these factors, there occurred an increase in income velocity of currency as well as M3 (Appendix Table IV.3). The incremental money multiplier (M3/RM), on a point-to-point basis, also showed a substantial increase following reductions in both the currency-deposit ratio and the bank reserves-deposit ratio (Appendix Table IV.4).
BANKING TRENDS
4.10 A phenomenal increase in aggregate deposits, especially demand deposits, and a noticeably low growth of overall bank credit, characterised the scheduled commercial banks' operations during the financial year 1991-92 (March 22, 1991 to March 20, 1992). .
4.11 Expansion in aggregate deposits accelerated to Rs.38,216 crore (19.8 per cent) from the previous year's level of Rs. 25,583 crore (15.3 per cent) and outstripped substantially the revised working estimate of Rs. 28,500 crore announced in the credit policy for the second half of 1991-92 (Appendix Table IV.5). Apart frorn the sizeable foreign exchange accruals, the restoration of banks' competitiveness in attracting deposits by means of periodical enhan- cements in bank deposit rates, special factors such as large amounts of addi- tional cash margins imposed against imports and kept by borrowers, the margin money deposits kept by the canalising agencies, and the float money associated with the buoyancy observed in the capital market, contributed to the rapid increase in bank deposits during 1991-92. The tempo of deposit growth has continued during the first quarter of 1992-93.

Table 4.4 : BanMng Vorinhles - Growth Rates
(In per cent)
1991-92 1990-91 1989-90 1988-89 1987438 April -June
Variables 1992-93 1991-92
1 2 3 4 5 6 7 8
Aggregate Deposits 19.8 15.3 19.1 18.7 14.9 4.5 3.4
Demand Deposits 35.8 15.0 23.6, ' 15.3 5.3 0.3 3.7
Time Deposits 16.5 15.4 18.2 , 19.4 17.1 5.6 3.3
Bank Credit 8.0 14.6 19.8 20.1 11.4 6.5 0.8
Food Credit
Non-food Credit
Investments . 20.2 16.6 17.8 17.5 20.5 4.5 4.2
Note: No sign is indicated for positive variation. .
4.12 Notwithstanding the accelerated expansion in aggregate deposits, total, bank credit witnhsed a markedly slower pace of expansion. Food credit ex- pansion was modest at Rs.164 crore as against Rs.2,500 crore during 1990-91 on account of a fall in procurement of foodgrains in the year alongside higher offtake leading to a steep fall in their stock levels. Restrictive credit policy measures and general slowdown of the economy together with the increasing cost of credit brought about a lower expansion in non-food credit placed at Rs.9,127 crore (8.2 per cent) as compared with Rs. 12,348 crore (12.4 per cent) in 1990-91 and Rs.15,497 crore (18.5 per cent) in 1989-90. In line with the large expansion in bank deposits, banks' investments in Government and other approved securities increased by a much higher amount than that in the pre- vious year.
4.13 In recent years, scheduled commerciaI banks have been reporting an unusually large rise in aggregate deposits and bank credit in the last week of March. In 1991-92 this phenomenon was not visible (Appendix Table IV.6) The increase in aggregate deposits in the seven-day period March 20 to March 27, 1992 of 3.0 per cent and that in bank credit of 4.7 per cent, as reported by banks, is modest as compared with large increases reported in previous years. The fact that the reduced statutory liquidity ratio of 30 per cent was applicable on the increase in net demand and time liabilities over the level of April 3, 1992 could have discouraged banks from resorting to high year-end deposit growth. This fact is also borne out to an extent when the rise in deposits, as between the last reporting Friday of March and March 31, 1992, of Rs.11,310 crore (4.9 per cent) is compared with a higher amount of Rs.12,232 crore (6.4 per cent) mobilised by the banks between the last report- ing Friday of March 1991 and March 31, 1991. The unwinding of these

TI-ends in the First Quarter: 1992-93
Non-food Credit Expansion During . 1992-93 (UP to July 1992)
deposits in the first few days of April was more striking this year than in-the past, reflecting the influence of incremental SLR prescription referred to above. Within 3 days between March 31 and April 3, 1992, there was an absolute decline of Rs.7,824 crore in aggregate deposits constituting 69 per cent df the accrual between the last reporting Friday of March and March 31, 1992 (as against a decline of Rs.6,705 crore during the 5-day period-March 31, 1991 to April 5, 1991).
4.14 With a substantial amount of deposit resources available to the banks, the use of non-deposit resources by banks showed a distinct decline during 1991-92 (Appendix Table IV.7). On an aggregate basis, the use of additional non-deposit resources during 1991-92 declined by Rs. 1,025 crore; during 1990-91 banks had used additional non-deposit resources to the tune of Rs.65 crore,
4.15 The accretion to aggregate deposits was higher at Rs.10,438 crore (4.5 per cent) as compared with that of Rs.6,566 crore (3.4 per cent) in the com- parable quaier of 1991-92. The expansion in bank credit was even more striking at Rs.8,166 crore (6.5 per cent) as compared to Rs.960 crore (0.8 per cent) in the previous' year.
4.16 There has occurred a phenomenal increase in non-food credit rendered by scheduled commercial banks during the current year so far (up to July 24, 1992). The increase during this four month period was Rs.9,994 crore (or 8.3 per cent) as against the actual increase of only RstJ714 crore (or 0.6 per cent) and Rs. 874 crore (or 0.9 per cent), respectively, during the corresponding periods of 1991-92 and 1990-91 (Table 4.5). The increase during the four - month period exceeded the increase during the entire financial year 1991-92 at Rs.9,127 crore (or 8.2 per cent). There is some indication of an inventory build-up in some sectors. 'When the April 1992 credit policy was announced, it was visualised that non-food credit expansion would be around Rs.4,000 ' crore (or 3.3 per cent) for the first half of 1992-93.

Table 4.5 : NON.FOOD CREDIT EXPANSION OF SCHEDULED COMMERCIAL BANKS (Rupees crore)
Financial Year Outstanding Variations Absolute Percentage
Full Year
1991-92
1990-91
1989-90
Period so far
1992-93
up to July 24,1992*
1991-92 - up to July 26,1991
1990-91
July 27, 1990
* Provisional.
Sec toral 4.17 Data on sectoral deployment of gross bank credit for the financial year, Deploy- 1991-92 indicate that expansion in non-food gross bank credit was substan-ment of tially lower this year (Appendix Table IV.8). The industry-wise break-up of Credit incremental credit to industry (Appendix Table IV.9) shows that credit expan-
sion to all engineering, chemicals group, coal, iron and steel, other metals and metal products, cotton textiles, other textiles, paper and paper products and constructions in the main decelerated.
RBI 4.18 Considering the paramount need to promote exports and also to provide Refinance greater incentive to banks to finance exports, export credit re finance pol icy was
further liberalised during the year. The increase in export credit interest rates together with the liberalisation of the export credit refinance formula acted as major incentives to banks to increase the flow of credit to the export sector (Appendix Table IV.lO).

Table 4.6: Export Credit Refinance
Export Export Ratio of
As on Credit Credit Co1.(3) to (Outstand- Refinance Co1.(2)
in^) Limits (Per cent)
Rupees crore
March 22,1991
March 20,'1992
June 26, 1992
July 24, 1992
4.19 As referred to earlier, a new scheme of refinance against post-shipment - export credit denominated in US dollar was introduced with effect from January 4,1992, under which banks are provided export credit refinance equivalent to 133 113 per cent of the post-shipment export credit denominated in U.S.dollars extended by them to the exporters. In order to make the scheme more attractive, it was further liberalised in February and ~ ~ r i l 1992. The dollar-denominated export credit increased from Rs.23 crore as on April 3,1992 to Rs.390 crore as on June 24,1992. The refinance limits under the new scheme during the above period increased from Rs.31 crore to Rs.519 crore.
TRENDS IN THE SHORT-TERM MONEY MARKET
DFHI 4.20 Discount and Finance House of India (DFHI) has been seeking to develop an active secondary market for the money market instruments and integrate, various segments of the market in order to facilitate the smoothening of short-term liquidity imbalances. Its turnover in call money market was sig- nificantly higher at Rs.2,96,862 crore in 1991-92 as compared with Rs.2,02,792 crore in 1990-91. As a result, the daily average lendings by DFHI in the call money market increased to Rs.813 crore in 1991-92 as against Rs.546 crore in 1990-91. There was an increase in the cumulative turnover of DFHI in money market instruments during 1991-92 as also in .the first few months of 1992- 93 (Appendix Tables IV.11,12 and 13).
Call 4.21 After witnessing sharp volatility during April-June 1991, the call money Money rates tended to stabilise at lower levels in July 1991. DFHIYs weighted average Market lending rates came down from 23.4 per cent in July 1991 to 11.0 per cent in
December 1991 and remained around that level till the last week of March 1992 (Appendix Table IV.14). The easy conditions in the call money market were due to the excess short-term liquidity in the financial system on account of foreign inward remittances, counterpart funds of India Development Bond and

sluggish demand for non-food credit. As a result, the averap daily borrowings of 32 major scheduled commercial banks in the call money market came down from around Rs.7,200 crore in July 1991 to around ~s .5 ,700 crore in January 1992. The average daily lending by these commercial banks in the call money market increased from around Rs.1,780 crore in July 1991 to around Rs.3,420 crore in April 1992. The average daily borrowings of these 32 major scheduled commercial banks was around Rs.6,520 crore in April 1992. With the increased resources of the banking system, banks' borrowings in the call money market from financial institutions were reduced. The daily average lending of financial institutions in the call money market declined from around Rs.5,630 crore in ~ u n e 1991 to around Rs.3,760 crore in April 1992.
4.22 During the months of April and May 1992, there was a flare up in interest rates with rates reaching dizzy heights of 100 per cent on April 28, 1992. The volatility in the call rate was caused by increased borrowings by some banks to cover their enhanced CRR requirements on year-end increase in- deposits, inadequate supply of call funds and uncertainty in the market in the context of irregularities in funds management by commercial banks and tinan- cia1 institutions, particularly in relation to their operations i n Government securities. By the end of May 1992, however, call money rates subsided to lower levels of 15-20 per cent. During the month of June, inter-bank call money market ruled fairly easy with a marginal upward movement by the middle-of June 1992. The rates firmed up to 20-25 per cent thereafter, for some time but by the end of June 1992 they declined to 2-3 per cent which were short-lived with the rates ruling in the range of 10 to 15 per cent i n July 1992.
182 - Day 4.23 There was an ovenvhelming response to 182- day Treasury bills in the Treasury fiscal year 1991-92. The outstanding amount of 182-Hay Treasury bills as at Bills the end of March 1992 was Rs.3985.52 crore as compared with Rs.1077.59
crore as at the end of March 1991 (Appendix Table IV.15). During the period underpview, the cut-off yield on these bills moved between 8.77 per cent to 10.08 per cent per annum. There was an auction on April 11, 1992 (the last held in this maturity in the current year so far) at which bids worth Rs.245 crore were accepted at a cut-off yield of 8.77 per cent.
364-Day 4.24 As part of the overall development of the Government securities Treasury market, the Government of India decided in April 1992 to float Treasury bills Bills of varying maturities up to 364 days on an auction basis. During the period up
to August 1992, nine auctions were held for 364-day Treasury b4ls and the outstanding amount as on August 19, 1992 was Rs.7,159.63 crore (Appendix Table 1V.16). The cut-off yield on these bills in the first five auctions was 11.42

per cent, while the cut- off yields in the last four auctions were 11.36 per cent, 11.27 per cent, 11.20 per cect and 11.17 per cent per annum, respectively.
Certificates 4.25 The volume of Certificates of Deposit (CDs) has been growing and of as on June 12, 1992 the outstanding amounted to Rs.6,556 crore. (Appendix Deposit Table IV.l'I).While the primary issues have been increasing, the transactions and in the secondary market have not developed as holders have a strong preference Commer- to hold the CDs to maturity. This points to the possibility that relative to cia1 demand, banks are pricing the interest rate on CDs at a somewhat higher level Paper than necessary. While the primary market in Commercial Paper (CP) has made
si'gniticant progress and outstanding has increased from Rs.64.70 crore as on June 30, 1991 to Rs.145.05 crore as on July 31, 1992, the secondary market is yet to develop.
PRICE TRENDS
4.26 A disquieting aspect of the macro-economic scene during 1991-92 was the furth'er accentuation of inflationary trends which began towards the second half of the previous year (Table 4.7). This could be attributed partly to certain macro-level imbalances and partly to a number of sectoral develop- ments. The pressure of excess demand, generating from the large and persistent fiscal deficits over the years, resulted in an excessive liquidity expansion, there- by fuelling inflationary pressures in the economy. The other sources of pres-
Table 4.7 : Annual Rate of Inflation in Ternrs of WPI (Point-to-Point 12-Month Period Increase)
(In Per cent)
At the en3 of 1992-93 1991-92 1990-91 1989-90 1988-89
April +13.6 t11.4 t9 .O +5.9 t9.6
May June
July
August
September
October
November
Dccemkr
January
February
March
P : Provisional. * Up to Adgust 8, 1992.

sures have been very many : uneven progress of monsoon until the end of August 1991 and the consequent stimulus to price expectations; supply-demand imbalances in sensitive commodities like pulses, edible oils, raw cotton, etc., due to shortfall in domestic production and constraints in augmenting their domestic availability caused by foreign exchange shortage; exchange rate adjustments in early July 1991 leading to an increase in import costs contribut- ing to some cost- push in import-intensive industries; decline in industrial production, especially in the manufacturing sector; a sharp increase in procure- ment prices of cereals and consequent rise in their issue prices; increase in prices of administered items such as, coal, petroleum products (other than diesel and 'kerosene), fertilisers and electricity; and increases in excise duties in the Union Budgets for 1991-92 and 1992-93.
4.27 The increase in the general index of wholesale prices (base: 1981-82 = loo), on a point-to-point basis, was 9.1 per cent in 1989-90 and 12.1 per cent in 1990- 91; it further rose to 13.6 per cent in 1991-92. The increase on an average basis at 13.7 per cent was also higher than that of 10.3 per cent in the previous year (Appendix Table IV.19). There was no noticeable seasonal let-up both in 1990-91 and 1991-92 (Appendix Table IV.18).
4.28 The prices of 'primary articles' recorded the largest increase (15.3 per cent as against 17.1 per cent) (Appendix Table IV119). Again, the increase in prices of 'food articles' in this major group was of the order of 20.9 per cent on top of an increase of 18.9 per cent in 1990-91. Among food items, rice, wheat, coarse cereals and sugar witnessed increases in the range of 12.3 per cent and 65.5 per cent. Raw cotton prices also went up by 24.7 per cent. The index of the 'fuel' group rose significantly owing to hikes in the 'administered prices of its sub-groups, viz., coal (27.4 per cent), mineral oils (9.2 per cent) and electricity (13.7 per cent). The substantial increases in the prices of the 'primary articles' and the 'fuel' group and the hike in the administered prices of fertilisers (28.8 per cent), cement (17.4 per cent) and non-ferrous metals excluding aluminimum (9.7 per cent) imparted considerable upward push to prices of the 'manufactured products' group. As a result, this group con- tri buted the most to the rise in the general price level in 1991-92 (52.7 per cent as against 43.0 per cent in 1990-91) (Appendix Table IV.20).
. 4.29 Apart from the price increase getting generalised, commoditiesz of common consumption faced by far the sharpest increase in the past two years which was reflected in the sizeable increase in the specially constructed com- posite price index for 'food items' (Table 4.8).

Table 4.8 : Coniposile: WPI or Food ltcnrs & Non-food 1lc111s
Weight Percentage Variation Weighted Cdnlribution
Item 1991-92 1990-91 1989-90 1991-92 1990-91 198090
All Commodities 100.000 13.6 12.1 . 9.1 100.0. 100.0 ' 100.0
Food Items1 Composite 27.529 . 17.2 16.9 5.7 37.0 . 39.0 .- 18.2
a) Food 17.386 20.9 18.9 2.1 29.4 . 28.1 4.5 Articles (Primary)
b) Food 10.143 10.2 13.2 12.9 7.6 . 10.9 13.7
Products
( ~ a ~ n f i d . )
Non-food 72.471 12.1 10.2 10.4 63.0 61 .O 81.8, Items
4.30 The large rise in the prices of 'food items' was reflected in the be- haviour of the three consumer price indices (CPIs) in respect of which the weight of 'food items' is about twice their weight in WPI (Appendix Table IV.21). Thus, the CPI for Industrial Workers registered an increase of 13.9 per cent, that for Urban Non-manual Employees 13.6 per cent,and that for Agricul- tural the highest at 21.9 per cent as it has the largest weightage, amongst CPIs, for 'food items'.
First 4.31 During the first quarter of the current financial year 1992-93;the general Quarter index of wholesale prices registered a smaller rise of 2.3 per cent as compared Trends: with the increase of 4.3 per cent in the similar period in 1991-92. Since the April-June beginning of the financial year, there has occurred a steady downward trend in 1992-93 the annual rate of inflation month by month (see Table 4.7 and graph 2). The
indices o,f all major commodity groups showed easiness. Apart from the demand resistance to high levels of commodity prices, the price expectations have been, to an extent, kept under check due to various macro-level policy initiatives. During the first quarter of the current financial year, the CPI for Industrial Workers registered an increase of 3.1 per cent as compared with the increase of 4.0 per cent in the corresponding quarter of 1991-92.
Bullion Prices
4.32 ,Prices of gold and silver registered greater gyrations during, 1991-92. Overall, the price of gold in the Bombay market rose by about 25 per cent on
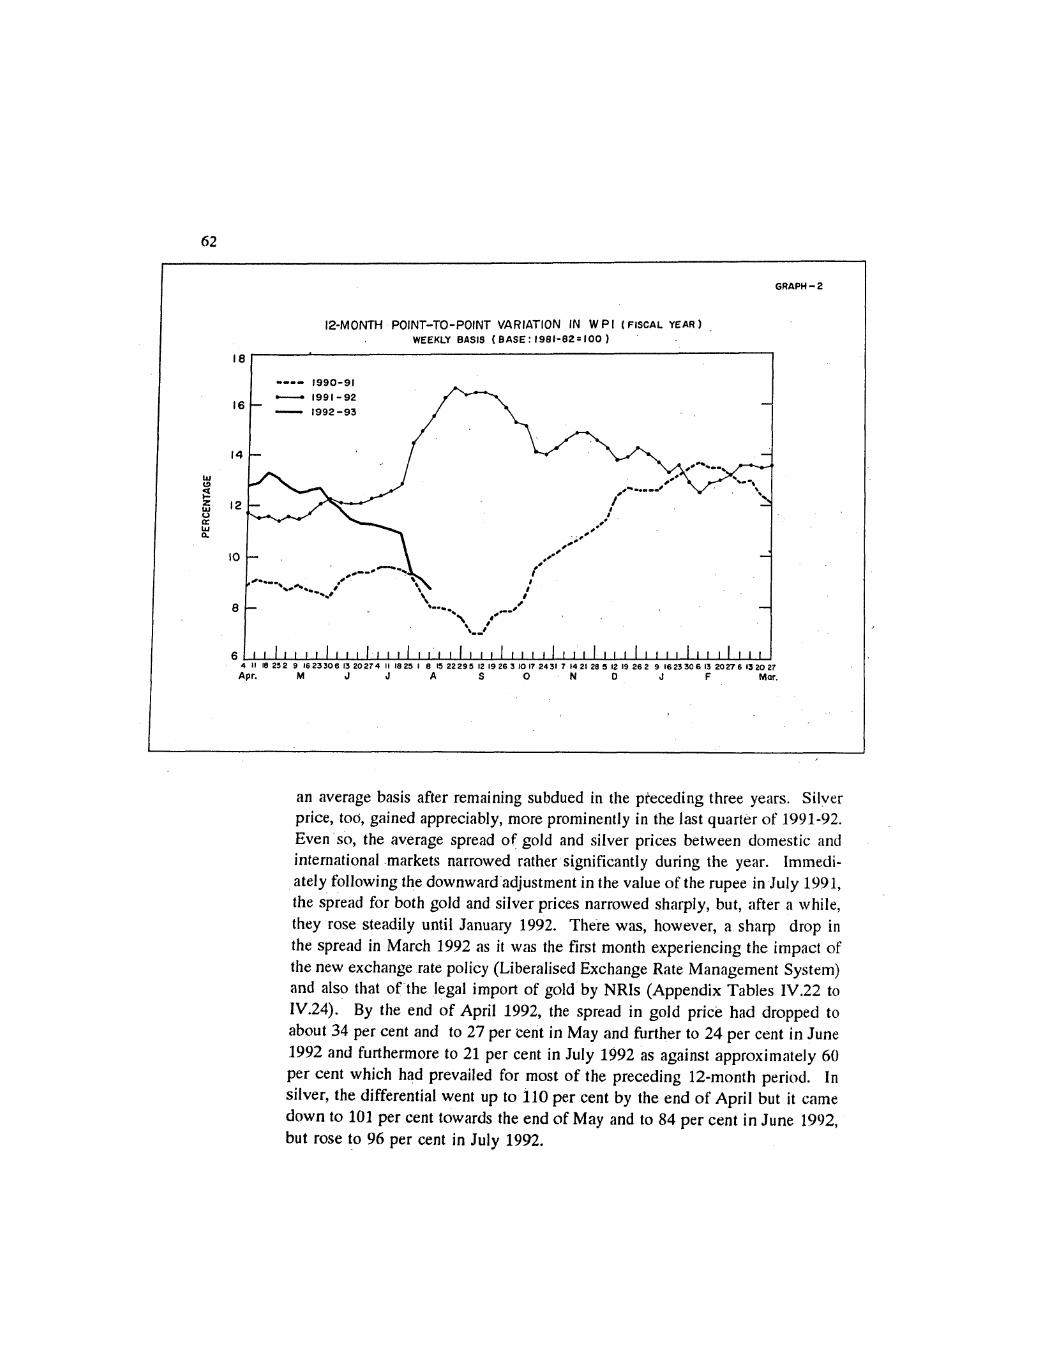
GRAPH - 2
12-MONTH POINT-TO-POINT VARIATION IN W PI ( FISCAL YEAR WEEKLY BASIS ( B A S E : 1981-82: 100 )
18
---- 1990-91 - 1991-92 l 6 - - 1992-93
-
14 -
10 -
I
8 - '-... / ,.--' - 0
L - 0
6 1 1 ~ 1 1 1 1 1 1 1 1 1 1 1 1 1 1 1 1 1 ~ 1 1 1 1 ~ 1 1 1 1 ~ 1 1 1 1 1 1 1 1 1 1 1 1 1 1 1 1 1 1 ~ 4 11 18252 9 16233061320274 11 1825 1 8 I522295 1219263101724317 14212851219262 9 1623306I320276132027
Apr. M J J A S 0 N 0 J F Mar.
an average basis after remaining subdued in the pteceding three years. Silver price, too, gained appreciably, more prominently in the last quarter of 1991-92. Even so, the average spread of gold and silver prices between domestic and international markets narrowed rather significantly during the year. Immedi- ately following the downward adjustment in the value of the rupee in July 1991, the spread for both gold and silver prices narrowed sharply, but, after a while, they rose steadily until January 1992. There was, however, a sharp drop i n the spread in March 1992 as i t was the first month experiencing the impact of the new exchange rate policy (Liberalised Exchange Rate Management System) and also that of the legal import of gold by NRIs (Appendix Tables IV.22 to IV.24). By the end of April 1992, the spread in gold price had dropped to about 34 per cent and to 27 per cent in May and further to 24 per cent in June 1992 and furthermore to 21 per cent in July 1992 as against approximately 60 per cent which had prevailed for most of the preceding 12-month period. I n silver, the differential went up to 110 per cent by the end of April but it came down to 101 per cent towards the end of May and to 84 per cent in June 1992, but rose to 96 per cent in July 1992.

V. CAPITAL MARKET DEVELOPMENTS
Assistance by Term- financing and Investment Institutions
Corporate Investment Forecast
5.1 As a sequel to various liberalisation measures effected since July 1991, the Indian capital market witnessed during 1991- 92 an unprecedented buoyan: cy in its secondary market segment and a significant improvement in new issue activities. The buoyancy in the secondary market, particularly after the Central Budget for 1992-93, defied economic fundamentals to a very large extent, pointing towards a more than usual build-up of speculative pressures. Once such speculative pressures were brought out in the Report of the Committee to enquire into securities transactions of banks and financial institutions (Chair- man: Shri R.Janakiraman) and expeditious action was taken by the Government, there occurred in May-June 1992 a sizeable correction to the undue increase in equity prices.
5.2 Disbursements by all-India development banks (net of inter- 'institution- al flows) at Rs.11,693 crore during 1991-92 (April- March) registered an in; crease of Rs.1,915 crore or 19.6 per cent against a increase of Rs.2,204 crore or 29.1 per cent in the previous year ( Appendix Table Val). Reflecting largely the difficult economic situation, as also the resource constraints faced by these institutions, the increase in their sanctions during 2991-92 decelerated rather significantly from 24.0 per cent in 1990-91 to 11.6 per cent. On the other hand, the investment institutions (UTI, LIC and GIC) showed buoyant resource posi- tion and expanded phenomenally their sanctions and disbursements under various schemes of assistance/investments during 1991-92.
5.3 Estimates of corporate investment, hitherto presented on a calendar year basis,according to a methodology developed by Dr. C. Rangarajan, are generated on a financial year basis as from the year 1991-92. The study, the fourth in series on annual forecast of investment of private corporate business sector based on expected phasing of capital expenditures on all projects for which assistance has been sanctioned by IDBI, ICICI and IFCI, has estimated that capital expenditures aggregating Rs.19,049 crore in nominal terms would have been incurred during 1991-92 denoting a rise of 3.0 per cent over the expected capital expenditure during 1990- 91. Including the amounts expected to be disbursed under the institutions' Bills Rediscounting Scheme and the Technical Development Fund Scheme, the expected total capital expenditure during 1991-92 worked out to Rs.19,357 crore. When deflated by an ap- propriate deflator, the total investment in real terms (i.e.,at 1980-81 prices) shows a rise of 15.4 per 'cent in 1990-91 and a decline of 1.4 per cent in 1991-92 over the corresponding expenditures iri respective previous years. In- dustry-wise, 'metals and metal products' accounted for the highest share of 39.0 per cent (127 projects or Rs.9,349 crore) followed by 'chemicals and

Trends in Growth of Depo- sits with Non- Banking Corporate Sector
New Issue Market
petrochemicals'at 10.0 per cent (179 projects or Rs.2,396 crore). 'Textiles (other than jute)' followed next with a share of 9.6 per cent (228 projects or Rs.2,296 crore).
5.4 According to the provisional data available, during the year ended March 31, 1991 the aggregate borrowings of 9,901 reporting non-banking com- panies rose by Rs.10,532 crore and stood at Rs.44,063 crore as against Rs.33,531 crore held by 10,140 companies as at the end of March 1990.The total regulated deposits of the reporting companies recorded an increase of Rs.1,245 crore and stood at Rs.8,003 crore while exempted borrowings rose by Rs.9,287 crore to Rs.36,060 crore. Non- financial companies accounted for 59.6 per cent of aggregate borrowings while financial companies accounted for 35.5 per cent and miscellaneous non-banking companies and residuary non-banking companies for 4.9 per cent each. The regulated deposits held by the non-bank- ing sector were equivalent to 3.9 per cent of the total deposits of all scheduled commercial banks (Appendix Table V.2).
5.5 Approvals (consents/acknowledgments including premium but exclud- ing bonus shares) granted by the Controller of Capital Issues (CCI) to both Government and non-Government companies for 1991-92 (April-March) were higher by 56.1 per cent over the approvals granted in the previous year (Ap- pendix Table V.3). In particular, approvals to non-Government companies recorded a substantial rise of 95.8 per cent.
5.6 New capital issues (including premium but excluding bonus issues) ag- gregated Rs.5,751 crore, registering during 1991-92 a significant rise of 35.9 per cent in contrast to a decline of 34.6 per cent recorded during 1990-91 (Appendix Table V.4). Debenture issues dominated the new issue market ac- counting for about 70 per cent of the total new capital issues. Convertible debenture issues increased by 48.1 per cent. Equity issues amounting to Rs.1,730 crore witnessed an increase of 34.5 per cent over those in the previous year. A marked feature of the new issue market during 1991-92 was the sub- stantial rise in rights issues. The total amount of rights issues at Rs.3,847 crore registered an increase of 76.0 per cent and accounted for 66.9 per cent of the total capital issues during 1991-92 in contrast to 51.7 per cent during 1990-91.
Perfor- 5.7 According to the Bombay Stock Exchange (BSE) data, overall public mlrnce response to the new issues continued to be encouraging in 1991-92. The number Analysis of issues which were subscribed to more than ten times accounted for 50.5 per of New cent of the total issues for which data were available, as against 21.9 per cent Issues in the previous year. The amount offered for public subscription accounted for

49.1 per cent. of the total issue as compared with 45.0 per cent in 1990-91. More recent data suggest that despite the difficulties and disruption faced by the secondary market, 'the number and amount of primary issues have been sizeable and the public response has continued to be encouraging.
Equity 5.8 During 1991-92, the stock market witnessed boom conditions - large- Prices scale increase in. activities and upsurge in share prices. Though equity prices
.moved up slowly during the first quarter of the year, they rallied sharply fol- lowing the presentation'in' July 1991 of the. Union Budget for 1991-92 and .
continued to rise till the third week of September 1991. The equity prices movedin narrow ranges thereafter, although the undercurrent remained optimis- tic. The Union Budget for 1992-93* had a buoyant effect on stock markets. As a result, share prices rose by 35.6 per cent' in March 1992. Appendix Table V.5 provides the movements in the RBI All-India (Weekly) Index Numbers of Ordinary Share Prices (base : 1980-81=100). From. 527.9 for the week ended March 30,1991 the index spurted to 792.3 for the week ended September 21, 1991 and further to 868.8 during the week ended January 28, 1992. The phenomenal buoyancy in February and March 1992 had driven the index up to 1485.4 by the week ended March 28,. 1992.
5.9 Though the average RBI index for 1991-92 at 776.2 showed an increase of 55.1 per cent, on a point- to-point basis, the index recorded a gain of 181.4 per cent from 527.9 during the week ended March 30, 1991 to 1485.4 during the week ended March 28, 1992. ' 8
5 .I0 The industry-wise .analysis indicated that all the industry groups made gains of more than 100 per cent during 1991-92 except for the share prices of aluminium and automobiles and auto-ancillaries which, however, gained 97.3 per cent and 99.3 pet cent, respectively. The shipping group's shares outper- formed all the others with a phenomenal gain of 580.5 per cent followed by cement (344.2 per cent) and rubber and rubber products (268.9 per cent).
5.1 1 Along with the increase, there was also volatility in share prices. The co-efficient of variation (CV) of the index of ordinary share prices during 1991-92 at 27.0 per cent was substantially higher -than the CV in the previous year (14.7 per cent). The dispersion (the range between High and L>w) in the * Sonie of the important proposals in the Budget contributing to this buoyant fervour were : abolition of wcaltli tax
on financial assets, enhrging the scope o f provision relating to exen~ption of income fron~ specified niutual f~lnds. including tliose in tlie private and joint sectors, consideration to pernlit foreigt~ investors (pension funds) to invest in Indian capital market, proposal to do away witli Governnient control over capital issues including preniiu~~i fixation and pern~ission for Indian companies to issue iquity/convertible debentures to investors abroad wit11 the same tax treatment as available For off-shore niutual funds.
index at 948.5 was 3.7 times the range for the previous year (258.6).
Major 5.12 The considerable increase in the activities of the secondary market has Indicators been also reflected in all the major indicators, as are available from the Bombay of Stock Stock Exchange (BSE) data, viz., turnover, market capitslisation and price-earn- Market ing ratio. The average monthly turnover at Rs.5,981 crore doring 1991-92 was Activities almost twice as that of the previous year (Rs.3,001 crore). Market capitalisation
. based on BSE data as at the end of March 1992 at ks.2,76,434 crore (provisiona1)was more than three-and-a-half times that at the end of March 1991 (Rs.75,348 crore). The average monthly price earning (PIE) ratio (calculated from 30- scrip BSE sensitive index, base : 1978-79=100) rose to 26.1 in 1991- 92 from 19.3 in 1990-91. There has been a continuous increase in P/E ratio since January 1992 with the peak reaching at 44.3 during March 1992.
Carl-ection 5.13 The phenomenal upsurge in share prices during the last quarter January- to the March 1992 also continued during April 1992. Reflecting this, the RBI index Speculative of equity prices (base : 1980-81=100) peaked to an all-time high of 1,656.9 Fervaur during the week ended April 4, 1992. However, this high level of share prices
could not be sustained as certain irregularities in securities dealings and financ- ing of share transactions came to light.Consequently, a correction to the speculative fervour occurred in May and June 1992, resulting in a fall in the RBI index to 1,162.1 for the week ended ~une'27, 1992 showing an erosion of 29.9 per cent from the peak level of April 4, 1992. The BSE 30- share Sensitive Index - SENSEX (base:1978-79 = 100) reached the all-time peak of 4,467.32 on April 22, 1992 but fell to 3,080.54 on June 26, 1992 (the last trading day of the month); it remained at 3,034.94 on August 21, 1992 sh6wing a fall of about 32 per cent over the peak level. The latest SENSEX as on August 21, 1992 still shows an increase of 77.7 per cent over the level a year ago. Thus, recent correction appears very moderate when considered against the increase of 90.7 per cent in the RBI index between the week ended January 25, 1992 and the week ended April 4, 1992, or an increase of 108.8 per cent shown by the SENSEX between January 24, 1992 and April 22, 1992. The downward inflexibility of share prices is as much a reflection of scarcity of scrips as it is of market imperfections and the rigidities in the market structure.
Stock 5.14 The experience of the year under review shows that there is a need to Market undertake a well-coordinated package of stock market reforms so as to contain Reforms the instability of the market. With the statutory status accorded to SEBI, it is
expected that issues, such as, registration of brokers, reporting system, capital adequacy of broker, institutional membership, settlement system and insider trading would be addressed quickly and effectively.

5.15 The fact that capital issues are phenomenally high during the first quarter of the fiscal 1992-93 indicates that investor confidence in the primary market remains unimpaired.
Credit 5.16 The Credit Rating Information Services of India Limited (CRISIL), Rating established by ICICI and UTI, made steady progress during 1991-92. CRISIL Agencies: rated 155 debt instruments issued by 103 companies covering a debt volume CRISIL of Rs.5,866.5 crore during the review period as against 77 debt instruments
issued by 46 companies covering a debt vblume of Rs.1,689.9 crore in 1990-91. Apart from rating instruments like fixed deposit programmes, convertible and non-convertible debentures, CRISIL also rated 56 commercial paper program- mes covering a total volume of Rs.948 crore. CRISIL, for the first time, rated an asset-backed security, viz., 'auto loans' originated by Citibank and also assigned rating to a new instrument, viz., 'Structured Obligation'. Since its inception in 1988, CRISIL had, by the end of March 1992, rated 304 debt instruments for a total debt value of Rs.10,626 crore. These instruments were issuedby 228 companies of which 5 companies are in the public sector. The increase in'the number of credit rating during the year 1991-92 is attributed to the fact that according to the CCI/SEBI. guidelines, credit rating is mandatory for companies issuing debentures to the public. CRISIL has also completed Credit Assessment of 58 companies. Apart from these operations, CRISIL entered into the area of providing technical assistance and training to Rating Agency Malaysia Berhad (RAM). It also rendered assistance to MALLOT - the Israel Securities Rating Company Limited and has agreed to provide training to its staff.
ICRA 5.17 Investment Information and Credit Rating Agency of India Ltd. (ICRA) commenced its operations in September 1991 and up to March 31,1992, it had rated 47 debt instruments issued by 24 companies (both manufacturing and financial companies) involving Rs.1,161.8 crore of debt to be raised from the financial market. Credit ratings were in respect of 33 debenture issues (Rs.985.3 crore), 11 fixed deposit programmes (Rs.104.5 crore) and 3 commercial paper programmes (Rs.72.0 crore). ICRA, in addition to providing rating, has also started providing credit assessment and general assessment services.

VI. DEVELOPMENTS IN THE EXTERNAL SI3cTOR
6.1 The severe pressures of a crisis proportion suffered by the Indiar economy in its external payments situation during the fiscal year 1990-91 anc the first quarter of 1991-92 were highlighted in the previous year's Annua Report. The Gulf crisis of August 1990, the global slowdown in world trade and the break-up of the erstwhile Soviet Union were some of the external factors impinging on India's balance of payments. The pressure on the external situation persisted through the second quarter (July-September) of 1991-92 aftel which, however, there occurred a marked turnaround in the country's interna- tional reserves. The foreign exchange assets, which dipped to a low of US $ 975 million (Rs.2,492 qrore) as on July 12, 1991, made a remarkable recovery and attained the level of US $ 5,631 million (Rs.14,578 crore) by the end of March 1992. The series of crisis management measures, as also the brisk action on stabilisation and structural adjustment programmes undertaken during the year, have combined to achieve a remarkable transformation in the country's international liquidity position. In particular, the drastic compression of imports and the determined efforts made to encourage repatriation of capital have helped the process. A measure of balance of payments support was also
. received from bilateral and multilateral donors. Balance 6.2 Final balance of payments data for 1991-92 are not yet available. How- o f ever, 'Quick Estimates' have been prepared based on data available with the Payments Reserve Bank and other sources of information and are presented in Tables 6.1
and 6.2 . These reveal a sharp contraction in merchandise trade deficit to US $ 3,078 million (Rs.6,915 crore) as compared with US $ 7,750 million (Rs.13,906 crore) during 1990-91, largely as an.outcome of the massive con- traction of imports. As regards invisibles, tourist arrivals, including nationals of Pakistan and Bangladesh, during 1991-92 were higher by 10.3 per cent as compared with an absolute fall of 8.6 per cent during the preceding year. Hence tourist receipts are estimated to show a moderate rise. Due to accruals of US $ 863 million under Foreign Exchange (Immunities) Scheme, 1991, private transfer receipts during 1991-92 are likely to show an increase though other remittances from non-resident Indians working abroad, which are a major component of private transfers, are estimated to be at the same level as in the preceding year. Interest payments as well as outward remittances on account of royalty, technical knowhow, etc., would continue to show an increase. On balance, net receipts from invisibles including accrued interest as also official transfers are expected to be somewhat higher than in 1990-91. Nevertheless, essentially as a result of the drastic cut-back in trade deficit, the current account deficit (CAD) (including accrued interest on NRI deposits) stood slashed to US $2,835 million (Rs.6,251 crore) from US $ 7,728 million (Rs.13,865 crore) in the preceding yea\ As a proportion to GDP, CAD is estimated at 1.1 per cent as compared with 2.6 per cent in 1990-91.

69
Table 6.1 : India's Overall Balance Of Payments
In IIS % million In Rupees cmre
Item 1991-92 1990-91 1989-90 1991-92 1990-91 1689-90 (Quick (Provi- (Quick (Provi-
htima- sional Estima- sional tes) Estima- tes) Estima-
tes) tes)
A. Current Account
1. Exports, f.0.b. 18,135 18,491 16,955 44,607 33,178 28,229
2. Iinprts,c.i.f.
3. Trade Balance
4. Current Account -2,835 -8,424 -7,269 -6,251 -15,114 -12,102 Balance @
B. Total Capital Account, 6.409 7,146 6,529 16,092 12,821 10,870 I M F and SDR Allocation
C. Reserves and Monetary Gold -3,574 1,278 740 -9,841 2,293 . 1,232 (Increa se-/Decrease+)
@ ~ f t e r taking into account errors and omissions. See also ~ p ~ e n d i x Table VI.1.
Table 6.2 : Current Account Transactions as Proportion of GDP at Currcnt Market Prices (In per cent)
1991- 1990- 1985- 1989- 1988- 1987- 1986- 1985- 1980- Item 92 91 90 90 89 88 87 86 85
(Quick (Pro- Ann- Ann- Esti- visi- ua 1 ua I
mates) onal ave- ave- Esti- rage rage
mates)
1 2 3 4 5 6 7 8 9- 10
1. Exports 7.2 6.3 5.1 6.4 5.2 4.9 4.5 4.4 5 -0
2. Imports 8.4 8.9 8.3 9.2 8.7 7.7 7.7 8.1 8.4
3. Trade deficit 1.2 2.6 3.2 2.8 3.4 2.8 3.2 3.7 3.4
4. Invisible 3.3 2.7 2.9 2.8 2.9 2.8 2.8 3 .O 3.6 Receipts @
5. Invisible 2.9 2.4 1.9 2.2 2.0 1.9 1.6 1.6 1.5 Payments (3.2) (2.7) .. (2.7) (2.4)
6. lnvisibles 0.4 0.3 0.9 0.6 0.8 0.9 1.2 1.4 2.1 (net)(d-5)@ (0.1) (0.0) .. (0.1) (0.5)
7. Current Account 0.8 2.3 2.2 2.2 2.6 1.9 2.0 2.3 1.3 Deficit (3-6 )@ (1.1) (2.6) (2.7) (2.9)
. . Not available. Include official grants which are treated as part of current account receipts here.
Nole : 1:igures in brackets indicate ixrcentages including ac~rued interest on NRI delmsits. Data for the period prior to1988-80 are not avirilnblc.

6.3 The capital account was characterised by mobilisation of funds from non-resident Indians and larger assistance from bilateral and multilateral donors. During the year there occurred an outflow of US $ 1,627 million -
(Rs.3,641 crore) under the FCNRA scheme (as against an inflow of US $ 168 million (Rs.255 crore) during 1990-91) but the bulk of these outflows amount- ing to nearly US $ 1 billion occurred during April-June 1991 - a period of overall uncertainty, As measures of stabilisation were put in place rapidly, the outflows tapered down to US $ 152 million in the last quarter of the year 1991-92 which also seem to represent portfolio switches in favour of other schemes. Simultaneously, subscriptions to India Development Bond (IDBs) aggregated US $ 1,627 million. As such the large outflow under the FCNRA was recouped through the IDBs with the added advantage of lengthening of maturities. Utilisation of external assistance, excluding exceptional financ- ing of US $ 1 billion by the World Bank, the ADB and Japan, was at-the same level as in 1990-91. Commercial borrowings other than IDBs were significant- ly lower during the year due to the downgrading of India's rating by the Rating Agencies. Net purchases from the IMF during the year were lower at US $ 781 million (Rs.2,079 crore) as compared with US $ 1,214 million (Rs.2,178 crore) (excluding repayments to the IMF under Trust Fund Loan) during 1990- 91. Drawings from the IMF took the form of a second drawal equivalent to US $ 221 million (~s .570 crore) in July 1991 and a third drawal equivalent to'US $ 637 million (Rs.1,647 crore) in September 1991 under the Compen- satory and Contingency Financing Facility (CCFF) and US $ 117 million (Rs.305 crore) in November 1991 and US $ 263.59 million (Rs.685 crore) in January 1992 under the Stand-by Arrangement (Table 6.3). Appendix Table VI.2 presents the modes of financing of the current account deficit; this shows how there was a significant departure in mode of financing during 1991- 92 from that of the past years.
6.4 The Aid-India Consortium committed aid during 1991-92 up to US $ 6.7 billion for India of which US $ 2.3 billion would be fast-disbursing. The IMF approved on October 31, 1991 an Upper Credit Tranche Stand-by Arran- gement amounting to SDR 1,656 million (US $ 2.2 billion) which would be available in instalments over 20 months subsequent to the date of approval. The first instalment of SDR 85 million (US $ 117 million) was drawn in November 1991 and the second instalment of SDR 185 million (US $26359 million) in January 1992. In July 1992 there was a drawal of third instalment of SDR 462 million (US $ 663 million).

Table 6.3 : Special Factors Aflecting Movemtnl In Foml~n Cumncy Assets
, In US % million In Rupees cmrc
1991-92 1990-91 1991-92 1990-91
I. Change in Foreign Currency Assets
11. Special Factors
(a) Exceptional Financing
Germany
Japan
ADB.
World Bank
(b) Transactions with IMF* (net SDR . .
transactions affecting foreign currency assets)
(c) Other Schemes
Foreign Currency (Banks & Others) Deposits Foreign Currency Non- Resident Accounts
NRI Bonds and other deposits
. , India Development Bonds
Immunity Schemes
(d) Swaps
111. Change in Foreign Currency Assets. (1-11)
* Represents changes in foreign currency assets arising from drawals from the IMF and from sale/purchase of SDRs on Government Account.
** Of total collection of U S $ 1,627 million under ID Bond, U S $ 1,374 million accrued to foreign exchange assets of the ' RBI during 1991-92.
Note : Due to valuation change during the year the trend in rupee terms would not correspond with US dollar value.

Foreign 6.5 India's foreign exchange reserves (comprising foreign currency assets of Exchange the Reserve Bank of India (RBI), gold held by the RBI and SDR balances Reserves held by the Government) rose from US $ 5,834 million (Rs.11,416 crore) at
the end of March 1991 to US $ 9,220 million (Rs.23,850 crore) at the end of March 1992 showing an increase of US $ 3,386 million (Rs.12,434 crore) (see Appendix Table V1.3). As compared with end-August 1991 when the level of reserves had fallen to US $ 4,624 million (Rs.11,975 crore), the end-March 1992 level was almost twice that size. Exclusive of gold revaluation and also of transactions(with the IMF (other than the Trust Fund Loans), the foreign exchange reserves increased by US $ 2,793 million (Rs.8,637 crore) during 1991-92 against a fall of US $ 2,351 million (Rs.3,560 crore) during 1990-91. Foreign currency assets rose by US $ 3,395 million (Rs.10,190 crore) during 1991-92 as compared with a fall of US $ 1,132 million (Rs.1,399 crore) during 1990-91. Between end-March and endJune 1992, foreign currency assets rose further by US $ 590 million . (Rs.1,547 crore).
SDRs 6.6 Holdings of SDRs fell by SDR 10 million during 1991-92 (April-March) as compared with a fall of SDR 6 million during the preceding year. The decline during 1991-92 was the combined result of a net acquisition of SDRs, wonh SDR 225.0 million, IMF drawals worth SDR 397.2 million, repur- chases of SDR 337.5 million, payment of charges/interest amounting to SDR 218.7 million (net of interest subsidy) to IMF, and sale of SDRs worth SDR 76.2 million. During April-June 1992, there was an increase of SDR 14.4 million offset by repurchases amounting to SDR 54.2 million primarily due to acquisition of SDR 120 million.
-
FOREIGN DCMAE BSERMS: MONTH-END ( FISCAl YEAR ) ( 1990-91 TO 1992-93)
1991-92

Gold 6.7 The gold holdings of the Reserve Bank of India at US $ 3,499 million (Rs.9,039 crore) at the end of March 1992 reflected an addition to gold stocks to the extent of 18.36 tonnes (to 350.92 tonnes) consequent upon the sale of gold by the Government of India to the RBI in December 1991 (equivalent in value of Rs.493.81 crore or US $ 191 million).
6.8 The gold (46.91 tonnes) pledged by RBI i n four instalments in July art of its reserve management policy and as a means of raising
resources temporarily to the Bank of England (BOE) to raise loans of US $ 405 million fiom BOE and the Bank of Japan,was redeemed by repayments during September to November 1991. Earlier, in May 1991, Government had leased 19.99 tonnes out of confiscated gold to State Bank of India which, in turn, entered into a sale of 18.36 tonnes With a repurchase option in the inter- nati'onal market. The gold was repurchased by the State Bank of India in NovemberDecember 1991; the quantity of 18.36 tonnes was subsequently sold by the Government to the Reserve Bank of India. The balance of 1.63 tonnes of gold has since been returned by the State Bank of India to the Government. The gold holdings of the Reserve Bank of India involved in both the transac- tions, adding'up to 65.27 tonnes, are kept abroad for the time being.
6.9 As stated earlier, foreign currency assets, which had touched a low of US $ 975 million (Rs.2,493 crore) on July 12,1991, rose to US $5,631 million (Rs.14,578 crore) at the end of March 1992. Inflows under the two special schemes mentioned earlier, borrowings from the IMF and the fast-disbursing assistance extended by multilateral and bilateral agencies, facilitated the reserve build-up. After the amounts involved in the above transactions are netted out, there still remained an inflow of US $ 1 billion. It represents the net position of receipts and paymelits on account of merchandise trade and invisibles (exdudinithe amount received under the Immunity Scheme). This is also od rroborated by RBI transactions with Authorised Dealers (ADS). During the period fiom April 1, 1991 to March 31, 1992, net purchases by RBI from ADS amounted to US $ 1.8 billion (Rs.5,215 crore) in contrast to net sales of US $ 5.8 billion (Rs.10,358 crore) in the previous 12-month period, implying a turnaround of US $ 7.6 billion. They indicate a faster repatriation of export proceeds and inward remittances following a break in expectations of a depreciation of the exchange rate. As mentioned earlier, the stability of the US dollar - rupee rate combined with increases in interest rates including those for financing exports and imports had a powerful effect on reversing the outflow of foreign exchange into a large inflow.
Merchan- 6.10 The fiscal year 1991-92 witnessed a striking improvement in trade d ise balance contributed mainly by a severe compression in imports. Imports
Trade declined by 19.4 per cent in dollar terms during the year in sharp contrast to n

rise of 13.2 per cent in the previous year. The trade deficit would have shrunk still further but for the fall in exports. According to the provisional data on foreign trade, the trade deficit declined sharply to US $ 1,556 million (Rs.3'835 crore) from US $ 5,930 million (Rs.10,640 crore) in 1990-91.The break-up of the total deficit into oil and non-oil components suggests a reveal- ing picture. 'Non- oil deficit', which stood at US $425 million (Rs.762 crore) during 1990-91;turned into a surplu~ of US $ 3394 million ,(Rs.8,272 crore) during 1991-92 reflecting the impact of severe import compression measures. In contrast, 'oil deficit' rose by 22.6 per cent from Rs.9,878 wore in 1990-91 to Rs.12,107 crore in 1991-92 which, however, arose from the downward adjustment in the external value of the rupee; in dollar terms,.the 'bil deficit' declined by 10.1 per cent from US $5,505 million to US $ 4,950 million. The surplus in 'non-oil deficit' partially moderated the deficit in the oil account to keep the total deficit at a lower level (Table 6.4).
Table 6.4: India's Foreign Trade
Item
US $ million Rupees crore
1991-92 1990-91 1989-90 1991-92 1990-91 1989-90 (PI (PI (PI ( 1')
1 2 3 4 5 6 7
I. Exports 17,840 18.143 16,626 43,978 32,553 27,681 + (-1.7) (9.1) (1 9.0) (35.1) (17.6) (36.8)
Crude oil POL 415 523 418 1,022 938 697
(-20.7) (24.9) (20.0) (9.0) (34.6) (38.0) Non-oil 17,425 17,620 ' 16,208 42,956 31,615 26,985
(-1.1) (8.7) (19.0) (35.9) (17.2) (36.8) 11. Imports 19,396 24,073 21,272 47,813 43,193 35,416
(-19.4) (13.2) (9.1) (10.7) (22.0) (25.4) Oil & POL 5,36563 6,028 3,768 13,129 10.816 6,274
(-11.0) (60.0) (25.2) (21.4) (72.4) (43.0) Non-oil 14,031 18,045 17,504 34,68d 32,377 29.142
(-22.2) (3.1) (6.2) (7.1) (11.1) (22.0) 111. Trade Balance -1,556 -5,930 -4,646 -3,835 -10,640 -7,735
Oil Balance -4,950 -5,505 -3,350 -12,107 -9,878 -5,577 s
Non-oil Balance +3,394 -425 -1,296 +8,272 -762 -2,157
(P) : ProvisinaI. @ Converted in U S dollar terms by using official average exchange rate. For other eornmdities m m p s i t e average ex-
change rate for March 1992 is used.
Notes: 1. See also Appendix Table VI.4.
2. Final data for the year 1989-90 are not available from DGCJRrS.
3. Figures in brackets iepresent percentage change over the previous year.
iource : D.G.C.I. & S.

India's Trade with Rupee Payment Area (RPA) and General Currency Area (GCA)
Indo-USSR Trade Protocol
6.11 After attaining significant increases in the export base continuously for four years, the export performance during 1991-92 was sluggish. Exports declined by 1.7 per cent in dollar terms, although in rupee terms they increased by 35.1 per cent due to exchange rate changes. Exports were adversely affected by both domestic and external factors. Internal factors included inter alia the imposition of import compression measures and tight monetary policy. The general uncertainty o d the economic front prevailing in the initial part of the year and expectations of a reduction in Customs tariffs before the 1992-93 Central . 1 Budget contributed to an overall slowdawn in, foreign trade activity. External factors related to kecessionary conditions in major developedcountries, particularly the USA and the UK, a slowdown in the expansion of world trade to 0.9 per cent in 1991 from 4.2 per cent in 1990 and 7.3 per cent in 1989 and the break-up of the erstwhile Soviet Union, which severely disrupted India's trade with the region.
6.12 Appendix Tables V1.5 and V1.6 present exports and imports, respec- tively, by major categories and commodities for three years.
6.13 As mentioned earlier, exports during 1991-92 were adversely affected by the severe disruption of trade with the erstwhile USSR. The USSR ac- counted for 95 per cent of the total trade turnover between India and the three countries under RPA, viz., the USSR, Czechoslovakia and Romania. There was a steep decline in exports to RPA by 42.5 per cent in dollar terms and by 21.0 per cent in Rupee terms during 1991-92. Furthermore, there was a shortfall of 45.2 per cent in the total trade turnover (exports plus imports) with RPA in dollar terms during 1991-92 as compared with the corresponding period of the previous year.
6.14 The extent of the decline in exports to RPA was so pronounced'that total exports showed a decline of 1.7 per cent (in dollar terms) during 1991-92 even though exports to GCA (total exports minus exports to RPA) recorded a positive growth of 6.6 per'cent during the same period (Appendix Table VI.7).
6.15 For the calendar year 1991 the Indo-USSR Trade Protocol (prior to the break-up of the USSR) envisaged a total trade turnover of Rs.9,411 crore con- sisting of Rs.5,081 crore of exports to the USSR and Rs.4,330 crore imports from the USSR. Against this target, a total trade turnover of Rs.6,413 crore was actually realised during 1991 -- Rs.4,164 crore of exports to the USSR and Rs,2,249 crore of imports therefrom. The shortfall was larger in India's imports (Rs.2,081 crore or 48.1 per cent) than in exports (Rs. 917 crore or 18.0 per cent).
6.16. The provisional data indicate that exports to the erstwhile USSR declined by Rs.1,287 crore to Rs.3,967 crore during the fiscal year 1991-92.

New Agreement on Trade and Economic Co-opera-tionbetween Govern-ment o f India and Russian Federa tion
The shortfall in exports is attributable to a steep decline in exports of agricul-tural and allied products by Rs.838 cmre. Total imports aggregated Rs.1,780crore during 1991-92 as compared with Rs.2,548 crore in 1990- 91, showing a fall of Rs.768 crore. Imports under the item 'Others' (including crude oil and Petroleum products)declined by Rs.708 crore to Rs.1,000 crore in 1991-92,reflecting the sharp fall in imports of crude oil and Petroleum products.Non-ferrous metals also declined by Rs.108 crore to ~ s . 5 crore in 1991-92.
6.17 Consequent upon their separation, the countries of the erstwhile USSR have formed the Commonwealth of Independent States (CIS) and efforts are being made by the Government of India and the Republics of CIS to establish trade and economic links with each other. So far, trade and economic co-opera-tion agreements have been reached between India and six Republics of the CIS, viz., the Russian Federation, Kazakhstan, Kyrghyzstan, Ukraine, Uzbekistan and Turkmenistan. All the Republics have opted for payments in freely con-vertible currencies. As regards trade with all other remaining Republics of CIS with which trade agreements remain to be concluded, the trade between India and these Republics and the contracts to be concluded between them shall be carried out in freely convertible international currencies in conformity with the laws and regulations of respective countries. The general form of agreement between India and the Republics of the CIS is that they shall accord to each other the most-favoured-nation (MFN) treatment in all matters of trade and commercial co-operation.
6.18 A trade and payments protocol was concluded between India and the Russian Federation on February 22, 1992. On the basis of the agreement; which provides for trade on a bilateral basis as also for trade in freely convertible currencies, the trade between the two countries during the calendar year 1992 shall be effected on a balanced basis in accordance with the specified list of goods. Pending finalisation of the modalities for carrying out trade under the trade protocol and consequential amendments to the agreement, a memorandum of understanding was signed on May 5, 1992 between the two Governments whereby Government of India agreed to the advance utilisation by the Russian Federation of technical credit to the extent of US $ 85 million for export of goods from India, viz., tea (US $ 32 million), coffee (US $ 15 million), tobacco (US $ 25 million), spices including black pepper (US $ 2 million), cigarettes (US $ 4 million), medicines (US $ 3 million) and fruit pulp concentrates (US $ 4 million). Import of goods from Russia consists of 15 items. The import and export of goods as specified above shall be carried out on the basis of contracts concluded at internationally competitive prices and denominated in U S dollars. There shall, however, be no outflow/inflow of US dollars from/to India on account of trade transactions under the trade protocol.

External Assistance
Accretions to NR(E)R and FCNR Accounts
6.19 Apart from the total turnover of US $ 2,200 million (i.e., US $ 1,100 million each in two-way trade), the protocol provides for freedom for both the sides to import and export goods and services from each other outside its ambit on the basis of countertrade, commodity exchange, barter, buy-back operations, or of any other internationally recognised form of business cooperation.
6.20 The inflow of external assistance rose during 1991-92. Gross utilization. of loans and grants at US $ 4,527 million (Rs.11,078 crore) was higher by US $ 791 million (Rs.4,374 crore) than that of US $ 3,736 million (Rs.6,704 crore) during 1990-91. The amortisation payments continued to show a rising trend and amounted to US $ 1,455 million (Rs.3,559 crore) during 1991-92 as against US $_ 1,298 million (Rs.2,329 crore) in the preceding year. Net inflow of ex- ternal aid rose by US $ 634 million (Rs.3,144 crore) to US $ 3,072 million (Rs.7,519 crore) during 1991-92(Appendix Table VI.8)though the increase in- cludes the disbursements under exceptional financing that was arranged as balance of payments support. Under this arrangement, a sum of US $ 295 million (Rs.610 crore) was provided by Japan, US $ 60 million (Rs.151 crore) by Germany, US $ 125 million (Rs.323 crore) by ADB and US $ 455 million (Rs.1,.173 crore) by the World Bank under a structural adjustment loan.
6.21 Under Non-Resident (External) Rupee Accounts [NR(E)RA] Scheme, provisional data for 1991-92 indicate a withdrawal of US $ 27 million (Rs.44 crore) (excluding estimated interest e1ement)as compared with an inflow of US $ 87 million (Rs.156 crore) in 1990-91. However, the decline does not.neces- sarily imply outflow of foreign exchange. The account is to a large extent maintained for meeting the local expenditure of NRIs in India. There was, however, a sizeable outflow of US $ 1627 million (Rs.3,641' crore) under Foreign Currency (Non-Resident) Accounts (FCNRA) in 1991-92 as against an inflow of US $ 168 million (Rs.255 crore) in 1990-91 (Appendix Table VI.9). Although the outflows were heavy in the first quarter (April-June 1991), they slowed down from July 1991 onwards after the institution of many policy reforms. Under Foreign Currency (Ordinary Non-Repatriable) Scheme, intro- duced in June 1991, there was an inflow of US $ 5 million during 1991-92.
6.22 Appendix Table V1.9 shows that at the end of March 1992, non-resident deposits stood at US $ 7,847 million or Rs.21,679 crore (US $ 2,591 million under NR(E)RA and US $5,256 million under FCNRA equivalent to Rs.8,071
' crore and Rs.13,608 crore, respectively).
6.23 With a view to tiding over the foreign exchange crisis faced by the country during 1990-91, the Reserve Bank of India introduced in November 1990 a new scheme called the Foreign Currency (Bank and Others) Deposit Scheme [FC(B&O)D]. The terms and conditions of this scheme are similar to

those in the case of Foreign Currency Non-Resident (FCNR) Scheme except in two respects,viz., i) the FC(B&O)D Scheme is also open t o , foreign citizens/banks and/or other institutions as against only NRIsIoverseas corporate bodies (OCBs) in the case of FCNR accounts; and ii) withdrawals before maturity are strictly not allowed.
6.24 Under the FC(B&O)D scheme, net inflow during 1991-92 amounted to US $ 304 million as compared with US $ 262 million during the preceding year. During the first quarter (April-June) of the current financial year, inflow under this scheme amounted to US $ 1,237 million and were substantially higher than the amount of US $ 77 million received during the same period of the preceding year. When the scheme was suspended temporarily with effect from July 31, 1992, the amount outstanding under it was US $ 2,232 million.
Interest 6.25 In view of the trends in interest rate movements in the international Rates - markets, the interest rates on deposits under FCNRA Scheme were revised three Non- times in 1991.92, that is, relatively less frequently as compared with the pre- Resident vious two years. Since the beginning ,of the fiscal ,year 199393, however, a Deposits further change in interest rates has been effected. Appendix Table VI.10 sets
out the rates of interest on FCNRA deposits for different currencies during the period under review. Interest rate on NR(E)RA was revised last on April 13, 1991.
External 6.26 With the generally growing deficit in the current account of balance Debt o f payments, India's external debt liabilities comprising multilateral and
bilateral assistance, commercial borrowings and non-resident. Indian (NRI) deposits, have gradually risen over the years. India's medium and long-term debt, i.e., having an original. maturity of more than one year and excluding NRI deposits, amounted to US $ 57.6 billion (Rs.1,71,305 crore) as at the end of March 1992 as compared with US $ 51.7 billion (Rs.1,00,466 crore) as at the end of March 1991 (Appendix Table VI.ll). Including NRI deposits of all maturities and short-term debt in the nature of trade credit, suppliers' credit (with less than one year's maturity), credit under bankers' acceptance facility (BAF),etc., India's external debt liabilities at the end of March 1992 stood at US $ 68.8 billion (Rs.2,01,671 crore) as compared with US $ 67.1 billion (Rs.1,30,638 crore) at the end of the preceding year. A major part of the debt increase in rupee terms is attributable to the downward adjustment of the rupee vis-a-vk major currencies carried out in July 1991 and in view of introduction of LERMS in March 1992,
6.27 In relation to GDP at current market prices, medium a n d long-term external debt and NRI deposits are estimated to have risen to 31.2 per cent at the end of March 1992 as against 23.4 per cent at the end of March 1991

reflecting essentially the rupee depreciation refered to above. The debt (as defined above) to export ratio was around 259 per cent at the end of March 1991 and rose to about 303 per cent at the end of March 1992. The debt-ser-vice ratio (i.e., ratio of debt-service payments to exports of goods and services excluding official transfers) is estimated to have increased to 26.2 per cent during 1991-92 from 25.2 per cent in 1990- 91, which is partly reflective of the decline in export earnings during 1991-92.
6.28 Based on the data available, the Reserve Bank has been publishing statistics of India's medium and long-term external debt in its Annual Reports. The Government of India and international agencies have also been publishing similar 'data. However, due to differences in definitions and coverage, both the total and components of debt have shown variations as between different sour- ces of data. With a view to reconciling the different sets of figures, and stream-lining the procedures and evolving a reliable system of debt statistics, the RBI appointed a Policy Group (to be assisted by a Task Force) to look into the
. coverage, definition and classification of external debt statistics of India. The Reports of the two Groups have been submitted, According to the definition and classification recommended by the Groups, India's medium and long-term external debt including NRI deposits (of more than one year maturity) amounted to US $ 57,295 million (Rs.1,10,715 crore) as at the end of March 1991. Short-term- debt amounted to US $ 5,839 million (Rs.11,283 crore). Short-term debt acbording to the recommended definition includes NRI deposits up to one year and excludes all trade credits up to 180 days as they are treated as normal trade credits. The total debt mentioned above excludes RupeelRoublebilateral credit of U S $ 1,669 million (Rs.2,559 crore) and Rupee Suppliers' Credits of US $ 34 million (Rs.67 crore). They do not involve any drawdownof reserves. The Groups also compiled the data for the end of December 1991on the lines of the new definition. The medium and long-term debt stood at US $ 61,050 million (Rs.1,57,345 crore) and short-term debt at US $ 5,010 million (Rs.12,912 crore) as at the end of December 1951. RupeelRoublebilateral credit of U S $ 1,227 million (Rs.3,164 crore)and Rupeesupplier'sCredits of US $ 22 million (Rs.56 crore) are not included in the medium-term and long-term debt.
Exchange 6.29 The year under review saw some radical changes in policy in regard to Rate of the exchange rate of the Rupee. First, the Rupee rate was adjusted downwards the . in two stages, on July 1 and July 3,1991. The two-step downward adjustment Rupee of the Rupee in terms of the intervention currency, viz., t h e Pound sterling,
worked out to 17.38 per cent. Thereafter, the Rupee exchange rate was anchored on a Rupee-US dollar rate close to Rs.26 a dollar.

6.30 Secondly, as announced. in the budget speech for 1992-93, effective March 1, 1992, the partial convertibility of the Rupee was introduced in the form of Liberalised Exchange Rate Management System (LERMS). Under the system all foreign exchange receipts on current account transactions (exports, remittances, etc.) are required to be surrendered to the authorised dealers (ADS)in full as hitherto. The rate of exchange for these transactions is the free market rate quoted by the ADS except for 40 per cent of the proceeds which would be based on the RBI official rate. The ADS in turn will surrender to RBI 40 per cent of their purchase of foreign currencies representing current account receipts at the official rate of exchange announced by the RBI. They are free to retain the balance of 60 per cent of foreign exchange for being sold in the free market for permissible transactions.
6.31 Those who need to import goods and services or undertake travel abroad are expected to buy foreign exchange at market-determined rates from the ADS subject to the transactions being eligible under the liberalised trade and exchange control regime.
6.32 i n respect of certain specified priority imports and transactions, provision has been made in the scheme for making available foreign exchange at the official rate. The RBI will thus sell foreign exchange at the official rate
' to ADS only for, (i) import of specified goods covering Government departmental needs, crude oil, diesel, kerosene and fertilisers, as authorised by the Department of Economic Affairs, Ministry of Finance, Government of India, (ii) imports under Exim Scrips unutilised as on February 29, 1992, and (iii) imports of life-saving drugs and equipment under licences.
6.33 For imports under Advance Licences and Special Imprest Licences and imports for replenishment of raw materials for gem and jewellery exports, foreign exchange is available at official rates for 40 per cent of the value. The remaining requirement may be met through purchases in the free market.
6.34 Exporters of goods and services and other recipients of inward remit- . tances in convertible currencies are allowed to retain up to 15 per cent of the
receipts in foreign currency account with banks in India out of the amount to be surrendered to the ADS at market rates.
6.35 During the first eleven months of 1991-92 (April-February), the pound sterling-Rupee parity was revised 290 times as compared with 282 revisions in the preceding full year (April-March). Subsequently, when the US dollar has been the intervention currency, the Reserve Bank's buying and selling rates for US dollar have been kept unchanged at Rs.100 = US $3.8720 and Rs.100= US $ 2.8530, respectively.

6.36 There is an urgent need to settle the question of the Rupee-Rouble rate, particularly in relation to the settlement of outstanding debt to the Russian Federation. So far the Rupee-Rouble rate used for debt repayments was fixed, according to the 1978 Trade Protocol. However, the Rupee-Rouble, Rupee- Dollar and Dollar-Rouble exchange rates have been such that the cross-rates have not been properly aligned. The Russian Federation has become a Member of the International Monetary Fund and has declared its exchange rate. It is necessary to arrive at a more realistic Rupee-Rouble rate to settle the outstand- ing debt obligations of India owed to the Russian Federation.
6.37 As for the behaviour of the Rupee exchange rate in the free market, it was perceived at the time of introducing the partial convertibility that the market exchange rate for the rupee would deviate from the official rate by about 15 per cent and roughly by not.more than 20 per cent. Analysing the indicative rates of Foreign Exchange Dealers Association of India (FEDAI) it is found that the'Rupee - US dollar rate, the average of selling and buying which opened at Rs.29.1971 per US dollar on March 3, 1992, moved down steadily to Rs.31.4713 on March 24, 1992, at which the 'deviation from the official rate worked out to about 21.55 per cent (Table 6.5). Thereafter, the market rate registered a recovery in the month of May and remained steady in the month of June 1992. During this period, the spread between the official and market rate remained in a narrow range of 17 to 18 per cent.
Table 6.5 : Rupee Exchange Rate Movements (Rupees per US dollar)
RBI Rate FEDAI Spread Weighted Indic between Rate @I
ative Co1.(3) Dates Rate and
cQ1.(2) (in p e r cent)
1 2 3 4 5
February 28, 1992 26.0382 N.A.
March 3, 1992 25.8906 29.1971 12.77 27.8745 (-10.82) (-659)
March 24, 1992 25.8900 31.4713 21.56 29.2388 (-17.26) (-10.95)
March 31, 1992 25.89(K) 3 1.2256 20.61 29.0913 (-16.61) (- 1 0.N)
Apif 30,1992 25S9W 30.6138 18.25 28.7243 (-15.95) (-9.35)
May 29, 1992 25.8900 305577 48.03 28.6906 (-14.79) (-9.24)
June 30,1992 25.8900 30 6607 18.43 28.7524 (- 15.08) (-9.4 4)
@ 40 per a n t of official (RBI) and 60 per cent of FIJDN (Indicative) rates.
Note : Figurt! in brackets indicate apprccia(ii~n(+)/dcprccii~~inn(-) of rulm against ~hc tIS dollar over February 28, 1992 rate.
6.38 During the year, the official rate of the rupee showed a depreciation against all currencies on an average basis : by 30.7 per cent against Yen, by 26.7 per cent against US dollar, by 21.9 per cent against Pound sterling and by 21.8 per cent against the Deutsche Mark (Appendix Table VI.12).
Inter- 6.39 World output growth which had shown a sustained rise after 1982, national turned out to be a small decline of 0.3 per cent in 1991. In the major industrial Economic countries it slowed for the third consecutive year to 0.8 per cent in 1991. In Develop- developing countries, it is estimated to have declined by 3.4 per cent. The world ments trade in volume terms slowed to 3.3 per cent in 1991 from 4.1 per cent in 1990.
These developments took place against the background of persistence of reces- sionary tendencies in the US and Europe and the continuation of economic and social restructuring process in the countries of central and eastern Europe and the former USSR.
6.40 The difficult external environment has been a major problem confront- ing developing countries in their efforts to integrate themselves into the world economy through introduction of trade policy reforms, reduction of controls on foreign direct investment and lowering of tariff and other trade barriers. The successful implementation of market-oriented reforms in developing countries would require support by the international community, in particular industrial countries in the form of increased access to world markets. A balanced outcome of the Uruguay Round is of utmost importance to strengthen the multilateral trading system.
6.41 The' former Soviet Union transformed itself into 15 independent States and international assistance is critical in ensuring the viability of these States. The IMF estimates financing requirement for these States at about $ 40-45 billion. The real challenge would be to meet these investment needs witllout adding to pressures on interest rates while at the same time safeguarding flows to the traditional recipients, viz., developing countries.
6.42 A few major countries have not yet given their approval either for the Ninth Quota Review or for the Third Amendment to the Articles of Agreement of the IMF. It has serious implications for developing countries especially in the context of the likely use of Fund's resources by the newly admitted mem- bers.

VII. ASSESSMENT AND PROSPECTS
7.1 The previous Sections have set out the major policy developments, as also the economic performance during 1991-92. While the year 1991-92 began with a crisis, swift action taken on many fronts produced, by the middle of the year, clear signs of a restoration of international confidence in the Indian economy as a result of the wide-ranging economic reform measures. A dramatic improvement in the country's foreign exchange reserves followed. In contrast, the real concerns in 1992-93 centre on the need to bring about a revival in industrial and agricultural growth. Two years of double-digit inflation, and the persistently strong growth of liquidity in the economy pose a dilemma for monetary management. The recent problem arising from irregularities in deal- ings in securities has focused attention on the financial sector. A satisfactory and early restoration of fuller confidence in the functioning of banks and finan- cial institutions is vital. Financial sector reforms is still the need of the hour; the recent events serve to emphasise the importance of hastening the pace of reform.
7.2 Economic reforms in general, including trade, industry and fiscal reforms, should be completed as quickly as possible. The causes leading to export shortfall, which contributed to a stagnation in industrial output in 1991- 92, due to external factors like the break-up of the erstwhile Soviet Union and the recessionary conditions in major developed markets, continue to dominate the economic scene. Persistent inflationary potential, reflecting fiscal imbalance and monetary growth in a situation of shortages in certain sectors, makes macro-economic adjustment a more difficult task.
7.3 The country has embarked on a major structural system reform and the underlying rationale of the move from a command economy to an economy more responsive to market signals has essentially been to achieve greater economic efficiency. By and large, the macro-economic reform of the recent period has been managed satisfactorily though there are still serious concerns about the basic infrastructure and, moreover, there is still a hiatus between policy formulation and implementation at the ground level. These issues will undoubtedly need to be given greater attention if the reform process is to gather momentum.
Agricul- 7.4 The delayed South-West monsoon during the current year, which ini- turd tially created considerable apprehensions about crop prospects, has turned out Prospects to be quite favourable as the season progressed. Out of 35 Meteorological
sub-divisions, the cumulative rainfall up to August 12, 1992 was excess/normal in 25 sub-divisions and deficient in 10 sub-divisions as against excess/normal in 24 sub-divisions and deficient in 11 sub-divisions during the same period of

the previous year. Amongst the 10 sub-divisions which received deficient rain- fall, in at least six, the deficiency has been moderate. Also these six i;i clude tow States like4Haryana .and Uttnr Pradesh with considerable area under irriga- tion. Foodgrains production is thus expected to show some improvement over the previous year's production of 169-171 million tonnes. Even so, the target for the year 1992-93, placed at 183 million tonnes, may be difficult to attain.
7.5 While a fair degree of resilience has been achieved by the agricultural sector over the years, the increase in per capita per day availability in foodgrains is still not too significant; the figure of 455.1 grammes during the five-year period 1981 to 1985 has risen to 474.8 grammes during the next five- year period 1986 to 1990.or by 4.3 per cent. An efficient public distribution system (PDS) is necessary to improve the consumption level of the poor and thus help increase labour productivity. In this regard, the focus on revitalising the PDS in selected blocks, which have concentration of poorhouseholds, should be helpful. The pace of agricultural growth has decelerated in recent years, with the growth rates drifting downwards in almost all regions - in better-endowed as much as in drought-prone areas. Shortages have persisted in some important crops like pulses. Studies show that excessive reliance on price incentives is not only insufficient to trigger a faster growth process in agriculture but can also be a source of general inflation in the economy.. At the farm level, rising costs of farm inputs, stagnation of farm technology, un- favourable terms of trade for farm products, and reduced labour absorption, have brought to the fore the problems of the agricultural sector. Public invest- ment in agriculture has slowed down during the 1980s; so has complementary private investment. The Government's recent decision to substantially raise the Plan outlay for rural development should help to reverse this trend. Apart from larger investment, better farm technology and infrastructure, institutional reforms and organisational improvements should play a greater role in provid- ing an integrated package of crop and non-crop-based rural development projects with focus on agro-climatic zones already identified in terms of area- based coherence of soil type, rainfall, temperature and water resources. It is necessary to ensure that benefits of higher prices reach the farm community. There is considerable scope for supplementing farm incomes, through expanded activities of m k e t gardening, horticulture, sericulture, animal husbandry and dairying, poultry and fishing. Many of these allied activities and the associated agro-business and food-processing industries have proven export potential. Areas of export potential in them should be given a special thrust. These would require, apart from better physical inputs and institutional. credit, concerted attempts at improving infrastructural facilities and a new dynamism in the ex- tension service network in rural and semi-urban areas.

Prospects 7.6 The stagnation of industrial output in 1991-92 - after a growth of about for 8.0 per cent per annum in the past decade - was far worse than that was Industrial expected in the context of the stabilisation policies; in particular, the import Growth compression measures, credit restraint, and fiscal adjustment leading to a
reduction in public sector demand for goods and services, expectations regarding exchange rate changes and Customs duty reductions, all contributed to slippages in production and investment activities. The import-intensity of the economy, though generally low, has been higher than perceived and the import compression measures seem to have adversely affected output activities over a wide spectrum of industries. Now that the reform measures have been clearly set out and the availability of imports, as also bank credit, has been fully restored, it could be expected that there would be a pick-up in industrial investment and output during the fiscal year 1992-93. Corporate investment forecast, based on expected phasing of capital expenditures on all projects for which assistance has been sanctioned by major all-India term-financing in- sti tutions, suggests a sizeable increase in such capital expenditures during 1992- 93 as against a small decline in real terms in 1991-92. Industrial growth may also benefit from the expected improvement in exports. Considering the demand recession experienced by a number of industries, and the weak recovery in overall output, it would be reasonable to expect that in 1992-93 industrial growth would be moderate at around 4-5 per cent; a return to the trend rate of over 8 per cent could be expected to be attained only in 1993-94 after there is a full revival of industrial investment. \
Ovel-all 7.7 Overall, real GDP growth during 1992-93 is expected to be around 3.5 GDP per cent which would be an improvement over the 1991-92'level of a little less Growth than 2.0 per cent.
Inflation 7.8 A matter of concern to the Reserve Bank has been the persistence of strong underlying inflationary potential in the economy. With a view to con- taining aggregate demand, determined efforts have been made to integrate fis- cal and monetary policies which in turn have sought to operate in tandem with the restructuring of the exchange rate, trade and industrial policies. Demand management measures by themselves are insufficient to controI inff ation, espe- cially in the short-term. Insofar as the general inflationary tendencies in the country are concerned, it is necessary to give clear signals to the commodity markets that the authorities would deploy, as the situation develops, a part of the foreign exchange assets for augmenting domestic supplies of key consump- tion goods, particularly cereals and pulses. The recent decision to import wheat is an appropriate response in this context. Three successive years of sharply above-trend inflation rates provide a serious danger signal for the economy. The Indian economy has been characterised by the virtue of lack of inflation

tolerance. Continuing.of a double-digit inflation rate in 1992-93 would signal a loss of sensitivity to high inflation rates. It is, therefore, necessary to consider the avowed objective of bringing down the inflation rate to 8 per cent in 1992- 93 as the central objective of overall economic policy.
Employ- 7.9 A worrisome feature in the current macro-economic scene is the slow ment growth in overall employment opportunities. The social implications of adjust- Goal ment, the equitable nature of the burden borne, will be determined by how
soon and by how much employment will respond to increases in output. As the Planning Commission have brought out in their Eighth Five-Year Plan: 1, 1992-37, a declining trend in employment elasticity with respect to GDP growth, combined with a gap between the addition to labour force and the increase in employment, has left behind a large backlog of unemployment. Estimates suggest that if the growth of overall employment remains only at around 2.0 per cent per annum as in the recent past instead of 3.0 per cent per annum as anticipated, the backlog of unemployment would grow from an es-. timated 23 million at the beginning of the Eighth Plan to 28 million at the end of the Plan. Until rapid and high economic growth takes care of the need for improving employment growth, special employment programmes for the un- employed and supplementary employment for the under- employed would need to be continued. In this context, the proposed linking of the PDS with the IRDP would be a useful measure.
Other 7.10 Apart from the employment goal, the hlfilment of the other quantitative Eighth dimensions of the Eighth Plan would also require very determined efforts. Plan First, to the extent the real GDP growth during.1992-93, the first year of the Goals Plan, is below the 5.6 per cent per annum target, the actual growth in the
subsequent years would have to be accelerated to 6 per cent per annum or beyond. The backlog in the projected agricultural growth rate (3.1 per cent in value added terms) would be still larger. Secondly, the domestic saving rate, even at an unchanged level of 21.6 per cent average for the Eighth Plan, would require a sharp reduction in the dissaving of the public sector which, if achieved without substantial improvement in factor productivity and general efficiency, would have inflationary implications because of the need to reduce subsidies and to enhance public sector prices, tariffs and freights. Also, the increase in public sector saving may mean some curtailment of household disposable in- come and hence of saving unless restraints are exercised in consumption. Final- ly, it is the performance on the external front vis-a-vis the Plan goals that would determine the success or otherwise of the adjustment programmes. The planned reduction in the current account deficit (CAD) from an average of 2.4 per cent during the Seventh Plan period to 1.6 per cent during the Eighth Plan would require an export growth of 13.6 per cent in volume terms and a restraint

on import growth to 8.4 per cent. Such an achievement is all the more impera- tive as the medium-term scenario regarding the debt-service burden is of con- cern with the burden rising from about $ 7.5 billion a year (including NRI deposits) in the initial years to around $ 11.0 billion a year in the last two years . of the Plan.
The 7.11 While the trauma of the external liquidity crisis has been swiftly over- Immediate come, the question of the fundamental disequilibrium on the balance of pay- External ments front still remains. The reduction in current account deficit to 1.1 per Sector cent of GDP in 1991-92, was entirely due to the severe compression in im- Scenario ports, which took its toll in a reduced growth of the economy. While the
management of the external sector was rendered possible as a result of the import compression, the resulting dislocation of industry and employment raises serious questions about the feasibility of the import compression route as a way out of the balance of payments disequilibrium. In order to revive growth, restrictions on imports have been virtually removed with the exception of a small negative list. A spurt in imports may therefore be expected in 1992-93 with beneficial effects on exports and hopefully, the rate of growth of the economy.
7.12 In the light of the radical reforms in trade and industrial policies, it is no doubt reasonable to expect a substantial rise in export growth. - With the new trading arrangements with some of the countries constituting the Common- wealth of Independent States (CIS), there is a need for a reappraisal of India's export strategy. Vigorous efforts are required to identify new markets and to expand the country's share in the existing markets. In the final analysis, the benefits of trade liberalisation may be reaped only if the domestic infrastructure like port facilities, transport and commurrications, and uninterrupted supply of power, are improved with utmost speed and urgency.
7.13 While imports are essential for the growth of the economy and for exports, the recent growth in imports has to a large extent been on account of crude oil and petroleum products. Attainment of viability on the balance of payments front requires concerted efforts at both more efficient use of petroleum products and augmenting as well as diversifying energy sources. The package of energy conservation measures should include appropriate pricing to restrain consumption. In this context, the pass-through of imported petroleum prices and an appropriate exchange rate system are inevitably intertwined.
7.14 An area which requires immediate attention is the augmentation of private remittances from Indian expatriates through official channels, The ex- istence of the parallel markets through which a substantial proportion of such remittances was diverted earlier, that is to say, prior to the introduction of

LERMS, was facilitated by the more favourable unofficial exchange rate for the rupee prevailing in these markets vis-a-vis the official rate, The introduction of LERMS and a number of other related policy reform measures since March 1992 have facilitated attraction of remittances through official banking chan-nels. The facility to import gold is another favourable factor since parallel market transactions in foreign exchange have been to a large extent linked to the clandestine imports of gold. A large flow of remittances through official channels which will be induced through these measures will also require im-provement in the operational efficiency of banking channels which have to become sufficiently responsive to the needs of customers who remit and those who receive.
7.15 The non-resident deposit schemes have gained importance over the years, and the inflows under these schemes have met nearly one-fourth of total financing needs during the Seventh Plan period. The large-scale withdrawal of funds from the Foreign Currency (Non-Resident) Accounts (FCNRA), in the aftermath of the balance of payments crisis in 1991-92, has rendered it an uncertain source. Besides, its cost has become a matter of some concern. The cost, apart from interest rate differential, also reflects the exchange rate protec-tion given to FCNRA and other special-purpose deposits. It may be argued that no foreigner or NRI will place deposits unless he gets the incentive of a high enough return either through exchange rate protection or interest rate spreads or both. Recently, a new scheme for non-repatriable deposits with very attractive features has been introduced; the response to this is still to be seen. The policy objective should be to restructure the various NRI schemes with a view to maintaining attractiveness while reducing (i) the incentive for volatility, (ii) the exchange burden on the central bank of the country, and (iii) the overall effective cost to the country in terms of foreign exchange for such borrowing.
7.16 The country's external debt, inclusive of non-resident Indians' deposits, is at about US $ 70.0 billion or Rs. 2,05,000 crore as on March 31:1992 and an increasing proportion of debt is on commercial terms. In view 01the limited possibilities of a quantum jump i n aid flows, there is a need tc attract foreign direct investment (FDI) on a sizeable scale which confers mu1tiple benefits in the form of balance of payments support, finance for invest ment, technology transfer, enhancement of competition and efficiency in thcIndian industry, and an enlarged export base. The encouragement to FDI in liberal economic environment has no doubt begun. The attainment of at leas an FDI level of, say, US $ 2.0 billion a year, would require the assurance of stable economic environment, considerable promotional efforts and, above a1the availability of adequate infrastructural facilities.

Overall Perfor- mance of Balance 0 P Payments
Fiscaf Correction
7.17 Given various uncertainties, it is somewhat difficult to forecast the over- all performance of the balance of payments in 1992-93. The trade with East European countries is yet to pick up although agreements have been entered into with a number of these countries. Exports to the General Currency Area in the April-June quarter of the year, have shown an increase of 8.4 per cent; their performance in the remaining months will depend as much on the environ- ment in world trade as on the revival of industrial activity in the country. With the freeing of imports and various reform measures put in place, a better per- formance on the export front is, however, expected in 1992-93 as compared with that in the previous year. On the basis of current trends, it appears that the country's balance of payments will continue to be under pressure with a current account deficit of US $ 6 to 7 billion. Keeping in view the possible inflow of capital from various sources, an exceptional financing need of the order of US $ 3 billion is envisaged.
7.18 The downward adjustment in the exchange rate of the rupee (by about 18.7 per cent in US dollar terms). and the subsequent introduction of the LERMS combined with other complementary measures, have brought in a num- ber of benefits : removal of budgetary subsidies for exports; faster realisation of export proceeds; some correction to the rate for the rupee in the parallel market; and signs of larger remittances through official banking channels. Sig- nificantly, this system of partial convertibility has functioned well and the open market premium over the official rate has generally remained in a narrow range of 16 to 18 per cent. This experience has to be viewed against a number of factors which have,contained the demand pressures on foreign exchange resour- ces: sizeable forward sales by banks; the more-than-anticipated level of EXIM scrips available in the market; and the delayed response to import li beralisation measures. Once import demand picks up, the pressure on reserves and hence on the free market exchange rate would begin to be felt. Also, there is the question of the domestic inflation rate which, in the context of the current macro-economic scene, continues to cause concern, although it has declined relative to the last two years' experience. The time-table for introducing full convertibility of the rupee for current account transactions will have to be carefully chalked out keeping in view the macro-economic, including the budgetary, implications of such a decision and the need to increase incentives
- - for exports and remittances.
7.19 At the outset, it has to be recognised that fiscal correction at the Centre and the States is long overdue if debt is to be kept within reasonable levels. Fiscal correction means essentially that Governments should have their revenues cover expenditures and where they do not, returns from investment should cover amortisation costs. So long as revenue deficits continue at the
Centre and are financed by borrowing, the vicious cycle of increased borrowing and attempts to force the banks to lend at below-market rates will continue. Credit repression and crowding-out of productive business activity flow frorn the basic flaw of Governments' not balancing their consumption outlays with revenues. The correction of the fiscal imbalance has to focus on this root cause of the disequilibrium. The Government's medium-term objective of substantial- ly reducing the Central Government's gross fiscal deficit has to be perceived in the context of ensuring that the level of domestic debt is kept within a sustainable limit. This is all the more necessary in view of the fact that the need to move towards market-related interest rates on Government dated securities and Treasury bills is a prerequisite for successhl reform of the finan- cial system, as also to enable the pursuit of an effective monetary policy. The Centre's gross fiscal deficit has been reduced from 8.4 per cent of GDP in 1990-91 to about 6.5 per cent in 1991-92 and .is further expected to decline to 5.0 per cent in 1992-93. As a result of the growing interest burden, the adjustment has turned out to be much shader in terms of the primary deficit (gross fiscal deficit minus net interest payments) from about 6.0 per cent of GDP in 1990-91 to 3.5 per cent in 1991-92 and is further expected to decline to 2.3 per cent of GDP'in 1992-93. In order to achieve this, the net market borrowing of the Centre has been reduced to Rs.5,000 crore for 1992-93, a third lower than the level of Rs.7,500 crore in 1991-92. While the Government's reliance on market borrowing has rightly been sought to be reduced, a word of caution is necessary in that the pace of reduction in market borrowing has to be consistent with the downward adjustment of the gross fiscal deficit. While reducing the market borrowing care needs to be taken to ensure that the monetised deficit does not increase because of higher cost of borrowing from other sources as this would be counterproductive to an early fiscal correction. At the same time, it is necessary to ensure that the system of financing the Government budget deficit is altered by an early date.
7.20 The Reserve Bank has been emphasising now for some years, that its accommodation should take the form of only Ways and Means advances to the Central Government up to an agreed level which should be cleared at the end of each year. Excessive reliance on net Reserve Bank of India credit to the Centre contributes to considerable monetary instability. T o ensure that the monetised deficit does not have deleterious effects on the economy, there is a need for a law restricting the extent to which the Centre can run a deficit and moreover there should be a legal ban on the Government borrowing frorn all sources beyond a certain ceiling with a sub-ceiling on borrowing from the Reserve Bank of India. The upsurge in the Central Government's borrowing in the 1980s, the increase in the coupon rates on Government securities and

the compression of maturities, have given rise to a bunching of repayments and, unlike in the past, in the foreseeable future repayments could by far outstrip the fresh loan floatations. It is in this context that it is necessary to consider the reintroduction of a Consolidated Sinking Fund to redeem the public debt. It is unfortunate that this salutary system of redeeming the Government debt was dispensed with; an early introduction of this system would go a long way towards establishing long-term viability of Government borrowing.
7.21 Measures to curtail the grossfiscal deficit of the Centre have had cqrtain unavoidable repercussions on transfer of resources from the Centre to the States which have suffered due to the rationalisation of the Central taxation structure. Interest rate changes have also indirectly reduced attractiveness of small savings. Excessive strain on the States' finances is translated into frequent resort to overdrafts. With the pressure on the Centre's resources, advances released to the States have been discontinued which in turn have put the finan- ces of a number of State Governments into a bind. To avoid disruption in the States' finances as a result of the operation of the States' Overdraft Regulation Scheme, which requires the Reserve Bank to stop pdyments of State Govern- ments which run an overdraft for eight consecutive working days, there is a need to undertake a fundamental reform of State finances to ensure - that the States do not have structural deficits. In the case of State Governments, there is a dilemma in that they bear the brunt of agricultural and rural expenditures, as also expenditures on social and economic infrastructures. Any severe and across-the-board curtailment of such expenditures could have a direct bearing on the process of development. In their case, therefore, the focus should be on achieving improvements in the efficiency of resource use simultaneously with reduction in the size of expenditure. Also, there exists, no doubt, substan- tial scope for augmenting the resource base of State Governments through rationalisation of the States' taxation system including the practices of granting Sales Tax and other exemptions and tax write-offs. The minimisation of the large hidden subsidies is long overdue. It is apparent that utmost priority is required to be accorded for strengthening the tax administration and for im- proving tax compliance in contrast to the increase in tax rates or the intro- duction of new taxes. More importantly, there is greater scope for mobilising resources through non-tax revenues, particularly by improving the financial positions of the State departmental and non-departmental enterprises. During the three-year period 1989-90 to 1991-92, the estimated losses of State Electricity Boards work out to over Rs.17,000 crore, and those of departmental commercial undertakings at Rs,5,600 crore. In this regard, a recent initiative to strengthen the financial position^ of the State Electricity Boards is an impor-

tant step in the right direction. While the agreement to impose a minimum electricity tariff for agricultural consumers, who have hitherto enjoyed a sig- nificant amount of subsidy in this respect, is a welcome beginning, there are many more areas requiring similar attention. In particular, State Transport Cor- porations and departmentally-run irrigation projects have been incurring mas- sive losses partly due to their inefficiencies of operation and partly due to uneconomic pricing policies. These and other fiscal issues no doubt call for systematic dialogue with State Governments in the context of the stabilisation programme. The introduction of a quarterly review of the budgetary operations of the States would facilitate such a dialogue.
7.22 With the pressure on the overall borrowing programme in 1992-93 because of the reduction in the SLR, the burden of adjustment has fallen on the Centre and Centrally-guaranteed institutions, while the State and State- guaranteed institutions' borrowing has been maintained at the previous year's level. Herein lies a dilemma: the increase in coupon rates on Government securities which is a direct consequence of inflationary trends and the need to maintain a real interest rate, leads to a problem for all borrowing entities. In particular, the States, the institutions of which are running relatively ineffi- ciently find, this a problem. Further, debt servicing at these ,rates requires ;! much more careful screening of projects which, financed with such high-cost money, can in no way expect a rate of return at a level which would enable servicing of the debt. In the first instance, it is necessary for the States to limit their recourse to high-cost borrowing to finance their revenue deficits and losses of public enterprises.
7.23 The root of the problem is the increasing revenue deficits of States which have then to finance them by borrowing at high cost, These costs in turn add to the revenue deficits leading to an explosive increase in debt. It is in- evitable that given the Central Government's fiscal constraints, the States have to balance their revenue budgets with a modicum of transfers from the Centre. If this is not done, the fundamental disequilibrium in States' fiscal situation will continue. The practice of solving the problem by increased transfers from the Centre will only shift the burden of adjustment from the States to the Centre - an increasingly difficult task.
Financial 7.24 In recent years substantial reform measures have been implemented in Sector respect of the financial sector. The Narasimharn Committee on the Financial Reform System has provided a sharp focus on the need for more rapid reorientation of
the financial sector. The Committee's far-reaching recom'mendations have been- discussed in Section I of the Report; quite a few of the recommendations have already been implemented.

7.25 While the need for n basic policy shift from reserve requirements as a tool of monetary control to a more active open market operations policy is well accepted, the central issue is really one of the phasing of this reform. It is recognised that the statutory requirements for banks have reached such high levels that they have tended to become counter-productive and this has fostered the process of disintermediation to an extent. The pace of reduction in reserve requirements needs to be carehlly worked out as too rapid a pace of adjust- ment could conceivably aggravate the problem of excessive liquidity creation in the economy. Thus, a reduction of the CRR to more realistic levels is pos- sible only when there are clear signs of an enduring abatement of inflationary pressures in the economy, As the Narasimham Committee has emphasised, the Reserve Bank should have the flexibility to operate the CRR instrument to serve its monetary policy objectives. An important matter in the CRR regime is the payment of interest on cash balances. It is better to prescribe a low CRR without interest rather than a high CRR with high interest. The dilemma is that the CRR adjustment alters the assets of banks while the reduction in interest affects the income of banks. Thus, the level of CRR and interest rate on cash balances have to be finely modulated to ensure that overall bank profitability is not affected. Again, there is a trade-off between refinance and CRR. It is probably better to move towards a system of lower CRR and lower refinance rather than higher CRR and higher refinance. Ideally, the normal level of CRR should be such that it leaves the banking system viable even if no interest is paid and while the CRR may be raised when monetary expansion is excessive there should be expeditious downward movements when monetary growth comes back to the desired path.
7.26 The Narasimham Committee has recommended that the SLR should be brought down to 25 per cent over a five-year period. This is a reasonable objective to work towards. The phasing of the SLR adjustment should, how- ever, be consistent with the market borrowing programme. A substantial reduc- tion in the SLR was effected in April 1992. The pace of adjustment in the SLR in the future would depend on the pace of fiscal adjustment, the monetary expansion and the inflation rate. The Central Government and Centrally- guaranteed institutions have, in the current year, undertaken a significant reduc- tion in the borrowing programme but the States and State-guaranteed institutions have maintained the borrowing at the previous year's level. While moving to market-related rates on Government and other approved securities, it would be necessary to move the entire borrowing (Centre and States) to market-related rates and as such the phasing needs to be carefully worked out.
7.27 The basic thrust of the Narasimham Committee, that real interest rates should be positive and that concessive interest rates should nut be the veiiicle
for subvention, is well accepted. A considerable extent of interest rate reform has already been undertaken in terms of money market rates, lending and deposit rates and interest rates on Government securities. While these measures need to be persevered with, there is a need for a cautious step-by-step approach rather than a rapid deregulation of all rates in the system. The experience in a number of countries has been that too rapid a deregulation of interest rates and reserve requirements results in a loss of monetary control - something which the Indian economy can ill afford at this stage.
7.28 There are a number of other recommendations of the Narasimham Com- mittee such as reduction in priority sector lendings, the appoin'tment of Special Tribunals for speeding up the process of loan recoveries, the establishment of an Asset Reconstruction Fund (ARF), and reorganisation of the rural credit structure, which need detailed examination and these recommendations have far-reaching implications both in terms of the structure of the financial system and also the financing required to implement these recommendations.
7.29 As regards reduction of the priority sector targeted credit, there is a need to carefully assess the credit requirements of the economically weaker sections of society. The repercussions of any change in the share of these segments on output and employment would have to be studied carefully as the economic structure in India is a highly differentiated one. There are two aspects of priority sector credit which need to be clearly delineated. First, the banking system cannot be expected to bear the subvention in terms of low interest rates and to a large extent this matter has been resolved by relating the conces- sionality to the size of the loan. Secondly, it can be argued that in an economy at the stage of development at which India is, an equitable distribution of credit to the weaker sections can contribute not only to higher output but also help ensure social justice. Whether the banking system is the best instrument for achievement of social goals is a matter of some debate. However, it cannot be denied that the experience in a number of countries shows that some element of direction of credit is necessary in the development process.
7.30 While the Narasimham Committee has recommended the setting up of an Asset Reconstruction Fund (ARF) to take over bad and doubtful debts off the balance sheets of banks and financial institutions, there are certain issues which need attention, and before implementing such a scheme, it would be necessary to be clear about the sources of funding. The impact of such a scheme on recovery climate would also need to be considered. The question of the recovery process is being considered. The Narasimham Committee recommen- dations on the setting up of Special Recovery Tribunals, when implemented, would enable the speedy enforcement of banks' claims. The Reserve Bank has already set out certain norms on capital adequacy, income recognition arid

provisioning. It is recognised that the provisioning will, as a consequence, require large infusion of capital. If these large capital requirements are to be met by the Government or the Reserve Bank, it would merely imply a large monetisation with obvious deleterious effects on the economy. Thus, the
strategy for raising fresh capital by banks needs to be carefully worked out.
Agricul- 7.31 ~nstitutional credit to the agricultural sector has been affected by the turd overdues syndrome that has, over a period of time, debilitated the process of Credit recycling of funds. The Agricultural and Rural Debt Relief Scheme, 1990, has
accentuated the problem of recovery. Further, the relatively low rates of interest stipulated for agcicultural advances are not only unremunerative but even do
i not cover the cost of funds and other expenses incurred by co-operative and other credit institutions. As a result, every rupee of deposit mobilised and lent by the co-operative institutions, for instance, means a negative spread and a consequent loss. There is a built-in disincentive to co-operativelrural credit agencies to expand their deposit mobilisation and lending activities so long as they have to lend at low interest and raise deposits at competitive rates. With co-operative credit societies not being able to mobilise adequate deposits to meet credit needs, this has implied greater recourse to refinance from NABARD/RBI.
7.32 A basic prerequisite for a successful financial sector reform is that the rural credit delivery system, which has developed serious problems in the recent period, is revamped and an enduring institutional structure put in place. While the question of imparting improved viability to the rural credit structure has engaged the attention of various Committees, a viable structure has yet to be evolved. The Government is considering a proposal to set up a National Rural Bank of India. The question of whether all the regional rural banks (RRBs) should be merged into one national level bank or into four or five zonal banks needs urgent attention. The alternative suggested by the Narasimham Committee of merging the RRBs into rural subsidiaries of banks could also be considered. It is imperative to devise a rural credit delivery system which will not require large subvention. In this context, better alignment of interest rates and mix of target and non-target lending would need to be given attention. The problems of the RRBs is a serious one and it would require a multi-pronged approach. To the extent that the rural, credit delivery system is satisfactory in an area, it may be feasible to allow existing institutions and new institutions such as rural subsidiaries of commercial banks to develop on their own strength. There are, however, vast areas where the rural delivery system is quite clearly unsatisfactory and it is imperative that early measures are taken to bring about an enduring improvement in the credit delivery system.

Lessons 7.33 In an earlier section, the genesis and ramifications of the recently from the detected irregularities in the securities operations of banking and financial in- Irregulari- stitutions have been explained. The details of the action taken by the Reserve ties in Bank and the Government, are set out in Part Two of this Report. The Bank Securities is undertaking a fresh look at its own operations and organisational structure Operations and staffing . In particular, the Bank is modernising its operations, strengthen-
ing its operational efficiency, establishing a regular and systematic economic ntelligence apparatus and instituting a strong Supervisory Authority under its 3egis which would have powers of comprehensive supervision over banks, Financial institutions and non-banking financial companies.
7.34 The avowed objective of the Reserve Bank and the Government of India is to restore confidence, both in India and abroad, in the country's finan-cial system. The financial system would become stronger and much more effi-cient by undertaking appropriate follow-up measures in the light of the recent episode.
7.35 An important issue relates to the impact of these irregularities on the reform process in the financial sector. These irregularities are not attributable to the process of liberalisation. It is necessary to note some of the facts about the process of liberalisation. First, the policies of stabilisation and structural adjustment began towards the end of June 1991. Secondly, the liberalisation process so far has essentially been concerned with fiscal correction, industrial licensing, trade reforms, exchange rate adjustment and rectification of the balance of payments disequilibrium. Thirdly, the instruments of monetary policy were tightened in 1990-91 and the first half of 1991-92 more than ever before with the highest-ever interest rates on bank lendings and severe restric-tions on bank credit so as to restrain ag~regate demand in the Indian economy in general and import demand in particular; moreover, the traditional instru-ments of reserve requirements were used as major tools of policy during this period. It is pertinent to note that the financial sector reform is intended to enforce better financial discipline. A link between financial liberalisation and irregularities in securities dealings would thus not be tenable. Finally, it is significant to note that all types of banks and financial institutions - public, private, foreign and co-operative - have been involved in the recent episode. With the vast growth and diversification of the financial system, which has been facilitated by a series of policy initiatives taken during the past few years, the system has now entered a phase of development where further progress is possible only if its efficiency, productivity and profitability are considerably and rapidly improved. The medium-term objective is to put in place a credible and coherent system of financial sector reform. It is, therefore, important that the recent episode, though an unfortunate one, does not put back the clock of

reforms. As the Narasimham Committee has emphasised, the deficiencies in the financial system are structural and a vibrant and competitive financial system is necessary to sustain the ongoing reform process to remove structural impedi- ments in the real economy. For this purpose, a well-structured and comprehen- sive financial sector reform package has to be pursued vigorously so that it would ensure operational flexibility and functional autonomy for the sector.
Board for 7.36 'The Narasivham Committee has recommended the setting up of a Su- Financial pervisory Board under the aegis of the Reserve Bank of India. The Government Supervision have decided to set up a high-powered Board for Financial Supervision under
the aegis of the Reserve Bank with the Governor as Chairman.' The Vice Chairman will be a Deputy Governor of the Reserve Bank of India exclusively assigned to the work relating to supervision. The Board will consist of four to five full-time members. The Board for Financial Supervision will have an Ad- visory Council which will consist of eminent persons with background ex- perience in banking, economics, auditing, management, law and public policy. The Board will undertake supervision and also follow-up on compliance.
Money 7.37 When the call rates in the money market were freed in May 1989, it Market was expected that a stable and healthy money market would emerge. The past Operation three years' experience, however, indicates that the call money rates fluctuate and sharply during any single reserve requirement fortnight. The freeing of interest Reserve rates in one segment, while rates in other segments are generally regulated, Require- does result in the former bearing the bruni of the volatility. The instability in men ts call money rates could be traced to factors, both systemic as well as regulatory,
governing the maintenance of reserve requirements. An issue in this context is whether the present system of maintenance of CRR by the banks on the basis of a daily average for a fortnight has contributed to volatility. While the present system of maintenance of CRR provides flexibility to banks both on the bor- rowing and lending side, the very flexibility afforded to banks has contributed to volatility in the call money rate. In contrast, the SLR is required to be maintained on a daily basis with the liability being lagged by a fortnight as compared with the CRR liability date. In this context, various options can be considered. The liability date for both CRR and SLR could be the same; given the communication system in the country the reference date would be as for SLR and as such the CRR would need to be further lagged than what it is now. If this option is adopted, the logical corollary would be that CRR should, like SLR, be required to be maintained on each day. A'lagged reserve requirement attenuates the policy-and therefore requires much higher levels to be prescribed. i n this context, the reserve requirements could be contemporaneous; this would, however, pose a problem given the present state of communications. It should be recognised that any change in the system of reserve requirements

will require a change in the law. While considering a basic change in the reserve requirements it would be best to first undertake the phased reduction in reserve requirements and then consider a fundamental change in the legislative framework. To the extent that some banks have a structural dependence on the money market, call money rates will remain erratic and the resolution of the high volatility in call money rates lies less in reserve requirement systems than in the over-extended position of some banks.
7.38 In the recent period there had been a phenomenal increase in the amount of churning in the dated secbrities market largely in the form of ready-forward transactions; such activity, ostensibly to adjust reserve requirements, inter alia facilitated the recent irregularities in the securities market. It was for this reason that the Reserve Bank felt it necessary to put a temporary ban on ready-forward transactions in dated securities. A legitimate question that arises is whether there are adequate facilities for inter-bank adjustments of liquidity. Ready-for- ward transactions in Treasury bills are, however, allowed and a market of nearly Rs.8,000 crore should suffice for the fortnightly adjustments. There are a number of reasons for not immediately resuming ready-forwards in dated securities. First, the present reserve requirements and the interest rate regula- tions could provide scope for predatory activity to circumvent the regulatory framework. Secondly, the unwinding of the transactions prior to the ban needs to be completed in view of the serious problems faced by the system. Thirdly, the market borrowing programme and auctions for longer-dated Treasury bills have been proceeding very smoothly despite the disruption of the secondary market. In view of all these factors it is prudent to continue the ban onready- forward transaction in Government securities at least for some time.
7.39 A prerequisite for a well-developed financial system is close integration of various segments of the money market leading to greater stability in and narrowing of differentials. among the relative interest rates. Convergence in interest rates on different money market instruments will have to wait till the rates in other segments of the financial markets are freed. A precondition.for this to be achieved is that the phenomenon of a large monetisation of the Government debt would need to come down drastically.
Monetary 7.40 The macro-economic scene outlined earlier - the possibility of supply PA ie shortages due to reduced agricultural output and their consequences on the Stance inflationary situation - calls for considerable vigil on the monetary front. A
sharp reduction in the M3 target for 1992-93 to less than 11 per cent, as compared with 18.5 per cent in 1991-92 is considered as very crucial in such a milieu, but this is predicated on a significant adjustment i n the gross@cal deficit, as also in the monetised deficit. In this regard, an aspect of fiscal and monetary developments which has been a source of concern to the Reserve

Bank relates to the persistence of considerably higher-than-targeted levels of net RBI credit to the Centre and the budgetary deficit. During the first four and a half months of 1992-93 so far, the budget deficit has been much higher as compared with its levels in the previous year; it has also risen at a faster pace as compared with the previous year's pace of increase. The injection of RBI credit has a multiplier effect working through the system and resulting in con- siderable secondary expansion. In the current policy environment, the monetary system is considerably short of instruments to sterilise liquidity. The reserve requirements have reached such high levels that, as explained in the earlier paragraphs, their potency has been considerably diluted; any further increase in them would be counter-productive and would also contribute to the process of disintermediation. The interest rate weapon has to be flexibly used against the backdrop of inflation behaviour. The real rates of interest have been positive and kept consciously so to fight inflation. There is a case for persisting with the existi-~g rates until the abatement of inflation is found to be of an enduring nature. For the interest rate policy to be effective, it is necessary that there should be a moderation of fiscal deficits. Considering the recessionary condi- tions obtaining in industry, we need to improve the credit delivery so that small and medium and large-scale industries alike augment their investment and out- put activities. A reform in the present system of determining the structue of rates will have to await the emergence of market-determined reference rates in the money market - RBI refinance rate for short-term instruments and the long- term yield rates on Government dated securities. The process of putting in place a dynamic internal debt management policy has been initiated with a move towards market-related rates of interest on Government debt instruments. It would, however, be quite a while before open market operations become an effective instrument of monetary policy. Be that as it may, it is of utmost importance that the size of the monetised deficit is restricted to realistic levels throughout the year. In fact, in a medium-term context, it is imperative, as has been emphasised by the Reserve Bank of India in the past, that, beyond a mutually agreed quantum of Ways and Means accommodation from the Reserve Bank, it is necessary that Government aims at placing its entire debt including the short-term requirements in the market at appropriate interest rates and, moreover, there should be a ceiling on the Government's access to the
b
Reserve Bank. Apart from the fact that this would allow for a more effective monetary management in the system with a view to achieving a sharp break in inflationary expectations, it would also facilitate the implementation of many other important financial reform measures such as the deregulation of interest rates and the lowering of reserve requirements and the introduction of level playing fields among different types of financial institutions.

7.41 With the shift in emphasis of monetary policy instruments away from reserve requirements, it is essential that interest rate policy is used actively to control monetary expansion and thereby to control inflation. The interest rate policy has played a central role along with the stable exchange rate policy in reversing the leads and lags and this has been an important factor in the sharp recovery of the country's foreign exchange reserves. As such there is a need to persevere with the present lending rates until monetary expansion slows down and there is an enduring reduction in the inflation rate. Monetary policy during 1992-93 has the unenviable task of bringing about a drastic reduction in overall liquidity without curtailing the resources available for reviving economic activity. While there are always multiple objectives, ultimately the mission of the Reserve Bank has to be to steer monetary policy with its sights set firmly on inflation control.

PART TWO-THE WORK~NG AND OPERATIONS OF THE RESERVE BANK OF INDIA
VIII. INTRODUCTION
8.1 The accounting year has been one of the most eventful years in the recent history of the Reserve Bank of India. The crucial role played by the Reserve Bank in day-to-day management of external liquidity when it had reached precariously low levels, in averting the crisis and achieving a remark-able recovery in external reserves, and in initiating and/or participating in deliberations associated with stabilisation and structural adjustment measures have all been comprehensively set out in the previous Sections. Two major aspects of its operations which received pointed attention in the context of the reform measures relate to exchange control regulations and banking regulations and supervisory issues; the issues concerning industrial sickness and rehabilita-tibn, rural credit and credit for small-scale industries, urban co-operative bank-ing, regulations of deposit acceptance activities of non-banking financial companies, and the subject of currency management, have all received fresh focus in the changed context.
8.2 Anticipating the need for reorienting the roles oftdifferent wings of the Bank in the current and prospective economic environment, the Bank had al- ready begun as early as in February 1991 to take a fresh look at various aspects of its operations and its own organisational structure and staffing and to prepare a Strategic Plan with an overall perspective of the decade ahead broken into suitable shb-periods. In August 1991, two private consultancy organisations were shortlisted for helping the Bank in preparing the Strategic Plan. An in- house group was set up under the Chairmanship of 5hri R. Janakiraman, Deputy Governor, in September 1991. On the basis of its report submitted in Decem- ' ber 1991, the RBI set up a Task Force to formulate the Bank's corporate plan. After detailed'discussions with the internal Task Force in January 1992 the two consultancy organisations made preliminary presentations to the Reserve Bank. Finally, one of the consultants, M/s A.F. Ferguson & Co. was selected in March 1992 to assist the Task Force and other officers, staff and employees of the Bank. Earlier, in November 1991 an Expert Committee under the Chair-manship of Shri S.S.Marathe, a member of the Bank's Central Board, was set up to review the existing policies relating to human resources development in the Bank. '
8.3 Considering the need for sharpening the supervisory function of the Bank, a Working Group under the Chairmanship of Shri S.Padrnanabhnn,

former Chairman, Indian Overseas Bank, was appointed in May 1991 and its report had been under the consideration of the Bank. Subsequent to the recom- mendations of the Narasimham Committee on the Financial System, the broader question of an appropriate supervisory system for the banks and financial in- stitutions has come into sharp focus and it has now been decided to set up a high-powered Board of Financial Supervision under the aegis of the Reserve Bank of India. The precise details regarding its organisational structure and staffing are being worked out. With a view to providing a forum for collabora- tive efforts between the Bank's professional staff and the academic community, a Development Research Group (DRG) has been constituted in the Bank.
8.4 The magnitude and ramification of the irregularities in securities deal- ings of banks and financial institutions turned out to be much larger and deeper than what were visualised when preliminary enquiries began in January 1992. As explained in a subsequent paragraph, such co-ordinated frauds can occur in any system. That apart, the Reserve Bank and the Government have now before them the avowed objective of restoring public confidence and the confidence of the international community in the country's financial system. Towards that end, the lessons and lacunae thrown up by the episode and anticipated by the Janakiraman Committee are being sifted so that foolproof checks and balances are put in place to prevent a recurrence in future. In the meantime, a 30-member Joint Parliamentary Committee (JPC) comprising honourable members from both the Houses of Parliament has been set up in August 1992 to probe into the whole gamut of securities irregularities (Details are given in Chapter IX j.
8.5 In the light of these major developments and also keeping in view the changing economic structure, information technology and business environ- ment, therole, functions and operations of the Bank assume greater importance. Part 11 of the Report deals with some of these issues as also the operational aspects of the Bank during 1991-92, touching thereupon wherever necessary the policy initiatives foreseen to face the challe,~ging situation ahead.

IX. DEVELOPMENTS CONCERNING COMMERCIAL BANKS
Blanch 9.1 The previous Annual Report mentioned about some element of freedom Expansion to the scheduled commercial banks in respett of opening of Extension Counters of Cnmmer- and swapping of some unremunerative branches. With the completion of the cia1 branch expansion policy for the period 1985-1990, the objective of providing Bank9 adequate banking infrastructure throughout the country, particularly in rural
areas, had been broadly achieved; the opening of new branches in rural areas is being permitted on the basis of the felt need and viability. In response to the suggestions received from banks seeking greater freedom in operational matters in the context of the recent steps towards deregulation and in the light of the recommendations of the Narasimham. Committee, a liberalised licensing policy has been put in place the details of which have been already set out in Section I (Paragraph 1.80).
Prudential 9.2 Likewise, a number of other policy actions like capital adequacy Norms measures, norms relating to income recognition, assets classification, provision-
ing of bad debts on a prudential basis, and accounting standards for invest- ments, have also been set out. With a view to bringing about greater transparency in the annual accounts of banks, beginning from the accounting year 1991-92 (April-March), banks are required to prepare their annual accounts in the revised formats which disclose their accounting policies regarding key areas of operations.
Inspection 9.3 The Reserve Bank has been carrying out two types of inspections under of Banks Section 35 of the Banking Regulation Act, 1949: (i) Financial Inspection (FI)
at intervals of two to four years which involves visits to Head Offices, Con- trolling Offices and a cross-section of branches; and (ii) Annual Financial Review (AFR), so far confined to public sector banks, that covers Head Offices and a quarter of the Controlling Offices only, and relies mostly on the banks' Management Information System.
9.4 'TO obviate the major shortcomings in the AFR exercise, a 'Modified Scheme af Bank Inspection' for all the public sector banks has been introduced on an experimental basis from January 1, 1991. With a view to making the AFR more purposive and to make the findings more pointed, it was thought best to cover a wider cross-section of branches also under this Scheme. Ac- cordingly, the Regional Offices have been advised to take up inspections of as many larger branches of public sector banks as possible in the half-year January to June. It is the intention to cover all the branches with advances of more than Rs.5 crore each.' The Branch Inspection notes are expected to serve as part of

support system for AFRs of Head Offices. The Principal Inspecting Officer will updatelsupplement the findings of those notes with observations during the course of the inspection of Head .Offices/Co~itrolling ~ f t i c e s . However, the financial inspections of private sector banks and foreign banks are being con- ducted as hitherto.
9.5 In May 1991, as referred to earlier, a Working Group (Chairman : Shri S . Padmanabhan) was set up to look into the present system of the RBI inspec- tions of commercial banks and to make recommendations with a view to milking them more purposeful and effective. The group commenced its deliberations on June 8, 1991 and submitted its report to Governor on Septem- ber 10, 1991.
Moratorium, 9.6 Consequent upon the appointment of a Receiver by the Regulators at Amalgama- Cayman Islands to look after the affairs of the Bank of Credit & Commerce tion and International Ltd., the BCCI (Overseas) Ltd., Bombay, had suspended all pay- Liquidation ments and other transactions with effect from July 1, 1991. With a view to
preventing the affairs of BCCI(0) Ltd., Bombay, being conducted in a manner detrimental to the interests of the depositors including the NRI depositors and other creditors of the bank, and with a view to keeping the assets and liabilities of the Bombay branch of the bank separate from the Head Office operations and to settle the claims of Indian depositors, the Reserve Bank filed a petition in the High Court of Bombay to appoint SBI as provisional liquidator of the BCCI(0) Ltd., Bombay, for winding up the operations of the bank. The High Court granted an ad interim order on July 15, 1991 appointing SBI as provisional liquidator.
9.7 Due to large scale irregularities in the securities transactions undertaken by the Bank of Karad Ltd., on behalf of certain brokers involving a very large financial liability which the bank may not be able to fulfil, the bank's con- tinuance would have been prejudicial to the interest of the public and the bank's depositors. On a petition filed by the RBI with the High Court, Bombay, for the appointment of an official of Bank of Baroda, as the provisional liquidator for winding up the operations of the Bank of Karad Ltd., the High Court granted the prayer by passing an ad interim order on May 27, 1992.
9.8 While the above two banks were taken into liquidation during the year, 28 banks in liquidation process were treated as dissolved. The number of banks under liquidation now stands at 96.
9.9 During the period under review the Reserve Bank conducted Annual Financial Reviews in respect of 28 public sector banks and 13 Local Head Offices of State Bank of India. The financial inspections of public sector banks,

fourteen private sector banb and ten foreign b a n b were undertaken during the year.
Irregulari- 9.10 A pointed reference has been made to the recent episode of gross ir- ties in the regularities in the securities transactions of banks and financial institutions in Securities - Sections I and VII of this Report. Two interim reports, as also a Third report, Operations su.bmitted by the Janakiraman Committee, which have all been released, have of Banks brought out the genesis, the modus operandi, the size and nature of these and fraudulent dealings in Government securities, public sector bonds, units of the Financial UTI, and other similar instruments. Institutigns
9.11 The major findings of the Committee in the two interim reports have indicated serious deficiencies in the functioning of the banks and financial institutions involved, absence of necessary internal control in various functions, raising of funds against securities which proved to be not genuine, deployment of funds in call money market while the banks receiving the funds credited the amounts to brokers' accounts, large concentration of transactions in securities with only a few selected brokers (The Committee has observed that over sixty per cent of the transactions were entered into through the medium of brokers) and massive collusion between the concerned officials and the brokers involved in dealings in Government securities, public sector bonds and units, etc. The Committee has listed the devices adopted for diversion of funds from the bank- ing system to the individual accounts of certain brokers which pi-ima facie constitute evidence of fraudulent misrepresentation. Funds-management opera- tions have been conducted in gross violation and with utter disregard of instruc- tions and guidelines issued by the Reserve Bank from time to time. The break-down of essential discipline regarding the issue and recording of Bank Receipts (BRs), the receipt and delivery of securities, and the receipt and pay- ment for settlement of the transactions in many of the transactions have been detailed in the Reports. The Committee has also come across instances wherein brokers have been financed by banks through the discounting of bills not sup- ported by genuine commercial transactions. Large-scale violations of RBI guidelines on portfolio management services by certain banks have been poin- tedIy brought out by the Committee in its Third report.
9.12 The total amount of exposure of bankslinstitutions involved in these transactions aggregated to Rs.3,542.79 crore (After taking into account the value of securities seized by a bank from a broker to the extent of Rs.350 crore).
9.13 The Committee has found that increase in the volume of transactions in securities and capital market instruments over the past year, particularly in the f ~ r m of ready-forward deals, led to indiscriminate use of BRs and even SGLs and facilitated diversion of funds to selected brokers. Funds have been

diverted to the broker involved in these irregular transactions and his associareuconcerns in a number of transactions put through particularly by NHB, State Bank of Saurashtra, SBI and SBI Cap. In several transactions the counterparties mentioned in the contracts provided by the concerned broker were only in name. Further, the facility of netting of the contracts afforded by SBI and SBI Cap. to the broker and collection and credit of bankers' cheques issued in favour of SBI in the broker's accounts and issue of bankers' cheques of SBI as per his instructions have also resulted in irregular operations. The ir-regularities observed by the Committee in regard to SBI's transactions with the broker indicate that the investment account in SBI's books and SBI's accounts with Public Debt Office (PDO) of RBI had been manipulated to accommodate the broker's transactions.
9.14 The Committee found that the functioning of the Public Debt Ofticeof the Reserve Bank of India required considerable speeding up and corn-'puterisation to effectively handle the large number of transactions and to pro-vide relevant information to the banks for reconciliation at regular intervals to detect fraudulentlirregular transactions.
9.15 The Committee has made the following recommendations in its First Interim Report :
(i) The practice of banks entering into ready-forward and ,double ready-forward deals with other banks should be restricted to Government securities only and should be prohibited in other securities including PSU bonds, units and shares.
and double ready-forward deals may be (ii) ' ~ e a d ~ - f o r w a r d prohibited under portfolio management schemes.
(iii) The RBI's prohibition regarding banks entering into buy-back deals with non-bank clients should be strictly enforced.
(iv) Banks should be required to formulate internal exposure limits for transactio~ns including limits in regard to brokers.
(v) Brokers' contraclnotes should indicate counterparty and brokerage charged. . .
(vi) When banks act as custodian of brokers' or other parties' securities, the documentation for all transactions effected for such customers should indicate the banks' status.
(vii) The existing prohibition on banks issuing cheques drawn on their account with the RBI for third party transactions should be strictly en-forced.

(viii) Banks' transactions on behalf of their merchant banking sub- sidiaries should be transparent giving full details to the subsidiaries.
(ix) Banks may be required to conduct all their transactions in PSU bonds, units and similar securities through a separate institution like the Stock Holding Corporation, which can be established to. obviate the need to issue BRs.
(x) Speeding up of the work in SGL Section of Public Debt Office and furnishing of information to banks.
(xi) Widening of scope of the RBI inspections with greater emphasis on the treasury transactions and supplementing of on-site inspection by the RBI by reporting of compliance by banks duly certified by the statutory auditors, with prudential and other bwidelines.
(xii) The RBI should review the adequacy of the Internal Audit Department of the banks.
(xiii) Separate audit by the banks' statutory auditors for the portfolio management operations of the banks.
(xiv) Strengthening of the RBI's organisation responsible for market intelligence.
(xv) Institutional arrangements for inspection of National Housing Bank.
9.16 Apart from accepting these recommendations and initiating follow-up action with utmost speed and urgency, the Reserve Bank has taken a number of other steps as detailed in a subsequent paragraph.
9.17 The scrutiny of securities transactions of banks/insti tutions is continuing with a view to tracing the flow of funds involving various cheques drawn by banks and the brokers.
9.18 The Government and the RBI have taken serious note of gross violation of the RBI guidelines, the failure of internal control systems as also the flouting of banking norms regarding Account Payee cheques. The process for fixing responsibility for lapses and collusion and fraud has been initiated and a CBI enquiry is being undertaken. Government has initiated all steps to ensure that action is takeri to recover the dues of the banking system.
9.'19 Governor held a special meeting with Chairmen and Managing Direc- tors and Chief Executives of banks and .financial institutions on June 9, 1992 for a detailed discussion on the findings and recommendations of the Janakiraman Committee's First Interim Report. The meeting noted the public

concern at the recent revelations in the securities transactions of banks and financia1,institutions and emphasised the need to restore public confidence in their functioning as quickly as possible. The Chief Executives informed the Governor that remedial action has already been initiated by them to introduce proper internal control systems, strengthen monitoring, and remove lacunae in existing systems and procedures so as to prevent the recurrence of similar lapses in future. The Chief Executives expressed their commitment to implement the further guidelines being issued by the RBI based on the Janakiraman Commit- tee Report.
9.20 The Reserve Bank of India and the Government have taken a number of other steps as under with a view to unearthing the entire ramitlcations of the episode to enable appropriate remedial measures:
(i) The entire securities transactions of all the banks and institutions for the past one year are under examination by the Inspecting Officers of the RBI,
/
(ii) Appropriate action has been taken to facilitate the investigations by the Committee, as also the Central Bureau of Investigations (CBI) who has been asked by the Government of India to investigate into the matter.
(iii) The Chairman and two Directors of the Bank of Karad Ltd., which is involved in the case, were served with show-cause notices by the Reserve Bank asking them to step down from the posts. Subsequently, with a view to protecting the interests of depositors of the bank, Bank of Karad Ltd. was put under liquidation, and a liquidator has been appointed to take care of the assets of the bank. The Bank of Karad Ltd., a private bank with an asset base of Rs.80 crore, had an exposure to the tune of Rs.753 crore by issuing BRs without any backing or against non-existent securities. Any option other than liquidation (i.e., amalgamation/merger or moratorium) was not considered feasible having regard to the circumstances of the case. The decision t o place the bank in liquidation was also in the best interest of small depositors. Any amalgamationlmerger with some other bank would have meant that the acquir- ing bank would have to be willing to take on a liability to the tune of ~s .794.22 crore, Moratorium would have made it possible for the institutional creditors to move their preference claim against the bank's assets to the detriment of the interest of a large number of small depositors even to get their deposit insurance money released to the extent of Rs,30,000 each. On the recommendations of the Reserve Bank of India, the DICGC has been directed to release necessary funds against their insurance liabilities.
(iv) The operations of the Bank of Madura Ltd. are being inves- tigated and an observer from the Reserve Bank has been.appointed.,

(v) The Reserve Bank has recommended to the Government of Mnhiira~htra for directing the State's Registrar of Co-operativesto proceed with the winding up of Metropolitan Co-operative Bank involved in the securities malpractices.
(vi) With a view to safeyarding the banks'/institutions' interest and speeding up the process of recovery of their dues, an Ordinance has been promulgated by the Government of India attaching the properties of all those persons involved in the malpractices and placing them with the Custodian ap- pointed4for the purpose by the Government of India.
(vii) The Reserve Bank has de-listed four brokers from the Bank's list of approved brokers.
(viii) The Reserve Bank has directed SBI and ANZ Grindlays Bank Ltd. to make provisions for squaring up their obligations to the National Hous- ing Bank. While SBI has since paid the amount to NHB, ANZ has also brought in the finds to provide for the claim.
, (ix) A 'special court' has been set up by the Government of India to exclusively attend to the cases relating to securities transactions of bankshn- stitutions.
(x) The recommendations of the Janakiraman Committee in its in- lerir?? report have been accepted by the Reserve Bank of India and the same have already being implemented by the Bank. It has already taken up the work of computerising SGL Section of PDO, The Reserve Bank has already intro- duced a computerised system for the processing of SGL transactions in the PDO and the system has since become operational for Central Government loans at Bombay which would be extended shortly to State Government loans also and to other major PDOs. The system provides for (a) promt and imme- diate processing of SGL transfer forms and (b) dispatch of certain essential statements to the individual SGL account holders. A Committee under the
, Chairmanship of Shri S.S. Nadkarni, Chairman of IDBI, has been appointed by the Reserve Bank to suggest modalities for the setting up of a Depository on the lines of the Stock Holding Corporation of India for trading in units and PSU bonds by banks and institutions and the Committee's Report received on August 8, 1992 is under consideration.
(xi) The Reserve Bank has appointed experienced firms of Chartered Accountants to verify the securities transactions of a number of bankslinstitu- tions, including subsidiaries of banks, bank mutual funds and four foreigr banks.

(xii) Action is being taken to drastically overhaul and strengthen the supervisory system for banking and financial institutions and towads that end, to constitute a high-powered Banking Supwisory Board under the aegis of the Reserve Bank of 1ndia.
(xiii) The inspection ~rocedures of the Reserve Bank of India (DBOD) are being modified commencing from the current financial year providing for detailed annual inspection of all banks with Focus on fin:inciaf evaluation. Treasury operations of banks will be looked into specifically and at more rkular intervals.
(xiv) The role of the Audit profession is being enlarged in the RBI's supervisory process from the current financial year.
(xv) Issuance of special guidelines including the prohibition of inter- bank ready-forward deals in dated securities and approvedltrustee securities except treasury bills of all maturities and prohibition of double ready-forward deals in Government securities including treasury bills, along with detailed guidelines on the internal control system required to be put in place and i\C-
counting standards required to be followed.
9.21 The JanakiramanCommittee now proposes to confine its further work to an examination of the findings of the scrutiny already undertaken by the RBI Inspecting Officers under the direction of the Committee and to report thereon.
JPC 9.22 A 30-member Joint Parliamentary Committee (JPC) comprising honourable members from both the Houses of Parliament has been constituted in August 1992 with the following terms of reference: .
~ ( i ) to go into the irregularities and fraudulent manipulations in all its aspects and ramifications in transactions relating to securities, shares, bonds and other financial instruments and the role of the banks, stock exchanges, financial institutions and public sector undertakings in transactions relating thereto, which have or may come to'light.
(ii) to fix responsibilities of the persons, institutions or authorities in respect of such transactions.
(iii) in the above context, to identify the misuse, if any, of and the failures/inadequacies in the control mechanism and the supervisory mechanism.
(iv) to make recommendations for safeguards and improvement in the system for elimination of such failures and occurrences in future.
(v) to make appropriate recommendations regarding policies and regulations to be followed in future.

Industrial Credit un'd Changing Role of the Reserve Bank
9.23 With the discontinuance of the system of prior credit authorisation as also post-sanction scrutiny of credit proposals of large borrowers on cent per cent basis, the role of the Reserve Bank in administering the industrial credit system has undergone a significant change. The observance of the norms has to be increasingly assessed from the view point of prudential requirements rather than that of credit regulation. Large borrowers have also begun to diver- sify their sources of finance with increasing reliance on funds from non-banking sources. Simultaneous1 y,the subject of industrial sickness, overt as well as in- cipient, and its repercussions on credit provided by banks and financial institu- tions, have assumed added significance particularly in the context of structural reforms under way, In the rapidly changing structure, the Reserve Bank would have a wider role to play not only in preventing industrial sickness and mini- mising non- performing assets of banks but also in serving as a catalytic agent in promoting industrial credit by banks on healthlier lines. The translation of these broader themes into concrete action programmes, policies and organisa- tional preparedness is receiving increasing attention.in the Bank.
Sick 9.24 The Reserve Bank issued fresh guidelines to banks in August 1991 on Industrial industrial sickness including measures to strengthen the banks' organisational Under- machinery for detection of incipient sickness, taking corrective measures like takings augmentation of capital by promoters, better co-ordination between the banks
and financial institutions, mandatory participation by banks in the rehabilitation packages, designation of Nodal Monitoring Agency (lead banwfinanci a1 insti tu- tion), and devising of a time-frame for implementation of rehabilitation pack- ages. In order to speed up implementation of the rehabilitation package, the Reserve Bank has evolved a 'Single Window Concept for Lending' under the consortium arrangement for sicklweak units for disbursement of credit (working capitallrehabilitation term loan). The banks and financial institutions have also been given the option, on a case-by-case basis, of conversion of interestherm debt into equity or quasi-equity so as to reduce the debt burden of the unit under rehabilitation.
9.25 The Reserve Bank has withdrawn the requirement of its prior approval for extension by banks of concessions/reliefs beyond the prescribed limits to sicklweak units under revival with a view to speeding up the rehabilitation process. Instead, it has introduced a system of quarterIy reports to be submitted by commercial banks to monitor their performance in the area of rehabilitation of sick/weak industrial units. The Sick Industrial Co. (Special Power) Act,1985 was amended in December 1991 widening its scope and coverage so as to bring public sector and Government companies within the purview of the Act.

9.26 Between September 1989 and September 1990, the number of SSI sick units (which covers rural artisans, cottage and village industries also) increased from 1,86,441 to 2,25,324. Other larger sick/weak units increased from 2,181 to 2,284. The outstanding bank credit increased to Rs.9,930.38 crore as against Rs.6,501 crore in the previous period forming 9.7 per cent of the total bank credit and 17.7 per cent of total bank advances to industry.
l-
The 9.27 The Reserve Bank was granting loans on soft terms to public financial Reserve institutions in order to augment their resources, out of its National Industrial Bank's Credit (LTO) Fund. But in accordance with the decision taken as part of the Assistance Union Budget for 1992-93, the practice, of appropriating amounts from out of to the profits of the Reserve Bank of India to the LTO Funds for providing assis- Financial tance to industrial and agricultural financial institutions has been discontinued. Institutions Therefore, no allocation would be made to the eligible institutions out of the
LTO Funds from the year 1992-93 onwards. .
9.28 It was mentioned in the last year's Report that the Financial Institu- tions Cell set up to function as a nodal unit in-the Reserve Bank for all issues pertaining to financial institutions, had introduced a quarterly information sys- tem in this respect. The data collected under this system are being analysed and used as background information for purposes of policy and monitoring of operations. So far eleven' major all-India financial institutions have been brought under the monitoring of the Cell. In the context of the emerging finan- cial sector reforms, and in view of the recommendations of the Committee on the Financial System, the Reserve Bank of India would be more closely in- volved with the supervision of the financial institutions. The major recommen- dations of the Committee, as applicable to- financial institutions, can be classified under two broad categories, viz., (a) those relating to accounting practiceslstandards (such as, capital adequacy, income recognition, provisioning and asset classification, valuation of investments, disclosure in financial state- ments and taxation) and (b) those relating to 'treatment of bad and doubtful debt portfolios of financial institutions. While the decisions in respect of some of the recommendations of the Committee relating to capital adequacy and pruden- tial accounting norms, as applicable to commercial banks, have already been taken, insofar as financial institutions are concerned, the Reserve Bank in con- sultation with the major all-India financial institutions will be introducing ap- propriate norms.
Housing 9.29 Apart from continuing the target of 1.5 per cent of incremental deposits Finance (computed for the period April 1991 - March 1992) for housing finance alloca-
tion by each bank, it was stipulated during the year that (i) 30 per cent of the allocation would be by way of direct lending, of which at least one-half should be in rural and semi-urban areas; (ii) 30 per cent as term loans to housing

finance companies, housing boards and other public housing agencies; and (ii., the balance of 40 per cent in the form of subscription to guaranteed bonds and debentures of National Housing Bank and Housing and Urban Development Corporation. Banks may exceed their individual targets having regard to their resources position and compliance with their statutory reserve requirements.
9.30 In the case of finance to intermediary lending agencies, the lending rate is 3 percentage points below the minimum rate applicable for credit limits in the category of over Rs.2 lakh. This concession is available only if not less than 75 per cent of the dwelling units are meant for economically weaker sections and lower income groups as defined by HUDCO and the lending rates charged to the ultimate beneficiaries are in accordance with the lending rates structure prescribed by the Reserve Bank of India for scheduled commercial banks. Loans up to Rs.5,000/- to SCIST beneficiaries were provided at an interest rate of 4 per cent per annum. Effective May 14, 1991, these loans may be covered under the DRI Scheme, subject to such beneficiaries fulfilling the income criterion under the Scheme.
9.31 Banks have been advised to ensure that speculative activities in land deals were not supported by the banking system and that there can be no increase in the credit outstanding for 'Real Estate' purposes. Loans provided by banks under their housing finance targets are, however, exempt from this restriction.
9.32 The National Housing Bank was notified by the Government of India on July 26, 1991 as a 'public financial institution'. This move enabled the NHB to diversify its activities towards effective mobilisation of resources. A Board of Directors of the NHB was constituted under a notification issued by the Central Government on April 3, 1992. The share capital of the NHB was raised in March 1992 by Rs.50 crore to Rs.250 crore. During the year under review the Reserve Bank advanced to NHB a loan of Rs.50 crore out of the National Housing Credit (Long-term Operations) Fund raising the total loans advanced out of the Fund to Rs.175 crore.
Service 9.33 The Service Area Approach launched three years ago is in the process Area of getting stabilised. As per the recommendations of the Central Evaluation Approach Team constituted by the Reserve Bank, the work of computerisation of data
under Service Area Monitoring and Information System was awarded to various external computer agencies in different States and the work of computerisation of Lead Bank Returns has since begun.

Agricul- 9.34 As reported in the previous year's Report, the implementation of t u r d and Agricultural and Rural Debt Relief Scheme, 1990 came to a close on June 30, Rural 1991. Earlier figures reported by public sector banks and NABARD. indicated Debt that debt relief to the extent of about Rs.7,917 crore has been provided by Relief banks, of which public sector commercial banks provided Rs.2,962 crore,Scheme, Regional Rural Banks (RRBs)Rs.808 crore and co-operative banks Rs.4,147 1990 crore. Against this, after carrying out verification of debt relief provided, the
banks have claimed an aggregate amount of Rs.7,800 crore, commercial banks Rs.2,841 crore, RRBs Rs.804 crore and co-operatives Rs.4,155 crore(provisional). The amount of Rs.2,925 crore released up to June 1992 by the Government of India out of budgetary allocations for the years 1990-91 and 1991-92 has been allocated for reimbursement to the three agencies - Rs.755.04 crore to public sector commercial banks, Rs.592 crore to RRBs and Rs. 1,577.16 crore to co-operatives. Also, loans aggregating Rs. 1,604.16 crorewere arranged through NABARD for meeting the State Governments' share of 50 per cent in implementation of the Scheme for borrowers of co-operatives.
Committee 9.35 The Committee on Customer Service in Banks has submitted its Report on to the Reserve Bank of India wherein it has identified's number of areas of Customer customer services which call for improvement and made a number of recorn-Service in mendations to improve customer service in banks. The Bank has carefully Banks examined the various recommendations of the Committee and it has been
decided that banks should speedily implement them so as to provide better banking services to the customers.
Committee 9.36 In December 1991 the Reserve Bank of India appointed a Committee on under the Chairmanship of Shri P.R.Nayak, the then Deputy Governor of the small-scale Bank,. to review the arrangements for meeting the working capital and term Industries loari requirements of small-scale industrial units, etc. The Report is scheduled
for submission by end-August 1992.

X. ISSUES RELATING TO THE CO-OPERATIVE CREDIT STRUCTURE
Committee 10.1 As reported in the last year's Annual Report, the Reserve Bank had set on up a Committee under the Chairmanship of Shri S.S. Marathe, a member of Licensing J / the Bank's Board, to review the policy relating to the licensing of new urban of New : co-operative banks and other related matters. The Committee in its Report Urban submitted on May 20, 1992 has favoured a somewhat more liberal entry policy Co-opem- and recommended that organisation of new urban co-operative banks may be tive permitted on criteria of need for the co-operative institution and the potential Banks in the proposed centre/area. The Committee has advocated a pro-active ap-
proach to promote the growth of the urban co-operative banking movement in the regions where it has not taken strong roots. It has suggested increased pre-registration entry point criterion relating to initial share capital and achieve- ment of revised norms of viability within 3 to 5 years. Existing banks are also expected to achieve the same norms. It has recommended relaxations in the entry point norms and elongated time-frame schedule for achieving the viability for banks organised in the least and less developed States and Tribal Areas and also an upward revision of existing norms relating to the scheduling of urban co-operative banks in the light of various factors including the revised norms for new urban banks. The Committee favoured the urban co-operative banks in metropolitan areas to operate in the contiguous urban agglomeration areas thereto. In order to ensure the existence of a strong and viable urban banking structure, the Committee has suggested introduction of a monitoring system to generate early warning signals and timely detection of sickness, determine the revival strategies and future set-up of banks failing to respond to revival strategies. In order to remove the existing feeling of alienation of urban co- operative banks it has been recommended that State GovernmentsIState Co- operative BanksIDistrict Central Co-operative Banks may look into various aspects relating to facilities/sewicing to be provided to urban co-operative banks.
10.2 Once the recommendations of the Marathe Committee are accepted and begun to be implemented, the main thrust of the Bank's policy initiative in the area of urban co-operative banking would relate to a controlled deregulation in the licensinq of new banks, a promotional initiative for the organisation of UCBs in 4 .: less developed States based on a region-specific approach, rationalisation of the position in respect of as many as 313 unlicensed banks, weeding out of weak banks and consolidatio- f the system along sound and viable lines including strengthening of the r~gulatory as well as supervisory mechanism.

Rehahili- tation of Weak Co-opera- tive Banks
Wi~ldiltg up of Metro- politbn Co -o pera - tive Bank Ltd.
Charlge in the Accounting Year for Co- operative Bunks
10.3 As part of its responsibility to supervise, control and develop the urlx~n co-operative banking system, the Reserve Bank has to ensure the existence of a sound and viable urban co-oper;ltive hanking structure. With this objective in view, the efforts of the Reserve Bank are directed towards rehabilitation of banks classitled as weak due to heavy erosion i n their owned funds, high level of overdues, non-compliance with Section ll(1) of Banking ~eg i l a t i on Act, 1949 (as applicable to co-operative societies) regarding minimum share capit:~l, and non-attainment, in stipulated time, of viability norms, prescribed by the Reserve Bank. As a sequel to the adverse findings of inspection/investigation of complaints, indicating substantial deterioration in the financial position, directions under Section 35A of the Banking Regulation Act, 1949 (;IS ap- p1ic:lble to co-operative societies) were issued to 3 primary urban co-operative banks placing restrictions, among others, on payment to depositors incurring expenditlire beyond specified amounts and prohibiting granting/renew;il of loans and advances. With this, a total of 11 banks were working under such directions.
10.4 A reference has been made earlier to the involvement of the Metropolitan Co-operative Bank Ltd. in issuing Bank Receipts (BRs) to some banks the outstanding amount of which exceeded Rs. 1,300 crore as against tile bank's total working capit;ll of less than Rs.8 crore. Considering tlie sericlusness of the irregularities, the Reserve Bank in May 1992 asked the Registrar of Co-operative Societies, Mahsrashtra, in terms of Section 1 IOA(iii) of the Maharashtra Co-operative Societies Act, 1960 to irnmedi;ltely replace the Board of Directors of the co-operative bank by an Administrator to take charge and run its affairs. After due consideration and consultation with the concerned authorities, the Reserve Bank accorded its sanction for the winding up of the bank on June 19, 1992. The Deposit Insurance and Credit Guarantee Corpora- tion (DICGC) has been requested to stand ready to pay to the depositors of the bank, the amount outstanding to their credit up to a maximum of Rs.30,000 per tfach depositor.
10.5 The accounting period of the co-operative banks has been brought in line with that of commercial banks from the accounting period 1991-92 on- wards. Section 29(i) read with Section 56 of the Banking Regulation Act, 1949 has been amended providing for the Central Government to specify the date with reference to which annual accounts are to be drawn by co-operative banks. The Central Government accordingly issued a notification on January 29, 1992 specifying March 31 of each year as the date fo r closing of annual accounts and March 31, 1992 as the date for closing of accounts covering the period 1st day of July 1991 to 31st day of March 1992 by co-operative hanks.

XI* DEPOSIT ACCEPTANCE BY NON-BANKING FINANCIAL AND NON-FINANCIAL COMPANIES
Chit 11.1 The Act has so h r been brought into force in 19 StatesNnion Ter- Funds ritories, viz., Assam, Bihar, Goa, Himachal Pradesh, Karnataka, Madhya Act, 1982 Pradesh, Meghal;~ya, Orissa, Rajasthan, Sikkim, Tamil Nadu, Uttar Pradesh,
West Bengal, Andaman & Nicobar Islands, Chandigarh, D:~dra & Nagar Haveli, Dnman & Diu, Lakshadweep and Pondicherry. Necessary follow-up action is being taken with the remaining States/Union Territories..
Acccptunce 11.2 During the year under review, three more Union Territories 11:ive issued of De- notitici~tions authorising suitable oftlcers to take action against unincorporated posiCs i>y bodies as envistlged in Sections 45T and 58E of the Reserve Bank of India Act, Uniri- 1934 thereby bringing the total number of such StatesIUnion Territories to 30. corporutecl Tlie matter is being pursued with the remaining States. Of the prc>secutinns Bodies against 19 unicorporated bodies initiated as reported in the last Report, 5 cases
have been disposed of by the trial courts. The other cases are at viirious stages of trial.
Working 11.3 In May 1992, tlie Reserve Bank has set up a Working Grcwp under G~.oul) on the Cli:~ir~nansliip of Dr.A.C. Shah, Chairman, Bank of Bnrod:~ to study in depth Firtulacii~l tlie role of non-banking t'inancial companies and suggest regulatory and control Compuilics me;lsures to ensure he;ilthy operations of these companies. The Group is ex-
pected to submit its report by the end of August 1992.
Bank's Policy and Regula- tions to wards Deposits Accep- tar~ce i)y Non- Bunking Corn- pa nits
11.4 It was mentioned in the earlier Report that effective July 27, 1901 the ~n:ixi~num rate of interest that non-banki ng financial companies and misccl- 1;ineous non-banking companies can offer on their deposits lirid been raised from 14 per cent to 15 per cent per annum. In September 1991, i t was prescribed that interest could be paid or compounded at quarterly rests. From June 17, 1992, however, these companies have beer] allowed to pay interest or compound interest at rests not shorter than monthly rests. The requirement of maintaining liquid assets in tlie form of bank deposits and investments in Government and approved securities by hire-purchase and equipment-leasing companies has been raised from 10 per cent to 15 per cent of the deposit li;ihilities which would be achieved in phases of one per cent in each quarter commencing from November 1, 1991 and reaching 15 per cent on and from November 1, 1992. Out of the 15 per cent liquid assets, n minimum of 5 per cent is required to be- kept in the form of Central and State Govern~nent securities andlor Central and State Government-guaranted bonds. The mini- mum and maximum period for which deposits can be accepted by 1n:ln :lnd investment companies have been raised from 6 months and 36 months, respec-

tively, to over 24 months and 60 mc~nths, respectively,;a in the c;rse will1 Ihehire-purchase and equipment-leasing con~panies. It h;rs illso heeti stipuli~ted th:rti f a cornp;lny is engaged both in hire-purchase finnnct: and erluipmetlt-leiisingactivities, its business in both these activities will be taken together in deter-mining its principal business and classificiition. On a 3-year average the cotn-pany should hold at least 50 per cent of its assets in hire-purchase andequipment-leasing and should Ilave at least a third of its income from these twoactivities so as to be classitied :IS a hire-purchase or leasing compnny.

XII. DEPOSIT INSURANCE AND CREDIT GUARANTEE CORPORATION
12.1 Under the Deposit Insurance Scheme of the Corporation, the insuri~nce coveriigz per depositor per bank and rate of insurance premium remained un- altered at Rs.30,000/- and 4 paise per Rs.100/- per annum, respectively. As at the end of June 1991, the fully- protected accounts constituted 96.4 per cent of the total number of deposit accounts. During the year, the Corporation paid an aggregate amount of Rs.7.64 crore towards settlement of claims in respect of one commercial bank and four co-operative banks. Furthermore, a provision of Rs.50.97 crore has been made for claim liabilities (inclusive of Rs.45.43 crore in respect of the Bank of Karad Ltd.). There have been increasing demands that the existing limits of insurance cover are inadequate. Any increase in the insurance cover would, however, necessitate a stepping-up of the premium rate from the existing level. The matter is under consideration.
12.2 Out of its six credit guarantee schemes, the Corporation has terminated three Schemes, viz., Small Loans (Financial Corporations) Guarantee Scheme, 1971, Service Co-operative Societies Guarantee Scheme, 1971 and Small Loans (Co-operative Credit Societies) Guarantee Scheme, 1982 with effect from April 1, 1992 on account of either nil or negligible guaranteed advances and persistent default in payment of guarantee fee, etc., by participating institutions. The two schemes for small borrowers, viz., Small Loans Guarantee Scheme, 1971 and Small Loans (Co-operative Banks) Guarantee Scheme, 1984 and the one Scheme for Small-Scale Industrial sector, viz., Small Loans (Small-Scale Industries) Guarantee Scheme, 1981 which together cover more than 99 per cent of the total guaranteed advances are, however, in operation. The guaran- teed advances under these Schemes amounted to Rs.46,543 crore as on March 31, 1991. In spite of the increase in the guarantee fee rate from 50/75 paise to Rs.1.50 per Rs.100 with effect from April 1, 1989, the guarantee fee receipts fell short of the guarantee claims receipts consecutively over the last two years. There is, therefore, a need for reviewing the operational viability of the existing guarantee schemes.

XIII, EXCHANGE MANAGEMENT AND EXCHANGE CONTROL
13.1 The year under review saw considerable reorientation in exchange management and control. The introduction of the Liberalised Exchange Rate Management System (LERMS) effective from March 1,1992, as explained ear-lier, constituted a major step forward in regard to the medium-term objective of aiming at making the rupee convertible in a phased manner for external transactions- in current account. The Reserve Bank has also liberalised many aspects of exchange control, simplified some of them, reduced their rigour and shed its powers in favour of delegating them to authorised dealers for the convenience of users af foreign exchange. The Bank has, however, been entrusted with additional responsibilities in granting automatic approval fordirect foreign investment, as also for technology agreements, on high-priority industries, and in approving foreign currency loans/credits of short maturities.
Foreign 13.2 Foreign investment in high priority industries requiring large invest-Investment ments and technology collaboration will be encouraged to obtain higher
technology to increase exports and to expand the production base. In this light, automatic approval is now being granted by the Reser~e~Bank for direct foreign investment up to 51 per cent foreign equity in high-priority industries listed in Annexure I11 to the Statement on Industrial Policy. Such investment in trading companies primarily engaged in export activity is also being permitted. Simul-taneously, non-resident Indian (NRI) investment up to 100 per cent equity is being allowed in such high-priority industries. To encourage NRI investment, it has been decided to allow existing or new companies engaged in the areas of specified real estate development to issue shares1 convertible debentures to non-resident Indians (NRIs) and overseas corporate bodies (OCBs) owned by them, on non-repatriation basis,up to 100 per cent of the new issue.
13.3 In order to achieve technological' upgradation required for improvingcompetitiveness of the Indian Industry in (he international market, autom:lticapproval is being given by the Reserve Bank for technology agreements he-tween Indian companies and their foreign collaborators. In order to help this process, the hiring of foreign technicians and foreign testing of indigeneouslydeveloped technologies have been freed from prior clearance of Govern-mentlResente Bank as required hitherto.

Direct 13.4 The Reserve Bank has granted general permission to NRIsIOCBs to NRI take up or to subscribe to, on non- repatriation basis, the shares or convertible Investment debentures, whether by public issue or private placement, by a company incor- on Non- porated in India as also to invest by way of capital contribution in any reputria tion proprietory or partnership concern in India, without prior approval, subject to Busis certain conditions.
Investment 13.5 With a view to providing further incentives to NRIs, it has been decided by Non- to permit NRIs and their OCBs to acquire both on repatriation and non-repatria- ~es idents tion basis, subject to certain prudential limits and a general body resolution to of Indian that effect, sharesldebentures of Indian companies through stock exchange(s) Nutionulity/ in India, under Portfolio Investment Scheme (PIS), up to 24 per cent of total Origin paid-up equity capital of a company concerned and 24 per cent of total paid-up under PIS value of each series of convertible debentures issued by a company, as against
the earlier limit of 5 per cent each.
Acquisition 13.6 General permission has now been granted to foreign citizens of Indian of Im- origin, whether resident in India or not, to acquire immovable properties movable situated in India for residential purposes against payment in foreign exchange Property subject to certain conditions.
13.7 It has been decided to permit on application foreign citizens of non- Indian origin, whether resident in India or not, and foreign companies, trusts, societies and associates incorporated abroad to acquire, hold, transfer or dispose of immovable property in India provided purchase consideration is made in foreign exchange out of remittances from abroad. The permission to acquire the property would,however, be subject to the condition that neither the rental income nor the sale proceeds of the property would be allowed to be remitted at any time outside India.
Import of Gold by NRIs
13.8 General permission has been granted to persons of Indian nationality or origin to bring into India as part of their baggage, gold in any form up to 5,000 grams (i.e., 5 kilograms) provided duty payable on such gold under the Customs Act, 1962 is paid in any convertible foreign currency. The rate of duty which was initially fixed at Rs.450 per 10 grames has been reduced to Rs.220 per 10 grams. While in the case of non-residents the general perlnission is available once in six months, in the case of others the general permission is available provided their stay outside India immediately preceding their coming to India has not been less than six months.
FERA 13,9 Government has also announced its intention to undertake a comprehen- Review sive review of the Foreign Exchange Regulation Act, 1973 to simplify and
remove regulations which hinder free flow of foreign capital into India ;IS ;dso investments by Indian companies i n joint ventures overseas. In the meantime,
the Reserve Bank has issued various notifications under the existing provisions of FERA granting general permissions. Thus, restrictions imposed on FERA companies (i.e., companies incorporated in India in which the non-resident interest is more than 40 per cent) under Section 26(7), 28, 29 and 31 of FERA, 1973 have all been removed as indicated below thereby placing them on par with other Indian companies in regard to their operations in India. FERA Com- panies are now permitted,
(a) to borrow money or accept deposits from persons resident in India;
(b) to. accept appointment as agent or technical or management advisers in India of any person or company;
(c) to allow their trade marks to be used by any person or company;
(d) to carry on in India any activity of a trading, commercial or industrial nature except agricultural and plantation activity;
(e) to acquire any undirtaking in India carrying on any trade, commerce or industry or purchase the shares of any such company;*and
( f ) to acquire, hold, transfer or dispose of by sale, mortgage, lease, gift, settlement or otherwise any immovable property in India.
IDBs and 13.10 Under the 'Remittances of Foreign Exchange and Investment in Foreign the Exchange Bonds (Immunities and Exemptions) Act, 1991' which came into Immunities effect from September 18, 1991, two schemes were introduced. Scheme
13.11 In terms of Section 3(l)(a) of the Act, 'The Remittances in Foreign Exchange (Immunities) Scheme, 1991' was formulated by the Reserve Bank of India under which a one-time transfer of funds to India was permitted on a non-repatriable basis for which the recipients would not be asked about the source, of funds or the purpose and nature of the remittance and would enjoy exemption from exchange control regulations and direct tax laws. The Scheme which was initially open up to November 30, 1991 was extended up to January 31, 1992.
13.12 Under Section 5(l)(a) of the Act, the State Bank of India was permitted by the Reserve Bank to issue India Development Bonds (IDBs), originally in US dollars at a rate of interest of 9.5 per cent per annurn but later also in Pound Sterling at an interest rate of 13.25 per cent per annum, for a maturity period of five years from the date of allotment with full repatriation benefits for both interest and principal. Originally, the Scheme was to remain open between October 1, 1991 and November 30, 1991 but it was extended up to January 31, 1992. Eligible subscribers for the IDBs were NRIs, OCBs and banks acting in

a fiduciary capacity on behalf of NRls and OCBs. Authorised dealers have been permitted to grant rupee loans to the non-resident holders of IDBs against their security for certain specified purposes, the rupee loan not exceeding 75 per cent of the value of the security and the rate of interest at 4 per cent above the Bank Rate.
Swaps 13.13 The Bank commenced dollar/rupee swap transactions with effect from April 29, 1991. The swaps were in the nature of the RBI buying spot US dollar and selling forward for maturities in three and six months. The main purpose behind these deals was to mop up the excess liquidity in the inter-bank market which arises when authorised dealers purchase spot dollars to cover their for- ward sales to customers.
13.14 The swap window was extended to 2, 4 and 5 months in September 1991 and continued up to February 19, 1992 when it was temporarily suspended. After introduction of LERMS, the Bank reintroduced the swap facility with effect from March 3, 1992 in minimum lots of US dollar I million for tixed date deliveries in two, three, four,'five and six months. As on June 30, 1992, the outstanding under the swap deals was US $ 2051.25 million.
Foreign 13.15 A few new foreign currency/external accounts have been permitted to Currency1 be maintained. First, the 'Exchange Earners' Foreign Currency (EEFC) External Accounts' wherein all exporters of goods and services and other recipients of Accour~ts inward remittances in convertible currencies are allowed under LERMS to
retain up to 15 per cent of their receipts, The accounts can be maintained in any form, i.e., currentlsavings or term deposits with the banks in India. The funds held in such accounts can be used for meeting current account payment permitted under Trade and ~xcha'nge Control Regulations. In view of this, the existing Blanket, CAFEX and BAFEX permit holders were allowed to cccntinue to avail of the remittance facilities for all permitted purposes withinthe balance available against the said permits up to May 31, 1992.
13.16 Second, the opening of foreign currency accounts by Indian exporters with banks in India and abroad. Permission would be granted selectively to exporters having satisfactory track record and net foreign exchange earnings during the preceding year from exports to and imports from countries in the External Group of not less than Rs.4 crore to maintain foreign currency ac- counts with designated branches of authorised dealers in India. AS for main- taining foreign currency accounts with bank abroad, the Reserve Bank would consider such cases where exporters are in a position to arrange to raise foreign currency overdrafts/revolving lines of credit from banks abroad for tinancing their import requirements for export purposes. Normally, only one account will be :~llowed to be maintained by the exporter in US dollar or Pound sterling.

FCNR Swap Scheme
Accep t a ~ ~ c e of .Foreign Currency Deposits from ADS
Inter-bank Deposits
An exporter allowed to open a foreign currency account with either a bank in India or abroad will be permitted to credit proceeds of a11 export shipments made by him to countries in External Group (except countries which are mem- bers of the Asian Clearing Union)' to such accounts. The funds in the account will be permitted to be utilised for specified purposes:
13.17 The third is that of opening of Resident Foreign Currency (RFC) Ac- counts with authorised dealers in India by returning Indians. This new Scheme, replacing the existing 'Returning Indians Foreign Exchange Entitle- ment (RIFEE) Scheme', enables returning Indians who were residents in the External Group Countries to open and maintain RFC Accounts in US dollar with designated branches of authorised dealers in India to which they are per- mitted to credit the entire balances standing to the credit of their foreign cur- rency accounts held abroad in permitted currencies which are transferred to India within three months from the date of their arrival in India.
13.18 Deposits under the Foreign Currency (Non- resident) Deposit Scheme (FCNR) can be accepted in four currencies, viz., Pound sterling, U S dollar,
i and Japanese yen. It has now been decided that, in case a LzriE :J any other convertible currency, desires to place a deposit under the scheme, there will be no objection to authorised dealers undertaking a fully-covered swap in that currency against one of the FCNR currencies with an NRI depositor. This will enable a depositor with a non-FCNR currency to participate in the FCNR Scheme. There is also no objection to such a swap being done between two FCNR currencies. Swap difference may be paid to, or received from, the customer and may also be shared between the customer and their authorised dealer. However, the transaction between the authorised dealer and the Reserve Bank will be only in one of the four FCNR currencies and will be put through in the normal course under the FCNR scheme.
13.19 Authorised dealers have been advised tb-t the interest payable on US dollar deposits with the Reserve Bank for maturities beyond one month will be the London Interbank Offered Rate (LIBOR) for the corresponding maturities. Earlier, interest payable or. US dollar deposits for periods of one month and above was equal to one month's LIBOR prevailing on,the day before the date of transaction.
13.20 Authorised dealers have been permitted to manage their foreign curren- cy funds within prudential normslguidelines to be prescribed by their top managements and subject to adequate and effective internal contrt3ls in place. They would be required to place deposits in four major designated currencies, viz., US dollar, Pound sterling; Deutsche mark and Japanese yen, with other

authorised dealers within the local interbank market for amounts and periods of their choice, at market determined rates of interest. It is also not necessary that such transactions should be only for funding the Nostro accounts or for reducing overdrafts in such accounts.
Libemli- 13.21 With a view to mitigating the rigours of control, exchange controlsations in regulations have been relaxed in various areas as indicated below : Exchange Control i) Indian firms/companies have been permitted to engage the services Regulations of foreign technicians without the prior approval of the Reserve Bank provided
the terms of engagement conform to the prescribed guidelines relating to per-diem rate, duration of engagement, etc.
ii) The value limits for taking out gold jewellery and precious stones/non-gold jewellery by travellers' going abroad have been revised up- wards.
iii) Consequent on introduction of LERMS, the blanket/BAFEX/CAFEX permit schemes have been withdrawn. Authorised dealers have, how-ever, been permitted to release excl~ange for foreign travel of residents for business, medical treatment, employment, technical training, study tours, for attending conferences, etc.
iv) Additional powers have been given to authorised dealers to allow remittances of export claims, commission on exports, and to permit reduction in invoice value.

XIV. ORGANISATIONAL MATTERS OF THE BANK
Currency Chests
Currency Manage- ment
Committee on Currency Manage- men t
14.1 There were in all 3,922 currency chests functioning in the country at the end of June 1992. Out of this, 2,809 chests were with State Bank of India and its associate banks. The nationalised banks held 671, whereas the treasuries and sub-treasuries were having 418 chests. The number of chests with the Reserve Bank and Jammu and Kashmir Bank Ltd. continued to remain unal- tered at 17 and 5, respectively. Along with these chests, 492 repositories main- tained with public sector banks were also functioning.
14.2 As mentioned in the previous year's Report, a few private sector bank? have now been permitted to open currency chests. Fifteen private sector banks have sought permission to establish the chests of which seven have been per- mitted to set up one chest each in their respective arealzone of operations. Two private sector banks have already established currency chests while another had entered into an agreement with the Reserve Bank to open a chest.
14.3 There has not been much improvement in the position regarding the availability of fresh notes. The volume of supplies from the existing two note printing presses at Nasik and Dewas has remained, more or less, static for-quite sometime. With the increase in demand for fresh notes the gap between demand and supply has been widening and the supply constraints were acute in respect of higher denomination notes giving rise to complaints of non-av?ilability of fresh notes. Under the circumstances, the Bank has had to necessarily advise all the currency chests to sort out notes and salvage maximum number of reissuable notes on a continuing basis and to ensure that surplusldeficit chests are identified to effect inter-and intra-circle diversions. As a sequel to this move and the recycling of soiled notes, there has been deterioration in the quality of currency notes held with the public as also the currency chests. The immediate need to augment the supply of fresh notes in higher denominations to meet the ever increasing demand continues to, be of paramount importance.
14.4 In keeping with the decision taken by the Committee on Long-Term Coinage Policy of the Government and reiterated by the Committee on Curren- cy Management to coinize notes in denominations of Rupee one, Rupees two and Rupees five in a phased manner by 1995, the Standing Group of the Government of India has already implemented the decision by tinalising specificationsldesigns of coins. The other decisions of the Group include : (i) bringing out a new family of notes of reduced sizes coinciding with the corn- missioning of the two new note presses at Mysore and Salboni, and ( i i ) utilising the existing production capacity of the Nasik Press to also print notes of higher
New Note Press Project
Surveys Cor~ducted by the Reserve Bank
Progress of Compu- terisation
denominations in anticipation of increasing demand for such notes. Besides, the Bank has also initiated action with a view to changing the systems and proce- dures involved in cash handling within the Bank as recommended by the Com- mittee on Currency Management.
14.5 The pace of civil construction including provision of various infrastruc- turd facilities required at the project sites at Mysore (Karnataka) and Salboni (West Bengal) for the new note printing presses has progressed further during the year under review. The New Note Press Project had reinvited tenders for possible use of web technology for printing notes of lower denominations. On the basis of a techno-economic re-assessment, however, i t has been decided to go in for sheet tecl~nology for all denominations of notes. As part of the tender processing for the main plant and equipment, the financial packages offered by the tenderers have been evaluated and the choice of successful tenderer is expected to be finalised shortly.
14.6 The 'Survey of Foreign Currency (Non-Resident) and Non-Resident (External) Rupee Account' conducted earlier for the period July 1985 to June 1988 has been launched again in November 1991 to cover a further three-year period from July 1988 to June 1991 and the results are awaited. As referred to in the previous year's Report, the decennial All-India Debt and Investment Survey (AIDIS) 1991-92 was launched by the National Sample Survey Or- ganisation (NSSO) as part of the subject programme of their 48th Round, The Bank was actively associated with the technical work of designs, schedules, tabulation formats, etc., for the survey. The field work commenced in January 1992 and is expected to be completed by December 1992. 14.7 Internal Accounting and Chest Accounting modules are running live at the Issue Departments of Ahmedabad, Byculla, Nagpur, Madras, Hyderabad, Bangalore, New Delhi and Kanpur. The systems are going to be operationalised at Jaipur and Trivandrum shortly. Computerised payroll module is fully opera- tional at Bangalore, Ahmedabad, Madras and Kanpur, Payroll package has been loaded on the Issue Department Systems at Nagpur and Hyderabad and presently is on the parallel runs at Nagpur. The payroll software will be loaded on the Issue Department Systems at New Delhi and Trivandrum next month. As regards other offices, it would be taken up in a phased manner.
14.8 For preparation of various reportslstatements relating to Weekly State- ments, Profit and Loss Accounts, Balance Sheet of the RBI and reconciliation of the RBI General Accounts, etc., 3 personal computers with UNIX operating system have been installed in the Department of Government and Bank Ac- counts. Five additional PC ATs have been installed in the Department of Economic Analysis and Policy' for computerising the activities of the department. ,Signature storage and retrieval systems have been installed at Nag-

pur and Bangalore. The system at Bangalore is fully operational. Signature. capture work was completed and the system is being t~tilised for retriev:ll and verific;ttion cjf sign:ltuns. A similar system is delivered to Citlcutt;i Oftice also. A mini-computer system was installed in the Legal Department for storage and quick retrieval of legal decisions. Software development is in progress. ALPMs (with LAN) were delivered and installed in Madras Office. Software is ported and test runs have started. ALPMs have been delivered at New Delhi; 2 ALPMs have been installed but not yet operationalised.
14.9 The process of replacement of the present Cii-Honeywell Bull Mainframe Computer System in the Department of Statistical Analysis and Computer Services (DESACS) by a state-of-the-art large Mainframe Computer System is in progress. The new system is expected to be installed early next year. A back-up payroll application package has been developed on the IBM computer system of National Clearing Cell so as to avoid any dislocation of processing of sensitive payroll application in the event of break-down of the existing mainframe system which has, of late, become prone to frequent failures. The software packages were developed on PCs for general accounting and pension processing, which can also be used with advantage by various departments of the Bank. Development of software for implementing certain administrative applications like advances for consumer articles, housing loan, etc., is in progress. The first phase consisting of SGL Transfers (local) in respect of Central Government loans has been operationalised since July 2, 1992 and work in respect of remaining items is in progress.
Computeris- 14.10 One-way inter-city clearing was further extended to connect Trivan- iltion of drum and' Baroda to Bombay and Coirnbatore, Salem, Trichy, Madurai and Cheque Trivandrum to Madras. The concept of 'Electronic Clearing Service' was in- Clearance troduced with the salary credit of the RBI employees through the Clearing
House Mechanism. The scheme is now operational at Madras and one salary disbursing unit of Central Office. Pension credit through clearing house mechanism has also commenced at Madras, Calcutta and Bombay. National Clearing Cell, Madras, has also been conducting electronic clearings with the monthly interest payment transactions of Madras-based financial companies.
OfTice 14.1 1 Further progress has been made in respect of office aids and equipment! Auton~ation in the Bank. In addition to the existing number of Fax machines operating i~
the Bank, 34 more Fax machines were installed in 8 Central Oftice Depart ments, 3 Training Colleges and 21 Offices.

Strategic 14.12 The Reserve Bank is now actively engaged in a Strategic Planning Piunnil~g Exercise, which has an overall perspective of 10 years, broken up into smaller in the periods of 2, 3 and 5 years, The exercise aims at identifying those trends and Reserve changes which are likely to occur in the global and national economic environ- Bank ment :~nd their implications for the Reselve Bank.
14.13 The future plan of action regarding computerisation in the Reserve Bank has to be organised in the context of sweeping reforms taking place in the financial sector, introduction of new financial instruments and widening of the financial markets. The macro-economic administration is expected to un- dergo considerable changes due to several measures initiated by the Govern- ment in an environment of delicensing, deregulation and market determined mechanism for transactions and pricing. In this environment, there will be greater scope for computerisation of new items of work apart from computeris- ing items of work in existing areas. The installation of new state-of-the-art Mainframe Computer System at the Department of Statistical Analysis and Computer Services would provide considerable avenues for development of software, communication experiments for exchange of data with banks and new and quicker methods for data processing and retrieval. The expertise i n systems and software areas in the Bank will need to be put to optimum use by creating congenial organisational structure. Existing computer/communication resour2 ces, such as, BANKNET and IBM Mainframe will have to be optimally used. MICR or input-based computerised clearing for local and inter-ci ty cheque processing will have to be extended to more and more commerci;illy important towns. It is also necessary to interconnect the four metropolitan towns for
.clearing settlement operations so that each member bank knows its net funds position immediately after each settlement through BANKNET.
14.14 The stage has now reached to atleast network commercially important centres so as to facilitate instant information/data transfer. There is need for real time on-line access to money market indicators (stock market, money market, securities market, etc.,) within the country to start with and globally in the shortest span of time. The flow of information should be at a great speed with efticiency. There should be effective use of expertise and software fo r creating and using the data base. BANKNET should .be suppfernented with FAX and Electronic Mail facilities. There is a greater need to have an 'in- tegrated on-line payment settlement' system for identified commercially impor- tant centres on the patterns of FEDWIRE of USA. It is essential to have a system of on-line updation of SGL account of banks and others with the Reserve Bank and consequenti;tl instant payment settlement of such transac- tions. Even smaller towns getting sizeable NRI remittances may hirve t~ be networked. This is ;ill the more necessary for the Reserve B:lnk beci~ljse of its

C.D. Deshn~ukll Melxloriul Lecture
SEANZA Central Ban king Course
His tory of the Reserve Bank
Training
Deveiop- nlerlt Resea rcli Group
1G IDR
crucial role as the central banking institution charged with overseeing the functioning of banks and financial institutions.
14.1 5 The Seventh Chintaman Deshmukh Memorial Lecture was delivered by Mr. Jacques de Larosiere, Governor, Banque de France on March 24, ,1992 in Bombay on 'The World-wide Adjustment Process in the 1990s'.
14.16 The nineteenth SEANZA Council of Governors' meeting was held on November 22, 1991 in Tokyo hosted by the Bank of Japan. The Governor of the Reserve Bank of India presented the Report of the Directing Staff on t he eighteenth SEANZA Central Banking Course held in Bombay in Oc- tober/Decemher 1990 as also the Report on the cost of the said Course and the principles of cost-sharing. The lectures and notes of the eighteenth SEANZA Central Banking Course have been brought together in the form of a book.
14.17 Work on the History of the Reserve Rank of India is on hand and the drafting of the volume covering developments from 1951 to 1967, under the guidance of the Committee of Direction, is in progress in the History Cell set up for the purpose.
14.18 In the recent period the Bank has been exploring the introduction of new and innovative avenues for improving the general efficiency and profes- sional skill of its employees. As of now, there are a number of scliemes in operation and in this year also the Bank came out with certain new schemes and the number of employees availing the facilities and deriving the benefit hiis been increasing steadily.
14.19 The economic reform measures throw up complex and varied issues that their ramifications and long-term effects would need to be discussed by a series of research studies undertaken with intellectual inputs of a high order. With a view to fulfilling this need, the Development Research Grcwp (DRG) was constituted in the Bank's Department of Economic Analysis and Policy in November, 1991. The DRG aims at producing quick and quality papers on subjects of current policy issues and areas of interest to the Bank. The special feature of DRG studies is that it is an outcome of collaborative effort between external experts - academics, consultants and professionals - and a team of research workers within the Bank. These studies are published for wider dis- cussion among professional economists and policy makers. During the first six months of its working, the DRG has published three studies and six studies are on hand.
14.20 The Indira Gandhi Institute-of Development Research (IGIDR) con- tinued its research activities and completed, during the year, studies in the areas

Bankers Training College (BTC), Bombay
Reserve Bar] k Staff Ccillege (RBSC), Madrus
College of Agricul- tural Banking (CAB), Pune
of methods of planning and policy analysis, energy policy, agriculture and rurnl developmer~t, industrial sector, macroeconomic and monetary policy is- sues, external sector and environmental studies. It also- conducted various con- ferences and workshops on topics, such as, trade policy reforms, CNG implementation for transportation, challenges of development, economic growth and poverty alleviation, energy modelling and long-range planning fo r enkrgy resources, and development and environmental sustainability. The In- stitute is conducting a four-year Ph.D. Programme in Development Policy since August 1990. It has enrolled the second batch in August 1991.
14.21 The new programmes introduced by the College during the year were in the areas of Mutual Funds, Credit Monitoring, Profile and Financing of Selected Industries, Monetary Management, Security and Risk Management for Security Officers, and Programme for Disciplinary Authorities. The College also arranged seminars on Financial System and Profitability of Commercial Banks.
14.22 During the year, the College conducted 94 progralnmes (including 9 programmes in ~ i n d i ) with 2,396 participants, bringing the total number of participants trained at the College since its inception in 1954 to 43,774.
14.23 The College introduced a few new programmes, such as, Office Management and Housekeeping, Development Programme for Rajbh:isha Of- ficers, Programme on 'UNIX' and 'C' Programming Language, and Programme on Structured Systems Analysis and Design.
14.24 During the year, the College conducted 76 programmes, imparting training to 1,627 participants and the total number of officers trained since its inception in 1963 rose to 28,490.
14.25 During the year, the College conducted four new programmes, viz., Programme on Successful Implementation of Rural Development Schemes, Programme on Financing of Sericulture, Programme on Methods of Recovery of Agricultural Loans, Orientation Programme on Inspection 'for UBD officers and a Seminar on Agro-exports. Besides, an international programme on 'Management of Financing of Small-Scale Projects' was conducted on behalf of the Asian and Pacific Regional Agricultural Credit Associ;ition (APRACA). Other programmes include four special programmes of four weeks duration each for officers of the National Savings Bank of Sri Lanka and a programme ' on 'Term Credit Lending' for the officers of Agricultirral Development Bank of Afghanistan.
14.26 During the year, the College conducted I04 yrogr;immes (inolirding 1.1 pnlgr;tmmes exclusively in Hindi) imparting training to 2,422 of'ticers. Tlie totiif

Zonal Training Centres '
(ZTCs)
Training in Commer- cial Banks
Deputation of Ofli- cers for Training in India and A broad
Training Facilities to om- cel-s of Foreign Banks
number of officers trained by the College since its inception in 1969 was 40,478.
14.27 The programmes conducted by ZTCs during the year included a one- week programme on computer appreciation for Class I11 staff. During the year, 1,902 Class 111 and 295 Class IV staff received training, raising the total number of staff trained by the ZTCs to .40,002 and 2,984 respectively.
Training in Com- puter Technology
14.28 .Under the scheme of training of the Bank's officers in Grades 'A', 'B' and 'C' in commercial banks, 116 officers have completed the training so far since its introduction in 1986. The scheme was reviewed and revised suitably during the year. Forty officers have been deputed to commercial banks this year for undergoing training under the revised scheme. During the year, two senior officers completed a six-months attachment in key departments of commercial banks while one more officer is currently undergoing the same.
14.29 During the year, the Bank deputed 314 officers to participate in training programmes, seminars and conferences organised by managementbanking in- stitutes in India. Two officers are currently attending M. Phil. Course in Ap- plied Economics at the Centre of ~kve lo~rnen t Studies, Trivandrum.
14.30 Twenty six officers were deputed during the year for traininglstudy to banking and financial institutions i n the USA, UK, Switzerland, Germany, Japan, Thailand, South Korea, Iran, Philippines and Malaysia.
14.31 Under the scheme for award of scholarships to the Bank's officers for higher studies abroad for a duration not exceeding one year, introduced in 1985 as a part of the Golden Jubilee celebrations of the Bank, 4 ofticers are being selected every year. Until now 24 officers have had the benefit of this scheme.
14.32 During 1991-92, in all, 174 foreign officials from different countries availed the training and study facilities extended by the Bank. Of these, 127 were from Sri Lanka, '13 from Iran, 8 from Afghanistan, 7 each from Kenya and Tanzania, 4 from Uganda, 2 each from Botswana and Nepal, and one eack from Ethiopia, Malavi, Kizighistan and Gambia. The total number of officer! of foreign banks trained since 1981 was 813.
14.33 Since 1987 the Bank has been providing incentives for acquirinj qualification in the field of computers and in all 117 officers and 476 clerica staff ,have joined courses at various institutions in the country.

Incen- tives fibr Acclnil-iag Profession ;rl Quali- flco tions
Scheme 0 f Sponsor- ship tbr PI1.D.
North Eos tern Institute of Bank Munage- inen t
Employer- employee Relations
14.34 Under a scheme of offering incentives to the employees w l ~ o success- fully complete the Chartered Financial Analysts programme conductedby the Institute of Chartered Fin:~ncial Analysts of India (ICFAI), Hyderabad, 151 - employees h;id availed of the benefit of the scheme.
14.35 The Bank introduced another Scheme a year ago of sponsoring ofticers from the Department of Economic Analysis and Policy for Ph.D. programme and two officers are presently pursuing their studies in IIT, Bombay, while another officer is prosecuting study at the Indira Gandhi Institute of Develop- ment Research, Bombay.
14.36 North Eastern Institute of Bank Management (NEIBM) was established in Guwahati in 1980 with a view to catering to the training needs of the North Eastern Region. The Institute is engaged in training, research and consultancy in the banking and management development areas. As these f:icilities needed to be expanded i n order to cater more effectively to the banking development potential in the North Eastern States, NEIBM proposed broadbasing of its spon- sorship (which was till then confined to just three banks) and requested the Bank to become one of the sponsors. Accordingly, the Bank agreed, in August 1991, to become its lead sponsor, simultaneously with the induction of three more banks including NABARD. The Bank's share in the funding of NEIBM's activities will not be more than 30 per cent, and the Deputy Governor in charge of training is the ex-officio Chairman of its Governing Board.
14.37 The employer-employee relations at various centres of the Bank by and large remained cordial during the year. 14.38 A Joint Study Team comprising 6 members each from All-India Reserve Bank Employees' Association and the Bank was set up in August 1990 to look into the question of providing promotion avenues to Class 111 employees, consistently with organisational needs and achieving greater flexibility in the deployment of staff. The Bank has accepted the Report of the Team and implemented its agreed recommendations in respect of the Cash Department. Another Joint Study Team on similar lines has been constituted by the Bank along with the All India Reserve Bank Workers' Federation to go into the question of recruitment to base cadres, regularisation of part-time employees into full-time service, absorption of daily wage employees into regular service, etc., :lnd its Report is awaited.
14.39 In respcmse tc? requests fiom the Bank's Ofticers' Assc~ci:itions for ;i
reapprz~isal of various policies affecting their career, an Expert Cornmittee was set up under the Chnirm:~nship of Shri S.S. Marethe, to review the existing

policies relating to Human Resources Development pnrticul:~rly those of Direct Recruitment and Prclmotion in the Oftkers' cadres. Tlie Expert Gominittee h;ts since submitted its Report and it is being processed by the Bank for ph:lsed implementaticm.
StutT 14.40 During the year under review, the Reserve Bank intrcxluced inany wel- Well'are f ire 1ne:aures for the benefit of the staff at large. A mention was tn:lde in the
last year's Report about establishment of a Fund in commernoriltion of the birth centenary of Dr. Babasaheb Ambedkar. A new scheme entitled 'Blii~r:~t Ratnil Babasaheb Dr. B.R. Ambedkar Centenary Year Scholarship Sclierne' was in- troduced f i r grant of scholarships from out of this Fund exclusively for the children of Scheduled C:~ste/Sclieduled Tribe Workmen employees of tlie Bank.
14.41 The Bank has liberalised -the scope and extent of scholnrships gr:~nted to the wards of employees under the 'Bank's Golden Jubilee Year Scliol:rrsliip Scheme'. The liberalisations include doing away with the lirnit as to the number of scholarships by covering all eligible wards and granting of ti n:~iicial :~ssis- tence for purchasepf books to the wards of workmen employees. who are awarded this scholarship.
14.42 In the context of increasing incidents of robberies :ind terrorist attacks on banks and their employees, the Reserve Bank has, :IS outlined by the Gc>vvcrnmrnt of India, made available n packdge of co~~ipens:~tic>n/re~viird, for its own employees injured1 killed in such incidents. As per this package, tlie fi~mi ly of the deceased is eligible for receiving compens:ltion ranging ,from rupees one lakh to five lakh, besides various other benefits. This Scheme along with the Bank's own scheme of compensation for injuriesfdeath due to acci- dents, while on duty, adequately provides for the employees/families i n case of any untoward incidents.
'. 14.43 The Bank effected certain amendments to the RBI Pension Regulaticms which included an important amendment providing for grant of premature retirement pension to e~nployees seeking voluntary retirement a f er rendering 2 0 years of qualifying service and addition up to a m:~ximum of 5 years to qualifying service for sucfl retirement. The employees who had e:lrlier opted for contributory provident fund were allowed to exercise fresh options in favour OF pension, in response to which the percentage of pension optees has now gone up to 45.21 per cent. A decision has also been taken to give the henetit of pas1 service in the Public Sector banksf SBIJCentral and State Governments/Centra' autonotnous bodies as qualifying service for pension broadly on the lines o similar provisions existing in the Central Government Pension Scheme.

Employ- 14.44 The representation to Scheduled Castes (SCs) and Scheduled Tribes ment to (STs) in different categories of recruitment in the Bank during the calendar year Reserved 1991 was as under : Categories; SCs ISTs.
Total of which Percentage Category Number of
Candidates SC ST SC , ST Recruited
Class I .- 59 16 9 27.1 15.3
Class 111 186 33 26 17.7 14.0
Class IV 270 9 6 24 35.6 8.9
Of whom 4
(a) Excluding 226 67 20 29.6 8.8 Sweepers
(b) Sweepers 44 29 .4 65.9 9. J
With this, the total number of SC and ST employees in the Bank as on January 1, 1992 rose to 2,362 and 704 in Class IV, 2,495 and 1,190 in Class 111 and 525 and 109 in Class I, respectively. During the year, the Liaison Ofticer for SC/ST employees conducted inspection of reservation rosters maintained at Bangalore, Bombay, Calcutta, Guwahati, Kanpur and Patna offices of the Bank. There has been a continuing dialogue between the management and the repre- sentatives of the All India Reserve Bank SC/ST and Buddhist Employees' Federation to discuss matters relating to implementation of the reservation policy by the Bank. During the year, three such meetings were held at Bombay.
Ex- 14.45 During the calendar year 1991, out of 186 and 270 vacancies tilled in Servicemen Classes 111 and IV respectively, 27 and 66 posts were required to be reserved
for ex- servicemen at the prescribed rates of reservation of 14.5 per cent for Class 111 and 24.5 per cent for Class IV. As against this, 26 vacancies in Class I11 and 54 in Class IV were filled up by appointing ex-servicemen raising their total strength in the Bank to 787 in Class 111 and 1,081 in Class IV as on December 31, 1991.
Physically 14.46 During the calendar year 1991, eight physically handicapped personsliandi- were recruited in each of Class Ill and Class IV raising the total number of capped physically handicapped employees in the Bank to 424. Pel-sons
Promotion 14.47 The Bank has been making continuous efforts to promote Hindi in its of Hindi day-to-day functions. During the year, full time functional Hindi Training
Programme for senior officers and Intensive Training Programmes for middle level officers were conducted in which 232 officers participated. Similarly, 1009 ernploye'es/officers were trained in Hindi Workshops during the year. Training in Hindi typing was also imparted to 38 English Typists.
14.48 The fourth revised and enlarged edition of 'Banking Shabdavali' was published during the year. Work on 'Banking Paribhasha Kosh', an interpreta-tive dictionary of banking terms and phrases was completed and ready for publication.
14.49 September 14, 1991 was celebrated as Hindi Diwas at all offices of the Bank, In order to increase the competitiveness among employees as well a s officers for increasing use of Hindi, inter-office and inter- departmental .com-petitions were held during the year and shields were awarded.
14.50 Contributions in Hindi to the in-house journal 'Without Reserve' have increased. Similarly, the Hindi quarterly 'Banking Chintan Annchintan' pub-lished by the Bankers Training College continued to make valuable contribution of original Hindi to banking literature. 4
Office 14.51 During the year, 1991-92 a sum of Rs.14.24 crore was spent on con-Building -struction/acquisition of office buildings and residential quarters, additions and and alterations to the existing premises and purchase of land. 15 officers' quarters Residential and 92 staff quarters were completed at Lucknow and Bhubaneswar during the Accorn- year. The work on construction of office buildings at Jammu and that of modation Bankers Training College complex at Hyderabad is in progress. Construction
of 560 officers' quarters and 468 staff quarters are in progress at different Centres. Plans have been finalised for constructing an office building together with quarters for Class 111 and IV staff at New Bombay.
14.52 The Bank has laid down satisfaction norms for residentialxquarters at ass I1 and 75 per cent for offices (Transferable) and at 50 per cent each for Cl \
IV staff (non-transferable). The Bank has achieved the required level of satis-faction in respect of officers' quarters at 11 ,centres. Similarly, in respect of Class 111 and IV quarters the required level of satisfaction has been achieved at more than 50 per cent of the centres and with the completion of the projects

under cons~ruction/planning almosl80 per cent of tho centres where the Bank's oftlces art? located would achieve the norm.
fiousing 14.53 During the period July 1, 1991 to June 30, 1992, the Bank sanctioned Loan n total amount of Rs. 14.26 crore towards housing loans to employees
(societies/ individuals). The details are given below :
cat egory No. of No. of Amount in
Saciclics Employees Itupccs
1 2 3 4
A, Co.opcrnlivc
llousing Socictics 35 141 64,98,830
i) Fresh loans
ii) Additional loi~ns 35 141 64.98.830
B. Individual loans sanctioned by Ccnlml OlYice 322 3,43,25,189
i) Frcsh loilns 209 3,09,07,122
ii) Additional loans 113 34,18,067
C. Individuiil loans sanclioncd by llegional Ofliccs 1,264 * 10,17,95,886*
i) Fresh loi~ns 709 7,83,90,5 13
ii) Additionill loilns 555 2,34,05,373
Total (A+D+C) 35 1,727 14,26,19,905
* In respect of Jammu, Ji~ipur, Kanpur and Calcutta (Banking) offices, the housing loans relate to sanctions up to March 31, 1992.
Central 14.54 Dr. C. Rangarajan, Deputy Governor of the Bank relinquished charge Board of his office with effect from August 20, 1991 consequent upon his appdintment
as a full-time Member, Planning Commission. The Board wishes to place on record its high appreciation of the services rendered by Dr. C. Rangarajan.
14.55 Shri A. Ghosh, Deputy Governor of the Bank relinquished charge of his office with effect from the close of business on January 20, 1992 on com- nletion of his term. The Board wishes to place on record its high appreciation
f the services rendered by Shri A. Ghosh.
4.56 Shri P.R. Nayak, Deputy Governor of the Bank relinquished charge of is office with effect from the close of business on March 31, 1992 on com- letion of his term. The ~ o a ' r d wishes to place on record its high appreciation f the services rendered bv Shri P,R, Navak.
Local Board
14.57 Shri S.S. Tarilpore, forn~er Executive Diwccor of tile B ~ I I I ~ was np- pointed as Deputy Governor with effect from January 30, 1002 for :\ period up to September 30, 1996.
14.58 Shri S.P. Shukl;) cei~sed to ht: I11e Government nilminee on the Ccnlrirl Board with effect from Noveinher 6, 1991 an3 Shri Montek Singh Ahluw;lli:l, Secretary, Economic Affairs, Government of India, was nnmin;~ted i n his pl;lce from that date. The Boi~rd wishes to plilce on record its ;~ppreci:\tinn of the services rendered by Shri S.P. Shukla.
14.59 The Board regrets to report the sad demise on March 29, 1902 of Col. B.H. Zaidi, former director. CoI. Zaidi had heen on the Central Board of the Bank from September 16, 1958 to December 12, 1963. The Board wishes to plztctt on record its deep sympathy to the members of his family in their bereavement.
14.60 The Board regrets to report the sad demise on June 5, 1992 OF Sllri D.C.Kothitri, former Director on the Central Board of the Bilnk from January 15, 1969 to June 30, 1972. The Board wishes to place on record its deep sympathy to the members of his family in their ben:wement.
14.61 The Board regrets to report the s;id demise on June 9, 1992 of SIwi Mahboob Ahmed, member of the Eastern Area Loc:ll Boilrd of the B:lnk from August 25, 1984 till his demise. The Boz1rc.l wishes to place on record its deep sympathy to tlie members of his family i n their bereavement.
14.62 There was no change i n the constitution of any of the h c i t l Boards during the year.
Appoint- 14.63 Shri W.S. Saraf was appointed as Executive Director wit11 effect from merit of February 1, 1992. Executives

XV., THE BANK'S ACCOUNTS FOR THE YEAR 1991 -92 (JULY-JUNE)
1. INCOME
15.1 During the accounting year ended June 30, 1992 the Bank's income, after making adjustments for various provisions, increased by RS-1074.59 crore (or 23.2 per cent) to Rs.5,699.56 crore from Rs.4,624.97 crore of the previous year. The sources of income are given below :'
(liupces crore)
Year ending
June 30, 1992
Year ending
Junc 30, 1991
(a ) . Intcrcst on securities, loans and advances to banks, Financial institutions, State Governments etc., (including interest on foreign securities, deposits, etc.,) 4,527.84
(b) Discount on rupee and foreign treasury bills
(c) Exchange on rcmiltanccs, TI'S purchased,etc., (including forcign transactions).
(d) Commission on management of public debt and other miscellancous income.
Total income :
15.2 There was an increase of Rs.1,112.28 crore in interest earnings during 1991-92. Discount earned registered a decrease of Rs.142.36 crore mainly on account of a fall in the discount earnings on Rupee Treasury bills.
2. EXPENDITURE
15.3 Total expenditure which was Rs.3,279.97 crore during 1990-91 (July- June) increased by Rs.919.59 crore to Rs.4,199.56 crore in 1991-92 (July-June). The increase was mainly due to the amount reimbursed to the Government for changes in respect of drawals from the IMF under the Extended Fund Facility, (under which drawings were made during 198111984) increased cost of estab- lishment, security printing, turnover commission paid to public sector banks for conducting Government business and payment of interest to scheduled banks on their additional eligible balances for C R R purposes. Of the interest payments of Rs.3,311.47 crore, interest payments to scheduled banks during the year on

Table 15.13 Reserve Bank of Indla : Lncome and Expenditure - 1981-82 to 1991.92
(Rupees' crore)
Sr. ' Particulars 1981-82 1982-83 1983-84 1984-85 1985-86 1986-87 1987.88 1988-89 1989-90 1990-91 1991-92 No.
1. Total Income'(Gross) 1185.42 1343.61 1645.13' 188628 2209.67 2896.85 3541.23 4030.25 4426.73' 4624.97' 5699.56
2. Appropriations to :
(a) NIC (LTO) Fund 290.00 315.00 315.00 350.00 400.00 430.00 450.00 450.00 ' 525.00 525.00 - - (b) NRC (LTO) Fund 180.00 225.00 275.00 300.00 350.00. 300.00. 330.00 330.00 375.00 400;00 -.
(c) NRC (Stabilisation)
Fund 75.00 75.00 80.00 25.00 10.00' 10.00 10.00 10.00 10.00 20.00 - (d) NHC (LM) Fund - - - - - - 50.00 25.00 50.00 50.00 -
3. Total (a+btctd) 545.00 615.00 67000 675.00 760.0 740.00 840.00 815.00 960.00 995.00 -
5. Expenditure :
(a) Interest paid to
Scheduled Comm. 228.66 303.19 503.28 625.00' 810.00 1042.99 1521.59 1829.82 2137.33 -2431.02 2683.68
Banks. . . (b) Agency Charges 70.16 82.28 93.93 132.85 ' 150.01 163.64 173.88 259.46 261.25 265.62 302.34
(c) Security Printing 4158 35.94 43.42. 58.28 100.08, 173.05 206.81 187.02 143.71 162.27 238.30
(d) Interest on Extended
Funds Facility (EFF) - - - - - 368.00 357.03 445.18 388.89 62.00 540.42
(e) Other Exp. @ FO.02 97.20 124.50 185.15 17958 199.13 231.81 283.64 325.43 359.06 434.82
6. Total Expenditure 430.42 518.61 765.13 1001.28 1239.67 1946.81 2491.12 3005.12 3256.61 3279.97 4199.56
(a+b+c+d+e)
7. Amount Transferred to
Government (4-6) 210.00 210.00 210.00 210.00 210.00 210.04 210.11 210.13 210.12 350.00 1500.00
Q Includes expenditure on Establishment, interest on funds and other Expenditure. (-) means 'nil'

their eligible additibnnl balances (i.e., above the 3 per cent statutory ratio) maintnined with the Reserve Bank for CRR purposes alone amounted to Rs.2,683.68 crore and constituted 63.9 per cent of total expenditure (Table 15.1).
15.4 Establishment cost went up by Rs.33.60 crore to Rs.277.29 crore andformed 6.6 per cent of total expenditure mainly on account of periodic increases in pay and allowances of staff in all categories and liberalisation in the schemes for reimbursement of medical expenses, leave fare concession, etc.
15.5 Security printing and incidental costs, which constituted 5.7 per cent of total expenditure, amounted to Rs.238.30 crore and were higher by Rs.76.02 crore than last year, on account of increase in the rates of charges for printing of note forms and cheque forms. ,
15.6 The higher turnover in Government transactions handled by Agency Banks resulted in Agency charges registering a rise of Rs.36.72 crore toRs.302.34 crore and formed 7.2 per cent of total expenditure.
15.7 A major policy decision taken during the year was to discontinue the practice of appropriating large amounts from the profits of the Reserve Bank for credit to various statutory funds for advancing loans to industrial and agricultural financial institutions before transferring the surplus to Government. Accordingly, the surplus profits transferred by the Reserve Bank to Government as announced in the Central Budget, 1992-93 stand at Rs.1,500 crore for 1991-92 (July-June) as compared with Rs.350 crore in 1990-91 and Rs.210 crore in the 1980s (Table 15.1).
3. BALANCE SHEET ' Banks' 15.8 The aggregate deposits of scheduled commercial banks rose by Deposits Rs.12,658.49 crore from the previous year's level of Rs.30,789.62 crore to
Rs.43,448.11 crore, whereas aggregate deposits of scheduled state co- operative banks, other scheduled co-operative banks, non-scheduled state co-operativebanks and other banks, declined by Rs.356.67 crore from the previous year's level of Rs.805.04 crore to Rs.448.37 crore during 1991- 92 (July-June).
0 t her 15.9 The rise of Rs.1,821.45 crore i n other deposits from the' previous year's Deposits level of Rs.5,868.62 crore to Rs.7,690.07 crore was mainly on account of an
increase of Rs.1,573 crore in the balance in IMF Account No.1.
Foreign 15.10 Foreign exchange reserves include foreign securities. in the Issue Exchange Department, balances held abroad and a part of 'Investments' in the Banking Assets Department. Such assets which stood at Rs.2,382.69 crore as on June 30, 1991
increiised by Rs. 13,742.24 crore to Rs.16,124.93 crore as on June 30, 1992.

G o I Rupee Securities and Invest-ments
Loans and Advances
Other Assets
Provisions for Exchange Cover fo r Foreign Currency Deposit Schemes
15.11 Investments in Government of India(GO1) Rupee Securities and shares of subsidiaries, which were at Rs.96,410.11 crore as on June 30, 1991 declined by Rs.2,381.35 crore to Rs.94,028.76 crore on account of disinvestments of Government of India Rupee Securities during the year.
15.12 The credit extended to scheduled banks and financial institutions registered a sharp increase of Rs.3,077.11 crore from Rs.9,506.43 crore as at the end of June 1991 to Rs.12,583.54 crore as at the end of June 1992 mainly owing to higher outstandings under export refinance (Rs.7,395 crore) to scheduled commercial banks.
15.13 Other assets increased by Rs.1,834.83 crore from Rs.2,513.35 crore as at June 30, 1991 to Rs.4,348.18 crore mainly on account of gold holdings in Banking Department (Rs. 1,188.65 crore) and accrued income receivable.
15.14 In recent period the profitability of the Bank is coming under severe pressure as the Bank is required to make large provisions to cover the exchange risk in respect of the foreign currencies borrowed under (i) Foreign Currency .
Non-Resident Accounts Scheme and foreign currencies deposited under similar scheme by foreign banks in India, (ii) hnds mobilised under the India Develop-ment Bond , and (iii) foreign currency loans obtained by financial institutions and deposited with the Reserve Bank pending utilisation. To cover the fluctua-tions in the exchange rate of the Rupee, further provisions .will have to be made in future as well and such provisions will have to come out of the Bank's
i profits.
15.15 During the year ended June 30, 1992, the burden devolving on the Reserve Bank of India on account of the exchange risk borne on FCNR Ac-count withdrawals/renewals aggregated Rs.5,53 1.91 crore as against Rs.2,513.83 crore borne in the year ended June 30, 1991. This burden has been borne by the Bank's internal reserves. It is in this context that an endeavour is being made to restructure various foreign currency deposit schemes (referred to earlier in paragraph 7.15) to reduce the exchange risk devolving on the Bank.
15.16' ThesAccounts of the Bank have been audited by M/s Sorab S. Engineer & Co., Bombay, M/s Brahmayya & Co., Madras, MIS N.M.Raiji & Co., Bom- bay, MIS Goel Garg & Co., New Delhi, MIS Guha Nandi & Co., Calcutta, and MIS ~ . ~ . ~ h a & a & Co., Kanpur. While the first two auditors were reappointed by the Government of India for 1991-92, the other four auditors have'besnnewly appointed. All the offices of the Bank divided into 6 Zones were allo-cated for audit by the Statutory Auditors.

RESERVE BANK OF INDIA BALANCE SHEET AS AT 30TH JUNE 1992
(Rs. Thousands)
ISSUE DEPARTMENT LIABILITIES 1991 -92 1990-91 ASSETS 1991 -92 1990-91
Rs. Rs. Rs. Rs.
Notes held In the Banking Gold Coin and Bullion Department 13,45,21 11,87,86 (a) Held in India 7275,91,94 741 0,79,89 Notes In circulation -**--------------- 64550,25,75 57858.45,88 (b) Held outside India 467,50,24 - ----------- ------ Total Notes Issued 64563,70,96 5787033.74 Foreign Securities
200 00 00 .-me..-..- L-..L-.. ..---..--. 200 L--.I--- 00 00
Total 7943,42,18 761 0.79.89 Rupee Coln 96,01,23 91,46,03 Government of lndia Rupee Securities 56524,2755 50168,07,82 Internal Bills of Exchange and other Commercial Paper - - --.------------.-. .--.---.----------- - - - - - - - - - - - - - -- - - - - - - - - - - - - - - -- - - - - - -
Total Llabllltles 64563,70,96 57870,33,74 Total Assets 64563.70.96 57870,33,73
BANKING DEPARTMENT
LlABlLiTlES Rs. Rs. ASSETS Rs. - Rs.
Capital pald up 5,00,00 5,00.00 Notes 13,45,21 1 1,87,86 Reserve Fund 6500,00.00 6500,00,00 Rupee Coin 7,57 10,89 National Industrial Credit (LTO) Fund 5675,00,00 5675,00,00 Small Coin 11,Ol 6,96 National Housing Credlt (LTO) Fund 175,00,00 175,00,00 Bills Purchased and Discounted Deposits (a) Internal - (a) Government (b) External -
(i) Central Government 47,30,04 105,62,06 (c) Government Treasury Bills 1827,77,18 (ii) State Governments 39.16,17 15,75,60 Balances Held Abroad 14690,06,84
(b) Banks Investments 38739,34,93 (i) Scheduled Commercial Banks 43448,10,84 30789.61,72 Loans and Advances to (ii) Scheduled State Co-operative Banks 250,01,04 548,01,79 (i) Central Government - (iii) Other Scheduled Co-operative Banks 1351 6,23 188,13,88 (~i) State Governments 170,73,00 (iv) Non-Scheduled State Co-operative
Banks 10,55,21 10,89,76 Loans and Advances to (v) Other Banks 52,65,07 57,98,58 (i) Scheduled Commercial Banks 7471,98,19
(c) Others 7690,07,35 5868,61,65 (ii) Scheduled State Co-operative Banks 12,68,58 Bills Payable 126,06,92 185,22,75 (iii) Other Scheduled Co-operative Banks - Other Liabilities 13857,74,23 15853,01,52 (iv) Non-Scheduled State Co-operative Banks -
(v) NABARD 3582,27,17 (vi) Others 1516,59,75
Loans, Advances and lnvestments from National industrial Credit (Long Term Opera- tions) Fund (a) Loans and Advances to
(i) lndustrial,Development Bank of India 3576,55,41 (ii) Export Import Bank of India 877,00,00 (hi) Industrial Reconstruction Bankof India 170,00,00 (iv) Others 840,00,00
(b) lnvestments in bqndsldebentures issued by
(i) Industrial Development Bank of India - (ii) Export Import Bank of India - (iii) industrial Reconstruction Bank of India - (iv) Others -
Loans, Advances and lnvestments from National Housing Credit (Long Term Opera- tions) Fund (a) Loans and Advances to 175,00,00
National Housing Bank (b) lnvestments in bondsidebentures issued
by National Housing Bank - ---------------- .------em-------*- Other Assets ----------L--L--- 4348 18 26
Total Liabilities 7801 1,83,10 65977,8931 Total Assets 78011.83.10
Notes to Accounts and Significant Accounting Policies as per Annexure.

IKS. Thousands)
PROFIT AND LOSS ACCOUNT FOR THE YEAR ENDED 30rH JUNE1992
INCOME 1991-92 1990-91 Rs. Rs.
Interest, Discount, Exchange, Commission, etc.'
Total
EXPENDITURE
Total
Interest 331 1.47.46 2547.69,66 Establishment 277.29,02 243.68.89 Directors' and Local Board Members' Fees & Expenses 8,26 534 Remittance of Treasure 5.59.14 4.73.59 Agency Charges 302.34.1 0 265.62.33 Security Printing (Cheque, Note forms, etc.) 238.29.63 , 162,27.50 Printing and Stationery 3.00.97 2.54.43 Postage and Teiecommunication charges. 5.31.53 4.68,05 Rent, Taxes, Insurance, Lighting, etc. 15.83.94 12,78,63 Auditors' Fees and Expenses 8.32 9,16 Law Charges 45.89 1 1,44 Depreciation.and Repairs t o Bank Property 20.47.81 20.28,OO Miscellaneous Expenses 19.30.37 15,40,32
--- 4199,56,44 3279,97,34
. . Available Balance 1500,00,00 1345.00,00 LESS : Contributionsto: . - - . . - . Nationai Industrial Credit (Long Term Operations) Fund - 525,00,00 National Ruralcredit (Long Term Operations) FundZ - 400.00,OO Nationai Rura! Credit (dtabilisatibn) Fund2 - 20.00,OO National Housing Credit (Long Term Operations) Fund - 50,00,00 - -----.-
- 995,OO.OO
Surplus Payabieto Central Government 1500,OO.OO 350.00,OO
1. After making the usual or necessary provisions i~ terms of Section 470f the Reserve Bank of India Act, 1934. 2. These funds are'maintained by National Bank for Agriculture and Rural Development (NABARD).
(V.G. Athavale) Chief Accountant
(s.s. ~araporej Deputy Governor
(R. Janakiraman) Deputy Governor
(S. Venkitararnanan) Governor
REPORT OF THE AUDITORS TO THE PRESIDENT OF INDIA
We, the undersigned Auditors ot'the Reserve Bank of India, do hereby report to the Central Government upon the Balance Sheet of the Bankas at 30th June 1992 and the Profit and Loss Account for the year ended on that date.
We have exam~ned theabove Balance Sheet of the Reserve Bank of lndla as at 30th June 1992 and the Prof~t and Loss Account of the Bank for the year ended on that date and report that where we have called for explanations and Information from the Bank, such lnformatlon and explanations have been glven and have been satisfactory.
In our opinion and according to the best of our information and explanations given to us and as shown by the books of accounts of the Bank, the Balance Sheet read with Notes to Accounts and Significant Accounting Policies is a full and fair Balance Sheet containing all necessary particulars and is properly drawn up in accordance with the Reserve Bank of India Act, 1934 and Regulations framed thereunder so as to exhibit a true and correct view of the state of the Bank's affairs.
MIS Sorab S. ~ n ~ i n e e r & Co. MIS Brahmayya & Co. M/sGoel Garg 8 Co. Mls N.M. Raiji & Co. MIS Guha Nandi & Co. M/s J.N. Sharrna & Co. Auditors Auditors Auditors Auditors Auditors Auditors
Dated 20th August 1992

RESERVE BANK OF INDIA ANNEXURE .
Notes to Accounts and Significant Accounting Policies 1. a) Gold holdings
Gold held in Issue and Banking Departments is valued on the basis of average London price of gold and resultant dollars are converted into rupees at the RBI buying rate for dollar prevailing as on the last busi-ness day of the year; 90%of the above rate is applied for valuation of gold.
b) investments in Foreign Securities Foreign Securities are valued at rates not exceeding the market rates prevailing on the last business
day of the year and are converted into rupee equivalent at the exchange rates prevailing on that date. While depreciation is charged to Profit and Loss account, no credit is taken for appreciation in the value of securities.
c) investments in Government of lndia Rupee Securities Securities are valued at rates not exceeding the market rates on the last working day of the month of
June. While depreciation is charged to Profit and Loss account, no credit is taken for appreciation in the value of securities. The sale proceeds of Rupee Securities are credited to Bank's Investment Account. ProfitILossis booked only at the time of redemption of securities.
d) Government Treasury Bills Treasury Bills are valued at cost.
e) Bank's investments Bank's investments in sharesof State Bank of India, Deposit Insurance and Credit Guarantee Corpora-
tion, National Bank for Agriculture and Rural Development, National Housing Bank and Discount and Finan-ce House of lndia Ltd., are valued at cost.
f Assets and Liabilities in foreign currencies are translated into rupees at the exchange rates prevailing on the Balance Sheet date except in cases where rates have been contractually fixed. lncome and Expenditure are translated into rupees at the holding rates for the month in which the transactions take place.
g) Profit and Loss Account Income and Expenditure are accounted for on accrual basis. Accounting for accrued income and provi-
sion for outstanding expenses are made only for individual items of Rs. 1 lakh and above.
h) Retirement benefits Contributions to the Gratuity Fund are made on the basis of actuarial valuation every year. An actuari-
al valuation for the recently introduced Pension Scheme for employees is to be obtained.
i) Depreciation Depreciation on assets such as premises, fixtures and electrical installations is charged on written
down value method and in case of computers, motor vehicles, etc. depreciation is charged on straight line method.
2. Reserve Fund Represents initial contribution of Rs. 5 crores made by Government of lndia in the form of Government
securities and appreciation of Rs. 6495 crores on account of revaluation of gold.
3. Deposits-- Others Include mainly deposits from Foreign Central Banks, Financial institutions, IMF balances and staff pen-
sionlprovident fund contributions.
4. Other Liabilities Include mainly reserves for exchange fluctuations, Asian Clearing Union account and other contingen-
cy accounts.
5. Other Assets Include mainly gold (valued at Rs. 1188.65 crores which is held outside India), fixed assets, capital
works in progress, Receivables, balances in inter-office accounts, staff loans and advances. Fixed assets are stated at cost less accumulated Depreciation.
6. Investments in Banking Department include Rs. 1234.87 crores (Previous year Rs. 95.1 4 crores)'heldabroad in foreign currencies.

INDEX OF APPENDIX TABLES
Table No. Title
I. POLICY DEVELOPMENTS AND PERSPECTIVES
1.1 Interest Rate Structure for Advances of . . , Scheduled Commercial Banks (Excluding lnterest Tax)
1.2 .Scheduled Commercial Banks' Interest . Rates on Deposits
1.3 Interest Rates on Export Credit of Scheduled Commercial Banks (Excluding lnterest Tax)
1.4 Minimum Margins and Level of Credit Ceilings (Effective April 22, 1992)
1.5 Foreign Collaboration Approvals
Page
II. THE REAL ECONOMY : PERFORMANCE AND PROBLEMS
11.1 Sectoral Composition and Growth 158 Rates of Real Gross Domestic Product
Estimates of Domestic Saving and Investment Ratios
Agricultural Production
Procurement, Off-take and Stocks of Foodgrains
Trends in Index of Industrial Production
Growth in Seventeen Major Groups of Manufacturing Sector
Growth Rate of Industrial Production : Use-based Classification
Trends in Production of Infrastructure l ndustries
111. GOVERNMENT FINANCE'S
Measures of Deficit-Monetised, Budget, Gross and Net Fiscal Deficits of Central Government
Fortnightly Levels of the Centre's Budget Deficit and Net RBI Credit to Central Government *
Financing of Gross Fiscal Deficit
Total Outstanding Liabilities of Government of India

111.5 Budgetary Deficit, Market Loans and RBI . . Support to Central Government
111.6 Measures of Deficit-Monetised, Budget, Revenue, Gross and Net Fiscal Deficits of States
Financing of States' Gross Fiscal Deficit
Combined Receipts and Disbursements of Central and State Governments : Developmental and Non-developmental Expenditures of Centre and States
Direct and Indirect Tax Revenues of the Centre and States
Market Borr&vings of Central and state Governments, Local Authorities and Institutions Sponsored by Central and State Governments - Coupon Rates on Central and State Governments Securities
IV. MONETARY AND PRICE TRENDS
IV. 1
IV.2
IV.3
Money Stock (M3) - Components and Sources
Reserve Money -Components and Sources
Trends in Income Velocify of Currency, Aggregate Deposits, MI and M3
Monetary Ratios
Important Banking Indicators - Scheduled Commercial Banks
IV.6 Variations in Selected Items of Scheduled Commercial Banks : Last Week of March
IV.7 Scheduled Commercial Banks' Non-deposit Resources
IV.8 Sectoral Deployment of Gross Bank Credit by Major Sectors
IV. 9 Industry-wise Deployment of Gross Bank Credit
IV. 1 0 RBI Accommodation to Scheduled Commercial Banks
IV. 1 1 Reserve Bank Refinance to DFHl
IV.12 Cumulative Turnover ofthe DFHl in Money Market Instruments
1V.13 Interest Rates for Reserve Bank Refinance to DFHl

Call Money Lending Rates of OFHl
1 82 Day Government of lndia Treasury Bills.
IV.16
IV. 1 7
364 Day Goverdment of lndia Treasury Bills.
Issue of Certificates of Deposit (CDs) by Scheduled Commercial Banks
Three phases of Variations in Wholesale Price lndex on Point-to-Point Basks
Variations in lndex Numbers of Wholesale Prices
Weighted .Contribution of GroupslCommodities to the Increase in the General Index ,of Wholesale Prices
Annual and Quarterly Rates of Price Increases as Reflected in WPI and CPI (Point-to-Point Basis)
Gold and Silver Prices in Domestic and I nternational Markets
Gold and Silver Ratio in Terms of Grammes
Monthly Spread between Gold & Silver Prices
V. CAPITAL MARKET DEVELOPMENTS
Assistance Sanctioned and Disbursed by , All Financial Institutions
Deposits with the Non-banking Corporate Sector
Consents/Acknowledgements granted by the Controller of Capital Issues to Government and Non-Government Companies for raising Capital
New Capital Issues by Non-Government Public Limited Companies
Reserve Bank of lndia All-India lndex Numbers of Ordinary Share Prices (Weekly)
Vl. DEVELOPMENTS IN THE EXTERNAL SECTOR
India's Overall Balance of Payments (Preliminary)
Financing Need and sources of Financing
India's Foreign Exchange Reserves

India's Foreign Trade
India's Exports of Principal Commodities
India's Imports of Principal Commodities
India's Trade with Rupee Payment Area (RPA) and General Currency Area (GCA)
External Assistance
Deposit Liabilities under NR(E)RA and FCNRA Schemes
Interest Rates on FCNRA Deposits
India's External Debt
Rupee Exchange Rates

APPENDIX TABLE 1.1 : 1NTEREST RATE STRUCTURE FOR ADVANCFS OF' SCHEDULED COMMERCIAL BANKS (EXCLUDING INTEREST TAX)
(per cenl pcr snnum)
Rata Rntes ECcdive prior to October Oclobe r April 22 9,1991 9,1991 1992
Category of Account
I. Size of limit
1) Upto and inclusive of Rs.7,500/-
2) Over Rs.7,500/- and upto Rs. 15,0001-
3) Over Rs.15,000/- and upto Rs.25,0001-
4) Over Rs.25,000/- and upto R~.50,000/-
16.5
20.0 I
19.0 (Minimum) (Minimur
4.0 4.0
5) Over Rs.50,000/- and upto Rs.2 lakh
6) Over Rs.2 lakh*
11. 1) DRI Advances 4.0
2) Term loans to agriculture, SSI and transport operators owning upto two vehicles
Size of limit
(i) Over Rs.25,000 and upto Rs.50,000/-
(ii) Over Rs.50,0001- and upto Rs.2 lakh
(iii) Over Rs.2 lakh 15.0 15.0
(Minimum) 15.0
(Minimum)
3) (i) Loans for purchase of, consumer durables
(ii) . Loans to individuals against shares and i debentures/bonds , Banks free to determine the rate
(iii) Other non-priority sector personal loans
111. Lending rate for commodities coming within the purview of Selective Credit Control (SCC)
Loans/Advances/Cash Credit/ * Overdrafts against commodities 18.5 * 20.0 19.0 subject to SCC (Minimum) (Minimum) (Minimum)

NO~LIJ: f ) Ihe cifcctivc interat ratc on bill discounting in the a s c of parties with cash crcdit/overdmfl lin~its of over lts.2 lakh should be onc p c m n t n p paint lowcr than thc rate c h a r p b l e on the cash credit/overdnft facility.
2) In the a s c of fini~ncc granted to intermediary agencies (including those for housing) for onlcnding to ultimate twncficiaric. nnd agcncics providing input support lhe rate should be a fixed rate of 3.0 percentage points helow the minimum rate npplicable for credit limits in the catcgory of over Rs.2 lakh.
3) Wherc short-term loans arc routed through PACS/LAMPS/FSS the ratcs to bc charged by banks lo the PACS/IAM13S/T3S shtll bc 25 percentage points l o w r than the rates to the ultimate borrolvcrs indicated in item f atmvc for the respcclivc size of the limit.
* The cllangcs madc in this rate sincc Septcmbcr 1990 are set out below:
16.0 (minimum) cffcclivc Scjxmbcr 9,1990 17.0 (minimum) cffcctive April 13 ,1991 18.5 (minimum) cEcctivc Ji~ly 4, 1991 20.0 (minimum) cffectivc Oclolxr 9,1991 10.0 (minimum) effective Marc11 2,1942.
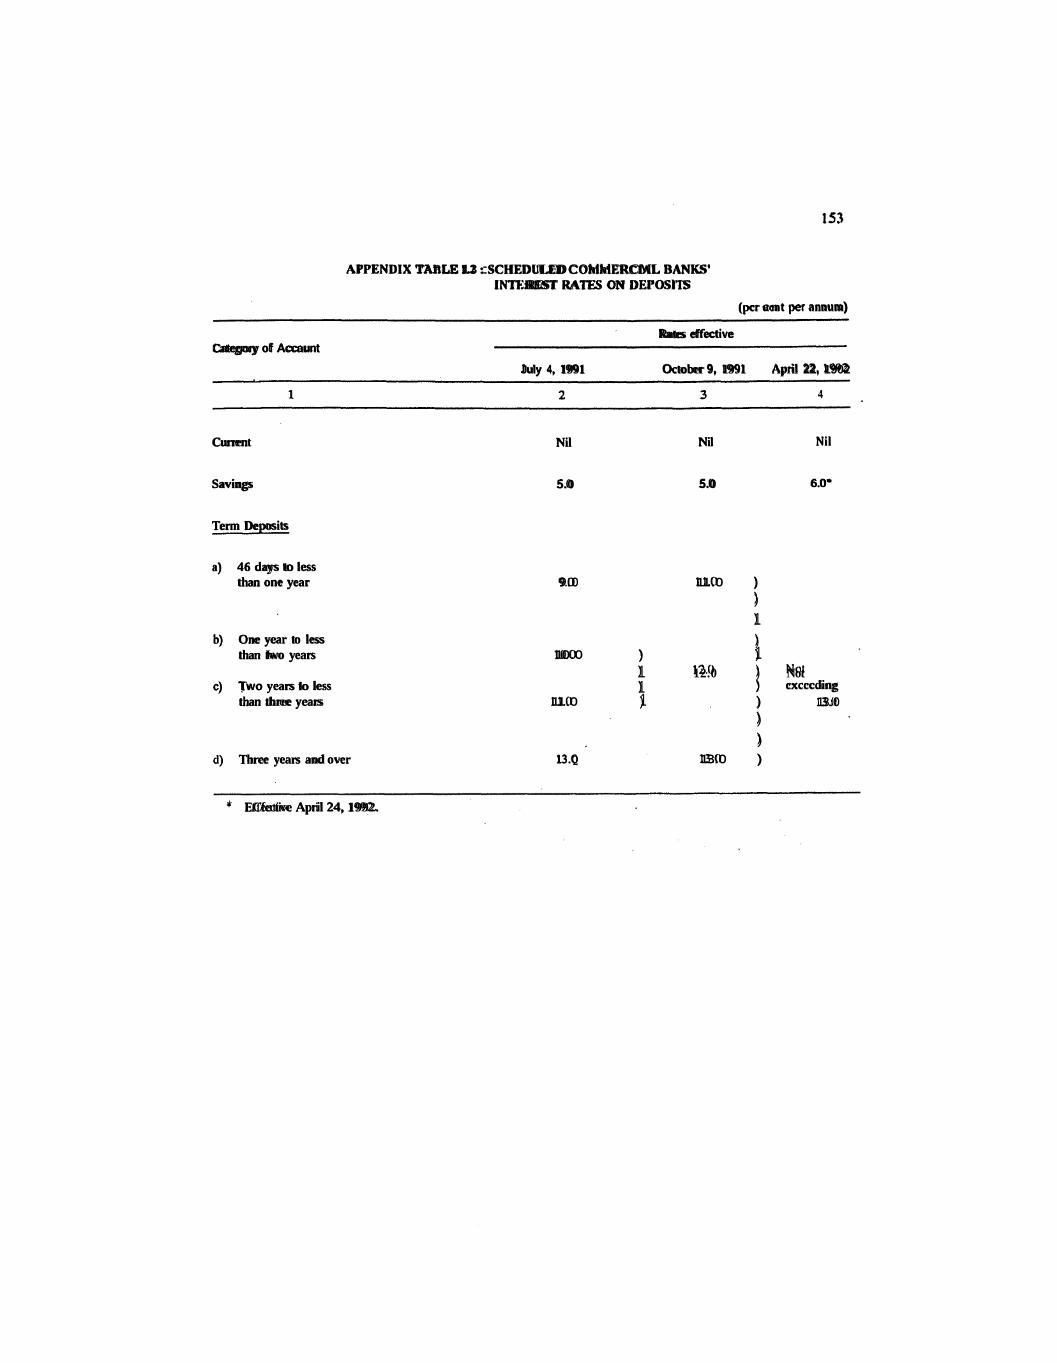
APPENDIX TAnLE 13 : SCHEDULED COhlhlERCML BANKS' INTI.:RFST RATES ON DEI'OSl'IS
(pcr a n t per annum)
Rates effective Category of Accaunt
July 4, 1991 October 9, 1991 April 22, 1902
Current
Savings
Term Deposits
a) 46 days to less than one year
b) One year to less than Iwo years
c) Two years lo less than three years
d) Three years and over
Nil
5.0
Nil
5.0
Nil
6.0'
9.0 11.0 ) )
1 )
10.0 ) 1 1 12.0 ) Not 1 ) cxcccding
11.0 1 ) 13.0 )
)
13.Q 13.0 )
* ECfective April 24, 1992.

APPENDIX TAn1.E 13 : 1NlEREST RATES ON EXPORT CREDIT OF SCHEDULED COMMERCIAL BANKS (Exdudlng Interest Tax)
( p r cent per annum)
Rates effective
Export Crcdit Apil 1, April 23, August 6, October 9, January 1, March 2, 1991 1991 1991 1991 1992 1992
1 2 3 4 5 6 7
1 Pre-shipment credit
a) i) Up ta 180 days 7.50 750 12.50 15.00 15.00 15.00
ii) Beyond 180 days and up to 270 days* 9.50 9.50 14.50 17.00 17.00 17.00
b) Agninst a s h inccntivcs, etc., covered by ECGC guarantee up to 90 days 7.50 750 12.50 15.00 15.00 15.00
2, Post-shipment credit
i) Demand bills for transit period (as specified by FEDN) 8.65 7.00 12.50 15.00 15.00, 15.00
ii) Usl\noe bills (for period comprising wancc period of export bills, transit period, as speci- fied by, FEDN, and grace period, wherever applicable)
a) Up to 45 days 7.001
) Beyond 45 days up to 90 days 8.65 8.65j 12.50 15.00 15.00 15.00
(up to 90 days)
c) Beyond 90 days up to 16.00 18.00 18.00 20.00 20.00 19.00 six rnonthsfrom date of (from the (from the (from the shipment date of date of date of
advance) advance) advance)
d) Beyond six months from date 16.00 25.00 25.00 25.00 25.00 24.00 of shipment (plus a (from the (from the
surcharge date of date of of 2.00 advance), advance)
from the date of
advance)
iii) Cash incentives, receivable from Government, cdvered by ECGC Guarantee (up to 90 days) 8.65 8.65 12.50 15.00 15.00 15.00
iv) Undrawn balance (up to 90 days) 8.65 8.65 12.50 ,15.00 15.00 15.00
v) Against retention money (for supplies portion only) payable within one year from the date of shipment (up to 90 days) 8.65 8.65 12.50 15.00 15.00 15.00

3. Deferred Credit
Deferred credit for the period beyond 180 days 8.65 8.65
4. Duty Drawback Credit Scheme, 1976 Aminst duty draw back as pr&isionaliy certified by the Free of Free of Customs Authorities (up to 90 days) interest interest
5. Export aedit not otherwise speciEied 16.00 18.00 (minimum) (minimum)
6. PostShipment Export Credit denominated in Foreign Currency
i) Demand bills for transit period (as specified by FEDAI)
ii) Usance bills (for total period comprising usance period of export bills, transit period, as specified by FEIIN, and grace period, wherever applicable, upto six months from date .
of shipment;
F m of F r a of interest interest - -
1850 20.00 20.00 19.00 (minimum) (minimum) (minimum) (minimum)
* Priot approval of the Reserve Bank of India is not considered necessary with effect from March 12, 1992.

APPENDIX TABLE 1.4 : MINIMUM MARGINS AND LEVEL OF CREDIT CEILINGS (effective April 22, 1992)
(In per cent)
Minimum Margins Level of Credit ceilings (Base
.Commodities Mills1 * Others Warehouse year : F r e e Processing receipts years ending
units 1990-91) (Nov.-Oct .)
1. Paddy/rice
2. Wheat
3. Pulses
4. Other foodgrains
5. Oilseeds (viz., groundnut, rapeseed/mustard, cottonseed, linseed, castorseed and all imported oilseeds)
6. Vegetable oils (viz., groundnut oil, rapeseedlmustard oil, 60 @. 75. 50 85 cottonseed oil, linseed oil, castor oil, vanaspati and all imported vegetable oils)
7. Sugar
a) Buffer stock nil - - - b) Unreleased stock 20 * - - - c) Released stock 75 75 60 -
8. Gur and Khandsari 45 75 60 - 9. Cotton and Kapas x 75 60 85
@ Applicable to registered oil mills and'vanaspati manufacturers. . - Not Applicable.
* At the rate of to 17.5 percent during the period May 9, 1991 to.August 8,1991.
x Exempt from the stipulations.

APPENDIX TABLE 1.5 : .FOREIGN COLLABORATION APPROVALS
- 1990 1991 1991-92 1990-91
(August- (August- - Items June) June)
(Post-Policy Period)
1. Total No. of Foreign Colla- bora tion Approvals by :
i) SIA
ii) RBI
iii) FIPB
TOTAL
2. No. of 'FC Appro- vals Involving Foreign Equity :
i) SIA
ii) RBI
iii) FlPB
TOTAL
3. Total Amount of Foreign Equity Involved (Rs. in million)
i) SIA
ii) RBI
iii) FIPB
TOTAL
Note : 10 million .: 1 crore. SIA- Secretariat for Industrial Approvals. RBI- Reserve Bank of India. FIPB- Foreign Investment Promolion Board.

APPENDIX TABLE 11.1 : SECTORAL COMPOSITION AND GROWTH R A W OF REAL GROSS DOMESTIC PRODUCT
(In per cent)
Sector Share in real GDP Growth Rate
1. Agriciilturc and Allied Activities 31.6 38.2 44.5 +4.2 +2.7 +16.4 t0.4 -1.7
a) Agriculture 29.5 34.7 39.7 +4.3 t2.6 +17.6 +0.5 -1.7
2. Industry
a) Manufacturing 20.6 17.6 16.1 +7.3 +7.2 . +8.5 +7.0 t7.0
TOTN, GDP 100.0 100.0 100.0 +5.6 t6.0 +10.5 +4.2 t4.3 - - - --
Quick Estimates (February 1992), Central Statistical Organisation.
@ Inclusive of Construction.

APPENDIX TABLE 11.2: ESTIMATES OF DOMESTIC SAVING AND INVESTMENT RATIOS
(In per cent)
Gross Saving and Investment Net Saving and Investment as percentage of GDP as percentage of NDP at a t Current Market Prices Current Market Prices
Fiscal Year 1991-92 1990-91 1989-90 1991-92 1990-91 1989-90
1. Household sector. Saving; 19.2 18.7 18.4 17.1 16.6 16.2 of which : Saving in Financial Assets* 9.5 8.9 9.5 10.6' 9.8, 10.6
2. Public Sector 1.2 0.9 1.6 -3.7 -4.1 -3.4
3. Domestic Private Corporate Sector
4. Total,: Domestic Saving 23.2 22.2 22.7 14.3 13.4 13.6 (1+2+3)
5. Net Inflow of Foreign Resources
6. Aggregate Investment
(4+5)
GDP/NDP at Current Market Prices (Rupees Crore) 6,19,000*** 5,29537 ** 4,50,601@ 557,079 ** * 4 J7,460* * 4,05,055 @
* These are adjusted for financial liabilities. As savings in finandal assets do not involve capital consumption for fixed asxts, net ratios work out higher than g o s s ratios: like-wise, in net inflow of foreign resources.
* * Quick ht imatcs
*** RBI Estimates.
Note : 1. Thc ratios for 1989-90 and 1990-91 differ from those given in the previous year's Annual Report of the Iknk and lhosc published in the CSO's Quick Estimates for 1990-91, because of rhe revision in the cstimatcs of national income and those of saving and investment consequent on the availability of fresh data.
2. Figures may not add up to the totals because of rounding off.

APPENDIX TABU I 1 3 t AGRICULTURAL PRODUCTION (In million tonnes)
1988-89 1989-90 1990-91 1991-92 CROP (final) Likely schievement
1 2 3 4 5
1, A U CROPS E 21.0 2.1 2.6 -1 .o
Cmrscgains f ' u l x ~ (a) M A R I F
Rice Coa rscgra ins Putscs
(b) RABI Rice
Wheat
Coarsegrains
Pulscs
3. OILSEEDS
4. SUGARCANE 5, COTTON*
6 , JUTE & MESi'A Q - - - -
* Million h l e s - one bale = 170 Kgs. @ Million bales - one bale = 180 Kg. f Growth rates.
Source : Ministry of Agriculture, Government of India,
APPENDIX TABLE IL4 : PROCUREMENT, OFF-TAKE AND STOCKS OF FOODGRAINS
(In million tonnes)
Fiscal year Procurement Off-take Stocks *
Rice Wheat Total Rice . Wheat Total@ Rice Wheat Total@
1989-90 11.2 9.0 20.2 8.4 7.3 15.8 7.9 3.6 11.7
1990-91 12.8 11.1 23.9 7.8 8.3 16.1 11.2 5.8 17.3
1991-92 $ 10.5 7.8 18.3 9.9 9.1 19.0 9.8 2.3 12.1
First quarter (Apri ]-June)
* Stocks are as at end-March for fiscal year period and as at endJune for first quarter period.
@ Includes coarsegrains. $ Provisional.
Source : Ministry of Food & Civil Supplies, Government of India.
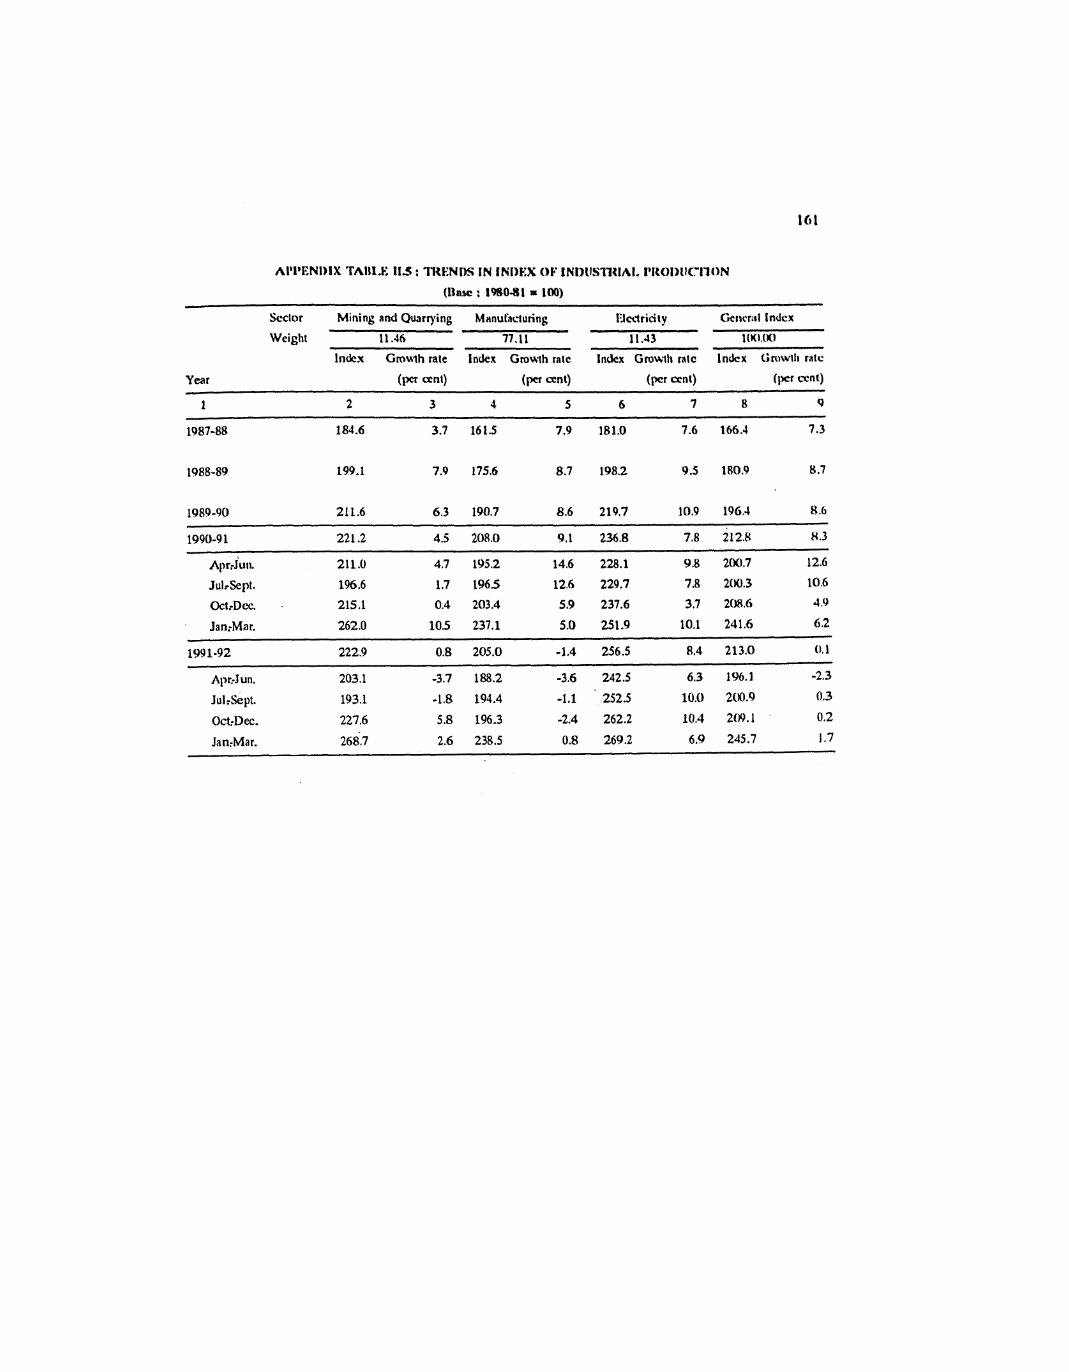
Scclor Mining and Quarrying MnnuCaauring Batridty Cxnrmi index
Weight 11.16 77.11 1 1 .d3 I(K\.(KI
hdcx Gromlh tale Index Groulh a l c I n k Gmutlr mtc Index Gm\wili mtc
Year (W ant) (Per (per ant) ( ~ ' c r mnt}
1990-9 1 221.2 4.5 208.0 9.1 236.8 7.8 212.8 8.3
ApaJ uo. 211.0 4.7 195.2 14.6 228.1 9.8 200.7 12.6
J~lrSept. 196.6 1.7 1965 12.6 229.7 7.8 200.3 10.6
OcttDcc. . 215.1 0.4 203.4 5.9 237.6 3,7 2OMi 4 .c)
Jan:Mar. 262.0 10.5 237.1 5.0 251.9 10.1 241.6 6.2

APPENOIX TAnLE 11.6 : GROWTH IN SEVENmEN MGJOR GROUPS OF MANUFACTURING SECTOR
Industry Group Weight Fiscal Year
1989-90 1990-91 1991-92
1 2 3 4 5
I. PoslnvE
ACCELERATION (During4991 -92)
I. Beverages, Tobacco and Tobacco Products 1.57 103.0 (t11.8)
2. Non-metallic Mineral Products
DECBL~~RATION (During 1991-92)
3. Basic Metal and.Nloys Industries
4. Paper and Paper Products
5. Food and Food Products
6. Chemicals and Chemical Products
7. Cotton Textiles
11. NEGATIVE (During 1991-92)
8. ~iscel'laneous Manufacturing Industries
9. Electrical ~ a c h i n e r ~
10. Leather and Leather and Fur Products 0.49 188.3 (+6.1)
11. Metal Products 2.29 142.6 (t6.8)
12. Wood and Wood Products 0.45 176.0 . (t2.5)
13. Textile Products (including wearing 0.82 151.7 apparel other than foohvear) (+13.0)
14. Jute, Hemp and Mesta Textiles
15. Machinery and Machine Tools 6.24 171.9 (+6.7)
16. Transport Equipment and Parfs 6.39 181.1 (+S.O)
17. Rubber, Plastic, Petroleum and 4.00 173.5 Coal Products (t3.1)
MANUFACTURING SECTOR 77.11 190.7
(+8.4)
Note : Figures in brackets are percentage variation oVer the previous year.
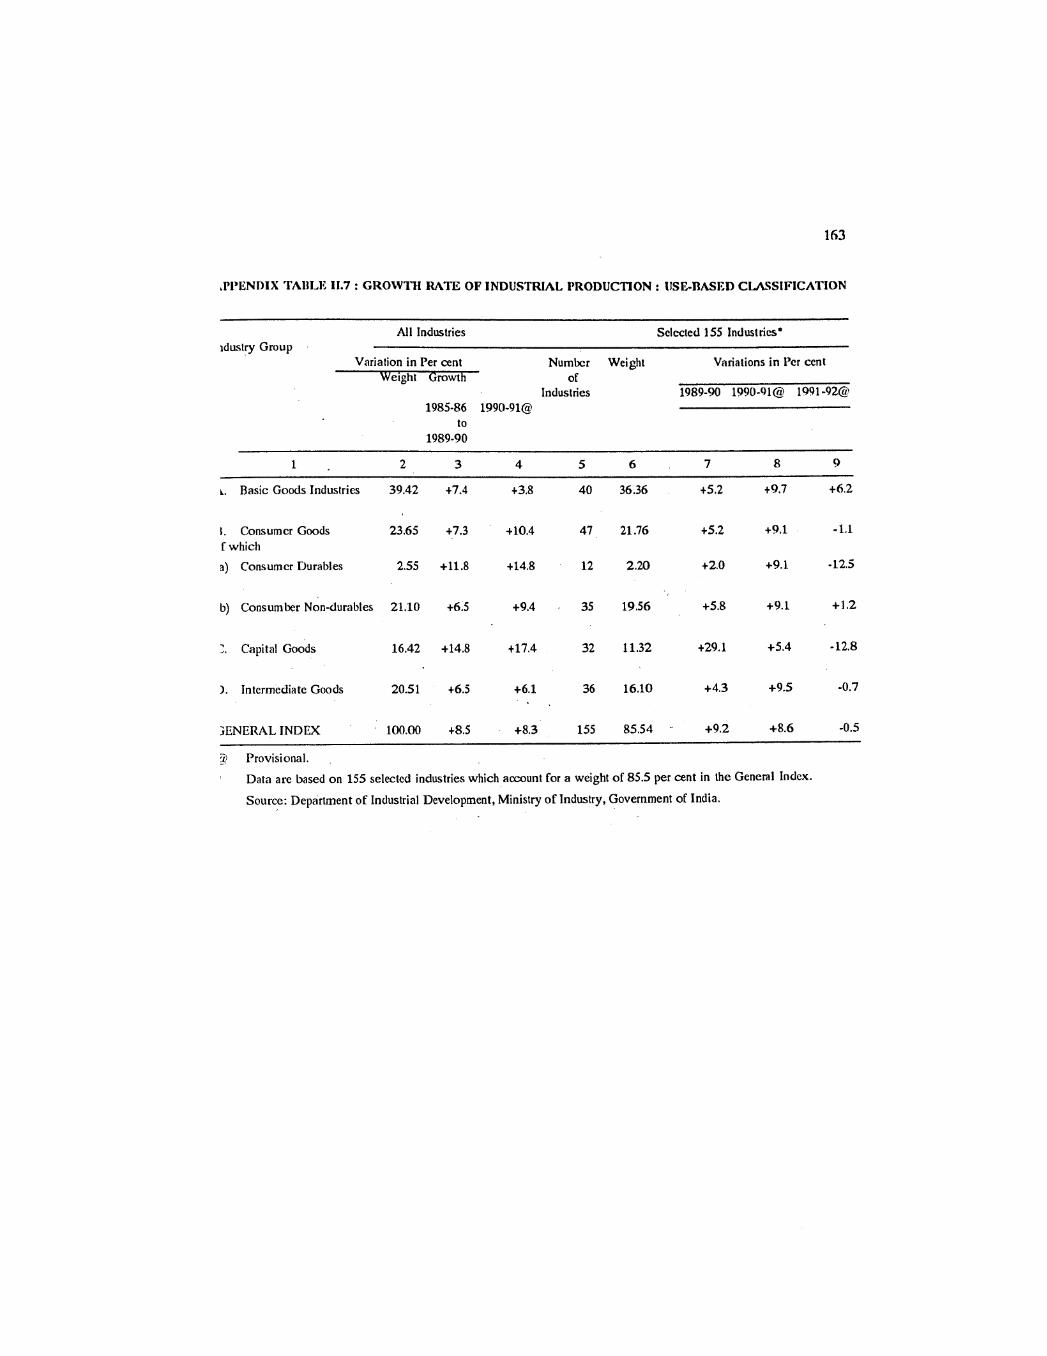
,PI'ENDIX TABLE 11.7 : GROWTH RATE OF INDUSTRIAL FRODUCTION : IISE-IRASED CIASSIFICATION
- - - - --
All Industries Sclccted 155 Industries* ~dustry Group
Variation in Per cent Numkr Weieht Variations in l'cr cent Weight Growth of
Industries
L. Basic Goods Industries 39.42 t7.4 t3.8 40 36.36 t5.2 t9.7 t6.2
I . Consumer Goods 23.65 t7.3 t10.4 47 21.76 t5.2 t9.1 -1.1 i which
a) Consumcr Durables 2.55 +11.8 t14.8 12 2.20 t2.0 +9.1 -12.5
b) Consumhr Non-durables 21.10 t6.5 t9.4 . 35 19.56 t5.8 +9.1 +1.2
, Capital Goods 16.42 +14.8 t17.4 32 11.32 t29.1 t5.4 - 12.8
1. Intermediate Goods 20.51 t6.5 +6.1 36 16.10 +4.3 +9.5 -0.7
3ENERAL INDEX 100.00 t8.5 +8.3 155 85.54 - +9.2 +8.6 -0.5
2 Provisional. : Data are based on 155 selected industries which account for a weight of 85.5 per cent in the General Index.
Source: Department of Industrial Development, Ministry of Industry, Government of India.

Industry Weight Unit Fiscal Year
Electricity 11.43 Billion Units
6.61 Million 200.90 211.70 229.30 Tonnes (+5.4) (t8.3)
Cement 1.60
Petroleum Crude
Petroleum Refinery Products 1.52 It 48.31 48.15. 47.82 (-0.3) (-0.7)
Comlmsitc Index Of Infra- 28.77 Number 205.2 215.0 228.0 structure Industries (+4.8) (+6.0)
Note : figures in brackets are percentage variation over the previous year.
Sourcc: Ministry of Planning & Programme Implementation, Government of India.
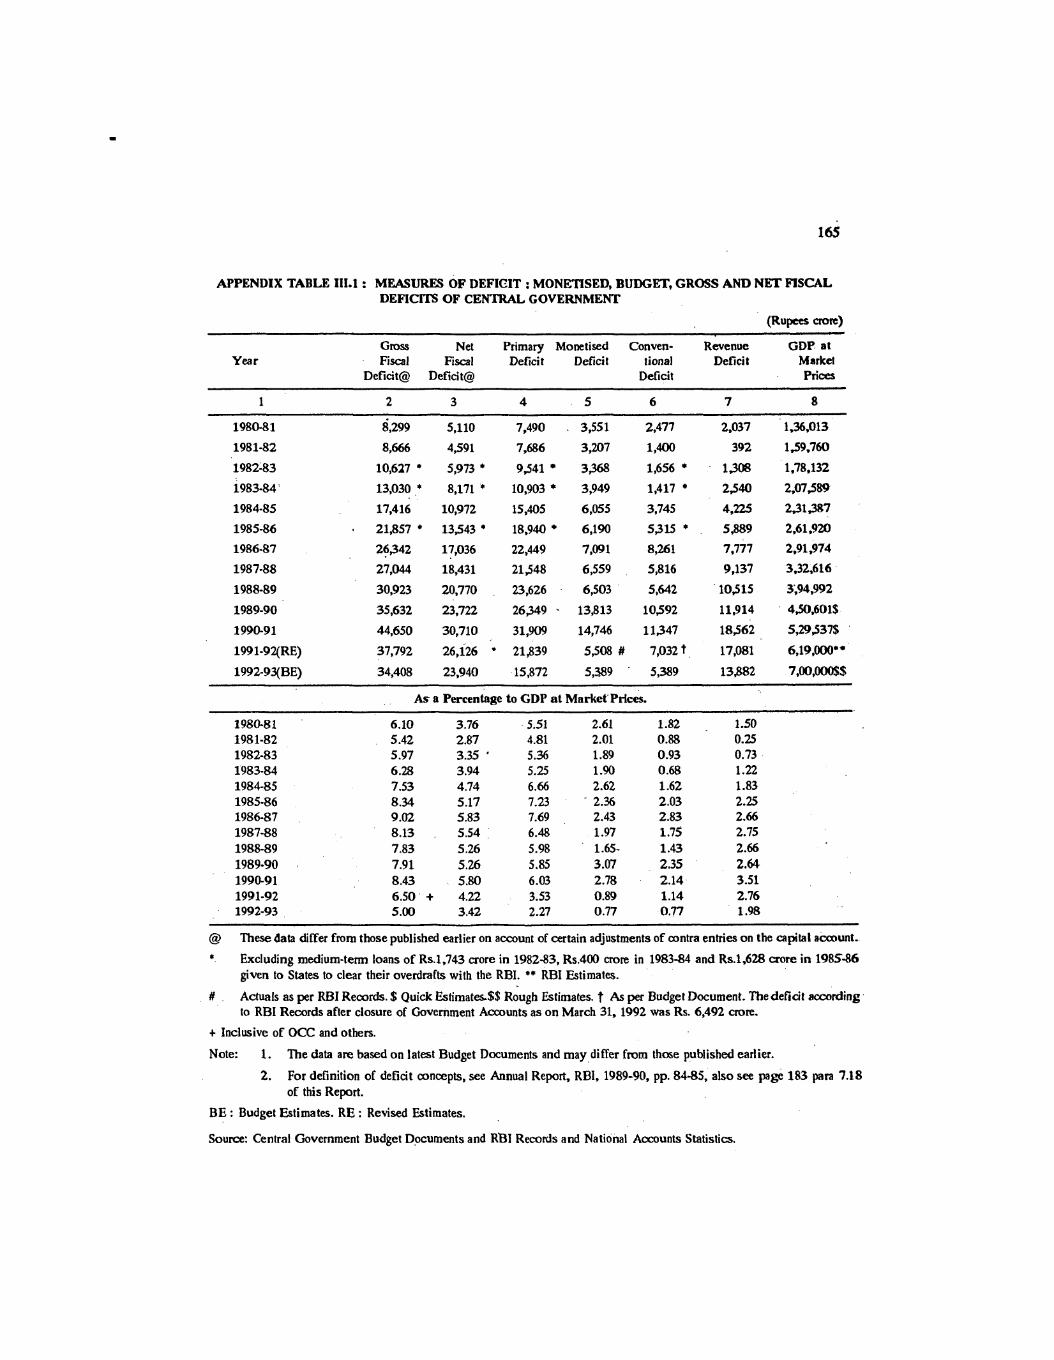
APPENDIX TABLE 111.1 : MEASURES OF DEFICIT : MONETISED, BUDGET, GROSS AND NET FISCAL DEFICIT3 OF CENTRAL GOVERNMENT
Year Gross Net Primary Monetised Conven- Revenue GDP. at Fiscal Fiscal Detici t Deficit tional Deficit Market
Deficit@ Deficit@ Deficit Prices
As a Percentage to GDP at ~arket'prick.
-- --
@ These data differ from those published earlier on account of certain adjustments of contra entries o n the capital account. * Excluding medium-term loans of Rs.1,743 aore in 1982-83, Rs.400 mre in 1983-84 and Rs.1.628 crore in 198546
given to States to clear their overdrafts with the RBI. ** RBI Estimates.
# Actuals as per RBI Records. $ Quick Estimates$$ Rough Estimates. t As per Budget Document. Thedeficit according to RBI Records after closure of Government Accounts as on March 31, 1992 was Rs. 6,492 crore.
+ Inclusive of OCC and others.
Note: 1. The data are based on latest Budget Documents and may differ from those published earlier.
2. For definition of deficit concepts, see Annual Report, RBI, 1989-90, pp. 84-85, also see page 183 para 7.18 of this Report.
BE : Budget Estimates. RE : Revised Estimates.
Source: Central Government Budget Documents and RBI Records and National Accounts Statistics.

APPENDIX TABLE 111.2 : FORTNfGHflLY I,EVEM OF THE CENTRE'S BUDGET DEFICIT AND NET RBI CREDIT TO CENTRAL GOVERNMENT @
(Rupees crore)
Centre's Budget Deficit Net RBI credit to Centre
Period 1989-90 1990-91 1991-92 1992-93 1989-90 1990-91 1991-92 1992-93
Budget Estivates 7,337 7,206 7,719 5,389 , 7,337 7,206 7,719 5,389 (Fortnight) Date S
1 5-4-91 1,170 2,679 2,271 4,774 2.011 2,712 2,427 3,847 2 19-4-91 3,497 3,204 - 3,716 6,115 3,722 4,050 3,269 6,522
3 3-5-91 6,045 5,754 5,508 6.604 5,461 4,994 3,%2 5,219 4 17-5-91 6,176 6,638 8,409 8,928 6,392 7,058 6,764 7,218 5 31-5-91 8,565 8,228 8,925 10,414 7,675 6,907 7,534 7,985 6 14-6-91 9,508 7,698 11,029 10,854 7,784 7,463 9,607 7,192
7 28-6-91 9,824 9,107 11,503 8,886 7,858 7,703 9,168 3,912 8 12-7-91 11,378 9,996 12,747 9,500 9,883 11,165 9 26-7-91 11,382 10,128 11,873 9,140 8,185 10,580 10 9-8-91. 13,416 10,976 12,793 10,277 9,018 10,759 11 23-8-91 12,596 8,729 011,571 9,938 6,543 10,303 12 6-9-91 13,265 10,290 13,442 10,664 8,209 11,029
13 20-9-91 11,535 10,289 10,393 9,111 7,269 8,890 14 4-10-91 12,953 11,971 12,406 11,186 9,245 10,445 15 18-10-91 10,375 10,755 13,097 9,869 10,241 111866 16 1-11-91 10,934 11,830 11,409 8,901 10,438 9,564 17 15-11-91 13,044 13,636 14,245 12,403 12,476 12,418 18 29-11-91 13,789 13,001 15,272 12,748 12,978 13,117 19 13-12-91 13,317 15,330 17,419 13,634 15,159 15,830 20 27-12-91 11,789 13,097 11,503 12,611 13,029 9,812 21 10-1-92 14,206 15,093 16,177 15,277 15,055 14,979 22 24-1-92 14,158 15,123 14,138 15,255 14,621 13,961 23 7-2-92 13,675 15,442 15,726 15,395 15,447 15,305 24 21-2-92 13,790 14,627 15,024 15,804 15,107 14,454 25 6-3-92 14,266 15,072 13,011 16,383 16,064 12,485 26 20-3-92 10,290 11,969 10,606 14,344 14,486 10,452
March 31 10,624 11,430 6,492 13,813 14,746 5,508 Quarterly Averages First Quarter 6,398 6,187 7,337 5,843 5,841 6,104
Second Quarter 12,262 10,068 12,137 9,772 8,185 10,454
T ~ ~ i r d Quarter 12,314 12,803 13,622 11,622 11,938 11,865 Fourth Quarter 13,398 14,554 14,114 15,410 15,130 13,606
Financial Year Average 10,947 10,818 11,508 10,635 10,336 10,209
@ Based on RBI Records.
S The relevant dates of fortnights for 1991-92 have been specified; the dates for other years pertain to corresponding fortnights.
Note: As per budgelary data. Centre's deficit was Rs.10392 crore in1989-90 and Rs. 11,347 crore in 1990-91.
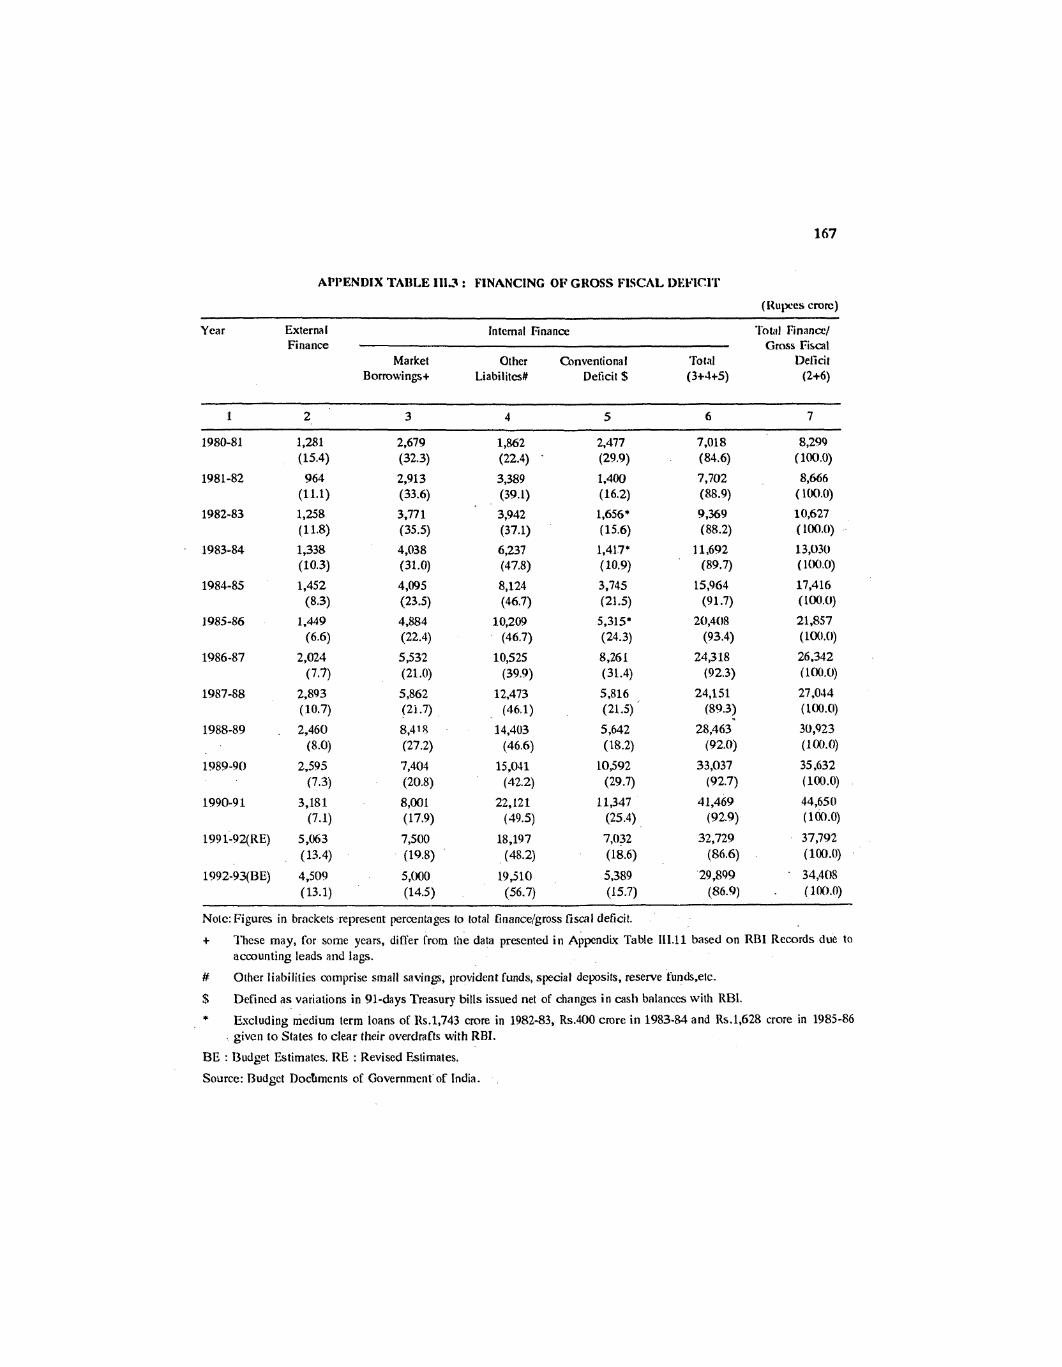
APPENDIX TABLE I113 : FINANCING OF GROSS FISCAL I)EI.'ICl'I'
(Hupces cront)
Year External Internal finance Total 17inancc/ Finance Gross Fiscal
Market Other Gnventional Total Delicit Borrowingst Liabilitcs# Deficit S (3+4+5) (2+6)
- - -- - - -- -- -- --
Note: Figures in brackets represent percentages to total finance/gross fiscal deficit.
+ l'hcse may, for some years, differ Crom the data presented in Appendix Table 111.11 based on RBI Records due to
accounting leads and lags.
# Other liabilities comprise small savings, provident funds, special deposits, reserve funds,elc.
$ Defined as variations in 91-days Treasury bills issued net of changes in cash balances with RBI. * Escluding medium term loans of Hs.1,743 crore in 1982-83, Rs.400 crore in 1983-84 and Rs.1.628 crore in 1985-86
given to States to clear their overdrafts with RBI.
BE : Budget Estimates. RE : Revised Estimates.
Source: Budgct Docfimcnts of Government'of India.

APPENDIX TABLE 111.4 : TOTAL OUTSTANDING LIABILITIES O F GOVERNMENT OF INDIA (Rupees crore)
- -
Provident Reserve Total External Total Internal Small Fund & 0th- Fund & Internal Liabili- Liabili-
Year Debt Savings er Acoounts Deposits Liabilities ties -ties (2+3+4+5) (6+7)
Note: Figures in brackets represent percentages to GDI' at current market priccs.
Source : Budget Documents of Government of India.
BE : Budget Estimates. RE : Revised Estima~es.

APPENDIX TABLE 111.5 : BUDGETARY DEFICIT, MARKET LOANS AND RBI SUPPORT TO CENTRAL GOVERNMENT
(Rupees crore)
Items 1990-9 1 1991-92 1991-92 1992-93 (Accounts) (BE) (RE) (BE)
1 2 3 4 5
1 .. Revenue Account
i) Receipts(a)
ii) Expnditure(a)
iii) Surplus(+)/Deficit(-)
2. Capital Account
' i ) Receipts
ii) Disbursements
iii) Surplus(+)/Deficit(-)
3. Total Receipts(l(i)+2(i))
4. Total Expenditure (l(ii)+2(ii))
5. Overall Surplus(+)Deficit(-)
6. (5) as percent of (4)
7. Net Market Loans*
8. (7) as percent of (3)
9. Increase(+)/Decrease(-) in RBI holdings of Government Rupee Securities other than Treasury Bills(b)
10. Increase(+)/Decrease(-) in net RBI credit to Central Government(c)
a) Include commercial departments.
b) On book value basis, according to RBI Records. Excludes Special Securities worth Rs.30,000 crore and Rs.5,000 crorc due to funding of ad hoc Treasury bills during 1990-91 and 1991-92, respectively.
c) As per memorandum item given in the Unian Budget. * Figures in brackets represent gross market loans.
BE : Budget Egtimates.
RE : Reviscd Estimates.
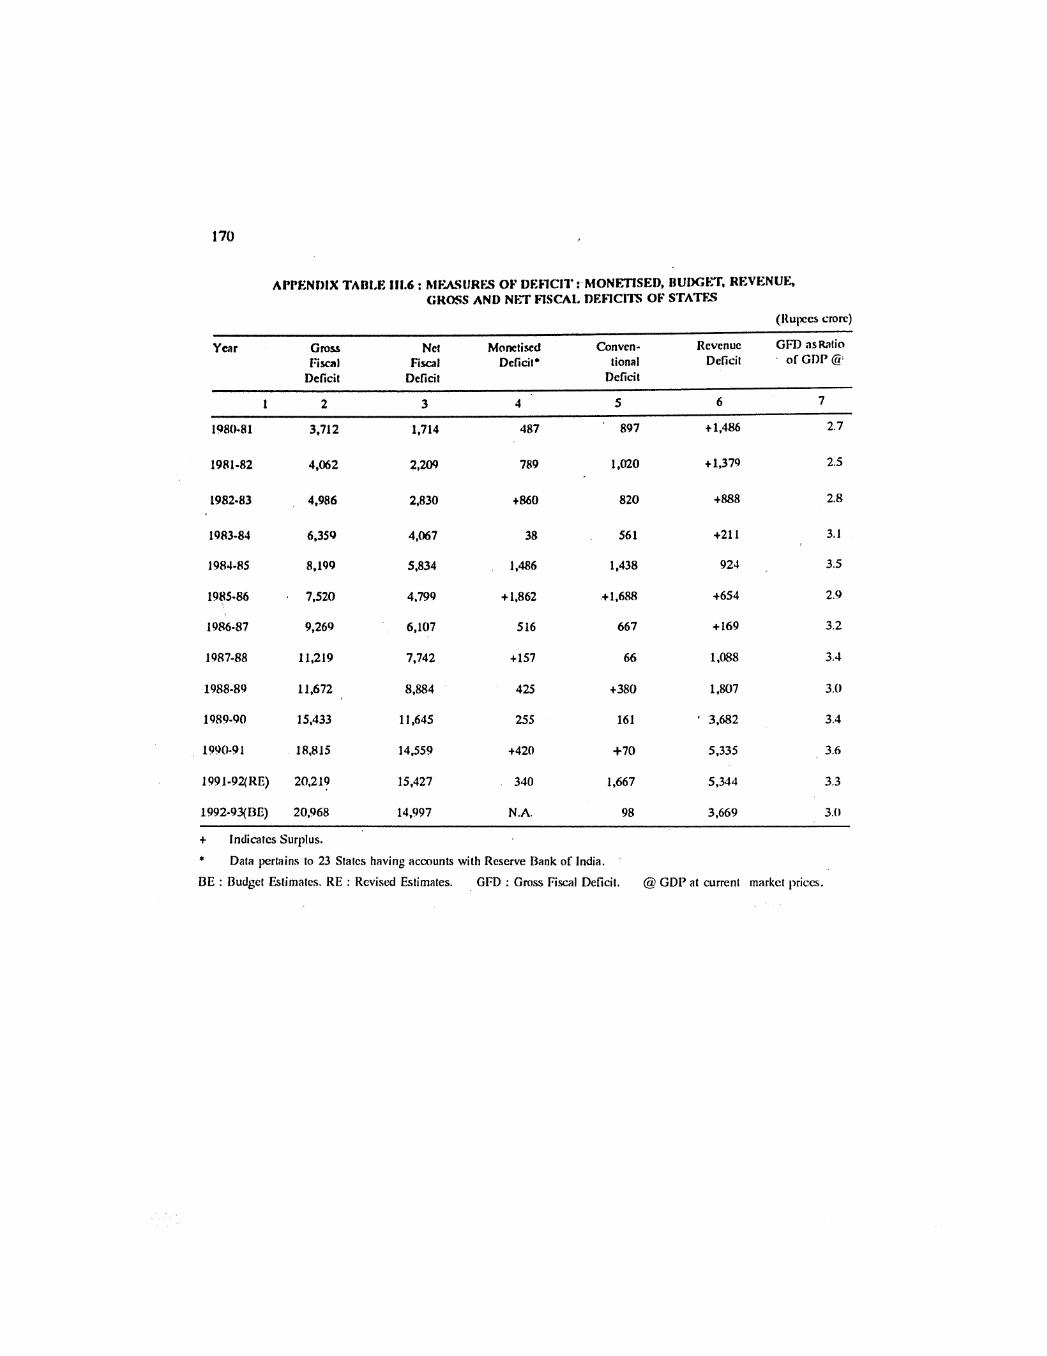
API'ENIIIX TAOl,fz, 111.6 : ICIFASIJftFS OF DEElClT :.MONETISED, RUDCkT, REVENUE, CROSS AND NkX FISCAL DEFfCtTX OF STATFS
Y a r Gms Net Monetised Conven- Revenue GFD asmtio Fiscal Fiscal Deficit* tional Deficit of GDP @.
Deficit Deficit Deficit
1991-92(11E) 20,219 15,427 340 1,667 5,344 3.3
1992-93(DE) 20,968 14,997 N.A. 98 3,669 3.0
t Indicates Surplus. * Data pertains to 23 States having accounts with Reserve Bank of India.
BE : Budget Estimates. RE : Revised Estimates. GFD : Gmss Fiscal Deficit. @ GDP at current market prices.

APPENDIX TABLE 111.7 : FINANCING OF STATES* CROSS FISCAI. DEFICIT
(Rupees m r c )
Year L.oans Market Others Gross Stales' Outstanding lial~ililics from Borrowings Fiscal (end-year)
Central (net) Deficit Govt. (net) (2t3t4) Loans Rr Mnrkcl
Total S Adva nccs Lna ns from
Ccntrc GJ
1980-81 1,564 183 1,964 3.7 12 23,977 17,071 2,973 ( 42.1 ) ( 5.0 ) ( 52.9 ) ( 100.0 )
1981-82 2 J W 339 1,723 4,062 27,729 19,080 3,328 ( 49.2 ) ( 8.3 ) ( 42.5 ) ( 100.0 )
1982-83 2,7i5 393 1.858 4,986 29,457 20,425 @) 3,735 ( 54.9 ) ( 7.9 ) ( 37.2 ) ( 100.0 )
1983-84 3,031 563 2,765 6,359 38,493 27,539 @! 4.4OU ( 47.7 ) ( 8.9 ) ( 43.4 ) ( 100.0 )
1984-85 3,s 80 693 3,926 8,199 44,394 3 1,226 5,1(10 ( 43.7 ) ( 8.5 ) ( 47.8 ) ( 100.0 )
1985-86 5,757 1.010 753 7,520 $2,474 38,682 @ 6.104 ( 76.6 ) ( 13.4) ( 10.0 ) ( l(KI.0 )
1986-87 3,786 1,147 3,336 9,269 59,273 43.468 7.25 1 ( 51.6 ) ( 12.4 ) ( 36.0 ) ( 100.0 )
1987-88 5,832 1,523 3,864 11,219 68,523 49 J(K) U.773 ( 52.0 ) ( 13.6 ) ( 34.4 ) ( 100.0 )
1988-89 6,688 1,973 3,011 11,672 79,496 55,985 10,7(Wi ( 57.3 ) ( 16.9 ) ( 2 5 8 ) ( 100.0 )
1989-90 7,917 2;298 5,218 15,433 92,300 63,903 12,913 ( 51.3 ) ( 14.9 ) ( 33.8 ) ( 100.0 )
1990-91 9,950 * 2,184 - 6,681 18,815 1,08,236 73,852 15.097 ( 52.9 ) ( 11.6 ) ( 35.5 ) ( 100.0 )
1991-92(RE) 9,709 2,874 7,636 20,219 1,24,307 83,562 17,971 ( 48.0 ) ( 14.2 ) ( 37.8 ) ( 100.0 )
1992-93(BE) 12,069 2,940 5,959 20,968 1,43,348 95,630 20,V 1 1 ( 57.6 ) ( 14.0 ) ( 28.4 ) ( 100.0 )
S Includes other internal debts, small savings, provident fund etc., reserves funds, deposits and advances, suspnse Rr miscellaneous including contigency fund.
Includes medi urn term loans of Rs. 1,743 crore in 1982-83, Rs.400 uore in1983-84 and Rs.1.628 crore i n 198546 given by the Centre to States to clear their overdrafts.
BE : Budget Estimates. RE : Revised Estimates.
Note: Figures in brackets are percentages to the total.

APPENDIX TABLE 111.8 : COMBINED RECEIMS AND DISBURSEMENTS OF CENTRAL AND STATE GOVERNMENTS
(Rupees crore)
Items
1990-91 1991-92 1991-92 1992-93* Percentage Variations -(Accounts) (BE) (RE) (BE)
Co1.4 over Col.5 over Co1.2 Co1.4
I. Total Receipts (AtB)
A. Revenue Receipts of which:
Tax ~eceipts (atb)
a) Direct Taxes
b) Indirect Taxes
B. Capital Receipts
11.. ' Total Disbursements (AtBtC)
A. Developmental Expenditure (atbtc)
a) Revenue
b) Capital Outlay 16,366 17,647. 16,355 . . 17,975 . -0.1 9.9
c) Loans and Advances 11,035 11,493' 11,895 - , 10,959 7.8. -7.9
B. Non-Developmental Expenditure (atbtc) 63,973 74,440 74,025 85,541 15.7 15.6
a) Revenue 58,114 68,313 68,337 79,199 17.6 15.9
b) Capital Outlay 5,006 5,755 5,272 5,910 5.3 12.1
c) Loans and Advances 853 372 416 432 -51.2 3.8
2. Others 4,759 6,819 6,853 7,536 44.0 10.0
11. Overall Surplus(+)/Defici t(-) -11,277 -8,913 -8,699 -5,487
' Includes.effect of Budget proposals. BE : Budget ~stimates. RE :Revised Estimates.
Jore: 1. Regarding State Governments, data relate to 25 States of which 9 are from Vote-on-Account Budgets. -
2. 0;her disbursements comprise discharge of internal and external debt, compensation and assignments to local .bodies and Panchayati Raj Institutions, appropriation to contingency funds and net remittances and are adjusted for difference in figures of repayments of loans by States lo Central Government given in their respective budgets.

APPENDIX TABLE 111.9 : DEVELOPMENTAL AND*NON.DEVELOPMENTAL EXPENDITURES OF CENTRE AND STATES
(Rupees ctort)
Year Centre States Centre and States Combined
Non- Non- Non- Develop- Develop- Develop- Develop- Develop- Develop
mental mental Total@ mental mental Others* Total mental metal Others Total Expen- Expen- Expen- Expen- Expen- Expen- $%
diture diture diture diture diture diture
@ Excludes discharge of internal and external debt. * Comprise discharge of internal debt, repayment of loans to the Centre, appropriation for contingency fund and remit-
tances (net) and assignments to Local Bodies and Panchayati Raj institutions.
$$ Comprise discharge of internal and external debt, compensation and assignment to Local Bodies and Panchayati Raj institutions, appropriation for contingency funds, net remittances of State Governments and are adjusted for differences in the figures of repayment of loans by the State Governments to the Central Government given in their respective budgets.
+ Regarding State Governments, data relate to 25 States of which 9 are Vote-on-Account Budgets.
BE : Budget Estimates. RE : Revised Estimates.
Notes: 1) Figures in brackets represent percentages to respective total expenditure.
2) Figures for the Centre and States do not add up to the cornbined position due to inter-Governmental adjustments.
3) The figures for Centre's expenditure prior to 1989-90 do not take into account capital expenditure on Railways and loans to States against small savings collections.

APPENDIX TABLE 111.10: DIRECT AND INDIRECT TAX REVENUES OF THE CENTRE AND STATES (Rupees crore)
Centre (Gross) Statest Centre & States Combined
Year Direct Indirect Total Direct Indirect Total Direct lnirect total
+ Excluding States' share in Central taxes as reported in Central Budget Documents. * Regarding State Governments, data relates to 25 States of which 9 are from Vote- on Account Budgets.
Nole : (a).' Represents percentages to total tax revenue. (b) Indicates tax to GDP ratio in percentages.
BE : Budgef Estimates. RE : Revised Estimates.
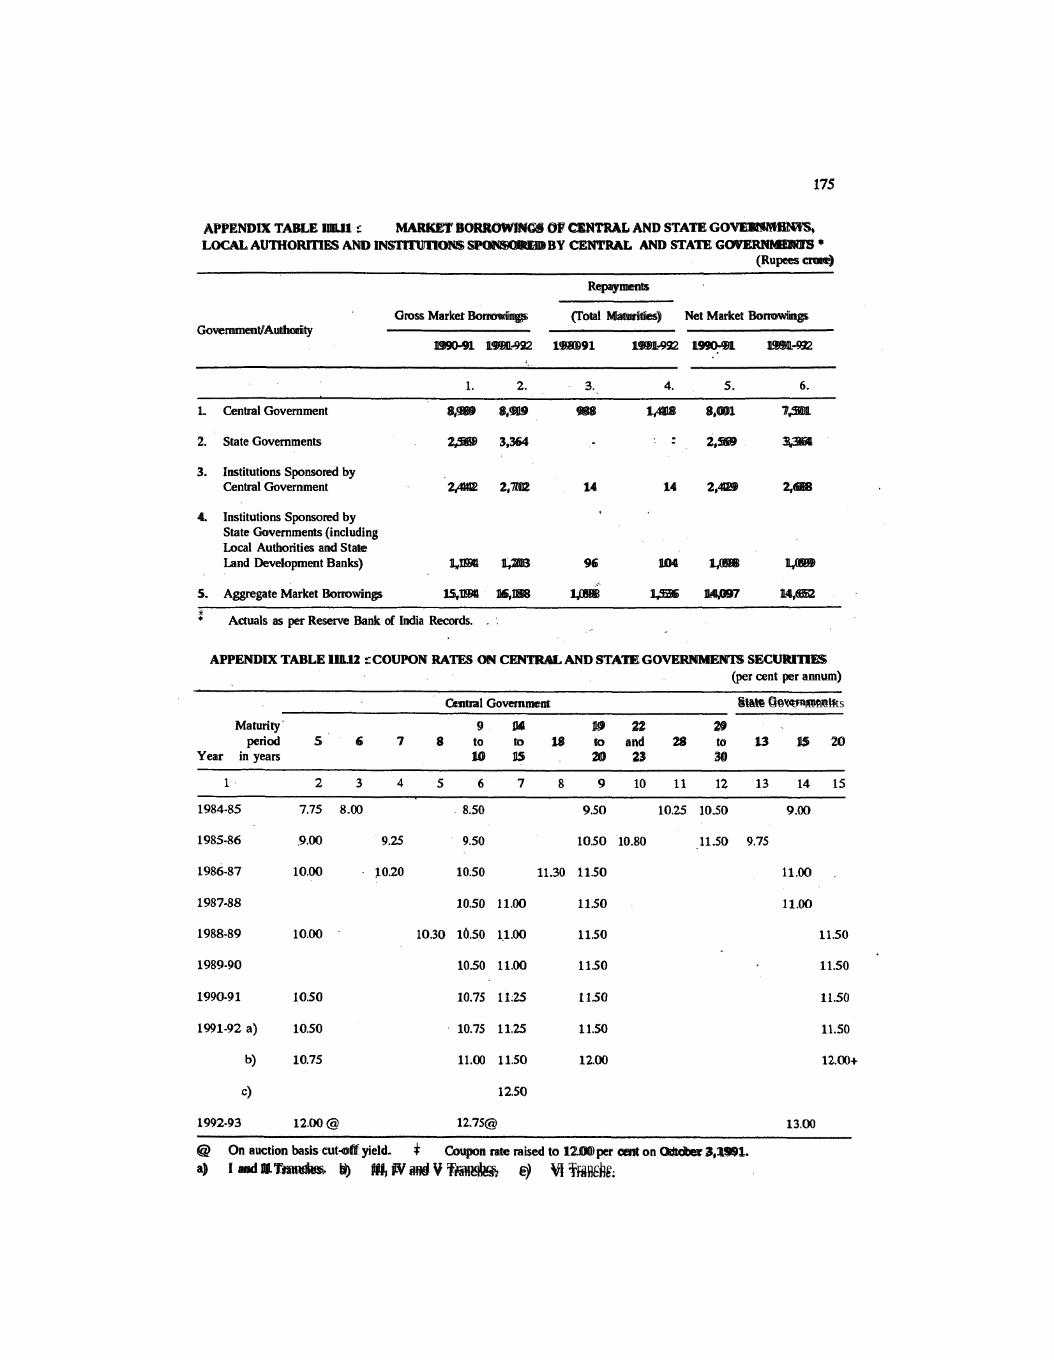
APPENDIX TABLE 111.11 : MARKET BORROWINGS OF CENTRAL AND STATE GOVERNMEWS,LOCAL AUTHORITIES AND INSTITUTIONS SPONSORED BY CENTRAL AND STATE GOVERNMENTS
(Rupees crore) - - -
Repayments
Gross Marker Borrowings (Total Maturities) Net Market Borrowings Government/Authori ty
1990-91 1991-92 199091 1991-92 1990-91 1991-92
1. Central Government 8,989 8,919 988 1,418 8,001 7,501
2. State Governments 2,569 3,364 ' - 2,569 3,364
3. Institutions Sponsored by Central Government 2,442 2,702 14 14 2,429 2,688
4. Institutions Sponsored by State Governments (including Local Authorities and State Land Development Banks) 1,194 1,203 96 104 1,098 1,099
5. Aggregate Market Borrowings 15,194 16,188 1,098 1,536 14,097 14,652
* Actuals as per Reserve Bank of India Records. . .
APPENDIX TABLE 111.12 : COUPON RATES ON CENTRAL AND STATE GOVERNMENTS SECURITIES (per cent per annum)
Central Government State Govc~nrncnts
Maturity 9 14 19 22 29 period 5 6 7 8 to to 18 to and 28 to 13 15 20
Year in years 10 15 20 23 30
Q On auction basis cut-off yield. + Coupon rate raised to 12.00 per cent on October 3,1991. a) I and 11 Tranches. b) 111, IV and V Tranchcs, c) VI Tranche.

APPENDIX TAnLE IV.1: MONEY STOCK (MJ)-COMPONENTS AND SOURCES (Rupees crore)
Outsta- . Variations during **
Items
nding as on 19W-91 1991-92. 1992-93 1991-92. March 31 (April-June) ' (April-June) 1992 - -
Abso- Percen- Abso- Perccn- Abso- Percen- A'&- Percen- lute tage lute tage lute' tage lute tage
I. M3(a+b+c) 3,15,084 34.878 5.1 49.256 185 18,243 a. Currency with the Public 61,232 6.748 14.6 8,184 15.4 2,719 h. Aggregate Deposits with Banks (1 t2) 2,52,956 28.054 15.2 40,850 19.3 10,534
o h External deposits (i+ii)'## - 28,273 4,777 26.7 5,606 24.7 3,909 i. All foreign currency deposits' 20,439 4.088 35.4 4,812 30.8 3,427 ii. NRE deposits 7.834 689 10.8 794 113 482 ,. Demand Deposits 51,983 5,008 14.7 12.813 32.7 44
2. Time Deposits 2,00,973 23.046 15.4 28.037 16.2 10,490 c. 'Other' Deposits with RBI . 896 76 12.7 222 32.9 4.990
/If. *Ml(a+b(i)+c) 1,14,111 11,832 14.6 21,219 22.8 7,753 111. SOURCES OF MONEY STOCK (M3) (1+2+3+4-5) I ,
' 1. Net Bank Credit to Government (AtB) 1,58,294 23,042 19.7 18,101 12.9 6,391 A. RBI's net Credi~ to Governnrent (i+ii) # 94,016 15,165 20.6 5.168 5.8 2,320 i. Net clainls on Central Government (a-b) 92,266 14,745 20.5 5.508 6.3 3.913
a. Claims on Central Government 94,348 15,086 20.6 5,904 6.7 1,906 b. Deposits of Central Government 2,082 341 25.4 396. 23.5 -2,007
ii. Net claims on State Governments (a-b) 1,750. 420 25.1 -340 -16.3 -1,593 a. Claims on State Governments 1.750 420 25.1 -340 -16.3 -1.577 b. Deposits of State Governments 16
B. Other hanks'credit to Government 64.278 7.877 18.1 12.933 25.2 4,071
2: Bankcredit to Conimercial Sector (A+B) 1,91,065 20,065 13.2 , 19.2% 11.2 8.493 4.4 89 0.1
A. RBI's credit to conlmercial sector @ 7.260 -7 -0.1 918 145 93 1.3 -850 -13.3 B. Other banks'credit to con~mercial sector 1.83.805 20.072 13.8 18.378 11.1 8,400 4.6 939 0.6
3. Net Foreign Exchange Assets of Banking Sector(A+B)$ 19,517 1.854 27.2 10.855 125.2 549 4.3 . -1,225 -14.1
(-4,694) (-65.8) (9.141) (105.4) (1.039) (5.4) (-1,507) (-20.8) A. RBI's net foreign excl~a~ige assets 18.838 1,915 31.6 10,855 136.0 849 4.5 -1.225 -15.3 B. Other hanks' nct foreign exchange assets 689 -61 -8.1
4. Government's Currency Liabilities to the Public 1,696 66 4.2 75 4.6 -- 33 1 .-I
5. Banking Sector's Net Non-monetary Liabilitiesotller than Time Deposits (A+B) 55,498 10,149 21.9 9 9 -1.6 -2.510 -4.5 -3,204 -5.7
A. Net non-monetary liabilities of RBI$ 27,403 9,486 54.1 381 1.4 -2.195 -8.0 257 1 B. Net non-monetary liabilitiesof 28,095 663 2.3 -1,310 -4.5 -315 -1.1 -3.461 -11.8
other banks (residual)
* Based on data pertaining to March 31 in respect of the Reserve Bank and the last reporting Friday of March in respcct of sclicdulcd comn~ercial banks.
* Provisional # Includes special securities. @@ Incrcnx ovrr /rrcr.
@ Excludes. since the establishment of NABARD, its refinance to hanks. % Inclusive of appreciation in the value of gold following its revaluation close to international niarkct price cffcctive
October 17.' 1990. Such appreciation has a corresponding effect on Reserve Bank's net non-monetary liabilities. Figurch witl~in brackets are net of such revaluation.
## Figure rela~es to scheduled comniercial banks.
Notc: Constituent itcnts may not add upto totals due to rounding off.

APPENDIX TABLE IV.2: RESERVE MONEY - COMPONENTS AND SOURCFS
(Rujxes crore)
Outstanding Variation during S as on March 31, 1990-91 1991-92. 1992-93. 1991-92'
Items 19E8 (April- (April- June) June)
1 2 3 4 5 6
RESERVE MONEY (1 +2+3 t4) 99,509 10,188 11,730 6,027 4,725 (13.1) (13.4) (6.1) (5.4)
1. Currency with the Public 61,232 6,748 8,184 2,719 3,737 (14.6) (15.4)
2. 'Other'Deposits with RBI (4.4)
, 896 (7.0)
76 222 4,990 734 (12.7) (32.9) (556.9) (108.9)
3. Cash a i ~ h Banks 2,499 248 2 65 317 482
(125) (1 1.9) (12.7) (21.6) 4. Bankers' De'psits with RBI 34,882 3,116 3,059 -1.999 -228
(10.9) (9.6) (-5.7) (-0.7) SOURCES OF RESERVE MONEY (1 +2+3+4+5-6)
1. Net RBI credit to Government # 94,016 15,165 (20.6)
2. RBI's claims on commercial and 5,102 2,535 co-operative banks @ (33.9)
3. RBI's credit to commercial sector 7,260 -7 918 93 -850
(-0.1) (14.5) (1.3) (-13.4) 4. Net foreign exchange assets
of RBI 18,838 1,915'. (-4,633)@@ 10,855 ** (9,141)@@ 849 ** (1,049)@@ -1,225 ** (.1.807)@@ (31.6) (-76.4) (136.0) (114.5) (4.5) (5.6) (-15.3) (-22.6)
5. Government's currency liabilities 1,696 66 75 22 to the public (4.2) (4.6) (1.4)
6. Net non-monetary liabilities of RBI 27,403 9,486 ** 381 ** -2,195 f * 257 *" (54.1) (1.4) (-8.0) (1.0)
Net Domestic Assets of RBI 80,671 8,273 875 5,178 5,950
* Provisional $ Based on data pertaining to March 31.
Q Including NABARD. # Includes special securities.
** Inclusive of appreciation in the value of gold following its revaluation close to international marielprices effective October 17, 1990. Such appreciation has a corresponding effect on Reserve Bank's net non-monetary liabilities.
QQ Excluding gold revaluation.
Note: Figures in brackets indicate percentage variation.

Af'PENDIX 'I'Anf,E 1V3 : TRENIH IN INCOME VELOCITY OF CURRENCY, AGGREGATE DEPOSITS, MI AND MJ
Avcmgcs * (Rupees mrc) I m m e Velodty Ratios
Year 1 2 3 4 5 6 7 8
1986-87 27,062 1,03,620 47,009 1,30,938 10.789 2.818 6.211 2.230 1987-88 3 1,490 1,21,744 53.039 1,53546 10.563 2.732 6.155 2.166
1988-89 35,934 1,43,556 61,877 1,79,884 10.992 2.751 6.384 2.196
1989-90 42,678 1,70354 74,370 2,13,807 10.558 2.642 6.059 2.108
1990-91 50,046 1,Q8,066 87,375 2.49,282 10.581 2.674 6.061 2.124
1991-92@ 57,661 2,32,092 l,W,l21 2,91,130 10.735 2.667 5.945 2.126
* Avemgcs of rcprting Fridays of the year.
@ I'rovisional.
APPENDIX TABLE IV.4 : MONETARY RATIOS
Items 1986-87 1987-88 1988-89 1989-90 1990-91 1991-92 @
Point-to-point basis
(Incremental Ro tios)
a) CurrencyIAggregatc Deposits (C/AD) 0.176 0.298 0.198 0.269 0.241 0.200
d) Broad Money Multiplier (M3/RM) 3.348 2.608 3.086 2.560 3.423 4.199
e) Narrow Money Multiplier (MlBM) 1.117 0.811 0.869 0.975 1.161 1.809
f) Bank Reserves/Aggregate Deposits (RIAD) 0.175 0.197 0.182 0.228 0.120 0.081
Average basis
(Incremental Ratios)
a) Currency/Aggregate Deposits (C/AD) 0.178 0.244 0.204 ; 0.250 0.268 0.224
c) Aggregate Deposi t s m 3 (AD/M3) 0.848 0.802 0.828 0.796 0.776 0.813
d) Broad Money Multiplier (M3/RM) 3.163 2.482 3.127 3.159 3.026 3.353
e) Narrow Money Multiplier (Ml/RM) 0.978 0.772 0.930 1.163 1.109 1.342
f ) Bank Reserves/Aggregate Deposits (RIAD) 0.194 0.255 0.179 '0.138 0.116 0.175
@ Provisional.
Note: i) On a point-to-point basis, the ratios are based on March 31 data while on an average basis, the ratios have been worked out on the basis of average of reporting Fridays of the year. All ratios in this table are incremental ratios.
ii) On point-to-point basis the ratios presented here differ from those given in the earlier Reports as the basis for them was the last reporting Friday of March.

API'ENDIX TAn1.E IVS : IMPORTANT BANKING INDICISTQHS - SCHEDULED COMMEHCIAI, DANK5
(Rupees emre)
Items
Outstanding Variations during as on
March 20, 1989-90 1990-91 1991-92 1992-93' 199 1-92 1992 (AprilJunc)
1. Total Demand and Time Liabilities 2,51,795 29,208 26,241 39,709 14,791 6,591 (excluding borrowing from RBI/IDBI/NABARD)
2. Aggregate Depsits (a+b)
a) Demand Deposits
b) Time Deposits
3. Borrowings from RBI
4. Bank Credit (atb)
a) Food Credit
b) Non-food Credit
5. Investments (atb)
a) Government Securities
b) Other Approved Securities
6. Cash in hand
7. Balances with RBI
8. Credit-Deposit Ratio (%)' @ 54.4 60.8 60.4 54.4 55.5 58.9
9. Non-food Credit-Deposit Ratio (%) @ 52.4 59.6 58.1 52.4. 53.3 56.2
* . Provisional.
' @ Ratios relate to outstandings a s on respective last reporting Fridays.
Notes: 1. Figures in brackets are percentage variations.
2. Constituent items may not add up to the totals due to rounding off.
3. No sign is indicated for positive variations.

APPENDIX TABLE IV.6 : VARIATIONS IN SELECTED ITEMS OF SCHEDULED COMMERCIAL BANKS: LAST WEEK OF MARCH
(Rupees crore)
Variations during last week of March, 1991 Variations during last week of March, 1997
Itenls March March March March April April March March March March April April 22, 29, 31, 31, 5, 19, 20, 27, 31, 31, 3, 17, 1991 1991 1991* 1991* 1991* 1991. 1992 1992 1992' 1992* 1992* 1992* over over over over over over over over over over over over March March March March March April March March March March March April 23, 22, 29, 22, 31, 5, 22, 20, 27, 20, 31, 3, 1990 1991 1991 ' 1991 1991* 1991* 1991 1992 1992 19!?2 1992* 1992*
1 2 3 4 5 6 7 8 9 10 11 12 13
1. Aggregate 25,583 8,657 3,575 12,232 -6,705 -2,090 38,216 6,808 4,502 11,310 -7,824 985 Deposits (atb) (15.3) (4.5) (1.8) (6.4) (-3.3) (-1.1) (19.8) (3.0) (1.9) (4.9) (-3.2) (0.4)
[33.8] [14.0] l47.81 [17.8] [11.8] [29.6]
a) Denland Deposits 4,337 5,107 2,222 7,329 -5,268 -1,409 11,895 3,805 2,847 6,652 -6,136 983 (15.0) (15.4) (5.8) (22.1) (-13.0) (-4.0) (35.8) (8.4) (5.8) (14.8) (-11.9) (2.2)
(1 17.81 [51.2] [169.0] [32.0] [23.9] [55.9]
b) Time Deposits 21,246 3,550 1,353 4,903 -1,437 -681 26,321 3,002 1,656 4,658 -1,688 2 (15.4) (2.2) (0.8) (3.1) (-0.9) (-0.4) (16.5) (1.6) (0.9) (2.5) (-0.9) (0.0)
[16.7] [6.4] [23.1] [11.4] [6.3] [17.7]
2. Bank Credit 14,848 5,564 1,570 7,134 -5,059 19 9,291 5,928 4,079 10,007 -6,171 1,687 (a + !J) (14.6) (4.8) (1.3) (6.1) (-4.1) (0.0) - (8.0) (4.7) (3.1) (8.0) (-4.6) (1.3)
[37.5] [10.6] 148.01 [63.8] [43.9] [107.7]
a) Food Credit 2,500 63 0 63 -128 -50 164 -62 236 174 -266 -71 (124.6) (1.4) (0.0) (1.4) (-2.8) (-1.1) (3.6) (-1.3) (5.1) (3.7) (-5.5) (-1.6)
[2.5] (0.01 [2.5] [-37.81 (143.91 [106.1] b) Non-Food Credit 12,348 5,501 1,570 7,071 -4,931 69 9,127 5,990 3,843 9,833 -5,905 1,755
(12.4) (4.9) (1.3) (6.3) ( - 4 1 (0.1) (8.2) (5.0) (3.0) (8.1) (-4.5) (1.4) [445] [12.7] [57.3] [65.6] j42.11 [107.7]
* Provisional.
Notes : 1. Figures in parentheses indicate percentage variations.
2. Figures in square brackets indicate absolute variation as percentage of financial year variations.
3. No sign is indicated for positive variations.

APPENDIX TABLE IV.7 : SCHEDULED COMMERCIAL BANK'S NON-DEPOSIT RFSOURCES
(Rupees crore)
Items Outstanding as on last Variations Reporting Friday of March
1 2 3 4 5 . 6
1. Aggregate Deposits , 1,66,959 1,92542 2,30,758 25,583 38,216 (15.3) (19.8)
2. Gross Demand and Time Liabilities (DTL) 1,85,845 2,12,086 251,795 26,241 39,709 (14.1) (18.7)
3. Assets with the Banking System 5,444 5,582 7,927 138 2,345
(2.5) (42.0)
,4. Gross DTL excluding Inter-Bank Assets (2-3) 1,80,401 2,06,504 2,43,868 26,103 37,364 (14.5) (18.1)
5 . Differences (4-1)
6 . Other Borrowings
7. Bills Rediscounted with Financial Institutions 3,934 3,479
8. Non-Deposit Resources (5+7)
Memorandum Item
Call Money Borrowings from UTI, LIC, DFHI @ 2,600 2,275
@ Includes borrowings from UTI, LIC & DFHI only for March, 1990. March, 1991 and March, 1992 figures include borrowings from IDBI, NABARD and 'Others' also.
Note: Figures in brackets are percentage variations.

APPENDIX TABLE IV.8 : S E C T O W L DEPLOYMENT OF GROSS B m K CREDIT BY MAJOR SECTORS @
(Rupees crore)
Outstanding as on . , Variations during Sectors
March 23, March 22, March 20, 1990-91 1991-92
1990 1991 1992
(I) Gross Bank Crcdit (1t2) 1,112,671 1,18,019 1,26,006 15,348 7,987
1. Public Food Procurement Credit 2,006 4,506 4,670 2,500 164
2 , Non-Food Gross Bank Credit 1,00,665 1,13313 1,2i,336 12,848 7,823 (100.0) (100.0)
(A) Priority Sectors
1) Agriculture
2) Small Scale Industries
3) Other Priority Sectors 8,314
(13) Industry (Medium & Large)
(C) Wholesale Trade (other than food procurement)
i) Cotton Corporation of India
ii) Food Corporation of India (for fertiliser distribution)
iii) Jute Corporation of India
iv) Other Trade
(D) Other Sectors
(11) Export Credit (included under item I [2])
(111) Net Bank credit (including inter-bank participations)
. @ Provisional.
Note : 1. Data relate to 50 scheduled eommerdal banks (49 from March, 1990 and 48 From August, 1990 due to merger), which account for about 95 percent of bankcredit of all scheduled commercial banks. Gross bank credit data include bills rediscounted with RBI, IDBI, EXIM Bank, other approved financial institutions and inter-bank participations. Net bank credit data are exclusive of bills rediscounted with RBI, IDBI, EXIM Bank and other approved financial institutions.
2. Figures in brackets are proportions to incremental .non-food gross bank aedit. 3. Figures in square brackets are proportions to net bank aedit (including inter-bank participations) given in item 111.

r'
APPENDIX TABLE IV.9 : INDUSTRY-WISE DEPLOYMENT OF GROSS RANK CREDIT @
(Rupees cram)
. Outstanding as on Variations during
Industry March 23, March 22, March 20, 1990-91 1991-92 1990 1991 1992 '
Industry
(Total of small, medium and large scale)
1. Coal
2. Iron and Steel
3. Other Metals and Metal Products
4. All Engineering of which Electronics
5; Electricity
6. Cotton Textiles
7. Jute Textiles
8. Other Textiles
9. Sugar
10. Tea
11. Food Processing
12. Vegetable Oils (includin vanaspati)
13. Tobacco and Tobacco P:
14. Paper and Paper Producl
15. Rubber and Rubber Products
16. Chemical, Dyes, Paints, etc. of which
(i) Fertilisers
(ii)' ~Petro-Chemicals
(iii) -. Drugs and Pharmaceuticals
17. Cement
18. Leather arid Leather Products
19. Gems and Jewellery
20. Construction
21. Petroleum
22. .SAFAUNS*
23: Other Industries
@ Provisional. * Shipacquired from abroad under new scheme.

APPENDIX TABLE IV.10 : RBI ACCOMMODATION TO SCHEDULED COMMERCIAL BANKS @ (Rupees &ore)
As on Export Credit Standby Discretionary 182 Day Treasury Total Refinance the last Refinance Refinance Refinance Bills Refinance Reporting Friday of Limit Outst- Limit Outst- Limit Outst- Limit Outst- Limit Outst-
anding anding anding anding anding
1 2 3 4 5 6 7 8 9 10 11
March 4,129.08 2,812.25 - .3,225.97 533.97 210.93 - 7,565.98 3,346.22
April 4,575.76 4,448.34 - 4,987.00 4,655.00 348.03 10.00 9,910.79 9,113.34
May 5,111.06 3,167.57 - 3,065.76 120.00 291.38 37.50 8,468.20 3,325.07
June 5,222.10 4,467.98 - 2,432.02 1,546.33 555.10 . - 8,209.22 6,014.31
September 4,262.28 3,250.50 - 1,745.46 - 1,010.03 - 7,017.77 3,250.50
December 4,747.33 292.13 - 4,747.33 292.13
March 5,594.31 494.87 - - 5,594.31 494.87
April 5,746.88 3,694.07 - 5,746.88 3,694.07
May 6,841.93 1,619.86 - . - 6,841.93 1,619.86
June 7,163.34 1,531.83 - 7,163.34 1,531.83
July 7,655.61 1,562.36 - - 7,655.61 1,562.36
@ : Excluding special refinance against shipping ioans,duty drawback, etc.

APPENDIX TABLE IV.ll: RESERVE BANK REFINANCE TO DFHI
Refinance Against the Collaterals of 182 Day Treasury Bills
Limit Outst- Peak- Limit A s on the anding level comes- ' last day of utili-ponding to the month sation , the peak
during utilisa- the tion as
month in Col.4
(Rupees more)
Refinance Against Short- Refinance Against Dated Securities Term Commercial Bills of the Central Government*
-- --
Limit Outsta- Peak level Limit nding utilisa- comes-
tion ponding during the to the
month peak
Limit Outsta- Peak level Limit nding utilisa- wrres-
tion ponding during the to the
month peak utilisa-
1991 - March 200.00 126.81 230.26 W.00 700.00 700.00 700.00 700.00
(19.3.91) (303.91)
June 100.00 Nil 212.17 300.00 700.00 Nil 700.00 700.00 (20.6.91) (24.6.91) .
September 100.00 92.52 98.77 100.00 50.00 50.00 50.00 . 50.00 (12.9.91) (27.9.91)
December 100.00 Nil 337.04 600.00 50.00 Nil 50.00 50.00 (2.12.91) , ' (18.12.91)
March 600.00 Nil 580.48 600.00 50.00 , Nil 50.00 50.00 (28.2.92) (27 3.9 1)
June 100.00 2655 87.75 100.00 200.00 151.20 200.00 200.00 100.00 28.00 100.00 100.00 (19.5.92) (22.6.92) (27.6.92)
July 100.00 Nil 36.90 100.00 100.00 Nil 146.70 200.00 100.00 Nil 34.20 100.IK) (3.7.92) (2.7.92) (1.7.92)
* Effective April 2, 1992.
APPENDIX TABLE IV.12 : C U M U ~ T I V E TURNOVER OF THE DFHI IN MONEY-MARKET INSTRUMENTS
(Rupees cmre)
Instrument Fiscal year During During the year the year
1990-91 1991-92 1992-93 1991-92 (UP to (up to
Aug 7, 1992) Aug 9, 1991)
1 2 3 4 5
1. Call Funds (including .Notice Funds)
2. Trkasury Bills 32,329 23,166 9,634 11,699.
3. Commercial Bills 12,675 6,872 477 4,301
4. ckrtificates of 8 17 6 8
Depsi t 107 42 5. brnmerdal Paper
- 42
6. Term Deposits 3,532 5,961 987 2,150
7. Dated Cenfnl Government Securities 3,582

APPENDIX TABLE IV.13 : INTEREST RATES FOR RESERVE BANK REFINANCE TO DFHI (per cent per annum)
Refinance Against fioldings Refinance Against Commercial Refinance Against Dated of 182 day Treasury bills + Bills Securities @
Effective Rate of Effective Rate of Effective Rate of ,
Date Interest Date Interest Date Interest
1 2 3 4 5 6
1991 . - 1991 - 1992 - July 8 10.25 July 15 16.50 April 2 12.00
9 10.00 17 16.25
13 10.50 18 16.00
15 10.75 29 15.75
17 10.50 August 5 15.00
" 18 10.25 7 14.00
22
October 1 5
- 7
10.00 September 25 14.00
10.25 . 1992 - 11.00 April 13 15.00
9 11 .SO 28 . 20.00
12 12.50 May 5 17.00
19 10.00 July 11 15.00
November 4 10.00
6 10.00
11 10.00
12 10.00
13 10.00
18 10.50.
December
1992 - March
April
With effect from April 30, 1992 rate of interest relates to longer maturity treasury bills including 182 day Treasury bills.
@ A separate refinance limit of Rs.100 aore was sanctioned to DFHI against dated securities of Government of Indiawith effect from March 30, 1992.

APPENDIX TABLE IV.14 : CALL MONEY LENDING RATES OF DFHI
(per cent per annurn)
'For the fortnight . Lending rate For the fortnight Lending rate ended ended
Trough Peak Average* Trough Peak Average* of middle of middle
rate rate
1990 - July
August
September
October
November
December
January 11 25
February 8 22
March 8 22-
April 5 19
1991 - July 12
26
August 9 23
September 6 20
October 4 18
November 1 15 29
December 13 27
January 10 24
February 7 21
March 6 20
April 3 17
May * 3 24.25 45.00 32.25 May 1 20.00 86.00 42.05 17 20.00 60.50 42.90 15 6.00 51.00 34.15 31 4.50 45.00 29.10 29 3.50 36.00 17.03
June 14 13.50 28.00 23.40 June 12 4.50 16.50 11.43 28 6.00 38.00 25.15 26 5 .W 22.00 15.00
July 12 10.25 38.50 23.40 July 10 3.00 18.50 12.70 26 5.00 27.00 14.05 24 1.25 16.50 8.70
August 9 5.00 17.50 12.60 August 7 3.50 12.50 9.20
23 9.00 15.00 13.40 21 3.00 12.50 8.65
* This is a simple average of daily middle rates.
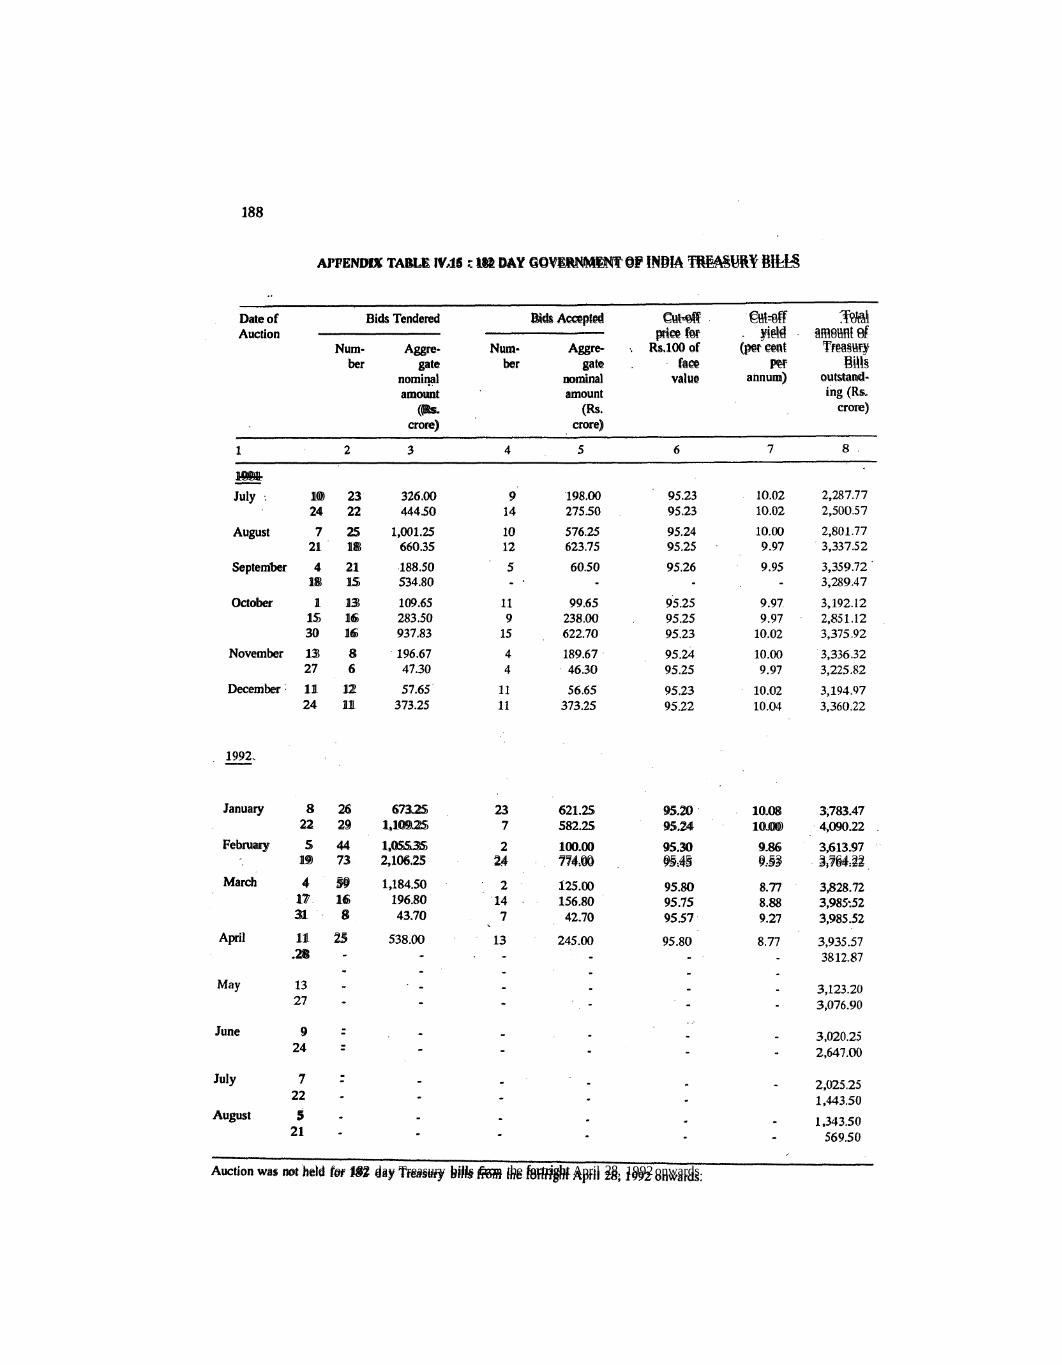
AJ'FENDIX TABLE IV.15 : 182 DAY GOVERNMENT OF INDIA TREASURY BILLS
Date of Bids Tendered Bids Accepted Cut-off Cut-off .Total Auction price for yield amount of
Num- Aggre- Num- Aggre- . Rs.100 of (per cent Treasury ber gate ber gate face Per Bills
nominal nominal value annum) outstand- amount
(Rs . crore)
amount (Rs.
crore)
ing (Rs. crore)
1991 - July . 10 23
24 22
August 7 25 21 18
September 4 21 18 15
October 1 13 15 16 30 16
November 13 8 27 6
December ' 11 12 24 11
January 8 26 673.25 23 621.25 95.20 10.08 3,783.47 22 29 1,109.25 7 582.25 95.24 10.00 4,090.22
February 5 44 1,055.35 2 100.00 95.30 9.86 3,613.97 19 73 2,106.25 24 774.00 95.45 9.53 3,764.22
March 4 59 17 16 31 8
April 11 25 .28
June 9 - 24 -
July 7 - 22
August 5 2 1
Auction was not held for 182 day Treasury bills from the fortright April 28, 1992 onwards.
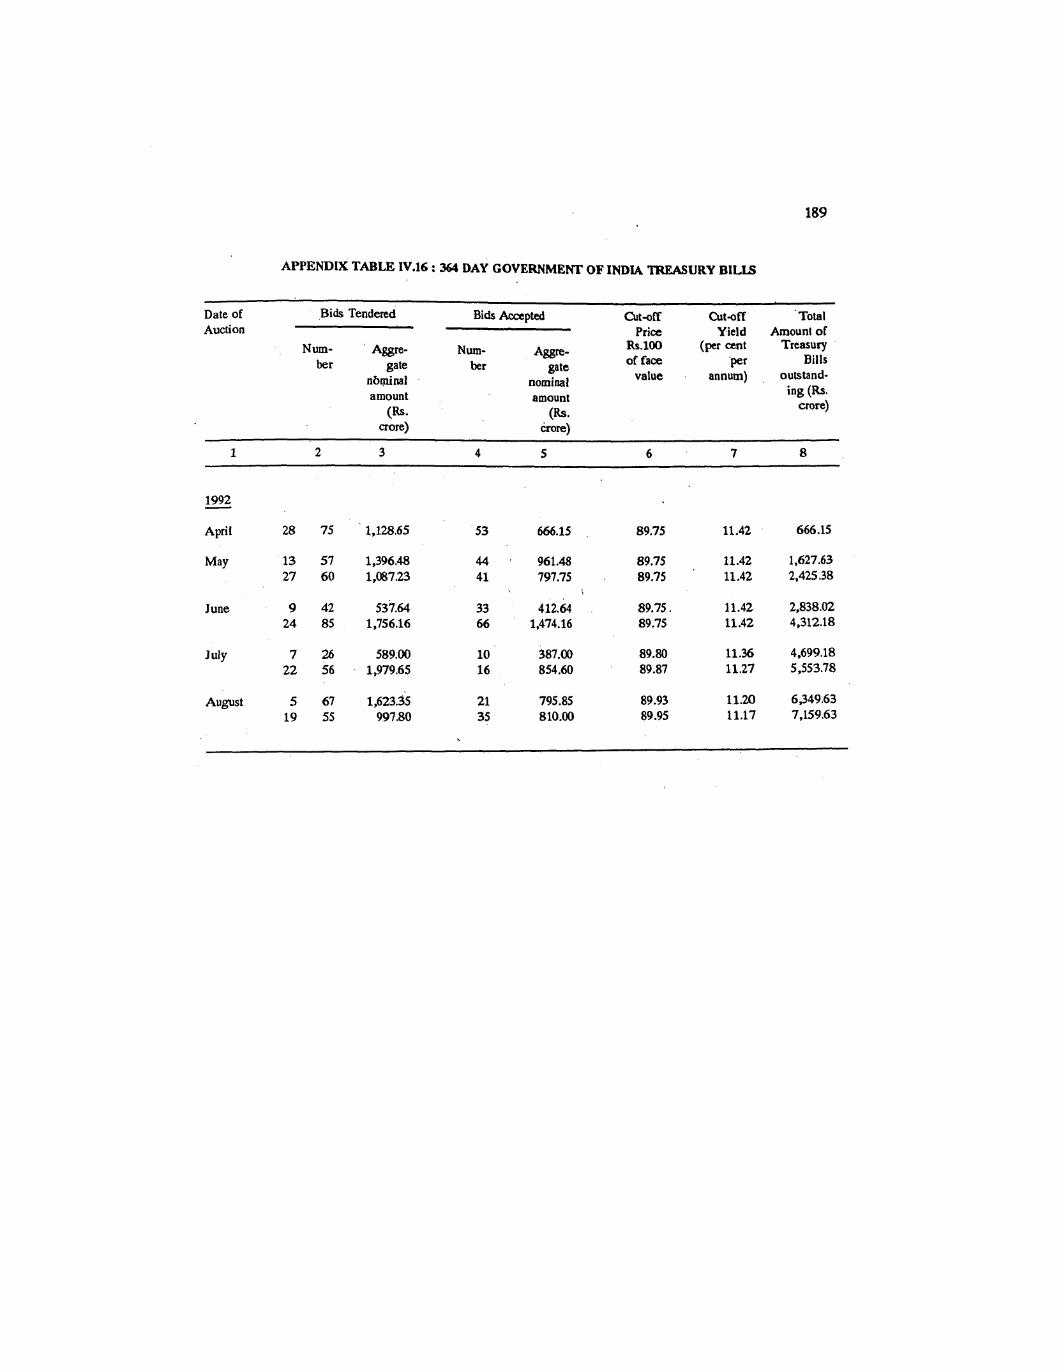
APPENDIX TABLE IV.16 : 364 DAY GOVERNMENT OF INDIA TREASURY BILLS
Date of Bids Tendered Bids Accepted Cut-off Cut-off Total Auction Price Yield Amount of
Num- Aggre- Num- Rs.100 A~P- (per cent Treasury
ber gate bet gate of face 'Per Bills nbminal nominal value . annum) outstand-
amount amount ing (Rs.
(h. crore)
crore) bore)
April 28 75
June 9 42 24 85
July 7 26 22 56
August 5 67 19 55

.sa!lrJnleru ile JOJ ~q%!uvoj aql %uynp panssj ** 'lyS!urioj 30 pua aql te sv
WSZ - SZ'ZT
OZ'LT - WET
00'87 - OO'ET
W'8T - OS'ZT
9ss69
826'5
P89'S
SEL'S
OO'LT - OS'ZT
OS'LT - oo'E1:
OO'LT - WZI
Z9'LT- OS'ZT
8Z'LT - OS'EI ,
IO'LT - OS'EI
OO'ZZ - W Z I
oorz - 0 0 . ~ 1
09'LT - OS'ZI99'LI - OS'ZT
0UTZ - OS'ZT OO'TZ - OO'TTOO'LT - OO'ET
OO'IZ - OO'ZT OO'IZ - OO'Z1:
EZO'S106'9
OO'TZ - 00'01: W L I - OO.1:T

APPENDIX TABLE IV.18: THREE PHASES OF VARIATIONS IN WHOLESALE PRICE INDEX ON POINT-TO-POINT BASIS (BASE: 1981-82 .: 100)
(In per cent)
Phase I Phase I1 Phase 111 Items
End-March to End-August End-August to End-December End-December to End-March
1989-90 1990-91 1991-92 1989-90 1990-91 1991-92 1989-90 1990-91 1991-92
All Commodities 6.5 5.6 9.6 -0.4 3.7 1.9 2.8 2.3 1.7
Primary 6.8 10.4 13.9 -3.5 2.9 2.6 3.3 3.1 . -1.3 Articles
Fuel, Power, 0.5 1.5 4.7 0.8 11.1 5.2 4.9 1.4 2.8 Light &Lubricants
Manufactured 7.5 3.7 8.0 1.2 2.9 0.9 2.1 2.1 3.3 Products

PPENDIX TABLE IV.19 : VARIATIONS IN INDEX NUMBERS OF WHOLESALE PRICES ( BASE : 1981-82 = 100 )
(In per cent)
.Financial year. . First quarter
~ a j o r Groups /Groups /Sub-groups1 Weight . .
Commodities Point-to-point basis Average basis Point-to-point basis
1990-91 1991-92 1990-91 1991-92 1991-92 1992-93P
ALL COMMODITIES 100.000
I. PRIMARY ARTICLES 32.295
*I. ~ood'articles a. Cereals i) Rice ii) Wheat b. Pulses c. Fruits and vegetables d. Milk e. Eggs, fish &meat f. Condiments & spices g. Other food articles i) Tea ii) Coffee
2. Non-food articles a. F i b ~ s i) Raw cotton b. Oilseeds.
3.. Minerals i) Petroleum crude & natural gas
11. FUEL,POWER,LIGHT AND LUBRICANTS 10.663 14.4 13.2 12.3 13.1 0.5 0.3
a. Coking coal b. Mineral oils C. Electricity
111. MANUFACTURED PRODUCTS 57.042 8.9 12.6 8.4 11.3 3.3 2.1
a. Sugar, khandsari &gur 4.059 i) * Sugar 2.013 ii) Khandsari 0.300 iii) Gur 1.746
b. Edible oils 2.445 c. Cotton textiles 6.093 d. Chemicals & chemical products 7.355 e. Cement 0.860 f. Iron & steel 2.441
'PI: provisional.

APPENDIX TABLE IV.20 : WEIGHTED CONTRIBUTION OF GROUPSICOMMODITIES TO THE INCREASE IN THE GENERAL INDEX OF WHOLESALE PRICES ( BASE : 1981-82 = 100 )
(In per cent)
Hnanaal year First quarter Major Gmups /Groups /Sub-groups1 Weight
Commodities Point-to-point basis Average basis Point-to-point basis
1990-91 1991-92 1990-91 1991-92 1991-92 ,1992-93P
ALL COMMODITIES 100.000
I. PRIMARY ARTICLES 32.295
1. 'Food articles 17.386 a. Cereals 6.824
i) Rick 3.685 ii) Wheat 2.248
b. Pulses 1.093 c. Fruits and vegetables 4.089 d. Milk 1.961 e. Eggs,fish&meat 1.783 f. Condiments & spices 0.947 g. Other food articles 0.689
i) Tea 0.564 ii) Coffee 0.125
2. N,on-bod articles 10.081 a. Fibres 1.791
Raw cotton 1.335 b. Oilseeds 3.861
3. Minerals 4.828 Petroleum crude & natural gas 4.274
11. FUEL,POWER,LIGHT AND LUBRICANTS 10.663
a. Coking coal 0.353 b. Mineral oils 6.666 c. Electricity 2.741
111. MANUFACTURED PRODUCTS 57.042
a. Sugar, khandsari & gur 4.059 i) Sugar 2.013 ii) Khandsari 0.300 iii) Gur 1.746
b. Fkiible oils 2.445 c. Cotton textiles 6.093 d. Chemicals & chemical products 7.355 e. Cement 0.860 f. Iron & steel 2.441
?: provisional,
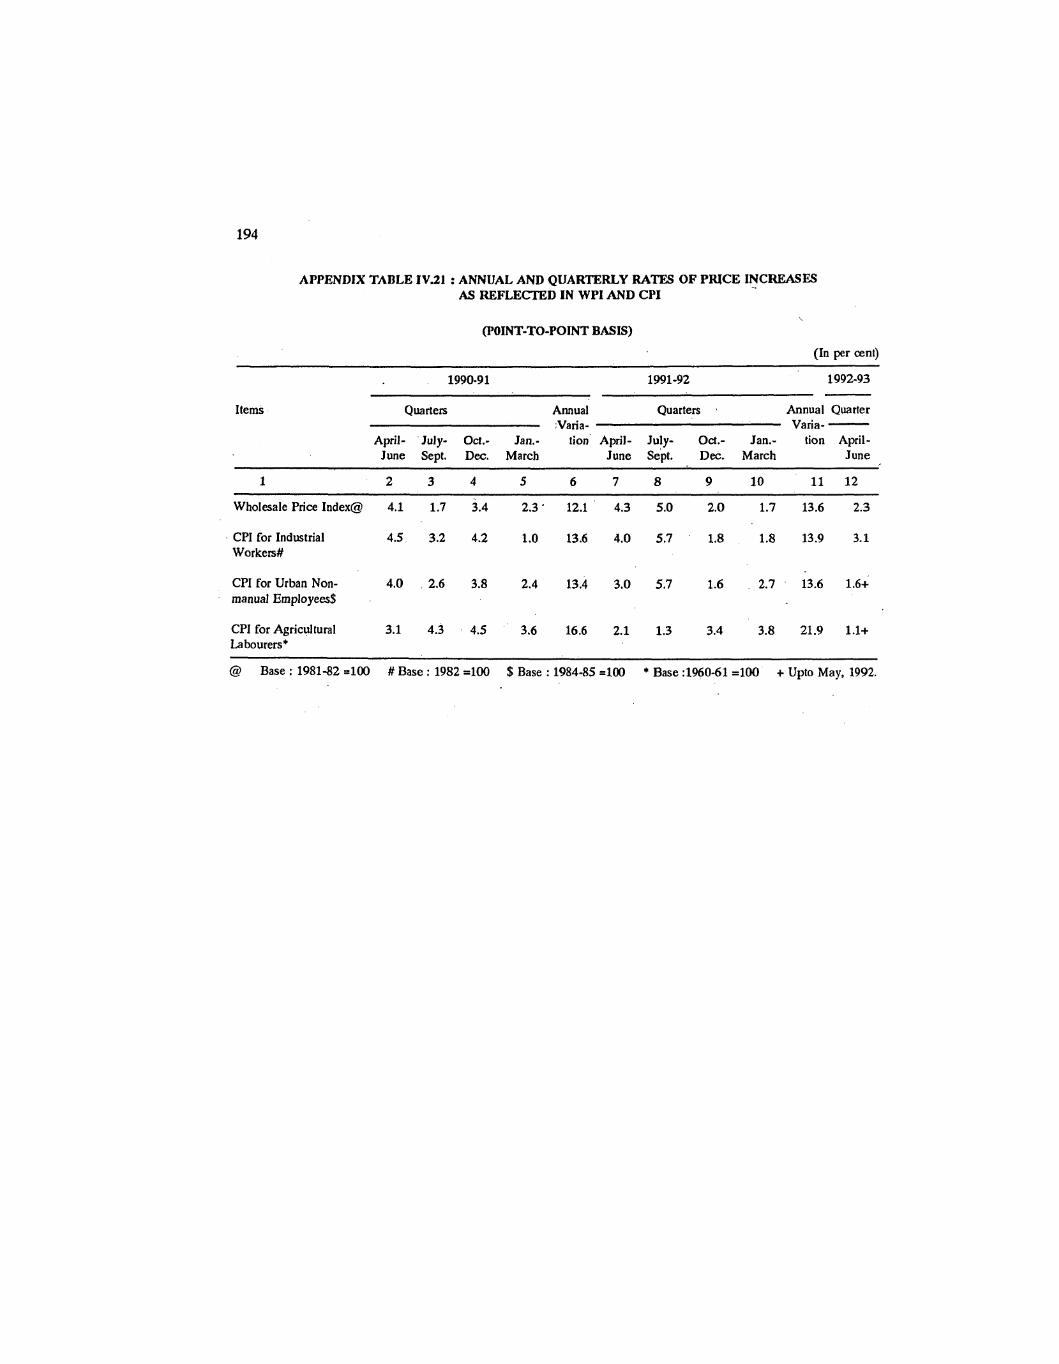
APPENDIX TABLE IV.21: ANNUAL AND QUARTERLY RATES OF PRICE INCRbSES AS REFLECTED IN WPI AND CPI
(POINT-TO-POINT BASIS)
(In per cent)
1990-91 199 1-92 1992-93
Items Quarters Annual Quarters . Annual Quarter Varia- Varia- -
April- July- 01%- Jan.. tion April- July- 01%- Jan.- tion April- June Sept. Dec. March June Sept. Dec. March June
Wholesale Price Index@ 4.1 1.7 3.4 2.3 ' 12.1 4.3 5.0 2.0 1.7 13.6 2.3
CPI for Industrial 4.5 3.2 4.2 1.0 13.6 4.0 5.7 1.8 1.8 13.9 3.1 Workers#
CPI for Urban Non- 4.0 2.6 3.8 2.4 13.4 3.0 5.7 1.6 2.7 13.6 1.6+ manual Employees$
CPI for Agricl~ltural 3.1 4.3 , 4.5 ' 3.6 16.6 2.1 1.3 3.4 3.8 21.9 1.1+ Labourers*
@ Base : 1981-82 =I00 # Base : 1982 =I00 $ Base : 1984-85 =I00 * Base :1960-61=100 + Upto May, 1992.

APPENDIX TABLE IV.22 : GOLD AND SILVER PRICES IN DOMESTIC AND INTERNATIONAL MARKE'IS
Year Gold Silva Spread between S p d betwlcen Bombay and Bombay and
Bombay Market (Rs. per 10 Bombay Market (Rs.pa Kg. London Prices N& York Prices granimes for standard gold) For 0.999 fineness) (Avmge in percentages)
Year-end Average Year-end Average Gdd Silver **
.Till February. 1992, the spread hag been worked.out after converting the quotations in dollars per troy &n& in London market into rupees per 10 grammes, at the a o s s rates based on daily average of spot buying and selling rates of U.S. dollars in London and average of Resewe Bank's spot buying and selling rates of .sterling. For March, 1992, the quotations have been converted at the daily average of FEDAI's spot buying and selling rate of U.S.dollars in Bombay.
** Till February, 1992, the spread has been worked out after converting the quotations in cents per tray ounce in New York market into nipees per Kg., at the cross rates based on the daily average of spot buying and selling rates of U.S. dollars in Londo'n and average of Reserve Bank's spot buying and selling rates of sterling, For March.1992, the quotations have been converted at the daily average of FEDAI's spot buying and selling rate of U.S; dollars in Bombay.
Note: Figures in brackets are percentage variations over the previous year.

APPENDIX TABLE IV.23 : GOLD AND SILVER RATIO IN TERMS OF GRAMMW+
In Bombay Market * In International Market $
Year On average On Year-end On average On Year-end Price basis Price basis Price basis Price basis
1 2 3 4 5
+ Grammes of silver available per one gramme gold. * Based on quotations of Bombay Bu!lion Association.
$ Based on quotations received from Press Trust of India for London and New York Markets.

APPENDIX TABLE IV.24 : MONTHLY SPREAD BETWEEN GOLD AND SILVER PRICI;;S
Gold Silver Bombay - London Bombay - New York
Month1 Year Absolute * Percentage Absolute @ Percentage
1991 - April
May
June
July
August
Septemhr
October
November
December
January
February
March 1,069.17 33.6 3,970.00 99.8
April 1,131.48 33.6 ', 4,396.74 110.0
June 796.89 24.1 3,313.47 84.0
July 708.55 20 .I 3,694.59 96.2
* Rupees per 10 grammes.
@ Rupees per Kilogram.

API'ENDIX TABLE V.1 : ASSISTANCE SANCTIONED AND DISUUHSEI) BY At,t, FINANCIAL INS'Z1TUlnONS
(Rupees crore)
1989.W 1990.91 1991-92 Variations in Variations in sanctions disbursements
lnslitutions S D S D S D 1990-91 1991-92 1990-91 1991-92 over over over over
-
A. All lndia @ 13.043.7 7374.1 16,172.3 9,778.1.18.053.6 11,693.2 3,128.6 1,8813 2,204.0 1.9!5.1 ~ e v c b n m c n r (24.0) (11.6) (29.1) (19.6)
Q 7,354.7 4.701.0 6.381.2 4.017.4 7,155.8 5,279.0
@@ 5,583.1 3.595.3 5.569.7 3,533.2 6,506.2 4,816.4
2. IFCI 2.794.9 1,111.8 2.965.1 1,574.8 2,869.2 1,605.2
3. ICIC7 2,850.6 1,357.1 3.744.0 1.967.6. 4,305.9 2,351.3
4. SIDBI @ . . .. 2,408.8 1,838.5 2,898.1 2,027.4
mi' . .. . 1.213.9 1.094.7 1,373.7 1,180.9
5. IRK31 146.6 1411 234.7 153.9 277.7 185.2
12.GIC 211.2 179.6 312.9 146.4 657.2
C. Total kssistancc Q 14,999.7 9,074.4 18,740.5 11,409.6 23,008.6 by All-India Financial fnstitulions (AQ+B@)
D. State-levellnsti~utions 2.177.0 1,692.1 2,663.0 1,857.7 2,970.5 (13 and 14) J3.SFCs 41511.0 1,154.6 1,848.0 1.267.3 2.065.0
(22.4) (11.1) (9.8) (13.5) E. Total Assistance 15.405.1 9.660.8 19.397.1 12,039.3 23,805.1 16.072.0 3.992.0 4 4 0 . 0 2.378.5 4.032.7
by All Financial (25.9) (22.7) (24.6) (33.5) Inslitutions(A@@+B@+D)

SLSlnctions D=Distnusrmen?s @ Dau ue adjusted for iota.iarri~tionrr(rIt.ln&a) fbwr
@Q Data rre adjusted for intcr.ins!itutio~l (rll.Indir and Sate Icvtl) flow
.. Not applicable *Indicates iDcreuc acluding small sector.
Note: 1. Data for 1991-92 u e provisional for all iastitutbns md egimrtd lot SFCs and SIDG.
2. Data bave been adjusted for inta-institutional f b w ~ b involves adjustment in regard to loms to md Investmenla in shares md bonds of fiimcirl institutions by IDBI, IDB1/SIDBl's refinance assistmce to S F 0 and SlDCs and Med capital a ~ a n c e , term bans given by LIC to IFU and ICICI, md special deposits by UIl to IDBI, lFCI md 1CICl.
3. Figures in brackets arc percentage variation ova the anraponding figure of tbc previous yut.
4. IDBI figures for 1989-40 include mirtonce to small sector (S-Rs. 2,1302 more. D-Rs. 1,5711) aorc).
5. SIDBl clornmmced its operations from April 2,19QO.
SOURCE: IDBI and Respective Enancia1 Institutions.

AFIVENI)IX TA1)I.F: V;Z : DEPOSITS W1T)I THE NON-DANKING CORPORATE SECTOR (as at the end of Mnrch)
(Rujxes mrc)
1990-91 (Provisional)
Category No. of Regulated Exempted Total NO. of Regulated ~ x e m ~ t c d Total relmrting deposits d e p i l s reporting deposits deposits companies companies
ii) Finitncial cornp~nics 6,538 1,825 9,139 10,964 6,416 2,184 13,450 15,634 (64.5) (27.0) (34.1) (32.7) (64.8) (27.3) (37.3) (35.5)
iii) Misccllancous Non-Banking 1,163 889 875 1,764 1,120 1,209 939 2,148 Campanics and Residuary (1 1.5) (13.2) (3.3) (5.3) (11.3) (15.1) (2.6) (4.9) Non-Ranking Compnics
Notc : Figurcs in bril~kcts arc percentages to total number of reporting companies /regulatcd/exernpted/aggre~~tcdejmsits ns the casc may Ix.

APPENDIX TABLE V 3 : CONSENTSIACKNOW~DGEMENTS G W D BY 'ITIF. CONTROLLER QF CAPITAL ISSUES TO GOVERNMENT AND NONGOVEWMENT COMPANIES FOR RAISING CAPITAL
Type of Issue 1990-91 1991-92 Number Amount Numbkt Amwnt
A. Non-Government Companies
1. ~hares(atb) 499 a) Initial 23 1 b) Further* 268
2. . Debentures (atb) 233
a) Convertible 137 b) Non-Convertible 96
3. Sub-Total (1t2)
4. Bonus Shares
5. Total (3+4)
B. Government Companies
1. Shares (atb) a) Initial b) Further
2. Public Sector Bonds 17
3. . Sub-Total (1t2) 21
4. Bonus Shares 10
5. Total (3t4) . .
C. Grand Total (A3tB3) [i.e. Excluding Bonus1
Of Which 1) Shares 503 2,613 801 3,995 2) Debentures & Bonds 250 9,577 392 15,035
D. Total Bonus Shares (A4+B4) 352 ' 441 70 372
E. Grand Total (CtD) 1,105 12,631- 1,263 19,402 Non-Government & Government Companies
* Including premium of Rs.274 crore in 1990-91; and Rs.402 crote in 1991-92. ** l&uding premium of Rs.0.19 crore. Source : Controller of Capital Issues.
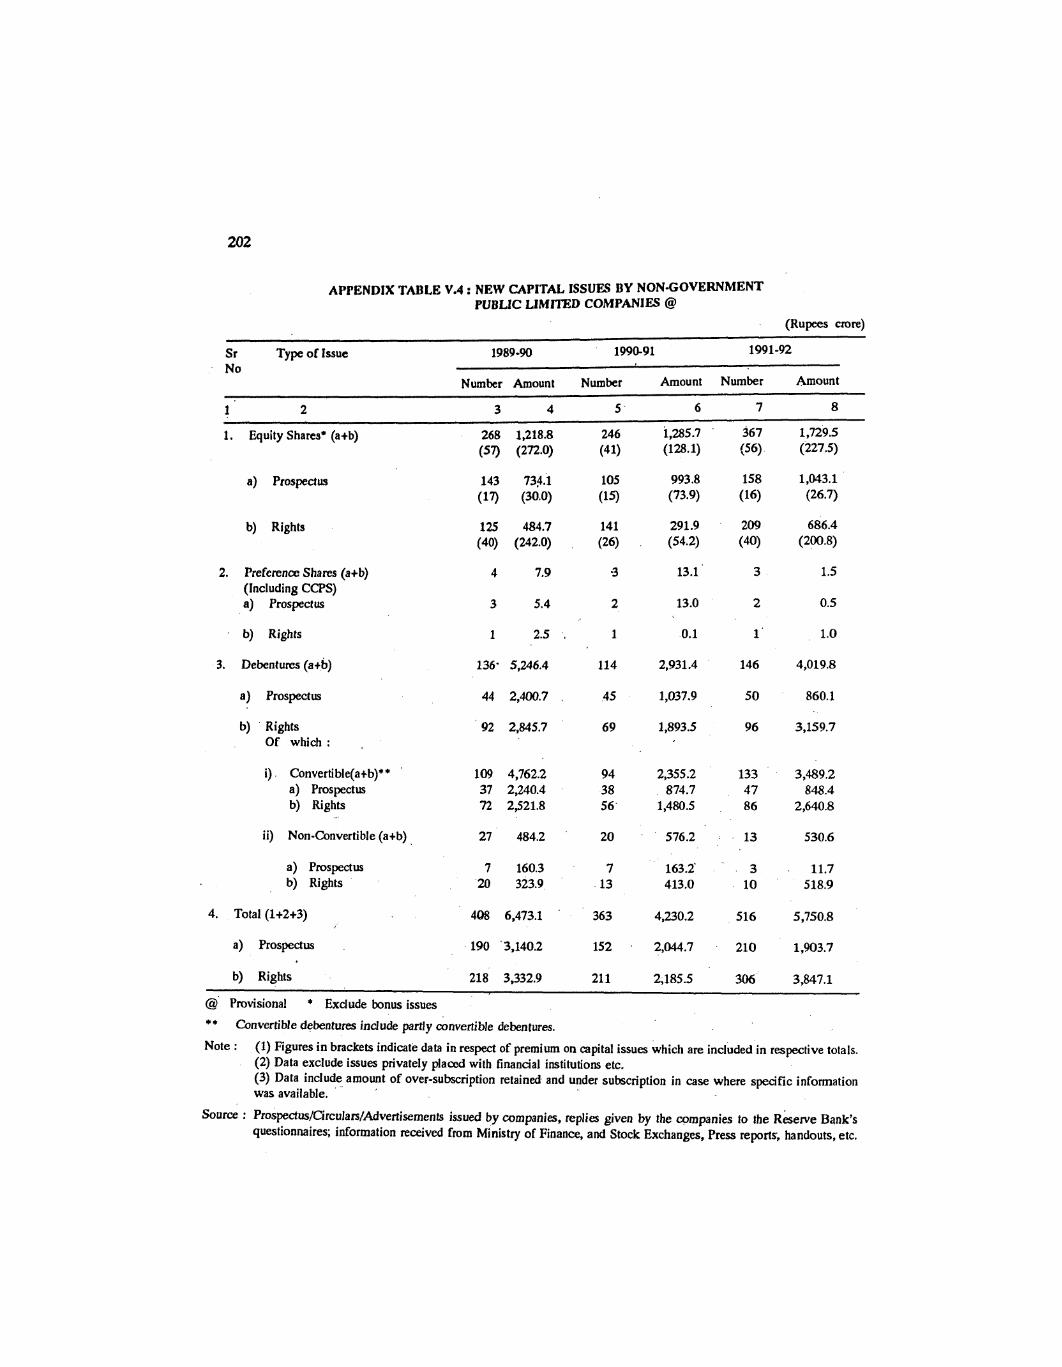
APPENDIX TABLE V.4 : NEW CAPITAL ISSUES BY NON-GOVERNMENT PUBLIC LIMITED COMPANIES @
(Rupees crore)
Sr Type of Issue No
1989-90 1990-91 199 1-92
Number Amount Number Amount Number Amount
Equity Shares* (a+b)
a) Prospectus
b) Rights
Preference Shares (a+b) (Including CCPS) a) Prospectus
b) Rights
3. Debentures (a+b)
a) Prospectus 44 2,400.7 . 45 1,037.9 50 860.1
b) Rights 92 2,845.7 69 1,893.5 96 3,159.7 Of which :
i) Convertible(a+b)** ' 109 4,762.2 94 2,355.2 133 3,489.2 a) Prospectus 37 2,240.4 38 874.7 47 848.4 b) Rights 72 2,521.8 56 1,480.5 86 2,640.8
ii) Non-Convertible (a+b) 27 484.2 20 576.2 13 530.6
a) Prospectus b) Rights
4. Total (1+2+3) 488 6,473.1 363 4,230.2 516 5,750.8
a) Prospectus
b) Rights 218 3,332.9 21 1 2,185.5 306 3,847.1
@' Provisional * Exclude bonus issues * Convertible debentures include partly convertible debentures.
Note : (1) Figures in brackets indicate data in respect of premium on capital issues which are included in respective totals. (2) Data exclude issues privately placed with financial institutions etc. (3) Data include amount of over-subscription retained and under subscription in case where specific information was available.
Source : Prospectus/Circula~~/Advertisements issued by companies, replies given by the companies lo the ~ A e r v e Bank's questionnaires; information received from Ministry of Finance, and Stock Exchanges, Press reports, handouts, etc.

APPENDIX TABLE VS : RESERVE BANK OF INDIA AtLINDtA INDEX NUMBERS OF ORDINARY SHARE PRICES (WEEKLY)
(Base : 198041r100)
Year/ Averaget Nigh Low Last mektnd Month of Ihc monthhzar
1990-91 (April-March)
1991-92 (April-March)
April 1991
June
July
August .
September
October
November 801.3 821'.4 781.8 813.4
December
January 1992
February
March
April
May
June* 1,164.9 1,183.4 1,139.3 1,162.1
Memorandum Items 1987-88 1988-89 1989-90 , 1990-91 1991-92 Average for the five years (1987-
- 88 to 1991-92)
A) 'Co-efficient of 4.82 16.36 5.90 14.66 27.04 13.76 Variation (in percentage) +
B) Dispersion 40.0 121.1 93.7 258.6 948.5 292.4 (The Range)
+ Based on weekly indices. * Provisional.
Note: Figures in brackets are percentage variation over the previous year.

APPENDIX TABLE VI.1: INDIA'S OVERALL BALANCE OF PAYMENTS (PRELIMINARY)
Rupees crore US $ million 1991-92 1WO-91 1990-91 1989-90 1988-89 1991-92 1990-91 1990-91 1989-90 1988-89
A. Current Account
1. Exports f.0.b. 2. lmpbrts, c.i.f.
3. Trada Balance
4. Non-Monetary Gold Movement
5. Offcial Transfers, net
6. Other Invisibleq net
7. Current Account Balance
1 .External Assistance, net 6,792.1 4,070.1 3.241.0 3,089.9 3,209.7 2,803.0 ,2,268.4 1,806.3 1,855.9 2,216.4
Disbursements
Amortisation
2. Commercial Borrowings, net
Disbursements
Amortisation
3. NRI Deposits.net
4. Other Capital(net)
5. Total Capital Account
C. IMF (Net)
D. SDR Allocation
E.TotaiCapitalAccount, 16,092.4 12,820.7 10,795.0 10,869.8 9,927.4 6,409.0 7,145.6 6,016.4 6,528.7 6,855.1 I.M.F. and SDR Allocation
F. Total Current Account, Capital
Account,l.M.F. and 9,841.4 -1,044.7 -2,293.0 -512.4 -1,652.7 -3.574.0 -582.0 -1,277.9 -307.8 -1,141.3
SDR Allocation
G. Errors & Omissions - -1,248.4 - -720.0 203.4 - -696.0 - -432.4 140.5
H.ReservesandMonetaryGold-9,841.4 2,293.1 2,293.0 1,232.4 1,449.3 -3,574.0 1,278.0 1,277.9 740.2 1,000.8
(Increase -r, Decrease+)'
@ Include India Development Bonds. Excluding refinancing credits QE : Quick Estimates PE : Provisional Estimate.
Note: Interest payments forming part of gross withdrawals under FCNRA deposits have now been segregated under invisible payments. Similarly interest accrued during the year and credited to NRI deposits has been treated as notional outflow under invisible payments and added as reinvestment in NRI deposits in Capital Acqunt. For this reason other invisible5 (net), curtent account and inflow under NRI deposits may not tally with those p!-blished elsewhere.,

APPENDIX TABLE V13: FINANCING NEED AND SOURCES OF FINANCING
Rupees aore US dollar million I tern Total Total
1989-90@ Seventh 1990-91@ 1991-92@ 1989-90@ Seventh 1990-91@ 1991-9%)
Jive-Year (PE) (QE) Five-Year (PE) (QE) Plan* Plan*
1. Cutrent Account Deficit including Errors & Omissions 10,544 39,285 15.1 14 6,251 7.269.1 27,998.9 8,423.6 2,835 .O
2. Repayment to IMF 1,460 5,153 1,156 1,127 876.7 3,610.3 644.0 459.0
3. Financing Need(lt2) 12,004 44,438 16,270 7,378 8,145.8 31,609.2 9,067.6 3,294.0
Financed by
4. External Assistance 3,090 12,728 4,070 6,792 1,855.9 9,115.5 2,268.4 2,803.0
(25.7) (28.6) (25.0) (92.1) (22.8) (28.8) (25.0) (85.1)
5. Commercial Borrowings 2,958 10,647 1,309 4,673 1,776.9 7,547.5 729.3 1,805.0
(24.7) (24.0) (8.0) (63.3) (21.8) (23.9) (8.0) (54.8)
6. Non-Resident ~ e ~ o s i t s 2,442 10,164 2,260 -1,562 2,402.6 7,323.5 1,259.5 -747.0
(20.3) (22.9) (13.9) (-21.2) (29.5) (23.2) (13.9) (-22.7)
7. Drawals from IMF - 3,004 3,206 - 1857. 8 1,240.0
(18.5) (43.5) (20.5) (37.6)
8. Other Capital 2,281 5,823 3,334 4,lSO 1,370.2 3,995.3 2,186.4 1,767.0
(19.0) (13.1) (20.5) (55.7) (16.8) (12.6) (18.5) (53.6)
9. Use of Reserves .1,233 5,076 2,293 -9,841 740.2 3,627.4 1,278.0 -3,574
, , . . ~ . .
Note: 1. Figures in brackets indicate proprtions to financing need (item 3). Conversions to U S $ has been made at rekct ive annual average races (Except transactions with the IMF in 1991-92).
2. Figures of commercial borrowing for 1991-92 include India Development Bonds of Rs.4212 crore(US $1,627 million)
QE Quick Estimate. PE Provisional Estimate.
@ Please see note under Appendix Table VI-1. * Excludes accrued interest on NHI deposits,

Fore
ign
Exc
hang
e R
eser
ves
Fore
ign
Exc
hang
e R
eser
ves
. T
otal
~
ov
emen
t R
eser
ve
Tra
ecti
on
with
the
IMF
Mov
emen
t in
Ed 01
Mon
th
(Rup
ees c
rore
) (U
S $
mill
ion)
Fo
reig
n in
Po
sitio
n (I
n SD
R m
illio
n)
Fore
ign
Exc
hang
e E
xcha
nge
Fore
ign
in th
e Reserves
SDR*
Gol
d@
Fore
ign
Tot
al
SDR
s G
old
Fqre
ign
Tot
al
Res
erve
s@
Exc
hang
e Fu
nd
Gro
ss
Cum
ulat
ive
Out
stan
d-
Net
Dra
wal
s (n
et o
f IM
Fucd
it C
urre
ncy
(2+
3+4)
C
urre
ncy
(6t7
t8)
(In
SDR
R
eser
ves
(In
SDR
D
raw
ings
R
epur
chas
es
ing
Net
(+
)/Rep
ay-
' an
d d
raw
l of
Ass
ets
Ass
ets
mill
ion)
(I
n SD
R
mill
ion)
dr
awin
g m
en&
(-) o
f R
eser
ve T
ranc
he)*
mill
ion)
(1
3 -1
4) IMF
Cre
dit*
(I
n SD
R m
illio
n)
(11-
16)
1 2
3 4
5 6
7 8
9 10
11
12
13
14
15
16
17
hf~
mh
tW
183
281
5,78
7 6
35
1
107
487
3,36
8 3,
962
3,04
5 -6
70
487
3,90
0 2,
752
1,14
8 -6
81
11
htrr
ch 1
991
200
6.83
8 4,
355
11.4
16
102
3.49
6 2,
236
5,83
4 4,
329
1,28
4 5,
169
3,22
1 1,
948
800
-w@
(2
,111
) (-
934)
(-
Z22
1)
June
189
1 13
3 7.
411
2,38
2 9,
926
63
3,
524
1,12
4 4,
711
3,56
4 -7
65
5,16
9 3,
300
1,86
9 -7
9 -6
86
(1,2
78)
(-83
3)
(-75
4)
Sept
embe
r 1W
1 47
6 8,
655
4,44
2 13
.576
18
4 3,
353
1,72
2 5,
259
3,83
8 -4
9 1
5,80
4'
3,39
6 2,
408
460
-95 1
(1
,766
) (-
345)
(-
sos)
k
mb
n19
Q1
120
9,48
9 9,
287
18.8
%
46
3,67
5 3,
580
7,30
1 5,
095
766
5,88
9 3,
463
2,42
6 47
8 25
5
(2,9
30)
(819
) (3
41)
htrr
eh 1
992
233
9.03
9 14
.578
23
,850
90
3,
499
5,63
1 9,
220
6,71
6 2,
387
6,07
4 3,
558
2,51
6 56
8 1,
819
(4,5
66)
(2,4
55)
(1,5
57)
Juac
1903
29
7 8.
933
16,1
25
25,3
54
115
3,45
9 6,
221
9,79
5 6,
538
122
6,07
4 3,
612
2,46
2 -5
4 17
6 (4
,822
) (2
56)
(310
)
# A
l R
up
-SD
R ex
chan
ge r
ate
at t
he e
nd o
f th
e re
spec
tive
mon
th.
* V
aria
tion
s ov
er t
he p
revi
ous
Mar
ch.
@
Go
idha
s be
en v
alue
d at
Rs.
84.3
9 pe
r te
n g
ram
mfi
in
d.3
and
at S
DR
35
per
troy
oun
ce a
s in
the
IFS
of
IMF
in d
.7 ti
ll O
ctob
er16
,199
0 an
d cl
ose
to in
tern
atio
nal
mar
ket
pric
e th
erea
fter
.
@@
Cov
er d
rrtw
al of
Res
erve
Pos
ition
in th
e Fu
nd (m
l. 12
).
me
: 1.
Gross
draw
ings
. re
purc
hase
s an
d ou
tsta
ndin
g li
abil
itie
s to
the
IM
F r
elat
e to
tra
nsac
tidn
s in
ies
pect
of
Ext
ende
d F
und
Fac
ilit
y,S
tand
-by
Cre
dit
Arr
ange
men
t and
Com
pers
ator
y an
d
Con
ting
efic
y F
inan
cing
Fac
ilit
y an
d ex
clud
e th
ose
rela
ting
to
Tru
st F
und
Loa
ns.
2.
Con
vers
ion
of f
orei
gn c
urre
ncy
asse
ts a
nd S
DR
s in
to U
.S d
olla
r is
don
e at
exc
hang
e ra
tes
supp
lied
by
the
IMF.
3.
Figu
res
in b
rack
ets
repr
esen
t res
erve
s adj
uste
d fo
r go
ld r
eval
uati
on.

APPENDIX TABLE VIr4 : INDIA'S FOREIGN TRADE
Rupees crore US $ million SDR million
1991-92 1990-91 1989-90 1991-92 1990-91 1989-90 1991-92 1990-91 1989-90
I. Expoas
Crude oil
POL
Non-oil
11. Imports
Oil &,POL
Non-Oil
111. Trade Balance -3,835 -10,640 -7,735 -1,556 -5,930 -4,646 -1,147 -4,282 -3,620
Oil Balance -12,107 -9,878 -5577 -4,950 -5,505 -3,350 -3,621 -3,975 -2,610
Non-oil Balance +8,272 -762 -2,157 +3,394 -425 -1,296 +2,474 -307 -1,010
- -
Note: (1) Final data for the year 1989-90 are not available from D.G.C.1 8t S.
(2) Figures in brackets relate to percentage variation over the previous year.
(3) P- Provisional.
(4) Data for imports of oil & POL in US dollar terms during 1991-92 are converted by using officialgaverageexchange rate , whereas, composite average exchange rate (40 per cent of official and 60 per cent of market exchange rate ) for March 1992, has been used for converting other data in U S dollar terms.
Source: D.G.C.1 & S.

APPENDIX TABLE V1.5: INDIA'S EXPORTS OF PRINCIPAL COMMODITIES
Petcentage Percentage Rupees crore variatibm US $ million variation
Commodity Group 1989-90 1990-91 1991-92 1989-90 1990-91 1991-92 (P) P ) 3 2 ) (4)/(3) . (PI (PI (8)/(7) (9)!(8)
1
Primary Products
of which : . Agriculture and allied products
Ores and Minerals
Manufactured Goods
of which : eathe her and leather Manufactures Chemical and related products
Engineering goods
Textile Fabrics and manufactures ,
of which : Cotton yarn, Fabrics,made-ups ,
Readymade Garments
Handicrafts
of which: Gems and Jewellery
Minerals and Lubricants *
Others
Total Exports
Note: (1) Final data for the year 1989-90 are not available from D.G.C.1 & S.
(2) Figures in brackets represent percentage to total exports.
(3) P-Provisional.
* Relates to petroleum crude and petroleum products.
Source- D.G.CI & S.

APPENDIX TABLE Vl.6: INDIA'S IMl'ORTS OF PRINCIPAL COhlMODlTIES
Rupees crore Percenta p US $ million Perccntegc variaton variation
Commodity Group 1989-90 19909 1 1991-92 1989-90 1990-91 1991-92 (PI (PI (3110) (4)1(3) (PI (PI (8)/(7) (9)1(8)
1 2 3 4 5 6 7 8 9 10 11 I. Bulk Imports 14,440 19,454 21,002 34.7 8.0 8,673 .-. 10,842 8,559 25.0 -21.1
of which <: (40.8) (45.0) (44.0) (40.8) (45.0) (44.1) . (A\ Pelroleurn. Petroleum . ,
products &' related material 6,274 10,816 13,129 72.4 21.4 3,768 6,028 5,365 @ 60.0 -11.0 (i.2 (x.0) (27.5) (17.7) (25.0) (27.7)
(B) Bulk consumption goods 989 636 8.2 -35.7 549 551 258 0.4 -53.2 of which : (2.6) (2.3) (1.3) (2.6) (2.3) (1.3).
(a) Cereals Rc cereal preparations 378 182 141 -51.9 -22.5 227 101 57 -55.3 -43.6
b Edible Oils 21 1 326 240 54.5 -26.4 127 182 97 43.4 9 . 4 c Pulses 228 48 1 254 111.0 -47.2 137 268 103 95.8 -61.6 d) Sugar i 97 9 1 -90.7 -88.9 58 5 0 -91.4:91.9
(C) Other bulk items 7,2S2 7,649 7,237 5.5 -5.4 4,356 4,263 2,936 . -2.1 -31.1 of which : (20.5) (17.7) (15.2) (20.5) (17.7) (15.2) .
(a) Fertilizers 1,776 1,766 2,259 -0.6 ' 27.9 ' 1,067 984 916 -7.7 4.9
01 which :
ti!) g $ k ~ r & unroasted iron pyrite
(iii) Manufactured (b) Non-ferrous metals (c) Paper, paperboard &
manufactures thereof (incl. newsprint)
. (d) Crude rubber (e) Pulp & waste paper (0 Metalliferrous ores
& metal scrap (g) Iron & Steel
11.. Noo-bnlk
Imports of which : (A) Capital goods 8,831 10,465 10,394 18.5 -0.7 5,304
(24.9) (24.2) (21.7) (24.9) (B) Mair~ly export related items 6,803 6,604 8,954 -2.9 35.6 4,086
(19.2) (15.3) (18.7) (19.2) of ufl~ich : (a) Pearls, precious Rc
semi-precious stone 4,242 3,738 4,822 -11.9 29.0 2,548 (b) Chemicals, organic Rc I loorganic 2,135 2,289 3,523 7.2 53.9 1,282 c Textile yarn, fabrics, etc. 349 443 343 26.9 -22.6 210 d Cashew nuts, raw 77 134 266 74.0 98.5 46
(C) Otllers 5,338 6,670 7,463 25.0 11.9 3,206 (15.1) (15.4) (15.6) (15.1)
of which : (a) Artificial resins & plastic
materials 996 1,095 1,403 9.9 28.1 598 (b) Professional, scientific 8:
optical gmds,etc. 886 1,060 1,041 19.6 -1.8 532 c Coal, coke &I briquettes, etc. 562 789 1,036 40.4 31.3 338 d Medicinal & pharmaceutical
products 272 465 456 72.1 -2.6 163 (e) Chemical material &
products 222 286 321 28.8 12.2 133 (0 Non-metallic mineral
manufactures 168 203 228 20.8 12 .3 101 Total imports ( I t I1 ) 35,416 43,193 47,813 22.0 10.7 21,272 Nd+: (1) Rnal data for the year 1969-90 are not available from D.G.CI 6: S.
(2) Fiyres in bracketsrcpresent percentage to total imports. Provisronal. (3) P-
(4) @: Converted in US dollar terms by using oficial average exchange rate. For other canmod~ties cunposite average exchange rate is used fa March 1192.
Source - D.G.C.16: S.

APPENDIX TABLE VI.7 : INDIA'S TRADE WITH RUPEE PAYMENT AREA (RPA) AND GENERAL CURRENCY AREA (GCA)
R ~ J A GCA Total Year (April-March) Exports Imports Trade bal. Exports Imports Trade bal. Exports Imports Trade bal.
1 2 3 4 5 6 7 8 9 10
Rupees &re
1988-89
1989-90 (P)
1990-91
1991-92 (P)
U S $ million
198647 1,746 (-7.5)
1987-88 1,885 (8.0)
1988-89 2,183 (15.8)
1989-90 (P) 3,107 (42.3)
1990-91 3,069 (-1.2)
1991-92 (P) 1,765 (-42.5)
Note: (1) Final data for the year 1989-90 are not available from D.G.C.1 & S.
(2) Figures in brackets represent percentage variation over the previous year.
(3) Till 1989-90 five countries are included in RPA muntries,namely,USSR, Romania, Czechoslovakia, GDR and Poland. Since 1990-91,onIyfirst three of the countries mentioned above are included.
(4) P- Provisional.
Source- D.G.C.1 & S.

APPENDIX TABLE VI.8 : EXTERNAL ASSISTANCE
Rupees ckae US $ rnillicn
Item 1985-86 1986-87 198748 198849 1989-901990-91R 1 9 9 i . 9 ~ 1985-86 1986-87 1987-88 1988-89 1989-90 1990-91R 1991-92P
1. Loans 2,493 3,176 4,574 4,738 5,U8 6,170 10,215 z038 2,485. 3,528 3,272 3,086 3,439 4,174
2. Grants 443 429 478 566 665 534 863 362 336 368 391 399 297 353
3. Gross 293.6 3,mS 5,052. 5,304 5803 6,704 11,078 2,400 2821 3,896 3,663 3,485 3,736 4527 Utilisaticn
4. Repayments 776 1,176 l,%1 1,646 1,987 2329 3,559 634 920 1,219 1,137 1,193 1,298 1,455
Note: 1. Loans are inclusive of non-government loans but exclusive of suppliers' credits and commercial borrowings.
2. Grants are exclusive of PL 480-11 grants.
3. R - ~Lvised.
4. P- Provisional.
5. Figures in U.S. dollar are converted at annual average rates.
Source : Controller of Aid, Accounts & Audit, Government of India. ,

APP
EN
DIX
TA
BL
E V
1.R I
lEI'O
SIT
LL
4BIL
ITIE
S U
ND
ER
NR
(E)R
A A
ND
FC
NR
A S
CH
EM
ES
As
at
the
year
@
outs
tand
ing
a th
e ye
ar @
Rup
ees
US
Rup
ees
US
Rup
ees
US
US
Poun
d D
M
Yen
T
otal
(8
to 1
1)
Rup
ees
US
R
upee
s U
S
CX
OR
$
mn.
cr
ore
$ m
n.
cror
e $
mn.
D
olla
r St
erlin
g cr
ore
$ m
n.
aore
$ m
n.
Rup
ees
US
(2
+6)
(3i7
) (4
t12)
(5
+13)
cror
e $
mn.
1
2 3
4 5
6 7
8 9
10
11
12
13
14
15
16
17
1987
47
7 37
3 4,
336
3,35
4 1,
173
918
3,04
7 46
4 -
3,51
1 2,7
20
1,65
0 1,
291
7,847
6,0
74
(236
0)
(224
) 19
88
477
368
5.10
7 3.
942
1,363
1,
051
4,40
6 54
1 -
4,947
3,
827
1,84
0 1,
419
10,0
54
7,769
(3
,410
) (2
22)
1989
23
5 16
2 5,
899
3,77
4 2,
230
1,54
0 6,
648
535
, 70
0 37
2 8,
255
5,275
2,4
65
1,70
2 14
,154
9,0
49
(4,2
45)
(203
) (8
48)
(31,
571)
19
%)
277
166
6,50
7 3.
777
2,165
1,3
09
9,30
4 33
7 1,
028
655
11,3
24
6,58
6 2,4
42
1,47
5 17
,831
10
,363
(5
,409
) (1
19)
(1,0
13)
(60,
327)
19
91
156
84
7,34
9 3,
746
255
168
11,2
70
305
1,00
5 82
5 13
,405
6,838
41
1 25
2 20
,754
10
,584
(5
,754
) (8
9)
(874
) (5
9.40
3)
1992
-4
4 -2
7 8,
071
2,59
1 -3
,641
- 1,
627
10,3
00
2,00
2 44
7 85
9 13
,608
5,
256
-3,6
85
- L65
4 21
,679
7,
847
(3,9
78)
'(445
) (2
84)
(44,
028)
$@
Exc
ludi
ng th
e es
tim
ated
acc
rued
inte
rest
. Io
clus
ivc o
f aq
ed
inte
rest
. D
o no
t in
clud
e ac
crue
d in
tere
st.
Not
e:
1. F
igur
es'in
bra
cket
s are
out
stan
ding
dep
osits
in t
he r
elev
ant
curr
enci
es in
mill
ion.
2.
Con
vers
ion
to U
S do
llar
has b
een
done
at a
nnua
l ave
rage
rate
in th
e ca
se o
f inf
low
s an
d at
yea
rend
rat
e in
the case of
outs
tand
ink
bala
nces
.
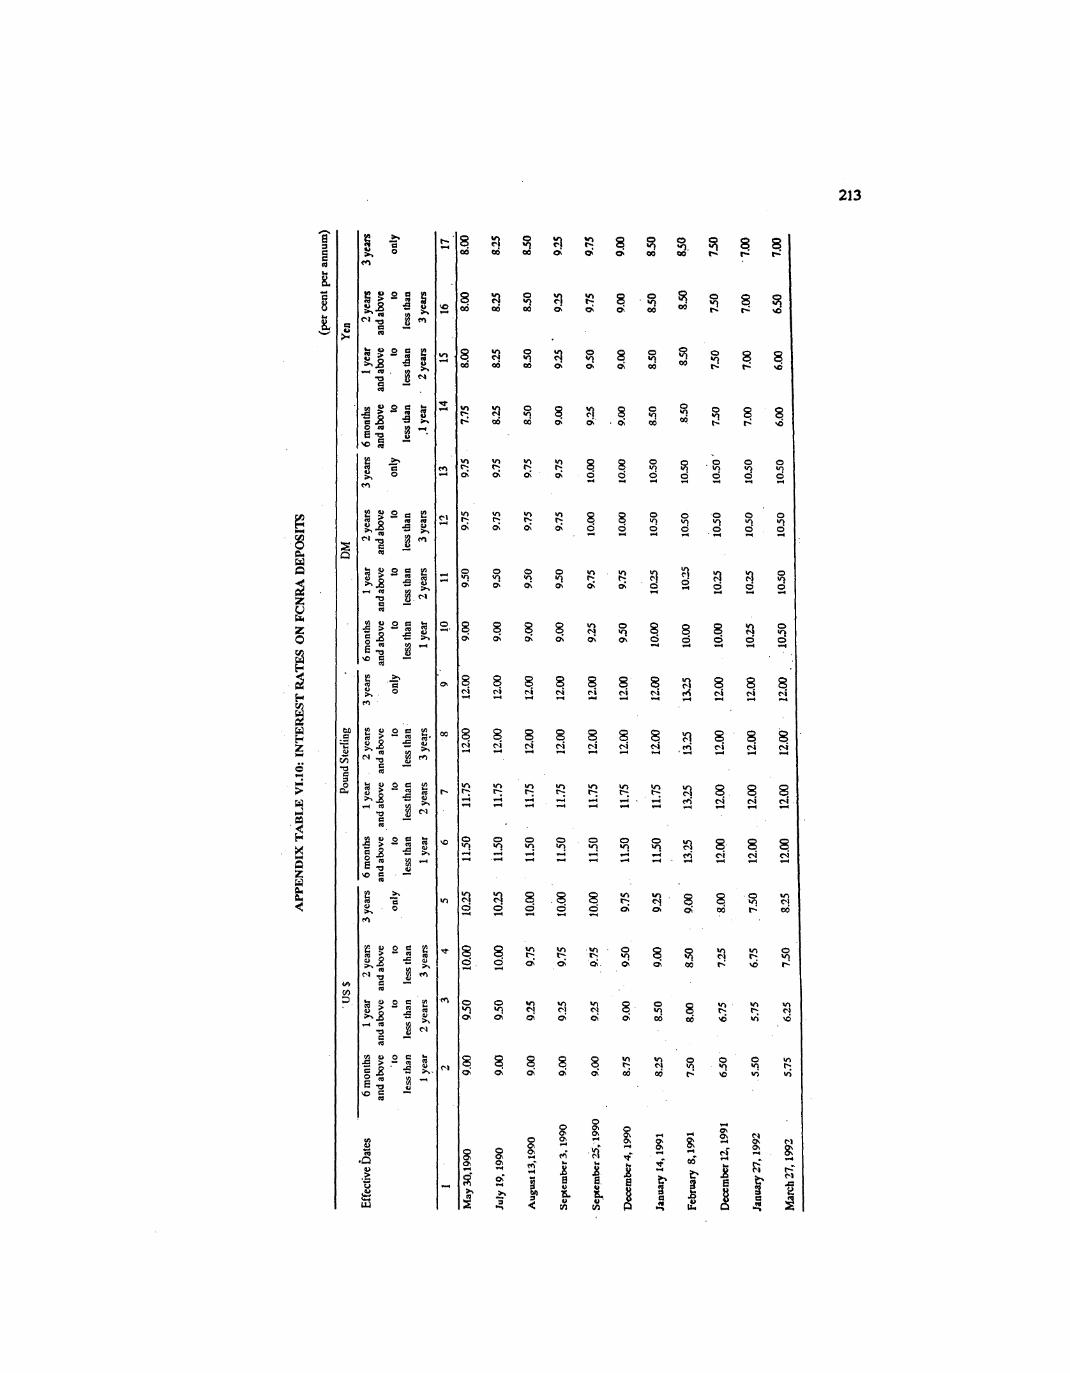
AP
PE
ND
IX T
AB
LE
VI.
lO:
INT
ER
ES
T RATES O
N F
CN
RA
DE
POSI
TS
(per
cen
t pe
r am
urn
)
.US
$
Poun
d St
erli
ng
DM
V
-.
- . was
Eff
ectiv
e ba
tes
6 m
onth
s 1 ye
ar
2 ye
ars
3 y
ean
6 m
onth
s 1
year
2
year
s 3 y
ears
6
mon
ths
1 ye
ar
2 ye
ars
3 ye
ars
6 m
onth
s 1 y
ear
2 yea
rs
3 ye
ars
and
abov
e an
d ab
ove
and
abov
e an
d ab
ove
and
abov
e an
d ab
ove
and
abov
e an
d ab
ove
and
abov
e an
d ab
ove
and
abov
e an
d ab
ove
to
to
to
only
to
to
to
on
ly
to
to
to
only
to
to
to
on
ly
less
than
le
ss th
an
less
than
le
ss th
an
less
than
le
ss th
an
less
than
le
ss th
an
less th
an
less th
an
less
than
less t
han
1 ye
ar
2 ye
ars
3 ye
ars
1 ye
ar
2 ye
ars
3 ye
ars
1 ye
ar
2 ye
ars
3 y
ears
.l
year
-
2 ye
ars
3 ye
ars
1 2
3
4
5 6
-7
8
9 10
11
12
13
14
IS
16
17
. .
May 30
.199
0 9.00
9.50
10.00
10.25
11.50
11.7
5 12
.00
12.0
0 '
9.00
9.
50
9.75
9.
75
7.75
8.00
8.00
8.00
July
19.
1990
9.00
9.50
10.00
10.25
11.50
11.75
12.0
0 12
.00
9.00
9.
50
9.75
9.7
5 8.2
5 8.
25
8.25
8.25
September
3,19
90
9.00
9.25
9.75
10.00
11.50
11.75
12.00
12.00
9.00
9
50
9.
75
9.75
9.
00
9.25
9.S
93
Sept
embe
r 5,1
99
0
9.00
9.
25
9.75
10.00
11.50
11.75
12.00
12.00
9.25
9.7
5 10
.00
10.0
0 9-
25
9.5'0
9.75
9.75
Janu
ary
14,1
991
8.25
8.
50
9.00
9.25
11.50
11.75
12.00
12.00
10.0
0 10
.S
10.5
0 1
05
0
85
0
8.50
85
0 83
5
Febr
uary
8,1
991
75
0
8.00
85
0
9.00
'
13.25
13.25
13.3
1 10
.00
10
.3
1050
10
.50
85
0
85
0
850
S50
Mar
ch 2
7,19
92
7.50
8.2
5 12.00
12.00
12.00
12.00
10.5
0 10
.50
lo5
0
10
50
6.
00
6.00
65
0 7.0
0 5.
75
6.25

APPENDIX TABLE VI.11 : INDIA'S EXTERNAL DEBT (Rupees crore)
Item
1 2 3 4 5 6 7 8
A. Medium and Long Term
1. External Assistance + 24,004 32,312 36,578 46,838 54,101 66,314 1@,981
19,311 (24,711) (29,182) (29,872) (32,145) (34,281) (38,101)
2. IMF
3. External Commercial 'Borrowings* 6,908
(5,558)
4. Total (1+2t3) 35,800 (28,801)
B. NRI Deposits 3,819 (3,075)
C. Total (AtB9 39,619 (31,876)
D. Short term N.A. N.A. N.A. N.A. N.A. 9,418 8,687 (4,800) (3,191)
E. Grand Total (C+D) 130,638 201,671 '
'57,070) (68,670)
Memorandum Items
1. Debt Stock
(Long & Medium term
and NRI deposits)
Export Ratio@ (in per cent) 201 270 258 272 247 259 303
2. Debt Service Ratio**
(For respective fiscal year)
(in per cent) N.A. N.A. N.A. 28.3 24.9 25.2 26.2
t Exclude non-Government loans. * Include non-Government loans under External Assistance Programme and suppliers' credits from East-European
countries repayable in rupees. ** Includes accrued interest on NRI deposits. , @ Eltports cover export of merchandise goods plus gross invisible rebeipts excluding official transfers. P : Provisional.
Note: 1. Figures in brackets indicate U.S.dollar in million. 2. Under the figures for 1992 external assistance, external commercial borrowings, NR(E)R deposits and short-
term debt other than BAF are converted at market rate. IMF, ID Bonds and BAF under short term are converted at official rate,
3. Commercial borrowings for 1992 include India Development Bonds of Rs.4,212 crore (US.$ 1,627 million). 4. Under NRI deposits, FCNR deposits do not include accrued interest. 5. Above data include NRI deposits and short term debt. But they are not according to the definition and
classification as recommended in the recent Reports on External Debt Statistics. 6. Debt Stock-Export ratio is worked out on the bs i s of the rupee figures.
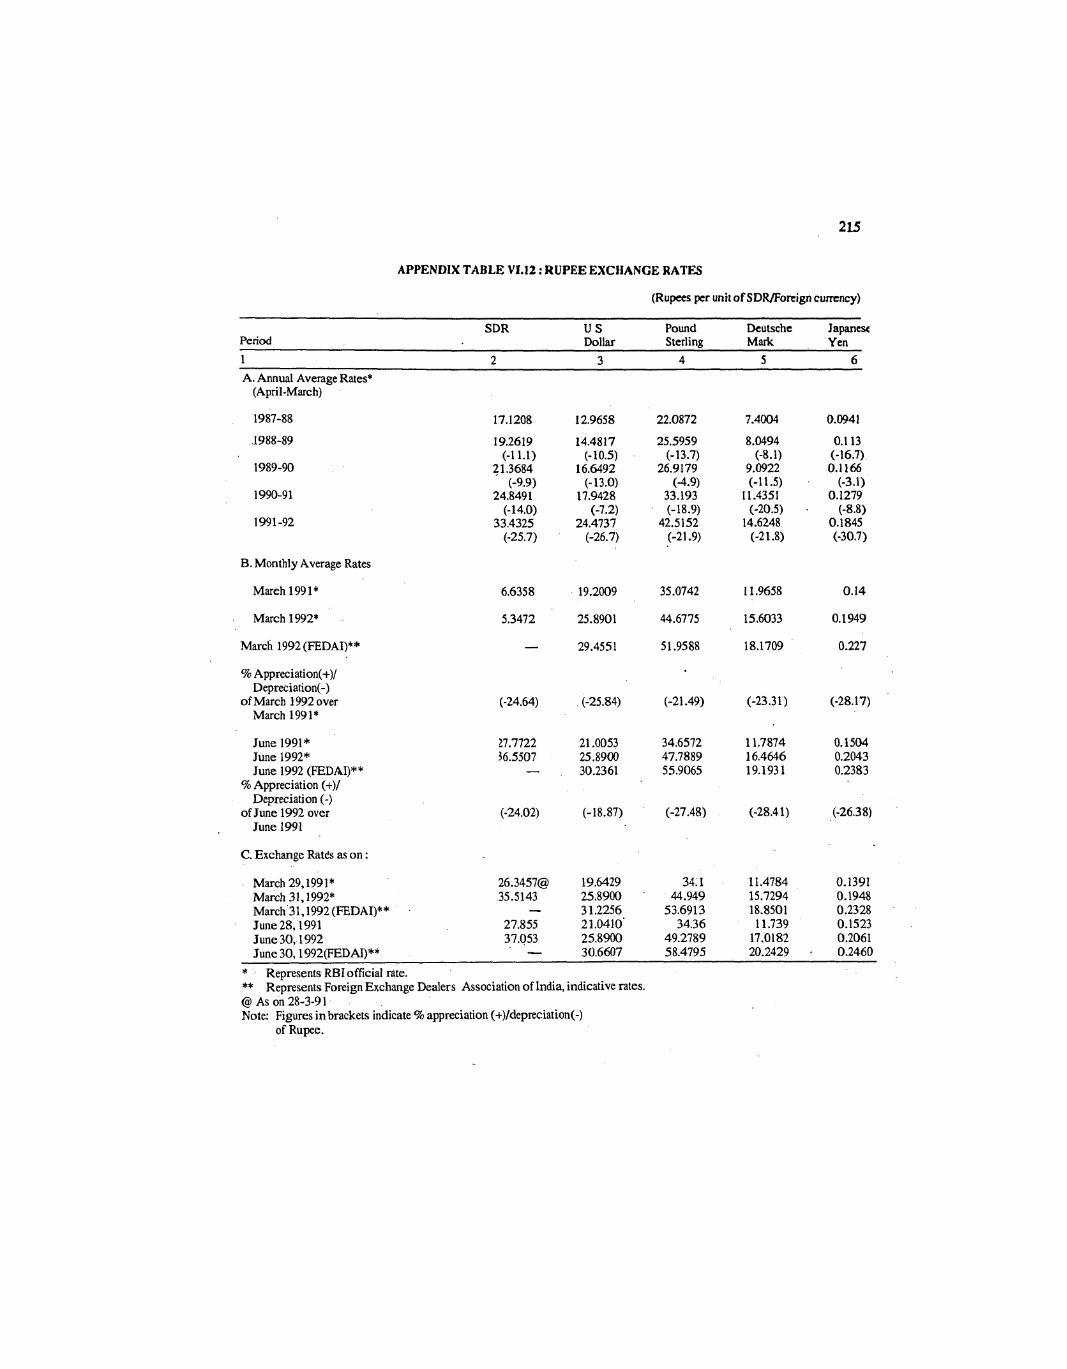
APPENDIX TABLE V1.12 : RUPEE EXCHANGE RATES
(Rupees pr unit of SDWForeign currency)
SDR U S Pound Deutsche Japanese Period Dollar Sterling MLlrk Yen 1 2 3 4 5 6
A. Annual Average Rates* (April-March)
B. Monthly Average Rates
March 1991*
March 1992*
March 1992 (FEDAI)**
% Appreciation(+)/ Depreciation(-)
of March 1992 over March 1991*
June 1991* June 1992* June 1992 (FEDAI)**
% Appreciation (+)I Depreciation (-)
of June 1992 over June 1991
C. Exchange Rates as on :
March 29,199 1 * 26.3457@ 19.6429 34.1 1 1.4784 0.1391 March 31,1992* 35.5143 25.8900 44.949 15,7294 0.1948 March 3 1,1992 (FEDAI)** - 3 1.2256 53.6913 18.8501 0.2328 June 28,1991 27.855 21.0410' 34.36 11.739 0.1523 June 30,1992 37.053 25.8900 49.2789 17.0182 0.2061 June 30,1992(FEDAI)** - 30.6607 58.4795 20.2429 , 0.2460
* Represents RBI official rate. ** Represents Foreign Exchange Dealers Association of India, indicative rates. @ As on 28-3-9 1 Note: Figures in brackets indicate % appreciation (+)/depreciation(-)
of Rupee.
Copyright © 2022 FDOKUMEN