
RESEARCH REPORT
121
INSTITUTE OF PLASMA PHYSICS NAGOYA UNIVERSITY Proceeding* of Topkal Meeting on Amide Beam Fiuton and Us Retried Frobtemi Vol.2 Edited by Kehhiro Niu (Received - Feb. 29,1986) IPPJ-76942) Mar. 1986 RESEARCH REPORT NAGOYA, JAPAN
-
Upload
khangminh22 -
Category
Documents
-
view
2 -
download
0
Transcript of RESEARCH REPORT

INSTITUTE OF PLASMA PHYSICS
NAGOYA U N I V E R S I T Y
Proceeding* of Topkal Meetingon
Amide Beam Fiutonand
Us Retried FrobtemiVol.2
Edited by Kehhiro Niu
(Received - Feb. 29,1986)
IPPJ-76942) Mar. 1986
RESEARCH REPORT
NAGOYA, JAPAN
Proceeding* cf Topical Meetingon
Particle Beam Fultonand
lit totaled ProMemVol.2
Edited by KebWro Niu
(Received - Feb. 29,1986)
IFPJ-769<2) MM. 1986
Further communication about thia report is to be tint to the ResearchInformation Center, Institute of Plasma Phyr.5-;s, Nagaya University, Nogoya464, Japan.

CONTENT
£2) Pulsed Power Technique Research at IBA In Beijin
N. Wang, fl. Heng, N. Zeng, V, Shan. tf. Liu, 3. Dy, C. Zhou, X. Wang and 6.
Wang (lost, ©f Atomic energy of C h i n a ) — — — — — — — ( 2 5 3 )
23) Divergence Angle ©f Inten§e Pulsed Ian Beaut Extracted from Dual-Currfmt-
Feod Magnetically Insulated Diode
Y. Shi mo tori, K. Aga, K. Naeugata, H. Tto and K. Yatsui (Tech. Univ. of
Nagaeka) — — - - — — — — (26?)
24) Seif-Nagnetieally-Insulated "Plasma-Focus Diode" as e New Source of <in
Intense Pulsed Light-Ion Bean
A. Takahashl, K. Ago, K. Kasugata, N. Ito and K. Yatmii (Tech. Univ. of
25) Final Focusing of Proton Beam by Z-Diaeharged Plasma Channel
N. Nurayama, N. Nemoto, K. Nasugata, H. Ito and K. Yam til (Teeh. Univ. of
Nagaoka)—— — —————>—.—————(293)
86) Observation ©f Ablation Process ef ten Beam-Target Interaction by
Backlighting Technique
N. Ikeda, K. Maaugata, M. Tte and K. Yatsui (Toeli. Univ. of Nagaoka)
27) Observation of Inductive Post-Acceleration of Highly Neutralized, Intense
Pulsed Ion Beam
T. Tanabe, A. Kanai, K. Takahaahi, A. Tokuehl, K. Masugata, H. Ito and K.
Yatsui (Tech. cniv. of Nagaoka)— (31V!
28) Generation and Focusing of Ion Bean from Conical Pinched Electron Brarn
Oiode
Y. Natsukawa (Osaka City Univ.) —• -~ (327)
29) Recent Results of Light Ion Beam Fusion Research on Reiden IV Particle
Bean Accelerator
T. Ozaki, S. Miyamoto, K. Imaaaki, N. Yugaml, T. Akiba, S. Sawada, Y.
Mizuguchi, X. Emura T. Suzuki S. Nakal and C. Yamanaka (Osaka Univ.)
30) New Pellet Compression Schemes by Indirect Irradiation of REB and Related
Preliminary Experiments
M. Sato, T. Tazima and H. Yonezu (Nagoya Univ.) (3d5)

31) First Beam Test of the RFQ LINAC "TALL"
N. Ueda, S. Yamada, M. Olivier, T. Nakanishi, S. Aral, T. Fukunhima, S.
Tatswoi and A. NiEObuehi \Univ. of T o k y o ) — — — — — — ( 3 6 3 )
32) Split Coaxial RfQ LINAC for Very Heavy Ion Acceleration
S. Aral, T. Fuji fie, T. Fukushinta, E. Tojyo, N. Tekuda and T. Mattori
(Univ. of Tokyo)—————————————————(368)
Pulaad povar technique research at IAE in Beijing
Waog Nalyan, Hong luashenf,,, Zcng Haigong, Shan Yuahang, Liu Wairan,
Du Shigang, Zhou Chuangchi, Wang Xiaojun and Wan Ganchang
Inatltuta of Atoaic Energy of China
Abatrace
The raaearch of pulaad power technique and its related problems at tAE
in Beijing ia evolving along the following five direction!: 1. Pulsed power
technology, an 80CW interne electron beaa accelerator haa bean built.
Switch research la ongoing. 2. Diode research, the exparlaentel research
and theoretical simulation of electron pinch in the diode have been carried
out. Pinch process has been lnveatlgated by Measuring the area collapsing
velocity of the pinching electron ring on the anode eurface. Expanding
velocities of the cathode and anode plasmas have been observed. The diode
with large area cathode of 38 x 5 ca can produce «6kA electron beaa
current with the beaa cross-section of 36 x 4 ca and good unlforalty for
puaplng of KrF laser. 3. Energy deposition of tne electron beaa on the
targets has been studied by swans of the aeasureaents of the intensity of
soft X-ray, the energy jprctrua of blow-off ions, the visible light spectra
and the rear surface velocity of the target. These experlaants show that
the results are in agreeaent with the classical Interaction aechanlsa for
high Z targete, but it is higher than the classical result for several
tlaea for low Z targets. 4. Electron beaa propagation in neutral gases with
various pressures, space and current neutralisation processes have been
investigated- S. The production of KrF laser puaped by electron bcaa. A
laser beaa vith energy of 13J and pulse duration of 70ns haa been obtained.
1. Pulsed power facility at IA1 of China
An 80GW intense elctron beaa accelerator haa been built et Institute
of Atoaic Energy of China for fundamental researched on pulsed power
technology and particle beaa lnartlal conflaeaent fusion. It's paraaetera
are electron energy of 1 HeV, pulse duration of 70 ns, beaa current of 80kA
and the diameter of electron beam on anode less than 1.5am by using cone
hollow cathode. Beam current of 150 kA can be obtained by using hollow
cathode instead of cone hollow cathode, but aeanwhlle the larger beaa
-258-

diameter of 2.5 ma was obtained.
This accelerator consists of an oil-iaaersed Harx generator, a
Blumleln transmission line, which is filled with deionized water, and a
field emission vacuum diode.
The Marx generator consists of 20 0.7 pT, 100 kV capacitors with 10
gas spark gaps, storss 34 kJ at charge voltage of 70 kV and has an output
capacity of 35 nF and inductance of 12 uH. Except the first three gaps,
which arc triggered by signals from a small Marx generator, the remainders
are overvolted by the transient voltages within the generator, and in sane
time are triggered by the signals, which are derived from the firing of
proceeding two stages and coupled by liquid rlsistors. This Improvement
greetly reduced the incidence of premature firinga. The probability if a
prefire of the system before full charge is less than one percent. The
Marx generator can ba successfully operated at charging voltages less than
50 percent of the mean self-breakdown voltage of Individual apark gaps.
2. Dioda research
Experimental research and theoretical simulation of electron beam
pinch in dioae have been carried out to find optimum conditions for maximum
focus of the electron beam. It is proved that a good focus requires not
only exceeding critical current but also enough energy to form anode
plasma. ' Both experimental research and theoretical simulation showed
that positive ions formed at the anode of the diode play an Important role
in forming the pinch. Experiments on beam pinch In a relatively high
impedance dloda with conical cathode confirm that anode conditioning can
Improve the repeatability of diode current focua.
The expansion velocity of the electrode plasma in the diode was
measured by Shadowgraph. Two beans of N, laser were triggered by the
signal from the diode - jlcage divider and pass through the diode region.
The shadowgraphs of the electrode plasma were recorded by Che photo places
inside the cameraa. In order to reduce the background brightness twoo
filtara with aA % 50 A and lens were used for each camera. The expansionbehaviours of the anode plasmas on the front and rear surfaces arc almosc
same for Cu and Al anodes, but there are some diffarencca for CH, anode
(Low Z) (Fig.l). 3.8 x 10 cm/sec mean expansion velocity of the anode
plasma for Cu anode was obtained roughly.
-254-

A hollow cathode waa uaad tor Cha raaaareh ef electron baa* pinch
procaaa In eha dloda. Tha aooda ehlcknaaa waa choaan aa thick aa eh«
claaaical range, eha anoda la actachad fallowing by a plaatic acintillator
and aoae optical fiber* ara put along tha radial dtraction. Tha output
light algnalt ara amplified by faae rtae tlae photowltlpliers and recorded
by oailloacopea with Case rlaa ciwa. Meat) area eollapiing velocity can be
calculated by eha forwila
- _ w(1)
tt can ba alao calculated theoretically
dx / v Ode • p "" '
(2)
Let AT • *00*C be taken tor releaalng the abaorbed gaa fro* the anode
aurface.
Tha experlaantal and calculativa data of the M a n araa collapalng
velocity ara ahoun in cable t.
Table 1. M a n area collapalng velocity for aeveral klnda of target
(1 - 100 kA)
Target aaterlal
Al
1 F.= C O.Sm(Cu lam subacrate)
Al 1 u«(Cu lam subaerate)
Cu 1 ua(Al 2 M substrate)
2 '•aan collapalng veloclty(ca /na) '
axparlaMotal
n.fift,
l.S
0.37
0.67
l.S
calculativa
0.94
!
0.47 1
0.94
2.3
-2S6-

Froa the data w* can gat th« following conclusions; chat a«*n area
collapsing velocity is alaost constant d(wr )/dt*conttant, s© dr/dt
increases during pinch process. Nasn arta collapsing velocity ii only
determined by the material character of tha chin layer (about Hum) on the
anode surface, this velocity increases wish the increasing ef atomic number
Z of anode Mterial.
3. Icaa-eariat interaction research
Teaperacure measurement on interactIon between telativistie electron
beam and thin CM., C.H.O., Al« Cu, Mo and Au foil targets has been
performed . Tha foil thicknesses were 7-7O|«. Focus spot areas were 3-7
am . TlM-nsolvad ultrasoft X-ray data have been obtained by using two
vlndowless X-ray diodas. Assuming isothanul condition and using
one-dlaenslonal fluid aquations of Motion, continuing and energy balance,
tha following equations can be used for calculating tha plasaa teaperature
p dx A At
m»
Absorbed energy subsequently appears as lonUatlonal and thermal
energy in the absorption layer and as the kinetic energy of the expanding
plasaa.
The plasma teaperatures on the rear eurfaces of the chin targets
obtained froa experiments are shown in table 2.
Electron beaa energy deposition in some chin targeta has been Inferred
froa the measurements of blow off ions . Ignoring the amount of energy
necessary for the lonlxatlon of the atoms, we consider the energy deposited
on the target la equal to the sum of thermal and kinetic energy of the
plasma particles. At large distances froa the target, however, nearly all
of the particle energy is transformed into kinetic energy due to the
-256-

expansion of the plasaa. Ion energy Is determined by m e hod of combining
Che tlm-ot-tlight technique with tht rscacdlng voltage Masurasanc.
Otherwise assualng dE/dx Co ba cha classical stopping powtr, wa can
calculate cha energy deposition c .,,* J"MC". Tha cospariaion e with
Is shorn In Tabla 3. C
Table 2 . The p l a s u cesjperature* on the rear surfaces
Al Cu Mo Autarget Material
thickness («•)
" " " 1 • " • • " " " i
I| I
70 30 20 20
area within thefWHH of the :electron profile 3.4 3.8 3.9 4.3 6.2 ' 6.2distribution ' ;
•i
M H (asi) 1.0 1.1 , 1.1 1.2 1.4
teaperiture (eV) 3.3 3.2 j 3.6 3.8 3.7 S.O '
_ ! _ _ J . j _. _ , < .... . ; . . . „ . _ . . . :
The results show that tha energy deposition is In agreement with tha
classical deposition for high 2 targets, but for low Z target It Is higher
than the classical result for several claes.
- 2 S 7 -

Table 3. Comparison of Ion energy
SerUa No.
215211
'•1234
1IU
Targat
AuAil
AuAuCM
i Ca
JI5J?5
31*280176 „
130
371261
-2?A297ISfi I129
201
9(11
) I U
206
271
273
275
AiA l
Al
«v.
c+
rc*rc*t
J I93
101
•6
2ft
74
21
i t
21
4;so
16.4
S.O
29
8.9
183.4
4. Klactroa baaai tranaoortaelon raaiarch In drift tuba
Tba charga aad currant aautralUatlon procataaa for RED ('v 660 KaV,
40kA, lOOna, v/r 2.3) propagating In nautral gaaaa Bj(0.1 - 20 Torr) and
M,(0.1 - IS Torr) hava bean lavaatlgatad.
Elactrona ««ra lnjaccad Into a atalnlaaa drift tuba (10 ca l.d. and
160 ca long) through a 20 all alualnlxad-Mjrlar wlndov on eh« anoda (2.6 ea
dlaaatar). Tba dioda voltaga and tba Injactad currant vara aaaaurad with a
divider and a currant ahuat raapactlvaly. On tba tuba's wall, tbara ware
aoaa aagnatle probaa and Rogowakl-Colla to aonltar the nat currant, and a
Faraday Cup anlaldad froa tba lov-anargy alactrona or plaeaa currant by a
20 all Al foil wma aountad at tha far and of tha tuba to observe the beaa
currant. Tha axpariaantal apparatus la Illustrated schematically in Flj 2.

A Monte-Carlo Codt was usad for calculating charge neutralisation
process, la which some physical process** war* involved such as electron
impact ioniiation, electron avalanche, ion impact ienflcatien, ien
avalanche, charge exchange and iteandary electron #§eioe.
A numerical simulation has betn cade te analyst the current
nuetralitation processes and explain the experimental results.
The net current wavoforms in Hydrogen and Nitrogen were measured by
the g colK^ 5ca from eh* anode)and are shewn in Fig.J and Fig.4. The
following conclusions have been got from the analyses of the experiment and
calculatlve result*)
1). to low pressure regime (£0.1 Torr)
The beam-Induced gas loalxatioo develops very slowly, therefore the
beam-front electrons suffer serious loss from the space charge effects
(e.g. radial expansion or virtual cathode formation) until the space charge
nuatrallzatlon Is received. This process leads eh* net current is large
and beam front is steepened.
When beam current exceeds critical currant (e.g. k » I. (1 +1 I * 2 fc«-
the propagation property depends strongly on Che formation of the virtual
cathode. After creation of the virtual cathode, beam transport is
stagnated and a deep potential well is formed. Within this potential well
there is a very intense electric field, electron ioniiation and ion
lonlxation are going on rapidly by the effect of this electric field. Beam
propagation will be started until a charge neutralizing ion back-ground is
created. Calculation shows that 100ns is required for charge
neutralization if only consider electron ionlxatlon and only 20 ns is
required If consider electron and loo lonlsation both. It means that ion
ioniiation effect can raise the ion pairs creation rate by almoat S times.
It Is very good in accordance with the experimental result, which we have
observed the rise time of the electron current is shorten than 20 - 30 ns
comparing with the Injected current.
2). In the intermediate pressure regime (0.5 - 5 Tore)
Space charge neutralisation time la sufficiently short that virtual
cathode can not be formed and the beam front electrons do not suffer from a
serious radial expansion. Beam begins its current neutralisation process
soon after Injecting into the gas.
Calculated results show that when pressure equal to 1 Torr(in H2 gas),
-259-

currant neutralization reaches to «axiaua *r.d sec current is ainlnua. It is
with ont accord comparing to the atperiaetiral aeaiureisent.
3). In high pressure regiFt Cp » 5 Terr)
Set currant increases with increasing ptessute. Spaet eharge
neutraliiation tiae is vary ahart, eurrent geutraiisaEien pteeess wsiniv
depends on tha lenitation ©r avalanche and the drift or the secondary
electrons. ,
'Tha gat eenduetivity Co * *' ) reduces, when the pressure of gas
increases, bacaute the ao«aaeua eeUisei
currant naucraiitation affaet daeraaaas.
5. Tha production of Krf laaar puwad by alactron baa»
KrF latar ayataa at 245 na puasad by alactron baaa la a short
wavalangth* hlgh-powar, high afflclaney laaar, which has racaivad Mich
attantlon la racant y a m .
A laser cell with 1.8 Ut«r of eKcltation voluaa Is used to study cite
KrF laser puaped by alectroo baM. The windows on eha call were quartz,
tranaaiaaion of the windows was 9$ I. The laser cavity consists of a flat
dielectric coated reflector with 99 X reflectance and a flat dielectric
coated output couplers with various reflectance between 30 * to 70 S, The
experlaental sef-up la ahown in Flg.S.
Electron bean with large cross section of 36 x * ca and good
uniformity is extracted froa tha diode with large cathode area of 38 x 5
ca . Thrae kinds of cathode (pLate cathode, aultl-pins cathode and
aulti-ringa cathode) have baan investigated. Our expariaents show that ch«
aultl-ringa cathode Is the best for producing the baaa with good unlforalty
and large beaa energy. The voltage and currant waveforas of this diode are
showa la Fig.6. The total laser energy of 13J froa the laser oscillator
waa aeasured by a caloriawter. The KrF U M C spactrua and fluorescence
apactrua of KrF (89.6X Ar + 10Z Kr + O.«2 F at 2 ata.) are shown in fig.7
and Flg.8. The tlae blatory of laaer pulse output and tha tlae correlated
laaer aadlua spontaneous ealsalon ware aeasured by fast (< 1 ns rise tlac)
•olar-blind photodloda ahown In Fig.9. Tha full width at half aaxiaua
(FWBt) of the laser pulse is approxlaatcly 70 ns. The burn patterns of the
laser output showed that the beaa output with 7.5 ca dlaaeter.
-260-

Rafarancaa
1). Wang Nalyan at al; Proceeding of cht Sch International Confaranca on
tha Hlgh-powtr Parclda Beaaa 60 (1983)
2). Du Shigaog at al; Proceeding of eha Firat Confaranca on lntrtUl
Confinaaianc Fualon In China (1982)
3). Shan Yuiheng, Liu Weirn, Ma Weiyi and Song Yaniun; Proceeding of the
Tanth Confaranca on Platu Phyeict and Controlled Muelcar fuiion
Raaaarch Vol.3 (1984) 169
4) Hong Runshangt Fang Ql and Su gaorung; Proceeding of the First
Confaranca on Inarclal Confiaaaaot Fualon in China (1982)
-261-

(b)
(e)
Flg.lShadowgraph awaauraawaea of expansion valoclcy of Cha alactroda p l r n i .
(a) 20 in cu anoda ( eha ela* ralacad to the two ICMMI ara 135 na and 17Sna raaptcelvaly)
(b) 40 us AL anoda ( eha tia* ralacad to cha ewo fraMi ara 160 ns and 17Sat)
(c) 100 ita Cl, aaoda ( tha elawa ralatad to eha twt f rasas Mtm 170 as and
200 ns)
tit.2. Expariaantal aatups 1. cathoda2. anoda 3 . V-41vid«r 4. abuot 3,6,7,8. B-cotXi 9.10. R-eoll« 11. AI fo i l
V.
12. Fanday «ap 13. drift tub*
* TO GASIN
TOVACUUM GAUGE
\
- 282 -

J*
ikA) *
•
/
• a «
t ( u )
Fig. 3. Niuund act eurrcat iwvvforH fori m r t l Hfdrofin prtisurai (torr).
N
t
1Lt-(kA) m
$J
* i mt ( «» )
m m
t ( us )
fI f . 4< ttaasuzvd nat eurraat varaforaa forMvarsl Nitrof«a pr«ssur*s (Torr).
- S O -

rig.5 TIM arraagatwnt for tt» BrF Ui«r axparlaant
l.ettnod S.anod* 3<H»*Cffl-typ« aaaaaoly 4.U>«r o t U S.etUwindow* '«.output cou|d.ar,7. total r«fl«etor t.piiofo-diodcS.apUCMr lU.ealorlM««r U.pIafM gnciac »p«eero|raphlU.vaetniB- and x » «ya«w
X (KA) Tim (m)•0 ISO 1*0
Flf.6 TJM eornUMd a-baaa cttrrant and valtag*.
- 2 6 4 -

8484 I
9 .1* A8496 A
M».7 of tfcf ( Ar*10JUCr»0.4SF « t 8 4 t a .
n«.8 PluorcaeiBM spaetroB of Krf ( *r*lOfXr*O.A%r mt 2 ats. )

TUB (n»)tUO 400
Fig.9 Tla* correlated Utir Malta spontaneous••Isslon u d laser output.
-2B5-

Divergence Angle of Intense Pulsed Ion Beam Extracted fromDual-Current-Feed Magnetically Insulated Diode
Yutaka Shimotori, Keigo Aga, Katsuni Nasugata, Michiaki Ito and Klyoshi ','atsuiLaboratory of Bean Technology, The Technological University of
Nagaoka, Nagaoka, KHgata 949-54Abstract
Experimental studies are presented of on diagnostics and evaluation of alocal divergence angle of an Intense pulsed Ion beam extracted from dual-cur-rent-feed magnetically Insulated diode. Tht divergence angle has been foundto decrease with Incrosing insulating magnetic field strength or decreasingelectron current (or Ion current). Studying a temporal behavior of the di-vergence angle within one shot, we have found that the divergence angle of thehigh-energy component that Is produced In the Initial stage of the voltagepulse 1s relatively large. Measuring Ion species by the change of the flash-board anode (polyethylene, polycarbonate, and acryl), we have observed thatprotons dominate (more than * 80 t) over other Ion species Independent ofthese materials.
I. IntroductionRecently, considerable attention has been given In the 1iterature to an
inertial confinement fusion by an Intense pulsed Ion beam. ' For this pur-pose, it Is required for us to develop highly bright Ion diodes,2' or the con-centration of beam power density more than 100 TW/cm for an Implosion. ' Un-der these circumstances, It Is vry Important for us to reduce a local diver-gence angle (#) * ' which has a serious effect on the beam divergence by under-standing how and why It comes from and behave In several parameter spaces.Basically, the local divergence angle is considered to originate from a densityInhomogeneity of anode and cathode plasma or some instabilities,2'4'6' the de-tails of which have not been made clear still now.
In our previous paper, we have reported basic characteristics of a dual-current-feed magnetically Insulated diode.6' In this paper, we would like topresent detailed characteristics particularly associated with the local diver-gence angle In several parameter spaces. Detailed experimental results willbe presented on energy- and time-resolved measurement of the local divergenceangle. Finally, experimental studies are shown In detail on ton species andenergy of the Ion beam extracted by changing materials of the flashboard anode(polyethylene, polycarbonate, and acryl).
-267-

II. Experimental Apparatus and DiagnosticsFigure 1 schematically Illustrates the cross-sectional view of the ex-
perimental apparatus and arrangement. The experiment has been carried outusing the "ETIGO-I", an Intense pulsed Ion-beam generator 1n the TechnologicalUniversity of Nagaoka. * ' ' The design parameters of the pulse-poweroutput art as follows: voltage 1.2 MV, current 240 kA, pulse width SO nsec,giving an output energy of 14.4 kJ. The Ion diode utilized in the experi-ment is a flat type of dual-current-feed magnetically Insulated diode. 'The gap length between the anode and cathode is dA_K
s 7 mm. The cathodeworks as a one-turn theta pinch coll, which produces an Ir.suiating transversemagnetic field up to 16 kG by being fired by a slow capactior bank (5 kV, 1600t<F). The rising time of the magnetic field Is % 35 us. The cathode of thebeam extraction side Is made of 13 vanes of brass (1-mm thick, 10-mm width),the transparency of which Is t 90 2. On the surface of the anode (aluminum),we have attached a 1.5-mm-thick polyethylene sheet (Dashboard) having the di-mensions of 110 m x 120 mm. Approximately, 840 holes (1 mm In diameter each)are drilled on the Dashboard.
The diode voltage (Vd) was monitored by a resistive voltage divider(CuS04), while the diode current (I^) by a Rogowski coll. The total ion cur-rent (Ij) was measured by « imdti-aptrtured (1 mm in diameter each x 49) bi-ased ion collector (81C) (rectangular; effective dimensions of 100 mm x 100mm). Tne BIC was biased at -500 V.
To diagnose a local divergence angle (•) In detail, we have utilized a Ru-therford scattering pinhole camera,6* '5* the principle of which Is illustratedIn Fig. 2. It Is composed of three sections; two pinholes (1 inn In diametereach), a scatterer (!00-i*i-th1ck copper) and a solid-state track detector (CR-39). The Ion beam passed through the first pinhole 1s scattered by the scat-terer that declines 45* with respect to the beam. The beam thus scattered arethen observed by a pinhole camera that 1s comprised of the second pinhole andthe solid-state detector. In order to remove carbons, we have placed a mylarsheet (1.5-um thick) 1n front of the detector. The track density on the de-tector has been counted by a microscope. From the FWHN (Full Width at HalfMaximum) of the density distribution measured, we have evaluated the local di-vergence angle (*).
Figure 3 Illustrates the basic principle of an energy-resolved diagnosticsystem of *. The Ion beam passed through the first pinhole (square; 20 tun x20 \M) 1 S again passed through the slit (20-UM width), and then deflected by atransverse magnetic field to be energy-resolved in the direction perpendicular

to the slit. The Ion detector used is again a CR-39 film, which ts coveredwith a 1.5-um-thick mylar sheet to eliminate carbons.
Figure 4 Illustrates the basic principle of a time-resolved diagnosticsystem of 4 by use of a plastic scintillator (NE 102A) and an image convertercamera (IMACON 790). The ion beam passed through the pinhole (0.3 mm in di-ameter) 1s Irradiated onto the scintillator, which ts converted into a lightsignal. The light is observed with an image converter camera, hence beingto be time-resolved. In order to eliminate a direct Irradiation of visiblelight (generated at the diode) onto the camera, we have coated a 0.5-ym-thkkaluminum just in front of the scintillator.
In order to evaluate the ion species and energy spectra of the ion beamextracted, we have used a conventional Thomson-parabola spectrometer. Wehave changed materials of the flashboard anode (polyethylene, polycarbonate,and acryl), and studied the ion species as well as the energy distribution ofthe beam extracted.
III. Experimental Results and Discussionss) Waveforms
Figure 5 shows typical waveform of an inducitvely-calibrated diode volt-Age (Vd ) and a diode current (1^). As reported elsewhere, there appears avoltage reflection due to the Impedance mismatch between the pulse-formingline and the diode; the diode works at a relatively high impedance In the firstphase (phase I), while the Impedance decreases In the second phase (phase II),due to the presence of a residual anode-sheath plasma.7' 'b) Dependences of Local Divergence Angle In Parameter Spaces
Figure 6 shows the angle 4 plotted against the Insulating magnetic fieldstrength normalized by the critical field (B/Bc). In this experiment, we haveobserved that the diode current (I d), ion current (If) and electron current (I) monotonicaily decrease with Increasing magnetic field. As seen fro* Fig. 6,the angle 4 decreases with Increasing B/Bc when we keep constant Vd*. Underthe constant value of B/Bc> 1n addition, we see the angle 4 Increases with In-creasing vd .
Figure 7 shows the divergence angle (4) plotted against (a) electron cur-rent (Ie) and (b) 1on current (Ij). From Fig. 7, we clearly find that the an-gle + increases with Increasing I or If. Under the constant value of I , theangle 4 decreases with increasing V^ , as seen from Fig. 7 (a). From Fig. 7(b), furthermore, the angle 4 Increases with Increasing I{, being Independenton V .*.
d

c) Energy-Resolved Measurement of Local Divergence Anglerigure 8 (a) shows an example of the pattern on the CR-39 film obtained
by the energy-resolved measurement shown 1n F1g. 3. From Fig. 8 (a), the low-energy region 1s seen to be shifted toward a left-hand side, which Is due tothe fact that the Ion beam after passing through the diode gap 1s deflected bythe transverse magnetic field. Figure 8 (b) shows ttw distribution of trackdensttyin an energy range of 350 «v 650 keV. From Fig. 8 (b), we clearly seethat the angle 4 of the high-energy component that Is produced In the Initialstage of the voltage pulse Is large compared to that of the low-energy compo-nent.d) Time-Resolved Measurement of Local Divergence Angle
Figure 9 shows an example of the time-resolved measurement of the angle *obtained by the method shown In Fig. 4. The part seen to be "white" In theframing photographs of F1g. 9 Indicates the beam divergence. In particular.as seen fror the photo #3, there appear many "Islands". This seem to be dueto the fact that the anode plasma does not grow uniformly throughout the anodesurface, and that the 1on beam Is extracted from many "source" Islands thatare localized. From these results, we consider that an Inhomogeneity ofthe anode plasma has an Important role for the Initial stage of the beam oro-duction. As the time goes by, furthermore, there appear two circular pat-terns, which Indicates the "smoothing*1 of the anode plasma (see photos H %6). After smoothing, however, there exists a relatively large divergence,which seems to be due to the appearance of some plasma Instabilities. Thuseresults obtained above qualitatively agree to the fact that the high-energycomponent of the 1on beam has a relatively large divergence as mentioned pre-viously.
e) Ion Species ExtractedFigure 10 shows the energy distribution of various ion species extracted
from three types of the fiashboard anode (polyethylene, polycarbonate, andacryl), ' which have been obtained by a Thomson-parabola spectrometer. Allof these anodes have the same sizes, 1 1 0 m m x 1 3 0 m m x 2 m M (thick). Appro-ximately, 1000 ho1es(1 mm In diameter each) tre drilled on the flashboard.From Fig. 10, we clearly find that the low-energy component of protons domina-tes for all three kinds of the flasnboard.
Table I summarizes the fractional percentage of several kinds of ion spe-cies extracted after integrating number density for each kinds of species.From Table I, we see that more than 80 t Is composed of protons for threeflashboards. In particular, a fractional percentage of protons becomes86.7 X for the polyethylene.
-270-

IV. ConclusionsWe have studied the local divergence Angle extracted from a dual-current-
feed magnetically Insulated diode In detail. Conclusions obtained can be sum-marized as follows.
(1) The local divergence angle increases with decreasing magnetic fieldstrength or Increasing electron (or Ion) current.
(2) from the energy-resolved measurement of the divergence angle withinone shot, we have found that the high-energy component of the Ion beam has arelatively large divergence.
(3) From the time-resolved measurement of r.he divergence angle, we haveobserved that an Inhomogeneity of the anode plasma has an important role forthe divergence In the Initial stage of the beam production.
(4) Changing materials of the flashboard anode (polyethylene, polycarbo-nate, and acryl), we have found that the low-energy component of protons domi-nates for all three materials, and that more than 80 I Is composed of protons.
Ac know!edgemen tsThis work was partly supported by a Grant-in-Aid for Scientific Research
from the Ministry of Education, Science, and Culture of Japan. Professor H.Takuma of the University of Electro-Communications continuously encouraged theauthors. Nr. H. Uenaga of the Technological University of Nagaoka kindlyhelped the authors with various measurements. Framing photographs were takenby an Image converter camera belonging to the Institute of Plasma Physics,Nagoya University, under a collaborative research program. The authors wouldlike to express their sincere thanks to many persons concerned above.
-271-

References1) S. Humphries, Jr.: Nucl. Fusion 20, 1549 (1980).2) J. P. VanDevender et al.: Laser and Particle Beams 3_, 93 (1985).3) M. J. Clausen Phys. Rev. Letters 35, 848 (1975).4) K. Yatsui, K. Masugata and M. Matsui: Phys. Rev. A26, 3044 (1982).5) K. Masugata et al.: Proc. Int'l Top. Ntg on 1CF Res. by Light-Ion Beam (
Nagaoka, 198?) ed, by K. Yatsui, IPPJ-6U (1981) p. IS.6) I. Sal et al.: Proc. Col lab. Res. Htg on Development and Applications of
High-Power Particle Beans, ed. by K. Yatsui, IPPJ-742 (1985) p. 69.7) K. Yatsui: Proc. US-Jpn Workshop on Compact Toroids (Welding Res. tnst.,
Osaka Univ., 1981) p. 105.8) K. Masugata et al.: Jpn. J. Appi. Phys. 20, L347 (1981).9) K. Yatsui et al.: Proc. 4th Int'l Top. Conf. on High-Power El. and Ion
Beam Res. and Technology (Paiaiseau, France), 1_, (1981) p. 27.10) K. Yatsui et al.: Proc. 1984 INS Symp. on Heavy Ion Accelerators and
Their Applications to Inertial Fusion (Tokyo, 1984) p. 882.11) T. YosMkawa et al.: J. Appl. Phys. 56, 3137 (1984).12) K. Yatsui et al.: Laser and Particle Beams 3, 119 (1985).13) T. Matsuzawa et al.: Rev. Sci. Instruim. 56, 2279 (1985).14) 0. J. Johnson, A. V. Farnsworth, Jr., 0. L. Fehl, R. J. Leeper and 6. W.
Kuswa: J. Appl. Phys. SO, 4524 (1979).15) 0. J. Johnson et al.: J. Appl. Phys. 54, 2230 (1983).16) In evaluating a supplementary coefficient between track density and N/AE
, there was an error In Fig. 9 of Ref. 6, which has been revised as fig.10 1n the present paper.
-2!2-

Table I Fractional percentage of several ion species for
three types of flashboard anode; a) polyethylene
, b) polycarbonate, and c) acryl.
Ions
H+
C+
C2+
C3+
C4+
H+H2
Total
a) Polyethylene
86.7 7.
8.1
4.1
0.8
0.0
0.3
100.0
b) Polycarbonate
82.1 7.
11.9
4.8
0.4
0.0
0.8
100.0
c) Acryl
83.7 7.
9.2
5.2
1.2
0.0
0.7
100.0
-273-

Figure Captions
Fig. 1 Cross sectional view of experimental apparatus and arrangement.Fig. 2 Principle of Rutherford scattering pinhole camera.Fig. 3 Schematic of energy-resolved measurement system of local divergence
angle,rig. 4 Schematic of time*resolved measurement system of local divergence
angle,fig. S Typical waveforms; Inductively-calibrated diode voltage (Vd ) and li-
od* current (1^). B/Bc % 2.1.Fig. 6 Local divergence angle (•) vs transverse magnetic field strength (8/Bc)
An example of track-density distribution on CR-39 Is also presented Inthe Inset.
Fig. 7 Local divergence angle (•) vs (a) electron current (!) and (b) ioncurrent (I.).
Fig. 8 (a) An example of track pattern on CR-39 In the energy-resolved meas-urement of local divergence angle, (b) Distribution of track densityfor different energy range of 350 % 650 keV.
Fig. 9 Framing photographs of time-resolved measurement of local divergenceangle.
Fig. 10 Energy spectra of Ion beam extracted for three types of flashboardanode; (a) polyethylene, (b) polycarbonate, and (c) acryi. Vd
530 kV, ld • 70 * 77 kA, B/Bc * 2.S, d^_K « 8.3 m .
-274-

(RogowskI coil)
IMACON
Cathod*Plastic (Ont-turncoil)ScintiUator
\ CR-39 Maqn#{
ScatteringPinhot* Camera
ThomsonPiraboia
BIC
4-x «—•
FIG,
CR-39.
2nd Pinhole(1.0 mm*)
Beamy
—v
PinholeCamera
Scattrrvr(Cu.iOOjjm1)
1st Pinhole(1.0mr.iO
FIG. 2
- 2 7 5 -

Olod*IonBum P i n h o l t < 20 jum * 20 jum
4 ^ T — 1 Slit { 20jum Width )
200mm
Fir,.
PFL
IonB
Anode cCathode
Al(0.5jum)
Pinhole Plastic Scintillator^ (NE102A)
47mm I 66.5mmI
FIG.
- 2 7 6 -

0 100 200 300 400 500t(nsec)
FIG. 5
LI«0
O) -2 J 0 .1 *2* (mm}
- 650 kVconst.)
- 450 kV(const.)
1 2B / Be
FIG. 6

enT3
•e-1
a)
y$ n>.i . • * Vd-650kV
Vd-450kV (const.)( const.)
0 10 20 30 40 50 60U ( kA )
2
en•a
• '
n
b)
rtA•
>
Vj - 450 kV (-650kV(
• i
i
i
•
-
: • ) •
o)
10( kA )
20
FIG. 7
- 2 7 8 -

a)
380 keV^500 keV-J600 keV-
^ 350 keV1.-450 keV1— 550 keV
"• 650 keV0 x
x ( mm ) CR-39
35 30 25 w 35 30 25x (mm) («k) x (mm)
100
35 30 25x(min)
35 30 25(%) * ( m m )
35 30 25x(mm)
35 30 25x ( mm )
35 30 25x ( mm )
FIG. 8
- 2 J 9 -

10mm shot #32104, 32107
1 2 3 4 5 6 7 8 9 10 1112131415
£800
^400
0
II ii n il ! =i !3 3
I I
200 400t(nsec)
FIG. 9
- 2 8 0 -

s
4
3
UJ
3 2Z
1
0
•
•
•
H I —
Polyethylene •
» L jfrtrfg I I £200300400500800 700 800900
E/Z ( keV)
200 300400500800700800900E / Z ( keV )
0 200 300 400 500 600 700 800 900
E / Z ( keV )
FIG. 10
-2B1-

M H
Seif-Magneticaily-Insuiated Piasmti-Focus Diode as a New Sourceof an Intense Pulsecl Light-Ion Beam
Akira Takahashi, Keigo Aga, Katsumi Masugata, H1ch1ak1 Ito andK1yosh1 Yatsui
Laboratory of Beam Ttchnology, The Technological University ofNagaoka, Nagaoka, NHgata 949-54
AbstractA new and simple type of stif-magnetlcally-insulated diode named Plasma-
Focus 01odt has been successfully developed, where anode and cathode are con-stituted by a pair of coaxial cylindrical electrodes similarly to a Mather-type plasma-focus device. Operating conditions trt typically as follows:Inductively-calibrated diode voltage * 660 kV, diode current * 142 kA, totalIon current * 32 kA, pulse width * 90 ns and diode efficiency % 22 %. Multi-ple-shots operation more than SO shots has been possible without changingflashboard. Local divergence angle has been observed to be 0.9° -v 1.6°.Using such a simple Ion diode, we have demonstrated a possibility of high con-centration of beam-power density onto a target placed at the center.
I. IntroductionRecently, considerable attention has been given In the literature to an
Inertial-confinement fusion (ICF) by an Intense pulsed light-Ion beam (LIB).Production of high power density of the LI8 Is believed to be one of the mostImportant themes In this particular field of Interests. As widely known, thepower density (Pb) concentrated onto a target Is given by
1'
J1 vd, (1)
4,
where Jj Is the current density at the Ion source, Vd 1s the diode voltage,e Is the local divergence angle, 6 Is the deviation angle from the Idealtrajectory, ' and • is the solid angle subtended by the anode. In order toIncrease P^, as seen from eq. (1), It Is required for us to Increase J{, Vrfand * or reduce e and «.
In the present experiment, we have developed a new and simple ion diodeof self-magnetically-insulated type, where cnode and cathode are constitutedby a pair of coaxial cylindrical electrodes. Since the shape Is similar to
-282-

tl II
a Mather-type piasuc-focus device, we have named It Plasma-Focus Diode (PFD).In this paper, we wish to present characteristics and properties of the PFO Indetail.
II. PrincipleFigure 1 schematically Illustrates the basic principle of the PFD.
Anode and cathode are constituted of a pair of cylindrical electrodes, wherea flashboard 1$ attached just on the anode surface. As widely known, theself-magnetically Insulated condition of electrons (n an anode-cathode gapcan be written by3'
r "'Ic • 8500 0 Y (In — ) , (2)
rK
where B - v/c, y • (1 - 8 ) , and r. and rR denote radii of anode and cath-ode, respectively. If the diode current (Id) exceeds a certain critical cur-rent O c ) given by eq. (2), electrons tend to be pinched around the top of thediode (z • 40 mm), yielding electron beam toward the top of the anode or z-di-rection, as seen from Fig. 1. The Ion beam extracted from the flashboard an-ode passes through a perforated cathode, and tends to be concentrated onto thecentral axis.
Features of the PFD can be summarized as follows. (1) The configurationIs very simple. (2) Electrons do not pinch on the active area of the Ionsource, being possible a multiple-shots operation without changing fiashboard.(3) Due to the Irradiation of electrons onto the anode before the start ofmagnetic Insulation, a large amount of Jj can be expected.4' (4) The en-hancement of a solid angle (•) Is expected. (5) Since the Ion beam tends tobe concentrated onto the central axis, we expect a uniform Irradiation of highpower density of the LIB onto the target placed In the center.
III. Experimental Arrangement and DiagnosticsFigure 2 shows the experimental arrangement of the experimental device.
M M5 7)
The experiment has been carried out using a pulse-power machine, ETIGO-I , 'at the Technological University of Nagaoka, which comprises a Marx generatorof 43 kJ of stored energy. The design parameters of the pulse-power outputare voltage 1.2 MV, current 240 kA, pulse width 50 ns, yielding the beam out-put of 14.4 kJ.

The anode 1s made of a brass (Inner diameter 40 mm), inside which afiashfeoard made of a methyimetacrylate (acryl) Is attached. The dimensionsof the flashboard are as follows: Inner diameter 35 mm, length 40 mm, thick-ness 2.5 mm. In order to promote flashover, there are 200 holes (1 mm diame-ter each) on the flashboard with an Interval of 5 mm. The cathode 1s alsomade of a brass, where 112 holes (4 mm diameter each) are drilled. Thetransparency of the cathode Is 45 t. The gap length between anode and cath-ode Is dA_K • 5 m .
Diode voltage (V d), diode current (1J and Ion-current density (J^) havebeen measured by a resistive voltage divider (CuSO.), Rogowski coll and bi-ased-ion collector (BIC), respectively. Taking an Inductance of central cur-rent feeder (Lf % 140 nH) Into account, we have also obtained the Inductively-calibrated diode voltage (Vd*) by
An energy and species of the Ion beam extracted have been measured by aThomson-parabola spectrometer. ' To extract Ion beam toward the z-d(rect1on,we have placed a cone-shaped scattertr made of lead that Is movable In the zdirection, by which the beam 1s subject to a Rutherford scattering.9' Thethickness of the lead Is * 10 mm, which can be sufficiently thick compared toa range of the beam considered h e n ( t. 6 i#). Moving the scatterer In thez direction, we have measured the z-distrfbution of the Ion beam by use of aRutherford scattering pinhoie-camera technique. ' As a recording medium,we have used a solid-state track detector (CR-39) after being coiHmatedthrough a pinhole (0.3 mm diameter).
Using a solid-state Integrated dosimetric film (radcolor film), we havestudied an Initial Irradiation process of electrons onto the anode, which 1sattached onto the anode surface. ' As known well, the radcolor film changesits color from green to ted according with the absorbed dose from 1 Hrad to10 Mrad, respectively.
IV. Experimental ResultsFigure 3 presents typical waveforms of the experiment. From Fig. 3 (a),
we see Vd* (peak) * 660 kV, Irf (peak) * 142 kAt T (pulse width of Vd*) •». 90nsec (full-width at half maximum, FWHH). Z (Impedance between 50 to 150 nsecafter the start of Vd*) « 7 - 3 a. From F1g. 3 (b), we see Jf (peak) -v- 1.4kA/cm , which gives Ja (1on-current density on the anode surface) t 720 A/cm
2,
-2M-

li (total 1on current) <*. 32 kA, and n (diode efficiency) - I|/I<J ^ 22 X.Damages due to electrons on the PFD have been examined In detail.
Little damages are present on the active area of the anode, where strong dam-ages are present on the top of the anode or the point 0 Inside the pulse-power feeder with a diameter of 20 % 30 mm (see Fig. 2).
From eq. (2), we have estimated the critical current (Ic) of magneticInsulation for electrons to be Ic % 52 kA at Vd * 660 kV, where e s 0.9, Y *2.29, r. (radius of flashboard) * 17.5 mm, and rK * 12.5 mm. Thus, we find
id/Ic % 2.7 . (4)
Comparing eq. (4) with Fig. 3, we find that magnetic Insulation for electronstakes place at % 60 ns later of the start of Vd .
Figure 4 shows the trace of CR-39 of a Thomson-parabola spectrometer.From Fig. 4, we find the presence of proton and carbons. If we consider theerror of geometric spot size (2.8 mm diameter) on CR-39 taking the diameterof pinhoies of two coilimators Into account (0.8 mm diameter each), we haveestimated the maximum energy of protons (E_) to be '
Ep • 380 - 700 keV . (5)
Since, however, we have used a Rutherford scattering due to thick target, wecould not Identify the energy distribution of Ion species or the charge state.
Figure 5 (a) shows the z-distribution of particle numbers of the Ionbeam measured by a Rutherford-scattering pinhole camera. Figure 5 (b) showsradcolor films after being irradiated by electrons. From Fig. S (a), wefind that the number of particles Increase with Increasing distance towardthe top of the anode (z • 40 mi), and that It increases * 30 % at the top ofthe anode (z - 34 mm) compared to that at the root (z • 4 mm). From Fig. 5(b), we see that the Initial irradiation Intensity of electrons Is * 1 Nradat z - 5 - 15 mm and 5 - 10 Nrad at z - 20 - 35 mm. Thus, It 1s found thatthe Initial irradiation of electrons takes place more strongly as the dis-tance Increases toward the top of the anode. From these results, we under-stand that the Increase in the particle number at the top of the anode Is dueto the enhancement of surface fiashover by the Initial Irradiation of elec-trons.
Placing a shadowbox inside the cathode, we have measured local divergence
-286-

angle (•) and deviation angle (fi) for three sizes of diameter of the cathodeholes (3, 4, 5 mm In diameter). Experimental results are presented In Fig.6 to show damages of heat-sensitive paper and Table 1 to summarize these di-vergence angles. From these results, we have found that these angles (* and6) strongly depend on the diameter of the cathode hole, and that they decreasewith decreasing diameters. This can be considered that the electric fieldand the electron sheath are significantly disturbed when the diameter of thecathode holes (particularly 5 mm) becomes comparative to the anode-cathode gap(Sum).
V. ConclusionIn summary, we have developed a new type of seif-magneticaily-insuiated
Plasma-Focus Diode (PFO). Studying basic characteristics and properties ofthe PFO, we have obtained the following conclusions.1) Good efficiency of Ion production ( * 22 %) is obtained with good repro-ducibmty at Vd* * 660 kV, Id * 142 kA and I, -v 32 kA. A multiple-shot op-eration more than 50 shots has been possible under the above condition.2) Little damages are present on the active area, and the electrons have beenpinched toward the top of the anode. Correspondingly, particles Increase to-ward the top of the diode.3) Ion species extracted have been Identified to be proton and carbons. Themaximum energy of protons has been found to be 380 - 700 keV.
With the extension of the PFO developed above, If we spherically arrangeboth anode and cathode to focus two-dimensionally. It might be possible to con-centrate very high power density onto the target placed at the center.
AcknowledgementsThis work was partly supported by a Grant-In-Aid for Scientific Research
from the Ministry of Education, Science, and Culture of Japan. ProfessorH. Takuma of the University of Electro-Communications continuously encouragedthe authors throughout this work. Messrs. Y. Araki and H. Isobe helped theauthors with technical assistance or measurements. The authors would liketo express their sincere thanks to many persons concerned above.

References1) J. P. VanDevender, J. A. Swegle, D. J. Johnson, K. W. Bieg, £. J. T. Burns,
J. W. Poukey, P. A. Miller, J. N. 01 sen and G. Yonas: Laser and ParticleBeams 3, 93 (1985).
2) K. Yatsui, K. Masugata and H. Hatsui: Phys. Rev. Af£, 3044 (1962).3) J. H. Grctdon: J. Appl. Phys. 48, 1070 (1977).4) T. Yoshikawa, K. Masugata, M. Ito, M. Matsui and K. Vatsui: J. Appl. Phys.
S6, 3137 (1984).5) K. Yatsui: Proc. US-Jpn Workshop on Compact Toroid (Welding Res. tnst.,
Osaka Univ., 1981) p. 105.6) K. Masugata, T. Nakayama, V. Inazuni, K. Konno, M. Nakabaru, S. Takano,
M. Matsui, J. IMsawa and K. Yatsui: Jpn. J. Appl. Phys. 20, L347 (1981).7) K. Yatsui, A. Tokuchi, H. Tanaka, H. Ishizuka, A. Kawai, E. Sal, K. Masugata,
M. Ito and M. Matsui: Laser and Particle Beams 3, 119 (1985).8) T. Matsuzawa, A. Takahashi, K. Masugata, M. Ito, M. Matsui and K. Yatsui:
Rev. Sc1. Instrum. 56, 2279 (1985).9) J. N. Olsen, T. A. Mehlhorn, 0. .1. Johnson, P. L. Ore Ike and L. P. Nix: Proc.
5th Intn'l conf. on High-Power Particle Beams (San Francisco, 1983), ed.R. J. Briggs and A. J. Toepfer, (Lawrence Livermore National Laboratory, CA,1983) p. 121.
10) D. J. Johnson, P. L. Oreike, S. A. Slutz, R. J. Leeper, E. J. T. Burns,J. R. Freeman, T. A. Mehlhorn and J. P. Quintenz: J. Appl. Phys. 5£, 22J0(1983).
11) E. Sal, Y. Shimotori, K. Aga, K. Masugata, M. Ito and K. Yatsui: Proc.Collaborating Res. Meeting on Development and Applications of High-PowerParticle Beans, ed. K. Yatsui, IPPJ-742 (Inst. Plasma Phys., Nagoya Univ.,1985) p. 69.
12) Y. Shimotori, K. Aga, H. Uenaga, K. Masugata, M. Ito and K. Yatsui: to bepublished In IPPJ, ed. K. Hiu (Inst. Plasma Phys., Nagoya Univ., 1986).
-287-

Figure captionsFig. 1 Basic principle of the PFO.Fig. 2 Schematic of the experimental apparatus.Fig. 3 Typical waveforms of the experiment; (a) inductively-calibrated diode
voltage (Vd ), diode current (f d). and (b) lor. current density (J^.Fig. 4 Trace of CR-39 obtained by a Thomson-parabola spectrometer after being
fired by twelve shots.Fig. S (a) Axial distribution of particle number measured by a Rutherford-
scattering pinhole-camera technique,(b) Irradiation pattern of electrons obtained by radcolor film.
Fig. 6 Damage patterns of heat-sensitive paper in shadow box. Diameter ofpinhoie of shadow box • 1 mm; distance between cathode and pinhoie -5 m \ distance between pinhoie and heat-sensitive paper • 15 mm.
-288-

/Anode//Flashboard
®B
• • W • • •
——Ion Beam--- -•€-•
\
4i0B ExB-
n'Cathode
0 K) 20 X 40z (mm)
FIG. 1
(Rogowcki) |r|
(CuSOJ
FIG. 2

0 100 200 300t (nsec)
^ 00 100 200 300
t (nsec)
FIG. 3
W 1 5 O -N200---300-LUSOOi
O
C 1 +C J
FIG. 4
-290-

c3
<5Q.z
11
10
9
8
7
6
a)•
•I
i
1t
•
I•
i
i:
*t
10 20 30 40z (mm)
b)
h0 10 20 30
(mm)40
FIG. 5

4mmf «
I—i—i—i—i0 20 40
z (mm)
FIG. 6
TabLa 1. Local divacganca angle (#) and daviationangle from idaal trajectories (6) for va-rious diaaatars of cathode hole, whichhave bean avaragaly calculated after beingfired by two shots.
3 mm*
4 mm*
5 mm*
fz j e
i tf *a3ln cf * a i10 -aaJO.9 _os
1 6 -0.6
Z U -0.9
1 ft* * a 11 8 -1 . *
L l -1.2
sz
4 3 -1.2
6.0 . 2 9
4 D -0.7
e• •/ -o.9
• • ' -0.6
3 7 . - 2 . 0* ' -2.6
-292-

Final Focusing of Proton Bean by z-01scharged Plasma Channel
Hinoru Mjrayama, Nasahiro Nemo to, Katsumi Nasugata, MichUkt Ito, andKlyoshi Yatsui
Laboratory of Beam Technology, The Technological University ofNagaoka, Nagaoka, Niigata 949-54
AbstractE).ptriMtnta1 and theoretical results art presented of final focusing of
proton beam by a z^discharged plasma channel that produces an azimuthai mag-netic field. Experimentally, density of protons has been observed to beenhanced «1th a factor of (11 * IS) at the focal point. Numerical calcula-tion has iiso been carried out of trajectories of proton beam assuming themonly to be subject to Lorentz force. Reasonable agreement Is obtained on theenhancement factor of protons between the experiment and the theory.
I. Introduction
Recently, an Intense pulsed Ion bean Is believed to be a promising can-didate as an energy driver for an Inertiai confinement fusion. ' Neverthe-less* the focusing and the transport of the Ion beam are the most seriousproblems to be broken through. In an actual reactor system supposed, theIon beam will be focused by a geometric focusing technique. Later, the beammust be transported by a z-discharged plasma channel. ' The present authorshave studied and reported several types of beam-transport experiments; wire--Initiated channel,3' wall-confined plasma channel,4"8' wall-confined overlap-ping channels, and wall-confined channel stabilized against a sausage In-stability.10*
In 1982, Coopersteln et ai of Naval Research Laboratory proposed an Ideaof a final focusing by use of a plasma channel. The basic concept Is totransport Ion beams In large-diameter channels, which are connected by plasma-filled magnetic focusing section to bring the beam to pellet dimensions!1'In this scheme, the final focusing appears around a quarter of the betatronwavelength. No experimental studies have been carried out on this particu-lar Interest. In this paper, we would like to report preliminary results onthis topic.
II. Experimental Arrangement and DiagnosticsFigure 1 schematically Illustrates the outline of the experimental ap-
paratus and arrangement. The experiment has been carried out using the"ETIGO-I", *n Intense pulsed Ion-beam generator at the Technological Univer-
-2W-

sity of Nagaoka. 3- 1 0» 1 2» 1 3) The design parameters of the poise-power out-put are as follows: voltage 1.2 MV, current 240 kA, pulse width SO nsec, gi-ving an energy of 14.4 W . The Ion diode utilized In this experiment was aflat-type magnetically Insulated diode (HID). The MID was typically opera-ted under the following conditions; Vd*(1nductively-caHbrated diode voltage) • 850 % 990 kV, Id (diode current) % 80 kA, (pulse width of Vd*) * 75nsec (FHHN, Full Width at Half Maximum). The plasma channel was produced1M a pyrex tube being fired by a capacitor bank (G(capadtor) • 1.9 uF, Vfih(charging voltage) • 32 kV, Ich (channel current) * 52 kA). Dimensions ofthe pyrex tube was 50 M I In diameter and 140 m 1n length. The length wasdetermined so that a quarter of the betatron wavelength Is Involved In thistube. Pressure at the diode was kept at * 10"4 Torr, while that at theplasma channel to be p * 0.2 Torr (air), those of which were separated by a2-IM mylar foil. Since the mylar foil Is "thick" for carbons, but "thin"for protons, the 1on species In the present experiment can be considered tobe protons only.
In order to measure protons by a conventional carbon-activation techni-que,14'15' we have placed a carbon In the exit of the plasma channel. Pre-viously, we have found that "blow-off" takes place under the conditions ate.g., 640 keV, 80 nsec, 30 A/cm2, and 10 1 3 protons/cm2. To damp the Inci-dent Ion beam, we have utilized a copper mesh with the transparency of 46 t.
III. Experimental ResultsFigure 2 shows a typical waveform of the channel current (I c n). which 1s
superimposed by the diode voltage (Vd) uncaiibrated. As seen from F1g. 2,the diode voltage begins to rise at t % 2 tisec after the start of Id.
Figure 3 presents a typical example obtained by a shadow box placed atthe entrance for the plasma channel. The distance between pinholes (1 DMIn diameter each) and a heat-sensitive paper was 18 ma. Using Fig. 3, weobtain the Initial divergence angle (*0) that has at the entrance to be
• 0 - 3 ° % 4 ° . (1)
To study a homogeneity of protons Injected, we have divided the crosssection of the channel entrance Into eight sections (see F1g. 4 (a)). Ifwe pick four samples up and compare the number of protons with a measurementof a carbon-activation technique, we have found that the ratio of the maximumproton number to the minimum Is * 1.6. Such a nonuniformity seems to comefrom an electron-density inhomogeneity due to the electron drift In the NI0.
-2M-

Figure 5 shows the axial distribution of proton density, where an aper-turt 10 D M In diamtttr has been used In the carbon-activation technique.Fro* F1g. 5, we see tht density of protons (N_) at the channel entrance to be
Np % 0.1 x 10 1 4 /cm2.At i • IIS MR, on tht other hind, we find
H p » i . U I . S x 1 0 M /cm2.
Therefore, we have observed • factor of (11 * IS) Increase In proton densityIn this experiment. Tht focal distinct (z <v> 112 mm) observed above, wheretht peak density appears, Is a Httlt bit farther than a quarter of beta-tron wavelength calculated theoretically (z * 100 mm), which will be shownlater.
IV. Numerical CalculationIn this section, we present some numerical calculation by supposing a
simplified mriti Illustrated 1n Fig. 6. Protons that havt been InjectedInto tht channel with an angle # Q tend to be bended by tht azimuthai magneticfield B0 that Is produced by tht discharge current, and then transported to-ward tht focusing point. Other assumptions made in this calculation art asfollows.
a) Tht beam has no velocity component In tht t direction.b) Tht channel Is highly charge neutralized by tht plasma, hence giving
no electric Mtid.c) Beam-energy loss In tht channel Is small. 'd) Only the azimuthai magnetic field B0 exists In tht channel.Using the above assumptions, we write tht basic equation of motion;
(2)
dz- eB.—
• dt
dr ° dt
where m and e are the mass of protons and charge, respectively.Assuming a uniform flow of the channel current through the channel whose
radius Is given by RQ, we can write the magnetic field in the form,
Be(r) - br, (3)
where

Using tq$. (2) and (3), we derive r and i as follows;
• I—- (cos* - cos *0 • —*-) ,tbr«
2mv.
co$n dn
cost) + k
(4)
2eb•cos *,
and rQ denotes the position at tht entrance of the channel, and « the angleof the line element with respect to the z axis.
Figure 7 shows some examples of trajectories of protons. For the caseof 4 Q • 0, as seen from Fig. 7 (b), the beam can be focused Just on the z-axis at z * 100 MM, which (s a auarter of a betatron wavelength. For *0• - 2* (see Fig. 7 (a) or «Q - 2* (see Fig. 7 (c)), on the other hand, It Isfound that no oeint focusing takes place.
Assuming that the Incident angle uniformly distribute from - *0 to *Q,we have calculated trajectories of protons. Figure 8 shows the axial dis-tribution of the radius r , which represents the radius where eighty percen-tage of the number of protons Is Included. From Fig. 8, even If *0 distri-bute uniformly, best focusing takes place at z ^ 100 mm as Is similar to thecase of *Q - 0 (cf. Fig. 7 (b)). The distance z ( * 100 MM) that yieldsthe best focusing 1n Fig. 8 Is clearly seen to be closer than that observedexperimentally (z *>- 112 mm, cf. Fig. 5). The distance z at which the bestfocusing takes place does not move even when the distribution of the diver-gence angle 1s changed. Furthermore, It 1s found from Fig. 8 that the mini-mum value of r depends on the divergence angle. From Fig. 8 (b), in addi-tion, we see
min 12 mm for *0 * - 4.5 * + 4.5,
8 mm for f0 - - 2.5 <v + 2.5.
-296-

These values of r *n roughly corresponds to a half and a third the Intialradius of Injection (RQ • 25 M M ) . Therefore, the averaged Ion current den-sity seems to give the enhancement factor of 4 or 9. As Mentioned previ-ously, a factor of (11 * 15) Increase In the bean density has been observedIn the experiment, being a little bit larger than that calculated theoreti-cally. Such a discrepancy seems to come from the facts that the density ofprotons within r j n Is not uniform In the experiment, and that the measure-ment has been carried out In a higher density region since the aperture (10m In diameter) Is smaller than r min.
Figure 9 snows the relation between r * and divergence angle «Q. ASseen from Fig. 9, the radius r <n Increases with Increasing divergence an-gle.
Figure 10 plots the distance z ^ that gives the best focusing as afunction of the channel current (I c n). It 1s evident from Fig. 10 that thedistance z ^ decreases as the channel current Increases.
V. ConclusionsInjecting a proton bean (energy 900 keV, divergence angle 3 * 4 ) Into
a z-discharged plasma channel (current 52 kA, pressure 0.2 Torr (air)), wehave carried out a final focusing experiment using the "ETI60-I" accelerator.A factor of (11 + 15) Increase In the proton density has been observed atthe focal point (z * 112 mm), a little bit farther than a quarter of beta-tron wavelength calculated theoretically (z * 100 mm).
Numerical calculation has also been carried out on trajectories of pro-ton beam assuming them only to be subject to Lorentz force. From theseestimates, 1t has been found that the radius r min where 80 X of protons Isinvolved becomes one third the Initial injection radius (RQ • 25 mm). Areasonable agreement Is obtained on the enhancement factor of proton densitybetween the experiment and the theory. The position of the best focusingapproximately corresponds to a quarter of the betatron wavelength. Fur-thermore, several dependences of r «n and z .„ that gives the best focusingon divergence angle, channel current, and beam energy Injected.
AcknowledgementsTechnical assistance given by Mr. K. Kongoh of the Technological Univer-
sity of Nagaoka is greatly appreciated. This work was partly supported by aGrant-in-Aid for Scientific Research from the Ministry of Education, Scienceand Culture of Japan.

Figure CaptionsFig. 1 Schematic of experimental arrangement.F1g. 2 Waveform of channel current superimposed by diode voltage. Vd \
1190 kV. Id -v 80 kA, Vch * 32 kV, I£h * 52 kA, p * 0.2 Torr. 500mec/div.
Fig. 3 A data by shadow box placed at the entrance of the channel. Vd %1080 kV, id % 116 kA.
F1g. 4 (a) Cross section of channel entrance divided Into 8 sections, (b)Number of protons Measured with carbon-activation technique In se-veral regions A * D In (a). Vd «• 1080 kV, 1^ * 116 kA.
Fig. 5 Axial distribution of number of protons. Vd •». 990 kV, Id ~ 80kA.
F1g. 6 Trajectory of proton beam 1n a simplified model.Fig. 7 Calculated trajectory of protons for several divergence angle; (a)
•0 • - 2* (b) *0 - 0, and (c) 4 0 • 2*. E b (energy of protons) •900 keV, Ic|) - SO kA.
Fig. 8 Axial distribution of r*, where 80 t of protons Is Involved, (a)E b • 900 keV, Ic|) - 30 kA. (b) E b • 900 keV, I c h • SO kA.
Fig. 9 Radius r*m^n ** * function of divergence angle, (a) E b • 600 keV, (b) E b • 900 keV.
Fig. 10 Distance zm^n as a function of channel current, (a) *0 • - 2.52.5*. (b) *0 « - 4.5**4.5".
-218-

References
Present address: Japan Atonic Energy Research Institute, Mukoyama, Naka,Ibaraki 319-11.
1) S. Humphries, Jr.: Nucl. Fusion 20, 1S49 (1980).2) D. Nosher et al.: Proc. 3rd Int'l Conf. High-Power Particle Beams (Novo-
sibirsk, USSR, 1979) p. 576.3) K. Yatsui et al. Phys. Letters A89, 235 (1982).4) T. Yamada et al.: Jpn. J. Appi. Phys. 21, L699 (1982).5) T. Yamada et al.: Jon. J. Appl. Phys. 22, L27G (1983).6) K. Yatsui et al.: Proc. 5th Int'l Conf. High-Power Particle Beams (San
Francisco, USA, 1983) p. 34.7) K. Yatsui et al.: Proc. 5th Int'l Conf. High-Power Particle Beams (San
Francisco. USA, 1983) p. 80.8) K. Yatsui et al.: Proc. 1984 INS Int'l Symp. Heavy Ion Acclerators and
Their Applications to Inertiai Fusion (Tokyo, 1984) p. 882.9) S. Nakamura et al.: Proc. Collab. Res. Htg. Particle Applications to Fu-
sion Res. (Nagoya, 1984) p. 266.10) N. Nakahama et al.: Jpn. J. Appl. Phys. 25, * 1 (1986).11) G. Cooperstein et al.: Proc. Int'l Top. Htg. ICF Res. by Light-Ion Beam
(Nagaoka, 1982) p. 1.12) K. Masugata et al.: Jpn. J. Appl. Phys. 20, L347 (1981).13) K. Yatsui et al.: Laser and Particle Beams 3, 119 (1985).14) F. C. Young et al.: Rev. Sc1. Instrum. 48, 432 (1977).15) H. Tanaka et al.: Jpn. J. Appl. Phys. 21., L647 (1982).16) Energy loss of proton beam with an energy of 900 keV into an air of 0.2
Torr. can be estimated to be 85 eV, which Is evidently negligible small.

140 mm
.^Copper{ Sheet
60kV,1.9sjF
TargetMesh
7=467.)
TITPump
FIG. 1
FIR. 2
- 3 0 0 -

FIG. 3!1W
• / / / /
20mm
Rtgion
AB
C
0
Proton Numbtr(icM/shot)
2.92.4
2.11.9
1.6
(b)
FIG.
- 3 0 1 -

o<l
moIa.
Plasma
FIG. 6
E
0 40 80z (mm)
££
0 40 80z ( mm )
40 80 120 160 200
z (mm )
FIG. 7- 8 0 2 -

b)
Z (mm)
Et,*900k«VIch=50 kA
SO 100Z (mm) *•
150
FIG. 8
-303-

E
•3
FIG. 9
UO
E 100
a)900 k*V
J *Eb : 600 keV
100
0 30 50
Eb: 600 keV
0 30 50
FIG. 10

Observation of Ablation Process of Ion Bean-Target Interaction
by Backlighting Technique
Hitsugu Ikeda, Katsumi Masugata, Nichiaki Ito and Kiyoshi Yatsui
Laboratory of Beam Technology, The Technological University of
Nagaoka, Nagaoka, NHgata 949-64
Abstract
A New diagnostic technique for the measurement of ablation process In
an Intense pulsed light-Ion beam-target interaction has been successfully
developed of a high-speed streak photographing, where a strong light generated
from a 7-discharged plasma Is used as a backlight. Irradiating a proton
beam with a power density of 2.4 x 10 W/cm onto a 15-um aluminum target,
we have observed the ablation velocity and the ablation pressure to be 1.9 x
103 m/s and 1.6 x 10³ bar, respectively.
I. Introduction
Recently, considerable attention has been given In the literature to an
inertial confinement fusion by an intense pulsed Mght-ion beam. ' Exact
evaluation of an ablation process In the bean-target Interaction 1s believed
to be one of most important themes in this area of Interest.
In the past, a shadowgraph technique * using e.g. H, lasers has been
currently used In this measurement, which is useful to obtain two-dimensional
Information of target in an arbitrary timing. However, there »rt some prob-'
I ems in this method: 1) Only the Intermittent Information can be obtained.
2) Nuiti-channei laser system is required, and therefore these alignment are
relatively difficult.
In order to Improve above drawbacks, we have newly developed a high-speed
streak photographing, where a strong light from z-discharged plasma Is used
as a backlight. Features of this technique can be summarized as follows.
1) Using a streak camera makes it possible to diagnose continuously the be-
havior of targets, resulting In exact determination of change in velocity
of targets. 2) Since the diagnostic system can be arranged in the same op-
tical axis, its alignment Is relatively easy.
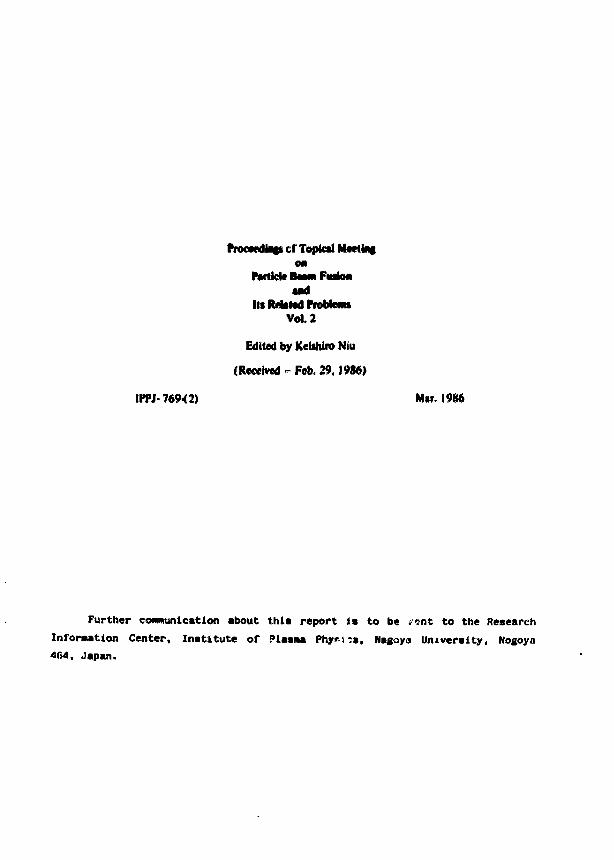
II. Experimental ApparatusFigure 1 schematically illustrates the outline of the experimental set-
M «
up. The experiment has been carried out using the ETIGO-I , an Intense
-306-

pulsed Ion-beam generator at the Technological University of Nagaoka. " 'Design parameters of the pulse-power output are as follows; voltage 1.2 MV,current 240 kA, and pulse width SO ns, giving an energy of 14.4 kJ. The Iondiode utilized here was a magnetically Insulated diode with a geometric fo-cusing type. The curvatures of the anode and cathode ^r* 160 m and ISO ran,respectively, and hence the gap length between anode and cathode Is 10 mm.The effective » m of the anode Is 95 cm2. The anode Is made of an aluminum,which Is covered with a polyethylene sheet (1.5-m» thick) as a fiashboard.
Materials of the targets used In this experiment are aluminum (5- or 15-m thick) and mylar (2-»jm thick), which have the same sizes of 50 m x 10 mm.The target has been placed vertically with respect to the beam axis.
A z-discharge tube as a backlighting source has been placed on the win-dow (pyrex; 5-mm thick) above the target. The discharge tube 1s made ofpyrex glass (2-mm thick), and has the dimensions of 25 mm In Inner diameterand 96 mm In length, which Is filled with an air at 0.35 Torr. The tube wasfired by a fast capacitor bank (1.0 |»F, SO kV). The discharge tube be-gan to fire at 1 <v 2 us before the beam irradiation. An image convertercamera (WACOM 790) has been used for the diagnostics of behavior of the tar-get.
To measure Ion-current density (J,) of the ion beam, we have used a bi-ased-Ion collector (BIC) that is biased at -I kV, which has an aperture of0.3 mm In diameter.
III. Experimental ResultsFigure 2 presents waveforms of (a) Inductively-calibrated diode voltage
(Vd ) and diode current (I,), and those of (b) Ion-current density (Jj) atthe geometric focusing point (z • 160 mm), and the resulting power densityInjected (P1n)> The maximum power density for this particular shot Is seento be P|fl * 1.1 x 10
9 W/cm2. Changing diode voltage, we have controlledpower density that Is Irradiated onto the target. Table I summarizes vari-ous parameters cf the several choices of the experiments, where we have keptconstant B/Bc - 2.3 i 2.6. The maximum power density examined In this ex-periment Is 2.4 x 10⁹ W/cm2 at Vrf* % 1010 kV, Id * 96.9 kA, and Jj % 6.2kA/cm2.
Figure 3 (a) shows the waveform of discharge current for the backlight-ing tube. From Fig. 3 (a), we find the peak current is % 30 kA, and therising time is -v 2.5 us. Figure 3 (b) shows the streak photograph of an
-aw-

aluminum target (15-KM thick) without the Irradiation of the ion beam. FromFig. 3 (b), we see the presence of strong light at t (time after the startof the discharge) • 1 A. 3 us and 6 A, 8 us, which roughly corresponds to thetiming of the Increase In the discharge current (cf. F1gs. 3 (a) and (b)).
Figure 4 shows the high-speed streak photographs obtained by the back-lighting technique developed here. From Fig. 4, we have obtained the rearvelocity (vr) for these targets;
vr <v 1900 m/s for 15-w" Al\I at v / % 1010 kV (cf. R A, 14.1 vm)
v, A. 4600 m/s for $-„* Al / ar
vr A, 930 m/s for 2-mm mylar at Vd* t 590 kV (cf. R A. 7.6 urn) ,
where R denotes the range calculated theoretically. For the case of 15-I#IM 1
Al (see Fig. 4 (a)), which corresponds to thick target compared to therange for the beam Injected, we see the change of the velocity at t <v 1.0 us,which seems to be due to the fact that the pusher begins to be heated andexpanded by a thermal conduction from the ablator ("Bumthrough").
Figure S shows the rear velocity at a function of beam power densityirradiated. For 2-um mylar, the velocity linearly Increases with Increasingpower density. For 5-ym Al, the velocity Increases at PJn > 0.5 x 10 W/cm .Forcreases
15-um Al, the velocity does not Increase at P|(| < 1 x 10⁹ W/cm2, but 1n-
ses rapidly at Pf|) > 1.5 x 10⁹ W/cm2.
IV. DiscussionsIn this section, we estimate the range of the Ion beam In the targets
using the following assumptions: 1) The range Is determined by protons sinceIt 1s the longest. 2) The energy of protons Is estimated from the diodevoltage Vd*. 3) The target Is cold.
Using the Bethe-Bioch equation, we write the stopping power as
} . (1)
where m Is the electron mass, C the shell correction , y the projectile ve-locity, e the electron charge, I the mean excitation potential, 0 • v/c,
-807-

Z. and Z» the atomic number of projectile and target, respectively. Fromeq. (1), we have calculated the range for these targets;
R % 6.4 urn for Al \ *] at Vd v 590 kV
R * 7.6 urn for mylar /
R % 14.1 m for A1,)« Vd -v 1010 kV
R -v 18.0 m for mylar-
From these estimates, we understand that 15-t* aluminum Is "thick" forprotons for all the conditions studied 1n Table I, hence being to be an "ab-lative" acceleration. On the other hand, 5-um aluminum or 2-um mylar cor-responds to "thin" or "explosive" for all the conditions.
The ablation pressure (Pa) Is now estimated by the relation,
Pt - S L . , (2)
where m Is the mass density of the pusher, v the velocity of the pusher, andT the ablation time. We have estimated the ablation pressue by the atsum-tions given below: (1) The velocity of the pusher Is given by vr. (2) Theablation time Is estimated by the full width at half maximum of P1fl. (3)The thickness of the ablator Is obtained by the depth of the proton deposi-tion, which 1s calculated from the range given by eq. (1). (4) The thick-ness of the pusher Is obtained by the extraction of the ablator thicknessfrom that of the target.
Figure 6 shows the relation between the ablation pressure thus obtainedand the beam power density Injected. From Fig. 6, we see the rapid IncreaseIn the pressure at P,n • 1.1 * 1.5 « 10
9 W/cm2. The reason why the ablationpressure Is low at P1(| < 1.1 x 10
9 W/cm seems to be due to the fact that alarge amount of the beam power Injected will be absorbed by the 1onizat1onor excitation of the target.
6 x 10³ bar atbeam energy in-
jected can be perfectly absorved by the target, the hydrodynamic efficiency (» H) can be written by
Kinetic energy of pusher, ™ x 100 (j) . (3)
Ion-beam energy Injected
Furthermore, the ablation pressure Is obtained as P * l.Pin t, 2.4 x 10
9 w/cm2 (for 15-jjm Al). If we assume that the

From eq. (3), we roughly evaluateiv. <«. 1 (.
V. Conclusions(1) A new diagnostic technique for the measurement of the ablation pro-
ctss In an 1on«beam-target Interaction has been developed, whtrt a stronglight fro* a t«d1scharged plasma Is used as a backlight.
(2) For a thick target such as 18-ui A1, the rear velocity rapidlychanges at 1.0 »s after the bean Injection due to "Burnthrough".
(3) The ablation pressure has been observed to be P§ <v 1.6 x 10 bar atPtn * 2.4 x 10
9 ll/cm2 for the 15-ua Al, Mhere the range has been evaluatedas 14.1 in*.
In the above experiment, however, the D M * power density obtained Isunfortunately low, and hence a large amount of energy could be absorved byan lonizatton or excitation. The exact scaling of the ablation pressurecould not be obtained. The detailed study should be carried out In a morehigh power range of the beam power density.
AcknowledgementsThis work was partly supported by a Grant-1n-A1d for Scientific Research
from the Hinistry of Education, Science, and Culture of Japan. Professor H.Takuma of the University of Electro-Communications continuously encoraged theauthors throughout this work. Streak photographs were taken by an Imageconverter camera belonging to the Institute of Plasma Physics, Nagoya Univer-sity, under a collaborative research program. Mr. Y. Kawano of the Techno-logical University of Nagaoka helped the authors with various measurementsthroughout this work. The authors would like to express their sincerethanks to many persons concerned above.
-aw-

References1) S. Humphries, Jr.: Nucl. Fusion 20, 1549 (1980); also, many references
clttd therein,2} B. H. R1p1n, R, Oecoste, S. P. Obensehain, S. E. Bodner, E. A. McLean, F.
C. Young, P. R. Whitlock, C. N. Armstrong, J. Grun, J. A. Stamper, S. H.Go'd, 0. J. Nagtl, R. H. Uhibtrg «nd J. H. NcMahon: Phys. of Fluids 23,1012 (l9tO).
3) N. Canarcat, B. Toumier, C. Bourgeois, J. Deivaux and R. Baiiiy-Sains:Rev. Set. Instrum. 55, U 2 5 (1984).
4) K. Yatsui: Proc. US-Jpn Workshop on Compact Toroids (Welding ResearchInst., Osaka Univ., 198*) p. 105.
5) K. Masugata et ai.: Jpn. J. Appi. Phys. 20, L347 (1981).6) K. Yatsui et ai.: froc. 4th Int'l Conf. High-Power El. 1 Ion Beam Res. &
Technology (Palafseau, France, 1981) p. 27.7) K. Yatsui, K. Hasugata and M. Hatsui: Phys. Rev. A26, 3044 (1982).8) K. Yatsui et ai.: Proc. 5th Int'l Conf. High-Power Particle Beam (San
Francisco, USA, 1983) p. 34.9) K. Yatsui et al.- Pro>:. 1984 INS (nt'1 Symp. Heavy Ion Accelerators and
Their Applications to Inertial Fusion (Tokyo, 1984) p. 882.10) K. Yatsui, A. Tokuchi, H. Tanaka, H. Ishituka, A. Kawai, E. Saf, K. Masu-
gata, N. Ito and N. Hatsui: Laser and Particle Beans 3, 119 (1985).
-310-

Table I. Operating conditions and paraaetars of g«oa«tric
focusing aagnetlcally-insuLatcd diode utilised
in the present experinane.
Vd*(kV)
Id(kA)
J, (kA/crr?)
P^GWfcnfi
A
590
38.8
12*0.11 1 -0.1
03 -Q01
B
690
485
1 5 4 O L 2
(15 *° '1 5a 5 -0.U
C
800
646
z<1 -0 .3
" -0.07
D
900
87.2
1 5 -0.10
E
1010
969
co*1.1&z-05
2 4 * 0 A 2
-ai-

Figure CaptionsFig. 1 Schematic of the experimental apparatus and arrangement.Fig. 2 Waveforms of (a) Inductively-calibrated diode voltage (Vd*) and
diode current (Id), and (b) Ion-current density (Jj) and beam-powerdensity Injected (P,n). Vd (diode voltage uncalibrated) % 910kV, Id * 65 kA, B/B. * 2.6. The BfC to measure J was placed atz • 160 MR.
Fig. 3 (a) Waveform of discharge tube for backlighting at charging volt-age of * 30 kV. (b) Streak photograph of 15-ym A1 target placedat z • 160 M I without irradiation of Ion beam.
Fig. 4 Streak photographs taken by the backlighting technique, (a) and(b) Vd * 1200 kV, Id * 97 kA, B/Bc * 2.5. (c) Vd * M O kV, !d* 38 kA, B/Bc * 2.3. These targets were placed at i • 160 mm.
Fig. 5 Rear velocity (vr) as a function of beam power density Injected(P t n). A - 2-um mylar, O - 5 - u m A I , • - 1 5 - m n A I . B/Bc •2.3 * 2.6.
Fig. 6 Ablation pressure (P4) as a function of beam power density injected(Pjn) for lS-iM Al. B/Bc « 2.4 % 2.6.
-312-
Cathode Rashboard ^ „ _ 1.0pF,30kVDischarge Ti
•o o-
Capacitor Bank5kV.1600jjF
wmdow(Pyrtx)
Drift Tube(SUS)
IMACON790
FIG. 1
- 3 1 8 -

KX) 200 300 400t(ns)
(M
Eu
KX) 200 300 400
t (ns)FIG. 2
-314-

b)Targtt 10 mm
FIG. 3
a) Al (15/jm) b) Al (5jim) c) Mylar (2jjm)
LIB LIB LIB
FIG.
- 8 1 5 -

3.0
2.0
^ 1.0
•»£ 0.6
0.2
0.1
•Hh
FIG. 5
• *
FIG. 6
03 05 1.0 20 40R(x109W/cm2)in
- 3 1 6 -

Observation of Inductive Post-Acceleration of Highly Neutralized,Intense Pulsed Ion Beam
T. Tanabe, A. (Canal, K« Takahashl*, A. Tokuchi*, K. NasuptaM. Ito and K. Yatsui
Laboratory of Stain Technology, The Technological University ofNagaoka, Nagaoka, N H p t a 919-P
AbstractAn induction accelerator system, MAUA-J , has been successfully oper-
ated to post-accelerate an Intense pulsed Ion beam that Is highly spaee-efoarge-and eurrent-neutraHzed. An annular Don beam (energy 90 keV, current 4 kA,pulse width 750 nsec) extracted from an appiied-8 magnetically-Insulated diodeIs Injected into the Induction accelerator, where a short pulse (210 kV, SOnsec) is applied. Measurements of beam energy by a Thomson-parabola spec-trometer before and after the post-acceleration have confirmed the increasein beam energy of H* up to •* 240 keV after being post-accelerated.
1. IntroductionAn Intense pulsed light-ion beam (LIB) such as W* with an energy of *- 19
MeV is considered to be a promising candidate of an energy driver for in In-ertial-confinement fusion (ICF) since It is relatively et%y to obtain high-power beauts w U h a considerably low cast. nevertheless, there 1s a seriousproblem to be solved: divergence angle is large, hence yielding poor focusing. '
On the other hand, to use a medlum-iMss Ion beam (NIB) such as B withhigher energy greater than several tens of MeV seems to be an alternative candi-date instead of protons.24*' To obtain such a high-energy MIB, we use a multi-stage induction accelerator. ' ' The basic idea Is to post-accelerate a space-charqe- an4 c^rsnt-neutralized Ion beam by use of many accelerating gaps that»re Insulated magnetically. The features can be suimarized as follows: 1)Since the energy Is high (higher than LIB but much lower than heavy-Ion beam(MB)) and the current is low (lower than LIB but much higher than HI8), beamdivergence due to space-charge effect can be reduced. ' 2) Since an energydensity dissipated In accelerating gaps becomes low, damages In gaps reduce,and hence reliability of pulse-power source Is Improved, being possible to behighly repetitive. 3) Influence of anode-source plasma that strongly affectsbeam divergence is reduced In such a multi-gap system.
As a first step of the multi-stage acceleration of a space-charge- andcurrent-neutralized 1on beam, we have constructed an Induction accelerate
-817-

system, MALIA-I , which stands for Medium-mass Atom linear Induct ion Acceler-
ator, * ' and made the first observation of the post-acceleration of the space-
charge* and current-neutralized LIB and NIB, which will be described in this
paper.
ft. Experimental Apparatus
Figure 1 Illustrates the schematic of the experimental apparatus, MA11A-
t . At seen from Fig. 1, it consists of two sections: ion diode and post-ae-
eelerator.
The (on diode Is «n app1ied-Bf magnetically-Insulated diode,*'10* which <s
directly connected to a N a m generator (200 kV, S kJ). The anode (aluminum)
is annular, and equipped with a fiashboard of polyethylene sheet (outer diame-
ter 170 KM, Inner diameter 100 MM, effective area M S m m , thickness 1.5 mm),
on which approximately 1500 holes (1 MM diameter each) tit drilled. The cath-
ode comprises two coaxial cylinders, of which diameters art 180 mm and 90 mm,
respectively. The gap length between anode and cathode is 15 mm. Insulating
magnetic field is produced by coaxial cods, which *rt fired by a slow capacHer
bank (S kV, 400 i#). Number of turns are 5 and I® for the outer and inner
coils, respectively. The magnetic flux density H typically ••• 0,1$ T at the
center of the anode, r * 67.5 mm, if charged it 1 kV. frm a computational
calculation using a finite-element method, the magnetic lines of forces are sup-
posed to be nearly parallel to the anode surface.
The post accelerator Is dirven by a Bluwiein puise-formlng-iine (PR.) with
switching reversed, where four-channels switch is located between the outer and
intermediate conductors. Oesign parameters of the PFL *re 300 kV, 50 nsec, and
15 n. The PFL Is charged by a Marx generator with a stored energy of 900 J.
The center conductor of the PFL Is directly connected to the post accelerator
through three 50-n-cables (diameter of Inner conductor 6 m, diameter of outer
conductor 33 mm), where neither prepuise switch nor charging Inductor Is pre-
sent. In the charging phase of the PFL, therefore, the reversed current {pre-
flows through the vacuum chamber inside which ten pieces of ferrite cores
are Installed, by which the ferrite cores are ready to reset to full swing.
Ferrite cores used In the post accelerator are made of Ni-Cu-Zn ferrite, '
which 1s characterized by <&B (flux swing) <v 0.63 T, i^ (initial relative pente-
abiiity) 300, c (specific resistivity) ^ 10* n-m. The dimensions of ferrite
cores are as follows: outer diameter 508 mm, inner diameter 308 mm, thickness
25 mm/each, hence giving the effective cross section, S • 250 cm2. Using a
simple relation,
-318-

V - T - S-fiB,
where » is the pulse width and V is the induced voltage, we thus calculate
V-T • 1.S7 x 10"2 V-sec. (1)
Post-accelerating gap, separated by 20 mm, is provided by a pair of two coaxialcylinders (outer diameter 180 m , inner diameter 90 m). The gap Is immersedin a transverse magnetic field (Br * 0.09S T) for the Insulation of electrons.To avoid bombardment of Ion beam onto electrodes at the acceleration gap, abeam Hmiter (0.1-mm>thick copper) has been placed at 94 m upstream from thegap. The bean Hmlter has a silt of 138 mm In outer diameter and 122 m inInner diameter, hence yielding an annular beam with a thickness of 8 mm.
Output voltage (VpFL) and current (lpFL) of PFL are measured by a voltagedivider (CuSOj) and a Rogowski coll, respectively. One-turn voltage (VQt)induced in one ferrIte core Is measured by a voltage divider (CuS04) (see a InFig. 1). Excitation current of ferrite cores (I ) Is measured by a Rogowskicoll placed 1n the outer side of the current feeders (see b in Fig. 1).
Figure 2 shows the equivalent circuit of *WlA-[". In Fig. 2, Lf ( •».330 nH) is the Inductance of the current feeders, LFC ( * 7.6 WH) the induct-ance of ferrite cores, and I ( % 20 nH) the Inductance In the duct that formsthe accelerating gap, Vjft<J the induction voltage through ferrite cores. Froma simple circuit theory, we easily find the relations:
h n " *ex * "gap •
dlV • V - L W
'gap *1nd ugap dt
Figure 3 shows waveforms of the Br-MID; a) diode voltage (Vd) and diodecurrent (IJ, and b) ion-current density (Jf) measured by a biased-Ion collec-tor (BIC) placed at z - 171 mm (at the accelerating gap). As seen from Fig.3 a), the diode voltage 1s kept at Vj * 90 kV for 500 nsec, decreases gradually,and finally tends to diminish at t (time after the start of Vd) % 1.4 ysec.From Fig. 3 b), the peak ion-current density Is found to be Jj * 20 A/cm , andthe pulse width Is <v 750 nsec (FWHH). Integrating the radial distribution ofJj(r), we have estimated the total Ion current to be 1 * 4 kA. From themeasurement by BIC with and without the bias voltage (see Fig. 3 b)), we have

calculated the current-neutralization factor to be f x 0.8 at z • 171 mm.121Furthermore, the beam Is considered to be highly charge-neutralized. '
III. Experimental ResultsFigure 4 shows waveforms of a) VpFL, b) V(n() and c) lfx, where broken and
solid lines represent those without and with beam, respectively. From Fig.4 a), we see the peak voltage of V p F L (without bean) % 390 kV and V p a (withbeam) % 320 kV. From Fig. 4 b), in the absence of the beam, we find V(nd
(peak) % 285 kV, t % 60 nsec, and hence V,nd*t <« 1.7 x 10"* V-sec, which Isin a good agreement with that designed (cf. eq. (1)). In the presence of thebeam, on the other hand, the Induction voltage decreases to be V 1 n d (peak) %210 kV, which seems to be due to the decrease In Vpp, and the Increase In thevoltage drop due to Lf with Increasing I (cf. Fig. 2 and eq. (2)). FromFig. 4 c), In the charging phase of the PFL, a reversed current Is seen to flowto be Iex (without beam) % 7.5 kA and lex (with beam) % 5.8 kA, by which theferHte cores *rt ready to reset to full swing as mentioned previously. Inthe above experiment, we have applied V p F L at t * 0.9 msec. If we change thetiming of VpF,, waveforms of the post-accelerator change drastically. In fact,when we apply V p F L at t • 0.9 to 1.2 wsec, we have found Vj n d (with beam) *210 kV to 100 kV, respectively. Furthermore, 1f we fire V p F L near the peak ofIon current, t % 1.4 msec, we have observed V j n d % 50 kV, hence yielding littleacceleration.
Figure 5 shows the results of Thomson-parabola spectrometer a) before andb) after the post-acceleration. As the recording medium of the detector, wehave used a cellulose nitrate film (CN-85). The distance between anode surfaceand first pinhole of the spectrometer Is z • 388 mi. From Fig. 5 a), we findthe presence of H*. H2*. C* and C
2 f. The peak energy of H*. H2* and C2* *re
t 90 keV/Z. The track density corresponding to the energy of 80 * 90 keV/ZIs relatively high, which Is comparable to the peak diode voltage as shown inFig. 3 b). For C* Ions, on the other hand, the peak energy Is * 170 keV, whichseems to be due to charge exchange with C Ions.
Applying V f m ) t 210 kV at t * 0.9 u$ec (see the arrow In Fig. 3 b)), wehave carried out the post-acceleration experiment. As seen from Fig. 5 b),we evidently find the peak energy to be % 240 keV for H*. which Is % 150 keVhigher than that before the post-acceleration.

IV. Summary« ii
By using an inductively post-accelerator, MALIA-I , we have cirried outthe experiment of the beam production and its post-acceleration. Conclusionsobtained are summarized as follows.
1) Using in app11ed-Br HID, we have produced the Ion beam with Vd % 90 kV,Ji % 20 A/on
2, I, % 4 icA, and T % 7S0 nsec (FWHH), which is highly charge-and current-neutralized.
2) Low-energy H* beam extracted above 1$ then Injected Into the post-ac-celeration gap, where a short pulse (210 kV, SO nsec) Is applied at t % 0.9usec, and we have confirmed the Increase In beam energy of H+ up to % 240 keVafter being post-accelerated.
Although the above experiment has clearly shown the Inductive post-accel-eration of H* that is charge- and current-neutralized, we have not evaluatedthe propagation efficiency of particles or energy spectra of beams post-accel-erated. These will be clarified in a more suitable machine where a short-pulsed Ion source is utilized with an accurately controlled post-accelerator.
AcknowledgmentsThis work was partly supported by a Grant-In-Ald for Scientific Research
from the Ministry of Education, Science, and Culture of Japan. ProfessorH. Takuma of the University of Electro-Communications continuously encouragedthe authors throughout this work. Ferrite cores were specially designed andprepared by TDK Co. Ltd. for the present experiment. The authors would like'to express their sincere thanks to many persons concerned above.
-321-

References
* Present address: Hitachi Cable, Ltd., 5-1 Hidaka-cho, Hitachi, Ibaraki319-14.
• Present address: Tokki Branch 1, Nichtcon Capacitor Co. Ltd., Yakura 2-3-1,Kusatsu, Shiga 525.
1. S. Humphries., Jr.: Nuci. Fusion 20, 1M9 (1980).2. J. P. VanDevender, J. A. Swegie, 0. J. Johnson, K. M. Bieg, I. J. T. Bums,
J. W. Powkey, P. A. Miller, J. N. 01sen and G. Yonas: Laser and ParticleBeams 3, 93 (1985).
3. S. Humphries, Jr., J. R. Freeman, J. Greenly, G. W. Kuswa, C. W. Mendel,J. M. Powkey and 0. H. Moodali: J. Appi. Phys. 51., 1876 (1980).
4. K. Yatsui, Y. Araki, K. Nasugata, H. Ito and M. Natsui: Proc. 5th Intn'lTop. Conf. on High-Power Particle Beams, ed. by R. J. BHggs and A. J.Toepfer, p. 34, (San Francisco, 1983).
5. K. Vatsui, A. Tokuchi, T. Yamada, T. Yoshikawa, K. Nasugata, Y. Araki,N. Ito and N. Natsui: Proc. 1984 INS Intn'l Symp. on Heavy Ion Acceleratorsand Their Applications to Inertial Fusion, ed. by Y. H1rao, p. 882 (Tokyo,1984).
6. K. Yatsui, A. Tokuch1, H. Tanaka, H. Ishizuka, A. Kawai, I. Sal, K. Nasugata,N. Ito and H. Matsui: Laser and Particle Beams 3, 119 (198S).
7. S. Humphries, Jr., T. R. Lockner and J. R. Freeman: IEEE Trans. Nuci. Sci-ence NS-28. 3410 (1981).
8. I. Roth, G. Still, S. Zhang, J. Ivers and J. A. Nation: Proc. 5th Intn'lTop. Conf. on High-Power Particle Beams, ed. by R. J. Briggs and A. J.Toepfer, p. 493, (San Francisco, 1983).
9. S. Humphries, Jr. and G. W. Kuswa: Appi. Phys. Lett. 35, 13 (1979).10. J. Nizui, K. Nasugata, Y. Nakagawa, K. Yatsui, N. Sato, H. Yonezu and
T. Tazima: Proc. 5th Intn'l Top. Conf. on High-Power Particle Beams, ed.by R. J. Briggs and A. J. Toepfer, p. 151, (San Francisco, 1983).
11. S. Watabe and Y. Narumiya: Proc. 3rd Intn'l Conf. on Ferrites (Kyoto, 1980),ed. by H. Watanabe, S. I Ida and N. Sugimoto, (Center for Academic Publi-cations Japan), p. 328 (1981).
12. The space-charge neutralization factor (f ) has not been determined In thisexperiment. However, 1f we assume f$ < 99 I, a simple estimate gives usthat radial electric field due to a space charge will be produced as E r >
-82-

17 kV/om at the outer edge of the beam (r • 90 M I ) . Such a strong electricfield will diverge the bean more than twice as wide as that at the diode,and hence the bean cannot be transported up to the post-acceleration tap(2 * 171 MR dowstream from the diode). Therefore, we can suppose f$ > 99t at least, hence almost fully charge-neutral lied. Regarding space-chargeneutrality of the Ion beam more In detail, see the following article:K. Vatsui, K. Nasugata and N. Natsui, Phyi. Rev. AJ|, 3044 (1982).
If such a highly charge- and current-neutralized ion beam (e.g., ener-gy of protons •% 90 fceV) Is Injected into the post-acceleration gap, neu-tralizing electrons will be returned back to the anode even In the absenceof transverse magnetic field since the energy of electrons ( * 50 eV forthis case) 1s sufficiently low compared to the gap voltage (e.g., V 1 m | *210 kV), and hence only Ions can be accelerated in the gap.
Figure captionsFig. 1 Schematic of induction-accelerator system, " M A U A ~ I , where a and b
denote voltage divider (CuSO^and Rogowski coll, respectively.Fig. 2 Equivalent circuit of " W l A - f .Fig. 3 Waveforms of Incident Bf-H30; a) Vd and ld, and b) J r Broken and
solid tines In b) show those without and with bias voltage (• 90 V),respectively. The arrow at t *> 0.9 msec in b) Indicates timing where
1ndFig. 4 Waveforms of a) V p F L, b) V1(|<J and c) l(x without (broken Hoes) and
with (solid lines) beam.F1g. 5 Thomson-parabola spectrometer data a) before and b) after post-accel
eration.

Post-Acctltrator
PFL
Coil'
1Pump
100mm
PFL-*
PFL
FIG. 2
-824-

0,5 1,0 1.5 20 2.0
FIG. 3
400
1.0
FIG. 4

x (mm)
x(mm)
FIG. 5
SO
- S 2 6 -

GENERATION AND FOCUSINC OF ION BEAM
FROM CONICAL PINCHED ELECTRON BEAM DIODE
Yoahlnobu NATSUKAWA
Research Institute Cor Ateale Energy,
Osaka City University,
Sugiaoto 3-3-138, Suaiyoshi-ku, Osaka 558
II. Introduction
The requlreaent to the Ion beasi as energy driver of ICP Is that the
focused power density to the target is larger than 100 TW/CP*. The power
density is expressed by 4Ba, B is the brightness of the Ion bets *nd a Is
the ratio of the solid angle (1 subtended by the ion beaa at the target to
4«PIt is necessary to increase the brightness and the solid angle to get
large power density on the target. VanDevender presented that the bright-
ness of the ion bea* la proportional to the 1.8 th power of the dlodt* vol-
tage irrespective of the type of the diode (rig. 1)1*
Usually the divergence angle of the ion bean fron Magnetically tabu-
lated diode (NID) is smaller than that froa pinched electron heaa diode
(PED), In contrast to this the current density of the ion beaa froa PGD is
larger than that froa HID.
In order to obtain the diode with large brightness soae trial to de-
crease the divergence angle have been aade for MID but it is effective to
Increase the current density for FED.
It was reported previously1**1' that the high density Ion beaa with high
brightness Is generated around the apex of the anode of conical pinched el-
ectron beaa diode. The value of the brightness of the ion beaa eaitted froa
the center of the anode is about 0.12 TW/cazradx at the Ion energy of 200*
250 keV, this value Is acre than ten tiaes as large as that at the corres-
ponding voltage on the line presented by VauDevender (see Fig. 1).
To aake large solid angle and saall focus diaaeter at the target in
the vicinity of the source, the ion beaa froa this type of diode with con-
cave spherical apex waa focused on its center of curvature.
Soae results of the simulation by PIC aethod on this diode is presen-
ted.
-827-

Ii
•
A+ /A*A 0
1
OMI
(if. 1
|2. Focusing of Ion Baaa
Tha apax angle of the an-
ode of the diode used in this
experiaent la 56* and that of
the cathode is 40*. Tha ion
energy la 20OV2S0 keV. These
paraaetara are as large as
those of the experiment repot-
ed in reference 3.
At the apex the anoda has
tha concave spherical part ma-
de froa aolded epoxy resin
with dlaaeter of 3 ca as ahown
in Fig. 2. The radius of cur-
vature of the concave part la
2 ca, th« aenith angle and so-
lid angle respect to the center
of curvature Is 48.5* (0.85 rad) and 4*xO.17 aterad reipeetlvcly. Other
part of the anode ia aadc froa insulator (ceraaics or plastics) as shown In
Fig. 2.
Coppar daaaga plate fixed at tha focus point was irradiated by the
focused ion beaa. When two plates 0.3 aa in thickness are aettled aa ahown
in Fig. 3-a, the center part of the
first plate 5 aa in diaaeter was cut
out and adhere on the second plate
as shown in Fig. 3-b. It is known
froa this that tha Ion beaa froa the
concave spherical anode apax is fo-
cused within tha region 5 aa in dia-
aeter. A copper plate 1 aa in thick-
ness was banded to the depth of 4 aa
and a plate 2 aa in thickness was be-
nded to the depth of 1 aa.
The total ion current is consi-
dered to be nearly 10 kA, because the
ion beaa current density at the center
Fig. 2
-828-
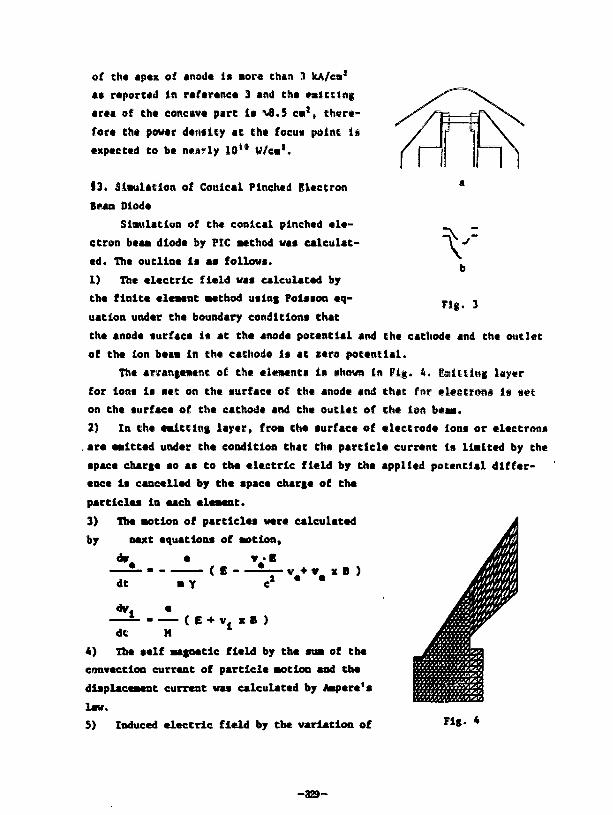
of the apex of anod« is mora than 3 kA/ca'
as reported In reference 3 and the emitting
area of the concave part It *v»8.5 ca!, there-
fore tht power density at the focus paint it
expected to be nearly 1 0 " W/cm'.
13. Simulation of Conical Pinched Electron
Bean Diode
Simulation of the conical pinched ele-
ctron beam diode by PIC method waa calculat-
ed. The outline la aa follow*.
1) The electric field waa calculated by
the finite element Method uaing Polaaon eq-
uation under the boundary condition! that
the anode surface ia at the anode potential and the cathode and the outlet
of the ion beaa in the cathode it at sero potential.
The arrangement of the elenenti is thewn in Fig. 4. Emitting layer
for lona it tec on the surface of the anode and that for electrons is set
on the surface of the cathode and the outlet of the ion beam.
2) In the emitting layer, fro* the surface of electrode ions or electron!
, are emitted under the condition that the particle current is limited by the
apace charge ao aa to the electric field by the applied potential differ-
ence la cancelled by the space charge of the
particles la each clement.
3) The motion of particles were calculated
by next equations of motion.
Vb
Fig. 3
dt( E-
i- ( E + V. x B )
dt M
4) The aelf magnetic field by the sum of the
convection current of particle motion and the
displacement current was calculated by Ampere's
law.
5) Induced electric field by the variation ofFig. *
-329-

Magnetic field vat taken into consideration.
6) Whan electrons inject to the insulator part of the anede it ii
factory to consider that they leave chart* *n the diode gpaee and are re-
jected at tl.e aetal part after drift with low velocity.
iy the calculation under thle condition strong electric field is gene-
rated on the anode surface due to accumulation of very dense electron cloud
near the anode and intense ion beaa is extracted.
In this calculation the condition of insulator is applied to only the
flat part of apex of anode.
In Fig. 5 S O M results of simulation, cqulpotentlal surface, trajecto-
ries and distribution of particles are shown.
ELECTION
Fig. S
References
1) C.L. Olson : J. Fusion Energy. I. (1981) 309
2) J.P.VanDeveoder : Proc. 5th Int. Conf. High-Power Particle Beau,
San Francisco, 1983, p.17
3) Y.Matsukava et ml : Jpn. J. Appl. Phys. 21 (1982) L6V5
*) T.Matsukawa et al : Proc. Sth Int. Conf. High-Power Particle Beau,
San Francisco, 1983, p.155
-830-

Recent Results ©f Light Ion Beam Fusion Researchon Reiden IV Particle Beara Accelerator
Tetau© QlhKl, Shuji MIYAMOTO, Ka«u® IMASAKI, Nebsru VUGAMJTatsure AKIBA, Seiiehi SAWASA, Yasunari MllOGUeill, Katsuji EMURA
SUZUKI, Sadae NAKAI and €hiy@@ YAMANAKA
Institute @£ Laser Engineering)Osakd University
2-6 Yawada-^ika, Suit a Osaka, S6S
Introduction
Light ion bean (LfBl fusion researches have been pursued atinstitute of Laser Engineering Osaka University. ' In light ionbean fusion, there are three key issuesj
U ) Pulse power(2) Ion beacn seuree(3) LID target interaction.
We have developed Reiden IV high voltage00 and Reiden tV superhigh voltage source(StiV) fer the light ion beam generation andfree electron laser oscillation. Plasma opening switches usinghigh speed plasma gun Cor the pulse compression and the pre-pulsereduction have been also developed. In the ion bean sourcestudy, we performed the beam generation experiments using theflat-shaped inverse pinched diode with applied magnetic field.
2 2
High beam brightness of 160 TW/cn rad was obtained using the
pulse compression by plasma opening erosion switches (POCS). In
the concave anode, the weak focusing was observed in spite of the
high bean, brightness.
The reasons were that;
(1) the ion are generation from the anode surface was not
uniform,
(2) virtual cathode was not parallel with the anode surface.To improve these weak points, we have been studying the anodeactive ion «-ource and developing the diode code to design to the
-381-
focus diode. Wire explodings and the flauhover of tins print
bases were used as flash ultraviolet radiation sources. In diodt*
code development, two typo codes are under doveloping; the
magnetic field code and the particle simulation code. Tin-
partiele e@de Is the 2=1/2 dimensional 3uasiBeleetr@n'ifUjnet it?
partiele in eell eede.
In LIB target experiments, we observed target hydrodynamics
fee obtain the ablation pressure sealing at the high bean) energy
region. The triple layer target with coppers and the
polyethylene was irradiated by 3 MeV, 0.1 TW, 20 ns proton beam.
We observed high ablation pressure at the high beam energy region
due to the cannon-ball effect.
Experimental Devices
Figure 1 stows the Reiden IV-II and fteiden 1V-SI1V. Thf
parameters of R@id@n IV were 1.1 JteV, 0.S MA, 60 as. In !<<.-5<Jr!i
IV-H, the impedance ©Kehange line was connected with thir
transmission line ©f Reiden JV t© intrrease the voltage frwi 1 MV
to 2.S MV, Additionally these ©utpat voltage was aneroatied l.y
the inductive storage pulse e^npressiew using piaen-ia opening
switches up t@ € MeV, 3fi ©to, 10 ns.
Reiden IV-SiiV
Reiden 1V-SHV was developing t© generate the dual ion ho/mi
and the free electron latter oscillation. Figure 7 uuHcuici, 1 im-
pulse forming line. The distribution line output was divided '<<•>
sets, 50 ohm coaxial cables t© match the output impedance ,w
shown in Pig.3. In near future, the induction died*- cavity nf
four stages are connected with these coaxial cables. Induct ion
diode cavity consisted of the mctafiass magnetic cores,
insulation coils and the power feed as shewn in Fig.4.
The dummy load experiments were performed using two water
resisters placed at the cable output position. The output
monitor was set at the stalk of the distribution line. In the
distribution line output, we observed the flat-top pulse, which
was proper to generate the mono energetic beam as shown in Fig.5.
POES

Wo used two type plasma guns;(l) the coaxial plasma gun
(Mendel gun ) (2) flash board gun. The Mendel gun consisted of
the coaxial sable and the spiral wire. The velocity of 1.2 x 10
em/s was measured at the coaxial plasma gun using th@ time ©f
flight method of the biased charge collectors. The high plasma
velocity of 3 x 10 em/s was obtained at the flash beattl gun
maybe due to the non-collapse at the plasma acceleration phase.
The efficient opening was expected using high velocity plasma
injection. Figure 6 indicates the diode voltage waveforms with
and without plasma opening switches. We observed the 2.3 voltage
increasing and efficient pre-pulse reduction using PGES.3*
Inverse Pinched Diode
We proposed the new ion diode; the flat-shaped Inverse
pinched diode with the applied magnetic field. In this diode,
there is no electron pinched area {in which the beam direction
and increasing the beam divergence are disturbed). The highest
beam brightness of 160 TW/emrad was observed at this diode,
jneunted en Reiden IV-il using the FOES as shewn in Pig.?. Figure
8 indicates the beam brightness sealing for the beam energy.
Data of magnetically insulated diode in fteiden III and pinched
electron beam diode were also plotted in this figure to compare
data each other. The beatn brightness In high voltage region over
1 MV lay on & % V1*9 where g(»Vj/S2)» j, *B and V were the beara
brightness, the bean current density, the bean divergence and
diode voltage, respectively, since the current density
theoretically obeyed the Child-Lang»uire(j V3<^2) and e was
proportional to j 0 * 2 in our •Kperiment. in the low voltage
region under 1 MV, the current density was limited by plasma2 8
formation (jMf ) rather than the space charge limit. Then beam
brightness was proportional to V * . In the pinched electron
beam data, emission was not limited by the plasma formation
rather than the space charge limit because the electron was
strong pinched on the anode surface. The beam brightness scaling
might promise the achieveaent the ignition condition at proton
beam energy of 8 MeV as shown in Pig.9.
Focus Diode
-aw-

Focus diode experiments was performed by the radial applied
magnetic field insulation diode. We selected the aluminum anode
baekplate because the magnetic field was weakly diffused into the
anode. Magnetic field coils were set in the stainless steel
cathode. The focusing power and the spat size were 0.12 TW/em
and S nun-diameter, respectively, whose values were lower than
that we have expected from the results of the flat diode
experiments. The resons might be due to the non-uniform emission
of the bean from the anode surface and magnetic field
configuration, which made the virtual cathode.
Active Ion Source
To Improve the non-uniform emission and the fast turn-on, we
have been continuing the active anode ion source experiment using
the wire exploding and the flashover ultraviolet radiation
source.
Field Code
Me have developed the tw@-di<mensional magnetic field
diffusion code in order t© simulate the magnetic field
configuration in the magnetically insulation diode. The magnetic
diffusion equation in conducting materials is given by=* =» "#&A • -uj - 9 3A/3t# <D
B - ?*A, (2)
where X, u, o, t and § are the vector potential, the
permeability, the conductivity of the material, the time and the
magnetic field, respectively. The equations were solved using
the successive over relaxation (SOR) method . In this code,
non-uniform nesh division, both Cartesian and cylindrical
coordinates were available. Figures 10(a) and (b) indicate the
magnetic field lines in our new magnetic insulation diode for two
different coil current waveforms. In Fig.10(b), the negative
seed current produces the offset magnetic field in aluminum amx>e
and the diffusing magnetic field by the main current could be

expected to be cancelled out. Additionally the field lines couldbe parallel with the anode surface so as to focus the ion beam.
Diode Code DevelopmentThe 2-1/2-dimensional quasl-electromaqnetie particle in cell
code have been developing to design the magnetically insulationdiode and the SHV diode and to simulate the diode experiments.The fundamental equation consists of the steady state-Maxwellequation,S)
a • - - © A (3)
A A - - wj, (4)
E - - ?«, (5)
where $, p, c and I are the scalar potential, the charge density,the electric permittivity and the electric field, respectively.The particle movement are solved by the Newton-Lerentz equation
=* * •* *m du/dt - q (E * u * B/vl, 16)
u * Y dx/dt, (7)
where m, u, q, x and y were the particle mass, the characteristicvelocity, the particle charge, the particle position and therelativistlc mass factor, respectively. The Maxwell equation andN'cwton-Lorentz equation are solved by the SOR method and Bunemanalgorithm, respectively. In this code, non-uniform meshdivision, both Cat .osian and cylindrical coordinates can be alsoused in order to simulate the complicate diode configuration.The code are now under developing.
Target experimentThe response of the target irradiated by high energy beam (3
MeV) also have been researched. ' Figure 11 shows theexperimental setup. The sandwich target, consisted of the copperIS micron, the polyethylene 100 micron and the copper 10 micron,was used. Proton beam (1011 H/cm2, 3 MeV, 15 ns and 30*) wasgenerated from the focused-type inverse pinched diode with the

applied magnetic field adding the plasma opening switch system
mounted on Reiden IV-H. The beam intensity and the oi*ergy were
monitored by the Cu (p,n)Zn nuclear reaction neutron
measurement. The target hydrodynamics were measured four channel
nitrogen laser shadowgraphy. Figure 12 indicates the ablation
pressure as function of the ion beam intensity. T© e©fflpare data
at 1 MeV data also plotted in this figure. points imply the
simulation*! data, whieh calculated by the the one-dimensional
HtSHO hydrodynafflic code. The high ablation pressure at 3 MeV
might be due to the cannon ball effect in polyethylene region.
Summary
We developed Iteiden IV super high voltage source(SUV) for
free electron laser oscillation and the light ion beam
generation. Plasma opening switches using high speed plasma gun
for the pulse compression and the pre-pulse reduction have been
also developed. In ion bean source study, we performed the
experiments o£ flat shaped inverse pinched diode with applied
magnetic field. High beam brightness up to 160 TW/em2rad2 were
obtained using pulse compression by plasma opening switehe§. in
concave shaped anedc, the weak focusing was observed maybe due to
the nonuniformity of the ion bean generation from the anode
surface and disturbed virtual cathode. To improve these weak
points, w« have been studying the anode active ion source and the
diode code development. Wire explodings and the flashover of the
print bases were used as the flash ultraviolet radiation sources.
In diode code development, two typ« code were under developing;
magnetic field code and particle simulation code. Particle code
was 2-1/2 dimensional quasi-electromagnetic particle in ceil
code.
In LIB-target experiments, we observed target hydrodynamics
to obtain the ablation pressure scaling at the high beam energy
region. The triple layer target with coppers and polyethylene
were irradiated by 3 MeV, 0.1 TW, 20 ns proton beam. He observed
high ablation pressure at high beam energy region due to the
cannon-ball effect.
References

1) k. Xmasaki, S. Miyamoto, T. Ozaki, Hirokasu Pujita, N. Yugami,S. Higaki, S. Nakai, K. Nishihara, Chiyoe Yamanaka, K. Yateui,Y. Arai, K. Masugata, K. Ito, T. Takahashi, H. Tamura,M. iiijikawa and 11. Yonedai Pros, of 10th Hit' i Cenf. ©n PlasmaPhysics and Controlled Nuclear Fusion Research, Lsnden U.K.IAfA-CN-44/B-II-2 (1984).
2) C. Mendel, Jr. and S. Goldstein, J. Appi. Phys. 4£, 1004(1977).
3) S. Miyamoto, A. Yoshinouehi, N. YugaiBi, K. tmasaki S. Nakaiand Chiyoe Y&ieanakai Jpn. J. Appl. Phys. 23, L109U984).
4) H. Lewis, Jr., J. Appl. Phys. 21* 2541 (1966).5) T. Ozaki, S. Miyamoto, A. Yoshinouchl, X.Xnasaki,
K. Nishihara, S. Higaki, S. Nakai and Chiyoe YananakaiTechnol. Reprts Osaka Univ. 34_, 75 (1984).
6) S. Miyamoto, K.Enasaki, T. Ozaki, N. Yugami, T. Akiba,S. Sawada, K. Bnura, Y. Mlxuguchi, S. Nakai andChiyoe Yamanakai Proe. of 7th International Workshop on LaserInteraction and Related Plasna Phenontena, Monterey, CA,(1985).
Figure Captions
Fig. 1 The photograph of Reiden IV-il and Reiden 1V-SHV.Fig. 2 The pulse forming line and the distribution line of
Reiden IV-SHV.Fig. 3. The line connection between the Reiden IV-H and Reiden
rv-sHv.Fig. 4 The induction cavity of the Reiden IV-SHV.
Fig. 5 The distribution output voltage waveform in the dummy
load experiment.
Fig. 6 The diode voltage waveforms with and without the plasma
opening switch.
Fig. 7 The experimental setup of the flat inverse pinched
diode with the applied magnetic fisld.
Fig. 8 The results of the beam brightness aa function of the
diode voltage.
Fig.9 The beam brightness scaling.
Fig.10 The magnetic field configuration in the magnetically
insulation diode,
-3»7-

(a) without the negative seed current,
(b) with th« negative aeed current.
Pig.11 The bean-target experimental setup
Pig.12 The ablation pressure sealing.
-388-

REIDEN IV-SHV
DISTRIBUTION LINE
EIDEN IV-H
Fig. 1
REIDEN IVDistributor

THE SCHEMATIC CONHGURATIONOF
REIDEN IV-SHV
Fig. 3 InductionCavtttos
T V.
Fig. 4
-8*0-

withPEOS
Cak.
Fig. 6
JI a X-PHC
Pig. 7
- M l -

woo
r0.1 •
O.OOI -
•
i
/ /
/
»
/
Fig. 8
BRIGHTNESS MT W / c m 2 / r « d 2
100
10
1
0.1
O.O1
0.001
O PINCH REFLEX• OSAKA - APPLIED B •A APPLIED FIELDD AMPFION
IGNITION
A
1
O.1 O.2 0.5 1.0 2.0VOLTAGE MV
Fig. 9-M2-
5.0 -to.o

. CURRENT(KA)SI o * $
CURRENTQcA)
en s.
-sa-

Pig.12
QD110
Aoe«l<hati»K FWwwe by LIB
K)Intensity CW/ow*J
Fig-11
-3M-

New Pellet Compression Scheaes by Indirect Irradiation of REB
and Related Preliminary Experiments
M. Sato, T. Taclma and H. Yonezu
Institute of Plasma Physics, Nagoya University,
Nagoya 464
Abstract
Preliminary experiments on a proposed scheme for pellet compression is
carried out with a Point Pinch Diode. A high current density of ion beam
is observed, and its value corresponds to 13.5 kA/cm2 from the anode to the
cathode.
SI. Introduction
Relatlvlstic electron beam (REB) has been actively investigated as a
driver for pellet compression In inertia! confinement fusion, because it
has the highest conversion efficiency from electrical energy to beam among
driver candidates (e.g. glass laser, light ion beam). However direct
irradiation of SIB causes serious preheating of the pellet by REB itsslf
and bremsstrahluag. Moreover transport of REB through vacuum to the pellet
is also difficult problem.
In order to resolve these problems, we propose three simple schemes
for pellet compression (Fig. 1). In these schemes, a pellet section is
directly connected with the pulse power machine through a slender MITL
(self magnetically insulated transmission line), and the pulse power is
directly fed to the diode. The schemes for pellet compression (a), (b) and
(c) are called Spherical Plasma Diode scheme", Ring Pinch Diode scheme2'
and Point Pinch Diode scheme3', respectively. The principles in each
scheme are same. The electrons emitted from the cathode (inner sphere or
cylinder) bombard the ancde (outer sphere or cylinder), and there a high
density plasma is produced. The electron flows are shown in Fig. 1 as the
arrows (the arrows turned to the left In Fig. 1 (c) mean X-ray). The
pellet Is compressed by energy fluxes from the anode plasma. The energy
fluxes are thought to be in the form of plasma itself, high energy ion beam
and radiation. In order to uniformly compress the pellet, two stage
compression of the pellet should be needed in the schemes (b) and (c).
That is, finally the pellet is compressed by radiation from a high
-ae-

temperature plasma which is formed by compression of gas filled in a
container (e.g. cone) in the cathode. Moreover, to increase the pellet
gain, energy multiplication by compression of a second pellet by X-ray from
a burning first pellet can be expected in the scheme (c).
We study to make clear the common physical processes in each scheme by
experiments on the Point Finch Diode, and preliminary results are reported.
§2. Experimental setup
The pulte power machine "LIMAY-I" is used in the preliminary
experiments. The characteristics of "LIMAV-I" are followings. The maximum
stored energy of the Marx generator is 13.1 kJ at the output voltage of
1.6 MV. The characteristic impedance of the pulse line is 3 ft. The pulse
width at the end of the pulse line is 70 ns. All of the experiments
reported below are carried out at 1.1 MV which is the output voltage of the
Marx generator. The MITL of length 1 a is connected at the end of the
"LIMAY-I". Figure 2 shows the experimental setup at the end of the MITL.
A cathode is the sphere of diameter 9.52 ma. This cathode is connected to
the MITL with the rod of diameter 4 am. An anode is a hollow sphere, and
is located with the anode-cathode (A-K) gap length of 3 aa. A He-He laser
la uoed at setting of this A-K gap length. The cathode, the anode and the
rod are made of stenlcss steel, but the brass cork of diaaeter 5 aa la
located on the anode at the point where the electrons are focussed. The
voltage supplied to the diode is aeasured with a resistive voltage divider.
The current passing through the diode Is aeasured with a Rogowski coil.
Radiation from the A-K gap is observed with an image converter caaera
(IMACON-790) at a framing aode operation.
In the experimental setup mentioned above, the experiaents are carried
out with the negative polarity on the inner conductor of the MITL. In this
negative polarity aode, it is difficult to measure the Ion beam accelerated
to the cathode, because the spherical cathode is so small. Therefore the
experiment to measure the ion beam is carried out in a positive polarity
aode (see Fig. 3). The ion beaa is extracted through the aperture placed
on the cathode, and is aeasured with a biased ion collector (BIC). The
minimum diaaeter cf the aperture is 2 ma. The spherical cathode is the
saae one as used in the negative polarity aode. The anode is the brass rod
of diaaeter 10 aa. The A-K gap length is 2 am.
-346-

§3. Experimental results
3-1 Negative polarity mode
Quantitative measurement for the plasma is not performed. However
some qualitative results are obtained from experiments. As shown in Fig. 4
(a), a stenless steel pipe is put into a groove on the cathode. The
diameter, the thickness and the length of the pipe are 1.26. 0.18 and 3 mm,
respectively. This pipe is collapsed after the high voltage pulse power is
supplied to the diode (Fig. 4 (b)). In this time, a hole damage appears at
the surface on top of the brass cork which is located at the anode (Fig. 4
(c)). The diameter of the hole is about 0.5 to 2 mm, and the depth is
about 1 mm. From these results, it is made clear that compression for the
pellet (cone) is capable. It is not known which the energy flux from the
anode to the cathode is dominant.
Figure 5 shows the framing pictures of radiation emitted from the
plasmas in the diode. From these pictures, it is found out that the
radiative parts on the anode and the cathode expand, and fill the apace
between the anode and the cathode.
3-2 Positive polarity mode
In order to investigate which the energy flux from tha anode plasma is
dominant, i.e., plasma itself, ion beam, or radiation, a following
experiment of which setup is shown in Fig. 3 is carried out. The
capacitance of the BIC is relatively large, and the output resistivity of
it is so small. The ion collector plate of the BIC is located at 30 to
50 an distance from the cathode surface. Figure 6 shows the signal of the
ion beam current measured with the BIC. The peak value of it is 420 A.
From the calculation in which the ion beam uniformly pass through the
aperture 2 mm in diameter, this value corresponds to the high current
density of 13.5 kA/cm2 from the anode to the cathode. The value of A/Z is
estimated about 20 from the calculation of time-of-flight for the ion beam,
where A is the mass of atoms and Z is the charge number of atoms. To make
clear the species of the accelerated ions, we are now planning to perform
the experiment with a Thomson parabora mass analyzer.
3-3 Transport of energy from the anode to the cathode
As mentioned above, it is considered that there are three processes
for transport of energy from the anode to the cathode in the schemes for
pellet compression. There are plasma itself, the high energy ion beam and
radiation. The contribution by radiation is not remarkable until the
-347-

temperature of the plasma produced by REB reaches the order of 100 eV.
Since the temperature of the plasma produced in our experiment is
considered several electron-volts, the contribution by radiation is
negligible small. Therefore we roughly estimate the power densities by
plasma itself and the ion beam. The result is following.
The powar density of plasma itself (Wpl)
Assuming that the temperature (T) t< 5 eV, the density (n) \ 1021 /cm3,
and the expansion velocity of the plasma (v) t 106 cm/s.
Dpi • 3/2 k I n v • 1.2 x 10⁹ W/cm2.
The power density of the ion beam (Wion)
Assuming that the energy of the ions equals to the voltage supplied to
the diode (i.e. E i o n t< 300 keV), the current density jion * 13.5 kA/cm2.
"ion * Eton * Jion - 4-1 x 10⁹ W/cn2.
Here k is Boltzmann constant. Although Wpi may be overestimated, and Wion
may be underestimated in these calculations, V±oa should be greater than
Wpi. Therefore it is considered that the contribution by the ion beam to
cylinder compression is dominant in the Point Pinch Diode scheme.
S4. Summary
The experiments on the Point Pinch Diode are carried out. The
summaries are followings.
1. It is made clear that compression for the pellet (cone) is capable,
because the stenless steel pipe which is put into the groove on the
cathode is collapsed.
2. The ion beam (E * 300 keV, A/Z * 20) with high current density is
observed. The peak current density of the ion beam corresponds to
13.5 kA/cm2 from the anode to the cathode.
3. According to the comparison of the power densities of plasaa itself and
of the ion beam, it is made clear that the contribution by the ion beam
is dominant in the Point Pinch Diode scheme.
References
1. A. Mohri, K. Ikuta and T. Tazlma: Jpn. J. Appl. Phys. 22 (1983) 1582.
2. J. Mizui, M. Sato, H. Tonezu and T. Tazima: Jpn. J. Appl. Phys.
24 (1985) L556.
3. T. Tazima: Internal Report of IPP "Purazuma-Ken Dayori" 2 No.7 (1985) 1
(in Japanese).
-348-

Figure captions
Fig. 1. The conceptual drawings of pellet compression schemes by indirect
irradiation of REB.
Fig. 2. The experimental setup with the Point Pinch Diode.
Fig. 3. The experimental setup on the positive polarity mode.
Fig. 4. The simple drawing of the experimental result on the negative
polarity mode.
Fig. 5. The framing pictures of radiation emitted from the plasmas in the
diode, (exposure time 10 ns, Interval SO ns)
Fig. 6. The signal of the ion beam current measured with the BIC.
(190A/dlv)
-^349-

(a) • WMwmm
(b)
Fig. 1
He-Ne Laser
VoltageDivider
Rogowski Coil W1.50 Pinhole
\ x20Lens Xf=150 / _ \
/ • Screen
IMACONCamera
Fig. 2
- 3 5 0 -

C A T II 0 0 B
ANODB
MB 311
B I C
| I O N
ITION COLLECTOR
(-480V)
Fig. 3
Fig. 4
-351-

(a)
(b)
"\
field of view
Fig. 5
Fig. 6
-352-

FIRST BEAM TEST OF THE RFQ LINAC 'TALL'
N. Ueda, S. Yamada, M. Olivier*, T. Nakanishi,S. Arai, T. Fukushima, S. Tatsuni, and A. Mizobuchi
Institute for Nuclear Study. University of Tokyo,t Laboratoire National Saturne, CEN. Sacley. France
AbstractThe INS RFQ linac 'TALL' accelerated successfully protons and hydrogen
molecular ions first in suMer, 1985. The RFQ is of four vane structuredriven with a single loop coupler at 101.3 MHz. The machine is designed toaccelerate ions vith charge to mass ratio of 1 - 1/7 up to 800 keV/u in thevane length of 7.25 •.
S 1. IntroductionThe RFQ linac converges charged particle by rf quadrupole field
excited with four electrodes tuned 'vane' and accelerates them by the axialcomponent generated with the 'Modulation' - scallop shape of the vanetip." It was shown that the structure is very effective for accelerationof light particles of high intensity in a low energy region.2'
The RFQ linac is, also, suitable for the lowest energy stage of aheavy ion linac system for the following reasons:(1) Short cell length of the RFQ accepts low velocity ions.(2) It can capture and bunch more than 90 * of the injected dc been.
In order to develop RFQ linac for a heavy ion accelerator system, atest linac 'LITL' (Lithium Ion lest Linac) was constructed and itsperformance was studied.3) It accelerated 7Li* up to 138 keV/u in the vanelength of 1.2 a. It gives a capture efficiency exceeding 90S». On thebasis of the succesful work on the LITL, a long RFQ linac 'TALL' has beenconstructed. It is to be used as the first stage of an injector linacsystem for the heavy ion synchrotron 'TARN II *, which is under constructionat INS. The design parameters of the TALL are given in Table 1. Adetailed description of the cavity structure and vane alignment is given inanother paper.*'
3 2. Acceleration CavityThe four vane cavity is separated longitudinally into four sections,
—353—

each of which is about 1.8 m long and was assembled independently (Figs.l,2). The cavity cylinder is made of mild steel, copper plated to athickness of 100 IM. Two sets of vanes are prepared for the TALL.One is for low power operation. It is made of aluminum and has no coolingchannel. The other is made of copper and has cooling channels for highpower operation. Now the cavity is equipped with the aluminum vanes. Thevane is mounted into the cylinder with three base plugs. The vanes andcylinders contact electrically through C-shaped contactors made ofstainless steel, silver coated to a thickness of 50 ion.
The vanes of each section were aligned within an error of ± 50 im ofthe vane top position. The four sections are joined on a bed which hasfive supporting flats. The flats are levelled within an error of± 20 IM. The beam axis is aligned within an error of 200 IM over thelength of 7.3 m. The transverse dislocations between the longitudinallyadjacent vanes at the joints are within 100 IM. A computer simulationshows that alignement errors of the bean axis of 100 IM at the three jointsdo not decrease the transmission significantly.5*
i 3. Rf CharacteristicsThe field distribution was tuned by using end inductive tuners
roughly, and fine tuning vas done with aide inductive and end capacitivetuners. The electric field distribution was measured by using a dielectricperturbator which was ran guided with the vanes. The field uniformityerror is within ± 2% azimuthally and ± 5* longitudinally. The resonantfrequency of the TE210 mode is 101.3 FHz. The closest mode TE111 has afrequency of 0,9 Mfe higher. The quality factor is 7100, about 70% of theideal one.
J 4. Beam testProton beam from a microwave ion source was injected at 8 keV into the
RFQ. Figure 3 shows the output beam current versus the forward rf power.The duty factor is 68 and repetition period is 2 ms. The ouput beam energywas conjectured calorimetrically to be about 800 keV by measuring thetemperature rise of a copper target and beam current. Bunch structure ofthe output beam was also observed. It agrees with a computer simulation.
Hultipactorings were observed in three ranges of rf level (Fig.3).They were past over easily after a few hour outgassing on the first highpower test. Power feed with a single loop coupler had no problem up to the
-354-

maximum output 25 kW of an rf power supply. The cavity is pumped with two
turbomolecular pumps of 500 l/s. The vacuum pressure was 1 • 10"6 Torr with
no rf power. It increased to a range of 10~s Torr on the outgassing
process.
| 5. Conclusion
The RFQ TALL has a length of 7.3 • or 2.4 times the wave length. It
is driven with a single loop coupler and has no vane coupling ring. The
field uniformity obtained so far is vithin ± 2* azimuthally, and ± 5S
longitudinally. The TE210 mode has an enough separation of 0.9 MHz to the
closest mode TE111. The successful acceleration shows that the vane
separation is an answer for a long RFQ to get a field uniformity. It makes
much easy the vane mchining and assembly.
An enittance measurement device and analyzer magnet has been set
behind the RFQ. Measurement of the quality of the output beam will be made
before long.
The authors are grateful to Prof. Y. Hirao and the members of the
Accelerator Research Division, INS. The acceleration cavity was
manufactured by Sumitomo Heavy Industires, Ltd.
References
1) K. R. Crandall et al., Proc. 1979 Linear Ace. Conf., Montauk, NY, USA,
(1979) BNL-51134, 205.
2) J. E. Stovall, K. R. Crandall and R. V. Hum, Proc. 6th Conf. on
Applications in Research & Industry, Denton, Texas, Nov.3-5, I960, IEEE
Trans. NS-28, 1508-1510 (1990).
3) N. Ueda et al., Proc., 1933 Particle Ace. Conf.. Santa Fe, NM, USA, IEEE
Trans. Nuclear Sci., NS-30, No.4 (1983).
4) N. Ueda et al., Proc. 1985 Particle Ace. Conf., May 13-17. 1935,
Vancouver, Canada.
5) T. Nakanishi et al., Proc. 5th Symp. Ace. Sci. & Technology. 1934, KEK.
Ohomachi, Ibaraki, Japan.
-866-

Table 1. Design parameters of the TALL.
Ions (q/A)
Operating frequency (tftz)
Input energy (IceV/u)
(Xitput energy (IceV/u)
Vane length (cm)
Cavity diameter (cm)
Characteristic bore radius, r0 (cm)
Minimum bore radius, a (cm)
Intervane voltage for q/A = 1/7 (kV)
Maximum field (kV/cm)
Rf power wall loss for q/A = 1/7 (kW)
Transmission for input beam with
a normalized emittance of
0.6* mm.mrad for q/A = 1/7
1 - 1/7
100
8
800
725
58
0.54
0.29
81
205 (1.8 Kilpat.)
180
0 mA 0.94
2 mA 0.91
10 mA 0.63
coo.no j»wrt
Fig.1. Schematic drawing of the acceleration cavity of the TALL.
-356-
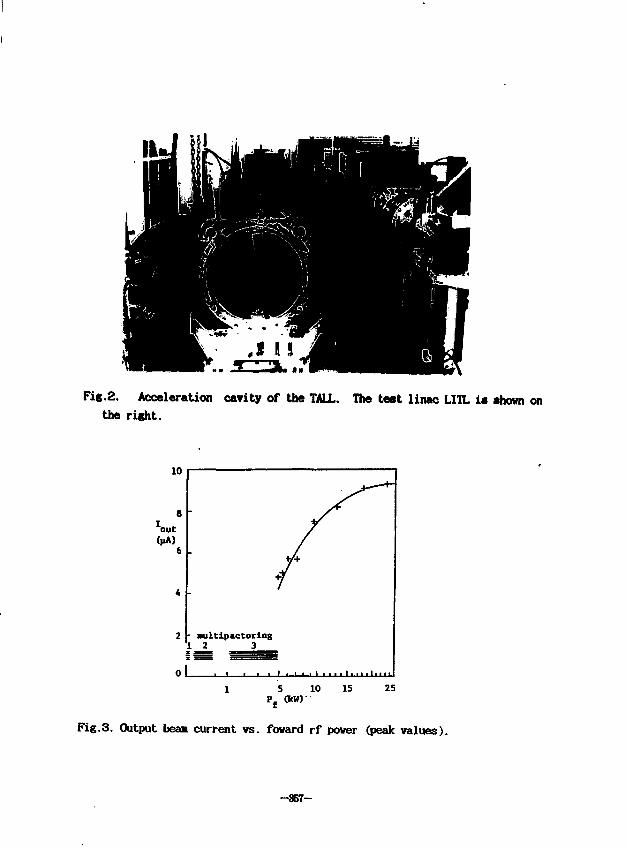
II
Fig.2. Acceleration cavity of the TALL. The test linac LITL is shown onthe right.
10 IS 25
Fig.3. Oitput bean current vs. foward rf power (peak values).
- 3 S 7 -

SPLIT COAXIAL HFQ LINAC FOR VERY HEAVY ION ACCELERATION
S. Arai, T. Fujino, T. Fukushima, E. Tojyo, N. Tokuda
Institute for Nuclear Study, University of Tokyo.
Tanashi-shi, Tokyo 188. Japan
T. Hattori
Tokyo Institute of Technology,
Ohokayama, Meguro-ku, Tokyo 152. Japan
Abstract
A split coaxial RPQ linac with Modulated vanes is under
development for very heavy ion acceleration. As a first step of the
development, a 1/4 scaled itodel with flat vanes has been
constructed. The easy assembling of vanes and the mechanical
stability of structure are achieved by employing a multi-module
cavity structure. This model is about 2 m in length, and 0.4 m in
diameter. The rf characteristics are investigated experimentally
and theoretically. The resonant frequency is calculated to be 37.7
MHz. which is about 1023 of the experimental value of 37.1 MHz.
Azinuthal balance and longitudinal flatness of the quadrupole field
are obtained with accuracy better than ±2.5% .
$ 1. Introduction
A low-/? very heavy ion accelerator is required to satisfy the
following conditions: structure is compact nevertheless operation
frequency is low such as 12.5 Miz, and strong focussing is
provided. Low operation frequency is due to the low velocity of
ions injected into accelerator, and the injection velocity is
limited by the available voltage of Cockcroft. On the other hand,
to keep constantly the level of limiting current due to space
charge, stronger focussing force is necessary as the velocity
-858-
- 1 -

becomes lower. Focussing force in the accelerator is generated by
Lorentz force, F=qE+qu*B . Since the force due to magnetic field
depends on the velocity, the electrostatic focussing is effective in
the case of low-/} accelerator. Therefore, RPQ linac is most
suitable for the low-/} very heavy ion accelerator. So far, some
kinds of RPQ linac for very heavy ions have been investigated or
developsd at GSI li2 , Frankfurt 3, Argonne 4 and so on.
The resonator structure of the RPQ linac is evaluated by
considering the following items: necessary electrode potential, good
mechanical stability, ease of manufacture, simple tuning, reasonable
dimension, good power efficiency and so on. As for the RPQ
electrode, rod-shaped electrodes held in rings, drift tube with
fingers and nodulated circular rods have been proposed and used from
the reason that Manufacturing cost is economical. On the other
hand, modulated vane has been proposed from the reason that the
accelerating and focussing fields are expressed exactly by a simple
formula 5 and electrode structure becomes simple. Though the
various combinations between resonant cavities and electrode
structures are considered, we have chosen a combination between the
split coaxial (S.C.) resonator and the Modulated vanes
finaly. However, in a respect of the electrode setting, it seems to
be difficult to apply the Modulated vanes to the S.C. resonator.
At INS, a Multi-module cavity structure 6 has been developed
based on the new idea to support the vanes by stems at several
points for improving the vane alignment and Mechanical
stability. As the first step, a 1/4 scaled model 7 installed with
flat vanes has been fabricated. In the present paper, the
experimental and theoretical results obtained so far are presented,
and a Model of uranium RPQ is introduced which is planned to
accelerate protons in near future.
S 2. Outline of a 1/4 scaled Model
A 1/4 scaled Multi-Module cavity structure is shown
-359-
- 2 -

schematically in Pig. 1. One Module divided by two stems
corresponds to one resonant cavity and the structure consists of
four modules in the present case. Horizontal and vertical vanes are
supported by two vertical and three horizontal stems every one
module periodically and alternately. Since each module is coupled
on rf by the vanes and steins with each other, the cavity is excited
in a x-mode, i.e., the phase of field changes every one module by
* . In this structure, diamond-shaped plats beams ( triangular plate
beams in both end modules ) are used to improve the voltage flatness
along the bean axis and to strengthen the support of vanes. Two
coupling rings are used in each module, to short opposite vanes
electrically and to determine a distance between the opposite vanes
precisely.
The resonant frequency of the structure is determined mainly by
the tank radius, the module length, the stem width, the mean width
and thickness of the diamond-shaped plate beams, and the capacitance
between vanes. The dimensional parameters of the structure are
summarized in Table 1.
The rf power is fed by the single loop coupler set at an end
module cavity. Input impedance of the structure is matched by
rotating the loop coupler to feeder line.
Table 1. Dimensional Parameters of a 1/4 Scaled Model
Number of modules
Length of one module
Inner radius of tank
Stem width
Stem thickness
Max. width of diamond-shaped beam
Min. width of diamond-shaped beam
Beam thickness
4
51.0
20.0
7.5
1.0
7.5
1.50.5
cmcmcmcm
cm
cmcm
-360-
- 3 -

§ 3. Experimental Results of rf Characteristics
Measured resonant frequency of the fundamental mode is 37.1
MHz. At the same time, the resonant frequencies of the first three
higher harmonics have been measured to be 75.09 MHz. 132.99 MHz and
185.36 MHz. In order to examine the effect of stem on the
inductance, the resonant frequencies have been measured in the cases
when each end space of the module cavity has been closed by the
semicircular plates, the results are shown in Fig. 2. After
matching the coupler to 500, unloaded Q value has been measured to
be 2000. The resonant resistance has been obtained by feeding the
rf voltage from a signal generator to adjacent electrodes directly
and by measuring the inter-vane voltage at feeding point and the
output voltage from coupler matched to 50 fl. The obtained value is
80 kfl/module. Measurement system of the resonant resistance is
explained in Fig. 3 schematically.
Azimuthal field balance have been measured by passing a
dielectric perturbator between the vane tips as shown in Fig. 4. The
results show that the azimuthal field unbalance is within ±2.5% and
vane positioning has been achieved within ±0.1 mm if the strength
of the electric field is determined only by the distance of vane
gap. Longitudinal field distributions of the fundamental and higher
order modes have been measured by passing a dielectric rod, 9.5 mm
in diameter and 5.5 mm in length, through the beam aperture. The
error of longitudinal flatness at the fundamental mode is less than
±2.0% as shown in Fig. 5.
§ 4. Comparison between Experiments and Estimations
In order to design the dimensions of a cavity structure, it is
important to estimate precisely the rf parameters of the cavity such
as resonant frequency, Q-value and power loss. The results of
estimation are compared with experimental results in Table 2. In
this table, results of a small model from aluminum are also compared
-361-
- 4 -

for checking the effectiveness of the calculation method. The
structure of small model is illustrated in Fig. 6.
Table 2. Comparison between Calculations and Experinents
* Capacitance of 1/4 scaled multi-module cavity structure
Calculation Experiment Unit
Capacitance 150 180 pF
* Measured C is used in the following calculation.
1. The case of 1/4 scaled multi-module cavity structure
1-1. When the module ends are closed by the semicircular plates.
Inductance
Resonant frequency
1-2. When the stems are
Calculation
159.5
41.5
Experiment
157.1
41.8
used and the nodule ends are open.
Calculation Experiment
Unit
nHMHz
Unit
Inductance
Resonant frequency
Resonant resistance
Unloaded Q
48.437.7
120
2650
49.837.1
80
2000
nHMHz
kn/module
-362-
- 5 -

2. The case of small S.C. cavity
Calculation Experiment Unit
Inductance 51.8 50.8 nH
Resonant frequency 74.0 74.8 MHz
3 5. A model of Uranium RPQ
Based on the remarkable achievements on the 1/4 scaled model
with flat vanes, a model of uranium RPQ has been designed to
accelerate proton beam. The purpose of construction of accelerating
model is to evaluate synthetically the performance of a vane type
S.C. RPQ which adoptes a multi-module cavity structure. In the vane
design, this model can accelerate the ions with charge to mass ratio
of 1/15 from 2 keV to 60 keV. In fact, proton acceleration is
enough to examine the problems on the beam dynamics.
Beam dynamics parameters and structure parameters are
summarized in Table 3 and in Table 4, respectively. As for vanes,
the copy of TALL vanes 8are used by the economical reason. TALL is
operated at 100 MHz. Therefore, the characteristics of the beam
dynamics has been investigated when the TALL vanes have been
operated at a frequency of 50 MHz. The problem interested in the
beam dynamics is how a half electrode potential on the beam axis
affects the transmmision efficiency and the divergence of output
beam.
-363-
- 6 -

Table 3. Vane Parameters of a Kodel of Uranium RFT) 'AMOUR'
Charge to mass ratio
Frequency (/)
Kinetic energy (T) 2
Normalized emittance (ts )
Kilpatrick factor
Intervane voltage (V)
Focusing strength (6)
Max. defocusing strength (Ab)
Synchronous phase (<pt )
Max. modulation Ovn )
Number of cells
Vane length
Mean bore radius (ro )
Min. bore radius (a»in )
Margin of bore radius (a,in /at.0.)
Transmission (0 emA)
(2e«A)
(4.-A)
Design
0.06667
50
.00 - 59.6
0.03
1.23
43.5
3.8
-0.075
-90 - -30
2.48
168
205.19
0.541
0.294
1.15
84
69
56
MHzkeV/u
x cm • mrad
kV
deg
cmenen
**
-364-
- 7 -

Table 4. Parameters of 'AMOUR' Cavity Structure
Frequency (/)
Number of Nodules
Length of one Module
Radius of cavity
Stem width
Stem thickness
Max. beam width
Min. bean width
Beam Thickness
Total inductance
Electrode capacitance
Rosonant resistance
Unloaded Q value
rf power (to accelerate protons )
rf power (to accelerate
ions with q/A=l/15 )
Design
50
4
51.0
20.0
14.0
1.0
14.0
2.8
0.9
27.7
369
34
3910
124
27.9
MHz
CM
enencacmCD
cmnHPFkfl
V
kV
The length of radial Batching section is required to be even
times a unit cell length. As shown in Fig. 7, variation of the
transmission has been calculated as a function of the nunber of unit
cell length by using PARMTBQ. The variation of transmission due to
space charge is shown in Fig. 8.
S 6. Conclusion
Frew the above achievenents in the experimental study, we
conclude that the multi-module cavity structure has good Mechanical
and electrical characteristics. An estimation method for the
-365-
- 8 -

structure design has been established in the explanation of the
experimental results of a 1/4 scaled model. In the beam simulation
for a model of uranium RPQ, it has been clarified that the vanes
designed at 100 MHz can be used as vanes operated at 50 MHz.
The authors express their sincere gratitude to Professor
Y. Hirao for his encouragement. The 1/4 scaled model is
manufactured at the machine shop of INS. The beam simulation and
structure design have been carried out with the computer PACOM M380
of the INS computer facility.
References
1. R. W. Mueller, GSI-Report 79-7. May 1979.
2. R. W. Mueller et al., Proc. 1984 Linear Ace. Conf., Seeheim,
Fed. Rep. of Germany, p. 77.
3. H. Klein et al., GSI-Report 82-8, 1982, p. 150.
4. A. Moretti et al., Proc. 1981 Linear Ace. Conf., Santa Fe, NM,
USA, p. 197.
5. K. R. Crandall et al., Proc. 1979 Linear Ace. Conf., Montauk,
N.Y., USA, p. 205.
6. S. Arai, GSI-Report 83-11, 1983.
7. S. Arai et al., IEEE Trans. Nucl. Sci., Vol.NS-32, No. 5,
October 1985, p. 3175.
8. N. Ueda et al., IEEE Trans. Nucl. Sci., Vol. NS-32, No. 5,
October 1985, p. 3178.
-366-
- 9 -

Jll!
Fig. 1.
»
42
4 1
40
39
38
37
• Expwimtnt
e Calculation
900
Number of Module EndClosed by Semicircular Plates
Fig. 2. Fig. 3.
Fig. 1. A 1/4 scaled four-Bodule cavity structure with flat vanes.
Fig. 2. Variation of the resonant frequency when the ends of •odule
cavity are closed by the semicircular plates.
Fig. 3. Schematic diagram of the measurement system of the resonant
resistance.
- 3 6 7 -
- 10 -

M t t m * dwif • • « • Aata(Unit • On* Mo*** Ltnttti)
Fig. 4.
275
280
1 2 3 4
Olstanc* along Btam Axis(Unit: On* ModuU Ltngth)
Fig. 5.
Unit iron
Fig. 6.
Fig. 4. Longitudinal field distributions Measured in the four gaps
between vanes.
Fig. 5. Longitudinal field distributions of the fundamental node
and higher modes with frequencies: ft =37.12 MHz,
/2 = 75.09 Hfe, /3 = 132.99 «fe and /4 = 185.36 MHz.
Fig. 6. A structure of snail »odel from aluminum.
- 11 -

100
100
5? "-"
so
• c « 1/15. i .1/7• c-1
1/70 1
0 10 20
Number of Calls of Radial Matcher
Fig. 7 .
« - • 0 0.1 0.2 OJ 0.4 0.3 0.6
Beom Current (mA)
Fig. 8 .
Fig. 7. The relation between the transmission efficiency and thelength of radial Hatching section.
Fig. 8. The variation of transmission due to space charge.
- 3 6 9 -
- 12 -