Research Online @ ECU
197
Edith Cowan University Edith Cowan University Research Online Research Online Theses: Doctorates and Masters Theses 1-1-2004 Discovering the factors impacting the evaluation of knowledge Discovering the factors impacting the evaluation of knowledge management in the organizational domain management in the organizational domain Jozef G. Loermans Edith Cowan University Follow this and additional works at: https://ro.ecu.edu.au/theses Part of the Business Commons Recommended Citation Recommended Citation Loermans, J. G. (2004). Discovering the factors impacting the evaluation of knowledge management in the organizational domain. https://ro.ecu.edu.au/theses/768 This Thesis is posted at Research Online. https://ro.ecu.edu.au/theses/768
-
Upload
khangminh22 -
Category
Documents
-
view
2 -
download
0
Transcript of Research Online @ ECU

Edith Cowan University Edith Cowan University
Research Online Research Online
Theses: Doctorates and Masters Theses
1-1-2004
Discovering the factors impacting the evaluation of knowledge Discovering the factors impacting the evaluation of knowledge
management in the organizational domain management in the organizational domain
Jozef G. Loermans Edith Cowan University
Follow this and additional works at: https://ro.ecu.edu.au/theses
Part of the Business Commons
Recommended Citation Recommended Citation Loermans, J. G. (2004). Discovering the factors impacting the evaluation of knowledge management in the organizational domain. https://ro.ecu.edu.au/theses/768
This Thesis is posted at Research Online. https://ro.ecu.edu.au/theses/768

Edith Cowan University
Copyright Warning
You may print or download ONE copy of this document for the purpose
of your own research or study.
The University does not authorize you to copy, communicate or
otherwise make available electronically to any other person any
copyright material contained on this site.
You are reminded of the following:
Copyright owners are entitled to take legal action against persons who infringe their copyright.
A reproduction of material that is protected by copyright may be a
copyright infringement. Where the reproduction of such material is
done without attribution of authorship, with false attribution of
authorship or the authorship is treated in a derogatory manner,
this may be a breach of the author’s moral rights contained in Part
IX of the Copyright Act 1968 (Cth).
Courts have the power to impose a wide range of civil and criminal
sanctions for infringement of copyright, infringement of moral
rights and other offences under the Copyright Act 1968 (Cth).
Higher penalties may apply, and higher damages may be awarded,
for offences and infringements involving the conversion of material
into digital or electronic form.

DBA Thesis EDITH COWAN UNIVERSITY
UBRARY
Discovering the Factors Impacting the Evaluation of Knowledge Management in the Organizational Domain
Prepared By
Jozef G Loermans
Student# 4101095
Edith Cowan University
Perth Western Australia
Faculty of Business and Public Management
Supervisor Associate Professor Dr Dieter Fink
March 2004

USE OF THESIS
The Use of Thesis statement is not included in this version of the thesis.

I certify that this thesis does not, to the best of my knowledge and belief
• Incorporate without acknowledgement any material previously submitted for a degree or diploma in any institution of higher education;
• Contain any material previously published or written by another person except where due reference is made in the text; or
• Contain any defamatory material.
Signed Date: d-1.i12ootf
Publications
Loermans J, 2002, Synergising the Leaming Organization and Knowledge Management, Journal of Knowledge Management, 6(3): 285-294.
Loermans J, 1999, Measuring the Effectiveness of Knowledge Management Initiatives: preliminary research challenges and issues, Proceedings of the 2nd Western Australian Workshop on Information Systems Research, Nov 27.
Dillon E, Loermans J, 2003, Telehealth in Western Australia: The challenge of evaluation. 3rd International Conference on Successes and Failures in Telehealth. August. Pp 38-45.
Acknowledgements
Associate Professor Dr Dieter Fink for his consistent and high level of patient support and professional guidance for the full four years of this study particularly during the early stages of changes in direction and occasional disillusionment.
My family Janet, Michael, Susan, Kevin, Melissa and Steven for their unwavering support, confidence and encouragement during some high pressure times in my career development and silent stoic acceptance of my long hours and short tempers.
Ms Veronique Preau General Manager of the Rio Tinto Knowledge Management Team for assisting in providing a pragmatic focus for this study and for convincing me that every answer inevitably leads to more questions.
John Doyle and Terry Lennard from the West Australian Health Department for encouragement and acceptance of my occasionally ineffective attempts to balance my work and academic endeavours.

Table of Contents
1. BACKGROUND/INTRODUCTION ................................................................ 1
1.1 Significance and Scope of Knowledge Management .................................................................... !
1.2 Viability of KM as a Research Topic ............................................................................................ 4
1.3 Significance of KM Evaluation ...................................................................................................... 5
1.4 Research Questions ....................................................................................................................... 10
1.5 Outcomes and Benefits ................................................................................................................. 10
1.6 Summary ....................................................................................................................................... 12
2. DEFINITIONS AND THEORETICAL CONTEXT ......................................... 13
2.1 The Need for Definitions .............................................................................................................. 13
2.2 Data ................................................................................................................................................ 14
2.3 Information ................................................................................................................................... 15
2.4 Knowledge ..................................................................................................................................... 17 2.4.1 The Data, Information and Knowledge Transition Perspective .............................................. 17 2.4.2 Epistemological and Ontological Views of Knowledge ......................................................... 19
2.5 Knowledge Management .............................................................................................................. 21
2.6 Intellectual Capital ....................................................................................................................... 24
2.7 Knowledge Management Initiatives ............................................................................................ 28
2.8 Evaluation and Measurement ...................................................................................................... 29
2.9 Other Related Topics .................................................................................................................... 30 2.9.1 Innovation .............................................................................................................................. .30 2.9.2 Organizational Learning Culture ............................................................................................ 31 2.9.3 Competence and Capability .................................................................................................... 32 2.9.4 Information and Knowledge Sharing ...................................................................................... 32 2.9.5 Quality .................................................................................................................................... 33 2.9.6 Organizational Memory .......................................................................................................... 33 2.9.7 Continuous Improvement. ....................................................................................................... 34 2.9.8 Collaboration and Communities of Practice .......................................................................... .34
2.10 Previous Research in KM Measurement .................................................................................... 34
2.11 Summary ....................................................................................................................................... 36
3. RESEARCH APPROACH ............................................................................ 37
3.1 Research Paradigm ....................................................................................................................... 37
3.2 Precedence and Rationale for Using Literature Reviews for IS Research ............................... 38
3.3 Research Focus, Scope and Boundaries ...................................................................................... 40
3.4 Data Source ................................................................................................................................... 41
ii

3.5 Selection Process ........................................................................................................................... 42
3.6 Data Analysis Methodology ......................................................................................................... 45 3.6.1 Content Analysis .................................................................................................................... .45 3.6.2 Tools ...................................................................................................................................... .45 3.6.3 Data Classification Process .................................................................................................... .46
3. 7 Research Process Flowchart ........................................................................................................ 47
3.8 Validity and Reliability ................................................................................................................ 49 3.8.1 Data Source ............................................................................................................................ .49 3.8.2 Research Software .................................................................................................................. 50 3.8.3 Validity vs Reliability ............................................................................................................. 50 3.8.4 Judgement ............................................................................................................................... 51
4. DAT A ANALYSIS ........................................................................................ 52
4.1 Meta-data Analysis ............................................................................................................ : .......... 52
4.2 KM Evaluation Models ................................................................................................................. 54 4.2.1 Categorisation ......................................................................................................................... 54 4.2.2 Ranking of Measurement Categories ...................................................................................... 55 4.2.3 Trends in Measurement Categories ......................................................................................... 55 4.2.4 Metrics Within KM Evaluation Categories ............................................................................. 58
4.3 Chronological Analysis ................................................................................................................. 59 4.3.1 1996 ........................................................................................................................................ 59 4.3.2 1997 ........................................................................................................................................ 67 4.3.3 1998 ........................................................................................................................................ 70 4.3.4 1999 ........................................................................................................................................ 76 4.3.5 2000 ......................................................................................................................................... 83 4.3.6 2001 ........................................................................................................................................ 91 4.3.7 2002 ........................................................................................................................................ 96 4.3.8 Chronological Summary by Measurement Category ............................................................ 100
4.4 Geographical Analysis ................................................................................................................ 103 4.4.1 Overview ............................................................................................................................... 103 4.4.2 North America (USA and Canada) ....................................................................................... 104 4.4.3 Scandinavia ........................................................................................................................... 107 4.4.4 Europe (other than UK and Ireland) ..................................................................................... 108 4.4.5 UK and Ireland ...................................................................................................................... 110 4.4.6 Japan ..................................................................................................................................... 112 4.4.7 Australia ................................................................................................................................ 114 4.4.8 Geographic Summary ........................................................................................................... 115
5. CONCLUSIONS, LIMITATIONS AND FURTHER RESEARCH ................ 118
5.1 KM Evaluation Conclusions ...................................................................................................... 118 5.1.1 Usefulness of this Study ........................................................................................................ 118 5.1.2 Evaluation Conclusions ........................................................................................................ 120 5.1.3 Evaluation Shortcomings and Barriers .................................................................................. 131 5.1.4 Future Evaluation Issues ....................................................................................................... 137 5.1.5 A KM Evaluation Framework ............................................................................................... 145
5.2 Study Limitations ........................................................................................................................ 147
5.3 Further Research ........................................................................................................................ 148
MAIN REFERENCE LIST ................................................................................... 150
APPENDIX A: LIST OF SOURCE DATA ARTICLES BY AUTHOR. .............. 159
APPENDIX B: NUMBER OF ARTICLES BY JOURNAL ................................ 170
iii

APPENDIX C: LIST OF DEVELOPED COUNTRIES ....................................... 173
APPENDIX D: ARTICLES BY COUNTRY OF ORIGIN ................................... 174
APPENDIX E: CATEGORISED KM MEASURES ........................................... 175
List of Figures: Figure 1: The Data, Information and Knowledge Continuum .................................................................... 18 Figure 2: Relationship Between Data, Information and Knowledge .......................................................... 18 Figure 3: Epistemological vs Ontological Perspectives .............................................................................. 20 Figure 4: Components of IC and KM in relation to total Market Value ..................................................... 28 Figure 5: Research Focus ........................................................................................................................... .40 Figure 6: Research Methodology Flowchart .............................................................................................. .48 Figure 7: Ranking of KM/IC Measurement Categories .............................................................................. 55 Figure 8: Trends in Major Measurement Categories .................................................................................. 57 Figure 9: A Suggested KM Evaluation Framework .................................................................................. 146
List of Tables: Table 1: Examples of Knowledge Organizations ........................................................................................ .3 Table 2: KM vs IM Projects ....................................................................................................................... 23 Table 3: KM Related Concepts ................................................................................................................... 30 Table 4: Selected Documents .................................................................................................................... .43 Table 5: Articles by Year of Publication .................................................................................................... 44 Table 6: Measurement themes ................................................................................................................... .46 Table 7: Articles within Journal Category .................................................................................................. 53 Table 8: KM Evaluation Categories ........................................................................................................... 54 Table 9: Trends in measurement categories ................................................................................................ 56 Table 10: Summary of Chronological KM Evaluation Factors ................................................................ 102 Table 11: Summary of Geographic Evaluation Factors ............................................................................ 117 Table 12: Shortcomings and Barriers to KM Evaluation .......................................................................... 131 Table 13: Future Evaluation Issues ........................................................................................................... 138
iv

Abstract
The knowledge, skills and experience possessed by employees, customers, suppliers and other stakeholders are major components of an organization's Intellectual Capital, the effective management of which has been found to be critical for business success. In order to manage knowledge at an organizational level however, it is necessary to be able to define it in the context of the organization, measure its existence and, more importantly, assess how its creation, use, dissemination, evaluation and management impacts business performance and learning.
Whilst the term "Knowledge Management" has evolved since the early nineties into a generally recognisable management discipline in its own right, significant literature over the past eight years has focussed on the management of knowledge as a more generic organizational competence making Knowledge Management Initiatives difficult to identify and define and even more difficult to evaluate. Despite the challenges, the subjects of knowledge management and intellectual capital are gaining strategic management exposure particularly in relation to how investment in, and outputs from, these initiatives can or should be evaluated.
Knowledge management and intellectual capital are inextricably related, and whilst some previous research has gone into evaluating knowledge as an extension or derivative of information and into intellectual capital as a discrete item on the balance sheet, little has been done to analyse the development of models that attempt to evaluate the impact of knowledge management as an organizational process or capability.
A comprehensive meta-analysis by literature review of international articles dealing with knowledge management and intellectual capital evaluation from a broad range of business and scientific journals was undertaken to identify precisely what has been measured by public and private sector organizations within the Knowledge Management, Intellectual Capital and other closely related domains between the years 1996 to 2002.
By the end of 2002, human capital based measures were found to be the most frequently quoted in KM literature. Financial, human capital, internal infrastructure and composite measures such as the Balanced Scorecard have grown in varying degrees in frequency of use, whilst customer, process, intellectual property, innovation and quality related measures have gradually lost ground compared to other metrics between 1996 and 2002.
Significant differences occur in the evaluation and reporting of KM initiatives amongst the main geographic regions of North America, Europe, Scandinavia and Japan, but these differences seem to be more related to public policy differences and to management style than to a result of any definitive or deliberate differences in formal evaluation plans and methodologies.
Generally, KM evaluation between 1996 and 2002 has focused on explicit (rather than tacit), internal (rather than external) and outcome (rather than process) oriented measurement processes.
Inadequate accounting systems, lack of measurement and reporting standards, lack of long-term vision and poor understanding of the contribution of knowledge to competitive advantage have been and remain major constraints to the future development of KM.
V

1. Background/Introduction
This chapter provides the background to, and examines the concept and significance of
Knowledge Management, its viability as a research topic and the importance of, and the
driving factors behind the need for its evaluation. The research focus is on the
evaluation of Knowledge Management in conjunction with other disciplines that have
been closely associated with it. The chapter concludes with the specific research
questions that will be addressed in this study followed by the anticipated benefits and
outcomes of this study.
The Chapter structure is depicted as follows:
Background /Introduction
I I I I Significance Validity of Significance Research Outcomes & Scope of KM as a of KM Questions &
KM Research Evaluation Benefits Topic
1.1 Significance and Scope of Knowledge Management
Knowledge has been the subject of philosophical and epistemological debate since
ancient Greek times and its management is far from a new concept. What is new is that
organizational and managerial practices have become more knowledge focussed in
recent times. This change in focus appears to have been driven by an ever-increasing
demand for organizations to adapt more quickly to the rapidly changing market-place
and global economy. In this context, knowledge has emerged within a relatively short
time-span of the past ten years, as one of the major means of attaining sustainable
competitive advantage and a primary source of wealth creation at the organizational and
national levels (Drucker 1998; Davenport & Prusak 1998; Stewart 1998; Bassi 1999;
Guthrie 2002).
Interest in the concept of knowledge management (KM) is growing (Blumentritt &
Johnston 1999; Olson 1999; Swan, Scarborough, & Preston 1999; Guthrie 2002). A
particularly significant surge of interest in KM occurred in 1998 with more references to
it in management literature in the first six months of 1998 than appeared in the previous
five years (Swan et al. 1999). As well as, or perhaps because of, its growing interest

and status, KM is also increasing in scope (Duffy 2002), to the extent that it appears to
be merging with or even subsuming the management of other related concepts such as
Organizational Learning (Swan et al. 1999) and the management of Intellectual Capital
(Birkinshaw 2001). Organizational Learning (OL) and Intellectual Capital (IC) will
feature strongly in the scope of this study as concepts that have had an impact on the
growth of KM and have been associated with KM principles in one way or another1•
Whilst OL as a management issue appears to be losing momentum to some extent in
favour of KM (Swan et al. 1999), IC is strongly implicated in recent economic,
managerial, technological and sociological developments in a manner previously
unknown and largely unforeseen (Guthrie 2002).
The management of knowledge as a major component of IC, has been found to be
important and applicable for all organizations, regardless of size, type or location, not
just those that have become known as "knowledge organizations" (Sullivan 1999). As
Allee (1997: p7) explains,
"every industry is a knowledge industry, everyone is in the information
business and almost everyone is now a knowledge worker".
This adds weight to the position taken in this research project that the understanding of
the management and evaluation of knowledge in particular, and IC in general, is crucial
for the success of all organizations including governments, non-profit organizations and
commercial businesses.
Commonly quoted examples of knowledge oriented ( or "learning") organizations that
have become international KM benchmarks are shown in the following table:
~w ·• i ••• ,. r·· ·•Counu. ":source· . p,h:
British Petroleum UK Davenport & Prusak, 1998 Buckman Laboratories USA Davenport & Prusak, 1998 Canon Japan Nonaka & Takeuchi, 1995 Chaparral Steel USA Davenport & Prusak, 1998 Canadian Imperial Bank of Commerce Canada Edvinsson & Malone, 1997 (CIBC) CSIRO Australia Davenport & Prusak, 1998 Dow Chemical USA Davenport & Prusak, 1998 Electricite de France France Allee, 1997 Eli Lilly & Co USA Perez & Hynes, 1999 Ernst& Young USA Davenport & Prusak, 1998 Finnair Finland CIO Magazine, 1999
,., ,''-
1 The connections between Organizational Learning, Intellectual Capital and Knowledge Management are established in section 2.9.
2

Hewlett Packard USA Davenport & Prusak, 1998 Hoffman-LaRoche Switzerland Davenport & Prusak, 1998 Honda Japan Garvin 1998 IBM USA Davenport & Prusak, 1998 Matsushita Japan Nonaka & Takeuchi, 1995 McKinsevs USA Davenport & Prusak, 1998 NEC Japan Davenport & Prusak, 1998 Oticon Denmark McKinsev, 1998 Royal Dutch Shell Netherlands Bahrami, 1995 Skandia Sweden Edvinsson & Malone, 1997 The World Bank USA Liebowitz & Wright, 1999 Xerox USA Davenport & Prusak, 1998
Table 1: Examples of Knowledge Organizations
The above-mentioned list of organizations is far from complete but indicates the range
of organizations that have started to look at knowledge as a serious resource and also
shows the range of countries that the individual organizations represent. The above
"knowledge oriented" organizations range from banks, oil companies, consulting firms,
manufacturing companies, research companies and service providers indicating that KM
as a concept is not unique to any industry, organization type or country.
From a geographic perspective, the USA, Scandinavia and Japan are well represented in
KM/IC literature with the UK and other European countries such as the Netherlands and
France also receiving some mention. Australia is not well represented with the CSIRO
being the only example encountered in a preliminary literature review.
It has been claimed that 90 percent of large private sector enterprises and 40 percent of
federal public sector organizations in the US have at least one KM initiative in progress
(Caldwell 2000). This does not necessarily mean that the US manages knowledge better
than any other nation. Nonaka and Takeuchi (1995) go to some lengths to explain the
differences between the Japanese and American approaches to KM with the
management of knowledge purportedly being a lower profile in Japan largely because it
has always been an obvious and normal part of conducting their business and far from a
new management concept. Different approaches to KM by different nations are
explored further in section 4.4.
Knowledge creation, as a critical component of KM has been discussed at both
organizational and national levels. It is widely accepted that firms which consciously
invest in the creation of new knowledge through research and development activities or
through more informal learning processes, tend to do better than those that ride on the
coat-tails of knowledge created by others (Boisot 1998). In the same vein, the effective
3

generation and application of knowledge at the national level is being seen as a crucial
basis of economic competitiveness and an essential element of effective operation of a
modern economy and society (Johnston 1998). Furthermore, national economic
competitiveness, together with it~ ability to meet social and cultural objectives, rests on
the strength of the national knowledge infrastructure and the strength of the connections
between its various components (Johnston 1998). The generation and application of
relevant knowledge therefore needs to be recognized as a central economic activity and
not just an organizational improvement initiative.
Despite the growing acceptance of corporate knowledge as the most important factor of
production for the 21st century, few organizations have mastered the principles of
evaluating their KM initiatives and the relevant metrics involved. From a poll of eighty
large organizations for example, Stewart (1998) established that whilst 80 percent of
managers believed that managing organizational knowledge should be an important part
of business, only 15 percent believed that they did it well, with one of their main
admissions of weakness being their perceived lack of ability to measure the
effectiveness of their knowledge based initiatives.
There are many related concepts that need to be understood and considered before any
benefits can be realized from investments in knowledge related initiatives. These
concepts are discussed in the Theoretical Context Overview in Chapter 2. Having
established the relevance and importance of KM to organizational success, the next
section looks at the viability of KM as a subject for a research thesis.
1.2 Viability of KM as a Research Topic
The management of knowledge at the organizational level has been regarded by some
authors as a flawed concept (Draper, 1999; Kidman, 1999). Prusak, (1999) also
acknowledges that "knowledge management" is a misnomer in the sense that we cannot
really manage knowledge any more than we can manage the forces of nature, but he
accepts the term as a de facto label for this nascent field of organizational endeavour.
Whilst the term is not immediately nor widely understood in management or
information systems parlance, KM has become an acceptable and mature concept in its
own right (Kidman 1999) and an important management discipline and business process
(Caldwell and Harris 2002). The Gartner Group, furthermore, believes that KM will
emerge from its "Trough of Disillusionment" in 2002 and be acknowledged as a
required business process for most enterprises (Caldwell and Harris 2002).
4

Schultze ( 1999) adds that the management of knowledge is an important research topic
in a number of academic disciplines, including management, strategy and information
systems. Teece (1998) agrees that KM requires considerable scholarly enquiry and
adds (p289) the warning that:
"there is a real danger that KM will become discredited if it proceeds in ignorance of extant literatures thereby creating unnecessary intellectual clutter and confusion".
Teece further adds that the economics and evaluation systems for knowledge need to be
better understood and that empirical evidence of the value of KM is urgently needed.
The need for research into KM evaluation and measurement models is supported by
Lalor & Okkerse, (1998: p6), who believe that:
"The results of KM must be measured and recorded. The results may be evaluated as things like improved client service and satisfaction or shorter time to market with new products and services. Evaluation will help monitor the value of, and justify the investment in, KM initiatives".
Whilst acknowledging the challenges presented by the "fuzziness" of this topic, the
above issues provide justification for empirical research into what organizations
internationally have done in relation to assessing the viability of their knowledge
oriented activities and KM initiatives.
It is now necessary to look more closely at why the evaluation and measurement of
knowledge related initiatives is so important.
1.3 Significance of KM Evaluation
Being elusive and not easily defined, knowledge is very difficult to measure and indeed
becomes increasingly more difficult to measure as we consider the transition of
knowledge between the progressively more complex levels of the individual, team,
department, organization, industry and nation. This leads to multiple dimensions of
knowledge that demand different evaluation models2 depending on the nature of the
entity, the context of the knowledge being applied within it and with its external
stakeholders and the level at which the evaluation is being conducted.
2 Evaluation models are assumed to include relevant approaches, frameworks, methodologies, systems, procedures and practices involved in the evaluation process.
5

Dawson (2000) maintains that the value of knowledge is entirely dependent on the
context in which it is made available. For knowledge to be valuable to an organization,
the organization must be in a position to act on it, and the profitability of the resulting
action will then provide an indication of its value (Dawson 2000). The process of KM
evaluation therefore needs to encompass far more than just an attempt to measure
knowledge as an asset, it also needs to measure the propensity and capacity to act on the
knowledge acquired or generated and the ability of an organization or nation to develop
a knowledge creating culture.
The growing importance of knowledge to business success has been accompanied by
the need to place a value on the anticipated benefits to be derived from investment in
KM relayed initiatives. Claims of significant business benefits resulting from such
investments include:
Andersen Consulting who claimed that their firm saved millions a year in FedEx bills alone by using Intranet and other knowledge sharing tools (Stewart 1995).
Olson ( 1999), who reported that:
• Texas Instruments avoided spending $500M on a new silicon fabrication facility by leveraging internal knowledge of best practice in its existing plants;
• Booz Allen & Hamilton claimed savings of $21.3M over three years by using KM to better deploy its professional services staff;
• Skandia Insurance was able to set up its office in Mexico in six months using previously acquired and documented knowledge whereas previously it had expected this task to take seven years.
These and other claimed success stories only provide possible indicators, as opposed to
sound evidence, that implementation of a KM philosophy can result in significant
benefits to the organization. No evidence was provided in these cases to show precisely
how or to what extent the claimed successes in cost and time savings resulted directly
from KM investments, rather than from some other business or environmental factors.
Swanborg and Myers (1997) believe that whilst KM has become a major business trend,
the efforts and claimed successes of early adopters have been both distorted and made
so generic that the relationship between KM initiatives and the benefits purported to
result from them are little more than assumptions. This adds weight to the need for this
type of research to provide an understanding of the nature and extent of this
relationship.
6

Developing this relationship requires an understanding of the knowledge creation
process. Since the process of creating knowledge is dynamic in nature, it makes more
sense to think in terms of developing capabilities in these areas rather than attempting to
manage knowledge per se (Dawson 2000). Dawson also recognizes the need to
consider the individual and organizational perspectives in developing knowledge
creation and management capabilities. Attempting to value knowledge as an object or
physical asset, which appears to have been the predominant evaluation approach to date,
is a narrow view that does not embrace the full potential of the KM concept. Without
considering the effects on the knowledge accumulated in the heads of employees,
suppliers, customers and other organizational stakeholders, all other performance
indicators remain incomplete and inadequate for judging the capabilities of an
organization (Strassmann 1996).
Improvement in the amount and value of IC is seen as an identifiable benefit resulting
from the KM process. Models for the evaluation of IC are emerging (Edvinsson &
Malone 1997; Sveiby 1997; Stewart 1998; Liebowitz & Wright 1999), but do not
appear to have been formalised in Accounting standards and appear to be a long way
from becoming generally accepted business practice. Many of these models attempt to
quantify the value of knowledge as an intellectual asset but generally do not identify the
full range of organizational benefits that may result from the effective creation, use,
dissemination, sharing and management of corporate knowledge. While the appraisal
of knowledge assets is an important component of evaluating the effectiveness of KM
initiatives, it is only part of the total KM evaluation process and many other issues need
to be addressed to provide a comprehensive understanding of the evolving nature and
characteristics of models that attempt to evaluate the success of these initiatives.
(Nonaka 1991) p98 provided the following perspective on measurement of KM:
"In most companies the ultimate test for measuring the value of new knowledge is economic - increased efficiency, lower costs, improved ROI etc. But in the knowledge creating company, other more qualitative factors are equally important. Does the idea embody the company's vision? Is it an expression of top management's aspirations and strategic goals? Does it have the potential to build the company's organizational knowledge network?"
As some of the benefits of KM can only be measured in qualitative terms, this study
will take a broad perspective in the investigation of both the quantitative and qualitative
factors involved in the evaluation of KM.
Sullivan (1999) maintains that only 2-3 dozen firms in the world are systematically
extracting value from their corporate knowledge. Despite the steady growth in interest
7

in the subject of KM, the lack of hard data to support its worth is believed to be
restricting its further development (Hilderbrand 1999; Nasseri 1996). Furthermore, the
success rate for KM projects, on the basis of achieving their original objectives, appears
over recent years, to be fairly poor, with only half of the companies with a KM initiative
achieving their stated objectives (KPMG 1998). This is a poor indictment on the ability
of organizations to effectively manage knowledge oriented initiatives. It is suggested
that the lack of understanding of the organizational factors affecting the evaluation of
KM initiatives may be contributing to the poor success rate of KM oriented projects.
Many organizations (even large organizations in developed nations) are still reluctant to
embrace the concepts of KM and its evaluation in any form. Apart from the lack of
legal mandate for organizations to report on intangible assets, the reasons appear to be a
combination of it being too difficult (Wallman 1999), and too subjective (Gold et al.
2001). According to Abramson (1998), the young field of KM lacks the sophisticated
tools to evaluate such an "esoteric endeavour" and the impossibility of evaluating KM
has been suggested by some as being "conventional wisdom". Another possible reason
for the limited credibility of KM evaluation models is that many of these models
attempt to measure the wrong things (Guptara 1999) and may therefore send the wrong
message to internal and external stakeholders. KM demands a rigorous regime of
measuring the right volume of the right things otherwise the evaluation system becomes
unmanageable and the results meaningless or unintelligible by those who need to take
action from them.
Despite the problems of execution and methodology, there seems to be general
agreement that measuring the return on investment from knowledge initiatives is highly
desirable as subjective measures used to-date have been described as inadequate
(Abramson 1998). Hilderbrand (1999), uses Teltech Resource Network Corporation as
an example of an organization that has developed a methodology that appears to defy
the "conventional wisdom" that the impact of knowledge based initiatives on
organizations cannot be measured. Other organizations such as Skandia, the World
Bank (Blumentritt and Johnston 1999), Dow Chemical (IFAC 1998) and Eli Lilly
(Perez and Hynes 1999) have also developed workable models which, at the very least,
suggests that this exercise is not impossible. However, many models developed to date
appear to be less than comprehensive and poorly focussed. Edvinsson & Malone (1997:
p124) for example, quote the OECD in their claim that:
"for all the importance of the knowledge and skills of all workers as factors in performance, the means for measuring them are remarkably crude".
8

And on a national perspective, Edvinsson & Malone warn (p8) that:
"an economy that cannot properly measure its value, cannot accurately distribute its resources nor reward its citizens".
Managing and measuring the intellectual component of an entire economy is becoming
increasingly critical in the public sector as government authorities are being subjected to
increasing public scrutiny and pressure to achieve equitable resource distribution.
Accepting the axiom that it is difficult to manage what cannot be measured, evaluation
models are necessary to ensure that the knowledge infrastructure, both nationally and
organizationally, can be and is, effectively managed.
Whilst KM has its roots in a number of information technology related disciplines such
as Information Systems and Information Management (Swan et al. 1999), the
Accounting profession is also an interested stakeholder in the concept by virtue of its
concern with measuring and reporting IC. The International Federation of Accountants
reports that top executives of Canadian Financial Post 300 firms and US Fortune 500
firms view knowledge resources as critical for their success (IF AC 1998). Much of this
interest by the Accounting profession in non-financial measures stems from the inability
of current accounting systems to cope with the variety and complexity of new key
performance indicators needed for business survival in an increasingly competitive
global market place (Fisher 1992) driven by information and knowledge rather than the
more traditional factors of production of land, labour and money.
Because of the importance of corporate values and philosophy in the management
processes of many successful companies, the emphasis on the tangible, explicit aspects
of knowledge3 that characterize most knowledge management projects is unlikely to
provide much value and may be at worst, a diversion from where and how companies
should be focusing their attentions (Pfeffer and Sutton 1999). It is necessary to
understand why knowledge is being collected and why it is of value, otherwise it soon
becomes dormant and not likely to contribute to organizational wealth.
By understanding the factors for evaluating the impact of KM, organizations will be in a
better position to make informed decisions about what to measure and how to conduct
such evaluations. This process of evaluation facilitates a deeper understanding of the
interaction between the technology and the underlying organizational processes within a
particular organizational context and facilitates a dialectic process which will generate
3 See definitions Section 2.4.
9

motivation, commitment and knowledge (Serafeimidis and Smithson 1997). This
provides the essence of this research study.
The next section defines the research questions that provide the focus for this thesis.
1.4 Research Questions
The main research questions to be dealt with by this study are:
• What are organizations measuring when evaluating knowledge management and its related initiatives?
• What are the factors impacting what is being measured under the label of KM evaluation?
These questions seek to develop an understanding of precisely what organizations are
measuring within the context of KM evaluation and what impacts the KM measurement
models used by organizations. By using sophisticated computer based qualitative data
analysis tools to examine the contents of selected papers from quality business and
scientific journals that deal (exclusively or otherwise) with KM and closely related
concepts over the past decade, significant insights were also gained into the following
questions:
• What trends have emerged in the development of KM evaluation?
• To what extent are the practices of KM evaluation different between the major international regions of North America, Europe, UK, Scandinavia, Japan and Australia?
• What are the factors inhibiting the development and acceptance of KM evaluation?
• What are the lessons to be learnt from the adopters of KM evaluation between 1996 and 2002?
The next section looks at the potential outcomes and benefits that will ensue from the
analysis of the research questions outlined above.
1.5 Outcomes and Benefits
The specific outcomes expected from this research project include:
• The generation of an understanding of the KM and IC evaluation models and
processes that has developed since the early nineties. In each organization covered
in the literature, precisely what has been measured will be analysed and discussed.
IO

• Categorisation of the main types of measures that have been used and an indication
of relative frequencies of use of the various measurement models used by
organizations over the history of KM between 1996 and 2002. This historical
perspective will provide an indication of whether evaluation models are converging
or diverging in terms of evaluation methods and will provide a springboard for
further research projects.
• A comparison of evaluation methods used by organizations in different geographic
regions identifying the different approaches used by different countries which in
tum are expected to offer some explanations as to why different styles and
approaches to KM measurement have evolved in different regions.
• On the basis of the results achieved from data analysis, shortcomings in previous
KM evaluation models will be identified and strategies for moving forward will be
offered.
• A high level framework for KM evaluation will be developed to provide a platform
for the future development of KM evaluation.
As pointed out by Malone (1999), there are significant social, as well as organizational
benefits to be gained from this type of study. If better information on intellectual assets
can be presented, capital and resources will be better allocated in the economy,
representing a significant social benefit. Better information to investors reduces risk
and thus reduces the cost of capital which is another clear social benefit (Wallman
1999). At the organizational level, understanding the evaluation of KM and IC will
make companies more efficient and competitive and ultimately more valuable (Malone
1999). Malone (1999:p42), recognizing the connection between KM and IC4, also
claims that:
"IC is not confined to business, it is likely to be the first universal evaluation tool for all human institutions through which we will be able to construct a more valuable society and is our best hope for continued prosperity; learning how to evaluate it is the only path to getting there".
This research project will provide a significant step in this learning process.
4 Discussed further in 2.6.
11

Results from this research will provide KM practitioners, consultants and academics
insights into KM evaluation which in turn will lead to a better understanding of the
context within which KM evaluation should be used to enhance organizational learning
and performance. The generation of a means of classification of KM evaluation models
as a by-product of this study will also help public and private organizations in deciding
which models are applicable to their particular circumstances and their individual
approaches to knowledge and KM. The results of this research could also be
instrumental in improving the success rate of KM initiatives.
1.6 Summary
The management of organizational knowledge has developed since the early nineties
into a critical organizational improvement activity. Proving the organizational value of
KM has become one of the major issues and challenges for management in the
implementation of a KM philosophy.
The KM concept has gained significant acceptance since the early nineties but its
further development is being hampered by a poor understanding of KM as a
management process and the evaluation models associated with it. Complicating the
KM evaluation process are the relationships between KM and other activities such as
the management of Intellectual Capital (IC) and the Organizational Learning (OL)
process.
This study responds to the demand for more research into the evaluation of knowledge
in the organizational context by examining the relevant literature on KM and associated
organizational improvement activities over the entire history of KM. Research
questions focus on the evaluation models and methods that organizations have used
over the short history of KM to assess the value of knowledge itself and projects under a
variety of titles that have purported to manage organizational knowledge in whatever
form. Benefits will result from the study in regard to the development of such models
and the distillation of meta-data into a generic framework for the development of KM
evaluation models.
The following chapter defines the necessary terms that have been associated with KM
and explains the meanings and relationships between the major concepts.
12

2. Definitions and Theoretical Context
This chapter clarifies the terms used throughout this thesis and explains the components
and principles of KM, IC and other related disciplines. The need for definitions is
discussed prior to developing the continuum from data through information and various
perspectives of knowledge. The concepts of KM and IC are then explained and how
they interrelate. Other topics connected in a variety of ways with KM and IC are then
briefly introduced and their relationships to KM and IC explained.
The Chapter structure is as follows:
Need for Definitions
Information
Knowledge Management
Knowledge Management
Initiatives
Definitions & Theoretical
Context
Previous Research In KM
Evaluation
Knowledge Intellectual Capital
2.1 The Need for Definitions
Evaluation & Measurement
Other Related Topics
Prior to the emergence of knowledge as something separate and distinct from data and
information, it was commonly accepted that information was derived from data and that
information is generally more valuable and useful than data in managerial decision
making. It was not until interest started to be taken in knowledge as something
conceptually different to data and information that the distinction between the three
terms started to become confused, resulting in increasing demands for clarification.
Allee (1997) suggests that the need to sort out what is useful and relevant has caused
people to grapple with the definitions of information and knowledge and the
13

relationship between them. Davenport ( 1997: p9) whilst not making any distinction
between the three terms himself, concedes that:
"defining these terms can show where a company has focused its IT energy, where the data it generates has a real use, whether the assumptions for structuring information make sense and if any of it has paid off'.
This is an indication that KM in its early stages of development was closely aligned
with IT which in itself may have contributed to some of the confusion. Consulting
firms and software vendors for example, have incorrectly used the terms data,
information and knowledge to describe the nature of their products and to gain financial
advantage from the emerging interest in the KM concept. Davenport ( 1997) asserts
that misuse or non-use of information, wasted investment and poor use of information
technology has resulted from a lack of understanding of the basics of data, information
and knowledge. This was later backed up by Davenport and Prusak (1998: pl) with the
claim that:
"we can understand knowledge best when we have a good understanding of data and information. Understanding what these things are and how to get from one to another is essential to doing knowledge work successfully".
A clear understanding of these terms is therefore necessary in order for a meaningful
analysis of KM evaluation to be conducted.
2.2 Data
Davenport ( 1997: p9) defines data as "observations of states of the world". Examples
could be the number of items of stock in a warehouse, temperatures, pressures and
dollar values of transactions. Davenport and Prusak (1998: p2), define data a little more
specifically as "a set of discrete, objective facts about events".
Data is easy to capture, communicate and store, can be managed efficiently and
effectively by technology, does not require analysis, exists in its own quantifiable form
and generally does not require any interpretation to understand it. Brabb (1976: p6)
makes the connection between data and information in his claim that:
"data are raw facts, that may or may not be information since they are the raw material from which information is created".
Davenport (1997: p9) makes another important observation about data by stating that
"People tum data into information". This doesn't define data but connects people to
data and information. The human element in data and information is particularly
14

important to the subject of knowledge as it suggests that the transition from data to
information is initiated and managed by people not machines. Data is normally
regarded as just words and numbers but it is important to appreciate that sounds (voice
recordings) and images (videotapes, photographs) etc are also important forms of data.
Allee ( 1997: p 110) takes this even further with the view that; "we gather data with all
our senses, nose, ears, eyes, taste and touch". The processing of data, once it has been
codified, is largely routine, repetitive and mechanical, requiring highly predictable
courses of action depending on well established conditions. This makes data processing
highly adaptable to computerisation, but the actual conversion of data into information
requires human intervention.
Few organizations analyse or understand their data gathering processes. This raises the
important question - if organizations cannot even manage their own data effectively,
how can they expect to manage their knowledge? Whilst efficient and effective data
management is important for all organizations, it is generally a back-office activity and
has little to do with decision making, productivity or organizational growth. Thus,
although an understanding of the nature of data in relation to information and
knowledge is important, evaluation of data is not relevant for the purposes of this study.
2.3 Information
In the last 20 years or so, the definition of information has not changed significantly as
evidenced by the following:
"information is communicated knowledge expressed in a form that makes it immediately useful for decision making" (Brabb 1976: p6).
"data that has been organized or prepared in a form that is suitable for decision making" (McFadden and Hoffer 1988: p4).
"information refers to a body of facts in a format suitable for decision making or in a context that defines relationships between pieces of data" (Zikmund 1997: p131).
All three definitions above make the connection between information and decision
making and it is interesting to note that the definition from Brabb in 1976 included a
reference to "knowledge" as a special type of information. The more common view of a
transition or continuum from data to information then to knowledge is used for this
study and is explained further in 2.4.1.
A commonly quoted definition of information by Drucker (1998:p5) is that
"Information is data endowed with relevance and purpose". Davenport and Prusak
15

( 1998) liken information to a "message" which can be in the form of a document or
some other form of visible or audible communication. In regard to information, it is
generally implied that it is explicit and documented in a form that can be read or
analysed by humans. Data and information are often interchanged and incorrectly used
terms, and in many cases, the subjects of Information Management and Management
Information Systems refer to data not information (see further discussion in 2.5).
Davenport (1997: p9), advises that: "unlike data, information requires some unit of
analysis". As previously stated, only people not computers convert data into
information because this requires an appreciation of the context of the data and
information and why the conversion is necessary. When humans however have made
the conversion, Information Technology can take over again to manage, communicate,
store and disseminate this new information in the same way that it processes data. From
a computer's perspective, data is no different to information. It is the human
interpretation that makes words, numbers, images, sounds etc data or information.
The distinction between data and information is however not quite as clear as may have
been suggested up to this point. McFadden and Hoffer (1988: p31), for example
maintain that:
"the distinction between data and information is often difficult to maintain. Data becomes information when used in the context of making a specific decision or when applied to the solution of a particular problem".
McFadden and Hoffer (1988) thus believe that the definition depends on how the data
( or information) is used rather than on their inherent properties. In other words, data can
be data or information depending on how and where it is used. This may have led to the
overuse of the interchangeability of the two terms to a large extent. Stewart (1998: p69)
takes this one step further by suggesting that "one man's knowledge is another man's
data". Context is thus important in the definitions of data, information and knowledge.
The distinction between data, information and knowledge becomes particularly
important when it becomes necessary to assess the respective contributions of these
"assets" to organizations and when it is necessary to design systems that deal with their
relative differences in complexity. There is still much confusion about the distinction
between high level information and explicit knowledge. This is explained more fully in
2.4.1.
16
It is generally accepted that information is more valuable than data and that it can be
bought and sold like a commodity. Allee (1997: p7) makes an important observation in
relation to the valuation of information by claiming that: "a remarkable phenomenon of
the knowledge economy is that information has emerged as a product in its own right".
However, as with data, it is the valuation of knowledge not information that is of
interest in this study.
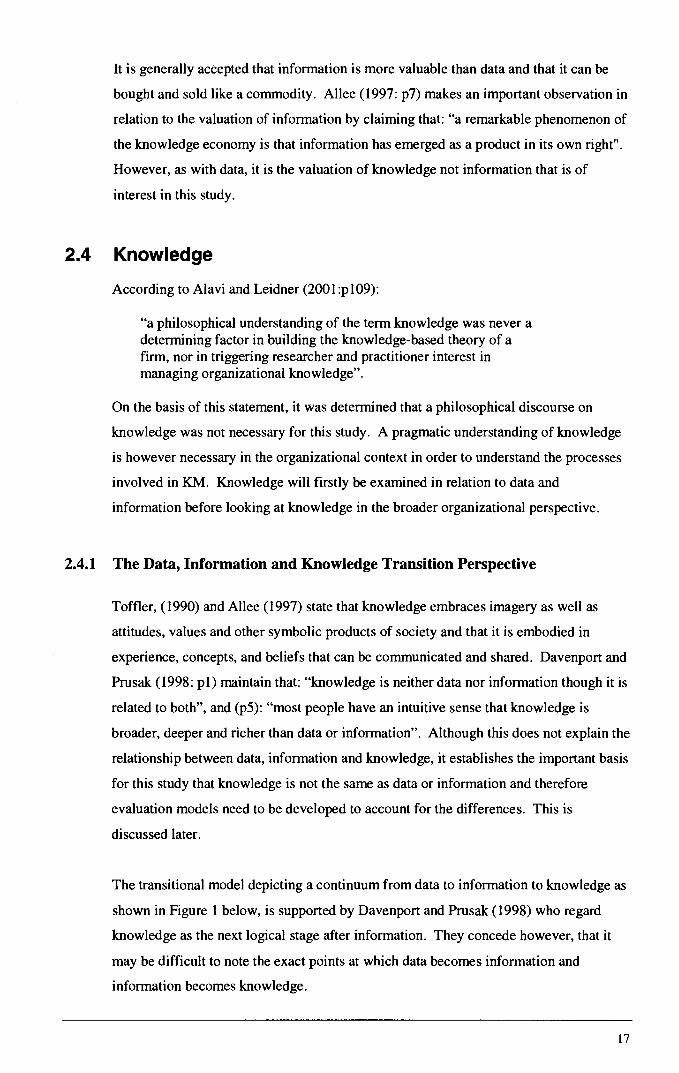
2.4 Knowledge
According to Alavi and Leidner (2001:p109):
"a philosophical understanding of the term knowledge was never a determining factor in building the knowledge-based theory of a firm, nor in triggering researcher and practitioner interest in managing organizational knowledge".
On the basis of this statement, it was determined that a philosophical discourse on
knowledge was not necessary for this study. A pragmatic understanding of knowledge
is however necessary in the organizational context in order to understand the processes
involved in KM. Knowledge will firstly be examined in relation to data and
information before looking at knowledge in the broader organizational perspective.
2.4.1 The Data, Information and Knowledge Transition Perspective
Toffler, (1990) and Allee (1997) state that knowledge embraces imagery as well as
attitudes, values and other symbolic products of society and that it is embodied in
experience, concepts, and beliefs that can be communicated and shared. Davenport and
Prusak (1998: pl) maintain that: "knowledge is neither data nor information though it is
related to both", and (p5): "most people have an intuitive sense that knowledge is
broader, deeper and richer than data or information". Although this does not explain the
relationship between data, information and knowledge, it establishes the important basis
for this study that knowledge is not the same as data or information and therefore
evaluation models need to be developed to account for the differences. This is
discussed later.
The transitional model depicting a continuum from data to information to knowledge as
shown in Figure l below, is supported by Davenport and Prusak (1998) who regard
knowledge as the next logical stage after information. They concede however, that it
may be difficult to note the exact points at which data becomes information and
information becomes knowledge.
17

Data Information
Figure 1: The Data, Information and Knowledge Continuum
Alavi and Leidner (2001) do not support this view and assert that examination of
knowledge in a data, information and knowledge continuum rarely survives scrupulous
evaluation as knowledge is possessed in the minds of individuals and is thus highly
personalised. It is possible however, to adapt this continuum concept to address Alavi
& Leidner's assertion by introducing the distinction between explicit and tacit
knowledge. The following diagram, based on the continuum model has been developed
to explain the interrelationships .
.......•••••..........................•.................•••..•......
Data
Domain of : Information : Technology .................
Insights Value Systems Culture Experience Environment Perceptions Judgement Skills -------.•
Desires Mental models Beliefs Intuition Hunches Emotions ...... ~g~---""
Figure 2: Relationship Between Data, Information and Knowledge
Advantage
Figure 2 shows the relationship between data, information and knowledge and the
intersection of the Information Technology and Knowledge Management domains. It
shows that tacit knowledge is required in order to converf data into information and
information into explicit knowledge. Some of the inputs to tacit knowledge such as
insights, culture, skills and beliefs are shown which are clearly outside the domain of
1 ll

IT. The diagram further shows that Information Technology alone cannot create
knowledge and that the continuous cycle between tacit and explicit knowledge is
required for organizational innovation, creativity and competitive advantage to occur.
The cycle between explicit and tacit knowledge is further explained in 2.4.2.
Because computers make no distinction between data and information, information
sharing may be automated and may even be done totally by machines. Knowledge is
intellectually intensive whilst information is Information Technology intensive (Moody
and Shanks 1999) meaning that knowledge sharing cannot be automated to the same
extent as information (using the broadest meaning of knowledge). Tacit knowledge
transfer is not complete until the recipient accepts and understands the new knowledge.
The recipient may have a new way of looking at the knowledge acquired and thus, as
knowledge is transferred, it evolves into richer contexts. The understanding of this
cycle is germane to the principles of KM.
Knowledge has also been seen as the result of learning (McMaster 1996) and can be
conveniently grouped into employee knowledge and skills, physical technical systems,
managerial systems and values and norms (Leonard 1998). Although the focus of this
study is on organizational knowledge, the distinction between personal and
organizational knowledge is important in management and measurement contexts.
Personal knowledge is the experiences, values, intuitions, perceptions, skills etc
possessed by individuals and shown in Figure 2 as factors influencing tacit knowledge.
Myers (1996: p2) distinguishes personal from organizational knowledge by explaining
that:
"Organizational knowledge is the processed information embedded in routines and processes which enable action".
Organizational knowledge is thus action oriented and this principle represents a
significant contribution to the value of KM. Myers also believes that whilst information
can be hoarded, knowledge cannot as it is constantly changing and evolving: if it doesn't
evolve it will lose value very quickly and thus to retain its maximum value, knowledge
must be shared not hoarded.
2.4.2 Epistemological and Ontological Views of Knowledge
As introduced in 2.4.1, knowledge is commonly referred to and discussed in terms of its
explicit and tacit characteristics. Leonard and Sensiper ( 1990) explained that explicit
knowledge is shared through a combination process and becomes tacit through a
19

process known as internalisation. The cycle continues by tacit knowledge being shared
with others through a socialisation process and becomes explicit again through
externalisation. They believed that even semi-conscious or unconscious knowledge,
that we are not even aware of, is not entirely tacit. This is supported by Alavi and
Leidner (2001), who state that tacit and explicit are not dichotomous states of
knowledge but mutually dependent and reinforcing qualities of knowledge. Explicit
knowledge cannot exist in an organizational context without the tacit knowledge of
individuals and teams continuously enhancing it. Furthermore, Nonaka and Takeuchi
(1995) maintain that explicit knowledge is only the tip of the knowledge iceberg and
that it is tacit knowledge that presents the most important organizational benefits and
management challenges.
The inter-relationships between the epistemological and ontological aspects of
knowledge (as seen by Nonaka and Takeuchi, 1995) are shown in the following
diagram:
Epistemological Dimension
Explicit Knowledge
Socialisation
Externalisation
Internalisation
Ta.cit Knowledge '----------------------..,. Ontological
Individual Group Organisation Inter-Organisation Dimension
.-------- Knowledge Level
Figure 3: Epistemological vs Ontological Perspectives.
Figure 3 supports the belief of Alavi and Leidner (2001) that tacit and explicit are
mutually dependent and reinforcing qualities of knowledge. The diagram shows that it
is not only the constant interaction between explicit and tacit knowledge (the
epistemological dimension) that leads to the generation of organizational knowledge, it
20

also requires the c·ontinuous interaction between individuals and teams both within and
between organizations (the ontological dimension). This spiral does not occur
naturally; it usually requires organizational direction and strategic action to ensure that
the knowledge generated is the most appropriate knowledge at the right time and is
made available to those who need it. These elements need to be measured somehow to
ensure that the knowledge generation process is working effectively and in accordance
with organizational objectives. Every organization needs to establish what type of
knowledge it needs in order to survive and develop. Being able to measure this process
and its outcomes will improve the likelihood of an organization achieving its objectives.
Knowledge generation also implies the evaluation of the processes and outcomes of the
continuous spiral from internalization, socialization, externalization and combination
and the evaluation of the development of organizational learning within individual,
group, organization and inter-organizational levels.
Previous KM research criticized some organizations for focusing too heavily on the
explicit component of knowledge (Fahey & Prusak, 1998; Nonaka 1991). Whilst it is
accepted that explicit knowledge is easier to grasp and is more quantifiable, a balance is
necessary between how much tacit knowledge needs to be made explicit and what needs
to be left in tacit form. This is discussed further in section 2.6.
The spiral described above in Figure 3 encapsulates what has become known as the
phenomenon of KM. The next section defines this term more fully for the purposes of
this thesis.
2.5 Knowledge Management
As there are a number of different approaches for organizations to view their
knowledge, so there are numerous different perspectives as to how to manage that
knowledge. KM has been seen by a variety of exponents as a state of mind (Scott
1998), a technique (Webber 1999), a framework or system (ICAA 1998), a process
(Keyser 1997), a practice (Dale 1998) or indeed any other organizational endeavour that
attempts to manage any form of Intellectual Capital5• KM can be seen to be related to
the wider field of management in the context of overlapping and synergistic
relationships in such activities as learning and innovation, benchmarking and best
practice, strategy, culture and performance measurement (Martin 2000).
5 Defined in 2.6.
21

Nissen et al. (2000) and Swan et al. (1999) identified that KM has its roots in a number
of information technology systems and principles including Artificial Intelligence,
Business Process Reengineering (BPR), Information Systems, Information
Management, Expert Systems, Decision Support Systems and Data Mining/Data
Warehousing. The legacy of information systems and technology appears to have
influenced many organizations to take a technological approach to KM which fails to
consider the importance of tacit knowledge and its continuous cycle with explicit
knowledge to create organizational value as explained in 2.4.1.
Garner ( 1999) believes that definitions of KM tend toward the abstract and are, at best,
nebulous. Indeed, a standard definition for KM may never be agreed (Hunter 1999;
Ives, Torrey et al. 1999) as each individual, team, group and organization will need to
develop its own approach to learning, knowledge generation and management that suits
its unique culture and nature of operation. The complexity of this task is a major
contributing factor to the poor understanding of the KM concept.
One of the first issues that needed to be addressed in this study was to find an
appropriate organizationally oriented definition of KM. Swan et al., ( l 999:p669) define
KM as:
"any process or practice of creating, acquiring, capturing, sharing and using knowledge, wherever it resides, to enhance learning and performance in organizations".
This definition fits closely with Alavi and Leidner's (2001) view of knowledge as a
process which is the position taken in this study. The expression "wherever it resides"
is taken to include tacit as well as explicit knowledge in all its forms. A variety of KM
approaches and systems need to be employed in organizations to effectively deal with
the diversity of knowledge types and attributes (Alavi and Leidner 2001). This range of
approaches and systems will require multiple evaluation methods to assess their
contribution to the organization. Measurement as a KM activity must therefore be
added to the definition and domain of KM. This point is germane to this thesis and it
will be established that the evaluation of the effectiveness of KM initiatives must be
built into the KM process in order for the KM initiative itself to achieve its desired
benefits.
The objectives of enhancing organizational learning and performance are also important
from the point of view of understanding the models that attempt to value these
objectives. Sierhuis and Clancey ( 1997) add that an important aspect of KM is
improving an organization's learning capability as well as its propensity. An
22

organization can only sustain itself if its people act, collaborate, learn and evolve as an
entity in action. In accepting this proposition, it can thus be said that the LO and KM
disciplines must become mutually self-supporting; one concept simply cannot operate
without the other (Loermans 2002). As Allee (1997:p70) put it,
"In order to be a high-performing learning organization, work processes must incorporate conscious and deliberate attention to every aspect of knowledge".
If the discipline of KM operates in such a way as to improve an organization's learning
capability, it thus improves the capacity of the organization to generate new knowledge
and thus systematically expands the knowledge base of the organization. For this cycle
to operate effectively and continuously, organizational learning and knowledge
generation need to be fully integrated into every mission-critical business process.
It has been established above that information and knowledge are not the same thing
and it can therefore also be logically concluded that knowledge management is not the
same as Information Management. The inclusion of "knowledge creation" in Swan et
al's definition, is considered to be one of the important characteristics of KM that
distinguishes it from the process of Information Management which does not create
information. The distinction between IM and KM is explained in the following table
adapted from De Long et al. (1997):
Emphasis on one-way transfer of information
Balanced focus on technology and culture issues Heavy technology focus in creatin im acts Variance in inputs to system precludes automating Assumes information capture can be automated ca ture rocess
Table 2: KM vs IM Projects
From the above table, it becomes reasonable to conclude that IM systems cannot
manage knowledge and that measures for IM projects will therefore not be appropriate
for evaluating KM projects. Indeed, the different measures required for knowledge
oriented projects may be alien to the traditional measures used by the developers of IM
systems. The need for a combination of technical and human elements is something
information management projects have in common with KM projects, but in KM
projects, it has been found that the complexity of human factors to be managed is much
23

greater than for data or information management projects (Davenport et al. 1997). The
human element in KM will become increasingly apparent in subsequent chapters.
It is believed that attempting to formalise or compartmentalise KM as a discrete
management discipline will restrict the analysis and richness of what is a critical
concept for organizational survival and growth. From this point on therefore, Swan et
al' s definition of KM will be used in its broadest possible generic context as the
management of knowledge at any organizational level and not with any suggestion of
the concept being a formal definitive discipline.
This study will demonstrate that the approach taken by organizations to knowledge and
its management will directly impact the measurement models that are used to evaluate
the organizational impact of their KM initiatives6• One of the most commonly quoted
concepts associated with the evaluation of KM is Intellectual Capital.
2.6 Intellectual Capital
In 1993 Leif Edvinsson, in a supplement to Skandia's annual financial report, used for
the first time the term "intellectual capital" instead of the more common accounting
term "intangible assets" (Brennan and Connell 2000). Intellectual Capital is more
encompassing than the traditional view of intangible assets and its definition is
important in order to understand the scope and context of KM. Stewart ( 1998:p67)
offers a view of IC as:
"intellectual material that has been formalised, captured and leveraged to produce a higher-valued asset".
Stewart's definition includes the sum of an organization's patents, processes,
employees' skills, experience, technologies and information about customers and
suppliers and as such applies in different ways to different organizations. This
definition of IC covers elements of explicit (patents etc) and tacit knowledge (skills,
experience etc) which suggest an inextricable link between IC and KM. Duffy (2002)
believes that the ultimate objective of managing knowledge is to capitalise on IC
specifically to encourage knowledge transfer and support knowledge sharing and re-use.
Another view of the synergy between KM and IC is that KM, as a business process,
administers the IC of the company just as the discipline of managerial accounting tracks
the financial investments (Geisler 1999).
6 Defined in 2. 7.
24

Skandia has been conducting evaluations of its IC since about 1993; its IC report
contains 91 different measures (Edvinsson and Malone 1997). Even pioneers in this
field like Skandia however, do not suggest that this evaluation process is a simple
exercise. According to Edvinsson and Malone (1997), Skandia takes the view that IC
evaluation needs to deal with subjective and even irrational factors, some of which resist
any attempt to translate them into empirical measures.
IC can be broken up into components in a number of different ways. The four
components of IC as proposed by Brooking, ( 1998) are:
Intellectual Property
patents, copyrights, trade-marks, design rights etc
Internal Infrastructure
technologies, methodologies, processes, culture, structure, databases,
information and communication systems, rules, policies, management
philosophy etc.
External Market
brands, reputation, customer loyalty, repeat business, backlogged
orders, distribution channels, contracts, agreements, licenses,
franchises, business partnerships and alignments etc.
Human Assets
individual know-how, collective expertise, creative problem solving
and decision making, capability, leadership, entrepreneurial and
managerial skills, education, work related competencies,
innovativeness etc.
Intellectual Property, Internal Infrastructure and External Market are comprised almost
entirely of explicit intellectual material (that is documented or recorded in one form or
another), although there may be some tacit elements in these components. Human
Assets on the other hand are almost entirely tacit. It is also worth noting that whilst
Intellectual Property, Internal Infrastructure and Market assets are owned or controlled
by the organization, human assets are not, and can permanently walk out the door of an
organization at any time.
A pervasive assumption made in many existing IC measurement models is that
knowledge must be made explicit before it can be effectively valued. Supporters of this
25

codification approach, such as Andersen Consulting and Ernst & Young, believe that a
formative goal in measuring IC is to identify tacit knowledge and to make it as explicit
as possible (Kanter 1999). This codification model has been underpinned by the
assumption that tacit knowledge cannot be measured and therefore must be converted
into something that can be measured. This argument is not sustainable as it is simply
not possible to convert all tacit knowledge into explicit knowledge (Sveiby 1994). This
approach also suffers from the fact that as soon as tacit knowledge becomes explicit, it
generally becomes more available (perhaps even into the public domain) which
potentially reduces its value. Apart from losing value, Alavi and Leidner (2001)
maintain that attempting to make all knowledge explicit may result in a rigidity and
inflexibility which would impede rather than improve organizational performance.
An opposing view to the codification approach is used by Bain, Boston Consulting
Group and McKinsey' s who use a personalisation approach that focuses more on tacit
dialogue than documentation (Hansen, Nohria et al. 1999). Whilst it may be tempting
because of potential loss of value to leave all knowledge in the tacit domain from where
it originated, the organization then runs the risk of losing it completely if the tacit
knowledge owner leaves the organization. A balance is therefore necessary between
what is made explicit and what can prudently be left in tacit form and this balance is
likely to be unique for each and every organization.
Intangibles such as knowledge stocks and flows, knowledge distribution and the
relationship between the creation of knowledge and economic growth are still largely
unmapped (Amidon 1998) and as a result, IC models are struggling to provide a
complete and reliable evaluation system of knowledge contribution to organizational
performance and learning. Existing models and projects seem to focus too heavily on
the quantity of knowledge rather than what the sharing of relevant knowledge can do for
the organization (Pfeffer and Sutton 1999). Davenport added that trying to track the
growing value of knowledge as it moves through the organization is not currently
possible but the business results of knowledge can be measured. As Allee (1997:plO)
puts it:
"more knowledge does not necessarily mean more value to the organization, it must be effectively shared in order for it to multiply - that is the economic reality of the knowledge society".
A corporate strategy perspective of IC focuses on four corporate knowledge phases
beginning with its acquisition, accumulation, transformation, and ending with its
valuation (Carroll and Tansey 2000). IC is best conceived as the knowledge and
creativity available to a firm to implement a business strategy that maximizes
26

stakeholder value. This broad definition includes any benefits that can accrue to a firm
along the value chain from applying knowledge and creativity (Carroll and Tansey
2000).
The measurement of IC is most frequently discussed in an accounting domain and as
such, will need some form of standards to be established if valuing intangible assets
(including knowledge in whatever form) becomes compulsory for public reporting
purposes. IC measures have been reported to be incompatible with current historical
cost based accounting systems. From an accounting perspective, IC as an asset can be
seen as either the result of a knowledge transformation process or the knowledge itself
(IFAC 1998). KM or the management of knowledge on the other hand is a process or
capability that will be unique for each and every organization (IFAC 1998) and will not
lend itself to be subject to a high degree of standardisation. Advocates of wholesale
changes to the current accounting system to cater for its treatment of knowledge assets
include: Davenport and Prusak (1998); Amidon (1998); Edvinsson and Malone (1997);
IFAC (1998); Teece (1998); and Miles et al. (1998).
Whilst it is unlikely that IC measurement will replace traditional accounting practices in
the foreseeable future, it is reasonable to expect IC measures to be presented as a
supplement to existing financial reports. As a supplement however, it is not likely to
receive the level of credibility it deserves. There is also a pervasive tendency to
measure what is easiest to measure rather than what is important (Serafeimidis and
Smithson 1997) and this could adversely impact the reliability of and confidence in IC
reports. Furthermore, whether as a supplement or a stand-alone report in its own right,
the IC report needs industry and professional mandates before it is likely to become
standard practice. Implementation of IC measures in financial reporting is thus likely to
be slow and somewhat less than consistently applied.
The relationship between KM and IC and total organizational capital is shown in the
following diagram which depicts the market value of a firm consisting of financial and
intellectual capital. The components of IC are similar to the breakup proposed by
Brooking ( 1998) earlier in this section and represent the domain of influence of KM.
27

Market Value
I ......... -----·-·· ·~-~--................ I ....... I ... .......
Financial /,···· Intellectual '··,, ..... Capital ,' Capital
·' / ./· I
I I I
Human Structural Capital Capital
I \ Source: Edvinsson & Malone 1997
j !
i \
I Customer Organizational Capital Capital
i . \ . !
i . i i ! : i \ I . Domain of I \
• Knowledge Innovation Process Management
Capital Capital J \\..... :
....... ,/,.. ' , ' / -.. .,... ....
·, •.. , ..... ,........ ____ ... ,, .......................... _ .............. -··· ...
Figure 4: Components ofIC and KM in relation to total Market Value
It is necessary to make a clear distinction between IC management (ICM) and KM.
From Brooking's components, it can be seen that the management of IC is more than
just the management of the traditional accounting perspective of intangible assets or
Intellectual Property. ICM has been described as the leveraging of human, internal and
external structural capital in combination (Edvinsson and Malone 1997). Another view
is that ICM is the organizational process that manages the intangible assets and provides
the mechanisms by which these assets can be measured and recorded in the books of the
enterprise. This is the essence that distinguishes ICM from KM. From the point of
view of this thesis then, KM is the more relevant focus for this study because it is a
broader concept that deals with the processes of enhancing organizational performance
and learning rather than just a leveraging and measurement mechanism, which is still
important but not the only consideration. KM is therefore assumed to encompass the
principles of ICM.
2. 7 Knowledge Management Initiatives
Not all attempts to evaluate KM will involve a definitive project or program. Evaluation
of knowledge whether at individual, team or organization level, may be an on-going
activity and not necessarily related to a specific initiative. Most evaluation efforts
28

however are expected to involve the evaluation of a designated project of some kind.
The term "Knowledge Management Initiative" (KMI) is taken to mean any system,
project, program or any other formal organizational process that satisfies Swan et al's
definition of KM discussed in 2.5. Within Swan et al' s definition of KM, KMis are
taken here to include any organizational improvement activity designed to enhance
business performance or learning that involves the leverage of corporate knowledge in
one form or another. Examples include the evaluation of product innovation strategies,
competence, continuous improvement and training programs connected with KM7• This
includes initiatives designed specifically to increase the value of IC. The view taken in
this study is that many organizational improvement initiatives may satisfy the definition
of KM but may not have been specifically labelled as KM or knowledge oriented
initiatives.
According to De Long, et al (1997), the majority of KMls are undertaken at the
Business Unit, functional or operational process level where they have the most
immediate impact on performance and tend to focus on objectives such as reducing
cycle times and costs, more efficiently using knowledge assets, enhancing functional
effectiveness, increasing organizational adaptability, increasing value of existing
products and services and creating new knowledge intensive products, processes and
services. Hilderbrand (1999) categorises KMI objectives into: generating revenue
(45%), containing costs (35%), enhancing customer service (10%), improving quality
(6%) and refining internal processes (4%). In other words Hilderbrand believes that
80% of such projects focus only on improving financial returns. Indeed, existing
knowledge oriented projects seem to focus heavily on the quantity of information and
knowledge rather than on what the sharing of relevant knowledge can do for the
organization. Neef & Davenport, (1997), found that many KMis focused on the storage
and distribution of large quantities of explicit knowledge but few projects tackled the
essential tasks of developing user enthusiasm, giving users and providers more time to
exchange knowledge and developing meta-knowledge that can help guide its effective
management. Most KMis have a strong technological focus, but De Long et al., (1997)
and Alavi & Leidner (2001) found that more frequently, it is cultural and human factors
that differentiate KMI successes from failures.
2.8 Evaluation and Measurement
The term "evaluation" is taken to include measurement, appraisal, assessment of value
or amount of, or justification for, KM or IC improvement initiatives. The process of
7 see section 2.9 for more detailed coverage of these topics
29

evaluation may be purely subjective and thus may not involve the measurement of a
specific KM element or factor. Unless a specific type of evaluation is intended to be
expressed in the ensuing text, the use of the term "evaluation" will mean any or all of
these elements.
The reason for the use of the terms "evaluate" as well as "measure" in the selection
criteria for relevant articles (see section 3.5) is that measurement is an objective and
functionalist view whilst evaluation is broader and more subjective, thus providing a
pluralistic platform for analysis. The combination of the terms "evaluation" and
"measurement" in the selection criteria resulted in the extraction of a broader and richer
range of material than would have otherwise occurred.
2.9 Other Related Topics
Schultze and Leidner (2002) overcame a limitation in their research of ambiguous
definition of KM by including "organizational learning" and "memory" into their
selection criteria for KM related articles. This study goes one step further by extending
the nomenclature into a number of other topics that have been connected one way or
another with KM. The following table shows the topics related to KM in addition to
those used by Schultze and Leidner.
Innovation
Organizational learning
Com etence & ca abilit Information and knowledge creation, sharing and transfer
ualit
Collaborative work Communities of practice
Table 3: KM Related Concepts
Edvinsson and Freij 1999 Senge 1990; Schultze & Leidner 2002 Allee 1997 Schultze 1999
Huan , Lee et al. 1999 Schultze 1999 Ar ris 1998 Schultze 1999 Wenger and Snyder 2000
The relationship between each of these concepts and KM is briefly explained below.
2.9.1 Innovation
Edvinsson & Malone ( 1997) quote Drucker in claiming that every organization needs
innovation as its one core competency and every organization needs IC management as
a way to record or appraise its innovative performance. The most established and still
30

the most commonly used indicators of innovation are technology-based, including
capital expenditure, expenditures on research and development (R&D) and patent
activity (Tidd and Driver 2001). Many traditional accounting and finance indicators
concentrate on short-term measures of profitability that tend to undervalue innovation.
Measures based on value-added, market to book value and the price to earnings multiple
have been found to be better indicators of innovation (Tidd and Driver 2001). Tidd and
Driver established that there is a demand for measures to be developed of the efficiency
and effectiveness of the innovation process; efficiency in the sense of how well
companies translate technological and commercial inputs into new products, processes
and services; and effectiveness in the sense of how successful such innovations are in
the market and their contribution to financial performance (Tidd and Driver 2001). KM
clearly has a major role in this innovation initiative which in turn improves the value of
IC and enhances bottom-line results.
2.9.2 Organizational Learning Culture
Despite Swan et al' s prediction of KM taking over the mantle of Organizational
Leaming (OL), the concept of the Leaming Organization (LO) is still relevant to 21st
century management because of the increasing complexity, uncertainty and rapidity of
change of the organizational environment (Malhotra 1996). Cultures that value and
provide opportunities for communicating tacit knowledge appear to be rare in
contemporary organizations. Such cultures are most frequently pursued under the
banner of Organizational Leaming at firms like AT&T, Ford, Intel and EDS, all under
the tutelage of Peter Senge' s Systems Thinking and Organizational Learning Centre at
MIT (Davenport 1997). The understanding of the OL process and its connection with
the generation of organizational knowledge is far from clear (Macleod 1999; Gourlay
1999; Schein 1997). This problem was identified even earlier by Nonaka and Takeuchi
(1995:p45) who stated that:
"organizational learning theories basically lack the view that knowledge development constitutes learning and most OL theories concentrate on individual learning and have not developed a comprehensive view of learning at an organizational level".
According to Sandelands (1999) and Amidon (1996), companies that are not able to
embrace shared learning and knowledge generation at organizational level simply
disappear. Brown and Woodland (1999:p190) add further insight into the need for
further study into organizational learning by claiming that:
"it is impossible for an organization to sustain competitive advantage without constantly learning and developing new knowledge".
31

The definition of KM from Section 2.5 states that OL is one of its major objectives and
thus it becomes necessary to consider the evaluation of the learning process in
organizations despite the fact that the devotees of OL rarely relate their goals to the day
to-day management of information or knowledge (Davenport 1997). KM is inextricably
linked to OL with the two concepts needing to always be discussed in concert
(Loermans 2002). Birkinshaw (2001) believes that the concepts of OL and IC both
overlap somewhat with KM.
2.9.3 Competence and Capability
Winter (1998) acknowledges the importance of knowledge and competence in business
strategy and indeed in human society and recognizes that different approaches to the
management of knowledge and competence assets prevail in different industries.
McMaster (1996) connects competence with knowledge by stating that development of
core competency strategy is an approach to creating and sharing knowledge and that
this practice is becoming more popular. McMaster adds that strategic alignment of
organizational and individual competencies is key to success.
Nonaka and Takeuchi (1995:p47) quote Prahalad and Hamel in their definition of core
competence as:
"the collective learning in the organization, especially how to coordinate diverse production skills and integrate multiple streams of technologies".
Nonaka and Takeuchi found little difference in the literature between organizational
competence and capability and Sveiby ( 1997) saw competence as a synonym for both
the process of knowing and knowledge as an asset and regarded competence as the most
important component of intangible assets.
2.9.4 Information and Knowledge Sharing
According to Quinn, et al. (1998), information sharing is critical in the KM context
because intellectual assets increase in value with use. This must occur within the
organization amongst employees and with sources outside the organization for
maximum benefits to be gained. Knowledge sharing is the same concept on a broader
scale taking into consideration the tacit/explicit cycle explained in 2.4.2. Just
exchanging or transferring information or knowledge is not enough as this alone does
not necessarily lead to the information or knowledge being used more effectively. By
32

sharing however, which involves a feedback loop, amplification and modification, the
benefits can become exponential (Quinn et al. 1998).
Cultural issues overlap information and knowledge sharing to a large extent.
Professionals are often reluctant to share the information or knowledge that they possess
as it represents their unique competitiveness, power and status in the market place.
Changing this culture is difficult and likely to take considerable time but is necessary
for information and knowledge sharing to become part of the normal way things are
done in the organization.
2.9.5 Quality
A quality culture is critical in a learning organization because it breaks down the
barriers to OL and because the quality of information and knowledge in addition to
products and services directly impacts the long-term sustainability of quality of changes
and innovation in an organization (Huang et al. 1999). Huang et al believe that
information and knowledge quality can be assessed through the dimensions of accuracy,
believability, reputation, relevancy, value-added, timeliness, completeness, volume,
interpretability, ease of understanding, conciseness, accessibility, security and ease of
manipulation. All of these attributes are measurable in varying degrees either as direct
measures of quality or as surrogate measures for OL.
Davenport and Prusak (1998) noted that a popular approach to getting started with KM
is to build on a company's quality or re-engineering efforts. Zhao and Bryar (2001)
went a step further and established that TQM and KM principles can be implemented
synchronously and that there is an inherent synergy between them.
2.9.6 Organizational Memory
Brown (1998) introduced organizational memory as a concept related to OL by citing
an example of capturing stories from service representatives and constantly refining
them through conversations amongst each other to create a powerful organizational
memory which in tum improves their capacity to learn from previous failures and
successes. McMaster (1996) added that it is necessary to understand the mechanisms,
structures, systems and language patterns that form organizational memory in order to
effectively break with the past and make intelligent decisions about the future.
Brooking (1998) believes that the IC knowledge base forms the basis for organization
33

memory which provides the potential to significantly boost utilization of the skills
possessed by individuals.
2.9.7 Continuous Improvement
Argyris (1998) linked Continuous Improvement (Cl) with OL by suggesting that
companies need to make the ways managers and employees reason about their
behaviour a key focus of OL and CI programs. McAdam, et al. (2000) connect CI with
innovation and Quality Management, Bessant and Francis (1999) consider CI to be part
of organizational dynamic capability and Barker (2001) sees human intellectual energy
to be part of CI. Teaching people how to reason about their behaviour in new and more
effective ways requires a CI culture that in tum breaks down the defences that block the
organizational learning process. Kuhn (2001) provides a broad network of interrelated
concepts and connected CI, KM, LOs and Communities of Practice as interrelated and
mutually supporting concepts.
2.9.8 Collaboration and Communities of Practice
Although Chua (2002) noted that Communities of Practice (COP) were first introduced
in about 1992, Wenger and Snyder (2000) described them as new organizational forms
that promised to complement existing structures and radically galvanize knowledge
sharing, learning and change. Skyrme (1997) also made the connection between COPs
and KM by suggesting that COPs are being increasingly applied in the KM context.
People in COPs share their experiences and knowledge in free flowing creative ways
that foster new approaches to problems. COPs can drive strategy, generate new lines of
business, solve problems, promote the spread of best practices, develop people's
professional skills and help companies recruit and retain talent (Wenger and Snyder
2000). COPs are the heart and soul of the World Bank's KM strategy and are also
strongly supported and nurtured by companies such as Royal Dutch Shell and Xerox
(Wenger and Snyder 2000).
2.10 Previous Research in KM Measurement
Whilst snapshot reviews of KM projects have been conducted in the past, (eg DeLong
et al 1997), little comprehensive chronological or geographic research on KM
evaluation or measurement models has hitherto been conducted.
Previous research studies on KM evaluation models have been fairly narrow in focus
but have indicated that few firms have begun to actively manage their knowledge assets
34

on a broad scale and that in many cases, KM has been addressed at either a
philosophical or technological level with little pragmatic discussion on how knowledge
can be managed and used more effectively (Davenport 1998). Some of the exceptions
have been identified in Table 1. Indications are that an increasing number of
knowledge-intensive firms are beginning to maintain records of the competencies of
individual employees (Den Hertog and Huizenga 2000) and other records under
initiatives that may not have been called "knowledge based" but nevertheless deal with
organizational knowledge in one form or another. Examples of knowledge oriented
initiatives that may not mention knowledge include case studies that have been
conducted of initiatives in innovation, continuous improvement and collaborative work.
The geographic perspective has been touched on to some extent in previous research but
generally only in the US versus Japanese approach to KM (Nonaka and Takeuchi 1995).
Skyrme (1997:p2) observed that:
"the Japanese have been quietly practicing their own form of knowledge
management for many years".
This observation has led to the inclusion of a component of this research project to
establish if any different approaches to KM evaluation can be determined between
major geographic areas.
Previous research has shown that the gap between market and book value is gradually
widening (Wallman 1999). This has resulted in the information currently being
presented to investors becoming increasingly unreliable and even misleading (Wallman
1999; Fisher 1992). Furthermore, current accounting systems have been found in
previous research to be inadequate and whilst strong recommendations have been made
for new rules and measures to be established (Malone 1999; Petrash 1999), little
direction is offered to organizations in how to structure an effective KM evaluation
framework.
Some valuations have focused on one or two classes of intangibles for a limited number
of firms. For example Hurwitz et al. (2002) found examples which calculated human
and structural capital for 43 Swedish firms that have calculated brand capital for brand
intensive firms and others that have calculated the intangibles associated with
technology investments in over 400 US firms. While these and other approaches all
conclusively demonstrate that intangible assets exist at the firm level, no examples were
35

found of attempts to develop a comprehensive chronological and geographic study
across all classes of intangible assets across a broad spectrum of firms.
Previous research in KM and IC has consistently advocated that a business case must be
defined in order to justify necessary investment strategies in KM and that further
research is needed in this area to clarify the evaluation framework for the new forms of
intellectual capital. This thesis will help to clarify the KM/IC evaluation framework.
2.11 Summary
Whilst the management and evaluation of knowledge are critical for organizational
success in the burgeoning knowledge economy, there appears to be few frameworks and
guidelines in place to assist organizations in how to approach this somewhat fuzzy and
esoteric endeavour.
An organization's approach to knowledge will impact the way it manages and measures
knowledge and knowledge oriented projects. Knowledge management is the discipline
that manages an organization's Intellectual Capital and has been associated with a
number of other organizational improvement initiatives such as innovation
enhancement, continuous improvement and organizational learning. This has
complicated the subject of KM evaluation somewhat because it means having to
determine what constitutes a KM initiative even when such initiatives may not have
been deliberately connected with organizational knowledge. A definition of KM was
established as a basis for extraction of relevant articles from the literature and in order
to focus further analysis.
Previous research on KM evaluation has tended to be narrowly focussed and "snapshot"
views rather than comprehensive functional or chronologically based studies.
The next stage defines the scope of the study and source data that will provide the
information to answer the research questions posed in 1.4.
36

3. Research Approach
This chapter describes the research approach and the methodology used for data identification, extraction and analysis.
The Chapter structure is depicted in the following diagram:
I I
Research Approach
I I I
Research Precedence & Research Focus, Research Validity Paradigm Rationale for Scope & Process &
Literature Review Boundaries Flowchart Reliability Research
I I
Data Selection Data Source Process Analysis
Methodology
I I
Content Tools Data Analysis Classification
Process
3.1 Research Paradigm
It was considered important for the outcomes of this project that the research objectives
should determine the most appropriate research paradigm rather than a selected
paradigm driving the direction of the research on the basis of convenience or personal
preference of the researcher. The objective of this research project is focused on
providing understanding and clarity, not proving any particular hypotheses, and thus, a
predominantly qualitative approach (with some quantitative support) was seen to be the
most appropriate overall style.
According to Myers (1997), there are three underlying paradigms or philosophical
perspectives in research: positivist, interpretive and critical. Whilst all three have their
particular relevance in certain circumstances, interpretive research was seen to be the
most relevant for this type of study because it focuses on the full complexity of sense
making as the situation emerges (Myers 1997). Furthermore, an interpretive approach,
as defined by Burrell and Morgan (1985) and Sveiby (1994), as opposed to a
37

functionalist or positivist approach, has been chosen for this thesis because evaluation,
by its very nature, involves subjective elements and cannot be separated from human
intellect, history, culture and social organization and because an interpretive approach
was seen to be the more appropriate approach to achieve the objectives of this study.
Whilst research in the field of Information Systems has been dominated by quantitative
positivist research (Goles and Hirschheim 2000), qualitative research in Information
Systems (IS) has gained significant acceptance in recent years and has been spurred by
a general shift away from technological to managerial and organizational issues (Myers
1997).
Interpretive research can be based on different modes of analysis in the form of
hermeneutics or phenomenology, with hermeneutics being primarily concerned with the
meaning of a text or text-analogue (Myers 1997). This project deals primarily with
providing clarity and understanding from textual sources and was thus seen as an
example of hermeneutic analysis. Hermeneutics supports the object of the interpretive
effort of attempting to make sense of the organization and the relationship between
people, the organization and information technology (Myers 1997). This mode of
analysis supports the objective of a chronological and geographic approach to KM
evaluation and developing an understanding of evaluation processes in complex human
and technological environments.
KM is neither purely a physical nor a social science and is not a pure IS discipline
either. As discussed in 2.9, KM relates to many other fields apart from IS, but many
still see the strong IS heritage in KM and thus the IS research paradigm (see 3.2)
features strongly in previous KM research. No single research paradigm or approach
fits perfectly with the principles of KM or the objectives of this study. A
methodological pluralism as advocated by Garcia and Quek (1997) and Goles and
Hirschheim (2000), was therefore adopted. Some quantitative components in terms of
documenting the occurrences of evaluation models by year and by geographic region
are covered, but only to clarify the meaning and to support or explain qualitative
findings.
3.2 Precedence and Rationale for Using Literature Reviews for IS Research
Meta-analysis has been used successfully in a number of previous IS research studies
using a combination of quantitative and qualitative methods. DeLone and McLean's
1992 research on Information Systems Success Factors provides a useful model and
38

research methodology for this study. DeLone and McLean conducted a comprehensive
study using meta-analysis which resulted in a classification of evaluation methods and
the development of a model for the evaluation of IS effectiveness. They cited 180
articles from seven leading publications between 1981 and 1987 in their analysis. A
taxonomy was developed in their study comprising six major dimensions or categories
of IS success covering over one hundred different measures.
Swan et al., (1999) used a similar literature search style using articles extracted from
1562 different journals in the on-line ProQuest and Social Science Citation Index
databases to identify general themes within KM. They used quantitative techniques to
analyse frequency of references to search terms such as KM and LO followed by
qualitative analyses of conditions for the effective implementation of KM. As with this
research study, their objective was to illustrate trends and, although comprehensive, did
not claim a high degree of scientific precision.
Mahmood et al (2000) also used meta-analysis in their studies on evaluating
information systems satisfaction. Forty five empirical studies from eight major journals
dated between 1986 and 1998 were reviewed as part of their analysis. The Mahmood et
al style of research is also relevant as supporting model and precedent for this project
because, as with this study, its objective was to reduce confusion by studying a
phenomenon over an extended period of time.
Another example of this type of research was provided by Schultze and Leidner (2002)
who used six specific academic IS journals for their research and selected 78 articles
from these journals via an on-line ABI Inform database (offered by ProQuest) and
manual scans of abstracts. They found that an initial perusal of abstracts retrieved by
the key word searches identified articles that were not directly related to the objective of
their research and thus had to be excluded from the sample. This research project
encountered similar issues as will be discussed later.
Tidd and Driver (2001), suggest that collecting data from on-line sources is a cost
effective method that avoids contacting companies directly and thus minimises
resources and the burden on industry. The increasing availability of data in a variety of
on-line sources makes this an increasingly rich and viable resource for research.
Comparisons over time are also possible using literatures reviews which would not be
possible with surveys or interviews. See further comments on data validity in section
3.8.
39

3.3 Research Focus, Scope and Boundaries
The following diagram depicts the research focus for this study which covers the
dimensions of KM and IC and their major related disciplines as defined in section 2.9.
Data Sources: ABI Inform Global Academic Research Library Proquest European Business Proquest Asian Business Proquest Computing
Individual, team or Organizational competence
or ca abilit
Innovation
Figure 5: Research Focus
Information & knowledge sharing
& information quality
Intellectual Capital IP, internal,
External and human ca ital
Figure 5 above shows the staged filtering process that was used to select the relevant
articles for this study. The data sources are defined in 3.4 below. The high level filter
was defined as any variation of the words "measure" or "evaluate". This was further
refined by a specifically selected variety of topics that were found to be associated with
KM as previously defined in section 2.9. Although the initial search extended back to
the early eighties, no occurrences of the required data were found prior to 1992.
The final filter was to select only empirical studies8 as opposed to purely theoretical
papers. Theoretical studies did not provide the level of detail required for this study and
were thus eliminated in either the selection or data analysis phases. This process is
discussed further in section 3 .5 .
8 Empirical is taken to mean any articles dealing with first-hand research of KM measurement models in actual use in organizations or reports providing evidence of such models that have actually been implemented in organizations.
,1(\

3.4 Data Source
It was necessary to decide on a collection of on-line resources that would provide a
comprehensive body of data preferably in the one location and in a consistent format. A
number of databases were selected from the total on-line ProQuest resources available
through the Edith Cowan University library in Perth, Western Australia. These were
selected on the basis of the journal listings provided with each database and selecting
those databases that contained the most likely collection of journals, on the basis of
journal title, that would cover topics connected with the evaluation of knowledge and/or
IC initiatives.
ABI Inform Global was the main data source where full text articles have been available
from more than 500 ABI journals since about 1971. This easily covers the full history
of KM which did not become acceptable management parlance until the early nineties.
In addition to ABI Inform Global, four other databases were included in the source
library. The ProQuest Academic Research Library was selected with the intention of
including many of the KM initiatives from non profit organizations such as the medical
and government sources. The intention with the selection of the Proquest Computing
database was to include the Information Systems oriented articles dealing with KM and
IC that may not have been covered by the business and managerial periodicals in the
ABI Inform Global collection. ProQuest European and Asian Business databases were
included in an attempt to balance out the US dominance of the subject and to provide a
wider geographic perspective to the study.
Unlike the approach used for the DeLone and McLean, Swan et al and Schultze and
Leidner research reports mentioned in 3.2 where a small number of specific journal
titles were selected as the data source, specific journals were not selected as sources of
articles for this study. This minimised journal selection bias to a large extent.
A constraint with this on-line selection was that some journals do not offer their articles
on-line to ProQuest and some journal articles are only available in full-text form on-line
a year or more after publication in hard-copy journals. However, on the basis of World
rankings of the top 50 IS journals by Mylonopoulos and Theoharakis (2001), it was
found that sufficient internationally recognised journals were represented in the
ProQuest on-line databases to provide a sufficiently rich range of material to draw from.
It was expected that Management and IS journals would cover KM fairly
comprehensively but perhaps not IC as this subject was seen to be more of an issue for
accountants and economists. It was found for example that MISQ, HBR,
41

Communications of the ACM and IS Research (all represented in the top 50 ranking)
covered KM and other related issues comprehensively and that these journals were
available in the Proquest libraries mentioned above. The Journal of IC was the most
prolific provider of articles on IC and one of the few journals available on-line that
covered this topic in any depth but predictably is not represented in the top 50 IS
journals.
3.5 Selection Process
The following selection criteria, derived predominantly from the preliminary literature
review described in chapter 2, were used to extract potentially suitable articles from the
target databases.
All derivatives of the word evaluate or measure in addition to any occurrences in the
article title or abstract of:
Knowledge and all derivatives of the word manage Organi*ational learning (where * = s or z) learning organi *ation information sharing knowledge creation knowledge generation knowledge transfer intellectual capital innovation competence or competency organi*ational capability human capability internal structure external structure customer capital structural capital market assets human assets infrastructure assets intellectual property assets collaborative work organi*ational memory communities of Practice human capital
The reason for separating the terms "knowledge" and "management" was to pick up
articles that dealt with the evaluation of managing knowledge and management of
knowledge in addition to "knowledge management" per se.
A total of 1539 articles from the database collections potentially satisfied the above
selection parameters as per the first and second filters shown in figure 5 in section 3.3.
42

A manual review of all abstracts was then conducted to assess the relevance of the
potential articles to the objectives of the research. This was done by ensuring that the
context of the abstract was clearly targeted towards the measurement or evaluation of
KM, IC or the other related topics identified in the literature review in chapter 2. Figure
6 (see later) provides a diagrammatic view of the research method.
The combination of the software guided selection process and the manual review of
relevance resulted in only 223 articles out of the original 1539 (14.5%) being copied to
the research database for further analysis. The breakdown of articles within each
selection category is shown in the following table.
8.5% 0.0% 0.0% 1.8%
17 0 0.0% 4 0 0.0% 9 5 2.2%
382 39 17.5% 469 63 28.3%
7 0 0.0% 1 0 0.0%
internal structure 30 0 0.0% external structure 0 0 0.0% customer ca ital 0 0 0.0% structural ca ital 0 0 0.0% market assets 1 0 0.0% human assets 6 1 0.4% infrastructure assets 1 0 0.0% intellectual ro e assets 3 0 0.0% collaborative work 0 0 0.0% or ani*ational memo 1 1 0.4% Communities of Practice 15 0 0.0% human capital 169 18 8.1%
,,,:~100~00%
Table 4: Selected Documents
The selected 223 articles were sourced from 126 different journals thus significantly
extending the scope and comprehensiveness of previous reviews conducted by DeLone
and McLean (1992), Mahmood et al. (2000), Schultze and Leidner (2002) and Swan et
al. (1999). The full list of authors and titles of articles comprising the research database
for this thesis is shown in Appendix A and the full list of journals and the number of
articles selected from each journal and journal category is shown in Appendix B.
43

The reasons for rejecting such a high percentage (85.5%) of articles included:
• The words "measure" or "evaluate" or their derivatives may not have related to
the measurement or evaluation of KM or related concepts as identified earlier;
• Some articles particularly from medical journals referred to measurement or
evaluation of specific systems, processes or technology rather than elements of
KM or IC;
• Different meanings of concepts of key terms such as "human capital" - in some
cases these referred only to the actual number of people not their value to the
organization in the KM context;
• Terms such as "creation" or "generation" often referred to the creation or
generation of other things apart from knowledge or IC.
The numbers of articles selected by year of publication between 1992 and 2002 were
recorded and are tabled below:
1992 1 0.4 1993 0 0 1994 0 0 1995 2 0.9 1996 23 10.3 1997 9 4.0 1998 14 6.3 1999 36 16.1 2000 58 26.0 2001 49 22.0 2002 31 14.0
Table 5: Articles by Year of Publication
Data for 1992 and 1995 were rejected as insufficient occurrences of empirical
measurement were found during this period for meaningful analysis and were thus
excluded from further analysis, thus leaving 220 articles for further analysis. Apart
from the relatively low number of relevant articles in 1997 and 1998, numbers for other
years are reasonably well spread between 1996 and 2002.
44

3.6 Data Analysis Methodology
3.6.1 Content Analysis
The principles of Content Analysis were used to analyse the data for the appropriate
keywords. Content Analysis, according to Hussey and Hussey (1997), represents a
formal approach to qualitative data analysis and is particularly useful when attempting
to make sense of large volumes of open-ended material as was the case with this study.
By using software tools (see 3.6.2 below) it was feasible to identify keywords
associated with each KM evaluation model that would determine the most appropriate
category that the model should fit into. Using this technique, it was the data that
determined the categories into which the models would be classified. Any coding unit
(sentence in this case) that referred to an empirical example of the measurement or
evaluation of KM or IC or its associated topics from table 4 in section 3.5 was stored for
further analysis.
3.6.2 Tools
NUD*IST ® (QSR N6 Student version 6) was used to identify the major themes in
KM/IC evaluation and measurement models. NUD*IST has particular strengths in
managing, exploring and searching textual material, managing and exploring ideas
about data, linking ideas and constructing theories about data, testing theories and
generating reports including statistical summaries (University of Hong Kong, 1995).
The unit of text analysis used within the NUD*IST system to extract relevant material
was the sentence. The other text coding options of line or paragraph were not
considered appropriate as individual lines would not provide the necessary context for
the reference and an entire paragraph was seen to be excessive, potentially diluting the
focus of the selected sentence. If further context was required for the sentence selected,
NUD*IST provided the options of selecting additional sentences either side of the
selected text unit as required.
Microsoft Excel® spreadsheets were used in conjunction with the NUD*IST database
to facilitate analysis and sorting of node elements by important parameters such as date,
geographic orientation, actual measures used etc.
45

3.6.3 Data Classification Process
All sentences that covered some aspect of evaluation or measurement of KM or related
concepts were firstly coded to a number of "free nodes" within the NUD*IST database.
These free nodes were not initially linked to each other in any way and were
constructed according to identifiable keywords within the sentence that described the
nature of what was being measured such as "quality", "competence" or "customer". A
total of 40 nodes or individual measurement themes were created in this way as shown
in the following table.
AAAAA A AAAA,AA,_ /
"''
1 Financial, accountinq, economic 2 T echnoloav, information systems 3 Customer, markets 4 Human capital 5 Knowledge as an asset or Intellectual propoerty 6 KM as a process 7 Information or knowledqe sharinq, transfer or dissemination 8 Operational processes and procedures 9 Efficiency, effectiveness or productivity
10 Innovation, creativity 11 Quality 12 Composite measures 13 Relationships and Alliances 14 Learninq ability, propensity, opportunity 15 New product development 16 Competition 17 Knowledge creation and use 18 Looistics and deliverv 19 Orqanizational culture 20 Capability, competency 21 Decision makinq 22 Communications 23 Structural capital 24 Outcomes 25 Teamwork, participation, Communities of Practice 26 Social capital 27 Chanqe 28 Leadership 29 Project success 30 Performance 31 Strateqic issues 32 Risks 33 Losses 34 Commitment, action orientation 35 Image, reputation 36 Conflict, turbulence, instability 37 Training 38 Control 39 Project Management maturity 40 Organizational maturity, sophistication
Table 6: Measurement themes
46

On completion of the coding exercise it was apparent that many of the free nodes could
be consolidated as they were measuring or evaluating similar things but perhaps using
slightly different terminologies. For example, measures dealing with skills,
competence, capability, ability to learn and leadership were distinctly human attributes
and could thus be consolidated under a human capital category. The 40 free nodes were
consolidated into 12 major measurement categories. These categories are further
discussed in 4.2.1.
The actual descriptions of the metrics were then extracted from the coded units
(sentences) in the NUD*IST database and loaded into an Excel spreadsheet to facilitate
sorting of parameters such as dates and measurement mechanisms. This resulted in 838
spreadsheet entries (see Appendix E), each corresponding to a single example of a KM
metric used by an organization at some stage between 1996 and 2002. Each metric was
then allocated to one of the 12 identified KM measurement categories.
3. 7 Research Process Flowchart
The process for the conduct of the research is depicted in the following flowchart.
47

Search parameters
838 example of KM
Source Libraries
Identify Potential articles On-line
First stage Review
Save to disk
Saved Articles
Copy all articles to NUD*IST Database
Excel Spreadsheet
measurement ------
Categorise measurement
and evaluation models
Document Results and Conclusions
PROQUEST LIBRARY ABI Inform Global Academic Research Periodicals Proquest Computing Proquest European Business Proquest Asian Business
1539 articles
Review abstracts for occurrences of "measurement" or "evaluation".
223 articles
Deletion of 3 articles for 1992 to 1995
220 entries Database
Identify main measurement/evaluation themes using NUD*IST
Analyse themes, trends, and evaluation models
12 categories
40 nodes or themes
Suggest further research opportunities
I Write Thesis -.i.___
Figure 6: Research Methodology Flowchart
48

In summary, 223 articles from 124 different journals were selected from 1539
potentially useful articles identified by automated search tools. Three articles dated
1992 to 1995 were deleted. From the remaining 220 articles, 838 examples of KM
measurement were identified which were then placed into 40 "free nodes" within the
NUD*IST system. These 40 nodes were then refined and consolidated into 12 major
measurement categories that provided the basis for more detailed analysis.
3.8 Validity and Reliability
3.8.1 Data Source
As advocated by Webster and Watson (2002), a deliberately broad base for source data
was selected for potential articles for this study covering a number of topics associated
with the key area of KM, a broad set of journals across a number of disciplines and
wide geographic coverage. This significantly enhances the relevance and validity of the
study.
The main source of data was the ProQuest ABl/lnform database which has been a
reliable and comprehensive source of articles for academia, industry and government
for more than thirty years (lnnodata 2003; Convera 2003). ABI Inform Global contains
over 550,000 articles from over 1,000 international business and management
periodicals. Full text articles are available from more than 500 of these journals. More
than 350 of the database's sources are English-language articles published outside the
US (ProQuest 2003), thus enhancing the international focus of this study. According to
ProQuest, their approach to indexing and abstracting using about twenty indexing
elements provides precision in researching and makes it easy to determine which
articles meet the researcher's needs.
The ProQuest Research Library covers more than 2,600 journal titles from a wide range
of subject areas including business, education, literature, political science and
psychology (ProQuest 2003). ProQuest also claim that their editorial and technical
processes ensure that many complete articles are made available on-line within 48 hours
of receiving the hard copies. This added re-assurance that the ProQuest material would
be up-to-date.
ProQuest European Business covers more than 110 leading titles including The
Economist, Fortune and European Business Journal (ProQuest 2003) thus ensuring an
adequate representation of European material. ProQuest Asian Business comprises
49

articles from more than 75 key publications including Asiaweek and Far Eastern
Economic Review (ProQuest 2003). ProQuest Computing articles are sourced from
over 260 Information Science and Technology journals including Computerworld,
Info World, PC World (ProQuest 2003) thus ensuring access to relevant KM articles
from the IS school.
Only feature articles (as opposed to commentaries, book reviews, editorials etc) from
periodicals (as opposed to newspapers etc) were included in the acceptable articles
types in an attempt to maximise validity and relevance of empirical material. Only
feature articles were found to contain the necessary depth of analysis and detail of
empirical studies.
3.8.2 Research Software
The use of specialist software tools was particularly critical to add rigour and validity to
this study. The NUD*IST software product is one of the most widely recognised
qualitative research software products available (currently used in over 80 countries
according to the vendor, QSR) and has been used successfully in a number of IS related
research projects in recent years (Cannon 1998; Collins & Caputi 1998; Rotter 1999;
Lau et al 2001). As with this study, the Cannon study involved "making sense" of a
large amount of ~mpirical unstructured textual data.
Efficient and effective use of the right software tools can benefit and enrich any
research project. According to Barry (1998), NUD*IST is particularly strong in
providing structure, project management functions and searching capability. The use of
keyword searches under software control to identify the 1539 potentially useful articles
in the selected databases provided a high degree of rigour to the selection process by
eliminating the possibility of missing potential articles by manually reading the text and
also eliminating initial selection bias.
3.8.3 Validity vs Reliability
Validity is the extent to which the research findings accurately represent what is really
happening in the real world (Hussey and Hussey 1997). This study claims a high level
of validity on the basis of the number of empirical studies used for source data, the
rigorous research procedures used, and the adoption of a hermeneutic paradigm. In this
study, the aim is to gain knowledge and meaning from empirical studies of the
phenomenon of KM and IC evaluation and as such, a high degree of validity is claimed
50

to be maintained. The appropriateness and validity of this interpretive approach is
supported by Schultze and Leidner (2002), who established that research that is part of
the interpretive discourse aims to create a coherent, consensual and unified
representation of what the organizational reality is "actually" like, despite its
complexities and contradictions.
Reliability relates to the degree to which the research findings can be repeated (Hussey
& Hussey 1997) and whilst the selection process used in this study is certainly
repeatable, the source data bases change continuously and the manual review of
abstracts will provide different results depending on who conducts the review. Even if
the study was to be repeated by the author, a different mind-set is likely to have
developed in terms of relevance of articles. High levels of reliability are therefore very
difficult to achieve in qualitative research of this nature. It can be argued however that
low reliability is entirely consistent with high validity if the subject matter is volatile or
subject to differing perspectives or levels (Ratcliff 1995) as is the case with this topic.
3.8.4 Judgement
The first stage review of appropriateness of articles on the basis of relevance to the
research topic required some subjective judgement by manually reading all 1539
abstracts. There was no other convenient way to automate or improve on the reliability
of this process because of the nuances of meaning and context and the range of
disciplines associated with KM as identified in Chapter 2. Furthermore, as no previous
research could be found using this research methodology for this topic, no co
researchers could be approached to verify the rigorousness of the coding.
See Section 5.2 for further discussion on this issue.
51

4. Data Analysis
This chapter identifies and discusses the results from the data analysis phase and covers
findings in relation to data sources, evaluation categories and individual measurement
types and their trends over time and within major geographic regions.
The Chapter structure is depicted as follows:
Data Analysis
I I I I I
Meta-data KM Evaluation Chronological Geographic Analysis Models Analysis Analysis
Categorisation and trends
4.1 Meta-data Analysis
The wide range of journals from which the 220 articles were extracted shows the
pervasiveness and relevance of KM and IC to a variety of disciplines in business,
academia, education, medicine and science in both the private and public sectors.
Appendix B shows the full list of journals from which relevant articles were selected.
Journals were categorised in order to identify the main focus areas from which articles
were selected. Journal categories were established on the basis of keywords in the
journal title rather than on any extensive analysis of the journal contents. For example,
keywords such as "health", "medicine" and "nursing" were categorised as Medical
whilst "computing", "IT" and "database" related journals were categorised as
Information Systems.
The number of articles selected from each journal type in descending order of
occurrences is shown in the table below.
52

81 23
Financial, Accountin 20 Medical 16
12 11 4 8 4
Learnin Or anization/Or anizational Leamin 8 4 8 4
Research 6 3 6 3 5 3
2 1 1 1 1
Table 7: Articles within Journal Category9
From the above table, whilst it can be deduced that the evaluation of KM is
predominantly a management issue with 38% of the total number of articles being
sourced from management oriented journals, the number of articles in the other
disciplines indicates that KM evaluation is far from exclusive to any one, or a narrow
range of disciplines. It is accepted that Management is a very broad category and
includes titles such as management development, small business management, hotel
management, marketing management, project management, business strategy, quality
management, change management and so on, but the point is made that evaluation of
knowledge and knowledge related initiatives have become important considerations in
all aspects of management. Knowledge management, human resource management and
library management have been separated out as discrete journal categories simply to
highlight these as separate specific examples. Different conclusions can obviously be
made by combining or splitting these categories and representing them in different
ways. If IC was to be included in the Financial, Accounting and Economics category
for example, this category would become much more significant at 19% of the total
number of articles.
Journal categories from the above table also indicate a maturing of the KM concept
outside the earlier boundaries and heritages of Information Management. Indications
9 Note that the number ofrelevant articles was reduced from 223 to 220 as explained in section 3.5.
53

from the above table are that KM evaluation is not a significant Information Systems or
Information Technology (IS/IT) issue with only 5% of articles corning from IS/IT
related sources. It was noted that the medical field is showing a more significant
interest in KM evaluation than the IS/IT profession.
4.2 KM Evaluation Models
4.2.1 Categorisation
As described in section 3.6.3, the 43 "free nodes" of evaluation themes constructed in
NUD*IST were consolidated into 12 measurement categories which are described in the
following table.
Customer Capital
Financial Human Capital
Internal Infrastructure
Intellectual Pro e Market Intelli ence Innovation & Creativit Process
Quality
Supplier related Technology
Composite Measures
C
F H
I
IP
M
N
p
Q
s
T
X
customer satisfaction; brand value from customer perspective; customer (including potential customer) perceptions of organizational image and re utation an financial! oriented measure usin dollars as the metric includes individual skills; competence, capability or ability to learn; years of education; hours of training; entrepreneurial spirit; tacit knowledge; leadership; social capital, empowerment, ability to cope with stress, conflict, chan e and turbulence. Organizational culture; explicit knowledge and information bases, knowledge and information transfer infrastructures and systems; structural ca ital; information and knowled e sharin culture. patents; copyright; trade secrets; trademarks; registered brands; intellectual ro e ri hts. any measures associated with competition and the overall market position as o osed to individual customer measures .
new product development; continuous improvement initiatives; innovative abili , ca aci and ro ensi to innovate or create includes decision making practices; effectiveness of operations; knowledge creation processes; productivity improvements; efficiency and effectiveness measures; cycle times; speed of service delivery; measurements of rocess outcome. "fitness for purpose' of the product or service; defect rates; measures of com liance with s ecifications. measures dealing with alliances and partnerships with suppliers.
sophistication of the technology in use; use of or take-up of new technolo ; level of technolo ical maturi . Combination of any of the other categories into a formal framework of inte rated measures
Table 8: KM Evaluation Categories
Each of the 838 individual KM related metrics extracted from the 220 articles were then
allocated to one of these categories. These categories provided the structure for further
analysis.
54

4.2.2 Ranking of Measurement Categories
The number of metrics within each category were charted to arrive at a ranked list of the
relative frequency of use of these categories as used by organizations between 1996 and
2002. This resulted in the following pie chart (Figure 7). The legend relates to the
codes allocated to each of the categories as identified in Table 8 above.
Ranking of KM/IC Measurement Categories
oH F
oP oC
41 • I
49 oM
• N ox • IP oQ
oT 122
oS
Figure 7: Ranking of KM/IC Measurement Categories From Table 8.
This table shows that, over the period 1996 to 2002, Human Capital was the most
commonly used category of measurement for KM followed in descending order of
frequency by Financial, Process, Customer, Internal Infrastructure, Market Intelligence,
Innovation, Composite Measures, Intellectual Property, Quality, Technology and
Supplier Related measures.
The analysis of specific measures within each of these categories is further explored in
the following sub-sections.
4.2.3 Trends in Measurement Categories
By charting the number of measures within each category against each year from 1996
to 2002, some identifiable trends were highlighted. The following Table 9 shows the

results. It was determined that the actual numbers of cases have limited meaning as
they are directly dependent on the number of on-line articles available in the selected
databases which may or may not be representative of the number of real-life cases. The
percentages of each category to the total number of cases for each year were seen to be
more meaningful than the actual numbers of cases and are highlighted in the following
table.
1996 1997 1998 1999 2000 2001 2002 Category # % # % # % # % # % # % # % C 6 7.23 0 17 21.5 18 13.5 24 8.45 11 7.64 5 6.1 F 14 16.9 7 21.2 12 15.2 15 11.3 53 18.7 39 27.1 27 32.9 H 25 30.1 5 15.2 20 25.3 33 24.8 86 30.3 38 26.4 28 34.1 I 1 1.2 1 3.03 2 2.53 7 5.26 18 6.34 11 7.64 9 11 IP 0 6 18.2 3 3.8 3 2.26 10 3.52 1 0.69 0 M 4 4.82 1 3.03 8 10.1 10 7.52 13 4.58 2 1.39 2 2.44 N 1 1.2 2 6.06 3 3.8 10 7.52 15 5.28 6 4.17 0 p 20 24.1 10 30.3 7 8.86 25 18.8 34 12 23 16 3 3.66 Q 5 6.02 1 3.03 1 1.27 4 3.01 9 3.17 1 0.69 0 s 3 3.61 0 0 5 3.76 2 0.7 3 2.08 0 T 0 0 1 1.27 3 2.26 5 1.76 5 3.47 2 2.44 X 4 4.82 0 5 6.33 0 15 5.28 4 2.78 6 7.32 Totals 83 100 33 100 79 100 133 100 284 100 144 100 82 100
Table 9: Trends in measurement categories identified in Table 8.
Table 9 above shows the changing emphasis between the measures over the period 1996
to 2002. Charting the percentages for the 6 most significant categories from this table,
over the period from 1996 to 2002, resulted in the following chart:
Totals 81
167 235 49 23 40 37
122 21 13 16 34
838

Trends in Major KM Measurement Categories
; 35.00 -t------------------------1 G)
~ 30.00 G)
a. 25. 00 --t-----,,d'----~--1/1 G) :i 20. 00 -;------~ Ill m 15. oo -1---- - -----l----&..,---------c,,C,...,.-----*-------,,,,,,.""'-- -----1
E .... 10.00 ---j------J---..li~:----~ ----_.,_.""'----'-'-----l
; 5.oo L~,--__/.~ -=-_::;~J::===~===~_J
1996 1997 1998 1999 2000 2001 2002
Figure 8: Trends in Major Measurement Categories
--+- C
-a- F
H
~ I
~ M _._ p
Table 8, and the graphical representation of data in Figure 8 above, highlight some
significant changes in the use of KM evaluation models between 1996 and 2002.
Customer capital related measures ( code C) show a steady decline in relative use from
21.5% in 1998 to 6.1% in 2002. There was no data for this category in 1997, which
appears to be an anomaly, and no explanation for this could be deduced from the
literature. The decline since 1998 was unexpected given the literature focus in the late
nineties on the importance of customer orientation and its strong relationship to
business performance (Kennedy 1998; Li and Cavusgil 1999; Stivers and Joyce 2000;
Moore et al. 2001; Lenskold 2002). The decline in customer related measures seem to
have been offset to some extent by increases in the frequency of use of Human Capital
(H) and Financial (F) measures in particular since 1998.
Human Capital measures (H) have gained in overall use from 15% in 1997 to 34% in
2002. No explanation can be offered for the fall from 30% in 1996 to 15% in 1997.
Once again 1997 seems to be an aberration in the data.
Financial measures (F) were fairly high at 17% in 1996 but then fell for some reason
between 1997 and 1999 before growing strongly again in use to achieve an even more
significant 34% in 2002. This was unexpe~d given the criticism that financial
measures have received in connection with KM and IC since the mid nineties (Ahmed
1999; Kaye and Anderson 1999; Wurzburg 1998).

Internal infrastructure measures (I) have grown steadily from 1 % in 1996 to 11 % in
2002. This may be due to the increasing focus on explicit information and knowledge
bases as assets. The other category that appears to be losing significant favour is the
Process (P) related category with 30% in 1997 falling to 3.6% in 2002. Measures of
Market Intelligence (M) have remained fairly stable between 4% and 10% over the
period but with a notable downward trend since 1998 consistent with the downward
trend in the category dealing with customer related measures to which it is closely
related.
The other measurement categories of Intellectual Property, Innovation, Quality,
Suppliers and Technology were not charted in Figure 8 because of low data numbers but
are nevertheless significant. Knowledge measures dealing with Intellectual Property
(IP) seem to have lost ground significantly from 18% in 1996 to nil in 2002. This may
suggest a re-focussing away from the more tangible forms of patent oriented measures
to the more human capital type measures. Innovation and creativity measures (N) were
low but relatively stable over the period with 6% in 1996 falling only slightly to 4% in
2001 but then falling inexplicably to zero in 2002. This was unexpected as the literature
over this period claimed that models for these types of measures were emerging (Bobic
et al. 1999; Bain et al. 2001; Kleysen and Street 2001; Frigo 2002; Stivers and Joyce
2000).
Quality (Q) related measures fell from 6% in 1996 to zero in 2002. This may have
resulted from increasing pressures on organizations to implement more comprehensive
measurement systems than ones just based on quality alone. Consolidated measures (X)
were on the increase, but only slightly, rising from 4.8% in 1996 to 7.3% in 2002.
There were very few occurrences on which to make any conclusive judgements about
the composite measurement category but a tentative suggestion that this type of model
is gaining in acceptance and use, would seem to be justified.
Cases of Supplier (S) and Technology (T) related measures were insignificant overall.
No particular trends could be identified from the available data and these were
eliminated from further analysis; thus leaving ten major categories from the original
twelve shown in Table 8.
4.2.4 Metrics Within KM Evaluation Categories
Within each measurement category there was considerable variability in precisely what
was being measured. In some cases, identifying precisely what was being measured
58

was not clear until more detailed analysis was conducted into how the measurement was
being conducted. In some cases the category had to be changed when what was being
measured was more clearly understood. For example, although an article may have
stated that it was the knowledge oriented culture of the organization that was being
measured (initially placing the case in the "I" or Internal Infrastructure category) it was
not until it was explained that it was tacit knowledge sharing that was actually being
measured that the category needed to be changed to "H'' for Human Capital.
Appendix E shows the full list of measures in category and date order showing,
wherever applicable, a column describing how the measures were conducted. Appendix
E shows for example, customer related measures including customer satisfaction,
customer retention, customer perceptions and orientations and so on, as examples of
specific metrics related to customers.
4.3 Chronological Analysis
This section shows the chronological development of the ten previously identified
categories of KM evaluation methods from 1996 to 2002 and the factors impacting KM
measurement methods under these categories. In order to avoid tedious repetition, it
may be assumed that discussions in the following sub-sections refer directly or
indirectly to the evaluation of knowledge oriented organizational learning or
performance improvement initiatives as per the definition of KM in 2.6.
4.3.1 1996
The main elements of KM evaluation models that prevailed in 1996 were an increasing
awareness of the importance of customer related (external) measures in conjunction
with internal financial, internal infrastructure and process oriented measures. A wide
variety of financial measures were being used despite the failure of traditional
accounting principles for intangible assets being well recognized. Very basic measures
of human capital were in place and whilst organizational culture was seen as being
conducive to organizational learning, few methods existed to evaluate it. Interest was
also being shown in innovation as an indicator of effective use of knowledge but again,
apart from counting patents, no effective methods were available to evaluate it. Process
measures tended to focus on quantitative elements and the Balanced Scorecard was the
main form of composite measurement method in use.
59

Customer (C)
Examples of customer related measures used in knowledge related initiatives in 1996
included studies by Davis (1996) who established that customer satisfaction was the top
priority for large organizations such as General Electric (GE). Customer service levels
at GE were monitored on a daily basis which showed a particularly high level of
reliance on this type of measure for large internationally focussed companies like GE at
the time.
Chenhall (1996) quoted a case of a large furniture manufacturer who stressed the
importance of measures that were supportive of efforts to develop a heightened
awareness (tacit knowledge) within the organization of customer needs and rapid
response times. Managers from seven high performing manufacturing divisions noted
that their flexibility was enhanced by learning about the changing needs of customers
and how these needs impacted manufacturing operations (Chenhall 1996). This was an
example of using a de facto or surrogate measure (customer satisfaction) to provide
indicators of success or otherwise in another parameter (level of knowledge regarding
manufacturing effectiveness).
The National Call Management Centre (NCMC) at IBM UK used an external
independent organization to measure customer satisfaction (Mortlock 1996). This
indicated the high profile that customer satisfaction measurement had at the time to
provide evidence of organizational learning and performance as well as the importance
of the perceived credibility of the measurement methodology by virtue of using an
external consultant to conduct the measure rather than conducting it internally.
Financial (F)
A wide variety of financial measures were encountered in 1996 in connection with
KMis with no particular preferences being evident. The evaluation of organizational
and management performance involved the use of budgetary controls and the
development of financial indicators such as return on investment, sales growth, cost
reductions and the like.
Accounting systems were regarded as a legacy of the industrial age and that they had
developed to support a system which hitherto had been labour and capital intensive.
Despite quite high reliance on financial measures, the recognition of the failure of these
traditional accounting systems in the knowledge society was widely recognised even at
this early stage of KM evaluation development. It appeared that conventional aggregate
financial indicators were becoming inappropriate in modern manufacturing settings
60

which seemed to be relying more and more heavily on knowledge and innovation as
major inputs to production. Whilst many organizations appeared to believe that the
traditional accounting systems did not provide the required tools for measurement in the
knowledge domain 10, few had any idea of what was needed to improve the measurement
and reporting process.
Human Capital (H)
Although it was obvious at the time that employees acquire useful skills and knowledge
that the organization could and should capitalize on, it was not obvious that these skills
and knowledge were a form of capital that had grown in Western societies at a much
faster rate than conventional (nonhuman) capital (Sweetland 1996).
Having accepted the principles of Organization Leaming (OL) as a KMI in section 2.9,
it was identified from the data that building an environment where learning and
education happen as a matter of course had the potential to directly affect the bottom
line. A study by the University of Michigan and Hay Management Consultants was
quoted which found that organizations providing a week or more of educational
opportunities for their employees each year had significantly higher profits than those
companies which chose not to do so (Francis and Mazany 1996). Better educated
workers were found to set more challenging goals for themselves and those with longer
periods of employment with the same employer would be less inclined to leave, thus
enhancing human capital for the organization (Weisberg 1996). These were examples
of quantitative measures of learning (days of training and years of education) that were
seen to lead to identifiable organizational benefits.
Qualitative measures of training effectiveness were also used in 1996. It was generally
accepted that training as an element of OL (and thus KM) was concerned with
equipping managers with the requisite knowledge, skills and also attitudes, as
determined by job and role requirements, for effective job performance (Loan-Clarke
1996). This generated pressure to develop effective evaluation models to determine the
effectiveness of training programs. Although such model had been around for a number
of years prior to 1996, they appeared to be gaining considerable interest around this
time as a result of this growing pressure. Kirkpatrick's model ( 1967) for example (as
cited in Loan-Clarke 1996) advocated the need to measure the effectiveness of training
at four different levels, reactions, learning, job behaviour and organizational change.
Major surveys of evaluation activity indicated that Kirkpatrick's model was only being
applied to any great extent at the first level, that of the individual trainee perceptions
10 such as the examples offered io Iable 1
61

and reactions. In the UK, the "Training in Britain" survey conducted in 1989, found
that 90 per cent of organizations used this reaction level of evaluation, but only 19 per
cent attempted to evaluate training in terms of benefits to the organization (Loan-Clarke
1996).
Some researchers examined the relationship between training and productivity, and
discovered that measures of training effectiveness were largely subjective up to this
time. Black and Lynch (1996) for example, recognized that although the main problem
with subjective measures of productivity was that they were not comparable across
firms or even within firms over time, they concluded that employer provided training
raised the subjective productivity measure by almost sixteen percent. This type of
research seemed to have the effect of increasing the acceptability of subjective measures
in general, which were only beginning to be accepted at this time.
Measurement of the ability to learn and change was also seen as a way of tracking how
well an organization was able to maintain its competitive advantage (Robinson and
Kleiner 1996). At United Airlines "management by walking around" was used to foster
informal information exchange, which led to more productive use of existing human
capital (Robinson and Kleiner 1996).
An example of the application of human capital in "excellent" companies was the
concept of the champion who was seen to persevere and fight for new ideas or
innovations and drive development of new products (Robinson and Kleiner 1996). It
was recognized however, that just generating new ideas was not enough for the
knowledge driven organization - champions were also needed to drive and support the
process to implement the new ideas and to be instrumental in the critically important
process of evaluation of the initiative.
The 360-degree feedback process was gaining interest in 1996 and offered an effective
tool for performance measurement facilitation. This model created a mirror that
measured colleagues' perceptions of performance. Edwards ( 1996) found that nothing
motivated human behaviour more than the esteem of colleagues and this information
was given high credibility. The 360-degree feedback process supports continuous
learning (a KMI) because it not only targeted developmental areas but also sustained
interest and motivation to improve in those areas. Some organizations like Florida
Power and Light, Federal Express, The Royal Bank of Canada, and IBM used variations
of this model for creating very effective succession planning processes (Edwards 1996).
These factors were recognized as important elements in retaining human capital. It was
62

discovered that the 360 degree feedback model made better performance possible
because it enhanced information and knowledge quality, provided specific performance
feedback, targeted developmental areas, provided strong motivation, facilitated
performance improvement, allowed measurement of training effectiveness, enhanced
self knowledge, supported continuous learning and improved the reliability and validity
of performance information (Edwards 1996).
One of the more unusual aspects of human capital measurement that was quoted in 1996
was that of assessing the ability of employees to cope with stress and pressure. Zea et
al. (1996) quoted the Behavioural Attributes of Psychosocial Competence scale to
measure competent coping. This showed some diversity of thinking in human capital
evaluation models that were being considered at the time.
Internal Infrastructure (I)
Robinson and Kleiner ( 1996) stressed the value of IC to human resource development in
that once meaningful measures had been developed for IC (and thus KM), it was found
to be possible to measure the effectiveness of programmes designed to increase the
amount of IC. The focus on the amount of knowledge and IC that existed in the
organization as opposed to its effective use was prevalent at the time.
The IDEO company deliberately created a culture dedicated to innovation by hiring the
right people, banning bureaucracy, using mentors and small teams and adopting
environments conducive to idea cross-fertilization (Robinson and Kleiner 1996). This
was an example of creating the right environment within which knowledge creation
could be nurtured rather than trying to value knowledge itself. Another example was
provided by Kaplan and Aronoff ( 1996) who found that no measurement system had
been devised prior to 1996 to calculate the productivity benefits of a high-quality office
environment, despite the fact that many organizations were sufficiently convinced of the
importance of the work setting and had invested heavily in it. Steelcase Corporation,
Chrysler Corporation, and Digital Equipment were used as examples of organizations
that had all built multi-million dollar facilities designed around the concept of providing
work settings tailored to the tasks of the occupants in the form of being conducive to
learning and collaboration (Kaplan and Aronoff 1996). Although there were no studies
that could reliably predict the returns on such facility investments, there was sufficient
compelling (albeit subjective and anecdotal) evidence to support the notion that a better
work environment promoted better organizational performance.
63
Intellectual Property (IP)
No data.
Market Intelligence (M)
Chenhall ( 1996) quoted a case study of an electronics firm which found that being
evaluated on factors such as how often they were first to market with new products and
the time it took to design new products helped them develop a culture of fast response.
This was an example of using Market Intelligence metrics to improve the organizational
learning and innovative culture.
A report by the Institute of Management stressed the need for organizations to make the
link between investment in management development (learning) and long-term
competitiveness (Davis 1996). Although this association between competitiveness and
learning was accepted, the Institute of Management did not specify how or to what
extent investment in learning improved market position.
It was found that firms that had higher skill levels were more highly valued in the
marketplace provided they could use this capital to create value (Robinson and Kleiner
1996). Merger and acquisition specialists in 1996 regularly put a market value on this
know-how to the extent that it provided a competitive advantage (Robinson and Kleiner
1996), but once again, whilst a connection was established between an element of IC
(skill level in this case) and market value, no guidelines were available for organizations
to calculate the strength of this connection.
Another useful measure was found to be the ability of organizations and their members
to learn and adapt to a changing market environment (Robinson and Kleiner 1996).
Innovation (N)
Whilst there was a growing interest in innovation in 1996 that was being increasingly
highly regarded as an intellectual asset, measures tended to focus on the impact of
innovation on the organization rather than the value of innovation itself. A case in
point was GE who had an interesting term for innovation, which they called "Vitality"
which was a measure of the number of new products that had been introduced within
the previous five years (Davis 1996). Increasing emphasis was being given to
innovation as a significant component of "Balanced" corporate measurement systems
which integrated customer satisfaction, process quality, innovation and financial
64

performance11 (Davis 1996). Justman and Mehrez (1996) found that many firms
accumulated knowledge over time by investing resources into projects designed
explicitly to improve innovation and innovative capacity.
According to Robinson and Kleiner ( 1996) some firms were better at value creation
than others because of their IC in the form of process development, know-how,
problem-solving skills or ability to innovate. The measure of innovative activity in
these cases was specified as the level of value that the innovative initiative generated for
the firm, but no examples or guidelines were offered in the literature to explain how this
cause and effect relationship should be approached or evaluated. IDEO, a contract
R&D firm mentioned previously under Internal Infrastructure, was an examplar of a
firm that considered innovation to be its greatest strength and created a culture
dedicated to innovation (Robinson and Kleiner 1996) but again this example did not
explain how to measure these attributes of innovation.
No models appeared to be available at the time to measure the level of investment
required in innovative capacity, the effectiveness of the process to generate the
innovative capacity or in the effectiveness of outcomes derived from innovative
initiatives.
Process (P)
The BPR of the early nineties had the effect of moving organizations from hierarchical
to process driven modes of operation (Mortlock 1996). This had a significant impact on
the evaluation models in use at the time and was instrumental in the development of
process based KM measurement models. An example used by GE was a type of root
cause analysis which, on the surface, appeared to be a knowledge acquisition
endeavour, but proved to be a process that focussed on the effective utilization of labour
resources. The primary scorecard measures that were targeted were equipment
downtime, daily production rates, and overtime usage (Davis 1996) and process cycle
and setup times (Chenhall 1996). These were clearly quantitative measures with little
learning component. The only knowledge component in these initiatives was that the
causes of these problems were identified and tracked and this "knowledge" was
recorded in a variety of information and knowledge bases. This indicated that
measurement models were more focussed on the outcomes of processes rather than on
the efficiency and effectiveness of the process itself.
11 See Composite Measures in 1996 for further discussions.
65

Kruzner and Trollinger (1996) established that, as companies concentrated on core
competencies (a KMI as identified in 2.9), performance of key operational processes
became paramount. Performance measurement was the means for making informed
knowledge-based decisions about important business issues such as minimizing
operational costs, manufacturing the right mix of products, identifying the most
profitable distribution channels and optimising the utilization of assets (Kruzner and
Trollinger 1996). Measuring performance was also a means of identifying and
addressing areas where a company needed to make the kinds of organizational and
process improvements that could develop, sustain, and amplify competitive advantage
over the long haul such as using new knowledge-harvesting capabilities to
systematically determine what products to produce, what assets to deploy, and what
processes to change for long-term competitive advantage (Kruzner and Trollinger
1996). The generation of actionable organizational knowledge was found to result from
leveraging this process performance oriented data.
Measuring the effectiveness of teamwork processes was popular in 1996. Four
measurement techniques which sought to capture in different ways the effectiveness of
workshops and thus contribute to the organization knowledge base were described as:
meeting defined workshop objectives, measuring change in team functioning,
participant evaluation, and job performance (Francis and Mazany 1996). It was
recognized that valuable knowledge about the organization could be held at a number of
different levels within and external to the organization by individuals, teams, groups,
external consultants and even governments. Evaluation of external knowledge
generation processes however was not conducted.
Feedback was seen to be advantageous to developing an understanding of decision
making processes, identifying problems and opportunities for improvements and
integrating both market and cost-based strategic priorities (Chenhall 1996). Feedback
from explicit measures of the manufacturing process were found to assist in clarifying
goals and expectations and when they formed part of the performance evaluation of
managers, they would assist in motivating managers to achieve objectives.
Quality (Q)
IBM in the UK used the Baldrige self-assessment quality management and evaluation
model to create an image and culture of being a quality organization (Mortlock 1996).
Self-assessment was an important component of this quality management system and
was gaining in popularity at the time as a means for an organization to learn about itself.
Measuring quality was also being recognised as an opportunity to learn about internal
66

processes and customers' needs as well as an opportunity to improve production
processes.
Parallels between commercial and medical organizations were identified by Miller and
Adam (1996) who found that measuring quality and productivity was a major issue in
the healthcare industry since traditional accounting practice did not reflect the
complexity of the actual organizational constructs.
Composite Measures (X)
GE was an early and keen user of the Balanced Scorecard (BSC) as a means of
providing a holistic picture of its performance (Davis 1996). GE's approach to the use
of the BSC integrated customer satisfaction, process quality, innovation and financial
performance and it was seen to be essential that the scorecard be "decomposed" into
measures that were meaningful to lower level employees at the shopfloor level (Davis
1996). This led to the development of a set of measures that were tailored specifically to
different employee groups to maximise understanding and action by those who were
accountable for the performance of the function being measured. Generally, financial
objectives at GE took precedence at the top, while production volume, quality and
service objectives had the highest priority at the frontline employee level. This action
highlighted the importance of communication of relevant understandable performance
results to the most appropriate levels within the organization.
OXY USA and other organizations (such as McDonnell-Douglas, Intel, and American
Airlines) used multi-source assessment as a type of composite measurement system that
provided examples of targeted employee development designed to enhance major
performance areas with the highest profile needs (Edwards 1996). Other examples such
as the US Department of Energy and Motorola began using composite type
measurement models to assess the effectiveness of leadership development and
performance management initiatives (Edwards 1996). Users at AlliedSignal, Meridian
Oil and DuPont noted for example that the 360-degree feedback model provided better
information than the existing performance appraisal processes that prevailed at the time
(Edwards 1996).
4.3.2 1997
Number of patents, sales, profits and expenditure on R&D were the main financially
based measures for organizational innovation. Management performance, leadership
development, employee attitudes, collaboration and teamwork effectiveness were
67

beginning to be measured in connection with KMis and direct relationships between
quality improvement and financial improvement were being established.
Customer (C)
No data.
Financial (F)
Financial expenditures on research and development (R&D) as a percentage of GDP
were used as measures of competitiveness and as indicators to the creation of
technology that contributed to innovation and the development of successful products in
the global marketplace (Leal and Powers 1997). Investment in IT, which was fairly
easy to quantify, was used as a convenient surrogate measure for innovative capability
(Leal and Powers 1997). However, the strength of the correlation between IT
investment and innovative capability was not established.
Financial measures of KMis in 1997 tended to relate to measuring the effectiveness of
quality improvement programs and included mostly surrogate metrics such as net profit
as a percentage of sales, return-on-assets for the past year and for the average of the past
three years, as well as sales growth as an average of the past three years (Adam, Corbett
et al. 1997).
Human Capital (H)
Jubb and Robotham ( 1997) examined the performance of managers in the workplace
prior to 1997 and concluded that there was no single measure that was capable, by itself,
of assessing their performance. Abdul-Gader (1997) found that knowledge workers'
computer experience, typing skills, number of communication partners, and perceived
voluntariness affected their level of satisfaction, productivity, and use of systems,
thereby highlighting the importance of human perceptions and attitudes regarding the
efficient and effective use of organizational tools. Measuring these employee
perceptions and attitudes was being recognized as a challenge but a necessary and
worthwhile KMI evaluation activity.
The University of San Diego School of Nursing conducted a continuous 4-year
evaluation cycle which was regarded as a major component of its learning objective
(Clark 1997). The curriculum committee and the School of Nursing Faculty identified
the evaluative questions to be addressed, delineated the standards to be used, and
specified the sources and modes of data collection to answer the questions posed (Clark
1997). Data regarding program performance were then compared to the established
68

standards, discrepancies were identified, and recommendations for eliminating
discrepancies jointly developed by the evaluator and the client (Clark 1997).
Internal Infrastructure (I)
Organizations were introducing computer mediated communication systems (CMCS) to
their employees as means of improving office productivity and communications (Abdul
Gader 1997) and therefore learning. Such systems included messaging and "teamware"
and formed the means by which employees could collaborate and work together.
Measuring degrees of collaboration between employees presented another challenge but
was considered to be necessary in order to measure the effectiveness of CMC systems
that were becoming to be regarded as "knowledge enabling tools".
Intellectual Property (IP)
Patents were seen to be proxy measures of the output of R&D activities in the form of
inventions and, as well as other measures of innovative activity, were found by Leal and
Powers (1997) to be referenced in the literature as popular surrogates for innovation in
society.
Market Intelligence (M)
No data.
Innovation (N)
No data.
Process (P)
Insufficient detail was provided in the cases found for meaningful analysis.
Quality (Q)
Studies suggested a relationship between quality improvement and financial
improvement (Adam et al. 1997). The major factors that were found to influence
quality were the organization's knowledge of quality management and management's
involvement with a comprehensive approach to improve quality which was
characterized by customer focus (Category C), a continuous improvement philosophy
(Category N) and teamwork (Category H).
The popular statistical analysis and problem solving approach to quality management
prior to 1997 was starting to give way to the use of management processes, including a
spiral of continuous improvement and quality project teams (Adam et al. 1997). In
69

addition, behavioural approaches and management attitudes were beginning to be
recognized as crucial to quality improvement and thus needed to be evaluated somehow.
Adam et al. (1997) established that the literature at the time suggested that many
productivity improvement techniques and measurement systems were used in tandem
with quality improvement approaches to achieve improved operating performance.
Items such as traditional industrial engineering process analyses and work
measurement, inventory reduction, employee selection, decentralizing decision making,
and providing objective feedback on performance were gaining in popularity with
performance quality being influenced by obtaining knowledge about quality
improvement, focusing on customers, and management involvement (Adam et al. 1997).
Composite Measures (X)
No data.
4.3.3 1998
Human Capital based measures emerged as the most dominant metrics for KM/IC
evaluation during 1998, marginally ahead of customer related measures whilst financial
and process related measures seemed to be losing favour. It was recognized that new
measurement models were necessary for intangible assets to supplement rather than
replace existing measurement systems. Work experience, training and employee
satisfaction and attitudes were popular focal points for human capital measures.
Employee empowerment was recognized as a form of IC and skills and competencies
were being recognized. Image and reputation were valued as well as the degree of
company uniqueness in the market place. The value of brands was appearing on
balance sheets and organizational learning was being directly connected to financial
results. A mixture of quantitative and qualitative approaches to KM measurement was
emerging.
Customer (C)
Organizations in 1998 were found to be just as likely to have stated and measured KM
objectives covering customer relations and people-related issues as they were to report
on profit and profitability improvements (Thompson 1998). This is supported by the
graph in Figure 8 in section 4.2.3. Thompson recognized the apparent trade-off between
customer and financial orientation in relation to measuring KMis. Appelbaum and
Reichart ( 1998) also recognised that managers needed a balanced presentation of both
financial and operational measures with operational measures focusing on customer
70

satisfaction, internal processes, and the organization's innovation and improvement
activities.
Frequency of repeat orders was seen as an appropriate objective measure or indicator of
customer satisfaction and whilst Kennedy (1998) believed that it was difficult to prove
causal impacts on company performance, he also maintained that customer attitudes
could be successfully measured with polls, questionnaires and surveys over time.
Attempts were also being made at the time to judge the extent to which customer
satisfaction was growing over time (Kennedy 1998).
A well-recognised and positive public image and reputation was found to improve the
admiration rankings; and, correspondingly, linkage with a major corporate mistake or
mishandled crisis had a negative effect, especially if social and ethical responsibilities
were involved (Thompson 1998). It was noted for example, that Microsoft, General
Electric and Coca-Cola, had highly respected strategic leaders and this in itself was seen
to enhance the IC of these organizations (Thompson 1998). There were no models
however to evaluate this component of IC, just a binary perception of whether the
organization was seen to be respected or not by their respective existing and potential
customer bases. It was found that corporate reputations were significant components of
IC that created economic value, and that image, because it embodied the company's
uniqueness, was a key competitive tool (Thompson 1998).
Figure 8 shows that 1998 was the peak year for customer related measures of KM while
human capital measures were beginning their significant relative growth path,
apparently in preference to financial measures at the time. Although Kennedy (1998)
found strong associations between strategies and tactics associated with better KM and a
variety of measures of company performance such as customer satisfaction, he found
the signs of progress with respect to more systematic management of knowledge less
than encouraging.
Financial (F)
Following on from the pressures encountered in 1996, the IC school continued to exert
pressure on existing accounting and measurement practices. The gradual shift in labour
categories for example, called into question the effectiveness of historical cost-based
measures in an information-intensive environment (Kennedy 1998).
A plethora of financial performance measures were used to help evaluate the relative
success and progress of a business. These measures included, for example, ratios such
71

as return on capital employed (ROCE) and return on shareholders' funds (ROSHF),
earnings per share (EPS), the share price itself and the price to earnings (PE) ratio
(Thompson 1998). There was no suggestion that financial measures should become less
important, but it was generally accepted that new models were necessary in order to
evaluate intellectual assets with a view to supplementing and augmenting rather than
replacing existing financial measures. Although still largely financially based,
Economic Value Add (EVA), which compares a company's after-tax operating profits
with its cost of capital, was emerging as a valid measure for the new economy.
Furthermore, companies were increasingly including their brands as balance sheet assets
and were, often for the first time, attempting to place a value on them (Thompson 1998).
A major barrier to the development of new models at the time was that, although most
practitioners argued that the point of metrics was to provide a framework to measure the
success or failure of a KM initiative, for senior executives, the reality was that
measurement systems needed to offer the means to justify the expenditure of resources
in the first instance (Skyrme 1998). It was becoming obvious that different stakeholders
needed different measures.
Human Capital (H)
Most human capital studies measured work experience in terms of tenure, defined as
years in a job, years in an organization, or years in a position or the number of times an
individual had completed a certain task or operation (Tesluk and Jacobs 1998). New
measurement models however were emerging to assess skills and competencies of
workers; technology-assisted communication links were being developed that aimed to
improve feedback and communication across operating divisions and across hierarchical
boundaries (Wurzburg 1998). Technology assisted communication tools were seen to
enhance the collaborative work environment and thus contribute to teamwork and
innovation (Bal, Wilding et al. 1999).
Between 1995 and 1998, all specialty chemical division employees at Honeywell
received 40 hours of annual training in the use of a Six Sigma continuous improvement
process (Harrold 2000). The result was that productivity improved 4.7% annually and
added $2 billion in measured savings to Honeywell's bottom line (Harrold 2000). With
respect to the more qualitative components, studies on managerial development found
that certain types of experiences, such as assignments that required change
implementation or involved a high level of responsibility were related to learning the
skills and acquiring the knowledge and insights that were critical for effective executive
performance (Tesluk and Jacobs 1998). Human capital and its impact on organizational
72
performance was tending towards a mixture of quantitative and qualitative measures
that were seen to be more visible than in the case of financial measures alone.
A highly qualitative KM evaluation example from the medical profession recognized
that three behaviours were required on the part of clinicians in order to enhance
individual empowerment and the provision of effective healthcare: ability to evaluate
one's own knowledge and skills for practice, an awareness of resources available for
development of new competencies for practice, and a willingness to engage in this self
assessment (Oermann 1998). This approach closely matched Senge's (1990) disciplines
of personal mastery and mental models in connection with learning organizations.
Adding weight to the qualitative argument for KM evaluation, Thompson (1998),
established that satisfied employees were productive, and productive employees were
essential for financial success. He also suggested, on the basis of empirical research,
that employee satisfaction depended on compensation schemes and rewards, the culture
of the organization, the prevailing style of management and job design and
responsibility. Organizational culture and management style were common themes in
the literature that were seen to impact the organization's approach to knowledge itself,
its management and its measurement.
Internal Infrastructure (I)
A 1998 conference on creating and leveraging IC reported that most corporate
initiatives to manage IC were focused on specific projects, the most common of which
deployed technology to share and leverage knowledge and best practices (Pfeffer and
Sutton 1999). Much of this knowledge and IC was in the form of facts, statistics,
canned presentations, stock of knowledge, the number of patents, the compilation of
skills inventories, and knowledge captured on overheads or reports and made available
over some form of groupware (Pfeffer and Sutton 1999). This explicit knowledge is
owned by the organization and thus forms part of its internal infrastructure.
Whilst there was increasing recognition that organizations needed to learn how to learn,
Appelbaum and Reichart ( 1998) found that it was difficult to find examples of true
learning organizations. Skip LeFauve was president of the Saturn project for much of
its history and was in charge of the General Motors University, the intention of which
was to take the lessons from the Saturn project and the best practices and knowledge
from throughout the company and diffuse them throughout the organization (Pfeffer and
Sutton 1999). Dissemination of best practice was becoming a common objective for
73

KM projects but as with other examples, the evaluation of the effectiveness of such
projects created a major measurement challenge.
Intellectual Property (IP)
Wurzburg ( 1998) suggested that there was substantial anecdotal evidence of companies
adopting strategies and tactics that included more systematic management and
measurement of intellectual property such as patents and copyrights. However, this
seemed to contradict the results in Table 9 in section 4.2.3 which shows IP at only 3.8%
of KM measurement at the time and on a downward trend.
Market Intelligence (M)
Appiah-Adu and Singh (1998) established a positive correlation between market
orientation and innovation12 by explaining that the relevance of innovative activity by
an organization is a reflection of the transformation of modem market environments in
which new product development and differentiation have become important aspects of
the business development of many firms. Regardless of whether market related metrics
were used to value innovative activity as an element of IC or to evaluate an innovation
generation activity as a KMI, they included measures of organizational competitive
intensity and market dynamism (Appiah-Adu and Singh 1998), as well as market share
and share price (Thompson 1998).
Understanding the competitive environment was becoming an important KM initiative
by virtue of the ever increasing market pressures imposed by a global economy and its
organizational learning perspective. Appiah-Adu and Singh (1998) found market related
metrics that enhanced the organizational knowledge base by evaluating the threats
posed by a business environment, as well as the behaviour and the ability of competitors
to be distinctive. An evaluation method for market awareness was implemented by
examining business performance over a three-year period relative to the main
competition, using new product success rate, sales growth and Return on Investment
(ROI) (Appiah-Adu and Singh 1998).
Innovation (N)
Innovation as a component of an organization's IC was the most important factor for
organizational growth (Thompson 1998). Innovation, supported by learning, was seen
to underpin customer care and service, and while it was found to be difficult to measure
objectively, it was also recognised that attempts could be made to judge the level of
12 Note the connection between innovation and KM in section 2.9.
74

innovative activity within the organization and the extent to which it was growing over.
a period of time (Thompson 1998).
Appiah-Adu and Singh (1998) found that a high degree of emphasis on innovativeness
tended to be linked with a higher level of customer orientation because the commitment
to innovation forced a firm to become externally focused and thus, more customer
oriented. This customer orientation was supported in this study by a high level of
customer oriented measurement models that were in use in 1998 but was not supported
by a correspondingly high level of innovation based metrics. The correlation between
customer orientation and innovativeness claimed by Appiah-Adu and Singh (1998) was
thus not supported by the findings in this study.
Process (P)
Process measurements were being established for all the important processes in the
company. According to Eskildsen (1998), when process changes were suggested, all
the relevant people were involved, knowledge and experience on "best practice" was
shared with all colleagues in the company and the company motivated employees to be
innovative in their work. Eskildsen however, also believed that goal setting and
performance evaluation were weaknesses as there were insufficient process
measurements available at the time. This is supported by Table 9 which shows a
significant reduction in the use of process oriented measures in 1998 compared to the
previous two years, perhaps in recognition of the fact that process based measures had
not moved with changes in the knowledge based economy.
Quality (Q)
No data.
Composite Measures (X)
It was well understood in many large organizations at the time that no single measure
could provide a clear performance target or could focus attention on all the critical areas
of business (Appelbaum and Reichart 1998). The trend towards using a "balanced
scorecard" approach recognizing the emerging importance of non-financial measures of
KMls such as organizational learning programs, was gaining momentum. Organizations
that were able to create and use a set of measures that tied financial results to their
learning management activities seemed to be coming out ahead of others according to
Appelbaum and Reichart (1998). It was recognized that operational measures provided
the drivers of future financial performance and that they should focus on a combination
75

of customer satisfaction, internal processes, and the organization's innovation and
improvement activities (Appelbaum and Reichart 1998).
4.3.4 1999
Evidence was emerging of organizations jumping on the Organizational Learning and
KM "bandwagons" without a clear understanding of what was involved or how to
measure the effectiveness of new knowledge oriented initiatives. More effective
learning about customers however, was becoming an important element of customer
satisfaction surveys. Sales, profits and Return on Investment (ROI) were the main
financial measures for KM whilst employee retention, knowledge and leadership skills
and effectiveness of mentoring programs were being implemented under human capital
evaluation. Generative rather than adaptive learning was being valued and measures of
organizational culture were being developed. Knowledge about patents rather than just
the number or value of patents was becoming valuable and the effectiveness of
knowledge transfer mechanisms was studied. Measures to assess the degree of market
orientation of the firm resulting from KM initiatives were emerging.
Customer (C)
Li and Cavusgil ( 1999) established that most measures of market orientation prior to
1999 were more reflective of cultural norms or customer satisfaction using examples
such as, customer commitment, creating customer value, measuring customer
satisfaction, and after-sales service. Learning about customers in 1999 generated
knowledge that allowed firms to explore innovation opportunities arising from
emerging market demand and reduced potential risks of misfitting customer needs (Li
and Cavusgil 1999). Measures prior to 1999 tended to examine only one aspect of
customer learning, that of information acquisition, which whilst necessary, only
focussea on a narrow perspective of KM. Other aspects, such as the value of
information processing, were not evaluated (Li and Cavusgil 1999). Learning from
competitors and assessing the contributions of this initiative to the organization was
recognized as being just as important as learning from customers.
Financial (F)
The Department of Trade and Industry (DTI) in Victoria Australia, attempted to
prove the relationship between profitability and use of business expertise as part
of their Continuous Improvement initiatives but found this to be an extremely
complex and difficult exercise (Bryson, Daniels et al. 1999). Other organizations
were also experimenting with intangible measurement models but few seemed to
76

be able to convert these experimental efforts into sustainable workable models
(Mohanty and Deshmukh 1999; Pfeffer and Sutton 1999). This failure and
disillusionment may have contributed to financial measurement models for
intellectual assets regaining some of the ground that was lost in the years prior to
199913•
Bryson, et al. (1999) conducted a study to measure the effectiveness of external
consultants which was seen to be a popular means of "buying" external knowledge in
order to enhance IC. The measurable organizational impacts of this study took three
years to develop. This highlighted another major barrier to KM evaluation in the form
of long lead times between investment in relevant initiatives and the ability to identify
and measure their results. Bryson, et al. (1999) identified that the most important
change to occur in the company being studied was the one which they felt could not be
measured; it was now open and receptive to new ideas and outside influences and thus
enhanced the environment within which knowledge could be generated, disseminated
and used. As part of their implied KMI, the company was actively looking for ways to
improve, as well as trying to develop new products by listening to its customers as well
as trying to learn from its competitors.
Human Capital (H)
A series of studies prior to 1999 had theoretically proposed, but not empirically
demonstrated, that a firm's learning orientation was likely to indirectly affect
organizational performance by improving the quality of its market-oriented behaviours
and directly influencing organizational performance by facilitating the type of
generative learning that led to innovations in products, procedures, and systems (Baker
and Sinkula 1999). Increasing interest was being shown in how an organization learns
through its employees.
Freeman ( 1999) found that formal performance measures for staff were tied to the level
and quality of participation and that the lack of formal performance metrics was largely
due to the perceived difficulty in quantifying the ongoing effectiveness of the
collaboration process. Whilst on the one hand attempts were being made to adapt
existing quantitative measures, others were experimenting with new qualitative
measures.
Shaw et al. ( 1999) examined levels 2, 3, and 4 of Kirkpatrick's training evaluation
framework mentioned in 4.3.1, where the aims of training evaluation included assessing
13 See Table 9 sectiao 4 2 3
77

whether a change in learning or behaviour had occurred; whether the change could be
attributed to the training rather than to other causes; and whether the magnitude of the
change was worth the effort and expenditure of providing the training. Shaw et al found
that determining whether a change had occurred normally required both a pretest and a
posttest, and that examples of effective implementation of these had been extremely rare
in assessing the impact of organizational behaviour teaching methods up to that time.
As also established by Loan-Clarke in 1996, the most common assessment of training
took the form of the simpler approach of assessing self-reported proficiency (learning
criteria) at the start and end of the course (Shaw et al. 1999). Little appeared to have
changed in measuring the effectiveness of training since 1996.
Gabris et al. (1999) conducted an empirical study on Leadership Credibility (LC), the
enhancement of which can be argued to be a KMI within the context of section 2.9.
Items measured were communication of vision, communication of the rationale behind
the vision, sharing the vision, delegation of authority and power, practicing what was
preached, following through on promises and recognition of good performance and
rewarding it. These measurement parameters focussed on organizational culture which
was becoming a critical factor in the development of KM and its evaluation, but again,
measuring the impact of these parameters proved problematical.
While Gibb (1999) found that formal mentoring programs were very popular, there was
little critical analysis of their relative successes and failures, and little theoretical
exploration of the whole area at the time. An evaluation of a pilot mentoring scheme
showed that most mentors and trainees had valued their participation in the process but
had no means of measuring any specific benefits (Gibb 1999).
Despite the general low level of externally oriented measures being conducted at the
time, Bryson et al. (1999) established that the use of externally acquired expertise was
strongly related to the education and personality of the CEO. Personality however, was
found to be a factor that was difficult to measure without using sophisticated
psychological tests and it was precisely these types of tests which had not yet entered
the sphere of KM evaluation. One indication of the importance of senior management
personality was displayed by a company that did not use external advisers because the
owner considered such expertise to be of limited value. An analysis of the education
qualification of the CEO in relation to the use of external advisers revealed that
managers with higher qualifications (MBA or other Professional Qualification) were
more likely to consult external experts (ie to buy external knowledge) than managers
with only secondary level school education (Bryson et al. 1999). Acquiring external
78

knowledge is one way of building the corporate knowledge base and increasing the
value of IC.
Internal Infrastructure (I)
A study by Gardiner (1999) aimed to measure the extent to which a learning orientation
had been achieved in two organizations who regarded themselves as "learning
organizations". A learning orientation is closely related to, and dependent on, the
culture of the organization. Research findings from questionnaires and interviews
showed that neither company could claim to be learning orientated at that time on the
basis of LO principles available from the literature. Both organizations had moved
towards a degree of learning orientation in terms of empowerment of employees and
implementation of flexible organizational structures, but neither had developed wider
involvement of employees in policy making or the establishment of environmental
links. It was discovered that it was difficult to implement notions of shared learning if
the mechanisms for passing on, sharing and measuring information and information
flows were not in place.
Fifteen different online communities (OLC's) were studied by Cothrel and Williams
(1999) to measure their performance and levels of success. OLCs are related to
collaborative work groups and Communities of Practice identified in 2.9. Those who
possessed superior knowledge and expertise were respected and acknowledged by other
members, and they played an important role in how the community evolved. These
experts served as informal leaders and were essential in creating the boundaries of
discussions. It was identified that effective OLCs drew new members into the
committee readily as knowledge-seekers were found to go where the answers could be
provided. The measurement emphasis in this case was very much on subjective rather
than quantitative models.
In 1999 the Victorian Department of Infrastructure in Australia implemented a
networked information infrastructure that connected all staff in its urban and regional
sites (de Gooijer 2000). An explicit KM strategy was defined, and a steering committee
was put in place charged with planning, implementation and overall coordination of the
initiative. The problem remained of developing a performance management framework
for measuring the impact of these initiatives. Thus the question: what benefit could be
demonstrated by KM for the Department of Infrastructure's business, was expected to be
resolved by designing a performance management framework that measured KM
outcomes. These outcomes included increased collaboration within the Department and
with its stakeholders and project partners, improved information sharing amongst staff
79

and with stakeholders, faster response to the changes in the Department's external
environment, and better coordination of development projects under the agency's
responsibility. An extensive review of organizational practices in measuring KM
initiatives had failed to surface a model that could be directly applied to the Department.
Three approaches offered pragmatic ideas that provided a basis for evaluation: a KM
map, based on the structure of an information ecology framework that considered the
whole of an organization's culture, structure and processes; tacit and explicit knowledge
transfer processes; and the notion of sense-making as a key element in electronic work
and computer-mediated communication (de Gooijer 2000).
One of the more unusual examples of a measure in use at the time was reported by Mark
Graham Brown, a performance-measurement consultant based in Los Angeles who
reported working with a telecommunications company whose culture expected its
managers to review 100 to 200 pages of data a week (Pfeffer and Sutton 1999). What
was considered to be appropriate "data" was not defined in this example. If the
intention was to enhance organizational learning then the measure of the number of
pages read would hardly have been appropriate. Assessing the quality and relevance of
the input would have been far more appropriate than quantity.
Intellectual Property (IP)
The prevailing view of knowledge taken by many consultants, organizations, and
management writers at the time was of something to be acquired and distributed and
something reasonably tangible that could be measured by way of (for example) number
of patents (Pfeffer and Sutton 1999). Measurement of knowledge as intellectual
property or assets was advocated as an important component of management control
systems for future organizations (Armistead 1999). Armistead added that, in order to
adequately protect intellectual property it was necessary to conduct a detailed
knowledge analysis to place a value on it.
Although Wurzburg ( 1998) claimed that there was substantial anecdotal evidence of
companies adopting strategies and tactics that included more systematic management of
intellectual property in the form of patents and copyrights, Table 9 shows minimal
interest by organizations in this type of measure for KM initiatives.
Market Intelligence (M)
Although Prahalad and Hamel identified that market and functional integration were
core competencies in 1990 (Li and Cavusgil 1999), measures for the market attributes in
80

particular were still evolving in 1999. Market Intelligence measures in use in 1999
focused on behavioural processes of market learning instead of focussing more on
organizational culture norms and value systems which were customer related measures
identified by Li and Cavusgil (1999) as being more appropriate. Effectiveness of
performance, the success of a business' products and programs in relation to those of its
competitors in the market was measured by such items as sales growth in comparison
with that of competitors or changes in market share (Baker and Sinkula 1999).
Although learning activities in relation to market and competition had received some
attention up to this time, measures were restricted. For example, only one item was
retained for competitor intelligence and it did not assess competitor learning directly (Li
and Cavusgil 1999). The interpretation mode was measured by questions dealing with
the degree of systematic analysis of competitor information. Learning about
competitors enabled a firm to understand weaknesses and strengths of rivals, and to
create benchmarks for new product development (Li and Cavusgil 1999). In an
examination of market information processing, market knowledge competence was
found to be an organizational core competence but figure 8 in this study does not
support this as the focus at the time seemed to be more on specific customer knowledge
than on general market knowledge.
Innovation (N)
Freeman (1999) identified that the transition to a knowledge-based economy was
creating unique organizational challenges - specifically how to organize and manage
people and resources in order to optimise their knowledge generation and innovative
capacity. What Freeman was looking for was synergies of the algorithm for applying
best practices to organizations, and the metrics for measuring progress and diagnosing
problems on the way to becoming truly innovative, although he found that there were
limited formal measurement systems to assess the effectiveness of individuals in their
propensity and effectiveness in innovative behaviour.
The Kirton Adaptation-Innovation Inventory (KAI) model, originally published in 1976
was designed to measure propensity to innovate versus propensity to adapt - a
personality dimension which was claimed to be significant for understanding and
building organizational effectiveness (Bobic et al. 1999). Bobic, et al. established that
the KAI model was still a valid measure of innovativeness in 1999, and that it could be
an important human resource management tool for composing the makeup of work
forces. Innovativeness was measured by the degree to which standard practice had not
been relied upon (Bobic, Davis et al. 1999). In another case, the quantity of innovation
81

was defined as the number of new ideas generated with the quality of innovation being
related to the idea's usefulness (Cady and Valentine 1999). Cady' s research suggested
that as the quantity of ideas generated within an organization increases, the quality
decreases.
Process (P)
Ahmed ( 1999) identified different stages of measurement where the first was almost
entirely financially based and the second stage characterised by non-financial measures.
These stages applied to KM as well as to other organizational performance evaluation.
Characteristically these measures were related to manufacturing strategy and to
operational processes that facilitated decision making for managers and workers and
fostered improvement rather than just monitoring performance and change within the
dynamics of the market place (Ahmed 1999). Ahmed also established that investment
in KMis such as process improvement lead to pay-backs and impacts on future financial
performance and that the drivers which underpinned the knowledge performance
measures such as teamwork, learning, communication, knowledge processes, tools and
techniques etc. required non-financial performance measures to ensure that adequate
progress was being made.
Armistead (1999) maintained that all activities within an organization could be
described in terms of processes and the inputs and outputs of processes could be
described and, to varying degrees, measured. The origins of the process-based view of
the organization (business process management) are predominantly operational and
predominantly concerned with managing flows of material, people or information.
Measuring the flow of information is a KMI within the definition described in 2.7.
When General Motors became more serious about implementing lean and flexible
manufacturing principles, attention switched to enhancing measures of intermediate
outcomes and in-process indicators (Pfeffer and Sutton 1999) which enhanced the
learning opportunity from the measurement process.
Buckmaster (1999) found that traditional process measurement systems of non-profit
organizations had been characteristically low in complexity prior to 1999, focusing
mostly on such constructs as inputs and outputs, with a view to evaluating efficiency
and effectiveness. This highlighted that very little consideration had been given to KM
evaluation in non-profit organizations prior to this time.
82

Quality (Q)
Process improvement focused on attempts to change practices to be more responsive to
customers and to improve performance in quality, time, speed and reliability, while
reducing production costs (Armistead 1999). Approaches emerging in quality
management and lean manufacture, tested across a range of manufacturing and service
sectors, demonstrated that changing practices to manage process and activity flow could
bring about radical improvement in specific performance dimensions (Armistead 1999).
Measurement of the effectiveness and efficiency of the flow was an integral component
of these changing practices which enhanced the organizational knowledge in relation to
internal processes.
Kathuria et al. (1999) developed a framework that took into account the importance of
aligning systems for manufacturing, planning, and control, as well as for quality
management with the manufacturing strategy of the company. Their framework
suggested that an IT application for example, should be aligned with both the
competitive priorities (cost, quality, flexibility, delivery, etc) and the process structure
of an organization in a manufacturing environment. This enhanced the Armistead study
of management and measurement of process flow into the strategic domain. A strategic
focus is consistent with the objectives of quality and knowledge oriented organizations.
Composite Measures (X)
No data
4.3.5 2000
Increased relative use of human capital oriented metrics indicated that Human Capital
measures were consolidating their position as the most important form of KM/IC
evaluation. Improvements in customer retention were seen as indicators of
effectiveness of organizational improvement initiatives. Whilst financial measures for
intangibles still lacked a cohesive model, the degree to which the organization had
achieved its vision was being recognized as a useful indicator of effectiveness of the
vision in driving the organizational culture. Competencies in communication, measures
of ability to learn and uniqueness of an organization's knowledge capital were gaining
momentum. It was recognized that the KM/IC measurement systems needed to be
consistent with the business strategy. Whilst IP rights and trade secrets were being
recognized for accounting purposes, benchmarking was becoming an important means
of gaining knowledge about the competition the positioning of the organization in the
market place. Measures for innovation were still crude whilst more qualitative
83

measures of quality were emerging. More composite models of KM evaluation were
being developed to challenge the Balanced Scorecard.
Customer (C)
Most companies were still using generic measures such as customer retention, customer
acquisition, customer satisfaction, and customer profitability as indicators of effective
learning (Stivers and Joyce 2000). Top executives perceived customer service factors
as most important, followed by measures of market performance and goal achievement
(Stivers and Joyce 2000).
Financial (F)
Financial measures were still the most familiar form of measurement of IC for both
external and internal decision-makers (Brennan and Connell 2000). Although financial
measures allowed for a high degree of comparability between firms, their main
drawbacks were that they were based on historical data and were also dependent on the
continuity of existing markets for their products (Brennan and Connell 2000). Pressures
were continuing to be applied on financial measures from business, government,
academic and professional institutions with strongly argued cases being presented along
the lines that financial measures distorted reality, and represented lagging instead of
leading business success indicators (Carroll and Tansey 2000).
Common financial measures of organizational performance included profitability, return
on capital, economic value-add, revenue growth, cost reduction, and cash flow (Stivers
and Joyce 2000). These metrics were also heavily used to evaluate knowledge oriented
initiatives as well as organizational performance.
The ICM Group Inc conducted a study on measuring IC and found that collectively,
companies were still measuring under the "tangible" assets scenario (Liebowitz and
Suen 2000). Second, many of the cited metrics lacked "creativity" in terms of
determining the size and growth of the organization's knowledge base. Most of the
metrics used were fairly straightforward and did not necessarily address the types of
knowledge that produced the most value-added benefits for the organization (Liebowitz
and Suen 2000). For example, metrics to determine "return on vision" were only just
being developed by such companies as Andersen Consulting and was seen to be a
totally different mindset than producing metrics to assess returns on investment.
EV A (Economic Value Add) and the Balanced Scorecard were two tools many
companies used to improve employee performance (Zwell and Ressler 2000). While
84

different in methodology, it was recognized that both were still predominantly
financially based and attempted to determine, measure and value the factors controlling
economic performance regardless of the improvement initiatives that contributed to that
performance.
Human Capital (H)
Grossman (2000) established that although senior management lived or died by
numbers, they were becoming increasingly aware that if human resource management
really wanted to be a business partner, it must be judged by the same standards as
everyone else in the organization. In the employee area it was found that many
companies captured evaluations such as employee satisfaction, employee retention, and
employee productivity (Stivers and Joyce 2000) as components of IC. The Danish
Trade and Industry Development Council discovered that companies that managed their
own IC ( of which human capital was regarded as the most valuable form) outperformed
other companies (Bornemann and Leitner 2002).
Choice used its competency database for annual readiness assessments, which were
used in determining current leaders' capabilities and formed the basis for selection,
promotion, and succession planning (Enz and Siguaw 2000). Competence was
measured by the person's confidence in his/her ability to do the job, self-assurance about
personal capabilities to perform work activities, and sense of mastery regarding
necessary job skills (Siegall and Gardner 2000).
Simpson House Inn, a bed and breakfast located in Santa Barbara, California, devised
the "Simpson House University" as part of its training curriculum (Enz and Siguaw
2000). Whilst not defined as such by Simpson House, corporate Universities can be
seen as OL or KM initiatives. The general manager developed training modules using a
variety of innovative activities that promoted understanding, improved staff
communication and self-understanding, and enhanced self-esteem (Enz and Siguaw
2000). The hospitality industry in general was seen to be strong on the concept of
satisfied employees leading to satisfied customers (Enz and Siguaw 2000).
Consulting heavyweight Watson Wyatt completed a research project that found a
correlation between human capital and shareholder value (Grossman 2000). Wyatt's
evaluation system for HR included recruiting excellence, collegial flexible workplace,
communications integrity, clear rewards and accountability and prudent use of
resources.
85

Craig (2000) established that by helping healthcare employees sharpen their skills and
hone their knowledge, healthcare providers kept them on board thus retaining their tacit
knowledge and ensuring that patients and clients consistently received high-quality care.
Joia (2000) found that, despite being a mature capital intensive industry, the mineral
processing sector depended heavily on innovation and, by consequence, on human
capital, as new processes needed to be developed through the heavy use of technology.
Despite not being a classic knowledge-intensive industry such as those involved in
information technology and telecommunications, such companies continued to strive to
develop new knowledge from that already deployed - the main characteristic of the
knowledge economy.
In the competitive environment of the time, high-performing organizations had learned
how to deploy human resource practices to enhance competitive advantage (Enz and
Siguaw 2000). The most successful firms created a bundle of employee practices that
were customer focused, were aligned with each other, and reinforced the organization's
strategic position (Enz and Siguaw 2000). The five categories of HR best practices
were found to be leader development, training and knowledge building, employee
empowerment, employee recognition, and HR cost management (Enz and Siguaw
2000).
Empowerment was found to be a valid component of IC by a US Government body in
1998 (Hepworth 1998) but was not evaluated as such until 2000. The four
psychological dimensions of employee empowerment were impact, competence,
meaningfulness, and choice (Siegall and Gardner 2000). Using the same measures in a
study of middle managers in a large company, it was found that low role ambiguity,
strong socio-political support, access to information, and a participative climate were
also associated with perceptions of empowerment (Siegall and Gardner 2000).
Measures for feelings of empowerment were developed from previously devised metrics
in conjunction with new measures of communication with supervisors and general
relations with the company, measures of general communication/teamwork and concern
for performance (understanding the larger vision) (Siegall and Gardner 2000).
Development of evaluation systems for communication effectiveness in the US was
exemplified by the Conversational Skills Rating Scale (CSRS) which measured the
dimensions of alter-centrism (eg., attention to partner), composure (eg., confidence),
expressiveness (eg., nonverbal animation) and interaction management (eg., tum taking)
(Waldron and Lavitt 2000).
86

Internal Infrastructure (I)
Several key organizational infrastructure intangibles such as corporate culture and
environmental orientation were recognized at the time as key drivers of superior
performance (Bharadwaj 2000). In general, firm-specific intangibles tended to be tacit,
idiosyncratic, and deeply embedded in the organization's social fabric and history
embedded in the skills and experience of its employees, as well as in its processes,
policies, and information repositories (Bharadwaj 2000). A firm's knowledge capital
was widely recognized as a unique, inimitable, and valuable resource (Bharadwaj 2000).
The University of Maryland Baltimore County (UMBC) reused about 30 percent of its
knowledge on research projects and started a laboratory for KM to use expert systems
and KM systems for capturing online expertise (Liebowitz and Suen 2000). Developing
metrics and studies for measuring IC were found to help to consolidate the KM field
and give the discipline further credibility (Liebowitz and Suen 2000).
Whilst successful companies were found to manage IC better than less successful firms,
managers of all companies surveyed by Brennan and Connell (2000) felt that structural
indicators (such as Internal Infrastructure) were the least useful of all the measures
considered. This supports the graph in Figure 8 in section 4.2.3 up to 2000 at least
when Internal Infrastructure seemed to gain increasing focus.
Intellectual Property (IP)
The level of organizational innovation was still being measured predominantly on the
basis of the number of patents owned (Balkin et al. 2000). Whilst patent counts were
shown to be related to changes in firm value, profitability, and sales growth (Balkin et
al. 2000), establishing the value of each patent to the organization presented significant
challenges.
IP rights at Intel were recognized for accounting purposes because an objective value of
these could be attached to their costs based on actual market transactions (Carroll and
Tansey 2000). However, no relationship could be found between tangible assets and
present value of future benefits of IP rights (Carroll and Tansey 2000). The limitations
to the use of patents in innovation research were well known at the time. These
weaknesses included that industries varied widely in their propensity to publish, that
much patenting was defensive and not necessarily advancing the body of knowledge,
and that many companies were beginning to rely more on trade secrets than patents to
protect their innovations (McMillan and Hamilton 2000). Yet, even with these
87

constraints, patenting activity (and publishing to a somewhat lesser extent) were found
to be good indicators of knowledge creation in terms of being documented information
(explicit) that had been verified by a meticulous and, in the case of patents, legalistic
research process (McMillan and Hamilton 2000). Thus, even though much of the
research at the time sought to move beyond explicit knowledge into the tacit area, a
substantial amount of evaluation work was still being conducted in the explicit realm.
Market Intelligence (M)
Six marketing capabilities were suggested by the literature and were confirmed via
managerial interviews conducted by Vorhies and Harker (2000). These capabilities or
competencies consisted of six areas: marketing research, product development, pricing,
distribution, promotion, and marketing management. The results of the Vorheis and
Harker study demonstrated that the 43 market driven firms outperformed the 44 less
market-driven firms across adaptability, customer satisfaction, growth, and profitability
dimensions (Vorhies and Harker 2000). This finding supported the theoretical work in
marketing regarding the competencies of market-driven firms and extended the
empirical findings of the market orientation researchers beyond simple measures of
performance. The Vorhies & Harker study provided insights into the importance of
developing a focused market-driven strategy and provided opportunities for learning
about internal processes including evaluation models which contributed to achieving a
business orientation. These insights however had not yet been translated into
measurement practice.
Innovation (N)
Despite the well recognized importance of innovation, its evaluation was still trapped in
traditional financially based thinking. Innovation was regarded by Balkin et al. (2000)
as a composite measure computed by adding standardized values of R&D spending and
number of patents. As with knowledge, an organization's definition of, and approach
to, innovation significantly impacted how it approached its evaluation.
Process (P)
A dichotomy appeared to be emerging between process and outcome measures of
process effectiveness particularly in the provision of healthcare. Process measures of
quality were being increasingly used in healthcare (Peabody et al. 2000). Linkages
between the provision of care and better health status had been firmly established and
there were substantiated benefits to measuring process over measuring outcomes as
processes could be measured more frequently than outcomes ( eg, a death or
complication), did not require a lengthy interval to become manifest, and were generally
88

less expensive to monitor. The most common methods for measuring process included
assessments of the competence of the clinician and what the clinician actually did, chart
abstraction, what services were being provided, whether they were provided efficiently,
and whether they led to better health (Peabody et al. 2000).
Noble and Klein (2000) on the other hand established that outcomes measurement
satisfied numerous objectives including the demonstration of treatment effectiveness;
identifying which treatments at what level of intensity and duration were effective for
which types of patients; and permitting tailoring of treatment based on data. The
Quality Model for Quality Assurance in Managed Care environments comprised four
components: access, clinical care, finance and client satisfaction. These four
components were measured through direct care measures of patient care and client
satisfaction measures, which were statistically assessed to the cost of care and to patient
outcomes (Noble and Klein 2000).
The value-creating process was becoming clearer in 2000 by virtue of understanding
how knowledge was created, integrated, converted, and used (Carroll and Tansey 2000).
The KM process itself was being valued in terms of results such as: acquiring a patent
or trademark, enhancing organizational efficiency resulting in identifiable cost savings
and subsequent higher return of investment, or improved innovative capacity measured
by performance indicators (Carroll and Tansey 2000).
A project management maturity analysis methodology was developed by Ibbs and
Kwak (2000) and was applied by benchmarking 38 different companies and government
agencies in 4 different industries. This assessment methodology provided solid and
comparative studies on project management processes across companies and industries.
It also provided a set of tools for organizations to use in identifying key areas of
opportunity for improvement in project management. This study was one of the few, if
not the first attempt, to truly integrate project management knowledge areas and project
management processes against actual project performance data (Ibbs and Kwak 2000).
In doing so, this study was an important step toward a factual and quantitative way to
measure the effectiveness and efficiency of project management processes and
performance.
Quality (Q)
Nine measures of organizational assessment for quality (OAQ) were identified by
Gilbert and Parhizgari (2000): importance of the mission, supportive policies toward the
work force, appropriateness of the organizational design, working conditions, pay and
89

benefits, positive supervisory practices, work force loyalty and pride, operational
efficacy and customer oriented behaviour. Gilbert and Parhizgari (2000) believed that
such measures would aid organizational leaders in their efforts to track progress within
their organizations and pinpoint specific performance measures where the greatest
opportunity for internal improvement may exist. OAQ could thus be seen as a
Continuous Improvement initiative as defined in 2.9. The principles of OAQ embraced
an increased emphasis on qualitative measures compared to the measures employed by
previous quality management regimes such as TQM.
Composite Measures (X)
The A$72 million difference between the net book value and market value of Morgan
and Banks Australia was identified as the invisible intangible part of the company
balance sheet (Martin 2000). It comprised such items as employee competence in the
form of expertise, education, experience, values and social skills; internal structure such
as patents, concepts, models and computer and administrative systems; external
structure such as relationships with customers and suppliers, brand names, trademarks
and reputation and image (Martin 2000).
Sveiby's Intangible Asset Monitor (initially introduced in 1997) was used in 2000 to
classify results of a major international business study into 24 selected IC indicators.
From replication of Svieby's work in Ireland, Brennan and Connell (2000) found that
IC was rarely reported in annual reports and, when reported at all, lacked a consistent
framework. The top four indicators (all internal) were found to be leadership skills,
employee satisfaction, employee motivation, and years of experience (Brennan and
Connell 2000). Other internal factors included strategy implementation, innovativeness
and the company's ability to attract and retain high calibre employees were also found to
be crucial for organizational success. The Irish study also found externally oriented
measures such as customers and business collaborations and market share to rank highly
(Brennan and Connell 2000).
Carroll and Tansey (2000) found that the well known and often quoted Skandia model
may have been an overkill, warning that it was unclear which measures were reliable
predictors of a firm's long-run profitability, that some measures may be irrelevant, and
that too many critical measures made the system uncontrollably complex. Demands for
more relevant, more focussed and simpler measures for IC were gaining momentum.
Using findings from an Internet survey as well as industry literature and conversations
with business and academic researchers, a research team developed a list of the nine
90

most critical categories of non-financial performance that determined corporate value
creation: innovation; quality; customer relations; management capabilities; alliances;
technology; brand value; employee relations; environmental and community issues
(Low 2000). Taken together, these value drivers were combined to form a single
measure of non-financial performance - a value creation index (VCI) - that represented
the sum total of a company's performance across the most critical intangible categories
(Low 2000). The VCI model demonstrated that fully 50 percent of a traditional
company's value was based on these nine factors whilst for e-commerce companies, it
was found that a very significant 90 percent of their value was based on these factors
(Low 2000).
4.3.6 2001
Relational capital 14, brand loyalty, customer orientation, indicators of corporate image
and trust by customers were seen as important elements of IC. In the absence of
appropriate frameworks and models, some organizations were starting to measure too
much of the wrong things in relation to IC. Despite a number of models that had been
in existence for a number of years prior to 2001, the need for all organizations to
develop their own models that suited their particular business characteristics was
recognised. The effectiveness of skills transfer and team performance were being
measured in conjunction with the assessment of the knowledge generation environment
and culture within the organization. Knowledge maps, knowledge bases and other
mechanisms for identifying and ascertaining the existence and extent of knowledge
within the organization were emerging. Competitive Intelligence was emerging as a
marketing discipline to manage competitive knowledge. The ability of intellectual
assets to generate value for the organization was becoming more important than the
intrinsic value of the asset itself.
Customer (C)
Within Continuous Improvement initiatives, critical measures of customer orientation
such as perfect order achievement, inventory dwell time (the ratio of days inventory sits
idle in the supply chain relative to the days it is productively being used) and total days
supply chain inventory, enabled firms to better monitor, manage and control their
customer logistics offerings (Stank et al. 2001). Measurement integration employed
analysis methods such as total landed costing (including capital components), segmental
costing, and activity-based management that enabled firms to learn about their
14 Relational capital represents the knowledge embedded in the organizational value chain and is impacted by human capital (Bontis 1998).
91

customers and focus resources on customers of choice (Stank et al. 2001). Relational
capital also emerged as a new form of customer capital that included brand loyalty,
customer referrals and recommendations and customer complaints (Roslender and
Fincham 2001).
Financial (F)
One of the key financial measures of corporate success in 2001 was return on assets
(ROA). Corporate strategies and financial investors used ROA to compare
management's use of the firm's total assets to industry averages as well as to the firm's
direct competitors. While ROA was still a valuable measure, depending on it became
problematic in an era when the traditional definition of assets was becoming outmoded
(Oliver 2001).
Like much of the management accounting philosophies and practices developed in the
1970s, human resource accounting continued to be conducted under financial
accounting and reporting principles and practices (Ros lender and Fincham 2001). The
information it provided, the models that underpinned it and the time frames involved
were all consistent with the prevailing mindset of historical short-term financial
reporting (Roslender and Fincham 2001).
Arguments that traditional accounting, as a mechanism for knowledge creation
regarding the future was fundamentally flawed, was gaining momentum (Cooper et al.
2001 ). Traditional accounting was found to fail significantly to recognise the
informational poverty of historically based accounting systems and the inability to use
analysis of past behaviour as a predictive model for the future (Cooper et al. 2001 ). An
example of measurement obsession at the time was a financial services company that
was tracking 500 different measures and required individuals to report on them on a
weekly basis (Kuczmarski 2001).
While IC focused on value creation and growing shareholder wealth, it broke
fundamentally with the financial database that economic value added (EV A) shared
with other financial management approaches. Rather than measuring performance or
calculating corporate financial attainment, it was observed that IC statements were
concerned to underscore and visualize knowledge creation directing attention to
priorities (Roslender and Fincham 2001).
92

Human Capital (H)
Government agencies began to realise that they could not achieve their mission without
human brainpower, and yet, there was no generally accepted standard for measuring and
reporting this asset on financial statements (Berkowitz 2001). In government as in
industry, real value was found to be highly dependent on the ideas, insights and
information in the minds of employees (tacit) and in the data banks (explicit) that these
employees maintained.
Schooling and work experience were still standard measures of human capital (Hao and
Kawano 2001). Medical educators took this one step further by seeking to improve
measures to assess the clinical competency of residents as they completed their graduate
medical education (Blumenthal et al. 2001).
A study by Miller (2001) measured the relationship between team levels of Knowledge,
Skills and Ability (KSA) and team effectiveness. The results of this investigation of the
Teamwork Test generally found that high team-level KSA scores did not produce better
group performance. It was therefore suggested that the Teamwork Test may be
measuring some individual capabilities but that these characteristics were better
predictors of individual rather than team-level performance (Miller 2001). This
highlighted the need for different measures depending on the knowledge context and
organizational level that was being assessed.
The growth rate of the consulting profession at the time was averaging a rate twice that
of the world economy (Simon and Kumar 2001). This led to the need to more
effectively evaluate this form of human capital. The top five performance indicators for
hiring consultants were: achieving objectives agreed upon, customer/client satisfaction,
timeliness of service delivery, recommendations actually implemented and achieving
measurable results (Simon and Kumar 2001). The top five strategic capabilities which
clients identified as important to success, in order, were: ability to listen to and
comprehend the client, quality of service, client-consultant communication, integrity
and honesty and technical knowledge (Simon and Kumar 2001). Typically, Simon &
Kumar did not suggest how these capabilities were or should be measured.
Internal Infrastructure (I)
Knowledge sharing was being used by the US military in the form of "after action
reviews" and even the Police force (particularly in the UK) was recognising the value of
IC when it was argued that value lies in the flows, the utilization of IC in the pursuit of
93

prevention and detection of crime, and to the maintenance of public order, road safety
and the public confidence (Collier 2001).
Knowledge maps were emerging and were found to be a convenient way of identifying
where key knowledge existed within an organization (Fahey et al. 2001). Such
knowledge maps went beyond the functional roles typically identified in process flow
diagrams. For example, they could include descriptions of the nature and quality of the
relationships between internal units involved in executing adjacent tasks, for example,
between order takers, order processors, and service deliverers within customer
relationship management processes. They may also describe the history (know-what),
nature (know-how), and rationales (know-why) for the interactions between firm
subunits and customers and other entities in the value net (Fahey et al. 2001). It was
recognised that knowledge produced by individuals reached its full potential to create
economic value when it became embedded in organizational routines (Clarke and Rollo
2001).
Intellectual Property (IP)
No data.
Market Intelligence (M)
Mostly large organizations of all types possessed some method for gathering
information on competitors and the external business environment, even if it was an
informal process. Many of these organizations however lacked a formal process for
collecting, assimilating, and converting competitive information into knowledge and
intelligence that was seen to be useful for strategy formulation. Diverse types and
sources of information on competitors were readily available via the Internet and other
sources and utilizing competitive intelligence was becoming simpler and less tedious
than in years past. Research found that most small to medium organizations did not
realize the benefits that could be obtained from market or competitive intelligence
(Groom and David 2001).
The effectiveness of on-line performance was normally measured by developers and
evaluated by its proposers. Since there was still no universal standard to measure on
line effectiveness, differing methods were used, measuring on-line effectiveness
according to their own objectives and expectations. Research in Market Intelligence
and information system measurement at the time advocated the use of integrated
evaluation methods and established that single measures of online effectiveness were no
longer appropriate in order to understand the performance of marketing initiatives such
94

as the company Web site (Ranchhod et al. 2001). Effectiveness was measured by
matching online results with management expectations. For more meaningful online
marketing effectiveness measurement, it was necessary to adopt a multiple approach to
understand what was being achieved. In particular, it explored the role of the Internet
developer, the importance of the management of knowledge and learning, the impact of
on-line technological capabilities and proper measurement (Ranchhod et al. 2001).
Innovation (N)
Researchers in Information Systems had begun to rely on the theories of innovation
diffusion to study implementation problems (Al-Gahtani 2001). Climates conducive to
innovation had been investigated at the organizational level, however, in team-based
organizations, the climate for innovation at the team level took on increasing
importance (Bain et al. 2001). A sample of 193 scientists and technologists in 20
research teams and 18 development teams were measured on their team's climate for
innovation and team performance (Bain et al. 2001).
Lucent created the Value Creation Model (VCM) as a productivity measure for
research-driven innovation projects, thereby providing managers with the ability to
measure meaningfully a portfolio of projects (Kirchhoff et al. 2001).
Process (P)
Whilst libraries were commonly regarded as repositories of knowledge and learning,
they themselves were being forced to become learning organizations to satisfy
increasing consumer demands and make more effective use of publicly provided funds.
Poll (2001) identified that libraries were developing indirect measures of evaluation,
such as studying the use of their collections and services; the speed of delivering
information and services; the accuracy of delivery; the costs of the library's products
and services; the adequacy of processes; and the satisfaction rate of the population
served.
Moore et al. (2001) found in some industries that corporate intellectual assets (the
employees' collective knowledge and strengths) were well established as the firm's
primary competitive advantage. Such firms were searching for ways to measure and
guide the process of sustaining that advantage and, as a result, found that opportunities
to create value were relying more heavily on the success of strategies designed to
effectively manage intangible assets such as customer relationships, product
innovations, operating processes, and employee knowledge and contributions (Moore et
al. 2001).
95

Quality (Q)
No data.
Composite Measures (X)
A portfolio approach for measuring and managing the technology commercialisation
process developed by the Advanced Technology Division of Lucent Bell Laboratories
described a system for managing high technology R&D which consisted of a set of four
quantitative financial factors condensed into two metrics, plus six qualitative attributes
taken from four categories: strategic initiatives, market categories, intellectual property
classes, and business unit designations (Kirchhoff et al. 2001). This showed an
increasing emphasis on the use of an integrated collection of measures that worked
together to provide a comprehensive holistic picture of an entire process.
In terms of library-specific measurement frameworks, Winkworth (2001) found the
most complete was "The Effective Academic Library" developed by the Joint Funding
Councils Ad-hoc Group on Performance Indicators for Libraries in 1995. There were a
number of Library Management Statistics in common use at the time based on number
of employees, total library expenditure per full-time-equivalent (FTE) employee, user
expenditure on information provision per FTE, user expenditure on staffing per FTE,
and user output measures such as seats offered per week per FTE user and loans per
FTE user. Although leaning towards composite models in an attempt to provide holistic
performance indicators for the entire organization, the measures were still largely
quantitative.
4.3.7 2002
KM measurement frameworks were emerging, a more pro-active perspective was
gaining recognition and enterprise wide knowledge was being recognised. A survey of
25 financial services organizations described 15 latent constructs of contemporary
management issues as: employee satisfaction; employee motivation; human capital;
management leadership; knowledge sharing; employee commitment; value alignment;
structural capital; process execution; knowledge integration; training, retention of key
people; relational capital; knowledge generation; and business performance (Bontis and
Fitz-enz 2002). The recognition of the importance of these issues to the organizational
culture set the scene for the development of KM evaluation in 2002.
96

Customer (C)
Customer lifetime value (CL V) captured the impact of marketing on purchasing
behaviour and was a valuable measurement for targeting marketing activities (Lenskold
2002). Marketing campaigns intended to increase the profit per customer or improve
customer retention rates and depended on the measurement of the CL V to demonstrate
results. Measuring CL V allowed marketers to plan marketing efforts and extend offers
to customers and prospects that were expected to return a higher value to the company
(Lenskold 2002).
Financial (F)
Most reported methods for valuing a firm's IC provided a basic framework to put the
development of IC in line with strategic goals, but did not provide a complete and
manageable set of relevant IC measurements (Rodov and Leliaert 2002). Professor
Baruch Lev of New York University developed such a framework to measure
intangibles performance for any company, or division of a company, that used
traditional financial reporting and that had publicly traded equity (Hurwitz, Lines et al.
2002). Professor Lev also established how the performance of intangibles was possibly
linked to stock returns. Lev's Knowledge Capital Calculation Model attempted to
estimate the value of the knowledge assets of a firm calculating employed "normalized
earnings" which were a combination of the average actual earnings for the past three
years plus stock analyst's forecasts of earnings for three years into the future (deTore et
al. 2002). This represented an example of future oriented financial measures of KM.
Other examples of future orientation were provided by Bukh et al. (2002) who
established that EV A, balanced scorecards and intellectual capital statements shared a
"commitment to crafting a technology of managing" which pointed out relevant assets
to be managed that were all concerned with connecting the future prospects of firms
directly to the competence of management.
Human Capital (H)
Despite having established that businesses improve their market valuation (as well as
many other measures of financial performance) when they invest more in training, Bassi
et al. (2002) found that most businesses still did not know whether, or how much, value
was being created by their training efforts. Furthermore, it was becoming increasingly
apparent that organizations were suffering from human capital depletion primarily
through turnover, as IC in the form of tacit knowledge in the heads of key individuals
literally walked out of the door (Bontis and Fitz-enz 2002).
97

Internal Infrastructure (I)
Bukh et al. (2002) used a software engineering firm to demonstrate that, first and
foremost, the organization relied on the knowledge and competency of its employees
(human capital), but also on the knowledge and experience of its customers, processes
and technologies (structural capital). The purpose of the firm's IC statement was to
make its knowledge resources visible and to shed light on management's efforts to
develop these resources. Here, the firm offered a way to read the statement that was
said to be concerned with management's efforts to influence the structure of the firm's
knowledge resources. It was not about the value in monetary terms of the firm's IC, but
more about its management's efforts to develop knowledge resources (Bukh et al. 2002).
Three general strategies were used to create more value from the knowledge assets of a
life insurance firm (deTore et al. 2002). Firstly knowledge product strategies enhanced
the firm's offerings by increasing the knowledge content of the products or services that
were being delivered to their customers. Secondly intellectual property strategy
explicitly managed the intellectual property (patents, copyrights, trademarks) of the
firm. Thirdly knowledge work strategy implemented specific infrastructures and
management practices designed to improve how knowledge was created, shared and
used. Earnings that could not be traced to physical and financial assets were traced
from knowledge assets (deTore et al. 2002).
Intellectual Property (IP)
No data.
Market Intelligence (M)
According to Accenture's Insight Driven Marketing report, a 2001 survey of 175
marketing executives in the United States and United Kingdom revealed that 68%
reported having difficulty measuring the ROI of their marketing campaigns. In an
increasingly knowledge oriented economy, Lenskold (2002) believed that ROI was still
the most appropriate marketing measurement tool, and that the adoption of ROI
marketing measurements was becoming more of an organizational issue than one of
measurability because the difficulties being experienced by many organizations resulted
from their lack of understanding of the impact of measurement of marketing campaigns
on strategic performance.
Innovation (N)
In a survey by Frigo (2002), over 60% of respondents indicated that innovation was a
key feature in their company's mission statement, yet more than half rated their
98

performance measurement system for innovation as poor or less than adequate. Only
8% considered their performance measurement system very good or excellent in
supporting innovation. Effective measurement of innovation continued to be a rare
occurrence.
Process (P)
Globerson and Zwikael (2002) found that, in order to evaluate the quality of a project,
products of each single process within the project (including explicit and tacit
knowledge) needed to be evaluated. A field study was conducted to evaluate the extent
of a project manager's involvement in the planning processes and to evaluate the quality
of this involvement. A major problem in designing this study was to establish a way to
evaluate the extent to which planning processes were used in projects and their quality
level. Overall project success was measured as the ability to complete the project
according to desired specifications and within the specified budget and the promised
time schedule, while keeping customers and stakeholders happy (Globerson and
Zwikael 2002).
Quality (Q)
No data.
Composite Measures (X)
Different approaches to consolidating a variety of IC metrics into a cohesive framework
were becoming accepted benchmarks but Collardin and Vogele (2002) found that only a
small number of firms, practitioners and consultants were experienced with the use of
these models. Among the best-known (and most frequently quoted) methods for IC
measurement were Skandia's Navigator, Sveiby's Intangible Assets Monitor,
Brooking's Technology Broker, Buena's Competence-Based Strategic Management
Model (de Pablos 2002) and Kaplan & Norton's Balanced Scorecard (Frigo 2002).
deTore et al. (2002) developed a KM valuation model which required the construction
of a hybrid knowledge/financial model called a "knowledge value driver tree". In order
to link the operational impact of a proposed project to drivers of discounted cash flows
for a firm, the knowledge value driver tree provided a set of metrics for management
decision making as well as guidance for the KM project implementers.
In the software engineering firm mentioned earlier in the section under Internal
Infrastructure, their balanced scorecard approach emphasised that financial, customer
and learning and growth measurements provided appendices to the internal process
99

perspective and the IC statement was recognised as an active part of KM, because it
created new networks and caught the interest of valued resources such as prospective
employees and customers (Bukh et al. 2002).
The true measure of a company's value was being seen to rest in its people and ideas
rather than in its equipment and real estate (Collardin and Vogele 2002). Collardin and
Vogele (2002) also believed that KM/IC measurement approaches were tending, to a
greater or lesser extent, towards synthesizing the financial and non-financial value
generating aspects of the company into one external report, but added that it was still
too early to predict whether or not a model or system for measuring knowledge capital
would be integrated successfully into existing management and financial reporting
systems.
4.3.8 Chronological Summary by Measurement Category
The table on the following 2 pages shows the main measures identified from the 838
individual measurement cases sorted into year and measurement category.
100

Customer needs and No data Customer relationships Customer satisfaction still Customer satisfaction and Relational capital, brand Customer perceptions via web satisfaction were the measured. popular but interest increase interest in the loyalty and customer based surveys and dominant measures. emerged in learning about impacts of customer orientation. measurement of customer
customers and quality of relations on corporate value lifetime value supplied services and creation. Customer success of service/client retention and acquisition. relationshi s.
Financial (F) Mixed bag of costs, cost Focus on sales and profits Earnings and ROCE, Sales and profit focus and Mixed bag of costs, EVA, ROA still popular. Some Future market returns, reduction, income, and R&D expenditure as ROSHF, EPS and share ROI. Measuring knowledge profitability, revenue, ROA, organizations going recognition of "investmenr in investment, sales growth, measures of innovation. price. Emergence of bought in by organizations. ROI and sales. Retumon overboard with number of training. Lev's Knowledge ROI measures and Economic Value Add (EVA). Measuring effectiveness of vision recognized. measures. Capltal Calculation Model. budgetary controls. Value Need for new models in external consultants. IC focussed on value Frameworks there but not what Chain margin mgt. Failure addition to the old. creation. to measure. of GAAPs for KM/IC reco ized.
Human Years of education, training Interest in measuring Work experience, training, Employee retention Competencies emerging as Medical Competence in HC and knowledge retention
Capital (H) in terms of hours per FTE management performance employee satisfaction and measures, knowledge and a viable measure especially Health industry. Movement measurement. and participants reaction to but no metrics available. attitudes. leadership skills recognized in relation to in HC. Skills transfer Retention of key people. training courses. Individual Measuring employee Empowerment emerged as as important attributes to communications. emerging. and team performance perspectives and attitudes. a HC measure. Need to measure. Organizational Effectiveness of HR and Governments recognizing measures. Building Effectiveness of leadership learn how to learn. Skills & culture measurement under learning abilities being human capital. learning environments. development. competency recognized. review. Social skills measured. Correlation Individual vs team Education linked to profits. Six Sigma model emerged. emerging as important HC established between human performance tests. Very basic metrics. Mix of qualltative and measure. Generative capltal and shareholder Evaluation of Consulting Kirkpatrick's model used quantitative metrics. learning and collaborative value. Models to assess firms. superficially. 360 deg processes valued. learning emerging. feedback model emerging. Measuring synergies
between measurement categories. Leadership credibillty. Mentoring models.
Internal Culture of innovation via Office productivity via Organizational culture and Knowledge transfer and Measurement of Knowledge environment Enterprise knowledge
Infrastructure design of work settings computer mediated logic. Image and reputation information integration and empowerment gets serious recognized, knowledge recognized. Impact of
(I) conducive to learning. communication systems. recognized. Corporate data collection frameworks. consideration. sharing and its impact on corporate knowledge on assets Increase in amount of IC Collaboration and Universities. Degree of learning Uniqueness of decision making. and performance. Knowledge measured. teamwork. orientation. On-line organizational knowledge Information and knowledge flows and transfer.
communities studied. capltal recognized. bases and knowledge Measurement of management Importance of measurement maps. Measure of efforts to develop knowledge systems supporting organizational cultures and resources. organizational strategy. climates that support
innovation.
101

Intellectual No data Patents as surrogate Patents and copyrights. Knowledge about patents Knowledge development in No data No data
Property (IP) measures for innovation. rather than value of patent patenting. IP rights perse. recognized for accounting
purposes. Trade secrets recognized as knowledge assets.
Market Market share and No data Market dynamism and Market growth and market Market value-add, relative Competitive intelligence ROI of marketing
Intelligence (M) competitiveness as competitive industry. orientation of the firm. performance vis-vis major effectiveness and on-line campaigns not working. surrogate measures of IC. Company uniqueness Leaming from competitors. competitors. marketing effectiveness Benchmarking as means of recognized as valuable. Behavioural processes Further development of evaluation. Brands valued on balance instead of value systems benchmarking.
sheets. measured.
Innovation (N) GE "vitality". Increasing No data Innovation recognized as Propensity to understanding Measures still crude and Team Leaming, innovation Innovation key but interest in innovation. factor for organizational organizational effectiveness patent related. diffusion. Value Creation measurement systems
growth. Focus on and innovation Model. poor. innovation found to link to hiah customer satisfaction.
Process (P) Problems resolved, Insufficient detail for Sharing best practices. Flexibility, ability to respond Team effectiveness, lndirecVsurrogate measures Project Success being increases in productivity, meaningful analysis. Recognized lack of process to customer requests, effective use of resources. for process effectiveness. measured but difficult to meeting objectives, % of on- measurement models. reliability, consistency, Process vs outcome compare with other time deliveries. Move from speed and dependability. measures debated. organizations. hierarchical to process Knowledge mapping. Process measures being driven models. Quantitative Sense-making. Metrics still adapted to healthcare. metrics. Teamwork very basic. In-process Project management processes and feedback indicators. maturity model developed. measured.
Quality (Q) Quality culture. Self- Direct relationship found No data. Measuring quality of Quality of services. More Use of OMS by private No data assessment. Quality in between quality process flows. qualitative measures of sector (but not public healthcare measured. improvement and financial quality emerging. sector).
improvement.. OMS becoming popular. Behavioral approaches & management attitudes crusial to OMS.
Supplier Insufficient data for Insufficient data for Insufficient data for Insufficient data for Insufficient data for Insufficient data for Insufficient data for meaningful analysis meaningful analysis meaninaful analysis meaninnful analvsis meaninnful analysis meaningful analysis meaningful analysis
Technology Insufficient data for Insufficient data for Insufficient data for Insufficient data for Insufficient data for Insufficient data for Insufficient data for meaningful analysis meaningful analysis meaningful analysis meaningful analysis meaninaful analysis meaninaful analysis meaninaful analvsis
Composite Balanced Scorecard. No data. Intangible Asset Monitor No data BSC, Value Creation Index. BSC. Portfolio approach to BSC and Intangible Asset
Measures (X) Importance of measures and BSC. Leaming Intangible Asset Monitor. measurement. Monitor, Technology Broker, that all employees can connected to financial Competence based understand. results. Strategic Management
Model. Value based manaaement initiatives
Table 10: Summary of Chronological KM Evaluation Factors
102

4.4 Geographical Analysis
4.4.1 Overview
It was suggested by Adam et al. (1997) that location of an organization has a
considerable influence on the business strategies chosen, the structures set up, and the
performance achieved by managers. It is therefore reasonable to expect that different
international locations would also impact the evaluation methods used to assess the
effectiveness of these strategies, structures and performance and that such methods
would in tum impact KM/IC evaluation models. A review of the KM measurement
models extracted from the 220 source articles identified that the geographic location of
an organization does indeed have a significant impact on the way the organization
approaches knowledge, its management and how knowledge initiatives are measured.
Whilst the vast majority of KM evaluation case studies are sourced from developed
nations (see Appendix C), the World Bank believes that it is difficult to envisage any
organization, anywhere, commercial or not-for profit, arguing that it did not need to
manage its knowledge (Martin 2000). A recent World Bank report called for the
management of knowledge to assist in the development process both for fostering
knowledge flows between developed and developing nations and in helping developing
countries to more effectively manage and measure their knowledge (Martin 2000).
Managers of firms operating in Asia and the Middle East were found by de Pablos
(2000) to be very interested in KM and IC measuring and reporting that had become
popular in Europe, but when it came to learning how to build this new type of report,
they turned their attention to Scandinavian firms (de Pablos 2002).
Organizations in the developed world in particular have gone through somewhat of a
metamorphosis in the last century, from capital intensive to information and more
recently to knowledge intensive. In a study performed on 2,959 US corporations, Paul
Strassmann determined that only 9.4% of the companies surveyed are now capital
intensive, with the remaining 90.6% being information-intensive (Strassmann 1996).
Whilst this point alone is a significant driver for the need for most organizations to
effectively manage and measure their knowledge and its organizational impact, another
factor is that, over the past two decades, the difference between market and book values
of large organizations in the developed world has gradually increased (Barsky and
Marchant 2000). In addition, empirical studies have shown that there is a growing body
of evidence depicting a steady decline in the relationship between tangible assets and
market value right across the international industrial spectrum (Martin 2000).
103

4.4.2 North America (USA and Canada)
Empirical research has shown that top executives in large US and Canadian businesses
agree that new IC measures are required to help manage knowledge assets (St Leon
2002). However, at the Fourth World Congress on the Management of Intellectual
Capital held at the McMaster University in Canada in January 2001, a warning was
issued that one of the greatest impediments to the progress and adoption of the IC
paradigm was the lack of support among senior managers, particularly at the level of the
CEO and board of directors (Bart 2001). There is pervasive evidence now to support
the proposition that management in general agrees that embracing and measuring
knowledge and other forms of IC is necessary, but many organizations still seem to be
reluctant to take the first step.
Commenting on the papers at a conference on KM, Don Cohen noted that in the U.S.,
most knowledge practice focuses on collecting, distributing, re-using, and measuring
existing codified knowledge and information (Pfeffer and Sutton 1999). Another
example of the North American focus on quantitative measures is Sequent Computing
in Oregon in the US who uses a best-practice, knowledge sharing initiative to analyse
project costs and cycle times in its supply channels and other knowledge-intensive
activities in the firm's value chain (Martin 2000). Generally, investment in IT is seen in
the US as being closely related to, and an adequate measure of, innovative capability.
Despite being surpassed by Japan, Germany and Switzerland in patent applications per
10,000 population, the USA by far obtained the best dollar benefits from its past
innovative activity (Leal and Powers 1997). The US captured the market for memory
chips in the 1980s largely because it was better than its Japanese rivals at leveraging its
IC (Carroll and Tansey 2000).
Highly conservative accounting and security regulators in the US have favoured strict
adherence to historic cost measurement and proscribed capitalization of internally
generated intangible assets with only a few exceptions, due to concerns with reliability
of measurement (Wyatt 2002). The US Federal Accounting Standards Board (FASB)
and the Securities and Exchange Commission (SEC) carry enormous weight in
determining how expenditures are measured and reported by organizations and although
both organizations have given some consideration to new standards or requirements in
areas like human capital, significant changes are made slowly and often reluctantly, and
neither has yet moved for more significant public disclosure of knowledge-related
104

capital generally (Bassi et al. 2002). Indeed, a study using the 1996 annual reports of all
US Fortune 500 companies found that not a single organization released meaningful
information on its training expenditures, and less than five released any information on
training time. Canada is closely following the US model in terms of accounting and
reporting.
Although the US still treats training as a hidden cost, there is an expected increase in the
importance of human capital investments, such as training, in affecting organizations'
financial performance as economic value becomes more highly dependent on firms'
knowledge-based assets (Bassi et al. 2002). Despite the inappropriate treatment of
training costs, research on a dataset of US publicly-traded companies found that training
investments were positively related to a variety of measures of financial performance
(Bassi et al. 2002). It was found that US firms that spend more than average on training
have total stockholder returns that are 86 per cent higher than firms that spend less than
average, and 45 per cent higher than the market average (Bassi et al. 2002). This
establishes the connection between the generation of knowledge resulting from training
activities and increased market value for the organization.
Another study by Bassi et al. (2002) analysed data for 157 manufacturing firms in the
US that had applied for state subsidies to support private training programmes and
found that receipt of a training subsidy increased training hours within a firm by a factor
of two to three in the short term, and reduced output scrap rates by around 13 per cent
( corresponding to savings of between US$30,000 and $50,000 per year). The
connection established here is between knowledge generation and improved operational
efficiency.
The American Society for Training & Development (ASTD), has standardised measures
of training outcomes (as assessed by training participants and their managers), but
currently, these have only been used by relatively few (some hundreds of) organizations
(Bassi, Ludwig et al. 2002). One example is at Montsanto in the US, where the
company's strategy for growth is linked to the development of core competencies such
that knowledge and information are used effectively across the organization so as to
create a learning and sharing environment (Martin 2000). This is an example of focus
on the development of a long-term learning culture rather than a focus on short-term
profit or operational efficiency.
Further findings from the US confirm that companies such as Sears are engaged in a
number of knowledge communication activities including the use of so-called "town
105

hall meetings" and "learning maps" to inform its employees and through the
establishment of Sears University as an internally focussed educational activity (Martin
2000).
One of the most celebrated knowledge cultures in the world is that at Buckman
Laboratories in Memphis, Tennessee where the CEO, Robert Buckman estimates that
90 per cent of his company's KM efforts have gone into changing from a command-and
control culture with a focus on pharmaceutical products to a knowledge sharing culture
focused on customers (Martin 2000). This knowledge sharing approach, which began
in 1982 (long before KM became fashionable), was also needed to support a greatly
expanded sales team as Buckman Laboratories moved to become a global operation
(Martin 2000). Despite the focus on knowledge sharing, the solid business goal was to
have 80 per cent of company associates effectively working on customer problems by
the year 2000 (Martin 2000). This is a relatively simple and quantifiable measure which
is a surrogate for a measure dealing with knowledge use. The use of surrogate measures
for KM was found to be particularly prevalent in the US. This propensity for
quantitative measures however, may have been distracting management from
attempting to measure the effectiveness of the knowledge generation process.
Using a more balanced approach between quantitative and qualitative metrics, Dow
Chemical in the US considers the most significant measures for IC to be: percentage of
new business initiatives protected by intellectual assets; percentage of technically
relevant, competitive intellectual assets that require a business response, and the value
contributed to the business by significant and/or extraordinary intellectual asset
management actions (Martin 2000).
A rare example of a departure from explicit/codified knowledge syndrome occurs at
Bechtel in the US, where due consideration is given to the source of knowledge and its
reliability, to potential users and to the degrees of its applicability (local or global) and
transferability (ease and practicality of transferability between users) (Martin 2000).
Categorisation of knowledge occurs by identifying knowledge respectively as quick
access (easy to find and use when needed), broad-based (broadly applicable and easily
transferable), complex (broadly applicable but not easily transferable) and one-off
(neither easy to transfer nor broadly applicable) (Martin 2000).
The Kaplan and Norton Balanced Scorecard (BSC) model for evaluating intangibles has
received much literary acclaim in the U.S (Hepworth 1998) and has been enhanced by
different organizations that have gained significant experience in its use. As previously
106

identified in section 4.3.5, a US governmental body formed to consider government
wide procurement practices, successfully identified and included employee
empowerment as an additional BSC focus (Hepworth 1998). The BSC has been applied
successfully across many diverse industries and within the public sector in the USA. It
has also been suggested that, despite the propensity for quantitative measurement in the
US, the use of the BSC is more acceptable within the US management culture than in
the more conservative British organizations (see 4.4.5).
4.4.3 Scandinavia
Scandinavian countries (in particular Denmark, Sweden and Norway) are the leaders in
IC management and reporting (Petty and Guthrie 2000; Edvinsson et al. 2000; Wise
1999; Skyrme 1998; Wurzburg 1998). The reason appears to be partly because of
strong federal government support in Scandinavia and to a lesser extent in Western
Europe (Petty and Guthrie 2000; Wise 1999). Scandinavia also appears to be more
open and transparent in its business conduct as evidenced by the nature and
comprehensiveness of its external IC reporting.
IC Reporting in Scandinavia emerged in the early nineties. Skandia, a Swedish based
insurance firm, has expanded its business evaluation processes to include an integrated
evaluation model known as the Business Navigator, which classifies core business
processes into five categories: Financial Focus, Customer Focus, Process Focus,
Renewal and Development Focus, and Human Focus (Barsky and Marchant 2000). The
Navigator model is based on Kaplan and Norton's Balanced Scorecard (BSC) method
mentioned in 4.4.2 and is used for both internal and external reporting (Barsky and
Marchant 2000).
Another model developed in Sweden by the Konrad Group, was the Intangible Assets
Monitor approach to evaluation which ignores the balance sheet altogether and focuses
instead on three core dimensions: external structure, internal structure and individual
competence (Martin 2000). There is a clear distinction between these reporting
approaches and that adopted by the US which (when reported at all) focuses on
quantification of intangibles and IC reporting within the existing accounting framework.
Pioneers such as the Danish Government with their Guidelines for Intellectual Capital
Reporting have contributed considerably to exploring the field of intangible assets and
IC (Bornemann and Leitner 2002). In addition, the Norwegian Government has
107

sponsored research since 1992 to develop a competence capital model which has
evolved into an ISO-type certification process that includes IC (Petty and Guthrie
2000). The initiatives taken by the Government of Norway have encouraged industry
across Scandinavia to report on their performance in a variety of non-financial ways.
Furthermore, the Danish and Norwegian governments have provided incentives for
organizations to investigate and experiment with IC (Petty and Guthrie 2000). Telia in
Sweden and Danisco in Denmark are examples of organizations that have successfully
adopted the new reporting models. Arguably, the most advanced work in this area has
been carried out in Denmark, where a set of descriptions of intangibles in company
accounts has been prepared as a tool to measure, manage and report corporate
intangibles on a comparable basis (Wurzburg 1998).
4.4.4 Europe (other than UK and Ireland)
The increased innovative capability of European countries was noted in the late
seventies when it was observed that the perceived "technology gap" between the USA
and Europe was closing (Leal and Powers 1997). Although not as advanced as
Scandinavia in this regard, companies in Europe are way ahead of their counterparts
elsewhere when it comes to the measurement, reporting and management of their IC
(Guthrie 2002). The reader is reminded that KM has been described in section 2.5 as
the discipline that manages a firms IC. The Netherlands, UK and France have been
frequently used as examples of European countries that appear to be adopting the
Scandinavian model for IC and even top Spanish firms have started to build their IC
accounts (de Pablos 2002). Leal and Powers (1997) established in their research that
Germany, France and the UK fund R&D adequately, have inventiveness coefficients
close to or greater than that of the USA, have relatively high diffusion ratios, and a
rising technology balance of payments ratio thus eroding the US technology balance of
payments coverage ratio.
In France, social account reporting (the bilan social and training expenditure reporting
under the Law of 1971) is compulsory (Wurzburg 1998). Many publicly traded
companies including Mannesmann in Germany and Pinault-Printempts Redoute in
France, include varied information on human resources and other intangibles, such as
training expenditure, participation in training and qualifications of workers, in their
annual reports (Wurzburg 1998). The areas covered include information on operating
results, as well as forms of IC that might have an effect on results, such as R&D,
108

patents, licenses, experience and qualifications of directors and managers, and numbers
of employees (Wurzburg 1998).
Switzerland is second in the world behind Japan with number of patents per 10,000
population with Germany following closely in third position. The number of patents
applied for or granted is a popular measure for national inventiveness and thus an
indicator of a nation's ability to learn and convert its knowledge into innovative
products. Middle of the road countries in terms of patent generation per head of
population include Austria, Finland, France, Germany, Norway, Portugal, Spain, and
the UK (Leal and Powers 1997). Germany is also a leading innovator and shows
considerable openness in its inventive activity (Leal and Powers 1997).
A knowledge codification strategy was employed at the Swiss pharmaceutical giant
Hoffman-LaRoche in an attempt to reduce the time and costs involved in new drug
development (Martin 2000). A new division at Hoffman-LaRoche called Protodigm
was established as a knowledgeable venture with a culture of sharing and the objective
of delivering a document to drug approval authorities in Europe, the US or Asia (Martin
2000). By coordinating internal processes and capturing the knowledge imbedded in
them on an intranet while outsourcing all nonessential operations, they are promising a
40 per cent reduction in costs and a reduction in the time taken for drug development
from seven years to four (Martin 2000). Whilst many organizations regardless of
geographic region find it difficult to prove conclusively that business benefits do indeed
result from KM efforts, this example from Switzerland indicates that it can be done.
Following on from the pioneering work in Scandinavia, the first European Research
Technology Organization (RTO) and the Austrian Research Centers (ARC)
implemented and published two IC Reports for the business years of 1999 and 2000
(Bornemann and Leitner 2002). There are several bottom-up approaches and models
quoted in the literature, ranging from indicator-based models derived from managerial
information systems and performance monitoring instruments such as the Balanced
Scorecard or the European Foundation for Quality Management (EFQM) model, to
monetary-oriented solutions in search of the exact numerical figure with which to
represent intangible assets (Bornemann and Leitner 2002). The problem with these
methods is that the choice is left to individual organizations to select the most
appropriate model for their individual operations with no guidelines being provided as
to how to make an informed selection.
109

In general, structure-oriented models such as the Skandia model from Sweden, separate
different intangible assets and are primarily intended to describe the organizational
space or place of knowledge; whereas process-oriented models such as the Austrian
ARC-IC model try to reflect the flow of knowledge (knowledge production and
utilisation process) within an organization (Bornemann and Leitner 2002). The ARC-IC
Model was designed to trace the knowledge production processes and knowledge flows
of a research organization and is integrated with the classification of IC. It also meets
the specific requirements for IC Reporting of RTO, with respect to providing
information for management and assessing the various kinds of outputs that are
important nodes of the Austrian National Innovation System (Bornemann and Leitner
2002).
4.4.5 UK and Ireland
In the late 1980's, "control" was a key word in UK management parlance in sharp
contrast to the Japanese approach which, whilst equally highly controlled, included
involvement of employees who were adding value to material (Barker 2001). By
comparison, it was seen that when Japanese companies gained control of UK
brownfield sites such as in the cases of Komatsu and Toshiba, the whole culture of the
organization was changed by the arrival of a new Japanese management team (Barker
2001). The new Japanese culture tended to impact production systems integration,
people and work organization and the focus of business development (Barker 2001).
This new culture supported a learning orientation and supported an environment in
which knowledge generation was facilitated. The UK manager was found to be focused
on a confrontational relationship, rather than a partnership alliance with employees and
a "crudeness" of style in contrast to the Japanese approach that began human
development strategies twenty years earlier at companies like Toyota and Canon
(Barker 2001). The UK approach was found to inhibit learning and knowledge
generation.
Generally British service businesses score very highly in the European poll but,
significantly, do not score as well in the manufacturing sections which are traditionally
dominated by German, Swedish and Swiss companies (Thompson 1998). Hierarchical
organizational structures which prevented employees from contributing more
intellectual inputs into the workplace appeared to be common within the UK
manufacturing sector with many re-engineering projects, at various locations within UK
110

industry being found to be managed under command-and-control type structures
(Barker 2001).
In attempting to answer why a non-involvement management style should continue to
exist within the UK, it was assumed by Barker (2001), that many UK managers are
"naturally autocratic". This management style is inconsistent with the evaluation of
employee involvement or knowledge contribution. The UK has clearly adopted a more
conservative style than North America or Australia (see 4.4.7) in terms of KM, ICM and
their evaluation.
The Industrial Relations Services (IRS) in the UK in 1997 showed that, on a national
level, there was still complacency and ignorance about world-class standards, an over
reliance on financial measures (which generally focused attention on the short rather
than the long term), and a national adversarial culture which failed to integrate
stakeholders into a cohesive network of inter-dependent organizations (Thompson
1998). Although this indictment would suggest a significant barrier to the
implementation of KM initiatives in the UK, some significant UK based success stories
such as British Petroleum (BP) have been frequently cited in Management, KM and IC
journals (Allee 1999, Liebowitz 2002, Martin 2000). BP is widely acknowledged as a
company that has succeeded in unleashing and then harnessing the power of learning
(Martin 2000). BP sought to leverage learning by replicating what was learned
throughout the company and linking these lessons directly to an understanding of
company purpose (that is, who they are and what makes them distinctive) (Martin
2000). In teaching their organization how to learn, knowledge managers sought to instil
the belief that generating value was everybody's job and reinforced this point by tying
individual performance to the kinds of targets that would promote learning (Martin
2000). BP has developed models to measure this increase in organizational learning
and appears to have closely aligned its KMI evaluation model with the Japanese model
(see 4.4.6). The IRS research confirmed that an increasing number of UK organizations
now accept that they must measure customer satisfaction, employee wellbeing and the
contributions made by people at both the individual and team levels (Thompson 1998).
The use of composite evaluation models is rare in the UK. To date, the only evidence of
the BSC being employed in the UK has been within The British Army, specifically the
Food Services branch of The Royal Logistic Corps (Hepworth 1998). And whilst
Continuous Improvement did not appear to be a common improvement regime in the
UK in general, it did seem to get some support in Ireland where many enterprises
111

experienced beneficial effects of becoming more innovative from having adopted a
programme of CI (McAdam et al. 2000).
4.4.6 Japan
Japan leads the world in patent applications per 10,000 population (the inventiveness
coefficient) by a wide margin (Leal and Powers 1997) but follows a unique course
regarding its technological and information management activities that strongly
differentiate it from other countries (Ahmed 1999; Barker 2001; Francis and Mazany
1996). Quality of product and of process, and a commitment to proactive change, just
in-time, total quality management, Kanban, quality circles, and statistical quality control
are a few examples of the Japanese approach to production management which have
included integrated processes for the management (but not evaluation) of information
and knowledge.
The Japanese have taught W estem business a lot about how to run a good company and
have also demonstrated that managers are neither omnipotent nor omniscient (Francis
and Mazany 1996). In Japanese companies the management ethos is that the senior
person knows that he ( or she) is not there because he has the best ideas, he is there to
listen to the ideas of others (Barker 2001). A large Japanese auto manufacturer
(Toyota) was quoted as placing strong emphasis on mechanisms for embedding
knowledge sharing behaviours in the culture so that they become the way things are
done and taught to others (Bessant and Francis 1999). The success of Japan as a
manufacturing nation and in particular the Toyota Motor Company is seen as simply a
result of human intellectual energy overcoming adversity (Barker 2001).
Japan recognized the tangible versus intangible dilemma around 1980 when Hiroyuki
Itami noticed a difference in performance among Japanese companies and after some
study attributed it to differences in the firm's intangible assets (Harrison and Sullivan
2000). Pascale documented the "Honda effect" in 1984 whereby the Japanese
automaker capitalized on its inexperience in the automotive industry and encouraged its
members to try out new ideas when designing and building their first generation of
automobiles (Mirvis 1996). This experimental philosophy persists today.
Case studies of suggestion systems presented by Bessant and Francis (1999) included
companies such as TCM and Daikin Industries where reward and recognition for ideas
varies with the level of suggestion. Appropriate reward systems have been found to
112

lead to higher levels of idea contribution and more valuable contributions. Some
employees contribute over 200 suggestions per year. Ideas are evaluated and ranked in
terms of their potential contribution to profit and a big idea would need to contribute
lM Yen upwards (Bessant and Francis 1999). This is a good example of providing an
organizational environment within which knowledge generation in the form of ideas can
thrive. The value of these ideas however is not likely to appear in the company's
financial statements.
The Japanese have long viewed knowledge to be an integral part of their work, and
hence have been using quality circles and job rotation as part of their knowledge
programme for many years (Ahmed 1999). The Japanese have a structure laid out in the
form of quality initiatives which is part of their organizational make-up, but this is
relatively new in other western cultures (Ahmed 1999). This is evident in the workings
of Japanese manufacturing organizations that often hold meetings with their suppliers to
exchange views and to discuss new projects (Ahmed 1999). This is an example of
judicious use of knowledge gained from outside the organization which was found to be
rare in most other regions.
Bessant and Francis (1999) found CI to be particularly prevalent in Japanese firms but
rare in the west. The Japanese approach to CI is entirely consistent with their approach
to incremental step-by-step improvements (Bessant and Francis 1999, Kaye and
Anderson 1999). The evolution of suggestions can be seen in data collected by the
Japanese Human Relations Management Association which suggest that on one
industrial site for example, there was 100 per cent participation of the "eligible
employees" (around 85 per cent of the total workforce) in kaizen based team work
(Bessant and Francis 1999). The characteristic feature of many Japanese CI systems of
involving every employee may help explain why there is such a strong "track record" of
strategic gains through CI (Bessant and Francis 1999).
In contrasting the approach to knowledge and learning of Japanese and Western
organizations, Leitch et al. (1996) demonstrates that Japanese companies take a very
pragmatic view of learning by treating the learning process as inseparable from taking
action and applying knowledge to real situations. Senge's belief in continual learning is
reminiscent of the Japanese concept where continual self-development is emphasized
both at a personal and professional level (Leitch et al. 1996). In addition, another
Japanese social attitude, that of team spirit or collective responsibility, has been adopted
into the learning company concept (Leitch et al. 1996).
113

Much of the success of Japanese manufacturing giants such as Honda, Canon,
Matsushita, NEC, Sharp and Kao has been attributed to their ability to manage the
creation of new knowledge (Martin 2000). The desire for a wider perspective of people
with a broad range of knowledge and skills which can provide the basis for functional
flexibility rather than narrow task-based multi-skilling is echoed in the findings of
Koike and Inoki, who reported that increased productivity as found in Japanese
factories, (which were compared with those in Malaysia and Thailand at the time),
resulted from the Japanese employees' ability to solve problems more effectively
because of the depth and breadth of their training (Rex worthy and Rothwell 1996). The
Japanese have clearly made the connection between individual training and
organizational learning but see no need to measure the extent or strength of that
connection.
4.4. 7 Australia
Little work has been done to provide an understanding of where Australian
organizations are situated in relative international terms when it comes to the
measurement, reporting and management of their IC (Guthrie 2002). A study
conducted by Guthrie in 2002 shows that the key components of IC in Australia are
poorly understood, inadequately identified, inefficiently managed and are not reported
within a consistent framework. While there is some evidence that Australian enterprises
are engaging in the process of identifying their stock of IC, overall Australian
companies do not compare favourably with their overseas counterparts in their ability to
manage, develop, support, measure and report on their IC (Guthrie 2002).
One effort to address the measurement gap between book and market values in
Australia was the development of the new Australian Accounting Standard AAS 38
Revaluation of Non-current Assets (adapted from the International IAS38). Caddy
(2002) however, believes this approach has serious limitations. A sample of 172 large
Australian listed companies found that they were reporting intangible assets
superficially on the balance sheet in the form of capitalized purchased goodwill and
identifiable intangible assets which is a long way short of the comprehensive IC
reporting practiced by some Scandinavian firms (Wyatt 2002). Although favourable
reviews of the BSC approach to managing intangibles from an accountancy perspective
have been noted in Australia, no evidence to support its employment has been evident
(Hepworth 1998).
114

Another Australian study found entrepreneurial spirit to be the most frequently favoured
management quality that was often mentioned in reports, followed by the importance of
customer relationships and management processes (Brennan and Connell 2000).
Entrepreneurial spirit, as a valued quality in an organization could be seen as another
form of IC. Brennan's study did not specify how these valued attributes are being
measured by Australian organizations.
With very little empirical data to work with, it is too early to assess whether Australia is
following the US, Japanese, Scandinavian or the European models.
4.4.8 Geographic Summary
The geographic location of an organization is likely to impact its approach to
knowledge and how it is managed and measured. Whilst the vast majority of KM
evaluation models originated in the US, companies in Europe and Scandinavia are way
ahead of their counterparts elsewhere when it comes to the measurement, reporting and
management of their IC.
The following table summarises the major geographic factors impacting KM evaluation
identified in this section.
115

ti' Approach to knowledge More than 90% of US Balanced explicit/tacit Growing recognition of Strong knowledge Mixture between US and
organizations are now approach customer and employee generation and sharing UK approach knowledge intensive. knowledge. culture. Recognize Knowledge treated as an importance of external artefact. knowled e.
Approach to learning and KM Pragmatic. Collection, Becoming normal An emerging Control Normal part of Too early to assess distribution and use of practice, Highly management discipline. management - not a codified knowledge structured. Flow and process separate discipline.
oriented. Built into Qualit . Approaches to Measurement Measure knowledge as Balanced approach Focus on Quality and Conservative. Heavy Measurement of KM not A little less conservative
an asset. High considering the context of Process reliance on financial necessary. than US quantification focus knowledge in the measures.
or anization Continuous Improvement Weak on Cl. Fairly strong Implied in Business Not popular in UK but Kaizen, small, proactive Emerging
Improvement by Quantum Processes. gaining acceptance in incremental leas Ireland. im rovements.
Composite Measurement Much literary acclaim, Leaders in "Balanced" Emerging. Rarely used. Nia Gaining corporate Models some support from reporting. acceptance,
industry & government. Mostly for internal re ortin .
Accounting for KM/IC Conservative. IC as an Developed their own. developing Conservative. Nia Little evidence out ut from KM.
Reporting Cautious and reluctant. Open and transparent, Following the Mostly internal Nia A little more open and Internal. strongly supported. Good Scandinavian model external than the US.
balance between external & internal re ortin .
Government Support Low. No direction. Strong. Government Supportive but little Supportive but no High Supportive but little incentives for business. direction direction. direction
Senior Mana ement Su Ori low hi h hi h Generali low. hi h low Culture Mostly command & Focus on customers, Innovation and Customer Command & control. Tight control but Less command and
control but some employees and focussed Based on hierarchical employee focussed. control oriented than US exceptions processes structures. Strong focus on or UK, more collaborative
or anizational learnin . culture.
Table 11: Summary of Geographic Evaluation Factors
117

5. Conclusions, Limitations and Further Research
This chapter expands on the results of the data analysis phase and discussions from
Chapter 4, looks at the factors behind the KM measurement systems and models used
by organizations, examines the problems being experienced by organizations in their
evaluation experiences and makes conclusions as to what these issues mean to
contemporary management and to the future of KM evaluation. The Chapter closes
with a proposed framework for KM evaluation, limitations of this study and
opportunities for further research. The following diagram shows the relationships
between the sub-sections of this chapter.
Conclusions, Limitations & Further Research
I I KM Limitations of Further
Evaluation This Study Research Conclusions
I I I I I
Usefulness Evaluation Evaluation Future KM of this Conclusions Shortcomings & Evaluation Evaluation Study Barriers Issues Framework
I Evaluation Conclusions Conclusions Models& from from Categories Chronological Geographic
Analysis Analysis
5.1 KM Evaluation Conclusions
5.1.1 Usefulness of this Study
The major contributions of this study are in the areas of defining KM in the
organizational domain, identifying what has been measured under the label of KM
evaluation, identifying the numerous diverse factors that have contributed to its
evaluation and the distillation of these factors into a KM evaluation framework ( see
Figure 9 in 5.1.5). The framework assists organizations in reducing the complexity and
ll8

"fuzziness" of the topic and provides a balanced generic and holistic approach on the
basis of which organizations can develop a structured flexible KM evaluation model.
This study has taken a much broader view of KM than previous studies by including
measurement models for topics that may not have been explicitly associated with KM
or IC but nevertheless are relevant by virtue of their consistency with the objectives and
definition of KM. This has broadened the perspective of KM and placed it in a strategic
organizational context. KM was defined in the organizational environment by
suggesting that any activity that exploits knowledge to enhance organizational learning
or business performance is a KM activity. On the basis of findings to this point, a
revised definition of KM can now be offered as: "any process or practice of creating,
acquiring, capturing, sharing, using and evaluating internal or external knowledge, to
enhance organizational learning, pe,formance and image."
The research design and methodology worked quite well with few problems being
encountered during the data collection and analysis phases. The NUD*IST software
product was instrumental in identifying the most relevant topics associated with KM
and in constructing the evaluation categories by virtue of its ability to rapidly search all
articles for specific words or phrases. More than one hundred text searches were
conducted across all 220 articles to identify relevant evaluation themes. Apart from the
speed and convenience afforded by NUD*IST, this software support allowed the focus
to remain on the subject matter and objectives of the research rather than being overly
distracted by the techniques of analysis.
This study has identified what organizations have been measuring between 1996 and
2002 in relation to KM initiatives. Trends were identified in the main categories of
measures and differences in approach to KM evaluation between major geographic
regions were identified. Factors inhibiting the development and use of KM evaluation
models were explained and lessons distilled from the literature. The different types of
measures that need to comprise a comprehensive KM measurement model were
identified. These achievements effectively answer the research questions posed in 1.4.
As a journey of discovery, the chronological and geographic approaches to data analysis
were enlightening as they allowed a wider variety of different perspectives of KM
evaluation to be identified than would have occurred using only one domain. The
chronological approach provided a detailed examination of trends which in tum
highlighted many problems that organizations had experienced over the research period
and provided an holistic picture of KM evaluation developments between 1996 and
119

2002. The geographic analysis indicated that factors such as regional culture and
government policy and direction also impact the way in which organizations approach
knowledge, its evaluation and how it is reported. The geographic analysis also provided
some explanation as to why some organizations adopted particular KM evaluation
approaches.
The results of this study have made KM evaluation somewhat less of an esoteric subject
which in tum may improve the success rate of KM initiatives, may convince more
organizations to embrace the activity and may improve the credibility of KM evaluation
as a viable means of assessing the gap between market and book value. A strategically
oriented framework is offered within which organizations can now plan their approach
to KM evaluation. By using the framework developed as a by-product of this study,
organizations may be in a position to more accurately identify the KM initiatives that
contribute to their success and will be able to more effectively manage the knowledge at
their disposal.
The future success of this study will depend on the extent to which it generates further
more detailed research in the evaluation of KM.
5.1.2 Evaluation Conclusions
Models & Categories of KM Evaluation KM/IC evaluation models have emerged, either directly or indirectly, from a number of
diverse influences including Business Performance and Quality Management Models,
development of IC as an ever increasing important factor of production, inadequacy of
existing accounting systems to deal with intellectual assets, the emergence of
organizational learning as an important management discipline and changing corporate
values. Boulton et al. (2000) add that the Knowledge Economy is being built on the
economic and social power of intangibles like relationships, knowledge, and intellectual
property, the impact and importance of which are multiplied by the effects of the ever
expanding networked global economy. In this complex and rapidly changing business
environment that characterised the eighties and nineties, a number of specific models
and approaches have been advocated and developed for achieving business excellence
and continuous improvement. Examples included the Business Excellence Model, the
Malcolm Baldrige National Quality Award, the Deming Model, Total Quality
Management (TQM), Business Process Re-engineering (BPR), Investors in People
(IIP), and ISO 9000 (Kaye and Anderson 1999). All of these models have measurement
components associated with them and have impacted the development of KM/IC
120

evaluation models in varying degrees. The impact of these models on KM/IC
evaluation however, has not been entirely positive and may have sent KM/IC evaluation
on the wrong path.
This study supports the growing body of evidence depicting a steady decline in the
relationship between tangible assets and market value across the entire industrial
spectrum (Martin 2000). This phenomenon in itself has prompted research into viable
systems to measure the extent and nature of this gap. Gap analysis as an evaluation
model, identifies deficiencies in organizational processes which in tum leads to the
development of new continuous processes and new process related measures. However,
as identified in Chapter 4, very few organizations have actually implemented working
measurement models that effectively and comprehensively measure this gap as part of
their performance measurement regimes. In order to better understand this gap, it
appears that KM/IC managers have lost faith in generic business measurement models
and are searching for measurement models that are easy to apply and that will be
acceptable to the financial and investment community (Wurzburg 1998).
The main problem with these generic business evaluation models is that they attempted
to provide a holistic approach to evaluation of organizational performance but did not
sufficiently emphasize the factors which are necessary to generate and sustain a
continuous improvement momentum. The scoring mechanisms, which managers rarely
had time to understand and implement, were shown to encourage number chasing rather
than business improvement (Kaye and Anderson 1999). KM and IC measurement
models seem to have inherited the same problems as evidenced by the continued focus
on explicit knowledge and financially based measures of KMI effectiveness.
Furthermore, management has not been adequately trained in how to develop
appropriate measurement systems that will help to achieve organizational objectives.
Some managers have demonstrated a willingness to learn "how" in terms of detailed
practices, behaviours and techniques, but not "why" in terms of philosophy and general
guidance for action (Pfeffer and Sutton 1999). This claim by Pfeffer and Sutton is
supported by the current research findings as very little supporting documentation was
found explaining "why" KM/IC measures were seen to be applicable to the
organizations implementing them.
This study supports the findings of a number of studies since 1997 which found that
most firms' KM efforts (particularly in the US) consisted of investing in explicit
knowledge repositories in one form or another such as intranets, data warehouses and
knowledge bases, building networks so that people could find each other, and
121

implementing technologies to facilitate workgroup collaboration and Communities of
Practice. These are all activities that treat knowledge as products or assets, to be
gathered, shared, and distributed. Few organizations measure the more tacit forms of
knowledge implementation and how knowledge is actually used to promote learning
and improve organizational performance. As can be seen from Table 10, qualitative
measures for assessing the organizational impact of knowledge repositories and
artefacts were found to be rare but are nevertheless gaining momentum. As a
consequence of this explicit focus, KM measurement systems have correspondingly
tended to focus on the stock of knowledge manifested in things like the number of
patents, the compilation of skills inventories, and knowledge captured on overheads or
in reports. Measuring organizational knowledge by, for example, the size of a
knowledge base in mega-bytes or on the basis of number of records, has little relation to
how the knowledge contained therein is actually distributed, shared and used and is thus
of limited value in assessing the impact of the knowledge on the organization.
In the case of human capital, the evaluation of knowledge, skills, competencies and
expertise of employees developed during the eighties and nineties to the point where
human capital measures have become the most popular form of KM evaluation by 2002
(see Fig 8 section 4.2.3.). However this does not mean that human capital evaluation
systems were necessarily well implemented or used particularly successfully.
Evaluation techniques have been found to be fragmented and lacking in strategic
purpose. Most studies of human capital measured work experience in terms of tenure,
defined as years in a job, years in an organization, or by the number of times an
individual has completed a certain task or operation. What these studies shared in
common was that they all described and assessed work experience in quantitative terms
instead of focussing on the value of that experience to the enterprise (Tesluk and Jacobs
1998). Qualitative measures of human capital such as employee satisfaction and
morale, although growing, are still rare.
The ability of an organization to learn is an example of the application of human capital
that was beginning to make inroads into KM evaluation models in the late nineties.
Robinson and Kleiner (1996) recognized that the ability of an organization to learn in
one sense depended on the mental models that decision makers had built and that these
mental models (a form of tacit knowledge), made routine decision making easier and
more effective. A measurement of the extent to which decision makers were
encouraged to re-evaluate their mental models was recognized to be one way of
identifying organizational learning ability but no examples of practical application of
this technique were found at this time (Robinson and Kleiner 1996).
122

Acceptance of IC as a model for identifying and measuring intangibles in modem
organizations appears to have been overcome, in large organizations at least. The works
of Sveiby and Edvinsson amongst others in the early to mid nineties, have significantly
influenced the thinking about the non-tangible factors that determine the success of
companies. Despite these influences by early adopters of the concept, a particular
weakness in the early stages of development of IC measurement models was the lack of
coverage of elements of IC that needed to be derived from sources external to the
organization. Although internal and external components of IC were intended to be
included in the reporting models that were used at the time, the external focus was
usually limited only to customer relations and not to other stakeholders such as
suppliers and government advisory bodies (refer Table 10). One of the early exceptions
was the Swedish company Skandia AFS, which first published an IC report in 1993 and
targeted a wide range of both internal and external performance elements. After a
decade, such success stories of comprehensive IC reporting even in large organizations,
are still rare.
Apart from having learnt that measuring too much is neither efficient not effective,
organizations seemed to have had no means of assessing whether a small number of
measures would provide a sufficiently complete and adequate coverage. Until now,
managers who wished to manage intangibles have had to rely on a bewildering variety
of available scorecard metrics without any understanding of which metrics were likely
to be more important, how their company's metrics measured up to the competition, or
whether the company's performance is enhanced as a result (Hurwitz et al. 2002). Many
evaluation systems fail to be effective because they are disparate and often measure
activities that are of a local or individual interest to a manager rather than a key activity
for the business (Ahmed 1999).
There is currently no evidence to support the notion that qualitative and quantitative
measures will work in harmony to achieve any form of balance between the currently
available KM evaluation models. The only clue towards the future development of KM
evaluation models is the strong growth of financial and human capital measures that
have occurred since 1999 (see Fig 8) which may eventually lead to some degree of
measurement duopoly which, without adequate balancing measures from other
categories, will not enhance the cause of KM or its effective evaluation.
123

Conclusions from Chronological Analysis
KM evaluation appears to be struggling to develop significantly beyond its heritage in
traditional measurement of organizational performance. The measurement of
organizational performance appears to have undergone a number of phases in
development since the eighties. The first phase, which is deemed to have started in the
early 1980s, focussed heavily on financial measures such as profits, ROI and
productivity. Within this system, measures were based on the traditional system of
management accounting. This perspective was handicapped by a number of
shortcomings (see 5.1.3), which fuelled the second phase characterised by the
development of non-financial measures. Characteristically these are measures that are
related to manufacturing strategy and operational matters that facilitate decision making
for managers and workers, foster improvement rather than just monitor performance and
change with the dynamics of the market place Ahmed (1999). The third phase is
characterised by integrated use of financial and non-financial measures. The emergence
of the second and third phases does not mean that the first phase has been totally
superseded - it still persists and indeed appears to be growing in many organizations as
shown in 4.2.3. Evidence of this third stage is apparent in the evaluation systems
emerging under the umbrellas of KM and IC, particularly in the composite type
measures such as the Balanced Scorecard.
Quality management and its associated metrics have undergone a separate and distinct
history. Four major quality eras have been identified: inspection, statistical quality
control, quality assurance, and strategic quality management (Kaye and Anderson
1999). In the fourth quality era the focus is on the customer and in this mode, the
organization is more proactive in anticipating and responding to both customer and
market needs. The strategic quality management approach, however, appears to be
inadequate to meet today's rapidly changing business environment which is
characterised by uncertainty and unpredictability. To meet these challenges, a fifth
quality era known as "competitive continuous improvement" was identified by Kaye
and Anderson (1999) as having developed in the late nineties where the primary
concern is with the organization being flexible, responsive and able to adapt quickly to
changes needed in strategy in the light off eedback from customers and from
benchmarking against competitors. Based on a synthesis and interpretation of these
views, five important and common evaluation factors were identified by Kaye &
Anderson as: leadership, strategic focus, organizational culture and focusing on
employees, processes, standardisation and measurement and learning from results.
Elements of all these factors were found in varying degrees in the KM/IC evaluation
124

models in use over the past decade but generally in an ad hoc fashion and not part of, or
integrated with, any structured or formal framework.
The theoretical roots of IC have followed two different streams of thought since the
early nineties - the strategic stream and the measurement stream (Brennan and Connell
2000). The strategic stream focused on the creation and use of knowledge and the
relationship between knowledge and value creation. The measurement stream related to
the need to develop a new information system, measuring non-financial data with
traditional financial tools (Brennan and Connell 2000). Despite the fact that the wisdom
of using traditional financial tools to develop KM/IC evaluation models had been
questioned by a number of authors (as identified in Chapter 4), the focus in 2000 was
more on the measurement rather than on the strategic stream. Measurement of
intangibles using traditional accounting tools however, was found to be a distraction and
diverted the focus of KM evaluation away from the strategic advantages to be gained
from a more balanced quantitative and qualitative evaluation approach.
The approach adopted by most organizations in the selection of KM evaluation models
seems to have been very much trial and error and whatever was easy to measure with
few organizations having any notion of how to systematically assess whether or not
their evaluation regimes were producing the required information to enhance
organizational learning and performance. A major challenge facing contemporary
management in the development of KM/IC evaluation models, that no doubt contributed
to this trial and error approach, has been the relentless and accelerating pace of change
in all areas of management responsibility. Correspondingly, performance measures and
measurement systems and models have been, and still are, in a state of constant and
significant change as organizations seek better ways to communicate and support
execution of business strategies in the knowledge economy. This is evidenced by a
performance measurement survey conducted in 2001 where 80% of respondents
reported making changes in their performance measurement systems within the previous
three years (Frigo 2002). Many of these changes have included major overhauls of
existing measurement systems and the implementation of new systems based on
integrated, composite measurement frameworks such as the Balanced Scorecard and
Value-Based Management initiatives. The Mason Haire University of California
Institute of Industrial Relations subscribes to the notion that what gets measured gets
done to the extent that, in order to change how an organization behaves, it is necessary
to change the measurement system (Thompson 1998). This assumed relationship
between measurement and action may have contributed to many organizations
125

measuring too much of the wrong things in the assumption that this would lead to
higher productivity.
Efforts to revise and adapt financial accounting standards to cater for the measurement
of intangibles have been slow to evolve and have fallen short of what was needed
inasmuch as they continued to be overly concerned with financial information
(Wurzburg 1998). Most of the solutions offered have been geared towards profit
making commercial firms by measuring IC and the intangible assets on a company's
balance sheet and thus have had limited application for non-commercial enterprises
such as the public sector (de Gooijer 2000). An attempted step in this new direction
was the International Accounting Standards Committee that developed a new
accounting standard on intangible assets (standard IAS 38) in 1998. Although IAS 38
provided for the disclosure of some IC elements in the annual report, it only went part
of the way and most IC resources remain undisclosed.
Further to the tendency to cling to traditional accounting measurement, Allee ( 1999)
established that organizations have been tempted to try to stretch the traditional
Industrial era way of thinking and apply it to the idea of knowledge and value creation.
This study supports Allee' s findings. Allee found that this approach was useful for only
a very limited range of knowledge products and that such models fell far short as a way
to think about knowledge in its cyclical development between socialisation,
externalisation, internalisation and combination (as discussed in 2.4.2). The old ways of
modelling the enterprise via value chains, organizational charts, process diagrams and
workflows have been found to be inadequate, slow and cumbersome in attempting to
address the key business question of how to understand knowledge and the value
creation processes associated with it (Allee 1999).
The adage "what you measure is what you get" has been generally shown to be true
with the correlation between what is measured and what is achieved, being found to be
imperfect, but definitely positive (Appelbaum and Reichart 1998). Some organizations
seemed to rely on this as sufficient basis for implementing extensive evaluation models.
More recently, it has begun to be recognized that parameters such as quality
relationships and trust are fundamental principles of a successful value network, but few
organizations had any idea of how to measure these elements of organizational
performance.
It was established during the eighties and early nineties that, meeting the educational
needs of experienced managers had the ability to enhance the reputation of a company
126

as an employer, enhance managerial excellence, positively impact the bottom line and
lead to the growing realization that education was a strategic weapon for achieving
competitive advantage (Francis and Mazany 1996). However, while the qualitative
benefits of education were recognized to represent important contributions,
organizations have found that each benefit was difficult to measure. The failure to
conclusively relate OL to dollar benefits may have contributed to the waning of interest
in the concept of OL in the mid nineties. Since then there have been important debates
regarding the extent of the role of learning processes in creating organizational
knowledge. Whilst models for measuring learning (such as Kirkpatrick's model15) have
been available for some time, they have not been used effectively and have not been
effectively integrated with KM/IC measurement tools. Models are still emerging from
such debates to evaluate the effectiveness of learning programs in line with KMis.
Emerging out of the debates in the late nineties was the notion that if the rate or quality
of knowledge flow in the organization was increased, accumulation of IC stock in the
form of human, structural or relationship capital would naturally follow and that value
would consequently increase (Allee 1999). This may or may not be the case. Whilst the
literature suggested the necessity to demonstrate the connection between these
knowledge flows and how they generate value for the organization, no evidence was
found of any cases where this connection had been systematically and demonstrably
established. Many of the emerging theories in relation to KM and IC evaluation have
not been tested in practice.
Creating value through the flow and management of knowledge takes a number of
different forms. Some of the rarely quoted factors of IC such as human and
organizational values, principles, and ethics have become critically important to
organizational success over the past decade through core values such as integrity,
honesty, responsibility, inclusion and respect (Allee 1999). These values contribute
heavily to creating the "right conditions" for fair exchanges of knowledge to take place.
In the old competitive business environment, one could occasionally jeopardise a
relationship for the sake of a short-term gain. In the more complex and open world of
Value Networks of the late nineties, such actions could damage a company's standing
and trust, impacting its value creating capacity at multiple levels (Allee 1999). This
study indicates that organizations are beginning to recognize that customer and public
perceptions of organizational ethics and social responsibility are important components
of their Intellectual Capital that need to be evaluated and reported, both internally and
15 see 4.3.1.
127

externally. Few organizations are actually doing this and those that are, are not doing it
very well, partly due to lack of skills and lack of knowledge as to how to approach it.
After investing significant amounts of money and time in KM since 1996, managers
towards the end of the nineties started to wonder whether their efforts had been
worthwhile (Ahmed 1999). This is evidenced by the volatility in the use of major KM
measurement categories between 1998 and 2000 before some clearer trend patterns
started to emerge, particularly the upward trends in financial and human capital
measures and downward trends in customer, market and process related measures16•
KM measurement was found to be important to determine what to pay attention to and
improve, to provide a scoreboard for people to monitor their own performance levels, to
give an indication of the cost of poor implementation, to give a standard for making
comparisons and to help efforts comply with business objectives (Ahmed 1999).
However, many organizations found that randomly selecting a large number of
measures without a plan, structure or framework, was not the answer. Supporting
Ahmed's findings, more than half the respondents in a 2001 survey, rated their
organizational performance measurement system17 as poor, or less than adequate, and
less than 10% considered their performance measurement system excellent in
communicating strategy (Frigo 2002). The literature does not offer any evidence to
suggest that KM/IC measurement is any more or less effective than generic
organizational performance measurement systems but it was found by Frigo (2002) that
users of the Balanced Scorecard method, rated the effectiveness of their performance
measurement systems in supporting and communicating strategy much higher than
nonusers. This indicates that a balanced model drawing appropriate metrics from a
variety of categories offers the most viable KM evaluation approach.
As established in Chapter 4, there is still a pervasive preference for quantitative
measurement purportedly in the interests of objectivity. But perhaps 100% accuracy
and reliability is no longer enough with relevance of issues becoming more important
than absolute reliability and objectivity. A somewhat futuristic statement comes from
Simon and Kumar (2001) who claim that increasing technological and communications
advancements are leading to a society where information and intellectual property will
be akin to currency. Being in the very early stages of this transition, it remains to be
seen if and how this recognition and acceptance of IC as currency will occur.
16 See Fig 8 in section 4.2.3. 17 which has been taken to include KM/IC measurement in whatever form
128

The eclectic influences on KM/IC evaluation models present a complex but rich
environment upon which current evaluation models are based. Evaluation has been
recognized as a critical organizational performance issue but managers in 2003 are still
a long way from being able to measure and manage knowledge and IC effectively. The
raw materials in terms of variety of possible metrics are adequate and available, what is
needed is a framework to assist organizations in putting together the appropriate raw
materials into an integrated holistic model. This is discussed further in 5.1.4.
Conclusions from Geographic Analysis
As identified in Table 11, the main geographic factors impacting KM measurement are:
the different approaches that countries take to learning, knowledge and to the discipline
of KM; different approaches to measurement in general; attitudes towards business
improvement concepts such as Continuous Improvement; accounting and reporting
regulations; Government support; management attitudes and national cultures. Multi
national organizations in particular will need to be mindful of these factors as one form
of KM evaluation is unlikely to be appropriate for branches in different major regions of
North America, Scandinavia, Europe, UK, Japan and Australia.
In Japan and most of the western world, information and knowledge, or more precisely,
the effective use of them, have become factors of production in their own right. Only
the western world however, seems to be concerned with evaluation and measurement of
KM and IC. Japan regards KM as such a natural and normal part of management that is
integrated with their business processes in such a way that knowledge itself or the
outputs from KMis do not need to be measured because management and organizational
performance evaluation encompasses the measurement of the effective use of corporate
knowledge from the shop floor to senior management. The Japanese are more focussed
on knowledge creation as shown by formal and comprehensive reward systems that they
have put in place to encourage the generation of new ideas.
Management styles, attitudes and organizations cultures in different regions impact the
organization structures which, as the UK has discovered with their traditional
"command and control" type structures, can stifle the sharing and use of knowledge.
The lack of senior management support for qualitative forms of KM evaluation in the
US has had a significant impact on the way North American organizations manage and
value their knowledge.
129

Government can also have significant impacts on KM evaluation through accounting
and business regulations, incentive schemes for different types of performance reporting
and provision of relevant infrastructures for training, higher education and knowledge
dissemination. It is somewhat paradoxical that the US government has recognized that
human capital is its most valuable asset and yet its distinctly conservative policy on
reporting of intangibles has significantly impacted its ability to accept qualitative
measures in any form as viable for reporting. By contrast, policy development by
central governments in Japan and Scandinavia for initiatives such as Continuous
Improvement is far more prevalent than in other regions. Government support for KM
evaluation in the UK, Europe and Australia is still weak and provides little direction for
industry.
Whilst Scandinavia continues to set the standard for IC reporting and seems to have
found the appropriate balance between the explicit and tacit elements, Australia has a
long way to go and as such, has significant opportunities to learn from the other major
regions. While Australia seems to follow the North American model in things like
quality improvement, it is more liberal than the US in accepting alternative accounting
systems for measuring intellectual capital. Opportunities exist for Australia to take the
best KM evaluation practices from the other regions and thus avoid many of the
shortcomings encountered by early adopters.
Apart from Japan, East and South East Asia were conspicuous by their absence in
KM/IC literature. Whilst Singapore, Malaysia and South Korea have established
significant manufacturing bases in their respective regions, they do not seem to have
adopted the Japanese penchant for KM. It remains to be seen if these non-Japanese
industrial entities can compete with other knowledge based economies.
Different cultures and values inevitably result in different employee motivators which in
tum have been found to lead to different evaluation approaches, particularly for
intellectual assets. For example, the Japanese kaizen approach versus the US preference
for quantum leaps in organizational change may suggest that the Japanese are more
focussed on process while the US is more focussed on outcomes or results. The US
preference for quantum leaps may also explain the US reluctance to embrace
Continuous Improvement (Cl) initiatives as the principles of CI are more supportive of
incrementally managed procedural changes.
The global economy will no doubt demand that internationally accepted standards be
developed for accounting and reporting of intellectual assets but it is difficult for such
130

standards to develop while there are such significant differences in the approaches by
central governments and large organizations to knowledge, its management and
evaluation. Significant additional work needs to be done by International Accounting
Standards setting bodies to establish the standards for KM and IC evaluation and
reporting that can be interpreted and adapted by national bodies to satisfy different
national and professional standards and practices. Somehow international standards
will need to consider the geographic factors mentioned above in the design of
universally acceptable KM evaluation models that will cater for the unique needs of
each and every organization. The extent to which this is possible is yet to be
determined.
5.1.3 Evaluation Shortcomings and Barriers
The problems and shortcomings that were identified by this study as being experienced
by organizations in their attempts to implement KM evaluation models between 1996
and 2002 have presented significant barriers to the development of effective KM/IC
evaluation models and have significantly influenced the rate of acceptance and adoption
of new measurement principles.
The following table represents the main shortcomings and barriers to KM evaluation
and the contributors to each issue identified by this study.
Poor understanding of KM/IC measurement principles leading to measuring too much of the wrong things
Incompatibility of traditional financial accounting and reporting systems with KM/IC measurement and reporting
Excessive "command and control" rather than improvement and action orientation. KM measures too narrowly focused, not strategically aligned and not embedded in overall business
erformance model. Results of measures not being adequately communicated throughout the or anization.
Ahmed 1999, Kaye and Anderson 1999, Lenskold 2002, Liebowitz and Suen 2000, Brah, Ong et al. 2000, Clarke and Rollo 2001, Davis 1996, Kaplan and Aronoff 1996, Kleysen and Street 2001, Kuczmarski 2001. Ahmed 1999, Bassi 1999, Berkowitz 2001, Bontis 1998, Bornemann and Leitner 2002, Brennan and Connell 2000, Carroll and Tansey 2000, Collier 2001, Grossman 2000, Joia 2000, Ma 1997. Lynn and Reilly 2000, Carroll and Tansey 2000, Li and Cavusgil 1999, Thompson 1996.
Ahmed 1999, de Gooijer 2000, Kaye and Anderson 1999, Kruzner and Trollinger 1996, Frigo 2002.
Thompson 1998, Grossman 2000, Frigo 2002.
Table 12: Shortcomings and Barriers to KM Evaluation
131

These issues are discussed in more depth below.
Poor Understanding of Principles KM evaluation in the 21st century is being embraced with little common understanding
of its principles to the point where poor and ineffective measurement system design and
implementation is potentially destroying the opportunity of achieving significant
benefits. Some organizations displayed particular weaknesses in regard to their
approaches to performance evaluation which included: - lack of identification of critical
success factors; lack of understanding of the concepts of measurement of quality and
continuous improvement; insufficient integration of continuous improvement activities;
existence of a "blame culture"; reliance on "quick fixes" and fire fighting; low level of
employee empowerment and perceived lack of non-financial performance measures
(Kaye and Anderson 1999; Barsky and Marchant 2000; Bontis 1998; Kleysen and Street
2001). In addition, many organizations failed to implement effective performance
evaluation systems to support their development due to failure to operationally define
performance, failure to relate performance to the process, failure to define the
boundaries of the process, misunderstanding or misusing measures, failure to
distinguish between control and improving measures, measuring the wrong things, fear
of distorting performance priorities, fear of exposing poor performance and perceived
reduction in autonomy (Ahmed 1999; Thompson 1998; Wise 1999; Liebowitz and Suen
2000). Ahmed (1999) also believed that the disillusionment by organizations to achieve
the expected benefits from KM arose because management failed to put in place an
appropriate tracking system to measure progress. All of these factors apply equally to
KM evaluation methodologies as they do to organizational performance evaluation in
general.
Contributing to the lack of understanding of KM/IC measurement, indications from this
study are that many managers do not have the necessary expertise to carry out
appropriate KM/IC evaluation. Poor skill levels may have contributed to many KM/IC
measures in current use lacking focus and precision (Bontis and Fitz-enz 2002). The
difficulties are exacerbated by the attitudes of particularly accounting and finance
managers, who are less likely to appreciate or advocate the importance of such
measurement and are thus not likely to develop the necessary skills in themselves or in
their subordinates (Bontis and Fitz-enz 2002).
There are shortcomimgs with the tendency to see knowledge or know-how as something
tangible or as an artefact like a patent. First, the conception of knowledge as something
explicit and quantifiable draws a problematic distinction between knowledge as a
132
tangible good and the use of that good in ongoing practice (Pfeffer and Sutton 1999).
Second, the emphasis that has resulted has been to acquire or develop intellectual
property under the presumption that knowledge, once possessed, will be used
appropriately and efficiently (Pfeffer and Sutton 1999). As intellectual assets do not
behave in the same way as physical assets (Rodov and Leliaert 2002), they cannot and
should not be measured the same way.
Inadequate Accounting and Reporting Systems
Performance measures in general and KM evaluation in particular, to a large extent are
still locked in the traditional perception of measurement systems as "command and
control" mechanisms, fitting comfortably with the Industrial era model of management
which is still cripplingly prevalent in many managers' minds (Monkhouse 1996). This
legacy has adversely impacted the development of KM evaluation models.
The traditional accounting system is historically based and focuses on monetary
amounts of past transactions, while IC is future oriented and focuses on subjective
qualities, making it difficult to value such assets in quantitative terms. IC accounting
evolved in the early nineties as a tool to help measure the results of KM at all levels of
the organization and was designed to show whether an organization was on the right
track in implementing its strategies and policies (de Pablos 2002). The IC report as an
output of the IC accounting process was developed in order to make the organizational
intangible resources visible to internal and external stakeholders. According to Skyrme
(1998) the underlying accounting principles for the emerging knowledge economy,
shareholder value and innovative organizational practices and processes are still
undefined and poorly understood. Furthermore, traditional accounting measures have
been accused of being myopic, often sacrificing relevance for reliability and do not tell
users anything about the psychological climate that motivates workers (Carroll and
Tansey 2000). Traditional accounting practices do not appropriately measure or value
attributes such as speed or velocity (e.g. time-to-market, time-to-full-value usage,
customer responsiveness); they don't measure intelligence (e.g. what is known or how
fast it is learnt); they don't measure degree of satisfaction ( e.g. employee morale or
customer satisfaction) and they fail to cover the critical dimension of connectedness in
the form of ease of doing business, how appropriate and well-executed the channel
strategy is or the quality of relationships (May and Kahnweiller 2000).
Although technology, connectivity and human capital are playing an increasingly
dominant role in contemporary management, the inadequate accounting systems are
proving to be slow to adapt to new measurement needs. Whilst most practitioners
133

would argue that the point of metrics is to provide a framework to measure the success
or failure of a KM initiative (the ex post view), for senior executives the reality is still
that measurement systems need to offer a way to justify the expenditure of resources
(the ex ante view) in the first instance (Skyrme 1998). Many managers believe in the
growing importance of investing in skills through formal and informal training but
existing accounting and other structures mean that most organizations are unable to
adequately measure, report and evaluate these key investments (Bassi, Ludwig et al.
2002). Existing accounting systems do a poor job of providing the necessary tools at
either ends of the ex-ante/ex-post spectrum and are poor at conveying information on
the skills and know-how of a company workforce, the ability of companies to
systematically locate useful information and to get it quickly to where it can add value
in the production process and the strength of relationships with suppliers and customers,
etc (Wurzburg 1998). Reliance on financial statements measures are almost certainly
impeding the financing of knowledge based initiatives because assets in the form of
human resources are not given appropriate recognition.
In addition to these limitations it is well documented that relying on single financial
measures such as ROI or net income to measure performance leads to sub-optimal
business decisions and dysfunctional behaviour (Carroll and Tansey 2000). The failure
to measure and record IC can lead to the misallocation of capital, under-investment in
IC creating activities such as training, and unrealistic income reporting (Carroll and
Tansey 2000). The bottom line of all these on-measured attributes of success are that
return on investment (ROI) is no longer an appropriate indicator of business success and
yet is still extensively relied upon as shown in Appendix E and section 4.2. Another
problem with these measures is that they do not provide any mechanism for
improvement.
Adding to the informal and fragmented approach to KM/IC evaluation, in the absence of
appropriate accounting and reporting standards, each organization has had to develop its
own reporting model and its own naming conventions for IC components making
comparisons between organizations difficult. Without a common set of principles and
shared understanding across organizations on how to measure IC, it would be extremely
difficult for public disclosure to be useful, even if it were to occur (Bassi, Ludwig et al.
2002). Information disclosed voluntarily is available to competitors, and competitive
advantages can quickly disappear if inappropriately reported (Brennan and Connell
2000). Moreover information manipulation can occur in a situation where there is no
standard IC reporting framework and where surveillance by independent bodies is not
required (Vander Meer-Kooistra and Zijlstra 2001). Managers are also reluctant to
134

disclose more than what is necessary for fear that they could create unrealistic
expectations from internal and external stakeholders which may or may not be met
(Vander Meer-Kooistra and Zijlstra 2001). HR managers in particular are worried
about what they'll find if their programs are measured rigorously and accurately, and as
a result, they often claim it's too hard to do (Grossman 2000). These issues not only
reduce the credibility of IC reports, it makes them less likely to be produced at all.
Poor Orientation
A number of authors maintained that there was too much emphasis on command &
control orientation in KM evaluation and not enough on improvement and action
(Monkhouse 1996, Carroll and Tansey 2000, Thompson 1996).
According to Monkhouse (1996), the folly of steering the business entirely "through the
rear view mirror", as conventional financial performance measures had been described,
had been well documented and, by some businesses, well understood, but he questioned
whether this understanding was being translated to action by anything but a relatively
small number of high-profile organizations.
Whilst Thompson (1996) saw a "command and control" philosophy as valuable for
managing resources efficiently, he believed it was not conducive to rapid change or
organizational flexibility, which is critical for KM (Kaye and Anderson 1999).
Command and control management also requires the organization to be separated into
functions, businesses and/or divisions for clarity whilst knowledge oriented
organizations demand different forms of organizational integration, both formal and
informal, in order to share both information and learning (Thompson 1996).
An over-emphasis on financial measures are giving misleading signals for continuous
improvement and innovation activities demanded by the contemporary competitive
environment and they do not provide any mechanism for improvement (Carroll and
Tansey 2000, Li and Cavusgil 1999). If companies could measure their innovation
process and had reliable metrics to gauge their performance, specific problem areas
could be addressed and managers might see improvement in their innovation efforts
(Lynn and Reilly 2000).
135

Lack of Strategic Focus
Kaye and Anderson ( 1999) highlighted the need for strategic focus in the evaluation of
continuous improvement initiatives which highlighted the importance of the linkage
between strategy, actions and measures. This linkage is essential and unless
organizations adapt their measures and measurement systems to facilitate compatible
introduction of these elements, implementation will fail to reap the expected benefits
(Ahmed 1999). The experiences of companies pioneering in the field of performance
management demonstrate that, once the means are at hand to make measurements
demonstrably linked to strategy, a whole new realm of managerial possibilities opens up
particularly in regard to the transformation of passive data into actionable business
knowledge (Kruzner and Trollinger 1996).
Frigo (2002) also identified the gap between performance measures and strategy stating
that the innovation component of an organization's knowledge strategy is often not
clearly defined or articulated within the overall strategy for value creation.
Organizations should examine how best to create and leverage intangible assets in
conjunction with their business strategies.
Lack of Adequate Communication
Thompson's (1998) research suggests that even when IC related issues are actually
evaluated and measured, the results are not always communicated through the
organization to an appropriate and desirable degree. Frigo (2002) maintained that there
are gaps in the effectiveness of performance measures to communicate strategy to
employees and to support strategic initiatives such as innovation. Given that different
measures apply at different levels of the organization it is often not clear how lower
level production and service related measures translate into upper level financial results.
It is possible that significant meaning and relevance could be lost in the translation from
one level to another.
A common contemporary constraint to the evaluation of intangibles is that senior
management, the market, and shareholders may not be willing to invest in change if the
benefits cannot be adequately quantified (Stank et al. 2001 ). The perception is that if it
cannot be quantified then the meaning will be unclear and therefore should not be
reported at all. An example of this is human resource data which, unlike pure financial
metrics, tends to derive from softer, qualitative sources like surveys and interviews,
making them less exacting than number-crunchers would like (Grossman 2000).
136

5.1.4 Future Evaluation Issues
This section projects the results, shortcomings and conclusions in regard to KM
evaluation into considerations and recommendations into how organizations can make
their KM evaluation models more effective and potentially improve the effectiveness of
their KMis.
Overview
As highlighted by the findings in Chapter 4, KM/IC evaluation is far more involved
than adding a few metrics to the accounting system - it requires a whole new way of
thinking and a new approach to what is considered valuable to an organization. Indeed,
progress in describing, measuring and analysing dynamics in the knowledge economy
depends on a "paradigm shift" in economic thinking to accommodate changing
relationships between the accumulation of knowledge and physical capital, the shift in
the relative importance of tacit knowledge and codified information and differing
conditions for efficient functioning of markets (Wurzburg 1998). There is also a need
for progress with regard to measuring knowledge itself although, as identified earlier,
measuring knowledge as an asset should not be the only consideration.
Significant opportunities exist for learning and cross fertilization of KM evaluation
experience across industries and between organization types. The study of KM
evaluation models over the past ten years has highlighted the need for all organizations,
regardless of size or industry type, to not only learn how to learn in a knowledge
oriented environment, but also to know how to measure what they have learnt and to
extrapolate that into what needs to be learnt in the future. As part of this learning
process, some un-learning may be necessary to discard inappropriate KM measurement
practices before the course for the future can be confidently charted. Despite the
encouraging progress, there is still a long way to go and progress is likely to be slow.
The major issues for the future of KM evaluation are shown in the following table with
specific topics within each major issue identified.
137

Objectives of KM • Convertin Measurement Approach • Compliance with Measurement theory
• Validit and reliabilit of measurement Organizational Issues • Strategy
• Leaming • Measuring corporate mission • Structure (levels)
Human Aspects • Evaluation as a medium for communication • Language of measurement • Measurement and human behaviour
Metrics • Service vs product • Explicit vs tacit • Internal vs external
Table 13: Future Evaluation Issues
Objectives of KM - Converting Knowledge to Value
Nowhere in KM does the clash of old thinking and new thinking show up more vividly
than in the way people attempt to address knowledge flow and in the conversion of
knowledge into some form of identifiable value (Allee 1999). It has clearly become
necessary to consider value beyond simple monetary value, which practitioners and
academics have already acknowledged is far too limiting. An expanded definition of
value would be a tangible or intangible quality, good, knowledge, benefit or service that
is desirable or useful to its recipient to the extent that they are willing to return a fair
price or exchange (Allee 1999). Each of these types of value is in itself a potential
medium of exchange, not just money. In other words, it is possible to exchange
knowledge directly for knowledge, exchange knowledge for tangible goods, services or
money or even exchange knowledge for an intangible value such as customer loyalty
(Allee 1999).
Recent developments have recognised that value creation models must focus on
managerial decisions in relation to the allocation of R&D funding, must provide
management with information used to set baseline operations and objectives, must be
easy to understand by all members of the organization, must be accessible interactively,
must link R&D to corporate and financial strategies and must include the critical
corporate value creation factors associated with all the objectives of the technology
commercialisation process (Allee 1999). Few organizations were found to have reached
this level of sophistication in process evaluation whether KM related or otherwise.
There is also a need to look towards the enablers that lead to the production of results
(Ahmed 1999) and to measure the effectiveness of processes in order to develop an
138

understanding of the knowledge oriented factors that contribute to organizational
success. The reason for the focus on knowledge is not to have more, better or faster,
knowledge - but to create value from it (Allee 1999). Although companies must learn
how to combine evaluation with a process for turning insight into action (Lynn and
Reilly 2000), it is entirely conceivable that converting knowledge into value may
involve doing more with less and perhaps even slowing down some processes in order
to understand, manage and measure key processes more effectively. The focus needs to
move from the current preference for explicit metrics to a balance between tacit and
explicit measurement systems to provide the required information.
JoJeasurernentApproach
Compliance With Measurement Theory
KM evaluation should comply with the conventions of measurement theory in that they
must represent the property or manifestation on an unambiguous scale that is not ad hoc;
must be agreeable, objective, testable and repeatable and the mapping must be
meaningful and empirical (McPherson and Pike 2001).
Balance between Validity and Reliability
Evaluation systems must be flexible and capable of dealing with both hard and soft
issues and must support organizational decision making processes. Some elements of
KM such as competencies, will need to be evaluated by indicators which are inevitably
subjective in nature rather than by formalised, hard measures. Improving competence in
key areas demands more robust measurement of effectiveness, stakeholder satisfaction
and corporate values. Thompson (1998) believes that,just because this may be more
difficult, is no excuse for concentrating on measuring those factors that are simply easy
to measure as they may not be the ones which make a real difference. This introduces
the validity versus reliability argument18• The focus in future should be more on
arriving at a balance between validity and reliability rather than predominantly on
reliability. An approach offered by Kuczmarski (2001) that balances validity with
reliability is that all firms should consider using two types of metrics: innovation
performance metrics or those that measure growth, and innovation program metrics that
measure and reflect program management and control.
18 This was introduced in section 3.8 in relation to the validity versus reliability of this study, but is also relevant in regard to KM measurement.
139

A few measures that are directly related to the basic business model are considered to be
better than a plethora of measures that produce a lack of focus and confusion about what
is important and what is not (Pfeffer and Sutton 1999). It is necessary for KM
practitioners for example to get much better at measuring things like employee
absenteeism that did not occur because air quality was improved, injuries that did not
happen because ergonomically appropriate furnishings were chosen, or ideas and
initiatives that were not lost because the work setting facilitated effective collaboration
(Kaplan and Aronoff 1996). These are all important benefits that are virtually invisible
to financial-accounting measures. However, whilst the validity of such measures would
be relatively simple to demonstrate, it would be difficult to prove the reliability and
verifiability of such measures to corporate regulators.
Organizational Issues
Matching Measures to Strategy
The effectiveness of the relationship between organizational knowledge and competitive
advantage is moderated by the firm's ability to integrate, transfer, and apply knowledge
at a strategic level (Bharadwaj 2000). According to Nonaka and Takeuchi (1995), KM
requires a commitment to create new task-related knowledge, disseminate it throughout
the organization, and embody it in products, services, and systems. Part of this strategic
focus is a need to improve performance measures for the intangibles that drive most of
the value creation in today's economy but there are gaps in the effectiveness of current
performance measures to communicate strategy to employees and to support strategic
initiatives (Frigo 2002). Performance measures for intangible drivers need to be closely
articulated with strategy and every strategy requires a diffc:rent set of measures. The
key is to devise unique metrics that assess strategic value and effectiveness, not just
efficiency. A linkage between strategy, actions and measures is essential and unless
companies adapt their KM/IC measures and measurement systems to be strategically
compatible, implementation will fail to reap the expected benefits. In addition, specific
performance measures need to contribute to broader goals which require the
implementation of KM measures that cross traditional organizational boundaries
(Kruzner and Trollinger 1996). Such externally oriented measures are covered further
in 5.1.4.6. Furthermore, KM performance measures need to be embedded in the overall
business performance model, and not be a marginal "add-on" to the core measures (de
Gooijer 2000) as has been found to be the case with contemporary approaches.
Embracing Organizational Learning and Associated Measures
140

For an organization to become a learning organization it is critical that both an
evaluation methodology and communications medium be formalized (Appelbaum and
Reichart 1998). What is required for a specific business must be evaluated by the
organization itself with the first step being to define the status quo followed by a clear
articulation of where the organization wants to be in the future. The actual journey from
one state to another is also a learning experience, the effectiveness of which the LO
evaluates in order to more effectively conduct such transitions in the future.
The learning organization should be meaningful, manageable, and measurable
(Appelbaum and Reichart 1998). The three Ms may indicate why it has been so difficult
to find examples of learning organizations, each M is independent, yet like the learning
organization itself, is interdependent. Thus although many definitions have attempted to
capture the essence of the learning organization it still remains difficult to move the
theory to reality without effective measurement tools. Measurements must be taken to
assess the status quo, in order to determine which actions must be taken to manage the
progression towards a learning orientation. It is critical to select measures that reflect
those competencies which hold the key to the organization's strategic and critical
success. These must be measured rigorously and targeted, to ensure there is a drive to
improve them. Vigilance must ensure that changes of emphasis and priority are also
reflected in new or amended measures (Thompson 1998).
Measuring Corporate Mission
The actual measures and variables selected should be customized to the industry, the
environment and to the strategy of the unit (Stivers and Joyce 2000). Further to the
unique measurement framework for each organization recommended earlier, different
evaluation models may be required depending on the characteristics that the
organization decides are valuable to its internal and external stakeholders. The need to
measure corporate values is particularly challenging as it involves measuring
achievement of the corporate mission which may have been conceived without any
consideration being given to how its achievement should be measured. Many
organizations have no means of assessing whether or not they have in fact achieved
their corporate missions.
Applying Different Levels of Evaluation
As identified in Chapter 4, the nature of the organization, its location and its approach to
knowledge are amongst the many factors that will impact the choice of measurement
systems and metrics employed. An important issue is to understand the quantity, format
and nature of the knowledge that KM evaluation systems are required to deal with and
141

why the selected measures are the most appropriate to satisfy the performance
measurement and learning objectives of the organization. As well as different models
being applicable to different organizations, different metrics are required for different
levels within the organization mainly because the measurement models need to be
understood by the data collectors and the users of the information produced and these
users will reside at different levels within the organizations.
Characteristics of a good knowledge evaluation system include: performance being
measured at the strategic, tactical and operational levels; performance measurement
being a distributed activity reflecting various levels of ownership and control;
performance measurement reflecting a blend of measures for individual tasks and
activities to manage processes and performance measurement and highlighting
opportunities for improvement in all areas (Ahmed 1999). This leads to the need for a
very complex vertically and horizontally oriented evaluation framework within which
each organization needs to construct its unique KM evaluation model. Whilst a
framework can be generic, the KM evaluation model must be unique for each
organization. Part of this unique model for each organization is that measures must
provide specific guidance to individuals telling them what they must do well for the
organization to achieve its objectives.
Human Aspects
Using Evaluation as a Medium for Communication
Measures conducted by the organization (whether KM related or otherwise) provide
indicators to stakeholders of what is important. They illustrate where the emphasis has
been placed in the past and help in determining where the emphasis should be to
achieve the company's goals in the future (Kennedy 1998). Employees and managers
both pay attention to areas that are measured, although perhaps for different reasons and
with different outcomes. It is logical therefore, that management can and should use
measurement as a tool for communicating direction and priorities for the entire
organization.
Language
There is a need for progress in the development of a KM language for conveying to
capital markets credible information on their relationship to companies' performance
because, without such progress, much of what is useful about KM risks being
condemned to the status of something that is a marginally useful internal managerial
142

tool that has little impact for external stakeholders in how they view an enterprise
(Wurzburg 1998). The required language and metrics (analogous to the language and
metrics of financial standards) will help standardise the presentation of non-financial
information. Indications from this study are that language and metrics are still in their
early stages of development even in the more advanced regions of Scandinavia and
Europe.
Measurement & Human Behaviour
Metrics to monitor key HR practices that have been proven to grow human capital in a
broad spectrum of businesses for example need to be established. Organizational
performance evaluation models need to maintain their current high human resource
focus because performance measures need to promote and encourage appropriate
behaviours within an organization (Ahmed l 999). This applies more so to KM than
other performance measures because of the high people factor in KMis. Any
measurement system will drive behaviours to some extent, the challenge for KM in
particular is to ensure that the most appropriate behaviours result from the KM
evaluation effort. This concept extends into a new form of IC known as social capital.
By managing and measuring social innovation capital, managers can improve the rate
and quality of innovation in their firms, as well as their competitive stance in the
marketplace (McElroy 2002).
Metrics
Balancing Service and Product Measurement Focus
A product oriented measurement focus alone will not work for KM/IC measures
because products are "function-centric" whilst service is "customer-centric" (Davis
2000). Although one can draw parallels between the two relationships, the fundamental
difference is that service equals perception while product equals function. A service
focus considers the impact of intangibles, product focussed measures do not.
Knowledge-intensive services are based on the professional's ability to apply and
combine knowledge (facts, methods, rules, instruments, etc.) within different fields to
find a more or less unique solution to each client's specific needs or problems. This type
of operation is becoming more common as the knowledge front advances and broadens.
The evaluation of knowledge itself and of KMis will play a major role in the
development of knowledge intensive services.
143

Balancing Explicit versus Tacit Metrics
As alluded to in section 2.6, a dilemma has emerged in how much qualitative data
should be quantified. According to Vander Meer-Kooistra and Zijlstra (2001), trying to
quantify IC information as much as possible is important but the inevitable problem
arises when a large proportion of IC information is not suitable for quantification. A
very important IC component is tacit knowledge and experience which cannot be made
explicit, it can only be shared by working closely together in a master-apprenticeship
relationship and measured in relation to the effectiveness of this relationship and the
extent of knowledge sharing that occurs. As discussed in 2.6, it would appear to be
prudent to make explicit whatever needs to be managed and measured in that format and
leave in tacit form whatever does not benefit from such conversion.
Balancing Internal versus External Focus
Knowledge is transformed into value not only within the organization, but also through
knowledge based interactions with its external entities such as customers, suppliers, and
other partners (Chun 2001). As identified in Chapter 4, the predominant KM/IC
evaluation focus to date has been on internal measurement. It is important to increase
the focus on external components of learning and performance measurement.
Ultimately, the goal of KM is to leverage the IC that is resident in the organization and
to convert that knowledge into sustainable competitive advantage through increased
business performance (Bontis and Fitz-enz 2002). It is essential then, but only as a first
step, to measure resource utilisation efficiencies. But this, by nature, is predominantly
an internal perspective, and it has been established that a business cannot sustain long
term success if it fails to satisfy its external stakeholders. The external sources of
knowledge consist of former employees, retirees, competitors, suppliers and customers,
all of whom potentially provide a rich and valuable knowledge resource but are rarely
considered as viable information sources.
In a competitive environment, effectiveness measures, such as customer satisfaction
linked to service, are critical - as many organizations have now recognised. Selected
aspects of this can be measured straightforwardly with various types of satisfaction
surveys, but other elements are more complex. Innovation, supported by learning,
underpins customer care and service. While this must, by nature, be difficult to measure
objectively, attempts can be made to judge the level of activity and the extent to which
it is growing (Thompson 1998).
Reporting externally on IC has its own requirements and challenges. External
stakeholders expect that they can compare the companies' reports to other organizations.
144

This requires standardisation of the information and the way in which it is reported.
They further expect that the information is reliable and objective, and that possibilities
of window dressing and subjectivity are ruled out (Vander Meer-Kooistra and Zijlstra
2001). Auditing IC information would make it more credible, improving users' reliance
on it (Brennan and Connell 2000). Such assets, however, due to their nature, cannot be
audited in the same manner as tangible assets. New procedures to validate the
evaluation techniques for KM need to be established and new auditing methods are
required. Without new tools and techniques for auditors, the quality of the information
(including standardisation, reliability, objectivity) cannot be guaranteed by demanding
an independent assessment of the information. Therefore, including the IC report in the
annual statement is not possible as it cannot be validated to the same level of confidence
as the traditional financial statements. For the time being therefore, IC reports will need
to be issued separately from the financial reports.
5.1.5 A KM Evaluation Framework
The current situation with KM measurement is very much trial and error and
fragmented with little discernible interrelationships between the measurement
categories identified in 4.2. It is organizational culture and management style that
provides the environment within which knowledge in an organization is created,
disseminated, used, managed and measured. In the absence of any mandatory reporting
requirements, the organizational culture in tum determines its approach to knowledge
itself, its management and its evaluation.
Five major branches of KM measurement were identified: Financial, Internal
Infrastructure and Human Capital, Market and Customer metrics, Innovation and
Intellectual Property and Quality/Process related metrics. Data from these five groups
of metrics in the past have been used on an ad hoc basis without any consideration as to
how they needed to fit together to produce a comprehensive measurement framework.
In the interests of avoiding the tendency to measure too much and as supported by
Pfeffer and Sutton (1999) in 5.1.4, it is suggested that a manageable number of
measures (perhaps four or five) from each of these branches would provide a
comprehensive balanced measurement model for an organization to effectively assess
the value of its KM initiatives. The following diagram describes the prescribed
framework:
145

Knowledge
&
Learning
Culture
,---- - - - - -- - - - -- -- - - -- ---------. I I
: Composite KM Scorecard i I Metrics : i 1 I I 1 Financial 1
Metrics
Organizational Culture & Strategy KM Metrics
Figure 9: A Suggested KM Evaluation Framework
The KM/IC Lens
Enhanced
Outcomes
This diagram shows that a knowledge and learning oriented culture is necessary before
an organization is likely to derive any benefits from KM. The culture and strategy
determines why KM evaluation is considered to be necessary for the organization which
in tum provides the ground rules for what needs to be measured. The main categories
of metrics derived from this study are displayed in five branches. The
Marketing/Customer branch provides the external component, Quality/Process metrics
provide the necessary focus on process rather than products or outcomes and provide
the continuous improvement mechanism. Tacit elements are covered in the Human
Capital, Innovation and, to a lesser extent other factors, and all branches have a future
orientation in the sense that they attempt to measure the propensity for the organization
to learn, improve and create a positive image. Financial metrics are still important
wherever relevant to add credibility, reliability and verifiability to t~e evaluation
package. This framework also satisfies the conditions of effective evaluation systems
as discussed previously.
A composite consolidated KM Scorecard Evaluation model ( depicted as the shaded box
behind the individual KM. metrics) should be-con~tructed by selecting a manageable
number of strategically focussed appropriate metrics from each of the five branches.

The lens depicts the organizational approach to KM evaluation and measurement and
represents the decision making processes that determine how the results are to be
interpreted and reported to internal and external organizational stakeholders. It is
suggested that by approaching KM evaluation in this way the desired objectives of KM,
being enhanced business performance and organizational learning, are likely to be
achieved.
5.2 Study Limitations
Some of the issues that were encountered during this study that may have impacted the
validity and reliability of results include:
• Many organizations have implemented knowledge oriented programs but may
not have called them "knowledge oriented" or "knowledge management"
projects. However, KM is the only generally accepted term to describe these
types of initiatives. This thesis attempted to minimize the impact of this by
introducing the measurement of other topics (as identified in 2.9) that have been
shown to be closely related to KM. The identification of topics related to KM
may not have been exhaustive and no examination was conducted as to the
degrees or strength of relevance or correlation that the identified related topics
had to KM or IC. Thus the selection criteria for articles may not have been as
broad as it could have been for a truly comprehensive literature review.
• Because of problems of definition and identification of knowledge versus
information management, a number of invalid articles were included in the first
phase of data selection. However, whilst accepting a certain amount of overlap
in definition, articles which referred to initiatives which clearly did not satisfy
the Swan et al definition of KM19 were rejected in subsequent phases of data
analysis.
• Whilst the intention of this research was to focus only on empirical studies, it
was often difficult to establish whether an article was purely theoretical or
empirical or both from a review of the abstract. As a result, during the abstract
review phase, some theoretical papers that may have contained some useful
empirical data, may have been erroneously rejected. On the other hand some
articles that appeared, from the abstract, to contain useful empirical evidence,
19 "any process or practice of creating, acquiring, capturing, sharing and using knowledge, wherever it resides, to enhance learning and performance in organizations"
147

were found to be less than useful during the data analysis phase. The impact of
these data selection problems were not expected to significantly impact the
overall results because they were relatively low in number and because the
focus of the study is more on trends and comparisons than magnitude of
occurrences.
• Rejection of documents as not being relevant to the scope and objectives of this
study was based on the researcher's judgement by reading abstracts of all
articles. Others reading the abstracts may disagree as to the level of relevance
of the article to the study objectives and may arrive at a different list of selected
articles. However there was no rigorous way of using the NUD*IST software
to automate this selection process. It is possible that some articles that were
rejected may have actually dealt with the subject in more depth than what was
suggested in the abstract. However, such omissions are not likely to have
significantly impacted the results.
• The geographic location of some organizations was not quoted in many articles
selected. This resulted in the geographic analysis being based on a reduced data
set than what was available for the analysis of evaluation models and was
therefore not covered in the same depth.
5.3 Further Research
The research conducted in conjunction with this thesis opens up significant
opportunities for further research by identifying many of the problem areas being faced
by organizations in relation to KM/IC evaluation.
Identifying the factors that favour an accelerated rate of learning in organizations and
the impact that evaluation of the learning experience can have on organizational
performance is a promising area of future research. This comprehension can allow
investments in training and innovation to lead to better and quicker results than those
achieved up to the end of 1999 (Joia 2000). Another very important facet to be further
researched is the corporate knowledge depreciation process which indicates that more
research is necessary to identify the factors affecting the rate of learning and
"forgetting" in organizations (Joia 2000).
The impact of KM/IC evaluation on strategic performance warrants further
investigation. While some evidence on the important role of intangible measures in
148

effecting strategic priorities have been presented in this study, there is little empirical
evidence on the nature of the relationship between intangible measures, strategies and
organizational performance. Research into finding comprehensive models that can be
adapted to all levels of the organization would also be useful.
Further work on developing a measure of self-awareness has been called for (Dulewicz
and Higgs 2000) and applies to other disciplines as well as KM/IC. Although this may
be seen to be perpetuating an internal focus, it has been established that organizational
self-awareness is important before any meaningful comparisons can be made to other
organizations.
Evaluation of innovation at organizational level as a significant KMI, requires a more
comprehensive analysis. While some recent studies have used more comprehensive
measures of individual innovation, little effort has been made to develop a richer
measure with greater construct validity through a systematic review of the literature and
development and test of a theoretical factor structure (Kleysen and Street 2001).
Opportunities exist to further examine the identified trends in KM evaluation. For
example, explaining the decline in frequency of use of customer and market related
measures would be particularly interesting as it was such an unexpected result.
Conversely, it would also be enlightening to establish why human capital based
measures have become the primary focus in KM evaluation.
Further research on geographic impacts on KM evaluation would be useful in the areas
of cultural impacts on measurement and how cultural differences impact the knowledge
and learning cultures of organizations, the selection of measurement models and the
interpretation and reporting of results.
Testing the model presented in section 5.1.5 would prove the value of the model to
organizations that are in the process of developing their KM strategies by either
consolidating it as a valuable stepping stone for the development of further
enhancements to this evaluation model or would prove the model ineffective, in which
case further insights would be gained into why it was ineffective and what alternative
approaches may prove to be more effective.
149

Main Reference List
Abdul-Gader, A. H. (1997). "Determinants of Computer Mediated Communications success in Saudi Arabia." The Journal of Computer Information Systems 38(1): 55-66.
Abramson, G. (1998). "Measuring Up." CIO Enterprise Magazine(May 15).
Adam, E. E., L. M. Corbett, et al. (1997). "An international study of quality improvement approach and firm performance." International Journal of Operations & Production Management 17(9): 838.
Ahmed, P. K. (1999). "Measurement practice for knowledge management." Journal of Workplace Learning 11(8): 302-311.
Alavi, M. and D. E. Leidner (2001). "Knowledge Management and Knowledge management Systems: Conceptual Foundations and Research Issues." MIS Quarterly 25(1): 107-136.
Al-Gahtani, S. (2001). "The applicability of TAM outside North America: An empirical test in the UK." Information Resources Management Journal 14(3): 37-46.
Allee, V. (1997). The Knowledge Evolution: Expanding Organizational Intelligence. Newton MA, Butterworth-Heinemann.
Allee, V. (1999). "The art and practice of being a revolutionary." Journal of Knowledge Management 3(2): 121-131.
Amidon, D. M. (1996). "The Momentum of Knowledge Management." Research Technology Management(May/June).
Amidon, D. M. (1998). "Blueprint for 21st Century Innovation Management." Journal of Knowledge Management 2(1): 23-31.
Andriessen, D. (2001). "Weightless wealth: Four modifications to standard IC theory." Journal of Intellectual Capital 2(3): 204-214.
Appelbaum, S. H. and W. Reichart (1998). "How to measure an organization's learning ability: the facilitating factors - part II." Journal of Workplace Learning 10(1): 15-28.
Appiah-Adu, K. and S. Singh (1998). "Customer orientation and performance: a study ofSMEs." Management Decision 36(6): 385.
Argyris, C. (1998). Teaching Smart People How to Learn. Harvard Business Review on Knowledge Management. Boston, Harvard Business School Press: 81-108.
Armistead, C. (1999). "Armistead C. KM and process performance." Journal of Knowledge Management 3(2): 143-154.
Bahrami, H. (1995). The Emerging Flexible Organization: Perspectives from Silicon Valley. Knowledge Management and Organizational Design. USA, Butterworth-Heinemann: 55-75.
Bain, P. G., L. Mann, et al. (2001). "The innovation imperative: the relationships between team climate, innovation and performance in research and development teams." Small Group Research 32(1 ): 55-73.
Bain, V. (2001). "Are you underestimating your team members?" The Journal for Quality and Participation 24(4): 39-41.
Baker, W. E. and J.M. Sinkula (1999). "The synergistic effect of market orientation & learning orientation on organizational performance." Academy ofMarketing Science Journal 27(4): 411-427.
Balkin, D. B., G.D. Markman, et al. (2000). "Is CEO pay in high tech firms related to innovation?" Academy of Management Journal 43(6): 1118-1129.
Barker, B. (2001). "Manufacturing best practice and human intellectual energy." Integrated Manufacturing Systems 12(1): 7-14.
Barsky, N. P. and G. Marchant (2000). "The most valuable resource - measuring and managing intellectual capital." Strategic Finance 81(8): 58-62.
Bart, C. K. (2001). "Measuring the mission effect in human intellectual capital." Journal oflntellectual Capital 2(3): 320-330.
Bassi, L. J. (1999). Harnessing the Power of Intellectual Capital. The Knowledge Management Yearbook 1999-2000. J. W. Cortada and J. A. Woods. Boston, Butterworth-Heinemann: 422-427.
Bassi, L. J., J. Ludwig, et al. (2002). "Profiting from learning: Firm-level effects of training investments and market implications." Singapore Management Review 24(3): 61-76.
Berkowitz, S. J. (2001). "Measuring and reporting human capital." The Journal of Government Financial Management 50(3): 13-17.
150

Bessant, J. and D. Francis (1999). "Developing strategic continuous improvement capability." International Journal of Operations & Production Management 19( 11 ): 1106.
Bharadwaj, A. S. (2000). "A resource-based perspective on information technology capability and firm performance: An empirical investigation." MIS Quarterly 24(1): 169-196.
Birkinshaw, J. (2001). "Making Sense of Knowledge Management." Ivey Business Journal 65(4): 32-36.
Black, S. E. and L. M. Lynch (1996). "Human capital investments and productivity." The American Economic Review 86(2): 263.
Bloemer, J., K. Ruyter, et al. (1999). "Linking perceived service quality and service loyalty: a multidimensional perspective." European Journal ofMarketing 33(11/12): 1082-1106.
Blumenthal, D., M. Gokhale, et al. (2001). "Preparedness for clinical practice." The Journal of the American Medical Association 286(9): 1027-1034.
Blumentritt, R. and R. Johnston (1999). "Towards a Strategy for Knowledge Management." Technology Analysis & Strategic Management 11(3): 287-300.
Bobic, M., E. Davis, et al. (1999). "The Kirton adaption-innovation inventory." Review of Public Personnel Administration 19(2): 18-31.
Boisot, M. (1998). The Information Space (I-Space). Knowledge Assets: Securing Competitive Advantage in the Information Economy. NY, Oxford University Press: 42.
Bontis, N. and J. Fitz-enz (2002). "IC ROI a causal map of human capital antecedents and consequents." Journal of/ntellectual Capital 3(3): 223-247.
Bornemann, M. and K.-H. Leitner (2002). "Measuring and reporting intellectual capital: The case of a research technology organization." Singapore Management Review 24(3): 7-19.
Boulton, R., B. D. Libert, et al. (2000). "A business model for the new economy." The Journal of Business Strategy 21(4): 29-35.
Brabb, G. J. (1976). Computers and Information Systems in Business. Boston, Houghtin Mifflin.
Brah, S. A., A. L. Ong, et al. (2000). "Understanding the benchmarking process in Singapore." The International Journal of Quality & Reliability Management 17(3): 259-275.
Brennan, N. and B. Connell (2000). "Intellectual capital: current issues and policy implications." Journal of Intellectual Capital 1(3): 206-240.
Brooking, A. (1998). Intellectual Capital: Core Asset for the Third Millennium Enterprise. London, Thompson Business Press.
Brown, J. S. (1998). Research That Reinvents the Corporation. Harvard Business Review on Knowledge Management. Boston, Harvard Business School Press: 153-180.
Bryson, J. R., P. W. Daniels, et al. (1999). "Methodological problems and economic geography: the case of business services." The Service Industries Journal 19( 4): 1-16.
Buckmaster, N. (1999). "Associations between outcome measurement accountability and learning for non-profit organizations." The International Journal of Public Sector Management 12(2): 186.
Bukh, P. N., M. R. Johansen, et al. (2002). "Multiple integrated performance management systems: IC and BSC in a software company." Singapore Management Review 24(3): 21-33.
Burrell, G. and G. Morgan (1985). Sociological Paradigms & Organizational Analysis. Sydney, Gower Publishing.
Caddy, I. (2002). "Issues concerning intellectual capital metrics and measurement of intellectual capital." Singapore Management Review 24(3): 77-88.
Caldwell, F. (2000). Justifying an Enterprise Knowledge Management Program, Gartner Group.
Caldwell, F. and K. Harris (2002). The 2002 Knowledge Management Hype Cycle, Gartner.
Cannon, J. (1998). Making Sense of the Interview Material: Thematising, NUD*IST, and 10MB of Transcripts. Annual Meeting of the Australian Association for Research in Education, Adelaide.
Carroll, R. F. and R. R. Tansey (2000). "Intellectual capital in the new Internet economy - Its meaning, measurement and management for enhancing quality." Journal oflntellectual Capital 1(4): 296-31 l.
Chenhall, R.H. (1996). "Strategies of manufacturing flexibility manufacturing performance measures and organizational performance: an empirical investigation." Integrated Manufacturing Systems 7(5): 25-32.
Chua, A. (2002). "Cultivating Communities of Practice." Journal of Knowledge Management Practice(Oct).
Chun, W. C. (2001). "The knowing organization as Learning Organization." Education & Training 43(4/5): 197-205.
151

CIO Magazine (1999). "Knowledge management: Big Challenges, Big Rewards." CIO Magazine(15 Sept).
Clarke, T. and C. Rollo (2001). "Corporate initiatives in KM." Education & Training 43(4/5): 206-214.
Collier, P. M. (2001). "Valuing intellectual capacity in the police." Accounting, Auditing & Accountability Journal 14(4): 437-455.
Collins, C. and P. Caputi (1998). Broadening Our Horizons with Qualitative Methodologies: Investigating Antecedents of End-user Satisfaction and Performance. Wollongong, University of Wollongong, Department of Psychology.
Cooper, S., D. Crowther, et al. (2001). "Challenging the predictive ability of accounting techniques in modelling organizational futures." Management Decision 39(2): 137.
Cothrel, J. and R. L. Williams (1999). "Online communities: helping them form and grow." Journal of Knowledge Management 3(1): 54-60.
Craig, M. (2000). "Help employees learn." Veterinary Economics 41(4 ): 70-75.
Dale, R. (1998). Knowledge Management, Business Processes Resource Centre.
Davenport, T. H. (1997). Information Ecology: Mastering the Information and Knowledge Environment. New York, Oxford University Press.
Davenport, T. H. (1998). Some Principles of Knowledge Management.
Davenport, T. H., D. W. De Long, et al. (1997). Building Successful Knowledge Management Projects, Ernst & Young: 1-24.
Davenport, T. H. and L. Prusak (1998). Working Knowledge: How Organizations Manage What They Know. Boston, Harvard Business School Press.
Davis, K. (2000). "Knowledge as a transformation agent." Journal of Knowledge Management 4(2): 138.
Davis, T. R. V. (1996). "Developing an employee BSC: linking frontline performance to corporate objectives." Management Decision 34(4): 14-18.
Dawson, R. (2000). Adding Value to Information: From Information to Knowledge. Developing Knowledge-Based Client Relationships. Melbourne, Butterworth-Heinemann: 59-79.
de Gooijer, J. (2000). "Designing a knowledge management performance framework." Journal of Knowledge Management 4(4): 303-310.
De Long, D., T. Davenport, et al. (1997). What is a Knowledge Management Project?, Ernst & Young.
de Pablos, P. 0. (2002). "Evidence of intellectual capital measurement from Asia, Europe, and the Middle East." Journal of Intellectual Capital 3(3): 287-302.
Den Hertog, J. F. and E. Huizenga (2000). The Knowledge Enterprise: Implementation of Intelligent Business Strategies. London, Imperial College Press.
deTore, A., M. Clare, et al. (2002). "Measuring the value of Lincoln res R&D." Journal of/ntellectual Capital 3( 1 ): 40-50.
Dika, S. L. and K. Singh (2002). "Applications of social capital in educational literature: A critical synthesis." Review of Educational Research 72( 1 ): 31-60.
Draper, T. (1999). Intellectual Capital Measurement for Start-Ups: The Best oflntentions, the Worst of Outcomes. Capital for Our Time: The Economic, Legal and Management Challenges of Intellectual Capital. Stanford, Hoover Institution Press: 233-249.
Drucker, P. (1998). The Coming of the New Organization. Harvard Business Review on Knowledge Management. Boston, Harvard Business School Press: 1-19.
Duffy, J. (2002). "Managing Intellectual Capital." Information Management Journal 35(2): 59-63.
Dulewicz, V. and M. Higgs (2000). "Emotional intelligence: a review and evaluation study." Journal of Managerial Psychology 15(4): 341-372.
Edvinsson, L. and A. Freij ( 1999). Skandia: Three Generations of Intellectual Capital. Capital for Our Time: The Economic, Legal and Management Challenges of Intellectual Capital. Stanford, Hoover Institution Press: 192-200.
Edvinsson, L. and M. S. Malone (1997). Intellectual Capital: Realising Your Company's True Value by Finding Its Hidden Brainpower. New York, HarperCollins Publishers Inc.
Edwards, M. R. (1996). "Improving performance with 360 degree feedback." Career Development International 1(3): 5-8.
Enz, C. A. and J. A. Siguaw (2000). "Best practices in human resources." Cornell Hotel and Restaurant Administration Quarterly 41(1): 48-61.
152

Eskildsen, J. K. (1998). "Identifying the vital few using the European foundation for quality management model." Total Quality Management 9(4/5): 892-894.
Fahey, L. and L. Prusak (1998). "Eleven Deadliest Sins of Knowledge Management." California Management Review 40(3).
Fahey, L., R. Srivastava, et al. (2001). "Linking e-business and operating processes: the role of KM." IBM Systems Journal 40(4): 889-904.
Farbey, B., F. Land, et al. (1999). Evaluating Investments in IT: Findings and a Framework. Beyond the IT Productivity Paradox. L. P. Willcocks and S. Lester. London, John Wiley & Sons Ltd: 183-215.
Fink, D. (1999). Maximising Intellectual Capital through Technology-Enabled Knowledge Management. School of MIS. Perth, Edith Cowan University.
Fisher, J. (1992). "Use of nonfinancial performance measures." Cost Management(Spring): 31-38.
Francis, S. D. and P. C. Mazany (1996). "Developing elements of a learning organization in a metropolitan ambulance service Strategy, team development and continuous improvement." The Journal of Management Development 15(4): 4.
Freeman, T. (1999). "Assessing the innovation capacity of the consortium: an evaluation of the CAM-I cost management systems program." Journal of Knowledge Management 3(1): 61-65.
Frigo, M. L. (2002). "Strategy business execution & performance measures." Strategic Finance 83(11): 6-8.
Gabris, G. T., K. Grenell, et al. (1999). "Managerial innovation as affected by administrative leadership and policy boards." Public Administration Quarterly 23(2): 223-249.
Garcia, L. and F. Quek (1997). Qualitative Research in Information Systems: Time to be Subjective? IFIP WG8.2 Working Conference on Information Systems and Qualitative Research, Philadelphia, Chapman & Hall.
Gardiner, P. (1999). "Soaring to new heights with learning oriented companies." Journal of Workplace Leaming: 11(7): 255-265.
Garvin, D. A. (1998). Building a Learning Organization. Harvard Business Review on Knowledge Management. Boston, Harvard Business School Press: 47-80.
Geisler, E. (1999). "Harnessing the Value of Experience in the Knowledge Driven Firm." Business Horizons(June ).
Gibb, S. (1999). "The usefulness of theory: a case study in evaluating formal mentoring schemes." Human Relations 52(8): 1055-1075.
Gilbert, G. R. and A. M. Parhizgari (2000). "Organizational effectiveness indicators to support service quality." Managing Service Quality 10(1): 46-51.
Globerson, S. and 0. Zwikael (2002). "The impact of the project manager on project management planning processes." Proiect Management Journal 33(3): 58-64.
Gold, A.H., A. Malhotra, et al. (2001). "Knowledge management: An organizational capabilities perspective." Journal of Management Information Systems 18( 1 ): 185-214.
Gourlay, M. J. (1999). Foundationalism: The Problem of Knowledge.
Groom, J. R. and F. R. David (2001). "Competitive intelligence activity among small firms." Advanced Management Journal 66(1): 12-20.
Grossman, R. J. (2000). "Measuring up." HR Magazine 45(1): 28-35.
Guptara, P. (1999). "Why Knowledge Management Fails." Knowledge Management Review 9(July/Aug): 26-29.
Guthrie, J. (2002). "The Management, Measurement and reporting of Intellectual Capital." Journal of Intellectual Capital 2(1): 27-39.
Hansen, M. T., N. Nohria, et al. (1999). "What's Your Strategy for Managing Knowledge?" Harvard Business Review 77(2): 106-116.
Hao, L. and Y. Kawano (2001). "Immigrants welfare use and opportunity for contact with coethnics." Demography 38(3): 375-389.
Harrison, S. and P. H. S. Sullivan (2000). "Profiting from intellectual capital Leaming from leading companies." Journal oflntellectual Capital 1(1): 33-46.
Hepworth, P. (1998). "Weighing it up - a literature review for the balanced scorecard." The Journal of Management Development 17(8): 559-563.
Hilderbrand, C. (1999). "Making KM Pay Off." CIO Magazine(Feb 15).
Huang, K.-T., Y. W. Lee, et al. (1999). Quality Information and Knowledge. New Jersey, Prentice Hall.
153

Hunter, R. (1999). Enterprise management Update: Knowledge Management is Successful Only if Positive Changes Occur in an Enterprise, Gartner Group.
Hurwitz, J., S. Lines, et al. (2002). "The linkage between management practices, intangibles performance & stock returns." Journal of/ntellectual Capital 3( 1 ): 51-61.
Hussey, J., Hussey, R (1997). Business Research. London. McMillan. 247-275.
lbbs, C. W. and Y. H. Kwak (2000). "Assessing project management maturity." Proiect Management Journal 31(1): 32-43.
ICAA (1998). "Glossary." ICAA(22): 9.
IFAC (1998). The Measurement and Management oflntellectual Capital: An Introduction, International Federation of Accountants.
Johnston, R. (1998). The Changing Nature and Forms of Knowledge: A Review. Sydney, Department of Employment, Education, Training and Youth Affairs.
Joia, L. A. (2000). "Measuring intangible corporate assets: linking business strategy with IC." Journal of Intellectual Capital 1(1): 68-84.
Jubb, R. and D. Robotham (1997). "Competences in management development: challenging the myths." Journal of European Industrial Training 21(5): 171.
Kanter, J. (1999). "Knowledge Management, Practically Speaking." Information Systems Management(Fall): 7-15.
Kaplan, A. and S. Aronoff ( 1996). "Productivity paradox: worksettings for knowledge work." Facilities 14(3/4): 6.
Karp, S.S. and M. L. Lawrence (1999). "Use of the new competencies to assess entry level dieticians." Journal of the American Dietetic Association 99(9): 1098-1100.
Kathuria, R., M. Anandarajan, et al. (1999). "Linking IT applications with manufacturing strategy: an intelligent decision support system approach." Decision Sciences 30( 4 ): 959-991.
Kaye, M. and R. Anderson (1999). "Continuous improvement the ten essential criteria." The International Journal of Quality & Reliability Management 16(5): 485-506.
Kennedy, F. (1998). "Intellectual capital in valuing intangible assets." Team Performance Management 4(4): 121.
Keyser, C. (1997). Knowledge Management And How It Works, Biz Monthly.
Kidman, A. (1999). "Rebuffing the Cynics." Comorate IT(Sept): 30.
Kirchhoff, B. A., M. J. Merges, et al. (2001). "A value creation model for measuring and managing the R&D portfolio." Engineering Management Journal 13(1): 19-22.
Kirkpatrick K.L., "Evaluation of training", in Craig R.L. and Bitten L.R. (Eds), Training and evelopment Handbook, American Society for Training and Development, McGraw-Hill, New York, NY, 1967.
Kleysen, R. F. and C. T. Street (2001). "Toward a multi dimensional measure of individual innovative behaviour." Journal of/ntellectual Capital 2(3): 284-296.
KPMG (1998). Knowledge Management Research Report.
Kruzner, D. and R. Trollinger (1996). "Performance management vital in implementing new strategies." Oil & Gas Journal 94( 46): 66-72.
Kuczmarski, T. D. (2001). "Five fatal flaws of innovation metrics." Marketing Management 10(1): 34-39.
Kuhn, J. (2001). Linking Continuous Improvement and Knowledge Management. Sindelfingen Germany, DaimlerChrysler AG, Centre for International Distribution.
Lalor, P. and P. Okkerse (1998). "Welcome to the Information Age." Institute of Chartered Accountants(Spring). .
Lau, F., D. Straub, et al. (2001). "Fostering an Internet-Based Work Group in Community Health Through Action Research." Journal of Healthcare Information Management 15(3).
Leal, R. P. and T. L. Powers (1997). "A taxonomy of countries based on inventive activity." International Marketing Review 14(6): 445-460.
Leitch, C., R. Harrison, et al. ( 1996). "Learning organizations: the measurement of company performance." Journal of European Industrial Training 20(1): 31.
Lenskold, J. D. (2002). "Marketing ROI: Planning to win." Marketing Management 11(3): 30-34.
Leonard, D. (1998). Wellsprings of Knowledge: Building and Sustaining the Sources of Innovation. Boston, Harvard Business School Press.
154

Leonard, D. and S. Sensiper (1990). "The Role of Tacit Knowledge in Group Innovation." California Management Review: 112-132.
Li, T. and S. T. Cavusgil (1999). "Measuring the dimensions of market knowledge competence in new product development." European Journal oflnnovation Management 2(3): 129-145.
Liebowitz, J. and C. Y. Suen (2000). "Developing knowledge management metrics for measuring intellectual capital." Journal oflntellectual Capital 1(1 ): 54-67.
Liebowitz, J. and K. Wright (1999). A Look Toward Valuing Human Capital. Knowledge Management Handbook. Florida USA, CRC Press: 1-13.
Loan-Clarke, J. (1996). "Management standards/NVQs and business benefits The need for empirical evidence and an evaluation framework to provide it." The Journal of Management Development 15(4): 35.
Loermans, J. (2002). "Synergizing the Learning Organization and Knowledge Management." Journal of Knowledge Management 6(3): 285-294.
Low, J. (2000). "The value creation index." Journal oflntellectual Capital 1(3): 252-262.
Lynn, G. S. and R. R. Reilly (2000). "Measuring team performance." Research Technology Management 43(2): 48-56.
Macleod, M. (1999). "The Knowledge Chain." Supply Management(Feb 4).
Mahmood, M.A., J.M. Burn, et al. (2000). "Variables affecting information technology end-user satisfaction: a meta-analysis of the empirical literature." International Journal on Human-Computer Studies(52): 751-771.
Malhotra, Y. (1996). Organizational Learning and Learning organizations: An Overview.
Malone, M. S. (1999). Reflecting a New World of Business. Capital for Our Time: The Economic, Legal and Management Challenges oflntellectual Capital. Stanford, Hoover Institution Press: 36-41.
Martin, B. (2000). "Knowledge management within the context of management: An evolving relationship." Singapore Management Review 22(2): 17-36.
May, G. L. and W. M. Kahnweiller (2000). 'The effect of a mastery practice design on learning and transfer in behaviour modelling training." Personnel Psychology 53(2): 353-373.
McAdam, R., P. Stevenson, et al. (2000). "Innovative change management in SMEs: beyond continuous improvement." Logistics Information Management 13(3): 138-149.
McElroy, M. W. (2002). "Social innovation capital." Journal oflntellectual Capital 3(1): 30-39.
McFadden, F. R. and J. A. Hoffer (1988). Data Base Management. California, Benjamin/Cumming Publishing.
McKinsey (1998). "The New Economics of Organization." The McKinsey Quarterly(l): 19-25.
McMaster, M. D. (1996). The Intelligence Advantage: Organising for Complexity. Boston, ButterworthHeinemann.
McMillan, G. S. and R. D. Hamilton (2000). "Using bibliometrics to measure firm knowledge: An analysis of the US pharmaceutical industry." Technology Analysis & Strategic Management 12(4): 465-475.
McPherson, P. K. and S. Pike (2001). "Accounting empirical measurement & IC." Journal oflntellectual Capital 2(3): 246-260.
Miles, G., R. E. Miles, et al. (1998). "Some Conceptual and Research Barriers to the Utilization of Knowledge." California Management Review 40(3): 281-288.
Miller, D. L. (2001). "Re-examining teamwork KSAs and team performance." Small Group Research 32(6): 745-766.
Miller, J. L. and E. E. Adam (1996). "Slack & performance in health care delivery." The International Journal of Quality & Reliability Management 13(8): 63-74.
Mirvis, P.H. (1996). "Historical foundations oforganization learning." Journal of Organizational Change Management 9(1): 13.
Monkhouse, E. (1996). "The role of competitive benchmarking in small- to medium-sized enterprises." Benchmarking for Quality Management & Technology 2(4): 41.
Moody, D. L. and G. G. Shanks (1999). Using Knowledge management and the Internet to Support Evidence Based Practice: A Medical Case Study. 10th Australasian Conference on Information Systems.
Mortlock, B. (1996). "Winning with quality at IBM: Best practice at the National Call Management Center." Business Process Re-Engineering & Management Journal 2(2): 57.
Myers, M. D. (1997). "Qualitative Research in Information Systems." MIS Quarterly 21(2): 241-242.
155

Myers, P. S. (1996). Knowledge Management and Organizational Design: An Introduction. Knowledge Management and Organizational Design. USA, Butterworth-Heinemann: 1-5.
Nasseri, T. (1996). Knowledge Leverage: The Ultimate Advantage.
Neef, D. and T. Davenport (1997). "Making the Case for Knowledge Management." Groundwork 2(4).
Noble, E. and L. Klein (2000). "Quality assurance the measure of quality culture in a managed case setting." Total Quality Management 11(2): 199-205.
Nonaka, I. (1998). The Knowledge Creating Company. Harvard Business Review on Knowledge Management. New York, Harvard Business School Press: 21-45.
Nonaka, I. and H. Takeuchi (1995). The Knowledge-Creating Company: How Japanese Companies Create the Dynamics oflnnovation. New York, Oxford University Press.
Germann, M. H. (1998). "Professional reflection: Have you looked in a mirror lately?" Orthopedic Nursing 17(4): 22-26.
Oliver, R. W. (2001). "The return on human capital." The Journal o(Business Strategy 22(4): 7-10.
Olson, G. (1999). "Knowledge Management: What does it mean to you?".
Peabody, J. W., J. Luck, et al. (2000). "Comparison of vignettes standardized patients and chart abstraction: a prospective validation study of 3 methods for measuring quality." The Journal of the American Medical Association 283( 13 ): 1715-1722.
Perez, R.R. and M. D. Hynes (1999). "Assessing Knowledge Management Initiatives." Knowledge Management Review(8): 16-21.
Petrash, G. P. (1999). Intellectual Capital Accounting as a Management Tool. Capital for Our Time: The Economic, Legal and Management Challenges of Intellectual Capital. Stanford, Hoover Institution Press: 202-207.
Petty, R. and J. Guthrie (2000). "Intellectual capital literature review Measurement, reporting and management." Journal oflntellectual Capital 1(2): 155-176.
Pfeffer, J. and R. I. Sutton (1999). "Knowing "what" to do is not enough: Turning knowledge into action." California Management Review 42(1): 83-108.
Poll, R. (2001). "Performance processes and cost: managing service quality with the BSC." Library Trends49(4): 709-717.
Prusak, L. (1999). Knowledge Management: The Ultimate Competitive Weapon, IBM.
Quinn, J.B., P. Anderson, et al. (1998). Managing Professional Intellect. Harvard Business Review on Knowledge Management. Boston, Harvard Business School Press: 181-205.
Ranchhod, A., F. Zhou, et al. (2001). "Factors influencing marketing effectiveness on the web." nformation Resources Management Journal 14(1): 4-12.
Rexworthy, C. and A. Rothwell (1996). "The Advanced GNVQ in Management Studies - who wants it?" The Journal of Management Development 15(6): 44.
Robinson, G. and B. H. Kleiner (1996). "How to measure an organizations IC." Managerial Auditing Journal 11(8): 36-39.
Rodov, I. and P. Leliaert (2002). "Financial method of intangible asset measurement." Journal of Intellectual Capital 3(3): 323-336.
Roslender, R. and R. Fincham (2001). "Thinking critically about IC accounting, Accounting." Accounting. Auditing & Accountability Journal 14(4): 383-398.
Rotter, N. G. (1999). Moving Telecommuting Forward: An Examination of Organizational Variables, New Jersey Institute of Technology.
Schein, E. H. (1997). "Organizational learning: What is New?" Society for Organizational learning, MIT Sloan School of Management.
Schultze, U. (1999). Investigating the Contradictions in Knowledge Management, Southern Methodist University School of Business: 155-174.
Schultze, U. and D. Leidner (2002). "Studying Knowledge Management in Information Systems Research: Discourses and Theoretical Assumptions." MIS Quarterly 26(3): 213-242.
Scott, K. (1998). "Knowledge Management Is a State of Mind." lnformationweek Online(Nov 9).
Seddon, P. B. (1997). "A Respecification and Extension of the DeLone and McLean Model of IS Success." Information Systems research 8(3): 240-253.
Senge, P. M. (1990). The Fifth Discipline: The Art & Practice of the Learning Organization. Sydney, Random House.
156

Serafeimidis, V. and S. Smithson (1997). Information Systems Evaluation: The Interpretive Paradigm. London, Alexandros Onassis Public Benefits Foundation, the British Council, University of Surrey and London School of Economics: 823-836.
Shaw, J.B., C. D. Fisher, et al. (1999). "Evaluating organizational behavior teaching innovations: more rigorous designs, more relevant criteria and an example." Journal ofManagement Education 23(5): 509-536.
Siegall, M. and S. Gardner (2000). "Contextual factors of psychological empowerment." Personnel Review 29(6): 703.
Sierhuis, M. and W. J. Clancey (1997). Knowledge, Practice, Activities and People, University of Calgary.
Simon, A. and V. Kumar (2001). "Clients view on strategic capabilities which lead to management consulting success." Management Decision 39(5/6): 362-372.
Skyrme, D. (1998). "Measuring the Value of Knowledge: Metrics for the Knowledge-Based Business." Journal of Knowledge Management; 2(1): 83.
Skyrme, D. J. (1997). Knowledge Communities - Helping Them Thrive, 13 Update. 2003.
Smith, K. D. and W. G. K. Taylor (2000). ''The LO ideal in Civil Service organizations: deriving a measure." The Leaming Organization 7(4): 194-205.
St Leon, M. V. (2002). "Intellectual capital: Managerial perceptions of organizational knowledge resources." Journal oflntellectual Capital 3(2): 149-166.
Stank, T. P., S. B. Keller, et al. (2001). "Performance benefits of supply chain logistical integration." Transportation Journal 41(2/3): 32-46.
Stewart, T. A. (1998). Intellectual Capital: The New Wealth of Organizations. London, Nicholas Brealey Publishing. ·
Stivers, B. P. and T. Joyce (2000). "Building a balanced performance management system." Advanced Management Journal 65(2): 22-29.
Strassmann, P.A. (1996). "The Value of Computers, Information and Knowledge." The Electronic College of Process lnnovation(January).
Sullivan, P.H. (1999). Extracting Profits from Intellectual Capital. Capital for Our Time: The Economic, Legal and Management Challenges oflntellectual Capital. Stanford, Hoover Institution Press: 209-231.
Sveiby, K. E. (1994). Towards a Knowledge Perspective on Organization. Stockholm, Sweden, University of Stockholm.
Sveiby, K. E. (1997). The New Organizational Wealth: Managing & Measuring Knowledge-based Assets. San Francisco, Berrett-Koehler Publishers Inc.
Swan, J., H. Scarborough, et al. (1999). Knowledge Management -The Next Fad to Forget People? European Conference on Information Systems, Copenhagen.
Swanborg, R. W. and P. S. Myers (1997). "Wise Investments." CIO Magazine(Oct 15).
Sweetland, S. R. (1996). "Human capital theory: Foundations of a field of enquiry." Review of Educational Research 66(3): 341.
Teece, D. J. (1998). "Research Directions for Knowledge Management." California Management Review 40(3): 289-292.
Tesluk, P. E. and R. Jacobs (1998). "Toward an integrated model of work experience." Personnel Psychology 51(2): 321-355.
Thompson, J. L. (1998). "Competency and measured performance outcomes." Journal of Workplace Learning 10(5): 219-231.
Tidd, J. and C. Driver (2001). Technological and Market Competencies and Financial Performance. From Knowledge management to Strategic Competence. J. Tidd. London, Imperial College Press: 94-125.
Toffler, A. (1990). Power Shift: Knowledge, Wealth and Violence at the Edge of the 21st Century. New York, Bantam Books.
Vander Meer-Kooistra, J. and S. M. Zijlstra (2001). "Reporting on IC." Accounting, Auditing & Accountability Journal 14(4): 456-476.
Vorhies, D. W. and M. Harker (2000). "The capabilities and performance advantages of market driven firms." Australian Journal ofManagement 25(2): 145-172.
Waldron, V. R. and M. R. Lavitt (2000). ""Welfare-to-work": assessing communication competencies and client outcomes in a job training program." The Southern Communication Journal 66(1): 1-15.
157

Wallman, S. M. H. (1999). The Importance of Measuring Intangible Assets: Public Policy Implications. Capital for Our Time: The Economic, Legal and Management Challenges of Intellectual Capital. Stanford, Hoover Institution Press: 181-189.
Webber, A. (1999). Conversations with Industry Innovators, Fast Company.
Weisberg, J. (1996). "Differential teamwork performance: the impact of general and specific human capital levels." Journal o(Manpower 17(8): 18-29.
Wenger, E. C. and W. M. Snyder (2000). "Communities of Practice: The Organizational Frontier." Harvard Business Review(Jan-Feb): 139-145.
Winkworth, I. (2001). "Innovative United kingdom approaches to measuring service quality." Library Trends 49(4): 718-731.
Winter, S. G. (1998). Knowledge and Competence as Strategic Assets. The Strategic Management of Intellectual Capital. USA, Butterworth-Heinemann: 165-187.
Wise, L. R. (1999). ''The use of innovative practices in the public and private sectors: The role of organizational and individual factors." Public Productivity & Management Review 23(2): 150-168.
Wurzburg, G. (1998). "Markets and the knowledge economy: Is anything broken? Can government fix it?" Journal of Knowledge Management 2(1): 32-46.
Wyatt, A. (2002). "Towards a financial reporting framwork for intangibles: Insights from the Australian experience." Journal oflntellectual Capital 3(1): 71-86.
Zea, M. C., C. A. Reisen, et al. (1996). "Reliability, ethnic comparability and validity evidence for a condensed measure of proactive coping." The BAPC-C Educational and Psychological Measurement 56(2): 330.
Zhao, F. and P. Bryar (2001). Integrating Knowledge Management and Total Quality: A Complementary Process. Melbourne, RMIT University.
Zhou, A. Z. and D. Fink (2003). "The intellectual capital web: a systematic linking of intellectual capital and knowledge management." Journal of Intellectual Capital 4(1): 34-48.
Zikmund, W. G. (1997). Business Research Methods. USA, Dryden Press.
Zwell, M. and R. Ressler (2000). "Powering the human drivers of financial performance." Strategic Finance 81(11): 40-45.
158

Appendix A: List of Source Data Articles by Author.
159

Appendix A: List of Articles by Author (Data Reference List)
Abdul-Gader AH. Determinants of Computer Nediated Communications success in Saudi Arabia, The Journal of Computer Information Systems, 1997.
Adam EE, Corbett L M, Flores BE, Harrison NJ, Lee TS, Rho B, Ribera J, Samson D, Westbrook R. An international study of quality improvement approach and firm performance, International Journal of Operations & Production Management, 1997
Ahmed PK, Lim K K, Zairi M. Measurement practice for KM, Journal of Workplace Leaming, 1999.
Al-Gahtani S. The applicability of TAM outside North America: An empirical test in the UK, Information Resources Management Journal, 2001.
Allee V. The art and practice of being a revolutionary, Journal of Knowledge Management, 1999.
Andriessen D. Weightless wealth: Four modifications to standard IC theory, Journal of Intellectual Capital, 2001.
Ang CL, Davies M, Finlay P N. Measures to assess the impact of IT on QM, The International Journal of Quality & Reliability Management, 2000.
Appelbaum SH, Reichart W. How to measure an organizations learning ability: the facilitating factors, Journal of Workplace Leaming, 1998.
Appiah-Adu K, Singh S. Customer orientation and performance: a study of SMEs, Management Decision, 1998.
Armistead C. KM and process performance, Journal of Knowledge Management, 1999.
Bain PG, Mann L, Pirola-Merlo A. The innovation imperative: the relationships between team climate, innovation and performance in research and development teams, Small Group Research, 2001.
Bain V. Are you underestimating your team members? The Journal for Quality and Participation, 2001.
Baker WE, Sinkula J M. The synergistic effect of market orientation & learning orientation on organizational performance, Academy of Marketing Science Journal, 1999.
Bal J, Wilding R, Gundry J. Virtual teaming in the agile supply chain, International Journal of Logistics Management, 1999.
Balkin DB, Markman GD, Gomez-Mejia LR. Is CEO pay in high tech firms related to innovation? Academy of Management Journal, 2000.
Barberis N, Maxim B, Shleifer A, Tsukanova N. How does privatization work: evidence from Russian shops, The Journal of Political Economy, 1996.
Barker B. Manufacturing best practice and human intellectual energy, Integrated Manufacturing Systems, 2001.
Barsky NP, Marchant G. The most valuable resource measuring and managing IC, Strategic Finance, 2000.
Bart C K. Measuring the mission effect in human Intellectual Capital, Journal of Intellectual Capital, 2001.
Bassi L J, Ludwig J, McMurrer DP, Van Buren M. Profiting from learning: firm-level effects of training investments and market implications, Singapore Management Review, 2002.
Bedell JR, Cohen N L, Sullivan A. Case management: the current best practices and the next generation of innovation, Community Mental Health Journal, 2000
160

Berkowitz SJ. Measuring and reporting human capital, The Journal of Government Financial Management, 2001.
Bessant J, Francis D. Developing strategic Continuous Improvement capability, International Journal of Operations & Production Management, 1999.
Bexley J B, Duffy J M. Adapting financial institution directors roles in the management process to achieve competitive advantage, Advanced Management Journal; Cincinnati, 2000
Bharadwaj AS. A resource based perspective on IT capability and firm performance: an empirical investigation, MIS Quarterly, 2000
Black SE, Lynch L M. Human capital investments and productivity, The American Economic Review, 1996.
Bloemer J, Ruyter K, Wetzels M. Linking perceived service quality and service loyalty: a multidimensional perspective, European Journal of Marketing, 1999.
Blumenthal D, Gokhale M, Campbell E G, Weissman JS. Preparedness for clinical practice, The Journal of the American Medical Association, 2001.
Bobic M, Davis E, Cunningham R. The Kirton adaption-innovation inventory, Review of Public Personnel Administration, 1999.
Boland R J, Singh J, Salipante P, Aram JD et al. Knowledge representations and knowledge transfer, Academy of Management Journal, 2001
Bontis N. IC an explanatory study that develops measures and models, Management Decision, 1998
Bontis N, Fitz-enz J. IC ROI a causal map of human capital antecedents and consequents, Journal of Intellectual Capital, 2002
Bornemann M, Leitner K H. Measuring and reporting IC: the case of a research technology organization, Singapore Management Review, 2002
Boulton R, Libert B D, Samek SM. A business model for the new economy, The Journal of Business Strategy, 2000.
Brah S A, Ong A L, Rao B M. Understanding the benchmarking process in Singapore, The International Journal of Quality & Reliability Management, 2000
Brennan B C, Connell B. IC: current issues and policy implications, Journal of Intellectual Capital, 2000.
Bruce B C, Case studies of a virtual school, Journal of Adolescent & Adult Literacy, 2001.
Bryson J R, Daniels PW, Ingram D R. Methodological problems and economic geography: the case of business services, The Service Industries Journal, 1999.
Buckmaster N. Associations between outcome measurement accountability and learning for non-profit organizations, The International Journal of Public Sector Management, l 999.
Bukh P N, Johansen MR, Mouritsen J. Multiple integrated performance management systems: IC and BSC in a software company, Singapore Management Review, 2002.
Caddy I. Issues concerning IC metrics and measurement of intellectual capital, Singapore Management Review, 2002.
Cady SH, Valentine J. Team innovation and perceptions of consideration: what difference does diversity make? Small Group Research, 1999.
Carroll R F. IC in the new internet economy its meaning, measurement and management for enhancing quality.Journal of Intellectual Capital, 2000.
161

Chenhall R H. Strategies of manufacturing flexibility manufacturing performance measures and organizational performance: an empirical investigation, Integrated Manufacturing Systems, l 996.
Chrisman J J, McMullan WE. Sources and measurement of benefits of small business assistance programs, Journal of Small Business Management, 2002.
Christoffersen S. The Textile industry: does R&D deliver success? Competitiveness Review, 2002.
Chun WC. The knowing organization as Learning Organization, Education & Training, 2001
Clark M J. Life in the fast lane: an evaluation of an accelerated RN-MSN program, Evaluation & the Health Professions, 1997
Clarke T, Rollo C. Corporate initiatives in KM, Education & Training, 2001.
Collardin M, Vogele A. Knowledge intangibles - leveraging the tax advantages, International Tax Review; 2002
Collier PM. Valuing intellectual capacity in the police, Auditing & Accountability Journal; 2001.
Cook T, Emler N. Bottom up versus top down evaluation of managerial potential : an experimental study, Organizational Psychology, 1999.
Cooper S, Crowther D, Carter C. Challenging the predictive ability of accounting techniques in modelling organizational futures, Management Decision, 2001
Cothrel J, Williams R L. Online communities: helping them form and grow, Journal of Knowledge Management; l 999.
Craig M. Help employees learn, Veterinary Economics, 2000
Davern M J, Kauffman R J. Discovering potential and realizing value from IT investments, Journal of Management Information Systems; 2000.
Davis TR V. Developing an employee BSC: linking frontline performance to corporate objectives, Management Decision, 1996
Davis K. Knowledge as a transformation agent, Journal of Knowledge Management; 2000.
DeGooijer J. Designing a KM performance framework, Journal of Knowledge Management, 2000.
DePablos P 0. Evidence of IC measurement from Asia, Europe and the Middle East, Journal of Intellectual Capital; 2002
deTore A, Clare M, Weise J. Measuring the value of Lincoln res R&D, Journal of Intellectual Capital, 2002
Dewan NA, Daniels A, Zieman G, Kramer T. The national outcomes management project: a benchmarking collaborative, The Journal of Behavioural Health Services & Research; 2000.
Dika SL, Singh K. Applications of social capital in education: a review and evaluation study, Review of Educational Research; 2002
Dube L, Enz C A, Renaghan L M, Siguaw J a. Managing for excellence, Cornell Hotel and Restaurant Administration Quarterly; 2000
Dulewicz V, Higgs M. Emotional intelligence: a review and evaluation study, Journal of Managerial Psychology; 2000.
162

Edens J F, Poythriss NG, Nicholson R A, Otto R K. Effects of state organizational structure and forensic examiner training on pretrial competence assessments, The Journal of Behavioural Health Services & Research; 1999.
Edvinsson L, Kitts B, Beding T. The next generation of IC measurement - the digital IC landscape, Journal of Intellectual Capital; 2000
Edwards M R. Improving performance with 360 degree feedback, Career Development International; 1996.
Elliott R K, Pallais D M. Build on your firms strengths, Journal of Accountancy; 1997.
Enz C A, SiguawJ A. Best practices in human resources, Cornell Hotel and Restaurant Administration Quarterly; 2000.
Eriksson K, Majkgard A, Sharma D D. Path dependence and knowledge development in the internationalisation process, Management International Review; 2000.
Eskildsen J K. Identifying the vital few using the European foundation for quality management model, Total Quality Management; 1998.
Fahey L, Srivastava R, Sharon JS, Smith DE. Linking e-business and operating processes: the role of KM, IBM Systems Journal; 2001.
Farmer MC, Kingsley G. Locating critical components of regional human capital, Policy Studies Journal, 2001
Fayyad U, Haussler D, Stolorz P. Mining scientific data, Communications of the ACM; 1996
Findlay P, McKinlay A, Marks A, Thompson P. Labouring to learn OL & mutual gains, Employee Relations, 2000
Flannery T P, Grace J L. Managing nursing assets: a primer on maximising investment in people, Nursing Administration Quarterly; 1999
Francis SD, Mazany PC. Developing elements of a LO in a metro ambulance service Strategy, team development and continuous improvement, The Journal of Management Development, 1996
Freeman T. Assessing the innovation capacity of the consortium: an evaluation of the CAM-I cost management systems program, Journal of Knowledge Management; 1999.
Frigo M L. Strategy business execution & performance measures, Strategic Finance, 2002.
Gabris GT, Grenell K, Ihrke D, Kaatz J. Managerial innovation as affected by administrative leadership and policy boards, Public Administration Quarterly; 1999.
Galup SD, Dattero R, Hicks RC. KM systems: an architecture for active and passive knowledge, Information Resources Management Journal; 2002.
Gardiner P. Soaring to new heights with learning oriented companies, Journal of Workplace Leaming; 1999.
Gibb S. The usefulness of theory: a case study in evaluating formal mentoring schemes, Human Relations; 1999
Gilbert GR, Parhizgari AM. Organizational effectiveness indicators to support service quality, Managing Service Quality; 2000.
·rnasmeier A K, Fuellhart K, Feller I, Mark M. The relevance of firm learning theories to the re-design and evaluation of manufacturing modernisation programs, Economic Development Quarterly; 1998
163

Globerson S, Zwikael O.· The impact of the project manager on project management planning processes, Project Management Journal, 2002
Goffin K, New C. Customer support and new product development: an exploratory study, International Journal of Operations & Production Management; 2001
Groom J R, David FR. Competitive intelligence activity among small firms, Advanced Management Journal; 2001.
Grossman R J. Measuring up; HR Magazine, 2000.
Grote D. Staff performance advice for CPAs, Journal of Accountancy; 1999.
Guthrie J. The management measurement & reporting of IC, Journal of Intellectual Capital; 2001.
Haltiwanger J C, Lane J I, Speltzer J R. Productivity differences across employers: the role of employer size, age and human capital, The American Economic Review; 1999
Hancock S. How to learn more by studying less, Management Services, 1999.
Hao L, Kawano Y. Immigrants welfare use and opportunity for contact with coethnics, Demography, 2001.
Harris R L. Anatomy of a web site, Journal of Property Management; 2002.
Harrison S, Sullivan PH. Profiting from IC learning from leading companies, Journal of Intellectual Capital; 2000.
Harrold D. Developing IC, Control Engineering, 2000.
Hepworth P. Weighing it up - a literature review for the BSC, The Journal of Management Development; 1998.
Higgs M, Dulewicz V. Top team processes, does 6 + 2 = IO? Journal of Managerial Psychology; 1998.
Hunton J E, McEwan RA. Surrogate expertise indicators of professional financial analysts, Journal of Managerial Issues; 2000.
Hurwitz J, Lines S, Montgomery B, Schmidt J. The linkage between management practices, intangibles performance & stock returns, Journal of Intellectual Capital; 2002.
Ibbs CW, Kwak Y H. Assessing project management maturity, Project Management Journal; 2000.
Joia L A. Measuring intangible corporate assets: linking business strategy with IC, Journal of Intellectual Capital; 2000.
Jubb R, Robotham D. Competences in management development: challenging the myths, Journal of European Industrial Training; 1997.
Justman M, Mehrez A. A welfare analysis of innovation in R&D markets, International Journal of Social Economics; 1996.
Kaplan A, Aranoff S. Productivity paradox work settings for knowledge work, Facilities, 1996.
Karp S S, Lawrence ML. Use of the new competencies to assess entry level dieticians, Journal of the American Dietetic Association; 1999.
Karr S S. IT certification pays off, Financial Executive, 2001.
Kathuria R, Anandarajan M, Igbaria M. Linking IT applications with manufacturing strategy: an intelligent decision support system approach, Decision Sciences, 1999.
164

Kaye M, Anderson R; Continuous improvement the ten essential criteria, The International Journal of Quality & Reliability Management, 1999.
Keeble D, Lawson C, Moore B, Wilkinson F. Collective learning processes networking and institutional thickness in the Cambridge region, Regional Studies, 1999.
Kennedy F. Intellectual capital in valuing intangible assets, Team Performance Management; 1998.
Kirch DP, Tucker ML, Kirch CE. The benefits of emotional intelligence in accounting firms, The CPA Journal; 2001.
KirchhoffB A, Merges M J, Morabito J. A value creation model for measuring and managing the R&D portfolio, Engineering Management Journal; 2001.
Kleysen RF, Street CT. Toward a multi dimensional measure of individual innovative behaviour, Journal of Intellectual Capital; 2001.
Kocarek C E, Talbot, D M, Batka JC, Anderson M Z. Reliability and validity of 3 measures of multicultural competency, Journal of Counseling and Development, 2001.
Kruzner D, Trollinger R. Performance management vital in implementing new strategies, Oil & Gas Journal, 1996.
Kuczmarski TD. Five fatal flaws of innovation metrics, Marketing Management, 2001.
Kuczmarski T D. Measuring your return on innovation, Marketing Management, 2000.
Kumar R L. Justifying data warehousing investments, Journal of Database Management; 2000.
Lamb KV, Minnick A, Mion LC, Palmer R, Leipzig R. Help the health care team release its hold on restraint, Nursing Management, 1999.
Leal RC, Powers TL. A taxonomy of countries based on inventive activity, International Marketing Review, 1997.
Leese B, Baxter K, Goodwin N, Scott J, Mahon A. Measuring the success of primary care organizations -is it possible? Journal of Management in Medicine; 2001.
Leitch C, Harrison R, Burgoyne J, Blantern C. Learning organizations the measurement of company performance, Journal of European Industrial Training; 1996.
Lenskold JD. Marketing ROI: Planning to win, Marketing Management, 2002.
Li T, Cavusgil ST. Measuring the dimensions of market knowledge competence in new product development, European Journal of Innovation Management; 1999.
Liebowitz J, Ching Y. Developing KM metrics for measuring IC, Journal of Intellectual Capital; 2000.
Liebowitz J. Facilitating innovation through knowledge sharing: a look at the US Naval Surface Warfare Center - cardstock division, The Journal of Computer Information Systems; 2002.
Loan-Clarke J. Management standards/NVQs and business benefits: the need for empirical evidence and an evaluation framework to provide it, The Journal of Management Development; 1996.
Long C. Measuring your strategic agility, Consulting to Management; 2000.
Looney RE. Economic development in Iraq: Factors underlying the relative deterioration of human capital formation, Journal of Economic Issues; 1992.
Lovingsson F, Dellorto S, Balati P. Navigating with new managerial tools, Journal of Intellectual Capital, 2000.
165

Low J. The value creation index, Journal of Intellectual Capital; 2000.
Lynn MP, Murray MA. Expert system domain identification, evaluation and project management, a TQM approach, The International Journal of Quality & Reliability Management; 1996.
Lynn GS, Reilly RR. Measuring team performance, Research Technology Management; 2000.
Marson D. Competency assessment and research in an aging society, Generations, 2002.
Martin B. Knowledge management within the context of management: an evolving relationship, Singapore Management Review; 2000.
May TA. The death of ROI: re-thinking IT value measurement, Information Management & Computer Security; 1997.
May G L, Kahnweiller W M. The effect of a mastery practice design on learning and transfer in behaviour modelling training, Personnel Psychology; 2000.
McAdam R, Stevenson P, Armstrong G. Innovative change management in SMEs beyond continuous improvement, Logistics Information Management; 2000.
McElroy MW. Social innovation capital, Journal of Intellectual Capital; 2002.
Mcgee J E, Peterson M. Toward the development of measures of distinctive competencies among small independent retailers, Journal of Small Business Management; 2000.
McMillan G S, Hamilton R D. Using bibliometrics to measure firm knowledge: an analysis of the US pharmaceutical industry, Technology Analysis & Strategic Management; Abingdon; 2000.
McPherson PK, Pike S. Accounting empirical measurement & IC, Journal of Intellectual Capital; 2001.
Miller D L. Re-examining teamwork KSAs and team performance, Small Group Research; 2001.
Miller GE, Rowney JI A. Workplace diversity management in a multicultural society, Women in Management Review; 1999.
Miller J L, Adam EE. Slack & performance in health care delivery, The International Journal of Quality & Reliability Management; 1996.
Mirvis PH. Historical foundations ofOL, Journal of Organizational Change Management; 1996.
Mitra D, Golder P N. Whose culture matters? Near market knowledge and its impact on foreign market entry timing, Journal of Marketing Research; 2002.
Mohanty R P, Deshmukh S G. Evaluating manufacturing strategy for a LO: a case, International Journal of Operations & Production Management; 1999.
Moore C, Rowe BJ, Widener SK. HCS: designing a balanced scorecard in a knowledge based firm, Issues in Accounting Education; 2001.
Mortlock B. Winning with quality at IBM: Best practice at the National Call Management Center, Business Process Re-Engineering & Management Journal; 1996.
Munro-Faure L. Using employee surveys to drive improvement, Management Services, 2000.
Neuliep J W, GrohskopfE L. Uncertainty reduction and communication satisfaction during initial interaction: an initial test and replication of a new axiom, Communication Reports, 2000.
Ngai E WT, Cheng TC E. A knowledge based system for supporting performance measurement of AMT projects: a research agenda, International Journal of Operations & Production Management; 2001.
166

Noble E, Klein L. Quality assurance the measure of quality culture in a managed case setting, Total Quality Management; 2000.
Germann M H. Professional reflection: Have you looked in a mirror lately? Orthopedic Nursing; 1998.
Oliver R W. The return on human capital, The Journal of Business Strategy; 2001.
Onyx J, Bullen P. Measuring social capital in five communities, The Journal of Applied Behavioural Science; 2000.
Osteraker M C. Measuring motivation in a LO, Document Measuring motivation in a learning organization, Journal of Workplace Leaming; 1999.
Owen-Smith J. Managing laboratory work through scepticism: processes of evaluation and control, American Sociological Review; 2001.
Park W G, Ginarte C. Intellectual property rights and economic growth, Contemporary Economic Policy; 1997.
Peabody J W, Luck J, Glassman P, Dresselhaus TR, Lee M. Comparison of vignettes standardized patients and chart abstraction: a prospective validation study of 3 methods for measuring quality, The Journal of the American Medical Association, 2000.
Pegels CC, Yang B. The impact of managerial characteristics on strategic assets management capabilities, Team Performance Management; 2000.
Perdue J, Ninemeier J, Woods J. Competencies required for club managers, Cornell Hotel and Restaurant Administration Quarterly; 2000.
Petty R, Guthrie J. IC literature review measurement reporting and management, Journal of Intellectual Capital; 2000.
Pfeffer J, Sutton RI. Knowing what to do is not enough: turning knowledge into action, California Management Review; 1999.
Pino NW. Community policing and social capital, Policing, 2001.
Poll R. Performance processes and cost: managing service quality with the BSC, Library Trends, 2001.
Potter F. Event-to-knowledge: a new metric for finance department efficiency, Strategic Finance, 2001.
Ranchhod A, Zhou F, Tinson J. Factors influencing marketing effectiveness on the web, Information Resources Management Journal; 2001.
Ransone J, Dunn-Bennett LR. Assessment of firstaid knowledge and decision making of high school athletic coaches, Journal of Athletic Training; 1999.
Ratchford B T. The economics of consumer knowledge, Journal of Consumer Research; 2001.
Reigle RF. Measuring organic and mechanistic cultures, Engineering Management Journal; 2001.
Rexworthy C, Rothwell A. The advanced GNVQ in management studies - who wants it? The Journal of Management Development; 1996.
Robinson G, Kleiner B H. How to measure an organizations IC, Managerial Auditing Journal; 1996.
Rodov I, Leliaert P. Financial method of intangible asset measurement, Journal of Intellectual Capital; 2002.
Roslender R, Fincham R. Thinking critically about IC accounting, Accounting, Auditing & Accountability Journal; 2001.
167

Sacks MA, Ventresca M J, Uzzi B. Global institutions and networks: contingent change in the structure of world trade advantage 1965-1980, The American Behavioural Scientist; 2001.
Sanchez P, Chaminade C, Olea M. Management of intangibles - an attempt to build a theory, Journal of Intellectual Capital, 2000.
Savery L K. The congruence between the importance of job satisfaction and the perceived level of achievement, The Journal of Management Development; 1996.
Savulescu J, Crisp R, Fulford K, Hope T. Evaluating ethics competence in medical education, Journal of Medical Ethics; 1999.
Schmid A A. Using motive to distinguish social capital from its outputs, Journal of Economic Issues; 2002.
Scott W B. USAF space battlelab assessing new concepts, Aviation Week & Space Technology; 1997.
Shama A. Private sector management: the case of Russia, Journal of Small Business Management; 2001.
Shaw J B, Fisher CD, Southey G N. Evaluating organizational behaviour teaching innovations: more rigorous designs, more relevant criteria and an example, Journal of Management Education; 1999.
Siegall M, Gardner S. Contextual factors of psychological empowerment, Personnel Review, 2000.
Sim KL. An empirical examination of successive incremental improvement techniques and investment in manufacturing technology, International Journal of Operations & Production Management; 2001.
Simmonds P G, Dawley D D, Ritchie W J, Anthony W P. An exploratory examination of the knowledge transfer of strategic management concepts from the academic environment to practicing managers, Journal of Managerial Issues; 2001.
Simon A, Kumar V. Clients view on strategic capabilities which lead to management consulting success, Management Decision, 2001.
Skyrme D. Measuring the value of knowledge: metrics for the knowledge based business, Journal of Knowledge Management; 1998.
Smith K D, Taylor W G K. The LO ideal in Civil Service organizations: deriving a measure, The Leaming Organization; 2000.
Snyder-Halpern R. Measuring organizational readiness for nursing research programs, Western Journal of Nursing Research, 1998.
Stainer A. Business performance & corporate social responsibility, Management Services, 2002.
Stank T P, Keller S B, Closs D J. Performance benefits of supply chain logistical integration, Transportation Journal, 2001.
Stern GM. Ideas, Link-Up; 2002.
Stivers B P, Joyce T. Building a balanced performance management system, Advanced Management Journal; 2000.
StLeon M V. IC managerial perceptions of organizational knowledge resources, Journal of Intellectual Capital; 2002.
Sweetland SR. Human capital theory: Foundations of a field of enquiry, Review of Educational Research; 1996.
Tesluk PE, Jacobs R. Toward an integrated model of work experience, Personnel Psychology; 1998.
168

Thilmany J. What does it mean, Mechanical Engineering; 2002.
Thompson J L. Competency and measured performance outcomes, Journal of Workplace Learning; 1998.
Thompson Peter, Process vs product innovation: do consumption data contain any information, Southern Economic Journal; 2000.
Thompson John L, Strategic effectiveness and success: the learning challenge, Management Decision, 1996.
Trombetta W. Leap of faith branding and ROI, Pharmaceutical Executive; 2001.
Turner G, Jackson-Cox J. If management requires measurement how may we cope with knowledge? Singapore Management Review; 2002.
Vander Meer-Kooistra J, Zijlstra SM. Reporting on IC, Accounting, Auditing & Accountability Journal; 2001.
Vinkler P. The institutionalization of scientific information: a scientometric model, Library Trends, 2002.
Vorhies D W, Harker M. The capabilities and performance advantages of market driven firms, Australian Journal of Management; 2000.
Waldron V R, Lavitt MR. "Welfare-to-work": assessing communication competencies and client outcomes in a job training program, The Southern Communication Journal; 2000.
Walters D, Virtual organizations: new lamps for old, Management Decision, 2000.
Weisberg J. Differential teamwork performance: the impact of general and specific human capital levels, Journal of Manpower, 1996.
Wilson PH, Strutton D, Farris M T. Investigating the perceptual aspect of sales training, The Journal of Personal Selling & Sales Management; 2002.
Winkworth I. Innovative UK approaches to measuring service quality, Library Trends, 2001.
Wise LR. The use of innovative practices in the public and private sectors: the role of organizational and individual factors, Public Productivity & Management Review; 1999.
Wolf J. The TDL advantage, Occupational Health & Safety; 2000.
Wurzburg G. Markets & the Knowledge economy: is anything broken? Can government fix it?, Journal of Knowledge Management, 1998.
Wyatt A. Towards a financial reporting framework for intangibles: insights from the Australian experience, Journal of Intellectual Capital, 2002.
Zea MC, Reisen CA, Tyler F B. Reliability, ethnic comparability and validity evidence for a condensed measure of proactive coping, The BAPC-C Educational and Psychological Measurement; 1996.
Zwell M, Ressler R. Powering the human drivers of financial performance, Strategic Finance, 2000.
169

Appendix B: Number of Articles by Journal
170

APPENDIX B: Number of Articles Per Journal
1 Education & Trainina Educ 2 2 Review of Educational Research Educ 2 3 Educational & Psvcholoaical Measurement Educ 1 4 Journal of Adolescent and Adult Literacv Educ 1 5 Journal of Athletic Training Educ 1 6 The Journal of Management Education Educ 1 8 7 Control Enaineerina Ena 1 8 Mechanical Engineering Eng 1 9 Oil & Gas Journal Eng 1 3 10 Strateaic Finance F/AC/EC 3 11 Accounting, Auditing and Accountabilitv Journal F/AC/EC 3 12 Journal of Accountancy F/AC/EC 2 13 Journal of Economic Issues F/AC/EC 1 14 The American Economic Review· F/AC/EC 2 15 Contemoorarv Economic Policv F/AC/EC 1 16 Economic Develooment Review F/AC/EC 1 17 Financial Executive F/AC/EC 1 18 International Tax Review F/AC/EC 1 19 Issues in Accounting Education F/AC/EC 1 20 Southern Economic Journal F/AC/EC 1 21 The CPA Journal F/AC/EC 1 22 The Journal of Political Economv F/AC/EC 1 19 23 Policing Gov 1 24 Public Administration Quarterly Gov 1 25 Public Productivitv and Manaaement Review Gov 1 26 Review of Public Personnel Administration Gov 1 27 The International Journal of Public Sector Manaaement Gov 1 28 The Journal of Government Financial Manaaement Gov 1 6 29 Career Development International HR 1 30 Emplovee Relations HR 1 31 HRMaaazine HR 1 32 Human Relations HR 1 33 Journal of Counsellina and Develooment HR 1 34 Personnel Review HR 1 35 The American Behavioral Scientist HR 1 36 The Journal of Applied Behavioral Science HR 1 8 37 Journal of Intellectual Capital IC 23 23 38 Information Resources Management Journal IS 3 39 The Journal of Computer Information Systems IS 2 40 Association for Computina Machinerv: Communications of the ACM IS 1 41 IBM Systems Journal IS 1 42 Information Manaaement & Computer Securitv IS 1 43 Journal of Database Manaaement IS 1 44 Journal of Manaaement Information Systems IS 1 45 MIS Quarterly IS 1 46 Link-up IS 1 12 47 Journal of Knowledae Manaaement KM 11 11 48 Library Trends LIB 3 3 49 Manaaement Decision M 6 50 International Journal of Ooerations & Production Management M 6 51 Singapore Management Review M 5 52 International Journal of Quality & Reliability Manaaement M 5 53 The Journal of Manaaement Development M 5 54 Cornell Hotel & Restaurant Administration Quarterly M 3 55 Journal of Small Business Manaaement M 3 56 Manaaement Services M 3 57 Marketing Management M 3 58 S.A.M. Advanced ManaQement Journal M 3 59 Academy of Manaaement Journal M 2 60 Enaineerina Manaaement Journal M 2 61 Journal of Manaaement Issues M 2 62 Proiect Management Journal M 2 63 Team Performance Management M 2 64 The Journal of Business StrateQy M 2 65 Total Quality Manaaement M 2 66 Australian Journal of Manaaement M 1 67 Business Process Reenaineerina and Manaaement Journal M 1 68 California Management Review M 1 69 Communication Reports M 1 70 Competitiveness Review M 1 71 Consultina to Manaaement M 1 72 European Journal of Innovation Manaaement M 1 73 Eurooean Journal of Marketina M 1 74 Facilities M 1
171

75 76 77 78 79 80 81 82 83 84 85 1 86 1 87 1 88 1 89 The Southern Communications Journal M 1 90 Trans rtatlon Journal M 1 91 Women in Mana ement Review M 1 82 92 lnte rated Manufacturin S stems Man 2 93 The Journal for Quali and Partici ation Man 1 3 94 The Journal of Behavioral Health Services and Research Med 2 95 The Journal of the American Medical Association Med 2 96 American Dietetic Association Med 1 97 Communi Mental Health Journal Med 1 98 Evaluation and the Health Profession Med 1 99 Journal of Mana ement in Medicine Med 1 100 Journal of Medical Ethics Med 1 101 Nursin Administration Quarter! Med 1 102 Nursin Mana ement Med 1 103 Occu ational Health & Safe Med 1 104 Ortho edic Nursin Med 1 105 Med 1 106 Med 1 107 Med 1 16 108 OL 5 109 OL 2 110 OL 1 8 111 Ps ch 2 112 Ps ch 2 4 113 SmallGrou Research Res 3 114 Journal of Consumer Research Res 115 Journal of Marketin Research Res 116 Research Technolo Res 6 117 Sc 118 Sc 119 Decision Sciences Sc 3 120 American Sociolo ical Review Soc 121 Demo ra h Soc 122 Generations Soc 123 International Journal of Social Economics Soc 124 Re ional Studies Soc 5
Journal Category Codes:
Educ Educational Eng Engineering F/AC/EC Financial, Accounting, Economics Gov Government HR Human Resources IC Intellectual Capital IS Information Systems/Information Technology KM Knowledge management M Management Man Manufacturing Med Medical OL Organizational Learning/Learning Organizations Res Research Sc Scientific Soc Sociology
172

Appendix C: List of Developed Countries.
Australia Austria Belgium Canada Czech Republic Denmark Finland France Germany Greece Hungary Iceland Ireland (Republic of) Italy Japan South Korea Luxembourg Mexico Netherlands New Zealand Norway Poland Portu.e;al Slovakia Spain Sweden Switzerland Turkey United Kingdom United States of America
Source OECD: http://www.hhs.se/personal/suzuki/default.htm.
173

Appendix D: Articles by Country of Origin
USA/Canada 135 60.5 UK 51 22.9 Australia/NZ 8 3.6 Western Euro e other than UK 8 3.6 Scandinavia 7 3.1 Middle East 5 2.2 Asia other than Australia and NZ 5 2.2 Eastern Euro e 2 0.9 Un known/International 2 0.9
174

Appendix E: Categorised KM Measures
175

KM/IC Measurement/Evaluation Categories · C ateaorv
Geographic reler Code Category Year Author Orlentallon What Is being measured How or Why measured codes Financial 1996 Davis us customer comclaints C Customer/Market 1996 Davis us customer satisfaction customer sefVice level C Customer/Market 1996 Edwards us customer service internal C Qualitv 1996 Lvnn UK customer eXD8Cllltlons C Customer/Market 199! Mort1ock UK customer satisfaction C Customer/Market 1996 T= us customer satisfaction C Customer/Market 1998 AnoAlbaum Canada customer satisfaction C Customer/Market 1998 AnnAlbaum Canada customer satisfaction oraanizational leamina abilitv C Customer/Market 1998 AnlliahAdu UK customel orientation C Customer/Market 1998 Eskildesen Denmark customer satisfaction C Customer/Market 1998 Esklldesen Denmark customel satisfaction 1meorv behind the customel satisfaction index C Customer/Market 1998 Kennedv us customer satisfaction. treauencv of receat orders C
identifies the key customers who present challenging projects to Customer/Market 1998 Kennedv us customers encourage amwth and knowladae enhancement. C Efficiecv, Effectiveness, Produclivil 1998 Kennedv us customers' needs. how well the amanization is saistvina customers' needs. C
measured by the percentage of sales of the top five customers sales/customer ratios or the number of customers accounting for fifty percent of the
Customer/Market 1998 Kennedv us sales. C Customer/Market 1998 Thompson UK customer satisfaction C Customel/Market 1998 Tnornoson UK customer satisfaction customer satisfaction C Svstem/T echnoioav 1998 Thompson UK customer satisfaction C Customer/Market 1998 Wurzburo lntematnl customer contact netWOf!<s C Customer/Market 1998 Wurzburo lntematnl customer satisfaction C Customer/Market 1999 Ahmed UK Customer base number of customers C
Performance communicate how an aclivity is meeting the needs of internal Customer/Market 1999 Ahmed UK or external customers C Customer/Market 1999 Ahmed UK 1reoeat purchases number of repeat customers C Customer/Market 1999 Armistead UK customer service service aualitv and customer service C Customer/Market 1999 Baker us buyeroower relatlonshio between market orientation & cerformance C Customer/Market 1999 Brvson UK Qualitv of supplied service ren<1at business C Customer/Market 1999 1:1rvson UK success of a service/client interaction client cerception of the level of satisfaction with the service C
experiences of consumers during and after program Efficiecv, Effectiveness, Produclivih 1999 Buckmaster Australia customer cerceptions participation C """lem/T echnninnu 1999 Kave UK customer and stakeholder focus C Customer/Market 1999 Li UK customer commitment C Customer/Market 1999 Li UK customer orientation create customer value C Customer/Market 1999 Li UK customer orientation customer satisfaction obieclives C Customer/Market 1999 Li UK customer orientation after sales service C Customer/Market 1999 Li UK knowteaae about customers dellth of customer knowteaae C Customer/Market 1999 Li UK market orientation customer satisfaction C
:,oumwest Alnlnes rocuses on the Clltical measures or lost bags, customer complaints, and on-time performance-keys to customer satisfaction and therefore to success in the ai~ine
Customer/Market 1999 Pieffer us customer satisfaction industry. C Financial 2000 Ana Malavsia customer satisfaction C
each clienrs ability to attract new business and enhance Financial 2000 Barskv us customer assets Celami's image. C Customer/Market 2000 Barskv us customer k!Valtv C Financial 2000 Brennan Ireland customer service C Customer/Market 2000 Carroll us customel complaints number C Efficiecv, Effectiveness, Produclivi~ 2000 Dewan us customer satisfaction with healthcare C Customer/Market 2000 Dube us customer satisfaction C Customer/Market 2000 Dube us customer satisfaction the effects of that practice on customer satisfaction C Financial 2000 Enz us customer satisfaction C Customer/Market 2000 Grossman us service. C Customer/Market 2000 lbbs us Customer service and aualitv (CSQ) C
the extent to which our relationship with the client contributes to Svstem/Technoloav 2000 Lona us customer relationship the creation of value. C Customer/Market 2000 Low us oomnrate value creation customer relations C
evaluated on seven-point scales, with values ranging from Customer/Market 2000 McGee us customer comolaints "much worse" to "much better." C Culture 2000 Noble us customer satisfaction loatient satisfaction survevs, C
Assessment measures focus on symptoms, functionality (skill developmen~ community adjustment, quality of ltte) and
Customer/Market 2000 Noble us service effectiveness (healthcare) customer satisfaction. C 2000 Slivers us customer cerceptions of imaae and reputation. C
Customer/Market 2000 Slivers us customer acauisition C Customer/Market 2000 Slivers us customer retention C Customer/Market 2000 Slivers us customer satisfaction C Customer/Market 2000 Slivers us customer service factors C
comprehensive evaluation of customer support at the design Customer/Market 2001 Gollin UK customer suoooo stage. C
brand innovation quotient (number of customers who view the brand as innovative divided by the total number of potential
Customer/Market 2001 Kuczma us customer cerceotions customers) C products and company's distincliveness with innovation loyalty (number of repeat purchasers divicled by total
Customer/Market 2001 Kuczma us l(and perceived value to) customers. number of purchasers) C Financial 2001 Leese UK Customer service C Customer/Market 2001 Moore us customer lovaltv C Customer/Market 2001 Moore us customer retention C Customer/Market 2001 Moore us customer satisfaction C Customer/Market 2001 Moore us value creation for customers, C
176

Financial 2001 Poll Germanv customer satisfaction ,nnnulation satisfaction rate C Customer/Market 2001 Poll Germany service effectiveness IDOOtJlation satisfaction with library services C Oualitv 2001 Trombetta us customer ranking of the product C Customer/Market 2002 Bukh Denmark customer perceptions C
measurements as Web hits, clickthrough rates, or 'stickiness' were held in high esteem, attracting capital and skyrocketing
Customer/Market 2002 Lenskold us customer P81C8Ptions r.nmru,nv valuations. C Customer/Market 2002 Lenskold us impact of marketing on purchasing behavior customer lifetime value C
Marketing campaigns intended to increase the Customer/Market 2002 Lenskold us orofit oer customer or il'lllrove retention rates customer lifetime value C Financial 1996 Chenhall Australia performance management F ~=tem/Technninnv 1996 Chenhall Australia performance orowm F Financial 1996 Davis us cash flow F Financial 1996 Davis us income nMratina income bv division F Financial 1996 Davis us inventorv turnover F Financial 1991 Davis us ROE NPAT/em•nditure F Financial 1996 Davis us sales arowth auartertv sales nmwm F Financial 1996 Justman investment in R&D R&D intensitv F
cost of manufacturing a specific product and distributing It Financial 1996 Kruzner us cost of manufacturing through a Darticular channel. F Financial 1996 Kruzner us value of distribution channels. the true economic value of distribution channels. F Financial 1996 LoanClarke UK investment in management devA1mment F
discounted cash flow to measure the value of intellectual Human Capital 1996 Robinson us value of IP orooertv. F ~=tem/Tecnnninnv 1- SweeUand us cost of education F Financial 1996 Weisbel'll Israel cost/benefit results of the incentive scheme. F Financial 1997 AbdulGader Saudi Arabia lorofit performance F Human canital 1997 Adam lntemalnl IProfitisales ratio F Financial 1997 Adam lntemalnl ROA NPAT/assets over time F Financial 1997 Adam lntemalnl sales arowth Average sales arowth for oast 3 vears F
Expenditures on research and development as a percentage of Financial 1997 Leal us IEm<1nditure on R&D GDP F Financial 1997 Leal us sales exoon sales of tecnnninnieal capabilitv F Financial 1997 Park lnternalnl economic growth F Svstem/T echnnioov 1998 AmiahAdu UK investment in technoimv within ones industrv F Financial 1998 Ken"""" us EPS EBIT oer share F Efficiecv, Effectiveness, Productivih 1998 Kennedv us market value over book value F Customer/Market 1998 KennA<N us lorofit orofit aenerated bv the capital invested in a cornoanv F Financial 1998 SIMm8 us cash flow F Financial 1998 Skvrme us economic value add F Financial 1998 Thomoson UK cash flow F Financial 1998 Thom•.,... UK EPS F Financial 1998 Thomoson UK EVA F Financial 1998 Thomoson UK !Price to earnings ratio F Financial 1998 Thomoson UK ROCE F Financial 1998 Thompson UK ROSHF F Financial 1999 Ahmed UK lorofits net income F Financial 1999 Ahmed UK ROI NPAT/lnvestrnent F Customer/Market 1999 Ahmed UK sales per customer !per period 8Q Qtlv or VIV F
1999 Baker us ,orowth sales orowth cornoared to competition F Financial 1999 Baker us ROI NPAT/lnvestment F Financial 1999 Baker us sales arowth revenue over time F Financial 1999 Bessant Japan cost cost reduction lbv soecific % ) F 1Svstem1Techno1oav 1999 Brvson UK cost of assets F Financial 1999 Brvson UK !Profit income - costs F Financial 1999 Brvson UK sales exponsales F Financial 1999 Brvson UK sales F Financial 1999 Haltiwanger us sales the natural loa of firm sales divided bv emnKWment. F Financial 1999 Li UK pre-tax orofit maroin IProfitmarain F Financial 1999 Mohantv India strateQic manufacturing initiative. cost effectiveness F Financial 1999 Pfeffer us success near-term economic returns on know!= investment.' F Financial 2000 Ang Malaysia costs Reductions in ooerating costs F Customer/Market 2000 AnniahAdu UK ROI NPATnnvestment F Financial 2000 Arv1iahAdu UK sales orowth revenue F Financial 2000 Balkin us ExDflnditure on R&D F Financial 2000 Balkin us ROA NPAT/net assets F Financial 2000 Barskv us economic value add (EV A) F Efficiecv, Effectiveness, Productivit. 2000 Bharadwai us assets total book value of assets F Financial 2000 Bharadwai us income 1ooerating income per emolovee F Financial 2000 Bharadwai us ROA NPAT/net assets F Financial 2000 Bharadwai us ROS lretum on sales) NPAT/sales F Financial 2000 Bharadwai us sales income F Customer/Market 2000 Brennan Ireland cost of sunonn F Financial 2000 Brennan Ireland costs support costs F Financial 2000 Brennan Ireland exoenditure per emnlnvee IT sMMina per emmnvee F Financial 2000 Brennan Ireland stock of intanaible resources assets F Financial 2000 Brennan Ireland cost of IT soendina oer emolovee F
enhancing organizational efficiency resulting in identifiable cost Financial 2000 Carroll us knowledoe management process savings and subseouent higher return of investment, F Financial 2000 Carroll us revenue percentage of revenue cornina from new oroducts. F Financial 2000 Carroll us revenue from new products F Financial 2000 Davern us mwnack F Financial 2000 davem us ootential value of IT value of information for decision makino F Financial 2000 Davern us realized value value actually achieved F Financial 2000 Davern us revenue realized revenue nnnnm•nitv F Financial 2000 Davern us revenue realized revenue value as % of potential value F
177

Financial 2000 Davis us sales !Droduct F Financial 2000 Dube us lorofitability of a hotel F Financial 2000 Dube us I Profitability increase in F Financial 2000 Enz us IProfitabilitv NPAT F Financial 2000 Grossman us revenue total return to shareholders F KnowtAmA asset 2000 Grossman us Tobin's a F
the total of R&D expenditures allocated solely to new product development over a 3-to-5-year period divided by total R&D
Financial 2000 Kuczma us expenditure on new products expenditures for the same time. F New Product Develooment 2000 Liebowitz us Exoenditure on R&D F Financial 2000 Liebowitz us ,profits profits from new business aeneration F Human Caoital 2000 Liebowitz us value extraction F Financial 2000 Low us economic value add F Financial 2000 Low us expenditure on R&D F
success by near-tenn economic returns on knowledge Financial 2000 Martin Sino.annre ROI investment. F
the value contributed to the business by significant and/or Financial 2000 Martin Sinaanore value add extraordinarv intellectual asset manaaement actions F Financial 2000 McGee us aross profit F Financial 2000 McGee us sales nrnwm over cast 3 yrs sales over time F Financial 2000 Noble us debt debt service to coveraae ratio F Financial 2000 Noble us IProfitiabilitv F New Product Development 2000 Noble us revenue F
ROI an index of relative efficiencies of how well the firms are Financial 2000 Peoels us convertino strateoic assets inlo economic perfonnance F Financial 2000 Peaels us ROS (return on sales) NPAT/sales F Financial 2000 Sanchez Spain ROA NPAT/assets F Financial 2000 Stivers us cash fiow F Financial 2000 Stivers us cost reduction F Financial 2000 Stivers us EVA F Financial 2000 Stivers us ,profitability F Financial 2000 Stivers us Revenue arowth revenue increase over time F Financial 2000 Stivers us AOC NPAT/capital F Financial 2000 Stivers us cuslomer profitability F Financial 2001 Berkowitz us cash F
ROI in brainpower, information bases and technological Financial 2001 Berkowitz us ROI capabilities over time F Financial 2001 Berkowitz us value of on11inment book value of assets F Svstem/T echnalOOV 2001 Berkowitz us value of inventorv book value of assets F Financial 2001 Berkowitz us value of materials book value of assets F Financial 2001 Berkowitz us value of plant book value of assets F Financial 2001 Berkowitz us value of orooenv book value of assets F Financial 2001 Berkowitz us value of supplies book value of assets F Financial 2001 Collier UK costs comPUter databases F Financial 2001 Collier UK costs eauipment F Financial 2001 Collier UK costs software F Financial 2001 Collier UK costs maintenance F Financial 2001 Goffin UK revenues from customer su!JOO/T percentage of revenues from cuslomer suooort F Financial 2001 Groom ROA NPAT/net assets F
return-on-investment measure based on estimated Financial 2001 Kirchhoff us ROI future cash flows. F
the value creation model includes the portfolio value metric financial effectiveness of the research projects in (PVM), which measures the expected (future) financial
Svstem/Technoloav 2001 Kirchoff us the oortlolio effectiveness of the research projects in the oortlolio F Human Caoital 2001 Kuczma us viabilitv of a new Product viabilitv of a new product initiative. F Financial 2001 Moore us customer satisfaction 1arowth in orofitabilitv F Financial 2001 Moore us economic value add (EVA) F Financial 2001 Moore us e"""nditure on R&D F Financial 2001 Moore us expenditure on R&D F Financial 2001 Moore us income net F Financial 2001 Moore us ooerational alianment with strateaic aoals financial ratios F Financial 2001 Moore us profitability short term F Svstem/T echntllll/lll 2001 Moore us ROI NPATnnvestment F Financial 2001 Moore us sales sales from new oroducts F Financial 2001 Poll Gennanv costs F Financial 2001 Poll Gennanv costs of the librarv's Products and services; F Financial 2001 Roslender UK Caiculated intangible value (CIV) F Financial 2001 Roslender UK cost cost of information svstems per sales dollar F Financial 2001 Roslender UK market-t<HJOOk ratio F Financial 2001 Roslender UK Tobin's a F Financial 2001 Stank us cash lo cash cvcle F Quality 2001 Trombetta us brand awareness financial impact of brand awareness F Financial 2001 Trombetta us brand knowledae financial impact of brand knowledae F Financial 2001 Trombetta us brand loyalty financial impact of brand loyalty F Financial 2001 Winkworth UK expenditure per FTE F Financial 2001 Winkworth UK expenditure per FTE F Innovation & Creativitv 2001 Winkworth UK expenditure per FTE on infonnation provision F Customer/Market 2002 Bassi us future market returns finns' trainina investments F Customer/Market 2002 Bassi us future market returns 1aross profit margin F Cuslomer/Market 2002 Bassi us future market returns ROA F Cuslomer/Market 2002 Bassi us future market returns sales per emo1avee F Financial 2002 Bassi us future market returns market lo book ratio F Financial 2002 Bassi us laross orofit marain F Financial 2002 Bassi us income per emo1avee F Cuslomer/Market 2002 Bassi us IPrice lo book ratio F Financial 2002 Bassi us ROA NPAT/net assets F
178

Financial 2002 Bontis us cost of trainino F Financial 2002 Bontis us invesbnent in trainino F Financial 2002 Bontis us lorofit oer ernn..,ee F Financial 2002 Bontis us revenue oar e111D10Vee F
The compensation factor metric measures the average Financial 2002 Bontis us waoes/salaries lcnmoAnsation oai<I to each emnl<wee F Financial 2002 Bukh Denmark revenue revenue created bv add-on sale. F Financial 2002 Bukh Denmark sales turnover from new customers in the new taroet seoment F Financial 2002 Christi I Drofitabilitv Tobins a F Financial 2002 Christi stock market valuation of firms contribution of IC F Financial 2002 dePablos lntematnl invesbnent in trainino F Financial 2002 deTOJe us cash flow DCF F Customer/Market 2002 Hurwitz value relative to market value called the C0111Drehensive-tcHnarket value (CM) ratio. F Financial 2002 Lenskold us ROI ROI F Financial 2002 Lenskold us ROI of market oroorams NPATnnvesbnent F Financial 2002 McElrov us effects on the bottom line chanoes in P&L F
links the IC value to the market valuation over and above book Comoostte measures 2002 Rodov value of intanQible assets value F
surrogate measure for the value of the knowledge acquired from Financial 2002 Turner UK cost of education a particular level of education. F Financial 2002 Turner UK value of knowll!(](]II, 1oraomatic cost based measures F
measured by the combined management and ownership TeamWOfk & oarticioation 1996 Barberis us Human caoital chanoe H Human Caoital 1996 Black us trainino Increase in rvnctur.tivttv H KMWIAdMasset 1996 Francis NZ 1ioD penormance lob oerformance over time H Customer/Market 1996 Francis NZ meetino Olliectives meetino the defined workshOD obiectives H Outcomes 1996 Francis NZ loarticiMnt evaluation H Human : ::inital 1996 Francis NZ team effectiveness chanoe in team functionino H
absenteeism and turnover, may reflect the behaviour of the Human Capital 1996 LoanClarke UK management behaviour manaoer in charoe. H Customer/Market 1996 LoanClarke UK loerformance leaoue tables (indivi<lual) H Financial 1996 LoanClarke UK loerformance oerformance !indivi<luall H
90% of organizations used the reaction level of training evaluation, but only 19% attempted to evaluate training in
Human Canilal 1996 LoanClarke UK trainino terms of benefits to the OJoanization, H 86% of the FOftune 500 companies 'usually' evaluated their
Human Caoital 1996 LoanClarke UK trainino courses at a reactions level at the end of the course. H Svstern/T echnoiOCJV 1996 Robinson us know-how, oroblem solving and accountabilitv. H
extent to which decision makers are encouraged to re-evaluate Human Cffil:u 1996 Rollilson us OJIWli,ational leamino abilttv. their mental ITIDdels H Human Caoital 1996 Robinson us trainina amount of trainino oer emn,nuee H
the importance of job satisfaction factors on an indivi<lual's level HumanCaottal 1996 Saveiv Australia WOfk satisfaction of satisfaction and dissatisfaction wtth the iob H
1996 Sweettand us education vears of tenure H Leamino abilitv 1996 Sweetland us education formal H Leaming abilitv 1996 Sweetland us emn,nvee utilization number of weeks WOfked H Human caoital 1996 Sweetland us jignOJance H Leamino abilttv 1996 Sweetland us WOfk exoerience H HumanCaottal 1996 Weisbero Israel education vears of schoolino H
employee perception of their own participation; managerial attitudes; age of the programme in a company; expectations of
T eamWOfk & participation 1996 Welsbero Israel teamwork oerformance the olan; and whether an executive takes a leadino role. H measured accOfding to the average worke(s experience as
HumanCaottal 1996 Weisbero Israel tenure r8Dt'esented bv WOfk tenure and indicated the SHC. H During the past 15 years, several measures to assess coping
Financial 1996 Zea us ability to 0008 have been develooed. H TeamWOfk & oarticioation 1997 AbdulGader Saudi Arabia loroductivitv user assessment H Human Capital 1997 AbdulGader Saudi Arabia user satisfaction H Human ,;anital 1997 Adam lntematnl emo1evee turnover H Financial 1997 Clark us education level oraduate GPA H Human Ganital 1997 Clark us education oroorams affect on student leamino H Financial 1998 Heoworth us emoowerment H HumanCapttal 1998 Hims UK I performance teamWOfk H Financial 1998 Kennedv us Emoklvee attitudes POiis & ouestionnaires over time H
skill and experience of a company's professional The total number of years employees have WOfked in their Human caottai 1998 Kennedv us lbodv profession as well as the averaoe per professional. H
an indivi<lual's belief in ano acceptance of OJgamzational goals and values, willingness to exert a considerable effort on behalf of the organization, and desire to maintain membership in the
Customer/Market 1998 Snvdertlalpem us emn1<wee oeri:Antinns and attitude OJOanization H lypeS of environments, duties, training classes, supe,visOfy
HumanCaottal 1998 Tesluk us exrwience ouality OPPOrtunlties, and activities involved in trainino, H the number of times an lndivi<lual has completed a certain task
Culture 1998 Tesluk us WOfk exoerience Of eperation H tenure, defined as years in a job years in an organization Of
Customer/Market 1998 Tesluk us WOfk exoerience vears in a pesltion H HumanCaottal 1998 Tesluk us WOfk exoerience measures of lenoth of time in a nnsttion H
an understanding of experience along dimensions of the densily HumanC•nil•I 1998 Tesluk us WOfk exoerience and timino of the elQl8rience. H Human Caoital 1998 Tesluk us WOfk exoerience level of resnnn•ibilttv H Human Caoital 1998 Tesluk us WOfk elQl8rience task freouencv, recencv of task pertOJmance, H Human Caoital 1998 Tesluk us work exoerience amount of trainino, and amount of feedback, H Svstern/T echnoloov 1998 Tesluk us work experience tvoe of assignment Of complexity of previous WOfk, H HumanCaoital 1998 Thomason UK contributions indivi<lual & team H Human CaottaJ 1998 Thompson UK emninvee satisfaction H Human ;;inital 1998 Thomrn:nn UK emo1evee wellbeing H
179

Qualitv 1998 Wurzburg lntematnl loualitv of manaaement H Customer/Market 1998 WurzburQ lntematnl retention H Human Caoilal 1998 Wurzbura lntematnl trainina H Humancaoilal 1999 Ahmed UK communication KMWIAMA oorformance H Human Caoilal 1999 Ahmed UK ermlOYee utilization number of workers rotated H Human Caoital 1999 Ahmed UK leamina 1-oorformance H
number of workers participating In ace and number of workers Teamwork & particioation 1999 Ahmed UK QUalilV rotated. H Human Canir., 1999 Ahmed UK teamwork ,-oorformance H
new measures for knowledge sharing, as well as metrics for Teamwork & oarticioation 1999 Allee us Human caoital increases in external, internal or human caoital. H
process performance learning at individual and organisational level, and the potential Leamina abilitv 1999 Armistead UK for knowledae productlvitv H Human C•niT•• 1999 Brvson UK emmnvment emn1nvee numbers H
impact of external consultancy use on firm Human Caoilal 1999 Brvson UK loorformance emolovment chanae, but not necessarilv ermlovment amwlh. H
outcome measure is the number and percentage of illiterate children gaining effective reading skills and successfully
Leamino abilitv 1999 Buckmaster Australia OUICOl'ne completinQ the nmaram. H Canabilitv & Comootencv 1999 Buckmaster Australia [performance ,...,.rreviews H Human Caoital 1999 Cook UK social skills H OutcOl'nes 1999 Cook UK trustworthiness H
a rational (appreciation) and factual (undarstanding) capacities of defendanlS with respect to these comprehension of the proceedings, as well as the capacity to
Teamwork & participation 1999 Edens us 11..,., domains. consult with counsel (reasoninal. H Human Caoital 1999 Freeman us 1Derformance to level and QUalitv of participation. H Human Caoital 1999 Gardiner UK ,nmanizational leamina interviews & ouestionnaires H
Evaluation is typically done by self-reports from mentors and/or learners, asking participanlS how they rate their mentoring
Communications 1999 Gibb UK mentorina schemes eXDeriences. H labor productivity computed as the natural log of firm sales
Human Caoital 1999 Haltiwanaer us !Performance divided bv ermlovment. H Human Capital 1999 Haltiwanaer us workforce aae, education, aendar, and foreign-born variables. H
composition of the firm's workforce as measured by observable Human Caoital 1999 HalliwaMAr us workforce worker characteristics. H
based on employer ratings and self-ratings of graduates in Caoabilitv & r=tencv 1999 Karo us COl'nDetencv of entrv~evel dieticians dietetics. H
avanaomiy to stan, recog1111M1 or successes;· empioyee involvement • use of improvement teams; • training and development and use of the Investors in People standard; • the constructive use of self-assessment techniques; • measurement
Canabilitv & Comoatencv 1999 Kave UK leadershio and direction setting and feedback. H development of a culture for continuous improvement and
Financial 1999 Kave UK leadership and direction settina communications H Svstenv'T echno1oov 1999 Keeble UK learning caoacity H
knowledge, untt beliefs about practice patterns, HumanCaottal 1999 Lamb us ethical concerns H
measurement of market knowledge competence dimensions in Human Caoital 1999 Li UK market knowledaA COl'nPetence new oroduct devel()l)ment. H Caoabilitv & Comootencv 1999 Li UK ,nrnonizational comootence usina the outcome of leamino to measure cOl'nPetence. H
viewing Market knowledge competence as a series of Knowi"'1nA asset 1999 Li UK 1nmanizational oornnAtence behavioral processes in new nrrvtuct develooment H Human Caoital 1999 Pfeffer us emn1rn1ee retention H
being able to identify ethical issues (awareness) and being able to reason about these issues and come to a justifiable
Financial 1999 Savulescu UK critical thinking skills resolution as to what should be done. H measured three variables: knowledge, confidence and
1999 Savulescu UK nrnanization orientation resnnnsiveness. H Human Capital 1999 Shaw us Work experience H
extent to which managers believe their organization Caoabilitv & Competencv 1999 Wise us nrn:anizalional culture demonstrates a concern for emnlnvees' well-beina. H Human Caoital 2000 Ana Malavsia employee satisfaction H
in a study of IT management competencies, provide measures HumanCaottal 2000 Bharadwai us COl'nD8tellCV for assessina the man.,,..rial IT """""'tencies of firms. H Human Caoital 2000 Bharadwai us ITcapabilitv oeer rankina of IT leaders H
used the IW ranking as a measure of an organization's IT HumanCaottal 2000 Bharadwai us """r evaluations =>abilitv. H
human capital in firms and the renewal and development of Financial 2000 Brennan Ireland human caoital those resources. H Financial 2000 Brennan Ireland skills stock of intanaible resources H
an mven1U1y ui emplOyee competencies; • KJenniy1ng ana usnng competencies that must be mustered to i~ement firm strategy; • developing a system to acquire these competencies; implementing a pertormance appraisal and reward system linked to matching of the attainment of IC resources to strategy
1Svstenv'Technntnnv 2000 Carroll us ermlovee comoetencies implementation. H employees' views were listened to and evaluated based on
Human Caoital 2000 Carroll us ideas their intellectual mer1t H the effect of a monetary- incentive scheme on employee
Leamina abilitv 2000 Dube us ermlovee productivitv productivitv or satisfaction) H Teamwork & particiPation 2000 Dulewicz UK ea. IQ and MO """""'lencies H
means of explaining variations in outcOl'ne measures not Human Capital 2000 Dulewicz UK social intelligence accounted for bv IQ. H Performance 2000 Enz us education and trainina access to education and trainina bv all emmnvees H Customer/Market 2000 Enz us ernDIOVee satisfaction H
180

HumanCaoital 2000 Enz us emoKJVee performance evaluation continuous H Human Capital 2000 Enz us emoowennent H
aosemee1sm: ..,...,u1ate me average numoer or empioyees per untt and multiply H by the average number of workdays in the measurement period. Take the resutt of that calculation and divide it into the number of person days lost during the
HumanCaoital 2000 Enz us HR effectiveness measurement period. H Human Capital 2000 Enz us HR effectiveness emn..,ee turnover rate H Human CMil•I 2000 Enz us leadership oorantial H
management performance appraisals by peers subordinates & Customer/Malket 2000 Enz us manaaement oerformance suoeriars H Human : ;;mh., 2000 Enz us motivation continuous H Customer/Malket 2000 Enz us loerformance H Human C.nital 2000 Enz us training interactive CD based training H Cutture 2000 Gilbert us emnlnvee knowledae and exoertise H
measures the extent to which the work force believes the organization treats its employees fail1y and genuinely cares
Human Capital 2000 Gilbert us emnlnvees (treatment oil about the emnlnvees' welfare. H
the degree to which employees report their pay and benefits to Customer/Market 2000 Gilbert us perceotion of remuneration be rvwt when compared with those of emolovees elsewhere H
the extent to which employees view their supervisors to be providing positive training, coaching, involvement, team work
Human Canital 2000 Gilbert us perception of supervision and direction enabling the emolovees to perform effectively H HumanCaoital 2000 Grossman us absenteeism H Human Canilal 2000 Grossman us emninvee oroductivltv H Human r.anital 2000 Grossman us emolOYees Quits and discharQes as % of total ema10vees H Human Canital 2000 Grossman us IC H Human C.Oital 2000 Grossman IQUality of new emntovees H Human : =Hal 2000 Grossman us tenure of emnlOvees in various iobs average H Human CapHal 2000 Grossman us turnover H Efficiecv, Effectiveness, Productivil\ 2000 Harrold us training H lnfo/knowl"""" sharina 2000 Liebowitz us education IYears of H Human CapHal 2000 Liebowitz us 1AYnArience lvears of H Financial 2000 Liebowitz us relationships number of new colleaQue relationshiPS develOlleCt H Financial 2000 Liebowitz us scholarshios number H Financial 2000 Liebowitz us student/facultv ratio H Financial 2000 Liebowitz us students number H
the extent to wnich sharing responsibility leads to all the key people in a project being able to make decisions and take
Financial 2000 Lona us action orien talion action on the soot as oooortunities oresent themselves H Capability & =tencv 2000 Low us ,r.arumilities manaooment H
2000 Low us emntovee relations 1enrnm1te value creation H Human : =ital 2000 Low us intangibles valu~ed management H SvstemlT echnninnv 2000 Lvnn us effectiveness of nrniect team fr9Quency & effectiveness of meetinos H Teamwork & oarticioation 2000 Lynn us effectiveness of nmiect team team stabilitv H Teamwork & oarticioation 2000 Lynn us effectiveness of nmiect team Team teaming car,acity H
wim the hope mat snunc"<llnmgs can oe identi,.,., and, using this information, management can then begin to systematically address and improve the deficiencies in its ability to innovate
Leaming ability 2000 Lynn us IMrinnnance of product team better and faster. H Consultants at both Ernst & Young and McKinsey for example, are evaluated partly on the knowledge they contribute to human
Capability & Comoetencv 2000 Martin Sinaaoore Consultants evaluation networks H Teamwork & oarticioation 2000 Mavt11e us looanitive recall measured knowle<l<lA retention 4 weeks after training H
immediate knowledge, knowledge retention, and behavior/skill Capability & Comoetencv 2000 Mavlhe us Leaming demonstration. H Leamina abilitv 2000 Mavthe us listening skills H
measure the distinctive competencies and their relationship to the performance of large Health Maintenance Organizations
C•n:ohilitv & Comoetencv 2000 McGee us competencies i(HMOs). H required respondents to evaluate their company's respective
C'.an:ohilltv & ComnA!Ancv 2000 McGee us competencies competencies on a seven-ooint scale was constructed '. H measure the competencies of small Turkish casting and
Leamina ability 2000 McGee us competencies machinerv manufacturing finns. H competencies of industrial or manufacturing a 19-item scale used to measure the distinctive competencies
Capability & Competency 2000 McGee us finns. of industrial or manufacturina finns. H competency activities and their relationship to measured 55 distinctive competency activities and their
Capability & Comoetencv 2000 McGee us the performance of larae industrial finns. relationshio to the performance of laroe industrial finns. H Customer/Malket 2000 McGee us competency and performance measures. the ability to recoonize oooortunities. H Human Caoital 2000 McGee us competencv and performance measures. IPrOPensity to take risks H Customer/Malket 2000 McGee us strenoms awareness of store strengths H Comoostte measures 2000 Neulieo us communication comoetence assertiveness and interpersonal resooosiveness. H Teamwork & participation 2000 Neuliep communication comoetence. H social caoital 2000 Onvx Australia social capital. H Customer/Malket 2000 Pe•nnnu us oormAtence and oractice of ohvsicians H
(1) functional heterogeneity; (2) educational heterogeneity; (3) age heterogeneity; (4) finn tenure; (5) TMT tenure; and (6)
Human Capital 2000 Pagels us arouo or team heterooeneity tenure in current oosition. H System/T echnnlnnv 2000 Sanchez Soain innovation knowleaae H
1aeve""""' our own measures ot communication W1m supervisors and general relations with the company, measures of general communication/leamwolk and concern for
Capability & Comoetencv 2000 Sieaall us communication I performance H Human r.anHaJ 2000 SiAAAII us competence related to se~-i!Steem H Human Canital 2000 Sieaall us competence manaaerial effectiveness H
181

person's confidence in his/her ability to do the job, sett-assurance about personal capabilities to perfonn work activities,
2000 Sieaall us comoetence and sense of masterv reaardina necessarv iob skills. H low role ambiguity, strong sociopolitical support. access to information, and a participative climate were associated with
Caoabilitv & Comoetencv 2000 Sieaall us emoowerment loerceotions of emnnwerment. H Human C8Dital 2000 Sieaall us emnnwerment emrnnvees' oerceotions of their WOOOllace H Human Caoital 2000 Sieaall us emoowerment H
measured teamwork, which referred to 'group processes characterized by helpfulness, cooroination of effort, open
Teamwork & oarticioation 2000 Sieaall us teamwork communication, and friendliness' . H Human , ;;mital 2000 SiAMJI us work effectiveness """188 of emnnwArment H
empowerment and measures of general communication/teamwork and concern for
HumanCaoital 2000 Si8Q81 us perfonnance H Financial 2000 Stivers us emoklvee oroductivitv. H Financial 2000 Stivers us emn..,ee retention H Financial 2000 Stivers us erooklvee satisfaction H Leamina abilitv 2000 Stivers us teamina & arowth lllACXlle H New Product Development 2000 Vomies us marketina caoabilitv H Innovation & Creativitv 2000 Waldron us communication The communication characteristics of successful clienls H
the effecls of the training on measures of communication Leamino abilitv 2000 Waldron us communication competence lcomoetenca H Gaoabilitv & CMmAtoncv 2000 Watters UK 1aooraisal of investment alternatives emAriance (oersonalised knowt=• H Svstem/T echnninnv 2001 AIGahtani UK lsvstem success user satisfaction H
systematic and creative evaluation of knowledge, rootives, and Human <'.anital 2001 Bain us knowtArinA, motives, and skills skills in relation to nrruinizational needs. H HumanCaoital 2001 Barker UK success human intellectual enel!IV H
training as a percent of payroll, percentage or employees trained, number of employee suggestions and employee
Human Capital 2001 Bart Canada training attitudes about (and satisfaction with) the omanization H
1Svstem1Technn1nnu 2001 Barkowitz us Humancaoital measure whether human capital is amreciatina or deoreciatina H perfonnance on a subsequent decision-making decision satisfaction, decision diversity, decision richness, and
HumanCaoital 2001 Boland us task decision task realism. H Svstem/T echnoloov 2001 Collier UK costs experience H
post-incident evaluation, similar to the alter-action review that Perfonnance 2001 Collier UK incidenls, takes olace in the militarv. H Human<'..,,ital 2001 Hao us education Schooling H HumanCaoital 2001 Hao us education work exoeriance H
the highest educational level, English proficiency and the total HumanCaoital 2001 Hao us educational level number of workers in the unit. H
contact with cerethnics and coethnics' economic inactivity, and examine the use of AFDC and SSI in two subpopulations:
socialcaoital 2001 Hao us social caoital lcommunitv) single-mother families and elderly unils. H grade point average, and 10-retated measure, and a relatively
HumanCaoital 2001 Kirch us suitabilitv for Amnlnvment short interview. H Relationship, Comfort, and Multicultural Awareness,
ICaoabilitv & Comoetencv 2001 Kocarek us comoetencv Knowledoe, and Skills. H Caoabilitv & Comoetencv 2001 Kocarek us comoetencv awareness of sett, knowleaoe, and communication skills H
supervisory ranngs or maiv1aua1 errecnveness on wna1 was referred to as the technical or task perfonnance (an average of scores on technical knowledge and learning orientation) and supervisol's ratings of the individual's team perfonnance (an average of scores on self-management, team contribution, and
1Svstem/T echnnlnnu 2001 Miller us criterion validltv measures communication). H Teamwork & particioation 2001 Miller us effectiveness of oroiect team suoervisor ratinos of an individual's team oerformanca H
verbal, quantitative, perceptual, and mechanical reasoning Customer/Market 2001 Miller us employment aotitude tesls abilities. H
measures of Individual task knowledge and task-related skills Financial 2001 Miller us oerforrnanca and abilities H Human Capital 2001 Moore us emDklvee morale survey. H Humancaoital 2001 Moore us emnlnvee attitudes H HumanCaoital 2001 Moore us emn""'ee rA..,...,,,se time H Knowledae asset 2001 Moore us instances of successful conflict resolution H
2001 Moore us oertormance investment in =le H examine the effectiveness of networks built from norms and
socialcaoital 2001 Pino UK social trust values of trust and reciorocitv H Human Caoital 2001 Ranchod UK effectiveness of on~ine marketing the marketing executives' knowle<lOe of Internet technoloQv. H SVStem/Techrlllklnll 2001 Rostender UK emoklvee Droductivitv H Svstem/T echnnllYN 2001 Roslender UK emn""'ee retention H Svstem/T echnoloQv 2001 Roslender UK emoiovee satisfaction H Human r .. nital 2001 Roslender UK user satisfaction svstem usaae H
secondary education enrollmenls as a percentage of the Communications 2001 Sacks us enrollmenls lnnnulation aae 14 to 17 in a oarticular vear. H Caoabilitv & Comoetency 2001 Shama Russia behavior in-<lellth interviews H Caoabilitv & Comoetencv 2001 Shama Russia economic oerfonnance in..,..,th interviews H Carumilitv & """""'tencv 2001 Shama Russia entrepreneurial values in-rlAnth interviews H Leamina abilitv 2001 Simon Australia 1oo-ooeration H Leamina abilitv 2001 Simon Australia effective skills transfer, H Leamina abilitv 2001 Simon Australia intearation of consultant into oraanisation. H Innovation & Creativitv 2001 Stank us comoetence internal intearation H Innovation & Creativitv 2001 Stank us 1MmnAtence customer integration H Svstem/T echno1oov 2001 Stank us 1comoetence measurement inteoration & relationshio imeoration H E"""""", Effectiveness, Productivmi 2002 Bassi us loerfonnance lquantiy of trainino H
182

Outtomes 2002 Bassi us trainina evaluations of trainina outcomes. H Capabilitv & Competency 2002 Bassi us financial petfoonance training H Human Capital 2002 Bontis us human capital depletion H
the aggregate result of all drivers of HC management that Svstem/T echnoloov 2002 Bontis us human canital effectiveness influence emolovee behaviour H Communications 2002 Bon1is us involuntaiv turnover H
The development rate describes how well an organization Outcomes 2002 Bon1is us organizational development rate provides access to trainill!I oroarams for its workforce. H Human Capital 2002 Bontis us voluntarv turnover H Human Caoital 2002 caaav Australia env,111Vee retention H Communications 2002 Collardin UK comoanv value ID90Dle and ideas H KnowfAMA asset 2002 dePabfos lntematnl absenteeism H HumanCaoital 2002 dePabfos lntematnl emolOVee satisfaction H Leamina abilitv 2002 dePablos lntematnt lost time iniuries H Human Capital 2002 dePablos lntematnl ratio of trainina hours/working hours H Human Capital 2002 dePablos lntematnl trainina trainina davs per emok!Vees H
family structure, parent-child discussion, intergenerational social caoilal 2002 Dika us social canital closure, moving, and reliaious participation H
social capital 2002 Dika us socialcaoital lanauaae Proficiencv as a source of cultural and social capital H measured social capital with social network indicators (e.g.,
social caoital 2002 Dika us social caoital status of network members, number of non-kin). H most of these measures (e.g., number of parents, number of siblings or household size, church attendance) are crude and
social capital 2002 Dika us social e.,milal arbitrarv. H Financial 2002 Friao us human canital !Performance measures for emplovees H
Social innovation capital managers can not only measure and value their firms' capacity to innovate, but also enhance their
Svstem/T echnnlnnv 2002 McElrov us caoacitv to innovate I performance and numut H Efficiecv, Effectiveness, Productivi!'. 2002 Mitra us effects of KIIOWIAMA near-market economic •-. H
measures of connection, support, belonging, participation, social capital 2002 Schmid us social capital emoowarment, and safetv. H social capital 2002 Schmid us social caoital familv structure, crime, trust, values, and civil societv. H
Peoples' trust in various organizations has been measured over social e.anital 2002 Schmid us social caoital time. H social caoital 2002 Schmid us social c•niT•• inauire of the radius of orelerential treatment H
Measures the mix of one's own motives and those expected of social caoital 2002 Schmid us social capital others. H Human Capital 2000 Mavthe us knowi"""" retention H Human =ital 2001 Bart Canada ll<nOWU!008 and skill base H
how often they are first to market with new products and the Culture 1996 Chenhall Australia culture of fast response. time to desian new oroducts I
measures protection against losses arising from three sources: working requirements, compulsory licensing, revocation of
Commitment, action orientation 1997 Park lntematnl lorotection aaainst losses loatents. I KnnwlMnA asset 1998 SnvMrhalDem us lomanizational culture The measurement of oraanizational commitment. I In sharina 1998 Tnnmnson UK ,oomorate IOOic I
reliability of knowledge its timeliness, completeness and Decision makina 1999 Armistead UK lknowledae transfer success accessibility. I
Communications 1999 Kave UK organizational culture for Cl and communications I Human :;anital 1999 Li UK communication I Innovation & Creativitv 1999 Li UK customer leamina information amuisition I
Customer information is barely/fully integrated in new product 1999 Li UK Information lntearation software dA.sioo'. I
Svstem/TechllDIOOV 1999 LI UK market orientation cultural norms I a telecommunications company expected its managers to
Customer/Market 1999 Pfeffer us data collection review 100 to 200 ,,.,,... of data a week. I Humancaoital 2000 Barsky us comoanv's value =•izational culture, I Culture 2000 Barsky us IC omanizational culture I Customer/Market 2000 Bharadwai us IT infrastructure. Keens reach and ranae framework I KnowiecJaa creation & use 2000 Brennan Ireland IC in a way that is useful for dlecision making. I Communications 2000 Davern us lomanizational culture fosterina of a knowl=-sharina culture I
the value of the information they provide for dlecision making lnfo/knowladae sharina 2000 Davern us lootential value of IT under uncertainty. I
measured as the ratio of structural capital to human capital, Losses 2000 Edvinson Sweden transformina velocity also called 'the IC-multiplier'. I
measures of internal organizational structures and processes 1Svstem/Technoloov 2000 Gilbert us oraanizational structures and processes or oraanizational effectiveness. I
quantity of information passed and the number of messages Human Caoital 2000 lbbs us communication sent I Customer/Market 2000 Lvnn us oroiect team effectiveness implementation of learnina I
Consultants at Ernst & Young and McKinsey are evaluated ICaoability & Comoetency 2000 Martin Sinaaoore Consultants evaluation partly on the knowiedae they contribute to repositories I
the flow of knowleage between those who produce information, to those who add value to i~ to those who finally need and
Innovation & Creativitv 2000 Martin Sinnaaore knowiedae flows consume this knowil!dnA. I the innovation model which collectively creates that innovation
Customer/Market 2000 McAdam UK innovation culture. I company's functional activities rated as a distinctive strength,
Knowledae asset 2000 McGee us competencies weakness, or as averaae. I Human Capital 2000 McGee us competency and oertormance measures. level of innovation, I
quality measure of a company's scientific analyzing the citation patterns of its papers and its technological Capabilitv & Competencv 2CW McMIiian us knowiedae knowledae (by examinina the citation patterns of its Patents). I Human Capital 2000 Neulieo us communication measures of communication satisfaction and uncertainty. I
183

KnowledM asset 2000 Sieaall us comoetence access to information about the nrru1nization's mission, I the extent to which the misslOll statement influences the day-to-day behavior of members throughout the organization; the extent to which the mission statement is actually being
Communications 2001 Bart Canada lomanizational culture achieved I Culture 2001 Berkowitz us ROI return on invesbnent in information bases I
knowledge representations in a labofaloly evaluated intelJ)letative, general, and particular knowledge Decision makina 2001 Boland us exoeriment with manaaers. reoresentations in a labofalo!V exoeriment with manaaers. I
evaluate the impact of knowledge structures on managerial In sharina 2001 Boland us manaaerial decision makina. decision making. I Culture 2001 Collier UK Kl10Wl8(J(J8 environment devAIMinn rvnanizational knowlAmA structures I Structural caoilal 2001 Collier UK knOW18(JQe sharillQ I Know!.,,,,. asset 2001 Karr us 1llllf!cific abilities. certification I System/T echnolOOV 2001 Poll Germany utilization of information and services sn..,ina the use of their collections and services; I Financial 2001 Reinale us oraanizational culture. I Human Capital 2001 Stank us cornoetence internal inteaation I Human,;;,nitaJ 2001 Trombetta us effectiveness of a marketing campaign unaided recall I Customer/Market 2002 Bornemann Ausllia know!"""" flows & oulDuts I
2002 deTore us outcomes of R&D know!"""" assets I C•.,,.nilitv & , =tencv 2002 Friao us information capital I Customer/Market 2002 Galup us enterorise knawl"""" evaluatina an entAmrise's knnwww,e assets. I Culture 2002 Mitra us effects of knowledae near-market cultural knowleaoe I
a firm's understanding of the culture of potential new markets based on knowledge generated from operating in similar
Leamina abilitv 2002 Mitra us impact of economic and cultural knowledoe markets. I impact of knowledge generated in similar
lnfo'knowledM sharina 2002 Mitra us markets I Teamwork & oarticioation 2002 Mitra us Kl10Wl8(J(J8 transfer transfer of knowlB<JOA within multinational oomorations. I
lnfw1<nowlA<lnA sharina 2002 Turner UK store of knowledae embodied in an organisation comoosite of each individual's expliclt or domain knowledoe I Efficiecv, Effectiveness, Productivil 1997 Leal us innovative activitv Patents, IP Financial 1997 Leal us loatent aualitv citations IP
inventions output of research and development in the form of Knowledoe asset 1997 Leal us loatents inventions IP
the number of patent applications per 10,000 population, 1997 Leal us !patents representing an inventiveness coefficient (OECD, 1993). IP
Knowledae asset 1997 Leal us relative cornoetitiveness of an economy Patents, IP KnnwiA<lnA asset 1997 Park lntematnl intellectual orooenv riahts IP Customer/Market 1998 Skvrme us brands IP Knowledae creation & use 1998 SkVrme us oatents IP
value-based models, such as brands and Learnina abilitv 1998 SkvrmA us patents. IP Structural capital 1998 Wurzburg lntematnl innovation patents and licenses IP Knowleda9 asset 1999 Armistead UK .patents number of patents as indicator of level of R&D IP Financial 1999 Armistead UK process performance protection of the value of knawledae IP Knowledae asset 1999 Pieffer us Kl10Wl8(J(J8 Patents, IP In sharina 2000 Balkin us innovation measured by number of patents and R&D spending. IP KnowlAmA asset 2000 Balkin us IP cmvriaht IP Knowieaoe asset 2000 Balkin us IP trade secrets IP Knowl"'1M asset 2000 Balkin us patents number IP Knowledae asset 2000 Carroll us •MWIAOOA manaaernent nmr.ess acnuirina a patent or trademark IP Knowledae asset 2000 Carroll us 1patents or trademarks acauisition IP Leamina abilitv 2000 Low us camorate value creation brand value IP
percentage of technically relevan~ competitive intellectual lnfo'knowlodnA sharina 2000 Martin Sinoaoore IC assets that reauire a business resoonse, IP
percentage of new business initiatives protected by intellectual Knowledoe asset 2000 Martin Sinoaoore IC assets; IP
Sell-citation has bean examined in the patenting literature with a theoretical base that It is a measure of internal knowledge
2000 McMillan us knnwiAdnA develooment develnnment IP KMWIMllA asset 2000 Vorhies us innovation Patents, IP Know!"""" asset 2001 Berkowitz us oatents mvemment-owned oatents aenerated oer emo10Yee IP Financial 1996 Chenhall Australia performance (divisional) compared to industry averaaes over the prior three years M Customer/Market 1996 Davis us market share market share M Svstem/T echnolOOV 1996 LoanClarke UK cornoetitiveness Iona term comoetilivness over time M
a WWf of tracking how well an organization will be able to KnnwlMnA asset 1996 Robinson us abilitv to learn and chanae maintain its comoetitive advantaae. M Svstem/T echnotoaY 1997 Park lntematnl market freedom M
behaviour and ability of competitors to be Financial 1998 IAnoiahAdu UK distinctive. M EfficiecY, Effectiveness, Productivit, 1998 ADDiahAdu UK cornoetition nature of competitors' strateaies and actions M Knowledae asset 1998 ADDiahAdu UK enmMtilive intensitv M
evaluated the degree to which changes occurred in the types Customer/Market 1998 'AnniahAdu UK market dvnamism and preferences of a firm's customers M Measures of Competition 1998 AnniahAdu UK market dynamism nature of comoetitors' strateaies and actions M Financial 1998 AnniahAdu UK threats nosed bv a business environment M Customer/Market 1998 Thompson UK market share M
comparing and contrasting one company with another, against Financial 1998 Thomason UK nrru1nisational oerformance some selected and defensible criteria. M Customer/Market 1998 Thompson UK share price M Measures of : :nmnetition 1999 Ahmed UK Customer measurements market share M Measures of Comof!tition 1999 Baker us ease of entry M Customer/Market 1999 Baker us market orowlll M K"""""""" asset 1999 Baker us market share chanaes in market nn.ltion M Customer/Market 1999 Baker us market share market oosition M
184

Financial 1999 Baker us market share chanQe in market share relative to the finn's lamASt oornoetitor M relationship between market orientation &
Customer/Market 1999 Baker us performance ease of entrv M relationship between market orientation &
Measures of Comoetition 1999 Baker us oerformance market arowth M Customer/Market 1999 Baker us seller concentration M Measures of Comoetition 1999 Buckmaster Australia external benchmarkina M Customer/Market 2000 Barsky us brand eauitv M Financial 2000 Barsky us market value-added /MVAl M
measurements based on actual results and uses It to generate qualttative information that can be compared with data from
Customer/Market 2000 Bharadwai us IT capabilitv & finn performance other comoanies M me extent to whicn practitioners or benchma1111ng nave attainea their objectives, justified costs by the benefits attained from benchmarking and their perception of the overall success of the
Customer/Market 2000 Brah Sinoaoore success of benchmarking process. M Customer/Market 2000 Brennan Ireland market share M Knowteaae asset 2000 Grossman us benchmarkina outside benchmarking M Customer/Market 2000 Grossman us market value M Financial 2000 Stivers us market performance M Svstem/TechnolO!IY 2000 Stivers us market share M
market orientation, marketing capabilities, and Customer/Market 2000 Vorhies us performance M
generation of market intelligence, dissemination of market intelligence across departments and work groups, and
Measures of Comoetition 2000 Vorhies us market orientation reonnn•iveness to market intelligence. M Financial 2000 Vorhies us Product-market SC""" M
measured by asking respondents to assess their business Measures of Competition 2000 Vorhies us Relative pertonnance unit's performance relative to that of major competitors. M Knowt"""" asset 2001 Groom us competitive intelliaence effectiveness. M
the approaches used to evaluate on-line marketing Customer/Market 2001 Ranchod UK on~ine marketing effectiveness effectiveness M Measures of • :nmnAtition 2002 Bukh Denmark turnover turnover from new customers in the new taraet sonment M Measures of Comoetition 2002 Harrison us results of its Web site. M
Vitality refers to new products which have been introduced Innovation & Creativitv 1996 Davis us innovation within the last five vears. N Innovation & Creativitv 1997 Leal us innovative activitv sales and ourchases of technotooical capability N Financial 1997 Leal us oorential conmetitive performance measures of innovative activity N New Product Develooment 1998 =lbaum Canada innovation & imorovement activities N Innovation & Creativitv 1998 AooiahAdu UK innovation orientation, N New Product Deve1mment 1998 AooiahAdu UK new product success N New Product Develooment 1999 Baker us new oroduct success success level N
High-grade ideas move up to the company committee responsible for evaluation and these are rewarded with larger
Strateov 1999 Bessant Janan ideas sums. N
New Product Develmment 1999 Bobic UK Innovativeness measured by the dimension 'deoarture from standard oractice.' N each idea a team develops is evaluated to compute an overall
1999 Cadv us ideas score for the qualitv of innovation N Customer/Market 1999 Cadv us laualitv of ideas N
evaluated using Debra Amidon's innovation assessment, and Innovation & Creativity 1999 Freeman us innovation canacity of this orooram the results are presented. N
the importance given to product variety, abillty to make rapid Leamina abilitv 1999 Kathuria us Product Flexibility chanQes in product mix, and the abHilY to customize products. N Outcomes 1999 Kave UK Cl stratonir. focus; N Innovation & Creativity 1999 Li UK new product competitivness newness, rellabllity, productivitv, and uniqueness N
the extent of cooperation in establishing product development goals, generating and screening new product ideas, and
Innovation & Creativitv 1999 Li UK new oroduct competitivness evaluating and refinina new products. N New Product Devetooment 2000 AnniahAdu UK new nmduct success success level N
knowledge management process improved innovative capacity measured by performance Innovation & Creativitv 2000 Canoll us indicators. N
Most finns have a method for evaluating the innovative ideas Innovation & Creativitv 2000 Harrison us innovative ideas that emeroe from the innovation process. N
the percentage of new products commercialized by number Innovation & Creativitv 2000 Kuczma us Innovation oortfolio mix and bv revenue. N
divide the number of new products exceeding the 3-to-5-year original revenue forecast by the total number of new products
Teamwork & particioation 200( Kuczma us ratio of new products to total product mix commercialized over the same period. N Innovation & Creativitv 2000 Liebowitz us knowledae assets Number of new oroducts. N Financial 2000 Low us corporate value creation innovation N
number of patents and the importance of patents has the New Product Develooment 2000 Low us innovation areatest imoact on market value. N
speed of development and new product success, scale Items Financial 2000 Lvnn us leamina by teams -e develmAd based on nost exoloratoiv research N
New Product Develooment 2000 Lvnn us new product success scale Items were develmAd based on past exoloratorv research N Success measured by a long-tenn capability to succeed through
New Product Develooment 2000 Martin Sinnanore innovation N Svstem/Technninnv 2000 McAdam UK innovation continuous imorovement N Innovation & Creativity 2000 McAdam UK innovation. The Centrim Innovation Model N Innovation & Creativitv 2000 Sanchez Soain innovation process technolooical innovation N I Svstem/Technninnu 2000 Sieaall us competence innovative behavior, N
185

individuals' and teams' ratings of their innovation, lists of innovations, and experts' ratings of the magnitude, adicalness,
Innovation & Creativity 2001 Bain us innovation measures and noveltv of innovations listed bu the teams. N Depth was measured as the maximum number of appropriate
Customer/Market 2001 Boland us ideas idea units in a maior catennru. N Innovation & Creativitv 2001 Goffin UK new product develooment N
looking for opportunities to innovate, recognizing opportunities, gathering information about opportunities, and paying attention
Measures of l'.nmMtition 2001 Klevsen Canada ernolovee behaviors to OPPOrtunitv sources. N
measure of role innovation which captures how many changes an individual has initiated in his or her job in comparison to the last role occupant and Rogefs (1983) operationalization of
Innovation & Creativitv 2001 Klevsen Canada innovation innovators as oersons who anmt innovations before others. N brand innovation quotient (number of customers who view the
company's distinctiveness with (and perceived brand as innovative divided by the total number of potential Measures of Competition 2001 Kuczma us value to) customers. customers) N
100m survey ana case evKlence indicated mat a s1gmticant1y large proportion of high performing divisions achieving high levels of manufacturing flexibility were using manufacturing performance measures as part of their formal managerial
I Svstem/T echnnlnnv 1996 Chenhall Australia manufacturina oerformance evaluation svstems. p
Formal measurement of process and outputs of manufacturing can provide feedback that may lead to improved learning and,
Customer/Market 1996 Chenhall Australia lnutnuts of manufacturino conseouentlv, enhanced DArformance. p
Customer/Market 1996 Chenhall Australia IProdUCtivitv cvcle-time p
11>"\/Stem/TechnOIOOV 1996 Chenhall Australia technninnical factors oreventive maintenance p technological factors productivity measures related to physical inputs; • minimum
Efficiecv, Effectiveness, Productiviti 1996 Chenhall Australia inventorv levels p technological factors materials' throughput time; • set-up times; • success in making
I Svstem/T echnnlnnv 1996 Chenhall Australia new technolooies work; • p
Financial 1996 Davis us cost control Productivitv imorovement from vear to vear. p
IOnerational Processes 1996 Davis us Customer service levels DArcentaDA of line items filled with an overall nnal of 95% p
Oualitv 1996 Davis us leouipment downtime p
Performance 1996 Davis us on time deliverv; Percentaae of on time deliveries. p
Qualitv 1996 Davis us overtime usaae. p Manufacturing plant scorecard In each plant. measures were
Customer/Market 1996 Davis us IPlant efficiencv and effectiveness develnnAti to track soeed, oualitv and cost. p
Oualitv 1996 Davis us !production rates oer oeriod dailv p
Svstem/T echnoionv 1996 Davis us speed deliverv p meeting the defined workshop objectives, measuring the change in team functioning, a participant evaluation
Customer/Market 1996 Francis NZ effectiveness of a workshoo auestionnaire, and iob oerformance over time. p
1996 Kruzner us strateav. Pertormance non< p measured the refining, distribution, and marketing process as
Svstem/T echnnlnnv 1996 Kruzner us value chains an inteorated value chain. p Leamina abilitv 1996 LoanClarke UK oerformance =artmental outcomes p
Outcomes 1996 Loan Clarke UK performance activitv levels p number of calls per week answered within a number of seconds by a certain number of staff • the processes
Caoabilitv & ComnAtencv 1996 Mortlock UK call centre efficiencv themselves were more difficult to evaluate. p
Financial 1997 AbdulGader Saudi Arabia oraanizational effectiveness imoactof IS p Svstem/T echnOIOOV 1997 AbdulGader Saudi Arabia svstem utilization treouencv of use p
Svstem/T echnnlnnv 1997 AbdulGader Saudi Arabia time savina p the success level of CMCS and the factors that influence
Efficiecv, Effectiveness, Productivit 1997 AbdulGader Saudi Arabia use of svstems CMCS p Customer/Market 1997 Adam lntematnl effectiveness of decision makina level of centralisation vs decentralisation p Customer/Market 1997 Adam lntematnl emnonvee selection effectiveness of the selection orocess p
Efficiecv, Effectiveness, Productivit 1997 Adam lntematnl inventorv reduction inventon, movements over time p Svstem/T echnninnv 1997 Adam lntematnl loerformance obiectivitv of feedback p
Svstem/T echnolOOV 1997 Adam lntematnl work measurement work flow effectiveness and industrial enaineerino analvsis p
Efficiecv, Effectiveness, Productivit 1997 Leal us innovative activitv sales & purchases of technoloaical caoabilitv p
Customer/Market 1998 IAnnolbaum Canada IProcesses internal p 1998 IAnaiahAdu UK market dynamism rate at which oroducts/seivices become obsolete p
Efficiecv, Effectiveness, Productivil 1998 Eskildesen Denmark Proiect success abilitv to complete accordina to soec p Financial 1998 Eskildesen Denmark Proiect success abilitv to cornolete within time p
Svstem/T echnoloav 1998 Kennedv us Efficiencv how well an oraanization is usina its caoacitv. p
Financial 1998 Kennedv us information oroductivitv index manaaement costs/benefits received p
Customer/Market 1998 Wurzbura lntematnl decision makina practices p the vital signs which quantify how well activities within a
1999 Ahmed UK achievement of soec ified nnols lorocess or the outnuts of a orocess achieve a soecified anal p
Knowiedae process 1999 Ahmed UK contribution contribution of each team or orocess to the oroanisation's nnal" p Svstem/T echnoloav 1999 Ahmed UK knowleooe performance measures knowledae processes p
reflect the contribution of each team or process to the IOaarational Processes 1999 Ahmed UK Pertormance oroanisations' nnals. p
Customer/Market 1999 Ahmed UK IProductivitv IProductivitv p Innovation & Creativity 1999 Armistead UK caoabilitv to oertorm well deoendabilitv to keen arranned times p Efficiecv, Effectiveness, Productivih 1999 Armistead UK caoabilitv to perform well abilitv to resoond auicklv to chances reouested bv customers p
measures of quality in consistency, speed and dependability of delivery and flexibility to cope with changes to order, while at
Svstem/T echnoloav 1999 Armistead UK looerational Processes the same time irnorovina oroductivitv. p Project Success 1999 Armistead UK laualitv s= and deoendabilitv of deliven, p
Teamwork & participation 1999 Armistead UK 1aualitv flexibilitv to Cnnf> with chanaes to order p
Knowl= Process 1999 Bessant Jaoan deliverv reliabilitv imorove deliveN reliabiilivibv •=ific '/J p
186
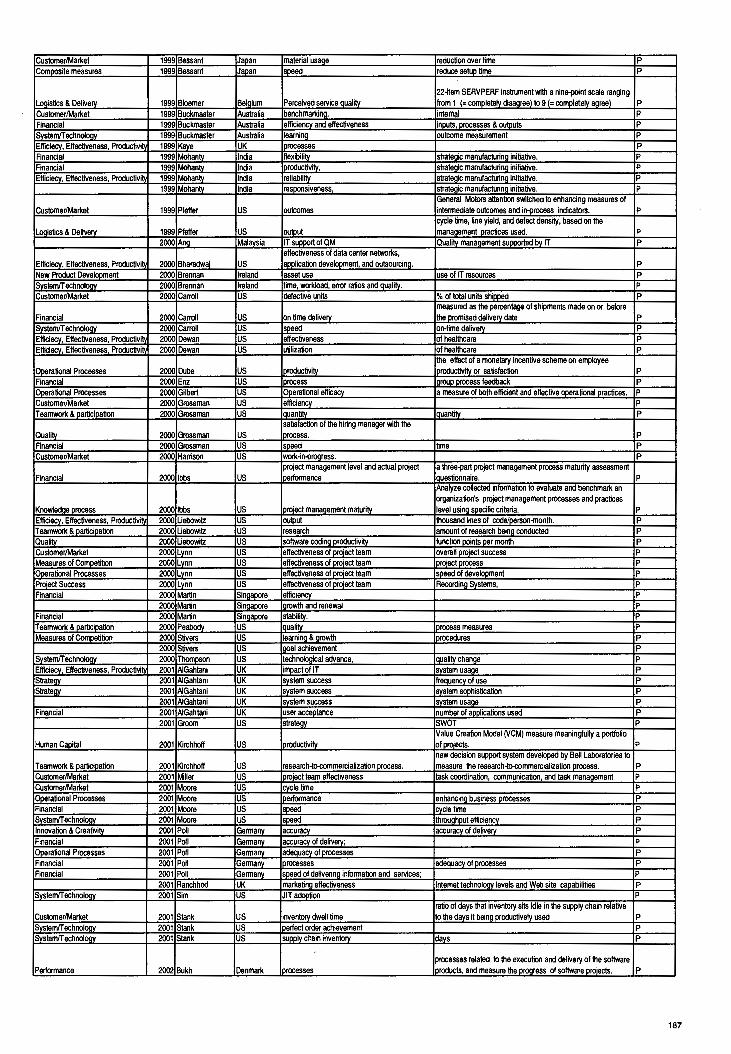
Customer/Market 1999 Bassani Jaoan material usaae reduction over time p Comoosite measures 1999 Bessant Jaoan speed reduce setup time p
22~tem SERVPERF instrument with a nine-point scale ranging LOQistics & Deliverv 1999 Bloemer Belqium Perceived service Quality from 1 (= completely disagree) to 9 (= completely aqree) p
Customer/Market 1999 Buckmaster Australia benchmarkina. internal p Financial 1999 Buckmaster Australia efficiencv and effectiveness inpu1s, processes & outputs p Svstem/Technnlnnv 1999 Buckmaster Australia leaminQ outcome measurement p Efficiecv. Effectiveness, Productivi~ 1999 K"'1e UK orocesses p
Financial 1999 Mohanty India flexibility strategic manufecturina initiative. p Financial 1999 Mohantv India productivity, strateQic manufecturina initiative. p Efficiecv, Effectiveness, ProductiviN 1999 Mohantv India reliabilitv strateaic manufecturing initiative. p
1999 Mohanty India resoonsiveness. strateqic manufacturina initiative. p General Motors attention switched to enhancing measures of
Customer/Market 1999 Pfeffer us outcomes intermediate outcomes and in-process indicators. p cycle time, line yield, and defect density, based on the
L.ooistics & Deliverv 1999 Pfeffer us outout manaaement oractices used. p 2000 Ana Malavsia IT SUPIX)(! of QM Quaity manaaement sunooned by IT p
effectiveness of data center networks, Efficiecv. Effectiveness, Productivil'I 2000 Bharadwai us anolication development, and outsourcinq. p New Product Develooment 2000 Brennan Ireland asset use use of IT resources p Svstem/T echllOIOOv 2000 Brennan Ireland time, workload, error ratios and aualitv. p Customer/Market 2000 Carroll us defective units % of total units shipped p
measured as the percentage of shipments made on or before Financial 2000 Carroll us on time deliverv the promised deliverv date p SVstem/T echnolnnv 2000 Carroll us snAed on-time deliverv p Efficiecv. Effectiveness. ProductiviN 2000 Dewan us effectiveness of healthcare p Efficiecv, Effectiveness. Productivil'I 2000 Dewan us utilization of healthcare p
the effect of a monetary incentive scheme on employee Ooerational Processes 2000 Dube us productivitv productivitv or satisfaction p Financial 2000 Enz us process aroup process feedback p ""'rational Processes 2000 Gilbert us X>Arational efficacv a measure of both efficient and effective ooerational oractices. p
Customer/Market 2000 Grossman us efficiency p Teamwork & Particioation 2000 Grossman us lauantitv lauantitv p
satisfaction of the hiring manager with the Quality 2000 Grossman us 1process. p Financial 2000 Grossman us soeed time p Customer/Market 2000 Harrison us work-in.nrnnress. p
project management level and actual project a three-part project management process maturity assessment Financial 2000 lbbs us I oerforrnance auestionnaire. p
Analyze collected information to evaluate and benchmark an organization's project management processes and practices
KnowlA<inA orocess 2000 lbbs us IProiect manaaement maturitv level usina specific criteria. p Efficiecv, Effectiveness, Productivih 2000 Liebowitz us 1n1nnut thousand lines of code/person-month. p Teamwork & Participation 2000 Liebowitz us research amount of research beina conducted p Qualitv 2000 Liebowitz us software codina oroductivitv function POints oer month p Customer/Market 2000 Lynn us effectiveness of project team overall oroiect success p Measures of Competition 2000 Lvnn us effectiveness of project team 1oroiect process p nn..rational Processes 2000 Lvnn us effectiveness of nmiect team soeed of develooment p Project Success 2000 Lynn us effectiveness of oroiect team Recording Svstems. p Financial 2000 Martin Sinru,nnre efficiency p
2000 Martin Sinn•nnre larowth and renewal p Financial 2000 Martin Sinaaoore stability. p Teamwork & Particioation 2000 Pe•nnnv us lauality lorocess measures p Measures of Competition 2000 Stivers us learnina & arowth !procedures p
2000 Stivers us 1ooal achievement p Svstem/T echnninnv 2000 Thomoson us technoloaical advance, ,aualitv chanae p Efficiecv, Effectiveness, Productivitv 2001 AIGahtani UK impact of IT system usage p StrateQV 2001 AIGahtani UK system success freauencv of use p Strateav 2001 AIGahtani UK svstem success lsvstem soohistication p
2001 AIGahtani UK system success system usage p Financial 2001 AIGahtani UK user acceptance number of aoclications used p
2001 Groom us strateav SWOT p Value Creation Model (VCM) measure meaningfully a portfolio
Human Caoital 2001 Kirchhoff us 'oroductivity oforoiects. p new decision support system developed by Bell Laboratories to
Teamwork & Particioation 2001 Kirchhoff us research-to-<:ommercialization process. measure the research-~mmercialization orocess. p Customer/Market 2001 Miller us loroiect team effectiveness task coordination, communication. and task management p Customer/Market 2001 Moore us 1cvcle time p nn..rational Processes 2001 Moore us I oerforrnance enhancina business orocesses p Financial 2001 Moore us speed cycle time p System/Technoloav 2001 Moore us soeed throuahout efficiencv p Innovation & Creativity 2001 Poll Germany accuracv accuracy of delivery p
Financial 2001 Poll Germanv accuracv of deliverv; p 1ooerational Processes 2001 Poll Germany adeauacy of processes p Financial 2001 Poll Germany orocesses =uacv of orocesses p Financial 2001 Poll Germany soeed of delivering information and services; p
2001 Ranchhod UK marketinQ effectiveness Internet technolOQV levels and WrtJ site capabilities p SvstemfTecMOIOOV 2001 Sim us JIT amntion p
ratio of days that inventory sits idle in the supply chain relative Customer/Market 2001 Stank us inventorv dwell time to the davs it beina oroductivelv used p System/T echnolDDV 2001 Stank us erfect order achievement p Svstem/T echnolDDV 2001 Stank us suoalv chain inventorv davs p
processes related to the execution and delivery of the software Performance 2002 Bukh Denmark orocesses oroducts. and measure the nrnnress of software oroiects. p
187

evaluate the extent of the project manager's involvement in the Financial 2002 Globerson Israel oroiect manage(s role planning orocesses and to evaluate their QUali\v. p
ability to complete the project according to desired specifications and within the specified budget and the promised time schedule, while keeping the customer and stakeholders
Efficiecv, Effectiveness, Productivit.. 2002 Globerson Israel Proiect success hanov. p Svstern/T echnn&nnu 1996 Chenhall Australia oroductivitv TOM nrnnram. a CustomertMaiket 1996 Chenhall Australia quali\v of comoonent parts number of defects a Customer/Market 1996 Chenhall Australia ,aualitv of 001T1DMAnt oarts defect free oomut a Svstern/T echnolO!IY 1996 Davis us QUalitv number of defects a
1996 Davis us Quality customer feedlack a Oualilv 1997 Adam lntematnl auality % items defective a Quality 1998 Wurzburo lntematnl Quality of oooas & services a Oualitv 1999 Armistead UK QUality imorovina productivity. a Quality 1999 Armistead UK aualitv consistencv a
emphasizes the level of consistency and is measured using three items: conformance to product specifications, ensuring
Oualitv 1999 Kathuria us Qualilv of Conformance accuracy in manufacturing, and consistent QUali\v. a Qualitv 1999 Kathuria us Oualilv of Deskin emohasizes Product oerformance, a Oualilv 2000 Dewan us qualitv evaluation of healthcare Qualilv a KnowlAmA nrocess 2000 Dube us 'aualilv service QUalilv a Financial 2000 Grossman us ,aualitv a KnowtAdnA process 2000 Liebowitz us defects bad lines of code a Financial 2000 Low us comorate value creation Quality a Financial 2000 McGee us aualitv service aualitv a Quality 2000 McGee us quality !Quality of services provided to customers a Quality 2000 McMillan us aualitv bibliometrics a Qualitv 2000 Thomoson us QUali\v change a CustomertMar1<et 2001 Leese UK aualilv a Financial 1999 Buckmaster Australia oublic oerr.ontions A CustomertMar1<et 2000 Enz us reputation guest surveys A lmaae, reoutation 2000 Grossman us oerceotions human reaction A
Peoples' trust in various organizations has been measured over Human C".anital 2002 Schmid us trust time. A Svstern/T echnninnv 1996 Chenhall Australia productivity suoolier reliability s Relationships/Alliances 1996 Chenhall Australia Suoolier reliability s Relationshios/Alliances 1996 Chenhall Australia technolO!lical factors vendor reliabililv and resoonsiveness s
sUl)f)lier meetings; - supplier development programmes; -1Svstern/T echnoloov 1999 Ahmed UK Supplier rating benchmarking activities between suooliers. s
relationship between maiket orientation & Customer1Mar1<et 1999 Baker us loerformance seller concentration s
relationship between mar1<et orientation & Relationshios/ Alliances 1999 Baker us I Performance suoolier oower s Relationshios/Alliances 1999 Baker us suoolier oower s
1999 Bal us turt>ulence. instability in the suooiv chain s Human Caoital 2000 Liebowitz us amount of industrv contacts I Partnerships s CustomertMar1<et 2000 Low us ,r.nmnrate value creation alliances s
2001 Fanner us 1omaram evaluation 1aooraise oublic-onvate alliances for technoionv develooment. s factors relating to facilitation of future change, for example, the
CustornertMar1<et 2001 Leese UK success develooment of aood internal and external relationshios. s Financial 2001 Stank us IOOITl!l8tenc8 material & service suoolier intearation s Svstern/T echnolO!IY 1998 ADDiahAdu UK mar1<et dvnamism technnl<VN within the industry T Svstern/T echnoloQv 1999 Ahmed UK knowl9Cla9 performance measures tools & techniQues T
relationship between mar1<et orientation & Svstern/T echnoloQv 1999 Baker us !performance technological change T CustomertMar1<et 1999 Baker us techno1oaical chanae T CustomertMar1<et 2000 Bharadwai us loerformance IT caoabilitv T
the total number of systems and number of specific hardware Svstern/T echnoloav 2000 Bharadwai us technoloov svstems such as DOint-of-sale svstems, etc. T Systern/T echllOIO!IY 2000 Brennan Ireland use of technnonnu effective IT use T CustomertMar1<et 2000 Low us comorate value creation techllOIO!IY T Human Caoital 2000 Stivers us leamina & arowth svstems T Svstern/T echnolOQY 2001 Bruce us technology IT use T Svstern/T echnolnnv 2001 Ranched UK technolOQY aspects of technOIOOV caoacity T Svstern/TechnolOOV 2001 Roslender UK database arowth database consultation T Svstern/T echnotOQY 2001 Roslender UK database growth database upgrades T conflict, turt>ulence, instability 2001 Stank us comoetence technolav & Plannina intearation T CustomertMar1<et 2002 Bornemann Austria technolOOV transfer performance T Svstern/T echnninnv 2002 dePablos various utility of a finns databases and intranets T Cornposile measures 1996 Davis us balanced scorecard in a manufacturing plant aualitv, volume, material cost, yields and labour usage. X Composite measures 1996 Davis us GE comorate scorecard BSC X CustomertMar1<et 1996 Edwanjg us the 360 """ree feedback svstem X
single common, comprehensive measurement system across Cornoosite measures 1996 Kruzner us comoosite all plant and business unit oraanizations. X Composite measures 1998 IAPoelbaum Canada learning performance. BSC X Cornoosite measures 1998 Heoworth us loerformance BSC + emo1ovee emoowennent X Composite measures 1998 Kennedy us intanaible assets BSC X comoosite measures 1998 Kennedy us intangible assets Intangible Asset Monitor X
BSC to describe a framewor1< of four groups of measures, and argue that organisations should select critical measures for
Cornoosite measures 1998 Thnrnnsnn UK comoetencv each one of these areas. X Cornoosite measures 2000 Barskv us intearated set of measures. Naviaator /Skandia\ X Composite measures 2000 Brennan Ireland IC Skandia model X Comoosite measures 2000 Carroll us 'Performance BSC X
188

Knowledge Management Performance Scorecard performance in foor key result areas: (1) financial performance;
Cornoosite measures 2000 deGooi'er Australia 12) internal business processes; (3) customers; and (4) growth. X Human Canital 2000 Dulewicz UK comoosite indicator overall rate of advancement !ROA) X Comoosite measures 2000 Grossman us loertormance BSC X
measurements covering the financial, customer, human, Com=ite measures 2000 Liebowitz us IC (Skandia) renewal and develooment, and orocess areas. X Comoosite measures 2000 Low us intanaibles the balanced scorecard X Cornoosite measures 2000 Law us pertormance value creation index X
Cap Gemini Ernst & Young researchers to develop a rigorous, Cornoosite measures 2000 Low us value creation comprehensive model X
BSC which combines financial measures with others related to customer satisfaction, internal processes and the organisation'!
Cornoosite measures 2000 Martin Sinaaoo,e KM abilitv to learn and improve. X market standing, innovation, productivity, customer se,vice, and employee involvement are critical measures for inclusion in
Human Caoital 2000 Stivers us balanced pertormance a balanced pertormance manaaement svstem. X
Increase grant income, Decrease operating expenses, Increase collections with se,vice, Increase new patient revenue, Customer Perspective Goals Patient satisfaction, Patient retention, Patient acquisition, Se,vice accessibility, Internal Processes Goals Patient visit efficiency Collection efficiency. Physician productivity Administrative efficiency, Leaming and Growth Goals Employee empowerment Employee development Embrace technology Measures Number and income per grant Cost per patient visit per se,vice Average collections at time of se,vice New patient revenue Measures Satisfaction suMy scores Number of patients transferred Number of new patients by payer Number of se,vices provided Measures Throughput time for se,vice Collection rate at time of se,vice Patients seen per month per physician Percentage of revenue for administration Measures Percentage of suggestions implemented Dollars invested in employee training
Human Canital 2000 Stivers us balanced performance Number of technolOQical enhancements X combined measures in foor perspec1ives: financial, customer,
Financial 2000 Stivers us balanced scorecard internal processes, and learning and growth. X financial, customer, internal processes, and learning and
Cornoosite measures 2000 Stivers us strateov arowth. X Balanced Scorecard and Kari-Erik Sveiby's Intangible Asset
Cornoosite measures 2001 Guthrie UK IC Monitor. X balanced scorecard in which pertormance measures are linked
Cornoosite measures 2001 Moore us pertormance to the firm's strategy. X finances, internal processes, and potentials (innovation)-are
Composite measures 2001 Poll Germanv Performance combined to oroduce a 'balanced" evaluation of the libra,v. X measures that meet the needs of specific businesses, and that
r.nmnnsite measures 2001 Roslender UK IC lbv Implication va,v over time. X Cornoosite measures 2002 Bukh Denmark oertormance BSc X Composite measures 2002 Collardin UK IC Intangible Asset Monitor X Cornoosite measures 2002 Collardin UK IC BSC X
Skandia navigator, intangible assets monitor (Sveiby), technology broker (Brooking, 1996) and competence-based
Composite measures 2002 dePablos Asia IC strateaic management model (Bueno, 1998,1999). X Comnnsite measures 2002 Frioo us pertormance Balanced Scorecard X Comoosite measures 2002 Frioo us pertormance Value-Based Manaaement initiatives. X
189