Methodology for evaluating static six-degree-of-freedom (6DoF) perception systems
Upload
khangminh22Category
view
3download
0

Research Methodology

This page intentionally left blank

Research MethodologyA Practical and Scientific Approach
Edited by Vinayak Bairagiand Mousami V. Munot

CRC PressTaylor & Francis Group52 Vanderbilt AvenueNew York, NY 10017
© 2019 by Taylor & Francis Group, LLC
CRC Press is an imprint of Taylor & Francis Group, an Informa business
No claim to original U.S. Government works
Printed on acid-free paper
International Standard Book Number-13: 978-0-8153-8561-5 (Hardback)
This book contains information obtained from authentic and highly regarded sources. Reasonable efforts havebeen made to publish reliable data and information, but the author and publisher cannot assume responsibilityfor the validity of all materials or the consequences of their use. The authors and publishers have attempted totrace the copyright holders of all material reproduced in this publication and apologize to copyright holders ifpermission to publish in this form has not been obtained. If any copyright material has not beenacknowledged please write and let us know so we may rectify in any future reprint.
Except as permitted under U.S. Copyright Law, no part of this book may be reprinted, reproduced,transmitted, or utilized in any form by any electronic, mechanical, or other means, now known or hereafterinvented, including photocopying, microfilming, and recording, or in any information storage or retrievalsystem, without written permission from the publishers.
For permission to photocopy or use material electronically from this work, please access www.copyright.com(http://www.copyright.com/) or contact the Copyright Clearance Center, Inc. (CCC), 222 Rosewood Drive,Danvers, MA 01923, 978-750-8400. CCC is a not-for-profit organization that provides licenses and registrationfor a variety of users. For organizations that have been granted a photocopy license by the CCC, a separatesystem of payment has been arranged.
Trademark Notice: Product or corporate names may be trademarks or registered trademarks, and are usedonly for identification and explanation without intent to infringe.
Library of Congress Cataloging-in-Publication Data
Names: Bairagi, Vinayak, editor. | Munot, Mousami V., editor.Title: Research methodology : a practical and scientific approach / editors,Vinayak Bairagi, Mousami V. Munot.Description: Boca Raton : CRC Press, Taylor & Francis Group, 2019. |Includes bibliographical references and index.Identifiers: LCCN 2018046891| ISBN 9780815385615 (hardback : alk. paper) | ISBN 9781351013277 (ebook)Subjects: LCSH: Research–Methodology.Classification: LCC Q180.55.M4 R46445 2019 | DDC 001.4/2–dc23LC record available at https://lccn.loc.gov/2018046891
Visit the Taylor & Francis Web site athttp://www.taylorandfrancis.com
and the CRC Press Web site athttp://www.crcpress.com

Dedicated to
the contributing authors and our well
wishers

This page intentionally left blank

Contents
Preface . . . . . . . . . . . . . . . . . . . . . . . . . . . . . . . . . . . . . . . . . . . . . . . . . . . . . . . . . . . . . . . . . . . . . ixContributors . . . . . . . . . . . . . . . . . . . . . . . . . . . . . . . . . . . . . . . . . . . . . . . . . . . . . . . . . . . . . . . . xi
1. Introduction to Research . . . . . . . . . . . . . . . . . . . . . . . . . . . . . . . . . . . . . . . . . . . . . . . . . 1Geetanjali V. Kale and J. Jayanth
2. Literature Survey and Problem Statement . . . . . . . . . . . . . . . . . . . . . . . . . . . . . . . . . 25Dr. Manoj S. Nagmode
3. Research Design. . . . . . . . . . . . . . . . . . . . . . . . . . . . . . . . . . . . . . . . . . . . . . . . . . . . . . . . 69Prachi Joshi
4. Basic Instrumentation . . . . . . . . . . . . . . . . . . . . . . . . . . . . . . . . . . . . . . . . . . . . . . . . . . . 99Pradeep B. Mane and Shobha S. Nikam
5. Applied Statistics. . . . . . . . . . . . . . . . . . . . . . . . . . . . . . . . . . . . . . . . . . . . . . . . . . . . . . 161Varsha K. Harpale and Vinayak K. Bairagi
6. Presenting and Publishing the Research Findings . . . . . . . . . . . . . . . . . . . . . . . . . 207Krishna Warhade, Vinayak K. Bairagi, and J. Jayanth
7. Plagiarism . . . . . . . . . . . . . . . . . . . . . . . . . . . . . . . . . . . . . . . . . . . . . . . . . . . . . . . . . . . . 237Mousami V. Munot, Sesha S. Srinivasan, and Anand S. Bhosle
8. Intellectual Property Rights . . . . . . . . . . . . . . . . . . . . . . . . . . . . . . . . . . . . . . . . . . . . . 265Dipali Kasat, Rajeev Kumar, and Shailaja Patil
Index . . . . . . . . . . . . . . . . . . . . . . . . . . . . . . . . . . . . . . . . . . . . . . . . . . . . . . . . . . . . . . . . . . . 291
vii

This page intentionally left blank

Preface
“Research” is no longer confined just to students and academics but is an importantcomponent for all professionals and promising experts (both offline and online) in everydomain. Any investigation involving validation of facts, revealing intriguing results,and/or new actualities demands exhaustive research to ensure excellence. Researchmethodology includes a wide assortment of tools and techniques for systematic andeffective research. This book, Research Methodology: A Practical and Scientific Approach,presents the essential fundamentals and directional pointers to researchers and post-graduates to enable them to initiate research, lay foundations, proceed methodically,and continue steadily. This recommended textbook contains precise reading material forboth researchers and their research guides/supervisors. The editors of the book and theauthors of each chapter have unanimously made a sincere attempt to provide a blend oftechnical and nontechnical language, test cases, and samples, in order to ensure easyreading and understanding. Starting in the first chapter with a brief introduction toresearch and research methodology, the book highlights other dimensions of researchincluding surveys, problem formulations, research design, the importance of statistics,instrumentation, plagiarism, and intellectual property rights through numerous practicalexamples, tools, and Web sources. Various scientific methods and basic postulates arealso detailed. This book will prove useful to all researchers irrespective of field. Thisbook is also beneficial to students pursuing their postgraduate degrees andexaminations.
Dr. Vinayak K. BairagiDr. Mousami V. Munot
ix

This page intentionally left blank

Contributors
Vinayak K. Bairagi completed the M.E. (Electronic) at Sinhgad COE, Pune, in 2007(1st rank in Pune University). The University of Pune awarded him a Ph.D. degree inengineering. He has teaching experience of 12 years and research experience of 8 years.He has filed 10 patents and 5 copyrights in the technical field. He has published morethan 58 papers, of which 26 are in international journals. He is a reviewer for ninescientific journals, including IEEE Transactions, The IET Journal, and other Springerjournals. He is the P.I. for a UoP-BUCD research grant. He has received the “Maniratna”Best Teacher Award for Excellent Academic Performance (2013). He has received an IEInational level Young Engineer Award (2014) and an ISTE national level YoungResearcher Award (2015) for his excellence in the field of engineering. He is a memberof INENG (UK), IETE (India), ISTE (India), and BMS (India). He worked on imagecompression at the College of Engineering, Pune, under Pune University. Currently he isassociated with the AISSMS Institute of Information Technology (affiliated college to S.P. Pune University), Pune as a professor in electronics and telecommunication engineer-ing. He is a recognized Ph.D. Guide in electronics engineering at Savitribai Phule PuneUniversity. Presently he is guiding seven Ph.D. students.
Anand S. Bhosle is currently working as an assistant professor in the Department ofElectronic and Telecommunication at the Pune Institute of Computer Technology, PICT,Pune, India. He completed the B.E. in electronics and communication engineering fromVTU (Visvesvaraya Technological University), Belgaum Karnataka. He obtained his M.Tech. in communication systems from Rashtreeya Vidyalaya College of Engineering(RVCE), Bangalore. He has over six years of teaching experience and two years ofindustrial experience. His research interests include wireless networks and computernetworks. He has published papers in five IEEE international conferences publications.
Varsha K. Harpale received the M.E. degree in electronics and telecommunicationengineering (E&TC) from SPPU University, Pune, India, in 2009 specializing in in VLSIand embedded systems. She has teaching experience of 17 years and currently ispursuing her Ph.D. degree in E&TC engineering with a specialization in biomedicalsignal processing at the AISSMS Institute of Information Technology, SPPU University,Pune, India. She has published 19 papers and has received two best paper awards atIEEE and Springer conferences. She currently is working as an assistant professor in thedepartment of E&TC at Pimpri Chinchwad College of Engg, SPPU, Pune, India. Herresearch interests include biomedical signal processing, processor design, and thedevelopment of real-time embedded systems.
Jayanth J. received a B.E. degree in Electronics and Communication Engineering fromVidya Vikas Institute of Engineering and Technology, Mysore, Karnataka, India, in 2008,an M.Tech. in Digital Electronics and Communication Systems from Malnad College ofEngineering, Hassan, Karnataka, India, in 2010, and a Ph.D from VTU, Karnataka, India,in 2017. He has eight years of teaching experience. He has published 35 papers, of which15 are in international journals. He has authored one book chapter and written threebooks on image fusion and image classification using fuzzy logic for remote-sensed data
xi

classification. He is a Co-PI for the DST NRDMS project research grant. He hascompleted three consultancy projects for Infy-cloud Bangalore. His subjects of interestinclude image processing, swarm intelligence, and remote sensing. He is a member ofISTE. Currently, he is working with the GSSS Institute of Engineering & Technology forWomen, Mysuru, Karnataka (affiliated with the Visveswaraya Technological University(VTU), Belagavi, Karnataka), as an associate professor in electronics and communicationengineering. He is a recognized Ph.D. Guide in electronics engineering.
Prachi Joshi completed her Ph.D., M.Tech, and B.E. in computer engineering at Collegeof Engineering, Pune (COEP), the University of Pune. She has more than 10 years ofteaching and research experience. She is co-author of Artificial Intelligence, published byPHI; she also has contributed chapters to a book on big data analytics. She hassuccessfully supervised many projects at the graduate and post-graduate level in theareas of artificial intelligence, data mining, and machine learning. Her research interestsinclude information retrieval and incremental machine learning. She also maintains ablog on machine learning. She worked at the MIT College of Engineering as an associateprofessor in the Department of Computer Engineering. She is currently a freelancer andis actively involved in conducting workshops on data analytics.
Geetanjali V. Kale completed her B.E. (Computer Science and Engineering) with Dr.Bamu in 2001 and her M.E. (Computer Engineering) at the Pune Institute of ComputerTechnology in 2004. She completed her Ph.D. in Computer Engineering in 2017 fromSavitribai Phule Pune University. She has 16 years of teaching experience. She has filedone patent and published more than 18 papers in international journals and conferenceproceedings. She also has worked as a reviewer for several conferences and journalpapers. She was the P.I. for a UoP-BUCD research grant. She is member of ACM and alifetime member of ISTE. Her area of interest include computer vision, machine learning,and data science. She is associated with the Pune Institute of Computer Technology(affiliated with Savitribai Phule Pune University) as an assistant professor in computerengineering.
Dipali Kasat is an M.Tech. from VIT, Pune, Maharastra. She completed her Ph.D. fromAmravati University, Maharashtra. She has teaching experience of 15 years and researchexperience of 8 years. She has filed two patents and two copyrights registered in thetechnical field. She has published more than 15 papers. She co-authored ManagementInformation System. She is a reviewer for scientific journals, international conferences,and Ph.D. theses at the universities of Amravati (Maharashtra) and Jhunjhunu(Rajasthan). She is the resource person for IPR at the Gujarat Council for Science andTechnology(GUJCOST). She was director of Gujarat Technology University’s InnovationSankul project for the Surat region. She is the member of IETE (India), ISTE (India), andCSI(India).Currently she is at the Sarvajanik College of Engineering and Technology(affiliated college of Gujarat Technological University), Surat, Gujarat, as an associateprofessor in the computer engineering department, and she heads the IP cell andcontributes to IPR culture promotion among students.
Rajeev Kumar is an assistant professor in the Department of Environment Studies,Panjab University, Chandigarh. He completed his B.Sc. and M.Sc. (Honours School)degrees in chemistry from the Centre of Advanced Studies in Chemistry, PanjabUniversity, Chandigarh. He also received his Ph.D. in organomettalic chemistry with
xii Contributors

Prof. K. K. Bhasin and Prof. S. K. Mehta there. He has published seven book chaptersand 21 research publications in international journals. His publications have more than150 citations. He currently is working with six Ph.D. students; one student completedher Ph.D. in March 2018. He received the MASHAV Fellowship from the Ministry ofForeign Affairs, Israel, in 2017.
Pradeep B. Mane received his B.E. (E&TC) and M.E. (E&TC) from the GovernmentCollege of Engineering, Pune, India, and his Ph.D. from Bharati Vidyapeeth University,Pune. He worked for Philips India Ltd., Bharati Vidyapeeth COE Pune, and currently isworking as a principal at AISSMS’s Institute of Information Technology, Pune, affiliatedwith Savitribai Phule Pune University. He was a member of the BOS for the electronicsfaculty at Bharati Vidyapith University and Savitribai Phule Pune University. He has co-authored six books for engineering courses on radio and TV engineering and computernetworks. He has published 50 papers and attended national, international confer-ences, and seminars. He has 47 publications in international journals. He is a regularreviewer for Wireless Personal Communication. His area of interests are wired andwireless communication and computer networks. He was CO-PI for an ISRO-UOPresearch grant. He is a fellow of IEI and IETE and a member of IEEE, ISA, IJERIA,and ISTE. He has received national awards for the Best Engineering College Principal(2017) from Bharatiya Vidya Bhavan (ISTE) and the Computer Society of India (CSI).He is recognized as a Ph.D. Guide for Savitribai Phule Pune University and BharatiVidyapeeth deemed university in Electronics engineering. Three students havecompleted their Ph.D. under his guidance and eight students are currently workingwith him.
Mousami V. Munot is currently an associate professor in electronics and telecommuni-cation department at Pune Institute of Computer Technology, PICT, Pune, India. She has13 years of teaching experience and 7 years of research experience. She completed herM.Tech. (1st rank holder) from the College of Engineering, Pune, CoEP, in 2007.Savitribai Phule Pune University, SPPU, awarded her a Ph.D.in 2013. She received afellowship from the Indian National Academy of Engineering (INAE) for research workunder Dr. Jayant Mukhopadhyay, Department of Computer Sciences, IIT, Kharagpur,India. She also received support from DST (ITS) to present a research paper at IET –Image Processing Conference, London, UK. She has received best paper awards atnational and international conferences. She has received grants worth 20 Lakhs fromDST, AICTE, and SPPU-BCUD for various projects. She has served as session chair,IEEE-WIECON, AISSMS, Pune, India, 2016; a TPC member, ICDECT, 2016; Lavasa City,Pune-India, 2016; session chair, EEECoS, 2016; AISSMS, Pune, India, 2016; and as guesteditor for a special issue on soft computing in the Journal of Electrical and ElectronicsEngineering (January 2015). She is a reviewer for several journals, including IEEE, System,Man and Cybernetics, Springer Medical and Biological Engineering Computing, SpringerJournal of Medical Sciences, Canadian Journal of Electrical and Computer Engineering, andIET –Image Processing. She is a member of IET, ISTE, BMESI, and IoE..
Manoj Nagmode has a Ph.D. (Electronics and Telecommunication Engg) from theGovernment College of Engineering, Pune (2009) from Savitribai Phule Pune University(formerly known as University of Pune). He has teaching experience of more than 21years. He has published more than 40 papers, 26 of which are in international journals,six of which are in SCI indexed journals. He has worked as an expert for various
Contributors xiii

research review committees. He has published four books. He is a reviewer for severalscientific journals. His research domain is in the area of signal and image processing,video processing, VLSI design, and embedded systems. He is a member of ISTE (India)and ISOI (India). Currently he is associated with the Government College of Engineeringand Research, Avasari (established by the Higher and Technical Education Department,Government of Maharashtra, and affiliated with S. P. Pune University), as a Professorand Head of the Department in Electronics and Telecommunication Engineering. He is arecognized Ph.D. guide in Electronics Engineering at Savitribai Phule Pune University.Presently he is guiding six Ph.D. students.
Shobha S. Nikam received her B.E. (E&TC) degree from SVPMS’s College of Engineer-ing, Malegaon, India, in 2007 and her M.E. (E&TC – Microwaves) from AISSMS’sCollege of Engineering, Pune, in 2012. She is currently pursuing her Ph.D. at AISSMS’sInstitute of Information Technology, Savitribai Phule Pune University, Pune. She hasteaching experience of 10 years and research experience of 1.5 years. Currently she isassociated with the AISSMS Institute of Information Technology (affiliated college toSavitribai Phule Pune University), Pune, as an assistant professor in electronics andtelecommunication engineering. She has published papers in 13 international journals andpresented papers at five international conferences. She was the principal investigator foran ISRO-UOP research grant. She is a member of IEEE, ISTE, and IEIE.
Shailaja Patil is currently working as a professor in the Department of Electronics andTelecommunication, and Dean (R&D) at the Rajarshi Shahu College of Engineering,Pune, India. She has 21 years of teaching and 3 years of research experience. Shereceived a D.Phil. in computer engineering from Saradar Vallabhbhai Patel NatioalInstitute of Technology, Surat, in 2013. She has carried out research on statisticaltechniques in localizationa and tracking using wireless sensor networks. She completedher P.G. Diploma in Patent’s Law at Nalsar Law University, Hyderabad, in 2018. Shehas authored Feedback Control System. She has six patents and four copyrights to hercredit and more than 60 publications in national and international journals and confer-ences proceedings. She is a regular reviewer of IET-Circuits, Devices & Systems. She hasserved as session chair in several international conferences. She has received fundingworth 8 Lacs from BCUD-SPPU and AICTE for Research and Faculty developmentprograms. She is a Fellow of the Institution of Engineers and a member of variousprofessional bodies, including IEEE, ISTE, GISFI, ISA, and ACM. Currently she isguiding seven Ph.D. students.
Sesha S. Srinivasan is currently an assistant professor of physics at Florida PolytechnicUniversity (FPU), Florida, USA. Before moving to FPU in 2014, he was a Tenure TrackAssistant Professor of Physics, at Tuskegee University (TU), Alabama, USA. Dr. Srini-vasan has more than a decade of research experience in the interdisciplinary areas ofsolid state and condensed matter physics, inorganic chemistry, chemical and materialsscience engineering. His Ph.D. focused on the development various rare-earth, transitionmetals and intermetallic alloys, composites, nanoparticles, and complex hydrides forreversible hydrogen storage and environmental air/water purification applications. Dr.Srinivasan and his Ph.D. advisor, Professor O.N. Srivastava (BHU, Varanasi), havesuccessfully converted a 4-stroke, 100 cc Honda motorcycle to run on hydrogen gas,which was delivered from the on-board metal hydride canister. He and his post-doctoraladvisor from the University of Hawaii, USA, have extensively collaborated with
xiv Contributors

scientists around the world for the hydrogen storage on lightweight complex hydrides,funded by the U.S. Department of Energy (DOE) and WE-NET, Japan. He has estab-lished a state-of-the-art research laboratory at the CERC and supervised several gradu-ate and undergraduate students. He has also served as Associate Director of FloridaEnergy Systems Consortium (FESC) at USF to co-ordinate a number of research projectson clean energy and environment, which was funded by the State Energy Office Florida($9M grant). Dr. Srinivasan has been awarded many research grants. He has recentlyawarded with two U.S. patents on hydrogen storage nano-materials’ development andmethodologies and one nonprovisional disclosure is filed on a recent technology inregard to waste water remediation. He has published eight book chapters and reviewarticles, more than 85 journal publications, and many more peer-reviewed conferenceproceedings. Dr. Srinivasan has served as a reviewer in the panel review committee ofthe National Science Foundation (NSF), SMART and NDSEG panels of ASEE, ad-hocmerit review committee of US Department of Energy, and a panelist for Qatar NationalResearch Fund (QNRF). Dr. Srinivasan currently serves as an associate editor ofdeGruyter Open Book publications in physics, materials science, and astronomy, andguest editor for a special issue of the Journal of Nanomaterials, Hindawi Publications andApplied Sciences. Dr. Srinivasan was a guest speaker on “Green Energy” at the 95thIndian Science Congress. He hosted a USA-India workshop-cum-conference on greenchemistry/engineering and technologies graduate program at Florida Polytech.
Krishna Warhade completed B.E. (Electronics) and M.E. (Instrumentation) from ShriGuru Gobind Singhji Institute of Engineering and Technology Nanded, Maharashtra,India. He completed his Ph.D. at the Indian Institute of Technology Bombay (IITBombay), India. He has teaching experience of 22 years, including four years researchof experience. He has published several papers in SCI journals and attended manyconferences. He authored Video Shot Boundary Detection. Currently he is working as aprofessor in electronics and communication in the engineering department at MITWorld Peace University, Pune, Maharashtra, India. His research interests include videoretrieval, wavelets, digital signal processing, biomedical signal and image processing,filter design, and precision agriculture.
Contributors xv

This page intentionally left blank

1Introduction to Research
Geetanjali V. Kale and J. Jayanth
CONTENTS1.1 Introduction . . . . . . . . . . . . . . . . . . . . . . . . . . . . . . . . . . . . . . . . . . . . . . . . . . . . . . . . . . . . .21.2 Objectives of Research. . . . . . . . . . . . . . . . . . . . . . . . . . . . . . . . . . . . . . . . . . . . . . . . . . . . .31.3 Motivation behind Research. . . . . . . . . . . . . . . . . . . . . . . . . . . . . . . . . . . . . . . . . . . . . . . .31.4 Important Ingredients for Research . . . . . . . . . . . . . . . . . . . . . . . . . . . . . . . . . . . . . . . . .4
1.4.1 Componential Theory of Individual Creativity . . . . . . . . . . . . . . . . . . . . . 51.4.2 Workgroup Creativity . . . . . . . . . . . . . . . . . . . . . . . . . . . . . . . . . . . . . . . . 6
1.5 Types of Research . . . . . . . . . . . . . . . . . . . . . . . . . . . . . . . . . . . . . . . . . . . . . . . . . . . . . . . .61.5.1 Basic Research . . . . . . . . . . . . . . . . . . . . . . . . . . . . . . . . . . . . . . . . . . . . . . 61.5.2 Applied Research. . . . . . . . . . . . . . . . . . . . . . . . . . . . . . . . . . . . . . . . . . . . 71.5.3 Descriptive Research . . . . . . . . . . . . . . . . . . . . . . . . . . . . . . . . . . . . . . . . . 71.5.4 Analytical Research . . . . . . . . . . . . . . . . . . . . . . . . . . . . . . . . . . . . . . . . . . 81.5.5 Correlational Research . . . . . . . . . . . . . . . . . . . . . . . . . . . . . . . . . . . . . . . . 81.5.6 Qualitative Research . . . . . . . . . . . . . . . . . . . . . . . . . . . . . . . . . . . . . . . . . 81.5.7 Quantitative Research . . . . . . . . . . . . . . . . . . . . . . . . . . . . . . . . . . . . . . . . 81.5.8 Experimental Research. . . . . . . . . . . . . . . . . . . . . . . . . . . . . . . . . . . . . . . . 91.5.9 Explanatory Research. . . . . . . . . . . . . . . . . . . . . . . . . . . . . . . . . . . . . . . . . 9
1.5.10 Exploratory Research . . . . . . . . . . . . . . . . . . . . . . . . . . . . . . . . . . . . . . . . . 91.6 Phases of Research/Research Process. . . . . . . . . . . . . . . . . . . . . . . . . . . . . . . . . . . . . . .10
1.6.1 Selection of Domain. . . . . . . . . . . . . . . . . . . . . . . . . . . . . . . . . . . . . . . . . .121.6.2 Formulating a Research Problem (Tentative) and
Identification of Keywords. . . . . . . . . . . . . . . . . . . . . . . . . . . . . . . . . . . . .131.6.3 Literature Review . . . . . . . . . . . . . . . . . . . . . . . . . . . . . . . . . . . . . . . . . . .141.6.4 Redefining Research Problem, Objectives (Final) and
Outcomes/Formulating Hypothesis. . . . . . . . . . . . . . . . . . . . . . . . . . . . . .151.6.5 Research Proposal . . . . . . . . . . . . . . . . . . . . . . . . . . . . . . . . . . . . . . . . . . .161.6.6 Identifying Variable/Parameters and Research Design . . . . . . . . . . . . . . .171.6.7 Data Collection and Representation . . . . . . . . . . . . . . . . . . . . . . . . . . . . . .17
1.6.7.1 Selection of Appropriate Method for Data Collection . . . . . . . . . . . .181.6.7.2 Selection of Appropriate Methods for Data Representation . . . . . . .19
1.6.8 Testing of Proposed Design on Collected data/Hypothesis Testing. . . . . .191.6.9 Results and Analysis . . . . . . . . . . . . . . . . . . . . . . . . . . . . . . . . . . . . . . . . .20
1.6.10 Research Report Writing . . . . . . . . . . . . . . . . . . . . . . . . . . . . . . . . . . . . . .211.7 Research Methods versus Methodology. . . . . . . . . . . . . . . . . . . . . . . . . . . . . . . . . . . . .221.8 Features of a Good Research Study. . . . . . . . . . . . . . . . . . . . . . . . . . . . . . . . . . . . . . . . .231.9 Summary . . . . . . . . . . . . . . . . . . . . . . . . . . . . . . . . . . . . . . . . . . . . . . . . . . . . . . . . . . . . . .24Further Reading. . . . . . . . . . . . . . . . . . . . . . . . . . . . . . . . . . . . . . . . . . . . . . . . . . . . . . . . . . . . . 24
1

Research is what I’m doing when I don’t know what I’m doing.—Wernher von Braun
Research is to see what everybody else has seen and think what nobody has thought.—Albert Szent Gyorgyi
Learning objectives of this chapter include, to
• Understand basic terminology and fundamental concepts in research• Comprehend basic flow of research process and formulate it for individual research• Select and write problem definition in domain of choice• Write research proposal for selected problem definition• Analyze types of research methods and apply appropriate methods for defined
problem• Define research methodology for selected problems
This chapter will enable the researcher to:
• Initiate and systematically continue research work in a procedural way• Define the research problem and propose the hypothesis• Propose a research methodology for selected problems• Select and apply appropriate research methods to research problems
1.1 Introduction
The word research is combination of “re” and “search,” which means a systematicinvestigation to gain new knowledge from already existing facts. In other words, researchis a scientific understanding of existing knowledge and deriving new knowledge that maybe applied for the betterment of mankind. It is basically search for truth. Researchcontributes significantly to the progress of the nation as well as an individual withcommercial, social, and educational advantages. Research is an important parameter tojudge the development of any nation. Research is an important component of private andgovernment sectors. Nowadays, interdisciplinary research is at high demand.
Research should always aim at providing efficient solutions to routine problems.Researchers should carefully choose the appropriate research method and follow aresearch process by referring to existing theories. Research differs from a traditionalway of education, that is, learning concepts and writing the examination or performingactivity. According to Clifford Woody, “Research comprises of defining and redefiningproblems, formulating the hypothesis for suggested solutions, collecting, organizing andevaluating data, making deductions and reaching conclusion and further testing theconclusion whether they fit into formulating the hypothesis.”[1]
2 Research Methodology
This chapter discusses the basics of research and will provide a bird’s-eye view of theresearch process for novice researchers.
1.2 Objectives of Research
The main purpose of research is to find solutions to unsolved problems using scientificprocedures and also to understand various phenomena scientifically. In addition, one ofthe major objectives of research is to find out a hidden, undiscovered truth. There arevarious objectives behind undertaking research by individuals as well as variousorganizations. However, there are some identified purposes for each research work.Some general objectives behind research include:
• Propose and test certain hypotheses that provide causal relationships betweenvariables
• Discover and establish the existence of relationship, association, and independencebetween two or more aspects of a situation or phenomenon. (Such studies areknown as correlational studies)
• Understand different phenomena and develop new perceptions about it• Study and describe accurately the characteristics of situations, problems, phenom-
ena, services, groups, or individuals. (This type of study/research is known asdescriptive research)
• Explain unexplored horizons of knowledge• Test reported findings and conclusions on new data and novel conclusions on
previously reported data• Study the frequency of research that is connected with unspecified study. (This type
of study/research is known as diagnostic research)
1.3 Motivation behind Research
Research is a long process, so the main driving factor is motivation. For some research-ers and post-graduate students, the main objective behind the research is to earn adegree. For organizations including defence and research laboratories, research is animportant aspect. To philosophers and thinkers, research may mean the outlet for newideas and insights, whereas to intellectual people research may mean the developmentof new styles and creative work. Irrespective of any domain, research demands passion.
Initially the research is a random walk (research scholar is not sure about topic/research problem), but one need to systematically continue to get the destination. Failure isan inevitable step in the research phase, for example, failure in getting results, publications,and so on. But the researcher’s passion and motivation helps in such situations.
Introduction to Research 3

1.4 Important Ingredients for Research
Creativity, good written and verbal communication skills and in-depth knowledge ofthe subject are essential for successful completion of research work. Figure 1.1 showsimportant ingredients of research. A researcher should have sound fundamental knowl-edge of the domain to be undertaken. A querying attitude is one of the importantfactors. Anything and everything is questionable; this questioning attitude is essence ofresearch and invention.
A creative person does things that have never been done before. Prof. Robert Sternberg haslisted some “must have” characteristics in order to be creative. These skills are a combinationof synthetic intelligence and practical intelligence. Practical intelligence is the ability to adoptday-to-day requirements. Persistent, tenacious, uncompromising, and stubborn are some ofthe characteristics of creative people. One should always challenge conventional solutions toa problem. Velcro and Post-it Notes, for example, are outcomes of creative thinking.
Some examples of creativity include:
• Apple iPhone, which convinced people for the value of replacing the keyboard witha touchpad, and touchscreen operations controlled by fingers as a replacement for astylus. The invention of laptops, the Internet, supercomputers, and so on are someexamples in the computer science and engineering domains
• Newton’s law of motion and the universal law of gravity are some examples ofcreative inventions in physics
• Composing beautiful music and creative writing are examples of creativity in art• Analyzing a situation in a different way is also creativity
Ingredients
for Good
Researcher
Creativity
Verbal
Communication
Domain
Knowledge
Written
Communication
Consistancy
and
Patience
Dedication
and
Commitement
FIGURE 1.1Ingredients for a good researcher
4 Research Methodology

• Analyzing history with a different angle and solving and analyzing cases in lawwith different perspectives are also creativity
• Putting philosophy differently is also creativity. For example, Charles Darwin’stheory of biological evolution by natural selection is contradiction to the previousbiological theories. However, Darwin’s theory is base for many modern biologicalinventions
Creativity is a combination of generating ideas and validating it, including research,development, production, and marketing. Creativity is also considered to be a pre-innovation process; it is a prerequisite for scientific and technological innovation.Creativity is an inevitable component of any impressive action. Creativity is a qualitythat adds essence to the expected outcomes.
Important instances of creativity are to provide a novel work process through avaluable innovation. Scientific creativity is a source of innovation that is subdividedinto four types, listed here:
• Set a new idea for formulation, which opens up a new cognitive frame to a newlevel of basic assumptions
• A new empirical formula should be discovered, which stimulates a new theory (forexample, Darwin’s theory of evolution)
• A new methodology should be developed to solve a theoretical problem that can betested empirically
• A novel technique/instrument should be designed, which can propose a newtechnique with new possibilities
Creativity is observed at individual as well as group level. Detailing is given insubsequent section.
1.4.1 Componential Theory of Individual Creativity
The componential theory of individual creativity has three essential components ofindividual creativity:
• Expertise• Creative thinking skills• Intrinsic task motivation
Expertise comprises actually occurring knowledge, which consists of technical expertisewith a special skill that can be rooted to distinct personality in the working group.Creative-thinking skill is “working with an unknown data with a greater extent thanusual,” found in people who work with an original idea to emphasize that there shouldbe a separation between generating ideas and validating those ideas. Intrinsic motiva-tion determines what a researcher should actually do and is influenced by environmen-tal factors.
Creative process can be determined in a sequential way depending on preparation,incubation, illumination and verification. Incubation is a period during which a problemis banned from conscious thought, and solutions are generated in an unconscious way.
Introduction to Research 5
Triggering subconscious thinking during the incubation period is an effective approachof grooming creativity. Verification is a stage where the work is been tested for thevalidity of novelty and usefulness of the idea.
1.4.2 Workgroup Creativity
Research and development mainly generates scientific and technological information,which transforms the work into novel ideas and products through a process. Creativityin a group includes working in a laboratory with respect to organisational settings,which helps most scientific and artistic innovation through joint conversations as well asthinking that emphasizes the importance of the social dimension of creativity.
Knowledge is another very important ingredient. After getting an idea, one has todecide on the design and implementation. To improve on communication skills aresearcher can take courses and listen to talks given by inventors and other researchersto understand how they communicate their ideas. Oral and written communication isintegral part of research and it helps to convince people about your ideas, methodolo-gies, and results.
Researchers should be focused on their own problem definition; however, they shouldalways investigate whether the solution proposed fits in a global scenario. An advisorplays a very important role in research, specifically when pursuing a Ph.D.. An advisorguides the right path at different junctions and are torch bearers.
There is always scope for improvement in everything and one should always strive forexcellence. Researchers should not neglect any of the skills required for research andcontinuously improve and strengthen those skills. In addition, researchers require quali-ties such as hard work, consistency, and patience. A researcher needs to be extremelycommitted to the research work to enjoy the fulfillment and rewarding moments.
1.5 Types of Research
Different research types are discussed in this section. They are classified in variouscategories including applicability, the mode of enquiry in conducting the study, andmajor objectives of the study. Selection of research method depends on the discipline ofthe research, objectives, and the expected outcomes. One research problem may usemultiple research types. Main research types discussed in this section include basicresearch, applied research, descriptive research, analytical research, correlational research,qualitative research, and quantitative research (see Figure 1.2).
1.5.1 Basic Research
Basic research is pure or fundamental research; there is no immediate need, but newtheories can be added to the knowledge cluster. This type of research may solveproblems but may not have practical applications. It has a broader scope compared toapplied research. Theories in basic sciences and mathematics are examples of basicresearch.
6 Research Methodology

Newton’s laws of motion is an example of basic research. This has been applied inmany product design and testing.
1.5.2 Applied Research
Applied research tries to solve an immediate specific problem faced by industry orsociety. The obtained solution can be deployed to solve the problem. The duration ofapplied research is shorter as a quick solution is expected. An optimized search problemon the Internet is an example of applied research in the computer engineering domain.“Analysis of cell/body organ behavior in cancer” is an example of hybrid research. Aresearcher may use data analytics, image processing, algorithms, and knowledge of themedical industry.
The outcome of applied research should either address the unsolved problem orimprove the existing solution.
1.5.3 Descriptive Research
Descriptive research is generally used in business analysis or social problems. This typeof research does not have any control over the parameters or variables. It just tries torepresent or analyze the previous and or current facts.
Some of the examples of descriptive research include an analysis of customer purchasepatterns, that is, purchases from the mall, online, or retailer, as well as the study of travelmode used by people. All kinds of correlational methods, survey methods, and compara-tive studies are descriptive research. Various kinds of systematic surveys are conducted,including the study of various cultural practices, the region-specific study of particulardecease, and an analysis of the development of particular businesses. This is also known asex-post facto research. Study of the effect of global warming on birds is also an example ofdescriptive research. One specific example is: “To study socioeconomic characteristics ofresidents of particular community during certain period for specific country.”
Types of
Research
Descriptive Research
Correlational Research
Analytical Research
Experimental Research
Explanatory Research
Exploratory Research
Quantitative Research
Qualitative Research
Basic Research
Applied Research
FIGURE 1.2Types of research
Introduction to Research 7

1.5.4 Analytical Research
Analytical research uses existing information to explain a complex phenomenon or toperform a critical evaluation. The identified hypothesis can be accepted or rejected depend-ing on the analysis; from experience the hypothesis can be redefined. Analytical research isobserved in historical study, forensic work, food, in the medical domain, and so on.
Analytical research summarizes and evaluates the ideas in historical research for acces-sing both witness and literature sources to document past events. Philosophical researchorganizes data that can be presented to support the data in comprehensive model.
1.5.5 Correlational Research
Correlational research focuses on exploring the relationship or association betweenincidences, variables, and so on. Examples of correlational research include “To studythe effect of a modern lifestyle on obesity” and “Analysis of the impact of technology onemployment.” In the first example, a modern lifestyle and obesity are two variables andresearchers should study a group of people living both a modern lifestyle and anonmodern lifestyle. The groups should be segregated on the basis of obesity para-meters. Collected data may be analyzed to establish the relationship between twovariables: “obesity” and “modern” lifestyle. Similarly, researchers need to study“employment” and “availability of technology.” From the collected data, researchersmay come up with number of observations and analytics.
An institute organizes a conference and takes feedback from participants as its regularpractice, to provide input for evaluating the quality of current conference and to makeimprovement in next conference. Participants who attended the conference gave feed-back stating that there was a difficulty in reaching the location. For the next conference,the survey question can include a question, “Was there a sufficient service available forreaching the location?”
1.5.6 Qualitative Research
Qualitative research mainly deals with the quality or the types of the parametersconsidered for the research. Here, it is assumed that the world is unstable anddifferences in the parameter may occur with time. Research related to human behaviouris an example of qualitative research. Everybody can react to the situation differentlyand it is difficult to propose the predictive conclusions. This type of research is morecomplicated and requires more guidance. Less emphasis is given on generalization andmore focus is towards individual. An example can be “Study of behaviour of employeesin an organization.” Here, behavior of an employee may vary with different parameterssuch as gender, post, skill set, expertise, socioeconomic status, and religion. Focus of thework is to find results with respect to qualitative parameters. Another the example ofqualitative research is, “How and why there is an upward movement in the value ofdollar and its impact on the Indian currency.”
1.5.7 Quantitative Research
Quantitative research involves measurements of quantities of characteristics that can beused as features for the research study. Unlike qualitative research quantitative researchassumes that world is stable and uses statistical analysis on parameter values for
8 Research Methodology

conclusions. Statistical quantities that can be measured are involved in quantitativeresearch. Example of quantitative research is “Finding number of individuals takingbenefits of different government policies.” This is a statistical report of various govern-ment policies and number of individuals and does not involve any qualitative parameter.Another example is to conduct a survey every weekend and a random question is beenasked, “Who is your favorite actor?” and response of this questions is self-controlled byproviding a multiple choice question. The outcomes are provided briefly in judgementform with statistical respective.
1.5.8 Experimental Research
Experimental research focuses on the fieldwork and experiments that can control theindependent variable. Study of the effect of the new drug on a specific group of peopleor animal is an example of experimental research in medicine domain. In computerengineering, “Analysing performance of algorithms on various dataset” is an exam-ple of experimental result. A researcher wants to examine changes in the land coverusing satellite data. In this example, to ensure the changes in the study area,researchers randomly place the area of changes including change in the agriculturalland due to land degradation, NH roadways, and so on, which can be verified withquasi experimental research and can be tested and trained with pre- and postexperi-mental research design.
1.5.9 Explanatory Research
Explanatory research tries to analyze and justify the reason behind the occurrence ofparticular phenomenon or association between the variables. It basically answers the“Why” type of questions. It aims to explain why a relationship, association, or inter-dependence exist.
Explanatory research is also called as a causal research with a three importantcomponents like time-to-time sequences which will occur before the effect, concomitantvariations, where the variations will be systematic between two variables.
Some of the examples of explanatory research are “Why the modernisation createshealth problem?”, “Why some students have casual attitude towards study, while othersare sincere?”, “Why will customers buy our food products in green packages?”, “Whichof the two advertising company will help students by providing the internship?”, ‘whichcompany will be more effective and why?’
1.5.10 Exploratory Research
This kind of research generally explores the areas that have required meagre attentionor it is for checking the possibility of research in the particular domain or area. Asmall-scale study is done to decide the further scope of advancement in domain.Depending on outcomes of exploratory study, domain is further explored for in depthresearch on the specific topic. Exploratory studies are also conducted to develop,refine and test procedures, policies, and tools. Some of the examples of exploratoryresearch are, “Why product sales are reduced, due to already existing data or theproducts which have been acquired recently for the agricultural company?” Gener-ally, the research statements that span across multiple domains come under explora-tory research.
Introduction to Research 9

1.6 Phases of Research/Research Process
Efficient and well-planned activities always see success. Therefore, one need to effi-ciently plan a research activity, execute it meticulously, and publish it for outside world.
In a house-building task, the first blueprint needs to be finalized and one has tovisualize all minute details such as position and size of rooms, doors, windows,balconies, and so on. Estimation of all required material should be finalized along withquality and quantity. Improper planning and estimates may not able to produce theexpected dream house. Similarly, researchers should follow research process to getoptimized research outcomes. General steps in the research process are shown inFigure 1.3 and selection of research problem is shown in Figure 1.4. Identification orselection of research domain is a very initial stage in the process of research, followed byformulating a tentative research problem. Selection of research guide can be done atinitially or at any intermediate stages of research problem selection. If the problem iswell-defined with research objectives initial phases can be combined and researcher candirectly start with literature survey. Literature survey can be revisited number of timesduring research process. Researcher can switch from intermediate state to literaturesurvey and back to the same state.
Research Report / Theses writing / Publication / Patent
Results & Analysis
Testing of proposed design on collected data /Hypothesis testing
Data Collection & representation
Identification of variable / parameters & Research Design
Preparing Research Proposal
Redefining Research Problem & Objectives (Final) / Formulating Hypothesis
Literature Review
Formulating a Research problem (tentative) & Identification of Keywords
Selection of Domain
FIGURE 1.3Phases of research
10 Research Methodology

General research process include:
• Selection of domain• Formulating a research problem (rough) and identification of keywords• Literature review• Redefining research problem, objectives (final) and outcomes/formulating hypothesis• Preparing research proposal• Identifying variable/parameters• Data collection and representation• Testing of proposed design on collected data/hypothesis testing• Writing and comparing results• Research report writing
Refine / finalize a specific problem
Narrow down the domain use reputed
publications
Initiate research
Select the broad area of interest
Identify few problems in domain
Attend conference / workshops/ STTP in
selected domain
Discuss with R&D colleagues
Validate for
research
potential from
domain expert
No
Yes
FIGURE 1.4Phases of selection of research problem
Introduction to Research 11

1.6.1 Selection of Domain
Selection of domain/area of research is the very first step in the process of research.There are different purposes behind undertaking particular research. If it is getting thedegree, there is a high possibility to select the domain of the research guide or the guidemay suggest selection of the particular domain. Otherwise, research domain can beselected from area of interest, identified gap in the literature and individual skill set. Ifthe researcher is working in research organisation or laboratory the researcher has towork on the domain of organisation’s interest. The purpose of this research may be todesign and develop the new product, to upgrade available one, to study and analyse theeffects of the product specifications in drug industry etc.
Every time, selection of brand new topic / domain for research is not required, ineach field there are some topics that are old but still there is scope for research. InElectrical Engineering, domains like VLSI, Microelectronics, photonics, optics, digitalsignal processing, energy conversion has lot of material available still there is scopefor more research. In Mechanical Engineering conceptualization, material analysis indesign and manufacturing, thermal engineering, design of components (design ofdifferent engines like thermal engine), special tools and machines for manufacturing,electronically controlled internal combustion engine, diesel engine (reduce pollu-tion), alternative fuel, taking real time pictures of machine and try to optimize theprocess. In Computer Engineering designing GPU / multi core enabled algorithms,management and analysis of large amount of data, data security and wirelesscommunication in IoT devices are some of the areas of research. Interdisciplinarytopics like IoT, application of genetic algorithms for optimization problems indifferent domain of engineering, application of analogy etc. are also open problems.
Even though there are different parameters for selection of domain, one should gowith an area of his/her interest and current and future market trends. Researcher’sinterest is very important in basic research as outcome may not be immediately appliedfor product design or other social or commercial purposes. For applied research oneshould look at current and future requirements of market.
Austin O’Malley has well said that, “Well begun is not only half done but often fullycooked.” Identification of an area of research and defining research problem are mostimportant steps in the journey of research. One needs to give sufficient time and thoughtfor the problem formulation. Before deciding domain or selecting problem one need tounderstand his/her passion, strengths, weaknesses, likes and dislikes. Area of researchshould be of your interest and it should have potential applications after completingyour research. The motivation/reason behind the selection of research domain is veryimportant. Some of the reasons for selecting particular research topic are the topic is ofyour interest, your research supervisor is expert in that domain and working on somerelated project, you have identified the gap in the literature, the topic has very goodfuture prospects. In academic research, your supervisor may give you the topic or mayask you to select your own. While selecting your own research problem brainstorm thepossible topics, verify the feasibility of a selected topic. Identify the important relatedkeywords and review the literature with the identified keyword. Revisit the definedproblem and rewrite if required. One should avoid selection of overdone topics unlessyou have some unique aspect for it. Also, a topic should not be too general and old. Oneshould concentrate on current social or technical affairs of interest and keyword of thatcan also be used for research.
12 Research Methodology

One invention gives rise to more opportunities for research in a particular domain.First Aeroplane designed by Wright brothers in 1903 was simple craft and if you look attoday’s aeroplanes, they are totally different. More sophisticated and efficient versionswith modifications right from fuel consumption to the chair design for passenger’scomfort. Over the period many engineers, researchers, and scientists from industry aswell as academia worked on identified gap or problem faced during use and providedmore efficient solutions than the existing ones. So, the problem can be totally new or itcan be identified as a gap in the existing solution.
Researcher should choose a challenge suitable for his/her skill set. It should not betoo high or too low in comparison with skill set.
1.6.2 Formulating a Research Problem (Tentative) and Identification of Keywords
For an in-depth literature survey researcher has to first define tentative researchproblem definition and identify the related keywords for literature search. Beforestarting with research; researcher should be equipped with all the tools and domainknowledge required for research. Research requires ability to go in depth of particulartopic. The flowchart shown in Figure 1.4 provides general guideline for selection ofresearch problem. Discussion of the state-of-the-art with colleague and domain expert isvery important and helps a lot to finalize research problem. Attending workshops,conferences and or short term training programs is integral part of research work rightfrom conception of problem to completion of work. Researcher should prepare theresearch tentative plan of research work. Table 1.1 shows the sample research plan
TABLE 1.1
Research Plan
Month (M)Tasks
M1toM6
M7toM12
M13toM18
M19toM24
M25toM30
M31toM36
M37toM42
Selection of Domain
Formulating a Research problem (tentative) & Identificationof Keywords
Literature Survey
Redefining Research Problem & Objectives (Final)/Formulating
Hypothesis
Preparing Research Proposal
Identification of variable/parameters & Research Design
Data Collection & representation Analysis
Testing of proposed design on collected data/Hypothesistesting
Results & Analysis
Research Report/Theses writing/Publication/Patent
Introduction to Research 13

prepared. Time span and tasks may change with domain, expert level of researcher,purpose of research, and so on.
Research statement should be clearly defined and its objectives should be SMART(Specific, Measurable, Achievable, Realistic, and Time-bound). Initially, one can startwith tentative problem definition and review the state of the art literature related totopic. Subsequent section discuss in brief about literature review.
1.6.3 Literature Review
The literature survey is a comprehensive study of technical and authorised contentrelated to research keywords. It is very important step in the initial phase of research,however, this step is revisited by researcher number of times during research journey.Literature survey provide details of research progress of particular domain. It helps theresearcher to understand the approaches, methodologies, algorithms, and datasets usedby other scientists. Also, it is important to identify where the gap is. Where can Icontribute to an existing knowledgebase? It helps the researcher to understand theprogress of domain and state of the art in the domain. Literature survey also helps toavoid duplication of work. One should always avoid reinventing the wheel; this isimportant if one of the purposes of the research is to get a PhD degree. Isaac Newtonsaid, “If I have seen further than others, it is by standing upon the shoulders of giants.”Researchers should able to use previously done work as foundation and propose newidea above that may be supporting or contradicting to previous work.
Open Access journals are one of the good sources of research articles, one can alsoaccess articles from library subscription, some university libraries etc. Good literaturesources are periodicals, conference proceedings, research reports, standards, theses,dissertation reports, research reports, white papers, patents, reviews, textbooks, hand-books, encyclopaedia etc.
There are different strategies to search literature. One needs to first identify thekeywords related to the problem definition and searching articles using keywords isthe more precise way to search article. Backward and forward reference search is alsopopular and beneficial to understand the background of the research area. One canchoose the latest article from the reputed journal written by good researcher and studyall related references of that paper. This is a backward reference. One can also find theimportant old article in the domain and find all the papers that referred the article. Thisis forward reference search.
Novice researchers can follow below steps for literature survey-
(i) First download 100–120 research papers from published papers of IEEE/ACM/Wiley/Elsevier/Springer/T and F or some other good SCI Indexed Journalsrelated to research topic and start reading it. Normally, we do this type of searchwith the help of keywords of research problems. Some of the search engines forthe literature survey are Google Scholar, Citeseer, and so on.
(ii) Researchers can initially read only title, abstract and conclusion of each researchpaper and decide whether it is related to research topic. If yes, include in list, elseskip it. From this step you will get to know “What has been done in this area andwhat can be done in future?” From this understanding one can come up with his/her research problem statement.
14 Research Methodology

(iii) Read shortlisted papers in detail and start taking notes of different parametersconsidered, methodologies used, conclusions derived, and related mathematics/theories used. Researchers can finalize research hypothesis after this step and alsocan write good survey paper.
Another approach for literature survey is selecting any one best paper related toparticular research problem of your interest. Try to find/download those papers thatare cited and included in the references section. This approach leads to a better literaturesurvey of a particular research problem.
During the literature survey process, researchers should able to identify the top 10researchers in his/her domain. He/she should find good universities where people areworking on the same or similar problems. Literature survey is a step that is often visitedduring the research journey. Researchers should always look at what other top research-ers are doing in respective area of research.
Researchers should provide main focus on comparing the approaches, Identifying theweaknesses and strengths in recent research articles in the subject. Each paper’s studycan be summarized in systematic manner. Literature surveys can be done with respectto following points:
• What• How (process schematic)/standard procedure (system block schematics)• Discussion on major steps involved• Design criteria and performance measures• Techniques currently in use• Comparative analysis (table or any suitable tool to discover and list pros and cons/
strength/weakness/future scope of existing techniques)• Scope for research/gap in research
Researcher may add some more parameters to be studied about the research paper andcan prepare a format for same to keep record of each paper.
Summarization and representation of literature surveys is an important part in thetheses, presentations and in journal writing. Literature survey can be represented intextual, tabular or graphical format using different parameters.
1.6.4 Redefining Research Problem, Objectives (Final) and Outcomes/FormulatingHypothesis
Problem definitions should be unambiguous, clear statement that states the majorobjective of the research. There should be generally three to six subobjectives definedfor research work. There should be a clear indication of the research work which shouldnot be the recurrence of the same research. There should also be an outcome which hasbe initialized while mentioning the research objective. Objective should be given point-wise (three to six points).
It is important to define outcomes of research work to be carried out, which shouldshow an impact of the proposed research work.
After domain selection and identifying the problem definition, researchers shouldformulate a hypothesis. State-of-the-art literature review on related topic creates a
Introduction to Research 15
sufficient background for formulating the hypothesis. Reporting problem with thetentative solution is a hypothesis. The hypothesis is a tentative solution based oninsufficient evidence that can be true or false. For example, “Algorithm A1 outperformover algorithm A2 for given data,” “People who do not take balanced diet are obsessedthan the people who take balanced diet.” In the end, researchers either approve ordisapprove the null hypothesis. Generally, it is easier to disapprove the null hypothesisas only one counter example is sufficient. On the contrary, exhaustive examination of allpossible cases is required to prove the hypothesis.
If the outcome does not support the null hypothesis, we conclude with an alternatehypothesis. One can define a problem using null hypothesis as “There is no relationbetween the illness of children and change in season.” If the result rejects the hypothesis,an alternate hypothesis is “Illness of children occurs mainly due to change in season.”The null hypothesis is the precise statement about the parameters. Researchers eitherapprove the hypothesis or disapprove the hypothesis. If researcher disproves the nullhypothesis, all other possibilities are represented by alternative hypothesis. Null hypoth-esis does not provide a statistically significant relationship between variable, whereas,alternate hypothesis provides a statistically significant relationship between them.
1.6.5 Research Proposal
Researchers should able to convince people for selected topic and objectives through theresearch proposal. It is very important document that is reviewed by different commit-tees. In industry proposal needs to be written for approval of top management, financeand marketing department. Research proposal is mandatory document to be submittedto the university or research organisation during the registration for a PhD degree. It canalso be written to avail the funding from different agencies. Every agency generally hasits own research proposal format. Research proposal formats generally include thefollowing sections: Introduction (Proposed Topic of Research/Rational and Significanceof the Study), Literature Survey (Background of the Proposed Research/Study ofResearch Work Done in the Area and Need for More Research), Motivation, ResearchStatement, Objectives of the Research Proposed, Probable Methodologies/Techniques tobe Used, Expected Outcome(s) (the kinds of conclusions expected and their possiblevalue), Plan of Research Work, References/Bibliography.
• Introduction (250–300 words)/Proposed Topic of ResearchIn this part, the introduction to the area of interest can be included along with itspotential for research and its application. Introduction also specifies the work to beproposed and it should be related to the title of the theses in case of the PhDdissertation.
• Literature Review of Research Topic (1,500–2,000 words)Present status of topic of research from existing literature can be written in this partof proposal. Literature of our work is been prepared by the scholar after goingthrough the contemporary literature done in the area of interest after referring theScience Citation Indexed (SCI) Journals/e-journal, reputed conferences, magazines,MTech and PhD dissertations, reports published in the institution and companyorganisations along with patents in domain of research. In this context there shouldbe a broad summary that should reveal the present status in the area of work andshould highlight the identified research gap.
16 Research Methodology

• Gap in Existing ResearchIssues that are unresolved on the research topic should be reported in the projectwith reference to the current status. Furthermore, possible utilization of the researchoutcome can also be suggested.
• Objective of the Proposed ResearchIt should be clearly indicating the perception of the research work and should notbe a mere repetition of the topic of research. What is to be achieved as an outcomeof the research has to be visualized while mentioning the objective of the research.Objectives should be given pointwise (three to six points).
• OutcomeIt is important to make clear the impact of the proposed research and the particularaspect of the problem that is anticipated to produce an original contribution(s) by thecandidate.
• MethodologyMethodology should provide the experimental/infrastructural/computing facilitiesneeded to carry out the research work and it should be described in the logicalphases that are used to investigate the identified research problem. There should be aphasewise description with a brief explanation under each phase. The methods andapproach can also be represented by figures and flowcharts.
1.6.6 Identifying Variable/Parameters and Research Design
The variable is basic quality or attribute that differs in value under different circum-stances. The researcher should identify all related variables or parameters. Parameterscan be identified during literature survey and it may vary depending on the proposedhypothesis. In hypothesis “Illness of children occurs mainly due to change in season,”parameters can be age, whether ill, duration of illness, type of illness, season duringillness, weight, height, temperature, and so on. These are some of the variables forconsidered hypothesis. One need to define the domain and range of each variable. Itsrange can vary with application. Variable can be either dependent or independent.Independent variables show changes in dependent variables. It may possess eithercontinuous or discrete values.
To prove or disprove the hypothesis one needs to decide on the design strategy ofresearch. The researcher needs to shift the paradigm from “what is my research?” to“how am I going to conduct it?” The research design is a systematic plan designed toobtain a solution to the research problem. Which data should be tested, which proce-dure/algorithm/methodology will be applied is decided in the design phase.
Research design should be carefully planned and checked for feasibility. It is blueprint of your research. Good research design provides maximum outcome with mini-mum efforts. The researcher should think about size and type of samples and dataset tobe considered, parameters to be considered. Researcher can revisit the literature reviewstep again to check with state of the art design methodologies used by other researchersand can come up with methodology suitable for his/her own research hypothesis.
1.6.7 Data Collection and Representation
Data can be either directly collected afresh known as primary data or already collectedand used data is known as secondary data. Secondary data is already considered by
Introduction to Research 17

researchers to test the hypothesis. Most of the times in experimental research data iscollected afresh to test the methodologies, hypothesis or algorithms. If researcherdecides to use afresh data, then he has to decide carefully on method of data collection.Depending on problem definition and research objectives some parameters needs to becontrolled during the data collection. In image or video processing applications relatedresearch topics researcher may control the parameters like frame rate, image resolution,illumination conditions, colour, number of cameras, and so on. These different para-meters can be either kept constant or included in the study.
Consider the research topic “Study of effect of exercise on thyroid patient.” Personshaving hypothyroid or hyperthyroid are of interest and normal individuals are not.Thyroid level, duration of exercise, type of exercise, age, eating habits, and so on aredifferent parameters that need to be taken into consideration during research.
Data can be represented in simple text, tables, graphs, audio, video, or images.Researchers should consider sufficient amount of data with all parameters. An incom-plete dataset may not give a conclusive result.
Collected raw data should be first examined for errors, this is called editing of data. Itshould be coded and represented in user friendly format.
1.6.7.1 Selection of Appropriate Method for Data Collection
Nature, Scope and objective of enquiry constitute the most important factors affectingthe choice of a particular method.
Funding availability decides the method for collection of data and the disposal of theresearch in a limited version. So selecting a cheaper method may not be efficient andeffective but as to act within its limitation.
Time availability is also needed to be taken into account for deciding the method ofcollecting the data and takes more time when compared with shorter duration methods.Thus affects the selection of the method for processing the data. Another importantthing that should be considered is the time precision for collection of the data.
The reliability can be tested by finding out the following:
• Who collected the data?• What were the sources of the data?• Were they collected by using proper methods?• At what time were they selected?• What level of accuracy was desired?• Was accuracy achieved?
The data that are suitable for one enquiry may not necessarily be found suitable inanother enquiry. In this context, the researchers must carefully scrutinise the definitionof various terms and units of collection used at the time of collecting the data from theprimary source originally. If the researchers find the difference in these, the data willremain unsuitable for the present enquiry and should not be used.
If the level of accuracy achieved in data is found inadequate for the purpose of thepresent enquiry, they will be considered as inadequate and should not be used by theresearcher.
18 Research Methodology

1.6.7.2 Selection of Appropriate Methods for Data Representation
Tabulation is a process that conserves space and reduces explanatory and descriptivestatement and also provides the comparison from one state to another. Tabulation alsoprovides various statistical computational information, which facilitates the summationof items and detection of errors and omission.
lmportance of Tabulation
• Each table will give a clear title that does not require an explanation• Each table will be provided with a separate number that will be easy for referring
Tables can be categorized in a chronological, geographical, and alphabetical order. Tableshould be made as logical, clear, accurate, and simple as possible. Most of the researchoutcomes consist of data that are of same kind; these types of data are needed to be reducedfor the better understanding of the result. Classification of the data depends on the nature ofa fact that is involved. Classification can be categorised under two sections such asnumerical and descriptive. Descriptive refers to qualitative phenomenon which cannot bemeasured quantitatively and depends on the specified attributes. Whenever the data isclassified according to the attributes, researchers should give a clear picture related to theattributes.
The numerical classification refers to the phenomenon which will measure the dataquantitatively using statistics. Data related to the salary, classes of age, and so on, comesunder these classes. Such data are known as statistics of variables and are classified onthe basis of class interval.
Graphical representation helps to understand the data easily. All statistical package,offers a wide range of graphs. In case of qualitative data, the most common graph is barchart and pie chart.
1.6.8 Testing of Proposed Design on Collected data/Hypothesis Testing
Researcher defines the hypothesis and he/she needs to test that hypothesis to proveor disprove. Hypothesis defining is discussed in Section 1.6.4, this section focus onhypothesis testing. Hypothesis testing is expressed as either a null hypothesis oralternative hypothesis. If the researcher compares two methods P and Q for super-iority and if proceed on the assumption that both methods are equally good, thenthis assumption is termed as the null hypothesis (H0). If the researcher thinks that“Method A is superior and the method B is inferior,” then it is termed as alternativehypothesis (Ha). There are Type I and Type II errors related to the null hypothesis.We may reject H0 when H0 is true. This is a Type I error. Type I error meansrejection of hypothesis that should have been accepted. Type II error means accept-ing the hypothesis that should have been rejected. The researcher may accept H0
when H0 is not true. α and β denotes the probability of Type I error and Type IIerror, respectively. Curve with conditional probability of rejecting H0 as a function ofpopulation parameter and size of the sample is known as power curve of hypothesistesting. In short it is a plot of values of (1-β) for each possible value of populationparameter for which the H0 is not true. This curve is defined by a function known aspower function. Some of the important limitations of the discussed test are (i) theresult cannot be expressed with full certainty, they are probabilistic, and (ii) testing is
Introduction to Research 19

not a decision-making activity in itself, but the researcher should not use it in amechanical way.
Validity of the hypothesis should be tested on the basis of the data collected by theresearcher. The procedure for hypothesis testing refers to all of those steps that weundertake for making a choice between the rejection and acceptance of a null hypoth-esis. The various steps involved in hypothesis testing are as follows:
• Setting up of hypothesis consists of the data that makes the statement of a nullhypothesis, which should clearly state the nature of the research problem
• Particular expression of the hypothesis is an important aspect while considering agoal or purpose of the considered problem
• Hypothesis can be validated when the values are decided in advance for thesignificance of the work when they are directional and nondirectional
• Test statistics will be conducting hypothesis test for means and variance. The formulafor test statistics and their distributions are discussed depending on the value of teststatistics using observations selected by the researcher and the parametrical valuestated under null hypothesis
• Using different type of critical value for test statistic, level of significance, and thetype of test we obtain a critical value
• The null hypothesis is rejected or accepted by comparing the distribution of teststatistics
Some of the important limitations of the discussed test are
• Results cannot be expressed with full certainty; they are probabilistic• Testing is not a decision-making activity in itself, the researcher should not use it in
a mechanical way• Tests don’t explain the reason why the dissimilar result has been obtained due to
fluctuation• Significance of the results is been validated on the basis of the probabilistic condi-
tions which cannot be explained fully• Inference the statistical data cannot provide the evidence for the truth of the
hypothesis
There exist the number of statistical tools like t-test, F-test, chi-square test, D-W test, etc.to test the validity of the hypothesis.
1.6.9 Results and Analysis
The result is an important section of the research. If the topic is totally new then onecannot compare his/her results with existing. Here, the hypothesis should be testedwith multiple approaches and that results can be compared. If already some scien-tists worked on methodologies or the topic it is important to compare your resultswith the existing state of the art results from the literature. While comparing resultsone should look at the considered parameters, dataset, and so on. Results should berepresented in the visual format using tables, figures and or graphs. It should be
20 Research Methodology

properly labelled, clear and easy to understand. Carefully choose the type of graphtaken for result representation. The relationship between the data in tables/graphsshould be explained along with observations. Result section may include the pro-blems faced during collection of data and complete analysis of results.
1.6.10 Research Report Writing
There are different purposes for writing the research report. The research report is amedium to convey research outcomes, contributions, findings and results to the outsideworld. It decides the quality of your research work. Without approval of experts in domain,the research is incomplete. Publication of research in open, referred international journal isvery important aspect of the research. It can be research papers written for publicationthrough different agencies like IEEE, Springer, Elsevier, T&F, and so on. Research reportcan be in the form of the theses for academic research and it is compulsory and importantpart of the completion of the degree. Patents, copyrights, and white papers are also possibleoutcomes of the research. Communicating ideas is important aspect of research. Peopleshould agree that your work is creative and novel. For good writing, lot of good reading isrecommended to understand how people communicate their ideas.
Different agencies provide their own formats for writing the report. Format andlength of the report depend on the type agency.
The researcher should first start with an introduction and can continue with literaturesurvey, methodology, datasets, and results. Then conclusion section can be added and atlast abstract of the paper, report or theses can be written. These are general guidelinessuggested for novice researchers and not hard and fast rule. These may include thefollowing sections:
• Abstract• Introduction• Review of Literature• Problem Definition and Objectives• Methodology• Observations and Results• Discussion• Summary• Conclusion• Publications• Bibliography/References• Appendixes
This is a general guideline and every university or organization may have their ownformat of theses.
Researchers should be aware of plagiarism issues, copyright issues, procedures, andpenalties. Plagiarism is to literally steal the work of another person, presenting it as originalresearchwithout proper citation. There are different agencies including Turnitin, Unkund thatverify the copied content in written document with its source. After completion of writing, aplagiarism check of the written document by an authorized agency is recommended.
Introduction to Research 21

While reporting own work, if the researcher is referring to work by other scientists orresearchers, all of this should be acknowledged and added to the references. Referencescan be organized in alphabetical or chronological order. Acknowledgments to people,funding agencies, or other organizations that helped directly or indirectly in thecompletion of the research work should be added.
The writer should have good command over the language especially the grammar ofthe language in which the work is reported. In science and technology domain researchwork is generally reported in the English language.
At glance during research process researcher should monitor following stage-wise details,
• First stage
◦ Where do you start?◦ Area of interest should be decided◦ Check out why this area is of interest◦ Discuss your idea with local R&D staff
• Second stage
◦ From the existing source systematic reviews should be considered carefullybefore starting the research
◦ Duplication of research which is not of sufficient quality is itself unethical. Soworking/reviewing with existing knowledge is an important step
• Third Stage
◦ Research domain should be determined◦ Data should be arranged for a specific purpose and statistically analysed◦ Determine top-down or bottom-up approach or combination◦ Data should be compared and validate on the work done◦ Data should provide the information and action performed for comparison ofthe work
◦ Results should dealt with a means of solving the problem◦ Research validation should be verified with surveys◦ Perform research validation using research methods (interviews, surveys, etc.)◦ Appropriateness of the work should be justified◦ Cost should be specified◦ Test Practicality
1.7 Research Methods versus Methodology
Researcher should understand the difference between research method and research meth-odology. Researchmethodology explains more about the research process whereas research
22 Research Methodology
methods aim at finding answers to research questions. All of the methods, approaches,processes and techniques used by researcher during research process can be referred asresearch methods. It can be methods applied during dataset creation, data preprocessing,and data collection to decide sufficiency of data. Researcher has to use different analyticaltools and techniques at the time of statistical analysis and to check accuracy of obtainedresults. Examples ofmethods applied during dataset creation are surveymethods, interviewmethod, questionnaires, thorough observations, and input through mechanical/electricaldevices. Some of the examples of statistical analysismethods aremean,mode,median, meandeviation, standard deviation, skewness, kurtosis, and histogram. Methods such as findingprecision, recall, f-score, and t-test are used in result analysis.
Researchers should be able to identify appropriate relevant methods applicable ateach step. For researchers, along with an understanding of different research methods,design of methodology for his/her research problem is very important and it may differfrom problem to problem. Consider the example of building a house; first, the architectwill design a plan for your house according to your requirements. In his/her plan hefulfils each and every requirement and comes up with final solutions including positionsof different rooms, windows, doors, staircases, and so on. The quality and quantity ofeach and every material is decided before constructing actual house. Estimation ofbuilding house is prepared before starting actual work. Then contractor decides howthe construction should be completed, which tools and methods should be used at everystage of progress and plan is executed accordingly. First, complete plan of process ofconstruction is prepared and then executed using tools and techniques. Similarly, inresearch researcher is expected to prepare plan of research from problem definition, thatis, methodology for research process. At the time of deciding on a specific methodology,researchers should look at different available methods, analyse them and should choosethe appropriate one for his/her research. In short, different research methods are part ofresearch methodology.
1.8 Features of a Good Research Study
Related state-of-the-art literature should be studied in depth to avoid reinvention ofwheel. Good research should clearly define the methodologies used, which should bereplicable. It should be time-bound and realistic. Good research should have system-atically chosen methodologies and datasets to prove the proposed hypothesis. Validityand reliability of data should be checked and researchers should consider an adequateamount of data. Good research should be creative and valid in the longer term. Some ofthe important features of good research are:
• Research purpose should be clearly defined• Procedure for the research should be detailed sufficiently which should help the
other to continue the work by referencing our work• Research work should be carefully planned to get the results in related to the
specified objectives• Reports should be created by a researcher stating that what was the procedure adopted
for completing the work which should also include errors in their findings
Introduction to Research 23

• Conclusions should be confident to those justified by the data of research
Research is guided by the rules of logical reasoning. The logical process of induction anddeduction are of great value in carrying out research. In fact, logical reasoning makesresearch more meaningful in the context of decision making. Good research is empiricalwhen the research is related basically to one or more aspects of a real situation and dealswith concrete data that provides a basis for external validity to research results. Goodresearch is recreated when research results are verified by studying the results and compar-ing the obtained results based on the decision which is sound enough to justify the research.
The research work should either form foundation for further advancement in thedomain, draw some concrete conclusions or it should be beneficial from the social,commercial, or educational point of view.
Good research is systematic and logical. The report should be well written and itshould be published through refereed journal. As, publications, copyrights, and patentshelp to reach the research to all intended audience.
1.9 Summary
Research inculcates scientific, curious and inductive thinking. It is an importantcomponent of the development of nation and individual. Research has special signifi-cance in deciding government policies in economics, in solving various operationaland planning problems of business and industry, and in seeking answers to varioussocial problems.
Research opens different avenues in particular domain for the betterment of mankind andworld. Research activity develops critical thinking about the problem, systematic examina-tion, developing and testing new theories, and draw important meaningful conclusions.
Ability of in-depth analysis and understanding a topic helps researcher to explore inmany domains around. Research also helps researcher to sharpen the dimensions ofhis/her own personality in many folds.
Further Reading
1. Clifford Woody, “A survey of educational research in 1923,” J. Educ. Res., vol. 9, no. 5,pp. 357–381, 1924.
2. Chakravanti Rajagopalachari Kothari, “Research Methodology: Methods and Techniques”,New Age International Publishers, New Delhi 2004.
3. Ranjit Kumar, “Research Methodology- A Step-by-Step Guide for Beginners”, 3rd ed., SAGEPublications India Pvt Ltd, New Delhi, 2011.
4. David V. Thiel, “Research Methods for Engineers”, Cambridge University Press, Cam-bridge, UK, 2014.
5. Robert Jeffrey Sternberg, “Beyond IQ: A Triarchic Theory of Human Intelligence”, CambridgeUniversity Press, Cambridge, UK, 1985.
24 Research Methodology

2Literature Survey and Problem Statement
Dr. Manoj S. Nagmode
CONTENTS
2.1 Introduction . . . . . . . . . . . . . . . . . . . . . . . . . . . . . . . . . . . . . . . . . . . . . . . . . . . . . . . . . . . .262.2 Conducting Background Research . . . . . . . . . . . . . . . . . . . . . . . . . . . . . . . . . . . . . . . . .27
2.2.1 Need for Background Research Study . . . . . . . . . . . . . . . . . . . . . . . . . . . .282.2.2 Incorporating the Background Information . . . . . . . . . . . . . . . . . . . . . . . .292.2.3 Background Research Plan. . . . . . . . . . . . . . . . . . . . . . . . . . . . . . . . . . . . .292.2.4 Primary and Secondary Sources of Background Research . . . . . . . . . . . . .30
2.3 Resources for Literature Survey. . . . . . . . . . . . . . . . . . . . . . . . . . . . . . . . . . . . . . . . . . . .312.3.1 Systematic Manual Search . . . . . . . . . . . . . . . . . . . . . . . . . . . . . . . . . . . . .312.3.2 Snowball Method. . . . . . . . . . . . . . . . . . . . . . . . . . . . . . . . . . . . . . . . . . . .312.3.3 Online Information Access. . . . . . . . . . . . . . . . . . . . . . . . . . . . . . . . . . . . .31
2.3.3.1 Encyclopaedias and Dictionaries . . . . . . . . . . . . . . . . . . . . . . . . . . . . .342.3.3.2 Reputed Journals/Impact Factor Journals. . . . . . . . . . . . . . . . . . . . . .35
2.3.4 Use of Interviews, Focus Groups and Questionnaires . . . . . . . . . . . . . . . .352.4 How to Read a Scientific Paper, White Paper, and Patent . . . . . . . . . . . . . . . . . . . . . .38
2.4.1 Scientific Paper . . . . . . . . . . . . . . . . . . . . . . . . . . . . . . . . . . . . . . . . . . . . .382.4.2 White Paper. . . . . . . . . . . . . . . . . . . . . . . . . . . . . . . . . . . . . . . . . . . . . . . .422.4.3 Patent . . . . . . . . . . . . . . . . . . . . . . . . . . . . . . . . . . . . . . . . . . . . . . . . . . . .43
2.5 Research Reports . . . . . . . . . . . . . . . . . . . . . . . . . . . . . . . . . . . . . . . . . . . . . . . . . . . . . . . .462.5.1 Types of Reports . . . . . . . . . . . . . . . . . . . . . . . . . . . . . . . . . . . . . . . . . . . .472.5.2 Components of a Research Report . . . . . . . . . . . . . . . . . . . . . . . . . . . . . . .472.5.3 Writing the Methods/Procedures and Findings. . . . . . . . . . . . . . . . . . . . .482.5.4 Writing the Conclusions . . . . . . . . . . . . . . . . . . . . . . . . . . . . . . . . . . . . . .482.5.5 Publishing . . . . . . . . . . . . . . . . . . . . . . . . . . . . . . . . . . . . . . . . . . . . . . . . .492.5.6 Authorship . . . . . . . . . . . . . . . . . . . . . . . . . . . . . . . . . . . . . . . . . . . . . . . .492.5.7 How to Read Primary Research Article . . . . . . . . . . . . . . . . . . . . . . . . . . .50
2.6 Recording and Summarizing the Findings of Literature Survey. . . . . . . . . . . . . . . . .512.6.1 Finding and Selecting Resources and Materials Needed for Research . . . .522.6.2 Searching the Quality Material . . . . . . . . . . . . . . . . . . . . . . . . . . . . . . . . .522.6.3 Scanning, Accessing and Evaluating the Literature . . . . . . . . . . . . . . . . . .532.6.4 Developing the Contents of Literature Review . . . . . . . . . . . . . . . . . . . . .542.6.5 Where to Place the Literature Review in the Theses?. . . . . . . . . . . . . . . . .552.6.6 Sequencing/Organizing the Literature Review . . . . . . . . . . . . . . . . . . . . .552.6.7 Writing Literature Review . . . . . . . . . . . . . . . . . . . . . . . . . . . . . . . . . . . . .552.6.8 Literature Survey Table: Case Study . . . . . . . . . . . . . . . . . . . . . . . . . . . . .56
2.7 Formulation of the Problem Statement . . . . . . . . . . . . . . . . . . . . . . . . . . . . . . . . . . . . . .562.7.1 Definition and Selection of a Research Problem. . . . . . . . . . . . . . . . . . . . .57
25

2.7.2 Clearly Defining the Problem . . . . . . . . . . . . . . . . . . . . . . . . . . . . . . . . . .612.7.3 Method Used in Defining the Problem . . . . . . . . . . . . . . . . . . . . . . . . . . .622.7.4 Study of Available Literature for the Problem Statement. . . . . . . . . . . . . .632.7.5 Generating Ideas through Discussions for the Formulation of
Problem Statement. . . . . . . . . . . . . . . . . . . . . . . . . . . . . . . . . . . . . . . . . . .632.8 Scope and Significance of the Research Problem. . . . . . . . . . . . . . . . . . . . . . . . . . . . . .64
2.8.1 How to Define a Problem Statement . . . . . . . . . . . . . . . . . . . . . . . . . . . . .652.8.1.1 Review the Problem Statements Based On . . . . . . . . . . . . . . . . . . . . .652.8.1.2 Poor Way of Writing Problem Statements. . . . . . . . . . . . . . . . . . . . . .65
2.8.2 Errors in Defining the Problem Statement . . . . . . . . . . . . . . . . . . . . . . . . .662.9 Summary . . . . . . . . . . . . . . . . . . . . . . . . . . . . . . . . . . . . . . . . . . . . . . . . . . . . . . . . . . . . . .66Further Reading. . . . . . . . . . . . . . . . . . . . . . . . . . . . . . . . . . . . . . . . . . . . . . . . . . . . . . . . . . . . . 67
Do all the good you can, By all the means you can, In all the ways you can, In allthe places you can, At all the times you can, To all the people you can, As long asever you can.
—John Wesley
Learning objectives of this chapter are to:
• Comprehend the fundamental concepts of literature survey and literature review• Identify and scrutinize the resources available for literature survey• Distinguish between scientific paper, white paper and patent• Organize, compare and contrast the components and findings of reported research• Define problem statement and frame the scope and objectives• Plan the research activity
This chapter will enable the researcher to
• Understand the difference between literature survey and literature review• Efficiently search and summarize the reported literature using various online and
offline resources• Learn and understand the scientific paper, white paper and patent• Formulate the problem statement, aim and objectives• Plan the research activities under the guidance of the experienced researcher
2.1 Introduction
Research is a mind-set. It requires calm, patient and controlled mind, hard work by heart,logic by brain and ability to tolerate hurdles by positive thinking to achieve the requiredoutcome. The most important preliminary task to undertake a research study is to pursuethe existing literature available in the field of interest. The survey of literature and review
26 Research Methodology

of literature is an integral part of the research to acquaint with the existing knowledge ormaterial available in the area of interest. Literature survey means penetrating through theavailable literature in the selected area of research, whereas, literature review involvesassessment and examination of the reported contributions/findings. Recording, summar-izing and evaluating the existing findings and being able to provide expert judgment ofthe methods and finding is also called as literature review. [1]
When you are travelling from one city (source) to the other city (destination), consider twopossible ways of finding your destination. In the first case one can go by railway. In this case,there is no need to know the route from the source to destination. Second way is to use yourown car. In this case, you need to take help of geographical map (i.e. supervisor/guide inresearch). In Google maps, various routes are available such as low traffic route, fastest route,shortest route and so on. You need to plan your journey to reach to the destination. In thesame way, when you are pursuing your research, you need to plan your journey of research,you need a help of your guide (like a Google map). Also, you need to devise your own planto reach the destination.
Literature survey helps you to find out many answers while pursuing the research. Itcan be time consuming in initial stage. [2] But if literature survey is not done in initialstage, then you might get stuck up while pursuing the research. Some authors have alsogiven the meaning of literature review as the critical study of literature survey.
A researcher cannot progress in the area of interest without the literature survey. Aliterature survey can be divided into three parts
• Searching of the literature in the area of interest• Collection/acquisition of literature or data• Critical study of literature/review of literature in the area of interest
Literature review helps you to widen the knowledge in the selected domain. It is veryimportant to know the contributions of other researchers in the existing area or domain.Moreover, questions like, what challenges, which problems, what advantageous anddisadvantageous of the existing systems, should trigger the thought process. Thesequestions help to focus on finding answers to those limitations and accordingly youcan define your own problem statement. [3]
Literature survey and literature review should go hand in hand. After searching thematerial available in the selected area of research, researcher has to read it, understandit, and note down the important points. Again, find the latest literature, read it, under-stand it, and note important points. This process of literature survey and literaturereview should be continuous.
2.2 Conducting Background Research
One of the important steps in devising a problem statement is the background study for it.Conducting background research is very important part of all types of research. Backgroundstudy of any topic consists of explanation of the area of research and context of the problem tobe studied and solved. It helps to arm yourself with general knowledge to more effectivelynarrow down your research topic and finding relevant source to pursue the research.
Literature Survey and Problem Statement 27
2.2.1 Need for Background Research Study
Background research is an important part to undertake the research in the area ofinterest. The study of background research is useful in order to know what approachor methodology the other researchers have used for their research study. Backgroundresearch is necessary in order to know how to design and understand the research topic.When devising a background research plan, you have to ask yourself a number ofquestions Such as
• Why you need to pursue research in the selected area?• How are you going to pursue the research?• What are the constraints of pursuing the research?• Which laboratory is to be used for experimentation?• Is the topic latest or demanding?• Which is the best method for the experimentation?• What are the limitations of existing technique?• Is the research topic feasible?• Does the research/problem statement have substantial research component?• Is there any social use for the selected topic?• Does it harm the society?• Is there any parallel research being pursued by another person in the selected area?
Background research helps you to understand the subject and the nature of yourresearch topic. Based on the background research, we can ask help from guide, seniorsand colleagues. Background research is a continuous process. It should continuethroughout the research process. It helps you to draw the aim and objectives of theresearch to pursue. During the study of background research, a researcher has fullflexibility to consider utilization of various information sources and decide which arelikely to be most useful. As the background research is a continuous process, it helpsyou to be ready to modify the requirements as the search progresses.
There is a need to ask questions in order to get the correct information about thebackground research. You need to ask proper questions related to the area of research.One need to identify the relevant questions. Relevant questions are those questions thatwill help you to design and understand the research topic and its limitations. To identifythe limitations of the related research topic is very important, as it decides the correctparameters to choose for the experimentation.
Identifying limitations of existing research topic is possible only through the properbackground research. If the background research is not conducted thoroughly then, it isquite possible that other researcher has already reported the results. on the same topic itmay happen that the other researcher might have given the results on the selectedresearch topic. In such cases, the researcher does not have the idea about the resultsalready obtained. Therefore, the background research should be completed thoroughly.
In some cases a question posed may not be relevant to the topic. At that time, youneed an opinion of more experienced researchers/person. Experienced researchers arenothing but those researchers, who have worked on the selected research topic. They willguide you whether you are going in the proper direction or not. Otherwise, you will get
28 Research Methodology

stuck while pursuing your research. You can ask questions to the expert such as, “Whichconcept/book/paper should I study to understand the selected area of research?” Youshould be specific when asking your questions. The expert will get puzzled by somequestions. If the questions you ask are generic, then it will leave experts pondering theanswers.
Research is also based on learning from the experiences of other researchers. Experi-ence is important in order to avoid the repetition of mistakes which the other research-ers have made. It also avoids blundering around the mistakes of others. Research topicshould also include the effects on the human life. Therefore, the background research isvery important in order to identify a series of problems that can be tackled individually.
2.2.2 Incorporating the Background Information
The importance of incorporating background information into the introduction or at thestart of the literature is to provide the researcher with the critical information about thetopic being studied. It includes
• Introductory detail of the area of interest• Methodology used for the topic to be studied• Broad overview of the topic to be studied• Name of the authors/researchers who are authorities in the area of interest• Important happenings or events in the area• Keywords and subject related to the vocabulary terms, which can be used to search
the database• Local, national and international status of the work• References and bibliographies that can lead to additional search• Explanation about the fundamental study conducted in the past• The important historical dates and events of the major work carried out related to
the topic• The information why and in what way the research problem is important• Social relevance and contribution
2.2.3 Background Research Plan
Planning of the research is an important part in order to streamline the research processideally. But in practical case the research may not go as per the plan. It may requiremuch more time than predicted for the accomplishment of the task. There is no timelimit or no one will decide the time required for the research to complete. It is actually atimeless and limitless work.
Some simple steps, the researcher can follow in order to plan and manage the processof literature search. These steps include:
• Identifying the research query or research problem• Plan your search related to research area• Experimentation based on existing techniques or methods
Literature Survey and Problem Statement 29

• Evaluating the results of existing techniques or methods and recording the results• Revise and review your research plan based on your results obtained• Try to test your database, based on new methodology or techniques• Compare results of existing techniques with the new technique• Analyse and synthesize the results obtained
Identifying research problem or research query is a tedious job. First, you have to decidewhat you want to search. You have to start with the broad idea of the research domainyou want to look at. Asking yourself some questions related to the broad area, whichyou have selected, will help to exactly pinpoint focus down the research query orproblem you want to pursue for the research, At this stage browsing on the Internetcan help you to clarify your thoughts and finding exactly what you want to research.For example, “What is the importance of video enhancement?” Such questions shouldbe asked to clarify the doubts.
Along with the background research we need to study mathematical formulas orequations that will describe the results of your experimentation. You can also plan forthe background research on the past results of the same type of experiments orinventions. Researchers have to devise their own plan to reach to the outcome of theresearch. Otherwise you will go around randomly, until you finally reach to the out-come. That is the need of background research plan. It helps you to pursue yourresearch in a systematic and proper way with less hurdles. Hurdles are always there,but to overcome those hurdles, planning of research makes your journey simple andhappy. Therefore to avoid getting lost, you need a background research plan.
2.2.4 Primary and Secondary Sources of Background Research
Primary and secondary resources are important in the background research.
(i) Primary source: It is a document, which is created while pursuing the research. It iswritten by a researcher who lived during the time period of his/her research and wroteabout the findings about it later. Background research of primary sources is useful forthe secondary source of background research. There are various types of primarysources available such as: newspaper articles, letters, raw data, diaries/memories (alsoknown as a firsthand account), laws, photographs, posters, interview of persons work-ing in the area, drawings, records of different institutes such as government organiza-tions, reputed educational institutes, speeches of experts. These primary sources help togenerate the information, which is important for background information. Primarysource of research are generally based on experimentations carried out by otherresearchers, clinical trials, surveys, and qualitative studies.
(ii) Secondary source: The secondary source of research takes help of primary sourcefor the explanation about the background research. It also expresses the content ofthe background research. Secondary sources use the evidences of primary sourceto back up assertions. Secondary sources are generally based on systematicreviews, analysis of reviews, guidelines by other researchers etc.
Primary and secondary sources of background research are given in Figure 2.1. Thesecondary source may become primary depending on how it is used.
30 Research Methodology

2.3 Resources for Literature Survey
There are various resources for literature survey as shown in Figure 2.2.
2.3.1 Systematic Manual Search
Systematic manual search is done through the hard copy of research journal, paper andso on. A systematic manual search is time-consuming, but it is required so that one canunderstand the flow of research paper and how abstracting and indexing is used.
2.3.2 Snowball Method
In this approach, it is necessary to first identify recent papers, that is, primary sources.These recent papers are used for tracking back from the references of the recent paper.Also, cross references can be used for earlier publications.
2.3.3 Online Information Access
Online information access method includes the periodical visit to web pages of journalsin order to know the contents of recent issues. Study material is available in variousforms. One of the oldest ways to conduct a literature review is through books andmaterials published in magazines that are available in libraries in the form of hard
Primary Sources
• Experiments
• Clinicaltrials
• Surveys
• Qualitative studies
Secondary Sources
• Overviews based on
reviews, met analysis
• Guidelines by other researchers
• Decision Analysis
• Economic Analysis
FIGURE 2.1Primary and Secondary Sources of Background Research
Resources of Literature Survey
Based on hard copy
of Research Journals
Based on Primary source and
then tracking back
Based on periodical
visit to web pages
Systematic Manual
Search
Snow Ball
Method
Online Information
Access
FIGURE 2.2Resources of Literature Survey
Literature Survey and Problem Statement 31

copies. In the current era when the Internet is available almost in every part of theworld, online resources plays an important role in literature study. A huge amount ofinformation is available on the World Wide Web and one can identify research domains,available solutions, problems faced in current scenarios, and so on.
The problem faced in online resources is authenticity of resources available. In an onlineliterature survey it is the responsibility of the researcher to use only that information orreference that is acquired from an authentic source. After choosing a topic, it is required toidentify preliminary sources that can give basic information about the research topic. Incase of unfamiliar or less researched topics, it is very important to find basic informationfrom authentic resources at the beginning. Online resources are depicted in Figure 2.3.
Some online resources include:
(i) Google scholar: This is the best option. Google scholar contains scholarlyresearch. But it also provides access to a limited number of journals. To useGoogle scholar, you have to put your search term and also put the time periodon the left to get a good overview of a topic for search.
(ii) Google Books: Google books provide the digitized holding of the world’sgreatest academicians. It gives the world’s greatest academic libraries. Thesufficient background information to start your paper is available throughGoogle books. It saves the time to visit to the library and to issue a book.
(iii) Wikipedia (Evaluating e-books, journal papers, and websites): This is the freeencyclopaedia that anyone can edit.
All of the online resources used for literature survey should be evaluated using someparameters.
(i) Evaluating e-Books: Any book used for background research can be evaluatedbased on• Authority: Information about the author and publisher of the book• Addressees: Information about the book, if book is written for some specific
audience in some specific context or general• Correctness: Has author consulted any other authorities to find accurateness
of results?
Online resources
Scholars
Wikipedia White
papers
News letter
Books
Encyclopedia and
Dictionaries
Electronics
letters
Research
Gate
FIGURE 2.3Online Resources
32 Research Methodology

• Neutrality: Is book is unbiased and discusses all the possibilities of researchproblems?
• Relevance on time: Is book new or old? If it is old then is it still relevant inthe current scenario?
(ii) Evaluating Journal Papers: Journal papers are usually evaluated based on theirimpact factor and process of review. Papers in reputed journal are rigorouslyreviewed by experts. Generally, such papers give more authentic informationthan articles or informative websites. The following things should be taken intoconsideration before using any journal article for reference:• Source of the journal/article: You have to look for the article from scholarly
journals which are written by the experts in research area. Some referencesmay be available, which can lead you to the additional references of articleor books. For some research topic a huge database may be available. In thatcase you can limit your search by the type of research article, reviewprocess, an editorial or a clinical trial
• Length of the article/journal: Note the length of the article. It can be a goodclue to check whether the article will be useful for initial research or not
• Authority: Use authoritative sources in the research article. You have to usearticle which are written by experts in the research domain. The expertsshould be from the research domain and academic/research institute
• Date of publication of research: We need the latest information in theresearch domain. Research in almost any area requires the current informa-tion available. You need to ask yourself the questions such as: Is the article/journal you are referring is up to date for your research purpose?
• Usefulness of the article/journal: Is the article/journal you are referring isrelevant to your research topic?
• Audience referring the article/journal: What type of readers are referringthe article/journal? If the article/journal you are referring is written forsome other research domain/area, then it will use the term/language/key-words special to that research domain
• Citations: Citation refers to the work published in past years. It is areference to the previous case, used as guidance. Citation means you have toadd a reference to the source where the mentioned idea/fact/statistics hasbeen given. It is very important to cite the credible sources in your essay
• Citation search engine: Citation search engine are used to find the citationsof scientific research paper. Different Databases are available to find cita-tions of research paper or author. These include web of science (WOS),SCOPUS, Google scholar and IN-Recs
• (WOS)Web of science: This is one of the best tools for finding the number ofcitations of a specific article. It provides various options for finding citation.“Times Cited” section gives the number of citations in WOS
• SCOPUS: This gives a list of results including the number of citations thatpapers have received. SCOPUS is the largest citation and abstract databaseof peer-reviewed literature. SCOPUS indexing includes scientific journals,books and conference proceedings. Scopus h-index is used to measure thepublished work of scholar or scientist. It measures both the impact and
Literature Survey and Problem Statement 33

productivity of published work of a scholar or scientist. H-index is not astatic value; it is calculated live on a set of results each time you look it up.
• Google Scholar: This search provides data on citations of authors and theirpublished work. It searches for journals, books and chapters in the book.Google scholar shows information on the number of citations a paper hasreceived among the different documents available in its database
• Indexed Journals: The quality of journals considered by the indexation ofthe journal. Indexed journals are of higher scientific quality as compared tonon-indexed journals. There are various indexation services developed suchas SCOPUS, EBSCO, PubMed, EMBASE, MedLine and SCIRUS
(iii) Evaluating websites: Authenticity of data available on various web sites ismany times questionable. In this era of the World Wide Web, informationabout anything and everything is available on one click in the form of websites,blogs, social media pages, and so on. Checking the authenticity of such materialis very important before using it for research. Anybody can add to suchinformation without having actual knowledge of topic. To check whetherinformation is genuine or not, check who are the authors providing the informa-tion? If the author is working in the same domain then information can beconsidered as authentic. Also check the references and bibliography given byauthor.
Other than authenticity, another concern in using online resources is copyright ofinformation. Many times the information, code and data set available on the Internet isunder copyright. Researchers should take care to obtain the required permissions beforeusing any such information. Lastly, all material used for research should be properlycited in the documentation related to research.
2.3.3.1 Encyclopaedias and Dictionaries
Encyclopedias and dictionaries gives you overall views of the selected research topic. Itgives keywords and hints for searching. List of sources are also available throughencyclopedias and dictionaries.
Electronic database: We can search more than thousands of journals back a century ormore through the electronic database.
Conference papers: Researchers should attend the conferences relevant to the area ofresearch domain. In conferences, research scholar and professionals explore the latesttrends, new ideas and presents new research. Finding or searching conference proceed-ings, one can get a feel of what is going on in a particular institution or within a particularresearch domain. Most of the electronic database include conference proceedings.
Internet: It is valuable resource of getting most of the information. We need tocritically evaluate the information from the internet source. Research GATE is the bestexample of the collaborative scientific community that indexes the article available onthe internet. We can find the full text of the article at no extra charge using the InternetSo, at an initial stage we need to utilize the Internet for getting maximum informationrelevant to the topic and then critically evaluate the internet information.
Library: Library is available in all institutions/organizations. The libraries are wellequipped with different varieties of resources. If you need resources which are notavailable in the library, then they can get these resources through interlibrary loan.
34 Research Methodology

2.3.3.2 Reputed Journals/Impact Factor Journals
Impact factor is the most important measure to measure the quality of journal. Journalimpact factors are based on journal citation reports (JCR). Journal citation reports are theunique data base which is used to determine the relative importance of journals withintheir subject categories. Impact factor of a journal is calculated by the number ofcitations received by the journal, from other journals within the (WOS) web of sciencedatabase. The Thomson Reuters (Now Clarivate Analytics) impact factor is the mostimportant impact factor.
Following are also the most commonly used resources for literature survey
• IEEE electronic library: It is basically for electrical and electronics engineeringresearchers
• ASCE (American Society of Civil engineers): It is for civil engineering researcher• ASME (American Society of Mechanical Engineering): It is for mechanical engi-
neering researcher• Nature: Nature is a weekly International Journal publishing the finest peer-
reviewed research. It is in all fields of science and technology on the basis of itsoriginality, importance, interdisciplinary interest, timeliness, accessibility, eleganceand surprising conclusions
• Springer: This is an American publishing company of academic journals and books• IEEE Explore: This provides full text access to IEEE transactions, journals, maga-
zines and conference proceedings. It is published since 1988• Science Direct: This is the worlds best resource for research journals, abstract
databases and reference• SciFinder scholar: This provides the most accurate and comprehensive chemical
and related scientific information• Math SciNet: This includes world mathematical literature since 1940• JCCC: J-gate Custom Content for Consortia: JCCC is a customized solution for
sharing and accessing journal literature, which is subscribed by IITs, IISc and IIMs• JCCC@JNDEST: It is a common gateway for accessing e-journals from different
publishers subscribed by IITs, IISc and IIMs• ACM: Association for Computing Machinery• SCOPUS: This is the Indexed Journal most commonly used for literature survey
2.3.4 Use of Interviews, Focus Groups and Questionnaires
Interviews, focus groups and questionnaires are the primary research tools. They arebasically used to collect original or new information through questions. Using theseprimary research tools, the researchers can frame the questions, specific to the researchtopic to be studied. They are used to collect database for in-depth understanding of theresearch project.
Interviews and focus groups are for the qualitative analysis of the research work to becarried out. These are based on discussions and some set of questions. It may includesome visual observations and visual concepts. Most of the time it includes trial and error
Literature Survey and Problem Statement 35

method. People opinions and their views are taken into consideration. If it is engineer-ing research, the question may be what are the improvements the people want from theresearch?
Data collection is very important part of any type of research. Data collection isachieved through Interviews, focus groups and questionnaires. Some research problemsneed collection of some specific data from group of society or individual. Methodemployed by researchers for collecting primary data depends on type of problem aswell as understanding of individuals from whom data is to be collected.
(i) Interviews
Research interview explores the outlook, understanding, and perspective of individualson problem under research. Interviews are a qualitative method which provides aprofound understanding of problem. They are predominantly suitable when the peoplemay not want to discuss about the issues in a group environment.
Some important points to be considered while conducting the interviews:
• Proper/relevant questions to be framed• There should be time limit for conducting interviews• Opinions and feelings of the interviewee are important• Recording of interview from the respondent, where appropriate• For sensitive/social issues, obtain permission to record the interview from the
respondent• Collect the demographic information of the interviewee
Three fundamental types of research interviews are given in Figure 2.4.
Types of InterviewsIn a structured interview, a list of predetermined questions is asked to all the
individuals and their responses are noted down. No variation or follow up questionsare allowed in this format. It makes the analysis of collected answers simple. This typeof interviews can generate a database, which can be quantified easily and used forfurther statistical analysis. Drawback of this type of interviews is that the depth is notachieved in answers as individual is not allowed to explore the questions. For example:Asking questions to a class of students and noting their answers.
Unstructured interviews are more flexible and do not reflect any fixed type ofquestions, theories or ideas. The questions are not organized and flow of questions
Types of Interviews
Structured
Interview
Unstructured
Interview
Semi-structured
Interview
FIGURE 2.4Types of Interviews
36 Research Methodology

depends on response received from individual. The researcher needs to be moreexperienced to draw appropriate inference from the answers received. Unstructuredinterviews are time consuming and might fail to generate data, which can be quantifiedfor further analysis. This type of interview is mostly used when depth is required inanswers to analyse the problem further or area of the problem is less researched. Forexample: Asking questions in meetings or seminars.
The third type of interview is a semistructured interview, which tries to combineadvantages of both structured and unstructured types of interviews. Semi structuredinterviews have list of some key questions but allow the interviewer to explore moredepending on the previous answer and knowledge of interviewee. This helps togenerate a dataset which can be quantified and at the same time gives depth to data.Also some times this approach helps to acquire data that is not previously thoughtof. Collective views of a group of a people is used for generating information,participant’s experiences and beliefs are very useful in generating the informationnecessary for data.
(ii) Focus groups
A focus group is more than the structured data collection from multiple individuals inone place. A focus group is a facilitated group interview with individuals that havesomething in common. In this, combined information and various perspectives aboutsome specific problems can be gathered.
To get the best results from the focus group, forming of correct group should be donewith utmost care. The number of members of the group is one of the key factors. Veryless number can generate incorrect data and very large number can generate chaos.There is no specific rule for how many members should be there in one group. It is upto the researcher’s judgment to select number of members. If the group is non-homogeneous then perspectives and opinions of members can be too much variedwhich might not help researcher to reach to any conclusion. On other hand, if there isno diversity in group then there won’t be much data generated as discussion on topicwill be less. Interaction between members is a key to a successful focus group. Ifmembers are from diverse backgrounds then they might not interact comfortably. Toavoid this many times groups are formed before the time, in which all the membersalready know each other and used for Focus group data collection. Conversely, in fewspecific problems, where discussion is not possible in known group because of societyor any other pressure, more discussion and data is generated through group of totallyunknown members.
For focus groups, there are no specific rules and it is up to the researcher to decidenumber of members and type of members. With properly formed group, focus groupscan work successfully and generate useful data for research.
If it is a management research the questions may be what are the important peoplewant to see in the business? Interviews and focus groups, also helps you to collectvariety of data. As the data collection is a very important part of research. By askingdifferent types of questions to different peoples, we can collect a variety of data. Thisdata may be useful for qualitative analysis of research, which include textual or visualanalysis observation, and so on.
One example of a focus group is a meeting of parents, which may include the views ofthe parents about the school or the institute.
Literature Survey and Problem Statement 37

(iii) Questionnaire
Questions are framed to get the answer from a group of people. Questionnaires aregenerally a fixed set of questions. These questions are used to collect the information foranalysis. The questions are like the questions such as, Are you aware of the productavailable in the market? What are the weaknesses and strengths of the specific techni-que/method? and so on.
Questions are framed to be generally of the following types:
• Yes/no or true/false or correct/wrong• Multiple choice• Rating or ranking (i.e. agree or disagree or 1,2,3,4)
Before framing the questions, you need to test your questions with the help of a friendor family. Ensure that the questions are easy to answer and well framed. Questionsshould be short and relevant. Questions should be framed in proper word, which can beeasy to understand. The questions you should like to frame, shouldn’t lose interest ofparticipants, for giving misleading answers. Questionnaires are usually effective, whencarried out one-to-one. It can also be completed over the phone.
To have productive conversations with people, we need to prepare a list of questions. Atinitial stage, key points based on the research topic are to be prepared and from these keypoints, questions are framed. One can also frame subquestions related to some importanttypes of the research topic. We need to make sure the answers must be recorded or takewritten notes or at least note down some important points related to questions.
2.4 How to Read a Scientific Paper, White Paper, and Patent
Scientific papers white papers and patents are important repositories for significantinformation. They provide valuable pointers and are most important to pursue researchbut reading and understanding the technical contents is challenging.
2.4.1 Scientific Paper
Scientific papers are most looked upon by the research community for understandingthe concepts and contributions. However, it is difficult to understand scientific researchpaper at once. Some scholars are reading scientific papers as a text book. They arereading the paper from title to the end. They are digesting the contents, keywords andevery word without any type of criticism. A scientific paper gives the idea about theScience/Engineering behind the research topic. It helps the reader to understand thelogic/methodology of the research subject. Therefore there is a need to read a scientificpaper carefully and with full attention.
Each part of the scientific paper serves a unique purpose and helps researcher tounderstand the research work correctly. The researchers, pursuing research in engineer-ing or science community, scientific papers are the heart of science community. In a
38 Research Methodology

scientific paper, the results and ideas about new techniques/methods to follow aregiven. A scientific paper helps to understand the following things:
• What has already been discovered in research domain?• What questions remain unanswered?• How the experiments are conducted?• What is the time duration to conduct that experiment?• Which tools/equipment’s needed to conduct the experiment?• Details about how to perform the experiments?
All of this information is necessary to perform your own experiment. Sometimes, due toequipment constraints, it is not possible to conduct experimentation. At that time, theresearch has to find out whether the research is feasible or not. In such cases, theresearcher has to apply for funding from industry.
In scientific research paper, the research article is divided into different sections such as:
• title• abstract• introduction• literature survey• methodology• block schematic• hardware and software used• experimentation• results• discussions and conclusion• future scope• references
These sections serve a unique purpose, which help researcher to understand researchwork correctly. Now we will see how to read these sections one by one.
(i) Reading Abstract
The summary of the paper is given in the abstract. At initial stage, reading ofthe abstract gives you the overall idea of the research paper. After reading abstract,one can decide whether the research paper is in the selected domain or not. If theresearch domain matches with the abstract, then may one can read the other detailsof paper.
Abstract highlights the main problems of authors investigated as a research domain. Itprovides the key points or important results and observations from the experimentation.After that it gives the overview of authors’ conclusion and discussions. Abstracts aregenerally available for free. They can be available at journals website or in the literaturedatabase. The abstract plays an important role, in deciding the overall contents of theresearch paper.
Literature Survey and Problem Statement 39
(ii) Reading Introduction
Background information about research paper is given in the introduction part of theresearch paper. It sets the background for the research work to be carried out. Theintroduction part is based on the citations and can be used by the researcher foradditional background reading. The introduction gives the basic idea and significanceof the topic.
(iii) Reading Literature Survey and Noting Some Important Points
A literature survey gives the idea about the research work about the other authors/researchers have already carried out.
(iv) Reading Methodology Used in the Research Paper
The methodology section gives the technical details of how the experimentation wascarried out. It also talks about data set used for experimentation. This section givesactual technical details of work carried out by authors. It is very helpful to understandthis section correctly for taking the research in same domain ahead.
(v) Understanding the Block Schematic of the System
The pictorial view of the technique/methodology used is given by the block schematic.It helps to understand the methodology used in the paper in an easy way.
(vi) Knowing Hardware and Software Used in the Paper
The types of hardware tools/kits used in the experimentation is given in this section.The results will vary as the hardware changes. Therefore, mentioning the specificationsof Hardware is very important.
Similarly, what type of software tools used for simulation or experimentation is veryimportant. The researcher has to specify the tools used for experimentation. As thehardware and software changes, accordingly to that the experimentation results willalso change. If the experimentation is based on the performance analysis and theresearchers are using different specification of hardware, then the result will vary.
(vii) Experimentation Done in the Research Paper
How the experimentation is carried out is given in the experimentation section. Theexperimental or surrounding conditions to be considered are also important, whileperforming the experimentation. The sequence of steps used in the experimentation isalso very important.
(viii) Checking Results in the Scientific Research Paper
The results obtained after the experimentation are given in the result section. In this, theresults can be given in tabular or graphical formats. In some scientific research papers,the results are given in various ways such as:
40 Research Methodology

• quantitative analysis• qualitative analysis• time performance analysis
From this analysis of results, different types of information can be extracted such as howto represent the similar data for the comparison with different techniques/methods. Onecan also draw the conclusion from the results about the advantages or drawbacks of theexisting methods. The researcher’s contribution toward the research is given in theresults. The research findings are reflected in the results. One can use these results forthe comparison with his/her own findings or to use to build his/her own hypothesis.To get the most out of the results section, understanding of the graphs, pictures, andtables are necessary.
(ix) Understanding and Noting Down Discussion and Conclusion from the Scien-tific Research Paper
In the discussion section, the author explains about how the results are obtained. Also,the results obtained by the author are compared with other results and the comparisonis discussed. Actually, the interpretation of results are given in the discussion section.The discussion is useful for comparing the results obtained from the other methods.Here the exchange of ideas between researchers takes place.
In discussion, the author can also highlight the existing weaknesses for the improve-ment. After the discussion, it is also observed that some questions are still unanswered.
The conclusion is based on the results. The actual results obtained are given in theconclusion.
(x) Knowing the Future Scope for Further Research
Based on the discussion and conclusion points, there are always chances of improve-ment, proposed by the researcher. These improvement raises the challenges for thefurther research study.
(xi) Scanning the References for the Past Work Done
The author has referred the information from other papers. These citations are listed inreference section. These citations can be used by researchers for additional backgroundreading. Introduction gives basic idea and significance of the topic. Throughout thearticle, the authors refer to information from other papers. These citations are all listedin the references section. Both review articles and primary research articles, as well asbooks or other relevant sources, can be found in the reference section. Regardless ofthe type of source, there will always be enough information (authors, title, journalname, publication date, etc.) for the reader to find the source at a library or online. Thismakes the reference section incredibly useful for broadening your own literaturesearch. If you’re reading a paragraph in the current paper and want more informationon the content, you should always try to find and read the articles cited in thatparagraph.
Literature Survey and Problem Statement 41

2.4.2 White Paper
White papers are useful for R&D engineers, designers, finance, sales persons, andmarketing persons. There are various definitions of white papers. Some of the defini-tions are given here.
• “A white paper is an authoritative report or guide helping readers understand anissue, solve a problem and make a decision.” White papers are used in the mainspheres, government, and business-to-business marketing. They may be consideredas grey literature
• “A white paper is an article that states a company’s position or philosophyabout a social, political or other subject or a not too detailed technical explana-tion of an architecture, framework or product technology,” posted by MagretRouse
• “An information document issued by a company to promote or highlight thefeatures of a solution, product or service. White papers are sales and marketingdocuments used to entice or persuade potential customers to learn more aboutor purchase a particular product, service, technology or methodology”
• “White paper is a value added content that can add value to your deliverables andyour career” by Mak Pandit
The information in the white paper should be objective and truthful. Some importantpoints need to be considered for writing white papers are
• Include accurate information from your research• Avoid using biased or noncredible sources• Include all relevant information• A white should be educational, not promotional in tone• It must attract the right audience: such as researchers, academician, and so on• It must engage the reader or researcher• The title is very important for white paper. It is a key for the success of the paper.
Choose a title that conveys both the specific purpose of the White Paper and onethat will gain the attention of your intended audience
White papers are generally written by institutions such as:
• Academic, Research and Development• Government Organizations• Company
White papers contain the following information
• Technical data, technical and facts• Information about the process• Comparison
42 Research Methodology

• Analysis• Opinions• Conclusions• Recommendations
2.4.3 Patent
Understanding patent specifications is an important skill for any researcher or technologymanager. This primer gives a basic overview of a complex and constantly evolving topic toenable you to read and make sense of patent specifications relevant to your field oftechnology.
A patent is defined as a set of exclusive rights granted by a sovereign state orintergovernmental organization. It is granted to an inventor or assignee for a limitedperiod of time in exchange for detailed public disclosure of an invention. An inventionis a novel solution to a specific technological problem and is a process or a product.Patents are a form of intellectual property (IP). The details are:
(i) Patent application: For the grant of a patent, a patent application is filed. Apatent application is a submitted to the patent office. It is actually a requestpending in the patent office for granting the patent for the invention describedand claimed by that application. It is also used to refer to the process of applyingfor a patent, or to the patent specification itself
(ii) Patent specification: The description of an invention is called as a Patentspecification. It is submitted together with the official forms and correspondencerelating to the application. It is a document describing the invention for whichthe patent is filed and setting out the scope of the protection of the patent. Aspecification generally contains:• A title for the application• Detailing of the background and overview of the invention• A description of the invention• Embodiments of the inventions and claims• It may include figures to aid the description of the invention
Patent specification should comply with the laws of the office concerned. A patent isgranted for the invention described and claimed by the specification.
(iii) Patent Prosecution
It is a process of “negotiating” or “arguing” with a patent office for the grant of a patent.It is also the interaction with a patent office with regard to a patent after its grant.
(iv) Patent litigation
Patent litigation is related to the legal proceedings for infringement of a patent after it isgranted.
Literature Survey and Problem Statement 43

(v) Claims
A granted patent application includes one or more claims that defines the invention. Apatent may include many claims. Claims define a specific property right. The claimsmust meet relevant requirements for claiming the patent such as novelty, usefulness,and non-obviousness. To prevent the misuse of the invention an exclusive right isgranted to a patentee in most countries. It is the right to prevent others, or at least totry to prevent others, from commercially making, using, selling, importing, or distribut-ing a patented invention without the legal permission. Claims describe the invention ina legal style. It sets out the essential features of the invention in a manner to clearlydefine what would infringe the patent. Amendment of claims are done during theprosecution to narrow or expand their scope. The rights of a patent for an inventionlies with the first person to file an application for the protection of that invention.Therefore, it is beneficial to file the patent application as soon as possible.
(vi) Patent pending
It is a warning that an alleged invention is the subject of a patent application. This termis used to mark products containing the invention to alert a third party to the fact thatthe third party may be infringing a patent if the product is copied after the patent isgranted.
(vii) Search
After filing the patent, a search is carried out, either systematically or in somejurisdictions. The main purpose of this search is to reveal the prior art which may berelevant to the patentability of the alleged invention. The patent is published 18months after the priority date of the application, and as such is a public document.The search report is important to check, if there is a prior art which prevents the grantof the useful patent. In this case the application may be abandoned before theapplicant incurs further expenses. Competitors can also use this search report, to getthe idea for the scope of protection.
(viii) Examination
This is a process to ensure that an application complies with the requirements of therelevant patent laws. Examination is an iterative process. The patent office notifies theapplicant about its objection. In such a case, the applicant may respond with anamendment or an argument to overcome the objection. The amendment or argumentmay be accepted or rejected. After that again the applicant waits for the further responseand so forth until a patent is issued or the application is abandoned.
(ix) There are three types of patent applications.
• National• Regional• International
44 Research Methodology

(i) National applications: National applications are generally filed at a nationalpatent office. In the United Kingdom there is an office called the “UnitedKingdom Patent Office.” It is used to obtain a patent in the country of thatoffice.
(ii) Regional applications: This is an application that may have an effect in a rangeof countries. For example, The European Patent Office (EPO) is a regionalpatent office. It grants patents that can take effect in some or all countriescontracting to the European Patent Convention (EPC), following a singleapplication process.Filing and prosecuting an application at a regional granting office is advanta-
geous. It allows patents in a number of countries to be obtained without havingto prosecute applications in all of those countries. The cost and complexity ofobtaining protection is therefore reduced.
(iii) International applications: The World Intellectual Property Organization (WIPO)operates the Patent Cooperation Treaty (PCT). It is a centralized applicationprocess. The PCT system enables an applicant to file a single patent applicationin a single language. The application, called an international application, can, at alater date, lead to the grant of a patent in any of the states contracting to the PCT.WIPO, or more precisely the International Bureau of WIPO, performs many of theformalities of a patent application in a centralised manner, therefore avoiding theneed to repeat the steps in all countries in which a patent may ultimately begranted.
(x) A general patent format is having following points.
Similar to a journal research paper, a patent can be read by understanding thefollowing parts.
• Abstract• Background• Summary of the invention• Detailed description of the invention• Claims• Figures
(i) Abstract: The abstract summarizes the invention. It is mainly used for patentsearching purposes and is published with the application’s bibliographicalinformation on the respective office’s patent search website.
(ii) Background: The background outlines the basic area of the invention. It alsodescribes the work done in area before the patent filing date. The backgroundis referred to as the “prior art.” Typically the background also notes the short-comings in current solutions. This gives the significance of the new invention tosolve the problems identified.
Literature Survey and Problem Statement 45

(iii) Summary of the invention: This section includes statements that set out thekey features of the invention which the inventor believes are novel andinventive over the prior art. Each different embodiment (example) of theinvention should be identified in this section. If the invention is a combina-tion of steps of a method, or features in a particular configuration, thesecombinations/configurations should be specifically defined. The statementsin this section typically mirror the wording of the claims. Since the patentclaims define exactly what must be done to infringe the patent, they mustcontain clear, unambiguous language. If there are words used in the sum-mary of the invention that would be ambiguous when read by the skilledperson, those words should be defined in the detailed description of theinvention.
(iv) Detailed description of the invention section: The detailed description of theinvention includes a detailed discussion of the features of the invention andhow it would be made and used. It should also contain definitions of any termsused in the specification that may be ambiguous to a skilled person. Thedescription often continues the narrative from the background. For example itmay state how the invention solves the problems previously identified, or listbenefits of the invention over the prior art. It is important to describe alter-natives and variations of features so that a broader claim scope can be justified.For example, where functional groups could be substituted without affectingthe core functionality of the compound as a repellent, these functional groupsshould be identified and details of optional substituents provided. Workingexamples of the invention are also typically included within the description.Examples demonstrate to the reader that the invention has been made andworks as a mosquito repellent as promised. Patent examiners may only grant apatent if scientific evidence supporting the invention is presented in thespecification.
(v) Claims: The claims are the key part of the specification because they defineexactly what a person must do to infringe the patent. In this way, they definethe scope of the patent itself. The claims are a list of numbered statementsfound after the description. They consist of a preamble and one or morefeatures which outline the novel and inventive features of the invention. Forchemical compound inventions it is allowable to include the chemical structurein the claim itself and define the functional groups of the formula.
2.5 Research Reports
An important goal of the research scientist is the publication of the results of acompleted study. Scientific journals do not allow for literary embellishments andexpressions, often seen in other journals, as the purpose is to communicate thescientific findings as clear as possible, in a highly stylized, distinctive fashion. Thisoften makes it difficult for the applied professional to grasp all that the article has tooffer. The purpose of this article is to help bridge much of that communication breachin scientific writing.
46 Research Methodology

2.5.1 Types of Reports
There are many different formats for reporting research; journal articles, technicalresearch reports, monographs or books, graduate theses or dissertations. Research isalso reported orally at professional meetings, seminars, symposia, and workshops.These oral reports, however, are usually based on previous written reports
Journal articles are the most condensed form of writing. Journals have severe spacelimitations and often all the details of a complex research project can’t be presented inone article. They are the most “prestigious” format for reporting disciplinary work.Involve a peer-review process which evaluates quality and importance of a paper. Theyreceive wide distribution to disciplinary and subject-matter readers. To reach otheraudiences, other publications must be used. Sometimes, research can be written asjournal articles as well as other formats to reach different users. Be careful, though, notto violate exclusive publication rights of journals – get permission!
Graduate theses and dissertations tend to be on the other extreme of length andcompleteness. This is the report of the student’s work to his/her graduate committeeThese tend to be long and sometimes more wordy than necessary. But completeness isconsidered more important than efficiency in this writing. (In this respect, they are theopposite of journal articles.)
2.5.2 Components of a Research Report
The components of a research report often include: Title, Acknowledgments, Abstract,Table of Contents, Introduction, Literature Review, Conceptual Framework, Methodsand Procedures, Results, Summary, and Conclusions.
• Title: This includes the name of the research report, Authors, affiliations, keywordand similar information written on title page
• Acknowledgments: Recognize the assistance and support of individuals andorganizations
• Abstract: This is a compact summary of the research report, sometimes called“executive summary”. The abstract is extremely important: It is the only thing thatmost people will read
• Table of Contents: A listing or outline of the organization of the report. It showsheadings, subheadings and other divisions. Sometimes includes lists of Tables andFigures
• Introductions: Styles for introductions vary, from long and detailed to short oreven absent
• Review of Literature: Serves the same purpose as in the research proposal• Methods and Procedures: This section explains how the analysis portion of the
research was conducted. It includes data collection and manipulation, data sources,analytical procedures, models developed and used, empirical procedures andtechniques, and analyses conducted. Also includes problems encountered andhow they were addressed
• Results (Findings): Presents and explains the results of the analysis. This is the endproduct of all the analyses from which objectives were either achieved or not.Hypotheses have been tested and the results reported here
Literature Survey and Problem Statement 47

• Summary and Conclusions: This provided the reader with a general understand-ing of the research project. It most often includes an overview of the entire study,emphasizing problems, objectives, methods, procedures and results
• Conclusions: This represents the researcher’s interpretations of the results• List of References: A listing of all references used in every part of the report are
included in this section• Appendices: These can be very useful, but are not always used. They can be used
to present material that might disrupt the flow of thoughts in the report (eg. toomuch detail) or include information of interest to only some readers. eg. Mathe-matical proofs or derivations, some statistical estimations or tests etc
2.5.3 Writing the Methods/Procedures and Findings
Writing these sections in a research report can have some important differences from theproposal. First, the methods are largely written for other economists. Others may beinterested, but will tend to leave judgments of the validity of methods and proceduresto the economists. The effectiveness of this section depends on the organization andthoroughness. The procedures need to be described in a logical sequence. Explain thedata used, their source, and any manipulations or adjustments of the data. Explain andjustify your analytical assumptions. Also explain models you may have used and be explicitabout assumptions made. Describe problems you may have encountered and how theywere resolved. Also, note unsuccessful approaches, techniques and procedures – this mayhelp others to avoid problems or mistakes.
Be sure readers know how calculations were made and estimates derived. Define allvariables, including units of measurement. (These details are easily overlooked, but areimportant.) Use graphs or other visual aids where appropriate to increase understand-ing by the reader; for example, a diagram of a multisector model may help to makelinkages and equations used in the model more clear. This presents and explains theresults of the study.
Validity of hypotheses are discussed, along with various test of validity used.Don’t just present empirical estimates, these must be analysed, interpreted andpossibly tested to make findings complete. The empirical results are often only thebeginning of the most meaningful part of the research economic understanding,expertise and insight are needed to fully interpret the meaning and implications ofthe estimates.
Tables and figures are often effectively used to present findings. They help to organizeand emphasize information in the findings. A recommended approach in writing thissection is to construct the tables and figures that form the core of the findings first andthen write the narrative which describes and explains the tables and figures.
2.5.4 Writing the Conclusions
Sometimes people confuse conclusions with results. Results are nothing but findingsand they are used to test hypotheses. Conclusions are concerned with implicationsor tests of hypotheses. Conclusions address questions such as “so what”? Conclusionsextrapolate beyond the findings: examining and interpreting the implications of thestudy.
48 Research Methodology

Conclusions allow judgment of the researcher about implications of the study. Thisjudgment must be supported by logic, but is subjective. Conclusions are a final inductivephase of the research, which are a matter of judgment. You may offer insights about theimplications of your study and findings of other studies. Policy implications of yourstudy may be considered, even if these were not among the objectives of the study.Conclusions may specify what the study implies as well as what it does not imply.Researchers may see a need to avoid improper use of the research results.
2.5.5 Publishing
Written research reports communicate knowledge within the research and scientificcommunity. Publications are the primary means of disseminating research knowl-edge. Once published, research results become public knowledge. However, originalideas must always be recognized. In addition to journal publications, other outletsinclude, technical bulletins or reports, proceedings, papers, symposia, and workshoppapers.
Among common reasons the proposed refereed publications fail to be accepted are:
• Inadequate identification of a research problem• Inappropriate or unclear methods and procedures• Inappropriate material for the proposed publication• Failure to communicate what is important and original• Poor organization.
2.5.6 Authorship
This can be a sensitive matter that deserves careful consideration.Credit for the written research paper can be given in following three ways.
• Authorship of the research paper• Citations or references• Acknowledgments
The most prestigious type of credit given for the research paper contribution is theauthorship. The researchers/persons, those who are involved “directly” and giving“important” or “substantial” contributions are included as authors. First author isgenerally assumed to have the greatest involvement in the research.
Interdisciplinary research may result in special difficulties in recognizing contributionand authorship. Research related to laboratory and field sciences, place special emphasison the generation of data (sometimes as the end product of research). Economists arelikely to view such data as “inputs” to their research, which only requires acknowl-edgement. Conversely, laboratory and field scientists may assume that activities (such asdetermining economic implications) are not part of “research” and thus don’t deserveinclusion in authorship. Order of authorship can be a difficult issue.
The inclusion of administrators or advisors as authors, even if they had little to dowith the research, can be a contentious issue. It is best to discuss authorship up frontand openly among all involved in the research.
Literature Survey and Problem Statement 49

2.5.7 How to Read Primary Research Article
Abstract include the summary of the entire research paper. Generally experiencedscientist avoids, reading the abstract at the start.
The following steps are used to read a primary research article.
• Identification of important questions
We need to identify important questions, in order to understand the research workcarried out in the paper. The questions can include “What is the problem solved in thisresearch?” “What are the methods/techniques used to solve the research problem?”These questions help you to identify why this research is being done. It also helps tofind out the agenda for the motivated research.
• Summarize the background in less sentences
Summarization of the background in your ownwords is very important. This should include:
• What work has been done in this area of research to answer the importantquestions?
• What are the weaknesses/limitations of this work?• What is the future scope, to overcome the limitations?• Why this research is done/What is the motivation behind the research work?
This summarization points are very important in order to decide your research topic.
• Study the Approach and Methodology Used in the Paper.
The methodology used in the paper is the methodology followed for the experimenta-tion. This methodology need to be studied for getting the correct results. We need todraw the diagram for each experiment. It shows exactly, what the authors did. We needto include maximum details in order to understand the work done.
• Draw Conclusion from the Results Section
Note down the results given by the authors. Whatever results given by the authors, weneed to note down. Study those results and write some sentences in order to understandthe meaning of results. In research articles, the results are summarized in figures, tablesand graphs. We need to study those graphs and figures carefully. In most of the researcharticles, comparison of different techniques and results obtained are given in graphicalform. It makes easier for the authors to represent their results. We need to draw ourconclusion from those results. In some graphs, error bars are shown. These error barsindicate a lack of confidence intervals.
• Study Dataset Used by Authors
The results are obtained based on the database/dataset provided. The number ofsamples of dataset decides the effectiveness of the algorithm/methodology provided.
50 Research Methodology

Complexity of the dataset decides the robustness of the algorithm. Study the dataset setin detail. What are the challenges involved in the dataset. It decides the execution of thealgorithm. We can use the same dataset, as the test dataset for executing our ownalgorithm.
• Carefully Read Discussion/Conclusion/Interpretation Section
The opinions of the authors based on the results are given in the discussion andconclusion section. Whether the results obtained are correct or incorrect are justified inthe discussion section. Any weaknesses/limitations identified in the research area aregiven in the conclusion section. In interpretation of results, the advantages and dis-advantages are discussed and based on that the conclusion is drawn.
• Now Read the Abstract
After reading the whole paper, it is time to read the abstract. In the abstract, one need tocheck whatever the contents given in the paper matches with the abstract or not? Does theabstract also reflect in the conclusion section of the paper. List out the opinion of the otherresearchers about the paper. In order to continue your research in same domain, opinion ofthe research paper given by other researchers is important.
We need to identify the experts in this particular research field. These experts musthave studied the research area. They should think critically about the research domain.The criticism given by expert researchers should be considered seriously. One can alsouse Google to find the possible criticism or challenges involved in the researchdomain. Then only, you will prepare your mind set in order to do the research in theselected area.
2.6 Recording and Summarizing the Findings of Literature Survey
In literature, a summary of the work done in existing research topic is given. Generally,it is all based on the secondary sources, that is, what other researchers/people havealready written about research project. It is not concerned about the novel or newdiscoveries about the research. Actually, it should find the way for further research.
The central interest of literature survey is always on the theories put together by therecognized experts in the research domain/field. It also includes the data collected fromthe different experts, who have already worked on the same research topic. A literaturereview will try to find the existing research, which is already done in the selectedresearch domain. It should review the important scholarly books in the relevant area.But, reading only scholarly books is not sufficient, one should take a keen interest injournals articles. Journal articles give you more updated information about the researchsubject.
Preparation of literature survey involves following points
• Summarizing the key points from the literature• Searching of accurate, reliable, and latest information on the research topic or subject
Literature Survey and Problem Statement 51

• Listing the ideas and concepts into a summary of what is known• Synthesizing, discussing and evaluating these ideas and concepts• Criticising and identifying the particular area for debate or controversy• Preparation of mind-set of the researcher and relevant resources for the application
of these ideas for new research to be proposed
2.6.1 Finding and Selecting Resources and Materials Needed for Research
Availability of resources for selected research topic plays an important role. If the properresources are not available, then you cannot conduct your research work. So, first thingis always to provide proper resources for the experimentation purpose.
We need to ask following questions such as:
• What is my research title or research focus?• What kind of hardware and software tools, do I need to carry out experimentation?• What are the different types of journals/books/government documents available
for literature?• Is my search wide enough to ensure that I have identified all the relevant material?• On the contrary, is my search narrow enough to exclude irrelevant material?• Is the literature, good enough for the Ph.D level?• Have I considered the alternative or other points of view?• Will the other reader find my literature review more relevant, appropriate, and useful?
2.6.2 Searching the Quality Material
The major thing, you have to look the most up-to-date or latest material for the researchsubject. In this only the important book/reference books, which are written by experi-enced experts and leading scholars should be taken into consideration. Good literaturereview sets out the many perspectives as possible. One has to balance between sub-stantial academic books and the latest journal articles.
One can also look for the bibliography provided with the module documentation.Choose one or more similar looking contents of books or articles and then scan throughthe bibliographies provided by these authors.
Keywords are important for finding the literature from the library catalogue searchengines. We can try number of other keywords to capture as many items as possible for thevarieties of data. We also need to look for over generalizations. Try to be specific forsome research related area. Afterwards, we can narrow the field down, so you get just afew dozen results. If the material collected through the search engine is not sufficient,then browse library shelves in the relevant subject area and look for the book, whichcan capture your eye. Check the index and contents of the book to see if they are likelyto help. If not put the book back and try again to find the other relevant material for theresearch subject.
We can also take the help of librarian to get the proper book from the librarysupervisor. Research guide will also help you for getting the proper direction for theliterature survey but remember, the survey must be done by the research scholar.
52 Research Methodology

There is no limit for referring to journal articles. The number of journal articles, youneed to refer depends on the following points:
• The type and nature of the subject• Duration of the research work to be carried out• Level of study etc
Find out the obvious gap in the existing literature survey. It helps to provide thescope for improvement. You have to use your judgment for referring to the number ofbooks and research journals. But the references should be from varied sources and oneshould capture the latest information about the research subject taken into considera-tion. If your subject involves new emperical research, then you need the latest literaturepresented by the author. At the same time, we need to consult with experiencedresearchers in the same domain.
2.6.3 Scanning, Accessing and Evaluating the Literature
After identifying the relevant research article and books pertaining to your researchsubject, you need to scan through their research article, journal and books. Try to findout the idea or clue, which will help you to contribute to your study. If the researcherhad got some clues, then he can concentrate on some selected research/journal articlefor further study. If the researcher didn’t get some idea/clue from the literature, then hehas to choose some different research article/book.
After identifying some clues the researcher has to read the selected/chosenmaterial carefully. In the selected material one has to understand the concept andlogic, given in the article and paper. One has to look especially for the followingpoints:
• What are the keywords given by the author?• What are the proofs and evidences the author has produced to support the idea
presented in the paper?• The evidences interpreted by the authors can these by represented in other way?• What type of results provided by the authors, such as quantitative, qualitative or
experimental?• Is there enough mathematical analysis given by the author, to support the research
work?• Comparison of theoretical values with the practical values• Critical evaluation of other literature• Has the author included the literature, which has opposed his/her idea presented
in the paper?• Validity of research information provided in the paper, is it from the reliable
source?• Is it possible for you to provide your own judgment to deconstruct the argument?• Is it possible to identify the gaps or future scope for improvement in the existing
research?
Literature Survey and Problem Statement 53

• What type of information or contribution is provided to your own researchsubject?
• Are there any strengths and limitations given in the paper?
While scanning, accessing, and evaluating the research article, you need to note downthe important points provided in each research article and book. Even at initial stages,you didn’t find these notes important, you may need these notes for a later summary. Soalways keep these references with you after indexing them properly.
2.6.4 Developing the Contents of Literature Review
The literature review will contain a number of “mini reviews” based on the materialread. Every mini review contains the following important points:
• A brief summary of the article/book• Critically evaluated points in the book or article:
(i) Brief summary of the article/book: along with the brief description of theresearch presented in the book for your own research subject. At least one keypoint or keyword is given in each research article or book. One has to under-stand this key point or keyword and the relation of this key point with yourown research. This key point is related with new techniques/method/claimgiven in the research article book.
(ii) Critically evaluated points in the book/article: Critically evaluated pointsinclude the strengths and weaknesses given by the research article/book. If thestrengths and weaknesses are not provided by the author directly, thenresearcher has to identify the strength and weaknesses of the research article/book. After going through the conclusion and discussion sections of researcharticle/paper. One has to find out the following points• Does the author produces sufficient evidence to establish the point they
want to make?• The researcher has to identify the points that the author has conveniently
left out or skated over• What is the author not saying related to the work carried out?• Has the author given proper answer to the arguments?• What are the evidences for those arguments?• Identify carefully the loop holes in the presentation• Generally the author is spinning the evidence. Is it possible for you to spin
the evidence in another direction?• What is the impact would this have on overall argument given by the author?• Here you find some clues for research area. Based on your reading the
material, you need to ask yourself, what if this particular author is comple-tely right or partially right or completely wrong
If you are able to answer these questions, then it means that you have criticallyevaluated the research article or paper.
54 Research Methodology

2.6.5 Where to Place the Literature Review in the Theses?
Generally the literature review is placed, immediately after the introduction part of thetheses. This is the “traditional” way to place the literature review to be distributed over thetheses as a whole. The advantage of this is that, the entire theses reads like a continuousand ongoing process throughout the research duration. The decision to place the literaturereview should be taken only after the discussion with your supervisor/guide.
2.6.6 Sequencing/Organizing the Literature Review
The structure and the sequence of the literature review section or chapter should havethe beginning, middle and end. The chapter, based on the literature review could guidethe reader based on the following points:
• Strategy you have adopted for selecting the books or article• Presenting the topic theme for the review• Analysis from the referred book or article thoroughly• Conclusion of literature review should be based on the key point referred from
article/book
One has to work systematically between the article/book selected. Make some sub-sections based on the research topic selected. A paragraph is generally enough for onearticle/book selected in the research paper.
For each article/book one has to commit on following points:
• Brief summary of the main idea• Limitations and weaknesses of the existing subject• Methodology followed by author• Relevance of the book or article for your research subject• Future scope given in the article/book
In a Ph.D theses, the literature review is typically one chapter. The content of thischapter will vary depending on the subject of research. Take help of your supervisor/Guide for the preparation of literature review. One “traditional” approach is to organizeyour literature review into historical orders. Some researchers prefer to organize theliterature review with the main theories and giving more space to theory and keepingthe less important stuff later. Some researchers prefer to group some key ideas, concept,fact and approaches together and then bouncing the idea of each other.
Whatever the approach is adopted by the researcher, one has to take care that, yourreview should flow smoothly, that is, one idea of book/article leads neatly to the next.Reader should be able to understand the literature review effortlessly through asequence with a clear, precise, correct, accurate and interesting information.
2.6.7 Writing Literature Review
Writing literature review starts only after taking adequate thinking time. When youhave done all the reading and planning for the different sections, then start writing. The
Literature Survey and Problem Statement 55
introduction to the literature review includes mentioning of the references used for theresearch subject. Guide the reader through the material presented neatly and clearly. Donot make claims directly, it should be supported by evidences. If it is managementrelated research, then there may be too many “Quotes.” Support “Quotes” with theproper evidences. Avoid too many “Quotes.”
The summary of the literature review should be done in your own words. Here aresome important points to be noted for writing literature review:
• Claims should be supported with evidence: whatever the claim given in theliterature review, it should be supported with the proper evidences. You shouldbe careful while interpreting the evidence
• Keywords from the literature: From each literature survey, only selected pointsshould be considered. Use your judgment to identify what is important and whatis secondary from the literature
• Summary from the literature: Your own words should be used to summarize thefinding from the literature
• Arguments should be presented with evidence: Use your own thinking and voicewith a clear-cut argument. Arguments should be supported with evidence
• Avoid too much I/we language: It is better to avoid too much I/we language. Usemore indirect language such as “It is observed from the results,” “It could beconcluded that,” and so on
• Revision of drafting: Revise, refine, and edit the drafting, number of times.Grammar and spelling should be checked number of times. Fluency of languageshould be checked as well as the references that you have used
2.6.8 Literature Survey Table: Case Study
Examples of preparing survey tables for literature survey are given in Tables 2.1 and 2.2. Inthis table the research is based on object detection and classification. Column number threegives the limitations of the work carried out in the research area. Similarly Table 2.2 showsthe comparative study of action recognition and behavior understanding methods.
2.7 Formulation of the Problem Statement
After finalizing the topic it is required to do background study of the topic to finalizethe problem statement. Appropriate background study helps to make the problemstatement precise and clear.
Every problem statement should have following characteristics:
• Known fact: Problem statement should be based on some already known factwhich can be used to introduce the topic
• Gap: It should identify gap from the current solution• Appealing: Interest of the Researcher should be preserved
56 Research Methodology

• Exploratory: can be investigated through the collection and analysis of data• Noteworthy: It should contribute for the improvement in the research subject• Feasible: It should fit the researcher’s level of research skills, available resources,
and time restrictions• Ethical: Solution proposed should be ethical and should not harm anybody• Challenging: Problem statement should be challenging• Clarity: Problem statement should be clear cut defined
2.7.1 Definition and Selection of a Research Problem
Definition of Research ProblemA problem statement is actually a challenge based on the limitations, which a Researcheridentifies in context of a practical or theoretical situation and wants to find a solution forthe same. Problem statement formulation is really a challenge in the research domain. Inany research, may be engineering, management or medical, the first and important step isto define the research problem in correct words. It should clearly define what type andimprovement in the research is going to propose by the researcher. Researchers mustexamine all the possibilities concerning the problem before defining the research problem.
To define a research problem, a researcher must know the limitations/weaknesses inthe selected research subject. The research problem can be defined for an individual or agroup of persons. Technical description of a problem, which the individual or a group ofpeople faces, is called as a research problem. If the individual or group, wants a desiredoutcome, then there are different ways (or methods) to achieve that outcome. These
TABLE 2.1
Literature Survey Table Based on Object Detection and Classification
Subtopic Methodology used Limitations
Object detection[4–9]
Methods to detect single and/or multipleobject have been proposed using single ormultiple background models
Multiple object detection in varyingenvironments is a challenging task
Object Classification[10–11]
Semi-supervised and unsupervisedclassification methods using single ormultiple features have been proposed.Shape based and motion based features suchas area size, compactness, speed etc. areused for classifying objects
Classification of objects in complexenvironment and with low computationalcost is still an unsolved problem
Object Tracking[12–15]
Region-based, contour-based, feature-based,model-based and hybrid approaches havebeen proposed.
Tracking of multiple objects and grouptracking does not give accurate results
Action Recognition[16–19]
Direct and indirect recognition of activitiesquantizing feature vectors, shape mask,human kinematics and model basedapproaches have been proposed
Recognition of actions in cluttered scenariosis still a problem
Behaviour Analysis[20–23]
Supervised and unsupervised models usingSVM classifier, optical flow based methodshave been proposed
Complex action having interaction betweentwo blobs are difficult to analyse
Literature Survey and Problem Statement 57

methods may not have equal efficiency for the desired objective(s) and there is always adoubt which method (or course of action) is best.
Usually a research problem does exist for the following conditions:
• Individual or a group has some difficulty or the problem• Objective(s)/outcome(s) to be attained. If there is no objective/outcome, one
cannot have a research problem
TABLE 2.2
Comparative Study of Action Recognition and Behavior Understanding Methods
Sr.No
Ref.no Name of the Author Methodology Used Limitations
1 [20] Carolina Garate,Sofia Zaidenberg,et al.
Group tracking is done using sevenfeatures. Behavior recognition is doneusing knowledge model and event model
Prediction of dangerous eventsnot done.
2 [24] Tian Wang, HichemSnoussi
Histogram of optical flow orientation iscomputed and nonlinear one class SVMclassifier is applied
Small deviations in scene are notdetected
3 [25] Jasper R. Van Huis,Henri Bouma et al.
Track based secondary features are derivedfrom basic features and rule based eventclassification is done
Only single track actions andinteractions under controlledenvironments are used.
4 [26] Maria Anderson,Fredrik Gustafssonet al.
Unsupervised Kmeans clustering andsemisupervised hidden Markov model isused
Does not work under occlusionand for large crowds
5 [22] Sofia Zaidenberg,Bernard Boulay et al.
Trajectories of people are analysed andclustered using mean-shift algorithm. Anevent description language is proposed
Internal group movements arenot recognised
6 [27] Xu, M., Zuo, L.,Iyengar, S., Goldfain,A., DelloStritto, J
Semisupervised training approach isproposed for detecting simple and complexactivities
Limited number of activities areconsidered
7 [28] Vishwakarma, S.,Agrawal, A.
A non-hierarchical approach is proposed.Feature vectors of interest points arequantized using a histogram
Computational complexity ismore
8 [16] Vishwakarma, S.,Sapre, A., Agrawal
Multiclass activities is considered in a threedimensional coordinate system which isrobust to scale and view changes
Number of features required aremore
9 [17] MahfuzulHaque, andManzurMurshed
An approach based on shape masksobtained from background subtraction torepresent actions is used
Objects smaller in size are notdetected
10 [18] Ronald Poppe et al. A holistic approach using global bodystructure and dynamics is used to representactions is used
Tested only on small set onactions
11 [29] Yan Song et al. Each depth pixel is mapped tocorresponding RGB pixel. Spatial–temporalinterest point (STIP)detector is used togenerate initial points and KLT tracker togenerate trajectories.
Method is specific for Depthcameras.For MSR_daily datasetproposed method outperformsother methods.
12 [23] Nick C Tang et al. Information from offline multimodaldataset is used to retrieve thecorresponding depth map and skeletonstructure.
Offline multimodal videodataset is required
58 Research Methodology

• There must be alternative methods/means for achieving the objective(s). At leasttwo methods must be available to a researcher for finding the solution
• Some doubt must remain in the mind of a researcher while selecting the alter-natives. It means that the Researcher must answer some questions concerning therelative efficiency of the possible alternatives
• Based on the environmental conditions, the difficulty varies. With different envir-onmental conditions, difficulty level also changes
• What type of input or database used to check the desired outcome
From above points, one can understand that a research problem is one which requiresa researcher to perform number of experimentation in order to find out the best possiblesolution for the desired problem. It means that, the researcher has to find out by whichmethods (alternatives) the outcome/objective can be attained with optimum perfor-mance in the context of a given environment. Different factors need to be considered,which may result in making the problem more complicated. The number of alternativesmay be very high. Persons not involved in making the decision may be affected by itand the person may react to it, favourably or unfavourably. All of these factors areconsidered in the context of a research problem. Researcher has to consider thechallenges in the context of a research problem.
But still, we have a plan with us to pursue the research. From the data we havecollected, from the literature survey, we need to plan different things, in order toidentify important issues with the research work you have planned to do. One has tospecify his/her own interest in the fields such as:
• Education: in terms of displaying video on LCD• Advertising: in terms of creative designs, media channels, and so on• Households: watching video on television, sending or receiving video through
digital media
At this point, there is a need to find the limitations of your investigation. For finding thelimitations one can consider the following parameters.
• Time: For example, processing time for the execution of the algorithm• Internet BW: For receiving or transmitting the data or information• Legal issues: To check the legal issues in processing the data or information• Quality: Quality of the output• Storage: Storage space for data
Based on these parameters, we need to focus at an early stage at some specific researcharea. After taking the basic review we need to again refocus on the questions later.
Plan your search according to the selected research area. There are a number ofapproaches:
• Retrospective: In the retrospective approach, one has to find out the most recent orlatest method/technique and then work backward. In this the journal articles arereferred to work backwards
Literature Survey and Problem Statement 59

• Systematic approach: In this approach, one has to find out all relevant materialavailable in the library
• Targeted approach: In a targeted approach, one has to pinpoint the topic andconcentrate on the narrow area of the research topic. One can target more on theselected area, when we have a clear picture of what we need to find out
Selecting the research problem is the difficult task. The researcher has to selectresearch problem after discussing it with the research guide. But, at last, everyresearcher must select his own research problem. It depends on the mind-set and thepassion of the researcher, to select the research problem. The Guide will only help theResearcher for the selection of Research subject. But the research problem has to beselected by the researcher only.
The following points should be considered by the researcher in selecting the researchproblem:
• Too narrow or too vague statements for the research problem should be avoided• Researchers should avoid the selection of controversial subjects for the research
problem• Research subjects that are done by a number of researchers generally avoided for
the selection of research problem• The research problem should be feasible for experimentation/implementation• Sufficient numbers of publications/materials should be available for finding the
limitations/weaknesses of the subject• The researcher’s qualification, the importance of the subject, costs involved for
experimentation and time factors should be considered
Even though these points are considered, it is somewhat difficult to propose definiteideas concerning how a researcher should obtain the research problem. Researchersshould take advise from an expert in the same research domain. If the literature surveyis done sufficiently, then it is easier for the researcher to discuss his/her own ideas withthe expert in the same research domain. After discussing with the experts, the researcherhas to obtain his/her own ideas for the research problem. Researcher can also discussthe research topic with his/her colleagues. In this way, the researcher has to make allpossible efforts in selecting a Research problem. The researcher has to ask the followingquestions to himself before the selection of the final research problem:
• Whether sufficient resources are available for the researcher to carry out theresearch
• Budget provided/available for the research• Cooperation from other colleagues/faculty to carry out the research work
After answering these questions, the practicability of the research problem is to bechecked and the decision should be taken for the selection of the research problem.When the research problem is relatively new, and the sufficient well-equipped resourcesare not available, a brief feasibility study should be undertaken. This step is importantbecause, this increases the confidence of the researcher to undertake relatively newresearch problem. It also makes the research interesting for the researcher and it will not
60 Research Methodology
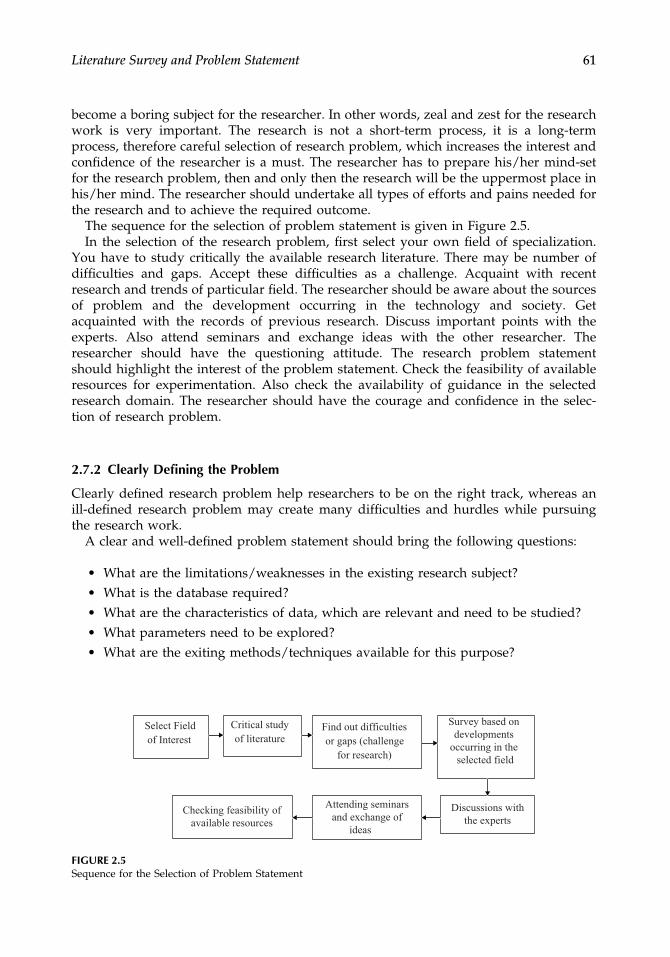
become a boring subject for the researcher. In other words, zeal and zest for the researchwork is very important. The research is not a short-term process, it is a long-termprocess, therefore careful selection of research problem, which increases the interest andconfidence of the researcher is a must. The researcher has to prepare his/her mind-setfor the research problem, then and only then the research will be the uppermost place inhis/her mind. The researcher should undertake all types of efforts and pains needed forthe research and to achieve the required outcome.
The sequence for the selection of problem statement is given in Figure 2.5.In the selection of the research problem, first select your own field of specialization.
You have to study critically the available research literature. There may be number ofdifficulties and gaps. Accept these difficulties as a challenge. Acquaint with recentresearch and trends of particular field. The researcher should be aware about the sourcesof problem and the development occurring in the technology and society. Getacquainted with the records of previous research. Discuss important points with theexperts. Also attend seminars and exchange ideas with the other researcher. Theresearcher should have the questioning attitude. The research problem statementshould highlight the interest of the problem statement. Check the feasibility of availableresources for experimentation. Also check the availability of guidance in the selectedresearch domain. The researcher should have the courage and confidence in the selec-tion of research problem.
2.7.2 Clearly Defining the Problem
Clearly defined research problem help researchers to be on the right track, whereas anill-defined research problem may create many difficulties and hurdles while pursuingthe research work.
A clear and well-defined problem statement should bring the following questions:
• What are the limitations/weaknesses in the existing research subject?• What is the database required?• What are the characteristics of data, which are relevant and need to be studied?• What parameters need to be explored?• What are the exiting methods/techniques available for this purpose?
Select Field
of Interest
Critical study
of literature Find out difficulties
or gaps (challenge
for research)
Survey based on
developments
occurring in the
selected field
Discussions with
the experts
Attending seminars
and exchange of
ideas
Checking feasibility of
available resources
FIGURE 2.5Sequence for the Selection of Problem Statement
Literature Survey and Problem Statement 61

Above questions, decides the planning of the research based on the clearly definedresearch problem. Clearly and properly defining the research problem is a step of thehighest importance. Careful detailing the research problem occurs only when theresearcher, puts all his/her efforts while pursuing the literature survey and that alsocomes out from his/her heart and mind. Formulation of a research problem is moreimportant than its solution. It is due to the fact that the solution comes afterward, whilepursuing the research work.
2.7.3 Method Used in Defining the Problem
The research is to define the problem within the boundaries within which it is to bestudied. The research problem is defined with the predetermined objectives in mind. Itis a complex task to define the research problem which must be tackled intelligently, toavoid the difficulties encountered in research operation.
Generally, the approach used to define the research problem is that the researchershould himself generate a question for the research subject. In some cases, someone elsewants the researcher to carry on the research, it may be the concerned individual or anorganization or an authority to pose a question to the researcher for defining theresearch problem. But this approach does not produce the definite results because thequestion phrased/posed in this fashion is generally in broad general terms and it maynot be in a form suitable for testing. As discussed earlier, defining the research problemis a crucial part of the research study and it takes time for defining the researchproblem. One should think calmly before deciding each and every word in the researchproblem, after considering all the dimensions of the research problem. A systematicdefinition of problem is very important after considering weightages to all the relatedpoints.
Following points need to be considered for defining the research problem:
• Available literature need to be studied• Nature of the problem need to be studied• An idea is generated after the discussion with colleagues, friends, seniors and
experts in the research subject• The research problem need to be rephrased into a working proposition
For all the above points, a brief description needs to be written
Important steps for the method involved in defining the problem statement:
• Initially, the problem is written in a broad general way. This is done due to thepractical feasibility or due to some intellectual/scientific interest
• The researcher should think thoroughly before posing the research problem• If the research topic, is related to the social research, then, it is better to do some
field observation. For this purpose, the researcher should do some preliminarysurvey. It is also called as the pilot survey
• Next, the researcher should take advice from the supervisor/guide or the subjectexpert in accomplishing this task. Guides help the researcher to put forth the problemin some general statement. But it is up to the researcher to narrow the problem andwrite the problem in operational term, to pinpoint the exact research domain
62 Research Methodology

• If the researcher is working in some research institute or organization, then he cantake help of the expert from the research institute or organization for stating theproblem statement
• If the problem contains some ambiguities information, then it should be resolvedby thinking over the problem again and again, with the cool and calm mind
• While rethinking about the problem, the feasibility about the particular solutionhas been considered. Feasibility and available resources should be taken in mindwhile stating the problem
In defining the problem, one has to understand its nature and origin clearly. For thispurpose, we need to discuss it with the people, who first raised it. The discussion gives theidea about how the problem originally came and what objectives/outcomes expected fromthe research. Even though the problem is stated by the researcher himself, he has to considerall the possibilities concerning the problem statement. For understanding the nature of theproblem, he must discuss the problem with the experts, who has a good knowledge of theproblem concerned. The researcher has also to find out the other similar problems related tothe research subject. The environment also plays very important role, in deciding theproblem. The environment affects the problem to be studied in different situations.
2.7.4 Study of Available Literature for the Problem Statement
All available literature material, which is in hand with the researcher, must necessarilybe surveyed and examined before the definition of the research problem. It means that,the researcher is conversant with the relevant theory concerning the subject to bestudied. Also, records and findings related to the research topic is studied thoroughlyby the researcher. There is always a need to devote sufficient time in revising/reviewingof the research, which has already undertaken by other researchers in related domain.
It also helps to identify, what type of data and material is available for operationalpurpose. The availability of data helps to narrow down the problem itself. It is alsoeasier to decide the technique/method to be used for the experimentation purpose.Study of available literature survey also helps to identify the gaps in the theories orwhether the existing theories applicable to the problem under study. All of these pointshelp the researcher to think about new ideas, which occurs in his mind to take newstrides in the field for improving the knowledge. Such type of study also helps theresearchers to find out the new lines of approach to the present problem.
2.7.5 Generating Ideas through Discussions for the Formulation of Problem Statement
While pursuing any type of research, discussion with colleagues and experts gives youmany ideas and produces useful information. Discussion with others is often known asExperience Survey. Other researchers with rich experience are in a position to providemaximum help in different aspects of the proposed study and their comments are veryhelpful for the researcher. Researcher has to take advice given by expert seriously. Thiswill help sharpen the research problem statement and the focus of attention on specificaspects within the area of research subject. Researchers expect the points such as generalapproach to the given problem, techniques that might be used, possible outcomes orsolutions and so on.
Literature Survey and Problem Statement 63

Rephrasing the problem into analytical or the operational terms is not a difficult task.The following points need to be observed while defining the research problem.
• Assumptions related to the research problem should be clearly stated• Different technical words, terms and phrases with special meanings, used in the
problem statement, should be clearly defined• Criteria for the selection of problem should be provided• Sources of data available and the time limit should be taken into consideration• The environment/circumstances within which the problem is to be studied must
be mentioned explicitly in defining a research problem
Defining the research problem the following steps are generally used
• Define problem in a broader sense• Resolve the ambiguities involved• Rethinking about the problem statement and redefining
Continuously thinking about the problem statement, result in a more specific formulation ofa problem Statement: It becomes realistic, in terms of the available data and resources and italso becomes analytically meaningful. It results in well-defined problem statement and iscapable of paving the way for the development of working hypotheses.
2.8 Scope and Significance of the Research Problem
It is not easy to clearly define the problem statement. There are some examples inscientific research, where the researcher might spend years for exploring, thinking andresearching, before they are clear about what type of research questions they are going toanswer. In most of the cases, when the research problem is too wide, the feasibility alsoneeded to be checked. Also, the time required and the resources for the research problemare very important. The depth and focus of the research problem should be understoodfrom the title. The problem statement helps you to keep on track with your research. Theresearch problem statement should be adequate. Researcher generates many problemstatements that may arise from the same situation. But in practical case, your researchwill pursue only one problem statement in depth.
The problem statement should have the following characteristics:
• The problem statement should be based on factual evidence• The problem statement should be meaningful and testable• It should be relevant and meaningful• It should reflect the need for the society• The problem statement should include research component• The problem specified in the problem statement should be solvable, achievable and
measurable
64 Research Methodology

The problem statement should make it clear about the purpose of the research? Thepurpose of the research should be clear to you and the reader. The subsequent elabora-tion of method should be provided for the research.
2.8.1 How to Define a Problem Statement
The problem statement should highlight the limitation/negative points of the currentsituation and explain why this matter. The problem statement should be a greatcommunication tool. It should help to get the support from other. The important goalof problem statement is to define the problem in a clear and precise way. The goalshould be to focus onto the improvement of research activity. Creation of a problemstatement, involves the following steps:
• Write different statements, related to the problem. Compare each statement, look-ing for common things and working
• After comparing different statements, write an improved statement related to thecommon theme
• Ensure that the problem should reflect social approach or some needy solution.• Also, ensure that the problem focuses existing problem in the research domain/
subject• Include time frame over which the problem has been occurring• Quantify the problem• One should be able to ask the question related to the problem (why and how?)• Problem statement should be defined as you start reading the literature root level
2.8.1.1 Review the Problem Statements Based On
• It should focus on only one problem• It should not be more than two statements• The problem statement should not suggest the solution
2.8.1.2 Poor Way of Writing Problem Statements
The problem statement “Novel algorithm to improve the speed of classification usingK-means clustering method,” is an inappropriate one. In this, the “K-mean” clusteringmethod is given in the problem statement itself, which is wrong. When one writes thespecific method then he/she has to use that method only for experimentation. Itlimits the scope of the research. As said earlier, research is not time bound. Whilepursuing research, the researcher goes on doing experimentation, he/she may devisenew methods or techniques for getting better result. So, one should not specify themethod in the problem statement itself. Also in this statement “novel” and “algo-rithm” words are used, which are to be avoided. As the research is always used todevise novel/innovative/new method/algorithm, for improving or optimizing someparameters. Therefore one should not write the words such as “novel” and “algo-rithm” in the problem statement itself.
Literature Survey and Problem Statement 65

Another example of poor problem statement is “Finding/identifying the defects in thefetus using video enhancement.” In this statement, “fetus” is used, but the video orimages of a fetus are not allowed legally. So while determining the problem state-ment, words such as “fetus” should not be used, as the database for fetus is notpermitted legally.
2.8.2 Errors in Defining the Problem Statement
If the sufficient time is not given by the researcher for deciding the problem statement,then there may be errors in defining the problem statement. The researcher has to takeutmost care and provide sufficient time in defining the problem statement to pursue.When researcher fails to pursue the following important points, then there are errors indefining the problem statement. These errors are generally due to the following points:
• Researchers don’t have an idea about what exactly to do (pinpointing of theresearch subject)
• Researchers are not qualified in the subject to carry out research design• Why you feel that the topic is innovative or meaningful or of interest to the
research• Availability of database for the selected research subject• Any legal issues related to the research domain• Any issues related to the safety (such as military applications, etc.)• No consideration of the cost involved while pursuing the research• Too narrow or too vague problem statement• Don’t select a controversial problem• Don’t choose a subject/topic that is overdone; it is difficult to throw new light on
such cases
If these points are not considered properly and the researcher has not given any thoughtrelated to them, then there are chances of errors in defining the research problem.
2.9 Summary
Literature survey and its review plays an important role in the definition of the problemstatement. As a result, the different ways of performing the literature survey and reviewis explained in detail. This chapter is a treasure for those who would like to understandthe concepts behind the literature survey and review. The different ways of collectingthe information or data through interviews, focus groups and questionnaire areexplained. Based on literature survey and review the researchers should be able todefine their own problem statement. Hence this chapter can serve as an importantchapter for identifying problem statement for post graduate students as well as researchscholars.
66 Research Methodology
Further Reading
1. Abdulla Ramdhani, Muhammad ali Ramdhani, Abdusy Syakur Amin, “Writing a LiteratureReview Research Paper: A step by step approach” International Journal of basic and AppliedScience, Vol 03, No 01, pp.47–56, July 2014.
2. Justus J. Randolph Walden University, “A Guide to Writing the Dissertation LiteratureReview, A peer-reviewed electronic journal, Practical Assessment, Research & Evaluation”,ISSN 1531–7714, Volume 14, Number 13, pp 1–13, June 2009, ISSN 1531–7714.
3. D. R. Rowland, The Learning Hub, Student Services, The University of Queensland, Reviewingthe Literature: “A Short Guide for Research Students”, pp1–20.
4. Y. Chen, L. Zhang, B. Lin, Y. Xu, X. Ren. Fighting Detection Based on Optical Flow ContextHistogram. Proc. of IEEE 2nd Int. Conf. on Innovations in Bio-inspired Computing andApplications, pp. 95–98, 2011.
5. Rub´en Heras Evangelio and Thomas Sikora, “Complementary Background Models for theDetection of Static and Moving Objects in Crowded Environments”, 8th IEEE InternationalConference on Advanced Video and Signal-Based Surveillance, 2011
6. Pierre-Marc Jodoin, Venkatesh Saligrama, Janusz Konrad, “Behavior Subtraction”, IEEE Trans.Image Process, vol. 21, no. 9, pp. 4244–4255, September 2012.
7. Dawei Li, Lihong Xu, Erik D. Good Man, “Illumination-Robust Foreground Detection in aVideo Surveillance System”, IEEE Trans. On Circuits and Systems for Video Technology, vol.23, no. 10, pp. 1637–1650, October 2013.
8. Kalyan Kumar Hati, Pankaj Kumar Sa, Banshidhar Majhi, “Intensity Range Based BackgroundSubtraction for Effective Object Detection”, IEEE Signal Processing Letters, vol. 20, no. 8, pp.759–762, August 2013.
9. R. Cutler, L. Davis, “Robust Real-Time Periodic Motion Detection, Analysis, and Applica-tions”, IEEE Trans. Pattern Anal Mach. Intell, vol. 22, no. 8, pp. 781–796, August 2000.
10. L. Zhang, S. Li, X. Yuan, S. Xiang, “Real-Time Object Classification in Video Surveillance Basedon Appearance Learning”, Proc. IEEE Int. Workshop Visual Surveillance in Conjunction withCVPR, 2007.
11. M. Kafai, B. Bhanu, “Dynamic Bayesian Networks for Vehicle Classification in Video”, IEEETrans. Ind. Inf., vol. 8, no. 1, pp. 100–109, February 2012.
12. Tianzhu Zhang, Si Liu, Changsheng Xu,Hanqing Lu, “Mining Semantic Context Informationfor Intelligent Video Surveillance of Traffic Scenes”, IEEE Transactions on Industrial Infor-matics, vol. 9, no. 1, pp. 149–160, February 2013.
13. Q. Chen, Q.S. Sun, P.A. Heng, D.S. Xia, “Two-Stage Object Tracking Method Based on Kerneland Active Contour”, IEEE Trans.Circuits Syst. Video Technol., vol. 20, no. 4, pp. 605–609,2010.
14. Y. Chai, S. Shin, K. Chang, T. Kim, “Real-Time User Interface using Particle Filter with IntegralHistogram”, IEEE Trans. Consum. Electron, vol. 56, no. 2, pp. 510–515, 2010.
15. J. Chiverton, X. Xie, M. Mirmehdi, “Automatic Bootstrapping and Tracking of Object Con-tours”, IEEE Trans. Image Process, vol. 21, no. 3, pp. 1231–1245, 2012.
16. S. Vishwakarma, A. Sapre, A. Agrawal, “Action Recognition Using Cuboids of Interest Points”,IEEE Int. Conf. on Signal Processing, Communications and Computing (ICSPCC), ElectronicISBN: 978-1-4577-0894-7, pp. 1–6, 2011.
17. Mahfuzul Haque, Manzur Murshed, “Robust Background Subtraction Based on Percep-tual Mixture-of-Gaussians with Dynamic Adaptation Speed”, Proc of the 2012 IEEEInternational Conference on Multimedia and Expo Workshops (ICMEW ‘12), Melbourne,Australia, pp. 396–401, July 2012.
18. Ronald Poppe, “A Survey on Vision-Based Human Action Recognition”, Image VisionComput. J., vol. 28, no. 6, pp. 976–990, June 2010.
19. Saad Ali, Mubarak Shah, “Human Action Recognition in Videos Using Kinematic Features andMultiple Instance Learning”, The IEEE Transactions on Pattern Analysis and Machine Intelli-gence, vol. 32, no. 2, pp. 288–303, February 2010.
Literature Survey and Problem Statement 67

20. Carolina Garate, Sofia Zaidenberg, Julien Badie, Francois Bremond, “Group Tracking andBehavior Recognition in Long Video Surveillance Sequences”, VISAPP – 9th International JointConference on Computer Vision, Imaging and Computer Graphics, January 2014.
21. Hala H. Ahmed Taha Zayed, et al., “On Behavior Analysis in Video Surveillance”, Proc of The6th International Conference on Information Technology, 2013
22. Sofia Zaidenberg, Bernard Boulay, et al., “A Generic Framework for Video UnderstandingApplied to Group Behavior Recognition”, International Conference on Advanced Video SignalBased Surveillance (AVSS), 2012.
23. Nick C. Tang, et.al, “Robust Action Recognition via Borrowing Information Across VideoModalities”, IEEE Transactions on Image Processing, vol. 24, no. 2, pp. 602–614, February 2015.
24. Tian Wang, Hichem Snoussi, “Detection of Abnormal Visual Events via Global Optical FlowOrientation Histogram”, IEEE Trans. On Information Forensics And Security, Vol 9, No 6, June2014.
25. Jasper R. Van Huis, Henri Bouma et.al., “Track-based event recognition in a realistic crowdedenvironment”, In proc of Society of Photo-Optical Instrumentation Engineers, SPIE, 2014
26. Maria Anderson, FredrikGustafsson et. Al, “Recognition of Anomalous Motion patterns inUrban Surveillance”, Selected Topics in Signal Processing, IEEE Journal Volume:7 , Issue: 1, 22January 2013.
27. Xu, M., Zuo, L., Iyengar, S., Goldfain, A., DelloStritto, J, “ A semi-supervised hidden Markovmodel-based activity monitoring system.”, In 33rd Annual Int. Conf. of the IEEE Engineeringin Medicine and Biology Society (EMBC), Boston, Massachusetts USA, pp. 1794–1797 (2011).
28. Vishwakarma, S., Agrawal, A.: A novel approach for feature quantization using one-dimensional histogram. In: Annual IEEE India Conference (INDICON), pp. 1–4 (2011)
29. Yan Song et.al, “Describing Trajectory of Surface Patch for human Action Recognition on RGBand Depth Videos”, IEEE Signal Processing Letter, Vol. 22, No. 4, April 2015.
68 Research Methodology

3Research Design
Prachi Joshi
CONTENTS
3.1 Introduction . . . . . . . . . . . . . . . . . . . . . . . . . . . . . . . . . . . . . . . . . . . . . . . . . . . . . . . . . . . .703.1.1 What Is Research Design? . . . . . . . . . . . . . . . . . . . . . . . . . . . . . . . . . . . . .703.1.2 Necessity of Research Design. . . . . . . . . . . . . . . . . . . . . . . . . . . . . . . . . . .713.1.3 Framework of Research Design . . . . . . . . . . . . . . . . . . . . . . . . . . . . . . . . .713.1.4 Parameters of a Research Design . . . . . . . . . . . . . . . . . . . . . . . . . . . . . . . .713.1.5 Design and Methods . . . . . . . . . . . . . . . . . . . . . . . . . . . . . . . . . . . . . . . . .74
3.2 Approaches of Research Design . . . . . . . . . . . . . . . . . . . . . . . . . . . . . . . . . . . . . . . . . . .753.2.1 Qualitative versus Quantitative Research. . . . . . . . . . . . . . . . . . . . . . . . . .75
3.3 Types of Research Designs . . . . . . . . . . . . . . . . . . . . . . . . . . . . . . . . . . . . . . . . . . . . . . . .753.3.1 Explanatory Research Design. . . . . . . . . . . . . . . . . . . . . . . . . . . . . . . . . . .753.3.2 Descriptive Research Design . . . . . . . . . . . . . . . . . . . . . . . . . . . . . . . . . . .773.3.3 Diagnostic Research Design . . . . . . . . . . . . . . . . . . . . . . . . . . . . . . . . . . . .773.3.4 Experimental Research Design. . . . . . . . . . . . . . . . . . . . . . . . . . . . . . . . . .773.3.5 Exploratory Research Design . . . . . . . . . . . . . . . . . . . . . . . . . . . . . . . . . . .783.3.6 Hypothesis-Testing Research Design . . . . . . . . . . . . . . . . . . . . . . . . . . . . .78
3.4 Principles of Experimental Design . . . . . . . . . . . . . . . . . . . . . . . . . . . . . . . . . . . . . . . . .793.4.1 Principle of Replication . . . . . . . . . . . . . . . . . . . . . . . . . . . . . . . . . . . . . . .793.4.2 Principle of Randomization . . . . . . . . . . . . . . . . . . . . . . . . . . . . . . . . . . . .803.4.3 Principle of Local Control . . . . . . . . . . . . . . . . . . . . . . . . . . . . . . . . . . . . .80
3.5 Design of Experiments . . . . . . . . . . . . . . . . . . . . . . . . . . . . . . . . . . . . . . . . . . . . . . . . . . .803.5.1 Post-Test Only Design . . . . . . . . . . . . . . . . . . . . . . . . . . . . . . . . . . . . . . . .813.5.2 Pre-Test Post-Test Only Design . . . . . . . . . . . . . . . . . . . . . . . . . . . . . . . . .813.5.3 Completely Randomized Design . . . . . . . . . . . . . . . . . . . . . . . . . . . . . . . .833.5.4 Randomized Block Design . . . . . . . . . . . . . . . . . . . . . . . . . . . . . . . . . . . . .843.5.5 Latin Square Design. . . . . . . . . . . . . . . . . . . . . . . . . . . . . . . . . . . . . . . . . .853.5.6 Factorial Design . . . . . . . . . . . . . . . . . . . . . . . . . . . . . . . . . . . . . . . . . . . . .863.5.7 Quazi-Experimental Design . . . . . . . . . . . . . . . . . . . . . . . . . . . . . . . . . . . .873.5.8 Cross over Design . . . . . . . . . . . . . . . . . . . . . . . . . . . . . . . . . . . . . . . . . . .88
3.6 Sampling Concepts . . . . . . . . . . . . . . . . . . . . . . . . . . . . . . . . . . . . . . . . . . . . . . . . . . . . . .883.6.1 Design of Sample. . . . . . . . . . . . . . . . . . . . . . . . . . . . . . . . . . . . . . . . . . . .893.6.2 Principles of Sampling . . . . . . . . . . . . . . . . . . . . . . . . . . . . . . . . . . . . . . . .893.6.3 Preparing a Sample Design . . . . . . . . . . . . . . . . . . . . . . . . . . . . . . . . . . . .903.6.4 Sampling and Nonsampling Errors . . . . . . . . . . . . . . . . . . . . . . . . . . . . . .913.6.5 Selection of Sampling Procedure . . . . . . . . . . . . . . . . . . . . . . . . . . . . . . . .91
3.7 Methods of Sampling . . . . . . . . . . . . . . . . . . . . . . . . . . . . . . . . . . . . . . . . . . . . . . . . . . . .923.7.1 Probability Sampling . . . . . . . . . . . . . . . . . . . . . . . . . . . . . . . . . . . . . . . . .92
69

3.7.2 Nonprobability Sampling. . . . . . . . . . . . . . . . . . . . . . . . . . . . . . . . . . . . . .963.7.3 Sampling in machine learning approaches. . . . . . . . . . . . . . . . . . . . . . . . .97
3.8 Summary . . . . . . . . . . . . . . . . . . . . . . . . . . . . . . . . . . . . . . . . . . . . . . . . . . . . . . . . . . . . . .98Further Reading. . . . . . . . . . . . . . . . . . . . . . . . . . . . . . . . . . . . . . . . . . . . . . . . . . . . . . . . . . . . . 98
The Twelve Principles of Character AreHonesty, Understanding, Compassion, Appreciation,Patience, Discipline, Fortitude, Perseverance, Humour, Humility, Generosity and Respect.
—Kathryn B. Johnson
Learning objectives of this chapter are to:
• Understand the importance of research design• Analyse the various types of research designs and select appropriate design for
experimentation• Distinguish and learn the applicability of the experimental designs• Investigate the sampling techniques and select suitable method for research
This chapter will enable the researcher to:
• Use the research design in the proposed research experimentation• Select and apply the design as per the need of the proposed research• Identify and use the sampling method as per the requirement• Exploit the research design for improved research findings
3.1 Introduction
Any research implementation needs a systematic approach toward development. This isimportant from the view of exploring right directions to come up with concrete results.So what relationship exists between the methodology and the design? Which aspects ofdesign are required for a problem at hand? What about the samples used? How to selectthem? Let us understand. The chapter is split into two major sections, research designand the sampling concepts.
3.1.1 What Is Research Design?
At the heart of the research lies in the understanding of the problem. A researcher is capableto capture and identifying the need of the research and formulate the problem definition.This is the most preliminary step but lot of questions that need to be addressed are -How tocarry out the research? How to practically deploy solutions and deliver accurate results?
A research design is the most important step in giving a direction to the researchproblem. It is the overall plan that deals with the aspects of complete design from thestudy type, data collection approaches, experimental designs, and statistical approachesfor data samples.
70 Research Methodology

3.1.2 Necessity of Research Design
Why is the research design so very important? A researcher can logically decide and selecton the methods, build his/her own plan and work. But it does not happen this way. For aresearcher of any field, the design guides him from the perspective of the type of data thatcan be used, the collection methods which can be looked at, to determine methods suitablefor the problem at hand and finally able to have concrete deliverables!
In daily life too, there exists a proper planning; a to do list possibly that every one ofus makes and follows some plan to get a “tick mark” on those lists. Similarly, a researchdesign guides us to overcome the difficulties that one is likely to face during theresearch to get outcomes. Whether one is working in mechanical industry or it couldbe on the IT product development, a mind-map needs to be prepared. The dependenciesof the components, the requirements of experimentation and research, the data/equip-ment availability, the economic front and other things are required to be concentratedupon for coming up with effective results. A failure in planning of any of the aspectscould land up causing an irrevocable error.
The research design helps the researcher to understand the dependencies, consider theoverall road map for carrying out the research along with identifying the minute details.So, in a nutshell, it is extremely necessary that a research design should be preparedmeticulously and exploited for the betterment of a benchmark research.
3.1.3 Framework of Research Design
From the preceding points, one thing is clear that the design actually facilitates theresearch toward a right direction. So essentially a research framework deals with:
(i) Defining precise, up to the point problem statement(ii) Approaches/techniques that can be put to practice to collect samples/data(iii) The details about the data that need to be analyzed and further researched upon(iv) Approaches/experimental setups to be executed for the data processing and
analysis.
One thing that a researcher need to keep in mind is that all types of research designs(which we would be studying further) are not applicable to all types of researchproblems and vice-versa is also not true. The type of research study would be the onedetermining the design for it.
In general, without belonging to any specific category of research, the framework isconstituted of components as shown in Figure 3.1.
3.1.4 Parameters of a Research Design
In this section, we will discuss some important terminology used while developing aresearch design. Based on the lines of framework, how the entire research would beplaced is detailed as below:
(i) Title of research:Every researcher wants to focus, develop, and deliver a very potential researchcomponent. He is keen to showcase the necessity of the proposed work. This needs
Research Design 71

to be made clear by properly defining the title of the research. There should be noambiguity; needs to be concise and clearly state what the researcher plans to do.
(ii) Importance of the research:The title gives a first-level idea about the research but the importance of theresearch in a more elaborate way should be mentioned and the researcherhimself should be well aware of the necessity. This section puts forth thesignificance of the work being carried out.
(iii) Literature survey:While coming up with research design it is equally necessary to understand,relate and study what other researchers have contributed to. So, an under-standing of which reference material needs to be applied and studied furtheron along with identification of shortfalls other researchers is important fromthe researcher’s perspective. This aids in defining the scope of research and tohave achievable objectives.
(iv) Scope/objectives and problem statement:The design should put forth the clarity on the objectives and a concreteproblem statement. A clear idea about the tasks that are required to be carriedout as a part of research should be explicitly mentioned with the objectives. Aproblem statement defines the outcomes expected out of the research in a veryprecise way. The statement should be written in concise way and as suchshould be able to put light on the issues that the researcher will be addressing.Literature survey shows way to define the problem statement.
(v) Concepts of the terminology used:A key aspect while coming up with research design is that the researcher needsto have understanding of the terms he would be using in the research. In thissub-point, we will high light the terms with regard to the research design:
Defining
objectives
Data collection
techniques
Selection of key
components of data
Implementation of
techniques for
processing and
analysis
Reporting
findings
FIGURE 3.1Research Design Framework
72 Research Methodology

• Variables – An item used in research that can take up different values. Thesevalues can be quantitative like temperature (Celsius/Fahrenheit), measure-ment of earthquake (Richter scale) and so on. Variables could be continuous –numerical values as mentioned earlier or categorical-qualitative. Qualitativevariable can be quality of air (good/bad). They are further classified asdependent and independent. A relation between weight and height of anindividual – these variables can be termed as dependent variables. Relationbetween amount of rainfall and height of an individual – independentvariables
• Extraneous variable – independent variable that may not affect theresearch directly but could be a governing factor for a dependent variableis termed as extraneous variable. For example, a relation between timespent on social media and the type of person (introvert or extrovert). Timespent on social media and type of person are two independent variables.But time spent on social media is dependent variable for an extraneousvariable – time spent on exercising. So, a third variable affecting thiswhich is actually not considered in the research study. One needs to bevery careful thus while framing the statements and understanding theextraneous variables
• Control – term typically used in research design to reduce the influence ofextraneous variable
• Confounded relationships – If the dependent variable is restricted by theextraneous variable, it is confounded relationship
• Hypothesis – one of the most important aspect of research design. Hypoth-esis is a probable or a tentative solution to a given problem. It is a claim thata researcher needs to test prior to coming to a conclusion that it is valid. Noresearcher can proceed without stating a hypothesis
• Experimental and control groups – While dealing with experimentaldesigns, when a group of samples is experimented with normal or tradi-tional conditions, it is referred to as control group whereas when a groupis experimented with new/certain specific conditions/environment it istermed as experimental group. These would be dealt in detail in theexperimentation design section later
• Treatments – The varied conditions to which the above-mentioned groupsare exposed to are referred to as treatments
(vi) Data – Selection and collection and analysis:While one is ready with the concepts and the research topic, as mentioned in theresearch design framework, one has to narrow down on the data selection andcollection methods. The amount of data viz. number of samples, the type of data,the testing data to be used should be decided prior to the commencement ofresearch. This is dependent on the nature of research like if it’s a research basedon description – it would need large amount of data as compared to others. Datacollection is the most time-consuming task. Many times the researcher faces aproblem of unavailability of the data. In this design phase, following factorshould be taken care of.• from where to get the data – reaching out to experts and getting complete
understating of the data to be used during the research process
Research Design 73

• how to collect – whether in the form of questionnaire or surveys or any othermethod
• whether to use any specific equipment/new online forms to gather the requireddata
• type of collection process – whether it is required throughout the research orthe data needs to be acquired only in the beginning. This is again charac-terised by the nature of research one would be doing.
One of the biggest challenges that a researcher often faces is getting the accurateand precise data. Hence data acquisition is a very essential step that needs to beaddressed during the design stage.Although analysis is dealt with while the research is ongoing, the planningabout what analysis needs to be performed should be done prior. This is to getan overall idea about how the research would proceed and what needs to bedone.
(vii) Results: Interpretations and conclusionsWhy are we discussing about results at this stage? A very crucial aspect that aresearcher should know is; how he plans to deliver the results and state his/her claims while interpreting the results. Though a variety of methods –
graphs, tables, scatter plots etc. can be used – the way the results arepopulated, what factors need to be concentrated upon while talking aboutresults, any specific parameters that can been further taken up to gain moreinsights need to made clear. With reference to the previous base cases andearlier research, the new claims should be justified to derive conclusions.This planning about the parameters that one expects at the result should bedone in the beginning – and hence in the research design. A detailjustification of the expected results and the actual results needs also to beadded at the end and researcher cannot leave it without giving an answerto “why” the difference was identified.
(viii) Further research:Once we begin with the planning of objectives to data collection, the analysis toresults, the other aspect that one can specify is the further research. When oneis defining the scope, a researcher gets the clarity of thoughts as to whichparticular arears he would be exploring and what can be done ahead which heis not accounting into his/her scope. Of course, many times despite mentioningabout the further research or areas out of scope in this design stage, the picturegets clearer during or when the research is coming to an end. Despite this fact,it is a good practice to mention about it.
3.1.5 Design and Methods
One fundamental aspect one needs to take care of is to understand the differencebetween design and method. Design is not any method that one needs to carry out.It is a way of planning things. No explicit method in research design talks about theway in which data collection should occur or any specific approach to be applied.The fact is that it is a plan that deals with the different research areas that would beexperimental or analytical. There are different approaches or methods that areperformed or used for different design types. For example, a design type can be
74 Research Methodology
“case study.” For such a design, one could go with detailed data collection withonline forms or questionnaire and then go ahead with any method the researcherfinds appropriate to get the analysis.
3.2 Approaches of Research Design
What is it that one wants to come up with? Essentially what philosophy exists inapproaches while carrying out the research? Let us explore more.
3.2.1 Qualitative versus Quantitative Research
A measurable amount is referred as “quantity.” So, something that one can express in theresults with a specific amount that could be compared can be called as quantitativeresearch. Imagine a researcher trying to gain insights about the amount of pollution andits percentage impact. Such a research is a case of quantitative research- that has rigorousexperimentation and a lot of findings. So, for the said example findings can be differentplots with percentile impacts on people in different geographical areas and so on.
In case of qualitative research, its deals with subjective analysis. More of psychologicalaspects involved here. A survey about how much people are depressed if they spend timeon social media can be an example of qualitative analysis. We can relate it to the behaviouror cognitive sciences. A very common example we can say about qualitative analysis is ofsocial network sites. We often get recommendations for some specific posts. Though there issome sort of intelligence embedded in the methodology that is used, but the outcomes arequalitative. We get to know the kind of person, his/her likes, dislikes and so on.
Yet there has been a long debate as to whether research design is actually gettingimpacted with the qualitative or quantitative research. With the reference to casestudies, the researchers claim that it is actually insignificant to classify the design intoqualitative or quantitative.
3.3 Types of Research Designs
This section deals with the different research designs. Addressing the different ways inwhich the data collection affects and how the type of research is formulated and takesplace contribute in formulation of a research design. One point that every researcher hasto understand is that the design framework described earlier is a baseline. Depending onthe type of research, the design has to be moulded to have adoptions of differentvariants. This could be for hypothesis building, the data collection or any other step.
3.3.1 Explanatory Research Design
As the name suggests, this type of research design addresses the “Why” questions.Consider a research area where one has to study as to why majority of students are keenin pursuing engineering degree despite several other avenues. This question changes the
Research Design 75

way in which data collection occurs. Detailed data collection for the problem at handneeds to be carried out while creating the research design.
While carrying out explanatory research, we need to understand causal relationships.Since it’s all about addressing the question of why we need to determine the impactsand effects of one attribute with other that is involved in the research.
While saying so, the causal relationships are typically given as X Y, where Y issome attribute or characteristic that is affected by X. Causal relationships can be direct,indirect, or complex, or a combination of direct and indirect.
For example: in case of direct relationship, educational qualifications will have impacton job opportunity. Whereas in case of indirect relationship, it can be represented as acausal chain such as many in -between links from educational qualifications to domainareas and then job opportunities.
While talking about complex relationships, one link can be established from Educa-tional qualification to internships and finally to job opportunity where as other link canbe from Educational qualification to domain area and then job opportunity. Figure 3.2depicts the relationships.
While dealing with explanatory relationships, it is extremely necessary to carefullyunderstand and identify the relationships. Many times, a researcher can land up inselection of parameters which are insignificant but due to some changes that haveoccurred in a particular parameter, they then need to consider it to be a part of causalrelationship. Since we are trying to have a reasoning justified in this kind of design, thefactors which are influential and are not related; if are yet counted in the experimenta-tion, they may lead to wrong findings.
For example, in recent years the number of people who have started living in old agehomes has increased at the same time number of youth that has gone abroad for workhas increased. It is not necessary that the youth taking up jobs abroad has caused the
Educational
qualifications
Job
opportunities
Domain area
Internships
undertaken
Educational
qualificationsJob
opportunities
Domain areaEducational
qualifications
Job
opportunities
(a) Direct relationship
(b) Indirect relationship
(c) Complex relationship
FIGURE 3.2Causal Relationships
76 Research Methodology

count of people in old age home to increase. There could be other factors too. So, dataparameters for reasoning are very much important!
While it is equally important that while working on explanatory relationships, wronginferences or conclusions to the “why” questions should be omitted in the design.
3.3.2 Descriptive Research Design
When we talk about descriptive research design, it deals with finding out the characteristicsor particular behaviour or pattern in a specific group. It could be a case where a researcheris trying to find out some outlier by performing the study of the group of data points.
This study deals with coming up with findings in predictive way to understand thedifferent/unusual characteristics or unnoticed behaviour. The research enlists, describesthe reasons and the observations.
While preparing design for this type of research, one has to definitely follow theformal earlier explained process but the basic research design needs to ensure that acomparative study is also added up. Since the study deals with observing the peculia-rities and publishing their findings, the data collection here can include previouslyrecorded data, questionnaire, or any other means of getting authentic data.
3.3.3 Diagnostic Research Design
Diagnostic research deals with finding out associations. More specific, it is trying toconclude with findings that establish relationships. We can say about it as one aspectthat exists and has led to other aspect. A typical example for association can be thefindings of research in a supermarket shopping. It can be study of establishing associa-tions about people who tend to buy butter along with bread or even associations ofbuying eggs along with milk. Such a study involves mining associations.
A research design for this analysis should be carefully worked on. It is necessary toget data samples that suit or are belonging to the category of association the researcheris trying to explore. So, again in design where we are following the typical researchdesign framework, the design needs to accommodate and perform changes as per thetype of research. So, in this diagnostic category, the sample design needs to be preparedto accurately get the data set required for study. Many researchers would be keen onusing the different sampling techniques – random, cross-fold, or any other. A goodmixture of samples are necessary while doing this type of research.
While describing the diagnostic research, there are a lot of similarities between thedescriptive one and diagnostic type. Even the sample design to populate the data, thecomparative analysis to understand associations, the tabulation of results and their formatscan be very much similar and one could see a significant overlap between these two designs.
The major difference in these two studies is the methods that would be worked onand finally the conclusions are different.
3.3.4 Experimental Research Design
Whenever we perform any type of experiment, we tend to infer or come up withsomething novel. As a researcher, knowing the involved parameters and theirlimitations, we make attempts to determine some new things. When the research isof such a category, the research design has to ensure that, it makes use of followingparameters in the planning stage. It involves validations and full proof conclusions to
Research Design 77

portray that the experiment is valid. We can relate this type to hypothesis testingresearch as well.
In this type of research design following things are accounted:
(i) Problem formulation(ii) Defining the hypothesis(iii) Preparation of the experimental design – this includes the variables, the quan-
tities, their relations, their properties, the environment in which the experimentis to be performed, proper selection of the equipment for experimentation andselection of any other material/substances in the procedure.
(iv) Analysis of the impact and effect on the variables post experimentation.(v) Validation of the experiments with statistical reasoning and testing.
There are different variants and principles in case of experimental design. They willbe discussed in a later section in this chapter.
3.3.5 Exploratory Research Design
Let us discuss this type of research design by an example. Assume you are fond ofeating. There is a typical hotel, one of your favorites, and you often visit that hotel.This is where you are exploiting a known place. Now if there is a new hotel that hasopened and if you go to this new hotel rather than your regular one – you areexploring! Maybe you would like or you won’t like the food there but you never knowunless you go there!
So, in exploratory design, the bonus is on inventing or discovering new things!In such a research, the design needs to be very flexible. The most important factor in
exploratory study is the survey!While doing exploratory study, surveys are very much important to lead to a strong
hypothesis. Surveys can be in the form of literature review so that the previous findingsassist the researcher in concise definition of the problem statement. Many times onlinesurveys or questionnaire where researcher gets data filled from experts helps in analysisof the real issues. This type of survey is named as experience survey. There could beother approaches like – selection of data samples that carry potential information forfurther exploratory analysis. This can be merged with the ones discussed earlier. Manytimes interviews too are used as a collection approach for obtaining critical informationrequired in the exploratory analysis.
So, to summarize – exploratory is all about – findings with new tasks associatedwith the dependencies along with lot of surveys!!!
3.3.6 Hypothesis-Testing Research Design
In case of hypothesis testing, the study deals with finding out the causal relationshipsbetween the variables associated. Generally, a researcher is trying to explain or claimdependency of “Y” (a dependent variable) on “X” (an independent variable). Such arelation can be put forth in the form of hypothesis.
F(X) = Y; where X: independent variable and Y: dependent variable
78 Research Methodology

So, while defining the hypothesis, it needs to be very precise and clear with noambiguity. As an example, the hypothesis can be “Students pursuing Masters inEngineering are likely to buy this book of Research Methodology than students studyingother streams,” Such statements need to be tested against the evidence, need performingexperiments to validate the claims to infer about the dependencies. So, often whiletalking about hypothesis testing, it’s about the experimentation design.
This design was evolved owing to the work by Professor R. A. Fisher, who carried outexperimentation on the agricultural land and later came up with the notion for hypoth-esis testing. He divided the land and set up experiments and inferred on yield and otherparameter and variables. It all motivated him to formulate the hypothesis to determinethis outcome. Hence, hypothesis testing makes use of experimental designs!
Figure 3.3 depicts key aspects of the different research designs.
3.4 Principles of Experimental Design
Though a brief introduction to experimental designs has been done in the previoussection, let us understand in detail what are the principles to deal with such a design.While developing a research design, a lot of experimentation needs to be carried out. Butwhile doing so, there are basic principles that need to be followed to validate the results ofthe experimentation. Let us understand them.
3.4.1 Principle of Replication:
To put forth results on any experimentation, performing the experiment just once is notsufficient. The principle of replication states this – to perform the experiment number oftimes and not relying on the output obtained after performing it just once.
Explanatory
research design
Addresses why
questions
Causal relationships
Experimental
research design
Inferring novel
approach/ techniques
Performing varied
experiments
Diagnostic
research design
Finding associations
that lead to
establishing
relationships
Descriptive
Research design
Finding out
characteristics/
behaviour/pattern in a
group
Exploratory
research design
Discovery/invention of
new things
Data collection in the
form of surveys
Hypothesis testing
design
Causal relationships
Makes use of
experimental designs
FIGURE 3.3Summary of the Research Designs
Research Design 79

For example, we want to test the impact of eating two types of fruits – apples andbananas on kindergarten school children. One can think of different ways to carryout this experiment. Assume that we split the kids and form two groups and testthem by giving one group bananas and other group apples. This is just one experi-ment that we performed. But instead if we split them into multiple sub-groups andcompare the results – we are trying to replicate it! It’s not sufficient, the sameexperiment can be carried out multiple times may be for few days or months. Whatwe get at the end of experimentation by replication is more precision. Accuracy fordrawing conclusion to justify the claims! Do remember replication is computationallyexpensive!
3.4.2 Principle of Randomization:
In the replication principle we discussed about repeating the same experiment –
simultaneously with the groups formed and also repeating it for a period of time, butwhat matters also are the samples in the group. While forming the groups – during theReplication principle, if same groups are used for the experimentation n number oftimes, the results could be biased. What is essential is that we have random samples inthe groups. So, the sub-groups will have different kids for an experiment to replicaterather than going with fixed subgroups. By doing this in each turn of experiment, theresults can be statistically justified and moreover are generalized over the randomizedsamples.
3.4.3 Principle of Local Control:
Replication talks about performing repetitions of the same experiment, randomizationtalks about selection of random samples, and local control talks about reducing theexperimental error.
Typically, while carrying out the experimentation, there are factors known as extra-neous variables which would cause high error rate. In our example – obese kids can bethought of as an extraneous variable. So even though while forming groups withrandom samples, the obese kinds falling in one subgroup could impact the experimenta-tion outcome. Hence varying this variable more; can help in reducing the error. So,initially with homogeneous groups been formed, which are referred to as “blocks” –
they are further divided by taking into account this factor of obese kids. Then theexperimentation variables are assigned to measure the outcomes.
3.5 Design of Experiments
This section discusses the different variants in which experimentation can be structured.Typically, in experimentation designs, the samples are split into the experimentation ortest group and control groups (refer to Section 3.1.4). The outcomes of the experimenta-tion are measured based on these groups.
80 Research Methodology

3.5.1 Post-Test Only Design
Any experimentation design often has the first part as splitting of the samples – samplesto be assigned to the experimentation group and control group. After this the test iscarried out. In post-test, the treatment (as discussed in earlier section, the conditions towhich the groups are exposed is treatment) is then introduced to the experimentationgroup only. The impact of the treatment is obtained by calculating the differencebetween the dependent variable from experimentation group and control group.
One major consideration under this design is it is assumed that the group’s perfor-mance toward the treatment is similar. Unlikely that the assumption would fail, anextraneous variable could be encountered in the treatment.
For example, to study the impact of introduction of a soft skills workshop for second-year students. In the Experimentation group, the students are exposed to the treatment,that is, workshop is conducted along with the regular lectures whereas the controlgroup just follows the regular lectures. An evaluation for the outcome measurementpost treatment is done. So the performance of the control group at the end and theperformance of the experimentation group at the end is evaluated. The differencebetween these outcomes will express the impact of conduction of soft skills workshop.
Figure 3.4 shows the post-test control design. As we can observe the outcome is themeasure of X–Y, where X is control group dependent variable and Y is the experimenta-tion group. Many times conducting a pre-test is expensive and hence only a post-test isconducted.
3.5.2 Pre-Test Post-Test Only Design
There are two variants of this design:
(i) without control group(ii) with control group
In case of without control group, following steps are applied:
• The experimentation group is selected and is only taken for treatment
Control group
Experimentation
groupOutcome Y
Soft skills workshop
and regular lectures
Regular lectures
Treatment introduced
Outcome X
Impact = X - Y
FIGURE 3.4Post-Test Control Design
Research Design 81
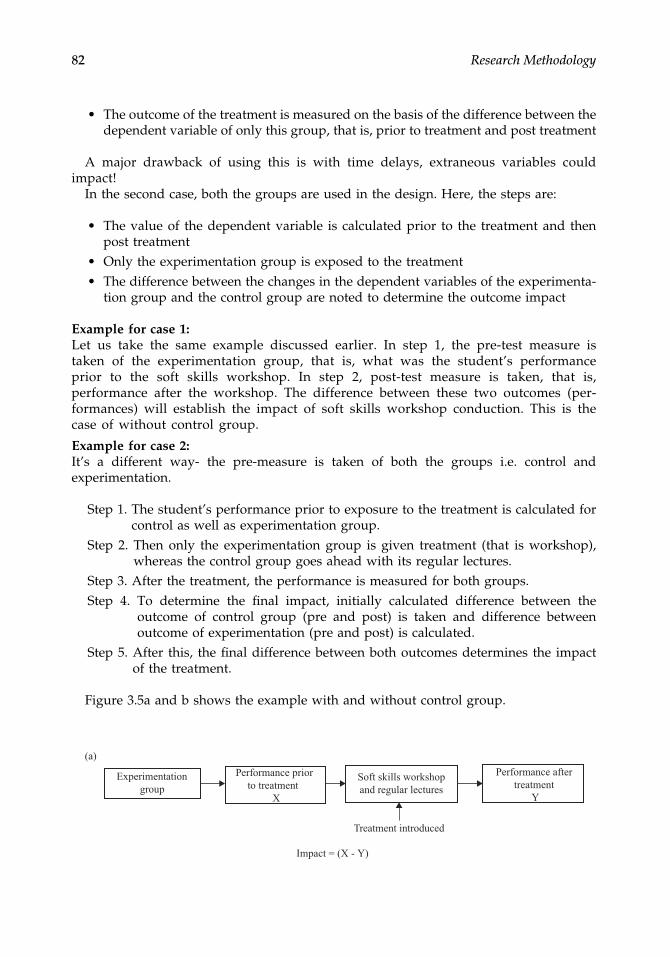
• The outcome of the treatment is measured on the basis of the difference between thedependent variable of only this group, that is, prior to treatment and post treatment
A major drawback of using this is with time delays, extraneous variables couldimpact!
In the second case, both the groups are used in the design. Here, the steps are:
• The value of the dependent variable is calculated prior to the treatment and thenpost treatment
• Only the experimentation group is exposed to the treatment• The difference between the changes in the dependent variables of the experimenta-
tion group and the control group are noted to determine the outcome impact
Example for case 1:Let us take the same example discussed earlier. In step 1, the pre-test measure istaken of the experimentation group, that is, what was the student’s performanceprior to the soft skills workshop. In step 2, post-test measure is taken, that is,performance after the workshop. The difference between these two outcomes (per-formances) will establish the impact of soft skills workshop conduction. This is thecase of without control group.
Example for case 2:It’s a different way- the pre-measure is taken of both the groups i.e. control andexperimentation.
Step 1. The student’s performance prior to exposure to the treatment is calculated forcontrol as well as experimentation group.
Step 2. Then only the experimentation group is given treatment (that is workshop),whereas the control group goes ahead with its regular lectures.
Step 3. After the treatment, the performance is measured for both groups.Step 4. To determine the final impact, initially calculated difference between the
outcome of control group (pre and post) is taken and difference betweenoutcome of experimentation (pre and post) is calculated.
Step 5. After this, the final difference between both outcomes determines the impactof the treatment.
Figure 3.5a and b shows the example with and without control group.
Experimentation
(a)
group
Performance after
treatment
Y
Soft skills workshop
and regular lectures
Treatment introduced
Impact = (X - Y)
Performance prior
to treatment
X
82 Research Methodology

3.5.3 Completely Randomized Design
After having understood the pre and post-test designs, there are a few aspects indesigning an experiment which are left out.
In this type of design, there are two categories or types in which the sample assign-ment to both the groups occurs:
• Two group randomized design• Random replications design
(i) Two group randomized design
Two group randomized design one of the simplest forms of design. It states that there shouldbe random assignment of the selected samples to the two groups and random selection of thesamples from the entire sample set/population. So, for example, if we are to study impact ofintroduction of soft skills workshop of second-year students, from the entire population, wecan select any 20 – randomly (first level random selection) then assign any 10 randomly tocontrol group and 10 to experimentation group (second level random selection).
In this type of design, the treatment can be applied to both the groups. Most oftenpreferred and used by researchers in the behaviour sciences. It can be used along withthe pre-test post-test only. Figure 3.6 depicts this design.
One of the major concern factor here is the impact of the extraneous variable leadingto confounding relationships.
(ii) Random replications design
There could be many drawbacks for the two group randomized design. As men-tioned, the extraneous variable and moreover the way in which the samples are split.Just random selection of the samples and then applying the treatment to both thegroups will lead to biased outcomes. It is most sensible to have repetitions of the twogroup randomized design. In random replications design, the sample set is consid-ered to be available as study group and experiment group; from this further randomselection for “selected group” – study and treatment takes place. Then it is assigned
Control group
(b)
Regular lecturesPerformance after
without treatmentB
Experimentation
group
Performance after
treatment
Y
Soft skills workshop
and regular lectures
Treatment introduced
Impact = (B-A) - (Y-X)
Performance prior
to treatment
X
Performance prior
without treatment
A
FIGURE 3.5(a) Without Control Group. (b) With Control Group
Research Design 83

to the Experimental and Control group – that too randomly!! The samples areassigned to “n” number of Experimental and Control groups (“n” will be dependenton the nature of experimentation). So, if “n” is three then, three experimental groupsand three control groups will be formed. This leads to the creation of groups withreduced bias.
So, adding replications to the previous design, here for the same example where wehave to study impact of introduction of soft skills work shop of second year students,from the entire population, we will first split it into two parts. It is possible that wealready have two different populations. So, assuming that we have 50 samples in eachgroup – study and experiment – initial population.
Post this, random samples will be selected – forming “selected group”. So, from 50,maybe 25 samples are selected in the study and experiment group.
Further from these “selected groups,” again random samples will be selected to finallyassign to experimentation and control group. So, may be samples are selected randomlyto be now assigned to the experimentation and control from the previous step. Remem-ber there are “n” groups formed with “n” samples assigned for the groups.
Then each of this experimentation and control group now undergoes the treatment.Figure 3.7a and b depict the working of the random replications.
3.5.4 Randomized Block Design
In case of randomized block design, this design is used when there are more numberof treatments. The samples are clubbed to form blocks. Each block has x number ofsamples. The formation of the blocks is such that each block would comprise ofhomogeneous samples. That means the bias within the block is made minimal. Now,for every block, there are set of treatments that have to be taken. For every block, ifrandomly the treatment is undertaken by the samples, then it is called as randomizedblock design (R.B.) design.
For example, if the number of treatments is five and the number of blocks is four,Figure 3.8 shows possible assignment and the way in which the treatments can betaken up.
Sample set
Random selectionExperimentation
group
Selected samples
Treatment ‘P’
introduced
Treatment ‘Q’
introduced
Control group
Impact analysis
Random selection
and assignment
FIGURE 3.6Two Group Randomized Design
84 Research Methodology

3.5.5 Latin Square Design
Typically, in a R.B. design, the treatments are assigned randomly to the blocks. Hereevery treatment gets assigned once to a block, unlike in completely randomiseddesign. To overcome the cost factor involved in the replication and assignmentsinvolved in R.B. design, Latin Square design is used. This type of design is bestsuited in agricultural research. The central theme is to split the experiment data intorows and columns such that each row and column will have same number oftreatments being assigned.
So, Latin Square with order “x” will bear x symbols such that it equals to x^2 cells.Each cell will be of x rows and columns and will carry the symbol only once.
A Latin Square of order 4 is given here:
Consider an example where the impact of use of mobile phones on students ondifferent days is to be studied. So, we have different mobile phones, differences in theway students use it and differences in which their days are tied up.
Sample set –
initial population
For study
(a)
Random
selection
Selected samples
Select group - treatment
Sample set –
initial population
For treatment
Random
selection
Selected samples
Select group - study
Random selection
and assignment
Random selection
and assignment Group no.2
Group no.3
Group no.4
Group no.1
Experimentation group
Treatment ‘P’
introduced
Impact analysis
Treatment ‘Q’
introducedGroup no.2
Group no.3
Group no.4
Group no.1
Experimentation group
Control group
Control group
(b)
FIGURE 3.7(a) Working of the Random Replications. (b) Working of the Random Replications
LS1 LS2 LS3 LS4
LS2 LS3 LS4 LS1
LS3 LS4 LS1 LS2
LS4 LS1 LS2 LS3
Research Design 85
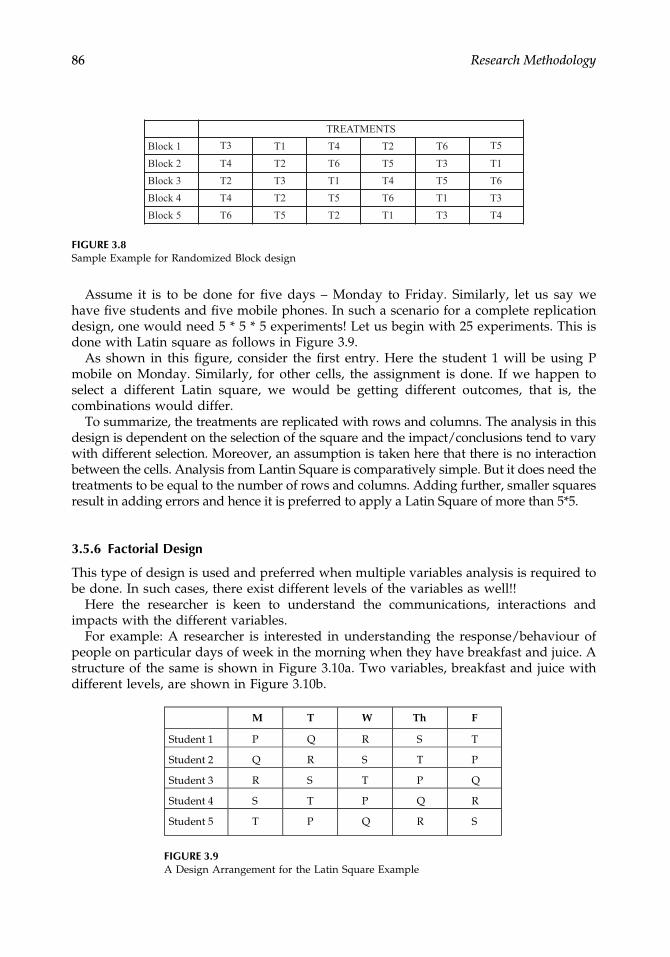
Assume it is to be done for five days – Monday to Friday. Similarly, let us say wehave five students and five mobile phones. In such a scenario for a complete replicationdesign, one would need 5 * 5 * 5 experiments! Let us begin with 25 experiments. This isdone with Latin square as follows in Figure 3.9.
As shown in this figure, consider the first entry. Here the student 1 will be using Pmobile on Monday. Similarly, for other cells, the assignment is done. If we happen toselect a different Latin square, we would be getting different outcomes, that is, thecombinations would differ.
To summarize, the treatments are replicated with rows and columns. The analysis in thisdesign is dependent on the selection of the square and the impact/conclusions tend to varywith different selection. Moreover, an assumption is taken here that there is no interactionbetween the cells. Analysis from Lantin Square is comparatively simple. But it does need thetreatments to be equal to the number of rows and columns. Adding further, smaller squaresresult in adding errors and hence it is preferred to apply a Latin Square of more than 5*5.
3.5.6 Factorial Design
This type of design is used and preferred when multiple variables analysis is required tobe done. In such cases, there exist different levels of the variables as well!!
Here the researcher is keen to understand the communications, interactions andimpacts with the different variables.
For example: A researcher is interested in understanding the response/behaviour ofpeople on particular days of week in the morning when they have breakfast and juice. Astructure of the same is shown in Figure 3.10a. Two variables, breakfast and juice withdifferent levels, are shown in Figure 3.10b.
TREATMENTS
Block 1 T3 T1 T4 T2 T6 T5
Block 2 T4 T2 T6 T5 T3 T1
Block 3 T2 T3 T1 T4 T5 T6
Block 4 T4 T2 T5 T6 T1 T3
Block 5 T6 T5 T2 T1 T3 T4
FIGURE 3.8Sample Example for Randomized Block design
M T W Th F
Student 1 P Q R S T
Student 2 Q R S T P
Student 3 R S T P Q
Student 4 S T P Q R
Student 5 T P Q R S
FIGURE 3.9A Design Arrangement for the Latin Square Example
86 Research Methodology

In factorial design, the number of levels in each factor decide the symmetry of thedesign. If for two factor the number of levels remain same, it is symmetric elseasymmetric.
Figure 3.10 (a) Is a Symmetric Factorial Design Whereas. (b) Is Asymmetric.Further a complex factorial design mentions the use when there are more than two
variables involved. Generally, a researcher starts with a simple design and thenproceeds in coming up with complex one. A complex design of 2*2*2 is shown inFigure 3.11.
Response from the different variables at different levels is captured with thecomplex factorial design. Breakfast here can be treated as the control variable,whereas the intake of juice made available are the different treatments been givento the participants.
Factorial designs show accuracy results at par with other designs and are an easy andeconomical way of obtaining the results. Further, the interactions and interest points canbe captured with the graphs based on data values in the cells.
3.5.7 Quazi-Experimental Design
This type of design is used when the cost of experimentation is high. The design is usedwhen the confounding relationships come in picture and it is not possible to control itsimpact on the experimentation. Also, there is no random assignment involved in thistype of design.
The pre-test and post-test design we studied; fall under this category of experimentaldesign. Time series, regression discontinuity are the other types of designs that areunder this design type.
No juice With juice
No breakfast Response of participants without breakfastand juice
Response of participants without breakfastbut with juice
Withbreakfast
Response of participants with breakfast butwithout juice
Response of participants with breakfast andwith juice
FIGURE 3.10(a) 2*2 Factorial Design
No juice With half glass of juice With full glass of juice
Nobreakfast
Response of participantswithout breakfast and juice
Response of participants withoutbreakfast but with half glassjuice
Response of participants withoutbreakfast but with one glass ofjuice
Withbreakfast
Response of participantswith breakfast but withoutjuice
Response of participants withbreakfast and with half glass ofjuice
Response of participants withbreakfast and with one glass ofjuice
FIGURE 3.10(b) 2*3 Factorial Design with Levels
Research Design 87

Times series design – interrupted time series design is a variant of the pre-test andpost-test design. In this type, the impacts are analysed at intervals with interruption. Forexample- assume that in a class, students’ performance is to be measured for everyweekly test that is conducted. To have interrupted time series analysis, an interrupt ofsome treatment takes place. This could be say scheduling group activities or somechallenging session in between the weeks. Post this the performance is then measured.Unlike simple pre-test and post-test design where the impact analysis takes just once inbetween, this design is a series of pre-test post-test designs.
In case of Regression-Discontinuity (RD) design, it is a pre-test post-test design but adifference in the assignment. In the sense, what sets RD design different from others isthe way the samples/participants are exposed and assigned to different treatments. A“Cut-off” score is calculated. This is on the basis of pre-experimentation, prior to theconduction of the design test. For example, to take decision regarding selection of aplayer in a team. In such cases a prior-performance cut-off can be employed and thenthe tests can be experimented. The issues here too are the assignment of pre-cut-offs andhence the dependency lies on the assignment.
3.5.8 Cross over Design
It is a design structure where the samples are supposed to undergo different treatmentsat different time intervals. This type of design belongs to clinical research or even can beapplied in agricultural domain. Unlike parallel design where the sample is subjected tosingle treatment throughout, the crossover experiments with different treatment.
From medical perspective for example if a person (experimental sample) is undergoingclinical treatment; is treated with P treatment initially and then there is a washout/ waitover time period after which treatment Q is also introduced.
In such cases, the impact analysis is carried out at after every treatment. But there aredifficulties while following this design as the impact of treatments could be negative.
Figure 3.12 shows the Cross over design pattern.
3.6 Sampling Concepts
Throughout the research design concepts in Section A, we mentioned about population,sample set, data sets and so on. How much important this is? Every experimentationneeds large amount of data and to work with entire data available is difficult. Practicallyspeaking, not necessarily the entire data is of importance and could contain some
With half glass oforange juice
With glass oforange juice
With half glass ofpineapple juice
With glass ofpineapple juice
No breakfast Response 1 Response 2 Response 3 Response 4
With breakfast Response 5 Response 6 Response 7 Response 8
FIGURE 3.11Complex Factorial Design
88 Research Methodology

redundant information. This could lead to biased opinions in the outcome for the impactanalysis. A simple sample can be, for example, a group of 60 students from a populationof 900. But are these 60 sufficient? Why only 60? On what basis? So, to what extent thesamples taken influence the entire experimentation?
We will address these questions in this section.Figure 3.13 depicts the sample and population relationship.
3.6.1 Design of Sample
We have studied research design where we discussed about the samples selected andassigned. Here we will discuss about the actual design of sample – the way in which thesamples are obtained from the population. So, a method to capture, retrieve, select thesamples from the entire population set that is available is referred to sampling.
3.6.2 Principles of Sampling
So, it is clear that we need to select particular and effective samples in sampling. Thetheory of sampling is based on two basic principles as follows:
(i) Principle of statistical regularity:This principle is based on the probability theory. It states that a sufficient numberof samples selected on random basis from the target population of study possessthe required features of the population.
(ii) Principle of inertia of large numbers:This principle states that larger the number of samples, more accurate the resultswould be.
Sample ATreatment X
introduced
Impact analysisPerformance prior to
treatment X
Wait over time
Sample ASample ATreatment Y
introduced
Impact analysis
FIGURE 3.12Cross over Design
Sample
Interested study population
population
FIGURE 3.13Sample-Population Relationship
Research Design 89

3.6.3 Preparing a Sample Design
Prior to the selection and building of sample design, it is necessary to understand fewaspects which are vital for preparation of the sample design.
(i) Population: The population is the entire group of participants a researcherwould be looking at prior to carrying out the experimentation. This isessentially a large set. A population is a subset of the entire universe. So, toconsider this, the researcher needs to understand the finite and infinite thingsof the universe. An example of population can be students in a school. Thiscan be called as the target population, from which the interested studypopulation is looked at. The target population needs careful selection. Manytimes, the researcher could take help of experts for this. Further dependingon the population size, the interested study population and the sample isselected. If the population itself is very small in number, one might have totake it up entirely.
(ii) Sample frame: A sample frame contains list of data items with names fromwhich the samples are to be taken. This is a very precise, comprehensiverepresentation of the population and very much essential to prepare it.
(iii) Unit of sampling: What is it the researcher is interested in? A college, a factory, ahousing society? This forms the unit. It could be a geographical area, or somelocality.
(iv) Size of the sample: A most important and key factor that rules the experimentationimpact. Often a point of concern to the researcher is “How many samplesshould I take?” A small sample size may not fulfil the requirements of thestudy resulting into lower accuracy results or wrong findings. But at the sametime, taking large sample size result in generalisation and lack the actualprecise findings. From this it is clear that samples that are suitable, adhering torequired parameters of interest should be drawn. The experimentation outcomefrom these samples should be within the acceptable limits and the confidenceintervals laid down.
(v) Parameters: In continuation to the sample size, the selection is governed bythe parameters that the researcher knows are influential in the study. Con-sider a dataset of student. From this population, parameters like the addresswould be less important if the study is concern with the age groups of thestudents. Similarly, their mobile number, local address is of no use in thestudy if it is about their marks. But there could be some factors whichinfluence. So, a meticulous selection of parameters is required.
(vi) Monetary requirements: A very common problem a researcher faces is thebudget planning to get the sample. Collection of data say from medical fieldcould be costly. This can impact the size of sample as well. A well-plannedbudget is necessary.
(vii) Method of sampling: Selection of techniques and methods to be applied for thesample selection are important. This represents the sample design. Consideringthe earlier-mentioned factors, the design selection must be able of accommodateand satisfy the requirements the researcher is interested in.
90 Research Methodology

3.6.4 Sampling and Nonsampling Errors
In sampling theory, one of the factors that is important is the error. Sampling errors arethe errors introduced owing to the inappropriate selection of the samples. That meansthe sample selected does not hold the potential to suffice the outcomes of the experi-mentation thus named as sampling error. So, the main reason for these errors is thedeviation between the population and the sample means. (A sample mean is an estimateof the population mean.)
In the case of nonsampling errors, these are the ones that are formed due to humanerror. These errors can occur at every stage during the planning and the execution.Often happen when surveys are conducted. These errors can occur owing to absence ofknowledge of the population, the problem to be solved, faulty approaches to the datacollection and the data tabulation.
One thing is to be understood here that the data collection using surveys introducesboth the types of errors. Also, one important point is that when the sample size is small,the sampling errors would be high and nonsampling errors would be less and viceversa.
A sampling design that would always have lesser sampling error should be the choiceof the researcher.
3.6.5 Selection of Sampling Procedure
Though a researcher is keen on selection of a design that would minimize the samplingerrors, there is a notion of “systemic bias” that occurs due to the sampling procedurethat is selected. There is necessity to keep in control this bias. This comprises ofsampling bias as well as nonsampling bias.
Few of the aspects for which the control needs to be established in order to reduce theimpact of bias are discussed here.
(i) The sampling frame – selection of the frame for sampling affects the bias.(ii) Equipment – the devices deployed to carry out the measurements also have a
significant impact on the bias. Here it could be due to the human interventionwho is responsible for surveys that is looked upon as device or it could be theactual physical equipment.
(iii) Non-participants – many times, people are reluctant to participate and giveopinions in surveys or other data collections methods like interviews. In suchcases, the inability to sample the participants results in bias.
(iv) Observable environment – data collection and sampling in an observed environ-ment too adds up to bias. This is because the participants are aware that they arebeen observed and hence the efficiency will differ in comparison to an unob-served environment.
(v) Bias because of the publishing data – this kind of bias is the result of incorrectfacts and figures been published. This is because where and who is going topublish the facts and figures is important. For an NGO, figures of poor, illiteratepeople would be large but for government organisations, they would portray itto be minimal.
Research Design 91

So, to summarize, the sampling errors and the above-mentioned parameters need tobe minimized and looked upon while selection of sampling procedure.
The steps in sampling process are:
(i) Identifying and defining the population that is to be experimented.(ii) Defining the sampling frame.(iii) Mentioning the sampling method, thus finalizing it.(iv) Specifying the sample size.(v) Employing the sampling plan as laid down along with selection of sampling
units.(vi) Actual sampling and data collection.(vii) Reviewing the entire process.
3.7 Methods of Sampling
This section finally deals with the sampling designs – methods of sampling. Differentdesigns are in place and as discussed, the overall research design and the outcomes arehighly influential with the selection of the sampling design. Let us explore them.
3.7.1 Probability Sampling
In case of probability sampling, the samples selection is a fair decision. Each samplegets a fair chance of getting selected in the sample set. The probability of a samplegetting selected can be determined. This type of design is also called as EqualProbability of Selection design. There are different variants of this sampling, let usstudy them.
(i) Simple random sampling
This type of simple random sampling technique is used when the population is small.Moreover, the population needs to homogeneous and easily available. In such circum-stances, the sampling method gives every possible combination of the samples to getselected in the set with equal probability. There is a notion of sampling with replace-ment and without replacement.
Here for the random sampling, the selection of samples is without replacement. Thismeans that once the sample is selected in the sample set, it will not be included again inthe sample. So, just once. (But many times, formally, researchers would also beinterested in sampling with replacement where the sample may occur more than oncein the sample set.)
An example of this sampling can be random selection of students from a list ofstudents studying in a college. A random number generator technique can be used tohave the selection.
This sampling technique adheres to the principle of statistical regularity and hencemany times is a preferred technique.
92 Research Methodology
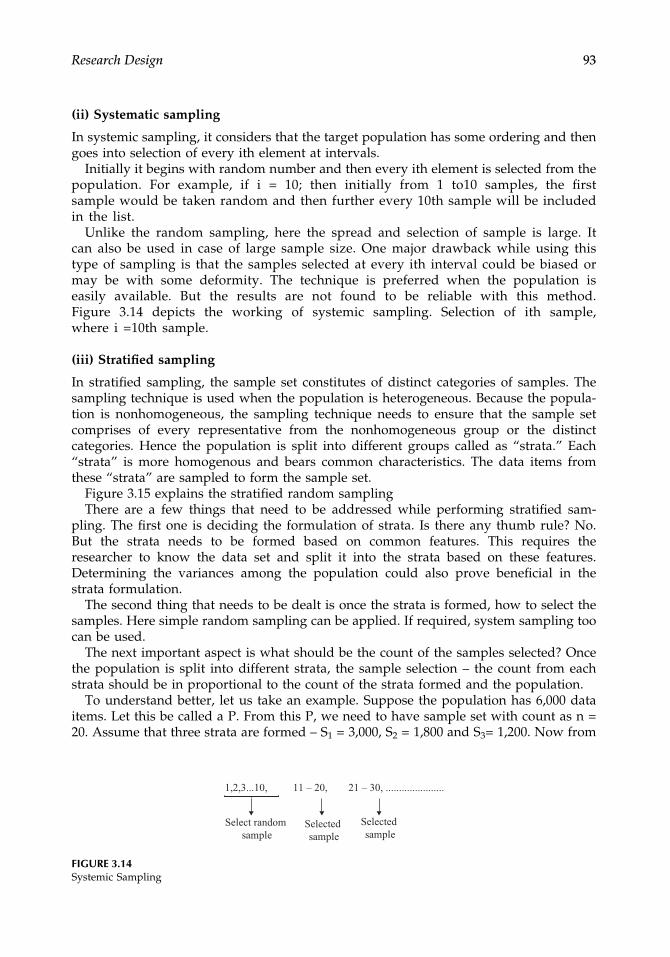
(ii) Systematic sampling
In systemic sampling, it considers that the target population has some ordering and thengoes into selection of every ith element at intervals.
Initially it begins with random number and then every ith element is selected from thepopulation. For example, if i = 10; then initially from 1 to10 samples, the firstsample would be taken random and then further every 10th sample will be includedin the list.
Unlike the random sampling, here the spread and selection of sample is large. Itcan also be used in case of large sample size. One major drawback while using thistype of sampling is that the samples selected at every ith interval could be biased ormay be with some deformity. The technique is preferred when the population iseasily available. But the results are not found to be reliable with this method.Figure 3.14 depicts the working of systemic sampling. Selection of ith sample,where i =10th sample.
(iii) Stratified sampling
In stratified sampling, the sample set constitutes of distinct categories of samples. Thesampling technique is used when the population is heterogeneous. Because the popula-tion is nonhomogeneous, the sampling technique needs to ensure that the sample setcomprises of every representative from the nonhomogeneous group or the distinctcategories. Hence the population is split into different groups called as “strata.” Each“strata” is more homogenous and bears common characteristics. The data items fromthese “strata” are sampled to form the sample set.
Figure 3.15 explains the stratified random samplingThere are a few things that need to be addressed while performing stratified sam-
pling. The first one is deciding the formulation of strata. Is there any thumb rule? No.But the strata needs to be formed based on common features. This requires theresearcher to know the data set and split it into the strata based on these features.Determining the variances among the population could also prove beneficial in thestrata formulation.
The second thing that needs to be dealt is once the strata is formed, how to select thesamples. Here simple random sampling can be applied. If required, system sampling toocan be used.
The next important aspect is what should be the count of the samples selected? Oncethe population is split into different strata, the sample selection – the count from eachstrata should be in proportional to the count of the strata formed and the population.
To understand better, let us take an example. Suppose the population has 6,000 dataitems. Let this be called a P. From this P, we need to have sample set with count as n =20. Assume that three strata are formed – S1 = 3,000, S2 = 1,800 and S3= 1,200. Now from
1,2,3...10, 11 – 20, 21 – 30, ......................
Select random
sampleSelected
sample
Selected
sample
FIGURE 3.14Systemic Sampling
Research Design 93

these three strata, samples are to be selected in appropriate proportion to form thesample set of 20. So, the number of samples to be taken from each strata are given in thefollowing equation:
SSi ¼ n� Si =Pð Þ ð3:1Þwhere SSi represents the number of samples from “i”th strata selected.
n is the count of sample set, Si is the number of samples existing in the “i”th strataand P is the population.
Putting the values for our example, we getSS1= 20 * (3,000/6,000) = 10.SS2= 20 * (1,800/6,000) = 6.SS3 = 20 * (1,200/6,000) = 4.So, in all the samples selected from each strata are 10,6 and 4 forming n = 20.Cases in which the strata comprise of variable samples, the variability factor should be
considered and then we have the revised equation to get the number of samples drawnfrom each strata as here:
SSi ¼ n� Siσið ÞS1σ1 þ S2σ2 þ . . . Skσk
ð3:2Þ
Where deviation factor of each strata is added. σi represents the standard deviation ofith strata. In all, k strata are formed.
In addition to the variability, the cost factor too can be considered. This is the cost ofsampling of the strata. Following equation considers the cost factor as well:
SSi ¼ n� Siσið Þ= ffiffiffiffiffiCi
p
S1σ1=ffiffiffiffiffiffiC1
p þ S2σ2 =ffiffiffiffiffiffiC2
p þ . . . Skσk=ffiffiffiffiffiCk
p ð3:3Þ
Where C1 to Ck is the cost for sampling in strata 1 to k.
Strata 1
Population
. . . . .
Strata 2 Strata 3 Strata k
. . . . .
Random samples
selection
Random samples
selection
Random samples
selection
Random samples
selection
Sample set
FIGURE 3.15Stratified Random Sampling
94

A stratification sampling done with different characteristics is referred to as crossstratification. For example, a survey to understand the reviews of people working inIT industry with launch of new online car booking app can be with respect to thespecific company, specific section of work in that company and so on.
(iv) Cluster sampling
In case of cluster sampling, the population is grouped to form relatively smaller groupsor clusters. This sampling is used if the population is large enough and the entire area ofpopulation is divided into nonoverlapping groups or clusters.
So, for example if total population is of 6,000, smaller clusters – 120 can be formed,each comprising of 50 data items. Further, from these clusters, samples are randomlyselected. Although there is no mention in literature about the number of n – samples tobe drawn from each of the cluster. The sampling techniques proves to be economicaland the impact analysis computed is sensibly accurate owing to the formulation ofcompact and precise clusters. It also helps in reduction of the cost as it deals withgroups. Figure 3.16 shows the cluster sampling.
(v) Multistage sampling
This sampling procedure is an extended form of the cluster sampling. It comprises of levelsof sampling from the clusters. For example, if an experimentation is to be performed tounderstand the use of social media on teenagers in schools in a state, the initial clusterscould be on the basis of the talukas. Further from each taluka representative towns could beselected and then from them the schools and so on. This is multistage sampling.
cluster
1
Formation of
nonoverlapping
clusters
Random samples
selection
Sample set
Population
cluster
3cluster
2
cluster
4
Random samples
selection
Random samples
selection
Random samples
selection
FIGURE 3.16Cluster Sampling
Research Design 95

If at every level, the selection of the samples is done at random, it is multistagerandom sampling. This type of sampling is used when the experimentation is involvedwith large geographical area. Owing to the sequential clustering, many units of samplescan be accommodated in this type of sampling and also managing the clusters andgaining significant insights from clusters is also simple. There two reasons explain theuse of multi-stage sampling. Figure 3.17 depicts the multistage random sampling.
3.7.2 Nonprobability Sampling
This sampling technique is not based on the probability of the sample selection. In fact,unlike probability-based techniques of sampling, where every sample had fair chanceof getting selected in the sample set, the nonprobability sampling technique is the onewhere the researcher will select the samples. So, it is up to the researcher whichsamples to include. This sampling method is also known as deliberate or judgmentsampling. The samples here loose the fair chance of making their way into the finalsample set.
For example, if an analysis is to be carried out for faculty feedback in any instituteregarding lecture conduction; the researcher would deliberately select the students whoare most regular ones in attending. But many times this could lead to bias opinions aswell. Let us explore different ways of nonprobability sampling.
cluster
1
Formation of
nonoverlapping
clusters
Random samples
selection
Sample set
Population
cluster
3cluster
2
cluster
4
Random samples
selection
Random samples
selection
Random samplesselection
cluster
2cluster
3
cluster 4
cluster
1
Level one
Level two
FIGURE 3.17Multistage Random Sampling – Two Levels
96 Research Methodology

(i) Quota Sampling
Somewhat related to the stratified sampling, this approach of quota sampling workson selection of representatives – quota but without probability. The population issplit into subgroups and then based on judgments, the samples could be selected.For example, in an interview process, the HR personnel is responsible for selectingspecific candidates from 150 candidates among which 80 are men and 70 arewomen (strata formed). The person has specific requirements of selection that 10%should be women from the total number of 45 vacancies to be recruited. The personmay be biased with the selection for quota, where known candidates are likely tomake way for the sample set. This is also again a type of judgmental sampling. So,everything is at the judgment and opinion of the interviewer.
(ii) Convenience Sampling
As the name suggests, this type of sampling relates in getting samples that theresearcher finds convenient. This is nonprobability-based sampling and, at a givenpoint in time, the researcher draws and selects samples readily available. Forexample, assume a survey needs to be conducted about hoteling on weekends inmalls. Assume the researcher visits the mall and at that point of time only four tofive participants are available. Inclusion of these samples will be biased andlimited. This sampling lacks generalization and is preferred for pilot testing.
(iii) Snowball Sampling
This type of sampling technique is used when the researcher faces the problemof data collection and locating the samples. If the researcher is working onpopulation involving tribal people, homeless people or any of such undocumen-ted participants, there lies a great difficulty in reaching out and getting the data.In such cases, snowball sampling is used.
The researcher would generally locate some participant who is a part of thestudy and then rely on the information and sources from him to further locateparticipants. But such a sampling technique needs to include almost all theparticipants and often finds very few representatives of the samples as expectedby the researcher.
3.7.3 Sampling in machine learning approaches
Till now we discussed about the different ways to capture the data samples and theirapplicability. While those are the most common methods, when it comes to machinelearning approaches – percentile split, cross validation are the common approaches usedto validate the results. Let us look at them.
Percentile split: A most common method that splits the available samples includelabelled data (where the researcher is aware of the output class) into train data and testdata. The train data is used to by the machine learning approach – a supervised one, tobuild a model. This model is then further tested with the test data. The percentage ofsamples to be used are generally 70% for train data and 30% for test data. However, inthe case of noisy data, this could vary.
Cross validation: Often when we are dealing to build a robust classifier (a supervisedmachine learning approach), cross validation is used. This ensures good generalisationof the classifier and at the same time avoids overtraining. There are two variants of crossvalidation – 1. Hold-out and 2. K-fold
Research Design 97

In case of hold-out technique for sampling the data, the entire labelled data availableis split into three parts – (i) train, (ii) validate, and (iii) test. The classifier model istrained with the training subset samples and validated with the validated samples. Thevalidated samples are used periodically to test the performance of the classifier. If theperformance levels are acceptable, then test data is used to further validate the accuracyof the model generated.
K-fold cross validation is used to raise the performance higher than that of hold-out.The entire sample set – labelled one is divided into k parts, each bearing same size. Onepart forms the test data, remaining parts form the training data. A model is built basedon the training data. and tested on the test data. The same process is repeated k times;each time with next part as test sample and all remaining as train samples. In eachiteration, the performance of the model is noted and summarised after all the iterationsare over. Often, the number – k is selected to be 10.
3.8 Summary
This chapter has focused on the necessity of appropriate and concise research plan tocarry out the research without hindrances. The design explains the use and the ways inwhich the experimentation can be conducted and analysis of the impact can be carriedout. The presence of extraneous variables and the problems to deal with it, arediscussed in the chapter. Further, the sample selection and the techniques with whichthe researcher would work are extremely important to have good unbiased predictionsof the experimentation.
Further Reading
1. C.R. Kothari, “Research Methodology – Methods and Techniques”, New Age InternationalPublishers.
2. Santosh Gupta, “Research Methodology and Statistical Techniques”, Deep and DeepPublications.
3. Ranjit Kumar, “Research Methodology”, Sage Publications.4. Catherine Dawson, “Introduction to Research Methods”, Viva books Pvt. Ltd.5. https://onlinecourses.science.psu.edu/stat509/node/1236. http://home.iitk.ac.in/~shalab/anova/chapter4-anova-experimental-design-analysis.pdf7. https://wagner.nyu.edu/files/doctoral/Campbell_and_Stanley_Chapter_5.pdf8. https://www.mff.cuni.cz/veda/konference/wds/proc/pdf10/WDS10_105_i1_Reitermanova.pdf
98 Research Methodology

4Basic Instrumentation
Pradeep B. Mane and Shobha S. Nikam
CONTENTS
4.1 Introduction . . . . . . . . . . . . . . . . . . . . . . . . . . . . . . . . . . . . . . . . . . . . . . . . . . . . . . . . . . .1014.2 Characteristics of Instruments . . . . . . . . . . . . . . . . . . . . . . . . . . . . . . . . . . . . . . . . . . . .101
4.2.1 Static Characteristics . . . . . . . . . . . . . . . . . . . . . . . . . . . . . . . . . . . . . . . . 1014.2.2 Dynamic Characteristics. . . . . . . . . . . . . . . . . . . . . . . . . . . . . . . . . . . . . . 104
4.2.2.1 Case Study-I: Sphygmomanometer . . . . . . . . . . . . . . . . . . . . . . . . . .1054.3 Instrumentation Schemes . . . . . . . . . . . . . . . . . . . . . . . . . . . . . . . . . . . . . . . . . . . . . . . .106
4.3.1 Block Diagram of Instrumentation Scheme . . . . . . . . . . . . . . . . . . . . . . . 1064.3.2 Simple Instrumentation Scheme: Oxygen Cylinder . . . . . . . . . . . . . . . . . 1074.3.3 Complex Instrumentation Scheme: Heat Exchanger. . . . . . . . . . . . . . . . . 108
4.4 Experimental Setup . . . . . . . . . . . . . . . . . . . . . . . . . . . . . . . . . . . . . . . . . . . . . . . . . . . . .1104.4.1 Laboratory Based Experimental Setup (Indoor Setup) . . . . . . . . . . . . . . . 111
4.4.1.1 Advantages . . . . . . . . . . . . . . . . . . . . . . . . . . . . . . . . . . . . . . . . . . . . . .1114.4.1.2 Limitations. . . . . . . . . . . . . . . . . . . . . . . . . . . . . . . . . . . . . . . . . . . . . . .1124.4.1.3 Case Study for Laboratory Based Experimental Setup . . . . . . . . . .112
4.4.2 Field Based Experimental Setup (Outdoor Setup) . . . . . . . . . . . . . . . . . . 1134.4.2.1 Advantages . . . . . . . . . . . . . . . . . . . . . . . . . . . . . . . . . . . . . . . . . . . . . .1134.4.2.2 Limitations. . . . . . . . . . . . . . . . . . . . . . . . . . . . . . . . . . . . . . . . . . . . . . .1134.4.2.3 Case Study for Field Based Experimental Setup. . . . . . . . . . . . . . . .113
4.4.3 Natural/Quasi Experiments. . . . . . . . . . . . . . . . . . . . . . . . . . . . . . . . . . . 1144.4.3.1 Advantages . . . . . . . . . . . . . . . . . . . . . . . . . . . . . . . . . . . . . . . . . . . . . .1144.4.3.2 Limitations. . . . . . . . . . . . . . . . . . . . . . . . . . . . . . . . . . . . . . . . . . . . . . .1144.4.3.3 Case Study for Natural Experimental Setup . . . . . . . . . . . . . . . . . . .115
4.4.4 Steps of Experimental Setup: Laboratory Experiments. . . . . . . . . . . . . . . 1154.4.5 Calibration of Instruments . . . . . . . . . . . . . . . . . . . . . . . . . . . . . . . . . . . . 115
4.4.5.1 Need of Calibration . . . . . . . . . . . . . . . . . . . . . . . . . . . . . . . . . . . . . . .1164.4.5.2 Steps for Calibration. . . . . . . . . . . . . . . . . . . . . . . . . . . . . . . . . . . . . . .1164.4.5.3 Case Study: Calibration of Blood Pressure Measurement
Equipment . . . . . . . . . . . . . . . . . . . . . . . . . . . . . . . . . . . . . . . . . . . . . . .1164.5 Reliability of an Instrument . . . . . . . . . . . . . . . . . . . . . . . . . . . . . . . . . . . . . . . . . . . . . .117
4.5.1 Reliability Metrics . . . . . . . . . . . . . . . . . . . . . . . . . . . . . . . . . . . . . . . . . . 1184.5.2 Reliability and Availability . . . . . . . . . . . . . . . . . . . . . . . . . . . . . . . . . . . 1194.5.3 Reliability Management . . . . . . . . . . . . . . . . . . . . . . . . . . . . . . . . . . . . . . 1194.5.4 Reliability Characteristics. . . . . . . . . . . . . . . . . . . . . . . . . . . . . . . . . . . . . 1194.5.5 Designing for Higher Reliability . . . . . . . . . . . . . . . . . . . . . . . . . . . . . . . 1254.5.6 Reliability and Cost . . . . . . . . . . . . . . . . . . . . . . . . . . . . . . . . . . . . . . . . . 126
4.5.6.1 Product Law of Reliability. . . . . . . . . . . . . . . . . . . . . . . . . . . . . . . . . .127
99

4.5.7 Environmental and Other Physical Effects on Reliability . . . . . . . . . . . . . 1274.5.7.1 Case Study 1: Medical Product Reliability Testing. . . . . . . . . . . . . .1284.5.7.2 Case Study 2: Temperature and Environmental Product Test . . . .1284.5.7.3 Case Study 3: Reliability and Failure of Electrocardiogram (ECG)
Machine . . . . . . . . . . . . . . . . . . . . . . . . . . . . . . . . . . . . . . . . . . . . . . . . .1284.5.7.4 Error Due to Lead Reversals . . . . . . . . . . . . . . . . . . . . . . . . . . . . . . . .129
4.6 Data Collection . . . . . . . . . . . . . . . . . . . . . . . . . . . . . . . . . . . . . . . . . . . . . . . . . . . . . . . . .1314.6.1 Types of Data . . . . . . . . . . . . . . . . . . . . . . . . . . . . . . . . . . . . . . . . . . . . . 131
4.6.1.1 Advantages of Primary Data. . . . . . . . . . . . . . . . . . . . . . . . . . . . . . . .1324.6.1.2 Disadvantages of Primary Data . . . . . . . . . . . . . . . . . . . . . . . . . . . . .1324.6.1.3 Advantages of Secondary Data. . . . . . . . . . . . . . . . . . . . . . . . . . . . . .1334.6.1.4 Disadvantages of Secondary Data . . . . . . . . . . . . . . . . . . . . . . . . . . .133
4.6.2 Sources of Data Collection . . . . . . . . . . . . . . . . . . . . . . . . . . . . . . . . . . . . 1334.6.2.1 Advantages . . . . . . . . . . . . . . . . . . . . . . . . . . . . . . . . . . . . . . . . . . . . . .1344.6.2.2 Disadvantages . . . . . . . . . . . . . . . . . . . . . . . . . . . . . . . . . . . . . . . . . . . .1344.6.2.3 Advantages . . . . . . . . . . . . . . . . . . . . . . . . . . . . . . . . . . . . . . . . . . . . . .1354.6.2.4 Disadvantages . . . . . . . . . . . . . . . . . . . . . . . . . . . . . . . . . . . . . . . . . . . .1354.6.2.5 Advantages . . . . . . . . . . . . . . . . . . . . . . . . . . . . . . . . . . . . . . . . . . . . . .1364.6.2.5 Disadvantages . . . . . . . . . . . . . . . . . . . . . . . . . . . . . . . . . . . . . . . . . . . .136
4.7 Scaling . . . . . . . . . . . . . . . . . . . . . . . . . . . . . . . . . . . . . . . . . . . . . . . . . . . . . . . . . . . . . . . .1374.7.1 Comparative Scaling . . . . . . . . . . . . . . . . . . . . . . . . . . . . . . . . . . . . . . . . 1374.7.2 Noncomparative Scaling . . . . . . . . . . . . . . . . . . . . . . . . . . . . . . . . . . . . . 1374.7.3 Linear Scaling . . . . . . . . . . . . . . . . . . . . . . . . . . . . . . . . . . . . . . . . . . . . . 139
4.7.3.1 Limitations. . . . . . . . . . . . . . . . . . . . . . . . . . . . . . . . . . . . . . . . . . . . . . .1394.8 Role of Digital Signal Processing in Data Collection and Noise Filtering . . . . . . . . .139
4.8.1 Sources of Noise . . . . . . . . . . . . . . . . . . . . . . . . . . . . . . . . . . . . . . . . . . . 1404.8.2 DSP in Noise Filtering . . . . . . . . . . . . . . . . . . . . . . . . . . . . . . . . . . . . . . . 141
4.9 Measuring Instruments and Tools in Engineering Discipline . . . . . . . . . . . . . . . . . .1454.10 Summary . . . . . . . . . . . . . . . . . . . . . . . . . . . . . . . . . . . . . . . . . . . . . . . . . . . . . . . . . . . . . .145Further Reading. . . . . . . . . . . . . . . . . . . . . . . . . . . . . . . . . . . . . . . . . . . . . . . . . . . . . . . . . . . . 159
Always use branded items in life. For Lips – Truth, For Voice – Prayer, For Eyes –
Sympathy, For Hands – Charity, For Heart – Love, For Face – Smile.—Abdul Kalam
Learning objectives of this chapter are to:
• Describe instrumentation schemes and identify process variables• Distinguish static and dynamic characteristics and predict the reliability of an
instrument• Select experimental setup, test and verify hypothesis• Choose appropriate data collection method• Construct linear scale for data collection• Apply Digital Signal Processing (DSP) for data filteration
100 Research Methodology

This chapter will enable the researcher to:
• Understand scope of instrumentation schemes• Recognize static and dynamic characteristics and predict the reliability of an instrument• Categorize various factors improving reliability by reducing failures and errors• Model experimental setups to prove hypothesis• Describe major approaches in data collection• Interpret the concept of linear scaling• Employ data filtering on collected samples
4.1 Introduction
This chapter introduces the basics of instrumentation in general and discusses the character-istics and parameters of instruments that can be used by a researcher to perform experimentalwork to validate hypothesis formulated by him. Instrumentation facilitates interdisciplinaryresearch. Researchers usually use instrument as a generic term for any measuring device(survey, test, questionnaire, and so on). To help distinguish between instrument and instru-mentation, an instrument is a device and instrumentation is the course of action (the processof experimenting, testing, and using the device)[1]. The researcher should know the basiccharacteristics of any system/ instrument before choosing it for the experimentation. Thefollowing section discusses the static and dynamic characteristics of instrument. Researchermust select appropriate instrument to avoid inaccurate readings. For example, a typical lab3½ Digital Multi Meter (DMM) having the limited frequency response (much below 10 KHz)cannot be used to measure the voltage at GSM frequency. Hence, researcher must knowcharacteristics along with limitations of selected instrument for his/her research.
4.2 Characteristics of Instruments
It is of immense importance that, A researcher should understand basic system specifi-cations and the generic characteristics of an instrument that appear in almost allspecifications. There are two categories of performance characteristics of an instrument.They are mainly divided into[2]:
• Static characteristics• Dynamic characteristics
Classification of performance characteristics of instruments (Figure 4.1):
4.2.1 Static Characteristics
When quantities being measured by instruments are either slowly varying with time orare constant, they are called as “static characteristics”.
Basic Instrumentation 101
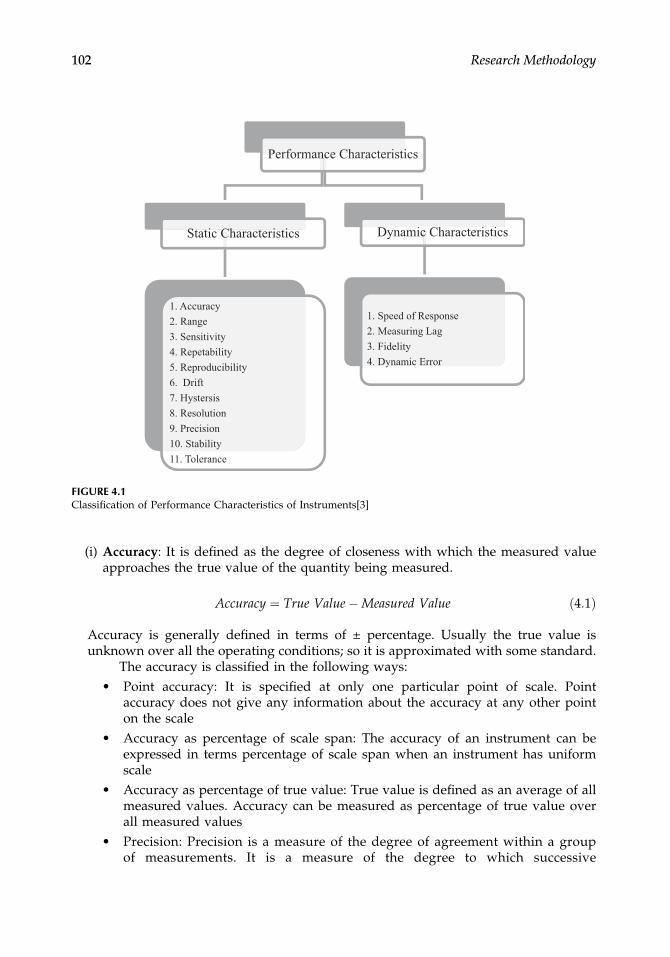
(i) Accuracy: It is defined as the degree of closeness with which the measured valueapproaches the true value of the quantity being measured.
Accuracy ¼ True Value�Measured Value ð4:1Þ
Accuracy is generally defined in terms of ± percentage. Usually the true value isunknown over all the operating conditions; so it is approximated with some standard.
The accuracy is classified in the following ways:• Point accuracy: It is specified at only one particular point of scale. Point
accuracy does not give any information about the accuracy at any other pointon the scale
• Accuracy as percentage of scale span: The accuracy of an instrument can beexpressed in terms percentage of scale span when an instrument has uniformscale
• Accuracy as percentage of true value: True value is defined as an average of allmeasured values. Accuracy can be measured as percentage of true value overall measured values
• Precision: Precision is a measure of the degree of agreement within a groupof measurements. It is a measure of the degree to which successive
Performance Characteristics
Static Characteristics
1. Accuracy
2. Range
3. Sensitivity
4. Repetability
5. Reproducibility
6. Drift
7. Hystersis
8. Resolution
9. Precision
10. Stability
11. Tolerance
Dynamic Characteristics
1. Speed of Response
2. Measuring Lag
3. Fidelity
4. Dynamic Error
FIGURE 4.1Classification of Performance Characteristics of Instruments[3]
102 Research Methodology

measurements differ from one another. It is the measure of repeatability/reproducibility
(ii) Range (or Span): The range/ span of an instrument is defined as the maximumand minimum values of the inputs or the outputs for which the instrument isrecommended to use.
(iii) Sensitivity: It is defined as the ratio of the incremental output to the incrementalinput. While defining the sensitivity, it is assumed that the input-output character-istics of the instrument are approximately linear in that range.
(iv) Repeatability: It is defined as the variation in scale reading of an instrument forthe same quantity to be measured.
(v) Reproducibility: It is defined as the degree of closeness with which a given valuemay be repeatedly measured by an instrument. It is specified in terms of scalereadings over a given period of time.
(vi) Drift: Drift is grouped into following three categories:• Zero drift: Zero drift occurs in an instrument when whole calibration gradually
shifts due to undue warming up of an electronic component, slippage andpermanent set
• Span drift or Sensitivity drift: If there is proportional change in the indicationall along the upward scale, the drift is called span drift or sensitivity drift
• Zonal drift: It is defined as drift for a portion of span of an instrumentThe details of drift (span and zero) are depicted in Figure 4.2.
(vii) Hysteresis: Hysteresis exists not only in magnetic circuits, but in instruments also.For example, the deflection of a diaphragm type pressure gauge may be different forthe same pressure, but one for increasing and other for decreasing. The hysteresis isexpressed as the maximum hysteresis as a full-scale reading[4].
(viii) Resolution: Resolution is defined as the smallest change in input which can bemeasured by the instrument. If the input is slowly increased from some arbitraryinput value instrument does not respond until a certain increment is exceeded.This increment is called as resolution as depicted in Figure 4.3.
Input
Output
Expected
Results
Actual Results
Expected
Results
Input
OutputActual
Results
Drift
FIGURE 4.2Span Drift and Zero Drift
Basic Instrumentation 103

(ix) Precision: A researcher should understand difference between precision andaccuracy. Precision indicates the repeatability or reproducibility of an instrument,but does not indicate accuracy. If an instrument is used to measure the same input,but at different instants of time, the successive measurements may vary randomly.The random fluctuations of readings are commonly represented with a Gaussiandistribution. A precision of an instrument indicates that the successive readingwould be very close, or in other words, the standard deviation σe of the set ofmeasurements would be very small.
(x) Stability: It is defined as the ability of an instrument to maintain its performancethroughout its specified operating life.
(xi) Tolerance: Tolerance is defined as the maximum allowable error in the measure-ment of an instrument.
4.2.2 Dynamic Characteristics
When quantities being measured by instruments changes rapidly with time, they arecalled as “dynamic characteristics.”
The dynamic characteristics are categorized as follows[5]:
(i)Speed of response: It indicates how fast the measuring system responds tochanges in the measured quantity.
(ii)Measuring lag: It is the retardation or delay in the response of a measurementsystem to changes in the measured quantity. The measuring lags can be categor-ized as follows.• Retardation type: In this type of measuring lag an instrument responds
immediately after the change in quantity being measured occurs• Time delay lag: If the response of an instrument begins after a dead time on
the application of the input this type of measuring lag is called as timedelay lag
(iii)Fidelity: It represents faithful reproduction. It is the degree to which an instrumentindicates the changes in the measured variable without dynamic error.
Input
Output
Imin Imax
∆I
FIGURE 4.3Resolution
104 Research Methodology

(iv)Dynamic error: It is defined as the difference between true value of the quantitybeing measured changing with time and the value indicated by the measurementsystem assuming zero static error. It is also called as measurement error.
Performance of the instrument depends on its static and dynamic characteristics. It allowsuser to select the most suitable instrument for a specific measuring job. Dynamic behaviorand steady state behavior of the system is closely related to its performance character-istics. In the following subsequent topic, the case study of sphygmomanometer is studiedto understand the static and dynamic characteristics of the instruments/systems.
4.2.2.1 Case Study-I: Sphygmomanometer
Medical equipment is designed to assist in the diagnosis, monitoring or treatment ofmedical conditions. To understand these explained characteristics, let us consider theNoninvasive (or Indirect type) Sphygmomanometer Blood Pressure Measuring equip-ment (depicted in Figure 4.4).
(i) Accuracy:In the fields of science and engineering, the accuracy of a measurement system is thedegree of closeness of measurements of a quantity to that quantity’s true value.Standard range of Blood Pressure is 80 mmHg-120 mmHg if measured range is 79 mmHg-119 mmHg then it can be concluded that accuracy of an instrument is ± percentageof standard reading. Accuracy = ± (0.1% of Range ± 1 mmHg).
(ii) Span:As illustrated in Figure 4.4 for a Noninvasive type (Indirect type) Sphygmoman-ometer Blood Pressure Measurement instrument the minimum or start reading
Measuring Lag
Dynamic Error
Speed of Response
Fidelity
Span
Repeatability
Accuracy
Sensitivity
FIGURE 4.4Sphygmomanometer
Basic Instrumentation 105

range is 0 mm Hg and maximum or end reading is 240 mmHg. It can be said thatspan of instrument is 0 mmHg – 240 mmHg.
Dynamic Characteristics:
(i) Fidelity: The system is said to have fidelity if it reproduces output same as theinput. E.g. Blood pressure will be 80 mm Hg-120 mm Hg and tested equipmentreading is also 80 mm Hg-120 mm Hg then it can be said that test equipment ishaving 100% Fidelity.
(ii) Speed of Response: Speed of response is the time required for a system to react tosome signal and to indicate the output. In digital type blood pressure measure-ment instrument, after providing the input, time taken to show the systolic anddiastolic pressure reading output is called as speed of response.
(iii) Measuring Lag: Time taken by Sphygmomanometer to respond to the changes ininput.
(iv) Dynamic Error: Let us consider the condition at the time of calibration, standardreading at normal stage is 80 mm Hg-120 mm Hg but the instrument indicates 70mm Hg-110 mm Hg while taking the readings. Then it can be said that 10 mm Hgdifference in Systolic and Diastolic reading is the dynamic error.
(v) Reliability: It gives validity and consistency of sphygmomanometer. Test resultsare determined through statistical methods after repeated trials. For examplepatient’s first reading is 80 mm Hg-120 mm Hg and if the readings remain samefor repeated trials over a span of time then the instrument is said to be reliable.
4.3 Instrumentation Schemes
An instrumentation scheme comprises two words, one is Instrumentation and other isscheme. The former is art and science of measurement and control of the process variableswithin a production or manufacturing area; whereas the later means a systematic plan orarrangement for attaining some particular objective or putting particular ideas into effect.So, combining these two, we can say that the Instrumentation scheme is a systematicarrangement of various instruments to attain desired objective. Generally, in any industry,the process variables used are; Level, Temperature, Pressure, Humidity, Flow, pH, Force,Speed, and so on. Instrumentation scheme identifies any of the earlier-mentioned processvariables and converts it into some usable form, that is, electrical form. This electrical formof physical variable can be further used either to display for monitoring or control or insome interrelated processes to attain desired output. The general block diagram ofinstrumentation scheme is discussed in the following section.
4.3.1 Block Diagram of Instrumentation Scheme
The instrumentation scheme can be either simple or complex depending on the applica-tion and the specifications of the system. The instrumentation scheme for a process, asystem, or an application includes following blocks as illustrated in Figure 4.5.
106 Research Methodology

The environment where process/experiment is performed can affect the process/experiment, measuring sensors and equipment thereby disturbing measurement results.Variables such as ambient temperature, pressure, noise, EMI, stress, strain, vibrations,gravity, and elevation can impact the measurement results. The primary sensor sensesthe appropriate physical variable. If necessary, secondary sensor comes in picture beforeconverting physical parameter into electrical form. This electrical signal is then trans-ferred to master controller through analog signal processing and analog to digitalconvertor units. Master controller then takes appropriate corrective or controllingactions and sends corrected digital signals to digital signal processing and digital toanalog convertor unit. The corrected analog signal is then sent to final control element toget desired output from the process.
4.3.2 Simple Instrumentation Scheme: Oxygen Cylinder
Oxygen cylinder is an oxygen storage vessel, which is either held under pressures in gascylinder, or as liquid oxygen in cryogenic storage tank. Nowadays, oxygen cylinder are usedin variety of applications like in hospitals as a breathing gas, in rocket engines as liquidrocket propellants, during mountain climbing and scuba diving, and so on. As oxygen isvery much prone to fire, its pressure is rarely held higher than 200 bar/3000 psi. Safetyconsiderations limit the upper value while for normal operation the pressure needs to beabove a certain value. Apart from restricting the pressure within these two limits, rarelydoes the need arise to measure or regulate it precisely. Oxygen cylinder is normally fittedwith pressure gauges that indicate the contents of the gases in the cylinder. The range of thepressure gauge is from 0 to 200 kg/cm2. Whenever the new oxygen cylinder is hooked upand taken in line, the pressure indicator should be above this mark to confirm the cylinder isfilled. With the gradual usage of this cylinder the reading would drop gradually, when theindicators show that the pressure has fallen below the minimum level of acceptance, thecylinder should be refilled. On the other hand, if for any reason, the pressure gauge showsthe reading above 200 kg/cm2 during use, the cylinder should be disconnected immediatelyand replaced. The accuracy of pressure indicator should be ±1% of range span. Here the
Primary
Sensor
Secondary
Sensor
Analog
Signal
Processing
Digital
Signal
Processing
Master
Controller
Digital
Signal
Processing
Digital to
Analog
Converter
Process
Ambient temperature,
Ambient Pressure,
Humidity,
Noise, EMI, Lightning,
Vibration, Strain,
Stress, Elevation,
Gravity
Computer
Output
Output
FIGURE 4.5General Block Diagram of Instrumentation Scheme
Basic Instrumentation 107

basic function of pressure gauge is to indicate oxygen cylinder pressure. The minimumrequirement of this instrument (pressure gauge) is, it should be robust, accurate, and reliableto avoid accidents. Figure 4.6 shows the simple instrumentation scheme for oxygen cylinder.
4.3.3 Complex Instrumentation Scheme: Heat Exchanger
The complexity of the system increases with the increasing number of measuring andcontrolling parameters. Consider a heat exchanger process as depicted in Figure 4.7 withmultiple measuring and controlling parameters. Heat exchanger is a means where heatcan be exchanged between solid objects and liquid or between two or more liquids. Toprevent direct contact or mixing of these liquids, it holds solid walls as a partition. Thecommonly used type of heat exchanger is a shell and tube type as it is suitable for widerange of pressure and temperature applications.
FIGURE 4.6Oxygen Cylinder Instrumentation Scheme
Tube Sheet
Tube SheetBaffles
Shell-side
fluid in
Shell-side
fluid out
Tube-side
fluid in
Tube-side
fluid out
FIGURE 4.7Shell and Tube Type Heat Exchanger
108 Research Methodology

It consists of an outer shell with tubes inside it. The process fluid whose temperatureis to be controlled flows through the shell and other fluid like steam flows inside thetubes to exchange the heat between the two fluids. The more is the steam flowingthrough tubes the more amount of heat can be exchanged and vice versa.
Figure 4.8 shows the control loop for heat exchangerHere, the temperature of process fluid OUT shown as TTI1 OUT is depending upon
various parameters like
• Temperature of process fluid IN (TTI1 IN)• Flow rate of process fluid IN (FTI1)• Flow rate of steam IN (FTI2)
So, to take process fluid OUT temperature at desired value (set point), it is necessary tokeep all above parameters in the suitable range. To achieve this, the process fluid IN line,OUT line and steam line should have appropriate temperature and flow rate indicatorsand respective transmitters. Indicators display process parameter value locally whiletransmitters convert that process parameter value in suitable electrical form. This electricalform is then transferred to controller to take controlled actions. By implementing appro-priate control algorithm, controller drives the process fluid IN temperature, fluid IN flowrate and steam IN flow rate in suitable range by sending controlled signal to respectivefinal control element.
Steam IN
CV IN INCV
IN
Master
Controller
FTI2 FTI1FTI1
TTI1
OUT
TE
Process Fluid IN
Heat Echanger
TE:
TTI1 OUT:
TTI1 IN:
FTI1 IN:
FTI2 IN:
CV:
Temperature element
Process fluid OUT temperature Transmitter & Indicator
Process fluid IN temperature Transmitter & Indicator
Process fluid IN flow transmitter & Indicator
Stream IN flow transmitter & Indicator
Control Valve
Process
Fluid IN
FIGURE 4.8Heat Exchanger Control Loop
Basic Instrumentation 109

To make this heat exchanger more sophisticated we can add personal computer (PC)in the loop so that:
• The set point can be changed with requirements• Commands to start and stop the process can also be given from keyboard
The overall instrumentation and control scheme for this heat exchanger is shown inFigure 4.9.
4.4 Experimental Setup
A Researcher formulates hypothesis to solve the problem or to bridge the gap in existingsystem using mathematical model or scientific methods. In order to test hypothesis, aresearcher performs experiments. Experiment is divided into two groups, experimentalgroups and control groups. It provides a standard of comparison to examine if any changeoccurs as a result of independent variable. The experimental group gets the independentvariable. The control group does not get the variable, it has dependent variables. It willprovide platform for the data analysis and the researcher may accept or reject the hypothesis.
An experimental setup is systematic and scientific approach used to test the effect ofvariables on an outcome to support or validate a hypothesis. The variables that theresearcher manipulates are called as the independent variables. The variables which are
Master
Controller
Temperature
Sensor
Flow Sensor
PC
Set
point
Analog
signal
processing
&
ADC
Digital
signal
processing
&
DAC
Temperature,
flow Final
Control
element
Controlled
output
FIGURE 4.9Instrumentation Scheme for Heat Exchanger
110 Research Methodology

controlled and/or measured are dependent variables. It plays an important role in thedevelopment of a researcher, as it develops continuous learning attitude of a researcher.In science, the experimental setup is the part of research. Broadly experimental setupcan be divided into three types:
• Laboratory based,• Field Based,• Natural Experiments
4.4.1 Laboratory Based Experimental Setup (Indoor Setup)
A laboratory provides controlled conditions in which experiments, measurements orresearch can be performed. Those experiments, measurements, or research work thathave laboratory-based setup enable the experimenter to measure the effects of indepen-dent variables on dependent variables precisely, thus establishing cause and effectrelationships. With this, they can predict the behavior of dependent variable in thefuture. Various fields of science and engineering have different requirements. As perthose requirements laboratory setups take many forms. For example, Physics, Metal-lurgy, Chemist, Biologists, Computer Scientist, and Technical Institute Laboratories havevarious equipments, apparatus, and laboratory conditions.
In technical institutions, traditional real laboratories are used, but they have lot oflimitations. The basic as well as advanced laboratory equipment required for researchmay be limited due to lack in availability of resources. The limited working hours of aninstitute may restrict the researchers from doing experiments according to their ownschedules. With the advancement and modernization in technology for engineeringeducation, it is possible to access the remote laboratory setup via web, such setups arecalled as Web-based experimental setup or virtual laboratory experimental setup. Use ofvirtual laboratories for performing experiments is one of the most efficient ways ofutilizing available technical resources.
4.4.1.1 Advantages
• Control – laboratory experiments have a high degree of control over the environ-ment and other extraneous variables, so experimenter can assess the effectsprecisely. It results in enhanced accuracy of results. Also, it has higher internalvalidity
• Isolation of variables – controlled condition of laboratory experiment eliminatesthe effect of extraneous variables. These variables are the undesirable variableslike noise which are not of interest but might interfere with the results of theexperiment. Also, a controlled condition of laboratory experiment can isolateindependent variables easily than other experiment methods. So, it becomespossible for an experimenter to test results with one or more independentvariables easily
• Reliability – Due to high levels of control, experiments can be performed repeat-edly, so that the reliability, precision of results can be checked
Basic Instrumentation 111

4.4.1.2 Limitations
Lack of external validity: As lab experiments are conducted in controlled condition, thatis, artificial environment, these conditions are far different from natural real-life condi-tions, the results tell very little about how dependent variables will act in real lifeconditions, that is, the results cannot be easily generalized. Due to this limitation,sociologists hardly ever use lab experiments.
4.4.1.3 Case Study for Laboratory Based Experimental Setup
Testing of the antenna parameters in anechoic chambers is discussed below as a casestudy of laboratory based experimental setup.
The laboratory based experimental setup to test antenna parameters includesanechoic chamber. An anechoic chamber is a huge Faraday enclosure, which elim-inates reflection, external noise and interference caused by electromagnetic waves. Allinner surfaces of the chamber are lined with RF/microwave absorbers, which mini-mize the amplitude and phase ripples in the test zone. Hence, an anechoic chamberprovides accurate and precise measurement of antenna parameters such as antennafar-field patterns, gain, directivity, radiation efficiency, input impedance and polariza-tion. It provides controlled electromagnetic environment. A picture of an anechoicchamber is shown in the Figure 4.10 along with experimental setup to measureantenna parameters.
Position
Controller Acoustic Wall
Testing
EquipmentDUT
Network
Analyzer
FIGURE 4.10Anechoic Chamber to Test Antenna Parameters
112 Research Methodology

4.4.2 Field Based Experimental Setup (Outdoor Setup)
Some experiments need to be performed in the real world, that is, at a field place ratherthan in the laboratory, are known as field-based experiments. Field experimental setupsare completely different from laboratory experimental setup. Laboratory experimentsenforce scientific control by testing a hypothesis in the artificial and highly controlledsetting of a laboratory. These experiments take place in real-life settings such asindustries, geographical locations, classroom, workplaces, and so on. The field experi-ments are sometimes seen as having higher external validity than laboratory experi-ments as they are performed in natural environment rather than in a laboratoryenvironment. However, like natural experiments, field experiments suffer from thepossibility of contamination: experimental conditions can be controlled with moreprecision and certainty in the laboratory.
4.4.2.1 Advantages
• External validity – As field experiments take place in normally occurring naturalconditions, they have reasonable external validity than lab experiments
• Larger-scale involvement – As it is possible to do field experiments in largepremises like in large institutions, in schools or workplaces, large number ofpeople can interact in the process
4.4.2.2 Limitations
• Less control: In field experiments, experimenter has less control on variables thanlab experiments which might result in more distortion of findings due to inter-ference of extraneous variables and which lead to lower internal validity
• Experimental effect: Field experiments are generally performed with larger scalesettings involving more people who may reduce the validity of results as respon-dents may act differently just because they know they are part of an experiment
• Practical problems: For lab experiments, access is not a major issue, but with fieldexperiments, and workplaces, institutions might not be willing to allow experi-menter to do so
4.4.2.3 Case Study for Field Based Experimental Setup
In some applications like an antenna mounted on an aircraft, mobile systems parameterscannot be tested in Laboratory (anechoic chambers) hence, field based experimentalsetups are required.
The antenna parameters that can be tested in outdoor ranges are far-field patterns,gain, directivity, radiation efficiency, input impedance and polarization. These para-meters are affected by Electromagnetic environment and by other RF losses like fading,free space path loss, ground reflections, shadowing, and so on. The outdoor sites forantenna parameter measurement provides propagation of signal in the line of sight(LOS) as illustrated in Figure 4.11 which must be unobstructed and free from groundand other reflections from nearby objects like human beings, buildings, ground, and soon. The reflected signal in elevated range is the major cause for error in radiation patternand gain measurements.
Basic Instrumentation 113

The researcher must take care while performing experiments on field (outdoor) as theenvironmental effects usually degrade the measured values.
4.4.3 Natural/Quasi Experiments
In natural experiments, experimenter does not manipulate variables deliberately as thevariables change naturally. So, experimenter just measures the effect of something that isalready happening. Natural experiments are used in observational studies. Naturalexperiments are employed as study designs when controlled experimentation is extremelydifficult to implement or unethical example evaluating health impact due to particulardisease. When controlled experimentation like Laboratory experiment is not possible tostudy the situation, in such cases, Natural experiments are often performed. Situationslike policy changes, weather events and natural calamities create circumstances for naturalexperiments. Natural experiments are used most commonly in the fields of epidemiology,political science, psychology, and social science.
4.4.3.1 Advantages
High external validity – As experimenter does not manipulate the variables andvariables change naturally, the findings/results can be easily generalized to real-lifesettings. So, these experiments have high external validity.
4.4.3.2 Limitations
• Lack of control – In these experiments, as variables change naturally and experi-menter does not have control over them, extraneous variables and other environ-mental settings can affect findings. So, these experiments have low internal validity
• No repetition – Experiments cannot be repeated as the researcher has no controlover variables. Reliability of results cannot be checked in these experiments
(a) (b)
Sourse Antenna
Test Antenna
Ground
Reflections
Building
FIGURE 4.11Illustration of Outdoor Range Setup
114 Research Methodology

4.4.3.3 Case Study for Natural Experimental Setup
Effect of Smoking on Health is discussed below as a case study of natural experimental setup.In Helena, Montana a natural experiment regarding smoking ban from all public places
was performed over a period of six-month. A study was carried out on health issues.When the ban was in effect, 60% drop in heart attacks was reported by investigators forthe study area. As such experiments cannot be performed in the Laboratory, they fallunder the category of natural experiments [6].
4.4.4 Steps of Experimental Setup: Laboratory Experiments
Figure 4.12 indicates the steps of experimental setup as detailed below:
(i) Identify the Problem Statement: Initially the researcher has to define the Problemstatement, which helps him/her to study in more narrow area appropriately.Defining proper problem statement leads in formulation of proper hypothesis.
(ii) Formulate the Hypothesis: Hypothesis is the objective of experimental setup. Itgives direction to the researcher. In a hypothesis statement, the researcher makes aprediction about what he/she thinks will happen in the experiment. They predictabout the results.
(iii) Test the Hypothesis with experimentation: To test a hypothesis, the researcherperforms experimentation on input data. While conducting experiment, they haveto identify and control the non-experimental factors like noise which can affect theresult. Selection of instrument should be proper. Special focus should be given onaccuracy, precision, range, response time of instrument. Instrument should becalibrated before use. A Researcher can perform an experiment with properlyselected instrument. After experimentation they have to collect and compile theobtained results in a systematic way that can be usable.
(iv) Analysis of Experimental results: After getting output i.e. result they check theobtained result with the actual one. This is analysis of data. If the obtained resultis not within acceptable range as per the hypothesis, the above steps are repeated.The above process is repeated until results are acceptable. In some cases, theresearcher may have to make some modification in hypothesis too.
(v) Conclusion: Finally with the help of analyzed data researchers formulate theconclusion. In the conclusion researcher has to comment on observations, theyexamined through-out the experiment process. Repetition of experimentation isnecessary because when same results are obtained, it gives confidence to results.
To test hypothesis researcher collects data and then performs experimentation oncollected data using appropriate instrument. It is of prime importance that researchershould select instrument which will show true value at the output, and for thatcalibration of instrument with standard instrument is necessary.
4.4.5 Calibration of Instruments
Calibration is a method used to compare the measuring, and test instruments to arecognized reference standard of known certified accuracy and precision, noting thedifference and adjusting the instrument, where possible, to agree with the standard.
Basic Instrumentation 115

4.4.5.1 Need of Calibration
Instrument error can occur due to a variety of factors: drift, environment, electricalsupply, addition of components to the output loop, process changes, and so on. Sincecalibration is performed by comparing or applying a known signal to the instrumentunder test, errors are detected by performing calibration.
4.4.5.2 Steps for Calibration
Step 1: Identify the Measuring Devices/InstrumentsStep 2: Determine Certification, Calibration, and Accuracy Check RequirementsStep 3: Calibration processStep 4: Corrective ActionStep 5: VerificationStep 6: Documentation and Record Keeping
4.4.5.3 Case Study: Calibration of Blood Pressure Measurement Equipment
The steps to calibrate self-measured blood pressure device at doctor’s clinic to measure itsaccuracy against a mercury sphygmomanometer or primary device are discussed below.
1. Make the subject under test (Patient) sit down with his/her arm at heart levelcompletely relaxed.
2. Before starting the measurement ask the patient to rest/relax for five minutes.
Conclusion/hypothesis Proved
Yes
Identify the problem statement/
Define aim of the experiment
Formulate the Hypothesis
Test the Hypothesis with experimentation
Analysis of experimental results
Result acceptable
No
FIGURE 4.12Flow Diagram Indicating the Steps of Experimental Setup
116 Research Methodology

3. During the measurements do not allow the subject under test (Patient) to conversewith anybody to prevent change in blood pressure.
4. With a gap of 30 seconds take a total of five sequential same-arm blood pressurereadings.
5. Take the first two readings with the BP device under calibration.6. Take the third reading, preferably with a mercury sphygmomanometer or primary
device by the health care clinician.7. Take again the fourth reading with the same BP device under calibration.8. Take the fifth and final reading again with a mercury sphygmomanometer or
primary device by the health care clinician.9. Compare the difference between the readings from the two cuffs.
a. BP readings generally reduce over the five measurements. The final systolicblood pressure reading may be as much as 10 mm Hg lower than the first.
b. The comparison is acceptable if the difference is 5 mm Hg or less.c. If the difference is greater than 5 mm Hg but less than 10 mm Hg. Repeat the
above calibration procedure.d. If the difference is greater than 10 mm Hg the device may not be accurate.
10. Repeat this procedure if the device is not calibrated as per the specifications.
4.5 Reliability of an Instrument
Any system/instrument cannot work satisfactorily over a long period of time unless thefailure rate of the components is zero. In practice it is not possible to manufacture eachcomponent perfectly as some other factors will also force it towards failure. Componentfailure results in system/instrument failure. To avoid this, component is manufacturedwith greater reliability (generally R = above 0.9899 as a standard). In order to increasethe reliability of an instrument/system the concept of redundancy can also be usedwhich will help to avoid stoppage of work due to system failure.
A failure is partial or total depending upon the loss or change in the properties of aninstrument in such a way that functioning is partially or completely stopped. Failure, ingeneral can be grouped into different modes depending upon nature of failure whichcan be categorized as below:-
• Initial failure: Occurring during initiation phase• Early failure: Occurring after a short time after installation• Random failure: Occurring at an arbitrary instance• Catastrophic failure: Occurring due to major failures and stopping the• functioning for long time• Wear out: Occurring after long usage of system/instrument• Failure density: This is the ratio of number of failures during the given unit of time
interval to the total number of items at the beginning of the test. The failure
Basic Instrumentation 117

density is usually carried out during the trail phase of any system/instrument toknow the performance parameters
• Failure rate: It is defined as ratio of number of failures to number of componenthours. Hence for electronic components Failure rate (FR) is generally stated as:
Failure rate λð Þ ¼ Number of failuresNumber of component hours
ð4:2Þ
Failure rate is usually a calculation done when the system/instrument is used for a longduration of time to know its performance and state.
Further the key causes of failure and unreliability are:
(i) Poor design(ii) Wrong manufacturing techniques(iii) Lack of total knowledge and experience.(iv) Complexity of system/instrument.(v) Poor maintenance policies(vi) Bad quality control(vii) Storage or transport(viii) Misuse and mishandling(ix) Human errors (Human errors can be further classified)
• Lack of knowledge of equipment• Lack of understanding process• Carelessness• Forgetfulness• Poor judgment skills• Physical inability
4.5.1 Reliability Metrics
Reliability is the ability of the instrument/system to maintain its quantity and qualityunder specified condition for a specified time. Reliability of a system/instrument is theprobability that the system/instrument performs intended function adequately for givenperiod of the time under the stated operating condition or environment. The reliabilitydefinition stresses four elements namely:
• Probability• Intended function• Time• Operating Conditions
118 Research Methodology

There is a thin line of difference between reliability and quality. It goes hand in hand. Inconclusion; there cannot be reliability if the system /instruments are not of quality. TheComparison between Reliability and Quality is given in Table 4.1.
4.5.2 Reliability and Availability
Although the definition of availability appears to be similar to reliability, availability hasdifferent meaning. Reliability emphasis on failure free operation up to time t whereasavailability means the status of equipment at time t. The availability function doesconvey about the number of failure that occurs during time t, but depends upon boththe failure and repair rates.
4.5.3 Reliability Management
Reliability management is concerned with performance and conformance of the system/instruments over the expected life. Reliability management includes planning, designing,verifying and tracking of the products throughout their life to achieve reliability. Relia-bility of a system is often specified by the failure rate λ. For most of the systems/instruments, λ(t) is a “bath-tub curve”: To do the reliability management, reliabilitycharacteristics play a very important role.
4.5.4 Reliability Characteristics
The reliability characteristics are classified as Repairable Systems and Non-RepairableSystems.
(i) Parameters playing vital role for Non-Repairable Systems:• Reliability=Availability• Failure Rate: The number of failures per unit of gross operating period in terms
of time, events, cycles• MTTF (Mean Time to Failure): It is the average time to first failure occurrence
TABLE 4.1
Comparison between Reliability and Quality
Reliability Quality
Reliability of an instrument/system is the probability that itperforms its intended function adequately for a given periodof time under stated operating condition or environment.
Quality of instrument/system is the degree ofconformance to applicable specification andworkmanship standards.
Reliability is primarily associated with designing of a system/instruments.
Quality is associated with manufacturing of asystem /instruments
Reliability depends on time and environmental condition Quality is not concern with time and environmentcondition
Reliability can be defined by numerical value. Quality cannot be defined by numerical valueFor reliability creating a redundancy in the system ismandatory for better reliability and avoidance to failure rate.
It is impossible to construct good quality systemby having a redundancy.
Basic Instrumentation 119

• MTTF is a statistical value and is meant to be the mean over a long period oftime and
• a large number of units• Time to First Failure: The first failure occurrence during the operating period• MRL (Mean Residual or remaining Life): It is the mean time for which the
system/instruments works after which the failures has already occurred andbefore stoppage
(ii) Parameters playing vital role for Repairable Systems:
• Availability (Function of Reliability and Maintainability)• Failure Rate and Repair: It is defined as ratio of number of failures to number• of component hours and the repairs done after the occurrence of the same• MTBF (Mean Time Between Failures): It is the average time between failure• occurrences. The number of items and their operating time divided by the total• number of failures for repairable items• MRL(Mean Residual or remaining Life): It is the mean time for which the• system/instruments works after which the failures has already occurred and the• maintenance and repairs costing is taken into consideration
To calculate reliability for any system/instrument some important formulas are statedfor ready reference:
• MTBFðθÞ ¼ Total time= Total Number of failures ð4:3Þ
• Average Failure Rate
λ ¼ 1=θ ! λθ ¼ 1 ð4:4Þ
• Hence λ= Total Number of failures/ Total time• Mean time to failure (MTTF)
¼ 1=λ ð4:5Þ
• Maintainability can be measured with Mean Time to Repair (MTTR), MTTR is• average repair time and is given by:
MTTR ¼ Total Maintenance Down TimeTotal Number Of Maintenance Actions
ð4:6Þ
• Failure Rate:
¼ f tð ÞR tð Þ ð4:7Þ
•
•
•
•
•
120 Research Methodology
Example 4–1. 600 buses have accumulated for 54,000 hours, 10 failures are observed.What is the MTBF? What is the failure rate?
Solution: Consider car as repairable system,MTBF(θ) = Total time/Total Number of failuresMTBF = 54,000/10 = 5400 hours.Average Failure Rate λ = 1/ θAverage Failure rate λ = 10/54,000 = 0.000185 per hour.
Example 4–2. Six water pumps were tested with failure hours of 54, 32, 52, 96 and 104.What is the MTTF and failure rate?
Solution: consider pumps as nonrepairable systems
MTTR ¼ Total Maintenance Down TimeTotal Number of Maintenance Actions
MTTR = (54+32+52+96+104)/6 = 56.3 hoursFailure rate λ = 6/(54+32+52+96+104) = 0.01775 per hour.Note that MTTF is a reciprocal of failure rate, so MTTF = 1/λSubstituting the values of λ,MTTF is 56.33hours
Example 4–3. In an illustration here assume 10 components were tested and forComponent1 to 5 failed after 58, 26,132,323,520 hours. Component 6 to 10 failed after300,400,525,700,400 hours. The components failed are not repairable. Find the failurerate and mean time till failure. What is the mean time till failure assuming a constantfailure rate?
Solution: Calculate failure rates from historical information.No. of failures = 10.Total operating time as per the data furnished = additions of all failure rates58 + 26 + 132 + 323 + 520 + 300 + 400 + 525 + 700 + 400 = 3384 hoursFailure rate is calculated asλ = No of failures/total operating timeλ = 10/3384 = 0.00295Mean time till failure (MTTF) = 1/λ = 1/0.00295 = 338.40 hours.
Example 4–4. For example, if you had 6 hydraulic pumps in standby mode and each ranfor 1000 hours in standby and 4 failed during the standby time. Find the failure rate instandby mode.
Solution: Total standby hours = No. of pumps * standby time= 6*1000 hours = 6000 hours
Failure rate in standby mode = No. of pumps Failed/Standby time= 4/6000= 0.00066 failures per hour
The other Important Analytical Functions in Reliability Engineering are:
• Failure Probability Density Function• Failure Rate Function• Reliability Function
Basic Instrumentation 121

• Conditional Reliability Function• Mean Life Function.
Reliability Function and Failure Rate Calculations:For a probability density function f xð Þ for the time till failure, reliability functions can bedefined as;
R tð Þ ¼ P T4tð Þ ¼ð∞t
f tð Þdt ¼ 1�ðt0
f tð Þdt ¼ 1� F tð Þ ð4:8Þ
Where, F tð Þ ¼ Ðt0f tð Þdt is the cumulative disrtibution function:
Failure Rate
; tð Þ is failure rate function at time t, given that it survived until time t:
; tð Þ ¼ f tð ÞR tð Þ ð4:9Þ
Relationship between Failure Density and Reliability
f tð Þ ¼ �ddt
R tð Þ ð4:10Þ
Relationship between h(t), f(t), F(t) and R(t),
h tð Þ ¼ f tð ÞR tð Þ ¼
f tð Þ1� F tð Þ ð4:11Þ
Remark: The failure rate h(t) is a measure of proneness (degree of getting subjected offailure) to failure as a function of age, t.
Relationship between MTBF/MTTF and Reliability:
MTBF ¼ MTTF ¼ð∞0
R tð Þdt ð4:12Þ
Example 4–5. Trial data shows that 105 items failed during a test with a total operatingtime of 1 million hours. (For all items, that is, both failed and passed). Also, find thereliability of the product after 1000 hours, that is, (t) = 1000
Solution: The failure rate λ=No of failures/total operating timeλ ¼ 105
1000000 ¼ 1:05x10�4 per hour
Reliability at 1000 hours = e�λt
122 Research Methodology

R 1000ð Þ ¼ e� 1:05x104x1000ð Þ ¼ 0:9
Therefore the item has a 90% chance of surviving for 1000 hours
Example 4–6. The data below shows operating time and breakdown time of a machine.Operating Time is 20.2, 6.1, 24.4, 35.3 and 46.7Down Time is 2.5, 7.1, 4.2 and 1.8
a) Determine the MTBF.b) What is the system reliability for a mission time of 20 hours?
Solution:Total operating time = 20.2 + 6.1 + 24.4 + 4.2 + 35.3 + 46.7= 136.9 hoursThe failure rate λ = No of failures (Down time iterations)/total operating timeλ = 4/136.9 = 0.02922Therefore, θ = MTBF = 1/λ = 34.22 hoursNow let us calculate the system reliabilityR = e-λt where t = 20 hours,Substituting the values R = e-(0.02922) (20)
R = 55.74%
Maintainability:Maintainability is the measure of the ability of a system/instrument to be retained orrestored to a specified condition when maintenance is performed by qualified personnelusing specified procedure and resources. Maintainability can be measured with MeanTime To Repair (MTTR), MTTR is average repair time and is given by
MTTR ¼ Total Maintenance Down TimeTotal Number of Maintenance Action:
ð4:13Þ
Also, MTBMA is an acronym for Mean Time Between Maintenance Actions includingpreventive and corrective maintenance tasks.
Researchers can use Software’s like ReliaSoft’s, Weibull++, RGA and BlockSim-packages which are useful for illustration and calculations. These software’s arereadily available online. Simulation software helps an engineer to determine thesample size, test duration or expected number of failures in a test. To determinethese variables, analytical methods need to make assumptions such as the distribu-tion of model parameters. In case of small sample size the simulation method is moreaccurate than the analytical method because it does not require any assumptions.Generally, a manufacturer has to prove that at any given point of time that a certainproduct has met a goal of certain reliability with a specific confidence.
Procedure to Use Weibull++ Software for Reliability Test:The procedure to use weibull++ software is illustrated in the following steps. Fourexamples are shown in following section.
Basic Instrumentation 123

(i)Determining Units for Available Test Time
If duration of available testing facility is known, then to achieve reliability goals itis required to determine the number of units to test for this amount of time with nofailures.Example: Given that the parametric binomial method is used to design a test todemonstrate a reliability of 90% at 100 hours with a 95% confidence with zerofailure during the test. Determine the units for available test time.Assume a Weibull distribution with a shape parameter β = 1.5.
R ¼ e� t=ηð Þβ
η ¼ t
�ln RDEMOð Þð Þ1β¼ 448:3
RTEST¼ e
� tTESTη
� �β¼96:6 %
Substitute the appropriate values into the cumulative binomial equation givenhere:
1� CL ¼ Pfi¼0
n!i! n�ið Þ! � 1� e�
tTESTηð Þβ
� �i
� 1� e�tTEST
ηð Þβ� �n�i
n ¼ 85:49 or ¼ 86:
(ii)Determining Time for Available Units
Consider a case where 20 units are to be tested. The value of the scale parameter, η,are already been determined in previous example. The binomial equation with theWeibull distribution for tTEST can be solved since the values of n, CL, f , η and β arealready calculated in previous example. This value is 126.43[7]
(iii)Test to Demonstrate MTTF: (Parametric Binomial Method)
To determine the number of units to test for 60 hours a test is to be designed todemonstrate a MTTF= 75 hours with a 95% confidence with zero failure during thetest f=0. Assume a Weibull distribution with a shape parameter β=1.5.From the following MTTF equation determine the value of the scale para-
meter η. MTTF ¼ η:� 1þ 1β
� �Where:�(x) is the gamma function of x. This can be rearranged in terms of η:
η ¼ MTTF
� 1þ 1β
� � ¼ 83:1
Since MTTF and β have been specified η can be calculated as 83.1. The value ofRTEST is calculated as:
124 Research Methodology

RTEST ¼ e� tTEST
η
� �β
¼ 54:1%
By solving the binomial equation for n, the value is calculated as 4.88 or n = 5units (The fractional value must be rounded up to the next integer value).
(iv) Test to Demonstrate MTTF: (Non-Parametric Binomial Method)For non-parametric demonstration test design the same binomial equation can beused.
The time value is not associated with non-parametric binomial method. Hence it canbe assumed that the value of RTEST is associated with the amount of time for which unitswere tested. The given non-parametric binomial equation is widely used in practicewhen the available test time is equal to the demonstration time:
1� CL ¼Xf
i¼0
nið Þ 1� RTESTð ÞiRTESTn�i
Where:CL is the confidence level,f is the number of failures,n is the sample size,RTEST is the demonstrated reliability,RTEST can be simply written as R if reliability is not related to time.Example:Determine the required sample size with zero-failure using non-parametric binomial
method to demonstrate a reliability of 80% at a 90% confidence level.
4.5.5 Designing for Higher Reliability
A number of techniques are available to enhance the system reliability. Some of theimportant techniques are[8]:
(i) Safety Critical Design: There is a relation between product reliability and safety.In case of a product performing a safety-critical role, then failure of a keycomponent can have direct consequences. There are different approaches to mini-mizing or preventing the risk of catastrophic failure.
(ii) Over-specification: In the building and construction industry for product applica-tions, “x5” factor is mandatory for safety factoring all material strength calcula-tions. Example: to have a suspension bracket for a 10kg light fitting, the systemshould be designed to carry at least 50kg.
(iii) Redundancy (parallel): Multiple identical machineries are used distinctly, any oneof which would be proficient of supporting usual product function. Examples:Data processing systems, Protective systems for nuclear reactors, Satellite commu-nication subsystems, interconnected power systems, Aircraft propulsion systems,temperature control systems for space vehicles, Ignition systems for rocketengines. For example, a passenger lift has 4 cables carrying the lift cabin, all
Basic Instrumentation 125

share the weight. Any one cable would be proficient of carrying the full nearsidelift load. A catastrophe of up to threecables will not risk the lift inhabitants. Flightregulates and tool systems in some aircraft adopt alike policy. Dual cabling inmilitary systems advances survivability.
(iv) Redundancy (standby): A back-up scheme is held in stand-in and arises into operationonlywhen themain system fails, for sample stand-by generators in hospitals, and stand-in parachutes. Standby redundancy is often pronounced as a “belt & braces”method.
(v) Fail-safe design: Assumes an integrate risk of failure for which the rate of any ofthese three approaches would be excessively high. The merchandise or system isdesigned to drop into a safe state in the event of partial or total failure.For example:
• The gas supply to a local central heating boiler is closed off in the nonappear-ance of a “healthy” signal from the water pump, flame sensor, water pressuresensor, or exhaust fan
• Toys can be designed to crack at predetermined weak points so as to leave nosharp forecasts that would injure a child
• Railway train brakes are released by vacuum and applied by applying air. If abrake pipe bursts, the admitted air automatically applies the train brakes
Design faults create revise costs. Faults detected during the component plan phase canbe adjusted locally without serious effect on development times and costs[9]. However,with each following stage in development, the rework cost rises by a factor of ten asshown in Table 4.2.
Through testing at each step the manufacturer tries to keep cost of the product low,especially during prototype and preproduction phases.
4.5.6 Reliability and Cost
From user point of view, the most rational criteria for deciding best system/instrumentis by its cost. The two main component of this cost are purchasing cost (capital cost) andmaintenance cost throughout its useful life. The reliability and purchase cost of theinstrument/system goes on increasing, because of better design, quality control produc-tion technique. Hence for higher reliability the maintenance cost comes down. The totalsum of these two keeps going down up to a point and then starts increasing again aftera long period of time due to wear out of systems/instruments[10].
TABLE 4.2
Correction Errors with Respect to Stage of Production
Stage of productionRework Costs(correcting errors)
Component design and manufacture x1Prototyping and subassembly manufacture x 10Final product assembly x 100Volume product shipped to dealers x 1000Volume product sold to customers and in use x 10,000
126 Research Methodology
The cost of various method of achieving the reliability will vary according to:
• Components used• Maintenance cost• Associability of product for the maintenance• Time and man power availability for design• Constraints such as weight, volume, and so on
The initial cost (design and production) increases, but the operating cost decreases withthe reliability and hence there exist value of reliability for which the cost is minimum.
4.5.6.1 Product Law of Reliability
The system/instrument comprises of many subsystems or many components. Failure ofany one subsystem or components leads to failure of the total system. This is seriesreliability problem. This is best explained by taking closed connections of switches orrelays in series. It is assumed that, the failure is dependent and one failure leads tofailure of other items. In practice, it is possible that failure of one component may leadto failure of other components. Where, Rx, Ry. . . shows the reliability of individualunits. Therefore, Rs=Rx*Ry. Hence if the reliability of an individual subsystem orcomponent is known then, the total system reliability is the product of individualreliabilities of all items.
Example 4.7 Consider two subsystems with the reliability of 85% and 90% (i.e. 0.85 and0.9) then total subsystem reliability is given as:
Solution: Rs = 0.9*0.85 =0.765 or 76.5%
4.5.7 Environmental and Other Physical Effects on Reliability
The environment, in which an instrument or a system operates, has a profound effect onits reliability. This is true whether the instrument is operating (active), switched off orstored. In fact, when switched off, the effect of environment may be more damagingbecause there is no self-generated heat to counteract the effect of moisture. Followingare some major environmental factors that affect the reliability.
(i) Temperature: The most important parameter is temperature. When the tempera-ture rises above the normal value the rate of chemical reaction increases. It alsospeeds up oxidation process in the presence of increased moisture. Highertemperature results in development of stress caused by expansion. At very lowtemperatures, material hardens and become brittle.Components like electrolytic capacitors become ineffective because of freezing of
an electrolyte. As the temperature goes up, the electrolyte starts drying and thusreduces capacitor value permanently. The temperature effect that proves to bemost damaging is those of rapid temperature cycles. This may happen when theequipment is in an unpressurised aircraft.
(ii) Humidity: The percentage of humidity in atmosphere can vary from 3% to96% RH.
Basic Instrumentation 127

The main effects of humidity are:• Reduction in the value of insulation resistance, which leads to electrical
breakdown• Corrosion due to moisture forming an electrolyte between dissimilar metals• Reduction in insulation due to fungi growth
(iii) Mechanical vibrations and shock: An instrument experiences some degree ofmechanical shock and vibration when transported and handled. Portable instru-ments like mobile equipment suffer the most. These effects can weaken thesupports, loosen connections and wires and may physically break components,which inevitably are the reasons of failures and less reliability in the long run.
(iv) Variations in pressure: Low pressure causes a decrease of electrical breakdownvoltage between contacts using air insulation, which can reduce reliability of thesystem/instruments. For illustration two case studies of a reliability test per-formed by Delserro Engineering Solutions, Inc. (DES) [http://www.desolutions.com/blog] are described below:
4.5.7.1 Case Study 1: Medical Product Reliability Testing
A leading medical equipment manufacturer needed help to set reliability goals andperform product reliability testing on their new product. DES helped them identifyreliability goals. After the goals were set, DES developed a custom product reliabilitytest plan that defined how the tests would be performed and how the test results wouldbe quantified into a field life. DES designed and built automated test setups andperformed life cycle testing on different components of their product. The test resultswere reported and analyzed with reliability computer software to determine the pro-duct’s field life or Mean Time to Failure (MTTF)[11].
4.5.7.2 Case Study 2: Temperature and Environmental Product Test
A manufacturer of consumer products was looking for a way to quantify their product’sfield life. Specifically, they were looking for a way to quantify the degradation of theirproduct vs. time in the field. After discussing their project with DES, DES designed atest plan to expose their products to cyclic temperature and humidity. Severe use fieldconditions were defined and the conditions were accelerated during testing. Sampleswere periodically removed during the test and measurements were made. A statisticalanalysis was performed to demonstrate that the product would not degrade signifi-cantly over the customer’s 15 year lifetime requirement.
4.5.7.3 Case Study 3: Reliability and Failure of Electrocardiogram (ECG) Machine
Following case study provides researcher basic understanding about performancecharacteristic under operating conditions. In the previous section reliability and failureof instruments and how it affects the performance are discussed. In this case study 12-lead electrocardiogram is taken and will discuss how diagnosis gets affected by fewerrors and how it can mislead to false results[11].
128 Research Methodology

The 12-lead electrocardiogram (ECG) is extensively used tool for the diagnosis andidentification of cardiac condition which mainly include myocardial infarction andischemia[12].
The correct placement of each electrode plays vital role for correct patient diagnosis asshown in Figure 4.13 Any incorrect placement of leads mainly leads to a wrongdiagnosis which may cause wrong ECG result. ECG waveform under normal conditionfor healthy person is shown in Figure 4.14. Standard placement of electrode is given inTable 4.3.
4.5.7.4 Error Due to Lead Reversals
Lead switch placement is a common mistake when ECGs are taken which mainly leadsto false diagnoses of patients giving false results.
FIGURE 4.1312-Lead Placement for ECG[12]
TABLE 4.3
Position of Leads in ECG
ELECTRODE PLACEMENT
RL Place anywhere above the ankle and below the torsoRA Place anywhere between the shoulder and the elbowLL Place anywhere above the ankle and below the torsoLA Place anywhere the shoulder and the elbowV1 Place in the 4th intercostal space to the right of the sternumV2 Place in the 4th intercostal space to the left of the sternumV3 Place at midway between V2 and V4V4 Place at 5th intercostal space at the mid-clavicular lineV5 Place at anterior axillary line at the same level as V4V6 Place at mid-axillary line at the same level as V4 and V5
Basic Instrumentation 129

• Left-right arm inversions prompt a negative (-ve) complex in lead I with a negative(-ve) P wave in lead I. This is the essential reason for right axis deviation whichoccurs on the ECG waveform
• Arm-foot changes prompt a little or “far field” motion in lead II or III• Chest lead inversions prompt wrong R wave progression in ECG waveform
So if any right axis or even a little change in a furthest point lead ought to be onereason enough to check lead position. Any disturbance or an error caused due toelectrical interference and movement of leads is called as “Artifact”.
As filter settings impact the interpretation of the ECG and furthermore decreaseelectrical interference of ECG machine. Provision for both low pass filter and high passfilter settings is made in the ECG machine. A high-pass filter is mainly used todecrease low frequency noise. It diminishes base line drift in the ECG waveformwhereas a low-pass filter is mainly used to decrease high frequency noise (deliveredby chest, extremity muscles where electrical interference is produced by the powergrid). In monitor mode the high-pass filter which is principally set at 0.5–1.0 Hz andthe low-pass filter on the 40 Hz frequency. This is the most attainable filter setting andit allows only narrow frequency signals to pass through these filters. This setting ishelpful for rhythm monitoring in that noise can divert ST segment, which is not thatimportant. In this mode, pacemaker spikes seem to be invisible which further getsfiltered on.
Diagnostic mode in this the high-pass filter is set at 0.05 Hz frequency and the low-pass filter at 40Hz, 100 or 150 Hz frequency. This improves the diagnostic accuracy andreliability with minimum error in the ST segment. On the other side a base line drift isobtained more easily.
Interference of the monitored ECG is very common among operating theatre andmedical care unit environments, that is, (ICU). Art factual signals, that corrupt theconventional cardiac signal, might arise due to few internal sources and few externalsources. Many electrical devices employed in the clinical applications will introduceartifacts by numerous completely different mechanisms. All these artifacts could also benonspecific or might tally serious arrhythmia. Easy measures, comparable to correct
T
R
P U
Q
S
FIGURE 4.14ECG Waveform under Normal Condition for Healthy Person
130 Research Methodology

attention to basic principles of medical instrument measure, will eliminate some artifacts.In persistent cases, skilled facilitate could also be needed to spot the precise supply andminimize interference on the ECG. Technological advancements in ECG signal could alsobe helpful to discover and reduce artifacts. Ultimately, associating improved understand-ing of the artifacts generated by an instrument, and their distinctive characteristics, is veryimportant to neglect misdiagnosis, misinterpretation and induced complication.
Reliability of an instrument plays key role in research. The selection of the instrumentto produce measurement of variables must be reliable and valid which will lead toconsistent and accurate foundation of the element in research. Selection of an appro-priate data collection instrument is an important component of research finding because,a basic element of validity and reliability of the study depends on the chosen qualitativemethod (e.g., questionnaire) or quantitative method (e.g., survey). Data collection,analysis and formulation are the important aspects in the research. Following sectiondescribes types of data and the different methods of data collection with advantages,disadvantages and applications.
4.6 Data Collection
Data collection is the process of collecting and measuring information of selectedvariables in an established systematic manner. The systematically collected data enablesresearcher to answer relevant questions and evaluate outcomes. Data collection isimportant factor of research in all fields of study including physical and social sciences,humanities, Engineering and Technology and business. Data collection methods vary bydiscipline, the emphasis on ensuring accurate and honest collection is common[13]. Thegoal of data collection is to get quality evidence which will allow researcher to analyseformulation of convincing and credible answers to prove his/her hypothesis. Datacollection begins after finalization of research problem, accurate data collection isnecessary for maintaining the integrity of research. Inaccurate data causes consequencesthat includes the inability to answer research questions accurately and the inability torepeat and validate the research.
4.6.1 Types of Data
To decide the method of data collection a researcher should know types of data. AResearcher would have to decide which kind of data is required for research and thenaccordingly he will have to decide the method of data collection. To reduce likelihood oferrors occurring selection of appropriate data collection instruments (existing, modified,or newly developed) and clearly delineated instructions for their correct use are needed.The data has been divided into two types: primary and secondary.
(i) Primary data:
The data which are collected fresh for the first time are called as primary data. This mayinclude number of ways like interviews, focus groups, telephone surveys, and so on.
Basic Instrumentation 131

Primary data can be collected from large population and across wide geographicalcoverage through emails and posts.
4.6.1.1 Advantages of Primary Data
• The primary data is original and pertinent to the subject of the research to achievehigh accuracy in research
• The researcher can get a realistic view about the topic under consideration fromthe primary data
• Primary data are highly reliable because these are collected by the researcher orconcerned and reliable party
4.6.1.2 Disadvantages of Primary Data
• To collect primary data coverage is restricted in size and for larger coverage amore number of researchers are required
• The cost of the data collection will increase with increase in time and efforts ofmore people but the importance of the research may drop
• Primary data collection takes lot of time and efforts. The problem of the researchcan become serious or out dated before completing the process of data collection,analysis and report preparation. It may defeat the purpose of the research
• In collection of survey based data one can face design problems while preparingquestionnaire. The prepared questionnaire must be simple to understand andrespond
• Timely responses are not received from some respondents
Respondents may give socially acceptable, fake answers to suppress the realities.In primary data collection incomplete questionnaire can give a negative impact on research.Skilled personnel are required for data collection. Unskilled person in data collection
may give inadequate data of the research
(ii) Secondary data:
The data which has already been collected by someone else, analysed and statisticallyprocessed is called as secondary data. It has been collected by someone not related to thecurrent research field but collected this data for some other motive and at different time inthe past. If the researcher uses this data to make conclusions then this becomes secondarydata for the researcher. Secondary data may be available in written, typed or in electronicforms. Sources of secondary information are available to the researcher for assembling dataon an industry, market place and potential product applications. The researcher gains aninitial insight into the research problem from secondary data. Secondary data can be ofinternal or external type. If information is acquired within the organization where researchis being carried out the data is called as internal or in-house secondary data. If data isobtained from outside sources then data is called as external secondary data. Advantagesand disadvantages of using secondary data are listed here.
132 Research Methodology

4.6.1.3 Advantages of Secondary Data
• Secondary data is economical and faster to access• It gives a way to use the work of the best intellectuals all over the globe• It imparts a persuasion to the researcher about direction he/she should follow for
the selected research topic• Secondary data adds value to the research study by preserving time, effort, and
money
4.6.1.4 Disadvantages of Secondary Data
• The data collected by someone else may not be as reliable and as accuratecompared with primary data
• Data collected at one location may not be acceptable for the other location becauseof inconsistent environmental conditions
• As time passes the data becomes obsolete and antiquated• Collected secondary data may pervert the results of the research• To use secondary data a special care and permissions are necessary to amend or
modify for use• To use secondary data, care should be taken to avoid issues of copyright and
authenticity
Considering the benefits and limitations of sources of data, demand of the research topicand time factor, both the data sources, that is, primary and secondary can be selected.These are used in combination to give proper coverage to the topic.
4.6.2 Sources of Data Collection
After knowing types of data, a defined data collection process is required to ensure thatthe data gathered are both systematic and accurate and that succeeding decisions basedon arguments embodied in the findings are valid. The data collection process gives anidea about a baseline from which to measure and in certain cases an indication of whatto improve. Classification of sources of data collection is represented in Figure 4.15.
Information gathered from primary sources is collected using first approach. Tocollect primary data there are three sources viz. Observation of research field, interview-ing group of people and sending questionnaire to group coming under research area.
(i) Observation: A complex source of primary data collection is observation. As it forcesresearcher to do multitasking and to use a number of techniques continuously;including her/his five senses to collect data. The objective of observation method is toobserve people in their natural ways as they follow their everyday lives. Observationmethods can be preferred because it can overcome the issues like validity, bias inquantitative research methods. These methods are primarily useful when its subjectcan provide inaccurate information. Out of available methods for collecting primarydata for the topic of study survey and observation methods have been found suitable.Observation can be participant or non-participant based on participation of researcher.
Basic Instrumentation 133

• Participant: The researcher observes actual situation carefully by puttinghimself in that situation. On the basis of relevance to research topic, his/herskills, knowledge and experience he collects the data from respondents byobserving their natural behaviour. The results of participant observation com-pletely depends on the talent and skills of the researcher. This method can beused only by experts and experienced researchers
• Nonparticipant: It is a data collection technique whereby the researcher doesnot take an active part in the situation under scrutiny only watches the subjectsof his or her study, with their knowledge. The data obtained can be invalid asobserved people may behave differently hence this approach is sometimescriticized
4.6.2.1 Advantages
• Subjective bias can be eliminated• Data is unaffected by past behaviour or future intentions• Natural behaviour of group is allowed to record
4.6.2.2 Disadvantages
• Gives limited amount of information• Unseen factors can affect the observation task
Methods of data collection
Primary sources
Observation
-Participant
-Non-participant
Interviewing
-Structured
-Unstructured
Questionnaire
-Mailed questionnaire
-Collective questionnaire
Secondary sources
Documents
-Govt
Publications
-Earlier research
-Census
-Personal
Records
-Client histories
-Service records
FIGURE 4.15Sources of Data Collection
134 Research Methodology

(ii) Interviewing:
In this method of primary data collection the interviewer (researcher) personally com-municates with the informants and asks required questions to them about the researchtopic. Data can be efficiently collected from the informants by cross examining them.Efficient and tactful interviewer is required to retrieve relevant and accurate data fromthe informants. Interviews can be structured or unstructured. As per the need of thestudy personal interview, depth interview or telephone interview can be conducted.
• Structured: A set of questions or a questionnaire related to the topic of researchstudy is prepared by the researcher and questions have been asked according tothat. It gives quantitative data and evaluates explicit data. This method is applic-able to validate information
• Unstructured: Unstructured Interview is an interview in which the questions to beasked to the respondents are not prepared in an advance. This method is unre-hearsed and very casual. It depends on conversation which tends to focus respon-dents personal qualities related to the work. Questions can be asked about skills,knowledge and strengths and should be answered formally similar to structuredinterview. It gives qualitative information and evaluates implicit information. Thismethod is applicable to judge if the candidate is right person for job
4.6.2.3 Advantages
• This method allows the researcher to gather information from illiterate humankind• As interviewer collects data personally there are nil chances of non-response• As interviewer tactfully collects the data by cross examining the responders hence
collected data is very reliable
4.6.2.4 Disadvantages
• It has chances of bias• The informants may avoid answering few personal questions• The process is time-consuming• Requirements of money and manpower are very high
For successful implementation of interviewing, the researcher should take the follow-ing care to improve the accuracy of the data collected. The interviewer should becarefully selected. The interviewer and respondent must be attentive, and observant.They must possess the technical competence and necessary practical experience.Occasional field checks must be arranged to ensure that interviewers are not cheatingor deviating from instructions given to them. Interviewer should be able to answerlegitimate question(s) if asked by the respondent and must clear any doubt that thelatter has. Efforts should be taken to create friendly atmosphere of trust and con-fidence, so that respondents can feel ease while talking and discussing with inter-viewer. The interviewer must ask questions intelligently and properly and must recordthe complete response.
Basic Instrumentation 135

(ii) Questionnaire:
A set of questions which has been prepared to ask and collect answers from respondentsrelated to the topic of research is called a questionnaire. Individuals need to answerquestions usually in printed or electronic form. Questionnaires are mailed questionnaireand collective questionnaire. To obtain statistically useful information about a given topica series of questions have been asked to individuals. The feedback forms often preparedwith blank spaces where answers can be written. Sets of such forms relating to researchtopic have been distributed among groups and the answers are collected.
Properly constructed and responsibly administered, questionnaires can become a vitalinstrument to make conclusions about specific groups or people or entire populations.The survey may become valueless if inappropriate questions, incorrect ordering ofquestions, incorrect scaling, or bad questionnaire format are used, as it may notaccurately reflect the views and opinions of the participants. To validate questionnaireand making sure it is accurately recording the required information a pre-test among asmaller subset of target respondents can be suggested. Questionnaire helps in achievingfour basic purposes:
• Collect the appropriate and required data• Make data differentiable and biddable to analysis• Reduce bias in constructing and interrogating questions• Make questions engaging and interesting
Mailed questionnaire:The respondents who are located at a long distance or across borders and other
communication ways are difficult then mailed questionnaire is used for collection ofdata. The required thing is that the researcher should have the postal addresses of therespondents. The questionnaire can be posted or mailed to the respondents them, but inevery case it will return to the researcher via mail. At their own convenience respon-dents can answer the questions. The detailed information can be collected for theresearch purpose as respondents cannot be biased by the researchers.
4.6.2.5 Advantages
• Large amounts of information can be collected from group of people in costeffective way
• Can be carried out by the researcher or by any number of people with limitedaffect to its validity and reliability
• Quick and easy quantification of the results can be done by either a researcher orthrough the use of software
• Scientific and objective analysis can be done effectively compared to other forms ofresearch
4.6.2.5 Disadvantages
• The response rate is very less due to low literacy rate or lack of interest in the researchtopic
136 Research Methodology

• It is criticized to be inadequate to recognize some forms of information –, that is,changes of emotions, behavior, feelings, and so on
• Gives only a limited amount of information without any explanation of it• Truthfulness of a respondent is difficult to measure
Sample Questionnaire
Following example shows questionnaire for taking feedback of students about resourceperson called for expert lecture at college /university departments. To rate expertperson called for lecture five scales are defined as strongly agree, agree, no opinion,disagree, and strongly disagree. For successful implementation of questionnaire theresearcher should take the following care to improve the accuracy of the data collected.
The researcher must be clear about the various aspects of his/her research problem tobe dealt with in the course of research project. A Researcher should re examineinvariably and in case of need must revise the questionnaire. Pilot study must be carriedout for pretesting the questionnaire. Questionnaire must have simple and straightforward directions for the respondents. A sample questionnaire is shown in Figure 4.16.
Secondary sources are equally important in research. It contains already availabledata. It includes government publications, earlier research, census, personal records,client histories, and service records.
4.7 Scaling
It is the process of generating the continuum, a continuous sequence of values, uponwhich the measured objects are placed. Scaling techniques are classified as comparativescaling techniques and noncomparative scaling techniques.
4.7.1 Comparative Scaling
It gives direct comparison of stimulus objects. Data is interpreted in relative terms and ismeasured on ordinal scale. This technique is non-numeric technique. These are the easytechniques to apply. The respondents have to choose between two brands of cold drink“A” and “B” even if there is very small difference in their liking of two brands. The maindisadvantage is inability to generalize beyond the stimulus. Example, if someone wants tocompare third brand of cold drink “C” with A and B, we have to conduct new study.
4.7.2 Noncomparative Scaling
In this method of scaling each object is scaled independently of the remaining. Examplerespondents are asked to give preference on 1 to 5 scales, 1: not preferred at all while 5:highly preferred. Respondents are asked to give score for cold drink brand A and B on 1to 5 scales. To compare C, score can be collected for C on the same scale.
Basic Instrumentation 137

FIGURE 4.16Sample Questionnaire
138 Research Methodology
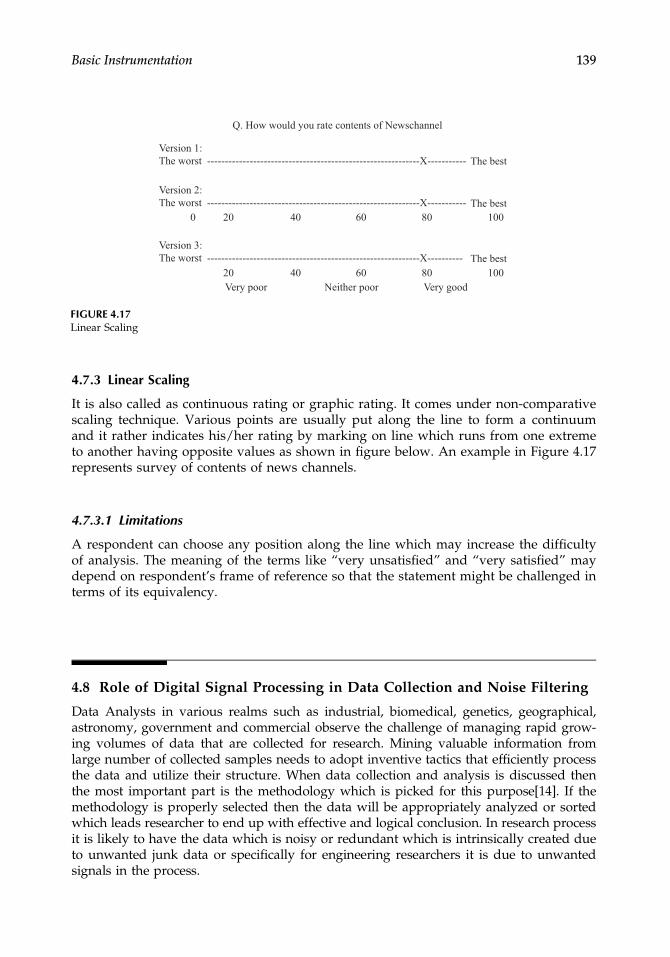
4.7.3 Linear Scaling
It is also called as continuous rating or graphic rating. It comes under non-comparativescaling technique. Various points are usually put along the line to form a continuumand it rather indicates his/her rating by marking on line which runs from one extremeto another having opposite values as shown in figure below. An example in Figure 4.17represents survey of contents of news channels.
4.7.3.1 Limitations
A respondent can choose any position along the line which may increase the difficultyof analysis. The meaning of the terms like “very unsatisfied” and “very satisfied” maydepend on respondent’s frame of reference so that the statement might be challenged interms of its equivalency.
4.8 Role of Digital Signal Processing in Data Collection and Noise Filtering
Data Analysts in various realms such as industrial, biomedical, genetics, geographical,astronomy, government and commercial observe the challenge of managing rapid grow-ing volumes of data that are collected for research. Mining valuable information fromlarge number of collected samples needs to adopt inventive tactics that efficiently processthe data and utilize their structure. When data collection and analysis is discussed thenthe most important part is the methodology which is picked for this purpose[14]. If themethodology is properly selected then the data will be appropriately analyzed or sortedwhich leads researcher to end up with effective and logical conclusion. In research processit is likely to have the data which is noisy or redundant which is intrinsically created dueto unwanted junk data or specifically for engineering researchers it is due to unwantedsignals in the process.
60
Q. How would you rate contents of Newschannel
80 100
The best
The best
The best
Very goodNeither poorVery poor
Version 3:
The worst ------------------------------------------------------------X----------
Version 2:
The worst ------------------------------------------------------------X-----------
Version 1:
The worst ------------------------------------------------------------X-----------
4020
60 80 1004020
0
FIGURE 4.17Linear Scaling
Basic Instrumentation 139

While dealing with collected data it is challenging how to deal with noisesuppression, pattern matching, random deletion in data stream for example inbioinformatics due to many junk DNA it is possible that two DNA sequence cancode same gene or in speech or written text data analysis various adjectives can bedeleted or added. It may occupy the wide frequency range and can affect currentand voltage conditions. Characteristics of noise determine performance of system. Ininstrumentation and measurement system effect of noise plays a critical role as itaffects the accuracy.
4.8.1 Sources of Noise
Operational reliability of system mostly depends on the environmental factor called asnoise. Noise can be:
• Random in nature• Repetitive• Continuous• Independent burst
To eliminate or reduce noise it is important to understand the sources of noise. Sourcesof noise can include internal sources, external sources, and locally produced noise.
(i) Internal Noise Sources
This type of noise is generated by components of electronics system. Following are someexamples of noise generated by internal noise sources.
• White Noise: This type of noise affects equally all the frequencies. It has Gaussianamplitude distribution
• Shot Noise (Poisson noise): It is a type of electronic noise which can be modelledby a Poisson process. Shot noise originates from the discrete nature of electriccharge. Shot noise also occurs in photon counting in optical devices, where shotnoise is associated with the particle nature of light
• Thermal Noise: This is the electronic noise generated by the thermal agitation ofthe charge carriers (usually the electrons) inside an electrical conductor at equili-brium, which happens regardless of any applied voltage
• Flicker Noise: This is a type of electronic noise with a 1/f power spectral density.This noise increases with decrease in frequency so it is also called as 1/f noise
• Barkhausen Noise: If the system contains some magnetic sensors then due to finitesize of domains of ferromagnetic materials the noise get introduced, that noise iscalled as Barkhausen noise
• Contact Noise: When there is breakdown of contacts between adjacent particles incurrent path the noise introduced is called as contact noise
(ii) External Noise sources
This type of noise is caused due to external factors or due to other electrical systems.
140 Research Methodology

• Switching current and voltages: When high current load switches turns on and offthey cause transients in power supply lines because of their inductance andcapacitance
• Power Lines interference: When a high current is flowing through the line parallelto signal line it produces noise even if it is few distance away
• Sparking and radiation: Electromagnetic wave as a noise is produced wheneverthere is spark or arching. Unshielded lines and open conductors are also causesnoise
• Environmental and atmospheric noise: Lightening discharge in thunderstormcauses spurious radio waves in the form of impulses that affects radiobroadcasting
• Electrostatic discharge: This serious problem observed in areas where there ismuch dryer air, air conditioned buildings, and continental climates
(iii) Local Noise Sources
This type of noise is associated with circuit interconnections, board interfacing, trans-mission cables, and power supplies. This can be reduced by providing attention whiledesigning the circuits.
4.8.2 DSP in Noise Filtering
To prove research hypothesis it is of prime importance to use noiseless data or avoid useof redundant data. To achieve noiseless data different signal processing techniques areused. Vast spectrum of digital signal processing which is now going beyond the limits ofelectronics field made it more popular among all the streams of engineering researchand its expansions have vividly impacted modern society everywhere. DSP applicationspectrum includes but not limited to digital/Internet audio or video, digital recording,CD, DVD, and MP3 players, digital cameras, digital and cellular telephones, digitalsatellite and TV or wire and wireless networks. A medical instrument provides usefulinformation for precise diagnoses with the help of digital electrocardiography (ECG)analyzers or digital x-rays and medical image systems that uses DSP. DSP is a powerfultool which scientists, engineers, and researchers can use to analyze and visualize dataand perform research.
Following are the typical examples of research area where DSP can be used to processnoisy data.
(i) Geophysical data signal processing
Geophysical signal analysis deals with the detection and processing of signals.Any varying signal conveys valuable information, to understand the informa-tion entrenched in such signals, it is necessary to “detect” and “extract data”from such signals. Geophysical signals are information bearing signals whichcarry data related to petroleum deposits beneath the surface and seismic datahence they are of immense important. Analysis of geophysical signals givesqualitative understanding of occurrence of a natural catastrophe such as earth-quakes or volcanic eruptions.
Basic Instrumentation 141

(ii) Structural health monitoring in civil engineering
In many parts of the world incidents such as building and bridge collapse are onrise without little apparent warning. It has become of immense importance todevelop methods to detect the damage/degradation of the civil structures as thenumber of such incidences has rapidly increased. To avoid impending disabilityor collapse buildings and critical infrastructure are monitored like a patient in ahospital, for signs of degradation. Sensors are used to monitor state of the healthof the structures and technologies like human brains to analyze the abnormalsituation [15].
(iii) Medical Instrumentation
Images are nothing but the signals with special characteristics. Parameters ofimage signals are measured over space, that is, distance and contain greatinformation hence in medical instrumentation field this subgroup of digitalsignal processing gained importance. Magnetic Resonance Imaging uses mag-netic field and radio waves to probe the interior of human body. The strengthand frequency of fields are carefully adjusted so that atomic nuclei in a localizedregion of body resonate between quantum energy states because of this second-ary radio waves are emitted. This emitted signal is captured by antenna placednear the body and it provides important information and it is in the form ofimage. This technique provides discrimination between different types of softtissue. This MRI technic provides important information regarding blood flowthrough arteries. MRI totally depends on digital signal processing.
(iv) Seismology
In reflection seismology a sound pulse is sent into the ground. This pulseproduces a single echo for each layer through which it is passed. Whilereturning to the surface of earth it has to pass through all other boundarylayers above where it is originated. This results into echo bouncing and it willproduce echoes of echoes. The signal detected at the surface is very complexand difficult to analyze as it contains secondary echoes. Digital signal proces-sing is widely used to isolate primary echo from secondary echo. The reflectionseismic method is primary method for locating petroleum or mineral deposits.Seismic researcher commonly uses DSP for data collection, analysis and filter-ing. Fast Fourier Transform is used to differentiate between natural seismicsignal and nuclear test explosions as they have different frequency spectrum.
(v) Genomics:In recent times, DSP has gained huge popularity in data analysis of Genomics.In this field DSP analyzes the DNA sequence data, identifies the coding andnon-coding regions and finds out abnormalities in coding region based onfiltering. A Discrete Fourier Transform–based spectral approach can be usedfor this purpose and Digital Infinite Impulse Response Low Pass Filter withButterworth approximation is used for enhanced data analysis and filtering.
(vi) Digital Filtering
It is a difficult task to represent a digitized noisy signal obtained from sensoroutput containing a useful low-frequency signal and noise that occupies all ofthe frequency range. After ADC, the noisy signal that is digitized with a numberof samples can be improved using digital filtering. The signal of interest
142 Research Methodology

contains low frequency components and high frequency components above theinterested frequency component considered as noise, this noise can be elimi-nated using a digital low pass filter. The signal that is a digitized noise signal isnow a digitized clean signal, this signal can be applied to appropriate DSPalgorithm for a concern application or it can be given to digital to analogconverter and reconstruction filter.
(vii) DSP in Electrocardiography
Problem with ECG signal recording is interference of 60Hz/50Hz power linesignal. Usually it can be minimized by proper grounding and using twistedpair cables but the appropriate method is to use digital notch filter. Thisdigital notch filter removes the specific frequency while keeping all otherneeded information. By this enhanced ECG recording accurate diagnoses canbe done. This digitized noise filter can also remove 60-Hz interferences inaudio systems.
(viii) Signal processing applications in AutomotiveNowadays in automotive systems various types of communication protocolssuch as Controller Area Networks (CAN), Local Interconnect Network (LIN)and others are used. These controllers mainly use digital signal processingchips for signal processing purpose. The processing can be done with 8-bitmicrocontrollers (MCUs), DSPs and field programmable gate arrays (FPGAs).8- and 16-bit MCUs are hardly used today because of their limited signalprocessing capabilities. Often to compromise costs system developers willchoose a processor with performance that is just enough to perform to specifictask. In some applications it may be sensible to build performance-basedsystem rather than cost. Automotive researchers will use DSP algorithms fordifferent infotainment challenges in automotive sector. Data from variousnodes in automotive is collected and analyzed. This reference data can beused for further optimized operations.
The following two case studies will make the role of DSP in data collection andanalysis to give correct prediction of result.
Case Study I: Structure of bird song
Classification of bird species according to specific category is now advanced applica-tion of DSP. Several methods are proposed and marked as successful for specificallylabeling the species of single birds among thousand other noisy environments[16].
Lawrence Neal, Forrest Briggs, RavivRaich, and xiaoliZ.fern_school of EECS, OregonState University, Corvallis have proposed a method of preprocessing and segmentingnoisy field recordings of bird song to isolate each bird syllable from rest of thesignal[17].
The song of bird consist of single vocalization syllables and such many syllablesremains relatively constant therefor the method of species recognition is mainly basedon classification at the level of syllables[18].
(i) Data Collection
The data required for the research to identify structure of bird song is collectedfrom audio recordings of bird songs consisting of sequential bird call syllables
Basic Instrumentation 143

separated by silence. Method of classification consist of characteristics of an audiosignal such as Mel-frequency ceptral coefficients (MFC) (MFC is a representationof the short-term power spectrum of a sound, based on a linear cosine trans-form of a log power spectrum on a nonlinear mel scale of frequency) to label eachsyllable in the audio signal as a bird species.The process of segmenting or extracting syllables from an audio signal is simple
in ideal conditions. If the bird call is only source in a signal then increased audioenergy will denote a syllable but in practical condition this assumption does notwork .Along with bird song there can be many other unwanted sources of soundin a recording process such as wind, steam and other background noise. Thisunwanted signal or noise can degrade the required data. While recording vocali-zation from two or more individual birds may occur simultaneously, which is oneof the complicated factors in data analysis because accurate segmentation isrequired for species classification.There are two main challenges faced in noisy environment:• Due to nonbird noises, false syllables are introduced as time-domain segmen-
tation is based purely on audio energy• Accuracy of classification degrades whenever multiple birds sing simulta-
neously at once because time-domain segmentation will group mixtures ofsyllables together
For this experiment author collected a four TB dataset of audio form recordedfrom automatic recorder placed on site (H.J.Andrews experimental forest).
Recording in this data set contains highly noisy data and simultaneous two ormore bird syllables.
(ii) Data Filtration
First of all input signals are transformed into a spectrogram representation. Afterformation of spectrogram supervised classifier is applied to create a binary masklabelling each time-frequency unit as either bird sound or background. Thisprocess will ensure extraction of individual syllable of bird song even whensyllable overlap in a time.To transform the signal into time frequency spectrogram a short time FFT is
applied with frame size of 512 samples and overlap of 256 samples betweeneach subsequent frame. To normalize the level of environmental noise at eachfrequency a whitening filter is applied to the spectrogram.
(iii) ResultsFrequency ranges below 1KHz contain little or no bird call so a band pass filterwill remove such noisy data under 1kHz.
Case Study 2: Physiological sounds in cardiac cycle
The heart normally produces repeatable physiological sounds in one cardiac cycle. Butin some pathologic conditions, such as with heart valve stenosis or a ventricular septaldefect, blood flow causes turbulence which leads to the production of additionalsounds which are called as murmurs. Murmur sounds are random in nature, whereas
144 Research Methodology

underlying heart sounds are deterministic so these two signals have differentspectrums.
(i) Data Collection Digital Subtraction Phonocardiography makes use of appropriatedigital filters to separate the random murmur component spectrum of thephonocardiogram from the underlying deterministic heart sounds spectrum. Theanalytical data in the form of signals can be collected from:• Different individuals with cardiac structural disease• Recordings from normal individuals• Individuals with innocent heart murmurs
(ii) Data Filteration
Data filteration, also called digital subtraction analysis of signals, is done withcustom computer program called Murmur gram. The recorded sound from twoadjacent cardiac cycles is subtracted to produce a difference signal using theMurmur gram.
(iii) ResultsAdvanced signal processing techniques can be used to separate heart soundsfrom murmurs.
4.9 Measuring Instruments and Tools in Engineering Discipline
The following table gives the details of various measuring instruments and tools used inengineering discipline which can be used by a researcher to perform experiments toprove his/her hypothesis. The following Table 4.4 gives a ready reference of various testand measuring instruments to the researchers who intend to work on interdisciplinaryresearch problems.
4.10 Summary
This chapter gives a brief introduction to instrumentation schemes. Instrumentationschemes can be classified as simple instrumentation scheme or complex instrumentationscheme based on number of measuring and controlling the parameters.
After identifying the process variables based on rate of change of variables, theperformance characteristics of an instrument are divided into two categories: Staticcharacteristics and Dynamic characteristics. If quantities being measured are eitherslowly varying with time or constant are called as static characteristics and if quantitiesbeing measured are rapidly varying, then known as dynamic characteristics. Staticcharacteristics includes Accuracy, Range, Sensitivity, Repeatability, Reproducibility,Drift, Hystersis, Resolution, Precision, Stability, and Tolerance, while Speed of Response,Measuring Lag, Fidelity, and Dynamic Error are dynamic characteristics.
Basic Instrumentation 145

TABLE 4.4
Various Test and Measuring Instruments Used in Engineering Discipline
Sr.No.
Name of Instrument Parameter Measurement
ELECTRONICS AND COMMUNICATION ENGINEERING
1. Ammeter (Ampermeter) Current2. Power Factor Meter Power factor3. Multimeter Resistance, Capacitance, voltage, current, and so on4. IC tester To detect faulty ICs5. Distortion meter It displays the amount of distortion added to the original
signal by an electronic circuit.6. Electricity Meter/Energy Meter The energy dissipated from the circuit7. Pulse Generator To generate rectangular pulses.8. Function Generator To generate electrical waveforms (sine, square, triangular,
and sawtooth/ramp) over a wide range of frequencies9. LCR-Q Meter Inductance, capacitance, and resistance and Q factor.10. Ohmmeter Resistance11. Mega-ohmmeter Electrical resistance of insulating components by testing their
strength.12. Leakage Tester The leakage across the plates of a capacitor13. Microwave Power Meter The electrical power at microwave frequencies typically in
the range 100 MHz to 40 GHz14. Oscilloscope (Cathod ray Oscilloscope) Displays waveform of a signal, allows to measure frequency,
time, voltage, offset15. Signal Analyzer Amplitude and the modulation of a RF signal16. Spectrum Analyzer To display frequency spectrum of signal.17. Sweep Generator It generates constant-amplitude variable frequency sine
wave signal that tests frequency response of it18. Voltmeter (DVM and VTVM) The potential difference between two points in a circuit19. VU Meter
Volume unit (VU) meter or standardvolume indicator (SVI)
The signal level in audio equipment
20. Wattmeter Power21. Peak Programme Meter (PPM) Level of an audio signal for AM radio broadcasting networks22. True Peak Programme Meter The peak level of the waveform irrespective of its duration23. Quasi Peak Programme Meter (QPPM) True level of peak if peak level exceeds up to certain
milliseconds, that is, for shorter duration24. Sample Peak Programme Meter (SPPM) Digital audio-which shows only peak sample values (up to
3 dB higher in amplitude). It may have either a “true” or a“quasi” integration characteristic.
25. Galvanometer To detect and indicate electric current26. Vibration Galvanometer To detect AC currents in the frequency of natural resonance,
as a null indicating instrument in AC bridge circuits andcurrent comparators
27. Thermo-Galvanometer Small electric current28. Time-Domain Reflectometer (TDR) To characterize and locate faults in metallic cables, To locate
discontinuities in a connector, printed circuit board, or anyother electrical path
(Continued )
146 Research Methodology

TABLE 4.4 (Cont.)
Sr.No.
Name of Instrument Parameter Measurement
29. Time To Digital Converter (AbbreviatedTDC)
Advice for recognizing events and providing a digitalrepresentation of the time they occurred
30. Transistor Testers To test electrical behaviour of transistors and solid-statediodes
31. Bus Analyzer To check, test, debug and validate designs of a hardware-based product, It is also used to examine communicationinteroperability between systems and between components,and clarifying hardware support concerns.
32. Logic Analyzer This instrument captures and displays multiple signals froma digital system. A logic analyzer can convert the captureddata into timing diagrams, protocol decodes, state machinetraces, assembly language, or can correlate assembly withsource-level software.Logic Analyzers have advanced triggering capabilities.
33. Network Analyzer S-parameters, Y-parameters, Z-parameters, andh-parameters.Network analyzers are used to characterize two-portnetworks but they can be used on networks with an arbitrarynumber of ports.
34. Vector Network Analyzer This instrument enables the RF performance of microwavedevices to be characterised in terms of network scatteringparameters, or S parameters.It can measure both amplitude and phase propertiesIt is also known as gain-phase meter or an automatic networkanalyzer.
35. Scalar Network Analyzer (SNA) This instrument can measure amplitude properties only.An SNA is functionally identical to a spectrum analyzer incombination with a tracking generator.
36. Microwave Transition Analyzer (MTA) OrLarge Signal Network Analyzer (LSNA),
Amplitude and phase of the fundamental component and itsharmonics.
37. Video Signal Generator Predetermined video and/or television oscillation waveforms,and other signals as an output. It is used in the synchronizationof television devices stimulates faults in, or aid in parametricmeasurements of, television and video systems.It includes horizontal and vertical sync pulses (in analog) orsync words (in digital). Generators of composite videosignals (such as NTSC and PAL) will also include a colorburst signal as part of the output.
38. Sync Pulse Generator Produces synchronization signals, with a high level ofstability and accuracy. They also provide a master timingsource for a video facility.
39. Vector Signal Analyzer It measures the magnitude and phase of the input signal at asingle frequency within the IF bandwidth of the instrument.The primary use is to make in-channel measurements ofknown signals.Vector signal analyzers are useful in measuring anddemodulating digitally modulated signals like W-CDMA,LTE, andWLAN. These measurements are used to determinethe quality of modulation and can be used for designvalidation and compliance testing of electronic devices.
(Continued )
Basic Instrumentation 147

TABLE 4.4 (Cont.)
Sr.No.
Name of Instrument Parameter Measurement
40. VSWR Meter(Voltage Standing Wave Ratio Meter)
It measures the standing wave ratio in a transmission line.It can also be used to indicate the degree of mismatchbetween a transmission line and its load (usually a radioantenna), or evaluate the effectiveness of impedancematching efforts.
41. Vectorscope It is a special type of oscilloscope which is used in both audioand video, phase of the colors in color TV applications.Vectorscopes are quite similar in operation to oscilloscopesoperated in X-Y mode; however those used in videoapplications have specialized graticules, and accept standardtelevision or video signals as input.
42. Videoscope Or Video Borescope A flexible Videoscope or Video Borescopeis an advancedtype of borescope, which has a very small CCD chipembedded into the tip of the scope.The video image is relayed from the distal tip and focusablelens assembly back to the display via internal wiring.
43. Antenna analyzer An antenna analyzer (also known as a noise bridge, RXbridge, SWR analyzer, or RF analyzer) is an instrument usedto measure the input impedance of antenna systems in radioelectronics applications.
44. Receptacle tester A receptacle tester or outlet tester is a instrument used toverify that an AC wall outlet is wired properly or not. Thetester itself is small device containing a power plug andseveral indicator lights.
45. Tail-pulse generator This instrument simulates the broad range of pulsesencountered in the nuclear field.
46. Continuity tester Identifies break in an electrical path between two points of acircuit.
47. Marx generator This instrument generates a high-voltage pulse from alow-voltage DC supply.Marx generators are used in high-energy physicsexperiments, as well as to simulate the effects of lightning onpower-line gear and aviation equipment.
48. Noise-figure meter The noise figure of an amplifier, mixer, or similar device.49. Electrostatic fieldmeter Noncontact electricity charge on an object and the
electrostatic field of an object in volts.50. Equivalent Series Resistance Meter The equivalent series resistance (ESR) of real capacitors.51. Distortion meter It determines specific frequencies that cause distortion in
electronic devices. The device is primarily used in audio-related equipment.
52. Cable tester Tests the strength and connectivity of a particular type ofcable or other wired assemblies.
53. Frequency counter Counts the number of oscillations or pulses per second(Frequency) in a periodic electronic signal.
54. Optical spectrometer Properties of light over a specific portion of theelectromagnetic spectrum, typically for spectroscopicanalysis to identify materials.
(Continued )
148 Research Methodology

TABLE 4.4 (Cont.)
Sr.No.
Name of Instrument Parameter Measurement
55. Jitterlyzer Jitterlyzer combines functions of jitter measurement andprotocol analysis, replacing a combination of BERT, jitter-generator, and oscilloscope
56. Slotted line Slotted lines are used for microwave measurements whichconsist of a movable probe to be inserted into a slot in atransmission line.SWR is measured by a slotted line.
57. Fiberscope It is a flexible bundle of optical fibre with an eyepiece on oneend and a lens on the other which is used to examine andinspect small places such as the insides of machines, locks,human body, and so on
58. Arbitrary Waveform Generator (AWG) Generates electrical waveforms either repetitive or single-shot (once only). The resulting waveforms can be injectedinto a device under test and analyzed as they progressthrough it, confirming the proper operation of the device orpinpointing a fault in it.
59. Bolometer It is a thermal detector that changes its electrical resistance asa function of the radiant energy striking it.
60. Pyrometer This device uses the radiant energy on each side of a fixedwavelength of spectrum. The band is quite narrow andusually centered at 0.65 µm in the orange-red area of thevisible spectrum
61. Digital Pattern Generator An electronic instrument that generates digital stimuli.The main purpose of a digital pattern generator is tostimulate the inputs of a digital electronic device.
62. Doppler RADAR Device It is specialized radar that uses the Doppler effect to producevelocity data about objects at a distance.This operation is done by bouncing a microwave signal off adesired target and analyzing how the object’s motion hasaltered the frequency of the returned signal.
63. Harmonic Analyser Calculates the total harmonic content of a sine wave withsome distortion, expressed as total harmonic distortion(THD).
64. Nd : YAG Laser Nd:YAG (neodymium-doped yttrium aluminium garnet;Nd:Y3Al5O12) is a crystal that is used as a lasing medium forsolid-state lasers.
65. Vernier Caliper Scale This device is a visual aid which allows measuring moreprecisely when reading a uniformly divided straight orcircular measurement scale.
66. Polarimeter Measures the angle of rotation caused by passing polarizedlight through an optically active substance.
SOFTWARE
67. Keil software The Keil is a complete software development environmentfor wide range of microcontroller devices.
68. Cadence Tool. To design the schematic and the layout of Analog, Digitaland mixed signal circuits.
(Continued )
Basic Instrumentation 149

TABLE 4.4 (Cont.)
Sr.No.
Name of Instrument Parameter Measurement
69. MATLAB Software It is a high-performance language that integratescomputation, visualization and programming in an easy-to-use environment where problems and solutions areexpressed in familiar mathematical notation.
70. Microwind Software Designing and simulating circuits at layout level.71. LabView Software
(Laboratory Virtual InstrumentEngineering Workbench)
A system-design platform and development environment fora visual programming language.LabVIEW programs/diagrams are termed virtualinstruments (VIs). Each VI has three components: a blockdiagram, a front panel, and a connector panel.
72. Scilab Scilab is free, open source software that provides a powerfulcomputing environment for engineering and scientificcomplex computation involving applications.
73. Express PCB It includes Express SCH Classic for drawing schematics andExpress PCB Plus for circuit board layout.
74. MultiSim It is an industry-standard, best-in-class SPICE simulationenvironment that captures and simulates program, which ispart of a circuit design programs, along with NI Ultiboard.
75. P-SPICE(Personal Simulation Program withIntegrated Circuit Emphasis)
It is a SPICE circuit simulator for simulation and verificationof analog and mixed-signal circuits.
76. PSIM It is an Electronic circuit simulation software package, whichis designed specifically for power electronics and motordrive simulations but can be used to simulate any electroniccircuit.It uses nodal analysis and the trapezoidal rule integration asthe basis of its simulation algorithm.
77. ORCAD It is electronic design automation (EDA) software tool, whichis used to create electronic schematics and electronic printsfor manufacturing printed circuit boards.
78. High Frequency Structure Simulator(HFSS)
It is advanced antenna performance simulation software,which provides fast and accurate prediction of installedantenna patterns, near-fields, and antenna-to-antennacoupling on large platforms.
79. CST microwave studio suite It is a special tool for the 3D Electromagnetic simulation ofhigh frequency components.
80. Virtual instrument software architecture(VISA)
This instrument provides standard for configuring,programming, and troubleshooting instrumentation systemscomprising GPIB, VXI, PXI, Serial, Ethernet, and/or USBinterfaces.
81. Network Simulator In communication and computer network, networksimulation is a technique where a software program modelsthe behaviour of a network by calculating the interactionbetween the different network entities (routers, switches,nodes, access points, links, and so on).ns-1, ns-2, and ns-3 are discrete-event computer networksimulators, primarily used in research and teaching.
82. Packet Tracer It is a cross-platform visual simulation tool which allows userto create different network topologies and imitate moderncomputer networks.
(Continued )
150 Research Methodology

TABLE 4.4 (Cont.)
Sr.No.
Name of Instrument Parameter Measurement
83. WireShark It is a free and open source packet analyser that is used fornetwork troubleshooting, analysis, software, andcommunications protocol development.
BIOLOGICAL AND BIOMEDICAL ENGINEERING
84. Pulse Oximeter Pulse rate and oxygen content85. Spectrophotometers Concentration of given chemical solution86. Blood Cell Counter Counts no of blood cells(i.e., RBCs, WBCs, Platelets)87. Flame Photo Meter The concentration of certain metal ions.88. Flow Meter Flow rate or quantity of a liquid/gas passing through
a pipe.89. Rate Meter It is also known as frequency meter that shows the rate of
pulses.90. Audiometer Acuity of hearing91. Chloridimeter It is used in determination of chlorides92. Ph Meter Measures pH of unknown solution93. Electronic Thermometer Measures temperature of object94. Bimetallic Strip Thermometer Used in industries in temperature control devices.95. Flurometer The intensity of fluorescence, used chiefly in biochemical
analysis96. Electron Microscope Uses a beam of electrons to create an image of
the specimen.97. ECG Machine To measure cardiac activities of living organisms.98. EEG Machine To measure brain activities of living organisms.
INSTRUMENTATION ENGINEERING
99. Gas Meter The volume of fuel gases such as natural gas, liquefiedpetroleum gas.
100. Planimeter (platometer) To determine the area of an arbitrary two-dimensional shape.101. Eudiometer In this device mixtures of gases can be made to react by an
electric spark, used to measure changes in volume duringchemical reactions.
102. Distributed Control System (DCS) It is a computerized control system for a particular plantusually with a large number of control loops, in whichautonomous controllers are distributed throughout thesystem.
103. Programmable Logic Controller (PLC) It is an industrial computer control system that monitors thestate of input devices continuously. It also makes decisionsbased upon given program to control the state of outputdevices.
104. Data Acquisition Card Data acquisition (DAQ) is the process of measuring anelectrical or physical quantities such as voltage, current,temperature, pressure, or sound with a computer.A DAQ system consists of sensors, DAQ measurementhardware, and computerized programmable softwareembedded in it.
(Continued )
Basic Instrumentation 151

TABLE 4.4 (Cont.)
Sr.No.
Name of Instrument Parameter Measurement
ELECTRICAL ENGINEERING
105. Tachometer Speed of an engine106. Anemometer To determine wind speed107. Barometer The atmospheric pressure.108. Manometer To determine pressure109. Dynamometer Force, torque or power of different systems.110. Clamp Meter It is an electrical test instrument that combines a basic digital
multimeter with a current sensor embedded in it.111. Wheatstone Bridge Electrical resistance112. Capacitance Meter Capacitance of different capacitors specifically discrete type
of capacitors.113. Ground Fault Protector To open ungrounded conductors when high currents,
especially those from line-to-ground are encountered insystems.
114. Hygrometer Humidity of the working environment.115. Shear Viscometer Viscosity of a non-Newtonian fluid at several different shear
rates.116. Thermocouple Temperature117. Megger Electrical leakage in wire.118. Varmeter Reactive power of the circuit.119. Watt-Hour Meter Electrical power passing through a circuit in a
certain time.120. Vector Impedance Meter Amplitude and phase angle of impedance (Z).
SOFTWARES
121. Mipower software It is a highly interactive, user-friendly windows based PowerSystem Analysis package which includes a set of modules forperforming a wide range of power system design andanalysis.
MECHANICAL ENGINEERING
122. Piezometer Pressure of a liquid or gas. They are often placed inboreholes to monitor the pressure or depth of undergroundwater.
123. Tribometer Measures tribological quantities, such as coefficient offriction, friction force, and wear volume between twosurfaces in contact.
124. Venturimeter The rate of flow of a fluid flowing through a pipe.125. Pitot tube It is a pressure measurement instrument which measures
flow velocity of any liquid.126. Exhaust Gas Analyzer (exhaust CO
analyzer)To measure carbon monoxide from other gases in theexhaust, caused by an incorrect combustion.
127. Salt Spray Chamber The salt spray (or salt fog) is standard and most popular testfor measurement of corrosion used to check corrosionresistance of materials and surface coatings.
(Continued )
152 Research Methodology

TABLE 4.4 (Cont.)
Sr.No.
Name of Instrument Parameter Measurement
128. Surface Roughness Tester This instrument is used to determine the surface texture orsurface roughness of a material accurately.It shows the measured roughness depth (Rz) as well as themean roughness value (Ra) in micrometers or microns (µm).
129. Tensile Tester Used for tension testing.
SOFTWARES
130. Solid Edge Software This software tool addresses all aspects of the productdevelopment process – 3D design, simulation,manufacturing, data management.
131. Ansys V12 software It supports product design and validation in a virtualenvironment that captures complex and coupled physicalphenomenon.
132. EdgeCAM and CADEM software It is CAD-CAM software specifically used for 3D milling,mill turn, multi-axis machining, and 3D machining.
133. AutoCad software It is a computer-aided drafting software program thatcreates blueprints for buildings, bridges, and computerchips, and so on
POLYMER ENGINEERING
134. Smoke Density Apparatus It measures and observes the relative amount (density) ofsmoke produced by the burning (combustion) ordecomposition of plastic andcables.
135. Limiting Oxygen Index Tester Determines the minimum oxygen in a flowing mixture ofoxygen and nitrogen for flaming combustion.
136. Conductivity Meter (EC meter) Measures the electrical conductivity in a solution. It iscommonly used in hydroponics, aquaculture, and freshwatersystems to monitor the amount of nutrients, salts orimpurities present in the water.
137. UV Spectrophotometer This instrument uses visible and ultraviolet light to studyand analyze the chemical structure of substance.A spectrophotometer is a special type of spectrometer, whichis used to measure relationship between the intensity of lightand its wavelength.
138. Fourier Transform Spectrophotometer It is a measurement technique where spectra are collectedbased on measurements of the coherence of a radioactivesource, using time-domain or space-domain measurements
139. FTIR spectrometer (Fourier Transforminfrared spectroscopy)
FTIR is a technique that provides an infrared spectrum ofabsorption or emission of a solid, liquid or gas.It simultaneously collects high-spectral-resolution data overa wide spectral range.
ENVIRONMENTAL ENGINEERING
140. Turbiditimeter The relative clarity of a fluid by measuring the amount oflight scattered by particles suspended in a fluid sample.
141. Nessler Tube This device compares color and turbidity between solutions.The tubes are often used to carry out a series of calibrationsolutions of increasing concentrations.
(Continued )
Basic Instrumentation 153

TABLE 4.4 (Cont.)
Sr.No.
Name of Instrument Parameter Measurement
142. Water Testing Kit It tests presence of bacteria, lead, pesticides, nitrites/nitrates,chlorine, hardness, and pH present in water.
143. Electronic Balance It measures the mass of a substance. It is used in experimentsin which precise amount of measurements are required ofevery substance for desired results.
144. BOD (biochemical oxygen demand) TestDevice
It determines the effect of industrial waste and privatehousehold waste on the water quality in sewage treatmentplants and their receiving waters.
145. Chloroscope This instrument checks presence of residual chlorine indrinking water.
CIVIL ENGINEERING
146. Pycnometer It is a kind of specific gravity bottle that determines thedensity of any liquid.
147. Hydrometer It is an instrument for measuring the density of liquids.148. Casagrande Device This device determines the moisture content at which clay
soils pass from plastic to liquid state.149. Jodhpur Permeameter This instrument measures rapidly the electromagnetic
permeability of samples of iron or steel with sufficientaccuracy for many commercial purposes.
150. Proctor Compaction Test Apparatus It is a laboratory method of determining the optimalmoisture content at which a given soil type will become mostdense and achieve its maximum dry density.
151. Optical Square It is a square refracting block which refracts an incident beamat an angle of 90 degrees. It can be used with anautocollimator for measuring squareness of a workpiece.
152. Prism Square A hand optical square used by surveyors to lay off correctangles that are multiples of 90° or 45°.
153. Line Ranger An instrument for locating an intermediate point in line withtwo distant signals.It consists of two reflecting surfaces so arranged as to bringimages of the two signals into coincidence when theinstrument is in line with the signals
154. Clinometer The angle or elevation of slopes.155. Trough Compass Used for marking the magnetic north line on the drawing
sheet of the plane table156. Sprit Level This device consists of a sealed glass tube partially filled
with alcohol or other liquid has an air bubble whoseposition reveals whether a surface is perfectlylevelled or not.
157. Dumpy Level It is a levelling optical instrument used to establish or verifypoints in the same horizontal plane.It is used in surveying and building with a vertical staff tomeasure height differences and to transfer, measure and setheights.
158. Level Staff (Level rod) Determines the difference in height between points orheights of points above a datum surface.
(Continued )
154 Research Methodology
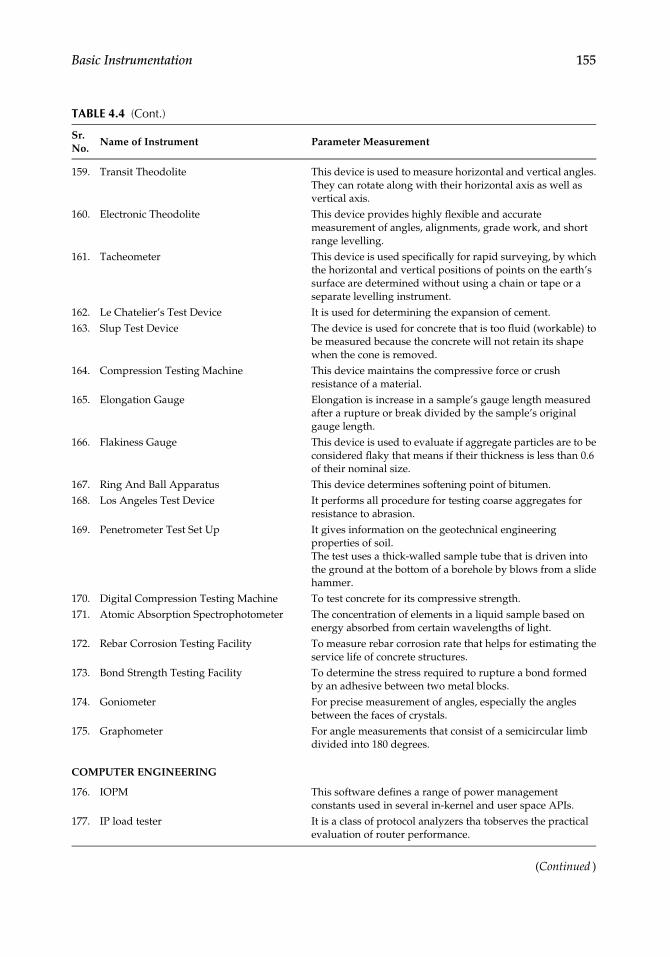
TABLE 4.4 (Cont.)
Sr.No.
Name of Instrument Parameter Measurement
159. Transit Theodolite This device is used to measure horizontal and vertical angles.They can rotate along with their horizontal axis as well asvertical axis.
160. Electronic Theodolite This device provides highly flexible and accuratemeasurement of angles, alignments, grade work, and shortrange levelling.
161. Tacheometer This device is used specifically for rapid surveying, by whichthe horizontal and vertical positions of points on the earth’ssurface are determined without using a chain or tape or aseparate levelling instrument.
162. Le Chatelier’s Test Device It is used for determining the expansion of cement.163. Slup Test Device The device is used for concrete that is too fluid (workable) to
be measured because the concrete will not retain its shapewhen the cone is removed.
164. Compression Testing Machine This device maintains the compressive force or crushresistance of a material.
165. Elongation Gauge Elongation is increase in a sample’s gauge length measuredafter a rupture or break divided by the sample’s originalgauge length.
166. Flakiness Gauge This device is used to evaluate if aggregate particles are to beconsidered flaky that means if their thickness is less than 0.6of their nominal size.
167. Ring And Ball Apparatus This device determines softening point of bitumen.168. Los Angeles Test Device It performs all procedure for testing coarse aggregates for
resistance to abrasion.169. Penetrometer Test Set Up It gives information on the geotechnical engineering
properties of soil.The test uses a thick-walled sample tube that is driven intothe ground at the bottom of a borehole by blows from a slidehammer.
170. Digital Compression Testing Machine To test concrete for its compressive strength.171. Atomic Absorption Spectrophotometer The concentration of elements in a liquid sample based on
energy absorbed from certain wavelengths of light.172. Rebar Corrosion Testing Facility To measure rebar corrosion rate that helps for estimating the
service life of concrete structures.173. Bond Strength Testing Facility To determine the stress required to rupture a bond formed
by an adhesive between two metal blocks.174. Goniometer For precise measurement of angles, especially the angles
between the faces of crystals.175. Graphometer For angle measurements that consist of a semicircular limb
divided into 180 degrees.
COMPUTER ENGINEERING
176. IOPM This software defines a range of power managementconstants used in several in-kernel and user space APIs.
177. IP load tester It is a class of protocol analyzers tha tobserves the practicalevaluation of router performance.
(Continued )
Basic Instrumentation 155

TABLE 4.4 (Cont.)
Sr.No.
Name of Instrument Parameter Measurement
178. Fedora 16 (formerly Fedora Core) Fedora is a Unix-like operating system based on the Linuxkernel and GNU programs (a Linux distribution).
179. JDK The Java Development Kit (JDK) is a software developmentenvironment used for developing Java applications andapplets.
180. NCTUNS NCTUNS is a Linux-based network simulator/emulator thathas a great deal of features such as the possibility to executereal-world applications without modifications, and provisionto model a wide range of network devices using real TCP/IPnetwork stack.
181. Oracle The Oracle database is an object-relational databasemanagement system.
182. Eclipse It is an integrated development environment (IDE) used incomputer programming, and is the most widely used JavaIDE.
183. SQL As per ANSI (American National Standards Institute), it isthe standard language for relational database managementsystems.
184. GFI (Ground Fault Interupter) It is a Network Security Scanner and Monitor185. Packet Broker It is used for bandwidth analysis and bandwidth calculations186. Microsoft Network Monitor It is used for monitoring the network187. Nagios It is used in the analysis of networks (network, server, and
log monitoring) and database.188. Open NMS (Network Management
System)It is used for network management
189. KVM (Kernel Based Virtual Machine) It is used to run multiple virtual machines at the same time190. Delta cloud It is used for managing heterogeneous clouds.191. Cloud9 IDE (Integrated Development
Environment)It is used to give different features to work together in team.
192. Codenvy Codenvy’s team workspaces allow developers andstakeholders to collaborate on premergecode withoutinstalling any software.
193. Eclipse PHP (Hypertext preprocessor)Developer Tools
It is used to support PHP IDE Projects.
194. Net Beans It is used for desktop and mobile web development.195. Eclipse ADT (Android Development
Toolkit)It is used to develop different versions of Android.
196. JBoss It provides support to open source application server.197. SDK and AVD Manager It is an Android Virtual Device Manger used to create an
Android application.198. DDMS (Dalvik Debug Monitor Server) A debugging tool used in the Android platform (port
forwarding, on-device screen capture, on-device thread, andheap monitoring)
199. LogCat It is a command-line tool that dumps a log of systemmessages, including stack traces when the device throws anerror and messages written from app with the Log class.
200. Draw 9-Patch It used to design graphics in Android OS.
(Continued )
156 Research Methodology

TABLE 4.4 (Cont.)
Sr.No.
Name of Instrument Parameter Measurement
201. FlowUp It is used to monitor the overall performance of android andiOS mobile app and get in-depth insights on various keyperformance metrics.
202. XAMPP: Cross-Platform (X), Apache (A),MariaDB (M), PHP (P) and Perl (P)
It is an open source cross-platform for a Web server solutionstack.
203. WAMP Server (Web Applications,Apache2, PHP and MySQL)
It is a local host server for Web development.
204. Wordpress It is a Web development tool.205. Filezilla It is a cross-platform FTP application (for client and server).206. Zenmap It is the official Nmap Security Scanner GUI. It used to
discover hosts and services on a computer network, thusbuilding a “map” of the network.
207. Adobe Dreamweaver Web design and development tool that enables visualizationof Web content while coding.
208. Firebug It is used for live debugging, editing, and monitoring of anywebsite’s CSS, HTML, DOM, XHR, and JavaScript.
209. Selenium It is a suite of tools used to automate a Web browser acrossdifferent platforms.
210. OpenVAS (Vulnerability AssessmentSystem)
It is used in the security world for vulnerability scanningpurposes.
211. Nikto It is a web server scanner that tests web servers fordangerous files/CGIs and outdated server software.
CHEMICHAL ENGINEERING
212. Gas Chromatography Used in analytical chemistry for separating and analyzingcompounds that can be vaporized without decomposition.
213. High Pressure Liquid Chromatography Used in analytical chemistry to separate, identify, andquantify each component in a mixture.
214. Cyclic Voltometry Measures the current developed in an electrochemical cell.215. Fluroscence Spectrophotometer It is a electromagnetic spectroscopy that analyses
fluorescence from given sample.216. Biophotometer It is used for quick and routine measurements of the optical
density of samples at predefined wavelengths. A Xenon flashlamp is used as light source.
217. Chemi Doc MP Imaging System It is used for imaging and analyzing gels and western blots.218. Multiporator Used for the transfection of eukaryotic cells and bacteria in
human, animal cells, plants, bacteria, and yeast.219. Gel Doc Used in molecular biology laboratories for the imaging and
documentation of nucleic acid and protein suspended withinpoly acrylamide or agarose gels.
220. Thermocycler (Thermocycler, PCRmachineor DNA amplifier)
Used to amplify segments of DNA via the polymerase chainreaction (PCR).
221. Centrifuge To separate fluids of different densities.222. Vortex Mixer (vortexer) To mix small vials of liquid.223. Probe Sonicator High power, programmable system ideal for
nanotechnology, cell disruption, and homogenizationapplications to agitate particles in a sample.
(Continued )
Basic Instrumentation 157

Reliability of an instrument has also been discussed in the chapter. It is a property ofany measure, tool, test, or of a whole experiment. It’s an estimation of how muchrandom error might be in the values around the true value. The reliability characteristicsare classified as Repairable Systems and Nonrepairable Systems. Parameters playingvital roles include Failure Rate, MTTF (Mean Time to Failure), Time to First Failure,MRL (Mean Residual or remaining Life), Availability, Failure Rate and Repair, MTBF(Mean Time Between Failures), and MRL (Mean Residual or remaining Life).
To prove a hypothesis, the researcher performs experiments. Experiments can beperformed in laboratory, directly on the field or a researcher can observe the naturalchanges in variables being measured. Hence, the experimental setup can be laboratory-based, field-based, or a natural experimental setup.
The data collection considerations and choice of appropriate data source is alsopresented. Data collection, analysis and formulation are the important aspects in theresearch. Data collection begins after finalization of research problem, accurate datacollection is necessary for maintaining the integrity of research. Data is classified asprimary data and secondary data. Observation, interviewing, questionnaire are primarydata sources and documents like government publications, earlier research, the census,personal records, client histories, and service records are some examples of secondarydata sources. Selection of an appropriate data collection instrument is an importantcomponent of research finding because, a basic element of validity and reliability of thestudy depends on the collected data.
Scaling is the process of generating the continuum, a continuous sequence of values,upon which the measured objects are placed. Linear scaling also called as continuousrating or graphic rating is most commonly used scaling technique. Various points areusually put along the line to form a continuum and rating can be given by marking online which runs from one extreme to another.
To prove research hypothesis it is of prime importance to use noiseless data or avoiduse of redundant data. A brief summary of different noise sources is presented. Toachieve noiseless data different signal processing techniques are in use. DSP application
TABLE 4.4 (Cont.)
Sr.No.
Name of Instrument Parameter Measurement
224. Phrase Contrast Fluorescent Microscope Converts phase shifts in light passing through a transparentspecimen to brightness changes in the image. Phase shiftsthemselves are invisible but become visible when shown asbrightness variations.
225. Gel Electrophoresis It is a used for separation and analysis of macromolecules(DNA, RNA, and proteins) and their fragments, based ontheir size and charge.
226. Katharometer The thermal conductivity detector (TCD) used in gaschromatography.
Metallurgy Engineering
227. Inverted Metallurgical Microscope For inspection of grain size and the state of the metals.228. Image Analyser Software: Digimizer It allows precise manual measurements and automatic object
detection with measurements of object characteristics.
158 Research Methodology
spectrum includes but not limited to digital/Internet audio or video, digital recording,CD, DVD, and MP3 players, digital cameras, digital and cellular telephones, digitalsatellite and TV or wire and wireless networks. Without DSP, scientists, engineers, andresearchers would have no powerful tools to analyze and visualize data and performtheir research.
List of measuring instruments and tools used in engineering discipline to prove ahypothesis is also presented at the end of the chapter.
Further Reading
1. D. V. S. Murty, “Transducers and Instrumentation”, Second edition, New Delhi: PHI LearningPvt. Ltd., 2008.
2. A. K. Sawhney, “Electrical and Electronic Measurement Measurements and Instrumentation”,Fourth Edition, New Delhi: Dhanpat Rai & Sons Educational and Publishers, 2011.
3. E. O. Doebelin, “Measurement Systems”, 6th edition, New Delhi: Tata Mcgraw Hill, 2012.4. Joseph J. Carr, “Elements of Electronic Instrumentation and Measurement”, Third Edition,
New Delhi: Person, 2003.5. B. C. Nakra, K. K. Choudhari, “Instrumentation Measurements and Analysis”, New Delhi:
Tata mcgraw Hill Education, 1985.6. http://www.davehitt.com/facts/helena.html7. http://reliawiki.org/index.php/Reliability_Test_Design8. Andrew Taylor, “bsc MA FRSA – Art and Engineering in Product Design.9. H. Choi, S. Choi, H. Cha, “Structural Health Monitoring System Based on Strain Gauge
Enabled Wireless Sensor Node”, Proceedings of the Fifth International Conference on Net-worked Sensing Systems, Kanazawa, Japan, June 17–19, pp. 211–214, 2008.
10. “Introduction to Reliability Engineering, e-Learning Course”, CERN.11. Joseph J. Carr, John M. Brown, “Introduction to Biomedical Equipment Technology”, Fourth
Edition, Person Education, 2002.12. Andrew R. Houghton, Alun Roebuck, “Pocket ECGs for Nurses”, CRC Press, 2015.13. C. R. Kothari, G. Garg, “Research Methodology: Methods and Techniques”, 4th edition, New
Delhi: New Age International Publications, 2017.14. “‘Digital Signal Processing’-Fundamentals and Applications: Li TAN”, 2nd edition, Devry
University, Decatur, Georgia: Academic Press, Elsevier, 2013.15. K. Maenaka, “MEMS Inertial Sensors and Their Applications”, Proceedings of the Fifth
International Conference on Networked Sensing Systems, Kanazawa, Japan, June 17–19, pp.71–73, 2008.
16. Andrew J. Hansen, William C. Mccomb, Robyn Vega, Martin G. Raphael, Matthew Hunter,“Bird Habitat Relationships in Natural and Managed Forests in the West Cascades of Oregon”,Ecological Applications, vol. 5, pp. 555–569, 1995.
17. Lawrence Neal, Forrest Briggs, Raviv Raich, Xiaoli Z. Fern, “Time-Frequency Segmentation ofBird Song in Noisy Acoustic Environments”, 2011 IEEE International Conference on Acoustics,Speech and Signal Processing (ICASSP).
18. Frederick F. Gilbert, Rochelle Allwine, Spring Bird Communities in the Oregon CascadeRange. In Leonard F. Ruggiero, Keith B. Aubry, Andrew B. Carey, Mark H. Hufftech. (Eds.),“Wildlife and Vegetation of Unmanaged Douglas-Fir Forests”, tech., Portland, OR: U.S.Department of Agriculture, Forest Service, Pacific Northwest Research Station, 1991 pp. 145–158 .
Basic Instrumentation 159

This page intentionally left blank

5Applied Statistics
Varsha K. Harpale and Vinayak K. Bairagi
CONTENTS
5.1 Introduction . . . . . . . . . . . . . . . . . . . . . . . . . . . . . . . . . . . . . . . . . . . . . . . . . . . . . . . . . . .1625.2 Regression Analysis . . . . . . . . . . . . . . . . . . . . . . . . . . . . . . . . . . . . . . . . . . . . . . . . . . . .163
5.2.1 Regression Model . . . . . . . . . . . . . . . . . . . . . . . . . . . . . . . . . . . . . . . . . . 1635.2.2 Simple Linear Regression Analysis . . . . . . . . . . . . . . . . . . . . . . . . . . . . . 1645.2.3 Linear Ordinary Least Square (OLS) Regression . . . . . . . . . . . . . . . . . . . 1665.2.4 Multiple Linear Regression . . . . . . . . . . . . . . . . . . . . . . . . . . . . . . . . . . . 167
5.3 Parameter Estimation . . . . . . . . . . . . . . . . . . . . . . . . . . . . . . . . . . . . . . . . . . . . . . . . . . .1695.3.1 Estimating the Parameters . . . . . . . . . . . . . . . . . . . . . . . . . . . . . . . . . . . . 1705.3.2 Point Estimate . . . . . . . . . . . . . . . . . . . . . . . . . . . . . . . . . . . . . . . . . . . . . 1705.3.3 Method of Moments . . . . . . . . . . . . . . . . . . . . . . . . . . . . . . . . . . . . . . . . 1715.3.4 Method of Maximum Likelihood Estimation . . . . . . . . . . . . . . . . . . . . . . 1715.3.5 Sampling Distribution of the Mean (SDM). . . . . . . . . . . . . . . . . . . . . . . . 1715.3.6 Performance Parameter for Estimation. . . . . . . . . . . . . . . . . . . . . . . . . . . 172
5.4 Inferential Statistics . . . . . . . . . . . . . . . . . . . . . . . . . . . . . . . . . . . . . . . . . . . . . . . . . . . . .1745.4.1 Chi-Square Test . . . . . . . . . . . . . . . . . . . . . . . . . . . . . . . . . . . . . . . . . . . . 1755.4.2 T-Test Analysis . . . . . . . . . . . . . . . . . . . . . . . . . . . . . . . . . . . . . . . . . . . . 176
5.5 Univariate, Bivariate, and Multivariate Data Analysis . . . . . . . . . . . . . . . . . . . . . . . .1785.5.1 Univariate Analysis . . . . . . . . . . . . . . . . . . . . . . . . . . . . . . . . . . . . . . . . . 1785.5.2 Bi-Variate Analysis . . . . . . . . . . . . . . . . . . . . . . . . . . . . . . . . . . . . . . . . . 1815.5.3 Multivariate Analysis (MVA). . . . . . . . . . . . . . . . . . . . . . . . . . . . . . . . . . 1825.5.4 Univariate Analysis of Variance (ANOVA) . . . . . . . . . . . . . . . . . . . . . . . 1825.5.5 Multivariate Analysis of Variance (MANOVA) . . . . . . . . . . . . . . . . . . . . 183
5.6 Principal Component Analysis . . . . . . . . . . . . . . . . . . . . . . . . . . . . . . . . . . . . . . . . . . .1845.6.1 Procedure of Computing Principal Components Is as Detailed Below . . . 184
5.7 State Vector Machines . . . . . . . . . . . . . . . . . . . . . . . . . . . . . . . . . . . . . . . . . . . . . . . . . . .1875.7.1 Principle of Support Vector Machine . . . . . . . . . . . . . . . . . . . . . . . . . . . . 187
5.8 Uncertainty Analysis. . . . . . . . . . . . . . . . . . . . . . . . . . . . . . . . . . . . . . . . . . . . . . . . . . . .1905.8.1 Uncertainty Analysis Using Probability Theory . . . . . . . . . . . . . . . . . . . . 1905.8.2 Uncertainty Analysis of Linear and Non-Linear Systems. . . . . . . . . . . . . 1915.8.3 Uncertainty of Measurement . . . . . . . . . . . . . . . . . . . . . . . . . . . . . . . . . . 1915.8.4 Uncertainty Analysis . . . . . . . . . . . . . . . . . . . . . . . . . . . . . . . . . . . . . . . . 1925.8.5 Uncertainty Calculation Example. . . . . . . . . . . . . . . . . . . . . . . . . . . . . . . 1935.8.6 Software Tool for Uncertainty Analysis . . . . . . . . . . . . . . . . . . . . . . . . . . 194
5.9 Modelling and Prediction of Performance . . . . . . . . . . . . . . . . . . . . . . . . . . . . . . . . . .1955.9.1 Concept of Mathematical Modelling . . . . . . . . . . . . . . . . . . . . . . . . . . . . 1955.9.2 Classification of Models . . . . . . . . . . . . . . . . . . . . . . . . . . . . . . . . . . . . . . 196
161

5.9.3 Stages of Modelling . . . . . . . . . . . . . . . . . . . . . . . . . . . . . . . . . . . . . . . . . 1965.9.4 Process of Modelling . . . . . . . . . . . . . . . . . . . . . . . . . . . . . . . . . . . . . . . . 1975.9.5 Advantages and Disadvantage of Mathematical Modelling . . . . . . . . . . . 1985.9.6 Example of Mathematical Modelling: Integrated Solar Water Heater. . . . 1985.9.7 Performance Measurement, Analysis, and Performance Curve . . . . . . . . 200
5.10 Multi-Scale Modelling. . . . . . . . . . . . . . . . . . . . . . . . . . . . . . . . . . . . . . . . . . . . . . . . . . .2015.10.1 Approaches to Analyse Multiscale Structures . . . . . . . . . . . . . . . . . . . . . 2015.10.2 Linear and Nonlinear Analysis of System . . . . . . . . . . . . . . . . . . . . . . . . 2025.10.3 Comparison of Linear and Nonlinear System . . . . . . . . . . . . . . . . . . . . . 204
5.11 Sensitivity Analysis . . . . . . . . . . . . . . . . . . . . . . . . . . . . . . . . . . . . . . . . . . . . . . . . . . . . .2045.12 Statistica Software Tool. . . . . . . . . . . . . . . . . . . . . . . . . . . . . . . . . . . . . . . . . . . . . . . . . .2045.13 Summary . . . . . . . . . . . . . . . . . . . . . . . . . . . . . . . . . . . . . . . . . . . . . . . . . . . . . . . . . . . . .205Further Reading. . . . . . . . . . . . . . . . . . . . . . . . . . . . . . . . . . . . . . . . . . . . . . . . . . . . . . . . . . . . 205
God Grant Me The Serenity To Accept The Things I Cannot Change, The Courage ToChange The Things I Can And The Wisdom To Know The Difference.
—Dr. Reinhold Niebuhr
Learning objectives of this chapter are to
• Demonstrate descriptive and inferential statistics• Apply linear regression analysis for estimating the relation between dependent
and independent parameters• Analyse the theory of estimation for promoting inferential statistics• Evaluate the impact of sensitivity and uncertainty analysis in the mathematical model• Introduce statistical tools such as principal component analysis and support vector
machine• Develop an ability to construct linear, nonlinear, and generalized mathematical models
This chapter will enable the researcher to:
• Understand the importance of regression models, estimation theory, statisticaltools, and design of the mathematical model
• Select and formulate the statistical model for estimated parameters• Formulate research problem using mathematical and statistical methodologies and
solve using relevant structures• Apply the properties of parametric, semiparametric, and nonparametric testing
procedures and hypothesis testing for validating estimated models
5.1 Introduction
This chapter highlights the role of statistics in research for collecting and analyzingsmall scale or large data. Statistics is a branch of mathematics used to demonstrate
162 Research Methodology

research findings, support hypotheses, give credibility to research methodology anddraw conclusions. It helps the researcher in understanding how to plan, conduct, andevaluate the research. The sections in this chapter will detail the selection of statisticalmethodology, includes a selection of suitable measures or parameters, a selection ofevaluation methodology and analyzing data for drawing reliable conclusions by defin-ing appropriate system models.
5.2 Regression Analysis
Regression concept was first introduced by F. Galton in the nineteenth century forbiological research. The regression method was further extended by integrating it withvarious methodologies such as nonparametric regression, Bayesian-based regression,logistic regression, and polynomial regression. The regression involves estimation ofdependent variables on the basis of controlled variables, and their relation using statisticalmodeling. The relation is observed by means of curves, images, and graphs/plots.
Thus, regression analysis is an estimation tool for anticipating conditional average valuesof dependent variables with reference to the constant value of the independent variable.
Sometimes in rare scenarios, the focus is on the location of the conditional distributionof the dependent variable with respect to the independent variables. Regression analysisis a most preferred method of defining the interrelation of variables in machine learn-ing–based prediction or forecasting models.
Regression may be parametric regression, in which the regression function is definedin terms of a finite number of unknown parameters that are estimated from the data ornonparametric regression. The regression function lies in a specified set of functionswhich may use infinite-dimensional space. The performance of this method depends onthe selection of data generation method, regression approach, assumptions, and types ofvariables. It is proven to be the most important tool for modelling and analysis of data.
For example, the rate of heart attack and affected age group of patients is one of theregression problems.
The benefits of regression analysis are as follows
• It estimates the effective relationships between the dependent variable andindependent variable
• It derives the effect of multiple independent variables on a dependent variable
5.2.1 Regression Model
To estimate these independent variables a linear model is define called regressionmodel, it contains following parameters and variables:
• The undefined scalar or vector parameters also called unknown parameters (β)
• The autonomous or explanatory or independent variable, “X”• The reliant or response variable, Y
Applied Statistics 163

In regression model response variable Y is function of X and β as shown inequation (5.1),
Y ≈ f X; βð Þ ð5:1Þ
The approximation or estimation is given as E(Y|X) = f (X, β). Proper selection ofregression function “f” optimizes the performance of the regression analysis. Let β is avector of the length “m” and consider information of dependent variable Y is a user-defined value then regression analysis can be performed in various condition asstated here.
Case 1: If data points of the form (Y, X) are “N” and it is observed that N < mthen regression analysis is underdetermined due to the short length of data tocalculate β.
Case 2: If function f is linear and it is observed that N=m, then Y ≈ f (X, β) and canproduce an exact solution with linear values of X.
Case 3: If N>m then the system observed is overdetermined even though it providesenough information with a best fit value of β. This regression analysis is similar to themethod of least squares where the distance between actual value and the predictedvalue of Y is minimized.
Let a regression model contain three unknown parameters, βa, βb, and βc with 10observations and independent variables X1, X2, and X3. Due to lack of enough informa-tion, this regression model could not estimate unique values of βa, βb, and βc. So calculatean average value and standard deviation of corresponding dependent variable Y. Ifregression of three different value of X is performed then it estimates three separateunknown parameters β.
In linear regression, if N>m and XTX is invertible then the measurement errors arenormally distributed and (N−m) shows an excess of information used for a statisticalprediction about unknown parameters. This excess of information is referred as thedegree of freedom of the regression.
5.2.2 Simple Linear Regression Analysis
The simple regression analysis is method in which single regressor is used to deriveresponse of the system or to estimate the value of dependent variable. It is defined byequation (5.2) given below
Y ¼ β0 þ β1X þ ε ð5:2Þ
Where β0 is intercept and β1 and slope of the behaviour
Assumptions of the linear regression model are as follows:
• For the prediction, the sample represents the population• The error 0ε0 is a random variable with a mean of zero conditional on the
explanatory variables• The autonomous variables are measured with no error thus 0ε ¼ 00
• The autonomous variables are linearly independent
164 Research Methodology

• The variance-covariance matrix of the errors is diagonal and each nonzero elementis the variance of the error
• The variance of the error is constant across observations
The modified simple regression model is designed after applying all assumptionSometimes spatial trends and spatial autocorrelation in the independent and depen-
dent variables can violate statistical assumptions of regression.
Examples on Regression Analysis:A randomly selected dataset of five students who appeared for mathematics test andscored as given below
• Find linear regression equation, which predicts statistic performance,• Evaluate grading of the students with 80 marks in aptitude test• Develop best fitted or estimated regression model for the system with calculation
shown in Table 5.1
The regression function is linear and represented as bY ¼ β0 þ β1X� �
.
It is necessary to calculate values of b0 and b1 using formulas given below
β1 ¼X Xi� X
� �Yi� Y� �
Xi� X� �2h i ¼ 460
730¼ 0:63
β0 ¼ Y� β1 � X ¼ 77� 0:63ð Þ � 78ð Þ ¼ 27:84
Thus, the calculated regression model is Y ¼ 27:84þ 0:63X. This regression equation willdescribe the data by line of best fit using scatter plot as shown in Figure 5.1 drawn withan Excel tool where the equation of estimation is Y ¼ 25:76þ 0:654X. This statescorrelation between marks and appeared students but optimized best-fitted line is notobserved for this dataset but regression model can be estimated with a minimum errorby approximating fixed intercept.
TABLE 5.1
Calculation of Linear Regression Model
SubjectNo.
No. ofStudentsXi
MeasuredYi Xi� X
� �Yi� Y� �
Xi� X� �2
Yi� Y� �2 Xi� X
� �Yi� Y� �
Calculate:PredictedbY ¼ β0 þ β1X
ERROR=ðYi� bYÞ
1 60 70 −18 −7 324 49 126 65.64 4.16
2 70 65 −8 −12 64 144 96 71.94 −6.94
3 80 70 2 −7 4 49 −14 78.24 −8.24
4 85 95 7 18 49 324 126 81.39 13.07
5 95 85 17 8 289 64 126 87.69 −2.69
Sum 390 385 730 630 460
Mean 78 77
Applied Statistics 165

5.2.3 Linear Ordinary Least Square (OLS) Regression
Linear ordinary least squares (OLS) regression is score-based simple regression analysisand it uses the score of independent variable “X” to calculate the score of the dependentvariable “Y”. If these scores are linear then linear regression is preferable and can beapplied as shown here:
• Linear straight line equation is used to determine regression line• Determine the prediction score from this regression equation• Evaluate the distribution of scores by calculating Standard Error of the Esti-
mate(Sxy)
Data values “X” and “Y” are utilized to derive the regression equation using Pearson’srule. If the relation between the variables is significantly linear then selection ofappropriate linear regression is important to estimate values of “Y” by the equationbY ¼ β0 þ β1X� �
. Where bY; a predicted score and β1 is a slope of regression line with Y
intercept β0.In OLS regression slope of the regression line is given by
β1 ¼nP
X � Y�PX �PY
nP
X2 � ðPXÞ2
ð5:3Þ
Where X & Y are mean of the variables X and Y, respectively.β0 intercept is calculated by
β0 ¼ Y� β1 � X ð5:4Þ
y = 0.6548x + 25.761
R2 = 0.8447
0
20
40
60
80
100
0 20 40 60 80 100
Appti
tute
Exam
mar
ks
Students Appeared for Exam
Linear Regression Relation Between
marks & appeared students
Measured Yi
Linear (Measured Yi)
FIGURE 5.1Line of Best Fit for Linear Regression Relation between Marks and Appeared Students
166 Research Methodology

5.2.4 Multiple Linear Regression
As discussed earlier regression is a tool used to predict the performance of the systemby estimating parameters and deriving the relationship between independent anddependent variables. In multiple regression models, there will be single dependent andmultiple independent variables.
Let “x” series are for independent variables also called regressors and “y” is adependent or response variable. In multiple regression, multiple regressors affectoutput response variable. If there are “k” numbers of regressors, then the model isrepresented with the linear equation given here:
yi ¼ β0 þ β1xi 1 þ β2xi 2 þ β3xi 3 . . . . . . . . .þ βk�1xik�1 þ εi ð5:5Þ
Where β0, β1, β2, βk�1 are unknown coefficients that need to be estimated to define themodel. εi is an error observed in the response and it is assumed to be following normaldistribution, that is, εi � 0; σ2
� �.
Estimation of these parameters defines regression model Y ¼ βX þ ε of the system.The most commonly least square method is used for estimation of parameters andcharacterizes by the Squared Sum (SS) and Mean Squared Value (MS).
The estimated model is defined as
byi ¼ bβ0 þ bβ1xi 1 þ bβ2xi 2 þ bβ3xi 3 . . . . . . . . .þ bβk�1xik�1 ð5:6Þ
Where estimated bβ is calculated by
bβ ¼ X0Xð Þ�1 � X0Y ð5:7Þ
This model follows statistical properties as
• EðbβÞ ¼ β, the estimated parameter• VðbβÞ ¼ σ2 X0Xð Þ�1, the variance
The squared sum (SS) values for “n” observations of each of the regressor arecalculated as
SST ¼Xni¼1
ðyi � yÞ2 ¼X
yi2 � ny2 with Df ¼ n� 1 ð5:8Þ
SSResidual ¼Xni¼1
ðyi � byiÞ2 with Df ¼ n� k ð5:8Þ
SSRegression ¼ SST � SSResidual ¼ bβ0X0Y� ny2 with Df ¼ k� 1 ð5:9Þ
The ideal model should have maximum SSRegression and minimum SSResidual.
Applied Statistics 167

For Example:Consider the following dataset containing two regressors and one response variable
and define a model for this response and validate the model.
Step 1: Define estimated model f1 or the system
Y ¼ bβ0 þ bβ1x1 þ bβ2x2 þ o
Y ¼
6810532�410�35
266666666666666664
377777777777777775
X ¼ 1; x1; x2½ � ¼
1 1 81 4 21 9 �81 11 �101 3 61 8 �61 5 01 10 �121 2 41 7 �21 6 �4
266666666666666664
377777777777777775
β ¼β0β1β2
24
35
Let estimate bβ ¼ X0Xð Þ�1 � X0Y ¼14�2
�1=2
24
35; β0 ¼ 14; β1 ¼ �2; β2 ¼ �1=2
Thus, the fitted equation is bY ¼ 14� 2x1 � 1=2x 2
Step 2: Validating this fitted equation using Analysis of Variance (ANOVA)
X1 X2 Y
1 8 64 2 89 −8 111 −10 03 6 58 −6 35 0 210 −12 −42 4 107 −2 −36 −4 5
168 Research Methodology

a) Calculate SST; SSResidual and SSRegression
b) Calculate ANOVA table:
c) State hypothesis using confidence level α ¼ 0:05
H0: β1 ¼ β2
H1: βj ≠ 0 for at least one value of j
By F distribution table for confidence level α ¼ 0:05 and Df = 10, Fcritical = 4.46d) From the statistics, it is clear that Festimated > Fcritical so reject H0 hypothesis and
the fitted equation can represent multiple linear regression model asy ¼ 14� 2x1 � 1=2x 2
Thus linear regression estimates the coefficients of the linear equation to determine therelation between a response variable and explanatory variables. The regression analysisis of various types based on the distribution of the dependent variable. If “Y” iscontinuous then use linear regression model, if dichotomous use logistic regression, ifthe variable is Poisson or multinominal use log-linear regression model and if data istime-based with conditional cases then use Cox regression model for prediction of “Y”.
5.3 Parameter Estimation
Statistical inference is an estimation theory used to estimate values of parameters such asmean, deviation, variance or correlation coefficients from randomly empirical data. Thus
X1 X2 Y bY ¼ 14� 2x1 � 1=2x 2 ðY � bYÞ2 Pyi2ð Þ � ny2 SST SSResidual SSRegression
1 8 6 8 4 9
190 68 122
4 2 8 5 9 259 −8 1 0 1 411 −10 0 −3 9 93 6 5 5 0 48 −6 3 1 4 05 0 2 4 4 110 −12 −4 0 16 492 4 10 8 4 497 −2 −3 1 16 366 −4 5 4 1 4
Source of Variation Df SS MS= SS/Df F score= MSReg./MSRes.
Regression 2 122 61 7.7Residual 8 68 8.5Total 10 190
Applied Statistics 169

unknown parameters are estimated using measurement techniques [1]. The statisticalinference facilitates estimating behavior of large data called population from sample datawith a calculated degree of uncertainty. The well-known methods of statistical inferenceare an estimation and Null Hypothesis Test of Significance (NHTS). Hogg and Tanis (2001)explains, estimation is the process of obtaining numerical values of parameters or theirrange based on sample observation of the specific distribution. Outcome values areestimated and method used is called estimator. Estimators are random variables havingtheir own probability distribution. For example, the process uses sample mean to estimatepopulation mean (μ) and population proportion (p). Similarly, sample standard deviationis used to estimate population standard deviation (σ).
Properties of estimators include:
• If an individual parameter can estimate sufficiently the estimator is good• Good consistency• It may or may not be unbiased• A minimum variance unbiased estimator is most sufficient estimator
For example, radars are used to find the range of the target by transmitting highstrength signal and analyzing received echoes of transmitted pulses. Due to electricalnoise, their actual values are randomly distributed, thus estimation of the transit time isa need of a model.
5.3.1 Estimating the Parameters
To find interrelation of variables and its performance, parametric estimation plays avery important role. Most commonly estimated parameters are:
• If the variance is known estimated parameter is amplitude <Aj>• The noise variance based parameter, second moment <Aj, Ak>• SNR (Signal to Noise Ratio)• PSD (Power Spectral Density in watts/Hz)
The methods of parametric estimation are as discussed here.
5.3.2 Point Estimate
The statistical method used to estimate population from the single-valued sample iscalled “a point estimate” by Rohatgi [2]. A point estimate can be used for a populationmean, a population variance, a population proportion (or) any other characteristic of thepopulation.
Methods of point estimate most commonly used are method of moments, maximumlikelihood estimation, minimum chi-square, least squares and minimum variance
Some desirable properties of point estimators include:
• Bias (η): The error observed in actual value and the estimated value of theparameter is a bias and given by E bpη � p
� �
170 Research Methodology

• Consistency: If the quantity of data increases the estimator is said to be consistentonly in a case where it estimates p to cover true value of p
• Efficient Estimator: The efficiency of the estimator is defined by the variance of theestimators and lower the variance or correlation higher the efficiency of theestimator and is given by, Varðbpη1Þ=Varðbpη2Þ
The estimation method is based on finding most predicted parameter and can bemeasured by the difference between the observed sample covariance matrix.
5.3.3 Method of Moments
The method of moments uses the distribution function of a random variable topredict the expected value of parameters. It is based on comparing sample momentsvalues with actual values of moments and solving this comparison could estimatesthe values of parameters. Let E(Xk ) is the kth(theoretical) moment of the distribution,
and let is Mk ¼ 1n
Pni¼1
Xki the kth sample moment for k=1,2. . .. . . Comparing these k
moments, It estimates values of the parameters by solving the resulting E(Xk ) =Mk.This estimator is consistent than any other biased estimator has less computationalcomplexity.
5.3.4 Method of Maximum Likelihood Estimation
If a random sample (x1,x2,x3 . . . xn) of size n is selected from a population withProbability Density Function (pdf), f (xi,θ) for estimation then the likelihood function ofthe observed sample usually calculated from joint density function is L=L(θ)
For continuous random variable L θð Þ ¼ ∏n
i¼1f xi; θð Þ, and
For discrete random variable L θð Þ ¼ ∏n
i¼1p xi; θð Þ
Where p xi; θð Þ is a probability mass function, L signifies relative likelihood for a set ofsamples and it is a function of the actual value of the parameter. Thus the method ofmaximum likelihood estimates the parameters with a maximum value of likelihoodfunction L. It also follows the same properties as point estimates, that is, bias (low),efficiency (minimum variance), and consistency.
5.3.5 Sampling Distribution of the Mean (SDM)
A hypothetical distribution derives variability of X called Sampling Distribution ofMean (SDM) [3]. As in a point estimate, x gives reflections of parameter μ, but not theprecision of the estimate. The probability of hypothetical outcomes is estimated from ahypothetical Probability Distribution Function (PDF).
The SDM divulge that:
• x is an unbiased estimate of μ;• As the sample is huge and normalized then the SDM will tend to be normal
(Gaussian)
Applied Statistics 171

• The predicted values of x are used to finds clusters around μ these statistics is theStandard Error of the Mean (SEM) and is given by:
SEM ¼ σffiffiffin
p ð5:10Þ
Where σ is a standard deviation of the related external source of the size n.For example, Let σ = 10 and n= 1, 4, 16 then by formula SEM is observed as 10, 5, 2.5
respectively. Thus for quadruple “n”, the SEM observed to be half, this is called assquare root law which states the relation between precision and the square root of thesample size [4].
5.3.6 Performance Parameter for Estimation
(i) Interval estimate.A probable range of parameter can be estimated to within which its true valuelies, it’s called as interval estimate. For example X15X5X2 is an interval estimateof the population mean μ. The interval estimate is defined with a range ofparameters and confidence level generally in a percentage, and it is associatedwith estimated ranges of a population parameter [1].
(ii) Confidence Intervals (CI) is a range of parameters within which unknownvalues are observed. In statistics, the confidence interval is used to defineprecision and uncertainty associated with various sampling methods. A con-fidence interval is characterized by confidence level, related statistics, andmargin of error. Confidence intervals are preferred to point estimates becauseconfidence intervals indicate the precision of the estimate and the uncertainty ofthe estimate.
The confidence level is the probability of finding confidence interval that includes thetrue population parameter. Let all possible samples are considered to estimate popula-tion parameters and confidence interval calculated for each one of the sample then someof the CI could include true population parameters. This is represented using confidencelevel such as 95% confidence level means that 95% of the intervals contain the truepopulation parameter and so on.
The margin of error is the range of values above and below the sample statistic inconfidence interval. For example, if an election survey is conducted in the newspaperthen the reports states that 30% of the vote will be received by the independentcandidate.
Estimate
Estimate –Margin
of Error
Estimate +Margin
of Error
FIGURE 5.2Confidence – Interval Range
172 Research Methodology

The survey had a 5% margin of error and a confidence level of 95%, means surveyoris 95% confident that the independent candidate will receive between 25% and 35% ofthe vote.
As shown in Figure 5.2, the range of the estimate is calculated from (Estimate �Margin of Error) and referred to as a confidence limit. The factor α is level ofsignificance and (1−α) is called confidence coefficient which shows lack of confidence.This (1−α)*100% represents the confidence level of a confidence interval and its value isdepending on the precision of the estimate [5]. For example: Let there be n = 10observations and a select sample of x ¼ 29:0 with SEM = 4.30, then calculate CI for μ
with following formulas:
1) SEM ¼ σffiffin
p
2) Calculate z quantile of 1� αð Þ ¼ z1�/=2� �
3) Calculate CI ¼ p� z1�/=2� �
SEMð Þ
Thus the confidence level increases as margin of the error increases. Also, if variationin the population increases, the margin of the error increases, whereas if sample sizeincreases, the margin of error decreases.
Steps involved in Estimation of a proportion:
Step 1. Review the research problem for identification of the parameters involved inthe model. Select sample value that can address a binomial proportion (p).
Step 2. Point estimate. Calculate the sample proportion (p) as the point estimate ofthe parameter.
Step 3. Confidence interval. Calculate confidence interval by p� z1�/=2� �
SEPð Þ of
normal distribution and the standard error of the proportion SEP =ffiffiffiffipqn
q. Where p is
point estimate and q is (1− p) with sample size “n”.Step 4. Interpret the results. Estimate proportion variable relation and its confidence
level with population parameter.
Illustration
In a survey of 2673 people it was observed that 170 have risk factor X. Calculatepopulation prevalence of the risk factor with 95% confidence.
Sr.No.
Confidence level(CI for μ) z quantile CI ¼ bx� z1�/=2
� �SEMð Þ
Marginof Error
1 90%α=0.10
z1−0.10/2 = z0.95 = 1.64 29.0 ± (1.64)(4.30)= 29.0 ± 7.1 = (21.9, 36.1)
±7.1
2 95%α=0.05
z1−0.05/2 = z0.975 = 1.96 29.0 ± (1.96)(4.30)= 29.0 ± 8.4 = (20.6, 37.4).
±8.4
3 99%α=0.01
z1−0.01/2 = z0.99 = 2.58 29.0 ± (2.58)(4.30)= 29.0 ± 11.1 = (17.9, 40.1).
±11.1
Applied Statistics 173

Step 1. Estimate parameter p.Step 2. Point estimate proportion p ¼ 170
2673 ¼ 0:06360 ¼ 6:36%:
Step 3.
a) Apply “npqrule” for approximation and calculate npq ¼ 2673 0:0636ð Þ1� 0:636ð Þ ¼ 159
b) Calculate SEP ¼ffiffiffiffipqn
q¼
ffiffiffiffiffiffiffiffiffiffiffiffiffiffiffiffiffiffiffiffiffiffiffiffiffiffiffiffiffi0:0636ð Þ 1�0:0636ð Þ
2673
q¼ 0:00472.
c) Calculate z quantile for 95% of confidence level z1�/=2 ¼ 1:96d) Calculate Confidence Interval for proportion p : p� z1�/=2
� �SEPð Þ ¼
0:636� 1:96 � 0:00472 ¼ 0:0543; 0:0729ð Þ ¼ 5:4%; 7:3%ð ÞStep 4. The prevalence in the sample was 6.4%. The prevalence in the population is
between 5.4% and 7.3% with 95% confidence [4].
5.4 Inferential Statistics
Inferential statistics is a group of methods which draws a conclusion about thepopulation from sample information using hypothesis testing. The sample is arandomly drawn subset of the population used to estimate population characteristicsaccurately.
Definition of inferential statistics
• It is “a method of reaching conclusions about unmeasurable populations by usingsample evidence and probability”
• Vogt [6] define it as “Using probability and information about samples to drawconclusions (‘inferences’) about a population or about how likely it is that a resultcould have been obtained by chance.”
A simple hypothesis test is used to draw the conclusion about the population such aschi-square test, T-test, and ANOVA, and so on. Hypothesis testing is used to estimatethe population parameters or their relations. It is performed with the NULL hypothesis,H0, and ALTERNATIVE hypothesis, H1.
Procedure for Hypothesis Testing:
Step 1: State Null hypothesis H0 and alternative hypothesis H1
Step 2: Choose confidence or significance level for estimation, αStep 3: Calculate degree of freedom, DfStep 4: Find critical or standard distribution for defined confidence level from
standard distribution tableStep 5: Calculate test statistics and compare with its critical value for drawing a
conclusion about the populationStep 6: State the conclusion
174 Research Methodology

5.4.1 Chi-Square Test
A test or squared distribution used in statistics to check whether sample exactlyestimates the population or there is a specific relation between dependent and indepen-dent variables or to identify similarities in categorical variables.
The test is performed with chi-square coefficient, χ2 and is given as:
χ2 ¼P
Oi � Eið Þ2Ei
ð5:11Þ
where Oi, is an actual value, Ei, is expected value and χ2 is sample distribution withspecific degree of freedom. The degree of freedom is the number of independent valuesor quantities that can be assigned to a statistical distribution. For chi-square test it iscalculated from a number of columns, c and rows, r with formula Df=(c−1)x(r−1). PDFor chi-square distribution is as shown in Figure 5.3, which is used to make a decision ofhypothesis rejection.
For example, a set of education levels are presented in a dataset of 415 persons for themale and female category so estimate the relation between education level and gender.
Solution: First complete row and column wise analysis: (Oi)
Chi square distribution,
Chi square distribution
00
0.05
0.1
0.15
0.2
5
→X2 Critical =7.81
for alpha →=0.05
15
data1
PD
F
FIGURE 5.3Chi-Square Distribution
Category HSC Graduates Post Graduates PhD
Male 75 60 40 41Female 45 51 55 48
HSC Graduates Post Graduates PhD Total row wise
Male 75 60 40 41 216Female 45 51 55 48 199Total column wise 120 111 95 89 415
Applied Statistics 175

Follow the steps of hypothesis testing:
Step 1: State hypothesis H0 and H1
H0: Null hypothesis PM ¼ PF
H1: Alternative hypothesis PM ≠ PF
Step 2: Select confidence level about 95% i.e. α ¼ 0:05Step 3: Calculate Df ¼ (c−1) x (r−1) ¼ (4−1) x (2−1) ¼ 3Step 4: Find critical value from chi-square distribution table or contingency table for
α ¼ 0:05 and df ¼ 3. So χ2critical ¼ 7:81Step 5: Calculate test statistics:
• Calculate estimated values of each observed value by the formula
E ¼ Row total� Column TotalSample Size
ð5:12Þ
So estimated values are as (Ei).
• Now calculate χ2 by the formula
χ2 ¼P
Oi � Eið Þ2Ei
ð5:13Þ
Chi-square distribution for an individual is given as
Step 6: State Conclusion:As estimated χ24χ2critical and p < 0.05, reject the null hypothesis, which means there
will be no relation between gender and education level, that is, they are independent.
5.4.2 T-Test Analysis
T-test analysis is most commonly used if the standard deviation of the population isunknown. Thus standard deviation can be estimated using T-test. It follows same stepsof hypothesis testing with T-statistics as given here.
HSC Graduates Post Graduates PhD Total row wise
Male 62.45 57.77 49.44 46.32 216Female 57.54 53.22 45.55 42.67 199Total column wise 120 111 95 89 415
HSC Graduates Post Graduates PhD Total
Male 2.52 0.086 1.80 0.61 10.46Female 2.73 0.092 1.96 0.66
176 Research Methodology

a)For single dependent variable
t ¼ xDSD=
ffiffiffin
p ð5:14Þ
where xD is a difference of mean and SD is standard deviation difference with nnumber of sample size, which is calculated as
SD ¼
ffiffiffiffiffiffiffiffiffiffiffiffiffiffiffiffiffiffiffiffiffiffiffiffiffiffiffiffiPx2 �
Pxð Þ2
n
rn� 1
ð5:15Þ
b)For two or more dependent variable
t ¼ x1 � x2ð Þ μ1 � μ2ð ÞffiffiffiffiffiffiffiffiffiffiffiffiffiffiffiffiSp2
n1þ Sp2
n2
q ð5:16Þ
if μ1 and μ2 estimated means are given otherwise ignore the term as μ1 � μ2ð Þ ¼ 1where x1 and x2 are mean of two independent variables and Sp
2 is given as
Sp2 ¼ SS1 þ SS2Df1 þDf2
ð5:17Þ
SS is variation standard deviation as per the degree of freedom Df and calculated asSS ¼ Std2 (Df) with Df as (n−1).
For example:In a school, Class A and Class B scored marks as mentioned in the table. State their
performance analysis.
Solution:
Step 1: Define hypothesis for the given data
H0: μClassA ¼ μClassB; performance of the Class A and Class B is same
H1: μClassA ≠ μClassB; performance of the classes is different.Step 2: Consider confidence level 95% thus α ¼ 0:05Step 3: Calculate degree of freedom
Df ¼ n1 � 1ð Þ þ n2 � 1ð Þ ¼ 25� 1ð Þ þ 20� 1ð Þ ¼ 43Df1 ¼ n1 � 1ð Þ ¼ 25� 1 ¼ 24;Df2 ¼ n2 � 1ð Þ ¼ 20� 1 ¼ 19
Class No. of Students Average Score Standard Deviation
Class A 25 70 15Class B 20 74 25
Applied Statistics 177

Step 4: As per distribution table for α ¼ 0:05 and Df ¼ 43 critical values are �2.5%around the distribution, that is, �2:0167(refer standard distribution table for T-test)
Thus if −2.0167< t estimated < +2.0167 then reject hypothesis H0
Step5: Calculate test statistics: for two independent data of Class A and Class Ba) Calculate Sp:
Sp2 ¼ SS1 þ SS2Df1 þDf2
¼ 5400þ 1187524þ 19
¼ 401:74
SS1 ¼ Std12 Df1ð Þ ¼ 15ð Þ2 � 24 ¼ 5400
SS2 ¼ Std22 Df2ð Þ ¼ 25ð Þ2 � 19 ¼ 11875
b) Calculate t:c)
t ¼ x1 � x2ð ÞffiffiffiffiffiffiffiffiffiffiffiffiffiffiffiffiSp2
n1þ Sp2
n2
q ¼ 70� 74ð Þffiffiffiffiffiffiffiffiffiffiffiffiffiffiffiffiffiffiffiffiffiffiffiffiffi401:7425 þ 401:74
20
q ¼ �0:67
Step 6: State the conclusion:As testimated ¼ −0.67 < −2.0167 reject H1 and there is no significant difference in test
performance of Class A and Class B.
5.5 Univariate, Bivariate, and Multivariate Data Analysis
The mathematical tool used for collection, organization, and interpretation of numericaldata is referred as statistics population, samples, and variable are major components ofstatistical analysis. Thus statistics is used to estimate the parameters from discrete orcontinuous variable and categorizing them as per their characteristics or patterns.Figure 5.4 shows various well-known methods for statistical analysis [7].
5.5.1 Univariate Analysis
Univariate analysis is method of analyzing data using one variable. It describes orsummarizes the data and also states patterns of the data. A variable in univariateanalysis states about the behavior of data or it states category of the data. Level ofmeasurements also plays a very important role to find best fit analysis. These levels areNominal, Ordinal, Interval, and Ratio. Data are classified according to the highest levelthat it fits.
A sampling of the data decides the parametric estimation of the variable and samplingcan be of random, systematic, convenience, cluster, and stratified.
178 Research Methodology

Ways of expressing univariate data include central tendency (mean, mode andmedian) and dispersion: range, variance, maximum, minimum, quartiles (including theinterquartile range), and standard deviation [8].
(i) Frequency Distribution Table
Frequency distribution table signifies the occurrence of data with its frequency in eachsample of defined size. In statistics, this observation is useful in identifying theimportance of data. For example, Let 0, 1, 9, 9, 2, 3, 8, 4, 6, 9, 5, 1, 1, 9, 6, 9 is sampledata, then we can calculate the frequency of all symbols of data as shown in the table.
These tables are useful in the categorization of data in various quantitative orqualitative vectors.
Statistical Data Analysis
Univariate Data
Analysis
(Single Variable)
Bivariate Data
Analysis
(Two variables)
Multivariate Data Analysis
(variables>2)
Categorical
Variables
Continuous
Variables
Central Tendency: Mean,
Median, Mode, etc
Variation: Variance,
Std. Deviation, Range,
etc
Distribution: Normal,
Uniform, Random, etc
Plots: Histogram, Box
plot, Line chart,etc
Frequencies: Counts,
Frequency, Odds,
Percentage, etc
Plots: Bar Graphs, Pie
Charts, etc
Continuous: Multiple
Regression, Analysis
of Variance, Analysis
of Covariance
Dichotomous: Logistic
Regression,
Discriminant Analysis
Multivariate: Repeated
Measures, MANOVA
and Factor Analysis.
FIGURE 5.4Methods of Statistical Analysis
NumbersFrequency ofNumbers
1 32,3,4,5,8 16 29 5
Applied Statistics 179

(ii) Bar Graph
It is a display tool used to present pictorial representation of data using rectangular barsas shown in Figure 5.5. Bar graphs gives quantitative information with respect tomeasurable parameters.
The graph plotted here shows quantity on the y-axis for different categories shown onthe x-axis. Thus, comparison of various categories can be analyzed for finding lowpower utilization device.
(iii) Histogram
The histogram is a type of bar graph describing count of data in particular range. In ahistogram, the elements in inputs are analyzed using frequency distribution by distri-buting these elements into “n” number of discrete bins. The histogram block sorts allcomplex input values into bins according to their magnitude. The histogram value for agiven bin represents the frequency of occurrence of the input values. Let there are someobservations of data then as per their occurrence they will be divided in a bins. Forexample, consider sale of 22 items is given here and quantity-wise grouping of items isrequired then histogram is as shown in Figure 5.6.
Items sales information = [0,1,2,2,3,4,5,6,6,7,7,8,0,8,9,10,10];
29%
17%14% 13% 12%
4%
11%
Freezer AC TV Oven Lighting other charging Heater
Power Utilization of Home Appliances
FIGURE 5.5Bar Graph Presentation of Power Utilization
3
2.5
2
1.5
1
0.5
00 1 2 3 4 5
Bins
Histogram
Fre
quen
cy of
Ele
men
ts
6 7 8 9 10
FIGURE 5.6Histogram of Data
180 Research Methodology

(iv) Pie Chart
A pie chart is a circular graph used to represent proportion or size of the category.Each of the slices of the pie chart shows the percentage of data available in the
category.For example, Figure 5.7 shows the percentage of power utilization of home appliance
and gives an idea about highly power consumable device and an economical device asper power is concerned. Pie chart is a display tool most commonly used for presentingpercentage relation between various attributes.
5.5.2 Bi-Variate Analysis
The method of estimating relation or correlation or measure of association between twovariables is a bivariate analysis. Normally this correlation ranges between –1 and 1, thisnegative or positive relationship between the variables states direction of correlation. Ifthe correlation of variable is more away from 0 or more toward –1 and 1 then it representsmore perfect the relationship between the independent and dependent variations is calleddegree or extent of correlation. Measures of association and statistical significance that areused may vary as per the level of measurement of the variables analyzed [5].
Flow of Bivariate Analysis:Observe the distribution of the variable in the same group as well as in other groups ofvariables.
Formulate the relationship between these two distributions and find how much and inwhat way they differ.
In a model, if a numbers of variables are involved bivariate analysis can be applied to thestandardized pairs of the variable for better performances. The methods of bivariateanalysis are contingency tables, scatterplots, least squares lines, and correlation coefficients.
For example, Let there are data points describing the relation of points scored vsheight of the player in basketball then a bivariate scatter plot can be used to describetheir relationship as shown in Figure 5.8. It also shows regression best fit line for theestimated regression model. Persons-id is used to represent their height and score.
Freezer
29%
AC
17%TV
14%Oven
13%
Lighting
12%
other charging 4%
Heater
11%
Power Utilization
FIGURE 5.7Pie Chart of Power Utilization
Applied Statistics 181

5.5.3 Multivariate Analysis (MVA)
Most of the systems are defined with multiple independent or response variables andanalysis of such system using multiple variables is a multivariate Data Analysis. Thisstatistical technique is used to perform operable studies across multiple dimensionsconsidering the effects of all variables on the responses of interest. The uses of MVAcomprises:
a. Inverse and Capability-based designb.Analysis of Alternatives (AoA)c.Analysis of concepts with recent trendsd. Identification of critical design-drivers and correlations across hierarchical levels.
Multivariate analysis is suffered by high dimensionality and thus observed to becomputationally costly. As most of the systems are hierarchically designed this complex-ity increases with its level of design. Thus in MVA parametric optimization is one of thepreferred concepts of dimensionality reduction and in turn, reduces the complexity ofthe analysis.
5.5.4 Univariate Analysis of Variance (ANOVA)
0
5
10
15
20
25
30
160 170 180 190 200
Po
ints
Co
ver
ed
Height of Player
Points covered
Linear (Points
covered )
FIGURE 5.8Scatter Plot of Points Scored versus Height in Basketball
RMS Features of EEG signal for Patient 1
Srms Prms Nrms
93.13249 48.93294 41.93732106.1351 40.69793 32.29112103.0291 70.18156 62.07621109.3978 82.81073 42.88057100.5197 85.52586 25.3025659.98254 56.242 46.18233
182 Research Methodology

Univariate Analysis of Variance (ANOVA) is a statistical tool use to analyse themeans of the different dataset to test variation in two or more means. It is veryuseful tool for analysing behavior of attributes used in classification. The techniquecan be used for nonspecific NULL hypothesis, feature selection, classification andprediction methodologies.
For example: Consider classification of epileptic EEG signal in Pre-seizure, Seizureand Normal state. The features are extracted such as mean, variance, Root Mean Square(RMS) for different patients. Let consider RMS feature for Pre-seizure (prms), Seizure(srms), and Normal (nrms) state then an ANOVA technique is used to identify theimportance of this feature in this research by comparing prms and srms with nrms [9].The feature table and ANOVA table is as follows:
Thus, if P-value is less than α ¼ 0:05 then the RMS features are significant.
5.5.5 Multivariate Analysis of Variance (MANOVA)
MANOVA is an extended concept of Univariate Analysis of Variance (ANOVA). InANOVA the relation of one dependent variable is observed with respect to the groupindependent variables whereas in MANOVA multiple dependent variable metrics isanalyzed on the basis of multiple independent variables. To address multiple dependentvariables, MANOVA groups them together into a weighted linear combination orcomposite variable. These composite variables are known by eigenvalues, vectors, ordiscriminant functions.
Assumptions in MANOVA
• Independent Random Sampling: MANOVA assumes samples are randomlyselected considering all variables are independent of one another
• Level and Measurement of the Variables: Independent and dependent variablesare considered to be categorical and continuous variables in nature, respectively
• The Linearity of Dependent Variables: In MANOVA, moderately correlateddependent variables are preferred. Thus, if the dependent variables are exactlyseparable then the system will sacrifice on the degrees of freedom and alsodecreases the power of the analysis
Anova: Single Factor
SUMMARYGroups Count Sum Average Variance
Column 1 6 572.1967 95.36611 331.0251Column 2 6 384.391 64.06517 337.1164Column 3 6 250.6701 41.77835 158.8195ANOVASource of Variation SS df MS F P-value F crit
Between Groups 8696.199 2 4348.1 15.77378 0.000205 3.68232Within Groups 4134.805 15 275.6537
Applied Statistics 183

• Multivariate Normality: It is very sensitive to outliers and missing value. Thus, itis assumed that multivariate normality is present in the data
• Multivariate Homogeneity of Variance: It also assumes that the variance betweengroups is equal
MANOVA statistical analysis uses multivariate F-statistics for the analysis of variableand is given by the ratio of means sum of the square and mean error for the sourcevariable. Computation cost of MANOVA is very high as compared to ANOVA.
5.6 Principal Component Analysis
Principal Component Analysis (PCA) by Karl Pearson (1901) is a pattern recognitiontool used to identify similarities and differences. PCA is a nonparametric method ofextracting relevant information from complex data sets. In multivariable and highdimensions data, it is computationally difficult to analyze data thus PCA observed tobe a powerful tool for analysis of multidimensional data. PCA is also a very provenmethod of data compression without much loss of information in data mining and alsouseful in predictive models, graphical representation, and regression analysis. A new setof variables are produced from PCA called principal component (PCs), which maintainsa variation of original variables and are uncorrelated [10].
5.6.1 Procedure of Computing Principal Components Is as Detailed Below
Step 1: Read DataLet x and y are some random vectors of population “p” then variance, covariance or
correlation of “p” variables need to considered for PCAStep 2: Subtract the meanCalculate (x� x) and y� yð Þ, where x and y are mean of x and y vectors, respectively.Step 3: Covariance matrix calculationCovariance matrix is calculated as shown here:
Cov ¼ Cðx; xÞ Cðx; yÞCðy; xÞ Cðy; yÞ
� �ð5:18Þ
If nondiagonal elements of the covariance matrix are positive, then both the variablesare directly proportional to each other.
Step 4: Construct Eigenvectors and Eigenvalues of the covariance matrixThe eigenvectors and eigenvalues can be calculated from the covariance matrix. A
scalar λ is an eigenvalue of the m × m matrix A and x is an eigenvector related to theeigenvalue λ with relation Ax = λ x. If we square the A matrix, eigenvectors remain thesame and eigenvalues get squared:
detðA� λIÞ ¼ 0 ð5:19Þ
184 Research Methodology

Step 5: Choosing components and forming a feature vectorFor the dataset of size “n”, eigenvectors and eigenvalues are calculated and out of these
“n” values the highest eigenvalue is the principal component of the data set. Only first feweigenvectors get selected as a final dataset with dimension “p” and feature vector can beconstructed on the basis of these vectors. The feature vector is as given here:
Feature Vector Fð Þ ¼ ðeig1; eig2; eig3::Þ ð5:20Þ
Step 6: Deriving the new datasetThe final dataset is derived from the formula given here:
Final Data ¼ Row feature vector X row data adjust
Where Row feature vector is the transpose of the feature vector and row data adjust isthe mean-adjusted data transposed [10].
For Example:Let the dataset used here contains 10 observations of 3D object movement along withthree axes, then calculate new dataset representing these observations:
(i) Derive correlation matrix
R ¼1:00 0:67 �0:100:67 1:00 �0:29�0:10 �0:29 1:00
24
35
(ii) As per eigenvalues concept |R−λI| ¼ 0 where λ can have various values asshown here
X=
X-displacement Y-displacement Z-displacement
7 4 34 1 86 3 58 6 18 5 77 2 95 3 39 5 87 4 58 2 2
Λ Value Proportion
1 1.769 0.5902 0.927 0.8993 0.304 1.000
Applied Statistics 185

(iii) Calculate determinant of R which is the product of the eigenvalues = λ1 × λ2 ×λ3 = 0.499.
(iv) The highest eigenvalue is 1.769 considered to be a principal component andsubstituting it in the equation we get:
�0:769 0:670 �0:1000:670 �0:769 �0:290�0:100 �0:290 �0:769
24
35 v1
v2v3
24
35 ¼
000
24
35
By solving we get feature vector:
F ¼0:64 0:69 �0:340:38 0:1 0:91�0:66 0:72 0:20
24
35
(v) Calculate transpose of Row feature vector V ¼ F0ð Þ and row data adjust L1=2� �
which is a diagonal matrix whose elements are the square root of the eigenva-lues of R.Also calculate final data by
Final Data ¼ Row feature vector X row data adjust
0:64 0:38 �0:660:69 0:10 0:72�0:34 0:91 0:20
24
35 1:33 0 0
0 0:96 00 0 0:55
24
35 ¼
0:85 0:37 �0:370:91 0:10 0:40�0:45 0:88 0:11
24
35
(vi) So 0.91 is the correlation between the second variable and the first principalcomponent.Next compute the communality, using the first two eigenvalues only.
SS0 ¼0:85 0:370:91 0:09�0:45 0:88
24
35 0:85 0:91 �0:45
0:37 0:09 0:88
� �¼
0:8662 0:8140 0:06060:8140 0:8420 �0:3321�0:0606 �0:3321 0:9876
24
35
Communality consists of the diagonal elements.
Var Dia1 0:86622 0:84203 0:9876
264
375
This means that the first two principal components 86.62% of the first variable,84.20% of the second variable, and 98.76% of the third.
(vii) Calculate the coefficient matrix, B from reciprocals of the diagonals of L1/2.
186 Research Methodology

B ¼ VL� 1=2 ¼0:48 0:40 �1:200:52 0:10 1:31�0:26 0:95 0:37
24
35
(viii) Finally, the final dataset is calculated from ZB, where Z is the standard form ofX and columns of matrix F are the principal factors called reduced set ofvariables.
F ¼ ZB ¼
0:41 �0:69 0:06�2:11 0:07 0:63�0:46 �0:32 0:301:62 �1:00 0:700:70 1:09 0:65�0:86 1:32 �0:85�0:60 �1:31 0:860:94 1:72 �0:040:22 0:03 0:340:15 �0:91 �2:65
266666666666664
377777777777775
5.7 State Vector Machines
Vapnik and coworkers introduced supervised machine learning algorithm Supportvector machines (SVMs) in the 1990s. The algorithm uses statistical learning methodsof two-class discriminant functions from a set of training data. In recent research, SVMis most preferred classifier for linearly separable data and used in various applicationssuch as bioinformatics, computer vision, handwriting recognition, text categorization,face detection and in many more prediction models.
5.7.1 Principle of Support Vector Machine
The principle of a support vector machine is to derive the optimal separating hyper-plane which makes the best use of the margin of the training data. Figure 5.9 shows theconstruction of plot showing features and appropriate hyperplane for this dataset.
Linear SVM is a linearly scalable speedy data mining algorithm used to provide highperformance solution for multiclass classification challenge. A linear SVM model has thegreater performance for larger dataset with high accuracy. Support vector machineperformance basically dependent on n-dimensional space of features and selection ofoptimizing hyper-plane[11]
Working Principle:
• Analyze the data set and perform feature extraction and feature selection then plotthese features as shown in figure over n-dimensional features space
• Now iterates SVM steps for selection of optimized hyper-plane for classification offeatures in two classes. Let there are data points plotted with stars and circles then
Applied Statistics 187

selection process of a hyper plane in a different situation can be observed as givenbelow and graphically shown in Figure 5.10.
Case 1: Let there be three hyper-planes A, B, and C as shown in Figure 5.10 a then weneed to find an exactly separable hyper-plane which separates two classes effectively.Here hyper-plane B is observed to be a better selection for better performance.
Case 2: A, B, and C are observed to be separating two classes of features thenselection of optimizing plane will be on the basis of the distance between the planeand the nearest data points. This calculated perpendicular distance is called Margin. Asshown in Figure 5.10b, it is observed that hyper-plane C has a maximum distance fromdata points means high margin as compared to A and B. Thus selection of plane C isbetter in this case.
Case 3: In this case, there are two planes having high margin but data is not exactlyseparable due to the nonlinear distribution of features over a space. Thus select a planewhich provides high accuracy even it has low margin. Figure 5.10c hyper-plane A isobserved to be a better selection B even though it has low margin.
Case 4: Here due to nonlinear distribution as shown in Figure 5.10d, exact segregationof classes is not possible then find a hyper-plane that has maximum margin ignoringuncovered outliers.
Case 5: Data distributed over a graph is fully scattered or overlapped as shown inFigure 5.10e then cannot be separated by a linear hyper-plane. Thus we need to useinterrelation of x and y coordinate values of data such as z = x^2+y^2 and then plot z onthe graph to select hyper-plane as shown in Figure 5.10f. Here x and y values aresquared and then added for z value, which will be always positive. Thus proper linearhyper-plane can be selected.
SVM is an effective function that transforms features of non-separable problem fromlower space to higher dimensional space called Kernel [12]. Selection of kernel functiondepends on the complexity of nonlinear distribution of features and appropriate processfor separation of data.
0
5
10
15
20
25
30
35
165 170 175 180 185 190 195 200
Fea
ture
s
Data Samples
SVM
features 1
features 2
FIGURE 5.9Principle of SVM
188 Research Methodology

(a) (b)
(c) (d)
0
5
10
15
20
25
30
35
40
160 170 180 190 200
Fea
ture
s
Data Samples
SVMACB
0
5
10
15
20
25
30
35
40
160 170 180 190 200
Fea
ture
s
Data Samples
SVMABC
0
5
10
15
20
25
30
35
160 170 180 190 200
Fea
ture
s
Data Samples
SVMAB
0
5
10
15
20
25
30
35
40
160 170 180 190 200
Fea
ture
s
Data Samples
SVMA
(e) (f)
0
5
10
15
20
25
30
170 175 180 185 190
Fea
ture
s
Data Samples
SVM
0
5
10
15
20
25
30
35
170 175 180 185
Fea
ture
s
Data Samples
SVM
FIGURE 5.10Selection of Hyper-Plane in Various Conditions
Applied Statistics 189

Advantages of SVM:
• SVM works effectively with a high margin of separation• High dimensional spaces can be effectively addressed• SVM is very effective if the dimension of data is larger than the sample size• Only some of the effective training points called support vectors are used thus it is
memory efficient
Limitations:
• It requires high time for classifying higher dimensional data• Its efficiency is lower due to complex overlapping of the features• It has a non-probabilistic interpretation for classification
5.8 Uncertainty Analysis
In statistical complex model uncertainties are observed and are named as stochasticuncertainty and subjective or epistemic uncertainty. Stochastic uncertainty is observeddue to variation in system behavior at different conditions whereas epistemic uncer-tainty is a scientific uncertainty and it is due to limited data and related knowledge forestimation of parameters. In discrete random variables analysis, the epistemic uncer-tainty is modelled by probability distribution function (PDF).
For example, nuclear reactor power plant involves both stochastic and epistemicuncertainties: The risk analysis observed in a nuclear power plant states that stochasticuncertainty occurs due to the hypothetical accident scenarios, and uncertain parametersgenerate epistemic uncertainties consequently causes the estimation of the probabilitiesof hypothetical accident incidences.
If a system is specifically modelled for quantitative analysis then the précisedquantification and propagation of uncertainty is very important[13].
In a statistics, sensitivity and uncertainty analysis are very important and performedby response surface methods as explained here:
(a) Select few highly effective parameters of the system for modelling it(b) The sensitivity/uncertainty analysis is computed at a single point of interest(c) The response recomputed using parameter values at the selected point of interest
in (b) and the model parameters selected in (a);(d) Construct a response surface that corresponds to the conduct of the response(e) Estimate sensitivities and uncertainty distributions for the computed responses
5.8.1 Uncertainty Analysis Using Probability Theory
The uncertainty analysis is to evaluate the effects of parameter uncertainties on theoutput uncertainties. Normally the erroneousness in measured results is defined by the
190 Research Methodology

uncertainty of the system if a design with confidence probability. Probability statistics isa tool to explain actual variations in the outcome of realistic observations andmeasurements.
5.8.2 Uncertainty Analysis of Linear and Non-Linear Systems
Mathematically the system is designed in the form of:
• linear or nonlinear relation of independent variables, calculated parameters andresponse variables,
• inequality or equality control that defines the values of the parameters• single or multiple system output responses
If a system is linear system with linear dependent variables then it is represented withmathematical model “L”:
L αð Þu ¼ Q α xð Þ½ �x�Ω ð5:21Þ
Where
1. x ¼ x1; x2; . . . :xnð Þ is phase space position vector and Ω is a subset of realvector R
2. u xð Þ ¼ u1 xð Þ; u2 xð Þ . . . ::un xð Þ½ � denotes linearly normalized scalar field of real vector3. α xð Þ ¼ α1 xð Þ; α2 xð Þ . . . ::αn xð Þ½ �denotes the system parameter vector.4. Q α xð Þ½ � ¼ Q1 αð Þ;Q2 αð Þ . . . . . . . . . :Qn αð Þ½ �denotes a vector of homogeneous sources.
The uncertainty analysis for such a system will be performed by transformations andstatistics; discrete and continuous density functions; cumulative distribution functions;and indicator functions. The range of measurement error or uncertainty estimated byexperimentation is a measure of the nonreproducibility. An appropriately estimatedmeasurement uncertainty causes variation in respective result with respect to experi-mental results.[14]
5.8.3 Uncertainty of Measurement
Uncertainty is normally presented with range and equivalent confidence probability,and its measurement forms are classified as shown in Figure 5.11.
(i) Natural Variability: Natural variability observed due to temporal and spatialvariability with respect to the values of the subject. Natural variability can beimproved by selecting high resolution during simulation and improved calibrationof model parameters. The variability of output response is fully dependent onvariability of input values. The range of variation in output response varies witherrors in input, the values of parameters, initial boundary conditions, modelstructure, processes, and solution algorithms.
Applied Statistics 191

(ii) Knowledge Uncertainty: It consists of parameter value and model based uncer-tainty affected by boundary condition uncertainty, solution algorithmuncertainty.• Parameter Value Uncertainty: The estimated parameters are possible sources
of uncertainty observed in output response. If the system behavior isobserved by iterating model calibration procedure for multiple data sets,different parameter values would result and thus the different predictions.The prediction models are thus analyzed by parameter uncertainty withindefinite parameter values. This parameter value indistinctness is caused byfixed or variable imprecise specification of boundary conditions. These uncer-tainties can affect the model output, in the vicinity of the boundary, in eachtime step of the simulation
• Model Based Uncertainty: Model based uncertainty is observed due to errors inthe model structure and approximations made by numerical methods used inthe simulation. If the predicted model has an error then even though theestimated parameters are good, the system results in a residual model error.Normally a complex model of high dimensional space could results in errors inthe model
(iii) Decision Uncertainty: Uncertainty in the model predictions observed by unex-pected changes in model such as changes in nature, human goals, interests,activities, demands and impacts.
5.8.4 Uncertainty Analysis
Uncertainty analysis involves recognizing characteristics of probability distributions ofinput and output variables, and then the functions of random output variables definingperformance indicators or measures [15]. An uncertainty analysis selects random inputvalues and applies it to models to obtain the statistical measures of the distributions ofthe resulting outputs.
The output distributions can be used to
Model
Based
Parameter
Based
Objectives
Preference
Uncertainty
Natural
Variability
Knowledge
Uncertainty
Decision
Uncertainty
Temporal
Spatial
FIGURE 5.11An Uncertainty Measurement Forms
192 Research Methodology

• represent the limit of expected outputs of the system at a certain probability level• calculate the probability that the output will exceed a specific threshold or
performance measure target value
Uncertainty analysis is often used for:
• estimating the mean and standard deviation of the outputs• assigning a reliability level to a function of the outputs,• describing the likelihood of different potential outputs of the system• estimating the relative impacts of input variable uncertainties
5.8.5 Uncertainty Calculation Example
In uncertainty calculation, major parameters calculated are mean, standard deviationand probability distribution. In this example mean variation are observed for uncer-tainty analysis for the small dataset and large dataset with given formulas as listed inTable 5.2
Now let there be two datasets as mentioned here:
TABLE 5.2
Uncertainty Analysis Formulae
Parameters Description of parameters Small dataset Large dataset
Mean (Xavg ) The average value of dataset X Xavg ¼ X1þX2þ...::Xnn Xavg ¼
Pn
iXi
n
Range( R) It is the difference between max and min valuesof the dataset.
R ¼ XMax � XMin –
UncertaintyinA measure-ment(ΔXÞ
Uncertainty in dataset during measurement, itlies in min and max value of X
ΔX ¼ R2 ¼ XMax�XMin
2 ΔX ¼ σ ¼ffiffiffiffiffiffiffiffiffiffiffiffiffiffiffiffiffiffiffiffiffiffiffiffiffiffiffiffiPn
i¼1Xi�Xavgð Þ2n
r
Uncertaintyin Mean(Xavg)
Uncertainty in Mean are the values around Xavg ΔXavg ¼ ΔXffiffin
p ¼ R2ffiffin
p ΔXavg ¼ σffiffin
p
MeasuredValue Xm
The final measured value in consideration of Xmean and uncertainty in mean
Xm ¼ Xavg� ΔXavg Xm ¼ Xavg� ΔXavg
Measurements Database 1 Database 2
X1 85 82X2 72 81X3 75 83X4 80 85X5 86 80
Applied Statistics 193

Then we can calculate the actual value of the mean of X by considering mean of dataand uncertainty in database
For Database 1:
(i) Calculate the mean by formula
Xavg ¼ 85þ 72þ 75þ 80þ 865
¼ 79:6
(ii) Calculate the range of the database
R ¼ XMax � XMin ¼ 86� 72 ¼ 14
(iii) Calculate Uncertainty in X
ΔX ¼ R2¼ 14
2¼ 7
(iv)Calculate Uncertainty in mean
ΔXavg ¼ R2
ffiffiffin
p ¼ 142
ffiffiffi5
p ¼ 3:13
(v) Final Value of X mean is
Xm ¼ Xavg � ΔXavg ¼ 79:6� 3:13 ¼ 76:47; 82:73
Similarly, we can calculate the final value of mean for database 2 as given below
Xm ¼ Xavg � ΔXavg ¼ 82:2� 1:11 ¼ 81:09; 83:31
5.8.6 Software Tool for Uncertainty Analysis
UNICORN is a stand-alone software tool (http://ssor.twi.tudelft.nl/~risk/) for uncer-tainty analysis. The requirement of the tool is Dependence modelling of univariaterandom variables, although joint distributions in ASCII format are also supported.
Features of the software:
• Efficient formula parser with a min-cost-flow network solver• Post-processing provides report generation, graphics, sensitivity analysis and
probabilistic inversion
194 Research Methodology

5.9 Modelling and Prediction of Performance
Modelling is a process of applying proven methods in order to analyse research problemfor complexity, real world application. Modelling helped in perditions of outputresponse depending on inputs. Research methodology normally executed in four stagesas shown in Figure 5.12.
System engineering cycle is playing a very important role in solving research problemwith prototype evaluation as shown in Figure 5.12. Modelling is a middle step of thiscycle which exists in between system analysis cycle and system design cycle.
5.9.1 Concept of Mathematical Modelling
Real time function and methodology converted into the language of mathematics calledmodels. As mathematics is well proven tool to design concept in consideration ofassumptions, it contains well proven rules and can be easily implemented using acomputer or numerical calculation.
Stage I:
Selecting and Defining
research problem
Stage II:
Availability Testing of
Resources & Instruments
Stage III:
Selection of Statistical
methods and other
approaches
Stage IV:
Convertthe research problem
in the suitable mathematical
model.
FIGURE 5.12Execution Stages of Research Methodology
Research
Problem
Estimating Model Factors
Estimating
Model
Parameters
Acquire
Data
MODEL
Conceptual Design
Model
SimulationDesign
Optimization
Build PrototypePrototype Design
Final Design
FIGURE 5.13System Engineering Cycle
Applied Statistics 195

Firstly interfacing of components and approximately required variables are assumedin mathematical models then the implementation is exercised for the system. Duringimplementation need of the parameters identified and that variable are continuedfurther. Secondly, computation of model contributes to the complexity of the system.The basic objective of the mathematical model is to develop a scientific understandingwith qualitative expression.
The overall system design flow includes understanding of research problem, selectingappropriate model for design converting it into conceptual design and verifying it withsimulation, finally hardware prototyping will validate the solution to the problem. Thissystem design cycle is explain in Figure 5.13 and elaborated as follows
5.9.2 Classification of Models
• Deterministic models produce defined outcome from the same set of inputparameters
• A stochastic model determines the distribution of possible outcomes with morestatistical behavior
• Mechanistic models user large data at a different hierarchical level to understandchanges is the system
• Empirical models no mechanism is noted for changes but changes are analyses atdifferent condition
5.9.3 Stages of Modelling
Modelling process is composed of four activities as shown in Figure 5.14.
(i) Building stage comprises of system analysis on the basis of assumptions & flow ofthe model. Choosing a suitable mathematical expression with the analogy ofphysical and data exploration is also covered in the building stage.
Building Stage
Studying Stage
Testing Stage
Use Stage
FIGURE 5.14Stages of Modeling
196 Research Methodology

(ii) Studying Model is responsible for realizing system behavior mostly qualitativebehavior. Transformation into dimensionless quantities, analysing asymptoticbehavior and sensitivity analysis are some of the stages of studying model.
(iii) Verification and validation of system are covered by the testing model. Testing ofthe system depends on.• Assumption linearly and deterministic behavior• Model structure• Prediction of previously unused data• Estimating model parameters• Comparison of the model• Using model will facilitate user to predict data and outcomes• Prediction with precision estimation• Decision support
Finally, the mathematical model will be described and tested for functional behavior ofthe system. Mathematical modelling is just not about quantities measures but alsorelated to qualitative characteristics of the system.
5.9.4 Process of Modelling
The process of constructing model mostly works onto hypothesis testing [16]. The stepsinvolved are as shown in Figure 5.15.
• Functional requirements will be studies to understand observations required forsystem feasible observations then forwarded to informal model
Functional Behaviour
Selection of Observations
Informal Model
Specific Model
Mathematical Functions
New Deductions
Parameter
EstimationCompare
FIGURE 5.15Process of Constructing Model
Applied Statistics 197
• Informal model is set at possible parameter and methods that can explain theselected observation. These methods and parameters are tested for given system tosatisfy required accuracy and precision
• Formal model converts assumptions in the informal model to mathematicalform. The formal model translate text based informal model in the mathema-tical model
• A mathematical function decides exact methodology such as logic algebra, geome-try, probability theory, and computer-aided tools
5.9.5 Advantages and Disadvantage of Mathematical Modelling
Advantages:
• It decides various required characteristics of the system and defining non-feasiblecharacteristics also
• It helped in the designing hypothesis of the system and unknown and importantparameter also derived from it
• The mathematical model optimizes the system to fill up the gap between knowl-edge & requirement with less complexity
• The mathematical model thus can give a realistic representation of system usingstatistic and probable outcomes
• It is systemic, iterative and can be redefined• It predicts behavior at a system and can help to validate methodology in a physical
process
Disadvantage:
• It generates multiple outcomes of system so the selection of right outcomes isimportant
• As it is iterative consumes more time than traditional methods
5.9.6 Example of Mathematical Modelling: Integrated Solar Water Heater
(i) Specification of the system
• Data logger for analog to digital conversion with 16 bit, 0.1°C resolution• Thermos flask• Thermometer and thermocouples• Software for simulation purpose• Dynamometer to measure horizontal global solar radiations global solar radia-
tions in w/m2
• Leakage and pressure sensors
198 Research Methodology

(ii) Modelling solar water heater.Using macro model – thermal model
• Prediction of performance is a challenging task• Define a model able to predict water temperature depending on orientation and
location• Select analytical model to predict a performance using thermal network analysis• The macro model is given by J. I. Currie et al. [17]
Thus three parameters are considered as conduction, radiation, and convection inturns defines losses or gain.
(iii) Macro model defines following parameter
• Conversion from air cavity and water cavity• Converted from cover to environment and box to environment.• Radiation from place to cover and cover to the sky• Conduction through the box• The head capacitance of the system
(iv) Computing Model To Predict Performance of System:Computing model of performance prediction is called performance model of thesystem. The performance modelling is a method of understanding performancemeasurements and analysis by converting characteristic of the system into mathe-matical form. Various international groups work onto performance model design-ing such as Performance Evaluation Research Center (PERC), Scientific Discoverythrough Advance Computation (SciDAC) Program, and Los Alamos NationalLaboratory [LANL].
(v) Factors included in performance model:Performance modelling of a system defines with various factors & their combina-tions such as factors for a computer system.• System size• System Architecture• Processor speed• Multilevel cache latency and BW• Interprocessor network latency and BW• System software efficiency• Type of applications• Algorithms and paging language• Problem size• No of I/OsThus performance model can be defined to achieve accuracy, speed, latency andefficiency. The runtime functional behavior also affects the performance model.
Applied Statistics 199

5.9.7 Performance Measurement, Analysis, and Performance Curve
A model designed for runtime performance prediction with less computation on hard-ware efficient system is called performance model.
It includes steps such as: (1) Assumptions, (2) Parameters, (3) EquationsExample: Data-intensive applications designing.Assumptions considered here are:
• Computation time is negligible as compared to I/O speed• For work load optimization pipeline structure allows instructions to run parallel• Input data is evenly distributed• Deriving the model from I/O operation• I/O Operations are mapped with equations that depend on available data
(i) Performance Measurement and AnalysisPerformance measurement is an analysis of overall system including preventionand detection. Performance Measurement Process Flow can be well explained byFigure 5.16It is just not only related to collecting data with predefined performance
measures. It is the process of optimization to improve efficiency and effectivenessof the system. Most of the performance measures can be grouped into Effective-ness, Efficiency, Quality, Timeliness, Productivity, and Safety.
(ii) Performance Curve:Various research domains concerned with classifications task uses receiversoperations characteristics (ROC) curve to assess the quality of model or tocompare two or more models with respect to operating points. Researchers alsoprovide some statistics from ROC such as break-even points (BEP) or equal errorrate. Instead of ROC Curve, performance curve is preferable in machine learningcontext.
This Expected Performance curve (EPC) provides unbiased estimates of performance atvarious operating points. Performance parameters normally observe for classificationand some of the application specific parameters are as discussed in Example 1, Exam-ple 2 and Example 3. Example 1: Person Authentication (Model 1)
V1: False Acceptance Rate (FAR) =FP / (FN+TP)V2: False Rejection Rate (FRR) =FN / (FN+TP)& V: Half total error rate (HTER) = FAR/2 +FRR/2 = V1+V2/2
Example 2: Text Categorization (Model 2)
V1: Precision = TP/(TP+FP)V2: Recall: TP/(TP + FN)V: Aggregate Measure: 2V1.V2/(V1+V2)
Example 3: In Medical Studies
200 Research Methodology

V1: Sensitivity = TP/ (TP+FN)V2: Specificity = TN/(TN+FP)
For every model two performance parameters considered breakeven point (BEP) andequal error rate (ERR) which depends on V1 & V2 for each system. Thus ExpectedPerformance Curve (EPC) gives more realistic analysis and comparison of two models.
5.10 Multi-Scale Modelling
It is the field of solving problems which have important features at multiple scales oftime or space. Multiscale modeling predicts system behavior with different models suchas quantum mechanical models, molecular dynamics models, mesoscales, continuousmodel and device models. It allows predicting system behavior based on atomisticstructure and property of elementary processes in material engineering research. Inoperation research, it addressed challenges for decision makers that come acrossorganizational, temporal, and spatial scales.
5.10.1 Approaches to Analyse Multiscale Structures
• The physical analysis used for spatio-temporal structures with averaging methods,discrete method and multiscale method
• Averaging methods uses lumped parameters for certain spatio-temporal volumeby assuming the system to be uniform all over the volume
• Discrete methods most commonly used in computational mechanics and chem-istry as it reconstructs continuum behavior from the movement and interactionsof numerous particles with discrete attributes
Identify the Critical activity to be measured
Establish Performance goal
Collect Data
Analyze Actual Performance
Compare Performance
Achieved Goal
Need Corrections
FIGURE 5.16Performance Measurement Process Flow
Applied Statistics 201

• The multiscale methods consider the disparity of behavior and interactions ondifferent scales
• It identifies the prevailing behavior of complex systems• There are different multiscale methodologies such as descriptive, correlative and
analytical○ The descriptive multiscale describes the appearance of various structures on
different scales without analyzing their performance○ The correlative multiscale methodology explains the behavior on higher scales
by analysing the mechanisms on the next lower scales○ The analytical multiscale methodology reveals the relationship between scales
by formulating stability criteria dominant mechanism and compromise betweensubmechanisms
5.10.2 Linear and Nonlinear Analysis of System
(i) Linear System Response:• A mathematical model characterized by a linear relation of explanatory and
response variable or load and deflection variables is called linear system• Characteristics of the linear model
○ It can go through any disarticulation magnitudes○ The system is very stable and has no failure or critical points in response○ Superposition concept is applied to analyze the response of various loads○ Linear system without load is considered to be reference system
• The requirements of such a linear model are○ Perfect linear flexibility for any warp○ Microscopic deformation○ Unlimited strength
• These all requirements and characteristics are not physically realistic and alsocontradictory to each other. Thus a nonlinear model will be preferable. But thelinear model are observed to be good in an approximation of position than thenonlinear response
(ii) Nonlinear SystemA system in which output response is not directly proportional to the inputchanges means system which does not follow superposition theorem is callednonlinear system.The behavior of the nonlinear system is described by nonlinear equations. As
nonlinear equations are difficult to solve, nonlinear systems are commonlyapproximated by linear equations called linearization. In mathematics linear func-tions follows:
202 Research Methodology

Additive property: f(a+b) = f(a) +f(b) & homogeneity f(2a) = 2 f(a)When these two properties combine observed it follows superposition principle:
F 2aþmbð Þ ¼ 2f að Þ þmf bð Þ
This system is observed to be linear. Nonlinear equations are normally representedwith polynomial equations, for example, a2+b-1 ¼ 0. Nonlinear system also can berepresented with differential equation such as du/da ¼ −u2 OR du/da+u2 = 0.
Types of Nonlinear Response:
• Classical chaos – the unpredicted response of the system• Multistability – Output variation in multiple states• A periodic oscillation – a function that does not repeat values after some
period [18]
Properties of nonlinear systems:
• The nonlinear system does not follow the principle of superposition• Multiple isolated equilibrium points are observed in the system• Every time it not possible to model nonlinear systems
Analysis methods of nonlinear system:Nonlinear systems can be analyzed using various methods such as:
• Asymptotic techniques• Lyapunov stability analysis• Phase plane method• Singular perturbation method• Small gain theorem• Passivity analysis
Engineering applications of Nonlinear Analysis
• Strength Analysis• Deflection Analysis• Stability Analysis• Configuration Analysis• Progressive Failure Analysis• Envelope Analysis
Applied Statistics 203

5.10.3 Comparison of Linear and Nonlinear System
5.11 Sensitivity Analysis
The basic objective of sensitivity analysis is to measure the effects of parameter variations onoutput response. The local sensitivity analysis is related to analysis of output response withrespect to selected parameter, points of the analysis and state variables. Whereas globalsensitivity analysis will analyze critical points in the mutual phase space formed by theparameters, state variables, and adjoint variables, and subsequently analyze these criticalpoints by local sensitivity analysis. The extent of sensitivity analysis is to analyze sensitivitiesof the models based on estimated parameters, around their nominal values efficiently.
Thus sensitivity analysis is involved in identifying ranges of input data for whichoutput of linear model to remain unchanged. In statistics, sensitivity is one of tool tomeasure the accuracy of an instrument for classification. Thus sensitivity is defined asthe probability of correctly identifying some condition.
There are two procedures adopted by statistics, viz.:
• Forward Sensitivity Analysis Procedure (FSAP)• Adjoint Sensitivity Analysis Procedure (ASAP)
FSAP is a direct method of analysis, specifically used where the number of responses ofinterest exceeds the number of system parameters and/or parameter variations to beconsidered. ASAP is an advanced method of analysis applicable in the problem wherepractical interest comprises a large number of parameters and comparatively few responses.
Thus sensitivity and uncertainty analyses can be considered as formal methods forevaluating data and models because they are associated with the computation of specificparameters.
5.12 Statistica Software Tool
Statistica is an analytical tool originally developed by StatSoft for statistical analysis ofdata and currently provided by TIBCO Software Inc. It has a various analytical method,outputs are available in graphics, word or spreadsheet formats, tools for automation,collaboration, reporting, and data management. The software includes an array of dataanalysis, data management, data visualization, and data mining procedures; as well as a
Sr.No. Linear System Nonlinear System
1 Systems output follows superposition theorem Systems output does not follows superpositiontheorem
2 Outputs are directly proportional to the input Outputs are not directly proportional to the input3 Analysis is possible using standard test signals. Analysis is not possible using standard test signals.4 System do not demonstrate limit cycle System demonstrates limit cycle5 System do not demonstrate hysteresis/
resonanceSystem demonstrates hysteresis/resonance
204 Research Methodology

variety of predictive modeling, clustering, classification, and exploratory techniques.Statistica includes analytic and exploratory graphs in addition to standard two- andthree-dimensional graphs.
Features of Statistica (www.statsoft.com) Tool:
• Reliable tool for descriptive and inferential statistical analysis• Facility of selecting of multiple data mining data• Sample data mining projects are available• Highly flexible and customizable graphics user interface (GUI)• Ability to handle or process multiple data streams• Large data set is processed with optimization• Auto response to the changes of data for analyses and results generation• Fully programmable and customizable system• STATISTICA data analysis capabilities cover thousands of STATISTICA functions,
algorithms, tests, and methods ranging from simple break-down tables toadvanced nonlinear modeling, generalized linear models, time-series methods
The tool follows design and analysis flow for execution such as data acquisition invarious database formats, data preprocessing, transformation and selection, data model-ling, analysis, classification or prediction, and finally reports generation in appropriateformats [19] The statistical computing in the tool is executed using “R” programminglanguage and GNU-GPL compiler. The “R” program code can be executed and directlythe outputs are available in spreadsheet or word format in STATISTICA. This tool willencourage the research for various statistical analysis for their research problem.
5.13 Summary
This chapter highlights the relation between dependent and independent variable forvarious inferences. It includes concept of inferential and descriptive statistics, signifi-cance of regression analysis, theory of estimation, impact of sensitivity and uncertainty,study of statistical tools and design of various linear and non-linear models. Theconcepts are well explained using relevant examples and applications. The chapter willcontribute to researcher by stating significance of applied statistics and its usage fordrawing appropriate conclusions in the research.
Further Reading
1. Vajjha Hara Gopal, “Local Information Based Parameter Estimation for Continuous Distribu-tions”, Hydrebad, India: Department of Statistics, Omania University, pp. 3–12, 2009.
2. Vijay Rohatgi andMDEhsanes Saleh, Parametric Point Estimation. In V. K. Rohatgi &A. K. Saleh(Eds.), “An Introduction to Probability and Statistics”, 2011, doi: 10.1002/9781118165676.ch8.
Applied Statistics 205

3. Roger Levy, “Parametric Estimation”, Probabilistic Models in the Study of Language, pp. 51–76, 2012. https://www.scribd.com/document/200838920/Probabilistic-Models-in-the-Study-of-Language
4. Bud Burt Gerstman, “Basic Biostatistics”, Jones & Bartlett Publishers, Berlington, 2014, ISBN-13: 978-1284036015.
5. Phil Crewson, “Applied Statistics: Desktop Reference”, International and Pan-American Copy-right Conventions, US, 2016.
6. Vogt W. Paul, Burke Johnson, “The Dictionary of Statistics & Methodology: A NontechnicalGuide for the Social Science”, SAGE Publications, USA, 2011.
7. http://gchang.people.ysu.edu/class/s5817/L/Diagram02.pdf8. Stephanie, “Univariate Analysis: Definition, Examples”, Statistics how to, Word Press, 2018.9. Varsha Harpale, Vinayak Bairagi, “AnAdaptiveMethod for Feature Selection and Extraction for
Classification of Epileptic EEG Signal in Significant States”, Journal of King Saud University -Computer and Information Sciences, Elsevier, King Saud University, 2018, ISSN 1319-1578.
10. Jack Prins, “Process or Product Monitoring and Control”. In NIST/SEMATECH e-Handbookof Statistical Methods, 2012, http://www.itl.nist.gov/div898/handbook/pmc/section5/pmc552.htm.
11. Alessia Mammone, Marco Turchi, Nello Cristianini, “Support Vector Machines”, WIREsComput. Stat., vol. 1, no. 3, (November 2009), pp. 283–289, 2009, doi: 10.1002/wics.49.
12. https://www.analyticsvidhya.com/blog/2017/09/understaing-support-vector-machine-example-code/cs229.stanford.edu/notes/cs229-notes3.pdf
13. Jorge Arturo Hidalgo Toledo, “Model Sensitivity and Uncertainty Analysis”. In WaterResources Systems Planning and Management, pp. 255–290, 2009, ISBN 92-3-103998-9.https://issuu.com/jhidalgo54/docs/09_chapter09
14. Lab Manual, “Averaging, Errors and Uncertainty”, Department of Physics and Autonomy,University of Pennsylvania.
15. Dan Gabriel Cacuci, “Sensitivity and Uncertainty Analysis, Data Assimilation, and PredictiveBest -Estimate Model Calibration”, Handbook of Nuclear Engineering, Springer, Bostan, MA,pp. 1913-2051, 2010. https://doi.org/10.1007/978-0-387-98149-9_17.
16. Philip Schrodt, Mathematical modeling. In J. B. Manheim, R. C. Rich, & L. Willnat (Eds.),“Empirical Political Analysis: Research Methods in Political Science”, New York: Longman,pp. 290–312, 2002.
17. J.I. Currie, C. Garnier, T. Muneer, T. Grassie, D. Henderson, “Modelling Bulk Water Tempera-ture in Integrated Collector Storage Systems”, Building Services Engineering Research andTechnology, vol. 29, no. 3, pp. 203–218, 2008.
18. Klaus-Jürgen Bathe, Introduction to Non-Linear Analysis. In “RES.2-002 Finite ElementProcedures for Solids and Structures”, Spring, Massachusetts Institute of Technology: MITOpenCourseWare, https://ocw.mit.edu. License: Creative Commons BY-NC-SA, 2010.
19. S. Sarumathi, N. Shanthi, S. Vidhya P. Ranjetha, “STATISTICA Software: A State of the ArtReview”, World Academy of Science, Engineering and Technology International Journal ofComputer and Information Engineering, vol. 9, no. 2, pp. 473–480, 2015.
206 Research Methodology

6Presenting and Publishing the Research Findings
Krishna Warhade, Vinayak K. Bairagi, and J. Jayanth
CONTENTS
6.1 Introduction . . . . . . . . . . . . . . . . . . . . . . . . . . . . . . . . . . . . . . . . . . . . . . . . . . . . . . . . . . .2086.2 Types of Publication . . . . . . . . . . . . . . . . . . . . . . . . . . . . . . . . . . . . . . . . . . . . . . . . . . . .2096.3 Body of Research Papers, Reports, and Theses . . . . . . . . . . . . . . . . . . . . . . . . . . . . . .210
6.3.1 Body of the Research Paper . . . . . . . . . . . . . . . . . . . . . . . . . . . . . . . . . . . 2106.3.2 Body of Reports and Theses . . . . . . . . . . . . . . . . . . . . . . . . . . . . . . . . . . 211
6.4 Contents of Research Paper, Reports, and Theses . . . . . . . . . . . . . . . . . . . . . . . . . . . .2126.4.1 Title . . . . . . . . . . . . . . . . . . . . . . . . . . . . . . . . . . . . . . . . . . . . . . . . . . . . . 2126.4.2 Author’s Name and Affiliation . . . . . . . . . . . . . . . . . . . . . . . . . . . . . . . . 2126.4.3 Abstract . . . . . . . . . . . . . . . . . . . . . . . . . . . . . . . . . . . . . . . . . . . . . . . . . . 2126.4.4 Introduction of Paper Contents . . . . . . . . . . . . . . . . . . . . . . . . . . . . . . . . 2136.4.5 Literature Review . . . . . . . . . . . . . . . . . . . . . . . . . . . . . . . . . . . . . . . . . . 2136.4.6 Methodology . . . . . . . . . . . . . . . . . . . . . . . . . . . . . . . . . . . . . . . . . . . . . . 2146.4.7 Experiment Results and Discussions . . . . . . . . . . . . . . . . . . . . . . . . . . . . 2146.4.8 Conclusion and Future Scope . . . . . . . . . . . . . . . . . . . . . . . . . . . . . . . . . 2156.4.9 Acknowledgment and Conflict of Interest . . . . . . . . . . . . . . . . . . . . . . . . 215
6.4.10 References . . . . . . . . . . . . . . . . . . . . . . . . . . . . . . . . . . . . . . . . . . . . . . . . 2166.4.11 Tables and Figures. . . . . . . . . . . . . . . . . . . . . . . . . . . . . . . . . . . . . . . . . . 2176.4.12 Authorship . . . . . . . . . . . . . . . . . . . . . . . . . . . . . . . . . . . . . . . . . . . . . . . 217
6.5 Review System. . . . . . . . . . . . . . . . . . . . . . . . . . . . . . . . . . . . . . . . . . . . . . . . . . . . . . . . .2186.5.1 Types of Peer Review . . . . . . . . . . . . . . . . . . . . . . . . . . . . . . . . . . . . . . . 218
6.6 Guidelines for Selecting the Journal for Publishing Paper . . . . . . . . . . . . . . . . . . . . .2196.7 Identifiers to Identify Journals and Research Papers . . . . . . . . . . . . . . . . . . . . . . . . .2206.8 Subscription-Based Journal and Open Access Journals . . . . . . . . . . . . . . . . . . . . . . .2206.9 Journal Ranking and Journal Metrics . . . . . . . . . . . . . . . . . . . . . . . . . . . . . . . . . . . . . .221
6.9.1 Journal IF (Impact Factor) . . . . . . . . . . . . . . . . . . . . . . . . . . . . . . . . . . . . 2216.9.2 Source Normalized Impact per Paper (SNIP). . . . . . . . . . . . . . . . . . . . . . 2216.9.3 SCImago Journal Rank (SJR) . . . . . . . . . . . . . . . . . . . . . . . . . . . . . . . . . . 2226.9.4 Cite Score . . . . . . . . . . . . . . . . . . . . . . . . . . . . . . . . . . . . . . . . . . . . . . . . 2226.9.5 Eigen Factor and Article Influence Score . . . . . . . . . . . . . . . . . . . . . . . . . 2226.9.6 H Index and I10 Index and G Index . . . . . . . . . . . . . . . . . . . . . . . . . . . . 2226.9.7 Research Gate (RG) Score . . . . . . . . . . . . . . . . . . . . . . . . . . . . . . . . . . . . 225
6.10 Citation Index, Databases, Search Engines, Author Identifiers . . . . . . . . . . . . . . . . .2256.10.1 Citations and Citation Index . . . . . . . . . . . . . . . . . . . . . . . . . . . . . . . . . . 2256.10.2 Most Preferred Citation Index and Search Engines . . . . . . . . . . . . . . . . . 2266.10.3 Some Other Indexing Services . . . . . . . . . . . . . . . . . . . . . . . . . . . . . . . . . 2266.10.4 Unique Author Identifier for Efficient Search. . . . . . . . . . . . . . . . . . . . . . 226
207

6.10.5 Online Free Repository . . . . . . . . . . . . . . . . . . . . . . . . . . . . . . . . . . . . . . 2286.11 Use of Documentation Tools, Bibliography Tools, and Presentation Tools
Useful for Writing and Presenting Paper and Theses . . . . . . . . . . . . . . . . . . . . . . . . .2286.12 Presenting Research Papers, Reports and Theses . . . . . . . . . . . . . . . . . . . . . . . . . . . .229
6.12.1 Preparation and Presentation. . . . . . . . . . . . . . . . . . . . . . . . . . . . . . . . . . 2316.12.2 Presenting Posters . . . . . . . . . . . . . . . . . . . . . . . . . . . . . . . . . . . . . . . . . . 232
6.13 Summary . . . . . . . . . . . . . . . . . . . . . . . . . . . . . . . . . . . . . . . . . . . . . . . . . . . . . . . . . . . . .234Further Reading. . . . . . . . . . . . . . . . . . . . . . . . . . . . . . . . . . . . . . . . . . . . . . . . . . . . . . . . . . . . 234
Put it before them briefly so they will read it, clearly so they will appreciate it,picturesquely so they will remember it and, above all, accurately so they will be guidedby its light.
—Joseph Pulitzer
Learning objectives of this chapter include:
• Provide guidelines about contents and body of research papers, reports, and theses• Signify importance of various journal identifiers and author identifiers• Introduce various journal metrics with its significance• Create awareness about various citation index, databases, and search engines• Introduce standardized approach of documentation, bibliography, and presentation
tools• Guide way of effective present of research papers, posters, and theses
This chapter will enable the researchers to
• Write research papers, reports, and theses effectively in a proper flow with qualitycontents
• Understand definition of various metrics and the selection of referred journals• Effectively use various search engines and citation index for research• Recognize authenticity and originality of published journal using ISSN, DOI and
use ORCID, SCOPUS, and Researcher ID effectively• Choose documentation and bibliography tools for writing quality papers, reports,
and theses• Present research papers, posters, reports, and theses in a stipulated time period
6.1 Introduction
Presenting the research and publishing it, is one of the essential ingredient of research.After rigorous and scrupulous experimentation, it is always rewarding to share theresearch findings with the research community and it may be looked as a moral
208 Research Methodology

responsibility as well. Publishing a paper in a reputed journal / conference is a challen-ging demanding apt and precise presentation of task obtained results.
In today’s scenario, researchers prefer disseminating their novel contributions onvarious reputed platforms like book chapters, newsletters, conferences, and journalsand are keen to increasing their citations. A reputed publication necessarily ensuresthorough knowledge of researchers, contributions and innovations leading to advance-ments in the scientific community. Such a recognized publication automatically benefitsnot only the author/ researcher but also serves as a torch bearer to the entire researchcommunity and scientists with similar interests.
Good publication is also sometimes looked as a key to career advancements, gainingmonetary benefits. Writing a clear, and a reader friendly manuscript that highlightsnovel findings /contributions, supports it with valid results and signifies its importance,is critical and inevitable component of a good publication.
Writing /drafting of scientific manuscript is less about the individual style of the authorand more about the standard style recommended by the respective journal / conference.
The section ‘instructions to the authors’ on the journal/conference website details theexpected format of the manuscript.
Nevertheless, an impressive manuscript , should necessary include :
• Detailed research methodology and specific comparison of the obtained novelresults/contributions with the reported literature
• Reviews of the work related to particular area of interest• Documents that advances the knowledge of the recent trends in the area of interest
Following points should be avoided while publishing papers in scientific publication:
• Documents not related to scientific interest• Documents which are not in trend (outdated)• Replica/duplication of the already reported research• Unacceptable methodology, results, and conclusion
You need a GOOD manuscript to present your contributions to the scientific community.
6.2 Types of Publication
Full articles/original articles/research articles are often substantial and significantcompleted pieces of research.
• The page length of these articles is typically four to six printed pages• It requires sufficiently high quality of the paper, representing the novel methodol-
ogy and execution of the work• It presents novel results, fulfilling the expectations of the reviewers and editors
with expertise and awareness of recent trends in that domain• It requires significant contributions in comparison with reported literature
Presenting and Publishing Research Findings 209

Letters/rapid communications/short communications are quick and early communica-tion of significant and original advances. They are much shorter than full articles:
• They have short page length• The review time is less as compared to a full-length article• They usually require original results with significant change in the technology• Routine small incremental results are not suitable for this letter category of
publication
Review papers/ perspectives details the ongoing developments since the origin of theproblem and summarizes reported results. It is not a platform to introduce new information:
• Review papers provide a comparison of two or more theories and evidence of eachwork
• Review papers should also provide development of new tools, methods, and theories• Work should also compare various methodologies for same problem with their pros
and cons• A novel insight gained from a wider view of recent progress on a topic, or the
recognition of a critical new problem or issue previously unnoticed• A controversy: two or more camps with competing theories or explanations of a
phenomenon, with evidence for each
Various types of research publications are shown in Figure 6.1.
6.3 Body of Research Papers, Reports, and Theses
Research paper starts with introduction of the domain, defined problem statement,followed by detailed literature survey. The main section of the paper is the methodology,proposed algorithm, experimental results, discussion and conclusion.
6.3.1 Body of the Research Paper
Broadly, the body of the research paper usually consist of,
• Title• Authors name and affiliation• Abstract and keywords• Table of contents• Introduction• Methodology and proposed algorithm• Results and discussions• Conclusion
210 Research Methodology

• References• Appendices, if any
6.3.2 Body of Reports and Theses
Reports and theses are broadly categorized in to three parts
(i)Preliminary pages includes:
Title page, declaration by researcher, certificate by supervisor, abstract, table ofcontents, list of figures, list of tables, symbols, acronyms, and their meanings.
(ii)Main body of the theses includes:
The body includes following elements:• Introduction• Literature survey• Methods used and proposed algorithms• Results• Discussion• Conclusions
(iii)Acknowledgments and reference material
It includes these elements:• Acknowledgments• Bibliography• Appendixes
Choice of Research Publishing
Journal Publication Conference Publication
Full
ArticlesLetters / Rapid
Communication.
Research
Articles
Review
Articles
Paper (Oral)
PresentationPoster
Presentation
Research
Articles
Review
Articles
Thesis / Book
Publication
FIGURE 6.1Various Types of Research Publication
Presenting and Publishing Research Findings 211

6.4 Contents of Research Paper, Reports, and Theses
An imposing manuscript should be presented clearly, must be easily understandable, andshould convey the logic and scientific message to the researchers. The structure of the fullarticle is title, authors, abstract, keywords, main text with introduction, methods, resultsand discussion, conclusions, acknowledgments, references, and supplementary material.
6.4.1 Title
Title must be short and meaningful. It should give an idea of the research problemaddressed/ presented in the manuscript. Research papers are categorized/searched by thekeywords in the title. It is therefore imperative to be careful about the choice of thekeywords in the title.
The title should be informative and concise without any abbreviations. The title of themanuscript leaves the first impression to the reviewers/editors and should necessarilyjustify the subject matter or content of the manuscript. Mismatch in the same is likely tolead to direct rejection of the manuscript Keywords are the specific labels used in themanuscript and should use only establish abbreviations related to the title.
For Example:
• Poor title: A study of experimental tube with solar collector using supercritical CO2
• Correct title: An experimental study on evacuated tube solar collector using super-critical Carbon dioxide
• Keywords: Solar collector; supercritical CO2; solar energy; solar thermal utilization
6.4.2 Author’s Name and Affiliation
A team of researchers claims/owns the authorship of the manuscript, based on theirindividual contributions. Such a team may include corresponding author, mentor/supervisor/guide/co-supervisor/co-guide and other team-mates who have affirma-tively contributed in the research and the writing of the manuscript. The affiliations ofthe authors and their memberships of the professional bodies, if any, are necessary inthe manuscript.
6.4.3 Abstract
Abstract of the manuscript is one of its most important component. It summarizes theentire research detailed in the manuscript using mere 200-250 words. The choice ofwords in the abstract should therefore, be very impressive and should effectivelypresent a bird’s view of the manuscript. Abstract of the paper points to the researchdomain and the importance of the addressed problem. It states the gaps in the reportedliterature and further emphasizes on the addressed issues. A striking abstract indicatesthe methodology/ novel approach used to obtain the claimed results and precisely,presents its efficacy, highlighting the contributions of the research. On a lighter note, theabstract of the manuscript is equally important and impactful as the trailer of the movie.It indeed, advertises the manuscript.
212 Research Methodology

• Abstract should be limited to 200–250 words• One to two sentences should specify the aim and the problem addressed in the
manuscript• Two to three sentences should contain materials and methods used• Two to three sentences should emphasize the novelty of the results which should
be compared to the reported literature• Abstract should conclude with an argument signifying the contribution
Check the guidelines of the journal or conference for specific expectations regarding theabstract. Abstract should be always be extremely impressive, should summarize theentire manuscript and finally and leave a punch on the reader. Refer to [1] for details.
6.4.4 Introduction of Paper Contents
Main objective of introduction is to describe the purpose, motivation, relevance andimportance of research, to the research community. It is a key paragraph for readers.The reader will be more interested in a paper, if the introduction is clear and wellorganized. Researchers who are unfamiliar with subject or domain of presented papershould be able to read article quickly and understand the condensed history of thedomain. Hence it is important to write introduction and history of the problem statementwith citations. Mention the necessity of research and its significance in this part. Start withfew sentences that introduce topic to reader and make these sentences more interesting. Inthe paper, the introduction should be limited to few pages whereas in theses you canwrite one entire chapter on introduction. The sequence in the introduction part must belogical. Present the contribution and studies reported by the other researchers in thedomain with latest development in the topic. Outline the research statements beforestarting the initial draft. Present the initial draft with logical linking of paragraphs. Oncethe paper or theses draft is ready, revise your introduction before finalizing the furthercontent. Some researchers opt to write introduction part after writing the full draft oftheses. Never include any results and findings in the introduction.
6.4.5 Literature Review
Literature survey should be well structured and logically connected. It presents theoverview and current status of the problem statement. Include the literature which hassignificantly contributed to the domain. Link the relationship of each finding to oneanother. Relate new finding to the previous findings. Select the most relevant literaturefor your research problem. It should focus on the relevant theories put together bythe experts in the field. Search for reliable and recent material on the topic. You shouldtry to review major books and reputed journals for the quality content. Try to include allexisting relevant research in your topic subject to limitation of pages in paper andtheses. Number of books and journal articles to be reviewed depends on level of studyand type of research. During review, give more importance to the reputed journalspapers in your field of work. If you are writing a Master’s theses, the literature reviewcan be around 2,000–3,000 words, whereas for a PhD theses it may be one entire chapter.Traditionally, the literature review is organized in historical order. In conceptual format,literature is organized according to various theories. Literature review can also beorganized methodologically. Be selective and precise in summarizing the results and
Presenting and Publishing Research Findings 213

drawing conclusions from the available literature and use own words to summarize it.Identify the gaps and describe it clearly. Compare and evaluate research issues, point tounidentified problems in the domain. Literature survey should focus on finding andsummarizing ongoing research since the origin of the problem. The ultimate goal of theliterature survey should be to critically analyze research, identify gaps, and proposesolutions; refer to [2] for details.
6.4.6 Methodology
Methodology should include information about laboratory setup, equipment used;primary or secondary data used that will allow to validate and further improve results.Methodology must also include statistical models or own methodologies used toanalyze the data. Some research problem demand use of publically available datasetsand sometimes practical datasets may also have to be created using reliable andacceptable sources. Ensure that you are using large number of samples to be able toanalyze effectively, prove the efficacy and finally recommend the proposed approach.Unreliable methods produce unreliable results and may lead to wrong interpretation.
The methodology section may be presented in the following sequence:
• Discuss overall approach for investigating the research problem• Proposed methodology must be suitable to achieve objective of the research• Describe the methods used for data collection. If practical data is created, describe the
sources of the data and justify its reliability for acceptance by the research community• Explain the statistical method is used for data analysis. If new algorithm is
proposed then explain the theoretical concept and your contribution clearly• Explain limitation, if any, of data collection method used by the researcher. Process of
collecting data greatly impacts the findings. This will help other researchers to take carwhile extending your research. Avoid using irrelevant and unacceptable data
• Explain the approach used to study the defined/identified problem• If a novel approach is proposed/presented, feature the micro-details of the
approach to enable revalidation by other researchers• If an already reported method is adapted and further modified/extended, cite the
original idea and showcase the results achieved due to the proposed modification.Provide appropriate reasoning and justification for the obtained improvement andcontributions made
• Specify the hardware/software components and the system configurations usedfor implementation
• Use of acceptable and uniform notations to ensure easy understanding of your study
6.4.7 Experiment Results and Discussions
In experimental results, describe following points initially:
• Which data is used and how much portion of the data is used for analysis. Ifsecondary standard data is used, provide details
214 Research Methodology

• Which methodology, statistical method or algorithm is used for analysis of datafrom methodology section?
• Which instrument and/or software is used for implementation of algorithm ormethods?
• Provide specification and configuration of instrument and PC/laptop used
Do not entirely rely on descriptive text, instead use figures, charts, and tables to presentresults effectively. Select tables and figures that show research findings and significantcontributions clearly. Highlight the important findings discovered. Focus only on find-ings that are important and related to the research problem. State the limitations of theresearch findings clearly. Highlight negative results emerged from the study.
In the ‘discussion’ section of the manuscript/ theses, researcher should:
• Include major findings of the research• Explain importance of findings and how they are crucial to your research area• Provide relevance of the obtained results to similar studies• Discuss the research contribution and limitations• Suggest extension pointers for further research• Avoid exagaration / mis-interpretation of achieved results or critization of reported
ones
6.4.8 Conclusion and Future Scope
Conclusion should be the best part of the theses and paper. In addition to overallconclusion, each chapter of the PhD theses should also have a conclusion. In journalpaper, conclusion should be restricted to one paragraph.
The conclusion should discuss findings of the research. In addition to significantcontribution, highlight the limitation of the algorithm or research findings. This willhelp other researchers to improve the limitation of your algorithm In the ‘conclusion’section of the manuscript/ theses, researcher should:
• Not repeat the sentences in the abstract and results• Discuss the improvement / contribution /significance of your study as compared to
the reported literature or recent developments• Suggest future scope of the study and provide pointers to further improvement
6.4.9 Acknowledgment and Conflict of Interest
• Acknowledgment section should express thankfulness, help received and gratitudetowards everyone who have contributed in the completion of the study andsuccess of the research
• The statements should be professional, brief, and more informal than rest of the text,but specific to the people who have helped in completing the work. Example: Iwould like to thank Professor. Dr. Shivaprakash Koliwad, MCE Hassan, Karnatakafor his expertise and advice in the completion of this project
Presenting and Publishing Research Findings 215

• This section includes a thanking note for all the supporters and members who haveoffered any direct/indirect assistance , technical/non-technical help during theresearch. Example: I would like to thank Dr. Ridhima Pandit, Dept. of English,HC College, Maharashtra for her extraordinary efforts in drafting the manuscriptand ensuring appropriate use of English language to reach a larger community ofreaders
• In cases of funded research projects, financial help received from various local/national/ international funding agencies or scholarships / fellowships received shouldbe acknowledged. Example: This work is supported by Department of Science andTechnology, DST, Government of India under research grant: SR/TP/ETA-15/2009
• List other helpers who had helped in the laboratory experimentation, othercolleagues and family members. Example: I would like to thank my friends andcolleagues for their contribution in the labs. I would like to thank my familymembers for their support
Conflict of interest is a situation in which the authors are interested in multiple conceptsand serving one interest would be; like working against another. It is necessary todeclare the statement conflict for few referred journals.
6.4.10 References
References are detail description of the papers, books, or other sources from whichresearcher has obtained the information. Researcher must acknowledge the sources used,which will enable other researchers to identify and trace the sources for their research.References contain only those work cited within text. The bibliography includes not onlythe text referred in paper, but also the additional background material required for thereader.
The reference style is generally mentioned by universities for theses and by journalsfor papers.
The major citation styles and their examples include:
• IEEEK. Warhade, S. Merchant and U. Desai, “Effective algorithm for detecting variouswipe patterns and discriminating wipe from object and camera motion”, IET ImageProcessing, vol. 4, no. 6, p. 429, 2010.
• APA (American Psychological Association)Warhade, K., Merchant, S., & Desai, U. (2010). Effective algorithm for detectingvarious wipe patterns and discriminating wipe from object and camera motion. IETImage Processing, 4(6), 429. doi: 10.1049/iet-ipr.2009.0301
• Chicago Manual of StyleWarhade, K.K., S.N. Merchant, and U.B. Desai. 2010. “Effective Algorithm For Detect-ing Various Wipe Patterns And Discriminating Wipe From Object And CameraMotion”. IET Image Processing 4 (6): 429. doi:10.1049/iet-ipr.2009.0301.
• MLA (Modern Language Association)Warhade, K.K. et al. “Effective Algorithm For Detecting Various Wipe Patterns AndDiscriminating Wipe From Object And Camera Motion”. IET Image Processing, vol 4,
216 Research Methodology

no. 6, 2010, p. 429. Institution of Engineering And Technology (IET), doi:10.1049/iet-ipr.2009.0301. Accessed 4 Aug 2018
• Turabian StyleWarhade, K.K., S.N. Merchant, and U.B. Desai. “Effective Algorithm For DetectingVarious Wipe Patterns And Discriminating Wipe From Object And Camera Motion”.IET Image Processing 4, no. 6 (2010): 429. doi:10.1049/iet-ipr.2009.0301.
• HarwardWarhade, K., Merchant, S. and Desai, U. (2010). Effective algorithm for detectingvarious wipe patterns and discriminating wipe from object and camera motion. IETImage Processing, 4(6), p.429.
6.4.11 Tables and Figures
Tables present data directly and are preferred over graphs when the exact numericalvalues of the data are needed. It is easier for a reader to compare numbers arrangedwithin a row than within a column. It is also easier to compare numbers that are close toeach other. Often, 2D tables will benefit from marginal analysis, where rows andcolumns are totalled or expressed as a percentage of the total. Different journals havedifferent formatting requirements for tables. For example, many journals allow onlyhorizontal lines in the table. Before submitting the manuscript, review the table format-ting guidelines and render the table in the required format.
As a form of communication, figures (and in particular, the graphical display ofquantitative data) are uniquely suited to convey information from complex data sets;quickly and effectively. Whereas statistical analysis aims for data reduction (expressinga mass of data by a few simple metrics), graphing retains the full information of the data.
Guidelines for figures:
• Figure captions should not be an afterthought, they are an integral part of thefigure
• Label within the graph or in the caption as necessary to minimize the need to referback and forth from the text
• Graphs should have a title. Put the title information in the figure caption• Pie charts are not always the best option. Explore other options as well• Use bar charts only when you cannot find a better option. Bar charts should only
be used to plot categorical data, but if the categories have a natural order, then aline plot will usually work better
• Avoid all spurious three-dimensional (3D) effects, such as the use of 3D bars in abar chart. They only lead to confusion, never to greater clarity
• Choose plot scales (x- and y-axis start and stop values, for example) to avoid whitespace: try to use at least 80% of each scale to display data
6.4.12 Authorship
An author of a scientific paper is anyone who has made a creative contribution to thewords or ideas being presented that are claimed to be novel. To determine the proper
Presenting and Publishing Research Findings 217

list of authors for a paper, first ask, “What is novel about this work?” Then ask, “Whocontributed to the creation of this novel content?”
Authorship gives both credit and responsibility for the work. In this case first authoris assumed to be the person whom most credit and responsibility accrue. Authors arethen ordered according to decreasing contribution to the work. But different commu-nities have different cultures, and this system of author ordering is not universal.Another system is quite common when publishing involves the work of PhD studentsor postdocs. Here, the work generally represents the theses project of one student, whois then assigned the first author position. That student’s supervisor is assigned the lastauthor position. There are two undesirable approaches of listing the authors for amanuscript: leaving off someone who belongs on the list (a ghost author) and includingsomeone who does not belong on the list (a guest author).
6.5 Review System
The sequential processes and steps involved in the review systems are detailed asfollows:
• The manuscripts is initially screened and checked to match the guidelines pro-vided by the journal. The manuscript is examined for plagiarism. Authors will beinformed within one to two weeks after successful plagiarism check
• The senior editor decides whether to proceed or if manuscript should be rejectedwithout review. It is informed within 10 days after plagiarism approval
• Editors identify the reviewers depending on the expertise and their referencedatabases which are constantly being updated
• Typically the manuscript will be reviewed within 90 days. Should the reviewers’reports contradict one another or a report is unduly delayed, a further expertopinion will be sought
• The Senior Editor is responsible for the decision to reject or recommend themanuscript for publication. This decision will be sent to the author along withany recommendations made by the referees
• If changes are required 30 to 60 days’ time will be provided for resubmission andagain it will be verified by the editor and reviewer
• After acceptance, paper will be typeset and will be sent back to author for proofreading. After proof reading and final corrections, the article is made availableonline (online first edition), and a few weeks later this is compiled into an onlinevolume and issue
6.5.1 Types of Peer Review
Peer review is the process of evaluation of scientific work by others who are expert inthe same field. There are various types of peer review process as follows
218 Research Methodology

• Single-blind review
In this type of review, the names of the reviewers are hidden from the author. Reviewerknows about author of paper but author is unaware about the reviewer of his/hermanuscript• Double-blind review
In this model of peer review system, reviewers don’t know the author of the paperand the author does not know the reviewer of his/her paper• Triple-blind review
With triple-blind review, reviewers are anonymous and the author’s identity isunknown to both the reviewers and the editor• Open reviewIn this model of peer review, both the reviewers and authors are known to each otherduring the peer review process
For Example: Reviewers scheme of Taylors and series is as shown in Figure 6.2.
6.6 Guidelines for Selecting the Journal for Publishing Paper
To select the suitable journal first understand research area or domain and its targetapplication. It is suggested to follow some consideration before selecting any journal
Editor
receives a
paper.
The peer review process
Step
1
Step
2
Step
3
Step
4
Step
5Step
6
Step
7
The
editor selects
reviewers (usually
2-3 of your peers)
and they are sent
the paper. The
reviewers review the
paper and provide the
editor with comments,
suggestions and a
recommendation
(reject, revise or
accept).
The
editor checks the
reviews and sends them
to the author(s), with any
additional guidance. If
there are revisions the
author(s) decide whether
to make these and
re-submit.
Amendments
are made and
the paper is
re-submitted.
The paper
is accepted,
moves into
production and
is published.
The
editor checks
the paper fits the
journal’s aims and
scope (on Taylor &
Francis Online).
FIGURE 6.2Peer Review Process followed by Taylor and Francis Publishers (Courtesy: Taylor and Francis Publishers)
Presenting and Publishing Research Findings 219

for publication of the research paper or article. Many universities have set up theguidelines for publishing papers and have provided the list of journals whereresearch scholar is expected to publish the paper. General expectations are, thejournal should be listed in Science Citation Index (SCI) or Scopus Index list andhaving impact factor from Thomson Reuters (Now Clarivate Analytics), howeverthere are few high quality journals to whom impact factor is not provided thoughthey are quite old (i.e., Journal of the Institution of Engineers, established in 1920 andgranted royal charter in 1935). Hence, take the opinion of the research supervisorbefore submitting the manuscript to any journal. One must visit the journal homepage for checking the scope of journal. However, there are some website for theguidance to select the suitable journal [3–9].
6.7 Identifiers to Identify Journals and Research Papers
There are various identifiers/numbers/code formats available to recognize authenticityand originality of published journal. Example- ISSN/DOI/PMID/SSN number:
• ISSN: The term International Standard Serial Number could be a distinctivevariety to determine a print or electronic periodical (journal) title. ISSN numbersare usually encoded in BARCODE formats and are available on journal itself and/or on publisher’s websites, or on ‘ISSN.org’ for all cases. Moreover, there are someother online websites available for validating or verifying ISSN numbers authenti-city and provide necessary information to the author [10–13]
• DOI: Digital Object Identifier (DOI) is employed to unambiguously determineobjects within the digital setting, for instance a journal article or knowledge set.An Interior is that the symbol of varied entities viz physical, digital or abstract.DOI’s syntax is outlined by ISO 26324:2012 info and documentation – DigitalObject symbol System (DOI). It’s composed of a prefix and suffix: the interiorprefix is assigned to a company by an Interior Registration Agency; the suffix foran Interior is made by the organization depositing the Interior for a content itemwithin the Interior system
• PMID: PubMed Identifier (PMID) is a unique number allotted to each PubMedcitation. PubMed is collection of biomedical literature
6.8 Subscription-Based Journal and Open Access Journals
In subscription based journal the readers are paying for article to read it, whereas theauthors are not charged for publication charges. In open access journals the authorsare paying the cost of publication, whereas the article is freely available to all readerswithout any charges. There are more chances of getting referred by other researcheras the article is freely available to read and to download. Open access journals arefunded by article processing charges paid by the research sponsors. Some of open
220 Research Methodology

access papers are funded by academic institution, learned society where publicationscharges are not paid by the authors. Some of open access papers are provided accessafter 6–18 months.
6.9 Journal Ranking and Journal Metrics
Journal ranking is widely used in academic circles in the evaluation of an academicjournal’s impact and quality. Journal rankings are intended to reflect the position of ajournal in a specific field/domain, the relative difficulty of being published in thatjournal, and the prestige associated with it. Journal ranking is based on indexes/abstracts given by ISI, SCOPUS, DBLP, Google, and so on.
There are a various types of journal metrics. Journal metrics are used in the evaluationof impact and quality of journal. The most usable metrics are:
• Journal impact factor• SNIP and SJR and CiteScore metrics• EigenFactor and Article Influence Score• i10 index• H index• Immediacy Index along with cited half-life• RG Score
6.9.1 Journal IF (Impact Factor)
The journal Impact Factor (IF) is revealed each year by Thomson Reuters (now ownedby Onex Corporation and Baring Private Equity Asia, and known as Clarivate Analy-tics). The factor may be a quantitative relation of total range of articles cited in the lasttwo years and total range of articles published in the last two years. If 2017 is the currentyear, then journal impact factor of 2017 is calculated by the formula:
Journal Impact factor = [Citation 2016 + Citation 2015] / [Publications 2016 + Publica-tions 2015]
Impact factor definition is evolved over the years [14]. The impact factor of reputedjournals from IEEE, Springer, Elsevier, and Taylor and Francis are measured byThomson Reuters.
One can find Journal citation report released by Clarivate Analytics which includesjournal covered by Science Citation Index (SCI), Science Citation Index Expanded (SCIE)and Social Science Citation Index SSCI journals [3,15].
Few websites are useful to find impact factor of a particular journal [16], one cansearch by the name of journal, title, or ISSN.
6.9.2 Source Normalized Impact per Paper (SNIP)
Some categories of subject are receiving more citation as compared to others. So measuringonly Impact Factors of journal may not be sufficient in some cases of comparing the two
Presenting and Publishing Research Findings 221
journals of different domains. SNIP (Source Normalized Impact per Paper) is the kind ofnormalization process to normalize the difference in citation potential of different subjects.The process of normalization includes decreasing the raw impact factors of journals insubjects with a higher frequency of citations whereas increasing the raw impact scores forjournals covering subjects with relatively fewer citations. It is ratio of impact factor ofparticular journal to the relative citation potential of that journal in specific domain.
6.9.3 SCImago Journal Rank (SJR)
Is primarily based on citation facts of the more than 20,000 peer-reviewed journals listedthrough Scopus from 1996 onward. Citations are weighted, relying at the rank of thementioning journal. It expresses the average number of weighted citations received inthe selected year by the documents published in the selected journal in the threeprevious years [7]. A weight is given to the citation based on the status of the journalswhere such citations come from.
6.9.4 Cite Score
CiteScore is a new metric introduced by Elsevier which gives a more comprehensive,transparent and current view of a journal’s impact. It is the ratio of the citation receivedin current year to the paper published in last three year to the number of documentspublished in last three years. Few websites will help in finding the CiteScore, SNIP, andSJR of a particular journal [17]. For example if the site is searched by journal title IEEETransaction on image processing, CiteScore, SNIP, and SJR will be provided (refer toFigure 6.3 for the screenshot).
6.9.5 Eigen Factor and Article Influence Score
The Eigen factor score is, developed by Jevin West and Carl Bergstrom at the Universityof Washington. Journals are rated according to the number of incoming citations, withcitations from highly ranked journals weighted to make a larger contribution to theeigen factor than those from poorly ranked journals. Eigenfactor scores and ArticleInfluence Scores are calculated by eigenfactor.org
The Article Influence Score determines the typical influence of a journal's articles overthe primary five years after publication.
AIS = (0.01* Eigen factor score) / XWhere X is 5 year article count divided by the 5-year article count from all journals
6.9.6 H Index and I10 Index and G Index
• H-index: The h-index is a metric for evaluating scientist’s personal performancebased on publication and citation. It calculates scientist’s performance primarilybased on their profession publications, as measured through the lifetime widevariety of citations each article gets. The dimension is dependent on quantity ofpublications and range of citations of an individual researcher. H-Index is utilizedas most mainstream reference check record, it was concocted by Jorge Hirsch in2005, here h-Index’s “H” implies Hirsch, and it is a numerical pointer of howgainful and powerful a specialist is. The h-record of a researcher is the number “n”
222 Research Methodology
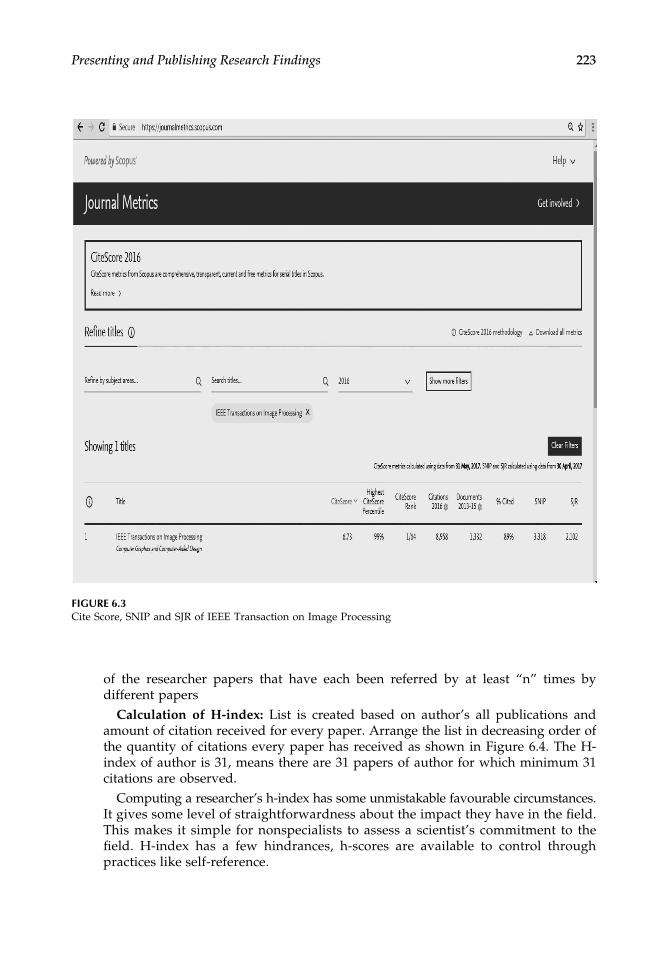
of the researcher papers that have each been referred by at least “n” times bydifferent papersCalculation of H-index: List is created based on author’s all publications and
amount of citation received for every paper. Arrange the list in decreasing order ofthe quantity of citations every paper has received as shown in Figure 6.4. The H-index of author is 31, means there are 31 papers of author for which minimum 31citations are observed.Computing a researcher’s h-index has some unmistakable favourable circumstances.
It gives some level of straightforwardness about the impact they have in the field.This makes it simple for nonspecialists to assess a scientist’s commitment to thefield. H-index has a few hindrances, h-scores are available to control throughpractices like self-reference.
FIGURE 6.3Cite Score, SNIP and SJR of IEEE Transaction on Image Processing
Presenting and Publishing Research Findings 223

• I10-index : The I10 index refers to the number of paper with 10 or more citationsand is created by Google Scholar. The i10 index of researcher in Figure 6.4 is108. This means that there are 108 papers of that researcher who have receivedcitation more than 10 citations
• G Index: The G-index was proposed by Leo Egghe as an alternative to theH-Index.G-Index is calculated as: For a given a number of papers, which are ranked in
decreasing order of the number of citations they have received, the G-Indexis the maximum number, such that the top G articles received at least G^2citations
• Immediacy Index: is a measure of the speed wherein content of specific journal iscited. The journal Immediacy Index gives the information about, how quickly articlesin a journal are being cited [18]
• Cited Half Life is a measure of the “achievability” of how long content is referredafter publication [19]
FIGURE 6.4Google Scholar Citations of Dr. U. B. Desai, which Includes H-index and I10 index
224 Research Methodology

6.9.7 Research Gate (RG) Score
The RG score is measured by Research Gate. The RG score is the metric that measuresscientific popularity based on how all of the work is received by peers. Authors RGscore is primarily based on the published research and contributions to Research Gateobtained by peers. RG Journal impact is also provided by Research Gate.
6.10 Citation Index, Databases, Search Engines, Author Identifiers
6.10.1 Citations and Citation Index
• Citations of researchers- An accountable researcher must offer respective credit todifferent researchers and acknowledge their ideas. The citation should be appro-priate as per respective publication standards of referencing
• Self-citation: Self Citation is citing own published paper during new publication. Itjust gives rise in overall citation count. Self-citation is not suggested until theprevious works has strong relevance with the current work, and should beencouraged only when it keeps up the genuine necessity
• Citation Index: It is an index of citations of papers by a researcher. Google citationquickly shows the citation index but there are some drawbacks of Google citationexperienced, as it will not cover journal that are not covered by Google scholarcoverage and hence the dependency start with indexing. Citation score/count canbe increase by focusing on simplicity and uniqueness of research keywords, step-by-step approach, articles, and results used in research paper/article [20]
List of citation index and search engines are-
○ Shepard’s Citations (1873): Eugene Garfield’s Institute for Scientific Information(ISI) – ISI has introduced the first citation index for papers published inacademic journals, currently known as Clarivate Analytics
○ Science Citation Index (SCI)○ Social Sciences Citation Index (SSCI)○ Arts and Humanities Citation Index (AHCI)○ CiteSeer○ IEEE Xplore○ Scopus○ Springer Link○ Web of Science○ PubMed○ Google Scholar○ Indian Citation Index○ CNKI Scholar○ Science Direct
Presenting and Publishing Research Findings 225

Every indexing agency has their own criteria for journals getting indexed in theirrespective database. Each of above PubMed, Scopus, Web of Science, and GoogleScholar have their own strength and weakness [21,22].
6.10.2 Most Preferred Citation Index and Search Engines
• SCOPUS is possessed by Elsevier. SCOPUS is a bibliographic database of peer-reviewed literature containing scientific journals, books and conference proceed-ings. It covers about 22,000 titles from more than 5,000 distributors, of which 20,000are peer-assessed diaries in the logical, specialized, medicinal, and sociologies [23].The journal indexed by SCOPUS assumed to be a reputed journal
• Science Citation Index (SCI) is a reference record initially delivered by the Institutefor Scientific Information (ISI) and made by Eugene Garfield. It is presently owned byClarivate Analytics (beforehand the Intellectual Property and Science businessof Thomson Reuters). Science Citation Index covers in excess of 8,500 outstand-ing and critical journals, crosswise over 150 orders, from 1900 to the present.The journal indexed by SCI assumed to be of higher reputed journal [3]. TheScience Citation Index (SCI) covers areas of life science, clinical solution,physical science, farming, science, veterinary prescription, building and specia-lized parts of incorporated recovery periodicals. Clarivate Analytics considernumerous variables while assessing journals for scope going from the subjectiveto the quantitative [24]
6.10.3 Some Other Indexing Services
• EI (Engineering Index): Dr. John Butler professor from Washington Universityfounded Engineering Index in 1884. In 1998 Elsevier purchase EI. EI compendexhas over 20 million index with more than 8, 00,000 added each year. EI has over 12databases containing e-books, patent and abstract
• ISTP (Index to Scientific & Technical Proceedings): The scholarly article record ofscience and innovation was established in 1978. The ISTP index includes docu-ments from life science, physics and chemistry science, agriculture, biology andenvironmental science, engineering, and applied science disciplines. The scholarlydocument can be a meeting documents or general conferences papers, forums,seminars, workshops, conference, and so on. Database consists of around 35% ofengineering and applied science literature
6.10.4 Unique Author Identifier for Efficient Search
There is possibility of authors having same initial name and surname are working insame domain of research and they are publishing the papers in scholarly journals. Itis very difficult to identify the exact authorship only from name of authors. Uniqueauthor identifies are used to deal with such situation of ambiguity in authoridentity.
Using such ID, research work by the same author in various journals and conferencescan be searched uniquely, provided it is linked to authors.
226 Research Methodology

Many distinctive author identifiers are developed, however widely unique authoridentifies are: SCOPUS Author ID (developed by Elsevier and employed in SCOPUSand connected products); ORCID (developed by ORCID opposition, that is nonprofit,community-driven organization, based mostly within the United States, but with inter-national membership) and Researcher ID (provided by Thomson Reuters).
• ORCID: It is unique digital identifies given to author. You can register on-line onfollowing site to induce ORCID ID [25] (Refer Figure 6.5 for registering at ORCID).Eg: Orchid Id of Dr Krishna Warhade is 0000–0002-0282–9766
• SCOPUS ID: SCOPUS identification ID is routinely assigned to all authors. Theauthor can search papers by means of authors name or SCOPUS identity on theWeb link [26]Eg: SCOPUS author ID of Dr. Krishna Warhade is 26656459200
• Researchers ID: Researcher ID is employed to spot authors and allows users tomake a publication profile and generate citation metrics from internet of Science.Researcher ID provides a novel way to researchers to manage their publicationlists, track their cited counts and h-index, establish potential collaborators andavoid author misidentification [27].Eg: Researcher ID of Dr. Krishna Warhade is E-5841–2018
In addition to these IDs, Google Scholar and Research Gate also provides authorspecific login with h-index and RG score metrics, respectively. Authors can openaccount in google scholar and ResearchGate to share their research profile to the world.
Google Scholar is a freely accessible internet search engine that indexes the full textor metadata of scholarly literature, while, ResearchGate is a social networking site forscientists and researchers to share their research, to raise queries and to propose solutionto researcher’s queries, and locate collaborators.
FIGURE 6.5ORCID ID Registration and Sign In
Presenting and Publishing Research Findings 227

6.10.5 Online Free Repository
There are various online free repository available like ResearchGate, academia.edu,Kidos,/own College website, and so on, where researchers can deposit their researchpapers. Such papers are freely available.
Guidelines to be followed while putting your papers in free repository like Research-Gate/own College website, academia.edu, Kidos, and so on.
• Do’s: Putting research data/papers on repositories is always a good option, it willenable users to take out the data remotely without depending on his/her laptop orcomputer. There are various repositories available to trace out and reuse ourresearch information/papers/article just in time. Such repositories are a quickway to share author’s information to other researchers as well. Such practicesshall increase researchers citations because research papers/contents are easilyavailable to others researchers also
• Don’ts: However, there are some concerns, where researchers need to look upon.If, the journals and conferences are under copyright agreement, do not share paperdirectly with others, instead provide URL of the journal website where the papersare available. Check the copyright rules and regulations of the journal beforeputting your paper on repositories, otherwise it may consider as copyright infrin-gement. You may maintain the privileges as public, private or protected (shared tolimited users)
6.11 Use of Documentation Tools, Bibliography Tools, and PresentationTools Useful for Writing and Presenting Paper and Theses
The term “bibliographic” means “A list of the written or existing sources of informationon a particular subject.” The “bibliographic database” is the database of bibliographicrecords organized in specific way. Here is a list of few bibliographic database tools,documentation tools, and tools for writing paper and theses,
• Mendeley bibliographic tools: Mendeley is a product of Elsevier. It is useful inmanaging the references. It consists of application accessible for Windows,MacOS and Linux. Mendeley requires the client to store all essential referenceinformation on its servers with specific comments in database. Upon enrollment,Mendeley furnishes the client with 2 GB of free web storage, which is upgrade-able on utilizing certain cost
• Easy Bib: Easy Bib is user-friendly citation option with an automated bibliographymaker, and having three reference format alternatives: MLA, APA, and Chicago
• Zotero: Zotero is a free tool that helps the researchers to gather, cite, share, andorganize research sources. It collects researcher’s studies and reference documentsin a single, searchable interface
• RefDot: This is an expansion for Google Chrome program. RefDot enables you tonaturally bookmark and refer to any site or online article, and Amazon book pages
228 Research Methodology

• Citelighter: Citelighter provides a browser extension and allows researcher tobookmark the segments of website pages, spare them with notes, and make alist of sources
• Citefast: Citefast is a simple and free programmed reference index producer Itallows the researchers to generate, organize and manage the citations quickly andaccurately
• EndNote: It is product of Clarivate Analytics. Using endnote researcher cancreate and manage references from hundreds of online resources. One can read,review, and add comment in it. Researchers can create their own rules toautomatically organize the references as per requirement. One can share his/her library to others
• Bibme: It’s a definitive (free!) programmed book index producer with auto-fill.With Bibme, researcher should simply look for a book, site, article, or film, or fill inthe data yourself. One can add to his/her own book index and download it in anyrequired format of references like MLA, APA, Chicago, or Turabian design
• Noodle Tools: Noodle Tools is an online asset that gives you a chance to makereferences for any source. Researcher has to select the required style (MLA, APA,or Chicago)
• RefWorks: RefWorks is an online research management, writing and collaborationtool. It helps researches to easily gather, manage, store and share all types ofinformation. It also helps them to generate citations and bibliographies
• Latex: LaTeX is used to write reports, theses, conferences, and journal papers.LaTeX is considered as standard freeware for the publication of scientific documents
• Grammarly: It is an online spelling and grammar checker to check your docu-ments. There are many more online Grammar checking software freely available
• Typeset: It allows you to auto format your paper in any journal template [28].Refer the screen shot Figure 6.6 for sign in and the features of Typeset
• eXtyles: eXtyles is a software product from Inera. It is a tool, which allow publish-ers to convert word file from any sources into required standard style documentincluding citation style. It thus avoids time-consuming process of writing paperand provides error free document. It is an editorial and XML tool, which ispreferably used by publishing staff of many publishers. Refer Figure 6.7 for detailsof the tool [29]
One can also look for other tools like colwitz, NinjaEssays, ReadCube, Qiqqa, andCitavi, which will help you to simplify writing of your research work.
6.12 Presenting Research Papers, Reports and Theses
Presentation of the research is very important and leads to discussion and better under-standing of problem statement to examiners and other researchers working in the same area.
Following points are important while presenting your research to research community.
Presenting and Publishing Research Findings 229

• The presentation contents should be simple, clear, and audience-knowledge-specific. Practice presenting it for improvement of presentation skill andconfidence
• Distribute handouts of the presentation to examiners and other researchers prior tothe presentation
• Good time management of presentation is a key of impressing the audience. Forpaper presentation, generally 15–20 minutes are given, whereas for theses presen-tation 45 min to 90 min are provided. Timing may vary and depends on confer-ences and Universities guidelines. Prepare number of slides according to the timeallotted to you. The presenter should be ready with any dynamic change inpresentation such as change in timing and duration
• Start your presentation with confidence. Be calm and relax. Maintain eye contactswith audience and talk loudly and clearly
• Focus on the proposed methods and experimental results. Convey your contribu-tion in the research through tables and figures
• If the questions are raised during presentation, understand the question and givemeaningful answers with facts and proofs
FIGURE 6.6Sign In for Typeset
230 Research Methodology

6.12.1 Preparation and Presentation
Novel ideas are recognized with its effective demonstration. The presentation should beclear, confident and sufficiently practiced.
(i) Audience Focus:• Presentation should be delivered in such a way that it should relate to other
presentation, keynote sessions and theme of conference• Ensure correct choice of words to retain the curiosity and interest of the
audience• Eye contact should be maintained with audience throughout the presentation• Maintain audience awake by adding cartoons, animations and videos in the
slides and make sure the visual aids and audios are audible• Maintain backup of slides for transparencies
(ii) Explanation:• Many ideas should not be highlighted on the same concept• Only five minutes should be spent for explaining the importance of
the work
FIGURE 6.7eXtyles from Inera for Publishers.
Presenting and Publishing Research Findings 231

• Five minutes should be spent for key idea as an approach for the solution• Five minutes should be spent for methodology and algorithm/flowchart• Five minutes should be utilised for comparing the results and prove it
better than the existing solutions• Rest three minutes should be used for conclusion and future work
(iii) Tips for Slides:
• Keep only few slides excluding your Introduction and Question/Suggestionslides
• A slide should contain abstract, agenda, existing system/proposal, metho-dology, algorithm/flowchart, two slides for experimental results, compar-ison, conclusion, and reference
• Include color slides only for results and use professional templates• For text use large fonts and do not put more text on slides, do not make
audience make busy reading the slides instead of listening• Slides in the text should be grammatically correct• Avoid using gratuitous animation• Use illustrations to explain complex algorithms• Omit minor details, focus on the important concepts• Presenter may not have enough time to discuss all ideas clearly• Better to explain one idea in detail, other ideas briefly• Anticipate technical questions, and prepare explanatory slides• Accent may not be easy to understand• Talk slowly in an audible range with modulation in voice
6.12.2 Presenting Posters
Poster presentation is included in most of the conferences and also used in academicsfor project presentation. It provides good opportunity to present visual summary of theresearch and innovation to the larger audience. Poster should be self-explanatory andacademically sound. Poster presentation is a way to share your findings and results withthe researchers working in your area. Poster is a visual aid for effective communicationwith conference delegates. Poster presentation success depends on preparation of aneffective poster. Effective Poster presentation can improve your reputation in yourorganization and outside your organization. It is a way to disseminate research findings;hence they must be prepared and presented appropriately.
Quality poster can result in starting collaboration, fetching funds for the project anddeveloping researcher’s network. There will be dedicated time allotted in conference tosee posters and discuss the work with delegates. Be present during that time and giveattention to all delegates. You will be given a set of guidelines from the conference toprepare poster presentation. As there is a limitation of space in poster, text must containsound scientific content with clarity. For developing a quality poster, guidelines andsample templates are available on various web sites. Select font properly which is easyto read. Do not use more than two fonts, use limited colors, and use bold, italic, orunderline to show important words.
232 Research Methodology

Posters typically include following sections:
• Title: Title is the most important part of poster, as it draws attention of delegates.Title should be short but long enough to indicate the nature of the study. It shouldbe seen from a distance of 5–10 feet. Capitalize the first letter of each word
• Authors: Put the names of all authors and their affiliations below the title. If youare working on a collaborative project, then include name of collaborators andtheir affiliations
• Introduction: In introduction, state the importance of the topic, literature about thetopic and what is already achieved by others and brief about your work
• Methods: Mention the algorithms or procedures use to study. Also elaborate aboutthe primary or secondary data used and how the data is analyzed
• Results: the analysis and findings of the research must be illustrated by graphs,charts, table or pictures. Preferably by using graphs, this may save space in poster
• Conclusion: State clearly your research finding, its importance and future scope• References: Keep the list of references short in poster, preferably three to five
important references can be included• Acknowledgment: Acknowledge the people who have contributed in your
research, including your advisor. If you are working with collaborators, theirnames should also be acknowledged. Thanks the funding agencies for fundingyour project
Results
Conclusion and Futurework
References
Acknowledgement
Contact
Information
Introduction
Title
Name of theauthors and affiliation,
Collaborator and affiliation
Methods
Organization
Logo
Results
collaborator
Logo
FIGURE 6.8Template for Poster Presentation
Presenting and Publishing Research Findings 233

• Contact Information: Include your full name, official address, and email. ProvideURL of your own home page or the department home page. This will helpdelegates to contact you in near future for collaborative or consultancy work.Refer Figure 6.8 for poster presentation template
6.13 Summary
Presentation and publication is vital aspect of research. There are various publica-tions options are available to author. Publication in reputed journal is credit-full toauthors. Journal reputation is determined by journal impact in the field of research.Journal metric provides an extra insight into the different aspects of the journal’simpact. It also helps authors in selecting a journal when submitting an article forpublications
Further Reading
1. Chittaranjan Andrade, “How to Write a Good Abstract for a Scientific Paper or ConferencePresentation,” Indian J. Psychiatry, vol. 53, no. 2, pp. 172–175, Apr–June 2011.
2. Justus Randolph, “A Guide to Writing the Dissertation Literature Review,” Prac. Assess. Res.Eval., vol. 14, no. 13, pp. 1-13, June 2009.
3. http://mjl.clarivate.com/cgi-bin/jrnlst/jloptions.cgi?PC=K4. http://www2.le.ac.uk/library/for/researchers/publish/choose_where_to_publish5. http://www.lib.vt.edu/find/journals/select-journal-publish.html6. http://cms.iopscience.org/0659756d-d278-11e1-9b7a-4d5160a0f0b4/choosing-submit-paper.html7. http://www.scimagojr.com/journalrank.php8. http://journalfinder.elsevier.com/9. http://www.springer.com/?SGWID=0-102-12-988548-0
10. https://portal.issn.org/11. https://library.iit.edu/find/journals/by-issn12. http://www.worldcat.org/13. http://nsl.niscair.res.in/ISSNPROCESS/issnassignedinfo.jsp14. https://clarivate.com/essays/impact-factor/15. http://ipscience-help.thomsonreuters.com/incitesLiveESI/8275-TRS.html16. https://www.scijournal.org/17. https://journalmetrics.scopus.com/18. http://ipscience-help.thomsonreuters.com/incitesLiveJCR/glossaryAZgroup/g7/7751-TRS.html19. http://ipscience-help.thomsonreuters.com/inCites2Live/indicatorsGroup/aboutHandbook/
usingCitationIndicatorsWisely/citedHalfLife.html20. https://www.aje.com/en/arc/10-easy-ways-increase-your-citation-count-checklist/21. htts://www.researchgate.net/publication/5958226_Comparison_of_PubMed_Scopus_We
b_of_Science_and_Google_Scholar_Strengths_and_weaknesses22. https://en.wikipedia.org/wiki/List_of_academic_databases_and_search_engines23. https://www.elsevier.com/solutions/scopus24. https://clarivate.com/essays/journal-selection-process/
234 Research Methodology

25. https://orcid.org/signin26. https://www.scopus.com/freelookup/form/author.uri?zone=TopNavBar&origin=NO%
20ORIGIN%20DEFINED27. http://www.researcherid.com/Home.action28. https://typeset.io/29. https://www.inera.com/extyles-products/extyles
Presenting and Publishing Research Findings 235

This page intentionally left blank

7Plagiarism
Mousami V. Munot, Sesha S. Srinivasan, and Anand S. Bhosle
CONTENTS
7.1 Introduction . . . . . . . . . . . . . . . . . . . . . . . . . . . . . . . . . . . . . . . . . . . . . . . . . . . . . . . . . . .2387.2 Plagiarism. . . . . . . . . . . . . . . . . . . . . . . . . . . . . . . . . . . . . . . . . . . . . . . . . . . . . . . . . . . . .2397.3 Reasons for Plagiarism . . . . . . . . . . . . . . . . . . . . . . . . . . . . . . . . . . . . . . . . . . . . . . . . . .2407.4 Types of Plagiarism . . . . . . . . . . . . . . . . . . . . . . . . . . . . . . . . . . . . . . . . . . . . . . . . . . . . .241
7.4.1 Plagiarism of Words . . . . . . . . . . . . . . . . . . . . . . . . . . . . . . . . . . . . . . . . 2417.4.2 Stitching Sources (Potluck Plagiarism) . . . . . . . . . . . . . . . . . . . . . . . . . . . 2417.4.3 Patchwork Plagiarism . . . . . . . . . . . . . . . . . . . . . . . . . . . . . . . . . . . . . . . 2417.4.4 Self-Plagiarism (the Self-Stealer). . . . . . . . . . . . . . . . . . . . . . . . . . . . . . . . 2427.4.5 Cyber and Digital Plagiarism. . . . . . . . . . . . . . . . . . . . . . . . . . . . . . . . . . 2427.4.6 Accidental Plagiarism . . . . . . . . . . . . . . . . . . . . . . . . . . . . . . . . . . . . . . . 2427.4.7 Plagiarism of Authorship. . . . . . . . . . . . . . . . . . . . . . . . . . . . . . . . . . . . . 2427.4.8 Plagiarism of Ideas . . . . . . . . . . . . . . . . . . . . . . . . . . . . . . . . . . . . . . . . . 2437.4.9 Reuse of Programming Code . . . . . . . . . . . . . . . . . . . . . . . . . . . . . . . . . . 243
7.5 Plagiarism in Various Fields and Its Consequences . . . . . . . . . . . . . . . . . . . . . . . . . .2447.5.1 Music Industry . . . . . . . . . . . . . . . . . . . . . . . . . . . . . . . . . . . . . . . . . . . . 2447.5.2 Plagiarism in Academia . . . . . . . . . . . . . . . . . . . . . . . . . . . . . . . . . . . . . . 2457.5.3 Plagiarism in Journalism . . . . . . . . . . . . . . . . . . . . . . . . . . . . . . . . . . . . . 247
7.6 Software Used for Identifying Plagiarism . . . . . . . . . . . . . . . . . . . . . . . . . . . . . . . . . .2477.7 Plagiarism Policies. . . . . . . . . . . . . . . . . . . . . . . . . . . . . . . . . . . . . . . . . . . . . . . . . . . . . .252
7.7.1 IEEE (Institute of Electrical and Electronics Engineers) . . . . . . . . . . . . . . 2527.7.2 Springer . . . . . . . . . . . . . . . . . . . . . . . . . . . . . . . . . . . . . . . . . . . . . . . . . . 2527.7.3 Elsevier . . . . . . . . . . . . . . . . . . . . . . . . . . . . . . . . . . . . . . . . . . . . . . . . . . 2537.7.4 Committee of Publishing Ethics (COPE) . . . . . . . . . . . . . . . . . . . . . . . . . 2547.7.5 Government Rules and Polices . . . . . . . . . . . . . . . . . . . . . . . . . . . . . . . . 254
7.8 Techniques to Avoid Plagiarism . . . . . . . . . . . . . . . . . . . . . . . . . . . . . . . . . . . . . . . . . .2547.8.1 Referencing . . . . . . . . . . . . . . . . . . . . . . . . . . . . . . . . . . . . . . . . . . . . . . . 2547.8.2 Paraphrasing . . . . . . . . . . . . . . . . . . . . . . . . . . . . . . . . . . . . . . . . . . . . . . 2577.8.3 Tips and Strategies to Avoid Plagiarism . . . . . . . . . . . . . . . . . . . . . . . . . 2597.8.4 Creative Commons License . . . . . . . . . . . . . . . . . . . . . . . . . . . . . . . . . . . 261
7.9 Summary . . . . . . . . . . . . . . . . . . . . . . . . . . . . . . . . . . . . . . . . . . . . . . . . . . . . . . . . . . . . .261Further Reading. . . . . . . . . . . . . . . . . . . . . . . . . . . . . . . . . . . . . . . . . . . . . . . . . . . . . . . . . . . . 262
237

If you steal from one author it’s plagiarism; if you steal from many it’s research.—Wilson Mizner
Learning objectives of this chapter are to:
1. Comprehend and adopt best practices that would ensure the writer to avoidplagiarism.
2. Understand the various policies of various reputed journals such as IEEE, Springer,and Elsevier and so on.
3. Apply various techniques of avoiding plagiarism to ensure ethical and integralwriting
4. Utilize various free and paid software for identifying plagiarism and implementparaphrasing
This chapter will enable the researcher to:
1. Cite and paraphrase the document effectively2. Create/submit/publish a plagiarism free document/manuscripts3. Ensures the originality and uniqueness of the work.
7.1 Introduction
Intellectual morality that guarantees integrity is indispensable to avoid any scientific oracademic misconduct. While presenting and publishing any document, it is imperativeto ensure its uniqueness and credibility. Attempts of manipulation, fabrication orfalsification of the data, experiment, process, equipment, procedures, observations,findings, or results lead to issues of misconduct and are extremely unethical. Plagiarismis another most common type of misconduct and, in some jurisdictions, it may also beillegal. While most of the people in general have just nominal degree of awareness aboutplagiarism, not everyone is precisely educated about it. The Josephson Institute Centerfor Youth Ethics surveyed 43,000 high school students in public and private schools andfound that:
• 59% of high school students admitted cheating on a test during the last year; 34%self-reported doing it more than two times
• One out of three high school students admitted that they used the Internet toplagiarize an assignment
This report was published in June 2017 (https://www.plagiarism.org/article/plagiarism-facts-and-stats).This chapter discusses plagiarism at length and enables the readersto gain insight to what is plagiarism, related offences, ways of avoiding plagiarism, andthe repercussions of plagiarizing.
238 Research Methodology

7.2 Plagiarism
Plagiarism is an inappropriate act of claiming credit or ownership of someone else’sideas or unfair annexation of another’s work and entitling it as your own. Such actionsare very common since the existence of human life on the universe. For as long as therehave been poems and poetics, music and musicians, science and scientists, math andmathematicians, and so on, time has witnessed acts of seemingly unnamed literarythefts in every possible domain/field and by every possible means.
The origin of word “plagiary” (a derivative of plagiarus,) dates back to the firstcentury AD and it involves a Roman poet, Martial, who complained that anotherpoet had “kidnapped his/her verses.” Although the word “plagiarism,” took 15centuries for its first appearance in English (in the various battles among Shake-speare and his/her peers), the Oxford English Dictionary credits Ben Jonson as thepioneer to introduce and use it in print in 1601 to describe someone guilty of literarytheft. Since then, both the act and the rise of importance of the word “plagiarism”
exponentially increased and has put a very high value on “originality” in anycontribution. All of the developed and developing countries across the globe nowconsider expression of original ideas as intellectual property, which is protected bycopyright laws, just like original inventions.
According to the Merriam-Webster’s Online Dictionary, plagiarism is an act of fraud thatinvolves both stealing someone else’s work and lying about it afterward. To “plagiar-ize” means to:
• Steal and pass off (the ideas or words of another) as one’s own• Using other work or idea (another’s production) without crediting them• Commit literary theft• Present as new and original, an idea or product derived from an existing source
The copying words or sentences of the other work in our work without citing,crediting their work and claiming as own and failing to put in marks or givingincorrect information about the source of a quotation, changing words but copyingthe sentence structure of a source or copying so many words or ideas from a sourcethat it makes up the majority of your work, whether you give credit or not, are allexamples of plagiarism.
Other form of plagiarism include intentionally copying lengthy passages from a bookor journal article, or purchasing or downloading whole papers and submitting them asyour own work leading to misconduct.
Plagiarism, intentional or unintentional, is always seen as clear violation of the code ofethics and the ramifications, in any case, remain the same. Many times the words or thetext copied is not “substantial”; however, the action is still reflected as plagiarism.Consider the following examples:
(i) A researcher working on a problem in biomedical imaging uses DelaunayTriangulation to identify and disentangle overlapping chromosomes and publisheshis/her contribution in a reputed journal. Another researcher working in the domainof automation of manufacturing processes copies just one word, “Delaunay Trian-gulation,” and publishes an algorithm/methodology for extrication of overlapping
Plagiarism 239

using gears. Only one word is plagiarized in this case, but it is the key wordcontributing to a novel approach and is reported in biomedical domain. Unacknow-ledged use of the same concept in a different domain of manufacturing process is stilldefinitely considered as plagiarism of idea.
(ii) A postgraduate student working on a project copies the aim, objective, andhypothesis from another report, assuming that actual number of words that arecopied are relatively less compared to the total number of words in the entirereport and therefore the overall similarity report of the dissertation will be withinlimit. Such cases are undeniably categorized as plagiarism cases because thecontent copied, although is a small part, is very important to overall dissertation.In another scenario, consider a researcher writing his/her PhD theses. He/sheattempts to use survey paper already published by another researcher as one ofthe chapter in his/her own theses. A literature survey is not the most criticalfactor in the theses and does not usually have novelty in it. It is usually a generalsummarization of reported studies/finding and issues, and therefore act of usinga published survey paper as a chapter in the theses may apparently seemobvious. However, such an act is still upheld as plagiarism. The dictionarymeaning of the word “substantial” may therefore not necessarily be alwaysapplicable from the perspective of “plagiarism.” It depends on the significanceof the text (images, photographs, tables, and so on) that is copied.
7.3 Reasons for Plagiarism
There is lot of research going on to analyse the reasons people choose to intentionallyplagiarize or unintentionally end up cheating. Some of the most obvious reasons arelisted here:
(i) Most popularly reported reason, people plagiarize is the human nature of procras-tination. People tend to postpone the expected and inevitable tasks/assignments/exercises until the last minute. This leaves them very limited time before thedeadline and therefore important issues like integrity of the content are paidmeagre attention. Sometimes procrastinators recurrently and deliberately look forjustification for adjourning the work and avoid it. It is a short-term panic responsethat in the long run reflects their perpetual struggle against themselves, theirindiscipline, and sometimes their hidden fears, thwarting their career paths. Withconsistent efforts, it is possible to overcome the habit of procrastination and ensurethe integrity and honesty in the assigned work and contributions.
(ii) People lack knowledge about proper citations. People end up casually usingreadily available information in the electronic documents or pages on the Inter-net and other sources without seeking their permission and acknowledging orciting the source. Response to loads of information available at their fingertips,which can be comfortably replicated/duplicated, also leads to plagiarism.
(iii) Students are not fully aware about plagiarism and they do not fully understandthe conventions required in the academic/scientific/technical/non-technicalwriting.
240 Research Methodology

(iv) At some instances, people are overconfident about their skill set and believe theycan escape and get away with plagiarism. They are comfortable to plagiarizewhen they realize that the content was not submitted to plagiarism detectiontools or not uploaded on other internet sources.
(v) Sometimes negative emotions and competitive urges to gain the credits for themodule without sincerely working enforce conscious decision of plagiarizing onthe students.
Colleges and universities are taking efforts to educate the society about plagiarism andhave launched massive online open courses about plagiarism. Institutes have their ownpolicies that define plagiarism and it is a standard practice to establish strategies fordealing with cases of plagiarism. The consequences of plagiarism are usually severe,ranging from an automatic “F” in the respective course to temporary suspension or evenpermanent expulsion from the institute/conference or journal. Some of other multitudi-nous penalties include loss of personal pride because of cheating yourself and lettingyourself down. It ultimately leaves the plagiarist with fabricated levels of attainment,fulfilment, satisfaction, and glory on personal fronts.
7.4 Types of Plagiarism
There are various ways of categorizing the act of plagiarism. Some of the types aredetailed later in this chapter.
7.4.1 Plagiarism of Words
This is also called as “The Ghost Writer.” The writer copies every single word from thesource without use of quotation mark, citation, acknowledgment, or attribution. Ghostwriting or plagiarism of words involves direct use. . . . . . . . . .
(Direct use of the entire statement/definition makes the document being entitles asplagiarized and is infringement of academic policy or code of ethical conduct.
7.4.2 Stitching Sources (Potluck Plagiarism)
The internet is flooding with large amount of informative data from numerous sourcesthat are readily available for use. Writer tries to fetch essential and appropriate contentby copying from several different sources. Modifying and stitching the relevant contentsfrom various documents, books, online sources, web pages and repositories to makethem fit together and look appropriately linked leads to potluck plagiarism.
7.4.3 Patchwork Plagiarism
The third type called patchwork plagiarism. Such plagiarism occurs when we borrowthe content from original source and weaves them into our paper without citing. Heresources are used more than one like above. Suppose a student obtain four sourcesfrom where he/she copied one sentence from A source, one sentence from B source,
Plagiarism 241

one sentence from C source and one sentence from D source, and so on. Here thestudent thought that they are not copying anything and even they cited the referencesof sources. But still this is plagiarism due to unorganized and not composedsentences they used in their work. In such a case, direct quoted words should becited with quotations.
7.4.4 Self-Plagiarism (the Self-Stealer)
Self-plagiarism is the use of our own previous work in another new context withoutciting that it was used previously. The idea behind is the reader should know that thiswas not first use of the material. Therefore republished text work is considered as self-plagiarism and the credit received from previous work is considered as corrupt. Hencethe writer must cite when using previous written work.
7.4.5 Cyber and Digital Plagiarism
Cyber digital content includes the information posted by authors on the Web such ase-books, notes, graphs, video, audio, music, images, online databases, questionnairies,electronic reserves and so on. Such information is usually protected using copyright.However, it is mistaken, as a public area property and is used by the people leading tocyberdigital plagiarism. The author needs to take the permission from such website andinclude the date when the material was accessed or downloaded.
7.4.6 Accidental Plagiarism
Accidental plagiarism occurs due to the ignorance of a person resulting in failure toproperly paraphrase, quote and cite their research. Improper method of documentationresults in misattributing. This means you are claiming someone else’s work as own. Inother words, if you have taken reference from a book or may be expressed the meaningof a paragraph of an article in your research work, but you do not include an in-textcitation, then the reader will assume that the idea/words are yours, not someone else’s.This is nothing but an example of authenticity violation. Only by mentioning thereference of the sources in reference list it is not enough. The missing citation at textused makes it plagiarism.
It is sole responsibility of author to understand when and how to cite the materialused and provide references to the sources. If an author knowingly claims ownership ofalready reported work, it is considered as intentional plagiarism. It includes buyingpapers online, copying and pasting the information from any available sources. Acci-dently failing to cite the references appropriately is an un-acceptable excuse and such anattempt is still considered as plagiarism.
7.4.7 Plagiarism of Authorship
The authorship means presenting the other author work with simple modification ofsentence and presenting as own work.
242 Research Methodology

7.4.8 Plagiarism of Ideas
Using and presenting somebody else’s idea as your own and taking away all the creditwithout any reference to the original idea and also submitting a paper by incorrectlyciting another’s ideas. This is where the student uses one of the following as the basisfor the whole, or a substantial part, of the assignment:
• published or unpublished books, articles, reports, or magazines• some resources from the Internet• some sort of ideas pitched in a TV program or a radio program• an essay from an essay bank• a piece of work previously submitted or to be submitted by another student• from any newspaper article• from an unpublished manuscript or record book
7.4.9 Reuse of Programming Code
With exponential increase in the number of developers and available software, the reuseof the programming code is usually encouraged, but it is important to realize the factthat such programming projects are done to improve one’s individual skills.
You learn very little when you copy the programming code from other source.Even you do not understand the logic of the code written by other. If you are usingother people’s code, to avoid being accused of plagiarism make sure to give properreferences and citations. You must clearly state the source of the code, for example,name of author, page in the book that you have taken the code from, web page URLaddress. Not giving reference to the code you have used is a plagiarism offence and isdealt with as such.
Note you will always awarded good marks for different unique code written to solvethe problem and the originality you used, than the code you use from others. If youdon’t do any code on your own and just copy the entire program (referencing theauthors), you will be awarded no marks as you have made no contribution to yourcoursework.
There are two main detection techniques of plagiarism. One is manual and another issoftware-assisted. It’s very difficult to check plagiarism by manually because it requiresgood and excellent skills and memory to identify plagiarism. Even it’s very difficult forhuman being to check all documents on various millions of sources. Hence it is wiser togo for the software based testing for plagiarism, where the software automaticallychecks all sources and generates the report automatically as will be detailed further inthis chapter.
The act of plagiarism comes from copying both published and unpublished workfrom different sources. It’s not just copying from published work of source but includesunethical use of unpublished sources as well. Moreover, just copying the other workand representing it in your work by simply modification and arrangement of few wordswithout proper citation at text place and without showing the direct copied sentence byquotation and references at reference list is still plagiarism. Such things are easilydetected in the modern tools like Turnitin.
Plagiarism is an act of fraud that is stealing some persons work and then lyingafter is absolutely unacceptable. If you are under pressure of any workload you may
Plagiarism 243
get many ideas, you may take shortcut to do your work, you may copy the thingsfrom other work but the idea of thinking is bad, find the solution, find new ideas,solution to do the work. Don’t feel under pressure, if you are finding it hard take advisefrom your experts ask them and try something new you will get complete new resultsdon’t worry if it’s bad or good, don’t think of future consequences. You never knowwhat coming in your way it may be interesting and worthwhile reading. Even you’ll getmany ideas from the people appreciate them give credits they deserve.
7.5 Plagiarism in Various Fields and Its Consequences
Here we discuss few important domains where plagiarism act is considered seriouslyand have more impact on original work and violating copyright act.
7.5.1 Music Industry
Music industry generates revenue by selling the original copyright write songs/albums,even by live music events/shows. The music composition is very highly technical andcreative task for composition of songs. It takes several months to compose good songs.Its highly hard work to create good composition of songs, but some people are desire tomake money by copying other work that’s why even the music industry also fall prey toplagiarism. According to music plagiarism law, the sound recording and music compo-sition are included in separate copyrights. Both sound recording and music compositionare considered separate work. Even we can copyright our published and unpublishedmusical work.
Let’s take few national and international examples of songs.In some situations the music plagiarism is very tricky act, some song may be
accidently or not, they inevitably like other songs. It takes very difficult process tocheck music plagiarism, it can be neglected, when the similarity is less, but the thingsbecome messier when the similarity is more, in that case the copyright law get involved.
Few example international case of music plagiarism listed here.
• Miley Cyrus, “We Can’t Stop” and Flourgon, “We Run Things”• Ed Sheeran, Faith Hill, and Tim McGraw, “The Rest of Our Life” and Jasmine Rae,
“When I Found You”• Meghan Trainor’s “All About That Bass” and Koyote’s “Happy Mode”• The Beatles, “Come Together” and Chuck Berry, “You Can’t Catch Me”• Jennifer Lopez, “On the Floor” and Kaoma, “Lambada”
Case 1: Miley Cyrus, “We Can’t Stop” and Flourgon, “We Run Things”Recently in March 2018 Jamaican reggae musician Michael May performed in name ofFlourgon, but its filed a lawsuit against Flourgon claiming that the “We Run Things”song is copied and pulls from a 1988 Miley Cyrus song “We Can’t Stop.” According tothe lawyers, the melody/rhythm/cadence/inflection, are similar to old Miley Cyrussong name “We Can’t Stop”.
244 Research Methodology

Case 2: Robin Thicke and Pharrell Williams sued Marvin Gaye’s family becausethe family claim that “Blurred Lines” violated the copyright of Marvin Gaye’s song.The claim was filed in August 2013. After five years the lawsuit was finally settled in2018. The jury found Robin Thicke and Pharrell Williams guilty and ordered them topay $4 million in damage of violating law of copyright. They agreed to pay some profitof $3.2 million that they earned from song. This is one of the biggest judgmentsconcerning copyright protections in the music industry.
Let’s take list few national examples of songs.
• Teraa mujhse hai pahle kaa naataa koii (Aa Gale Lag Ja, 1973) and “The YellowRose of Texas” (Traditional) both were criticized by many people for violatingcopyright
• Mil gayaa ham ko saathii (Hum Kisi Se Kum Nahin, 1977) and “Mamma Mia”(ABBA, 1975) both were criticized by many people for violating copyright
• Dilbar mere kabtakmujhe (SattaPeSatta, 1982) and “Zigeunerjunge” (Alexandra,1967) were both criticized by many people for violating copyright
• Tum se milke (Parinda, 1989) and “When I Need You” (Leo Sayer, 1977) both werecriticized by many people for violating copyright
Let’s move to the next section, which will cover the plagiarism in academic, how it beneficialfor the student to protect their data from unauthorized use.
7.5.2 Plagiarism in Academia
Plagiarism also plays a vital role in academic for violating the student’s work. It isconsidered as a biggest crime in academic. This is because students are always encour-aged to think on unique idea. They put full efforts on their unique idea; hence, it is goodacademic practice for every university to care about plagiarism.
(i) Reputed institutions encourages student/faculty for writing original work.
The most challenging task for every good scholar is to take what is already donebefore/said before. And further use this material to propose his/her work in originalways.
Some student may ask you why we should unnecessary efforts be taken in addingredundancy to existing work or paper “if this research paper is already argued, why arewe discussing the same topic?” The answer is as follows:
• It provides a model for our own work by doing research on the subject that youare interested and you become expert and familiar with existing updated works onthe interested subject in day to day with technology
• It is valuable because, the presentation and discussion on the represented informa-tion is totally unique from the other
• It helps to add more information and new dimension into your subjects, whichmay be made available for all
• It is also an opportunity to present your findings, report or argument
Plagiarism 245

Writing in academic may seem to be contradictory.
It is very challenging to build an original framework and still acknowledge everyidea/ reference used in your work. It is manadatory to preserve educational integrityand novelty of your honest work as well.
(ii) Oxford university plagiarism rules.
By employing the good academic principle and practices, it is very easy to avoid theplagiarism by adopting university mentioned rules. The university detail:
• Forms of plagiarism:○ exact (word for word) quotation without clear acknowledgment○ cutting and pasting from the Internet without clear acknowledgment○ paraphrase○ complicity○ incorrect references○ malfunction to acknowledge assistance○ use of material written by professional agencies or other persons○ auto-plagiarism
• Why does plagiarism matter?○ A principle of honesty: all academic community should acknowledge their
originator of idea, words and data○ It is unethical: can impact serious problem on future career○ It’s under estimate the whole academic record
• Why should you avoid plagiarism?There are many reasons to avoid plagiarism.
○ To impact and produce the highest quality work done by you○ Improve your lucidity and quality of writing skill○ Most importantly it provides honesty credibility and authority to your work
On the one hand, we ask you to: But also to:
Always find what is written on the selected searchtopic and report it and demonstrating the things thatwritten in the topic
Writing a topic in a original way.
Always try to bring in opinions of expert panel andrespective authorities in frequently for betterment.
Keep on working and doing more than simply report-ing them; don’t accept the opinion directly try toremark on this opinion, include them, have the sameopinion or oppose with them.
Notice articulate phrasing and learn from it, especiallyif you are trying to enhance your capability in English.
Make sure you are using your own words, when youputting these words into a paper directly.
246 Research Methodology

• What happens if you are thought to have plagiarized?○ University put penalties of reduction in marks
• Does this mean that I shouldn’t use the work of other authors?○ Give the credit to the main author form where you got the idea and observation
you cite• Does every statement in my essay have to be backed up with references?
○ No it’s not necessary to give references for fact that are common in disciplinebut before it we have to confirm whether it’s common or not
○ But is safer side better to be citing the referenceEvery University has their own policy against plagiarism.
7.5.3 Plagiarism in Journalism
Plagiarism is exponentially increasing in the field of journalism. The main assets of newsorganization are public accountability, professionalism, and reliability. The organizationshould report honest and accurate news when they report a story, from this the organiza-tion maintain reputation and ethical journalistic standards. Plagiarism in journalism affectstheir own individual reputation as well as harms organization who they represent
There are three essential types of plagiarism that occur in journalism.
• Collecting information from one reporter and passing it on media as their ownnews without giving credit to original reporter
• Copying others work and passing it on to newspaper as their own article• Plagiarizing other’s ideas as one’s own
The plagiarism in journalism is rising rapidly. Recently the plagiarism was discovered infour stories. An online editor of WQXR resigned after 10 stories they filed are foundplagiarized material. Recently many reporters are lost their job due to false filed stories.In 2012 CNN and Time suspended CNN’s Fareed Zakaria when he found in plagiarizedone of his/her Time magazine columns.
There are many more such cases of every possible way in absolutely every field andthe consequences are much severe than mere financial. They extend to causes of defame,loss of integrity, respect and confidence at personal and social level.
7.6 Software Used for Identifying Plagiarism
After writing any paper or story, it’s important to check the paper is free fromplagiarism or not. Plagiarism free paper is very beneficial for representing quality ofwork. The testing of plagiarism is done by software. There are many software tools areused to testing plagiarism. The software available online is of two types
• Paid software (iThenticate, Turnitin, Urkund)• Free software
Plagiarism 247

(i) iThenticateiThenticate is very famous software widely used in famous publications IEEE, Elsevier andSpringer and so on. iThenticate also provide different file type that we can upload easilywithout any restriction of file type. The file types that supported to upload in iThenticate areMicrosoft Word® (DOC and DOCX), Word XML, Plain Text (TXT), Adobe PostScript®,Portable Document Format (PDF), HTML, Corel WordPerfect® (WPD) and Rich TextFormat (RTF). Even submitting paper may not exceed 400 pages and file size may notexceed 100 MB.
The features provided by iThenticate are:
• Advanced Plagiarism checking• Match report• Content tracking• Review report• Major matches• Online sustain and guidance• Multiple user collaboration• API integration for organizations and many more
Example: Summary Report generated by the iThenticate tools.The snapshot depicted in Figure 7.1 indicates the overall similarity breakdown reportgenerated by iThenticate database. The generated report mode shows different color lineof the matches found followed by the paper with the matching areas highlighted indifferent color.
(ii) TurnitinTurnitin is widely used commercial internet based plagiarism software tool for plagiarismdetection services launched in 1997. University and many more IPR filling organizationsbuy this tool for plagiarism detection. Turnitin checks the submitted document in databaseand gives the similarities with existing sources. Consider a manuscript submitted to Turn-itin software for plagiarism detection. After submitting the paper, Software will check themanuscript line by line for similarity. If the content in the paper is found similar to the onealready existing in database, it is highlighted using various colours. Same colours are usedto match the copied sentence with its source for easy understanding and further in-depthanalysis, if required. Figure 7.2 depicts a snapshot of Turnitin software indicating thesimilarity report of a manuscript submitted for plagiarism check.
The above report is marked with various colors, it indicates the similarity found inthat particular colored line. Turnitin software, thus also calculates percentage of similar-ity found different paper that matched.
The final originality report is shown below in Figure 7.3.From the originality report, the research can easily analysis the sources for possible
similarities: 8% similarity index found in all paper, 3% content from internet source, 7%similarity found in different publication and 1% similarity found in student paper. Thereport shows student plagiarism of 1%. The material entitled under “student plagiarism” isunpublished. However, it is mandatory to take a serious note of even unpublished materialto ensure integrity of our write-up. It is also important to take note of a possibility where thematerial entitled student plagiarism is actually your own write-up submitted earlier for
248 Research Methodology

FIGURE 7.1Similarity report generated by ithenticate (courtesy Turnitin)
FIGURE 7.2Result of submitted paper in Turnitin (courtesy Turnitin)
Plagiarism 249

plagiarism check. Turnitin software provides an option of saving/not saving the material tothe repository thus giving the flexibility to the users. However, Urkund software bydefaults saves the material into its repository without offering any option to its users.
(iii) UrkundUrkund plagiarism software is widely used in throughout the Europe for plagiarismcheck. This software is completely automated used at universities and universitycolleges. Its check the submitted document against three central source areas:
• Internet• Published material• Before submitted student material
Based on this central search the Urkund software defines the percentage of plagiarismin the submitted paper and generate the report as depicted in Figure 7.4.
FIGURE 7.3Originality report generated by turnitin (courtesy: Turnitin)
250 Research Methodology

(iv) Free software:Modern technology and the Internet given us to access tons of information on the cloudof the Internet; hence everyone tries to access these information and extract usefulinformation in their own work that related to research, study and so on.
To avoid the copyright and plagiarism there are many more free software toolsavailable on internet. The most popular tools that are used widely for short plagiarismcheck included:
• Dupli Checker• Copyleaks• PaperRater• Plagiarisma• Plagiarism Checker• Plagium• PlagScan• PlagTracker• Quetext• Viper
FIGURE 7.4Urkund Summery report (courtesy Urkund)
Plagiarism 251

Dupli Checker is one of the most effective free plagiarism software detection tools on theInternet. It is free of charge, is user friendly and permits 50 scans per day for everyregistered user. However, for every unregistered user only one search per day is permitted.
All the freely available free software tools have their own rules and regulations andeven they have few restrictions about the plagiarism check. Such tools are widelypreferred in plagiarism check in small article with few 100 words.
Most of the software tools developed for identifying the plagiarism in material/document and manuscript are restricted to only checking and validation of the textcontent and the similarity report is generated accordingly. However, it is alsonecessary to examine the plagiarism in the diagrams, images and figures to ensurefull integrity.
7.7 Plagiarism Policies
As already discussed, the documents/manuscripts submitted to various journals arescrupulously examined for plagiarism to ensure originality in the contents. Plagiarismpolices of some journals (global level) and the Government (national level) are summar-ized in this section.
7.7.1 IEEE (Institute of Electrical and Electronics Engineers)
The IEEE (Institute of Electrical and Electronic Engineers) organization is global andprofessional body for working towards research, development and enhancement oflatest technology in wide areas.
IEEE refuses plagiarism of prior processes, results, or words without acknowledgingthe proper sources. Various Engineers and Scientists from all around the world sendtheir papers to IEEE for publishing. These papers are passed through rigorous plagiar-ism check and the papers that fail the test are rejected. Plagiarism at any stage isunacceptable. The levels of misconduct described in the sections are [26]:
• Level 1: 50–100% copied. (Uncredited Verbatim Copying of a Major Portion)• Level 2: 20–50% copied. (Uncredited Verbatim Copying of a Large Portion)• Level 3: < 20% copied (Uncredited Verbatim Copying of Individual Elements like
Paragraph, Sentence, Illustration, and so on)• Level 4: Improper paraphrasing• Level 5: Credited but without clear delineation
7.7.2 Springer
Springer is a member of cross check. Springer also has online instrument (iThenticate) tocheck a composed conflict with that database. Springer is putting forth this screeningprogramming to journal editors of Springer diaries and society and publishing partnersdiaries. A software can be utilized as a part of the publication procedure to recognizecontents however, a manual examination of the coordinating content is yet required for
252 Research Methodology

judgment to recognize if copyright infringement has happened or not. The article “Publish-ing Ethics for Journals” (https://www.springer.com/gp/authors-editors/journal-author/journal-author-helpdesk/publishing-ethics/14214) on the Springer site tosses some lighton the stand taken by Springer on the issue of unoriginality. It is anyway Springer’s viewthat in remarkable cases (e.g., in instances of rehash guilty parties or creators utilizinginjurious dialect) the Editor-in-Chief/Editorial Board of a Springer journal reserves theright and has the privilege to decline the manuscripts in cases of severe infringement.
7.7.3 Elsevier
Elsevier is also a member of cross-check. Elsevier follows some code of ethics whichincludes but is not limited to:
• Authorship of the paper: Three basic criteria must collectively be met to becredited as an author:○ Significant input to the study conception and design, data attainment, exam-
ination, and understanding○ Draft or revise the article for scholar contentApproval of the final version
• Originality and plagiarism: The writers should ensure that they have composedcompletely unique works, and if the writers have utilized the work and addition-ally expressions of others, this has been fittingly referred to or cited
• Data access and preservation: The creators might be requested to furnish the crudeinformation regarding a paper for article survey, and ought to be set up to givefree to such information
• Acknowledgement of sources: Proper acknowledgment• Disclosure and conflicts of interest: All entries must incorporate revelation of all
connections that could be seen as displaying a potential irreconcilable situation• Fundamental errors in published works: At the point when a creator finds a huge
mistake or error in his/her own particular distributed work, it is the creator’scommitment to instantly tell the diary supervisor or distributor and coordinatewith the proofreader to withdraw or remedy the paper
• Reporting standards: Creators of reports of unique research should show a preciserecord of the work executed and in addition a target exchange of its importance
• Hazards and human or animal subjects: Articulations of consistence are required ifthe work includes synthetic substances, systems or hardware that have anyunordinary risks intrinsic in their utilization, or in the event that it includes theutilization of animal or human subjects
• Use of patient images or case details: Studies on patients or volunteers requiremorals board endorsement and educated assent, which ought to be recorded inthe paper
There is a plagiarism factsheet prepared by Elsevier that lists various unethical actionsand ways to avoid them or prevent them.
Plagiarism 253

7.7.4 Committee of Publishing Ethics (COPE)
The first meeting of COPE took place in April 1997 and it was a generally casualsocial occasion of a gathering of concerned editors. At that first gathering it turnedout to be certain that the gathering had witnessed and experiences cases of researchmisconduct, fraud, unethical behaviour and misinterpretations. COPE is formulatedat a global level to reinforce to importance ethics and integrity in publishing. Itinvolves numerous distributors, all those associated with production and publishersas members. COPE has enriched resources and practices to assist the editors ofscholarly journals, publishers/owners and educational institutions to preserve andpromote integrity.
7.7.5 Government Rules and Polices
Government of all the developed, developing and even the under developed countriesare striving to ensure integrity in academia and research. For example, in India, Ministryof Human Resource Development (MHRD) has taken strict actions leading to dismissalagainst the cases of plagiarism. With a view to check plagiarism in higher education,University Grant Commission (UGC) in India has notified the Promotion of AcademicIntegrity and Prevention of Plagiarism in Higher Educational Institutions Regulations,2018. The objective of the regulations is to stimulate academic research and restrainplagiarism by developing systems to detect it.
7.8 Techniques to Avoid Plagiarism
One of the essential components that need to be inevitably cultivated and inculcated inhuman beings is a practice to take pride in your own work and enjoy genuinesatisfaction in your own work with real level of attainment matching your actual ability.Beyond being unethical, unfair, or dishonest, Plagiarism of any kind, whether caught ornot, is always cheating yourself and letting yourself down and should therefore beavoided.
7.8.1 Referencing
Key to avoid plagiarism is to acknowledge the sources used, whether published orunpublished.
Giving credit to the work of other writers or contributors in the correspondingdomain exhibits highest level of integrity. Moreover, it showcases your efforts of rigorousground work, thorough analysis and further also guides the readers with all availablerelevant sources, used by the author. Most importantly, when the material is aptly cited, itenables the readers and other likeminded community to clearly distinguish your ideas fromthe reported literature and appreciate the originality of your work.
While preparing your work, it is a standard practice to refer to records, volumes,articles, reports, newsletters, newspapers or other programs and documents. Anarticle or a manuscript may therefore include wide assortments of statements, facts,opinions, results, findings, discussions and concluding remarks. Referencing the
254 Research Methodology

contents appropriately reduces the chances of suspicion of plagiarism; however, itmay not be required to reference every sentence in the article. In order to aptly citethe references it is essential to understand the difference between statements, facts,and opinions.
Consider the following examples:
“India celebrates its independence day on 15th August.”
This statement is neither a direct quotation nor is contentious. It is actually a verywell-known fact and absolutely every Indian is aware of it. Such a statement in yourassignment or document would not need any referencing or citing. While some facts arecategorized as “common knowledge,” it is important to note that lesser known factsmay need referencing. There exists absolutely no globally acceptable agreement on thedefinition of “common knowledge.” For example, consider the statement:
“Jawaharlal Nehru, the first Prime Minister of independent India, delivered a speech on ‘Trystwith Destiny’ on 14/08/1947.”
It is considered as a common knowledge that Jawaharlal Nehru is the Prime Ministerof free India, but the fact that he delivered a speech on “Tryst with Destiny” may notnecessarily be equally well known and may not be unanimously considered as commonknowledge. In all uncertain and doubtful cases, it is always strongly recommended tocite the source. (The book Midnight’s Children by Salman Rushdie, the novel Train toPakistan by Khushwant Singh.)
If the author further plans to include various statements of the speech delivered by allthe leaders on 15/08/1947, quotation marks are indispensable. It is also obligatory toprovide references and cite the sources. In text referencing is preferred when someslogans in the speech are included in the documents, whilst if couple of lines of thespeech are copied in the write-up, it is necessary to use an indent (move theparagraph/lines away from the set margin of the document) so as to illustrate clearmark and extend of quotation. If the author finally concludes the assignment with his/her opinion (original and unreported) and unique concluding remarks, referencing isdefinitely not expected and in fact may contradict the originality or the noveltycomponent of the assignment. However, if the opinion (positive, negative or neutral)is formulated based on some survey or existing reports, it is necessary to give duecredit to the sources based on which your opinion is articulated. Thus it is imperativeto understand and distinguish between facts, lesser known facts and opinions duringthe process of referencing.
Reference list and bibliography are often used interchangeably, which may or may notbe acceptable to journals/newsletters depending on their policies. To ensure the trans-parency in our presentation, it is also necessary to understand the difference in citationand referencing. As quoted by Dr. Sarah Eaton, an educational leader, researcher, authorand professional speaker, in her blog “Knowing the difference between a citation and areference is one of those subtle details that move you from the category of “noviceresearcher” to “respected researcher .”
These terms are explained here:
(i) Citation: It is an act or practice of mentioning/attributing/indicating a specificsource or quote material in the body of your paper. MLA, Vancouver referencingstyles, and American Psychological Association (APA) are common styles orformats of citation. Nevertheless any citation styles in general include the details
Plagiarism 255

of the author, year of publication and page number. In-text citations are alwaysrecommended when referring to a sizeable chunk in the write-up using round orsquare brackets; “(. . .)” “[. . .]”. The use of quotation marks is also suggestedwhen a specific quote is included.
(ii) References: It is the list of the sources explicitly used in completing the write-upor the manuscript. It includes detailed depiction of the author, journal/proceed-ing/book, publisher, publication year, volume, issue no., and page no. (or date ofdownload in case of multimedia sources).
(iii) Bibliography: This is a list of all the sources that are used in completion of themanuscript but may have not been directly used in the contents of the assign-ment/assignment. It is the list of all the references published/unpublished whichhave provided background information and provided better understanding ofthe topic/concept but are not explicitly mentioned in the manuscript. TheBibliography is obviously bigger than the reference list.
Diagrams, images, graphs equations and tables used in the article should also beacknowledged using appropriate and acceptable referencing style. It is a standardpractice to acknowledge the source in the caption using parenthesis.
The descriptions used in the sources should not be replicated directly without anyquotation marks and the corresponding reference’s number, as it would lead toplagiarism. The quotation marks should not be used by extensively copying thedata, as it would almost destroy the very purpose of writing a research paper. Aspreviously explained, the quotation marks should be used with the appropriatereference number for descriptions that could not be explained any better than thesource/reference itself.
For example, consider a statement; A research could be termed as the “processing ofthe information”. The sources concerned with the research should be properly con-sulted. “Research is a dynamic cerebral activity, while reporting is a mechanical one”. Itshould be ensured that a research paper is not biased and well cited. Citation is neededfor both the above sentences.
In case of a scenario where an already existing concept is explained so well that itcannot be explained any better, it is allowed to use the same description. But, notethat such a description should be enclosed within quotes and appropriate citationshould be provided, else the research paper risks being plagiarized. Explaining anexisting concept in the writer’s own words is allowed, as it defines the understand-ing of the writer and his/her capability to summarize and phrase the “description”.It would not lead to plagiarism “if the writer is putting the information in his/herown words as it demonstrates the understanding of the information” as far as thewriter is concerned.
A report is sometimes good enough even though it merely includes data gatheredfrom multiple sources, but a research paper leads to fruition only if some essence isextracted from the available data.
A research paper should be balanced as far as the academic arguments are concerned.As previously mentioned, a report is merely a collection of ideas, while a research is athorough analysis of those ideas. A research paper should not merely be rhetoric, but itshould be written in a clear and concise manner. It should be written in such a way thatit is used extensively as a citation or as a source for other writers.
256 Research Methodology

7.8.2 Paraphrasing
Some of the literature on “Plagiarism” categorizes paraphrasing as a type of plagiarism,whereas some of the literature describes paraphrasing as a technique to avoid plagiar-ism. This section presents both the cases considering appropriate examples.
Paraphrasing is expressing an already reported idea/contribution in your own choiceof words or text. In such a scenario, where the author summarizes someone else’s workby just changing the words, reframing them or uses synonyms retaining the essence ofthe already reported work is still categorized as intentional plagiarism. Consider thefollowing example.
Original text:
Results-based instruction has been the theme of caustic discussions in numerousstates and educational systems. The tumult amazed a few instructors who, follow-ing quite a while of hearing calls for “comes about” from political and businesspioneers, accepted that most guardians and nationals would bolster a move tomore unmistakable results and methods for surveying them. Maybe the lion’sshare of individuals do concur with the standards of OBE – or would in the eventthat they comprehended them – however exceptionally vocal commentators havehow brought up enough issues about how OBE may function by and by to makequestions among educated individuals from the general population about itsallure. Should instruction be result based? Some may contend that it as of now is,to some degree. Almost all training organizations have objectives that apparentlydirect their work. At the point when instructors design educational programs oreducators design exercises for their classes, they typically begin by clearing up thereasons.
(Source: Curriculum Handbook: An Overview of OutcomeBased Education, by Ron Brandt)
Unacceptable Paraphrase or Plagiarism
Outcome-based education has been the subject of discordant discussions in manystates and school systems. This surprised some of the educators because theyassumed that society would appreciate the students being assessed on definiteoutcomes and means of assessing them. Perhaps the majority of people were infavor of the principles of OBE, however some concerns were also registered amongthe members of the public. There is also ongoing debate on the issue that is theeducation outcome based with supports in favor and against. Nevertheless all theinstitutes are driven by goals, purposes and objectives.
In this example the author attempts to paraphrase or summarize the original text byusing synonyms which ultimately is still considered as plagiarism, despite the fact thatboth the versions are not exact match of words. Acrimonious is replaced by discordant,
Plagiarism 257

debate by discussion and so on. Moreover some of the text in the original version is justrearranged to make it look different or unique. So the new edited version is notsignificantly unique and doesn’t reflect the originality of the author’s ideas. It isimportant to note that even if such a modified version is referenced, it is still a case ofplagiarism because it is still remains a mere copy of the existing text or material.
Acceptable Paraphrase
Outcome Based Education (OBE) is emerging as an inevitable dimension in theeducation system demanding a complete shift of teaching-learning paradigm. RonBrandth, in the Curriculum Handbook has presented an overview of “OutcomeBased Education (OBE).” The author has presented various dimensions of OBEhighlighting the importance of definite outcomes achieved by the students andmeasureable means of assessing them from the prospective of the parents andcitizens. The author also clarifies the role of goals set by the respective educationinstitute which defines the expected outcomes and obviously the correspondingobjectives of the courses.
[25].
In this example, that demonstrates acceptable paraphrase, the sources referred by theauthor are precisely acknowledged and there is no attempt of taking credit of someoneelse’s work and ideas. Moreover, most importantly as expected in a successful para-phrase, the author has integrated the entire context presented in the original source andexpressed his/her understanding of the context in his/her own choice of words,retaining the attribution to original source. Such an attempt of paraphrasing is consid-ered as an acceptable technique to avoid plagiarism. It is also imperative to note thateven if it is considered as acceptable paraphrase, it is always recommended to providefootnotes and endnotes indicating the details of the broader ideas/sources or informa-tion used to write the article, assignment or manuscript. Due care taken by the authorwhile preparing an assignment is directly proportional to the credibility/integrity andobviously inversely proportional to the probability of being accused of unacknowledgedintentional/unintentional plagiarism. A genius writer also makes it a habit of usingmultiple sources, while paraphrasing. An approach of explaining a concept usingvarious sources, providing further clarification, presenting the comparison of theviews/findings/conclusions or perspectives reported by the various authors and finallygoing beyond just merely presenting the survey to add on your own opinion, identifyingunreported/unaddressed issues and novel finding of the topic under the discussion,makes it a great article/assignment and makes you a genius author exhibiting highestdegree of integrity.
With exponentially increasing need of paraphrasing as a tool to avoid plagiarism andwith automation, touching almost every nook and corner of human life, it is absolutely;no wonder to discover internet flooding with the numerous free, online tools andsoftware for automated paraphrasing and text rewriting. Some of them are listed here:
• https://paraphrasing-tool.com/• http://www.paraphrasing-tool.org/
258 Research Methodology

• https://www.prepostseo.com/free-online-paraphrasing-tool• http://www.paraphrasing-tool.net/• https://seomagnifier.com/online-paraphrasing-tool• https://www.rewritertools.com/paraphrasing-tool• http://www.goparaphrase.com/• https://www.paraphrase-online.com/• https://articlerewritertool.com/• https://paraphrase.online/
7.8.3 Tips and Strategies to Avoid Plagiarism
Research writing is an art of giving something novel to academia. It should not merely be anamalgamation of facts and ideas from different available sources. The writer must have athorough conversation with the sources from which they want to obtain information. Theymust delve deep into the subject they are dealing with. The research no longer remains one,if the facts from different sources are just merged into one unit. Unlike report, it rendersinformation about an idea, rather than solely being a chain of few concepts. Educators mustequip students to develop their own ideas or develop insights into existing ideas. Moreover,researchers should be readily encouraged to pursue researches. Every idea should beappropriately backed by an existing concept. It should not be written based on an opinion;rather some experiments should be conducted to support a claim. It is suggested to explorethe topics of interest in great detail, put a genuine effort to conduct research in it and penthe inferences in the form of a research paper in such a way so as to not be subjected toplagiarism. Some of the tips are detailed to avoid infringement of plagiarism polices.
(i) Inculcate habit of writing down your own ideas, findings and conclusion andalso taking systematic, comprehensive and effective notes of the material fromall the sources. This will help the writer to:• Develop clear understanding of citation and avoid plagiarism• Evaluate the sources for their usefulness and accordingly acknowledge the
relevant material• Distinguish his/her thoughts from the reported or existing ones to highlight
novelty• Create an outline of the proposed paper/article/manuscript• Formulate the approaches to fit the contents in the identified journal or
newsletter• At whatever point, you download material from the Web, make certain to
make a different archive petition for that material. Web locales are moreunstable than print sources. Material on numerous web destinations is refreshedonce a day and a webpage that you find right off the bat in your examinationmight be passed when you compose your last draft. Hence, you ought todependably record bibliographic data for every web sources as you utilize it
(ii) With an idea in hand, it is advised to follow a top-down approach. Breakingdown the crux of the idea in hand for further details is suggested in a researchpaper. Writer should know the details to be avoided from the available
Plagiarism 259

information. The information which really matters for the research papershould be part of it. The details should not be reciprocated exactly; instead,the conclusion which the writer draws out from those details should come tolight, else it turns to be similar to a report
(iii) Understand the difference between paraphrasing and summarizing:A summary of an article is expected to include only key points and shouldhighlight the important facts of the article. The exact words or some content maybe replicated in the summary. It is akin to an abstract of a manuscript andtherefore is always much shorter (lengthwise) than the original article. A para-phrase, on the other hand, may be about the same length as the original article.Rules already discussed need to be precisely followed during paraphrasing.
(iv) Understand difference between collaboration and collusion
Almost everyone has difficulty identifying where collaboration stops andcollusion begins.
(Carroll & Appleton, 2001, p. 15)
Collaboration is encouraged in academia and other domains as well. However, ifnot carefully dealt, the threat of collusion outweighs the advantages of collabora-tive learning. For example, students are expected to work as a team, in a group fortheir final year undergraduate engineering project but are assessed individuallyfor their technical knowledge and presentation skill during their project examina-tion. It is imperative that the team mates are taught and guided to collaborateeffectively, share ideas and jointly with synergy during the planning of the projectand its execution. This collaboration and coordination should necessarily end atthis stage and should not cross the limit while the students individually compilethe report and present the results during the submission for individual assess-ment. Restricting the team work to legitimate discussion which demand contribu-tions from all the team mates in the initial phase and later focusing on individualcontributions will avoid chances of collusion. The scenario will be completelydifferent with absolutely no chances of collusion if the same project group nowparticipates in a competition where they are assessed as group and group as awhole gets the marks.
(v) Develop good academic, personal and literacy skills. This will inculcate habitof being disciplined, avoid laziness. The authors should also undertakecourses to improve academic/technical/nontechnical writing and improvingpresentation skills
(vi) Study the expectations/rules and regulations under academic sections in youruniversity or the corresponding domain where you aim to publish. The plagiar-ism policies are well defined and differ across the disciplines, various journalsin a discipline, and also across various organizations.
(vii) Follow the terms of open source license that applies to publically availablematerial. The copyright material must not be published (for example on awebsite) unless you have permission from the owner of the copyright.
(viii) Faculty are encouraged to create assignments that minimize the chances ofplagiarism and emphasize on original thinking of the students. For example:An assignment on the course of Network Analysis may be framed as:
260 Research Methodology

Design a series resonating circuit to have the cut-off frequency, Fc (in kHz),which is your “Roll Call Number.” Assume the value of capacitor (in mF) whichequals your “Permanent Registration Number” (PRN). Find the deviation incalculated cut-off frequency of the series resonating circuit if the bandwidthhas to be changed to your CGPA score of first year.
7.8.4 Creative Commons License
Creative Commons (CC) is a worldwide charitable association that empowers sharingand reuse of innovativeness and learning through the arrangement of free legitimatedevices. CC permit is one of a few open copyright licenses that empower the freeconveyance of a generally copyrighted work. A CC permit is utilized when a creatorneeds to give individuals the privilege to share, utilize, and expand upon a work thatthey have made. CC gives a creator adaptability (for instance, they may permit just non-business employments of their own work) and ensures the general population whoutilize or redistribute a creator’s work from worries of copyright encroachment as longas they keep the conditions that are indicated in the permit by which the creatorconveys the work.
There are a various types of CC licenses. The licenses contrast by a few blends thatcondition the terms of appropriation. They were at first discharged on December 16,2002, by Creative Commons, a U.S. nonbenefit organization established in 2001. Therehave likewise been five variants of the suite of licenses, numbered 1.0 through 4.0. As ofFebruary 2018, the 4.0 permit suite is the most present.
CC0 empowers researchers, instructors, scientists, the contributors and proprietors ofcopyright- or database-secured substance to postpone those interests in their works andin this manner put them as totally as conceivable in people in the “public domain” soothers may uninhibitedly expand upon, improve, and reuse the works for any reasonswithout limitation under copyright or database law.
(https://creativecommons.org/share-your-work/public-domain/cc0)
Creative Commons Attribution (CC BY): Provides opportunities to make abstracts, andother changed variants, adjustments or subsidiary works of or from an article (for example,an interpretation), to incorporate into an aggregate work (for example, a compilation), tocontent or data mine the article, notwithstanding for business purposes, as long as theycredit the author(s), don’t characterize the writer as embracing their adjustment of thearticle, and don’t alter the article so as to harm the writer’s respect or notoriety.
Creative Commons Attribution – Non Commercial – No Derivs (CC BY-NC-ND): fornon commercial purposes, gives others an opportunity to disseminate and duplicate thearticle, and to incorporate into an aggregate work, (for example, a treasury), as long asthey credit the author(s) and gave they don’t adjust or alter the article.
7.9 Summary
Literary theft is a typical and major issue in the scholarly field and somewhere else.Copyright infringement in the scholarly world can happen in content or source code. It
Plagiarism 261

facilitates one‟s errand at the cost of someone else. Much of the time, copyrightinfringement happens because of absence of appropriate affirmation of work done byothers. This circumstance can be effortlessly maintained a strategic distance from byoffering direction to understudies on the hugeness of incorporating appropriate refer-ences in their work. From this section we come to know different programmingapparatuses and prescribed accepted procedures, the understudy, workforce, look intoresearchers or other individuals, can ready to present their papers or original copies unoriginality free. Be that as it may, even we come to know appropriate free and paidprogramming for testing counterfeiting, and consequently it is extremely advantageousfor speaking to the nature of work. Subsequently, this empowers to stay away fromliterary theft in understudy and also proficient life.
Further Reading
1. Urkund website2. https://timesofindia.indiatimes.com/life-style/fashion/designers/rahul-mishra-accuses-
indian-ethnic-wear-brand-and-a-french-label-of-plagiarism/articleshow/64176354.cms3. https://timesofindia.indiatimes.com/articleshow/65261081.cms?utm_campaign=andapp&utm_
medium=referral&utm_source=whatsapp.com&utm_source=contentofinterest&utm_medium=text&utm_campaign=cppst
4. https://www.plagiarismtoday.com/2018/01/04/copyright-plagiarism-2018-2017/5. Copyright and Fair Use Portal at Stanford University, http://fairuse.stanford.edu/, visited:
22 July 20066. J. Band, “The Google Library Project: Both Sides of the Story”, Plagiary: Cross-Disciplinary Studies
in Plagiarism, Fabrication, and Falsification, vol. 1, pp. 1–172006.7. https://www.plagiarismtoday.com/2011/10/04/the-world%E2%80%99s-first-plagiarism-case/8. COPE (https://publicationethics.org/)9. MIT, (March 25, 2003), “Budget Projections, Student Discipline Report Presented to Faculty”,
http://web.mit.edu/newsoffice/2003/facmeet.html, visited: 22 July 200610. http://www.ascd.org/publications/curriculum_handbook/413/chapters/An_Overview_of_
Outcome-Based_Education.aspx (example of outcome based education)11. EVE Plagiarism Detection System website, http://www.canexus.com/eve/, visited: 22 July 2006.12. The Stanford Daily, February 12, 2003 By A. Alemozafar, http://daily.stanford.edu/article/
2003/2/12/onlineSoftwareBattlesPlagiarismAtStanford, visited: 22 July 200613. Berkeley University of California, Student Conduct, Sanctions, http://students.berkeley.edu/
osl/sja.asp?id=1004, visited: 22 July 2006.14. Glatt Plagiarism Services website, http://www.plagiarism.com/, visited: 22 July 2006.15. www.centralia.edu/academics/writingcenter/16. http://www.hygeiajournal.com/downloads/Editorial/1597787464plagiarism.pdf. Hygeia: Journal
for Drugs and Medicines. ISSN 2229 3590 (online).K. R. Vinod, S. Sandhya, K. D. Sathish, A. Harani, D. Banji, O. J. F. Banji. “Plagiarism-History,Detection and Prevention”
18. J. D. Beasley, “The Impact of Technology on Plagiarism Prevention and Detection”, Plagiarism:Prevention, Practice and Policies 2004 Conference.
19. https://www.tru.ca/arts/php/history/A_Handbook_for_TRU_History_Students/Plagiarism.html
20. Massachusetts Institute of Technology Policies and Procedures, http://web.mit.edu/policies/10.0.html, visited: 22 July 2006.
262 Research Methodology

21. Stanford Honor Code, http://www.stanford.edu/dept/vpsa/judicialaffairs/guiding/pdf/honorcode.pdf, visited: 22 July 2006
22. https://en.wikipedia.org/wiki/Plagiarism23. https://plagiarismsearch.com/blog/6-scandalous-plagiarism-stories-that-you-should-know.
html24. Plagiarism Tour at turnitin.com, http://www.turnitin.com/static/flash/tii.html, visited:
22 July 200625. https://timesofindia.indiatimes.com/topic/plagiarism
Plagiarism 263

This page intentionally left blank

8Intellectual Property Rights
Dipali Kasat, Rajeev Kumar, and Shailaja Patil
CONTENTS
8.1 Introduction . . . . . . . . . . . . . . . . . . . . . . . . . . . . . . . . . . . . . . . . . . . . . . . . . . . . . . . . . . .2668.1.1 Intellectual Property . . . . . . . . . . . . . . . . . . . . . . . . . . . . . . . . . . . . . . . . 2668.1.2 Difference between Industrial Property and Intellectual Property . . . . . . 267
8.2 Significance of Intellectual Property Rights . . . . . . . . . . . . . . . . . . . . . . . . . . . . . . . . .2678.3 Forms of IPR. . . . . . . . . . . . . . . . . . . . . . . . . . . . . . . . . . . . . . . . . . . . . . . . . . . . . . . . . . .268
8.3.1 Patent . . . . . . . . . . . . . . . . . . . . . . . . . . . . . . . . . . . . . . . . . . . . . . . . . . . 2688.3.2 Copyright . . . . . . . . . . . . . . . . . . . . . . . . . . . . . . . . . . . . . . . . . . . . . . . . 2798.3.3 Trademarks . . . . . . . . . . . . . . . . . . . . . . . . . . . . . . . . . . . . . . . . . . . . . . . 2808.3.4 Collective Marks . . . . . . . . . . . . . . . . . . . . . . . . . . . . . . . . . . . . . . . . . . . 2828.3.5 Industrial Design . . . . . . . . . . . . . . . . . . . . . . . . . . . . . . . . . . . . . . . . . . . 2828.3.6 Integrated Circuit. . . . . . . . . . . . . . . . . . . . . . . . . . . . . . . . . . . . . . . . . . . 2838.3.7 Geographical Indications . . . . . . . . . . . . . . . . . . . . . . . . . . . . . . . . . . . . . 283
8.4 Importance of IPR in Global Economy . . . . . . . . . . . . . . . . . . . . . . . . . . . . . . . . . . . . .2848.4.1 Valuation of IPR . . . . . . . . . . . . . . . . . . . . . . . . . . . . . . . . . . . . . . . . . . . 285
8.5 Role of Intellectual Property in Technology Transfer . . . . . . . . . . . . . . . . . . . . . . . . .2868.5.1 IPR and Licensing . . . . . . . . . . . . . . . . . . . . . . . . . . . . . . . . . . . . . . . . . . 286
8.6 The Philosophy of Intellectual Property Rights . . . . . . . . . . . . . . . . . . . . . . . . . . . . . .2878.7 IPR as an Instrument for Development . . . . . . . . . . . . . . . . . . . . . . . . . . . . . . . . . . . .2878.8 Some Examples of Patent . . . . . . . . . . . . . . . . . . . . . . . . . . . . . . . . . . . . . . . . . . . . . . . .287
8.8.1 Self-Healing Power Grid and Method Thereof (U.S. PatentNo. 8504214) . . . . . . . . . . . . . . . . . . . . . . . . . . . . . . . . . . . . . . . . . . . . . . 287
8.8.2 Infectious Disease Detection (U.S. Pat. App. No. 20130130227) . . . . . . .2888.9 Summary . . . . . . . . . . . . . . . . . . . . . . . . . . . . . . . . . . . . . . . . . . . . . . . . . . . . . . . . . . . . .288Further Reading. . . . . . . . . . . . . . . . . . . . . . . . . . . . . . . . . . . . . . . . . . . . . . . . . . . . . . . . . . . . 289
Intellectual Property has the shelf life of a banana.—Bill Gates
Learning objectives of this chapter are to:
• Understand various forms of Intellectual Property• Explain the strategic value of IP and how IPR is applicable in research
265

• Illustrate the role of Intellectual Property Rights in research and in transfer oftechnology
• Evaluate the importance of IPR in modern global economic scenario
This chapter will enable the researcher to:
• Understand the scope of IPR• Predict and protect the research novelty in the form of IP• Select the IPR tools that acquire legal rights of exclusively using creations of one’s
own for a certain period of time• Judge research innovation from patenting aspect
8.1 Introduction
It is accepted universally today, that Intellectual property (IP) and intellectualproperty rights (IPRs) are important in the progress of nation development, andare considered as a barometer of research and development activities. The mainaim of this chapter is to give researcher an experience of deep dive into theworld of Intellectual Property. Following sections will help you to understandthe strategic value of IP and how IPR can be applied to the research, innovationsand the artistic creations by encouraging technology transfer. For a fastpace technological/industrial development an understanding of IPR is utmostessential.
8.1.1 Intellectual Property
There are various forms of invention, creativity, research, innovations, artistic creationsthat are covered by Intellectual property. In daily life, we come across various forms ofIP like, literary work (e.g., Book), electronic devices (e.g., Mobile), songs, movies,pharmaceutical products etc. The legal rights covering IP are called as Intellectualproperty rights. For example, an original literary work and an invention are intellectualproperty and when protected by the IPR, they will be termed as “copyright” and“patent,” respectively.
There are two types of properties:
1. Physical Property: It is the tangible property such as Land, Ornaments, House,Money, Building, and so on.
2. Intellectual Property: It is the intangible property such as Patent, Copyright,Trademark, Design, Geographical indications, and so on.
Like physical property, intellectual property can also be protected by registering itunder an appropriate legal regime. Intellectual property laws differ in each jurisdic-tion. The implementation of IP rights obtained distinctly in each territory of interest,is directed by the rule of the country in force, namely the Law of IntellectualProperty Rights.
266 Research Methodology

IPR is a tool for the owner of IP providing exclusive rights in the form of Copyright,Patent, Trademark, Integrated Circuit, Geographical Indication, or Industrial Design.The owner of IP acquires legal rights of his/her creations for a term period, known asTerm of IPR. Table 8.1 provides a summary of the types of intellectual properties alongwith the duration, called as Term and the subject matter.
8.1.2 Difference between Industrial Property and Intellectual Property
The word Property authorizes those articles that are normally acknowledged to be anasset of a single entity or a group. For the ease of understanding, the IP can becategorized as, Industrial Property and Copyright. Industrial Property refers to theindustrialized intellectual yields, such as patents, designs, trademarks, trade secrets,and so on. In addition to Industrial property, the Intellectual Property includes otherrights such as copyright for literary works, artistic works, software etc. However, today,it is common practice to use the word Intellectual Property as a catch-all term thatcomprises of all properties resulting from the practice of human brainpower.
The colloquial definition of Intellectual Property can be stated as it is that intangibleproperty that is coming from the exercise of human intellect, such as inventions, ideas,music, design, article, poems, and so on. In short, Intellectual Property is about creative ideas.
There is a wide range of creations covered in Intellectual Property Rights, such as acopyright on an article or book, a trademark, which is a logo that distinguishes its logodesign signifying a firm and its services, a patent on the invention or innovative design/process, various trade secrets, geographical indication such as Darjeeling Tea, trade-related aspects such as trade secrets, and so on.
8.2 Significance of Intellectual Property Rights
In the modern business model, concepts and understanding are important from thebusiness point of view. A major worth of pharmaceutical and cutting-edge technologyproducts lies in the extent of innovation, research, design and testing, invention involved.
TABLE 8.1
Forms of IP with Subject Matter and Term
Form of IP Subject Matter Protected Term of IPR
Patents Inventions 20 years (from the date of priority)Industrial Designs The aesthetic or ornamental aspect of
useful objects15 years
Trademark Indications to distinguish the source/origin of a product or service
10 years from the date of registration
Copyright Literary, artistic, dramatic, and musicalworks
60 years
GeographicalIndications
Indications of geographical origin wherespecial features are attributable corre-sponding to the territory
10 years
Integrated Circuits Layout designs 10 Years
Intellectual Property Rights 267

For business growth of any enterprise today, it is important to protect the novelty inthe form of IP because it is a key element required to maintain a competitive point in themarketplace. IP is an integral part of the commercial process. The supervision andprotection of IP can mean the difference between victory and disappointment inbusiness today. The Movies, music rendition recordings, theater renditions, books,computer applications, and online facilities are basically traded due to the originalityof content. Many commodities that used to be imported or exported, now containinnovation and design in their goods, like brand-named products/clothing. Therefore,inventors are given the Intellectual property rights to inhibit others from using theirfoundations, inventions, or designs. Thus, IPRs are the key handlers of economicperformance in Research and Development–based business models by preventingothers from infringing the original creation. It is to be noticed that rationalization ofthe implementation of the rights ensued is restricted to the territory/country whichpermits such rights and cannot be extended beyond the province of the that country.
8.3 Forms of IPR
World Trade Organization (WTO) recognizes following forms of IPR, under Trade-Related Aspects of Intellectual Property Rights, known as TRIPS agreement [1]:
• Patents• Copyrights• Geographical indications• Integrated circuits• Trademarks• Trade secret• Designs
In addition to all this, there are other forms such as plant variety protection, utilitymodel, and so on. However, the important and common forms of IPR include Patents,Copyright, Trademark and Design. The Patents, Copyrights, and Designs all fall underthe category of IPRs that encourage inventive and artistic works. Trademarks andGeographical indications formulate the informative category of IPRs. Figure 8.1 sum-marizes the forms of intellectual property associated with the IPR.
8.3.1 Patent
The word “patent” is originated from a Latin word “patere,” which means “to lay open”(i.e. to make accessible for unrestricted assessment). Patent is a form of IPR attained byan inventor for his/her technological invention. An invention can be termed as a novelproduct or procedure involving an innovative step and capable of industrial applica-tions. To be patentable, an invention must be Original, Nonobvious, and Industriallyapplicable.
268 Research Methodology

• Original:
○ not previously known or used by anyone in the public domain○ not available in any document of any publication in the electronic or print media
(no publication even of the inventor as author prior to filing a patentapplication)
• not a part of the state of the art Nonobvious:
○ should include the element of technological advancement and economicsignificance
○ have a known use or produce a concrete and tangible result not clear to anyonehaving average skills in that area of technology allied to that invention
• Industrially applicable:
○ Capable of being manufactured and used in the industry. In broader sense, theterm “Industry” is applicable to all other fields also like medical, agriculture,public services etc. It also means, invention should be infeasible for non-patentable subject matters such as perpetual law of motion, methods of medicaltreatment etc
The inventor can check these three features, viz. originality, nonobviousness, andindustrial applicability of his/her invention by doing a thorough prior art search. Todo a prior art search the inventor must
Patents
Trademarks
Intellectual
Property
Copyrights
Geographical
Indications
Plant
Breeder
Rights
Trade
Secrets
Registered
Designs
FIGURE 8.1Forms of Intellectual Property Rights
Intellectual Property Rights 269

• Derive the outline of the invention and identify the keywords with all the possiblesynonyms
• Think about where most relevant information would be. A lot depends on thenature of the invention
• Search journal articles and research papers• Go through books related to the discipline• Check on Internet search engines (e.g., Google)• Search the prior patents in commercial databases and national patent office databases• Patent Databases
○ The Indian government allows the public to freely search on their Web site,ipindia.nic.in. [2]. Additionally, other national offices allow you to search theirdatabases
○ European databases on patent [3]○ Japanese database on patent (in English): [4]○ The United States Patent and Trademark Office (USPTO) website: [5]○ World Intellectual Property Organization (WIPO) website: [6]
After prior art search with reference to above links, the inventor should decide thecategory of his/her invention. An invention to be patented falls in one of the followingcategories
• Utility: process (method), machine, manufacture, or composition• Design: ornamental design for an object, Industrial design of the product• Plant: new variety or any new and useful technological improvements
(i) Utility Patent: The former and most regular patent is known as a utility patent. Autility patent ensures the way an item is utilized, merchandized and it is widelyrecognized. The other type of patent one can acquire is known as a design patent alsocalled as outline patent, which secures the way an object looks. The last type of patentone can get is known as a plant patent, as the name suggests, it ensures disclosure ofnovel assortments of plants.
After the prior art search and decision of category, the inventor can then proceed tofile a patent application. Patent filing specification can be either provisional specificationor complete specification. If the invention is still at a conceptual stage, the inventor cansecure his/her idea by filing the provisional patent or else the inventor secures theinvention with complete specification. But legal rights are granted for complete specifiedpatent only; provisional specification is preferred just to fix the patent’s date of priority.The Provisional patent application is used to secure the idea and the inventor gets aperiod of twelve months to submit the complete details of the invention.
(ii) Who can apply for a PATENT?Patent must be connected with the names of the “innovators” who have contributed inthe development of patent. In the event that any individual has made some commitmentabout the origination of one component in any claim recorded in the patent applicationclaims, at that point that individual must be recorded as a designer in the patentapplication. It doesn’t make a difference whether you have contributed 99.9% towardthe origination of your creation. In the event that someone else has contributed the
270 Research Methodology

remaining .1% toward the creation, at that point you should apply for the innovationwith that individual if that .1% is a piece of any entitlement in his/her application.There can be combined inventorship if two or more participants work toward theinvention.
Wherever two people are absolutely ignorant of each other’s work respectively,regardless of whether they are utilized by a similar organization, there is no combinedinventorship.
(iii) Benefits of applying for a patentA patent is a legal protection that gives an inventor monopoly and the right toexclude others from doing certain endeavor in the country of issuance. The interna-tional norm is to provide a term of at least 20 years from the date of submission of apatent application. Patent rights prevent others from commercially using, making,importing or selling, or distributing it. Similar to any other property right, a patentmay be licensed, transferred, sold, or simply abandoned. However, on the grant ofpatent, a patentee enjoys all the rights conferred by the law. The patentee can setup aventure, launch the product in market and gain profit till the term ends. There is a hardfact about patent, beautifully quoted by Mark Twain, “The man with a new idea is acrank until the idea succeeds.” The protection ends once a patent terminates, and suchinvention enters into the public domain, wherein the proprietor holds no exclusiverights to the invention. Such a patent can be used by any other interested person orentity for manufacturing and distributing to be used in favor of public at lower price. Avery good example of such case can be seen in generic drugs. After the completion ofterm of any pharmaceutical product, such drugs are manufactured and sold as genericdrugs at a price that is affordable to general public.
(iv) Common consideration in patent filingAn idea with potential commercial application needs hard efforts of a researcher. But ittakes lot of efforts, labor, time, and resources to get that idea in one’s name in the formof “Patent”. Getting an invention protected by a patent needs continuous patience andyet hard efforts. Apart from investing in time, money and resources in the patent filingprocess, one must spare some time understanding the pitfalls that one can fall prey to,inadvertently, in the process of getting a patent granted. A little more effort to developan understanding of the “Invention Industry” can put you on the safe track, right fromthe beginning of patent protection idea.
Following are the few prerequisites for patent filing:Getting an idea and its preliminary success cannot assure it as a patent. There are a lot
more check points which an idea has to successfully cover in order to assure its claim forprotection as patent.
• Novelty
The idea must be novel in every sense. The science or the skill might be well versedwith the world but the art or its use must be new. This is the very first step in patentfiling process which needs a lot of time and capital investment. A careful andintelligent approach can help to cross the first barrier on whose basis preliminaryscreening of a patent application is done. It is very encouraging to look oneself for thesimilar inventions or ideas in literature through internet. Such self-searching rules outthe major apprehensions about the novelty of the work. But relying completely on theInternet self-search can put the invention in trouble as there can be chances that some
Intellectual Property Rights 271
of the filed applications similar to the intended invention might just not come up assearch result. There is a problem with most of the inventors who are so enthusiasticabout their invention or idea that they want to do it all by themselves. This might befor saving capital resources but this small act of money saving can make theapplication prone to cancellation on a novelty basis.• Utility
This is very important for an invention to find utility in society. There is no use of aninvention or idea that cannot serve in public. Finding the utility is sometimes over-looked by inventors. One must be clear about the section of society whom theinvention is going to benefit. This not only widens the horizon of initial idea andconcept but also adds to the clarity of the scope of your invention which is to bementioned in Provisional Patent application. A proper market survey also helps toknow about what edge your invention has over the pre-existing products in themarket. A true picture of marketability of your invention or product gives you aclearer insight to make the deals with product licensing firms in future who will takeup your product to the market and save you from making wrong choices or losingprofitable deals.Once the invention or idea passes all of these mentioned prerequisites, it isconsidered to be ready to put into the patent filing procedure. The degree andamount of hard work that brought the invention in reality is what is againsought, to get the invention protected through patent. One is expected to betechnically aware of all the legal terms and conditions of “Invention Industry”that are to be followed throughout the journey of “Patent Granted” status. Thetwo main terms are:• Date of conception of idea/invention:This date has got a great significance as it marks the time since you claim theinvention. This is not just the date when the inventor started working on the ideabut the date when inventor owned the complete functional idea of the invention.• Selling the invention or first public use:
Once the invention is sold or is used publicly, the significance of date of conception inpatent filing application is carried away by the date of first public use of invention after itis sold.
According to USPTO, in 2011, it is not just enough to be “first to invent” as perthe date of conception of invention. They introduced “first to file” rule and made itimportant to complete the non-provisional and provisional filing process to claimfor any invention. The section below describes some important facts to be consid-ered by the inventor while filing a patent application.
(v) Do’s and Don’ts of Patent Filing Procedure:
• Protecting intellectual property:Having known the novelty and market value of the invention, it is apparent for anynoble inventor to go and talk about it among peers and society. Though donefor bragging or to grab some more good ideas for improvisation, this act is generallythe most avoidable in case of patent filing. The invention that is intended to be filedfor patent must be kept secret for as long as possible. By keeping secret, it is meantto not to disclose the invention in any form that might lead to its copy or even
272 Research Methodology

improvisation. It is wiser to stay silent till you get it. It is very important to protectyour idea till patent is filed.• Time limit for patent filing (or the 12-month window)The USPTO or any patent granting organization gives a particular time span (12months for USPTO) starting from the date of conception of invention or date of firstpublic use, after which the patent file is not considered for granting the patent.Missing the last date to file the patent can, in the first place, end the possibility ofgetting a patent granted.• Drafting claims in filing patentThe idea of invention must be clear and informative enough that a novice too canunderstand. It must reflect a perfect understanding of the inventor about the func-tional details of the invention. The description of invention at every step of filing thepatent (be it primary non-provisional application or the final provisional patentapplication) should be same and equally supporting to the expected product ofthe invention. Any mismatch between the facts or description presented about theinvention in applications or the final product may lead to the cancellation of theapplication. This means starting all over again.• AssuranceThe popular phrase “haste makes waste” makes perfect sense with inventorswhen it comes to a new invention. Any sort of act to make money or recognitioncan put the fate of patent on stake. Rest assured by filing the application forpatent and selling the invention even before the patent is granted, can be adisaster if, there occurs any discrepancies with the Provisional Patent applicationresulting in cancellation of file. This puts you again on step 1 of patent filingwhich now considers the date of first public use of invention. In case of refilingthe patent, there are increased chances of crossing the required time limit forfiling the patent and losing the opportunity to ever get the invention protectedwith your name.• Clarify inventorship and ownershipWhen there are two or more persons involved in an invention, it becomes veryimportant to clarify the ownership rights of the patent to protect the commercialvalue of the patented invention, in case of any dispute between the rightful inventorsof the invention. Any failure or delay in reaching to an agreement can affect themarket value of the patented invention.• Diligence in record keepingGetting an invention protected by patent in your name is a long and time-consumingprocess that requires an additional diligence in keeping the record of each and everydetail. Any negligence in keeping records and verifiable proofs of date of conceptionof idea can endanger the viability of otherwise granted patent in case of any litigationagainst your application or claim.
A careful understanding of these points can be instrumental in strengthening thepatent filing process and saving of time, energy, and resources of an inventor whointends to protect the intellectual property through patent.
Intellectual Property Rights 273

(vi) Patent Application filing in IndiaThe Patent Act, 1970 governs patents in India, which was modified in the years 1999 and2016, respectively. A patent is a lawful control conferred to the owner of an inventionfor a specific duration. With this right, a patentee can stop others from selling, import-ing, or manufacturing the patented invention.
The time-span of examination and granting of patent varies depending on number ofapplications received at Patent office. Once a patent is granted, a patentee can enjoy itsbenefit for 20 years from the date of filing an application. The following Figure 8.2shows the patent application process in India.
(vii) Application of Patent:In harmony with the requirements of Patent Act, the inventor, his/her assignee or legalagent of deceased person, can apply for patents. Application can be made at the IndianPatent Office or its branches according to the territorial jurisdiction.
Patents can be filed online in respective jurisdiction: Mumbai, Kolkata, Delhi, andChennai.
18 months if early
pub. not requested
Deemed
WithdrawnFirst Examination
Report (FER)
Issued
Response to FER No Response to FER
Deemed WithdrawnIn Order for
GrantNot in Order
for Grant
Publication in respect
of Grant Refused
Open for Post-Grant
Opposition
Open for Appeal
at IPAB
12 Months
Patent Application
[Provisional Specification]
No Complete
Specification
Deemed
Withdrawn
Complete
Specification
Publication
Open for PRE-Grant
Opposition
Request For
Examination
No Request For
Examination
12 Months
48 Months
Patent Application
[Complete Specification]
FIGURE 8.2The Patent Filing Process in India
274 Research Methodology

(viii) Regional Patent Office’s JurisdictionThe forms and documents that are mandatory for filing a patent application in India areas under:
• Form No.1- Application• Form No.2: Provisional or complete specification• (The complete specification must be filed within 12 months from the date of
Provisional Application filing)• Form No.3 – Statement of undertaking• Form No. 5: Declaration of inventorship• Form No. 26: Power of attorney (if filed through Patent Agent)
Online filing option is also available to inventors by using E-Filing Portal of the PatentOffice. (https://ipindiaonline.gov.in/epatentfiling/goforlogin/dologin) Indian PatentOffice’s and their territorial Jurisdiction are shown in Table 8.1.(ix) Types of Patent ApplicationFollowing are the types for filing national and international applications
A. National Application• Provisional application:
Provisional application is basically for securing the inventors of idea and metho-dology. The provisional application contains description of the creation beginningwith a title adequately indicating the invention related subject-matter, and draw-ings, wherever required. It should be noted that a Provisional Specification can’tbe submitted in case of Convention or a PCT National Phase Application. Here,filing a Complete Specification is compulsory. The thorough description should besubmitted within 12 months from the priority date of the provisional application. Ifthis requirement is not fulfilled, the claim shall be believed to be abandoned as perSection 9 (1) of the Indian Patents Act, 1970.• The components of a Provisional Patent filling
There are two broad divisions of provisional patent specifications: Title andDescription.Title: Provisional patent specification begins with the title of the invention. Theword limit for title is fifteen.
TABLE 8.1
Indian Patent Office’s Jurisdiction
Patent Office Branch Territorial Jurisdiction
Mumbai The States of Maharashtra, Goa, Gujarat, Madhya Pradesh, Chhattisgarh, The UnionTerritories of Daman and Diu, Dadra and Nagar Haveli
Chennai The States of Andhra Pradesh, Telangana,Kerala, Karnataka, Tamil Nadu, The Union Territories of Pondicherry andLakshadweep
New Delhi The States of Delhi, Punjab, Haryana, Rajasthan, Himachal Pradesh, Uttar Pradesh,Jammu-Kashmir, Uttarakhand, and the Union Territory of Chandigarh.
Kolkata (Head Office) The rest of India.
Intellectual Property Rights 275

Description: The description should begin with the preamble and contain thesections of field and object of invention. The technical field of invention should bementioned in the field. It should be described aptly so that the nature of theinvention and classification of its technology can be easily identified. The section ofobject is describing the necessity of the invention. It is essential to mention, whatadvantages the invention would bring as solutions to the existing issue.• Complete Specification Application:
A complete specification is a document, which describes all details of an invention in asufficiently clear and concise manner. The complete specification is different from thatof the provisional specification. The complete specifications conclude with a set ofclaims. The important aspect of specification drafting is that, each claim in the completespecification may define an invention. Hence, a priority date is associated with eachclaim. The necessary forms required are already mentioned in above section. Inaddition to these forms, the applicant can request for early publication in Form No. 9,wherein the patent will be published within a month. If such request is not received,then the patent is published after 18 months from the date of filing. Note that, inventormay not be necessarily applicant. In such cases the applicant owns the patent.A request for examination should be made in Form 18, within 48 months from thepriority date. In case of nonreceipt of such application, patent application will notbe examined.• Components of complete specifications:
A complete specification should be submitted in Form No. 2. As mentioned earliercomplete specification must contain the claims. The components of complete specifi-cation are as follows:
○ Title○ Preamble of the invention○ Technical field○ Background○ Objects○ Brief description of the drawings○ Detailed description○ Claims (for complete specification)○ Abstract
B. International Patent Application
1. International Patent application can be filed in two ways, Paris Convention2. Patent Cooperation Treaty (PCT).
• Paris convention
The Paris Convention is first international treaty, signed at Paris in 1883. In Paris Conven-tion inventors are allowed to file a patent in their own country first, and they get a timeperiod of 12 months (after its initial filing date) to file elsewhere in other countries. Thisgives innovators extra time to perfect their product (with respect to need of market).
276 Research Methodology

Within this time span one can also look for funding options. The Paris Convention allowsinventors to use priority date of his/her own country while filing the patent in othercountry (within twelve months only). It saved the inventors time and money from havingto file patents simultaneously in all the countries that he or she wishes to file.• Patent Cooperation Treaty:
The PCT is an International patent law treaty that provides security for his/her inventionin many countries. PCT is administered by World Intellectual Property Organization(WIPO). As of now, there are 152 countries that are signatories of PCT [7, 8].Through PCT, it is possible to get patent protection for an invention in all signatorycountries simultaneously, by filing an international patent application. Residents ofIndia can file an international application with the Indian Patent Office at Mumbai,Delhi, Chennai, and Kolkata as the Receiving Office or the International Bureau ofWIPO as the Receiving Office.• The PCT procedureThe PCT procedure consists of two main phases. The international application is filedin first phase and the international application enters into PCT designated countries,where the application is evaluated under the patent laws. Thus, there are two phases:“international phase” and a “national phase.”
○ International Phase: It is the phase before the entry of international patentapplication into designated countries. During the international phase, the inter-national patent application is published, searched and examined
○ National Phase: The National Phase follows the International Phase and involvesin finalizing the application in the Patent Office of specific countries. It isessential for an applicant to submit a nationwide phase application in corre-spondingly selected nation, where patent protection is requested for, within 30/31 months from the earliest filing date of the initial application. The granting/nongranting of patents is decided by the national or regional patent Offices inwhat is called the “national phase”
Figure 8.3 shows the international filing system and its timeline.Procedure for PCT requires application consisting of a request containing description,
claims, abstract, drawings of the invention. The language can be English or Hindi. Theinternational application needs to be filed in triplicate. The PCT procedure includes:
Enter National
Phase
Timeline in monthsTimeline in months
0
12
File Local
Application
File Application
Abroad
12 0
File PCT
Application
File Local
Application
PCT Route Paris
Convention
30
FIGURE 8.3International Filing System
Intellectual Property Rights 277

• Filing: Application can be filed in regional patent office• International Search: An International Searching Authority (ISA) verifies the pub-
lished patent application and prior art that may have an influence on whether yourinvention is patentable, and gives a written opinion on your invention’s potentialpatentability
• International Publication: On expiration of 18 months from the filing date, thepatent application is published
• National Phase: Usually at 30 months from the filing date of application, fromwhich priority is claimed, the grant of patents can be pursued directly at nationalpatent Offices of the countries where the applicant wants to obtain the grant
(x) Oppositions:There are two types of opposition that an application might face Pre-Grant and Post-Grant Opposition.
• Pre-Grant Opposition
The Section 25(1) of Indian Patent Act 2005 (amendment) discusses about filing a pre-grantopposition against a patent application. Under this provision, the patent application can bechallenged by any person, or third party. An application can be submitted to the controllerof patents in writing regarding an opposition to the published patent, before the patentis granted.
Pre-grant opposition are like safety net that captures objectionable patent applicationsbefore grant of patent. The opposition can be filed on the following grounds, asmentioned in Patent Act, Amendment Act, 2005 in Section 25(1)[(a) to (k)]
• If the invention is obtained wrongfully• Lack of inventive step or obviousness• Nonpatentable subject matter• Prior public knowledge or public use in India• Prior publication anticipation• Prior claiming or anticipation in India• Insufficiency of description of the invention
• Post-Grant Oppositions:As the name suggests, the opposition can be filed even after the patent is granted. Apost grant opposition can be filed within one year from the date of grant. A patenteehas to justify that his/her invention is genuine and doesn’t fall under any of theaccusations made on the grounds, as mentioned below. A patent can be opposed onvarious grounds as mentioned in the Section 25(2) of the Indian Patent Act, 1970, asenlisted:
• If a patentee wrongfully obtains the invention from an opponent• The patent claim/s are published in India or elsewhere before the date of priority• The invention claimed by patentee was known publicly in India or elsewhere• The invention is obvious or lacks an inventive step
278 Research Methodology

• The invention includes nonpatentable invention• The complete specification does not reveal the methodology used for invention or
wrong information of the source; or biological material’s geographical origin• Failure to disclose information to the controller, regarding any applications that
might be filed in any foreign country for the same invention• Not filing the convention application within the 12 months from the date of priority• Invention anticipated with traditional knowledge from India or elsewhere
The grounds of both, the pregrant and postgrant opposition proceedings are similar.This ensures a two-tier method of opposition to check frivolous patent claims andwrongful monopoly of the patentee.
(xi) Patent Renewal/Maintenance FeeAs per the Indian Patent act, the patent remains in force for 20 years from the date offiling with the payment of renewal fee or annuity fee. To maintain the patent rightsand enjoy the ownership, patentee has to pay the fee each year from the third year to20 years (Rule 80[1A,Patents act]).
The applicable fee varies depending upon natural person, start-up, and small entity;and also whether e-filing or physical filing is done. The renewal needs to be done everyyear before the end of grant date. For example, the restoration cost/fee may be paidbefore completing the fifth year from the date of grant, for the sixth year (in advance).The applicable patent renewal cost to pay can be found on patent official websites [9]. Incase of inability to pay, an extension period of 6 months is available. Such ceased patentcan be reinstated, by paying the renewal fee within 18 months from the date on whichthe patent ceased to have effect.
8.3.2 Copyright
Copyright is the right given by law that protects creativity and expression of ideas ofauthors, artists, etc. for their work. Copyright includes expression of ideas in an originalway, in the form of poetry, book, drama scripts, music and other forms of artistic workslike choreography, sculptures, paintings, drawings, photographs, and so on. Copyrightprotects the expression of idea but not the idea. The types of copyright works can besummarized as:
• Original literary work includes any form of published or unpublished, nondra-matic textual works, databases, computer programs, and so on
• Dramatic work such as plays, dramas, and screenplays• Artistic work such as painting, architecture work, craftsmanship, a sculpture, a
drawing including a chart or plan, diagram, map, photograph, and so on• Musical works• Sound recordings, cinematography, or broadcasts
Following rights are exclusive to the copyright holder and consent is needed to:
• Create copies of the work• Circulation of copies of the work
Intellectual Property Rights 279

• Present the work publicly (such as for plays, film, or music)• Exhibit the work publicly (such as for artwork, or any solid material used on the
Internet or television)• Derivative works including making alterations of the original work• Copyright owners can give diverse users unlike rights from this list. The same
image can also be used on a glossy magazine cover, in a commercial or included ina documentary film, for example
To file a copyright the author can follow the stepwise approach:
• Categorize work in appropriate category• Determine the ownership• Identify the application forms• Fill the registration form online/offline as desired• Pay the fee and submit the required documents
Copyright infringement is an act wherein the other party acts as having the exclusiverights of an author without the consent or authorization of the author. One cannotassume that any work on the internet is in community purview. Altering an imageis an exclusive right of the copyright owner and requires permission almost allthe time.
Any use of copyrighted material will not be considered as infringement when theseare used for reproduction in news reporting, teaching, research, criticism, national cause,religious programs, and so on.
8.3.3 Trademarks
A trade mark is an identity that distinguishes goods and services of one from others.There are many types of trademark that receive protection under Lanham act. Acommon trademark contains word, phrase, name, logo, or symbol to identify source ofproducts or goods. In addition, trademarks have other forms such as certification mark,collective mark and service mark, trade dress, and so on.
• Trademark: A mark that includes any combination of words, letters and numerals,logo, device, to form a label, signature, colored marks, and three-dimensionalsigns. Trademarks also includes audible signs (sound mark), olfactory mark(smell mark). It is an identity that enables a customer to identify the foundationor source of a product or facility
The unregistered trademarks are depicted by the symbol “TM”. The registered trademarkis denoted by the “®” symbol. A registered trademark is supposed to guarantee thequality of goods bearing the mark. It can be used as for marketing and building a brand.
The attributes that a trademark must possess are: it must be an invented work, and itmust be distinctive. Also, the mark must not be deceptively similar to an existing mark,name, or surname of person, word that reveals the nature of product, or geographicalname. Following the examples of trademarks depicted in Figure 8.4 uses either Word orLogo Mark ()
280 Research Methodology

• Service Mark: A service mark is used to distinguish the services provided byany enterprise. The service mark is identified by symbol SM as opposed to TM.The line of difference between the SM and TM is very thin. The SM is used forservices, whereas TM is used by enterprise to identify and distinguish products.The SM can be a system supplying public needs such as electricity, water,transport, communication, maintenance or repair work, or any such service.There are many enterprises those manufacture products as well as provideservices such as Amazon. A very prominent example of service mark forrestaurant services is McDonald’s. Similarly, Dmart and Walmart are registeredservice marks for retail store services (depicted in Figure 8.5)
• Certification Mark:
The certification mark does certify the origin or nature of the goods and services. Thecertification mark is defined in The Indian Trade Marks Act, Section 2(1) (e) as:
a mark capable of distinguishing the goods or services in connection with which itis used in the course of trade which are certified by the proprietor of the mark inrespect of origin, material, mode of manufacture of goods or performance ofservices, quality, accuracy or other characteristics from goods or services not socertified [10].
When any product successfully passes a test, it is said to meet certain standard imposedby the certification authority.
The CM shows the level of standard of a company, that is, it shows that goods andservices of the trader are certified as meeting certain standards laid by certificationagency. With this, the consumer is assured that the manufacturer has ensured thestandard of production. The certification mark identifies the material, origin, and the
FIGURE 8.4Some Examples of Trademarks
FIGURE 8.5Some Examples of Trademarks
Intellectual Property Rights 281

quality of the goods and services that distinguishes a specific brand/company fromother competitors. In short, certification marks define “standard” of goods and services.
Example: ISI mark used for industrial product, Woolmark is certification for fabrics,Agmark for all agricultural products, and so on. Figure 8.6 depicts examples ofcertification marks.
8.3.4 Collective Marks
As the name suggests, the collective mark (CM) is associated to a group and not anyproduct or service. The Indian Trademarks act 1999 (Section 61) defines collective markin Indian context.
Such trademarks are owned by some association, institute or organization. Thesetrademarks are primarily owned by an organization, institutes or any association thatis related to several members.
The CM is used by a group, who wants to be identified by quality and accuracy. Thisalso includes geographical origin or other specific features set by the organization inwhich they are working or are related with. Many traders use the collective mark, whenthey are associated with that organization. It indicates the membership of the associa-tion, union, or organization.
Examples of collective trademarks are depicted in Figure 8.7. “CA,” which is used bythe Institute of Chartered Accountants; 2. “CPA,” which is used by Society of CertifiedPublic Accountants
8.3.5 Industrial Design
To protect the aesthetic aspect of any design, the Patent Office confers an industrialdesign right. Industrialization is the main cause for growth of protection of designs. TheIndian Patent and Design act was passed in 1911 and amended in 2000. The act definesthe design as “features of shape, pattern or ornament, lines or color applied to anyobject” [11].
The main principle for acquiring protection rights for a design is uniqueness andcreativity of the design, for example, design varieties applicable to tooth brushes,furniture, electronic devices, jewelry, and so on. The creator should protect an industrialdesign generated from his/her creative thinking because keeping an industrial design isan incentive for their creativity and adds commercial value to a product. When themarketplace is loaded with a large variety of products with exactly same functionality,
FIGURE 8.6Some Examples of Certification Marks
282 Research Methodology

industrial design is the key of choice in factors that magnetize consumers to a productor leads them to select one product over another.
However, the industrial design right protects exclusively the nonfunctional aspects ofan industrial product but not technical features of the object. Once the design isregistered, the design remains in force for 15 years.
8.3.6 Integrated Circuit
The protection of an integrated circuit refers to the protection of layout design of thecircuit.
Every electronic device contains integrated circuit. With advent of technology, thesemiconductor industry is developing very fast, and huge number of components isbeing accommodated on a single chip. Here, layout design of a semiconductor inte-grated circuit plays a very important role. Hence, layout design of integrated circuit isincluded in IPR. India is a signatory of the World Trade Organization, which follows the“Semiconductor Integrated Circuits Layout-Design Act” passed in the year 2000, underTRIPS agreement [12].
This act defines what is meant by the layout design and Semiconductor IntegratedCircuit. The layout design is defined as, “a layout of transistors and other circuitryelements and includes lead wires connecting such elements and expressed in anymanner in a semiconductor integrated circuit” [13].
The semiconductor integrated circuit is defined as “a product having transistors andother circuitry elements which are inseparably formed on a semiconductor material oran insulating material or inside the semiconductor material and designed to perform anelectronic circuitry functions” [13].
An application for layout design protection can be made by the creator of the layoutdesign or any legal representative. The application should be filed at any regional officecorresponding to territory. A Term of Protection is 10 years for layout designs.
8.3.7 Geographical Indications
A geographical indication (GI) is a mark used on products that have a specificgeographical origin such as country, region, city, and town; and possess abilities ora repute that are due to that origin. GIs have been given status of intellectualproperty because the product gets more commercial value by associating it to aparticular place.
FIGURE 8.7Some Examples of Collective Trademarks
Intellectual Property Rights 283

The Geographical Indication is defined in TRIPS Agreement, Article 22 as “indicationswhich identify a good as originating in the territory of a Member, or a region or localityin that territory, where a given quality, reputation or other characteristic of the good isessentially attributable to its geographical origin” [14].
In India the protection of GI was enacted in 1999, as it was the member state of theTRIPS Agreement. Advantages of Registration and Protection Act states that Consu-mers are protected from deception by inhibiting misuse of GI by any unauthorizedperson and interest of producers is maintained. Moreover, the export market will havegoods of Indian GI.
Geographical indications are goods such as natural, agricultural, or manufacturedgoods, where its features are attributable to its geographical origin, such as climate, soil,and a traditional method of production. Some examples of GI are Alphonso mango,Nagpur Oranges, Surat Zari craft, Chanderi Saree, Kanjeevaram Silk, Feni and Scotchwhisky, Darjeeling Tea, Champagne, and so on.
It is important to note that, a single product such as a cell phone can have multiple IPRsassociated with it. The new features invention can be patented. The device software can becopyrighted. Fashionable or stylish design of body of cell phone can be protected underIndustrial Design. The logo on the device can have a trademark of a manufacturer.
8.4 Importance of IPR in Global Economy
The IPR have played a significant role in enhancing the scientific advancementsworldwide and these rights have helped industries of all types (small, medium, andlarge) to grow up. There is direct role of IPR in facilitating economic growth, however,this topic has to be looked at by different perspectives for developed and developingnations, for national and state economies, and so on. There may be cultural differencesor socioeconomic variations prevailing in same state as well. IPR not only induceseconomic growth but also creates enticement framework that inspires research, inno-vation, and development. More importantly, in today’s world where globalization hastaken over, IPR also helps to give remedies to various global challenges, so thatincreasing demands of food, pharmacy products, alternative energy sources, climaticchallenges, and so on can be easily coped up.
The United States has set an example of IPR related economic growth; therefore, thistopic has grabbed the attention of rest of the world and many studies are beingconducted worldwide, on IPR related laws, policies, and theories to study theeconomic growth because of IP. Likewise, enforcement and protection of IPR is alsoimportant for international trades. Towards approaching this task, where economicgrowth was related to IP, the research was carried out by Rapp and Rozek in year 1990[15], which is known as RR approach. The RR approach dealt with compulsorylicensing, patents for pharmaceutical products, and so on; however, this approach didnot take into account enforcement laws and effectiveness [16]. However, in 1977Ginarte and Park used the RR approach and studied more exclusively five moreaspects to compare patent laws of different countries including duration of protection,level of coverage, and so on. Maskus and Penubarti gave an empirical mathematicalrelation, which deals with the IPR and GDP.
284 Research Methodology

Furthermore, it is very important to state that along with other parameters, foreign directinvestment (FDI) also plays a major role in the economic development of country. It has beenobserved that an increase in the rate of innovation can be directly correlated to the increase inthe rate of economic growth. However, IP solely is not responsible for economic growth;other important facts such as country’s research base, trading policy, stable macroeconomicconditions, etc are also required for sustained growth in economy through inventions.
The role of IPR in economic growth is further analyzed using the example ofUnited States and India. According to one report, the United States’s IP is worth $5.8trillion that is more than the GDP of some of the other countries in the world.Among that IP-intensive industries are around 38% of total GDP of the United States.IP also accounts for 74% of exports in the United States [17]. An overall analysisdepicts that the direct and indirect economic impacts of invention are quite effectivewhich is responsible for more than 40% of U.S. economic growth and employment.In order to analyze the role of IPR protection in R&D, which in turn leads toeconomic growth, an analysis was carried out that revealed that if IPRs would nothave been protected in the United States, 60% of pharmaceutical industries and 40%of chemical industries would not have been developed.
Discussing about a developing nation like India, efforts are being made towards devel-opment of policies regarding Indian IP system. According to a report published in 2013, it’sthe advancement of inventions through research and development in the country that hasestablished the Indian IP status in the world. It is believed that the growth in Indianeconomy is an effect of growing IP impact in the country. Major steps were taken in Indiaregarding IPR in the TRIPS agreement, complying the U.S. and European IPR structure [18].Since the establishment of patent Law in India, many reforms have been made andaccording to the survey in 2013, there is 20 times increase in Trademark and Patent filingsin comparison towards the previous years. This has increased the interest of foreigncompanies in India and many public and private R&D centers have been built up.
Recently, in May 2016, government has approved the National IPR Policy that willgive the direction to the future of IP in India. By understanding the role of IP ineconomic growth, government is now taking initiative towards promoting IPR throughoutreach activities, to strengthening the Legal and Legislative Framework, strengtheningthe enforcement and adjudicatory mechanisms, and so on.
It has been assessed that developing nation like India needs to improve the IPframework mainly regarding protection of life sciences IP, new enforcement mechan-isms, and specialized IP courts. This requires new procedures for local production,procurement, and manufacturing, and so on [19, 20].
8.4.1 Valuation of IPR
As it has been understood by now, how IPR is directly related to economic growth,thereby its importance has increased over the years. Because globalization is increasingat a very rapid rate in all spheres, therefore, it has become increasingly important to getthe invention evaluated. The global economic environment has led to the formulation ofnew models for international and national trading, where valuation of IPR is an integralpart. Thus, the importance of the valuation of IPR is because of the following reasons:
• To protect invention from exploitation• To raise funds
Intellectual Property Rights 285

• For sharing of profit (in case of multiple IP owners)• To save taxation• For assessing damage claims in a dispute, infringement or breach of contractual rights• To assess transfer pricing of patents or licensing a trademark
The valuation of IP is done using cost, market, and income [21].These methods can be used individually or using a combined approach where all the
three methods are utilized concurrently.The various factors that should be kept in mind while valuing IPR are as follows
• IP should be clearly identified• Unambiguous title should be avoided• Qualitative and quantitative characteristics of the IP• IP should be assessed in terms of earnings capacity and profitability• IP has indulgence in Market share• Legal rights and restrictions, and risks associated with the IP• Historical growth and prospects for the future
8.5 Role of Intellectual Property in Technology Transfer
Technology transfer in simple words is the transfer of research/developments in to aproduct form which can be commercialized. Due to constantly growing level of compe-titive passion, technological expertise has occurred as some of the chief motivatingcompetencies for incredible corporate and new-age start-ups. The fast developments intechnological expertise have redefined the establishments’ function and behaviour ofindustry throughout zones. In this digital age, science has become invaluable thusallowing infringers to easily counterfeit any creation, therefore decreasing the origina-tor’s incentive to involve in such routine. IPR supports the inventors to look after theircreations and to prohibit others to create, trade, or fabricate for a period of predefinedyears. IPRs permit innovators to get worthwhile skills on the market, for the reasonfavorable to them for his or her progressive struggles and reward them for the fundsacquired in the course of the study and progress.
An adequate and strong IPR policy aids setting up nations in growth and sciencetransfer, therefore benefiting for novelty and offering revenues in research and progress.
8.5.1 IPR and Licensing
Licenses will also be within the type of price, royalty or profit-sharing groundwork, as aresult delivering the right to supply or fabrication of the product for a given interval oftime within a distinctive area. Organizations giving inferior technology productsinvolved in licensing as compared to other routes corresponding to FDI. Sometimes asa part of strategy, competitor party can be prevented from obtaining patent by defensivepublication. Superior IPR defense can slash licensing price. It additionally discourages
286 Research Methodology

novelty available in the market. Thus, IPR defense has a constructive influence inlicensing.
8.6 The Philosophy of Intellectual Property Rights
IPR maintains the establishments of the human brain and intellect. The intellectualproperty rights method has been developed in order to achieve two clashing aims:
• To advertise the e-newsletter of recommendations, innovations and creations, withthe intention to make them on hand to others, who can then give an extra boost tothem, which may increasingly nurture scientific development or inventive proposal
• To stipulate an economic incentive for public to formulate or to engage iningenious works, via making certain that the inventor can obtain monetaryrewards from his/her efforts
The answer accepted was to present the discoverer or creator a provisional monopoly,in trade for making his/her concept known to humanity.
A patent needs the inventor to reveal his/her innovation, in conversation with aprovisional monopoly on its use. On account that of this invention, the originator willlikely be capable to receive a profit in case of commercialization of the invention, bothvia direct utilization or through royalties, further giving a license to make use of theinvention. Creation of the similar product by the way of a dissimilar constructionmethod however does not contempt an approach patent.
8.7 IPR as an Instrument for Development
IPR security helps inventers to gain incentive to invent and inspire long term develop-ment. Strengthening the IPR management can enhance country’s development andresults in better growth in open market. Enhanced IPR safety may additionally supportin decreasing imitation, which leads to scale back competitors and inspire innovationwithin the domestic market. There is a lined relationship between IPR and developmentas IPRs are destined to affect trade leading to higher trade flows for industries asexcessive technology or patent sensitive.
8.8 Some Examples of Patent
8.8.1 Self-Healing Power Grid and Method Thereof (U.S. Patent No. 8504214)
Smarter electrical programs are being developed with the aid of more than a fewmanufacturers involved in engineering electrical techniques on the building or grid
Intellectual Property Rights 287

stage. Some of these improvements deal with the efficient use of electrical energy,including programs of drawing power to a building from a grid in a way that takestop demand hours into account, establishing more price-mighty vigor programs. Thesetrends have the capability to largely alter vigor use foundation.
The USPTO issued this patent to the overall electric organization of Niskayuna,New York, in August 2013 to safeguard a self-medication electrical grid that maymaintain small malfunctions from causing main grid outages. A grid monitoringprocedure judges the infectiousness fee of the add-ons making up the grid, which is ameasure of the chance of a single element breaking down and creating an excessiveload on neighbouring components. If the infectiousness price passes a special thresh-old, the grid can alter the running capacity of the add-ons to avoid better grid issuesfrom establishing.
8.8.2 Infectious Disease Detection (U.S. Pat. App. No. 20130130227)
In an increasing world, air travel takes core stage because the main mode of transporta-tion for business gurus and vacationers are alike. As the global leader in aviation, theFederal Aviation Administration (FAA) owe to engage internationally for increase inglobal safety standards and enhance aviation safety and efficiency. Some of the excellentconsiderations of safe air travel are the ability for handling infectious sickness to journeyhalfway around the globe within hours, reaching a colossal population where a deadlydisease would be disastrous.
This patent software, filed with the USPTO by means of The Boeing manufacturer ofChicago, IL, would shield a procedure competent of deciding upon whether or not acontagious disease is gift in a field of an airport. The approach makes use of quite a lotof sensors that may become aware of contagion stages of a disorder and alert amanagement system if those phases point out that a severely infectious disorder is gift.This system could be used to observe the presence of tuberculosis, the Ebola virus,influenza or a style of alternative contagions that can be detected via the presence ofmicro organism, an epidemic, or a different particulate.
8.9 Summary
Awareness, significance, and encouragement toward IPR is exponentially increasing inthe research community. This chapter has provided foundations and directions to an IPenthusiast to ponder upon key provisions and various forms of IP such as copyright,patent, trademark, geographical indications, integrated circuit, and so on. The chapterdetails the procedures of patents and highlights the do’s and don’ts. Critical issues suchas defense IPR are also briefed. Similarly, the issues related to IP domain encompassingthe role of IP in global economy, valuation, and technology transfer, IPR philosophy hasbeen discussed in brief. Examples presented at the end of the chapter provide insights inIPR and validates that role of IPR in overall development ensures integrity andtransparency in the growth.
288 Research Methodology

Further Reading
1. www.wipo.int/designs/en/2. http://www.theglobalipcenter.com/resources/why-is-ip-important/3. https://www.wto.org/english/docs_e/legal_e/27-trips_04b_e.htm4. https://www.theglobalipcenter.com/5. Kaushik Laik, “Role of intellectual property in economic growth”, J. Intellectual Property Rights,
vol. 10, pp. 465–473, 2005.6. http://patentscope.wipo.int/search/en/structuredSearch.jsf7. http://www.adelaide.edu.ac/CIES/00228. http://www.thehindu.com/business/Economy/Intellectual-Property-index-India-remains-
near-bottom/article17277994.ece9. https://www.jpo.go.jp/
10. http://www.wipo.int/export/sites/www/sme/en/documents/pdf/ip_panorama_11_learning_pdf
11. http://www.ipindia.nic.in/form-and-fees.htm12. http://www.wipo.int13. http://www.ipindia.nic.in/14. Maskus Keith, Intellectual property rights and foreign direct investment, Policy Discussion
paper 0022, University of Adelaide, November 24, 2004.15. https://www.wto.org/english/tratop_e/trips_e/intel2_e.htm16. www.wipo.int/wipolex/en/text.jsp?file_id=12808917. http://sicldr.gov.in/18. http://www.espacenet.com/access/index.en.htm19. http://www.ipindia.nic.in/writereaddata/Portal/IPOAct/1_43_1_trade-marks-act.pdf20. http://www.ipindiaservices.gov.in/publicsearch21. http://www.uspto.gov/patft/index.html
Intellectual Property Rights 289

This page intentionally left blank
Index
A
abstractsreading, 50reports, 46scientific papers, 38
acknowledgments, reports, 46ACM (Association for
Computing Machinery), 35action recognition
literature survey, 56methods, 57
Adjoint Sensitivity Analysis Procedure(ASAP), 204
Agrawal, A., 68Ali, Saad, 67Allwine, Rochelle, 159alternative hypothesis (Ha), 19analysis, 12, 20
result analysis, 23statistical analysis methods, 23
analytical research, 6, 8Andrade, Chittaranjan, 234appendices, reports, 47Apple iPhone, 4application research, 6applied research, 6applied statistics, 160
bi-variate analysis, 181inferential statistics, 174modelling, 194–198multi-scale modelling, 201multivariate analysis (MVA), 182multivariate analysis of variance
(MANOVA), 183parameter estimation, 169performance prediction, 199principal component analysis, 184regression analysis, 161–166sensitivity analysis, 204state vector machines (SVM), 187Statistica software tool, 204uncertainty analysis, 190–191univariate analysis, 178univariate analysis of variance
(ANOVA), 182articles. See also primary research articlecritically evaluated points, 54
journal papers, evaluating, 32journals, 14, 34ASCE (American Society of Civil
Engineers), 35ASME (American Society of Mechanical
Engineering), 35Aubry, Keith B., 159audience focus, presentation, 231authorship, research report, 49automoative applications of digital signal
processing, 143
B
background research, 27incorporating information, 29planning process, 29planning questions, 29sources, 30topic limitations, 27
Badie, Julien, 68Bairagi, Vinayak K., 159, 206Band, J., 261Banji, D., 262Banji, O.J.F., 262bar graph, 180Barkhousen noise, 140basic research, 6Bathe, Klaus-Jürgen, 206Bayesian-based regression, 163Beasley, J.D., 262behaviour analysis
literature survey, 56methods, 57
Bhanu, B., 67Bhosle, Anand S., 235bibliographies, plagiarism and, 251bibliography tools, 228Bibme research tool, 229biological engineering, measurment
instruments, 151bi-variate analysis, flow, 181block schematic, scientific papers, 39Boulay, Bernard, 68Bremond, Francois, 68Briggs, Forrest, 159Brown, John M., 159
291

C
Cacuci, Dan Gabriel, 206calibration of instruments, 115Carey, Andrew B., 159Carr, Joseph J., 159causal relationships, explanatory research
design, 76certification marks (CM), 280Cha, H., 157Chai, Y., 67Chang, K., 67cheimcal engineering, measurment
instruments, 157Chen, Q., 67Chen, Y., 67chi-square test, 20
inferential statistics, 174Chiverton, J., 67Choi, H., 146Choi, S., 146Choudhari, K.K., 159citations
plagiarism and, 251scientific papers, 40–41
Citavi research tool, 229Citefast research tool, 229Citelighter research tool, 229civil engineering, measurment
instruments, 154Clarivate Analytics, 35classification, 19cluster sampling, 95collective marks (CM), 280colwitz research tool, 229comparative scaling, 137completely randomized experiment
design, 83random replications design, 83two group design, 83
complex relationships, explanatory researchdesign, 76
componential theory of individual creativity, 5computer engineering
measurment instruments, 153–155topics, 12
conclusions, 49reports, 47research design, 73research report, 47–48scientific papers, 40
conference papers, 34confounded relationships, 73
contact noise, 140control groups, 73
pre-test post-test only design, 81Controller Area Networks (CAN), 143controls, 73convenience sampling, 97copyrights, 279correlational studies, 3, 7Creative Commons (CC) license, 261Creative Commons Attribute (CC BY), 261Creative Commons Attribution - Non
Commercial - No Derivs(CC BY-NC-ND), 261
creativity, 4examples, 4individual, componential theory, 5workgroups, 6
Crewson, Phil, 206Cristianini, Nello, 206cross over experiment design, 88Currie, J.I., 206Cutler, R., 67
D
Darwin, Charles, 5data collection, 11, 17–18, 131
collection method, 17–18digital signal processing, 139–143primary data, 131secondary data, 132sources, 132–137
data representation. See also classificationgraphical, 19methods, 18–19
datasets, studying, 50Davis, L., 67Dawson, Catherine, 98descriptive research, 3, 6–7
research design, 76device input, 23diagnostic research, 3
research design, 76digital filtering, digital signal processing, 142digital signal processing
automotive applications, 143bird song structure case study, 143digital filtering, 142electrocardiography, 141genomics, 142geophysical, 141medical instrumentation, 142
292 Index

noise filtering and, 139noise sources, 140physiological sounds in cardiac cycle, 144seismology, 142structural health monitoring, civil
engineering, 142direct relationships, explanatory research
design, 76discussion
reading, 50scientific papers, 38
Doebelin, E.O., 159D-W test, 20dynamic characteristics of instruments
accuracy, 104dynamic error, 104–105fidelity, 104lag measurement, 104response speed, 104span, 105sphygmomanometer case study, 105
E
Easy Bib bibliography maker, 228e-books, evaluation, 32electrical engineering
measurement instruments, 152topics, 12
electrocardiography, digital signalprocessing, 141
electronic databases, 34electronics engineering, measurement
instruments, 145–149encyclopaedias/dictionaries
conference papers, 34electronic databases, 34Internet, 34libraries, 34
EndNote research tool, 229engineering, measuring instruments,
145–157environmental effects on reliability, 127–133environmental engineering, measurement
instruments, 153errors, sampling/nonsampling, 91Evangelio, Rub’en Heras, 67Expected Performance curve (EPC), 200experiment design, 79
completely randomized, 83cross over, 88factorial, 86Latin Square, 85
post-test only, 81pre-test post-test only, 81–83quazi-experimental design, 87randomized block, 84
experimental groups, 73experimental research, 9experimental research design, 77
principle of local control, 80principle of randomization, 80principle of replication, 79
experimental setup, 110case study, field based setup, 112field based (outdoor), 111–113instrument calibration, 115laboratory based (indoor), 111natural/quasi experiments, 114steps, laboratory experiments, 115
experimentation, scientific papers, 39explanatory research, 9
research design, 75–76exploratory research, 9
research design, 77extraneous variables, 73eXtyles, 229
F
factorial experiment design, 86fail-safe design, 126Fern, Xiaoli Z., 159field-based experimental setup, 113figures, 20findings. See also results
conclusions, 49qualitative analysis, 41quantitative analysis, 41recording, 51–55reports, 47research design and, 73research report, 47scientific papers, 40summarizing, 51–55time performance analysis, 41
flicker noise, 140focus groups, literature survey, 36–37formulation of hypotheses, 12Forward Sensitivity Analysis
Procedure (FSAP), 204frequency distribution table, 179F-test, 20fundamental research, 6further research, scientific papers, 41future scope, scientific papers, 41
Index 293
G
Galton, F., 163gap in research, proposal, 16Garate, Carolina, 68Garnier, C., 206Gates, Bill, 265genomics, digital signal processing, 142geographical indications, 279geophysical data signal processing, 141Gerstman, Bud Burt, 206Ghost Writer (plagiarism), 241Gilbert, Frederick F., 159Good Man, Erik D., 67Google Books, 32Google Scholar, 32–33Gopal, Vajjha Hara, 205Grammerly, 229graphical representation, 19graphs, 20
bar graph, 180frequency distribution table, 179histogram, 180pie chart, 181
Grassie, T., 206Gupta, Santosh, 98Gyorgyi, Albert Szent, 2
H
H0 (null hypothesis), 18Ha (alternative hypothesis), 18Hansen, Andrew J., 159Haque, Mahfuzul, 67Harani, A., 262hardware, scientific papers, 39Harpale, Varsha K., 159, 206Hati, Kalyan Kumar, 67Henderson, D., 206Heng, P.A., 67Hidalgo, Jorge Arturo, 206histograms, 180Houghton, Andrew R., 159Hufftech, Mark H., 159humidity, reliability and, 127Hunter, Matthew, 159hypotheses, 3
formulating, 10, 15null hypothesis (H0), 19research design and, 72testing, 11, 19–20
hypothesis testingalternative hypothesis, 19
chi-square test, 20D-W test, 20F-test, 20limitations, 20null hypothesis, 19steps, 20t-test, 20Type I errors, 19Type II errors, 19
hypothesis-testing research design, 78
I
identification of keywords, 11, 13idustrial design, 270IEEE electronic library, 35IEEE Explore, 35impact factor journals, 35indirect relationships, explanatory research
design, 76industrial property, 265inertia of large numbers, sampling and, 89inferential statistics, 174
chi-square test, 174T-test, 174–176
instrument calibration, 115instrument characteristics
dynamic, 104–105static, 100–105
instrument reliabilityavailability and, 119characteristics, 119cost and, 126designing for, 125ECG (electrocardiogram) case study, 128environment effects, 127–130failure density and, 122failure rate, 117function and failure rate calculation, 122maintainability, 123managing, 119medical product case study, 128metrics, 118MTBF/MTTF and, 122non-repairable systems, 119quality and, 118, 118repairable systems, 119–120temperature and environmental case study,
127Weibull++ and, 123
instrumentation, 99–100data collection, 131engineering measuring instruments, 145–157
294 Index

experimental setup, 110–115instrument characteristics, 100–105instrument reliability, 115medical, digital signal processing, 141scaling, 137
instrumentation engineering, measurementinstruments, 151
instrumentation schemesblock diagram, 106complex (heat exchanger), 106–108simple (oxygen cylinder), 106
integrated circuits, 283intellectual property (IP), 266
versus industrial property, 265licensing and, 284technology transfer and, 286
intellectual property rights(IPRs), 266
collective marks, 280copyrights, 279development and, 287geographical indications, 283in global economy, 284industrial design, 282integrated circuits, 283oppositions, 278patents, 267–274philosophy of, 287significance, 265trademarks, 280valuation, 285
intelligencepractical, 4synthetic, 4
international patent applicationsParis Convention, 276Patent Cooperation Treaty
(PCT), 276post-grant opposition, 278pre-grant opposition, 278
Internet, 34interpretation section, 51interpretations, research design, 74interview methods, 23interviews
data collection and, 139semistructured, 37structured, 36unstructured, 36
introductionreports, 46scientific papers, 39
iPhone, 4
J
Jayanth, J., 1, 206JCCC (J-gate Custom Content for Consortia), 35JCCC@JNDEST, 35Jodoin, Pierre-Marc, 67Johnson, Burke, 206Jonson, Ben, 239journal citation reports (JCR), 35journal papers, evaluating, 32journalism, plagiarism in, 247journals
ACM (Association for ComputingMachinery), 35
ASCE (American Society of CivilEngineers), 35
ASME (American Society of MechanicalEngineering), 35
IEEE electronic library, 35IEEE Explore, 35impact factor journals, 35JCCC (J-gate Custom Content for
Consortia), 35JCCC@JNDEST, 35Math SciNet, 35Nature journal, 35Open Access, 14reputed journals, 35Science Direct, 35SciFinder scholar, 35SCOPUS, 34Springer publishing company, 35
K
Kafai, M., 67Kale, Geetanjali V., 1Keith, Maskus, 289keyword identification, 11Kim, T., 67Konrad, Janusz, 67Kothari, Chakravanti Rajagopalachari,
24, 98, 159Kumar, Ranjit, 24, 98
L
laboratory-based experimental setup, 111steps, 115
Laik, Kaushik, 289LaTeX, 229Latin Square experiment design, 85Levy, Robert, 206
Index 295
Li, Dawei, 66Li, S., 66libraries, 34Lin, B., 67linear ordinary least square (OLS)
regression, 166linear scaling, 139literature review, 11, 14–15
content development, 54organizing, 55presentation, 15proposal, 16sources, 14survey steps, 14thesis location, 54writing, 55
literature surveyaction recognition, 56behaviour analysis, 56encyclopaedias and dictionaries, 34findings, recording and summarizing,
51–63focus groups, 35–37interviews, 35–36journal citation reports (JCR), 35object classification, 56object detection, 56object tracking, 56online information access method, 31parts, 27patents, 43–45points, 15questionnaires, 35, 38research design and, 71research reports, 46resources, 30–37scientific papers, 39reading, 38–41snowball method, 31systematic manual search, 31white papers, reading, 42
Liu, Si, 67local control, experimental research, 80Local Interconnect Network (LIN), 143Lu, Hanqing, 67
M
machine learning, sampling and, 97Maenaka, K., 159Majhi, Banshidhar, 67Mammone, Alessia, 206Mane, Pradeep B., 103
Math SciNet, 35mathematical modelling, 195
model classification, 194modelling process, 196modelling stages, 194solar water heater example, 198
Mccomb, William C., 159MCUs (microcontrollers), 143mechanical engineering
measurement instruments, 152topics, 12
mechanical vibrations/shock,reliability and, 128
medical instrumentation, digital signalprocessing, 142
Mendeley bibliographic tools, 228method of maximum likelihood estimate, 171method of moments, 170methodology
proposal, 16research, versus research methods, 22–23
methodsreports, 46research, 22–23research report, 47
Mirmehdi, M., 67MIT (Massachusetts Institute of Technology),
plagiarism and, 240–241Mizner, Wilson, 238modelling
mathematical, 195–196performance measurement, 199
monetary requirements, samples, 90multiple linear regression, 167multi-scale modeling
linear/nonlinear analysis, 202structures, 201
multistage sampling, 95multivariate analysis (MVA), 182multivariate analysis of variance
(MANOVA), 183Muneer, T., 206Munot, Mousami V., 235Murshed, Manzur, 67Murty, D.V.S., 159
N
Nagmode, Manoj J., 25Nakra, B.C., 159national patent applications
complete specification, 270provisional, 270
296 Index

natural/quasi experiments, 114Nature journal, 35Neal, Lawrence, 159Nehru, Jawaharlal, 255Newton, Isaac, 14Newton’s laws, 7Nikam, Shobha S., 99NinjaEssays research tool, 229noise (digital signal processing)
atmospheric, 141Barkhousen noise, 140contact noise, 140electrostatic discharge, 141environmental, 140external sources, 140flicker noise, 140internal sources, 140power lines, 141radiation, 141shot noise, 140sparking, 141thermal noise, 140white noise, 140
noncomparative scaling, 137nonparticipant-based observation, 134nonprobability sampling, 96nonsampling errors, 91Noodle Tools, 229null hypothesis (H0), 19
Type I error, 19Type II error, 19
O
object classification, literature survey, 56object detection, literature survey, 56object tracking, literature survey, 56objective research, 6objectives
proposal, 16redefining, 15research design and, 71–72
observation, 23data collection and, 132–133
O’Malley, Austin, 12online information
e-books, 32Google Books, 32Google scholar, 32journal papers, 32–33websites, 33Wikipedia, 32
Open Access journals, 14
outcomes, proposal, 19over-specification, design and, 125Oxford University plagiarism rules, 246
P
Pandit, Mak, 42papers, shortlisted, 14parameter estimation, 169
estimator properties, 170method of maximum likelihood estimate, 171method of moments, 170Null Hypothesis test of Significance
(NHTS), 170performance parameter, 172point estimate, 170sampling distribution of the mean
(SDM), 171parameters
identification, 10, 16samples, 89
paraphrasing, plagiarism and, 252–257participant-based observation, 133Patent Cooperation Treaty (PCT), 45patents, 14
applicants, 276application, 43, 268application types, 269–273benefits of application, 271characteristics, 281–286claims, 43examination, 44filing considerations, 269filing in India, 269filing procedure tips, 269infectious disease detection example, 288international applications, 45, 275litigation, 43national applications, 45, 275novelty, 266patent pending, 44prosecution, 43regional applications, 45regional office jurisdiction, 274searches, 43sections, 48self-healing power grid example, 287specification, 43utility, 268
Paul, Vogt W., 206philosophy of intellectual property
rights (IPRs), 287pie chart, 181
Index 297

plagiarism, 21, 235academia, 245accidental, 237–242of authorship, 242avoiding, 251–257bibliography and, 255citations and, 256COPE (Committee of Publishing
Ethics), 254Creative Commons (CC) license, 261cyber plagiarism, 237definition, 241digital plagiarism, 237Elsevier, 248–253forms, 246free software, 247government rules/policies, 254of ideas, 243IEEE (Institute of Electrical and
Electronics Engineers), 252iThenticate software, 247journalism, 247music industry, 244paraphrasing and, 258patchwork plagiarism, 237programming code reuse, 243reasons for, 235–237references and, 255self-plagiarism, 237Springer, 248stitching sources (potluck
plagiarism), 237Turnitin software, 248Urkund software, 250of words, 237
point estimatebias, 170consistency, 170efficient estimator, 171
polymer engineering, measurmentinstruments, 153
Poppe, Ronald, 67population, samples, 89posters, 232Post-it Notes, 4post-test only experiment design, 81practical intelligence, 4presentation, 206
audience focus, 231explanation, 231posters, 232reports, 229–243research papers, 228–234
slides, 230theses, 228–230tools, 228
pressure variations, design and, 126pre-test post-test only experiment design, 81–83primary data, 131primary research articles, reading, 50primary sources, background research, 30principal component analysis (PCA), 184
computing principal components, 184Prins, Jack, 206probability distribution function (PDF), 190probability sampling, 92problem statement. See also research problem
background research, 27characteristics, 64defining, errors, 66defining, method used, 61–62, 64–66defining clearly, 61formulating through discussion, 62–63formulation, 56limitations, 59literature available, 62research design and, 71–72selection sequence, 60
proceduresreports, 46research report, 47
publications, 14. See also reports; researchpapers; theses
abstract, 210acknowledgements, 212–215articles, 209author name and affiliation, 209authorship, 217bibliography tools, 228body of research paper, 207–208citations/citation index, 222–225conclusion, 212conflict of interest, 215contents, 210documentation tools, 228experiment results/discussions, 214figures, 215future scope, 215introduction, 210journal identification, 216–217journal metrics, 221journal ranking, 221journal selection guidelines, 216letters, 209literature review, 213methodology, 212
298 Index

open access journals, 220perspectives, 210presentation tools, 228rapid communications, 210references, 216research paper identification, 220research report, 48review papers, 210review system, 218short communications, 210subscription-based journals, 220tables, 215title, 209
publishing, 206Pulitzer, Joseph, 208
Q
Qiqqa research tool, 229qualitative analysis, 41qualitative research, 6, 8
research design and, 74quantitative analysis, 41quantitative research, 6, 8
research design and, 74quazi-experimental design, 87questionnaires, 23
data collection and, 139literature survey, 39mailed, 136sample, 137
quota sampling, 97
R
Raich, Raviv, 159Randolph, Justus, 234randomization, experimental research, 80randomized block experiment design, 84Ranjetha, P., 206Raphael, Martin G., 159ReadCube research tool, 229reading methodology, scientific papers, 40redefining research problem and
objectives, 11, 15redundancy, design and, 125RefDot research tool, 228references
plagiarism and, 258reports, 47scientific papers, 40–41
RefWorks research tool, 229Registered trademarks (TM), 280
regression analysisBayesian-based, 163effective relationships, 163regression model, 161–167
regression modelindependent variable, 163linear ordinary least square (OLS) regression,
166multiple linear regression, 167response variable, 163simple linear regression analysis, 161–164unknown parameters, 163
reliability of instruments, 117availability and, 119characteristics, 119–131failure density and, 122failure rate, 117function and failure rate calculation, 122maintainability, 123managing, 119–120metrics, 118MTBF/MTTF and, 122non-repairable systems, 119quality and, 118repairable systems, 119–120Weibull++ and, 123–124
Ren, X., 66replication, experimental research, 79reports. See also publications: research report
abstracts, 47acknowledgments, 47appendices, 48conclusions, 47contents, 210–220introductions, 47methods, 47presentation, 228–230procedures, 47references, 48results (findings), 47review of literature, 47summary, 47table of contents, 47title, 46
representation of data, 11, 17. See alsopresentation
reputed journals, 35research design, 14, 17, 69–70
conclusions, 74data, 73descriptive research, 77diagnostic research, 77experiment design, 79–87
Index 299

experimental research, 77explanatory research, 75–76exploratory research, 78framework, 71hypothesis-testing, 78importance, 72interpretations, 74literature survey, 72method, 74necessity, 71objectives, 72parameters, 71–74problem statement, 71–72qualitative research, 75quantitative research, 75results, 74sampling, 88–91scope, 72terminology, 72title, 71
research methodsdevice input, 23interview method, 23observations, 23questionnaires, 23result analysis methods, 23statistical analysis methods, 23survey methods, 23
research papers. See also publications: contents209–214: presentation 227–230
research problem. See also problem statementcharacteristics, 64defining clearly, 61definition, 57–62formulation, 12, 12–13redefining, 15research statement, 14SMART (Specific, Measurable, Achievable,
Realistic, and Time-bound), 14research process, 10
data collection, 11, 17–23data representation, 19formulating hypothesis, 11, 15hypothesis testing, 11, 19–20identification of keywords, 11, 13identification of variable/parameters, 14,
14–17literature review, 11, 14–15patent, 14preparing research proposal, 11, 15–16publication, 14redefining research problem and
objectives, 11, 15
research design, 14, 17research problem formulation, 10, 12–13research report, 11, 21–25results and analysis, 20selection of domain, 11–12testing of proposed design on collected data,
11, 19–20thesis writing, 11
research proposal, 16format, 16preparation, 10, 15–16sections, 16
research report, 11, 21, 46. See also reportsauthorship, 49components, 47conclusions, 47–48findings, 47format, 20–21hypotheses, 47methods, 47plagiarism, 21primary article reading, 49–50procedures, 47publishing, 49purposes, 21sections, 21stages, 22 types 54
research statement, 14research design and, 71–72SMART (Specific, Measurable, Achievable,
Realistic, and Time-bound), 14research analytical, 6–7
application, 6applied, 6basic, 6correlational, 6–7descriptive, 3, 6–7diagnostic, 3existing theories and, 2experimental, 9explantory, 9exploratory, 9features of good research, 23fundamental, 6importance, 6motivation, 3objective, 2, 6phases, 10–22qualitative, 6, 8quantitative, 6, 8types, 5–9
researchers, characteristics, 3–6resources
300 Index

evaluating, 52–53literature survey, 31–39locating, 51quality material, 52selecting, 52
result analysis methods, 23results, 11, 20. See also findings
conclusions, 49qualitative analysis, 41quantitative analysis, 41reports, 47research design and, 73scientific papers, 40time performance analysis, 41
retrospective approach, research problemselection, 59
review of literature, reports, 47Roebuck, Alun, 159Rohatgi, Vijay, 205Rouse, Magret, 42Ruggiero, Leonard F., 159Rushdie, Salman, 255
S
Sa, Pankaj Kumar, 66safety critical design, 125Saleh, MD Ehsanes, 205Saligrama, Venkatesh, 67sample design, 90
errors, 91preparation, 90procedure selection, 91
sampling distribution of the mean (SDM), 171sampling cluster, 94
control, 91convenience, 97cross validation, 97errors, 91hold-out technique, 98inertia of large numbers, 89K-fold cross validation, 98machine learning approaches, 97method of sampling, 90monetary requirements, 90multistage, 95nonprobability, 96parameters, 90percentile split, 97population, 89probability, 92quota, 97sample frame, 90
simple random sampling, 92size, 90snowball, 97statistical regularity, 89stratified, 93–96systemic, 93unit of sampling, 90
Sandhya, S., 262Sapre, A., 67Sarumathi, S., 206Sathish, K.D., 262Sawhney, A.K., 159scaling
comparative, 137linear, 139noncomparative, 137
Schrodt, Philip, 206Science Direct, 35scientific papers, 38
abstract, 39block schematic, 39citations, 40–41conclusion, 41discussion, 41experimentation, 39further research, 41future scope, 41hardware used, 39introduction, 39literature survey, 39objectives, 42reading methodology, 40references, 40–41results, 40software used, 39
SciFinder scholar, 35SCOPUS, 33, 34secondary data, 132secondary sources, background research, 30seismology, 142selection of domain phase, 10–12sensitivity analysis, 204service marks (SM), 281Shah, Mubarak, 67Shakespeare, William, 239Shanthi, N., 206Shin, S., 67shortlisted papers, 15shot noise, 140Sikora, Thomas, 67simple linear regression analysis, 161–164simple random sampling, 92Singh, Khushwant, 255
Index 301
slides, 230SMART (Specific, Measurable, Achievable,
Realistic, and Time-bound), 14snowball method, 31, 97software, scientific papers, 39sources
background research, 29–30data collection, 132–139evaluating, 52–53finding, 51literature review, 14quality material, 52selecting, 52
Springer publishing company, 35Srinivasan, Sesha A., 235state vector machines (SVM), 187static characteristics of instruments
accuracy, 102drift, 103hysteresis, 103precision, 104range (span), 103repeatability, 103reproducibility, 103resolution, 103sensitivity, 103stability, 104tolerance, 104
Statistica software tool, 204statistical analysis methods, 23, 178statistical regularity, sampling and, 89statistics. See also applied statisticsSternberg, Robert, 4Sternberg, Robert J., 24stratified sampling, 93–97structural health monitoring,
civil engineering, 142structured interviewing, 135studies, correlational, 3summary, reports, 47Sun, Q.S., 67survey methods, 23synthetic intelligence, 4systematic approach, research problem
selection, 60systematic manual searches, 31systematic sampling, 93
T
table of contents, reports, 47tables, 20Taha, Ahmed, 68
Tang, Nick C., 68targeted approach, research problem
selection, 60Taylor, Andrew, 159technology transfer, 286temperature, reliability and, 127terminology, 2
confounded relationships, 73control, 73control group, 73experimental group, 73extraneous variable, 73hypothesis, 73variables, 73
testing of proposed design on collected data, 11,19–20
thermal noise, 140theses. See also publications: contents 209–214:
location in literature review 54;presentation 227–230; writing 10
Thiel, David V., 24Thomson Reuters, 35. See also Clarivate
Analyticstime performance analysis, 41title, reports, 46topic of research
limitation, 27proposal, 16
trademarks, 280certification marks (CM), 282collective marks (CM), 282Registered (TM), 280service marks (SM), 281
T-test, 20inferential statistics, 174
Turchi, Marco, 206Type I error, null hypothesis, 19Type II error, null hypothesis, 19Typeset, 229
U
uncertainty analysiscalculation example, 193linear and non-linear systems, 191measurement and, 191probability distribution function (PDF), 190probability theory, 190UNICORN software, 194
UNICORN software, 194univariate analysis, 178
bar graph, 180central tendency, 179
302 Index

dispersion, 179frequency distribution table, 179histogram, 180pie chart, 181
univariate analysis of variance(ANOVA), 182
unstructured interviewing, 135
V
variables, 73identification, 10, 16–17
variations in pressure, designand, 128
Vega, Robyn, 159Velcro, 4Vidhya, S., 206Vinod, K.R., 262Vishwakarma, S., 67visual formats, 20von Braun, Wernher, 2
W
Warhade, Krishna, 206web of science (WOS), 35website evaluation, 33Weibull++, 123–124Wesley, John, 26white noise, 140white papers
authoring, 41contents, 47definitions, 42
Wikipedia, 32Woody, Clifford, 24workgroups, creativity, 6World Intellectual Property Organization
(WPO), 45Wright brothers, 13
X
Xia, D.S., 67Xiang, S., 67Xie, X., 67Xu, Changsheng, 67Xu, Lihong, 67Xu, Y., 67
Y
Yuan, X., 67
Z
Zaidenberg, Sofia, 68Zayed, Hala, 68Zhang, L., 67Zhang, Tianzhu, 67Zotero research tool, 228
Index 303

Copyright © 2022 FDOKUMEN