requisite empirical risk data for integration of safety
80
REQUISITE EMPIRICAL RISK DATA FOR INTEGRATION OF SAFETY WITH ADVANCED TECHNOLOGIES AND INTELLIGENT SYSTEMS by MATTHIEU DESVIGNES University of Colorado at Boulder, 2014 A thesis submitted to the Faculty of the Graduate School of the University of Colorado in partial fulfillment of the requirement for the degree of Master of Civil Engineering Department of Civil, Environment and Architectural Department 2014
-
Upload
khangminh22 -
Category
Documents
-
view
3 -
download
0
Transcript of requisite empirical risk data for integration of safety

REQUISITE EMPIRICAL RISK DATA FOR INTEGRATION OF SAFETY
WITH ADVANCED TECHNOLOGIES AND INTELLIGENT SYSTEMS
by
MATTHIEU DESVIGNES
University of Colorado at Boulder, 2014
A thesis submitted to the
Faculty of the Graduate School of the
University of Colorado in partial fulfillment
of the requirement for the degree of
Master of Civil Engineering
Department of Civil, Environment and Architectural Department
2014

SIGNATURE PAGE
This thesis entitled: Requisite empirical risk data for integration of safety with advanced technologies and
intelligent systems written by Matthieu Desvignes
has been approved for the Department of Civil, Environment and Architectural Department
Prof. Amy N. Javernick-Will
Prof. Paul Goodrum
Prof. Matthew R. Hallowell
November 14, 2014
The final copy of this thesis has been examined by the signatories, and we Find that both the content and the form meet acceptable presentation standards
Of scholarly work in the above mentioned discipline.

iii
Matthieu Desvignes (M.S., Civil Engineering)
Requisite empirical risk data for integration of safety with advanced technologies and
intelligent systems
Thesis directed by Professor Matthew R. Hallowell
The Construction field is known to account for a disproportionate number of disabling
injuries and fatalities. Unfortunately, the industry has reached saturation with respect to
the traditional safety strategies (Esmaeili and Hallowell 2012), and the emerging risk-
based methods have shown to not be robust enough to adapt the transient, dynamic, and
variable nature of construction work. To tackle these issues, professionals have tried to
adapt emerging technologies and intelligent systems to improve construction safety. Also,
empirically driven attribute-based risk data have been introduced but have been limited in
application to struck-by injuries (Esmaeili 2012). Despite these advancements, there are
still major limitations with significant opportunities for improvement. In this study, the
authors review the actual safety applications of ten technologies to highlight the quasi-
systematic lack of robust safety data as sources. They then present an attribute-based risk
analysis method as a mean to improve the quality and versatility with which safety data
can be integrated with technologies in both design and construction. Our team vastly
improves the quality and quantity of available data by considering all injury types and
leveraging 7,033 detailed injury reports provided by a total of 243 independent contractors.
In total, 79 safety attributes were identified following a strict manual content analysis
procedure and an attribute-based risk analysis was conducted based on these robust and
viable safety data. The findings indicate that ‘No/Improper PPE’ (69.49), ‘Pontoon’ (21.75),
and ‘Lifting/Pulling’ (20.54) attributes presented the highest risks on construction sites.
New safety applications and insights are detailed as primary uses of the attribute risk data
with the technologies. The authors also discuss the combination of several technologies to

iv
create an intelligent system that aims at reducing the number of injuries on worksites. The
combination of attribute risk data and technologies is believed to have the potential to
change safety managers’ approach to construction risks, lay the foundations for innovative
technological safety applications and make construction sites safer.

v
TABLE OF CONTENTS
TABLES ................................................................................................................................................. viii
FIGURES .................................................................................................................................................. ix
INTRODUCTION ..................................................................................................................................... 1
LITERATURE REVIEW ......................................................................................................................... 3
Barcode ............................................................................................................................................................... 4
a. Definition and Principles ..................................................................................................................................... 4
b. General use in construction and safety ......................................................................................................... 4
Radio Frequency Identification (RFID) ................................................................................................... 5
a. Definition and Principles ..................................................................................................................................... 5
b. General use in construction and safety ......................................................................................................... 6
Ultra Wide Band (UWB) ................................................................................................................................ 8
a. Definition and Principles ..................................................................................................................................... 8
b. General use in construction and safety ......................................................................................................... 8
Global Positioning System (GPS) ............................................................................................................... 9
a. Definition and Principles ..................................................................................................................................... 9
b. General use in construction and safety ....................................................................................................... 10
Graphical Information System (GIS) ....................................................................................................... 11
a. Definition and Principles ................................................................................................................................... 11
b. General use in construction and safety ....................................................................................................... 12
3D Range Imaging Camera & Visual Monitoring ................................................................................ 13
a. Definition and Principles ................................................................................................................................... 13
b. General use in construction and safety ....................................................................................................... 14
Virtual Reality (VR) and Simulation ....................................................................................................... 15
a. Definition and Principles ................................................................................................................................... 15
b. General use in construction and safety ....................................................................................................... 16

vi
Augmented Reality (AR) ............................................................................................................................. 17
a. Definition and Principles ................................................................................................................................... 17
b. General use in construction and safety ....................................................................................................... 18
Cyber-‐Physical System (CPS) ..................................................................................................................... 20
a. Definition and Principles ................................................................................................................................... 20
b. General use in construction and safety ....................................................................................................... 21
Building Information Modeling (BIM) ................................................................................................... 23
a. Definition and Principles ................................................................................................................................... 23
b. General use in construction and safety ....................................................................................................... 24
Patterns and Limitations ............................................................................................................................ 27
Risk Analysis ................................................................................................................................................... 34
POINT OF DEPARTURE ..................................................................................................................... 35
RESEARCH METHODS ....................................................................................................................... 36
Objectivity, reliability and viability ........................................................................................................ 37
Extraction Protocol ....................................................................................................................................... 39
Attribute-‐based Risk Analysis .................................................................................................................. 42
a. Exposure data ......................................................................................................................................................... 42
b. Relative risk values .............................................................................................................................................. 44
RESULTS ................................................................................................................................................ 45
Upstream Attributes .................................................................................................................................... 46
a. Materials ................................................................................................................................................................... 46
b. Equipment ............................................................................................................................................................... 47
c. Design ......................................................................................................................................................................... 47
Transitional Attributes ............................................................................................................................... 48
a. Equipment & Tools ............................................................................................................................................... 48
b. Materials & Substances ...................................................................................................................................... 48
c. Site Quality ............................................................................................................................................................... 49
d. Weather & Environment ................................................................................................................................... 49

vii
e. Other ........................................................................................................................................................................... 50
Downstream Attributes .............................................................................................................................. 50
a. Human Behavior .................................................................................................................................................... 50
b. Site Characteristics .............................................................................................................................................. 50
Attribute-‐based Risk Analysis Results ................................................................................................... 51
a. Exposure data (e) .................................................................................................................................................. 51
b. Attribute severity occurrence (ni) ................................................................................................................. 51
c. Relative risk values .............................................................................................................................................. 52
IMPLICATIONS .................................................................................................................................... 56
Barcode ................................................................................................................................................. 61
RFID ........................................................................................................................................................ 61
UWB ........................................................................................................................................................ 61
GPS .......................................................................................................................................................... 61
GIS ........................................................................................................................................................... 61
Visual Monitoring .............................................................................................................................. 61
VR ............................................................................................................................................................ 61
AR ............................................................................................................................................................ 61
CPS .......................................................................................................................................................... 61
BIM .......................................................................................................................................................... 61
LIMITATIONS ...................................................................................................................................... 62
CONCLUSION ........................................................................................................................................ 63
ACKNOWLEDGEMENTS .................................................................................................................... 64
REFERENCES ........................................................................................................................................ 65
viii
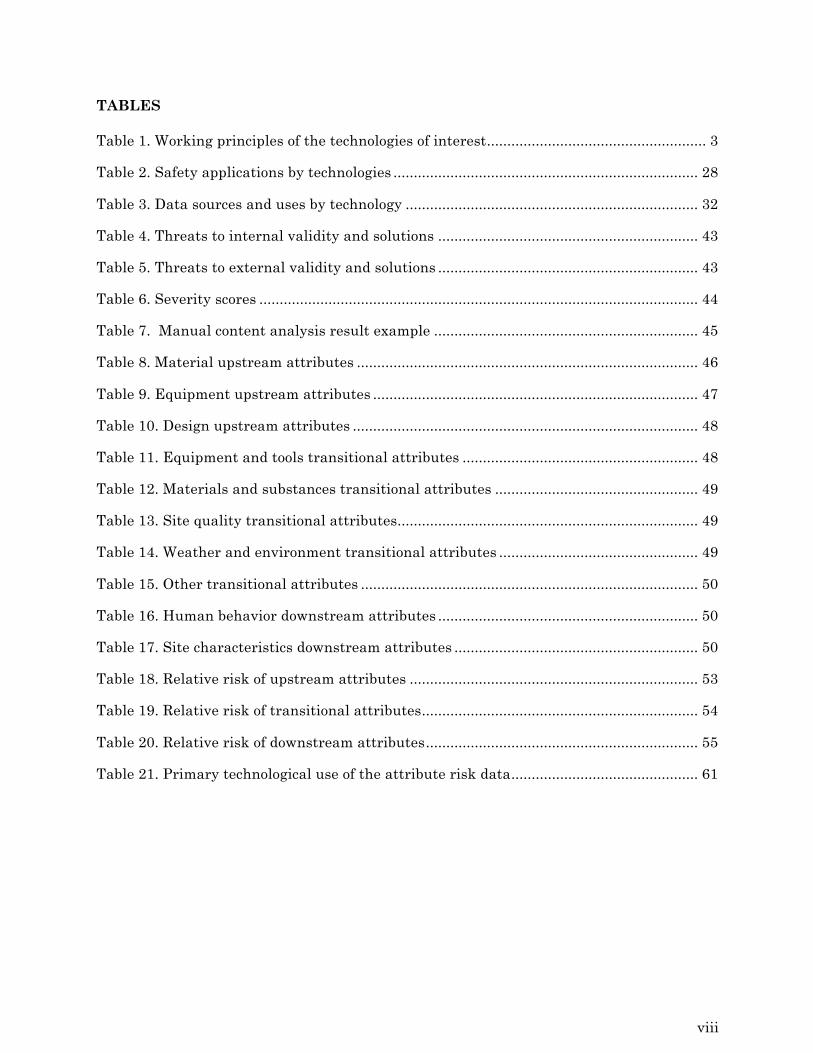
TABLES
Table 1. Working principles of the technologies of interest ...................................................... 3
Table 2. Safety applications by technologies ........................................................................... 28
Table 3. Data sources and uses by technology ........................................................................ 32
Table 4. Threats to internal validity and solutions ................................................................ 43
Table 5. Threats to external validity and solutions ................................................................ 43
Table 6. Severity scores ............................................................................................................ 44
Table 7. Manual content analysis result example ................................................................. 45
Table 8. Material upstream attributes .................................................................................... 46
Table 9. Equipment upstream attributes ................................................................................ 47
Table 10. Design upstream attributes ..................................................................................... 48
Table 11. Equipment and tools transitional attributes .......................................................... 48
Table 12. Materials and substances transitional attributes .................................................. 49
Table 13. Site quality transitional attributes .......................................................................... 49
Table 14. Weather and environment transitional attributes ................................................. 49
Table 15. Other transitional attributes ................................................................................... 50
Table 16. Human behavior downstream attributes ................................................................ 50
Table 17. Site characteristics downstream attributes ............................................................ 50
Table 18. Relative risk of upstream attributes ....................................................................... 53
Table 19. Relative risk of transitional attributes .................................................................... 54
Table 20. Relative risk of downstream attributes ................................................................... 55
Table 21. Primary technological use of the attribute risk data .............................................. 61

ix
FIGURES
Figure 1. Connection between tag, antenna, reader and computer system ............................ 5
Figure 2. Cyber-Physical System architecture ........................................................................ 21
Figure 3. Manual content analysis procedure ......................................................................... 41
1
INTRODUCTION
Despite significant efforts to improve safety and the increased implementation of injury
prevention strategies in the past few decades, the construction industry still accounts for
one of the highest fatal occupational injury rates among the U.S industry sectors. Indeed,
according to the Bureau of Labor Statistics (2013) data, its preliminary fatal occupational
injury rate equals 9.4 per 100,000 full-time equivalent workers for an annual all-worker
fatal injury rate of 3.2. Moreover, the construction sector has consistently accounted for the
most fatalities of any industry in the private sector since 2005, with a preliminary count of
796 fatal injuries in 2013. Even though these figures have significantly decreased following
the inception of the Occupational Safety and Health Act (OSHA), construction injuries,
illnesses, and fatalities still have a dramatic impact on the economy of the country and
most importantly on workers’ families. Because of economic and productivity impacts
associated with these events, improving safety has become the priority of many
construction professionals (Gambatese 2008).
Unfortunately, the industry has reached saturations with respect to the traditional
safety strategies originally implemented to comply with OSHA regulations (Esmaeili and
Hallowell 2012). Risk-based approaches have begun to emerge in an effort to formalize the
safety management process and integrate it with other project management functions.
Unfortunately, existing risk data upon which these methods are built are not robust enough
to adapt the transient, dynamic, and variable nature of construction work. They usually are
limited to a certain number of situations, work task scenarios, and are highly dependent of
past injury cases or safety managers’ experiences. As a consequence, the demand for both
new injury prevention practices and more robust risk data has rapidly grown in the last
decade.

2
Although the construction industry is well-known for its slow adoption of innovative
products (Egan 1998; Navon and Sacks 2007), researchers and professionals have tried to
adapt emerging technologies and intelligent systems to improve construction safety, which
include Global Positioning Systems (GPS), Radio Frequency Identification (RFID), and
Virtual Reality (VR). Although initial implementation of these technologies has shown
promising results for safety, the safety information used in these technologies is severely
limited as it is primarily based on regulations, intuition, or judgment (Hallowell et al.
2011). To address this issue, Esmaeili (2012) introduced empirically driven attribute-based
risk data that model construction injuries as resultants of the spatial and temporal
relationships among a finite number of characteristics of the work site. Such data have the
potential to be integrated with advanced technologies and intelligent systems to address a
wide array of potential construction scenarios early in the project delivery process.
In the initial demonstration of attribute-based safety risk analysis Esmaeili (2012)
identified attributes for struck-by injuries from 1,771 brief injury reports contained in
National databases. In this study, our team vastly improves the quality and quantity of
available data by considering all injury types and leveraging 7,033 detailed injury reports
provided by a total of 243 independent contractors. In this study, we also explore how these
data can be integrated within emerging technologies and intelligent systems to address
pervasive and systematic limitations of the application of these systems for safety
management.

3
LITERATURE REVIEW
The focus of this literature review is on emerging technologies and intelligent systems
that, according to the research community, have potential for improving construction
safety. Specifically, this review discusses Barcode, Radio Frequency Identification (RFID),
Ultra Wide Band (UWB), Global positioning System (GPS), Global Information System
(GIS), Visual monitoring, Virtual Reality (VR), Augmented Reality (AR), Cyber-Physical
System (CPS), and Building Information Model (BIM) and their respective applications to
construction safety. Each section follows the same outline by providing a brief definition
and the working principles of the technology, its general use in the industry and its current
application for construction safety purposes. They are presented from the simplest to the
more complex ones in term of functioning and also grouped by working principles.
Technologies Tag-based Radio frequencies
Satellite-based
Computer-based
Sensor-based
Barcode ✓
RFID ✓ ✓
UWB ✓ ✓
GPS ✓ ✓
GIS ✓
VM ✓
VR ✓ ✓
AR ✓ ✓
CPS ✓ ✓
BIM ✓
Table 1. Working principles of the technologies of interest

4
Barcode
a. Definition and Principles
Barcodes are now well known and widely used in almost all industry sectors. Barcodes
are considered to be the attributes to the Radio Frequency identification (RFID) technology;
however, even though they share some similarities (e.g., storing information about the
object tagged), they differ in their working principles. The barcode technology is based on
symbology, which is composed of several standards such as encodation rules, dimensional
tolerances, or print density (Bell and McCullouch 1988; Stukhart and Cook 1990). Barcode
scanners are needed to access stored data associated with the scanner. These may be
stationary or hand-held devices like laser scanners. Bar code symbols can be easily
generated and commercially printed, which makes them inexpensive and accessible. The
strengths of barcoding are its ease to use, low cost, and popularity.
b. General use in construction and safety
The barcode technology has a large number of applications in the construction industry,
mostly related to identification and tracking functions. Tracking information flow such as
available material, tasks achieved, or worker locations are vital on a construction site.
Barcodes provide a means to uniquely tag resources so that, once they are scanned, the user
may identify a resources location, availability, and installation status (Bell and McCullouch
1988; Rasdorf and Herbert 1990). Furthermore, researchers have shown that more than
50% of inspection time may be saved by using barcodes to track material delivery from the
supply chain through construction (Bell and McCullouch 1988). Similarly, researchers have
proposed to use barcodes in the design phase to identify documents, facilitate information
flow and potential drawing revisions and notes (Rasdorf and Herbert 1990). Finally,
barcodes are useful tools to identify workers on site, keep track of their specialty or work

5
hours, and anticipate possible manpower needs. The technology can also be implemented to
measure how often certain tools or equipment and strategically schedule preventive
maintenance (Rasdorf and Herbert 1990). Interestingly, a thorough literature review has
not yet revealed potential applications to safety although, as will be presented later, safety
risk data may pose a new opportunity.
Radio Frequency Identification (RFID)
a. Definition and Principles
Tracking and localization technologies that capture the changing site information have
been deployed in several sectors such as manufacturing, the distribution or the healthcare
and have shown promising results. Among these technologies, radio frequency
identification (RFID) systems have received the greatest attention in the construction
industry.
The function of an RFID system is to detect and locate tagged objects or persons
through the data they transmit. A typical RFID system consists of three elements: (1) tags
or radio transponders; (2) a reader usually connected to a computer network to interpret
and react to the data it receives; and (3) antennae (Figure 1). RFID systems use radio
frequencies to establish a connection between tags and readers, also known as coupling.
The communication between the two through antennas on a 120kHz to 980MHz frequency
band allows the system to collect and transfer data at all time within a defined range. The
lower the frequency, the slower the transfer rate (Bhuptani and Moradpour 2005).
Tag Antenna Reader Computer system
Figure 1. Connection between tag, antenna, reader and computer system

6
Maintaining sufficient signal availability in constantly changing construction sites is
the main challenge for RFID tracking accuracy. Materials, equipment, structural elements,
and even people cause signal attenuation and multipath, which alter signal power and
quality, respectively (Pradhan et al. 2009; Lee et al. 2012). Solutions have been suggested
and tested by researchers to reduce the impacts of these issues including the Time of Flight
(ToF) method, Chirp Spread Spectrum (CSS) and assistant tags (Jiao et al. 2007; Lee et al.
2012).
b. General use in construction and safety
RFID technology was originally designed for automatic and effective data capture
(Hightower and Borriello 2001). However, the use of RFID was later used as an accurate
localization system considering the combination of its benefits such as tag data storage,
reader data transfer capability, and relatively inexpensive installation cost.
RFID has been found to be a viable resource for tracking tools, equipment and workers.
Specifically, Jaselskis and El-Misalami (2003) showed that tagging every large piece of
equipment that enters or leaves a stock could save, on average, 30% of the time spent
tracking and locating a specific material. It can also eliminate traditional paperwork
needed for certifications and inspections. In addition, tagged machines could provide faster
access to maintenance history, hours in use and other information for preventive
maintenance. Finally, RFID could provide a better alternative for personnel management
and job status than existing technologies.
In terms of safety, researchers have focused their efforts on one particularly promising
application: a pro-active real-time personnel-warning system to alert workers and
equipment operators of dangerous proximity (Chae and Yoshida 2008; Fullerton et al.2009;
Hallowell et al. 2010; Lee et al. 2012). Pratt et al. (2001) showed that 51% of vehicle-related

7
fatalities happened when the vehicle was in reverse mode, which they linked to the large
amount of blind spots in the backside of a vehicle. Pratt et al. (2001) discovered that the
best method to improve safety on a work zone is by altering the behavior of the individuals
on the safety zone. By nature, workers on foot and equipment operators become unaware of
their surroundings due to fatigue and task repetition, which directly impacts their hazard
recognition skills (Pratt et al. 2001; Fullerton et al. 2009). To address this issue,
researchers have developed a safety management support system based on active RFID
technology to automatically alert machine operators when a worker on foot is nearby
(Fullerton et al. 2009; Chae and Yoshida 2010).
RFID warnings are provided by a system with an Equipment Protection Unit (EPU)
composed of an antenna, a reader, and an alarm installed in the cabin of the heavy
equipment. Workers are equipped with a Personal Protection Unit (PPU), which contains a
tag, a battery and an alarm. When an equipped worker enters the reception field of a
programmed reader – a pre-determined ‘unsafe’ area around the vehicle – the alarm of the
PPU is triggered and the information is instantaneously sent back to the reader, which in
turn activates the in-cab alarm so that both the operator and the worker are aware of their
proximity and the potential danger. Implementing this system is hypothesized to reduce
the number of collisions due to poor visibility, inattention and/or blind spots during
equipment maneuvers. A similar but simpler version has already been installed in some
warehouses, mines and train depots to trigger visual and/or sound alarms when a forklift or
vehicle is in approach in tight areas (Fullerton et al. 2009; Teizer et al. 2010).
Finally, the RFID system can also address the lack of information of near misses, which
are unplanned events that didn’t result in an injury or damage but had the potential to do
so (Fullerton et al. 2009). Tags and readers can be programmed so they can store and record
information such as the number of times a specific tag breach a safety perimeter, how close

8
a tag and a reader were at all times, how operators behave in risky areas, etc. These data
can then be analyzed to help decision makers and managers to take effective safety
countermeasures (Pradhananga and Teizer 2012).
Ultra Wide Band (UWB)
a. Definition and Principles
The Ultra Wide Band (UWB) technology is similar to RFID in that it is a proximity and
location detection system that uses radio frequencies and tags to track the location of an
object or subject. UWB systems are composed of multiple slave sensors that decode the
radio signal using Time of Flight (ToF) and Angle of Arrival (AoA) technics and are
accountable to the master sensor that decrypt all the information received. However,
compared to RFID, UWB can transmit large amounts of digital data over a wide spectrum
of frequency bands at very low power (less than 0.5mW) (Ghavami et al. 2004). Moreover,
although RFID tracking technology can be seriously impaired by signal reflections due to
the construction environment, UWB systems are more stable as they can distinguish the
direct path signal from the signal noises because they use short pulses that greatly enhance
localization accuracy down to 10cm on a wide range (300 to 500m) (Giretti et al. 2009;
Zhang et al. 2012).
b. General use in construction and safety
UWB systems tend to be applied for the same purposes as RFID systems. However, they
are preferred when high accuracy and low error rate is essential such as collision avoidance
as noted by several researchers who have applied UWB to safety. For example, Hwang
(2012) and Zhang et al. (2012) investigated an application of UWB collision-prevention for
tower crane safety. They highlighted that the efficiency and safety of tower crane
operations highly depend on human cognitive ability, constant attention and intuitive

9
perception, which can sometimes fail the operators and signalmen. The risk of collision and
other safety failures is greatly increased when multiple cranes are in use. To avoid such
incidents, the researchers proposed a UWB system to monitor load trajectories and warn
the operators with visual and audible alerts when a potential collision is about to occur.
Researchers have also explored localization systems using the higher accuracy and
noise-free UWB technology. Giretti et al. (2009) and Carbonari et al. (2011) implemented a
human and equipment path monitoring system to prevent workers from accessing
hazardous zones where the risk of being struck by falling objects is particularly high (e.g.,
under suspended loads). Their system was able to warn managers and workers before they
were at risk.
Global Positioning System (GPS)
a. Definition and Principles
The Global Positioning System (GPS) was opened to the public in the 1990’s. Since that
time, GPS has spread widely when it was adapted to mobile phones use in 2004. Although
the system is still controlled by the DoD, the signal is available to civilian users all around
the world considering its continuing modernization and the recognition of its increasing
potential for non-military purposes. Specifically, the system is composed of 24 GPS
satellites that constantly orbit the Earth and transmit radio signals. It was developed in a
way that anywhere on the planet is in the line of sight of at least four satellites. By
measuring the travel time of radio signals between a satellite and a receiver, GPS receivers
are able to accurately determine the location in terms of latitude, longitude and altitude.
The Global Positioning System can be used everywhere in all weather conditions but offers
greater accuracy with a clear line of sight.

10
b. General use in construction and safety
GPS use on construction sites has seen steady growth thanks to its increasing efficiency,
range of application and decreasing cost. GPS has been used in earth moving operations to
remotely monitor and control equipment in hazardous environment, where human presence
is not encouraged (Oloufa et al. 2003). This technology is particularly beneficial in earth
moving operations where the topology of the site keeps changing and the number of heavy
vehicles involved is important. Also, GPS is the only known tracking technology that
doesn’t require pre-installed infrastructure and thus, doesn’t suffer from dirty
environments, large objects or changing environment where radar systems often fail
(Behzadan et al. 2008). Moreover, GPS devices have now been installed on heavy
equipment to track location and activity. GPS trackers have helped operators to calculate
trajectories and optimal path during truck loading or compaction. Another area of
application is quality control of compaction and paving operations. By combining GPS and
RFID technologies or GPS and density sensors, the system was able to monitor asphalt-
paving operations from the production to the actual spreading of the desired thickness at
the right temperature (Peyret and Tasky 2002), or indicate to the operator the exact
number of passes needed, the area he already covered and when the optimal compaction
has been reached, in real-time (Jaselskis et al. 2001).
In terms of safety, GPS, like RFID and UWB, has been especially mostly for collision
detection and avoidance. Thanks to the GPS technology, location, direction and speed of
equipped heavy vehicles are known at all time and allow the collision algorithm to compute
the potential point of impact of two converging equipment. The system is able to calculate
the braking distance needed to avoid the collision. As soon as the safe braking area is
breached, the program send alerts to the vehicles involved along with direction

11
recommendations to prevent the accident (Oloufa et al. 2003). The system is, however,
limited by the accuracy of the technology, the conditions of the site environment and the
potential delays in delivering warnings or executing the command. Furthermore, tracking
critical resources can be used to analyze safety conditions on construction sites and take
proactive safety measures when unsafe activities are about to be undertaken. As an
example application, Pradhananga and Teizer (2012) tracked workers on roofs or in the
vicinity of equipment and used continuous data collection to identify zones where most
unsafe activities take place and develop future safety plans.
Graphical Information System (GIS)
a. Definition and Principles
A geographic information system (GIS) is a broad term to designate different
technologies, processes, or methods designed to manage, analyze, and assess all types of
spatial information and geographical data. GIS is a computer-based system that can
associate unrelated information together by using location as the key variable.
Geographical digital data mostly result from digitization of hard copy maps, survey plans,
aerial photography, and satellite imagery through the use of Computer Aided Design (CAD)
programs and geo-referencing capabilities. When using this technology, information of
interest should be identified first and are usually organized in databases that are then
mapped in layers and combined with geographical input. GIS addresses the lack of
geospatial analysis of Building Information Modeling (BIM) or 4D Computer Aided Design
(4D CAD) systems that can be vital in some projects. For instance, site topography,
environmental conditions, access route planning or flooding areas are crucial safety
information that can be modeled with GIS but not in BIM (Bansal 2011).

12
b. General use in construction and safety
Successful integrations of GIS systems can be found in many areas such as business
analysis, urban planning, facilities management, transportation and civil engineering. For
example, using GIS data, Li et al. (2003) were able to manage spatial information to
optimize costs of transportation, select the most competitive price of material within a
defined range, and propose efficient routes in order to deliver goods on construction sites.
Moreover, Cheng and Yang (2001) developed a GIS-based tool called MaterialPlan to
identify the suitable areas for materials storage to avoid organization conflict on sites and
improve productivity. The authors also combined GIS with CAD to compute quantity
takeoffs, assess materials and generate bills of material (BOM) based on the design
drawings specifications. Bansal and Pal (2007) used AutoCAD combined with ArcView, a
GIS software with a better user-friendly interface, to add a visual dimension to the quantity
takeoffs. GIS has also been used to help project managers dealing with increased data and
optimizing construction sequences in depicting spatial relationships between construction
objects on concrete dam project (Zhong et al. 2004).
There have also been important applications where GIS has been used to improve
construction safety. Bansal (2011) applied 4D GIS to safety planning on a construction
project in India to integrate geospatial information that BIM models don’t, such as
topography, thermal comfort or flooding areas, which are important to consider in
construction planning as they directly impact workers’ safety. The author first developed a
safety database in GIS that solicit safety data from experienced professionals and safety
procedures found in the Bureau of Indian Standards (BIS) related to different activities.
Then, to answer the questions of when and where safety measures are needed, he linked
this database to the Construction Planning and Management (CPM) schedules so that

13
safety managers can benefit from past accident cases. The 4D GIS system facilitated the
analysis of execution sequence from a safety point of view by retrieving, managing and
assessing non-spatial and spatial safety information. Safety recommendations appear when
a specific geographical configuration or component is used in the 3D building model to
ensure compliance to safety regulations during the design phase and provide help in
deciding safe work methods during construction. The GIS system allows correcting a
planned sequence before implementation in case of a recognized hazard situation so that
the system keeps improving. Monitoring the time and location schedules of the construction
tasks on the system allowed safety planners to recognize how workers affect one another
and create dangerous situations, and thus they were able to know when, where and why
intervening.
3D Range Imaging Camera & Visual Monitoring
a. Definition and Principles
Construction sites are constantly evolving environments that require managers and
stakeholders to constantly revise their plans, drawings, and decisions. Up-to-date and
accurate information about the site are key elements for efficient decision-making and
management in general but site inspections are still mostly manual, error prone and
resource intensive. Thus, visual monitoring on construction work sites through the
installation of high-resolution digital cameras has received attention. Whether by taking
static images or record videos, cameras offer a wide range of applications and can provide,
in real time, information managers demand (Bohn and Teizer 2009).
3D range imaging camera systems or 3D Flash LADAR is another promising technology
that supports capture of fast and safe range acquisition of untagged objects at a high lateral
resolution. This technology measures absolute distances resorting to the time of flight

14
(TOF) principle with phase shift measurement. The camera illuminates the entire scene
simultaneously with a modulated light and then, once the light wave is reflected back to the
receptor/sensor chip by objects in the scene, the system is able to compute a 3D map of the
actual scene (Lange and Seitz 2001; Teizer et al. 2007). 3D range imaging cameras offer
high resolution, rapid acquisition and high update rate (1 second to 10Hz) to a distance of
up to 50 meters and, thus, can adequately handle moving vehicles, equipment or workers
while basic LADAR systems cannot (Teizer et al. 2005). Moreover, 3D range imaging
cameras do not require long installation protocols and do not endanger workers when they
are set it up in dangerous areas such as traffic zones. 3D flash LADAR can even be
mounted on a vehicle and will adequately assess the work environment while integrating
the displacements of the vehicle.
b. General use in construction and safety
Digital and 3D range imaging cameras are versatile in a sense that they offer multiple
applications and can be applied to various activities within the construction industry. For
example, the technology has been implemented to monitor construction task progress. By
accessing time-lapse pictures or videos from a standardized site point of view, managers
can assess potential problems with a specific task, detect re-work at its early stages, or
predict upcoming roadblock and thus better anticipate heavy equipment trajectories (Bohn
and Teizer 2009). Visual monitoring allows saving time and money on inspections as the
task can be performed remotely (Brilakis 2007). As previously stated in other technology
applications, enhancing communication and information flows are vital to improve decision-
making and the accumulation of delays. Using visual monitoring and time-lapse
photography can reduce information retrieval time, instantly provide the project status to
the meeting participants and reduce confusion or misunderstanding that technical drawing

15
can produce. In addition, these sequenced pictures can also be used for training, marketing
strategies or even legal purposes such as dispute avoidance and litigation (Bohn and Teizer
2009).
Work safety can also benefit from the 3D range imaging technology. Hazards can be
recognized remotely and improper methods or missing protection equipment can be rapidly
identified, especially at night, and then addressed during safety training (Bohn and Teizer
2009). Furthermore, Everett and Slocum (1993) introduced a video system - CRANIUM, to
transmit a real-time picture of the loads to the crane operator for improved communication
and safety. Finally, coupled with computer vision algorithms, Yang et al. (2011)
demonstrated that the technology could recognize crane activities and track jib rotation and
trolley position based on a color density approach.
Virtual Reality (VR) and Simulation
a. Definition and Principles
Virtual Reality (VR) technology generates realistic environments in which the user is
completely immerged in a computer model. This technology is based on highly dynamic and
responsive computers and servers where the system can quickly respond to the user’s
interactions, decisions, and manipulations. VR models can process various input such as
speech, gesture, sound or position (Blach et al. 1998). To make a simulation an authentic
experience, the system operates in near real time with response rates fast enough to make
the movements and the numerous possibilities unconstrained and intuitive. Virtual reality
technology could be a major element in revolutionizing data presentation and information
access, going beyond simple 3D representations (Caneparo 2001). Multiple stakeholders can
also experience a construction project, even remotely, when VR is created and shared
online.

16
b. General use in construction and safety
Virtual reality systems are already heavily used to train vehicle drivers, pilots, and ship
navigators. The success of these models has served as the impetus for the construction
industry to develop VR for heavy equipment operator training (Wang and Dunston 2005).
Professional personal training simulators have also been developed for operators of tower
cranes, excavators, mining trucks, and bulldozers. In each of these simulations the operator
is asked to perform different maneuvers, lifts, and loadings to practice for the real work
environment.
The ability to virtually explore building and infrastructure has made VR a viable tool
for collaboration and prevention through design; however, its efficiency is highly dependent
of the level of the detail and realism of the construction model. As mentioned above, VR has
been used to give updates of the design process, to share information with the project
participants and can greatly enhance the understanding of the project (Caneparo 2001). By
navigating the model, designers can better predict how their work would influence how
people use and interact with construction objects and tasks. For example, VR can be used to
model how crowds would behave with specific configurations and constraints (Caneparo
2001). Furthermore, Caneparo (2001) promotes shared virtual reality models where VR
models are no longer individual experiences but, instead, are collective and collaborative
experiences. Thus, while experiencing the model, individuals groups of project participants
can quickly visualize and discuss design alternatives during virtual group tours.
Researchers have suggested various applications of VR to construction safety, ranging
from application to enhance injury prevention through design to worker hazard recognition
training. Hadikusumo and Rowlinson (2002) discussed how visualization of the construction
project in its early stages could greatly improve the construction hazard prevention during

17
design. One key element to promote injury prevention through design is to raise designer’s
awareness about their responsibility in this area. Viewing the facility in virtual reality may
reveal hazards that typically remain latent until construction thereby enhancing safety
concerns and compelling design changes that promote worker safety. Also, other authors
suggested using VR for safety hazard recognition programs for workers (Hadikusumo and
Rowlinson 2002; Albert et al. 2014). During safety training, workers would be able to
survey the virtual site to detect dangerous zones or risks, and safety managers could
monitor their performance and provide safety recommendations accordingly. For instance,
Hadipriono and Barsoum (2002) developed an interactive training model for construction
workers to prevent fall from heights while working on scaffoldings. In the virtual model,
trainees were able to follow the safe form scaffolding erection steps and recognize
hazardous situation in existing scaffolding structures.
Augmented Reality (AR)
a. Definition and Principles
Augmented reality (AR) is a technology that creates an environment where virtual
objects and digital content generated by a computer are superimposed into the user’s view
of the physical world. While VR completely immerses the user into a simulated
environment, AR gives the user the ability to leverage the familiarity and comfort of
conventional workspaces with the flexibility and power of computers by inserting critical
elements of the cyber world into the real world (Wang and Dunston 2005; Yeh et al. 2012;
Lin et al. 2014). As many other technologies, augmented reality was first developed for
military and medical purposes and was later adapted by the industrial, commercial, and
entertainment fields (Azuma 1997). AR doesn’t operate as a complete simulator where the
user is completely immerged in the virtual world; rather, it operates as a tool to supplement

18
reality by providing the individual with the elements needed to better interact with the
environment (Lin et al. 2014).
b. General use in construction and safety
Work on construction sites requires managers to constantly make decisions based on the
information available as tasks evolve, the configuration of the workspace changes, and the
project progresses. Such work demands constant updates and quick visualizations of the
status key project conditions. Such information and visualizations are offered by
augmented reality (Wang et al. 2013).
In addition to individual decision making AR systems can be used as a cooperation tool,
designed to improve communication, reduce construction conflicts, and enhance information
transfer (Lin et al. 2014). According to Wang and Dunston (2008), AR can foster
communication and information sharing among architectural designer team members and
improve design creativity as well as provides a powerful tool for design problem solving.
Compared to 2D drawings, AR technology has been found to better facilitate collaboration
tasks. Specific types of AR facilitate such collaboration, known as augmented reality-
multiscreen system (AR-MS system), which is composed of a physical and a cyber-
environment and information interaction. Lin et al. (2014) built a mobile device, the BIM
table, which can display a wide range of data such as maps, drawings but especially BIM
models so that managers can address conflicts directly on sites and quickly show new task
instructions as well as safety recommendations to workers. Similarly, Wang and Dunston
(2008) investigated how mixed-reality/augmented (MR/AR) reality systems could enhance
construction clashes, problem solving and design review collaboration from the user point of
view. In their MAR/AR model, the user is able to interact with the virtual objects he can see
with a head mounted display by using computers. Their test results showed that the

19
participants using the MR system were faster to identify design errors and that the system
provides better quality of visual presentation, a larger level of immersion and more overall
suitability for making decisions on design models compared to 3D paper drawings.
Yeh et al. (2012) took advantage of the rapidly developing and increasingly powerful
wearable devices to create projection-based augmented reality device called, iHelmet. The
goal of implementing the device was to reduce the difficulties of on-site information
retrieval by combining building information model (BIM) and AR technologies on a helmet
so that the user can access construction drawings and models on demand. Coupled with a
relatively small projector equipped on the helmet, the device is able to create an augmented
reality environment by projecting the information retrieved in front of the worker, who can
then review his tasks, consult safety recommendations or verify the adequacy of his work
with the plans.
Augmented reality has also been used with Global Positioning System (GPS) technology
and traditional Computer Aided Design (CAD) models to detect existing subsurface utility
lines during excavation work. During such operation, hitting the utility system can greatly
delay the project under construction, cause unwanted money spending and even be fatal. To
avoid such accidents, increase safety of urban construction projects and reduce potential
costs, Behzadan and Kamat (2009) proposed the integration of augmented reality and
global positioning system technologies to accurately detect and display in real time the
utility network’s location to site managers and operators so that excavation operations can
dodge utility lines.
Finally, another application domain for augmented reality is operator training. Wang
and Dunston (2005) conceptually designed a training system by embedding an augmented
workspace with virtual objects such as stockpiles, target positions into the existing real
work environment. Because of its flexibility and endless possibilities of scenarios, the

20
system can generate training sessions that focus on the operator’s needs and progression.
Furthermore, safety while operating a heavy vehicle or equipment can be greatly improved
with the program by simulating risky conditions such as overload charges, tipping
equipment, or fall of elevated virtual materials, and this without any ethical issues, over
costs or even environmental concerns (noise, dust, etc.).
Cyber-Physical System (CPS)
a. Definition and Principles
A cyber-physical system (CPS) is the integration of physical devices such as sensors,
tags, and cameras with informational components such as Building Information Modeling
objects or sensed data to form a system that intelligently respond to dynamic changes of the
real world (Tang et al. 2010). In other words, embedded computers and networks can
monitor and control the physical processes with feedback loops, where the physical
processes affect computations and vice-versa (Derler et al. 2012). The key feature of a
Cyber-Physical System is its ability to bridge cyber information with the physical reality
via sensors and data acquisition technologies (Wu et al. 2011) so that the modification of a
physical component can be simultaneously reflected on the virtual model. Conversely, in a
CPS, cyber information can affect the physical world, which generally means making
control decisions to react to specific sensed information and physically control the building
components (Akanmu 2012). Although, the term is relatively new, the concept is not and is
already implemented in various sectors of activity such as the transportation system
(intelligent traffic systems), the healthcare system or rescues with the support of the global
positioning system (GPS), accelerometers and microphones or other various sensors.
Applications in the construction field date back to 2009 when cyber-physical systems have
been deployed for real-time structural health monitoring of civil structures (Lynch et al.

21
2009; Hackmann et al. 2014). More concretely, a cyber-physical system’s architecture is
divided into five layers in order to connect the physical world to the virtual model in both
ways, from the sensing process to the actuation layer and vice-versa. The architecture of a
CPS is showed in Figure 2.
b. General use in construction and safety
There have been several applications of CPS in construction. According to Anumba et al.
(2010), cyber-physical systems have the potential to epitomize the paradigm shift
construction needs to overcome its relatively poor productivity compared to other industries
Figure 2. Cyber-Physical System architecture

22
sectors, its lack of evolution in processes that are still mainly manual, and the general
uncertainties that are characteristic of the construction field such as final costs or delivery
dates. To that end, the authors proposed a project delivery process based on bi-directional
flows of information to enable greater process control, improved predictability of outcomes,
and more intelligent, sustainable facilities that are also safer to build.
Akanmu (2012) presented a cyber-physical system that could visualize, locate, monitor
and control tagged light fixtures. The interaction between the virtual model and the
physical light fixtures could enhance the energetic performance of the building and thus
reduce energy losses, which are mostly caused by poor monitoring and control (Newsham et
al. 2004; Boyce et al. 2003 as cited in Towards cyber-physical systems integration in
construction, Akanmu, 2012).
Structural health monitoring (SHM) is another area of application for CPS explored by
researchers. Hackmann et al. (2014) adopted a flexibility-based method to develop an
energy-saving CPS system that identifies and locates in real-time damages on civil
structures. Likewise, Lynch et al. (2009) used self-sensing materials for distributed sensing
to create ultra-low power wireless sensors. The authors exploited the piezoelectric
properties of their sensors to accurately identify deterioration areas on civil structures and
map crack states in two or three dimensions.
Finally, cyber-physical systems have recognized the benefits of modeling for safety
management of temporary structures (Chi et al. 2012; Yuan et al. 2014) and have used
sensing technology to monitor formwork operations as a way of preventing structural
failures (Moon et al. 2012). According to Fabiano et al. (2008), most of the time, temporary
structures such as scaffolding, formwork systems or earth retaining structures are
considered as static elements that do not need an increased control, and yet have proven
that they can cause severe accidents as they are dynamic systems. Yuan et al. (2014)

23
explored two major applications of CPS to prevent temporary structures collapses. First, a
CPS could serve as a checker to verify if the built assembly corresponds to the virtual
model, as gaps between the engineered model and the actual installations constitute one of
the primary causes of system failure (Thornton 2012 as cited in Yuan et al. 2014).
Moreover, the installed sensing network could also monitor the performance parameters of
the structures both during construction and while in use or during severe environment
events. Second, the same approach could be used for scaffolding. By implementing a CPS on
a scaffold, safety managers would be able to determine whether or not the structure is used
within its design limits and predict its stability at all time by looking at the sensed data on
the virtual model. In both examples, a CPS would provide real-time inspection, quick
problem identification and potentially automatic stabilization depending on the
performance of the system.
Building Information Modeling (BIM)
a. Definition and Principles
Building Information Modeling (BIM) is an efficient tool to accurately design and
generate a virtual digital model of a physical structure or project. BIM software can
represent all kinds of structural components such as concrete beams, steel columns,
commercial floors and walls, and all their connections. The strength of the BIM technology
is its ability to enrich a virtual model with geometric properties of building elements with
other information such as site schedule sequencing, product information or safety
precautions. Numerous functions within the BIM software can provide the user all sorts of
information he might need to compute quantity takeoffs, costs estimations or task
schedules. Researchers have proven that resorting to BIM in construction and structural
firms have greatly enhanced design, management and labor productivity, and have been

24
beneficial for all stakeholders during the entire construction process (Kam et al. 2003; Kaner
et al. 2008; Jordani 2008; Howard and Björk 2008; Goedert and Meadati 2008).
b. General use in construction and safety
The Building Information Modeling (BIM) technology has probably the widest range of
applications of those reviewed in this paper. BIM for safety has been studied and
successfully implemented at each stage of a project, from the marketing and design phase
to the maintenance of the built structure through the actual construction phase.
Researchers have consistently highlighted the powerful potential of BIM models to
integrate various information into 3D or 4D models but to also to foster communication
between designers, contractors and the stakeholders and to improve construction
productivity as well as safety (Lopez del Puerto and Clevenger 2010; Yeh et al. 2012; Lin et
al. 2014).
Safety concerns have been addressed at the design phase within BIM models to tackle
risky situations, task congestion and fall hazards at the early stages of a project. Indeed,
researchers such as Gambatese and Hinze (1999) and more recently Bansal (2011) have
long emphasized the crucial role of designers in safety and have encouraged the
involvement of experienced safety managers in the design review. To that end, Hammad et
al. (2012) proposed a method for automatically identifying falling and collision risks and
generating dynamic virtual fences (DVF) in BIM. Similarly, Zhang et al. (2013) with Tekla
Structures and later Qi et al. (2014) with Solibri Model Checker, developed a rule-based
system to automatically check, locate and correct identified safety hazards during the
design phase. The system also proposed schedule for the implementation of proactive safety
measures. According to Qi et al. (2014), the ideal prevention through design software
should be able to help and guide designers during the main design phase by suggesting

25
alternative construction configuration to minimize safety non compliance; run safety
checking on the overall project at the end of the design phase; and be able to correct any
safety detected issues. However, previous studies and the authors recognized that such
software is often too intrusive and thus ignored by under-pressure designers, and that the
number of safety recommendations should be limited.
Although BIM is essentially an information-rich design technology, it can also be used
as a tool for safety management to monitor and diminish safety hazards during the
construction phase. Collins et al. (2014) studied the use of 4D BIM throughout scaffolding
activities to assist safety managers in implementing preventative measures by integrating
experts opinions and safety risk factors in the model. BIM has also been employed for real-
time work progress monitoring. By comparing as-planned BIM designs with the as-built
structure captured by laser scanning technology, managers were able to effectively detect
missing safety components such as guardrails or safety nets (Ciribini et al. 2011, as cited by
Chi et al. 2012). Yeh et al. (2012) combined BIM with augmented reality to provide on-site
building information retrieval to managers so they could access buildings plans effortless
and without carrying multiple drawings on-site. Likewise, more recently, Lin et al. (2014)
proposed a device – the BIM table, which combine augmented reality and BIM technologies
to facilitate information retrieval on site, improve communication between designers,
managers and workers, and to better safety recommendation understanding. BIM models
have also been paired with localization and tracking technologies such as RFID, UWB, GPS
and GIS in order to create sensing-warning systems that send alerts to workers when they
enter a BIM predefined hazardous zone (Chae and Yoshida 2008; Fullerton et al. 2009;
Costin et al. 2014).
BIM technology has also been helpful to enhance safety planning and training. Kim et
al. (2014) proposed an automated information retrieval system that can automatically

26
search for and provide, as a push system, similar accident cases. The retrieval system
extracts building information modeling (BIM) objects and composes a query set by
combining BIM objects with a project management information system (PMIS). In this case,
a query set is composed based on work, work conditions, and laborers. This program is
based on the result that similar accident cases provide direct information for determining
the risks of scheduled activities and for planning safety countermeasures and on the fact
that "Laborers [...] do not tend to voluntarily retrieve past accident cases related to
themselves due to their overconfidence in their experiences and skills" (Kim et al. 2014, p.1).
Lopez del Puerto and Clevenger (2010) illustrated BIM applications in safety planning by
investigating potential “pinch-point” accidents ahead of actual material installation. Bansal
(2011) has mixed BIM and GIS systems to make safety uneducated Indian workers
visualize the construction sequences along with its surrounding so they better understand
task interactions and safety recommendations.
Finally, some studies have investigated BIM’s benefits for safer facility management,
emergency plans and maintenance. Ruppel and Abolghasemzadeh (2009) assessed different
fire safety scenarios to optimize emergency evacuation within a virtual BIM environment.
The flexibility of the BIM model allowed the researchers to evaluate the fire diffusion, its
sources, the potential obstructions and how protective equipment would react or be
accessible for rapid intervention. Analogously, Leite and Akinci (2012) studied the
vulnerability of facilities during an emergency by triggering by a failure in the building
system to identify which critical assets might be affected by the current emergency. By
embedding electrical and plumbing network photographs into BIM, Lopez del Puerto and
Clevenger (2010) showed that BIM could also be used to locate hidden components for
maintenance and repairs.

27
Patterns and Limitations
Exploring patterns in safety applications between the various technologies may help to
identify opportunities of improvement for future research. An overview of the technologies
by safety applications along with their intervention phase presented in the literature
review is given in Table 2. From this table, two main application trends can be identified.
First, computer-based technologies mostly intervene at the early stages of a
construction project. As design is essentially virtual, it is not surprising that this type of
technologies such as BIM, VR and GIS are the only technologies to integrate safety before
construction even begins. These digital tools are used to check virtual models, suggest safer
design alternatives, consider geospatial information, and provide step-by-step visualization
of construction tasks for pre-planning and safety management support. Following Reason’s
(1990) human error causation model, virtual models and computer-based technologies are
the first resort to reduce hazards and potential workers’ unsafe behavior on sites. However,
compared to the range of safety applications in the construction phase, only few tools are
available in the design phase to assist designers in achieving construction safety, which
confirms the findings of Zhou et al. (2012).
Researchers have long emphasized the necessity of implementing pro-active safety
measures such as workers training or prevention-through-design tools to tackle future
safety issues on site (Gambatese and Hinze 1999; Bansal 2011; Zhang et al. 2013; Qi et al.
2014), and yet construction safety applications in the design phase are less mature than
those in the construction phase. Indeed, well-known construction companies, which can
afford these types of technology on their projects, are usually aware of organizational
health and safety regulations and do not struggle with their application, which most of
DSFP tools are designed for.

28
Description Approach Phase RFID UWB GPS GIS VM VR AR CPS BIM
Prevention through Design
Simulation and review of construction process for design related safety issues. Rules-‐based algorithms and software used to detect hazards in the design phase, incompatibility with OSHA rules, and suggest safer alternatives
Design ✓ ✓
Geospatial considerations for safety
Integration of geospatial information in safety planning such as flooding area, topography, access route planning, light and temperature
Design, Pre-‐ and Construction
✓
Safety Training -‐ Hazard recognition and Operator training
Training for workers and operators: hazard recognition, simulation exercise, crane operation, reverse mode maneuver, awareness of surroundings
Pre-‐Construction ✓ ✓ ✓ ✓
Safety in Construction Planning Management
Decomposition of construction tasks into basic elements to remind the workers the correct steps, recognize hazards, provide safety recommendations
Pre-‐Construction ✓ ✓ ✓ ✓
Safety information retrieval
Retrieve past accident cases based on workers' profiles to provide safety recommendations adapted to the tasks of the day
Pre-‐Construction ✓ ✓
Structural risk assessment
Evaluation of operational risk levels and structural safety analysis
Pre-‐Construction, Construction ✓ ✓
Decision Support System
Assist engineers and managers in safety monitoring and controlling construction tasks such as excavations, especially near utility lines
Pre-‐Construction, Construction
✓ ✓
Collision avoidance
Prevent worker-‐equipment, equipment-‐equipment, objects at height-‐worker collisions with tracking, braking distance, blind spot visualization and monitoring
Construction ✓ ✓ ✓ ✓
Warning system
Send visual, sound alerts to workers/operators when they are in the vicinity of equipment, craned loads, hazardous areas in real time
Construction ✓ ✓ ✓ ✓ ✓ ✓
Crane monitoring Monitor loads, trajectories, improve operator
visualization Construction ✓ ✓ ✓ ✓
Critical resource tracking for risk tracking
Tracking of large, heavy or hazardous material installation that are known to be accident prone to take preventive measures at the right place and time
Construction ✓ ✓ ✓ ✓
Remote safety control and inspection
Remote inspection and hazard recognition of on-‐going or future construction task. Detect, model and track the position of static or moving obstacles, resources, and workers.
Construction ✓ ✓ ✓
Information collection and near misses
Collect information that will potentially serve for future analysis, hazard recognition and prevention such as frequency of proximity with equipment, hazardous area. Record info before/during accident.
Construction, Post-‐Construction
✓ ✓ ✓
Table 2. Safety applications by technologies

29
Second, tag-based technologies constitute the core body of pro-active safety applications
on sites. These technologies are based on information transfer between the tags and the
reader to track, locate and monitor in real-time assets such as workers, equipment or
materials. These technologies have shown great potential and encouraging results in safety
monitoring and pro-active safety measures. Nonetheless, based on our previous literature
review, applications have been limited in scope to collision avoidance and warning systems
to alert in real-time workers when they are in the vicinity of heavy equipment or have
entered a predefined hazardous area.
From Reason’s causal model perspective, if computer-based technologies constitute the
first resort to reduce future safety issues on sites, tag-based technologies are the final
safety barrier to potential accidents workers have, should all the other safety practices and
training fail. Regarding these systems, some limitations in application have already been
identified. In fact, Hallowell et al. (2010) questioned the implementation feasibility of such
pro-active safety systems especially in terms of the volume of warnings. Some tasks on the
field require both heavy equipment and workers-on-foot to work in concert, excavation
operations or embankment works for instance. Implementing collision avoidance systems
with such activities would generate continuous false alarms and could lead workers to
deactivate their personal protection unit while the collision risk is still present. The same
remark applies for equipped workers who are performing a task in an automatically
predefined hazardous workspace due to their activity, as described in Hammad et al.'s
(2012) dynamic virtual fences system.
Some researchers have emphasized that tracking technologies could also be used to
collect data about near misses to help managers correcting and improving their safety
strategies. However, such articles often lack details on the nature of the data that should be
collected, how they could be used and how safety managers could benefit from them.

30
The most critical limitation of previous research is the tenuous link between theoretical
safety applications the aforementioned technologies can achieve and real applications on
sites. Table 3 summarizes the data sources and data use of every safety application articles
cited in the literature review. The color-coding in the data source column aims to highlight
the general trends in the safety data researchers have integrated in their intelligent
systems. Red was used to show the absence of robust data sources or that the application
parameters were left to the user’s discretion. Yellow emphasize that researchers resorted to
experts’ opinions to identify risks and improve the application scope of their systems.
Finally, green means integrating safety data such as regulations and governmental safety
recommendations as data sources to address safety issues. All technologies except BIM
have no safety data sources or only rely on experts’ knowledge and judgments whereas BIM
resort to both experienced managers’ opinions and health and safety regulations. Because
OSHA regulations and safety codes in general are limited to fall hazard prevention, the
BIM safety application scope has been restricted to detect openings and risky
configurations and specify where guardrails are missing and/or needed.
There is a clear lack of viable and robust safety data to justify what, when, where and
why injuries happen and safety applications are needed, which are the major issues safety
managers have to tackle. Previous studies usually address only one or two of these
perspectives. The integration of health and safety regulations at the design phase and all
studies that aim to reduce accidents by identifying risks associated with specific activities
fail to address when and where accidents occur. Other pro-active safety applications have
combined pre-planning, task schedule and regulations to propose safety management
support tools but they did not address the necessary questions of where and why these
particular measures are important. Construction plans, procedures and safety codes
typically address what types of safety measures are needed and why, while safety planners

31
can answer when and where they are required. These two types of applications need to be
linked to fully tackle safety issues on sites. However, as hazard recognition and safety
planning highly depend on the level of knowledge and experience of managers in most
presented technological systems, safety strategies can suffer from dissimilarities, human
errors and capacities or incorrect safety priorities that empirically driven risk data could
address as developed later on. Because construction projects differ from one another in
terms of configuration, location or crews, safety strategies should be adequately prioritized
to tackle the actual risk situation of the worksite that risk analysis can reflect. By giving an
objective numerical value to a specific risk, safety managers would be able to identify more
risks and know how to prioritize safety resources to address them regarding their relative
importance and not because of subjective judgments or in reaction of the accident.

32
Technology Authors Data sources Data use
RFID
Fullerton et al. 2009 None Proximity and warning device
Collision avoidance Chae and
Yoshida 2010 None Proximity and warning device Collision avoidance
Teizer et al. 2010
None At user's discretion
Proximity and warning device Collision avoidance
Lee et al. 2012 None Real-‐time locating system Possible warning system
UWB
Giretti et al. 2009
None At the user's discretion
Real-‐time locating system Virtual fences for dangerous zones
Warning system
Carbonari et al. 2011
None At the user's discretion
Real-‐time locating system Virtual fences for overhead hazard zones
Warning system
Hwang 2012 None Crane operator support Collision avoidance Warning system
Zhang et al. 2012 None
Crane operator support Collision avoidance Warning system
GPS
Oloufa et al. 2003 None
Vehicle Tracking Collision avoidance Warning system
Pradhananga and Teizer 2012
None Arbitrary proximity areas (10m)
Continuous collection of location/proximity data between workers, equipment and hazardous areas
GIS
Cheng et al. 2002
Experts' knowledge and experience Individual's judgments and past experiences
Geographic data collection for computer-‐aided decision support in excavation operations
Bansal 2011 Experts' knowledge and experience
Bureau of Indian Standards (BIS) codes Risk factors related to an activity
4D GIS for construction safety planning
Visual Monitoring
Everett et al. 1993 None Real-‐time crane operator support system
Bohn and Teizer 2009
Experts' knowledge and experience At user's discretion Site camera monitoring for remote hazard recognition
VR
Hadipriono and Barsoum 2002 Experts' knowledge and experience
Virtual training for scaffold erection and hazard recognition in existing platforms
Hadikusumo and Rowlinson
2002
UK Health and Safety Executive (HSE) Occupational Safety and Health Act (OSHA)
Construction Site Safety Regulation of Hong Kong Hong Kong Housing Authority’s accident report
Design for safety tool Hazard recognition at the design phase
Albert et al. 2014 Experts' knowledge and experience Virtual hazard recognition training
AR
Wang and Dunston 2005
None At user's discretion
Equipment operator training
Behzadan and Kamat 2009
Construction site experience Reaction to a known delay prone and sometimes
life threatening problem
Utility lines damage prevention Warning system
Yeh et al. 2012 None (Safety) information retrieval system
CPS
Moon et al. 2012
Contractors' discretion with preset guidelines and engineers' stability calculus
Data collection of temporary structure parameters Monitor stability via sensor/computer based system
Yuan et al. 2014 Engineers and experts' knowledge
Construction site experience Reaction to a known life threatening problem
Warning system Sensor and computer-‐based system to check correct erection and monitor stability of temporary structures
to prevent collapse or potential hazards Table 3. Data sources and uses by technology

33
Technology Authors Data sources Data use
BIM
Lopez and Clevenger 2010
Engineering controls Administrative controls
Experts' knowledge and experiences
BIM-‐enabled safety controls Elimination and substitution of hazards at the design phase + 3D visualization of construction sequences to
prevent pinch-‐point accident
Hammad et al. 2012 Safety Code of Quebec Provence
Generation of Dynamic Virtual Fences Collision avoidance + Fall protection
Warning system based on RTLS
Chi et al. 2012
Workplace Health and Safety Queensland (WHSQ)
Occupational Health and Safety legislation (OHS) Experts' knowledge and experience
3D BIM scaffolding and formwork objects for incorporation with safety features and constructability
elements BIM checklist for safety inspection
Zhang et al. 2013
Occupational Safety and Health Act (OSHA) Construction Best Practices
Automated safety rule checking PTD computer software-‐based system
Compliance checking and safety suggestion
Qi et al. 2014
Experts' knowledge and experience UK Health and Safety Executive (HSE) Safety design manuals and checklists CII researchers recommendations
Occupational Safety and Health Act (OSHA)
Automated safety rule checking PTD computer software-‐based system
Compliance checking and safety suggestion
Lin et al. 2014 None Enhance discussion by using a BIM table to provide visual content and quick information retrieval, task
schedule and construction processes
Kim et al. 2014
Korean Occupational Safety and Health Act (KOSHA)
UK Health and Safety Executive (HSE) Occupational Safety and Health Act (OSHA)
Safety information retrieval based on workers' profile for hazard recognition program
Collins et al. 2014
Industry safety professional survey to get likelihood, severity, risk factor and risk level for each step of a scaffolding setting, monitoring
and dismantling
4D BIM system for safety management of scaffolding activities at each stage of the project
Table 3. Data sources and uses by technology (continued)

34
Risk Analysis
Risk defines a potential event that results in an unplanned outcome. The risk value is
the product of a probability, or chance of occurrence, and a severity, the magnitude of the
undesired outcome (Yi and Langford 2006). In construction safety, risks are interpreted as
potential accidents and the outcomes as injuries.
For safety risk, while probability can be measured in terms of worker-hours per
incident, severity can be assessed in monetary terms or in terms of the degree of injury
(Pain, first aid, medical case, lost work time, permanent disablement and fatality) but is
much more difficult to evaluate. Risk has also been quantified as the product of a
probability, a severity and an exposure, which is defined as the frequency of occurrence of a
particular hazard (Jannadi and Almishari 2003; Hallowell and Gambatese 2007).
Risk quantification methods usually result from opinions of experts and government
statistics but rarely from robust empirical data. Based on their field experience, managers
are asked to evaluate on Likert-type scales the risk frequency associated with a particular
activity. Combined with statistics from governmental studies, these methods have been
used to help safety planners to identify high-risk activities on site, prioritize appropriate
safety precautions more efficiently and thus prevent potential accidents (Jannadi and
Almishari 2003; Baradan and Usmen 2006; Hallowell and Gambatese 2009). Nonetheless,
such methods are task-based and only applicable to a restricted number of construction
scenarios. The dynamic and transient characteristics of jobsites and the variety of
construction tasks have limited their widespread use.
To expand the application area of risk quantifications, researchers have tried to break
down general activities into simpler task or trade they could more easily assess (Baradan
and Usmen 2006; Shapira and Lyachin 2009). However, by considering tasks or trades
independently, they omitted the on-going interactions that actually occur on a construction

35
site and that are a critical factor in risk management. To overcome such limitations, some
researchers have proposed to interpret construction activities and environment in terms of
safety attributes. The attribute-based risk analysis relies on the theory that every
construction accident results from the conjunction of a finite number of hazardous
precursors. Preliminary studies with this new approach have produced robust and viable
safety risk data but have yet been limited to the study of struck-by accidents (Behzad
Esmaeili 2012).
POINT OF DEPARTURE
Despite the advancements in integrating technologies in the construction industry and
the various safety applications presented in previous literature, there are still major
limitations with significant opportunities for improvement. For example, no safety
application for barcodes has been encountered in the literature, even if the technology has
shown a great potential in other areas. Moreover, the analysis of the given safety
applications have shown that most of them lack viable and robust safety data sources, and
that they essentially rely on experts’ judgment and intuition. This study takes a step back
from previous literature to provide the reader a global picture of the trends in use and
limitations of current safety applications. Additionally, this study offer attribute-level
safety risk data as a means to improve the quality and versatility with which safety data
can be integrated with technologies in both design and construction.
To this end, the following sections aim to highlight safety application patterns among
technologies, address the quasi-systematic lack of robust safety data as sources by
introducing and conducting an attribute-based risk analysis, suggest ways to integrate such
data with the emerging technologies, propose a general framework to combine multiple
technologies in one intelligent safety-oriented system, and finally give the reader some
insights about future research and potential improvements.

36
RESEARCH METHODS
As mentioned earlier, there is a lack of independent, robust and viable safety data
managers can use to assess safety risks on construction sites. Indeed, actual technological
safety applications mostly rely on experienced field managers’ opinions to identify
hazardous situations and take preventive actions to reduce injuries on worksites. Although
qualified safety planners know that many factors can cause an accident, they rarely
perceive the degree of risk associated with a particular construction site. Thus, identifying
attributes and their interactions to find the real causes of accidents and quantifying their
risk would help safety managers to adopt the most effective pro-active measures depending
on the configuration and the different actors present on their jobsites. Such data have the
potential to be integrated with advanced technologies and intelligent systems to address a
wide array of potential construction scenarios early in the project delivery process.
To achieve these objectives, a team of 9 researchers was formed to conduct a structured
manual and automated content analysis on 7,033 injury reports provided by a total of 243
independent contractors. The raw data consisted of various detailed information about the
injuries or fatalities such as a description of the accident circumstances, the worker’s
domain of activity or the injured body part. This document is the result of the partner firms’
safety department initiative to reduce its internal injury rate. It reports the incidents that
happened between the beginning of 2013 and February 2014.
Manually analyzing such a volume of data would have been time-consuming,
cumbersome and error prone thus, the research team implemented a combined manual
content analysis to extract viable and robust safety precursors, building on the work of
Prades (2014). A content analysis is defined as “a research method for the subjective
interpretation of the content of text data through the systematic classification process of

37
coding and identifying themes or patterns” (Hsieh and Shannon 2005), which was
appropriate to identify the latent hazardous attributes in the accident descriptions.
Because existing literature on safety precursors is limited and would benefit from
further research, the team followed the protocol of a directed content analysis as described
by Hsieh and Shannon (2005). This involves beginning the analysis with prior methods of
coding and theory. Data that cannot be coded are identified and analyzed later to determine
if they represent a new category or a subcategory of an existing code. This approach is
generally used to contradict or on the contrary further refine, extend and enrich prior
research. As our team vastly improves the quality and quantity of available data by
considering all injury types, the automated part of this analysis is still in progress.
Consequently, this paper only details the manual analysis part of the overall project, which
consisted in analyzing a set of 1,280 randomized injury reports. The results of this first
phase were then used to generate a list of keywords that serves as input for the automated
process in order to analyze the rest of the dataset.
Objectivity, reliability and viability
Directed content analysis present however some limitations that need to be addressed
to improve data quality. One particular issue was to achieve objective and unbiased results,
which are prerequisites to reliability. The team had to deal with a large amount of data and
might have found evidence of attributes that resulted from personal interpretations of the
accident descriptions. Objectivity describes the fact that the analysis should be
meticulously designed so that neither the research team members, nor external factors can
affect the results (Campbell et al. 1981). Imperfect methodologies are detrimental to the
objectivity of an experiment. In this study, objectivity was enhanced by following a strict
protocol and by using inter-subjective agreement: if two or more observers can agree on a

38
phenomenon, their collective judgment can be said to be objective (Lincoln and Guba 1985).
Reliability is in turn a precondition to validity; an unreliable measure cannot be valid
(Lincoln and Guba 1985). To achieve an acceptable level of reliability, it must be reasonable
“to assume that each repetition of the application of the same, or supposedly equivalent,
instruments to the same units will yield similar measurements” (Ford 1975, p.324). In
order for the coding schemes and the results yield to be used as robust data sources for
future applications, intercoder reliability had to be assessed. Researchers worked
independently from each other using the same instructions and an agreement coefficient
was computed to ensure reliability and thus reproducibility. “In content analysis,
reproducibility is arguably the most important interpretation of reliability […]
Reproducibility is about data making, not about coders” (Krippendorff, 2004, p. 215). This
was realized by asking two independent experts to code a randomized fraction (15%) of the
analyzed injury reports of each process iteration and computing an agreement rate
(Neuendorf 2002; Krippendorff 2004). A goal of 95% agreement was set at the beginning of
the analysis and was calculated using the following formula:
Agreement rate % = 1 − !"#$%& !" !"#$% !"#$!%&!"#$% !"#$%& !" !"#$"%"& !"#$!%&
× 100 (Equation 1)
In cases of inconsistency or disagreement, the overall set of reports was reviewed by the
members of the team before resubmitting another portion of the results to the experts.
Moreover, another challenge of this type of analysis is to develop a complete understanding
of the context, which, in case of misinterpretations, can result in findings that do not
accurately represent the data. This criteria is what Lincoln and Guba (1985) defined as
internal validity and what Cook and Campbell (1979, p.37) describe as “the approximate
validity with which we infer that a relationship between two variables is causal or the

39
absence of a relationship implies the absence of a cause”. The internal validity of the study
was enhanced through activities such as peer debriefing and member checks as suggested
by Lincoln and Guba (1985) and Manning (1997).
External validity may be defined as “the approximate validity with which we infer that
the presumed causal relationship can be generalized to and across alternate measures of
the cause and effect and across different types of persons, settings, and time” (Cook and
Campbell 1979, p.37). To ensure optimal external validity injury reports were randomly
selected so that resulted precursors were representative of the overall dataset and expected
to be general enough to adapt the transient, dynamic, and variable nature of construction
work.
Extraction Protocol
For the extraction protocol, the team followed the recommendations of Lincoln and
Guba (1985), Neuendorf (2002), Krippendorff (2004), and Hsieh and Shannon (2005) in
terms of methodology, objectivity and reliability. As mentioned earlier, our team resorted to
the results and industrial attributes of Prades (2014) to begin the manual data extraction
process. Precursors that could not be categorized were analyzed later to determine if they
constitute new safety attributes. Based on past experience of the initial project (Prades
2014), an attribute was considered as a new safety precursor when found at least eight
times in the analyzed injury reports and was discussed among the researchers. Accident
reports with too few details, collisions between two equipment and near misses were
omitted in this analysis to avoid data interpretations, to focus on human safety risk and to
assess actual resulted injury severity. The manual content analysis protocol and the
keyword dataset generation process are presented in Figure 3 and detailed in the following
paragraphs.

40
Attributes are independent elements identifiable in the design phase or on the jobsite
before a task is initiated. Attributes can be physical elements such as equipment, tools,
materials, design features, but also conditions of the work environment or weather
conditions. Following Prades’ methods (2014), attributes were classified in three major
categories: upstream, transitional and downstream safety attributes.
Upstream Attributes that can be reasonably identified during the design phase of a
project, before construction begins and that are independent of human
behavior. Incidents with identifiable upstream attributes can theoretically
be foreseen and prevented by adopting new design solutions. Upstream
attributes can be divided into three sub-categories: Materials, Equipment
and Design.
Transitional Attributes that can be reasonably identified before construction begins but
that require some research and/or projections of environmental conditions
and construction means/methods. Transitional attributes are generally the
responsibility of the contractor, as he or she is required to provide a safe
workspace according to OSHA regulations. Transitional attributes can be
divided into five sub-categories: Equipment & Tools, Materials &
Substances, Site Quality, Weather & Environment and Other.
Downstream Attributes that could not be observed and identified until construction
actually begins. Downstream attributes can be divided into two sub-
categories: Human behavior and Site Characteristics.

41
One iteration of the process consisted in analyzing 200 injury reports from the 1,280
randomized dataset. First, researchers were asked to individually identify upstream,
transitional and downstream attributes but also the severity and maximum potential
severity of the injury, its energy source and its injury code as described by OSHA
regulations, Prades (2014) and Albert et al. (2014), in 30-50 injury descriptions. Second, a
peer review system was implemented to keep the results updated and provide a primary
verification. In pairs, the team members reviewed each other’s work, discuss potential
change, disagreement or lack of attributes and update their results regarding the adoption
of new precursors. Shifting pairs every new iteration enhanced these benefits and limited
the spread of misinterpretations. When precursors were extracted from the 200 reports, the
< 95% agreement
Injury reports for automated content
analysis (n ≈ 6,000)
Injury reports for manual content
analysis (n = 1,280) 200 per iteration
Text reports of construction injuries (n=7,033) compiled from
243 contractor partners
Initial Attribute Data n injuries with
attribute severity, injury type, body part, energy etc.
≥ 95% agreement
Iterate
Manual content analysis with team (7 researchers)
Manual content analysis (2 independent experts)
Agreement Rate
Investigate errors, add, refine and calibrate in team meeting
Random 15%
Prades 2014 Industrial
Precursor List New Precursor list
Random Distribution
Figure 3. Manual content analysis procedure

42
two independent experts reviewed 15% of the results and computed the agreement rate on a
strictly basis: a missing or incorrect attribute was counted as a False/Wrong. Their
conclusions were then submitted during weekly meetings so that researchers could be on
the same page. These meetings also aimed at discussing the introduction of new precursors,
defining their boundaries and their application.
Attribute-based Risk Analysis
a. Exposure data
In order to perform a safety risk analysis, the exposure data for every identified
attribute were needed. Exposure data represent the relative time value or the probability a
given safety attribute is likely to be found on a construction site. To obtain such data, the
research team conducted a two-rounds survey among project managers of the 243
independent contractors of the study. Based on their field experience, managers were asked
to evaluate the percentage of time a given crew would be likely to find each of the 79
characteristics or attributes on a site. To ensure consistent interpretations of the various
attributes, precursor descriptions were provided along with the questions.
After the first round of surveys, the data were aggregated and the median exposure and
the variances for each attribute were computed to evaluate the level of consensus as an
important step toward quality data. A second round was needed to refine the degree of
consensus in which experts were asked to accept or reject the median responses from the
first round and provide their final ratings if they rejected it. Giving the high volume of
responses, a consensus among the managers was reached after the second round. Moreover,
to collect robust and reliable data, threats to internal and external validity were addressed,
as detailed in Table 4 and Table 5, as advised by Campbell et al. (1966) and LeCompte and
Goetz (1982).

43
Relevant threats to Internal Validity (Campbell et al. 1966) Solutions
History The specific external events occurring between the first and second measurement other than the experimental variables.
Wide geographical and occupational dispersion of the participants
Maturation Processes operating within the respondents as a function of the passage of time per se.
All participants provided data in a single session.
Testing The effect of taking a test upon the scores of a second testing. Participants usually do better on their second test than the first one.
Not applicable
Instrumentation Changes in the observers or scores used. Observers and units kept consistent
Regression Tendencies for movement toward the mean when comparison groups have been selected on the basis of initial extreme scores or positions.
This threat could not be controlled
Differential Selection Effects of comparing essentially non-‐comparable groups. Attributes were modeled as independent
Experimental Mortality The effect of differential loss of respondents from comparison groups, rendering them non-‐comparable.
The high number of initial participants from which initial median scores were obtained
Maturation Interaction An effect that in certain designs may be mistaken for the effect of the experimental variable.
Not applicable
Table 4. Threats to internal validity and solutions
Threats to External Validity (LeCompte and Goetz 1982) Solutions
Selection effect The fact that constructs being tested are specific to a single group, or that the inquirer mistakenly selects groups to study for which the constructs do not obtain.
All project manager leads were included and responded representing the entire population of knowledgeable experts
Setting effect The fact that results may be a function of the context under investigation. Not applicable
History effect The fact that unique historical experiences may militate against comparisons.
Data obtained from multiple raters and medians reported
Construct effect The fact that constructs studied may be peculiar to the studied group. Not applicable
Table 5. Threats to external validity and solutions

44
b. Relative risk values
The risk analysis was conducted using the attribute database results from the manual
content analysis and the exposure values obtained from the survey. As described earlier,
risks were assessed using the methods developed by Baradan and Usmen (2006):
𝑪𝒖𝒎𝒖𝒍𝒂𝒕𝒊𝒗𝒆 𝑹𝒊𝒔𝒌 = 𝑭𝒓𝒆𝒒𝒖𝒆𝒏𝒄𝒚 𝒏 × 𝑺𝒆𝒗𝒆𝒓𝒊𝒕𝒚 𝒔 × 𝑬𝒙𝒑𝒐𝒔𝒖𝒓𝒆 (𝒆) (Equation 2)
By definition, the frequency is the number of accidents that happened per unit of time.
It corresponds to the number of times an attribute is identified as part of an injury divided
by the percentage of time this particular attribute is found on a construction site, which we
defined earlier as the attribute exposure. Therefore, the previous equation can be
reformulated as follow and provide the relative risk value of an attribute, based on its
actual occurrence on a jobsite:
𝑹𝒆𝒍𝒂𝒕𝒊𝒗𝒆 𝑹𝒊𝒔𝒌 = 𝑨𝒕𝒕𝒓𝒊𝒃𝒖𝒕𝒆 𝒐𝒄𝒄𝒖𝒓𝒓𝒆𝒏𝒄𝒆𝑨𝒕𝒕𝒓𝒊𝒃𝒖𝒕𝒆 𝒆𝒙𝒑𝒐𝒔𝒖𝒓𝒆
× 𝑨𝒕𝒕𝒓𝒊𝒃𝒖𝒕𝒆 𝒔𝒆𝒗𝒆𝒓𝒊𝒕𝒚 (Equation 3)
In order to translate the qualitative data of the attribute severity into quantitative data
and scale the risks accordingly, the research team resorted to the severity scores (si) table
(Table 6) proposed by Hallowell and Gambatese (2009).
Subjective Severity Level Severity Score (si)
Pain 12
1st Aid 48
Medical Case 138
Lost Work Time 256
Permanent Disablement 1,024
Fatality 26,214
Table 6. Severity scores
The occurrence or frequency per level of severity (ni) of a particular attribute was assessed
by determining the number of time it was found in the analyzed incident reports. Finally,
the relative risk of a specific attribute was computed as follow:
𝑹𝒆𝒍𝒂𝒕𝒊𝒗𝒆 𝑹𝒊𝒔𝒌 = 𝒏𝒊∗𝒔𝒊𝒆
(Equation 4)

45
RESULTS
This attribute-based analysis is the first attempt and the first step to vastly improve the
quality and quantity of available data by considering all injury types and leveraging such
amount of detailed injury reports. The manual content analysis of the randomly distributed
set of 1280 injury reports required 6 iterations of the procedure described in the research
methods. Departing from Prades’ (2014) dataset of 51 independent industrial attributes,
finding new precursors was an on-going objective during the data extraction process, which
required constant refinements of the model and previous analysis. The research team
expected to find additional precursors more suitable to the four domains of activities of the
construction partners. By the end of the process, 28 precursors for a total of 79 independent
attributes were added based on their coherence with the reports and their number of
occurrence. Upstream, transitional and downstream attributes are described in the
following tables (Tables 8 to 17). All the reports associated with each attribute were then
used to generate a keyword list for the automated part of the content analysis. The
description and the details of the automated part of this project are not in the ambition of
this paper.
Description
Sheet metal worker was cutting panels using a circular saw when foreign body entered his left eye. Worker went and flushed his eye then he notified his supervisor. The employee’s eye was flushed about half an hour until the eye was clear. He reported that there is no irritation in his eye.
Upstream Steel/Steel section
Transitional Powered hand tool, Small particle
Downstream No/Improper PPE
Severity First Aid
Maximum Severity Medical case
Energy source Motion
Injury code Struck-‐by
Table 7. Manual content analysis result example

46
Upstream Attributes
a. Materials
Attribute Description
Concrete This attribute refers to concrete, cement and mortar in its solid state. It includes concrete structural elements like beams and columns as well as tasks involving rigid concrete like chipping or grinding.
Concrete pouring
Concrete pouring refers to concrete, cement and mortar in their liquid form. It applies to the action of pouring and all related injury and also the action of curing or transporting liquid concrete.
Heavy Material
Heavy material defines material with a considerable weight. It is also used when the description states a two digits weight for this particular material (≥10 lbs.).
Lumber Any kind of timber elements including timber, plywood, 2x4, 2x8, etc.
Grout This attribute refers to liquid and dry grout whether the worker is mixing, applying or removing it.
Pontoon A flat-‐bottomed boat or hollow metal cylinder used with others to support a temporary bridge or floating landing stage. ‘Pontoon cell’ already includes the idea of confined workspace.
Soffit The underside of an architectural structure such as an arch, a balcony, or overhanging eaves.
Valve Valves are used to control the passage of a fluid through a pipe or a duct.
Piping This attribute refers to any kind of pipes that are used in the construction field. Working on or being struck by a pipe requires using this attribute.
Conduit A conduit is defined as a long and usually flexible channel with a small diameter to convey cables and wires. A conduit can be buried underground or suspended from the ceiling using trays.
Scaffold Raised platform used to access and work at height. Scaffold can also refers to smaller parts of the components like planks or scaffolding. Lumber or steel members that are used to erect the scaffold are already included in this attribute.
Stairs Any kind of stairs including single steps except ladders. Stairs in itself are not sufficient to describe a ‘slip and fall’ or ‘miss a step’ incident as the cause of the slip is unknown and can’t be observed before the actual incident.
Steel/Steel section
Any steel components that are used on the site. Steel/Steel section also includes angles, rods, flanges and can be designated by their section or their dimensions e.g. I-‐beam or 2”x6”x6”.
Metal studs Metal pieces used to build outdoor and indoor partition walls. Metal studs are also used to frame windows or as parts of a roof structure.
Wire Wire refers to steel wires used to assemble rebar. Cables are not included in this attribute.
Rebar This attribute refers to any steel reinforcement bars whether they are bundled or installed on the site. However, it does not include rebar made dunnages or rebar mat when they designate walking surfaces, which are uneven surfaces, a separated attribute.
Door Doors and door frames in general.
Cable Any kind of cable: electrical, communication, etc. Different from hose that are basically hollow.
Cable Tray System used to support any kind of cables in general.
Dunnage Material used to load and secure cargo during transportation, or support jacks, pipes, air conditioning and other equipment above the roof of a building.
Spool Any kind of spool/reel: electrical cables, film, magnetic tape, etc.
Tank A large receptacle or storage chamber, especially for liquid or gas. This attribute already includes the idea of a confined workspace.
Table 8. Material upstream attributes

47
b. Equipment
Attribute Description
Crane This attribute is used when a crane is involved in the incident or in the activity that led to an injury like spotting the hook or giving directions to the crane operator.
Heat source Each time a worker is exposed to an unprotected source of heat like a steam pipe or a machine. Concrete or chemical burns are not defined as from a heat source.
Heavy vehicle Large and heavy vehicles that are used to transport materials or equipment like trucks or to perform heavy tasks like bulldozers, rollers, graders, etc.
Machinery This attribute refers to any kind of machines used on site like generators, pumps or light-‐plants.
Welding
Welding refers to the activity in itself but also to all powered and unpowered hand tools a worker uses to performs his weld. It also includes torching and cutting with torch. In that perspective, heat created by the action of welding a metal piece is already included in this attribute and thus, it does not require selecting ‘Heat source to’ describe the incident.
Grinding Grinding refers to the activity in itself but also to all powered and unpowered hand tools a worker uses to performs the task. For instance, selecting grinding includes using a grinder and thus, the attribute ‘Powered hand tool’ should not be selected.
Drilling Any action that consists of drilling holes with a powered or unpowered tool, on any kind of material.
Chipping Chipping concrete or a weld, removing material excess or breaking into small pieces a layer of concrete.
Stripping
Disassembling
Dismantling
Stripping is the action of removing lumber elements from a formwork after the concrete or a similar material has strengthened. Although the definition already mentions lumber parts, ‘Lumber’ and ‘Formwork’ should also be selected to correctly assess this incident. If mentioned in the description, some precisions about the tools used should be added in the transitional attributes e.g. Pry bar as an unpowered hand tool.
Formwork This attribute refers to the erection and all activities related to erecting or disassembling a formwork. If mentioned in the description, some precisions about the tools used should be added in the transitional attributes.
Job Trailer Some incidents occur in the job trailer or while accessing/exiting it. In these cases, this attribute should be selected to describe the environment and the potential cause of the injury.
Unpowered transporter
Unpowered transporter refers to any kind of trolleys, wheeled barrow or carts used to manually transport material or equipment.
Guardrail Handrail
Barrier used to keep workers or equipment from accessing a specific area or prevent falls. Handrails are steel components that
Manlift Manlift is a motorized passenger elevator that allows the worker to access an elevated workspace and perform his task from it.
Table 9. Equipment upstream attributes
c. Design
Attribute Description
Working Overhead Activities or tasks that the worker has to perform directly above his head.

48
Confined workspace
A confined workspace is a design issue. It refers to a closed and restricted area where the air evacuation is limited, light and sounds are amplified and heat exacerbated. A confined workspace can be a box or a cell. This attribute does not include tanks, which are separated attributes, but they give a good illustration of a confined workspace.
Congested workspace
A congested workspace is a site management issue. It refers to any area where there is a limited egress essentially due to the accumulation of material or equipment or because of the structure under construction itself. E.g. Having a lot of workers and equipment in activity in the same area.
Object at height
Attribute used to describe any object or material at height. The object should be higher than the story directly above the injured worker for this attribute to apply.
Object at height on same
story
‘Object at height on same story’ refers to objects or materials from a reaching distance of the worker or directly above the worker. This attribute does not apply to describe the fact that the worker is working on a material above his head. In that case, ‘Working overhead’ is more appropriate.
Working at height
This attribute describes the fact of working from an elevated platform.
Working below elevated
workspace
An elevated workspace is defined as a potential platform or work area overhead where workers can walk on and work from it. E.g. the above story on a scaffold. This attribute is used to highlight the consequences of having workers above your head when you are performing a task.
Table 10. Design upstream attributes
Transitional Attributes
a. Equipment & Tools
Attribute Description
Forklift A forklift is a vehicle with a pronged device in front for lifting and carrying heavy loads.
Powered hand tool
Any kind of hand tools using electricity, gas or pressure to operate. E.g. electrical drill, chain saw.
Unpowered hand tool
Any kind of hand tools, tool bags, tool belt and ropes that only requires human power to operate. E.g. saw, screwdriver, wrench, etc.
Ladder Any kind of ladders.
Hose Any kind of hoses or lines used to convey water, pressurized steam or air or any fluid in general.
Wrench Any kind of wrench.
Hammer Any kind of hammers. E.g. hammer, sledge hammer, etc.
Light vehicle ‘Everyday’ vehicles/cars people used to commute which also include pick-‐up truck.
Table 11. Equipment and tools transitional attributes
b. Materials & Substances
Attribute Description
Nail Any kind of nails.
Screw Any kind of screws that helps to fasten pieces together.
Bolt Any kind of bolts that helps to fasten pieces together.

49
Hand size pieces
Any kind of materials or objects that is small enough to fit in human hands except hand tools, nails, screws, bolts.
Electricity This attribute is used to describe injuries due to electrical chocks in general whether they are from an equipment dysfunction or lightning. It can also apply from tasks involving an electrical panel.
Hazardous substance
Substances that are toxic, acid, irritating or are known to cause cancer and long term diseases when they contact human skin or are inhaled. For instance, liquid concrete, asbestos, fiberglass, oil, gas, etc.
Sharp edge This attribute refers to exposed sharp edges and materials. E.g. the extremities of a cut tube
Slag/Spark Small steel particle that results from the operation of grinding or welding and thus can be incandescent or not. In case of a burn injury related to a spark, the attribute ‘Heat source’ is already included in ‘Slag/Spark’.
Splinter, Sliver
A small, thin, sharp piece of wood, glass, or similar material broken off from a larger piece.
Small particle It refers to “foreign object” or “foreign body”, “small particle”, “small debris” that was found in the eye. E.g. saw dust, air born particle, dust, etc.
Table 12. Materials and substances transitional attributes
c. Site Quality
Attribute Description
Cleaning Action of cleaning the workspace or the site in general. However, it does not include the action of cleaning a weld or cleaning a piece of material by using a grinder for instance.
Slippery surface
This attribute refers to surfaces that do not ensure a normal grip. Most of the time, it designates wet surfaces due to heavy rains for instance. Stairs, concrete floors or wooden platforms are not slippery surfaces because they are not supposed to be slippery even if the description clearly mentions that the worker slipped or tripped.
Unstable support/surface
Any unstable surfaces, usually temporary supports or loose planks to access a specific workspace.
Table 13. Site quality transitional attributes
d. Weather & Environment
Attribute Description
Poor visibility
This attribute refers to any situations where the visibility is limited or reduced due to smoke, steam, fog, dust or darkness for instance. It also includes dazzling lights and non visible objects.
Snow/Ice Snow or ice on the ground or at height
Mud Mud that can result from heavy rains or melting snow but also mud/sludge from sewer, working near water (pontoon), mud from hazardous waste materials.
Wind Natural wind, gust of wind or explosion blast.
Table 14. Weather and environment transitional attributes

50
e. Other
Attribute Description
Exiting, transitioning
Exiting machinery, equipment, vehicle, job trailer, elevated platform... More generally transitioning from one area or workstation to another.
Lifting/Pulling Material Lifting, pulling and manual handling.
Insect Any kind of insect (e.g. wasp, bugs, etc.). ‘Insect’ includes the idea of venom and thus does not require selecting the attribute ‘Hazardous substance’.
Table 15. Other transitional attributes
Downstream Attributes
a. Human Behavior
Attribute Description
Improper body position
Body position that isn’t defined as common practice and that is contrary to the activity procedure. An improper body position can result from inattention, taking shortcuts for the task or a congested workspace among others. It is usually refer to as ‘awkward position’.
Improper security of
tools
Tool that wasn’t tangled to the worker or properly secured on the site. Improper security of tools refers to dropping and/or falling tools from height. A tool is not supposed to fall, and thus, if such an injury occurs, we systematically add this attribute.
Improper security of materials
It refers to unsecured bundled material or an improper installation of a structural element that fails to achieve its primary purpose. It also applies for protruding material that should have been secured. For instance, a protruding nail that should have been hammered down or bended.
Repetitive Motion
Repetitive movement that led to an injury and that is clearly stated in the description of the incident. Repetitive motion means undertaking a similar action over a long period of time e.g. Tightening bolts all afternoon.
Fatigue This attribute includes both physical and psychological fatigue such as stress, time constraints, pressure management, etc. It ranges from small breaks to exhaustion.
Table 16. Human behavior downstream attributes
b. Site Characteristics
Attribute Description
Uneven surface
Uneven surface can designate slopes and non-‐flat surfaces in general but also long-‐lasting installations on the floor like rails, unistrut or bolt anchored in the ground for instance.
Poor Housekeeping
A poor housekeeping refers to objects or piece of equipment on the floor that are not supposed to be there and should be disposed or stored in a more adequate place. Housekeeping is the idea of the global organization and reasonable cleanliness of the site that should provide a safe workspace.
Object on the floor
Object on the floor means the presence of an object that is supposed to be on the floor at the time of the incident. It can also be a part of the task like a piece of material or a tool. Here, object means that it is not a part of the surface and it is supposed to be removed later in the project. E.g. cable trays
No/Improper PPE
Absence or incorrect personal protection equipment. No or improper PPE should be clearly mentioned in the description of the incident and not be the result of interpreting how less severe the injury could have been vs. what it actually is. Exceptions to this rule are eye injuries and concrete burns, which always call for No/Improper PPE.
Table 17. Site characteristics downstream attributes

51
Attribute-based Risk Analysis Results
a. Exposure data (e)
The survey targeted the construction managers of the partner firms of this study with
no specific restriction regarding their years of experience or domain of expertise. The
research team expected to obtain a large number of responses so that a consensus could be
rapidly reached. The recommended volume of answers for traditional surveys is a panel size
of at least 8 experts. We received 68 responses but 2 of them were dropped because of
missing data and incomplete survey. The average number of years worked in the
construction industry of these 66 managers was 18.7 years. Considering their domain of
activity, 11% of the respondents worked in Building, 23% in Energy, 64% in Infrastructure
and 3% in Mining. However, due to the important number of responses and the activity
domain repartition, the variances of the exposure for several attributes were too high. As
described earlier, the degree of consensus was not reached in the first round and in order to
refine these results, a second round was needed. Most exposure median values were
accepted in the second survey. The exposures (e) for each attribute are shown in the risk
analysis tables (Table 18 Table 20).
b. Attribute severity occurrence (ni)
The research team obtained the frequency of occurrence of each attribute for each level
of severity (ni) by simply counting the number of reports in which a particular attribute
contributed to an accident resulting in pain, first aid, medical case, lost work time,
permanent disablement or fatality.

52
c. Relative risk values
The results of the attribute-based risk analysis are shown in the following tables. Each
attribute has a relative risk value that typically indicates how risky this particular
precursor can contribute to an accident if observed on a jobsite. In other words, the higher
the relative risk value is, the more ‘chance’ the attribute is likely to be part of an incident or
cause a severe injury. Indeed, a high relative risk value can be explained by the
combination of a very low exposure but a high level of severity for the accidents resulting
from the attribute. Similarly, an attribute with a low exposure and a high frequency of
occurrence will be qualified as risky and would require particular attention if observed.
The highest relative risk value in the upstream attributes is ‘pontoon’ (21.75) because it
combines a very low exposure (4%) and a low frequency (8) but a high severity: 25% of the
accidents involving pontoon can cause a lost work time. However, metal studs have the
highest potential impact considering the maximum potential severity (288.52). On the
contrary, the attribute ‘congested workspace’ presents a very high exposure and a relatively
low frequency and thus has the lowest relative risk value in the upstream precursors (0.77).
In other words, congested workspaces are common on jobsites but rarely contribute to an
accident, and when it does, the severity is generally low (83% of the accidents resulted in
first aid). In transitional attributes, the highest value is 10.03 for ‘hazardous substances’
and the lowest ‘Forklift’ (1.05) besides ‘Poor visibility’ (0). The highest relative risk value
can be found in the downstream attributes and corresponds to ‘No/Improper PPE’ (69.49),
which seems logical: the absence of adequate PPE is rare on sites but when it occurs, the
risk of suffering an injury is very high. Finally, the lowest one in downstream is repetitive
motion (1.69), which is present 50% of the time on sites but rarely causes an accident and
has a low severity.

SEVERITY Relative Risk
MAXIMUM POTENTIAL SEVERITY Relative Risk 12 48 138 246 1,024 26,214 12 48 138 246 1,024 26,214
UPSTREAM ATTRIBUTE n e Pain First Aid Medical
Case Lost Work
Time Permanent Disablement Fatality Pain First Aid Medical
Case Lost Work
Time Permanent Disablement Fatality
Pontoon 8 4.0% 0 5 1 2 0 0 21.75 0 1 3 3 1 0 55.60
Steel/Steel section 126 40.0% 18 98 5 5 0 0 17.10 0 10 59 47 8 2 202.01
Piping 71 30.0% 7 60 2 2 0 0 12.44 0 3 33 34 1 0 46.95
Confined workspace 31 19.0% 2 27 1 1 0 0 8.97 0 0 20 9 2 0 36.96
Scaffold 52 35.0% 15 33 2 2 0 0 7.23 0 6 25 16 4 1 108.53
Metal studs 12 10.0% 1 9 2 0 0 0 7.20 0 1 6 3 1 1 288.52
Timber 75 60.0% 1 67 6 1 0 0 7.17 0 4 36 28 5 2 115.99
Heavy material 82 73.0% 17 54 3 8 0 0 7.09 0 1 30 46 4 1 62.76
Concrete 40 56.5% 2 28 6 4 0 0 5.63 0 1 24 11 3 1 62.57
Working at height 30 50.0% 4 18 2 6 0 0 5.33 0 4 4 11 7 4 230.95
Rebar 50 55.0% 5 43 0 2 0 0 4.76 0 2 24 24 0 0 16.93
Working below elevated wkspace 24 27.0% 4 19 0 1 0 0 4.47 0 3 9 8 2 2 214.19
Wire 32 40.0% 1 30 0 1 0 0 4.25 0 5 25 1 0 1 75.38
Concrete pouring 28 48.0% 2 20 5 1 0 0 4.00 0 1 16 8 3 0 15.20
Stairs 31 50.0% 6 22 1 2 0 0 3.52 0 3 8 20 0 0 12.34
Door 13 25.0% 1 10 2 0 0 0 3.07 0 1 6 4 1 1 116.39
Grout 10 22.5% 0 9 0 1 0 0 3.01 0 0 8 0 2 0 14.01
Conduit 13 22.5% 2 10 1 0 0 0 2.85 0 0 6 6 1 0 14.79
Soffit 7 22.5% 0 6 0 1 0 0 2.37 0 0 5 2 0 0 5.25
Valve 10 22.5% 1 8 1 0 0 0 2.37 0 1 7 1 1 0 10.15
Tank 10 24.0% 0 10 0 0 0 0 2.00 0 0 8 2 0 0 6.65
Object at height 12 59.0% 1 9 1 1 0 0 1.40 0 0 1 6 3 2 96.80
Object at height on same level 7 24.5% 0 7 0 0 0 0 1.37 0 0 5 1 0 1 110.82
Sharp edge 14 50.0% 0 14 0 0 0 0 1.34 0 0 13 1 0 0 4.08
Congested workspace 6 63.0% 0 5 0 1 0 0 0.77 0 1 3 1 1 0 2.75
Table 18. Relative risk of upstream attributes
53

SEVERITY Relative Risk
MAXIMUM POTENTIAL SEVERITY Relative Risk 12 48 138 246 1,024 26,214 12 48 138 246 1,024 26,214
TRANSITIONAL ATTRIBUTE n e Pain First Aid Medical
Case Lost Work
Time Permanent Disablement Fatality Pain First Aid Medical
Case Lost Work
Time Permanent Disablement Fatality
Hazardous substance 47 32.0% 4 32 10 1 0 0 10.03 0 0 35 10 2 0 29.18
Small particle 111 71.0% 7 94 10 0 0 0 8.42 0 5 96 10 0 0 22.46
Slippery surface 46 30.5% 9 33 1 3 0 0 8.42 1 1 17 24 2 1 119.91
Hose 34 30.0% 7 21 4 2 0 0 7.12 0 2 14 14 4 0 31.89
Powered hand tool 81 81.0% 10 64 4 3 0 0 5.53 0 5 44 21 10 1 59.18
Unpowered hand tool 88 81.0% 14 68 5 1 0 0 5.39 1 9 47 27 4 0 21.81
Snow/Ice 22 25.0% 5 12 5 0 0 0 5.30 0 1 5 15 0 1 122.57
Ladder 46 70.0% 6 31 3 6 0 0 4.93 0 2 13 23 7 1 58.47
Hand size pieces 56 64.5% 7 47 0 2 0 0 4.39 1 7 28 19 0 1 54.42
Hammer 44 72.0% 2 37 3 2 0 0 3.76 0 3 20 20 0 1 47.28
Slag/Spark 24 30.0% 3 21 0 0 0 0 3.48 0 3 18 3 0 0 11.22
Nail 28 60.5% 0 25 1 2 0 0 3.02 0 1 16 7 2 2 96.62
Uneven surface 34 65.0% 4 28 0 2 0 0 2.90 0 1 16 15 1 1 51.05
Wind 20 43.5% 0 18 1 1 0 0 2.87 0 2 14 2 1 1 68.41
Unstable support 15 25.0% 2 13 0 0 0 0 2.59 0 1 3 10 1 0 15.78
Insect 11 25.0% 1 10 0 0 0 0 1.97 0 0 9 2 0 0 6.94
Mud 10 33.0% 0 9 1 0 0 0 1.73 0 0 9 1 0 0 4.51
Forklift 9 60.0% 0 8 0 1 0 0 1.05 0 0 6 0 3 0 6.50
Electricity 2 60.5% 0 1 0 1 0 0 0.49 0 0 0 0 0 2 86.66
Poor visibility 0 20.0% 0 0 0 0 0 0 0.00 0 0 0 0 0 0 0.00
Table 19. Relative risk of transitional attributes
54

SEVERITY Relative Risk
MAXIMUM POTENTIAL SEVERITY Relative Risk 12 48 138 246 1,024 26,214 12 48 138 246 1,024 26,214
DOWNSTREAM ATTRIBUTE n e Pain First Aid Medical
Case Lost Work
Time Permanent Disablement Fatality Pain First Aid Medical
Case Lost Work
Time Permanent Disablement Fatality
No/Improper PPE 136 11.0% 10 112 12 2 0 0 69.49 0 5 107 20 3 1 447.38
Lifting Pulling 233 60.5% 49 165 7 12 0 0 20.54 1 12 100 110 9 1 127.07
Improper security of materials 42 20.0% 2 36 3 1 0 0 12.06 0 0 19 16 5 2 320.53
Cleaning 29 40.0% 1 26 1 1 0 0 4.11 0 1 19 7 1 1 79.08
Object on the floor 29 34.5% 2 26 1 0 0 0 4.09 0 0 11 18 0 0 17.23
Working overhead 32 50.0% 6 24 1 1 0 0 3.22 0 2 23 7 0 0 9.98
Improper security of tools 9 19.0% 0 9 0 0 0 0 2.27 0 1 2 6 0 0 9.47
Poor housekeeping 8 30.0% 0 7 0 1 0 0 1.94 0 1 2 5 0 0 5.18
Improper body position 13 30.5% 2 11 0 0 0 0 1.81 0 1 2 8 2 0 14.23
Repetitive motion 21 50.0% 7 13 1 0 0 0 1.69 0 6 6 9 0 0 6.66
Table 20. Relative risk of downstream attributes
55

56
IMPLICATIONS
In the literature review we identified the major trends in application and limitation of
the technologies of interest. The major flaw in actual technological safety applications is
that they mostly rely on experts’ judgments and experience on sites to determine what
safety measures, why, when and where they are needed. Besides experts’ opinions, BIM
technological applications have used safety regulations to help designers achieve safer
construction projects. However, using such regulations and codes has limited its application
scope to fall prevention hazards.
The results of our attribute-based risk analysis specifically aim to address this lack of
safety data. The attribute-based risk analysis relies on the theory that every construction
accident results from the conjunction of a finite number of hazardous precursors. These are
the real cause factors that lead to an accident. Thus, identifying the attributes that are
present on a construction site will help safety managers find the causes of potential
accidents independently from any environmental conditions. Moreover, integrating such
viable and robust data within emerging technologies and intelligent systems could provide
new opportunities of applications, refine or widen their application scope and help safety
planners prioritize the adequate technologies depending on the attributes they observe on
their jobsites.
In our review of the literature of the different technologies we also found no evidence of
a practical safety application for barcodes. Combined with attribute data and the newly
developed risk analysis, barcodes have the potential to contribute in turning construction
sites into safety information rich environments. In fact, barcodes can become an integral
part of jobsites and could be disseminated in various areas where risky attributes have
been identified. Prior his task or as a mandatory step to achieve it or start an engine, a
worker would be invited to scan a barcode that would display the attached safety

57
recommendations and retrieve relevant information as more complex intelligent systems
have tried to implement. Barcodes could also improve worker safety trainings by giving
safety managers the tools to illustrate particularly risky events attribute-based risk
analysis have highlighted. For instance, instead of using immersive virtual reality models,
the intelligent system developed by Albert et al. (2014) to recognize safety hazards on sites
could be transpose to reality by using barcodes. In groups or individually under the
supervision of a safety manager, workers could walk through a barcoded worksite to
identify hazardous situations and scan a barcode to access the gaming platform the authors
sought in the first place.
By considering the highest relative risk values instead of experts’ opinions, the
application scope of intelligent systems could be redefined to specifically address the major
risks a worker is likely to encounter. On the contrary, resources allocated to what is found
to be a low relative risk value attribute could be reinvested to high priority attributes.
Indeed, tag-based technologies such as RFID, UWB and GPS could benefit from attribute-
based risk analysis to know what, why, when and where to tag specific areas, workers,
equipment or materials. This new method could also help safety managers who use 3D
range imaging to determine the best spots to install their cameras in order to focus on the
particularly risky operations highlighted by the risk analysis. Algorithms that have been
developed to track crane activities could be expanded to monitor specific material and
equipment attributes to detect abnormalities or their relative proximity. The BIM
technology could also greatly benefit from the integration of attribute-based data in order to
extend its application scope beyond fall prevention by automatically detecting missing
guardrails around openings. Attributes could provide the reliable and wide application
range data sources that BIM models lack to assess risk at the design phase. Rules checking
programs could be improved by suggesting design alternatives to designers in order to

58
reduce the impact of the upstream design attributes early in the project. Furthermore, the
BIM technology is so versatile that it has been coupled with several other technologies to
propose new safety applications. With these technologies, BIM essentially serves as an
information source, in which data are attached to every virtual object. Technologies use
virtual models generated with BIM to interact with the user, to allow him or her to
visualize tagged objects and construction progress, define dangerous zones based on on-
going or future tasks, and issue alerts when safety hazards are detected. Integrating
attribute-based data within BIM could thus improve their efficiency and potential as
combined intelligent systems. Attribute-based risk analysis could be the keystone previous
authors were expected to encourage designers to get involved in achieving safer projects.
For instance, the combination of BIM and VR for immersive attribute-based safety design
reviews would replace the necessary meetings between designers and experienced safety
managers to detect hazards at the design phase that previous researchers have
recommended.
CPS is a sensor-based system that enables communication between the physical and
cyber worlds. Besides monitoring temporary structures as suggested in previous literature,
the personal protection equipment available to construction workers could also benefit from
this technology. Indeed, a wide range of sensor-based applications has been developed in
the last few years and especially to provide health monitoring. Thus, some attributes
related to human behaviors could be assessed such as ‘repetitive motion’ or ‘fatigue’. By
creating a safety jacket that includes gyro-sensors, a health oriented CPS system could
warn the worker and help safety managers anticipate injuries caused by movement
repetitions such as back pains which are frequent on jobsites. Moreover, some contractors
have required their crews to avoid any work overhead due to the high number of resulting
muscle pains, eye injuries and general discomforts or soreness. Integrating an inclinometer

59
sensor or a gyro-sensor on hard hats could also assist workers to prefer a more adequate
body position and thus minimize ‘working overhead’ incidents. Other small devices like flex
sensors could ideally prevent ‘improper body positions’ and dangerous ‘lifting, pulling
materials’, which account for one of the highest relative risk values according to our
attribute-based risk analysis (20.54). To address the particularly risky attributes
‘No/Improper PPE’ and ‘small particles’ that essentially results in eye injuries, selective
infrared short-range proximity sensors could be attached to both eye protection equipment
and specific tools that are known to generate dust and ‘small particles’, so that the powered
hand tool could not be used without the appropriate matching safety glasses. Optical dust
sensors have also been developed and could shut down any equipped tool when a too dense
dust cloud is generated, which is the most frequent cause of eye injuries in ‘confined
workspaces’. To power all these low-consumption sensors, safety jackets could be equipped
with kenetic energy chargers. Some sensors could also be randomly triggered by incoming
radio signals like RFID passive tags in order to communicate their actual state to the
combined RFID/CPS system. Sensors alone cannot evaluate the data they measure, this is
why such RFID/CPS intelligent system would be necessary to collect and analyze all these
information to detect any body position, environmental or equipment abnormalities. Other
applications could be used to assess adverse environmental conditions with a combination
of CPS and GIS systems. On construction sites where the attribute ‘Insect’ is particularly
prominent, ultrasonic generators could be periodically activated by the general system to
repel pests. Gas sensors to assess the concentration of volatile substance could warn
workers in case of hazardous concentrations and situations. Linking geotechnical
information with humidity, temperature sensors data and meteorological records could
create a real-time condition map of the different areas of a worksite, and might be used to

60
forecast the formation of mud or slippery surfaces that have shown to be one of the
attributes in some accidents.
The GPS technology is the outdoor tracking and locating system by excellence. Another
way to address the risk of ‘No/Improper PPE’ would be to merge this technology with a
similar CPS sensor-based system as previously described to send visual and/or sound
alarms to a worker when he enters a predefined area with inadequate personal protections.
For instance, some construction zones where attributes such as ‘welding’, ‘grinding’,
‘slag/sparks’ or ‘small particles’ and ‘wind’ have been identified would not be accessible to
personnel without appropriate safety glasses. The GPS/CPS system could also be able to
retrieve the altitude at which a particular worker is performing his task, and automatically
determine if he or she is properly equipped and thus help to reduce ‘working at height’
related injuries. Likewise, it could also detect simultaneous tasks and track crews so that
‘working below elevated workspace’ situations can be avoided if possible, or at least it could
raise workers’ awareness of their surroundings and that there is an on-going task above or
below.

61
Technologies Primary uses of the attribute risk data
Barcode This technology could transform worksites into safety information rich environments. Barcodes could provide information retrieval based on attributes identified on site during safety trainings, meetings and pre-task. It could also be used to display prerequisite safety recommendations before starting an engine or using a powered hand tool.
RFID Attribute-based risk analysis yield which attributes are critical to track and monitor in order to prevent accidents. The results could be used to determine what physical asset should be tagged, why, when and where. RFID would allow longer distance communication between sensors and computer-based system in CPS.
UWB The UWB technology is very similar to RFID but can achieve a better accuracy and is less subject to multipath signal issues. Thus, RFID applications can also be applied with UWB.
GPS Determine what asset should be tagged, why, when and where. Combined with CPS, this technology could determine if workers are properly equipped when entering a predefined area where hazardous attributes have been identified. It could also raise workers’ awareness of their surroundings such as on-going simultaneous tasks above or below.
GIS Attributes can be displayed on a map of the construction site in GIS software. Combined with a CPS sensor-based system, the technology could provide real-time evolution of certain environmental and site characteristics attributes.
Visual Monitoring
Depending on the attributes present on sites, managers would be able determine the best spots to install the 3D range imaging cameras and monitor specific tasks or equipment. Additional algorithms could be developed to monitor various assets at the same time and track the evolution of particularly risky attributes during the project life.
VR Combined with both attribute risk data and BIM, virtual reality could help designers address a wider spectrum of risk in the design phase and thus considerably strengthen the first barrier to potential accidents in Reason’s causal perspective.
AR Basically, AR is used to reveal hidden information and project objects informatically designed. No particular safety application has been found other than the ones suggested in previous literature such as revealing hidden utility lines by combining GPS with this technology. Some VR applications might be transposed to AR.
CPS Combined with RFID, this technology could be used to implement a sensor-based system to periodically or continually monitor workers’ health status to prevent injuries related to repetitive motion, working overhead or fatigue. The system could also be used to reduce eye injuries with dust sensors and/or selective PPE detection.
BIM Similarly to VR, BIM could benefit from attribute risk data that would help designers address a wider range of potential risks at the design phase and inspire more safety design alternatives based on existing attributes. Upstream attributes are typically the precursors that could be addressed at the design phase.
Table 21. Primary technological use of the attribute risk data

62
LIMITATIONS
While several promising and exploratory insights about the integration of attribute-
based risk data with emerging technologies and intelligent systems have been given, this
study has some limitations that should be considered. First, the attribute ‘No/Improper
PPE’ particularly reflects the lack of adoption of adequate safety glasses that led to eye
injuries as mentioned in the description of this precursor, which explains the high relative
risk value of this attribute. Eye injuries have systematically been identified as the absence
of proper personal protection, which might not be the case regarding the safety policies of
the firm. Nonetheless, the analysis clearly proves there is an issue with the application of
proper PPE that needs to be addressed.
Second, the research team did its best to identify and define attributes so that no
ambiguity remains. However, even if the attribute descriptions have been provided with the
surveys, different interpretations could exist between the research team and the managers
and that the number of responses could not minimize.
Third, “Many methodological problems in testing reliability stem from violating the
requirement for coders to be truly independent, working with coding instructions they
cannot follow or applying them to data that they fail to understand” (Krippendorff 2004,
p.415). All efforts have been focused on implementing a strict procedure and on collecting
high quality safety data, which is the issue this paper stands for. Nonetheless, some
limitations might also exist in the manual extraction process.
Fourth, the attribute list is believed not to be exhaustive. Even if the distribution of the
injury reports was randomized, the research team put aside several potential attributes due
to their low frequency of occurrence (<8 occurrences) and thus, the automated part of the
content analysis could yield additional precursors. These attributes were extracted from
injury reports of U.S contractors, which might restrict the application scope of the

63
presented risk analysis method. Moreover, evolution in technics and practices on sites could
challenge the attribute-based analysis regarding the exposure values.
Finally, even if looking at attributes instead of task or trades like previous risk analysis
has overcome most limitations regarding task interactions, they still need to be addressed
from the attribute perspective. For example, ‘small particles’ and ‘No/Improper PPE’ are
highly correlated in our risk analysis due to the important number of eye injuries including
both attributes. On-going interactions between attributes have been barely developed in
this paper and require further research to refine the model and compute more precise risk
value. Ideally, interactions between 3 to 5 attributes would be significant enough to obtain
risk values developed to the 3rd, 4th or 5th order that reflect actual risky situations on sites.
CONCLUSION
This study discussed Barcode, Radio Frequency Identification (RFID), Ultra Wide Band
(UWB), Global positioning System (GPS), Global Information System (GIS), Visual
monitoring, Virtual Reality (VR), Augmented Reality (AR), Cyber-Physical System (CPS),
and Building Information Model (BIM) and their respective applications to construction
safety. The authors found that most of them lack viable and robust safety data sources, and
that they essentially rely on experts’ judgment and intuition. The findings also revealed
that most intelligent systems applications of interest are still theoretical and that previous
research fails to provide practical considerations to make safety on site real. To address this
issue, this research drew on and is a continuation of the work of Esmaeili (2012) but has
vastly improved the quantity and the quality of the process by considering all types of
injuries of a 1,280 large injury reports database provided by 243 independent contractors.
The introduced attribute-based risk analysis was designed to reinforce this tenuous link
between theory and practice. In addition, it was found that the relative risk values for each

64
potential hazard attributes that can be found on a worksite could provide the robust and
viable tool safety managers need to effectively identify risky situations, prioritize safety
strategies more efficiently and implement adequate intelligent systems. Such data are
independent from any environmental conditions and thus can be adapted to the transient
and dynamic nature of construction sites at almost every stages of a project. Integrated to
intelligent systems, they are the answer to what, why, when and where safety is needed on
sites but also how technologies could make construction sites safer. Examples of
integrations of attribute risk data with the technologies have been developed as well as
technology fusion applications to tackle safety issues.
As mentioned in the limitations section of this paper, future research should focus on
improving the model by exploring how attributes interact with each other and if consistent
links between some of them could be measured to refine the attribute-based risk analysis
methods. The authors also advocate practical implementations of the suggested
technological systems that are believed to have the potential to change safety managers’
approach to construction risks and make construction sites safer.
ACKNOWLEDGEMENTS
I dedicate this work to my friends, my family and my better half who supported me from
the distance. I also would like to thank here the team of talented people of the safety lab’
that made the data collection process possible and efficient: Pr. Alex Albert (North Carolina
State University), Antoine Tixier (PhD), Marc Prades (MS), Dillon Alexander (MS), and
Siddharth Bhandari (BS) from the University of Colorado at Boulder. My special thanks to
my advisor, Dr. Matthew R. Hallowell for his guidance and for sharing his expertise all
along my research.

65
REFERENCES
Akanmu, Abiola A. 2012. “Toward Cyber-‐Physical Integration in Construction.” The Pennsylvania State University.
Albert, A., M. Hallowell, B. Kleiner, A. Chen, and M. Golparvar-‐Fard. 2014. “Enhancing Construction Hazard Recognition with High-‐Fidelity Augmented Virtuality.” Journal of Construction Engineering and Management 140 (7): 04014024.
Anumba, Chimay J., Abiola Akanmu, and John Messner. 2010. “Towards a Cyber-‐Physical Systems Approach to Construction.” In Construction Research Congress 2010, 528–38. American Society of Civil Engineers.
Azuma, Ronald T. 1997. “A Survey of Augmented Reality.” Presence, the Massachusetts Institute of Technology, 6 (4): 355–85.
Bansal, V. K. 2011. “Application of Geographic Information Systems in Construction Safety Planning.” International Journal of Project Management 29 (1): 66–77.
Bansal, V. K., and Mahesh Pal. 2007. “Potential of Geographic Information Systems in Building Cost Estimation and Visualization.” Automation in Construction 16 (3): 311–22.
Baradan, S., and M. Usmen. 2006. “Comparative Injury and Fatality Risk Analysis of Building Trades.” Journal of Construction Engineering and Management 132 (5): 533–39.
Behzadan, Amir H., Zeeshan Aziz, Chimay J. Anumba, and Vineet R. Kamat. 2008. “Ubiquitous Location Tracking for Context-‐Specific Information Delivery on Construction Sites.” Automation in Construction 17 (6): 737–48.
Behzadan, Amir H., and Vineet R. Kamat. 2009. “Interactive Augmented Reality Visualization for Improved Damage Prevention and Maintenance of Underground Infrastructure.” In Construction Research Congress 2009, 1214–22. American Society of Civil Engineers.
Bell, L., and B. McCullouch. 1988. “Bar Code Applications in Construction.” Journal of Construction Engineering and Management 114 (2): 263–78. 9364(1988)114:2(263).
Bhuptani, Manish, and Shahram Moradpour. 2005. RFID Field Guide: Deploying Radio Frequency Identification Systems. Upper Saddle River, NJ, USA: Prentice Hall PTR.
Blach, Roland, Jürgen Landauer, Angela Rösch, and Andreas Simon. 1998. “A Highly Flexible Virtual Reality System.” Future Generation Computer Systems, Virtual Reality in Industy and Research, 14 (3–4): 167–78.
Bohn, Jeffrey S., and Jochen Teizer. 2009. “Benefits and Barriers of Monitoring Construction Activities Using Hi-‐Resolution Automated Cameras.” In Construction Research Congress 2009, 21–30. American Society of Civil Engineers.
Boyce, P. R., Jennifer A. Veitch, G. R. Newsham, M. Myer, and C. M. Hunter. 2003. Lighting Quality and Office Work: A Field Simulation Study (PNNL 14506). PNNL 14506. Richland, WA, USA: Pacific Northwest National Laboratory.
Brilakis, Ioannis K. 2007. “Long-‐Distance Wireless Networking for Site–office Data Communications.” Journal of Information Technology in Construction 12: 154–64.
Campbell, Donald T, Marilynn B Brewer, and Collins. 1981. Scientific Inquiry and the Social Sciences. San Francisco: Jossey-‐Bass.

66
Campbell, Donald T, Julian C Stanley, and N. L Gage. 1966. Experimental and Quasi-‐Experimental Designs for Research. Chicago, Ill.: R. McNally.
Caneparo, Luca. 2001. “Shared Virtual Reality for Design and Management: The Porta Susa Project.” Automation in Construction, Multimedia in Construction, 10 (2): 217–28.
Carbonari, Alessandro, Alberto Giretti, and Berardo Naticchia. 2011. “A Proactive System for Real-‐Time Safety Management in Construction Sites.” Automation in Construction, Selected papers from the 26th ISARC 2009, 20 (6): 686–98.
Chae, Soungho, and Tomohiro Yoshida. 2008. “A Study of Safety Management Using Working Area Information on Construction Site.” Proceedings of the 25th International Symposium on Automation and Robotics in Construction, June, 292–99.
———. 2010. “Application of RFID Technology to Prevention of Collision Accident with Heavy Equipment.” Automation in Construction, 25th International Symposium on Automation and Robotics in Construction, 19 (3): 368–74.
Cheng, M., and S. Yang. 2001. “GIS-‐Based Cost Estimates Integrating with Material Layout Planning.” Journal of Construction Engineering and Management 127 (4): 291–99.
Chi, Seokho, Keith D. Hampson, and Herbert C. Biggs. 2012. “Using BIM for Smarter and Safer Scaffolding and Formwork Construction: A Preliminary Methodology.” In Modelling and Building Health and Safety. Singapore.
Ciribini, A. L. C., A. Gottfried, M. L. Trani, and L. Bergamini. 2011. “4D Modelling and Construction Health and Safety Planning.” In Proceedings of the 6th International Structural Engineering and Construction Conference -‐ Modern Methods and Advances in Structural Engineering and Construction, 467–71. Zurich, Switzerland.
Collins, Rachel, Sijie Zhang, Jochen Teizer, and Kyungki Kim. 2014. “Integration of Safety Risk Factors in BIM for Scaffolding Construction.” In Computing in Civil and Building Engineering (2014), 307–14. American Society of Civil Engineers.
Cook, Thomas, and Donald T. Campbell. 1979. “Chapter 2: Validity.” In Quasi-‐Experimentation: Design and Analysis Issues in a Field Setting, 37–94.
Costin, Aaron, Nipesh Pradhananga, and Jochen Teizer. 2014. “Passive RFID and BIM for Real-‐Time Visualization and Location Tracking.” In Construction Research Congress 2014, 169–78. American Society of Civil Engineers.
Derler, P., E.A Lee, and A-‐S. Vincentelli. 2012. “Modeling Cyber-‐Physical Systems.” Proceedings of the IEEE 100 (1): 13–28.
Egan, John. 1998. Rethinking Construction. Construction Task Force Rep. for Dept. of the Environment, Transport and the Regions. London: Her Majesty’s Stationery Office (HMSO).
Esmaeili, Behzad. 2012. “Identifying and Quantifying Construction Safety Risks at the Attribute Level.” University of Colorado at Boulder.
Esmaeili, B., and M. Hallowell. 2012. “Diffusion of Safety Innovations in the Construction Industry.” Journal of Construction Engineering and Management 138 (8): 955–63.
Everett, J., and A. Slocum. 1993. “CRANIUM: Device for Improving Crane Productivity and Safety.” Journal of Construction Engineering and Management 119 (1): 23–39.
Fabiano, Bruno, Fabio Currò, Andrea P. Reverberi, and Renato Pastorino. 2008. “A Statistical Study on Temporary Work and Occupational Accidents: Specific Risk Factors and Risk

67
Management Strategies.” Safety Science, Regulatory Issues, Safety Climate, Culture and Management Papers selected from the third international conference Working on Safety (WOS2006), September 12-‐15th, 2006, Zeewolde, The Netherland, 46 (3): 535–44.
Ford, Julienne. 1975. Paradigms and Fairy Tales: An Introduction to the Science of Meanings. London; Boston: Routledge & K. Paul.
Fullerton, Clare E., Ben S. Allread, and Jochen Teizer. 2009. “Pro-‐Active-‐Real-‐Time Personnel Warning System.” In Construction Research Congress 2009, 31–40. American Society of Civil Engineers.
Gambatese, J. 2008. “Research Issues in Prevention through Design.” Journal of Safety Research 39 (2): 153–56.
Gambatese, J, and J Hinze. 1999. “Addressing Construction Worker Safety in the Design Phase: Designing for Construction Worker Safety.” Automation in Construction 8 (6): 643–49.
Ghavami, M., L. B. Michael, and R. Kohno. 2004. “Front Matter.” In Ultra Wideband Signals and Systems in Communication Engineering, i – xxviii. John Wiley & Sons, Ltd.
Giretti, Alberto, Alessandro Carbonari, Berardo Naticchia, and Mario DeGrassi. 2009. “Design and First Development of an Automated Real-‐‑time Safety Management System for Construction Sites.” Journal of Civil Engineering and Management 15 (4): 325–36. 3730.2009.15.325-‐336.
Goedert, J., and P. Meadati. 2008. “Integrating Construction Process Documentation into Building Information Modeling.” Journal of Construction Engineering and Management 134 (7): 509–16.
Hackmann, G., Weijun Guo, Guirong Yan, Zhuoxiong Sun, Chenyang Lu, and S. Dyke. 2014. “Cyber-‐Physical Codesign of Distributed Structural Health Monitoring with Wireless Sensor Networks.” IEEE Transactions on Parallel and Distributed Systems 25 (1): 63–72.
Hadikusumo, B. H. W, and Steve Rowlinson. 2002. “Integration of Virtually Real Construction Model and Design-‐for-‐Safety-‐Process Database.” Automation in Construction 11 (5): 501–9.
Hadipriono, FABIAN C., and ASHRAF S. Barsoum. 2002. “Modeling for Safety Against Falls from Form Scaffolding in a Virtual Environment.” Civil Engineering and Environmental Systems 19 (2): 119–39.
Hallowell, Matthew, Behzad Esmaeili, and Paul Chinowsky. 2011. “Safety Risk Interactions among Highway Construction Work Tasks.” Construction Management and Economics 29 (4): 417–29.
Hallowell, Matthew R., and J. Gambatese. 2007. “A Formal Model of Construction Safety Risk Management.” In Construction and Building Research Conference (COBRA), 6–7.
Hallowell, Matthew R., Jochen Teizer, and Wes Blaney. 2010. “Application of Sensing Technology to Safety Management.” In Construction Research Congress 2010, 31–40. American Society of Civil Engineers.
Hallowell, M., and J. Gambatese. 2009. “Construction Safety Risk Mitigation.” Journal of Construction Engineering and Management 135 (12): 1316–23. 7862.0000107.
Hammad, A, Cheng Zhang, S. Setayeshgar, and Y. Asen. 2012. “Automatic Generation of Dynamic Virtual Fences as Part of BIM-‐Based Prevention Program for Construction Safety.” In Simulation Conference (WSC), Proceedings of the 2012 Winter, 1–10.

68
Hightower, Jeffrey, and Gaetano Borriello. 2001. “Location Systems for Ubiquitous Computing.” Computer.
Howard, Rob, and Bo-‐Christer Björk. 2008. “Building Information Modelling – Experts’ Views on Standardisation and Industry Deployment.” Advanced Engineering Informatics, Network methods in engineering, 22 (2): 271–80.
Hsieh, Hsiu-‐Fang, and Sarah E. Shannon. 2005. “Three Approaches to Qualitative Content Analysis.” Qualitative Health Research 15 (9): 1277–88.
Hwang, Seokyon. 2012. “Ultra-‐Wide Band Technology Experiments for Real-‐Time Prevention of Tower Crane Collisions.” Automation in Construction, Planning Future Cities-‐Selected papers from the 2010 eCAADe Conference, 22 (March): 545–53.
Jannadi, O., and S. Almishari. 2003. “Risk Assessment in Construction.” Journal of Construction Engineering and Management 129 (5): 492–500. 9364(2003)129:5(492).
Jaselskis, E., and T. El-‐Misalami. 2003. “Implementing Radio Frequency Identification in the Construction Process.” Journal of Construction Engineering and Management 129 (6): 680–88.
Jaselskis, E., H. Han, J. Grigas, L. Tan, and D. Fahrion. 2001. “Status of Roller Mountable Microwave Asphalt Pavement Density Sensor.” Journal of Construction Engineering and Management 127 (1): 46–52.
Jiao, Lei, Jianping Xing, Jun Zhang, Xuan Zhang, and Chaoli Zhao. 2007. “A GPS-‐Free City Bus Real-‐Time Positioning System.” In International Conference on Transportation Engineering 2007, 846–51. American Society of Civil Engineers.
Jordani, David. 2008. “BIM: A Healthy Disruption to a Fragmented and Broken Process.” Ournal of Building Information Modelling 2 (2): 24–26.
Kam, Calvin, Martin Fischer, Reijo Hänninen, Auli Karjalainen, and Jarmo Laitinen. 2003. “The Product Model and Fourth Dimension Project.”
Kaner, I., Rafael Sacks, W. Kassian, and T. Quitt. 2008. “Case Studies of BIM Adoption for Precast Concrete Design by Mid-‐Sized Structural Engineering Firms.” ITcon Vol. 13, Special Issue <A HREF
Kim, H., H. Lee, M. Park, B. Chung, and S. Hwang. 2014. “Information Retrieval Framework for Hazard Identification in Construction.” Journal of Computing in Civil Engineering 0 (0): 04014052.
Krippendorff, Klaus. 2004. “Reliability in Content Analysis.” Human Communication Research 30 (3): 411–33.
Lange, R., and P. Seitz. 2001. “Solid-‐State Time-‐of-‐Flight Range Camera.” IEEE Journal of Quantum Electronics 37 (3): 390–97.
LeCompte, Margaret D., and Judith Preissle Goetz. 1982. “Ethnographic Data Collection in Evaluation Research.” Educational Evaluation and Policy Analysis 4 (3): 387–400.
Lee, H., K. Lee, M. Park, Y. Baek, and S. Lee. 2012. “RFID-‐Based Real-‐Time Locating System for Construction Safety Management.” Journal of Computing in Civil Engineering 26 (3): 366–77.
Leite, F., and B. Akinci. 2012. “Formalized Representation for Supporting Automated Identification of Critical Assets in Facilities during Emergencies Triggered by Failures in Building Systems.” Journal of Computing in Civil Engineering 26 (4): 519–29.

69
Li, Heng, Zhen Chen, Liang Yong, and Stephen C. W. Kong. 2005. “Application of Integrated GPS and GIS Technology for Reducing Construction Waste and Improving Construction Efficiency.” Automation in Construction, International Conference for Construction Information Technology 2004, 14 (3): 323–31.
Li, H., C. Kong, Y. Pang, W. Shi, and L. Yu. 2003. “Internet-‐Based Geographical Information Systems System for E-‐Commerce Application in Construction Material Procurement.” Journal of Construction Engineering and Management 129 (6): 689–97. 9364(2003)129:6(689).
Lincoln, Yvonna S., and Egon G. Guba. 1985. Naturalistic Inquiry. SAGE.
Lin, T., C. Liu, M. Tsai, and S. Kang. 2014. “Using Augmented Reality in a Multiscreen Environment for Construction Discussion.” Journal of Computing in Civil Engineering 0 (0): 04014088.
Lopez del Puerto, C., and C. Clevenger. 2010. “Enhancing Safety throughout Construction Using BIM/VDC.” In Proceedings of the 2010 BIM-‐Related Academic Workshop, 6–10.
Lynch, Jerome P., Vineet Kamat, Victor C. Li, Michael Flynn, Dennis Sylvester, Khalil Najafi, Timothy Gordon, et al. 2009. “Overview of a Cyber-‐Enabled Wireless Monitoring System for the Protection and Management of Critical Infrastructure Systems.” In , 7294:72940L – 72940L – 11.
Manning, Kathleen. 1997. “Authenticity in Constructivist Inquiry: Methodological Considerations Without Prescription.” Qualitative Inquiry 3 (1): 93–115.
Moon, S., B. Choi, and B. Yang. 2012. “USN-‐Based Data Acquisition for Increasing Safety in the Concrete Formwork Operation.” Journal of Computing in Civil Engineering 26 (3): 271–81.
Navon, Ronie, and Rafael Sacks. 2007. “Assessing Research Issues in Automated Project Performance Control (APPC).” Automation in Construction 16 (4): 474–84.
Neuendorf, Kimberly A. 2002. The Content Analysis Guidebook. SAGE.
Newsham, Guy, Jennifer Veitch, Chantal Arsenault, and Cara Duval. 2004. “Effect of Dimming Control on Office Worker Satisfaction and Performance.” In Proceedings of the Annual Conference of the Illuminating Engineering Society of North America, 19–41. Tampa, FL.
Oloufa, Amr A, Masaaki Ikeda, and Hiroshi Oda. 2003. “Situational Awareness of Construction Equipment Using GPS, Wireless and Web Technologies.” Automation in Construction, Design e-‐ducation: Connecting the Real and the Virtual, 12 (6): 737–48. 5805(03)00057-‐8.
Peyret, François, and Robert Tasky. 2002. “Asphalt Quality Parameters Tracability Using Electronic Tags And Gps.” In Proceedings of 19th International Symposium on Automation and Robotics in Construction (ISARC), 155–60. Gaithesburg, USA: NIST Special Publication.
Pradhan, A., E. Ergen, and B. Akinci. 2009. “Technological Assessment of Radio Frequency Identification Technology for Indoor Localization.” Journal of Computing in Civil Engineering 23 (4): 230–38.
Pradhananga, Nipesh, and Jochen Teizer. 2012. “Spatio-‐Temporal Safety Analysis of Construction Site Operations Using GPS Data.” In Construction Research Congress 2012, 787–96. American Society of Civil Engineers.
Pratt, S. G., D. E. Fosbroke, and S. M. Marsh. 2001. “Building Safer Highway Work Zones: Measures To Prevent Worker Injuries From Vehicles And Equipment,” April.

70
Qi, J., R. Issa, S. Olbina, and J. Hinze. 2014. “Use of Building Information Modeling in Design to Prevent Construction Worker Falls.” Journal of Computing in Civil Engineering 28 (5): A4014008.
Rasdorf, W., and M. Herbert. 1990. “Bar Coding in Construction Engineering.” Journal of Construction Engineering and Management 116 (2): 261–80.
Reason, James J. 1990. Human Error. Cambridge UP. New York.
Ruppel, U., and P. Abolghasemzadeh. 2009. “BIM-‐Based Immersive Evacuation Simulations.” In 18th International Conference on the Application of Computer Science and Mathematics in Architecture and Civil Engineering. Weimar, Germany.
Shapira, A., and B. Lyachin. 2009. “Identification and Analysis of Factors Affecting Safety on Construction Sites with Tower Cranes.” Journal of Construction Engineering and Management 135 (1): 24–33.
Stukhart, G., and E. Cook. 1990. “Bar-‐‑Code Standardization in Industrial Construction.” Journal of Construction Engineering and Management 116 (3): 416–31. 9364(1990)116:3(416).
Tang, Lu-‐An, Xiao Yu, Sangkyum Kim, Jiawei Han, Chih-‐Chieh Hung, and Wen-‐Chih Peng. 2010. “Tru-‐Alarm: Trustworthiness Analysis of Sensor Networks in Cyber-‐Physical Systems.” In 2010 IEEE 10th International Conference on Data Mining (ICDM), 1079–84.
Teizer, J., C. Caldas, and C. Haas. 2007. “Real-‐Time Three-‐Dimensional Occupancy Grid Modeling for the Detection and Tracking of Construction Resources.” Journal of Construction Engineering and Management 133 (11): 880–88.
Teizer, Jochen, Ben S. Allread, Clare E. Fullerton, and Jimmie Hinze. 2010. “Autonomous pro-‐Active Real-‐Time Construction Worker and Equipment Operator Proximity Safety Alert System.” Automation in Construction, Building Information Modeling and Collaborative Working Environments, 19 (5): 630–40.
Teizer, Jochen, Changwan Kim, Carl Haas, Katherine Liapi, and Carlos Caldas. 2005. “Framework for Real-‐Time Three-‐Dimensional Modeling of Infrastructure.” Transportation Research Record: Journal of the Transportation Research Board 1913 (January): 177–86.
Thornton, Tomasetti. 2012. Indiana State Fair Commission, August 13, 2011 Collapse Incident, Investigative Report.
Wang, Xiangyu, and Phillip S. Dunston. 2005. “Heavy Equipment Operator Training via Virtual Modeling Technologies.” In Construction Research Congress 2005, 1–10. American Society of Civil Engineers.
———. 2008. “User Perspectives on Mixed Reality Tabletop Visualization for Face-‐to-‐Face Collaborative Design Review.” Automation in Construction 17 (4): 399–412.
Wang, Xiangyu, Mi Jeong Kim, Peter E. D. Love, and Shih-‐Chung Kang. 2013. “Augmented Reality in Built Environment: Classification and Implications for Future Research.” Automation in Construction 32 (July): 1–13.
Wu, Fang-‐Jing, Yu-‐Fen Kao, and Yu-‐Chee Tseng. 2011. “From Wireless Sensor Networks towards Cyber Physical Systems.” Pervasive and Mobile Computing 7 (4): 397–413.
Yang, J., P. A. Vela, J. Teizer, and Z. K. Shi. 2011. “Vision-‐Based Crane Tracking for Understanding Construction Activity.” In Computing in Civil Engineering (2011), 258–65. American Society of Civil Engineers.

71
Yeh, K., M. Tsai, and S. Kang. 2012. “On-‐Site Building Information Retrieval by Using Projection-‐Based Augmented Reality.” Journal of Computing in Civil Engineering 26 (3): 342–55.
Yi, K., and D. Langford. 2006. “Scheduling-‐Based Risk Estimation and Safety Planning for Construction Projects.” Journal of Construction Engineering and Management 132 (6): 626–35.
Yuan, Xiao, M. Kevin Parfitt, and Chimay J. Anumba. 2014. “The Use of Cyber-‐Physical Systems in Temporary Structures—An Exploratory Study.” In Computing in Civil and Building Engineering (2014), 1707–14. American Society of Civil Engineers.
Zhang, C., A. Hammad, and S. Rodriguez. 2012. “Crane Pose Estimation Using UWB Real-‐Time Location System.” Journal of Computing in Civil Engineering 26 (5): 625–37.
Zhang, Sijie, Jochen Teizer, Jin-‐Kook Lee, Charles M. Eastman, and Manu Venugopal. 2013. “Building Information Modeling (BIM) and Safety: Automatic Safety Checking of Construction Models and Schedules.” Automation in Construction 29 (January): 183–95.
Zhong, D., J. Li, H. Zhu, and L. Song. 2004. “Geographic Information System-‐Based Visual Simulation Methodology and Its Application in Concrete Dam Construction Processes.” Journal of Construction Engineering and Management 130 (5): 742–50.
Zhou, Wei, Jennifer Whyte, and Rafael Sacks. 2012. “Construction Safety and Digital Design: A Review.” Automation in Construction, Planning Future Cities-‐Selected papers from the 2010 eCAADe Conference, 22 (March): 102–11.