Requires Improvement: the causes of educational failure
130
REQUIRES IMPROVEMENT September 2013 Breakthrough Britain II The causes of educational failure
-
Upload
independent -
Category
Documents
-
view
1 -
download
0
Transcript of Requires Improvement: the causes of educational failure

REQUIRES IMPROVEMENT
September 2013
Breakthrough Britain II Requires Im
provement: T
he causes of educational failureT
he Centre for Social Justice
£25.00
The Centre for Social Justice
4th Floor, Victoria Charity Centre,
11 Belgrave Road
London
SW1V 1RB
ISBN: 978-0-9573587-8-2
www.centreforsocialjustice.org.uk@CSJThinktank
Breakthrough Britain II
The causes of educational failure

Breakthrough Britain II: Educational Failure | Contents 1
contentsContents
About the Centre for Social Justice 3
About Breakthrough Britain II 4
Preface 6
Members of the CSJ Working Group 8
Special thanks 12
Executive summary 13
Introduction 20
1 Measuring educational failure 25 1.1 GCSEs 25
1.2 Basic skills 27
1.3 Changing standards 30
1.4 Qualifications and gaming 31
1.5 International comparisons 33
1.6 Conclusion 35
2 The children and families worst affected 37 2.1 Aspiration 38
2.2 Parental education 41
2.3 Parental engagement 44
2.4 Family breakdown 45
2.5 Child neglect and abuse 47
2.6 Children in care 48
2.7 Domestic violence 50
2.8 Addiction 51
2.9 Mental health 52
2.10 Speech and language difficulties 54
2.11 Children on free school meals 56
2.12 Regional disadvantages: the national vs. local picture 61
2.13 Conclusion 64
3 Schools, settings and transitions 65 3.1 School readiness, Early Years and early intervention 65
3.2 Early Years Foundation Stage Profile 67
3.3 Children entering school 69
3.4 Early Years provision 73
3.5 School reform 74
3.6 The Pupil Premium 75
3.7 The Academies programme 80

The Centre for Social Justice 2
3.8 Teaching and teacher quality 96
3.9 Leadership 107
3.10 Further Education (FE) and Vocational Education 113
3.11 Conclusion 126
Conclusion 128
Requires Improvement: The causes of educational failure
© The Centre for Social Justice, 2013
Published by the Centre for Social Justice,
4th Floor, Victoria Charity Centre, 11 Belgrave Road, SW1V 1RB
www.centreforsocialjustice.org.uk
@CSJThinktank
ISBN: 978-0-9573587-8-2
Designed by Soapbox, www.soapbox.co.uk

Breakthrough Britain II: Educational Failure | About the Centre for Social Justice 3
aboutAbout the Centre for Social Justice
The Centre for Social Justice (CSJ) aims to put social justice at the heart of British politics.
Our policy development is rooted in the wisdom of those working to tackle Britain’s deepest
social problems and the experience of those whose lives have been affected by poverty. Our
Working Groups are non-partisan, comprising prominent academics, practitioners and policy
makers who have expertise in the relevant fields. We consult nationally and internationally,
especially with charities and social enterprises, who are the champions of the welfare society.
In addition to policy development, the CSJ has built an alliance of poverty fighting organisations that
reverse social breakdown and transform communities.
We believe that the surest way the Government can reverse social breakdown and poverty
is to enable such individuals, communities and voluntary groups to help themselves.
The CSJ was founded by Iain Duncan Smith in 2004, as the fulfilment of a promise made to
Janice Dobbie, whose son had recently died from a drug overdose just after he was released
from prison.
Managing Director : Christian Guy

The Centre for Social Justice 4
About Breakthrough Britain II
When the Centre for Social Justice (CSJ) published Breakthrough Britain in 2007, the British
political landscape was fundamentally altered. The policy-making context was changed and a
tired national debate about tackling poverty was reinvigorated.
These experience-led reports – shaped by mass domestic and international evidence-
gathering – presented an unprecedented diagnosis of poverty in the UK and outlined a fresh
vision for fighting it. This vision rested on recognising that using money alone to combat
disadvantage, as important as income is, is too narrow an approach.
Through these conclusions and the thousands of people who shaped them, the CSJ
demonstrated the need to identify and tackle the root causes of poverty, not merely the
symptoms. We showed that for too long, five pathways to poverty have characterised life
in our poorest neighbourhoods. These are: family breakdown; economic dependency and
worklessness; educational failure; drug and alcohol addiction and serious personal debt. These
pathways are interconnected. For example, a child who experiences family breakdown is less
likely to achieve at school. Someone who fails at school is less likely to enter work and more
likely to be on benefits. Consequently they are then more likely to live in financial poverty
and debt. And so the cycle continues.
As a result of Breakthrough Britain, a debate was initiated about social and family breakdown
in the UK. Yet much has changed in the policy-making environment since we published in
2007. In particular, the economic crisis has led to one of the deepest and longest recessions
on record and there will be significant public expenditure reductions to deal with the national
deficit. We also have the first Coalition Government since 1945.
However, what remains clear within the debate about putting Britain on a secure financial
footing is the need for a social recovery, as well as an economic one. The costs of social
breakdown are significant and often preventable. The CSJ believes it is time to revisit
Breakthrough Britain. In view of the monumental challenges now confronting policy-makers
and society, such a review would lay fresh foundations for tackling poverty in an age of
austerity. Once again, this must be based on recognition of poverty’s root causes.

Breakthrough Britain II: Educational Failure | About Breakthrough Britain II 5
aboutThe CSJ has conducted a national audit of social breakdown for each of the six policy areas
which comprise Breakthrough Britain II. This ‘State of the Nation’ report sets out the key
problems and trends and will act as a ‘springboard’ for the main report to be published in
Spring 2014, comprising a number of policy recommendations for government in relation to
each of the policy areas.
The Centre for Social Justice 6
Preface
Education is a gateway to a better future for our nation’s young people. Their time at
school is an opportunity to discover the possibilities which lay before them and to gain the
knowledge and skills they will need to step into adulthood. Or at least it should be.
Most young people in our country are offered a solid education and take their chance. The
system, although requiring significant improvement, tends to equip the next generation with
the skills they need to find work and make progress.
Radical and necessary reforms are now underway to give school leaders more freedom, to
ask more of teachers and to improve standards dramatically. Some were set in train under the
previous Government and some were called for by the Centre for Social Justice in our 2007
Breakthrough Britain education report. Many in Westminster and across the country agree with
the need to focus on those themes, regardless of any practical concerns which emerge, and credit
must go to Michael Gove for his determination to take on those who are satisfied with average.
But there remain stark inequalities within the education system as this interim report
demonstrates. Over two million children attend schools that fall short of being good or
outstanding. More than 230,000 pupils fail to achieve five A* to C grades at GCSE including
English and mathematics. For those on free school meals – the common poverty measure in
our education system – only 36 per cent achieved five A* to C grades compared to 63 per
cent of those not eligible.
The report also reveals how certain ethnic groups fare – with white working class boys
particularly struggling. We also reveal that some children start school at the age of four in
nappies, with the behavioural level of one year olds, unable to answer to their name or speak.
This represents a significant and damaged minority. For those at the bottom, such educational
failure and its poor outcomes can wreak havoc. All too quickly many are on the pathway to
poverty, crime, social breakdown and worklessness in later life.
Through the lens of the children and families worst affected, our review focusses on five
key themes: school readiness at entry level; school reform, including an assessment of Free
Schools and the Academies programme; teaching; leadership and Further Education. We have
gathered academic and anecdotal evidence from across the country, learning from those on
the front line of educational failure.
Breakthrough Britain II: Educational Failure | Preface 7
one
In publishing this report my thanks go to the review’s Chairman, Sir Robin Bosher, for his
leadership and expertise, and to our excellent Working Group for being willing to give so
much time to this work. They are: Sir Robin Bosher, Wendy Lee, Ros McMullen, Dame Sally
Coates, Amanda Spielman, Diana Owen, Dr. Vanessa Ogden and Hazel Slavin. I am also
grateful to CSJ team members Holly-Lee Davis, Alex Burghart and Sophie Carter, who have
worked very hard to produce this crucial paper.
This is part one. For the next 12 months the team will develop ideas which can spark
educational reform to transform the experiences of the poorest children and the work
of schools in the most deprived neighbourhoods. But in publishing this state-of-the-nation
report our hope is that it will act as a window into life at the bottom of our education system
for people who are yet to see it. For others who are already familiar with these challenges,
we hope it might be the encouragement they need to make a difference in the lives of the
most disadvantaged children.
Christian Guy Director, Centre for Social Justice

The Centre for Social Justice 8
Members of the CSJ Working Group
Sir Robin Bosher, Director of Primary Education at the Harris Federation of Academies, Chair
Sir Robin Bosher is the Director of Primary Education for the Harris Federation. Prior to this,
he was a headteacher for 22 years and during that time he led three very different primary
schools. Lately, he was the Executive Headteacher of the federation between Fairlawn,
Haseltine and Kilmorie Primary Schools in Lewisham. Fairlawn was deemed by The Office for
Standards in Education, Children’s Services and Skills (Ofsted) as ‘outstanding’ in every category.
Robin is a National Leader of Education and Fairlawn was a National Support School, and was
designated as one of the first Teaching Schools in the country. Sir Robin was awarded the National
College Primary School System Leader of the Year award in 2010. He is a National Professional
Qualification for Headship coach and has worked on the programme for over ten years.
Robin has experience as a Department for Education City Challenge Adviser and has led
the London Challenge Primary Programme as the Operational Director. He was the Primary
Headteacher on the board of the Department for Education ‘Achievement for All’ steering
board and is currently a member of the Primary Reference Group.
Wendy Lee, Professional Director, The Communication Trust
Wendy Lee is Professional Director for The Communication Trust, which is a consortium
of mainly third sector organisations with an interest in children’s speech, language and
communication issues.
She has worked as a speech and language therapist for 25 years, both in clinical practice and in
higher education. She has worked full time in the third sector since 2007 and has been involved
in a range of projects for both I CAN and The Communication Trust.

Breakthrough Britain II: Educational Failure | Members of the Working Group 9
mem
bers
Recent work has involved supporting the development of Speech, Language and Communication
units of qualification, developing a wave 2 intervention as part of the A Chance to Talk project,
consultation work with children and young people and as lead professional advisor for the
national year of communication campaign. Wendy’s specific area of interest is on working
together with colleagues in education settings to enable ways of providing the best support
for children with speech, language and communication needs in mainstream settings.
Ros McMullen, Principal, David Young Community Academy
Ros McMullen was a headteacher in Wigan between 2000 and 2004 where she turned around
a school which was the 15th worst performing into one of the most improved schools in the
country, gaining recognition both locally and nationally.
In 2005 she became Principal of David Young Community Academy and spent five terms
preparing for the opening in September 2006. DYCA replaced two of the lowest performing
schools in Leeds and has the highest deprivation indices of all secondary schools in Leeds.
In September 2012 DYCA became a founding member of the LEAF Academy Trust and Ros is
the Chief Executive of the Trust. LEAF is an acronym for Love, Enterprise, Aspiration and Faith.
Ros has been a National Leader of Education since 2011.
Dame Sally Coates, Principal, Burlington Danes Academy
Dame Sally Coates is the Principal of the Burlington Danes Academy in White City. Sally has
worked in teaching since she was 22 and took on the headship at Burlington Danes in 2008.
She turned round the fortunes of the school which had previously been in ‘special measures.’
Under her leadership, this has gone on to become one of the most improved schools in the
country. Sally has expertise working with disadvantaged pupils and is also Chair of the Teachers’
Standards Review Group. Sally also sits on the Lord Bew Review of Key Stage 2 Accountability
and Testing.

The Centre for Social Justice 10
Amanda Spielman, Chair of Ofqual and Education Adviser for ARK Schools
Amanda Spielman is Chair of Ofqual and Education Adviser for ARK Schools, the education
charity and academy sponsor, which she joined as part of its founding management team
in 2005. She has had particular responsibility for the development of ARK’s curriculum,
assessment and teaching model to secure exceptional standards in high-disadvantage schools.
She also serves on ARK’s International Education board which oversees projects in India and
Africa.
Amanda worked for more than 15 years in corporate finance, corporate strategy and business
planning for Nomura International plc, Mercer Management Consulting, Bridgewater Business
Analysis Ltd, Kleinwort Benson Ltd and Thomson McLintock, latterly at director and principal
level.
She has been a trustee of Wales Millennium Centre, the charities Pilotlight and Saving Faces
and the National Council of Women of Great Britain.
Diana Owen, Chief Executive, L.E.A.D Academy Trust
Diana is the Chief Executive of the L.E.A.D. Academy Trust and has a wealth of experience
working in different schools for over 20 years. She has been the headteacher of Huntingdon
Primary School for the past 14 years and during this time has led it from special measures to
outstanding. In 2010 she became an Executive Head taking responsibility and accountability
for more than one school. Diana’s previous teaching experience has been in both Nottingham
and London.
Using a distributed leadership style has allowed Diana to support other schools both in
Nottingham and around the country. In 2008 Diana became a National Leader of Education
which has involved her working with and supporting schools’ leadership teams nationally.
As part of this role she has also met with ministers on a number of occasions to help steer
government agendas.
Dr. Vanessa Ogden, Headteacher, Mulberry School for Girls
Vanessa is the headteacher of Mulberry School for Girls in Tower Hamlets. She is currently
leading the foundation of Mulberry University Technical College in the borough.

Breakthrough Britain II: Requires Improvement | Members of the Working Group 11
one
11
mem
bers
Vanessa’s teaching career has spanned two decades of practice in inner-city schools across London.
Mulberry School for Girls pioneers work on overcoming barriers to success caused by disadvantage
and poverty. The school is a founding partner of ‘City Excellence in Teaching’, a cluster of schools
developing teachers as expert practitioners in areas affected by social disadvantage.
Vanessa is a National Leader in Education, supporting schools in challenging circumstances.
She is also a Visiting Fellow at the Institute of Education and she has a doctorate specialising
in education policy and school improvement. Vanessa is a trustee of Teach First and Chair of
the Impact Committee.
Hazel Slavin, Advisor, Kusuma Trust
Hazel has a background in education, starting in Further Education in Whitechapel, where she
taught Literacy to newly arrived immigrants, English Language and Literature. She was a team
member of an innovative Schools Council curriculum programme on Health and Personal
Education for 16–19 year olds and then Advisor in Health, Personal and Social Education in
the Inner London Education Authority before moving to a Principal Lectureship at South Bank
University where she ran a Diploma and Master’s programme in Health Communication. She
now works in International Development in Behaviour Change Communication for Health
across the developing world and is the Chair of the Trustees of Women and Children First.
Hazel is an advisor to the Kusuma Trust UK, an independent grant making organisation that
has provided a grant for the work of the committee. She has a deep interest in educational
failure, with extensive experience in the field.
Holly Lee Davis, Researcher, the Centre for Social Justice
Lee is the lead researcher for educational failure, working on the quality of teaching, transitions
and adult learning and skills development.
Lee graduated with First Class Honours from the London School of Economics, with a degree
in Social Policy. She has also completed an MSc for which she was awarded Distinction. Before
undertaking her masters, she worked in student housing and language provision, and has also
worked abroad.

The Centre for Social Justice 12
Special thanks
The CSJ would like to thank the many people, schools and organisations who have kindly
given their time to contribute evidence during the course of this review. Our thanks go to
the Working Group for their time and expertise. Particular thanks go to Sir Robin Bosher, the
Group’s Chairman, for his incredible leadership and commitment to the review. Thanks also go
to the group’s advisers, Sir Peter Birkett and Martin Tune, and to Sophie Carter who was the
initial CSJ researcher on this project. Special thanks go to Alex Burghart, CSJ Director of Policy,
for his invaluable help and guidance.
We are also very grateful to the Kusuma Trust for their generous support for this paper.
The Kusuma Trust UK believes that every child and young person has the potential to
transform and improve their life, and should have opportunities to grow and develop as active
and productive citizens in their communities. Their mission is to facilitate and increase access to
education and other life opportunities for children and young people, with a focus on the most
economically disadvantaged. The Trust has provided funding to the CSJ for the educational
failure volume of Breakthrough Britain II.

13
summ
ary
Breakthrough Britain II: Educational Failure | Executive summary
Executive summary
Educational failure can have a catastrophic impact on a child’s life chances and opportunities.
Not only is it an injustice harming the outcomes of those children affected, it represents an
economic and social strain on the whole of society that creates and perpetuates cycles of
disadvantage. Children leaving school with few or no meaningful qualifications are less likely
to enter into and progress in work and less likely to be able to support the learning of their
own children.
England’s education system is currently undergoing extensive and widespread reform, the
full consequences of which will not be felt for some time. However, it is clear that there is a
need for reforms to go further in order to spread success to those children and communities
that it has yet to reach. This first, state-of-the-nation report into educational failure in England
considers the factors that hold some children back, looks at some of the reforms already in
process and asks on which areas the next phase of reform will need to focus.
Measuring educational failure
Although results have been improving in recent years, an unacceptable number of children
still leave school with very poor qualifications:
�� Two out of every five pupils (more than 231,000) do not achieve five A* to C grades,
including English and mathematics;1
�� In 2011, 156,000 pupils who did not have statements of special educational need did not
get an A* to C grade in GCSE English, and 179,000 did not get an A* to C grade in GCSE
mathematics;2 120,000 did not get A* to C in either ;3
�� Over 1,650 pupils finish Key Stage 4 with no A* to G grades, including equivalent
qualifications;4
�� It is estimated that 8.1 million adults lack basic numeracy skills.5
1 Department for Education, Revised GCSE and equivalent results in England: academic year 2011 to 2012, London: Department for Education, 2013 (see Table 3a, applicable to all state funded schools)
2 Hansard, Written answers and statements, 12 November 2012 3 Ibid 4 Department for Education, Revised GCSE and equivalent results in England: academic year 2011 to 2012, London: Department for
Education, 2013 (see Table 3a)5 Department for Business Innovation & Skills, 2011 Skills for Life Survey, London: Department for Business, Innovation & Skills, 2012

The Centre for Social Justice 14
The children and families worst affected
The importance of family cannot be overstated. Children who benefit from supportive and
engaged parents are far more likely to do well at school. Factors like parental time and
engagement have a positive impact on outcomes at school, even when accounting for socio-
economic background.
�� Children are only at school for 15 per cent of their waking hours;6
�� If parents engage with their child’s education, their attainment increases by 15 per cent,
regardless of the family’s social background.7
The CSJ has been told that where children’s parents do not hold high aspirations for them, it
is unlikely that their children will. Where parents have had a poor experience of education and
employment, it is understandably less likely that they will believe that education is worthwhile.
White British pupils on free school meals (FSM) are thought to be particularly affected by
low aspiration. These pupils are a major group, accounting for nine per cent of all pupils at the
end of Key Stage 4, yet they perform worse than nearly all other groups:
�� Only 26 per cent of white British boys eligible for FSM achieved five A* to C grades at
GCSE including English and mathematics, compared to 36 per cent of all pupils on FSM, 63
per cent of all other pupils, and, for example, 40 per cent of black boys on FSM.8
Children who come from families that have suffered family breakdown are likely to see it
affect their education.9 At the most extreme end of family breakdown, children who are taken
into care perform considerably worse than almost any other group:
Only 15 per cent of children looked after for at least a year achieved five A* to C grades at
GCSE including English and mathematics, compared to 58 per cent for other children.10
Poorer children who are eligible for FSM often face multiple barriers to learning, including
having less home support, weaker language and communication skills, and difficulties in basic
literacy and numeracy.11 Consequently, they often perform less well at school than other
children. Last year only 36 per cent of pupils eligible for FSM achieved five A* to C grades at
GCSE including English and mathematics, compared with 63 per cent of those not eligible.12
6 Campaign for Learning, Animate Learning! Family Handbook, London: Campaign for Learning, 20137 Oxford School Improvement, The Pupil Premium: making it work in your school, Oxford: Oxford University Press, 20128 Department for Education, GCSE and equivalent attainment by pupil characteristics in England: 2011 to 2012, London: Department for
Education, 20139 Goodman A et al, Inequalities in educational outcomes among children aged 3 to 16, Final report for the National Equality Panel, 2009
[accessed via: http://sta.geo.useconnect.co.uk/pdf/Inequalities%20in%20education%20outcomes%20among%20children.pdf (23/02/13)]10 Department for Education, Outcomes for Children Looked After by Local Authorities in England, as at 31 March 2012, London: Department
for Education, 201311 See for example, Oxford School Improvement, The Pupil Premium: making it work in your school, Oxford: Oxford University Press, 201212 Department for Education, GCSE and equivalent attainment by pupil characteristics in England: 2011 to 2012, London: Department for
Education, 2013

15
summ
ary
Breakthrough Britain II: Educational Failure | Executive summary
However, whilst the disadvantages endured by children on FSM is of deep concern, the vast
majority of children who leave school without good qualifications are not eligible: 78 per cent
of those who did not achieve A* to C in English and mathematics GCSEs last year were not
recorded as eligible for FSM.13
Whilst some progress has been made, it has not been spread evenly across the country.
For many years, attainment in London was recognised as poor. However London is now
outstripping other parts of the country. Educational failure is especially acute across a number
of regional areas. For example, in nine local authorities, fewer than 50 per cent of pupils
achieved five good GCSE passes including English and mathematics last year.14 In Knowsley,
only 40.9 per cent of pupils did.15
School readiness
By the time of their first assessment, conducted in the final year of the Early Years Foundation
Stage, it is clear that many pupils are already some way behind other children:
�� Six per cent of boys do not know that in English, print is read from left to right and top
to bottom;16
�� 19 per cent of children could not link sounds to letters, naming and sounding letters of
the alphabet.17
However, this assessment is conducted after many children have already been in school for
a year. The CSJ has heard heart-breaking accounts of children entering school with very low
levels of development which put them at an immediate disadvantage relative to other pupils.
The CSJ has been told of children entering school at the age of four who:
�� Commonly act as though they are 12 to 18 months old;
�� Are unable to socialise having had no practice at being sociable;
�� Are still in nappies and not toilet-trained;
�� Do not know their own names and are unable to speak.
This shockingly acute disadvantage stretches the capacity of schools and threatens to
place those children at a disadvantage for the rest of their school careers as some of their
contemporaries will already be several years more developed than they are. This stresses the
importance of greater and more effective early intervention.
13 Ibid14 Department for Education, Revised GCSE and equivalent results in England: academic year 2011 to 2012, London: Department for
Education, 201315 Ibid 16 Department for Education, Early Years Foundation Stage Profile Results in England, 2011/12, London: Department for Education, 201217 Ibid
The Centre for Social Justice 16
School reform
Pupil Premium
The CSJ welcomes the introduction of the Pupil Premium to support the education of
children on FSM by paying additional funds to their schools on a per capita basis. Whilst we
accept that it was necessary to tie it to FSM in order to introduce it swiftly, we believe it is
now time to consider how it can be better directed so as to include pupils who suffer from
disadvantage but who may not be signed up and so that it is made part of Universal Credit.
The Academies programme
By increasing the autonomy and flexibility of schools, the Academies programme has
offered schools considerable opportunity to improve education for their pupils as they see
fit. In particular, academy chains which can share experience and expertise are delivering
considerable improvement to schools which have long suffered disadvantage.
It is important, however, that this success is extended to communities with the greatest need.
The CSJ has learnt that some chains and federations have been slow to move into areas
outside of London and that there are a number of local areas in which performance is poor
that do not, as yet, benefit from the presence of a single academy that is part of a chain.
Similarly, the Academies programme has great potential for invigorating primary schools
which are now entitled to become academies. It will be important to consider, however, how
conversion might take place and be effective in a phase of education in which schools are
much smaller and more numerous (16,784 against 3,281 secondaries).18
Free Schools are an excellent opportunity to bring new providers to disadvantaged areas.
However, the CSJ is concerned that only a relatively small proportion of new schools – fewer
than a fifth of those which opened in 2012 – have been started by charities; more must
be done to harness the potential of the third sector to provide well-tailored support to
disadvantaged communities. Similarly, too few Free Schools are, as yet, catering for the most
disadvantaged pupils. In January 2012 only five of the 18 primary Free Schools and two of the
six secondary schools had a higher proportion of children on FSM than the national average.19
The extension of academy freedoms to alternative provision will also allow for greater
innovation when working with some of the most vulnerable children in the education system.
It is important, however, that commissioners are equipped to find the most effective settings
for children and are monitored to ensure that they are fulfilling this duty.
18 Department for Education, Schools, pupils and their characteristics: January 2013, London: Department for Education, 201319 Hansard, Written Answers and statements, 13 May 2013

17
summ
ary
Breakthrough Britain II: Educational Failure | Executive summary
Teaching
The most important school-based factor affecting outcomes is the quality of teaching. This
is especially important for disadvantaged children, with the most to gain from attending
excellent schools. Yet too often, teaching is substandard and leadership is weak.
Over two million children attend schools that fall short of being good or outstanding.20
According to Ofsted, the quality of teaching is good or outstanding in over 80 per cent of
primary schools serving the least deprived areas but at only 69 per cent of those serving
the most deprived communities.21 The CSJ has heard how it is difficult for schools in some
parts of the country to recruit good teachers in key subjects. In addition, whilst the quality of
teachers now coming into the profession is considered to be of a high standard, it is vital that
more is done to help existing teachers – who will form the majority of teachers for some
time – to improve and develop.
A number of teachers and headteachers have raised concerns with the CSJ that many poor
teachers are currently being circulated around the system. Whilst the Government has made
reforms in this area, it is clear that substandard teachers are still being passed around the
system because of ‘agreed references’ or ‘compromise agreements.’
Leadership
Strong leadership is essential to helping schools provide excellent education for their pupils.
Good leadership fosters the high quality teaching on which children depend. It is therefore
concerning that effective leadership is not well distributed across the system.
In the most deprived areas of England, 74 per cent of primary schools have been judged
good or outstanding for leadership and management, compared with 88 per cent of primary
schools in the least deprived areas in England. The gaps also vary by region: leadership and
management are less likely to be outstanding in secondary schools in some parts of the
North East, compared to parts of London.22
Similarly, good governors can be an effective tool in improving school quality by acting as a
‘critical friend’ to headteachers and monitoring school improvement. However, at present
approximately 30,000 governor positions are vacant, calling into question whether the schools
most in need of additional support are receiving it.23 The CSJ has also heard concerns about
whether the current system is making reasonable demands on the volunteers who currently
act as governors.
20 Office for Standards of Education, Children’s Services and Skills, The Annual Report of Her Majesty’s Chief Inspector of Education, Children’s Services and Skills, schools, London: Office for Standards of Education, Children’s Services and Skills, 2012
21 Office for Standards of Education, Children’s Services and Skills, Unseen children: access and achievement 20 years on, Manchester : Office for Standards of Education, Children’s Services and Skills, 2013
22 Ibid 23 SGOSS, Governors for Schools [accessed via: http://www.sgoss.org.uk/newsletters/251-sgoss-newsletter-september-2012.
html?showall=&start=18 (15/08/13)]

The Centre for Social Justice 18
Further Education (FE)
FE should assist young people to move from education into employment. However, as a
recent government review has recognised, FE providers often have to provide remedial
support for students who have not acquired basic skills in secondary school.24 FE caters for
three times as many students eligible for FSM than at maintained school sixth forms and yet
students at FE are not eligible for FSM and do not attract a pupil premium.
The Government has released national statistics on the destinations of 16–18-year-old Key
Stage 4 and 5 students leaving FE.25 This is a very positive step which should ultimately allow
FE providers to be held to greater account. However, as yet national data do not show the
destinations of the most disadvantaged students, those studying only to Levels 1 and 2.
Conclusion
Whilst there is significant political commitment to the reform of the education system, far
too many children are still being failed. The CSJ welcomes the Government’s determination
to set high standards for all children and to provide additional funding to support the most
disadvantaged pupils. However, this can only be the first phase of reform. The next must
ask how success can be spread to those pupils and parts of the system which have yet to
experience it. In particular, we will ask:
�� How the Pupil Premium can be fine-tuned to ensure that it helps more of those in need;
�� How greater support can be given to disadvantaged children and their families prior to
their arriving at school;
�� How educational reform can be successfully further extended into primary schools;
�� What more can be done to encourage effective chains and federations of academies to
move into areas of greatest need;
�� How the quality of teaching and leadership can be improved amongst the existing school
workforce;
�� What the new administrative architecture of the education system should look like as the
role of local authorities continues to recede;
�� How improvements can be made to the provision of FE so as to provide an effective
transition between education and employment.
Answering these questions will help to ensure that the education system does even more to
help the next generation of children overcome their disadvantages and fulfill their full potential.
24 Department for Business, Innovation & Skills, Professionalism in Further Education, Interim Report of the Independent Review Panel, London: Department for Business, Innovation & Skills, 2012
25 Department for Education, Destinations of key stage 4 and key stage 5 pupils: 2010 to 2011, London: Department for Education, 2013

19
summ
ary
Breakthrough Britain II: Educational Failure | Executive summary

The Centre for Social Justice 20
Introduction
Just as a good education is one of the surest routes out of poverty, so a poor education can trap
people in it. Children leaving school with few or no qualifications are likely to be disadvantaged for
life. Those who perform better are more likely to have better lives by a huge range of measures.26
Nor is education simply about helping this generation move out of poverty. Those who perform
worse are more likely to have children who themselves fail at school.
Educational failure undeniably affects career prospects, and can lead to low pay and worklessness.27
Across the most developed countries in the world, employment rates are on average 18 per
cent higher for those with an upper secondary education and 28 per cent higher for those with
a tertiary education.28 At the most severe end of educational disadvantage young people who
do not receive a decent education are considerably more likely to end up in the criminal justice
system. Nearly half of prisoners surveyed said they had no qualifications.29
‘You can identify it from an early age. Without the right support, many of these youngsters
may well end up in prison or a secure estate. You see these kids with so many problems
around them and wonder how they can possibly cope. They don’t have solid families
around them and they don’t have the resilience. The fact the majority of inmates have
literacy problems means you can spot which kids will end up in prison. Last week, a
primary school aged boy actually said to me “I know my life’s sh*t.’’ Many of these kids
think from an early age, that they’ve got no chance.’
John d’Abbro OBE, head of the New Rush Hall School
School pupils represent the country’s next generation of citizens, voters and workers. A fair
and effective education system must equip them with the right skills and opportunities to fulfill
those roles. It must give children the best start in life.
It is questionable whether national investment in education over the past few decades has
been effective. As a proportion of GDP, education spending has increased by approximately a
fifth since 1991/92, taking total government spend to £92.8 billion and making education the
third largest area of government spending after welfare and health.30
26 OECD, Education at a Glance, OECD indicators, Paris: OECD, 2013 (see for example, p202)27 Ibid28 Ibid 29 Ministry of Justice, The pre-custody employment, training and education status of newly sentenced prisoners, London: Ministry of Justice, 201230 HM Treasury, Statistical Bulletin: Public Spending Statistics, London: HM Treasury, 2013

Breakthrough Britain II: Requires Improvement | Introduction 21
introduction
Despite this huge spend, standards are still not good enough. In 2011, 156,085 children (29
per cent) did not manage a C grade in GCSE English, 178,977 (33 per cent) did not manage
a C in GCSE mathematics, and 120,248 did not manage a C in either subject.31 Over 1,650
pupils in state-funded mainstream schools finish Key Stage 4 with no A* to G grades, including
equivalent qualifications.32 More than a third of businesses are dissatisfied with the basic
literacy of school and college leavers and nearly a third with their basic numeracy.33 One in
five employers are providing remedial training in one or more of English, mathematics and IT
for those young people joining them lacking acceptable levels in these basic skills.34
The context
The Coalition Government has driven forward educational reform at unprecedented speed.
The number of academies has grown from 203 in 2010 (prior to the formation of the Coalition
Government) to 3,086 as of August 2013,35 greatly extending the amount of autonomy enjoyed
by schools. The programme has also extended to encompass primary and special schools for the
first time. A major effect of this has been to reduce the role of most local authorities in education
and to lead to the development of a number of academy chains and federations. A Pupil
Premium has been introduced so that poorer pupils attract additional funds to their schools. The
Free Schools initiative has been launched and parents, charities and not-for-profit organisations
have, to January 2013, established 79 new schools with many more planned.36 League tables have
been adjusted to encourage schools to focus on core subjects and to take account of all pupils’
attainment. The relevance of many vocational qualifications has also been reviewed.
It is in the context of these rapid changes – the full effects of which are unlikely to be felt
for some years – that this report is written. As was set out in Breakthrough Britain, the CSJ
supports this broad direction of education reform – indeed a number of ideas that the
Government has implemented were presented in our previous work on educational failure.
The challenge for this state-of-the-nation report and its successor piece that will make
recommendations to political parties is to ask how ministers can go further in spreading
opportunity to the children, families and communities still cut-off from it.
The scope of the report
The purpose of this state-of-the-nation report is to examine the failures of the mainstream
education system and the reasons behind those failings – particularly where these affect the
most disadvantaged members of society with the most to gain from formal education, as well
31 Hansard, Written answers and statements, 12 Nov 2012 32 Department for Education, Revised GCSE and equivalent results in England: academic year 2011 to 2012, London: Department for
Education, 2013 (see Table 3a)33 Confederation of British Industry, Learning to grow: what employers need from education and skills, London: CBI, 201234 Ibid35 Department for Education, All open academies August 2013 [accessed via: http://media.education.gov.uk/assets/files/xlsx/a/all%20open%20
academies%20aug%202013%20v1%2000.xlsx (07/07/13)]36 Department for Education, Schools, pupils and their characteristics: January 2013, London: Department for Education, 2013 (This reflects
the number of primary free schools, secondary free schools, special free schools and alternative provision free schools, open as of January 2013)

The Centre for Social Justice 22
as to examine some of the key reforms introduced since Breakthrough Britain. This will form
the foundations for Breakthrough Britain II, where the CSJ’s Educational Failure Working Group
will make a series of policy recommendations to improve on current practice.
We live in a meritocratic society where outcomes are expected to vary. However, equality of
opportunity should be the norm. To achieve this we must better understand the source and
nature of the disadvantages that some children are forced to combat on a daily basis. Whilst
some stem from the home a child has come from, many failings are still rooted in our school
system; the quality of teaching, in particular, has an exceptionally large impact on attainment
for disadvantaged pupils.
There are many groups of disadvantaged children who require more from education.
Children from poorer backgrounds are still considerably less likely to do well at school. Last
year, only 36 per cent of pupils known to be eligible for FSM37 achieved five or more GCSEs
at A* to C or equivalent including English and mathematics, compared with 63 per cent for
all other pupils.38
However, the vast majority of children who suffer educational failure are not those from
minority subsections of society, such as those eligible for FSM or those looked after in the
care system. Of the 228,455 children who failed to get good passes in both English and
mathematics GCSE last year – in itself a truly dismal figure – 78 per cent were not eligible for
FSM.39 However, they are considerably more likely to struggle to find work and to progress
in it, risking the opportunities for their own children down the line.
The quality of a child’s home learning environment and the support they receive from
their parents have a colossal effect on their outcomes. Children are in school for 15 per
cent of their waking hours/life between birth and the age of 16.40 Parents on low incomes
with difficult work commitments may struggle to find as much time to support their children
as they would like. Similarly some parents are held back by addiction, domestic abuse or poor
mental health. Where it happens, parental neglect has catastrophic effects on attainment.
Parents who were themselves failed by the education system often distrust it to serve their
children well. If parents do not have high aspirations for their children’s education, it is unlikely
that their children will.
Likewise, the importance of transitions and the cumulative effects of disadvantage cannot be
underestimated. As the CSJ has long argued, it is vital to intervene early before disadvantages
have accumulated and worsened. This report will shed light on the fact that too often
children arrive at primary school underdeveloped and unready for learning. If a child starts
school unable to answer to their own name, put a sentence together or understand simple
37 Children eligible for free school meals is a common metric of income poverty. Children are currently eligible if for example, their parents receive any of a range of qualifying benefits, such as Income Support, and if they have ever received this in the last five years. Other groups are also eligible, such as looked after children and the children of service personnel.
38 Department for Education, GCSE and equivalent attainment by pupil characteristics in England: 2011 to 2012, London: Department for Education, 2013
39 Ibid40 Campaign for Learning, Animate Learning! Family Handbook, London: Campaign for Learning, 2013

Breakthrough Britain II: Requires Improvement | Introduction 23
introduction
instructions – their chances of fulfilling their potential are immediately thwarted. Whilst
literacy and numeracy are essential, so is good communication. A staggering 50 per cent of
children in some areas of social disadvantage start school with poor language.41
Just as the early years affect what happens in primary school, secondary schools are partially
reliant on the success of their feeder primary schools. Instead of excelling, pupils leaving
primary school with inadequate levels of literacy and numeracy are forced to spend their
time in secondary school catching-up. Many never do. Last year, 81 per cent of those who, at
the end of primary school, scored in the top third of the Level 4 mark range in both English
and mathematics went on to achieve at least five GCSEs A* to C, including English and
mathematics – whereas only 47 per cent of pupils who did not score in the top or middle
third of the mark range did so.42
Responsibility cannot rest solely with primary schools. Poor transitions and outcomes also
reflect low expectations from some secondary schools during Years 7 and 8. Low expectations
from both families and schools have a significant effect on outcomes, with children responding
to the expectations and aspirations held for them. Whilst what happens at the end of primary
school (Year 6) is very important, so too is how this is supplemented by what happens at the
start of secondary school in Years 7 and 8.
In some cases, so excellent is the quality of schools, their leadership and their teaching that
they manage to overcome all the other disadvantages a child may face. The quality of teaching
is the most important school-based factor determining pupils’ educational outcomes.43 Yet
sadly, too often the quality of teaching is substandard and inert to reform. Excellent leadership
and teaching should constitute a norm, rather than an example of best practice.
In looking at these key issues, we have sought not only to look at the plentiful data which
exists for educational inputs and outcomes, but also to listen to the insight of those teachers
and headteachers who work in the system and see its strengths, weaknesses and full potential.
Their views have revealed factors which are not always revealed in the statistics and have
brought to the fore issues that might otherwise be lost.
There are also subjects that the Working Group has decided not to consider. Notable
amongst these is special educational needs (SEN). Whilst many young people with SEN
– such as those in mainstream school and those in alternative provision – will be covered
by the topics discussed here, we have not discussed the role of statementing or special
schools. These extremely important issues would have made the study too long and deserve
treatment in their own right.
Much excellent work is already done in our schools – indeed over the past 25 years there
have been some important improvements in the quality of education across the country.
41 Ainscow et al, An Evaluation of The Communication Trust’s ‘Talk of the Town’ Project, Manchester : Centre for Equity in Education, 201242 Department of Education, Press Release, Package of primary school measures will raise ambition – and standards, 5 March 2013 [accessed
via: https://www.gov.uk/government/news/package-of-primary-school-measures-will-raise-ambition-and-standards (04/06/13)]43 Chetty R, Friedman J and Rockoff J, The long-term impacts of teachers: teacher value-added and student outcomes in adulthood, NBER
Working Paper No 17699, Cambridge, MA: National Bureau of Economic Research, 2011

The Centre for Social Justice 24
However, there is, unquestionably, a very long way to go. There are huge cohorts of children
for whom school does not provide the tools they need in order to get into and progress in
work. These young people will be disadvantaged for life. The intention of these two reports
is to examine how the great successes that can be found in parts of the education system
can be replicated and spread to the children, families, schools and communities that they are
yet to reach. Doing this offers the chance to give the next generation greater advantages and
opportunities, more security, and give them routes out of poverty.

Breakthrough Britain II: Requires Improvement | Measuring educational failure 25
onechapter oneMeasuring educational failure
By every measure, far too many children are still not achieving their potential in education. Any
child, from any background, who leaves school without basic, applicable skills and qualifications
is likely to be disadvantaged for life. Although there has been an increase in the number of
young people achieving five A* to C grades at GCSE including English and mathematics (the
most used benchmark) there are still a shockingly large number of children who are not
meeting this basic level. More worryingly, it is recognised that despite the fact that the number
of pupils passing GCSEs has increased almost every year, there is good evidence to suggest
that this is in part representative of grade inflation rather than improvement.
This chapter looks at the extent of failure and inequality within the education system and
considers whether standards really are improving.
1.1 GCSEs
One of the simplest ways to measure educational failure is by the qualifications pupils have
achieved by the time they complete compulsory schooling at KS4 (GCSE level). In recent
years, the standard benchmark for pupils and schools has been based on a measure of five
A* to C grades, including English and mathematics.
In 2012, though the results have improved almost every year since GCSEs began, two out of
every five pupils (or more than 231,000 young people) did not hit the target of five A* to C
including English and mathematics.44
44 Department for Education, Revised GCSE and equivalent results in England: academic year 2011 to 2012, London: Department for Education, 2013 (see Table 3a)

The Centre for Social Justice 26
Whilst45 attainment would appear to have increased overall, too many children, schools, and areas
are not keeping pace. Last year, 195 state-funded mainstream schools across England failed to hit
the Government’s GCSE floor standard of having at least 40 per cent of pupils achieve five A* to
C grades including English and mathematics.46 In the same year, there were eight local authorities
in which at least 20 per cent of schools fell below the GCSE floor standard. These areas are also
amongst some of the most economically and socially disadvantaged in the country.47
Table 1
Local Authority Percentage of schools below the floor standard
Nottingham 46.2
Barnsley 42.9
Knowsley 42.9
Blackpool 37.5
Isle of Wight 33.3
Stockton-on-Tees 25.0
Portsmouth 20.0
Thurrock 20.0
TOTAL (State-funded mainstream sector) 6.6
At secondary level, in 2011, one in ten schools in the most deprived decile failed to reach
the KS4 floor target, compared with only one in 100 in the least deprived. The same pattern
45 Department for Education, Revised GCSE and equivalent results in England: academic year 2011 to 2012, London: Department for Education, 2013 46 Department for Education, Revised GCSE and equivalent results in England: academic year 2011 to 2012, London: Department for
Education, 2013; a school is below the floor standard if less than 40 per cent of pupils achieve five A* to C grades at GCSE including English and mathematics and the expected progress between KS2 and KS4 is less than the median of 70 per cent in English and less than the median of 70 per cent in mathematics.
47 Department for Education, Revised GCSE and equivalent results in England: academic year 2011 to 2012, London: Department for Education, 2013
0
10
20
30
40
50
60
70
80
90
100
2004
/05
2005
/06
2006
/07
2007
/08
2008
/09
2009
/10*
2010
/11
2011
/12
% o
f pup
ils a
chie
ving
indi
cate
d re
sult
Any passes
5+ GCSEs A*-C or equivalent
5+ GCSEs A*-C or equivalent(including English and mathematics)
Figure 1: Time series of GCSE or equivalents attempts and achievements45

Breakthrough Britain II: Requires Improvement | Measuring educational failure 27
one
is present at primary school: one in five schools in the most deprived decile failed to reach
the floor target at KS2, compared with only one in 50 schools in the least deprived areas.48
‘Educational failure for disadvantaged young people opens up an even wider gulf to their
peers and potentially impacts their life as an adult with restricted work opportunities leaving
low-paid work, welfare or “off the market” (illegal) activities as the only really viable options.’
Matt Band, Executive Director at One in a Million (charity and Free School)
Whilst the majority of pupils do gain at least one pass at grade C, attaining a C or above in
both English and mathematics is increasingly viewed as the bare minimum level all pupils should
achieve. Such passes are essential for most careers as entry-level employment frequently
expects passes in these subjects as a prerequisite for applications, as do most university courses.
Despite the fundamental importance of these subjects, nearly a quarter of a million pupils –
228,455 pupils or 41 per cent of pupils at state-funded schools did not get A* to C in both
English and mathematics last year.49 Whilst this marks a substantial improvement from the 60
per cent of pupils who were not passing both subjects in 2002/03, it still means that, since that
time, over three million children have not been able to hit this most basic of benchmarks.50
‘It’s genuinely tragic how many pupils are leaving school without the basic qualifications to
get onto the next steps in life, often only missing out on crucial grades, particularly in English
and mathematics at GCSE by a small margin. Failure to achieve this important benchmark
severely limits their chances of going on to further education, employment or training, leading
to all manner of social problems, and worst of all, destroying their self esteem and potential.’
Susannah Clark, Action Tutoring
Of further concern are children who receive no good grades at GCSE. Over 1,650 pupils
leave school with no passes (A* to G grades) at all, including equivalent qualifications.51 When
equivalents are excluded the figures are even starker. In 2011, there were a shocking 2,177
secondary schools where ten per cent of pupils did not achieve one single grade at A* to C,
excluding equivalents and 371 in which 30 per cent or more did not.52
1.2 Basic skills
An indicator of past educational failure is the large number of adults currently lacking good
literacy and numeracy skills. These are the basic skills all members of society should have. The
most recent Skills for Life Survey estimates that 5.1 million adults have Entry Level 3 or below
Literacy Levels and 8.1 million had Entry Level 2 or below numeracy skills.53
48 Hansard, Written answers and statements, 12 November 201249 Department for Education, GCSE and equivalent attainment by pupil characteristics in England: 2011 to 2012, London: Department for
Education, 201350 Hansard, Written Answers and Statements, 17 July 2013 51 Department for Education, Revised GCSE and equivalent results in England: academic year 2011 to 2012, London: Department for
Education, 2013 (see Table 3a)52 Hansard, Deposited paper [accessed via: http://data.parliament.uk/DepositedPapers/Files/DEP2012-1706/PQ128019_v2.xlsx (20/08/13)]53 Department for Business Innovation & skills, 2011 Skills for Life Survey, London: Department for Business, Innovation & Skills, 2012

The Centre for Social Justice 28
Poor literacy skills are a substantial barrier to progressing once in work. 63 per cent of men
and 75 per cent of women with very low literacy skills have never received a promotion.54 It
also makes it far harder for parents affected to support and nurture their children’s learning
at home, for example, by reading to their children or by keeping track of homework set.
‘Literacy is everything. Some schools don’t recognise that some of their pupils are the
NEETs55 of tomorrow. They think all the future NEETs are in the pupil referral units, when
in reality, they’re the ones who can’t read or write properly – the ones sitting right under
their noses.’
Robert Loach, deputy headteacher of Harrogate Pupil Referral Unit
Progress has certainly been made in improving literacy. The key indicator, the percentage
of pupils reaching the level expected for their age in reading and writing tests at age 11,
has increased from 63 per cent in 1997, to 85 per cent last year. The percentage of pupils
achieving Level 4 or above (the expected level) in KS2 reading tests increased by three
percentage points from 84 per cent in 2011 to 87 per cent in 2012.56
This partly reflects achievements made through the introduction of the National Literacy
Strategy. This was established in 1997 to raise standards of literacy in primary schools over a
five- to ten-year period.57
Attention has also focussed on improving children’s numeracy. In 1997 the National
Numeracy Pilot began and became the National Numeracy Strategy in 1999. By 2010, 98,000
more pupils achieved the expected standard than in 1998.58 In 2008, 79 per cent of pupils
achieved expected levels in Maths at KS2 and in 2012, 84 per cent of pupils did so.59
In an attempt to make further progress, the Government has raised the floor standard so that
from 2014, primary schools will need to have at least 65 per cent of pupils achieving Level 4
(the expected levels of most 11-year-olds) in reading, writing and mathematics.60 If the floor
standard had been 65 per cent in 2011, 1,915 schools could have been below the floor. In
2012, 476 schools were below the primary school floor standard, but if the 65 per cent floor
standard had been used – this would have risen to 866 schools.61
There remains enormous concern that too many young people leave school unfit for the
work place. 35 per cent of businesses are dissatisfied with the basic literacy of school and
college leavers and 30 per cent are dissatisfied with their basic numeracy.62
54 Dugdale G and Clark C, Literacy changes lives: An advocacy resource, London: National Literacy Trust, 200855 NEETS represent young people not in education, employment or training56 Department for Education, National Curriculum Assessments at Key Stage 2 in England, 2012, London: Department for Education, 2012.
Assessments involving English are not directly comparable to previous years. 57 Beard R, National Literacy Strategy, Review of Research and other Related Evidence, Suffolk: Department for Education and Employment,
2000 58 Department for Education, The National Strategies 1997–2011, A brief summary of the impact and effectiveness of the National Strategies,
London: Department for Education, 2011 59 Department for Education, National Curriculum Assessments at Key Stage 2 in England, 2012, London: Department for Education, 201260 Department for Education, Press Release, Package of primary school measures will raise ambition – and standards, 5 March 2013
[accessed via: https://www.gov.uk/government/news/package-of-primary-school-measures-will-raise-ambition-and-standards (08/06/13)]61 Ibid62 Confederation of British Industry, Learning to grow: what employers need from education and skills, London: CBI, 2012

Breakthrough Britain II: Requires Improvement | Measuring educational failure 29
one

The Centre for Social Justice 30
In our report, Signed on, Written off, we evidenced the importance of ‘soft’ skills. We argued
that ‘soft’ skills or ‘employability’ skills are more interpersonal and intuitive, and whilst they
are identifiable, they are less easily taught or measured. Examples include motivation,
communication, problem-solving and self-management.63 The National Careers Service also
outlines the importance of key ‘soft’ skills that employers need from their workforce, such as
good communication, commitment and good time management.64 Securing a job is one thing,
but key skills like good manners and good time-keeping will help a person sustain, and then
progress once in work.
A CSJ employer survey found that 82 per cent of entry level employers rated attitude and
work ethic as important to progression versus 38 per cent for literacy and numeracy.65
The Confederation of British Industry (CBI) also suggests many British employers view
recruitment with an 80/20 rule – where 20 per cent of the weighting is concerned with ‘hard’
skills and 80 per cent to non-certified generic and ‘soft’ skills.66
1.3 Changing standards
1.3.1 The rise of attainment and grade inflation
With the exception of 2012 and 2013, GCSE exam results have risen year on year since
they began. Whilst this should suggest that attainment is rising, there is concern that this
masks a more stagnant reality. It is becoming well acknowledged that whilst there have been
improvements, grade inflation is one factor behind this rise.
In its 2012 report Ofqual stated that:
‘We know that the current system can lead to grade inflation, for various reasons. Awarding
committees may apply the benefit of the doubt when making decisions about whether to
set a grade boundary mark at, say, 67 or 68: they will often recommend the lower mark,
which will inflate rather than deflate overall outcomes. These decisions are understandable
and are made with the best intentions. But if they are made each time grade boundaries
are set, the cumulative effect of these small changes is that results creep slowly upwards,
without there being any real evidence of improvement in the quality of students’ work.’67
Grade inflation makes it harder to identify the highest achieving students, makes it harder to
track genuine progress, and risks downplaying some pupils’ accomplishments.
Research on 3,000 KS3 pupils sitting a mathematics paper containing questions identical to
one set in 1976 showed that whilst GCSE results have improved, levels of understanding are
63 Centre for Social Justice, Signed On, Written Off, An inquiry into welfare dependency in Britain, London: Centre for Social Justice, 2013 64 National Careers Service, What are the ‘soft skills’ employers want? [accessed via: https://nationalcareersservice.direct.gov.uk/aboutus/
newsarticles/Pages/Spotlight-SoftSkills.aspx (18/07/13)]65 Centre for Social Justice, Creating Opportunity, Rewarding Ambition, London: Centre for Social Justice, 201166 Confederation of British Industry, Shaping Up for the Future: The Business Vision for Education and Skills, London: CBI, 200767 Office of Qualifications and Exam Regulations, GCSE English 2012, Coventry: Office of Qualifications and Examinations Regulation, 2012

Breakthrough Britain II: Requires Improvement | Measuring educational failure 31
one
broadly similar to what they were more than 30 years ago.68 Grade inflation is also evident
when comparing GCSE results with OECD Programme for International Student Assessment
(PISA) data used to compare different countries’ educational performance. Whilst GCSE
results have improved each year, PISA data implies a decline in the UK’s performance. A 2011
OECD report stated that improvements in exam results are out of sync with independent
indicators of performance, suggesting ‘grade inflation could be a significant factor.’69
In response to allegations of grade inflation, some schools have adopted alternative exams
like the IGCSE or the International Baccalaureate. Following scrutiny of the English GCSE
marking scandal in 2012, the debate on grade inflation intensified. Data from the Financial
Times showed that for 2011/12, English seems to have become slightly harder overall,
particularly concentrated at the C/D borderline.70 The Government also announced that a
single board would take responsibility for all examinations, although this appears to have now
been abandoned.
‘In the past answers to lower order skills, knowledge and understanding were given the
same weighting as higher order answers; and there was over marking at the C/D border
as the pressure comes on schools from pupils and their parents, Ofsted, local performance
tables and the DfE. I understand that Ofqual is very much aware of these factors and
is looking for means to ensure this is not the case in future assessments. However,
there needs to be a more statistical and scientific analysis of results to reflect expected
standards as required for a modern and effective workforce be it in academia or the
workplace. This should be comparable with those countries leading on education.’
Dame Dana Ross-Wawrzynski DBE, Executive Head, Altrincham Grammar School for Girls and CEO, Bright Futures Educational Trust
1.4 Qualifications and gaming
Existing league tables have also incentivised schools to choose exams based on how easy they are
to pass, rather than on their value for pupils. The five A* to C benchmark also incentivised some
schools to focus on attainment in five subjects alone, rather than stretching pupils beyond this.
Moreover, perverse incentives encouraged ‘cream-skimming,’ occurring where pupils close
to the C/D boundary receive greatest attention by teachers.71 Disturbingly, this encouraged
some schools to neglect pupils at opposite ends of the spectrum – those who could have
done far better (and instead allowed to ‘coast’ at the C mark) and those too far away from
the C/D boundary to merit attention.
68 TES Newspaper, Hit and myth: the truth about standards, 11 December 200969 OECD, Economic Surveys United Kingdom, Paris: OECD, 2011, p1070 Financial Times, English GCSE and grade inflation, 07 January 2013 71 Department for Education, Secondary School Accountability Consultation, London: Department for Education, 2013

The Centre for Social Justice 32
In recognition of this, Secretary of State for Education Michael Gove announced plans to
reform league tables, proposing a more meaningful accountability system. This will involve
two new measures:72
�� The percentage of pupils in each school reaching an attainment threshold in English and
mathematics;
�� An average point score showing how much progress every student makes between KS2
and KS4 (age 7–16).
The average point score measure will reflect pupils’ achievement across a broad range of eight
subjects and will ensure that the results of all students contribute to a school’s league table
results. A focus on progress is also positive, as it reflects the ‘distance travelled’ by students
and encourages them to continually strive towards higher standards, benefitting pupils at both
the higher and lower ends of the attainment spectrum.
Similarly, until recently, GCSE tables have not compared like with like. Since their introduction,
GCSE tables have allowed consideration of a number of subjects as being ‘equivalent’ to GCSE
passes. Some schools have encouraged pupils to take ‘equivalents’ to boost their league table
rankings. Many equivalents have been worth multiple GCSEs, despite often being regarded as
considerably easier than core academic subjects. This led to a situation where pupils may have
the equivalent of 12–15 GCSEs but lack passes in English or mathematics.73 For example, a
Business and Technology Education Council (BTEC) First Certificate is worth two GCSE A* to
C grades, and a First Diploma is worth four. As the graph below shows, BTECs have dominated
this trend.
72 Speech by Secretary of State for Education, Rt Hon Michael Gove MP, Curriculum, exam and accountability reform, 7 February 201373 Wolf A, Review of Vocational Education – The Wolf Report, London: Department for Education, 201174 Department for Education, Revised GCSE and equivalent results in England: academic year 2011 to 2012, London: Department for
Education, 2013 (e.g. see chart 6)
0
50,000
100,000
150,000
200,000
250,000
300,000
350,000
400,000
VR
Q
Key
Ski
lls
NV
Q
NV
Q la
ngua
ge u
nits
Basi
c Sk
ills
Func
tiona
l Ski
lls
BTEC
Aw
ards
BTEC
Cer
tific
ates
BTEC
Dip
lom
as
OC
R N
atio
nal A
war
ds
OC
R N
atio
nal
Cer
tific
ates
Free
-sta
ndin
g M
athe
mat
ics
Ass
et L
angu
ages
Awards contributing to level 1 only Awards contributing to level 2
Figure 2: Equivalent qualification results of pupils at the end of Key Stage 4 in all schools, by type of qualification, 2011/1274

Breakthrough Britain II: Requires Improvement | Measuring educational failure 33
one
Following a review of vocational education by Professor Alison Wolf, the Government has
reduced the number of GCSE equivalent qualifications available, from 3,175 to 125. Of these,
only 70 will count towards the five A* to C benchmark.75 To prevent gaming, each qualification
will also count for a maximum of one GCSE.
The potential extent of gaming is seen in the staggering number of pupils who, in 2011, sat
one of the qualifications that will no longer be included in 2014 tables. For example, 110,885
pupils took a Vocationally Related Qualification (VRQ) Level 2 in Computer Use, 10,960 took
a course in Self Development and 10,078 took a course in Hazard Control. Other courses
which have been axed include a BTEC in Fish Farming, Keyboarding Application and a VRQ
Level 2 in Cake Decorating.76
Whilst this will mark an improvement, it will not itself improve outcomes. Amanda Spielman,
Chair of Ofqual and Education Adviser for ARK Schools, predicts that the cuts to the number
of equivalents will have an impact, but many of the “cut” equivalents will be redesigned to fit
the new criteria. Indeed, any system can be gamed, however well-designed.
There have also been concerns that many schools were entering fewer and fewer pupils for
core academic subjects. To ensure that GCSEs taken were of value, in 2010, the Government
introduced a new GCSE performance measure called the English Baccalaureate (EBacc)
requiring passes in English, mathematics, the sciences, one language, and history or geography.
In a speech earlier this year, Michael Gove referred to this measure as showing ‘just how many
students were getting the core elements of a liberal education. The sort of education those
who can pay for their children’s schooling demand as of right.’77
The Government argues this has been done in order to reverse a decline in entries in core
academic subjects like history, geography and foreign languages. Using the EBacc criteria,
attainment has been extremely low. In 2012, only 16 per cent of all pupils and only 5 per cent
of pupils on FSM achieved the EBacc.78
This is important given the evidence that pupils’ overall subject choice has a substantial impact
on later outcomes. Regardless of pupil characteristics, pupils are more likely to achieve five A*
to C grades at GCSE, including English and mathematics, when they study EBacc subjects.79
1.5 International comparisons
Despite the increases in spending on education highlighted in the introduction, relative to
other countries, standards in education have not increased substantially.
75 Department for Education, Press Release, Performance tables: only the highest quality qualifications to be included, 31 January 2012 [accessed via: https://www.gov.uk/government/news/performance-tables-only-the-highest-quality-qualifications-to-be-included (08/04/13)]
76 Hansard, Deposited Papers, 17 July 201277 Speech by Secretary of State for Education Rt Hon Michael Gove MP, The Progressive Betrayal, 05 February 2013 78 Department for Education, Revised GCSE and equivalent results in England: academic year 2011 to 2012, London: Department for
Education, 201379 Deloitte, Quality Counts: What can analysis of the National Pupil Database tell us about educational outcomes? London: Deloitte, 2012

The Centre for Social Justice 34
A supposed fall in the international PISA league tables has been heavily cited as a premise
behind many of the Government’s sweeping educational reforms. In 2011, Michael Gove
referred to PISA figures as evidence of an internationally comparative decline in standards,
damning it as ‘Literacy, down; numeracy, down; science, down: fail, fail, fail.’80 82
Between 2000 and 2009 (the latest year for which data are available), England fell from fourth
to 16th in science, from eighth to 27th in mathematics and from seventh to 25th in reading.
Table 2: England’s rankings in the PISA results for 15-year-olds in science, mathematics and reading between 2000 and 200981
Rankings for England
Subject 2000 (32 Countries) 2006 (57 Countries) 2009 (65 Countries)
Reading 7th 17th 25th
Mathematics 8th 25th 27th
Science 4th 14th 16th
The strong performance of East Asian education systems stands out in these rankings. In the
2009 PISA mathematics study, Shanghai was ranked top, Singapore second, Hong Kong third,
South Korea fourth, Taiwan fifth and Japan ninth.82 Their education systems have played a role
in their economic performance and are now having a strong influence on our policy-making
environment.
The high value these countries place on education is reflected in the quality of their teachers
and in the emphasis on learning at home; evidenced through parents’ investment in tutoring
services and the large number of hours spent in independent study.83 This implies the need for
a cultural shift recognising the value of education. East Asian children significantly out-perform
their English peers, even within the English education system.
TIMSS (Trends in International Maths and Science Study) also identifies Japan, Hong Kong and
Korea as high maths test performers. However, whilst PISA rankings suggest our standards
have fallen, TIMSS suggests England’s performance may have risen over roughly the same
period as the PISA data.84 Dr. John Jerrim, a lecturer at the Institute of Education, told the CSJ
that ‘the changes in our PISA rankings over time are not conclusive and the fall in our PISA
ranking doesn’t hold up to any real statistical scrutiny.’
TIMSS focusses on children’s ability to meet an internationally agreed curriculum, whereas
PISA examines functional ability – how well young people can use the skills in ‘real life’ situations.
80 Hansard, Oral Answers to Questions, 7 February 2011 81 Department for Education, Press Release, Major international study shows England’s 15-year-olds performing poorly in mathematics, science
and reading, 7 December 2010 [accessed via: https://www.gov.uk/government/news/major-international-study-shows-englands-15-year-olds-performing-poorly-in-mathematics-science-and-reading 06/07/13)] (PISA uses countries/economies)
82 Jerrim J and Choi A, The mathematics skills of school children: How does England compare to the high performing East Asian jurisdictions? DoQSS Working Paper No. 13–03, London: The Institute of Education and the University of London, 2013
83 Pearson, The secrets of Asian education success [accessed via: http://thelearningcurve.pearson.com/articles/article/the-secrets-of-asian-education-success (07/06/13)]
84 Jerrim J and Choi A, England’s “plummeting” PISA test scores between 2000 and 2009: Is the performance of our secondary school pupils really in relative decline? London: The Institute of Education, 2011

Breakthrough Britain II: Requires Improvement | Measuring educational failure 35
one
TIMSS is said to more closely resemble our national curriculum and may explain why
performance was better on this test.85
Additionally, the two most recent PISA tests were set in November or December
rather than in March, April or May. This means that pupils sitting tests in earlier years
had approximately five months more schooling than those tested in 2006 and 2009.
The total number of countries in PISA has also increased from 43 in 2000 to 65 in 2009: Dr
John Jerrim argues it is easier to come tenth in a league of 43 than it is in a league of 65.86
These caveats are important given how much emphasis has been put on PISA rankings by
policymakers.
OECD data also show that in the UK, expenditure on educational institutions as a percentage
of GDP exceeded the OECD average, and exceeded countries like Korea and Japan.87
Either way, international comparisons show that despite spending more than many other
countries, there has not been a marked improvement in the relative performance of our
education system.
1.6 Conclusion
The extent of failure in our education system remains shocking. Far too many children are
leaving school ill-equipped to progress in life and work. There is an urgent need to drive
up standards for those pupils – regardless of background – who may leave school without
even basic qualifications. Whilst there have been some improvements it is clear that there is
still an extremely long way to go. The rest of the report looks at some of the factors that
continue to hold children back, the groups of young people who suffer from disproportionate
disadvantage, and the current quality of schools, teaching and leadership.
85 Jerrim J and Choi A, The mathematics skills of school children: How does England compare to the high performing East Asian jurisdictions? DoQSS Working Paper No. 13-03, London: The Institute of Education and the University of London, 2013
86 Jerrim J and Choi A, England’s “plummeting” PISA test scores between 2000 and 2009: Is the performance of our secondary school pupils really in relative decline? London: The Institute of Education, 2011
87 OECD, Education at a Glance, OECD indicators, Paris: OECD, 2013. (See chart B2.2 p184. This refers to non-tertiary education [not universities] and includes public and private funding).

The Centre for Social Justice 36
Breakthrough Britain II: Requires Improvement | The children and families worst affected 37
twochapter two
The children and families worst affected
Disadvantage is not spread evenly across society. Tragically, some children are far more likely
to experience worse outcomes in education. Children’s backgrounds and families have an
enormous impact on their educational outcomes. This impact is reflected across a variety of
dimensions, all affecting the ability to learn at both school and at home. Correlation is not
necessarily causation and it can be difficult to isolate the effects of one particular disadvantage
on outcomes. Many of these factors – parental aspiration, parental education, parental
addiction and income poverty – are likely to occur simultaneously, therefore exacerbating the
disadvantages children face.88
This chapter considers the factors that make it harder for young people to do well at school
and looks at some of the groups who are particularly badly affected.
‘You can put schools right, but the other factors don’t necessarily change. This stuff will
still be going on in the background. Instead of regenerating the estate, we are the escape
tunnel out of it. The social context is a driver of educational failure. You can have great
schools with exceptional leaders that will overcome it, but they won’t overcome it 100
per cent of the time for 100 per cent of the children. It is very difficult for the school to
change that context.’
Ros McMullen, CEO of LEAF Academy Trust and Principal of the David Young Community Academy in Leeds
88 Oxford School Improvement, The Pupil Premium: making it work in your school, Oxford: Oxford University Press, 2012
‘I would advise every child to choose their parents wisely.’88
Professor Sir Michael Rutter

The Centre for Social Justice 38
2.1 Aspiration
Aspiration is very closely associated with educational attainment, regardless of a young
person’s background.89
Parents of those children who succeed against the odds are those that reinforce high
standards of behaviour and academic expectation. A Department for Education funded
project on quality provision, found that even if these parents did not have much money or a
high educational attainment, they strongly believed in their own ability to support their child’s
learning – and where they were unable to, they found others who could.90
Children seen as ‘clever’ develop a more positive self-image, which is reinforced both at
school and at home. However, children who experience learning difficulties or who are not
regarded as very clever often develop a negative self-image and ‘a sense of helplessness’ –
contributing to a self-fulfilling prophecy of underachievement.91 One head told us that ‘in the
vast majority of cases a lack of aspiration explains variation in outcomes.’
Parental interest and aspiration have a particularly large effect on economically disadvantaged
children. Parents from higher socio-economic groups tend to have higher aspirations: only half
of parents in the bottom quintile think their child is likely to apply to university, compared to
four out of five parents in the top socioeconomic position quintile.92
Aspirations and ambition also vary across ethnic groups. Frank Field MP argues that the fact
some ethnic groups do exceptionally well points to clues in the home environment: children
from families of Chinese ethnicity seem far more able to overcome all the disadvantages
associated with being income-poor.93
Sir Greg Martin is the Executive Head of the Durand Academy, where 97 per cent of pupils
are from an ethnic minority and around 50 per cent are eligible for FSM. He told the CSJ
that:
‘most of the parents hold high expectations of their children, despite themselves facing
multiple disadvantages. This reflects parents’ recognition of the importance of good
qualifications, for their children – many of whom may suffer from other disadvantages – to
have the very best chance of succeeding in life.’
89 Centre for Research on the Wider Benefits of Learning, The Institute of Education. Determinants of Aspirations, London: Centre for Research on the Wider Benefits of Learning, 2008, p16
90 Siraj-Blatchford I et al, Performing against the odds: developmental trajectories of children in the EPPSE 3–16 study, Research Brief DFE-RB128, London: Department for Education, 2011
91 Ibid92 Institute for Fiscal Studies, The Role of Attitudes and Behaviours in Explaining Socio-Economics Differences in Attainment at Age 16, 2010
[Accessed via http://www.ifs.org.uk/wps/wp1015.pdf (14/08/2013)]93 Field F, The Foundation Years: preventing poor children becoming poor adults. The report of the Independent Review on Poverty and Life
Chances. London: Cabinet Office, 2010

Breakthrough Britain II: Requires Improvement | The children and families worst affected 39
two
One study found that parents’ educational aspirations for their children to continue in full-
time education were significantly higher among all minority groups than for white British
parents.94 It also found that Indian parents were most likely to have paid for private classes or
tuition in subjects also taught in school and white British parents the least likely.95
Professor Denis Mongon, Senior Associate at the Innovation Unit, writes about a gap white
British low-income families face between aspiration (what young people hope for) and
expectation (what they think will really happen).96 Low expectations can arise because of
what they see happen to older generations in their family or because of what they see
happen to their peers in the years above at school.
Many have reiterated how the decline of manufacturing industries has led to long-term and
intergenerational unemployment in some communities which has understandably affected
educational aspiration. Ruth Lupton, Professor of Education at the University of Manchester, told
the CSJ that ‘because success in education was not a pre-requisite for the industrial employment
that young people in white working class communities would have traditionally have expected
to get, further and higher education were not necessarily perceived as important.’
Rick Mower, Chief Executive at Aspire Oxford, a charity supporting homeless and
disadvantaged people back into work, told the CSJ that ‘there are now far fewer jobs to go to
in some areas- but recognition of the value and relevance of education hasn’t caught up. Plus,
third-generation worklessness is much more common and the lack of working role models
in many families is often a major part of the problem.’
‘Families where generations of parents have been on benefits have created dependency
and a lack of aspiration and ambition for what education can deliver. Many of the families
I see don’t value what education can offer. Instead, there is a culture of “easy money” –
where the parents look first to avenues like benefits, compensation claims, engaging in
illegal activity and the informal economy.’
Headteacher in the midlands
94 Strand S, Minority Ethnic Pupils in the Longitudinal Study of Young People in England (LSYPE), Centre for Educational Development Appraisal and Research, Department of Children, Schools, and Families, Nottingham: University of Warwick, 2007
95 Ibid96 New Statesman, The problem of low educational attainment among white working class students, 28 March 2013 [Accessed via http://www.
newstatesman.com/lifestyle/2013/03/problem-low-educational-attainment-among-white-working-class-students (14/08/2013)]
White working-class pupils
‘Raising the aspirations and results of white working-class boys would do more than anything to
cut the supply route to Britain’s burgeoning underclass.’
Rt Hon Frank Field MP in evidence to the CSJ
Whilst children on FSM are as a whole, far more disadvantaged than other children, white boys on FSM
are now the lowest attaining group of all. White British children do not constitute a minority – they
represent a large group of children presently failed by the system. In 2012, there were 51,521 white British

The Centre for Social Justice 40
97 Department for Education, GCSE and equivalent attainment by pupil characteristics in England: 2011 to 2012, London: Department for Education, 2013 (See table 2a)
98 Department for Education, GCSE and equivalent attainment by pupil characteristics in England: 2011 to 2012, London: Department for Education, 2013
99 Ibid100 Ibid101 Office for Standards of Education, Children’s Services and Skills, Removing barriers to literacy, Manchester : Office for Standards of
Education, Children’s Services and Skills, 2011
pupils eligible for FSM at the end of KS4 – representing just under two-thirds (64 per cent) of the total
number of pupils eligible for FSM and nine per cent of the whole cohort.97
Last year only 26 per cent of white British boys eligible for FSM achieved five A* to C grades at GCSE
including English and mathematics. This compares with 36 per cent of all pupils on FSM and 63 per
cent for all other pupils. At 40 per cent, attainment for black boys eligible for FSM is far higher.98 White
British girls on FSM are also amongst the lowest attaining: last year, only 35 per cent attained five A*
to C grades including English and mathematics, compared with 41 per cent of all girls on FSM, and 68
of girls not eligible for FSM.99
Policymakers have so far failed to close the gap for British white boys on FSM: the gap is now 0.5
percentage points wider than in 2007/08. By contrast, the gap for pupils from a black background has
narrowed by an impressive 3.9 percentage points.100
The graph below shows that Gypsy / Roma children do particularly badly (although constituting a
minority) whilst children of Chinese and Indian ethnicity are the highest attaining. The attainment gap
between white British pupils on, and not on FSM, is startling.
The reasons for this growing attainment gap between the country’s major ethnic groups are complex,
but it is clear that schools are not always dealing with the issue. During a 2011 survey of 37 secondaries,
Ofsted noted that none of the schools were focussing specifically on engaging with the families of white
British students, where they were a minority.101 It noted that one high-attaining, inner-city secondary
0.0
10.0
20.0
30.0
40.0
50.0
60.0
70.0
80.0
90.0
Whit
e Brit
ish
Gypsy
/ Rom
a Iri
sh
Trave
ller o
f Irish
Her
itage
Whit
e and
Blac
k Car
ibbea
n
Whit
e and
Blac
k Afri
can
Whit
e and
Asia
n
Any o
ther
mixe
d bac
kgro
und
Indian
Pakis
tani
Bang
lades
hi
Black
Car
ibbea
n
Black
Afri
can
Any o
ther
Blac
k bac
kgro
und
Chines
e
Any o
ther
ethn
ic gr
oup
Pupils eligible forFree School Meals
All other pupils
Any o
ther
Whit
e bac
kgro
und
Any o
ther
Asia
n bac
kgro
und
Figure 3: Achievements at GCSE and equivalent for pupils by ethnicity and FSM status, 2011/12

Breakthrough Britain II: Requires Improvement | The children and families worst affected 41
two
2.2 Parental education
The impact of parents’ education is highly significant in influencing the outcomes of their own
children. As one contributing factor, parents who did not achieve at school are more likely to have
children who suffer the same.104 This means that getting education right is not only advantageous
for those children now in school, but also for their own children in years to come.
Another reason why these children are less likely to do well at school is because parents with
poor literacy, or who had a negative experience at school, are less likely, and less able, to support
their children’s learning. Professor Chris Husbands told the CSJ that ‘society must invest hugely in
parents’ education: school should be a place where parents (as well as children) learn.’
Juliette Collier, Deputy Chief Executive of the Campaign for Learning, said that parents who
had bad experiences of education can have a deep distrust of schools. This can contribute to
antagonism between both the parents and the teachers.
102 Ibid103 The Guardian, Working Class Zeros, White boys failing, you say? Let them be plumbers, 13 December 2005104 OECD, Education at a Glance, OECD indicators, Paris: OECD, 2013
school was working effectively with groups like black Caribbean boys and Somali girls but that the same
school had not attempted similar work with its lowest-attaining group: white British students eligible for
FSM. Another primary school had been judged outstanding at its previous inspection, but senior staff
had not recognised that the achievements of the white British pupils (forming a minority in the school)
were now particularly poor: 30 percentage points lower than other students in the same cohort.102
‘I too have sat through whole rafts of assemblies about Nelson Mandela, Rosa Parks and
Jessie Owens. The only white person mentioned all term is Adolf Hitler. … There must be more
identifiably working-class white male writers in Britain than Simon Armitage. Surely, there’s also
the odd chemist or mathematician. It might be nice if white kids got to know about them.’
Phil Beadle, former UK Secondary School Teacher of the Year 103
Hugh Rayment-Pickard, Director of Development and External Affairs at IntoUniversity, told the CSJ:
‘In some communities where we work – in West Nottingham, for example – there are white
working-class families who can’t always see the usefulness of education. And you can find a
“so what?” attitude towards post-16 education. These families are at a disadvantage because
they don’t know anyone who went to university, so can’t easily see the relevance of progression
routes into higher education. In some ways it’s unfair to expect parents to be advocates of higher
education to their children, because they themselves don’t have this aspiration.’
Hugh told us that some of IntoUniversity’s centres receive more applications from ethnic minority parents
than white working-class parents. He said that even if these parents did not go to university themselves,
there is a high cultural value placed on education and the professions, and an esteem attached to going
to university.

The Centre for Social Justice 42
‘All parents want the best for their children. But if you found learning and school irrelevant
or humiliating yourself when you were young, it’s difficult to build a positive relationship
with your child’s school and help your child effectively. Children are only at school for
15 per cent of their waking hours: if we want the best outcomes for children, we must
therefore create positive, equal partnerships between parents and teachers, so they can
work together and support each other to raise children’s motivation and achievement.
Teachers don’t currently get training and support to work with parents, despite the body
of research evidence that demonstrates that what parents do has a huge impact on
children’s attainment. This is the single biggest thing we could do to start breaking down
barriers and help them work with parents towards a shared goal.’
Increasing parental education has a positive effect on children’s outcomes evident at age four,
which continues to be visible up to and including the high stakes exams taken at age 16.105
The higher a parent’s educational attainment the more likely it is to have a positive effect on
their child’s schooling. Young people from families with low levels of education are less than
half as likely to be in higher education, compared with the proportion of such families in the
population.106
Children of parents with degrees spend twice as much time on homework, reading and study
in the home as children from less educated families. A third of 15-year-olds whose parents
had little or no formal education claimed that no (or almost no) homework is ever set for
them. This compared with only ten per cent of those with graduate parents.107
Middle-class children are also two and a half times as likely to have a computer, over four
times as likely to have more than 200 books in the home and are significantly more likely to
borrow books from a public library.108 Parents from higher social groups are also more likely
to help their children with homework, pay for tutors and engage in school activities.109
Juliette Collier criticises the way funding streams tend to be siloed – designated to either
the child or the adult, instead of seeing this as an opportunity for whole family learning. She
told the CSJ that an adult who found learning irrelevant or humiliating the first time round
is unlikely to put themselves in that position again. Yet when learning is framed around their
child’s needs, this motivates parents to reengage with learning, in order to be able to support
their children. This first step builds parents’ confidence, so that they can then see learning as
an opportunity to develop their own skills, for their own gain.
105 I CAN, Language and Social Exclusion, London: I CAN, 2009 [accessed via: http://www.ican.org.uk/~/media/Ican2/Whats%20the%20Issue/Evidence/4%20Language%20and%20Social%20Exclusion%20pdf.ashx (03/08/13)]
106 OECD, Education at a Glance, OECD indicators, Paris: OECD, 2013107 Sutton Trust, Evidence of educational support out of school, 2009 [Accessed via http://www.suttontrust.com/public/documents/1Sutton_
Trust_Home_Education_Support.pdf (14/08/2013)]108 Sutton Trust, Press Release, New report reveals stark education gaps beyond the classroom, 1 December 2009 [Accessed via http://www.
suttontrust.com/news/news/new-report-reveals-stark-education-gaps-beyond-the-classroom/ (14/08/2013)]109 Ibid

Breakthrough Britain II: Requires Improvement | The children and families worst affected 43
two

The Centre for Social Justice 44
2.3 Parental engagement
Parental engagement in education has a huge impact on their children’s schooling. If parents
engage with their child’s education, their attainment increases by 15 per cent, regardless of
the social background of the family.110 Professor James Law, an international expert in speech
and communication, told the CSJ that parental interest is key:
‘too often, parents fail to realise how important it is to talk to their infants and misguidedly
think that the children can’t understand, they can’t talk and therefore there’s just no
point in explicitly teaching them new words or helping them develop their langauge. They
couldn’t be more wrong.’
Pupils are more likely to do well at KS4 if they have supportive parents, even after controlling
for a wide range of family background and school characteristics, as well as attainment at age
11.111 Parental interest alone also increases a child’s chance of moving out of poverty as an
adult by as much as 25 percentage points.112
Dr Vanessa Ogden, head at Mulberry School for Girls, told the CSJ that parental interest
has a vital impact on school outcomes, hence the importance of schools building strong
relationships with families. Poor attendance in primary school is especially problematic
because it sets in motion trends around truancy and subsequent low attainment.113
‘I often see single mothers in my community who are raising their child/ren, leave their
child’s education to the school instead of seeing it as the responsibility of both parents
(even if the relationship breaks down) to work in partnership with the school to ensure
their child reaches his or her full potential. The priority is that child/ren are safe, fed, clothed
and clean and educational attainment often falls by the wayside. I see lots of children
who aren’t doing as well as they could be doing at school because many single mums
just don’t have the time and energy to invest in their education.’
Selena Gray, Journalist
Seamus Oates, Executive Head of the TBAP Multi-Academy Trust and The Bridge Alternative
Provision Academy, warns that society must not stigmatise parents given that ‘they’re a
big part of the problem so you’ve got to make them a big part of the solution.’ Another
headteacher told the CSJ that many parents do not trust government parenting classes which
they viewed as stigmatising and patronising. By contrast, her pastoral staff talk to parents about
the issues concerning them, such as housing, benefits and relationships:
110 Oxford School Improvement, The Pupil Premium: making it work in your school, Oxford: Oxford University Press, 2012111 Institute for Fiscal Studies, The Role of Attitudes and Behaviours in Explaining Socio-Economics Differences in Attainment at Age 16, 2010
[Accessed via http://www.ifs.org.uk/wps/wp1015.pdf (14/08/2013)]112 Department for Work and Pensions, ‘Bucking the trend’: What enables those who are disadvantaged in childhood to succeed later in life?
Leeds: Corporate Document Services, 2006, and see also Field F, The Foundation Years: preventing poor children becoming poor adults. The report of the Independent Review on Poverty and Life Chances. London: Cabinet Office, 2010
113 Department for Education, Young children suffering, or likely to suffer, significant harm: Experiences on entering education, London: Department for Education, 2012

Breakthrough Britain II: Requires Improvement | The children and families worst affected 45
two
‘Parents ask how to get their kids up in the morning, because they just don’t know how
and never set those boundaries in place. But now they’ve got to because they’re in trouble
with courts over non-attendance.’
2.4 Family breakdown
A stable and supportive family environment has a monumental impact on children’s success
at school. The environment that children wake up to, and the environment to which they
come home after a long day at school, has a massive effect on their ability to learn and
concentrate. Family breakdown creates instability at home, and stretches lone parents’ time
and resources which often has a knock-on effect on a child’s education. Family breakdown is
a major problem facing the country. Over three million children are growing up in lone-parent
households,114 about a million of whom have no meaningful contact with their fathers.115
Sir Robin Bosher, Director of Primary Education at the Harris Federation of Academies,
emphasises that 25 years as a headteacher has taught him that society must not underestimate
the impact of family breakdown – and the colossal effect a parent leaving home has on
children. He argues that having male teachers is positive but this is not a substitute for a child
having male role models at home.
John d’Abbro OBE, head at the outstanding rated New Rush Hall School, told the CSJ that
family breakdown lies at the root of almost all exclusions he sees. Many of the boys grew-
up without fathers and a lack of discipline at home meant they tested boundaries at school.
Some even suggested there are cultural changes at play too:
114 Office for National Statistics, Statistical Bulletin: Families and Households, 2012, [accessed via: http://www.ons.gov.uk/ons/publications/re-reference-tables.html?edition=tcm%3A77-278923 (03/04/13)]
115 Centre for Social Justice, Fractured Families: why stability matters, London: Centre for Social Justice, 2013
School Home Support
Jan Tallis is Chief Executive of School Home Support, a charity working with families to improve
attendance and educational outcomes for disadvantaged children. They emphasise that a successful
approach must ensure children are given aspirations and the opportunity to overcome the educational
failure of their parents.
She told the CSJ that poor outcomes are not caused simply by financial poverty but by ‘poverty of
aspiration and knowledge.’
‘Providing basic, practical support like clean school shirts and providing a washing machine helps
parents better support their children and leads to improved outcomes at school... You wouldn’t
believe how often the reason these children aren’t going to school is because they’ve been bullied
for being dirty.’

The Centre for Social Justice 46
‘I’d get pillared for being racist if I said this, but I never used to see Asian students in
the pupil referral unit and now I do. Perhaps this reflects the second generation changes
that some Asian families now face around family breakdown that some Afro-Caribbean
families faced in the 1970s.’
Anonymous headteacher, in evidence to the CSJ
The National Equality Panel used surveys to analyse the impact of family type on educational
attainment, finding a persistent cognitive advantage amongst the children of married parents,
compared to other family types.116 In addition, children from lone-parent families in both the
UK and Hong Kong have statistically significant lower levels of educational aspiration than
those from two-parent families.117
Children can flourish further if they experience a safe and secure family environment. This
not only concerns children from broken families, but those growing up in homes where there
is significant conflict, tension, a lack of stability and a revolving door of new partners. These
children are far less likely to do well at school.
A three-year UK longitudinal study of 230 children aged 11–13 drawn exclusively from two-
parent families found that parental conflict was linked to a subsequent lowering of children’s
educational attainment, largely attributed to the children’s consequent sense of ‘self-blame.’118
Children in couple families experiencing conflict had poorer outcomes than children in lone-
parent families.119 Family breakdown also affects attainment because of its effects on income
poverty. Approximately four in ten children in lone-parent families are in income poverty,
compared to just over two in ten children in couple families.120
‘I’ve got one Year 9 boy in my class; he’s a good kid and actually quite articulate when
he speaks. But he can hardly write. He can write his name and things like that but he
couldn’t write a paragraph. I keep trying to explain the difference between a full-stop and
a comma, and he just doesn’t get it. But then you hear about how many times he’s moved
school and how many times he’s moved home and it starts to make sense, how he got
to this point. He doesn’t know his dad at all. His social worker told me that literally every
single time she’s been to visit his mum; she’s got a new boyfriend living there. He’s got
absolutely no stability. We’re doing our very best for him but it’s hard because he’s 13 now.’
Teacher, anonymous
The temporary and transient nature of men in the home means many children do not have
stable male role models, and instead, have a succession of men passing through the home.
In the CSJ’s report, Fractured Families: why stability matters, we argued that where family
116 Goodman A et al, Inequalities in educational outcomes among children aged 3 to 16, Final report for the National Equality Panel, 2009 [accessed via: http://sta.geo.useconnect.co.uk/pdf/Inequalities%20in%20education%20outcomes%20among%20children.pdf (23/02/13)]
117 Wang M, and Sek-Yum Ngai S, ‘The Effects of Single Parenthood on Educational Aspiration: A Comparative Study of Children in the United Kingdom and Hong Kong’, Child & Youth Services, 32, 2011, pp.135–154.
118 Harold G T, Aitkin J J and Shelton K H, ‘Inter-parental conflict and children’s academic attainment: a longitudinal analysis’, Journal of Child Psychology and Psychiatry, 48, 2007, pp. 1223–1232.
119 Mooney A, Oliver C and Smith M, Impact of Family Breakdown on Children’s Well-Being, London: Department for Children, School and Families, 2009
120 Department for Work and Pensions, Households Below Average Income, an analysis of the income distribution 1994/95 – 2010/11, London: Department for Work and Pensions, 2011 (after housing costs)

Breakthrough Britain II: Requires Improvement | The children and families worst affected 47
two
structures change again and again, such as with the introduction of new partners, this has a
particularly negative effect on children. Research using the Millennium Cohort Study found
that mothers who re-partner are less likely to have a good relationship with their child, are
less likely to engage in educational activities and are more likely to use negative discipline.121
Kanika Mayi runs a programme at Waltham Forest Council for Black, Asian and Minority
Ethnic (BAME) students otherwise not fully engaged with education. Kanika herself grew up
on a council estate in a deprived part of London and was one of only a few in her area to go
to university. She told the CSJ that family breakdown and father absence is a significant factor
behind low attainment, especially among the BAME communities she works with:
‘growing up, most of the kids on the estate didn’t have fathers. They were disengaged at
school and had no discipline at home. Lots of the boys joined gangs and lots of the girls
got into bad relationships with men. But all they needed and wanted was a father. Even
though my parents split-up when I was little, both my parents were very involved in my
upbringing and education – that made the difference for me.’
2.5 Child neglect and abuse
Neglect can have a considerable impact on a young person’s education. Sadly, neglect, abuse
and maltreatment affect a large proportion of children across the country.
Abuse and neglect can have a dangerous effect on brain development. As trauma hinders
brain development, children exposed to chronic and unpredictable stress, for example, if a
child has a parent who lashes out in fury, will suffer deficits in their ability to learn.122 Children
who suffer neglect tend to have lower grades, increased absence, increased disciplinary
problems and higher rates of school dropout.123
Of those children who have suffered neglect:124
�� Over 50 per cent experienced some type of difficulty in school – including poor attendance
and disciplinary problems;
�� Roughly 30 per cent had some form of cognitive or language impairment;
121 Holmes J and Kiernan K, Fragile Families in the UK: evidence from the Millennium Cohort Study, Draft Report, 2010, p12122 Centre for Social Justice and The Smith Institute, Early Intervention: Good Parents, Great Kids, Better Citizens, London: Centre for Social
Justice and The Smith Institute, 2008 123 Abuse and Neglect, 23 December 2009 [accessed via: http://www.education.com/reference/article/abuse-and-neglect/#B (06/07/13)]124 Ibid
‘The big issue is that there are just lots of dirty, unkempt, uncared-for children. It’s emotional and physical neglect.’ Jonty Clark, Executive Head of Beckmead School

The Centre for Social Justice 48
�� More than 22 per cent showed evidence of a learning disorder;
�� Approximately 25 per cent required some form of special education services.
Abuse and neglect harm the emotional and behavioural development of at least half the
children affected by it. A study found that those who experience maltreatment as infants had
the worst outcomes at age five.125
Schools are in a unique position to flag up problems, given that they see children on a consistent
basis. Yet, as discussed below, specialist services do not always effectively communicate with
schools and the 2011 Munro Review of Child Protection emphasised that services are too
focussed on adults with too little attention on the children affected by adults’ problems.
One head told us about a 14-year-old boy in her school:
‘He has very challenging and disruptive behaviour, which can be a danger to those around
him. His father is a violent criminal and we know that he comes from a very chaotic
home environment – where there are overlapping issues around disadvantage and abuse
constantly in the background. He clearly needed medical attention and yet nothing was
being done. So last week, we as a school took it upon ourselves to take him to A&E –
only for his mum to get angry with us because she had to pick him up from the hospital
and said we’d wasted her time! There needs to be awareness of the contexts we work
with on a day-to-day basis and that some of these pupils have so many problems that
educational attainment is not their major concern.’
Another head told us about an eight-year-old boy who would soon be starting at the school:
‘mum and gran were stood in my office, and they said to me “he’s a nightmare. A f******
nightmare. Good luck with him.” And this little boy was just stood there in the middle. It
was just excruciating to watch. This is extreme emotional neglect we’re talking about.’
2.6 Children in care
At present approximately one in every 170 children in England are looked after by the
state.126 Children in care start off extremely disadvantaged, with these disadvantages often
exacerbated by the care system. These children are more likely to need additional support
with their emotional, mental or physical health and wellbeing than any other group.127 Many
of them will suffer enormous disruption during their school years. Every year 7,000 children
have three or more placements.128 Of the children leaving care in the year to 31 March
125 Ward H et al, Young children suffering, or likely to suffer, significant harm: Experiences on entering education, Centre for Child and Family Research, Loughborough: Loughborough University, 2012
126 Department for Education, Children looked after by local authorities in England, including adoption, London: Department for Education, 2012
127 All-Party Parliamentary Group for Looked After Children and Care Leavers, Education Matters in Care, A report by the independent cross-party inquiry into the educational attainment of looked after children in England, 2012 [accessed via: http://www.thewhocarestrust.org.uk/data/files/Education_Matters_in_Care_September_2012.pdf (19/08/13)]
128 Burghart A, A Better Start in Life, London: Policy Exchange, 2012

Breakthrough Britain II: Requires Improvement | The children and families worst affected 49
two
2011, around 1,270 had had more than ten placements.129 Instability of other kinds is also
commonplace. Although figures are not routinely collected, surveys suggest that some children
have more than 20 different social workers whilst they are in care.130 Another survey also
found that almost half the group had attended six or more schools and seven had attended
more than ten different schools.131
The levels of attainment for these children are appalling. Only 15 per cent of children
looked after for at least a year achieved five A* to C grades at GCSE including English and
mathematics last year, compared with 58 per cent for non-looked after children.132
As a result of the poor educational outcomes experienced by so many children in care, the
Government has allocated Pupil Premium funding for children who have been in care for
more than six months.133 It has also built on the work of the last government which set up
the Virtual School Head (VSH) initiative as a way of improving attainment and provision for
looked after children. A VSH is someone who has been appointed by the local authority to
promote the educational achievement of all the children looked after by that council. These
children are on a ‘virtual’ school roll, although physically spread out across schools in the
borough and beyond.134
As a school may have a very small number of children in care on its register, they may not
have the expertise to support the needs of these children. By contrast, the VSH will have
specialist knowledge and experience, which they can then use to support headteachers.
They can also liaise with the local authority and with all schools in the area on how they can
promote the learning and education available to these children.135
Looked after children in local authorities with strong VSH arrangements in place have achieved
improved results. Last year, 40 per cent of looked after children in Warrington achieved five
good GCSEs and 38 per cent in North Tyneside.136 This compares to the national average of
15 per cent who achieved five A* to Cs including English and mathematics last year.137
This Government has announced plans to make the VSH a statutory post with responsibility
for discharging the existing duty on local authorities to promote the educational achievement
of their looked after children.138
129 Ibid (data provided by the Department for Education for the report)130 Centre for Social Justice, Couldn’t Care Less, London: Centre for Social justice, 2008131 Barnardo’s, Failed By The System, The views of young care leavers on their educational experiences, London: Barnardos, 2006132 Department for Education, Outcomes for Children Looked After by Local Authorities in England, as at 31 March 2012, London: Department
for Education, 2013133 Department for Education, How schools can support looked after children, 04 May 2012 [accessed via: http://www.education.gov.uk/
childrenandyoungpeople/families/childrenincare/education/a00208595/school-support (20/08/13)]134 The Who Cares Trust, Virtual headteachers, [accessed via: http://www.thewhocarestrust.org.uk/pages/virtual-headteachers.html
(17/08/13)] 135 Department for Education, Improving the adoption system and services for looked-after children, 31 July 2013, [accessed via: https://www.
gov.uk/government/policies/improving-the-adoption-system-and-services-for-looked-after-children (16/08/13)]136 Department for Education, Help for children in care to achieve better school results, 12 December 2012 [accessed via https://www.gov.uk/
government/news/help-for-children-in-care-to-achieve-better-school-results (18/08/13)]137 Department for Education, Outcomes for Children Looked After by Local Authorities in England, as at 31 March 2012, London: Department
for Education, 2012138 ‘Edward Timpson MP letter to all directors of children’s services and lead members’, London: Department for Education, 12 December
2012

The Centre for Social Justice 50
This is a step in the right direction, one that the CSJ called for in 2008.139 However, more must
be done to improve the outcomes of children in care and the outcomes they experience
when they leave care. Contributing to our understanding of these issues, the CSJ is conducting
research into outcomes and interventions for care leavers which we will report on over the
course of the next year.
2.7 Domestic violence
The CSJ’s report, Beyond Violence: Breaking cycles of domestic abuse, highlighted evidence
that children caught up in domestic abuse are at greater risk of suffering behavioural and
educational problems.140 Domestic violence is associated with depression, loss of confidence,
stigma, isolation, sleep deprivation and drug or alcohol misuse. Growing up in a home
where there is domestic violence can result in lower cognitive functioning, poor educational
engagement, poorer problem solving skills and lower attainment.141 Consequently, domestic
abuse has a terribly negative impact on educational outcomes.
The risk of domestic violence is almost doubled when there are children in the household.142
An estimated 950,000 children are affected by domestic violence, either directly or indirectly
as witnesses.143 It is estimated that around one in six children who are aged between 11 and
17 have experienced domestic violence between adults in their homes.144
Becky Rogerson, Director of My Sister’s Place, a Middlesbrough-based charity which offers
services to women affected by domestic violence, told the CSJ about the catastrophic impact
domestic violence has on children’s education:
‘These children sometimes spend the night at A&E or at the police station. Many mothers say
to me “he’d never do it in front of the kids” – but the kids pick up on that and it’s common for
older children especially to miss school or stay up all night acting as a “human-shield.” When
these children do go to school, they’re just too exhausted, or too worried to learn.’
The shortage of local refuges means families can be sent across the country, often at short-
notice. This means they must change schools and often end up staying in temporary B&B
accommodation, where they turn up at school without books or clean clothes. This not only
means these children fall behind, but sadly it often leads to bullying, which is itself associated
with negative outcomes and poor attendance.
Jonty Clark, Executive Head of Beckmead School, told the CSJ that domestic violence is
almost always present as an underlying cause of the severe attachment issues affecting the
majority of the children at the school:
139 Centre for Social Justice, Couldn’t care less, London: Centre for Social Justice, 2008140 Centre for Social Justice, Beyond violence: Breaking cycles of domestic abuse, London: Centre For Social Justice, 2012141 Wagstaff M, Through the eyes of a child: How do children who have experienced domestic violence see the world, Bristol: University of Bristol, 2009 142 Home Office Research Project, Domestic violence, sexual assault and stalking: Findings from the British Crime Survey, London: Home Office,
2004 143 4Children, The Enemy Within, 4 million reasons to tackle family conflict and family violence, London: 4Children, 2012144 Radford L et al, Child abuse and neglect in the UK today, London: NSPCC, 2011

Breakthrough Britain II: Requires Improvement | The children and families worst affected 51
two
‘eventually, the children and their mums will open up about these problems at home, as
they start to trust us. Often, domestic violence is linked to mothers having multiple and
transient partners in the home.’
Dr Elly Farmer, a Clinical Psychologist, told the CSJ that:
‘Children who are being abused or who are living with domestic violence frequently struggle to
make the most of learning opportunities at school – many experience traumatic memories
intruding into their minds without warning, interrupting trains of thought that are so key to
understanding; they often cope with difficult memories and feelings by either retreating from
reality and/or by being on “red alert” and either one means that they may find it extremely
difficult to concentrate; and low self-esteem and shame act to inhibit children from taking
on the challenges which are so often at the heart of new skills emerging.’
2.8 Addiction
Addiction to drugs and/or alcohol not only affects those with the addiction themselves, but it
has serious and far reaching consequences on their children, often affecting their performance
at school.
This is not a marginal issue. There are an estimated 700,000 children in Britain living with a
dependent drinker and 335,000 children live with a dependent drug user.145
These problems affect children of all ages. Women using cannabis whilst pregnant tend to
have babies with a lower birth weight and have lower subsequent cognitive ability.146 When in
school, these children often worry about parents’ safety, experience bullying or miss school to
care for dependent parents. Parental addiction can lead to neglect and abuse as these parents
struggle to prioritise their children’s needs.
Some parents will be completely unable to care for their children. Many of these children are
then looked after by ‘kinship carers.’ A study found that whilst these children faired significantly
better than those looked after in non-kin foster care, they still fared worse than children
in the general population. The Strengths and Difficulties Questionnaire (SDQ) is a brief
behavioural screening questionnaire about three to 16 year olds. 34 per cent of the group
scored abnormally on the SDQ scale.147
Andrew Brown from Mentor UK told the CSJ that ‘teachers are the ones that notice when a
parent turns up drunk or when a child is late for school. They can spot things other services
can’t.’ However, teachers are not always trained in spotting the signs or in knowing what
145 Manning et al, ‘New estimates of the number of children living with substance misusing parents: results from UK national household surveys’ BMC Public Health, 9, 2009
146 Sherwood R A, Keating J and Kavvadia V, ‘Substance misuse in early pregnancy and relationship to fetal outcome’, European Journal of Pediatrics, 158, 1999, pp488–492
147 University of Bristol in partnership with Buttle UK,The Poor Relations? Children and Informal Kinship Carers Speak Out, Summary Report, 2013

The Centre for Social Justice 52
procedures to follow. He criticises what he sees as a ‘culture of suspicion’ where teachers can
feel it is not their place to interfere or ask parents difficult questions.
The children of problematic drug users are seven times more likely to grow up with drug
and alcohol problems themselves.148 The long-term effects of this are severe. Research
spanning 38 countries found a positive correlation between those who had experienced early
drunkenness and five other risky behaviours – smoking, cannabis use, injuries, fights and low
academic performance.149
2.9 Mental health
Mental health can have a substantial impact on educational outcomes, contributing to
difficulties concentrating, learning and in getting on with peers. Children are affected either
because their parents suffer from mental health problems, or because they experience them
directly.
Many children grow up with a parent who, at some point, will have some degree of mental
illness.150 At any one time it is estimated that as many as one in six of the population
experience mental ill health. Around 630,000 adults are estimated to be in contact with
specialised mental health services.151
Alarmingly, no data is collected either nationally or locally about how many adults receiving
specialised mental health services are parents or carers.152 However it is estimated that 30 per
cent of adults with mental ill health have dependent children.153 Many parents with long-term
mental health problems face alcohol or drug problems as well.154
The effects on children and their education are substantial. Children may find it necessary
to act as carers, either for their parents or for siblings – leading them to miss school and fall
behind. There are an estimated 175,000 young carers in the UK who are caring for a parent
or other family member with mental health problems.155 If a parent is admitted to hospital,
this can also be extremely disruptive and stressful.156
148 Mckeganey N, ‘Pre-teen Children and Illegal drugs’, Drugs: Education, Prevention and Policy, 11, 2004, pp. 315–327149 Kuntsche E, ‘Not Early Drinking but Early Drunkenness Is a Risk Factor for Problem Behaviors Among Adolescents from 38 European
and North American Countries’, Alcoholism: Clinical and Experimental Research, 37, 2013. 150 The Royal College of Psychiatrists, Parental mental illness: the impact on children and adolescents: information for parents, carers and
anyone who works with young people, [accessed via: http://www.rcpsych.ac.uk/expertadvice/parentsandyouthinfo/parentscarers/parentalmentalillness.aspx (27/06/2013)]
151 Family Action, Families Affected by Parental Mental Health Difficulties, briefing [accessed via: http://www.family-action.org.uk/uploads/documents/Mental%20health%20briefing%231%23.pdf (15/08/13)]
152 Office for Standards of Education, What about the children? Joint working between adult and children’s services when parents or carers have mental ill health and/or drug and alcohol problems, Manchester : Office for Standards of Education, 2013
153 Family Action, Families Affected by Parental Mental Health Difficulties, briefing [accessed via: http://www.family-action.org.uk/uploads/documents/Mental%20health%20briefing%231%23.pdf (15/08/13)]
154 The Royal College of Psychiatrists, Parental mental illness: the impact on children and adolescents: information for parents, carers and anyone who works with young people [accessed via: http://www.rcpsych.ac.uk/expertadvice/parentsandyouthinfo/parentscarers/parentalmentalillness.aspx (27/06/2013)]
155 The Mental Health Foundation, Parents, [Accessed via: http://www.mentalhealth.org.uk/help-information/mental-health-a-z/P/parents/ (14/08/13)]
156 Ibid

Breakthrough Britain II: Requires Improvement | The children and families worst affected 53
two
Naturally, some will become withdrawn and find it near-impossible to concentrate on
their school work.157 They may experience greater levels of emotional, psychological and
behavioural problems. 158 In addition to worrying about their parents, sadly, some children will
face stigma or bullying at school.159
About one in five children have a mental health problem in any one year and one in ten at
any one point in time.160 This can substantially affect their learning. Three in five children with
SEN will also develop a mental health problem161 and children of single-parent families are
twice as likely to have a mental health problem as children of two-parent families.162 Around
60 per cent of looked after children have been reported to have emotional and mental health
problems.163
Common mental health problems affecting pupils include Attention Deficit Hyperactivity
Disorder (ADHD), depression and eating disorders. Conduct disorders are the most common
reason for referral to mental health services for young children. They affect approximately 6.5 per
cent of boys, and 2.7 per cent of girls.164
The response to supporting these children is, sadly, often inadequate. This is deeply
concerning given the prevalence and impact mental health problems can have on children
and their education. Child and Adolescent Mental Health Services (CAMHS) is an umbrella
term covering services like support and advice and more intensive interventions such as
inpatient care. Worryingly, access to CAMHS is often limited. Sarah Brennan, Chief executive
of YoungMinds, told the CSJ that many heads are frustrated with CAMHS. Even when they
are able to access services, its ‘silo-approach’ and rules around confidentiality mean almost no
information can then be relayed back to the school.
The School Survey run by the Audit Commission found that a large proportion of schools
were not satisfied with mental health support provided. 44 per cent of schools rated the
effectiveness of local services in meeting the mental health needs of children and young
people as below satisfactory.165 Two-thirds of local authorities have reduced their CAMHS
budget since 2010 with one council reporting a drop of 41 per cent.166
157 The Royal College of Psychiatrists, Parental mental illness: the impact on children and adolescents: information for parents, carers and anyone who works with young people [accessed via: http://www.rcpsych.ac.uk/expertadvice/parentsandyouthinfo/parentscarers/parentalmentalillness.aspx (27/06/2013)]
158 The Mental Health Foundation, Parents [Accessed via: http://www.mentalhealth.org.uk/help-information/mental-health-a-z/P/parents/ (14/08/13)]
159 Ibid 160 The Mental Health Foundation, Lifetime Impacts: Childhood and Adolescent Mental Health, Understanding The Lifetime Impacts, 2005161 Specialist Schools and Academies Trust, Mental health and emotional well-being The new dimension in the curriculum for children and young
people with special educational needs, London: Specialist Schools and Academies Trust, 2010 [accessed via: http://www.education.gov.uk/complexneeds/modules/Module-3.4-Emotional-well-being-and-mental-health/All/downloads/m12p010b/mental_health_and_emotional_wellbeing.pdf (16/06/13)]
162 Meltzer H et al, Mental Health of Children and Adolescents in Great Britain, London: The Stationery Office, 2000163 National Institute for Health and Care Excellence, public health guidance 28: Looked-after children and young people, Manchester :
National Institute for Health and Care Excellence, 2010 164 The Royal College of Psychiatrists, Conduct disorders: an overview [accessed via: http://www.rcpsych.ac.uk/files/samplechapter/80_3.pdf
(16/08/13)] 165 Audit Commission, National School Survey Results, London: Audit Commission, 2008 [accessed via: http://archive.audit-commission.gov.uk/
auditcommission/SiteCollectionDocuments/AnnualReports/2008/SchoolSurvey2008.pdf (28/07/13)]166 Young Minds, Local authorities and CAMHS budgets 2012/2013 Briefing, [accessed via: http://www.youngminds.org.uk/about/our_
campaigns/cuts_to_camhs_services (09/06/2013)]

The Centre for Social Justice 54
Pupils also often refuse to access CAMHS externally. Some leaders have therefore taken it
upon themselves to pay for a CAMHS worker to come into their school, and offer support
on-site where the pupils can easily, and more readily, access the services. John d’Abbro told
the CSJ that ‘the pupils won’t go to CAMHS so I’ve had to bring CAMHS to the pupils.’
Seamus Oates also has a CAMHS worker on-site as otherwise ‘the stigma is so great that the
pupils would never access it. Or at best, they would go once and never go again.’
The stigma surrounding mental health, especially for young people, remains a substantial
problem. Jonty Clark told the CSJ that ‘some of the families find any association with CAMHS
stigmatising following unsuccessful engagements with older siblings. The CAMHS model fails
to realise the utter chaos affecting most of these families – where traumatic events like death,
parental imprisonment, unemployment and illness are almost “normal” life-events. These
families are affected by crisis after crisis.’
Camden Clinical Commissioning Group, in partnership with Camden Council, ensures that
CAMHS is in secondary schools for at least one day a week – increasing pupils’ propensity
to access support on-site. Sarah Brown, Senior Joint Commissioning Manager of Children
Schools and Families at the London Borough of Camden, said that:
‘mental health shouldn’t be seen as something children either “do or don’t have” but more
holistically as a continuum of needs. This means offering support early on and addressing
needs before they escalate.’
Amanda Spielman told the CSJ that there are certainly substantial levels of mental health
problems in schools and yet simultaneously:
‘mental health is a continuum – there’s a danger of us boxing all the problems up
together with a big label when actually some problems are normal issues around
adolescence.’
2.10 Speech and language difficulties
Children with poor language skills are more likely to struggle in education, whereas those with
good language skills are less affected by the negative influence of socio-economic disadvantage
and more likely to succeed in education and employment.167 Approximately one in every
62 children (1.61 per cent) is known to have Speech, Language and Communication Needs
(SLCN).168
Because communication precedes literacy, if children cannot first communicate effectively, it
will be considerably harder for them to learn to read or write.169
167 Blanden, J ‘Bucking the trend’: What enables those who are disadvantaged in childhood to succeed later in life? London: Department for Work and Pensions, 2006
168 Law J et al, Early language delays in the UK, Newcastle University and Save the Children, London: Save the Children, 2013169 Hart B and Risley T R, The Social World of Children Learning to Talk. Baltimore, Paul Brookes, 1999

Breakthrough Britain II: Requires Improvement | The children and families worst affected 55
two
A large-scale study of children born in and around Bristol in the early 1990s found that the
communication environment – including how many books a child has in the home and how
much television is watched – is a more dominant predictor of early language and of ‘school
readiness’ than social background.170 Children owning more books and who were taken to the
library more frequently at age two achieved higher scores on the school assessment when
entering primary school.171
These disadvantages persist into adulthood: 35 per cent of offenders have only basic-level
speaking and listening skills.172
Professor James Law observes that:
‘boys tend to develop later than girls in the early years and tend to be more
commonly referred to specialist children’s services. Concern is sometimes expressed
about boys being singled out as being “problems” early on in primary school
because they have difficulties expressing themselves and teachers sometimes assume
that they are being naughty when they simply do not understand what is being said to
them. Recent data suggest that, although school exclusions are falling overall, those in
primary schools and especially those from socially disadvantaged backgrounds or with
special needs are rising.’
SLCN has a significant effect on employment prospects. As shown, good communication
and related ‘soft’ skills are viewed by employers as being absolutely fundamental. There is an
emphasis on more customised high value goods and services173 where success often depends
on the quality of interactions between employees and customers.174
Some communities are particularly badly affected by SLCN. The Communication Trust found
in their Talk of the Town project in Wythenshawe, South Manchester, that more than 50 per
cent of children start school with poor language. Most disturbingly, 26 per cent of children had
such poor speech, language and communication skills that in many areas they would qualify for
a statement of SEN.175
170 Roulstone S et al, Investigating the role of language in children’s early educational outcomes, Department for Education, Bristol: University of the West of England, Bristol, 2011
171 Ibid 172 C4EO, Grasping the Nettle: Early intervention for children, families and communities, London: Centre for Excellence and outcomes in
Children and Young People’s Services, 2010173 Delarue A Van Hootegem G, Procter S, and Burridge, M, Teamworking and Organisational Performance: A Review of Survey-based Research
International Journal of Management Reviews, 2007, pp127–148174 Coats D et al, Advancing opportunity: the future of good work, London: The Smith Institute, 2009175 Ainscow et al, An Evaluation of The Communication Trust’s ‘Talk of the Town’ Project, Manchester : Centre for Equity in Education, 2012

The Centre for Social Justice 56
2.11 Children on free school meals
Children in income poverty are noticeably less likely to fulfill their educational potential, often
facing multiple barriers to learning, such as:176
�� Less home-support for their learning;177
�� Weaker language and communication skills;178
�� Difficulties in basic literacy and numeracy skills;179
�� Potentially less likely to believe they can control events affecting them;180
�� Low parental education;181
�� Low aspirations;182
�� Poorer health.183
176 Education Endowment Foundation, The Communication Trust: Talk of the Town, 20 March 2013 [accessed via: http://educationendowmentfoundation.org.uk/projects/the-communications-trust-talk-of-the-town (17/08/13)]
177 Joseph Rowntree Foundation, Poorer children’s educational attainment: how important are attitudes and behaviour? York: Joseph Rowntree Foundation, 2010
178 Sutton Trust, Low income and early cognitive development in the UK, London: Sutton Trust, 2010 179 Every Child a Chance Trust, The long term costs of literacy difficulties and The long term cost of numeracy difficulties, 2009180 JInstitute for Fiscal Studies, The role of attitudes and behaviours in explaining socio-economic differences in attainment at age 16, Economic
and Social Research Council, 2010 [accessed via: http://www.ifs.org.uk/wps/wp1015.pdf(18/02/13)]181 OECD, Education at a Glance, OECD indicators, Paris: OECD, 2012182 Institute for Fiscal Studies, The role of attitudes and behaviours in explaining socio-economic differences in attainment at age 16, Economic
and Social Research Council, 2010 [accessed via: http://www.ifs.org.uk/wps/wp1015.pdf(18/02/13)]183 Spencer N, Health Consequences of Poverty for Children, End Child Poverty with the support of the GMB [accessed via: http://www.
endchildpoverty.org.uk/files/Health_consequences_of_Poverty_for_children.pdf (17/08/13)]
The Communication Trust, Talk of the Town
The programme, Talk of the Town, was developed by The Communication Trust, a coalition of almost
50 voluntary and community organisations with expertise in speech, language and communication. The
work grew from a pilot in Wythenshawe, a deprived area of Manchester, funded by the Department for
Education. It aims to facilitate early identification, encourage joined-up working and improve outcomes for
children with SLCN. It addresses the high level of poor language that exists, especially in areas of social
deprivation.
The programme provides targeted training for teaching staff through part-time speech and language
therapists, to deliver evidence-based interventions for raising attainment. It also supports leadership to
embed a sustainable, long-term strategy to support all children’s communication needs.176
Wendy Lee from the Communication Trust told the CSJ that teachers typically do not have knowledge of
communication development in the same way as they do with reading and writing. Teachers can struggle
to identify children who may be significantly behind, seeing only symptoms of the issue; poor behaviour,
poor literacy, poor attainment and poor self-esteem, rather than the problem itself. Teachers need to be
better able to recognise when children are falling behind. She said that under-identification of children
with SLCN is a massive issue and in the Talk of the Town project, teachers were missing around 40 per
cent of the children with difficulties.

Breakthrough Britain II: Requires Improvement | The children and families worst affected 57
two
The standard measure for income-related poverty in education is whether a child is known
to be eligible for free school meals (FSM). In January 2013, 1,265,770 pupils were eligible for
and claiming FSM.184 Although, as discussed below, this measure is not perfect, it serves an easy
means of revealing the issues that some children with parents on low incomes face. 185 186187
Children eligible for FSM routinely perform less well at school than those who are not. Last
year, only 36 per cent of pupils eligible achieved five GCSEs A* to C including English and
mathematics compared to 63 per cent of those who were not.188 Whilst attainment has
improved for each income decile year-on-year, there is still a sizeable attainment gap between
income groups and a child’s background continues to dictate their attainment throughout
their school career.189
At primary school only 66 per cent of pupils eligible for FSM achieved expected levels in Key
Stage 2 (age 7–11) English and mathematics, compared with 82 per cent of all other pupils.190
Furthermore, children eligible for FSM within more advantaged areas are often less likely to
do well at school than those eligible in more deprived areas. This occurs because, tragically,
184 Department for Education, Schools, Pupils and their Characteristics: January 2013, London: Department for Education, 2013 (This refers to pupils known to be eligible for and claiming free school meals who have full time attendance and are aged 15 or under, or pupils who have part time attendance and are aged between 5 and 15)
185 Holford A, Institute for Social and Economic Research University of Essex, Take-up of Free School Meals: Price Effects and Peer Effects, University of Essex: ISER, 2012
186 Newcastle City Council, Free school meals: Frequently asked questions, 27 September 2012 [accessed via: http://www.newcastle.gov.uk/education-and-learning/grants/free-school-meals-frequently-asked-questions (19/08/13)]
187 Department for Education, Apply for free school meals, [accessed via: https://www.gov.uk/apply-free-school-meals (06/05/13)]188 Department for Education, GCSE and equivalent attainment by pupil characteristics in England, 2011/12, London: Department for
Education, 2013 189 Hansard, Written Answers, 22 Apr 2013190 Department for Education, National Curriculum Assessments at Key Stage 2 in England, 2011/12, London: Department for Education,
2012
Free School Meals
FSM enable parents to claim a free school dinner for their child, representing a ‘social safety net’ of
nutrition for some children.185
Estimates vary, but families with two children qualifying could save £741.00 over the year.186 They
therefore also represent significant financial relief, especially for those families with several children.
Children are currently eligible for FSM if their parents receive any of the following benefits:187
�� Income Support;
�� Income-based Job Seekers’ Allowance;
�� Income-related Employment and Support Allowance;
�� Support under Part VI of the Immigration and Asylum Act 1999;
�� The guaranteed element of State Pension Credit and Child Tax Credit (CTC), provided they are not
also entitled to Working Tax Credit (WTC) and have an annual gross income of no more than £16,190;
�� Where a parent is entitled to WTC Run-on; and
�� Children who receive a qualifying benefit in their own right.

The Centre for Social Justice 58
their failures are being ‘hidden’ behind the successes of the majority. This is a huge injustice
penetrating the heart of our education system.191
Areas like Buckinghamshire, Dorset and Surrey have some of the lowest levels of deprivation in
the country, but are among those with the worst results for disadvantaged pupils. For example,
the attainment gap between those eligible for FSM, and the rest of pupils, is 38 percentage points
in West Berkshire and a staggering 43 percentage points in Buckinghamshire. By contrast, many
of the local authorities with higher levels of deprivation have smaller attainment gaps; areas like
Southwark and Tower Hamlets.192
Whilst investment in education has benefitted those at the bottom, it has failed adequately to
close attainment gaps at KS4. Professor Chris Husbands, Director of the Institute of Education,
told the CSJ that:
‘one of the unintended consequences of New Labour’s policies was that whilst performance
rose, the gap did not truly narrow... If you improve inputs in a society which is highly unequal,
you will almost certainly widen the gap between outcomes. One of the consequences of
increasing teacher quality has been to increase the gap in pupil outcomes. In policy, we often
talk about the fact we want to raise standards and also, to narrow the curve. But it’s almost
impossible to develop universalistic interventions which do both.’
Professor Chris Husbands, in evidence to the CSJ
Additionally, whilst the use of benchmarks can be helpful in monitoring standards, they can
also be misleading. The difference in attainment between those on and not on FSM varies
depending on which benchmark is used.
191 Hansard, Written answers and statements, 22 Apr 2013192 Department for Education, GCSE and equivalent attainment by pupil characteristics in England: 2011 to 2012, London: Department for
Education, 2013
0
10
20
30
40
50
60
70
80
90
2007
/08
2008
/09
2009
/10
2010
/11
2011
/12
0-10% IDACI most deprived decile
10-20%
20-30%
30-40%
40-50%
50-60%
60-70%
70-80%
80-90%
90-100% IDACI least deprived decile
% o
f Chi
ldre
n ac
hiev
ing
5+ A
*-C
gra
des
Figure 4: Percentage of Children achieving 5+ A* to C GCSEs including English & mathematics by decile of deprivation (IDACI)191

Breakthrough Britain II: Requires Improvement | The children and families worst affected 59
two
As Figure 5 shows, when looking at those achieving five A* to C grades, the attainment gap
has decreased substantially each year. However, when including English and mathematics, the
gap is not only much larger, it has scarcely reduced at all.193
The gap is even larger when excluding equivalents from the benchmarks. As discussed in
Chapter One, many equivalent qualifications have been criticised as being low value, with
some schools encouraging pupils to take them as a means of boosting their rankings on league
tables. These issues mean that far less progress has been made in the very subjects that have
the greatest effect on children’s access to continued learning and access to employment. 194
193 Department for Education, GCSE and equivalent attainment by pupil characteristics in England: 2011 to 2012, London: Department for Education, 2013
194 Ibid
0.0
5.0
10.0
15.0
20.0
25.0
30.0
2007/08 2008/09 2009/10 2010/11 2011/12
Perc
enta
ge a
ttai
nmen
t ga
p
5 or more GCSEs at grade A*-C or equivalent
5 or more GCSEs at grade A*-C or equivalent including
English and mathematics
GCSEs or iGCSEs
Figure 5: FSM attainment gaps 2007/08 to 2011/12193
A*-C
in a
Moder
n
Fore
ign La
ngua
ge
A*-C
in En
glish
&
mathem
atics
GCSE
s
68.9
36.3
85.9
36.8
15.2
27.7
9.2 5.0
85.3
62.6
95.6
63.0
31.3
56.0
25.4
18.0
0.0
20.0
40.0
60.0
80.0
100.0
5+ A
*-C gr
ades
5+ A
*-G gr
ades
inclu
ding
Engli
sh &
math
emati
cs G
CSEs
5+ A
*-C gr
ades
inclu
ding
Engli
sh &
math
emati
cs G
CSEs
5+ A
*-C gr
ades
exclu
ding e
quiva
lents
includ
ing
Engli
sh an
d math
emati
cs G
CSEs
Enter
ed th
e
Engli
sh B
acca
laure
ate
Achiev
ed th
e
Engli
sh B
acca
laure
ate
FSM All other pupils
Figure 6: Attainment at Key Stage 4, 2011/12194

The Centre for Social Justice 60

Breakthrough Britain II: Requires Improvement | The children and families worst affected 61
two2.12 Regional disadvantages: the national vs. local picture
Educational failure is unevenly distributed across the country. Unfortunately, some children are
automatically disadvantaged by where in the country they happen to live and by where they
go to school. In some areas schools are operating in an incredibly challenging context, often
dealing with extremely complex social problems.
‘If a politician stood in my office and looked out the window, I could guarantee they would
see a drug deal, or a shoplifter taking requests. On “order-day,” parents stand outside the
school-gates placing orders with the local shoplifters. There is a sense that they shouldn’t
have to pay for things.’
Anonymous headteacher in the North of England, in evidence to the CSJ
Educational failure is especially acute across a number of regional areas. Knowsley, in particular,
has very poor results; last year only 40.9 per cent of pupils achieved five good GCSEs
including English and mathematics. In Nottingham, the figure was 49.6 and in Kingston upon
Hull, 47.8.195
Table 3: Local authorities where fewer than 50 percent of pupils achieved five or more A* to C including English & mathematics GCSEs196
Local Authority Percentage of pupils attaining five GCSEs A* to C including English and mathematics, 2011/12
Knowsley 40.9
Isle of Wight 44.5
Barnsley 45.3
Middlesbrough 47.6
Kingston upon Hull, City of 47.8
Blackpool 47.9
Hartlepool 48.8
Peterborough 49.3
Nottingham 49.6
Destination measures show that not a single student at schools or colleges in eight local
authorities – Sandwell, Islington, Barking and Dagenham, Swindon, Knowsley, Halton, Barnsley
and Rochdale – attended Oxbridge.197
Recently, Ofsted has suggested that coastal towns are now amongst the most educationally
disadvantaged and deprived parts of the country,198 something that the CSJ’s own research
has supported.199 In relatively isolated communities with intergenerational unemployment,
aspirations are understandably low.
195 Department for Education, Revised GCSE and equivalent results in England: academic year 2011 to 2012, London: Department for Education, 2013 196 Ibid 197 Department for Education, Destinations of key stage 4 and key stage 5 pupils: 2010 to 2011, London: Department for Education, 2013198 Office for Standards of Education, Children’s Services and Skills, Unseen children: access and achievement 20 years on, Manchester : Office
for Standards of Education, Children’s Services and Skills, 2013 199 Centre for Social Justice, Turning the Tide: social justice in five seaside towns, London: Centre for Social Justice, 2013

The Centre for Social Justice 62
One region, however, has managed to improve its results quite dramatically. For many years,
attainment in London was recognised as poor, however this is no longer the case. Instead
London is now outstripping other parts of the country.
In Tower Hamlets, in particular, an impressive 61.8 per cent attained five GCSEs A* to C
including English and mathematics. This is despite having very high levels of deprivation and
numbers of children eligible for FSM.200201
London local authorities dominate the table of those councils sending the highest proportion
of students to university – with Redbridge (66 per cent), Ealing and Enfield (both at 64 per
cent) at the top.202
There is marked inequality in a child’s access to high quality schools. London in particular has
experienced a substantial increase in attainment over the years. One of the key reasons for
this success, after many years of failure, has been the London Challenge (see below) which,
between 2003 and 2010 managed to improve substantially the quality of schools in the capital.
So far attempts to replicate its achievements – in the Greater Manchester Challenge and
City Challenge (working in the Black Country) – have failed to match its results, suggesting, as
discussed in Chapter 3, that it may be easier to draw high quality school leaders and teachers
to London than to other regions.203
200 Department for Education, Revised GCSE and equivalent results in England: academic year 2011 to 2012, London: Department for Education, 2013 201 The Department for Education, GCSE and equivalent attainment by pupil characteristics in England, 2011/12, London: Department for
Education, 2013202 Department for Education, Destinations of key stage 4 and key stage 5 pupils: 2010 to 2011, London: Department for Education, 2013203 Office for Standards in Education, Children’s Services and Skills, The London Challenge, Manchester : Office for Standards of Education,
Children’s Services and Skills, 2010
30 35 40 45 50 55 60 65 70 75 %80
Camden Hackney
Hammersmith and Fulham Haringey Islington
Kensington and Chelsea Lambeth
Lewisham Newham
Southwark Tower Hamlets
Wandsworth Westminster
Barking and Dagenham Barnet Bexley Brent
Bromley Croydon
Ealing Enfield
Greenwich Harrow
Havering Hillingdon Hounslow
Kingston upon Thames Merton
Redbridge Richmond upon Thames
Sutton Waltham Forest
LONDON
National average
Figure 7: Percentage achieving five A* to C grades including English and mathematics, in inner and outer London, 2011/12201
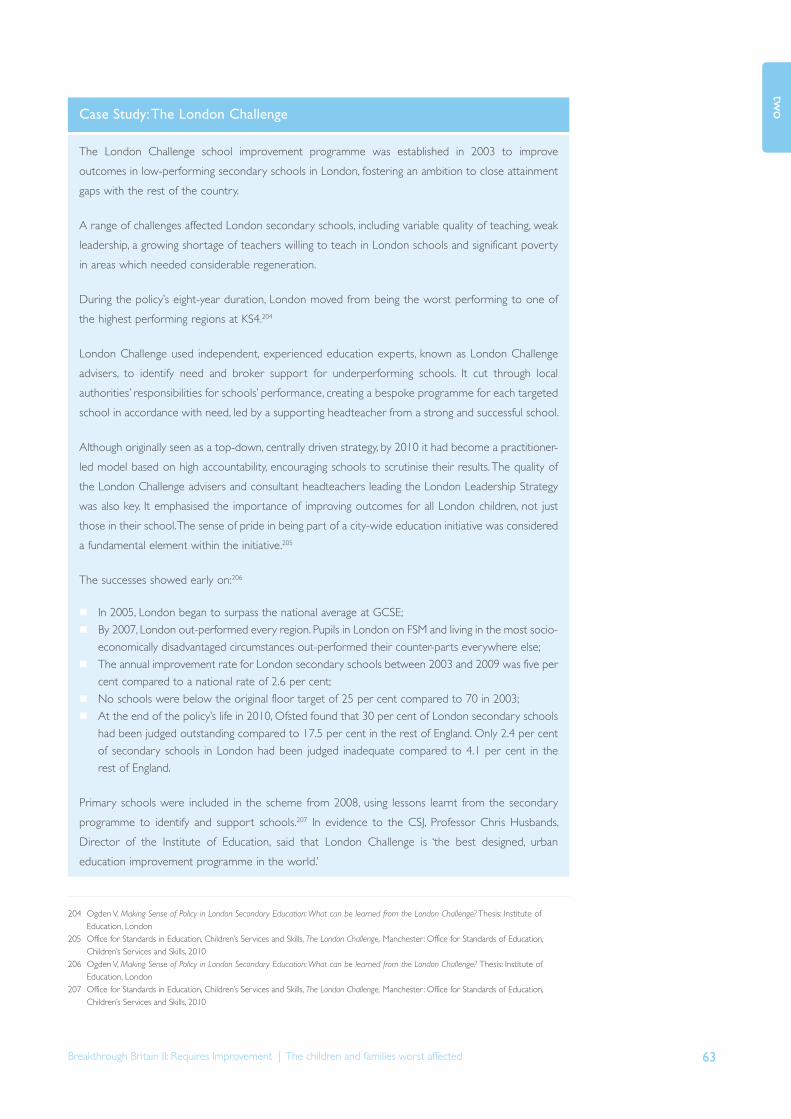
Breakthrough Britain II: Requires Improvement | The children and families worst affected 63
two
204205 206 207
204 Ogden V, Making Sense of Policy in London Secondary Education: What can be learned from the London Challenge? Thesis: Institute of Education, London
205 Office for Standards in Education, Children’s Services and Skills, The London Challenge, Manchester: Office for Standards of Education, Children’s Services and Skills, 2010
206 Ogden V, Making Sense of Policy in London Secondary Education: What can be learned from the London Challenge? Thesis: Institute of Education, London
207 Office for Standards in Education, Children’s Services and Skills, The London Challenge, Manchester: Office for Standards of Education, Children’s Services and Skills, 2010
Case Study: The London Challenge
The London Challenge school improvement programme was established in 2003 to improve
outcomes in low-performing secondary schools in London, fostering an ambition to close attainment
gaps with the rest of the country.
A range of challenges affected London secondary schools, including variable quality of teaching, weak
leadership, a growing shortage of teachers willing to teach in London schools and significant poverty
in areas which needed considerable regeneration.
During the policy’s eight-year duration, London moved from being the worst performing to one of
the highest performing regions at KS4.204
London Challenge used independent, experienced education experts, known as London Challenge
advisers, to identify need and broker support for underperforming schools. It cut through local
authorities’ responsibilities for schools’ performance, creating a bespoke programme for each targeted
school in accordance with need, led by a supporting headteacher from a strong and successful school.
Although originally seen as a top-down, centrally driven strategy, by 2010 it had become a practitioner-
led model based on high accountability, encouraging schools to scrutinise their results. The quality of
the London Challenge advisers and consultant headteachers leading the London Leadership Strategy
was also key. It emphasised the importance of improving outcomes for all London children, not just
those in their school. The sense of pride in being part of a city-wide education initiative was considered
a fundamental element within the initiative.205
The successes showed early on:206
�� In 2005, London began to surpass the national average at GCSE;
�� By 2007, London out-performed every region. Pupils in London on FSM and living in the most socio-
economically disadvantaged circumstances out-performed their counter-parts everywhere else;
�� The annual improvement rate for London secondary schools between 2003 and 2009 was five per
cent compared to a national rate of 2.6 per cent;
�� No schools were below the original floor target of 25 per cent compared to 70 in 2003;
�� At the end of the policy’s life in 2010, Ofsted found that 30 per cent of London secondary schools
had been judged outstanding compared to 17.5 per cent in the rest of England. Only 2.4 per cent
of secondary schools in London had been judged inadequate compared to 4.1 per cent in the
rest of England.
Primary schools were included in the scheme from 2008, using lessons learnt from the secondary
programme to identify and support schools.207 In evidence to the CSJ, Professor Chris Husbands,
Director of the Institute of Education, said that London Challenge is ‘the best designed, urban
education improvement programme in the world.’

The Centre for Social Justice 64
2.13 Conclusion
A great many of the factors that threaten to limit children’s chances in education are rooted
in the challenges children and their families face. Whilst, at its best, the education system can
ameliorate many or all of a child’s disadvantages, this task will be considerably easier if pupils
have stable and supportive home environments. This serves to show two things. Firstly, any
government that wishes to improve educational standards cannot do this solely through
schools but must also look to, for example, reduce family breakdown, treat addiction, and help
more people into and to progress in work. Secondly, whilst many children who are in poor
families suffer from a range of factors which may hold them back, educational failure is more
complex than financial poverty.

65
three
Breakthrough Britain II: Requires Improvement | Schools, settings and transitions
chapter threeSchools, settings and transitions
This chapter considers the state of education and education reform in settings and schools
from the early years through to post-16. This Government has embarked on one of the
most ambitious programmes of education reform since the 1940s, reviewing the early years,
introducing a Pupil Premium to boost the attainment of poorer children, rapidly expanding and
extending the Academies programme to give more schools autonomy, enabling Free Schools,
seeking to improve teaching and leadership in schools, reforming vocational education, and
seeking to improve pedagogy in Further Education. Whilst the full impact of many of these
reforms will not be felt for some time, here we look at some of these key policies that are
currently reshaping education in England, examine their potential, and start to consider areas
in which more could be done to help children fulfill their potential.
3.1 School readiness, early years and early intervention
‘The consequences of delay in the early years leads to poor educational attainment, poor literacy
skills, poor social interaction, fewer job and career prospects and a continuation of the cycle when
they become parents themselves. There are also lots of links to anti-social behaviour.’
Janet Cooper, Programme Manager at Stoke Speaks Out
The importance of early intervention cannot be overstated. As the CSJ argued in its report
Early Intervention: good parents, great kids, better citizens in 2008, early intervention not only
means problems can be addressed before they have worsened, it provides a recognised way
of making-up for the impediments that sadly, some children face early on. Education must be
seen as something that starts long before primary school.
Early intervention not only delivers better social outcomes, it is far more cost effective
to the taxpayer than reactive, ameliorative approaches. Whilst the latter have dominated
the country’s response to social problems, they only address issues once already deeply
entrenched. Prevention is always better than cure.208
208 Allen G and Duncan Smith I, Early Intervention: Good Parents, Great Kids, Better Citizens, London: Centre for Social Justice and Smith Institute, 2008

The Centre for Social Justice 66
A child’s development score at only 22 months can serve as an accurate predictor of their
education outcomes at 26.209 There is also evidence that by age three, a child’s brain is already
80 per cent developed.210 When a parent consistently fails to show their child any empathy,
the child can drop those emotions from his or her repertoire.211
Under the Coalition Government a number of reviews have considered children in the
early years, notably the Field Review of Poverty and Life Chances, the Allen Review of Early
Intervention and the Tickell Review of the Early Years Foundation Stage.
These reports have raised awareness of the importance of the early years. Frank Field MP
has called for wider recognition of the Foundation Years (pregnancy to age five) and for a
commitment to achieving high levels of ‘school readiness’ for all children regardless of family
income.212 A mother’s interaction with her child, the resources available and the feelings
transmitted – in terms of a sense of support and wellbeing, are shown to be important when
children start school at age five.213
One of the effects of the Field Review in 2010 was greater awareness of the importance of
the Foundation Years, from pregnancy to age five. It also led to a promise from both David
Cameron and Nick Clegg ‘to broaden and lengthen our concept of poverty’ and the need ‘to
look at people’s experience of poverty in all its dimensions.’214
Graham Allen MP’s review emphasised the role of the early years and the importance of
parents on children’s later outcomes. A positive initiative to have come out of the Allen
Review has been the launch of the Early Intervention Foundation.215
209 Allen G, Early Intervention: the Next Steps, London: Cabinet Office, 2011210 Ibid211 Allen G and Duncan Smith I, Early Intervention: Good Parents, Great Kids, Better Citizens. London: Centre for Social Justice and Smith
Institute, 2008212 Field F, The Foundation Years: preventing poor children becoming poor adults. The report of the Independent Review on Poverty and Life
Chances. London: Cabinet Office, 2010 213 Hamer C, NCT Research overview: Parent-child communication is important from birth, London: NCT, 2012 214 ‘PM and Deputy PM letter to Frank Field’, London: Prime Minister’s Office, 3 December 2010215 Early Intervention Foundation, Our Vision and Purpose, London: Early Intervention Foundation [accessed via: http://www.
earlyinterventionfoundation.org.uk/about-us/vision (10/08/13)]
The Early Intervention Foundation (EIF)
The EIF was launched on 15 April 2013 with cross-party support and set up by a consortium
of organisations, including the CSJ. It follows the recommendations of Graham Allen’s 2011 Early
Intervention report, championing the greater use of early intervention measures to tackle the root
causes of social problems amongst children and young people, from 0–18 years old.
‘The EIF wants every baby, child and young person to realise their potential by having the basic
social and emotional skills that most take for granted…By addressing a problem’s root causes
rather than its symptoms, we can pre-empt a problem becoming entrenched, which can lead to
better educational attainment, reduced drink and drug abuse, reduced teen pregnancies, better
parenting and lower rates of worklessness.’215

67
three
Breakthrough Britain II: Requires Improvement | Schools, settings and transitions
The Tickell Review has also had an important impact. This sought to improve the Early Years
Foundation Stage framework (introduced in 2008 and discussed below), seeking to create a
revised framework which is more flexible and more accessible.216 The influence of this review
is reflected in changes to the framework, implemented from September 2012. This seeks to
simplify the measures used and to also give parents a new progress check at age two.
Whilst the recommendations from these reviews have huge promise, it is clear that there is
still a great deal more left to do. We have consistently heard from professionals working at
primary school level about the educational disadvantages that many children continue to face.
3.2 Early Years Foundation Stage Profile
The earliest official and national measure, the Early Years Foundation Stage Profile (EYFSP),
measures children at the end of the academic year in which he or she reaches the age of
five.217
This reveals that some children have a worrying lack of development in areas like reading,
writing and problem solving. Whilst this is highly concerning, these tests only measure children’s
development after many have already been in that setting for a year. During that time, providers
will have worked hard to overcome some of the deficiencies these children arrived with.
The data do not reveal the true extent of disadvantage some children already suffer from
when they start school. To understand the scale and extent of this issue, the CSJ has obtained
supportive anecdotal evidence which sheds light on the extreme end of disadvantage
experienced in the early years. We have heard evidence of children entering Reception or
Year 1 classes unable to talk, not answering to their own name and not toilet-trained.
The EYFSP provides the most in-depth and earliest national evaluation of development.218
It measures development against 13 assessment scales (with nine points within each scale)
grouped into six areas of learning.
The worst scores were in ‘Communication, Language and Literacy: Writing.’ Here, about one
in 12 children were not working within the early learning goals. Boys performed worse than
girls, with 11 per cent of boys not exceeding three points.219 The scores reveal other deeply
concerning gaps in development:
216 Tickell C, The Early Years: Foundations for life, health and learning, London: Department for Education, 2011217 In 2008 the Early Years Foundation Stage (EYFS) was introduced with the intention of providing a framework to deliver consistent and
high quality environments for all children in pre-school settings. It is a statutory assessment for children at the end of the Foundation Stage and is a way of summing up each child’s development and learning at the end of the Reception year. Local authorities must collect and report results for all children at the end of the Foundation Stage in their maintained schools and nurseries. Results for children in private, voluntary and independent providers are only required to be reported where the child is still in receipt of Government funding at the end of the foundation stage.
218 Department for Education, Early Years Foundation Stage Profile Results in England, 2011/12, London: Department for Education, 2012. The individual scale point data is currently submitted on a voluntary basis and for 2012 data were submitted for 57 per cent of children. The statistical release notes that while the data have been assessed as representative, they are still based on a sample. There are also no checks that the individual scale points achieved conform to the requirements of the EYFSP, for example, that scale points 1–3 are achieved before the others.
219 Ibid

The Centre for Social Justice 68
�� One in 33 children cannot ‘represent some sounds correctly in writing’;
�� One in 33 children do not ‘recognise a few familiar words’;
�� 12 per cent of children could not write their own name and other words from memory;
�� Six per cent of boys do not know that in English, print is read from left to right and top
to bottom;
�� 19 per cent of children could not link sounds to letters, naming and sounding letters of
the alphabet.
A good level of development is defined here as children scoring at least 6 points across the
7 scales in Personal, Social and Emotional Development and Communication, Language and
Literacy, and achieving at least 78 points across all 13 scales.
Ofsted showed that the proportion of children achieving a ‘good level of development’ has
risen incrementally since 2007.220 However, nationally, 36 per cent of children are not achieving
a ‘good level of development.’ In some parts of the country, scores were considerably lower.221
Table 4: Ten local authorities with the lowest percentage of children achieving a good level of development, according to the EYFSP
Local Authority areaPercentage of children achieving a good level of
development, 2012
Middlesbrough 51
South Tyneside 52
Blackpool 52
Halton 54
Kingston Upon Hull, City of 55
Liverpool 55
Luton 55
Oldham 55
Telford and Wrekin 55
Tower Hamlets 55
Lack of development is associated with disadvantage. In the 30 per cent most deprived
national areas, 56 per cent of children achieved a good level of development, compared with
68 per cent for children in other areas. The gap is especially large in places like Middlesbrough:
only 44 per cent of children in the 30 per cent most deprived areas achieved the target,
compared to 66 per cent of children in all other areas in Middlesbrough – a gap of 22
percentage points. This means that poorer children here are far more likely to lag behind
their better-off peers.222
220 Office for Standards of Education, Children’s Services and Skills, Unseen children: access and achievement 20 years on, Manchester : Office for Standards of Education, Children’s Services and Skills, 2013
221 Department for Education, Early Years Foundation Stage Profile Results in England, 2011/12, London: Department for Education, 2012. This measure defines children achieving 78 points or more across the scales and at least 6 in each of the scales associated with the Personal, Social and Emotional and Communication, Language and Literacy areas of learning.
222 Department for Education, Early Years Foundation Stage Profile Results in England, 2011/12, London: Department for Education, 2012. Deprived areas refer to the 30 per cent most disadvantaged Super Output Areas in England based on the 2010 Index of Multiple Deprivation. The number of children in the deprived areas will vary considerably between local authorities.

69
three
Breakthrough Britain II: Requires Improvement | Schools, settings and transitions
Whilst some of these children may have for example, SEN or hereditary problems, experts
have told the CSJ that this does not by any means account for all children not achieving
expected levels of development.
Mary Hartshorne, Director of Outcomes and Information at I CAN, told the CSJ that:
‘We currently underestimate the size of this problem and the Early Years professionals
we work with frequently comment on the presence of extreme-level problems amongst
many of the children they see...assuming special educational needs [SEN] accounts for
all of these children is deeply misguided.’
3.3 Children entering school
These EYFSP scores show that many children are falling far short of expected levels of
development and suggest poor educational experience prior to compulsory schooling. What
makes them even more worrying is that assessments are only made at the end of the Early
Years Foundation Stage. It is likely that when the children first arrived – their development
and ‘readiness for learning’ was actually far worse.
The CSJ has gathered heart-breaking evidence of children trapped in some of the most
severe disadvantage. These children are starting school drastically behind the levels of
development expected of their age. The early years experiences endured by these children
have been so abysmal that they begin compulsory schooling absolutely not ready for learning
and, potentially, permanently disadvantaged.
Sir Robin Bosher estimates that in a school with over 50 per cent on FSM, about 25 per cent
of the reception year will be at this extreme end:
‘In one school, some children at four years old are developmentally nearer to two when
they start school and so it is important to ensure the first two terms of education help
accelerate their language as well as their social and emotional well-being, this will be the
teachers’ priority...children enter Reception with very poor language and social skills. The
children need immediate support and a bespoke curriculum if they are going to thrive at
school and catch-up. An example would be children who need to be taught how to use
a knife and fork to eat and how to sit at the table and socialise during the meal time.’
Staff told the CSJ that they are increasingly expected to deal with basic development issues
like potty-training. In some schools, we have heard that it is so common for the pupils to need
help going to the toilet that teachers must routinely carry disposable hand gloves. According
to a recent survey, 62 per cent of primary school staff in the UK have noticed an increase
in the number of children wetting or soiling themselves during the school day over the past
five years. This increased to 71 per cent amongst those working specifically with three to
five-year olds.223
223 ATL, More children starting school before they have been toilet-trained – ATL/ERIC survey, 6 February 2012 [accessed via: http://www.atl.org.uk/media-office/media-archive/More-children-starting-school-before-they-have-been-toilet-trained-ATL-ERIC-survey.asp (06/07/13)]

The Centre for Social Justice 70

71
three
Breakthrough Britain II: Requires Improvement | Schools, settings and transitions
One head said to the CSJ that:
‘...in the last three years we have had to toilet-train children who came to school in
nappies at age five. Parents ask me how we managed to do it. Many of them just can’t
be bothered, they think it’s our responsibility to do it for them.’
Matt Hannam of the Joshua Project told the CSJ that:
‘The boundaries have definitely been blurred as the understanding of what is a parental
responsibility and what is a school one have become less clear.’
Mark Edwards, Principal of Manston St James Primary Academy in Leeds estimates the
prevalence at the extreme end at approximately ten per cent of each class:
‘Sometimes I see children arriving at school aged four or five unable to string a sentence
together, almost completely unable to speak...I can easily spot which children have not
gone to nursery. They may not have benefitted from strong interactions with adults or
with other children. This means many start school much less developed in their abilities to
share, cooperate and communicate. These children then get easily frustrated, explaining
why some bite or lash-out in the classroom.’
Sir Robin Bosher also said that:
‘I see about ten per cent in each class who are so unsociable that they hurt others, adults
and other young children. You get horrible incidents where those unsociable children have
hurt another child. But they’re unsociable because they’ve no practice at being sociable.’
Another head confirmed that there were problems with identifying these problems as SEN:
‘Whilst some of these children do have special educational needs – this is often used
as an excuse for low expectations and under-preparation on the part of parents. Whilst
children with SEN are likely to make up some of these figures, this must not be used as
an “excuse” for worrying levels of underdevelopment.’
One headteacher told the CSJ that in her experience it is very common in deprived areas for
three- or four-year-olds to start school clearly unable to cope with schooling. She said that
when they get the children at age three, they commonly act like 12–18-month-olds:
‘They don’t even have the concentration to talk and say an answer in any kind of
sentence. We’ve had children that don’t answer to their name. They don’t recognise their
name...they’re not toilet-trained.’
Another head told us that most primary schools now have Foundation Stage Units, especially
those in deprived areas:

The Centre for Social Justice 72
‘When these children first arrive at the Unit, it’s common for them to babble and to not even
know their own names. By the time they’re four or five, they’re still well below but they’re
doing much better because of the fantastic work being done in the Foundation Units.’
Mary Hartshorne, director of I CAN, told the CSJ that:
‘… often these extreme developmental problems are in areas of deprivation. Those facing
deprivation often have multiple stresses to deal with, then combined with a general lack
of awareness of the importance of communicating with their children, nor of what to
expect – what is “typical development” in the early years.’
Part of the problem is that many parents are not aware of the key developmental milestones
affecting their children. This means they may think it is ‘normal’ when their children are not
reaching levels expected of their age. A survey by the Communication Trust found that only
20 per cent of parents surveyed knew that on average children talk in sentences of three to
five words at around three years.224
Janet Cooper is Programme Manager at Stoke Speaks Out, a partnership approach to tackling
the causes of language delay in the city. She said that:
‘The issue lies with the quality and quantity of the language model from birth and the security
of the emotional attachments of the child-parent. I believe most parents love their children but
do not have the knowledge and skills to promote their development fully. Parents do not always
realise the significance of the first three years when the majority of brain development is taking
place and fall foul of marketing of dummies, forward facing buggies, bottles, TV, game stations,
iPods etc.. Many parents opt for what they think is an easy life – putting the child in front of
the TV – but do not realise that this will cause them more issues in the long-run.’
Whilst families in poverty are the most at risk, Stoke Speaks Out sees increasing numbers of
children with poor listening and attention across all income groups. Janet Cooper feels this is
‘partly due to increased time pressures on families, less family conversation taking place and
224 The Communication Trust, Press release, Computers and TV Wrongly Blamed for Children’s Speech Disorders, 20 January 2011 [accessed via: http://www.thecommunicationtrust.org.uk/media/1445/communication_survey_results_31_jan.pdf (08/08/2013)]
‘Yesterday, a Year 3 boy was sent to see me by his teacher because he had deliberately urinated on the floor. We know he has lots of problems at home and often desecrates the home to get attention. All he wanted was attention and that is simply his way of communicating. When I told him that he looked “sad” he looked confused and asked me what that meant, because he had heard the word, but didn’t really understand its meaning.’ Anonymous headteacher

73
three
Breakthrough Britain II: Requires Improvement | Schools, settings and transitions
over reliance on TV and electronics at home.’ Mark Edwards, Principal of Manston St James
Primary Academy told the CSJ that:
‘Even though I see this problem in my school, and there are definitely children at this extreme
end, we have a relatively small number on FSM. This problem – issues around under-
development – should not be seen as just being about parents’ income. It goes way beyond this.’
Teachers are being expected to teach those basic necessities that most children should have
mastered before starting school. Starting from this deficit means they are spending less time on
what they should be teaching. The cumulative harms of falling behind on transitions, and playing
‘catch-up’ have been emphasised earlier. Not only is this an unproductive use of teachers’ time,
it risks fuelling resentment amongst the teaching profession.
As this section has shown, considerably more needs to be done both to help disadvantaged
young people before they arrive at primary school and to offer them support once they arrive.
A system in which some children are effectively four years behind some of their contemporaries
by the age of five will always struggle to help those children reach their full potential. The next
phase of our research will closely consider this transition between pre-school and primary school.
3.4 Early Years provision
Too many children suffer poor educational outcomes because of the disadvantages they face
at home. The CSJ has long called for greater recognition of the monumental impact the early
years have on subsequent outcomes and for more to be done to support families and improve
the quality of provision offered by the state which can help ameliorate these problems.
This is particularly important for improving outcomes for the most disadvantaged children
in society. The difference between attending high and low quality pre-school is greater for
children from disadvantaged backgrounds.225 Yet children from low-income families are less
likely to attend high quality early education and care programmes.226
By December 2012, 74 per cent of providers were judged to be good or better compared
to 65 per cent at the end of August 2009.227 Whilst improvements in early years provision
have been made they have not always been spread evenly.
The Government has introduced a welcome increase in provision for three- and four-year-
olds. These children are currently entitled to 570 hours of funded early education, usually
taken as 15 hours per week over 38 weeks. From September 2013, this will be extended to
reach the least advantaged 20 per cent of two-year-olds, aiming to increase this to around 40
225 The Panel on Fair Access to the Professions, Unleashing Aspiration: The Final Report of the Panel on Fair Access to the Professions, London: The Cabinet Office, 2009
226 Office for Standards of Education, Children’s Services and Skills, Unseen children: access and achievement 20 years on, Manchester : Office for Standards of Education, Children’s Services and Skills, 2013
227 Office for Standards of Education, Children’s Services and Skills, The Annual Report of Her Majesty’s Chief Inspector of Education, Children’s Services and Skills, Manchester : Office for Standards of Education, Children’s Services and Skills, the early years, 2012

The Centre for Social Justice 74
per cent from September 2014. A statutory duty has also been placed on local authorities
to secure early education places for eligible two-year-olds through the Education Act 2011.228
From September 2013 two-year-old children will be eligible if their family meets the income
and benefit criteria for FSM or if they are looked after by their local authority.
However, the CSJ has heard that a lack of awareness of best practice in the early years is a
major barrier to improving outcomes and provision for these children. This is an area in which
it is to be hoped that the EIF will be able to offer substantial assistance by assessing what
programmes work and their value for money translating this into practical, evidence-
based advice to local commissioners, service providers and potential investors.229 There must
be greater thought on what is most effective, and how policy can effectively target those
parents with most to gain from early years provision.
Some school leaders have told the CSJ that they would welcome the opportunity to play a
bigger role in early years provision:
3.5 School reform
Whilst families have an enormous impact on a child’s educational outcomes, the quality of our
schools is paramount. Outstanding schools can overcome so many of the other disadvantages
a child may face. The coming sections on schools, teaching and leadership examine the vital
role schools play in shaping children’s educational outcomes, considers some of the changes
already underway in the education system and asks what further steps need to be taken to
allow success to reach those groups and parts of the country that it has not yet reached.
Unsurprisingly, it is far more likely that a pupil will perform well if they go to a good or
outstanding school, regardless of their background. In particular, all things being equal, the
performance of pupils from the most deprived backgrounds can be improved by attending
the best schools.230
Overall, the quality of schools is improving. In December 2012, 74 per cent of maintained
schools were judged good or outstanding for overall effectiveness, compared with 66 per cent
228 Department for Education, Early education for two-year-olds, London: Department for Education, 2012 229 National Association for Voluntary and Community Action, Early Intervention, National Association for Voluntary and Community Action,
2013 [accessed via: http://www.navca.org.uk/early-intervention-foundation (04/07/13)]230 Deloitte, Quality Counts, What can the analysis of the national pupil database tell us about educational outcomes? London: Deloitte, 2012
‘We do a fantastic job but we only get the children once they’re four or five. I would like to see more excellent primary schools getting involved in early years provision.’Dame Sally Coates, head of Burlington Danes Academy

75
three
Breakthrough Britain II: Requires Improvement | Schools, settings and transitions
in August 2009.231 Over this period, the percentage of outstanding schools has also risen by
five percentage points, to 21 per cent.232 However, the proportion of good or outstanding
schools is 20 percentage points lower in the most deprived areas than in the least deprived
areas.233 Over two million children – 31 per cent – attend schools that fall short of being
either good or outstanding.234
3.6 The Pupil Premium
In recognition of the challenges faced by poorer children, the Coalition Government has
introduced a Pupil Premium which attempts to close the attainment gap by directing
additional funds to schools for any pupil who has been eligible for FSM at any time in the
last six years.
In 2011/12 the Pupil Premium was set at £488 per pupil, rising to £600 in 2012/13, and £900
in 2013/14. Schools are free to spend the allocated funds as they choose, though they are
held accountable for the decisions they make through performance tables which show the
performance of disadvantaged pupils compared with their peers, and through the Ofsted
inspection framework.235
‘If the Pupil Premium is to succeed in achieving its ambitious goals, the choices that
schools make in allocating the money are of vital importance.’236
Education Endowment Foundation
A recent evaluation of the programme noted that whilst it was too early to measure the
impact of the Pupil Premium on attainment, over half of all schools had introduced new
support for disadvantaged pupils as a direct result of the Pupil Premium.237
However, over 90 per cent of schools had focussed on supporting disadvantaged pupils before
the Pupil Premium and over 80 per cent said that the Pupil Premium was not enough to
fund the support they offered.238 Furthermore, many schools are not spending the funding
as effectively as evidence suggests they could. For example, over two-fifths of school leaders
surveyed said they used the money to fund teaching assistants.239 This is deeply concerning
given that teaching assistants are amongst the least effective ways of improving outcomes.240
231 Office for Standards of Education, Children’s Services and Skills, Unseen children: access and achievement 20 years on, Manchester : Office for Standards of Education, Children’s Services and Skills, 2013
232 Ibid233 Ibid234 Office for Standards of Education, Children’s Services and Skills, The Annual Report of Her Majesty’s Chief Inspector of Education, Children’s
Services and Skills, schools, Manchester : Office for Standards of Education, Children’s Services and Skills, 2012235 Department for Education, Pupil Premium – what you need to know, 22 May 2013 [accessed via: http://www.education.gov.uk/schools/
pupilsupport/premium/a0076063/pp (28/07/13)] 236 Education Endowment Foundation, About the toolkit, [accessed via: http://educationendowmentfoundation.org.uk/ (07/07/13)]237 Carpenter C et al, Evaluation of Pupil Premium: Research Report, London: Department for Education, 2013 238 Ibid 239 Office for Standards of Education, Children’s Services and Skills, The Pupil Premium: How schools are using the Pupil Premium funding to
raise achievement for disadvantaged pupils, Manchester : Office for Standards of Education, Children’s Services and Skills, 2012 240 Education Endowment Foundation, Toolkit [accessed via: http://educationendowmentfoundation.org.uk/toolkit/ (07/07/13)]

The Centre for Social Justice 76
There are also concerns the Pupil Premium does not represent ‘additional’ funding, and
instead that it is being used to plug gaps left by funding cuts rather than specifically to support
the learning of disadvantaged pupils.241 Although the pressure on budgets would have been
worse in the absence of the Pupil Premium, it forms a relatively small proportion of schools’
total income – on average, between 3.8 per cent for primary schools with high levels of FSM
and only one per cent for secondary schools with low levels of FSM.242
‘The pupil premium is excellent use of government funding because it is focussed on
closing the gap but because of cuts in other areas it is not entirely new money and may
have to be used sometimes just to sustain what is already happening.’
Dame Sally Coates, head of Burlington Danes Academy
Ofsted found that only one in ten school leaders said the Pupil Premium had significantly
changed the way they worked.243 There is broad correspondence between overall levels of
Pupil Premium funding and effects produced: ten of the 12 mainstream school leaders who
said the allocation made a significant difference were in the highest FSM quintiles, serving pupils
from backgrounds with higher than average levels of deprivation and receiving greater funding
allocations. Eight of the 11 primary school leaders who said that the Pupil Premium was making
no difference were in FSM quintiles 1 or 2: they received lower levels of funding.244
Whilst many schools do monitor the impact of support provided, improving accountability
is an important next step.245 Schools must now publish a statement for the previous year
confirming their allocation, spend and impact. The new Ofsted inspection framework also
focusses on how well gaps are narrowing within the school and in comparison to national
trends. Centrally, schools will no longer be rated outstanding unless they close their attainment
gaps – and if they fail to improve, a headteacher from a school that has closed the gap will
be brought in to advise them.
Another headteacher told the CSJ that they spend their allocation on need – even if this benefits
children who did not themselves attract the Pupil Premium. At the end of the year the school
is then forced to lie about what their allocation is spent on. In a recent survey, most schools
surveyed (91 per cent of pupil referral units, 90 per cent of special schools, 84 per cent of
primary schools and 78 per cent of secondary schools) aimed their support at all disadvantaged
pupils, according to their definition of disadvantage, of which FSM was just one part.246
3.6.1 Reforming free school meals and the Pupil Premium
The CSJ strongly supports the principles behind the Pupil Premium. We recognise that it was
important for the Government to establish it swiftly and that using FSM provided an easy and
241 Office for Standards of Education, Children’s Services and Skills, The Pupil Premium: How schools are using the Pupil Premium funding to raise achievement for disadvantaged pupils, Office for Standards of Education, Children’s Services and Skills, 2012
242 Carpenter C et al, Evaluation of Pupil Premium: Research Report, London: Department for Education, 2013243 Office for Standards of Education, Children’s Services and Skills, The Pupil Premium: How schools are using the Pupil Premium funding to
raise achievement for disadvantaged pupils, Manchester : Office for Standards of Education, Children’s Services and Skills, 2012 244 Ibid 245 Carpenter C et al, Evaluation of Pupil Premium: Research Report, London: Department for Education, 2013246 Ibid

77
three
Breakthrough Britain II: Requires Improvement | Schools, settings and transitions
simple means of allocating funding directly to schools. However, moving forward it is worth
considering whether there are better ways in which the Pupil Premium might be directed.
For a variety of reasons, not all children in poverty are currently being identified by the FSM
measure. There are also children who are not eligible despite being desperately disadvantaged
and in need. Finally, the roll-out of Universal Credit makes reform essential as it replaces many
of the benefits that currently determine eligibility.
Many children who are entitled to FSM do not claim them. These children who are not
registered by their parents constitute a ‘hidden poor’ and neither receive meals nor attract
Pupil Premium funding. Whilst estimates suggest around 1.4 million children aged 4 –15 in
England are entitled to FSM (21 per cent), only 1.2 million are registered (18 per cent).247
This means 200,000 pupils – 14 per cent of pupils eligible – are not accessing this benefit and
their schools are not receiving the Pupil Premium.248
Parents registering for FSM must fill out forms which identify the basis for their entitlement,
usually coordinated by the local authority and/or the school. Some parents are not aware of
the benefit of the meal itself or the premium it attracts, or they may not be aware that they
are eligible in the first place. However, there is a separate section of the population who are
so desperate to avoid official attention that they avoid filling out the forms which would grant
their children access to FSM. These children represent the ‘hidden poor.’ These pupils are not
only not claiming, they are not even known as being eligible.
One headteacher told the CSJ that some parents are reluctant to complete the necessary
forms to access the benefit. They want to stay below the radar for whatever reason they have.
They do not want to accept official help. The headteacher said some parents in the school have
several cash-in-hand jobs and do not want to register in case it attracts ‘unwanted attention.’
Some families are worried they may be in the country illegally and although most are here
legitimately they avoid official forms where possible. This means that many children in need of
support are going undetected. These children are not currently entitled to FSM, despite having
an obvious need.
Parents may also not register their children because of the stigma attached. Stigma reduces
the likelihood parents will register in the first place and it also reduces the likelihood children
will then eat the meals. Although the vast majority of secondary schools now use a Smartcard
or biometric system to administer school meals, some still use separate tokens, coloured trays
or artificial coins. Whilst not the case in all schools in the area, in some schools in Cumbria
for example, ‘pupils are given a token to make their own selection.’249
‘The two major factors which I believe still persist are that some families either do not
know how to access this support or in the worst of instances do not get round to doing
so; the second area is that pupils often do not want their parents to let their school know
247 Iniesta-Martinez S and Evans H, Pupils not claiming free school meals, London: Department for Education, 2012 248 Ibid 249 Cumbria County Council, Free school meals [accessed via: http://www.cumbria.gov.uk/childrensservices/schoolsandlearning/fsm.asp
(16/08/13)]

The Centre for Social Justice 78
that they are eligible for a free school meal. I believe as a society we can be creative in
finding a way to ensure those children eligible for a free school meal do so.’
Dame Dana Ross-Wawrzynski DBE
As the CSJ has argued, poverty lines form arbitrary cut-off points – which mean that children
can be defined as in or not in relative income poverty on the basis of a £1 difference in
income.250 FSM eligibility rules mean children whose family income is just above the threshold
of £16,190 are ineligible, even though they may experience many or all of the problems
experienced by children on the other side of the line.251
‘Around 50 per cent of the pupils are eligible for FSM even though the overwhelming
majority of pupils live on one of the nearby council estates. This means there may be
two pupils living next door to each other, on the same estate, with the same material
surroundings, and yet one is entitled and the other is not.’
Sir Greg Martin, Executive Head of the Durand Academy
A further complication will present itself because of the roll out of Universal Credit. In our
report, Dynamic Benefits: Towards welfare that works, we identified severe failings of the existing
benefits system, namely that counter to its aims, it disincentivises work, where the swift
withdrawal of benefits offsets any earnings from work, punishing the lowest earners trying to
earn more.252
Universal Credit represents a simplified system where there are greater rewards attached to
working under the premise that no one should ever be better-off out of work. All benefits
are paid by a single agency based in the Department for Work and Pensions, regardless of
whether a person is in work or not. It also aims to ensure that low earners do not face the
cliff-edge withdrawal of benefits that occurs under the existing system.
Avoiding cliff-edges is an important aim of an effective welfare system. The introduction
of Universal Credit necessitates reform because it means the criteria currently used to
determine eligibility must change. This is because it replaces many of the benefits that are
currently used to determine eligibility to FSM, such as Income-based Job Seekers’ Allowance
(JSA).
One of the core principles of Universal Credit is that it should be universal in order to
ensure that people can move in and out of work without facing sharp withdrawals of benefits.
Because, at present FSM still sits outside the benefits that it encompasses, the threat of its
withdrawal – at a value of £1,100 a year to a family with three children – may inhibit some
people from taking work or earning more. Consequently, it is important to examine how this
cliff-edge can be removed whilst retaining a link between income and FSM.
250 See e.g. Centre for Social Justice, Rethinking Child Poverty, London: Centre for Social Justice, 2012 251 Iniesta-Martinez S and Evans H, Pupils not claiming free school meals, London: Department for Education, 2012 252 Centre for Social Justice, Dynamic Benefits, Towards welfare that works, London: Centre for Social Justice, 2009

79
three
Breakthrough Britain II: Requires Improvement | Schools, settings and transitions

The Centre for Social Justice 80
3.7 The Academies programme
Given the importance of school quality, and the fact that not all children are attending schools
which are good enough, a variety of reforms and initiatives have been introduced to improve
standards. The expansion of Academies (and the introduction of Free Schools) is a major part
of this. There have also been ongoing attempts to increase collaboration and improve school
leadership and governance. This section discusses some of the attempts to improve school
quality, including where these have been successful and where they need to do far more.
Increased school autonomy has been a distinctive and recurring feature of English education
policy over the past 25 years. Academies – and converter academies in particular – are the
most recent and fullest manifestation of this policy first introduced with Grant Maintained
Schools in 1988. As we stated in Breakthrough Britain, the CSJ strongly agrees with the
objectives of the Academy Programme and believes that giving schools freedoms and
autonomy will enable them to innovate and flourish.253
Academies benefit from a range of freedoms not granted to other schools. For example, they
can set their own pay and conditions for staff, enjoy greater flexibility around their curriculum
and have greater flexibility on the length of term and school day. These freedoms represent
a shift away from centralised decision-making, as ‘one “move” in a more general process
of “destatization” – tasks and services previously undertaken by the state are now being
done by various “others.”254 In recognition of their newly adopted responsibilities, academies
receive the same level of per-pupil funding as they would receive from the local authority
as a maintained school, plus additions to cover services no longer provided for them by the
local authority.
The first ‘city academy’ opened in 2002 with the programme intended to benefit schools with
the lowest performance in geographic areas blighted by disadvantage, many of which had
been placed in special measures.
Expansion under the Coalition Government has been marked, forming a pivotal plank
of Michael Gove’s education reforms. The Academies Act 2010 enabled an expansion
in academies through introducing the Free Schools Programme and by enabling more
mainstream schools to convert to academy status.
When we published Breakthrough Britain in 2007,255 there were 47 academies, including 23 in
London. By May 2010 this had grown to 203, and as of August 2013, there were 3,086 academies
open in England.256 The Department for Education projects that by March 2015 ‘around one
quarter of schools will be Academies or Free Schools if conversion continues at its current rate.’257
253 Centre for Social Justice, Breakthrough Britain, Ending the costs of social breakdown, Volume 3: Educational Failure, London: Centre for Social Justice, 2007
254 Ball S J, ‘Academies, Policy Networks and Governance’, in H. Gunter (Ed.), State and Education Policy. London: Continuum Books, 2010255 Centre for Social Justice, Breakthrough Britain Ending the costs of social breakdown, Volume 3:Educational Failure, London: Centre for Social
Justice, 2007256 Department for Education, All open academies August 2013 [accessed via: http://media.education.gov.uk/assets/files/xlsx/a/all%20open%20
academies%20aug%202013%20v1%2000.xlsx (07/07/13)]257 Department for Education, The Department for Education Review Report, London: Department for Education, 2012

81
three
Breakthrough Britain II: Requires Improvement | Schools, settings and transitions
3.7.1 Academy results258 259 260
Whilst converter academies convert on the basis of their already good standards, the
opposite is true of sponsor-led academies. Sponsored academy chains have grown rapidly
with Department for Education brokers matching underperforming schools with a sponsor
that has the capacity to take on the school and turn it around.261
There have been extraordinary cases of success with examples of these academies
significantly raising attainment levels. In 1994, Mossbourne Academy, then known as Hackney
Downs School, had been labelled the worst school in the country.262 Yet by 2012, nearly 90
per cent of pupils achieved five A* to C grades at GCSE including English and mathematics,
compared with the local authority average of 60 per cent.263
In local authority maintained mainstream schools, 59 per cent of pupils achieved five A* to
C GCSEs or equivalent, including English and mathematics last year. In converter academies,
attainment was almost ten percentage points higher : 68 per cent.264
258 Department for Education, Free Schools [accessed via: http://www.education.gov.uk/schools/leadership/typesofschools/freeschools (15/08/13)]259 Department for Education, University Technical Colleges and Studio Schools, [accessed via: http://www.education.gov.uk/schools/
leadership/typesofschools/technical (15/08/13)]260 Ibid261 National College for School Leadership, The growth of academy chains: implications for leaders and leadership, Nottingham: National
College for School Leadership, 2012262 New Statesman, Hackney’s education success story, 26 August 2012 [accessed via: http://www.newstatesman.com/blogs/
staggers/2012/08/hackneys-education-success-story (18/04/13)]263 Department for Education, School and Local Statistics, Mossbourne Community Academy, 13 Jun 2013 [accessed via: http://www.
education.gov.uk/cgi-bin/schools/performance/school.pl?urn=134693 (27/06/13)]264 Department for Education, Revised GCSE and equivalent results in England: academic year 2011 to 2012, London: Department for
Education, 2013
Academies
�� Converter academies: Converter academies are existing schools which have been approved to
convert to become an academy. They became academies by choice, and are already outstanding
or good;
�� Sponsor-led academies: Sponsor-led academies have usually (though not always) had their status
forced on them because their standards are not good enough. Their governors lose control of the
school and governance and oversight is handled by the ‘sponsor’ – accredited by the Department
for Education and who tend to be charities, religious foundations, or businesses;
�� Free Schools: Free Schools are all-ability state-funded schools set up in response to what local
people or groups say they want and need in order to improve education for their community;258
�� Studio Schools: Studio Schools are schools for 14- to 19-year-olds, backed by local businesses and
employers. They focus on equipping young people with a wide range of employability skills and a
core of academic qualifications;259
�� University Technical Colleges: University Technical Colleges (UTCs) are technical academies for 14-
to 19-year-olds. They specialise in subjects that need modern, technical, industry-standard equipment
– such as engineering and construction, taught alongside business skills and the use of ICT.260
These initiatives will each be discussed in greater detail in the sections to follow.
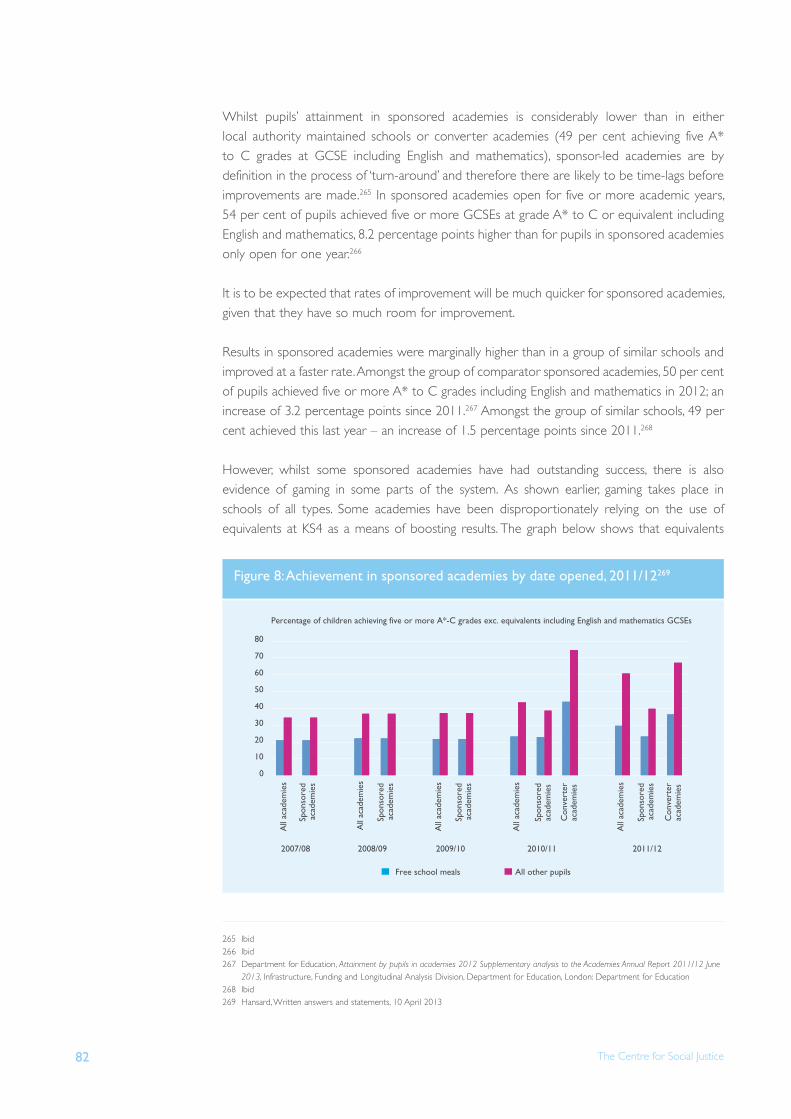
The Centre for Social Justice 82
Whilst pupils’ attainment in sponsored academies is considerably lower than in either
local authority maintained schools or converter academies (49 per cent achieving five A*
to C grades at GCSE including English and mathematics), sponsor-led academies are by
definition in the process of ‘turn-around’ and therefore there are likely to be time-lags before
improvements are made.265 In sponsored academies open for five or more academic years,
54 per cent of pupils achieved five or more GCSEs at grade A* to C or equivalent including
English and mathematics, 8.2 percentage points higher than for pupils in sponsored academies
only open for one year.266
It is to be expected that rates of improvement will be much quicker for sponsored academies,
given that they have so much room for improvement.
Results in sponsored academies were marginally higher than in a group of similar schools and
improved at a faster rate. Amongst the group of comparator sponsored academies, 50 per cent
of pupils achieved five or more A* to C grades including English and mathematics in 2012; an
increase of 3.2 percentage points since 2011.267 Amongst the group of similar schools, 49 per
cent achieved this last year – an increase of 1.5 percentage points since 2011.268
However, whilst some sponsored academies have had outstanding success, there is also
evidence of gaming in some parts of the system. As shown earlier, gaming takes place in
schools of all types. Some academies have been disproportionately relying on the use of
equivalents at KS4 as a means of boosting results. The graph below shows that equivalents
265 Ibid266 Ibid267 Department for Education, Attainment by pupils in academies 2012 Supplementary analysis to the Academies Annual Report 2011/12 June
2013, Infrastructure, Funding and Longitudinal Analysis Division, Department for Education, London: Department for Education 268 Ibid269 Hansard, Written answers and statements, 10 April 2013
0
10
20
30
40
50
60
70
80
All
acad
emie
s
Spon
sore
d ac
adem
ies
All
acad
emie
s
Spon
sore
d ac
adem
ies
All
acad
emie
s
Spon
sore
d ac
adem
ies
All
acad
emie
s
Spon
sore
d ac
adem
ies
Con
vert
er
acad
emie
s
All
acad
emie
s
Spon
sore
d ac
adem
ies
Con
vert
er
acad
emie
s
2007/08 2008/09 2009/10 2010/11 2011/12
Free school meals All other pupils
Percentage of children achieving five or more A*-C grades exc. equivalents including English and mathematics GCSEs
Figure 8: Achievement in sponsored academies by date opened, 2011/12269
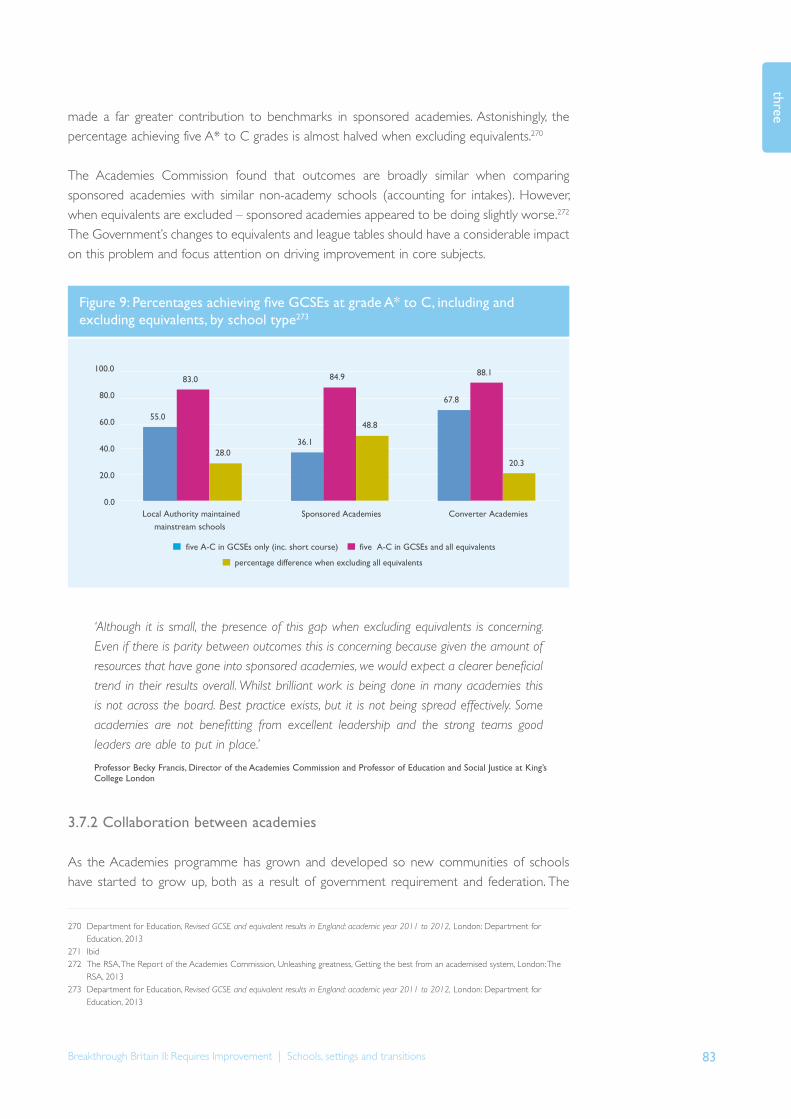
83
three
Breakthrough Britain II: Requires Improvement | Schools, settings and transitions
made a far greater contribution to benchmarks in sponsored academies. Astonishingly, the
percentage achieving five A* to C grades is almost halved when excluding equivalents.270
The Academies Commission found that outcomes are broadly similar when comparing
sponsored academies with similar non-academy schools (accounting for intakes). However,
when equivalents are excluded – sponsored academies appeared to be doing slightly worse.272
The Government’s changes to equivalents and league tables should have a considerable impact
on this problem and focus attention on driving improvement in core subjects. 273
‘Although it is small, the presence of this gap when excluding equivalents is concerning.
Even if there is parity between outcomes this is concerning because given the amount of
resources that have gone into sponsored academies, we would expect a clearer beneficial
trend in their results overall. Whilst brilliant work is being done in many academies this
is not across the board. Best practice exists, but it is not being spread effectively. Some
academies are not benefitting from excellent leadership and the strong teams good
leaders are able to put in place.’
Professor Becky Francis, Director of the Academies Commission and Professor of Education and Social Justice at King’s College London
3.7.2 Collaboration between academies
As the Academies programme has grown and developed so new communities of schools
have started to grow up, both as a result of government requirement and federation. The
270 Department for Education, Revised GCSE and equivalent results in England: academic year 2011 to 2012, London: Department for Education, 2013
271 Ibid 272 The RSA, The Report of the Academies Commission, Unleashing greatness, Getting the best from an academised system, London: The
RSA, 2013273 Department for Education, Revised GCSE and equivalent results in England: academic year 2011 to 2012, London: Department for
Education, 2013
55.0
36.1
67.8
83.0 84.9 88.1
28.0
48.8
20.3
0.0
20.0
40.0
60.0
80.0
100.0
Local Authority maintained mainstream schools
Sponsored Academies Converter Academies
five A-C in GCSEs only (inc. short course) five A-C in GCSEs and all equivalents
percentage difference when excluding all equivalents
Figure 9: Percentages achieving five GCSEs at grade A* to C, including and excluding equivalents, by school type273

The Centre for Social Justice 84
CSJ has heard that there are strong advantages to such communities as they can spread best
learning and best practice from school to school.
Every school converting to academy status will have committed to supporting another school,
whether through a formal chain or more informal arrangement. There are three main types
of collaborative structures for converting:274
�� Multi-academy trust: the strongest and most formalised type of collaboration, where all
schools are governed by one trust and one board of directors;
�� Umbrella trust: schools of different categories set up their own individual academy trusts,
but where representatives can provide shared governance and collaboration for the
schools within the trust;
�� Collaborative partnerships: schools convert as single academy trusts, and there is no shared
trust or formalised governance structure.
This is a promising initiative. However the Academies Commission has found that not all of
the good and outstanding schools that have converted since 2010 as standalone academies
are fulfilling their commitment to supporting other schools to improve.275 The Commission
found that amongst some converter academies, efforts to support other schools were not
always prioritised.276
Chains are partnerships of academies that have made a commitment to supporting each
other and raising educational standards.277 The Commission also said it was wise for chains
to expand slowly, in order to ensure they continued to support their current schools
where improvement was still needed. This appears to suggest the importance of chains not
expanding too quickly.278
The degree of integration and reasons for collaboration vary.279 In some cases, a high-performing
school will join a weaker school to help raise standards (a ‘performance federation’) or they
may do so because of a shared ethos, such as religion (‘faith federations’).280 Often the prime
motivation is financial: a federation can help its member schools save money, particularly from
economies of scale in procurement.281
Chains are important because, where they are effective, they lead to better collaboration
between schools and, ultimately, are more likely to lead to better outcomes for pupils.
Academies in chains perform better than standalone, sponsored academies. Of the sponsor-
274 Department for Education, Academy Chains FAQs, 20 July 2012 [accessed via: http://www.education.gov.uk/schools/leadership/typesofschools/academies/secondary/faqs/a00204883/academy-chains-faqs#faq2 (10/08/13)]
275 The RSA, Report of the Academies Commission, Unleashing greatness, Getting the best from an academised system, London: The RSA, 2013
276 Ibid 277 Department for Education, Academy Chains FAQs, 20 July 2012 [accessed via: http://www.education.gov.uk/schools/leadership/
typesofschools/academies/secondary/faqs/a00204883/academy-chains-faqs#faq2 (10/08/13)] 278 Ibid279 School Enterprise, Safety in numbers, [accessed via: http://www.school-enterprise.com/strategic/legal/federation.html (17/07/13)]280 Ibid281 Ibid

85
three
Breakthrough Britain II: Requires Improvement | Schools, settings and transitions
led academies inspected by 31 August 2012, 25 per cent of those in chains were judged
outstanding, compared with only 8 per cent not in chains.282
Sam Freedman, a director at Teach First and former adviser to Michael Gove, told the CSJ that
chains can usually turn around weaker schools as, once they have a model that works, they
can quickly use it to turn another school around.
This in part reflects the greater resources and expertise chains have to invest in leadership
as well as their greater opportunities for collaboration which can drive improvement
and support the dissemination of best practice. As a continuation of this, the Coalition
Government has called for a shift towards new localism, where family clusters of schools are
part of a self-improving system.283 This reflects a situation where schools work together and
collaborate, moving away from greater local authority control and centralised decision making.
However, the CSJ has heard concerns that academy chains are still reluctant to reach out to
some of the most deprived and disadvantaged communities. Whilst the number of academies
has flourished in London, this has not been the case in other parts of the country. This is
important because in London, the Academies programme is considered to have had a
profound effect on results. The most successful academy chain providers, run by the Harris
Federation and Ark schools, are concentrated in the capital.
There is clearly further scope and need to extend best practice and learning into parts of
the country experiencing acute educational disadvantage. Of the 25 authorities that do not
have an academy in a chain, ten score worse than the national average for five A* to C grades
at GCSE including English and mathematics. Of these ten, three – Knowsley, Blackpool and
Hartlepool – are in the ten worst performing local authority areas in the country.284
As one source told the CSJ:
‘Federation is better in London...There are a number of reasons, partly it’s because they
don’t have the level of turnover they have in London, but also because of an attitude and
a mindset on their part. They’re just not as dynamic.’
This is a missed opportunity. It is imperative that government does more to encourage
and incentivise successful chains to take their skills and expertise into more areas of great
disadvantage.
The Academies reforms show great promise; giving schools the autonomy to flourish and
excel is a positive step. However, far more remains to be done. It is important to ensure that
perverse incentives do not creep into the system, meaning that schools can deliver good
282 Office for Standards of Education, Children’s Services and Skills, The Annual Report of Her Majesty’s Chief Inspector of Education, Children’s Services and Skills, schools, Manchester : Office for Standards of Education, Children’s Services and Skills, 2012
283 Hadfield M and Jopling M, School-led networking and collaboration: Problems and possibilities, University of Wolverhampton, [accessed via: http://www.wlv.ac.uk/default.aspx?page=31171 09/08/13)]
284 Hansard, Deposited paper [accessed via: http://data.parliament.uk/DepositedPapers/Files/DEP2012-1883/Chains_Data_121102forPQ.xls (20/08/13) https://www.gov.uk/government/uploads/system/uploads/attachment_data/file/219338/sfr04-2013ntla.xls]

The Centre for Social Justice 86
results and valued outcomes for all pupils. Greater thought must also be given to how more
of the best chains and sponsors can be drawn to disadvantaged parts of the country, and
how the Academies programme can support the large number of primary academies in need
of support.
3.7.3 New types of academy
The Coalition has extended the Academies programme in a number of ways. It has allowed
primary and special schools to acquire academy status as well as allowing new, community
inspired schools – Free Schools – to be set up. This section looks at the progress, potential
and remaining barriers to success of these schools.
3.7.3.1 Primary academiesIn 2010, the academy scheme was applied to primary schools. By January 2013, there were a total
of 1,006 primary academies – only around six per cent of England’s 16,784 state-funded primary
schools.285 Perhaps unsurprisingly, the CEOs of larger sponsored chains (ten or more academies)
see most of their growth over the next three years being in the primary sector.286
One reason why academisation has so far had a greater impact on secondary schools is because
secondary education tends to attract far greater attention. As one head said to the CSJ:
‘Secondary schools politically always have so many more brownie points, because of
16-year-olds and GCSEs. It’s much more measurable.’
The CSJ has also been told that Church of England control of a large number of primary
schools has inhibited greater primary academisation. Approximately one million children
attend Church of England schools and 25 per cent of all primary and middle schools are
controlled by the Church of England.287 One source said that:
‘Some dioceses are very resistant to change – as bad as the worst local authorities. It’s
something that politicians find very difficult to talk about because they don’t want to have
a row with the Church... it’s a real issue.’
There remains an urgent need for greater focus on improving primary education. Not enough
children have access to high quality primary education. Given the importance of transitions,
this is a worrying trend. 1,300,703 pupils are attending primary schools rated satisfactory or
inadequate.288
285 Department for Education, Schools, Pupils and their Characteristics: January 2013, London: Department for Education, 2013286 National College for School Leadership, The growth of academy chains: implications for leaders and leadership, Nottingham: National
College for School Leadership, 2012 287 The Church of England, The Church School of the Future Review, a Archbishops’ Council Education Division, 2012 [accessed via http://
www.churchofengland.org/education/church-schools-academies.aspx and via: http://www.churchofengland.org/education/church-schools-academies.aspx (07/07/13)]
288 Office for Standards of Education, Children’s Services and Skills, The Annual Report of Her Majesty’s Chief Inspector of Education, Children’s Services and Skills, schools, Manchester : Office for Standards of Education, Children’s Services and Skills, 2012

87
three
Breakthrough Britain II: Requires Improvement | Schools, settings and transitions

The Centre for Social Justice 88
Access to high quality primary education is not evenly spread across the country. Ofsted
found that over 80 per cent of children in Dorset attend primary schools that are good or
outstanding compared to only 56 per cent in North East Lincolnshire. This inequality is also
more likely to affect disadvantaged communities: only seven per cent of schools in the primary
phase serving the most disadvantaged communities were judged outstanding.289
It is positive if good secondary schools support improvements in their local primary schools.
However, this cannot form the solution in its entirety. As primary schools tend to be much
smaller, there are not enough outstanding secondary schools to support the large number of
primaries in need of support.
It is also misguided to assume that what works in secondary schools can be easily transferred
to primary schools. Failing primary schools require specific expertise and leadership on what
works in primary education. This includes delivering high quality teaching in a primary setting
and expertise in curriculum design and pedagogy. Sir Robin Bosher, Director of Primary
Education at the Harris Federation of Academies, told the CSJ that until recently even
successful chains neglected the importance of this. Exploring ways in which primary schools
can be better included in the family of academies is a major challenge for the next five years.
3.7.3.2 Free Schools The CSJ supports the ethos of the Free Schools programme, having recommended the
initiative in our 2007 paper, Breakthrough Britain: Educational Failure.290 We called for Pioneer
Schools to offer free education on a non-selective basis within the state system, but not
subject to local authority sanction or control. These schools were to be free to recruit and
remunerate employees and teachers would be free to employ imaginative methods. We
strongly hoped that they would offer an opportunity to parental and third sector groups
to find innovative solutions to deeply entrenched educational failure by setting up new
schools.291
Technically, Free Schools are academies created in direct response to local demand. They
can be primary or secondary schools and can be established by a wide range of proposers
including charities, universities, parent groups, businesses, educational groups and teachers.
Similar to converter academies, they have a large degree of autonomy and in some cases,
even more. They are expected to be open to all pupils of all abilities in a given area.292
The first group of 24 Free Schools opened in September 2011 with the number operating
slowly increasing. By the 2012/13 school year, there were approximately 10,170 pupils in Free
Schools.293
289 Ibid 290 Centre for Social Justice, Breakthrough Britain Ending the costs of social breakdown, Volume 3:Educational Failure, London: Centre for Social
Justice, 2007291 Ibid 292 Deloitte, Quality Counts, What can the analysis of the national pupil database tell us about educational outcomes? London: Deloitte, 2012 293 Department for Education, Schools, pupils and their characteristics January 2013, London, Department for Education, 2013

89
three
Breakthrough Britain II: Requires Improvement | Schools, settings and transitions
92 Free Schools are set to open in September 2013.294 Michael Gove has also approved 102
new Free School applications to open in 2014 and beyond – delivering approximately 50,000
new school places.295 In his recent spending review the Chancellor announced funding for
180 new Free Schools in 2015–16.296 However, there are no official government estimates
on the number projected to open long-term. This reflects the ethos of the programme as
something designed to meet local demand – rather than something driven from within
central government.
The initiative is so new that the success of the programme is, as yet, unclear. However, the
first 24 Free Schools have all had their Ofsted inspection results recently published, with three
quarters of these rated good or outstanding.297
This is positive, but there is a sense that the programme has stalled and not made as great an
impact as it could have. One of the most substantial barriers has been the lack of appropriate
or available buildings. This not only makes the programme expensive, but can present real
challenges to those wanting to set up schools in areas where appropriate buildings are either
not available, or where there are delays to them being used. This is especially problematic in
places like London.
The CSJ has been told that the main limiting factor on the size of the programme has been
the quality of applications: with better applications there could have been around 150 to
200 Free Schools a year. Setting up a Free School requires a lot of time and expertise. The
organisations best placed to do this are therefore charities – yet at present a surprisingly small
proportion of Free Schools are set up by charities.
Of the Free Schools which opened in September 2012: 12 were set up by teachers, 19 by
parent or community groups, and 13 by existing education providers. However, only nine
were set up by charities.298 Of the 102 opening in 2014, 70 of these are being set up by
teachers, existing schools, and educational organisations, whilst only 32 are being set up
by parents, community, charity and other groups. 46 of these new schools will also be in
London.299 This is deeply disappointing. The CSJ had hoped that more charities would come
forward to set-up Free Schools in disadvantaged areas across the country.
We have been told by a number of charities that they may be interested in being involved
in the creation of Free Schools once the programme is more established. Few charities were
eager to be trailblazers and face the subsequent risk to reputation and future fundraising.
294 Department for Education, Information for free schools in the pre-opening stage, 15 July 2013(accessed via: http://www.education.gov.uk/schools/leadership/typesofschools/freeschools/b00222077/pre-opening (19/08/13)]
295 Department for Education, Press Release, More than 100 free schools applications approved, 22 May 2013 [accessed via: https://www.gov.uk/government/news/more-than-100-free-schools-applications-approved (19/08/13)]
296 HM Treasury, Spending Round, London: The Stationery Office, 2013 297 Department for Education, Press Release, Three-quarters of free schools rated good or outstanding by Ofsted at first inspection, 1 August
2013 [accessed via: https://www.gov.uk/government/news/three-quarters-of-free-schools-rated-good-or-outstanding-by-ofsted-at-first-inspection (05/08/13)]
298 Data supplied by the Department for Education299 Department for Education, Press Release, More than 100 free schools applications approved, 22 May 2013 [accessed via: https://www.gov.
uk/government/news/more-than-100-free-schools-applications-approved (19/08/13)]

The Centre for Social Justice 90
‘I’m not surprised that there are so few. This is partly due to the application forms that
need to be completed which do not make it easy at the start of the process. Those
who are not educationalists may need to buy in additional support in the completion
of such a form.... in the process of forming a Free School there are many hurdles to get
over to do with land, perhaps build or refurbishment and the monies for this is tight with
accommodation developed to a formula rather than need. Staffing also needs to be done
in phases and in secondary schools this is difficult in attracting good staff if you can only
in the first few years offer a small part-time growing to full-time over several years. Your
good teachers who have mortgages and other financial pressure cannot just take part-
time for two or three years until the school fills up to its full capacity.’
Dame Dana Ross-Wawrzynski DBE
Because Free Schools are set up in response to local demand, applications may not be
approved in those areas of greatest educational need, where parents are disengaged from
education, or where the shortage of school-places is most acute. There have been more than
three times as many applications per 1,000 16-year-olds in Greater London than in the North
East.300 This is significant given that, as shown, London already has some of the best schools in
the country, even within disadvantaged areas.
The initiative is also not serving the poorest and most disadvantaged pupils as equitably
as it might. In January 2012, the vast majority of existing Free Schools had lower than the
local average number of pupils on FSM. Of 18 primary Free Schools, only five had above
the national average number of children eligible for FSM. Of the six secondary schools, only
two did.301 Clearly more needs to be done in order to ensure that Free Schools benefit the
neediest – rather than just the most demanding – communities.
3.7.3.3 Alternative Provision (AP) and Pupil Referral Units (PRUs)There has long been a demand for fresh practice within this part of the education system.
Approximately 5,000 pupils are permanently excluded every year,302 but considerably more
are given fixed-period exclusions. Last year 304,370 children were temporarily excluded
(what is known as a fixed-period exclusion), and 162,400 pupils received one or more fixed-
period exclusions.303 They represent one of the most disadvantaged groups in the education
system. Last year, only 1.3 per cent of pupils in AP (including PRUs) attained five A* to C
grades including English and mathematics, compared with 58.8 per cent of pupils in state-
funded schools.304
As already discussed, the catastrophic outcomes experienced by many often reflect a
combination of low expectations, low quality provision and a harmful environment at home.
300 Financial Times, Free school applications higher in London, 24 February 2013301 Hansard, Written Answers and statements, 13 May 2013302 Department for Education, Permanent and Fixed Period Exclusions from Schools and Exclusion Appeals in England, 2011/12, London:
Department for Education, 2013303 Ibid 304 Department for Education, Revised GCSE and equivalent results in England: academic year 2011 to 2012, London: Department for
Education, 2013 (see table P1). Pupils also registered at an institution included within the Secondary School Performance Tables are excluded. As set out by the data, common reasons for a young person receiving alternative provision include exclusion from mainstream schools, medical needs or school refusal.

91
three
Breakthrough Britain II: Requires Improvement | Schools, settings and transitions
‘We work with these children to build positive relationships. Often they grow up with an
expectation that they won’t amount to much. They’ve experienced low expectations at
home and negative relationships with adults. Many of the children here have been let
down by an adult at some point in their life.’
Seamus Oates, Executive Head of the TBAP Multi-Academy Trust and The Bridge Alternative Provision Academy
Negative outcomes are also evident when these children reach adulthood. A survey of young
people in custody found that 86 per cent of young men and 82 per cent of young women
said they had been excluded from school.305
High quality AP is seen as that where, for example, there is a specific focus on literacy and
numeracy at an appropriate level. Other features identified include good arrangements in
working with other relevant services such as social care, and a goal of reintegrating pupils into
mainstream education when they are ready.308
Seamus Oates, Executive Head of the Bridge Alternative Provision Academy, rated outstanding
by Ofsted, told the CSJ that their success is rooted in excellent leadership, teachers and a
relentless dual focus on both academics and the development of positive relationships. It
is important that academic attainment is on par with mainstream schools – particularly in
English and mathematics. Retaining an academic focus also means others see the provider as
a school, making it less stigmatising for the children who attend.
Unfortunately, inspirational examples of good practice like this do not constitute the norm. Too much of the provision available is poor quality.309 Indeed, children can be placed in a PRU
for a great variety of reasons.
Children may go to a PRU if they have been excluded from school, are not attending school for
other reasons because they are disengaged at mainstream school or because they are not gaining
qualifications at school. Many of the children attending PRUs have SEN and many also have
statements of SEN – which are usually for emotional and behavioural difficulties. Some of these
children may be gradually introduced back into mainstream schools or into special schools.310
305 Summerfield A, Children and Young People in Custody 2010–11, London: HM Inspectorate of Prisons and Youth Justice Board, 2011306 Taylor C, Improving Alternative Provision, London: Department for Education, 2012307 Department for Education, Schools, pupils and their characteristics January 2013, London: Department for Education, 2013308 Ibid 309 Ibid 310 Kent City Councils, Pupil referral units, Online, Kent City Council, 2013 [accessed via: http://www.kent.gov.uk/education_and_learning/
school_attendance__behaviour/exclusion_or_suspension/alternatives_to_school/pupil_referral_units_prus.aspx (07/08/13)]
Alternative Provision
The Department for Education defines AP as education arranged by local authorities for
pupils who, because of exclusion, illness or other reasons, would otherwise not receive suitable
education.3056Provision available varies, from therapeutic independent schools for children with severe
behavioural emotional and social difficulties (BESD) to very small local providers offering training in
car maintenance. PRUs are also a form of AP: in January 2013 there were 12,950 pupils in PRUs.307

The Centre for Social Justice 92
Recognition of poor outcomes has led the Government to introduce a number of reforms
that seek to improve provision in the sector. Whilst these are welcome, they are at such an
early stage that their effects remain to be seen.
In 2011, Charlie Taylor, the Government’s behaviour expert, was asked to conduct a review of
existing AP and to make recommendations that would improve outcomes for these children.
The premise of the review was that ‘the focus of pupil referral units and alternative provision,
just as it is in schools, should be about getting high quality education for all pupils and the
best value for public money.’311
In keeping with the wider drives to increase autonomy in the education system, the
Government believes that greater autonomy is a key way of raising standards for these
children. PRUs are being offered the opportunity to take control of their budgets, staffing
decisions and other freedoms offered by academy status.312
Since February 2012, PRUs have been able to register an interest in converting to Academy
status with the first PRU opening as an AP Academy on November 2012.313 There are already
14 PRUs with Academy status314 and a further 15 applications have been approved.315 The
Secretary of State may also make an Academy Order for a PRU issued with a notice by
Ofsted that it requires special measures or significant improvement (i.e. a failing PRU).316
Charlie Taylor has recommended that:
‘By 2018, the only PRUs remaining would be those where maintenance by the LA [local
authority] added value to the operation of the PRU.’317
Since 1 April 2013, the way funding is allocated to PRUs has also changed: PRU management
committees now have delegated budgets, as well as responsibility for all other financial
decisions necessary to manage and spend budgets effectively. This puts them on par with
mainstream schools. Direct state-funded AP institutions receive base funding of £8,000 per
place, topped up by funding from the commissioning local authority or school for each pupil
admitted.318 Primary responsibility for the recruitment and management of staff now also
rests with the PRU management committee.
John d’Abbro OBE, head of the New Rush Hall School, is positive about these changes, but
is concerned that:
311 Taylor C, Improving Alternative Provision, London: Department for Education, 2012 312 Ibid 313 Department for Education, Academies Annual Report, Academic Year: 2011/12, London: The Stationery Office, 2013 314 Department for Education, All open academies August 2013 [accessed via: http://media.education.gov.uk/assets/files/xlsx/a/all%20open%20
academies%20aug%202013%20v1%2000.xlsx (07/07/13)]315 Department for Education, Publication list for converter academies, 05 August 2013 [accessed via: http://media.education.gov.uk/assets/files/
xlsx/p/publication%20list%20for%20converter%20academies%20aug%202013%20v2%2000.xlsx (18/08/13)]316 Department for Education, Consultation on the Education (Pupil Referral Units) (Application of Enactments) (England) (Amendment)
Regulations, London: Department for Education, 2012 317 Taylor C, Improving Alternative Provision, London: Department for Education, 2012318 Department for Education, Funding Alternative Provision – Frequently Asked Questions, London: Department for Education [accessed via:
http://media.education.gov.uk/assets/files/pdf/f/faqs%20-%20funding%20alternative%20provision.pdf (18/08/13)] The amount of the top-up is a local decision based on services provided to meet the needs of the individual child and any additional overheads not covered by the base funding

93
three
Breakthrough Britain II: Requires Improvement | Schools, settings and transitions
‘in the short term some schools will think they can provide it [AP] cheaper themselves
and then they’ll realise they can’t and come back to us.’
If schools seek to cater for pupils who need AP ‘on-site’ they may also fail to provide sufficient
physical separation for those pupils where gang membership and negative peer influences are
part of the problem and may risk creating a ‘sin-bin’ mentality among schools.
The headteacher of one PRU told the CSJ that only giving PRUs the top-up when pupils are
on-site is unreasonable – as they have to plan ahead and pay teachers. If policy-makers want
provision to be high-quality, providers need to be able to plan ahead. There are concerns that
the value of the top-up is ambiguous, failing to reflect that in London there are higher costs,
higher salaries and according to the headteacher, more complex needs.
Robert Loach, deputy headteacher of Harrogate PRU points to another concerning issue.
Special schools receive £2,000 more per-place than PRUs, even though a large proportion of
pupils in PRUs have SEN. He told the CSJ that even though special schools are often not able
to manage these children on more money, local authorities are sending pupils with statements
of SEN to PRUs because it is cheaper.
It will be important that these reforms avoid the risk of schools avoiding exclusions wherever
possible even when children with complex needs would be better served in a specialist
setting. When these children stay in the system too long their needs increase and the
education of everyone around them suffers. Amanda Spielman, Chair of Ofqual and Education
Adviser for ARK Schools, told the CSJ that:
‘these are often the most vulnerable children, but that doesn’t mean that it is only their
needs that should be considered to the exclusion of other children’s.’
John d’Abbro told the CSJ that ‘we should not see AP as a dirty word and stigmatise those
for whom actually, a period away can be a good thing.’ Author and teacher, Tom Bennett has
referred to the ‘idiot sentiment’ that children must be retained in school no matter what –
under a climate where exclusion translates as a school’s failure.319
To avoid this, providers will need the knowledge and expertise to deal adequately with their
new responsibilities and budgetary autonomy. The Bridge AP Academy is one of the first
providers to gain Academy status. Whilst outstanding providers like this have been able to
take advantage of overall changes in the sector, its head, Seamus Oates, is concerned that:
‘other PRUs may not have the leadership and expertise to break away from the local
authority – which have historically acted as providers’ “line managers.” Issues around
having your own budget are complex and new, even for us. In theory – it’s good, but in
practice, it can be very challenging.’
319 TES Connect, Better out than in: why exclusions are often the answer, 3 March, 2013 [accessed via: http://www.tes.co.uk/article.aspx?storyCode=6322545 (07/05/13)

The Centre for Social Justice 94

95
three
Breakthrough Britain II: Requires Improvement | Schools, settings and transitions
3.7.3.4 Improving AP accountabilityAnother important reform has been an attempt to improve accountability for excluded
children. One reason for poor outcomes has been the lack of clarity over who is accountable
for these children’s outcomes. Parents must currently supervise their child for the first five
days of exclusion. On the sixth day, the local authority assumes responsibility for providing
full-time education for the pupil. Charlie Taylor’s review noted evidence of a lack of care in
the commissioning of AP, where one-third of schools did not visit the provider before they
placed a pupil. He also noted that some schools or local authorities were drawn to cheap
provision, with price not quality as the primary magnet.320
To address this, in 2011 the Department for Education announced a three-year school
exclusion trial where schools are responsible for finding and funding AP themselves. They
may for example, buy places from the local authority, the voluntary sector or local colleges,
or collaborate with other schools to provide suitable places themselves. Critically, schools will
remain accountable for those pupils they exclude – whose academic performance will still
count on the school’s performance tables. It is hoped that this will also incentivise schools to
avoid exclusion where possible.
The trial aims to improve pupil outcomes by boosting accountability and testing new
approaches for an evidence-based exclusions policy for the future. Schools involved in the
trial take statutory responsibility for commissioning the most appropriate placement and local
authorities devolve a proportionate amount of Dedicated Schools Grant for individual schools
to fund their new responsibilities. Around 300 schools in 11 local authorities are taking part.321
Chris Whitfield from Wiltshire Council told the CSJ that:
‘the trial has enabled Schools, Alternative Providers and the local authority to work in
partnership for the benefit of vulnerable young people in our care. There is improved
shared accountability and schools are working together to develop a more preventative
approach.’
This is positive given the best schools tend to focus on early intervention.322
Cambridgeshire devolved funding for out-of-school provision well in advance of the trial.
Howard Gilbert, head of St Ivo School, said that doing this has meant schools are now
more closely connected to those referred, receiving reports on attainment, behaviour and
attendance.
Good Quality Assurance is essential to the success of this approach as commissioners will
need access to the right information in order to be able to decide which provision is right
for individual pupils and their needs.
320 Taylor C, Improving Alternative Provision, London: Department for Education, 2012321 Department for Education, school exclusion trial 2011–14, 25 June 2012 [accessed via: http://www.education.gov.uk/schools/pupilsupport/
behaviour/exclusion/b00200074/exclusion-trial (02/07/13)]322 Taylor C, Improving Alternative Provision, London: Department for Education, 2012

The Centre for Social Justice 96
‘Good Quality Assurance must look at indicators like how many [pupils] become NEETs,
or how many end up in prison. If placements don’t end with reintegration into mainstream
school – the school should still record information on destinations. If someone’s predicted
to get ten GCSEs and gets two – this is a disaster. But if they’re predicted to commit
suicide or be drug dependent – and they get two – that’s a massive achievement.’
John d’Abbro, head of the New Rush Hall School
Children in AP and those excluded from school are amongst the most vulnerable in the
education system – they are also amongst those most likely to suffer poor outcomes later
in life. Getting provision for them right is absolutely essential if we are to break the cycles of
disadvantage that many of them face. The Government’s reforms in this area are extremely
promising, however it is essential that commissioners are equipped to find the most
appropriate settings for children and are monitored to ensure that they are fulfilling this duty.
3.8 Teaching and teacher quality
The quality of teaching is the most important school-based factor affecting pupils’ educational
outcomes; as supported by international evidence.323 In polling carried out by the CSJ/
YouGov, 59 per cent of people said they had had at least one teacher whose contribution to
their education has had a lasting, positive impression on their life.324
The effects of high quality teaching are especially great for pupils from disadvantaged
backgrounds: over the course of one year a good teacher can add 18 months of learning
to a student from a disadvantaged background, compared with six months for a less able
teacher.325 Over the same period, pupils with a very effective mathematics teacher gain 40
per cent more learning than those with a poorly performing one.326
The impact is particularly great for those for whom school is the only place where they have
a supportive learning environment. For them, school represents the only place where their
disadvantages can be offset.
There is evidence that the quality of teaching is improving. Between the end of 2008 and
2012, the proportion of schools judged to have good or outstanding teaching at their latest
323 Department for Education, The Importance of Teaching The Schools White Paper, London: Department for Education, 2010 324 CSJ/YouGov polling, 2012325 Sutton Trust, Improving the impact of teachers on pupil achievement in the UK – interim findings, London: Sutton Trust, 2011326 Ibid
‘There is a general trend in our education system, where those children that need the best teachers seem to get the worst. This happens in PRUs, FE and in mainstream schools. It’s shocking.’ Seamus Oates, Executive Head of the TBAP Multi-Academy Trust and The Bridge Alternative Provision Academy

97
three
Breakthrough Britain II: Requires Improvement | Schools, settings and transitions
inspection increased from 65 to 71 per cent.327 However, there are still too many schools
where the quality of teaching is not good enough. Of the maintained schools inspected by
Ofsted in 2011/12, more than one-third required improvement.328
The greater focus on the quality of teaching now in Ofsted’s inspection framework means a
higher proportion of schools have been judged inadequate: 548 schools (three per cent of all
schools) were judged inadequate at 31 August 2012, compared with 455 a year earlier.329 A
focus on teaching, and recognition of the role it plays in school quality, is welcome.
The quality of teaching varies substantially across the regions. In London, pupils benefited
from good or better teaching in over three-quarters of schools located in the ‘most deprived’
areas. By contrast, in the North East, under a third of schools in the most deprived areas were
considered good or better for teaching.330
Improving teaching in primary schools is particularly important. In secondary school, pupils
have a different teacher for most subjects studied and, therefore, some of the impact of
having one poor quality teacher can be offset by excellent teaching elsewhere. However, in
primary school, pupils have only one teacher for the entire academic year. This means the
negative consequences of having one poor quality teacher are far greater for these children.
According to Ofsted, the quality of teaching is good or outstanding in over 80 per cent of
primary schools serving the least deprived areas but at only 69 per cent of those serving the
most deprived communities.331
Attracting good applicants is also harder in schools where pupils face greater challenges.
Disturbingly, schools and areas in greatest need of high quality teachers are often less able to
attract the best.
‘Attracting good teachers to Manchester or to other major cities in the UK isn’t usually
a problem. In Manchester it’s more the issue of the school. There’s still some stigma
attached to certain (usually underperforming) schools where issues of behaviour or pupils’
engagement in their lessons may be a deciding factor. It’s also true that certain subject
specialisms are difficult to fill such as mathematics, physics, chemistry and modern foreign
languages. As these specialisms are hard to fill for most schools, persons able to fill these
posts can be very selective as to where they may wish to work.’
Dame Dana Ross-Wawrzynski DBE, Executive Head, Altrincham Grammar School for Girls and CEO of Bright Futures Educational Trust
Substandard teaching not only constitutes a social injustice, it also carries a serious cost to
Britain’s international competitiveness. Bringing the lowest-performing ten per cent of teachers
in the UK up to the average would greatly boost attainment and lead to a sharp improvement
327 Office for Standards of Education, Children’s Services and Skills, The Annual Report of Her Majesty’s Chief Inspector of Education, Children’s Services and Skills, schools, Manchester : Office for Standards of Education, Children’s Services and Skills, 2012
328 Ibid 329 Ibid330 Ibid 331 Ibid

The Centre for Social Justice 98
in the UK’s international ranking. This would, for example, increase the UK’s OECD ranking in
reading from 21st to seventh.332
Countries with the most successful education systems recruit teachers from the highest
performing and academically able graduates.333 East Asian countries differ in the quality of their
teachers and over the status bestowed upon them, where teachers must often combine teaching
with academic research. They also receive high earnings relative to teachers internationally and
relative to other professions. Korea obtains its annual teacher intake from the top five per cent of
graduating students, using high levels of pay to compensate for large class sizes and to reflect the
profession’s esteemed status.334 Yet in England, almost a quarter of secondary school mathematics
teachers, and one in five English teachers do not hold a relevant post-A level qualification.335
The CSJ has heard that it is important to look at the mind-set or ‘moral imperative’ of
teachers in order to recruit those who are resilient and will hold high aspirations for pupils,
rather than those purely motivated by money. One head told the CSJ that:
‘You need to sell the challenge that teaching is the most demanding and intellectually
stimulating job out there – if you can sell this image of teaching, you will attract the best’.
3.8.1 Teacher quality and the ‘dance of the lemons’
Last year, Michael Gove vowed to crack-down on what he called the ‘dance of the lemons,’
where poor teachers turn up at a new school and get a job by presenting well at an
interview.336 Whilst this may not be as widespread as the well-documented problem in the
United States,337 the CSJ has heard that the rotation of substandard teachers remains a
problem in England.
In 1995, Her Majesty’s Chief Inspector of Schools, Chris Woodhead claimed there were
around 15,000 incompetent teachers working in schools – approximately five per cent of the
teacher workforce.338
The General Teaching Council (GTC) was established by the Teaching and Higher Education
Act 1998, to help improve standards of teaching and standards of teachers’ professional
conduct.339
332 Sutton Trust, Improving the impact of teachers on pupil achievement in the UK – interim findings, London: Sutton Trust, 2011 333 McKinsey&Company, How the world’s best-performing schools come out on top, 2007 [accessed via: http://mckinseyonsociety.com/
downloads/reports/Education/Worlds_School_Systems_Final.pdf (07/02/13)]334 Economist Intelligence Unit, Pearson, The Learning Curve, Lessons in Country Performance in Education, London: Pearson Plc, 2012 335 Department for Education, School workforce in England: November 2012, London: Department for Education, 2012 336 Daily Mail, Poor teachers to face sack under new ‘zero tolerance’ powers as well as children reading to Ofsted inspectors, 2 September 2012337 Chilcott L and Guggenheim D, Waiting for Superman [Motion picture], United States: Paramount, 2010 338 NASUWT, Teacher capability/competence, A review of the evidence, Birmingham: NASUWT, 2010 339 Department for Education, General Teaching Council, [accessed via: http://www.education.gov.uk/vocabularies/educationtermsandtags/5543
(18/08/13)]
99
three
Breakthrough Britain II: Requires Improvement | Schools, settings and transitions
However, serious concerns were raised about its effectiveness. Across the 11 years of the
GTC only 6,657 teachers were identified for bad conduct and incompetence by the GTC340
– considerably fewer than Woodhead’s snapshot of 15,000 in 1995.
Over the past decade, relatively few teachers have been struck off for incompetence.
Between 2001 and 2011, only 17 teachers were prevented from applying for another job
after being judged incompetent by the GTC,341 suggesting that poor teachers are rarely
evicted from the profession.
In 2012, the Government reformed the system, and from 1st April 2012, the GTC was
replaced by the Teaching Agency. The Teaching Agency took on the regulatory role with
regards to misconduct cases, with cases referred at the discretion of headteachers, and cases
of teacher competence to be handled in individual schools by the headteacher.342 On 2 April
2013, the National College for Teaching and Leadership was formed through a merger of the
National College for School Leadership and the Teaching Agency.
The National College for Teaching and Leadership now deals with cases of serious misconduct,
which can lead to teachers being banned from the profession. Since the introduction of the
new system, the number of teachers banned has increased from 68 in 2011/12 (the last year
of the GTC) to 98 in 2012/13.343
Since 1 September 2012, new arrangements for teacher appraisal and capability have been
in place giving schools more freedom over managing their teachers through less prescriptive
appraisal regulations. They also removed regulation that prevented headteachers from
observing teachers in the classroom for more than three hours a year, allowing schools
greater freedom to monitor teacher quality.344
Michael Gove told the House of Commons that the new appraisal and capability arrangements
‘should make it easier for governing bodies and headteachers to tackle underperformance.’345
There is now no informal stage in the capability procedure and the suggested length of the
monitoring and review period following a first warning has been significantly reduced from 20
weeks to between four and ten, allowing headteachers to move faster against incompetence.
The changes also require teachers to be assessed yearly against the new Teachers’ Standards.
These set the standard to which all trainees should aspire and to which all qualified teachers
should work towards. Schools are expected to make arrangements for teachers to improve
340 ChronicleLive, Teaching union says figures reflect hard-working professionals, 30 December 2012 [accessed via: http://www.chroniclelive.co.uk/news/north-east-news/teaching-union-says-figures-reflect-1376908 (25/02/13)]
341 Daily Mail, Poor teachers to face sack under new ‘zero tolerance’ powers as well as children reading to Ofsted inspectors, 2 September 2012 [accessed via http://www.dailymail.co.uk/news/article-2197197/Poor-teachers-face-sack-new-zero-tolerance-powers-children-reading-Ofsted-inspectors.html (05/06/13)]
342 ATL the education union, GTCE: the verdict, 2012 [accessed via: http://www.atl.org.uk/publications-and-resources/report/2012/march-school-trips.asp (07/08/13)]
343 TES Magazine, Teacher bans soar under more ‘rigorous’ system, 31 May 2013 [accessed via: http://www.tes.co.uk/article.aspx?storycode=6337126 (27/07/13)]
344 Department for Education, Schools get more freedom to manage teacher performance, 13 January 2012 [accessed via: https://www.gov.uk/government/news/schools-get-more-freedom-to-manage-teacher-performance (17/07/13)]
345 Hansard, Oral Answers to Questions, 22 Apr 2013
The Centre for Social Justice 100
their practice and ultimately, can take action via capability procedures, potentially leading to
dismissal.346
These reforms mark a substantial step forward, however, major problems in the system
persist. The CSJ has been told that substandard teachers are still being passed on to different
schools, often before heads have even followed competency proceedings.
Sir Robin Bosher said that the use of ‘agreed references’ or ‘compromise agreements’ is a
significant factor behind why poor quality teachers are able to get jobs in new schools. Agreed
references are references that have had the content agreed by the referee and the subject,
often standardised and brief. A compromise agreement refers to the arrangements then
made in exchange for the subject agreeing to take no further action against their employer.
Often it will be cost effective for headteachers to pay compensation under a compromise
agreement rather than fight a claim in the employment tribunal – a process that can cost a
school tens of thousands of pounds and more.
Poor quality teachers are regularly not dealt with adequately because unions advise their
members to resign before procedures are filed. One head told the CSJ that union deals are
the cause of this problem:
‘Unions will talk to heads and strike a deal...and because the process is so long – they
make the deal just to get rid of that person as quickly as possible.’
Headteachers have anonymously told the CSJ that this is often the best option for the school
as well, saving cost, work and further damage.
‘We still find it very difficult to remove a member of staff on competency grounds
because most the time when you raise their underperformance with them they go on
sick leave. Sometimes they then raise a grievance, claim bullying, involve the unions and
then threaten tribunals and unfair dismissal claims – if this hits the press there is the risk
of brand damage [and] this is why a compromise agreement is often brokered!’
Headteacher
Many headteachers who spoke to the CSJ acknowledged that agreed references are being
used to get rid of underperforming teachers. As one put it:
‘I know this is illegal and that it means I am contributing to the problem by passing bad
teachers on, but good schools and good heads should be able to spot a bad teacher. If
they can’t – it means the school has bigger problems anyway. I’ve got to be selfish and
think about what’s best for my school and my children.’
However, a number of professionals told us that this problem extended beyond agreed
references. As one put it:
346 The standards apply to all of those who are assessed for QTS on or after 1 September 2012

101
three
Breakthrough Britain II: Requires Improvement | Schools, settings and transitions
‘It’s happened a few times over the past few years that a teacher has been really poor and
everyone starts talking about it. The pupils tell us, and we can just tell. But as soon as they
realise it’s been noticed, they go on sick leave, because they’re worried about capability
procedures. But we all know they’re not sick because I know the doctor who writes their
notes – he sells them for £20! Anyone can get one! There have also been cases where a
teacher has been given, not just an agreed reference – but an OUTSTANDING reference,
just so the head can get rid of them as quickly as possible. It’s extremely frustrating for
everyone else in the school.’
Teacher in London, anonymous
The CSJ has also been told that where unions manage to negotiate a compromise agreement,
it is possible to write a reference that would mean that teacher could not go on to get
another job.
‘My experience of “negotiated references” is that it is absolutely clear it is a negotiated
reference. When someone resigns without a post to go to and has a short reference, we
all know what has happened! We then pick up the phone and talk to the head!’
Ros McMullen, CEO of LEAF Academy Trust and Principal of the David Young Community Academy
However, some heads have less choice. Some heads have told us that teachers working in
subjects where there are shortages can have their pick of schools – often regardless of their
ability or the quality of their reference. One head told the CSJ that a lack of good supply in
their area prompted them to hire what they suspected was a ‘dodgy’ teacher, only for these
suspicions to soon be confirmed:
‘English teachers are like gold dust and he isn’t all bad so I expect he’ll circulate around
for a few more years yet.’
One union official we spoke to conceded that agreed references were an issue, but felt that
more needed to be done to improve teacher quality in school without having to move these
teachers on:
‘Agreed references do occasionally take place, but the recycling of poor quality teachers is not
in anyone’s interests. Instead, we need to improve the support we make available to these
teachers.’
The need to improve the quality of the existing workforce is an extremely important point,
one that we return to below.
Improving the avenues for dealing with underperforming teachers is important, but so too is
addressing the current mismatch in teacher supply and demand which forces some schools
to hire these teachers, therefore enabling them to permeate. Schools in special measures,
for example, are prevented from hiring newly qualified teachers (NQTs) and therefore are
sometimes forced to rely on supply teachers, often the poorest quality and least committed. Ros McMullen told the CSJ:

The Centre for Social Justice 102
‘I NEVER use supply teachers and, in my opinion schools who use recruitment agencies
are bonkers. Interestingly there are more and more who do. Crazy!’
According to some heads who have spoken to the CSJ, too many supply teachers are
substandard. Some heads also raised concerns about teachers who were just above the
competency threshold but ultimately not as strong as pupils and parents would like. Dame
Sally Coates said that ‘we need to be able to address this issue adequately, dealing with those
teachers who are “OK” but not quite good enough. These teachers may not be bad enough
to warrant competency procedures, but they are not good enough to teach in our schools.’
The solution to these problems is likely to lie in a combination of adjusted regulation and on
school leaders. Sam Freedman told the CSJ Working Group that ‘the dance of the lemons’
is indeed a problem but one that will subside as the quality of leadership and initial teaching
improves. Focussing solely on competency procedures misses the bigger picture: there is
a need to develop the quality of leadership in schools so that headteachers can protect
children against poor teaching by hiring competent teachers, helping to raise the professional
standards of their staff and by removing teachers who are incapable of improving.
3.8.2 Initial Teacher Training
The CSJ has heard concerns raised by numerous sources about Initial Teacher Training (ITT).
There are hundreds of different ITT courses available: universities, colleges and schools all
display varying characteristics, strengths and entry requirements, not to mention course
content and structures. Some can be completed alongside a degree, straight after a degree
or as a full-time course, including employment-based routes.
Some have raised concerns that too many teachers still pass their initial teacher training when
they are not suited to, or good enough for the profession. Sir Greg Martin, Executive Head
of the Durand Academy told the CSJ that:
‘In their induction year there are termly reviews and if a teacher is not satisfactory they
can move on to another school, where they will often pass. We need to promote higher
standards across the system – we wouldn’t tolerate pilots who can’t fly planes or doctors
who can’t treat patients; nor must we accept teachers who can’t teach.’
Vivienne Porritt, Executive Director at the London Centre for Leadership in Learning, Institute of
Education, told the CSJ that ‘whilst NQTs are now the best trained we have ever had, continuing
teacher education would still benefit from more personalisation and opportunities to take account
of the individual learning needs of teachers and their context – “one size can’t ever fit everybody.”’
This makes it inflexible and insufficiently tailored to the individual needs of both pupils and
teachers. This is worrying given the varied circumstances teachers face, for example, in rural
and urban schools, or in schools with higher percentages of SEN, FSM or English as an
Additional Language.
103
three
Breakthrough Britain II: Requires Improvement | Schools, settings and transitions
Teachers have told the CSJ that they currently receive insufficient training on the emotional and
social needs of children. Interventions which target social and emotional learning (SEL) seek to
improve attainment by improving the social and emotional dimensions of learning, as opposed
to focussing directly on the academic or cognitive elements. They have a significant impact on
outcomes (on average around three to four months additional progress), at a very low cost
(according to the EEF toolkit). SEL programmes benefit disadvantaged or low-attaining pupils
more than other pupils and are effective from nursery through to secondary school.347
A major spur to the recruitment of high quality teachers in the past decade has been Teach First
which trains high attaining graduates to become inspirational teachers in schools in low-income
communities and which was commended in Breakthrough Britain. Where significant, partnering
with Teach First explains 20–40 per cent of the between-school variance in pupil performance
at GCSE level. This equates to approximately one-third of a GCSE per pupil per subject.
Applicants must have a 2:1 degree or above and a Grade C or above in GCSE mathematics
and English (and science for primary schools). Each year, a new group of trainees joins the
347 Education Endowment Foundation, Social and emotional learning [accessed via: http://educationendowmentfoundation.org.uk/toolkit/approaches/social-and-emotional-aspects-of-learning/ (08/07/13)]
Case study: Family Links
Family Links is part of the CSJ Alliance. It is a charity that helps create a calm, respectful school community
thereby improving behaviour and encouraging positive relationships. Family Links is a recognised form of
professional development, available for teachers.
One school which used the programme said that the lack of training on emotional health leads to poorer
outcomes for children and high stress situations for teachers – ultimately leading to higher staff-turnover:
‘No matter how chaotic the family, they cannot be used as an excuse for educational failure, it’s
still the schools’ responsibility to deliver learning.’
The headteacher believes that where problems in the home are manifest in children’s behaviour at
school – it is the school’s responsibility to use services like Family Links so that they can manage the
additional challenges arising from different pupil intakes.
In one school which had benefitted from Family Links, a large proportion of the class were on FSM.
There were also children with autism, and a large proportion had come to the attention of social
services at some point. The headteacher said that mental health problems among parents are rife and
many have experienced family breakdown.
The headteacher was adamant that the training Family Links provided to the form tutor was
absolutely pivotal to her ability to manage the class and get them to trust her. Annette Mountford,
CEO and co-founder of Family Links, said
‘Ideally the training we provide for teachers would be compulsory. Emotional wellbeing is as
important as it gets. It benefits the students but also the workforce – it’s a genuine need.’

The Centre for Social Justice 104
organisation and its university partners for six weeks of intensive training before teaching in
one of the partner schools for at least two years, after which they achieve a PGCE. Teach First
is now the UK’s third largest graduate recruiter and in 2012, six per cent of all Russell Group
finalists applied to the programme.348
Teach First aims to get up to 2,000 teachers in a cohort. Whilst this represents only around
seven to eight per cent of teachers in each year, the scheme’s impact is likely to grow as more
and more Teach First graduates enter leadership and headship positions, thereby spreading
the programme’s wider influence throughout the education system.
For a school to be eligible for partnership with Teach First, at least 50 per cent of pupils
must come from the lowest 30 per cent of the IDACI – also prioiritising those schools which
have higher levels of deprivation.349 The number of schools partnering with Teach First and
appointing Teach First teachers to their staff has increased from 45 in 2003/04 to 374 in
2011/12, including 67 primary and all-through schools. In 2012, Teach First recruited its tenth
cohort of 996 graduates, and planned to place approximately one-fifth of this cohort in
primary, and four-fifths in secondary schools in low income communities350
Sam Freedman, a director at Teach First, told the CSJ Working Group that a major area of
future growth for the scheme will be in primary schools and from September 2013 it will also
be extended to those working with early years children aged three and four. The extension of
the Teach First Leadership Development Programme into the early years will hopefully attract
more talented people into this sector.
3.8.3 Teaching assistants
Teaching assistants (TAs) now form a staple of many classrooms across the country –
supporting the work of teachers in the classroom. Their primary tasks include working with
small groups of children who need extra support in an area of the curriculum such as literacy
or numeracy. They are also often responsible for hearing children read and helping teachers
undertake administrative tasks.351 TAs can therefore provide support and relief for teachers,
especially where working with challenging intakes. They are less qualified than teachers and
paid approximately half of teachers’ salaries. TAs have been found to have a positive effect on
teachers’ workloads, job satisfaction and stress. Consequently, teachers like having TA support
and feel that TAs have a positive impact on pupils’ academic progress.352
There has been an unprecedented expansion in the number of TAs:353
348 Hill R. Teach First: Ten Years of Impact, London:Teach First, 2012349 TeachFirst, About TeachFirst, [accessed via: http://graduates.teachfirst.org.uk/about/schools-pupils.html (18/08/13)]350 Hill R. Teach First: Ten Years of Impact, London:Teach First, 2012 351 Education Endowment Foundation, Teaching assistants [accessed via: http://educationendowmentfoundation.org.uk/toolkit/approaches/
teaching-assistants (08/07/13)] 352 Oxford School Improvement, The Pupil Premium: making it work in your school, Oxford: Oxford University Press, 2012 in reference to:
Case study on the impact of IOE research The Deployment and Impact of Support Staff (DISS) project, DISS study IOE, 2010353 Department for Education, School workforce in England: November 2012, London: Department for Education, 2012

105
three
Breakthrough Britain II: Requires Improvement | Schools, settings and transitions
�� Between 2011 and 2012, the number of TAs employed in schools in England on a full-time
basis rose by 12,500 to over 232,000;
�� Between Spring 2000 and November 2012, the number of full-time TAs increased by 194
per cent;
�� Schools now employ more than one TA for every two full-time teachers.
The sharp rise in the use of TAs is deeply concerning given that they are associated with very
small or even no effect on pupils’ attainment.354 It is also worrying that paying for TAs is the
most common use of the Pupil Premium355 and that every year schools spend over £2 billion
pounds on TAs.356
The Institute of Education has shown that the more TA support a child received, the less
progress they made.357 The effects were large, present even after controlling for prior
attainment, SEN, FSM and EAL, applied for all ages and to English, mathematics and science.
The study also found that TAs are more likely to prompt pupils, mainly geared around
ensuring children completed tasks set by teachers.
TAs are often deployed to support children with SEN. Disturbingly, this means those children
who can find learning most challenging, spend their time with the least qualified adults.358 On
the other hand, the study also found that TAs can boost teachers’ productivity, reduce their
stress levels and improve classroom progress. This suggests that the most important issue
here is how TAs are used and deployed. Although too often not the case, TAs can be effective
when used in a well-planned and evidence-based manner.359
Whilst TAs can have a positive impact where used effectively, the primary focus should
always be on improving the quality of teaching experienced by all pupils in a class. As one
headteacher told the CSJ, ‘Schools need better leadership and teaching, not more TAs as a
default response.’
3.8.4 Professional standards and Continuing Professional Development (CPD)
‘CPD is there to help pupils and in doing so, it helps teachers. Many schools haven’t
grasped this explicitly yet. They know how important teacher quality is for student
outcomes – and yet not all schools recognise how important CPD is for teacher quality.
How can we ask children to learn when the adults are not able to or refuse to?’
Vivienne Porritt, Executive Director at the London Centre for Leadership in Learning
354 Education Endowment Foundation, Teaching assistants [accessed via: http://educationendowmentfoundation.org.uk/toolkit/approaches/teaching-assistants (08/07/13)] (where staff are not used or deployed effectively)
355 Office for Standards of Education, Children’s Services and Skills, The Pupil Premium: how schools are using the Pupil Premium funding to raise achievement for disadvantaged pupils, Manchester : Office for Standards of Education, Children’s Services and Skills, 2012
356 Oxford School Improvement, The Pupil Premium: making it work in your school, Oxford: Oxford University Press, 2012357 Blatchford P et al, Deployment and Impact of Support Staff Project, Institute of Education and the Department for children, schools and
families, 2009 358 Institute of Education, Case study on the impact of IOE research The Deployment and Impact of Support Staff (DISS) project , DISS study
IOE, 2010. see also Oxford School Improvement, The Pupil Premium: making it work in your school, Oxford: Oxford University Press, 2012359 Ibid

The Centre for Social Justice 106
Whilst there is general agreement that today’s NQTs are the best that have ever been, they
account for only a small proportion of the teaching workforce. There is consequently a huge
need to drive up the standards of professionals already in post.
The benefits of effective professional development are especially great for disadvantaged
students. In a New Zealand study, classes where teachers had taken part in high quality
professional development improved twice as fast as those in other classes. This was
particularly true of the least able pupils. The 20 per cent of pupils deemed ‘least able’ made
improvements four to six times as fast as their peers.360
Countries like Finland and Singapore have been praised for their education systems and
both use CPD to a greater extent than does England. In Singapore, teachers are valued as
a resource in need of continual nurture – reflected in the strong initial training and ongoing
development they receive. For example, teachers are entitled to complete 100 hours of
professional development per year and the Teacher Growth Model has been launched to
establish a holistic, student-centred approach to teaching.361
However, in England, CPD is not used as effectively as it should be. An OECD report found that
the quality and nature of continuing training available in the UK is extremely varied.362 According
to David Weston, Chief Executive of the Teacher Development Trust (TDT), schools in England
spend only 0.25 per cent of their budget on developing the classroom skills of their teachers –
meaning they spend just £8 on average per student.363
Brigitte Clay, also from the TDT, told the CSJ that schools’ use of CPD is often too focussed
on ‘what the teacher needs’ rather than being ‘pupil-focussed’ and thinking more strategically
about what would deliver the greatest benefits to pupils in that class. Many schools also use
CPD to react to external drivers, instead of using it to proactively develop their workforce.
Providers report that the only courses and conferences guaranteed to sell out relate to
changes in Ofsted inspections or to changes in government regulations. Worryingly, the
CSJ has been told, the most common training also involves merely watching PowerPoint
presentations.
CPD is not only under-used, it is insufficiently evaluated. David Weston also told the CSJ that
barely one per cent of training was effectively transforming classroom practice and only seven
per cent of schools even evaluate whether training has any effect on attainment.
According to David Weston:
360 Teacher Development Trust, Why focus on professional development? [accessed via: http://www.teacherdevelopmenttrust.org/evidence/ (07/07/13)] see also Parr J et al, Literacy Professional Development Project: Identifying Effective Teaching and Professional Development Practices for Enhanced Student Learning, Report to the Ministry of Education, New Zealand: Ministry of Education, 2007
361 Teacher Development Trust, Author Archives: Carole Haynes, 08 August 2012 [accessed via: http://www.teacherdevelopmenttrust.org/author/carole-haynes/ (06/04/13)]
362 Musset P, Initial Teacher Education and Continuing Training Policies in a Comparative Perspective: Current Practices in OECD Countries and a Literature Review on Potential Effects, OECD Education Working Papers, No. 48, Paris: OECD Publishing, 2010
363 Teacher Development Trust, launch, May 13, 2012, [accessed via: http://www.teacherdevelopmenttrust.org/teacher-development-trust-launch/ (11/08/13)]

107
three
Breakthrough Britain II: Requires Improvement | Schools, settings and transitions
‘There is a culture in many schools where CPD is seen as a tool to “fix” teachers and
help leadership teams respond to accountability pressures. This is compounded by a
history of observation being used to judge how teachers are behaving and performing
in the classroom rather than focussing on whether learners are making progress. If we
want to engage teachers as drivers of school improvement rather than as merely passive
recipients of techniques and delivery mechanisms for lessons then we need to empower
them to take control of their own self-improvement. We must move away from CPD being
seen as merely courses and lectures and toward a professional continuous learning culture
which is sustained over a long period of time, collaborative, focussed on improving learner
outcomes, evidence-informed and carefully evaluated.’
Bridget Clay said that ‘CPD is often very “top-down” – seen by some teachers as something
that has been imposed or ‘forced’ on them. This sends a negative signal about the system-wide
benefits professional development brings. More schools need to see CPD as a valued part
of the whole-school culture, driven by demand from teachers but also facilitated by heads
and leaders.’
Poor CPD is also draining the profession of new recruits. Only 73 per cent of NQTs in the
maintained sector were still teaching in the maintained sector five years later.364 Effective
professional development can not only strengthen standards but enhance teacher morale and
thereby improve retention.
3.9 Leadership
Leadership plays a pivotal role in delivering excellence within schools. Good leaders are more
effective in attracting good teachers to schools, ensuring effective professional development
for staff and are better able to ensure good governance.365 Improving leadership, and ensuring
excellent leaders are operating in those schools where they are most needed is essential if we
are to improve outcomes for children. The CSJ is therefore deeply concerned that effective
leadership is not well distributed across the system.
‘Exceptional leaders and teachers transform schools and the lives of the pupils who
attend them...but there is too much variation across the country and between schools
serving the least and most deprived communities.’ 366
Ofsted
For every 100 schools with good leadership and management, 93 will have good standards
of student achievement. Yet for every 100 schools that do not have good leadership and
management, only one does.367 A report from Ofsted stressed there was ‘no denying the
364 Hansard, Written evidence submitted by the Department for Education, 2010 [accessed via: http://www.publications.parliament.uk/pa/cm201012/cmselect/cmeduc/1515/1515we02.htm (19/08/13)]
365 Office for Standards of Education, Children’s Services and Skills, Twenty outstanding primary schools – Excelling against the odds, Manchester : Office for Standards of Education, Children’s Services and Skills, 2009
366 Office for Standards of Education, Children’s Services and Skills, Unseen children: access and achievement 20 years on, Manchester Office for Standards of Education, Children’s Services and Skills, 2013
367 Barber M, Whelan F and Clark M, Capturing the leadership premium, How the world’s top school systems are building leadership capacity for the future, London: Mckinsey & Company, 2010

The Centre for Social Justice 108
pivotal role of the Headteacher in creating the ethos for the school and exercising strong
pedagogical leadership.’368
In England, the quality of leadership and management has improved markedly over the past
five years, the proportion of schools judged outstanding for leadership and management
having increased by eight percentage points since 2008.369
Excellent leadership is not spread evenly across the country, and is not reaching enough of
the most disadvantaged areas. As at 31 December 2012, 74 per cent of primary schools in
the most deprived areas of England were judged good or outstanding for leadership and
management, compared with 88 per cent of primary schools in the least deprived areas. The
gaps are even bigger elsewhere in the country. For example, only 64 per cent of primary
schools in the most deprived areas in the East Midlands were judged good or outstanding for
leadership and management, compared with an impressive 88 per cent of primary schools in
the least deprived parts of this region.370
Dr. Vanessa Ogden is head of Mulberry School for Girls, where she says that 76 per cent of the
students are on FSM, 94 per cent are British Bengali and 98 per cent have English as an Additional
Language. She told us that to deliver good leadership, school leaders need to really understand their
communities. She believes that strong leadership comes through knowing your students, knowing
your local context and knowing local employment needs. Good leaders ensure learning is deeply
embedded within the school, involving not only the pupils but parents as well.
Cllr Paul Bell, a school governor and Councillor told the CSJ that heads and governors need
to understand the parents they are working with:
‘the head is like the Prime Minister – the first among equals. They need to be leaders
but also need to have strong relationships with teachers and with parents alike. Instead
of blaming teachers, we need to look at leadership: the headteacher, the governing body
and the association behind that school, whether it is a federation or the local authority.’
There are increasing numbers of system leaders giving focussed school-to-school support in
the roles of National Leaders of Education, Local Leaders of Education, Specialist Leaders of
Education and National Leaders of Governance.
368 Office for Standards of Education, Children’s Services and Skills, Twenty outstanding primary schools – Excelling against the odds, Manchester : Office for Standards of Education, Children’s Services and Skills, 2009
369 Office for Standards of Education, Children’s Services and Skills, Unseen children: access and achievement 20 years on, Manchester : Office for Standards of Education, Children’s Services and Skills, 2013
370 Ibid

109
three
Breakthrough Britain II: Requires Improvement | Schools, settings and transitions
However, where there are fewer371372373374outstanding schools, there are typically fewer NLEs and more
schools in need of support. London, the North East and the North West have a better ratio
of NLEs to schools than for example, the East Midlands and Yorkshire and Humber.375 Dr.
Vanessa Ogden warns that NLEs (of which she is one) are not being deployed systematically
at the present time since there is little central co-ordination of their work or quality assurance
of it. She said that ‘it is not enough for government to rely on the moral purpose of individuals
in this way. There needs to be a better strategy for deployment, better funding for their work
and the incentive of recognition for the work they do.’
Teaching Schools are another recent initiative designed to improve leadership and quality.
Established in 2011, Teaching Schools are outstanding schools that have been given a lead role
in the training and professional development of teachers, support staff and headteachers, as
well as contributing to the raising of standards through school-to-school support.376 There
are currently 363 Teaching Schools in England.377 It is hoped that they will take greater
371 Department for Education, National leaders of education and national support schools [accessed via: http://www.education.gov.uk/nationalcollege/index/support-for-schools/national-leaders-of-education.htm (18/08/13) http://www.education.gov.uk/nationalcollege/docinfo?id=157129&filename=nle-fact-sheet-2.pdf
372 Department for Education, Local Leaders of Education Programme [accessed via: http://www.education.gov.uk/nationalcollege/index/support-for-schools/lle.htm(16/08/13)]
373 Department for Education, Specialist leaders of education [accessed via: http://www.education.gov.uk/nationalcollege/index/support-for-schools/specialist-leaders-of-education-programme.htm (16/08/13)]
374 Department for Education, National leaders of governance [accessed via: http://www.education.gov.uk/nationalcollege/index/support-for-schools/national-leaders-of-governance.htm (16/08/13)]
375 Office for Standards of Education, Children’s Services and Skills, Unseen children: access and achievement 20 years on, Manchester : Office for Standards of Education, Children’s Services and Skills, 2013
376 Department for Education, National Teaching Schools [accessed via: http://www.education.gov.uk/nationalcollege/teachingschools.htm (16/08/13)]
377 Department for Education, Press Release, ‘Teaching schools get £10 million to boost quality of teacher training’, 21 March 2013 [accessed via: https://www.gov.uk/government/news/teaching-schools-get-10-million-to-boost-quality-of-teacher-training (08/08/13)]
�� National Leaders of Education: recruits ‘outstanding’ headteachers or principals as National Leaders
of Education (NLEs) and deploys them to support schools in challenging circumstances. The
objective is to increase leadership capacity of other schools to help raise standards. It has a target
to designate 1,000 NLEs by 2014 –2015.371
�� Local Leaders of Education: a partnership working between schools and academies. These are
successful headteachers with three or more years experience whose role is to work with other
heads in challenging circumstances to encourage improvements and build capacity to ensure
improvements can be sustained. It met its target of 2,000 LLEs and now recruits only on the basis
of maintaining numbers and guaranteeing national support.372
�� Specialist Leaders of Education: these are ‘outstanding’ senior and middle leaders who support
individuals or teams in similar positions in other schools to help establish outstanding leadership
practice in their area. The scheme recognises the importance of senior and middle leaders in
achieving successful outcomes. Over 2,500 SLEs have been appointed since 2011, with 5,000 the
target for 2014 –15, and 10,000 as a longer term target for national coverage.373
�� The Future Leaders Trust: a charitable organisation whose mission is to address educational
disadvantage by transforming outstanding current or former teachers into effective school leaders
for challenging schools.
�� National Leaders of Governance: National Leaders of Governance are effective chairs of governors
who use their skills and expertise to support Chairs in other schools. This aims to increase
leadership capacity to raise standards and maintain improvements.374

The Centre for Social Justice 110
responsibility for school improvement, empowering the best schools to lead the system and
creating networks of schools which can work together.378
Evaluating the impact of Teaching Schools will be an extremely important step going forward.
However, some feel that their potential has not been capitalised as effectively as it might have been:
‘The Teaching Schools development was in principle a good proposal...but the new
emerging Teaching Schools have been very much left to develop on their own too soon.
At such an early phase of development there should be more structure and leadership
coming centrally. Some Teaching Schools have been very creative and are in their own
communities making some difference. Unfortunately, too many are struggling and worrying
more about competition from other nearby Teaching Schools or other organisations which
is having an adverse effect on their contribution as Teaching Schools and for some it has
become an albatross. Those same schools without a structure and support are feeling
strain both financial and in their capacity to support others.’
Dame Dana Ross-Wawrzynski DBE, Executive Head, Altrincham Grammar School for Girls and CEO of Bright Futures Educational Trust
3.9.1 Governors
Good governance is an essential component of excellence in schools, and often linked to
good leadership. Governors have a responsibility to keep the school in check and should hold
the headteacher to account on outcomes. Poor governance is not only related to weaknesses
in leadership, but has an important effect on overall school quality.
The role and remit of governors is significant. Ofsted look at the extent to which governing
bodies for example: ensure clarity of vision, ethos and strategic direction; provide challenge
and hold the headteacher and other senior leaders to account for improving the quality of
teaching, pupils’ achievement and pupils’ behaviour and safety; support and strengthen school
leadership and use the Pupil Premium and other resources effectively.
However, good governance is lacking in a huge number of schools. Ofsted states that the 6,000
schools rated less than good usually have weaknesses in their leadership and governance.379
Weak governance occurs where:
�� Governors have not challenged leaders or held them to account;
�� Governors have neglected students’ achievement;
�� The board has not focussed enough on ensuring the school’s allocated Pupil Premium is
spent effectively; and where
�� Members of the governing body have been too accepting of the school’s view of its performance.
378 Department for Education, Teaching Schools [accessed via: http://www.egfl.org.uk/export/sites/egfl/categories/improvement/docs/lesley.html/Teaching_Schools_Information.pdf (20/08/13)]
379 Office for Standards of Education, Children’s Services and Skills, Press Release, Chief inspector raises the stakes for school governance, 27 Feb 2013 [accessed via: http://www.ofsted.gov.uk/news/chief-inspector-raises-stakes-for-school-governance (26/04/13)

111
three
Breakthrough Britain II: Requires Improvement | Schools, settings and transitions

The Centre for Social Justice 112
The Government has made attempts to strengthen the functioning of governors. In addition
to a stronger focus on governance in Ofsted inspections, from September 2013 new
regulations come into effect creating a simpler framework for the roles, procedures and
allowances of maintained school governing bodies.380
Good governance requires that those sitting on the governing board ‘know their school.’381
However, to do this governors must have access to transparent data and readily understand
what it means. Raiseonline is an online tool, to help enable schools to analyse performance data,
covering the attainment and progress of pupils in Key Stages 1–4. Whilst it is a thorough and
in-depth instrument, there is evidence that it is too complex for many governors.382
To assist with this, Ofsted’s new Data Dashboard provides a snapshot of school performance at
Key Stages 1, 2 and 4. It covers pupils’ attainment and progress in core subjects, their attendance
and how well the school does for its disadvantaged pupils. It also shows how well schools are
performing compared with national averages and compared with similar schools; whose pupils
had similar attainment when they entered the school. Sir Michael Wilshaw, Chief Inspector
of Schools In England and head of Ofsted, said this meant there were no more excuses for
governors who did not know their school well enough.
However, the CSJ has heard concerns that the Data Dashboard is too simple, for example,
giving no context and with the categories of comparison between children too wide to
be useful. It also omits information on several key indicators, such as the Value Added
Best 8 measure (a pupil’s performance in their best eight qualifications, plus the English
and mathematics bonus, is expressed as a point score). Data is also of little use or value if
governors are not able to identify or respond appropriately to trends in the data.
Worryingly, many schools struggle to recruit good governors. According to a submission from
the National Governors Association, in some areas, often those with less social capital and in
primary schools, it can be particularly hard to find good parent governors prepared to stand
for election. Yet in other areas, parent governors can be those driving school improvements.383
Matching supply and demand is harder in areas where there is less industry and fewer
employees to recruit from, such as in more rural areas. According to the School Governors’
One-Stop Shop (SGOSS), an online governor recruitment service, around 33,000 governor
positions are vacant at any one time.384
380 Department for Education, Governors’ Handbook For governors in maintained schools, academies and free schools, London: Department for Education, 2013
381 The National Governors’ Association, Submission from the National Governors’ Association on the Role of Governing, Birmingham: The National Governors’ Association, 2012 [accessed via: http://www.nga.org.uk/getattachment/Resources/Consultation/NGA-Evidence-to-the-Select-Committee-Inquiry-on-Go/Submission-from-NGA-to-Select-Committee.pdf.aspx (15/03/13)]
382 LKMco, Wilshaw, data dashboards and governors: Why it matters, 26/02/2013 [accessed via: http://www.lkmco.org/article/wilshaw-data-dashboards-and-governors-why-it-matters-26022013 (20/02/13)]
383 The National Governors’ Association, Submission from the National Governors’ Association on the Role of Governing, Birmingham: The National Governors’ Association, 2012 [accessed via: http://www.nga.org.uk/getattachment/Resources/Consultation/NGA-Evidence-to-the-Select-Committee-Inquiry-on-Go/Submission-from-NGA-to-Select-Committee.pdf.aspx (15/03/13)]
384 SGOSS, Governors for Schools [accessed via: http://www.sgoss.org.uk/newsletters/251-sgoss-newsletter-september-2012.html?showall=&start=18 (15/08/13)]
113
three
Breakthrough Britain II: Requires Improvement | Schools, settings and transitions
There have been suggestions (including from Sir Michael Wilshaw) that paying governors might
be an option in the future, especially for under-performing schools. However, remuneration
risks attracting those who are purely financially motivated. The sheer number of governors
also means remuneration would be extremely costly and somewhat unrealistic. Liz McSheehy,
Chief Executive of SGOSS, told us money is not the answer:
‘recruiting volunteers is effective because it means that those who join are genuinely
committed. Governors need to be better valued by society, not in terms of money, but
through greater appreciation of the social contribution they make.’
There are also concerns that attempts to professionalise the governance model is somewhat
misguided. Amanda Spielman told the CSJ that:
‘there is an unrealistic expectation that governors will become more like professional
inspectors, able to interpret and manage what is in reality, highly complex data. There
are tensions growing between the rising expectations of governors, and the limitations of
non-executive lay participation in schools.’
A major challenge for government is how it can increase the number of governors whilst
requiring more of them. It is also important to consider whether the system is currently
making reasonable demands of a group of volunteers who may not have any first-hand
experience of school management.
3.10 Further Education (FE) and Vocational Education
England’s vocational education has come under heavy criticism, both domestically and in
comparison to international standards.385 Yet high quality FE provision is more important than
ever. We are now enduring the effects of a ‘skills-mismatch.’386
This mismatch is present at both the higher and lower ends of the labour market, harming not
only a young person’s job prospects, but the country’s wider economic competiveness. Lord
Baker has said that British industry faces a shortfall of around 40,000 scientists, engineers and
technicians each year, forcing employers to recruit highly-skilled workers from abroad.387 At
the other end of the spectrum, the CBI found that 35 per cent of businesses are dissatisfied
with the basic literacy of school and college leavers, and 30 per cent are dissatisfied with their
basic numeracy.388
FE colleges have the potential to address both ends of the spectrum: offering vocational
routes but simultaneously offering a second chance to those who slipped through the net.
There have been many reviews of the sector, yet it is only relatively recently, for example, with
385 SKOPE, Developing Vocational Excellence: Learning Environments within Work Environments, Oxford: SKOPE, 2012 386 Think Young, Skills mismatch [accessed via: http://thinkyoung.eu/overcoming-the-skills-mismatch/ (20/08/13)]387 The Telegraph, Rise in arts degrees ‘has left UK with major skills crisis’ ,02 May 2013 [accessed via: http://www.telegraph.co.uk/education/
educationnews/10031303/Rise-in-arts-degrees-has-left-UK-with-major-skills-crisis.html (04/05/13)] 388 Confederation of British Industry, Learning to grow: what employers need from education and skills, London: CBI, 2012
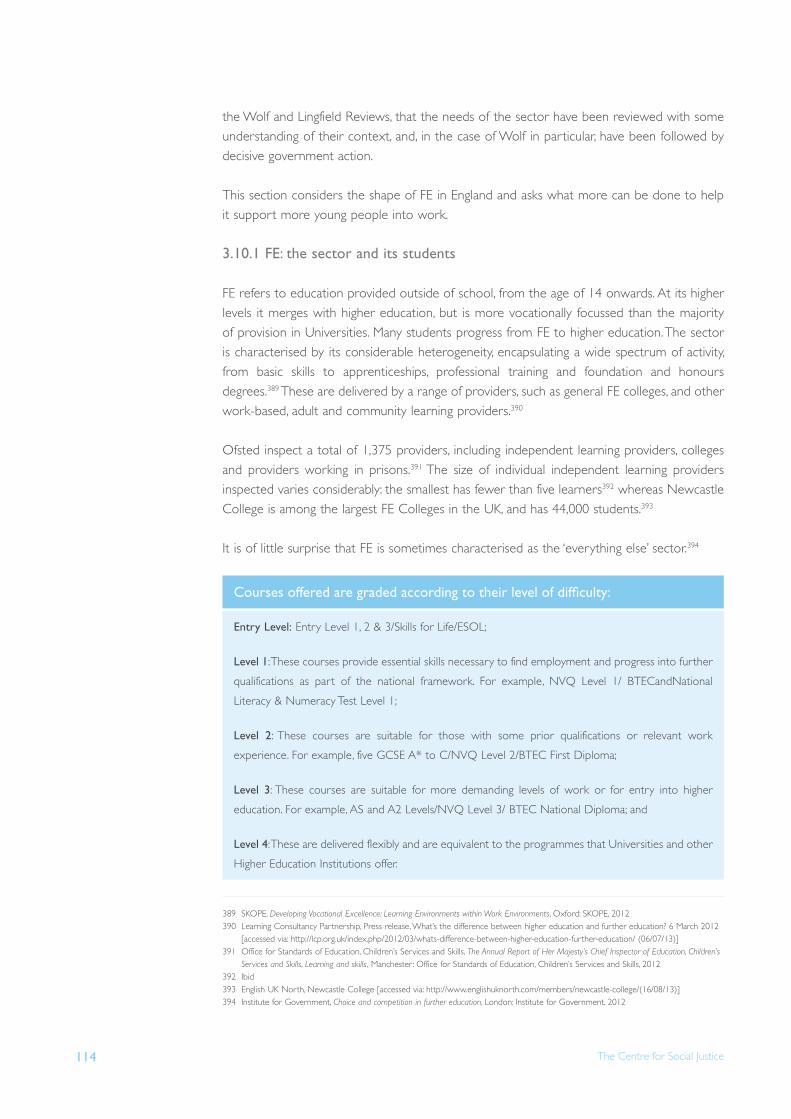
The Centre for Social Justice 114
the Wolf and Lingfield Reviews, that the needs of the sector have been reviewed with some
understanding of their context, and, in the case of Wolf in particular, have been followed by
decisive government action.
This section considers the shape of FE in England and asks what more can be done to help
it support more young people into work.
3.10.1 FE: the sector and its students
FE refers to education provided outside of school, from the age of 14 onwards. At its higher
levels it merges with higher education, but is more vocationally focussed than the majority
of provision in Universities. Many students progress from FE to higher education. The sector
is characterised by its considerable heterogeneity, encapsulating a wide spectrum of activity,
from basic skills to apprenticeships, professional training and foundation and honours
degrees.389 These are delivered by a range of providers, such as general FE colleges, and other
work-based, adult and community learning providers.390
Ofsted inspect a total of 1,375 providers, including independent learning providers, colleges
and providers working in prisons.391 The size of individual independent learning providers
inspected varies considerably: the smallest has fewer than five learners392 whereas Newcastle
College is among the largest FE Colleges in the UK, and has 44,000 students.393
It is of little surprise that FE is sometimes characterised as the ‘everything else’ sector.394
389 SKOPE, Developing Vocational Excellence: Learning Environments within Work Environments, Oxford: SKOPE, 2012 390 Learning Consultancy Partnership, Press release, What’s the difference between higher education and further education? 6 March 2012
[accessed via: http://lcp.org.uk/index.php/2012/03/whats-difference-between-higher-education-further-education/ (06/07/13)]391 Office for Standards of Education, Children’s Services and Skills, The Annual Report of Her Majesty’s Chief Inspector of Education, Children’s
Services and Skills, Learning and skills, Manchester : Office for Standards of Education, Children’s Services and Skills, 2012392 Ibid393 English UK North, Newcastle College [accessed via: http://www.englishuknorth.com/members/newcastle-college/(16/08/13)]394 Institute for Government, Choice and competition in further education, London: Institute for Government, 2012
Courses offered are graded according to their level of difficulty:
Entry Level: Entry Level 1, 2 & 3/Skills for Life/ESOL;
Level 1: These courses provide essential skills necessary to find employment and progress into further
qualifications as part of the national framework. For example, NVQ Level 1/ BTECandNational
Literacy & Numeracy Test Level 1;
Level 2: These courses are suitable for those with some prior qualifications or relevant work
experience. For example, five GCSE A* to C/NVQ Level 2/BTEC First Diploma;
Level 3: These courses are suitable for more demanding levels of work or for entry into higher
education. For example, AS and A2 Levels/NVQ Level 3/ BTEC National Diploma; and
Level 4: These are delivered flexibly and are equivalent to the programmes that Universities and other
Higher Education Institutions offer.

115
three
Breakthrough Britain II: Requires Improvement | Schools, settings and transitions
FE colleges cater to a large number of students. In 2011/12 almost 4.2 million learners
engaged in some form of government-funded education or training in the learning and skills
sector.395 Almost a third of 16–18 year-olds at the end of 2012 were in General FE, tertiary
and specialist colleges. This compares to 22 per cent in state-funded schools and only eight
per cent in sixth form colleges.396
The number of students catered for is likely to increase even further. From 2013, all young
people must continue in education or training until the end of the academic year in which
they turn 17, rising to 18 from 2015. This means many of those students who would have
otherwise left school are likely to be drawn to FE.397 Another reason is the expected
demographic upturn in the 16–18 population after 2017/18.398
Responsibility for funding post-16 learning in England is shared between the Department for
Education (16–18-year-olds) and the Department for Business, Innovation & Skills (19-year-
olds and over). According to Paul Grainger, Co-Director of the Centre for Post-14 Research
and Innovation at the Institute of Education, ‘this leads to very complex funding arrangements
for FE, heavily bureaucratic, and frequently unpredictable.’ Despite its key role, FE is also not
funded at the same level as school Sixth Forms. As highlighted by the Schools White Paper,
‘Post-16 funding, although distributed on a more transparent basis, is also inherently unfair,
with school sixth forms being funded on average £280 more per student than general FE
colleges and sixth form colleges.’399
The Government has pledged to end this funding gap by 2015.400 However, colleges face
other financial disadvantages. Whereas 11–18 schools can cross-subsidise by moving resources
between age ranges, colleges cannot, leading to considerable differences between the median
funding per learner in schools and colleges.401 Colleges are also obliged to pay VAT on goods
and services (unlike schools and academies who can claim it back).402 Moreover, pupils in
college are still not entitled to FSM, unlike those in school sixth forms, academies, Free Schools
and University Technical Colleges.403
Colleges often serve the most disadvantaged young people yet, at present, their students are
unlikely to be as well-supported as pupils who have stayed in school.
3.10.2 Supporting disadvantaged students
As David Blunkett MP told the CSJ:
395 Office for Standards of Education, Children’s Services and Skills, The Annual Report of Her Majesty’s Chief Inspector of Education, Children’s Services and Skills, Learning and skills, Manchester : Office for Standards of Education, Children’s Services and Skills, 2012
396 Department for Education, Participation in Education, Training and Employment by 16–18 year olds in England, London: Department for Education, 2013
397 Norton S, Potential Realised or Same Old Cinderella? Future Options for England’s Further Education Sector, SKOPE Research Paper No. 109, Cardiff: SKOPE, 2012
398 Ibid399 Department for Education, The Importance of Teaching, The Schools White Paper, London: The Stationery Office, 2010400 Ibid401 Kewin, J, Sixth Form Colleges and funding: for stakeholders, London: Local Government House, 2012402 Ibid403 Hubble S, Free school meals for students in post-16 education, London: House of Commons, 2013

The Centre for Social Justice 116
‘FE has always been the Cinderella story. They pick-up the pieces for what failed before.
We as a nation need to take that very seriously.’
Professor Keep, an expert in vocational education, refers to FE as ‘educational warehousing’
and says that many people see vocational routes as something for ‘other people’s children.’
He suspects that if FE were not catering to ‘lesser children’, poor provision would not have
been allowed to persist.404
Alongside its wider academic and vocational role, FE tends to accept responsibility for highly
disadvantaged learners, many of whom have severe barriers to learning. Post-16 and adult
learners interviewed by Ofsted in 2011 commented on their negative experiences of school,
and how these led to continued barriers to learning, such as a fear of ‘feeling thick’ and the
stigma of attending a literacy class.405
More than half (56 per cent) of 17-year-olds in full-time education in FE colleges are from
the bottom three socio-economic groups. This compares with only 22 per cent in maintained
school sixth forms.406
There are three times as many students eligible for FSM at colleges than at maintained school
sixth-forms,407 yet students at FE are not eligible for FSM and there is no Pupil Premium
within the sector. It is imperative to ensure that the important work, and resources targeted
at disadvantaged pupils in schools, is then not diluted post 16.
FE is also the main provider of post-16 provision for learners with learning difficulties and/
or disabilities. Often, providers will need to engage actively with these learners, for example,
through extensive pastoral work or good outreach. In the market town of Malton, South
Ryedale, the outreach team of one college delivers learning within a sheltered housing
complex for NEETs, turning the common room into a classroom during lessons.
FE is often less formal. Ade Brownlow, Head of Student Services at Askham-bryan College,
told the CSJ that FE providers treat learners differently to how they were treated in school:
‘We try to make the relationship more like the one between a boss and an employee,
rather than a teacher and their pupil. The relationship is more informal, but the discipline
can then be far more genuine. When one of our learners behaves inappropriately, we try
to discuss it with them, in a cognitive way, just as an employer would, rather than just
enforcing our rules, as tended to happen in school.’
404 Keep E, ‘Where next for vocational education?’, Extended Review Essay, British Journal of Sociology of Education, pp315–322.405 Office for Standards of Education, Children’s Services and Skills, Removing barriers to literacy, Manchester : Office for Standards of
Education, Children’s Services and Skills, 2011406 2020 Public Service HUB, The further education and skills sector in 2020: a social productivity approach, London: 2020 Public Service HUB,
26 May 2011 407 The Association of Colleges, No Free Lunch? Key Statistics, [accessed via: http://www.aoc.co.uk/en/parliament-and-campaigns/campaigns/
no-free-lunch/key-statistics.cfm (11/08/13)] (According to the Association of Colleges, this is based on: 103,000 16–18 year olds in 2009/10 who claimed free school meals at age 15, with the average cost of a lunch estimated at £1.95 and assuming the average student is at College for 190 days each year. This estimate does not include administration and capital costs.)

117
three
Breakthrough Britain II: Requires Improvement | Schools, settings and transitions
Many FE students will not only need to gain hard-skills, but those ‘soft’ skills which are essential
in the workplace. Skills like turning up to work on time, dressing appropriately and dealing
with criticism should not be dismissed. There is little long-term benefit of getting someone
into a job if this employment cannot be sustained.
The FE sector also enables adults to update their existing skills, or offers a second chance to
those who left school with few or no qualifications. There are approximately 3 million adult
learners participating in FE in one form or another, and 90,100 offenders aged 18 or over in
the prison system participated in learning during 2011/12.408
3.10.3 Remedial education
In many cases students at FE are not studying at a higher level than they were during
compulsory schooling. In 2012, of learners aged 16 –18, 89,000 studied at Level 1 as their
highest qualification aim and 179,100 at Level 2 – the equivalent to GCSE level.409 This lack
of progression is concerning, however a more serious concern is to be found in the fact
that many FE settings have to provide remedial training for those who have left compulsory
schooling without basic skills.
In addition, FE is often effectively required to offer remedial education in literacy and
numeracy.410 However, the attempts to provide this remedial support are often not successful;
in 2012, Ofsted inspectors found that the management of functional English and mathematics
was generally weak in colleges, with little effective staff development.411 These problems,
unaddressed, continue into the workplace. The CBI has found that around one in five employers
are providing remedial training in one or more of English, mathematics and IT for those young
people joining them lacking acceptable levels in these basic skills.412
‘The FE and skills sector is being asked to deal with a lack of success in English and
mathematics at school. What schools failed to achieve in five years, FE colleges are
expected to achieve in one to two. That’s a big ask and an enormous challenge for the
sector...learners come to FE to develop their vocational skills in practical environments,
often seeing English and mathematics as something that happens in school, a phase of
their education they are often pleased to have left behind.’
FE provider in the North of England, anonymous
408 The Skills Funding Agency and the Department for Business Innovation & Skills, Quarterly Statistical First Release, Further Education & Skills: Learner Participation, Outcomes and Level of Highest Qualification Held, London: Department for Business, Innovation & Skills, 2013
409 Department for Education, Participation in Education, Training and Employment by 16–18 year olds in England, London: Department for Education, 2013
410 Department for Business, Innovation & Skills, Professionalism in Further Education, Final Report of the Independent Review Panel, London: Department for Business, Innovation & Skills, 2012
411 Office for Standards of Education, Children’s Services and Skills, The Annual Report of Her Majesty’s Chief Inspector of Education, Children’s Services and Skills, Learning and skills, Manchester : Office for Standards of Education, Children’s Services and Skills, 2012
412 Confederation of British Industry, Learning to grow: what employers need from education and skills, London: CBI, 2012

The Centre for Social Justice 118
This was recently identified as a major concern in Lord Lingfield’s review of FE which drew
attention to the fact that providers were being distracted from their core purpose.413
‘FE providers are undergoing “mission drift” opposite to that normally observed and rightly
criticised, but equally damaging to the country’ prospects, downwards into the proper
territory of secondary schooling. That drift is the result of both the remedial task inherited
by FE from weak schools...’
Lord Lingfield, Professionalism in Further Education 414
Ideally, secondary school education should be providing pupils with literacy and numeracy –
ensuring this would free up FE providers to offer students the practical learning which leads
to the availability of a technically-skilled workforce to power high economic performance.
3.10.4 Improving pedagogy – the quality of teaching in FE
Teaching in the FE sector has also been criticised. In Ofsted’s 2012 inspections, only 56 per
cent of providers were judged good or outstanding for teaching and learning.415 Weaknesses
identified included teacher/trainers’ lack of updated expertise in specialist vocational and subject
areas, and that lessons did not focus enough on developing learners’ skills for employment.416
One source told the CSJ that ‘improving the quality of FE teachers recruited is essential,
although challenging, given that most people prefer to teach their subject academically. The fact
Ofsted have now put teaching and learning into the framework properly is the main reason
why some providers have dropped a grade, and why so few are being found outstanding.’
FE teachers generally have direct experience of working in their field. This can make them
better equipped to offer learners practical advice on access to work and give them good
knowledge of local labour market needs. But they can also sometimes lack the same
pedagogical skills as teachers in mainstream education.
The Institute for Learning (IfL) was established in 2002 to provide a professional body for
FE staff. Whilst membership became compulsory for a period, as a result of the Lingfield
Review’s recommendations, the IfL has returned to being a voluntary professional body.417
The Department for Business, Innovation & Skills has established a new professionalism and
standards organisation, the Education and Training Foundation, launched on 1 August 2013,
briefly known as the FE Guild.418 Responsibility for professional qualifications has transferred
from the Learning and Skills Improvement Service to the Education and Training Foundation.
A new Chartered Status scheme will also recognise the best-performing providers. As with
other reforms, the effects of this remain to be seen.
413 Department for Business, Innovation & Skills, Professionalism in Further Education, Final Report of the Independent Review Panel, London: Department for Business, Innovation & Skills, 2012
414 Ibid 415 Office for Standards of Education, Children’s Services and Skills, The Annual Report of Her Majesty’s Chief Inspector of Education, Children’s
Services and Skills, Learning and skills, Manchester : Office for Standards of Education, Children’s Services and Skills, 2012416 Ibid417 NIACE, Lingfield: the future of professionalism in FE, Winter 2012 [accessed via: http://www.niace.org.uk/sites/default/files/documents/
adults-learning/AL-December-Vol23-V15-pg13-17.pdf (05/08/13)] 418 FE Week, New FE professionalism body launched, Aug 1, 2013 [accessed via: http://feweek.co.uk/2013/08/01/new-fe-professionalism-
body-set-for-launch/ (27/07/13)]

119
three
Breakthrough Britain II: Requires Improvement | Schools, settings and transitions
The Lingfield Review highlighted that the in-service teaching qualifications are over-complicated.
It also criticised FE ITT programmes, saying for example, that Programmes appear largely
generic and theoretical, rather than related to the professional and occupational expertise
of college lecturers. It also said that the commitment of FE employers to support their staff
to attain excellence in pedagogy appears uneven.419 The Review suggested that a number of
changes are required, for example that teachers of English and maths as well as those working
with students with learning difficulties or disabilities should have specialist qualifications.
Recognising these challenges, the Government has brought forward a raft of reforms affecting
the FE sector. An FE Commissioner will be the single point of contact acting on behalf of the
government and reporting to ministers. The FE Commissioner will consult with and act on
behalf of the Department for Business, Innovation & Skills, the Department for Education, the
Skills Funding Agency and the Education Funding Agency.420 Failing provision will be identified
through three measures of performance: an inadequate rating by Ofsted; learner success rates
below minimum standards; and a rating of inadequate by the Skills Funding Agency in either
financial health or financial control.421
3.10.5 The transition to work
The primary purpose of FE should be to provide a transition from education into work, giving
students the skills useful for both the national and local economy.
The country’s best FE is excellent, providing an effective means of educating and training
participants – benefitting both employees and employers. Level 3 courses and apprenticeships
are particularly good, as identified by Professor Wolf. However, this contrasts with low-
level vocational qualifications and short courses. Professor Wolf condemned these as one
factor behind the ‘churning’ of many young people between education and short-term
employment.422 Around one-third of all 16 –19 year olds in England are following vocational
courses with qualifications that are more or less valueless in the labour market, and which do
not support progression within learning.423
Paul Grainger, Co-Director of the Centre for Post-14 Research and Innovation at the Institute
of Education, told the CSJ that ‘there is vocational as license to practice, and vocational as
motivational. Wolf favours the former, but that leaves a gap.’
The transition to work is an extremely important one, yet it has too often been neglected.
The Department for Business, Innovation & Skills has researched the impact FE has on
learners’ opportunities in the labour market and reported that:424
419 Department for Business, Innovation & Skills, Professionalism in Further Education, Interim Report of the Independent Review Panel, London: Department for Business, Innovation & Skills, 2012
420 Department for Education and Department for Business Innovation & Skills, Rigour and Responsiveness in Skills, London: Department for Business, Innovation & Skills, 2013
421 Department for Business Innovation & Skills, New Challenges, New Chances, Further Education and Skills, System Reform Plan: Building a World Class Skills System, London: Department for Business Innovation & Skills, 2011
422 Wolf A, Review of Vocational Education – The Wolf Report, London: Department for Education, 2011423 Ibid 424 Department for Business Innovation & Skills, The Impact of Further Education Learning, BIS, London: Department for Business Innovation
& Skills, 2013
The Centre for Social Justice 120
�� 35 per cent of men and 29 per cent of women who participated in FE got a better job
as a result;
�� 18 per cent of men and 12 per cent of women got promoted;
�� There was a 2.75 per cent increase in salary following course completion by participants.
These figures raise considerable questions about the effectiveness of the sector if, for example,
65 per cent of men and 71 per cent of women have not improved their employment
opportunities as a result of their participation in FE.
In an attempt to get a stronger grip on the effectiveness of individual settings, the Government
has started to release statistics on the destinations of 16–18-year-old KS4 and KS5 students
leaving FE.425 This is a step in the right direction, adding transparency and accountability
on learners’ outcomes. However, as yet, national data do not show the destinations of the
most disadvantaged students aged 16–18, those studying at Levels 1 and 2. It will only be by
including and refining this data that government will be able to hold FE providers to account
on a national basis, as to whether they are successfully assisting students into sustained
employment.
Alison Morris, Deputy Director at the UK Commission for Employment & Skills, told the CSJ
that:
‘for most people, education and qualifications are about being able to get a good
job. That’s why it’s so important to measure outcomes as well as outputs. Achieving a
qualification is great. Knowing the qualification leads to good, sustainable employment
is even better. Traditionally, we haven’t been good at doing this, so shifting our focus and
ensuring we measure what matters is important.’
3.10.6 Improving relationships with employers
One way of improving the transitions made into work is through improving the relationships
between providers and employers. Employers and leaders from the business sector should
arguably have a greater role in shaping provision.
The Government is currently attempting to increase links with employers by investing £340
million over four years into the Employer Ownership Pilot, which enables employers to shape
training provision.426 £4.5 million has also been invested in 25 colleges to trial innovative
approaches to work experience for 16- to 19-year-olds, with specific aims of encouraging
improved partnerships between the FE sector and employers.427
425 Department for Education, Destinations of Key Stage 4 and Key Stage 5 Pupils, 2010/11 (experimental statistics), London: Department for Education, 2013
426 Department for Education and Department for Business Innovation & Skills, Rigour and Responsiveness in Skills, London: Department for Business, Innovation & Skills, 2013
427 Department for Education, Work experience and non-qualification activity : Work experience pilot, 21 June 2013 [accessed via: http://www.education.gov.uk/schools/teachingandlearning/qualifications/b00223495/post-16-work-exp-enterprise-educ/work-experience-pilot (07/07/13)]

121
three
Breakthrough Britain II: Requires Improvement | Schools, settings and transitions
In addition to engaging with larger employers, it is essential that FE is plugged into the local
economy. FE must improve how it works with local businesses and ensure there is greater
understanding of what the local labour market needs from its future employees.
A recent report from the Commission on Adult Vocational Teaching and Learning highlighted
the need to re-balance a nationally specified core with a more tailored element to meet
local demand.428 It emphasised the importance of a ‘two-way street’ where there is genuine
collaboration between colleges and training providers and employers.
Alison Morris also said that:
‘there are many examples of colleges that are engaging effectively with employers.
Where these relationships are strongest they are strategic, initiated at a senior level and
embedded in practices across the whole college. Where it works well employers can
influence the curriculum and ensure that training is relevant and will meet their business
needs. Colleges and employers need to challenge themselves and consider whether their
current practice could be improved.’
428 Commission on Adult Vocational Teaching and Learning, It’s all about work. Excellent adult vocational teaching and learning, Learning and Skills Improvement Service, 2013
Case study: Askham-bryan College
Ade Brownlow is Head of Student Services at Askham-bryan College. The College works across many
local authorities, covering the large and diverse regions of North and West Yorkshire, Cumbria and the
North East. The College is focussed on land-based subjects, such as agriculture, horticulture, animal care/
management and equine care. The College engages in outreach and is focussed on outcomes for their
learners.
Ofsted praised the College’s relationships with local employers – such as the nearby wildlife parks
and charities like the RSPCA – as outstanding at their last inspection. Because they are focussed on
the land-based sector, the college cannot simply rely on a few large corporate employers. Instead, the
employers most suitable for many of their learners’ needs are SMEs and micro-size businesses, such
as feed and pet supplies, livery yards, local agricultural / horticultural firms and farmers; employers
which are more likely to employ four people, rather than 50.
Ade told the CSJ that whilst larger companies may integrate active recruitment of those most in need
of employment into their CSR policy, many smaller businesses may not be comfortable with the risk of
taking on lower-skilled learners. However, apprenticeships and specifically, traineeships (which cater to
lower-skilled learners), will need employers prepared to take that risk. If apprenticeships only pick-up the
already engaged and motivated students – the system will continue to leave behind those already failed
by the education system.

The Centre for Social Justice 122
429430
429 University Technical Colleges, About University Technical Colleges [accessed via: http://www.utcolleges.org/about/about (18/07/13)]430 Department for Education, Press Release, New wave of approved studio schools will take total to more than 40, 10 April 2013 [accessed
via: https://www.gov.uk/government/news/new-wave-of-approved-studio-schools-will-take-total-to-more-than-40--2 (08/07/13)]
University Technical Colleges429
UTCs offer 14 –18-year-olds the opportunity to take a highly regarded, full-time, technically-oriented
course of study. They are sponsored by a university and aim to offer clear progression routes into
higher education or further learning in work.
Learning is often practical, integrating national curriculum requirements with the technical and
vocational elements. The UTC ethos and curriculum is heavily influenced by local and national
employers who also provide support and work experience for students.
They are sub-regional, taking students from a wide geographical area. This reduces negative impact for
any one local school in terms of student roll.
UTCs specialise in subjects that require technical and modern equipment, for example, engineering,
product design, health sciences, construction, and land and environmental services. However they
all teach business skills and the use of ICT. The chosen specialism reflects the university’s areas of
excellence and the needs of local employers.
They are aimed at recruiting the most able students, for whom a vocational route is more suitable.
However, schools sometimes prevent UTCs from coming in to talk to pupils, to prevent them from
‘stealing’ their highest achieving pupils. One headteacher told the CSJ that whilst schools will try to
stop UTCs recruiting their brightest pupils (and therefore harming that school’s own league tables),
they are more than happy to pass-on their lowest achieving pupils.
Dr Vanessa Ogden told us that UTCs are critical, because of the current gap between education and
the labour market:
‘UTCs are a great way of persuading employers to become involved directly in the education system.
It’s a great way of getting schools and employers to learn what each wants from the other and
then developing a curriculum that gives pupils the right skills. There is an employability skills gap
for many young people. It’s not just about KS4 and then “that’s it”, it’s about these transitions and
access to jobs.’
Studio Schools
13 new Studio Schools are set to open from September 2014, joining the 15 already preparing to
open and the 16 currently open.430 Studio Schools are designed for 14 –19 year olds of all abilities,
where pupils study core GCSEs alongside vocational qualifications.
They are fairly small (300 students), operating longer days and terms, mirroring the workplace and
aiming to ensure students’ learning is rooted in the real world. Students can also take part in work
activity, and for those aged 16 or over this is up to two days and usually paid. As part of this, Studio
Schools are backed by a large number of national and local employers.

123
three
Breakthrough Britain II: Requires Improvement | Schools, settings and transitions
3.10.7 Apprenticeships 431432
Apprenticeships can offer excellent on-the-job training and improve how we prepare more
people for industry. The 2012 Richard Review of Apprenticeships stressed that we must
attempt to imitate the high esteem in which apprenticeships are held in countries like
Germany.433
The Government has committed itself to expanding and improving apprenticeships and
stressed the importance of Level 3 apprenticeships in particular.434 Positively, there were
520,600 apprenticeship starts in 2011/12, 63,400 more than the number of starts in the
2010/11 academic year, and 240,900 more than in the 2009/10 academic year.435
However, Ofsted has found that too many apprentices did not have appropriate and
sustained employment during and after their apprenticeship.436 Ofsted has found examples
of poor practice where apprentices were only given low-level work or where they became
unemployed as soon as they had finished their training.437
The Richard Review highlights that the relationship between employer and apprentice is no
longer as central as it once was. Instead, apprenticeships have become akin to a government-
led training programme, shaped by training professionals not employers.438 The review has
therefore recommended that ‘The relationship between an employer and an apprentice must
once again rise to the fore.’439
431 Department for Education, Press Release, Big business backs new studio schools, 18 July 2012 [accessed via: https://www.gov.uk/government/news/big-business-backs-new-studio-schools (16/07/13)]
432 Hendry E and Sharpe T, An evaluation of the Studio Schools Trust and its role in raising the status of practical & vocational learning, London: Edge Foundation, 2013 [accessed via: http://www.edge.co.uk/media/107740/evaluation_of_studio_schools_trust_-_feb13-1.pdf (19/08/13)
433 Richard D, The Richard Review of Apprenticeships, Copyright 2012: Doug Richard, CEO and Founder, School for Startups, 2012434 SKOPE, One Step Forward, Two Steps Back? Skills Policy in England under the Coalition Government, SKOPE Research Paper No. 102, Cardiff:
SKOPE, 2011435 Hansard, Economic Policy and Statistics, 8 February 2013 436 Office for Standards of Education, Children’s Services and Skills, The Annual Report of Her Majesty’s Chief Inspector of Education, Children’s
Services and Skills, Learning and skills, Manchester : The Annual Report of Her Majesty’s Chief Inspector of Education, Children’s Services and Skills, Learning and skills 2012
437 Ibid 438 Richard D, The Richard Review of Apprenticeships, Copyright 2012: Doug Richard, CEO and Founder, School for Startups, 2012439 Ibid
Summarising the ethos of this initiative, Michael Gove said:
‘Studio schools benefit both business and young people – they are a brilliant way for employers to
become involved in helping give young people what they need to get good jobs. They are aimed
at children who learn in more practical ways and offer good qualifications alongside the kind of
skills employers want.’ 431
Studio Schools are at an early stage in their development and therefore their full impact remains
to be seen. However, one early evaluation suggests the signs look positive. Staff and students at the
schools they looked at were responding positively and that where there had been exam results, these
had been very good.432

The Centre for Social Justice 124
Another problem concerns the length and level of many of these apprenticeships. Two-thirds
of apprenticeships are only at Level 2 and most programmes last only one to two years.440
In Germany, by comparison, nearly all apprenticeships are at Level 3 and most programmes
take three years to complete.
According to Sam Freedman, one of the main barriers we face is the fact there is no longer a
pre-18 labour market. This means it is extremely difficult to get companies to take on younger
people. In the UK the proportion of employers recruiting young people leaving the education
system at any level (school, college or university) has reduced, partly reflecting the declining
size of the youth labour market.441
Providing apprenticeships for younger learners will be especially challenging. Growth in
apprenticeships has been fastest amongst those aged 25 and over.442 In 2011/12, 44 per cent
of apprenticeship starters were over 25, compared with only 18 per cent in 2009/10.443
3.10.8 Reforms and challenges facing the sector
The overall effectiveness of learning and skills providers has improved slightly over the past
three years; the proportion of outstanding providers is greater now than in 2010, but so is the
proportion of inadequate providers.444 In 2011/12, one in every three learners in the sector
– around 1.5 million people – attended providers judged inadequate or satisfactory at their
last inspection.445Therefore further change is needed. FE has not been adequately looked at
until recently and it is only starting to have its needs addressed. Therefore it will take time to
see what effect changes will have.
Ofsted’s proportionate approach to inspection means the sample of providers selected are
not representative of all providers. This is because they will contain a greater percentage
of previously satisfactory or inadequate providers, and a greater percentage of good /
outstanding providers believed to be at risk of declining. This means those providers inspected
are not fully representative of providers as a whole and therefore the judgments actually
reflect relatively little about the sector.446
A more transparent funding system is being introduced to support for example, the raising
of the participation age.447 Institutions will attract a standard rate of funding for each student
weighted for necessary course costs, retention and with additional funding for those at a
440 Steedman H, A Report for the Apprenticeship Ambassadors Network, Apprenticeship Ambassador’s Network, the State of Apprenticeship in 2010 International Comparisons Australia Austria England France Germany Ireland Sweden Switzerland, London: Centre for Economic Performance, The London School of Economics and Political Science , 2010
441 SKOPE (Keep E), Youth Transitions, the Labour Market and Entry into Employment: Some Reflections and Questions, Cardiff: SKOPE, May 2012
442 Department for Business Innovation & Skills, Further Education and Skills: Learner Participation, Outcomes and Level of Highest Qualification Held in England, London: Department for Business Innovation & Skills, 2013
443 Hansard, Economic Policy and Statistics, 8 February 2013 444 Office for Standards of Education, Children’s Services and Skills, The Annual Report of Her Majesty’s Chief Inspector of Education, Children’s
Services and Skills, Learning and skills, Manchester : Office for Standards of Education, Children’s Services and Skills, 2012445 Ibid446 Department for Business, Innovation & Skills, Professionalism in Further Education, Final Report of the Independent Review Panel, London:
Department for Business, Innovation & Skills, 2012 447 Department for Education, 16 to 19 funding formula review 02 July 2013 [accessed via: http://www.education.gov.uk/aboutdfe/
executiveagencies/efa/a00210682/funding-formula-review (20/08/13)]
125
three
Breakthrough Britain II: Requires Improvement | Schools, settings and transitions
disadvantage, all adjusted for area costs. Providers will be able to deliver innovative and
flexible programmes, including work experience, and success rates will be removed from
formulas so as to remove perverse incentives preventing providers from encouraging
students to take challenging courses.
From September 2013, 24+ Advanced Learning Loans will also be available for study at Level
3 and 4.448 There is a risk that this will add another barrier for adult learners. This is on top
of already challenging obstacles like low income, stigma and lack of motivation. There is also
inadequate transparency given that not all college websites display course prices and students
can face price variations of several hundred pounds.449
However, a study from the Department for Business, Innovation & Skills found that whilst
respondents were initially concerned about the idea of a loan, perceptions tended to change
when respondents understood the arrangements surrounding the loan, for example, over
the low rate of repayment.450 Repayments only start from April 2016 and are only applicable
when learners earn more than £21,000 a year.451
From September 2013, schools, colleges and other providers are also expected to introduce
Study Programmes for 16- to 19-year-olds. These consist of a minimum of 540 learning hours
per learner, per academic year, and all students must take or work towards GCSE A* to C in
English and/or mathematics as part of this. Performance tables and data will also be reformed,
for example, on those achieving English and mathematics GCSE having failed to do so at
KS4. This, while still complex, will go some way to reducing the disparity in funding between
college and school.
To improve the status and rigour of vocational education the Government is introducing the
Technical Baccalaureate Standard for courses beginning in September 2014 and reported
in league tables in January 2017.452 This is a performance measure seeking to provide an
alternative to the A-level study route for post-16 education, marking achievement by those
aged 16–19 across three elements – a high-quality level 3 vocational qualification, a Level
3 ‘core mathematics’ qualification, including AS level mathematics and finally, the extended
project – testing students’ skills in for example, extended writing and communication.453
From September 2013, some FE colleges will be able to enroll, on a full time basis, 14 –16-year-
olds.454 New ‘14 to 16 centres’ will offer a combination of high quality vocational as well as
448 The National Careers Service, 24+ Advanced Learning Loan, [accessed via: https://nationalcareersservice.direct.gov.uk/advice/courses/funding/Pages/24AdvancedLearningLoans.aspx (07/07/13)]
449 TES FE Focus, Journey into the unknown – navigating the new landscape of FE loans proves challenging, 02 April 2013 [accessed via: http://www.tes.co.uk/article.aspx?storyCode=6326193 (28/05/2013)]
450 Department for Business Innovation & Skills, Attitudes to Further Education Loans, BIS Research Paper number 73, London: Department for Business Innovation & Skills, 2012
451 Benefits & credits, 24+ Advanced Learning Loans 12 July 2013 [accessed via: https://www.gov.uk/advanced-learning-loans/overview (18/08/13)]
452 Department for Education, Press Release, New TechBacc will give vocational education the high status it deserves, 22 April 2013 [accessed via: https://www.gov.uk/government/news/new-techbacc-will-give-vocational-education-the-high-status-it-deserves (07/06/2013)]
453 Ibid454 Only some colleges will be able to do this, for example, those rated good or above at their last Ofsted inspection and those with a
dedicated space for students to go to for advice, tuition and some teaching. The ‘14 to 16 centre’ will be inspected under Ofsted’s schools framework rather than the post-16 framework.

The Centre for Social Justice 126
academic subjects. This aims to, for example, attract students of all abilities who want early
access to more practical forms of learning and/or wish to train for a technical profession.455
It follows Wolf ’s findings that some young people also do better in core academic subjects if
following a vocational route at 14.
Giving students a vocational choice early on can be very positive but a focus on English and
mathematics must be retained. Pathways must be flexible and ensure younger learners still
have the option of following an alternative route later-on if they wish to.
Seamus Oates is worried that FE providers will not be able to deal with the 14 –16 year-olds
most likely to go down this route:
‘FE teachers are paid less than teachers. They’ve usually come from another background
and they expect to teach adults. They won’t be able to deal with younger pupils, especially
ones with complex needs.’
3.11 Conclusion
The importance of high quality vocational and skills training must not be underestimated.
A huge number of young people depend on being able to move from FE into work, just as
businesses require vocational training to supply high quality employees. The Government’s
reforms promise to do much to improve the quality of teaching in FE settings and to reduce,
over time, the amount of remedial education that the sector needs to undertake.
These are welcome steps; currently, it appears that for many students, FE has no significant
impact on their opportunities in the labour market. This is unacceptable and makes the
decision to try and track students’ destinations so as to improve accountability all the more
important. However, it is essential that these figures ultimately include those studying at all
levels so that potential students, parents and government can see, nationally, whether those
who may be most disadvantaged are actually being helped into work. More generally, it is
essential that disadvantaged students in FE and vocational education do not find themselves
less supported than their contemporaries who stayed in mainstream school.
455 Department for Education, 14- to 16-year-olds in further education 12 June 2013 [accessed via: http://www.education.gov.uk/childrenandyoungpeople/youngpeople/qandlearning/f00225819/full-time-enrol-14-16-fe (16/07/13)]

Breakthrough Britain II: Requires Improvement | Members of the Working Group 127
one

The Centre for Social Justice 128
Conclusion
The education system needs always to be relentlessly ambitious for every child. In order to
do this we need schools that are well-led, have excellent teachers and have the autonomy
necessary to adapt their work to the particular needs of their children. It is also important
that education remains accountable to the taxpayer and that the system can be swift to react
when children are being failed.
Whilst there is significant political commitment to the reform of the education system, far too
many children are still being failed by their education.
The CSJ welcomes the Government’s determination to set high standards for all children and
to provide additional funding to support the most disadvantaged pupils. However, this can
only be the first phase of reform. The next must ask how success can be spread to those
pupils and parts of the system which have yet to experience it. In particular, we will ask:
�� How the Pupil Premium can be fine-tuned to ensure that it helps more of those in need;
�� How greater support can be given to disadvantaged children and their families prior to
their arriving at school;
�� How educational reform can be successfully further extended into primary schools;
�� What more can be done to encourage effective chains and federations of academies to
move into areas of greatest need;
�� How the quality of teaching and leadership can be improved amongst the existing school
workforce;
�� What the new administrative architecture of the education system should look like as the
role of local authorities continues to recede;
�� How improvements can be made to the provision of Further Education so as to provide
an effective transition between education and employment.
Answering these questions will help to ensure that the education system does even more to
help the next generation of children overcome their disadvantages and fulfil their full potential.

REQUIRES IMPROVEMENT
September 2013
Breakthrough Britain II Requires Im
provement: T
he causes of educational failureT
he Centre for Social Justice
£25.00
The Centre for Social Justice
4th Floor, Victoria Charity Centre,
11 Belgrave Road
London
SW1V 1RB
ISBN: 978-0-9573587-8-2
www.centreforsocialjustice.org.uk@CSJThinktank
Breakthrough Britain II
The causes of educational failure