Requirement of neuronal- and cardiac-type sodium channels for murine sinoatrial node pacemaking
14
J Physiol 559.3 (2004) pp 835–848 835 Requirement of neuronal- and cardiac-type sodium channels for murine sinoatrial node pacemaking Ming Lei 1, ∗ , Sandra A. Jones 2, ∗ , Jie Liu 1 , Matthew K. Lancaster 2 , Simon S.-M. Fung 1 , Halina Dobrzynski 2 , Patrizia Camelliti 1 , Sebastian K. G. Maier 3 , Denis Noble 1 and Mark R. Boyett 2 1 University Laboratory of Physiology, University of Oxford, Oxford OX1 3PT, UK 2 School of Biomedical Sciences, University of Leeds, Leeds LS2 9JT, UK 3 Medizinische Universit¨ atsklinik W¨ urzburg, 97080 W¨ urzburg, Germany The majority of Na + channels in the heart are composed of the tetrodotoxin (TTX)-resistant (K D , 2–6 µM) Na v 1.5 isoform; however, recently it has been shown that TTX-sensitive (K D , 1–10 nM) neuronal Na + channel isoforms (Na v 1.1, Na v 1.3 and Na v 1.6) are also present and functionally important in the myocytes of the ventricles and the sinoatrial (SA) node. In the present study, in mouse SA node pacemaker cells, we investigated Na + currents under physiological conditions and the expression of cardiac and neuronal Na + channel isoforms. We identified two distinct Na + current components, TTX resistant and TTX sensitive. At 37 ◦ C, TTX-resistant i Na and TTX-sensitive i Na started to activate at ∼−70 and ∼−60 mV, and peaked at −30 and −10 mV, with a current density of 22 ± 3 and 18 ± 1 pA pF −1 , respectively. TTX-sensitive i Na inactivated at more positive potentials as compared to TTX-resistant i Na . Using action potential clamp, TTX-sensitive i Na was observed to activate late during the pacemaker potential. Using immunocytochemistry and confocal microscopy, different distributions of the TTX-resistant cardiac isoform, Na v 1.5, and the TTX-sensitive neuronal isoform, Na v 1.1, were observed: Na v 1.5 was absent from the centre of the SA node, but present in the periphery of the SA node, whereas Na v 1.1 was present throughout the SA node. Nanomolar concentrations (10 or 100 nM) of TTX, which block TTX-sensitive i Na , slowed pacemaking in both intact SA node preparations and isolated SA node cells without a significant effect on SA node conduction. In contrast, micromolar concentrations (1–30 µM) of TTX, which block TTX-resistant i Na as well as TTX-sensitive i Na , slowed both pacemaking and SA node conduction. It is concluded that two Na + channel isoforms are important for the functioning of the SA node: neuronal (putative Na v 1.1) and cardiac Na v 1.5 isoforms are involved in pacemaking, although the cardiac Na v 1.5 isoform alone is involved in the propagation of the action potential from the SA node to the surrounding atrial muscle. (Resubmitted 25 May 2004; accepted after revision 12 July 2004; first published online 14 July 2004) Corresponding author M. Lei: University Laboratory of Physiology, University of Oxford, Oxford OX1 3PT, UK. Email: [email protected] Under physiological conditions, the cardiac action potential originates in specialized pacemaker cells located in the centre of the SA node. The pacemaker activity of the SA node cells is due to the presence of a spontaneous diastolic depolarization (the pacemaker potential) that is driven by a net inward current. This net inward current results from the deactivation of outward current, i.e. delayed rectifier K + current (i K ), and the activation of inward currents, including Na + -dependent background ∗ S. A. Jones and J. Liu contributed equally to this work. current (i b,Na ), hyperpolarization-activated current (i f ), T- and L-type Ca 2+ currents (i Ca,T , i Ca,L ) and, probably, the sustained inward current (i st ) (Irisawa et al. 1993; Boyett et al. 2000). Although inward voltage-dependent Na + current, i Na , has been recorded from SA node cells (Brown, 1982; Nathan, 1986; Irisawa et al. 1993; Honjo et al. 1996), it is unclear whether it contributes to the pacemaker potential. For example, i Na may be inactivated at the relatively positive potentials during the pacemaker potential in the SA node. During the last decade, significant progress has been made in understanding the molecular basis of C The Physiological Society 2004 DOI: 10.1113/jphysiol.2004.068643
-
Upload
eastanglia -
Category
Documents
-
view
3 -
download
0
Transcript of Requirement of neuronal- and cardiac-type sodium channels for murine sinoatrial node pacemaking
J Physiol 559.3 (2004) pp 835–848 835
Requirement of neuronal- and cardiac-type sodiumchannels for murine sinoatrial node pacemaking
Ming Lei1,∗, Sandra A. Jones2,∗, Jie Liu1, Matthew K. Lancaster2, Simon S.-M. Fung1, Halina Dobrzynski2,Patrizia Camelliti1, Sebastian K. G. Maier3, Denis Noble1 and Mark R. Boyett2
1University Laboratory of Physiology, University of Oxford, Oxford OX1 3PT, UK2School of Biomedical Sciences, University of Leeds, Leeds LS2 9JT, UK3Medizinische Universitatsklinik Wurzburg, 97080 Wurzburg, Germany
The majority of Na+ channels in the heart are composed of the tetrodotoxin (TTX)-resistant(K D, 2–6 µM) Nav1.5 isoform; however, recently it has been shown that TTX-sensitive (K D,1–10 nM) neuronal Na+ channel isoforms (Nav1.1, Nav1.3 and Nav1.6) are also present andfunctionally important in the myocytes of the ventricles and the sinoatrial (SA) node. Inthe present study, in mouse SA node pacemaker cells, we investigated Na+ currents underphysiological conditions and the expression of cardiac and neuronal Na+ channel isoforms.We identified two distinct Na+ current components, TTX resistant and TTX sensitive. At37◦C, TTX-resistant iNa and TTX-sensitive iNa started to activate at ∼ −70 and ∼ −60 mV,and peaked at −30 and −10 mV, with a current density of 22 ± 3 and 18 ± 1 pA pF−1,respectively. TTX-sensitive iNa inactivated at more positive potentials as compared toTTX-resistant iNa. Using action potential clamp, TTX-sensitive iNa was observed to activatelate during the pacemaker potential. Using immunocytochemistry and confocal microscopy,different distributions of the TTX-resistant cardiac isoform, Nav1.5, and the TTX-sensitiveneuronal isoform, Nav1.1, were observed: Nav1.5 was absent from the centre of the SA node,but present in the periphery of the SA node, whereas Nav1.1 was present throughout theSA node. Nanomolar concentrations (10 or 100 nM) of TTX, which block TTX-sensitiveiNa, slowed pacemaking in both intact SA node preparations and isolated SA node cellswithout a significant effect on SA node conduction. In contrast, micromolar concentrations(1–30 µM) of TTX, which block TTX-resistant iNa as well as TTX-sensitive iNa, slowed bothpacemaking and SA node conduction. It is concluded that two Na+ channel isoforms areimportant for the functioning of the SA node: neuronal (putative Nav1.1) and cardiac Nav1.5isoforms are involved in pacemaking, although the cardiac Nav1.5 isoform alone is involvedin the propagation of the action potential from the SA node to the surrounding atrialmuscle.
(Resubmitted 25 May 2004; accepted after revision 12 July 2004; first published online 14 July 2004)Corresponding author M. Lei: University Laboratory of Physiology, University of Oxford, Oxford OX1 3PT, UK.Email: [email protected]
Under physiological conditions, the cardiac actionpotential originates in specialized pacemaker cells locatedin the centre of the SA node. The pacemaker activity ofthe SA node cells is due to the presence of a spontaneousdiastolic depolarization (the pacemaker potential) that isdriven by a net inward current. This net inward currentresults from the deactivation of outward current, i.e.delayed rectifier K+ current (iK), and the activation ofinward currents, including Na+-dependent background
∗S. A. Jones and J. Liu contributed equally to this work.
current (ib,Na), hyperpolarization-activated current (if),T- and L-type Ca2+ currents (iCa,T, iCa,L) and, probably,the sustained inward current (ist) (Irisawa et al. 1993;Boyett et al. 2000). Although inward voltage-dependentNa+ current, iNa, has been recorded from SA node cells(Brown, 1982; Nathan, 1986; Irisawa et al. 1993; Honjoet al. 1996), it is unclear whether it contributes to thepacemaker potential. For example, iNa may be inactivatedat the relatively positive potentials during the pacemakerpotential in the SA node.
During the last decade, significant progress hasbeen made in understanding the molecular basis of
C© The Physiological Society 2004 DOI: 10.1113/jphysiol.2004.068643
836 M. Lei and others J Physiol 559.3
voltage-gated Na+ channels. They are composed ofpore-forming α (Nav) subunits and auxiliary β subunits(Catterall, 2000; Goldin et al. 2000; Goldin, 2001). Tenα subunits and four β subunits have been identifiedso far (Goldin, 2001; Yu & Catterall, 2003). Differentα subunit isoforms are expressed in different tissues andhave different pharmacological properties (Goldin, 2001).Nav1.5 is mainly expressed in cardiac tissue and is inhibitedby micromolar concentrations of tetrodotoxin (TTX),whereas Nav1.1, Nav1.2, Nav1.3 and Nav1.6 are mainlyexpressed in the central nervous system and are inhibitedby nanomolar concentrations of TTX, as is the isoformexpressed in skeletal muscle (Nav1.4). However, aneuronal Na+ channel (Nav1.1) has been reported inthe SA node in the newborn rabbit (Baruscotti et al.1997a). Neuronal Na+ channels are also present in theadult heart: multiple neuronal Na+ channel isoforms(Nav1.1, Nav1.3, Nav1.6), as well as Nav1.5, are expressedin adult mouse ventricular myocytes and are involvedin excitation–contraction coupling (Maier et al. 2002b).In another recent study, TTX-sensitive neuronal Na+
channel isoforms have been shown to be expressed inthe adult mouse and adult rat SA node and block ofthe channels has been shown to lead to a slowing ofthe heart rate in the isolated mouse heart (Maier et al.2003). Although these recent studies highlight possibleroles of neuronal Na+ channels in the adult heart, includingSA node pacemaking, Na+ current through the channelshas not been recorded under physiological conditions.Therefore, it is unclear whether the properties ofneuronal Na+ channels are appropriate for them tocontribute to the relatively positive pacemaker potentialsin SA node cells.
The aim of the present study was to study iNa inadult mouse SA node cells. In isolated SA node cells,we have shown that both Nav1.1 and Nav1.5 can beexpressed and there are corresponding TTX-sensitiveand -resistant Na+ currents. The TTX-sensitive(putative Nav1.1) current has appropriate propertiesfor it to be involved in the pacemaker potential.Experiments on the intact SA node show that Nav1.1 andNav1.5 are both involved in pacemaking, but only Nav1.5is involved in action potential propagation.
Methods
Cell isolation
Cells were isolated from the mouse SA node based on themethod for isolation of rabbit SA node cells previouslydescribed (Lei & Brown, 1996; Lei et al. 2002a,b). Briefly,20–30 g C57BL/6J adult mice (age, 10–12 weeks; fromCharles River UK Ltd, Kent, UK) were killed by cervicaldislocation and the heart quickly removed and washedby Langendorff perfusion for 5–10 min using oxygenated
Tyrode solution. All animal procedures were performed inaccordance with the United Kingdom Animals (ScientificProcedures) Act, 1986. The right atrium was cut from theheart and placed in a dissection chamber perfused withTyrode solution and illuminated from below. A thin stripof SA node tissue (∼0.2 mm × 0.8 mm), limited by thecrista terminalis, the atrial septum and the orifices of thevenae cavae, was cut from the right atrium and allowedto regain spontaneous activity. The SA node tissue stripwas incubated for 5 min in Ca2+-free Tyrode solution,incubated for 20–30 min in enzyme-containing Ca2+-freeTyrode solution (230 units ml−1 Type I collagenase;15 units ml−1 Type IIA elastase; Sigma, Poole, UK) and,finally, washed and stored in Kraft-Bruhe (KB) medium at4◦C for at least 1 h.
Whole-cell current and voltage clamp
Cells were superfused with Tyrode solution at 37◦Cat a rate of 2 ml min−1 via a heat exchanger. SAnode cells were identified by their characteristicmorphology and spontaneous activity. The whole-cellpatch clamp technique was used for electrical recordingfrom single cells with amphotericin-permeabilized orruptured patches. Pipettes (tip diameter, ∼1–2 µm;resistance, 1–2 M� for ruptured patch and 2–5 M�
for amphotericin-permeabilized patch) were made from1 mm diameter glass (Clark Electromedical Instruments,Reading, UK) using a Narishige pipette puller (PP-830,Narishige Scientific Instruments Laboratory, Tokyo,Japan). Amphotericin 200 µg ml−1 was added to thepipette solution just before use. An Axopatch-200Bpatch clamp amplifier (Axon Instruments Inc., UnionCity, CA, USA) was used for current and voltageclamp. Cell capacitance (Cm) was obtained from thecapacity compensation control of the amplifier after thewhole-cell capacity current (in response to 5 ms pulses to−70 mV at 100 Hz from a holding potential of −60 mV)was eliminated. The series resistance was electronicallycompensated (> 80%) and the current signal was filteredby a low pass Bessel filter with a cut-off frequency of5 kHz (−3 dB). Data were digitized at 1–2 kHz usinga Digidata 1200A A/D converter (Axon InstrumentsInc.) and stored on a computer for later analysisusing pCLAMP version 8.2 software (Axon InstrumentsInc.).
For action potential clamp, experiments were carriedout, with some modifications, using the techniquedescribed by Doerr et al. (1989). In the current clampmode, spontaneous action potentials were recorded for30–60 s after a stable perforated whole-cell configurationwas achieved. After switching to the voltage clamp mode,the pre-recorded action potentials were applied to the samecell as the command waveform.
C© The Physiological Society 2004
J Physiol 559.3 Sodium channels in the SA node 837
Electrical mapping
Dissection of the intact SA node was carried outas previously described (Lei et al. 2001, 2002a). Thepreparation was superfused with Tyrode solution at37◦C at a rate of 5–6 ml min−1 via a heat exchanger.Extracellular potentials and intracellular action potentialswere recorded by bipolar electrodes and conventionalmicroelectrodes (resistance, ∼30 M�), respectively, asdescribed by Yamamoto et al. (1998). Electrical signalswere digitized at 5 kHz by a DigiData 1322A A/D converter(Axon Instruments Inc.) and stored on a computer for lateranalysis.
Solutions
Normal Tyrode solution (mm): 140 NaCl; 5.4 KCl; 1.8CaCl2; 1 MgCl2; 10 glucose; 5 Hepes (pH 7.4 with NaOH).For recording iNa, NaCl was reduced to 67 mm (NaClreplaced by CsCl) and 300 nm nisoldipine was addedto solutions to block iCa,L; 40 µm NiCl was added toblock iCa,T in some experiments. KB solution (mm):25 KCl; 0.5 EGTA; 3 MgCl2; 80 l-glutamic acid; 20taurine; 10 KH2PO4; 10 glucose; 10 Hepes (pH 7.4 withKOH). The pipette solution for ruptured whole-cellrecording contained (mm): 10 NaCl; 140 KCl; 1 MgCl2;5 MgATP; 2 EGTA; 10 Hepes (pH 7.3 with KOH).The pipette solution for amphotericin-permeabilizedwhole-cell recording contained (mm): 140 KCl; 1.8MgSO4; 0.1 EGTA; 5 Hepes (pH 7.3 with KOH);prior to use, amphotericin was added as describedabove.
Immunocytochemistry
Immunocytochemistry was carried out on isolated cellsand tissue sections as previously described (Musa et al.2002). Ventricular and atrial cells were isolated aspreviously described (Ashley et al. 2002) and SA node cellswere isolated as described above. Cells were plated ontocollagen-treated slides and allowed to settle for 30 min. Theintact SA node was dissected as previously described (Lei,2001b, 2002) and then frozen. Tissue sections (8.0 µm;through the crista terminalis and the SA node) were cutperpendicular to the crista terminalis using a cryostat(Leica CM900, Wetzlar, Germany). Cells and sections werefixed in 10% formalin (Sigma) for 30 min, washed threetimes with phosphate buffer solution (PBS) over 30 min,permeabilized by 0.1% Triton X-100 (BDH, Poole, UK)for 30 min, washed three times with PBS over 30 min,and blocked with 1% bovine serum albumin (BSA; Sigma)and 10% normal donkey serum (Chemicon International,Temecula, CA, USA) in PBS for 1–2 h before applicationof primary antibody. Primary antibodies were diluted in1% BSA and 2% normal donkey serum in PBS. Cells
and sections were incubated with primary antibody (atan appropriate concentration) at 4◦C overnight. Cells andsections were briefly washed in PBS and then FITC orCy3-labelled donkey anti-rabbit or donkey anti-mousesecondary antibodies (Chemicon International) wereapplied. For double labelling, sections were incubatedwith a mixture of primary antibodies (raised in differentspecies) and then an appropriate mixture of secondaryantibodies. Cells and sections were washed three timeswith PBS and then mounted with Vectashield (H-1000or H1300; Vector Laboratories, Peterborough, UK) andcoverslips were sealed with nail polish. In controlexperiments on isolated cells and tissue sections, primaryantibodies were preincubated with their antigenic peptidesor no primary antibody was used and no labelling wasdetected.
Antibodies
Rabbit anti-connexin43 (Cx43; Sigma) was used at adilution of 1 : 500; mouse anti-desmoplakin I and II(Progen, Heidelberg, Germany) was used as supplied;rabbit anti-HCN4 (Alomone Laboratories, Jerusalem,Israel) was used at a dilution of 1 : 100; rabbit anti-Nav1.1,anti-Nav1.2, anti-Nav1.3, anti-Nav1.5 and anti-Nav1.6(Alomone Laboratories) were used at a dilution of1 : 50; rabbit anti-Nav1.5 (kindly provided by Dr W. A.Catterall, University of Washington, Seattle, USA) wasused at dilutions of 1 : 50 and 1 : 100. The specificityof anti-Nav1.1, anti-Nav1.2, anti-Nav1.3, anti-Nav1.5 andanti-Nav1.6 was previously described (Planells-Caseset al. 2000; Malhotra et al. 2001; Maier et al. 2002b,2003).
Confocal microscopy
Images were acquired using a confocal laser scanningmicroscope (LSM 510; Zeiss, Germany) equipped withargon and helium–neon lasers, which allowed excitationat 488 and 568 nm wavelengths for the detection offluorescein isothiocyanate (FITC) and Cy3, respectively.The images recorded were single optical sections and, inthe case of double labelling, the images were recordedsequentially. The images were saved and then processedusing Corel Photo-Paint and Corel Draw software (Corel,Ottawa, Canada).
Statistical analysis
Data are presented as means ± s.e.m. (number ofpreparations or cells). Differences were evaluated byStudent’s t test and a difference was considered significantif P < 0.05.
C© The Physiological Society 2004
838 M. Lei and others J Physiol 559.3
Results
Isolation and characterization of TTX-sensitiveand -resistant iNa in mouse SA node cells
Cells from the SA node were identified by theircharacteristic size, shape and morphology as well asspontaneous electrical activity. Current was recordedduring 20 ms pulses to potentials between −90 (or −70)and +30 mV from a holding potential of −120 (or−80) mV. iNa was recorded in all SA node cells studied.In three cells (holding potential, −80 mV), the currentwas abolished by 30 µm TTX (sufficient to block bothTTX-sensitive and -resistant Na+ channels; data notshown). The current was also Na+ dependent: in 67 mmNa+ the peak current density was 40 ± 3 pA pF−1 (holdingpotential, −120 mV; n = 9), whereas in 140 mm Na+ it was74 ± 20 pA pF−1 (holding potential, −80 mV; n = 6) and103 ± 13 pA pF−1 (holding potential, −120 mV; n = 2)(data not shown). These findings demonstrate that thecurrent was indeed iNa.
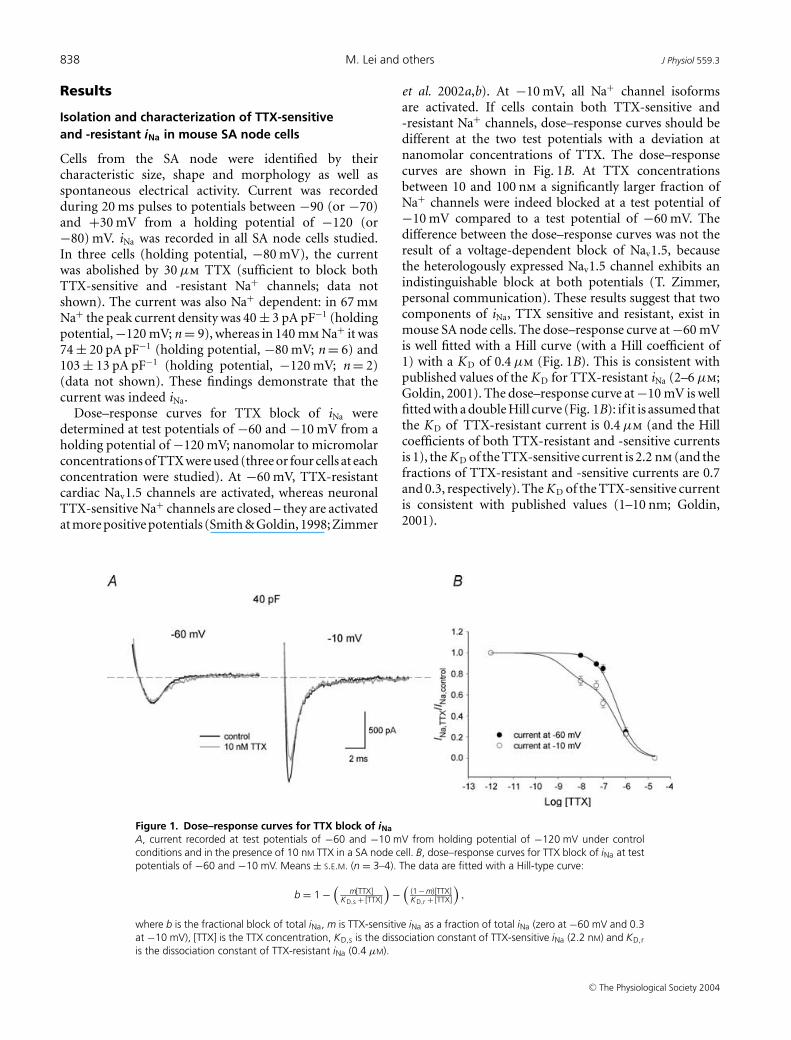
Dose–response curves for TTX block of iNa weredetermined at test potentials of −60 and −10 mV from aholding potential of −120 mV; nanomolar to micromolarconcentrations of TTX were used (three or four cells at eachconcentration were studied). At −60 mV, TTX-resistantcardiac Nav1.5 channels are activated, whereas neuronalTTX-sensitive Na+ channels are closed – they are activatedat more positive potentials (Smith & Goldin, 1998; Zimmer
Figure 1. Dose–response curves for TTX block of iNaA, current recorded at test potentials of −60 and −10 mV from holding potential of −120 mV under controlconditions and in the presence of 10 nM TTX in a SA node cell. B, dose–response curves for TTX block of iNa at testpotentials of −60 and −10 mV. Means ± S.E.M. (n = 3–4). The data are fitted with a Hill-type curve:
b = 1 −(
m[TTX]KD,s + [TTX]
)−
((1 − m)[TTX]KD,r + [TTX]
),
where b is the fractional block of total iNa, m is TTX-sensitive iNa as a fraction of total iNa (zero at −60 mV and 0.3at −10 mV), [TTX] is the TTX concentration, KD,s is the dissociation constant of TTX-sensitive iNa (2.2 nM) and KD,r
is the dissociation constant of TTX-resistant iNa (0.4 µM).
et al. 2002a,b). At −10 mV, all Na+ channel isoformsare activated. If cells contain both TTX-sensitive and-resistant Na+ channels, dose–response curves should bedifferent at the two test potentials with a deviation atnanomolar concentrations of TTX. The dose–responsecurves are shown in Fig. 1B. At TTX concentrationsbetween 10 and 100 nm a significantly larger fraction ofNa+ channels were indeed blocked at a test potential of−10 mV compared to a test potential of −60 mV. Thedifference between the dose–response curves was not theresult of a voltage-dependent block of Nav1.5, becausethe heterologously expressed Nav1.5 channel exhibits anindistinguishable block at both potentials (T. Zimmer,personal communication). These results suggest that twocomponents of iNa, TTX sensitive and resistant, exist inmouse SA node cells. The dose–response curve at −60 mVis well fitted with a Hill curve (with a Hill coefficient of1) with a K D of 0.4 µm (Fig. 1B). This is consistent withpublished values of the K D for TTX-resistant iNa (2–6 µm;Goldin, 2001). The dose–response curve at −10 mV is wellfitted with a double Hill curve (Fig. 1B): if it is assumed thatthe K D of TTX-resistant current is 0.4 µm (and the Hillcoefficients of both TTX-resistant and -sensitive currentsis 1), the K D of the TTX-sensitive current is 2.2 nm (and thefractions of TTX-resistant and -sensitive currents are 0.7and 0.3, respectively). The K D of the TTX-sensitive currentis consistent with published values (1–10 nm; Goldin,2001).
C© The Physiological Society 2004
J Physiol 559.3 Sodium channels in the SA node 839
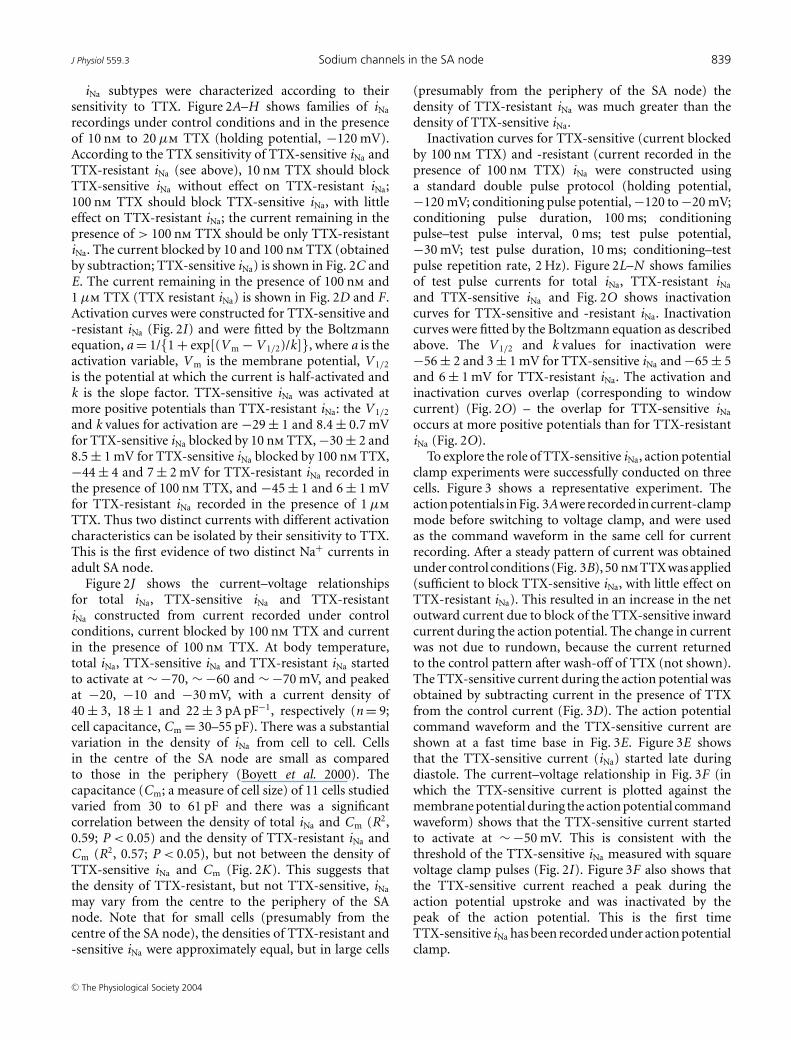
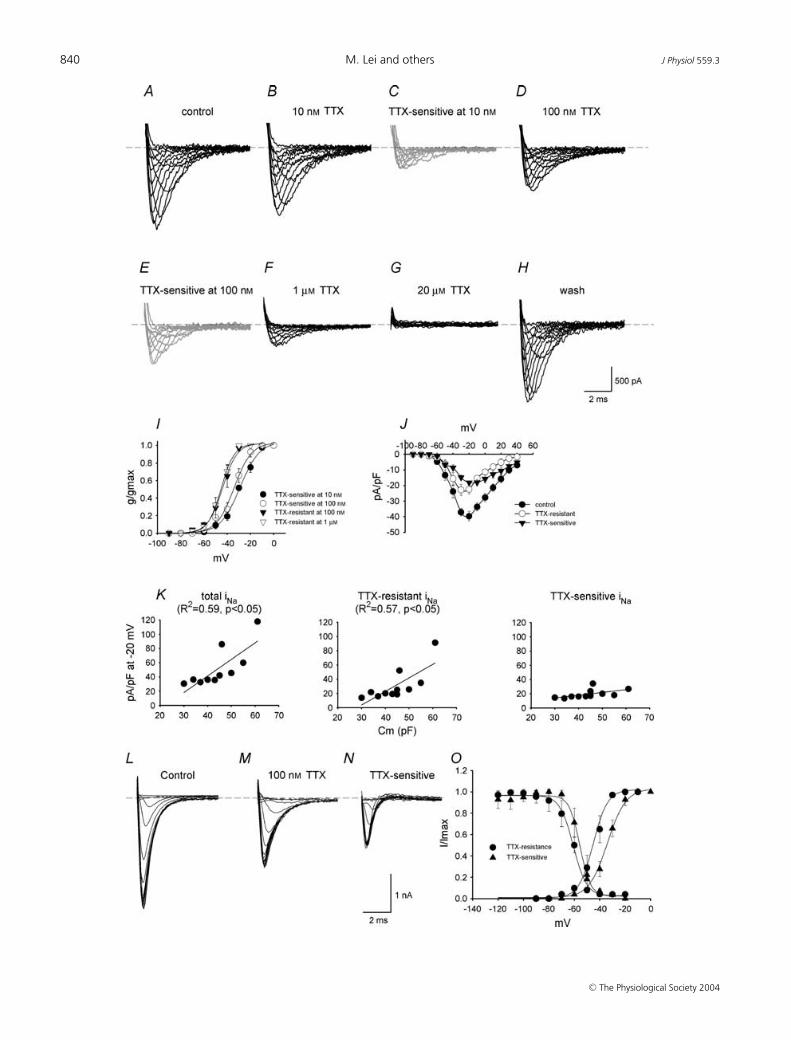
iNa subtypes were characterized according to theirsensitivity to TTX. Figure 2A–H shows families of iNa
recordings under control conditions and in the presenceof 10 nm to 20 µm TTX (holding potential, −120 mV).According to the TTX sensitivity of TTX-sensitive iNa andTTX-resistant iNa (see above), 10 nm TTX should blockTTX-sensitive iNa without effect on TTX-resistant iNa;100 nm TTX should block TTX-sensitive iNa, with littleeffect on TTX-resistant iNa; the current remaining in thepresence of > 100 nm TTX should be only TTX-resistantiNa. The current blocked by 10 and 100 nm TTX (obtainedby subtraction; TTX-sensitive iNa) is shown in Fig. 2C andE. The current remaining in the presence of 100 nm and1 µm TTX (TTX resistant iNa) is shown in Fig. 2D and F .Activation curves were constructed for TTX-sensitive and-resistant iNa (Fig. 2I) and were fitted by the Boltzmannequation, a = 1/{1 + exp[(V m − V 1/2)/k]}, where a is theactivation variable, V m is the membrane potential, V 1/2
is the potential at which the current is half-activated andk is the slope factor. TTX-sensitive iNa was activated atmore positive potentials than TTX-resistant iNa: the V 1/2
and k values for activation are −29 ± 1 and 8.4 ± 0.7 mVfor TTX-sensitive iNa blocked by 10 nm TTX, −30 ± 2 and8.5 ± 1 mV for TTX-sensitive iNa blocked by 100 nm TTX,−44 ± 4 and 7 ± 2 mV for TTX-resistant iNa recorded inthe presence of 100 nm TTX, and −45 ± 1 and 6 ± 1 mVfor TTX-resistant iNa recorded in the presence of 1 µmTTX. Thus two distinct currents with different activationcharacteristics can be isolated by their sensitivity to TTX.This is the first evidence of two distinct Na+ currents inadult SA node.
Figure 2J shows the current–voltage relationshipsfor total iNa, TTX-sensitive iNa and TTX-resistantiNa constructed from current recorded under controlconditions, current blocked by 100 nm TTX and currentin the presence of 100 nm TTX. At body temperature,total iNa, TTX-sensitive iNa and TTX-resistant iNa startedto activate at ∼ −70, ∼ −60 and ∼ −70 mV, and peakedat −20, −10 and −30 mV, with a current density of40 ± 3, 18 ± 1 and 22 ± 3 pA pF−1, respectively (n = 9;cell capacitance, Cm = 30–55 pF). There was a substantialvariation in the density of iNa from cell to cell. Cellsin the centre of the SA node are small as comparedto those in the periphery (Boyett et al. 2000). Thecapacitance (Cm; a measure of cell size) of 11 cells studiedvaried from 30 to 61 pF and there was a significantcorrelation between the density of total iNa and Cm (R2,0.59; P < 0.05) and the density of TTX-resistant iNa andCm (R2, 0.57; P < 0.05), but not between the density ofTTX-sensitive iNa and Cm (Fig. 2K). This suggests thatthe density of TTX-resistant, but not TTX-sensitive, iNa
may vary from the centre to the periphery of the SAnode. Note that for small cells (presumably from thecentre of the SA node), the densities of TTX-resistant and-sensitive iNa were approximately equal, but in large cells
(presumably from the periphery of the SA node) thedensity of TTX-resistant iNa was much greater than thedensity of TTX-sensitive iNa.
Inactivation curves for TTX-sensitive (current blockedby 100 nm TTX) and -resistant (current recorded in thepresence of 100 nm TTX) iNa were constructed usinga standard double pulse protocol (holding potential,−120 mV; conditioning pulse potential, −120 to −20 mV;conditioning pulse duration, 100 ms; conditioningpulse–test pulse interval, 0 ms; test pulse potential,−30 mV; test pulse duration, 10 ms; conditioning–testpulse repetition rate, 2 Hz). Figure 2L–N shows familiesof test pulse currents for total iNa, TTX-resistant iNa
and TTX-sensitive iNa and Fig. 2O shows inactivationcurves for TTX-sensitive and -resistant iNa. Inactivationcurves were fitted by the Boltzmann equation as describedabove. The V 1/2 and k values for inactivation were−56 ± 2 and 3 ± 1 mV for TTX-sensitive iNa and −65 ± 5and 6 ± 1 mV for TTX-resistant iNa. The activation andinactivation curves overlap (corresponding to windowcurrent) (Fig. 2O) – the overlap for TTX-sensitive iNa
occurs at more positive potentials than for TTX-resistantiNa (Fig. 2O).
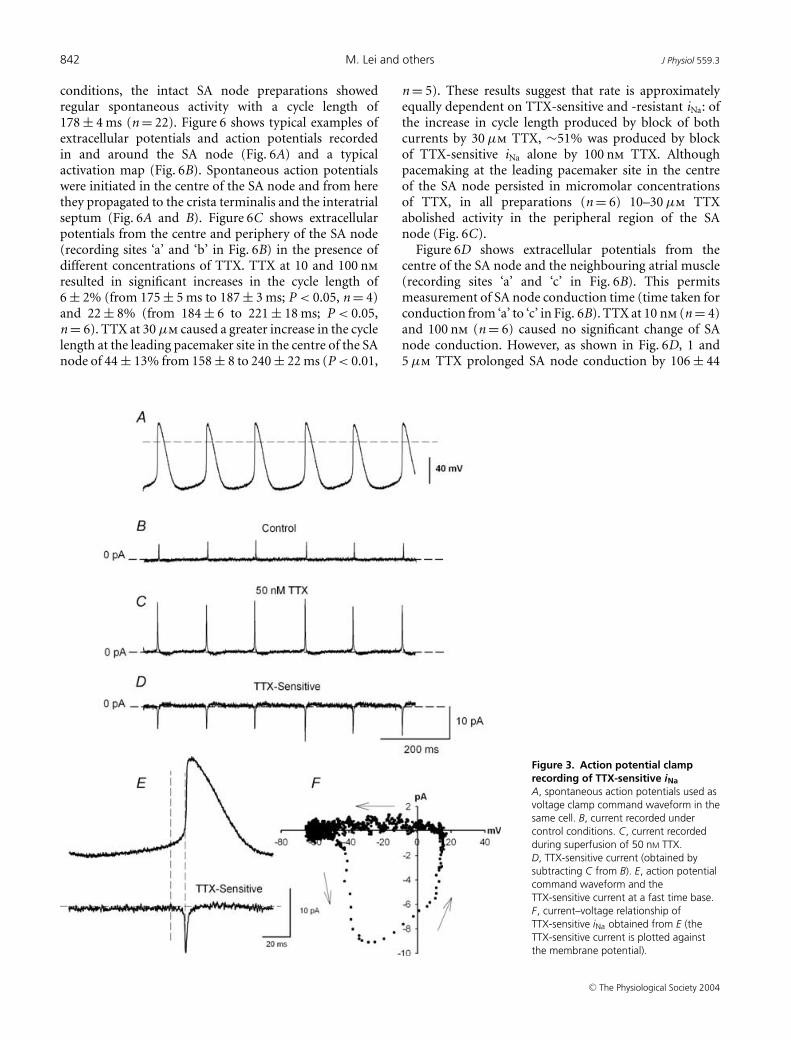
To explore the role of TTX-sensitive iNa, action potentialclamp experiments were successfully conducted on threecells. Figure 3 shows a representative experiment. Theaction potentials in Fig. 3A were recorded in current-clampmode before switching to voltage clamp, and were usedas the command waveform in the same cell for currentrecording. After a steady pattern of current was obtainedunder control conditions (Fig. 3B), 50 nm TTX was applied(sufficient to block TTX-sensitive iNa, with little effect onTTX-resistant iNa). This resulted in an increase in the netoutward current due to block of the TTX-sensitive inwardcurrent during the action potential. The change in currentwas not due to rundown, because the current returnedto the control pattern after wash-off of TTX (not shown).The TTX-sensitive current during the action potential wasobtained by subtracting current in the presence of TTXfrom the control current (Fig. 3D). The action potentialcommand waveform and the TTX-sensitive current areshown at a fast time base in Fig. 3E. Figure 3E showsthat the TTX-sensitive current (iNa) started late duringdiastole. The current–voltage relationship in Fig. 3F (inwhich the TTX-sensitive current is plotted against themembrane potential during the action potential commandwaveform) shows that the TTX-sensitive current startedto activate at ∼ −50 mV. This is consistent with thethreshold of the TTX-sensitive iNa measured with squarevoltage clamp pulses (Fig. 2I). Figure 3F also shows thatthe TTX-sensitive current reached a peak during theaction potential upstroke and was inactivated by thepeak of the action potential. This is the first timeTTX-sensitive iNa has been recorded under action potentialclamp.
C© The Physiological Society 2004
840 M. Lei and others J Physiol 559.3
C© The Physiological Society 2004
J Physiol 559.3 Sodium channels in the SA node 841
Expression of Na+ channel isoforms in mouse SAnode cells
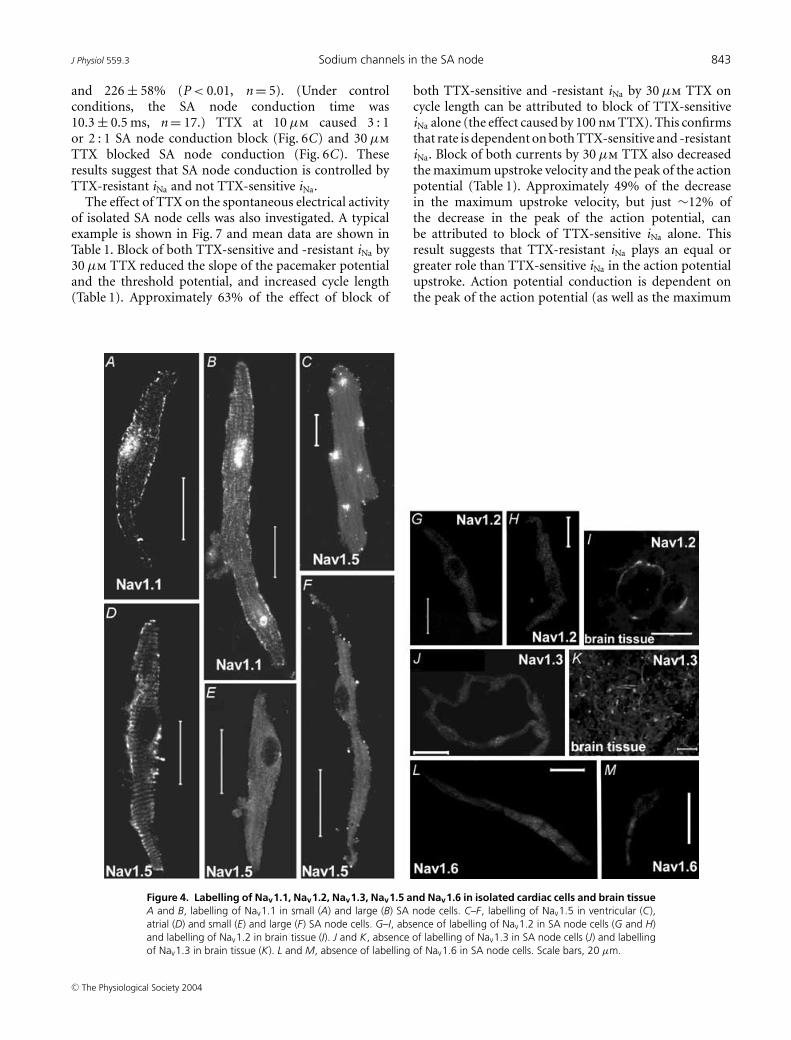
To examine the molecular basis of TTX-sensitiveand -resistant iNa, ∼100 isolated SA node cells wereimmunolabelled for Nav1.1, Nav1.2, Nav1.3, Nav1.5and Nav1.6. Figure 4 shows punctate labelling of theTTX-sensitive Nav1.1 along the cell membrane of small(Fig. 4A) and large (Fig. 4B) SA node cells. Nuclearlabelling by anti-Nav1.1 was also observed – thispresumably was non-specific labelling. There was labellingof the TTX-resistant Nav1.5 along the cell membrane inlarge (Fig. 4F), but not small (Fig. 4E), SA node cells(labelling of Nav1.5 in ventricular and atrial cells is alsoshown in Fig. 4C and D). No labelling of Nav1.2 wasobserved in SA node cells (Fig. 4G and H). Figure 4I showslabelling of Nav1.2 in brain tissue – this proves that the anti-body used is effective. No labelling of Nav1.3 was observedin SA node cells (Fig. 4J and K shows labelling of Nav1.3 inbrain tissue). Finally, no labelling of Nav1.6 was observedin SA node cells (Fig. 4L and M).
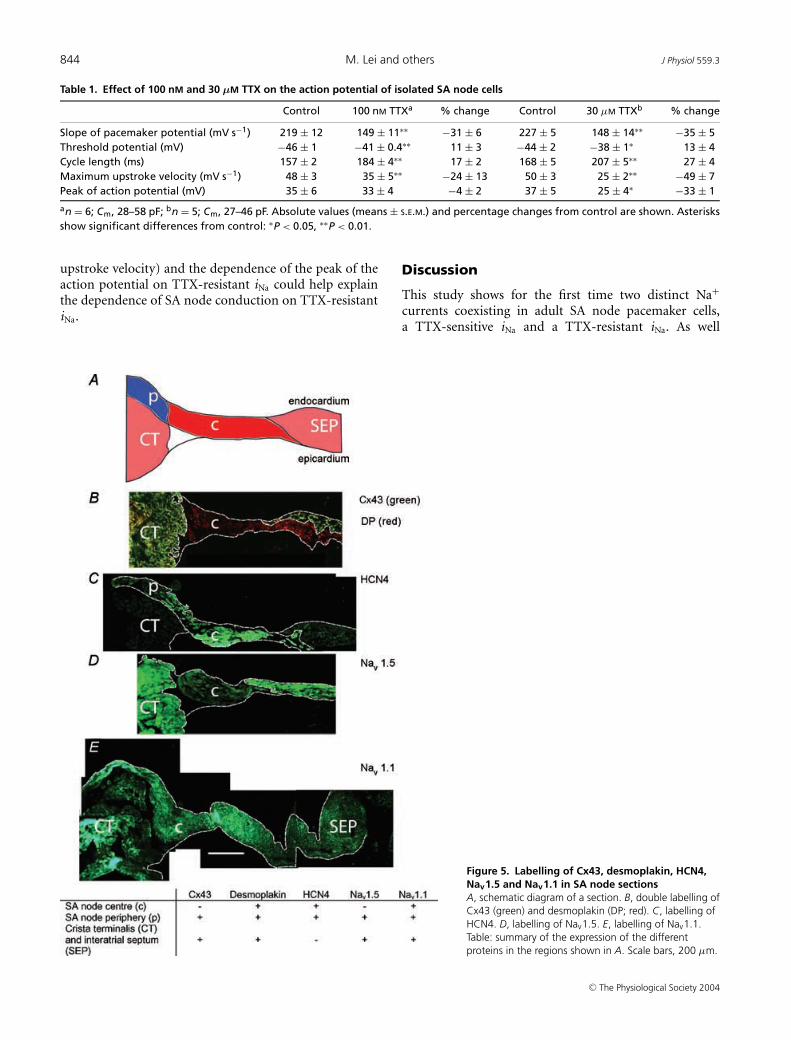
We also characterized the expression pattern of Nav1.1and Nav1.5 in tissue sections. Figure 5B–E shows sectionscut half-way between the superior and inferior venae cavae(approximate position of the leading pacemaker site). Thesections were cut through the crista terminalis (largelyatrial muscle), the intercaval region, and the interatrialseptum (atrial muscle). In the SA node of the rabbit,the centre of the SA node is located in the intercavalregion and the periphery of the SA node extends up theendocardial face of the crista terminalis (Boyett et al.2003). Nav1.1 and Nav1.5 were immunolabelled, but, inaddition, connexin43 (Cx43), desmoplakin and HCN4were immunolabelled as markers. Cx43 is a gap junctionprotein and is known to be present in atrial muscle andthe periphery of the SA node, but absent from the centreof the SA node (Boyett et al. 2003). Desmoplakin is acomponent of desmosomes (which provide mechanicalcoupling between cells) and is present in all myocytes(atrial muscle and SA node). HCN4 is the principal isoformresponsible for the hyperpolarization-activated channel
Figure 2. Characteristics of TTX-sensitive and -resistant iNaA–H, recordings of current under control conditions (total iNa; A), current in the presence of 10 nM TTX (B), currentblocked by 10 nM TTX (obtained by subtraction; TTX-sensitive iNa; C), current in the presence of 100 nM TTX(TTX-resistant iNa; D), current blocked by 100 nM TTX (obtained by subtraction; TTX-sensitive iNa; E), current inthe presence of 1 µM TTX (F), current in the presence of 20 µM TTX (G) and current after wash-off of TTX (H)(Cm, 45 pF). I, activation curves for TTX-sensitive (blocked by 10 or 100 nM TTX) and -resistant (in the presence of100 nM or 1 µM TTX) iNa. Means ± S.E.M. (n = 3 at 10 nM and 1 µM TTX, n = 9 at 100 nM TTX). J, current–voltagerelationships for total iNa, TTX-sensitive iNa (blocked by 100 nM TTX) and TTX-resistant iNa (in the presence of100 nM TTX). Means ± S.E.M. (n = 9). K, densities of total iNa, TTX-resistant iNa (in the presence of 100 nM TTX) andTTX-sensitive iNa (blocked by 100 nM TTX) plotted against Cm. The data are fitted with straight lines as a result oflinear regressions (R2 and P values shown). L–N, recordings of total iNa, TTX-resistant iNa (in the presence of 100 nM
TTX) and TTX-sensitive iNa (blocked by 100 nM TTX) during the test pulse of the inactivation protocol (Cm, 45 pF).O, activation and inactivation curves for TTX-sensitive (blocked by 100 nM TTX) and -resistant (in the presence of100 nM TTX) iNa. Means ± S.E.M. (n = 6–9).
and is known to be present throughout the SA node,but not in atrial muscle (Boyett et al. 2003). Figure 5Bshows that, whereas desmoplakin signal (red) was presentthroughout the section, Cx43 signal (green) was absentfrom the intercaval region adjacent to the crista terminalis.The Cx43-negative region corresponds to the centre of theSA node. Figure 5C shows that HCN4 signal was presentin the centre of the SA node in the intercaval region, butnot in the atrial muscle of the crista terminalis and towardsthe interatrial septum. Figure 5C shows that HCN4 signalwas also present on the endocardial surface of the cristaterminalis; this presumably corresponds to the peripheryof the SA node. Cx43 signal was present on the endocardialsurface of the crista terminalis (data not shown); it isknown that Cx43 is expressed in the periphery of the rabbitSA node (Boyett et al. 2003). The use of Cx43, desmoplakinand HCN4 therefore allows the centre and periphery ofthe SA node to be identified. Figure 5D shows that Nav1.5signal was present throughout the section except for thecentre of the SA node at the foot of the crista terminalis.In contrast, Nav1.1 signal was present throughout thetissue including the centre and periphery of the SA node(Fig. 5E). Figure 5E shows that, in the mouse SA node, theperiphery of the SA node on the endocardial surface of thecrista terminalis can be separated from the atrial muscleof the crista terminalis by connective tissue (as it is in therabbit SA node; Boyett et al. 2003). In summary, basedon the expression of Cx43, desmoplakin, HCN4, Nav1.5and Nav1.1, three tissue types were identified (SA nodecentre, SA node periphery, atrial muscle); the distributionof the tissues is summarized schematically in Fig. 5A andthe expression of proteins, including Nav1.5 and Nav1.1,in these tissues is summarized by the table in Fig. 5.
Effect of TTX on mouse SA node pacemakingand conduction
To address the roles of the TTX-sensitive and -resistantiNa in SA node pacemaking, nanomolar or micromolarconcentrations of TTX were applied to intact SA nodepreparations and isolated SA node cells. Under control
C© The Physiological Society 2004
842 M. Lei and others J Physiol 559.3
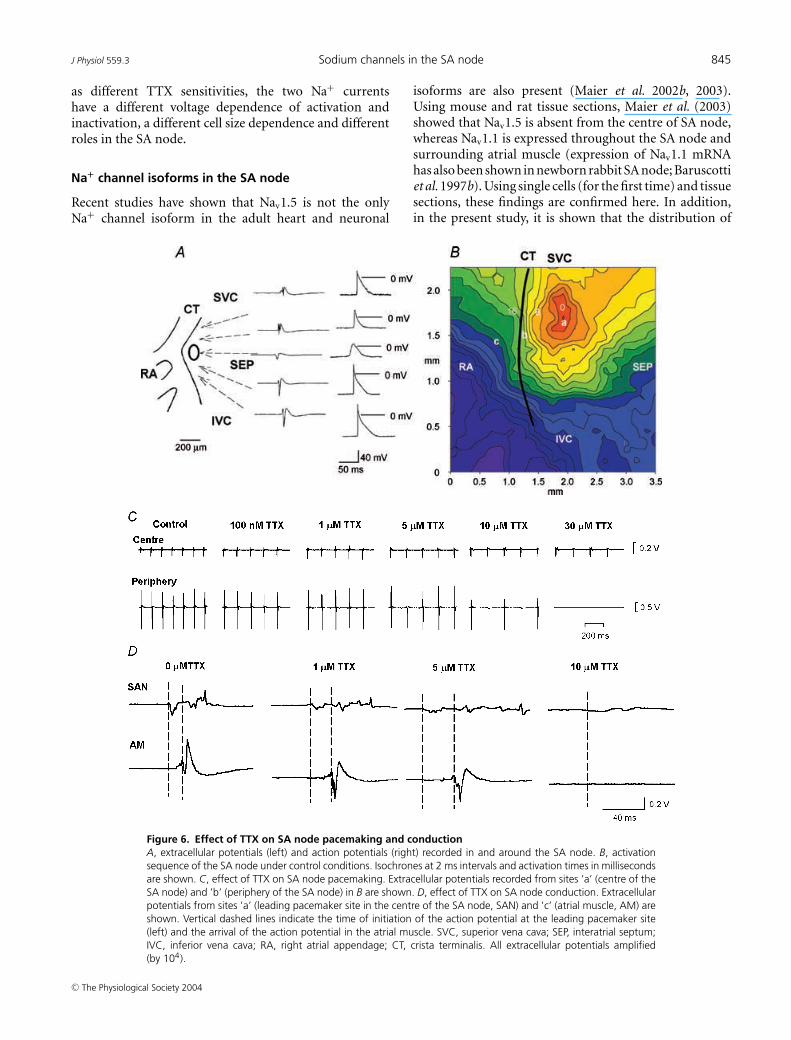
conditions, the intact SA node preparations showedregular spontaneous activity with a cycle length of178 ± 4 ms (n = 22). Figure 6 shows typical examples ofextracellular potentials and action potentials recordedin and around the SA node (Fig. 6A) and a typicalactivation map (Fig. 6B). Spontaneous action potentialswere initiated in the centre of the SA node and from herethey propagated to the crista terminalis and the interatrialseptum (Fig. 6A and B). Figure 6C shows extracellularpotentials from the centre and periphery of the SA node(recording sites ‘a’ and ‘b’ in Fig. 6B) in the presence ofdifferent concentrations of TTX. TTX at 10 and 100 nmresulted in significant increases in the cycle length of6 ± 2% (from 175 ± 5 ms to 187 ± 3 ms; P < 0.05, n = 4)and 22 ± 8% (from 184 ± 6 to 221 ± 18 ms; P < 0.05,n = 6). TTX at 30 µm caused a greater increase in the cyclelength at the leading pacemaker site in the centre of the SAnode of 44 ± 13% from 158 ± 8 to 240 ± 22 ms (P < 0.01,
Figure 3. Action potential clamprecording of TTX-sensitive iNaA, spontaneous action potentials used asvoltage clamp command waveform in thesame cell. B, current recorded undercontrol conditions. C, current recordedduring superfusion of 50 nM TTX.D, TTX-sensitive current (obtained bysubtracting C from B). E, action potentialcommand waveform and theTTX-sensitive current at a fast time base.F, current–voltage relationship ofTTX-sensitive iNa obtained from E (theTTX-sensitive current is plotted againstthe membrane potential).
n = 5). These results suggest that rate is approximatelyequally dependent on TTX-sensitive and -resistant iNa: ofthe increase in cycle length produced by block of bothcurrents by 30 µm TTX, ∼51% was produced by blockof TTX-sensitive iNa alone by 100 nm TTX. Althoughpacemaking at the leading pacemaker site in the centreof the SA node persisted in micromolar concentrationsof TTX, in all preparations (n = 6) 10–30 µm TTXabolished activity in the peripheral region of the SAnode (Fig. 6C).
Figure 6D shows extracellular potentials from thecentre of the SA node and the neighbouring atrial muscle(recording sites ‘a’ and ‘c’ in Fig. 6B). This permitsmeasurement of SA node conduction time (time taken forconduction from ‘a’ to ‘c’ in Fig. 6B). TTX at 10 nm (n = 4)and 100 nm (n = 6) caused no significant change of SAnode conduction. However, as shown in Fig. 6D, 1 and5 µm TTX prolonged SA node conduction by 106 ± 44
C© The Physiological Society 2004
J Physiol 559.3 Sodium channels in the SA node 843
and 226 ± 58% (P < 0.01, n = 5). (Under controlconditions, the SA node conduction time was10.3 ± 0.5 ms, n = 17.) TTX at 10 µm caused 3 : 1or 2 : 1 SA node conduction block (Fig. 6C) and 30 µmTTX blocked SA node conduction (Fig. 6C). Theseresults suggest that SA node conduction is controlled byTTX-resistant iNa and not TTX-sensitive iNa.
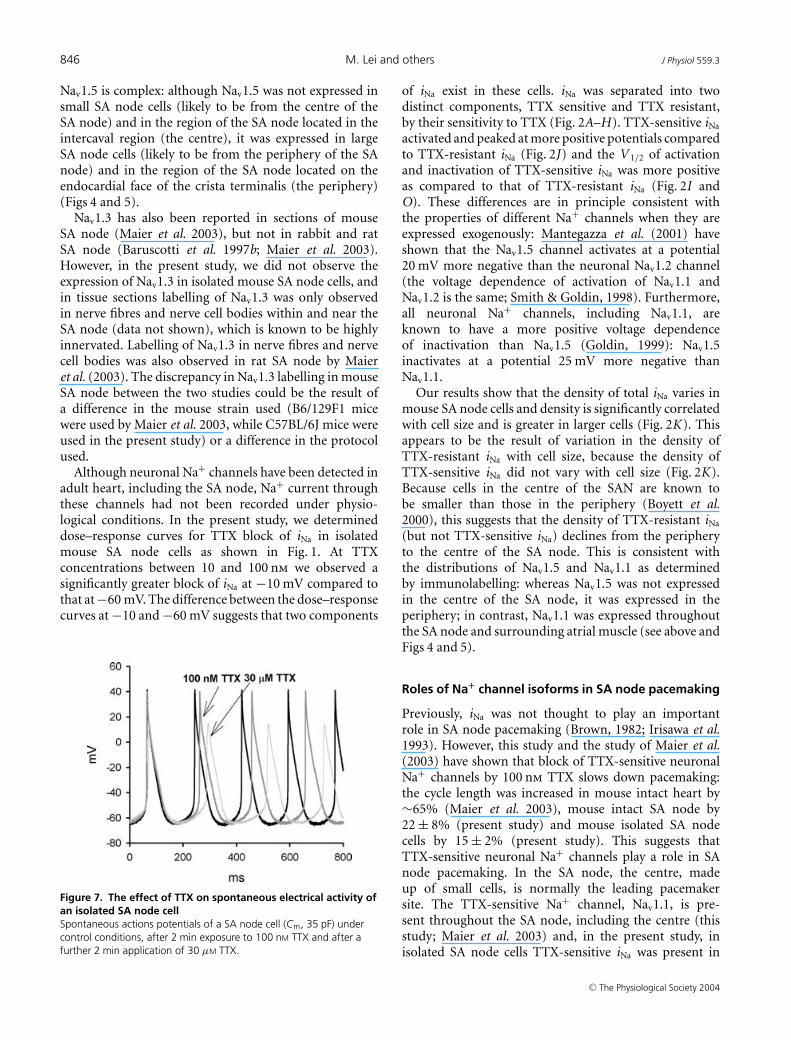
The effect of TTX on the spontaneous electrical activityof isolated SA node cells was also investigated. A typicalexample is shown in Fig. 7 and mean data are shown inTable 1. Block of both TTX-sensitive and -resistant iNa by30 µm TTX reduced the slope of the pacemaker potentialand the threshold potential, and increased cycle length(Table 1). Approximately 63% of the effect of block of
Figure 4. Labelling of Nav1.1, Nav1.2, Nav1.3, Nav1.5 and Nav1.6 in isolated cardiac cells and brain tissueA and B, labelling of Nav1.1 in small (A) and large (B) SA node cells. C–F, labelling of Nav1.5 in ventricular (C),atrial (D) and small (E) and large (F) SA node cells. G–I, absence of labelling of Nav1.2 in SA node cells (G and H)and labelling of Nav1.2 in brain tissue (I). J and K, absence of labelling of Nav1.3 in SA node cells (J) and labellingof Nav1.3 in brain tissue (K). L and M, absence of labelling of Nav1.6 in SA node cells. Scale bars, 20 µm.
both TTX-sensitive and -resistant iNa by 30 µm TTX oncycle length can be attributed to block of TTX-sensitiveiNa alone (the effect caused by 100 nm TTX). This confirmsthat rate is dependent on both TTX-sensitive and -resistantiNa. Block of both currents by 30 µm TTX also decreasedthe maximum upstroke velocity and the peak of the actionpotential (Table 1). Approximately 49% of the decreasein the maximum upstroke velocity, but just ∼12% ofthe decrease in the peak of the action potential, canbe attributed to block of TTX-sensitive iNa alone. Thisresult suggests that TTX-resistant iNa plays an equal orgreater role than TTX-sensitive iNa in the action potentialupstroke. Action potential conduction is dependent onthe peak of the action potential (as well as the maximum
C© The Physiological Society 2004
844 M. Lei and others J Physiol 559.3
Table 1. Effect of 100 nM and 30 µM TTX on the action potential of isolated SA node cells
Control 100 nM TTXa % change Control 30 µM TTXb % change
Slope of pacemaker potential (mV s−1) 219 ± 12 149 ± 11∗∗ −31 ± 6 227 ± 5 148 ± 14∗∗ −35 ± 5Threshold potential (mV) −46 ± 1 −41 ± 0.4∗∗ 11 ± 3 −44 ± 2 −38 ± 1∗ 13 ± 4Cycle length (ms) 157 ± 2 184 ± 4∗∗ 17 ± 2 168 ± 5 207 ± 5∗∗ 27 ± 4Maximum upstroke velocity (mV s−1) 48 ± 3 35 ± 5∗∗ −24 ± 13 50 ± 3 25 ± 2∗∗ −49 ± 7Peak of action potential (mV) 35 ± 6 33 ± 4 −4 ± 2 37 ± 5 25 ± 4∗ −33 ± 1
an = 6; Cm, 28–58 pF; bn = 5; Cm, 27–46 pF. Absolute values (means ± S.E.M.) and percentage changes from control are shown. Asterisksshow significant differences from control: ∗P < 0.05, ∗∗P < 0.01.
upstroke velocity) and the dependence of the peak of theaction potential on TTX-resistant iNa could help explainthe dependence of SA node conduction on TTX-resistantiNa.
Figure 5. Labelling of Cx43, desmoplakin, HCN4,Nav1.5 and Nav1.1 in SA node sectionsA, schematic diagram of a section. B, double labelling ofCx43 (green) and desmoplakin (DP; red). C, labelling ofHCN4. D, labelling of Nav1.5. E, labelling of Nav1.1.Table: summary of the expression of the differentproteins in the regions shown in A. Scale bars, 200 µm.
Discussion
This study shows for the first time two distinct Na+
currents coexisting in adult SA node pacemaker cells,a TTX-sensitive iNa and a TTX-resistant iNa. As well
C© The Physiological Society 2004
J Physiol 559.3 Sodium channels in the SA node 845
as different TTX sensitivities, the two Na+ currentshave a different voltage dependence of activation andinactivation, a different cell size dependence and differentroles in the SA node.
Na+ channel isoforms in the SA node
Recent studies have shown that Nav1.5 is not the onlyNa+ channel isoform in the adult heart and neuronal
Figure 6. Effect of TTX on SA node pacemaking and conductionA, extracellular potentials (left) and action potentials (right) recorded in and around the SA node. B, activationsequence of the SA node under control conditions. Isochrones at 2 ms intervals and activation times in millisecondsare shown. C, effect of TTX on SA node pacemaking. Extracellular potentials recorded from sites ’a’ (centre of theSA node) and ’b’ (periphery of the SA node) in B are shown. D, effect of TTX on SA node conduction. Extracellularpotentials from sites ’a’ (leading pacemaker site in the centre of the SA node, SAN) and ’c’ (atrial muscle, AM) areshown. Vertical dashed lines indicate the time of initiation of the action potential at the leading pacemaker site(left) and the arrival of the action potential in the atrial muscle. SVC, superior vena cava; SEP, interatrial septum;IVC, inferior vena cava; RA, right atrial appendage; CT, crista terminalis. All extracellular potentials amplified(by 104).
isoforms are also present (Maier et al. 2002b, 2003).Using mouse and rat tissue sections, Maier et al. (2003)showed that Nav1.5 is absent from the centre of SA node,whereas Nav1.1 is expressed throughout the SA node andsurrounding atrial muscle (expression of Nav1.1 mRNAhas also been shown in newborn rabbit SA node; Baruscottiet al. 1997b). Using single cells (for the first time) and tissuesections, these findings are confirmed here. In addition,in the present study, it is shown that the distribution of
C© The Physiological Society 2004
846 M. Lei and others J Physiol 559.3
Nav1.5 is complex: although Nav1.5 was not expressed insmall SA node cells (likely to be from the centre of theSA node) and in the region of the SA node located in theintercaval region (the centre), it was expressed in largeSA node cells (likely to be from the periphery of the SAnode) and in the region of the SA node located on theendocardial face of the crista terminalis (the periphery)(Figs 4 and 5).
Nav1.3 has also been reported in sections of mouseSA node (Maier et al. 2003), but not in rabbit and ratSA node (Baruscotti et al. 1997b; Maier et al. 2003).However, in the present study, we did not observe theexpression of Nav1.3 in isolated mouse SA node cells, andin tissue sections labelling of Nav1.3 was only observedin nerve fibres and nerve cell bodies within and near theSA node (data not shown), which is known to be highlyinnervated. Labelling of Nav1.3 in nerve fibres and nervecell bodies was also observed in rat SA node by Maieret al. (2003). The discrepancy in Nav1.3 labelling in mouseSA node between the two studies could be the result ofa difference in the mouse strain used (B6/129F1 micewere used by Maier et al. 2003, while C57BL/6J mice wereused in the present study) or a difference in the protocolused.
Although neuronal Na+ channels have been detected inadult heart, including the SA node, Na+ current throughthese channels had not been recorded under physio-logical conditions. In the present study, we determineddose–response curves for TTX block of iNa in isolatedmouse SA node cells as shown in Fig. 1. At TTXconcentrations between 10 and 100 nm we observed asignificantly greater block of iNa at −10 mV compared tothat at −60 mV. The difference between the dose–responsecurves at −10 and −60 mV suggests that two components
Figure 7. The effect of TTX on spontaneous electrical activity ofan isolated SA node cellSpontaneous actions potentials of a SA node cell (Cm, 35 pF) undercontrol conditions, after 2 min exposure to 100 nM TTX and after afurther 2 min application of 30 µM TTX.
of iNa exist in these cells. iNa was separated into twodistinct components, TTX sensitive and TTX resistant,by their sensitivity to TTX (Fig. 2A–H). TTX-sensitive iNa
activated and peaked at more positive potentials comparedto TTX-resistant iNa (Fig. 2J) and the V 1/2 of activationand inactivation of TTX-sensitive iNa was more positiveas compared to that of TTX-resistant iNa (Fig. 2I andO). These differences are in principle consistent withthe properties of different Na+ channels when they areexpressed exogenously: Mantegazza et al. (2001) haveshown that the Nav1.5 channel activates at a potential20 mV more negative than the neuronal Nav1.2 channel(the voltage dependence of activation of Nav1.1 andNav1.2 is the same; Smith & Goldin, 1998). Furthermore,all neuronal Na+ channels, including Nav1.1, areknown to have a more positive voltage dependenceof inactivation than Nav1.5 (Goldin, 1999): Nav1.5inactivates at a potential 25 mV more negative thanNav1.1.
Our results show that the density of total iNa varies inmouse SA node cells and density is significantly correlatedwith cell size and is greater in larger cells (Fig. 2K). Thisappears to be the result of variation in the density ofTTX-resistant iNa with cell size, because the density ofTTX-sensitive iNa did not vary with cell size (Fig. 2K).Because cells in the centre of the SAN are known tobe smaller than those in the periphery (Boyett et al.2000), this suggests that the density of TTX-resistant iNa
(but not TTX-sensitive iNa) declines from the peripheryto the centre of the SA node. This is consistent withthe distributions of Nav1.5 and Nav1.1 as determinedby immunolabelling: whereas Nav1.5 was not expressedin the centre of the SA node, it was expressed in theperiphery; in contrast, Nav1.1 was expressed throughoutthe SA node and surrounding atrial muscle (see above andFigs 4 and 5).
Roles of Na+ channel isoforms in SA node pacemaking
Previously, iNa was not thought to play an importantrole in SA node pacemaking (Brown, 1982; Irisawa et al.1993). However, this study and the study of Maier et al.(2003) have shown that block of TTX-sensitive neuronalNa+ channels by 100 nm TTX slows down pacemaking:the cycle length was increased in mouse intact heart by∼65% (Maier et al. 2003), mouse intact SA node by22 ± 8% (present study) and mouse isolated SA nodecells by 15 ± 2% (present study). This suggests thatTTX-sensitive neuronal Na+ channels play a role in SAnode pacemaking. In the SA node, the centre, madeup of small cells, is normally the leading pacemakersite. The TTX-sensitive Na+ channel, Nav1.1, is pre-sent throughout the SA node, including the centre (thisstudy; Maier et al. 2003) and, in the present study, inisolated SA node cells TTX-sensitive iNa was present in
C© The Physiological Society 2004
J Physiol 559.3 Sodium channels in the SA node 847
large and small cells and the density of the current didnot vary with cell size (Fig. 2K). TTX-sensitive iNa, morethan TTX-resistant iNa, has properties appropriate forSA node pacemaking: at the relatively positive potentials(∼ −60 mV) during the pacemaker potential, a greaterfraction of TTX-sensitive iNa than TTX-resistant iNa will beavailable, because the inactivation curve of TTX-sensitiveiNa is shifted to more positive potentials as compared tothat of TTX-resistant iNa (Fig. 2I). In addition, because ofoverlap of the activation and inactivation curves there isexpected to be window current for both TTX-sensitiveand -resistant iNa. However, window current in thecase of TTX-sensitive iNa is available at more positivepotentials (perhaps more appropriate for pacemaking)than window current in the case of TTX-resistant iNa
(Fig. 2O). In the present study, action potential clampexperiments confirmed that TTX-sensitive iNa activatedduring diastolic depolarization (Fig. 3). In the presentstudy, block of TTX-resistant iNa as well as TTX-sensitiveiNa by 30 µm TTX resulted in an extra slowing ofpacemaking as compared to block of TTX-sensitive iNa
alone by nanomolar concentrations of TTX in both theintact SA node and isolated SA node cells. This suggeststhat TTX-resistant iNa, as well as TTX-sensitive iNa, playsa role in SA node pacemaking. Although the properties ofNav1.5 are less appropriate for pacemaking, there can be agreater density of TTX-resistant iNa than TTX-sensitive iNa
(Fig. 2K) and this perhaps explains its importance. Evenin the presence of 30 µm TTX, pacemaking continued inintact SA node preparations (Fig. 6C) and isolated SA nodecells (Fig. 7) and this shows that currents other than iNa areinvolved in pacemaking.
Roles of Na+ channel isoforms in SA node conduction
Block of both TTX-sensitive and -resistant iNa by micro-molar concentrations of TTX, but not block of theTTX-sensitive iNa alone by 10 or 100 nm TTX, causeda slowing of SA node conduction (from the leadingpacemaker site in the centre of the SA node to thesurrounding atrial muscle via the periphery of the SAnode) or even SA node conduction block (Fig. 6D). Thisshows an important role for TTX-resistant iNa in SA nodeconduction. iNa is expected to control conduction, becausethe conduction velocity depends on both the upstrokevelocity and amplitude of the action potential and bothof these are dependent on iNa (Fig. 7). The SA nodeconduction time, as measured in this study, will primarilydepend on the periphery of the SA node and, in the peri-phery of the SA node, the dominant iNa is likely to be theTTX-resistant iNa (in large SA node cells, likely to be fromthe periphery, the density of TTX-resistant iNa was greaterthan that of TTX-sensitive iNa; Fig. 2K). This can explainthe dependence of SA node conduction on TTX-resistantiNa. Micromolar concentrations of TTX abolished activity
in the periphery, but not the centre, of the SA node. Thisis probably because the action potential upstroke in theperiphery, but not the centre, is dependent on iNa, whereasin the centre, it is dependent on iCa,L (Kodama et al.1997).
Physiological and clinical importance
The present study shows that Na+ channels play animportant role in the functioning of the SA node andthis is borne out by independent work. In the presentstudy, block of TTX-resistant iNa (presumably throughthe Nav1.5 channel) resulted in a slowing of SA nodepacemaking, a slowing of SA node conduction andSA node exit block (Fig. 6). These are symptoms ofsick sinus syndrome (Benditt et al. 1990). In a studyof the SA node from heterozygous Scn5a (gene forNav1.5) knockout mice, a sick sinus syndrome phenotypewas observed (unpublished data). Knockout of theNa+ channel β2 subunit also results in a sick sinussyndrome phenotype (Maier et al. 2002a). Recently,a case of familial sick sinus syndrome in a patientwas ascribed to a mutation in SCN5A (Benson et al.2003).
In conclusion, two distinct Na+ channels are expressedin the SA node. Both neuronal and cardiac Na+ channelscontribute to the initiation of the action potential in theSA node and, in addition, the cardiac Na+ channel is alsoresponsible for the propagation of the action potential outof the SA node.
References
Ashley EA, Sears CE, Bryant SM, Watkins HC & Casadei B(2002). Cardiac nitric oxide synthase 1 regulates basal andβ-adrenergic contractility in murine ventricular myocytes.Circulation 105, 3011–3016.
Baruscotti M, Westenbroek R, Catterall WA, DiFrancesco D &Robinson RB (1997a). The newborn rabbit sino-atrial nodeexpresses a neuronal type I-like Na+ channel. J Physiol 498,641–648.
Benditt D, Milstein S & Goldstein M (1990). Sinus nodedysfunction: Pathophysiology, clinical features, evalution,and treatment. In Cardiac Electrophysiology. From Cell toBedside, ed. Zips DP & Jalife J, pp. 708–734. W.B. Saunders,Philadelphia.
Benson DW, Wang DW, Dyment M, Knilans TK, Fish FA,Strieper MJ, Rhodes TH & George AL Jr (2003). Congenitalsick sinus syndrome caused by recessive mutations in thecardiac sodium channel gene (SCN5A). J Clin Invest 112,1019–1028.
Boyett MR, Dobrzynski H, Lancaster MK, Jones SA, Honjo H &Kodama I (2003). Sophisticated architecture is required forthe sinoatrial node to perform its normal pacemakerfunction. J Cardiovasc Electrophysiol 14, 104–106.
C© The Physiological Society 2004
848 M. Lei and others J Physiol 559.3
Boyett MR, Honjo H & Kodama I (2000). The sinoatrial node,a heterogeneous pacemaker structure. Cardiovasc Res 47,658–687.
Brown HF (1982). Electrophysiology of the sinoatrial node.Physiol Rev 62, 505–530.
Catterall WA (2000). From ionic currents to molecularmechanisms: the structure and function of voltage-gatedsodium channels. Neuron 26, 13–25.
Doerr T, Denger R & Trautwein W (1989). Calcium currents insingle SA nodal cells of the rabbit heart studied with actionpotential clamp. Pflugers Arch 413, 599–603.
Goldin AL (1999). Diversity of mammalian voltage-gatedsodium channels. Ann N Y Acad Sci 868, 38–50.
Goldin AL (2001). Resurgence of sodium channel research.Annu Rev Physiol 63, 871–894.
Goldin AL, Barchi RL, Caldwell JH, Hofmann F, Howe JR,Hunter JC, Kallen RG, Mandel G, Meisler MH, Netter YB,Noda M, Tamkun MM, Waxman SG, Wood JN & CatterallWA (2000). Nomenclature of voltage-gated sodiumchannels. Neuron 28, 365–368.
Honjo H, Boyett MR, Kodama I & Toyama J (1996).Correlation between electrical activity and the size of rabbitsino-atrial node cells. J Physiol 496, 795–808.
Irisawa H, Brown HF & Giles W (1993). Cardiac pacemaking inthe sinoatrial node. Physiol Rev 73, 197–227.
Kodama I, Nikmaram MR, Boyett MR, Suzuki R, Honjo H &Owen JM (1997). Regional differences in the role of the Ca2+and Na+ currents in pacemaker activity in the sinoatrialnode. Am J Physiol 272, H2793–H2806.
Lei M & Brown HF (1996). Two components of the delayedrectifier potassium current, IK, in rabbit sino-atrial nodecells. Exp Physiol 81, 725–741.
Lei M, Cooper P, Camelliti P & Kohl P (2002a). Contributionof the fast sodium inward current, iNa, to murine sino-atrialnode pacemaking. Biophys J 82, 605a.
Lei M, Cooper P, Camelliti P & Kohl P (2002b). Role of the293b-sensitive, slowly activating delayed rectifier potassiumcurrent, i(Ks), in pacemaker activity of rabbit isolatedsino-atrial node cells. Cardiovas Res 53, 68–79.
Lei M, Honjo H, Kodama I & Boyett MR (2001).Heterogeneous expression of expression of the delayed-rectifier K+ currents iK,r and iK,s in rabbit sinoatrial nodecells. J Physiol 535, 703–714.
Maier SK, Westenbroek RE, Chen C, Marble DR, Feigl EO, IsomLL, Catterall WA & Scheuer T (2002a). The β2-subunit ofvoltage-gated sodium channels is required for maintenanceof regular sinus rhythm in the heart. Biophys J 82, 609a.
Maier SK, Westenbroek RE, Schenkman KA, Feigl EO, ScheuerT & Catterall WA (2002b). An unexpected role for brain-typesodium channels in coupling of cell surface depolarization tocontraction in the heart. Proc Natl Acad Sci U S A 99,4073–4078.
Maier SK, Westenbroek RE, Yamanushi TT, Dobrzynski H,Boyett MR, Catterall WA & Scheuer T (2003). Anunexpected requirement for brain-type sodium channels forcontrol of heart rate in the mouse sinoatrial node. Proc NatlAcad Sci U S A 100, 3507–3512.
Malhotra JD, Chen C, Rivolta I, Abriel H, Malhotra R, MatteiLN, Brosius FC, Kass RS & Isom LL (2001). Characterizationof sodium channel α- and β-subunits in rat and mousecardiac myocytes. Circulation 103, 1303–1310.
Mantegazza M, Yu FH, Catterall WA & Scheuer T (2001). Roleof the C-terminal domain in inactivation of brain andcardiac sodium channels. Proc Natl Acad Sci U S A 98,15348–15353.
Musa H, Dobrzynski H, Berry Z, Abidi F, Cass CE, Young JD,Baldwin SA & Boyett MR (2002). Immunocytochemicaldemonstration of the equilibrative nucleoside transporterrENT1 in rat sinoatrial node. J Histochem Cytochem 50,305–309.
Nathan RD (1986). Two electrophysiologically distinct types ofcultured pacemaker cells from rabbit sinoatrial node.Am J Physiol 250, H325–H329.
Planells-Cases R, Caprini M, Zhang J, Rockenstein EM, RiveraRR, Murre C, Masliah E & Montal M (2000). Neuronal deathand perinatal lethality in voltage-gated sodium channelalpha II-deficient mice. Biophys J 78, 2878–2891.
Smith RD & Goldin AL (1998). Functional analysis of the rat Isodium channel in Xenopus oocytes. J Neurosci 18, 811–820.
Yamamoto M, Honjo H, Niwa R & Kodama I (1998). Low-frequency extracellular potentials recorded from thesinoatrial node. Cardiovasc Res 39, 360–372.
Yu FH & Catterall WA (2003). Overview of the voltage-gatedsodium channel family. Genome Biol 4, 207.
Zimmer T, Biskup C, Dugarmaa S, Vogel F, Steinbis M, BohleT, Wu YS, Dumaine R & Benndorf K (2002a). Functionalexpression of GFP-linked human heart sodium channel(hH1) and subcellular localization of the a subunit inHEK293 cells and dog cardiac myocytes. J Membr Biol 186,1–12.
Zimmer T, Bollensdorff C, Haufe V, Birch Hirschfeld E &Benndorf K (2002b). Mouse heart Na+ channels: primarystructure and function of two isoforms and alternativelyspliced variants. Am J Physiol Heart Circ Physiol 282,H1007–H1017.
Acknowledgements
We thank Dr P. Kohl for support in performing the experimentsand Dr R. Westenbroek for optimizing immunocytochemicalprocedures. We are grateful to Drs W. A. Catterall and T.Scheuer for helpful discussions. This work was supported bythe Wellcome Trust and the British Heart Foundation. M.L. is aWellcome Trust Career Development Fellow.
C© The Physiological Society 2004