
Report to the Maine Yankee Atomic Power Company
146
MAINE YANKEE MARINE SAMPLING STUDY FINAL REPORT Report to the Maine Yankee Atomic Power Company
-
Upload
khangminh22 -
Category
Documents
-
view
3 -
download
0
Transcript of Report to the Maine Yankee Atomic Power Company

MAINE YANKEE MARINE SAMPLING STUDY FINAL REPORT
Report to the Maine Yankee Atomic Power Company

MAINE YANKEE MARINE SAMPLING STUDY FINAL REPORT
Report to the Maine Yankee Atomic Power Company
C.T. Hess, Ph.D.
University of Maine
G. P. Bernhardt, Ph.D. University of Maine
J. H. Churchill, M.S.
Woods Hole Oceanographic Institute
M. Bowen, M.S. Normandeau Associates
V. Guiseppe, B.S., D. Breton, M.S., T. Gould, M.S., P. Smitherman University of Maine
February 2005

Maine Yankee Marine Sampling Study
Maine Yankee Final.doc 2/15/05 ii
Table of Contents
Page
1. EXECUTIVE SUMMARY......................................................................................................1 1.1 CHARACTERIZATION OF RADIONUCLIDES IN THE BACK RIVER AND INTERTIDAL
ZONE AROUND THE FORMER MAINE YANKEE NUCLEAR POWER PLANT SITE................1 2. PURPOSE OF THE MARINE SAMPLING STUDY ..........................................................3
3. FIELD SAMPLING.................................................................................................................4 3.1 SEDIMENT SAMPLING .......................................................................................................4
3.1.1 Phase 1 .................................................................................................................4 3.1.1.1 Intertidal Surface ................................................................................11 3.1.1.2 Intertidal Subsurface...........................................................................11 3.1.1.3 Subtidal Surface..................................................................................11 3.1.1.4 Subtidal Subsurface ............................................................................12
3.1.2 Phase II ..............................................................................................................12 3.1.2.1 Intertidal Surface and Subsurface.......................................................12 3.1.2.2 Subtidal Surface and Subsurface ........................................................12
3.1.3 Hard to Detect ....................................................................................................12 3.2 GAMMA SCAN OF INTERTIDAL ZONE ..............................................................................12 3.3 BIOTA SAMPLE COLLECTION ..........................................................................................13 3.4 QUALITY CONTROL ........................................................................................................14
3.4.1 Sample Tracking and Custody ...........................................................................14 3.4.2 Sample Storage and Transfer .............................................................................14
3.5 LABORATORY ANALYSIS................................................................................................14 3.5.1 Gamma Screening..............................................................................................14 3.5.2 Lead-210 and Cs-137 Dating .............................................................................15 3.5.3 Hard to Detects ..................................................................................................15 3.5.4 Quality Control ..................................................................................................15 3.5.5. Sample Disposal ................................................................................................15 3.5.6 Safety .................................................................................................................15 3.5.7 Quality Assurance..............................................................................................16 3.5.8 Background Measurements................................................................................16
4. NUMERICAL MODELING OF FLOWS AND RADIONUCLIDE TRANSPORT IN THE SHEEPSCOT RIVER ESTUARINE SYSTEM ...................................................17 4.1 INTRODUCTION...............................................................................................................17 4.2 HYDRODYNAMIC MODELING .........................................................................................17
4.2.1 Model Description .............................................................................................17 4.2.2 Model Grid Generation ......................................................................................18 4.2.3 Model Results ....................................................................................................19 4.2.4 Field Evaluation of the Model ...........................................................................30
4.3 MODELING OF RADIONUCLIDE TRANSPORT...................................................................38 4.3.1 Model History and Description..........................................................................38 4.3.2 Model Results ....................................................................................................39
4.3 MODELING SUMMARY....................................................................................................47

Maine Yankee Marine Sampling Study
Maine Yankee Final.doc 2/15/05 iii
5 GAMMA SCAN RESULTS ..................................................................................................49 5.1 SEDIMENT CORES ...........................................................................................................49 5.2 LEAD-210 CORE RESULTS..............................................................................................51 5.3 SURFICIAL SEDIMENTS ...................................................................................................51 5.4 BIOTA GAMMA SCAN .....................................................................................................52 5.5 HARD TO DETECT NUCLIDES..........................................................................................53 5.6 ERROR DISCUSSION OF GAMMA SCANS .........................................................................53
6. HOT PARTICLE SEARCH RESULTS ............................................................................102
7 MARINE SAMPLE DOSIMETRY....................................................................................106 7.1 MARINE SAMPLING DOSE ASSESSMENT ......................................................................106
7.1.1 Purpose of the Dose Assessment Document....................................................106 7.1.2 Inputs and Data Sources...................................................................................106 7.1.3 Current Maine Yankee Intertidal Zone Uses ...................................................107
7.1.3.1 Offsite Dose Calculation Manual (ODCM)......................................107 7.1.3.2 Bailey Cove Mudflats Occupancy....................................................107 7.1.3.3 Worm Digging..................................................................................108 7.1.3.4 Clam Harvesting...............................................................................108 7.1.3.5 Swimming ........................................................................................108 7.1.3.6 Fishing ..............................................................................................108
7.1.4 Potential Future Uses of the Intertidal Zone ....................................................109 7.1.4.1 Seaweed Growing and Harvesting ...................................................109 7.1.4.2 Flooding for Lobster Pound or Fish Farming...................................110 7.1.4.3 Land Reclamation Gardening...........................................................110
7.1.5 Identification of Scenarios and Pathways/Dose Assessment Framework........110 7.1.5.1 Commercial Worm/Clam Digger and Fish/Shell Fish Ingestor .......110 7.1.5.2 Seaweed Cultivator, Eater and Fertilizer User .................................111 7.1.5.3 Land Reclamation Farmer ................................................................112
7.1.6 Identification of Flora & Fauna Dose Contributors and Bioaccumulators ......112 7.2 DOSIMETRY RESULTS...................................................................................................113
8 CONCLUSIONS ..................................................................................................................116 8.1 SUMMARY.....................................................................................................................116 8.2 KEY FINDINGS ..............................................................................................................116
9 QUALITY ASSURANCE....................................................................................................118
10 PROJECT ORGANIZATION............................................................................................119
11. REFERENCES CITED .......................................................................................................120 APPENDIX A

Maine Yankee Marine Sampling Study
Maine Yankee Final.doc 2/15/05 iv
List of Figures
Page
Figure 3-1. Project location and background locations. ..........................................................................5 Figure 3-2. Project locus map and farfield sampling locations...............................................................6 Figure 3-3. Phase 1 station locations .......................................................................................................7 Figure 3-4. Phase 2 station locations around Little Oak and Foxbird Island..........................................8 Figure 3-5. Phase 2 station locations north and South of Little Oak and Foxbird Islands. ....................9 Figure 4-1. The final version of the grid used for the hydrodynamic and radionuclide models..........20 Figure 4-2a. Same as Figure 4-1 except showing the model grid over plain land and water
fields. Indicated is the boundary junction at which the offshore forcing, in the form of a tidal elevation series, is applied. Also indicated is the Sasanoa River, which is a principal opening to the modeled system not accounted for by the grid..........21
Figure 4-2b. The section of the model grid with the highest resolution. ................................................22 Figure 4-3a. The volume transport over a flood tide through selected model channels. The
transports show the splitting of the incoming tidal flow near the southern end of Westport Island and a minimum of tidal flow at the tidal node, where two opposing streams meet, a few km south of the diffuser location. ......................................24
Figure 4-3b. A smaller scale view of the flood tide volume transport in the vicinity of the Maine Yankee facility. ........................................................................................................25
Figure 4-3c. An even smaller scale view of the flood tide volume transport in the vicinity of the Maine Yankee facility. ..................................................................................................25
Figure 4-4a. The RMS value of volume transport within channels encircling Westport Island. These RMS transports show a minimum of tidal energy at the tidal node off the western shore of Westport Island........................................................................................26
Figure 4-4b. A smaller scale view of the RMS value of volume transport more clearly showing the minimum of tidal energy at the tidal node. Note that this is roughly 1 km south of the diffuser location. ....................................................................................27
Figure 4-5. Magnitudes of tidal excursions at selected model channels...............................................28 Figure 4-6. An ensemble of the positions of particles released from the location of the
diffuser into a modeled flow field forced with a boundary elevation series representative of a spring tide. ............................................................................................29
Figure 4-7. An ensemble of the positions of particles released from the location of the Bailey Cove discharge into a modeled flow field forced with a boundary elevation series representative of a spring tide. ............................................................................................29
Figure 4-8. A view of the model grid in the areas of Bailey Cove and Back River. Indicated is the location of a conductivity-temperature-depth (CTD) recorder set out over two tidal cycles during July 7-8, 2004 as well as the model channel (# 281) that encompassed the CTD location. .........................................................................................31
Figure 4-9. Time series of modeled water depth and water velocity in channel 281 (Figure 4-8). The series give evidence of a flood-dominated tidal asymmetry in Bailey

Maine Yankee Marine Sampling Study
Maine Yankee Final.doc 2/15/05 v
Cove. This is marked by a brief flood tide with a strong incoming flow and a long ebb tide with a relatively weak outgoing flow. ..........................................................31
Figure 4-10. A view of the type of drifter used in the field studies of July 7-8, 2004. The unit at the top of the drifter’s central cylinder (covered in tape) is a tracking device outfitted with a GPS receiver and a satellite transmitter. ...................................................33
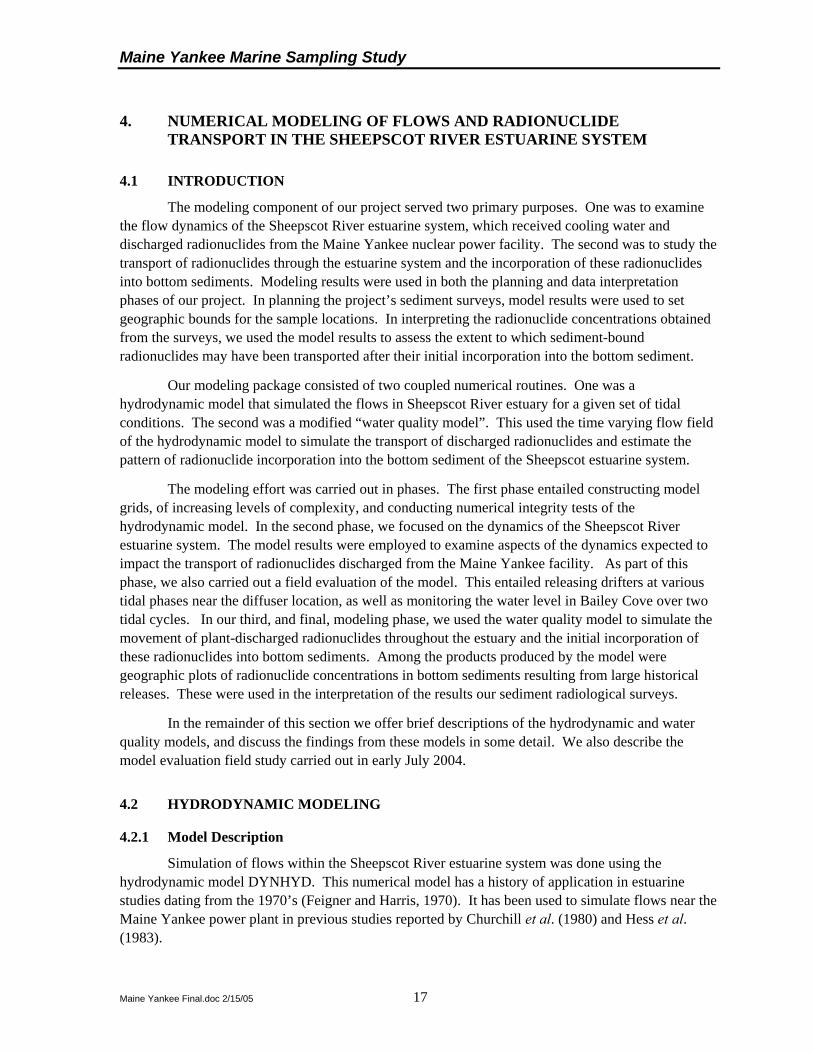
Figure 4-11. The top panels show the positions of drifter released during the ebb tide of July 7, 2004. The bottom panels show the positions of particles released into the model flow field at the same time and location as the first drifter position in the panel above. The particle positions encompass the same time period as the drifter tracks shown above. ............................................................................................................34
Figure 4-12. The top panels show the positions of drifter released during the ebb tide of July 8, 2004. The bottom panels show the positions of particles released into the model flow field at the same time and location as the first drifter position in the panel above. The particle positions encompass the same time period as the drifter tracks shown above. ............................................................................................................35
Figure 4-13. The sensor depth (i.e., water level) of the CTD deployed in Bailey Cove (at the location indicated in Figure 4-8). Indicated are the times of rising and falling water between the highest water level and a water level 0.5 m above the minimum sensor depth. These show a tidal asymmetry in which the rate of rising water of the flood tide exceeds the rate of falling water on the ebb tide. ..........................37
Figure 4-14. The modeled water level of channel 281 in Bailey Cove (Figure 4-8) during the time of the CTD measurements of water level shown in Figure 4-13. As in Figure 4-13, the times of rising and falling water between the highest water level and a water level 0.5 m above the minimum level are indicated. These show a tidal asymmetry of a degree nearly matching that indicated by the measurement of Figure 4-13. .....................................................................................................................37
Figure 4-15. Time series of the quarterly amounts of 60Co and 137Cs released from the Maine Yankee facility. Time periods of the Bailey Cove, diffuser and Little Oak Island discharges are indicated on the bar above time series lines. The circled values show the amounts of radionuclides released in the simulations of discharges from the Bailey Cove outflow and the diffuser. ..........................................................................40
Figure 4-16a. Modeled concentrations of 137Cs and 60Co in bottom sediments. These were derived from simulations of radionuclide release from the Bailey Cove discharge (depicted by the black diamond) during flood tide conditions. Note that these are volume concentrations in units of pCi l-1. They may be converted to mass concentrations in units of pCi kg-1 by dividing by the density of surfacial sediment, typically 1.8 kg l-1. ..............................................................................................42
Figure 4-16b. A smaller scale view of the modeled concentrations of 137Cs and 60Co of Figure 4-16a. ...................................................................................................................................42
Figure 4-17a. Modeled concentrations of 137Cs and 60Co in bottom sediments. These were derived from simulations of radionuclide release from the diffuser (depicted by the black diamond) during flood tide conditions................................................................43
Figure 4-17b. A smaller scale view of the modeled concentrations of 137Cs and 60Co of Figure 4-17a. ...................................................................................................................................43
Figure 4-18a. Modeled concentrations of 137Cs and 60Co in bottom sediments as derived from simulations of radionuclide release from the Bailey Cove discharge (depicted by

Maine Yankee Marine Sampling Study
Maine Yankee Final.doc 2/15/05 vi
the black diamond) during flood tide conditions. These are the same concentration fields shown in Figure 4-16, except with the effects of radioactive decay accounted for.............................................................................................................44
Figure 4-18b. A smaller scale view of the modeled concentrations of 137Cs and 60Co of Figure 4-18a. ...................................................................................................................................44
Figure 4-19a. Modeled concentrations of 137Cs and 60Co in bottom sediments as derived from simulations of radionuclide release from diffuser (depicted by the black diamond) during flood tide conditions. These are the same concentration fields shown in Figure 4-17, except with the effects of radioactive decay accounted for. .........45
Figure 4-19b. A smaller scale view of the modeled concentrations of 137Cs and 60Co of Figure 4-19a. ...................................................................................................................................45
Figure 4-20. Modeled concentrations of 137Cs and 60Co in bottom sediments. These were derived from simulations of radionuclide release from the Little Oak Island Outfall (depicted by the black diamond) during flood tide conditions. .............................46
Figure 5-1. 6-9 July 2004 Station Locations .........................................................................................54 Figure 5-2. 6-9 July 2004 Station Locations - Close to Plant ...............................................................55 Figure 5-3. 2-5 Aug 2004 Station Locations .........................................................................................56 Figure 5-4. 2-5 Aug 2004 Station Locations - Close to Plant ...............................................................57 Figure 5-5. Station Sasanoa core: 60Co and 137Cs vs. depth ..................................................................58 Figure 5-6. Station Pottle Cove core: 60Co and 137Cs vs. depth.............................................................58 Figure 5-7. Station Long Creek core: 60Co and 137Cs vs. depth ............................................................59 Figure 5-8. Station Barry Cove core: 60Co and 137Cs vs. depth.............................................................59 Figure 5-9. Station Wiscasset core: 60Co and 137Cs vs. depth ...............................................................60 Figure 5-10. Station Eddy core: 60Co and 137Cs vs. depth .......................................................................60 Figure 5-11. Station Chewonki Camp core: 60Co and 137Cs vs. depth ....................................................61 Figure 5-12. Station 2 core: 60Co and 137Cs vs. depth..............................................................................61 Figure 5-13. Station 8-1 core: 60Co and 137Cs vs. depth ..........................................................................62 Figure 5-14. Station 25 core: 60Co and 137Cs vs. depth............................................................................62 Figure 5-15. Station 34, Diffuser, core: 60Co and 137Cs vs. depth ...........................................................63 Figure 5-16. Station 38, Westport Island, core: 60Co and 137Cs vs. depth...............................................63 Figure 5-17. Station 44, Eaton Farm Point, core: 60Co and 137Cs vs. depth............................................64 Figure 5-18. Station 50, Pottle Cove, core: 60Co and 137Cs vs. depth .....................................................64 Figure 5-19. Station 59, South Oak Island, core: 60Co and 137Cs vs. depth ............................................65 Figure 5-20. Station 60, South Oak Island, core: 60Co and 137Cs vs. depth ............................................65 Figure 5-21. Station 61, Westport Island, core: 60Co and 137Cs vs. depth...............................................66 Figure 5-22. Station 62, Westport Island, core: 60Co and 137Cs vs. depth...............................................66 Figure 5-23. Station 63, Long Ledge, core: 60Co and 137Cs vs. depth.....................................................67

Maine Yankee Marine Sampling Study
Maine Yankee Final.doc 2/15/05 vii
Figure 5-24. Station 64, Long Ledge, core: 60Co and 137Cs vs. depth.....................................................67 Figure 5-25. Station 65, Bluff Head, core: 60Co and 137Cs vs. depth ......................................................68 Figure 5-26. Station 66-1 core: 60Co and 137Cs vs. depth ........................................................................68 Figure 5-27. Station 67, Cushman Cove, core: 60Co and 137Cs vs. depth ...............................................69 Figure 5-28. Station 68, Foxbird Island, core: 60Co and 137Cs vs. depth.................................................69 Figure 5-29. Station 73, Bailey Cove Outfall, core: 60Co and 137Cs vs. depth........................................70 Figure 5-30. Station 74, Bailey Cove Outfall, core: 60Co and 137Cs vs. depth........................................70 Figure 5-31. Station 77, Upper Bailey Cove, core: 60Co and 137Cs vs. depth .........................................71 Figure 5-32. Station 85, South Bailey Cove, core: 60Co and 137Cs vs. depth..........................................71 Figure 5-33. Station 99, North Bailey Cove, core: 60Co and 137Cs vs. depth..........................................72 Figure 5-34. Station 101, Eaton Farm Bailey Cove, core: 60Co and 137Cs vs. depth ..............................72 Figure 5-35. Station 105, Top of Bailey Cove, core: 60Co and 137Cs vs. depth ......................................73 Figure 5-36. Station 108, Bailey Point West, core: 60Co and 137Cs vs. depth.........................................73 Figure 5-37. Station 113, South Foxbird Island, core: 60Co and 137Cs vs. depth ....................................74 Figure 5-38. Station 117 core: 60Co and 137Cs vs. depth..........................................................................74 Figure 5-39. Station 118, Little Oak Island, core: 60Co and 137Cs vs. depth...........................................75 Figure 5-40. Station 134 core: 60Co and 137Cs vs. depth..........................................................................75 Figure 5-41. Station 143, Youngs Point, core: 60Co and 137Cs vs. depth ................................................76 Figure 5-42. Station 144, Oak Island Murphy Corner, core: 60Co and 137Cs vs. depth ..........................76 Figure 5-43. Station 145, Oak Island Murphy Corner, core: 60Co and 137Cs vs. depth ..........................77 Figure 5-44. Station 146, Darling Center, core: 60Co and 137Cs vs. depth ..............................................77 Figure 5-45. Station 147 core: 60Co and 137Cs vs. depth..........................................................................78 Figure 5-46. Station 148 (Darling Center) core: 60Co and 137Cs vs. depth..............................................78 Figure 5-47. Station 149 (Sasanoa) core: 60Co and 137Cs vs. depth.........................................................79 Figure 5-48. Station 144 core: 210Pb vs. depth.......................................................................................79 Figure 5-49. 60Co Concentrations at 6 in. (pCi/kg)..................................................................................80 Figure 5-50. 137Cs Concentrations at 6 in. (pCi/kg).................................................................................81 Figure 5-51. 60Co Average Core Concentrations (pCi/kg)......................................................................82 Figure 5-52. 137Cs Average Core Concentrations (pCi/kg) .....................................................................83 Figure 5-53. 60Co Surficial Concentrations (pCi/kg)...............................................................................84 Figure 5-54. 137Cs Surficial Concentrations (pCi/kg)..............................................................................85 Figure 5-55. 60Co Surficial Isocuric Concentrations (pCi/kg) - Close to Plant ......................................86 Figure 5-56. 137Cs Surficial Isocuric Concentrations (pCi/kg) - Close to Plant......................................87 Figure 6-1. Hot Particle Scan, 7 July 2004 ..........................................................................................103 Figure 6-2. Hot Particle Scan, 2 August 2004.....................................................................................103

Maine Yankee Marine Sampling Study
Maine Yankee Final.doc 2/15/05 viii
Figure 6-3. Hot Particle Scan, 18 August 2004...................................................................................104 Figure 6-4. Hot Particle Scan Map.......................................................................................................105
Maine Yankee Marine Sampling Study
Maine Yankee Final.doc 2/15/05 ix
List of Tables
Page Table 3-1. Number of Sediment Samples Collected for Maine Yankee in Phase 1 ...........................10 Table 3-2. Number of Sediment Samples Collected for Maine Yankee in Phase 2 ...........................10 Table 3-3. Species Selected For Biota Sampling .................................................................................13 Table 4-1. According to model simulations, the percent of the total radionuclide released
from the indicated location that is absorbed in the bottom sediment. The values were computed from simulations using velocities representative of spring tide conditions.............................................................................................................................47
Table 5-1. Sediment gamma scan results .............................................................................................88 Table 5-2. Summary of 137Cs peaks observed in cores. .......................................................................98 Table 5-3. Total 60Co and 137Cs activity contained in cores.................................................................99 Table 5-4. Biota gamma scan results..................................................................................................100 Table 5-5. Comparison with Pre- and Post-operational study ...........................................................101 Table 5-6. Results of the Hard to Detect Nuclides.............................................................................101 Table 7-1. Calculated Doses Using Average Concentrations of Gamma Emitters...........................114 Table 7-2. Calculated Doses Using Peak Concentrations of Gamma Emitters ................................115

Maine Yankee Marine Sampling Study
Maine Yankee Final.doc 2/15/05 x
List of Appendix Figures
Page Appendix Figure A-1. Project locus map (1978). ................................................................................A-3 Appendix Figure A-2. Channel network used for Montsweag Bay and Bailey Cove modeling.
(Source: Churchill et al. 1980; Hess et al. 1983).............................................A-3 Appendix Figure A-3. Actual contours for 60Co measured on September 18, 1974 during
licensed releases. ..............................................................................................A-4 Appendix Figure A-4. Actual contours for 60Co measured on June 12, 1975 during licensed
releases..............................................................................................................A-5 Appendix Figure A-5. Actual contours for measured 137Cs after Maine Yankee diffuser was
in place (Hess et al. 1978). ...............................................................................A-6 Appendix Figure A-6. Sample of currents at slack high tide (1978). ..................................................A-7 Appendix Figure A-7. Estimated 137Cs concentrations 4.38 hours after a release beginning at
high tide (1978). ...............................................................................................A-7 Appendix Figure A-8. Estimated 137Cs concentrations 4.38 hours after a release beginning at
mid-ebb tide (1978). .........................................................................................A-8 Appendix Figure A-9 Estimated 137Cs concentrations 17.5 hours after a release beginning at
high tide (1978). ...............................................................................................A-8 Appendix Figure A-10. Estimated 58Co concentrations 17.5 hours after a release beginning at
mid-ebb tide (1978). .........................................................................................A-9 Appendix Figure A-11. Simulated contours for 137Cs concentrations 17.5 hours after a release
beginning at high tide (Hess et al. 1978). ........................................................A-9 Appendix Figure A-12. Simulated contours for 58Co 17.5 hours after a release beginning at
high tide (1978). .............................................................................................A-10 Appendix Figure A-13. Actual contours for 58Co measured after 17.5 hours beginning at high
tide (1978).......................................................................................................A-11
Maine Yankee Marine Sampling Study
Maine Yankee Final.doc 2/15/05 xi
List of Appendix Tables
Page Appendix Table A-1. Pre-operational Laboratory Soil & Sediment Gamma Ray Analysis ...........A-12 Appendix Table A-2. Post-operational Laboratory Soil & Sediment Gamma Ray Analysi ...........A-13

Maine Yankee Marine Sampling Study
Maine Yankee Final.doc 2/15/05 1
1. EXECUTIVE SUMMARY
1.1 CHARACTERIZATION OF RADIONUCLIDES IN THE BACK RIVER AND INTERTIDAL ZONE AROUND THE FORMER MAINE YANKEE NUCLEAR POWER PLANT SITE.
As a result of the closure and decommissioning of the Maine Yankee Nuclear Power Plant, and the 1999 Federal Energy Regulatory Commission (FERC) settlement, Maine Yankee agreed with Raymond Shadis, Executive Director of Friends of the Coast (FOTC), to fund and conduct an environmental field survey of marine sediments in the Back River. The purpose of the study was to determine how licensed liquid radioactive effluent discharges from Maine Yankee are distributed in the environment. In the 2001 License Termination Plan (LTP) settlement, Maine Yankee further agreed to conduct a similar study in the intertidal zone surrounding selected portions of Maine Yankee property. By separate agreement, the State of Maine, subject to approval of FOTC, specified various aspects of the sampling program.
Researchers from the University of Maine, the Woods Hole Oceanographic Institute, and Normandeau Associates performed the study. The majority of samples were taken during the summer of 2004 after the final discharge of the plant’s spent fuel pool. This report characterizes radionuclides in the marine environment around Maine Yankee and describes the methodologies used in the study. Four sets of sampling were accomplished to complete this study. The results of each type of sampling are provided and are compared with a model of radionuclide distribution from licensed discharges. Additionally, the results are compared to previous work done in the area both pre and post plant operation. The results are also used to calculate an incremental intertidal zone dose, which is compared to the limiting “resident farmer dose calculations in the License Termination Plan for Bailey Point post-decommissioning.” Maine Yankee operated from 1972-1996. Plant decommissioning is scheduled to be complete in late spring of 2005.
This sampling effort included a search for areas high in nuclear radiation (hot particle search), samples from the surface of the tidal region, core samples from the tidal region, and samples of biota including seaweed, lobsters, mussels, and fish. The results are discussed in this order. In all, about 600 samples from 147 locations were collected and analyzed. To ensure that the sampling effort was as comprehensive and efficient as possible, a model was used to determine the best locations. The results of this effort are summarized here.
Before any sample collection, a model of the bay was developed to determine the effect of tidal influences on releases of radioisotopes. The model takes into account the action of the tides, the flow of water, and the discharges from various points. The work was necessary due to the changes made over time to the plant. In particular, three different discharge points were used as well as the removal of a causeway over the lifetime of the plant. A theoretical model was developed to determine the location of the hottest zones for radioisotopes. This model was tested using floats to validate the results. The predictions of the model became the points for the first sampling effort. After measuring this first set and refining the model, a second sampling effort was accomplished based on the results of the first set. In this manner, a coordinated study was possible.
The first results to discuss involve the search for localized areas high in radiation. To accomplish this goal, an instrument which measures radiation exposure called a High Pressure Ion

Maine Yankee Marine Sampling Study
Maine Yankee Final.doc 2/15/05 2
Chamber (HPIC) was used. The HPIC was placed on a sled and dragged across the mud flats at low tide. Three sets of measurements were taken. These sets were placed so that the HPIC system would pass close to the discharge points. If a single measurement of three times background was found, the HPIC would signal the researchers that a hot spot was found. No such measurement was found. In fact, the exposure seen away from shore was, in general, less than the background seen on shore. We feel this is due to the mixing of the sediment due to the action of tides and the turnover of sediment due to digging (clam or worm digging).
The next set of results involves the analysis of the samples taken from the surface of the intertidal zone. These samples were analyzed for certain radioisotopes associated with nuclear fission including 137Cs and 60Co. As expected, these were the predominate radioisotopes seen. The results were compared to measurements taken earlier. In general, the values seen are lower than before the plant was brought on line. We feel that the reason the values are so low is due to a mixing within the tidal flat, lowering the amount of radiation seen on the surface. The distribution of the Cesium and Cobalt is also consistent with the history of discharges. The Cobalt is highest near the recently used diffuser. Since Cobalt has a relatively short half-life, we expected to see very low levels at locations where discharges were stopped and highest where discharges were done more recently. Cesium, with a longer half-life, should be higher at locations that had more discharges. Overall the greatest concentration of plant derived radionuclides is in Bailey Cove and the area of the diffuser. Bailey Cove was the original plant discharge location prior to installation of the diffuser. The distribution is consistent with these assumptions.
As well as surface samples, cores were also taken, sectioned, and counted. The results show that the overall radiation is low. An individual core was sectioned and counted to determine how far into the soil the highest level of radiation exists. Most radiation was found below the surface, which is consistent with results from surface samples. Again, the data indicates that a mixing of the soil is occurring so that radioisotopes are distributed and do not remain localized.
In comparison, naturally occurring radionuclides such as 40K are found at higher levels in the marine environment than either Cesium or Cobalt. The average naturally occurring Potassium concentration was about 10 pCi/g, which results in an exposure rate of approximately 8 mrem/yr. The average Cesium or Cobalt concentration was about 0.073 pCi/g or 0.019 pCi/g which results in an exposure rate approximately 0.17 mrem/yr or 0.13 mrem/yr, respectively using NRC approved soil screening values.
Last, several biota samples were taken and analyzed. These samples included lobsters, clams, mussels, seaweed and fish. The samples were crushed and analyzed for the same radioisotopes as above. For the shellfish, the shells were counted separately from the meat. Additionally, these samples were sent to another laboratory to search for radioisotopes, such as Beta emitters and Plutonium, which are difficult to measure (hard to detects). The results show that all levels are very low, including the hard to detect values.
As a final calculation, the results of the above samples were used to calculate the average and peak doses that an individual would receive if they stood on the tidal flat went swimming, went fishing, harvested seaweed, or ingested the biota. The results range between 3 mrem/yr for land reclamation to 2.6 x 10⁻³ mrem/yr for swimming. Such exposures are a small fraction of normal exposures received naturally through a year. The low exposures are indicative of the low values seen in the data sets.

Maine Yankee Marine Sampling Study
Maine Yankee Final.doc 2/15/05 3
2. PURPOSE OF THE MARINE SAMPLING STUDY
In accordance with agreements with the Friends of the Coast and the State of Maine, Maine Yankee established a contract with the University of Maine, Wood’s Hole Oceanographic Institute and Normandeau Associates to conduct a radiological sampling and analysis study of the marine environment surrounding the Maine Yankee site. The purpose of this study is to:
1. Develop an isotopic (isocuric) picture of how licensed discharges are spatially distributed and accumulated in the environment.
2. Develop information which will be used to educated the public and enhance public confidence in the decommissioning process. This information includes:
a. A report of measured radiological concentrations in marine sediment and selected marine biota in the environs surrounding the Maine Yankee site concentrations in Bailey Cove performed by a third-party-contractor..
b. A dose assessment of these measured radiological concentrations

Maine Yankee Marine Sampling Study
Maine Yankee Final.doc 2/15/05 4
3. FIELD SAMPLING
The first sampling survey, Phase 1, entailed acquiring sediment samples over a broad region, including farfield locations and focusing on those areas identified by the numerical modeling as potential regions of sediment and radionuclide accumulation (Figures 3-1, 3-2, 3-3). During this phase, we conducted an intertidal search for particularly radioactive, “hot”, particles, and acquired samples of flora and fauna. This was followed by the more intensive Phase 2 survey with concentrated sampling in those areas identified to be of particular interest on the basis of the results of the first survey, and further guided by additional modeling (Figures 3-4, 3-5). We collected 398 sediment samples as part of this later survey. To ensure that the samples collected by these surveys were counted in a timely fashion, sufficient to guide the ensuing surveys, we employed three gamma counting devices available at the University of Maine, Orono.
Field sampling was conducted in both intertidal and subtidal areas, each with its own protocol. Surface and subsurface (core) marine sediment samples were collected in each area. Numbers of samples are listed in Table 3-1. These include a four-way split for 10% of the samples, which was accomplished by collecting four duplicate samples and delivering one set of duplicates to Maine Yankee, one set to the State of Maine, and one set to Friends of the Coast. Additional sediment samples were collected at the request of Friends of the Coast in farfield locations including Pottle Cove near Wiscasset Harbor, the “Eddy”, Robin Hood Cove, and the Sasanoa River (Station 149) (Figure 3-2). Background sediment samples were collected in Taunton Bay, Clarks Cove at the Darling Center (Station 148) in Damariscotta Bay (Figure 3-1).
The Phase 1 survey was conducted July 6, 7 and 8, 2004. Phase 2 was conducted on August 2 -5 and September 16-17, 2004. In accordance with our overall project plan, we designed the Phase 1 survey on the basis of modeling results and the findings of previous studies. This design is described in the next section. The Phase 2 survey was designed based on the Phase 1 results and additional modeling.
All field sampling was conducted in an environmentally conscientious manner. Access was either at public boat launches or by foot along pathways used by harvesters. Only abundant organisms were collected. Every effort was made to minimize disturbance to the marine environment during sampling.
3.1 SEDIMENT SAMPLING
3.1.1 Phase 1
The locations of the Phase 1 sediment sampling sites (Figure 3-3) were based on hydrodynamic modeling (Section 4.0) of the estuarine system that includes the Maine Yankee discharge, and on the results of previous measurements of radionuclide concentration in the area near the discharge. This tests how well the model predicts the location of nuclides in sediment. The initial modeling results revealed that the Maine Yankee discharge is located roughly a kilometer north of a tidal node. As a result, tidal currents in the area of the discharge are relatively weak and tidal excursions are small (on the order of 500 m). Tracking of particles released from the discharge location into the model flow field indicates that material released from the discharge should not be expected to travel very far over the course of a tide, even for spring tide conditions with maximum

Maine Yankee Marine Sampling Study
Maine Yankee Final.doc 2/15/05 5
Figure 3-1. Project location and background locations.

Maine Y
ankee Final.doc 02/15/05 6
Maine Yankee M
arine Sampling Study
Figure 3-2. Project locus map and farfield sampling locations.

Maine Y
ankee Final.doc 02/15/05 7
Maine Yankee M
arine Sampling Study
Figure 3-3. Phase 1 station locations
Maine Y
ankee Final.doc 02/15/05 8
Maine Yankee M
arine Sampling Study
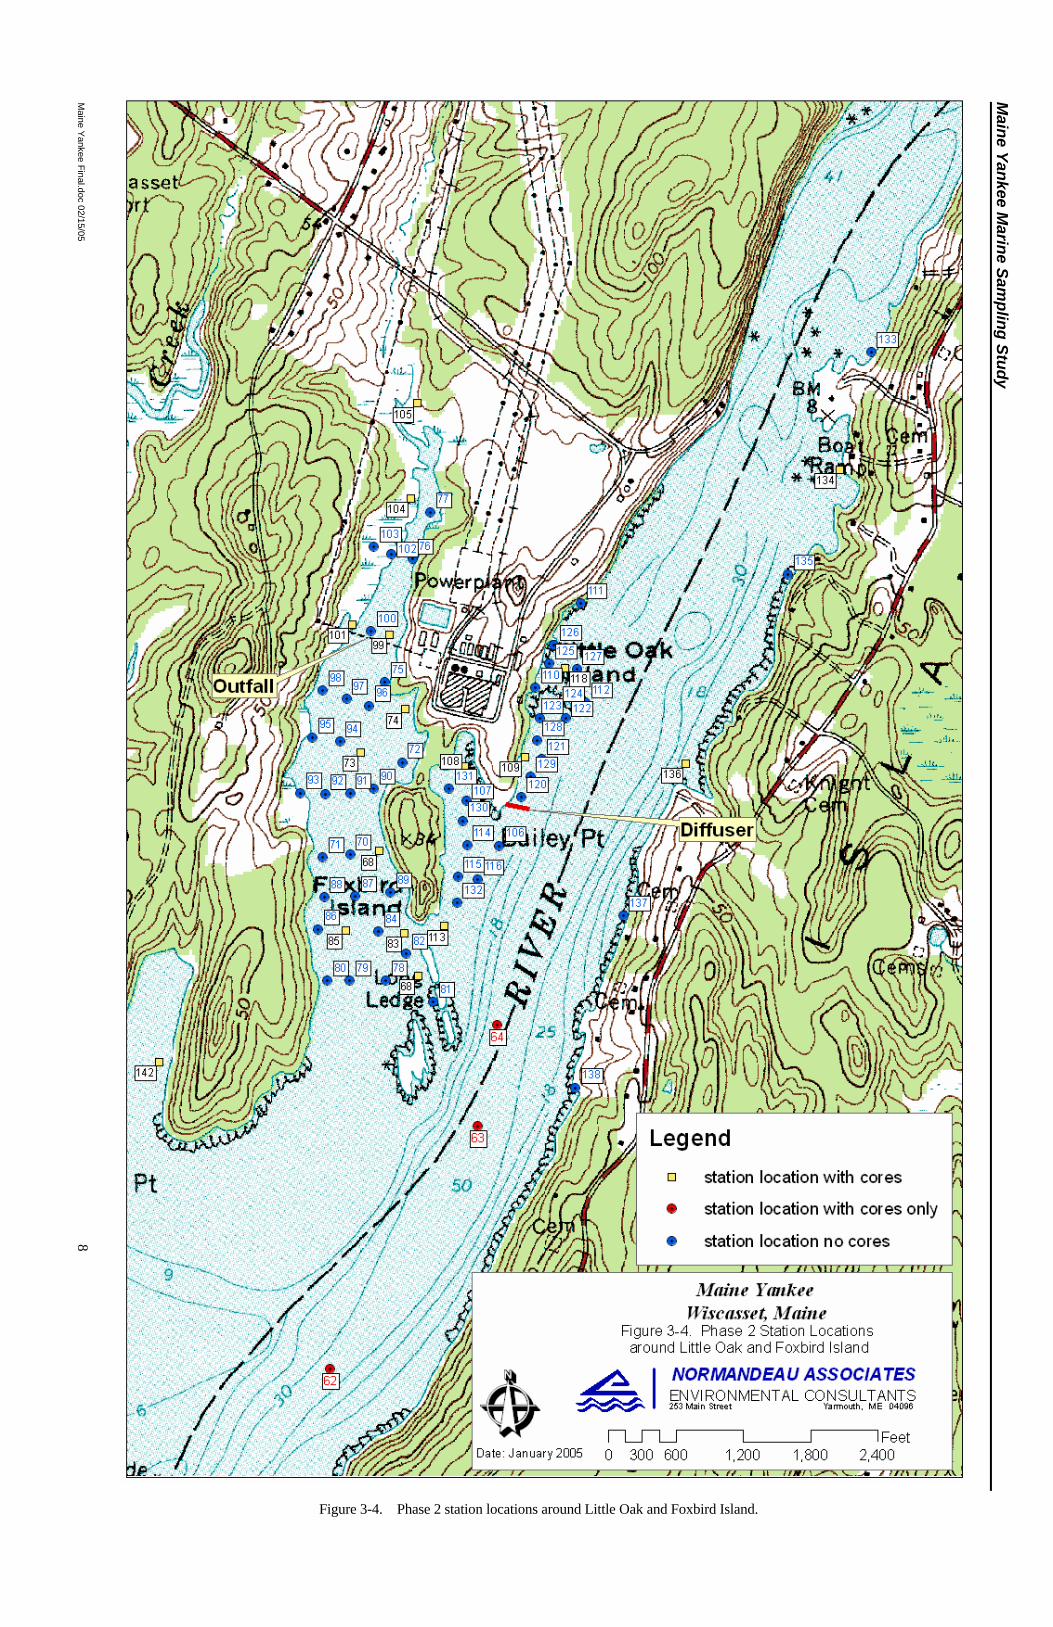
Figure 3-4. Phase 2 station locations around Little Oak and Foxbird Island.

Maine Y
ankee Final.doc 02/15/05 9
Maine Yankee M
arine Sampling Study
Figure 3-5. Phase 2 station locations north and South of Little Oak and Foxbird Islands.

Maine Yankee Marine Sampling Study
Maine Yankee Final.doc 2/15/05 10
riverine inflow. The model results also indicate a northward bias in the transport of material released from the diffuser, due to the asymmetry of the tidal flow moving northward of the tidal node.
These results are consistent with the findings of previous radionuclide surveys conducted in the region. In particular, the study conducted in 1978 found that radionuclide (137Cs and 58Co)
Table 3-1. Number of Sediment Samples Collected for Maine Yankee in Phase 1
Sample Location Sample Type Regular Duplicate Total
Intertidal surface 50 12 62 core 5 6 11 Subtidal surface 8 3 11 core 2* 3 5 Additional cores 4 4 Farfield (Taunton & Darling Ctr) 2 2 Total 74 24 95
73 surface Total Phase 1 samples collected for counting 192 core slices *One core not collected due to unsuitable substrate
Table 3-2. Number of Sediment Samples Collected for Maine Yankee in Phase 2
Sample location Sample Type Actual Duplicate Total Intertidal surface 75 18 93 core 18 6 24 subtidal surface 0 0 0 core 9 3 12 0 Total stations 102 27 129 Total samples collected for analysis (including all core slices)
398
concentrations in Back River were above background over a relatively small region, extending roughly 1-2 km from the diffuser, and that this region was biased (extended further from the diffuser) to the north of the diffuser (Hess et al., 1983). This survey also found significant radionuclide concentrations in the sediments of Bailey Cove, likely due to a combination of accumulation from early discharges into Bailey Cove and from the later diffuser discharges. Given the weak tidal energy of this area, we expected much of the radionuclide containing sediment of Bailey Cove to remain within the Cove.
Based on the initial hydrodynamic results, we focused much of our Phase 1 sampling in the area of Bailey Cove and in the region of Back River near the diffuser location (Figure 3-3). In hopes of determining the horizon of detectable radionuclide concentrations, we also set sampling locations

Maine Yankee Marine Sampling Study
Maine Yankee Final.doc 2/15/05 11
further south (into Montsweag Bay), further north in Back River (into Cushman Cove), and into tributary regions of Chewonki Creek and Montsweag Brook. We have identified 5 locations at which core samples were acquired, and later sectioned and analyzed. Analysis of a core sample acquired in February 2004 near the plant intake has shown highest radionuclide concentration at 6 cm depth. For this reason, we acquired core samples from at least 10 additional sites to be set aside for possible analysis, depending on the results of the core samples from the 5 sites designated for analysis.
Details of the sampling collection method follow.
3.1.1.1 Intertidal Surface Intertidal sediment samples were collected on foot at low tide. Staff made collections in areas
accessible from the shore by traversing the area on foot using existing pathways. Collections in areas that were inaccessible by foot (such as Back River and around Little Oak Island) were made by deploying staff at Little Oak Island via boat. Field staff first marked sampling locations for that tide cycle using a wire stake marked with the station number. Staff navigated to the approximate station location using the map and visual cues, and then marked the sampling site. One staff member recorded GPS coordinates as well as reference areas so that the exact location of the sample sites was known. The surficial sediment samples were collected at pre-established locations by removing the top centimeter of sediment from an approximately 32 X 32 cm square with a trowel and depositing the sample in a pre-labeled polyethylene jar, with internal and external labeling. Each marker stake was removed and brought back to the office when the sample had been collected. Samples were kept cool until transport to the laboratory.
3.1.1.2 Intertidal Subsurface Intertidal subsurface sediment samples were collected in the same manner as intertidal
surface samples but using a different device. A four-inch diameter pre-labeled Plexiglas core was deployed by hand to a depth of 12 inches (or refusal) in areas selected for subsurface sampling. The core was capped at both ends, then placed in a pre-labeled plastic bag and stored upright. Samples were kept cool until transport to the laboratory. The core was inspected visually both after sample collection and prior to slicing to ensure that the integrity of the core had been maintained. Samples were discarded if it is determined that the integrity had not been maintained. Each core was sliced using a core slicer into one-inch samples. One-inch layers were extruded from the end of the core and captured with a bucket, then placed into a pre-labeled container. Excessive water in the sediment sample was drained if necessary to maintain the integrity of the sediment.
3.1.1.3 Subtidal Surface Subtidal sediment samples were collected from a boat using a 0.04 m2 Young-Van Veen
grab. The locations of the subtidal samples are shown in Figure 3-1. The boat captain occupied the approximate location of each station using a navigational chart, fathometer, and GPS. The location was adjusted if necessary to ensure that samples can be safely collected and consist of soft substrate. Each grab was deployed and retrieved; surface sediment (< 1 cm depth) was removed from the grab and placed in a pre-labeled polyethylene jar, with internal and external labeling. The GPS coordinates were checked, the boat was relocated if necessary, and the Van Veen grab was redeployed. This process continued until sufficient sediment was collected. Samples were kept cool until transport to the laboratory.

Maine Yankee Marine Sampling Study
Maine Yankee Final.doc 2/15/05 12
3.1.1.4 Subtidal Subsurface Subtidal subsurface sediment samples were collected using a gravity corer. The approximate
locations of the subtidal samples are shown in Figure 3-3. The boat captain occupied the approximate location of each station using a navigational chart, fathometer, and GPS. Each core was deployed and one-inch layers of the sediment were retrieved, placed in a pre-labeled polyethylene jar, with internal and external labeling. Samples were kept cool until transport to the laboratory.
3.1.2 Phase II
The results of Phase I revealed concentrations of radionuclides at depth. The project team recommended that some of the surface samples be replaced with core samples. With Maine Yankee’s approval, the samples listed in Table 3-2 and shown in Figures 3-4 and 3-5 were collected.
3.1.2.1 Intertidal Surface and Subsurface This protocol was the same as for Phase I except that a hand held Magellan GPS was used to
record sample locations.
3.1.2.2 Subtidal Surface and Subsurface This protocol was the same as for Phase I.
3.1.3 Hard to Detect
Hard to detect samples were selected from the highest gamma scan samples for measurement of the hard-to detect nuclides. These were sent out to Duke Framatome ANP
3.2 GAMMA SCAN OF INTERTIDAL ZONE
An in situ gamma scan was conducted after the first phase of sampling was completed. The goal was to ascertain if there are any “hot particles” (defined as >100,000 cpm) in the intertidal areas. The initial survey, in addition to information from previous studies, helped focus this effort on most likely areas of deposition. The effort concentrated on the shoreline adjacent to Maine Yankee. Field staff traversed a 2-m strip encompassing roughly 207 m of shoreline in Bailey Cove and a 1-m strip encompassing roughly 1260 m of shoreline in Back River, resulting in 1674 square meters in total. Areas around the intake, forebay, and diffuser discharge are the most important.
Hot particle measurements were done by the high-pressure ion chamber, capable of measuring microrems/hour, and a three inch by three inch sodium iodide detector and laptop PC with a pulse height analyzer board mounted on a kayak-sled for transport over the wet sediment. The sensitivity of the system allows detection of a one microcurie source at one meter distance, and 0.03 microcuries is detected at 30 cm. Test of the sensitivity has been done by calculation and by actual measurements on land with buried test sources of 60Co, and 137Cs. This sled also had a portable GPS unit to measure position as a function of radioactivity. The sled was moved over the intertidal zone areas for direct measurement of hot particles. If a hot particle had been discovered, we would have flagged the area with a survey stake and recorded its location with GPS, then contacted Maine Yankee. Work would have continued unless an unsafe level is discovered (defined as three times the background level.

Maine Yankee Marine Sampling Study
Maine Yankee Final.doc 2/15/05 13
3.3 BIOTA SAMPLE COLLECTION
Five species were initially selected for dose pathway estimation based on their likely anticipated contribution to dose pathways as well as anticipated seasonal availability and abundance, based on a review of available literature (Larson, P.F. 1975; Larson, P.F. and Doggett, L 1991; Larson, P.F., Doggett, L. and A.C. Johnson. 1983; Maine Yankee 1978, 1994, 2002). The pathways to be investigated included direct exposure through harvesting activities (algae, soft-shell clam) and direct exposure through consumption (soft-shell clam, lobster, winter flounder) as shown in Table 3-3. These species give highest priority to sessile species (which are subject to continuous input), harvested species, and highest bioaccumulators (those higher in the trophic level that are consumed by humans). Preliminarily, we assumed these to be seaweed (Ascophyllum nodosum or Fucus spp.), soft-shell clams (Mya arenaria), blue mussels (Mytilus edulis), lobster (Homarus americanus), and winter flounder (Pleuronectes americanus). Clam and blood worms were also considered for dose pathway estimation but, since soft-shell clams have two possible pathways (contact and ingestion), they were thought to be a better choice.
Table 3-3. Species Selected For Biota Sampling
Pathway Primary species Organism type Alternative Direct contact through collection Consumption Fertilizer Use
Rockweed Algae none
Direct contact through collection Consumption Fertilizer Use of Shell
Blue Mussel filter feeding bivalve consider periwinkles (Littorina spp.) as possible substitute even though not a filter feeder
Direct contact through collection, human Consumption Fertilizer Use of Shell
Soft-shell clam deposit feeding bivalve none
Human consumption Winter flounder demersal fish smooth flounder Human consumption Lobsters demersal feeding
crustacean rock crab
Biotic samples of commercially-harvested species (soft-shell clams, and lobster) were obtained directly from harvesters in Bailey Cove (clams) and the Back River (lobsters). Blue mussels and algae were collected at Little Oak Island. Fish (winter flounder and hake) were collected by otter trawl in Back River near Maine Yankee. At least 2.3 kg (five pounds) of lobster and fish were collected; at least 2000 grams of seaweed (4.4 lb.) Clams and mussels were shucked and the edible tissue was macerated in a food processor, with sufficient sample to provide 910 g (2 lb) of wet weight tissue material. Shells were counted as separate samples. Sufficient material was collected in 10% of the samples (determined randomly in advance of sampling) to allow them to be split four ways. Lobster meat was restricted to tail and claw meat, the most commonly consumed tissue. The lobster hepatopancreas (tomalley) is known to accumulate organic contaminants, but there is no evidence that radionuclides would be selectively accumulated in any organ of the lobster. All samples were kept cool until returned to the laboratory where they were frozen in doubled plastic bags with proper indelible internal identification sandwiched between the two bags. As finfish were not of sufficient size to fillet, they were frozen whole. Biota for background measurements were collected the Darling Center in Damariscotta and in South Portland.

Maine Yankee Marine Sampling Study
Maine Yankee Final.doc 2/15/05 14
3.4 QUALITY CONTROL
Samples have been archived until delivery of this final report. Cross contamination was prevented using individual sample collection devices or by washing with water to remove sediment particles between sample collections.
3.4.1 Sample Tracking and Custody
Tracking and custody of samples in the field was the responsibility of the Normandeau’s Field Operations Manager. To ensure proper handling and identification of samples, they were labeled and packaged for shipment as they were collected in the field, or immediately upon returning to the field laboratory. Forms and containers specific to the task were used to ease handling and assure safety of the samples. Appropriate sections of each form were completed in the field and in each subsequent step of the process.
Sample control was accomplished by assigning unique numbers to each sample collected. These numbers were obtained from Normandeau’s Quality Assurance Department. In preparation for a collecting trip, a Field Card/Sample Submittal Form(s) was completed for each set of samples taken: Following the sampling event, the field cards were checked to insure that they were completely and correctly filled out. The samples were checked to insure that sample labels were properly filled out with correct sample control numbers are attached Originals of the sample submittal forms were reviewed and put into a fire proof vault at Normandeau-Yarmouth for the Senior Field Biologist's or designee's review. Copies of the original field cards were sent with the samples to the appropriate laboratory.(in this case University of Maine, Maine Yankee, State of Maine, or Friends of the Coast).
3.4.2 Sample Storage and Transfer
Sediment samples were kept cool and transferred as soon as feasible to the University of Maine Department of Physics and Astronomy (or, in the case of duplicates, Maine Yankee, State of Maine, or Friends of the Coast), for gamma scans. Biotic samples were frozen, then sent to University of Maine or, in the case of duplicates, Maine Yankee, State of Maine, or Friends of the Coast . Chain of custody was implemented with documentation and labeling of containers in advance and following the handling to the end of the measurement. Copies of the chain of custody forms accompanied all samples, with the original retained at Normandeau-Yarmouth.
3.5 LABORATORY ANALYSIS
3.5.1 Gamma Screening
The surficial samples and core samples were gamma scanned at the Environmental Radiation Laboratory at the University Department of Physics and Astronomy. Gamma ray counting was done with three Canberra high purity Ge detectors and three 1000 kg low background lead shields. Data were collected using Ace computer boards, and Trump software from Ortec and Gamma Track by Nucleus. The Physics Department’s detectors have been intercalibrated with the U.S.EPA National Exposure Research Lab in Las Vegas Nevada for Gammas in Water. Count times varied from four hours to 24 hours depending upon the concentration of radionuclides and interest in a particular sample. Chain of custody was preserved for all samples with labels and documentation in bound notebooks. Gamma ray spectra were analyzed using custom software which has been tailored to very low level counts (much less than Compton background, such as the expected counts at the bottom of the cores).
Maine Yankee Marine Sampling Study
Maine Yankee Final.doc 2/15/05 15
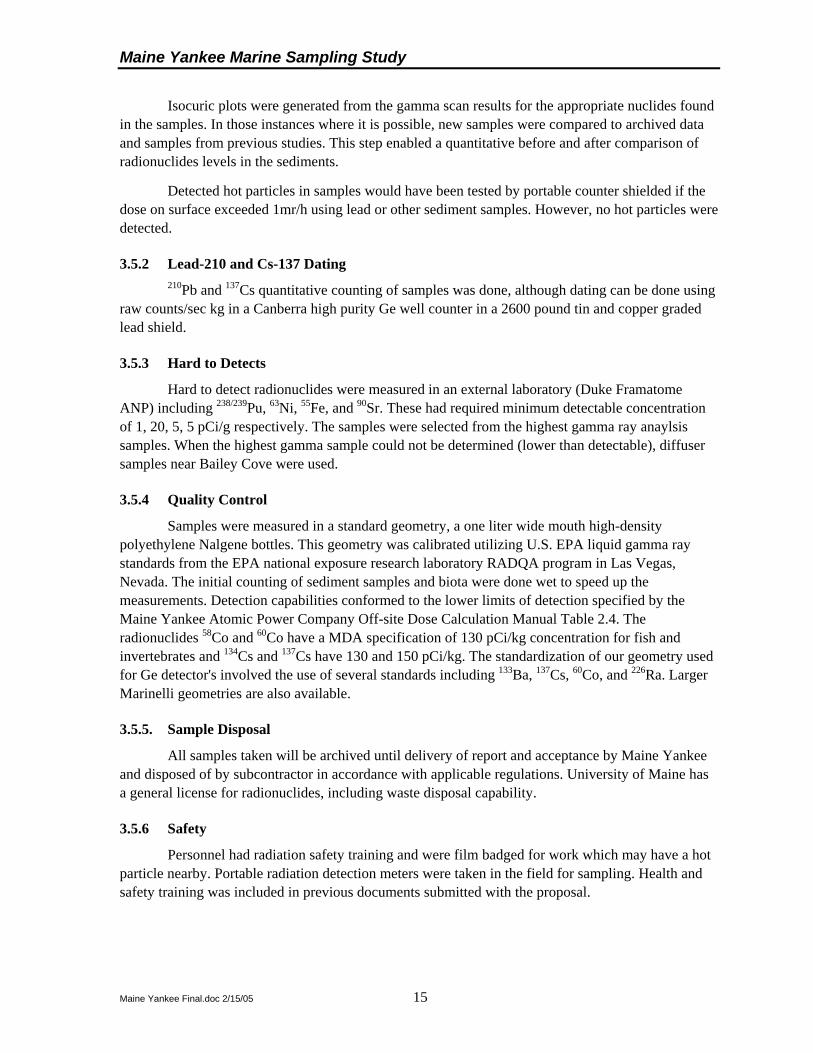
Isocuric plots were generated from the gamma scan results for the appropriate nuclides found in the samples. In those instances where it is possible, new samples were compared to archived data and samples from previous studies. This step enabled a quantitative before and after comparison of radionuclides levels in the sediments.
Detected hot particles in samples would have been tested by portable counter shielded if the dose on surface exceeded 1mr/h using lead or other sediment samples. However, no hot particles were detected.
3.5.2 Lead-210 and Cs-137 Dating 210Pb and 137Cs quantitative counting of samples was done, although dating can be done using
raw counts/sec kg in a Canberra high purity Ge well counter in a 2600 pound tin and copper graded lead shield.
3.5.3 Hard to Detects
Hard to detect radionuclides were measured in an external laboratory (Duke Framatome ANP) including 238/239Pu, 63Ni, 55Fe, and 90Sr. These had required minimum detectable concentration of 1, 20, 5, 5 pCi/g respectively. The samples were selected from the highest gamma ray anaylsis samples. When the highest gamma sample could not be determined (lower than detectable), diffuser samples near Bailey Cove were used.
3.5.4 Quality Control
Samples were measured in a standard geometry, a one liter wide mouth high-density polyethylene Nalgene bottles. This geometry was calibrated utilizing U.S. EPA liquid gamma ray standards from the EPA national exposure research laboratory RADQA program in Las Vegas, Nevada. The initial counting of sediment samples and biota were done wet to speed up the measurements. Detection capabilities conformed to the lower limits of detection specified by the Maine Yankee Atomic Power Company Off-site Dose Calculation Manual Table 2.4. The radionuclides 58Co and 60Co have a MDA specification of 130 pCi/kg concentration for fish and invertebrates and 134Cs and 137Cs have 130 and 150 pCi/kg. The standardization of our geometry used for Ge detector's involved the use of several standards including 133Ba, 137Cs, 60Co, and 226Ra. Larger Marinelli geometries are also available.
3.5.5. Sample Disposal
All samples taken will be archived until delivery of report and acceptance by Maine Yankee and disposed of by subcontractor in accordance with applicable regulations. University of Maine has a general license for radionuclides, including waste disposal capability.
3.5.6 Safety
Personnel had radiation safety training and were film badged for work which may have a hot particle nearby. Portable radiation detection meters were taken in the field for sampling. Health and safety training was included in previous documents submitted with the proposal.

Maine Yankee Marine Sampling Study
Maine Yankee Final.doc 2/15/05 16
3.5.7 Quality Assurance
Samples were collected under the Normandeau QA plan, were counted under the University of Maine QA plan, and modeled under the Churchill quality assurance modeling plan. Framatome was responsible for its QA plan.
3.5.8 Background Measurements
Sediment background samples were taken from Taunton Bay, Clark Cove, and Damariscotta Bay (Station 148), and Sheepscot Bay. Background biota samples were collected from South Portland and Damariscotta Bay. Every effort was made to collect all of the same species collected at Maine Yankee. These samples determined background values of nuclides.
Maine Yankee Marine Sampling Study
Maine Yankee Final.doc 2/15/05 17
4. NUMERICAL MODELING OF FLOWS AND RADIONUCLIDE TRANSPORT IN THE SHEEPSCOT RIVER ESTUARINE SYSTEM
4.1 INTRODUCTION
The modeling component of our project served two primary purposes. One was to examine the flow dynamics of the Sheepscot River estuarine system, which received cooling water and discharged radionuclides from the Maine Yankee nuclear power facility. The second was to study the transport of radionuclides through the estuarine system and the incorporation of these radionuclides into bottom sediments. Modeling results were used in both the planning and data interpretation phases of our project. In planning the project’s sediment surveys, model results were used to set geographic bounds for the sample locations. In interpreting the radionuclide concentrations obtained from the surveys, we used the model results to assess the extent to which sediment-bound radionuclides may have been transported after their initial incorporation into the bottom sediment.
Our modeling package consisted of two coupled numerical routines. One was a hydrodynamic model that simulated the flows in Sheepscot River estuary for a given set of tidal conditions. The second was a modified “water quality model”. This used the time varying flow field of the hydrodynamic model to simulate the transport of discharged radionuclides and estimate the pattern of radionuclide incorporation into the bottom sediment of the Sheepscot estuarine system.
The modeling effort was carried out in phases. The first phase entailed constructing model grids, of increasing levels of complexity, and conducting numerical integrity tests of the hydrodynamic model. In the second phase, we focused on the dynamics of the Sheepscot River estuarine system. The model results were employed to examine aspects of the dynamics expected to impact the transport of radionuclides discharged from the Maine Yankee facility. As part of this phase, we also carried out a field evaluation of the model. This entailed releasing drifters at various tidal phases near the diffuser location, as well as monitoring the water level in Bailey Cove over two tidal cycles. In our third, and final, modeling phase, we used the water quality model to simulate the movement of plant-discharged radionuclides throughout the estuary and the initial incorporation of these radionuclides into bottom sediments. Among the products produced by the model were geographic plots of radionuclide concentrations in bottom sediments resulting from large historical releases. These were used in the interpretation of the results our sediment radiological surveys.
In the remainder of this section we offer brief descriptions of the hydrodynamic and water quality models, and discuss the findings from these models in some detail. We also describe the model evaluation field study carried out in early July 2004.
4.2 HYDRODYNAMIC MODELING
4.2.1 Model Description
Simulation of flows within the Sheepscot River estuarine system was done using the hydrodynamic model DYNHYD. This numerical model has a history of application in estuarine studies dating from the 1970’s (Feigner and Harris, 1970). It has been used to simulate flows near the Maine Yankee power plant in previous studies reported by Churchill et al. (1980) and Hess et al. (1983).

Maine Yankee Marine Sampling Study
Maine Yankee Final.doc 2/15/05 18
A principal simplifying assumption of the model is that velocities and water properties are vertically uniform. Simulation of flows within an estuary is carried out by numerically integrating the equations of continuity and motion, expressed in a finite difference form, using a Runge-Kutta technique. This calculation is done within the framework of a grid that segments the volume of an estuary into a series of channels and connecting junctions. The channels are assumed to be flat bottomed and of rectangular cross-section. Properties assigned to each channel are length, width and a “Manning” friction coefficient. Throughout a tidal cycle, the channel length and width remain constant, while the channel cross-sectional area and hydraulic radius (depth of water) vary with the changing water level. Model output includes time series of vertically averaged velocities and hydraulic radii for each channel. The mean water level of each junction, relative to a horizontal datum, is also output by the program.
Application of DYNHYD to the waters near the Maine Yankee facility required modification of the program to allow for drying of channels. This modification and other details of the program’s operation are described by Churchill et al. (1980) and Hess et al. (1983).
In generating the model results to be shown in ensuing sections, we forced the model flow though two mechanisms: changes in tidal elevation at the boundary of the model grid, and inflow and outflow at specified model junctions. To account for the impact of the power plant’s operation, a steady inflow was specified at a junction coincident with the cooling water intake and a steady outflow was specified at one of the discharge locations: the outflow into Bailey Cove and the diffuser in the Back River. For runs aimed at modeling flows during the decommissioning period after the plant shutdown, a steady outflow was specified at the location of the waste water discharge near Little Oak Island. The influx of freshwater to the Sheepscot River estuary was accounted for in some runs by specifying an influx at a model grid’s northern most (most inshore) junction.
In specifying the changes of tidal elevation at the seaward boundary of the model domain, we made use of the Eastcoast 2001 data base of tidal constituents recently developed for the U.S. Army Corps of Engineers and described by Mukai et al. (2001). This data base allows a user to compute the tidal elevation for a given time window and at any given location within a domain that includes western North Atlantic. It was derived in the manner described by Westerink et al. (1994) by applying the hydrodynamic model ADCIRC (Luettich et al., 1992) to a domain comprised of the western North Atlantic, the Gulf of Mexico and the Caribbean Sea. Using the Eastcoast 2001 data base and a Fortran routine supplied by Dr. Richard Luettich of the University of North Carolina, we specified tidal elevation series at the location of the model grid’s southern most junction for a number of different time periods.
We should emphasize that by today’s standards, DYNHYD is relatively crude. The most advanced of the current generation of estuarine models typically represent velocities and water properties as 3-dimensional fields and have highly refined methods for determination of bottom friction. The principal advantages of DYNHYD over this class of models are in its ease of implementation, speed of operation and numerical stability. As will be shown below, DYNHYD provided a useful, albeit imperfect, view of the dynamics of the Sheepscot River estuarine system.
4.2.2 Model Grid Generation
Hydrodynamics of waters near the Maine Yankee power plant have been modeled in three previous studies; two with the use of DYNHYD (Churchill et al., 1980 and Hess et al., 1983) and the third with the use of finite element numerical model (Law, 1979). In all of these studies, only a small

Maine Yankee Marine Sampling Study
Maine Yankee Final.doc 2/15/05 19
portion of the Sheepscot River estuarine system was included in the simulation. In no study did the model domain extend beyond the diffuser location by more than 6 km to the south or 3 km to the north. Although useful, the previous model results offered little insight into the workings of the entire estuarine system and how the larger scale system dynamics may have impacted the movement of radionuclides discharged from the power plant. For this reason, we chose to extend the model domain of this study over the entire Sheepscot River estuarine system.
Generation of the model grid was accomplished using routines executed in MATLAB programming environment. The procedure was carried out in a number of steps with the user working with the cursor on an electronic chart of Sheepscot River estuary. In the first step, the user specified the center location of each of the grid’s junctions (by “left clicking” at the desired cursor location). In the second step, the user connected the junctions with channels. Marking of channel edges and specification of junction depths (relative to mean low water) were accomplished in subsequent steps. The final step entailed specifying junction area. For a particular junction, this could be set equal to the half the sum of the channels entering the junction or to the area of a polygon whose edges were specified by the user (again, by left clicking on desired vertex locations). Routines were also written for editing a particular grid, allowing for deletion or insertion of channels and junctions. Throughout the course of our study, the grid was expanded in steps, with detail added in areas deemed likely to receive plant discharged radionuclides based on results from the soon to be replaced model grid.
The final grid (Figures 4-1 and 4-2) consists of 301 channels and 228 junctions. It is highly resolved in areas considered likely to receive discharged radionuclides in high concentration. This includes Bailey Cove and a portion of the Back River and Montsweag Bay extending roughly 2 km north and 1 km south of the diffuser location. The skewing of this area of high grid resolution relative to the diffuser is consequence of the system dynamics, which will be discussed in the next section. While the grid encompasses most of the closed channels and embayments of the Sheepscot River estuarine system, it does not extend into the adjacent Kennebec River, which is connected to the Sheepscot River estuary by the Sasanoa River (Figure 4-2). The Kennebec-Androscoggin River system is highly complicated and could not have been adequately modeled within the time frame of our project.
4.2.3 Model Results
As noted above, the model was forced by changes in tidal elevation applied at the most seaward boundary (identified in Figure 4-2). Spring, neap and intermediate tidal conditions were simulated. An examination of the model results has revealed two important phenomena that had not been identified by previous studies, but which are expected to have a significant impact on the transport and redistribution of radionuclides discharged from the Maine Yankee facility. One is a tidal node located a short distance south of the diffuser location, and the other is an asymmetry of the tidal flow within Bailey Cove. In this section we examine the details of these phenomena as revealed by the model results.
From a simple examination of nautical charts, an astute navigator or a reasonably alert student of hydrodynamics, would infer the likelihood of a tidal node somewhere in the Sheepscot River estuarine system. Such an observer would note that the deepest channels of the system encircle the system’s largest island, Westport Island (Figures 4-1 and 4-2). He or she may then imagine the path of a tidal crest entering the system from the Sheepscot River mouth. At the southern

Maine Yankee Marine Sampling Study
Maine Yankee Final.doc 2/15/05 20
Figure 4-1. The final version of the grid used for the hydrodynamic and radionuclide models.

Maine Yankee Marine Sampling Study
Maine Yankee Final.doc 2/15/05 21
Figure 4-2a. Same as Figure 4-1 except showing the model grid over plain land and water
fields. Indicated is the boundary junction at which the offshore forcing, in the form of a tidal elevation series, is applied. Also indicated is the Sasanoa River, which is a principal opening to the modeled system not accounted for by the grid.

Maine Yankee Marine Sampling Study
Maine Yankee Final.doc 2/15/05 22
Figure 4-2b. The section of the model grid with the highest resolution.
end of Westport Island, the path this crest would be expected to split into two alternate routes: one moving northward through the Sheepscot River along the eastern shore of Westport Island and the other traveling northward through the series of bays and rivers that abut the western shore of Westport Island. Somewhere along the island, the two crests would recombine to form a tidal node. Our perceptive observer would predict that tidal velocities would be particularly weak at the location of the node. The reasoning would be that the tidal velocities are forced principally be gradients of the tidal elevation, which tend to be largest in the along-channel direction. The elevation of the two tidal waves meeting at the node should be roughly equal, giving a small (or nearly zero) elevation gradient at the node.
To examine the manner in which the tide propagates though the channels ringing Westport Island, we computed the total volume transported by the incoming tide flow through the model channels surrounding the island. This was determined as

Maine Yankee Marine Sampling Study
Maine Yankee Final.doc 2/15/05 23
∫+
=10
0)(
tt
tdttVT
where t is time and V(t) is the channel volume transport defined as
WtvtDtV )()()( =
where D(t) is the time varying water depth in the channel, v(t) is the modeled channel velocity and W is the channel width. The integral for the volume transported, T, is carried out over the period of the incoming tide (from t0 to t0+t1). A plot of flood-tide transport in selected channels (Figures 4-3a,b,c) shows the splitting and recombining of the transport in the channels abutting Westport Island. The principal schism occurs at the southern end of Westport Island where the incoming transport divides into two main streams. One heads into the estuarine region to the west of the island, while the other, larger, stream moves up the main channel of the Sheepscot to the east of the island. At the northern tip of the island, this latter stream splits again with one branch moving southward along the western shore of Westport Island. This branch continues past the location of the diffuser discharge. It then meets the northward moving stream it had parted with at the southern end of Westport Island. According to the model, this point where the flood tide streams encounter one another is roughly 1 km south of the diffuser.
To examine the effect of the splitting of tidal flows around Westport Island on tidal energy, we computed of root mean square (RMS) value of volume transport through the model channels over the course of a tidal cycle. This was computed according to
∫+
=20
0
2 )(21)(
tt
tdttV
tVRMS
where RMS(V) is the root mean square of the volume transport in the channel over the course of a tidal cycle that extends from t0 to t0+t2. This quantity (hereafter, RMS tidal transport) is proportional to the square root of tidal energy in a model channel. According to the model, the RMS tidal trans-port varies over two orders of magnitude in the channels surrounding Westport Island (Figures 4-4a,b). It exhibits a very deep minimum in the area of the tidal node, roughly 1 km to the south of the diffuser. At the diffuser location, the RMS tidal transport is only slightly greater than its minimum and is dwarfed by the RMS tidal transport on the other side of Westport Island, by more than an order of magnitude.
One may question why the flood tide stream that initially moves up the main channel of the Sheepscot manages to cover so much more distance than it weaker brother stream before reaching their collision point. It’s because this faster stream passes through a much deeper part of the system than its slower counterpart. The phase velocity of the tidal wave is proportional to the square root of channel depth, and so the location of the point where the model tidal waves meet, and produce the tidal energy minimum, is determined by the depths of the model channels. Accurately predicting this location in the model is principally dependent on properly specifying the main channel depths on either side of Westport Island.
As would be expected, the tidal excursions (the distances a particle moves from low to high tide, or vice-versa) are very small in the area of the tidal node and tend to increase dramatically moving away from the node. Here we show tidal excursions computed for neap-tide conditions

Maine Yankee Marine Sampling Study
Maine Yankee Final.doc 2/15/05 24
Figure 4-3a. The volume transport over a flood tide through selected model channels. The transports show the splitting of the incoming tidal flow near the southern end of Westport Island and a minimum of tidal flow at the tidal node, where two opposing streams meet, a few km south of the diffuser location.

Maine Yankee Marine Sampling Study
Maine Yankee Final.doc 2/15/05 25
Figure 4-3b. A smaller scale view of the flood tide volume transport in the vicinity of the
Maine Yankee facility.
Figure 4-3c. An even smaller scale view of the flood tide volume transport in the vicinity of the Maine Yankee facility.

Maine Yankee Marine Sampling Study
Maine Yankee Final.doc 2/15/05 26
Figure 4-4a. The RMS value of volume transport within channels encircling Westport Island. These RMS transports show a minimum of tidal energy at the tidal node off the western shore of Westport Island.

Maine Yankee Marine Sampling Study
Maine Yankee Final.doc 2/15/05 27
Figure 4-4b. A smaller scale view of the RMS value of volume transport more clearly
showing the minimum of tidal energy at the tidal node. Note that this is roughly 1 km south of the diffuser location.
(Figure 4-5). Near the diffuser, these neap tide excursions are of order 1.5 km. Only 1.2 km to the north of the diffuser, the excursions are substantially larger, of order 3.4 km.
The tidal node acts as something of a barrier to the north-south movement of material within the estuary. In particular, it may be viewed as an obstruction to the southward movement of material released from the diffuser. On an outgoing tide, material released from the diffuser is carried to the north. On an incoming tide, the movement of material discharged from the diffuser is somewhat more complicated, with some portion of the material being carried into Bailey Cove and some other portion being transported southward within the main navigation channel. However, this southward transport tends to stall at the tidal node.
To study the impact of the tidal node on the transport of material released at the diffuser, and discharged from the old Bailey Cove outflow, we conducted a number of particle tracking experiments using the modeled velocity fields. The basic approach was to release an ensemble of particles from the location of the diffuser, or the Bailey Cove outflow, and track these using the modeled velocity field over a specified period. The tracking routine was relatively simple. It was assumed that particles followed the modeled flow perfectly (i.e. they did not experience any diffusive “kicks”) and were confined to the model channels. Their path was thus explicitly defined at all times except when they encountered a junction where the flow could carry them into two or more channels. In such a case, the channel that a particle would enter was chosen through a modified Monte Carlo scheme in which the probability of entering a channel was prorated based on the transports of all the

Maine Yankee Marine Sampling Study
Maine Yankee Final.doc 2/15/05 28
Figure 4-5. Magnitudes of tidal excursions at selected model channels.
possible channels of entry. That is, the greater the transport of a channel, relative to companion channels meeting at the junction, the higher its probability of receiving particles entering the junction.
To define the scope over which the tide carried material released from a discharge location, we followed a procedure in which an ensemble of particles (typically 100 particles) was set out from the discharge location at some given time and then tracked for a full tidal cycle of 12.5 hours. This procedure of releasing a group of particles was repeated at regular time intervals (typically every 0.5 hours) through a full tidal cycle. The full collection of particle positions, from all the releases, gave the estimated region over which the tide may be expected to carry material set out from the given discharge location. Plots of these collections of particle locations were used in designating the scope of our sediment collection surveys and in choosing areas of high station density.
Here we show two examples of particle positions determined from the above procedure, one with the release point at the diffuser and the other with the release point at the Bailey Cove outflow (Figures 4-6 and 4-7). Both were determined using a flow field representative of spring tide conditions. The collection of particle positions released from the diffuser reflects the impact of the tidal node in that they are skewed to the north of the diffuser. The furthest extent of these particles is roughly 2.5 km to the north of the diffuser but no more than 1 km to the south of the diffuser. It is noteworthy that a number of the particles set out from the diffuser extend well into Bailey Cove. Not surprisingly, the collection of particles released from the Bailey Cove discharge fill up the cove. In the Back River, this ensemble of particle positions also reflects the influence of the tidal node, extending further to the north of their point of entry into the river than to the south.
We must caution against viewing the tidal node indicated by the model as an impermeable barrier. As will be shown in the results of Section 4.3.2, the modeled flow fields can carry material released from the diffuser to the south of the node. There also are a number of mechanisms not

Maine Yankee Marine Sampling Study
Maine Yankee Final.doc 2/15/05 29
Figure 4-6. An ensemble of the positions of particles released from the location of the
diffuser into a modeled flow field forced with a boundary elevation series representative of a spring tide.
Figure 4-7. An ensemble of the positions of particles released from the location of the Bailey
Cove discharge into a modeled flow field forced with a boundary elevation series representative of a spring tide.

Maine Yankee Marine Sampling Study
Maine Yankee Final.doc 2/15/05 30
accounted for in the model which may result in the transport of material across the node. Wind forcing of near-surface flow is one obvious candidate. Another is gravitational circulation associated with density differences within the estuary (which are ignored by DYNHYD). Nevertheless, the tidal node indicated by the model is an actual element of the Back River and Montsweag Bay flow field known to many who frequent the river (Don Hudson, Chewonki Foundation, personal communication). It is a feature that will clearly have a significant impact on the transport of material entering the river.
As noted above, the other important flow feature revealed by the model results was an asymmetry in the properties of the tide within Bailey Cove. Tidal asymmetries, marked by a significant difference in the length of the flood versus the ebb tide, have been recognized in a number of embayments (Boon and Bryne, 1981; Aubrey and Speer, 1985; Speer and Aubrey, 1985; Lincoln and Fitzgerald, 1988; Ranasinghe and Pattiaratchi, 2000). They have been attributed to the generation of short period “overtides” within the embayments (Speer and Aubrey 1985; DiLorenzo, 1988; van de Kreeke, 1988).
The model results show a “flood-dominant” tidal asymmetry in Bailey Cove. This is characterized by a short period flood tide with strong incoming flows and a longer period ebb tide with relatively weak outgoing flows. According to the model results, the degree of asymmetry depends principally on tidal range and position in Bailey Cove. It tends to increase with increasing tidal range and with increasing distance into the cove (going to the head of the cove). Here we show the signature of the tidal asymmetry revealed by the flows and water levels determined for spring tide conditions in a model channel (channel 281) located roughly 150 m NE of the old Bailey Cove discharge (Figures 4-8 and 4-9). Notably, under these tidal conditions, the modeled flood tide exhibits a maximum of velocity of 32 cm/s whereas the ebb tide flow peaks at only 14 cm/s. A flow pattern such as this would tend to lead to particle accumulation within the cove. This would occur because of a tendency for particle resuspension on the strong incoming flood tide and for particle settling on the weaker outgoing tide. As discussed in an ensuing section, particle accumulation in Bailey Cove is indicated by vertical profiles of radionuclides in bottom sediment samples acquired in this project and in previous projects.
4.2.4 Field Evaluation of the Model
In this report we have focused on the tidal node and the tidal asymmetry revealed by the model because these features are likely to have had a significant effect on the transport of radionuclides released into the Sheepscot estuarine system and on the retention of these radionuclides within the system. As noted above, the tidal node acts as something of a semi-permeable barrier to the southward transport of material released from the Maine Yankee facility into the estuary. As also noted above, the tidal asymmetry in Bailey Cove would tend to favor particle accumulation in the cove and possibly lead to the burial of radionuclides absorbed by sediments in the cove. These factors were taken into account when designing our sediment surveys. Based on the simulated particle trajectories produced with the model results (e.g., Figures 4-6 and 4-7), we biased our sample collection sites to the north of the Back River diffuser location. In view of the indication of tidal conditions favorable for particle accumulation in Bailey Cove, our sample plan called for a relatively large number of core samples to be collected from the cove.
Our reliance on the model results in the survey design makes the question of model reliability, especially in regard to the above mentioned features, especially important. Unfortunately,

Maine Yankee Marine Sampling Study
Maine Yankee Final.doc 2/15/05 31
Figure 4-8. A view of the model grid in the areas of Bailey Cove and Back River. Indicated is the location of a conductivity-temperature-depth (CTD) recorder set out over two tidal cycles during July 7-8, 2004 as well as the model channel (# 281) that encompassed the CTD location.
Figure 4-9. Time series of modeled water depth and water velocity in channel 281 (Figure 4-
8). The series give evidence of a flood-dominated tidal asymmetry in Bailey Cove. This is marked by a brief flood tide with a strong incoming flow and a long ebb tide with a relatively weak outgoing flow.

Maine Yankee Marine Sampling Study
Maine Yankee Final.doc 2/15/05 32
the limited time period and financial resources of our project did not allow for an extensive field evaluation of the model. Nevertheless, we were able to devote two days (July 7-8) to acquiring field measurements to compare with the model results. The measurements were directed at addressing two critical questions regarding the model’s performance. These were: how well does the model represent the actual movement of material in the region near the Back River diffuser; and is the tidal asymmetry indicated in Bailey Cove an actual feature, or simply a model artifact?
To address the first question, we released drifters near the location of the diffuser and tracked these over a number of hours. The drifters we employed were “Davis-style” surface trackers, designed to follow flow in the surface 1.3 m of the water column (Davis, 1985). They were purchased from the Gulf of Maine Lobster Foundation by contractor J. Churchill for use on another project and were effectively on loan for this study.
Each drifter consisted of central ballasted cylinder and four “sails”, which radiated from the cylinder and provided drag (Figure 4-10). The sails were suspended between four fiberglass rods that extended through cylinder. Affixed to the cylinder top was an electronics package manufactured by the Axonn Corporation, which included a GPS receiver and a satellite transmitter. The drifters were kept afloat by buoyant rings attached to the ends of the upper rods. In the water, each drifter was nearly fully submerged with only a small portion of the cylinder and the masthead electronics package above water.
Drifter tracking was accomplished via the drifter’s masthead electronics unit. This obtained GPS fixes of the drifter’s position and regularly transmitted these to satellites. The positions were available on the website of the tracking company, AeroAstro, in nearly real time. We had preprogrammed the masthead electronic units used in our study to transmit updated positions every 15 minutes, the smallest update time interval allowed by AeroAstro. However, the actual times between positions received through the AeroAstro system were often much longer, many exceeding 30 min.
A drifter was set out near the diffuser location and subsequently tracked four times, twice on July 7 and twice on July 8. All drifter releases occurred on the outgoing tide. In agreement with the flow pattern indicated by the model, the drifters initially traveled to the north (top panels of Figure 4-11 and 4-12). All drifters also experienced a reversal of motion with the tide change.
To generate modeled particle trajectories for comparison with the drifter tracks, we ran the model to simulate flows over the period of July 6-9, 2004. The model was forced only by the changes in tidal elevation at the seaward boundary, which were determined with the program ADCIRC as described in Section 4.2.1.
For comparison with the drifter trajectories, a total of 100 particles were set out into the model flow field at the time and location of each drifter release. Using the method described in Section 4.2.3, the trajectories of these particles were simulated over a period corresponding to the time of the drifter tracking. The resulting ensemble of modeled particle trajectories compare rather favorably with the drifter trajectories with regard to the direction of movement and time of tidal reversal (Figures 4-11 and 4-12). However, the overall extent of the modeled particles northward movement was generally 30-50 % of the northward extent of the drifters.

Maine Yankee Marine Sampling Study
Maine Yankee Final.doc 2/15/05 33
Figure 4-10. A view of the type of drifter used in the field studies of July 7-8, 2004. The unit at the top of the drifter’s central cylinder (covered in tape) is a tracking device outfitted with a GPS receiver and a satellite transmitter.
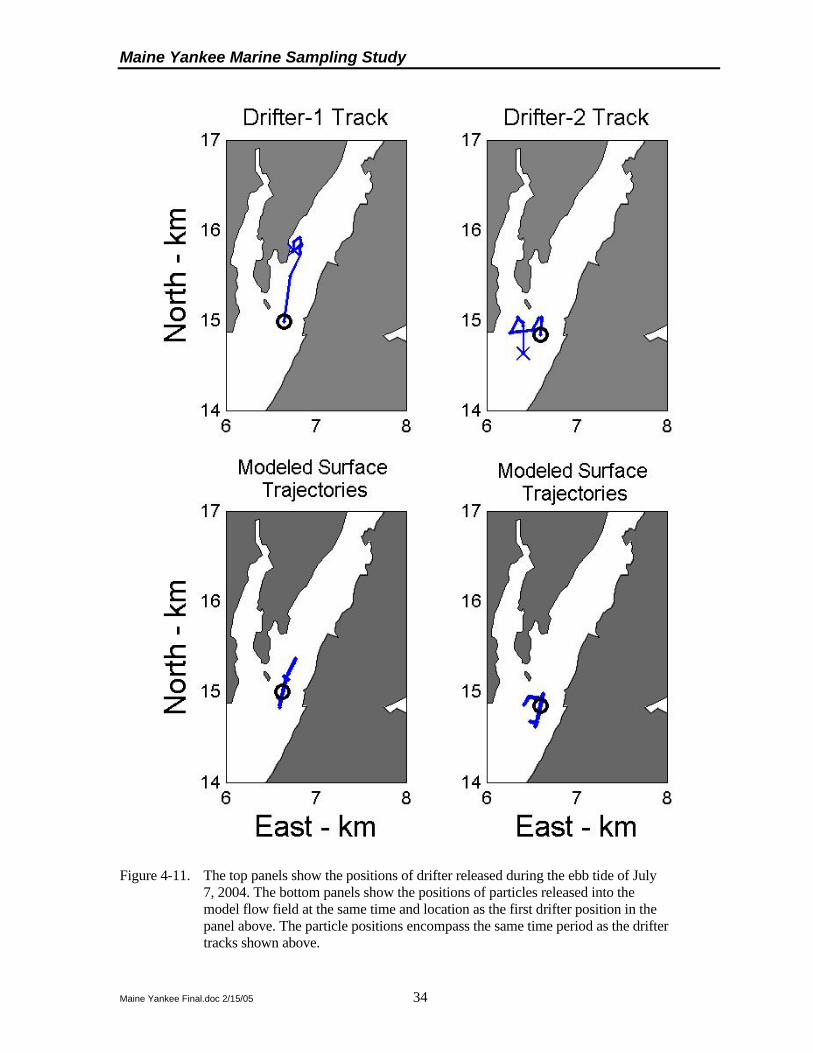
Maine Yankee Marine Sampling Study
Maine Yankee Final.doc 2/15/05 34
Figure 4-11. The top panels show the positions of drifter released during the ebb tide of July 7, 2004. The bottom panels show the positions of particles released into the model flow field at the same time and location as the first drifter position in the panel above. The particle positions encompass the same time period as the drifter tracks shown above.
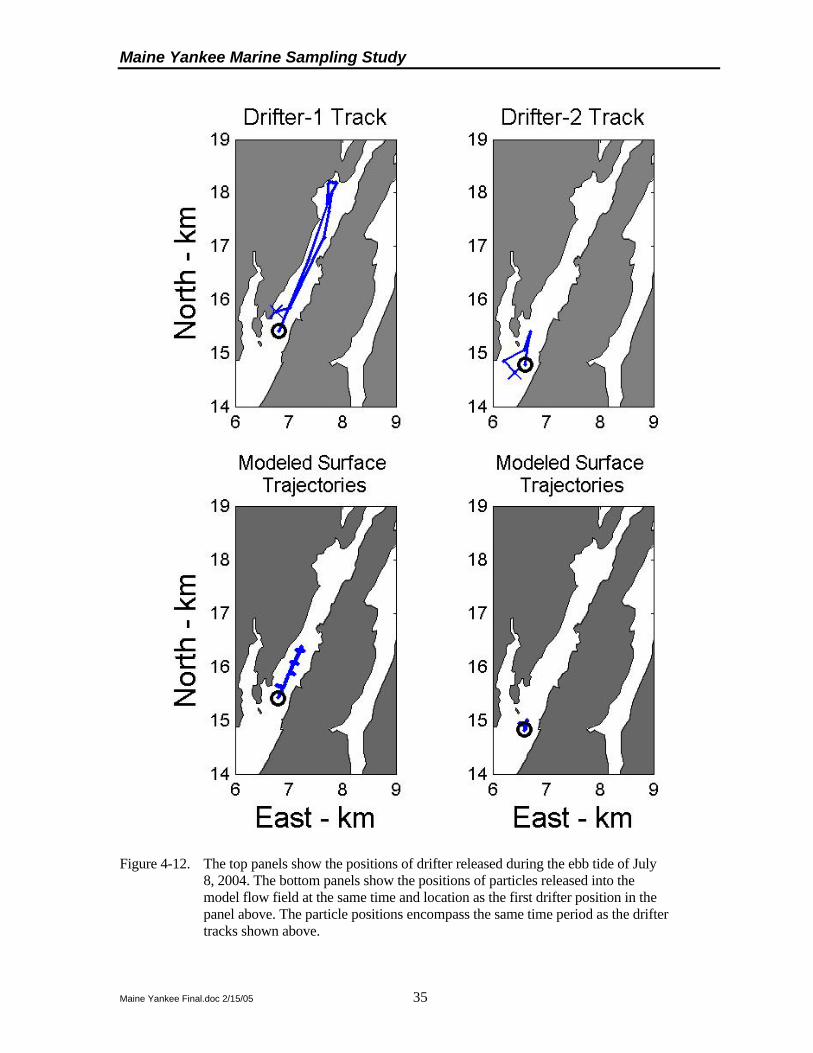
Maine Yankee Marine Sampling Study
Maine Yankee Final.doc 2/15/05 35
Figure 4-12. The top panels show the positions of drifter released during the ebb tide of July 8, 2004. The bottom panels show the positions of particles released into the model flow field at the same time and location as the first drifter position in the panel above. The particle positions encompass the same time period as the drifter tracks shown above.

Maine Yankee Marine Sampling Study
Maine Yankee Final.doc 2/15/05 36
On first consideration, this may seem to be an indictment of the model’s ability to accurately represent flows in the vicinity of the diffuser. However, further reflection puts this result in a more favorable light. A principal difference between the modeled and the actual estuary is that the model assumes a vertically uniform velocity, whereas flow in the actual estuary will clearly vary with depth. Consider, for example, the situation in which the estuarine flow is dominated by changes in tidal elevation (i.e., with winds and fresh water inflow having negligible impact on the flows). Because of the effect of bottom friction, we may expect the velocity magnitude in such a system to increase going from the bottom towards the surface. The depth-averaged velocity, which is essentially the velocity estimated by the model, would then be less than the near-surface velocity. For the case in which the velocity increases linearly going upward from a value of zero at the bottom, it is easily shown that the depth-averaged velocity is exactly half the surface velocity. That the modeled velocities are substantially smaller than measured near-surface velocities is thus consistent with expectations. The conservatively low velocities of the model may be well suited for estimating the transport of radionuclides that are absorbed by the bottom sediments. This is because these radionuclides should be carried predominately in near-bottom waters where velocities tend to be the lowest.
To address the second question listed above, of whether or not the tide in Bailey Cove is significantly asymmetric, we deployed a device in Bailey Cove that measured temperature, salinity and water level. The device, a conductivity, temperature and depth (CTD) sensor package manufactured by Seabird Instrument Systems, was set out in the channel within the northern portion of Bailey Cove (see Figure 4-8 for location). Its deployment occurred during low water on the morning of July 7, 2004. The CTD was enclosed in a stainless steel cage to which lead weights were attached. Recovery of the CTD was done during low water, and in a steady shower, on the afternoon of July 8. An important observation of the recovery crew was that the CTD and its cage were covered with thick mat of seaweed and other debris.
This debris almost certainly compromised the conductivity measurements of the CTD, as it likely deprived the conductivity cell of the necessary continuous flow of water. As a consequence, we have little confidence in the salinity record derived from the CTD measurements, which are computed from temperature and conductivity. Our lack of confidence does not, however, extend to the CTD’s pressure record, as the pressure measurement does not require a continuous flow of water.
The record of pressure sensor depth (Figure 4-13) shows two full tidal cycles and remarkably little difference between the two high water levels. A simple analysis of the depth record does indeed reveal a tidal asymmetry of the form predicted by the model (with a longer period of falling, as opposed to rising, water levels). As a measure of this, we have taken the times between the maximum sensor depth (high water) and a sensor depth of 0.5 m. For the first tidal cycle, the flood tide increases the sensor depth from 0.5 m to the maximum value over 4.2 hr, whereas the ebb tide decreases the sensor depth from its maximum level to 0.5 m over a longer period of 4.8 hr. A similar disparity between the rates of the rising and falling water level is observed over the second tidal cycle (Figure 4-13).
How well do these measured differences between the rates of falling and rising water in Bailey Cove compare with model predictions? To address this question, we have examined the modeled Bailey Cove water levels determined from the July 6-9 simulation mentioned above. Specifically, we have focused on the modeled water levels of channel 281, which encompasses the CTD location (Figure 4-8), over the period of the CTD data record (12:00 July 7 – 12:00 July 8).

Maine Yankee Marine Sampling Study
Maine Yankee Final.doc 2/15/05 37
Figure 4-13. The sensor depth (i.e., water level) of the CTD deployed in Bailey Cove (at the location
indicated in Figure 4-8). Indicated are the times of rising and falling water between the highest water level and a water level 0.5 m above the minimum sensor depth. These show a tidal asymmetry in which the rate of rising water of the flood tide exceeds the rate of falling water on the ebb tide.
Figure 4-14. The modeled water level of channel 281 in Bailey Cove (Figure 4-8) during the time of the CTD measurements of water level shown in Figure 4-13. As in Figure 4-13, the times of rising and falling water between the highest water level and a water level 0.5 m above the minimum level are indicated. These show a tidal asymmetry of a degree nearly matching that indicated by the measurement of Figure 4-13.

Maine Yankee Marine Sampling Study
Maine Yankee Final.doc 2/15/05 38
Over this time, the simulated water levels of channel 281 nicely match the CTD measurements in that they show two full tidal cycles with little difference in the levels of high water (Figure 4-14). To quantify the difference in the rates of falling and rising modeled water levels, we have used a measure similar to that applied to the CTD measurements. It is the time difference between the occurrences of high water and a water level 0.5 m water level 0.5 m above the level of low tide. By this measure, the rising tide of the first modeled tidal cycle is 0.8 hr shorter than the falling tide (Figure 4-14). By the similar measure applied to the CTD measurements, the rising tide of the first tidal cycle is 0.6 hr longer than the falling tide (Figure 4-13). The comparison for the second tidal cycle is similarly favorable. For this cycle, the times of rising and falling water between the two chosen benchmarks differs by 0.5 hr in the simulated results and by 0.4 hr in the CTD measurements (Figures 4-13 and 4-14).
It thus appears that tidal asymmetry in Bailey Cove, as indicated by the model results, is an actual phenomenon. For the intermediate tidal ranges encountered during our field effort, the model seems to be capable of accurately reproducing this tidal asymmetry. It remains to be seen, however, if the extreme degree of tidal asymmetry predicted by the model during spring tide conditions actually occurs.
4.3 MODELING OF RADIONUCLIDE TRANSPORT
4.3.1 Model History and Description
The transport of radionuclides discharged from the Maine Yankee facility and the uptake of these radionuclides into bottom sediment have been modeled in previous studies described by Churchill et al. (1980) and Hess et al. (1983).
Churchill et al. (1980) considered the sediment uptake of radionuclides released from the Bailey Cove discharge in the early 1970’s. Their approach was to simulate the movement of radionuclides entering Bailey Cove using the velocities derived from DYNHYD. Sorption of radionuclides into the bottom sediment was modeled according to
)]1(1[)( 0t
ekkkkeECtC α−−=
where Ck(t) and Ck0 are the water borne concentrations of the radionuclide, k, at times t and 0, respectively. The sorption of the radionuclide onto the bottom sediment is parameterized by the equilibrium constant, Eek and the sorption constant αk.
For the radionuclides considered by Churchill et al. (134Cs, 137Cs, 58Co and 60Co), the transfer parameters, Eek and αk, were specified based on the results of laboratory experiments in which a tank of estuarine water and suspended estuarine sediments was spiked with a known amount of the radionuclides. Samples of the suspension were extracted at regular times and measured for radionuclide absorption. The rate of this absorption was used in determining the transfer parameters.
A correlation analysis presented by Churchill et al. showed a strong statistical relationship between modeled sediment-bound radionuclide concentrations and radionuclide concentrations measured in surficial sediment samples from Bailey Cove. For 134Cs and 137Cs, the correlation coefficients relating the measured and modeled concentrations all exceeded 0.8. For 58Co and 60Co, the correlation coefficients were all in excess of 0.62.

Maine Yankee Marine Sampling Study
Maine Yankee Final.doc 2/15/05 39
Hess et al. (1983) used the same numerical programs as employed by Churchill et al. to model the sediment uptake of radionuclides released through the diffuser. They noted an excellent qualitative agreement between the modeled and measured patterns of the short-lived 58Co (half life of 70.8 days) in bottom sediments. The comparison between modeled and measured patterns of the longer-lived 137Cs (30.17 yr half life) in the bottom sediments was also good, but somewhat inferior to that for 58Co. Hess et al. attributed this difference to the impact of 137Cs from fallout and from plant discharges of previous years. They noted that such sources of 137Cs were not accounted for in the model, which simulated the initial sorption of the radionuclide onto bottom sediment from a single release or a small number of recent releases.
In modeling the transport of radionuclides, Churchill et al. (1980) and Hess et al. (1983) used the program DYNQUA. This is a Fortran-based companion program to DYNHYD (Feigner and Harris, 1970). In the modeling for this project, we decided against the use of DYNQUA for the principal reason that a working version of the program was not readily available. Instead, the same equations and numerical approach used by DYNQUA were implemented by MATLAB routines. In our experience, implementing numerical schemes is much easier in the MATLAB, as opposed to the Fortran, working environment. In addition, our analysis of the model results and the graphical presentation of these results were done entirely within MATLAB.
In our modeling, the basic procedure was to first upload files of time varying velocity fields produced by DYNHYD and use these to simulate the movement of discharged radionuclides through the model domain. The principal equation invoked was the diffusion-advection equation with a constant coefficient of turbulent diffusion. Sorption of radionuclides into the bottom sediments was modeled with the equation given above. The model was executed with a time step of 250 s.
The model produced averaged concentrations of sediment-bound radionuclides distributed over the top 1-cm of the sediment, a depth roughly corresponding to the average sampling depth of the surface sediment samples of our survey and the previous surveys described by Churchill et al. (1980) and Hess et al. (1983). The model-produced concentrations of sediment-bound radionuclides were thus volume concentrations. These are expressed here (Figures 4-16 to 4-20) in units of pCi l-1. To convert these to mass concentrations (in units of pCi kg-1, for example), one should note that a 1-liter sample of surface sediment from our study area typically has a mass of 1.8 kg.
4.3.2 Model Results
Our modeling effort needs to be viewed in the context of the history of radionuclide discharge from the Maine Yankee facility. Over the course of the power plant’s operation and decommissioning, the discharge location and mode of discharge have undergone a number of changes. From the time of the plant’s initial operation until July 1975, cooling water and radionuclides were discharged into Bailey Cove over a weir a short distance to the north of Foxbird Island (Figure 4-2b). On July 16, 1975, discharge was switched to the subsurface diffuser system. The diffuser was 305 m (1000 ft) in length and supported 42 discharge nozzles spaced 7.6 m (25 ft) apart. It was located off the southern tip of Foxbird Island (Figure 4-2b) at a depth range (relative to mean water) of 9 to 14 m. The diffuser system was used for the discharge of cooling water and radionuclides throughout the remainder of the plant’s operation. The mode of discharge was altered in the late 1990’s as a consequence of the plant’s decommissioning. In October 1998, Maine Yankee approved a change in the discharge procedure that allowed for effluent releases with low or no dilution flow from the service water system. Later, in February 1999, this method of release was augmented, to maximize tidal dilution of effluents, by requiring that the release of liquid radioactive

Maine Yankee Marine Sampling Study
Maine Yankee Final.doc 2/15/05 40
effluents be carried out under low tide conditions just after the tide had turned. The final major alteration in the mode of discharge occurred in July 2002 when the discharge path for liquid effluent was switched from the forebay-diffuser route to a hose which ran through the intake channel and discharged effluents a short distance north of Little Oak Island (Figure 4-2b).
Of the long-lived radionuclides discharged by the plant, 60Co and 137Cs were released in, by far, the greatest volumes. As revealed by the time series of their quarterly mass releases (Figure 4-15), most of the total mass of 60Co and 137Cs released was discharged during the time of the plant’s operation. For both nuclides, only a small amount of mass was released, relative to the total mass discharged, over the period of tide specific discharge from February 1999 through July 2002. When
Figure 4-15. Time series of the quarterly amounts of 60Co and 137Cs released from the Maine Yankee facility. Time periods of the Bailey Cove, diffuser and Little Oak Island discharges are indicated on the bar above time series lines. The circled values show the amounts of radionuclides released in the simulations of discharges from the Bailey Cove outflow and the diffuser.
considering the input of these radionuclides into the estuarine system, three modes of discharge stand out as most important. One is the discharge into Bailey Cove and another is the “non-tidal specific” discharge from the diffuser. These account for most of the total discharged mass of these radionuclides. The third is the discharge into the Back River near Little Oak Island. This is deemed important because it is the most recent source of radionuclides in the sediments of Back River and Montsweag Bay. Our modeling has focused on these three modes of discharge and considered only the release of 137Cs and 60Co. In modeling releases of these elements from the diffuser or the Bailey Cove outflow, we simulated episodic discharges in which a specified quantity of 137Cs or 60Co was set out at a steady rate over a 24-hr period. This mimicked actual discharges during the period of the power plant’s operation. During this time, most of the material set out during a quarterly period was discharged in one or two releases of roughly one day duration (Michael Whitney, Maine Yankee, personal communication). The simulations of the transport and sediment uptake of these releases

Maine Yankee Marine Sampling Study
Maine Yankee Final.doc 2/15/05 41
were carried out over the discharge period and the subsequent 4 days. The velocity fields used for these simulations were determined from DYNHYD runs with a steady intake of water (20 m3 s-1) imposed at the plant intake and a steady outflow (20 m3 s-1) at the location of either the Bailey Cove outflow or the diffuser. The total mass of 137Cs or 60Co set out was set equal to the largest quarterly amount of the radionuclide released from the diffuser (for the diffuser release simulations) or from the Bailey Cove outflow (these masses are displayed graphically in Figure 4-15). For each discharge location, these largest quarterly discharge amounts accounted for a large fraction of the total quantity of radionuclide set out from the location (Figure 4-15). For the period of diffuser discharge, for example, the largest quarterly release of 137Cs accounted for 50% of the overall quantity of discharged 137Cs.
The Little Oak Island releases differed from those from the diffuser and the Bailey Cove outflow in that they were not episodic but tended to be spread out over a number of days. In the simulations, these releases were represented by a steady discharge of 60Co or 137Cs extending over 4 days. The total amount released was set equal to the largest quarterly discharge amount from the Little Oak Island discharge. The simulations included this discharge period and the subsequent day.
For all discharge locations, simulations were carried out using DYNHYD velocity fields representative of spring and neap tide conditions. As would be expected, the distributions of sediment-bound radionuclides determined for spring tide conditions were a bit more expansive than the distributions computed for neap tide conditions. Nevertheless, overall patterns of radionuclide uptake determined for spring and neap tides were not dramatically different. Only those distributions resulting from spring tide simulations are displayed here (Figures 4-16 to 4-20).
The estimated distributions of sediment-bound of 60Co and 137Cs released from the Bailey Cove outflow (Figure 4-16) bear a close similarity in magnitude and structure to the modeled distributions determined from the study of Churchill et al. (1980). As would be expected, the concentrations within the sediments of Bailey Cove are the highest of the modeled distributions, exceeding 100 pCi l-1 for 60Co and 12000 pCi l-1 for 137Cs. Outside the cove, the model predicts substantial concentrations of 137Cs extending broadly over the estuary. For example, modeled 137Cs concentrations exceeding 500 pCi l-1 (an easily detectible level) stretch over more than 8 km of the estuary. These dwarf the modeled 60Co concentrations outside the Cove which do not rise above 75 pCi l-1. Both the 60Co and 137Cs concentrations exhibit a northward bias outside the cove, tending to be higher to the north of the cove mouth than to the south. This is a consequence of the tidal node that appears in the DYNHYD simulations roughly 1 km south of the mouth of Bailey Cove that was discussed at length in Section 4.2.3.
The concentrations of sediment-bound radionuclides released from the diffuser (Figure 4-17) also exhibit a northward bias, tending to be higher to the north of the diffuser than to the south. Perhaps one of the most significant indications of the modeled concentrations is the extent to which radionuclides released from the diffuser are incorporated into the sediments of Bailey Cove. In fact, the simulations indicate that the diffuser may be the principal source of 60Co found within Bailey Cove sediments. The concentrations of 60Co in Bailey Cove sediment that originate from the modeled diffuser release are no less than 200 pCi l-1, whereas the modeled concentrations in the cove’s sediment that stem from the modeled Bailey cove discharge are not greater than 200 pCi l-1. When comparing the modeled sediment-bound radionuclide distributions from historical releases with the recent measured distribution determined as part of this project, it is necessary to consider the effect of radioactive decay on the modeled concentrations. Clearly, there are other factors, such as desorption,
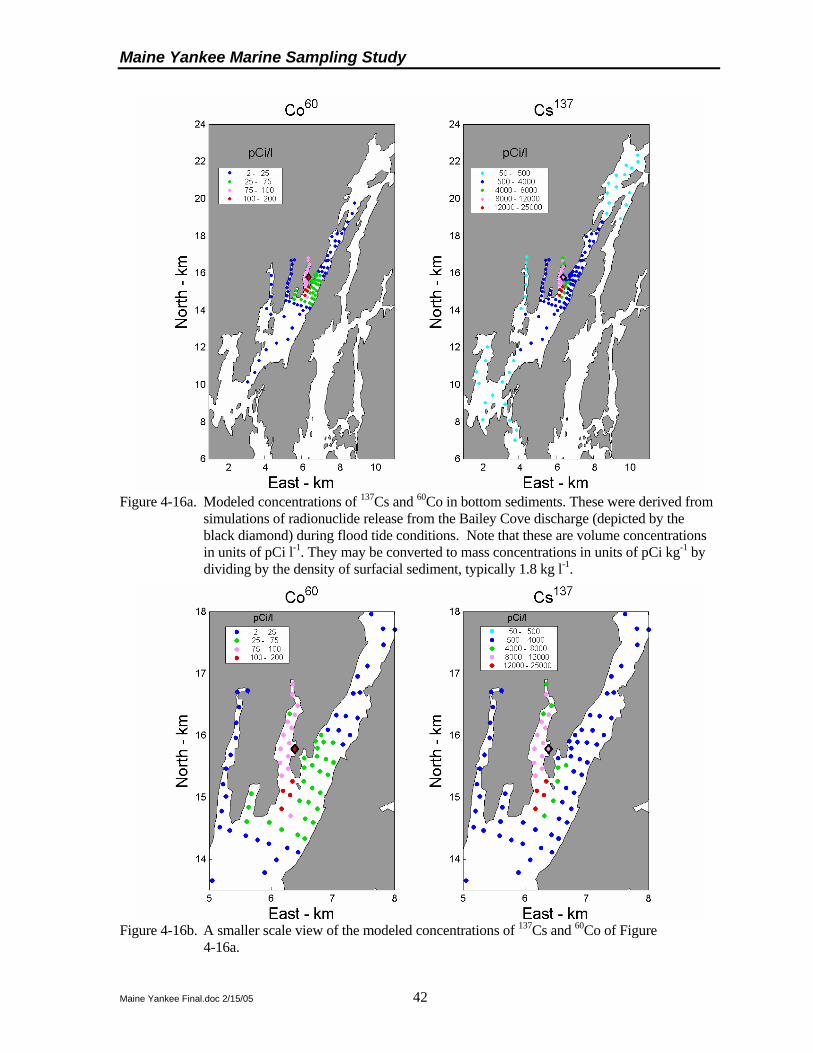
Maine Yankee Marine Sampling Study
Maine Yankee Final.doc 2/15/05 42
Figure 4-16a. Modeled concentrations of 137Cs and 60Co in bottom sediments. These were derived from
simulations of radionuclide release from the Bailey Cove discharge (depicted by the black diamond) during flood tide conditions. Note that these are volume concentrations in units of pCi l-1. They may be converted to mass concentrations in units of pCi kg-1 by dividing by the density of surfacial sediment, typically 1.8 kg l-1.
Figure 4-16b. A smaller scale view of the modeled concentrations of 137Cs and 60Co of Figure
4-16a.

Maine Yankee Marine Sampling Study
Maine Yankee Final.doc 2/15/05 43
Figure 4-17a. Modeled concentrations of 137Cs and 60Co in bottom sediments. These were
derived from simulations of radionuclide release from the diffuser (depicted by the black diamond) during flood tide conditions.
Figure 4-17b. A smaller scale view of the modeled concentrations of 137Cs and 60Co of Figure 4-
17a.

Maine Yankee Marine Sampling Study
Maine Yankee Final.doc 2/15/05 44
Figure 4-18a. Modeled concentrations of 137Cs and 60Co in bottom sediments as derived from simulations of radionuclide release from the Bailey Cove discharge (depicted by the black diamond) during flood tide conditions. These are the same concentration fields shown in Figure 4-16, except with the effects of radioactive decay accounted for.
Figure 4-18b. A smaller scale view of the modeled concentrations of 137Cs and 60Co of Figure
4-18a.

Maine Yankee Marine Sampling Study
Maine Yankee Final.doc 2/15/05 45
Figure 4-19a. Modeled concentrations of 137Cs and 60Co in bottom sediments as derived from
simulations of radionuclide release from diffuser (depicted by the black diamond) during flood tide conditions. These are the same concentration fields shown in Figure 4-17, except with the effects of radioactive decay accounted for.
Figure 4-19b. A smaller scale view of the modeled concentrations of 137Cs and 60Co of Figure 4-19a.

Maine Yankee Marine Sampling Study
Maine Yankee Final.doc 2/15/05 46
Figure 4-20. Modeled concentrations of 137Cs and 60Co in bottom sediments. These were
derived from simulations of radionuclide release from the Little Oak Island Outfall (depicted by the black diamond) during flood tide conditions.
that may lead to a decline in sediment-bound radionuclide concentrations; but radioactive decay is one that will unquestionably occur and the only one that can easily be accounted for through calculations.
We have done this “accounting” by applying a radioactive decay factor to the model results. This took the form of:
2/1/0 2 ktt
kk CC −=
Where Ck0 is the modeled concentration of radionuclide k due to an historical release, Ck is the current concentration with the effects of radioactive decay taken into account, t is the time since the release and tk1/2 is the half life of the radionuclide (30.17 yr for 137Cs and 5.26 yr for 60Co).
With this decay formula applied, the sediment-bound radionuclide concentrations derived from the simulations of large historical releases still rise above a detectable level over broad areas of the estuary (Figures 4-18 and 4-19). For 60Co, the “decayed” concentrations resulting from the simulated diffuser discharge are above 50 pCi l-1 (a conservatively low level of detection) over a band in Back River and Montsweag Bay of roughly 1.5 km in length (Figure 4-19b). Of particular significance are the relatively high decayed concentrations of 60Co in the upper reaches of Bailey Cove, where model results and observations reveal tidal conditions conducive to sediment accumulation (Sections 4.2.3 and 4.2.4). For 137Cs, the decayed concentrations are much higher and extend more broadly. The range of detectable 137Cs concentrations, determined from both simulated diffuser and Bailey Cove discharges, extend over a region encompassing Bailey Cove and all of the Back River and Montsweag Bay. Within Bailey Cove and in the southern portion of the Back River,

Maine Yankee Marine Sampling Study
Maine Yankee Final.doc 2/15/05 47
the decayed 137Cs concentrations are particularly high, well in excess of 2000 pCi l-1 in many locations.
In the absence of significant desorption and sediment movement, it thus appears very likely that remnants of large historical discharges of 137Cs may be found, at relatively high concentration, in the sediments of Bailey Cove and the Back River. By far, the largest of these historical discharges occurred in the mid-1970’s (Figure 4-15). If buried, the sediment-bound 137Cs from these discharges may very likely be found in a single depth band. Our results also indicate a likelihood of finding 60Co remnants from historical discharges, but that these remnants may be near the level of detection.
The most recent releases of radionuclides, from the Little Oak Island discharge, have contained much higher concentrations 60Co than 137Cs. This is reflected in the results of simulations of sediment uptake of these releases. The modeled concentrations of 137Cs in the sediment are everywhere well below the level of detection (Figure 4-20); whereas modest 60Co concentrations of 20-40 pCi l-1 are predicted near Little Oak Island. It should be noted that the simulation that produced these 60Co concentrations accounted for roughly 1/3 of the total mass of 60Co released from the Little Oak Island discharge. The model simulations thus indicate the possibility of sediment-bound 60Co concentrations of order 100-200 pCi l-1 resulting from the Little Oak Island releases.
An important property that is easily calculated with the model is the fraction of released radionuclides that are absorbed by bottom sediments. Here we refer to this as the fraction retained, as the remainder is presumably flushed from the estuarine system. The close agreement between modeled and measured sediment-bound radionuclide concentrations near the Maine Yankee facility reported by Churchill et al. (1980) and Hess et al. (1983) offer a good degree of confidence in the model’s estimates of such a fraction. Here we present fraction retained values of 137Cs and 60Co computed for all three release sites from simulations using spring tide velocities (Table 4-1). Taken together, these indicate that only a small fraction of the radionuclides released are retained in the system through absorption in the sediments. The fraction retained is of order 5% for 60Co and 10% for 137Cs.
Table 4-1. According to model simulations, the percent of the total radionuclide released from the indicated location that is absorbed in the bottom sediment. The values were computed from simulations using velocities representative of spring tide conditions.
137Cs 60Co Bailey Cove Outflow
12.6 4.9
Diffuser 8.7 3.4 Little Oak Island 5.2 2.0
4.3 MODELING SUMMARY
The modeling component of our project has yielded new insights into the workings of the Sheepscot estuarine system and the manner in which these affect the transport of radionuclides introduced to the system. Of particular importance is the indication of a tidal node to the south of the Maine Yankee diffuser. This corresponds to a minimum of tidal energy and is the product of the merging of two tidal waves which travel in opposite directions around Westport Island. Although the presence of this node was not recognized in previous studies of the region (e.g., Churchill et al., 1980 and Hess et al., 1983), its effect on the transport of material released from the Maine Yankee facility

Maine Yankee Marine Sampling Study
Maine Yankee Final.doc 2/15/05 48
is likely to have been significant. Our simulated particle tracks indicate that the node acted as something of a barrier to the southward movement of material released from the Back River discharge and from the Bailey Cove outflow. On the basis of this result, we biased our sample collection in the Back River-Montsweag Bay region to the north of the diffuser location.
We should note, however, that there is some question as to the exact location of the node. In the model simulations, it appears roughly 1 km south of the diffuser. As discussed earlier, however, this location is sensitive to the depths of the model channels ringing Westport Island. In addition, the model does not include the Kennebec River, which connects with the Sheepscot estuary through the Sasanoa River (Figures 3-2, 4-2a). The addition of the tidal wave from the Kennebec River mouth, which undoubtedly enters the Sheepscot estuary through the Sasanoa, will likely impact the tidal node’s location and complicate its dynamics.
Another important dynamical feature revealed by the modeling, and by the observations meant to test the model, is a tidal asymmetry within Bailey Cove. This is a flood dominated asymmetry, characterized by a flood tide flow that is shorter and stronger than the ebb tide flow. Such an asymmetry favors particle retention. A tendency for particles to be retained in Bailey Cove is confirmed by the measurements of this project. As will be shown in an ensuing section, the radionuclide concentrations within core samples from Bailey Cove indicate a substantial rate of sediment accumulation.
Modeling of radionuclide uptake by bottom sediments has indicated that easily detectable remnants of historical discharges of 137Cs are likely found over a broad area of the estuary. For 60Co, the model results indicate that marginally detectable remnants of historical releases may be found in bottom sediments. According to the model, sediment uptake of the recent releases near Little Oak Island is expected to produce marginally detectable levels of 60Co, but no detectable levels of 137Cs.

Maine Yankee Marine Sampling Study
Maine Yankee Final.doc 2/15/05 49
5 GAMMA SCAN RESULTS
5.1 SEDIMENT CORES
There are four sources of the radionuclides in the vicinity of the Maine Yankee nuclear reactor. The first was global fallout from the United States and Russian weapons testing which started in 1945 and became a maximum in 1957 through 1969. There were smaller additions in 1983 due to the Chernobyl reactor accident and from French and Chinese atmospheric weapons testing. This activity included radionuclides such as 137Cs, 134Cs, 60Co, 95Nb and 95Zr and 239Pu, and 240Pu to mention just a few. In the early 1970’s, Maine Yankee nuclear reactor discharged nuclides into Bailey cove on monthly basis using the cooling water. Their intake water came from near Oak Island on the other side of Bailey point.
Over the course of the power plant’s operation and decommissioning, the discharge location and mode of discharge have undergone a number of changes. From the time of the plant’s initial operation until July 1975, cooling water and radionuclides were discharged into Bailey Cove over a weir a short distance to the north of Foxbird Island. On July 16, 1975, discharge was switched to the subsurface diffuser system. The diffuser was 305 m (1000 ft) in length and supported 42 discharge nozzles spaced 7.6 m (25 ft) apart. It was located off the southern tip of Foxbird Island at a depth range (relative to mean water) of 9 to 14 m. The diffuser system was used for the discharge of cooling water and radionuclides throughout the remainder of the plant’s operation. The mode of discharge was altered in the late 1990’s as a consequence of the plant’s decommissioning. In October 1998, Maine Yankee approved a change in the discharge procedure that allowed for effluent releases with low or no dilution flow from the service water system. Later, in February 1999, this method of release was augmented, to maximize tidal dilution of effluents, by requiring that the release of liquid radioactive effluents be carried out under low tide conditions just after the tide had turned. The final major alteration in the mode of discharge occurred in July 2002 when the discharge path for liquid effluent was switched from the forebay-diffuser route to a hose which ran through the intake channel and discharged effluents a short distance north of Little Oak Island. The pattern of radionuclides in Bailey Cove and Montsweag Bay area depends upon these different types of releases as well as the sedimentation in the Montsweag Bay, Bailey Cove area.
As we look at the radionuclides taken in cores from 40 points in Tables 5-1, 5-2, 5-3, and Figures 5-1 to 5-52 in the Montsweag Bay, Bailey Cove area, we note that the 137Cs and 60Co are the strongest nuclides observed. Prior to 1982, the sediments in Bailey Cove were closed for clam digging allowing only worm digging. This was due to presence of sewage contamination in the Bay. After the cleanup of discharge waters in the area, the Cove was opened by the Department of Marine Resources for clam digging after radionuclides were measured in the clams sampled from Bailey Cove. The harvesting of worms and clams from this area has resulted in mixing of the sediments down to a depth of 2 feet. Cores taken in this area reflect this plowing and mixing of the sediments by human digging. At the same time the sediments in the Bay may be slowly increasing in depth even though the overall depth has not changed sufficiently to change the low tide area. Some of the change in sediments may be due to gradual compaction of the sediments near the bottom of the mixed zone. The four-inch cores that were taken in the zones which are exposed at low tide show sediments’ radioactivity from 137Cs down to the bottom of the 2 foot level. The less disturbed three-inch cores that were taken by boat from areas that are not exposed at low tide show activity down to 10 inches. The highest activity observed from 137Cs was observed in a core from the north end of Bailey Cove

Maine Yankee Marine Sampling Study
Maine Yankee Final.doc 2/15/05 50
near where the road crosses the small stream that enters in the north end of Bailey Cove. The sediments in this area are dominated by the freshwater input and have no value for clam or worm digging and are thus not disturbed. The core at station Long Creek shows its maximum of 913 pCi/kg at about 4 inches depth. Another core that has 250 pCi/kg of 137Cs at 6 inches was collected at station 68 near Long Ledge, close to the location of the diffuser. We would expect higher levels due to this discharge from diffuser starting in 1980. Finally the highest Co-60 sediments at 158 pCi/kg is found at station 109 in surface sediments just north of the diffuser. This location reflects releases during the final decommissioning phases of the reactor, which involved liquids from the spent fuel pool and from parts with high activity from the reactor vessel.
The general trend of radioactivity is higher close to the discharge points and lower as distance increases from them.
The distant cores included samples from distant locations such as the north end of Back River, Barry Cove, Chewonki, Robin Hood Cove and Sasanoa (Station 149) stations as well as samples from the Damariscotta River. We notice peak values of 137Cs between 100 and 127 pCi/kg at the distant Wiscasset, Eddy, Pottle Cove and 147 (Westport Island) stations. The Sasanoa station peaked at 5 inches with 330 pCi/kg, while control stations 148 and 149 had peaks of 36 and 73 pCi/kg, respectively. These levels represent fallout accumulation in the sediments along the coast. The circulation of water in the other direction toward the southwest, only Sasanoa is west. These values are lower than the Long Creek station in Upper Bailey Cove value of 913 pCi/kg at 4 inches. The 60Co concentrations observed at these locations are very near the average error value of 25 -30 pCi/kg.
Cores taken from Bailey Cove with high values of 137Cs include Long Creek station, station 74 in Bailey Cove, station 77 in Upper Bailey Cove, station 85 in South Bailey Cove, station 99 in North Bailey Cove, Station 101 in Eaton Farm of Bailey Cove, and Station 105 at the top of Bailey Cove. The highest of these is the Long Creek station with 913 pCi/kg. Upper Bailey Cove station 77 has 222 pCi/kg, South Bailey Cove station 85 has 70 pCi/kg, North Bailey Cove station 99 has 155 pCi/kg and Eaton Farm Bailey Cove shows 213 pCi/kg. The top of Bailey Cove station 105 shows 100 pCi/kg. All of these values are lower than values in Bailey Cove that were observed in the 1970s. Small amounts of 60Co about 20 to 30 pCi/kg also show up in the samples. The level of cesium decreases after 10 inches’ depth in the sediments of Bailey Cove and decreases after 6 inches at the top of Bailey Cove and for the Long Creek station.
Cores from Montsweag Bay shoreline had generally lower 137Cs concentrations, including station 113 and station 117, Little Oak Island; station 118; station 134, the Westport Island ferry landing; stations 143; station 144, Oak Island or Murphy Corner; and station 145 or Murphy Corner. The 137Cs levels range as much as 120 pCi/kg but generally are less than a hundred pCi/kg for the Stations. The 137Cs concentration with depth goes as deep as nine to 14 inches deep and in some instances we even see two peaks. Station 118 shows two peaks for the 137Cs. 60Co values in the stations range around 20 to 30 pCi/kg. Oak Island Murphy Corner shows 40 pCi/kg.
The cores from the mid-channel, Stations 38, 44, 50, 59, 60; South Oak Island 61, 62, 63; Long Ledge 64 ,65 and 67 were three-inch cores that show decrease in 137Cs from around 52 to as high as a 100 pCi/kg down to low values in six to 8 inches depth. They contained small amounts of 60Co of the order of 20 pCi/kg.

Maine Yankee Marine Sampling Study
Maine Yankee Final.doc 2/15/05 51
The cores have a structure of two 137Cs peaks for many instances. Low sedimentation rate will give one broad peak instead. Long Creek station shows this one broad peak, which represents dates from 1953-1983 as a single broad peak from 1" to 6" deep. Double peaks can be seen in Bailey Cove station 2 with a peak from 1" to 11" deep. This is 10" in 30 years. Two weak peaks are seen for Wiscasset station.from 3" to 9" (6" for 30 years). Station 8 has a peak at 6" to 13" with 7" in 30 years. Station 34 shows two peaks from 1" up to 7" or 6" in 30 years.
A summary of these peaks are given below in Table 5-2.
The results in table 5-3 show a total activity contained in the cores. It was calculated by summing the activity found in each slice of the core to yield a grand total activity (in pCi) for the whole core. This number gives the measure of activity still contained in the deep sediments of the bay. This number can be useful in determining the remaining total activity in the bay after 30 years of decay and loss by sediment dispersal and dilution due to off shore ocean sediment. Long Creek’s total activity is the highest 137Cs activity at 1297 pCi. The highest 60Co activity of 73 pCi was found at station 118 near Little Oak Island.
5.2 LEAD-210 CORE RESULTS
The station 144 core was analyzed for 210Pb and found to have a sedimentation rate dating to 4”= 20 years, or one inch for each 5 years. The graph of the data can be seen in Figure 5-48. This core is consistent with the double peak time of 30 years from 1957-87, or 30 years between the two peaks.
5.3 SURFICIAL SEDIMENTS
The University of Maine received 136 surface samples collected from around Maine Yankee Nuclear Power Plant. All samples were gamma counted on one of three systems, one being a very low background system. Each system is an intrinsic germanium detector and was calibrated using U.S. EPA Quality Assurance liquid gamma standards under the RADQA program. A cross calibration was then accomplished to ensure that each system provide the same result for a given sample. Thus, unless the very low background system was needed, the germanium system used was transparent to the results. The results were compared with a pre- and post-operational study of the area completed in 1976 (Technical Note 76.3).
The gamma spectrum was analyzed for 14 radionuclides with results presented in tabular fashion included with the table of core results. Surficial samples are marked with “S” in the depth column. However, this discussion concentrates on the results for 60 Co (1332.51 eV peak) and 137.Cs. To begin, the values were examined without regard to location to see the range of values. For sediment samples, the 137 Cs values ranged from a high of 287.2 pCi/kg to a low of 2.9 pCi/kg with one sample below detection limits while 60 Co ranged from 168.7 pCi/kg to a low of 0.5 pCi/kg with four samples below detection limits. These results are summarized in Table 5-5 along with the pre- and post-operational values.
The results indicate that currently, the values of 137 Cs sediment samples around the Maine Yankee site are lower than before the power plant was brought on line. There are two possible explanations for this result. First, the 137 Cs seen pre-operation has decayed. Second, a mixing is occurring within the tidal flat, lowering the radioactivity seen at the surface. The first explanation is certainly plausible since approximately one half life of 137 Cs has occurred since inception of the

Maine Yankee Marine Sampling Study
Maine Yankee Final.doc 2/15/05 52
power plant, but the second explanation is more tenable. As people dig clams or worms in the tidal flat area, they are turning over the tidal flat area, mixing any Cesium into the soil. Also, the area is washed by tides. In general, we feel that the 137 Cs values are low predominately due to a mixing in the tidal flat. For the 60Co sediment samples, the values, while still generally low, are higher than the pre-operational study which found all samples below detectable limits. However, the new 60 Co values are well below the post-operational study values. Again, these results are probably due to decay of the 60 Co and due to mixing within the tidal flat.
Additionally, six soil samples from dry ground were taken around power plant. The 137 Cs values ranged from 46.3 pCi/kg to 120.8 pCi/kg while the 60Co values ranged from 3.1 pCi/kg to 26.5 pCi/kg. The 137 Cs values are orders of magnitude less than soil samples taken in the pre-operational study, which found values from 1110 pCi/kg to 4960 pCi/kg. The pre-operational study values are also significantly higher than anything seen in the tidal marsh sediment during this study. Thus, no accumulation of radionuclides on dry ground was found.
It is now necessary to discuss the distribution of 60Co and 137 Cs around the power plant (Figures 5-53 to 5-56 with corresponding station numbers in Figures 5-1 to 5-4). Although a quick perusal of the results shows no significant accumulation and no “hot areas” by the 3x background definition, the distribution of 60Co and 137 Cs is not random. In particular, 60Co has its most significant values near the diffuser along the Back River while 137 Cs has its most significant values near the outfall in Bailey Cove. Figure 5-53 shows the distribution of 60Co values while Figure 5-54 shows the distribution of 137 Cs. The difference in distribution is related to a variety of factors. First, as shown in Figure 4-15, early Maine Yankee’s discharges into Bailey Cove before the diffuser installation were characterized by predominantly 137Cs effluents. Later Maine Yankee discharges through the diffuser into the Back River were characterized b predominantly 60Co effluents. Second, the shorter decay period of 60Co versus 137Cs makes the difference between the more recent Back River 60Co dominated effluents and the earlier Bailey Cove 137Cs dominated effluents more pronounced. Comparison with the modeling for 137 Cs shows that particles released from the diffuser also migrate to Bailey Cove as well.
5.4 BIOTA GAMMA SCAN
The biota gamma scan results are shown in Table 5-4. The biota included clamshells, mussels, rockweed, fish tissue, control mussels, clam tissue and lobster. The majority of the samples have less nuclide content than their errors in measurement. Some of the nuclides found above their two-sigma error are 16.8 pCi/kg of 137Cs in fish tissue, 97.2 pCi/kg of 65Zn in rockweed, 46.5 pCi/kg of 65Zn in lobster, 13.8 pCi/kg of 22Na in clam shells, and 8.4 pCi/kg of 54Mn in clam tissue.
Control biota samples were taken from South Portland and near the Darling Center in the Darmariscotta Bay. The results of the control biota samples are shown in the lower half of Table 5-4. The control sea scallops and rockweed each show a 60Co concentration above their 2 sigma level, but only from one of the two 60Co gamma ray energies. The control horse mussels have 14.4 pCi/kg of 137Cs. Other nuclides with a value greater than their 2-sima error are 65Zn found in the control sea scallops, oysters and blue mussels while 54Mn was found in the control sea scallops. These control results are similar to those found near the plant.

Maine Yankee Marine Sampling Study
Maine Yankee Final.doc 2/15/05 53
5.5 HARD TO DETECT NUCLIDES
The marine samples of clams, clam shells, muscles, mussel shells, fish, lobsters, seaweed, and sediments were measured by Framatome for hard to detect nuclides. The samples were collected from the vicinity of the diffuser, near Oak Island, and in Bailey Cove. Sites were selected where the sediments were highest. The samples were delivered to Framatome on October 22, 2004, measurements of 55Fe, 63Ni, 90Sr, 239Pu, 238Pu. Results were obtained on December 9-13, 2004. These results are shown in Table 5-6.
The results of the hard to detect measurements show very low concentrations for 35 out of the 40 measured. The five with a measured concentration greater then their 1-sigma uncertainty are: 1.5 pCi/g of 63Ni in mussel shells, 1.25 of 90Sr in lobster, 3.9 pCi/g of 63Ni in sediment, while 9.3 x 10⁻¹ of 90Sr in fish, and 9.3 x 10⁻³ pCi/g of 239Pu in sediment are above their 2-sigma uncertainty. All of the values measured are well below the required minimum detectable activity.
5.6 ERROR DISCUSSION OF GAMMA SCANS
The results of our gamma-ray measurements are stated with the value entered in a column labeled by a nuclide, 60Co for example, and the one-sigma statistical error in the measurement is given in the next column to the right. The average error for our 60Co and 137Cs columns is 10-15 pCi/kg and 20-25 pCi/kg, respectively. Measurements which are lower or equal to this error are so low that they represent a mixture of signal and noise. Our ability to determine the signal is hampered by the presence of counting noise. Thus, our certainty of the value or existence of low readings is doubtful for the smaller than error readings. A repeated counting of the same sample value may yield a positive value for one count and a reading of zero for another. When the sample shows values twice as large as the error, we can be more confident of the presence of the nuclide in the sample.
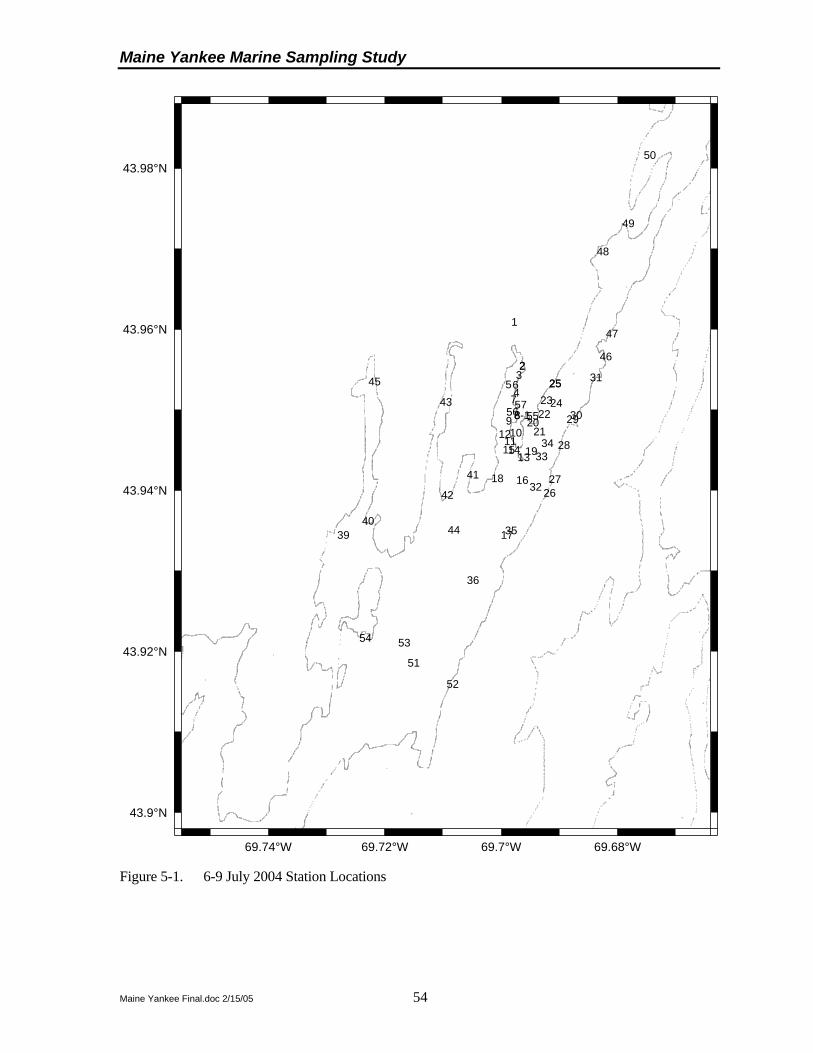
Maine Yankee Marine Sampling Study
Maine Yankee Final.doc 2/15/05 54
1
23
456789
1011
12
131415
16
17
18
19
2021
222324
25
2627
28
2930
31
32
3334
35
36
3940
41
42
43
44
45
46
47
48
49
50
51
52
5354
555657
2
25
8-1
69.74°W 69.72°W 69.7°W 69.68°W
43.9°N
43.92°N
43.94°N
43.96°N
43.98°N
Figure 5-1. 6-9 July 2004 Station Locations

Maine Yankee Marine Sampling Study
Maine Yankee Final.doc 2/15/05 55
2
3
45 6
7
88889
101112
13
1415
1618
19
20
21
22
2324
25
26
27
28
29
30
32
33
34
55
56
57
22222222222
252525252525252525252525
8-1
343434343434343434
69.705°W 69.7°W 69.695°W 69.69°W 69.685°W
43.94°N
43.945°N
43.95°N
43.955°N
Figure 5-2. 6-9 July 2004 Station Locations - Close to Plant

Maine Yankee Marine Sampling Study
Maine Yankee Final.doc 2/15/05 56
68
7071
72737475
7677
787980 8182848586
8788 89
91929394959798 99
100101
102103104
105
106107108109
110
111
112
113
114115116
117
119
120121122123124
125126127
128129130131
132
133134
135
137
139
140
143
144
145146
118
60
61
63
65
62
59
117
113
108
66-1
64
146
68
145
7374
134
144
85
67
143
69.74°W 69.72°W 69.7°W 69.68°W
43.9°N
43.92°N
43.94°N
43.96°N
43.98°N
Figure 5-3. 2-5 Aug 2004 Station Locations

Maine Yankee Marine Sampling Study
Maine Yankee Final.doc 2/15/05 57
68
7071
7273
74
75
76
77
787980 81
82
848586
8788 89
919293
9495
9798
99100101
102103
104
106
107
108 109
110
112
113
114
115116
117
119
120121
122123
124
125126127
128
129
130
131
132
13
137
777777777777777777777777
101101101101101101101101101101
118
6363636363
117117117117117117117117117
113113113113113113113113113113113113113
108108108108108108108108108
64646464646464646464
686868686868686868
7373737373737373737373
7474747474747474747474
858585858585
69.705°W 69.7°W 69.695°W 69.69°W 69.685°W
43.94°N
43.945°N
43.95°N
43.955°N
Figure 5-4. 2-5 Aug 2004 Station Locations - Close to Plant

Maine Yankee Marine Sampling Study
Maine Yankee Final.doc 2/15/05 58
0
50
100
150
200
250
300
350
0 2 4 6 8 10 12 14
Con
cent
ratio
n (p
Ci/k
g)
depth (in.)
Co60 1173 keVCo60 1333 keVCs137 662 keV
Figure 5-5. Station Sasanoa core: 60Co and 137Cs vs. depth
0
50
100
150
200
250
0 2 4 6 8 10 12 14
Con
cent
ratio
n (p
Ci/k
g)
depth (in.)
Co60 1173 keVCo60 1333 keVCs137 662 keV
Figure 5-6. Station Pottle Cove core: 60Co and 137Cs vs. depth
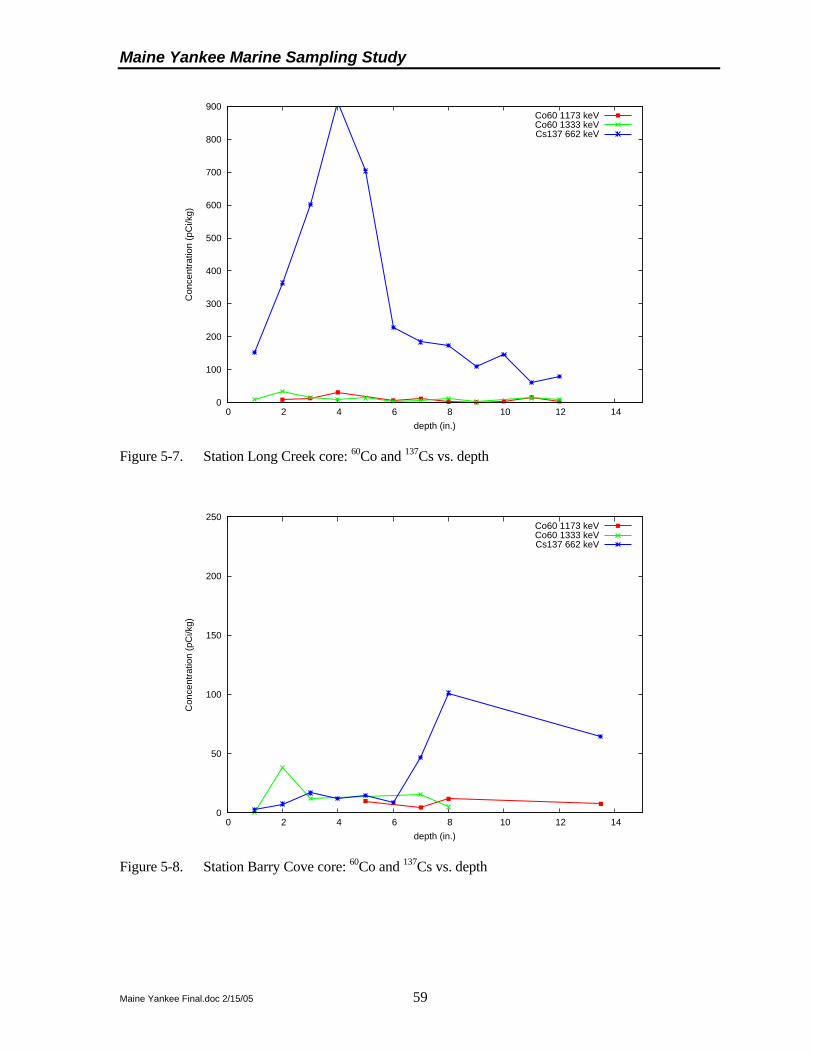
Maine Yankee Marine Sampling Study
Maine Yankee Final.doc 2/15/05 59
0
100
200
300
400
500
600
700
800
900
0 2 4 6 8 10 12 14
Con
cent
ratio
n (p
Ci/k
g)
depth (in.)
Co60 1173 keVCo60 1333 keVCs137 662 keV
Figure 5-7. Station Long Creek core: 60Co and 137Cs vs. depth
0
50
100
150
200
250
0 2 4 6 8 10 12 14
Con
cent
ratio
n (p
Ci/k
g)
depth (in.)
Co60 1173 keVCo60 1333 keVCs137 662 keV
Figure 5-8. Station Barry Cove core: 60Co and 137Cs vs. depth
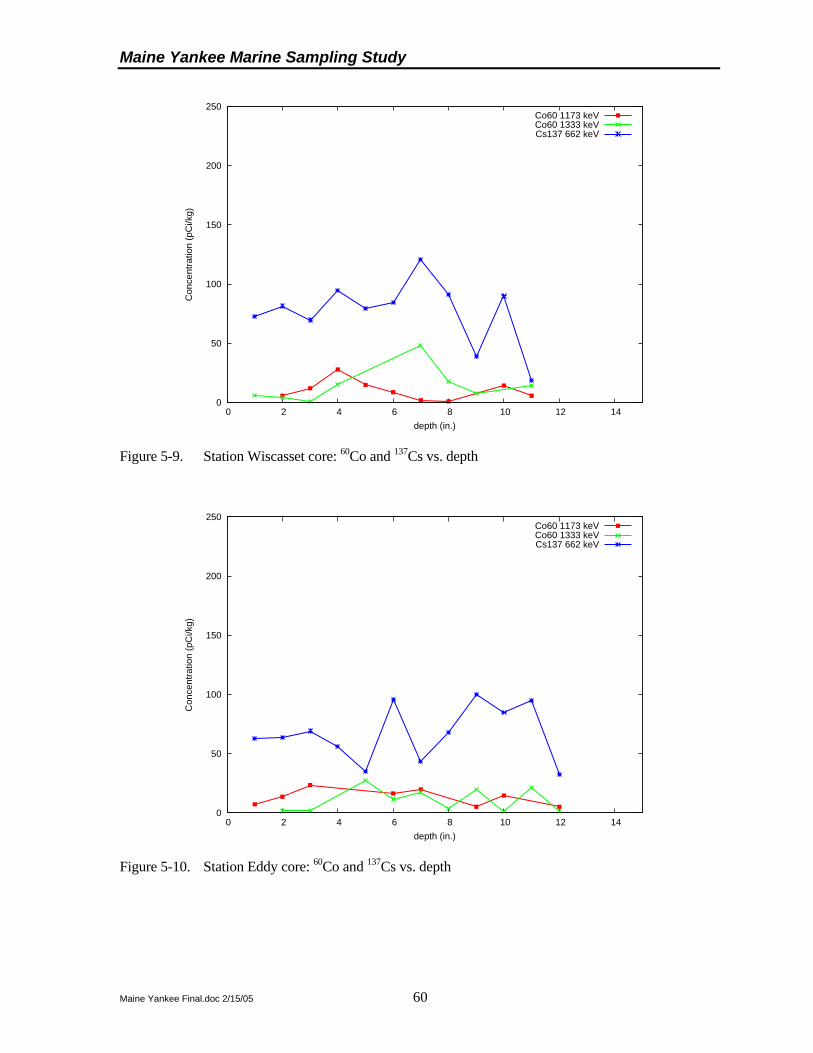
Maine Yankee Marine Sampling Study
Maine Yankee Final.doc 2/15/05 60
0
50
100
150
200
250
0 2 4 6 8 10 12 14
Con
cent
ratio
n (p
Ci/k
g)
depth (in.)
Co60 1173 keVCo60 1333 keVCs137 662 keV
Figure 5-9. Station Wiscasset core: 60Co and 137Cs vs. depth
0
50
100
150
200
250
0 2 4 6 8 10 12 14
Con
cent
ratio
n (p
Ci/k
g)
depth (in.)
Co60 1173 keVCo60 1333 keVCs137 662 keV
Figure 5-10. Station Eddy core: 60Co and 137Cs vs. depth

Maine Yankee Marine Sampling Study
Maine Yankee Final.doc 2/15/05 61
0
50
100
150
200
250
0 2 4 6 8 10 12 14
Con
cent
ratio
n (p
Ci/k
g)
depth (in.)
Co60 1173 keVCo60 1333 keVCs137 662 keV
Figure 5-11. Station Chewonki Camp core: 60Co and 137Cs vs. depth
0
50
100
150
200
250
0 2 4 6 8 10 12 14
Con
cent
ratio
n (p
Ci/k
g)
depth (in.)
Co60 1173 keVCo60 1333 keVCs137 662 keV
Figure 5-12. Station 2 core: 60Co and 137Cs vs. depth

Maine Yankee Marine Sampling Study
Maine Yankee Final.doc 2/15/05 62
0
50
100
150
200
250
0 2 4 6 8 10 12 14
Con
cent
ratio
n (p
Ci/k
g)
depth (in.)
Co60 1173 keVCo60 1333 keVCs137 662 keV
Figure 5-13. Station 8-1 core: 60Co and 137Cs vs. depth
0
50
100
150
200
250
0 2 4 6 8 10 12 14
Con
cent
ratio
n (p
Ci/k
g)
depth (in.)
Co60 1173 keVCo60 1333 keVCs137 662 keV
Figure 5-14. Station 25 core: 60Co and 137Cs vs. depth

Maine Yankee Marine Sampling Study
Maine Yankee Final.doc 2/15/05 63
0
50
100
150
200
250
0 2 4 6 8 10 12 14
Con
cent
ratio
n (p
Ci/k
g)
depth (in.)
Co60 1173 keVCo60 1333 keVCs137 662 keV
Figure 5-15. Station 34, Diffuser, core: 60Co and 137Cs vs. depth
0
50
100
150
200
250
0 2 4 6 8 10 12 14
Con
cent
ratio
n (p
Ci/k
g)
depth (in.)
Co60 1173 keVCo60 1333 keVCs137 662 keV
Figure 5-16. Station 38, Westport Island, core: 60Co and 137Cs vs. depth

Maine Yankee Marine Sampling Study
Maine Yankee Final.doc 2/15/05 64
0
50
100
150
200
250
0 2 4 6 8 10 12 14
Con
cent
ratio
n (p
Ci/k
g)
depth (in.)
Co60 1173 keVCo60 1333 keVCs137 662 keV
Figure 5-17. Station 44, Eaton Farm Point, core: 60Co and 137Cs vs. depth
0
50
100
150
200
250
0 2 4 6 8 10 12 14
Con
cent
ratio
n (p
Ci/k
g)
depth (in.)
Co60 1173 keVCo60 1333 keVCs137 662 keV
Figure 5-18. Station 50, Pottle Cove, core: 60Co and 137Cs vs. depth

Maine Yankee Marine Sampling Study
Maine Yankee Final.doc 2/15/05 65
0
50
100
150
200
250
0 2 4 6 8 10 12 14
Con
cent
ratio
n (p
Ci/k
g)
depth (in.)
Co60 1173 keVCo60 1333 keVCs137 662 keV
Figure 5-19. Station 59, South Oak Island, core: 60Co and 137Cs vs. depth
0
50
100
150
200
250
0 2 4 6 8 10 12 14
Con
cent
ratio
n (p
Ci/k
g)
depth (in.)
Co60 1173 keVCo60 1333 keVCs137 662 keV
Figure 5-20. Station 60, South Oak Island, core: 60Co and 137Cs vs. depth

Maine Yankee Marine Sampling Study
Maine Yankee Final.doc 2/15/05 66
0
50
100
150
200
250
0 2 4 6 8 10 12 14
Con
cent
ratio
n (p
Ci/k
g)
depth (in.)
Co60 1173 keVCo60 1333 keVCs137 662 keV
Figure 5-21. Station 61, Westport Island, core: 60Co and 137Cs vs. depth
0
50
100
150
200
250
0 2 4 6 8 10 12 14
Con
cent
ratio
n (p
Ci/k
g)
depth (in.)
Co60 1173 keVCo60 1333 keVCs137 662 keV
Figure 5-22. Station 62, Westport Island, core: 60Co and 137Cs vs. depth

Maine Yankee Marine Sampling Study
Maine Yankee Final.doc 2/15/05 67
0
50
100
150
200
250
0 2 4 6 8 10 12 14
Con
cent
ratio
n (p
Ci/k
g)
depth (in.)
Co60 1173 keVCo60 1333 keVCs137 662 keV
Figure 5-23. Station 63, Long Ledge, core: 60Co and 137Cs vs. depth
0
50
100
150
200
250
0 2 4 6 8 10 12 14
Con
cent
ratio
n (p
Ci/k
g)
depth (in.)
Co60 1173 keVCo60 1333 keVCs137 662 keV
Figure 5-24. Station 64, Long Ledge, core: 60Co and 137Cs vs. depth

Maine Yankee Marine Sampling Study
Maine Yankee Final.doc 2/15/05 68
0
50
100
150
200
250
0 2 4 6 8 10 12 14
Con
cent
ratio
n (p
Ci/k
g)
depth (in.)
Co60 1173 keVCo60 1333 keVCs137 662 keV
Figure 5-25. Station 65, Bluff Head, core: 60Co and 137Cs vs. depth
0
50
100
150
200
250
0 2 4 6 8 10 12 14
Con
cent
ratio
n (p
Ci/k
g)
depth (in.)
Co60 1173 keVCo60 1333 keVCs137 662 keV
Figure 5-26. Station 66-1 core: 60Co and 137Cs vs. depth
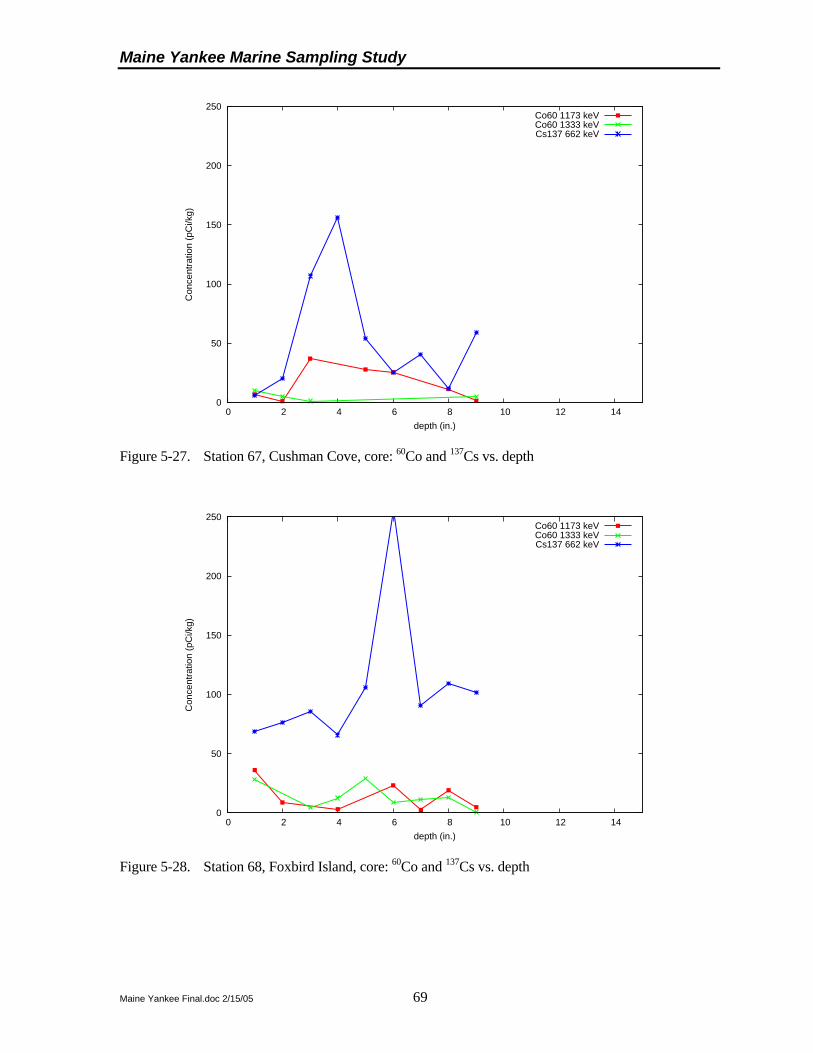
Maine Yankee Marine Sampling Study
Maine Yankee Final.doc 2/15/05 69
0
50
100
150
200
250
0 2 4 6 8 10 12 14
Con
cent
ratio
n (p
Ci/k
g)
depth (in.)
Co60 1173 keVCo60 1333 keVCs137 662 keV
Figure 5-27. Station 67, Cushman Cove, core: 60Co and 137Cs vs. depth
0
50
100
150
200
250
0 2 4 6 8 10 12 14
Con
cent
ratio
n (p
Ci/k
g)
depth (in.)
Co60 1173 keVCo60 1333 keVCs137 662 keV
Figure 5-28. Station 68, Foxbird Island, core: 60Co and 137Cs vs. depth

Maine Yankee Marine Sampling Study
Maine Yankee Final.doc 2/15/05 70
0
50
100
150
200
250
0 2 4 6 8 10 12 14
Con
cent
ratio
n (p
Ci/k
g)
depth (in.)
Co60 1173 keVCo60 1333 keVCs137 662 keV
Figure 5-29. Station 73, Bailey Cove Outfall, core: 60Co and 137Cs vs. depth
0
50
100
150
200
250
300
0 2 4 6 8 10 12 14
Con
cent
ratio
n (p
Ci/k
g)
depth (in.)
Co60 1173 keVCo60 1333 keVCs137 662 keV
Figure 5-30. Station 74, Bailey Cove Outfall, core: 60Co and 137Cs vs. depth

Maine Yankee Marine Sampling Study
Maine Yankee Final.doc 2/15/05 71
0
50
100
150
200
250
0 2 4 6 8 10 12 14
Con
cent
ratio
n (p
Ci/k
g)
depth (in.)
Co60 1173 keVCo60 1333 keVCs137 662 keV
Figure 5-31. Station 77, Upper Bailey Cove, core: 60Co and 137Cs vs. depth
0
50
100
150
200
250
0 2 4 6 8 10 12 14
Con
cent
ratio
n (p
Ci/k
g)
depth (in.)
Co60 1173 keVCo60 1333 keVCs137 662 keV
Figure 5-32. Station 85, South Bailey Cove, core: 60Co and 137Cs vs. depth

Maine Yankee Marine Sampling Study
Maine Yankee Final.doc 2/15/05 72
0
50
100
150
200
250
0 2 4 6 8 10 12 14
Con
cent
ratio
n (p
Ci/k
g)
depth (in.)
Co60 1173 keVCo60 1333 keVCs137 662 keV
Figure 5-33. Station 99, North Bailey Cove, core: 60Co and 137Cs vs. depth
0
50
100
150
200
250
0 2 4 6 8 10 12 14
Con
cent
ratio
n (p
Ci/k
g)
depth (in.)
Co60 1173 keVCo60 1333 keVCs137 662 keV
Figure 5-34. Station 101, Eaton Farm Bailey Cove, core: 60Co and 137Cs vs. depth

Maine Yankee Marine Sampling Study
Maine Yankee Final.doc 2/15/05 73
0
50
100
150
200
250
0 2 4 6 8 10 12 14
Con
cent
ratio
n (p
Ci/k
g)
depth (in.)
Co60 1173 keVCo60 1333 keVCs137 662 keV
Figure 5-35. Station 105, Top of Bailey Cove, core: 60Co and 137Cs vs. depth
0
50
100
150
200
250
0 2 4 6 8 10 12 14
Con
cent
ratio
n (p
Ci/k
g)
depth (in.)
Co60 1173 keVCo60 1333 keVCs137 662 keV
Figure 5-36. Station 108, Bailey Point West, core: 60Co and 137Cs vs. depth

Maine Yankee Marine Sampling Study
Maine Yankee Final.doc 2/15/05 74
0
50
100
150
200
250
0 2 4 6 8 10 12 14
Con
cent
ratio
n (p
Ci/k
g)
depth (in.)
Co60 1173 keVCo60 1333 keVCs137 662 keV
Figure 5-37. Station 113, South Foxbird Island, core: 60Co and 137Cs vs. depth
0
50
100
150
200
250
0 2 4 6 8 10 12 14
Con
cent
ratio
n (p
Ci/k
g)
depth (in.)
Co60 1173 keVCo60 1333 keVCs137 662 keV
Figure 5-38. Station 117 core: 60Co and 137Cs vs. depth

Maine Yankee Marine Sampling Study
Maine Yankee Final.doc 2/15/05 75
0
50
100
150
200
250
0 2 4 6 8 10 12 14
Con
cent
ratio
n (p
Ci/k
g)
depth (in.)
Co60 1173 keVCo60 1333 keVCs137 662 keV
Figure 5-39. Station 118, Little Oak Island, core: 60Co and 137Cs vs. depth
0
50
100
150
200
250
0 2 4 6 8 10 12 14
Con
cent
ratio
n (p
Ci/k
g)
depth (in.)
Co60 1173 keVCo60 1333 keVCs137 662 keV
Figure 5-40. Station 134 core: 60Co and 137Cs vs. depth

Maine Yankee Marine Sampling Study
Maine Yankee Final.doc 2/15/05 76
0
50
100
150
200
250
0 2 4 6 8 10 12 14
Con
cent
ratio
n (p
Ci/k
g)
depth (in.)
Co60 1173 keVCo60 1333 keVCs137 662 keV
Figure 5-41. Station 143, Youngs Point, core: 60Co and 137Cs vs. depth
0
50
100
150
200
250
0 2 4 6 8 10 12 14
Con
cent
ratio
n (p
Ci/k
g)
depth (in.)
Co60 1173 keVCo60 1333 keVCs137 662 keV
Figure 5-42. Station 144, Oak Island Murphy Corner, core: 60Co and 137Cs vs. depth

Maine Yankee Marine Sampling Study
Maine Yankee Final.doc 2/15/05 77
0
50
100
150
200
250
0 2 4 6 8 10 12 14
Con
cent
ratio
n (p
Ci/k
g)
depth (in.)
Co60 1173 keVCo60 1333 keVCs137 662 keV
Figure 5-43. Station 145, Oak Island Murphy Corner, core: 60Co and 137Cs vs. depth
0
50
100
150
200
250
0 2 4 6 8 10 12 14
Con
cent
ratio
n (p
Ci/k
g)
depth (in.)
Co60 1173 keVCo60 1333 keVCs137 662 keV
Figure 5-44. Station 146, Darling Center, core: 60Co and 137Cs vs. depth

Maine Yankee Marine Sampling Study
Maine Yankee Final.doc 2/15/05 78
0
50
100
150
200
250
0 2 4 6 8 10 12 14
Con
cent
ratio
n (p
Ci/k
g)
depth (in.)
Co60 1173 keVCo60 1333 keVCs137 662 keV
Figure 5-45. Station 147 core: 60Co and 137Cs vs. depth
0
50
100
150
200
250
0 2 4 6 8 10 12 14
Con
cent
ratio
n (p
Ci/k
g)
depth (in.)
Co60 1173 keVCo60 1333 keVCs137 662 keV
Figure 5-46. Station 148 (Darling Center) core: 60Co and 137Cs vs. depth

Maine Yankee Marine Sampling Study
Maine Yankee Final.doc 2/15/05 79
0
50
100
150
200
250
0 2 4 6 8 10 12 14
Con
cent
ratio
n (p
Ci/k
g)
depth (in.)
Co60 1173 keVCo60 1333 keVCs137 662 keV
Figure 5-47. Station 149 (Sasanoa) core: 60Co and 137Cs vs. depth
0
200
400
600
800
1000
1200
0 2 4 6 8 10 12 14
Con
cent
ratio
n (p
Ci/k
g)
depth (in.)
210Pb
Figure 5-48. Station 144 core: 210Pb vs. depth

Maine Yankee Marine Sampling Study
Maine Yankee Final.doc 2/15/05 80
Figure 5-49. 60Co Concentrations at 6 in. (pCi/kg)
1119
4
9
13
7
8
0
10
0
0
8
26
16
10
7
16
13
10
5
0
31
13
2
13
2
5
1
69.74°W 69.72°W 69.7°W 69.68°W
43.9°N
43.92°N
43.94°N
43.96°N
43.98°N

Maine Yankee Marine Sampling Study
Maine Yankee Final.doc 2/15/05 81
Figure 5-50. 137Cs Concentrations at 6 in. (pCi/kg)
118154
102
68
58
56
3
3
11
2
46
1
26
255
72
94
155
69
222
61
75
69
119
0
17
16
92
103
69.74°W 69.72°W 69.7°W 69.68°W
43.9°N
43.92°N
43.94°N
43.96°N
43.98°N

Maine Yankee Marine Sampling Study
Maine Yankee Final.doc 2/15/05 82
Figure 5-51. 60Co Average Core Concentrations (pCi/kg)
11
7
9
15
11
9
813
12
20
15
17
12
18
11
17
12
11
8
10
12
14
11
10
9
12
10
9
21
1210
14
69.74°W 69.72°W 69.7°W 69.68°W
43.9°N
43.92°N
43.94°N
43.96°N
43.98°N

Maine Yankee Marine Sampling Study
Maine Yankee Final.doc 2/15/05 83
Figure 5-52. 137Cs Average Core Concentrations (pCi/kg)
112
19
13
59
81
146
127133
49
83
94
54
14
39
7
11
12
56
48
54
54
107
62
103
143
71
141
46
80
53115
64
69.74°W 69.72°W 69.7°W 69.68°W
43.9°N
43.92°N
43.94°N
43.96°N
43.98°N

Maine Yankee Marine Sampling Study
Maine Yankee Final.doc 2/15/05 84
Figure 5-53. 60Co Surficial Concentrations (pCi/kg)
2220
43
7311593
16
147
32
113
42
2451
17
37
88116
21
32
95
17
89
34
77
51 159
82
41
26
38
37
18
57
50
129
60
11
23
7
18
4732
25
73
24
55
24
33
30
34
69
36
14
3181
14
16
12
38
29
16
294725
29
25 87
2226
18
5
10
14
15 8
13
2
8
17
10
5
9
1
6
12
18
10
5
4
4
19
5
9
7
9
5
26
12
5
3
10
01
87
1
15
5
2
8
26
7
11
6
9
0
4
2
12
10 9 4
11
4
0
69.76°W 69.74°W 69.72°W 69.7°W 69.68°W
43.9°N
43.92°N
43.94°N
43.96°N
43.98°N

Maine Yankee Marine Sampling Study
Maine Yankee Final.doc 2/15/05 85
Figure 5-54. 137Cs Surficial Concentrations (pCi/kg)
050
72
717080
118
83
58
36
58
2854
48
84
44110
90
44
72
28
57
22
6
100 55
61
32
70
54
58
75
92
92
61
79
58
49
65
97
2761
112
80
97
109
66
100
70
83
78
163
97
10172
80
85
60
80
78
68
786558
80
61 78
68134
72
66
127
56
154136
87
63
97
90
97
121
89
103
47
61
117
46
15
87
24
67
66
64
70
71
52
52
53
94
57
57
7032
4471
53
34
34
30
35
92
31
51
64
29
83
82
116
75
6494 69
54
79
16
69.76°W 69.74°W 69.72°W 69.7°W 69.68°W
43.9°N
43.92°N
43.94°N
43.96°N
43.98°N

Maine Yankee Marine Sampling Study
Maine Yankee Final.doc 2/15/05 86
Figure 5-55. 60Co Surficial Isocuric Concentrations (pCi/kg) - Close to Plant

Maine Yankee Marine Sampling Study
Maine Yankee Final.doc 2/15/05 87
Figure 5-56. 137Cs Surficial Isocuric Concentrations (pCi/kg) - Close to Plant

Maine Yankee Marine Sampling Study
Maine Yankee Final.doc 2/15/05 88
Table 5-1. Sediment gamma scan results
nuclide 60Co 60Co 137Cs 65Zn 22Na 54Mn 58Co 133Ba 7Be 210Pb 40K 214Bi 214Pb 212Pb 208Tl Gamma energy (keV) 1173.23 1332.51 661.62 1115.52 1274.54 834.81 810.75 383.7 477.56 46.52 1460.75 609.32 351.99 238.63 583.14 Branching Ratio 0.9986 0.9998 0.8462 0.5075 0.9994 0.9998 0.9945 0.0884 0.103 0.04 0.107 0.4609 0.371 0.431 0.861
sample mass(g) depth(in) station lat. long. pCi/kg +/- pCi/kg +/- pCi/kg +/- pCi/kg +/- pCi/kg +/- pCi/kg +/- pCi/kg +/- pCi/kg +/- pCi/kg +/- pCi/kg +/- pCi/kg +/- pCi/kg +/- pCi/kg +/- pCi/kg +/- pCi/kg +/-
Samples collected on 19 April 2004 (preliminary and distant samples): 2-C4-439-23 736 1 Barry Cove 43.9727 69.6797 -- -- 0.5 5.8 2.6 7.2 -- -- 2.7 7.1 4.7 7.1 1.9 5.9 -- -- 28.9 48.4 -- -- 11796.3 347.6 419.7 31.8 489.5 29 775.7 26.8 210.9 152-C4-439-24 272.7 2 Barry Cove 43.9727 69.6797 -- -- 38.4 17.6 7.5 16.1 12.4 33.6 -- -- 7.9 11 -- -- -- -- -- -- 340.8 651.6 16627.4 679.4 628.4 62.3 665.2 59.7 1088.6 52.7 314.3 30.72-C4-439-25 339.6 3 Barry Cove 43.9727 69.6797 -- -- 12.4 13.3 16.9 11.4 -- -- 16.3 11.3 33.1 10.9 -- -- -- -- -- -- 280.9 532.8 14183.8 563 363.6 46.7 534.2 47.7 811.4 41.6 242.9 24.72-C4-439-26 379.1 4 Barry Cove 43.9727 69.6797 -- -- -- -- 12.4 9.2 -- -- 8.6 10 18.4 11.9 5.6 9 79.4 70.8 3.2 58.1 77.4 388.5 13628.6 509.3 527.9 46.5 491.9 44.5 787.5 38.7 189.5 22.22-C4-440-27 329.9 5 Barry Cove 43.9727 69.6797 10 12.5 -- -- 14.5 12.6 -- -- 3 9.9 5.2 8.9 1.9 8.5 35.1 74.6 118.9 92.1 -- -- 12662.1 536.3 432.1 46 543.7 47.6 668.7 40.1 199.4 23.62-C4-440-28 446.7 6 Barry Cove 43.9727 69.6797 -- -- -- -- 8.9 8.3 30.3 21.4 6.7 7.7 6.5 5.8 7.9 8.4 114.9 92.3 8.2 54.8 -- -- 13153.9 470.5 432.5 42 515.1 41.3 815.2 35 237.2 20.52-C4-440-29 304.3 7 Barry Cove 43.9727 69.6797 4.6 17.3 15.6 15.8 47.1 13.8 174.8 49.9 1.1 12.3 -- -- 2.8 9.2 15.2 106.6 -- -- 241.1 481.9 17839.9 664.5 558.5 54.3 546.9 53.4 971.6 48.2 236.6 25.12-C4-440-30 266.5 8 Barry Cove 43.9727 69.6797 11.9 13.9 5.1 9 101.3 25.9 12.7 27.3 -- -- -- -- 3.2 11.4 76.7 133.6 -- -- 426.7 518.2 15817.5 679.9 515.4 56.8 622.6 59.1 624.9 43.7 261.5 26.9
440-32 11.5-13.5 Barry Cove 43.9727 69.6797 -- Not Counted -- 2-C4-440-33 327.5 13.5-15 Barry Cove 43.9727 69.6797 7.7 16.4 -- -- 64.4 23.8 -- -- 21.9 14.5 5.7 11.5 2.3 7.9 -- -- -- -- 28 467.1 11444.5 499.1 343.2 44.8 295.9 46.6 757 40.2 171.3 21.3
440-31 9-11.5 Barry Cove 43.9727 69.6797 -- Not Counted -- 2-NG-438-2a 748.9 S Barry Cove 43.9727 69.6797 -- -- 10.6 13.2 120.5 24.2 4.4 30.2 -- -- 34.8 19.4 5.1 14.2 143.2 116.1 446.8 149.9 1172 1219.1 15816.7 692 452.2 62.7 675.5 66.8 999.3 61.9 236.7 33.32-NG-438-2b 1215 S Barry Cove 43.9727 69.6797 8.8 14.7 -- -- 92.8 19.8 -- -- 9.4 10.8 5.4 9.7 6.6 8.6 -- -- 470.3 100.1 236.2 541.4 10470.9 433.8 355.4 40.5 472.1 46.8 684.4 39.9 168.5 21.6
2-C4-438-4 343.8 1 Chewonki Camp 69.7111 69.7111 -- -- 7.9 8.3 15.9 11.6 -- -- -- -- 20.1 10.1 1.8 7.8 23.6 69.4 35.7 66.7 569.1 342.1 10264.6 481 316.8 42.4 318.1 42.2 943.4 40.5 230.1 23.62-C4-438-5 492.5 2 Chewonki Camp 69.7111 69.7111 11 9.6 12.7 10.4 21.2 16.4 -- -- -- -- 7 7.2 7.7 7.5 21.2 56.6 54.8 86.7 -- -- 10339.9 397.7 326.8 33.6 354.9 35.7 857.7 33.5 227.8 19.82-C4-438-6 395.3 3 Chewonki Camp 69.7111 69.7111 1.5 9.1 0.9 7.2 40.7 15.7 -- -- 14.8 11.9 11.5 8.3 8.6 8.6 11.7 83.9 43.4 79.4 1030.2 578.4 10948.7 465.6 275.5 39.3 453.8 39.6 906.7 38.2 239.7 232-C4-438-7 356.4 4 Chewonki Camp 69.7111 69.7111 10.6 11.9 6.4 9.4 122.1 21.6 6.3 20.6 -- -- 15.4 12.8 -- -- 376.8 130.4 133 83.5 -- -- 11098.1 482.2 291.2 42.6 372.3 44.2 936.7 42 251.9 242-C4-438-8 358.8 5 Chewonki Camp 69.7111 69.7111 -- -- 1.9 7.4 155.7 23.3 110 36.8 -- -- -- -- 7.1 9.1 109.7 103.1 -- -- 184 396.3 12038.4 496.6 311.3 41.8 384.7 43 993.5 40.6 218 22.12-C4-438-8 358.8 5 Chewonki Camp 69.7111 69.7111 -- -- 1.9 7.4 155.7 23.3 110 36.8 -- -- -- -- 7.1 9.1 109.7 103.1 -- -- 184 396.3 12038.4 496.6 311.3 41.8 384.7 43 993.5 40.6 218 22.12-C4-438-9 382.2 6 Chewonki Camp 69.7111 69.7111 3.2 9.3 4.9 8.4 118.3 20.4 -- -- 4.3 8.7 -- -- 5.3 7 153.5 79.7 62.6 59.9 566.3 366.6 10339.9 452.6 285 39.7 326.6 40.5 803.5 36.5 214 20.6
2-NG-441-46a 1274.9 S Chewonki Creek 69.7111 69.7111 7 9.1 3.1 6.1 92.4 16.7 0.9 14.4 11.9 9.4 6.1 7.1 -- -- -- -- 623.8 132.8 198.6 494.8 9121 400.9 329.5 36.9 372.5 39.3 572.9 36.2 152 18.52-NG-441-46b 973.3 S Chewonki Creek 69.7111 69.7111 16.4 10 7.1 8.6 46.3 12.8 81 25.9 18.5 9.8 14.1 8 0.4 5 30.4 94.3 380.8 118.7 147.4 792.7 7996 430.1 229.6 37 305.8 45 506.3 39.1 127.8 18.3
2-C4-440-34 397.7 1 Long Creek 43.9597 69.6983 -- -- 9.6 7.5 152.1 20.4 14.2 25.5 -- -- 10.5 10.4 11.7 8.3 99 96.9 -- -- 392 470.2 15724.7 542.8 435.2 47 573.5 47.3 1195.4 43.7 321 25.42-C4-440-35 313.8 2 Long Creek 43.9597 69.6983 8.6 13 33.1 14.7 363.2 32.3 -- -- 20.8 14.7 4.8 10.8 3.6 11.1 -- -- 7.8 66.8 39 369.9 7213.8 524.1 540.9 49.8 632.3 57.4 1312.1 52.1 356.4 302-C4-440-36 373.3 3 Long Creek 43.9597 69.6983 13.4 13.4 14.6 11.8 601.8 32.6 -- -- 1.5 15.8 1.2 8.5 2.3 7.6 -- -- 65.7 75.3 956.6 481.2 14068.8 532.2 516.6 44.4 473 49.8 1000 43.7 263.4 25.22-C4-440-37 322.1 4 Long Creek 43.9597 69.6983 30.9 17.3 8.4 8.4 912.5 41.2 17.5 21.1 -- -- 8.7 8.8 5.7 9.8 -- -- -- -- -- -- 12699.7 548.8 422.1 50.4 430.1 51.8 994.9 46.7 226.1 27.72-C4-440-38 332.7 5 Long Creek 43.9597 69.6983 -- -- 14 13.2 704.2 37.2 -- -- 10.8 11.6 8.5 10 -- -- -- -- -- -- -- -- 13920.5 553.5 417 49.3 482.7 50.9 991.6 45.7 298.7 262-C4-440-39 421.8 6 Long Creek 43.9597 69.6983 6.4 9.3 3.8 6.3 228.6 25.3 -- -- 6.7 10.4 6.8 9.8 6.5 7.7 -- -- 29.1 62.6 243.5 355.4 10355.4 438.8 333.9 38.8 356.1 40.4 834.8 36.8 225.5 21.72-C4-441-40 324.1 7 Long Creek 43.9597 69.6983 11.8 13.7 5.6 10.5 184.1 24 7 21.9 2 8.8 8 7.3 -- -- 42.9 93 93.3 81.8 886.7 522.2 9925.9 482.6 295.4 43.6 344.4 45 808.5 40.3 262 23.22-C4-441-41 365.6 8 Long Creek 43.9597 69.6983 2.2 8.2 13.5 9.2 172.8 22.1 -- -- 19.6 9.8 -- -- 6.2 11 8.4 87.9 13.4 66.9 -- -- 10610.2 473.4 332.1 42.3 402.5 42.6 786.5 38.2 207.7 22.92-C4-441-42 378.5 9 Long Creek 43.9597 69.6983 1.1 13.4 1.8 12.6 108.5 18.5 121.6 30.3 5.2 10.4 5.7 5.7 3.4 6.1 67.3 67.6 38.9 61 -- -- 10582.9 454 394.5 38.1 403.5 41.4 783.1 35.6 160.7 20.72-C4-441-43 299.8 10 Long Creek 43.9597 69.6983 4 11.9 -- -- 146.1 25.2 -- -- 5.1 16.9 3.8 11 9.5 9.7 85 134.4 49.1 75.6 -- -- 12314.6 557.5 458.2 51.3 314.8 46.5 828.4 43.7 181.5 25.52-C4-441-44 485.1 11 Long Creek 43.9597 69.6983 15.7 11.9 14 8.5 60.7 13.9 35.4 16.1 9.9 10.9 4 6.9 8.7 6.1 46.9 77.7 48 51.7 329 412.8 9318.5 387.3 306 32.4 344.7 32.5 621.3 29.6 179.6 16.22-C4-441-45 459.5 12 Long Creek 43.9597 69.6983 3.7 12 8.1 7.3 78.4 13.9 -- -- 7.6 9.7 9.9 6.8 10.7 7.9 12.6 56.3 192.1 76.6 135.7 309.5 10003.7 405.3 360.8 34.1 352 32.3 613.1 32.1 195 18.52-NG-438-1a 1335.2 S Long Creek 43.9597 69.6983 6.6 9.1 9.2 7.1 115.9 19.6 -- -- 2.8 7 9.4 9 -- -- 127.4 87.1 435.2 144.4 -- -- 9736.7 396.7 385.6 41.6 462.6 39.2 779.2 37.5 184.7 20.42-NG-438-1b 781.5 S Long Creek 43.9597 69.6983 12.5 13.9 26.5 11.8 120.8 19.8 -- -- -- -- -- -- 17.9 11.5 18.9 179.6 355.7 172.8 442.7 526.5 14899 645.6 647.2 61.2 541.9 64.5 1152.1 59.7 247.9 342-C4-438-10 411.6 1 Wiscassett 44.0013 69.6633 -- -- 5.8 7 72.6 12.1 83.6 31.4 25.3 13.1 4.2 7.1 -- -- 11.3 77.3 25.8 68.5 347.6 300.8 7849.5 389.1 284.8 38.2 344 38.1 742.8 34.3 186.2 20.42-C4-438-11 368.3 2 Wiscassett 44.0013 69.6633 5.7 9.8 4.6 8.2 81.5 13.8 98 34.4 6.4 9.1 0.8 9.9 -- -- -- -- 46.6 58.6 187.6 338.4 8951.2 452.5 395.6 44.6 429.2 43.4 867.2 39.5 193.9 24.62-C4-438-12 316.9 3 Wiscassett 44.0013 69.6633 12 12.6 1.1 7.4 69.7 19.6 99.6 28.6 10.3 10.8 3.6 10.4 1.3 8.9 -- -- 59.3 82.3 -- -- 11682.9 529.8 377.6 48.5 505.2 49.1 973.8 44.2 254.7 25.22-C4-438-13 338 4 Wiscassett 44.0013 69.6633 27.9 14.7 15.1 12 94.4 16 -- -- 15 11 22.6 10.7 -- -- 36.5 86.6 -- -- 795.1 524 10912.6 498.5 376.6 43.5 379.8 48.1 968.9 42.6 238.8 242-C4-439-14 364.6 5 Wiscassett 44.0013 69.6633 14.9 10.7 -- -- 79.7 16.4 187.1 36.5 8.9 11.7 17.8 9.6 21.7 9.8 54 66.5 53.8 60.7 -- -- 9336.8 446.4 317.8 40.1 462.7 42.1 735.2 37.2 187.8 21.92-C4-439-15 347.4 6 Wiscassett 44.0013 69.6633 8.7 9.7 -- -- 84.8 15.6 22.7 18.9 4.7 9.2 -- -- -- -- 46.7 111.7 137.7 63.8 -- -- 9070.6 441 321.5 42.2 333 42 780.6 38.4 163.8 21.62-C4-439-16 298.4 7 Wiscassett 44.0013 69.6633 2 11.5 47.9 14.6 120.7 23.2 216.3 43.6 21.9 15.8 13 9.9 -- -- -- -- 180.8 75.1 635.2 341.3 9103.3 485.8 541.7 50.6 519.5 50.9 608.9 39.5 220.5 27.62-C4-439-17 310.1 8 Wiscassett 44.0013 69.6633 1 11.1 17.5 14.5 91.1 16.5 127.3 41.6 15.4 11.9 28.6 17.9 8.2 8.7 -- -- 90.2 97.2 -- -- 10519.4 509.5 364.7 46.1 408.3 48.4 848.9 41.8 205.3 25.32-C4-439-18 397.9 9 Wiscassett 44.0013 69.6633 -- -- 7.4 9.7 39.1 16.2 73.7 23.7 10.4 10 8.3 7.9 2.3 9.3 80 61.6 57.5 63.8 156.7 312.8 6904.4 356.3 273.7 33.7 254.4 30.6 537.8 30 124.9 16.92-C4-439-19 377.3 10 Wiscassett 44.0013 69.6633 14.4 10 -- -- 90 14.6 13.4 36 3.5 9.1 8 9.1 11 8.9 61.4 62.7 -- -- 573.7 355 9344.1 433.8 272.1 37.9 361.1 39.7 597 33.6 151.3 19.52-C4-439-20 423.2 11 Wiscassett 44.0013 69.6633 5.7 7.7 14.5 8.9 18.9 10.8 53.3 25.6 -- -- -- -- 1 5.4 -- -- -- -- 173.4 291.7 6118.9 333.6 229.5 29.7 260.2 32.2 404.9 27.4 117.6 15.6
439-21 12 Wiscassett 44.0013 69.6633 -- Not Counted -- 439-22 13 Wiscassett 44.0013 69.6633 -- Not Counted --
438-3 S Wiscassett 44.0013 69.6633 -- Not Counted --
Samples collected on 11 June 2004 (preliminary and distant samples) 2-C4-443-10 247.6 1 eddy 43.9944 69.6494 7.3 10.7 -- -- 62.8 21.7 77.4 30.7 4 9.9 1.2 14.7 -- -- 21.8 96.6 59.4 83.2 -- -- 9688.5 553.7 379.2 45.8 546.2 52.7 628.5 47.9 202.5 26.3
443-12 1 eddy 43.9944 69.6494 -- Not Counted -- 2-C4-443-9 307.6 2 eddy 43.9944 69.6494 13.7 17 1.7 8.6 63.6 19.8 71.5 30.7 -- -- 27.2 10.6 8.7 10.2 168.1 106.3 -- -- 339.9 439.1 8170.6 448.7 319.1 43.8 376.1 46.2 570.2 37.2 158.4 23
443-11 2 eddy 43.9944 69.6494 -- Not Counted -- 2-C4-443-8 165.6 3 eddy 43.9944 69.6494 23.6 30.5 2.1 13.1 69.2 22.5 32.3 37.1 5.9 14.9 20.9 14.4 10.2 13.5 69.9 116.6 133.3 166.9 531.7 665.3 10508.6 711.1 448.2 62.5 305.9 56.9 468.8 52.8 193.3 35.82-C4-443-7 341.6 4 eddy 43.9944 69.6494 -- -- -- -- 56.1 14.5 90.8 32.8 24.8 10.6 12.5 10.8 1.2 7.4 -- -- 35.9 59.9 -- -- 7743 439 339.1 39.4 395.1 32.4 480 34.7 133.2 20
2-C4-443-6B 322.6 5 eddy 43.9944 69.6494 -- -- 27.1 13.1 34.8 14.9 51.7 30.9 12.1 12.1 -- -- 23.3 14.9 147.1 84.4 -- -- 113.7 387 10391.1 499.3 474.2 46.7 344.5 46.2 799 41.9 190.9 20.42-C4-443-6A 402.6 6 eddy 43.9944 69.6494 16.5 9.4 11.8 9.1 95.5 18.8 -- -- -- -- 11.8 9.1 11.6 6.9 9.6 78.7 97.5 59.1 154.9 491.5 9988.2 440.7 349.8 38.9 429.8 39.3 646 34.6 177.1 20.7

Maine Yankee Marine Sampling Study
Maine Yankee Final.doc 2/15/05 89
nuclide 60Co 60Co 137Cs 65Zn 22Na 54Mn 58Co 133Ba 7Be 210Pb 40K 214Bi 214Pb 212Pb 208Tl Gamma energy (keV) 1173.23 1332.51 661.62 1115.52 1274.54 834.81 810.75 383.7 477.56 46.52 1460.75 609.32 351.99 238.63 583.14 Branching Ratio 0.9986 0.9998 0.8462 0.5075 0.9994 0.9998 0.9945 0.0884 0.103 0.04 0.107 0.4609 0.371 0.431 0.861
sample mass(g) depth(in) station lat. long. pCi/kg +/- pCi/kg +/- pCi/kg +/- pCi/kg +/- pCi/kg +/- pCi/kg +/- pCi/kg +/- pCi/kg +/- pCi/kg +/- pCi/kg +/- pCi/kg +/- pCi/kg +/- pCi/kg +/- pCi/kg +/- pCi/kg +/-
2-C4-443-6A 402.6 6 eddy 43.9944 69.6494 16.5 9.4 11.8 9.1 95.5 18.8 -- -- -- -- 11.8 9.1 11.6 6.9 9.6 78.7 97.5 59.1 154.9 491.5 9988.2 440.7 349.8 38.9 429.8 39.3 646 34.6 177.1 20.72-C4-443-5 393.6 7 eddy 43.9944 69.6494 19.9 12.9 17.7 9.5 43.7 12.3 106 32.8 -- -- 0.5 7.2 8.4 10.2 -- -- 31.2 93 -- -- 9181.7 421.4 322.5 39.9 423.5 39.5 628.9 38.3 192.9 21.32-C4-443-4 374.6 8 eddy 43.9944 69.6494 -- -- 4.1 13.5 67.7 15.9 64.7 24.1 3.5 6.8 -- -- 6.8 7.9 63.9 85.5 -- -- -- -- 10383.1 461.2 325 40.9 392.8 41.9 825.8 37.7 176.1 19.12-C4-443-3 395.6 9 eddy 43.9944 69.6494 5.3 9.7 19.8 8.7 100.3 20.6 15.2 24.3 7.4 9.4 18.6 8.4 2.1 7.3 -- -- 24.8 56.1 -- -- 10760.8 452.5 383.2 40.9 404.7 41.1 875.7 38.3 250.8 21.32-C4-443-2 430.6 10 eddy 43.9944 69.6494 14.7 9.1 1.1 8.6 85.1 19.6 154.9 31.3 2.3 8 -- -- -- -- 26.9 67.4 11.4 90.8 140.6 469.4 9862 418.7 434.6 41.3 441.9 39.7 806.6 35.4 233.3 20.42-C4-443-1 366.6 11 eddy 43.9944 69.6494 -- -- 21.6 12.5 94.7 17.3 -- -- -- -- 1.2 8 12.1 7.4 -- -- 63.6 67.5 -- -- 9607.3 456.9 410.6 42.7 433.9 42.8 819.6 39 175.6 23.5
2-NG-444-1 1275.5 12 eddy 43.9944 69.6494 5.2 8.7 1 7.9 32.6 18.6 -- -- 3 7.6 10.7 7.8 4 6.9 181.2 98.3 405.6 105.4 -- -- 8602.2 387.1 394 39.5 424.8 40.4 686.7 37.6 167.5 19.82-C4-442-12 445.6 1 pottle cove 43.9969 69.6708 10.4 13.8 -- -- 45.9 16.9 -- -- 3.4 8.5 -- -- 7.8 6.1 229.9 79.3 316.5 82.8 407.5 264.9 7056.1 351.3 284.9 31.4 263.6 33.1 525.7 29.4 128.5 17.72-C4-442-11 356.6 2 pottle cove 43.9969 69.6708 15.2 14.8 9.5 9.9 61.6 12.7 -- -- 21.9 14.2 6.5 9.4 2.8 9.7 -- -- 75.7 63.8 144 370.9 9896.2 454.5 420.6 40 345.1 41 591.8 39 133.1 21.62-C4-442-10 314.6 3 pottle cove 43.9969 69.6708 -- -- 15.1 12 71.3 18 -- -- -- -- -- -- 8.7 8.7 83.4 86.8 10.4 83.9 151.6 573.7 10390.9 513.4 407.9 45.9 353.2 47.2 714.1 41 211.4 22.7
2-C4-442-9 301.6 4 pottle cove 43.9969 69.6708 40.9 21.3 6.8 9.6 67.8 22.2 6.5 24.4 -- -- 11.5 9.5 2.8 9.1 115.2 83.6 20.3 69.8 97.3 443.3 11091.7 537.3 312.4 43.9 493 52.6 794.6 42.5 192.8 25.52-C4-442-8 308.6 5 pottle cove 43.9969 69.6708 -- -- -- -- 72.9 18.4 -- -- -- -- 8.4 10.8 -- -- -- -- 173.5 126.1 59.4 429.8 12244.2 538.7 361.9 44.5 493.3 48.1 766.4 42.3 221.2 24.62-C4-442-7 251.6 6 pottle cove 43.9969 69.6708 -- -- -- -- 127.4 24.4 -- -- 20.7 17.3 2.6 9.5 3.4 10.6 -- -- -- -- 194.4 572.2 11670.1 614.1 339.1 56.7 452.8 54.8 833.2 49 225.3 292-C4-442-6 245.6 7 pottle cove 43.9969 69.6708 -- -- 14.8 14.2 49.7 18.9 43.6 24.2 -- -- 11.2 13 5.2 10.6 -- -- 89.9 96 -- -- 10769.6 595.7 353.1 52.3 331.6 53.9 727 48.5 238.2 26.42-C4-442-5 278.6 8 pottle cove 43.9969 69.6708 11.9 13 4.9 10.5 71.2 20.5 -- -- -- -- -- -- 4.6 11.3 97 102 70.4 93.2 48.3 340.7 9730.3 532.9 274.9 52.7 427.1 49.3 736.8 45.7 153.6 25.42-C4-442-4 306.6 9 pottle cove 43.9969 69.6708 -- -- -- -- 101.4 19.8 34.9 33.4 -- -- 28.9 13.3 -- -- 45.3 84.3 12 110.1 -- -- 13262.6 569.9 448 50.5 478.3 52.4 997.7 45.8 267.9 26.72-C4-442-3 313.6 10 pottle cove 43.9969 69.6708 14.9 11 5.4 9.3 86.5 20.4 -- -- -- -- 15.6 10 -- -- 128 92 -- -- 245.7 255.9 8898.6 481.2 383.4 41.2 409.4 45.8 706.8 40.7 231.3 23.92-C4-442-2 323.6 11 pottle cove 43.9969 69.6708 -- -- 4.2 9.4 67.9 18.3 12.2 20.4 12.1 16.4 4 13.4 -- -- -- -- -- -- 389.2 310.9 9635.9 486.5 347.3 44.9 422.6 46.3 790.3 41.6 250.3 24.7
2-NG-444-2 1179.5 12 pottle cove 43.9969 69.6708 -- -- 5 10.5 61.3 18.2 28.2 22.6 6.4 8.3 19.9 11.9 -- -- -- -- 316.4 85.2 -- -- 9034 413.4 353.4 40.6 413.7 44 701.6 39.9 148.9 212-C4-442-1 174.6 12 pottle cove 43.9969 69.6708 38.8 21.5 -- -- 25.8 27.6 6.5 32.3 3.7 16.3 5.6 13.5 1.2 12.9 53 147.7 -- -- 1071.6 683.8 13401.7 804.7 472.8 72.1 473.7 75 866.9 65.1 270.9 37.1
2-C4-445-13 459.6 1 sassanoa 43.8944 69.7661 0.7 7.3 3.9 8.9 103 13.3 13.5 24.4 7.1 8.4 1.4 5.5 -- -- 52.9 50.3 159.2 90.9 -- -- 6373.5 325.8 255.1 30.5 311.3 31.9 565.4 30.9 116.1 16.32-C4-445-12 315.6 2 sassanoa 43.8944 69.7661 8.9 12.1 7.5 8.3 160.8 24.2 -- -- 11.4 9.2 -- -- -- -- 165.1 77.6 19.4 68.7 58.1 305.7 7315.4 431.3 286.9 42.5 336.8 45.4 599 37.9 159.4 23.42-C4-445-11 246.6 3 sassanoa 43.8944 69.7661 6.1 10.4 9.9 10.7 151 23.8 45.7 26.7 -- -- -- -- 9.4 9.2 450.7 115 102.8 93.4 1093.5 618.3 6227.5 468.6 306.6 46.3 297.3 46.4 505.4 43.4 109.1 23.12-C4-445-10 309.6 4 sassanoa 43.8944 69.7661 10.2 10.2 20.9 8 315.2 28.6 5.5 18.1 20.4 13.9 -- -- 8.2 7.9 127.1 117.3 59.4 99.8 521.4 406 7524.4 437.1 272.2 42.8 333.5 45.5 592.7 39.4 168.8 21.9
2-C4-445-9 242.6 5 sassanoa 43.8944 69.7661 19.9 15.3 5.6 11.6 329.8 34.1 17 26.5 9.4 10.8 17.8 10.6 13.1 11.3 222.7 121.1 40.4 122.2 -- -- 8259.2 533.9 224.2 47.1 346.2 53.9 791.7 48.6 189.1 27.32-C4-445-8 284.6 6 sassanoa 43.8944 69.7661 -- -- 11.9 12.5 292.6 29.6 23.8 30.7 5.2 10.1 6.8 9.4 5.5 9.7 203.4 127.9 -- -- 769.1 487.4 6942.9 457.4 279.1 39.2 273.7 47.6 653.2 42.3 138.7 24.62-C4-445-7 263.6 7 sassanoa 43.8944 69.7661 17.1 13 6.5 8.5 161.8 23.3 2.1 18.8 9.9 13.1 6.6 11.7 3.6 14.7 -- -- 27.9 88.1 640.2 464.1 8479.7 479.6 228.5 40.9 315.7 48.6 779.9 44 193.4 24.12-C4-445-6 251.6 8 sassanoa 43.8944 69.7661 8.4 11.7 0.9 11.5 144.8 30.5 -- -- -- -- 10.3 17.5 25.2 11.1 36.8 89.9 -- -- -- -- 7908.7 502.1 437 56.3 401.3 54 737.7 47.5 218.4 28.52-C4-445-5 295.6 9 sassanoa 43.8944 69.7661 4.1 11.3 7.5 11 131.5 23.6 16.2 21.5 4.4 9.1 -- -- -- -- 50.9 77.2 87.1 72.2 409.6 417 7294.4 442.5 318 44.3 299.5 43.5 750.3 41.5 158.6 21.42-C4-445-4 211.6 10 sassanoa 43.8944 69.7661 27 15.1 4.8 12.1 123.8 26.8 -- -- 9.2 12.5 11.2 12.1 -- -- 142.2 139.7 69.5 90.9 69.4 577.1 10065.5 601.9 233.9 50.1 268.6 57.7 1014.1 55.8 312.6 29.42-C4-445-3 266.6 11 sassanoa 43.8944 69.7661 -- -- 16.6 9.7 89 18.2 -- -- 14.7 17.5 19.1 9.8 6.6 12.4 130.3 139.2 -- -- 431.2 357.7 8855 518 284.9 49.9 373.5 59.5 873 47.3 311.1 30.4
2-NG-444-3 1280.5 12 sassanoa 43.8944 69.7661 -- -- 8.2 8.9 103.2 17.3 37.3 19.4 -- -- 5.8 8.2 -- -- 34.7 62.1 340.7 136.2 678.8 714.1 6967.3 351.6 319.7 37.1 396.4 40.8 724.9 36.9 170 20.82-C4-445-2 341.6 12 sassanoa 43.8944 69.7661 0.9 10.1 21.9 13.7 52.1 16.6 32.2 19.4 10.2 12.8 3.2 9.1 1.9 7.5 -- -- 70.6 83.9 -- -- 8849.1 452 277.2 42.2 324.2 40 764 38.2 202 21.72-C4-445-1 262.6 13 sassanoa 43.8944 69.7661 1.5 15 2.6 9.3 23.4 12.7 -- -- 11.2 11.6 25.9 14.2 3.2 8.7 130.8 117.7 3.1 103.4 253.8 530.4 9273.7 529.6 351.4 48.6 338.5 43.5 879.5 46.5 205.8 29.5
Samples collected 6-9 July 2004 (phase 1)+A224: 1-NG-171653 1519 S 1 43.960 69.698 -- -- 3.6 4.3 62.8 12.3 95 21.6 -- -- -- -- 9 5.3 51.9 79.6 299.9 73.7 610.6 178.7 8585.1 256.7 386.7 27 401.5 30.6 684.5 31.8 158.3 13.81-C4-171731 425.9 1 2 43.955 69.697 4.1 5.5 -- -- 60.9 9.9 5.1 9.3 5.5 5.7 1.6 4.2 5.3 4.6 -- -- 64.3 65.5 349.9 341.1 6977.4 260.2 223.1 24.8 175.3 30.5 452.4 25.8 136.2 12.61-C4-171732 234.2 2 2 43.955 69.697 -- -- 13.5 10.2 135.7 18.5 18.2 19.6 6.3 9.2 7.4 6.7 3 7 95.1 96.8 18.3 62.1 649.5 522.1 8942.2 409.8 244.4 43.7 288.2 42.2 562.7 41.7 167.5 19.91-C4-171733 254.6 3 2 43.955 69.697 34 12 9 7.3 136.3 20 78.1 27.8 7.7 9.1 10.5 7.2 16.4 9.2 -- -- 215.1 100.6 639.7 508.9 9528.9 389.1 223.6 37.8 314.1 40.4 552 39.5 175.5 19.51-C4-171734 262.1 4 2 43.955 69.697 -- -- 8.7 8.7 109.6 19.9 -- -- 9.5 7.2 -- -- -- -- 48.4 68.7 169.7 74.2 996.5 404 8536.1 367.4 254 35.2 299.3 40.9 584.9 38.6 155.1 18.31-C4-171735 294.1 5 2 43.955 69.697 3.5 10.6 -- -- 116 16.7 11.1 13.1 2.5 6.4 -- -- -- -- 172.6 100 93.1 82.7 175.9 377.9 8500 344.6 265.8 31.5 329.4 39 520.8 35.1 129.5 16.11-C4-171736 280.6 6 2 43.955 69.697 0.6 8.1 -- -- 102.8 17.8 131.6 27.9 1.3 6.7 14.3 9.1 1.4 5.9 48.2 102.7 -- -- 646.1 468.3 9234.4 367.3 222.5 32 227 31.3 475.7 35.9 143.6 17.41-C4-171737 358.8 7 2 43.955 69.697 12.9 9.1 5.3 6 190.5 16.8 -- -- 6.1 7 4.5 6.1 8.3 6.9 -- -- 78.7 48.7 942.1 294.7 8462.6 313.3 228.4 29.2 290.3 33.8 513 30.7 159.3 15.61-C4-171738 338.6 8 2 43.955 69.697 1.5 6.9 12.3 7.7 248.6 19.4 -- -- -- -- 13.2 7.3 8.6 6.4 193.9 116.8 16.8 62.8 594.4 446.1 10450.7 353.6 259 31.4 255.2 35.3 676.4 34.9 149.9 16.61-C4-171739 364.3 9 2 43.955 69.697 18.8 10.4 -- -- 237.6 18.5 15 12.5 3.5 6.2 6.2 6 -- -- 18.6 54.8 -- -- 669.2 350.6 10152.2 338 273.2 28.2 339.9 32.4 634.7 34 178.6 15.71-C4-171740 332.8 10 2 43.955 69.697 1.6 7 -- -- 175.4 18.9 9.9 14.5 -- -- 13.9 7.8 -- -- 33 61.3 45.4 75.9 380.1 388.2 10924.4 370.3 255.2 33.7 384 36.8 786.1 37.8 234.3 18.61-C4-171741 391.6 11 2 43.955 69.697 4 6.3 -- -- 95.1 16.1 -- -- 1.9 6.1 5.2 6.9 16.2 8.8 -- -- -- -- 1067.2 420.1 10867.9 335.1 262 31 372.7 33.5 787.3 33.9 198.5 17.8
1-NG-171654 1300.1 S 2 43.955 69.697 6.8 6.2 3.7 4.6 120.9 14.7 95.3 17.8 4.3 6.2 7.9 8.3 -- -- -- -- 205.4 71.7 439.4 203.6 9563.7 287.2 312.7 28.1 340.5 33 695.2 32.8 147.1 15.12-NG-171655 1401.6 S 3 43.954 69.697 -- -- 1.9 7.9 103.1 15.1 -- -- 1.6 9.7 1.4 6.9 9.6 8.1 -- -- 146.2 81.7 585.2 472.7 7987.7 371.8 181.8 39.1 312.4 36.6 570.1 33.4 133.2 18.91-NG-171656 1421.6 S 4 43.953 69.698 10.2 6.5 7.6 5.7 89.4 12.8 -- -- -- -- 1.1 4.2 6.5 4.9 18.5 74.9 279.9 70.7 748.1 248.2 7632.8 247.9 319.4 26.1 328.4 28.9 516.5 28.8 137.3 13.71-NG-171657 1377.6 S 5 43.953 69.698 16.3 7.9 3.9 4.6 96.6 11.9 22.5 21.7 12.9 6.2 11.7 5.7 7.6 5.6 9.5 47.1 463.7 102.7 1010 302.3 7309.8 246.2 213.7 24.8 247.1 31.1 483.8 27.6 142.9 12.61-NG-171658 1414.1 S 6 43.953 69.698 12.6 9.1 3.4 4.4 96.9 12.5 -- -- 14.8 6 0.8 4.3 4.6 4.3 9.3 46.2 277.1 77.8 594.4 224.5 7457.7 250.7 250 24.7 276.9 27.1 548 27.8 128.9 12.52-NG-171659 1409 S 7 43.951 69.698 18.9 10.7 16.8 9.1 117.4 17 -- -- -- -- 2.6 6.4 14.2 7.5 105 62.8 208.2 64.5 -- -- 8435.4 367.8 267 35.6 340.8 40.5 570.7 32.4 125.4 18.42-NG-171660 1368.3 S 8 43.949 69.698 11 8.7 4.3 10.7 135.7 19.5 -- -- 0.7 7 0.6 8.3 -- -- 16.2 81.8 318.8 108.2 1649.8 599.5 8826.3 384.7 245.9 30.3 366.1 38.5 595 33 132.8 18.71-C4-171754 281.6 1 8-1 43.949 69.698 24.6 10.6 10.8 6.7 93.7 14.9 9.3 16 10 8.2 2.5 8.6 -- -- 33 59.4 95.2 70.5 600.2 293.6 7012.7 318.3 238 29.1 276.6 35.9 478.3 34.2 109.3 16.82-C4-171755 369.5 2 8-1 43.949 69.698 16.7 10 6.1 9.1 94.1 16.5 -- -- -- -- 2.7 8 5.7 6.8 -- -- 51.4 61.3 1049.1 426.4 7664.9 397.9 237.5 36.5 212.9 36.4 465.7 31.9 148.2 18.41-C4-171756 350.6 3 8-1 43.949 69.698 3.5 6.6 8.1 5.9 72.1 12.6 19.6 12.4 -- -- 2.8 6.4 -- -- 2.4 52.5 80.5 63.2 677.8 219.1 7510.1 294.6 223.3 29.2 311.2 32.1 494.8 29.5 115.6 14.41-C4-171757 312 4 8-1 43.949 69.698 7.2 7.2 11.6 8.7 89.3 14.3 9.8 12.8 3.5 8 9.4 7.4 1.4 5.6 104.8 68.7 27.4 50.9 295.5 319.4 7817.3 319.4 261.2 32.5 272.1 35.2 494.1 33.1 102.9 16.32-C4-171758 312.6 5 8-1 43.949 69.698 11.6 10.6 2.9 10.4 92.1 15.4 7.8 29.7 21.6 14.8 5.9 13.2 2.7 10.1 -- -- 13.1 78.7 344.3 319.3 10058.2 504.4 364 42.5 320.6 45.7 669.6 39.3 209.3 25.62-C4-171759 334 6 8-1 43.949 69.698 12.6 13.6 14.3 9.8 118.8 22.5 -- -- 21.5 12.5 2.2 11.7 -- -- 18.5 79.5 -- -- -- -- 9870.4 486.2 250.3 40.8 283.3 41.7 544.5 37 154.9 21.21-C4-171760 331.6 7 8-1 43.949 69.698 10.1 8.9 4 5.9 78.2 16.7 13.8 14.7 2.2 6.4 26.4 9 -- -- 17.9 78.6 85.1 51.1 1315.9 317.2 8550.9 324.7 246.4 32.1 279.4 31 568.3 33.5 160.2 16.72-C4-171761 326.5 8 8-1 43.949 69.698 17.2 12.2 11.8 10.3 94.4 20.2 -- -- 9 9.6 2.6 8.2 3.2 7.5 -- -- 67.6 63.7 134.8 403.6 10569.6 504.1 274.1 40 303.8 42.3 649.4 38.5 193.3 222-C4-171762 298.1 9 8-1 43.949 69.698 7.1 11.6 22.1 12.2 90.1 16.1 -- -- 19 12.8 13.3 9.3 10.6 8.6 -- -- -- -- 155.1 280.8 10814.9 529.1 299 44.4 278.6 44.7 763.2 43.1 210.5 24.7

Maine Yankee Marine Sampling Study
Maine Yankee Final.doc 2/15/05 90
nuclide 60Co 60Co 137Cs 65Zn 22Na 54Mn 58Co 133Ba 7Be 210Pb 40K 214Bi 214Pb 212Pb 208Tl Gamma energy (keV) 1173.23 1332.51 661.62 1115.52 1274.54 834.81 810.75 383.7 477.56 46.52 1460.75 609.32 351.99 238.63 583.14 Branching Ratio 0.9986 0.9998 0.8462 0.5075 0.9994 0.9998 0.9945 0.0884 0.103 0.04 0.107 0.4609 0.371 0.431 0.861
sample mass(g) depth(in) station lat. long. pCi/kg +/- pCi/kg +/- pCi/kg +/- pCi/kg +/- pCi/kg +/- pCi/kg +/- pCi/kg +/- pCi/kg +/- pCi/kg +/- pCi/kg +/- pCi/kg +/- pCi/kg +/- pCi/kg +/- pCi/kg +/- pCi/kg +/-
1-C4-171763 326.4 10 8-1 43.949 69.698 2.1 6.8 2.9 8.5 112.3 15 -- -- 2.8 5.5 16.4 7.3 2.4 5.3 -- -- -- -- 662.1 365.4 8632.3 329.1 239.8 30.1 252.5 35.3 709.2 34.5 185 16.72-C4-171764 390.6 11 8-1 43.949 69.698 23.1 17 13.4 10.5 122.2 19.7 32.5 21.3 6.7 10.6 -- -- -- -- 4 118.6 54.4 77.5 175.3 445.8 9629.4 428.9 283.3 37 235.1 38.3 638.6 35.1 188.9 20.61-C4-171765 249 12 8-1 43.949 69.698 2.8 10.4 2.3 6.6 104.7 21.5 145.5 32.9 1.5 7.8 3.8 7.2 -- -- 61.1 115.5 115.4 74.1 715.8 540.5 9161 386.8 224 37.7 278.6 43.4 762.1 43.5 219.4 20.31-C4-171766 336.5 13 8-1 43.949 69.698 12.3 7.2 7.5 6.1 167.6 18.3 -- -- 2.2 6.3 5.3 8.1 -- -- 52.8 54.9 147.5 53.7 401.8 403 8695.5 323.5 199.2 31.1 259 34.4 665.5 34.2 181.9 17.52-C4-171767 330.6 14 8-1 43.949 69.698 -- -- -- -- 154.1 23 -- -- 3 9.8 6.5 12.9 -- -- -- -- 155.8 81.6 271.9 259.2 9175 469.5 313.7 42.8 271.7 33.9 827.1 40.7 225.3 23.62-C4-171768 283 15 8-1 43.949 69.698 -- -- 16.8 11.3 191.6 27.5 25.9 27 -- -- 4.6 9.5 3 8.8 12.3 80.5 69.3 77.5 -- -- 9811.8 549.4 397.1 47.7 300.3 48.1 780.5 44.4 222.1 24
2-NG-171664 1383.6 S 9 43.949 69.699 18.8 18.7 11.9 9.7 154 20.4 210.5 33 -- -- 1.9 5.4 4.9 8.2 10.7 90.4 704.5 154.1 2037.2 635 14353.5 476.1 429.1 40.5 346.8 39.2 521.6 42.4 176.3 19.92-NG-171665 1402.1 S 10 43.947 69.699 5.1 9.1 29.1 10.4 90.3 19.6 -- -- 7.7 9.7 4.6 8.4 -- -- 92.3 111.9 170.7 99.3 -- -- 9792.7 393.4 274.4 36.6 343.9 38 594.5 34.3 136.2 18.82-NG-171666 1265.9 S 11 43.947 69.699 12.6 7.7 -- -- 47.2 11.2 14 19.8 2 9.4 14.4 6.5 12.6 8 60.4 83.9 364.9 83.3 133.3 336.4 6040.3 319 215 29.4 234.9 30.3 251.1 27.5 132.9 16.81-NG-171667 1454.3 S 12 43.947 69.700 25 11.5 3 4.5 55.6 8.1 -- -- -- -- 0.5 4.6 -- -- 97.6 74 364.9 79.8 291.8 219.8 7604.6 244.9 295.1 25.3 295.8 29.6 513.2 28.8 148.2 13.12-NG-171668 1349.5 S 13 43.944 69.697 12.5 9.5 13.2 11.2 86.8 18 91.8 32.3 23 10 6.4 8.4 -- -- -- -- 473 131 -- -- 9487.1 404.4 286.7 34.1 425.1 37.7 608.5 34.8 193.8 18.82-NG-171669 1302.1 S 14 43.945 69.699 17.7 13.8 -- -- 93.5 16.4 21.7 21.2 15.3 8.1 0.7 7.9 -- -- -- -- 272.8 102.7 149.1 310.8 9716.3 409.3 348.1 37.4 448.1 40.2 663.1 35.9 142.2 221-NG-171673 1321.8 S 15 43.945 69.700 9 5.7 10.6 5.8 63.5 12.3 18.5 11.1 -- -- 11.9 5.8 1.8 5.2 -- -- 1.3 53.8 290.2 154.1 8059.4 265.7 288.3 27.3 318.3 31.8 631.9 31.1 155.2 14.12-NG-171674 1450.1 S 16 43.941 69.697 23.7 14.1 0.7 7 74.9 12.8 13 15.1 9.2 7.5 3.6 8.2 -- -- 149.6 75.2 181.9 111.8 721.6 493.8 9266.9 385.3 363.6 36.4 407.4 40.1 723.6 35.7 213.3 19.61-NG-171675 1312.6 S 17 43.934 69.700 14.3 5.9 8.2 5 53.5 12 -- -- 0.8 5 -- -- -- -- -- -- 295.2 81.8 608.2 330.7 7904 269.9 363.2 28.7 324.6 38.3 691 33.1 179.7 15.62-NG-171676 1449.1 S 18 43.941 69.702 3.7 9 10.9 8.4 69.8 14.5 -- -- 16.4 7.3 5.8 6.5 5.9 7.5 117.4 97.3 110.1 113.4 151.4 466 8668.1 367.6 262.9 29 320.4 35.4 603.1 32.1 129.5 17.72-NG-171677 1347.6 S 19 43.944 69.696 3.3 9 4.4 7.4 69.3 15.2 -- -- 0.7 7.3 1 6.7 -- -- 52.2 63.7 389.6 102.8 150.3 366.3 9186.3 390.6 326 36 328.2 38.1 609.7 34.8 201.4 19.61-NG-171678 1190.7 S 20 43.948 69.696 7.1 7.1 0.5 5.2 78.8 13 -- -- 7.3 6.6 4.9 5.7 -- -- 75 90.6 105.5 57.5 671.6 274.5 9445.3 304 346 30.9 342 34.2 667.3 34.3 151.6 15.32-NG-171679 1351.6 S 21 43.947 69.694 8.5 11.4 16.1 8.6 52.8 14.6 -- -- 11.2 9.7 1 8.3 8.5 6.6 5.5 62.4 463.7 91.6 -- -- 9718.5 393.4 398 39 379.7 45.8 663 38.6 176.1 17.32-NG-171680 1421.5 S 22 43.949 69.694 36 13.1 16.7 10 91.7 16.6 10.5 16.4 10.2 9.4 -- -- 26 11.7 98.9 92 370.3 112.6 130.6 434.7 9644.8 385.8 369.4 36.4 433.4 39.5 776.7 36.7 179.3 19.82-NG-171681 1546.1 S 23 43.951 69.693 22.9 14.8 -- -- 51.1 13.9 -- -- 0.8 10.2 3.7 8.8 3.7 9.7 -- -- 273 76.9 447.6 567.6 12460.2 414.8 560.3 41.9 541.5 41.3 824.7 35.7 185.1 202-NG-171685 1690 S 24 43.950 69.692 8 11.2 9 8.3 34.8 16.3 -- -- 2.2 8.4 -- -- 10.8 12.3 0.7 85.1 269.6 128.1 -- -- 15026 442.5 421.7 36.6 428.3 40.5 713.5 35.2 178.2 19.42-C4-171742 437.5 1 25 43.953 69.692 4.1 8.8 20.6 6.9 29.9 12.2 9 17.2 6 8.3 -- -- -- -- -- -- 224.2 90 -- -- 9781.7 400.7 282.2 34.9 352.6 34.7 555.3 30.5 151.2 17.22-C4-171743 494.6 2 25 43.953 69.692 1.6 10.6 2.1 6.8 31.7 11.6 -- -- -- -- -- -- 0.9 6.3 106.1 65.9 185.1 64.4 222.5 310.5 11978.1 424.8 408.2 34.3 406.3 36.4 631.2 31.9 170.8 17.82-C4-171744 349.1 3 25 43.953 69.692 9.5 11.4 -- -- 17.8 14.2 155 41.4 20.5 12.8 19.2 9.2 4.2 8.9 88.4 107.7 65.6 84.2 134.9 361.7 12869.4 534 447.1 46.8 421.5 50 732.1 41.7 179.8 23.82-C4-171745 493.4 4 25 43.953 69.692 12.6 10.8 -- -- 39 10.7 -- -- 7.9 9 9.6 9.4 6.4 6.2 -- -- 72.1 54.8 -- -- 11866.8 432.1 450.6 37.2 449.9 37.8 545.1 29 201.8 17.82-C4-171746 406.1 5 25 43.953 69.692 7.9 11.8 3.3 7.5 5.5 9 -- -- 8 9 3.2 7.6 9.9 7.2 59.9 69.7 106.7 74.8 1355.1 511.8 10683.2 458.4 471.5 42.7 492.9 43.2 778 36.8 222.9 20.71-C4-171747 412.3 6 25 43.953 69.692 2.5 6.3 -- -- -- -- -- -- 2.1 6.7 15.2 5.3 -- -- -- -- 60.2 43.5 357.7 318 7590.6 273.6 305.1 26.7 385.2 30.8 578.2 30.9 152.5 14.52-C4-171748 435 7 25 43.953 69.692 15.7 12.8 4.7 7.4 23.5 13.1 -- -- 8.5 10.7 12.6 9.9 -- -- -- -- 54.5 71.7 75.9 220.6 13228.8 487.4 431 43.1 500.4 40.9 724.2 36.2 229.3 20.52-C4-171749 413.1 8 25 43.953 69.692 -- -- 2.5 7.4 -- -- 30 25.5 3.2 9.7 -- -- 8.7 7.5 28 69.4 53.4 71.7 290.1 469 11689.5 474 423.2 42.3 450.2 42.9 761.2 38.1 248.8 21.32-C4-171750 413.3 9 25 43.953 69.692 15.1 12.9 9.9 7.8 1.5 8.1 -- -- 11.8 14.2 13.1 8.4 21 12 -- -- 29.7 63.5 204.2 365.7 12698.8 481.7 432.7 41.3 445.7 41 741.9 37.5 178.1 20.82-C4-171751 582.1 10 25 43.953 69.692 3.8 9.6 -- -- 1.4 6.3 -- -- -- -- 1.7 7.2 6.8 8 -- -- -- -- -- -- 11076.9 377.6 323.6 32.1 363.9 31.8 607 28 229.5 17.52-C4-171752 438.3 11 25 43.953 69.692 0.7 9.9 1.6 8.2 27.1 12.8 -- -- 13 10.5 4.9 7.8 3.9 6.8 -- -- -- -- 661.2 490.3 13833.1 490.3 435.9 41.5 419.1 41.2 755.8 36.5 226 21.52-C4-171753 850.6 12 25 43.953 69.692 5.7 5.5 2 4.6 13.3 6 -- -- 8.4 6.3 -- -- 1.2 4 62.6 45.8 43.2 36.2 -- -- 9870.8 289.7 325.4 24.4 280.1 23.9 386.8 18.7 142.7 11.5
1-NG-171686 1681.4 S 25 43.953 69.692 -- -- 3.6 6.2 30.2 8.9 -- -- 5.8 5.8 10.3 9.3 2.1 4 3.1 78.1 275.6 92.4 412.5 291.7 10868.1 274 373.1 27.1 447.8 30.5 732.5 31.1 187.9 14.11-NG-171687 1547.6 S 26 43.939 69.693 0.2 7.1 10.5 5.9 14.8 11.8 -- -- 9.4 5.1 10.2 5.1 2.8 5.4 99 70.7 513.7 88.6 756.7 341.6 9748.2 269.4 422.7 29.6 486.5 33.1 801.4 32.4 198.1 15.12-NG-171688 1445.4 S 27 43.941 69.692 8.6 10.3 10.5 7.9 46.2 11.8 -- -- -- -- 18 7.9 -- -- 71.7 61.5 542.2 125.9 140.1 465.9 8083.5 351.7 343.3 35.7 418.3 37 652.2 34.4 146.6 17.72-NG-171689 1343 S 28 43.945 69.690 9.9 9.5 0.7 6.4 51.8 17.1 -- -- -- -- 4.9 7.6 10 6.7 123.9 109.4 983.1 132.5 421 289.5 7401.2 349.7 191.5 27 207.2 36 497.5 32.4 122.1 17.51-NG-171690 1412.1 S 29 43.948 69.689 21 8.4 3.4 4.5 60.9 11.7 99 22.9 7.4 4.9 17.2 9.4 9.1 5.4 17.4 63.9 650.8 98.4 543.2 323.4 6919.1 241.3 273.8 26.1 296.7 30.1 545.2 29.1 169.8 13.42-NG-171691 1367.7 S 30 43.949 69.688 25.5 10.2 26 8.6 52.5 14.6 19.5 15.3 5.9 7.1 1.9 6.3 1.9 6.2 67.6 61 447.9 107.5 -- -- 7953 357.5 257.8 33.4 327.5 36.7 487.1 32.8 122.8 181-NG-171692 1382 S 31 43.954 69.685 -- -- 7.3 5.5 24.5 10.7 5.4 9.5 -- -- 0.8 5.1 8.4 7.5 112.2 63.8 562.6 95.3 265.7 231.9 6276.5 231.3 248.4 24.3 248.9 28.5 481.2 28.8 131.4 131-NG-171693 1650.5 S 32 43.940 69.695 6.5 7.3 7.3 5.4 30.7 9 -- -- -- -- 1.7 4.2 3.8 3.7 36.6 79 114.2 63.3 132.7 245 8678.4 246.3 351.3 24.7 376.7 28.6 549.5 27.8 153.5 12.61-NG-171694 1411.1 S 33 43.944 69.694 7 6.3 3.8 5.2 34.2 9.5 85.1 21.4 4.4 5.6 16.5 7.5 0.3 4.6 55.9 51.8 102.7 96.4 -- -- 12138.8 310.7 463.6 30.8 474.9 33.9 706.3 33.2 160.1 15.11-C3-171964 133.9 1 34 43.945 69.693 4.9 11.7 -- -- 7.2 10.5 16.6 24.9 4.2 13.8 18.5 11.7 -- -- 149.4 98.8 109.4 74.9 -- -- 11112.2 517.6 388.9 42.9 392.2 49.3 590.6 46.5 102.6 22.71-C3-171965 87.4 2 34 43.945 69.693 18.9 21.3 20.9 16.2 -- -- 11.3 26.5 11.2 14.5 1.5 15.4 9.6 15.5 -- -- 4.7 123.4 1099.6 528.1 13180.1 662.3 322.3 58.2 516.2 69.9 521.8 61.4 153.8 32.31-C3-171966 127.4 3 34 43.945 69.693 -- -- 0.6 14.8 2.3 10.9 -- -- 17.5 9.4 26.9 12.2 11.4 13.7 84.1 108.9 -- -- 130.2 416.3 11884.6 562.4 332.3 47.4 319.8 51 612.9 48.4 117.9 25.91-C3-171967 103 4 34 43.945 69.693 6.3 14.2 -- -- 2.8 11.8 -- -- 21 18 1 10.7 5 11.7 115.6 168.3 -- -- 683.2 542.1 11508.7 608.2 391.3 62.7 378.5 59 879.1 59.5 178.3 261-C3-171968 113.3 5 34 43.945 69.693 9.2 13.4 -- -- 13.1 13.2 -- -- -- -- 21 13.1 12.3 10 294.3 132.1 59.2 86.7 146.4 311.1 11643.5 583.9 258.2 56.4 428.5 60.7 752.3 55.3 252.2 31.21-C3-171968 113.3 5 34 43.945 69.693 9.2 13.4 -- -- 13.1 13.2 -- -- -- -- 21 13.1 12.3 10 294.3 132.1 59.2 86.7 146.4 311.1 11643.5 583.9 258.2 56.4 428.5 60.7 752.3 55.3 252.2 31.21-C3-171969 124.1 6 34 43.945 69.693 2.1 14.5 24 12.3 17.2 11.2 54.3 30.6 13.5 14.9 8 10.8 7.3 10.3 62.4 86.2 73.8 84.7 -- -- 11485.7 538.4 401.8 50.8 374.5 54.2 761.8 57.7 201 26.51-C3-171970 106.1 7 34 43.945 69.693 -- -- 7.3 14.2 -- -- 41.8 34.9 -- -- 6.5 11.4 5.5 9.2 -- -- 69 94.5 258.8 427.4 11553.5 617.4 386.4 55.7 344.1 64.9 737.2 67.9 176.1 271-C3-171971 94.1 8 34 43.945 69.693 11.1 15.3 1.5 13.5 34.1 18.2 -- -- 14.8 14.8 29.4 15 1.4 14 514.6 221 -- -- 1203.7 516.2 12513.7 674 292 58.3 366.5 50.8 820.1 63.9 191.5 35.31-C3-171972 132.7 9 34 43.945 69.693 3.9 11.6 8.7 9.9 11.7 13.2 14.9 20.6 9.1 13.1 -- -- -- -- -- -- 138 92.4 452.7 334.1 11870.3 525.8 465.9 47.1 427.7 54.6 641 48.2 158.5 25.3
1-NG-171695 1882.1 S 34 43.945 69.693 0.5 4.6 -- -- 16.1 9.5 -- -- 3.3 4.6 -- -- -- -- 41.9 43.1 62.1 47.1 -- -- 10186.5 249.3 387 26.4 427.2 28.8 554.1 26.7 143.7 12.42-NG-171696 1586.7 S 35 43.935 69.699 1.1 7.9 0.6 6.4 31.6 12.5 -- -- 15.5 7.7 4.1 6.2 -- -- -- -- 71.4 67.1 342.2 530.4 10235.4 376.2 415.4 37.1 451.5 39.3 796.7 34.6 163.1 18.82-NG-171697 1546.1 S 36 43.928 69.706 23.5 11.7 6.1 6.3 34 12.5 -- -- 7.4 6.9 16.4 7.2 3.7 5.7 47.8 98.3 125.7 77 81.9 299.1 9017.5 361.9 449.8 36.4 386.3 37.6 678.7 38 176.8 162-C3-171982 147.3 1 38 43.572 69.413 15.9 17.3 4.2 15 12.5 13.5 18.5 32.2 -- -- -- -- 2 11.3 218.6 106.5 17.3 86.7 -- -- 10031.4 609.7 290.1 58.6 273.4 46.1 504.1 45.2 159 22.12-C3-171983 125.6 2 38 43.572 69.413 15.4 20.9 9.9 19.4 -- -- 113.8 55 27.7 20.5 13.9 18.3 4.7 11.5 141 202.2 81.4 162.7 -- -- 10664 700.8 286 60.3 286.9 68.3 642.2 59.6 225.8 34.62-C3-171984 111.7 3 38 43.572 69.413 -- -- 7 21.4 40.5 20 -- -- 26.1 31.8 10.7 15.3 20.9 18.9 57.6 137.5 114.3 111.3 215.7 1193 11649.7 742.8 326.7 71.7 302 72.6 821.6 64.8 195.4 37.42-C3-171985 125.2 4 38 43.572 69.413 -- -- -- -- 15.8 18 45.5 38.5 7.2 16 23.9 20.5 10.5 12 180 153.4 -- -- 2013 1180.2 9727.3 639 491 64.8 444.4 69.8 745.6 60.6 228.5 332-C4-171986 105.2 5 38 43.572 69.413 14.3 28.2 32.3 27.8 29.8 21.1 171.5 90.9 -- -- 24.7 23.3 46.3 23.7 66 192.5 240.9 214.7 -- -- 17332.9 1142.5 400.1 102.4 443.8 91.5 1331.8 101.8 378.6 57.82-C3-171987 109.9 6 38 43.572 69.413 45.2 27.7 4.2 17.5 33.5 19.8 -- -- 8.2 15.3 25.8 15.9 2.7 14.4 124.5 125.8 25.8 130.2 -- -- 9836.7 681.6 231.6 65 225.6 61.9 636.5 64.4 178.8 36.22-C4-171988 104.6 7 38 43.572 69.413 82.1 33.6 14.6 24.4 24.8 31.3 -- -- 6.2 42.7 20.7 27.7 30.3 20.6 332 216.9 152.4 174.3 1075.6 1247.1 18585.7 1177.7 590.3 104.4 402.6 87.5 1457.1 101.4 330.9 42.8
1-NG-171699 1499.1 S 38 43.572 69.413 27.3 8 8.2 5.4 34.9 8.7 -- -- 1.2 5.6 -- -- 0.5 4 -- -- 257.9 61.6 3.3 326.3 7898.1 246.1 305.6 26.4 395.7 29.5 534 28.3 151.1 12.7

Maine Yankee Marine Sampling Study
Maine Yankee Final.doc 2/15/05 91
nuclide 60Co 60Co 137Cs 65Zn 22Na 54Mn 58Co 133Ba 7Be 210Pb 40K 214Bi 214Pb 212Pb 208Tl Gamma energy (keV) 1173.23 1332.51 661.62 1115.52 1274.54 834.81 810.75 383.7 477.56 46.52 1460.75 609.32 351.99 238.63 583.14 Branching Ratio 0.9986 0.9998 0.8462 0.5075 0.9994 0.9998 0.9945 0.0884 0.103 0.04 0.107 0.4609 0.371 0.431 0.861
sample mass(g) depth(in) station lat. long. pCi/kg +/- pCi/kg +/- pCi/kg +/- pCi/kg +/- pCi/kg +/- pCi/kg +/- pCi/kg +/- pCi/kg +/- pCi/kg +/- pCi/kg +/- pCi/kg +/- pCi/kg +/- pCi/kg +/- pCi/kg +/- pCi/kg +/-
1-NG-171700 1438.5 S 39 43.934 69.728 10.7 5.8 10.3 6.1 57 11.1 11.1 12.1 2.9 4.5 10.4 7.2 -- -- -- -- 136.5 90.5 618.3 301.4 7989.2 252.5 361.5 26.2 355.4 30 598.1 29.3 192 13.62-NG-171701 1403.6 S 40 43.936 69.724 -- -- -- -- 69.6 14.2 -- -- 10.8 9.4 3.3 9.3 14.1 6.6 -- -- 271.4 86.1 721.5 476.5 8133.9 365.3 346.6 36 434.8 42.5 657.8 33.2 138.1 17.41-NG-171702 1463.3 S 41 43.941 69.706 3 5.6 5.2 5.8 87.2 12.7 93.2 19.4 -- -- 5.6 4 -- -- -- -- 48.3 41.2 479.6 300.2 7799 248.6 303.2 25.2 290 29.5 494 28 155.3 13.32-NG-171703 1418.9 S 42 43.939 69.710 10.7 11 -- -- 65.9 14.7 1.9 15.9 -- -- 0.9 8.4 6 7.3 26.1 75.9 229.9 90.4 41.6 543.7 8318.3 354 365.5 37.1 388.7 37.3 670 34.7 175 18.61-NG-171704 1422.1 S 43 43.951 69.711 15.3 6.8 2.7 4.3 64.5 10.4 18 15 4.4 4.4 4.6 4.9 2.2 3.9 192.2 73.9 266.9 72.8 810 253 7014.1 237.6 193 24.4 256.4 27.9 478.3 27.5 124.4 11.92-C3-171973 199.5 1 44 43.935 69.709 -- -- 4.7 10.1 82.5 18 -- -- 6.4 16 2.2 8.7 -- -- -- -- 68.3 64.7 421.1 438.9 6881 431.1 308.1 41.9 223.1 39.6 349.6 31.1 81.6 17.22-C3-171974 99.8 2 44 43.935 69.709 -- -- 9.4 18.4 102.1 29.7 40.9 32.2 12 20.9 3 25.2 8.8 14.3 462.4 174.9 68.3 113.8 928.4 1096 9265.6 749.9 283.9 76.2 403.5 65.8 739.8 68.8 180.4 31.72-C3-171975 134.1 3 44 43.935 69.709 -- -- 13.1 12.5 88.6 25.1 -- -- 10 18.6 14.9 14.5 1.1 11.6 -- -- 194.7 122.5 635.7 544.1 8104.2 579.2 281.1 60.4 316.1 62.5 606.1 55.9 169.2 30.32-C3-171976 119.3 4 44 43.935 69.709 72.9 18 3.9 14.9 54.5 27.1 -- -- 15 19.2 18.8 19.1 18 18.4 20.2 118.6 -- -- 683.5 762.3 9728.9 691.7 387.1 59 473.8 69.4 790.4 62.7 114.7 36.22-C3-171977 112.1 5 44 43.935 69.709 7.4 23 -- -- 58.9 28.2 20.8 31.8 6 14.3 -- -- 6.1 15.8 143.6 194.8 -- -- 661.3 1011.5 9252.5 682.9 362 70.2 324.6 67.4 701.7 64.6 234.8 35.22-C3-171978 117.7 6 44 43.935 69.709 -- -- 2 12.7 15.6 15.8 19.8 41.6 23.8 16.2 17.8 13.8 14.9 19.4 266.7 173.8 130.2 146.8 -- -- 9456.2 715.6 281.5 54 238.1 60.2 789.5 61.2 204.3 33.92-C3-171979 101.5 7 44 43.935 69.709 22.4 19.5 13.8 20.1 -- -- -- -- -- -- 8.8 17.8 12 18.7 296 174.4 75.5 118.9 1058.9 1211.9 10284.5 739.9 260.2 62.2 275 76.6 529.1 78 138.5 39.12-C3-171980 114.9 8 44 43.935 69.709 3.6 28.1 8.1 22.1 -- -- 23.7 39.6 17.6 15.5 12.1 17.2 -- -- 171.6 130.7 -- -- 967.7 1402.3 10454.1 714.9 252.9 57.5 82.4 69.7 680 61.9 163.1 38.22-C3-171981 109.8 9 44 43.935 69.709 1.9 15.2 31.2 22.8 10.3 15 35.4 35 -- -- 22.3 15 13.3 13.2 77 131.2 98.2 150.5 702.1 1102.2 9967.2 713.2 317.8 64 331.4 76.7 720.2 62.6 260.5 35.6
2-NG-171708 1425.1 S 44 43.935 69.709 1.2 7.7 9 6.3 94.1 15.2 -- -- -- -- 7.8 6.5 0.9 9.3 41.5 58.7 29.8 56 47.4 518.3 8460.4 358.8 258.7 34.4 329.8 35.9 514.3 32.5 159.5 17.12-NG-171712 1372.1 S 45 43.953 69.723 -- -- 5.8 6.5 57.1 16.6 -- -- -- -- -- -- 1.9 6.1 62 62 626.5 107.4 166.1 278 7241.3 340.9 283.5 32.8 297.9 35.4 516.7 32.2 138.8 171-NG-171713 1425.1 S 46 43.956 69.683 6.9 5.4 10.8 6.2 70.6 10.5 78.1 21.1 2.6 4.6 3.6 4 10.6 5.8 20.3 45.7 489.6 85.6 607 233.9 7494 247.2 342.2 27.4 277.9 30.2 527.3 28.9 137.7 13.52-NG-171714 1362.1 S 47 43.959 69.682 2 8.4 -- -- 53.4 12.3 1.2 14 3.5 7.1 10 6.4 -- -- 62.5 59.6 430.8 120.2 532.8 532.7 7867.3 355.1 316.3 34.1 363.6 34.2 451.8 32.5 114 152-NG-171715 1387.6 S 48 43.969 69.684 10.2 8.6 0.9 9.4 64 12.7 -- -- -- -- -- -- 0.5 6.4 50.6 59.1 637.1 126.4 407.5 637.3 8180.4 362.7 288.8 34.3 271.7 36.6 584.6 32.7 157.5 17.22-NG-171719 1374.4 S 49 43.973 69.679 -- -- 37.1 12.4 67.3 14.7 31.5 21 3.5 7.2 9 6.9 3.2 5.7 70 60.7 469.1 126.5 1326.3 646.4 8442.4 370.9 332.9 33.1 276.7 36.2 564.1 33 155 18.42-C4-171953 496.1 1 50 43.981 69.676 -- -- 0.7 5.3 35.5 9.5 -- -- 9.2 10.2 6.5 5.7 -- -- 14 55.8 44.5 44.1 60.4 228.4 6652.3 321.3 198.6 22.3 168.6 24.9 382.6 23.9 95.3 14.12-C4-171954 297.8 2 50 43.981 69.676 -- -- 12.2 11 54.3 16.5 -- -- 5.5 9.4 -- -- 9.7 11 70 73.1 38.4 81.1 250.5 467.6 9481.3 498.5 235.3 36.8 214.7 44.2 530.5 37.6 118.2 15.42-C4-171955 339.3 3 50 43.981 69.676 7.1 10.8 22.1 10 67.5 13.7 -- -- 4.5 10.5 4.5 7.6 1.2 7.4 3.4 66.8 115.7 82.4 551.4 527.9 9343.3 460.8 262.7 41 201.9 35.9 516 34.5 131 20.82-C4-171956 310 4 50 43.981 69.676 13.6 11.3 15.4 10.7 117 19.9 55.8 30.4 3.2 17 3.5 8.6 31.4 12.9 -- -- 83.1 67.5 710.1 313.9 10019.5 489 327.8 43.4 320.8 43 611.8 39 148 23.12-C4-171957 316.6 5 50 43.981 69.676 -- -- 20.4 7.8 80.4 17.9 10.7 19 -- -- 10.2 9.7 15.8 13.7 12.2 87.7 3.9 67.6 -- -- 9547.9 484 309 42.8 258 41.3 565.4 37.3 144.5 21.72-C4-171958 315.6 6 50 43.981 69.676 4.8 10.5 -- -- 92.4 22 40.5 25 55.8 19.3 2.4 8.9 1.3 8.5 178.5 91.5 11.7 64.9 -- -- 9512.2 480.3 189 33.5 274.9 42.6 650.9 39.4 208.5 21.51-C4-171959 276.3 7 50 43.981 69.676 16.3 10.4 5.5 8.5 88.6 17 -- -- 1.3 7.2 8.7 7.7 2.1 6.1 -- -- -- -- 506 226.6 8903 361.1 285.2 32.1 388 40.9 590.9 37.6 180.7 202-C4-171960 296.2 8 50 43.981 69.676 17.6 13 -- -- 96.7 19.8 -- -- 15.4 9.6 -- -- 14.3 7.7 -- -- 45.5 72.5 330.3 548.6 10322.5 508 278.7 48.4 400.9 47.2 738.6 43.7 187.6 22.61-C4-171961 360.3 9 50 43.981 69.676 9.6 6.6 9.5 5.6 86.9 13.3 44.6 15.6 10.2 6.6 6.4 8 3.7 8.7 9.4 84.5 -- -- 520.2 408 8588.4 315.7 242.1 28.8 348.9 31.7 543.2 31.9 145.8 15.52-C4-171962 333.2 10 50 43.981 69.676 10.8 10.8 7.1 8.2 36.8 23.1 2.3 16.5 15.7 10.3 5.2 9.8 -- -- 13.9 75.3 36.8 86.2 205.5 309 11003.2 487.5 488.2 47.3 434.8 45.6 703 41 204.9 22.62-C4-171963 252.6 11 50 43.981 69.676 7.2 14 7 10.8 137.3 29.3 42.4 25 11.6 10.8 6.8 10.6 3.4 10.1 36.7 91.7 -- -- -- -- 11925.8 598.7 403.7 56.1 497.2 58.3 918.5 49.1 246.4 29.7
2-NG-171720 1400.6 S 50 43.981 69.676 12.2 10.7 0.7 6.7 60.4 14.8 -- -- 9.5 7 -- -- 3.2 6 -- -- 374.9 98.3 329.4 580.5 8536.4 367.9 211.2 33.9 302.4 36 530.8 33 154.9 17.92-NG-171721 1490.4 S 51 43.918 69.716 17.3 9.5 -- -- 28.6 12.2 -- -- -- -- 10.1 6.9 6 6.8 23.2 125.8 252.6 87.9 194.4 425.5 10240.6 388.4 366 36.6 409 37 624.5 33.9 179.1 18.52-NG-171725 1312.6 S 52 43.915 69.709 -- -- -- -- 83.2 13.5 14.4 14.5 -- -- 4 7.7 7.1 7.2 -- -- 382.4 95.4 424.3 541.4 7910.6 370.7 296.5 38.3 281.6 38.2 567.5 33.6 153.9 18.42-NG-171726 1347.3 S 53 43.921 69.718 5.5 11 8.8 6.7 71.2 13.4 17.3 15.2 1.4 7.7 -- -- -- -- -- -- 160.5 62.1 -- -- 7108.2 348.6 182.9 37.2 269.5 34.3 461.9 31.6 111.1 16.52-NG-171727 1585.9 S 54 43.921 69.724 14.5 11.9 2.5 6.4 43.5 12.8 -- -- -- -- 5.5 7.3 2.8 6 119.7 70.9 38.9 83.5 -- -- 8810.3 348.9 404.8 35.8 440.9 35.7 575.9 30.1 187.8 17.22-NG-171728 1230.1 S 55 43.949 69.696 4.3 14.8 3.2 8.7 81.8 19 -- -- -- -- 5.3 7.5 6.2 7.1 54.1 112.4 142.3 80.6 1331 547.3 11202.9 445.8 390.3 36.9 393.4 41.4 659.8 37.7 196.5 21.62-NG-171729 1407.2 S 56 43.949 69.699 1.7 9.7 17.6 7.1 127.3 17.3 10.7 17 6.7 6.3 8.3 9.2 5.1 6.7 36.8 57.1 147.2 75.7 40 333.8 6182.4 314 237.6 27.2 219.8 32.7 476.2 30.7 125.2 16.12-NG-171730 1387 S 57 43.950 69.698 -- -- 4.3 9.1 116.5 17 4.8 14.5 -- -- 1.4 6.5 5.5 6.9 -- -- 131.7 115.2 -- -- 9586.7 390.9 370.1 37 401.8 36.3 571.9 34.3 129.8 18.5
Sample collected 2-5 August 2004 (pahse 2):
1-C3-179285 78.6 1 59 43.921 69.718 25.7 22.1 3.7 14 113.3 26.9 78.4 31.5 46.2 12.8 15.1 12.7 -- -- 239.9 175 155.3 191.4 211.1 360 7984.8 552.7 185.4 54.8 218.8 52.1 559.1 64.1 109.2 32.21-C3-179286 111.7 2 59 43.921 69.718 -- -- 2.6 10.7 74.2 18.6 99.3 28.4 17.5 11.9 2.7 9.1 7 9.8 -- -- 5.5 81.2 507 421.6 7760.6 487.6 231.4 55.5 351.8 52.8 493.8 50.1 177.5 23.81-C3-179287 133.1 3 59 43.921 69.718 -- -- 12.5 9.7 26.2 13.6 40.8 22.6 10.5 16.6 2.2 8.8 0.7 7.3 13.4 87.3 -- -- 17.2 323.1 8326.9 455 357.2 47.9 364.8 50.5 661 46.4 187 26.71-C3-179288 116.6 4 59 43.921 69.718 15.3 16 -- -- -- -- -- -- 4.8 8.5 5.9 9.7 9.2 13.4 10.2 110.8 188.4 141.2 559.3 530.3 8588.4 496.1 289.4 53 338.7 43.1 780.1 53.7 216.4 291-C3-179289 127.5 5 59 43.921 69.718 -- -- 24.9 9.9 10.6 10.9 9 19.2 6.6 13.7 6.2 9 3.8 9.9 56 87.9 -- -- 417.3 332 9479.7 487.6 323.3 39.1 349.7 54.2 826.8 51.5 177.7 241-C3-179290 140.6 6 59 43.921 69.718 -- -- -- -- 2.8 9.3 178.3 37.5 1 10 7 10.6 -- -- -- -- 2.2 108.1 -- -- 9041.3 454.2 309.7 47.8 358.5 53.9 742.7 48.3 232 25.31-C3-179291 121.5 7 59 43.921 69.718 32.2 18.6 19 15 9.6 17 -- -- -- -- 11.4 10.9 0.8 8.3 94.7 173 156.7 85.4 249.5 297.4 10247.1 512.4 295.5 50.5 401.8 56.3 760.3 53 205.5 24.71-C3-179292 108.4 8 59 43.921 69.718 24.9 15.5 -- -- -- -- 120.1 39.1 11.6 11.6 11.9 12 4.5 9.6 71.4 110 -- -- 744.1 427.5 10720.7 577.6 430.9 59.5 395.4 59.6 875.9 58.7 231.2 32.31-C3-179247 163.4 1 60 43.918 69.716 12 9.9 14.1 10.9 1.2 8.4 -- -- 9.4 8.4 9.2 7.7 7.3 9.4 53.4 124.2 44.8 67.2 309.8 178.8 7343.6 392.3 222.3 35.6 239.7 43.6 637.5 40.4 180.3 20.71-C3-179248 124.7 2 60 43.918 69.716 7.9 16.6 23.2 10.9 1 11.3 15.8 26.2 12.3 11 5.6 8.9 -- -- 248.3 174.5 29.4 124.2 -- -- 7715.6 447.1 314.6 48.3 309.8 53.7 590.2 47 148 251-C3-179249 120.4 3 60 43.918 69.716 2.2 10.2 -- -- -- -- 28.7 25.9 -- -- -- -- 15.1 11.5 -- -- 219.6 153.8 572.6 438.8 8564.9 476.1 371.4 44.4 345 55.1 760.4 53.1 215 27.51-C3-179250 126.4 4 60 43.918 69.716 9.3 9.6 15.4 9.1 2 8 -- -- 11 9.7 -- -- 2.3 8.1 70.7 87.5 75.6 104.1 176.5 368.1 9297.6 499.7 283 41.2 313.6 52.8 724.9 50.4 184.7 22.41-C3-179251 90.6 5 60 43.918 69.716 8.6 13.7 -- -- 4.3 14.6 -- -- 20.5 16.4 23.5 13 18.2 12.1 -- -- 121.2 169.9 587.2 477.3 9255 591.5 359.6 65.2 473.1 70.9 691.8 63.2 179 321-C3-179252 121.2 6 60 43.918 69.716 -- -- 9.9 13.7 11.2 12.7 -- -- -- -- 8.2 10.6 7.7 13.2 24.6 88.6 5 103.6 986.5 469.5 9456.5 502.9 321.8 48.3 405 56.2 727.2 52.7 205.3 281-C3-179253 119.7 7 60 43.918 69.716 -- -- 1.2 10.5 4.9 11.5 93.1 32.7 25.3 22 7.9 12.9 -- -- 149.2 120.6 35.7 84.5 129 262.2 11373.3 546.4 366.1 47 382.4 58.1 785.6 54.2 276 32.11-C3-179254 116.9 8 60 43.918 69.716 19 18.4 29.6 14 14.9 11.5 25.3 27.3 27.8 16.1 15.2 12.1 8.9 12.5 34 119.6 5.2 74.4 553 373.9 11197.8 578.3 255.9 50.4 408.5 58 844.2 56 236.4 29.71-C3-179255 114.2 9 60 43.918 69.716 -- -- -- -- 19.2 14.1 1.1 30.2 7.7 17.4 0.9 14.4 33.2 13.5 109.5 96.8 114 106.6 285.5 249.4 11271.5 568.9 344.9 48.5 310.5 60.2 832.2 55.8 172.6 25.31-C3-179256 116.3 10 60 43.918 69.716 -- -- 2.5 9.9 -- -- 25.4 40.2 14 15.4 10.2 10.6 -- -- 92.1 97.9 81.3 93.8 510.6 401.3 10942.9 555.8 417.3 43.2 347.5 45.7 878.6 57.1 166 29.31-C3-179257 112.6 11 60 43.918 69.716 4.6 11.5 2.6 9.2 -- -- -- -- -- -- 10.5 16.3 -- -- 121.6 102.9 -- -- 1295.6 582.2 10462.9 557.1 428.1 53.7 344.2 60.4 798.3 56.6 245.4 29.91-C3-179258 128.1 1 61 43.928 69.706 17.8 11.8 10.1 9.8 -- -- 4.8 25.7 27.6 15.1 1.5 9 -- -- 111.5 119.8 258.8 137 -- -- 8595.1 485.6 346.4 48.9 310.9 52.6 815.2 48.9 172.9 261-C3-179259 128.4 2 61 43.928 69.706 -- -- -- -- 9.8 9.7 7.7 18.6 22.5 13.9 18.5 10.2 0.8 9.5 9.3 86.3 -- -- 280.7 353.9 9288.7 505.4 265.4 38.9 406 55.1 780.3 51.8 200.5 26.71-C3-179260 125.5 3 61 43.928 69.706 9.7 13.7 4.6 12.5 10.8 17 -- -- 8.9 9.7 18.9 10.4 -- -- 75.9 84.9 -- -- 555.2 436.4 8912.2 482.5 268.1 43.5 358.4 53.4 773.8 51.9 196.3 23.61-C3-179261 112.5 4 61 43.928 69.706 21.7 14.1 39.8 14.6 13.4 13.8 -- -- 13.6 12.6 2.6 10.2 5.2 8.7 47.6 94.8 13.6 125.3 -- -- 9851.6 504.7 269.4 45.8 396.3 56.9 743.6 54.8 241.1 26.1
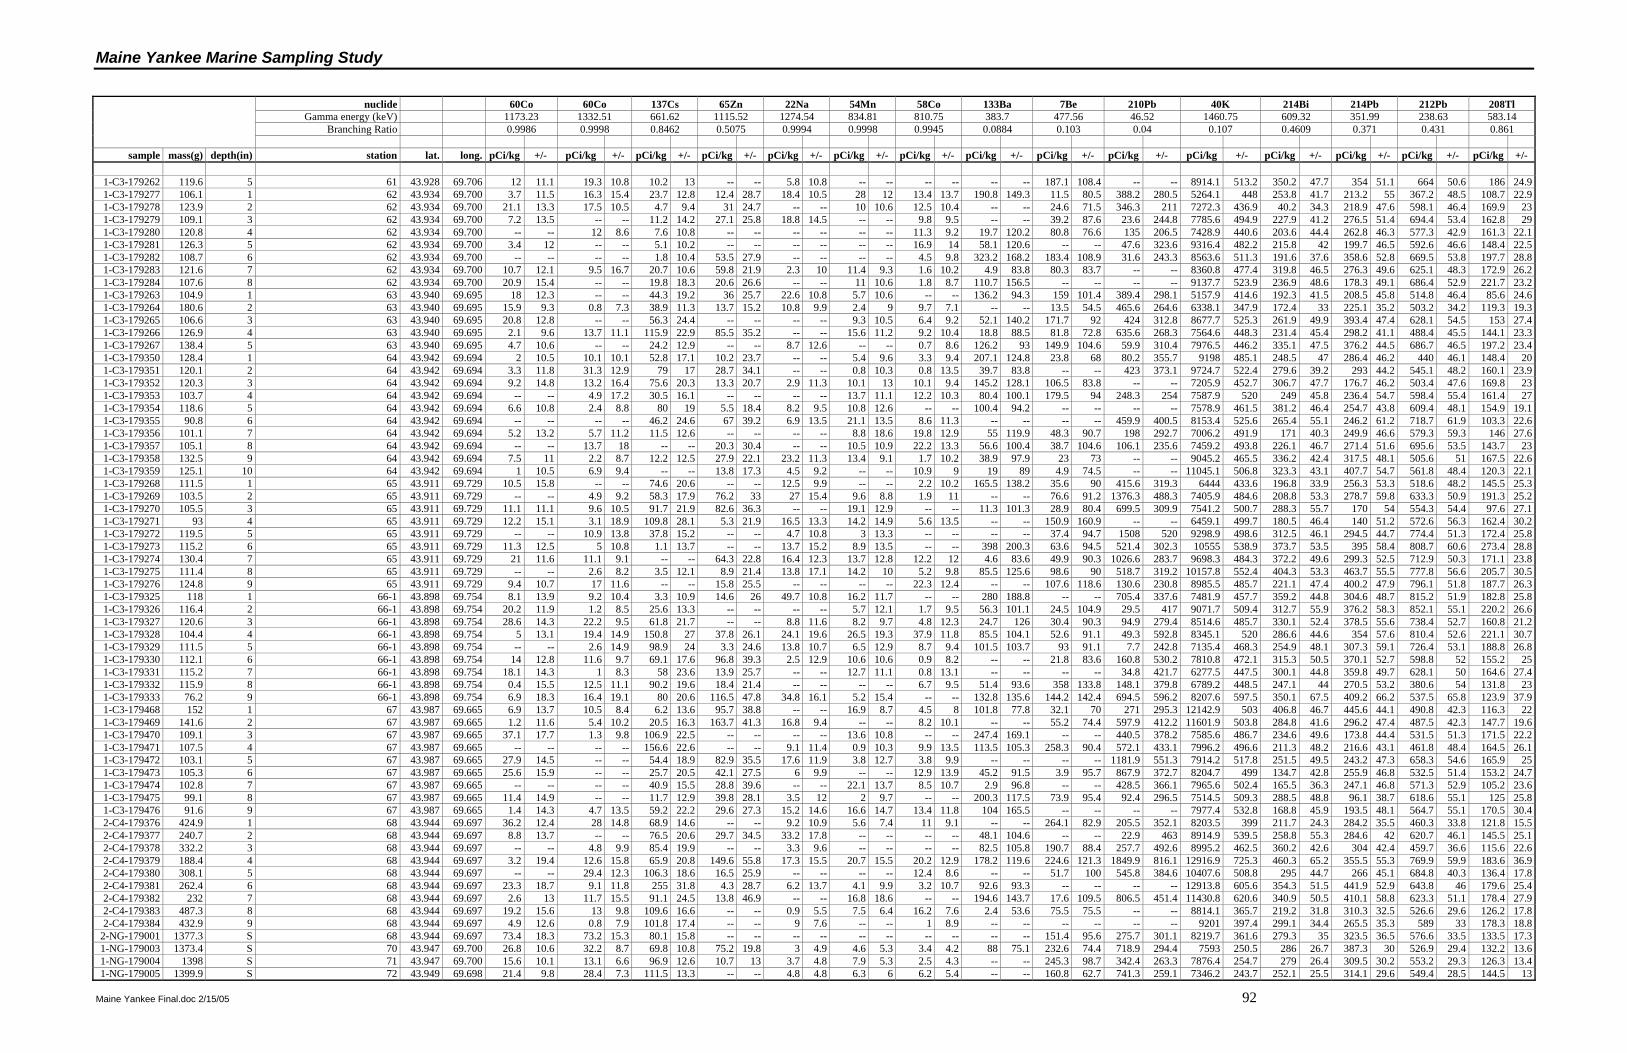
Maine Yankee Marine Sampling Study
Maine Yankee Final.doc 2/15/05 92
nuclide 60Co 60Co 137Cs 65Zn 22Na 54Mn 58Co 133Ba 7Be 210Pb 40K 214Bi 214Pb 212Pb 208Tl Gamma energy (keV) 1173.23 1332.51 661.62 1115.52 1274.54 834.81 810.75 383.7 477.56 46.52 1460.75 609.32 351.99 238.63 583.14 Branching Ratio 0.9986 0.9998 0.8462 0.5075 0.9994 0.9998 0.9945 0.0884 0.103 0.04 0.107 0.4609 0.371 0.431 0.861
sample mass(g) depth(in) station lat. long. pCi/kg +/- pCi/kg +/- pCi/kg +/- pCi/kg +/- pCi/kg +/- pCi/kg +/- pCi/kg +/- pCi/kg +/- pCi/kg +/- pCi/kg +/- pCi/kg +/- pCi/kg +/- pCi/kg +/- pCi/kg +/- pCi/kg +/-
1-C3-179262 119.6 5 61 43.928 69.706 12 11.1 19.3 10.8 10.2 13 -- -- 5.8 10.8 -- -- -- -- -- -- 187.1 108.4 -- -- 8914.1 513.2 350.2 47.7 354 51.1 664 50.6 186 24.91-C3-179277 106.1 1 62 43.934 69.700 3.7 11.5 16.3 15.4 23.7 12.8 12.4 28.7 18.4 10.5 28 12 13.4 13.7 190.8 149.3 11.5 80.5 388.2 280.5 5264.1 448 253.8 41.7 213.2 55 367.2 48.5 108.7 22.91-C3-179278 123.9 2 62 43.934 69.700 21.1 13.3 17.5 10.5 4.7 9.4 31 24.7 -- -- 10 10.6 12.5 10.4 -- -- 24.6 71.5 346.3 211 7272.3 436.9 40.2 34.3 218.9 47.6 598.1 46.4 169.9 231-C3-179279 109.1 3 62 43.934 69.700 7.2 13.5 -- -- 11.2 14.2 27.1 25.8 18.8 14.5 -- -- 9.8 9.5 -- -- 39.2 87.6 23.6 244.8 7785.6 494.9 227.9 41.2 276.5 51.4 694.4 53.4 162.8 291-C3-179280 120.8 4 62 43.934 69.700 -- -- 12 8.6 7.6 10.8 -- -- -- -- -- -- 11.3 9.2 19.7 120.2 80.8 76.6 135 206.5 7428.9 440.6 203.6 44.4 262.8 46.3 577.3 42.9 161.3 22.11-C3-179281 126.3 5 62 43.934 69.700 3.4 12 -- -- 5.1 10.2 -- -- -- -- -- -- 16.9 14 58.1 120.6 -- -- 47.6 323.6 9316.4 482.2 215.8 42 199.7 46.5 592.6 46.6 148.4 22.51-C3-179282 108.7 6 62 43.934 69.700 -- -- -- -- 1.8 10.4 53.5 27.9 -- -- -- -- 4.5 9.8 323.2 168.2 183.4 108.9 31.6 243.3 8563.6 511.3 191.6 37.6 358.6 52.8 669.5 53.8 197.7 28.81-C3-179283 121.6 7 62 43.934 69.700 10.7 12.1 9.5 16.7 20.7 10.6 59.8 21.9 2.3 10 11.4 9.3 1.6 10.2 4.9 83.8 80.3 83.7 -- -- 8360.8 477.4 319.8 46.5 276.3 49.6 625.1 48.3 172.9 26.21-C3-179284 107.6 8 62 43.934 69.700 20.9 15.4 -- -- 19.8 18.3 20.6 26.6 -- -- 11 10.6 1.8 8.7 110.7 156.5 -- -- -- -- 9137.7 523.9 236.9 48.6 178.3 49.1 686.4 52.9 221.7 23.21-C3-179263 104.9 1 63 43.940 69.695 18 12.3 -- -- 44.3 19.2 36 25.7 22.6 10.8 5.7 10.6 -- -- 136.2 94.3 159 101.4 389.4 298.1 5157.9 414.6 192.3 41.5 208.5 45.8 514.8 46.4 85.6 24.61-C3-179264 180.6 2 63 43.940 69.695 15.9 9.3 0.8 7.3 38.9 11.3 13.7 15.2 10.8 9.9 2.4 9 9.7 7.1 -- -- 13.5 54.5 465.6 264.6 6338.1 347.9 172.4 33 225.1 35.2 503.2 34.2 119.3 19.31-C3-179265 106.6 3 63 43.940 69.695 20.8 12.8 -- -- 56.3 24.4 -- -- -- -- 9.3 10.5 6.4 9.2 52.1 140.2 171.7 92 424 312.8 8677.7 525.3 261.9 49.9 393.4 47.4 628.1 54.5 153 27.41-C3-179266 126.9 4 63 43.940 69.695 2.1 9.6 13.7 11.1 115.9 22.9 85.5 35.2 -- -- 15.6 11.2 9.2 10.4 18.8 88.5 81.8 72.8 635.6 268.3 7564.6 448.3 231.4 45.4 298.2 41.1 488.4 45.5 144.1 23.31-C3-179267 138.4 5 63 43.940 69.695 4.7 10.6 -- -- 24.2 12.9 -- -- 8.7 12.6 -- -- 0.7 8.6 126.2 93 149.9 104.6 59.9 310.4 7976.5 446.2 335.1 47.5 376.2 44.5 686.7 46.5 197.2 23.41-C3-179350 128.4 1 64 43.942 69.694 2 10.5 10.1 10.1 52.8 17.1 10.2 23.7 -- -- 5.4 9.6 3.3 9.4 207.1 124.8 23.8 68 80.2 355.7 9198 485.1 248.5 47 286.4 46.2 440 46.1 148.4 201-C3-179351 120.1 2 64 43.942 69.694 3.3 11.8 31.3 12.9 79 17 28.7 34.1 -- -- 0.8 10.3 0.8 13.5 39.7 83.8 -- -- 423 373.1 9724.7 522.4 279.6 39.2 293 44.2 545.1 48.2 160.1 23.91-C3-179352 120.3 3 64 43.942 69.694 9.2 14.8 13.2 16.4 75.6 20.3 13.3 20.7 2.9 11.3 10.1 13 10.1 9.4 145.2 128.1 106.5 83.8 -- -- 7205.9 452.7 306.7 47.7 176.7 46.2 503.4 47.6 169.8 231-C3-179353 103.7 4 64 43.942 69.694 -- -- 4.9 17.2 30.5 16.1 -- -- -- -- 13.7 11.1 12.2 10.3 80.4 100.1 179.5 94 248.3 254 7587.9 520 249 45.8 236.4 54.7 598.4 55.4 161.4 271-C3-179354 118.6 5 64 43.942 69.694 6.6 10.8 2.4 8.8 80 19 5.5 18.4 8.2 9.5 10.8 12.6 -- -- 100.4 94.2 -- -- -- -- 7578.9 461.5 381.2 46.4 254.7 43.8 609.4 48.1 154.9 19.11-C3-179355 90.8 6 64 43.942 69.694 -- -- -- -- 46.2 24.6 67 39.2 6.9 13.5 21.1 13.5 8.6 11.3 -- -- -- -- 459.9 400.5 8153.4 525.6 265.4 55.1 246.2 61.2 718.7 61.9 103.3 22.61-C3-179356 101.1 7 64 43.942 69.694 5.2 13.2 5.7 11.2 11.5 12.6 -- -- -- -- 8.8 18.6 19.8 12.9 55 119.9 48.3 90.7 198 292.7 7006.2 491.9 171 40.3 249.9 46.6 579.3 59.3 146 27.61-C3-179357 105.1 8 64 43.942 69.694 -- -- 13.7 18 -- -- 20.3 30.4 -- -- 10.5 10.9 22.2 13.3 56.6 100.4 38.7 104.6 106.1 235.6 7459.2 493.8 226.1 46.7 271.4 51.6 695.6 53.5 143.7 231-C3-179358 132.5 9 64 43.942 69.694 7.5 11 2.2 8.7 12.2 12.5 27.9 22.1 23.2 11.3 13.4 9.1 1.7 10.2 38.9 97.9 23 73 -- -- 9045.2 465.5 336.2 42.4 317.5 48.1 505.6 51 167.5 22.61-C3-179359 125.1 10 64 43.942 69.694 1 10.5 6.9 9.4 -- -- 13.8 17.3 4.5 9.2 -- -- 10.9 9 19 89 4.9 74.5 -- -- 11045.1 506.8 323.3 43.1 407.7 54.7 561.8 48.4 120.3 22.11-C3-179268 111.5 1 65 43.911 69.729 10.5 15.8 -- -- 74.6 20.6 -- -- 12.5 9.9 -- -- 2.2 10.2 165.5 138.2 35.6 90 415.6 319.3 6444 433.6 196.8 33.9 256.3 53.3 518.6 48.2 145.5 25.31-C3-179269 103.5 2 65 43.911 69.729 -- -- 4.9 9.2 58.3 17.9 76.2 33 27 15.4 9.6 8.8 1.9 11 -- -- 76.6 91.2 1376.3 488.3 7405.9 484.6 208.8 53.3 278.7 59.8 633.3 50.9 191.3 25.21-C3-179270 105.5 3 65 43.911 69.729 11.1 11.1 9.6 10.5 91.7 21.9 82.6 36.3 -- -- 19.1 12.9 -- -- 11.3 101.3 28.9 80.4 699.5 309.9 7541.2 500.7 288.3 55.7 170 54 554.3 54.4 97.6 27.11-C3-179271 93 4 65 43.911 69.729 12.2 15.1 3.1 18.9 109.8 28.1 5.3 21.9 16.5 13.3 14.2 14.9 5.6 13.5 -- -- 150.9 160.9 -- -- 6459.1 499.7 180.5 46.4 140 51.2 572.6 56.3 162.4 30.21-C3-179272 119.5 5 65 43.911 69.729 -- -- 10.9 13.8 37.8 15.2 -- -- 4.7 10.8 3 13.3 -- -- -- -- 37.4 94.7 1508 520 9298.9 498.6 312.5 46.1 294.5 44.7 774.4 51.3 172.4 25.81-C3-179273 115.2 6 65 43.911 69.729 11.3 12.5 5 10.8 1.1 13.7 -- -- 13.7 15.2 8.9 13.5 -- -- 398 200.3 63.6 94.5 521.4 302.3 10555 538.9 373.7 53.5 395 58.4 808.7 60.6 273.4 28.81-C3-179274 130.4 7 65 43.911 69.729 21 11.6 11.1 9.1 -- -- 64.3 22.8 16.4 12.3 13.7 12.8 12.2 12 4.6 83.6 49.9 90.3 1026.6 283.7 9698.3 484.3 372.2 49.6 299.3 52.5 712.9 50.3 171.1 23.81-C3-179275 111.4 8 65 43.911 69.729 -- -- 2.6 8.2 3.5 12.1 8.9 21.4 13.8 17.1 14.2 10 5.2 9.8 85.5 125.6 98.6 90 518.7 319.2 10157.8 552.4 404.3 53.3 463.7 55.5 777.8 56.6 205.7 30.51-C3-179276 124.8 9 65 43.911 69.729 9.4 10.7 17 11.6 -- -- 15.8 25.5 -- -- -- -- 22.3 12.4 -- -- 107.6 118.6 130.6 230.8 8985.5 485.7 221.1 47.4 400.2 47.9 796.1 51.8 187.7 26.31-C3-179325 118 1 66-1 43.898 69.754 8.1 13.9 9.2 10.4 3.3 10.9 14.6 26 49.7 10.8 16.2 11.7 -- -- 280 188.8 -- -- 705.4 337.6 7481.9 457.7 359.2 44.8 304.6 48.7 815.2 51.9 182.8 25.81-C3-179326 116.4 2 66-1 43.898 69.754 20.2 11.9 1.2 8.5 25.6 13.3 -- -- -- -- 5.7 12.1 1.7 9.5 56.3 101.1 24.5 104.9 29.5 417 9071.7 509.4 312.7 55.9 376.2 58.3 852.1 55.1 220.2 26.61-C3-179327 120.6 3 66-1 43.898 69.754 28.6 14.3 22.2 9.5 61.8 21.7 -- -- 8.8 11.6 8.2 9.7 4.8 12.3 24.7 126 30.4 90.3 94.9 279.4 8514.6 485.7 330.1 52.4 378.5 55.6 738.4 52.7 160.8 21.21-C3-179328 104.4 4 66-1 43.898 69.754 5 13.1 19.4 14.9 150.8 27 37.8 26.1 24.1 19.6 26.5 19.3 37.9 11.8 85.5 104.1 52.6 91.1 49.3 592.8 8345.1 520 286.6 44.6 354 57.6 810.4 52.6 221.1 30.71-C3-179329 111.5 5 66-1 43.898 69.754 -- -- 2.6 14.9 98.9 24 3.3 24.6 13.8 10.7 6.5 12.9 8.7 9.4 101.5 103.7 93 91.1 7.7 242.8 7135.4 468.3 254.9 48.1 307.3 59.1 726.4 53.1 188.8 26.81-C3-179330 112.1 6 66-1 43.898 69.754 14 12.8 11.6 9.7 69.1 17.6 96.8 39.3 2.5 12.9 10.6 10.6 0.9 8.2 -- -- 21.8 83.6 160.8 530.2 7810.8 472.1 315.3 50.5 370.1 52.7 598.8 52 155.2 251-C3-179331 115.2 7 66-1 43.898 69.754 18.1 14.3 1 8.3 58 23.6 13.9 25.7 -- -- 12.7 11.1 0.8 13.1 -- -- -- -- 34.8 421.7 6277.5 447.5 300.1 44.8 359.8 49.7 628.1 50 164.6 27.41-C3-179332 115.9 8 66-1 43.898 69.754 0.4 15.5 12.5 11.1 90.2 19.6 18.4 21.4 -- -- -- -- 6.7 9.5 51.4 93.6 358 133.8 148.1 379.8 6789.2 448.5 247.1 44 270.5 53.2 380.6 54 131.8 231-C3-179333 76.2 9 66-1 43.898 69.754 6.9 18.3 16.4 19.1 80 20.6 116.5 47.8 34.8 16.1 5.2 15.4 -- -- 132.8 135.6 144.2 142.4 694.5 596.2 8207.6 597.5 350.1 67.5 409.2 66.2 537.5 65.8 123.9 37.91-C3-179468 152 1 67 43.987 69.665 6.9 13.7 10.5 8.4 6.2 13.6 95.7 38.8 -- -- 16.9 8.7 4.5 8 101.8 77.8 32.1 70 271 295.3 12142.9 503 406.8 46.7 445.6 44.1 490.8 42.3 116.3 221-C3-179469 141.6 2 67 43.987 69.665 1.2 11.6 5.4 10.2 20.5 16.3 163.7 41.3 16.8 9.4 -- -- 8.2 10.1 -- -- 55.2 74.4 597.9 412.2 11601.9 503.8 284.8 41.6 296.2 47.4 487.5 42.3 147.7 19.61-C3-179470 109.1 3 67 43.987 69.665 37.1 17.7 1.3 9.8 106.9 22.5 -- -- -- -- 13.6 10.8 -- -- 247.4 169.1 -- -- 440.5 378.2 7585.6 486.7 234.6 49.6 173.8 44.4 531.5 51.3 171.5 22.21-C3-179471 107.5 4 67 43.987 69.665 -- -- -- -- 156.6 22.6 -- -- 9.1 11.4 0.9 10.3 9.9 13.5 113.5 105.3 258.3 90.4 572.1 433.1 7996.2 496.6 211.3 48.2 216.6 43.1 461.8 48.4 164.5 26.11-C3-179472 103.1 5 67 43.987 69.665 27.9 14.5 -- -- 54.4 18.9 82.9 35.5 17.6 11.9 3.8 12.7 3.8 9.9 -- -- -- -- 1181.9 551.3 7914.2 517.8 251.5 49.5 243.2 47.3 658.3 54.6 165.9 251-C3-179473 105.3 6 67 43.987 69.665 25.6 15.9 -- -- 25.7 20.5 42.1 27.5 6 9.9 -- -- 12.9 13.9 45.2 91.5 3.9 95.7 867.9 372.7 8204.7 499 134.7 42.8 255.9 46.8 532.5 51.4 153.2 24.71-C3-179474 102.8 7 67 43.987 69.665 -- -- -- -- 40.9 15.5 28.8 39.6 -- -- 22.1 13.7 8.5 10.7 2.9 96.8 -- -- 428.5 366.1 7965.6 502.4 165.5 36.3 247.1 46.8 571.3 52.9 105.2 23.61-C3-179475 99.1 8 67 43.987 69.665 11.4 14.9 -- -- 11.7 12.9 39.8 28.1 3.5 12 2 9.7 -- -- 200.3 117.5 73.9 95.4 92.4 296.5 7514.5 509.3 288.5 48.8 96.1 38.7 618.6 55.1 125 25.81-C3-179476 91.6 9 67 43.987 69.665 1.4 14.3 4.7 13.5 59.2 22.2 29.6 27.3 15.2 14.6 16.6 14.7 13.4 11.8 104 165.5 -- -- -- -- 7977.4 532.8 168.8 45.9 193.5 48.1 564.7 55.1 170.5 30.42-C4-179376 424.9 1 68 43.944 69.697 36.2 12.4 28 14.8 68.9 14.6 -- -- 9.2 10.9 5.6 7.4 11 9.1 -- -- 264.1 82.9 205.5 352.1 8203.5 399 211.7 24.3 284.2 35.5 460.3 33.8 121.8 15.52-C4-179377 240.7 2 68 43.944 69.697 8.8 13.7 -- -- 76.5 20.6 29.7 34.5 33.2 17.8 -- -- -- -- 48.1 104.6 -- -- 22.9 463 8914.9 539.5 258.8 55.3 284.6 42 620.7 46.1 145.5 25.12-C4-179378 332.2 3 68 43.944 69.697 -- -- 4.8 9.9 85.4 19.9 -- -- 3.3 9.6 -- -- -- -- 82.5 105.8 190.7 88.4 257.7 492.6 8995.2 462.5 360.2 42.6 304 42.4 459.7 36.6 115.6 22.62-C4-179379 188.4 4 68 43.944 69.697 3.2 19.4 12.6 15.8 65.9 20.8 149.6 55.8 17.3 15.5 20.7 15.5 20.2 12.9 178.2 119.6 224.6 121.3 1849.9 816.1 12916.9 725.3 460.3 65.2 355.5 55.3 769.9 59.9 183.6 36.92-C4-179380 308.1 5 68 43.944 69.697 -- -- 29.4 12.3 106.3 18.6 16.5 25.9 -- -- -- -- 12.4 8.6 -- -- 51.7 100 545.8 384.6 10407.6 508.8 295 44.7 266 45.1 684.8 40.3 136.4 17.82-C4-179381 262.4 6 68 43.944 69.697 23.3 18.7 9.1 11.8 255 31.8 4.3 28.7 6.2 13.7 4.1 9.9 3.2 10.7 92.6 93.3 -- -- -- -- 12913.8 605.6 354.3 51.5 441.9 52.9 643.8 46 179.6 25.42-C4-179382 232 7 68 43.944 69.697 2.6 13 11.7 15.5 91.1 24.5 13.8 46.9 -- -- 16.8 18.6 -- -- 194.6 143.7 17.6 109.5 806.5 451.4 11430.8 620.6 340.9 50.5 410.1 58.8 623.3 51.1 178.4 27.92-C4-179383 487.3 8 68 43.944 69.697 19.2 15.6 13 9.8 109.6 16.6 -- -- 0.9 5.5 7.5 6.4 16.2 7.6 2.4 53.6 75.5 75.5 -- -- 8814.1 365.7 219.2 31.8 310.3 32.5 526.6 29.6 126.2 17.82-C4-179384 432.9 9 68 43.944 69.697 4.9 12.6 0.8 7.9 101.8 17.4 -- -- 9 7.6 -- -- 1 8.9 -- -- -- -- -- -- 9201 397.4 299.1 34.4 265.5 35.3 589 33 178.3 18.8
2-NG-179001 1377.3 S 68 43.944 69.697 73.4 18.3 73.2 15.3 80.1 15.8 -- -- -- -- -- -- -- -- -- -- 151.4 95.6 275.7 301.1 8219.7 361.6 279.3 35 323.5 36.5 576.6 33.5 133.5 17.31-NG-179003 1373.4 S 70 43.947 69.700 26.8 10.6 32.2 8.7 69.8 10.8 75.2 19.8 3 4.9 4.6 5.3 3.4 4.2 88 75.1 232.6 74.4 718.9 294.4 7593 250.5 286 26.7 387.3 30 526.9 29.4 132.2 13.61-NG-179004 1398 S 71 43.947 69.700 15.6 10.1 13.1 6.6 96.9 12.6 10.7 13 3.7 4.8 7.9 5.3 2.5 4.3 -- -- 245.3 98.7 342.4 263.3 7876.4 254.7 279 26.4 309.5 30.2 553.2 29.3 126.3 13.41-NG-179005 1399.9 S 72 43.949 69.698 21.4 9.8 28.4 7.3 111.5 13.3 -- -- 4.8 4.8 6.3 6 6.2 5.4 -- -- 160.8 62.7 741.3 259.1 7346.2 243.7 252.1 25.5 314.1 29.6 549.4 28.5 144.5 13

Maine Yankee Marine Sampling Study
Maine Yankee Final.doc 2/15/05 93
nuclide 60Co 60Co 137Cs 65Zn 22Na 54Mn 58Co 133Ba 7Be 210Pb 40K 214Bi 214Pb 212Pb 208Tl Gamma energy (keV) 1173.23 1332.51 661.62 1115.52 1274.54 834.81 810.75 383.7 477.56 46.52 1460.75 609.32 351.99 238.63 583.14 Branching Ratio 0.9986 0.9998 0.8462 0.5075 0.9994 0.9998 0.9945 0.0884 0.103 0.04 0.107 0.4609 0.371 0.431 0.861
sample mass(g) depth(in) station lat. long. pCi/kg +/- pCi/kg +/- pCi/kg +/- pCi/kg +/- pCi/kg +/- pCi/kg +/- pCi/kg +/- pCi/kg +/- pCi/kg +/- pCi/kg +/- pCi/kg +/- pCi/kg +/- pCi/kg +/- pCi/kg +/- pCi/kg +/-
1-C4-179422 457.6 1 73 43.949 69.699 7.2 5.5 26.6 7.7 47.1 10 -- -- -- -- 5.7 4.8 3.7 4.5 70.9 57.4 104.7 59.4 873 257.7 6082.5 232.3 258.8 22.4 223.9 24.1 350.2 26.3 127 121-C4-179423 363.8 2 73 43.949 69.699 15.2 7.9 29.1 9.1 79.3 14.6 21.6 21.2 8.1 6 1.7 7.6 4 4.6 9.3 50.1 47 41.8 394.2 326.3 7509.5 295.9 239.8 28.7 245.8 30.9 478.2 30.5 129.7 15.51-C4-179424 342.1 3 73 43.949 69.699 -- -- 4.4 5.7 59.9 12 11.9 11.8 4.3 6 -- -- -- -- -- -- -- -- 565.9 407.5 8347.4 324.6 234.2 25.7 278.5 33.4 521 31.8 151.5 15.11-C4-179425 426.6 4 73 43.949 69.699 17.2 6.5 5.8 4.9 79.2 12.5 -- -- -- -- 15.9 7 -- -- 18.5 61.4 2 39.2 569 259.4 7411.9 262.9 222.8 25.1 261.1 30.6 481.3 26.4 141.5 13.71-C4-179426 351.2 5 73 43.949 69.699 1.5 6.7 2.2 8.9 113.6 14.8 3.7 12.6 -- -- 9.5 5.5 -- -- 2.4 51 -- -- 857.4 348.3 8060.6 305.4 284.5 32.3 362.8 33.1 516.1 30.2 113.7 15.81-C4-179427 335.2 6 73 43.949 69.699 11.9 7.1 1.7 5.5 93.6 15.7 -- -- 3.3 5.7 5.6 6.4 -- -- -- -- 30.6 59.5 1049.6 432.5 7843.8 315.7 308.9 31.3 278 33.3 495.1 33 140.7 15.61-C4-179428 343.3 7 73 43.949 69.699 6 7.3 6.1 6.1 93.7 14.9 9.6 12 -- -- 7.8 7.3 0.4 5 103.5 71.6 19.9 58.1 -- -- 7836 306.7 208.6 29.5 268.2 32.9 576.2 33.4 162.6 15.61-C4-179429 335.4 8 73 43.949 69.699 7.7 7.6 17.6 11 123.3 17.1 -- -- 6.6 6.1 0.8 5.3 7.9 5.1 -- -- -- -- 616.1 407.4 8905.5 331.2 239.5 30.5 255.3 34.3 694.7 31.2 195.3 16.71-C4-179430 315.3 9 73 43.949 69.699 1.8 7.3 9.6 6.6 153.5 17.6 11.4 12.8 17.8 8.1 0.3 7.2 4.6 5.6 10.7 60.3 12.7 61.1 687.1 377.4 9047.8 344.6 279.6 32.3 275.2 37 716.4 35.4 194.9 18.61-C4-179431 388.9 10 73 43.949 69.699 -- -- 1 4.9 124.1 15.7 5.1 13.5 7.6 5.5 6.9 5.3 0.9 5.2 28.3 48.2 92.4 45.7 409.6 326.5 8184.3 293.6 230.8 27.5 273.2 31.2 607.7 31.1 185.8 15.41-C4-179432 355.5 11 73 43.949 69.699 10.7 8.2 -- -- 170.6 18.3 -- -- -- -- -- -- 2.6 5.6 176.9 98.6 1.6 57.2 289.6 333.9 8937.1 324.2 271.2 28.5 252.6 32.8 623.8 33.7 179.2 16.6
2-NG-179009 1423 S 73 43.949 69.699 19.5 10.5 45.8 11.2 100.1 16.5 90.1 24.2 13.6 10.1 1.8 6.6 -- -- 72.8 60.5 301.1 106 118.6 383.6 8359.5 363.3 309.5 34.7 376.2 40.2 537.1 32.8 147.8 17.32-C4-179433 602.6 1 74 43.950 69.698 20.5 12.3 0.8 6.1 67.5 10.3 -- -- 2.7 6 -- -- 2.1 4.5 30.7 50.3 -- -- -- -- 6719.2 288.6 230.2 25.5 203.4 25.9 378.6 22.6 99.4 13.12-C4-179434 377.9 2 74 43.950 69.698 4.8 9.2 -- -- 162.4 20.8 14.9 17.7 3.5 9.5 -- -- -- -- 93.9 79 -- -- 508.1 278.6 9099.9 435.5 309.9 32.7 304.8 38.4 493.5 35 180.9 212-C4-179435 311.1 3 74 43.950 69.698 8.7 11.7 4.4 13.6 183.8 21.6 7.9 29.9 -- -- -- -- 2.4 9.4 141.4 82.4 138 109.2 1043.6 569.4 10240.4 502.4 433.7 47.9 386.6 46.5 661.8 40.9 156.6 23.42-C4-179436 310.2 4 74 43.950 69.698 2.9 10.2 11 11 201 23.9 -- -- -- -- 16.7 14.8 24.1 10.8 92.1 96.4 -- -- 130.1 454.2 9912.5 495.9 252 38.7 327.2 54.4 629.8 46.5 209.2 23.92-C4-179437 375.9 5 74 43.950 69.698 16.8 11.2 13.6 8.7 261.8 24.5 17 17.5 10.4 11.5 8.6 7.8 -- -- 70.8 74.7 62 65.3 -- -- 10485.5 458.2 315 36.4 352.3 43.4 699.9 37.3 188.3 21.42-C4-179438 330.5 6 74 43.950 69.698 16.4 12.2 -- -- 155 22.7 11.9 22.3 1.3 11.6 10.5 13.1 -- -- 3.5 77.1 76.7 99.1 -- -- 8800.2 461.2 352.6 44.7 370 44.9 666.5 40.7 184.3 20.52-C4-179439 338.6 7 74 43.950 69.698 -- -- -- -- 209.1 25.9 -- -- -- -- -- -- 23.7 12.6 88.9 132.8 94.2 73 -- -- 9674.9 478.3 315.5 44.4 308 46.4 650.1 41.1 191.1 23.22-C4-179440 331.2 8 74 43.950 69.698 7.3 12.9 5.5 12.4 157.5 24 -- -- 37.4 18.2 30 13.2 -- -- -- -- -- -- 596.3 497 10759.8 491.6 389.6 46.2 275.8 49.1 737.2 42.4 196.5 252-C4-179441 332.8 9 74 43.950 69.698 6.3 15.4 -- -- 110.1 24.2 28.8 23.9 -- -- 3.2 8.9 9.5 8.3 20.9 75.3 18.4 67.6 716.5 552.3 9666.4 473.5 303.3 37.3 301.3 41.4 782.4 41.5 242.6 242-C4-179442 352.4 10 74 43.950 69.698 -- -- 1.9 11.8 29.6 11.3 3.2 24 -- -- 5.5 8.8 13.2 10 56.9 90.8 -- -- -- -- 9679.7 459.1 348.4 43.3 370.8 43.9 692.9 39.8 244.7 23.62-C4-179443 342.2 11 74 43.950 69.698 -- -- 19.2 13.1 40.7 11 -- -- 9.5 12.3 7.6 13.3 6.8 8.6 142.1 120.5 78.8 113.1 396.7 419.8 9563 467.3 294 41.9 317.3 44.3 829.8 39.6 164.2 23
2-NG-179010 1416 S 74 43.950 69.698 52.6 15.3 20.2 10.2 162.8 19.2 80 28.8 5.4 9.2 0.5 5.8 -- -- 133.2 64.8 245.4 97.1 -- -- 8877.8 369.2 330.7 34.3 313.5 37.5 535.2 33.5 97.8 191-NG-179011 1421.5 S 75 43.951 69.698 20.2 7.8 28.8 8.2 96.8 11.8 -- -- 2.6 4.8 0.8 4.3 6.3 4.5 -- -- 103.1 74.4 916.2 332.3 8043.4 258.6 316.5 27.5 322.6 31.1 509.7 32.7 132.1 12.12-NG-179012 1278.3 S 76 43.954 69.698 59.9 17.7 50.8 13.9 109.1 18.6 -- -- 0.7 7.7 9.2 11.8 8.7 7 46.3 82.8 324.2 123.9 -- -- 9439.8 401.3 246.9 36.7 360.6 38.3 598.7 35.7 169.7 19.22-C4-179213 472.6 1 77 43.955 69.697 9.6 8 21.6 8.1 54.6 11.8 -- -- 3.1 6.8 2.7 5.6 2.7 5.7 127.4 62.5 44.1 50.9 282 327.1 6476.9 332.2 160.7 28.2 168.6 28.6 371.1 25.7 85 14.92-C4-179214 368.6 2 77 43.955 69.697 -- -- 14.8 9.2 106.6 20.8 -- -- 2.7 9.1 4.1 7.6 17.8 7.6 52.3 104.3 153 98 806.2 509.1 8812.2 446 241.7 35.7 295.3 40.1 491.3 35.2 149.5 21.72-C4-179215 324.9 3 77 43.955 69.697 13 11.3 -- -- 128.5 24 23.1 20.6 -- -- 4.3 9.8 -- -- 71.3 77.9 218.9 110.7 1174.3 430.9 11315.2 514.6 245.5 33.3 443.5 46.6 625.8 40.2 177.3 23.42-C4-179216 267.7 4 77 43.955 69.697 2.3 12.2 2.5 11.1 161.3 29.5 59 38.1 7.3 11.2 40.4 15.2 17.4 9.9 34.6 141.6 100.8 133.1 -- -- 10515 559.1 296.1 47.8 254.9 51.5 626.6 45.7 132.8 182-C4-179217 335.6 5 77 43.955 69.697 5.4 11.8 9.1 8.4 221.9 25.7 2.2 18.5 13 12.6 12 10.8 4 8.9 110.4 80.5 -- -- 573.9 481.6 12209.5 521 332.8 42.3 379.9 49.3 630.9 39.5 152.1 242-C4-179218 314 6 77 43.955 69.697 13.4 13.6 6.1 13.2 222.2 29.3 -- -- 44.1 15 -- -- -- -- -- -- -- -- -- -- 13888.4 576.4 327 47.2 315.9 47.4 889.5 45.4 230.5 27.72-C4-179219 331.7 7 77 43.955 69.697 -- -- 6.8 12.6 202.3 23.6 -- -- -- -- 10.4 10.2 11.5 9.5 -- -- -- -- -- -- 12823.3 531.8 459.1 49.3 369.8 46.6 856.2 46.4 233.7 24.82-C4-179220 337.6 8 77 43.955 69.697 12.5 14.4 13.1 10.4 130.1 23.5 -- -- 25.1 11.5 17.2 8.9 4.4 8.4 -- -- -- -- -- -- 13903.3 551.8 374 40.1 326.2 42.4 988.2 44.4 238.1 25.82-C4-179221 316.5 9 77 43.955 69.697 -- -- -- -- 159.5 24.9 109.2 33.7 5.2 11.6 23.2 10.5 4.7 9.1 6.1 125.1 69.7 82.2 173.9 478.1 14074.4 575.9 400 42.3 355.1 50.8 1053.7 47.1 264.6 27.52-C4-179222 324.7 10 77 43.955 69.697 12.1 12.8 11.5 14.3 167 25.9 11.6 20.5 2 11.2 6.7 16.6 1.3 9.1 -- -- 11.3 73.1 -- -- 14413 581.8 385.6 45.9 352.4 49.8 924.9 47.3 274.3 26.82-C4-179223 344.6 11 77 43.955 69.697 25.3 12.1 -- -- 67.7 14.3 21.8 20.8 2.8 11.2 5 8.9 9.8 9.1 53.8 83.2 60.5 74 -- -- 14133.9 565 398.6 46.3 462.4 47.7 939.5 45 284.8 26.62-C4-179224 611.3 12 77 43.955 69.697 4.9 7.9 2.8 5.8 75 11 -- -- -- -- 6.4 6.7 -- -- 26.5 53.8 196.6 77.1 -- -- 9986.3 352.6 247.4 29.8 288 31.4 621.5 27.9 165.2 16.3
1-NG-179013 1234.3 S 77 43.955 69.697 70.5 11.9 66.9 11.9 78 13.8 -- -- -- -- 7.4 6.1 1.7 5.8 -- -- 593.9 85.9 348.2 314.8 8557.1 281 317.1 28.9 308.4 33.2 607.9 32.3 134.9 14.92-NG-179014 1414.4 S 78 43.944 69.698 45.1 14.9 19.6 10.3 61.1 13.1 -- -- 3.4 6.8 -- -- 0.9 5.3 10.5 57.1 38.2 78.5 -- -- 7384 344.9 261.4 34.6 323.6 36.4 563.3 32.8 151 18.12-NG-179015 1410.7 S 79 43.944 69.699 19.9 15.4 42 12.1 101.3 16 -- -- 13.9 9.6 2.8 6.7 7.7 6.5 59.4 72.7 255.4 73.9 414.8 364.9 9297.1 376.6 248.9 31.8 359.8 37.5 436.2 29.8 128.4 18.62-NG-179016 1405.8 S 80 43.944 69.700 45.8 13.9 23.2 8.5 82.9 17.7 -- -- 10.8 7.3 1.9 6.8 -- -- -- -- 296.6 95.4 -- -- 9150.2 372.8 325.1 34.3 333.7 37.7 599.7 34.6 177.8 18.21-NG-179017 1464.5 S 81 43.943 69.697 40.8 10.7 53.2 10.7 26.9 7.1 0.3 13.6 -- -- 4.6 5.3 2.4 5.8 43.1 45.7 168 52.7 181.1 139.4 7610 245.7 303 25.5 348.3 28.5 552.5 28.7 130.3 12.51-NG-179018 1417.8 S 82 43.944 69.697 80.4 11.3 81 10.1 72.4 13 107.3 20.4 1.1 4.6 -- -- -- -- 18.5 57.2 450.6 88.9 379.9 230.4 7645.7 248.5 289.2 26.3 312.6 30 474 29.5 119 13.21-NG-179020 1418.5 S 84 43.945 69.699 25.1 7.7 22.1 6.7 65.6 12.5 -- -- -- -- 6.6 4.8 0.5 5.5 59.9 88.8 110.7 69.3 529.3 215.6 7525 247 336.1 26.9 356.2 30 507.7 29.1 120.9 13.21-C3-179462 109.1 1 85 43.945 69.700 0.8 15.4 -- -- 71 15.2 -- -- -- -- 13.1 10.7 -- -- 29.1 113.5 186.5 103.5 550.6 386.9 8532.2 504.1 179.8 42.6 225.5 56.1 437.1 51.1 120.6 26.11-C3-179463 93.5 2 85 43.945 69.700 -- -- 13.9 10.9 43.8 21.2 -- -- 1.5 13.1 15.2 15.6 -- -- -- -- 221.9 133.8 871.9 503.6 9053.5 570.3 282.6 57.6 271.1 58.3 569.5 57 141.4 31.11-C3-179464 136.3 3 85 43.945 69.700 -- -- 17 9.1 57.3 20.8 -- -- 20.5 10.2 11.6 12.3 9.3 11.8 164.2 84.1 134.3 76 909.7 313.7 7459.1 429.9 307.3 42.1 251.4 47.2 510.1 41.1 137.9 24.81-C3-179465 124.7 4 85 43.945 69.700 6.3 10.9 6.2 12.3 72.2 23.6 -- -- 12.9 10.1 11.9 9.4 2.3 8.4 83.6 88.7 -- -- 509.2 373.1 7861.4 455.9 347.9 45.7 333.1 47.7 438.3 41.3 149.1 221-C3-179466 117.4 5 85 43.945 69.700 6.7 18.5 -- -- 72.8 18 11.2 24.8 13.1 14.6 1.1 11.9 3.3 9.6 177.5 96.4 109.2 84.9 328.9 491.3 9006.8 507.6 304.4 51.3 476.7 56.8 687.8 51.8 165.5 23.71-C3-179467 121.1 6 85 43.945 69.700 45.3 22.7 16.7 13.8 69.3 16.1 -- -- 6.9 12.5 -- -- 14.4 11.2 62.3 111 171.3 97.5 803.1 445.2 8551.5 494.3 352.7 51.3 371.4 54.4 726.5 50.8 185 27.3
2-NG-179021 1396.1 S 85 43.945 69.700 60.6 16.9 32.6 12.1 64.9 16.8 -- -- 4.8 7 6.1 9.9 6.4 6.7 83.9 113.4 348.4 98.2 -- -- 8318.4 362.1 372.3 40.5 374.1 38.2 513.9 33.4 153.8 18.11-NG-179022 1375.4 S 86 43.945 69.701 37.4 9.9 11.8 5.8 58.2 10.5 -- -- -- -- 6.3 5 4.2 4.4 -- -- 167.5 56.6 460.8 265.9 8740.7 263.6 365.1 27.5 330 30.8 514.5 30 126.8 14.21-NG-179023 1419.4 S 87 43.946 69.699 27.9 9.8 30.3 7.7 77.9 12.1 19 10.8 0.7 4.7 -- -- 5.3 4.3 1.9 48.8 162.3 69.2 252 261.2 7316.8 245.4 292.7 26.2 341 29.1 567 29.5 118.8 12.71-NG-179024 1390.3 S 88 43.946 69.700 29.5 10.3 21.2 6.1 61.4 9.4 2.7 11.8 -- -- -- -- 7 5.6 147.4 77.4 128.1 67.8 810 316 7873.9 254.8 278.1 26.6 355.8 30.4 535.2 29.2 151.9 13.91-NG-179025 1419.3 S 89 43.946 69.698 81.4 10.9 92.7 11.5 78.4 13.7 38.4 12.7 9.1 5.5 6 6.7 3.5 6 53.7 48.5 232.4 69.7 1269.2 283.4 7709.2 250.6 236 26.5 310.6 29.6 535.8 29.3 135.2 13.72-NG-179030 1408.8 S 91 43.948 69.700 1.9 8.9 30.6 11.4 68.5 13.8 -- -- 12.8 7.9 -- -- 1.4 6.2 7 75.9 317.9 100.4 958.5 364 8400.8 361.9 275.4 34.6 278.6 36.4 549.2 33.2 116.4 18.12-NG-179031 1350.5 S 92 43.948 69.700 35.4 12.2 17.6 9.9 133.6 20.4 -- -- -- -- -- -- 10.4 7.2 -- -- 234.4 78.3 712.4 507.2 8308.1 367.3 307.1 37.5 436.2 39.9 587.7 34.7 137.4 18.32-NG-179032 1368.5 S 93 43.948 69.701 23.5 15.2 21.2 8.8 68.5 14.7 -- -- 9.2 8.6 3.3 6.6 -- -- -- -- 379 89.6 575.6 593.8 8302 362.3 256.1 33 327 32.5 437.6 33.1 121.9 17.42-NG-179033 1406.8 S 94 43.949 69.700 41.6 13.7 16.9 9.5 80.2 15.1 111.3 31.9 2 6.9 2.3 6.2 10 7.8 -- -- 111.6 74.6 -- -- 8738.8 372.5 301.7 36.5 340.5 36.2 632.2 33.3 129.9 18.22-NG-179034 1371 S 95 43.949 69.701 27.6 11.3 1.4 8.4 79.5 17.1 -- -- -- -- -- -- 1.9 9.6 13.5 58.1 306.9 109.9 260.6 414.2 7831 347.6 306.8 30.2 407.6 39.6 433.6 29.3 150.2 16.92-NG-179039 1413.6 S 97 43.950 69.700 35.3 16 22.4 10.1 78.2 14.9 -- -- 1.3 6.7 0.5 6.6 2.3 6.2 -- -- 134.7 69.9 316.4 404.8 8678.9 369.8 323.7 34.5 361.9 36 509.7 32 113.3 18.12-NG-179040 1431.5 S 98 43.951 69.700 11.1 8.8 13.8 7.7 60.4 14 -- -- 7 8.7 -- -- -- -- 103.4 71.9 29.7 56.5 -- -- 8630.3 366.9 300.2 30.7 412.1 37 548.2 32.7 135.4 17.92-C4-179104 507.8 1 99 43.952 69.698 6.7 8.5 7.6 7.5 90.3 12.6 3.7 11.1 9.6 9 -- -- -- -- -- -- 43.5 46.6 342 341.7 6559.1 310 147.5 25.5 247.8 28.6 377 24.7 124 14.4

Maine Yankee Marine Sampling Study
Maine Yankee Final.doc 2/15/05 94
nuclide 60Co 60Co 137Cs 65Zn 22Na 54Mn 58Co 133Ba 7Be 210Pb 40K 214Bi 214Pb 212Pb 208Tl Gamma energy (keV) 1173.23 1332.51 661.62 1115.52 1274.54 834.81 810.75 383.7 477.56 46.52 1460.75 609.32 351.99 238.63 583.14 Branching Ratio 0.9986 0.9998 0.8462 0.5075 0.9994 0.9998 0.9945 0.0884 0.103 0.04 0.107 0.4609 0.371 0.431 0.861
sample mass(g) depth(in) station lat. long. pCi/kg +/- pCi/kg +/- pCi/kg +/- pCi/kg +/- pCi/kg +/- pCi/kg +/- pCi/kg +/- pCi/kg +/- pCi/kg +/- pCi/kg +/- pCi/kg +/- pCi/kg +/- pCi/kg +/- pCi/kg +/- pCi/kg +/-
2-C4-179105 308.1 2 99 43.952 69.698 5.9 11.7 3.9 8.9 135.5 24.6 7.3 19.6 9.2 11.4 2.8 8.7 5.5 7.6 132.8 98 221.6 101.9 -- -- 9496.3 490.2 313 46 358.2 45.2 567.8 40.5 151.2 22.92-C4-179106 287.4 3 99 43.952 69.698 27.2 20.5 6.2 9.5 117 21.7 3.9 21.8 6.8 12.4 6.3 12.6 -- -- 319.6 107.7 -- -- 191.5 285.3 10228.5 542.9 222.1 39.5 269.2 47.8 643.2 41.3 161.5 21.92-C4-179107 291.1 4 99 43.952 69.698 2.8 15.9 0.5 9.8 127.2 24.2 54.2 43.8 19.7 10.1 5.2 9.4 3.6 8.6 79.5 80.7 250.6 122.8 926.3 514.6 9538.8 513.2 319.9 47.1 386.1 46 617.6 44.1 144.1 24.82-C4-179108 341.7 5 99 43.952 69.698 7.1 13 16.6 10.2 99.4 19.1 20.9 25.7 18.1 10.9 7.6 8.3 2.1 9.6 71.1 124.3 -- -- 1224 568.8 10297.3 478.5 251.7 38.3 237.3 36.4 493.9 41.5 133.5 19.92-C4-179109 294.1 6 99 43.952 69.698 11.3 13.5 11.2 16.2 117.8 21.6 15.3 19.3 -- -- 12.5 9.2 13.7 9.1 -- -- 27.8 93 262 463.2 9983.7 520.4 297.2 39.7 333 47.4 655.6 42.8 218.9 24.62-C4-179110 324.3 7 99 43.952 69.698 -- -- 1 9.6 150.9 24.1 17.4 27.3 -- -- 7.1 10.9 0.7 8.3 3.6 81.9 -- -- 543 607.4 11416.3 521 242.8 46.4 372.4 45.7 789.9 43.3 205.1 24.22-C4-179111 358.8 8 99 43.952 69.698 23.5 16.5 11.4 9.3 155.1 23.8 -- -- -- -- -- -- 10.6 8 103.2 76.5 -- -- -- -- 11130.2 468.6 298.7 41.4 359.2 42.4 770.1 40.4 192.3 242-C4-179112 321.7 9 99 43.952 69.698 3.7 10.8 -- -- 139.3 22.1 18.7 21.3 -- -- 12.1 10.7 5.9 8.6 -- -- 172.8 90.7 1282.9 625.8 11637.9 531.2 333.2 47.3 368.3 49.4 939.2 44.3 219.4 26.22-C4-179113 230.6 10 99 43.952 69.698 1.3 15.6 1.5 11.3 148.2 31.7 24.4 37.3 26.9 14.9 72.7 21.4 3.7 11.3 -- -- -- -- 111.4 588.6 13274 665.7 388.1 59.5 447.8 62.5 1102.4 56.5 295.3 32.72-C4-179114 426.9 11 99 43.952 69.698 4.2 7.9 15.7 9.5 115.8 17.9 1.3 16.8 -- -- 8.1 8.1 -- -- -- -- 97.7 89.9 -- -- 9890.6 417.7 277.9 31.1 337.6 37.4 681 35.5 187.4 21.2
1-NG-179041 1428 S 99 43.952 69.698 44.8 13.1 31.2 8.5 80.2 12.4 -- -- 1.5 4.1 8.4 5.2 3.5 4.3 -- -- 261.6 78.7 551.5 141.7 7066.8 241.2 235.1 24.8 244.2 29 473.3 28 152.2 13.41-NG-179042 1338.3 S 100 43.952 69.698 14.2 8.1 21 7.3 71.6 11.2 -- -- -- -- 5 4.6 2.3 4.5 17.7 69.3 170.2 48.9 908.5 325 8563.4 272.8 303.3 26.9 386 30.7 590.5 32 151.7 14.52-C4-179225 399.2 1 101 43.952 69.699 24.1 14.3 6.4 9.1 81 18.1 124.3 39.9 5.7 7.7 11.6 11 6.4 6.5 46.4 63.7 -- -- 358.4 486.2 8379.9 394.6 252 35.1 204.6 35.7 394.2 30.3 117.1 20.42-C4-179226 262.6 2 101 43.952 69.699 14.9 13.7 -- -- 74.3 23.1 107.3 36.3 -- -- -- -- 12.5 14.2 379.1 128.3 -- -- -- -- 11141.6 578.7 295.9 53.1 335.3 52.6 585 46.5 118.5 27.52-C4-179227 256.9 3 101 43.952 69.699 4.7 14.2 -- -- 111.5 22.1 10.2 22.3 6.8 17 -- -- 14.8 9.9 108.2 115.9 28.6 81.8 1237.6 672.5 11672.2 610.2 351.1 43 350.6 46.9 600.9 47.7 150.4 26.72-C4-179228 243.1 4 101 43.952 69.699 62.4 25 5.6 14.8 99.3 24 -- -- 10.7 12.1 7.1 13.9 -- -- 114.3 101.7 3.4 104.9 870.3 701.5 11650.3 599.8 389.5 54.5 492.6 57 681.3 49.4 210.6 28.92-C4-179229 269.6 5 101 43.952 69.699 10.1 11.8 9.1 13.7 101.7 21.5 20.9 24.2 -- -- 8 13.5 10.2 10.1 -- -- 72.8 85.8 598.7 529.8 11361.5 567.6 464.5 51.6 335 54.3 539.7 45.9 177.4 25.92-C4-179230 262.3 6 101 43.952 69.699 13 18.8 25.1 13.9 154.1 31.1 1.4 19.8 13.1 17.1 3.3 11.6 -- -- 151.5 171.8 -- -- 517.5 540.8 11775.5 573.2 306.4 44.7 325 43.6 660.1 47.3 176.2 21.92-C4-179231 332.7 7 101 43.952 69.699 8.3 11.8 9.8 18.5 169.3 22.4 -- -- 11.2 13.3 25.3 16 1.5 8.7 -- -- 93 77.7 505.9 488.5 10551.7 529.2 298.1 36.4 365.6 46 631 44 201 24.62-C4-179232 364.4 8 101 43.952 69.699 5 8.6 1.9 8.8 161.2 23.7 12.4 30.5 3.6 12 11.3 9.2 1.9 9.5 22.2 82.6 20.2 105.8 -- -- 11063.8 477.6 295.1 40.9 357.9 44.2 679.5 38.5 187.9 22.72-C4-179233 315.4 9 101 43.952 69.699 -- -- 0.7 10 212.8 24.1 -- -- 4.7 11.3 15.5 11.1 -- -- 51.4 89.3 -- -- 286.9 360.4 11331.8 511.6 346.4 46.1 329 47.2 802.2 44.6 219.6 22.62-C4-179234 502.3 10 101 43.952 69.699 13.2 8.6 6.8 6.3 163.8 17.3 58.4 26.7 6.8 6.8 8.2 8.9 4.2 7.9 26.1 45.3 73.2 78.9 -- -- 8040.2 348.8 213.4 30 216.2 31.2 391.3 27.9 131.7 15.8
1-NG-179043 1374 S 101 43.952 69.699 12.2 9 20.4 8.1 85.1 12.5 4.6 10 8.9 4.9 -- -- 1.4 4.1 -- -- 167.7 90.3 1021.5 234.1 8302 263.4 203.1 25.5 344.5 30.3 500.5 29.2 142.8 13.31-NG-179044 1354.3 S 102 43.954 69.698 30.7 9.2 11.2 5.2 89.9 12 -- -- -- -- 5.8 5.2 1.3 4.9 19.4 79.1 451.1 68.7 433.8 232.6 7649.6 250.9 311.6 27.3 270.6 29.8 486.1 28.8 115.6 13.41-NG-179045 1350.2 S 103 43.954 69.698 16.5 6.3 16.5 6.2 118.5 12.7 16.7 17.9 -- -- 1.4 5.2 2.3 4.3 15.6 73.9 235.3 87.7 474.4 305.2 7232.4 249 231.3 25.2 225 28.5 505.8 27.7 130.5 13.41-NG-179049 1329.5 S 104 43.955 69.697 50.6 10.6 23.5 8.9 84 13.6 -- -- 0.4 4.5 8.9 4.7 8.1 5.3 -- -- 488.4 98.6 718.1 319.2 7908.1 259.8 232.3 25.7 296.5 29.8 515.5 28.8 137.1 13.72-C4-179201 416.8 1 105 43.958 69.698 26 11 -- -- 72.7 12.4 28.4 17.4 -- -- -- -- -- -- 69.4 92.4 153 92.7 466.5 351.3 8525.1 399.3 317.9 36 320.8 37.4 613.5 33 135.2 18.92-C4-179202 342.7 2 105 43.958 69.698 -- -- 11.9 7.8 84.8 17.1 35.1 28.1 4.8 9.1 20.2 11 -- -- -- -- 35.8 66.4 219.5 452.5 10378.5 487.4 297.6 43.9 442 52.6 636.2 38 143.5 17.42-C4-179203 360.6 3 105 43.958 69.698 3.1 13.4 14 8 81.7 19.9 9.4 17 -- -- 1.2 7.6 -- -- -- -- 64.6 88.7 -- -- 8873.1 437.5 321.3 39.5 304.6 40.8 486.8 35.7 162.7 21.12-C4-179204 315.3 4 105 43.958 69.698 2.9 12 -- -- 70.1 23.4 -- -- -- -- 8.9 8.9 -- -- 216.6 135.6 18.1 86.4 -- -- 11258.4 525.9 301.4 46.4 371.8 47.2 667.7 41.9 183.3 23.12-C4-179205 329.1 5 105 43.958 69.698 -- -- 2.1 7.9 49.9 16.2 -- -- 18.3 15.7 19.7 11.6 -- -- 165.3 106.6 5 102.8 468.2 592.4 10744.2 506.3 361.5 44.5 375.4 47.2 809.4 41.1 212.3 212-C4-179206 317.7 6 105 43.958 69.698 3.8 11.9 -- -- 101.8 23.5 5.3 19.7 -- -- 7.7 11.5 -- -- -- -- 54 75.4 -- -- 11457.1 527.8 323.9 39.4 396.1 46.1 698.1 42 221.6 24.52-C4-179207 313.2 7 105 43.958 69.698 8.7 11.4 15.2 10.2 24.8 17.5 43.2 24.5 -- -- 3.5 8.7 0.2 12.4 66.5 81.5 53.5 102.2 -- -- 10736.2 520.3 297.9 45.2 352.4 51 665.9 41.1 230.5 21.82-C4-179208 369.8 8 105 43.958 69.698 14.7 11.1 14.3 13 24.5 13.6 10.7 20.1 -- -- 4.1 8.1 -- -- 73 93 -- -- 178.6 489 13405.1 519.4 245.8 44.9 474.8 46 897.8 41.2 243.3 24.52-C4-179209 361.6 9 105 43.958 69.698 5.8 11.9 28.8 10.5 -- -- 60.8 27.4 1.8 13.9 23.5 11.5 6.4 8 80 78.7 -- -- -- -- 13891.3 543.4 441.3 47.2 475 46.5 1083.9 44.2 256.7 25.22-C4-179210 380.5 10 105 43.958 69.698 -- -- 6.3 7.8 9.2 15.7 -- -- 11.1 10.2 -- -- 11.5 10.2 48.7 93.9 5.4 95.5 298.9 421.7 13529.2 526.9 411.1 43.7 553.4 46.3 1069.9 43.3 327.1 25.31-C4-179211 266.9 11 105 43.958 69.698 11 8.9 -- -- 12.6 10.2 -- -- 1.4 9.2 1.7 9.5 10.9 7 -- -- 205.1 134 -- -- 8845.9 368.8 331.1 36.5 352.7 43.1 1010.3 45.7 233.4 21.42-C4-179212 328 12 105 43.958 69.698 -- -- 19.4 12.1 10 10.8 13.8 35.7 -- -- -- -- -- -- 176.5 122.3 97.2 75.3 622.6 605.8 14640 582 401.9 50.9 403.8 50.1 1052.1 48.1 325.3 27.7
1-NG-179050 1286.5 S 105 43.958 69.698 33.1 10.5 50.3 10.8 58.2 12.2 5.1 13 2.3 7 -- -- 8.6 7 25.2 76.1 488.4 81.6 710.4 241.5 8035.3 268.8 321.3 28.3 350.1 32.2 675.5 31.9 130.6 14.71-NG-179051 1409.5 S 106 43.947 69.695 73.5 11.7 72 11.4 70.8 11 -- -- 5.9 5.5 2.2 7.5 -- -- 16.8 49.3 182.7 78 507.5 264 7907 253.6 306 26.5 331.7 31.4 593.7 29.9 144.3 13.81-NG-179052 1331.5 S 107 43.948 69.696 125.9 14 99.7 11.6 36.3 11.8 -- -- 3.9 4.7 1.5 4.8 5.2 7.8 18.4 62 422.1 86.8 816.1 275.9 7848 259.6 286.2 27.1 324.7 32.8 568.7 32.6 152.4 13.52-C4-179315 299.5 1 108 43.949 69.696 24.1 13 72.7 17.6 43.7 16.4 -- -- 8 11.8 2.9 13.9 8.5 8.7 72.2 94.8 229.3 91.4 69.4 483.5 9444.8 484.5 222.4 42.5 217.7 41.1 402.6 37.3 85.5 22.92-C4-179316 334 2 108 43.949 69.696 18.9 11.6 -- -- 76.7 18.7 23.6 19.4 6.6 10.4 7.1 8.1 6.3 8 114.4 76.6 12.2 99 695.7 520.3 9258.1 479.6 221.2 39.3 199 32.5 427.1 37.7 134.2 21.62-C4-179317 348.8 3 108 43.949 69.696 4.3 10.2 11.7 11 41.5 13 35.6 19.5 4.4 9.1 -- -- -- -- 122.8 73.1 -- -- 94.7 404.2 8661.5 445.2 211.5 36 216.8 37.2 401.2 35 100.9 21.12-C4-179318 288.6 4 108 43.949 69.696 17.7 11.8 18.9 12 107.3 20.2 87.9 26.4 12.1 13 0.7 9.3 -- -- 101.6 94.3 48.2 86.9 940.7 428.8 10570.3 525 278.8 42.4 269.9 45.4 522.9 40.2 153.4 24.82-C4-179319 320.6 5 108 43.949 69.696 0.9 9.4 20.9 16.1 70.2 22 -- -- -- -- 21.6 8.5 6.4 9.3 101.1 69.3 53.5 106.8 -- -- 9742.3 483.2 239.1 42 273 43.2 459.5 36.5 95.8 20.92-C4-179320 314.2 6 108 43.949 69.696 5.1 14.6 13 10.9 68.2 14.9 14.4 23.1 -- -- 2.8 13.6 -- -- 36.8 98.3 145.7 131 -- -- 9852.5 491.1 288.1 43.1 272.9 34.4 509 39.3 115.1 21.92-C4-179321 314.3 7 108 43.949 69.696 17.2 10.8 18.8 10.7 100.9 18.7 80.7 27.6 -- -- 1.1 9.7 5.4 7.7 31.9 84.7 11.7 67.9 268.5 403.5 9496.4 482.9 237.3 37.6 267.2 42.3 517.9 37.5 106 202-C4-179322 282.1 8 108 43.949 69.696 12.8 15 8.4 10.6 112.4 19.4 13.3 20.7 -- -- 13.5 14.5 4.5 9 -- -- -- -- 390.1 335.8 9646.5 511.9 232.4 49.1 303.1 47 428 37.2 167 23.22-C4-179323 261.6 9 108 43.949 69.696 39.1 15.1 27.3 12.5 128.3 24.3 70.4 33.6 7.5 11 32.7 13.6 8.1 10.1 88.5 91.8 -- -- 320.2 408 10435.5 549.8 209.5 38.5 300.6 48 659.5 42.7 139.3 24.7
1-NG-179053 1347.1 S 108 43.949 69.696 40.8 7.8 60.3 11.2 100.3 12.6 8.8 9.8 4.4 5.9 -- -- -- -- 7.8 46.2 433.4 69.3 233.2 317.7 7804.8 257.3 229.3 27.7 226.8 29 488.2 32.4 122.3 152-NG-179054 1414.9 S 109 43.949 69.694 160.4 23.8 157 20.7 54.9 15.8 -- -- 6.9 10.5 4.9 8.7 -- -- 5.2 67.1 425.7 112.2 77.5 559.6 8827.7 376.5 327.2 37.7 381.8 40.1 655 35.7 138.1 192-NG-179055 1667.5 S 110 43.951 69.693 44.8 15.8 37.9 11.7 32.3 12.9 5 19.3 8.7 9.3 33.1 11.6 5.9 7.9 -- -- 314.9 82.2 394.8 475.3 11414 383.1 452.4 36.2 432.1 37.6 475.1 29.5 179.6 18.61-NG-179056 1579.5 S 111 43.956 69.689 35.7 9.5 31.3 7.1 21.6 8.4 11.5 10.8 -- -- 1.7 4.5 9.3 6.3 106.5 60 121 94.1 948 327.9 9145 259.3 420.7 27.9 461.7 32.2 704.1 30.9 156.1 13.32-NG-179060 1734.7 S 112 43.951 69.692 82 18.7 72.1 13.9 6.5 11.8 -- -- 12 8.8 0.8 7.4 6.4 7.3 99.5 85.5 111.3 92.4 525.4 459.5 11814.5 387.3 324.3 33.8 415.3 37.4 589.1 44.3 182.8 18.52-C4-179302 397.6 1 113 43.945 69.696 22.5 17.8 1.7 7.5 72 16.8 -- -- 1.6 6.6 -- -- 1.4 8.4 -- -- 133.6 74 58.4 460 8653.4 418.8 224.2 36 246.9 36.7 433.9 32.3 144.9 17.52-C4-179303 342 2 113 43.945 69.696 22.9 14.5 19.9 14.9 58.2 15.4 -- -- -- -- 5.1 8.1 9.7 11 107.2 99.5 64.5 66.3 -- -- 10420 482.5 251.5 42.5 234.4 41.8 566 37.3 155.4 20.52-C4-179304 320.5 3 113 43.945 69.696 10.3 11.3 -- -- 74.1 17.2 132.5 35 8.1 9 -- -- 7 9.6 79.5 127.8 76.5 114 -- -- 10134.8 484.8 215.7 37.6 297.6 44.4 616.1 37.8 133.1 22.92-C4-179305 335.8 4 113 43.945 69.696 22.7 13.7 14.2 9.9 50 21.5 1.7 21.3 27.7 16 12.9 8.9 -- -- 9.2 105.4 65.7 69.3 -- -- 10405.9 480.5 276.8 44.9 279.5 44.7 606.4 39.1 141.9 21.82-C4-179306 342 5 113 43.945 69.696 25.2 12.7 -- -- 122 22.5 -- -- -- -- 1.9 12.5 -- -- -- -- 69.3 121.6 311.1 418.6 9492.6 474.9 310.4 45.5 313.1 44.9 602.4 37.7 157 17.72-C4-179307 336.1 6 113 43.945 69.696 11.4 13.6 15.5 10.4 57.8 21.3 4.5 18 6.8 14.3 1.3 9.5 3.1 8.5 148.1 79.1 189.7 104.2 -- -- 9808.7 472.3 184.7 36.3 356.3 45.4 588.9 39.6 142 24.52-C4-179308 342 7 113 43.945 69.696 4.4 10.6 10 10 102.1 21.1 21.5 22.1 23.6 12.6 6.3 8.3 -- -- 91.7 73.7 14.4 83.7 371.5 565 9411.9 456.7 207.3 43.2 261.4 42.8 542.1 37 115.3 21.42-C4-179309 338.2 8 113 43.945 69.696 -- -- 1 10.1 107.1 19.6 35 21.4 20.6 12.6 -- -- 9.6 9.9 118.7 157.2 222.4 142.9 473.7 337.1 11107 507.3 233.8 31.4 493.6 46.2 564.8 41.2 180.3 22.42-C4-179310 343.9 9 113 43.945 69.696 -- -- -- -- 95.4 20.3 14.2 19.3 17.8 12.2 15.1 11.6 4.3 8 -- -- 35.7 69.5 69.3 401.1 11431 501.8 191.6 35.1 345.3 45.2 660.9 45.8 220.8 23.7

Maine Yankee Marine Sampling Study
Maine Yankee Final.doc 2/15/05 95
nuclide 60Co 60Co 137Cs 65Zn 22Na 54Mn 58Co 133Ba 7Be 210Pb 40K 214Bi 214Pb 212Pb 208Tl Gamma energy (keV) 1173.23 1332.51 661.62 1115.52 1274.54 834.81 810.75 383.7 477.56 46.52 1460.75 609.32 351.99 238.63 583.14 Branching Ratio 0.9986 0.9998 0.8462 0.5075 0.9994 0.9998 0.9945 0.0884 0.103 0.04 0.107 0.4609 0.371 0.431 0.861
sample mass(g) depth(in) station lat. long. pCi/kg +/- pCi/kg +/- pCi/kg +/- pCi/kg +/- pCi/kg +/- pCi/kg +/- pCi/kg +/- pCi/kg +/- pCi/kg +/- pCi/kg +/- pCi/kg +/- pCi/kg +/- pCi/kg +/- pCi/kg +/- pCi/kg +/-
2-C4-179311 342.5 10 113 43.945 69.696 -- -- -- -- 129 19.8 10.7 22.5 8.9 13.1 4.4 9.6 4.9 10 83.4 142.9 34.6 102.5 -- -- 10986.8 499.4 318 43.3 360 46 752.3 41.3 271.5 24.22-C4-179312 344.1 11 113 43.945 69.696 -- -- -- -- 116.7 19.8 3.3 25.3 10.9 10.5 0.6 9.1 -- -- 3.4 73.2 110.5 78 80 623.2 10144.9 489.3 291.3 44.8 474.8 47.3 631.9 41.8 196.4 24.22-C4-179313 237.5 12 113 43.945 69.696 0.4 22 14.8 16.7 161.1 25.7 -- -- 23.3 11.7 25.5 17.8 -- -- -- -- 194.5 132.2 584.4 690.3 14202 675.4 390.7 60.8 319.4 60.4 834.6 54.1 202.1 34.32-C4-179314 166.1 13 113 43.945 69.696 39.9 20.5 20.5 23 80.1 28 40.7 44 14.4 26.8 9.1 14.6 3.8 15.4 148.7 160.7 -- -- 876.1 605.6 13983.2 805.6 350.8 70.9 426.2 77.2 883.3 68.4 234.4 38.5
1-NG-179061 1350.3 S 113 43.945 69.696 73.5 13.1 90.3 13 61.2 9.5 93.1 19.4 3.1 4.8 -- -- -- -- 110.3 70.1 364.5 98.8 1112 321.8 7897.2 258.4 254.2 26.3 294.1 29.8 487.2 29.1 134.2 13.81-NG-179062 1302.6 S 114 43.947 69.696 71.8 15.2 106.4 13.2 57.2 11.9 -- -- -- -- 3.1 6.3 6.5 6.2 34.3 50.9 379.9 108.5 484.5 265.9 7685.5 260.1 268.3 27.9 255 31.9 576.8 32.8 154.5 14.61-NG-179063 1361.5 S 115 43.946 69.696 103.5 14.3 87.4 11.5 71.6 10.7 -- -- 4.8 4.8 5.5 4.7 1.4 4.7 -- -- 386.5 108 553.4 208 7743.9 254.7 273.8 26.8 288.2 31 524.4 29.1 129.4 132-NG-179064 1307.5 S 116 43.946 69.695 124.8 18.8 168.7 20.1 82.7 17.1 4.2 16.5 3.6 8.2 4.7 8.2 15.6 9 -- -- 225.6 112.9 -- -- 8735.6 389.4 278.3 36.4 386.9 39.8 592.2 36.6 149.9 15.82-C4-179293 304.8 1 117 43.949 69.693 25.7 13.4 40.2 14.3 36.3 14.4 6.2 17.9 -- -- 0.7 8.1 4.9 8.8 -- -- -- -- 529.6 433 8939.4 492.4 217.4 42.4 326.3 36 471 38.4 148.2 23.92-C4-179294 182.6 2 117 43.949 69.693 18.7 22 24.2 15 60.9 28.4 15.4 33.1 2.4 23.5 48.6 20.8 -- -- -- -- 98.5 147.4 -- -- 12074.2 736.7 438.8 67.3 453.4 61.8 745.9 61.9 185 30.62-C4-179295 269.1 3 117 43.949 69.693 17.9 14.3 5.1 14.3 55.3 15 11.2 21.8 19.4 15.3 1.6 9.6 6.8 11.7 30.1 86.1 63.8 89.8 377.2 360.7 10267.1 553.9 289.6 47.1 270.6 49.7 354.9 37.9 122.9 21.42-C4-179296 259.1 4 117 43.949 69.693 5.8 12.8 10.5 11.7 93.2 24.7 32.6 29.4 3.8 10 5.8 10.6 -- -- -- -- 118.3 83.5 -- -- 10476 558.3 301.2 49.5 331.9 52 645 45.6 123.8 26.52-C4-179297 338.4 5 117 43.949 69.693 12.5 13 28.1 13 38.5 14.3 15.5 27.9 5.8 11.1 -- -- 0.6 7.8 88.9 74.3 137.7 68 1087.7 492.8 9696 469.2 236.8 43.1 361.4 42.5 481.9 37.8 144.5 21.52-C4-179298 297.8 6 117 43.949 69.693 10.1 12.5 4.6 9 56 16.5 45.4 29.1 7.7 10.2 3.4 12.9 14.2 8.5 27.2 81.3 157.8 103.6 209.4 443.3 9354.4 492.3 291.2 39.7 356.1 46.2 591.5 41.5 117 19.92-C4-179299 191.1 7 117 43.949 69.693 37.8 29.5 -- -- 72.8 28.1 -- -- 14.8 18.3 40.7 17.5 8.9 12 96.9 198.3 25.7 107 -- -- 10684.5 649.8 403 66.9 446.1 82.6 634.9 59 171.8 29.72-C4-179300 501.6 8 117 43.949 69.693 22.8 10.4 15.3 8.8 42.8 13.1 -- -- 5.2 8.6 6 9 -- -- 20.8 91.2 24.4 58.9 469.9 277 7678.2 346 192.2 31.8 259 30.5 394.9 27.7 100 152-C4-179301 519.3 9 117 43.949 69.693 11.6 7.5 2.2 6.8 34 12.9 -- -- -- -- 0.8 5.6 6.9 6.2 -- -- 26 60.8 438 293.8 7556.7 330 250.3 29.6 245.3 30.7 479.1 26.5 110.6 15.8
2-NG-179065 1531.5 S 117 43.949 69.693 14.3 11.2 33.1 11.4 27.8 12.1 -- -- -- -- 1.1 8.2 -- -- -- -- 302.5 111.5 988.2 601.3 10327.8 385.1 395.3 35.4 447.5 39.7 710.2 34.1 183.3 18.72-C4-179235 613 1 118 43.952 69.692 19.3 13.1 -- -- 7.3 7.6 63.5 17.8 7.8 8.1 -- -- 7.9 5.5 -- -- -- -- -- -- 8889.8 331.9 284.6 28.6 229.3 27.5 414 23.9 99.2 11.92-C4-179235 613 1 118 43.952 69.692 19.3 13.1 -- -- 7.3 7.6 63.5 17.8 7.8 8.1 -- -- 7.9 5.5 -- -- -- -- -- -- 8889.8 331.9 284.6 28.6 229.3 27.5 414 23.9 99.2 11.92-C4-179236 369.1 2 118 43.952 69.692 1.6 18.4 -- -- 25.1 11.4 8.1 25.8 22.1 10.6 11.1 9.2 -- -- 43.9 115.5 99.7 78.2 329.7 345.5 12303.5 494.3 448.3 43.9 459.2 44.6 668.5 38.1 165.2 202-C4-179237 431.4 3 118 43.952 69.692 16.8 14.6 3.2 8.9 34.6 17.7 -- -- -- -- 4.5 7.6 -- -- 56.4 64.6 8.5 80.1 148.8 387.2 12093.7 459.2 385.9 37.8 334.6 39.9 605.5 33.9 139.9 18.82-C4-179238 351.8 4 118 43.952 69.692 25.1 15.7 -- -- 28.5 10.7 -- -- -- -- -- -- -- -- 120.7 88.2 53.4 82.5 432.8 570.5 12612.9 524.2 367.8 46.9 397.4 45.3 500.7 34.9 200.1 22.42-C4-179239 497.1 5 118 43.952 69.692 11.5 10.2 -- -- -- -- -- -- -- -- 4.2 13.3 1.7 6.6 218.9 119.9 63.2 58.3 -- -- 13696.2 456.7 405.4 37.3 369.5 36 780.9 34.9 205 19.92-C4-179240 376.6 6 118 43.952 69.692 -- -- 8.1 8.7 3.3 9.1 -- -- 6.9 10.3 1.5 7 10.5 9.9 21.5 73.7 -- -- 70.6 392.6 13715.4 529.6 471.1 38.8 437.2 42.7 729.7 39.6 241.7 18.82-C4-179241 386 7 118 43.952 69.692 28.1 11.1 5.3 8.9 4.6 12.8 -- -- 10.1 21.1 3.4 8 1.1 9.2 -- -- 19.1 105.4 -- -- 12025.3 486.4 422.7 41.9 364.8 43 715.8 37.7 179.6 22.12-C4-179242 415.6 8 118 43.952 69.692 5.1 10.5 1.6 10.5 12.3 9.8 1.8 18 -- -- 11.4 12 21.4 10.4 -- -- -- -- -- -- 11052 452.5 354.7 44 340 40.8 699.5 35.1 162.6 20.12-C4-179243 283.3 9 118 43.952 69.692 -- -- 6.4 13.5 21.7 13.6 -- -- -- -- 3.1 10 19.4 14.3 65.4 113 82.2 109.8 1282 607.3 14390 630.1 423.6 53.3 537.3 54.8 764.9 47.3 231 28.12-C4-179244 414.8 10 118 43.952 69.692 16.2 15.5 -- -- 3.9 8.9 12.2 21.4 5.2 10.9 3.1 7.6 7.7 7.2 -- -- 121.2 62.7 632.4 518.9 12347.8 482.6 400.4 43.5 467.9 42 733.4 36.4 211.8 212-C4-179245 340.9 11 118 43.952 69.692 15.9 14.3 26.4 11.5 3.6 15.5 3.3 17.8 14.3 11.1 10.2 8.7 -- -- -- -- 39.6 100.1 -- -- 12258.6 537.2 369.4 40.8 321.9 50.4 710.5 40.7 206.5 22.92-C4-179246 850.6 12 118 43.952 69.692 2.1 4.7 -- -- 8.2 5.4 1.8 9.6 1.7 5.2 -- -- 7.1 5 27.2 57.6 2.9 30.7 152.4 147.9 6296.6 236.8 227.5 21.9 265.2 21.7 401.3 19.3 125.6 11.5
2-NG-179066 1776.3 S 118 43.952 69.692 9 8.6 24.5 8.5 28.2 11 11.3 14.6 1.1 7.2 7.3 6.3 2.4 7 -- -- 172.4 64.3 353.2 480 11095.2 368.9 385.5 32.6 406.1 33.4 566.9 29.7 130.8 16.32-NG-179067 1443 S 119 43.953 69.692 34.4 15 51.1 14.9 71.7 15.6 -- -- 1.3 7.3 5 6.9 6.7 10.1 -- -- 192.6 120 908.4 532.1 8760.6 364.2 264.4 35.6 336.5 36.4 593.2 35.1 122.1 18.72-NG-179068 1370.9 S 120 43.948 69.694 103.8 16.7 125.4 18.8 69.6 11.9 12.2 17.4 -- -- 1.3 8.3 -- -- 9.9 86.5 191.5 76.4 455.5 488.9 7860.9 359.7 300.2 35.7 330.9 38.2 559.3 33.2 155 16.52-NG-179069 1389 S 121 43.949 69.693 104.9 21.4 81.8 18.3 80.3 17.3 22.8 18.3 1.4 8.1 12.7 7.4 15.6 7.3 95.9 104.4 315 81 595.4 681.6 8819.6 369.5 266.9 36.1 287.3 37.7 641.4 34.9 161.7 17.92-NG-179073 1370.9 S 122 43.950 69.692 80.2 16.3 21.1 12.5 53.9 15.9 -- -- 16.3 8.7 24.2 13 -- -- 64.8 89.9 242.2 86.4 -- -- 9552.3 396.9 308.8 36.3 319 39.1 621.6 37.1 131.3 19.52-NG-179074 1463.6 S 123 43.950 69.693 24.2 15.2 16.2 10.5 50.5 12.3 1.7 12.7 4.5 6.3 9.4 6.4 -- -- 86.9 75 320 71.3 349.8 352 8830.2 364.3 358.4 35.1 352.9 36.6 554.9 32.3 124.5 182-NG-179075 1670.7 S 124 43.950 69.692 10.6 9.2 33.5 9.9 -- -- 6.8 20 27.3 10.2 -- -- 1.9 5.9 -- -- 157.1 88.4 358.6 620.7 10981.9 381.6 322 33.6 330.2 35.7 586 31.6 148.3 14.12-NG-179076 1643.5 S 125 43.952 69.692 40.6 12.1 23.2 9.6 44.4 12.2 -- -- 0.6 7.5 -- -- 2.7 6 -- -- 253.7 85.6 215.7 450.1 9887.8 362.6 401.7 35.4 441.4 36.6 671.5 33.1 184.9 182-NG-179077 1517.6 S 126 43.952 69.693 15 13.3 48 14.9 58.1 13.4 94.4 29 4.4 7 15.9 6.8 9.2 6.5 214.5 102.3 215.4 105.7 89 600 10462.3 387.6 379.2 35.7 364.5 37.5 700.3 33.6 200.4 19.72-NG-179078 1563.2 S 127 43.952 69.692 33.2 13.4 -- -- 48.4 13.8 -- -- 1.2 7.4 7.9 7.2 -- -- 9.5 60 209.9 61.6 345.5 379 10118.4 377.3 366.1 35.9 357.6 36.4 607.2 33.1 153.1 18.72-NG-179082 1383.5 S 128 43.949 69.693 94.8 22.2 137.1 17.8 109.6 18.3 93.9 29.8 19.2 8.3 8.5 7.2 5.1 6.6 50.8 62.4 539.5 118.5 170.8 688.7 9188.4 381.9 315.3 37.1 328.5 39.1 579.5 34.7 141.9 14.62-NG-179083 1324.4 S 129 43.948 69.694 78.1 20.8 98.8 15.6 44.5 11.1 14.3 22.7 -- -- -- -- 0.3 8.1 134.1 95.1 433.4 112.5 662.7 683.9 7573.7 363.7 289.7 30.3 355.5 37.6 595.9 34.8 142.6 18.71-NG-179084 1343.4 S 130 43.947 69.696 39.6 11.3 81.3 11.4 78.6 12.1 -- -- 0.5 6 4.7 4.7 4.6 4.9 -- -- 70.2 77.2 896 322.6 8065.1 264.4 288.8 29.1 342.7 32.1 488.9 29.8 143.3 14.41-NG-179085 1317.1 S 131 43.948 69.696 62 13.4 52.4 10.9 92 12.6 82.7 19.3 -- -- 4.5 4.4 -- -- -- -- 345.2 69.5 895.3 319.6 7958.2 261.9 251.2 26.5 331.2 30.6 574.1 30.2 116.7 13.32-NG-179086 1276.7 S 132 43.945 69.696 147.2 24.5 110.4 17.4 60.9 18.1 14.1 16.5 0.5 9.2 2.5 9.8 4 8.4 -- -- 450.6 118.8 193.9 400.3 9293.7 405.6 368.5 37.6 375.2 41.1 590.9 36.5 158.7 20.32-NG-179087 1471.3 S 133 43.959 69.683 13.7 10 8.1 7.4 57.5 13.7 9.1 20.3 7.1 7.8 2.4 9.7 -- -- 52.8 60.2 119 71.4 -- -- 9983 374.6 355.4 35.4 377.1 36.4 575 33 145.2 181-C4-179444 517.7 1 134 43.957 69.684 18.1 7.4 1.5 4.4 46.2 8.5 1.9 9 2.8 4.1 -- -- -- -- 127.4 61.7 77.1 42.4 318.5 188.1 5964.3 216.5 227.9 20.9 223.9 22.3 387.2 22.1 98.1 9.71-C4-179445 290.1 2 134 43.957 69.684 7.2 8.1 -- -- 77.9 15.6 5.3 23.3 4.4 6.9 1.8 6 11.1 6.4 20.4 57.5 -- -- 1763.6 365.4 8400.8 340.6 300.7 34.8 240.9 32.6 553.2 34.5 168 18.81-C4-179446 264.9 3 134 43.957 69.684 19.9 9.5 11.2 7 69.8 15.5 -- -- 19.1 9.8 6.1 9.5 12.9 7.1 50 96.1 -- -- 29 497.1 8603.9 370.8 279 36 248.4 39.7 519.5 37.5 151.7 18.11-C4-179447 332.2 4 134 43.957 69.684 10.8 8.2 5.1 5.7 53.1 14.6 0.7 11.6 5.5 6.5 3.2 6 -- -- -- -- 67 96.2 727.7 350.2 9615.5 341.4 289.5 32.4 352.3 34.3 536.1 32.1 149.6 16.81-C4-179448 338.2 5 134 43.957 69.684 9.7 6.7 5.6 5.6 86.5 12.4 -- -- -- -- 4 5.5 -- -- -- -- 10.1 58.9 717.8 312.5 8145.5 315 222.6 31.3 276.1 32.7 563.6 32.1 139.5 15.61-C4-179449 352.2 6 134 43.957 69.684 4.4 6.6 15.4 6.5 72.4 10.8 49.3 19.8 12 6.8 3.4 5.1 3.7 5 44.8 60.2 48.6 50.7 921.9 328.2 7908.1 314.8 225.8 32.1 327.4 33.6 542.9 30.5 142.8 14.91-C4-179450 327.3 7 134 43.957 69.684 -- -- -- -- 65.8 14.4 -- -- 2.2 7.3 -- -- -- -- -- -- 107.2 72.1 976.4 323 8922.4 335.2 296.7 31.6 349.5 35.5 576.1 32.9 141.6 171-C4-179451 467.1 8 134 43.957 69.684 0.7 8.9 15.5 7 28.5 9.6 4.2 14.5 -- -- 18.3 9 5.9 5.1 37.7 92 40.3 51.9 114 245.7 19147 401.5 291.4 28.2 307.2 30.6 340.7 27.3 102.3 13.81-C4-179452 285 9 134 43.957 69.684 24.7 10.8 18.2 8.4 74.2 18.3 20.7 15.7 5.8 7 -- -- 2.8 6.6 -- -- 99.1 57.2 401.1 509.7 8524.5 355.7 276.3 33.4 307.1 38.9 632.2 35.2 140.1 17.91-C4-179453 323.1 10 134 43.957 69.684 9.6 10.1 10.4 6.9 58.7 13.7 -- -- -- -- 0.8 6 -- -- 73.3 68.4 -- -- 485 327.4 8225.8 320.9 253.6 32.2 305.4 35.8 491 33.6 153 16.21-C4-179454 273.2 11 134 43.957 69.684 6.3 10.5 18.1 10.9 49.2 12.8 3.2 13.2 1.3 7.1 -- -- 1.9 10 -- -- 29.2 68.7 899.8 357.5 8245 353.6 261.6 33.7 303.8 39.5 598.3 35.2 160.5 18.61-C4-179455 292.1 12 134 43.957 69.684 -- -- 2.4 8.8 74.7 16.7 12.7 13.6 -- -- -- -- 1.8 5.3 95.6 109.5 87.9 82.2 536.5 333.8 8695 350.4 229.5 32.8 339.1 36.7 544.4 36.1 136.1 18.61-C4-179456 334.6 13 134 43.957 69.684 21.2 11.6 0.8 7.1 46.1 15 -- -- -- -- 0.2 4.8 15.8 7.5 27.8 53.3 75 59.1 489 304.1 8272.9 321.8 281.3 29 291.9 31.3 536.6 31.3 124.7 15.7
2-NG-179088 1372.2 S 134 43.957 69.684 20.5 12.7 78.5 12.1 91.8 19 -- -- 27 9.2 6.2 6.8 5.6 8 161.7 85.9 328.2 76.8 405.9 402.2 9477.1 392.2 282.7 36.3 371.6 37 637.6 34.6 146 18.81-NG-179089 1411.1 S 135 43.952 69.685 48 10.2 26.5 9.7 57.8 9.2 -- -- 4.4 4.4 1.1 4.2 -- -- -- -- 178.9 58 748.9 310.3 7810.9 250.7 259.8 25.1 289.4 29.2 530.9 28.5 143.8 13.22-NG-179091 1355.7 S 137 43.945 69.690 47.1 14.7 29.9 11.5 54.1 18.5 3.4 19.3 15.4 10.6 0.3 5 2.4 5.7 -- -- 205 111.7 -- -- 8224.2 374.9 302.7 38 394.2 39.9 536 39.7 160.4 18.82-NG-179096 1374 S 139 43.929 69.700 32.5 14 19.8 11.4 70.2 13.1 2.4 17.2 3.5 8.1 4.4 8.3 6.5 7.4 -- -- 158.3 85.5 1596.9 488.9 14842.7 484.5 551.4 41.8 559.4 42.3 628.8 38 230 21.3

Maine Yankee Marine Sampling Study
Maine Yankee Final.doc 2/15/05 96
nuclide 60Co 60Co 137Cs 65Zn 22Na 54Mn 58Co 133Ba 7Be 210Pb 40K 214Bi 214Pb 212Pb 208Tl Gamma energy (keV) 1173.23 1332.51 661.62 1115.52 1274.54 834.81 810.75 383.7 477.56 46.52 1460.75 609.32 351.99 238.63 583.14 Branching Ratio 0.9986 0.9998 0.8462 0.5075 0.9994 0.9998 0.9945 0.0884 0.103 0.04 0.107 0.4609 0.371 0.431 0.861
sample mass(g) depth(in) station lat. long. pCi/kg +/- pCi/kg +/- pCi/kg +/- pCi/kg +/- pCi/kg +/- pCi/kg +/- pCi/kg +/- pCi/kg +/- pCi/kg +/- pCi/kg +/- pCi/kg +/- pCi/kg +/- pCi/kg +/- pCi/kg +/- pCi/kg +/-
1-NG-179097 1387.1 S 140 43.910 69.717 29.2 10.5 16.3 6.6 48.9 10.7 -- -- 0.8 4.3 12.2 6.7 3.9 4 -- -- 45.3 68.8 -- -- 7067 243.3 321.3 26.6 344.3 30.1 497.2 28.8 144.8 13.32-C4-179477 315.3 1 143 43.942 69.711 5.7 13.5 12.9 8.8 42.8 11.7 34 22.7 1 9.8 -- -- -- -- 3.7 75.7 215.2 135 494.5 558.5 8300.9 461.9 79.6 36.2 354.9 43.8 502 39 57.5 182-C4-179478 314.1 2 143 43.942 69.711 8.6 10.1 -- -- 52.1 22.1 21.5 24.9 5.7 8.6 7.1 11.6 -- -- 51.6 90.4 23.4 69.6 373.8 417.9 8167.1 457.7 288.2 44 324.7 44.2 618.1 38.7 223 22.52-C4-179479 333.1 3 143 43.942 69.711 -- -- 37.8 12.5 75.4 18.4 6.8 19.6 -- -- 3.9 8.1 18.2 9.7 222.4 124.3 3.7 66.2 214.8 261.4 8929.2 449.6 219 37 361.8 43.4 597.8 39.1 189 23.12-C4-179480 288 4 143 43.942 69.711 13.1 12.2 4.7 8.8 46.9 19 36.5 31.3 2.3 13.3 -- -- 4.4 9.2 -- -- -- -- 343.9 278.2 8726.6 510 132.5 38.5 137.4 38.1 594.4 43.8 114.8 21.42-C4-179481 327.5 5 143 43.942 69.711 2.8 9.9 8.3 10.9 91.2 17 43 22.1 18.6 13.9 0.9 17.3 6.5 8.9 63.6 75 86.1 71.7 22.4 252.7 9166.6 466.5 283.8 43 298.3 43.3 625.9 39.2 185.7 232-C4-179482 354.1 6 143 43.942 69.711 6.8 11.5 3.8 9.7 61.3 16.2 6.4 23 29.5 12.5 7.3 8.7 -- -- 189.6 119.3 216.4 132 -- -- 11659.7 499.9 233.1 35 483.8 43.2 751 39.4 140.4 24.42-C4-179483 303.7 7 143 43.942 69.711 3 11.8 4.5 8.8 8.8 10.5 -- -- 23.6 13.2 9.3 9.8 13 10.8 38.1 84.2 115.7 103.4 -- -- 11682.7 534.6 344.9 48.1 252.3 47.4 845 45 231.8 27.12-C4-179484 378.3 8 143 43.942 69.711 1.6 9.9 -- -- -- -- -- -- 3.4 9.3 7.4 8.1 -- -- -- -- 246.4 83.6 -- -- 9484.3 433.2 306.2 38.3 334 39.2 676.4 37.5 181.4 21.22-C4-179485 365.7 9 143 43.942 69.711 16.5 13.1 6.5 7.6 23.9 11.7 12.3 21.2 -- -- 13.5 8.4 2.9 7.4 158.3 102.7 33.5 58.3 558.4 499.2 10280.3 473.1 271.3 38.9 265 41 793.7 39 228 232-C4-179486 308 10 143 43.942 69.711 12.7 11.4 -- -- -- -- -- -- -- -- 22.1 12.1 10.3 8.2 48.9 80.7 47.8 73.6 717.6 441.5 11975.5 544.2 321 46.4 297.4 48.5 896.6 44.5 181.6 29.42-C4-179487 367.3 11 143 43.942 69.711 11.1 9.2 -- -- 10 9.1 13.3 26.1 10.7 13.3 4.7 10.1 12.7 9 -- -- -- -- 659.2 393.7 9872.2 449.9 282.4 42.8 357.1 40.2 720.4 38.2 172.8 22.4
2-NG-179100 1409.6 S 143 43.942 69.711 36.5 13.3 0.5 9.8 75.1 17.2 141.8 25.5 6.7 9 -- -- 4.5 5.7 -- -- 178.9 79.9 556.8 562.6 8796.5 369.5 417.4 37.6 359.5 37.4 641.5 34.7 162.7 20.21-C3-179457 122.7 1 144 43.930 69.728 10.6 13.2 44.7 15.4 89.9 21.1 -- -- -- -- -- -- -- -- 58.2 119.9 265.3 97.2 1063 475.6 8653.3 470.7 209.5 34.1 295.4 41.5 459 45.9 117.5 19.11-C3-179458 108.4 2 144 43.930 69.728 45.8 13.4 29.3 16.6 71.4 19.7 -- -- 9.4 11.3 15.2 12.4 9 11.7 -- -- 16.9 79.8 723 437.5 8372.6 501.7 272.9 48.3 233.5 47.2 601.6 51.4 142 27.81-C3-179459 118.7 3 144 43.930 69.728 3.7 13.4 -- -- 114.7 19.8 35.3 25 21.2 13.2 24.7 10.8 9 9.2 45.1 93 257.1 110.3 69.9 334.4 9079.7 498.9 297.8 47.7 397.5 51.8 638.3 45.8 128.7 21.71-C3-179460 127 4 144 43.930 69.728 4.1 10.8 -- -- 51.5 26 51.8 26.8 -- -- 6.2 11.4 3.1 8.4 -- -- -- -- 500 363.9 8486.3 477.3 272.2 48.5 266.7 34.3 689.4 49.4 166.2 24.71-C3-179461 103.6 5 144 43.930 69.728 10.1 11.8 -- -- 74.1 20.1 52.4 29.3 17.2 13.9 23.9 11.4 14.1 11.1 -- -- 110 112 -- -- 9027.3 556.5 387.5 48.8 341 58.6 869.2 59.1 213.7 30.5
1-NG-179101 1396 S 144 43.930 69.728 3.7 8.2 10 7 64.7 11.3 23.2 14 -- -- 2.8 7.1 0.6 5.2 57.7 57.5 155 82.7 5962.4 436.7 7539.1 247.6 293.2 25.9 279.4 29.8 512.5 29.4 132.6 131-C3-179418 123.7 1 145 43.920 69.731 15.1 14.2 7.8 12.3 110.3 25.3 -- -- 7.9 10.3 -- -- 25.9 11.7 -- -- 84.9 101.8 404.7 326.3 8301.2 482.2 245.9 44.5 334.7 50.5 570.2 47.5 111 20.61-C3-179419 139.2 2 145 43.920 69.731 0.9 10.7 12.4 10.6 82 17.9 46.1 28.1 -- -- 5.7 11.7 2.1 7.9 25.7 99.9 207.5 93 478.8 301.1 8459.3 443.4 222.1 36.8 373.5 50.4 709.6 46.3 237.7 25.71-C3-179420 135 3 145 43.920 69.731 18.4 10.2 10.7 11.5 18.6 10.8 -- -- 14.5 15 10.3 10 6.5 9.1 67.6 153 -- -- 563.6 407 8629.9 468.9 261 49.6 331.2 50.5 739 47.6 174.2 26.31-C3-179421 121.3 4 145 43.920 69.731 25.8 20.1 1.2 9.1 1.2 11.5 19 22.9 23 11.7 -- -- 4 8.8 402.5 119.8 -- -- 198.1 381.8 9820.4 500.6 395.1 45.7 344.6 46.1 808.4 54.4 194.6 28.7
2-NG-179102 1425.3 S 145 43.920 69.731 11.8 8.5 23.6 8.7 96.7 16.9 -- -- 4 8.4 19.9 9.3 10.7 7.8 55.4 78.6 211.3 90.5 -- -- 8211.6 359 264.7 35.8 381.3 37.7 681.7 33.6 144.1 18.81-C4-179360 203.6 1 146 43.919 69.751 -- -- 3.7 8 103.8 15.9 8.1 20.2 16.2 11.8 1.3 10 9.1 12.5 74.8 78.2 -- -- 480.4 363.6 7559.5 404.4 270.6 42.3 290.6 45.3 655 45.6 131 18.62-C3-179361 114.2 2 146 43.919 69.751 9.7 20.4 4.1 15.6 123 32.7 25.5 29 21.6 17.4 7.9 12.8 20.5 19.8 133.9 136.8 134.2 145.3 2109.5 800.9 8447.9 643.5 367.9 52.6 301.9 62.1 505.7 55.9 247.2 37.72-C3-179362 102.1 3 146 43.919 69.751 9.1 32.6 13.7 13.7 97 25 93.9 62.7 43.9 19.3 45.9 26.4 1.4 12.6 480.9 192.2 41.7 121.1 943.8 845.6 6769.3 668.4 202.2 48.5 284.9 63.3 289.7 45 82.1 24.62-C3-179363 117.3 4 146 43.919 69.751 -- -- 6 13.4 167.6 36.6 -- -- 19.1 15 5.1 15.8 -- -- 247 125.8 225 126.5 1200.7 988.1 8797.6 691.6 167.8 61.8 304.2 54.1 381.6 47.6 248.1 32.92-C3-179364 114.6 5 146 43.919 69.751 5.4 14.3 -- -- 119.3 31.7 98.3 51.7 20.5 13.4 13 14.8 8.7 12.1 21.1 119.8 -- -- 468.9 881.7 9982.3 682.5 278.7 58.9 391.5 71.6 755 62.1 203.3 35.92-C3-179365 122.2 6 146 43.919 69.751 -- -- -- -- 74.9 24.1 -- -- 29.3 18.7 -- -- 44.2 16.3 39.5 150 34.8 116 1678.3 1163.2 9907.6 666 361.5 67.8 318 59.1 748.4 58 158.7 312-C3-179366 103.2 7 146 43.919 69.751 25.4 24.5 -- -- 119.2 29 -- -- 10.9 17.8 7.7 17.9 8.5 14.3 -- -- 185.6 133.1 -- -- 9690.1 700.4 330.4 60.8 354.3 67.1 691.1 71.6 192.4 37.3
1-NG-179103 1411.5 S 146 43.919 69.751 7.7 7.1 1.9 4.2 66.2 12.8 -- -- 5.9 4.6 6.7 4.5 0.5 4.7 -- -- 330.2 93 942.4 228.4 7020.6 238.5 285.1 26.5 322.8 30 600.8 30.8 129.4 13.3
Samples collected 16-17 September 2004 2-C4-171841 420.5 1 147 Westport Is 43.9494 69.688 15 10 21 11.8 58.1 15.4 53.6 20.1 9.3 9.3 6.2 6.3 8.4 7.3 -- -- 163.3 60 366.4 383.9 7271.2 360.7 235.9 33.8 333.1 34.2 494.6 30.1 109.9 17.12-C4-171842 209.2 2 147 Westport Is 43.9494 69.688 13 14.3 21.1 13.1 23.5 18.4 35 29.4 4.7 14 17.9 13.2 -- -- -- -- 87.9 96.8 920.7 520 9544.7 562.4 324.2 50 321.4 56 642.4 54.2 190.9 28.32-C4-171843 273.6 3 147 Westport Is 43.9494 69.688 14.3 12 1.2 9 55.3 22.3 -- -- 34.6 16.6 12.6 9.4 1.5 9.4 56.4 99.7 636.4 177.2 643.6 641.9 10161.5 525.6 401.9 47.4 322.7 41.2 614.2 43.4 165.1 26.72-C4-171844 327.1 4 147 Westport Is 43.9494 69.688 29.2 16.3 23.6 11.9 36.9 11.9 144.1 34 1 8.7 13.2 9.3 0.4 12 67.2 74.5 -- -- -- -- 9633.5 475.5 337.2 42 265.3 43.5 560.1 38.9 136.4 21.52-C4-171845 363.4 5 147 Westport Is 43.9494 69.688 14.1 15 -- -- 71.9 17.7 6.2 21.3 3.1 9.3 -- -- 8.7 8.1 86 70.9 -- -- -- -- 9348.5 444.4 356 39.6 436.3 40.3 555.4 40 172.7 20.82-C4-171846 347.8 6 147 Westport Is 43.9494 69.688 13 11.1 15.6 11.7 66.7 18.4 -- -- 16.2 12 6.8 8.1 9.7 13.4 37.7 103.3 -- -- 269 543.4 8980.4 448.7 221.4 38.5 307.8 41.7 674.4 38.5 184.6 232-C4-171847 354.8 7 147 Westport Is 43.9494 69.688 4.1 9.6 11.5 9.4 120 21.4 -- -- 5.5 11.2 17.1 12.4 2.4 7.5 298 91.8 -- -- 558.4 405.8 10388 477.5 314.5 37.9 339.7 43.1 751.7 38.7 188.9 20.62-C4-171848 348.1 8 147 Westport Is 43.9494 69.688 -- -- 8.5 9.9 101.1 18.9 6.5 17.3 6.6 10 31.1 12.6 -- -- 159.6 99.1 82.2 79.5 -- -- 10257.3 486.9 247.1 35.4 298.8 44.3 830 40.2 224.2 24.22-C4-171849 340 9 147 Westport Is 43.9494 69.688 5.9 13.9 15.5 9.4 122.8 20.8 199 38.1 9.6 11.3 8.3 8.2 -- -- 231.5 92.9 25.2 70 199.6 249.3 10807.6 489 313.2 44.3 290.3 45.6 710 44.7 179.9 23.1
2-NG-179488 1387.5 S 147 Westport Is 43.9494 69.688 74.8 19.6 44.1 12 49.7 13.6 -- -- 15 10.3 11.3 7.5 1.4 6.2 -- -- 445.2 116 644.7 479.7 7661.5 349.5 308.9 35.3 339.3 36.4 585 33.3 145.2 17.32-C4-171876 526.7 1 148 Clarks Cv 43.928 69.5635 4.6 7.3 -- -- 36.1 11.9 9.3 14.6 2.5 6.8 7 6.3 0.4 5.5 35.2 78.9 2.3 63.9 -- -- 9734.3 388.5 245.6 29.8 272.2 30.1 389.7 25.4 109.7 14.82-C4-171877 393.9 2 148 Clarks Cv 43.928 69.5635 23.4 16 -- -- 6.2 8.4 -- -- 11.6 9.9 14.3 10 10 8.8 -- -- 59.1 83.3 177 369.6 13227.4 504.9 376.9 41.6 424.5 41.4 544 34.6 145.8 20.52-C4-171878 351.1 3 148 Clarks Cv 43.928 69.5635 7.5 11.4 -- -- 18.1 9 83.5 35.5 -- -- 8.9 11.2 7.6 12.5 42.9 68.5 31.4 62.6 -- -- 10248.7 481.3 405.5 42.4 278 38.3 315.2 30.7 117.5 19.42-C4-171879 430.5 4 148 Clarks Cv 43.928 69.5635 13.3 9.4 17.4 8.1 10.5 12.7 -- -- 4.5 8.9 10.5 10.4 -- -- -- -- 88.3 56.2 102.3 332.7 11925.7 450.3 282 36.5 339.5 37.7 463.9 31 103.3 17.62-C4-171880 411.8 5 148 Clarks Cv 43.928 69.5635 32.2 16.3 7.4 7.7 10.9 9.3 8.2 23.1 8.7 10 5.3 8.1 1 7.4 213.7 99.6 32.8 56.1 276.2 347.9 13006 482.5 353.8 35.1 360.1 40.4 508.7 32.4 122.6 15.92-C4-171881 443.9 6 148 Clarks Cv 43.928 69.5635 -- -- 7.2 6.1 17.5 9.8 37.3 17.9 -- -- -- -- 7.1 6 -- -- 173.1 64.4 181.8 248 10659.8 420.2 330.5 35.2 317.8 36.1 347.8 25.4 134.2 17.12-C4-171882 385.1 7 148 Clarks Cv 43.928 69.5635 15.6 13.1 3.5 8.5 26.9 12.5 16.1 21 12.5 8.9 9 7.7 2.7 7.9 3 62.4 105.1 84.7 104.8 269.6 12764.5 504.3 359.4 40.4 352.8 45.3 321.7 29.3 120 22.62-C4-171883 460.6 8 148 Clarks Cv 43.928 69.5635 8.3 11.3 0.7 7 19.3 8.6 7.3 18.5 5 8.1 12.5 8.5 6.9 6.5 45.2 86 -- -- -- -- 11033.5 429.9 301.2 33.7 380.6 35 502.7 30.2 134.3 17.22-C4-171884 485.4 9 148 Clarks Cv 43.928 69.5635 11.6 10.7 5 6.5 20.4 10.1 60.4 29.2 -- -- -- -- -- -- -- -- -- -- -- -- 11043.9 404.9 296.6 33 319.4 33.9 531.8 29.6 144.3 19.3
2-NG-179492 1748.9 S 148 Clarks Cv 43.928 69.5635 -- -- 12.1 7.8 2.9 7.4 106.7 34.8 -- -- 6.2 8.5 17.5 9.3 -- -- 133.2 90.7 -- -- 11058.6 371.7 309.4 32.7 357.8 34.3 549.8 29.4 146.4 15.92-C4-171831 401.4 1 149 Robin Hood Cv 43.8222 69.7486 15 12.9 1.7 7.7 55.4 12.8 141.2 28.6 5.4 10.4 -- -- 1.1 6.8 59.6 72.5 55 58.4 207.2 255.5 9033.5 422.4 291.8 31.1 292.6 37 448.2 32.1 132.9 18.52-C4-171831 401.4 1 149 Robin Hood Cv 43.8222 69.7486 15 12.9 1.7 7.7 55.4 12.8 141.2 28.6 5.4 10.4 -- -- 1.1 6.8 59.6 72.5 55 58.4 207.2 255.5 9033.5 422.4 291.8 31.1 292.6 37 448.2 32.1 132.9 18.52-C4-171832 294.5 2 149 Robin Hood Cv 43.8222 69.7486 4.9 11.6 3.8 11.8 87.5 18.1 107.2 38.3 6.6 12.1 16.2 11.8 6.1 8.7 144.7 127.7 4.2 72 1233.3 445.2 10316.2 523.1 412.2 47.6 313.6 46.5 612.9 40.9 186.6 22.22-C4-171833 311.9 3 149 Robin Hood Cv 43.8222 69.7486 -- -- 2.2 6.4 72.2 17.7 79.5 39.3 -- -- -- -- 0.5 11.9 42.1 90.3 125.8 94.4 -- -- 10114.1 500.8 302.5 44.8 355.5 45.4 598.9 38.7 102.6 18.52-C4-171834 316.5 4 149 Robin Hood Cv 43.8222 69.7486 -- -- 23.6 15 61.4 16.6 116.7 30.5 -- -- 10.5 12.2 2.7 8.4 8.5 106.9 77.5 87 962.1 509.4 10963.8 509.9 318.9 40.9 335.1 43.4 555.6 38.5 149.4 22.82-C4-171835 369.7 5 149 Robin Hood Cv 43.8222 69.7486 3.3 9.8 4.6 13.2 60.7 16.6 21.3 20 35.3 13.1 1.2 7.5 -- -- 357 115.3 -- -- -- -- 10567.6 469.7 280.2 37.9 258 32.3 554.4 35.4 153.9 20.32-C4-171836 290.9 6 149 Robin Hood Cv 43.8222 69.7486 6.2 11.9 10.5 10.5 72.9 17.3 15.5 31.7 25.8 18.5 5 11.3 13.1 13.2 220.2 161.8 -- -- -- -- 10701.2 545.6 338.6 53 324.4 50.3 574.5 43.5 166.9 24.52-C4-171837 354.1 7 149 Robin Hood Cv 43.8222 69.7486 -- -- 4.8 9.7 43.9 13.2 130.6 33.5 35.3 13.9 -- -- 13.7 8.3 -- -- 55.4 99.9 -- -- 11356.2 492.4 473.1 43.8 300.9 42.8 729.8 38 168.7 22.72-C4-171838 381.6 8 149 Robin Hood Cv 43.8222 69.7486 3.2 7.3 3.6 6.3 8.6 7.2 62 24.9 2.4 7 54.4 10.6 21.9 10.6 -- -- 45 47.7 71.1 322.3 3683.7 281.1 141.5 25.8 77.1 32.5 281 26.4 55 12.22-C4-171839 368.6 9 149 Robin Hood Cv 43.8222 69.7486 20.4 12 1.8 8.7 5 8.9 143.8 42.3 6.2 10.1 33.1 11.4 -- -- 25.1 87.5 143.7 83 29.9 548.8 10759 470 371.7 43.4 506.6 46.8 798.1 39.3 230.1 22.5

Maine Yankee Marine Sampling Study
Maine Yankee Final.doc 2/15/05 97
nuclide 60Co 60Co 137Cs 65Zn 22Na 54Mn 58Co 133Ba 7Be 210Pb 40K 214Bi 214Pb 212Pb 208Tl Gamma energy (keV) 1173.23 1332.51 661.62 1115.52 1274.54 834.81 810.75 383.7 477.56 46.52 1460.75 609.32 351.99 238.63 583.14 Branching Ratio 0.9986 0.9998 0.8462 0.5075 0.9994 0.9998 0.9945 0.0884 0.103 0.04 0.107 0.4609 0.371 0.431 0.861
sample mass(g) depth(in) station lat. long. pCi/kg +/- pCi/kg +/- pCi/kg +/- pCi/kg +/- pCi/kg +/- pCi/kg +/- pCi/kg +/- pCi/kg +/- pCi/kg +/- pCi/kg +/- pCi/kg +/- pCi/kg +/- pCi/kg +/- pCi/kg +/- pCi/kg +/-
2-C4-171840 347.4 10 149 Robin Hood Cv 43.8222 69.7486 6.9 9.9 20.6 12.2 15.9 10.2 129.8 39.5 -- -- 12.5 13.1 3 11.4 13.3 76.7 84.7 68.1 454.1 532.7 11315.8 502.7 468.3 44.7 520.7 46.5 820.4 42.1 237.5 24.12-NG-179493 1405.4 S 149 Robin Hood Cv 43.8222 69.7486 13.9 9 -- -- 51.7 15.7 14.2 19.3 4.5 8.3 -- -- 7.3 7.2 152.7 80 166.7 65.3 -- -- 6972.2 332.9 305 32.5 266.5 34.1 433.8 33 109.7 15.7
average of control samples: 12.3 12.5 9.9 10.2 72.4 17.0 61.5 28.7 10.5 11.1 12.3 10.5 6.9 9.2 97.7 94.0 99.9 81.8 355.6 448.5 10179.1 481.2 354.8 43.1 389.0 44.5 681.5 39.2 183.0 22.5 average of samples near plant: 19.2 12.4 17.8 10.4 73.2 16.5 36.1 24.3 10.4 10.6 9.2 9.7 7.6 8.8 87.8 95.7 154.9 89.3 551.3 421.6 9441.5 440.4 301.2 40.2 330.8 43.1 623.7 40.8 166.1 21.4

Maine Yankee Marine Sampling Study
Maine Yankee Final.doc 2/15/05 98
Table 5-2. Summary of 137Cs peaks observed in cores.
Location Station
No. Bottom
Of Peak 1 Top of Peak 2
30 y Separation
of Peaks pCi/Kg
Max Long Creek 1" 6" 5" 950 Bailey Cove 2 1" 11" 10" 250 Wiscasset 3" 9" 6" 92 Chewonki Camp 3" 6" 3" 135 Bailey Cove Outfall 8 6" 13" 7" 175 Diffuser 34 1" 7" 6" 17 Westport Island 38 2" 7" 5" 41 Eaton farm Point 44 1" 5" 4" 100 50 2" 10" 8" 120 South Oak Is 59 1" 3" 2" 115 South Oak Is 60 5" 9" 4" 20 61 Flat 10 62 1" 8" 7" 24 Long Ledge 63 1" 5" 4" 60 Long Ledge 64 1" 7" 6" 80 65 1" 6" 5" 110 67 2" 9" 7" 155 Foxbird Is 68 2" 7" 5" 252 73 1" 12" 11" 175 Bailey Cove 74 1" 10" 9" 250 Upper Bailey Cove 77 1" 12" 11" 225 South Bailey Cove 85 2" 6" 4" 70 North Bailey Cove 99 1" 11" 10" 155 Eaton Farm Bailey Cove 101 2" 10" 8" 150 Top of Bailey Cove 105 1" 7" 6" 100 108 1" 11" 8" 130 113 2" 13" 11" 160 118 2" 11" 9" 35 143 2" 11" 6" 90 Oak Island Murphy Corner 144 2" 5" 3" 110 Oak Island Murphy Corner 145 1" 3' 2" 110 146 1" 7" 6" 165 Taunton Bay Vc14 1cm 30cm 29cm 60 Taunton Bay Vc15 1cm 25cm 24cm 100 Vc23 1cm 25cm 24cm 250
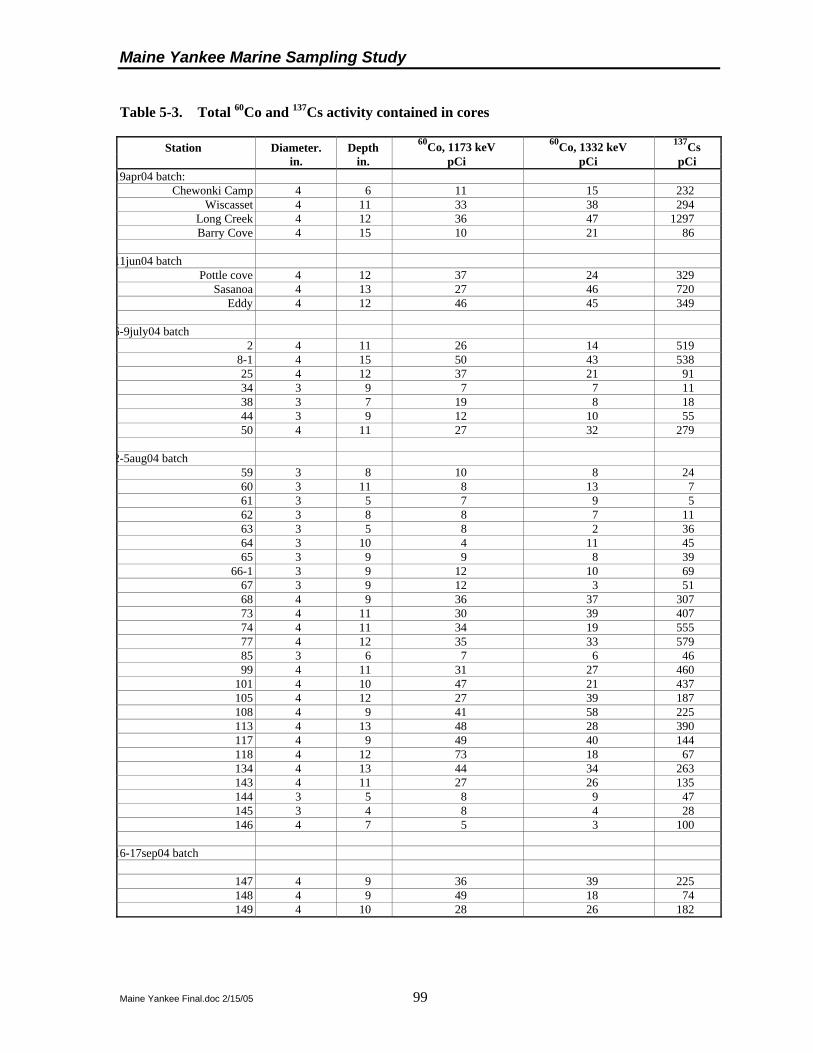
Maine Yankee Marine Sampling Study
Maine Yankee Final.doc 2/15/05 99
Table 5-3. Total 60Co and 137Cs activity contained in cores
Station Diameter. Depth 60Co, 1173 keV 60Co, 1332 keV 137Cs in. in. pCi pCi pCi
19apr04 batch: Chewonki Camp 4 6 11 15 232
Wiscasset 4 11 33 38 294 Long Creek 4 12 36 47 1297 Barry Cove 4 15 10 21 86
11jun04 batch
Pottle cove 4 12 37 24 329 Sasanoa 4 13 27 46 720
Eddy 4 12 46 45 349
6-9july04 batch 2 4 11 26 14 519
8-1 4 15 50 43 538 25 4 12 37 21 91 34 3 9 7 7 11 38 3 7 19 8 18 44 3 9 12 10 55 50 4 11 27 32 279
2-5aug04 batch
59 3 8 10 8 24 60 3 11 8 13 7 61 3 5 7 9 5 62 3 8 8 7 11 63 3 5 8 2 36 64 3 10 4 11 45 65 3 9 9 8 39
66-1 3 9 12 10 69 67 3 9 12 3 51 68 4 9 36 37 307 73 4 11 30 39 407 74 4 11 34 19 555 77 4 12 35 33 579 85 3 6 7 6 46 99 4 11 31 27 460
101 4 10 47 21 437 105 4 12 27 39 187 108 4 9 41 58 225 113 4 13 48 28 390 117 4 9 49 40 144 118 4 12 73 18 67 134 4 13 44 34 263 143 4 11 27 26 135 144 3 5 8 9 47 145 3 4 8 4 28 146 4 7 5 3 100
16-17sep04 batch
147 4 9 36 39 225 148 4 9 49 18 74 149 4 10 28 26 182

Maine Yankee Marine Sampling Study
Maine Yankee Final.doc 2/15/05 100
Table 5-4. Biota gamma scan results
nucl. 60Co 60Co 137Cs 65Zn 22Na 54Mn 58Co 133Ba 7Be 210Pb 40K 214Bi 214Pb 212Pb 208Tl E(keV) 1173.23 1332.51 661.62 1115.52 1274.54 834.81 810.75 383.7 477.56 46.52 1460.75 609.32 351.99 238.63 583.14 % 0.9986 0.9998 0.8462 0.5075 0.9994 0.9998 0.9945 0.0884 0.103 0.04 0.107 0.4609 0.371 0.431 0.861 sample mass(g) species Location pCi/kg +/- pCi/kg +/- pCi/kg +/- pCi/kg +/- pCi/kg +/- pCi/kg +/- pCi/kg +/- pCi/kg +/- pCi/kg +/- pCi/kg +/- pCi/kg +/- pCi/kg +/- pCi/kg +/- pCi/kg +/- pCi/kg +/-2-NG-171993 343.5 clam shells Little Oak Is. 6 7 -- -- 11.7 10 31.8 16.8 13.8 6.4 -- -- 8 6.7 3.6 62.9 83.7 66 364 676 2196.2 190 98.6 20.4 72.8 25.5 204 27.2 63.6 13.82-NG-172000 829.8 mussels Little Oak Is. 8.5 4.7 5 3.4 5.7 4.3 4.7 5.8 -- -- 1.3 2.7 -- -- -- -- 18.6 28.8 375 288 1243.2 89.4 14.3 7.9 9.5 10.3 30.1 5.9 5.7 3.62-NG-171998 280.9 rock weed Little Oak Is. 13.7 11.8 12.3 14.5 7.4 12.2 97.2 30.8 18 15.7 -- -- 2.6 9 -- -- 44.3 146 1282 884 15091 455 112 30.3 66.8 32.6 25.4 26.1 37.2 15.52-NG-171997 472.3 fish tissue Back River 5.6 7 2.4 5 16.8 7.6 8.8 16 10.4 8.1 0.2 4.9 5.7 6.8 -- -- -- -- 609 324 5325.4 215 10.3 12.9 57 24.6 53.3 20.1 28 10.72-NG-171989 999.2 clam tissue Little Oak Is. 7.1 4.1 -- -- -- -- 6.1 5.3 3.1 2.9 8.4 3.3 3.9 4.4 -- -- 72.1 32 146 237 1543.6 84 10.1 8.9 3.7 5.4 42.4 9.9 12.5 5.52-NG-45201 636.2 lobster 1.9 3.9 6.1 5 1 4.1 46.5 15.3 3.2 3.7 7.3 3.8 -- -- 9.7 34 18.9 38 -- -- 3236.7 143 31.4 12.5 40.6 14.1 17.5 11 8.8 5.2 average 7.1 6.4 6.5 7.0 8.5 7.6 32.5 15.0 9.7 7.4 4.3 3.7 5.1 6.7 6.7 48.5 47.5 62.2 555.2 481.8 4772.7 196.0 46.1 15.5 41.7 18.8 62.2 16.7 26.0 9.1 2-NG-179200 736.3 control mussels Darling Center 3.4 3.3 -- -- 2.5 4.3 1.5 8.2 3.9 3.8 -- -- 2.1 4 -- -- 49.5 36.8 -- -- 1804.5 108 51 11.8 32.9 16 48.5 13.4 15.1 3.92-NG-0100 237.6 control sea scallops Darling Center 5.4 11.9 30.1 10 -- -- 26.9 18.8 -- -- 13.3 9.6 14 12.5 25.9 104 121 117 2528 1103 3889.3 292 85.7 31.1 63.5 47.6 108 27.9 49.4 17.12-NG-0101 797.1 control oysters Darling Center 1.7 2.9 2.3 3.2 0.6 3.6 20.4 8.3 3.6 2.7 -- -- -- -- 29.4 43.6 44.7 29.9 -- -- 1178.3 83.9 17 9.5 21.6 12.9 22.7 5.5 7.8 4 2-NG-0102 883.5 control ocean quahogs Darling Center -- -- -- -- 5.5 3.7 5.2 7 3.6 2.6 1.8 2.9 2.4 3.6 14.2 35.4 46.6 34.8 358 264 1523.7 90.6 25.5 8.9 22.3 13 44.8 10.5 18 4.82-NG-0103 669.2 control horse mussels Darling Center 4.3 4.4 4.8 4.3 14.4 5.5 3.9 5.9 1.1 2.5 4.5 4.2 -- -- -- -- 83.7 40.9 526 356 1328.2 104 64.2 13.7 63.4 18.1 27.5 10.8 9.2 6 2-NG-045402 673 control blue mussels South Portland 2.9 3.6 3.8 4 8.1 6.2 21.9 10.7 3.3 3.6 -- -- 1.3 3.4 15.6 73 1.9 49.5 393 257 2427.9 122 53.6 16.5 83.7 15.3 58.6 12.3 14 4.92-NG-045401 459.6 control Rockweed South Portland 30.6 12.5 12.4 6.3 10.1 10.8 2.4 19.6 0.2 8.2 5.5 6.3 -- -- 2.7 76.4 122 66 563 375 6075.8 235 60.8 16.6 32.5 19.2 69 20.6 5.1 9.7 control average 8.1 6.4 10.7 5.6 6.9 5.7 11.7 11.2 2.6 3.9 6.3 5.8 5.0 5.9 17.6 66.5 67.0 53.5 873.5 470.9 2604.0 147.8 51.1 15.4 45.7 20.3 54.2 14.4 16.9 7.2

Maine Yankee Marine Sampling Study
Maine Yankee Final.doc 2/15/05 101
Table 5-5. Comparison with Pre- and Post-operational study
Cs-137 Low Cs-137 High Co-60 Low Co-60 High 2004 2.9 287.2 0.5 168.7 Pre 350 800 <30 <30 Post 500 1000 <30 2,420
Table 5-6. Results of the Hard to Detect Nuclides
Sample 63Ni
(pCi/g) 55Fe
(pCi/g) 90Sr
(pCi/g) 238Pu
(pCi/g) 239Pu
(pCi/g) Clams
-1.2 x 10⁻¹ ± 3.2 x 10⁻¹
-1.7 x 10⁻¹ ± 2.0 x 10⁻¹
-1 x 100 ± 1.1 x 100
0 ± 1.5 x 10⁻⁵
8.2 x 10⁻⁴ ± 8.2 x 10⁻⁴
Clamshell
-1.6 x 100 ± 2 x 100
-2.6 x 100 ± 1.2 x 100
-5 x 10⁻¹ ± 1.2 x 100
-3.2 x 10⁻⁴ ± 1.9 x 10⁻⁴
5.1 x 10⁻⁴ ± 8.5 x 10⁻⁴
Mussels
9.2 x 10⁻¹ ± 9.3 x 10⁻¹
-5.2 x 10⁻¹ 5.5 x 10⁻¹
5.0 x 10⁻¹ ± 1.2 x 100
-6.1 x 10⁻⁴ ± 2.5 x 10⁻⁴
5.0 x 10⁻⁵ ± 8.3 x 10⁻⁴
Mussel shell
1.5 x 100
± 1.2 x 100 -6.0 x 10⁻² ± 8.1 x 10⁻¹
-1.2 x 100 ± 1.2 x 100
0 ± 1.1 x 10⁻⁵
-3.3 x 10⁻⁴ ± 1.7 x 10⁻⁴
Lobster
2.0 x 10⁻¹ ± 1.2 x 100
-6 x 10⁻² ± 8.2 x 10⁻¹
1.25 x 100 ± 7.5 x 10⁻¹
0 ± 5.2 x 10⁻⁶
0 ± 5.2 x 10⁻⁶
Fish
9.0 x 10⁻² ± 3.8 x 10⁻¹
-2.3 x 10⁻¹ ± 2.6 x 10⁻¹
9.3 x 10⁻¹ ± 4.0 x 10⁻¹
-1.28 x 10⁻⁴ ± 5.7 x 10⁻⁵
0 ± 3.5 x 10⁻⁶
Rockweed
-6.0 x 10⁻¹ ± 2 x 100
-1.1 x 100 ± 1.2 x 100
-1.0 x 10⁻¹ ± 1.3 x 100
0 ± 1.6 x 10⁻⁵
-2.2 x 10⁻⁴ ± 1.6 x 10⁻⁴
Sediment
3.9 x 100 ± 2.2 x 100
-3 x 10⁻¹ ± 1.4 x 100
5.0 x 10⁻¹ ± 1.1 x 100
7.2 x 10⁻⁴ ± 7.2 x 10⁻⁴
9.3 x 10⁻³ ± 2.6 x 10⁻³

Maine Yankee Marine Sampling Study
Maine Yankee Final.doc 2/15/05 102
6. HOT PARTICLE SEARCH RESULTS
University of Maine researchers conducted a search for hot particles on three occasions, July 7, August 2, and August 18, around the site of the Maine Yankee Nuclear Power Plant. The goal of the search was to find any area on the tidal flat which measured three times normal background. The searches were conducted using a High Pressure Ion Chamber (HPIC) connected to a laptop computer. Each search was conducted at an extreme low tide so as to allow the investigators the ability to walk as far away from the shore into the tidal flat as possible. The HPIC records a dose in microrems/hour. At the same time, position was recorded using GPS. The HPIC was set to warn researchers if a measurement three times larger than background was detected by emitting a series of four beeps. Therefore, a background was initially established at a location well away from the power plant. In each case, the background was approximately 10 to 12 microrems/hour as expected. However, if a measurement over three times these values was noted, the researchers would mark the site with a flag, record the GPS location, notify Maine Yankee personnel, and return with a sodium iodide detector to perform a gamma ray analysis of the location. Results from the sodium iodide detector would provide a spectrum allowing a determination of the particular radioisotopes involved. The HPIC was loaded onto a sled and dragged over the tidal flat during low tide. The HPIC would record results for 30 seconds, then rest for 30 seconds. After recording for 30 seconds, the HPIC emitted a single beep at which time the researchers would move the sled for 30 seconds to the next location.
Results are shown in Figures 6-1 through 6-3. No measurement over three times background was seen. However, some variation was noted. The variation, from approximately 11 microrems/hour to approximately 5 microrems/hour, is most likely due to low sediment concentrations of nuclides and some gamma ray shielding by the ocean. As the researchers dragged the sled out away from the shore, the HPIC would see gamma rays from the immediate tidal flat, but not from the shore or from the soil underneath water. As a result of the low sediment concentrations and water shielding the HPIC from a large section of area, the values measured were reduced to very low values. These results are in agreement with a pre- and post-operational study of the area completed in 1976. In this report, total dose rates ranging from 8.89 to 14.45 microrems/hour (Technical Note 76-3). Figure 6-4 shows the three tracks taken around the power plant with the HPIC results color coded to show the variation. As can be seen from the figure, the three tracks were chosen to bracket the plant and to pick up any hot particles remaining in the area of the outfall and the diffuser. As stated above, no “hot” areas were seen.

Maine Yankee Marine Sampling Study
Maine Yankee Final.doc 2/15/05 103
5
6
7
8
9
10
11
11:45 11:50 11:55 12:00 12:05 12:10
Exp
osur
e R
ate
(µR
/hr)
GM Time: 7 July 2004
Figure 6-1. Hot Particle Scan, 7 July 2004
0
2
4
6
8
10
12
11:00 11:10 11:20 11:30 11:40 11:50 12:00 12:10
Exp
osur
e R
ate
(µR
/hr)
GM Time: 2 August 2004
Figure 6-2. Hot Particle Scan, 2 August 2004

Maine Yankee Marine Sampling Study
Maine Yankee Final.doc 2/15/05 104
2
4
6
8
10
12
14
12:30 12:35 12:40 12:45 12:50 12:55 13:00 13:05 13:10 13:15 13:20
Exp
osur
e R
ate
(µR
/hr)
GM Time: 18 August 2004
Figure 6-3. Hot Particle Scan, 18 August 2004

Maine Yankee Marine Sampling Study
Maine Yankee Final.doc 2/15/05 105
69.7°W 69.698°W 69.696°W 69.694°W 69.692°W 69.69°W 69.688°W
43.944°N
43.946°N
43.948°N
43.95°N
43.952°N
43.954°N
43.956°N
0.7 km
46
810
12
Exposure Rate
uR/hr
Figure 6-4. Hot Particle Scan Map

Maine Yankee Marine Sampling Study
Maine Yankee Final.doc 2/15/05 106
7 MARINE SAMPLE DOSIMETRY
7.1 MARINE SAMPLING DOSE ASSESSMENT
7.1.1 Purpose of the Dose Assessment Document
The purpose of this dose assessment is to support the study by identifying current and future uses of the marine environment around Maine Yankee and the associated dose pathways, by presenting the basis for the selection of marine biota for sampling and by establishing the framework to evaluate the results of the sediment and biota sample analysis. Specifically, the following objectives are accomplished in this dose assessment:
1. Identify the dose pathways associated with the intertidal zone considering both current and potential future uses. Maine Yankee will work with the Friends of the Coast to reach agreement on these dose pathways.
2. Develop a dose assessment framework to calculate an incremental intertidal zone dose from the sampling (characterization) results. Maine Yankee will use this framework to compare the incremental intertidal zone dose to the limiting “resident farmer” dose calculations in the License Termination Plan.
3. Present the dose basis for the identification of flora and fauna in the intertidal zone that may reasonably be considered contributors to an intertidal zone pathway dose (e.g., seaweed, shellfish, etc.). Priority in sampling and analysis should be given to both the highest bio-accumulator and the most significant dose pathways to human populations.
This dose assessment will be used by Maine Yankee in the Bid Specification to identify the current and future uses and associated dose pathways and by the Marine Sampling contractors to select flora and fauna for sampling and calculate the intertidal dose from the sampling results. The final report should include an assessment of the dose significance of the sampling results using this dose assessment basis.
7.1.2 Inputs and Data Sources
Engineering Calculation EC-041-01 “Diffuser and Forebay Dose Assessment”
NUREG -5512 “Residual Radioactive Contamination from Decommissioning”
Federal Guidance Report No. 11 (FGR-11) “Limiting Values of Radionuclide Intake and Air Concentration and Dose Conversion Factors for Inhalation, Submersion, and Ingestion” (September 1988)
Regulatory Guide 1.109 “Calculation of Annual Doses to Man from Routine Releases of Reactor Effluents for the Purposes of Evaluating Compliance with 10 CFR Part 50, Appendix I, October 1977
Maine Yankee Offsite Dose Calculation Manual
Maine’s Coastal Wetlands, by Alison E. Ward, for Maine Department of Environmental Protection dated September 1999

Maine Yankee Marine Sampling Study
Maine Yankee Final.doc 2/15/05 107
Maine Aquaculture Review, by Normandeau Associates, Inc. and Battelle, for Maine Department of Marine Resources dated February 2003
WWW.seaweed.ie, WWW.alcasoft.com, WWW.garden.org
7.1.3 Current Maine Yankee Intertidal Zone Uses
Currently the intertidal zone at Maine Yankee is used primarily for commercial baitworm digging and soft-shell clam harvesting. Other uses can, at times, include fishing, lobstering and even duck hunting. Recreational swimming has been known to occur historically in Young’s (also known as Long) Creek which leads into Bailey Cove.
7.1.3.1 Offsite Dose Calculation Manual (ODCM) Maine Yankee has been lawfully allowed to discharge low levels of radioactive effluents
through its licensed discharges. These include both liquid and gaseous effluents. These effluents were monitored, evaluated for their dose consequences and reported on a semi-annual or annual basis, as required, throughout the operation and decommissioning of the plant. The resultant whole body and organ doses from these effluents were determined by summing the contributions from all pathways using the Offsite Dose Calculation Manual (ODCM). These whole body and organ doses to a theoretical member of the public were similarly reported on a semi-annual or annual basis. The estimated annual doses due to liquid effluents were consistently calculated to be below the 10 CFR Part 50, Appendix I dose criteria.
Exposure pathways that currently are assumed to exist in the ODCM as a result of liquid effluents are ingestion of fish and shellfish, and direct exposure from shoreline sedimentation. The potable water pathway and the irrigated foods pathway are not considered since the receiving water is not suitable for either drinking or irrigation. The direct exposure to worm diggers on tidal flats has been accounted for with an occupancy factor of 325 hours per year (0.037). It is expected that this same occupancy factor would apply to clam harvesters.
The dose analysis for the fish and shellfish pathways assumes a 10 to 1 dilution based on the discharge of effluents via a submerged multipart diffuser which extends approximately 1,000 feet into the tidal estuary. For shoreline direct exposure, a dilution ratio of 25 to 1 has been applied in order to calculate the radionuclide deposition on the exposed sediment.
7.1.3.2 Bailey Cove Mudflats Occupancy The maximum personnel occupancy for the Bailey Cove was documented in the Maine
Yankee Environmental Report and Off site Dose Calculation Manual (ODCM) to be 325 hours. Maine Yankee technical personnel re verified this occupancy factor through interviews with cognizant personnel. Interviews were conducted with Maine Yankee security force personnel, a Maine State Marine Patrol officer, a licensed clam digger, three licensed worm diggers, and one bait shop owner. Based on these interviews, the licensee determined that the occupancy factor of 325 hours per year, presented in the ODCM, was a conservative value. These verification activities were documented in the following records:
Maine Yankee memorandum dated January 23, 1996 memorandum entitled, "1995 Density Characterization of Clam/Worm Digging Activities in Montsweag Bay;"

Maine Yankee Marine Sampling Study
Maine Yankee Final.doc 2/15/05 108
Maine Yankee memorandum dated February 1, 1996, memorandum entitled, "Occupancy Factors for Bailey Cove;"
Maine Yankee memorandum dated January 30, 1996, memorandum entitled "Information Gathered About Worm Digging Activity That May Impact Occupancy Factors in Bailey Cove;"
NRC Inspection Report No. 50-309/96-06, dated July 25, 1996. In this inspection report, NRC documented the results of the NRC inspector’s conduct of interviews of a Maine State Marine Patrol officer and a Maine State Radiation Control Inspector; reviews of the Maine Yankee ODCM; and walkdowns of the western perimeter of the site. None of the information reviewed by the inspector suggested that personnel occupancy, in areas affected by direct radiation in the Bailey Cove mudflats, exceeded the occupancy factor presented in the ODCM. Based on this review, the inspector concluded that the occupancy factor presented in the ODCM for the Bailey Cove mudflats was reasonable.
In order to derive an incremental dose to the individual clam/worm digger, the intertidal zone direct dose rate from the sediment must be compared to the direct dose rate from soil at background contamination levels. For instance, the hypothetical worm digger referred to in Maine Yankee’s Environmental Report dated April 19, 1972 (pg. 5.2-6) would receive a total exposure of about the same magnitude if he did not dig worms. This was because background levels on the mud flats were found to be lower than the background levels on land.
7.1.3.3 Worm Digging The two species of marine worms which form the basis for the commercial bait worm
industry of Montsweag Bay and the Sheepscot River Estuary are the bloodworm, Glycera dibranchiata, and the sandworm, Nereis virens. Since these biota are not directly ingested by humans, the human dose pathways from commercial bait-worm digging is limited to direct exposure from standing on the mudflats and, to some degree, exposure to limited amounts of sediment which might be ingested and/or carried away on clothes or skin.
7.1.3.4 Clam Harvesting Soft-shell clams are sometimes harvested in and around the Maine Yankee intertidal zone.
The exposure pathways are similar to the worm digger with the exception that this biota is directly ingested by humans and is, therefore, subject to an internal dose pathway associated with this consumption.
7.1.3.5 Swimming When swimming occurs the individual is subject to direct exposure pathways from the
sediment which is subject to shielding by the water. Since the mudflats are not amenable to sunbathing, the occupancy time and exposure pathways associated with the worm/clam digger are expected to result in more dose.
7.1.3.6 Fishing Fishing can be performed either from shore or a boat. Both forms of fishing subject the
individual to internal dose pathways associated with the consumption of fish. When fishing from

Maine Yankee Marine Sampling Study
Maine Yankee Final.doc 2/15/05 109
shore, the individual is subject to direct exposure pathways from the sediment. However, the occupancy time is not expected to be any more than that estimated for the worm/clam digger.
7.1.4 Potential Future Uses of the Intertidal Zone
Potential future uses of the intertidal zone at Maine Yankee include sea weed production, flooding for lobster pound or fish farming and land reclamation gardening. Each of these possible future uses would involve disturbance of the mudflat environment which would probably require extensive environmental permitting. The consideration of these possible future uses is for potential dose assessment purposes only and does not presume that these uses will be found to be environmentally acceptable or commercially suitable for actual use.
7.1.4.1 Seaweed Growing and Harvesting Seaweed is present in the shoreline surrounding Maine Yankee. It is used locally as garden
fertilizer and by some people as a dietary supplement. Seaweed as a staple item of diet has been used in Japan and China for a very long time. It accounts for some 10% of the Japanese diet and seaweed consumption reached an average of 3.5 kg per Japanese household in 1973. In the western world, seaweed is largely regarded as a health food and, although there has been an upsurge of interest in seaweed as food in the last 20 years, it is unlikely that seaweed consumption there will every be more than a fraction of the Japanese.
When gardeners talk about using seaweed on their plants, they are usually referring to a brown algae, specifically the one know as knotweed or rockweed (Ascophyllum nodosum). It’s common off the coast of Norway but also grows along the American coast from northern Maine to Canada and through out northern seas. Seaweed meals are best applied at the rate of 1 to 3 pounds per 100 square feet.
Seaweed cultivation takes many forms but there is a kind of evolutionary process through which it develops, the rate of which is market-driven. If demand is low and natural resources adequate, cultivation is unnecessary. As demand increases, natural populations frequently become inadequate and attempts are made to increase production by resource management techniques such as improving harvesting techniques, removing competing species, adding artificial habitats and seeding cleared areas. Such techniques are most highly developed in Japan, China and south-east Asia.
Should such management prove to be inadequate, the use of artificial structures to grow seaweeds becomes inevitable. Fragments of adult plants, juvenile plants, sporelings or spores are seeded onto ropes or other substrata and the plants grown to maturity in the sea. To do this, intimate knowledge of both the biology and life history of the plants is critical. For example, kelps cannot be grown from fragments as there is a high level of specialization and fragments of sporophytes do not regenerate. On the other hand, many red algae do not have this degree of specialization and can easily be grown from portions of the adult plant. Knowledge of the life history is critical in many cases and on-land cultivation of particular life history phases is often necessary for seeding. A considerable amount of technology has gone into the development of reliable methods for the cultivation of seed-stocks and their improvement.
The penultimate development in seaweed cultivation is the growing of plants in artificial impoundments on land. This involves the use of either tanks or ponds into which seawater is pumped and the seaweeds are grown detached and at very high densities. This necessitates the careful study of

Maine Yankee Marine Sampling Study
Maine Yankee Final.doc 2/15/05 110
the growth parameters of the seaweeds involved and the development of special strains, preferably with high growth rates, but more importantly, adapted to the artificial conditions.
The dose pathways from this potential future use would include direct ingestion of seaweed, indirect ingestion of vegetables fertilized with seaweed and any occupational dose associated with seaweed cultivation from direct exposure to sediment to the extent that impoundments are drained for seeding, harvesting or maintenance. The direct exposure occupancy time is not expected to be greater than that estimated for the worm/clam digger.
7.1.4.2 Flooding for Lobster Pound or Fish Farming Mudflat areas could be used for fish farming or lobster storage These uses could convert the
intertidal zone into a subtidal area by changing the hydrologic system, by the installation of a dam structure that allows seawater to flood at high tide. This is similar to the creation of ponds as described above for cultivation of seaweed. The dose pathways from this potential future use would include ingestion of fish and shell fish and any occupational dose from direct exposure to sediment to the extent that the impoundment is drained for placement, retrieval or maintenance. The direct exposure occupancy time is not expected to be greater than that estimated for the worm/clam digger.
7.1.4.3 Land Reclamation Gardening Although it is highly unlikely because of the amount of farmable land in Maine, it is possible
that future generations may consider reclaiming underwater land areas for farming. If this were the case, the sediment would be farmed as soil. One could then apply all of the dose pathways associated with the residential farmer as described in the License Termination Plan. A simple relationship between dose and residual soil contamination could be made using the soil screening values.
7.1.5 Identification of Scenarios and Pathways/Dose Assessment Framework
As a result of the current and possible future uses described above for the intertidal zone around Maine Yankee, the following scenarios are evaluated for identification of dose pathways and calculation of an incremental intertidal zone dose.
7.1.5.1 Commercial Worm/Clam Digger and Fish/Shell Fish Ingestor An individual harvests worms and/or clams in the intertidal zone surrounding Maine Yankee
at a rate of no more than 325 hours per year. In the process of worm/clam digging, the individual directly ingests a trace amount of sediment and become smeared with a trace amount of sediment in contact with his clothes and exposed surfaces of his skin for a period of about twice as long as the occupational time in the intertidal zone. In addition, the individual consumes fish and seafood in quantities equal to that assumed in the Offsite Dose Calculation Manual. This scenario should produce a greater dose than the possible future use of the intertidal zone as a lobster pound or fish farm or the recreational shoreline fisherman.
Dose from Standing on the Sediment Maine Yankee will calculate the dose from standing on three feet of sediment containing
residual radioactivity in concentrations of 1 pCi/g of 137Cs and the dose from a similar source of 1 pCi/g of 60Co. The hard-to-detect nuclides will be assumed to be present for the 60Co source in proportion to their nuclide fraction specified in the License Termination Plan for sediment, Table 2-

Maine Yankee Marine Sampling Study
Maine Yankee Final.doc 2/15/05 111
13. These relationships will be used to evaluate the average and maximum concentrations residual radioactivity found in the intertidal zone after the background concentrations have been subtracted.
Dose from Ingesting a Trace Amount of Sediment The individual is assumed to ingest 0.05 g/day of sediment as a consequence of working in
the mudflats. The exposure period is assumed to be 104 days per year, which is derived from two days per week for a year. The resulting dose is calculated by multiplying the dose factor from FGR-11 by the quantity of sediment ingested in a year for each nuclide.
Dose from Contact with a Trace Amount Sediment The individual is assumed to have a source of sediment spread over a 100 cm2 area of skin.
The dose rate calculated from VARSKIN was extrapolated from a 1pCi/cm2 to the actual 0.1 pCi/cm2 for 104 occurrences per year and 12 hours contact hours per occurrence and converted to dose equivalent resulting in an annual dose of 0.0096 mrem/yr per pCi/g for 137Cs and 0.0043 mrem/yr per pCi/g for 60Co.
Dose from Fish Ingestion The individual is assumed to consume 20.6 kg/y of fish as described in License Termination
Plan section 6.6.7, 6.6.9 and NUREG-5512. This consumption rate is used, along with the dose factors from FGR-11, to establish a relationship between the dose received from this pathway and the average and maximum concentrations of residual radioactivity found in fish after the background concentrations have been subtracted
Dose from Shell Fish Ingestion The individual is assumed to consume 1 kg/y of shell fish as described in License
Termination Plan section 6.6.9 and NUREG-5512. This consumption rate is used, along with the dose factors from FGR-11, to establish a relationship between the dose received from this pathway and the average and maximum concentrations of residual radioactivity found in shell fish after the background concentrations have been subtracted.
7.1.5.2 Seaweed Cultivator, Eater and Fertilizer User An individual cultivates seaweed for personal use as a dietary supplement and as a fertilizer
for the garden. This individual receives no more dose from the sediment that that experienced by the commercial worm/clam digger. The individual consumes seaweed at a rate equal to that assumed in Engineering Calculation 041-01, specified below. The individual also cultivates the garden with seafood used as a fertilizer at a use rate and accumulation factor equal to that assumed in Engineering Calculation 041-01, specified below.
Dose from Standing on the Sediment This dose will be calculated as described above.
Dose from Ingesting a Trace Amount of Sediment This dose will be calculated as described above.

Maine Yankee Marine Sampling Study
Maine Yankee Final.doc 2/15/05 112
Dose from Contact with a Trace Amount Sediment This dose will be calculated as described above.
Dose from Seaweed Ingestion The individual is assumed to consume 875 g/y of seaweed as described in Engineering
Calculation EC-041-01. This consumption rate is used, along with the dose factors from FGR-11, to establish a relationship between the dose received from this pathway and the average and maximum concentrations of residual radioactivity found in seaweed after the background concentrations have been subtracted.
Dose from Ingestion of Vegetables Fertilized with Seaweed The individual is assumed to consume 112 kg/y of vegetables fertilized with seaweed with a
biotransfer factors from the seaweed to vegetables of 0.08 for 60Co and 0.04 for 137Cs as described in Engineering Calculation EC-041-01 and NUREG-5512. This consumption rate and these biotransfer factors are used, along with the dose factors from FGR-11, to establish a relationship between the dose received from this pathway and the average and maximum concentrations of residual radioactivity found in seaweed after the background concentrations have been subtracted.
7.1.5.3 Land Reclamation Farmer This individual reclaims the submerged land and uses the sediment of the intertidal zone as a
garden. All of the dose pathways described for the residential farmer apply to this individual. For ease of use, the soil screening values described in the License Termination Plan are used to establish a relationship between the sediment/soil concentration of residual radioactivity and the resulting dose.
7.1.6 Identification of Flora & Fauna Dose Contributors and Bioaccumulators
The intertidal zone surrounding Maine Yankee is almost entirely made up of mud flats. Mud flats are organically rich regions that support large populations of shellfish, shrimp, mussels, quahogs, baitworms, and small invertebrates. By slowing tidal and wave energy, mud flats buffer the upland against tidal erosion and lessen impacts from storm surge events. Eelgrass beds and macroalgae that add structure to the habitat cover many flats in Maine. Sediments contain high concentrations of benthic diatoms that form the base of the benthic food web, remove nutrients from the mud, and lessen erosion by binding sediments. Small fish like mummichogs and sticklebacks forage on invertebrates and algae during flood and ebb tide. Flats support high concentrations of bacteria, fungi, and other microorganisms that contribute to nutrient cycling and provide food for larger macrofauna like sand worms. They are limited resources that perform a vital function as sinks for contaminants.
Mud flats are critical feeding grounds for 25 species of migrating and resident shorebirds, six species of herons, two species of egrets, glossy ibis, Canada geese, commercial and non-commercial finfish, herring gulls and waterfowl. Flats are nursery grounds for winter flounder and other flatfish. They provide roosting and staging areas for migrating shorebirds. Mud flats are potential habitat for the rare plant pipewort (Eriocaulon parkeri).
Mud flats contribute to a multi-million dollar seafood industry in Maine by providing structure and foraging habitat for soft-shell clams, Atlantic herring, blood worms, blue mussels, sand worms, periwinkles, alewife, winter flounder, rainbow smelt, Atlantic mackerel and sand shrimp. The primary dose contributors to the human population are those which are directly ingested.
Maine Yankee Marine Sampling Study
Maine Yankee Final.doc 2/15/05 113
Therefore, the fauna that should be considered for sampling are soft-shell clams, blue mussels, periwinkles, if available, winter flounder, rainbow smelt, and Atlantic mackerel. Samples of seaweed should also be obtained to support the dose assessment for the seaweed eater and fertilizer user.
7.2 DOSIMETRY RESULTS
Applying these concentrations to the dose calculations, we calculate doses shown in Table 7-1 and 7-2. We calculate total doses of less than 0.1 mrem/year when using average values of 60Co (6 pCi/kg) and 137Cs (28 pCi/kg), and less than 3.3 mrem/year when the maximum values of 60Co (180 pCi/kg) and 137Cs (1000 pCi/kg) are used.
Most of the doses for clam diggers, fisherman, and worm digger are over wet sediment or standing in wet sediment. The correct dose rates are then necessarily for wet sediment. However, for the farmer who drains the tidal flat to form a dry farm using sediment as soil, the sediment should be dry for the dose estimate. We have done this for sediment cores and have calculated an average increase of activity per mass at a fraction of 1.9 times the wet sediment activity per unit mass in the core. The dose will be increased by the same factor and will closely resemble the dose measured on dry land by the high pressure ion chamber (HPIC), which was dragged over the mud flat and back onto dry land. Since the wet or dry sediment on the skin surface is thin, wet or dry activity will have less importance for the gamma dose. All shellfish, finfish and seaweed samples were measured and would be consumed as wet as food. Trace contaminants of sediment in food are also consumed wet. For this reason, the sediment measurements are presented as wet measurements conforming to realistic HPIC measurements for the exposed workers such as clam diggers, fisherman, worm diggers and swimmers.

Maine Yankee M
arine Sampling Study
MAINE YANKEE FINAL.DOC 2/15/05 114
Table 7-1. Calculated Doses Using Average Concentrations of Gamma Emitters
Worm Clam Lobster Recreation Recreation Seaweed Lobster Land Digger Harvester Eater Fishing Swimming Harvester Pound Reclamation Pathways (mrem/yr) (mrem/yr) (mrem/yr) (mrem/yr) (mrem/yr) (mrem/yr) (mrem/yr) (mrem/yr) Direct Standing on Sediment 2.58E-03 2.58E-03 NA 2.58E-03 2.58E-03 2.58E-03 2.58E-03 NA Contact with Trace Sediment 1.71E-02 1.71E-02 NA NA NA 1.71E-02 1.71E-02 NA Ingestion of Trace Sediment 6.78E-05 6.78E-05 NA NA NA 6.78E-05 6.78E-05 NA Ingestion of Clams/Mussels NA 6.38E-03 NA NA NA NA NA NA Ingestion of Lobster NA NA 1.43E-02 NA NA NA 1.43E-02 NA Ingestion of Fish NA NA NA 2.34E-01 NA NA NA NA Ingestion of Seaweed NA NA NA NA NA 6.31E-04 NA NA Ingest Veg. Fertilized w/Shells NA 2.84E-03 2.84E-03 NA NA NA 2.84E-03 NA Ingest Veg. Fertilized w/Seaweed NA NA NA NA NA 4.80E-03 NA NA
Integrated Res. Farmer Dose NA NA NA NA NA NA NA 1.45E-01 Grand Total 1.97E-02 2.89E-02 1.71E-02 2.37E-01 2.58E-03 2.51E-02 3.68E-02 1.45E-01

Maine Yankee M
arine Sampling Study
MAINE YANKEE FINAL.DOC 2/15/05 115
Table 7-2. Calculated Doses Using Peak Concentrations of Gamma Emitters
Worm Clam Lobster Recreation Recreation Seaweed Lobster Land Digger Harvester Eater Fishing Swimming Harvester Pound Reclamation Pathways (mrem/yr) (mrem/yr) (mrem/yr) (mrem/yr) (mrem/yr) (mrem/yr) (mrem/yr) (mrem/yr) Direct Standing on Sediment 8.48E-02 8.48E-02 NA 8.48E-02 8.48E-02 8.48E-02 8.48E-02 NA Contact with Trace Sediment 2.67E-02 2.67E-02 NA NA NA 2.67E-02 2.67E-02 NA Ingestion of Trace Sediment 3.31E-04 3.31E-04 NA NA NA 3.31E-04 3.31E-04 NA Ingestion of Clams/Mussels NA 6.38E-03 NA NA NA NA NA NA Ingestion of Lobster NA NA 1.43E-02 NA NA NA 1.43E-02 NA Ingestion of Fish NA NA NA 2.34E-01 NA NA NA NA Ingestion of Seaweed NA NA NA NA NA 6.31E-04 NA NA Ingest Veg. Fertilized w/Shells NA 2.84E-03 2.84E-03 NA NA NA 2.84E-03 NA Ingest Veg. Fertilized w/Seaweed NA NA NA NA NA 4.80E-03 NA NA Integrated Res. Farmer Dose NA NA NA NA NA NA NA 3.31E+00
Grand Total 1.12E-01 1.21E-01 1.71E-02 3.19E-01 8.48E-02 1.17E-01 1.29E-01 3.31E+00

Maine Yankee Marine Sampling Study
Maine Yankee Final.doc 2/15/05 116
8 CONCLUSIONS
8.1 SUMMARY
This report characterizes radionuclides in the marine environment around Maine Yankee and describes the methodologies used in the study. Four sets of sampling were accomplished to complete this study. The results of each type of sampling were provided and are compared with a model of radionuclide distribution from licensed discharges. Additionally, the results are compared to previous work done in the area both pre and post plant operation. The results are also used to calculate an incremental intertidal zone dose, which is compared to the limiting “resident farmer dose calculations in the License Termination Plan for Bailey Point post-decommissioning. Maine Yankee operated from 1972-1996. Plant decommissioning is scheduled to be complete in late spring of 2005.
This sampling effort included a search for areas high in nuclear radiation (hot particle search), samples from the surface of the tidal region, core samples from the tidal region, and samples of biota including seaweed, lobsters, mussels, and fish. The results are discussed in this order. In all, about 600 samples from 147 locations were collected and analyzed. To ensure that the sampling effort was as comprehensive and efficient as possible, a model was used to determine the best locations.
8.2 KEY FINDINGS
a. The nuclide 60Co is stronger on the Oak Island side of Montsweag Bay, near the intake where recent discharges were released. This is reasonable since 5.2-year half-life of 60Co will reduce levels when no additions are released in recent times.
b. The nuclide 137Cs is stronger on the Bailey Cove north of the outfall. This is the same area where the 137Cs was high during the outfall discharge during 1972-76, before the diffuser was installed. Some of the 137Cs is seen near the diffuser release area.The long half-life of 137Cs makes this a reasonable result.
c. Maximum nuclide levels are 10-30 times lower in the sediments of Montsweag Bay and Bailey Cove in comparison to the 1972 and 1974 surveys.
d. Radionuclides in the biota are even lower by 10-30 than the concentration in sediments. This was seen in oysters 0.8pCi/kg (0.0008 pCi/g) versus sediment 4 pCi/kg (0.004 pCi/g) (1973-74).
e. The modeled nuclides follow the same general pattern as the measured nuclides. Sediment from the shore and intertidal zones are higher than those from the main channel of Montsweag Bay, due to higher fluctuations in the main channel.
f. Surficial samples were lower than deeper levels of core samples. This was due to burial of radionuclides in past releases in the lower ten inches of the cores.
g. Cores showed double peaks, one from early 1957-69, and a second peak in 1983-85. We think that the first peak is mainly fallout, and second is the Maine Yankee power plant, Chernobyl, and Chinese and French fallout. 210Pb dating of one core gives similar sedimentation rates( 6 inches equals 30 years). This agrees with the sedimentation rate from Hess et al., (1976), for sediments in Bailey cove.

Maine Yankee Marine Sampling Study
Maine Yankee Final.doc 2/15/05 117
h. The total dose from marine biota and sediment ranges from 1.9 x 10⁻² mrem/yr for worm diggers to 1.4 x 10 -1 mrem/yr for land reclamation farming. This calculation was based on average values in the sediment for 60Co and 137Cs.
i. The upper limit of doses from marine biota and sediment range from 1.1 x 10 -1 mrem/yr for worm diggers to 3.3 mrem/yr for land reclamation farming.

Maine Yankee Marine Sampling Study
Maine Yankee Final.doc 2/15/05 118
9 QUALITY ASSURANCE
The report underwent peer review by all of the project’s principal investigators. In addition, data collected during this study were compared to previous investigations.

Maine Yankee Marine Sampling Study
Maine Yankee Final.doc 2/15/05 119
10 PROJECT ORGANIZATION
At the outset of the project, the Project Manager Dr. Hess met with project staff to establish that the project would meet the highest standards of quality and safety. Copies of the Sample and Analysis Plan were distributed to all project staff. Prior to field collections, the field team leader met with field staff to review project protocol, safety, and operations. The core project staff (Dr. Hess, Mr. Churchill and Ms. Bowen ) had weekly conference calls, along with electronic and telephone conversations as needed, to plan and implement the project SAP. Each core staff member met frequently with project staff to communicate project safety and quality objectives.
Acknowledgements
We are grateful to the staff of Camp Chewonki in Wiscasset for use of their facilities and for logistical support. Particular thanks go to Dr. Don Hudson, President of the Chewonki Foundation, and to Ryan Linnahan, a vessel operator a Camp Chewonki. For assistance in specifying the tidal boundary conditions of our model, we are grateful to Dr. Richard Luettich of the University of North Carolina at Moorhead City, NC. In our modeling effort, we benefited through discussions with James Manning of the National Marine Fisheries Service in Woods Hole, MA. We are grateful to Raymond Shadis of Friends of the Coast for his input and advice through all stages of our study. Thanks also go to Christopher Doherty, president of Friends of the Coast, for his involvement in the project and for participating (with Ray Shadis) in the drifter operations of July 2004. Friends of the Coast dedicates their involvement in this project to the late member, Edward Myers of Bristol, the man who inspired and instigated their settlement stipulation for a marine and intertidal zone radiological survey. We also would like to thank David Sutter, lobster fisherman, for specially setting traps for this project. Carol James, Chewonki Foundation, for helping us with site access, and Tim James, Wiscasset Shellfish Commission, for assisting us with shellfish procurement.
The project team also wishes to thank the staff at Maine Yankee, especially Mike Whitney, and Pat Dostie, State of Maine, for their assistance with this project.

Maine Yankee Marine Sampling Study
Maine Yankee Final.doc 2/15/05 120
11. REFERENCES CITED Aubrey, D. G., and Speer, P. E. (1985). “A study of non-linear tidal propagation in shallow
inlet/estuarine systems, Part I: Observations,” Estuarine, Coastal and Shelf Science 21, 185-205.
Boon, J. D. and Byrne, R. J. (1981). “On basin hypsometry and the morphodynamic response of coastal inlets,” Marine Geology 40, 27-48.
Churchill J. H. 1976. Measurement and Computer Modeling of The Distribution of Reactor Discharged Radionuclides in the Estuarine Sediment near The Maine Yankee Power Plant in Wiscasset Maine. Master's Thesis, University of Maine, Orono Maine, 122 Pp.
Churchill J. H, C. T. Hess, and C. W. Smith. 1980. Measurement and Computer Modeling of Radionuclide Uptake by Marine Sediments Near a Nuclear Power Reactor. Health Physics Vol. 38 March pp 327 to 340.
Churchill J. H, C. W. Smith, C. T. Hess and A. Price. 1975. Measurement of radionuclides as a function of position in the estuary of the Maine Yankee atomic power plant. Presented at the American Physical Society Meeting New England section Apr. 19, 1975
Davis, R.E. (1985) Drifter observations of coastal surface currents during CODE: The method and descriptive view. Journal of Geophysical Research, 90, 4741-4755.
DiLorenzo, J. L. (1988). “The overtide and filtering response of small inlet/bay systems,” Hydrodynamics and sediment dynamics of tidal inlets. D. G. Aubrey and L. Weishar, eds., 24-53, Springer Verlag, New York, NY.
Feigner, K.D. and H.S. Harris (1970) Documentation Report FWQA Dynamic Estuary Model (Washington DC: FWQA Dept. of Interior).
GPS Duratek "Characterization survey report of the Maine Yankee atomic power plant 1998 survey package numbers R 0400, R 1900, R 2000
Hess, C. T., C. W. Smith, and A. H. Price, 1978, A Multiple Mechanism Description Of Radionuclide Loss from Marine Sediment, Nature, 807-809.
Hess, C. T., C. W. Smith, J. H. Churchill, and G.F. Burke. 1976. Radioactive ISA Topic Characterization of The Environment near Wiscasset Maine Pre and Post Operational Surveys in The Vicinity of The Maine Yankee Nuclear Reactor. Technical Note ORP/EAD-76-3, U.S. Environmental Protection Agency, Washington D.C. 56 Pp.
Hess, C.T., C. W. Smith, H. A. Kelly, and F. C. Rock. 1974. A Radioactive Isotopic Characterization of The Environment near Wiscasset Maine: a Pre-Operational Survey in The Vicinity of The Maine Yankee Atomic Power Plant. Radiation Data and Reports, 15 39-52.
Hess, C.T., Smith, C.W. and Pearce, B.R. (1983) Radionuclide concentrations in the estuarine sediments: comparison of measured and calculated values. In: Wastes in the Oceans, Volume 3 of Radioactive Wastes in the Oceans, Eds: Park, Kester, Duedall, and Ketchum, Wiley pp. 270-284.
Larson, P.F. 1975. Benthos study of the Sheepscot river Estuary. Annual report submitted to Maine Department of Marine Resources under project no. 3-205-R-1. 43 p.

Maine Yankee Marine Sampling Study
Maine Yankee Final.doc 2/15/05 121
Larson, P.F. and Doggett, L 1991. The macroinvertebrate fauna associated with the mud flats of the Gulf of Maine. J. Coastal Res. 7(2): 365-375.
Larson, P.F., Doggett, L. and A.C. Johnson. 1983. The macroinvertebrate fauna associated with the five sand flats in the northern Gulf of Maine. Proc. N.S. Inst. Sci. 33: 57-63.
Law, K.Y. (1979) Modeling of tidal flow and distribution of Radionuclides. Masters Thesis, University of Maine, Orono, Maine, 101 pp.
Lincoln, J. M., and Fitzgerald, D. M. (1988). “Tidal distortions and flood dominance at five small tidal inlets in Southern Maine,” Marine Geology 82, 133-148.
Luettich, R.A., J.J. Westerink, and Scheffner, N.W. (1992) ADCIRC: an advanced three-dimensional circulation model for shelves, coasts and estuaries, Report 1: theory and methodology of ADCIRC-2DDI and ADCIRC-3DL. Technical Report DRP-92-6, U.S. Army Engineer, Waterways Experiment Station, Vicksburg, MS.
Maine Yankee Atomic Power Company. 1978. Final Report. Environmental Surveillance and Studies at the Maine Yankee Nuclear Generating Station, 1969-1977. Maine Yankee Atomic Power Company.
Maine Yankee Memorandum H.R. Cummings to PL Anderson dated June 24 1994. Results of May 1994 Clam and Sediment Sampling
Maine Yankee Nuclear Power Station: Annual Radiological Environmental Operating Report, January-December 2002. Prepared by Framatome ANP.
Mukai, A.Y, J.J. Westerink, and R.A. Luettich (2001) Guidelines for using the Eastcoast 2001 database of tidal constituents within the western North Atlantic, Gulf of Mexico and Caribbean Sea. U.S. Army Corp of Engineers, Coastal and Hydraulic Engineering Technical Note (IV-XX).
Speer, P. E., and Aubrey, D. G. (1985). “A study of non-linear tidal propagation in shallow inlet/estuarine systems: Part II-theory,” Estuarine, Coastal and Shelf Science 21, 207-224.
U.S. Environmental Protection Agency, Environmental Analysis Division. 1976. Radioactive isotopic characterization of the environment near Wiscasset Maine using pre- and post-operational surveys in the vicinity of the Maine Yankee nuclear reactor.
van de Kreeke, J. (1988). “Hydrodynamics of tidal inlets,” Hydrodynamics and sediment dynamics of tidal inlets. D. G. Aubrey and L. Weishar, eds., 1-23, Springer, Berlin.
Westerink, J.J., R.A. Luettich and J.C. Muccino (1994) Modeling tides in the western North Atlantic using unstructured graded grids, Tellus, 46A, 178-199.

Maine Yankee Marine Sampling Study
Maine Yankee Final.doc 2/15/05 A-1
APPENDIX A

Maine Yankee Marine Sampling Study
Maine Yankee Final.doc 2/15/05 A-2
Introduction to Previous Work
This section shows the figures that were associated with two previous modeling projects in Bailey Cove and Montsweag Bay. The first study was done in 1972 modeling the area around Bailey Cove, and was done as a part of a Sea Grant Master’s Thesis project by Churchill (1976), and Churchill et al.(1980). The second involved modeling the diffuser and changes in Montsweag Bay as well as Bailey Cove. This project was completed in 1983 by Hess et al. Thomas L. Cameron also helped with the modeling in his undergraduate thesis at the University of Maine. Sediment changes were modeled in 1978 by Hess et al. Appendix Figure A-1 shows the map of the State of Maine and Bailey Cove with Montsweag Bay. Appendix Figure A-2 shows the channel network used for the modeling of Montsweag Bay and Bailey Cove after the diffuser was put in. Two early isocuric plots for 60Co in September 18, 1974 and June 12, 1975 are depicted in Appendix Figures, A-3 and A-4, and show concentrations of 60Co when the plant was releasing at the outfall. Appendix Figure A-5 shows a construction sheet for isocuric plots for 137Cs in a survey taken after the diffuser was in place and gives some higher values for 137Cs along the shore of Westport Island and in a vicinity of the old outfall at Bailey Cove. Appendix Figure A -6 shows a sample of currents calculated at slack high tide. Appendix Figure A-6 shows concentrations estimated in the sediment for 137Cs with releases at high tide of 4.38 hours. Appendix Figure A-8 shows sediment concentrations for 137Cs for releases of 4.38 hours beginning and mid-ebb tide and Appendix Figure A-9 shows estimated sediment concentrations of 137Cs for releases of 17.5 hours beginning at high tide. Appendix Figure A-10 shows sediment concentrations estimated for 58Co for releases of 4.38 hours beginning and mid tide. Appendix Figure A-11 shows simulated pCi/ft contours after a 17.5 hour release on high tide. This shows a major concentration of the nuclides in the vicinity of the diffuser and to the south. Appendix Figure A-12 shows simulated contours for 58Co for a 17.5 hour release on high tide, and also shows major concentrations around the diffuser and a smaller concentration at the head of Bailey Cove. Appendix Figure A-13 shows isocuric plots for the 58Co actually measured in pCi/kg and shows maximum values around the diffuser and upper Bailey Cove.
Fifty samples were taken in the first transect of Bailey Cove from south Long Ledge to the top of Bailey Cove, with one sample at the outfall. The maximum was 5620pCi/kg of 58Co and 500 pCi/kg of 60Co at #28. A hot particle was found on the Eaton Farm side of Bailey Cove, near the shore (7700 pCi of 60Co, 530 pCi of 58Co, 670 pCi of 46Sc, 120 pCi of 54Mn) for a total of 9000 pCi in a sample weighing 20 micrograms. The average sediment was 1000 pCi/kg of 58Co, and 120 pCi/kg of 60Co, with 137Cs at about 750 pCi/kg. The highest values were observed at the outfall and along the upper (north) half of Bailey Cove near the Eaton Farm side.

Maine Yankee Marine Sampling Study
Maine Yankee Final.doc 2/15/05 A-3
Appendix Figure A-1. Project locus map (1978).
Appendix Figure A-2. Channel network used for Montsweag Bay and Bailey Cove modeling.
(Source: Churchill et al. 1980; Hess et al. 1983)

Maine Yankee Marine Sampling Study
Maine Yankee Final.doc 2/15/05 A-4
Appendix Figure A-3. Actual contours for 60Co measured on September 18, 1974 during licensed
releases.

Maine Yankee Marine Sampling Study
Maine Yankee Final.doc 2/15/05 A-5
Appendix Figure A-4. Actual contours for 60Co measured on June 12, 1975 during licensed releases.

Maine Yankee Marine Sampling Study
Maine Yankee Final.doc 2/15/05 A-6
Appendix Figure A-5. Actual contours for measured 137Cs after Maine Yankee diffuser was in place (Hess et al. 1978).

Maine Yankee Marine Sampling Study
Maine Yankee Final.doc 2/15/05 A-7
Appendix Figure A-6. Sample of currents at slack high tide (1978).
Appendix Figure A-7. Estimated 137Cs concentrations 4.38 hours after a release beginning at high
tide (1978).

Maine Yankee Marine Sampling Study
Maine Yankee Final.doc 2/15/05 A-8
Appendix Figure A-8. Estimated 137Cs concentrations 4.38 hours after a release beginning at mid-ebb tide (1978).
Appendix Figure A-9 Estimated 137Cs concentrations 17.5 hours after a release beginning at high
tide (1978).

Maine Yankee Marine Sampling Study
Maine Yankee Final.doc 2/15/05 A-9
Appendix Figure A-10. Estimated 58Co concentrations 17.5 hours after a release beginning at mid-ebb tide (1978).
Appendix Figure A-11. Simulated contours for 137Cs concentrations 17.5 hours after a release
beginning at high tide (Hess et al. 1978).

Maine Yankee Marine Sampling Study
Maine Yankee Final.doc 2/15/05 A-10
Appendix Figure A-12. Simulated contours for 58Co 17.5 hours after a release beginning at high tide
(1978).

Maine Yankee Marine Sampling Study
Maine Yankee Final.doc 2/15/05 A-11
Appendix Figure A-13. Actual contours for 58Co measured after 17.5 hours beginning at high tide (1978).

Maine Yankee M
arine Sampling Study
MAINE YANKEE FINAL.DOC 2/15/05 A
-12
The actual original data are shown in Appendix Tables A-1 and A-2.
Appendix Table A-1. Pre-operational Laboratory Soil & Sediment Gamma Ray Analysis
Location Collection Date Count Date Type of Sample
Thorium Series pCi/kg
Uranium Series pCi/kg
Other Natural pCi/kg
137Cs pCi/kg
134Cs pCi/kg
58Co pCi/kg
60Co pCi/kg
54Mn pCi/kg
Foxbird Island 6/29/72 7/28/72 Tidal marsh sediment
250 ± 130
500 ± 180
15000 ± 350
350 ± 32
< 15 < 12 < 15 < 10
Murphy’s Corner
7/3/72 7/27/72 Tidal flat sediment
1660 ± 280
740 ± 120
15200 ± 1200
450 ± 80
< 30 < 25 < 30 < 20
Young’s (or Long) Creek
6/12/72 7/14/72 Tidal marsh soil
880 ± 250
1075 ± 120
18200 ± 400
800 ± 80
< 30 < 25 < 30 < 20

Maine Yankee Marine Sampling Study
Maine Yankee Final.doc 2/15/05 A-13
Appendix Table A-2. Post-operational Laboratory Soil & Sediment Gamma Ray Analysis
Location Collection
Date Count Date
Type of Sample
Thorium Series
pCi/kg
Uranium Series
pCi/kg
Other Natural
pCi/kg
137Cs
pCi/kg
134Cs
pCi/kg
58Co
pCi/kg
60Co
pCi/kg
54Mn
pCi/kg
Young’s (or Long)
Creek
8/14/74 1/18/74 Tidal marsh soil
1100 ± 120
800 ± 70
19400 ± 780
700 ± 50
<35 <25 <30 <15
Foxbird Island
8/14/74 11/16/74 Soil 900 ± 90
700 ± 200
7300 ± 950
4600 ±180
<35 <25 <30 <15
Murphy’s Corner
8/14/74 11/20/74 Tidal flat
sediment
900 ± 90
800 ± 72
18000 ± 500
500 ± 35
<35 <25 <30 <15