REPORT ON THE DRUG SITUATION IN ESTONIA 2007
75
1 2006 NATIONAL REPORT (2005 data) to the EMCDDA by the Reitox National Focal Point ESTONIA New developments, trends and in-depth information on selected issues REITOX
Transcript of REPORT ON THE DRUG SITUATION IN ESTONIA 2007
1
2006 NATIONAL REPORT (2005 data) to the EMCDDA
by the Reitox National Focal Point
ESTONIA
New developments, trends and in-depth information o n selected
issues
REITOX

2
REPORT ON THE DRUG SITUATION IN ESTONIA 2006
KAIT OOLE 1
AVE TALU 1
KAIRE VALS 1
MARIANNE PAIMRE 2
ANDRI AHVEN 3
ANU NEUMAN 4
GLEB DENISSOV 5
KATRI ABEL 1
1National Institute for Health Development/Research Centre, Estonian Drug Monitoring Centre/Estonian National Focal Point 2Institute of Law, University of Tartu
3Ministry of Justice 4Estonian Forensic Service Centre 5Statistical Office of Estonia
2006 Copyright © NIHD, Estonian Drug Monitoring Centre/ Estonian National Focal Point National Institute for Health Development 2006 Research Centre, Estonian Drug Monitoring Centre/Estonian NFP Hiiu 42 Tallinn 11619 ESTONIA Phone +3726593997 Fax +372 6593998 e-mail:[email protected] e-mail:[email protected] website: http://eusk.tai.ee http://www.tai.ee The content of this report do not necessarily reflect the official opinion of the European Monitoring Centre for Drug and Drug Addiction (EMCDDA) The responsibility for Opinions expressed in single chapters rests solely with their authors. This report was co-financed by the European Monitoring Centre for Drugs and Drug Addiction (Grant Agreement No CT. 06.RTX.158.10)

3
Table of Contents Summary....................................................................................................................................6
Part A: New Developments and Trends ..................................................................................10
1. National policies and context ...........................................................................................10
1.1 Legal framework ......................................................................................................10
1.2 Institutional framework, strategies and policies.......................................................11
1.3 Budget and public expenditure ................................................................................12
1.4 Social and cultural context.......................................................................................17
2 Drug Use in the Population..............................................................................................21
2.1 Drug Use in the general population.........................................................................21
2.2 Drug Use in the school and youth population .........................................................21
2.3 Drug Use among specific groups ............................................................................21
3. Prevention ........................................................................................................................22
3.1 Universal prevention ................................................................................................22
3.2 Selective prevention.................................................................................................24
4. Problem Drug Use (PDU) ................................................................................................25
4.1 Prevalence and incidence estimates.......................................................................25
4.2 Profile of clients in treatment ...................................................................................26
4.3 Main characteristics and patterns of use from non-treatment sources...................26
5. Drug-Related Treatment ..................................................................................................29
5.1 Treatment system ....................................................................................................30
5.2 Drug free treatment..................................................................................................31
5.3 Medically assisted treatment ...................................................................................32
6. Health Correlates and Consequences ............................................................................33
6.1 Drug-related deaths and mortality of drug users.....................................................33
6.2 Drug-related infectious diseases .............................................................................35
6.3 Psychiatric co-morbidity (dual diagnosis) ................................................................36
6.4 Other drug-related health correlates and consequences........................................37
7. Responses to Health Correlates and Consequences .....................................................37
7.1 Prevention of drug-related deaths ...........................................................................38
7.2 Prevention and treatment of drug related infectious diseases................................39
7.3 Interventions related to psychiatric co-morbidity .....................................................42
7.4 Interventions related to other health correlates and consequences. ......................42
8. Social Correlates and Consequences .............................................................................42

4
8.1 Social Exclusion.......................................................................................................42
8.2 Drug related crime ...................................................................................................44
8.3 Drug Use in Prison...................................................................................................46
8.4 Social Costs .............................................................................................................48
9. Responses to Social Correlates and Consequences......................................................48
10. Drug Markets................................................................................................................49
10.1 Availability and supply .............................................................................................49
10.2 Seizures ...................................................................................................................51
10.3 Price/Purity...............................................................................................................55
Part B – Selected Issues .........................................................................................................58
11. Drug Use and Related Problems among Very Young People ....................................58
11.1 Drug use and problematic drug use among very young people (<15 years old) ...58
11.2 Policy and legal developments ................................................................................60
12. Cocaine and Crack – Situation and Responses..........................................................61
12.1 Prevalence, patterns and trends of cocaine and crack use ....................................61
12.2 Problems related to cocaine use .............................................................................63
12.3 Responses and interventions to cocaine use..........................................................64
12.4 Cocaine-related crime and cocaine markets...........................................................64
13. Drugs and Driving ........................................................................................................64
Part C .......................................................................................................................................66
14. Bibliography .................................................................................................................66
� References...............................................................................................................66
� Alphabetic list of relevant databases.........................................................................70
� Alphabetic list of relevant Internet addresses .........................................................70
15. Annexes .......................................................................................................................71
� List of Standard Tables and Structured Questionnaires used in the text ...............71
� List of Figures used in the text.................................................................................71
� List of Tables used in the text..................................................................................72
� List of abbreviations.................................................................................................73
Part D. Standard Tables and Structured Questionnaires .......................................................75

5
Acknowledgements and introductory note
A national report on the drug situation in Estonia is drawn up annually for the European Drug
Monitoring Centre for Drugs and Drugs Addiction (EMCDDA) and the Ministry of Social
Affairs of Estonia. This report gives an overview of the political and legal framework, demand
and supply reduction interventions in the field of drugs in Estonia in 2005. The structure of
report has been provided by the EMCDDA.
We are very grateful to our collaborators Ms Ene Katkosilt (Ministry of Justice), Jevgenia
Epštein, Mr Kuulo Kutsar (Health Protection Inspectorate), Ms Liilia Lõhmus, Ms Kristi Rüütel,
Ms Aire Trummal and Ms Annika Veimer (National Institute for Health Development), Ms Urmel
Reinola (Health Care and Social Work Department of Tallinn City Government) and Mr Märt
Kõrgmaa (Central Law Enforcement Police) who have provided us with background information
and useful comments.
Special thanks to our proofreader Ms Anneli Saluste.
The website of the Estonian Drug Monitoring Centre is available at http://eusk.tai.ee or on
the website of the National Institute for Health Development at http://www.tai.ee (see
Research Centre).
6
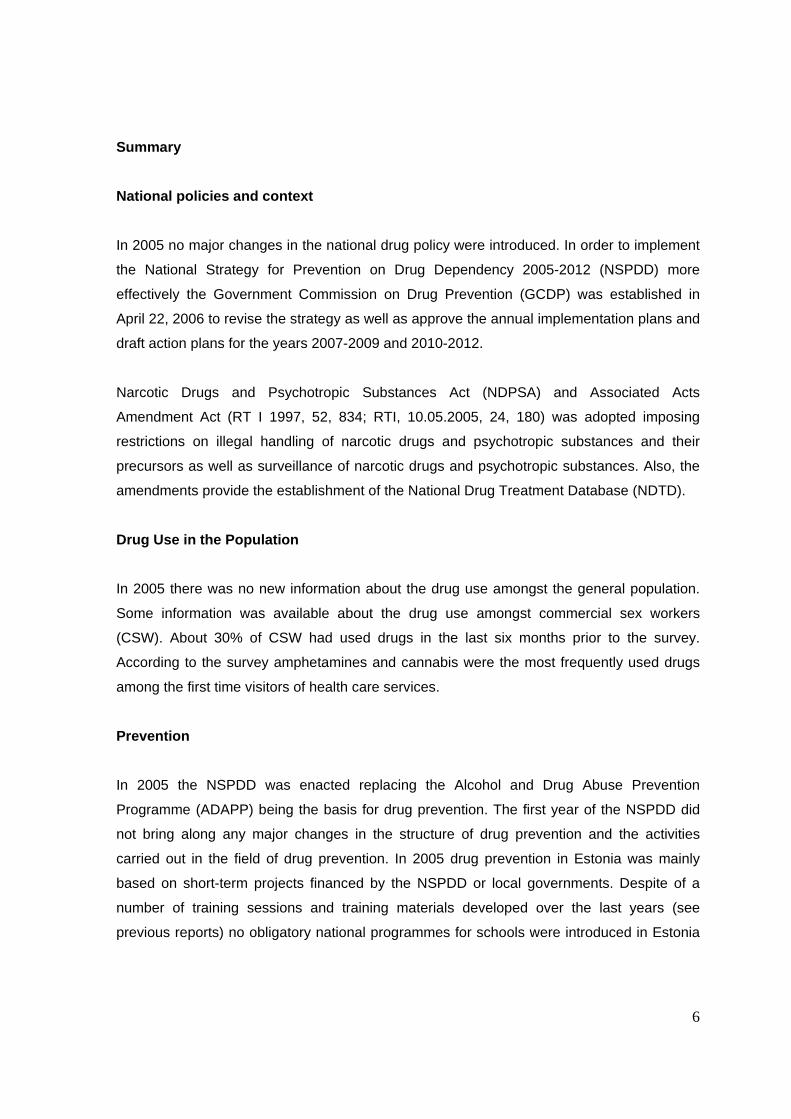
Summary
National policies and context
In 2005 no major changes in the national drug policy were introduced. In order to implement
the National Strategy for Prevention on Drug Dependency 2005-2012 (NSPDD) more
effectively the Government Commission on Drug Prevention (GCDP) was established in
April 22, 2006 to revise the strategy as well as approve the annual implementation plans and
draft action plans for the years 2007-2009 and 2010-2012.
Narcotic Drugs and Psychotropic Substances Act (NDPSA) and Associated Acts
Amendment Act (RT I 1997, 52, 834; RTI, 10.05.2005, 24, 180) was adopted imposing
restrictions on illegal handling of narcotic drugs and psychotropic substances and their
precursors as well as surveillance of narcotic drugs and psychotropic substances. Also, the
amendments provide the establishment of the National Drug Treatment Database (NDTD).
Drug Use in the Population
In 2005 there was no new information about the drug use amongst the general population.
Some information was available about the drug use amongst commercial sex workers
(CSW). About 30% of CSW had used drugs in the last six months prior to the survey.
According to the survey amphetamines and cannabis were the most frequently used drugs
among the first time visitors of health care services.
Prevention
In 2005 the NSPDD was enacted replacing the Alcohol and Drug Abuse Prevention
Programme (ADAPP) being the basis for drug prevention. The first year of the NSPDD did
not bring along any major changes in the structure of drug prevention and the activities
carried out in the field of drug prevention. In 2005 drug prevention in Estonia was mainly
based on short-term projects financed by the NSPDD or local governments. Despite of a
number of training sessions and training materials developed over the last years (see
previous reports) no obligatory national programmes for schools were introduced in Estonia

7
in 2005. In addition to the interventions of the NSPDD, Tallinn City Government has financed
drug prevention activities in the capital city of Estonia.
Problem drug use
Heroin is not the prevailing drug on illicit drug market which clearly has an effect on injecting
drug use in Estonia. In 2005 methylfentanyl and methylfentanyl mixed with fentanyl
accounted for the majority of seizures of opiates (see chapter 10 Drug Markets). A study on
HIV prevalence among injecting drug users (IDUs) conducted in 2005 showed that the
majority of IDUs had used fentanyles in the last 4 weeks (Uusküla et al. 2005). The IDU
population in Estonia is numerous – the estimated total number of IDUs is 13,801 IDUs (95%
CI 8 132-34 443) of which 12,387 (95% CI 7119-20600) are male and 1,414 female IDUs
(95% CI 1059-4132) (Uusküla et al. 2005).
Drug-Related Treatment
According to the national drug strategy the development of professional and effective
treatment for drug addicts, expansion of drug-related treatment services across the country
and improvement of the quality of services is one of the six main objectives. Limited data did
not enable us to give a comprehensive overview of drug-free and medically assisted
treatment. A study on drug treatment provision conducted by the Estonian Drug Monitoring
Centre (EDMC) can shed some light on these issues, however, due to its limited nature and
low response rate the findings should be treated carefully. The Global Fund (GF)
Programme is still the major provider of funds for medically assisted treatment. In 2005 the
funding included provision of methadone treatment for approximately 5% of IDUs in Tallinn,
Narva, Jõhvi and Kiviõli. The national strategy provides treatment for less than 1% of IDUs.
The low coverage of IDUs in the treatment funded within the framework of the national
strategy can be explained by the allocation of the majority of the funds of the national
strategy for the establishment of new treatment centres in 2005. Tallinn City Government
continued the funding of medically assisted and drug free treatment, however, data on drug
free treatment are not available.

8
Health Correlates and Consequences
57 drug-related deaths were registered in Estonia in 2005. The methodology of defining
drug-related deaths has not changed. Estonia uses the European Monitoring Centre for
Drug and Drug Addiction (EMCDDA) definition for General Mortality Registers, “selection B”.
Males, age group 20-29, urban residents, residents of Tallinn and North-Eastern Estonia,
ethnic Russians are more likely to suffer drug-related mortality in Estonia.
The incidence of HIV has been declining since 2002. From 1988 to December 31, 2005 a
total of 5,063 new HIV cases were registered in Estonia. Also, the number of new cases of
acute Hepatitis B virus (HBV) and Hepatitis C virus (HCV) has declined when compared to
the year 2004.
Responses to Health Correlates and Consequences
Responses to health correlates and consequences include a wide range of interventions
funded from the NSPDD, GF Programme and local governments. There are no nationwide
data on drug-related overdoses. The available statistics of Tallinn Emergency Service shows
that the number of drug-related overdoses has decreased from 1,217 cases in 2004 to 854
in 2005. The NSPDD 2012 recognizes the prevention of drug-related deaths and overdoses
as an important strategic target, however, the interventions aiming to decrease drug-related
deaths and overdoses were not implemented in 2005. Prevention and treatment of drug-
related infectious diseases have caught more political and media attention than ever before.
Reduction of drug-related infectious diseases and sexually transmitted diseases (STIs)
among different risk groups and the general population has been identified as an important
target of the HIV/AIDS National Strategy 2006-2015 (HANS) and NSPDD. The extent of
interventions and specialized services (e.g syringe exchange, condom distribution, sexual
education, methadone substitution treatment etc) aiming to decrease drug-related infectious
diseases among risk groups has increased. Anti-retrovirus (ARV) treatment is provided in
specialized hospitals. In 2005 the first centre for drug addicts with other psychiatric diseases
providing services for a maximum of 30 clients was opened in Tallinn.
9
Social Correlates and Consequences
There are still a number of social problems in Estonia like the increasing number of
homeless people, high level of school drop out and families living in poverty. Examples of
positive trends in Estonia include gradual decrease in unemployment rate since 2001 and
the 20% decrease in total number of drug offences registered by the police in 2005 when
compared to 2004. Drug use in prison is still a major concern. Findings of the prison survey
2005 show that 10-15% of prison inmates use drugs 1 to 2 times a week and less than 10%
use drugs 3-5 times a week.
Responses to Social Correlates and Consequences
There are no new data available on social reintegration programmes for drug users.
In 2005 the Police Board allocated total of EUR 76,694 for drug-related crime prevention to
carry out 68 crime prevention projects of which 36 projects carried out by the police
prefectures were partly or fully aiming at the prevention of drug misuse. Also, the Central
Law Enforcement Police carried out a project to meet similar objectives. The Police Board
allocated over EUR 42,616 for the implementation of drug misuse prevention projects. The
majority of the projects defined the youth as the target group.
Drug Markets
In 2005 synthetic amphetamine type stimulants (ATS) and ecstasy type of drugs were still
the most commonly used drugs in terms of the number of seizures, followed by cannabis
and opiates. Fentanyls became the most frequently seized opiates in 2005. The importance
of heroine on local illicit drug market has decreased substantially. The amount of seized
cocaine has increased when compared to 2004. In 2005 drug trafficking through and from
Estonia showed a pattern similar to the last few years. Recently increase in the smuggling of
cocaine from Central America to Estonian markets has been observed. According to the
police data the street prices of illegal substances increased in 2005 when compared to 2004
and the purity of most seized drugs decreased.

10
Part A: New Developments and Trends
1. National policies and context
In 2005 no major changes in the national drug policy were observed. In order to implement
the NSPDD more effectively the GCDP was established in April 22, 2006 to revise the
strategy as well as approve the annual implementation plans and draft action plans for the
years 2007-2009 and 2010-2012.
NDPSA and Associated Acts Amendment Act was adopted imposing restrictions on illegal
handling of narcotic drugs and psychotropic substances and their precursors as well as
surveillance of narcotic drugs and psychotropic substances. Also, the amendments provide
the establishment of the NDTD.
In terms of expenditure it is difficult to give a comprehensive overview of the funding of drug-
related activities. In 2005 the budget and reported expenditures on drug-related activities
remained nearly the same as in 2004.
In 2005 no large-scale opinion polls on drug-related topics were carried out. The survey of
2004 revealed that the general attitude towards drug smuggling is very negative and the
Eurobarometer survey carried out in 2006 demonstrated that one of the biggest fears of the
Estonians with regard to the EU membership was the increase in drug-related crime1.
1.1 Legal framework
NDPSA and Associated Acts (RT I 1997, 52, 834) has been amended by the NDPSA and
Associated Acts Amendment Act (RTI, 10.05.2005, 24, 180). The majority of amendments in
the legal acts were related to restricting the illegal handling of narcotic drugs and
psychotropic substances and their precursors and harmonization of Estonian legal acts with
the EU regulations. Also, the NDPSA and the Primary Substances Acts Amendment Act (RT
I 1997, 52, 834; RTI, 07.07.2006, 32, 247) provided improvement of the scope of
1 69% of Estonian citizens are satisfied with their life in Estonia. Available: http://www.emor.ee/arhiiv.html?id=1571

11
surveillance to prevent the availability and circulation of narcotic drugs, psychotropic
substances and their precursors. The State Agency of Medicines and the Estonian Tax and
Customs Board are responsible for the monitoring of the implementation of the NDPSA and
the Primary Substances Acts Amendment Act.
The amended legal act provides a basis for the collection of drug-related information.
According to §10 of section 3 of the amendment act the EDMC is responsible for the
collection and analysis of epidemiological and statistical data on drug situation and the
assessment of the prevalence of drug use. Also, the amendment act provides the
establishment of the NDTD (§ 11).
On the basis of the above-mentioned act amendments to the Psychiatric Care Act (RT1 I
1997, 16, 260), have been introduced providing that psychiatric care and diagnosis are
confidential personal information and specifying the subjects who have the right to disclose
such information. The NDPSA and the Primary Substances Acts Amendment Act provides
two additional subjects with such right – the NDTD and Estonian Health Insurance Fund
(EHIF).
Also, amendments to the Communicable Diseases Prevention and Control Act (RT I 2003,
26, 160) have been introduced stipulating the requirement to inform relevant agencies of any
suspicion of an extremely dangerous communicable disease and provide such information
together with personal data identifying the data subject. The list of communicable diseases
requiring personal data identifying the data subject will be stipulated by the regulation of the
Government of the Republic.
1.2 Institutional framework, strategies and polici es
The Ministry of Social Affairs (MSoA) is responsible for the overall administration and co-
ordination of the NSPDD. Other ministries are expected to implement the strategy in their
area of expertise. The National Institute for Health Development (NIHD) has been
responsible for the implementation of demand reduction since the NSPDD took effect in
2005. The NIHD provides funding for treatment centres, county governments and other
agencies as well as delivers training in the field of drugs. According to the strategy the
EDMC is responsible for the monitoring and evaluation of the implementation of the strategy.

12
However, evaluation of the strategy is an area to be improved. Therefore, quality
management and evaluation were included in the new Action Plan for the implementation of
the national drug strategy 2007-2009. Assessment of routine data collection and evaluation
of the strategy are considered to be necessary parts of the implementation process.
In 2005 no major changes in the national drug policy were introduced. A GCDP was
established on April 22, 2006 (The Government Order No 172 March 10, 2006) to implement
the NSPDD more effectively. The commission consists of representatives of all ministries
involved in the implementation of the drug strategy, the Estonian Psychiatrist Union,
Estonian Cities Union, Board of the Border Guard and EDMC. The GCDP is responsible for
revising the strategy, as well as approving the annual implementation plans and draft action
plans for the years 2007-2009 and 2010-2012. The Government Commission has to draft an
overview of the implementation of the drug strategy and submit it to the Government by 1
March. According to the Government Order No 172 of March 10, 2006 the EDMC is
responsible for providing the GCDP with a report on drug situation twice a year (February
1st; July 1st).
1.3 Budget and public expenditure
The scope of state expenditure on drug-related activities is difficult to estimate as data on
some areas of activity are not readily available. It is difficult to arrive at an accurate estimate
of costs associated specifically with supply and demand reduction, treatment, universal,
selective prevention and rehabilitation.
An overview of expenditures is available in terms of the activities of the NSPDD, National
Programme for HIV/AIDS Prevention (NPHAP), prevention projects of HIV/AIDS and drug
addiction in Tallinn and the GF HIV/AIDS programmes.
It is difficult to estimate the expenditures associated specifically with the NSPDD and the
NPHAP budget. In Estonia drug addiction and HIV/AIDS issues are closely related and
therefore, the NSPDD and NPHAP budgets are considered as one source of funding.

13
From 1998 to 2004 the activities related to the prevention of drug addiction were financed
from the ADAPP. In spring 2004 the NSPDD was adopted. Since 2005 the activities targeted
at the prevention of drug dependency have been funded from the NSPDD budget.
The expenditure of NSPDD for tackling drug dependency was budgeted almost at the same
level as in the last year - EUR 392,793 (Figure 1).
Figure 1. ADAPP and NSPDD funds in 1998-2005, (EUR).
398
280
389
241
402 393
474
60
0
100
200
300
400
500
1998 1999 2000 2001 2002 2003 2004 2005
Thousands
Source: Estonian Alcohol and Drug Abuse Prevention Programme, 1998-2004 and National
Strategy on the Prevention of Drug Dependency 2005.
The Health Care and Social Work Department of Tallinn City Government funded HIV/AIDS
and drug prevention projects with a total of EUR 406,728 in Tallinn. The projects involved
treatment, rehabilitation, prevention, counselling, training and information exchange activities
in the field of HIV/AIDS and drug prevention. The funding provided for HIV/AIDS and drug
prevention by Tallinn City Government has slightly increased when compared to the past
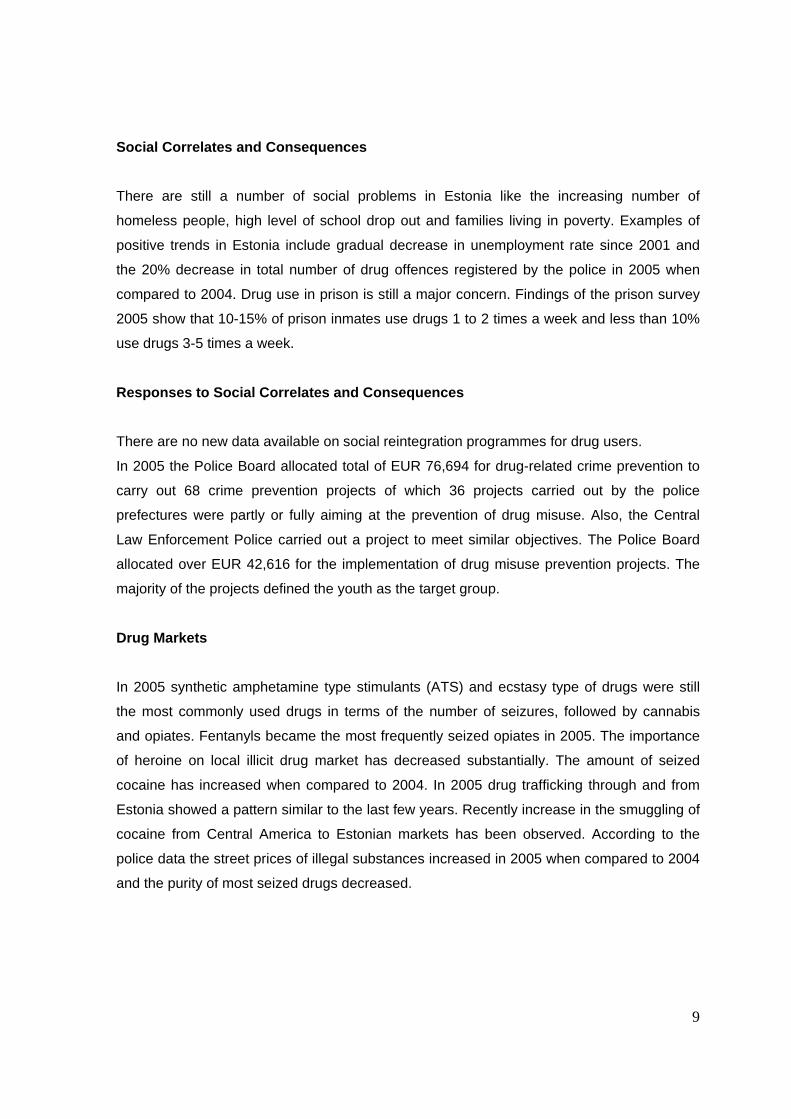
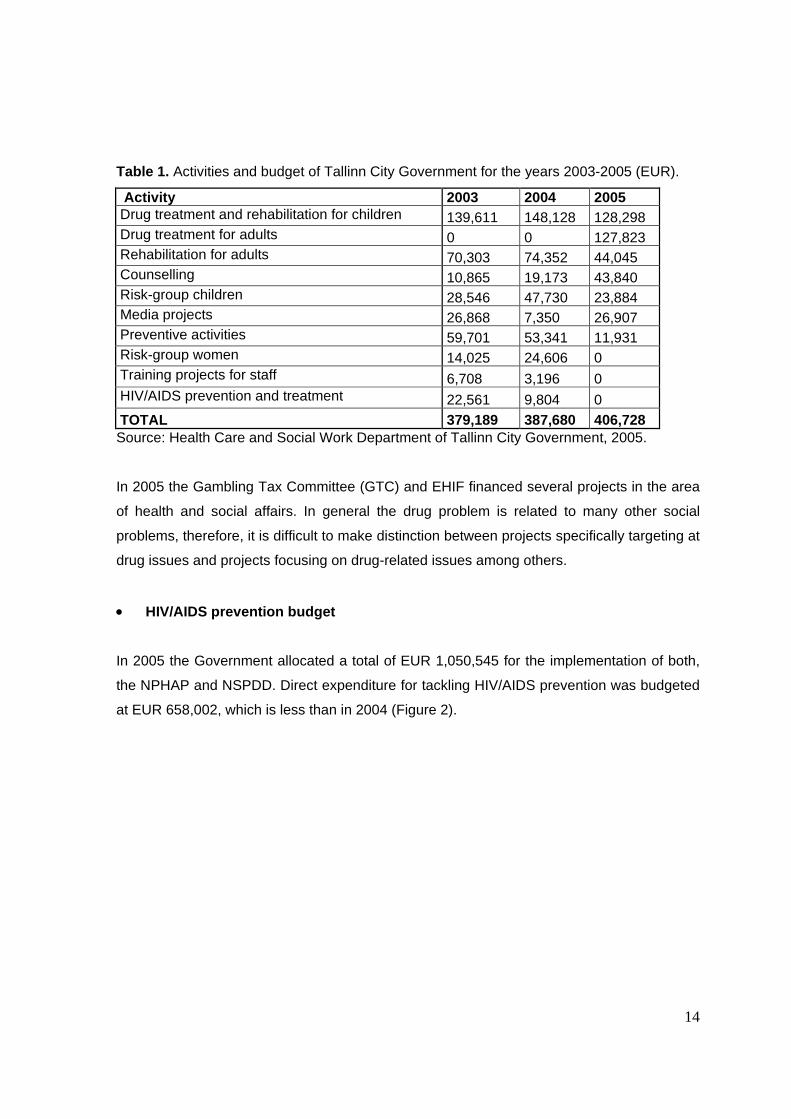
years (Table 1).
14
Table 1. Activities and budget of Tallinn City Government for the years 2003-2005 (EUR).
Activity 2003 2004 2005 Drug treatment and rehabilitation for children 139,611 148,128 128,298 Drug treatment for adults 0 0 127,823 Rehabilitation for adults 70,303 74,352 44,045 Counselling 10,865 19,173 43,840 Risk-group children 28,546 47,730 23,884 Media projects 26,868 7,350 26,907 Preventive activities 59,701 53,341 11,931 Risk-group women 14,025 24,606 0 Training projects for staff 6,708 3,196 0 HIV/AIDS prevention and treatment 22,561 9,804 0 TOTAL 379,189 387,680 406,728 Source: Health Care and Social Work Department of Tallinn City Government, 2005.
In 2005 the Gambling Tax Committee (GTC) and EHIF financed several projects in the area
of health and social affairs. In general the drug problem is related to many other social
problems, therefore, it is difficult to make distinction between projects specifically targeting at
drug issues and projects focusing on drug-related issues among others.
• HIV/AIDS prevention budget
In 2005 the Government allocated a total of EUR 1,050,545 for the implementation of both,
the NPHAP and NSPDD. Direct expenditure for tackling HIV/AIDS prevention was budgeted
at EUR 658,002, which is less than in 2004 (Figure 2).

15
Figure 2. Budget for tackling HIV/AIDS and drug addiction in 2000-2005 (EUR).
233
757 757
1 051
757
658738
502
0
200
400
600
800
1 000
1 200
2000 2001 2002 2003 2004 2005
Thousands
HAPP+NSPDD HAPP
Source: Annual Reports of HIV/AIDS and drug strategy, 2000 – 2005.
EUR 207,895 was allocated for the prevention and supporting activities targeted at the risk
groups of HIV/AIDS and EUR 370,630 was allocated for the prevention of drug use and
HIV/AIDS amongst the general population. EUR 39,354 was allocated for the training of the
staff of local authorities (public health specialists, medical staff etc.), EUR 39,354 for low-
threshold centres and EUR 40,123 for the studies in the field of drugs and HIV/AIDS (Table
2).
Table 2. Budget for tackling HIV/AIDS and drug addiction, 2005 (EUR).
Activity Expenditure Studies 40,123 Trainings 39,354 Activities tackling drug addiction 392,543 Activities tackling HIV/AIDS 207,895 Prevention 370,630 Source: Annual Reports of HIV/AIDS and drug strategy, 2000 – 2005.
As it was stated in our previous report (Abel et al. 2005) the Estonian contractual partner to
the GF entered into a contract on the implementation of the programme ‘National
Partnership to Increase the Scale of Estonia’s Response to a Concentrated and Rapidly

16
Developing HIV/AIDS Epidemic”. In 2005 the GF allocated a total of EUR 1,640,001 to the
NIHD to stop progressive spread of HIV/AIDS. The funding has been divided between 7
main targets of the programme such us young people, IDUs, commercial sex workers
(CSW), prisoners, men who have sex with men (MSM), HIV-infected and people in need of
ARV treatment, monitoring and evaluation, programme management and trainings. The
above mentioned areas were funded as follows: EUR 180,596 to reduce risk behaviour
among young people and increase the awareness of the public of HIV/ AIDS related issues,
EUR 456,999 to reduce risk behaviour of IDUs, EUR 484 52 to reduce risk behaviour of sex
workers, EUR 50,732 to prevent the spread of HIV in prison, EUR 42,077 to reduce risk
behaviour of MSM and to increase their awareness of HIV/AIDS related issues, EUR
532,577 to improve the quality of life of the people living with HIV/AIDS (PLWHA) and
increase their access to health care and support services. In 2005 allocations for PLWHAs
increased almost by 1/3, at the same time funding for preventive activities for young people
decreased by half.
The rest of the funds (EUR 328,568) were divided between two areas of activity aiming at
capacity-building of organizations participating in the GF programme and development of co-
operation between organizations in order to meet the objectives of monitoring and
evaluation, management and training of the programme.
In 2004 and 2005 the funds and interventions targeted at IDUs included syringe exchange
with counselling and methadone substitution treatment. Four non-governmental
organizations were responsible for syringe exchange within the framework of the GF
programme. These organisations had a total of 24 syringe exchange points (SEP) by the
end of 2005. 17 SEPs are located in Ida-Viru County and 7 in Tallinn and Harju County. In
2004 the SEPs of these 4 organisations were visited 56,484 times (38,729 visits in Eastern
Estonia and 17,755 in Tallinn). 80,689 visits were recorded in 2005 (49,826 visits in Eastern
Estonia and 30,863 in Tallinn).
17
1.4 Social and cultural context
In the following paragraphs the public opinion on drug-related issues in Estonia is examined.
Before the year 2005 a couple of surveys had been commissioned by the Estonian
government reflecting the general opinion of people on drug-related issues, e.g. a survey
commissioned by the State Chancellery and conducted by a poll company Turu-Uuringud to
which Eesti Päevaleht (EPL) referred to in 2004 (Koch 2004), however, in 2005 no large-
scale opinion polls on drug-related issues were carried out. The survey of 2004 revealed that
the general attitude towards drug smuggling is very negative, as negative as towards rape
and murder (however, it was not the case with abortion). In 2006 a Eurobarometer survey
was carried out once again demonstrating that increase in drug-related crime is one of the
biggest fears Estonians have in relation to the EU membership2.
Public opinion is also reflected in media. In TV programmes (e.g Raport on Channel 2) drug-
addicts are portrayed as criminals. According to the assessment of printed media carried out
in 2005 drug addicts have attributed an overly negative image. They are perceived as a
threat to ordinary/normal people – criminals who, in order to get high, are after people’s
personal possessions and assault their victims on dark alleys (Eesti Päevaleht 2005 b;
Vahter 2005). That is also a reason why ‘normal people’ do not want drug rehabilitation
centres to be built in their neighbourhood (Olvet 2005; Postimees 2005 b). According to a
journalist who has analysed the Internet commentaries, drug addicts are not much liked in
Estonia (Õunpuu 2005). As a result it has been understood on the national/government level
that drug addicts need support. Scientists (Lagerspetz 2005) stress that it is not reasonable
to classify them as ‘the others’ whose worries do not concern ‘us’.
• Attitudes towards drug addicts and drugs
Whenever drug addicts are referred to as ‘the dangerous elements in the society’, usually
heroin addicts are kept in mind (they are mostly non-Estonians being less well off). At the
same time the attitude of young people towards recreational drugs and drug users is much
more positive. The youth sociologist Allaste (2005) claims in EPL – cocaine as the drug of
2 69% of Estonian citizens are satisfied with their life in Estonia) Available: http://www.emor.ee/arhiiv.html?id=1571

18
‘the rich and beautiful’ has a rather glamorous image and cocaine is rather a sign of success
than decline (Allaste 2005).
• Initiatives of the Parliament and civil society
In 2005 the Parliament, more precisely, its Social Affairs Committee, adopted the NDPSA
and Associated Acts Amendment Act. Otherwise, there were no major initiatives on the
government level. However, drug issues were touched upon in the sessions of the
Parliament, also, the government discussed these issues in relation to other social problems
(e.g HIV, trafficking in humans, crime) (Lang 2005; Ansip 2006). Some attention was paid to
the public funding for combating drugs in the coming years (Minutes of Riigikogu 2005). In
his public addresses and speeches President Arnold Rüütel referred to drug and alcohol
abuse among schoolchildren as a serious social problem (e.g. New Year Address 2006 and
the Independence Day Address in February 2006) (Rüütel 2006).
In 2005 various drug prevention events were promoted by the state, local governments,
private sector, sportsmen, musicians etc. For example, in August there was a family event
free of charge ‘I am clean. Alive and beautiful. Drug-free’ (Postimees 2005 c). In November
Tallinn Youth Work Centre and students of the Advertising Chair of Tallinn University carried
out a campaign on social issues and placed posters made by the young people themselves
out in the streets of bigger cities targeting the campaign at young people aged 15-25 (Sarv
2005). In May a pop-star Dr Alban gave an anti-drug concert ‘No Coke!’ in Venus Club in
Tallinn (Postimees 2005 a). In August a charity event was held in Kadriorg Arena ‘Health for
Children – NO to drugs!’. In addition, several events were organised in counties and smaller
towns (e.g the traditional drug prevention week was carried out for the fourth time in Rapla
county in December. Students organised a conference ‘Drug addiction in the county today
and tomorrow (Eesti Päevaleht 2005 e).
• Media representation
The following gives a short overview of the media coverage in 2005. As big national daily
papers have a major role in shaping the public opinion the two biggest daily papers were
selected for the assessment –EPL and Postimees (PM). In addition, the major weekly
newspaper in Estonia – Eesti Ekspress (EE) – was assessed for background information.
19
When entering the word ‘drug’ in the search engines of the online versions of the three
newspapers, the number of hits was as follows: 447 in EPL, 504 in PM and 84 in EE, i.e. in
2005 the words ‘drug’ or ‘drug addiction’ or ‘drug trafficking’ featured either directly or
indirectly (the article was written on another subject) on 1,035 occasions. It is much more
when compared to e.g with ‘poverty’ or ‘unemployment’. Drugs/drug addiction was
mentioned in connection with crime and policy work, life of young people, foreign, social and
medical policies, health, HIV/AIDS, speeches by Estonian politicians, articles on the life in
Tallinn, but also, the life of Estonian peacekeeping troops in Afganistan, as well as in
connection with culture and art etc.
There were not all that many articles where drugs/drug addiction/drug trafficking was one of
the main subjects of the article: 171 articles on drug issues in EPL, 206 in PM and 26 articles
in EE. However, one or two articles/news on drug-related issues were published every day.
EPL and PM publish mostly articles on issues concerning drug traffickers or crooks, as well
as young people under the influence of drugs having been arrested by the police, customs
or border guard officials (31% of all the analysed articles on drug issues) followed by
courtroom news about drug dealers and persons connected with drugs (19%). Drug issues
abroad were covered in 10% of the articles; addiction treatment was the main issue in 9%,
crime and police work (not including arrests of drug smugglers) in 6%, drug prevention in
5%, research and statistics in 4% of the articles. Other issues were hardly ever discussed
(HIV 2% etc).
Events related to drug issues catching the attention of media in 2005 include: a)
superintendent of the drug unit of the Estonian Central Criminal Police was apprehended
and convicted (17 articles); b) the city decided to set up a ‘low-threshold’ centre but the
residents in the neighbourhood were against it and the court had to close it down (15 articles
of which some, written by scholars, officials etc were tolerant towards addicts, however, it did
not contribute to achieving the objective); c) an Estonian was caught in New York with some
cocaine and forged bank cheques (13 articles). In the latter case the following attitude
prevailed in media - ‘nice guy, too bad he got caught, he is no crook’. Also, his own words
were quoted – ‘cocaine is not a drug, people use it anyway, also in Estonian nightclubs, it is
like a rich man’s cappuccino’ (Kagge 2005). Fortunately this kind of attitude towards drug
use does not prevail in Estonian media – articles on glamorous drug use were very rare in
dailies.
20
Cannabis products were most often mentioned drugs in the daily papers subject to
assessment (mentioned in 80 articles) followed quite surprisingly by cocaine (64 articles)
and amphetamine (59 articles). In EE cannabis and cocaine were also referred to most
frequently, but differently from daily papers, followed by opiates (heroine mainly). More
profound and long articles e.g about HIV positives and prostitutes using heroine were
published in EE. Dailies publishing articles on arrests etc, concentrated more on synthetic
drugs.
Drug-related topics made the headlines on 4 occasions (3 in EPL and 1 in PM) and 1 in EE.
Topics of those editorials were: 1) sniffer dogs in Tallinn schools (Eesti Päevaleht 2005 a)
(the issue was about the use of appropriate drug prevention measures by the police in
schools); 2) companies have started to support anti-drug events (Eesti Päevleht 2005 c); 3)
Estonia has the leading position in Europe with regard to AIDS victims, however, our
decision makers have not taken this fact seriously (Eesti Päevaleht 2005 d); 4) the editor-in-
chief of EE expressed her disapproval of the glamorous media coverage of an Estonian
businessman having been caught with cocaine in the US (Kaalep 2005). In his column the
editor-in-chief of PM accused one of the most popular Estonian soap operas of promoting
cannabis smoking (Pullerits 2005). The two last examples demonstrate that Estonian leading
journalists have become socially more responsible than in the 1990s.
Finally, it can be concluded that public attitude towards drug addiction/addicts has been
quite negative in media. The negative attitude has been shown towards problem drug users
being mainly non-Estonians, as well as towards other drug addicts. Despite the fact that the
state drug prevention programme, strategy and scholars would rather perceive addicts as a
part of ‘us’, the public generally tends to be afraid of drug addicts and avoid them because
they are regarded as a threat to ‘normal people’. The interest of media in drug issues is still
high, though profound articles analysing the drug situation in Estonia are very infrequent in
our press. In our leading dailies the topic of drugs is presented mainly against the
background of criminality, whereas prevention, treatment and rehabilitation aspects have
been overshadowed by police and court news.

21
2 Drug Use in the Population
In 2005 there was no new information about the drug use in the general population. Some
information is available about the drug use of CSW where about 30% of CSW had used
drugs in the last six months prior the survey. According to the survey amphetamines and
cannabis were the most frequently used drugs amongst the first time visitors of health care
services.
2.1 Drug Use in the general population
No new data available.
2.2 Drug Use in the school and youth population
No new data available.
2.3 Drug Use among specific groups
In 2005 a survey (Trummal et al. 2005) was been carried out among CSWs by the NIHD
within the framework of the Global Fund to Fight AIDS, Tuberculosis and Malaria (GFATM)
in order to compare the data on first time and repetitive visitors using health care services of
the Health Centre Elulootus. The survey was designed to report on socio-demographic data
of CSWs, their knowledge on the ways of HIV transmission, indicators related to sex
industry, condom using habits and drug use. The data gathered from January to September
2005 from 106 first time clients and 72 repetitive clients have been used in the analysis.
The findings of the survey indicated that 30% of the first time clients and 28% of the
repetitive clients (CSWs) of the above mentioned health centre had used drugs in the last 6
months prior to the survey; the findings do not differ from those of the year 2004. Half of the
18-24-year-old commercial sex-workers had used drugs in the last 6 months prior to the
survey, at the same time the share of drug users in the older age class was 6%. However,
the number of respondents in both age classes was only 36 (Trummal et al. 2005).
According to the survey, amphetamines and cannabis were the most frequently used drugs
among the first time visitors (Trummal et al. 2005).

22
Some knowledge on the prevalence and patterns of drug use among sex-workers will be
acquired by another study to be carried out to obtain data on the prevalence of HIV, sexual
risk behaviour, substance use, practices of seeking health care and prevention behaviour
among CSWs. The study has been designed and will be carried out in the first half of 2006
by the NIHD within the framework of the GFATM. Information for the survey has been
collected from females in Tallinn according to the method of structured interviews. In
addition, respondents have provided a saliva test to test for HIV antibodies. The study is
based on a convenience sample. The findings of the study will be published in autumn 2006.
3. Prevention
In 2005 the NSPDD was enforced replacing the ADAPP which used to form the basis for
drug prevention. In the first year the NSPDD did not bring along any major changes in the
structure of drug prevention. Thus, in 2005 prevention activities were mostly carried out
within the framework of short-term projects financed by the NSPDD or local governments.
Despite of a number of training sessions and training materials developed over recent years
(see previous reports) no obligatory national school programmes were introduced in Estonia
in 2005. In addition to the funding provided by the NSPDD a number of drug prevention
activities in Tallinn were funded by Tallinn City Government.
3.1 Universal prevention
As already mentioned above no obligatory drug prevention programmes for schools were
introduced in 2005. It is necessary to develop a curricula-based drug prevention programme
to be introduced in Estonian schools. A number of schools have included drug prevention in
their human studies, however the possibility to do so depends on the willingness of schools
and availability of human resources. No regular information about the number of drug
prevention classes and topics covered at schools has been made available.
A number of drug-related/health-promoting projects and activities for youth were carried out
within the framework of the NSPDD in 2005. The activities and projects were mainly focusing
on information exchange and counselling activities which enabled youngsters to look for and
find information about the issues of interest. Information desks were set up in the biggest

23
youth-related events and conferences/exhibitions where drug prevention experts provided
information.
The biggest project “With cookies against drugs” involving 15 schools in Estonia was carried
out to disseminate information about drug issues and introduce drug-free alternative
activities. Community prevention included production of a movie about dangers of drug use
and violence. The production of the movie was financed by Tallinn City Government.
Most of the universal prevention activities of the NSPDD were carried out within the
framework of local drug and HIV prevention action plans coordinated by local drug
prevention or health promotion boards. It is difficult to assess drug prevention activities
carried out in 2005 separately from HIV/AIDS-related activities due to the „field-based“
financial system. Nine local HIV and drug prevention boards and six local health promotion
boards were allocated a total of EUR 81,489 for carrying out HIV and drug prevention
activities on local level. The local HIV and drug prevention action plans were developed as a
result of cooperation between local experts and representatives from the NIHD. Table 3
provides a list of activities carried out within the framework of local prevention action plans. A
major share of the budget of action plans was allocated for the funding of youth projects on
local level. There is no information available about the content of these projects because of
the lack of a reporting system. Another significant share of the available funds of local action
plans was spent on HIV and drug-related training of trainees, teachers, youth workers. Also,
some of the staff of bars/shops and other institutions related with youngsters were trained on
HIV and drug issues.
A number of counties organized drug/HIV prevention related lectures and events for
schoolchildren. The purpose of local action plans is to carry out HIV and drug prevention
activities across the country. The limited budget did not allow the involvement of all the
areas in Estonia and shortage of resources prevented from the implementation of all
planned activities. For example, funding of the NSPDD for the training of parents and
families on prevention issues was far too scarce.

24
Table 3. HIV/AIDS and drug prevention in counties by type of activity in 2005 (EUR).
Activity Expenditure (EUR) Creative work 3,892 Awareness raising of parents 741 Work group meetings 2,016 Cooperation and capacity building in counties 4,245 Information exchange 5,503 Drug-related training for the students 5,145 Training of teachers and support network 7,043 Risk children targeted activities 2,461 Anti-tobacco activities 288 Supporting the prevention activities in counties 18,378 Sexual behaviour and HIV/AIDS prevention 5,221 Mapping the situation 1,439 Local events 5,880 Training of support students 2,652 Provision of counselling services 1,214 Administrative costs 7,593 Conferences and round tables 5,605 Alternative activities 1,854 Joint trainings 320 TOTAL 81,490 Source: National Institute for Health Development, 2006.
3.2 Selective prevention
Projects targeting risk group children were mostly financed by Tallinn City Government. Total
of EUR 59,143 were allocated to the projects involving risk group children in Tallinn. Projects
provided risk group children with counselling services, also, very high risk group children
were provided with case management services.
Estonia has three special schools for children with behavioural difficulties: Kaagvere, Tapa
and Puiatu. Drug prevention in special schools is carried out within the framework of the
NSPDD and administrated by the NIHD. Like in previous years drug prevention in special
schools has been included in drug prevention action plans of special schools. In 2005 the
action plans focused on teachers´ self-education on drug issues, provision of counselling for
students, rehabilitation/treatment and alternative activities. Total of EUR 16,336 from the
NSPDD and the budgets of special schools were allocated for drug prevention activities.
Table 4 gives an overview of the drug prevention activities and expenses in three special
schools in 2005. In addition, drug prevention activities were financed by the NIHD and from

25
school budgets. The Ministry of Education and Science allocated resources for alternative
activities and selected educational programmes.
Table 4. Drug prevention activities in Estonian special schools in 2005 (EUR).
Activity Name of the special school Puiatu Kaagvere Tapa Trainings for students 1230 - 1,764 Trainings for teachers and school staff 511 - 172 Counselling 639 1,278 1,278 Alternative activities 1,358 3,835 264 Addiction treatment and rehabilitation 320 - 501 Project management 1,055 - 2,135 Total 5,113 EUR 5,113 EUR 6,110 EUR Source: National Institute for Health Development, 2006.
4. Problem Drug Use (PDU)
The definition of PDU used in Estonia is the same as defined by the EMCDDA. According to
the national drug strategy problem drug use is defined as injecting drug use or long-term
and/or regular use of opiates, cocaine and/or amphetamines (NSPDD 2004). However, the
changed drug situation (e.g changes in illegal drug market, patterns of use etc) refers to the
need to review the definition of PDU in Estonia.
Heroin is not the prevailing drug in illicit drug market, which clearly has an effect on injecting
drug use in Estonia. In 2005 methylfentanyl and methylfentanyl mixed with fentanyl
accounted for the majority of seizures of opiates (see chapter 10 Drug Markets). A survey on
HIV prevalence among IDUs conducted in 2005 showed that the majority of IDUs had used
fentanyles in the last 4 weeks prior to the survey (Uusküla et al. 2005).
4.1 Prevalence and incidence estimates
The first study aiming to evaluate the feasibility of IDU prevalence estimation in Estonia
based on routine data sources using capture-recapture methodology was conducted by the
NIHD, University of Tartu and Imperial College, London. The findings of the study show that
the number of the IDU population is very high – the estimated total number of IDUs is 13,801
(95% CI 8 132-34 443) of which 12,387 (95% CI 7119-20600) are male and 1,414 female

26
(CI95% 1059-4132) (see the table). The share of the IDU population of the population aged
15-44 is 2.4%. The IDU population is the most numerous in the capital of Estonia (4.2%),
followed by Ida-Viru county (3.4%). The share of IDUs is the smallest in the rest of Estonia
(0.4%) (Uusküla et al. 2005).
4.2 Profile of clients in treatment
No data available.
4.3 Main characteristics and patterns of use from n on-treatment sources
In 2005 two studies on injecting drug users, their background and risk behaviour were
carried out in Estonia – routine questioning of the visitors of SEP; HIV prevalence and risk
behaviour among IDUs in Tallinn and Kohtla-Järve.
• Questioning of the visitors of SEPs
Studies on SEPs have been carried out since 2003 by the NIHD and four non-governmental
organisations (NGO). A total of 1,680 first-time clients in 2003, 1,810 clients in 2004 and
1,218 first-time clients in 2005 were included in the sample, as well as 366 multiple clients in
2003, 397 in 2004 and 396 in 2005 (Trummal et al. 2006).
The findings show that 77% of the SEP clients were male and the average age of the visitors
was 23 years. Russians were the largest ethnic group of the SEP clients accounting for over
80% of the clients. 50% of the respondents were neither working nor studying, one third of
the clients was working and one tenth was studying. When comparing the three years the
number of unemployed persons has decreased to some extent and the number of employed
persons has increased (Trummal et al. 2006).
40% of the first-time visitors of the syringe exchange points had been injecting for one year
or less, 35% had been injecting for 2-4 years and 25% for 5 or more years. The substances
used most frequently by multiple visitors in 2005 included amphetamines, poppy extracts
and heroin – nearly 40% of the respondents had used these substances in the last month3.
3 Fentanyles were not included in the questionnaire of the SEP study.

27
The relative importance of injectors of amphetamines and heroin has decreased and the
number of users of poppy extracts has increased when compared to 2004 (Trummal et al.
2006).
The largest group of both first-time and multiple visitors included people who had not shared
a syringe with others in the last month. The share of this group among the new and multiple
clients increased significantly from about 60% to 75% in 2005 when compared to the
previous years. Over half of both new (55%) and multiple (67%) visitors had undergone HIV-
testing in the last year prior to the survey in 2005. The share of people tested for HIV has
increased in both groups (40% and 54% in 2003, respectively) (Trummal et al. 2006).
• Survey of HIV prevalence among injecting drug users
A study “HIV prevalence and risk behaviour among IDUs in two cities in Estonia (Tallinn and
Kohtla-Järve)” was carried out in Estonia in 2005. The study was funded by the GF
programme in Estonia and implemented by the NIHD. Data for the anonymous survey of
injecting drug users using respondent-driven sampling method were collected from 350 IDUs
from Tallinn and 100 IDUs from Kohtla-Järve in May and June 2005 (Uusküla et al. 2005).
The majority of the respondents were men (84%), the average age of the respondents was
24 years. 82% of the respondents were Russians and 12% Estonians which reflects the
situation in Estonia where most addicts belong to the minority group (Uusküla et al. 2005).
55% of the respondents (excluding respondents under 16 years of age) had been going to
school for 9 years or less. 24% of the respondents had completed or uncompleted
secondary education. Only 2% of the respondents had higher education (Uusküla et al.
2005).
In the last four weeks the largest group of the respondents (41%) had received the main
income from a regular or temporary job, 24% from theft or robbery and 25% from parents or
relatives. The share of respondents was higher in Kohtla-Järve when compared to Tallinn.
45% of the respondents had valid public health insurance the acquiring of which is subject to
the employment status in Estonia (Uusküla et al. 2005).

28
The mean age of the respondents when starting using drugs was 17.2 years. 19% of the
respondents started injecting drugs when they were less than 15 years old and 63% at the
age of 15-19. Only 11% of the respondents had started injecting drugs in the last two years
and almost 60% had been injecting for at least 6 years. 46% had had daily injections in the
last month. In case of daily injectors 6% had administered drugs once a day, 62% 2-3 times
a day and 33% 4 or more times a day (Uusküla et al. 2005).
Fentanyl and amphetamine were the most frequently used drugs – more than 60% of the
respondents had injected these substances in the last four weeks. The relative importance
of various substances differed significantly in different cities. In Tallinn the biggest number of
people reported having used fentanyl in the last four weeks, in Kohtla-Järve mainly home-
made opiates had been used (Table 5) (Uusküla et al. 2005).
Table 5. Main injected drugs in the last 4 weeks in the sites of survey (%).
Tallinn (%) Kohtla-Järve (%) TOTAL (%) Fentanyl 75.3 2.0 58.9 Amphetamin 22.6 10.2 19.4 Heroin 2.1 0.0 1.6 Home-made opiates 0.6 87.8 20.1
Source: A. Uusküla et al, 2005.
Almost 3/4 of the respondents had not shared a syringe or a needle with others in the last
four weeks before the study which is similar to the findings of the SEP study (see the
findings of the SEP study above). Only 12% of the respondents said that they had never
shared a syringe or needle in their lifetime (Uusküla et al. 2005).
88% of the respondents had tried to quit injecting drug at least once. 45% claimed that they
had received drug treatment at some point in their life. The mean age of the respondents
having received the first treatment was 20 years, they had decided to seek treatment in 3
years from the start of drug injection. 65% of the respondents had experienced overdose
during their lifetime (Uusküla et al. 2005).
The police had stopped 71% of the respondents in the last 12 months and 58% had been
detained and arrested. 64% of the respondents had been in prison in their lifetime (Uusküla
et al. 2005).
29
92% of the respondents had had vaginal intercourse in the last 12 months. From those
having reported the number of sexual partners 1/3 had had one sexual partner, almost 2/3
had had 2 or more partners. 60% of those who reported having had vaginal intercourse had
had sex with an injecting drug user in the last year. 43% of the IDUs had always used a
condom in vaginal intercourse in the last year, which is less than in case of the respondents
of the SEP study. 24% claimed never having used a condom (Uusküla et al. 2005).
Most of the respondents (90%) had been tested for HIV at least once in their lifetime. 173
respondents of 450 reported having been tested HIV positive in their last test. During the
survey a medical worker took a blood sample from all respondents to test for HIV antibodies
on the basis of a dry blood spot. 279 tests were positive i.e 62% of the injecting drug users
tested HIV positive. 54% of the 350 drug users surveyed in Tallinn had HIV whereas 90% of
the 100 drug users surveyed in Kohtla- Järve were carrying the infection (Uusküla et al.
2005).
5. Drug-Related Treatment
According to the national drug strategy the development of professional and effective
treatment for drug addicts, expansion the scope of drug-treatment services across the
country and improvement of the quality of services is one of the six main objectives. Limited
data did not enable us to give a comprehensive overview of drug-free and medically assisted
treatment. A study on drug treatment provision conducted by the EDMC can shed some light
on these issues, however, due to its limited nature and low response rate the findings should
be treated carefully. The GF Programme is still the major provider of funds for medically
assisted treatment. In 2005 the funding included provision of methadone treatment for
approximately 5% of IDUs in Tallinn, Narva, Jõhvi and Kiviõli. The national strategy provides
treatment for less than 1% of IDUs (Talu et al. 2006). The low coverage of IDUs in the
treatment funded from the national strategy can be explained with the allocation of the
majority of the funds of the national strategy for the establishment of new treatment centres
in 2005. Tallinn City Government continued the funding of medically assisted and drug-free
treatment, however, data on drug-free treatment are not available.

30
5.1 Treatment system
Several organisations (NIHD, GF, EHIF, local authorities) are funding the provision of drug
treatment in Estonia, however, a system of regular data collection has not been developed
and it is impossible to get reliable information on drug treatment in Estonia.
According to the Mental Health Act (RT1 I 1997, 16, 260) only psychiatrists can provide drug
treatment, however, they are not required to be specialized in that area, thus, theoretically
clients can choose any of the 226 psychiatrists in Estonia to provide them with treatment.
However, all the 226 psychiatrists do not provide drug treatment and a client seeking
treatment is referred to the psychiatrist providing such treatment.
43 drug treatment providers having issued invoices for the provision of drug treatment
(hospitals and private doctors) were registered in the database of the EHIF in the period of
2003-2004. Also, the NIHD collects data about the institutions receiving funding from the
budget of the NSPDD and the HANS. According to the NIHD there were 57 drug treatment
and rehabilitation providers in 2005, however, it is impossible to identify which institutions
provided drug treatment and/or rehabilitation as well as the scope of service provision in
2005.
The EDMC conducted a small survey in 2006 aiming to get an overview of the current
treatment providers and the scope and type of services provided in 2005. The EDMC sent
questionnaires to 43 drug treatment providers registered in the database of the EHIF of
which 37 responded and 6 did not fill in the questionnaire.
19 of 37 drug treatment providers claimed that their institution provided drug treatment, 18
answered that they did not provide drug treatment in 2005. 10 respondents providing drug
treatment were central or local hospitals and 9 were private medical centres or doctors.
Ten institutions provided only outpatient treatment and five respondents both, outpatient and
inpatient treatment in 2005. Also, there were two inpatient health care institutions and one
prison hospital, a low threshold centre and a NGO providing the treatment.

31
The findings of the survey do not allow to list the institutions specializing in drug treatment.
Most of the institutions have not separated drug treatment facilities from regular facilities (for
the treatment of other psychiatric disorders).
More than half of the respondents claimed that a part of their funding had come from the
EHIF and almost half of the respondents reported that some of the treatment had been
financed by the clients themselves. Seven respondents reported that local authorities had
contributed to the funding of the treatment provision and 5 respondents named the GF
and/or NIHD as the sources of funding. However, it is impossible to identify the share of
each source in the funding of drug treatment because most of the respondents had received
funding from various sources.
5.2 Drug free treatment
As stated earlier in this report, the absence of data does not allow us to give a
comprehensive overview of drug free treatment in Estonia. The number of clients receiving
drug free treatment is unknown.
According to the findings of a survey on treatment provision conducted by the Estonian
National Focal Point (NFP) in 2006 only 3 respondents did not provide drug free treatment.
However, this data should be treated with reservation as therapy can be combined with
medically assisted treatment and the actual scope of drug free treatment cannot be
identified. Three respondents claimed to be providing only one type of drug free treatment
(psychotherapy and family therapy), the rest provided at least 2 types of therapies in their
institutions (Table 6).
Table 6. Types of drug free treatment, 2005.
Treatment type No Psychotherapy, cognitive therapy 11 Group therapy 6 Family therapy 6 Self-help groups 5 Change model 2 Minnesota model/12 steps 3 Other 6
Source: EDMC, 2006.
32
5.3 Medically assisted treatment
Limited data does not enable us to give a comprehensive overview of medically assisted
treatment in Estonia. We have described medically assisted treatment on the basis of the
reports of Tallinn City Government, the NIHD, GF Programme and a survey conducted by
the EDMC in 2005.
In the reporting period the NIHD allocated EUR 392,793 from the budget of the NSPDD for
treatment and rehabilitation of which the majority was used for setting up 7 new
treatment/rehabilitation centres: a rehabilitation centre for patients with dual diagnoses and a
low-threshold centre in Tallinn (failed because of the opposition of the citizens), a low
threshold centre, two treatment centres and a rehabilitation centre in North-Eastern Estonia
and an advisory centre in Central Estonia. Thus, most of the funds were spent on the
establishment of new treatment centres and the resources for drug treatment were limited –
only 123 persons received treatment or rehabilitation (Talu et al. 2006).
However, in the same period Tallinn City Government supported 2 treatment projects with
EUR 228,676. Tallinn Children hospital and their drug treatment unit for children under 18
was allocated EUR 100,853 and West-Tallinn Central Hospital and their long-term
substitution and withdrawal treatment unit EUR 127,823.
Methadone treatment was provided within the framework of the GF programme in Tallinn,
Narva, Jõhvi and Kiviõli in 2005. The service was provided by 5 institutions. By the end of
2005 approximately five hundred people were receiving methadone treatment in Estonia
(including both substitution and detoxification treatment patients). At the beginning of 2004
the number of patients was several times lower than at the end of 2005 (128 in 2004 and
399 in 2005). As at the end of 2005 296 of the total of 399 clients were receiving treatment in
Eastern Estonia and 103 in Tallinn (Trummal et al. 2006).
The findings of the EDMC survey show that 1,339 persons received treatment in 19 medical
institutions in 2005. 511 persons received treatment for the first time in their life and 828 had
received treatment at some point in the past. 332 persons of the total of 1,339 received
inpatient and 1,007 outpatient drug treatment in 2005. However, these figures have not been
registered and may not be accurate as some of the drug treatment providers may not have

33
been included in this survey and some of the patients could have received treatment from
more than one treatment centre. 1 January 2007 collection of drug treatment data will be
initiated by the NDTD, thus, in 2008 we will be able to report on more accurate data.
82% of the visits to respondent institutions were related to opiate addiction, 5.8% to
stimulants and 12% to other substances. Estonian medical institutions are not obligated to
collect gender based information, thus, gender based data are not available. Establishment
of the drug treatment database will enable to identify gender-related differences.
Opiates are of major concern regarding the drug problem in Estonia (Uusküla et al. 2005).
Opiate use is very closely related to HIV/AIDS issues since most opiate users are injecting
drug users. Findings of the survey on injecting drug users indicate that addicts being aware
of their HIV+ status have not given up sharing the injecting devices and have not considered
less risky behaviour (Abel 2006).
6. Health Correlates and Consequences
57 drug-related deaths were registered in Estonia in 2005. The methodology of defining
drug-related deaths has not been changed. Estonia uses the EMCDDA definition for General
Mortality Registers, “selection B”. Drug-related mortality in Estonia is proportionally higher in
men, age group 20-29, urban residents, residents of Tallinn and North-Eastern Estonia,
ethnic Russians.
The incidence of HIV has declined since 2002. A total of 5,063 new HIV cases were
registered in Estonia within the period of 1988 to December 31, 2005. Also, the number of
new cases of acute HBV and HCV has declined when compared to the year 2004.
6.1 Drug-related deaths and mortality of drug users
A total of 57 direct drug-related deaths were registered in Estonia in 2005 compared to 98
deaths in 2004. The following analysis is based on the data of 2004-2005. 19 cases of 155
were reported to be “other and unspecified psychodisleptics” – T409, 105 cases “other and
unspecified narcotics” – T406, two cases “mental and behavioural disorders due to multiple

34
drug use and use of other psychoactive substances” – F192. The share of missing or ill-
defined toxicology data is 81.3%. This suggests that in the majority of cases toxicological
tests have either not been done or the results have not been available to the mortality
registry, thus, the situation needs to be improved. 6 cases were attributed to opium, 1 to
heroin, 8 to other opioids, 5 to methadone, 5 to other synthetic drugs, 2 to cocaine. The
majority of cases (139) were reported as accidental poisonings, one case – suicide, two –
disease (drug abuse), 13 cases – events of undetermined intent.
Classification of the deceased by age and sex is shown on Figure 3. More than half of them
are young men aged 20-29; only 15 out of 155 are women.
Figure 3. Number of direct drug-related deaths by sex and age of the deceased.
15
50
43
21
64
11 1
7
31 1 1
0
10
20
30
40
50
0-15
15-1
9
20-2
4
25-2
9
30-3
4
35-3
9
40-4
4
45-4
9
50-5
4
55-5
9
60-6
465
+
Males Females
Source: Statistical Office of Estonia, 2006.
The majority of the deceased was the residents of the capital Tallinn, 6% were residents of
the surrounding area (Harjumaa), 25% were residents of North-Eastern Estonia, 5%
residents of Southern Estonia, including the second largest city Tartu, and 3% residents of
other areas. Only five cases were related to residents of rural settlements, the remaining 150

35
were urban dwellers. According to the Statistics Estonia as at 1 January 2005 the residents
of the city of Tallinn contributed to 29% of the Estonian population, residents of Harjumaa,
North-Eastern Estonia and Southern Estonia to 9%, 13% and 31%, respectively.
Ethnic origin is an important background indicator. 79% of the deceased were ethnic
Russians, only 7% were ethnic Estonians, the rest were other ethnic groups like Ukrainians,
Belorussians, Armenians and Finns. According to the Population Census 2000 the share of
ethnic Russians in the population was 25.6%, the share of ethnic Estonians 68.0%.
6.2 Drug-related infectious diseases
The incidence of HIV has declined since 2002. From 1988 to 31 December 2005 a total of
5,063 new HIV cases were registered in Estonia. In 2005 621 HIV infected people were
recorded by the Health Protection Inspectorate (HPI). By region 42.3% of all HIV cases were
registered in Tallinn (N=263) and 43.2% in Ida-Viru county (N=268) of which half of the
cases were registered in Narva (N=121). Approximately 60% of HIV infected people were
20-29 and around one fifth 15-19 years old. More than 60% of HIV infected were male, the
share of women among all HIV infected increased to 37.2%.
The number of new acute HBV and HCV cases has declined when compared to the year
2004. In 2005 the HPI registered 78 (5.8 per 100,000 inhabitants) acute HBV cases while in
2004 127 HBV cases were recorded (9.5 per 100,000). In 2005 85 new acute HCV cases
were recorded (6.0 per 100,000) vs 124 HCV cases (9.2 per 100,000) recorded in 2004. The
risk factors of acute HBV included drug use (26.9%), sexual intercourse (11.5%), with
respect to 56.4% of the cases the risk factor was not specified (Kerbo et al. 2006).
The incidence rate of acute HBV and HCV was the highest in Läänemaa (the incidence rate
was 14.2 per 100,000 inhabitants), Ida-Virumaa (10.5 per 100,000), Narva (10 per 100,000)
and Tallinn (7.1 per 100,000). The incidence rate of acute HCV was higher in Narva (15.7
per 100,000). According to the data of the HPI 29.9% of all registered acute HBV cases and
44.4% of all registered acute HCV cases were related to drug use. The incidence rate was
the highest in Narva (15.7 per 100,000), Ida-Viru County (15.3) and Harju County (10.4).
Almost half of the registered acute HCV cases were related to young people aged 20-29
(Table 7) (Kerbo et al. 2006).

36
However, the existing HBV, HCV surveillance system does not allow to identify risk factors,
therefore, information about the risk factors is inadequate. In 2005 the risk factors were not
identified in 56.4% of the cases of acute HBV and 45.7% of the cases of HCV. As a result of
effective work carried out within the framework of the immunization programme in Estonia
the share of young adults in the acute cases of HBV has decreased almost 5 times in the
last 5 years (Kerbo 2006).
Table 7 . Description of persons with acute and chronic HBV, HCV in 2005.
Acute HBV Chronic HBV Acute HCV Chronic HCV 20 – 29 year olds 65.4% 39.1% 46.9% 56.9% Gender distribution: - Male -Female
69.2% 30.8%
60.9% 52.2%
74.1% 25.9%
66.1% 33.9%
Employment - employed - non-employed
41.0% 42.3%
56.5% 39.1%
33.3% 60.5%
25.7% 60.6%
Source: Health Protection Inspectorate, 2006.
A specific study on IDUs shows a very high prevalence of HBV and HCV among IDUs. The
findings of a survey on 222 IDUs including 100 visitors of Anonymous AIDS centres and 122
detainees of the Central Prison show that 65% of the visitors of Anonymous AIDS centres
and 89% of the detainees were HBV seropositive and 90% and 97.5% were HCV
seropositive, respectively (Priimägi et al. 2003). The share of injecting drug users in the
sample was very high and 85% (N=189) of the surveyed IDUs had shared syringes.
In 2005 a total of 109 chronic HCV cases were recorded (8.1 per 100,000). The highest
incidence rate was recorded in Ida-Virumaa (59.2 cases per 100,000), Narva (22.8 cases
per 100,000) and Viljandi County (14.1 cases per 100,000). Young people aged 20-29
accounted for over half of the registered HCV cases. Almost 70% of the people with chronic
HCV were hospitalized in 2005 (Kerbo et al. 2006).
6.3 Psychiatric co-morbidity (dual diagnosis)
No reliable data on psychiatric co-morbidity of drug users are available. There is only one
day-care centre for patients with dual diagnoses funded by the NIHD. The activities of the

37
NDTD will be launched on January 1, 2007 and thus, allow us to get some information on
psychiatric co-morbidity.
6.4 Other drug-related health correlates and conseq uences
No new data available.
7. Responses to Health Correlates and Consequences
Responses to health correlates and consequences include a wide range of interventions
funded from the NSPDD, NPHAP, GF Programme and local governments. The HANS was
approved by the Government on December 7, 2005 (Government decree No 771). The
HANS consists of 12 strategic targets listed below: the size of IDU population has decreased
(the same strategic target as identified in the NSPDD), the prevalence of HIV among IDUs is
declining constantly, the number of new HIV cases among young people aged 15-29 is
declining, the prevalence of HIV-infection has not increased and the prevalence of STIs has
decreased, the knowledge of HIV transmission routes and skills to assess the risk of
transmission has increased and the negative attitude towards PLWHA has decreased; HIV is
not transmitted inside the detention institutions; vertical transmission of HIV has decreased;
transmission of HIV has not increased among MSM; the prevalence of STI among the
general population has decreased; no incidence of HIV transmission related to an
occupation has been recorded; availability of HIV testing and counselling services has
increased; the recipient is ensured the safety of donor blood, donor transplants and tissues;
the quality of life of PLWHAs has improved; the activities are planned according to evidence-
based data; the number of individuals and organizations working with HIV-related issues has
increased; the number of services based on the description of service provision based on
the consensus of specialists has increased4.
There is no nationwide data on drug-related overdoses. Statistics of Tallinn Emergency
Service is the only available information showing that the number of drug-related of
4 The Government is responsible for the implementation of HIV/AIDS prevention and has set up a HIV/AIDS Commission in the MSoA. All ministries involved in prevention have to submit a report to the Commission on HIV/AIDS to inform the Government on the implementation of the strategy and related problems. The HIV/AIDS Commission is an advisory body of the Government. The commission consists of Deputy Secretary Generals of the ministries, representatives of local governments, PLWHAs and representatives of the permanent working groups at the MSoA.

38
overdoses has decreased from 1,217 cases in 2005 to 854 in 2005 (Tallinn Emergency
Service, 2006). The NSPDD recognizes the prevention of drug-related deaths and
overdoses as an important strategic target, however, specific interventions aiming at the
prevention of drug-related deaths and overdoses were not implemented in 2005. Prevention
and treatment of drug-related infectious diseases have received more political and media
attention than ever before. Reduction of drug-related infectious diseases and STIs among
different risk groups and the general population has been identified as an important target of
the HANS and NSPDD 2012. The scope of interventions and specialized services (e.g.
syringe exchange, condom distribution, sexual education, methadone substitution treatment
etc) aiming to decrease drug-related infectious diseases among risk groups has increased.
ARV treatment is provided in specialized hospitals. At the end of the year 2005 the first
centre for drug addicts with other psychiatric diseases serving maximum 30 clients was
opened in Tallinn.
7.1 Prevention of drug-related deaths
The Targeted Action Plan of the NSPDD does not specify any specific intervention such as
provision of Naloxone to opioid dependent IDUs, provision of training for IDUs and other
drug user groups on prevention of drug related deaths, safer drug use, firs aid etc) aiming to
reduce drug-related deaths (Action Plan 2004-2008). The revised Action Plan for the Year
2005 does not provide any specific intervention aiming to reduce drug-related overdoses
and deaths (Action Plan of NSPDD 2005 and 2006). However, the Report to the GCDP
suggested integration of the prevention of drug-related deaths into the work of SEPs where
a dedicated staff is working with IDUs on daily basis (Talu et al. 2006). As we indicated in
our last report 2005 selected members of the staff of SEP (from the NGO Me aitame Sind
and NGO Convictus) received training in Finland on the reduction of drug-related overdoses
and they are interested in providing drug users with training on safe drug use. As first aid
training is also not very frequently provided in Estonia the NIHD developed a special website
http://www.narko.ee in 2006 aiming to provide information on drugs and harm associated
with drug use. The website gives information on the provision of first aid in case of an
overdose.

39
7.2 Prevention and treatment of drug related infec tious diseases.
• Vaccination
According to the HPI 16,553 persons were vaccinated for HBV in 2005, of which the majority
(N=14 499) was 14-year-olds, followed by adults (N=2023) and 15-19-year-olds (N=31)
(Kerbo 2006).
According to the data of the HPI the overall coverage of immunization for HBV in 2005 was
95%. The coverage of immunization for HBV varies by regions being the highest in Lääne-
Viru county (93.4%), followed by Tallinn and Harju country. During the reporting period the
coverage of immunization of 2-year-old children has improved, the share of those having
been vaccinated for HBV has increased from 46.3% in 2004 to 92.8% in 2005. In 2005 the
coverage of immunization of 14-year-old children was 92.8%.
As a result of the immunization programme the share of young adults of acute HBV cases
has decreased almost 5 times in the last 5 years (Kerbo et al. 2006).
• Syringe provision programmers
The interventions targeted at IDUs include syringe and needle exchange, counselling,
condom provision and delivery of substitution treatment with methadone.
A survey on estimating IDU prevalence using the capture-recapture (CRC) method shows
that there are 13,801 IDUs (Uusküla et al. 2005). This data combined with the data on
syringe provision shows that the SEPs provide 62.8 syringes per IDU per year, which is not
enough. There is a need to increase syringe provision approximately 6 times which means
that the number of syringes delivered annually should be increased to at least 5 million.
Provision of paraphenalia is not widely used; however, the level of sharing of paraphernalia
among IDUs is high. A survey on HIV prevalence among IDUs conducted in 2005 showed
that 27% of the IDUs participating in the survey had used „frontloading“, 42% of the
respondents had shared water, 26% had shared a spoon or a container, 12% had shared a
filter/or cotton (Uusküla et al. 2005). A significant proportion of IDUs sharing the injecting

40
equipment suggests that needle exchange services have to be integrated with the provision
of above mentioned injecting supplies.
24 SEPs (incl 14 field work sites) operated in Estonia as at the end of the year 2005 of which
17 were located in Ida-Viru county and 7 in Tallinn and Harju county and during the reporting
period a total of 867,630 syringes were distributed among IDUs and 525,954 syringes were
returned to the SEPs by IDUs (Trummal et al. 2006).
• HIV testing and counselling
In 2005 the NIHD funded the provision of counselling and voluntary testing for HIV within the
framework of NPHAP. All the above-mentioned services as well as free testing for syphilis
were delivered by 6 anonymous AIDS counselling cabinets of which 2 are located in Tallinn,
1 Tartu, Narva, Kohtla-Järve, Pärnu and Puru. Also, it is possible to make HIV tests in all
Youth Counselling Centres. During the reporting period these 6 anonymous cabinets
provided counselling for 6,380 persons and HIV testing for 5,952 persons of which
approximately 4% turned to be HIV positive. In 2005 the NIHD launched an information
campaign with the purpose of informing the general population about the testing possibilities
in anonymous AIDS counselling cabinets. In 2005 a total of 122,178 HIV tests were made, of
which about one-third accounted for blood donors (Trummal et al. 2006).
Health care services for people in detention institutions have been delivered since 2002
within the framework of the Action Plan for HIV/AIDS prevention in the institutions under the
governance of the Ministry of Justice. Access to voluntary HIV counselling and testing has
been granted for every person in a detention institution.
• Condom provision
According to the data of the GF Programme 2005 a total of 385,390 condoms were
distributed among the visitors of the SEPs of which the majority (N=301 415) were given to
IDUs from Ida-Viru county and 83,975 were distributed in Tallinn. During the reporting period
37,200 condoms and 39,679 lubricants were distributed among sex-workers. (Trummal et al.
2006). Also, provision of condoms for prisoners was organized by the medical department.
According to the data of the GFATM provision of condoms to the prison population has
improved, the number of condoms has increased 5.8 times – from 5,023 condoms in 2004 to

41
29,257 in 2005 (Trummal et al. 2006). During the year condom provision was organized
within the framework of different information campaigns and events such us the
Remembrance Day of AIDS Victims, the World AIDS Day and other events.
• Information materials, educational approaches
Estonian Sexual Health Association (ESHA) has been the leading organization in this field
providing courses on sexual education and delivering trainings on sexual education to
teachers in Estonia. In 2005 a book for teachers “Sexual Education for 2nd and 3rd School
Levels” was drafted and published. Also, the ESHA organized a training course on HIV/AIDS
for pupils of grades 5-12. The above mentioned trainings were supported by the GFATM
Programme. The AIDS Prevention Centre and the Anti-AIDS Association delivered trainings
on HIV/AIDS and STIs for students of vocational schools.
During the reporting year several information campaigns were organized such as a
campaign entitled “Notice the person, not the disease” aimed to increase tolerance towards
PLWHAs (Trummal et al. 2006). This campaign was funded by the NPHAP and the US
Embassy in Estonia. The campaign included development of outdoor posters and a TV clip.
In 2005 a new website http://www.terviseinfo.ee for the provision of health information was
established including information on HIV/AIDS, STIs, ARV, drug treatment etc. Information
materials for PLWHAs were distributed mainly through 150 support groups organized by 5
service providers – the NGO Convictus, AIDS Prevention Centre, Narva Rehabilitations
Centre for Drug Users and Alcoholics and ESPO Society.
Peer education is already a widely used method in Estonia aiming to increase the
awareness of HIVIAIDS. During the period of 2004 to September 2005 three NGOs – Living
for Tomorrow, Anti-Liew and Hingehooldus in cooperation with local development partners
were involved in training of new peer-educators.
• Interventions related to other health correlates an d consequences
In October 2005 the first centre treating clients with dual diagnoses was opened in the
Psychiatric Clinic in Tallinn. The establishment of the centre was funded from the HIV/AIDS

42
prevention programme implemented by the NIHD. At the end of the year the centre delivered
services for 33 drug addicts with addiction problems and psychiatric disorders.
During the period of 2004-2005 health care of PLWHAs was funded mainly by the GFATM.
The 3-component ARV treatment was financed by the same fund and provided in 4 clinics in
Estonia – West-Tallinn Central Hospital, Ida-Viru Central Hospital, Narva Hospital and Tartu
University Clinic. According to the data of the GFATM a total of 255 PLWHAs received ARV
treatment in 2005.
7.3 Interventions related to psychiatric co-morbidi ty
No new data available.
7.4 Interventions related to other health correlate s and consequences.
No new data available.
8. Social Correlates and Consequences
There are still a number of social problems in Estonia like an increasing number of homeless
people, high level of school drop out and families living in poverty. However, gradual
decrease in the unemployment rate since 2001 and the 20% decrease in total number of
drug offences registered by the police in 2005 when compared to 2004 can be considered
as positive trends in Estonia. Drug use in prison is still a major concern. According to the
findings of the prison survey 2005, 10-15% of prison inmates use drugs 1 to 2 times per
week and less than 10% use drugs 3-5 times a week (Kikas et al. 2005).
8.1 Social Exclusion
• Homelessness
The number of calls to emergency aid for homeless people has increased roughly fourfold
since 1999. It has remained quite stable in the last years: in 2005 there were 221 more calls
than in 2004, whereas the number of calls with a similar purpose within the period of 2003 to

43
2004 increased by 264. There were a total of 1,499 calls to emergency aid for homeless
people in 2005 compared to 353 calls in 1999.
According to the data of the Statistics Estonia 2,606 persons stayed in shelters and
rehabilitation centres in 2005 indicating no change when compared to the year 2004. The
main reason for using the services was release from prison (22%) (Statistical Yearbook of
Estonia 2006).
• Unemployment
There has been a gradual decrease in unemployment rate in Estonia since 2001. The
unemployment rate was at its peak in 2001 (13.6%) and dropped to 7.9% in 2005 (Statistical
Yearbook of Estonia 2006).
The difference in unemployment rate between regions has been threefold in the last couple
of years. In 2005 the unemployment rate was the lowest in Central Estonia (5.1%) and the
highest in North-Eastern Estonia (16.2%) (Statistical Yearbook of Estonia 2006).
As opposed to unemployment rate which fell in 2005, the long-term unemployment
increased – the share of long-term unemployed was 52% in 2004 and 53% of the total
number of unemployed in 2005.
As regards gender differences, the unemployment rate of men has been higher than that of
women since 1995. According to the Statistics Estonia 8.8% of men and 7.1% of women
were unemployed in 2005. In terms of unemployment in different age classes, the
unemployment rate was approximately two times higher among 15-24-years-olds (15.9%)
when compared to 25-49-years-olds (7.5%) and 2.7 times higher when compared to 50-74-
years-olds (5.8%) (Statistical Yearbook of Estonia 2006).
• School drop out
14% of young people left school before obtaining secondary or equivalent level of education
in 2005. The level of drop out has been high since 2000 (12%-14%). Dropping out has been
higher among young men than among young women. The proportion of early school leavers

44
not in education or training was 17.4% among males and 10.7% among females in 2005
(Statistical Yearbook of Estonia 2006).
• Financial problems
In 2005 the disposable income per household member was 3,476 kroons. The disposable
income per household member was the highest in households including a working-age
couple without children (42% higher than the average) and in households of single working-
age persons (36% higher than the average). The disposable income per household member
was the lowest in a household of an adult with at least two children (58% of the average of
Estonia). The differences in disposable income by type of household increased. The
disposable income per household member in urban areas was 3,647 kroons and in rural
areas 3,113 kroons indicating a difference of 534 kroons. The difference in disposable
income of a rural household member and an urban household member has increased three
percent since 1996 (Statistical Yearbook of Estonia 2006).
• Social network
In 2004 the number of both marriages and divorces increased. The rate of marriage and
divorce was 4.5 and 3.1, respectively; in 2003 the corresponding rates were 4.2 and 2.9. In
2004 the number of marriages increased approximately by 300 when compared to the year
2003 with 5,699 marriages and 6,009 divorces. 4,158 marriages were divorced in 2004
(Statistical Yearbook of Estonia 2006).
8.2 Drug related crime
The total number of drug offences registered by the police decreased from 6,968 in 2004 to
5,544 in 2005 (20% decrease) (Figure 4). Those figures included both criminal offences and
misdemeanours.5 Criminal offences accounted for 20% of all drug offences in 2005 (16% in
2004) (Table 8). Decrease in the total number of drug offences and simultaneously, increase
in the share of criminal offences reflects a shift in the priorities of the police and customs.
5 Criminal offences (crimes): drug possession with intent to supply, drug trafficking, etc. Misdemeanours: drug abuse or possession of a small amount for personal use.
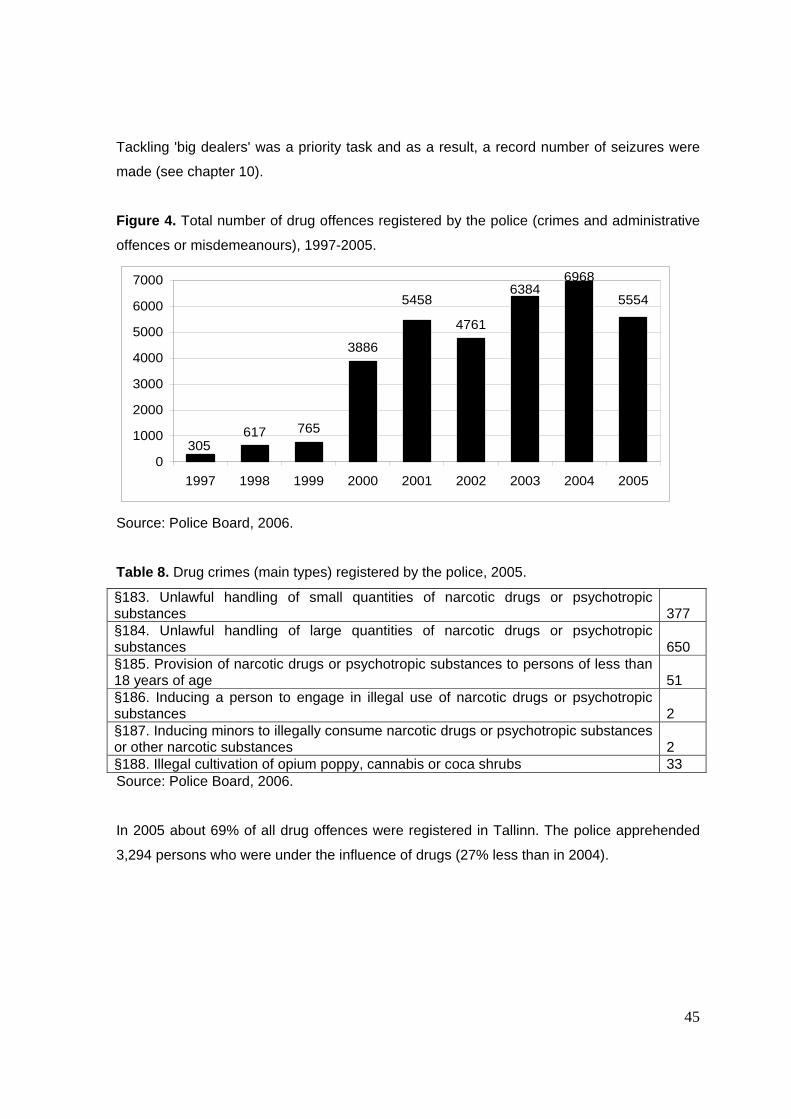
45
Tackling 'big dealers' was a priority task and as a result, a record number of seizures were
made (see chapter 10).
Figure 4. Total number of drug offences registered by the police (crimes and administrative
offences or misdemeanours), 1997-2005.
617 765
3886
4761
6968
305
555454586384
0
1000
2000
3000
4000
5000
6000
7000
1997 1998 1999 2000 2001 2002 2003 2004 2005
Source: Police Board, 2006.
Table 8. Drug crimes (main types) registered by the police, 2005.
§183. Unlawful handling of small quantities of narcotic drugs or psychotropic substances
377
§184. Unlawful handling of large quantities of narcotic drugs or psychotropic substances
650
§185. Provision of narcotic drugs or psychotropic substances to persons of less than 18 years of age
51
§186. Inducing a person to engage in illegal use of narcotic drugs or psychotropic substances
2
§187. Inducing minors to illegally consume narcotic drugs or psychotropic substances or other narcotic substances
2
§188. Illegal cultivation of opium poppy, cannabis or coca shrubs 33 Source: Police Board, 2006.
In 2005 about 69% of all drug offences were registered in Tallinn. The police apprehended
3,294 persons who were under the influence of drugs (27% less than in 2004).

46
• Other drug-related crimes
Drug abusers are committing a significant proportion of property crimes (especially thefts
from cars, shoplifting, pick-pocketing, robberies). According to the police statistics about 1/3
of cleared property crimes were committed by persons who had been charged for
committing a drug offence in the last four years.
There are no reliable data on offences committed under the influence of illicit drugs
(including driving offences – see chapter 2.3).
About 80% of convicted persons who have committed a drug offence in recent years have
continued committing drug offences or other offences (property crimes, violations of public
order etc) after serving the sentence. Over 50% of drug offenders have committed their first
drug offence at the age of 18-24 years (Police Board 2005).
8.3 Drug Use in Prison
The Ministry of Justice carried out a survey Drugs in Prison (Kikas et al. 2006) covering
mainly the year 2005. The purpose of the survey was to identify the attitude and knowledge
of prisoners and prison officers about narcotic substances; map drug use problems to plan
long-term activities in the field of prevention of drug use in prisons, make suggestions for the
development of appropriate rehabilitation programmes.
The target group of the survey was adult male detainees from the colony-type male prison
having experienced problems and/or health risks caused by drug use and related risk
behaviour. Murru Prison is the biggest colony-type prison in Estonia where 50% of all
convicted prisoners are serving their sentences.
In addition to prison inmates the respondents were selected from institutions closely related
to the target group and responsible for the provision of relevant information, such as non-
profit associations, prison officers and the police. Rapid Assessment and Response
methodology was used in the survey to explore these issues. In addition to the analysis of
secondary data new information was obtained by semi-structured and structured interviews
47
provided by focus groups. Data for the survey carried out in different stages were gathered
from a total of 95 respondents.
The findings of the survey indicate that both prisoners and staff members were uncertain
about the proportion of prisoners not using substances. According to the respondents the
share of prisoners not using drugs was 1 to 80%, according to the majority of respondents it
was 15-50%. All participants in the focus group were asked to find consensus on the
proportion of the prisoners not using substances. After a long discussion in the focus group
the staff members agreed on 60% of prisoners not using substances. The prisoners settled
on 25%.
According to the opinion of both the inmates and the prison staff the proportion of frequent
drug users (1 to 2 times per week) was 10-15%, while less than 10% was considered to use
drugs 3-5 times per week. The opinion of the prison staff and prison inmates of the
proportion of everyday drug users amongst the prison population varied a great deal. The
majority of the interviewed respondents believed that the proportion of everyday drug users
was less than 5%, whereas in focus groups the inmates settled on 6% and the prison staff
on 2%.
In terms of the age of the inmates using drugs, the number of drug users was the highest in
the age class 22-30, followed by age classes 18–21, 31– 40; the number of drug users was
the smallest among inmates over 40.
Thus, almost 40% of the drug using inmates in Murru prison belonged to the age class 22-
29, roughly a quarter to the age class 30-39, approximately 20% to the age class of 40 and
over and about one tenth of the drug users to the age class 18-21.
Almost all respondents agreed that less than 10% of the inmates using drugs had started to
use drugs in prison, while half of the respondents estimated the share to be less than 5%.
“Group pressure” and “lack of activities” were two major factors which might have played a
role in starting substance use in prison (first time use). “Curiosity” and “desire to escape
reality” were considered important only by the prison officers. Other factors considered
relevant by prison inmates in terms of initiation and continuation of drug use were “tension”,
48
“stress”, “need for social recognition and identity”, “desire to escape reality” and “group
pressure”.
According to the findings of the survey the most widely used drugs in prison were products
made from cannabis and amphetamines, followed by heroin and fentanyl. A few
respondents mentioned cocaine but added that it had been used rarely.
Cannabis products were most readily available in prison during the last 12 months, followed
by amphetamines and China White (fentanyl). Other substances were available only
occasionally.
According to the opinion of the respondents the main routes of administration of cannabis
and amphetamines were smoking and injecting, respectively. However, some respondents
said that amphetamines had mostly been swallowed or sniffed. All respondents shared the
view that heroin and fentanyl had mostly been injected.
8.4 Social Costs
No data available.
9. Responses to Social Correlates and Consequences
There are no new data available on social reintegration programmes for drug users.
In 2005 the Police Board allocated a total of EUR 76,694 for drug-related crime prevention to
carry out 68 crime prevention projects of which 36 projects carried out by the police
prefectures were partly or fully aiming at the prevention of drug misuse. Also, the Central
Law Enforcement Police carried out a project to meet similar objectives. The Police Board
allocated over EUR 42, 616 for the implementation of drug misuse prevention projects. The
majority of the projects defined the youth as the target group. There is no new data available
on social reintegration programmes for drug users.
The Ministry of Justice supported the implementation of 16 crime-related prevention projects
allocating EUR 83,356. Drug-related crime prevention was not the only focus of these
projects; this objective had been specified alongside with other objectives of the projects

49
financed by the Ministry of Justice in 2005. In terms of funding priorities the projects aiming
at changing the patterns of behaviour of the youth prone to committing offences, truancy or
using narcotic substances were preferred over the crime prevention projects.
10. Drug Markets
In 2005 synthetic ATS and ecstasy type drugs continued to be the most common drugs in
terms of the number of seizures, followed by cannabis and opiates. Fentanyls were the
opiates contributing to the biggest number of seizures in 2005. The importance of heroine on
local illicit drug market has substantially decreased. The quantity of seized cocaine has
increased when compared to 2004. The big quantity of cocaine (43.07kg) is the result of one
major seizure. The quantity of cocaine of the rest of 71 seizures was marginal. The number
of seizures and seized quantities of GHB has increased when compared to the last year. A
new psychoactive substance – mCPP 1-(3-chlorophenyl)piperazine was seized three times
in Estonia (5 tablets, designed to look like ecstasy and powder). These tablets are off-white
with multicoloured spots. In Estonia 1-(3-chlorophenyl)piperazine has not been tested
according to the terms of the 1961 or 1971 UN Conventions.
In 2005, drug trafficking through and from Estonia followed the patterns similar to the last
few years (see sub-chapter 10.2. Availability and Supply). Most recent development is
increase in the smuggling of cocaine from Central America to Estonian markets.
According to the data of the police the street prices of illegal substances increased and the
purity of most seized drugs decreased in 2005 when compared to 2004.
10.1 Availability and supply
In 2005 four clandestine laboratories were discovered by the police:
• one in Viimsi (Harju county) for illicit manufacturing of GHB (gammahydroxybutyrate).
11.44kg of GHB, 887g of GBL (a precursor) and 9.1kg of sodium hydroxide were
seized;
• one in Viimsi (Harju county) for illicit manufacturing of amphetamine. MDMA –
amphetamine (263g of 48-79%, 168 g of 0.34%, 434g liquid with amphetamine
50
traces), MDMA (15g of 40%), 7kg of phenylaceton (precursor), 17.8kg of formamide
and other reactives were found;
• one in Rapla county for illicit manufacturing of MDMA – reactor (400 l) and traces of
MDMA were found (A clandestine laboratory for making tablets of this product was
found in Pärnu county in 2004);
• one in Maardu (Harju county) for manufacturing methamphetamine as well as other
drugs. 17.43g of 90% methamphetamine, traces of amphetamine and 2C-B (Nexus),
precursors (for example safrole, phenylaceton, potassium permanganate, sulphuric
acid, hydrochloric acid, toluene, acetone, ethyl ether, traces of piperonal, isosafrole,
PMK) and various other chemicals were found.
In 2005 the police registered 26 cases of illicit cultivation of cannabis (of which 7 included at
least 6 plants). 351 cannabis plants were seized from the biggest plantation. The production
was targeted at local markets.
In the reporting period the customs and police seized 11 Psilocybe mushrooms or their
spores or myceliums and a mail delivery of mescaline-containing cactus.
Regarding the production, sources of supply and trafficking patterns within the country as
well as from and towards other countries it can be stated that in 2005 drug trafficking
through and from Estonia followed a pattern similar to the last few years. Increasing
smuggling of various types of drugs to Russia has been observed as a recent trend.
Synthetic drugs were smuggled from and through Estonia most actively. The majority of
synthetic drugs produced in Estonia was targeted at the Nordic countries, however, the
importance of Russian markets has increased. Hashish was smuggled mainly through
Germany and its 're-export' through Estonia to Russia has increased.
Widespread use of fentanyles (including methylfentanyl) as an alternative to heroin is
specific for Estonia. Fentanyles are smuggled from Russia. The importance of heroine on
local markets has substantially decreased and smuggled drugs are predominantly targeted
at Nordic countries.
51
Most recent development is increase in the scope of smuggling of cocaine from Central
America to Estonian markets (increasing purchasing power of consumers due to rapid
economic growth is a contributing factor). Also, cocaine smugglers of Estonian origin have
been active on international markets.
According to the Central Criminal Police the main routes of illicit trafficking of drugs through
or from Estonia in 2005 were the following:
• amphetamines from Estonia (local production) or from other countries (Lithuania, the
Netherlands) via Estonia to the Nordic countries and Russia;
• ecstasy from the Netherlands and Belgium via Estonia to Finland and Russia, or from
Estonia (local production) to the same countries;
• hashish from Spain via Germany and Estonia to Finland and Russia;
• cocaine from Central America via Estonia to Russia and Finland.
• heroin from Afghanistan, Tajikistan and Uzbekistan via Russia and Estonia to the
Nordic countries.
10.2 Seizures
The Estonian Forensic Service Centre being responsible for the identification of narcotic
drugs and psychotropic substances, made a total of 1,160 drug analyses in 2005 compared
to 1,139 analyses in 2004 (Figure 5).

52
Figure 5. Total number of analysis of drugs in 2000-2005.
9831020
1060
11601139
943
0
200
400
600
800
1000
1200
2000 2001 2002 2003 2004 2005
Number of drug cases
Source: Estonian Forensic Service Centre, 2006.
About 91% of these analysis were ordered by the Police and ca 9% by the Customs Board.
The Police ordered the analysis of all the drugs seized in prisons (125 analysis, ca 11%)
(Figure 6) – the total number of analysis of drugs ordered by different authorities).
The analysis of drugs ordered by Põhja Police Prefecture accounted for the biggest share of
the total number of analysis – 64.5% (749 analysis), the analysis made for Ida Police
Prefecture accounted for 12% (139 analysis), the analysis for Lõuna Police Prefecture for
6.6% (76 analysis), the analysis for Lääne Police for 3.5% (41 analysis) and the analysis
ordered by Central Criminal Police for 4.2% (49 analysis) of the total number of analysis.

53
Figure 6. Number of analysis of narcotic drugs ordered by different authorities in 2000-2005.
0
200
400
600
800
1000
1200
2000 2001 2002 2003 2004 2005
year
num
ber o
f cas
es
Police Police/prisons Prisons Customs Others
Source: Estonian Forensic Service Centre, 2006.
In 2005 amphetamine and ecstasy type of stimulants accounted for the biggest number of
substances submitted for the analysis in the Forensic Service Centre – stimulants were
analysed 6566 times – amphetamine type stimulants were analysed 473 times and ecstasy
type stimulants (MDMA, MDEA, 2C-B, MDA) 183 times (Figure 7).
6 Number of occurrence does not include traces of the substance.

54
Figure 7. Number of analyses of some type of narcotic drugs in 2000-2005.
0 100 200 300 400 500
Cannabis
ATS
Ecstasy type
GHB
Cocaine
Heroin
Fentanyles
2005
2004
2003
2002
2001
2000
Source: Estonian Forensic Service Centre, 2006.
Total of 13.5kg of amphetamine and methamphetamine (about four times less than in 2004
– 53.8kg) and 3.2kg of ecstasy type substances were seized (about two times less than in
2004 – 6.7kg). Seized ecstasy type tablets were mainly MDMA, the biggest quantity was
4,228 tablets.
5787 seizures involving cannabis and products made from cannabis were registered - 26
seizures of 698 cannabis plants, 290 seizures of marihuana and 162 seizures of hashish. A
total of 101,9kg of cannabis was seized (95,1kg in 2004). The biggest quantity of hashish
seized at a time was about 34.5kg. The maximum content of THC in cannabis plants,
marihuana and hashish was 11%, 16.6% and 8%, respectively.
With respect to opiates – heroin, poppy and poppy straw products, methylfentanyl,
methadone, buprenorphine and morphine – a total of 277 seizures of these drugs were
made in 2005. Unlike within the period of 2003-2004, in 2005 methylfentanyl accounted for
the majority of seizures of opiates – 105 times (164 times in 2004); mixed with fentanyl – 97 7 Number of occurrence does not include traces of the substance.

55
times (no such case in 2004). Heroin was seized 48 times (6 times in 2004) and heroin with
fentanyls 18 times (33 times in 2004). Opium poppies were seized 24 times a total of 34.4kg.
In 2005 a considerable quantity of cocaine was seized when compared to 2004 - 43.43kg.
Such big quantity (43.07kg) is the result of one major seizure. As little as 0.36kg of cocaine
was seized in the course of other 71 seizures.
The popularity of GHB has increased – the number of seizures (33 compared to 17 in 2004)
and seized amounts (33.06kg compared to 8.12kg in 2004) increased in comparison with the
previous year. The biggest quantity of GHB – 11.44kg was seized in an illegal lab
manufacturing GHB.
The biggest seizures of some types of drugs in 2005 were the following: amphetamines
1.92kg, MDMA (ecstasy) tablets – 4,228 tablets, cannabis plants – 13.95kg, hashish –
34.50kg, cocaine – 43.07kg, heroin – 0.16kg, poppy plants and poppy straw – 17.670kg,
methylfentanyle – 0.76kg, GHB – 11.44kg.
10.3 Price/Purity
According to the data of the police the street level prices of illegal substances increased in
2005 when compared to 2004 (Figure 8). The price of cannabis resin was EUR 11.1 varying
from EUR 6.3 to EUR 15.9 and the price of cannabis herb EUR 9.5, varying from EUR 3.1 to
EUR 15.9. The price of cocaine ranged from EUR 51.1 to EUR 95.8. The cocaine price was
EUR 73.4 showing an increase of 9 euros when compared to 2004. The minimum and
maximum prices for amphetamines powder were EUR 3.1 and EUR 15.9. The average price
of amphetamines powder has risen slightly since 2004, from 6.3 euros to 9.5 euros. The
street level price of Ecstasy type substances was comparable with the price of
amphetamines powder (EUR 9.5). Its minimum and maximum values were EUR 3.1 and
EUR 15.9, respectively. In 2004 and 2005 there is no data available on LSD.

56
Figure 8. Street prices of illegal substances in Euros in 2001-2005.
0 20 40 60 80 100 120 140
Cannabis resin (pergram)
Cannabis herb (pergram)
Heroin white (pergram)
Cocaine (per gram)
Amphetaminespowder (per gram)
Ecstasy (per tablet)
LSD
2005
2004
2003
2002
2001
Source: Police Board, 2006.
From 2002 to 2004 the purity at street level of white heroin, cocaine and amphetamines
increased steadily, however, the data on 2005 indicate a significant decrease in terms of
purity (Figure 9). Street level average percentage purity of white heroin and amphetamines
was 31% and that of cocaine 32%. Street level minimum and maximum percentage purity of
white heroin was 1.7% and 94%, cocaine 8.2% and 99% and amphetamines 6.3% and 96%,
respectively. The average percentage purity of cannabis resin was slightly higher (5%) than
of herbal cannabis (0.35%); in case of cannabis resin it varied from 0.62% to 8.2% and in
case of herbal cannabis from 0.03% to 16.6%.
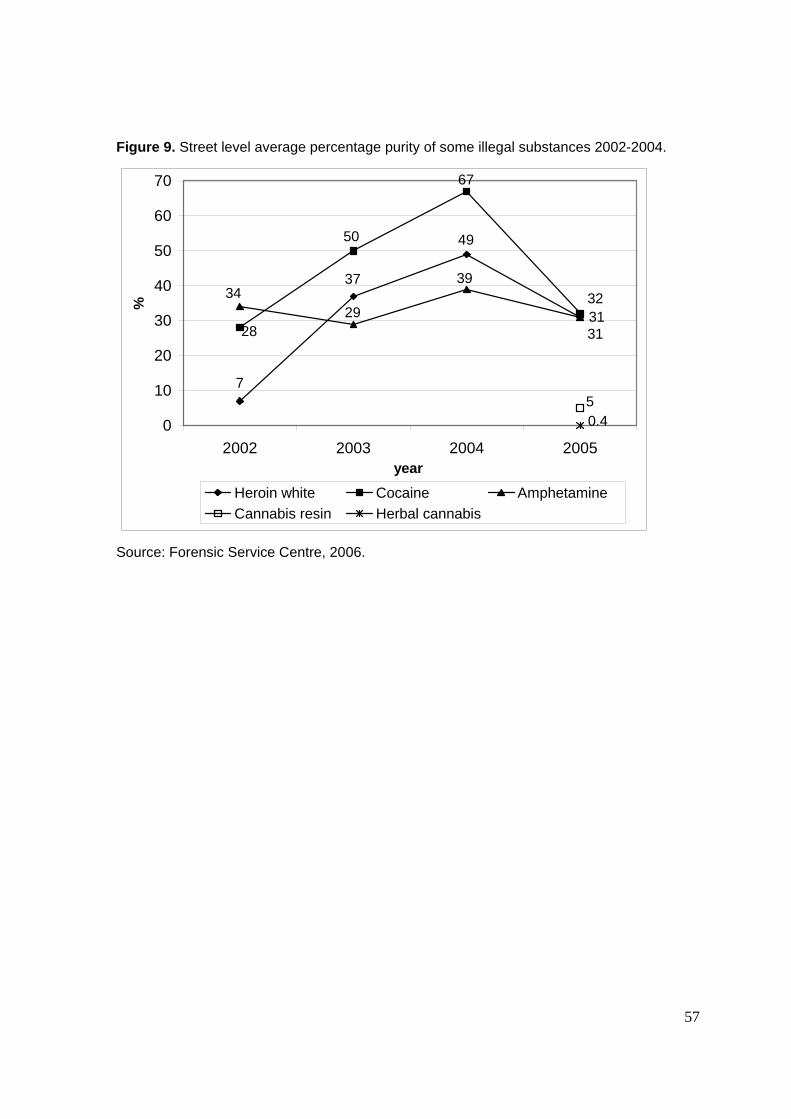
57
Figure 9. Street level average percentage purity of some illegal substances 2002-2004.
31
7
49
37
28
50
67
32
31
29
3934
50.40
10
20
30
40
50
60
70
2002 2003 2004 2005year
%
Heroin white Cocaine AmphetamineCannabis resin Herbal cannabis
Source: Forensic Service Centre, 2006.

58
Part B – Selected Issues
11. Drug Use and Related Problems among Very Young People
11.1 Drug use and problematic drug use among very y oung people (<15 years old)
(from specific studies)
The survey on HIV/AIDS related knowledge, attitudes and behaviour among Estonian youth
carried out in 2005 by the National Institute for Health Development within the framework of
the International GFATM provided some new information on the prevalence and patterns of
drug use among the youth. The findings were compared to an earlier study conducted in
2003. The survey was carried out from March to June 2005 among the 10-29 year old
Estonian inhabitants, comprising the population of the study. The sample of the 10-18-year-
olds was formed from schoolchildren of grades 4 to 12 (the sample size was 5,929, i.e 4.1%
of the population); the sample of 19-29-year-olds was formed of the young people in the
Population Register (the sample size was 7,302 i.e 3.4% of the population of the study).
Estonia was divided into 3 regions – Harjumaa, Ida-Virumaa and the rest of Estonia. The
age-based analysis was made according to 3 broad or 5 more detailed age classes: 10-13,
14-15, 16-18, 19-24 and 25-29 (Lõhmus et al. 2005).
In relation to drug use, the respondents were asked about drug use in general and about the
lifetime and the last 4-week prevalence of drug use prior to the involvement in the survey.
The findings of both surveys, 2003 and 2005 show that about 2% of the school-going young
people of the age class 10-13 had used drugs in their lifetime or repeatedly. The majority of
them had used drugs only once. 85.6% of the respondents of the age class 14-15 had never
used drugs, 7.8% had used drugs once and 6.6% reported the repeated use of drugs
(Lõhmus et al. 2005).
Overall, the quantity of drugs circulating among children has increased and the likelihood of
getting access to drugs has grown. The proportion of 10-13-year-olds who had been offered
drugs in the last 4 weeks had slightly grown being less than 1% in 2003 and slightly over 2%
in 2005, whereas with regard to the older age class of the respondents the increase was
more significant, 5.2% and 11.5%, respectively. The share of 10-13-year-old respondents
59
who had reported lifetime prevalence of injecting drug use decreased in 2005 when
compared to 2003, being 6% and 4%, respectively. In both surveys, 2003 and 2005, 7% of
the respondents of the age class 10-13 claimed to have experience in other ways of
administration of drugs, whereas among the 14-15-year-old respondents the indicator was
36.2% and 43% in 2003 and 2005, respectively (Lõhmus et al. 2005).
There appeared to be a statistically significant association between the use of drugs and
having acquaintances using drugs, as well as between the drug use and the frequency of
having been offered drugs in the last month. The average age of the young people having
tested drugs for the first time has decreased to some extent. In 2003 the average age of
young people of the age class 14-15 having used drugs for the first time was 13.1 years
(excl. injecting), whereas in 2005 it was 13.5 years (Lõhmus et al. 2005).
With regard to gender differences, the findings of both, the 2003 and 2005 survey showed
that there were less girls than boys among those respondents who had tested or used
drugs. With respect to the age class 14-15, there were 6% more boys than girls having had
contacts with drugs. Regarding regional differences, the proportion of 14-15-year-olds
having used drugs at least once in their lifetime was the highest in Harjumaa (19.4%),
followed by the rest of Estonia (11.9%) and Ida-Virumaa (11.8%) (Lõhmus et al. 2005).
The study indicated strong statistical correlation between drug use and smoking whereas the
correlation between drug use on the one hand and alcohol use, being drunk and going to
pubs on the other hand was statistically not significant. With respect to certain related social
aspects, such as family background and the pattern of smoking and alcohol drinking, the
study showed that approximately 3/4 of the 10-13-year-old respondents and 2/3 of the 14-
15-year-old respondents were living together with both parents (Lõhmus et al. 2005).
The study showed that 1/3 of the respondents of the age class 10-13 and 2/3 of the
respondents of the age class 14-15 had smoked a cigarette at least once in a lifetime.
Likewise, the percentage of daily smokers increased with the age: 93% of the 10-13-year-old
respondents had never smoked in the last month, compared to 69% of the 14 -15 year-old
respondents. Furthermore, about 1% of the 10-13-year-old respondents and 14% of the
older respondents smoked every day (Lõhmus et al. 2005).

60
58% of the 10-13-year-old respondents and the majority of the respondents of the older age
class reported lifetime prevalence of drinking alcohol. 14% of the 10-13-year-olds and half of
the 14-15-year-olds had drunk alcohol in the last 4 weeks; 1/3 of the respondents of the
oldest age class and 5% of the respondents of the youngest age class reported having been
drunk (Lõhmus et al. 2005).
The frequency of alcohol use has decreased to a certain extent in the age class of 10-13-
years when comparing the findings of the surveys 2003 and 2005, however, the frequency
and intensity of alcohol use in the other age class has increased (Lõhmus et al. 2005).
11.2 Policy and legal developments
As for regulatory measures aiming at prohibiting the provision and inducement of narcotic
substances to minors, section 185 of the Penal Code (RT1 I 2001, 61, 364; consolidated text
RT I 2002, 86, 504) which entered into force on 1 September 2002 specifies that an adult
person who illegally provides narcotic drugs or psychotropic substances to a person of less
than 18 years of age (a minor) shall be punished. Equally important, Section 187 of the
same Act provides that an adult person who induces a minor to illegally consume narcotic
drugs or psychotropic substances or other narcotic substances shall be punished.
With respect to specific regulations regarding the age restrictions in terms of purchasing of
tobacco, section 27 of the Tobacco Act (RT2 I 2005, 29, 210), which entered into force 5
June 2005 provides that a minor shall not smoke or consume smokeless tobacco products.
Section 28 of the same Act provides measures to enforce prohibition applied with regard to
minors. The Act provides that minors shall not acquire or possess tobacco products. Also,
the Tobacco Act prohibits selling of tobacco products to minors. In order to observe the
prohibition, a seller may demand identification from the buyer and refuse to sell tobacco
products if the buyer fails to present such identification. Also, adults are prohibited from
buying tobacco products for, offering tobacco products to and handing tobacco products
over to minors. It is prohibited to offer for sale or sell to minors products the shape of which
is similar to tobacco products. Minors shall not be employed for work related to the handling
of tobacco products.

61
Alcohol Act (RT1 I 2002, 3, 7), which entered into force 1 September 2002 prescribes the
prohibition on consumption of alcoholic beverages for minors. In order to observe the above
mentioned prohibition Section 47 of the Alcohol Act provides the following measures:
• Minors shall not obtain alcoholic beverages.
• It is prohibited to transfer alcoholic beverages to minors. In order to observe the
above-mentioned prohibition, a seller may demand identification from the buyer
and refuse to sell alcoholic beverages if the buyer fails to present such
identification.
• Minors shall not be employed for work related to the handling of alcohol.
• Adults are prohibited from buying alcoholic beverages for, offering alcoholic
beverages to and handing alcoholic beverages over to minors.
• A seller shall not knowingly serve any person who buys alcoholic beverages for the
purpose of offering or handing the alcoholic beverages over to minors.
• Providers of delivery services of alcoholic beverages are prohibited from handing
alcoholic beverages over to a minor. In order to observe the above-mentioned
prohibition, an employee of the service provider may demand identification from the
person who ordered alcoholic beverages and refuse to hand alcoholic beverages
over if the person who ordered alcoholic beverages fails to present such
identification.
• Minors do not have the right to send or receive alcoholic beverages in postal
consignments.
12. Cocaine and Crack – Situation and Responses
12.1 Prevalence, patterns and trends of cocaine and crack use
• Cocaine use among the general population
The data available on the prevalence of cocaine use among the Estonian population are
limited and outdated. Overall, according to expert estimations the prevalence of cocaine
powder and crack cocaine has remained on a low level.

62
The last national population survey providing information on the use of different drugs was
carried out in 20038. The Population Survey 2003 covered the Estonian population aged 15-
69. The data were collected via mailed questionnaire. The sample size of the survey was
3,982 respondents. The sample of the survey was based on the population registry; random
sampling procedure was used. The study covered different areas of life of the respondents
(work, family life, leisure, health, drugs) (Hansson 2004).
According to the Population Survey (2003) the last 12 months prevalence of cocaine use
(total including crack) was 0.6%, being higher among male respondents than female
respondents with 1.2% and 0.1%, respectively. According to the findings of the survey the
last 30 days prevalence of cocaine use was 0%. Among the youngest age group, 15-24-
year-olds, the last 12 months prevalence of cocaine use (including crack cocaine) was three
times higher in comparison with the whole survey population (1.8%). Again, the prevalence
of cocaine use among male exceeded that of female with 3.1% and 0.6%, respectively
(Hansson 2004).
As regards the use of other types of psychoactive substances, the last 12 months
prevalence of sedatives and/or tranquillizers was 20.4% (M: 12.9% and F: 26.2%), followed
by the prevalence of cannabis use (Total: 4.6%, M: 7.5%, F. 0.3%), ecstasy (T: 1.7%, M:
2.8%, F: 0.7%), amphetamines (T: 1.3%, M: 2.2%, F: 0.5%), LSD (T: 0.3%, M: 0.7%, F: 0%)
and heroin (0%) (Hansson 2004).
The latest all-national data on the prevalence of cocaine powder and crack cocaine use
among the youth originate from 2003 when the ESPAD survey was conducted (Hibell et al.
2004). The study covered the whole Estonian population involving the youth aged 15-16
from the 8th and the 9th grades of basic schools and from the 9th and the 10th grades of
secondary schools. The sample size of the survey was 2,463 (M: 1,246 and F: 1,217) and
the required method was random sampling (separate lists of Estonian and non-Estonian
schools).
The ESPAD 2003 indicated that the last 30 days prevalence of the use of cocaine powder
was 0.3% with regard to the total survey population, male accounted for 0.4% and female
respondents to 0.2% of the respondents. Regarding the total survey population the last 30
8 Source: EMCDDA standard table 01, 2004.

63
days prevalence of crack cocaine was 0.2% (male contributing to 0.5% of the respondents;
no data available on females). Last 12 months prevalence of cocaine powder was 0.3%
regarding the total survey population appearing to be higher among female (0.4%) than
among male respondents (0.2%). Similar age difference became also evident in case of the
last 12 months prevalence of the use of crack cocaine: females showed 0.7% prevalence,
whereas the prevalence of males was 0.5% (the corresponding figure for the total survey
population was 0.6%) (Hibell et al. 2004).
According to a survey carried out in 2005 among commercial sex workers (CSWs) using
health care services, the number of first time clients who had used cocaine was small. Only
a few sex-workers had used cocaine whereas the most widely used drugs were
amphetamines and cannabis. However, the number of respondents in the survey was small
(Trummal et al. 2005).
The findings of a survey on the prevalence and patterns of drug use among male prisoners
indicated that cocaine use was rare in prisons. The most frequently used drugs in prison
appeared to be cannabis products and amphetamines followed by heroin and fentanyl
(Kikas et al. 2006).
It is not possible to provide data on cocaine use among other specific groups because such
surveys have not been carried out. It is evident that more attention has to be paid to cocaine
use and the related problems as cocaine use has increased among the general population
and schoolchildren aged 15-16.
12.2 Problems related to cocaine use
Data on problems related to cocaine (e.g. drug treatment demand) use are not available.
However, data on seizures show that the quantity of seized cocaine has increased when
compared to 2004 (see point 3 of chapter 10 Seizures). Data of the General Mortality
Registry show that 2 cases of death caused by the use of cocaine were reported during the
period of 2004-5 (see Chapter 6). Cocaine-related death cases are underreported.
64
12.3 Responses and interventions to cocaine use
It is not possible to give an overview of cocaine treatment as data on drug treatment are not
available. However, problems related to cocaine use are not predominant. In 2006 the NIHD
funded the establishment of a website (http://narko.ee) to provide information on drugs and
the consequences of drug use for young people. This website provides information on all
types of drugs (e.g cocaine) and the likely harm.
For various reasons no specific policy has been developed to target cocaine use. Mostly
because the prevalence of cocaine use is low. According to the NSPDD the enforcement of
legal acts is targeted at the reduction of the supply of all illicit drugs. It is difficult to point out
any specific law enforcement activity in response to cocaine use. Increase in the number of
seizures and the quantity of seized cocaine shows that the police have been working
efficiently. In 2005 a big quantity of cocaine (43.43kg) was confiscated as a result of
effective co-operation between the Estonian police and its foreign partners (See section 3 of
Chapter 10 Seizures).
12.4 Cocaine-related crime and cocaine markets
There is no substance-specific data on cocaine-related crime.
13. Drugs and Driving
Statistics on traffic offences committed under the influence of illicit drugs are not fully
representative, as drivers with signs of impairment are usually tested for alcohol, and for
illicit drugs they are tested in case of suspicion only. Also, if a driver has given a positive
result for alcohol test (a breath or blood test), other substances are tested in exceptional
cases only – therefore there is almost no information available on possible use of both
alcohol and illicit drugs.
In 2005, the police detected 124 drivers who were under the influence of illicit drugs
(altogether, 15,900 intoxicated drivers were detected, the majority of them was under the
influence of alcohol). The police data indicate that 1-2% of drivers on average are driving
under the influence of alcohol. Although the data on the use of illicit drugs are not

65
comprehensive, it can be assumed that the percentage of drivers under the influence of illicit
drugs is relatively insignificant in comparison to alcohol-intoxicated drivers.
Drivers having caused an accident under the influence of illicit drugs contributed to 4% of all
drivers (12 of 323 cases where the drivers' intoxication level and the used substance was
known). In addition, traces of the use of illicit drugs were found in four cases (1%). The
figures may not reflect the actual situation as not all drivers involved in accidents were tested
for illicit drugs.
According to the Estonian Bureau of Forensic Medicine only one of all fatally injured drivers
(66) in 2005 had used illicit drugs (amphetamine) before the accident. At the same time, 28
drivers killed in the accident were tested positive for alcohol.

66
Part C
14. Bibliography
• References
Abel, K., Talu, A., Neuman, A., Ahven, A., Denissov, G., Laastik, L. (2005). Estonia. Drug
Situation. New Developments, Trends and In-depth Information on Selected Issues. TAI,
Tallinn.
Abel, K. (2006). HIV-positiivsete riskikäitumine süstivate narkomaanide hulgas. Tartu Ülikool,
Tartu.
Alcohol Act (RT1 I 2002, 3, 7). [online] Available:
http://www.legaltext.ee/text/en/X40060K3.htm. [accessed] 28.09.2005.
Allaste, A-A. (2005). Uimastid tulid Eesti ühiskonda 1990-ndatel koos klubikultuuriga [Drugs
reached Estonia in the 1990s together with club culture]. Eesti Päevaleht 16.06.2005.
Ansip, A. (2005). Peaminister vastas arupärimisele HIV/AIDSi leviku kohta Eestis. [The
Prime Minister answered an interpellation about the spreading of HIV/AIDS in Estonia].
Stenogramm. [online]. Available: http://www.riigikogu.ee/index.php?id=33046; [accessed]
07.02.2005.
Communicable Diseases Prevention and Control Act. (RT I 2003, 26, 160). [online]
Available: https://www.riigiteataja.ee/ert/act.jsp?id=1040625 [accessed] 03.08.2006.
Eesti Päevaleht. A sniffer dog – a part of everyday school- life. (2005a). Eesti Päevaleht
04.02.2005.
Eesti Päevaleht. People in Pirita are afraid of drug addicts. (2005b). Eesti Päevaleht
07.04.2005.
Eesti päevleht. Social policy of a company. (2005c). Eesti Päevaleht 27.08.2005.
67
Eesti Päevaleht. No1 cause of death. (2005d). Eesti Päevaleht 23.09.2005.
Eesti Päevaleht. - Schoolchildren for the prevenion of drugs. (2005e). Eesti Päevaleht
01.12.2005.
Eesti riiklik HIV ja AIDSi strateegia aastateks 2006 – 2015. [online] Available:
http://www.sm.ee/est/HtmlPages/HIVjaAIDSistrateegia_01_12_2005/$file/HIV%20ja%20AID
Si%20strateegia%2001.12.2005..doc. [accessed] 15.10.2005.
Eesti statistika aastaraamat. (2006). [Statistical Yearbook of Estonia]. Statistikaamet, Tallinn.
Hansson, L. (2004). Valikud ja võimalused. Argielu Eestis aastatel 1993-2003. TPÜ
Kirjastus, Tallinn.
Hibell, B., Andersson, B., Bjarnasson, T., Ahlström, S., Balakireva, O., Kokkevi, A., et al.
(2004) The ESPAD Report 2003. Alcohol and other drug use among students in 35
European Countries. Modintryckoffset AB, Sweden.
Kaalep, T. (2005) Ameerika haip. [An American hype]. Eesti Ekspress 15.12.2005.
Kagge, R. (2005). Kaljuvee: I wanted to test myself as I had no prior prison experience.
Postimees 17.12.2005.
Kerbo, N., Epštein, J., Dontšenko, I. (2005) Nakkushaiguste esinemine ja
immuunprofülaktika Eestis 2005. aastal. Tervisekaitseinspektsioon.
Kikas, K., Pendin, K., Murašin, M., Braam, R., Trautmann, F. (2006). Drugs in Prison.
Ministry of Justice. Tallinn.
Koch, T and Ammas, A. (2004). Moral in favour of abortion. Eesti Päevaleht 14.05.2004.
Lagerspetz, M. (2005) The painful formation and development of Estonian drug policy. In;
Drugs and drug users in Estonian Society, Allaste, A-A., Lagerspetz, M. and Kurbatova, A.
(ed), pp. 95-116. Tallinn.

68
Lang, R. (2005). Justiitsministri ettekanne, Kriminaalpoliitika arengusuunad aastani 2010"
elluviimise kohta [Presentation of the Minister of Justice about ciminal policy trends until
2010]. Stenogramme Minutes of Riigikogu. [online]. Available:
http://web.riigikogu.ee/ems/stenograms/2005/11/m05112209.html [accessed] 22.11.2005.
Lõhmus, L., Trummal, A. (2005). The study on HIV/AIDS related knowledge, attitudes and
behaviour among Estonian youth in 2005. Institute for Health Development. Tallinn.
Minutes of Riigikogu. (2005). V Session, 07.02.2005 B. [online]. Available
http://web.riigikogu.ee/ems/stenograms/2005/02/m05020704.html [accessed] 16.08.2006.
National Strategy on the Prevention of Drug Dependency 2004-2012. Available:
http://eusk.tai.ee/?id=547.
NDPSA and Associated Acts. (RT I 1997, 52, 834). [online] Available
http://www.legaltext.ee/text/en/X1049K3.htm [accessed] 02.09.2006.
NDPSA and Associated Acts Amendment Act. (RTI, 10.05.2005, 24, 180). [online] Available
https://www.riigiteataja.ee/ert/act.jsp?id=895473 [accessed] 12.09.2006.
NDPSA and the Primary Substances Acts Amendment Act. (RT I 1997, 52, 834; RTI,
07.07.2006, 32, 247). [online] Available https://www.riigiteataja.ee/ert/act.jsp?id=1044402
[accessed] 08.09.2006.
Olvet, T. (2005) Residents do not want drug addicts to become their new neighbours.
Postimees 28.04.2005.
Penal Code (RT1 I 2001, 61, 364; consolidated text RT I 2002, 86, 504). Available:
http://www.legaltext.ee/text/en/X30068K6.htm.
Police Board. (2005). Drug offences and their impact on crime in Estonia 1999-2004.Tallinn.
Postimees. Dr. Alban has a performance in Venus Club. (2005a). Postimees 06.05.2005.

69
Postimees.Ühisgümnaasium protests against a drug centre. (2005b).Postimees 11.05.2005.
Postimees.Vabaduse väljakul toimub uimastiennetusüritus noortele. (2005c). [A drug
prevention event for young people on Liberty Square.] Postimees 21.08.2005.
Priimägi, L., Tefanova, V. Tallo, T. (2003). “Emerging viral hepatitis B and C infections in
Estonia” NATO Advanced Research Workshop “Emerging Biological Threat” October 5−8.
Abstract book, Hungary, Budapest.
Psychiatric Care Act. (RT1 I 1997, 16, 260). [online] Available:
http://www.legaltext.ee/text/en/X1050K3.htm [accessed] 03.08.2006.
Pullerits, P. (2005). Free drug propaganda. Postimees 27.09.2005.
Rüütel, A. (2006). President Arnold Rüütli uusaastaläkitus. [New Year’s Address from
President A.Rüütel.]. Eesti Päevaleht 01. 01 2006. a
Rüütel, A. (2006). Prsedient A.Rüütli kõne EV 88. aastapäeval 24. veebruaril 2006 Estonia
teatrimajas. [Independence Day´s Address.] [online]. Available:
http://www.postimees.ee/240206/gfx/2946443ff2cfedf5ad.doc [accessed] 28.02.2006. b
Talu, A., Oole, K., Abel, K., Vals, K. (2006). Narkomaania Eestis 2005. Raport VV
narkomaania ennetamise komisjonile. TAI (not published).
Trummal, A., Lõhmus, L. (2005). Prostitutsiooni kaasatute meditsiiniteenuste külastajate
HIV/AIDS-ga seotud riskikäitumine ja teadmised. Tervise Arengu Instituut, Tallinn.
Trummal, A., Lõhmus, L. (2006). HIV/AIDS ennetus Eestis 2004. ja 2005. aastal. Tervise
Arengu Instituut, Tallinn.
Sarv, M. (2005). Kampaania kasutab noorte kõnepruuki. Uus kampaania üritab noori oma
tegude üle mõtlema panna. [The campaign uses the language young people can relate to.
The new campaign tries to make young people think about their actions.]. Eesti Päevaleht
03.11.2005.

70
Tobacco Act (RT2 I 2005, 29, 210). [online] Available:
http://www.legaltext.ee/text/en/X90018.htm [accessed] 27.09.2006
Uusküla, A., Abel, K., Rajaleid, K., Rüütel, K., Talu, A., Fischer, K., Boborova, N. (2005) HIV
prevalence and risk behaviour among IDUs in two Estonian cities (Tallinn and Kohtla-Järve).
TAI, Tallinn.
Vabariigi Valitsuse pressikonverents. (2006). [Press Conference of the Government of the
Republic] 26.01.2006. [online]. Available
http://www.valitsus.ee/brf/index.php?id=32331&tpl=1007&external=&search=&aasta
[accessed] 09.08.2006.
Vahter, T. (2005). The mobile phone is a drug-addict’s currency. Eesti Ekspress 30.03.2005.
Õunpuu, V. (2005) The ABC of a Commentator. Eesti Ekspress 22.02.2005.
• Alphabetic list of relevant databases
• Alphabetic list of relevant Internet addresses
Eesti Uimastiseire Keskus (Estonian Drug Monitoring Centre) http://eusk.tai.ee.
Hepatiit.net http://www.hepatiit.net.
HIV/AIDS info http://www.aids.ee.
Maksu – ja Tolliamet (Estonian Tax and Customs Board) http://www.emta.ee.
Narkoinfo http://www.narko.ee.
Ravimiamet (State Agency of Medicine) http://www.sam.ee.
Tervise Arengu Instituut (Nationale Institute for Health Development) http://www.tai.ee.

71
Tervisekaitse Inspektsioon (Health Protection Inspectorate) http://www.tervisekaitse.ee.
Vabariigi Valitsuse 07.detsembri 2005. a korralduse nr 771 „Riikliku HIV ja AIDSi strateegia
aastateks 2006-2015 kinnitamine ja Vabariigi Valitsuse HIV ja AIDSi komisjoni
moodustamine“ (Estonia’s National HIV/AIDS Strategy 2006-2015)
http://www.tai.ee/failid/HIV_ja_AIDSi_strateegia_01.12.2005.doc.
15. Annexes
• List of Standard Tables and Structured Questionnair es used in the text
• List of Figures used in the text
Figure 1. ADAPP and NSPDD funds in 1998-2005, (EUR).
Source: Estonian Alcohol and Drug Abuse Prevention Programme, 1998-2004 and National
Strategy on the Prevention of Drug Dependency 2005.
Figure 2. Budget for tackling HIV/AIDS and drug addiction in 2000-2005 (EUR).
Source: Annual Reports of HIV/AIDS and drug strategy, 2000 – 2005.
Figure 3. Number of direct drug-related deaths by sex and age of the deceased.
Source: Statistical Office of Estonia, 2006.
Figure 4. Total number of drug offences registered by the police (crimes and administrative
offences or misdemeanours), 1997-2005.
Source: Police Board, 2006.
Figure 5. Total number of analysis of drugs in 2000-2005.
Source: Estonian Forensic Service Centre 2006.
Figure 6. Number of analysis of narcotic drugs ordered by different authorities in 2000-2005.
Source: Estonian Forensic Service Centre, 2006.
Figure 7. Number of analyses of some type of narcotic drugs in 2000-2005.
Source: Estonian Forensic Service Centre, 2006.
Figure 8. Street prices of illegal substances in Euros in 2001-2005.
Source: Police Board, 2006.
Figure 9. Street level average percentage purity of some illegal substances 2002-2004.
Source: Forensic Service Centre, 2006.

72
• List of Tables used in the text
Table 1. Activities and budget of Tallinn City Government for the years 2003-2005 (EUR).
Source: Health Care and Social Work Department of Tallinn City Government, 2005.
Table 2. Budget for tackling HIV/AIDS and drug addiction, 2005 (EUR).
Source: Annual Reports of HIV/AIDS and drug strategy, 2000 – 2005.
Table 3. HIV/AIDS and drug prevention in counties by type of activity in 2005 (EUR).
Source: National Institute for Health Development, 2006.
Table 4. Drug prevention activities in Estonian special schools in 2005 (EUR).
Source: National Institute for Health Development, 2006.
Table 5. Main injected drugs in the last 4 weeks in the sites of survey (%).
Source: A. Uusküla et al, 2005.
Table 6. Types of drug free treatment, 2005.
Source: EDMC, 2006..
Table 7 . Description of persons with acute and chronic HBV, HCV in 2005
Source: Health Protection Inspectorate, 2006.
Table 8. Drug crimes (main types) registered by the police, 2005.
Source: Police Board, 2006.

73
• List of abbreviations
ADAPP - Alcohol and Drug Abuse Prevention Programme
ARV - Anti-retro virus
ATS – Amphetamine Type Stimulants
CRC - capture-recapture
CSW - commercial sex workers
EDMC - Estonian Drug Monitoring Centre
EE – Eesti Ekspress
EHIF - Estonian Health Insurance Fund
EPL – Eesti päevaleht
EMCDDA - European Monitoring Centre for Drug and Drug Addiction
ESHA - Estonian Sexual Health Association
GCDP - Government Commission on Drug Prevention
GF – Global Fund
GFATM - Foundation Global Fund to Fight AIDS, Tuberculosis and Malaria
GTC - Gambling Tax Committee
HANS - HIV/AIDS National Strategy 2006-2015
HBV - Hepatitis B virus
HCV - Hepatitis C virus
HIV – Human Immunodeficiency Virus
HPI - Health Protection Inspectorate
IDU - injecting drug user
MSoA - Ministry of Social Affairs
MSM - men who have sex with men
NIHD - National Institute for Health Development
NDPSA - The Narcotic Drugs and Psychotropic Substances Act
NDTD – National Drug Treatment Database
NFP - Estonian National Focal Point
NGO - non-governmental organisations
NPHAP - National Programme for HIV/AIDS Prevention
NSPDD – National Strategy for Prevention on Drug Dependency 2005-2012
PDU - Problem Drug Use
PLWHA - people living with HIV/AIDS

74
PM – Postimees
SEP - syringe exchange points
STIs - sexually transmitted diseases

75
Part D. Standard Tables and Structured Questionnair es
No of ST, SQ Title of Standard Tables and Questionn aires
ST 05 Acute/direct drug-related deaths
ST 06 Evolution of acute/direct related deaths
ST 07 National prevalence estimates on problem drug use
ST 08 Local prevalence estimates on problem drug use
ST 09 Prevalence of hepatitis B/C and HIV infection among injecting drug users
ST 10 Syringe availability
ST 11 Arrests/Reports for drug law offences
ST 13 Number and quantity of seizures of illicit drugs
ST 14 Purity at street level of illicit drugs
ST 15 Composition of tablets sold as illicit drugs
ST 16 Price in Euros at street level of illicit drugs
SQ 32 Policy and institutional framework

![[Estonia] National Cyber Security Strategy - 2008 - EN - ENISA](https://static.fdokumen.com/doc/165x107/63256e49051fac18490d427a/estonia-national-cyber-security-strategy-2008-en-enisa.jpg)