REPORT ON THE 2005 LEATHERBACK PROGRAM AT TORTUGUERO, COSTA RICA
25
REPORT ON THE 2005 LEATHERBACK PROGRAM AT TORTUGUERO, COSTA RICA Submitted to: Caribbean Conservation Corporation and the Ministry of Environment and Energy of Costa Rica, 28 March 2006 by Andrea de Haro, Field Coordinator and Sebastian Troëng, Scientific Director with the assistance of Philip Antman, Research Assistant Vidal Castillo, Research Assistant Pablo Garcés, Research Assistant Christopher Frohlich, Research Assistant Angerline Marín, Research Assistant Inés Palomares, Research Assistant Linda Reinhold, Research Assistant Alejandro Sagone, Research Assistant Enrique Vargas, Track Surveyor CARIBBEAN CONSERVATION CORPORATION Dirección: Apartado Postal 246-2050 4424 NW 13th St. Suite A-1 San Pedro Gainesville, FL 32609 COSTA RICA USA Tel: INT+ 506 297 5510 001+ 352 373 6441 Fax: INT+ 506 297 6576 001+ 352 375 2449 Email: [email protected] [email protected] Webpage: http://www.cccturtle.org http://www.cccturtle.org With the Financial Support of: Lemmon Foundatio n Elinor Patterson Baker Trust The Dreamcatcher Fund Mr. Jeffrey Phipps
-
Upload
independent -
Category
Documents
-
view
5 -
download
0
Transcript of REPORT ON THE 2005 LEATHERBACK PROGRAM AT TORTUGUERO, COSTA RICA
REPORT
ON THE 2005 LEATHERBACK PROGRAM
AT TORTUGUERO, COSTA RICA
Submitted to: Caribbean Conservation Corporation
and the Ministry of Environment and Energy of Costa Rica,
28 March 2006 by
Andrea de Haro, Field Coordinator and
Sebastian Troëng, Scientific Director
with the assistance of Philip Antman, Research Assistant Vidal Castillo, Research Assistant Pablo Garcés, Research Assistant
Christopher Frohlich, Research Assistant Angerline Marín, Research Assistant Inés Palomares, Research Assistant Linda Reinhold, Research Assistant
Alejandro Sagone, Research Assistant Enrique Vargas, Track Surveyor
CARIBBEAN CONSERVATION CORPORATION Dirección: Apartado Postal 246-2050 4424 NW 13th St. Suite A-1 San Pedro Gainesville, FL 32609 COSTA RICA USA Tel: INT+ 506 297 5510 001+ 352 373 6441 Fax: INT+ 506 297 6576 001+ 352 375 2449 Email: [email protected] [email protected] Webpage: http://www.cccturtle.org http://www.cccturtle.org
With the Financial Support of:
Lemmon
Foundatio
n
Elinor Patterson
Baker Trust
The Dreamcatcher
Fund
Mr. Jeffrey
Phipps
2
TABLE OF CONTENTS TABLE OF CONTENTS .................................................................................................................................... 2 LIST OF FIGURES............................................................................................................................................. 3 LIST OF TABLES............................................................................................................................................... 3 ACKNOWLEDGEMENTS ................................................................................................................................ 4 EXECUTIVE SUMMARY ................................................................................................................................. 5
MONITORING AND RESEARCH ACTIVITIES CONDUCTED ..................................................................................... 5 CONCLUSIONS .................................................................................................................................................... 6 RECOMMENDATIONS .......................................................................................................................................... 7
1. INTRODUCTION ........................................................................................................................................... 8
2. METHODS....................................................................................................................................................... 8 2.1 PREPARATIONS ............................................................................................................................................. 8 2.2 TRACK SURVEYS .......................................................................................................................................... 8 2.3 TAGGING OF NESTING SEA TURTLES............................................................................................................. 9 2.4 BIOMETRIC DATA COLLECTION .................................................................................................................... 9 2.5 DETERMINATION OF NEST SURVIVORSHIP AND HATCHING SUCCESS ............................................................ 9 2.6 PHYSICAL DATA COLLECTION .................................................................................................................... 10 2.7 COLLECTION OF HUMAN IMPACT DATA...................................................................................................... 10 2.8 DEAD TURTLES........................................................................................................................................... 10 2.9 ENVIRONMENTAL EDUCATION ACTIVITIES ................................................................................................. 10
3. RESULTS....................................................................................................................................................... 11 3.1 PREPARATIONS ........................................................................................................................................... 11 3.2 TRACK SURVEYS ........................................................................................................................................ 11 3.3 TAGGING OF NESTING SEA TURTLES........................................................................................................... 12 3.4 BIOMETRIC DATA COLLECTION .................................................................................................................. 12 3.5 DETERMINATION OF NEST SURVIVORSHIP AND HATCHING SUCCESS .......................................................... 13 3.6 PHYSICAL DATA COLLECTION .................................................................................................................... 14 3.7 COLLECTION OF HUMAN IMPACT DATA...................................................................................................... 15 3.8 DEAD TURTLES........................................................................................................................................... 17 3.9 ENVIRONMENTAL EDUCATION ACTIVITIES ................................................................................................. 18
4. DISCUSSION................................................................................................................................................. 18 4.1 PREPARATIONS ........................................................................................................................................... 18 4.2 TRACK SURVEYS ........................................................................................................................................ 18 4.3 TAGGING OF NESTING SEA TURTLES........................................................................................................... 18 4.4 BIOMETRIC DATA COLLECTION .................................................................................................................. 19 4.5 DETERMINATION OF NEST SURVIVORSHIP AND HATCHING SUCCESS .......................................................... 19 4.6 PHYSICAL DATA COLLECTION .................................................................................................................... 19 4.7 COLLECTION OF HUMAN IMPACT DATA...................................................................................................... 19 4.8 DEAD TURTLES........................................................................................................................................... 20 4.9 ENVIRONMENTAL EDUCATION ACTIVITIES ................................................................................................. 20
5. REFERENCES .............................................................................................................................................. 20 APPENDIX 1. SEA TURTLE ENCOUNTERS. ............................................................................................. 23 APPENDIX 2: OBSERVATIONS AND ANECDOTAL INFORMATION ON POACHING.................... 25
3
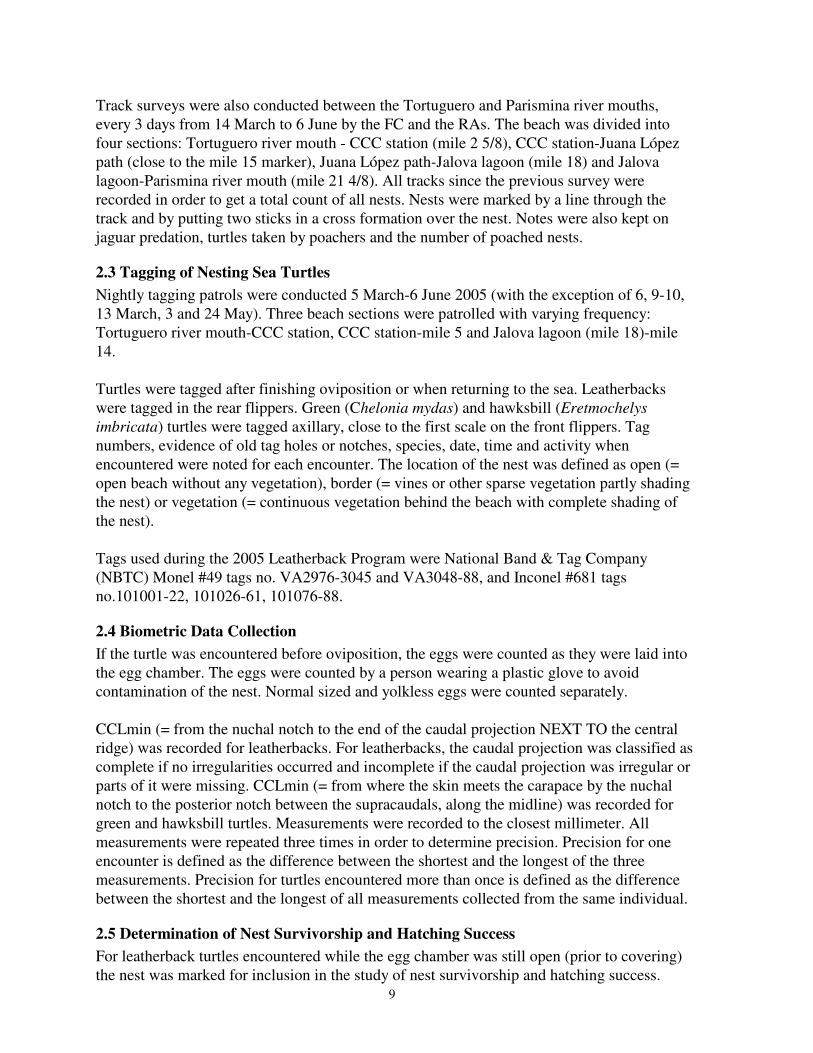
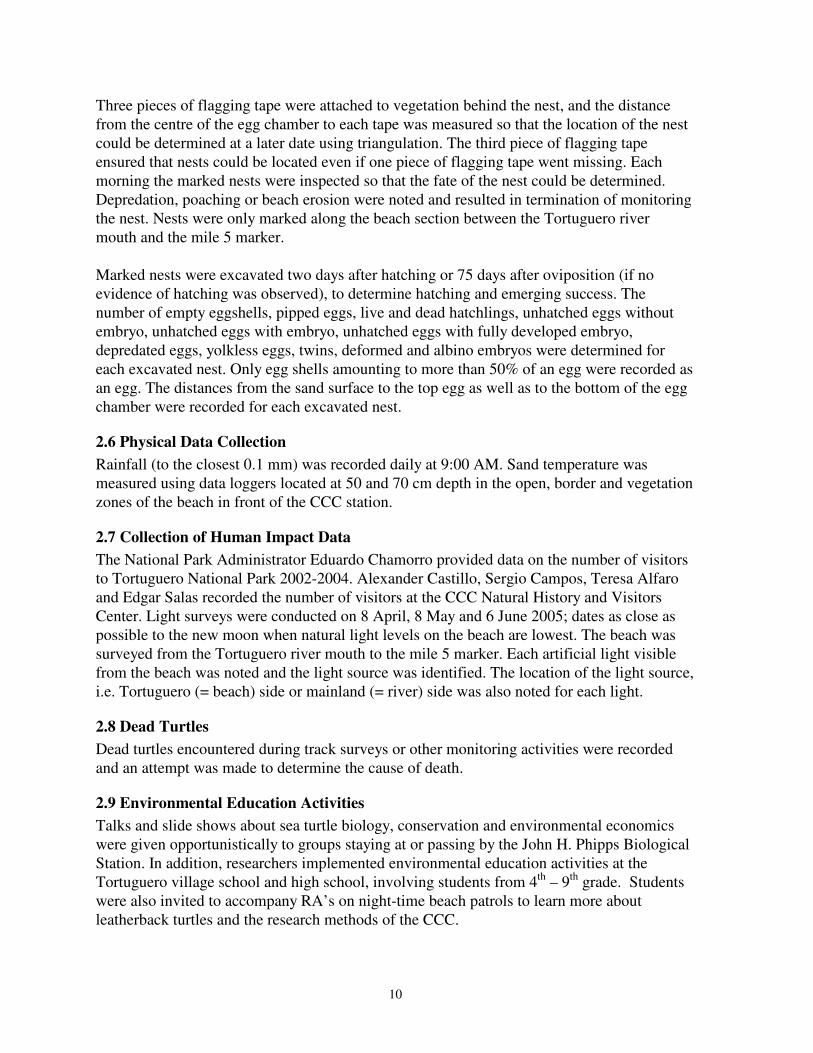
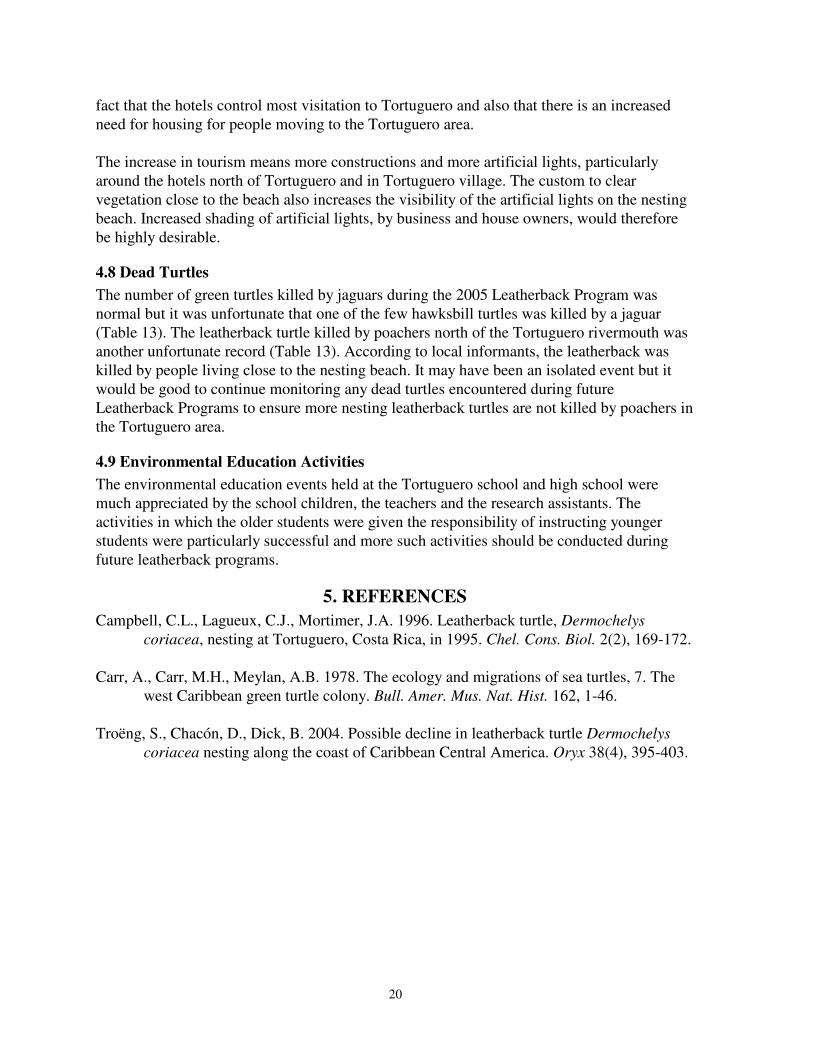
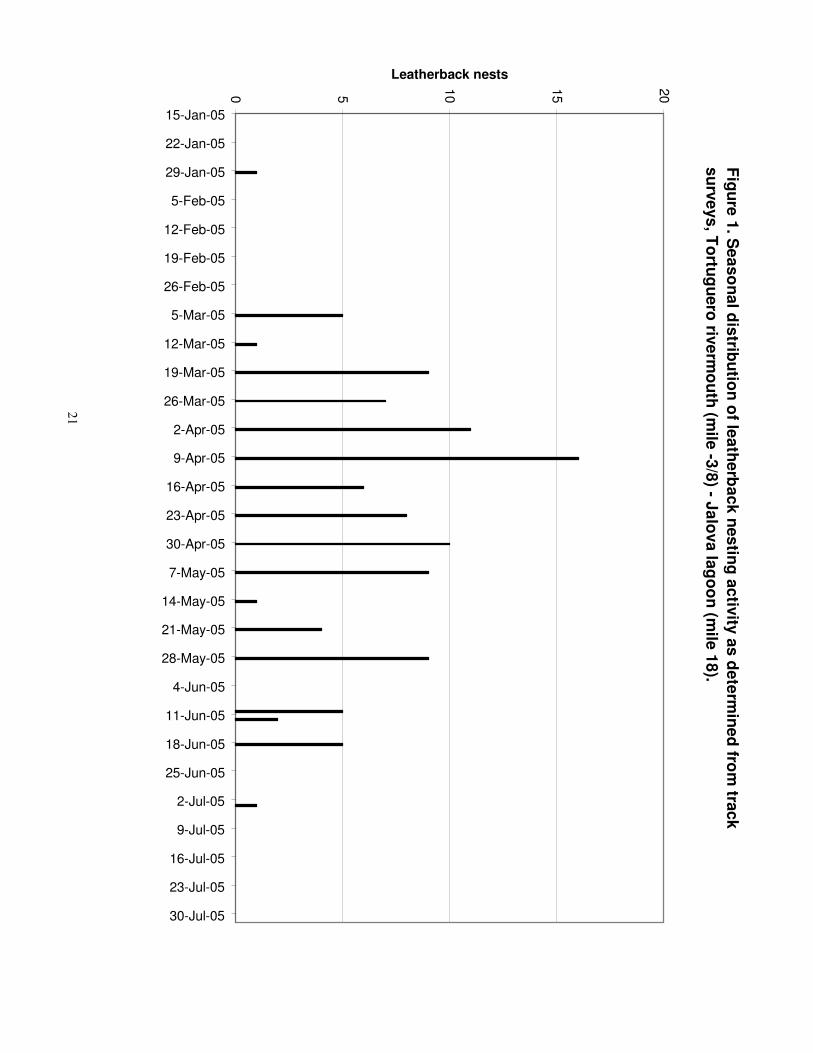
LIST OF FIGURES Figure 1. Seasonal distribution of leatherback nesting activity as determined from track surveys, Tortuguero rivermouth (mile -3/8) - Jalova lagoon (mile 18). Figure 2. Leatherback turtle nesting trend (Tortuguero rivermouth to Jalova lagoon).
LIST OF TABLES Table 1. Number of nests and poached nests as determined from total counts by RAs and FC. Table 2. Mean carapace length and clutch size of leatherbacks. Table 3. Mean carapace length and clutch size of green and hawksbill turtles. Table 4a. Precision of carapace measurements. Table 4b. Precision of carapace measurements for leatherbacks encountered more than once. Table 5. Fate, hatching and emerging success of marked leatherback nests. Table 6. Results of nest excavations. Table 7. Rainfall, December 2004-August 2005. Table 8. Mean monthly sand temperatures. Table 9. Number of Paying Visitors to Tortuguero National Park, 2002-2004. Table 10. Visitors to the CCC Natural History and Visitors Center, January 2005-August 2005. Table 11. Room and bed capacity of the hotels and cabinas in the Tortuguero area. Table 12. Artificial lights visible from the beach, Tortuguero river mouth to Mile 5. Table 13. Dead turtles.
4
ACKNOWLEDGEMENTS The 2005 Leatherback Program was conducted under a research permit from the Tortuguero Conservation Area of the Ministry of Environment and Energy of Costa Rica, detailed in resolution No ACTo-GASP-PIN-003-05. All data presented in this report were collected by Field Coordinator Andrea de Haro and her hardworking team of research assistants: Philip Antman (USA), Vidal Castillo (Mexico), Pablo Garcés (Ecuador), Christopher Frohlich (USA), Angerline Marín (Costa Rica), Inés Palomares (Spain), Linda Reinhold (Australia) and Alejandro Sagone (Guatemala). Enrique Vargas conducted the weekly track surveys. Many program participants assisted in data collection and their help is gratefully recognized. The Tortuguero Conservation Area park rangers under the leadership of National Park Administrator Sr. Eduardo Chamorro protected sea turtles and their nests and also shared their living-quarters with the research assistants at the Jalova ranger station. John H. Phipps Biological Field Station staff Sergio Campos (station manager), Teresa Alfaro (visitor center administrator), Cyrilo Martínez (captain), Katia Gómez (cook), Analive Guardamuz (cook) and staff of Halcón Dorado security provided logistical support, great meals and contributed to the cordial atmosphere at the field station. Tour guides and villagers of Tortuguero interacted with permanent and temporary program staff during the 2005 Leatherback Program. Hotel managers and cabina owners provided information of the capacity of their respective facilities on request. Roxana Silman (national director) and Ileana Vargas (administrative assistant) at the CCC San José office provided logistical support throughout the 2005 Leatherback Program. CCC staff in Gainesville, Florida purveyed necessary equipment and provided any support requested. For financial assistance we would like to thank Lemmon Foundation, Elinor Patterson Baker Trust, the Dreamcatcher Fund, Mr. Jeffrey Phipps and all the 2005 Leatherback Program participants.
5
EXECUTIVE SUMMARY
Monitoring and Research Activities Conducted 1. A total of 26 track surveys were conducted between the Tortuguero rivermouth and
Jalova lagoon between February and July 2005. 2. Peak nesting was recorded on 9 April when a total of 16 fresh leatherback nests were
recorded. 3. The Field Coordinator (FC) and the Research Assistants (RAs) conducted a total of 29
additional track surveys between the Tortuguero and Parismina rivermouths between 14 March and 6 June 2005. Poaching was estimated to a minimum of 17.1 % of leatherback nests and 4.0 % of green turtle nests.
4. Comparison of the leatherback nesting estimates obtained from track surveys conducted either by the track surveyor (703 nests) or by the RC and RAs (681 nests) between Tortuguero river mouth and Jalova lagoon between 14 March-6 June revealed that the two methods produced similar results.
5. A total of 157 leatherback turtle encounters were recorded during 1,018 hours of night patrols between 5 March and 6 June, 2005. In addition, four tagged leatherback turtles were reported by tourguides, park rangers and staff at the Caño Palma station. 33 were newly tagged females, 86 had tags from previous years and/or other nesting beaches, and 42 were renesters. In addition, 22 green turtles (21 females and one male), and eight hawksbill turtles were encountered.
6. A total of 71 % of female leatherback turtles bore tags from previous years or other nesting beaches. Previously tagged leatherback turtles (n = 86) were originally tagged on the beaches of Tortuguero (n = 27), Parismina (n = 7), Pacuare/Mondonguillo (n = 35), Gandoca/Playa Negra (n = 8) and in Panama (n = 9).
7. A total of 23 % (n=7) of newly tagged leatherback turtles (n = 31) showed evidence of old tag holes or notches when they were encountered for the first time.
8. A total of 80.9% of the encountered leatherback turtles nested in the open beach zone (n = 127), 8.9 % nesting in the border zone (n=14) and 10.2 % did not lay eggs (n = 16).
9. Mean carapace length (CCLmin) for leatherback turtles with a complete caudal projection (n = 105) was 154.1 cm and for turtles with an incomplete caudal projection (n = 9) was 144.2 cm. Mean clutch size was 82 normal and 29 yolkless eggs for females with complete caudal projection (n = 62) and 69 normal and 22 yolkless eggs for females with incomplete caudal projection (n = 5).
10. Mean carapace length (CCLmin) was 103.7 cm for green turtles (n=20), and 89.8 cm for hawksbill turtles (n = 8). Mean clutch size for green turtles was 89 normal eggs (n = 4).
11. Precision of the CCLmin measurement during the same encounter was 0.5 cm for leatherback (n = 152), 0.4 cm for green (n = 20) and 0.9 cm for hawksbill turtles (n = 8).
12. Precision of the CCLmin measurement for leatherback turtles measured during more than one encounter was 1.2 cm for two encounters (n = 15), 2.3 cm for three encounters (n = 7) and 2.6 cm for five encounters (n = 2).
13. A total of 29 leatherback nests were marked for monitoring. Four nests could not be located for excavation and so were eliminated from further analysis.
14. Overall hatching success for monitored leatherback nests (n = 25) was 23.6 -27. 6 % and overall emerging success was 23.0 – 27.0 %.
6
15. Mean distance between the sand surface and the top egg at the time of excavation for undisturbed nests (n=18) varied between 35 – 79 cm with a mean of 56 cm. The mean distance from the sand surface to the bottom of the egg chamber varied between 60 – 86 cm, with a mean of 76 cm.
16. The incubation period for leatherback nests for which emergence was observed (n = 7) ranged from 55-87 days with a mean of 64 days.
17. One deformed and three albino embryos corresponding to 0.06 % and 0.18 % of eggs were encountered during nest excavations.
18. Rainfall was heaviest in January (1187.2 mm) and June was the month with least rain (128.6 mm).
19. Monthly mean sand temperatures ranged between 25.2 – 32.6ºC. Sand temperatures were higher in the open zone than in the border and vegetation zones.
20. A total of 81,457 visitors paid to enter Tortuguero National Park in 2004. 21. The visitation at the CCC Natural History and Visitors’ Center decreased in 2005 and in
the first eight months of the year 20,712 tourists had visited the centre, an average of 85 visitors/day.
22. The capacity of hotels and cabinas in the Tortuguero area decreased to 583 rooms (but bed capacity increased to 1,495 beds) in 2005 as a result of more cabina owners renting their rooms to locals.
23. The number of artificial lights in Tortuguero village continues to increase, particularly in the village (mile 2 6/8 – mile 3 2/8).
24. One leatherback was killed by poachers, north of the Tortuguero rivermouth, during the 2005 Leatherback Program. A total of ten green turtles and a hawksbill turtle were killed by jaguars.
25. Training activities, including a beach clean-up, were organized by the FC and RAs for the Tortuguero high school students and a joint environmental education activity was implemented during which the high school students instructed and supervised the younger school students.
Conclusions 1. Replacing and painting mile markers along the entire beach is absolutely indispensable to
facilitate night patrols and track surveys. 2. Leatherback nesting was greater in 2005 than in 2004. The slightly declining nesting
trend since 1995, however, continues. 3. The two methods, track surveyor and FC/RAs track surveys, used to estimate the number
of leatherback nests produced very similar results. 4. Poaching levels within Tortuguero National Park are much lower than those outside the
park limits. 5. The number of leatherback turtles encountered during nightly patrols (n = 157) was much
greater than the encounters in 2004, as a result of increased patrol effort on behalf of the FC and RAs.
6. It is possible that low rainfall and high sand temperatures may have affected the hatching success of leatherback nests.
7. The leatherback which was killed by poachers demonstrates the need to monitor dead turtles during future Leatherback Programs.

7
Recommendations 1. The leatherback which was killed by poachers demonstrates the need to monitor dead
turtles during future Leatherback Programs. 2. It would be highly beneficial for the Tortuguero Conservation Area to commence a
minimum patrol effort along the Jalova-Parismina beach section during future leatherback nesting seasons.
3. The interchange of female leatherback turtles between different tagging projects emphasizes the need for increased coordination and information exchange between projects.
4. A review of leatherback hatching success at Tortuguero, including an evaluation of factors which may be used to predict hatching success (such as distance from high tide line at the time of laying), would be useful.
5. New displays, renovated facilities and improved management by the Visitor Center Administrator are urgently needed to make sure more visitors are attracted to the CCC Natural History and Visitor Center.
6. Increased shading of artificial lights, by business and house owners, should be promoted. 7. Education activities in which the older students are given the responsibility of instructing
younger students have proven to be successful and more such activities should be conducted during future leatherback programs.
8
1. INTRODUCTION Sea turtle research and conservation was initiated in Tortuguero in 1955 (Carr et al. 1978). Caribbean Conservation Corporation (CCC) began an annual leatherback (Dermochelys coriacea) program in Tortuguero in 1995 (Campbell et al. 1996). The leatherback program is implemented in order to fulfill CCC’s scientific mission in Tortuguero: “CCC will provide the scientific information necessary to conserve the populations of sea turtles that nest at Tortuguero, Costa Rica, so that they fulfill their ecological roles”. CCC staff and Scientific Advisory Committee revised the monitoring protocol in preparation for the 1998 Leatherback Program. The 2005 Leatherback Program represents the eleventh consecutive leatherback program and the eighth year of implementing the new monitoring protocol. The objectives of this report are to summarize the results of the 2005 Leatherback Program and to provide recommendations for future sea turtle programs, conservation efforts and research activities in Tortuguero.
2. METHODS
2.1 Preparations The Field Coordinator arrived in Tortuguero the first week of March to prepare for the 2005 Leatherback Program. The Research Assistants (RAs) arrived in Tortuguero on 7 March 2005. During the first two weeks of the 2005 Leatherback Program, RAs received training in sea turtle biology and conservation, and the Leatherback Program monitoring protocol was explained in detail. RAs also received practical training in sea turtle tagging, nest marking and other data collection from the Field Coordinator (FC) and the Scientific Director. In addition to practice night patrols along beach sections close to the field station, training was also conducted between Jalova lagoon and the CCC station on 11-12 March 2005. The positions of mile markers along the 22 miles (=36 km) of beach between the Tortuguero and Parismina river mouths were verified using a 300 feet fiberglass measuring tape. Mile markers were located every 1/8 of a mile between the Tortuguero river mouth (mile –3/8) and mile 5, and every 4/8 mile between mile 5 and the Parismina river mouth (mile 21 4/8). Three markers were put up in every location and the two markers nearest to the vegetation were painted white with the marker number in black.
2.2 Track Surveys Track surveys between the Tortuguero river mouth and Jalova lagoon were conducted approximately weekly by CCC track surveyor Enrique Vargas. Track surveys started near Tortuguero river mouth at 5:00 AM and were completed at Jalova lagoon at approximately 10:30 AM. Only sea turtle tracks from the previous night were counted. Notes were also kept on the number of turtles depredated by jaguars or taken by poachers and the number of poached fresh nests. The total number of leatherback nests for all nights was extrapolated by applying a GAM model and integrating resulting values using Berkeley Madonna software (Troëng et al. 2004).
9
Track surveys were also conducted between the Tortuguero and Parismina river mouths, every 3 days from 14 March to 6 June by the FC and the RAs. The beach was divided into four sections: Tortuguero river mouth - CCC station (mile 2 5/8), CCC station-Juana López path (close to the mile 15 marker), Juana López path-Jalova lagoon (mile 18) and Jalova lagoon-Parismina river mouth (mile 21 4/8). All tracks since the previous survey were recorded in order to get a total count of all nests. Nests were marked by a line through the track and by putting two sticks in a cross formation over the nest. Notes were also kept on jaguar predation, turtles taken by poachers and the number of poached nests.
2.3 Tagging of Nesting Sea Turtles Nightly tagging patrols were conducted 5 March-6 June 2005 (with the exception of 6, 9-10, 13 March, 3 and 24 May). Three beach sections were patrolled with varying frequency: Tortuguero river mouth-CCC station, CCC station-mile 5 and Jalova lagoon (mile 18)-mile 14. Turtles were tagged after finishing oviposition or when returning to the sea. Leatherbacks were tagged in the rear flippers. Green (Chelonia mydas) and hawksbill (Eretmochelys imbricata) turtles were tagged axillary, close to the first scale on the front flippers. Tag numbers, evidence of old tag holes or notches, species, date, time and activity when encountered were noted for each encounter. The location of the nest was defined as open (= open beach without any vegetation), border (= vines or other sparse vegetation partly shading the nest) or vegetation (= continuous vegetation behind the beach with complete shading of the nest). Tags used during the 2005 Leatherback Program were National Band & Tag Company (NBTC) Monel #49 tags no. VA2976-3045 and VA3048-88, and Inconel #681 tags no.101001-22, 101026-61, 101076-88.
2.4 Biometric Data Collection If the turtle was encountered before oviposition, the eggs were counted as they were laid into the egg chamber. The eggs were counted by a person wearing a plastic glove to avoid contamination of the nest. Normal sized and yolkless eggs were counted separately. CCLmin (= from the nuchal notch to the end of the caudal projection NEXT TO the central ridge) was recorded for leatherbacks. For leatherbacks, the caudal projection was classified as complete if no irregularities occurred and incomplete if the caudal projection was irregular or parts of it were missing. CCLmin (= from where the skin meets the carapace by the nuchal notch to the posterior notch between the supracaudals, along the midline) was recorded for green and hawksbill turtles. Measurements were recorded to the closest millimeter. All measurements were repeated three times in order to determine precision. Precision for one encounter is defined as the difference between the shortest and the longest of the three measurements. Precision for turtles encountered more than once is defined as the difference between the shortest and the longest of all measurements collected from the same individual.
2.5 Determination of Nest Survivorship and Hatching Success For leatherback turtles encountered while the egg chamber was still open (prior to covering) the nest was marked for inclusion in the study of nest survivorship and hatching success.
10
Three pieces of flagging tape were attached to vegetation behind the nest, and the distance from the centre of the egg chamber to each tape was measured so that the location of the nest could be determined at a later date using triangulation. The third piece of flagging tape ensured that nests could be located even if one piece of flagging tape went missing. Each morning the marked nests were inspected so that the fate of the nest could be determined. Depredation, poaching or beach erosion were noted and resulted in termination of monitoring the nest. Nests were only marked along the beach section between the Tortuguero river mouth and the mile 5 marker. Marked nests were excavated two days after hatching or 75 days after oviposition (if no evidence of hatching was observed), to determine hatching and emerging success. The number of empty eggshells, pipped eggs, live and dead hatchlings, unhatched eggs without embryo, unhatched eggs with embryo, unhatched eggs with fully developed embryo, depredated eggs, yolkless eggs, twins, deformed and albino embryos were determined for each excavated nest. Only egg shells amounting to more than 50% of an egg were recorded as an egg. The distances from the sand surface to the top egg as well as to the bottom of the egg chamber were recorded for each excavated nest.
2.6 Physical Data Collection Rainfall (to the closest 0.1 mm) was recorded daily at 9:00 AM. Sand temperature was measured using data loggers located at 50 and 70 cm depth in the open, border and vegetation zones of the beach in front of the CCC station.
2.7 Collection of Human Impact Data The National Park Administrator Eduardo Chamorro provided data on the number of visitors to Tortuguero National Park 2002-2004. Alexander Castillo, Sergio Campos, Teresa Alfaro and Edgar Salas recorded the number of visitors at the CCC Natural History and Visitors Center. Light surveys were conducted on 8 April, 8 May and 6 June 2005; dates as close as possible to the new moon when natural light levels on the beach are lowest. The beach was surveyed from the Tortuguero river mouth to the mile 5 marker. Each artificial light visible from the beach was noted and the light source was identified. The location of the light source, i.e. Tortuguero (= beach) side or mainland (= river) side was also noted for each light.
2.8 Dead Turtles Dead turtles encountered during track surveys or other monitoring activities were recorded and an attempt was made to determine the cause of death.
2.9 Environmental Education Activities Talks and slide shows about sea turtle biology, conservation and environmental economics were given opportunistically to groups staying at or passing by the John H. Phipps Biological Station. In addition, researchers implemented environmental education activities at the Tortuguero village school and high school, involving students from 4th – 9th grade. Students were also invited to accompany RA’s on night-time beach patrols to learn more about leatherback turtles and the research methods of the CCC.
11
3. RESULTS
3.1 Preparations Few of the mile markers were washed away during the 2005 Leatherback Program. It was only necessary to replace a couple of the mile markers at the start of the 2005 Green Turtle Program.
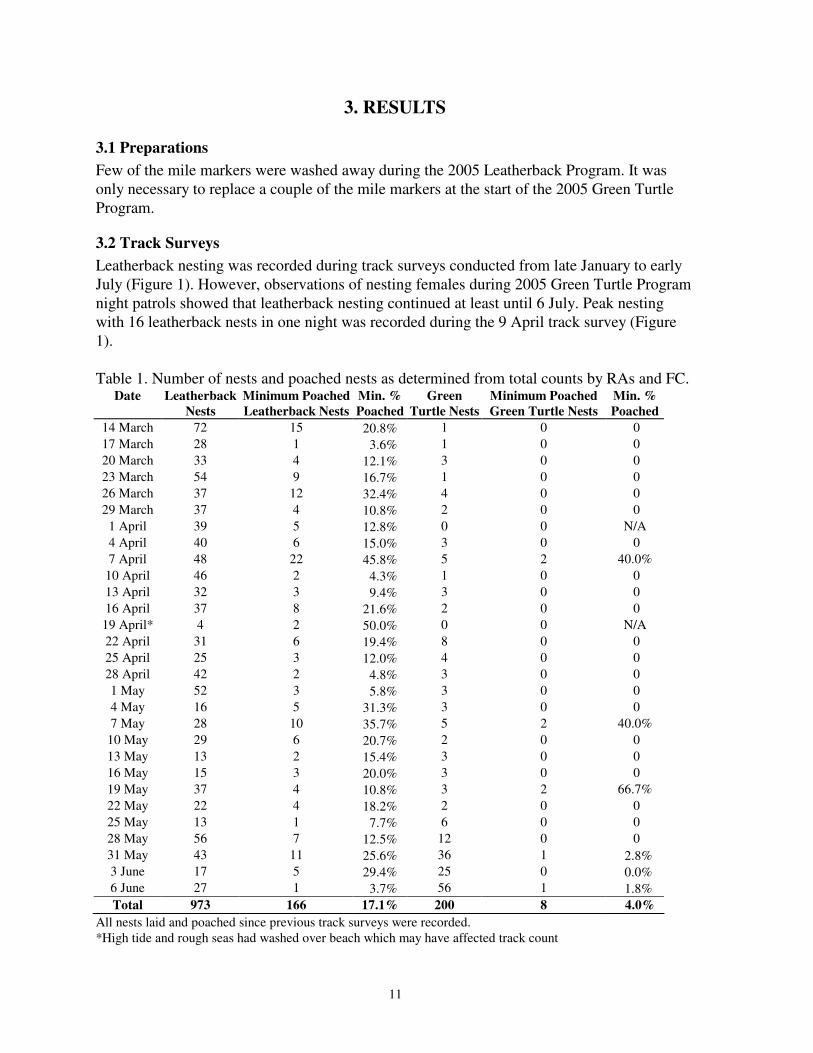
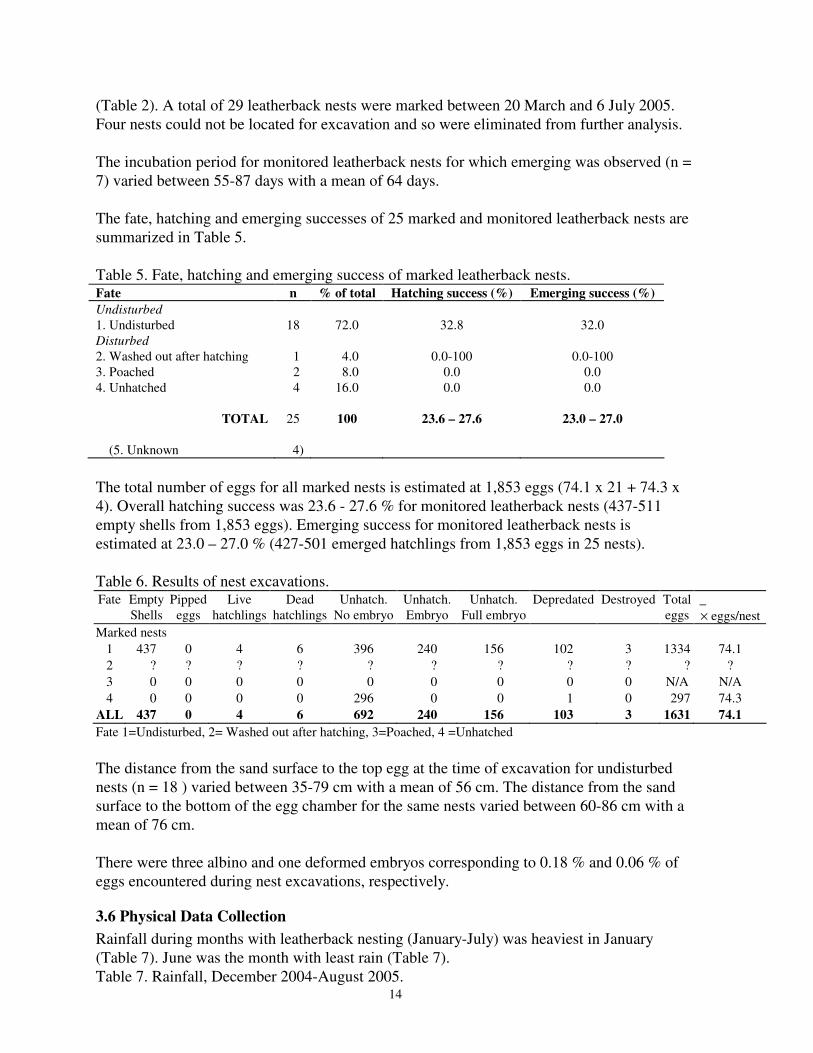
3.2 Track Surveys Leatherback nesting was recorded during track surveys conducted from late January to early July (Figure 1). However, observations of nesting females during 2005 Green Turtle Program night patrols showed that leatherback nesting continued at least until 6 July. Peak nesting with 16 leatherback nests in one night was recorded during the 9 April track survey (Figure 1). Table 1. Number of nests and poached nests as determined from total counts by RAs and FC.
Date Leatherback Nests
Minimum Poached Leatherback Nests
Min. % Poached
Green Turtle Nests
Minimum Poached Green Turtle Nests
Min. % Poached
14 March 72 15 20.8% 1 0 0 17 March 28 1 3.6% 1 0 0 20 March 33 4 12.1% 3 0 0 23 March 54 9 16.7% 1 0 0 26 March 37 12 32.4% 4 0 0 29 March 37 4 10.8% 2 0 0
1 April 39 5 12.8% 0 0 N/A 4 April 40 6 15.0% 3 0 0 7 April 48 22 45.8% 5 2 40.0%
10 April 46 2 4.3% 1 0 0 13 April 32 3 9.4% 3 0 0 16 April 37 8 21.6% 2 0 0 19 April* 4 2 50.0% 0 0 N/A 22 April 31 6 19.4% 8 0 0 25 April 25 3 12.0% 4 0 0 28 April 42 2 4.8% 3 0 0 1 May 52 3 5.8% 3 0 0 4 May 16 5 31.3% 3 0 0 7 May 28 10 35.7% 5 2 40.0%
10 May 29 6 20.7% 2 0 0 13 May 13 2 15.4% 3 0 0 16 May 15 3 20.0% 3 0 0 19 May 37 4 10.8% 3 2 66.7% 22 May 22 4 18.2% 2 0 0 25 May 13 1 7.7% 6 0 0 28 May 56 7 12.5% 12 0 0 31 May 43 11 25.6% 36 1 2.8% 3 June 17 5 29.4% 25 0 0.0% 6 June 27 1 3.7% 56 1 1.8% Total 973 166 17.1% 200 8 4.0%
All nests laid and poached since previous track surveys were recorded. *High tide and rough seas had washed over beach which may have affected track count
12
The poaching of leatherback nests increased in 2005 due to increased poaching outside Tortuguero National Park but a smaller proportion of green turtle nests was poached than during 2004. Poached nests represented at least 17.1% for leatherback nests and 4.0% for green turtle nests (Table 1). Poaching of leatherback nests was higher outside of Tortuguero National Park (minimum 33 %) than within the National Park (minimum 9%). Based on the weekly track surveys it is estimated that 767 leatherback nests were deposited between the Tortuguero river mouth and Jalova lagoon during the 2005 leatherback nesting season. For the period 14 March-6 June, extrapolations from the weekly surveys using the methodology described in Troëng et al. (2004) suggest that 703 leatherback nests were laid between Tortuguero river mouth and Jalova lagoon. The FC and RA track surveys, conducted every three days, recorded 681 leatherback nests along the same beach section during the same time period. Observations and anecdotal information regarding illegal take are summarized in Appendix 2.
3.3 Tagging of Nesting Sea Turtles In total, 1,018 team hours of night patrols were conducted between 5 March and 6 June 2005. During these patrols a total of 157 leatherback, 22 green, and eight hawksbill turtle encounters were recorded (Appendix 1). This is equal to a mean of 0.154 leatherback, 0.022 green and 0.008 hawksbill turtles encountered per patrol hour. In addition, four tagged leatherback turtles were reported by tourguides, park rangers and staff at the Caño Palma station. The turtles encountered correspond to 119 individual female leatherback turtles, 21 female green turtles, one male green turtle and eight female hawksbill turtles. A total of 71 % of female leatherback turtles were tagged previous to the first encounter with RAs during the 2005 nesting season (Appendix 1). Previously tagged leatherback turtles (n = 86) were originally tagged on the beaches of Tortuguero (n = 27), Parismina (n = 7), Pacuare/Mondonguillo (n = 35), Gandoca/Playa Negra (n = 8) and in Panama (n = 9). Evidence of holes or notches were found on 23 % (n = 7) of newly tagged leatherback turtles checked for previous tagging (n = 31) when they were encountered for the first time during the 2005 Leatherback Program. A total of 80.9% of the encountered leatherback turtles nested in the open beach zone (n = 127), 8.9 % nesting in the border zone (n=14) and 10.2 % did not lay eggs (n = 16).
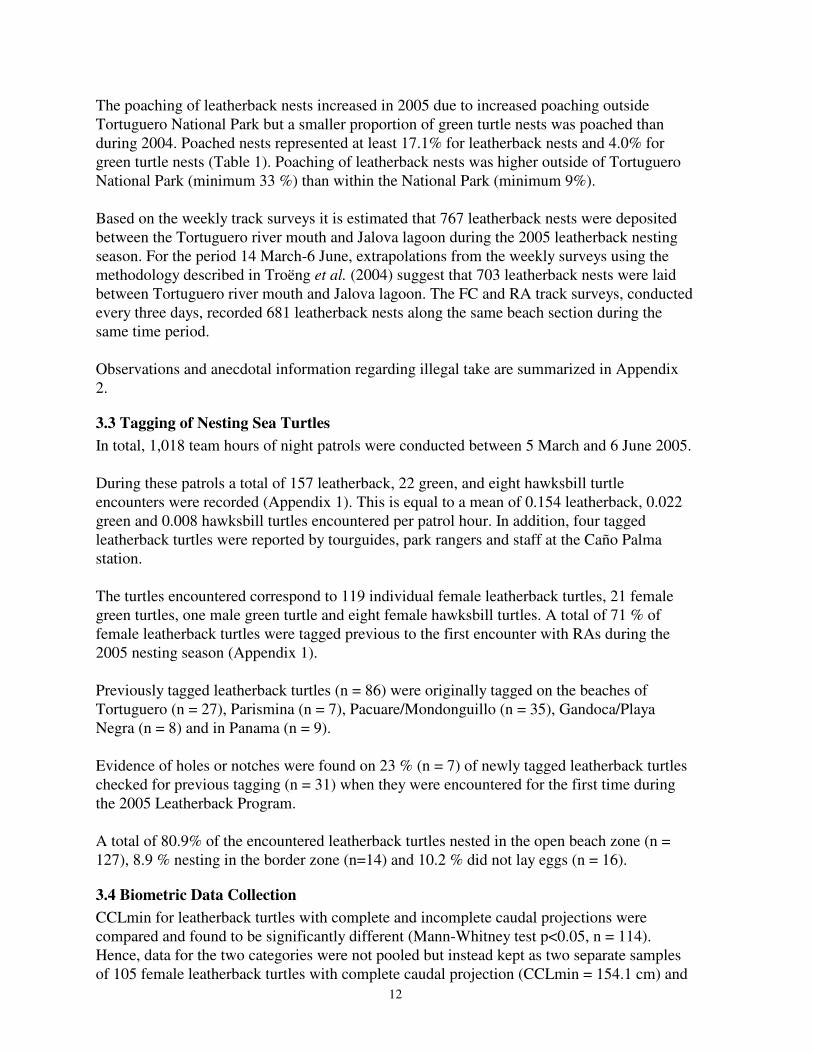
3.4 Biometric Data Collection CCLmin for leatherback turtles with complete and incomplete caudal projections were compared and found to be significantly different (Mann-Whitney test p<0.05, n = 114). Hence, data for the two categories were not pooled but instead kept as two separate samples of 105 female leatherback turtles with complete caudal projection (CCLmin = 154.1 cm) and
13
nine female leatherback turtles with incomplete caudal projection (CCLmin = 144.2 cm) (Table 2). Leatherback turtles sighted more than once (n = 25) had their caudal projection consistently identified as complete (n = 24) or consistently identified as incomplete (n = 1). Table 2. Mean carapace length and clutch size of leatherbacks. Carapace length _ Clutch size _
Caudal projection
n
_ ×××× CCLmin (cm) ± S.D.
n
×××× eggs ± S.D.
×××× yolkless eggs ± S.D.
Complete 105 154.1 ± 7.6 62 82 ± 18 29 ± 14 Incomplete 9 144.2 ± 7.5 5 69 ± 12 22 ± 6 Mean carapace length (CCLmin) for green turtles encountered during the 2005 Leatherback Program (n = 20) was 103.7 cm and the 4 clutches for which eggs were counts contained a mean of 59 eggs (Table 3). The eight hawksbill turtles that were measured had a mean carapace length (CCLmin) of 89.8 cm and the only hawksbill clutch contained 187 eggs (Table 3). Table 3. Mean carapace length and clutch size of green, hawksbill and loggerhead turtles. Species
n
_ Carapace length ×××× CCLmin (cm) ± S.D.
n
_ Clutch size ×××× eggs ± S.D.
Green 20 103.7 ± 4.7 4 89 ± 59 Hawksbills 8 89.8 ± 3.2 1 187 The precision of the CCLmin measurement during the same encounter was greater for leatherback and green than for hawksbill turtles (Table 4a). The precision of the CCLmin carapace measurements for leatherback turtles measured during more than one encounter was 1.2 cm for two encounters, 2.3 cm for three encounters and 2.6 cm for five encounters (Table 4b). Table 4a. Precision of carapace measurements. Species
n
_ ×××× precision for
CCLmin (cm) ± S.D. Leatherback 152 0.5 ± 0.4 Green 20 0.4 ± 0.3 Hawksbills 8 0.9 ± 0.4 Table 4b. Precision of carapace measurements for leatherbacks encountered more than once. Encounters
n
_ ×××× precision for
CCLmin (cm) ± S.D.
Range (cm)
2 15 1.2 ± 0.5 0.2-2.0 3 7 2.3 ± 1.2 1.0-4.1 4 N/A N/A N/A 5 2 2.6 ± 0.9 2.0-3.3
3.5 Determination of Nest Survivorship and Hatching Success Leatherback nests for females with complete caudal projection had a mean clutch size of 82 normal eggs and 29 yolkless eggs (Table 2). Nests laid by female leatherback turtles with incomplete caudal projection contained a mean of 69 normal eggs and 22 yolkless eggs
14
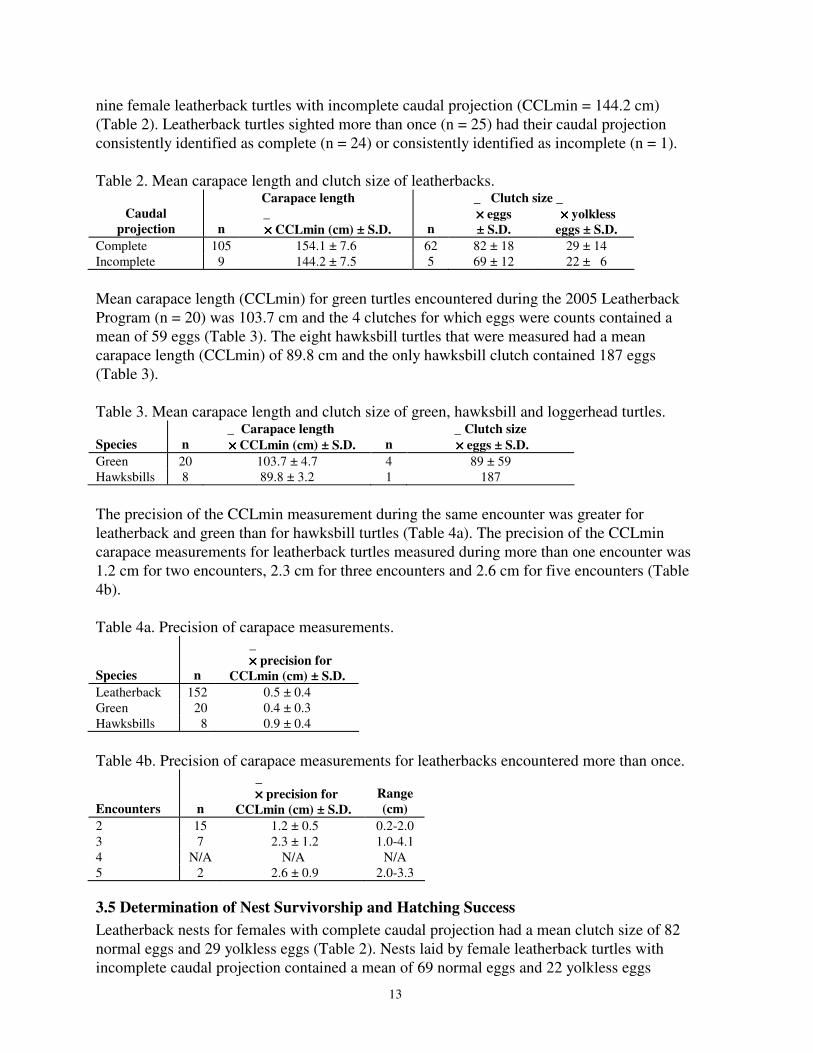
(Table 2). A total of 29 leatherback nests were marked between 20 March and 6 July 2005. Four nests could not be located for excavation and so were eliminated from further analysis. The incubation period for monitored leatherback nests for which emerging was observed (n = 7) varied between 55-87 days with a mean of 64 days. The fate, hatching and emerging successes of 25 marked and monitored leatherback nests are summarized in Table 5. Table 5. Fate, hatching and emerging success of marked leatherback nests. Fate n % of total Hatching success (%) Emerging success (%) Undisturbed 1. Undisturbed 18 72.0 32.8 32.0 Disturbed 2. Washed out after hatching 1 4.0 0.0-100 0.0-100 3. Poached 2 8.0 0.0 0.0 4. Unhatched 4 16.0 0.0 0.0
TOTAL 25 100 23.6 – 27.6 23.0 – 27.0
(5. Unknown 4) The total number of eggs for all marked nests is estimated at 1,853 eggs (74.1 x 21 + 74.3 x 4). Overall hatching success was 23.6 - 27.6 % for monitored leatherback nests (437-511 empty shells from 1,853 eggs). Emerging success for monitored leatherback nests is estimated at 23.0 – 27.0 % (427-501 emerged hatchlings from 1,853 eggs in 25 nests). Table 6. Results of nest excavations. Fate Empty
Shells Pipped eggs
Live hatchlings
Dead hatchlings
Unhatch. No embryo
Unhatch. Embryo
Unhatch. Full embryo
Depredated Destroyed Total eggs
_ × eggs/nest
Marked nests 1 437 0 4 6 396 240 156 102 3 1334 74.1 2 ? ? ? ? ? ? ? ? ? ? ? 3 0 0 0 0 0 0 0 0 0 N/A N/A 4 0 0 0 0 296 0 0 1 0 297 74.3
ALL 437 0 4 6 692 240 156 103 3 1631 74.1 Fate 1=Undisturbed, 2= Washed out after hatching, 3=Poached, 4 =Unhatched The distance from the sand surface to the top egg at the time of excavation for undisturbed nests (n = 18 ) varied between 35-79 cm with a mean of 56 cm. The distance from the sand surface to the bottom of the egg chamber for the same nests varied between 60-86 cm with a mean of 76 cm. There were three albino and one deformed embryos corresponding to 0.18 % and 0.06 % of eggs encountered during nest excavations, respectively.
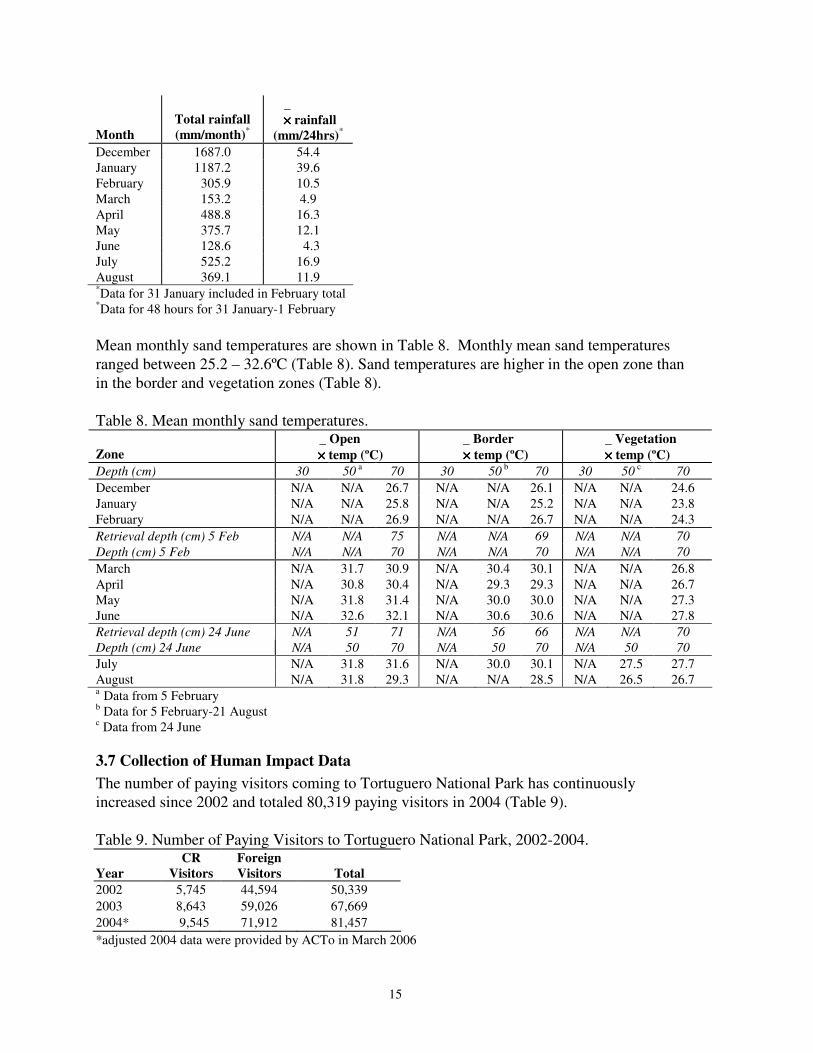
3.6 Physical Data Collection Rainfall during months with leatherback nesting (January-July) was heaviest in January (Table 7). June was the month with least rain (Table 7). Table 7. Rainfall, December 2004-August 2005.
15
Month
Total rainfall (mm/month)*
_ ×××× rainfall
(mm/24hrs)* December 1687.0 54.4 January 1187.2 39.6 February 305.9 10.5 March 153.2 4.9 April 488.8 16.3 May 375.7 12.1 June 128.6 4.3 July 525.2 16.9 August 369.1 11.9 *Data for 31 January included in February total *Data for 48 hours for 31 January-1 February Mean monthly sand temperatures are shown in Table 8. Monthly mean sand temperatures ranged between 25.2 – 32.6ºC (Table 8). Sand temperatures are higher in the open zone than in the border and vegetation zones (Table 8). Table 8. Mean monthly sand temperatures. Zone
_ Open ×××× temp (ºC)
_ Border ×××× temp (ºC)
_ Vegetation ×××× temp (ºC)
Depth (cm) 30 50 a 70 30 50 b 70 30 50 c 70 December N/A N/A 26.7 N/A N/A 26.1 N/A N/A 24.6 January N/A N/A 25.8 N/A N/A 25.2 N/A N/A 23.8 February N/A N/A 26.9 N/A N/A 26.7 N/A N/A 24.3 Retrieval depth (cm) 5 Feb N/A N/A 75 N/A N/A 69 N/A N/A 70 Depth (cm) 5 Feb N/A N/A 70 N/A N/A 70 N/A N/A 70 March N/A 31.7 30.9 N/A 30.4 30.1 N/A N/A 26.8 April N/A 30.8 30.4 N/A 29.3 29.3 N/A N/A 26.7 May N/A 31.8 31.4 N/A 30.0 30.0 N/A N/A 27.3 June N/A 32.6 32.1 N/A 30.6 30.6 N/A N/A 27.8 Retrieval depth (cm) 24 June N/A 51 71 N/A 56 66 N/A N/A 70 Depth (cm) 24 June N/A 50 70 N/A 50 70 N/A 50 70 July N/A 31.8 31.6 N/A 30.0 30.1 N/A 27.5 27.7 August N/A 31.8 29.3 N/A N/A 28.5 N/A 26.5 26.7 a Data from 5 February b Data for 5 February-21 August c Data from 24 June
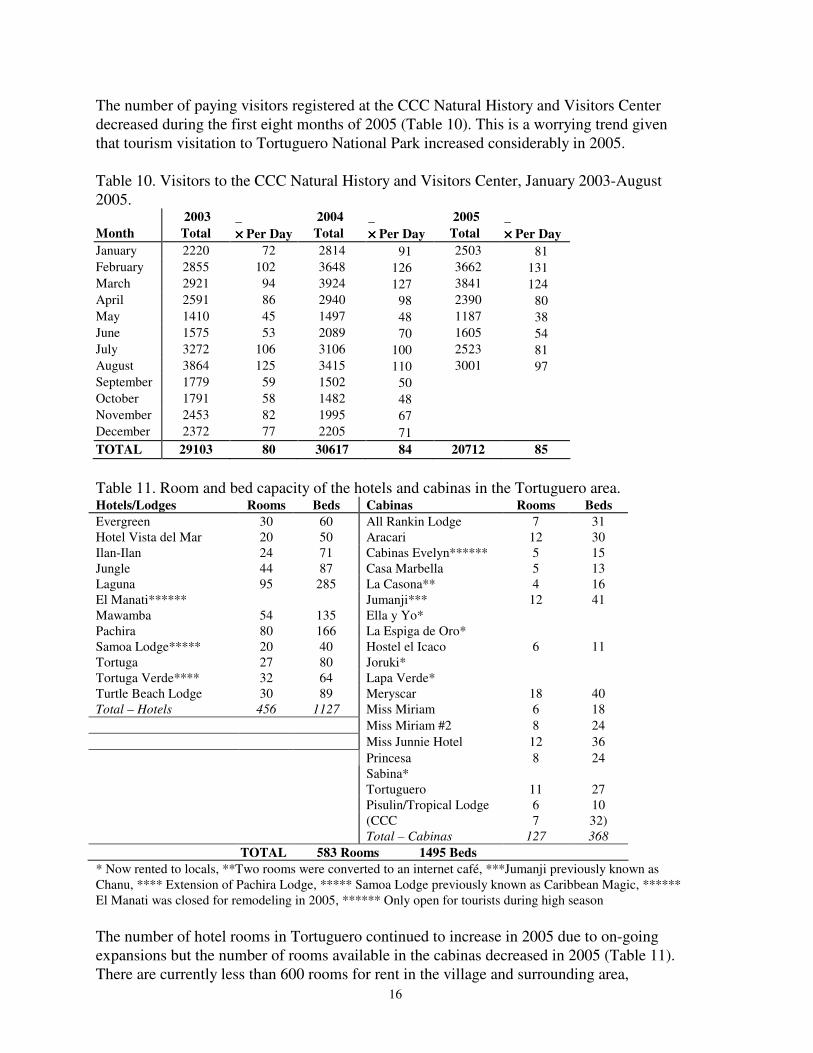
3.7 Collection of Human Impact Data The number of paying visitors coming to Tortuguero National Park has continuously increased since 2002 and totaled 80,319 paying visitors in 2004 (Table 9). Table 9. Number of Paying Visitors to Tortuguero National Park, 2002-2004. Year
CR Visitors
Foreign Visitors
Total
2002 5,745 44,594 50,339 2003 8,643 59,026 67,669 2004* 9,545 71,912 81,457 *adjusted 2004 data were provided by ACTo in March 2006
16
The number of paying visitors registered at the CCC Natural History and Visitors Center decreased during the first eight months of 2005 (Table 10). This is a worrying trend given that tourism visitation to Tortuguero National Park increased considerably in 2005. Table 10. Visitors to the CCC Natural History and Visitors Center, January 2003-August 2005. 2003 _ 2004 _ 2005 _ Month Total ×××× Per Day Total ×××× Per Day Total ×××× Per Day January 2220 72 2814 91 2503 81 February 2855 102 3648 126 3662 131 March 2921 94 3924 127 3841 124 April 2591 86 2940 98 2390 80 May 1410 45 1497 48 1187 38 June 1575 53 2089 70 1605 54 July 3272 106 3106 100 2523 81 August 3864 125 3415 110 3001 97 September 1779 59 1502 50 October 1791 58 1482 48 November 2453 82 1995 67 December 2372 77 2205 71 TOTAL 29103 80 30617 84 20712 85 Table 11. Room and bed capacity of the hotels and cabinas in the Tortuguero area. Hotels/Lodges Rooms Beds Cabinas Rooms Beds Evergreen 30 60 All Rankin Lodge 7 31 Hotel Vista del Mar 20 50 Aracari 12 30 Ilan-Ilan 24 71 Cabinas Evelyn****** 5 15 Jungle 44 87 Casa Marbella 5 13 Laguna 95 285 La Casona** 4 16 El Manati****** Jumanji*** 12 41 Mawamba 54 135 Ella y Yo* Pachira 80 166 La Espiga de Oro* Samoa Lodge***** 20 40 Hostel el Icaco 6 11 Tortuga 27 80 Joruki* Tortuga Verde**** 32 64 Lapa Verde* Turtle Beach Lodge 30 89 Meryscar 18 40 Total – Hotels 456 1127 Miss Miriam 6 18 Miss Miriam #2 8 24 Miss Junnie Hotel 12 36 Princesa 8 24 Sabina* Tortuguero 11 27 Pisulin/Tropical Lodge 6 10 (CCC 7 32) Total – Cabinas 127 368
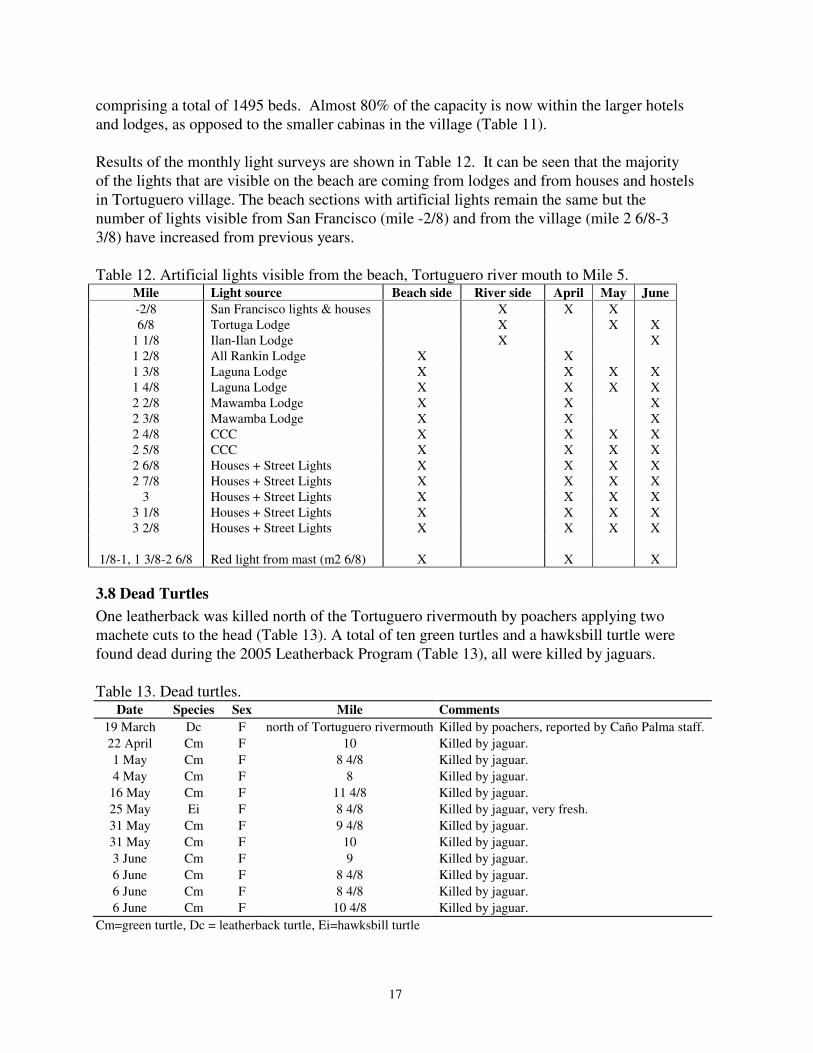
TOTAL 583 Rooms 1495 Beds * Now rented to locals, **Two rooms were converted to an internet café, ***Jumanji previously known as Chanu, **** Extension of Pachira Lodge, ***** Samoa Lodge previously known as Caribbean Magic, ****** El Manati was closed for remodeling in 2005, ****** Only open for tourists during high season The number of hotel rooms in Tortuguero continued to increase in 2005 due to on-going expansions but the number of rooms available in the cabinas decreased in 2005 (Table 11). There are currently less than 600 rooms for rent in the village and surrounding area,
17
comprising a total of 1495 beds. Almost 80% of the capacity is now within the larger hotels and lodges, as opposed to the smaller cabinas in the village (Table 11). Results of the monthly light surveys are shown in Table 12. It can be seen that the majority of the lights that are visible on the beach are coming from lodges and from houses and hostels in Tortuguero village. The beach sections with artificial lights remain the same but the number of lights visible from San Francisco (mile -2/8) and from the village (mile 2 6/8-3 3/8) have increased from previous years. Table 12. Artificial lights visible from the beach, Tortuguero river mouth to Mile 5.
Mile Light source Beach side River side April May June -2/8 San Francisco lights & houses X X X 6/8 Tortuga Lodge X X X
1 1/8 Ilan-Ilan Lodge X X 1 2/8 All Rankin Lodge X X 1 3/8 Laguna Lodge X X X X 1 4/8 Laguna Lodge X X X X 2 2/8 Mawamba Lodge X X X 2 3/8 Mawamba Lodge X X X 2 4/8 CCC X X X X 2 5/8 CCC X X X X 2 6/8 Houses + Street Lights X X X X 2 7/8 Houses + Street Lights X X X X
3 Houses + Street Lights X X X X 3 1/8 Houses + Street Lights X X X X 3 2/8 Houses + Street Lights X X X X
1/8-1, 1 3/8-2 6/8 Red light from mast (m2 6/8) X X X
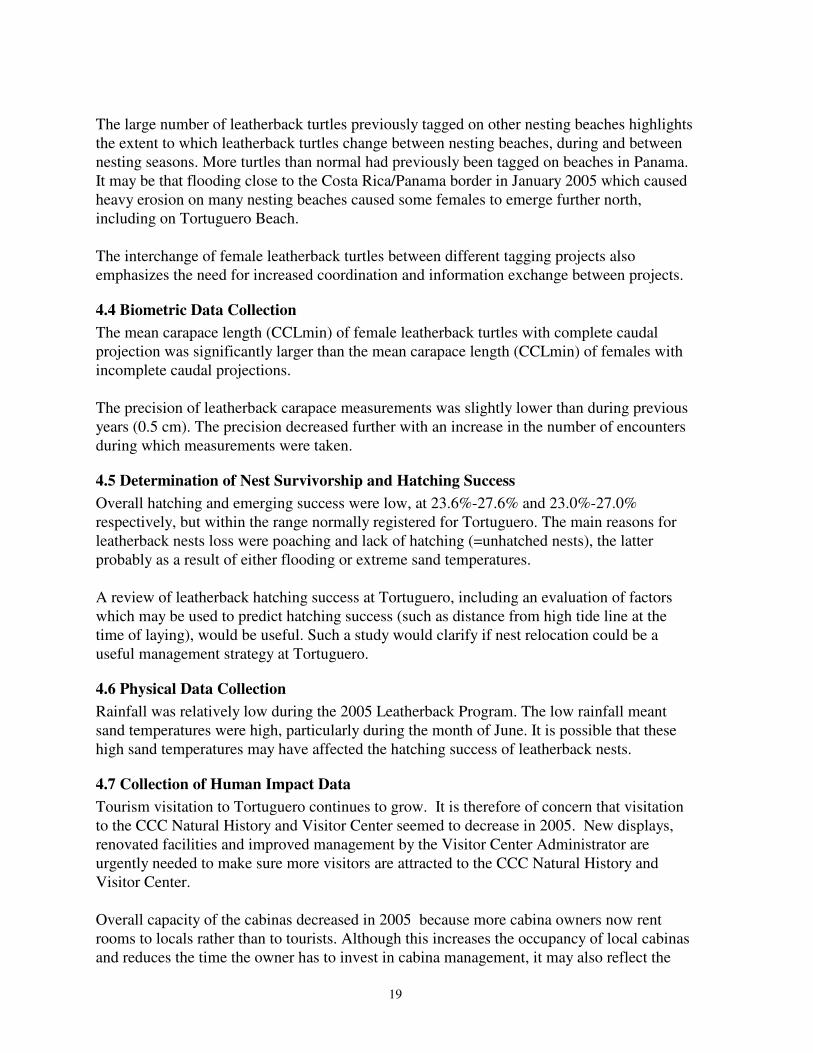
3.8 Dead Turtles One leatherback was killed north of the Tortuguero rivermouth by poachers applying two machete cuts to the head (Table 13). A total of ten green turtles and a hawksbill turtle were found dead during the 2005 Leatherback Program (Table 13), all were killed by jaguars. Table 13. Dead turtles.
Date Species Sex Mile Comments 19 March Dc F north of Tortuguero rivermouth Killed by poachers, reported by Caño Palma staff. 22 April Cm F 10 Killed by jaguar. 1 May Cm F 8 4/8 Killed by jaguar. 4 May Cm F 8 Killed by jaguar.
16 May Cm F 11 4/8 Killed by jaguar. 25 May Ei F 8 4/8 Killed by jaguar, very fresh. 31 May Cm F 9 4/8 Killed by jaguar. 31 May Cm F 10 Killed by jaguar. 3 June Cm F 9 Killed by jaguar. 6 June Cm F 8 4/8 Killed by jaguar. 6 June Cm F 8 4/8 Killed by jaguar. 6 June Cm F 10 4/8 Killed by jaguar.
Cm=green turtle, Dc = leatherback turtle, Ei=hawksbill turtle

18
3.9 Environmental Education Activities The FC and RA’s worked with students from the Tortuguero school and high school during the 2005 Leatherback Program. Training activities, including a beach clean-up, were organized for the high school students and later during the term a joint environmental education activity was implemented during which the high school students instructed and supervised the younger school students.
4. DISCUSSION
4.1 Preparations Replacing and painting mile markers along the entire beach is very hard work for the newly arrived RAs. The mile markers put up in March 2005, however, were absolutely indispensable for night-time patrols and track surveys by RAs and the track surveyor. In addition to the patrols of CCC personnel, the markers are often utilized by park rangers, and possibly by poachers, to locate themselves on the beach.
4.2 Track Surveys Leatherback nesting was observed from late January through early July with peak nesting during April (Figure 1). Track surveys conducted by the RC and RAs cover the period of heaviest leatherback nesting (Figure 1, Table 1). Estimated leatherback nesting was higher in 2005 than in 2004. However, the slightly decreasing nesting trend continues at Tortuguero (Figure 2). The two methods used for estimating the number of leatherback nests showed small differences. The small difference between counts could be the result of high tides erasing some of the tracks before the FC and the RAs could count them (Table 1). This could explain why the RC and RAs nest counts were slightly lower than the nest estimate derived from the results of the track surveyor (who only records fresh nests). Poaching of leatherback nests during the 2005 Leatherback Program was slightly higher than the levels of poaching seen in previous leatherback nesting seasons. Although this increase is discouraging, it is positive that poaching levels within Tortuguero National Park are much lower than those outside the park limits. The area south of Jalova lagoon still shows the highest levels of poaching (minimum of 33% in 2005), and it would be highly beneficial for the Tortuguero Conservation Area to commence a minimum patrol effort along that section of beach during future leatherback nesting seasons.
4.3 Tagging of Nesting Sea Turtles The period of tagging patrols from mid-March to mid-June coincides with the period of heaviest leatherback nesting (Figure 1) and it is suggested that night patrols be conducted during the same period in future years. The number of leatherback turtles encountered during nightly patrols (n = 157) was much greater than the encounters in 2004, as a result of increased patrol effort on behalf of the FC and RAs.
19
The large number of leatherback turtles previously tagged on other nesting beaches highlights the extent to which leatherback turtles change between nesting beaches, during and between nesting seasons. More turtles than normal had previously been tagged on beaches in Panama. It may be that flooding close to the Costa Rica/Panama border in January 2005 which caused heavy erosion on many nesting beaches caused some females to emerge further north, including on Tortuguero Beach. The interchange of female leatherback turtles between different tagging projects also emphasizes the need for increased coordination and information exchange between projects.
4.4 Biometric Data Collection The mean carapace length (CCLmin) of female leatherback turtles with complete caudal projection was significantly larger than the mean carapace length (CCLmin) of females with incomplete caudal projections. The precision of leatherback carapace measurements was slightly lower than during previous years (0.5 cm). The precision decreased further with an increase in the number of encounters during which measurements were taken.
4.5 Determination of Nest Survivorship and Hatching Success Overall hatching and emerging success were low, at 23.6%-27.6% and 23.0%-27.0% respectively, but within the range normally registered for Tortuguero. The main reasons for leatherback nests loss were poaching and lack of hatching (=unhatched nests), the latter probably as a result of either flooding or extreme sand temperatures. A review of leatherback hatching success at Tortuguero, including an evaluation of factors which may be used to predict hatching success (such as distance from high tide line at the time of laying), would be useful. Such a study would clarify if nest relocation could be a useful management strategy at Tortuguero.
4.6 Physical Data Collection Rainfall was relatively low during the 2005 Leatherback Program. The low rainfall meant sand temperatures were high, particularly during the month of June. It is possible that these high sand temperatures may have affected the hatching success of leatherback nests.
4.7 Collection of Human Impact Data Tourism visitation to Tortuguero continues to grow. It is therefore of concern that visitation to the CCC Natural History and Visitor Center seemed to decrease in 2005. New displays, renovated facilities and improved management by the Visitor Center Administrator are urgently needed to make sure more visitors are attracted to the CCC Natural History and Visitor Center. Overall capacity of the cabinas decreased in 2005 because more cabina owners now rent rooms to locals rather than to tourists. Although this increases the occupancy of local cabinas and reduces the time the owner has to invest in cabina management, it may also reflect the
20
fact that the hotels control most visitation to Tortuguero and also that there is an increased need for housing for people moving to the Tortuguero area. The increase in tourism means more constructions and more artificial lights, particularly around the hotels north of Tortuguero and in Tortuguero village. The custom to clear vegetation close to the beach also increases the visibility of the artificial lights on the nesting beach. Increased shading of artificial lights, by business and house owners, would therefore be highly desirable.
4.8 Dead Turtles The number of green turtles killed by jaguars during the 2005 Leatherback Program was normal but it was unfortunate that one of the few hawksbill turtles was killed by a jaguar (Table 13). The leatherback turtle killed by poachers north of the Tortuguero rivermouth was another unfortunate record (Table 13). According to local informants, the leatherback was killed by people living close to the nesting beach. It may have been an isolated event but it would be good to continue monitoring any dead turtles encountered during future Leatherback Programs to ensure more nesting leatherback turtles are not killed by poachers in the Tortuguero area.
4.9 Environmental Education Activities The environmental education events held at the Tortuguero school and high school were much appreciated by the school children, the teachers and the research assistants. The activities in which the older students were given the responsibility of instructing younger students were particularly successful and more such activities should be conducted during future leatherback programs.
5. REFERENCES Campbell, C.L., Lagueux, C.J., Mortimer, J.A. 1996. Leatherback turtle, Dermochelys
coriacea, nesting at Tortuguero, Costa Rica, in 1995. Chel. Cons. Biol. 2(2), 169-172. Carr, A., Carr, M.H., Meylan, A.B. 1978. The ecology and migrations of sea turtles, 7. The
west Caribbean green turtle colony. Bull. Amer. Mus. Nat. Hist. 162, 1-46. Troëng, S., Chacón, D., Dick, B. 2004. Possible decline in leatherback turtle Dermochelys
coriacea nesting along the coast of Caribbean Central America. Oryx 38(4), 395-403.
21
Figure 1. Seasonal distribution of leatherback nesting activity as determ
ined from track
surveys, Tortuguero riverm
outh (mile -3/8) - Jalova lagoon (m
ile 18).
0 5 10 15 20
15-Jan-05
22-Jan-05
29-Jan-05
5-Feb-05
12-Feb-05
19-Feb-05
26-Feb-05
5-Mar-05
12-Mar-05
19-Mar-05
26-Mar-05
2-Apr-05
9-Apr-05
16-Apr-05
23-Apr-05
30-Apr-05
7-May-05
14-May-05
21-May-05
28-May-05
4-Jun-05
11-Jun-05
18-Jun-05
25-Jun-05
2-Jul-05
9-Jul-05
16-Jul-05
23-Jul-05
30-Jul-05
Leatherback nests
22
Figure 2. Leatherback turtle nesting trend (Tortuguero rivermouth to Jalova lagoon).
0
500
1000
1500
2000
1995 1996 1997 1998 1999 2000 2001 2002 2003 2004 2005
Leat
herb
ack
nest
s
23
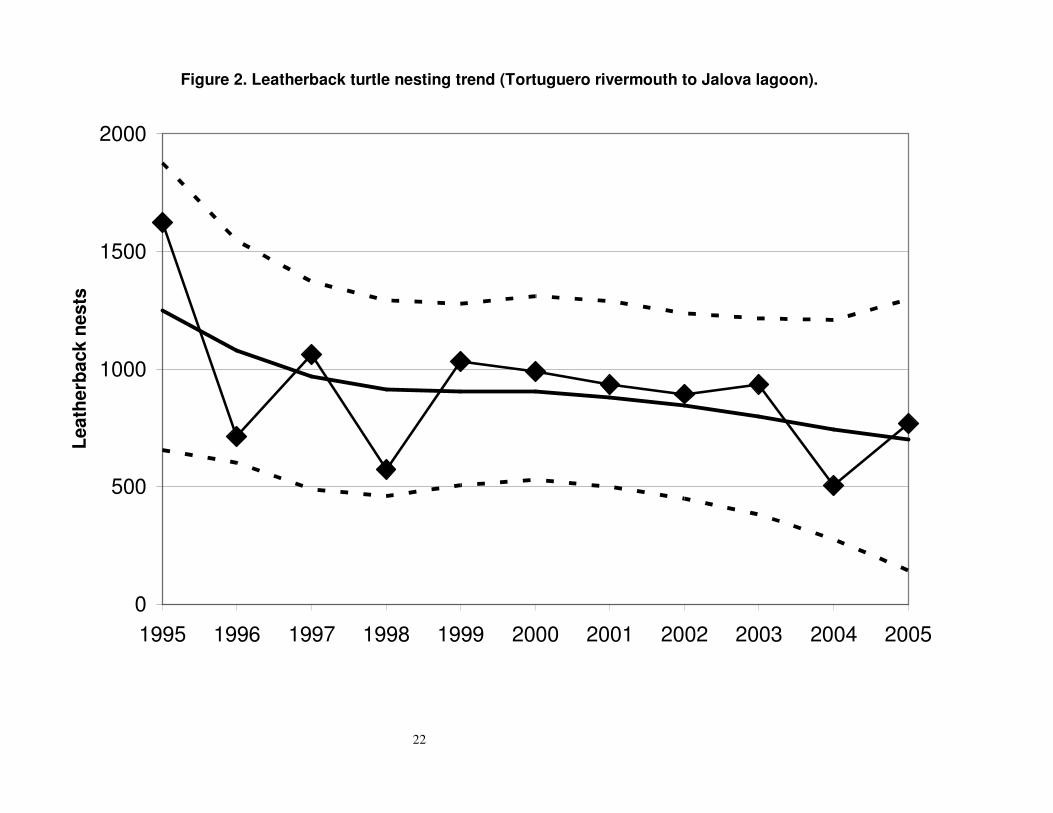
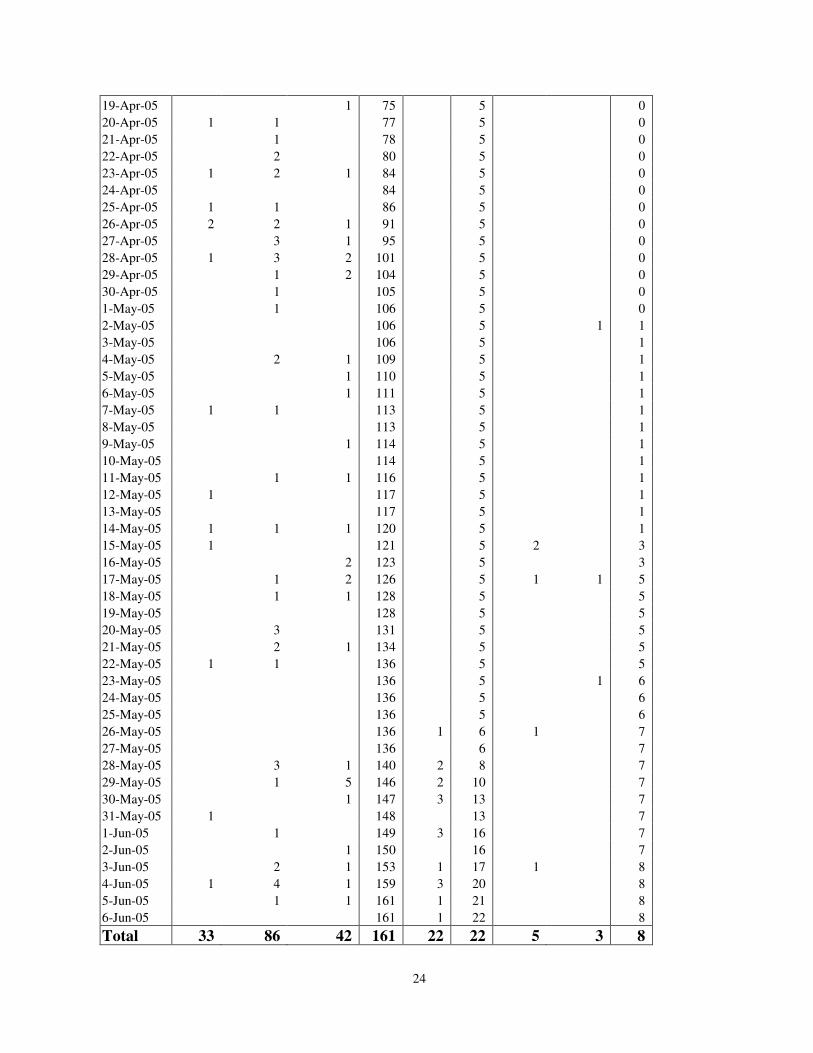
APPENDIX 1. SEA TURTLE ENCOUNTERS. Leatherbacks Greens Hawksbills
Date
Newly tagged turtles
Previous. tagged turtles
Renesters Total Newly tagged turtles
Total Newly tagged turtles
Previous. tagged turtles
Total
5-Mar-05 1 1 0 0 6-Mar-05 1 0 0 7-Mar-05 1 0 0 8-Mar-05 1 0 0 9-Mar-05 1 0 0 10-Mar-05 1 0 0 11-Mar-05 1 2 0 0 12-Mar-05 1 1 4 0 0 13-Mar-05 4 0 0 14-Mar-05 2 6 0 0 15-Mar-05 2 8 0 0 16-Mar-05 2 1 11 0 0 17-Mar-05 2 13 0 0 18-Mar-05 13 0 0 19-Mar-05 3 16 0 0 20-Mar-05 3 2 21 0 0 21-Mar-05 2 23 0 0 22-Mar-05 1 24 0 0 23-Mar-05 1 25 0 0 24-Mar-05 1 26 0 0 25-Mar-05 2 28 0 0 26-Mar-05 2 4 1 35 0 0 27-Mar-05 1 1 37 1 1 0 28-Mar-05 37 1 0 29-Mar-05 4 41 1 0 30-Mar-05 2 43 1 0 31-Mar-05 1 1 45 1 0 1-Apr-05 1 46 1 2 0 2-Apr-05 1 1 48 2 0 3-Apr-05 1 49 2 0 4-Apr-05 2 51 1 3 0 5-Apr-05 3 3 57 3 0 6-Apr-05 1 58 1 4 0 7-Apr-05 3 1 62 4 0 8-Apr-05 2 64 1 5 0 9-Apr-05 64 5 0 10-Apr-05 1 65 5 0 11-Apr-05 3 2 70 5 0 12-Apr-05 70 5 0 13-Apr-05 1 71 5 0 14-Apr-05 71 5 0 15-Apr-05 1 2 74 5 0 16-Apr-05 74 5 0 17-Apr-05 74 5 0 18-Apr-05 74 5 0
24
19-Apr-05 1 75 5 0 20-Apr-05 1 1 77 5 0 21-Apr-05 1 78 5 0 22-Apr-05 2 80 5 0 23-Apr-05 1 2 1 84 5 0 24-Apr-05 84 5 0 25-Apr-05 1 1 86 5 0 26-Apr-05 2 2 1 91 5 0 27-Apr-05 3 1 95 5 0 28-Apr-05 1 3 2 101 5 0 29-Apr-05 1 2 104 5 0 30-Apr-05 1 105 5 0 1-May-05 1 106 5 0 2-May-05 106 5 1 1 3-May-05 106 5 1 4-May-05 2 1 109 5 1 5-May-05 1 110 5 1 6-May-05 1 111 5 1 7-May-05 1 1 113 5 1 8-May-05 113 5 1 9-May-05 1 114 5 1 10-May-05 114 5 1 11-May-05 1 1 116 5 1 12-May-05 1 117 5 1 13-May-05 117 5 1 14-May-05 1 1 1 120 5 1 15-May-05 1 121 5 2 3 16-May-05 2 123 5 3 17-May-05 1 2 126 5 1 1 5 18-May-05 1 1 128 5 5 19-May-05 128 5 5 20-May-05 3 131 5 5 21-May-05 2 1 134 5 5 22-May-05 1 1 136 5 5 23-May-05 136 5 1 6 24-May-05 136 5 6 25-May-05 136 5 6 26-May-05 136 1 6 1 7 27-May-05 136 6 7 28-May-05 3 1 140 2 8 7 29-May-05 1 5 146 2 10 7 30-May-05 1 147 3 13 7 31-May-05 1 148 13 7 1-Jun-05 1 149 3 16 7 2-Jun-05 1 150 16 7 3-Jun-05 2 1 153 1 17 1 8 4-Jun-05 1 4 1 159 3 20 8 5-Jun-05 1 1 161 1 21 8 6-Jun-05 161 1 22 8 Total 33 86 42 161 22 22 5 3 8

25
APPENDIX 2: Observations and Anecdotal Information on Poaching Although poaching levels were relatively low throughout the season, on numerous occasions nests older than three days were found to have been poached. Old leatherback, green and hawksbill nests were observed poached during track surveys. Most of the poaching activity recorded during the 2005 Leatherback Program occurred between miles 7 – 18, within the limits of Tortuguero National Park. However, nests that were laid between miles 18 – 22 were even more frequently taken by poachers. This stretch of beach lies beyond the southern limit of the park, and hence receives no regular patrols from the park guards. Occasionally, people were observed on the beach during night patrols and track surveys. The observations suggest poaching continues to be a problem and also indicate that illegal activities of other types occur in the Tortuguero area.