
Report on operator training outcomes with multiple TSO ...
74
REPORT ON OPERATOR TRAINING OUTCOMES WITH MULTIPLE TSO SESSION HELD IN DTS IN WARSAW DELIVERABLE: D4.3 1 | 74 Report on operator training outcomes with multiple TSO session held in DTS in Warsaw D4.3
-
Upload
khangminh22 -
Category
Documents
-
view
6 -
download
0
Transcript of Report on operator training outcomes with multiple TSO ...

REPORT ON OPERATOR TRAINING OUTCOMES WITH MULTIPLE TSO SESSION HELD IN DTS IN WARSAW DELIVERABLE: D4.3
1 | 74
Report on operator training outcomes with multiple TSO
session held in DTS in Warsaw
D4.3
REPORT ON OPERATOR TRAINING OUTCOMES WITH MULTIPLE TSO SESSION HELD IN DTS IN WARSAW DELIVERABLE: D4.3
2 | 74
PROGRAMME H2020 COMPETITIVE LOW CARBON ENERGY 2017-2-SMART-GRIDS
GRANT AGREEMENT NUMBER 773505
PROJECT ACRONYM EU-SYSFLEX
DOCUMENT D4.3
TYPE (DISTRIBUTION LEVEL) ☒ Public
☐ Confidential
☐ Restricted
DUE DELIVERY DATE 30/04/2021
DATE OF DELIVERY …………………
STATUS AND VERSION
NUMBER OF PAGES 74
Work Package / TASK RELATED WP4 / Task 4.2
Work Package / TASK RESPONSIBLE Conor O’Byrne (SONI) / Jacek Wasilewski (PSE/PSEI)
AUTHOR (S) Main document authors: Jacek Wasilewski (PSEI), Mateusz Skwarski
(PSEI), Artur Mirowski (PSEI), Abhimanyu Kaushal (KUL), Simon
Nagels (KUL), Dirk Van Hertem (KUL), Sebastian Wende von Berg
(Fraunhofer)
DOCUMENT HISTORY
VERS ISSUE DATE CONTENT AND CHANGES
1.0 30/03/2021 First draft
1.1 13/04/2021 Including internal revisions by A. Kushal and
Dirk Van Hertem
1.2 19/04/2021 Including minor changes and comments by WP
lead
1.3 23/04/2021 Addressed WP lead comments and changes
DOCUMENT APPROVERS
PARTNER APPROVER
SONI Conor O’Byrne (WP Lead)
EDF Marie Ann Evans (EU SysFlex Technical Manager)
EirGrid John Lowry (EU SysFlex Project Co-Ordinator)

REPORT ON OPERATOR TRAINING OUTCOMES WITH MULTIPLE TSO SESSION HELD IN DTS IN WARSAW DELIVERABLE: D4.3
3 | 74
TABLE OF CONTENTS
EXECUTIVE SUMMARY ............................................................................................................................................................................... 9 1. OVERALL STRUCTURE OF SIMULATION STUDY-CASES .......................................................................................................................... 11 2. SCOPE OF INTEREST OF CONTINENTAL EUROPE POWER SYSTEM MODEL ............................................................................................. 14 3. OPERATION SCENARIOS ....................................................................................................................................................................... 16 4. STUDY-CASE METHODOLOGY ............................................................................................................................................................... 20
4.1 DAY-AHEAD TSO-DSO COORDINATION ................................................................................................................................................... 20 4.1.1 OVERVIEW OF THE GERMAN USE-CASE AND RELATED OPTIMISATION (DETERMINATION OF FLEXIBILITIES) ............................... 20 4.1.2 SMALL-SCALE SIMULATION ............................................................................................................................................................. 21 4.1.3 ALGORITHM .................................................................................................................................................................................... 22
4.2 DAY-AHEAD CROSS-BORDER COORDINATION ........................................................................................................................................ 23 4.2.1 EXPERT-BASED APPROACH ............................................................................................................................................................. 23 4.2.2 OPTIMIZATION-BASED APPROACH ................................................................................................................................................. 25
4.3 INTRADAY Q/V MANAGEMENT............................................................................................................................................................... 28 4.3.1 EXPERT-BASED APPROACH ............................................................................................................................................................. 29 4.3.2 OPTIMIZATION-BASED APPROACH ................................................................................................................................................. 29
4.4 REAL-TIME OPERATION........................................................................................................................................................................... 35 5. STUDY-CASE RESULTS .......................................................................................................................................................................... 37
5.1 DAY-AHEAD TSO-DSO COORDINATION ................................................................................................................................................... 37 5.2 DAY-AHEAD CROSS-BORDER COORDINATION ........................................................................................................................................ 38 5.3 INTRADAY Q/V MANAGEMENT............................................................................................................................................................... 41 5.4 REAL-TIME OPERATION........................................................................................................................................................................... 43
5.4.1 SUMMER DAY ................................................................................................................................................................................. 43 5.4.2 WINTER DAY 2................................................................................................................................................................................. 51
6. CONCLUSIONS ..................................................................................................................................................................................... 64 7. LITERATURE ......................................................................................................................................................................................... 69 APPENDIX ................................................................................................................................................................................................ 70
AGENDA OF DTS SESSION ............................................................................................................................................................................. 70 LIST OF ATTENDEES IN DTS SESSION ............................................................................................................................................................. 71 SAMPLES OF DECISION SUPPORT TOOL OUTPUT ......................................................................................................................................... 73

REPORT ON OPERATOR TRAINING OUTCOMES WITH MULTIPLE TSO SESSION HELD IN DTS IN WARSAW DELIVERABLE: D4.3
4 | 74
LIST OF FIGURES
FIGURE 1. STRUCTURE OF SIMULATION STUDY-CASES. ............................................................................................................................ 11
FIGURE 2. TASK ACTIVITIES AND THEIR INPUT. ........................................................................................................................................ 13
FIGURE 3. SCOPE OF INTEREST FOR CE POWER SYSTEM MODEL............................................................................................................... 14
FIGURE 4. SUMMER DAY OPERATION SCENARIO PROFILE. ....................................................................................................................... 18
FIGURE 5. WINTER DAY 1 OPERATION SCENARIO PROFILE. ...................................................................................................................... 18
FIGURE 6. WINTER DAY 2 OPERATION SCENARIO PROFILE. ...................................................................................................................... 19
FIGURE 7. IDEA OF GERMAN DEMONSTRATOR. ....................................................................................................................................... 20
FIGURE 8. ACTIVE AND REACTIVE FLEXIBILITY POTENTIALS FOR A GRID GROUP. ...................................................................................... 21
FIGURE 9. USE OF AGGREGATED FLEXIBILITIES. ........................................................................................................................................ 23
FIGURE 10. SCHEME OF THE CURRENT PROCESS OF CROSS-BORDER ACTIONS. ........................................................................................ 24
FIGURE 11. DIAGRAM OF THE EXPERT-BASED APPROACH FOR CONGESTION MANAGMENT ACTIONS. .................................................... 25
FIGURE 12. SCHEME OF THE PROPOSED CROSS-BORDER ACTIONS. .......................................................................................................... 26
FIGURE 13. INTERPRETATION OF Q/V INTRADAY SCHEDULING WITH THE USE OF DST. ............................................................................ 28
FIGURE 14. OVERVIEW OF DECISION SUPPORT TOOL. .............................................................................................................................. 30
FIGURE 15. PREVENTIVE AND CORRECTIVE CONTROL ACTIONS. .............................................................................................................. 30
FIGURE 16. MINIMUM REDISPATCH W.R.T. OPTIMAL STATE. ................................................................................................................... 34
FIGURE 17. RESULTS OF THE CONGESTION MANAGEMENT USING DAY-AHEAD TSO-DSO COORDINATION FOR WINTER DAY 2. ............... 37
FIGURE 18. REULTS OF REDISPATCHING COST PER COUNTRY FOR WINTER DAY 1. ................................................................................... 38
FIGURE 19. REULTS OF REDISPATCHING POWER PER COUNTRY FOR WINTER DAY 1. ............................................................................... 39
FIGURE 20. REULTS OF REDISPATCHING COST PER COUNTRY FOR SUMMER DAY. .................................................................................... 39
FIGURE 21. REULTS OF REDISPATCHING POWER PER COUNTRY FOR SUMMER DAY. ................................................................................ 40
FIGURE 22. REULTS OF REDISPATCHING ACTIVE POWER. ......................................................................................................................... 42
FIGURE 23. RESULTS OF REDISPATCHING REACTIVE POWER. ................................................................................................................... 43
FIGURE 24. SUMMER DAY SCENARIO APPLIED TO DTS. ............................................................................................................................ 44
FIGURE 25. HEAT MAP PRESENTING THE SPATIAL DISTRIBUTION OF PV GENERATION IN SUMMER DAY. ................................................ 45
FIGURE 26. VIEW ON EHV EUROPEAN NETWORK AT THE BEGINNIG OF THE DTS SIMULATION (SUMMER DAY). ...................................... 46
FIGURE 27. VIEW ON EHV AND HV NETWORK (IN POLAND) AT THE BEGINNIG OF THE DTS SIMULATION (SUMMER DAY). ...................... 46
FIGURE 28. LFC PARAMETERS DURING STEADY-SATE OPERATION OF POWER SYSTEM (SUMMER DAY). .................................................. 47
FIGURE 29. LFC PARAMETERS AFTER SOLAR ECLIPSE STARTED (SUMMER DAY). ...................................................................................... 48
FIGURE 30. TRIPPING THE BIGGEST GENERATION UNIT OPERATING IN POLISH POWER SYSTEM. ............................................................. 48
FIGURE 31. FREQUENCY AND ACE CHARTS AFTER THE EVENT OF TRIPPING GENERATOR. ........................................................................ 49
FIGURE 32. DIAGRAM OF SECONDARY VOLTAGE CONTROL SYSTEM FOR ŻARNOWIEC SUBSTATION. ....................................................... 49
FIGURE 33. CHANGE OF TAP POSITIONS IN PHASE-SHIFTERS LOCATED IN MIKUŁOWA SUBSTATION. ....................................................... 50
FIGURE 34. VIEW ON CENTRAL EASTERN EUROPEAN TRANSMISSION NETWORK WITH CONGESTED CROSS-BORDER LINES (WHITE BOLD
LINES). ..................................................................................................................................................................................................... 50
FIGURE 35. DTS VIEW ON HVDC SWEPOL LINK OPERATION. .................................................................................................................... 51
FIGURE 36. WINTER DAY 2 SCENARIO APPLIED TO DTS. ........................................................................................................................... 52
FIGURE 37. HEAT MAP PRESENTING THE SPATIAL DISTRIBUTION OF WIND GENERATION IN WINTER DAY 2. ........................................... 52
FIGURE 38. LOCATION OF BESS IN POLAND CONSIDERED IN WINTER DAY 2. ............................................................................................ 53
FIGURE 39. VIEWS ON EHV NETWORK IN POLISH POWER SYSTEM AT THE BEGINNIG OF THE DTS SIMULATION (WINTER DAY 2). ............ 54
FIGURE 40. HIGHLY OVERLOADED 110KV LINE IN THE NORTERN PART OF POLAND (LEFT SIDE, IN MAGENTA) AND RESOURCES
PROVIDING SERVICES FOR CONGESTION MANAGEMENT (RIGHT SIDE, WIND FARM AND BESS) (10:15 A.M.). ......................................... 54
FIGURE 41. OVERLOADED 110KV LINES (YELLOW AND MAGENTA) IN THE NORTH-EASTERN PART OF POLISH POWER SYSTEM
(10:45 A.M.). ........................................................................................................................................................................................... 55
FIGURE 42. LFC PARAMETERS DURING STEADY-SATE OPERATION OF POWER SYSTEM (WINTER DAY 2, 10:45 A.M.). .............................. 55
FIGURE 43. VIEW ON REAL-TIME CONTROL PANEL OF CM SERVICES BEFORE ANY DISAPTCHER ACTIONS................................................. 56
FIGURE 44. VIEW ON REAL-TIME CONTROL PANEL OF CM SERVICES AFTER NOMINATION AND ACTIVATION. .......................................... 57

REPORT ON OPERATOR TRAINING OUTCOMES WITH MULTIPLE TSO SESSION HELD IN DTS IN WARSAW DELIVERABLE: D4.3
5 | 74
FIGURE 45. OVERLOADED 110KV LINES IN THE NORTH-EASTERN PART OF POLISH POWER SYSTEM AND THE RESOURCES PROVIDING CM
SERVICE (11:20 A.M.). .............................................................................................................................................................................. 57
FIGURE 46. LFC PARAMETERS DURING STEADY-SATE OPERATION OF POWER SYSTEM (WINTER DAY 2, 11:45 A.M.). .............................. 58
FIGURE 47. OVERLOADED 110KV LINES IN THE NORTHERN PART OF POLISH POWER SYSTEM (MAGENTA AND YELLOW COLOR)
(12:50 P.M.). ............................................................................................................................................................................................ 59
FIGURE 48. LFC PARAMETERS DURING BALANCING PROBLEM IN THE POWER SYSTEM (WINTER DAY 2, 1:00 P.M.). ................................ 59
FIGURE 49. STATE OF EHV NETWORK IN THE NORTHERN PART OF POLISH POWER SYSTEM JUST BEFORE TRIPPING HVDC SWEPOL LINK 60
FIGURE 50. STATE OF EHV NETWORK IN THE NORTHERN PART OF POLISH POWER SYSTEM JUST AFTER TRIPPING HVDC SWEPOL LINK
(OVERVOLTAGES IN SUBSTATIONS). ........................................................................................................................................................ 60
FIGURE 51. STATE OF EHV NETWORK IN THE NORTHERN PART OF POLISH POWER SYSTEM AFTER TRIPPING HVDC SWEPOL LINK
(UNDERVOLTAGES IN SUBSTATIONS). ...................................................................................................................................................... 61
FIGURE 52. BLACKOUT STATE IN THE POLISH POWER SYSTEM AFTER THE VOLTAGE COLLAPSE (DEENERGIZED ELEMENTS MARKED IN
GREY, 1:20 P.M.). ..................................................................................................................................................................................... 61
FIGURE 53. LFC PARAMETERS AFTER VOLTAGE COLLAPSE IN THE POLISH POWER SYSTEM (WINTER DAY 2, 1:30 P.M.). ........................... 62
FIGURE 54. ENERGIZING SŁUPSK (SLK) SUBSTATION (LEFT SIDE) AND OPERATION OF HYDRO-PUMP POWER UNITS (RIGHT SIDE)
(1:50 P.M.). .............................................................................................................................................................................................. 63
FIGURE 55. RESTORING DISTRIBUTION SYSTEM NEAR ŻARNOWIEC SUBSTATION. ................................................................................... 63

REPORT ON OPERATOR TRAINING OUTCOMES WITH MULTIPLE TSO SESSION HELD IN DTS IN WARSAW DELIVERABLE: D4.3
6 | 74
LIST OF TABLES
TABLE 2-1: RES-E’S CAPACITIES CONSIDERED IN USE-CASES. .................................................................................................................... 15
TABLE 2-2: BATTERY ENERGY STORAGE SYSTEMS CONSIDERED IN POLISH POWER SYSTEM. .................................................................... 15
TABLE 4-1: BRIEF OVERVIEW OF THE OPTIMIZATION FUNCTIONALITIES OF THE ONLINE CONTROL CENTER OPTIMIZATION TOOL. .......... 22
TABLE 5-1: TOTAL COSTS OF REDISPATCHING. ......................................................................................................................................... 40
TABLE 5-2: TOTAL ACTIVATED POWER OF REDISPATCHING. ..................................................................................................................... 40
TABLE 5-3. VOLTAGE VIOLATIONS FOR OPTIMISATION- AND EXPERT-BASED APPROACH......................................................................... 41
TABLE 5-4 TOTAL COSTS OF REDISPATCHING ........................................................................................................................................... 43
REPORT ON OPERATOR TRAINING OUTCOMES WITH MULTIPLE TSO SESSION HELD IN DTS IN WARSAW DELIVERABLE: D4.3
7 | 74
ABBREVIATIONS AND ACRONYMS
ACE Area Control Error
ATC Available Transfer Capacity
BESS battery energy storage system
CB critical branches
CCR Capacity Calculation Region
CDGU centrally dispatched generation unit (in PSE’s nomenclature)
CM congestion management
CO critical outage
CXBCM Coordinated Cross-Border Congestion Management
D2CF Two Days Ahead Congestion Forecast
DA day-ahead
DACF Day-ahead Congestion Forecast
DSO Distribution System Operator
DSR demand side response
DST Decision Support Tool
DTS Dispatcher Training Simulator
EHV extra high voltage
EMS energy management system
ENS Energy Not Served
FB flow-based
FCR Frequency Containment Reserve
FRR Frequency Restoration Reserve
FSP flexibility provider
HV high voltage
ID intraday
IDCF Intraday Congestion Forecast
KUL University of Leuven, Belgium
LFC load-frequency controller
LODF line outage distribution factor
LV low voltage
MRA Multilateral Remedial Actions
MV medium voltage
NPDC National Power Dispatching Centre in Polish power system
PSE Polskie Sieci Elektroenergetyczne – Polish TSO
PST phase shifter
PTDF Power Transfer Distribution Factor
PV photovoltaics
Q/V reactive power and voltage
RES-E electricity from renewable energy sources
RPDC Regional Power Dispatching Centre in Polish power system
SCOPF Security constrained optimal power flow
SCUC security constraint unit commitment
SNSP System Non-synchronous Penetration

REPORT ON OPERATOR TRAINING OUTCOMES WITH MULTIPLE TSO SESSION HELD IN DTS IN WARSAW DELIVERABLE: D4.3
8 | 74
TSO Transmission System Operator
XB cross-border
XBR cross-border redispatching

REPORT ON OPERATOR TRAINING OUTCOMES WITH MULTIPLE TSO SESSION HELD IN DTS IN WARSAW DELIVERABLE: D4.3
9 | 74
EXECUTIVE SUMMARY
The EU-SysFlex project seeks to enable the pan-European power system to utilise efficient, coordinated
flexibilities in order to integrate a large share of renewable energy sources. Work Package 4 aims to develop tools
and procedures to accompany system operators with new operating practices as required by the introduction of
new system services.
Within this Work Package, Task 4.2 is responsible for simulation of selected transmission system operators (TSO)
processes using new system services and technologies as power system flexibility providers. For that purpose, a
sequence of logically consistent TSO planning and dispatching processes has been considered, starting from day-
ahead power system balancing and ending to real-time operation. Within the considered TSO processes a few
study-cases have been designed in order to emphasize the challenges and possible solutions for operators in near
future. The following study-cases have been analysed:
• Day-ahead flexibility TSO-DSO coordination (TSO-DSO study-case),
• Day-ahead cross-border coordination (DA-XB study-case),
• Intraday Q/V management (ID-Q/V study-case),
• Real-time operation (RT study-case).
Different tools have been applied for simulations to support the study-cases considered. DIgSILENT PowerFactory
software has been used in planning steps as a power system analysis tool for load flow and contingency
calculations especially. New optimisation tools have been applied in two study-cases related to the TSO planning
processes, i.e. DA-XB and ID-Q/V study-cases. In the former, a cost-sharing based optimisation method has been
developed by the National Nuclear Research Centre and practically implemented in the tool. The ID-Q/V study-
case utilizes a new Decision Support Tool developed by KU Leuven and VITO (as Energyville research
collaboration) (EU-SysFlex-D4.1, 2019). This tool utilises a probabilistic optimisation approach and provides both
predictive and corrective actions to the operator. One of the main tools is the Dispatcher Training Simulator
based on ARISTO environment (DTS-ARISTO). It has been developed by PSE and PSE Innowacje in order to explore
the challenges in training the system operators, considering the emergent challenges of a high share of renewable
energy sources for electricity (RES-E) as well as availability of new system services. The DTS has been utilized in a
RT study-case, where the simulation of real-time power system operation is demonstrated.
The study-case of day-ahead TSO-DSO coordination has demonstrated the proof of concept for the congestion
management in the transmission grid. The day-ahead TSO-DSO coordination method proposed within the German
demonstrator provides the alternative for TSOs in terms of congestion management, introducing novelty in the
field of using flexibility that can be leveraged from the DSO grid.
Centrally optimised coordination of the congestion management process among European TSOs is feasible for
large-scale systems. Additionally, a new means of applying the tool developed by NCNR for coordinated cross-
border congestion management has been demonstrated. It has been shown to be possible to optimally pre-select

REPORT ON OPERATOR TRAINING OUTCOMES WITH MULTIPLE TSO SESSION HELD IN DTS IN WARSAW DELIVERABLE: D4.3
10 | 74
the locations in which new PSTs would have the highest potential of reducing the cost of congestion management
or the severity of congestions.
The study-case of intraday Q/V management has shown a great value of optimisation-based approach utilising
the developed Decision Support Tool. Lower system costs and lower absolute redispatch volumes have been
achieved in comparison to the expert-based method.
The RT study case has shown the strong need for dispatchers to have access to flexibility resources. This flexibility
is related to both the provision of ongoing system balancing and RT congestion management process. During the
DTS session the importance of an automatic product activation or decision support before manual activation was
apparent. The value of making decisions based on data about future time periods (forecasts) was also
emphasized. In general, there is a need to implement semi-automatic approach to operate the power-system,
reducing manual actions by dispatchers if possible. It is noted that there should be still human-supervision giving
an option to switch into manual mode of operation if an emergency should occur. The session has also proved
that DTS-class tools are essential for system operators. DTS tools give TSO’s and DSO’s dispatchers many
opportunities, such as:
• preparation for extreme operational situations when operators may have to protect and/or restore the
power system,
• testing and learning how to use (activation phase) flexibility services provided by different kinds of
resources (DER, inverter-based, synchronous),
• testing and learning how to use system-level special protection schemes, automation systems and
decision support tools.
Further development of DTS tools should make them capable of representing much faster system phenomena,
such as fast frequency response or dynamic voltage support. DTS tools should also be developed into open-source
packages.

REPORT ON OPERATOR TRAINING OUTCOMES WITH MULTIPLE TSO SESSION HELD IN DTS IN WARSAW DELIVERABLE: D4.3
11 | 74
1. OVERALL STRUCTURE OF SIMULATION STUDY-CASES
All the study-cases investigated consider the short-term horizon, starting from day-ahead planning and ending
with real-time operation. The overall structure of simulation study-cases including the considered operator
processes is shown in Figure 1.
FIGURE 1. STRUCTURE OF SIMULATION STUDY-CASES.
In the DA horizon, one can distinguish three operator processes:
• Preparing input time series,
• DA balancing,
• DA congestion management.
The first of these processes is the preparation of time series which are the input to create the power system
operation scenarios. The preparation of input time series includes forecasting both power demand and non-
dispatchable generation as well as determining the international power exchange based on market transactions.
Three separate days are considered as study cases in the DA horizon: two winter days and one summer day. Each
of them has specific demand profile, RES-E generation level and ambient temperature affecting available network
capacity. In the next process, the power system is balanced by the units which participate actively in the balancing
market providing all the required reserve capacity for power and frequency regulation. In this step of the
sequence of operator processes, the power system is balanced, but the transmission network may not conform to
security standards. Congestion is expected both within a given country’s transmission network and in the vicinity
of cross-border connections.
In order to resolve the forecast congestion, DA congestion management methods focussing on relieving both
internal and cross-border congestions have been investigated in two study-cases. The TSO-DSO study-case
assumes congestions will periodically occur in the German transmission system during times of high wind and
photovoltaic generation. Such congestion problems have been shown to be solved using resources connected to
XB coordination (DACF) :• Expert based• Cost-sharing based
optimization
Preparing input
time seriesDA balancing
DA congestion
management• winter day 1• winter day 2• summer day
DA-XB study-case
TSO-DSO flexibililty coordination in German power network
TSO-DSO study-case
Update on input
time series
• winter day 1• winter day 2• summer day
Real-time
dispatching
Real-time power system operation
RT study-case
D-1 D
Intraday
coordination
Intraday Q/V management:• As usual• Using decision
support tool
ID-Q/V study-case

REPORT ON OPERATOR TRAINING OUTCOMES WITH MULTIPLE TSO SESSION HELD IN DTS IN WARSAW DELIVERABLE: D4.3
12 | 74
the 110kV distribution network and providing flexibility services. This study-case refers to the functionalities
presented in the German demonstrator in WP6. The cross-border (XB) study case considers problems related to
congestion management which can be solved by TSOs in the day-ahead congestion forecast process (DACF). Such
XB congestions result from discrepancies between the market solution and the physical flows (unscheduled
flows). Firstly, the XB congestion problems are solved using phase shifters (PSTs). If this is not enough, TSOs
coordinate redispatch of generation units. In Task 4.2, two approaches to XB congestion management have been
investigated. One of them is the expert-based approach supported by the standard power system analysis tools.
The second approach is to apply the cost-sharing based optimisation tool which was developed by NCNR within
Task 4.1 (EU-SysFlex-D4.1, 2019).
Simulations in the intraday (ID) horizon deal with two processes: ID coordination and real-time (RT) dispatching.
In the former, the study-case focuses on the reactive power and voltage (Q/V) management. In this study-case,
the optimisation-based decision support tool developed by KU Leuven and VITO has been utilized and compared
to the current approach, that is, expert staff making decisions based on experience and best practice. The latter
process engages DTS-ARISTO to simulate the operation of CE power system. This is the aim of the RT study-case in
which different aspects have been studied, such as balancing, congestion, voltage management and even black-
start.
A flow chart illustrating the activities performed in Task 4.2 is presented in Figure 2. The activities providing the
input data are not part of Task 4.2 (other work packages and other tasks). The rest of the activities have been
performed directly in Task 4.2 and can be divided into two groups: Preparation works and Study-cases.
The input data come from:
• Task 4.1 – providing the optimisation methods and tools,
• WP6 (German demo) – main assumptions of demonstrator, within the active power flexibilities connected
in the HV distribution grid,
• WP2 – scenarios for energy resource technology, RES-E capacity, demand, market flows,
• WP3 – specification of innovative services and products, especially for congestion management.
Preparation works have started to extend the present-day Continental Europe (CE) model in PowerFactory (PF).
The developed CE model implements one of the capacity scenarios for 2030 including the low inertia Thevenin
equivalents agreed in (EU-SysFlex-MS7, 2018). The scope of interest of the CE model is presented in Section 2.
Then, the CE model has been extended in the DTS-ARISTO to be unified with the model developed in PF. Based on
the CE model, future scenarios based on the available numerical weather data (EU-SysFlex-MS6, 2019) were
developed, and the input time series have been prepared. After power balancing, the operation scenarios for DA
planning purpose were ready. For ID planning and RT operation, the demand and RES-E generation have been
modified mimicking a change of forecasts and replicating the real-time behaviour of RES-E output. More details
about operation scenarios can be found in Section 3.

REPORT ON OPERATOR TRAINING OUTCOMES WITH MULTIPLE TSO SESSION HELD IN DTS IN WARSAW DELIVERABLE: D4.3
13 | 74
FIGURE 2. TASK ACTIVITIES AND THEIR INPUT.
In parallel to the aforementioned works, the low- and high-level functionalities of DTS-ARISTO have been
extended. Object control and automated routines have been improved in order to simulate a semi-realistic
behaviour of the power system. Additional high-level functionalities have been added to support real-time
dispatching simulation, especially in the inertia and congestion management. The detailed description of DTS-
ARISTO’s development and results is presented in (EU-SysFlex-D4.2, 2020).
The last stage of Task 4.2 is related to Study-cases and their analysis. Both the applied methodology and obtained
results can be found in Sections 4.1-4.4 and Section 5 respectively.
Extended functionality
Develop functionality,
model and scenarios
CE powersystem model
CE powersystem model
Develop model and
scenarios
Operationscenarios
Operationscenarios
Capacity and operationscenarios (WP2)
Flexibility services (WP3)
TSO-DSO study-case
German demo (WP6)
Results of studies
DA-XBR study-case
Results of studies
Optimisation tools (WP4)
RT study-case
Results of studies
ID-Q/V study-case
Results of studies
Input
Preparation
works
Study-cases
Tools:
PowerFactory (commercial)
Dispatcher Training Simulator (PSE)
XBR optimisation tool (NCNR)
Decision suport tool (Energyville)

REPORT ON OPERATOR TRAINING OUTCOMES WITH MULTIPLE TSO SESSION HELD IN DTS IN WARSAW DELIVERABLE: D4.3
14 | 74
2. SCOPE OF INTEREST OF CONTINENTAL EUROPE POWER SYSTEM MODEL
For the purpose of performing simulation studies, a power system model for CE has been prepared based on the
results of Tasks 2.2 and 2.3 (EU-SysFlex-D2.2, 2018) (EU-SysFlex-D2.3, 2018). This is the base large-scale model to
be implemented for analysing all the study-cases considered.
The CE model distinguishes different areas covered by three levels of modelling complexity:
• a detailed representation of the transmission 400kV and 220kV (EHV) and distribution 110kV (HV) power
grid in Poland,
• a simplified representation of the neighbouring countries (aggregation of lines in parallel, busbars, power
plants),
• synchronous equivalent models for Western and Southern Europe countries which are part of CE power
system.
Additionally, HVDC links are considered as non-synchronous equivalent models.
The scope of interest for the CE power system model is presented in Figure 3. Poland’s neighbouring area includes
Germany, Austria, Czech Republic, Slovakia and Hungary. Particular power systems are internally connected in the
synchronous mode. Only the EHV power network is represented as a nodal-branch model. Substation busbar
systems and sections are aggregated to one terminal. Generation units in a power plant are also aggregated to
one equivalent model and connected to single EHV terminal. The aforementioned data come from the models
which TSOs exchange regularly in operational processes.
Polish power system
• Polish transmission and distribution power grid – detailed representation of system elements for nominal voltages: 110kV, 220kV, 400kV and 750kV. Some MV feeders are also modelled.
Close abroad
• Control areas for TSOs: 50 Hz, SEPS and CEPS
• EHV network including the representation of substation on SCADA details.
Further abroad
• Areas DE, AT and HU are modelled as EHV network without substation layout representation (node-branch model)
Faraway abroad
• Dynamic equivalent connected to X-nodes.
FIGURE 3. SCOPE OF INTEREST FOR CE POWER SYSTEM MODEL.

REPORT ON OPERATOR TRAINING OUTCOMES WITH MULTIPLE TSO SESSION HELD IN DTS IN WARSAW DELIVERABLE: D4.3
15 | 74
The present-day CE model has been extended to represent the projected future conditions. The RES-E capacity
has been increased according to the considered “Going Green” scenario (2030) (EU-SysFlex-D2.2, 2018). Total
RES-E capacities in Poland and neighbouring countries are presented in Table 2-1. Moreover, the EHV network in
Poland was extended for 2011, in particular 220kV, 400kV and 110kV networks with transformation to higher
voltage, omitting the planned 110kV nodes of the distribution network (without connection to higher voltage). It
has been ensured that all study-cases utilise the same model, including the one implemented in DTS-ARISTO for
real-time simulation.
TABLE 2-1: RES-E’S CAPACITIES CONSIDERED IN STUDY-CASES.
Country Capacity (MW)
Wind PV
PL 19,860 (3,500 offshore) 3,260
DE 67,214 (20,000 offshore) 63,959
AT 4,545 2,821
CZ 488 2,391
SK 19 680
HU 477 106
Additionally, battery energy storage systems (BESS) have been modelled in Polish power system, close to the
offshore wind farms. Six standard BESS types have been considered to support balancing and solve congestion
problems. Details of considered BESS are shown in Table 2-2.
TABLE 2-2: BATTERY ENERGY STORAGE SYSTEMS CONSIDERED IN POLISH POWER SYSTEM.
ESS size type Power capacity (MW) Energy capacity (MWh) Number of ESSs 1 300 1200 3
2 100 400 1
3 50 200 5
4 20 80 39
5 10 40 36
6 5 20 111
Total 2,945 11,780 195
1 Works on extension of power network model are much resource and time-consuming. It was decided to represent the network model on 2021. Such assumption makes much severe conditions for operating the power system.

REPORT ON OPERATOR TRAINING OUTCOMES WITH MULTIPLE TSO SESSION HELD IN DTS IN WARSAW DELIVERABLE: D4.3
16 | 74
3. OPERATION SCENARIOS
For the purpose of performing simulation studies a set of three operational scenarios has been prepared for the
CE power system model. Proposed scenarios reflect different power system operational conditions, including
generation from both synchronous units and RES, load demand, and interconnection.
Operational scenarios developed for the CE power system model within WP4 activities need to take weather data
and nodal demand patterns into account for the purpose of the simulation studies. These data have been
prepared to model “real-time” measurement profiles with 15 minute resolution for load and intermittent
renewable energy sources like PV and wind turbines, according to the methodology presented in the (EU-SysFlex-
MS6, 2019). Load demand time series prepared for the purposes of WP4 simulations have been based on ENTSO-
E’s TYNDP 2018 Distributed generation 2030 scenario data (TYNDP, 2018). Operation setpoint schedules for the
centrally-dispatched units have been prepared as per the Polish TSO internal guidelines regarding unit
commitment and also the required available active power reserves for the frequency regulation. In general,
simulation of selected TSO processes using the tools considered requires operational scenario datasets at 15
minute resolution for each of the required quantities:
• load demand,
• active power setpoints for the centrally-dispatched conventional units,
• required value of the reserve for FCR and FRR,
• active power setpoints for the PV generation and wind farms,
• active power operation setpoints of Battery Energy Storage Systems providing balancing services,
• active power operation setpoints of the combined heat and power plants (CHP) providing balancing
services.
Operational scenario data have been prepared, including sets of 15 minutes time resolution snapshots, based on
the one summer and two winter days mentioned in the previous section:
• 19th of July 2030, referred further as Summer Day;
• 24th of February 2030, referred further as Winter Day 1;
• 22nd of February 2030, referred further as Winter Day 2.
Load demand profile alongside the generation types distinguished for the Summer Day is presented in Figure 4.
The operational scenario for the Polish Power System on this day can be characterized as follows:
• moderately high load demand, for which peak value is over 24GW;
• high ambient temperature and high solar irradiation in PL, leading to also a moderately high level of PV
generation with its peak reaching almost 2GW at 1 pm;
• low wind generation, reaching its peak at approximately 2837MW at 11:45 pm;
• operation scenario for PV generation also includes a prediction of the solar eclipse phenomenon in
Europe which is based on the historical irradiation data observed during a real event on the 20th of March
2015.

REPORT ON OPERATOR TRAINING OUTCOMES WITH MULTIPLE TSO SESSION HELD IN DTS IN WARSAW DELIVERABLE: D4.3
17 | 74
A general overview of the scheduled load demand and generation profile for the Winter Day 1 has been shown in
Figure 5. The operational scenario for the Polish Power System on this day can be characterized as follows:
• moderately high load demand, for which peak value is over 25GW within the period analysed. Alongside
the high wind generation, it leads to more problems expected with the power system balancing than in
the other scenarios, especially with the significant export of the energy from Polish grid;
• low ambient temperature and solar radiation in PL, leading to also a moderately low level of PV
generation, with its peak reaching approximately 0.7GW at 12:00 pm;
• low level of conventional synchronous generation leading to the reserve criterion merely being satisfied,
not exceeded;
• extremely high wind generation, reaching its peak at ~17GW from the very beginning of the day at 0:00
am, especially in the northern part of Poland, where there are no significant loads capable of consuming
such a large power infeed. This leads to congestion in the transmission and distribution grid and under
such conditions it is also expected that balancing problems could materialise.
• high export of electrical energy via HVDC links including Poland-Lithuania and Poland-Sweden
interconnections, and also conventional EHV transmission lines operating synchronously.
• in order to mitigate the excessive expected amount of wind generation, the use of Battery Energy Storage
Systems have been implemented in the initial day-ahead schedules for this operation scenario, balancing
the active power generation by wind turbines at the forecast peak in output.
• for the purpose of active power balancing due to the high wind power generation, also a flexibility-based
reduction of output of CHPs have been implemented, while maintaining the required minimum setpoints
for the stable operation of heat supply subsystems.
The daily scenario for the Polish Power System for the Winter Day 2, which has been presented in Figure 6, can be
characterized as follows:
• very high load demand, for which peak value is over 28GW within the period of operation analysed - this
leads to more problems expected with the congestion management than in the Summer Day scenario,
especially in the distribution grid.
• low ambient temperature and solar radiation in PL, leading to also a moderately low level of PV
generation, with its peak reaching approximately 0.5GW at 12:00 pm.
• limited level of active power reserves allocated for the frequency control due to very low level of the
conventional synchronous generation;
• extremely high wind generation, starting to raise significantly from 6:00 am and reaching its peak at
~16GW at 1:45 pm, especially in the northern part of Poland, where there are no significant loads capable
of consuming such a large power infeed. This leads to congestions in the transmission and distribution
grid and under such conditions it is also expected that balancing problems could materialise.
• high export of electrical energy with HVDC interconnections between Poland and Lithuania and also
Poland and Sweden.
In order to mitigate excessive expected amount of wind generation, use of BESS have been implemented in the
initial day-ahead schedules for this operation scenario, in order compensate active power generation by wind
turbines in the peak hours.

REPORT ON OPERATOR TRAINING OUTCOMES WITH MULTIPLE TSO SESSION HELD IN DTS IN WARSAW DELIVERABLE: D4.3
18 | 74
FIGURE 4. SUMMER DAY OPERATION SCENARIO PROFILE.
FIGURE 5. WINTER DAY 1 OPERATION SCENARIO PROFILE.

REPORT ON OPERATOR TRAINING OUTCOMES WITH MULTIPLE TSO SESSION HELD IN DTS IN WARSAW DELIVERABLE: D4.3
19 | 74
FIGURE 6. WINTER DAY 2 OPERATION SCENARIO PROFILE.

REPORT ON OPERATOR TRAINING OUTCOMES WITH MULTIPLE TSO SESSION HELD IN DTS IN WARSAW DELIVERABLE: D4.3
20 | 74
4. STUDY-CASE METHODOLOGY
4.1 DAY-AHEAD TSO-DSO COORDINATION
4.1.1 OVERVIEW OF THE GERMAN USE-CASE AND RELATED OPTIMISATION (DETERMINATION OF FLEXIBILITIES)
The German demonstrator set-up is located in a part of the German 110kV high-voltage distribution network.
Here, the focus is on coordinating distributed energy resources (DER) connected to high-voltage (HV) grids in
order to provide suitable active and reactive power (P-Q) flexibilities to the high-voltage grids of a DSO
themselves as wells as to the extra-high-voltage (EHV) grids of a TSO. Additionally, possible measures shall be
provided in case of foreseen congestion or voltage problems. The goal is to show that exploiting the flexibility of
decentralized energy resources as well as improving the communication between DSO and TSO, both grids can be
operated more reliably and efficiently compared to a situation where each operator utilises only flexibilities
offered by resources connected to their respective grid without coordination. This goal can be achieved by
enabling the provision of congestion-free P and Q flexibilities at “interface” nodes to TSOs as well as by improving
communication and data exchange between DSOs and TSOs.
With regard to the issues presented above, optimization tools with different application functionalities were
developed within the German demonstration with the aim of determining available flexibilities for enabling the
provision of active and reactive power to the TSO and for the DSO’s own use. The tool contributes to the objective
of optimizing available flexibility resources connected to meshed distribution grids with multiple grid connection
points to the transmission grid (see Figure 7).
FIGURE 7. IDEA OF GERMAN DEMONSTRATOR.
The optimization tool, named NETOPT, has the goal of providing (n-1) secure specific set points to the online
control centre of the DSO for individual generation units taking a few well-defined objective functions into

REPORT ON OPERATOR TRAINING OUTCOMES WITH MULTIPLE TSO SESSION HELD IN DTS IN WARSAW DELIVERABLE: D4.3
21 | 74
account like the calculation of the instantaneous reactive power flexibilities or the minimum possible active
power feed-in at several TSO-DSO grid connection points, taking the present active power values as well as the
actual operation modes of the generators into account. An exemplary result can be seen in Figure 8.
FIGURE 8. ACTIVE AND REACTIVE FLEXIBILITY POTENTIALS FOR A GRID GROUP.
A short overview about the main features and grid constraints, to be taken into account for the online grid control
centre optimization tool for the German demonstrator, is given in Table 4-1.
4.1.2 SMALL-SCALE SIMULATION
In the following, a large-scale simulation refers to the CE power system model and covers transmission grids and
certain distribution grids (Section 2). A small-scale simulation refers to a detailed model of a distribution grid in
Germany. The small-scale simulation is based on a grid model provided by MITNETZ Strom (MNS). It represents a
real grid with only minor modifications in order to match the over laying transmission grid model of the large-
scale simulation. The grid model was provided in PowerFactory format and converted into pandapower. For each
of the generating and consuming elements in the distribution grid, a time series was generated and provided by
large-scale model in order to define the simulation scenario. These time series were then matched, using the
pandapower model, on the related objects in the small-scale model. This way a grid situation with a 15-minute
resolution was realised. The small-scale model consists of 312 generators with an installed power of about 2.7GW
and 415 consumers with an aggregated peak consumption of about 2.5GW.

REPORT ON OPERATOR TRAINING OUTCOMES WITH MULTIPLE TSO SESSION HELD IN DTS IN WARSAW DELIVERABLE: D4.3
22 | 74
TABLE 4-1: BRIEF OVERVIEW OF THE OPTIMIZATION FUNCTIONALITIES OF THE ONLINE CONTROL CENTER OPTIMIZATION TOOL.
Optimization German Demonstrator
Voltage Level of Considered Flexibilities 110kV
Interconnection between: DSO and TSO (110kV and 220/380kV)
Objective active and reactive power management
Boundaries DER P and Q boundaries
Constraints grid constraints:
• bus voltage 108kV – 121kV (n-0)
• bus voltage 99kV – 123kV (n-1)
• line loading 50% (n-0)
• line loading 100% (n-1)
• load angle ≤ 30° in case of line current > 300A
Solver / Methods non-linear optimization of extended load flow problem
Algorithms interior point
Programming Language AMPL, PYTHON
Data Model based on mpc-format (Matpower case file)
Desired Accuracy 10-4
Risks long optimization time in case of several (n-1) problems which have to be considered
4.1.3 ALGORITHM
In the large-scale simulation, the transmission grid is simulated in detail, but the distribution grid is treated in this
study case as an equivalent. This distribution grid equivalent is modelled and simulated in detail in an additional
small-scale simulation. This small-scale simulation is carried out at Fraunhofer IEE and supports the large-scale
simulation, which is carried out by PSE. Using the optimization approach described above, active power flexibility
at grid connection points is determined using the detailed grid model in the small-scale simulation. These
flexibilities are then provided to the large-scale simulation which uses them in combination with the distribution
grid model equivalent (see Figure 9).
The following process steps are taking place:
1. Maximal and minimal Q and P flexibility potential will be computed for the whole grid (sum over
interconnection points).
2. Q/P-range will then be deduced from results for each contributing generating unit.
3. P-Sensitivities on interconnectors for each generating unit will be determined.
4. Generating units with similar sensitivities and same costs per MWh will be grouped.
5. Tables of generators (clusters) together with sensitivities and costs will be provided to TSO.

REPORT ON OPERATOR TRAINING OUTCOMES WITH MULTIPLE TSO SESSION HELD IN DTS IN WARSAW DELIVERABLE: D4.3
23 | 74
FIGURE 9. USE OF AGGREGATED FLEXIBILITIES.
4.2 DAY-AHEAD CROSS-BORDER COORDINATION
The XB congestions are solved by the TSOs. Overloading on the transmission lines occurs due to the divergence
between the market solution and unscheduled power flows. TSOs remedy the congestions by cross-border
actions referred to in this study-case as the expert-based approach. This approach is based on the knowledge and
expertise of dispatchers and inter-TSO coordination between them. The subsequent approach referred to as the
Coordinated Cross-Border Congestion Management (CXBCM) model proposes an optimised manner of solving
congestions. These methods are discussed in the following sections.
4.2.1 EXPERT-BASED APPROACH
The current process of XB actions is based on the Day-Ahead Congestion Forecast (DACF) process. The present-
day market sequence is presented in the Figure 10. The sequence starts with the performance of the two-days-
ahead forecast (D2CF). In the following step for the day-ahead period the zonal market coupling within
designation of Available Transfer Capacity (ATC) or Flow-Based approach (FB) are realised, followed by the
Security Constrained Unit Commitment (SCUC). The market procedures enable the national market to accomplish
final settlements of the energy and reserves. The next step considers the nodal operation framework of the DACF.
Market solutions are assessed in terms of their feasibility and the congestion management procedure is
implemented in accordance with the operator's directives. After the implementation of dispatching guidelines in
the day-ahead planning, the intraday Congestion Forecast (IDCF) process involves the further adjustments of
system operations. Ultimately, the cost sharing rules are implemented and costs divided between the TSOs
involved.
110 kV
400 kV 400 kV
t
P,Q
t
P,Q

REPORT ON OPERATOR TRAINING OUTCOMES WITH MULTIPLE TSO SESSION HELD IN DTS IN WARSAW DELIVERABLE: D4.3
24 | 74
FIGURE 10. SCHEME OF THE CURRENT PROCESS OF CROSS-BORDER ACTIONS.
Congestion management actions require further elaboration in order to designate the potential solutions to
mitigate cross-border violations. Congestion in the grid occurs when system operators are forced to take actions
to manage the flows in transmission branches that would otherwise be overloaded and where the power flow
would exceed the permissible capacity for a certain time period. The TSO has to avoid overload situations while
maintaining a reliable and cost-effective operation. Hence any congestion that occurs needs to be alleviated. The
countermeasures for tackling the aforementioned issues are henceforth referred to as the remedial actions (RAs).
From the TSO perspective available remedial actions are divided into two categories:
• non-costly, internal actions – switching taps of phase-shifting transformers (PSTs). Change of topology of
the transmission network by switching on or off selected elements,
• costly, external actions – change of the dispatch points of generation units in the congestion areas,
implementation of services based on demand side response (DSR).
The remedial actions are implemented based on the expert knowledge of operators, using direct communication
and are performed manually by the dispatchers of involved TSOs.
In order to decrease the congestion, the first procedure of the TSO is utilization of the costless remedial actions
such as using the PSTs. Change of the PSTs taps have following pros and cons:
• PSTs typically have a strong influence on cross-border flows and changing tap position has a significant
potential to reduce congestion.
• Coordinated use of the PSTs is an efficient way of significantly decreasing congestion. However, if the
PSTs are not coordinated, they could operate against each other, resulting the further exacerbation of the
existing overloads.
The second remedial measure involving costly actions is the coordinated redispatching of generation units on
both sides of the cross-border congestion, the process henceforth referred to as Cross Border Redispatch (XBR).
However, redispatching capabilities of generators in the proximity of cross-border lines are constrained. For
critical congestions redispatching actions of generation units located further from the cross-border lines are
required; this process is referred to as Multilateral Remedial Actions (MRA).

REPORT ON OPERATOR TRAINING OUTCOMES WITH MULTIPLE TSO SESSION HELD IN DTS IN WARSAW DELIVERABLE: D4.3
25 | 74
The overall process of the expert-based approach is supported by a complementary analysis. Except PST
coordination, the analysis of redispatching processes consists of a sensitivity analysis which results from the
sensitivity matrix of the power system in steady-state operation. Such PTDF submatrix indicates how a variation in
generator output power affects a change of the loading in the critical branch. The sensitivity matrix designates
two directions of sensitivity:
• Positive sensitivity – indicates that decreasing the generator output power reduces the loading on a
critical branch,
• Negative sensitivity – indicates that decreasing the generator output power increases the loading on a
critical branch.
The expert-based approach utilizes the information provided by the complementary analysis. Using this approach
redispatching is performed according to the sensitives; the group of generators with the highest sensitivity value
is indicated. Dispatchers respectively increase and decrease the operational points of generation units’ base in the
matrix. Ultimately, after implementation of redispatching the congestions are mitigated. The overall process of
the expert-based approach is summarized in the Figure 11.
FIGURE 11. DIAGRAM OF THE EXPERT-BASED APPROACH FOR CONGESTION MANAGMENT ACTIONS.
4.2.2 OPTIMIZATION-BASED APPROACH
The optimization-based approach offers the efficient procedure of using remedial actions within coordinated
manner across a wider area. This approach is referred as the CXBCM model. The new model is embedded in the
scheme of cross-border actions as presented in the Figure 12.

REPORT ON OPERATOR TRAINING OUTCOMES WITH MULTIPLE TSO SESSION HELD IN DTS IN WARSAW DELIVERABLE: D4.3
26 | 74
FIGURE 12. SCHEME OF THE PROPOSED CROSS-BORDER ACTIONS.
The concept implements the cross-border coordination tool with cost sharing method in order to improve the
current operator practice for congestion problems. This method is applied to the zonal market solution.
Subsequently the SC ED tool performs the correction of the redispatching. The idea of SCED tool is adaptation of
the all zonal-based or simplified the nodal-based market solutions (i.e. the XB coordination model) into the node
resolution (AC load-flow). Such functionality is out of scope of this task, but partially implemented as the
optimization-based approach in intraday Q/V management (Section 4.3.2).
The CCBCM model is formulated as mixed-integer linear programming (MILP) and aim of this model is to relieve
congestions while minimizing the overall cost of implementation the remedial actions. Types of remedial actions
utilized in the developed XB coordination tool (CBCT) are:
• non costly actions – tap changing of PSTs,
• costly actions, such as:
o cross border redispatching XBR and MRA,
o RES-E curtailment, reduction of the infeed of renewable energy sources,
o shedding load: i.e. non-zero Energy Not Served (ENS).
The CBCT determines sets of critical branches (CB) and corresponding critical outages (CO). They are indicated as
the group of (CBCO). In order to define the set of CO for particular CB, the model approximates the power flow
over CB during the outage stage by determining line outage distribution factors (LODF). The LODF calculates the
fraction of the flow over CO in the unaffected network, which is transferred by CB when the CO is switched off (N-
1). The final list of the CBCOs is identified if the LODF exceeds the certain threshold.
The optimization problem of CBCT with the objective function represents the costs of the congestion
management:
minV ����� � ���� � � ���� �������� �
��� �������
� � (4.1)
where:
• ! " #� � ��, ��, ��, %& is the vector of variables being minimised,

REPORT ON OPERATOR TRAINING OUTCOMES WITH MULTIPLE TSO SESSION HELD IN DTS IN WARSAW DELIVERABLE: D4.3
27 | 74
• � is the power shift up of generator unit ', • �� is the power shift down of generator unit ', • �� is the curtailed power of RES generator ', • � variable representing the energy curtailment of the demand or Energy Not Served per demand in bus ', • % variable representing the tap setting of PST ', • () is the number of generator units in the system,
• (* is the number of loads in the system,
• (+ is the number of RES generators in the system,
• �� is the cost of regulating up generator unit ', • �� � is the revenue from regulating down generator unit ', • �����is the penalty cost for curtailment of RES,
• ����� is the penalty cost for the energy curtailment.
In the CXBCM model the following strategy is utilized in order to derive redispatching costs �� and revenue from
regulation of generation �� � . The system-wide price of energy is estimated in each scenario by construction of
merit-order curve, the intersection with the total demand curve is obtained, and a market clearing price, MCP is
derived. Additionally, for each thermal generator, a variable cost is determined from data on OPEX, fuel cost,
efficiency, CO2 cost and emission intensity.
• It is assumed that generators selected for decreasing the production give back 95 % of the MCP price per
MWh. �� � "�0,95 ∙ MCP€/MWh (4.2)
• For generators which are selected for increasing generation:
o If the marginal cost of a generator is lower than MCP, it receives 105% of the MCP per MWh
�� " MCP ∙ 1,05€/MWh (4.3)
o If the marginal cost of a generator is higher than MCP the cost of production is calculated as
follows
�� " VariableCost ∙ 1,05€/MWh (4.4)
In the optimization model, the power flows are presented as the DC power flow approximation. The DC load-flow
is computationally efficient for solving congestion management optimization problems. For the CBCT, DC load-
flow is formulated:
BalanceBCD ≡ BalanceB� � ��, ��, ��, %D " 0 (4.5)
The abovementioned condition presents the set of nodal power balance equations. These equations respectively
depend on the change of the operation points of generating units, curtailed power of RES-E and ENS volumes.

REPORT ON OPERATOR TRAINING OUTCOMES WITH MULTIPLE TSO SESSION HELD IN DTS IN WARSAW DELIVERABLE: D4.3
28 | 74
The main advantage of the optimization-based approach is the global coordination of remedial actions with
accompanying fair rules of cost sharing. The CBCT implementing CXBCM model derives the efficient method of
coordinating PST tap settings and generation unit setpoints, ensuring that remedies do not adversely affect each
other. Ultimately, the cost-sharing methodology encourages TSOs to take a part in the global cost optimization.
4.3 INTRADAY Q/V MANAGEMENT
This study-case refers to intraday Q/V management in the frame of operator process. The task is to keep
reference signals for Q/V control in the power system, using schedules prepared in planning processes as well as
taking decisions as preventive and corrective real-time actions. The main goal of this study-case is to compare two
approaches in such defined intraday Q/V management. The first method applied is an optimisation-based
approach and considers outputs from the Decision Support Tool being developed in T4.1 of the EU-SysFlex project
(EU-SysFlex-D4.1, 2019). The second method applied is an expert-based approach has been also applied as a
benchmark method. More details about both applied methodologies are presented in Sections 4.3.1 and 4.3.2.
One of the operation scenarios for future CE power system has been considered. Winter day 2 has been chosen to
represent severe conditions because of the high power transfers and reactive power consumption which
characterise this day, as well as the close alignment with real-time simulations presented in Section 4.4 and 5.4.
The most severe two hours have been selected for this study-case, i.e. (9:45-11:45) a.m. and only generator
redispatching actions have been assumed as the Q/V management decisions.
Figure 13 shows the interpretation of Q/V intraday scheduling with the use of decision support tool (DST). Two
steps of redispatching schedules have been considered, before 9:45 a.m. and 10:45 a.m. Between 9:45 a.m. and
10:45 a.m. first schedule (before 9:45 a.m.) is applied (yellow area). At 10:45 a.m. the operator switches on the
second schedule (before 9:45a.m.). For simplicity, green areas consist of the same redispatching actions. It means
that no real-time events are assumed in this study-case between 9:45 a.m. and 10:45 a.m. Immediately after
10:45 a.m. tripping the largest generator synchronised to the Polish power system is simulated. The second
schedule considers such an event only as a prospective contingency. Dispatchers may implement redispatching
actions as corrective ones following this particular contingency.
FIGURE 13. INTERPRETATION OF Q/V INTRADAY SCHEDULING WITH THE USE OF DST.
before 9:45 a.m.
before 10:45 a.m.
tripping the largest generator
9:45 a.m. 10:45 a.m. 11:45 a.m.
schedule timereal-time
steps of schedule refreshing
REPORT ON OPERATOR TRAINING OUTCOMES WITH MULTIPLE TSO SESSION HELD IN DTS IN WARSAW DELIVERABLE: D4.3
29 | 74
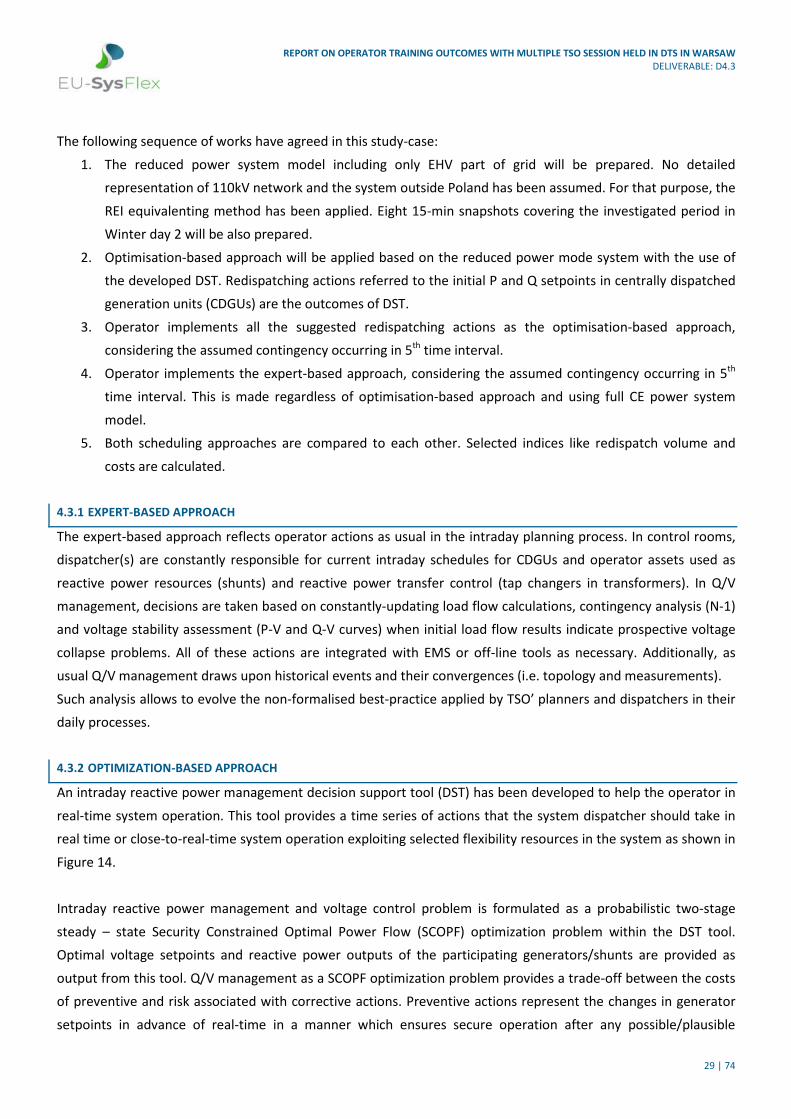
The following sequence of works have agreed in this study-case:
1. The reduced power system model including only EHV part of grid will be prepared. No detailed
representation of 110kV network and the system outside Poland has been assumed. For that purpose, the
REI equivalenting method has been applied. Eight 15-min snapshots covering the investigated period in
Winter day 2 will be also prepared.
2. Optimisation-based approach will be applied based on the reduced power mode system with the use of
the developed DST. Redispatching actions referred to the initial P and Q setpoints in centrally dispatched
generation units (CDGUs) are the outcomes of DST.
3. Operator implements all the suggested redispatching actions as the optimisation-based approach,
considering the assumed contingency occurring in 5th time interval.
4. Operator implements the expert-based approach, considering the assumed contingency occurring in 5th
time interval. This is made regardless of optimisation-based approach and using full CE power system
model.
5. Both scheduling approaches are compared to each other. Selected indices like redispatch volume and
costs are calculated.
4.3.1 EXPERT-BASED APPROACH
The expert-based approach reflects operator actions as usual in the intraday planning process. In control rooms,
dispatcher(s) are constantly responsible for current intraday schedules for CDGUs and operator assets used as
reactive power resources (shunts) and reactive power transfer control (tap changers in transformers). In Q/V
management, decisions are taken based on constantly-updating load flow calculations, contingency analysis (N-1)
and voltage stability assessment (P-V and Q-V curves) when initial load flow results indicate prospective voltage
collapse problems. All of these actions are integrated with EMS or off-line tools as necessary. Additionally, as
usual Q/V management draws upon historical events and their convergences (i.e. topology and measurements).
Such analysis allows to evolve the non-formalised best-practice applied by TSO’ planners and dispatchers in their
daily processes.
4.3.2 OPTIMIZATION-BASED APPROACH
An intraday reactive power management decision support tool (DST) has been developed to help the operator in
real-time system operation. This tool provides a time series of actions that the system dispatcher should take in
real time or close-to-real-time system operation exploiting selected flexibility resources in the system as shown in
Figure 14.
Intraday reactive power management and voltage control problem is formulated as a probabilistic two-stage
steady – state Security Constrained Optimal Power Flow (SCOPF) optimization problem within the DST tool.
Optimal voltage setpoints and reactive power outputs of the participating generators/shunts are provided as
output from this tool. Q/V management as a SCOPF optimization problem provides a trade-off between the costs
of preventive and risk associated with corrective actions. Preventive actions represent the changes in generator
setpoints in advance of real-time in a manner which ensures secure operation after any possible/plausible

REPORT ON OPERATOR TRAINING OUTCOMES WITH MULTIPLE TSO SESSION HELD IN DTS IN WARSAW DELIVERABLE: D4.3
30 | 74
contingency, whereas corrective actions corresponds to control actions i.e. changes in generator setpoints or load
shedding, immediately after the occurrence of a contingency. Different control actions associated with preventive
and corrective stages are as shown in Figure 15. Taking such preventive and corrective actions together ensures
secure and reliable power system operation. The DST tool has been developed in Julia/JuMP using open source
package of PowerModels.jl (Coffrin, 2018).
FIGURE 14. OVERVIEW OF DECISION SUPPORT TOOL.
FIGURE 15. PREVENTIVE AND CORRECTIVE CONTROL ACTIONS.
For reactive power management, different objective functions as described in literature were implemented. The
characteristics of these objective functions were analysed with this implementation. The details of the considered
objective functions are given in the following subsections.
Minimum redispatch cost
The aim of using this objective function is to minimize the generator redispatch cost in the preventive stage and
corrective risk associated with different contingencies. The corrective risk is the probability of contingency times
the cost of redispatch for that contingency. Only generators’ redispatch is allowed in the preventive stage
whereas load shedding in addition to generators’ redispatch is also allowed in the corrective stage. The use of this
REPORT ON OPERATOR TRAINING OUTCOMES WITH MULTIPLE TSO SESSION HELD IN DTS IN WARSAW DELIVERABLE: D4.3
31 | 74
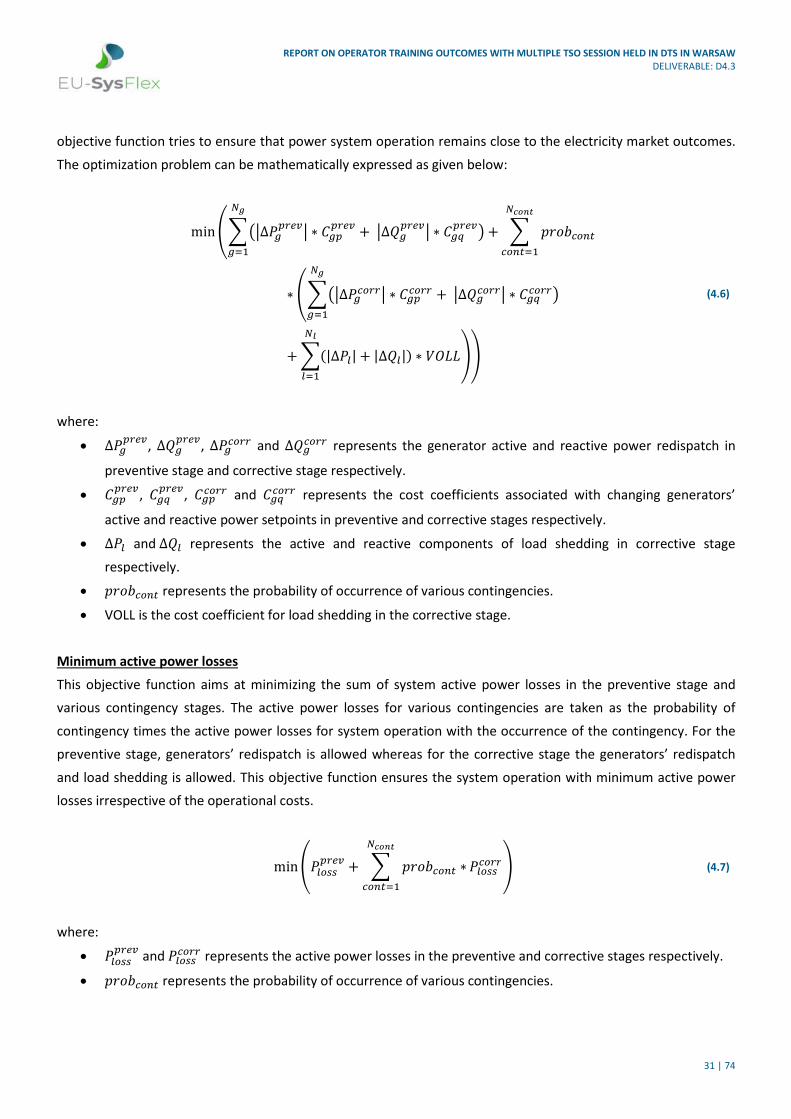
objective function tries to ensure that power system operation remains close to the electricity market outcomes.
The optimization problem can be mathematically expressed as given below:
minF��G∆IJKLMNG ∗ �JKKLMN �G∆PJKLMNG ∗ �JQKLMN� ��RJS� � TUVWXYZ[�\]^_
XYZ[S�∗ F��G∆IJXYLLG ∗ �JKXYLL �G∆PJXYLLG ∗ �JQXYLL�
�RJS�
��B|∆Ia| � |∆Pa|D ∗ !bcc�daS� ee
(4.6)
where:
• ∆IJKLMN, ∆PJKLMN, ∆IJXYLL and ∆PJXYLL represents the generator active and reactive power redispatch in
preventive stage and corrective stage respectively.
• �JKKLMN, �JQKLMN, �JKXYLL and �JQXYLL represents the cost coefficients associated with changing generators’
active and reactive power setpoints in preventive and corrective stages respectively.
• ∆Ia and∆Pa represents the active and reactive components of load shedding in corrective stage
respectively.
• TUVWXYZ[ represents the probability of occurrence of various contingencies.
• VOLL is the cost coefficient for load shedding in the corrective stage.
Minimum active power losses
This objective function aims at minimizing the sum of system active power losses in the preventive stage and
various contingency stages. The active power losses for various contingencies are taken as the probability of
contingency times the active power losses for system operation with the occurrence of the contingency. For the
preventive stage, generators’ redispatch is allowed whereas for the corrective stage the generators’ redispatch
and load shedding is allowed. This objective function ensures the system operation with minimum active power
losses irrespective of the operational costs.
minFIaYffKLMN � � TUVWXYZ[ ∗�\]^_XYZ[S� IaYffXYLLe (4.7)
where:
• IaYffKLMN andIaYffXYLL represents the active power losses in the preventive and corrective stages respectively.
• TUVWXYZ[ represents the probability of occurrence of various contingencies.
REPORT ON OPERATOR TRAINING OUTCOMES WITH MULTIPLE TSO SESSION HELD IN DTS IN WARSAW DELIVERABLE: D4.3
32 | 74
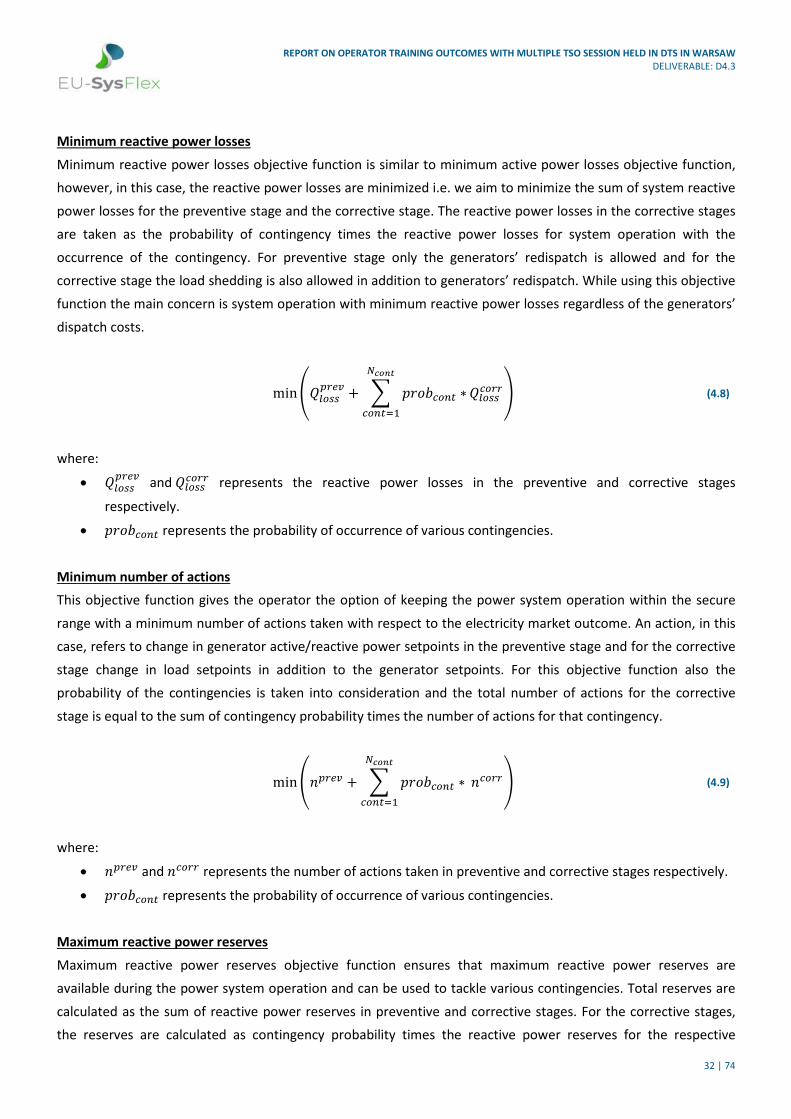
Minimum reactive power losses
Minimum reactive power losses objective function is similar to minimum active power losses objective function,
however, in this case, the reactive power losses are minimized i.e. we aim to minimize the sum of system reactive
power losses for the preventive stage and the corrective stage. The reactive power losses in the corrective stages
are taken as the probability of contingency times the reactive power losses for system operation with the
occurrence of the contingency. For preventive stage only the generators’ redispatch is allowed and for the
corrective stage the load shedding is also allowed in addition to generators’ redispatch. While using this objective
function the main concern is system operation with minimum reactive power losses regardless of the generators’
dispatch costs.
minFPaYffKLMN � � TUVWXYZ[ ∗�\]^_XYZ[S� PaYffXYLLe (4.8)
where:
• PaYffKLMN andPaYffXYLL represents the reactive power losses in the preventive and corrective stages
respectively.
• TUVWXYZ[ represents the probability of occurrence of various contingencies.
Minimum number of actions
This objective function gives the operator the option of keeping the power system operation within the secure
range with a minimum number of actions taken with respect to the electricity market outcome. An action, in this
case, refers to change in generator active/reactive power setpoints in the preventive stage and for the corrective
stage change in load setpoints in addition to the generator setpoints. For this objective function also the
probability of the contingencies is taken into consideration and the total number of actions for the corrective
stage is equal to the sum of contingency probability times the number of actions for that contingency.
minFgKLMN � � TUVWXYZ[ ∗�\]^_XYZ[S� gXYLLe (4.9)
where:
• gKLMN andgXYLL represents the number of actions taken in preventive and corrective stages respectively.
• TUVWXYZ[ represents the probability of occurrence of various contingencies.
Maximum reactive power reserves
Maximum reactive power reserves objective function ensures that maximum reactive power reserves are
available during the power system operation and can be used to tackle various contingencies. Total reserves are
calculated as the sum of reactive power reserves in preventive and corrective stages. For the corrective stages,
the reserves are calculated as contingency probability times the reactive power reserves for the respective

REPORT ON OPERATOR TRAINING OUTCOMES WITH MULTIPLE TSO SESSION HELD IN DTS IN WARSAW DELIVERABLE: D4.3
33 | 74
contingency. When using this objective function, again the cost of system operation is not considered as a limiting
criterion.
maxFPLMfKLMN � � TUVWXYZ[ ∗�\]^_XYZ[S� PLMfXYLLe (4.10)
where:
• PLMf "PJijk �PJ • PLMfKLMN andPLMfXYLL represents the reactive power reserves in the preventive and corrective stages
respectively.
• PJijkand PJ are the generator maximum reactive power limit and generator setpoint for preventive or
corrective stage.
• TUVWXYZ[ represents the probability of occurrence of various contingencies.
Multi-objective optimization
Individual objective functions were used to study various aspects of system operation such as generator dispatch,
redispatch and load shedding cost and voltage profile at various buses. Depending upon the objective function, it
was observed that the system profile varies and hence it was decided in consultation with PSE that a combination
of objective functions would be more suitable than any particular objective function for optimal system
operation.
A combination of minimum redispatch cost and maximum reactive power reserves for the preventive stage have
been considered and for the corrective stage, the objective function of a minimum number of actions has been
selected. Multiplication factors have been introduced to manage the contribution of reactive power reserves in
the preventive stage and number of actions in the corrective stage with respect to redispatch cost for the overall
objective function. These multiplication factors give the flexibility of changing the contribution of different
objectives - depending upon the choice of the operator.
The objective function can be mathematically represented as shown below:
minF��G∆IJKLMNG ∗ �JKKLMN �G∆PJKLMNG ∗ �JQKLMN� �l� ∗ PLMfKLMN �lm�RJS�
∗ � TUVWXYZ[ ∗�\]^_XYZ[S� gXYLLe
(4.11)
where:

REPORT ON OPERATOR TRAINING OUTCOMES WITH MULTIPLE TSO SESSION HELD IN DTS IN WARSAW DELIVERABLE: D4.3
34 | 74
• ∆IJKLMN and ∆PJKLMN represents the generator active and reactive power redispatch in preventive stage
respectively.
• �JKKLMNand �JQKLMN represents the cost coefficients associated with changing generators’ active and reactive
power setpoints in preventive stage respectively.
• PLMfKLMN represents the reactive power reserves in the preventive stages.
• gXYLL are the number of actions taken in the corrective stage.
• l� and lm are the weighing factors for reactive power reserves in preventive stage and number of
actions in the corrective stage respectively.
These different objective functions were tested on small test systems and the results were analysed. Direct
application of the method presented above on the large systems provided by Polish TSO encountered limitations
in simulation due to the computational complexities. These complexities arise due to system size, large number of
variables (continuous and discrete), hard constraints. Therefore, an approximation method was developed which
approaches the outcomes of the full method: the different contingencies are individually simulated with the
objective of minimizing the redispatch costs (Figure 16). Using this method, it was possible to get feasible
outcomes for the intraday Q/V management study-case with reduced computational complexity and simulation
time (from minutes to seconds).
FIGURE 16. MINIMUM REDISPATCH W.R.T. OPTIMAL STATE.
Stage-1 in Figure 16 represents the system state as per the data provided by Polish TSO and has been used as the
starting point for the optimization. The objective function for each of the contingency is as shown below:
l'gF��G∆IJG ∗ �JK �G∆PJG ∗ �JQ��RJS� e (4.12)
where:
• ∆IJ and ∆PJ represents the generator active and reactive power redispatch for each contingency with
respect to stage-1 respectively.
• �JK and �JQ represents the cost coefficients associated with changing generators’ active and reactive
power setpoints for the contingencies respectively.

REPORT ON OPERATOR TRAINING OUTCOMES WITH MULTIPLE TSO SESSION HELD IN DTS IN WARSAW DELIVERABLE: D4.3
35 | 74
Constraints for optimization
The above-mentioned objective functions were subjected to some constraints for generators, transmission lines
and various system nodes as detailed below.
All the generators in the system must follow the following limits:
IJinZ oIJ oIJijk PJinZ oPJ oPJijk (4.13)
where IJinZ, IJijk are generator active power limits and PJinZ, PJijk are the generator reactive power limits.
The following limiting constraints are applied for all the branches:
%npinZ o%np o%npijk qnpinZ oqnp oqnpijk (4.14)
where %npijk, %npinZ are the rated power flow limits and qnpinZ, qnpijk are the phase angle difference limits.
The voltages at all nodes of the system shall remain in the limits as given below:
rninZ orn ornijk (4.15)
where rninZ and rnijk are the minimum and maximum node voltage limits.
The outcome of this optimization problem in terms of generators’ active and reactive power setpoints is provided
to the system operator for various contingencies in the agreed format, consisting of a set of CSV files. Samples of
DST output are presented in Appendix.
4.4 REAL-TIME OPERATION
When considering the process of real-time power system dispatching, one study-case has been investigated. It
has been assumed that an input to the study-case of RT operation comes from the expert-based Q/V settings
correction (as usual study-case) within the ID coordination process. Two days have been chosen for the operation
scenarios:
• summer day (time between 10:30a.m. and 1:45p.m. – DTS time mimicking GMT+1)
• winter day 2 (time between 10:00a.m. and 2:00p.m. – DTS time mimicking GMT+1).
For a summer day, power system behaviour during the solar eclipse has been investigated. For both considered
days, a set of different real-time failures have been assumed resulting in tripping some of the critical power
system elements. Full description of the aforementioned operation scenarios can be found in Section 3.

REPORT ON OPERATOR TRAINING OUTCOMES WITH MULTIPLE TSO SESSION HELD IN DTS IN WARSAW DELIVERABLE: D4.3
36 | 74
The developed DTS-ARISTO has been used as a tool simulating the real-time CE system behaviour, including input
from and feedback to professional PSE dispatchers. The primary goal of this study-case was to explore the
challenges inherent in operating a power system in real-time with a high proportion of RES-E generation.
Additionally, the dispatchers have an opportunity to test the developed applications of inertia and congestion
management which are coupled with DTS-ARISTO. In this experiment, only the approach of decisions based on
human judgment and experience has been tested. Note that this experience was gained on the Polish power
system as it has evolved to date – but the test scenarios reflect assumed future conditions. The
demonstration/training session took place in 17th and 18th of December 2020. In addition to PSE dispatchers,
representatives (dispatchers and planners especially) of European TSOs and DSOs (within EU-SysFlex consortium)
were invited to the organized session. Initially, the DTS session was planned as a physical workshop, but the
pandemic of COVID-19 enforced the use of remote arrangements. In each of PSE’s locations in Poland, there are
DTS terminals available for use by dispatchers from Regional Power Dispatching Centres2 (RPDC, located in
Bydgoszcz and Poznań) and the National Power Dispatching Centre3 (NPDC, located in Konstancin-Jeziorna).
The new balancing market model required by the European Guidelines and Network Codes is likely to force a new
type of service directly related to congestion management. In (EU-SysFlex-D3.1, 2019) it is noted that at least two
products may be needed, corresponding to the time of activation of the offered reserve capacity and the time of
delivery of this volume. This corresponds to the parameters of aFRR, mFRR or faster frequency response products.
During the session, special attention was paid to the process of real-time congestion management. As presented
in (EU-SysFlex-D4.2, 2020), the functionality of congestion services activated in manual mode (on dispatcher's
instruction) has been considered:
• Manual fast redispatching (mFRD): full activation time – 5 min, maximum delivery time – 15 min.
• Manual normal redispatching (mNRD): full activation time – 12.5 min, maximum delivery time – 60 min.
Activation of CDGUs in the frame of mFRD or mNRD services is managed with the use of current DTS-ARISTO
tools. In turn, the activation of DER’s control units providing congestion services, such as:
• D-type wind farms
• energy storage systems with functionality corresponding to D-type generators
• D-type thermal or hydro generation units classified as units notdispatchable by the TSO
• Aggregates of different DER (B- and C-type PGMs and flexible loads) connected to the 110kV nodes.
Detailed coverage of this session and results are presented in Section 5.4. The results obtained from the DTS
session have only qualitative character.
2 Regional Power Dispatching Centres are responsible in Poland for operation of 110 kV network, as assets owned by DSO. 3 National Power Dispatching Centre is responsible for power balancing including international power exchange and congestion management in EHV network.

REPORT ON OPERATOR TRAINING OUTCOMES WITH MULTIPLE TSO SESSION HELD IN DTS IN WARSAW DELIVERABLE: D4.3
37 | 74
5. STUDY-CASE RESULTS
5.1 DAY-AHEAD TSO-DSO COORDINATION
For the purposes of the day-ahead TSO-DSO coordination, a study-case based on the German demonstration in
EU-SysFlex has been presented. The German Demonstrator uses flexibilities of generators in the HV grid of
MITNETZ STROM to provide onward flexibility to the EHV grid of 50Hertz. Therefore, it is located in the meshed
HV grid of MITNETZ STROM in the South of Brandenburg and Saxony-Anhalt and in the West and South of Saxony
(EU-SysFlex-D6.6, 2019). A presented study-case has been conducted for Winter Day 2. The Continental Europe
Power System model has been expanded with the detailed representation of the German HV grid under
consideration, including the time series for the load demand and also PV and wind generation. According to the
initial simulation results presented with the solid plots in Figure 17, several congestions for the EHV/HV Grid
Connection Points (GCPs) have been identified.
FIGURE 17. RESULTS OF THE CONGESTION MANAGEMENT USING DAY-AHEAD TSO-DSO COORDINATION FOR WINTER DAY 2.
The aim of the presented study-case was to integrate RES connected to the distribution HV grid into the schedule-
based process for congestion management in order to mitigate congestions found in the day-ahead planning
process. The presented approach considers the availability and cost of flexibility. In addition, the approach
considers the impact on requested given EHV/HV Grid Connection Point as activation of flexibility changes the
technical sensitivities in the grid. The actions discussed included the optimal redispatching of the active power
flexibility resources from the RES located in the HV grid with the use of sensitivities calculated by the German
Demonstrator tool, describing the impact of the specific RES flexibility assets on the GCP power flow for each of
the considered 15-minute snapshots.
Results of the congestion management using day-ahead TSO-DSO coordination for the Winter Day 2 are
presented in Figure 17 (with the dash-dotted plots). It may be observed that the proposed use of active power
flexibilities from the DSO-interconnected RES significantly contributed to the mitigation of congestions in the EHV

REPORT ON OPERATOR TRAINING OUTCOMES WITH MULTIPLE TSO SESSION HELD IN DTS IN WARSAW DELIVERABLE: D4.3
38 | 74
grid. For each of the GCPs, there are no overloading states identified following mitigation actions. The outcome
presented was achieved using only DSO-interconnected P-flexibilities; no actions in the EHV transmission grid
have been considered.
In conclusion, the presented results demonstrate the proof of concept for the considered method. The day-ahead
TSO-DSO coordination tool proposed within the German demonstrator provides an alternative for TSOs in terms
of congestion management, introducing novelty in the field of utilising flexible assets located in the DSO grid to
benefit the TSO grid. The presented method allows implementation of necessary remedial actions in an effective
way, and also enables coordinated utilisation of the flexibilities in the distribution grid with the assessment of the
impact of those actions on certain EHV grid points in order to mitigate congestions, alongside the optimization of
the congestion management costs.
5.2 DAY-AHEAD CROSS-BORDER COORDINATION
The results obtained for two study-days (Winter day 1 and Summer day; 8 selected hours in each day) are
presented in Figure 18−Figure 21. Tables show the costs of increasing generation and revenue from decreasing
production for particular countries. For some hours in Summer day, the congestion management costs are not
presented due to the fact that implementation of non-cost remedial action such as PSTs relieved congestions; in
these time periods there was no reliance on costly remedial actions. Additionally, for the third analysed day
(Winter Day 2) control of the PSTs tap changers mitigated cross-border overloading for each considered hour.
Redispatching cost (EUR)
Method AT CZ DE PL SK HU
expert 62 992 -739 -151 662 -569 0 124 071
CBCT 37 094 46 -98 125 -105 -1731 73 344
FIGURE 18. REULTS OF REDISPATCHING COST PER COUNTRY FOR WINTER DAY 1.
-50,000
-40,000
-30,000
-20,000
-10,000
0
10,000
20,000
30,000
40,000
50,000
expert CBCT expert CBCT expert CBCT expert CBCT expert CBCT expert CBCT expert CBCT
0:15 0:15 3:00 3:00 4:15 4:15 4:45 4:45 9:00 9:00 13:45 13:45 19:00 19:00
EUR
AT CZ DE PL SK HU

REPORT ON OPERATOR TRAINING OUTCOMES WITH MULTIPLE TSO SESSION HELD IN DTS IN WARSAW DELIVERABLE: D4.3
39 | 74
Redispatching power (MW)
Method AT CZ DE PL SK HU
expert 1530 -20 -4510 -15 0 3110
CBCT 952 1 -2969 -3 -45 2064
FIGURE 19. REULTS OF REDISPATCHING POWER PER COUNTRY FOR WINTER DAY 1.
Redispatching cost (EUR)
Method AT CZ DE PL SK HU
expert 50 945 12 682 -47 460 1101 0 5026
CBCT 15 724 2385 -19 487 2 295 0 1139
FIGURE 20. REULTS OF REDISPATCHING COST PER COUNTRY FOR SUMMER DAY.
-1500
-1000
-500
0
500
1000
1500
expert CBCT expert CBCT expert CBCT expert CBCT expert CBCT expert CBCT expert CBCT
00:15 00:15 03:00 03:00 04:15 04:15 04:45 04:45 09:00 09:00 13:45 13:45 19:00 19:00
MW
AT CZ DE PL SL HU
-30,000
-20,000
-10,000
0
10,000
20,000
30,000
40,000
expert CBCT expert CBCT expert CBCT expert CBCT expert CBCT expert CBCT
10:45 10:45 11:00 11:00 11:45 11:45 13:30 13:30 13:45 13:45 21:00 21:00
EUR
AT CZ DE PL SK HU
PSTs remedial actions

REPORT ON OPERATOR TRAINING OUTCOMES WITH MULTIPLE TSO SESSION HELD IN DTS IN WARSAW DELIVERABLE: D4.3
40 | 74
Redispatching power (MW)
Method AT CZ DE PL SK HU
expert 1234 320 -1384 20 0 120
CBCT 385 87 -556 56 0 28
FIGURE 21. REULTS OF REDISPATCHING POWER PER COUNTRY FOR SUMMER DAY.
The total costs and activated power of redispatching actions are shown in Table 5-1 and Table 5-2.
TABLE 5-1: TOTAL COSTS OF REDISPATCHING.
Applied approach Winter Day 1 Summer Day
expert-based 34 094 EUR 22 294 EUR
optimisation-based (CBCT) 10 523 EUR 2057 EUR
TABLE 5-2: TOTAL ACTIVATED POWER OF REDISPATCHING.
Applied approach
Winter Day 1 Summer Day
Increase Generation
Decrease Generation
Increase Generation
Decrease Generation
expert-based 4640MW -4545MW 1694MW -1384MW
optimisation-based (CBCT) 3017MW -3017MW 556MW -556MW
Results are presented for the comparison of congestion management cost and redispatch volume with respect to
methods utilized; the Expert-Based Approach and Optimization-Based Approach. Implementation of available
remedial actions such as tap changing of PSTs and generation redispatch solved the problem of congestions for
analysed cases Winter Day 1 and Summer Day. The highest congestions are observed on the German-Austrian
cross-border for both investigated days. In the case of Winter Day 1 for both applied approaches the highest
increase of the dispatching up generation appeared in Austria and Hungary, with an according decrease of the
generation in Germany; a similar tendency is noticeable for the case of Summer Day.
Total costs of redispatching indicate that the optimised model achieved approximately 3.5 times better results in
comparison with the expert approach for Winter Day 1 and roughly 11 times superior results for Summer Day.
Moreover, total activated power is significantly lower for CBCT model than the expert method. For Winter Day 1
the overall amount of power activated differs 1.5 times, subsequently for the Summer day there was a difference
-800
-600
-400
-200
0
200
400
600
800
expert CBCT expert CBCT expert CBCT expert CBCT expert CBCT expert CBCT
10:45 10:45 11:00 11:00 11:45 11:45 13:30 13:30 13:45 13:45 21:00 21:00
MW
AT CZ DE PL SK HU
PSTs remedial actions

REPORT ON OPERATOR TRAINING OUTCOMES WITH MULTIPLE TSO SESSION HELD IN DTS IN WARSAW DELIVERABLE: D4.3
41 | 74
at the level of 3 times. The expert based approach mitigated any congestion which occurred, however the main
drawbacks are that the congestion management costs are significantly higher and redispatching required that a
considerably higher number of generation units be activated.
In conclusion, the results presented demonstrate the superiority of the optimisation method over the expert
approach. The CBCT tool provides the alternative for TSOs. The optimised method allows a TSO to perform the
necessary remedial actions in the effective way, it enables coordinated implementation of the tap changing of
PSTs and redispatch of generation in order mitigate congestions and decrease the congestion management costs.
5.3 INTRADAY Q/V MANAGEMENT
Intraday Q/V management is shown for eight consecutive time stamps, starting from 9:45 a.m. and ending at
11:30 a.m. Because no preventive actions are identified, it is shown only for four time stamps between 10:45 a.m.
and 11:30 a.m. when the assumed contingency occurs. This section shows results of implementation of two
different redispatching methods, respectively optimisation-based and expert-based approach. Methodologies for
both methods are presented in Section 4.3. The objective of the synchronous generation redispatching in Q/V
management is to ensure the mitigation of voltage violations at extra-high voltage 220, 400kV nodes. Table 2-1
presents the results of voltage level analysis where voltage violations are indicated for three corresponding
operational cases. The first, referred to as initial operation concerns the stage where the power system is
undergoing maintenance operations, hence the network is prone to voltage disturbances. The second stage
analyses tripping the largest generator in the system with an active power output of 886MW. Finally, the last
operation captures implementation the redispatching of active and reactive power in accordance with the
optimisation- and expert-based approaches.
TABLE 5-3. VOLTAGE VIOLATIONS FOR OPTIMISATION- AND EXPERT-BASED APPROACH.
Operation Name Case Number of nodes below the 0.9 p.u. Number of nodes above the 1.1 p.u.
10:45 a.m. initial operation 25 14
10:45 a.m. tripping a generator 82 0
10:45 a.m. tripping a generator + redispatching 2 0
11:00 a.m. initial operation 6 302
11:00 a.m. tripping a generator 6 230
11:00 a.m. tripping a generator + redispatching 6 2
11:15 a.m. initial operation 0 19
11:15 a.m. tripping a generator 0 11
11:15 a.m. tripping a generator + redispatching 0 0
11:30 a.m. initial operation 0 0
11:30 a.m. tripping a generator 0 0
11:30 a.m. tripping a generator + redispatching n/a n/a
The results indicate the number of under- and overvoltage nodes in the EHV network before and after
implementation of redispatching for optimised and expert methods. The aforementioned methods provide the
same results in terms of the objective achieved, considering the main objective is decreasing number of

REPORT ON OPERATOR TRAINING OUTCOMES WITH MULTIPLE TSO SESSION HELD IN DTS IN WARSAW DELIVERABLE: D4.3
42 | 74
problematic nodes. The highest impact is noticeable especially for time stamps 10:45 a.m. and 11:00 a.m. In the
first time interval it is noted that the switching-off the generator caused voltage to plummet at 82 nodes. The
second time period of 11:00 a.m. reveals the highest number of nodes where the voltage level of 1.1 p.u. is
exceeded. Additionally, in the case of 11:00 a.m. the highest levels active power generation by synchronous and
non-synchronous units is recorded. Thus, in the contingency stage it is evident that limiting the active power by
turning off the generator resulted in the overall reduction of overvoltage problems. However, the implementation
of redispatching allowed the TSO to efficiently reduce over-voltage violations at the affected nodes. In the case of
11:30 a.m. remedial redispatching was not implemented due to the fact that tripping the generator had no
problematic impact on the voltage levels.
Time Stamp 10:45 a.m. 11:00 a.m. 11:15 a.m.
Method Optimisation Expert Optimisation Expert Optimisation Expert
Absolute Active Power 1290MW 2233MW 1716MW 2503MW 1054MW 1733MW
Increase 1005MW 2001MW 1039MW 1887MW 1054MW 1733MW
Decrease -285MW -232MW -677MW -616MW 0 0
FIGURE 22. REULTS OF REDISPATCHING ACTIVE POWER.
The results presented in Figure 22 and Figure 23 indicate the interaction and inter-dependency of active and
reactive power in the procedure for redispatching with the methods investigated. For each of the time stamps
analysed the optimization-based algorithm achieved superior results in comparison with the expert-based
approach. The overall absolute change of active power and reactive power is approximately 1.6 and 2.3 times
higher in the expert method, respectively. It is noticeable that in the expert approach the amount of decreased
active power is relatively small, and in addition the method utilized demanded significant release of inductive
reactive power in comparison with the optimised approach. Ultimately, Table 5-4 presents the total costs of
redispatching, the final cost is on average 20%less for the optimisation-based method.
-1000
-500
0
500
1000
1500
2000
2500
Optimisation Expert Optimisation Expert Optimisation Expert
10:45 a.m. 10:45 a.m. 11:00 a.m. 11:00 a.m. 11:15 a.m. 11:15 a.m.
P MW
Increase Decrease

REPORT ON OPERATOR TRAINING OUTCOMES WITH MULTIPLE TSO SESSION HELD IN DTS IN WARSAW DELIVERABLE: D4.3
43 | 74
Time Stamp 10:45 a.m. 11:00 a.m. 11:15 a.m.
Method Optimisation Expert Optimisation Expert Optimisation Expert
Absolute Reactive Power 3317MW 3440MW 344MW 1163MW 1064 2640MW
Capacitive 2613MW 2559MW 331MW 1112MW 0 934MW
Inductive -704MW -881MW -13MW -51MW -1064 -1706MW
FIGURE 23. RESULTS OF REDISPATCHING REACTIVE POWER.
TABLE 5-4 TOTAL COSTS OF REDISPATCHING
Time Stamp 10:45 a.m. 11:00 a.m. 11:15 a.m.
Method Optimisation Expert Optimisation Expert Optimisation Expert
Total cost Redispatch (EUR) 378 408 447 549 343 043 391 638 287 075 366 109
5.4 REAL-TIME OPERATION
The 2-day DTS session was organized on 17th and 18th of December 2020. The agenda and list of attendees is
presented in the Appendices to this report. The session started with an introductory part presenting the overall
structure of study-cases and methodology assumed for particular ones.
The next part of the session dealt with the real-time study-case started from the presentation of scenarios to be
simulated in DTS. As mentioned in Section 4.4, two days were going to be simulated, i.e. summer day and winter
day 2, focusing on selected hours within the considered days.
5.4.1 SUMMER DAY
The Polish power system schedule input to the DTS is shown in Figure 24. It can be characterized as follows:
• high load demand – the morning peak ∼24,035MW is observed at 1:00 p.m. (GMT+1); the evening peak is
not investigated in this study-case,
• high ambient temperature and high solar radiation in both in Poland and neighbouring countries – the
peak of the PV generation ∼1970MW is observed at 1:00 p.m. (GMT+1),
-1000
-500
0
500
1000
1500
2000
2500
3000
Optimisation Expert Optimisation Expert Optimisation Expert
10:45 a.m. 10:45 a.m. 11:00 a.m. 11:00 a.m. 11:15 a.m. 11:15 a.m.
Q Mvar
Capacitive Inductive

REPORT ON OPERATOR TRAINING OUTCOMES WITH MULTIPLE TSO SESSION HELD IN DTS IN WARSAW DELIVERABLE: D4.3
44 | 74
• low wind generation in the analysed time range (∼200MW), the peak ∼2837MW is observed at 11:45 p.m.
(GMT+1),
• reconstruction of the solar eclipse – based on the historical irradiation data observed during the real
event on 20th of March 2015.
The simulation starts from 10:30 a.m. The solar eclipse begins at 11:00 a.m. and PV generation losses amount to
∼900MW on the Polish power system. The decreased level of PV generation lasts about 2 hours, and the
maximum level is attained again at 1:00 p.m. It is notable that the peak load demand occurs at the same time as
the end of solar eclipse. The simulation of summer day ends at 1:45 p. m. The toughest moments for the power
system were expected at the beginning and end of solar eclipse.
FIGURE 24. SUMMER DAY SCENARIO APPLIED TO DTS.
The spatial distribution of PV generation in Poland for selected time instants is presented in Figure 25. All time
series records for RES-E generation have been taken, merged with their respective connection point locations and
presented the data on maps as shown below.

REPORT ON OPERATOR TRAINING OUTCOMES WITH MULTIPLE TSO SESSION HELD IN DTS IN WARSAW DELIVERABLE: D4.3
45 | 74
11:00 a.m. (beginning of the solar eclipse) 1:00 p.m. (end of the solar eclipse)
FIGURE 25. HEAT MAP PRESENTING THE SPATIAL DISTRIBUTION OF PV GENERATION IN SUMMER DAY.
Some real-time contingencies were intentionally forced to face the dispatchers to challenges with the system
control including power balancing as well as congestion management.
On the other hand, some of real-time failures could be randomly activated, depending on the actual state of the
simulation. These include examples presenting different elements of regular dispatchers training, which have not
been initially considered in the session plan. The expected challenges for the dispatchers are as follows:
• power system balancing issues caused by a loss of a significant amount of PV generation due to the solar
eclipse,
• PV generation forecast error causing inaccurate intraday coordination plan for centrally dispatched units
in the first moments of PV generation loss,
• possible random loss of one of the largest centrally dispatched generation unit (CDGU) during the solar
eclipse (limited resources of FRR).
• possible congestions in HV and EHV network due to the high load demand and high ambient temperature.
• possible random EHV network fault event based on tripping of a transmission line, forcing dispatchers to
implement remedial actions.
As mentioned earlier, the simulation starts from 10:30 a.m. The power system state in the Central European EHV
network and HV network in Poland are shown in Figure 26 and Figure 27 respectively.

REPORT ON OPERATOR TRAINING OUTCOMES WITH MULTIPLE TSO SESSION HELD IN DTS IN WARSAW DELIVERABLE: D4.3
46 | 74
FIGURE 26. VIEW ON EHV EUROPEAN NETWORK AT THE BEGINNIG OF THE DTS SIMULATION (SUMMER DAY).
FIGURE 27. VIEW ON EHV AND HV NETWORK (IN POLAND) AT THE BEGINNIG OF THE DTS SIMULATION (SUMMER DAY).
Some congestion in the 110kV network is observed. They have been solved by the RPDC using network
reconfiguration. These are manual actions, no automatic controllers are applied in the 110kV network. Note also

REPORT ON OPERATOR TRAINING OUTCOMES WITH MULTIPLE TSO SESSION HELD IN DTS IN WARSAW DELIVERABLE: D4.3
47 | 74
that special protection schemes are used for EHV lines which are directly connected to the biggest (most relevant)
power plants.
Twenty minutes later (10:50 a.m.), there is still quasi steady-state in the power system. The view of LFC interface
is presented in Figure 28. The LFC keeps the scheduled international power exchange in Polish power system (in
the import direction ∼985MW). The measured control error (ACE) is quite low. Thus, no remedial actions are
needed by the NPDC. The signal of -172MW is sent by LFC to the CDGUs instructing them to reduce their
generation. Note; on the right hand side of the dashboard illustrated in Figure 28 three bars display FCR (top), FRR
(middle) and spinning reserve (bottom) available to the operator. The right and left sides of each bar report
negative and positive balancing reserves, respectively.
FIGURE 28. LFC PARAMETERS DURING STEADY-SATE OPERATION OF POWER SYSTEM (SUMMER DAY).
As mentioned earlier, the solar eclipse starts from 11:00 a.m. Five minutes later, due to the PV generation loss,
the power exchange deviation increases up to ∼110MW (there is low value of ACE component related to
frequency deviation). The PV generation no longer corresponds to the forecast, upon which the unit commitment
for CDGU in the intraday coordination plan was based. The LFC therefore instructs CDGUs to increase generation
by ∼172MW. Available aFFR(+) is currently only 404MW instead of required 576MW. This system state is shown in
Figure 29. This situation in the power system forces to NPDC dispatchers to take a decision to start-up the energy
storage system for power generation. The dispatcher activates two hydro-pump power units in generating mode
(within mFRR(+) service). One of them is located in Żarnowiec (the northern part of Poland, capacity of 179MW)
and second one is located in Porąbka-Żar (the southern part of Poland, capacity of 135MW. Note that the ACE has
changed the sign (negative value) including the dominant component of frequency error (-59/-83MW). Available
aFRR(+) is recovering, but simultaneously, the PV generation is still reducing.

REPORT ON OPERATOR TRAINING OUTCOMES WITH MULTIPLE TSO SESSION HELD IN DTS IN WARSAW DELIVERABLE: D4.3
48 | 74
FIGURE 29. LFC PARAMETERS AFTER SOLAR ECLIPSE STARTED (SUMMER DAY).
At 11:15 a.m. aFRR(+) is almost exhausted (< 100MW), but generation starts to significantly increase according to
the current intraday CDGU schedule. The activation of primary frequency reserve is observed as well as the
recovery of available aFRR(+). The generation of hydro-pump power unit in Żarnowiec was stopped by the
dispatcher.
A real-time failure of tripping one of the biggest CDGU in Poland was instigated in DTS (11:22 a.m.) to present
dispatchers with more severe balancing challenges (Figure 30). The tripped generation unit is located in Kozienice
power plant. Its capacity is 1075MW, and the power output before the tripp is 886MW, and the energy stored in
the rotating masses synchronously connected to the Polish Power system has reduced from 147GWs to 140 Ws.
FIGURE 30. TRIPPING THE BIGGEST GENERATION UNIT OPERATING IN POLISH POWER SYSTEM.

REPORT ON OPERATOR TRAINING OUTCOMES WITH MULTIPLE TSO SESSION HELD IN DTS IN WARSAW DELIVERABLE: D4.3
49 | 74
It was been observed that the frequency nadir was c.a. -200 mHz. The ACE value has reached almost 800MW. As a
remedial action in this system state, mFRR(+) was activated from a battery energy storage system (BESS)
(150MW) and two hydro-pump power units (2×179MW) to recover both FCR(+) and aFRR(+). At 11:35 a.m. the
situation in the power system is stabilized, as shown in Figure 31.
FIGURE 31. FREQUENCY AND ACE CHARTS AFTER THE EVENT OF TRIPPING GENERATOR.
The Kozienice failure is modelled as temporary, hence the biggest CDGU is available for re-start. The NPDC
dispatcher sent an instruction to re-start this generation unit. The unit starts to energise its internal loads (pumps,
mills, etc.) to be available to deliver the energy to the power system (start-up time is captured in the DTS).
The following minutes are quite calm for the real-time operation. Because the high steady-state voltage
deviations are expected in the northern part of the Polish EHV network, the RPDC dispatcher changed the
reference voltage (from 415kV to 400kV, as in Figure 32) on all 400kV busbar systems in the Żarnowiec
substation. All the hydro-pump power units are operating in voltage control mode, decreasing the active power
output. The control mode of the tap changer in transformer TR1 has been changed by the dispatcher into voltage
regulation on 110kV busbars. It necessary to emphasize that, if the transformers operate in parallel they are
controlled in the master-slave mode.
FIGURE 32. DIAGRAM OF SECONDARY VOLTAGE CONTROL SYSTEM FOR ŻARNOWIEC SUBSTATION.

REPORT ON OPERATOR TRAINING OUTCOMES WITH MULTIPLE TSO SESSION HELD IN DTS IN WARSAW DELIVERABLE: D4.3
50 | 74
As an example of simulated TSO-TSO coordination, at 12:05 p.m. the NPDC dispatcher changed the tap positions
in phase-shifters (PSTs) located in Mikułowa substation (close to the Polish-German border). The DTS interface
enabling PST control is presented in Figure 33. The applied changes increased the power flow through Poland in
order to relieve congestions on German-Czech cross-border line (see Figure 34). Such action requires the
coordination of three TSOs: PSE (Poland), 50Hertz (Germany) and ČEPS (Czech Republic).
FIGURE 33. CHANGE OF TAP POSITIONS IN PHASE-SHIFTERS LOCATED IN MIKUŁOWA SUBSTATION.
FIGURE 34. VIEW ON CENTRAL EASTERN EUROPEAN TRANSMISSION NETWORK WITH CONGESTED CROSS-BORDER LINES (WHITE BOLD
LINES).
In the meantime, the complete exhaustion of aFRR(-) has been observed. It was necessary to rebuild this control
band by deactivating mFRR(+) system service. For that purpose, all the hydro-pump power units and BESS were
switched off by RPDC dispatchers.
After recovering aFRR(-), the next real-time failure was been applied in the DTS. The DTS time is 12:25 p.m. The
400kV overhead line between Krajnik and Morzyczyn substations was tripped due to a short-circuit event. The
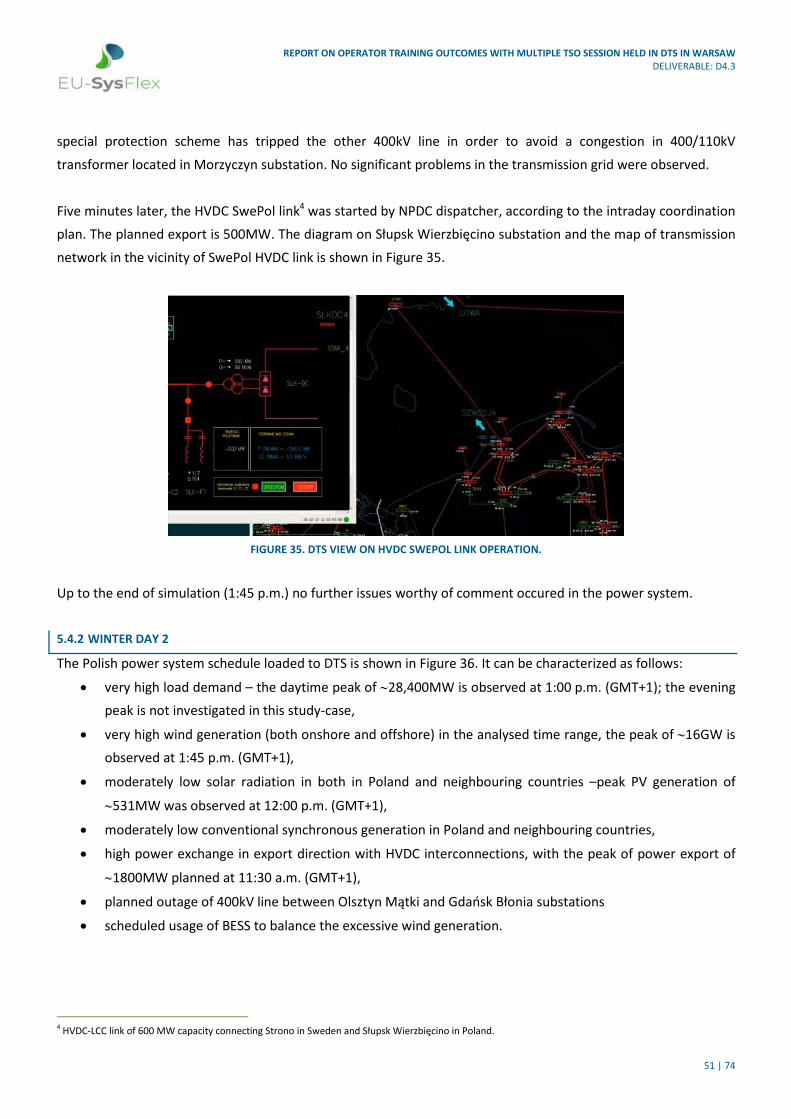
REPORT ON OPERATOR TRAINING OUTCOMES WITH MULTIPLE TSO SESSION HELD IN DTS IN WARSAW DELIVERABLE: D4.3
51 | 74
special protection scheme has tripped the other 400kV line in order to avoid a congestion in 400/110kV
transformer located in Morzyczyn substation. No significant problems in the transmission grid were observed.
Five minutes later, the HVDC SwePol link4 was started by NPDC dispatcher, according to the intraday coordination
plan. The planned export is 500MW. The diagram on Słupsk Wierzbięcino substation and the map of transmission
network in the vicinity of SwePol HVDC link is shown in Figure 35.
FIGURE 35. DTS VIEW ON HVDC SWEPOL LINK OPERATION.
Up to the end of simulation (1:45 p.m.) no further issues worthy of comment occured in the power system.
5.4.2 WINTER DAY 2
The Polish power system schedule loaded to DTS is shown in Figure 36. It can be characterized as follows:
• very high load demand – the daytime peak of ∼28,400MW is observed at 1:00 p.m. (GMT+1); the evening
peak is not investigated in this study-case,
• very high wind generation (both onshore and offshore) in the analysed time range, the peak of ∼16GW is
observed at 1:45 p.m. (GMT+1),
• moderately low solar radiation in both in Poland and neighbouring countries –peak PV generation of
∼531MW was observed at 12:00 p.m. (GMT+1),
• moderately low conventional synchronous generation in Poland and neighbouring countries,
• high power exchange in export direction with HVDC interconnections, with the peak of power export of
∼1800MW planned at 11:30 a.m. (GMT+1),
• planned outage of 400kV line between Olsztyn Mątki and Gdańsk Błonia substations
• scheduled usage of BESS to balance the excessive wind generation.
4 HVDC-LCC link of 600 MW capacity connecting Strono in Sweden and Słupsk Wierzbięcino in Poland.

REPORT ON OPERATOR TRAINING OUTCOMES WITH MULTIPLE TSO SESSION HELD IN DTS IN WARSAW DELIVERABLE: D4.3
52 | 74
FIGURE 36. WINTER DAY 2 SCENARIO APPLIED TO DTS.
Spatial distribution of wind generation in Poland for selected time moments is presented in Figure 37.
3:30 a.m. (wind peak-off) 1:45 p.m. (wind peak)
FIGURE 37. HEAT MAP PRESENTING THE SPATIAL DISTRIBUTION OF WIND GENERATION IN WINTER DAY 2.
It is worthy of note that BESS are energy resources which are expected to be intensively used in the Winter day 2
scenario. The map of BESS objects with their locations in Poland is show in Figure 38. They are fictious objects,
implemented for the purposes of EU-SysFlex project aiming to capture their future proliferation on the system.
The density of spatial distribution of these objects corresponds to the heatmap of wind generation (see Figure
37). BESS are located close to the big wind farms, assuming they will store excess wind energy produced by same.

REPORT ON OPERATOR TRAINING OUTCOMES WITH MULTIPLE TSO SESSION HELD IN DTS IN WARSAW DELIVERABLE: D4.3
53 | 74
FIGURE 38. LOCATION OF BESS IN POLAND CONSIDERED IN WINTER DAY 2.
It has been assumed that the dispatchers will face some real-time simulation session challenges, such as:
• power system balancing issues caused by excessive wind generation and minimum set of CDGUs as
conventional synchronous generation,
• congestion in the HV and EHV networks due to the very high load demand and high wind generation,
especially in the north of Poland,
• loss of large Centrally Dispatched Generation Unit (limited FRR resources),
• EHV network fault event based on simulated tripping of a transmission line, forcing dispatchers to
implement remedial actions.
Some of the challenges are implemented in DTS intentionally, but on the other hand, some of them might be
randomly activated, depending on the actual state of the simulation, as during Summer day session. They might
be telling examples presenting different elements of regular dispatchers training, which have been not initially
considered in the Winter day 2 session plan.
The simulation starts from 10:00 a.m. Figure 39 presents the state of EHV network in Polish power system
including the HVDC power export both to Sweden and Lithuania and high generation by offshore wind farms. The
energy stored in the rotating synchronous masses on the Polish power system is about 128GWs. In the whole CE
area, this parameter equals to 2675 TWs. The SNSP in CE is almost 20%.
15 minutes later (10:15 a.m.), the first overloaded 110kV line was observed (Figure 40). This line is located in the
area managed by RPDC-Poznań. To relieve this congestion, new system CM services (mFRD or mNRD) are to be
used by dispatchers. BESS and wind farms are the available resources located in the vicinity of the congested line
and providing the aforementioned CM services. In addition to activating CM services, the reconfiguration of
110kV network was needed (involving RPDC-Warszawa). Solving the identified congestion problem required
numerous interventions by RPDC dispatchers.
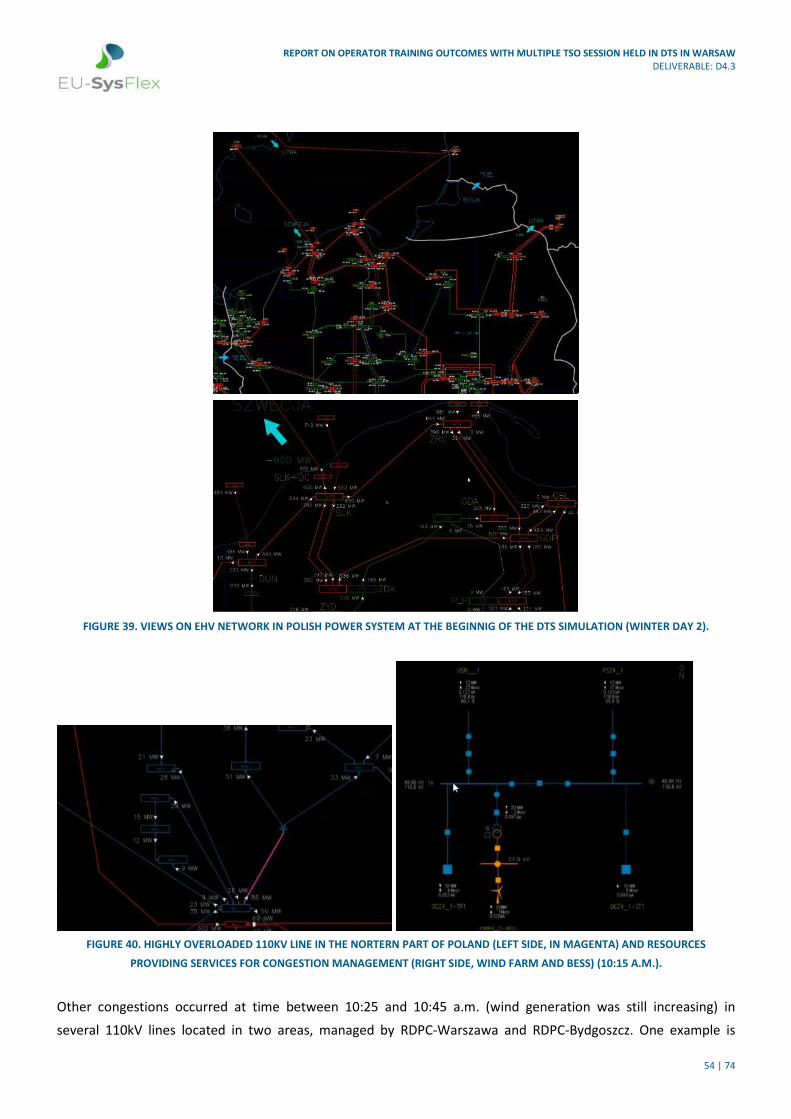
REPORT ON OPERATOR TRAINING OUTCOMES WITH MULTIPLE TSO SESSION HELD IN DTS IN WARSAW DELIVERABLE: D4.3
54 | 74
FIGURE 39. VIEWS ON EHV NETWORK IN POLISH POWER SYSTEM AT THE BEGINNIG OF THE DTS SIMULATION (WINTER DAY 2).
FIGURE 40. HIGHLY OVERLOADED 110KV LINE IN THE NORTERN PART OF POLAND (LEFT SIDE, IN MAGENTA) AND RESOURCES
PROVIDING SERVICES FOR CONGESTION MANAGEMENT (RIGHT SIDE, WIND FARM AND BESS) (10:15 A.M.).
Other congestions occurred at time between 10:25 and 10:45 a.m. (wind generation was still increasing) in
several 110kV lines located in two areas, managed by RDPC-Warszawa and RDPC-Bydgoszcz. One example is

REPORT ON OPERATOR TRAINING OUTCOMES WITH MULTIPLE TSO SESSION HELD IN DTS IN WARSAW DELIVERABLE: D4.3
55 | 74
shown in Figure 41. Because there are no resources providing mFRD or mNRD in the vicinity of the congested
lines, only topology changes in 110kV network were been applied by RPDC dispatchers. In those areas, 110kV
networks operate as a sub-transmission system. Except the line loading caused by wind generation, the power
transfers could be observed. In case of real-time balancing process, no problems were observed (Figure 42).
FIGURE 41. OVERLOADED 110KV LINES (YELLOW AND MAGENTA) IN THE NORTH-EASTERN PART OF POLISH POWER SYSTEM
(10:45 A.M.).
FIGURE 42. LFC PARAMETERS DURING STEADY-SATE OPERATION OF POWER SYSTEM (WINTER DAY 2, 10:45 A.M.).

REPORT ON OPERATOR TRAINING OUTCOMES WITH MULTIPLE TSO SESSION HELD IN DTS IN WARSAW DELIVERABLE: D4.3
56 | 74
In the north-eastern part of the Polish power system, the congestions do not occur, but for some 110kV lines, the
loading margin is very low. Some BESS operate according to their market schedule, but some of them provide
only the active power reserve within the assumed system services for CM. Figure 43 presents the window of
application enabling dispatchers to manage such services. In the presented example, one of the BESS located in
the area managed by RPDC-Warszawa is able to provide both mFRD and mNRD services. In this example, two
product schedules are active for the resource KAR2_1-ST1 (BESS technology) (green indicator SCHEDULE: ON).
According to these schedules, the BESS has not been nominated to provide any services in this moment. From the
technical point of view, the BESS can operate between ± 5MW, but for CM services, the provider has offered
2.5MW of reserve bid to the market for each product referred to this resource. To this moment, all the bids have
not been accepted by the market and there is no obligation for the resource to deliver the CM products.
FIGURE 43. VIEW ON REAL-TIME CONTROL PANEL OF CM SERVICES BEFORE ANY DISAPTCHER ACTIONS.
At 11:00 a.m. the RPDC dispatcher has nominated5 the considered BESS for mFRD MINUS. Because the scheduled
power equal zero, providing the reserve could start immediately (ability to increase the consumption of 2.5MW is
within the technically available 5MW). Thereafter, the dispatcher has activated mFRD MINUS and the BESS
started to ramp until it reached 2.5MW import (volume of the product). Dispatchers have an opportunity to
observe the most essential parameters related to both the product itself and technical availability of the
resource/resources delivering the product. In Figure 44 one can see the product parameters including current
volume (P_ACT = -2.0208MW), remaining time of delivery period (T_ACT = 31:08 min.), remaining time of ramping
(T_RAMP = 00:23 min.) as well as resource parameters such as: current power point (P_ARI_ACT = -2.0MW),
scheduled power point (P_SCHED = 0MW), energy capacity (E_SSRV_MAX = 20MWh), state of charge
(E_SSRV_ACT = 8MWh) and estimated time to reach the energy capacity in case of the permanent consuming of
2.5MW (TIME_TO_FULL = 366:52 min.).
5 Nomination means that a resource delivers capacity and is ready (in standby mode) to be activated (deliver the energy).

REPORT ON OPERATOR TRAINING OUTCOMES WITH MULTIPLE TSO SESSION HELD IN DTS IN WARSAW DELIVERABLE: D4.3
57 | 74
FIGURE 44. VIEW ON REAL-TIME CONTROL PANEL OF CM SERVICES AFTER NOMINATION AND ACTIVATION.
Wind generation continued to increase (11:20 a.m.). New overloading in the 110kV network was observed near
Piła Krzewina substation (north-eastern part of the Polish power system), as is presented in Figure 45. To solve
the identified problem, mFRD MINUS was activated by one of RPDC dispatchers. The activated service was
delivered by an aggregate of the wind farm KRW4_1-WG1N and BESS KRW4_1-WG1N (as also shown in Figure
45). To completely solve the congestion problem, five groups of resources (BESS and BESS + wind farm as an
aggregate) providing mFRD MINUS product and located in the vicinity of the overloaded line were used. In
parallel, dispatchers performed a series of load-flow calculations to meet all the N-1 criteria (branch loading,
voltage in nodes).
FIGURE 45. OVERLOADED 110KV LINES IN THE NORTH-EASTERN PART OF POLISH POWER SYSTEM AND THE RESOURCES PROVIDING CM
SERVICE (11:20 A.M.).
By 11:45 a.m. simulated time, all the congestions were relieved. The balancing situation in the Polish power
systems was stable (Figure 46).

REPORT ON OPERATOR TRAINING OUTCOMES WITH MULTIPLE TSO SESSION HELD IN DTS IN WARSAW DELIVERABLE: D4.3
58 | 74
FIGURE 46. LFC PARAMETERS DURING STEADY-SATE OPERATION OF POWER SYSTEM (WINTER DAY 2, 11:45 A.M.).
At 12:50 p.m. congestion problems occurred in the northern part of the 110kV network (Figure 47). RPDC
dispatchers activated mFRD MINUS in many resources located in the vicinity of the overloaded elements. These
actions caused a balancing problem, which is presented in Figure 48. A 700MW shortfall was observed on the
Polish power system. There was almost no available aFRR(+) (7/500MW). The hydro-pump power units in
Żarnowiec substation could not be used because they were consuming power (assumed the arbitrage in
electricity market) and do not offer mFRR(+). NPDC dispatchers took a decision to balance this excess of load, but
in other part of system where no congestions are expected. It was decided to start-up one of the CDGUs in
Ostrołęka (200MW of generation) power plant as well as run the emergency power purchase of 300MW from
Lithuania (using HVDC LitPol link). Additionally, the current intraday CDGU schedule was updated to cover the
missing power in the system. This situation has shown how important redispatching is when congestions are
managed.
As the balancing situation was stabilising, an unexpected tripp of the HVDC SwePol link was simulated (1:15 p.m.).
The state of transmission network in the vicinity of SwePol link before the failure event is shown in Figure 49.
Power export of 600MW was immediately lost in the northern part of the Polish power system. This improved the
balancing situation, but a huge amount of wind offshore and onshore generation has been pushed out from
northern Poland into the interior part of country. Huge power oscillations were observed resulting in changes in
power flows but also temporary over- (Figure 50) and undervoltage problems (Figure 51). Automatic voltage
control at the HVDC station has been assumed to be out of service. This tripp was also very severe, because of the
planned and applied outage of 400kV line between Olsztyn Mątki and Gdańsk Błonia substations, which is one of
the main paths to export wind generation into the eastern part of Poland.

REPORT ON OPERATOR TRAINING OUTCOMES WITH MULTIPLE TSO SESSION HELD IN DTS IN WARSAW DELIVERABLE: D4.3
59 | 74
FIGURE 47. OVERLOADED 110KV LINES IN THE NORTHERN PART OF POLISH POWER SYSTEM (MAGENTA AND YELLOW COLOR)
(12:50 P.M.).
FIGURE 48. LFC PARAMETERS DURING BALANCING PROBLEM IN THE POWER SYSTEM (WINTER DAY 2, 1:00 P.M.).

REPORT ON OPERATOR TRAINING OUTCOMES WITH MULTIPLE TSO SESSION HELD IN DTS IN WARSAW DELIVERABLE: D4.3
60 | 74
FIGURE 49. STATE OF EHV NETWORK IN THE NORTHERN PART OF POLISH POWER SYSTEM JUST BEFORE TRIPPING HVDC SWEPOL LINK
FIGURE 50. STATE OF EHV NETWORK IN THE NORTHERN PART OF POLISH POWER SYSTEM JUST AFTER TRIPPING HVDC SWEPOL LINK
(OVERVOLTAGES IN SUBSTATIONS).

REPORT ON OPERATOR TRAINING OUTCOMES WITH MULTIPLE TSO SESSION HELD IN DTS IN WARSAW DELIVERABLE: D4.3
61 | 74
FIGURE 51. STATE OF EHV NETWORK IN THE NORTHERN PART OF POLISH POWER SYSTEM AFTER TRIPPING HVDC SWEPOL LINK
(UNDERVOLTAGES IN SUBSTATIONS).
A quasi-steady-state developed in the Polish power system, with enduring undervoltage conditions and low
voltage stability margin. Simultaneously, the high overloading in some 400kV lines was occurring. At 1:20 p.m. the
400kV overhead line Morzyczyn – Dunowo (marked in yellow cross in Figure 51) tripped due to the unintentional
activation of a special protection scheme responsible for alleviation of overloads. This caused the voltage collapse
in almost whole the Polish power system. This was the blackout state as presented in Figure 52.
FIGURE 52. BLACKOUT STATE IN THE POLISH POWER SYSTEM AFTER THE VOLTAGE COLLAPSE (DEENERGIZED ELEMENTS MARKED IN
GREY, 1:20 P.M.).

REPORT ON OPERATOR TRAINING OUTCOMES WITH MULTIPLE TSO SESSION HELD IN DTS IN WARSAW DELIVERABLE: D4.3
62 | 74
After the voltage collapse, central part of Poland (near Warsaw) operated for a moment (c.a. 1 min) in island
mode, but it also collapsed completely. Only areas located in the southern Poland were energized. The major part
is still connected with the rest of CE power system, but there is also an island operating in generation excess
(over-frequency observed). The balancing state in the whole Polish power system seen in NPDC is shown in Figure
53. The LFC was switched to the manual control mode.
FIGURE 53. LFC PARAMETERS AFTER VOLTAGE COLLAPSE IN THE POLISH POWER SYSTEM (WINTER DAY 2, 1:30 P.M.).
All the dispatchers immediately started the restoration process. LFC was also switched to control only frequency.
In this mode, LFC does not attempt to maintain the scheduled international power exchange to/from the Polish
power system. The frequency deviation is only the element of ACE. The ext decision was to start four hydro-pump
power units in Żarnowiec providing the black-start capability and service (the level of water in the upper resevoir
was sufficient). The goal was to energize the CDGU located in the conventional power plant Dolna Odra
(connected to Krajnik substation). The automatic voltage control in Żarnowiec substation was also activated to
manage reactive power in the restored island (the reference voltage has been set equal to nominal values). After
four hydro-pump power units were started-up (one of them operating in generation mode and the rest of them
being synchronous compensators), the substation in Słupsk was energized as is shown in Figure 54.
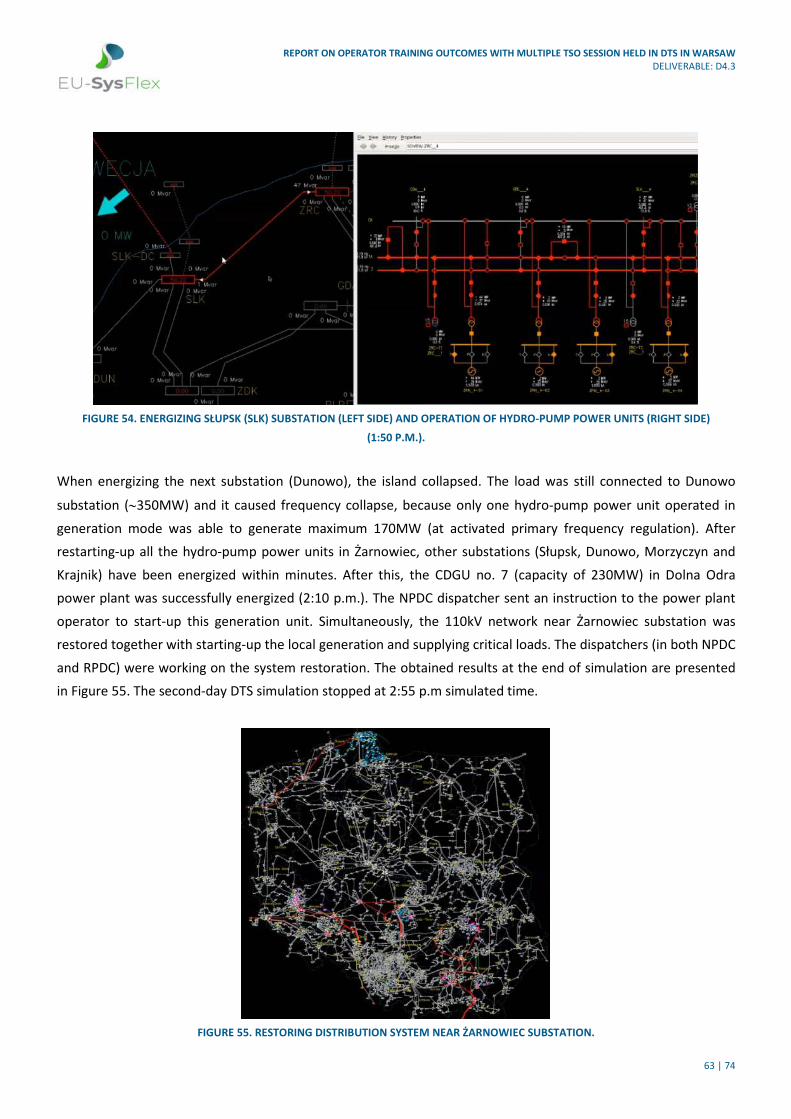
REPORT ON OPERATOR TRAINING OUTCOMES WITH MULTIPLE TSO SESSION HELD IN DTS IN WARSAW DELIVERABLE: D4.3
63 | 74
FIGURE 54. ENERGIZING SŁUPSK (SLK) SUBSTATION (LEFT SIDE) AND OPERATION OF HYDRO-PUMP POWER UNITS (RIGHT SIDE)
(1:50 P.M.).
When energizing the next substation (Dunowo), the island collapsed. The load was still connected to Dunowo
substation (∼350MW) and it caused frequency collapse, because only one hydro-pump power unit operated in
generation mode was able to generate maximum 170MW (at activated primary frequency regulation). After
restarting-up all the hydro-pump power units in Żarnowiec, other substations (Słupsk, Dunowo, Morzyczyn and
Krajnik) have been energized within minutes. After this, the CDGU no. 7 (capacity of 230MW) in Dolna Odra
power plant was successfully energized (2:10 p.m.). The NPDC dispatcher sent an instruction to the power plant
operator to start-up this generation unit. Simultaneously, the 110kV network near Żarnowiec substation was
restored together with starting-up the local generation and supplying critical loads. The dispatchers (in both NPDC
and RPDC) were working on the system restoration. The obtained results at the end of simulation are presented
in Figure 55. The second-day DTS simulation stopped at 2:55 p.m simulated time.
FIGURE 55. RESTORING DISTRIBUTION SYSTEM NEAR ŻARNOWIEC SUBSTATION.

REPORT ON OPERATOR TRAINING OUTCOMES WITH MULTIPLE TSO SESSION HELD IN DTS IN WARSAW DELIVERABLE: D4.3
64 | 74
6. CONCLUSIONS
An ever-increasing share of RES-E in the European power system causes increasing volatility in the generation
profile. Operation of inverter-based sources leads to reduced total moment of inertia of the synchronously
connected rotating masses and thus increasingly faster frequency transients in the power system. The number of
stakeholders actively participating in the European electricity market is continuously growing. Additionally, the
energy resources become more and more distributed in the system resulting in a lot of prospective information
about their operation and flexibility. Thus, the power system is going to be much faster, volatile and will require
support from and hence control of distributed resources. On the other hand, rapidly developing technology offers
higher observability and controllability. The conclusions which can be drawn from the performed simulations and
numerous discussions which took place in parallel, can be grouped as below.
Capacity allocation and congestion management
Implementing European guideline CMCA is a significant step to ensuring both optimal use of the transmission
infrastructure and operational security (EC-CACM GL, 2015). Implementation of Flow-Based Market Coupling in
Capacity Calculation Regions (CCRs) is essential to reduce the unscheduled flows in the European synchronous
systems. To minimize them, remedial actions relevant to cross-border elements are necessary. For this purpose,
the proper methodologies for coordinated redispatch and countertrading have been implemented by particular
CCRs. However, it is reasonable to consider the smallest possible bidding zones, optimally corresponding to
individual nodes of the power grid (nodal market). The smaller the size of bidding zones, the greater utilisation of
transmission assets. For such a market design, the impact on market liquidity and efficiency must be carefully
investigated.
Centrally optimised coordination of the congestion management process among European TSOs is feasible for
large-scale systems as is presented in Section 5.2. Today’s CM methodologies used by TSOs are more advanced
than the methodology presented in this report. However, for a new means of applying the developed tool for the
coordinated cross-border congestion management has been found. It is possible to optimally pre-select the
locations in which new PSTs would have the highest potential of reducing the cost of congestion management or
the severity of congestions. The details of this concept including numerical examples can be found in (Urresti-
Padrón, 2020).
The study-case of day-ahead TSO-DSO coordination has demonstrated the proof of concept for the congestion
management in the transmission grid. The day-ahead TSO-DSO coordination method proposed within the German
demonstrator provides an alternative for TSOs in terms of congestion management, introducing novelty in the
field of using flexibile assets located in the DSO grid. The presented method allows implementation of necessary
remedial actions in an effective way, and also enables coordinated implementation of the flexibilities in the
distribution grid with the assessment of the impact of those actions on certain EHV grid points in order to mitigate
congestions alongside the optimization of the congestion management costs.

REPORT ON OPERATOR TRAINING OUTCOMES WITH MULTIPLE TSO SESSION HELD IN DTS IN WARSAW DELIVERABLE: D4.3
65 | 74
It is also important that TSOs and DSOs should provide economic incentives for prospective CM service providers
to locate their flexibility resources in areas which are the most effective to solve congestion problems. Methods
based on sensitivities, PTDF or power flow tracing could be applied to determine demand for flexibility in
particular time horizons.
Real-time operation and intraday planning
First of all, advanced energy management systems (EMSs) are needed in operator control rooms. EMSs have to be
built around a high-performance, secure-by-design IT platforms with the functionality of network security and
resource optimization. They should solve a wide set of optimisation problems which should consider:
• multi-criteria approach
• network topology,
• available flexibility of network assets (HVDC, FACTS),
• available market-based flexibility of energy resources connected to both TSO and DSO network (in terms
of providing services for balancing and frequency regulation, congestion management and Q/V control),
• logic of special protection schemes,
• risk and uncertainty conditions including preventive and corrective actions,
• stability constraints,
• inter-TSO/DSO coordinated,
• multi-period constraints.
In order to enhance interoperability among particular EMS components in- and between control centres, vendor
agnostic solutions should be developed. The future control centres need a much more modular approach allowing
for multi-vendor and open-source applications to be integrated and maintained, which can communicate in a
secure and robust manner.
EMS systems should enable to the greatest possible extent the automatization both of real-time activation and
additional purchasing of flexibility products i.e. system services. Especially, if large volumes of some products are
activated in a manual way (e.g. mFRR delivered by many distributed resources and service providers via flexibility
platform), it is necessary to quickly aggregate them (considering the ramping, volume, location and sensitivity and
cost) and to achieve this in the required time.
Fast TSO actions required during the defence of power system (in emergency state) should be supported by AI-
based systems. There may not be enough time to solve optimisation problems in a conventional way. If market or
cost criteria are not relevant in such situations, an approximation approach (machine learning models or
metaheuristics) could be applied quickly, seeking a system state which is technically secure. Fast decision support
based on minimizing ENS is also relevant when the power system is in the restoration state after complete or
partial black-out.

REPORT ON OPERATOR TRAINING OUTCOMES WITH MULTIPLE TSO SESSION HELD IN DTS IN WARSAW DELIVERABLE: D4.3
66 | 74
It is extremely important for TSO’s real-time operation is to extend the application of Wide Area Measurement
Systems (WAMS). Today, available WAMS technology which integrate Phasor Measurement Units (PMUs), gives
the operator a wide spectrum of applications, such as:
• source of data for offline analysis and model validation.
• disturbance monitoring including sub-synchronous resonance and islanding detection,
• dynamic stability assessment (voltage, frequency transient, oscillatory, harmonic) and support in
controller parametrisation.
Nowadays, many operator decisions are taken by dispatchers based on current observations (tracking dispatch
and control). The effort should focus on the effective utilisation of future information in order to become more
proactive instead of reactive. On the one hand, dynamic state estimation techniques are implemented in EMSs
based on WAMS data. On the other hand, there are advanced tools or services which can provide high-quality
forecasts (load and RES-E generation including its flexibility, weather dependency, etc.) to predict a future system
state. It is important to have not only high-accuracy global RES-E and demand forecasts, but its spatial distribution
and mapping to power grid nodes.
The occurrence of extreme weather events (e.g., hurricanes, floods) and man-made attacks (cyber and physical
attacks) calls for developing control and operation methods to improve grid resilience against such events. The
development of so-called resilience management systems should be also relevant for system operators to assist
them with consistent assessment and continuously improvement considering possible failures of both physical
and digital infrastructures.
The study-case of intraday Q/V management has shown a great value of optimisation-based approach utilising
the developed Decision Support Tool. Lower system costs and lower absolute redispatching volumes have been
achieved in comparison to the expert-based method. The obtained results are promising, and further R&D works
are needed. Apart from steady-state voltage control, extended scope of intraday scheduling is also needed,
especially for resources and operator assets supporting system controllability, stability, stiffness, etc.
Power system operation in real time should be analogous to piloting a passenger plane, in that the human-
supervised “autopilot” functionality should be applied for all typical and normal states in the power system. In
case of non-typical or emergency states, the dispatcher (human) decision will be still crucial, although supported
by AI-based tools. There is an almost infinite space of possible scenarios resulting in decisions when power system
is operating in an abnormal state. The criteria and constraints in such situations are not often well defined. Thus,
applying autonomous, AI-based solutions should be done very carefully. Human decisions will be still taken at a
high-level of the operation process, mainly as the supervision. Automatic controllers will operate at lower-level,
especially if time available for decision making and subsequent action is very short and the amount of information
to process is too great for an unsupported human operator. This indicates that the human-machine approach for
real-time system operation will be researched and developed for years into the future.
REPORT ON OPERATOR TRAINING OUTCOMES WITH MULTIPLE TSO SESSION HELD IN DTS IN WARSAW DELIVERABLE: D4.3
67 | 74
Management of the grid at DSO level (e.g. 110kV grid) and cooperation between TSO-DSO should be extracted
from National Control Centre level. It is reasonable to delegate cooperation TSO-DSO at local/regional level at
TSO control local area keeping in mind hierarchical structure of grid management.
Dispatcher training
TSOs need to still develop training approaches for dispatchers to enable them to deal with all the new procedures
and to empower them to intervene in the real-time control process when human intervention is strongly needed,
especially in critical situations. A very important aspect of such trainings is inter-operability both between TSOs
and TSO and DSOs.
The reactive approach of developing training tools in response to changing realities is becoming inadequate
today. Use of the DTS demonstrates the potential of a proactive approach of familiarisation of TSO/DSO
dispatching and planning professionals with the challenges they will face in the near future. Based on this
proactive approach, system operators will be able to define requirements for their future work in sufficient time
e.g. functionality of ICT systems responsible for the activation of flexibility services or the additional purchase of
products within such services. Thus, operators will have optimal procedures in advance and will be equipped with
the effective tools for high RES-E power system operation planning and real-time dispatching.
Today, dispatchers use the term of system service, more as a technology-based service (e.g. battery energy
storage system service) than as a needs-based service (e.g. fast redispatching service). Dispatchers are strongly
accustomed to using terms that are used in their daily job when operating the power system. For instance, they
refer to terms like spinning reserve or cold reserve (strictly connected with thermal and rotating elements of the
conventional generation technology), as existing and individual services available today for a TSO. Thus, there is a
need to promote and require from dispatchers (if possible) using terminology standardized at the European level.
Dispatchers being trained should be faced with extreme simulations capturing outages of different automatic
controllers (even chaotic behaviour after a hypothetical cyber-attack) and decision supporting tools. Dispatchers
should always be ready to switch from semi-automated mode of power system operation into manual mode.
People who work in control centres should always have deep and up-to-date knowledge regarding to power
system engineering. They should also have relevant behavioural skills with particular focus on stress
management, human behaviour in critical situations, responsibility and motivation skills. Minimum requirements
for trainings have been already set in (EC-SO GL, 2017).
The DTS, as a class of tools should be developed into representing much faster phenomena as in electromagnetic
transients. Fast frequency response and dynamic voltage support might be services highly demanded by
operators. It is worthwhile to represent such fast interactions in the models utilized in DTS for trainings. New
system-scale automated routines (LFC, SPS, real-time feedback optimizers) or dispatcher decision support tools
should have an opportunity to test these services in combination with DTS simulation of such phenomena. This
approach is called a software-in-the-loop (SIL). Dispatchers, during some training scenarios, could then test new

REPORT ON OPERATOR TRAINING OUTCOMES WITH MULTIPLE TSO SESSION HELD IN DTS IN WARSAW DELIVERABLE: D4.3
68 | 74
software in a pre-production environment which uses the DTS to closely mimic real time operation before they
start to use it in the control rooms.
The power system community (R&D institutes, academies, TSOs, DSOs, technology providers) should support
open-source solutions, giving an impulse to create a computationally efficient and open for development, inter-
operable DTS software.
Finally, it is worthy of comment that thee COVID-19 pandemic has affected PSE and PSE Innowacje in that the
planned physical DTS workshop could not be held. Instead a remote session was organised. This example has
shown that the regular dispatcher training sessions should also be ready for remote way in order to keep the
continuity of training.

REPORT ON OPERATOR TRAINING OUTCOMES WITH MULTIPLE TSO SESSION HELD IN DTS IN WARSAW DELIVERABLE: D4.3
69 | 74
7. LITERATURE
Coffrin, 2018
Coffrin C., Bent R., Sundar K., Ng Y., Lubin M.: PowerModels.jl: An Open-Source
Framework for Exploring Power Flow Formulations, 2018 Power Systems
Computation Conference
EC-CACM GL, 2015 Commission Regulation (EU) 2015/1222 of 24 July 2015 establishing a guideline on
capacity allocation and congestion management
EC-SO GL, 2017 Commission Regulation (EU) 2017/1485 of 2 August 2017 establishing a guideline
on electricity transmission system operation
EU-SysFlex-D2.2, 2018 EU-SysFlex - Deliverable 2.2 – EU-SysFlex Scenarios and Network Sensitivities.
EU-SysFlex-D2.3, 2018 EU-SysFlex – Deliverable 2.3 – Models for Simulating Technical Scarcities on the
European Power System with High Levels of Renewable Generation
EU-SysFlex-D3.1, 2019 EU-SysFlex – Deliverable 3.1 – Product Definition for Innovative System Services
EU-SysFlex-D4.1, 2019 EU-SysFlex – Deliverable 4.1 – Developed dispatch & scheduling software for
multiple system services provision from new technology
EU-SysFlex-D4.2, 2020 EU-SysFlex – Deliverable 4.2 – Developed a Dispatcher Training Simulator of a
semirealistic EU High RES-E network
EU-SysFlex-D6.6, 2019 EU-SysFlex – Deliverable 6.6 – Demonstrators for Flexibility Provision from
Decentralized Resources, Common View
EU-SysFlex-MS6, 2019 EU-SysFlex – Milestone 6 – Weather data and nodal demand patterns developed for
DTS (document available for the project consortium), 2019
EU-SysFlex-MS7, 2018 EU-SysFlex – Milestone 7 – Modelling of low inertia Thevenin equivalents agreed
(document available for the project consortium), 2018
TYNDP, 2018 TYNDP 2018. Scenario report, available online at
https://tyndp.entsoe.eu/tyndp2018/scenario-report/
Urresti-Padrón, 2020
Urresti-Padrón E., Jakubek M., Jaworski W., Kłos M.: Pre-Selection of the Optimal
Sitting of Phase-Shifting Transformers Based on an Optimization Problem Solved
within a Coordinated Cross-Border Congestion Management Process. Energies,
13(14), 3748, 2020.

REPORT ON OPERATOR TRAINING OUTCOMES WITH MULTIPLE TSO SESSION HELD IN DTS IN WARSAW DELIVERABLE: D4.3
70 | 74
APPENDIX
AGENDA OF DTS SESSION
17th of December 2020 (Thursday):
1. Welcome – Leszek Jesień (PSE) (09:00 a.m. - 09:05 a.m.)
2. Overview of Task 4.2 and a role of DTS in the EU-SysFlex project
– Jacek Wasilewski (PSE Innowacje)
(09:05 a.m. - 09:30 a.m.)
3. Selected use cases related to the entire simulation process in T4.2
A) Flexibility delivered from German distribution systems
– Sebastian Wende von Berg (Fraunhofer Institute)
B) XB coordination in congestion management – Michał Kłos / Marcin
Jakubek (National Centre of Nuclear Research)
C) Applying decision support tool in Q/V management
– Dirk Van Hertem / Abhimanyu Kaushal (KU Leuven/Energyville)
(09:30 a.m. - 10:30 a.m.)
4. Coffee break (10:30 a.m. - 10:45 a.m.)
5. Introduction to the simulated summer day in DTS
– Mateusz Skwarski (PSE Innowacje)
(10:45 a.m. - 11:00 a.m.)
6. Real-time simulation according to the summer day scenario
– team of PSE Innowacje
(11:00 a.m. - 1:15 p.m.)
7. Lunch/coffee break (1:15 p.m. - 1:45 p.m.)
8. Discussion – all participants (1:45 p.m. - 2:30 p.m.)
18th of December 2020 (Friday):
1. Introduction to the simulated winter day in DTS – Mateusz Skwarski
(PSE Innowacje)
(09:15 a.m. - 09:30 a.m.)
2. Real-time simulation according to the winter day scenario (part 1)
– team of PSE Innowacje
(09:30 a.m. - 11:30 a.m.)
3. Lunch/coffee break (11:30 a.m. - 12:30 p.m.)
4. Real-time simulation according to the winter day scenario (part 2)
– team of PSE Innowacje
(12:30 p.m. - 2:00 p.m.)
5. Discussion – all participants (2:00 p.m. - 2:30 p.m.)

REPORT ON OPERATOR TRAINING OUTCOMES WITH MULTIPLE TSO SESSION HELD IN DTS IN WARSAW DELIVERABLE: D4.3
71 | 74
LIST OF ATTENDEES IN DTS SESSION
Name Company
Radosław Baczewski PSE Innowacje
Kamil Bukowski PSE
Marcin Chomik PSE
Gianluca Di Felice E-Distribuzione
Reinhilde D’hulst VITO
Marcin Jakubek NCNR
Arnold Jens Mitnetz Strom
Leszek Jesień PSE
Abhimanyu Kaushal KU Leuven
Donna Kearney EirGrid
Dariusz Knasiński PSE
Michał Kłos NCNR
Marek Kornicki PSE
Mariusz Krupa PSE Innowacje
Kaur Kubarsepp Elering
Kalle Kukk Elering
Krzysztof Matysik PSE
Patryk Mazek PSE
Simon Nagels KU Leuven
Jacek Nowaczkiewicz PSE
Conor O’Byrne SONI
Mateusz Osuch PSE
Daniel Owczarek PSE
Gunnar Pallas Elering
Andreas Persin Mitnetz Strom
Sławomir Pietraszek PSE
Dominik Rzeszowski PSE Innowacje
Mariusz Sienkiewicz PSE
Mateusz Skwarski PSE Innowacje
Mariusz Słowicki PSE
Maik Staudt Mitnetz Strom
Rene Sturm Mitnetz Strom
Łukasz Szczepaniak PSE
Kaido Vaade Elektrilevi
Tom Van Acker KU Leuven

REPORT ON OPERATOR TRAINING OUTCOMES WITH MULTIPLE TSO SESSION HELD IN DTS IN WARSAW DELIVERABLE: D4.3
72 | 74
Name Company
Dirk Van Hertem KU Leuven
Da Wang VITO
Marcin Zdunek PSE Innowacje
Patryk Żak PSE

REPORT ON OPERATOR TRAINING OUTCOMES WITH MULTIPLE TSO SESSION HELD IN DTS IN WARSAW DELIVERABLE: D4.3
73 | 74
SAMPLES OF DECISION SUPPORT TOOL OUTPUT
Output_text.txt:
For TESTCASE1_2019-02-22-44 and contingency Sym_30202_E change
(*) Generator sym_30089_5 setpoints to 150.0 MW and 64.98855859756767 MVAr( delta P =
30.047654172456628 MW and delta Q = 0.0 MVAr)
(*) Generator sym_30311_5 setpoints to 80.0 MW and 84.36979238573919 MVAr( delta P = 7.08316020357381
MW and delta Q = 74.42940212212062 MVAr)
(*) Generator sym_30045_5 setpoints to 360.0 MW and -64.48348723701457 MVAr( delta P =
101.92963490326576 MW and delta Q = 0.0 MVAr)
(*) Generator sym_30125_1 setpoints to -200.0 MW and 132.48850707366347 MVAr( delta P =
69.31465647057043 MW and delta Q = 3.989482064867553 MVAr)
(*) Generator sym_30072_7 setpoints to 135.0 MW and 37.54840339649621 MVAr( delta P =
30.359878532152422 MW and delta Q = 0.0 MVAr)
(*) Generator sym_30312_6 setpoints to 80.0 MW and 66.1287229450986 MVAr( delta P = 1.064376184703493
MW and delta Q = 54.76365752125989 MVAr)
(…)
bus_info.csv:
time_stamp,Contingency,Bus_name,V(pu)
TESTCASE1_2019-02-22-44,Sym_30202_E,450 TCN413,0.9137271907348316
TESTCASE1_2019-02-22-44,Sym_30202_E,882 OLT441,0.9306350568499142
TESTCASE1_2019-02-22-44,Sym_30202_E,1010 BEK211,0.9200702132474997
TESTCASE1_2019-02-22-44,Sym_30202_E,1480 PUL212,0.9463451565431082
TESTCASE1_2019-02-22-44,Sym_30202_E,1860 KHK223,0.9154664429060699
TESTCASE1_2019-02-22-44,Sym_30202_E,6450 EKB411,0.8655477696753522
TESTCASE1_2019-02-22-44,Sym_30202_E,1370 CHM222,0.9208995678999566
TESTCASE1_2019-02-22-44,Sym_30202_E,1580 ATA213,0.9177367986270061
TESTCASE1_2019-02-22-44,Sym_30202_E,eqTermAC-5(5),0.8506029383362228
(…)
gen_dis.csv:
time_stamp,Contingency,Gen_name,P (MW),delta_P (MW),Q (MVAr),delta_Q (MVAr)
TESTCASE1_2019-02-22-44,Sym_30202_E,sym_30030_4,129.0,1.1107093564954766,45.258736409455686,0.0
TESTCASE1_2019-02-22-
44,Sym_30202_E,sym_30024_8,110.00000000000001,18.349758185043864,137.46406868045628,2.5543557930
31118e-6

REPORT ON OPERATOR TRAINING OUTCOMES WITH MULTIPLE TSO SESSION HELD IN DTS IN WARSAW DELIVERABLE: D4.3
74 | 74
TESTCASE1_2019-02-22-
44,Sym_30202_E,REI_PQ_Minus_othg0deg(10),16.86159253006822,0.0,176.2063873491003,7.55751048199907
6
TESTCASE1_2019-02-22-44,Sym_30202_E,sym_30089_5,150.0,30.047654172456628,64.98855859756767,0.0
TESTCASE1_2019-02-22-44,Sym_30202_E,sym_30354_1,156.0,0.8469656274084809,274.3785860755297,0.0
TESTCASE1_2019-02-22-44,Sym_30202_E,sym_30559_1,33.0337958631637,0.0,40.674196473592424,0.0
TESTCASE1_2019-02-22-44,Sym_30202_E,REI_PV_Plus_pv30deg(5),615.202618120959,0.0,-
916.2862200824624,0.0
TESTCASE1_2019-02-22-
44,Sym_30202_E,REI_PQ_Plus_othg0deg(5),661.9265352051311,0.0,937.6567670614079,3.4442483754374096
TESTCASE1_2019-02-22-
44,Sym_30202_E,sym_30311_5,80.0,7.08316020357381,84.36979238573919,74.42940212212062
(…)
sys_info.csv:
Time_stamp,Contingency,Solve_time,Redispatch_cost
TESTCASE1_2019-02-22-44,Sym_30202_E,5.3810596,355914.4260849939