Report on Cancer Incidence in Nevada, 2001-2005
122
NEVADA CANCER REPORT, 2001-2005 NEVADA CANCER REPORT 2001-2005 Report on Cancer Incidence in Nevada, 2001-2005 Office of Health Statistics and Surveillance Bureau of Health Statistics, Planning and Emergency Response Nevada State Health Division Department of Health and Human Services Jim Gibbons Richard Whitley, MS Governor Administrator Michael J. Willden Tracey D. Green, MD Director State Health Officer Department of Health and Human Services Nevada State Health Division
-
Upload
khangminh22 -
Category
Documents
-
view
0 -
download
0
Transcript of Report on Cancer Incidence in Nevada, 2001-2005

NEVADA CANCER REPORT, 2001-2005
NEVADA CANCER REPORT 2001-2005
Report on Cancer Incidence in Nevada, 2001-2005
Office of Health Statistics and Surveillance Bureau of Health Statistics, Planning and Emergency Response
Nevada State Health Division Department of Health and Human Services
Jim Gibbons Richard Whitley, MS Governor Administrator Michael J. Willden Tracey D. Green, MD Director State Health Officer Department of Health and Human Services Nevada State Health Division

ii
NEVADA CANCER REPORT, 2001-2005
NEVADA CANCER REPORT 2001-2005
September, 2010
Luana J. Ritch, PhD Chief
Bureau of Health Statistics, Planning and Emergency Response
Alicia Chancellor Hansen, MS Chief Biostatistician
Office of Health Statistics and Surveillance Bureau of Health Statistics, Planning and Emergency Response
Juanamarie A. Harris, BS Program Manager
Nevada Central Cancer Registry Bureau of Health Statistics, Planning and Emergency Response
Adel Mburia-Mwalili, MPH Biostatistician
Office of Health Statistics and Surveillance Bureau of Health Statistics, Planning and Emergency Response
Readers of this publication are welcome to offer their suggestions and/or comments by filling out the attached form at the end of this report. Requests for additional information can be made to:
Alicia Chancellor Hansen, MS Chief Biostatistician
Office of Health Statistics and Surveillance Bureau of Health Statistics, Planning and Emergency Response
4150 Technology Way, Suite #104 Carson City, Nevada 89706
Phone: (775) 684-4161 Fax: (775) 684-4156
Email: [email protected]

iii
NEVADA CANCER REPORT, 2001-2005
ACKNOWLEDGEMENTS
This report would not have been possible without the efforts of the staff of the Nevada Central Cancer Registry who ensure the quality and completeness of cancer incidence data in Nevada. Additional appreciation goes to each staff member of every cancer reporting facility in Nevada and staff members at other state central cancer registries with data exchange agreements who submitted cancer abstracts to the Nevada Central Cancer Registry. This report would not have been possible without you. This publication was supported by the Centers for Disease Control and Prevention cooperative agreement number 5U58DP000804-03. Its contents are solely the responsibility of the authors and do not necessarily represent the views or opinions of the Centers for Disease Control and Prevention. Suggested citation: Nevada State Health Division: Office of Health Statistics and Surveillance. Nevada Cancer Report 2001-2005. Carson City: Nevada State Health Division; 2010. All material in this report is in the public domain and may be reproduced or copied without permission; citation as to source, however, is appreciated.

iv
NEVADA CANCER REPORT, 2001-2005
PREFACE
This report presents cancer incidence in Nevada for the 2001-2005 diagnosis years and is based on 51,742 newly diagnosed cancer cases among Nevada residents. Nationwide data are also presented for comparison purposes only. The American Cancer Society estimates that 12,230 people in Nevada will be diagnosed with Cancer in 2010 (excluding basal and squamous cell skin cancers and in situ carcinomas except for urinary bladder).1 The cost of cancer nationwide in 2010 is estimated to be $263.8 billion overall, including $102.8 billion in direct medical costs, 20.9 billion due to morbidity and $140.1 billion due to mortality.2
Cancer incidence for all types of cancers is covered in general as well as the highlights of the top ten leading cancers in Nevada. The top ten most prevalent malignancies in Nevada include: lung and bronchus, prostate, breast, colorectal, urinary bladder, non-Hodgkin lymphoma, melanomas of the skin, kidney and renal pelvis, leukemia and thyroid. The report includes age, gender, race/ethnicity and county/region information in order to highlight potential areas for cancer control programs, which will go a long way in reducing the risk and impact of cancer in Nevada. This publication and other publications are available from the Nevada State Health Division website at: http://health.nv.gov/FP_Publications.htm

v
NEVADA CANCER REPORT, 2001-2005
TABLE OF CONTENTS
ACKNOWLEDGEMENTS ................................................................................................................ iii PREFACE ........................................................................................................................................... iv LIST OF TABLES .............................................................................................................................. vi LIST OF FIGURES .......................................................................................................................... viii TECHNICAL NOTES ......................................................................................................................... x HIGHLIGHTS ..................................................................................................................................... 1 BACKGROUND ................................................................................................................................. 3 ALL CANCERS .................................................................................................................................. 4 LUNG AND BRONCHUS CANCER ............................................................................................... 23 PROSTATE CANCER ...................................................................................................................... 30 BREAST CANCER ........................................................................................................................... 37 COLORECTAL CANCER ................................................................................................................ 44 URINARY BLADDER CANCER .................................................................................................... 51 NON-HODGKIN LYMPHOMA....................................................................................................... 58 MELANOMAS OF THE SKIN......................................................................................................... 65 KIDNEY AND RENAL PELVIS CANCER .................................................................................... 72 LEUKEMIA ....................................................................................................................................... 79 THYROID CANCER ........................................................................................................................ 86 REFERENCES .................................................................................................................................. 93 APPENDICES ................................................................................................................................... 96
Appendix A: ICD-O-3 CODES USED .......................................................................................... 97 Appendix B: NEVADA POPULATION ESTIMATES, 2001-2005 ........................................... 101
Nevada Population Estimates by Age Groups, Race/Ethnicity, Gender, and .......................... 101 Region, 2001-2005 ................................................................................................................... 101 Nevada Population Estimates by Age Groups, County and Gender, 2001-2005 .................... 102
Appendix C: FORMULAS .......................................................................................................... 103 Appendix D: FEEDBACK AND SUGGESTIONS ..................................................................... 106

vi
NEVADA CANCER REPORT, 2001-2005
LIST OF TABLES Table 1: Percentage Distribution of All Types of Cancer by Site and Gender, Nevada Residents,
2001-2005 .................................................................................................................................... 5 Table 2: All Types of Cancer by Cancer Stage, Nevada Residents, 2001-2005 ................................. 8 Table 3: All Cancer Cases by County of Residence at Diagnosis, Nevada Residents, 2001-2005 ... 12 Table 4: All Cancer Cases by Gender, Race/Ethnicity and Region, Nevada Residents, 2001-2005 . 13 Table 5: All Cancer Cases by Race/Ethnicity and Gender, Nevada Residents, 2001-2005 .............. 16 Table 6: All Cancer Cases by Age Group and Gender, Nevada Residents, 2001-2005 .................... 17 Table 7: Top Ten Types of Cancer by County/Region of Residence, Nevada Residents, 2001-2005
.................................................................................................................................................... 20 Table 8: Top Ten Types of Cancer by Race/Ethnicity, Nevada Residents, 2001-2005 .................... 21 Table 9: Top Ten Types of Cancer by Gender, Nevada Residents, 2001-2005 ................................ 22 Table 10: Lung and Bronchus Cancer by County of Residence at Diagnosis, Nevada Residents,
2001-2005 .................................................................................................................................. 24 Table 11: Lung and Bronchus Cancer by Gender, Race/Ethnicity and Region, Nevada Residents,
2001-2005 .................................................................................................................................. 25 Table 12: Lung and Bronchus Cancer by Race/Ethnicity and Gender, Nevada Residents, 2001-2005
.................................................................................................................................................... 28 Table 13: Lung and Bronchus Cancer by Age Group and Gender, Nevada Residents, 2001-2005 .. 29 Table 14: Prostate Cancer by County of Residence at Diagnosis, Nevada Residents, 2001-2005.... 31 Table 15: Prostate Cancer by Race/Ethnicity and Region, Nevada Residents, 2001-2005 ............... 32 Table 16: Prostate Cancer by Race/Ethnicity and Gender, Nevada Residents, 2001-2005 ............... 35 Table 17: Prostate Cancer by Age Group, Nevada Residents, 2001-2005 ........................................ 36 Table 18: Female Breast Cancer by County of Residence at Diagnosis, Nevada Residents, 2001-
2005............................................................................................................................................ 38 Table 19: Female Breast Cancer by Race/Ethnicity and Region, Nevada Residents, 2001-2005 ..... 39 Table 20: Breast Cancer by Race/Ethnicity and Gender, Nevada Residents, 2001-2005 ................. 42 Table 21: Breast Cancer by Age group and Gender, Nevada Residents, 2001-2005 ........................ 43 Table 22: Colorectal Cancer by County of Residence at Diagnosis, Nevada Residents, 2001-2005 45 Table 23: Colorectal Cancer by Gender, Race/Ethnicity and Region, Nevada Residents, 2001-2005
.................................................................................................................................................... 46 Table 24: Colorectal Cancer by Race/Ethnicity and Gender, Nevada Residents, 2001-2005 ........... 49 Table 25: Colorectal Cancer by Age Group and Gender, Nevada Residents, 2001-2005 ................. 50 Table 26: Urinary Bladder Cancer by County of Residence at Diagnosis, Nevada Residents, 2001-
2005............................................................................................................................................ 52 Table 27: Urinary Bladder Cancer Gender, by Race/Ethnicity and Region, Nevada Residents, 2001-
2005............................................................................................................................................ 53 Table 28: Urinary Bladder Cancer by Race/Ethnicity and Gender, Nevada Residents, 2001-2005 . 56 Table 29: Urinary Bladder Cancer by Age Group and Gender, Nevada Residents, 2001-2005 ....... 57 Table 30: Non-Hodgkin Lymphoma by County of Residence at Diagnosis, Nevada Residents, 2001-
2005............................................................................................................................................ 59 Table 31: Non-Hodgkin Lymphoma by Gender, Race/Ethnicity and Region, Nevada Residents,
2001-2005 .................................................................................................................................. 60 Table 32: Non-Hodgkin Lymphoma by Race/Ethnicity and Gender, Nevada Residents, 2001-2005
.................................................................................................................................................... 63

vii
NEVADA CANCER REPORT, 2001-2005
Table 33: Non-Hodgkin Lymphoma by Age Group and Gender, Nevada Residents, 2001-2005 .... 64 Table 34: Melanomas of the Skin by County of Residence at Diagnosis, Nevada Residents, 2001-
2005............................................................................................................................................ 66 Table 35: Melanomas of the Skin by Gender, Race/Ethnicity and Region, Nevada Residents, 2001-
2005............................................................................................................................................ 67 Table 36: Melanomas of the Skin by Race/Ethnicity and Gender, Nevada Residents, 2001-2005 ... 70 Table 37: Melanomas of the Skin by Age Group and Gender, Nevada Residents, 2001-2005 ......... 71 Table 38: Kidney and Renal Pelvis Cancer by County of Residence at Diagnosis, Nevada Residents,
2001-2005 .................................................................................................................................. 73 Table 39: Kidney and Renal Pelvis Cancer by Gender, Race/Ethnicity and Region, Nevada
Residents, 2001-2005 ................................................................................................................. 74 Table 40: Kidney and Renal Pelvis Cancer by Race/Ethnicity and Gender, Nevada Residents, 2001-
2005............................................................................................................................................ 77 Table 41: Kidney and Renal Pelvis Cancer by Age Group and Gender, Nevada Residents, 2001-
2005............................................................................................................................................ 78 Table 42: Leukemia by County of Residence at Diagnosis, Nevada Residents, 2001-2005 ............. 80 Table 43: Leukemia by Gender, Race/Ethnicity and Region, Nevada Residents, 2001-2005 .......... 81 Table 44: Leukemia by Race/Ethnicity and Gender, Nevada Residents, 2001-2005 ........................ 84 Table 45: Leukemia by Age Group and Gender, Nevada Residents, 2001-2005 .............................. 85 Table 46: Thyroid Cancer by County of Residence at Diagnosis, Nevada Residents, 2001-2005.... 87 Table 47: Thyroid Cancer by Gender, Race/Ethnicity and Region, Nevada Residents, 2001-2005 . 88 Table 48: Thyroid Cancer by Race/Ethnicity and Gender, Nevada Residents, 2001-2005 ............... 91 Table 49: Thyroid Cancer by Age Group and Gender, Nevada Residents, 2001-2005 ..................... 92 Table 50: ICD-O-3 Codes Used for Cancer Groupings in This Report ............................................. 97

viii
NEVADA CANCER REPORT, 2001-2005
LIST OF FIGURES Figure 1: Percentage Distribution of All Cancer Cases by Age Group, Nevada Residents, 2001-2005
.................................................................................................................................................... 11 Figure 2: All Cancer Cases Age-Adjusted Rates by County/Region of Residence, Nevada Residents,
2001-2005 vs. U.S. 2001-2005 .................................................................................................. 14 Figure 3: All Cancer Cases by Race/Ethnicity, Nevada Residents, 2001-2005 ................................ 14 Figure 4: All Cancer Cases by Race/Ethnicity and Gender, Nevada Residents, 2001-2005 ............. 15 Figure 5: All Cancer Cases by Gender and Year of Diagnosis, Nevada Residents, 2001-2005 ....... 15 Figure 6: Leading Types of Cancer by Percentage, Nevada Residents, 2001-2005 .......................... 18 Figure 7: Top Ten Types of Cancer by Age-Adjusted Rates and Region, Nevada Residents, 2001-
2005............................................................................................................................................ 19 Figure 8: Lung and Bronchus Cancer Age-Adjusted Rates by County/Region of Residence, Nevada
Residents, 2001-2005 vs. U.S. 2001-2005 ................................................................................. 26 Figure 9: Lung and Bronchus Cancer by Race/Ethnicity, Nevada Residents, 2001-2005 ................ 26 Figure 10: Lung and Bronchus Cancer by Race/Ethnicity and Gender, Nevada Residents, 2001-
2005............................................................................................................................................ 27 Figure 11: Lung and Bronchus Cancer by Gender and Year of Diagnosis, Nevada Residents, 2001-
2005............................................................................................................................................ 27 Figure 12: Prostate Cancer Age-Adjusted Rates by County/Region of Residence, Nevada Residents,
2001-2005 vs. U.S. 2001-2005 .................................................................................................. 33 Figure 13: Prostate Cancer by Race/Ethnicity, Nevada Residents, 2001-2005 ................................. 33 Figure 14: Prostate Cancer by Year of Diagnosis, Nevada Residents, 2001-2005............................ 34 Figure 15: Female Breast Cancer Age-Adjusted Rates by County/Region of Residence, Nevada
Residents, 2001-2005 vs. U.S. 2001-2005 ................................................................................. 40 Figure 16: Female Breast Cancer by Race/Ethnicity, Nevada Residents, 2001-2005 ....................... 40 Figure 17: Female Breast Cancer by Year of Diagnosis, Nevada Residents, 2001-2005 ................. 41 Figure 18: Colorectal Cancer Age-Adjusted Rates by County/Region of Residence, Nevada
Residents, 2001-2005 vs. U.S. 2001-2005 ................................................................................. 47 Figure 19: Colorectal Cancer by Race/Ethnicity, Nevada Residents, 2001-2005 ............................. 47 Figure 20: Colorectal Cancer by Race/Ethnicity and Gender, Nevada Residents, 2001-2005.......... 48 Figure 21: Colorectal Cancer by Gender and Year of Diagnosis, Nevada Residents, 2001-2005 .... 48 Figure 22: Urinary Bladder Cancer Age-Adjusted Rates by County/Region of Residence, Nevada
Residents, 2001-2005 vs. U.S. 2001-2005 ................................................................................. 54 Figure 23: Urinary Bladder Cancer by Race/Ethnicity, Nevada Residents, 2001-2005 .................... 54 Figure 24: Urinary Bladder Cancer by Race/Ethnicity and Gender, Nevada Residents, 2001-2005 55 Figure 25: Urinary Bladder Cancer by Gender and Year of Diagnosis, Nevada Residents, 2001-2005
.................................................................................................................................................... 55 Figure 26: Non-Hodgkin Lymphoma Age-Adjusted Rates by County/Region of Residence, Nevada
Residents, 2001-2005 vs. U.S. 2001-2005 ................................................................................. 61 Figure 27: Non-Hodgkin Lymphoma by Race/Ethnicity, Nevada Residents, 2001-2005 ................ 61 Figure 28: Non-Hodgkin Lymphoma by Race/Ethnicity and Gender, Nevada Residents, 2001-2005
.................................................................................................................................................... 62 Figure 29: Non-Hodgkin Lymphoma by Gender and Year of Diagnosis, Nevada Residents, 2001-
2005............................................................................................................................................ 62
ix
NEVADA CANCER REPORT, 2001-2005
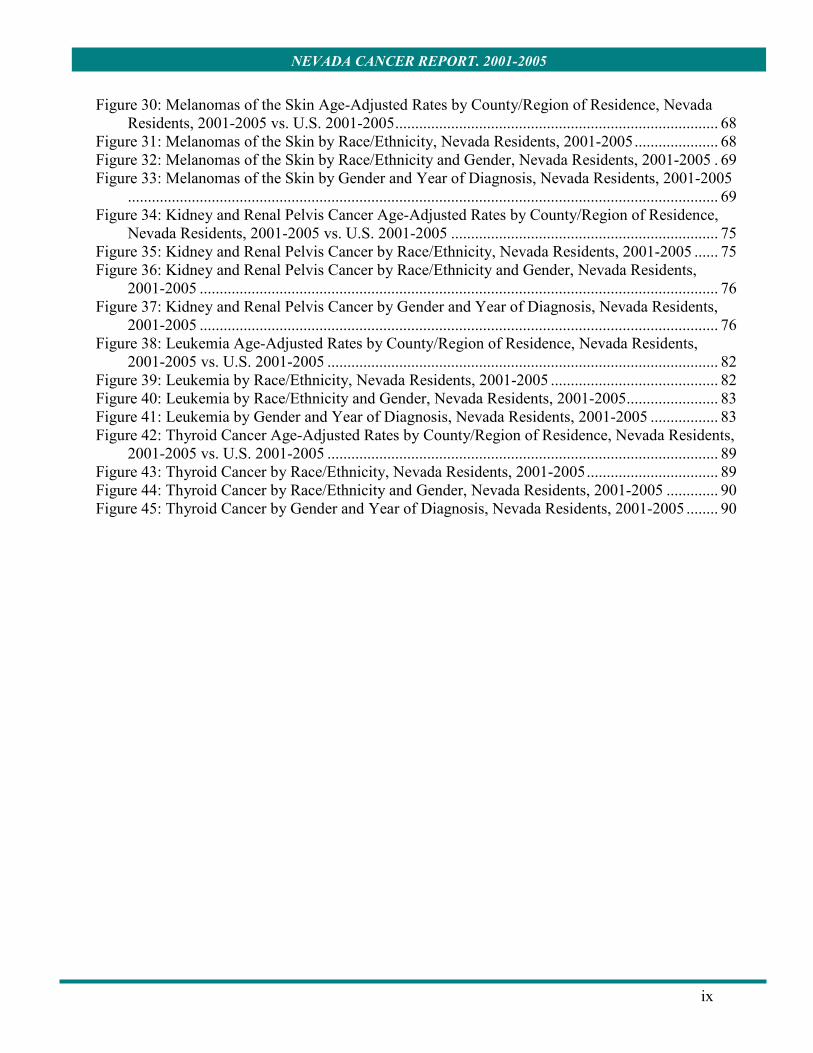
Figure 30: Melanomas of the Skin Age-Adjusted Rates by County/Region of Residence, Nevada Residents, 2001-2005 vs. U.S. 2001-2005 ................................................................................. 68
Figure 31: Melanomas of the Skin by Race/Ethnicity, Nevada Residents, 2001-2005 ..................... 68 Figure 32: Melanomas of the Skin by Race/Ethnicity and Gender, Nevada Residents, 2001-2005 . 69 Figure 33: Melanomas of the Skin by Gender and Year of Diagnosis, Nevada Residents, 2001-2005
.................................................................................................................................................... 69 Figure 34: Kidney and Renal Pelvis Cancer Age-Adjusted Rates by County/Region of Residence,
Nevada Residents, 2001-2005 vs. U.S. 2001-2005 ................................................................... 75 Figure 35: Kidney and Renal Pelvis Cancer by Race/Ethnicity, Nevada Residents, 2001-2005 ...... 75 Figure 36: Kidney and Renal Pelvis Cancer by Race/Ethnicity and Gender, Nevada Residents,
2001-2005 .................................................................................................................................. 76 Figure 37: Kidney and Renal Pelvis Cancer by Gender and Year of Diagnosis, Nevada Residents,
2001-2005 .................................................................................................................................. 76 Figure 38: Leukemia Age-Adjusted Rates by County/Region of Residence, Nevada Residents,
2001-2005 vs. U.S. 2001-2005 .................................................................................................. 82 Figure 39: Leukemia by Race/Ethnicity, Nevada Residents, 2001-2005 .......................................... 82 Figure 40: Leukemia by Race/Ethnicity and Gender, Nevada Residents, 2001-2005 ....................... 83 Figure 41: Leukemia by Gender and Year of Diagnosis, Nevada Residents, 2001-2005 ................. 83 Figure 42: Thyroid Cancer Age-Adjusted Rates by County/Region of Residence, Nevada Residents,
2001-2005 vs. U.S. 2001-2005 .................................................................................................. 89 Figure 43: Thyroid Cancer by Race/Ethnicity, Nevada Residents, 2001-2005 ................................. 89 Figure 44: Thyroid Cancer by Race/Ethnicity and Gender, Nevada Residents, 2001-2005 ............. 90 Figure 45: Thyroid Cancer by Gender and Year of Diagnosis, Nevada Residents, 2001-2005 ........ 90

x
NEVADA CANCER REPORT, 2001-2005
TECHNICAL NOTES
This report contains information from the Nevada Central Cancer Registry (NCCR) within the Bureau of Health Statistics, Planning and Emergency Response. Data inclusion and exclusion criteria
National Program of Cancer Registries (NPCR) 2009 data submission specifications were used for this report. The following are the specifications as outlined by NPCR:
Diagnosis Years: Include cases diagnosed in all residents of your catchment area beginning with your NPCR reference year (e.g., 1995) through December 31, 2007. For guidance on residency, refer to Chapter III of NAACCR Standards for Cancer Registries, Volume II. Reportable Diagnoses: All histologies with a behavior code of /2 or /3 (or in some cases behavior code of /0 [see 3h] or behavior code of /1 [see 3g]) in the International Classification of Diseases for Oncology, Third Edition (ICD–O–3) are reportable with the following exceptions or restrictions: a. Exclude neoplasms of the skin (C44.0–C44.9) with the following histologies UNLESS they occur at the mucoepidermoid sites [vagina (C52.9), clitoris (C51.2), vulva (C51.0–51.9), prepuce (C60.0), penis (C60.9) , and scrotum (C63.2)]: 8000–8005 Neoplasms, malignant, NOS 8010–8046 Epithelial carcinomas 8050–8084 Papillary and squamous cell carcinomas 8090–8110 Basal cell carcinomas b. Exclude carcinoma in situ of the cervix (C53.0-C53.9, any morphology and /2) after January 1, 1996. c. Exclude prostate intraepithelial neoplasia, grade III (PIN III) (C61.9, 8148/2) after January 1, 2001. d. Exclude squamous intraepithelial neoplasia, grade III (8077/2) of the following sites: anus (C21.1, AIN III), cervix (C53, CIN III), vagina (C52.9, VAIN III), and vulvar (C51, VIN III). e. If a pathologist reports a case as invasive (/3) and the histology is usually associated with a benign (/0) or borderline (/1) behavior code, the case is reportable. Include any appropriate over-ride codes. f. Include all pilocytic astrocytomas. If necessary, convert behavior code to /3 before submitting cases. g. Include all cases as reportable in the year they were diagnosed. For example, those cases reportable in ICD–O–2 but not ICD–O–3 would be included for diagnosis years 1995-2000 only. However, as noted above, all ICD–O–2 codes should be converted to the corresponding ICD–O–3 codes prior to submission. The following histologies should be reported for all cases diagnosed prior to January 1, 2001. These histologies are generally coded to ovary (C56.9), but are not limited to this primary site.

xi
NEVADA CANCER REPORT, 2001-2005
Descriptive Terms and Topography codes ICD-O-3 ICD-O-2 Serous cystadenoma, borderline malignancy (C56.9) 8442/1 8442/3 Serous tumor, NOS, of low malignant potential (C56.9) 8442/1 8442/3 Papillary cystadenoma, borderline malignancy (C56.9) 8451/1 8451/3 Serous papillary cystic tumor of borderline malignancy (C56.9) 8462/1 8462/3 Papillary serous cystadenoma, borderline malignancy (C56.9) 8462/1 8462/3 Papillary serous tumor of low malignant potential (C56.9) 8462/1 8462/3 Atypical proliferative papillary serous tumor (C56.9) 8462/1 8462/3 Mucinous cystic tumor of borderline malignancy (C56.9) 8462/1 8462/3 Mucinous cystadenoma, borline malignancy (C56.9) 8462/1 8462/3 Pseudomucinous cystadenoma, borderline malignancy (C56.9) 8472/1 8472/3 Mucinous tumor, NOS, of low malignant potential (C56.9) 8472/1 8472/3 Papillary mucinous cystadenoma, borderline malignancy (C56.9)
8473/1 8473/3
Papillary pseudomucinous cystadenoma, borderline malignancy (C56.9)
8473/1 8473/3
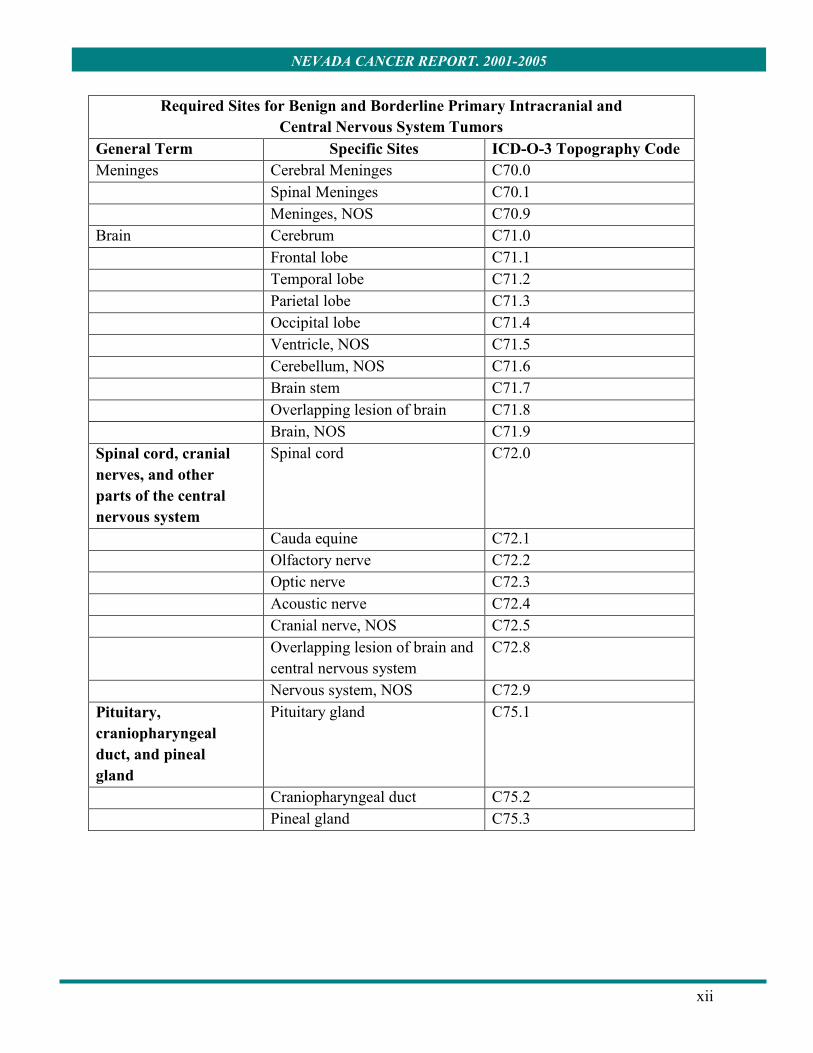
Papillary mucinous tumor of low malignant potential (C56.9) 8473/1 8473/3 h. Beginning January 1, 2004, all nonmalignant primary intracranial and central nervous system tumors (see following table) with a benign (/0) or borderline (/1) behavior code are reportable, and are to be included in the data submission. However, exclude benign and borderline tumors of the cranial bones (C41.0). For further guidance, please refer to the following table.
xii
NEVADA CANCER REPORT, 2001-2005
Required Sites for Benign and Borderline Primary Intracranial and Central Nervous System Tumors
General Term Specific Sites ICD-O-3 Topography Code Meninges Cerebral Meninges C70.0 Spinal Meninges C70.1 Meninges, NOS C70.9 Brain Cerebrum C71.0 Frontal lobe C71.1 Temporal lobe C71.2 Parietal lobe C71.3 Occipital lobe C71.4 Ventricle, NOS C71.5 Cerebellum, NOS C71.6 Brain stem C71.7 Overlapping lesion of brain C71.8 Brain, NOS C71.9 Spinal cord, cranial nerves, and other parts of the central nervous system
Spinal cord C72.0
Cauda equine C72.1 Olfactory nerve C72.2 Optic nerve C72.3 Acoustic nerve C72.4 Cranial nerve, NOS C72.5 Overlapping lesion of brain and
central nervous system C72.8
Nervous system, NOS C72.9 Pituitary, craniopharyngeal duct, and pineal gland
Pituitary gland C75.1
Craniopharyngeal duct C75.2 Pineal gland C75.3

xiii
NEVADA CANCER REPORT, 2001-2005
General considerations for this report include: Updated Data
The NCCR is constantly being updated with new information, so the numbers published in this report may not match, or be directly comparable, with previously published data. The data that are presented in this report are from the NCCR as of January 2009 NPCR submission. Cancer cases reported
The numbers of cases included in this report are those reported as having invasive cancer, except for urinary bladder cancer, which includes cases diagnosed with in situ cancer. Both melanomas of the skin and non-epithelial skin cancers exclude basal and squamous cancers.
Suppression of data
For all tables in this report, rates and 95% confidence intervals for categories with a count of less than ten have been suppressed (indicated by “--”), because when the number of cases in a cell is very small, the calculated rate is unstable.3 In addition, counts of less than five have been suppressed for privacy and confidentiality (indicated by “^”).
Cancer Classification
NCCR uses the International Classification of Diseases for Oncology coding structure (ICD-O-3) which includes topography (primary site) and morphology (tumor type). A detailed list of the actual groupings used for cancer incidence data, using both topography and morphology codes, can be found in appendix A.
Place of Residence
Cancer cases in this report are for persons who were recorded as Nevada residents at the time of diagnosis. Individuals who were listed as out of state residents have been excluded in the report.
County/Region of Residence
County/region of residence in this report has been categorized as: Clark County, Washoe County and ‘All Other Counties.’ Aggregation of the other 15 counties in Nevada to ‘All Other Counties’ was done, so as to address the small population sizes in these counties. This aggregation minimizes any extraneous fluctuations in the rates presented in this report that may occur due to the variance in the number of cancer cases for each of these 15 counties and their small populations. Counties included in the ‘All Other Counties’ category are: Carson City, Churchill, Douglas, Elko, Esmeralda, Eureka, Humboldt, Lander, Lincoln, Lyon, Mineral, Nye, Pershing, Storey, and White Pine.
Gender Specific Cancer Rates
For gender specific cancers, such as prostate and female breast, the rates listed in this report are per 100,000 gender-specific population, unless otherwise noted.

xiv
NEVADA CANCER REPORT, 2001-2005
Race/Ethnicity Groups Race/ethnicity groups used in this report include: White, Black, Native American, Asian, and Hispanic and were calculated to be mutually exclusive.
Other/Unknown Groups
The number of cases in the “other/unknown” category has not been shown separately but has been included in totals of the tables. In addition, rates and confidence intervals for these cases have not been calculated.
Stage of Cancer
Cancer stage measures the degree to which the cancer has spread or progressed. Summary staging, which is also used by Surveillance Epidemiology End Results (SEER), describes cancer in the following stages4:
In situ is early cancer that is present only in the layer of cells in which it began. Localized is cancer that is limited to the organ in which it began, without evidence of spread.
Regional is cancer that has spread beyond the original (primary) site to nearby lymph nodes or organs and tissues.
Distant is cancer that has spread from the primary site to distant organs or distant lymph nodes. Unknown is used to describe cases for which there is not enough information to indicate a stage. Population Estimates
Nevada population data for the denominators of incidence rates presented in this report are provided by the Nevada State Demographer and are race-specific (all races, White, Black, Native American, Asian and Hispanic) and sex-specific (both sexes, males and females). Population estimates are aggregated at the county level and are based on single years, which are summed up to form the five-year aggregate period (See appendix B). Therefore, slight variations may occur when comparing age-adjusted rates in this report with other sources that use United States Census population estimates.
Definitions • Crude incidence rate: A crude rate is the number of newly diagnosed cases occurring in
a defined population during a given time period. Crude rates do not account for the age distribution of the population, therefore, crude rates are unsuitable for comparison purposes.5
• Age-specific crude rate: Age-specific crude rate is the number of cause-specific events occurring in each specified age group by the corresponding population in the same age group.5

xv
NEVADA CANCER REPORT, 2001-2005
• Age-adjusted incidence rate (direct method): These are observed age-specific crude rates which are applied to the 2000 U.S. standard population 11 age groups to allow for comparison among populations with different age distributions.5
• 95% Confidence Interval (CI): This is a range of values for a rate that will include the true value of the rate 95% of the time.6
• Standard population This is the standard population or weights that are used in the calculation of age-adjusted rates to serve as an index.7 The 2000 U.S. standard population has been used in this report and it is also used as the standard population by many national agencies.

1
NEVADA CANCER REPORT, 2001-2005
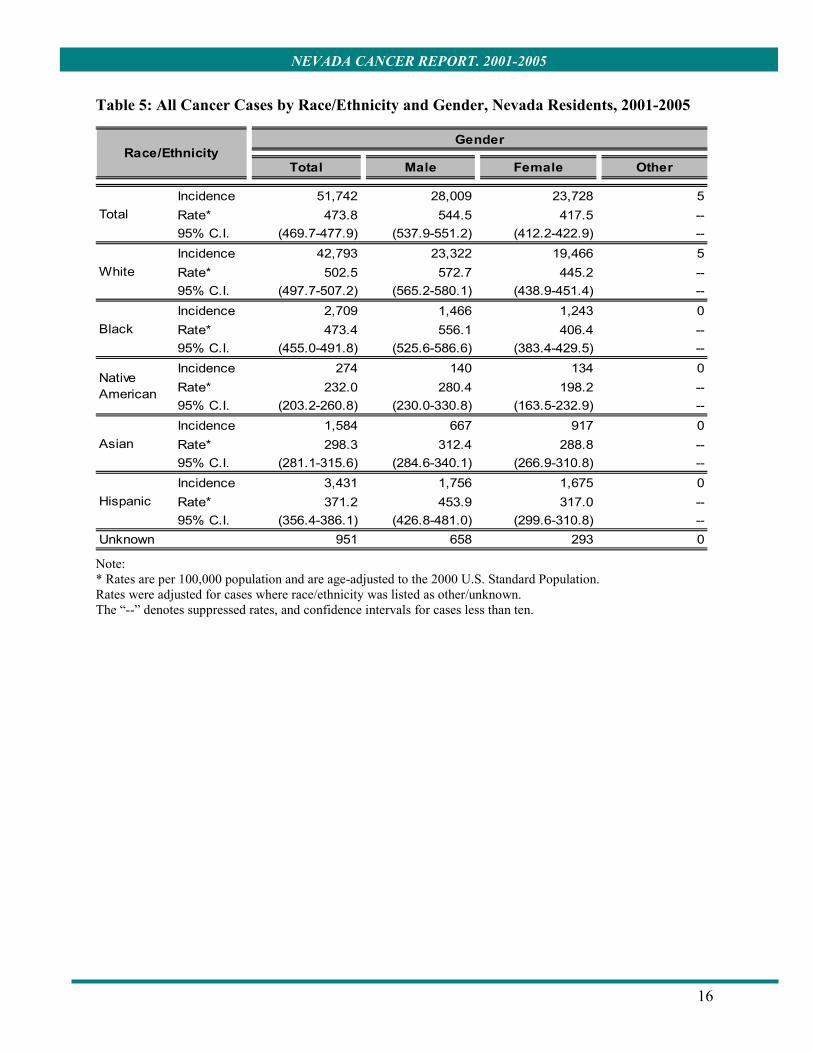
HIGHLIGHTS In Nevada, 51,742 (28,009 males, 23,728 females and 5 other gender) cancer cases were
reported among Nevada residents during the 2001-2005 period. Nevada’s incidence rate (473.8 per 100,000) for all cancers combined was almost identical to the national rate (473.7)8 during the same period. Males had a higher age-adjusted incidence rate (544.5) for all cancers combined compared to females (417.5). Washoe County had the highest incidence rate (483.9) compared to Clark County (475.0) and All Other CountiesŦ
(456.5). Other counties with high incidence rates were Lincoln (696.2) and Mineral (559.4). Whites had the highest incidence rate (502.5) compared to Blacks (473.4), Hispanics (371.2), Asians (298.3), and Native Americans (232.0).
Compared to the national rates, Nevada had higher rates for the following malignancies: lung and bronchus, urinary bladder, leukemia, and thyroid gland. Lower rates were observed for the following types of cancer: female breast, prostate, colorectal, melanomas of the skin, non-Hodgkin lymphoma, and kidney and renal pelvis.
Lung and bronchus cancer was the most common reportable malignancy among Nevada
residents, accounting for 15.8% of all invasive cases during 2001-2005 period. Prostate cancer was the second most common reportable malignancy among Nevada
residents, accounting for 15.0 % of all invasive cases during 2001-2005 period. Prostate cancer was the leading type of malignancy among males, followed by lung and bronchus, colorectal, urinary bladder, and melanomas of the skin.
Breast cancer was the third most common malignancy among Nevada residents,
accounting for 13.0% of all invasive cases during the 2001-2005 period. Breast cancer was also the leading type of malignancy among females, followed by lung and bronchus, colorectal, corpus uteri and uterus not otherwise specified, and thyroid.
Compared to females, males had higher incidence rates for the following malignancies:
lung and bronchus, colorectal, melanomas of the skin, urinary bladder, non-Hodgkin lymphoma, leukemia, and kidney and renal pelvis.
Clark County had the highest incidence rates for the following malignancies: lung and
bronchus, colorectal, non-Hodgkin lymphoma, leukemia, and thyroid compared to Washoe County and All Other Counties.
Washoe County had the highest incidence rates for female breast, melanomas of the skin,
and kidney and renal pelvis types of cancer, compared to Clark County and All Other Counties.
Ŧ “All Other Counties” consist of the following Nevada counties: Carson City, Churchill, Douglas, Elko, Esmeralda, Eureka, Humboldt, Lander, Lincoln, Lyon, Mineral, Nye, Pershing, Storey, and White Pine.

2
NEVADA CANCER REPORT, 2001-2005
All Other Counties had the highest age-adjusted rates for prostate and urinary bladder cancers compared to Clark and Washoe Counties. In contrast, All Other Counties had the lowest age-adjusted rates for seven of the top ten leading types of cancer.
The following racial and ethnic disparities were found:
• Whites had the highest incidence rates for the following malignancies: lung and
bronchus, female breast, urinary bladder, melanomas of the skin, non-Hodgkin lymphoma, and leukemia compared to Blacks, Native Americans, Asians, and Hispanics.
• Blacks had the highest incidence rates for prostate and colorectal malignancies compared to Whites, Native Americans, Asians, and Hispanics.
• Hispanics had the highest incidence rates for kidney and renal pelvis cancer compared to Whites, Blacks, Native Americans, and Asians.
• Asians had the highest incidence rates for thyroid cancer compared to Whites, Blacks, Native Americans, and Hispanics.
• Native Americans had the lowest incidence rates for the following malignancies: lung and bronchus, female breast, colorectal, and non-Hodgkin lymphoma. In addition, Native Americans had less than ten cases for urinary bladder, melanomas of the skin, leukemia, and thyroid cancers, therefore, the incidence rates for these malignancies were not calculated.

3
NEVADA CANCER REPORT, 2001-2005
BACKGROUND The Cancer Registries Amendment Act, Public Law 102-515, was enacted in 1992. Through this Act, Congress established the NPCR within the Centers for Disease Control and Prevention (CDC). NPCR was established to fund and support the operation of population-based, statewide cancer registries, in order to collect cancer data. NCCR is a statewide registry, which is regulated by both Nevada Revised Statute(s) (NRS) 457.230-457.280 and related regulations adopted by the State Board of Health. These statutes mandate the reporting of cancer in the state of Nevada. The Nevada Administrative Codes (NAC) 457.045-457.150 requires hospitals, pathology laboratories, free-standing cancer clinics, long-term care facilities, ambulatory surgery centers, and physicians to report cancer cases diagnosed and treated in Nevada to NCCR. NCCR is a population-based registry that maintains data on all cancer patients within the state of Nevada. The registry began collecting cancer incidence data in 1989. In 1995, the NCCR began receiving funding from the NPCR through the CDC. The registry receives data from cancer reporting facilities throughout the state of Nevada. The NCCR also operates under the standards set by NPCR and the North American Association of Central Cancer Registries (NAACCR). In accordance with NPCR and NAACCR standards, NCCR strives to achieve and maintain 95% complete case ascertainment within 24 months of diagnosis date. The data is compiled, aggregated, and submitted to both NPCR and NAACCR annually. Once submitted, the NCCR data is reviewed by each diagnosis year for completeness, accuracy and timeliness. Through NAACCR, registries are recognized for meeting the highest standards of data quality with gold or silver standard certifications for each year cancer data is submitted. The NCCR has achieved gold standard certification for the diagnosis years 2000 to 2006. With over five consecutive years of data qualifying for gold standard certification, NCCR data has been included in the United States Cancer Statistics (USCS) and the Cancer in North America (CINA) publications.

4
NEVADA CANCER REPORT, 2001-2005
ALL CANCERS Incidence During the 2001-2005 period, a total of 51,742 cancer cases were reported among Nevada residents. Nevada’s incidence rate (473.8 per 100,000) for all cancers combined was almost identical to the national rate (473.7)8 during the same period. Males had a higher age-adjusted incidence rate (544.5) for all cancers combined compared to females (417.5). Washoe County had the highest incidence rate (483.9) compared to Clark County (475.0) and All Other Counties (456.5). Other counties with high incidence rates were Lincoln (696.2) and Mineral (559.4). Whites had the highest incidence rate (502.5) compared to Blacks (473.4), Hispanics (371.2), Asians (298.3), and Native Americans (232.0). The top ten types of cancer in Nevada during the 2001-2005 period were: lung and bronchus, prostate, breast, colorectal, urinary bladder, non-Hodgkin lymphoma, melanomas of the skin, kidney and renal pelvis, leukemia, and thyroid.

5
NEVADA CANCER REPORT, 2001-2005
Table 1: Percentage Distribution of All Types of Cancer by Site and Gender, Nevada Residents, 2001-2005
Cases % Cases % Cases % Cases %Total 51,742 100% 28,009 54.13% 23,728 45.86% 5 0.01%Lip, Oral Cavity and Pharynx 1,242 2.40% 889 1.72% 353 0.68% Lip 63 0.12% 53 0.10% 10 0.02% Base of Tongue 200 0.39% 158 0.31% 42 0.08% Other & Unspecified Parts of the Tongue 179 0.35% 124 0.24% 55 0.11% Parotid Gland 117 0.23% 72 0.14% 45 0.09% Other & Unspecified Major Salivary glands 32 0.06% 21 0.04% 11 0.02% Floor of mouth 92 0.18% 62 0.12% 30 0.06% Gum 34 0.07% 19 0.04% 15 0.03% Palate 41 0.08% 23 0.04% 18 0.03% Other & Unspecified Parts of the mouth 67 0.13% 38 0.07% 29 0.06% Nasopharynx 75 0.14% 58 0.11% 17 0.03% Tonsil 173 0.33% 135 0.26% 38 0.07% Oropharynx 49 0.09% 38 0.07% 11 0.02% Pyriform Sinus 45 0.09% 36 0.07% 9 0.02% Hypopharynx 47 0.09% 33 0.06% 14 0.03% Other & Unspecified Oral Cavity & Pharynx 28 0.05% 19 0.04% 9 0.02%Digestive System 8,937 17.27% 5,119 9.89% 3,817 7.38% Esophagus 572 1.11% 450 0.87% 122 0.24% Stomach 674 1.30% 427 0.83% 247 0.48% Small Intestine 144 0.28% 83 0.16% 61 0.12% Colon (excluding Rectum) Cecum 838 1.62% 423 0.82% 415 0.80% Appendix 59 0.11% 32 0.06% 27 0.05% Ascending Colon 589 1.14% 275 0.53% 314 0.61% Hepatic Flexure 161 0.31% 71 0.14% 90 0.17% Transverse Colon 284 0.55% 144 0.28% 140 0.27% Splenic Flexure 84 0.16% 41 0.08% 43 0.08%
Descending Colon 194 0.37% 124 0.24% 70 0.14% Sigmoid Colon 1,077 2.08% 606 1.17% 471 0.91% Large Intestine, NOS 496 0.96% 275 0.53% 221 0.43% Rectum 1,007 1.95% 621 1.20% 386 0.75% Rectosigmoid Junction 453 0.88% 255 0.49% 198 0.38% Anus, Anal Canal and Anorectum 152 0.29% 56 0.11% 96 0.19% Liver 563 1.09% 404 0.78% 159 0.31% Intrahepatic Bile Ducts 39 0.08% 18 0.03% 21 0.04% Gallbladder 88 0.17% 39 0.08% 49 0.09% Other & Unspecified Biliary Tract 176 0.34% 103 0.20% 73 0.14% Pancreas 1,184 2.29% 632 1.22% 551 1.06% Rectroperitoneum 41 0.08% 21 0.04% 20 0.03%
Total Male FemaleType of Cancer
Other*
…continued

6
NEVADA CANCER REPORT, 2001-2005
Table 1: Percentage Distribution of All Types of Cancer by Site and Gender, Nevada Residents, 2001-2005 (continued)
Cases % Cases % Cases % Peritoneum, Omentum and Mesentery 37 0.07% 6 0.01% 31 0.06% Other Digestive Organs 25 0.05% 13 0.03% 12 0.02%Respiratory System 8,672 16.76% 4,652 8.99% 4,020 7.77% Nose, Nasal Cavity & Middle Ear 43 0.08% 28 0.05% 15 0.03% Accessory Sinuses 35 0.06% 26 0.05% 9 0.02% Larynx 385 0.74% 304 0.59% 81 0.16% Lung and Bronchus 8,190 15.83% 4,280 8.27% 3,910 7.56% Pleura 6 0.01% 5 0.01% ^ 0.00% Trachea ^ 0.01% ^ 0.00% ^ 0.00% Mediastinum & Other Respiratory Organs 9 0.02% 6 0.01% ^ 0.01%Bones, Joints and Articular Cartilage 84 0.16% 55 0.11% 29 0.06% Bones, Joints & Articular Cartilage of Limbs 37 0.07% 23 0.04% 14 0.03% Bones, Joints & Articular Cartilage of Other & Unspecified sites 47 0.09% 32 0.06% 15 0.03%Soft Tissue Including Heart 306 0.59% 174 0.34% 132 0.26% Heart ^ 0.00% 0 0.00% ^ 0.00% Peripheral Nerves & Autonomic Nervous System 10 0.02% 7 0.01% ^ 0.01% Connective, Subcutaneous & Other Soft Tissues 294 0.57% 167 0.32% 127 0.25%Skin (excluding Basal and Squamous) 2,124 4.10% 1,299 2.51% 824 1.59% Melanomas of the skin 1,936 3.74% 1,178 2.28% 757 1.46% Other Non-Epithelial Skin 188 0.36% 121 0.23% 67 0.13%Breast 6,731 13.01% 78 0.15% 6,652 12.86%Female Genital System 2,543 4.91% 0 -- 2,543 4.91% Cervix Uteri 515 1.00% 0 -- 515 1.00% Corpus Uteri 1,039 2.01% 0 -- 1,039 2.01% Uterus, NOS 44 0.09% 0 -- 44 0.09% Ovary 738 1.43% 0 -- 738 1.43% Vagina 33 0.06% 0 -- 33 0.06% Vulva 132 0.26% 0 -- 132 0.26% Placenta 6 0.01% 0 -- 6 0.01% Other Female Genital Organs 36 0.07% 0 -- 36 0.07%Male Genital System 8,066 15.59% 8,066 15.59% 0 -- Prostate 7,733 14.95% 7,733 15.41% 0 -- Testis 291 0.56% 291 0.56% 0 -- Penis 27 0.05% 27 0.05% 0 -- Other Male Genital Organs 15 0.03% 15 0.03% 0 --Urinary System 4,223 8.16% 3,080 5.95% 1,143 2.21% Urinary Bladder 2,708 5.23% 2,092 4.04% 616 1.19% Kidney 1,305 2.52% 858 1.66% 447 0.86% Renal Pelvis 82 0.16% 43 0.08% 39 0.08%
Type of CancerTotal Male Female
…continued

7
NEVADA CANCER REPORT, 2001-2005
Table 1: Percentage Distribution of All Types of Cancer by Site and Gender, Nevada Residents, 2001-2005 (continued)
Cases % Cases % Cases % Ureter 59 0.11% 37 0.07% 22 0.04% Other Urinary Organs 69 0.13% 50 0.10% 19 0.04%Eye and Orbit 65 0.13% 39 0.08% 26 0.05%Brain and Other Central Nervous System 1,048 2.03% 514 0.99% 534 1.03% Brain 697 1.35% 403 0.78% 294 0.57% Meninges 299 0.58% 85 0.16% 214 0.41% Spinal Cord, Cranial Nerves & Other Parts of CNS 52 0.10% 26 0.05% 26 0.05%Endocrine System 1,405 2.72% 381 0.74% 1,024 1.98% Thyroid gland 1,250 2.42% 295 0.57% 955 1.85% Adrenal gland 26 0.05% 19 0.04% 7 0.01% Other Endocrine (including Thymus) 129 0.25% 67 0.13% 62 0.12%Hodgkin Lymphoma 289 0.56% 157 0.30% 132 0.26%Non-Hodgkin Lymphoma 1,975 3.82% 1,136 2.20% 839 1.62% Myeloma 521 1.01% 308 0.60% 213 0.41%Leukemia 1,335 2.58% 798 1.54% 536 1.04% Lymphotic Acute Lymphocytic 176 0.34% 93 0.18% 83 0.16% Chronic Lymphocytic 395 0.76% 254 0.49% 141 0.27% Other Lymphocytic 46 0.09% 37 0.07% 9 0.02% Myeloid and Monocytic Acute Myeloid 420 0.81% 247 0.48% 172 0.33% Acute Monocytic 24 0.05% 11 0.02% 13 0.03% Chronic Myeloid 139 0.27% 78 0.15% 61 0.12% Other Myeloid/Monocytic 18 0.03% 8 0.02% 10 0.02% Other Other, Acute 51 0.10% 30 0.06% 21 0.04% Aleukemic, Subleukemic and NOS 66 0.13% 40 0.08% 26 0.05%Mesothelioma 105 0.20% 82 0.16% 23 0.04%Kaposi Sarcoma 57 0.11% 53 0.10% ^ 0.01%Other, Ill-defined and Unspecified Sites 2,014 3.89% 1,129 2.18% 884 1.71%
Type of CancerTotal Male Female
Note: NOS - not otherwise specified. CNS - central nervous system. * Only the total for other gender has been reported. ^ Cases less than five have been suppressed.

8
NEVADA CANCER REPORT, 2001-2005
Table 2: All Types of Cancer by Cancer Stage, Nevada Residents, 2001-2005
Total 51,742 1,256 16,587 7,512 8,187 18,200Lip, Oral Cavity and Pharynx 1,242 -- 314 375 78 475 Lip 63 -- 35 ^ 0 24 Base of Tongue 200 -- 37 78 15 70 Other & Unspecified Parts of the Tongue 179 -- 73 35 6 65 Parotid Gland 117 -- 32 24 8 53 Other & Unspecified Major Salivary glands 32 -- 5 10 0 17 Floor of mouth 92 -- 27 27 7 31 Gum 34 -- 5 12 6 11 Palate 41 -- 11 8 ^ 20 Other & Unspecified Parts of the mouth 67 -- 22 10 8 27 Nasopharynx 75 -- 5 27 10 33 Tonsil 173 -- 35 80 ^ 55 Oropharynx 49 -- 8 18 5 18 Pyriform Sinus 45 -- 7 23 ^ 12 Hypopharynx 47 -- 11 18 ^ 16 Other & Unspecified Oral Cavity & Pharynx 28 -- ^ ^ ^ 23Digestive System 8,937 -- 1,872 2,191 1,497 3,377 Esophagus 572 -- 88 82 118 284 Stomach 674 -- 106 162 125 281 Small Intestine 144 -- 28 44 24 48 Colon (excluding Rectum) Cecum 838 -- 206 313 135 184 Appendix 59 -- 19 17 8 15 Ascending Colon 589 -- 146 221 65 157 Hepatic Flexure 161 -- 42 47 22 50 Transverse Colon 284 -- 73 99 33 79 Splenic Flexure 84 -- 21 31 10 22 Descending Colon 194 -- 55 69 20 50 Sigmoid Colon 1,077 -- 330 315 169 263 Large Intestine, NOS 496 -- 43 56 87 310 Rectum 1,007 -- 299 236 99 373 Rectosigmoid Junction 453 -- 121 147 72 113 Anus, Anal Canal and Anorectum 152 -- 55 22 10 65 Liver 563 -- 125 40 68 330 Intrahepatic Bile Ducts 39 -- 6 7 ^ 24 Gallbladder 88 -- 13 24 20 31 Other & Unspecified Biliary Tract 176 -- 19 38 16 103 Pancreas 1,184 -- 64 208 364 548 Rectroperitoneum 41 -- 10 6 7 18
Type of Cancer Total In situ* Localized Regional Distant Unstaged
…continued

9
NEVADA CANCER REPORT, 2001-2005
Table 2: All Types of Cancer by Cancer Stage, Nevada Residents, 2001-2005 (continued)
Peritoneum, Omentum and Mesentery 37 -- ^ 5 14 15 Other Digestive Organs 25 -- 0 ^ 9 14Respiratory System 8,672 -- 1,235 1,362 2,423 3,652 Nose, Nasal Cavity & Middle Ear 43 -- 17 ^ ^ 21 Accessory Sinuses 35 -- ^ 11 ^ 18 Larynx 385 -- 132 52 23 178 Lung and Bronchus 8,190 -- 1,081 1,291 2,393 3,425 Pleura 6 -- 0 ^ ^ ^ Trachea ^ -- ^ ^ 0 ^ Mediastinum & Other Respiratory Organs 9 -- 0 ^ ^ 6Bones, Joints and Articular Cartilage 84 -- 21 10 11 42 Bones, Joints & Articular Cartilage of Limbs 37 -- 12 ^ ^ 19
Bones, Joints & Articular Cartilage of Other & Unspecified sites 47 -- 9 7 8 23Soft Tissue Including Heart 306 -- 99 28 30 149 Heart ^ -- 0 ^ 0 ^ Peripheral Nerves & Autonomic Nervous System 10 -- ^ ^ ^ 5 Connective, Subcutaneous & Other Soft Tissues 294 -- 97 25 29 143Skin (excluding Basal and Squamous) 2,124 -- 1,127 151 74 772 Melanomas of the skin 1,936 -- 1,064 142 72 658 Other Non-Epithelial Skin 188 -- 63 9 ^ 114Breast 6,731 -- 3,005 1,565 288 1,873Female Genital System 2,543 -- 985 447 382 729 Cervix Uteri 515 -- 219 126 36 134 Corpus Uteri 1,039 -- 579 148 47 265 Uterus, NOS 44 -- ^ 5 11 25 Ovary 738 -- 96 138 275 229 Vagina 33 -- 9 7 ^ 14 Vulva 132 -- 72 14 ^ 42 Placenta 6 -- ^ ^ ^ ^ Other Female Genital Organs 36 -- 6 8 5 17Male Genital System 8,066 -- 5,036 564 232 2,234 Prostate 7,733 -- 4,871 524 205 2,133 Testis 291 -- 151 35 26 79 Penis 27 -- 8 5 ^ 13 Other Male Genital Organs 15 -- 6 0 0 9Urinary System 4,223 1,256 1,334 390 253 990 Urinary Bladder 2,708 1,256 689 188 76 499 Kidney 1,305 -- 575 163 167 400 Renal Pelvis 82 -- 27 24 5 26
UnstagedLocalized Regional DistantType of Cancer Total In situ*
…continued

10
NEVADA CANCER REPORT, 2001-2005
Table 2: All Types of Cancer by Cancer Stage, Nevada Residents, 2001-2005 (continued)
Ureter 59 -- 31 10 ^ 14 Other Urinary Organs 69 -- 12 5 ^ 51Eye and Orbit 65 -- 17 ^ ^ 45Brain and Other Central Nervous System 1,048 -- 384 14 7 643 Brain 697 -- 360 13 7 317 Meninges 299 -- 18 ^ 0 280 Spinal Cord, Cranial Nerves & Other Parts of CNS 52 -- 6 0 0 46Endocrine System 1,405 -- 719 205 38 443 Thyroid gland 1,250 -- 702 200 30 318 Adrenal gland 26 -- ^ ^ 7 13 Other Endocrine (including Thymus) 129 -- 14 ^ ^ 112Hodgkin Lymphoma 289 -- 61 51 50 127Non-Hodgkin Lymphoma 1,975 -- 335 141 566 933Myeloma 521 -- 6 0 473 42Leukemia 1,335 -- ^ 0 1,307 27 Lymphotic -- Acute Lymphocytic 176 -- 0 0 176 0 Chronic Lymphocytic 395 -- 0 0 392 ^ Other Lymphocytic 46 -- 0 0 45 ^ Myeloid and Monocytic -- Acute Myeloid 420 -- 0 0 414 6 Acute Monocytic 24 -- 0 0 24 0 Chronic Myeloid 139 -- 0 0 138 ^ Other Myeloid/Monocytic 18 -- ^ 0 15 ^ Other -- Other, Acute 51 -- 0 0 49 ^ Aleukemic, Subleukemic and NOS 66 -- 0 0 54 12Mesothelioma 105 -- 13 15 23 54Kaposi Sarcoma 57 -- 23 ^ ^ 32Other, Ill-defined and Unspecified Sites 2,014 -- 0 0 453 1,561
Type of Cancer Total In situ* UnstagedLocalized Regional Distant
Note: NOS - not otherwise specified. CNS - central nervous system. * Noninvasive cancers have not been reported except for urinary bladder which includes in situ cases. ^ Cases less than five have been suppressed.

11
NEVADA CANCER REPORT, 2001-2005
Figure 1: Percentage Distribution of All Cancer Cases by Age Group, Nevada Residents, 2001-2005
0.1%0.2%0.2%0.2%0.3%0.5%
0.8%1.3%
2.0%3.3%
5.0%7.4%
10.6%12.9%
14.7%14.4%
12.5%8.4%
3.7%1.2%
0.2%
0% 2% 4% 6% 8% 10% 12% 14% 16%
<1 years1-4 years5-9 years
10-14 years15-19 years20-24 years25-29 years30-34 years35-39 years40-44 years45-49 years50-54 years55-59 years60-64 years65-69 years70-74 years75-79 years80-84 years85-89 years90-94 years
95+ years
Percent of Total Cases
Age
at D
iagn
osis
`

12
NEVADA CANCER REPORT, 2001-2005
Table 3: All Cancer Cases by County of Residence at Diagnosis, Nevada Residents, 2001-2005
Rate 95% C.I. Rate 95% C.I.
Carson City 1,651 627.3 (597.1-657.6) 538.0 (512.1-563.9)Churchill 622 483.9 (445.9-521.9) 498.4 (459.3-537.5)Clark 35,815 438.5 (433.9-443.0) 475.0 (470.1-480.0)Douglas 1,232 532.9 (503.2-562.7) 412.4 (388.9-435.8)Elko 649 278.4 (257.0-299.8) 418.3 (382.4-454.1)Esmeralda 31 541.0 (350.6-731.4) 419.4 (269.7-569.1)Eureka 26 357.2 (219.9-494.5) 333.8 (201.4-466.2)Humboldt 280 337.7 (298.1-377.3) 392.2 (344.9-439.4)Lander 114 415.3 (339.1-491.5) 501.8 (403.2-600.3)Lincoln 150 854.9 (718.1-991.7) 696.2 (582.5-810.0)Lyon 1,151 555.2 (523.1-587.3) 476.6 (448.9-504.3)Mineral 191 815.3 (699.7-930.9) 559.4 (477.9-640.9)Nye 1,212 653.2 (616.4-689.9) 441.0 (415.0-467.0)Pershing 97 359.9 (288.2-431.5) 359.2 (287.4-431.0)Storey 74 391.6 (302.4-480.8) 317.8 (240.5-395.0)Washoe 8,253 442.2 (432.7-451.8) 483.9 (473.4-494.4)White Pine 193 501.5 (430.7-572.2) 380.0 (325.6-434.5)Unknown‡ ^ -- -- -- --Total 51,742 448.7 (444.8-452.6) 473.8 (469.7-477.9)
County of Residence
at Diagnosis
2001-2005 Incidence
CasesCrude Rate* Age-Adjusted Rate**
Note: * Rates are per 100,000 population. ** Rates are per 100,000 population and are age-adjusted to the 2000 U.S. Standard Population. ^ Cases less than five have been suppressed. ‡ Cases of unreported county are listed as unknown The “--” denotes suppressed rates and confidence intervals for cases less than ten.

13
NEVADA CANCER REPORT, 2001-2005
Table 4: All Cancer Cases by Gender, Race/Ethnicity and Region, Nevada Residents, 2001-2005
Total Clark WashoeAll Other Counties Unknown‡
TotalCases 51,742 35,815 8,253 7,673 ^
Rate* 473.8 475.0 483.9 456.5 --95% C.I. (469.7-477.9) (470.1-480.0) (473.4-494.4) (446.3-466.8) --
GenderMale 28,009 19,235 4,385 4,389 0
Rate* 544.5 542.9 557.0 539.4 --95% C.I. (537.9-551.2) (534.9-550.9) (539.9-574.0) (523.1-555.6) --
Female 23,728 16,578 3,867 3,282 ^Rate* 417.5 422.2 429.2 382.9 --95% C.I. (412.2-422.9) (415.7-442.7) (415.7-442.7 (369.7-396.0) --Other 5 -- -- --
Race/EthnicityWhite 42,793 28,376 7,310 7,106 ^
Rate* 502.5 508.6 509.2 471.5 --95% C.I. (497.7-507.2) (502.8-514.5) (497.5-520.8) (460.5-482.5) --
Black 2,709 2527 149 33 0Rate* 473.4 474.6 553.0 339.6 --95% C.I. (455.0-491.8) (455.5-493.7) (461.5-644.5) (223.3-455.9) --
Native American 274 75 72 127 0Rate* 232.0 148.4 256.3 300.9 --95% C.I. (203.2-260.8) (118.8-185.0) (194.3-318.3) (247.6-354.3) --
Asian 1,584 1297 228 59 0Rate* 298.3 296.5 314.0 295.1 --95% C.I. (281.1-315.6) (277.5-315.5) (266.5-361.6) (210.7-379.6) --
Hispanic 3,431 2725 422 284 0Rate* 371.2 380.2 336 350.4 --95% C.I. (356.4-386.1) (363.0-397.4) (297.8-374.2) (304.4-396.3) --
Unknown 951 815 72 64 0
CategoryCounty/Region of Residence
Note: * Rates are per 100,000 population and are age-adjusted to the 2000 U.S. Standard Population. ^ Cases less than five have been suppressed. ‡ Cases of unreported county are listed as unknown. Rates were adjusted for cases where race/ethnicity was listed as other/unknown. The “--” denotes suppressed rates and confidence intervals for cases less than ten.

14
NEVADA CANCER REPORT, 2001-2005
Figure 2: All Cancer Cases Age-Adjusted Rates by County/Region of Residence, Nevada Residents, 2001-2005 vs. U.S. 2001-2005
473.7
473.8
456.5
475.0
483.9
0 100 200 300 400 500 600
U.S.
Nevada Total
All Other Counties
Clark
Washoe
Age-adjusted Incidence Rate
Coun
ty/R
egio
n of
Res
iden
ce
Figure 3: All Cancer Cases by Race/Ethnicity, Nevada Residents, 2001-2005
502.5 473.4
371.2
298.3
232.0
473.8
0
100
200
300
400
500
600
White Black Hispanic Asian Native American
Nevada Total
Age
-adj
uste
d In
cide
nce
Rat
e
Race/Ethnicity

15
NEVADA CANCER REPORT, 2001-2005
Figure 4: All Cancer Cases by Race/Ethnicity and Gender, Nevada Residents, 2001-2005
572.7556.1
453.9
312.4280.4
544.5
445.2406.4
317.0288.8
198.2
417.5
0
100
200
300
400
500
600
700
White Black Hispanic Asian Native American
Nevada Total
Age
-Adj
uste
d In
cide
nce
Rat
e
Race/Ethnicity
Male
Female
Figure 5: All Cancer Cases by Gender and Year of Diagnosis, Nevada Residents, 2001-2005
5,340
5,634 5,607 5,711 5,717
4,489 4,5764,660
5,041 4,962
0
1000
2000
3000
4000
5000
6000
7000
2001 2002 2003 2004 2005
Num
ber o
f Cas
es
Year of Diagnosis
Male
Female
Note: Cases of other gender have been excluded from figures 4 and 5.
16
NEVADA CANCER REPORT, 2001-2005
Table 5: All Cancer Cases by Race/Ethnicity and Gender, Nevada Residents, 2001-2005
Total Male Female Other
Incidence 51,742 28,009 23,728 5Rate* 473.8 544.5 417.5 --95% C.I. (469.7-477.9) (537.9-551.2) (412.2-422.9) --Incidence 42,793 23,322 19,466 5Rate* 502.5 572.7 445.2 --95% C.I. (497.7-507.2) (565.2-580.1) (438.9-451.4) --Incidence 2,709 1,466 1,243 0Rate* 473.4 556.1 406.4 --95% C.I. (455.0-491.8) (525.6-586.6) (383.4-429.5) --Incidence 274 140 134 0Rate* 232.0 280.4 198.2 --95% C.I. (203.2-260.8) (230.0-330.8) (163.5-232.9) --Incidence 1,584 667 917 0Rate* 298.3 312.4 288.8 --95% C.I. (281.1-315.6) (284.6-340.1) (266.9-310.8) --Incidence 3,431 1,756 1,675 0Rate* 371.2 453.9 317.0 --95% C.I. (356.4-386.1) (426.8-481.0) (299.6-310.8) --
Unknown 951 658 293 0
Asian
Hispanic
Race/EthnicityGender
Native American
Total
White
Black
Note: * Rates are per 100,000 population and are age-adjusted to the 2000 U.S. Standard Population. Rates were adjusted for cases where race/ethnicity was listed as other/unknown. The “--” denotes suppressed rates, and confidence intervals for cases less than ten.

17
NEVADA CANCER REPORT, 2001-2005
Table 6: All Cancer Cases by Age Group and Gender, Nevada Residents, 2001-2005
Total Male Female Other
Total 51,742 28,009 23,728 5Rate* 448.7 478.1 418.2 --95% C.I. (444.8-452.6) (472.5-483.7) (412.9-423.5) --
<1 43 28 15 0Rate* 25.3 32.1 18.1 --95% C.I. (17.7-32.8) (20.2-44.1) (8.9-27.2) --
1-4 122 70 52 0Rate* 18.6 20.8 16.2 --95% C.I. (15.3-21.9) (15.9-25.7) (11.8-20.6) --
5-14 192 110 82 0Rate* 11.9 13.3 10.4 --95% C.I. (10.2-13.6) (10.8-15.8) (8.2-12.7) --
15-24 409 220 189 0Rate* 24.9 25.8 23.9 --95% C.I. (22.5-27.3) (22.4-29.2) (20.5-27.4) --
25-34 1,086 421 665 0Rate* 64.4 47.9 82.4 --95% C.I. (60.6-68.2) (43.3-52.5) (76.1-88.6) --
35-44 2,730 993 1,737 0Rate* 155.4 108.9 205.8 --95% C.I. (149.6-161.3) (102.1-115.6) (196.1-215.5) --
45-54 6,421 2,882 3,539 0Rate* 409.9 362.9 458.4 --95% C.I. (399.9-420.0) (349.6-376.1) (443.2-473.4) --
55-64 12,152 6,761 5,388 ^Rate* 1,048.1 1,184.4 915.4 --95% C.I. (1029.5-1066.7) (1156.2-1212.6) (891.0-939.8) --
65-74 15,090 9,219 5,869 ^Rate* 2,012.7 2,498.9 1,541.2 --95% C.I. (1980.5-2044.8) (2447.9-2549.9) (1501.7-1580.5) --
75-84 10,836 6,070 4,766 0Rate* 2,529.0 3,137.4 2,028.2 --95% C.I. (2481.4-2576.6) (3058.4-3216.3) (1970.5-2085.7) --
85+ 2,660 1,235 1,425 0Rate* 2,593.0 3,564.5 2,097.5 --95% C.I. (2494.4-2691.5) (3365.7-3763.3) (1988.5-2206.3) --Unknown‡ ^ 0 ^ 0
AgeGroup
Gender
Note: * Rates are per 100,000 age-specific population. ^ Cases less than five have been suppressed. ‡ Cases of unreported age are listed as unknown. The “--” denotes suppressed rates and confidence intervals for cases less than ten.

18
NEVADA CANCER REPORT, 2001-2005
Figure 6: Leading Types of Cancer by Percentage, Nevada Residents, 2001-2005
8.5%0.6%0.7%1.0%1.0%1.1%1.2%
1.3%1.4%
2.0%2.1%2.3%2.4%2.4%2.6%
2.7%3.7%
3.8%5.2%
10.1%13.0%
15.0%15.8%
0% 5% 10% 15% 20%
All other sitesHodgkin lymphoma
LarynxCervix uteri
Multiple myelomaEsophagus
Liver & Intrahepatic bile ductsStomach
OvaryBrain & other CNS
Corpus uteri & uterus NOSPancreas
Lip, Oral cavity & PharynxThyroid
LeukemiaKidney & Renal Pelvis
Melanomas of the SkinNon-Hodgkin lymphoma
Urinary bladderColorectal
BreastProstate
Lung and Bronchus
Percent of Total Cases
Type
of C
ance
r
Note:NOS - not otherwise specified.CNS - central nervous system.

19
NEVADA CANCER REPORT, 2001-2005
Figure 7: Top Ten Types of Cancer by Age-Adjusted Rates and Region, Nevada Residents, 2001-2005
0 25 50 75 100 125 150 175
Thyroid
Leukemia
Kidney and Renal pelvis
Melanomas of the Skin
Non-Hodgkin Lymphoma
Urinary bladder
Colorectal
Lung and Bronchus
Female Breast
Prostate
Age-Adjusted Incidence Rate
Type
s of
Can
cer
Nevada Total All Other Counties Washoe Clark

20
NEVADA CANCER REPORT, 2001-2005
Table 7: Top Ten Types of Cancer by County/Region of Residence, Nevada Residents, 2001-2005
Total Clark WashoeAll Other Counties Unknown‡
1. Lung and Bronchus 8,190 5,702 1,242 1,246 0Rate* 75.8 76.9 74.7 72.2 --95% C.I. (74.1-77.4) (74.9-78.9) (70.5-78.9) (68.2-76.2) --
2. Prostate 7,733 5,171 1,250 1,312 0Rate** 149.3 144.6 159.1 159.2 --95% C.I. (145.8-152.7) (140.5-148.7) (149.9-168.2) (150.3-168.1) --
3. Female Breast 6,652 4,531 1,168 953 0Rate** 115.2 113.6 126.9 110.1 --95% C.I. (112.5-118.0) (110.2-116.9) (119.6-134.2) (103.0-117.1) --
4. Colorectal 5,242 3,663 817 761 ^Rate* 49.5 50.2 49.8 45.8 --95% C.I. (48.2-50.9) (48.6-51.9) (46.4-53.3) (42.5-49.1) --
5. Urinary Bladder 2,708 1,826 411 471 0Rate* 25.7 25.0 25.4 28.6 --95% C.I. (24.7-26.7) (23.9-26.2) (22.9-27.9) (26.0-31.2) --
6. Non-Hodgkin Lymphoma 1,975 1,386 306 283 0Rate* 18.4 18.7 17.9 17.2 --95% C.I. (17.5-19.2) (17.7-19.7) (15.9-20.0) (15.2-19.3) --
7. Melanomas of the Skin 1,936 1,349 351 236 0Rate* 17.3 17.5 19.6 14.5 --95% C.I. (16.6-18.1) (16.5-18.4) (17.5-21.7) (12.6-16.4) --
8. Kidney and Renal Pelvis 1,387 971 223 193 0Rate* 12.4 12.5 12.8 11.5 --95% C.I. (11.7-13.1) (11.7-13.3) (11.1-14.5) (9.8-13.1) --
9. Leukemia 1,335 1,001 161 173 0Rate* 12.6 13.7 9.6 10.5 --95% C.I. (11.9-13.2) (12.9-14.6) (8.1-11.1) (8.9-12.1) --
10. Thyroid 1,250 907 201 142 0Rate* 10.7 11.2 10.6 8.9 --95% C.I. (10.1-11.3) (10.4-11.9) (9.1-12.1) (7.4-10.3) --
Rank Type of CancerCounty/Region of Residence
Note: * Rates are per 100,000 population and are age-adjusted to the 2000 U.S. Standard Population. ** Rates are per 100,000 gender-specific population and age-adjusted to the 2000 U.S. Standard Population. ^ Cases less than five have been suppressed. ‡Cases of unreported county are listed as unknown. The “--” denotes suppressed rates and confidence intervals for cases less than ten.

21
NEVADA CANCER REPORT, 2001-2005
Table 8: Top Ten Types of Cancer by Race/Ethnicity, Nevada Residents, 2001-2005
Type of Cancer Total White BlackNative
AmericanAsian Hispanic Unknown‡
Lung and Bronchus 8,190 7,174 393 39 206 331 47 Rate* 75.8 81.4 70.8 33.9 38.6 46.8 -- 95% C.I. (74.1-77.4) (79.5-83.3) (63.5-78.0) (22.6-45.2) (32.7-44.6) (40.9-52.6) --Prostate 7,733 6,223 517 42 137 464 350 Rate** 149.3 151.7 203.2 95.2 67.0 151.4 -- 95% C.I. (145.8-152.7) (147.9-155.5) (184.7-221.8) (63.9-126.6) (54.7-79.4) (135.0-167.8) --Female Breast 6,652 5,397 363 43 250 491 108 Rate** 115.2 122.8 113.7 59.5 74.6 84.7 -- 95% C.I. (112.5-118.0) (119.6-126.1) (101.8-125.6) (41.4-77.7) (63.8-85.3) (76.4-93.0 --Colorectal 5,242 4,299 319 30 194 347 53 Rate* 49.5 50.5 57.5 23.6 42.1 44.3 -- 95% C.I. (48.2-50.9) (49.0-52.0) (50.9-64.2) (14.7-32.5) (34.8-49.5) (38.7-49.8) --Urinary Bladder 2,708 2,429 73 6 41 88 71 Rate* 25.7 28.8 14.3 -- 8.8 12.6 -- 95% C.I. (24.7-26.7) (27.6-29.9) (10.9-17.8) -- (5.6-12.0) (9.6-15.6) --Non-Hodgkin Lymphoma 1,975 1,614 87 11 54 153 56 Rate* 18.4 19.6 14.4 10.3 11.0 15.1 -- 95% C.I. (17.5-19.2) (18.6-20.5) (11.3-17.6) (3.9-16.7) (7.4-14.6) (12.3-18.0) --Melanomas of the Skin 1,936 1,874 7 ^ ^ 37 13 Rate* 17.3 22.5 -- -- -- 3.2 -- 95% C.I. (16.6-18.1) (21.5-23.5) -- -- -- (2.0-4.3) --Kidney and Renal Pelvis 1,387 1,098 86 14 38 132 19 Rate* 12.4 12.6 13.8 13.1 7.5 14.2 -- 95% C.I. (11.7-13.1) (11.8-13.3) (10.9-16.8) (5.9-20.3) (4.5-10.4) (11.4-17.1) --Leukemia 1,335 1,062 66 ^ 35 131 38 Rate* 12.6 13.4 10.2 -- 7.6 10.0 -- 95% C.I. (11.9-13.2) (12.6-14.2) (7.7-12.7) -- (4.5-10.6) (7.7-12.3) --Thyroid 1,250 938 50 7 95 141 19 Rate* 10.7 11.9 7.3 -- 14.0 8.4 -- 95% C.I. (10.1-11.3) (11.1-12.6) (5.2-9.3) -- (10.9-17.0) (6.9-10.0) --
Race/Ethnicity
Note: * Rates are per 100,000 population and are age-adjusted to the 2000 U.S. Standard Population. ** Rates are per 100,000 gender-specific population and age-adjusted to the 2000 U.S. Standard Population. ^ Cases less than five have been suppressed. ‡ Cases of other and unknown race/ethnicity are listed as unknown. Rates were adjusted for cases where race/ethnicity was listed as other/unknown. The “--” denotes suppressed rates and confidence intervals for unknown and cases less than ten.

22
NEVADA CANCER REPORT, 2001-2005
Table 9: Top Ten Types of Cancer by Gender, Nevada Residents, 2001-2005
Type of Cancer
1. Prostate 7733 1. Female Breast 6,652Rate* 149.3 Rate* 115.295% C.I. (145.8-152.7) 95% C.I. (112.5-118.0)
2. Lung and Bronchus 4,280 2. Lung and Bronchus 3,910Rate* 84.1 Rate* 68.795% C.I. (81.5-86.7) 95% C.I. (66.6-70.9)
3. Colorectal 2,867 3. Colorectal 2,375Rate* 57.1 Rate* 42.895% C.I. (54.9-59.3) 95% C.I. (41.1-44.6)
4. Urinary Bladder 2,092 4. Corpus Uteri 1,083Rate* 43.2 Rate* 18.795% C.I. (41.3-45.2) 95% C.I. (17.6-19.8)
5. Melanomas of the Skin 1,178 5. Thyroid 955Rate* 22.2 Rate* 16.695% C.I. (20.9-23.5) 95% C.I. (15.6-17.7)
6. Non-Hodgkin Lymphoma 1,136 6. Non-Hodgkin Lymphoma 839Rate* 22.1 Rate* 15.095% C.I. (20.7-23.5) 95% C.I. (14.0-16.0)
7. Kidney and Renal Pelvis 901 7. Melanomas of the Skin 757Rate* 16.9 Rate* 13.295% C.I. (15.8-18.1) 95% C.I. (12.3-14.2)
8. 8. Ovary 738
Rate* 16.2 Rate* 12.995% C.I. (15.1-17.3) 95% C.I. (12.0-13.8)
9. Leukemia 798 9. Urinary Bladder 616Rate* 16.1 Rate* 13.195% C.I. (14.9-17.2) 95% C.I. (12.0-14.2)
10. Pancreas 632 10. Pancreas 551Rate* 12.5 Rate* 9.995% C.I. (11.5-13.5) 95% C.I. (9.1-10.8)
Rank Male Female
Type of Cancer
Lip, Oral Cavity and Pharynx 889
Rank
Note: * Rates are per 100,000 gender specific population and are age-adjusted to the 2000 U.S. Standard Population. NOS – not otherwise specified.

23
NEVADA CANCER REPORT, 2001-2005
LUNG AND BRONCHUS CANCER
Incidence
Lung and bronchus cancer was the leading type of cancer in Nevada with 8,190 cases (4,280 males and 3,910 females) reported during the 2001-2005 period. Nevada had a higher incidence rate (75.8 per 100,000) compared to the national rate (68.9)8 Males had a higher incidence rate (84.1) compared to females (68.7). Clark County had the highest incidence rate (76.9) compared to Washoe County (74.7) and All Other Counties (72.2). Other counties with high incidence rates were Lincoln (97.6) and Nye (85.2). Whites had the highest incidence rate (81.4), compared to Blacks (70.8), Hispanics (46.8), Asians (38.6), and Native Americans (33.9) who had the lowest incidence rate. Risk Factors Cigarette smoking is a major risk factor for lung and bronchus cancer. The risk increases with the quantity and duration of cigarette smoking. Other risk factors include: second hand smoke, family history, exposure to benzene, radon, asbestos, and certain metals (chromium, cadmium, arsenic), air pollution, radiation, and, a history of tuberculosis.10 Signs and Symptoms Lung and bronchus cancer may not have any symptoms. Some signs and symptoms include: persistent cough, bloody sputum, chest pain, loss of appetite, shortness of breath, weight loss, wheezing, and recurring pneumonia or bronchitis.10
Diagnosis Lung and bronchus cancer may be diagnosed by sputum cytology, fine needle aspiration (FNA) biopsy, thoracentesis, thoracoscopy, light and electron microscopy, immunohistochemistry study, chest x-ray, bronchoscopy, computed tomography (CT), or positron emission tomography (PET).10,11
Treatment Treatment depends on the type of cell (small or non-small) and stage of cancer. Surgery, radiation therapy, chemotherapy or targeted biological therapy are possible treatment options.10

24
NEVADA CANCER REPORT, 2001-2005
Table 10: Lung and Bronchus Cancer by County of Residence at Diagnosis, Nevada Residents, 2001-2005
Rate 95% C.I. Rate 95% C.I.
Carson City 245 93.1 (81.4-104.7) 76.7 (67.1-86.3)Churchill 104 80.9 (65.4-96.5) 84.0 (67.8-100.3)Clark 5,702 69.8 (68.0-71.6) 76.9 (74.9-78.9)Douglas 204 88.2 (76.1-100.4) 66.7 (57.4-76.0)Elko 80 34.3 (26.8-41.8) 59.8 (45.5-74.2)Esmeralda 5 -- -- -- --Eureka 5 -- -- -- --Humboldt 46 55.5 (39.4-71.5) 67.3 (47.2-87.4)Lander 13 47.4 (21.6-73.1) 51.7 (21.0-82.4)Lincoln 22 125.4 (73.0-177.8) 97.6 (56.6-138.7)Lyon 194 93.6 (80.4-106.7) 76.4 (65.6-87.2)Mineral 29 123.8 (78.7-168.8) 79.1 (50.1-108.2)Nye 249 134.2 (117.5-150.9) 85.2 (74.3-96.1)Pershing 17 63.1 (33.1-93.0) 63.6 (33.2-94.1)Storey 8 -- -- -- --Washoe 1,242 66.6 (62.9-70.3) 74.7 (70.5-78.9)White Pine 25 65.0 (39.5-90.4) 48.5 (29.5-67.5)Total 8,190 71.0 (69.5-72.6) 75.8 (74.1-77.4)
County of Residence
at Diagnosis
2001-2005 Incidence
CasesCrude Rate* Age-Adjusted Rate**
Note: * Rates are per 100,000 population. ** Rates are per 100,000 population and are age-adjusted to the 2000 U.S. Standard Population. The “--” denotes suppressed rates and confidence intervals for cases less than ten.

25
NEVADA CANCER REPORT, 2001-2005
Table 11: Lung and Bronchus Cancer by Gender, Race/Ethnicity and Region, Nevada Residents, 2001-2005
Total Clark WashoeAll Other Counties
TotalCases 8,190 5,702 1,242 1,246
Rate* 75.8 76.9 74.7 72.295% C.I. (74.1-77.4) (74.9-78.9) (70.5-78.9) (68.2-76.2)
GenderMale 4,280 2,947 663 670
Rate* 84.1 84.4 86.7 80.695% C.I. (81.5-86.7) (81.2-87.6) (79.8-93.6) (74.3-86.8)
Female 3,910 2,755 579 576Rate* 68.7 70.5 65.4 64.895% C.I. (66.6-70.9) (67.9-73.2) (60.1-70.8) (59.5-70.1)
Race/EthnicityWhite 7,174 4,851 1,144 1,179
Rate* 81.4 83.8 79.5 74.795% C.I. (79.5-83.3) (81.4-86.1) (74.9-84.1) (70.4-79.0)
Black 393 363 25 5Rate* 70.8 70.2 92.2 --95% C.I. (63.5-78.0) (62.7-77.8) (54.6-129.8) --
Native American 39 20 10 9Rate* 33.9 41.3 39.2 --95% C.I. (22.6-45.2) (21.6-61.0) (13.4-65.1) --
Asian 206 167 31 8Rate* 38.6 38.1 44.0 --95% C.I. (32.7-44.6) (31.7-44.6) (26.1-61.8) --
Hispanic 331 261 29 41Rate* 46.8 48.7 25.8 60.695% C.I. (40.9-52.6) (41.8-55.7) (14.8-36.7) (40.7-80.5)
Unknown 47 40 ^ ^
CategoryCounty/Region of Residence
Note: * Rates are per 100,000 population and are age-adjusted to the 2000 U.S. Standard Population. ^ Cases less than five have been suppressed. Rates were adjusted for cases where race/ethnicity was listed as other/unknown. The “--” denotes suppressed rates and confidence intervals for cases less than ten.

26
NEVADA CANCER REPORT, 2001-2005
Figure 8: Lung and Bronchus Cancer Age-Adjusted Rates by County/Region of Residence, Nevada Residents, 2001-2005 vs. U.S. 2001-2005
68.9
75.8
72.2
74.7
76.9
0 20 40 60 80 100
U.S.
Nevada Total
All Other Counties
Washoe
Clark
Age-Adjusted Incidence Rate
Coun
ty/R
egio
n of
Res
iden
ce
Figure 9: Lung and Bronchus Cancer by Race/Ethnicity, Nevada Residents, 2001-2005
81.470.8
46.838.6 33.9
75.8
0
25
50
75
100
White Black Hispanic Asian Native American
Nevada Total
Age
-Adj
uste
d In
cide
nce
Rat
e
Race/Ethnicity

27
NEVADA CANCER REPORT, 2001-2005
Figure 10: Lung and Bronchus Cancer by Race/Ethnicity and Gender, Nevada Residents, 2001-2005
88.781.8
58.753.8 50.1
84.1
75.3
59.6
0
40.8
30.4
68.7
0
25
50
75
100
White Black Native American
Hispanic Asian Nevada Total
Age-
Adju
sted
Inci
denc
e R
ate
Race/Ethnicity
Male
Female
Figure 11: Lung and Bronchus Cancer by Gender and Year of Diagnosis, Nevada Residents, 2001-2005
811892
858 867 852
740 744822 838
766
0
200
400
600
800
1000
2001 2002 2003 2004 2005
Num
ber o
f Cas
es
Year of Diagnosis
Male
Female

28
NEVADA CANCER REPORT, 2001-2005
Table 12: Lung and Bronchus Cancer by Race/Ethnicity and Gender, Nevada Residents, 2001-2005
Total Male Female Other
Incidence 8,190 4,280 3,910 0Rate* 75.8 84.1 68.7 --95% C.I. (74.1-77.4) (81.5-86.7) (66.6-70.9) --
Incidence 7,174 3,709 3,465 0Rate* 81.4 88.7 75.3 --95% C.I. (79.5-83.3) (85.7-91.6) (72.8-77.9) --
Incidence 393 221 172 0Rate* 70.8 81.8 59.6 --95% C.I. (63.5-78.0) (70.6-92.9) (50.4-68.8) --
Incidence 39 30 9 0Rate* 33.9 58.7 -- --95% C.I. (22.6-45.2) (35.8-81.5) -- --
Incidence 206 108 98 0Rate* 38.6 50.1 30.4 --95% C.I. (32.7-44.6) (39.5-60.6) (23.7-37.2) --
Incidence 331 181 150 0Rate* 46.8 53.8 40.8 --95% C.I. (40.9-52.6) (44.0-63.6) (33.5-48.0) --
Unknown 47 31 16 0
Asian
Hispanic
Race/EthnicityGender
Native American
Total
White
Black
Note: * Rates are per 100,000 population and are age-adjusted to the 2000 U.S. Standard Population. Rates were adjusted for cases where race/ethnicity was listed as other/unknown. The “--” denotes suppressed rates and confidence intervals for cases less than ten.

29
NEVADA CANCER REPORT, 2001-2005
Table 13: Lung and Bronchus Cancer by Age Group and Gender, Nevada Residents, 2001-2005
Total Male Female Other
Total 8,190 4,280 3,910 0Rate* 71.0 73.1 68.9 --95% C.I. (69.5-72.6) (70.9-75.3) (66.8-71.1) --
<1 0 0 0 0Rate* -- -- -- --95% C.I. -- -- -- --
1-4 0 0 0 0Rate* -- -- -- --95% C.I. -- -- -- --
5-14 ^ ^ ^ 0Rate* -- -- -- --95% C.I. -- -- -- --
15-24 ^ ^ ^ 0Rate* -- -- -- --95% C.I. -- -- -- --
25-34 9 ^ 6 0Rate* -- -- -- --95% C.I. -- -- -- --
35-44 97 50 47 0Rate* 5.5 5.5 5.6 --95% C.I. (4.4-6.6) (4.0-7.0) (4.0-7.2) --
45-54 611 336 275 0Rate* 39.0 42.3 35.6 --95% C.I. (35.9-42.1) (37.8-46.8) (31.4-39.8) --
55-64 1,944 997 947 0Rate* 167.7 174.7 160.9 --95% C.I. (160.2-175.1) (163.8-185.5) (150.6-171.1) --
65-74 2,940 1,634 1,306 0Rate* 392.1 442.9 342.9 --95% C.I. (378.0-406.3) (421.4-464.4) (324.3-361.5) --
75-84 2,171 1,082 1,089 0Rate* 506.7 559.2 463.4 --95% C.I. (485.4-528.0) (525.9-592.6) (435.9-490.9) --
85+ 413 175 238 0Rate* 402.6 505.1 350.3 --95% C.I. (363.8-441.4) (430.3-579.9) (305.8-394.8) --
AgeGroup
Gender
Note: * Rates are per 100,000 age-specific population. ^ Cases less than five have been suppressed. The “--” denotes suppressed rates and confidence intervals for cases less than ten.

30
NEVADA CANCER REPORT, 2001-2005
PROSTATE CANCER Incidence Prostate cancer was the second leading type of cancer in Nevada and the leading type of cancer among males with 7,733 cases reported during the 2001-2005 period. Nevada had a lower incidence rate (149.3 per 100,000) of prostate cancer compared to the national rate (158.2) during the same period.8 All Other Counties had the highest incidence rate (159.2) compared to Washoe County (159.1) and Clark County (144.6). Other counties with high incidence rates were Lincoln (240.0) and Mineral (223.1). Blacks accounted for only 6.7% of all reported cases of prostate cancer and yet Blacks had the highest incidence rate (203.2) compared to Whites (151.7), Hispanics (151.4), Native Americans (95.2), and Asians (67.0), who had the lowest incidence rate.
Risk Factors The risk of prostate cancer is highest for African-Americans and older men. Other risk factors include: family history, exposure to cadmium, and a diet high in fat. 10,12
Signs and Symptoms Early prostate cancer has no symptoms. However, with advanced disease, symptoms may include the following although they are not specific to prostate cancer: delayed or slowed start of urinary stream, urinary retention, pain or burning with urination, pain with ejaculation, lower back pain, and pain with bowel movement. In addition, excessive urination at night, incontinence, bone pain or tenderness, blood streaked urine, abdominal pain, lethargy, and unintentional weight loss are other symptoms of prostate cancer.10,12 Diagnosis Prostate cancer may be diagnosed by digital rectal exam, prostate-specific antigen (PSA) test, transrectal ultrasound, and/or biopsy (transrectal and transperineal).13
Treatment Treatment options depend on the age, stage of cancer, and other medical conditions. They include; surgery, external beam radiation, and branchytherapy for early stage disease. Careful observation (“watchful waiting”), hormonal therapy, chemotherapy or a combination of these treatments may be used for late stage disease.10

31
NEVADA CANCER REPORT, 2001-2005
Table 14: Prostate Cancer by County of Residence at Diagnosis, Nevada Residents, 2001-2005
Rate 95% C.I. Rate 95% C.I.
Carson City 289 223.3 (197.6-249.0) 208.3 (184.2-232.4)Churchill 127 197.5 (163.2-231.9) 210.7 (173.5-248.0)Clark 5,171 124.5 (121.1-127.9) 144.6 (140.5-148.7)Douglas 258 221.8 (194.8-248.9) 176.1 (153.6-198.5)Elko 81 66.8 (52.3-81.4) 126.4 (90.7-162.1)Esmeralda 9 -- -- -- --Eureka 5 -- -- -- --Humboldt 41 93.9 (65.2-122.6) 111.1 (75.9-146.2)Lander 14 99.3 (47.3-151.3) 109.1 (46.9-171.3)Lincoln 26 301.2 (185.4-416.9) 240.0 (147.1-333.0)Lyon 190 181.6 (155.7-207.4) 153.4 (131.4-175.4)Mineral 40 340.2 (234.7-445.6) 223.1 (152.0-294.2)Nye 165 175.1 (148.4-201.9) 109.0 (91.8-126.3)Pershing 13 94.3 (43.0-145.6) 112.5 (48.9-176.0)Storey 14 142.1 (67.7-216.6) 94.1 (42.4-145.7)Washoe 1,250 132.0 (124.7-139.3) 159.1 (149.9-168.2)White Pine 40 212.5 (146.6-278.3) 167.3 (115.3-219.3)Total 7,733 132.0 (129.1-135.0) 149.3 (145.8-152.7)
County of Residence
at Diagnosis
2001-2005 Incidence
CasesCrude Rate* Age-Adjusted Rate**
Note: * Rates are per 100,000 male population. ** Rates are per 100,000 male population and are age-adjusted to the 2000 U.S. Standard Population. The “--” denotes suppressed rates and confidence intervals for cases less than ten.

32
NEVADA CANCER REPORT, 2001-2005
Table 15: Prostate Cancer by Race/Ethnicity and Region, Nevada Residents, 2001-2005
Total Clark WashoeAll Other Counties
TotalCases 7,733 5,171 1,250 1,312
Rate* 149.3 144.6 159.1 159.295% C.I. (145.8-152.7) (140.5-148.7) (149.9-168.2) (150.3-168.1)
GenderMale 7,733 5,171 1,250 1,312
Rate* 149.3 144.6 159.1 159.295% C.I. (145.8-152.7) (140.5-148.7) (149.9-168.2) (150.3-168.1)
Female 0 0 0 0Rate* -- -- -- --95% C.I. -- -- -- --Race/Ethnicity
White 6,223 3,934 1,097 1,192Rate* 151.7 146.1 163.1 161.595% C.I. (147.9-155.5) (141.5-150.7) (153.2-173.0) (152.2-170.8)
Black 517 481 29 7Rate* 203.2 206.2 228.0 --95% C.I. (184.7-221.8) (186.7-225.8) (139.0-317.0) --
Native American 42 ^ 13 25Rate* 95.2 -- 112.7 147.695% C.I. (63.9-126.6) -- (44.0-181.4) (87.3-207.8)
Asian 137 106 25 6Rate* 67.0 65.2 74.6 --95% C.I. (54.7-79.4) (51.1-79.4) (45.0-104.2) --
Hispanic 464 352 63 49Rate* 151.4 157.0 141.7 143.195% C.I. (135.0-167.8) (136.7-177.2) (100.7-182.6) (100.0-186.2)
Unknown 350 294 23 33
CategoryCounty/Region of Residence
Note: * Rates are per 100,000 male population and are age-adjusted to the 2000 U.S. Standard Population. ^ Cases less than five have been suppressed. Rates were adjusted for cases where race/ethnicity was listed as other/unknown. The “--” denotes suppressed rates and confidence intervals for cases less than ten.

33
NEVADA CANCER REPORT, 2001-2005
Figure 12: Prostate Cancer Age-Adjusted Rates by County/Region of Residence, Nevada Residents, 2001-2005 vs. U.S. 2001-2005
158.2
149.3
144.6
159.1
159.2
0 50 100 150 200
U.S.
Nevada Total
Clark
Washoe
All Other Counties
Age- Adjusted Incidence Rate
Coun
ty/R
egio
n of
Res
iden
ce
Figure 13: Prostate Cancer by Race/Ethnicity, Nevada Residents, 2001-2005
203.2
151.7 151.4
95.2
67.0
149.3
0
50
100
150
200
250
Black White Hispanic Native American
Asian Nevada Total
Age
-Adj
uste
d In
cide
nce
Rat
e
Race/Ethnicity

34
NEVADA CANCER REPORT, 2001-2005
Figure 14: Prostate Cancer by Year of Diagnosis, Nevada Residents, 2001-2005
1,5841,693
1,546 1,5311,379
0
400
800
1200
1600
2000
2001 2002 2003 2004 2005
Num
ber o
f Cas
es
Year of Diagnosis
Male

35
NEVADA CANCER REPORT, 2001-2005
Table 16: Prostate Cancer by Race/Ethnicity and Gender, Nevada Residents, 2001-2005
Total Male Female Other
Incidence 7,733 7,733 0 0Rate* 149.3 149.3 -- --95% C.I. (145.8-152.7) (145.8-152.7) -- --
Incidence 6,223 6,223 0 0Rate* 151.7 151.7 -- --95% C.I. (147.9-155.5) (147.9-155.5) -- --
Incidence 517 517 0 0Rate* 203.2 203.2 -- --95% C.I. (184.7-221.8) (184.7-221.8) -- --
Incidence 42 42 0 0Rate* 95.2 95.2 -- --95% C.I. (63.9-126.6) (63.9-126.6) -- --
Incidence 137 137 0 0Rate* 67.0 67.0 -- --95% C.I. (54.7-79.4) (54.7-79.4) -- --
Incidence 464 464 0 0Rate* 151.4 151.4 -- --95% C.I. (135.0-167.8) (135.0-167.8) -- --
Unknown 350 350 0 0
Gender
Native American
Total
White
Black
Asian
Hispanic
Race/Ethnicity
Note: * Rates are per 100,000 male population and are age-adjusted to the 2000 U.S. Standard Population. Rates were adjusted for cases where race/ethnicity was listed as other/unknown. The “--” denotes suppressed rates and confidence intervals for cases less than ten.

36
NEVADA CANCER REPORT, 2001-2005
Table 17: Prostate Cancer by Age Group, Nevada Residents, 2001-2005
Total Male Female Other
Total 7,733 7,733 0 0Rate* 132.0 132.0 -- --95% C.I. (129.1-135.0) (129.1-135.0) -- --
<1 0 0 0 0Rate* -- -- -- --95% C.I. -- -- -- --
1-4 0 0 0 0Rate* -- -- -- --95% C.I. -- -- -- --
5-14 0 0 0 0Rate* -- -- -- --95% C.I. -- -- -- --
15-24 0 0 0 0Rate* -- -- -- --95% C.I. -- -- -- --
25-34 ^ ^ 0 0Rate* -- -- -- --95% C.I. -- -- -- --
35-44 28 28 0 0Rate* 3.1 3.1 -- --95% C.I. (1.9-4.2) (1.9-4.2) -- --
45-54 556 556 0 0Rate* 70.0 70.0 -- --95% C.I. (64.2-75.8) (64.2-75.8) -- --
55-64 2,111 2,111 0 0Rate* 369.8 369.8 -- --95% C.I. (354.0-385.6) (354.0-385.6) -- --
65-74 3,107 3,107 0 0Rate* 842.2 842.2 -- --95% C.I. (812.6-871.8) (812.6-871.8) -- --
75-84 1,618 1,618 0 0Rate* 836.3 836.3 -- --95% C.I. (795.5-877.0) (795.5-877.0) -- --
85+ 311 311 0 0Rate* 897.6 897.6 -- --95% C.I. (797.9-997.4) (797.9-997.4) -- --
AgeGroup
Gender
Note: * Rates are per 100,000 male population. ^ Cases less than five have been suppressed. The “--” denotes suppressed rates and confidence intervals for cases less than ten.

37
NEVADA CANCER REPORT, 2001-2005
BREAST CANCER
Incidence Breast cancer was the third leading type of cancer in Nevada with 6,731 cases (78 males and 6,652 females) reported during the 2001-2005 period. Breast cancer was the leading type of cancer among females in Nevada. Nevada had a lower incidence rate (115.2 per 100,000) of female breast cancer compared to the national rate (123.5) during the same period.8 Washoe County had the highest incidence rate (126.9) of female breast cancer compared to Clark County (113.6) and All Other Counties (110.1). Other counties with high incidence rates of female breast cancer were Lander (147.4) and Carson City (137.6). Whites had the highest incidence rate of female breast cancer (122.8) compared to Blacks (113.7), Hispanics (84.7), Asians (74.6), and Native Americans (59.5), who had the lowest incidence rate. Risk Factors The risk of breast cancer is highest for Whites, and older women. Other risk factors include: family history, dense breast tissue, biopsy-confirmed hyperplasia, radiation therapy to the chest/breast, recent use of oral contraceptives, hormone replacement therapy, being obese or overweight, and heavy alcohol consumption.10,14,15 In addition, reproductive factors that increase the risk of breast cancer include; early age at menarche, older age at first birth, or never having children.10,14,15 Signs and Symptoms Early breast cancer does not usually have symptoms. Breast cancer symptoms include: lump in the armpit with uneven edges, which does not hurt, change in size, shape or feel of the breast or nipple, and discharge from the nipple.10,14,15 Symptoms of advanced breast cancer include: bone pain, breast pain or discomfort, skin ulcers, swelling of the arm next to the breast with cancer, weight loss and, a larger tumor may present as a painless mass.1, 10,14,15
Diagnosis Common tests and procedures for breast cancer diagnosis include: self and clinical breast exam, mammogram, breast ultrasound, magnetic resonance imaging (MRI), and/or biopsy (excisional, incisional, core, fine-needle aspiration).10,14,15 Treatment Treatment options depend on tumor size, stage and the person’s preference. Treatment may involve radiation, lumpectomy, mastectomy, chemotherapy, hormone therapy, or targeted biologic therapy. A combination of two or more methods is often used.10,14

38
NEVADA CANCER REPORT, 2001-2005
Table 18: Female Breast Cancer by County of Residence at Diagnosis, Nevada Residents, 2001-2005
Rate 95% C.I. Rate 95% C.I.
Carson City 229 171.2 (149.0-193.4) 137.6 (119.5-155.6)Churchill 70 109.0 (83.4-134.5) 105.6 (80.8-130.4)Clark 4,531 112.9 (109.6-116.1) 113.6 (110.2-116.9)Douglas 155 134.9 (113.7-156.2) 100.4 (84.4-116.5)Elko 83 74.2 (58.2-90.1) 93.0 (71.6-114.4)Esmeralda 5 -- -- -- --Eureka ^ -- -- -- --Humboldt 32 81.5 (53.3-109.8) 84.6 (54.2-114.9)Lander 17 127.4 (66.8-187.9) 147.4 (74.7-220.1)Lincoln 15 168.3 (83.1-253.4) 127.4 (62.0-192.8)Lyon 163 158.8 (134.4-183.1) 132.8 (112.2-153.4)Mineral 15 128.6 (63.5-193.6) 98.7 (45.9-151.5)Nye 126 137.9 (113.9-162.0) 94.0 (76.9-111.0)Pershing 13 98.7 (45.0-152.3) 88.0 (39.8-136.1)Storey 10 110.5 (42.0-179.0) 83.8 (30.2-137.4)Washoe 1,168 127.1 (119.8-134.3) 126.9 (119.6-134.2)White Pine 19 96.6 (53.2-140.1) 65.1 (35.3-94.9)
Total 6,652 117.2 (114.4-120.1) 115.2 (112.5-118.0)
County of Residence
at Diagnosis
2001-2005 Incidence
CasesCrude Rate* Age-Adjusted Rate**
Note: * Rates are per 100,000 female population. ** Rates are per 100,000 female population and are age-adjusted to the 2000 U.S. Standard Population. ^ Cases less than five have been suppressed. The “--” denotes suppressed rates and confidence intervals for cases less than ten.

39
NEVADA CANCER REPORT, 2001-2005
Table 19: Female Breast Cancer by Race/Ethnicity and Region, Nevada Residents, 2001-2005
Total Clark WashoeAll Other Counties
TotalCases 6,652 4,531 1,168 953
Rate* 115.2 113.6 126.9 110.195% C.I. (112.5-118.0) (110.2-116.9) (119.6-134.2) (103.0-117.1)
GenderMale 0 0 0 0
Rate* -- -- -- --95% C.I. -- -- -- --
Female 6,652 4,531 1,168 953Rate* 115.2 113.6 126.9 110.195% C.I. (112.5-118.0) (110.2-116.9) (119.6-134.2) (103.0-117.1)
Race/EthnicityWhite 5,397 3,500 1,025 872
Rate* 122.8 122.3 134.2 112.995% C.I. (119.6-126.1) (118.3-126.4) (126.0-142.4) (105.4-120.5)
Black 363 339 18 6Rate* 113.7 112.7 133.3 --95% C.I. (101.8-125.6) (100.5-124.9) (70.9-195.7) --
Native American 43 16 11 16Rate* 59.5 50.5 67.3 62.795% C.I. (41.4-77.7) (25.0-76.1) (27.3-107.2) (31.6-93.9)
Asian 250 207 31 12Rate* 74.6 73.5 67.8 135.295% C.I. (63.8-85.3) (62.0-85.0) (42.4-93.1) (29.5-240.9)
Hispanic 491 379 71 41Rate* 84.7 83.1 95.7 85.495% C.I. (76.4-93.0) (73.8-92.3) (70.7-120.8) (56.0-114.8)
Unknown 108 90 12 6
CategoryCounty/Region of Residence
Note: * Rates are per 100,000 female population and are age-adjusted to the 2000 U.S. Standard Population. Rates were adjusted for cases where race/ethnicity was listed as other/unknown. The “--” denotes suppressed rates and confidence intervals for cases less than ten.

40
NEVADA CANCER REPORT, 2001-2005
Figure 15: Female Breast Cancer Age-Adjusted Rates by County/Region of Residence, Nevada Residents, 2001-2005 vs. U.S. 2001-2005
123.5
115.2
110.1
113.6
126.9
0 50 100 150
U.S.
Nevada Total
All Other Counties
Clark
Washoe
Age-Adjusted Incidence Rate
Coun
ty/R
egio
n of
Res
iden
ce
Figure 16: Female Breast Cancer by Race/Ethnicity, Nevada Residents, 2001-2005
122.8113.7
84.7 74.6
59.5
115.2
0
50
100
150
White Black Hispanic Asian Native American
Nevada Total
Age
-Adj
uste
d In
cide
nce
Rat
e
Race/Ethnicity

41
NEVADA CANCER REPORT, 2001-2005
Figure 17: Female Breast Cancer by Year of Diagnosis, Nevada Residents, 2001-2005
1,402 1,3611,261 1,282
1,346
0
400
800
1200
1600
2001 2002 2003 2004 2005
Num
ber o
f Cas
es
Year of Diagnosis
Female

42
NEVADA CANCER REPORT, 2001-2005
Table 20: Breast Cancer by Race/Ethnicity and Gender, Nevada Residents, 2001-2005
Total Male Female Other
Incidence 6,731 78 6,652 ^Rate* 60.2 1.5 115.2 --95% C.I. (58.8-61.7) (1.2-1.9) (112.5-118.0) --
Incidence 5,469 71 5397 ^Rate* 63.6 1.7 122.8 --95% C.I. (61.9-65.3) (1.3-2.1) (119.6-126.1) --
Incidence 365 ^ 363 ^Rate* 60.4 -- 113.7 --95% C.I. (53.9-66.8) -- (101.8-125.6) --
Incidence 43 0 43 0Rate* 31.9 -- 59.5 --95% C.I. (22.0-41.7) -- (41.4-77.7) --
Incidence 253 ^ 250 ^Rate* 43.6 -- 74.6 --95% C.I. (37.3-49.9) -- (63.8-85.3) --
Incidence 493 ^ 491 ^Rate* 43.5 -- 84.7 --95% C.I. (39.0-48.0) -- (76.4-93.0) --
Unknown 108 0 108 0
Native American
Asian
Hispanic
Race/EthnicityGender
Total
White
Black
Note: * Rates are per 100,000 population and are age-adjusted to the 2000 U.S. Standard Population. ^ Cases less than five have been suppressed. Rates were adjusted for cases where race/ethnicity was listed as other/unknown. The “--” denotes suppressed rates and confidence intervals for cases less than ten.

43
NEVADA CANCER REPORT, 2001-2005
Table 21: Breast Cancer by Age group and Gender, Nevada Residents, 2001-2005
Total Male Female Other
Total 6,731 78 6,652 ^Rate* 58.4 1.3 117.2 --95% C.I. (57.0-59.8) (1.0-1.6) (114.4-120.1) --
<1 0 0 0 0Rate* -- -- -- --95% C.I. -- -- -- --
1-4 0 0 0 0Rate* -- -- -- --95% C.I. -- -- -- --
5-14 ^ 0 ^ 0Rate* -- -- -- --95% C.I. -- -- -- --
15-24 5 0 5 0Rate* -- -- -- --95% C.I. -- -- -- --
25-34 118 ^ 117 0Rate* 7.0 -- 14.5 --95% C.I. (5.7-8.3) -- (11.9-17.1) --
35-44 626 6 620 0Rate* 35.6 -- 73.5 --95% C.I. (32.9-38.4) -- (67.7-79.2) --
45-54 1,354 5 1,349 0Rate* 86.4 -- 174.7 --95% C.I. (81.8-91.0) -- (165.4-184.0) --
55-64 1,827 15 1,811 ^Rate* 157.6 2.6 307.7 --95% C.I. (150.4-164.8) (1.3-4.0) (293.5-321.9) --
65-74 1,553 26 1,527 0Rate* 207.1 7.0 401.0 --95% C.I. (196.8-217.4) (4.3-9.8) (380.9-421.1) --
75-84 967 22 945 0Rate* 225.7 11.4 402.1 --95% C.I. (211.5-239.9 (6.6-16.1) (376.5-427.8) --
85+ 280 ^ 277 ^Rate* 272.9 -- 407.7 --95% C.I. (241.0-304.9) -- (359.7-455.7) --
AgeGroup
Gender
Note: * Rates are per 100,000 age-specific population. ^ Cases less than five have been suppressed. The “--” denotes suppressed rates and confidence intervals for cases less than ten.

44
NEVADA CANCER REPORT, 2001-2005
COLORECTAL CANCER Incidence Colorectal cancer was the fourth leading cancer in Nevada with 5,242 cases (2,867 males and 2,375 females) reported during the 2001-2005 period. Nevada had a lower incidence rate (49.5 per 100,000) of colorectal cancer compared to the national rate (51.6) during the same period.9 Males had a higher incidence rate (57.1) compared to females (42.8). Clark County had the highest incidence rate (50.2) compared to Washoe County (49.8) and All Other Counties (45.8). Other counties with high incidence rates were Lincoln (109.1) and Mineral (84.5). Blacks had the highest incidence rate (57.5) compared to Whites (50.5), Hispanics (44.3), Asians (42.1), and Native Americans (23.6), who had the lowest incidence rate. Risk Factors The risk of colorectal cancer is highest for African Americans and older people. Other risk factors include: family history, personal history of colorectal, breast, ovary and endometrium cancers, colorectal polyps, inflammatory bowel disease (ulcerative colitis or Crohn’s disease) and certain hereditary conditions such as Lynch syndrome.16,17,18 Modifiable factors associated with the risk of colorectal cancer include: a diet high in red or processed meat, smoking, physical inactivity, being obese or overweight, and heavy alcohol consumption. 16,17,18
Signs and Symptoms Many cases of colon cancer have no symptoms. The following symptoms may be indicative of colon cancer: bloody stool, diarrhea, constipation or a change in bowel habits, narrow stools, unintended weight loss, vomiting, and lethargy. 16,17,18 Diagnosis Colorectal cancer may be diagnosed by physical exam and history, fecal occult blood test (FOBT), digital rectal exam, barium enema, sigmoidoscopy, colonoscopy, biopsy, and/or virtual colonoscopy.17 Treatment Treatment depends on the stage of cancer, patient’s health, and whether the cancer has recurred. Surgery, chemotherapy, radiation, targeted therapy, and clinical trials are some of the treatment options.18

45
NEVADA CANCER REPORT, 2001-2005
Table 22: Colorectal Cancer by County of Residence at Diagnosis, Nevada Residents, 2001-2005
Rate 95% C.I. Rate 95% C.I.
Carson City 163 61.9 (52.4-71.4) 53.2 (45.0-61.5)Churchill 54 42.0 (30.8-53.2) 45.0 (32.9-57.1)Clark 3,663 44.8 (43.4-46.3) 50.2 (48.6-51.9)Douglas 116 50.2 (41.0-59.3) 39.3 (32.0-46.6)Elko 69 29.6 (22.6-36.6) 44.9 (33.0-56.7)Esmeralda ^ -- -- -- --Eureka ^ -- -- -- --Humboldt 29 35.0 (22.2-47.7) 41.0 (25.5-56.5)Lander 12 43.7 (19.0-68.4) 51.6 (20.3-83.0)Lincoln 23 131.1 (77.5-184.7) 109.1 (63.5-154.6)Lyon 109 52.6 (42.7-62.4) 45.9 (37.1-54.6)Mineral 27 115.3 (71.8-158.7) 84.5 (51.6-117.3)Nye 120 64.7 (53.1-76.2) 42.3 (34.3-50.2)Pershing 6 -- -- -- --Storey 9 -- -- -- --Washoe 817 43.8 (40.8-46.8) 49.8 (46.4-53.3)White Pine 20 52.0 (29.2-74.7) 38.6 (21.4-55.9)Unknown ^ -- -- -- --Total 5,242 45.5 (44.2-46.7) 49.5 (48.2-50.9)
County of Residence
at Diagnosis
2001-2005 Incidence
CasesCrude Rate* Age-Adjusted Rate**
Note: * Rates are per 100,000 population. ** Rates are per 100,000 population and are age-adjusted to the 2000 U.S. Standard Population. ^ Cases less than five have been suppressed. The “--” denotes suppressed rates and confidence intervals for cases less than ten.

46
NEVADA CANCER REPORT, 2001-2005
Table 23: Colorectal Cancer by Gender, Race/Ethnicity and Region, Nevada Residents, 2001-2005
Total Clark WashoeAll Other Counties Unknown‡
TotalCases 5,242 3,663 817 761 ^
Rate* 49.5 50.2 49.8 45.8 --95% C.I. (48.2-50.9) (48.6-51.9) (46.4-53.3) (42.5-49.1) --
GenderMale 2,867 1,994 435 438 0
Rate* 57.1 57.9 57.4 53.7 --95% C.I. (54.9-59.3) (55.2-60.6) (51.7-63.1) (48.5-58.9) --
Female 2,375 1,669 382 323 ^Rate* 42.8 43.7 43.5 37.8 --95% C.I. (41.1-44.6) (41.6-45.9) (39.1-47.8) (33.7-42.0) --
Race/EthnicityWhite 4,299 2,867 729 702 ^
Rate* 50.5 51.1 52.1 46.5 --95% C.I. (49.0-52.0) (49.2-52.9) (48.3-55.9) (43.1-50.0) --
Black 319 302 15 ^ 0Rate* 57.5 58.8 52.6 -- --95% C.I. (50.9-64.2) (51.8-65.8) (25.2-80.1) -- --
Native American 30 5 8 17 0Rate* 23.6 -- -- 37.6 --95% C.I. (14.7-32.5) -- -- (19.4-55.9) --
Asian 194 161 28 5 0Rate* 42.1 42.7 44.8 -- --95% C.I. (34.8-49.5) (34.4-51.0) (24.9-64.7) -- --
Hispanic 347 289 28 30 0Rate* 44.3 47.8 24.8 42.1 --95% C.I. (38.7-49.8) (41.2-54.5) (15.0-34.6) (24.9-59.4) --
Unknown 53 39 9 5 0
CategoryCounty/Region of Residence
Note: * Rates are per 100,000 population and are age-adjusted to the 2000 U.S. Standard Population. ^ Cases less than five have been suppressed. ‡ Cases of unreported county are listed as unknown Rates were adjusted for cases where race/ethnicity was listed as other/unknown. The “--” denotes suppressed rates and confidence intervals for cases less than ten.

47
NEVADA CANCER REPORT, 2001-2005
Figure 18: Colorectal Cancer Age-Adjusted Rates by County/Region of Residence, Nevada Residents, 2001-2005 vs. U.S. 2001-2005
51.6
49.5
45.8
49.8
50.2
0 10 20 30 40 50 60
U.S.
Nevada Total
All Other Counties
Washoe
Clark
Age-Adjusted Incidence Rate
Cou
nty/
Reg
ion
of R
esid
ence
Figure 19: Colorectal Cancer by Race/Ethnicity, Nevada Residents, 2001-2005
57.5
50.5
44.3 42.1
23.6
49.5
0
10
20
30
40
50
60
70
Black White Hispanic Asian Native American
Nevada Total
Age
-Adj
uste
d In
cide
nce
Rat
e
Race/Ethnicity

48
NEVADA CANCER REPORT, 2001-2005
Figure 20: Colorectal Cancer by Race/Ethnicity and Gender, Nevada Residents, 2001-2005
68.2
58.2
50.9 44.8
28.2
57.150.2
43.438.5 40.4
21.4
42.8
0
10
20
30
40
50
60
70
80
Black White Hispanic Asian Native American
Nevada Total
Age-
Adju
sted
Inci
denc
e R
ate
Race/Ethnicity
Male
Female
Figure 21: Colorectal Cancer by Gender and Year of Diagnosis, Nevada Residents, 2001-2005
544 602 588 564 569
454 459 453 517 492
0
200
400
600
800
2001 2002 2003 2004 2005
Num
ber o
f Cas
es
Year of Diagnosis
Male
Female

49
NEVADA CANCER REPORT, 2001-2005
Table 24: Colorectal Cancer by Race/Ethnicity and Gender, Nevada Residents, 2001-2005
Total Male Female Other
Incidence 5,242 2,867 2,375 0Rate* 49.5 57.1 42.8 --95% C.I. (48.2-50.9) (54.9-59.3) (41.1-44.6) --
Incidence 4,299 2,371 1,928 0Rate* 50.5 58.2 43.4 --95% C.I. (49.0-52.0) (55.8-60.6) (41.5-45.4) --
Incidence 319 171 148 0Rate* 57.5 68.2 50.2 --95% C.I. (50.9-64.2) (56.6-79.8 (41.9-58.4) --
Incidence 30 14 16 0Rate* 23.6 28.2 21.4 --95% C.I. (14.7-32.5) (11.7-44.6) (10.7-32.1) --
Incidence 194 84 110 0Rate* 42.1 44.8 40.4 --95% C.I. (34.8-49.5) (32.5-57.1) (31.2-49.6) --
Incidence 347 189 158 0Rate* 44.3 50.9 38.5 --95% C.I. (38.7-49.8) (41.7-60.0) (31.7-45.4) --
Unknown 53 38 15 0
Hispanic
Total
White
Black
Native American
Asian
Race/EthnicityGender
Note: * Rates are per 100,000 population and are age-adjusted to the 2000 U.S. Standard Population. Rates were adjusted for cases where race/ethnicity was listed as other/unknown. The “--” denotes suppressed rates and confidence intervals for cases less than ten.

50
NEVADA CANCER REPORT, 2001-2005
Table 25: Colorectal Cancer by Age Group and Gender, Nevada Residents, 2001-2005
Total Male Female Other
Total 5,242 2,867 2,375 0Rate* 45.5 48.9 41.8 --95% C.I. (44.2-46.7) (47.2-50.7) (40.2-43.5) --
<1 0 0 0 0Rate* -- -- -- --95% C.I. -- -- -- --
1-4 0 0 0 0Rate* -- -- -- --95% C.I. -- -- -- --
5-14 0 0 0 0Rate* -- -- -- --95% C.I. -- -- -- --
15-24 8 ^ ^ 0Rate* -- -- -- --95% C.I. -- -- -- --
25-34 41 17 24 0Rate* 2.4 1.9 3.0 --95% C.I. (1.7-3.2) (1.0-2.9) (1.8-4.2) --
35-44 159 78 81 0Rate* 9.1 8.6 9.6 --95% C.I. (7.6-10.5) (6.7-10.4) (7.5-11.7) --
45-54 567 302 265 0Rate* 36.2 38.0 34.3 --95% C.I. (33.2-39.2) (33.7-42.3) (30.2-38.5) --
55-64 1,118 691 427 0Rate* 96.4 121.1 72.5 --95% C.I. (90.8-102.1) (112.0-130.1) (65.7-79.4) --
65-74 1,561 921 640 0Rate* 208.2 249.6 168.1 --95% C.I. (197.9-218.5) (233.5-265.8) (155.0-181.1) --
75-84 1,381 697 684 0Rate* 322.3 360.3 291.1 --95% C.I. (305.3-339.3) (333.5-387.0) (269.3-312.9) --
85+ 407 157 250 0Rate* 396.7 453.1 368.0 --95% C.I. (358.2-435.3) (382.3-524.0) (322.4-413.6) --
AgeGroup
Gender
Note: * Rates are per 100,000 age-specific population. ^ Cases less than five have been suppressed. The “--” denotes suppressed rates and confidence intervals for cases less than ten.

51
NEVADA CANCER REPORT, 2001-2005
URINARY BLADDER CANCER Incidence During the 2001-2005 period, 2,708 cases (2,092 males and 616 females) of urinary bladder cancer were reported in Nevada. Nevada had a higher incidence rate (25.7 per 100,000) of urinary bladder cancer than the national rate (21.9) during the same period.8 Males had a higher incidence rate (43.2) compared to females (11.1). All Other Counties had the highest incidence rate (28.6) compared to Washoe County (25.4) and Clark County (25.0). Other counties with high incidence rates were Carson City (36.5) and Mineral (33.2). Whites had the highest incidence rate (28.8) compared to Blacks (14.3), Hispanics (12.6), and Asians (8.8). The rate for Native Americans was not calculated due to extremely low numbers. Risk Factors
Smoking is a major risk factor for urinary bladder cancer. Other risk factors include: being older, male, White, exposure to certain dyes, rubber, leather, paint, and hairdressing supplies, arsenic in drinking water, and a diet high in fat and fried meats.10,19
Signs and Symptoms
The commonest symptom of urinary bladder is blood in the urine. Other signs and symptoms include: frequent urination, an urgency to urinate, painful urination, urinary incontinence, and lower back pain.10,19
Diagnosis
Urinary bladder cancer may be diagnosed by computerized tomography (CT) scan, urinalysis, internal rectal or vaginal exam, intravenous pyelogram (IVP), cystoscopy, biopsy, or urine cytology.19
Treatment Treatment options for urinary bladder cancer include: surgery, radical cystectomy, chemotherapy, immunotherapy, or radiation.10

52
NEVADA CANCER REPORT, 2001-2005
Table 26: Urinary Bladder Cancer by County of Residence at Diagnosis, Nevada Residents, 2001-2005
Rate 95% C.I. Rate 95% C.I.
Carson City 114 43.3 (35.4-51.3) 36.5 (29.7-43.2)Churchill 36 28.0 (18.9-37.2) 29.4 (19.7-39.1)Clark 1,826 22.4 (21.3-23.4) 25.0 (23.9-26.2)Douglas 74 32.0 (24.7-39.3) 25.9 (19.8-31.9)Elko 31 13.3 (8.6-18.0) 26.3 (16.2-36.5)Esmeralda ^ -- -- -- --Eureka ^ -- -- -- --Humboldt 12 14.5 (6.3-22.7) 16.7 (6.9-26.5)Lander 9 -- -- -- --Lincoln 9 -- -- -- --Lyon 69 33.3 (25.4-41.1) 29.7 (22.6-36.9)Mineral 11 47.0 (19.2-74.7) 33.2 (12.4-54.0)Nye 74 39.9 (30.8-49.0) 27.0 (20.6-33.3)Pershing 9 -- -- -- --Storey 6 -- -- -- --Washoe 411 22.0 (19.9-24.2) 25.4 (22.9-27.9)White Pine 14 36.4 (17.3-55.4) 25.7 (12.2-39.1)
Total 2,708 23.5 (22.6-24.4) 25.7 (24.7-26.7)
County of Residence
at Diagnosis
2001-2005 Incidence
CasesCrude Rate* Age-Adjusted Rate**
Note: * Rates are per 100,000 population. ** Rates are per 100,000 population and are age-adjusted to the 2000 U.S. Standard Population. ^ Cases less than five have been suppressed. The “--” denotes suppressed rates and confidence intervals for cases less than ten.

53
NEVADA CANCER REPORT, 2001-2005
Table 27: Urinary Bladder Cancer Gender, by Race/Ethnicity and Region, Nevada Residents, 2001-2005
Total Clark WashoeAll Other Counties
TotalCases 2,708 1,826 411 471
Rate* 25.7 25.0 25.4 28.695% C.I. (24.7-26.7) (23.9-26.2) (22.9-27.9) (26.0-31.2)
GenderMale 2,092 1,398 311 383
Rate* 43.2 41.7 42.8 49.895% C.I. (41.3-45.2) (39.3-44.0) (37.7-47.8) (44.7-55.0)
Female 616 428 100 88Rate* 11.1 11.1 11.6 10.195% C.I. (10.2-11.9) (10.0-12.2) (9.3-13.8) (8.0-12.3)Race/Ethnicity
White 2,429 1,588 385 456Rate* 28.8 28.6 27.5 30.495% C.I. (27.6-29.9) (27.2-30.0) (24.7-30.2) (27.5-33.2)
Black 73 69 ^ ^Rate* 14.3 14.8 -- --95% C.I. (10.9-17.8) (11.1-18.5) -- --
Native American 6 ^ ^ ^Rate* -- -- -- --95% C.I. -- -- -- --
Asian 41 38 ^ 0Rate* 8.8 9.3 -- --95% C.I. (5.6-12.0) (6.0-12.7) -- --
Hispanic 88 63 16 9Rate* 12.6 12.0 18.0 --95% C.I. (9.6-15.6) (8.7-15.4) (7.1-28.9) --
Unknown 71 66 ^ ^
County/Region of ResidenceCategory
Note: * Rates are per 100,000 population and are age-adjusted to the 2000 U.S. Standard Population. ^ Cases less than five have been suppressed. Rates were adjusted for cases where race/ethnicity was listed as other/unknown. The “--” denotes suppressed rates and confidence intervals for cases less than ten.

54
NEVADA CANCER REPORT, 2001-2005
Figure 22: Urinary Bladder Cancer Age-Adjusted Rates by County/Region of Residence, Nevada Residents, 2001-2005 vs. U.S. 2001-2005
21.9
25.7
25.0
25.4
28.6
0 10 20 30 40
U.S.
Nevada Total
Clark
Washoe
All Other Counties
Age-Adjusted Incidence Rate
Cou
nty/
Reg
ion
of R
esid
ence
Figure 23: Urinary Bladder Cancer by Race/Ethnicity, Nevada Residents, 2001-2005
28.8
14.312.6
8.8
0
25.7
0
10
20
30
40
White Black Hispanic Asian Native American
Nevada Total
Age
-Adj
uste
d In
cide
nce
Rat
e
Race/Ethnicity

55
NEVADA CANCER REPORT, 2001-2005
Figure 24: Urinary Bladder Cancer by Race/Ethnicity and Gender, Nevada Residents, 2001-2005
47.7
23.3 23.2
16.1
0
43.2
12.57.6
4.2 3.70
11.1
0
10
20
30
40
50
60
White Black Hispanic Asian Native American
Nevada Total
Age
-Adj
uste
d In
cide
nce
Rat
e
Race/Ethnicity
Male
Female
Figure 25: Urinary Bladder Cancer by Gender and Year of Diagnosis, Nevada Residents, 2001-2005
423387
432405
445
114 122 109127 144
0
100
200
300
400
500
2001 2002 2003 2004 2005
Num
ber o
f Cas
es
Year of diagnosis
Male
Female
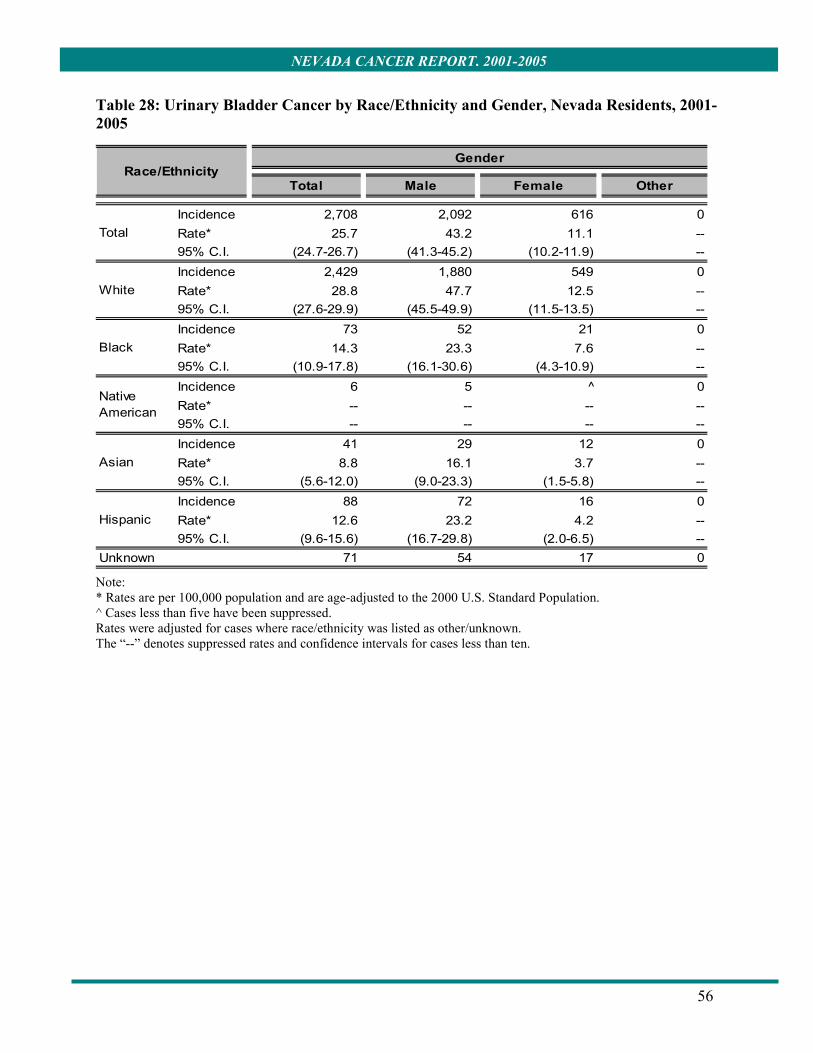
56
NEVADA CANCER REPORT, 2001-2005
Table 28: Urinary Bladder Cancer by Race/Ethnicity and Gender, Nevada Residents, 2001-2005
Total Male Female Other
Incidence 2,708 2,092 616 0Rate* 25.7 43.2 11.1 --95% C.I. (24.7-26.7) (41.3-45.2) (10.2-11.9) --Incidence 2,429 1,880 549 0Rate* 28.8 47.7 12.5 --95% C.I. (27.6-29.9) (45.5-49.9) (11.5-13.5) --Incidence 73 52 21 0Rate* 14.3 23.3 7.6 --95% C.I. (10.9-17.8) (16.1-30.6) (4.3-10.9) --Incidence 6 5 ^ 0Rate* -- -- -- --95% C.I. -- -- -- --Incidence 41 29 12 0Rate* 8.8 16.1 3.7 --95% C.I. (5.6-12.0) (9.0-23.3) (1.5-5.8) --Incidence 88 72 16 0Rate* 12.6 23.2 4.2 --95% C.I. (9.6-15.6) (16.7-29.8) (2.0-6.5) --
Unknown 71 54 17 0
Black
Native American
Asian
Hispanic
Race/EthnicityGender
Total
White
Note: * Rates are per 100,000 population and are age-adjusted to the 2000 U.S. Standard Population. ^ Cases less than five have been suppressed. Rates were adjusted for cases where race/ethnicity was listed as other/unknown. The “--” denotes suppressed rates and confidence intervals for cases less than ten.

57
NEVADA CANCER REPORT, 2001-2005
Table 29: Urinary Bladder Cancer by Age Group and Gender, Nevada Residents, 2001-2005
Total Male Female Other
Total 2,708 2,092 616 0Rate* 23.5 35.7 10.9 --95% C.I. (22.6-24.4) (34.2-37.2) (10.0-11.7) --
<1 0 0 0 0Rate* -- -- -- --95% C.I. -- -- -- --
1-4 0 0 0 0Rate* -- -- -- --95% C.I. -- -- -- --
5-14 0 0 0 0Rate* -- -- -- --95% C.I. -- -- -- --
15-24 ^ 0 ^ 0Rate* -- -- -- --95% C.I. -- -- -- --
25-34 11 8 ^ 0Rate* 0.7 -- -- --95% C.I. (0.3-1.0) -- -- --
35-44 61 46 15 0Rate* 3.5 5.0 1.8 --95% C.I. (2.6-4.3) (3.6-6.5) (0.9-2.7) --
45-54 185 132 53 0Rate* 11.8 16.6 6.9 --95% C.I. (10.1-13.5) (13.8-19.5) (5.0-8.7) --
55-64 537 437 100 0Rate* 46.3 76.6 17.0 --95% C.I. (42.4-50.2) (69.4-83.7) (13.7-20.3) --
65-74 905 689 216 0Rate* 120.7 186.8 56.7 --95% C.I. (112.8-128.6) (172.8-200.7) (49.2-64.3) --
75-84 814 643 171 0Rate* 190.0 332.3 72.8 --95% C.I. (176.9-203.0) (306.7-358.0) (61.9-83.7) --
85+ 192 137 55 0Rate* 187.2 395.4 81.0 --95% C.I. (160.7-213.6) (329.2-461.6) (59.6-102.3) --
AgeGroup
Gender
Note: * Rates are per 100,000 age-specific population. ^ Cases less than five have been suppressed. The “--” denotes suppressed rates and confidence intervals for cases less than ten.

58
NEVADA CANCER REPORT, 2001-2005
NON-HODGKIN LYMPHOMA Incidence During the 2001-2005 period, 1,975 cases (1,136 males and 839 females) of non-Hodgkin lymphoma were reported in Nevada. Nevada had a lower incidence rate (18.4 per 100,000) of non-Hodgkin lymphoma compared to the national rate (19.4) during the same period.8 Males had a higher incidence rate (22.1) compared to females (15.0). Clark County had the highest incidence rate (18.7) compared to Washoe County (17.9) and All Other Counties (17.2). Other counties that had high incidence rates include Elko (23.0) and Carson City (20.9). Whites had the highest incidence rate (19.6), compared to Hispanics (15.1), Blacks (14.4), Asians (11.0), and Native Americans (10.3). Risk Factors
The risk of developing non-Hodgkin lymphoma increases with age. However, the risk of non-Hodgkin lymphoma is greatest during adolescence and early childhood.1 Other risk factors include: being male, White, weakened immune system, having autoimmune diseases (for example: lupus), certain infections (for example: Epstein-Barr virus) exposure to benzene, pesticides and radiation, and a diet high in meat and fat.20,21 Signs and Symptoms
Signs and symptoms for non-Hodgkin lymphoma include: swollen lymph nodes in neck, underarm, groin, stomach or other areas, unintentional weight loss, drenching night sweats, fatigue, skin rash or itchy skin, and chest pain.20,21,22
Diagnosis Non-Hodgkin lymphoma may be diagnosed by physical exam and history, complete blood count (CBC) with white blood cell differential, blood chemistry studies, lymph node biopsy (excisional, incisional, and core), bone marrow aspiration, and/or biopsy and liver function tests. 20,21
Treatment Treatment for non-Hodgkin lymphoma may include: chemotherapy, immunotherapy, radioimmunotherapy, stem cell, or bone marrow transplant.22

59
NEVADA CANCER REPORT, 2001-2005
Table 30: Non-Hodgkin Lymphoma by County of Residence at Diagnosis, Nevada Residents, 2001-2005
Rate 95% C.I. Rate 95% C.I.
Carson City 61 23.2 (17.4-29.0) 20.9 (15.6-26.2)Churchill 26 20.2 (12.5-28.0) 20.6 (12.6-28.5)Clark 1,386 17.0 (16.1-17.9) 18.7 (17.7-19.7)Douglas 39 16.9 (11.6-22.2) 12.4 (8.5-16.3)Elko 35 15.0 (10.0-20.0) 23.0 (14.4-31.5)Esmeralda 0 -- -- -- --Eureka ^ -- -- -- --Humboldt 11 13.3 (5.4-21.1) 17.7 (6.9-28.4)Lander 6 -- -- -- --Lincoln 5 -- -- -- --Lyon 38 18.3 (12.5-24.2) 16.6 (11.3-22.0)Mineral 7 -- -- -- --Nye 41 22.1 (15.3-28.9) 15.1 (10.3-20.0)Pershing ^ -- -- -- --Storey 0 -- -- -- --Washoe 306 16.4 (14.6-18.2) 17.9 (15.9-20.0)White Pine 9 -- -- -- --Total 1,975 17.1 (16.4-17.9) 18.4 (17.5-19.2)
County of Residence
at Diagnosis
2001-2005 Incidence
CasesCrude Rate* Age-Adjusted Rate**
Note: * Rates are per 100,000 population. ** Rates are per 100,000 population and are age-adjusted to the 2000 U.S. Standard Population. ^ Cases less than five have been suppressed. The “--” denotes suppressed rates and confidence intervals for cases less than ten.

60
NEVADA CANCER REPORT, 2001-2005
Table 31: Non-Hodgkin Lymphoma by Gender, Race/Ethnicity and Region, Nevada Residents, 2001-2005
Total Clark WashoeAll Other Counties
TotalCases 1,975 1,386 306 283
Rate* 18.4 18.7 17.9 17.295% C.I. (17.5-19.2) (17.7-19.7) (15.9-20.0) (15.2-19.3)
GenderMale 1,136 800 189 147
Rate* 22.1 22.8 23.2 18.295% C.I. (20.7-23.5) (21.1-24.5) (19.7-26.6) (15.2-21.2)
Female 839 586 117 136Rate* 15.0 15.2 13.2 16.095% C.I. (14.0-16.0) (14.0-16.5) (10.8-15.6) (13.3-18.8)
Race/EthnicityWhite 1,614 1,090 265 259
Rate* 19.6 20.4 18.6 17.695% C.I. (18.6-20.5) (19.2-21.6) (16.3-20.8) (15.4-19.8)
Black 87 83 ^ ^Rate* 14.4 14.9 -- --95% C.I. (11.3-17.6) (11.6-18.2) -- --
Native American 11 5 ^ ^Rate* 10.3 -- -- --95% C.I. (3.9-16.7) -- -- --
Asian 54 37 13 ^Rate* 11.0 8.9 19.9 --95% C.I. (7.4-14.6) (5.4-12.5) (6.5-33.4) --
Hispanic 153 120 19 14Rate* 15.1 15.7 12.2 14.895% C.I. (12.3-18.0) (12.4-19.1) (5.4-19.1) (6.0-23.6)
Unknown 56 51 ^ ^
CategoryCounty/Region of Residence
Note: * Rates are per 100,000 population and are age-adjusted to the 2000 U.S. Standard Population. ^ Cases less than five have been suppressed. Rates were adjusted for cases where race/ethnicity was listed as other/unknown. The “--” denotes suppressed rates and confidence intervals for cases less than ten.

61
NEVADA CANCER REPORT, 2001-2005
Figure 26: Non-Hodgkin Lymphoma Age-Adjusted Rates by County/Region of Residence, Nevada Residents, 2001-2005 vs. U.S. 2001-2005
19.4
18.4
17.2
17.9
18.7
0 5 10 15 20 25
U.S.
Nevada Total
All Other Counties
Washoe
Clark
Age-Adjusted Incidence Rate
Coun
ty/R
egio
n of
Res
iden
ce
Figure 27: Non-Hodgkin Lymphoma by Race/Ethnicity, Nevada Residents, 2001-2005
19.6
15.1 14.4
11.0 10.3
18.4
0
5
10
15
20
25
White Hispanic Black Asian Native American
Nevada Total
Age
-Adj
uste
d In
cide
nce
Rat
e
Race/Ethnicity

62
NEVADA CANCER REPORT, 2001-2005
Figure 28: Non-Hodgkin Lymphoma by Race/Ethnicity and Gender, Nevada Residents, 2001-2005
23.4
18.6 18.5
13.9
0
22.1
16.0
10.012.6
8.8
0
15.0
0
5
10
15
20
25
30
White Black Hispanic Asian Native American
Nevada Total
Age
-Adj
uste
d In
cide
nce
Rat
e
Race/Ethnicity
Male
Female
Figure 29: Non-Hodgkin Lymphoma by Gender and Year of Diagnosis, Nevada Residents, 2001-2005
182
234 244 236 240
138
168 162
197174
0
50
100
150
200
250
300
2001 2002 2003 2004 2005
Num
ber o
f Cas
es
Year of Diagnosis
Male
Female

63
NEVADA CANCER REPORT, 2001-2005
Table 32: Non-Hodgkin Lymphoma by Race/Ethnicity and Gender, Nevada Residents, 2001-2005
Total Male Female Other
Incidence 1,975 1,136 839 0Rate* 18.4 22.1 15.0 --95% C.I. (17.5-19.2) (20.7-23.5) (14.0-16.0) --
Incidence 1,614 918 696 0Rate* 19.6 23.4 16.0 --95% C.I. (18.6-20.5) (21.9-25.0) (14.9-17.2) --
Incidence 87 57 30 0Rate* 14.4 18.6 10.0 --95% C.I. (11.3-17.6) (13.7-23.5) (6.3-13.6) --
Incidence 11 6 5 0Rate* 10.3 -- -- --95% C.I. (3.9-16.7) -- -- --
Incidence 54 27 27 0Rate* 11.0 13.9 8.8 --95% C.I. (7.4-14.6) (7.2-20.7) (4.9-12.7) --
Incidence 153 90 63 0Rate* 15.1 18.5 12.6 --95% C.I. (12.3-18.0) (13.2-23.8) (9.2-16.1) --
Unknown 56 38 18 0
Native American
Asian
Hispanic
Race/EthnicityGender
Total
White
Black
Note: * Rates are per 100,000 population and are age-adjusted to the 2000 U.S. Standard Population. Rates were adjusted for cases where race/ethnicity was listed as other/unknown. The “--” denotes suppressed rates and confidence intervals for cases less than ten.

64
NEVADA CANCER REPORT, 2001-2005
Table 33: Non-Hodgkin Lymphoma by Age Group and Gender, Nevada Residents, 2001-2005
Total Male Female Other
Total 1,975 1,136 839 0Rate* 17.1 19.4 14.8 --95% C.I. (16.4-17.9) (18.3-20.5) (13.8-15.8) --
<1 ^ ^ 0 0Rate* -- -- -- --95% C.I. -- -- -- --
1-4 ^ ^ ^ 0Rate* -- -- -- --95% C.I. -- -- -- --
5-14 20 16 ^ 0Rate* 1.2 1.9 -- --95% C.I. (0.7-1.8) (1.0-2.9) -- --
15-24 20 14 6 0Rate* 1.2 1.6 -- --95% C.I. (0.7-1.8) (0.8-2.5) -- --
25-34 53 39 14 0Rate* 3.1 4.4 1.7 --95% C.I. (2.3-4.0) (3.0-5.8) (0.8-2.6) --
35-44 160 106 54 0Rate* 9.1 11.6 6.4 --95% C.I. (7.7-10.5) (9.4-13.8) (4.7-8.1) --
45-54 224 132 92 0Rate* 14.3 16.6 11.9 --95% C.I. (12.4-16.2) (13.8-19.5) (9.5-14.3) --
55-64 420 262 158 0Rate* 36.2 45.9 26.8 --95% C.I. (32.8-39.7) (40.3-51.5) (22.7-31.0) --
65-74 519 291 228 0Rate* 69.2 78.9 59.9 --95% C.I. (63.3-75.2) (69.8-87.9) (52.1-67.6) --
75-84 425 214 211 0Rate* 99.2 110.6 89.8 --95% C.I. (89.8-108.6) (95.8-125.4) (77.7-101.9) --
85+ 130 59 71 0Rate* 126.7 170.3 104.5 --95% C.I. (104.9-148.5) (126.8-213.7) (80.2-128.8) --
AgeGroup
Gender
Note: * Rates are per 100,000 age-specific population. ^ Cases less than five have been suppressed. The “--” denotes suppressed rates and confidence intervals for cases less than ten.

65
NEVADA CANCER REPORT, 2001-2005
MELANOMAS OF THE SKIN Incidence In Nevada, 1,936 cases (1,178 males, 757 females) of melanomas of the skin cancer were reported during the 2001-2005 period. Nevada had a lower incidence rate (17.3 per 100,000) of skin cancer compared to the national rate (19.0) during the same period.8 Males had a higher incidence rate (22.2) compared to females (13.2). Washoe County had the highest incidence rate (19.6) compared to Clark County (17.5) and All Other Counties (14.5). Other counties with high incidence rates were Humboldt (18.5) and Churchill (17.7). Whites had the highest incidence rate (22.5), compared to Hispanics (3.2). Rates for Blacks, Native Americans, and Asians were not calculated due to extremely low numbers. Risk Factors Whites are at an increased risk of melanomas of the skin compared to other racial and ethnic groups. Other risk factors include: personal or family history, multiple or atypical moles, a large quantity of moles (greater than 50), exposure to sunlight or other ultra violet radiation, sunburn, fair complexion, older age, illnesses that suppress the immune system, and exposure to coal tar, pitch, creosote, radium, or arsenic compounds.10, 23,24
Signs and Symptoms Melanomas of the skin may have different appearances. The following simple ABCD rule outlines warning signs: A stands for asymmetry (one half of the abnormal skin area is different than the other half), B for border irregularity, C for color variation on the skin area, and D for a diameter of more than 6mm (usually, but not always). 10, 23,24
Diagnosis Tests that may be used to diagnose melanomas of the skin are biopsy (shave and punch) or excisional biopsy.23
Treatment Treatment for melanomas of the skin include: surgery, excision cuts, electrodessication and curettage, cryosurgery, radiation therapy, and certain topical medications. For advanced cases, palliative surgery, immunotherapy, and chemotherapy are some of the treatment options.10,24

66
NEVADA CANCER REPORT, 2001-2005
Table 34: Melanomas of the Skin by County of Residence at Diagnosis, Nevada Residents, 2001-2005
Rate 95% C.I. Rate 95% C.I.
Carson City 46 17.5 (12.4-22.5) 16.3 (11.5-21.1)Churchill 23 17.9 (10.6-25.2) 17.7 (10.5-25.0)Clark 1,349 16.5 (15.6-17.4) 17.5 (16.5-18.4)Douglas 37 16.0 (10.8-21.2) 12.9 (8.6-17.3)Elko 21 9.0 (5.2-12.9) 13.1 (6.8-19.5)Esmeralda ^ -- -- -- --Eureka 0 -- -- -- --Humboldt 13 15.7 (7.2-24.2) 18.5 (8.0-28.9)Lander ^ -- -- -- --Lincoln 6 -- -- -- --Lyon 36 17.4 (11.7-23.0) 15.3 (10.2-20.3)Mineral 5 -- -- -- --Nye 34 18.3 (12.2-24.5) 13.5 (8.6-18.4)Pershing 5 -- -- -- --Storey 5 -- -- -- --Washoe 351 18.8 (16.8-20.8) 19.6 (17.5-21.7)White Pine ^ -- -- -- --
Total 1,936 16.8 (16.0-17.5) 17.3 (16.6-18.1)
County of Residence
at Diagnosis
2001-2005 Incidence
CasesCrude Rate* Age-Adjusted Rate**
Note: * Rates are per 100,000 population. ** Rates are per 100,000 population and are age-adjusted to the 2000 U.S. Standard Population. ^ Cases less than five have been suppressed. The “--” denotes suppressed rates and confidence intervals for cases less than ten.

67
NEVADA CANCER REPORT, 2001-2005
Table 35: Melanomas of the Skin by Gender, Race/Ethnicity and Region, Nevada Residents, 2001-2005
Total Clark WashoeAll Other Counties
TotalCases 1,936 1,349 351 236
Rate* 17.3 17.5 19.6 14.595% C.I. (16.6-18.1) (16.5-18.4) (17.5-21.7) (12.6-16.4)
GenderMale 1,178 826 200 152
Rate* 22.2 22.5 23.9 19.295% C.I. (20.9-23.5) (20.9-24.1) (20.4-27.4) (16.1-22.4)
Female 757 522 151 84Rate* 13.2 13.2 16.2 10.395% C.I. (12.3-14.2) (12.0-14.3) (13.6-18.8) (8.1-12.6)Other ^ -- -- --
Race/EthnicityWhite 1,874 1,300 340 234
Rate* 22.5 23.8 23.4 16.695% C.I. (21.5-23.5) (22.5-25.1) (20.9-25.9) (14.4-18.8)
Black 7 6 0 ^Rate* -- -- -- --95% C.I. -- -- -- --
Native American ^ ^ ^ 0Rate* -- -- -- --95% C.I. -- -- -- --
Asian ^ ^ 0 0Rate* -- -- -- --95% C.I. -- -- -- --
Hispanic 37 31 5 ^Rate* 3.2 3.4 -- --95% C.I. (2.0-4.3) (2.0-4.8) -- --
Unknown 13 9 ^ 0
CategoryCounty/Region of Residence
Note: * Rates are per 100,000 population and are age-adjusted to the 2000 U.S. Standard Population. ^ Cases less than five have been suppressed. Rates were adjusted for cases where race/ethnicity was listed as other/unknown. The “--” denotes suppressed rates and confidence intervals for cases less than ten.

68
NEVADA CANCER REPORT, 2001-2005
Figure 30: Melanomas of the Skin Age-Adjusted Rates by County/Region of Residence, Nevada Residents, 2001-2005 vs. U.S. 2001-2005
19.0
17.3
14.5
17.5
19.6
0 5 10 15 20 25
U.S.
Nevada Total
All Other Counties
Clark
Washoe
Age-Adjusted Incidence Rate
Cou
nty/
Reg
ion
of R
esid
ence
Figure 31: Melanomas of the Skin by Race/Ethnicity, Nevada Residents, 2001-2005
22.5
3.2
0 0 0
17.3
0
5
10
15
20
25
White Hispanic Black Asian Native American
Nevada Total
Age
-Adj
uste
d In
cide
nce
Rat
e
Race/Ethnicity

69
NEVADA CANCER REPORT, 2001-2005
Figure 32: Melanomas of the Skin by Race/Ethnicity and Gender, Nevada Residents, 2001-2005
28.2
3.5
0 0 0
22.2
17.5
3.1
0 0 0
13.2
0
5
10
15
20
25
30
35
White Hispanic Black Asian Native American
Nevada Total
Age
-Adj
uste
d In
cide
nce
Rat
e
Race/Ethnicity
Male
Female
Figure 33: Melanomas of the Skin by Gender and Year of Diagnosis, Nevada Residents, 2001-2005
220 226240 229
263
144 142
177
151 143
0
50
100
150
200
250
300
2001 2002 2003 2004 2005
Num
ber
of C
ases
Year of Diagnosis
MaleFemale

70
NEVADA CANCER REPORT, 2001-2005
Table 36: Melanomas of the Skin by Race/Ethnicity and Gender, Nevada Residents, 2001-2005
Total Male Female Other
Incidence 1,936 1,178 757 ^Rate* 17.3 22.2 13.2 --95% C.I. (16.6-18.1) (20.9-23.5) (12.3-14.2) --
Incidence 1,874 1,148 725 ^Rate* 22.5 28.2 17.5 --95% C.I. (21.5-23.5) (26.5-29.8) (16.2-18.8) --
Incidence 7 ^ 6 0Rate* -- -- -- --95% C.I. -- -- -- --
Incidence ^ ^ ^ 0Rate* -- -- -- --95% C.I. -- -- -- --
Incidence ^ ^ 0 0Rate* -- -- -- --95% C.I. -- -- -- --
Incidence 37 16 21 0Rate* 3.2 3.5 3.1 --95% C.I. (2.0-4.3) (1.5-5.5) (1.6-4.5) --
Unknown 13 10 ^ 0
Native American
Asian
Hispanic
Race/EthnicityGender
Total
White
Black
Note: * Rates are per 100,000 population and are age-adjusted to the 2000 U.S. Standard Population. ^ Cases less than five have been suppressed. Rates were adjusted for cases where race/ethnicity was listed as other/unknown. The “--” denotes suppressed rates and confidence intervals for cases less than ten.

71
NEVADA CANCER REPORT, 2001-2005
Table 37: Melanomas of the Skin by Age Group and Gender, Nevada Residents, 2001-2005
Total Male Female Other
Total 1,936 1,178 757 ^Rate* 16.8 20.1 13.3 --95% C.I. (16.0-17.5) (19.0-21.3) (12.4-14.3) --
<1 8 6 ^ 0Rate* -- -- -- --95% C.I. -- -- -- --
1-4 0 0 0 0Rate* -- -- -- --95% C.I. -- -- -- --
5-14 ^ ^ ^ 0Rate* -- -- -- --95% C.I. -- -- -- --
15-24 36 19 17 0Rate* 2.2 2.2 2.2 --95% C.I. (1.5-2.9) (1.2-3.2) (1.1-3.2) --
25-34 130 55 75 0Rate* 7.7 6.3 9.3 --95% C.I. (6.4-9.0) (4.6-7.9) (7.2-11.4) --
35-44 233 128 105 0Rate* 13.3 14.0 12.4 --95% C.I. (11.6-15.0) (11.6-16.5) (10.1-14.8) --
45-54 353 183 170 0Rate* 22.5 23.0 22.0 --95% C.I. (20.2-24.9) (19.7-26.4) (18.7-25.3) --
55-64 406 252 154 0Rate* 35.0 44.1 26.2 --95% C.I. (31.6-38.4) (38.7-49.6) (22.0-30.3) --
65-74 424 304 119 ^Rate* 56.6 82.4 31.2 --95% C.I. (51.2-61.9) (73.1-91.7) (25.6-36.9) --
75-84 274 187 87 0Rate* 63.9 96.7 37.0 --95% C.I. (56.4-71.5) (82.8-110.5) (29.2-44.8) --
85+ 69 42 27 0Rate* 67.3 121.2 39.7 --95% C.I. (51.4-83.1) (84.6-157.9) (24.8-54.7) --
AgeGroup
Gender
Note: * Rates are per 100,000 age-specific population ^ Cases less than five have been suppressed. The “--” denotes suppressed rates and confidence intervals for cases less than ten.

72
NEVADA CANCER REPORT, 2001-2005
KIDNEY AND RENAL PELVIS CANCER Incidence During the 2001-2005 period, 1,387 cases (901 males and 486 females) of kidney and renal pelvis cancer were reported in Nevada. Nevada had a lower incidence rate (12.4 per 100,000) of kidney and renal pelvis cancer compared to the national rate (13.9) during the same period.8 Males had a higher incidence rate (16.9) compared to females (8.4). Washoe County had the highest incidence rate (12.8) compared to Clark County (12.5) and All Other Counties (11.5). Other counties with high incidence rates were Nye (14.4) and Elko (13.4). Hispanics had the highest incidence rate (14.2) compared to Blacks (13.8), Native Americans (13.1), Whites (12.6), and Asians (7.5).
Risk Factors Smoking is a strong risk factor for kidney and renal pelvis cancer. Additional risk factors include: family history, hereditary conditions (for example: Von Hippel-Lindau disease), obesity, high blood pressure, dialysis treatment, and misuse of some pain medications (Phenacetin).1,25,26 Signs and Symptoms
Early kidney and renal pelvis cancer usually has no symptoms. Signs and symptoms that may be present as the tumor progresses include: a lump in the abdomen or lower back, abdominal pain, flank pain, back pain, abnormal urine color (dark, rusty or brown), blood in the urine, varicocele (in men), emaciated appearance, unintentional weight loss, and anemia. 1,25,26
Diagnosis Diagnosis of kidney and renal pelvis cancer may be made by physical exam and history, blood chemistry studies, urinalysis, urine cytology, liver function tests, intravenous pyelogram (IVP), renal arteriography, serum calcium, abdomen and kidney ultrasound, and/or abdominal computed tomography (CT) scan. 25,26
Treatment Treatment options for kidney and renal pelvis cancer include: surgery, nephrectomy, chemotherapy, biologic treatment, or hormone treatment. 25,26

73
NEVADA CANCER REPORT, 2001-2005
Table 38: Kidney and Renal Pelvis Cancer by County of Residence at Diagnosis, Nevada Residents, 2001-2005
Rate 95% C.I. Rate 95% C.I.
Carson City 36 13.7 (9.2-18.1) 11.1 (7.5-14.8)Churchill 13 10.1 (4.6-15.6) 10.4 (4.7-16.1)Clark 971 11.9 (11.1-12.6) 12.5 (11.7-13.3)Douglas 33 14.3 (9.4-19.1) 10.8 (7.1-14.6)Elko 18 7.7 (4.2-11.3) 13.4 (6.3-20.4)Esmeralda ^ -- -- -- --Eureka ^ -- -- -- --Humboldt 8 -- -- -- --Lander ^ -- -- -- --Lincoln ^ -- -- -- --Lyon 29 14.0 (8.9-19.1) 11.9 (7.5-16.3)Mineral ^ -- -- -- --Nye 38 20.5 (14.0-27.0) 14.4 (9.6-19.3)Pershing 0 -- -- -- --Storey ^ -- -- -- --Washoe 223 11.9 (10.4-13.5) 12.8 (11.1-14.5)White Pine ^ -- -- -- --
Total 1,387 12.0 (11.4-12.7) 12.4 (11.7-13.1)
County of Residence
at Diagnosis
2001-2005 Incidence
CasesCrude Rate* Age-Adjusted Rate**
Note: * Rates are per 100,000 population. ** Rates are per 100,000 population and are age-adjusted to the 2000 U.S. Standard Population. ^ Cases less than five have been suppressed. The “--” denotes suppressed rates and confidence intervals for cases less than ten.

74
NEVADA CANCER REPORT, 2001-2005
Table 39: Kidney and Renal Pelvis Cancer by Gender, Race/Ethnicity and Region, Nevada Residents, 2001-2005
Total Clark WashoeAll Other Counties
TotalCases 1,387 971 223 193
Rate* 12.4 12.5 12.8 11.595% C.I. (11.7-13.1) (11.7-13.3) (11.1-14.5) (9.8-13.1)
GenderMale 901 621 142 138
Rate* 16.9 16.9 17.1 17.195% C.I. (15.8-18.1) (15.5-18.3) (14.2-20.0) (14.2-20.0)
Female 486 350 81 55Rate* 8.4 8.8 8.9 6.495% C.I. (7.7-9.2) (7.8-9.7) (7.0-10.9) (4.7-8.1)
Race/EthnicityWhite 1,098 737 195 166
Rate* 12.6 12.9 13.2 11.095% C.I. (11.8-13.3) (11.9-13.8) (11.4-15.1) (9.3-12.7)
Black 86 80 6 0Rate* 13.8 13.9 -- --95% C.I. (10.9-16.8) (10.8-16.9) -- --
Native American 14 ^ ^ 10Rate* 13.1 -- -- 25.195% C.I. (5.9-20.3) -- -- (9.1-41.1)
Asian 38 29 ^ 5Rate* 7.5 7.2 -- --95% C.I. (4.5-10.4) (3.9-10.6) -- --
Hispanic 132 105 16 11Rate* 14.2 14.2 11.8 16.495% C.I. (11.4-17.1) (11.1-17.4) (4.0-19.6) (5.8-27.0)
Unknown 19 18 0 ^
County/Region of ResidenceCategory
Note: *Rates are per 100,000 population and are age-adjusted to the 2000 U.S. Standard Population. ^ Cases less than five have been suppressed. Rates were adjusted for cases where race/ethnicity was listed as other/unknown. The “--” denotes suppressed rates and confidence intervals for cases less than ten.

75
NEVADA CANCER REPORT, 2001-2005
Figure 34: Kidney and Renal Pelvis Cancer Age-Adjusted Rates by County/Region of Residence, Nevada Residents, 2001-2005 vs. U.S. 2001-2005
13.9
12.4
11.5
12.5
12.8
0 5 10 15 20
U.S.
Nevada Total
All Other Counties
Clark
Washoe
Age-Adjusted Incidence Rate
Cou
nty/
Reg
ion
of R
esid
ence
Figure 35: Kidney and Renal Pelvis Cancer by Race/Ethnicity, Nevada Residents, 2001-2005
14.2 13.813.1 12.6
7.5
12.4
0
5
10
15
20
Hispanic Black Native American
White Asian Nevada Total
Age
-Adj
uste
d In
cide
nce
Rat
e
Race/Ethnicity

76
NEVADA CANCER REPORT, 2001-2005
Figure 36: Kidney and Renal Pelvis Cancer by Race/Ethnicity and Gender, Nevada Residents, 2001-2005
22.0 21.7
17.1 16.7
10.3
16.9
8.6
0
8.611.2
5.5
8.4
0
5
10
15
20
25
Hispanic Native American
White Black Asian Nevada Total
Age
-Adj
uste
d In
cide
nce
Rat
e
Race/Ethnicity
Male
Female
Figure 37: Kidney and Renal Pelvis Cancer by Gender and Year of Diagnosis, Nevada Residents, 2001-2005
195
158165
188 195
88 86100
11597
0
50
100
150
200
250
2001 2002 2003 2004 2005
Num
ber o
f Cas
es
Year of Diagnosis
MaleFemale

77
NEVADA CANCER REPORT, 2001-2005
Table 40: Kidney and Renal Pelvis Cancer by Race/Ethnicity and Gender, Nevada Residents, 2001-2005
Total Male Female Other
Incidence 1,387 901 486 0Rate* 12.4 16.9 8.4 --95% C.I. (11.7-13.1) (15.8-18.1) (7.7-9.2) --Incidence 1,098 721 377 0Rate* 12.6 17.1 8.6 --95% C.I. (11.8-13.3) (15.8-18.4) (7.7-9.4) --Incidence 86 50 36 0Rate* 13.8 16.7 11.2 --95% C.I. (10.9-16.8) (12.0-21.4) (7.6-14.9) --Incidence 14 11 ^ 0Rate* 13.1 21.7 -- --95% C.I. (5.9-20.3) (8.1-35.3) -- --Incidence 38 22 16 0Rate* 7.5 10.3 5.5 --95% C.I. (4.5-10.4) (5.0-15.5) (2.2-8.9) --Incidence 132 85 47 0Rate* 14.2 22.0 8.6 --95% C.I. (11.4-17.1) (15.7-28.3) (5.9-11.3) --
Unknown 19 12 7 0
Native American
Asian
Hispanic
Race/EthnicityGender
Total
White
Black
Note: * Rates are per 100,000 population and are age-adjusted to the 2000 U.S. Standard Population. ^ Cases less than five have been suppressed. Rates were adjusted for cases where race/ethnicity was listed as other/unknown. The “--” denotes suppressed rates and confidence intervals for cases less than ten.

78
NEVADA CANCER REPORT, 2001-2005
Table 41: Kidney and Renal Pelvis Cancer by Age Group and Gender, Nevada Residents, 2001-2005
Total Male Female Other
Total 1,387 901 486 0Rate* 12.0 15.4 8.6 --95% C.I. (11.4-12.7) (14.4-16.4) (7.8-9.3) --
<1 0 0 0 0Rate* -- -- -- --95% C.I. -- -- -- --
1-4 9 6 ^ 0Rate* -- -- -- --95% C.I. -- -- -- --
5-14 7 ^ ^ 0Rate* -- -- -- --95% C.I. -- -- -- --
15-24 3 0 ^ 0Rate* -- -- -- --95% C.I. -- -- -- --
25-34 7 ^ ^ 0Rate* -- -- -- --95% C.I. -- -- -- --
35-44 83 45 38 0Rate* 4.7 4.9 4.5 --95% C.I. (3.7-5.7) (3.5-6.4) (3.1-5.9) --
45-54 205 138 67 0Rate* 13.1 17.4 8.7 --95% C.I. (11.3-14.9) (14.5-20.3) (6.6-10.8) --
55-64 386 269 117 0Rate* 33.3 47.1 19.9 --95% C.I. (30.0-36.6) (41.5-52.8) (16.3-23.5) --
65-74 408 251 157 0Rate* 54.4 68.0 41.2 --95% C.I. (49.1-59.7) (59.6-76.5) (34.8-47.7) --
75-84 232 153 79 0Rate* 54.1 79.1 33.6 --95% C.I. (47.2-61.1) (66.5-91.6) (26.2-41.0) --
85+ 47 31 16 0Rate* 45.8 89.5 23.6 --95% C.I. (32.7-58.9) (58.0-121.0) (12.0-35.1) --
AgeGroup
Gender
Note: * Rates are per 100,000 age-specific population. ^ Cases less than five have been suppressed. The “--” denotes suppressed rates and confidence intervals for cases less than ten.

79
NEVADA CANCER REPORT, 2001-2005
LEUKEMIA Incidence During the 2001-2005 period, 1,335 cases (798 males, 536 females) of leukemia were reported in Nevada. Nevada had a slightly higher incidence rate of leukemia (12.6 per 100,000) compared to the national rate (12.5) during the same period.8 Males had a higher incidence rate (16.1) compared to females (9.6). Clark County had the highest incidence rate (13.7) compared to Washoe County (9.6) and All Other Counties (10.5). Other counties with high incidence rates were Humboldt (15.1) and Carson City (12.1). Whites had the highest incidence rate (13.4) compared to Blacks (10.2), Hispanics (10.0) and Asians (7.6). The rate for Native Americans was not calculated due to extremely low numbers. Risk Factors Being White and male are strong risk factors for leukemia. Other risk factors include: older age, smoking, past treatment with chemotherapy or radiation therapy, exposure to benzene, or atomic bomb radiation, pain in the bones or stomach, lumps in the neck, underarm or groin, and genetic conditions like Down’s syndrome.10,27
Signs and Symptoms
Signs and symptoms for leukemia may include: fever, petechiaes (a small red or purple spot on the body as a result of slight hemorrhage), shortness of breath, bruising easily or bleeding, fatigue, weight loss, and/or loss of appetite. 27
Diagnosis
Leukemia may be diagnosed by physical exam and history, complete blood count, blood chemistry studies, peripheral blood smear, bone marrow aspiration and biopsy, cytogenetic analysis, immunophenotyping, or reverse transcription–polymerase chain reaction test (RT-PCR). 27
Treatment
Chemotherapy is the most effective treatment for leukemia. However, in some instances, a bone marrow transplant may be necessary.10

80
NEVADA CANCER REPORT, 2001-2005
Table 42: Leukemia by County of Residence at Diagnosis, Nevada Residents, 2001-2005
Rate 95% C.I. Rate 95% C.I.
Carson City 36 13.7 (9.2-18.1) 12.1 (8.1-16.1Churchill 15 11.7 (5.8-17.6) 11.9 (5.8-17.9)Clark 1,001 12.3 (11.5-13.0) 13.7 (12.9-14.6)Douglas 20 8.7 (4.9-12.4) 6.6 (3.6-9.5)Elko 21 9.0 (5.2-12.9) 11.8 (6.3-17.2)Esmeralda 0 -- -- -- --Eureka 0 -- -- -- --Humboldt 10 12.1 (4.6-19.5) 15.1 (5.5-24.8)Lander ^ -- -- -- --Lincoln ^ -- -- -- --Lyon 21 10.1 (5.8-14.5) 9.0 (5.1-12.9)Mineral ^ -- -- -- --Nye 30 16.2 (10.4-22.0) 11.0 (6.8-15.2)Pershing 5 -- -- -- --Storey ^ -- -- -- --Washoe 161 8.6 (7.3-10.0) 9.6 (8.1-11.1)White Pine 5 -- -- -- --
Total 1,335 11.6 (11.0-12.2) 12.6 (11.9-13.2)
County of Residence
at Diagnosis
2001-2005 Incidence
CasesCrude Rate* Age-Adjusted Rate**
Note: * Rates are per 100,000 population. ** Rates are per 100,000 population and are age-adjusted to the 2000 U.S. Standard Population. ^ Cases less than five have been suppressed. The “--” denotes suppressed rates and confidence intervals for cases less than ten.

81
NEVADA CANCER REPORT, 2001-2005
Table 43: Leukemia by Gender, Race/Ethnicity and Region, Nevada Residents, 2001-2005
Total Clark WashoeAll Other Counties
TotalCases 1,335 1,001 161 173
Rate* 12.6 13.7 9.6 10.595% C.I. (11.9-11.6) (12.9-14.6) (8.1-11.1) (8.9-12.1)
GenderMale 798 596 86 116
Rate* 16.1 17.7 11.1 14.395% C.I. (14.9-17.2) (16.2-19.2) (8.6-13.5) (11.7-17.0)
Female 536 405 75 56Rate* 9.6 10.5 8.5 6.895% C.I. (8.8-10.4) (9.5-11.6) (6.6-10.4) (5.0-8.6)Other ^ -- -- ^
Race/EthnicityWhite 1,062 759 141 162
Rate* 13.4 14.7 10.4 11.395% C.I. (12.6-14.2) (13.7-15.8) (8.6-12.1) (9.5-13.1)
Black 66 61 ^ ^Rate* 10.2 10.0 -- --95% C.I. (7.7-12.7) (7.5-12.6) -- --
Native American ^ ^ 0 ^Rate* -- -- -- --95% C.I. -- -- -- --
Asian 35 31 ^ 0Rate* 7.6 7.4 -- --95% C.I. (4.5-10.6) (4.4-10.4) -- --
Hispanic 131 113 12 6Rate* 10.0 11.5 6.9 --95% C.I. (7.7-12.3) (8.5-14.4) (2.2-11.6) --
Unknown 38 35 0 ^
CategoryCounty/Region of Residence
Note: * Rates are per 100,000 population and are age-adjusted to the 2000 U.S. Standard Population. ^ Cases less than five have been suppressed. Rates were adjusted for cases where race/ethnicity was listed as other/unknown. The “--” denotes suppressed rates and confidence intervals for cases less than ten.

82
NEVADA CANCER REPORT, 2001-2005
Figure 38: Leukemia Age-Adjusted Rates by County/Region of Residence, Nevada Residents, 2001-2005 vs. U.S. 2001-2005
12.5
12.6
9.6
10.5
13.7
0 5 10 15 20
U.S.
Nevada Total
Washoe
All Other Counties
Clark
Age-Adjusted Incidence Rate
Cou
nty/
Reg
ion
of R
esid
ence
Figure 39: Leukemia by Race/Ethnicity, Nevada Residents, 2001-2005
13.4
10.2 10.0
7.6
0
12.6
0
5
10
15
White Black Hispanic Asian Native American
Nevada Total
Age
-Adj
uste
d In
cide
nce
Rat
e
Race/Ethnicity

83
NEVADA CANCER REPORT, 2001-2005
Figure 40: Leukemia by Race/Ethnicity and Gender, Nevada Residents, 2001-2005
17.4
13.2 12.6
4.3
0
16.1
10.0
7.8 8.19.8
0
9.6
0
5
10
15
20
White Hispanic Black Asian Native American
Nevada Total
Age-
Adju
sted
Inci
denc
e R
ate
Race/Ethnicity
Male
Female
Figure 41: Leukemia by Gender and Year of Diagnosis, Nevada Residents, 2001-2005
156
123
162 168
189
108 100 101
136
91
0
50
100
150
200
250
2001 2002 2003 2004 2005
Num
ber
of C
ases
Year of Diagnosis
MaleFemale

84
NEVADA CANCER REPORT, 2001-2005
Table 44: Leukemia by Race/Ethnicity and Gender, Nevada Residents, 2001-2005
Total Male Female Other
Incidence 1,335 798 536 ^Rate* 12.6 16.1 9.6 --95% C.I. (11.9-13.2) (14.9-17.2) (8.8-10.4) --Incidence 1,062 648 413 ^Rate* 13.4 17.4 10.0 --95% C.I. (12.6-14.2) (16.0-18.7) (9.1-11.1) --Incidence 66 38 28 0Rate* 10.2 12.6 8.1 --95% C.I. (7.7-12.7) (8.5-16.7) (5.0-11.1) --Incidence ^ 0 ^ 0Rate* -- -- -- --95% C.I. -- -- -- --Incidence 35 12 23 0Rate* 7.6 4.3 9.8 --95% C.I. (4.5-10.6) (1.8-6.8) (5.0-14.6) --Incidence 131 75 56 0Rate* 10.0 13.2 7.8 --95% C.I. (7.7-12.3) (8.5-17.9) (5.3-10.3) --
Unknown 38 25 13 0
Native American
Asian
Hispanic
Race/EthnicityGender
Total
White
Black
Note: * Rates are per 100,000 population and are age-adjusted to the 2000 U.S. Standard Population. ^ Cases less than five have been suppressed. Rates were adjusted for cases where race/ethnicity was listed as other/unknown. The “--” denotes suppressed rates and confidence intervals for cases less than ten.

85
NEVADA CANCER REPORT, 2001-2005
Table 45: Leukemia by Age Group and Gender, Nevada Residents, 2001-2005
Total Male Female Other
Total 1,335 798 536 ^Rate* 11.6 13.6 9.4 --95% C.I. (11.0-12.2) (12.7-14.6) (8.6-10.2) --
<1 5 ^ ^ 0Rate* -- -- -- --95% C.I. -- -- -- --
1-4 64 39 25 0Rate* 9.7 11.6 7.8 --95% C.I. (7.4-12.1) (8.0-15.2) (4.7-10.9) --
5-14 48 26 22 0Rate* 3.0 3.1 2.8 --95% C.I. (2.1-3.8) (1.9-4.3) (1.6-4.0) --
15-24 40 26 14 0Rate* 2.4 3.0 1.8 --95% C.I. (1.7-3.2) (1.9-4.2) (0.8-2.7) --
25-34 45 22 23 0Rate* 2.7 2.5 2.8 --95% C.I. (1.9-3.4) (1.5-3.5) (1.7-4.0) --
35-44 73 39 34 0Rate* 4.2 4.3 4.0 --95% C.I. (3.2-5.1) (2.9-5.6) (2.7-5.4) --
45-54 121 73 48 0Rate* 7.7 9.2 6.2 --95% C.I. (6.3-9.1) (7.1-11.3) (4.5-8.0) --
55-64 220 129 90 ^Rate* 19.0 22.6 15.3 --95% C.I. (16.5-21.5) (18.7-26.5) (12.1-18.4) --
65-74 301 196 105 0Rate* 40.1 53.1 27.6 --95% C.I. (35.6-44.7) (45.7-60.6) (22.3-32.8) --
75-84 322 199 123 0Rate* 75.2 102.9 52.3 --95% C.I. (66.9-83.4) (88.6-117.1) (43.1-61.6) --
85+ 96 48 48 0Rate* 93.6 138.5 70.7 --95% C.I. (74.9-112.3) (99.3-177.7) (50.7-90.6) --
AgeGroup
Gender
Note: * Rates are per 100,000 age-specific population. ^ Cases less than five have been suppressed. The “--” denotes suppressed rates and confidence intervals for cases less than ten.
86
NEVADA CANCER REPORT, 2001-2005
THYROID CANCER Incidence In Nevada, 1,250 cases (295 males and 955 females) of thyroid cancer were reported during the 2001-2005 period. Nevada had a higher incidence rate (10.7 per 100,000) of thyroid cancer compared to the national rate (8.9) during the same period. 9 Females had a higher incidence rate (16.6) compared to males (5.1). Clark County had the highest incidence rate (11.2) compared to Washoe County (10.6) and All Other Counties (8.9). Other counties with high incidence rates were Carson City (12.2) and Lyon (10.9). Asians had the highest incidence rate (14.0) compared to Whites (11.9), Hispanics (8.4) and Blacks (7.3). The rate for Native Americans was not calculated due to extremely low numbers. Risk Factors
The risk of thyroid cancer is highest for females and Asians. Other risk factors include: goiter history, family history of thyroid disease or thyroid cancer, being 25-65 years old, exposure to radiation of the head or neck during childhood, exposure to atomic bomb radiation, and genetic conditions like multiple endocrine neoplasia. 28
Signs and Symptoms
The commonest symptom for thyroid cancer is a lump or swelling in the neck. Other signs and symptoms may include: difficulty in breathing and swallowing, hoarseness of voice, a persistent cough that is not caused by a cold, and enlargement of the thyroid gland.28, 29
Diagnosis Diagnosis of thyroid cancer may be done by physical exam and history, laryngoscopy, blood hormone studies, blood chemistry studies, biopsy (fine-needle aspiration and surgical), and imaging tests which include: radioactive iodine (RAI) scan, computerized tomography (CT), magnetic resonance imaging (MRI), and positron emission tomography (PET) scans. 28, 29
Treatment Treatment varies depending on the type of tumor. Surgery is the primary treatment of choice combined with radiation therapy. Chemotherapy is used when the above two treatments are not effective. 29

87
NEVADA CANCER REPORT, 2001-2005
Table 46: Thyroid Cancer by County of Residence at Diagnosis, Nevada Residents, 2001-2005
Rate 95% C.I. Rate 95% C.I.
Carson City 34 12.9 (8.6-17.3) 12.2 (8.1-16.4)Churchill 12 9.3 (4.1-14.6) 9.5 (4.1-14.8)Clark 907 11.1 (10.4-11.8) 11.2 (10.4-11.9)Douglas 24 10.4 (6.2-14.5) 8.2 (4.8-11.6)Elko 17 7.3 (3.8-10.8) 9.0 (4.2-13.7)Esmeralda ^ -- -- -- --Eureka ^ -- -- -- --Humboldt 5 -- -- -- --Lander ^ -- -- -- --Lincoln ^ -- -- -- --Lyon 24 11.6 (6.9-16.2) 10.9 (6.4-15.3)Mineral 0 -- -- -- --Nye 14 7.5 (3.6-11.5) 6.7 (2.9-10.4)Pershing 0 -- -- -- --Storey 0 -- -- -- --Washoe 201 10.8 (9.3-12.3) 10.6 (9.1-12.1)White Pine 7 -- -- -- --
Total 1,250 10.8 (10.2-11.4) 10.7 (10.1-11.3)
County of Residence
at Diagnosis
2001-2005 Incidence
CasesCrude Rate* Age-Adjusted Rate**
Note: * Rates are per 100,000 population. ** Rates are per 100,000 population and are age-adjusted to the 2000 U.S. Standard Population. ^ Cases less than five have been suppressed. The “--” denotes suppressed rates and confidence intervals for cases less than ten.

88
NEVADA CANCER REPORT, 2001-2005
Table 47: Thyroid Cancer by Gender, Race/Ethnicity and Region, Nevada Residents, 2001-2005
Total Clark WashoeAll Other Counties
TotalCases 1,250 907 201 142
Rate* 10.7 11.2 10.6 8.995% C.I. (10.1-11.3) (10.4-11.9) (9.1-12.1) (7.4-10.3)
GenderMale 295 208 50 37
Rate* 5.1 5.2 5.1 4.495% C.I. (4.5-5.7) (4.5-6.0) (3.7-6.5) (3.0-5.9)
Female 955 699 151 105Rate* 16.6 17.3 16.3 13.495% C.I. (15.6-17.7) (16.0-18.6) (13.7-18.9) (10.8-16.0)
Race/EthnicityWhite 938 639 172 127
Rate* 11.9 12.4 11.9 9.495% C.I. (11.1-12.6) (11.4-13.4) (10.1-13.8) (7.7-11.1)
Black 50 47 ^ 0Rate* 7.3 7.3 -- --95% C.I. (5.2-9.3) (5.2-9.5) -- --
Native American 7 ^ ^ ^Rate* -- -- -- --95% C.I. -- -- -- --
Asian 95 78 14 ^Rate* 14.0 14.3 13.0 --95% C.I. (10.9-17.0) (10.7-17.8) (6.1-19.9) --
Hispanic 141 121 10 10Rate* 8.4 9.3 4.4 6.295% C.I. (6.9-10.0) (7.5-11.2) (1.2-7.6) (1.9-10.5)
Unknown 19 19 0 0
County/Region of ResidenceCategory
Note: * Rates are per 100,000 population and are age-adjusted to the 2000 U.S. Standard Population. ^ Cases less than five have been suppressed. Rates were adjusted for cases where race/ethnicity was listed as other/unknown. The “--” denotes suppressed rates and confidence intervals for cases less than ten.

89
NEVADA CANCER REPORT, 2001-2005
Figure 42: Thyroid Cancer Age-Adjusted Rates by County/Region of Residence, Nevada Residents, 2001-2005 vs. U.S. 2001-2005
8.9
10.7
8.9
10.6
11.2
0 5 10 15
U.S.
Nevada Total
All Other Counties
Washoe
Clark
Age-Adjusted Incidence Rate
Coun
ty/R
egio
n of
Res
iden
ce
Figure 43: Thyroid Cancer by Race/Ethnicity, Nevada Residents, 2001-2005
14.0
11.9
8.47.3
0
10.7
0
5
10
15
20
Asian White Hispanic Black Native American
Nevada Total
Age
-Adj
uste
d In
cide
nce
Rat
e
Race/Ethnicity

90
NEVADA CANCER REPORT, 2001-2005
Figure 44: Thyroid Cancer by Race/Ethnicity and Gender, Nevada Residents, 2001-2005
5.5 5.9
2.7
0 0
5.1
20.6
18.0
14.7
12.0
0
16.6
0
5
10
15
20
25
Asian White Hispanic Black Native American
Nevada Total
Age
-Adj
uste
d In
cide
nce
Rat
e
Race/Ethnicity
Male
Female
Figure 45: Thyroid Cancer by Gender and Year of Diagnosis, Nevada Residents, 2001-2005
51 54 52 59
79
176 169
192
221
197
0
50
100
150
200
250
2001 2002 2003 2004 2005
Num
ber o
f Cas
es
Year of Diagnosis
MaleFemale

91
NEVADA CANCER REPORT, 2001-2005
Table 48: Thyroid Cancer by Race/Ethnicity and Gender, Nevada Residents, 2001-2005
Total Male Female Other
Incidence 1,250 295 955 0Rate* 10.7 5.1 16.6 --95% C.I. (10.1-11.3) (4.5-5.7) (15.6-17.7) --
Incidence 938 246 692 0Rate* 11.9 5.9 18.0 --95% C.I. (11.1-12.6) (5.2-6.7) (16.7-19.4) --
Incidence 50 8 42 0Rate* 7.3 -- 12.0 --95% C.I. (5.2-9.3) -- (8.3-15.7) --Incidence 7 ^ ^ 0Rate* -- -- -- --95% C.I. -- -- -- --
Incidence 95 15 80 0Rate* 14.0 5.5 20.6 --95% C.I. (10.9-17.0) (2.6-8.4) (15.6-25.5) --
Incidence 141 22 119 0Rate* 8.4 2.7 14.7 --95% C.I. (6.9-10.0) (1.4-4.0) (11.9-17.6) --
Unknown 19 ^ 17 0
Native American
Asian
Hispanic
Race/EthnicityGender
Total
White
Black
Note: * Rates are per 100,000 population and are age-adjusted to the 2000 U.S. Standard Population. ^ Cases less than five have been suppressed. Rates were adjusted for cases where race/ethnicity was listed as other/unknown. The “--” denotes suppressed rates and confidence intervals for cases less than ten.

92
NEVADA CANCER REPORT, 2001-2005
Table 49: Thyroid Cancer by Age Group and Gender, Nevada Residents, 2001-2005
Total Male Female Other
Total 1,250 295 955 0Rate* 10.8 5.0 16.8 --95% C.I. (10.2-11.4) (4.5-5.6) (15.8-17.9) --
<1 0 0 0 0Rate* -- -- -- --95% C.I. -- -- -- --
1-4 0 0 0 0Rate* -- -- -- --95% C.I. -- -- -- --
5-14 ^ ^ ^ 0Rate* -- -- -- --95% C.I. -- -- -- --
15-24 60 12 48 0Rate* 3.7 1.4 6.1 --95% C.I. (2.7-4.6) (0.6-2.2) (4.4-7.8) --
25-34 181 23 158 0Rate* 10.7 2.6 19.6 --95% C.I. (9.2-12.3) (1.5-3.7) (16.5-22.6) --
35-44 284 56 228 0Rate* 16.2 6.1 27.0 --95% C.I. (14.3-18.1) (4.5-7.7) (23.5-30.5) --
45-54 295 60 235 0Rate* 18.8 7.6 30.4 --95% C.I. (16.7-21.0) (5.6-9.5) (26.5-34.3) --
55-64 240 73 167 0Rate* 20.7 12.8 28.4 --95% C.I. (18.1-23.3) (9.9-15.7) (24.1-32.7) --
65-74 124 51 73 0Rate* 16.5 13.8 19.2 --95% C.I. (13.6-19.4) (10.0-17.6) (14.8-23.6) --
75-84 56 17 39 0Rate* 13.1 8.9 16.6 --95% C.I. (9.6-16.5) (4.6-13.0) (11.4-21.8) --
85+ 7 ^ 5 0Rate* -- -- -- --95% C.I. -- -- -- --
AgeGroup
Gender
Note: * Rates are per 100,000 age-specific population. ^ Cases less than five have been suppressed. The “--” denotes suppressed rates and confidence intervals for cases less than ten.

93
NEVADA CANCER REPORT, 2001-2005
REFERENCES 1. American Cancer Society. Cancer Facts & Figures, 2010: American Cancer Society.
http://www.cancer.org/downloads/STT/Cancer_Facts_and_Figures_2010.pdf Accessed June 10, 2010. 2. National Institutes of Health. National Heart, Lung and Blood Institute. Fact Book Fiscal
Year 2009: National Institutes of Health, National Heart, Lung and Blood Institute; 2009. http://www.nhlbi.nih.gov/about/FactBook2009_final.pdf Accessed June 10, 2010. 3. Brillinger, D. The natural variability of vital rates and associated statistics. Biometrics
1986;42(4):693–734. 4. National Cancer Institute. Fact Sheet. Staging: Questions and Answers. http://www.cancer.gov/cancertopics/factsheet/detection/staging Accessed April 28, 2009. 5. World Health Organization. Help Topic: Crude vs. Standardized Rates: World Health
Organization. https://apps.who.int/infobase/help.aspx?helpid=43 Accessed June 10, 2010. 6. U.S. Cancer Statistics Working Group. United States Cancer Statistics: 1999-2006 Incidence
and Mortality Web-based Report. Atlanta: U.S. Department of Health and Human Services, Centers for Disease Control and Prevention and National Cancer Institute. http://apps.nccd.cdc.gov/uscs/cancersbystateandregion.aspx Accessed June 10, 2010.
7. Klein RJ, Schoenborn CA. Age adjustment using the 2000 projected U.S. population. Healthy People 2010 Statistical Notes; Number 20. National Center for Health Statistics 2001.
http://www.cdc.gov/nchs/data/statnt/statnt20.pdf Published January, 2001. Accessed June 28, 2010. 8. North American Association of Central Cancer Registries. CINA+ Online Cancer in North
America: North American Association of Central Cancer Registries. http://www.cancer-rates.info/naaccr/ Accessed June 23, 2009. 9. U.S. Cancer Statistics Working Group. United States Cancer Statistics: 1999–2005
Incidence and Mortality Web-based Report: Atlanta: U.S. Department of Health and Human Services, Centers for Disease Control and Prevention and National Cancer Institute. http://apps.nccd.cdc.gov/uscs/cancersbystateandregion.aspx Accessed July 9, 2009.
10. American Cancer Society. Cancer Facts & Figures, 2008: American Cancer Society. http://www.cancer.org/downloads/STT/2008CAFFfinalsecured.pdf
Accessed April 23, 2009. 11. Medline Plus Medical Encyclopedia: Lung Cancer: U.S. National Library of Science and the
National Institutes of Health. http://www.nlm.nih.gov/medlineplus/ency/article/000122.htm#Symptoms
Accessed June 23, 2010.

94
NEVADA CANCER REPORT, 2001-2005
12. Medline Plus Medical Encyclopedia. Prostate Cancer: U.S. National Library of Science and the National Institutes of Health; 2009.
http://www.nlm.nih.gov/medlineplus/ency/article/000380.htm Accessed June 24, 2009.
13. National Cancer Institute. U.S. National Institutes of Health. Prostrate Cancer Treatment (PDQ®): National Cancer Institute. U.S. National Institutes of Health; 2008. http://www.cancer.gov/cancertopics/pdq/treatment/prostate/patient Accessed June 24, 2009.
14. Medline Plus Medical Encyclopedia. Breast Cancer: U.S. National Library of Science and the National Institutes of Health; 2008. http://www.nlm.nih.gov/medlineplus/ency/article/000913.htm
Accessed June 23, 2009. 15. National Cancer Institute. U.S. National Institutes of Health. Breast Cancer Treatment
(PDQ®). National Cancer Institute, U.S. National Institutes of Health; 2009. http://www.cancer.gov/cancertopics/pdq/treatment/breast/Patient/page1/ Accessed June 23, 2009. 16. Medline Plus Medical Encyclopedia. Colon Cancer: U.S. National Library of Science and
the National Institutes of Health; 2008. http://www.nlm.nih.gov/medlineplus/ency/article/000262.htm Accessed June 24, 2009. 17. National Cancer Institute. U.S. National Institutes of Health. Colon Cancer Treatment
(PDQ®): National Cancer Institute. U.S. National Institutes of Health. 2009. http://www.cancer.gov/cancertopics/pdq/treatment/colon/patient Accessed June 24, 2009. 18. American Cancer Society. Detailed Guide: Colon and Rectum Cancer: American Cancer
Society; 2009. http://www.cancer.org/docroot/CRI/content/CRI_2_4_2X_What_are_the_risk_factors_fo r_
colon_and_rectum_cancer.asp?sitearea= Accessed June 24, 2009. 19. National Cancer Institute. U.S. National Institutes of Health. Bladder Cancer Treatment
(PDQ®): National Cancer Institute. U.S. National Institutes of Health, 2009. http://www.cancer.gov/cancertopics/pdq/treatment/bladder/patient
Accessed June 26, 2009. 20. National Cancer Institute. U.S. National Institutes of Health. Adult Non-Hodgkin Lympoma
Treatment (PDQ®): National Cancer Institute. U.S. National Institutes of Health; 2009. http://www.cancer.gov/cancertopics/pdq/treatment/adult-non-hodgkins/patient
Accessed June 26, 2009. 21. American Cancer Society. Detailed Guide: Lymphoma, Non-Hodgkin Type. What is Non-
Hodgkin Lymphoma?: American Cancer Society; 2009. http://www.cancer.org/docroot/CRI/CRI_2_3x.asp?dt=32
Accessed June 26, 2009. 22. Medline Plus Medical Encyclopedia. Non-Hodgkin’s Lymphoma: U.S. National Library of
Science and the National Institutes of Health; 2009. http://www.nlm.nih.gov/medlineplus/ency/article/000581.htm
Accessed June 26, 2009.

95
NEVADA CANCER REPORT, 2001-2005
23. National Cancer Institute. U.S. National Institutes of Health. Skin Cancer Treatment (PDQ®): National Cancer Institute. U.S. National Institutes of Health; 2009.
http://www.cancer.gov/cancertopics/pdq/treatment/skin/patient Accessed June 25, 2009.
24. Medline Plus Medical Encyclopedia. Skin Cancer: U.S. National Library of Science and the National Institutes of Health; 2008. Available at:
http://www.nlm.nih.gov/medlineplus/ency/article/001442.htm#top Accessed June 25, 2009.
25. National Cancer Institute. U.S. National Institutes of Health. Renal Cell Cancer Treatment (PDQ®). National Cancer Institute. U.S. National Institutes of Health; 2008.
http://www.cancer.gov/cancertopics/pdq/treatment/renalcell/patient Accessed June 29, 2009.
26. Medline Plus Medical Encyclopedia. Renal Cell Carcinoma: U.S. National Library of Science and the National Institutes of Health; 2009.
http://www.nlm.nih.gov/medlineplus/ency/article/000516.htm Accessed June 29, 2009.
27. National Cancer Institute. U.S. National Institutes of Health. Adult Acute Myeloid Leukemia Treatment (PDQ®). National Cancer Institute. U.S. National Institutes of Health; 2008. http://www.cancer.gov/cancertopics/pdq/treatment/adultAML/patient Accessed June 26, 2009.
28. National Cancer Institute. U.S. National Institutes of Health. Thyroid cancer treatment (PDQ®). National Cancer Institute. U.S. National Institutes of Health; 2008.
http://www.cancer.gov/cancertopics/pdq/treatment/thyroid/patient Accessed July 9, 2009. 29. Medline Plus. Medical Encyclopedia. Thyroid Cancer: U.S. National Library of Science and
the National Institutes of Health; 2009. http://www.nlm.nih.gov/medlineplus/ency/article/001213.htm#Treatment Accessed July 9, 2009.

96
NEVADA CANCER REPORT, 2001-2005
APPENDICES

97
NEVADA CANCER REPORT, 2001-2005
Appendix A: ICD-O-3 CODES USED Table 50: ICD-O-3 Codes Used for Cancer Groupings in This Report
ICD-O-3 Site ICD-O-3 Histology
Excluded Histology/Site
Total SumLip, Oral Cavity and Pharynx Sum of subgroups Lip C00 Base of Tongue C01 Other & Unspecified Parts of the Tongue C02 Parotid Gland C07 Other & Unspecified Major Salivary glands C08 Floor of mouth C04 Gum C03 9590-9989 Palate C05 9050-9055 Other & Unspecified Parts of the mouth C06 9140 Nasopharynx C11 Tonsil C09 Oropharynx C10 Pyriform Sinus C12 Hypopharynx C13
Other & Unspecified Oral Cavity & Pharynx C14Digestive System Esophagus C15 Stomach C16 Small Intestine C17 Colon (excluding Rectum) Cecum C18.0 Appendix C18.1 Ascending Colon C18.2 9590-9989 Hepatic Flexure C18.3 9050-9055 Transverse Colon C18.4 9140 Splenic Flexure C18.5 Descending Colon C18.6 Sigmoid Colon C18.7 Large Intestine, NOS C18.8-C18.9, C26.0 Rectum C20 Rectosigmoid Junction C19 Anus, Anal Canal and Anorectum C21 Liver C22.0 Intrahepatic Bile Ducts C22.1 Gallbladder C23 Other & Unspecified Biliary Tract C24 Pancreas C25 Retroperitoneum C48.0
Type of CancerICD-O-3 Codes
Sum of subgroups
…continued

98
NEVADA CANCER REPORT, 2001-2005
Table 50: ICD-O-3 Codes Used for Cancer Groupings in This Report (continued)
ICD-O-3 Site ICD-O-3 Histology
Excluded Histology/Site
Peritoneum, Omentum and Mesentery C48.1-C48.2 Other Digestive Organs C26.8-C26.9, C48.8Respiratory System Nose, Nasal Cavity & Middle Ear C30 Accessory Sinuses C31 Larynx C32 9590-9989 Lung and Bronchus C34 9050-9055 Pleura C38.4 9140 Trachea C33 Mediastinum & Other Respiratory Organs C38.1-C38.3,C38.8,
C39.0,39.8,39.9
Bones, Joints and Articular Cartilage Bones, Joints & Articular Cartilage of Limbs C40 9590-9989 Bones, Joints & Articular Cartilage of Other C41 9050-9055 & Unspecified sites 9140Soft Tissue Including Heart Heart C38 9590-9989 Peripheral Nerves & Autonomic Nervous System C47 9050-9055 Connective, Subcutaneous & Other Soft Tissues C49 9140Skin (excluding basal and squamous) Melanoma of the skin C44 8720-8790 Other Non-Epithelial Skin C44 8000-8005,
8010-8045,8050-8084, 8090-8110,8720-8790,9590-9989
9050-9055, 9140Breast C50 9590-9989
9050-9055, 9140Female Genital System Cervix Uteri C53 Corpus Uteri C54 Uterus, NOS C55 Ovary C56 9590-9989 Vagina C52 9050-9055 Vulva C51 9140 Placenta C58 Other Female Genital Organs C57Male Genital System Prostate C61 9590-9989 Testis C62 9050-9055 Penis C60 9140 Other Male Genital Organs C63
Sum of subgroups
Sum of subgroups
Sum of subgroups
Sum of subgroups
Sum of subgroups
Type of CancerICD-O-3 Codes
Sum of subgroups
…continued

99
NEVADA CANCER REPORT, 2001-2005
Table 50: ICD-O-3 Codes Used for Cancer Groupings in This Report (continued)
ICD-O-3 Site ICD-O-3 Histology
Excluded Histology/Site
Urinary System Urinary Bladder C67 Kidney C64 9590-9989 Renal Pelvis C65 9050-9055 Ureter C66 9140 Other Urinary Organs C68Eye and Orbit C69 9590-9989
9050-9055, 9140Brain and Other Central Nervous System Brain C71 9530-9539
9590-99899050-9055, 9140
Meninges C70 9590-99899050-9055, 9140
C72 9590-99899050-9055, 9140
C71 9530-9539Endocrine System Thyroid gland C73 9590-9989 Adrenal gland C74 9050-9055 Other Endocrine (including Thymus) C37, C75 9140Hodgkin Lymphoma 9650-9667Non-Hodgkin Lymphoma 9590-9596,
9670-9671,9678-9680,9689-9691,9698-9702,9708-9709,9714-9719,9727-9729,
9673, 9675, 9684,9687, 9695, 9705
9823, 9827 C42.0,C42.1,C42.4Myeloma 9731-9732, 9734Leukemia Lymphocytic Acute Lymphocytic 9826, 9835-9837 Chronic Lymphocytic C42.0,C42.1,C42.4 9823 Other Lymphocytic 9820, 9832-9834,
9940
Sum of subgroups
Spinal Cord, Cranial Nerves & Other Parts of CNS
Type of CancerICD-O-3 Codes
Sum of subgroups
Sum of subgroups
Sum of subgroups
…continued

100
NEVADA CANCER REPORT, 2001-2005
Table 50: ICD-O-3 Codes Used for Cancer Groupings in This Report (continued)
ICD-O-3 Site ICD-O-3 Histology
Excluded Histology/Site
Myeloid and Monocytic Acute Myeloid 9840, 9861, 9866.
9867, 9910, 99209871-9874, 9895-9897
Acute Monocytic 9891 Chronic Myeloid 9863, 9875, 9876
9945, 9946 Other Myeloid/Monocytic 9860, 9930 Other Other, Acute 9801, 9805, 9931 Aleukemic, Subleukemic and NOS 9733, 9742, 9800,
9831, 9870, 9948, 9963, 9964
C42.0, C42.1, 42.4 9827Mesothelioma 9050-9055Kaposi Sarcoma 9140Other, ill-defined and unspecified sites All other sites and histologies
Type of CancerICD-O-3 Codes
Note: NOS - not otherwise specified CNS - central nervous system
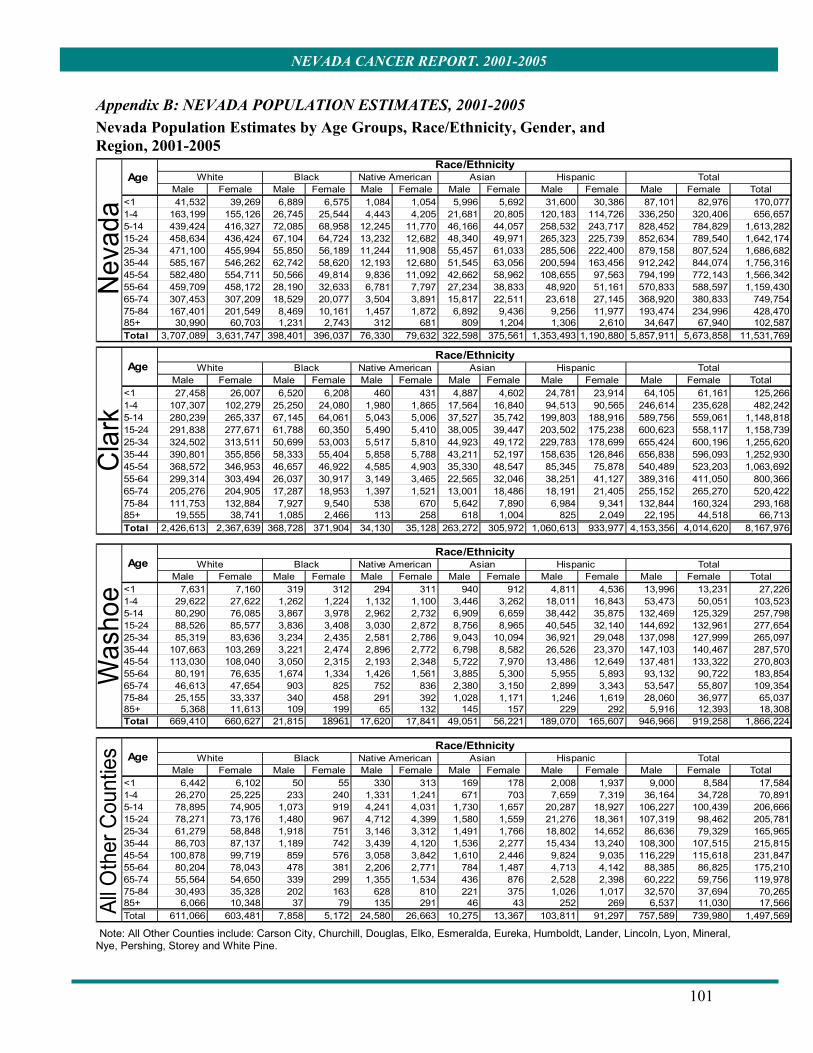
101
NEVADA CANCER REPORT, 2001-2005
Appendix B: NEVADA POPULATION ESTIMATES, 2001-2005 Nevada Population Estimates by Age Groups, Race/Ethnicity, Gender, and Region, 2001-2005
Race/Ethnicity
Male Female Male Female Male Female Male Female Male Female Male Female Total<1 41,532 39,269 6,889 6,575 1,084 1,054 5,996 5,692 31,600 30,386 87,101 82,976 170,0771-4 163,199 155,126 26,745 25,544 4,443 4,205 21,681 20,805 120,183 114,726 336,250 320,406 656,6575-14 439,424 416,327 72,085 68,958 12,245 11,770 46,166 44,057 258,532 243,717 828,452 784,829 1,613,28215-24 458,634 436,424 67,104 64,724 13,232 12,682 48,340 49,971 265,323 225,739 852,634 789,540 1,642,17425-34 471,100 455,994 55,850 56,189 11,244 11,908 55,457 61,033 285,506 222,400 879,158 807,524 1,686,68235-44 585,167 546,262 62,742 58,620 12,193 12,680 51,545 63,056 200,594 163,456 912,242 844,074 1,756,31645-54 582,480 554,711 50,566 49,814 9,836 11,092 42,662 58,962 108,655 97,563 794,199 772,143 1,566,34255-64 459,709 458,172 28,190 32,633 6,781 7,797 27,234 38,833 48,920 51,161 570,833 588,597 1,159,43065-74 307,453 307,209 18,529 20,077 3,504 3,891 15,817 22,511 23,618 27,145 368,920 380,833 749,75475-84 167,401 201,549 8,469 10,161 1,457 1,872 6,892 9,436 9,256 11,977 193,474 234,996 428,47085+ 30,990 60,703 1,231 2,743 312 681 809 1,204 1,306 2,610 34,647 67,940 102,587Total 3,707,089 3,631,747 398,401 396,037 76,330 79,632 322,598 375,561 1,353,493 1,190,880 5,857,911 5,673,858 11,531,769
Nev
ada
Age White Black Native American Asian Hispanic Total
Race/Ethnicity
Male Female Male Female Male Female Male Female Male Female Male Female Total<1 27,458 26,007 6,520 6,208 460 431 4,887 4,602 24,781 23,914 64,105 61,161 125,2661-4 107,307 102,279 25,250 24,080 1,980 1,865 17,564 16,840 94,513 90,565 246,614 235,628 482,2425-14 280,239 265,337 67,145 64,061 5,043 5,006 37,527 35,742 199,803 188,916 589,756 559,061 1,148,81815-24 291,838 277,671 61,788 60,350 5,490 5,410 38,005 39,447 203,502 175,238 600,623 558,117 1,158,73925-34 324,502 313,511 50,699 53,003 5,517 5,810 44,923 49,172 229,783 178,699 655,424 600,196 1,255,62035-44 390,801 355,856 58,333 55,404 5,858 5,788 43,211 52,197 158,635 126,846 656,838 596,093 1,252,93045-54 368,572 346,953 46,657 46,922 4,585 4,903 35,330 48,547 85,345 75,878 540,489 523,203 1,063,69255-64 299,314 303,494 26,037 30,917 3,149 3,465 22,565 32,046 38,251 41,127 389,316 411,050 800,36665-74 205,276 204,905 17,287 18,953 1,397 1,521 13,001 18,486 18,191 21,405 255,152 265,270 520,42275-84 111,753 132,884 7,927 9,540 538 670 5,642 7,890 6,984 9,341 132,844 160,324 293,16885+ 19,555 38,741 1,085 2,466 113 258 618 1,004 825 2,049 22,195 44,518 66,713Total 2,426,613 2,367,639 368,728 371,904 34,130 35,128 263,272 305,972 1,060,613 933,977 4,153,356 4,014,620 8,167,976
Hispanic Total
Cla
rk
Age White Black Native American Asian
Race/Ethnicity
Male Female Male Female Male Female Male Female Male Female Male Female Total<1 7,631 7,160 319 312 294 311 940 912 4,811 4,536 13,996 13,231 27,2261-4 29,622 27,622 1,262 1,224 1,132 1,100 3,446 3,262 18,011 16,843 53,473 50,051 103,5235-14 80,290 76,085 3,867 3,978 2,962 2,732 6,909 6,659 38,442 35,875 132,469 125,329 257,79815-24 88,526 85,577 3,836 3,408 3,030 2,872 8,756 8,965 40,545 32,140 144,692 132,961 277,65425-34 85,319 83,636 3,234 2,435 2,581 2,786 9,043 10,094 36,921 29,048 137,098 127,999 265,09735-44 107,663 103,269 3,221 2,474 2,896 2,772 6,798 8,582 26,526 23,370 147,103 140,467 287,57045-54 113,030 108,040 3,050 2,315 2,193 2,348 5,722 7,970 13,486 12,649 137,481 133,322 270,80355-64 80,191 76,635 1,674 1,334 1,426 1,561 3,885 5,300 5,955 5,893 93,132 90,722 183,85465-74 46,613 47,654 903 825 752 836 2,380 3,150 2,899 3,343 53,547 55,807 109,35475-84 25,155 33,337 340 458 291 392 1,028 1,171 1,246 1,619 28,060 36,977 65,03785+ 5,368 11,613 109 199 65 132 145 157 229 292 5,916 12,393 18,308Total 669,410 660,627 21,815 18961 17,620 17,841 49,051 56,221 189,070 165,607 946,966 919,258 1,866,224
Was
hoe
Age White Black Native American Asian Hispanic Total
Race/Ethnicity
Male Female Male Female Male Female Male Female Male Female Male Female Total<1 6,442 6,102 50 55 330 313 169 178 2,008 1,937 9,000 8,584 17,5841-4 26,270 25,225 233 240 1,331 1,241 671 703 7,659 7,319 36,164 34,728 70,8915-14 78,895 74,905 1,073 919 4,241 4,031 1,730 1,657 20,287 18,927 106,227 100,439 206,66615-24 78,271 73,176 1,480 967 4,712 4,399 1,580 1,559 21,276 18,361 107,319 98,462 205,78125-34 61,279 58,848 1,918 751 3,146 3,312 1,491 1,766 18,802 14,652 86,636 79,329 165,96535-44 86,703 87,137 1,189 742 3,439 4,120 1,536 2,277 15,434 13,240 108,300 107,515 215,81545-54 100,878 99,719 859 576 3,058 3,842 1,610 2,446 9,824 9,035 116,229 115,618 231,84755-64 80,204 78,043 478 381 2,206 2,771 784 1,487 4,713 4,142 88,385 86,825 175,21065-74 55,564 54,650 339 299 1,355 1,534 436 876 2,528 2,398 60,222 59,756 119,97875-84 30,493 35,328 202 163 628 810 221 375 1,026 1,017 32,570 37,694 70,26585+ 6,066 10,348 37 79 135 291 46 43 252 269 6,537 11,030 17,566Total 611,066 603,481 7,858 5,172 24,580 26,663 10,275 13,367 103,811 91,297 757,589 739,980 1,497,569
Hispanic Total
All O
ther
Cou
ntie
s Age White Black Native American Asian
Note: All Other Counties include: Carson City, Churchill, Douglas, Elko, Esmeralda, Eureka, Humboldt, Lander, Lincoln, Lyon, Mineral, Nye, Pershing, Storey and White Pine.

102
NEVADA CANCER REPORT, 2001-2005
Nevada Population Estimates by Age Groups, County and Gender, 2001-2005 Counties
Male Female Total Male Female Total Male Female Total Male Female Total Male Female Total<1 1,871 1,785 3,656 872 873 1,745 986 979 1,965 1,624 1,582 3,206 15 16 321-4 7,297 6,961 14,258 3,727 3,472 7,199 4,279 4,177 8,455 6,113 6,032 12,145 71 78 1495-14 18,498 17,749 36,247 10,467 10,170 20,636 13,366 12,510 25,876 19,084 18,147 37,232 326 248 57415-24 17,089 16,690 33,779 10,097 9,596 19,693 14,936 13,146 28,083 21,179 18,846 40,025 525 387 91125-34 15,378 14,249 29,627 7,924 7,830 15,755 11,288 10,924 22,212 17,834 15,344 33,177 394 319 71335-44 19,007 17,974 36,981 8,978 8,784 17,762 16,330 17,416 33,746 18,402 18,381 36,783 423 323 74645-54 20,024 20,228 40,252 8,867 9,069 17,935 20,587 21,179 41,766 18,031 16,451 34,482 439 417 85655-64 13,161 15,446 28,607 6,455 6,381 12,836 16,208 15,749 31,956 11,336 9,398 20,734 413 378 79165-74 8,958 10,830 19,788 4,021 4,329 8,350 11,058 10,713 21,771 5,767 4,742 10,509 313 244 55675-84 6,645 9,187 15,832 2,399 2,829 5,228 6,128 6,553 12,682 1,574 2,125 3,699 167 153 32185+ 1,492 2,662 4,154 498 907 1,405 1,133 1,528 2,662 265 856 1,122 35 46 80Total 129,420 133,760 263,180 64,303 64,240 128,543 116,299 114,875 231,174 121,210 111,904 233,114 3,121 2,609 5,730
Neva
da C
ount
ies Age Carson City Churchill Douglas Elko Esmeralda
Counties
Male Female Total Male Female Total Male Female Total Male Female Total Male Female Total<1 48 34 82 631 506 1,137 168 176 344 112 101 213 1,265 1,199 2,4641-4 172 202 374 2,583 2,336 4,919 832 800 1,631 431 352 783 4,966 4,906 9,8715-14 574 594 1,169 7,100 6,569 13,669 2,626 2,402 5,028 1,161 1,063 2,224 13,953 13,221 27,17415-24 363 377 740 6,461 5,708 12,169 2,100 1,914 4,015 1,773 1,594 3,367 13,859 12,677 26,53625-34 426 375 801 4,807 3,659 8,466 1,148 1,164 2,313 1,167 997 2,164 13,108 11,686 24,79435-44 665 595 1,260 6,729 6,317 13,046 2,171 2,218 4,390 835 936 1,771 14,931 15,400 30,33145-54 585 480 1,065 6,892 6,426 13,318 2,208 2,022 4,230 1,009 1,118 2,128 15,258 15,955 31,21355-64 462 386 848 4,644 4,062 8,706 1,775 1,512 3,288 769 1,008 1,777 12,390 12,263 24,65365-74 303 304 607 2,327 2,083 4,411 754 646 1,400 738 856 1,594 9,033 8,716 17,74975-84 132 141 273 1,209 1,108 2,317 241 347 588 534 635 1,170 4,825 5,205 10,03085+ 24 35 59 283 473 756 79 145 224 102 253 355 1,063 1,434 2,498Total 3,755 3,524 7,279 43,666 39,248 82,914 14,103 13,348 27,451 8,633 8,914 17,547 104,652 102,662 207,313
Lander Lincoln LyonEureka Humboldt
Nev
ada
Cou
ntie
s Age
Counties
Male Female Total Male Female Total Male Female Total Male Female Total Male Female Total<1 106 109 215 889 838 1,726 164 155 318 43 33 77 205 199 4041-4 453 476 929 3,612 3,374 6,987 619 593 1,212 179 108 287 830 861 1,6915-14 1,666 1,634 3,300 11,618 10,763 22,381 2,136 1,827 3,963 936 746 1,681 2,716 2,796 5,51215-24 1,687 1,346 3,032 11,099 10,281 21,380 2,390 2,553 4,943 1,131 1,015 2,147 2,630 2,331 4,96125-34 938 930 1,868 7,830 7,789 15,619 1,602 1,420 3,022 829 660 1,489 1,962 1,982 3,94335-44 1,293 1,364 2,657 12,538 12,402 24,940 2,030 1,699 3,729 1,451 1,514 2,965 2,517 2,192 4,70945-54 1,660 1,713 3,373 13,795 13,857 27,651 2,110 1,725 3,835 2,049 1,967 4,016 2,716 3,011 5,72655-64 1,535 1,551 3,086 13,976 13,306 27,282 1,275 1,452 2,727 1,833 1,558 3,391 2,154 2,374 4,52965-74 1,368 1,283 2,651 12,208 11,392 23,600 868 983 1,851 924 873 1,797 1,580 1,762 3,34175-84 900 902 1,802 5,713 6,173 11,886 481 531 1,012 428 428 856 1,194 1,375 2,56985+ 153 360 513 932 1,173 2,105 108 235 343 48 145 193 322 778 1,099Total 11,759 11,668 23,427 94,210 91,347 185,556 13,782 13,173 26,956 9,850 9,048 18,898 18,827 19,659 38,486
Nev
ada
Cou
ntie
s Age Mineral Nye Pershing Storey White Pine

103
NEVADA CANCER REPORT, 2001-2005
Appendix C: FORMULAS CRUDE RATE:
Crude Rate = 000,100×Population
EventsofNumber
AGE-SPECIFIC CRUDE RATE:
000,100×−
−groupagespecificinPopulation
groupagespecificainEventsofNumber
CRUDE RATE CONFIDENCE INTERVALS:
CI lower = ( )( )EventsEventsPopulation
×−×
96.1000,100
CI upper = ( )( )EventsEventsPopulation
×+×
96.1000,100
AGE-ADJUSTED RATE (ADR): If di = the number of events in the i-th age interval pi = the population size in the i-th age interval
mi = the age-specific crude rate in the i-th age interval = 000,100×i
i
pd
and
siP = proportion of the population in the i-th age group in the standard population (2000 U.S. population) k = Number of age groups Then,
ADR= )*(1
si
k
ii Pm∑
=

104
NEVADA CANCER REPORT, 2001-2005
AGE-ADJUSTED STANDARD ERROR (SE):
SE = ∑=
−k
isi
i
ii Pp
mm1
2)(*)000,100(*
AGE-ADJUSTED 95% CONFIDENCE INTERVALS (C.I.): 95% C.I. = (ADR-1.96 *SE, ADR+1.96*SE) OR
95% C.I.Lower = )*(1
si
k
ii Pm∑
=
-1.96* ∑=
−k
isi
i
ii Pp
mm1
2)(*)000,100(*
95% C.I.Upper = )*(1
si
k
ii Pm∑
=
+1.96* ∑=
−k
isi
i
ii Pp
mm1
2)(*)000,100(*

105
NEVADA CANCER REPORT, 2001-2005

106
NEVADA CANCER REPORT, 2001-2005
Appendix D: FEEDBACK AND SUGGESTIONS
In a continuing effort to provide an annual Cancer Report that is useful to the communities in Nevada, feedback and suggestions on the information contained in this report are welcome.
Please return the completed survey by mail, fax or email to: Alicia Chancellor Hansen, MS
Office of Health Statistics and Surveillance Bureau of Health Statistics Planning & Emergency Response
4150 Technology Way, Suite #104 Carson City, Nevada 89706
Fax: 775-684-4156 Email: [email protected]
1. How did you first obtain the report? Hard Copy Electronic Copy State Website 2. Please rate the overall value of the report: Extremely Valuable Moderate Of Little No Valuable Value Value Value 5 4 3 2 1 2. Please rate the overall IMPORTANCE of the report: Very Important Moderately Of Little Unimportant important Important Importance 5 4 3 2 1 3. Please rate the information on specific types of cancer included in this report:
Type of Cancer
All Cancers
Lung and Bronchus
Prostate
Breast
Colorectal
(PLEASE CONTINUE ON NEXT PAGE)
Type Extremely Helpful Somewhat A Little Not Not of Helpful Helpful Helpful Helpful Applicable Information 5 4 3 2 1 0

107
NEVADA CANCER REPORT, 2001-2005
Urinary Bladder
Non-Hodgkin
Skin
Kidney & Renal
Leukemia
Thyroid
Other Comments: ________________________________________________________________________________________________________________________________________________________________________________________________________________________________________________________________________________________________________________________________________________________________________________________________________________ If you would like to sign up for an email listserv that will provide updates when reports are released by the Office of Health Statistics and Surveillance, please visit: http://health.nv.gov/Health_Listservs.htm Optional: Name: __________________________________________Phone: ________________________ Business Organization or Affiliation:________________________________________________ Mailing Address:_________________________________________________________________ City: _____________________ State:___________________ Zip Code:____________________ Email Address:__________________________________________________________________