State Finance Audit Report of the Comptroller and Auditor ...
Upload
khangminh22Category
view
3download
0

Report of the
Comptroller and Auditor General of India
for the year ended 31 March 2020
Union Government (Commercial)
Report No. 12 of 2021
General Purpose Financial Reports of Central Public Sector Enterprises
(Compliance Audit)


i
Contents
Preface vii
Executive Summary ix
Chapter I Summary of financial performance of Central Public Sector Enterprises
1.1 Introduction 1
1.2 Investment in Government companies and corporations 4
1.3 Returns from the CPSEs 14
1.4 Operating efficiency of Government companies and corporations
21
Chapter II Oversight role of CAG
2.1 Audit of Public Sector Enterprises 39
2.2 Appointment of statutory auditors of Public Sector Enterprises by CAG
39
2.3 Submission of accounts by CPSEs 39
2.4 CAG’s oversight - Audit of accounts and supplementary audit
41
2.5 Result of CAG’s oversight role 42
2.6 Non-compliance with provisions of Accounting Standards/ Ind AS
69
2.7 Management Letters 72
Chapter III Disinvestment Process
3.1 Disinvestment Policy of Government of India 73
3.2 Mandate for disinvestment 74
3.3 Modes of disinvestment 74
3.4 Process of disinvestment 75
3.5 Target and achievement for disinvestment of CPSEs for last five years
76
3.6 Mode-wise realisation from disinvestment during the last five years
78
3.7 Implementation 78

Report No. 12 of 2021
ii
3.8 Other issues 93
3.9 Conclusion 95
Chapter IV Corporate Social Responsibility
4.1 Introduction 96
4.2 Audit Objective 97
4.3 Audit Scope and Coverage 97
4.4 Audit Criteria 98
4.5 Audit Findings 98
4.6 Conclusion 109
Chapter V Impact of implementation of Indian Accounting Standards in selected Non-Banking Financial Companies
5.1 Introduction 110
5.2 Implementation of Indian Accounting Standards (Ind AS) 110
5.3 Objectives of Audit 112
5.4 Scope of Audit 112
5.5 Audit Methodology 112
5.6 Adoption of Ind AS after CAG’s comment 112
5.7 Exemption on first time adoption of Ind AS 113
5.8 Impact of implementation of Ind AS on selected key areas 114
5.9 Conclusion 122
Annexures I List of Government companies/Government controlled other companies which came under/went out from the purview of CAG Audit during 2019-20
125
II A Details of accounts in arrears or company under liquidation or defunct company - Government companies and corporations
127
II B Details of accounts in arrears or company under liquidation or defunct company - Government controlled other companies
130
III List of Government companies where total assets were lower than the long term loans outstanding during 2019-20
131
IV List of Government companies and corporations which 132
Report No. 12 of 2021
iii
were added to the profit making CPSEs in 2019-20
V List of Government companies excluded from the list of profit making companies in 2019-20
133
VI List of Government companies having negative Net Worth as on 31 March 2020
134
VII Shortfall in dividend declared by Government companies 138
VIII Value of production, total assets and capital employed of Government companies and corporations
141
IX Return on capital employed of Government companies and corporations
154
X Return on Equity of Government companies and corporations
175
XI Rate of Real Return (RORR) of selected CPSEs during 2017-18 to 2019-20
216
XII Comparison of return on Central Government investment on the basis of historical value with RORR of listed CPSEs
221
XIII Listed CPSEs where Return on Equity is less than that of private companies in same sector for 3 or more years during last 5 years
223
XIV Listed CPSEs where Return on Capital Employed is less than that of private companies in same sector for 3 or more years during last 5 years
224
XV Listed CPSEs where Earnings Per Share is less than that of private companies with similar business for 3 or more years during last 5 years
225
XVI Listed CPSEs where Price Earnings Ratio is less than that of private companies with similar business for 3 or more years during last 5 years
227
XVII Listed CPSEs where Interest Coverage Ratio is less than that of private companies in same sector for 3 or more years during last 5 years
229
XVIII List of CPSEs which amended their financial statements 231
XIX List of CPSEs where Auditors’ Report revised 232

Report No. 12 of 2021
iv
XX List of CPSEs where comments were issued by CAG 234
XXI Details of CPSEs where there were non-compliance with Accounting Standards as reported by the Statutory Auditors
236
XXII List of CPSEs where Management Letters were issued by CAG
237
XXIII Explanatory note bringing out need for justification of assumptions adopted in valuation of Kamarajar Port Limited
243
XXIV Details of estimated valuation done on the basis of market inquiries 247
XXV CPSEs eligible for listing as per the revised criteria laid down by CCEA 248
XXVI List of 95 reviewed CPSEs 255
XXVII List of 154 CPSEs and 102 CPSEs considered for selection of CPSEs for review
258
XXVIII A Analysis of fund allocation, actual vis-a-vis required 2% expenditure and excess/shortfall in expenditure
265
XXVIII B Category wise analysis of fund allocation, actual vis-a-vis required 2% expenditure and excess/shortfall in expenditure
268
XXIX Details of adding back of CSR expenditure by CPSEs 271
XXX Sector wise CSR expenditure 273
XXXI CSR expenditure by Ratna companies 279
XXXII CSR expenditure on common theme 280
XXXIII Baseline Survey by CPSEs 284
XXXIV Manner of implementation of CSR activities 287
XXXV A Status of defining local area by CPSEs for CSR expenditure
292
XXXV B Details of CSR expenditure by CPSEs in local area 295
XXXVI Monitoring framework status 297
XXXVII List of Ind AS applicable 300
XXXVIII List of selected 19 non-banking financial companies 302

Report No. 12 of 2021
v
(NBFCs)
XXXIX Impact on PAT in respect of NBFCs selected 304
XL Impact on revenue in respect of NBFCs selected 305
XLI Impact on assets in respect of NBFCs selected 306
XLII Impact on net worth in respect of NBFCs selected 307


Report No. 12 of 2021
vii
PREFACE The accounts of Government Companies are audited by the Comptroller and Auditor General of India (CAG) under the provisions of Section 143(5) to 143(7) of the Companies Act, 2013. The Statutory Auditors (Chartered Accountants) appointed by the CAG certify the accounts of such companies which are subject to supplementary audit by the CAG. The CAG gives comments on or supplements the report of the Statutory Auditors. The Companies Act, 2013 empowers the CAG to issue directions to the Statutory Auditors on the manner in which the Company's accounts shall be audited.
2. The CAG is the sole auditor in respect of five Corporations, namely Airports Authority of India, National Highways Authority of India, Inland Waterways Authority of India, Food Corporation of India and Damodar Valley Corporation. The CAG has the right to conduct a supplementary audit in respect of Central Warehousing Corporation after Chartered Accountants appointed under the statutes have conducted their audit.
3. Audit Reports on the accounts of a Government Company or Corporation for the year ended 31 March 2020 have been prepared for submission to the Government under Section 19A of the Comptroller and Auditor General's (Duties, Powers and Conditions of Service) Act, 1971.
4. The accounts of the Central Public Sector Enterprises (CPSEs) reviewed in this Report cover the accounts for the years 2017-18, 2018-19 and 2019-20 (to the extent received). In respect of CPSEs where any particular year’s accounts were not received before 31 December 2020, the figures from the accounts last audited have been adopted.
5. In respect of some CPSEs, figures for the previous year might not agree with the corresponding figures shown in the Audit Report No.7 of 2020 owing to replacement of provisional figures by audited/revised figures.
6. All references to ‘Government Companies/Corporations' in this Report may be construed to refer to ‘Central Government Companies/ Corporations’ unless the context suggests otherwise.

Report No. 12 of 2021
ix
Executive Summary
I. Summary of financial performance of Central Public Sector Enterprises
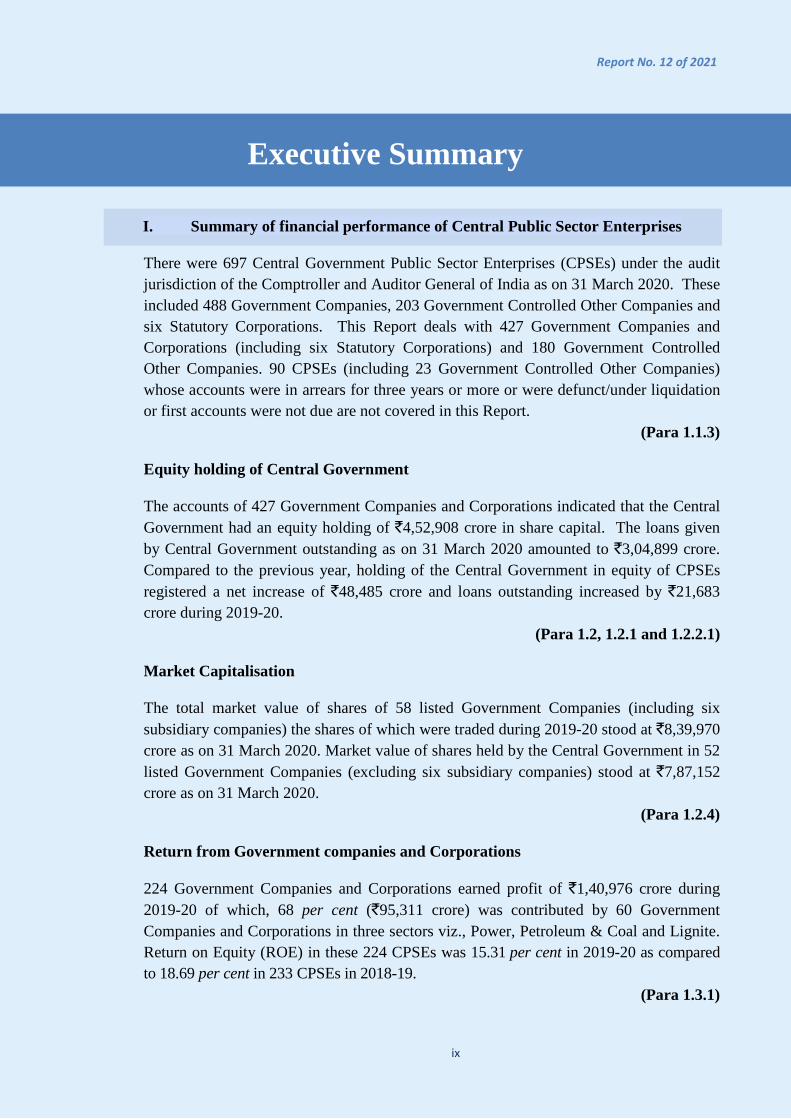
There were 697 Central Government Public Sector Enterprises (CPSEs) under the audit jurisdiction of the Comptroller and Auditor General of India as on 31 March 2020. These included 488 Government Companies, 203 Government Controlled Other Companies and six Statutory Corporations. This Report deals with 427 Government Companies and Corporations (including six Statutory Corporations) and 180 Government Controlled Other Companies. 90 CPSEs (including 23 Government Controlled Other Companies) whose accounts were in arrears for three years or more or were defunct/under liquidation or first accounts were not due are not covered in this Report.
(Para 1.1.3)
Equity holding of Central Government
The accounts of 427 Government Companies and Corporations indicated that the Central Government had an equity holding of `4,52,908 crore in share capital. The loans given by Central Government outstanding as on 31 March 2020 amounted to `3,04,899 crore. Compared to the previous year, holding of the Central Government in equity of CPSEs registered a net increase of `48,485 crore and loans outstanding increased by `21,683 crore during 2019-20.
(Para 1.2, 1.2.1 and 1.2.2.1)
Market Capitalisation
The total market value of shares of 58 listed Government Companies (including six subsidiary companies) the shares of which were traded during 2019-20 stood at `8,39,970 crore as on 31 March 2020. Market value of shares held by the Central Government in 52 listed Government Companies (excluding six subsidiary companies) stood at `7,87,152 crore as on 31 March 2020.
(Para 1.2.4)
Return from Government companies and Corporations
224 Government Companies and Corporations earned profit of `1,40,976 crore during 2019-20 of which, 68 per cent (`95,311 crore) was contributed by 60 Government Companies and Corporations in three sectors viz., Power, Petroleum & Coal and Lignite. Return on Equity (ROE) in these 224 CPSEs was 15.31 per cent in 2019-20 as compared to 18.69 per cent in 233 CPSEs in 2018-19.
(Para 1.3.1)
Report No. 12 of 2021
x
99 Government Companies and Corporations declared a dividend of `73,487 crore during the year 2019-20. Out of this, the dividend received/receivable by Central Government amounted to `34,944 crore which represented 7.72 per cent return on the total investment by the Central Government (`4,52,908 crore) in all Government Companies and Corporations.
13 Government Companies under the Ministry of Petroleum and Natural Gas contributed `26,349 crore representing 35.86 per cent of the total dividend declared by all Government Companies and Corporations. Non-compliance with directive of Government of India on declaration of dividend by 49 CPSEs resulted in a shortfall of `11,488 crore in the payment of dividend for the year 2019-20.
(Para 1.3.4)
There were 181 CPSEs that incurred losses during the year 2019-20. The losses incurred by these companies during the year 2019-20 amounted to `68,434 crore compared to `40,835 crore in 2018-19.
(Para 1.3.2)
Net Worth/Accumulated Loss
There were 188 Government Companies and Corporations with accumulated losses of `1,74,596 crore as on 31 March 2020. Of these, the net worth of 90 companies had been completely eroded by their accumulated losses. As a result, the aggregate net worth of these companies had become negative to the extent of `1,15,829 crore as on 31 March 2020. Only 13 out of these 90 companies earned profit of `1,713 crore during the year 2019-20.
(Para 1.3.3)
Rate of Real Return (RORR) on Government Investment
Out of 607 CPSEs covered in this report, the Central Government has direct investment in 193 CPSEs. RORR in respect of 136 CPSEs (54 listed CPSEs and 82 unlisted CPSEs) has been computed since 2000-01 to compare the same with the conventional rate of return on historical cost. RORR was 11.68 per cent in comparison to conventional rate of return on historical cost of 32.82 per cent in 2019-20. RORR has shown an increasing trend till 2006-07 after which it started to decline and ranged between 12 per cent to 28 per cent during the preceding five years from 2015-16 to 2019-20.
The company-wise analysis of RORR for the preceding three years revealed that while listed companies have given RORR between 34 per cent and 53 per cent during the preceding three years, unlisted CPSEs have given negative returns ranging between three per cent and seven per cent during the same period.
(Para 1.4.4)

Report No. 12 of 2021
xi
Return on Investment (ROI) of Listed CPSEs
ROI (Annual Average Rate) and ROI (Compounded Annual Growth Rate) of 54 listed CPSEs have been computed since 2000-01 to assess the benefit obtained from the investment done by the Central Government in these CPSEs. The consolidated ROI (Average Annual Rate) of these 54 CPSEs was 178.21 per cent during 2017-18, it reduced to 156.06 per cent in 2018-19 and 119.64 per cent in 2019-20. Similarly, ROI (CAGR) reduced from 21.46 per cent in 2017-18 to 19.74 per cent in 2018-19 and 17.45 per cent in 2019-20. Consolidated ROI (Annual Average Rate) indicated a continuous declining trend since 2007-08 from 476 per cent to 120 per cent in 2019-20.
(Para 1.4.5)
Performance of listed CPSEs with private companies
The performance of 36 listed CPSEs was compared with private companies with similar nature of business during the last five years on the five parameters (ROE, ROCE, EPS, P/E ratio and ICR). It was observed that out of total 36 CPSEs, ROE, ROCE, EPS, P/E ratio and ICR was on the lower side in 16, 17, 29, 28 and 17 CPSEs respectively in comparison to private companies in same sector.
(Para 1.4.6)
II. Oversight Role of CAG
Out of 691 CPSEs (excluding six statutory corporations) under the audit jurisdiction of CAG, Financial Statements for the year 2019-2020 were received from 573 CPSEs by 31 December 2020. While Financial Statements were not due from 35 CPSEs, Financial Statements of 83 CPSEs were in arrear due to different reasons.
(Para 2.3.2) Out of 573 CPSEs from which the Financial Statements were received by 31 December 2020, supplementary audit was undertaken in 334 CPSEs.
(Para 2.5.1)
Five CPSEs amended their Financial Statements and statutory auditors of 52 CPSEs revised their Audit Report before laying of the Financial Statements in Annual General Meeting. In addition, various comments highlighting inaccuracies in the Financial Statements were also issued.
(Para 2.5.1.1 and Para 2.5.1.2)
Report No. 12 of 2021
xii
The financial impact of significant comments, issued on the financial statements of the selected CPSEs, on profitability and assets/liabilities was `4,185.75 crore and `15,376.62 crore, respectively. A few Companies viz. IFCI Limited, ITI Limited, Mahanagar Telephone Nigam Limited, Tungabhadra Steel Products Limited, IRCON Davangere Haveri Highway Limited and Star Union Daiichi Life Insurance Company Limited did not take corrective action on the comments issued on financial statements in the past.
(Para 2.5.1.3) Deviations from the provisions of Accounting Standards/Ind AS in preparation of the Financial Statements were noticed in seven CPSEs by the Statutory Auditors. CAG also pointed out such deviations in 21 CPSEs.
(Para 2.6) Irregularities and deficiencies in the financial reports or in the reporting process observed during supplementary audit which were not material, were communicated to the Management of 194 CPSEs through ‘Management Letter’ for taking corrective action.
(Para 2.7)
III. Disinvestment Process
The Department of Investment and Public Asset Management (DIPAM) realised an amount of `50,299 crore during the year 2019-20 through 15 transactions of disinvestment. During the audit, following issues were noticed:
(i) As against the Revised Estimates of `65,000 crore for disinvestment proceeds
during the year 2019-20, the actual achievement was only `50,299 crore, thus registering a shortfall of 23 per cent.
(Para 3.5)
(ii) As part of strategic disinvestment, GoI sold (March 2020) its entire 66.67 per cent equity in Kamarajar Port Limited (KPL) to Chennai Port Trust (ChPT) for `2,383 crore. Due to poor financial condition, ChPT had to raise a loan of `1,775 crore at a rate of interest of eight per cent per annum for purchasing the GoI’s stake in KPL. In addition to principal repayment, it put an additional interest burden of approximately `142 crore (per annum) on the ChPT. Thus, the proceeds realised by GoI from disinvestment of KPL was substantially borrowed from the market by ChPT, which defeated the spirit of disinvestment.
{Para 3.7.2.3(a)}
(iii) While carrying out the valuation of Kamarajar Port Limited, the Transaction Advisor considered 20 per cent company specific discount/ additional risk premium under different valuation methods. Similarly, private land held by THDC India

Report No. 12 of 2021
xiii
Limited at and around Dehradun was discounted at 40 per cent over market price. Audit is of the view that given the significant impact such assumptions have on the reserve price, justification and underlying reasoning should have been clearly documented.
{Para 3.7.2.3(b)}
(iv) The Cabinet approved (November 2018) the mechanism and procedure for sale of the enemy shares held under the custody of Custodian of Enemy Property for India. The sale proceeds of such enemy shares were to be deposited as disinvestment proceeds in the Government account. An amount of `1,881 crore was realized from sale of enemy shares during the year 2019-20. However, the share certificates of enemy shares in 45 listed companies and 145 unlisted companies were not available with the Custodian and duplicate share certificates were yet to be issued. Further, the unlisted shares in the physical form were yet to be dematerialised for their disposal.
(Para 3.7.4)
(v) As per the revised criteria approved by CCEA (December 2018) for listing of CPSEs in stock exchange viz. ‘positive net worth, no accumulated losses and net profit in any one of the immediately three preceding financial years’, the number of eligible CPSEs for listing was 133. In the financial year 2019-20, however, only two CPSEs were brought to market for listing, which shows slow progress in listing of CPSEs.
(Para 3.8.1)
IV. Corporate Social Responsibility
The review covered 95 CPSEs (10 Maharatna, 11 Navratna, 47 Miniratna and 27 other companies) under the administrative control of various Ministries/Departments for a period of one year ended 31 March 2020. The following observations were made:
(i) All CPSEs were having minimum three Directors in the CSR committee in accordance with Section 135(1) of the Companies Act, 2013 except for Cotton Corporation of India Limited.
(Para 4.5.1.1) (ii) Out of 95 CPSEs reviewed, 29 CPSEs allocated more than the minimum two per
cent of average net profit of three immediate preceding financial years in pursuance of its CSR Policy and 60 CPSEs allocated the required minimum two per cent. While three CPSEs allocated less than two per cent, three CPSEs did not allocate funds on account of negative net profit under section 198 of Companies Act, 2013.
(Para 4.5.2.1)

Report No. 12 of 2021
xiv
(iii) Out of 95 CPSEs reviewed, 67 CPSEs incurred more than the required minimum two per cent, 10 CPSEs incurred the prescribed minimum two per cent and 18 CPSEs less than the minimum two per cent on CSR.
(Para 4.5.2.2) (iv) In terms of CSR expenditure in the States, the highest CSR expenditure was in
Odisha with `702.06 crore during 2019-20. It got the highest CSR funding successively for the third year since 2017-18. This amount of `702.06 crore was contributed by 37 CPSEs, of which nine Oil and Gas CPSEs alone contributed `350.75 crore during the year. Daman & Diu, Andaman & Nicobar, Chandigarh, Manipur, Nagaland and Mizoram were among the States which received least attention during the past three years.
(Para 4.5.2.5) (v) Overhead expenditure exceeded the limit of five per cent in respect of three CPSEs,
viz., NMDC Foundation, National Minorities Development and Finance Corporation and Mineral Exploration Corporation Limited.
(Para 4.5.2.7) (vi) Out of 95 CPSEs, 29 CPSEs incurred CSR expenditure less than the target of 60 per
cent, 53 CPSEs achieved the prescribed target while eight CPSEs did not incur any expenditure. Data for the remaining five CPSEs was not available. Similarly, data in respect of CSR expenditure on common theme at aspirational districts was available for 85 CPSEs, of which 34 CPSEs incurred less than 25 per cent in the aspirational districts, 32 CPSEs incurred in excess of 25 per cent and 19 CPSEs did not incur any expenditure in aspirational districts.
(Para 4.5.2.8)
V. Impact of Implementation of Indian Accounting Standards in selected Non-Banking Financial Companies
Ministry of Corporate Affairs, Government of India notified (16 February 2015) Indian Accounting Standards (Ind AS), converging the hitherto applicable Indian Generally Accepted Accounting Principles (IGAAP) with global standards, namely, International Financial Reporting Standards (IFRS). The Ind AS are mandatorily to be adopted by prescribed class of Companies w.e.f. 1 April 2016 in a phased manner and as per the roadmap laid down for implementation of Ind AS, Non-Banking Financial Companies (NBFCs) came in the third and last phase of implementation, w.e.f. 1 April 2018. Out of 35 NBFCs which have adopted Ind AS, an audit sample of 19 NBFCs was selected across different sectors based on net worth, profit after tax and turnover duly considering sector representation.
(Para 5.1, 5.2 and 5.4) One of the NBFCs in the audit sample, SBI Pension Fund (P) Limited did not adopt Ind AS in the preparation of financial statements for 2018-19, though it was required to do so w.e.f. 01.04.2018 as per the implementation roadmap. However, after CAG’s comment
Report No. 12 of 2021
xv
was issued (8 July 2019) at the time of certification of accounts pointing out the omission, Board of Directors decided to revise the financial statements as per Ind AS and the NBFC thereafter prepared the accounts as per Ind AS.
(Para 5.6) Audit analysis of selected 19 NBFCs indicated that adoption of Ind AS by the NBFCs impacted profit after tax, revenue, total assets and net worth of the selected NBFCs, in the following manner:
(i) Profit after tax (PAT) increased in seven NBFCs and decreased in 10 NBFCs. There was no impact on PAT in respect of two NBFCs. Cumulatively, the net impact on PAT in the 19 NBFCs was decrease in PAT by `201.62 crore.
(Para 5.8.1) (ii) Revenue increased in ten NBFCs and decreased in six NBFCs. There was no
change in the revenue of three NBFCs. Cumulatively, the net impact on revenue in the 19 NBFCs was an increase in revenue by `672.9 crore.
(Para 5.8.2) (iii) In respect of total assets, eight NBFCs recorded increase in assets and nine NBFCs
recorded decrease in assets. There was no change in the assets of two NBFCs. Cumulatively, the net impact on total assets in the 19 NBFCs was a decrease in total assets by `6252.04 crore.
(Para 5.8.3) (iv) Net worth of eight NBFCs increased and nine NBFCs decreased. There was no
change in net worth in the case of two NBFCs. Cumulatively, the net impact on net worth in the 19 NBFCs was a decrease in net worth by `7921.73 crore.
(Para 5.8.4) Hence the impact due to adoption of Ind AS was noticed across the financial statements of all the selected NBFCs. Major changes carried out pertained to fair valuation of financial instruments, accounting of deferred tax, application of Expected Credit Loss method and accounting of employee benefits through valuation of liabilities towards post-employment benefits.
(Para 5.8) Adoption of Ind AS also impacted key operating and financial ratios which provide insight into a company's liquidity, operational efficiency and profitability.
(Para 5.8.6.1)
Recommendations
1. In order to validate the assumptions/ judgements made in the valuation process in strategic disinvestments, and to draw requisite assurance that the same were reasonable, the underlying justification and reasoning may be clearly articulated
Report No. 12 of 2021
xvi
and consistently documented as they have a significant impact on the reserve price and valuation of assets.
(Para 3.7.2.4)
2. The mechanism of Independent External Monitor needs to function as per its terms of reference so that it can serve its intended purpose of overseeing the transaction process of strategic disinvestments as they are being undertaken, and vet the valuation of the CPSEs/ units, on a concurrent basis.
(Para 3.7.2.5)
3. Steps may be taken expeditiously to finalise the process of issue of duplicate shares and dematerialisation of shares, towards monetisation of enemy shares within a specified timeframe.
(Para 3.7.4)
4. Ministry of Corporate Affairs may issue clarification to CPSEs for following uniform practice in calculating the net profit under Section 198 of the Companies Act, 2013 for determining the quantum of CSR allocation.
{Para 4.5.2.1(a)}
5. Ministry of Corporate Affairs may issue directives to CPSEs for following a uniform practice regarding inclusion of salary in the administrative overheads as prescribed in Rule 4(6) of Companies (CSR Policy) Rules, 2014.
(Para 4.5.2.7)

Report No. 12 of 2021
1
Summary of Financial Performance of Central Public Sector Enterprises
CHAPTER I
1.1 Introduction
This Report presents the summary of financial performance of Government companies, Statutory Corporations and Government controlled other companies. In the Report, the term Central Public Sector Enterprises (CPSEs) encompasses those Government companies in which the direct holding of the Central Government is 50 per cent or more and subsidiary of such Government companies. The Statutory Corporations set up under statutes enacted by the Parliament and other companies owned or controlled, directly or indirectly by the Central Government have also been categorized as CPSEs.
A Government company is defined in Section 2(45) of the Companies Act, 2013 as a company in which not less than 51 per cent of the paid-up share capital is held by Central Government, or by any State Government or Governments, or partly by the Central Government and partly by one or more State Governments, and includes a company which is a subsidiary of a Government company.
Besides, any other company1 owned or controlled, directly or indirectly, by the Central Government, or by any State Government or Governments, or partly by the Central Government and partly by one or more State Governments are referred to in this Report as Government controlled other companies.
1Companies (Removal of Difficulties) Seventh Order, 2014 issued by Ministry of Corporate Affairs vide Gazette Notification dated 4 September 2014.
Government Company Any company in which not less than 51 per cent of paid-up share capital is held by Central Government or by one or more State Governments or partly by Central Government and partly by State Government(s) and includes subsidiary of a Government company.
Department of Public Enterprises (DPE) stated (August 2021) in its Public Enterprises Survey 2019-20 that CPSEs meant those Government companies, besides Statutory Corporations, wherein more than 50 per cent of the share in equity is held by the Central Government. The subsidiaries of these companies, if registered in India, are also categorized as CPSEs. It does not cover departmentally run public enterprises, banking institutions and insurance companies. In view of difference in definition adopted by the
Report No. 12 of 2021
2
Comptroller & Auditor General of India (CAG) and DPE, there may be difference in number of companies considered as CPSEs by CAG and by DPE.
1.1.1 Mandate
Audit of Government companies and Government controlled other companies is conducted by the CAG under the provisions of Section 143(5) to 143(7) of the Companies Act, 2013 read with Section 19 of the CAG’s (Duties, Powers and Conditions of Service) Act, 1971 and the Regulations made thereunder. Under the Companies Act, 2013, the CAG appoints the Chartered Accountants as Statutory Auditors for Government companies and Government controlled other companies and gives directions on the manner in which the accounts of such companies are to be audited. In addition, CAG has the right to conduct a supplementary audit. The statutes governing some Statutory Corporations require their accounts to be audited only by the CAG.
The Acts governing Reserve Bank of India, Export-Import Bank of India, National Bank for Agricultural and Rural Development and National Housing Bank contain provisions whereby the Central Government can appoint the CAG, at any time, as the auditor to examine and report upon the accounts of these institutions. No such appointment was made till 2019-20.
1.1.2 What this Report contains
This Report gives an overall picture of the financial performance of the CPSEs as revealed from their accounts.
Impact on revision of accounts as well as significant comments issued as a result of supplementary audit of the financial statements of the CPSEs conducted by the CAG for the year 2019-20 (or of earlier years which were finalised during the current year) is given in this Report. This Report also contains the impact on comments issued by the CAG on the financial statements of the Statutory Corporations where CAG is the sole auditor.
This Report also gives an overall picture of the status of the adherence of CPSEs to the provisions of the Companies Act, 2013 and guidelines issued by DPE on Corporate Social Responsibility, disinvestment in CPSEs and implementation of Indian Accounting Standards (Ind AS) by non-banking financial companies.
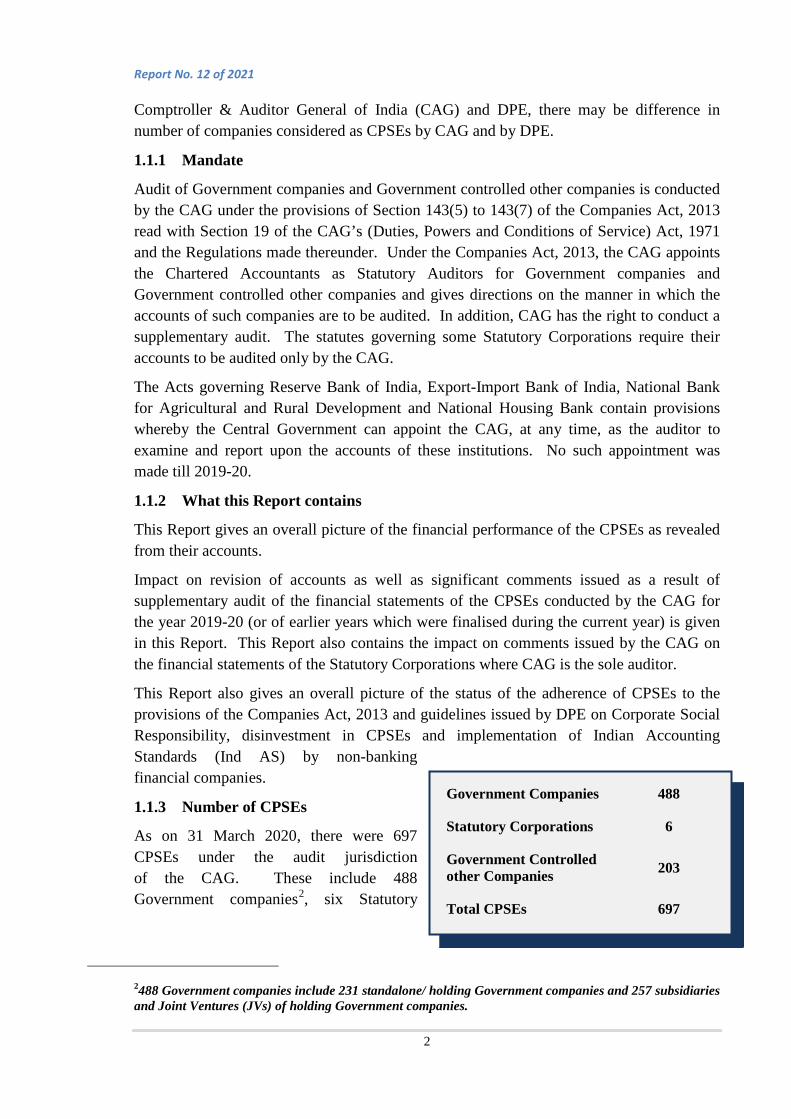
1.1.3 Number of CPSEs
As on 31 March 2020, there were 697 CPSEs under the audit jurisdiction of the CAG. These include 488 Government companies2, six Statutory
2488 Government companies include 231 standalone/ holding Government companies and 257 subsidiaries and Joint Ventures (JVs) of holding Government companies.
Government Companies 488
Statutory Corporations 6
Government Controlled other Companies 203
Total CPSEs 697

Report No. 12 of 2021
3
Corporations3 and 203 Government controlled other companies. Of these, summary of financial performance of 607 CPSEs is covered in this report and the nature of these CPSEs is indicated in Table1.1.
Table 1.1: Coverage and nature of CPSEs covered in this report
Nature of the CPSEs Total number of CPSEs
Number of CPSEs covered in the Report Number of CPSEs not covered in the Report
Accounts up to Total
2019-20 2018-19 2017-18
Government Companies 488 400 17 4 421* 67
Statutory Corporations 6 5 1 0 6 0
Total Companies/ Corporations (A) 494 405 18 4 427 67
Government Controlled other Companies (B)
203 174 5 1 180 23
Total (A+B) 697 579 23 5 607 90
*Out of 421 Government companies, Central Government has direct holding in 193 CPSEs. The remaining 228 CPSEs are subsidiaries and Joint Ventures (JVs) of these 193 CPSEs.
The details of Government companies/ Government controlled other companies which came under/ went out from the purview of CAG’s Audit during 2019-20 are given in Annexure-I.
This Report does not include 90 CPSEs (including 23 Government controlled other companies) whose accounts were in arrears for three years or more or were defunct/ under liquidation or first accounts were not due. These CPSEs are identified by two asterisks (**) in Annexure-II A & Annexure-II B.
3Airports Authority of India (AAI), Central Warehousing Corporation (CWC), Damodar Valley Corporation (DVC), Food Corporation of India (FCI), Inland Waterways Authority of India (IWAI), National Highways Authority of India (NHAI).

Report No. 12 of 2021
4
Summary of financial performance of Government companies and Statutory Corporations covered in this Report
Number of CPSEs 494
CPSEs covered 427
Paid up capital (427 CPSEs) ` 6,33,159 crore
Long term loans (427 CPSEs) ` 22,66,674 crore
Market capitalisation ` 8,39,970 crore
(58 listed traded Government Companies)
Net profit (224 CPSEs) ` 1,40,976 crore
Net loss (181 CPSEs) ` 68,434 crore
Zero profit/ loss (22 CPSEs)4
Dividend declared (99 CPSEs) ` 73,487 crore
Total assets (427 CPSEs) ` 56,83,065 crore
Value of production (427 CPSEs) ` 22,14,077 crore
Net worth (427 CPSEs) ` 16,36,946 crore
1.2 Investment in Government companies and corporations
The amount of equity and loans in 427 Government companies and corporations5 as at the end of 31 March 2020 is given in Table 1.2.
4Out of 427, there were 22 CPSEs, which earned no profit or incurred no loss during 2019-20 since either operations were not started or losses/ net expenses were adjusted with project cost. The loss of National Highways Authority of India was transferred to its fixed assets as net establishment expenses and loss of Inland Waterways Authority of India was adjusted with its IWAI Fund. Hence, these two Statutory Corporations have also been considered as zero profit/ loss CPSEs. 5494 CPSEs – 67 CPSEs whose accounts were in arrears for three years or more or were defunct/ under liquidation or first accounts were not due.

Report No. 12 of 2021
5
Table 1.2: Equity and loans in Government companies and corporations (` in crore)
Sources of investment
As on 31.03.2020 As on 31.03.2019
Equity Long term loans
Total Equity Long term loans
Total6
1. Central Government 4,52,908 3,04,899 7,57,807 4,04,423 2,83,216 6,87,639
2. Central Government Companies/ Corporations
84,055 51,866 1,35,921 65,911 46,000 1,11,911
3. State Governments/ State Government Companies/ Corporations
32,596 23,039 55,635 29,761 19,647 49,408
4. Financial Institutions and Others
63,600 18,86,870 19,50,470 48,323 14,57,427 15,05,750
Total 6,33,159 22,66,674 28,99,833 5,48,418 18,06,290 23,54,708
Percentage of investment of Central Government to total investment
71.53 13.45 26.13 73.74 15.68 29.20
Source: Audited accounts of CPSEs for the years 2018-19 and 2019-20
It was observed that the overall investment in the Government companies and corporations increased by `5,45,125 crore (23.15 per cent) during 2019-20 as compared to 2018-19, which included increase of `84,741 crore in equity and increase of `4,60,384 crore in long term loans.
1.2.1 Equity holding
During 2019-20, the total equity holding at face value in the 427 CPSEs covered in this Report registered a net increase of `84,741 crore. The equity holding of Central Government at face value in CPSEs has increased by `48,485 crore7 during 2019-20. Increase of `48,485 crore was the net result of issue of shares having face value of `53,739 crore in 37 CPSEs and disinvestment and buy back of shares having face value of `5,254 crore in 24 CPSEs8.
6 In respect of some CPSEs, previous year provisional figures have been updated with the accounts received. 7The provisional figures of 18 CPSEs have been included in this Audit Report on the basis of figures from their last audited accounts as the accounts for the year 2019-20 were not received before the cut-off date (31December 2020) for preparation of the Report. 8Capital reduced in NEPA Limited due to the Board for Industrial and Financial Reconstruction (BIFR) decisions.
Report No. 12 of 2021
6
Out of the new equity holding of `53,739 crore by Central Government during the year 2019-20, equity holding of `52,192 crore was in the form of equity in 33 CPSEs leading to cash inflow to the concerned CPSEs and `1,547 crore was in the form of issue of bonus shares in two CPSEs9. There was also transfer of assets into equity in two CPSEs10 not involving cash inflow to the concerned CPSEs. Review in Audit of the purpose of new equity holding of `52,192 crore involving cash flow in CPSEs indicated that cash infusion of `45,810 crore was for meeting capital items of expenditure in 25 CPSEs, `5,600 crore was for meeting both capital and revenue expenditure in two CPSEs11 and `782 crore was for meeting revenue items of expenditure in six CPSEs12.
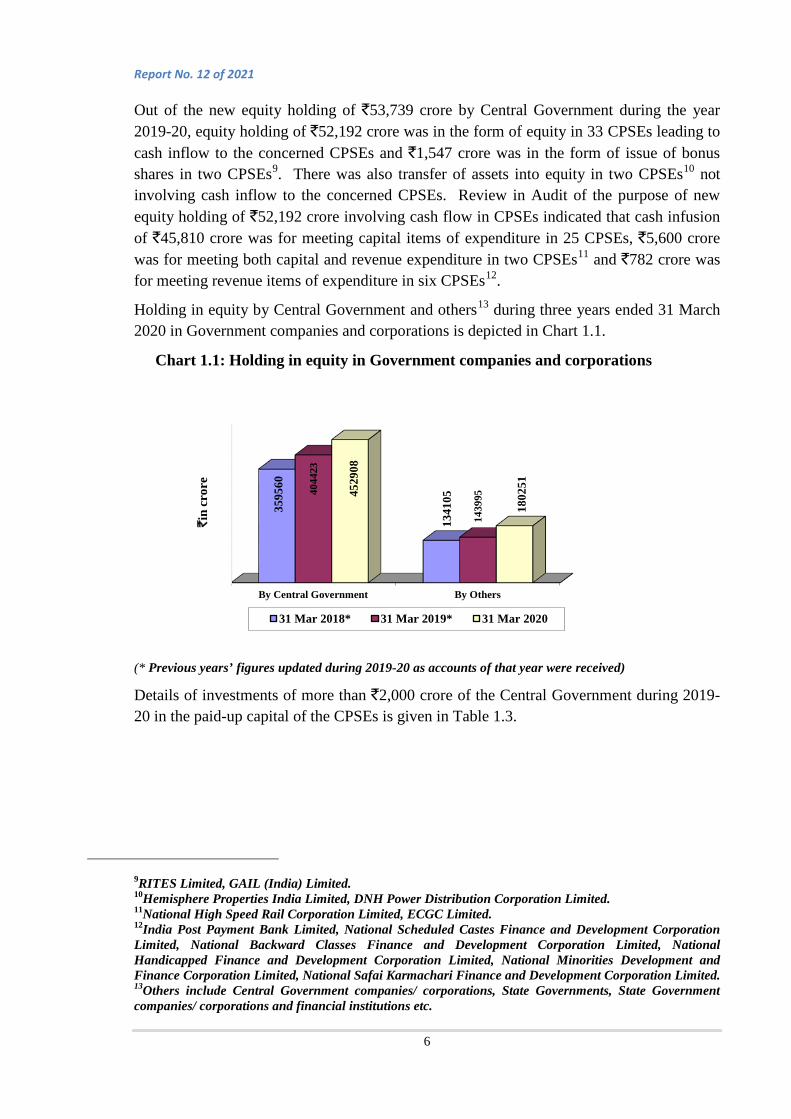
Holding in equity by Central Government and others13 during three years ended 31 March 2020 in Government companies and corporations is depicted in Chart 1.1.
Chart 1.1: Holding in equity in Government companies and corporations
(* Previous years’ figures updated during 2019-20 as accounts of that year were received)
Details of investments of more than `2,000 crore of the Central Government during 2019-20 in the paid-up capital of the CPSEs is given in Table 1.3.
9RITES Limited, GAIL (India) Limited. 10Hemisphere Properties India Limited, DNH Power Distribution Corporation Limited. 11National High Speed Rail Corporation Limited, ECGC Limited. 12India Post Payment Bank Limited, National Scheduled Castes Finance and Development Corporation Limited, National Backward Classes Finance and Development Corporation Limited, National Handicapped Finance and Development Corporation Limited, National Minorities Development and Finance Corporation Limited, National Safai Karmachari Finance and Development Corporation Limited. 13Others include Central Government companies/ corporations, State Governments, State Government companies/ corporations and financial institutions etc.
By Central Government By Others
3595
60
1341
05 40
4423
1439
95 4529
08
1802
51
`in
cror
e
31 Mar 2018* 31 Mar 2019* 31 Mar 2020
Report No. 12 of 2021
7
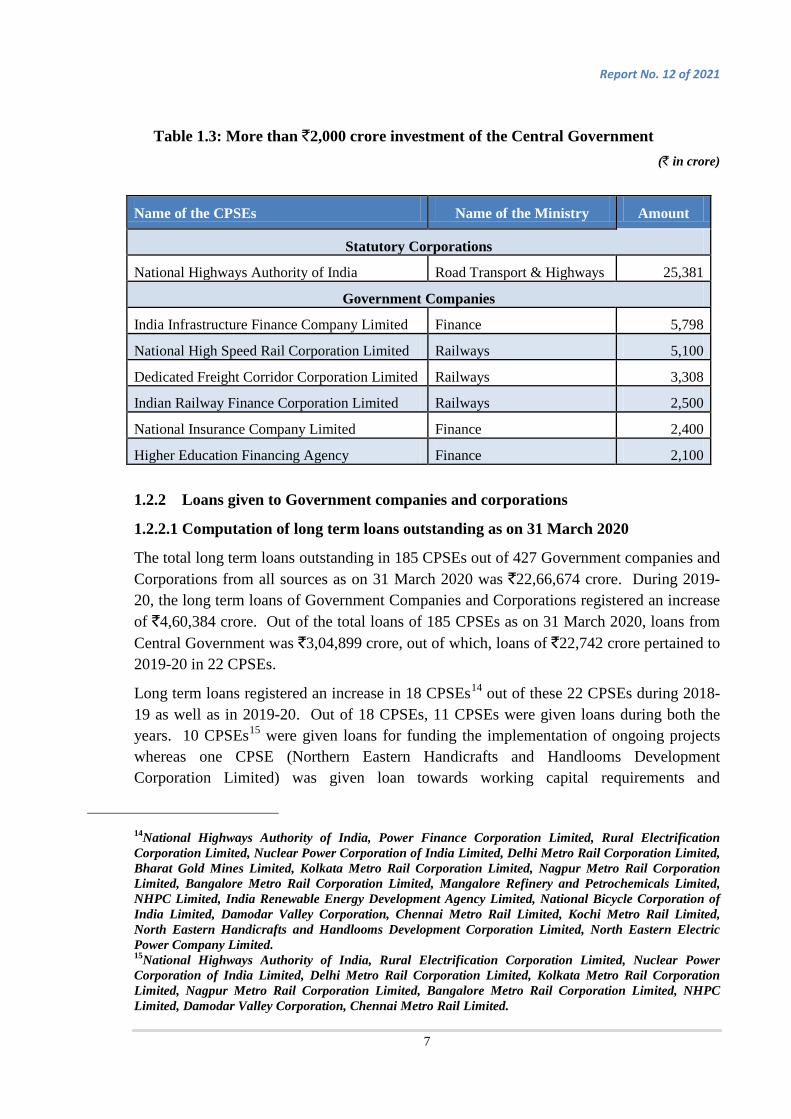
Table 1.3: More than `2,000 crore investment of the Central Government
(` in crore)
1.2.2 Loans given to Government companies and corporations
1.2.2.1 Computation of long term loans outstanding as on 31 March 2020
The total long term loans outstanding in 185 CPSEs out of 427 Government companies and Corporations from all sources as on 31 March 2020 was `22,66,674 crore. During 2019-20, the long term loans of Government Companies and Corporations registered an increase of `4,60,384 crore. Out of the total loans of 185 CPSEs as on 31 March 2020, loans from Central Government was `3,04,899 crore, out of which, loans of `22,742 crore pertained to 2019-20 in 22 CPSEs.
Long term loans registered an increase in 18 CPSEs14 out of these 22 CPSEs during 2018-19 as well as in 2019-20. Out of 18 CPSEs, 11 CPSEs were given loans during both the years. 10 CPSEs15 were given loans for funding the implementation of ongoing projects whereas one CPSE (Northern Eastern Handicrafts and Handlooms Development Corporation Limited) was given loan towards working capital requirements and
14National Highways Authority of India, Power Finance Corporation Limited, Rural Electrification Corporation Limited, Nuclear Power Corporation of India Limited, Delhi Metro Rail Corporation Limited, Bharat Gold Mines Limited, Kolkata Metro Rail Corporation Limited, Nagpur Metro Rail Corporation Limited, Bangalore Metro Rail Corporation Limited, Mangalore Refinery and Petrochemicals Limited, NHPC Limited, India Renewable Energy Development Agency Limited, National Bicycle Corporation of India Limited, Damodar Valley Corporation, Chennai Metro Rail Limited, Kochi Metro Rail Limited, North Eastern Handicrafts and Handlooms Development Corporation Limited, North Eastern Electric Power Company Limited. 15National Highways Authority of India, Rural Electrification Corporation Limited, Nuclear Power Corporation of India Limited, Delhi Metro Rail Corporation Limited, Kolkata Metro Rail Corporation Limited, Nagpur Metro Rail Corporation Limited, Bangalore Metro Rail Corporation Limited, NHPC Limited, Damodar Valley Corporation, Chennai Metro Rail Limited.
Name of the CPSEs Name of the Ministry Amount
Statutory Corporations
National Highways Authority of India Road Transport & Highways 25,381
Government Companies
India Infrastructure Finance Company Limited Finance 5,798
National High Speed Rail Corporation Limited Railways 5,100
Dedicated Freight Corridor Corporation Limited Railways 3,308
Indian Railway Finance Corporation Limited Railways 2,500
National Insurance Company Limited Finance 2,400
Higher Education Financing Agency Finance 2,100

Report No. 12 of 2021
8
administrative expenses. In case of remaining seven CPSEs, the increase in long term loans was not on account of the actual disbursement of loan but was due to the interest on earlier loans.
Audit noticed that 17 out of 18 CPSEs have not repaid principal amount of loan/ interest on loan during 2019-20 while one CPSE (Nuclear Power Corporation of India Limited) repaid loan of `730 crore during 2019-20.
Year wise details of outstanding long term loans of Government companies and corporations (by Central Government and others16) is depicted in Chart 1.2.
Chart 1.2: Long term loans outstanding in Government companies and corporations
(*Previous years’ figures updated during 2019-20 as accounts of that year were received)
Out of 427 CPSEs, 242 CPSEs (including one Statutory Corporation i.e., Central Warehousing Corporation) did not have any long term loan as on 31 March 2020.
1.2.2.2 Adequacy of assets to meet loan liabilities
Ratio of total debt to total assets is one of the methods used to determine whether a company can stay solvent. To be considered solvent, the value of an entity’s assets must be greater than the sum of its loans/ debts. The coverage of long term loans by value of total assets in 185 CPSEs which had outstanding loans as on 31 March 2020 is given in Table 1.4.
Table 1.4: Coverage of long term loans with total assets Positive Coverage Negative Coverage
No. of CPSEs
Long term loans
Assets Percentage of assets to loans
No. of CPSEs
Long term loans
Assets Percentage of assets to loans
(` in crore) (` in crore)
Statutory Corporations 5 4,27,064 8,50,614 199.18
16 Others include Central Government companies/ corporations, State Governments, State Government companies/ corporations and financial institutions etc.
By Central Government By Others
7725
4 1255
532
2832
16
1523
074
3048
99
1961
775
(` in crore)
31 Mar 2018* 31 Mar 2019* 31 Mar 2020
Report No. 12 of 2021
9
Listed Companies 38 11,60,424 27,59,587 237.81 1 238 87 36.55
Unlisted Companies 122 6,56,203 13,78,399 210.06 19 22,745 4,290 18.86
Total 165 22,43,691 49,88,600 20 22,983 4,377
Out of the 185 CPSEs, in respect of 20 CPSEs, the value of total assets was less than the loans outstanding (Annexure-III).
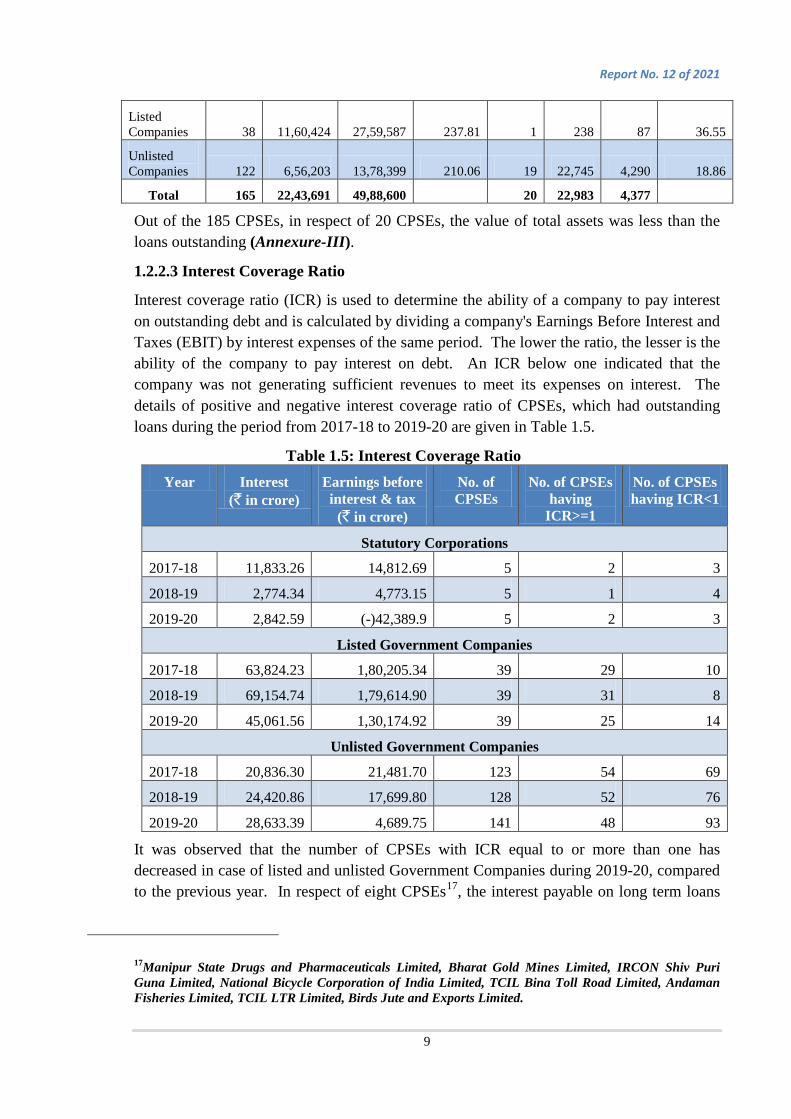
1.2.2.3 Interest Coverage Ratio
Interest coverage ratio (ICR) is used to determine the ability of a company to pay interest on outstanding debt and is calculated by dividing a company's Earnings Before Interest and Taxes (EBIT) by interest expenses of the same period. The lower the ratio, the lesser is the ability of the company to pay interest on debt. An ICR below one indicated that the company was not generating sufficient revenues to meet its expenses on interest. The details of positive and negative interest coverage ratio of CPSEs, which had outstanding loans during the period from 2017-18 to 2019-20 are given in Table 1.5.
Table 1.5: Interest Coverage Ratio Year Interest
(` in crore) Earnings before interest & tax
(` in crore)
No. of CPSEs
No. of CPSEs having
ICR>=1
No. of CPSEs having ICR<1
Statutory Corporations
2017-18 11,833.26 14,812.69 5 2 3
2018-19 2,774.34 4,773.15 5 1 4
2019-20 2,842.59 (-)42,389.9 5 2 3
Listed Government Companies
2017-18 63,824.23 1,80,205.34 39 29 10
2018-19 69,154.74 1,79,614.90 39 31 8
2019-20 45,061.56 1,30,174.92 39 25 14
Unlisted Government Companies
2017-18 20,836.30 21,481.70 123 54 69
2018-19 24,420.86 17,699.80 128 52 76
2019-20 28,633.39 4,689.75 141 48 93
It was observed that the number of CPSEs with ICR equal to or more than one has decreased in case of listed and unlisted Government Companies during 2019-20, compared to the previous year. In respect of eight CPSEs17, the interest payable on long term loans
17Manipur State Drugs and Pharmaceuticals Limited, Bharat Gold Mines Limited, IRCON Shiv Puri Guna Limited, National Bicycle Corporation of India Limited, TCIL Bina Toll Road Limited, Andaman Fisheries Limited, TCIL LTR Limited, Birds Jute and Exports Limited.

Report No. 12 of 2021
10
was higher than the value of their total assets as on 31 March 2020, which indicates a high risk of insolvency in these companies.
1.2.2.4 Age Wise Analysis of interest outstanding on Central Government loans
As on 31 March 2020, interest amounting to `6,110.42 crore was outstanding on long term loans of 15 CPSEs provided by Central Government. The age wise analysis of interest outstanding on Central Government loans in CPSEs is depicted in Table 1.6.
Table 1.6: Interest outstanding on Central Government loans (` in crore)
Sl. No.
Name of the CPSE Outstanding interest on
Central Government
loans
Interest on Central
Government loans
outstanding for less than
1 year
Interest on Central
Government loans
outstanding for 1 - 3
years
Interest on Central
Government loans
outstanding for more than
3 years
1 Bengal Chemicals and Pharmaceuticals Limited
86.22 0.59 20.32 65.31
2 Bharat Pumps and Compressors Limited
52.70 17.37 35.33 0.00
3 Birds Jute and Exports Limited
63.05 3.84 11.48 47.73
4 Cement Corporation of India Limited
123.85 0.00 0.00 123.85
5 Heavy Engineering Corporation Limited
48.13 10.53 27.45 10.15
6 Hindustan Insecticides Limited
32.96 4.70 14.09 14.17
7 HMT Machine Tools Limited
262.96 58.61 158.15 46.20
8 Hindustan Salts Limited
23.35 4.00 11.06 8.29
9 NEPA Limited 165.65 26.81 138.84 0.00
10 NHPC Limited 69.71 69.71 0.00 0.00
11 Dedicated Freight Corridor Corporation Limited
2,182.50 966.98 864.19 351.33
12 The Fertilizer and Chemicals Travancore Limited
717.05 239.02 478.03 0.00
13 Bharat Gold Mines 1,500.10 127.61 125.11 1,247.38

Report No. 12 of 2021
11
Sl. No.
Name of the CPSE Outstanding interest on
Central Government
loans
Interest on Central
Government loans
outstanding for less than
1 year
Interest on Central
Government loans
outstanding for 1 - 3
years
Interest on Central
Government loans
outstanding for more than
3 years Limited
14 Hindustan Organic Chemicals Limited
244.68 56.02 103.92 84.74
15 National Textile Corporation Limited
537.51 46.84 140.51 350.16
Total 6,110.42 1,632.63 2,128.48 2,349.31
1.2.3 Investment in Government controlled other companies
The capital invested by the Central Government, State Government and Central/ State companies/ corporations in 180 Government controlled other companies18 during the year 2019-20 is depicted in Chart 1.3.
Chart 1.3: Composition of share capital in Government controlled other companies
As on 31 March 2020, equity in these Government controlled other companies was `38,882 crore. The equity in Government controlled other companies increased by `1,937 crore in 2019-20.
1.2.4 Market capitalisation of equity investment in Government companies
Market capitalisation represents market value of the shares of companies whose shares are listed. As on 31 March 2020, shares of 70 Government companies consisting of 56 Government companies including two newly listed Government companies19, seven
18203– 23 Government Controlled other Companies whose accounts were in arrears for three years or more or were defunct/under liquidation or first accounts were not received or were not due. 19Indian Railway Catering and Tourism Corporation Limited, Rail Vikas Nigam Limited.
4,816
18,553
4,297 11,216
(` in crore)
Central Government, Central Government companies and corporations – `18,553 crore
State Government, State Government companies and corporations – `4,816 crore
Others – `4,297 crore
Financial institutions and banks – `11,216 crore
Report No. 12 of 2021
12
subsidiaries20 of Government companies and seven Government controlled other companies21 were listed on the various stock exchanges in India.
In respect of 54 (56-2 newly listed Government companies) listed Government companies, shares of 52 companies were traded and shares of two companies22 were not traded during 2019-20. In respect of seven subsidiaries of Government companies, shares of six subsidiaries were traded and shares of one subsidiary (Eastern Investments Limited) were not traded.
The total market value of shares of 58 traded listed Government companies23 (including six subsidiary companies) stood at `8,39,970 crore (equity investment being `88,194 crore) as on 31 March 2020 as compared to `14,41,435 crore as on 31 March 2019. The total market value of shares of these 58 CPSEs decreased by `6,01,465 crore (41.73 per cent) as on 31 March 2020. The top three sectors with maximum market capitalization were Petroleum and Natural Gas (`3,14,073 crore), Power (`2,36,525 crore) and Coal (`92,379 crore). Increase in market value of shares was not witnessed in any sector, whereas highest decrease in market value of shares was observed in Urban Development sector (75.34 per cent) followed by Heavy Industries and Public Enterprises sector (70.22 per cent) and Commerce and Industry sector (59.42 per cent). The market value of shares of 52 listed Government companies (excluding six subsidiary companies) stood at `7,87,152 crore as on 31 March 2020, out of which, the market value of shares held by the Central Government amounted to `4,75,542 crore.
During this period, S&P BSE Sensex24 decreased by 23.80 per cent from 38,672.91 as on 31 March 2019 to 29,468.49 as on 31 March 2020. S&P BSE-CPSE Index25 decreased by 39.70 per cent from 1,468.92 as on 31 March 2019 to 885.74 as on 31 March 2020.
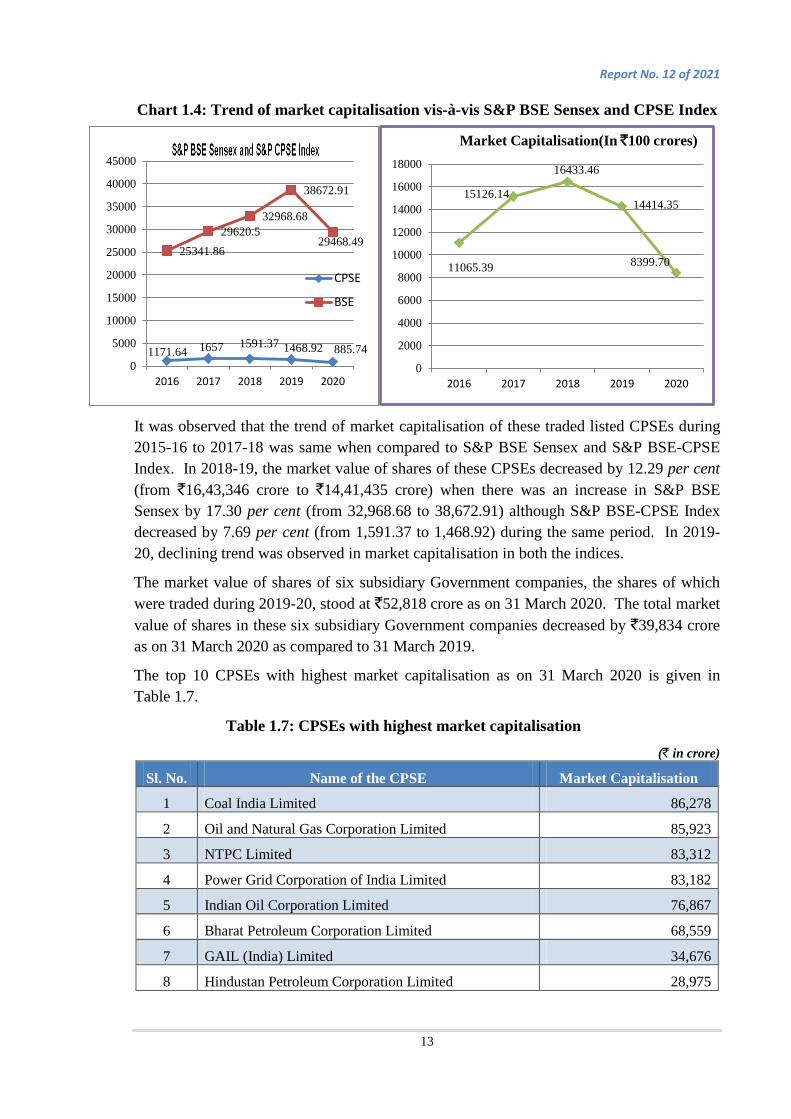
Trend of market capitalisation of the traded listed Government companies for the last five years vis-a-vis S&P BSE Sensex and S&P BSE-CPSE Index is depicted in Chart 1.4.
20Balmer Lawrie and Company Limited, Chennai Petroleum Corporation Limited, Hindustan Fluorocarbons Limited, Hindustan Petroleum Corporation Limited, Mangalore Refinery and Petrochemicals Limited, Rural Electrification Corporation Limited, Eastern Investments Limited. 21Dredging Corporation of India Limited, Indbank Merchant Banking Services Limited, The Bisra Stone Lime Company Limited, Tamil Nadu Telecommunication Limited, Indbank Housing Limited, The Orissa Minerals Development Company Limited, PNB Gilts Limited. 22Hindustan Cables Limited, Hindustan Photo-films (Manufacturing) Company Limited. 2358= 52 listed traded Government companies+ 6 listed traded subsidiary Government companies. 24S&P BSE SENSEX is a benchmark index of 30 constituent stocks representing a sample of large, liquid and representative companies. 25S&P BSE CPSE Index measures the performance of CPSEs listed at BSE.
Report No. 12 of 2021
13
Chart 1.4: Trend of market capitalisation vis-à-vis S&P BSE Sensex and CPSE Index
It was observed that the trend of market capitalisation of these traded listed CPSEs during 2015-16 to 2017-18 was same when compared to S&P BSE Sensex and S&P BSE-CPSE Index. In 2018-19, the market value of shares of these CPSEs decreased by 12.29 per cent (from `16,43,346 crore to `14,41,435 crore) when there was an increase in S&P BSE Sensex by 17.30 per cent (from 32,968.68 to 38,672.91) although S&P BSE-CPSE Index decreased by 7.69 per cent (from 1,591.37 to 1,468.92) during the same period. In 2019-20, declining trend was observed in market capitalisation in both the indices.
The market value of shares of six subsidiary Government companies, the shares of which were traded during 2019-20, stood at `52,818 crore as on 31 March 2020. The total market value of shares in these six subsidiary Government companies decreased by `39,834 crore as on 31 March 2020 as compared to 31 March 2019.
The top 10 CPSEs with highest market capitalisation as on 31 March 2020 is given in Table 1.7.
Table 1.7: CPSEs with highest market capitalisation
(` in crore) Sl. No. Name of the CPSE Market Capitalisation
1 Coal India Limited 86,278
2 Oil and Natural Gas Corporation Limited 85,923
3 NTPC Limited 83,312
4 Power Grid Corporation of India Limited 83,182
5 Indian Oil Corporation Limited 76,867
6 Bharat Petroleum Corporation Limited 68,559
7 GAIL (India) Limited 34,676
8 Hindustan Petroleum Corporation Limited 28,975
1171.64 1657 1591.37 1468.92 885.74
25341.86 29620.5
32968.68
38672.91
29468.49
0
5000
10000
15000
20000
25000
30000
35000
40000
45000
2016 2017 2018 2019 2020
CPSE
BSE
11065.39
15126.14
16433.46
14414.35
8399.70
0
2000
4000
6000
8000
10000
12000
14000
16000
18000
2016 2017 2018 2019 2020
Market Capitalisation(In `100 crores)
Report No. 12 of 2021
14
Sl. No. Name of the CPSE Market Capitalisation
9 NMDC Limited 24,495
10 Power Finance Corporation Limited 24,328
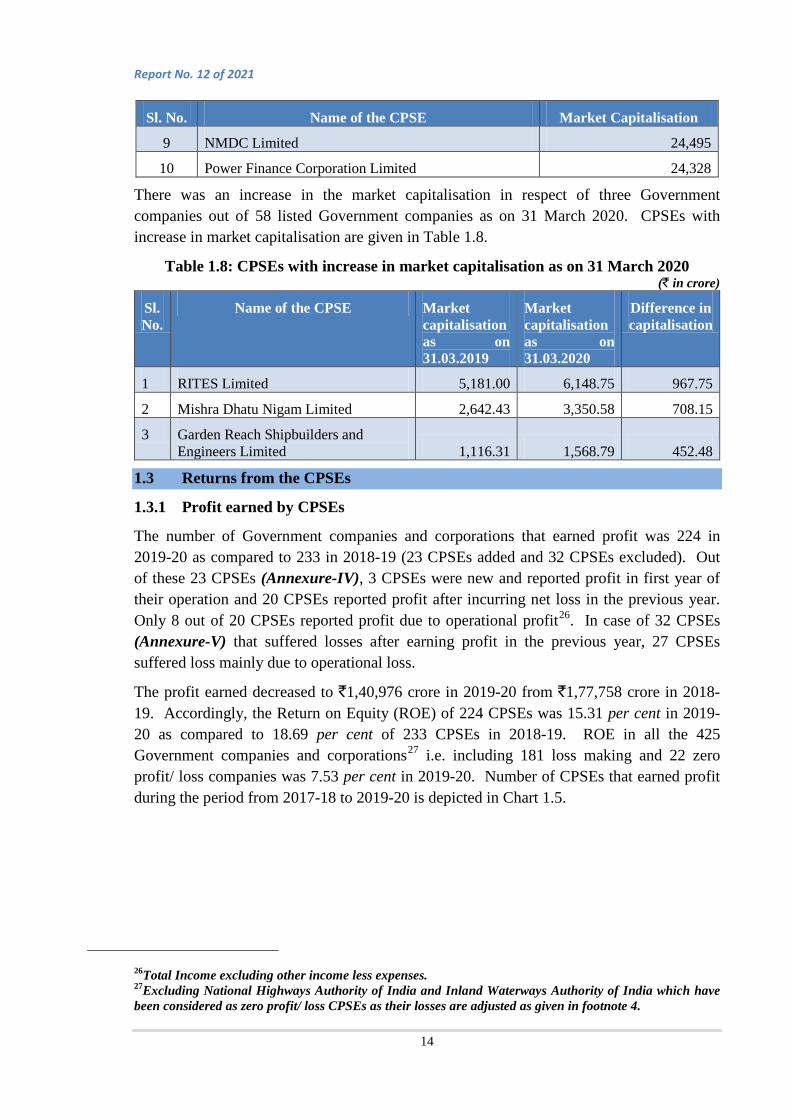
There was an increase in the market capitalisation in respect of three Government companies out of 58 listed Government companies as on 31 March 2020. CPSEs with increase in market capitalisation are given in Table 1.8.
Table 1.8: CPSEs with increase in market capitalisation as on 31 March 2020 (` in crore)
Sl. No.
Name of the CPSE Market capitalisation as on 31.03.2019
Market capitalisation as on 31.03.2020
Difference in capitalisation
1 RITES Limited 5,181.00 6,148.75 967.75
2 Mishra Dhatu Nigam Limited 2,642.43 3,350.58 708.15
3 Garden Reach Shipbuilders and Engineers Limited 1,116.31 1,568.79 452.48
1.3 Returns from the CPSEs
1.3.1 Profit earned by CPSEs
The number of Government companies and corporations that earned profit was 224 in 2019-20 as compared to 233 in 2018-19 (23 CPSEs added and 32 CPSEs excluded). Out of these 23 CPSEs (Annexure-IV), 3 CPSEs were new and reported profit in first year of their operation and 20 CPSEs reported profit after incurring net loss in the previous year. Only 8 out of 20 CPSEs reported profit due to operational profit26. In case of 32 CPSEs (Annexure-V) that suffered losses after earning profit in the previous year, 27 CPSEs suffered loss mainly due to operational loss.
Government companies and corporations27 i.e. including 181 loss making and 22 zero profit/ loss companies was 7.53 per cent in 2019-20. Number of CPSEs that earned profit during the period from 2017-18 to 2019-20 is depicted in Chart 1.5.
26Total Income excluding other income less expenses. 27Excluding National Highways Authority of India and Inland Waterways Authority of India which have been considered as zero profit/ loss CPSEs as their losses are adjusted as given in footnote 4.
The profit earned decreased to `1,40,976 crore in 2019-20 from `1,77,758 crore in 2018-19. Accordingly, the Return on Equity (ROE) of 224 CPSEs was 15.31 per cent in 2019-20 as compared to 18.69 per cent of 233 CPSEs in 2018-19. ROE in all the 425

Report No. 12 of 2021
15
Chart 1.5: Number of profit earning CPSEs
(*Previous years’ figures updated during 2019-20 when accounts of that year were received)
The details of top three sectors, which contributed maximum profit during 2019-20 are summarised in Table 1.9.
Table 1.9: Top 3 sectors which contributed maximum profit during the year 2019-20 Sector No. of profit
earning CPSEs
Net profit earned
(` in crore)
Percentage of profit to total CPSE profit
Power
Listed Government Companies 4 25,583 18.14
Unlisted Government Companies 33 7,763 5.51
Statutory Corporations 1 185 0.13
Sub-total (A) 38 33,531 23.78
Petroleum
Listed Government Companies 6 29,283 20.77
Unlisted Government Companies 8 2,904 2.06
Sub-total (B) 14 32,187 22.83
Coal and Lignite
Listed Government Companies 2 12,695 9.00
Unlisted Government Companies 6 16,898 11.98
Sub-total (C) 8 29,593 20.98
Total (A+B+C) 60 95,311 67.61
Net profit of `95,311 crore constituting 67.61 per cent of total profit of Government companies and corporations was contributed by 60 CPSEs in 2019-20 as compared to 73.06 per cent in 2018-19 in these three sectors.
020406080
100120140160180200
Statutory Corporations Listed Companies Unlisted Companies
2
51
165
2
51
180
3
45
176
2017-18* 2018-19* 2019-20

Report No. 12 of 2021
16
Net profit of `41,472 crore was contributed by 29 CPSEs, which functioned in defence, coal, atomic energy and space sectors, which were not open to market competition. This constituted 29.42 per cent of total profit of `1,40,976 crore in all 224 CPSEs during 2019-20. ROE of these 29 CPSEs in 2019-20 was 42.29 per cent as compared to 12.09 per cent in 195 CPSEs functioning in competitive environment.
The list of Government companies which earned profit of more than `5,000 crore during the year 2019-20 is given in Table 1.10.
Table 1.10: List of CPSEs which earned profit of more than `5,000 crore (` in crore)
Sl. No. Name of the CPSE Net Profit
1 Oil and Natural Gas Corporation Limited 13,445
2 Coal India Limited 11,281
3 Power Grid Corporation of India Limited 10,811
4 NTPC Limited 10,113
5 GAIL (India) Limited 6,621
6 Mahanadi Coalfields Limited 6,427
7 Power Finance Corporation Limited 5,655
Total 64,353
It may be seen that these seven CPSEs contributed 45.65 per cent of the total profit earned by 224 CPSEs during 2019-20.
Of the 180 Government controlled other companies, 124 CPSEs earned profit of `10,369 crore during the year ended 31 March 2020, which was an increase of `1,258 crore (13.81 per cent) as compared to profit of `9,111 crore earned by such 123 CPSEs in 2018-19. Accordingly, ROE of 124 CPSEs was 21.92 per cent in 2019-20 as compared to 20.33 per cent of 123 CPSEs in 2018-19. ROE in all the 180 Government controlled other companies was 19.26 per cent in 2019-20.
The profit earned by Government companies decreased by `36,782 crore (20.69 per cent) during 2019-20 from `1,77,758 crore in 2018-19 to `1,40,976 crore in 2019-20, whereas profit earned by Government controlled other companies increased by `1,258 crore (13.81 per cent) during 2019-20 from `9,111 crore in 2018-19 to `10,369 crore in 2019-20.
1.3.2 Loss incurred by CPSEs
There were 181 Government companies that incurred losses during the year 2019-20. Out of these 181 loss making companies, 115 CPSEs have incurred losses for 3 to 5 years in last 5 years whereas 64 CPSEs have incurred losses continuously for 5 years. The losses incurred by CPSEs increased to `68,434 crore in 2019-20 from `40,835 crore in 2018-19 as given in Table 1.11.

Report No. 12 of 2021
17
Table 1.11: Number of CPSEs that incurred losses during 2017-18 to 2019-20 Listed/ Unlisted
Year No of CPSEs incurred loss
Net loss for the year (` in
crore)
Accumulated loss
(` in crore)
Net worth28 (` in crore)
Statutory Corporations
2017-18 1 847 0 12,144
2018-19 1 1,115 0 11,370
2019-20 0 0 0 0
Listed Government Companies
2017-18 12 8,292 40,433 9,146
2018-19 12 5,476 35,149 -18,946
2019-20 18 11,987 39,239 1,20,571
Unlisted Government Companies
2017-18 130 31,630 89,907 1,33,517
2018-19 136 34,244 90,883 1,10,680
2019-20 163 56,447 1,15,821 1,31,406
Total
2017-18 143 40,769 1,30,340 1,54,807
2018-19 149 40,835 1,26,032 1,03,104
2019-20 181 68,434 1,55,060 2,51,977
Out of total loss of `68,434 crore incurred by 181 CPSEs in 2019-20, loss of `2,527 crore was contributed by 21 CPSEs, which were not open to market competition. CPSEs listed in Table 1.12 incurred a loss of more than `1,000 crore during the year 2019-20.
Table 1.12: CPSEs that incurred losses of more than `1,000 crore during 2019-20 (` in crore)
Sl. No. Name of the CPSE Net loss
1 Bharat Sanchar Nigam Limited 15,500
2 Air India Limited 7,766
3 ONGC Videsh Limited 7,264
4 National Insurance Company Limited 4,111
28Net worth means the sum total of the paid-up share capital and free reserves and surplus less accumulated loss and deferred revenue expenditure. Free reserves mean all reserves created out of profits and share premium account but do not include reserves created out of revaluation of assets and write back of depreciation provision.

Report No. 12 of 2021
18
Sl. No. Name of the CPSE Net loss
5 Rashtriya Ispat Nigam Limited 3,910
6 Mahanagar Telephone Nigam Limited 3,696
7 Lanco Teesta Hydro Power Limited 2,956
8 Mangalore Refinery and Petrochemicals Limited 2,708
9 ONGC Petro Additions Limited 2,090
10 Chennai Petroleum Corporation Limited 2,078
11 Oriental Insurance Company Limited 1,524
12 United India Insurance Company Limited 1,486
13 Bharat Heavy Electricals Limited 1,473
14 ONGC-Mangalore Petrochemicals Limited 1,400
Out of 180 Government controlled other companies, 56 companies incurred loss of `1,407 crore during the year 2019-20, which was a decrease of `980 crore (41.06 per cent) as compared to loss of `2,387 crore incurred by 55 CPSEs in 2018-19.
1.3.3 Erosion of capital in Government companies
As on 31 March 2020 there were 188 Government companies29 with accumulated loss of `1,74,596 crore. Of the 188 CPSEs, 140 CPSEs incurred loss in the year 2019-20 amounting to `22,203 crore, 48 CPSEs had not incurred loss (including zero profit) in the year 2019-20, even though they had accumulated loss of `19,536 crore. 33 out of 188 CPSEs were under winding up/ closure/ liquidation/ strategic disinvestment.
Net worth of 90 out of 188 CPSEs had been completely eroded by accumulated loss and their net worth was either zero or negative. The net worth of these 90 CPSEs was (-) `1,15,829 crore against equity investment of `49,422 crore in these CPSEs as on 31 March 2020 (Annexure-VI). This included seven listed companies whose net worth was (-) `39,008 crore against equity investment of `6,592 crore. Out of 90 CPSEs, whose capital had been eroded (being zero or negative net worth), 13 CPSEs had earned profit of `1,713 crore during 2019-20 (Annexure-VI).
In 17 out of 90 CPSEs whose capital had eroded, Government loans outstanding as on 31 March 2020 amounted to `6,045 crore. This included two listed companies with outstanding Government loans of `937 crore.
Net worth was less than half of their paid up capital in respect of 29 out of 334 CPSEs whose net worth was positive at the end of 31 March 2020, indicating their potential financial sickness. In the overall, net worth of all the 427 Government companies and corporations was `16,36,946 crore against their paid up capital of `6,33,159 crore.
29Excluding National Highways Authority of India and Inland Waterways Authority of India, which have been considered as zero profit/ loss CPSEs as their losses are adjusted as given in footnote 4.

Report No. 12 of 2021
19
1.3.4 Dividend payout by CPSEs
The details of profit earned and dividend declared by Government companies and corporations is given in Table 1.13.
Table 1.13: Profit earned and dividend declared Category No. of
CPSEs Paid up capital
(` in crore) Net profit
(` in crore) Dividend declared
(` in crore)
Statutory Corporations 2 725 2,357 844
Listed Companies 37 75,364 93,821 55,627
Unlisted Companies 60 49,175 32,593 17,016
Total 99 1,25,264 1,28,771 73,487
Out of 427 Government companies and Corporations, 99 CPSEs declared dividend in 2019-20. The dividend declared as a percentage of net profit of these 99 profit earning CPSEs increased from 44.01 per cent in 2018-19 to 57.07 per cent in 2019-20. In absolute terms, the dividend declared by the CPSEs in 2019-20 increased by `1,721 crore compared to previous year. Chart 1.6 depicts the dividend declared vis-a-vis net profit earned and paid up capital of CPSEs which declared dividend during the last three years.
Chart 1.6: Dividend declared vis-a-vis net profit earned and paid up capital (` in crore)
Out of total dividend of `73,487 crore declared by 99 CPSEs for the year 2019-20, dividend received/ receivable by Central Government was `34,944 crore (63.66 per cent of their total declared dividend of `54,890) in 68 CPSEs30 having equity investment of `79,680 crore. The return in the form of dividend received/ receivable by Central
3068 CPSEs are out of 199 CPSEs (193 Government companies + 6 Statutory Corporations) where Central Government has direct holding.
136233 118202 125263
152523 163074 128771
70398 71766 73487
2017-18 2018-19 2019-20
Paid up Capital Net Profit Dividend
Report No. 12 of 2021
20
Government on aggregate investment of `4,52,908 crore made by the Central Government in equity capital of 427 CPSEs was 7.72 per cent as compared to 9.16 per cent during 2018-19. Similarly, 42 CPSEs received `18,140 crore as dividend on paid up capital of `17,792 crore on the equity holdings in other CPSEs in 2019-20. 13 CPSEs under the Ministry of Petroleum and Natural Gas, declared dividend amounting to `26,349 crore which was 35.86 per cent of the total dividend of `73,487 crore declared by 99 CPSEs in 2019-20
The guidelines issued by Department of Investment & Public Asset Management (DIPAM) in May 2016 envisaged that every CPSE would pay a minimum annual dividend of 30 per cent of profit after tax or five per cent of the net worth, whichever is higher, subject to the maximum dividend permitted under the extant legal provisions. However, 49 Government companies (including 11 listed CPSEs) had not declared dividend prescribed by the Government as given in Annexure-VII. The total shortfall on this account was `11,488 crore in 2019-20. (shortfall of `8,011crore during 2018-19 by 36 Government Companies)
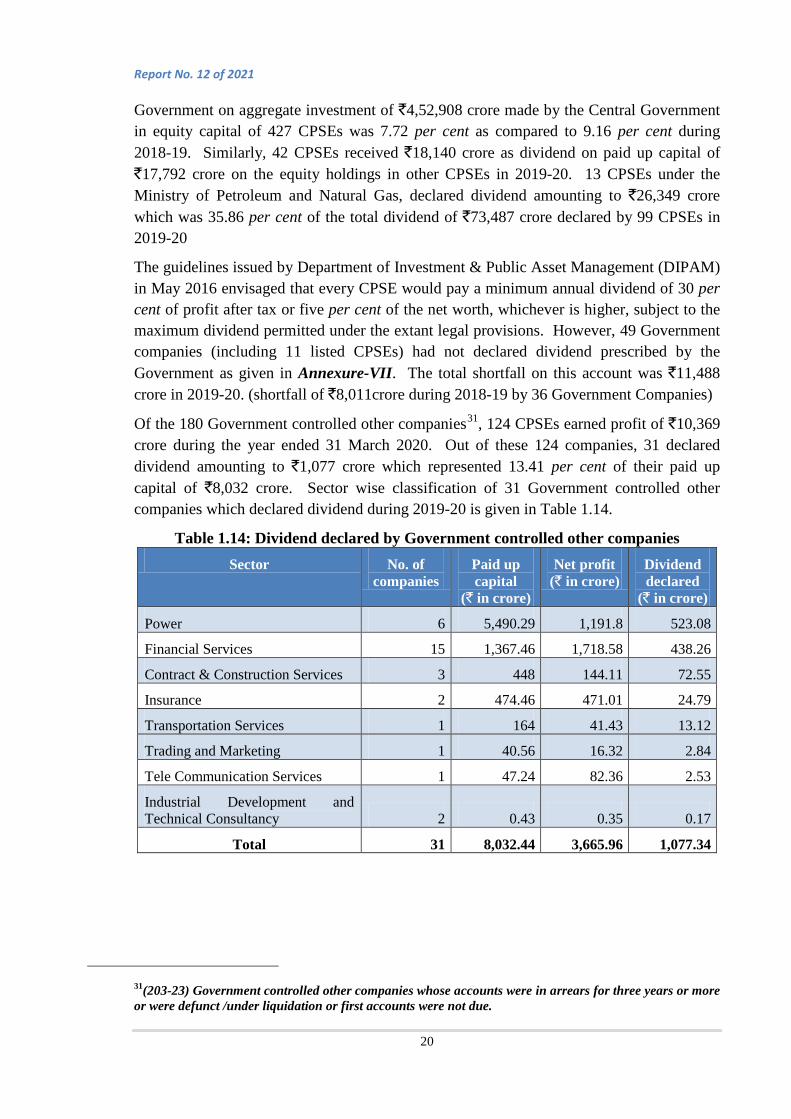
Of the 180 Government controlled other companies31, 124 CPSEs earned profit of `10,369 crore during the year ended 31 March 2020. Out of these 124 companies, 31 declared dividend amounting to `1,077 crore which represented 13.41 per cent of their paid up capital of `8,032 crore. Sector wise classification of 31 Government controlled other companies which declared dividend during 2019-20 is given in Table 1.14.
Table 1.14: Dividend declared by Government controlled other companies Sector No. of
companies Paid up capital
(` in crore)
Net profit (` in crore)
Dividend declared
(` in crore)
Power 6 5,490.29 1,191.8 523.08
Financial Services 15 1,367.46 1,718.58 438.26
Contract & Construction Services 3 448 144.11 72.55
Insurance 2 474.46 471.01 24.79
Transportation Services 1 164 41.43 13.12
Trading and Marketing 1 40.56 16.32 2.84
Tele Communication Services 1 47.24 82.36 2.53
Industrial Development and Technical Consultancy 2 0.43 0.35 0.17
Total 31 8,032.44 3,665.96 1,077.34
31(203-23) Government controlled other companies whose accounts were in arrears for three years or more or were defunct /under liquidation or first accounts were not due.
Report No. 12 of 2021
21
1.4 Operating efficiency of Government companies and corporations
1.4.1 Value of production
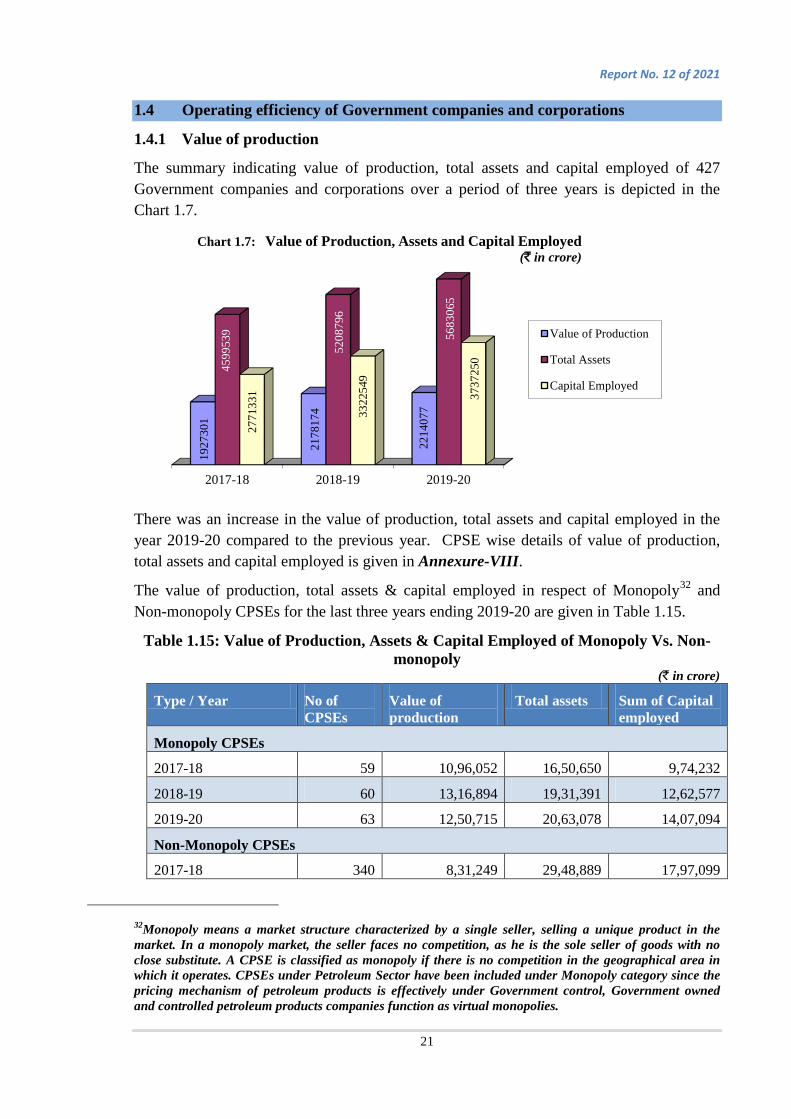
The summary indicating value of production, total assets and capital employed of 427 Government companies and corporations over a period of three years is depicted in the Chart 1.7.
There was an increase in the value of production, total assets and capital employed in the year 2019-20 compared to the previous year. CPSE wise details of value of production, total assets and capital employed is given in Annexure-VIII.
The value of production, total assets & capital employed in respect of Monopoly32 and Non-monopoly CPSEs for the last three years ending 2019-20 are given in Table 1.15.
Table 1.15: Value of Production, Assets & Capital Employed of Monopoly Vs. Non-monopoly
(` in crore)
Type / Year No of CPSEs
Value of production
Total assets Sum of Capital employed
Monopoly CPSEs
2017-18 59 10,96,052 16,50,650 9,74,232
2018-19 60 13,16,894 19,31,391 12,62,577
2019-20 63 12,50,715 20,63,078 14,07,094
Non-Monopoly CPSEs
2017-18 340 8,31,249 29,48,889 17,97,099
32Monopoly means a market structure characterized by a single seller, selling a unique product in the market. In a monopoly market, the seller faces no competition, as he is the sole seller of goods with no close substitute. A CPSE is classified as monopoly if there is no competition in the geographical area in which it operates. CPSEs under Petroleum Sector have been included under Monopoly category since the pricing mechanism of petroleum products is effectively under Government control, Government owned and controlled petroleum products companies function as virtual monopolies.
2017-18 2018-19 2019-20
1927
301
2178
174
2214
077
4599
539
5208
796
5683
065
2771
331
3322
549
3737
250
Chart 1.7: Value of Production, Assets and Capital Employed (` in crore)
Value of Production
Total Assets
Capital Employed

Report No. 12 of 2021
22
Type / Year No of CPSEs
Value of production
Total assets Sum of Capital employed
2018-19 347 8,61,280 32,77,405 20,59,972
2019-20 364 9,63,362 36,19,987 23,30,156
Total
2017-18 399 19,27,301 45,99,539 27,71,331
2018-19 407 21,78,174 52,08,796 33,22,549
2019-20 427 22,14,077 56,83,065 37,37,250
The value of production in respect of Government companies and corporations increased marginally by `35,903 crore (1.65 per cent) during 2019-20 from `21,78,174 crore in 2018-19 to `22,14,077 crore in 2019-20 whereas total assets and capital employed increased by `4,74,269 crore (9.11 per cent) and `4,14,701 crore (12.48 per cent) respectively during the same period.
1.4.2 Return on Capital Employed (ROCE)
ROCE is a ratio that measures a company’s profitability and the efficiency with which its capital is employed. ROCE is calculated by dividing a company’s earnings before interest and taxes (EBIT) by the capital employed33. The CPSE wise details of ROCE are given in Annexure-IX. The consolidated ROCE of 425 Government companies and corporations34 during the period from 2017-18 to 2019-20 is given in Table 1.16.
Table 1.16: Return on Capital Employed Year EBIT (` in crore) Capital employed (` in crore) ROCE (in per
cent)
2017-18 2,91,064 24,69,196 11.79
2018-19 3,07,096 29,33,856 10.47
2019-20 2,10,823 33,04,146 6.38
A consistent decreasing trend in ROCE of Government companies and corporations was observed during the last three years from 2017-18 to 2019-20. ROCE in the year 2019-20 decreased significantly in comparison to that for the year 2018-19 due to decrease in EBIT and increase in capital employed.
ROCE in respect of Monopoly and Non-monopoly CPSEs is given in Table 1.17.
33Capital Employed = Paid up Share capital + Free Reserves and Surplus + Long term loans – Accumulated losses – Deferred Revenue Expenditure. 34Excluding National Highways Authority of India and Inland Waterways Authority of India which have been considered as zero profit/ loss CPSEs as their losses are adjusted as given in footnote 4.

Report No. 12 of 2021
23
Table 1.17: ROCE of Monopoly vs. Non-monopoly CPSEs
Year Monopoly Non-monopoly
No. of CPSEs
EBIT
Capital employed
ROCE (in per cent)
No. of CPSEs
EBIT Capital employed
ROCE (in per cent)
(` in crore) (` in crore)
2017-18 57 1,16,170 6,72,097 17.28 340 1,74,894 17,97,099 9.73
2018-19 58 1,14,218 8,73,884 13.07 347 1,92,878 20,59,972 9.36
2019-20 61 67,689 9,73,990 6.95 364 1,43,134 23,30,156 6.14
It was observed that ROCE of monopoly Government companies and corporations was higher than that of non-monopoly Government companies and corporations during the last three years from 2017-18 to 2019-20. ROCE of monopoly Government companies and corporations decreased significantly in the year 2019-20 in comparison to that for the year 2018-19 mainly due to decrease in EBIT and increase in capital employed.
1.4.3 Return on Equity (ROE) of CPSEs
ROE35 is a measure of financial performance of companies calculated by dividing net income by shareholders' equity. The CPSE wise details of ROE are given in Annexure-X. The consolidated ROE of 425 Government companies and corporations during the period from 2017-18 to 2019-20 is given in Table 1.18.
Table 1.18: Return on Equity Year Net profit after tax &
preference dividend (` in crore)
Equity (` in crore)
ROE (in per cent)
2017-18 1,24,449 9,02,640 13.79
2018-19 1,35,660 9,63,594 14.08
2019-20 72,182 9,58,191 7.53
It was observed that ROE of 425 Government companies and corporations36 slightly increased in the year 2018-19 in comparison to that for the year 2017-18. However, ROE of Government companies and corporations decreased significantly in the year 2019-20 in comparison to that for the year 2018-19 mainly due to decrease in net profit.
35Return on Equity = (Net Profit after Tax and preference Dividend/ Equity)*100 where Equity = Paid up Capital + Free Reserves – Accumulated Loss – Deferred Revenue Expenditure. 36Excluding National Highways Authority of India and Inland Waterways Authority of India which have been considered as zero profit/loss CPSEs as their losses are adjusted as given in footnote 4.

Report No. 12 of 2021
24
ROE in respect of Monopoly and Non-monopoly CPSEs is given in Table 1.19.
Table 1.19: ROE of Monopoly Vs. Non-monopoly CPSEs Year Monopoly Non-monopoly
No. of CPSEs
Equity
Net profit after tax & preference dividend
ROE (in per cent)
No. of CPSEs
Equity
Net profit after tax & preference dividend
ROE (in per cent)
(` in crore) (` in crore)
2017-18 57 4,41,820 67,349 15.24 340 4,60,820 57,101 12.39
2018-19 58 4,77,224 68,567 14.37 347 4,86,370 67,093 13.79
2019-20 61 5,07,535 32,779 6.46 364 4,50,656 39,403 8.74
It was observed that ROE of monopoly Government companies and corporations was higher than that of non-monopoly Government companies and corporations during the years 2017-18 and 2018-19, however the same was lower in 2019-20. ROE of monopoly Government companies and corporations decreased significantly in the year 2019-20 in comparison to that for the year 2018-19 mainly due to decrease in net profit but increase in equity.
Sector wise ROE of Government companies and corporations where total equity of the sector is more than `10,000 crore during 2019-20 is depicted in Table 1.20.
Table 1.20: ROE of sectors with total equity of `10,000 crore and more (in per cent)
Sl. No.
Sector ROE during 2019-20
ROE during 2018-19
ROE during 2017-18
1 Petroleum 3.40 15.99 16.77
2 Power 12.88 13.22 12.95
3 Transportation services (-)17.65 (-)18.04 (-)5.69
4 Financial services 18.33 24.46 25.96
5 Coal & Lignite 65.40 72.46 43.02
6 Minerals and Metals 10.22 17.95 15.33
7 Insurance (-)17.19 (-)3.34 8.61
8 Heavy Industry (-)5.85 3.77 3.68
9 Steel (-)15.27 16.04 (-)11.73
10 Transport Equipment 22.89 24.87 17.12
1.4.4 Rate of Real Return on Government Investment (RORR)
RORR measures the profitability and efficiency with which equity and similar non-interest bearing capitals have been employed, after adjusting them for their time value, and assumes significance when compared with the conventional Rate of Return (ROR), which is calculated by dividing the PAT by the sum of all such investments counted on historical cost basis.
Report No. 12 of 2021
25
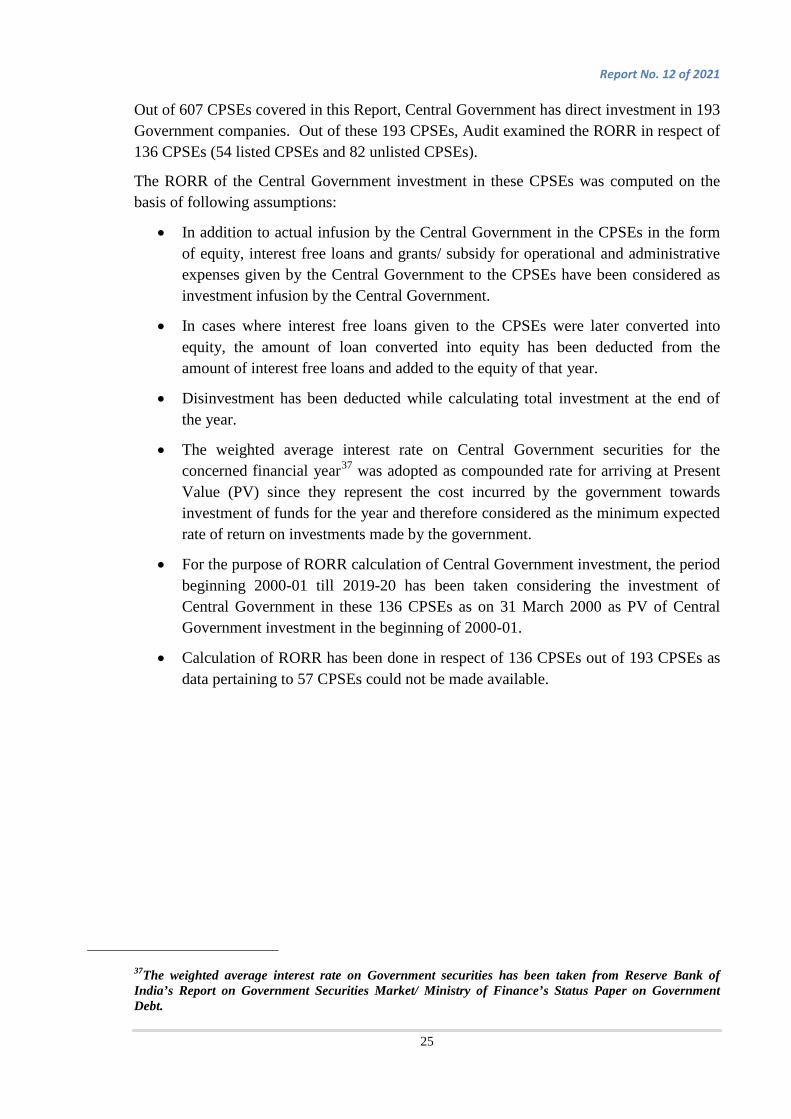
Out of 607 CPSEs covered in this Report, Central Government has direct investment in 193 Government companies. Out of these 193 CPSEs, Audit examined the RORR in respect of 136 CPSEs (54 listed CPSEs and 82 unlisted CPSEs).
The RORR of the Central Government investment in these CPSEs was computed on the basis of following assumptions:
• In addition to actual infusion by the Central Government in the CPSEs in the form of equity, interest free loans and grants/ subsidy for operational and administrative expenses given by the Central Government to the CPSEs have been considered as investment infusion by the Central Government.
• In cases where interest free loans given to the CPSEs were later converted into equity, the amount of loan converted into equity has been deducted from the amount of interest free loans and added to the equity of that year.
• Disinvestment has been deducted while calculating total investment at the end of the year.
• The weighted average interest rate on Central Government securities for the concerned financial year37 was adopted as compounded rate for arriving at Present Value (PV) since they represent the cost incurred by the government towards investment of funds for the year and therefore considered as the minimum expected rate of return on investments made by the government.
• For the purpose of RORR calculation of Central Government investment, the period beginning 2000-01 till 2019-20 has been taken considering the investment of Central Government in these 136 CPSEs as on 31 March 2000 as PV of Central Government investment in the beginning of 2000-01.
• Calculation of RORR has been done in respect of 136 CPSEs out of 193 CPSEs as data pertaining to 57 CPSEs could not be made available.
37The weighted average interest rate on Government securities has been taken from Reserve Bank of India’s Report on Government Securities Market/ Ministry of Finance’s Status Paper on Government Debt.
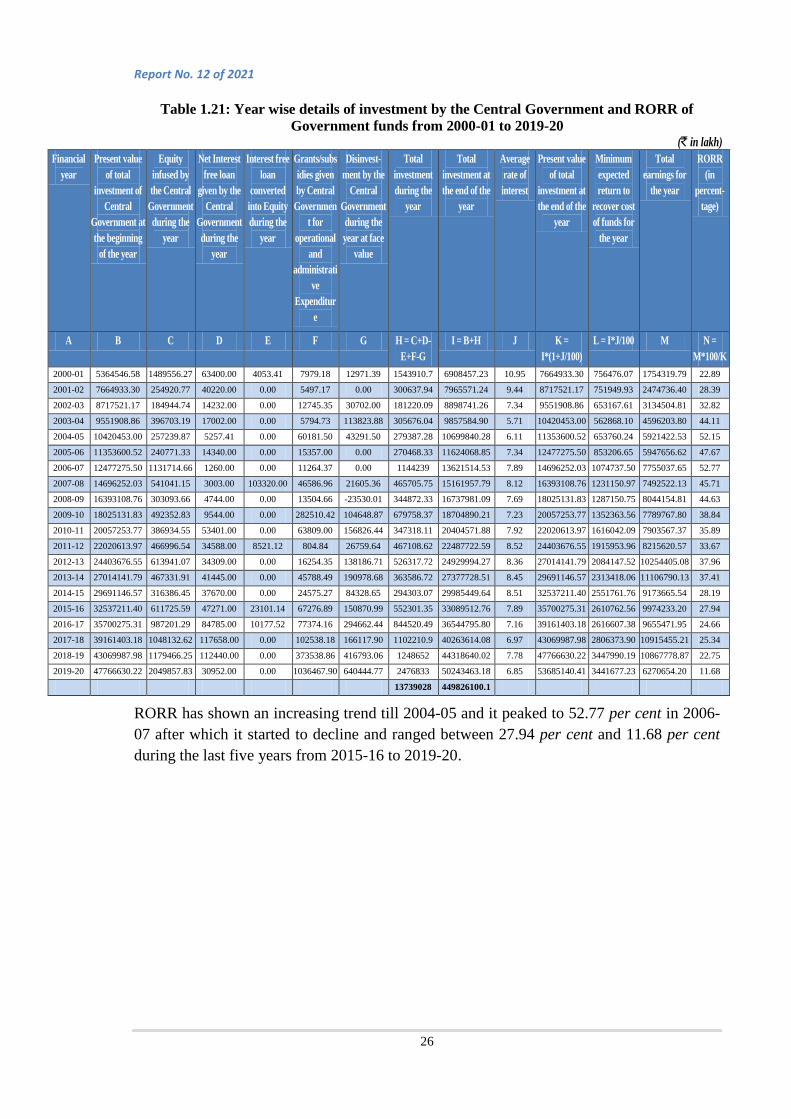
Report No. 12 of 2021
26
Table 1.21: Year wise details of investment by the Central Government and RORR of Government funds from 2000-01 to 2019-20
(` in lakh) Financial
year Present value
of total investment of
Central Government at the beginning
of the year
Equity infused by the Central
Government during the
year
Net Interest free loan
given by the Central
Government during the
year
Interest free loan
converted into Equity during the
year
Grants/subsidies given by Central
Government for
operational and
administrative
Expenditure
Disinvest-ment by the
Central Government during the year at face
value
Total investment during the
year
Total investment at the end of the
year
Average rate of interest
Present value of total
investment at the end of the
year
Minimum expected return to
recover cost of funds for
the year
Total earnings for
the year
RORR (in
percent-tage)
A B C D E F G H = C+D-E+F-G
I = B+H J K = I*(1+J/100)
L = I*J/100 M N = M*100/K
2000-01 5364546.58 1489556.27 63400.00 4053.41 7979.18 12971.39 1543910.7 6908457.23 10.95 7664933.30 756476.07 1754319.79 22.89
2001-02 7664933.30 254920.77 40220.00 0.00 5497.17 0.00 300637.94 7965571.24 9.44 8717521.17 751949.93 2474736.40 28.39
2002-03 8717521.17 184944.74 14232.00 0.00 12745.35 30702.00 181220.09 8898741.26 7.34 9551908.86 653167.61 3134504.81 32.82
2003-04 9551908.86 396703.19 17002.00 0.00 5794.73 113823.88 305676.04 9857584.90 5.71 10420453.00 562868.10 4596203.80 44.11
2004-05 10420453.00 257239.87 5257.41 0.00 60181.50 43291.50 279387.28 10699840.28 6.11 11353600.52 653760.24 5921422.53 52.15
2005-06 11353600.52 240771.33 14340.00 0.00 15357.00 0.00 270468.33 11624068.85 7.34 12477275.50 853206.65 5947656.62 47.67
2006-07 12477275.50 1131714.66 1260.00 0.00 11264.37 0.00 1144239 13621514.53 7.89 14696252.03 1074737.50 7755037.65 52.77
2007-08 14696252.03 541041.15 3003.00 103320.00 46586.96 21605.36 465705.75 15161957.79 8.12 16393108.76 1231150.97 7492522.13 45.71
2008-09 16393108.76 303093.66 4744.00 0.00 13504.66 -23530.01 344872.33 16737981.09 7.69 18025131.83 1287150.75 8044154.81 44.63
2009-10 18025131.83 492352.83 9544.00 0.00 282510.42 104648.87 679758.37 18704890.21 7.23 20057253.77 1352363.56 7789767.80 38.84
2010-11 20057253.77 386934.55 53401.00 0.00 63809.00 156826.44 347318.11 20404571.88 7.92 22020613.97 1616042.09 7903567.37 35.89
2011-12 22020613.97 466996.54 34588.00 8521.12 804.84 26759.64 467108.62 22487722.59 8.52 24403676.55 1915953.96 8215620.57 33.67
2012-13 24403676.55 613941.07 34309.00 0.00 16254.35 138186.71 526317.72 24929994.27 8.36 27014141.79 2084147.52 10254405.08 37.96
2013-14 27014141.79 467331.91 41445.00 0.00 45788.49 190978.68 363586.72 27377728.51 8.45 29691146.57 2313418.06 11106790.13 37.41
2014-15 29691146.57 316386.45 37670.00 0.00 24575.27 84328.65 294303.07 29985449.64 8.51 32537211.40 2551761.76 9173665.54 28.19
2015-16 32537211.40 611725.59 47271.00 23101.14 67276.89 150870.99 552301.35 33089512.76 7.89 35700275.31 2610762.56 9974233.20 27.94
2016-17 35700275.31 987201.29 84785.00 10177.52 77374.16 294662.44 844520.49 36544795.80 7.16 39161403.18 2616607.38 9655471.95 24.66
2017-18 39161403.18 1048132.62 117658.00 0.00 102538.18 166117.90 1102210.9 40263614.08 6.97 43069987.98 2806373.90 10915455.21 25.34
2018-19 43069987.98 1179466.25 112440.00 0.00 373538.86 416793.06 1248652 44318640.02 7.78 47766630.22 3447990.19 10867778.87 22.75
2019-20 47766630.22 2049857.83 30952.00 0.00 1036467.90 640444.77 2476833 50243463.18 6.85 53685140.41 3441677.23 6270654.20 11.68
13739028 449826100.1
RORR has shown an increasing trend till 2004-05 and it peaked to 52.77 per cent in 2006-07 after which it started to decline and ranged between 27.94 per cent and 11.68 per cent during the last five years from 2015-16 to 2019-20.

Report No. 12 of 2021
27
Table 1.22: Consolidated RORR on Central Government investment for the year 2019-20
Investment by the Central Government since inception till 2019-20 (` in lakh)
Return on Central Government investment on the basis of historical value (in per cent)
Present value of Central Government investment at the end of 2019-20 (` in lakh)
RORR on Central Government investment considering the present value of investments (in per cent)
A B C D E
Value of column M of above table
Total of the column H above + Govt. investment in the beginning of 2000-01
A*100/B Value of column K of above table
A*100/D
62,70,654 1,91,03,575
(1,37,39,028+53,64,547)
32.82 5,36,85,140 11.68
The company wise RORR for the last three years is given in Annexure-XI.
A perusal of the same would reveal that while listed companies have given RORR between 53.43 per cent and 33.59 per cent during the last three years, the unlisted CPSEs have given negative returns ranging between (-)2.52 per cent and (-)7.46 per cent during the last three years from 2017-18 to 2019-20.
RORR on the investment of Central Government was compared with return on the basis of historical value of investment for 136 listed and unlisted CPSEs under the category of monopoly and non-monopoly companies. The results for the year 2019-20 are given in Table 1.23.
Table 1.23: RORR on Central Government investment for monopoly and non-monopoly CPSEs for the year 2019-20
Total Earnings/
Loss in 2019-20
(` in lakh)
Investment by the
Central Government
since inception till
2019-20 (` in lakh)
Return on Central
Government investment on the basis of historical
value (in per cent)
Present value of Central
Government investment
at the end of 2019-20
(` in lakh)
RORR on Central
Government investment considering the present
value of investments (in per cent)
Listed Monopoly CPSEs
27,66,290 12,19,366 226.86 28,36,956 97.51
Listed Non-monopoly CPSEs
56,41,107 54,88,798 102.77 2,21,91,506 25.42

Report No. 12 of 2021
28
Total Earnings/
Loss in 2019-20
(` in lakh)
Investment by the
Central Government
since inception till
2019-20 (` in lakh)
Return on Central
Government investment on the basis of historical
value (in per cent)
Present value of Central
Government investment
at the end of 2019-20
(` in lakh)
RORR on Central
Government investment considering the present
value of investments (in per cent)
Consolidated Listed
84,07,397 67,08,164 125.33 2,50,28,462 33.59
Unlisted Monopoly CPSEs
(-)94,350 50,46,063 (-)1.87 83,67,860 (-)1.13
Unlisted/ Non-monopoly CPSEs
(-)20,42,394 73,49,347 (-)27.79 2,02,88,818 (-)10.07
Consolidated Unlisted
(-)21,36,743 1,23,95,410 (-)17.24 2,86,56,678 (-)7.46
It was observed that the RORR of listed CPSEs was higher than that of unlisted CPSEs. Overall, RORR of monopoly CPSEs was higher than that of non-monopoly CPSEs. The CPSE wise comparison of Return on Central Government investment on the basis of historical value with RORR of 54 listed CPSEs is given in Annexure-XII. It was observed that RORR was lower in comparison to Return on Central Government investment on the basis of historical value in respect of 52 CPSEs out of 54 listed CPSEs. The other two CPSEs where RORR was higher in comparison to Return on Central Government investment of the basis of historical value were MOIL Limited and Bharat Electronics Limited since disinvestment proceeds were higher than the historical value of investments made by the Central Government.
1.4.5 Return on Investment (ROI) of Listed CPSEs
Return on Investment (Annual Average Rate)38 of 54 CPSEs which are listed on the Stock Exchange has been computed since 2000-2001 to assess the benefit obtained from the investment made by Central Government in these CPSEs. ROI is a performance measure used to evaluate the efficiency of an investment. The ROI (Annual Average Rate) of these CPSEs was computed on the basis of following assumptions:
38{(Government’s share of the Market Capitalization of the company as at 31 March of FY + Present Value of Dividend Receipts of the Government as at 31 March of FY + Present Value of Disinvestment Receipts of the Government as at 31 March of FY) – (Paid-up Equity of the Government as at Inception + Discounted Value of Equity infused by the Government as at Inception + Discounted Value of Subsidy/Grants infused for meeting Operational and Administrative Expenditure as at Inception)}/ (Paid-up Equity of the Government as at Inception + Discounted Value of Equity infused by the Government as at Inception + Discounted Value of Subsidy/Grants infused for meeting Operational and Administrative Expenditure as at Inception)*100/Number of intervening annual periods.

Report No. 12 of 2021
29
• In addition to actual infusion by the Central Government in the CPSEs in the form of equity, grants/ subsidy for operational and administrative expenses given to CPSEs by the Central Government has been considered as investment infusion or outflow by the Central Government by recalculating their values at inception.
• Market capitalization of CPSEs at the end of the year and present value of dividend receipts and disinvestment proceeds since inception has been considered as inflow.
• Financial Year 2000-01 has been considered as the Inception Year. Data availability for the CPSEs is the reason for considering 2000-01 as the inception year.
Apart from the ROI (Annual Average Rate), CPSE wise ROI Compounded Annual Growth Rate39 (CAGR) of these CPSEs has also been calculated to determine the annual growth in the rate of return of the investment.
The consolidated position of the ROI (Annual Average Rate) and ROI (CAGR) of such Central Government investment in the CPSEs is indicated in Table 1.24.
39Compound Annual Growth Rate indicates geometric progression ratio that provides a constant rate of return over the time period.

Report No. 12 of 2021
30
Table 1.24: Year wise details of inflows by the Central Government and outflows to the Central Government and ROI (Annual Average Rate) and ROI (CAGR) during 2000-01 to 2019-20
(` in lakh)
Year
Equi
ty h
eld b
y Ce
ntra
l G
over
nmen
t
Equi
ty a
dded
by
Cent
ral
Gov
ernm
ent
Gra
nts\
subs
idy
give
n by
Cen
tral
G
over
nmen
t
Divi
dend
rece
ipts
by C
entr
al
Gov
ernm
ent
Disin
vestm
ents
re
ceip
ts by
Cen
tral
G
over
nmen
t
No. o
f Yea
rs
Rate
of i
nter
est
(r)
1+r
Ince
ptio
n va
lue o
f eq
uity
add
ed
Ince
ptio
n va
lue o
f G
rant
s\ su
bsid
y
PV o
f di
sinve
stmen
ts re
ceip
ts
PV o
f div
iden
d re
ceip
ts
Cost
of
inve
stm
ent
Mar
ket v
alue
of
Shar
e
Curr
ent v
alue
of
inve
stm
ent
ROI (
Annu
al
Aver
age R
ate)
ROI (
CAG
R)
a b C d e F G h i j k L M N o p q r
(1+h
)
c/pro
duct
of i
sinc
e in
cept
ion
to y
ear v
alue
of
(g-1
)
d/pr
oduc
t of i
sinc
e in
cept
ion
to y
ear v
alue
of
(g-1
)
f*pr
oduc
t of i
from
the
year
to th
e las
t yea
r
e*pr
oduc
t of i
from
the
year
to th
e las
t yea
r
b+Σj+Σ
k
o+Σl+Σ
m
((r-n
)/n)/g
*100
((p/n
)^1/
g-1)
*100
2000-01 1123309 41010 0 260949 12792 1 0.1095 1.1095 41010 0 53830 1098066 1164319 3698737 4850633 316.61 316.61 2001-02 1111402 8615 0 353168 0 2 0.0944 1.0944 7765 0 0 1339450 1160177 5141421 7632766 278.95 156.50 2002-03 1120424 4981 0 648409 0 3 0.0734 1.0734 4102 0 0 2247074 1173301 5515692 10254111 257.98 105.98 2003-04 1120424 38649 384 683554 1216976 4 0.0571 1.0571 29653 295 3929063 2206885 1203249 14046223 24920591 492.78 113.33 2004-05 1901679 22550 59110 1154740 268407 5 0.0611 1.0611 16367 42902 819757 3526754 2043773 23016293 38237172 354.18 79.64 2005-06 1901679 13578 2000 1134864 0 6 0.0734 1.0734 9287 1368 0 3266469 2054428 36851808 55339156 432.28 73.14 2006-07 2004724 151848 9277 1334669 0 7 0.0789 1.0789 96763 5912 0 3578876 2260148 38702557 60768781 369.82 60.04 2007-08 2387346 26085 39652 1429807 99482 8 0.0812 1.0812 15406 23420 247250 3553606 2681596 78860843 104727922 475.68 58.11 2008-09 2387346 68391 13180 1340456 0 9 0.0769 1.0769 37360 7200 0 3081330 2726157 57815312 86763722 342.52 46.88 2009-10 3526595 125038 282000 1571232 2267040 10 0.0723 1.0723 63428 143050 4839156 3353905 4071883 100640308 137781778 328.37 42.21 2010-11 4480096 225217 18000 2065446 2214954 11 0.0792 1.0792 106543 8515 4409191 4111573 5140442 117267448 162929682 279.05 36.92 2011-12 4480096 8671 0 2540757 1389405 12 0.0852 1.0852 3801 0 2562837 4686572 5144243 88476618 141388261 220.71 31.80 2012-13 4592296 49199 13000 2785930 2404814 13 0.0836 1.0836 19873 5251 4087558 4735356 5281568 71191349 132925906 185.91 28.16 2013-14 4592296 73364 0 3752151 1423613 14 0.0845 1.0845 27348 0 2233086 5885639 5308916 66214638 136067920 175.93 26.07 2014-15 4595911 19200 16500 2855537 2432259 15 0.0851 1.0851 6600 5671 3517982 4130206 5324802 80797181 158298652 191.52 25.38 2015-16 4595911 12003 55202 3369753 1850317 16 0.0789 1.0789 3802 17486 2466381 4491714 5346090 64959270 149418836 168.43 23.14 2016-17 4595911 477947 60881 3649950 2952040 17 0.0716 1.0716 140327 17875 3647163 4509410 5504291 87475931 180092070 186.58 22.77 2017-18 4967158 431016 55437 3736271 4344269 18 0.0697 1.0697 118092 15189 5008606 4307631 6008819 96830604 198762980 178.21 21.46 2018-19 5002984 71324 368453 3421956 4031110 19 0.0778 1.0778 18269 94373 4344730 3688184 6157288 78761971 188727261 156.06 19.74 2019-20 5223730 175698 697555 2987694 1243307 20 0.0685 1.0685 41754 165770 1431829 3440716 6585557 49331450 164169285 119.64 17.45

Report No. 12 of 2021
31
ROI (Annual Average Rate) indicates a continuous declining trend since 2007-08 as it was 475.68 per cent in 2007-08, which has reduced to 119.64 per cent in 2019-20.
ROI (Annual Average Rate) and ROI (CAGR) of listed CPSEs under the category of monopoly and non-monopoly companies were calculated and the results for the last three years are given in Table 1.25.
Table 1.25: ROI (Average Annual Rate) and ROI (CAGR) for monopoly and non-monopoly listed CPSEs during 2017-18 to 2019-20
(in per cent)
ROI (Average Annual Rate) ROI (CAGR)
2017-18 2018-19 2019-20 2017-18 2018-19 2019-20
Listed Monopoly CPSEs
544.37 504.81 404.64 29.08 27.22 24.64
Listed Non-monopoly CPSEs
137.37 117.58 88.04 19.77 18.03 15.74
Listed CPSE wise ROI (Average Annual Rate) and ROI (CAGR) for last three years is given in Table 1.26.
Table 1.26: ROI (Average Annual Rate) and ROI (CAGR) of CPSEs during 2017-18 to 2019-20
(in per cent)
Sl. No.
CPSE ROI (Average Annual Rate) ROI (CAGR)
2017-18 2018-19 2019-20 2017-18 2018-19 2019-20
1. Bharat Heavy Electricals Limited 726.42 677.61 453.85 31.15 29.19 25.35
2. Engineers India Limited 603.63 522.44 428.42 29.82 27.45 25
3. Power Finance Corporation Limited 187.35 196.58 162.91 30.08 28.69 25.41
4. GAIL (India) Limited 430.84 421.7 206.89 27.43 26.03 20.6
5. Housing and Urban Development Corporation Limited
501.95 159.15 50.43 501.95 104.52 35.95
6. IFCI Limited 28.39 15.7 1.47 18.03 11.17 1.4
7. Indian Oil Corporation Limited 411.3 386.65 292.48 27.11 25.47 22.67
8. MOIL Limited 628.8 523.35 423.92 63.59 53.78 45.79
9. National Fertilizers Limited 56.91 47.29 38.4 14.39 12.87 11.41
10. NHPC Limited 35.63 30.97 26.03 17.31 15.14 13.07
11. NTPC Limited 203.61 188.55 152.5 27.35 25.25 22.41
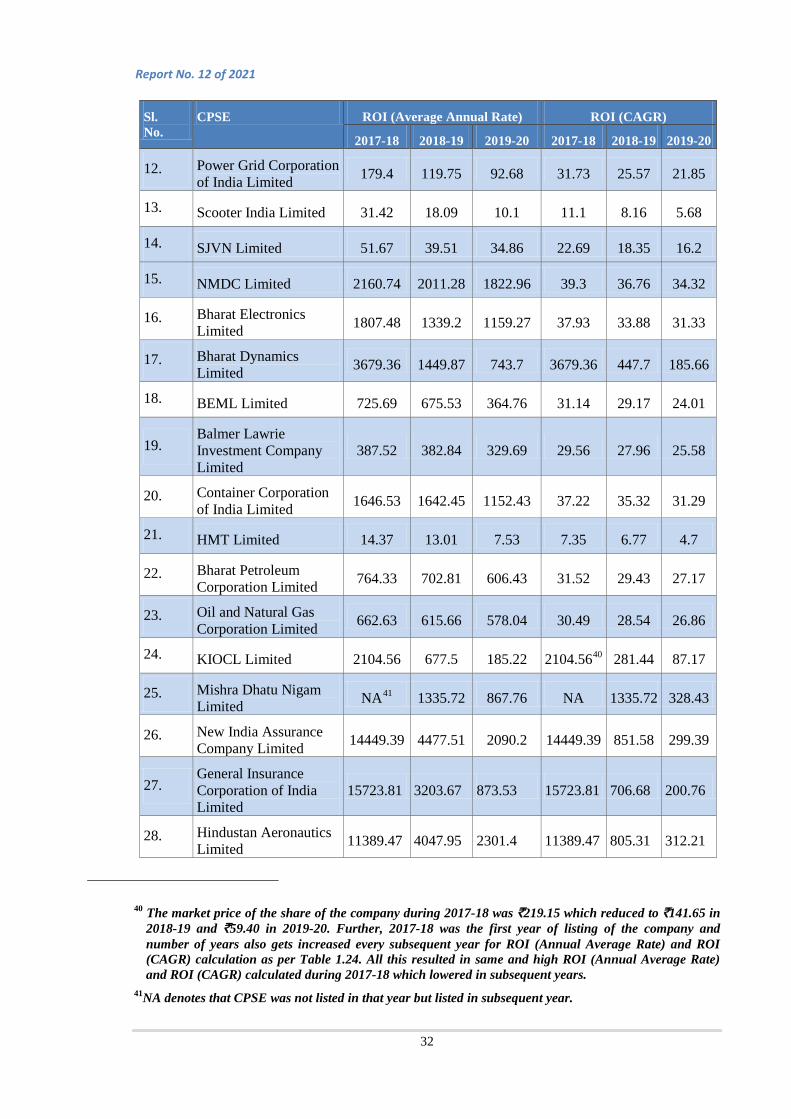
Report No. 12 of 2021
32
Sl. No.
CPSE ROI (Average Annual Rate) ROI (CAGR)
2017-18 2018-19 2019-20 2017-18 2018-19 2019-20
12. Power Grid Corporation of India Limited 179.4 119.75 92.68 31.73 25.57 21.85
13. Scooter India Limited 31.42 18.09 10.1 11.1 8.16 5.68
14. SJVN Limited 51.67 39.51 34.86 22.69 18.35 16.2
15. NMDC Limited 2160.74 2011.28 1822.96 39.3 36.76 34.32
16. Bharat Electronics Limited 1807.48 1339.2 1159.27 37.93 33.88 31.33
17. Bharat Dynamics Limited 3679.36 1449.87 743.7 3679.36 447.7 185.66
18. BEML Limited 725.69 675.53 364.76 31.14 29.17 24.01
19. Balmer Lawrie Investment Company Limited
387.52 382.84 329.69 29.56 27.96 25.58
20. Container Corporation of India Limited 1646.53 1642.45 1152.43 37.22 35.32 31.29
21. HMT Limited 14.37 13.01 7.53 7.35 6.77 4.7
22. Bharat Petroleum Corporation Limited 764.33 702.81 606.43 31.52 29.43 27.17
23. Oil and Natural Gas Corporation Limited 662.63 615.66 578.04 30.49 28.54 26.86
24. KIOCL Limited 2104.56 677.5 185.22 2104.5640 281.44 87.17
25. Mishra Dhatu Nigam Limited NA41 1335.72 867.76 NA 1335.72 328.43
26. New India Assurance Company Limited 14449.39 4477.51 2090.2 14449.39 851.58 299.39
27. General Insurance Corporation of India Limited
15723.81 3203.67 873.53 15723.81 706.68 200.76
28. Hindustan Aeronautics Limited 11389.47 4047.95 2301.4 11389.47 805.31 312.21
40 The market price of the share of the company during 2017-18 was `219.15 which reduced to `141.65 in 2018-19 and `59.40 in 2019-20. Further, 2017-18 was the first year of listing of the company and number of years also gets increased every subsequent year for ROI (Annual Average Rate) and ROI (CAGR) calculation as per Table 1.24. All this resulted in same and high ROI (Annual Average Rate) and ROI (CAGR) calculated during 2017-18 which lowered in subsequent years.
41NA denotes that CPSE was not listed in that year but listed in subsequent year.

Report No. 12 of 2021
33
Sl. No.
CPSE ROI (Average Annual Rate) ROI (CAGR)
2017-18 2018-19 2019-20 2017-18 2018-19 2019-20
29. Mahanagar Telephone Nigam Limited 38.34 32.7 28.1 12.17 10.96 9.91
30. Coal India Limited 638.84 543.59 433.43 63.91 54.42 46.11
31. Oil India Limited 779.18 627.32 487.94 60.61 51.51 43.87
32. Steel Authority of India Limited 74.89 63.36 45.95 16.01 14.47 12.31
33. Andrew Yule and Company Limited 27.47 15.83 3.3 10.41 7.58 2.56
34. Hindustan Copper Limited 108.69 90.48 61.47 18.29 16.5 13.81
35. MSTC Limited NA 1149.25 460.48 NA 1149.25 219.52
36. National Aluminium Company Limited 183.11 170.51 146.42 21.63 20.28 18.59
37. Shipping Corporation of India Limited 164.2 141.23 133.96 20.92 19.13 18.09
38. Rashtriya Chemicals & Fertilisers Limited 60.38 51.31 6.11 14.73 13.31 4.07
39. Hindustan Organics Chemicals Limited (-)3.16 (-)3 (-)4.07 (-)4.55 (-)4.35 (-)8.08
40. Bharat Immunologicals and Biologicals Corporation Limited
5.88 (-)1.03 (-)1.96 4.09 (-)1.14 (-)2.46
41. ITI Limited 8.6 7.69 3.24 5.33 4.85 2.53
42. NLC (India) Limited 117.35 127.91 115.9 18.77 18.54 17.27
43. Cochin Shipyard Limited 5063.7 2139.79 1071.39 5063.7 561.78 221.21
44. Fertilisers and Chemicals Travancore Limited
37.75 19.53 15.05 12.09 8.5 7.19
45. Madras Fertilisers Limited 54.88 21.1 3.82 33.7 15.5 3.5
46. NBCC (India) Limited 1719.19 1005.26 303.27 116.91 83.99 49.73
47. STC Limited 154.56 146.55 68.13 22.5 21.1 15.44
48. MMTC Limited 857.41 667.12 393.94 36.08 32.16 26.81
49. Indian Tourism Development
723.83 389.85 163.9 88.2 61.2 39.22

Report No. 12 of 2021
34
Sl. No.
CPSE ROI (Average Annual Rate) ROI (CAGR)
2017-18 2018-19 2019-20 2017-18 2018-19 2019-20 Corporation Limited
50. Garden Reach Shipbuilders & Engineers Limited
NA 648.63 486.7 NA 648.63 227.63
51. Rail Vikas Nigam Limited
NA NA 48.41 NA NA 48.41
52. Indian Railway Catering and Tourism Corporation
NA NA 2265.10 NA NA 2265.10
53. IRCON International Limited
NA 4285.73 1942.62 NA 4285.73 531.29
54. RITES Limited NA 2517.34 1,336.20 NA 2517.34 426.54
It was noticed that there is large variation in ROI (Average Annual Rate) and ROI (CAGR) of CPSEs. The following are the main reasons for large variations:
• Recent listing of the CPSEs; • Fluctuations in market price of the share of the CPSEs; • Fluctuations in the amount of dividend and disinvestment receipts by the Central
Government from the CPSEs; • Equity infused and grants/ subsidies given by the Central Government in CPSEs; and • Number of years during which the funds of Central Government remained invested in
the CPSE.
Out of 54 listed CPSEs, five CPSEs42 were not listed in 2017-18 whereas two CPSEs43 were listed only during 2019-20. From the review of ROI (Average Annual Rate) and ROI (CAGR) of 54 listed CPSEs, it was observed that ROI (Average Annual Rate) of 44 CPSEs and ROI (CAGR) of 46 CPSEs have reduced during the last three years from 2017-18 to 2019-20.
1.4.6 Performance of listed CPSEs with private companies
The performance of 36 listed CPSEs44 on the parameters of five ratios (ROE, ROCE, Earnings Per Share, Price Earnings Ratio and ICR) was compared with private companies with similar nature of business during the last five years from 2015-16 to 2019-20. The comparison revealed the following results:
42Mishra Dhatu Nigam Limited, MSTC Limited, Garden Reach Shipbuilders & Engineers Limited, IRCON International Limited, RITES Limited. 43Indian Railway Catering and Tourism Corporation Limited and Rail Vikas Nigam Limited were listed on the stock exchange during 2019-20. 44Shares of only 47 CPSEs were traded during the last five years. In case of 11 CPSEs no listed private companies with similar nature of business were found, hence 36 CPSEs were considered for comparison.

Report No. 12 of 2021
35
ROE: ROE in 16 out of 36 listed CPSEs was on the lower side as compared to private companies with similar nature of business for three or more years during the last five years. (Annexure-XIII).
ROCE: ROCE in 17 out of 36 listed CPSEs was on the lower side as compared to private companies with similar nature of business for three or more years during the last five years. (Annexure-XIV).
Earnings Per Share (EPS): EPS in respect of 29 out of 36 listed CPSEs was on the lower side as compared to private companies with similar nature of business for three or more years during the last five years. (Annexure-XV).
Price Earnings (P/E) Ratio45: P/E Ratio in respect of 28 out of 36 listed CPSEs was on the lower side as compared to private companies with similar nature of business for three or more years during the last five years. (Annexure-XVI).
ICR: ICR in respect of 17 out of 36 listed CPSEs was on the lower side as compared to private companies with similar nature of business for three or more years during the last five years. (Annexure-XVII).
In respect of 10 CPSEs, all the above parameters were less in comparison to private companies in same sector for three or more years. This indicates their lower performance in comparison to private companies with similar nature of business.
1.4.7 Sales and Marketing
During 2019-20, the total sales of 427 Government companies and corporations was `24,33,337 crore as compared to `24,99,682 crore in 407 CPSEs during 2018-19. Out of these 427 CPSEs, 130 CPSEs sold goods/ rendered services worth `2,71,007 crore to Government sector out of their sales of `11,58,179 crore. The overall percentage of sales of these 130 CPSEs to the Government sector with reference to their total sales worked out to 23.42 per cent.
Out of 427 CPSEs, 65CPSEs had exported goods/ services worth `1,18,997 crore (6.41 per cent of their total sales amounting to `18,56,711 crore) whereas 58 CPSEs had imported goods/ services worth `4,41,564 crore resulting in net import of `3,22,567 crore by the CPSEs.
The details of total sales, sales to Government sector and exports thereon in respect of monopoly and non-monopoly CPSEs are given in Table 1.27.
45Price Earnings Ratio (P/E Ratio) is the ratio for valuing a company that measures its current share price relative to its per – share earnings. The P/E ratio is calculated as Market Value per Share/ Earnings per Share.

Report No. 12 of 2021
36
Table 1.27: Sales details of Monopoly Vs. Non-monopoly CPSEs (` in crore)
Type /Year No of CPSEs
Total sales Sales to Government
sector
Export sales
Monopoly CPSEs
2017-18 58 12,50,833 58,260 27,135
2018-19 60 14,95,642 46,501 42,995
2019-20 63 14,25,157 50,357 44,308
Non-monopoly CPSEs
2017-18 332 9,03,889 1,76,977 48,191
2018-19 347 10,04,040 1,98,084 69,915
2019-20 364 10,08,180 2,20,650 74,689
Total
2017-18 390 21,54,722 2,35,237 75,326
2018-19 407 24,99,682 2,44,585 1,12,910
2019-20 427 24,33,337 2,71,007 1,18,997
Against the total sales of `24,33,337 crore by 427 CPSEs, the export sales by 65 CPSEs was 4.89 per cent (`1,18,997 crore). The CPSEs with export sales of more than `5,000 crore is given in Table 1.28.
Table 1.28: CPSEs with export sales of more than `5,000 crore during 2019-20 (` in crore)
Sl. No. CPSE Export sales
1 Indian Oil Corporation Limited 21,841
2 Mangalore Refinery and Petrochemicals Limited 20,823
3 ONGC Videsh Limited 12,192
4 Bharat Petroleum Corporation Limited 9,167
5 ONGC Petro Additions Limited 8,220
6 Oil and Natural Gas Corporation Limited 6,289
7 Hindustan Petroleum Corporation Limited 6,203
Total 84,735
The export sales of these seven CPSEs accounted for 71.21 per cent of the total export by all the 65 CPSEs.
1.4.8 Research & Development Patent of technology, product or invention enables the right of a company to exclude others from making, using or selling it. This also helps in recovering the development costs and to obtain a return of investment in the development of the patented technology. Registration of patent helps in limiting the risk that the technology, product or invention

Report No. 12 of 2021
37
developed on the same idea will be obtained by some other company. Table 1.29 indicates CPSE wise Research & Development expenditure vis-a-vis patents registered during the last three years.
Table 1.29: Research & Development Expenditure and Patents Registered
2017-18 2018-19 2019-20 R&D
expenditure (` in crore)
Patents registered
R&D expenditure (` in crore)
Patents registered
R&D expenditure (` in crore)
Patents registered
5,320 339 5,435 371 4,816 1,061
It was observed that Research & Development expenditure decreased by `619 crore during 2019-20 from `5,435 crore in 2018-19 to `4,816 crore in 2019-20 whereas patents registered increased by 690 during the same period.
Out of 1,061 patents registered during 2019-20, only 58 patents were commercialised by eight CPSEs and revenue of `275.47 crore was earned during 2019-20 as mentioned in the Table 1.30.
Table 1.30: Number of patents commercialised and revenue earned
Sl. No. CPSE Total expenditure on R&D (` in crore)
Patents registered
Patents commercialised
Revenue earned on commercialisation of patents (` in crore)
1 Artificial Limbs Manufacturing Corporation of India Limited
0.53 1 1 0
2 Bharat Petroleum Corporation Limited
92.18 12 4 254.07
3 Electronics Corporation of India Limited
47.43 8 2 0
4 Engineers India Limited 24.31 32 17 1.90
5 Hindustan Petroleum Corporation Limited
257.92 64 17 2.53
6 Indian Oil Corporation Limited
428.04 123 14 0
7 Konkan Railway Corporation Limited
0 1 1 1.19
8 Mishra Dhatu Nigam Limited 7.96 3 2 15.78
Total 858.37 244 58 275.47
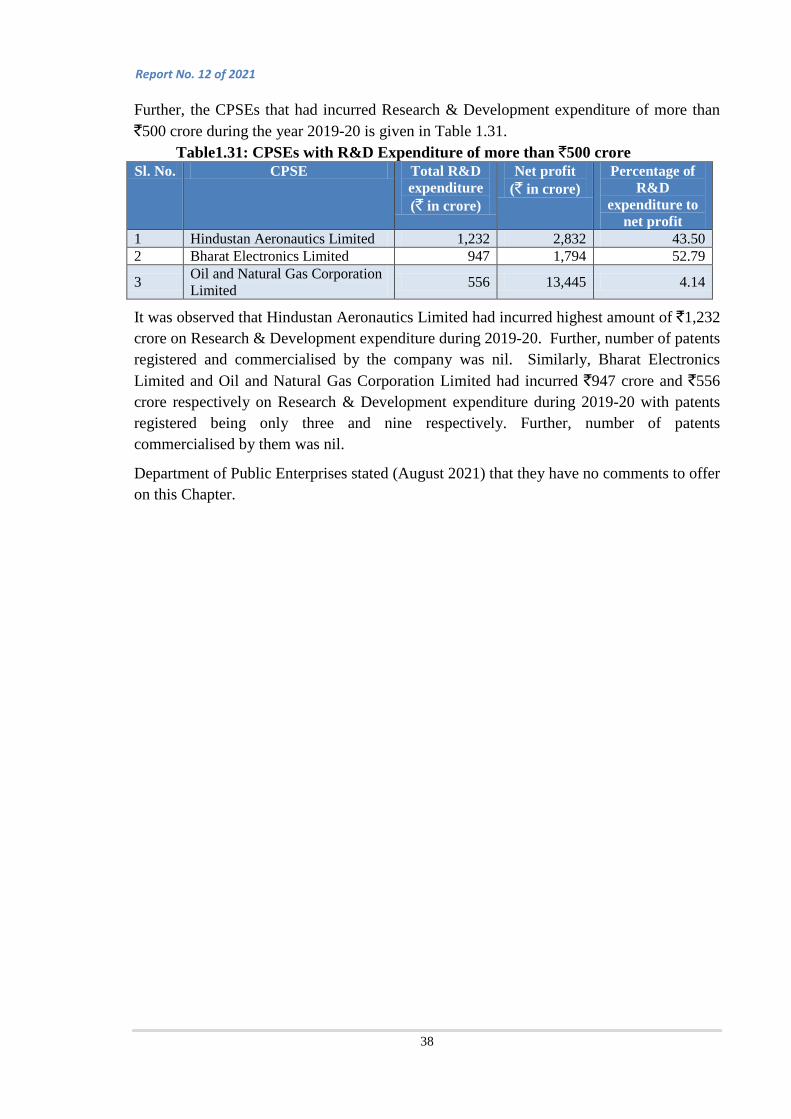
Report No. 12 of 2021
38
Further, the CPSEs that had incurred Research & Development expenditure of more than `500 crore during the year 2019-20 is given in Table 1.31.
Table1.31: CPSEs with R&D Expenditure of more than `500 crore Sl. No. CPSE Total R&D
expenditure (` in crore)
Net profit (` in crore)
Percentage of R&D
expenditure to net profit
1 Hindustan Aeronautics Limited 1,232 2,832 43.50 2 Bharat Electronics Limited 947 1,794 52.79
3 Oil and Natural Gas Corporation Limited 556 13,445 4.14
It was observed that Hindustan Aeronautics Limited had incurred highest amount of `1,232 crore on Research & Development expenditure during 2019-20. Further, number of patents registered and commercialised by the company was nil. Similarly, Bharat Electronics Limited and Oil and Natural Gas Corporation Limited had incurred `947 crore and `556 crore respectively on Research & Development expenditure during 2019-20 with patents registered being only three and nine respectively. Further, number of patents commercialised by them was nil.
Department of Public Enterprises stated (August 2021) that they have no comments to offer on this Chapter.

Report No. 12 of 2021
39
Oversight Role of CAG
CHAPTER II
2.1 Audit of Public Sector Enterprises
Comptroller & Auditor General of India (CAG) appoints the statutory auditors of a Government company and Government controlled other company under Section 139 (5) and (7) of the Companies Act, 2013. CAG has a right to conduct a supplementary audit and issue comments upon or supplement the Audit Report of the statutory auditor. Statutes governing some corporations require that their accounts be audited by the CAG and a report be submitted to the Parliament.
2.2. Appointment of statutory auditors of Public Sector Enterprises by CAG
Sections 139 (5) of the Companies Act, 2013 provides that the statutory auditors in case of a Government company or Government controlled other company are to be appointed by the CAG within a period of 180 days from the commencement of the financial year. The statutory auditors of these companies for the year 2019-2020 were appointed by the CAG during July and August 2019.
2.3 Submission of accounts by CPSEs
2.3.1 Need for timely submission
According to Section 394 of the Companies Act, 2013, Annual Report on the working and affairs of a Government company is to be prepared within three months of its Annual General Meeting (AGM). As soon as may be after such preparation, the Annual Report must be laid before both the Houses of Parliament, together with a copy of the Audit Report and comments of the CAG upon or as supplement to the Audit Report. Almost similar provisions exist in the respective Acts regulating Statutory Corporations. This mechanism provides the necessary parliamentary control over the utilization of public funds invested in the companies from the Consolidated Fund of India.
Section 96 of the Companies Act, 2013 requires every company to hold AGM of the shareholders once in every calendar year. It is also stated that not more than 15 months shall elapse between the date of one AGM and that of the next. The section further provides that in case of the first annual general meeting, it shall be held within a period of nine months from the date of closing of the first financial year of the company and in any other case, within a period of six months, from the date of closing of the financial year. The section also stipulates that the Registrar may, for any special reason, extend the time within which any annual general meeting, other than the first annual general meeting, shall be held, by a period not exceeding three months.
Statutory auditors of companies for the year 2019-2020 were appointed during July and August 2019.

Report No. 12 of 2021
40
Further, Section 129 of the Companies Act, 2013 stipulates that the audited Financial Statement for the financial year has to be placed in the said AGM for their consideration. The section also provides for levy of penalty like fine and imprisonment on the persons including directors of the company responsible for non-compliance with the provisions of Section 129 of the Companies Act, 2013.
Due to the difficulties faced by several companies in view of the Covid-19 Pandemic, Ministry of Corporate Affairs, vide circulars issued in May 2020 and August 2020, on one hand advised the companies to seek extension of date of holding the AGMs from the respective Registrar of Companies and on the other hand advised the Registrar of Companies to consider such applications for the period as applied for (upto three months) liberally. Thus, for the financial year 2019-2020, the Companies had the option to hold their AGMs by 31 December 2020 after taking approval from Registrar of Companies.
Despite this, annual accounts of various CPSEs were pending as on 31 December 2020, as detailed in the following paragraph.
2.3.2 Timeliness in preparation of accounts by Government Companies and Government Controlled Other Companies
As of 31 March 2020, there were 488 Government companies and 203 Government controlled other companies under the purview of CAG’s audit. Of these, accounts for the year 2019-20 were due from 459 Government companies and 197 Government controlled other companies. Accounts were not due from 29 Government companies and 6 Government controlled other companies, which were new. A total of 399 Government companies and 174 Government controlled other companies submitted their accounts for audit by CAG on or before 31 December 2020. Accounts of 60 Government companies and 23 Government controlled other companies were in arrears for various reasons. Details of arrears in submission of accounts of Government companies and Government controlled other companies are given in Table 2.1.
Table 2.1: Details of arrears of accounts Particulars
Government companies/ Government controlled other companies
Government companies
Government controlled other companies
Total
Total number of Companies under the purview of CAG’s audit as on 31.03.2020
488 203 691
Listed Unlisted Listed Unlisted Listed Unlisted
Listed/ Unlisted 63 425 7 196 70 621
Out of 691 companies, accounts of 83 companies were in arrears.

Report No. 12 of 2021
41
Particulars
Government companies/ Government controlled other companies
Government companies
Government controlled other companies
Total
Less: New Companies from which accounts for 2019-20 were not due
0 29 0 6 0 35
Number of companies from which accounts for 2019-20 were due
63 396 7 190 70 586
Number of companies which presented the accounts for CAG’s audit by 31.12.2020
63 336 7 167 70 503
Number of accounts in arrears 0 60 0 23 0 83
Break- up of Arrears
(i) Under Liquidation 0 20 0 8 0 28
(ii) Defunct 0 2 0 5 0 7
(iii) Others 0 38 0 10 0 48
Age–wise analysis of arrears against Others category
One year (2019-20) 0 18 0 5 0 23
Two years (2018-19 and 2019-20)
0 5 0 1 0 6
Three years and more 0 15 0 4 0 19
The names of these companies are indicated in Annexure II A and Annexure II B.
2.3.3 Timeliness in preparation of accounts by Statutory Corporations
Audit of six Statutory Corporations is conducted by the CAG. Of the five Statutory Corporations where CAG is the sole auditor, accounts of Airports Authority of India, Inland Waterways Authority of India, National Highways Authority of India and Damodar Valley Corporation for the year 2019-20 were presented for audit before 31 December 2020. The accounts of Food Corporation of India for the year 2019-20 were awaited as on 31 December 2020. In case of Central Warehousing Corporation, CAG conducts supplementary audit and the accounts were received before 31 December 2020.
2.4 CAG’s oversight - Audit of accounts and supplementary audit
2.4.1 Financial reporting framework
Companies are required to prepare the financial statements in the format laid down in Schedule III to the Companies Act, 2013 and in adherence to the mandatory Accounting
Report No. 12 of 2021
42
Standards prescribed by the Central Government, in consultation with National Advisory Committee on Accounting Standards. The Statutory Corporations are required to prepare their accounts in the format prescribed under the rules, framed in consultation with the CAG and any other specific provision relating to accounts in the Act governing such corporations.
2.4.2 Audit of accounts of Government companies by Statutory Auditors
The statutory auditors appointed by the CAG under Section 139 of the Companies Act, 2013, conduct audit of accounts of the Government companies and submit their report thereon in accordance with Section 143 of the Companies Act, 2013.
The CAG plays an oversight role by monitoring the performance of the statutory auditors in audit of public sector undertakings with the overall objective that the statutory auditors discharge the functions assigned to them properly and effectively. This function is discharged by exercising the power to:
• issue directions to the statutory auditors under Section 143 (5) of the Companies Act, 2013 and
• supplement or comment upon the Statutory Auditors’ report under Section 143 (6) of the Companies Act, 2013.
2.4.3 Supplementary audit of accounts of Government companies
The prime responsibility for preparation of financial statements in accordance with the financial reporting framework prescribed under the Companies Act, 2013 or other relevant Act is of the management of an entity.
The statutory auditors appointed by the CAG under section 139 of the Companies Act, 2013 are responsible for expressing an opinion on the financial statements under section 143 of the Companies Act, 2013 based on an independent audit in accordance with the Standard Auditing Practices of Institute of Chartered Accountants of India (ICAI) and directions given by the CAG. The statutory auditors are required to submit the Audit Report to the CAG under Section 143 of the Companies Act, 2013.
The certified accounts of selected Government companies along with the report of the statutory auditors are reviewed by CAG by carrying out a supplementary audit. Based on such review, significant audit observations, if any, are reported under Section 143 (6) of the Companies Act, 2013 to be placed before the AGM.
2.5 Result of CAG’s oversight role
2.5.1 Audit of accounts of Government companies/ Government controlled other companies under Section 143 of the Companies Act, 2013 Financial statements for the year 2019-20 were received from 399 Government companies (including 63 listed companies), 174 Government controlled other companies (including seven
CAG reviewed accounts of 334 companies and 5 Statutory Corporations for the year 2019-2020.

Report No. 12 of 2021
43
listed companies) and five Statutory Corporations by 31 December 2020. Of these, accounts of 255 Government companies and 79 Government controlled other companies and five Statutory Corporations were reviewed in audit by the CAG.
In total, CAG reviewed accounts of 64 per cent of the Government companies and 45 per cent of Government controlled other companies out of the accounts received up to 31 December 2020. The results of the review are detailed below:
2.5.1.1 Amendment of Financial Statements
As a result of supplementary audit of the financial statements for the year ended 31 March 2020 conducted by the CAG, three Government companies and two Government controlled companies as detailed in Annexure XVIII amended its Financial Statements before laying the same in the AGM.
2.5.1.2 Revision of Statutory Auditors’ Report
As a result of supplementary audit of the financial statements for the year ended 31 March 2020 conducted by the CAG, the Statutory Auditors’ of 41 Government companies and 11 Government controlled other companies as detailed in Annexure XIX revised their report before laying of the financial statements of these companies in their AGM.
2.5.1.3 Significant comments of the CAG issued as supplement to the Statutory Auditors’ reports on Government companies/ Government controlled other companies Subsequent to the audit of the financial statements for the year 2019-20 by statutory auditors, the CAG conducted supplementary audit of the financial statements of the selected Government companies and Government controlled other companies. The list of CPSEs in respect of whom comments were issued is given in Annexure XX. Some of the significant comments issued on financial statements of Government companies and Government controlled other companies, the financial impact of which on the profitability was `4,185.75 crore and on assets/ liabilities was `15,376.62 crore, have been given below. Despite being pointed out in the past, a few companies viz. IFCI Limited (Para a.i.2), ITI Limited (Para a.ii.3), Mahanagar Telephone Nigam Limited (Para a.ii.5), Tungabhadra Steel Products Limited (Para b.ii.11), IRCON Davangere Haveri Highway Limited (Para b.iii.11) and Star Union Daiichi Life Insurance Company Limited (Para d.i.2) did not take corrective action, which has also been indicated below:
a. Listed Government companies a.i. Comments on Profitability
Sl. No.
Name of the Company Comment
1. Bharat Electronics Limited (Consolidated Financial Statements and Standalone Financial Statements)
Revenue from Operations was overstated by `225.12 crore due to inclusion of ‘Bill and Hold’ sales in respect of three overseas deliveries based on customer’s letters to postpone delivery in view of the COVID 19 logistic problems. This was not in accordance
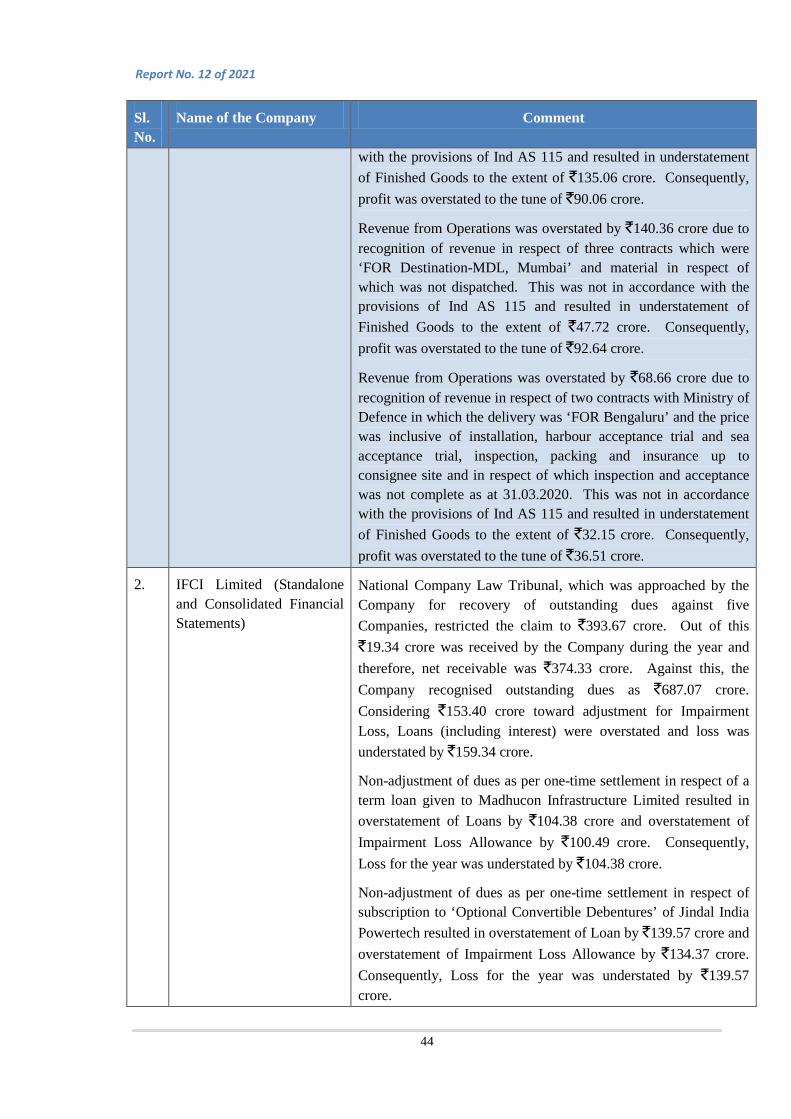
Report No. 12 of 2021
44
Sl. No.
Name of the Company Comment
with the provisions of Ind AS 115 and resulted in understatement of Finished Goods to the extent of `135.06 crore. Consequently, profit was overstated to the tune of `90.06 crore.
Revenue from Operations was overstated by `140.36 crore due to recognition of revenue in respect of three contracts which were ‘FOR Destination-MDL, Mumbai’ and material in respect of which was not dispatched. This was not in accordance with the provisions of Ind AS 115 and resulted in understatement of Finished Goods to the extent of `47.72 crore. Consequently, profit was overstated to the tune of `92.64 crore.
Revenue from Operations was overstated by `68.66 crore due to recognition of revenue in respect of two contracts with Ministry of Defence in which the delivery was ‘FOR Bengaluru’ and the price was inclusive of installation, harbour acceptance trial and sea acceptance trial, inspection, packing and insurance up to consignee site and in respect of which inspection and acceptance was not complete as at 31.03.2020. This was not in accordance with the provisions of Ind AS 115 and resulted in understatement of Finished Goods to the extent of `32.15 crore. Consequently, profit was overstated to the tune of `36.51 crore.
2. IFCI Limited (Standalone and Consolidated Financial Statements)
National Company Law Tribunal, which was approached by the Company for recovery of outstanding dues against five Companies, restricted the claim to `393.67 crore. Out of this `19.34 crore was received by the Company during the year and therefore, net receivable was `374.33 crore. Against this, the Company recognised outstanding dues as `687.07 crore. Considering `153.40 crore toward adjustment for Impairment Loss, Loans (including interest) were overstated and loss was understated by `159.34 crore.
Non-adjustment of dues as per one-time settlement in respect of a term loan given to Madhucon Infrastructure Limited resulted in overstatement of Loans by `104.38 crore and overstatement of Impairment Loss Allowance by `100.49 crore. Consequently, Loss for the year was understated by `104.38 crore.
Non-adjustment of dues as per one-time settlement in respect of subscription to ‘Optional Convertible Debentures’ of Jindal India Powertech resulted in overstatement of Loan by `139.57 crore and overstatement of Impairment Loss Allowance by `134.37 crore. Consequently, Loss for the year was understated by `139.57 crore.
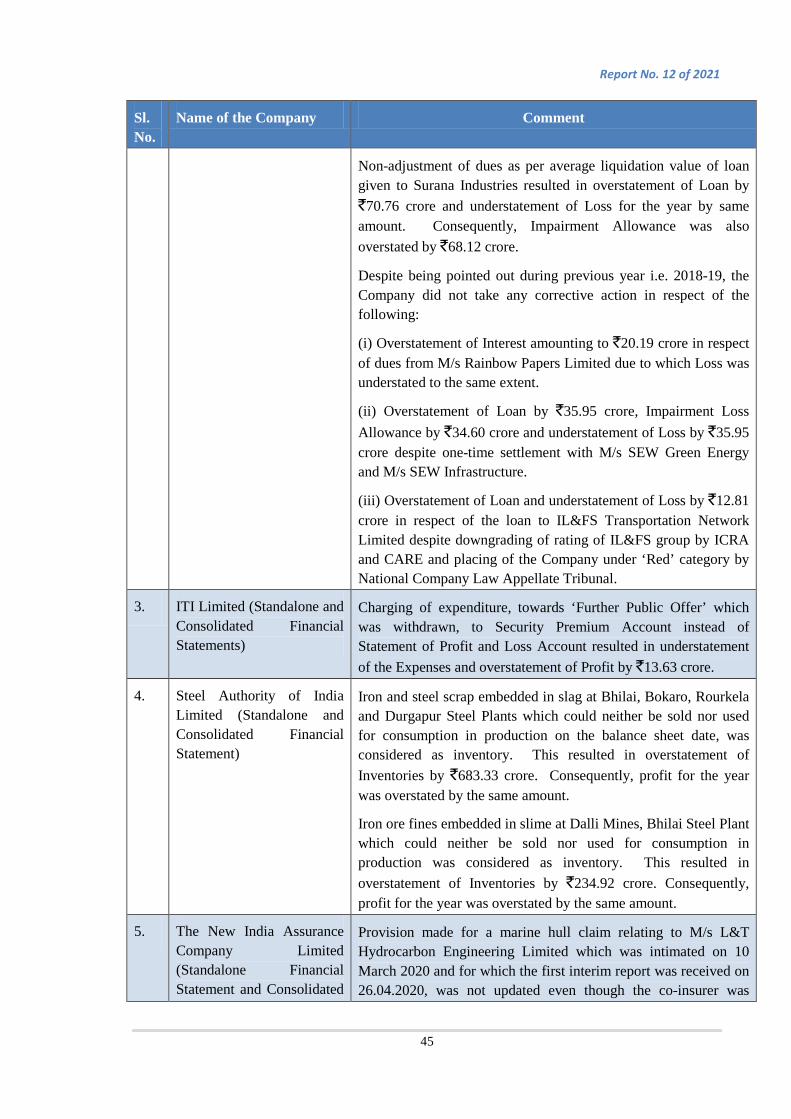
Report No. 12 of 2021
45
Sl. No.
Name of the Company Comment
Non-adjustment of dues as per average liquidation value of loan given to Surana Industries resulted in overstatement of Loan by `70.76 crore and understatement of Loss for the year by same amount. Consequently, Impairment Allowance was also overstated by `68.12 crore.
Despite being pointed out during previous year i.e. 2018-19, the Company did not take any corrective action in respect of the following:
(i) Overstatement of Interest amounting to `20.19 crore in respect of dues from M/s Rainbow Papers Limited due to which Loss was understated to the same extent.
(ii) Overstatement of Loan by `35.95 crore, Impairment Loss Allowance by `34.60 crore and understatement of Loss by `35.95 crore despite one-time settlement with M/s SEW Green Energy and M/s SEW Infrastructure.
(iii) Overstatement of Loan and understatement of Loss by `12.81 crore in respect of the loan to IL&FS Transportation Network Limited despite downgrading of rating of IL&FS group by ICRA and CARE and placing of the Company under ‘Red’ category by National Company Law Appellate Tribunal.
3. ITI Limited (Standalone and Consolidated Financial Statements)
Charging of expenditure, towards ‘Further Public Offer’ which was withdrawn, to Security Premium Account instead of Statement of Profit and Loss Account resulted in understatement of the Expenses and overstatement of Profit by `13.63 crore.
4. Steel Authority of India Limited (Standalone and Consolidated Financial Statement)
Iron and steel scrap embedded in slag at Bhilai, Bokaro, Rourkela and Durgapur Steel Plants which could neither be sold nor used for consumption in production on the balance sheet date, was considered as inventory. This resulted in overstatement of Inventories by `683.33 crore. Consequently, profit for the year was overstated by the same amount.
Iron ore fines embedded in slime at Dalli Mines, Bhilai Steel Plant which could neither be sold nor used for consumption in production was considered as inventory. This resulted in overstatement of Inventories by `234.92 crore. Consequently, profit for the year was overstated by the same amount.
5. The New India Assurance Company Limited (Standalone Financial Statement and Consolidated
Provision made for a marine hull claim relating to M/s L&T Hydrocarbon Engineering Limited which was intimated on 10 March 2020 and for which the first interim report was received on 26.04.2020, was not updated even though the co-insurer was
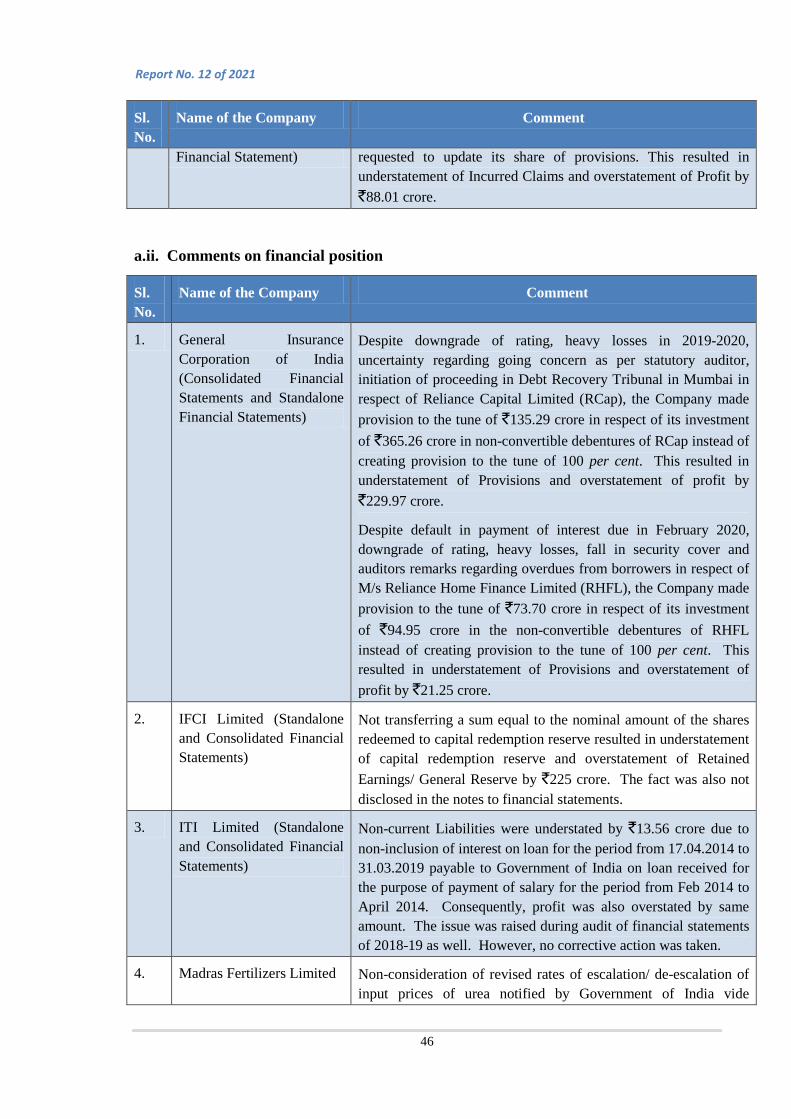
Report No. 12 of 2021
46
Sl. No.
Name of the Company Comment
Financial Statement) requested to update its share of provisions. This resulted in understatement of Incurred Claims and overstatement of Profit by `88.01 crore.
a.ii. Comments on financial position
Sl. No.
Name of the Company Comment
1. General Insurance Corporation of India (Consolidated Financial Statements and Standalone Financial Statements)
Despite downgrade of rating, heavy losses in 2019-2020, uncertainty regarding going concern as per statutory auditor, initiation of proceeding in Debt Recovery Tribunal in Mumbai in respect of Reliance Capital Limited (RCap), the Company made provision to the tune of `135.29 crore in respect of its investment of `365.26 crore in non-convertible debentures of RCap instead of creating provision to the tune of 100 per cent. This resulted in understatement of Provisions and overstatement of profit by `229.97 crore.
Despite default in payment of interest due in February 2020, downgrade of rating, heavy losses, fall in security cover and auditors remarks regarding overdues from borrowers in respect of M/s Reliance Home Finance Limited (RHFL), the Company made provision to the tune of `73.70 crore in respect of its investment of `94.95 crore in the non-convertible debentures of RHFL instead of creating provision to the tune of 100 per cent. This resulted in understatement of Provisions and overstatement of profit by `21.25 crore.
2. IFCI Limited (Standalone and Consolidated Financial Statements)
Not transferring a sum equal to the nominal amount of the shares redeemed to capital redemption reserve resulted in understatement of capital redemption reserve and overstatement of Retained Earnings/ General Reserve by `225 crore. The fact was also not disclosed in the notes to financial statements.
3. ITI Limited (Standalone and Consolidated Financial Statements)
Non-current Liabilities were understated by `13.56 crore due to non-inclusion of interest on loan for the period from 17.04.2014 to 31.03.2019 payable to Government of India on loan received for the purpose of payment of salary for the period from Feb 2014 to April 2014. Consequently, profit was also overstated by same amount. The issue was raised during audit of financial statements of 2018-19 as well. However, no corrective action was taken.
4. Madras Fertilizers Limited Non-consideration of revised rates of escalation/ de-escalation of input prices of urea notified by Government of India vide
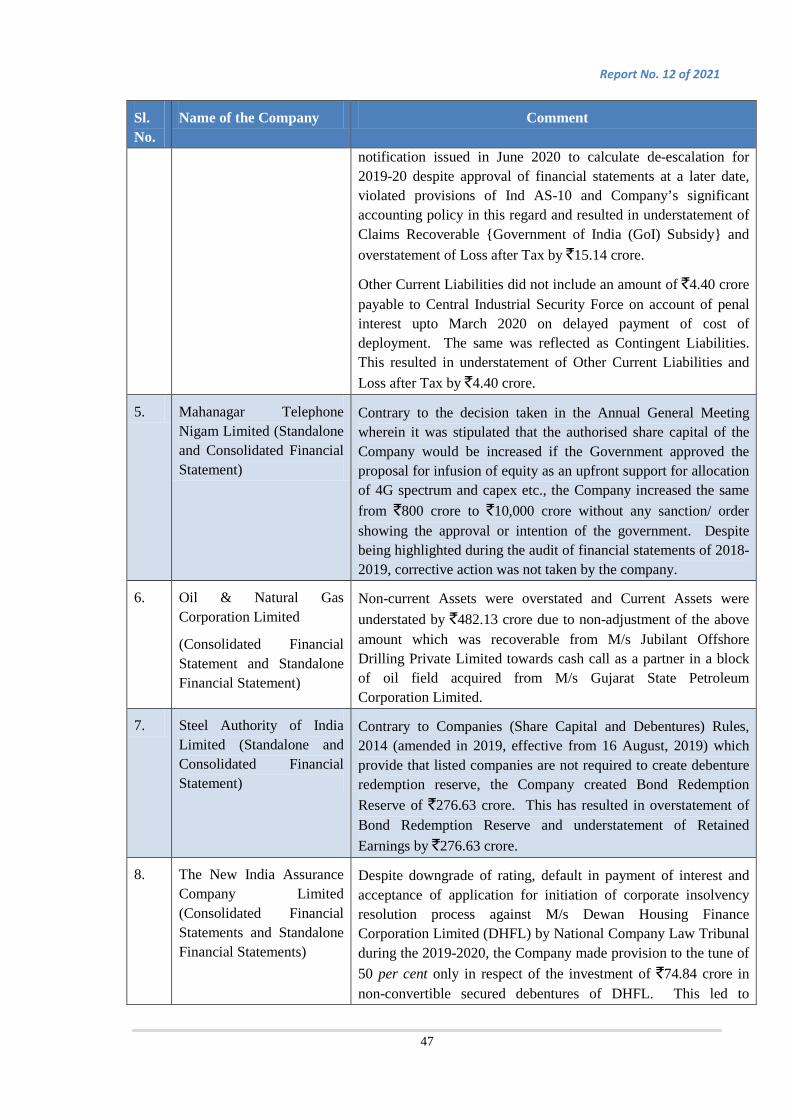
Report No. 12 of 2021
47
Sl. No.
Name of the Company Comment
notification issued in June 2020 to calculate de-escalation for 2019-20 despite approval of financial statements at a later date, violated provisions of Ind AS-10 and Company’s significant accounting policy in this regard and resulted in understatement of Claims Recoverable {Government of India (GoI) Subsidy} and overstatement of Loss after Tax by `15.14 crore.
Other Current Liabilities did not include an amount of `4.40 crore payable to Central Industrial Security Force on account of penal interest upto March 2020 on delayed payment of cost of deployment. The same was reflected as Contingent Liabilities. This resulted in understatement of Other Current Liabilities and Loss after Tax by `4.40 crore.
5. Mahanagar Telephone Nigam Limited (Standalone and Consolidated Financial Statement)
Contrary to the decision taken in the Annual General Meeting wherein it was stipulated that the authorised share capital of the Company would be increased if the Government approved the proposal for infusion of equity as an upfront support for allocation of 4G spectrum and capex etc., the Company increased the same from `800 crore to `10,000 crore without any sanction/ order showing the approval or intention of the government. Despite being highlighted during the audit of financial statements of 2018-2019, corrective action was not taken by the company.
6. Oil & Natural Gas Corporation Limited
(Consolidated Financial Statement and Standalone Financial Statement)
Non-current Assets were overstated and Current Assets were understated by `482.13 crore due to non-adjustment of the above amount which was recoverable from M/s Jubilant Offshore Drilling Private Limited towards cash call as a partner in a block of oil field acquired from M/s Gujarat State Petroleum Corporation Limited.
7. Steel Authority of India Limited (Standalone and Consolidated Financial Statement)
Contrary to Companies (Share Capital and Debentures) Rules, 2014 (amended in 2019, effective from 16 August, 2019) which provide that listed companies are not required to create debenture redemption reserve, the Company created Bond Redemption Reserve of `276.63 crore. This has resulted in overstatement of Bond Redemption Reserve and understatement of Retained Earnings by `276.63 crore.
8. The New India Assurance Company Limited (Consolidated Financial Statements and Standalone Financial Statements)
Despite downgrade of rating, default in payment of interest and acceptance of application for initiation of corporate insolvency resolution process against M/s Dewan Housing Finance Corporation Limited (DHFL) by National Company Law Tribunal during the 2019-2020, the Company made provision to the tune of 50 per cent only in respect of the investment of `74.84 crore in non-convertible secured debentures of DHFL. This led to
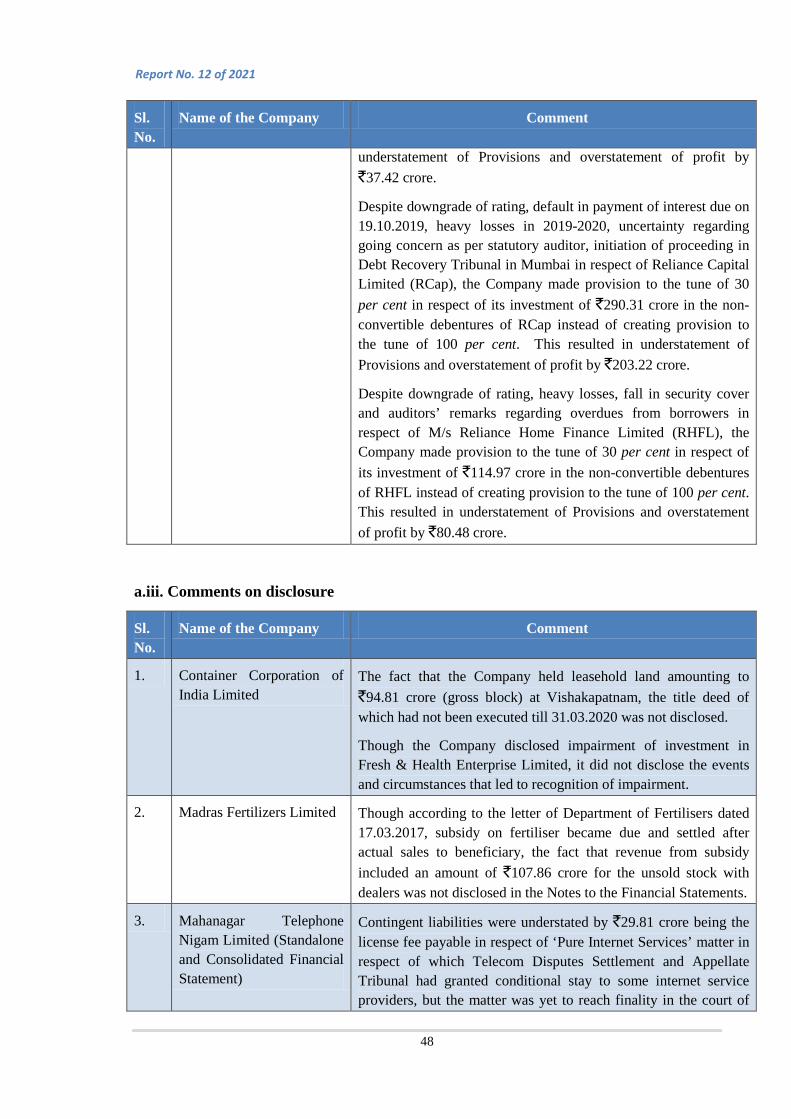
Report No. 12 of 2021
48
Sl. No.
Name of the Company Comment
understatement of Provisions and overstatement of profit by `37.42 crore.
Despite downgrade of rating, default in payment of interest due on 19.10.2019, heavy losses in 2019-2020, uncertainty regarding going concern as per statutory auditor, initiation of proceeding in Debt Recovery Tribunal in Mumbai in respect of Reliance Capital Limited (RCap), the Company made provision to the tune of 30 per cent in respect of its investment of `290.31 crore in the non-convertible debentures of RCap instead of creating provision to the tune of 100 per cent. This resulted in understatement of Provisions and overstatement of profit by `203.22 crore.
Despite downgrade of rating, heavy losses, fall in security cover and auditors’ remarks regarding overdues from borrowers in respect of M/s Reliance Home Finance Limited (RHFL), the Company made provision to the tune of 30 per cent in respect of its investment of `114.97 crore in the non-convertible debentures of RHFL instead of creating provision to the tune of 100 per cent. This resulted in understatement of Provisions and overstatement of profit by `80.48 crore.
a.iii. Comments on disclosure
Sl. No.
Name of the Company Comment
1. Container Corporation of India Limited
The fact that the Company held leasehold land amounting to `94.81 crore (gross block) at Vishakapatnam, the title deed of which had not been executed till 31.03.2020 was not disclosed.
Though the Company disclosed impairment of investment in Fresh & Health Enterprise Limited, it did not disclose the events and circumstances that led to recognition of impairment.
2. Madras Fertilizers Limited Though according to the letter of Department of Fertilisers dated 17.03.2017, subsidy on fertiliser became due and settled after actual sales to beneficiary, the fact that revenue from subsidy included an amount of `107.86 crore for the unsold stock with dealers was not disclosed in the Notes to the Financial Statements.
3. Mahanagar Telephone Nigam Limited (Standalone and Consolidated Financial Statement)
Contingent liabilities were understated by `29.81 crore being the license fee payable in respect of ‘Pure Internet Services’ matter in respect of which Telecom Disputes Settlement and Appellate Tribunal had granted conditional stay to some internet service providers, but the matter was yet to reach finality in the court of
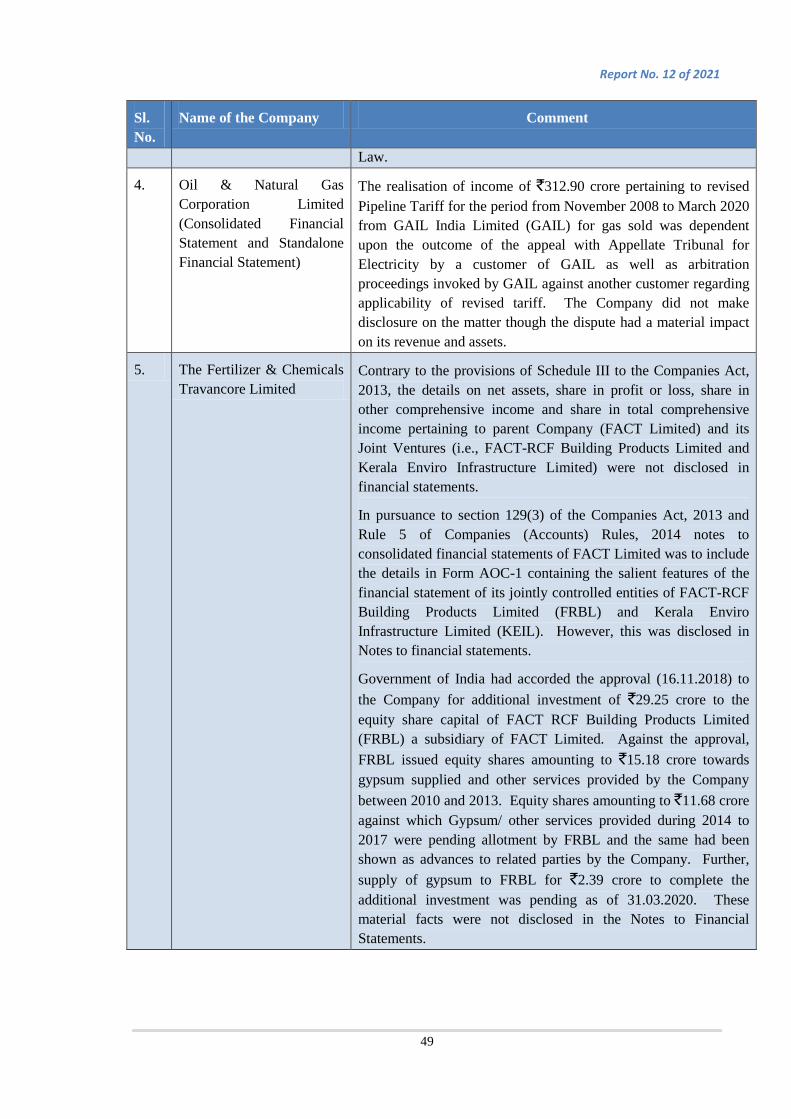
Report No. 12 of 2021
49
Sl. No.
Name of the Company Comment
Law.
4. Oil & Natural Gas Corporation Limited (Consolidated Financial Statement and Standalone Financial Statement)
The realisation of income of `312.90 crore pertaining to revised Pipeline Tariff for the period from November 2008 to March 2020 from GAIL India Limited (GAIL) for gas sold was dependent upon the outcome of the appeal with Appellate Tribunal for Electricity by a customer of GAIL as well as arbitration proceedings invoked by GAIL against another customer regarding applicability of revised tariff. The Company did not make disclosure on the matter though the dispute had a material impact on its revenue and assets.
5. The Fertilizer & Chemicals Travancore Limited
Contrary to the provisions of Schedule III to the Companies Act, 2013, the details on net assets, share in profit or loss, share in other comprehensive income and share in total comprehensive income pertaining to parent Company (FACT Limited) and its Joint Ventures (i.e., FACT-RCF Building Products Limited and Kerala Enviro Infrastructure Limited) were not disclosed in financial statements.
In pursuance to section 129(3) of the Companies Act, 2013 and Rule 5 of Companies (Accounts) Rules, 2014 notes to consolidated financial statements of FACT Limited was to include the details in Form AOC-1 containing the salient features of the financial statement of its jointly controlled entities of FACT-RCF Building Products Limited (FRBL) and Kerala Enviro Infrastructure Limited (KEIL). However, this was disclosed in Notes to financial statements.
Government of India had accorded the approval (16.11.2018) to the Company for additional investment of `29.25 crore to the equity share capital of FACT RCF Building Products Limited (FRBL) a subsidiary of FACT Limited. Against the approval, FRBL issued equity shares amounting to `15.18 crore towards gypsum supplied and other services provided by the Company between 2010 and 2013. Equity shares amounting to `11.68 crore against which Gypsum/ other services provided during 2014 to 2017 were pending allotment by FRBL and the same had been shown as advances to related parties by the Company. Further, supply of gypsum to FRBL for `2.39 crore to complete the additional investment was pending as of 31.03.2020. These material facts were not disclosed in the Notes to Financial Statements.

Report No. 12 of 2021
50
b. Unlisted Government companies
b.i. Comments on profitability
Sl. No.
Name of the Company Comment
1. Central Coalfields Limited Non-inclusion of cost of dumper operation pertaining to departmental projects in previous years lead to re-assessment and increase in the Mine Closure Plan claims by `251.47 crore in 2019-20 which should have been treated as event pertaining to prior years in compliance to the significant accounting policy and should have been adjusted against the retained earnings rather than booking the same as income for the year. Not doing so resulted in overstatement of Other Income as well as Profit for the year by `251.47 crore.
2. Higher Education Financing Agency
Interest received on deposits with bank was incorrectly booked as Other Income Instead of booking the same under Revenue from Operations which was not in compliance to Schedule III of the Companies Act 2013.
3. India Infrastructure Finance Company Limited (Consolidated and Standalone Financial Statement)
The Company extended loans of `730.57 crore to six special purpose vehicles promoted by IL&FS Transportation Networks Limited and to IL&FS Environment Infrastructure and Services Limited against which a provision of `366.68 crore was made. As per proceedings before National Company Law Appellate Tribunal available in public domain, all the above mentioned companies had been placed under Red category by the new Board of Directors appointed by the Union Government to manage the affairs of the IL&FS group of companies which meant that such entities were not in a position to meet their payment obligation towards even senior secured financial creditors. Accordingly, the entire loan of `730.57 crore in above companies should have been provided for. Not doing so has resulted in overstatement of Loan by `363.89 crore and understatement of Provisions to the same extent. Consequently, Profit was overstated by `363.89 crore.
4. Konkan Railway Corporation Limited
Depiction of the employee benefit expenses pertaining to prior periods from July 2017 to March 2019 in the current year instead of recasting of the financial statements as per Ind AS 8 resulted in overstatement of employee benefit expenses for the current year by `17.56 crore and understatement of profit of the company during the year by the same amount.
5. National Insurance Company Limited
As the claim ratio was less than 80 per cent under Swasthya Sathi Scheme, the Company was to refund premium of `194.43 crore to the Government of West Bengal as per the terms of the scheme. While refunding, an amount of `22.93 crore was adjusted by the
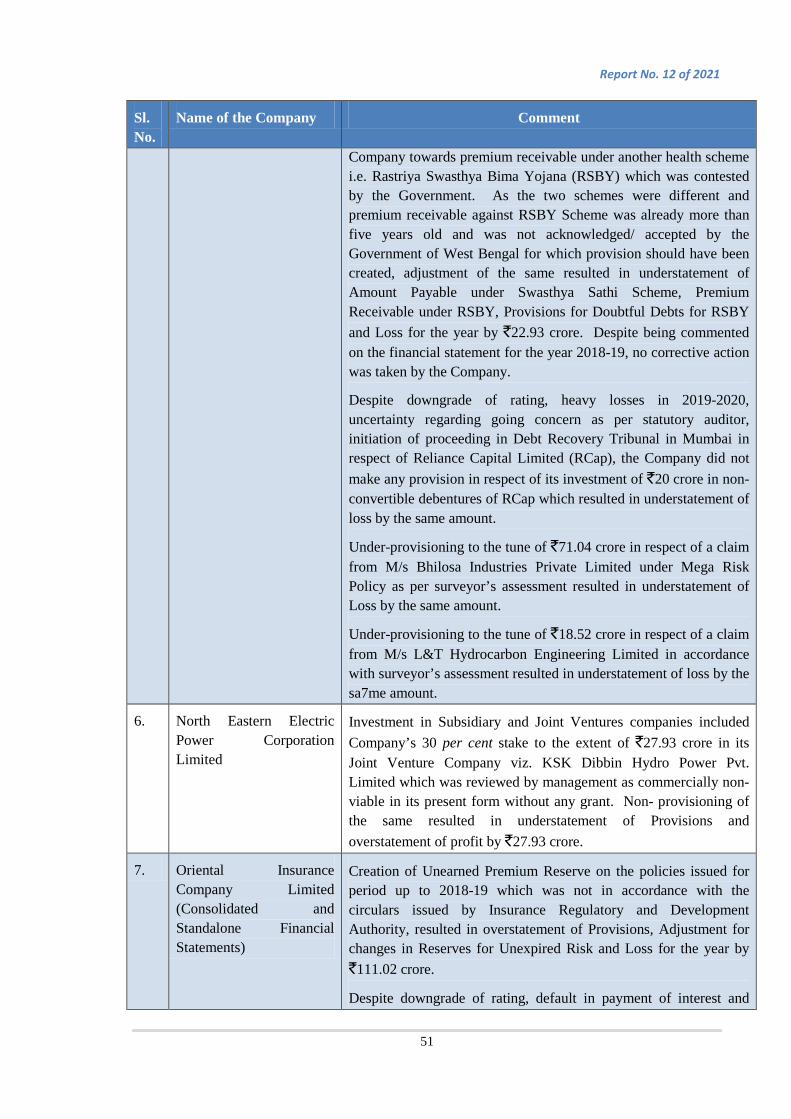
Report No. 12 of 2021
51
Sl. No.
Name of the Company Comment
Company towards premium receivable under another health scheme i.e. Rastriya Swasthya Bima Yojana (RSBY) which was contested by the Government. As the two schemes were different and premium receivable against RSBY Scheme was already more than five years old and was not acknowledged/ accepted by the Government of West Bengal for which provision should have been created, adjustment of the same resulted in understatement of Amount Payable under Swasthya Sathi Scheme, Premium Receivable under RSBY, Provisions for Doubtful Debts for RSBY and Loss for the year by `22.93 crore. Despite being commented on the financial statement for the year 2018-19, no corrective action was taken by the Company.
Despite downgrade of rating, heavy losses in 2019-2020, uncertainty regarding going concern as per statutory auditor, initiation of proceeding in Debt Recovery Tribunal in Mumbai in respect of Reliance Capital Limited (RCap), the Company did not make any provision in respect of its investment of `20 crore in non-convertible debentures of RCap which resulted in understatement of loss by the same amount.
Under-provisioning to the tune of `71.04 crore in respect of a claim from M/s Bhilosa Industries Private Limited under Mega Risk Policy as per surveyor’s assessment resulted in understatement of Loss by the same amount.
Under-provisioning to the tune of `18.52 crore in respect of a claim from M/s L&T Hydrocarbon Engineering Limited in accordance with surveyor’s assessment resulted in understatement of loss by the sa7me amount.
6. North Eastern Electric Power Corporation Limited
Investment in Subsidiary and Joint Ventures companies included Company’s 30 per cent stake to the extent of `27.93 crore in its Joint Venture Company viz. KSK Dibbin Hydro Power Pvt. Limited which was reviewed by management as commercially non-viable in its present form without any grant. Non- provisioning of the same resulted in understatement of Provisions and overstatement of profit by `27.93 crore.
7. Oriental Insurance Company Limited (Consolidated and Standalone Financial Statements)
Creation of Unearned Premium Reserve on the policies issued for period up to 2018-19 which was not in accordance with the circulars issued by Insurance Regulatory and Development Authority, resulted in overstatement of Provisions, Adjustment for changes in Reserves for Unexpired Risk and Loss for the year by `111.02 crore.
Despite downgrade of rating, default in payment of interest and
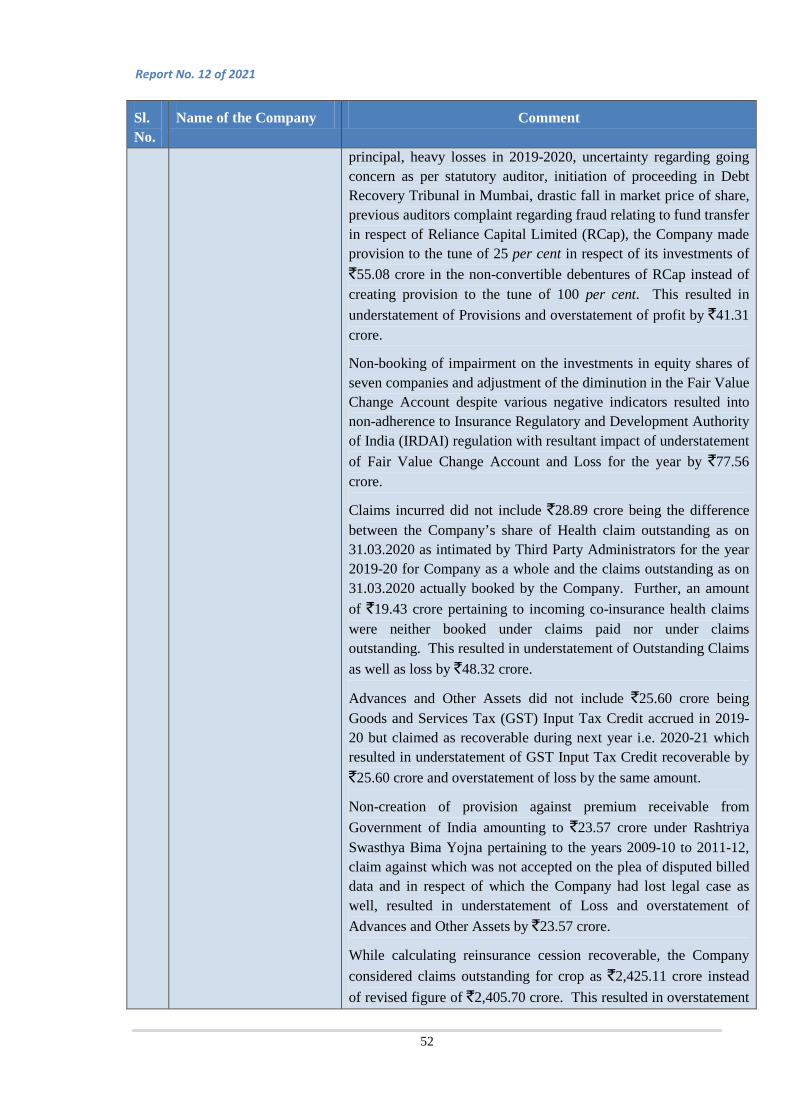
Report No. 12 of 2021
52
Sl. No.
Name of the Company Comment
principal, heavy losses in 2019-2020, uncertainty regarding going concern as per statutory auditor, initiation of proceeding in Debt Recovery Tribunal in Mumbai, drastic fall in market price of share, previous auditors complaint regarding fraud relating to fund transfer in respect of Reliance Capital Limited (RCap), the Company made provision to the tune of 25 per cent in respect of its investments of `55.08 crore in the non-convertible debentures of RCap instead of creating provision to the tune of 100 per cent. This resulted in understatement of Provisions and overstatement of profit by `41.31 crore.
Non-booking of impairment on the investments in equity shares of seven companies and adjustment of the diminution in the Fair Value Change Account despite various negative indicators resulted into non-adherence to Insurance Regulatory and Development Authority of India (IRDAI) regulation with resultant impact of understatement of Fair Value Change Account and Loss for the year by `77.56 crore.
Claims incurred did not include `28.89 crore being the difference between the Company’s share of Health claim outstanding as on 31.03.2020 as intimated by Third Party Administrators for the year 2019-20 for Company as a whole and the claims outstanding as on 31.03.2020 actually booked by the Company. Further, an amount of `19.43 crore pertaining to incoming co-insurance health claims were neither booked under claims paid nor under claims outstanding. This resulted in understatement of Outstanding Claims as well as loss by `48.32 crore.
Advances and Other Assets did not include `25.60 crore being Goods and Services Tax (GST) Input Tax Credit accrued in 2019-20 but claimed as recoverable during next year i.e. 2020-21 which resulted in understatement of GST Input Tax Credit recoverable by `25.60 crore and overstatement of loss by the same amount.
Non-creation of provision against premium receivable from Government of India amounting to `23.57 crore under Rashtriya Swasthya Bima Yojna pertaining to the years 2009-10 to 2011-12, claim against which was not accepted on the plea of disputed billed data and in respect of which the Company had lost legal case as well, resulted in understatement of Loss and overstatement of Advances and Other Assets by `23.57 crore.
While calculating reinsurance cession recoverable, the Company considered claims outstanding for crop as `2,425.11 crore instead of revised figure of `2,405.70 crore. This resulted in overstatement
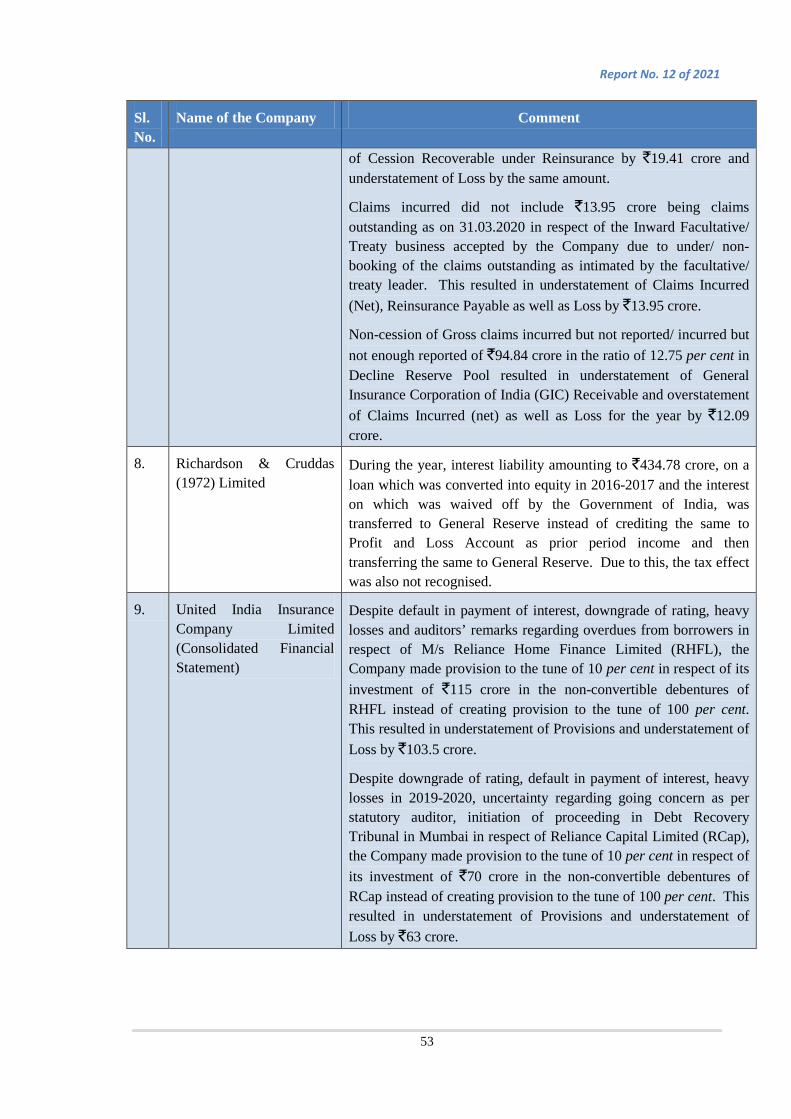
Report No. 12 of 2021
53
Sl. No.
Name of the Company Comment
of Cession Recoverable under Reinsurance by `19.41 crore and understatement of Loss by the same amount.
Claims incurred did not include `13.95 crore being claims outstanding as on 31.03.2020 in respect of the Inward Facultative/ Treaty business accepted by the Company due to under/ non-booking of the claims outstanding as intimated by the facultative/ treaty leader. This resulted in understatement of Claims Incurred (Net), Reinsurance Payable as well as Loss by `13.95 crore.
Non-cession of Gross claims incurred but not reported/ incurred but not enough reported of `94.84 crore in the ratio of 12.75 per cent in Decline Reserve Pool resulted in understatement of General Insurance Corporation of India (GIC) Receivable and overstatement of Claims Incurred (net) as well as Loss for the year by `12.09 crore.
8. Richardson & Cruddas (1972) Limited
During the year, interest liability amounting to `434.78 crore, on a loan which was converted into equity in 2016-2017 and the interest on which was waived off by the Government of India, was transferred to General Reserve instead of crediting the same to Profit and Loss Account as prior period income and then transferring the same to General Reserve. Due to this, the tax effect was also not recognised.
9. United India Insurance Company Limited (Consolidated Financial Statement)
Despite default in payment of interest, downgrade of rating, heavy losses and auditors’ remarks regarding overdues from borrowers in respect of M/s Reliance Home Finance Limited (RHFL), the Company made provision to the tune of 10 per cent in respect of its investment of `115 crore in the non-convertible debentures of RHFL instead of creating provision to the tune of 100 per cent. This resulted in understatement of Provisions and understatement of Loss by `103.5 crore.
Despite downgrade of rating, default in payment of interest, heavy losses in 2019-2020, uncertainty regarding going concern as per statutory auditor, initiation of proceeding in Debt Recovery Tribunal in Mumbai in respect of Reliance Capital Limited (RCap), the Company made provision to the tune of 10 per cent in respect of its investment of `70 crore in the non-convertible debentures of RCap instead of creating provision to the tune of 100 per cent. This resulted in understatement of Provisions and understatement of Loss by `63 crore.

Report No. 12 of 2021
54
b.ii. Comments on financial position
Sl. No.
Name of the Company Comment
1. Andhra Pradesh Solar Power Corporation Limited
No liability was created towards the engineering and supervision charges of `11.21 crore payable to Transmission Corporation of Andhra Pradesh Limited (APTRANSCO) for Ananthapuramu Ultra Mega Solar Park. Hence, Other Current liabilities and Capital Work- in- progress were understated to the tune of `11.21 crore.
2. BSNL Limited Provision as well as Loss were understated by `2,599.21 crore due to the following:
Particulars ` in crore
Non accounting of claim raised by LWE vendors on account of increase of Duty & Tax Rates in LWE Project
4.28
Non-accountal of liability towards Customer Authentication Form (CAF) penalty imposed by Department of Telecommunication
110.31
Non-provision of expenditure relating to pension contribution at maximum scale of pay for the period from 19.11.2009 to 01.12.2011
152.80
Non-accounting of provisional assessment of License Fee for the year 2012-13 and 2013-14
2,331.82
2,599.21
3. Electronics Corporation of India Limited
(Standalone and Consolidated Financial Statements)
Accounting of `19.85 crore under claims receivable from Department of Atomic Energy instead of adjusting against unspent grants resulted in overstatement of Claims Receivable and Overstatement of Other Liabilities by `19.85 crore.
While arriving at the taxable profit as per Income Tax Act, 1961, the Company deducted the value of Government Grants from the written down value of Fixed Assets. However, during computation of accounting profit, the value of Government Grants was not deducted while arriving at the carrying value of fixed assets. This resulted in understatement of deferred tax income by `15.61 crore and understatement of Profit after tax by `15.61 crore and corresponding understatement of Deferred Tax Assets by the same amount.
4. Haridaspur Paradip Fixed Deposit Receipts amounting to `76.92 crore having original
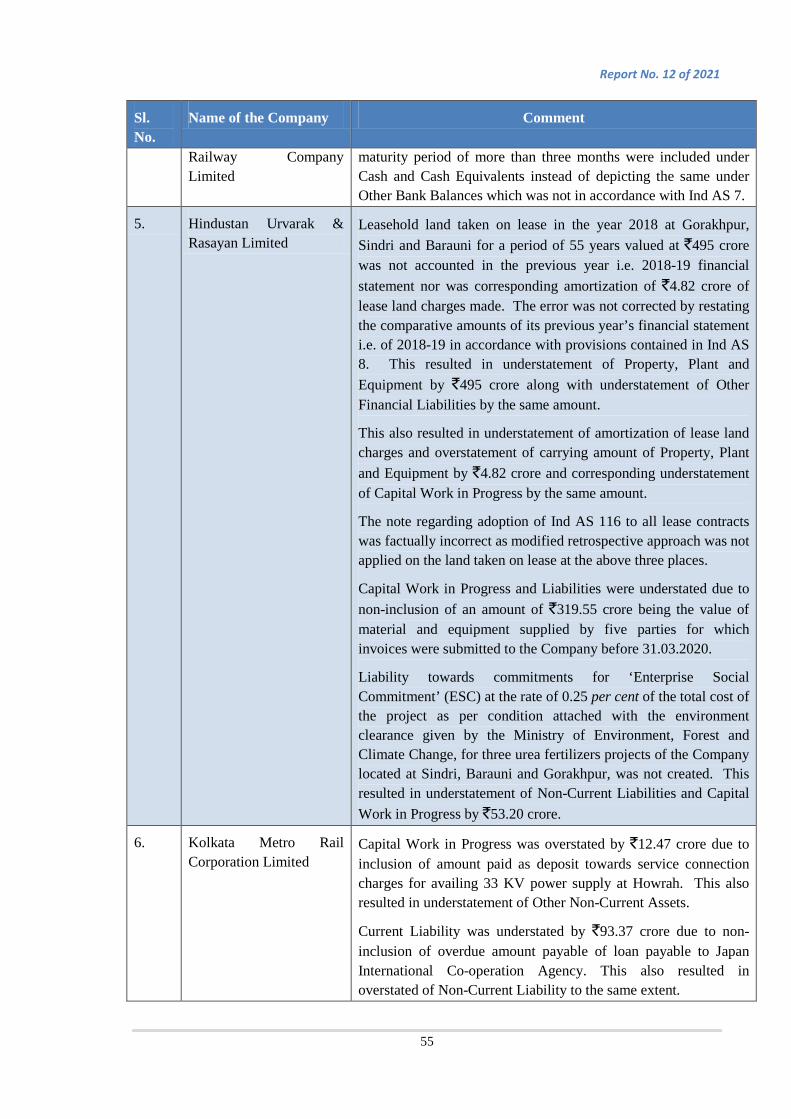
Report No. 12 of 2021
55
Sl. No.
Name of the Company Comment
Railway Company Limited
maturity period of more than three months were included under Cash and Cash Equivalents instead of depicting the same under Other Bank Balances which was not in accordance with Ind AS 7.
5. Hindustan Urvarak & Rasayan Limited
Leasehold land taken on lease in the year 2018 at Gorakhpur, Sindri and Barauni for a period of 55 years valued at `495 crore was not accounted in the previous year i.e. 2018-19 financial statement nor was corresponding amortization of `4.82 crore of lease land charges made. The error was not corrected by restating the comparative amounts of its previous year’s financial statement i.e. of 2018-19 in accordance with provisions contained in Ind AS 8. This resulted in understatement of Property, Plant and Equipment by `495 crore along with understatement of Other Financial Liabilities by the same amount.
This also resulted in understatement of amortization of lease land charges and overstatement of carrying amount of Property, Plant and Equipment by `4.82 crore and corresponding understatement of Capital Work in Progress by the same amount.
The note regarding adoption of Ind AS 116 to all lease contracts was factually incorrect as modified retrospective approach was not applied on the land taken on lease at the above three places.
Capital Work in Progress and Liabilities were understated due to non-inclusion of an amount of `319.55 crore being the value of material and equipment supplied by five parties for which invoices were submitted to the Company before 31.03.2020.
Liability towards commitments for ‘Enterprise Social Commitment’ (ESC) at the rate of 0.25 per cent of the total cost of the project as per condition attached with the environment clearance given by the Ministry of Environment, Forest and Climate Change, for three urea fertilizers projects of the Company located at Sindri, Barauni and Gorakhpur, was not created. This resulted in understatement of Non-Current Liabilities and Capital Work in Progress by `53.20 crore.
6. Kolkata Metro Rail Corporation Limited
Capital Work in Progress was overstated by `12.47 crore due to inclusion of amount paid as deposit towards service connection charges for availing 33 KV power supply at Howrah. This also resulted in understatement of Other Non-Current Assets.
Current Liability was understated by `93.37 crore due to non-inclusion of overdue amount payable of loan payable to Japan International Co-operation Agency. This also resulted in overstated of Non-Current Liability to the same extent.
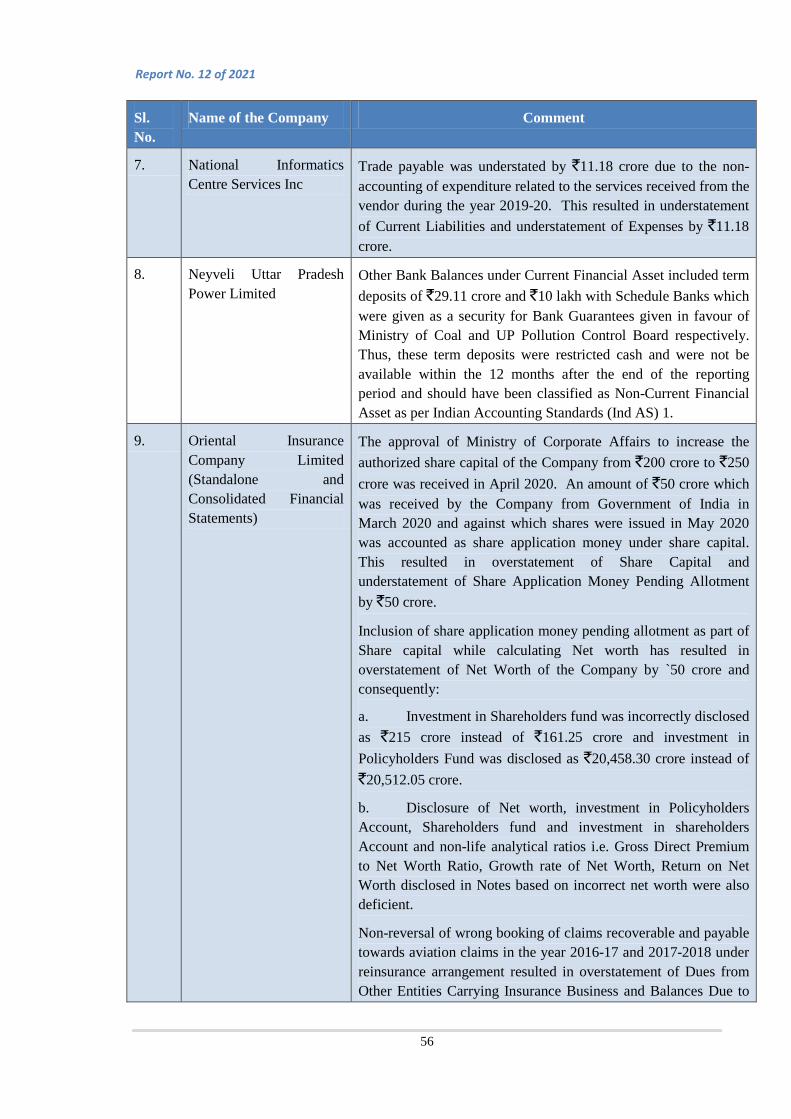
Report No. 12 of 2021
56
Sl. No.
Name of the Company Comment
7. National Informatics Centre Services Inc
Trade payable was understated by `11.18 crore due to the non-accounting of expenditure related to the services received from the vendor during the year 2019-20. This resulted in understatement of Current Liabilities and understatement of Expenses by `11.18 crore.
8. Neyveli Uttar Pradesh Power Limited
Other Bank Balances under Current Financial Asset included term deposits of `29.11 crore and `10 lakh with Schedule Banks which were given as a security for Bank Guarantees given in favour of Ministry of Coal and UP Pollution Control Board respectively. Thus, these term deposits were restricted cash and were not be available within the 12 months after the end of the reporting period and should have been classified as Non-Current Financial Asset as per Indian Accounting Standards (Ind AS) 1.
9. Oriental Insurance Company Limited (Standalone and Consolidated Financial Statements)
The approval of Ministry of Corporate Affairs to increase the authorized share capital of the Company from `200 crore to `250 crore was received in April 2020. An amount of `50 crore which was received by the Company from Government of India in March 2020 and against which shares were issued in May 2020 was accounted as share application money under share capital. This resulted in overstatement of Share Capital and understatement of Share Application Money Pending Allotment by `50 crore.
Inclusion of share application money pending allotment as part of Share capital while calculating Net worth has resulted in overstatement of Net Worth of the Company by `50 crore and consequently:
a. Investment in Shareholders fund was incorrectly disclosed as `215 crore instead of `161.25 crore and investment in Policyholders Fund was disclosed as `20,458.30 crore instead of `20,512.05 crore.
b. Disclosure of Net worth, investment in Policyholders Account, Shareholders fund and investment in shareholders Account and non-life analytical ratios i.e. Gross Direct Premium to Net Worth Ratio, Growth rate of Net Worth, Return on Net Worth disclosed in Notes based on incorrect net worth were also deficient.
Non-reversal of wrong booking of claims recoverable and payable towards aviation claims in the year 2016-17 and 2017-2018 under reinsurance arrangement resulted in overstatement of Dues from Other Entities Carrying Insurance Business and Balances Due to
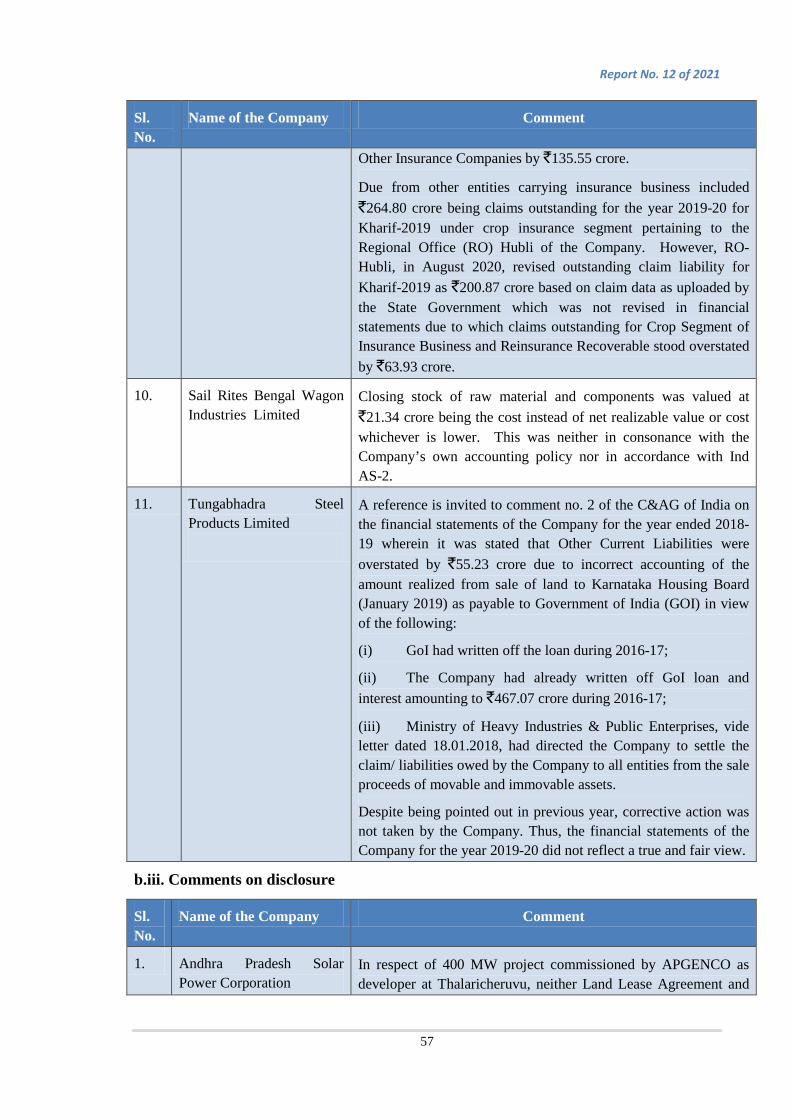
Report No. 12 of 2021
57
Sl. No.
Name of the Company Comment
Other Insurance Companies by `135.55 crore.
Due from other entities carrying insurance business included `264.80 crore being claims outstanding for the year 2019-20 for Kharif-2019 under crop insurance segment pertaining to the Regional Office (RO) Hubli of the Company. However, RO-Hubli, in August 2020, revised outstanding claim liability for Kharif-2019 as `200.87 crore based on claim data as uploaded by the State Government which was not revised in financial statements due to which claims outstanding for Crop Segment of Insurance Business and Reinsurance Recoverable stood overstated by `63.93 crore.
10. Sail Rites Bengal Wagon Industries Limited
Closing stock of raw material and components was valued at `21.34 crore being the cost instead of net realizable value or cost whichever is lower. This was neither in consonance with the Company’s own accounting policy nor in accordance with Ind AS-2.
11. Tungabhadra Steel Products Limited
A reference is invited to comment no. 2 of the C&AG of India on the financial statements of the Company for the year ended 2018-19 wherein it was stated that Other Current Liabilities were overstated by `55.23 crore due to incorrect accounting of the amount realized from sale of land to Karnataka Housing Board (January 2019) as payable to Government of India (GOI) in view of the following:
(i) GoI had written off the loan during 2016-17;
(ii) The Company had already written off GoI loan and interest amounting to `467.07 crore during 2016-17;
(iii) Ministry of Heavy Industries & Public Enterprises, vide letter dated 18.01.2018, had directed the Company to settle the claim/ liabilities owed by the Company to all entities from the sale proceeds of movable and immovable assets.
Despite being pointed out in previous year, corrective action was not taken by the Company. Thus, the financial statements of the Company for the year 2019-20 did not reflect a true and fair view.
b.iii. Comments on disclosure
Sl. No.
Name of the Company Comment
1. Andhra Pradesh Solar Power Corporation
In respect of 400 MW project commissioned by APGENCO as developer at Thalaricheruvu, neither Land Lease Agreement and

Report No. 12 of 2021
58
Sl. No.
Name of the Company Comment
Implementation Support Agreement were entered into nor the one-time upfront development charges were paid by the APGENCO. However, after commission of the Project, a purchase order with terms of payment was issued by APGENCO, the terms of which were yet to be approved by the Board of Directors of the Company. Further, the receivables from APGENCO viz. One-time Development charges, Land Lease charges and Operations and Maintenance charges had been accounted for during the year 2019-20 based on the above purchase order. Above facts were not disclosed in Notes to accounts in Financial Statements.
Contingent liabilities were overstated by `15.80 crore due to inclusion of land lease charges for land at villages NP Kunta and P. Kothapally for Ananthapuram Ultra Mega Solar Park for which liability had already been provided for in the books.
The Company declared a dividend of `14 crore for the year 2018-19 while the guidelines issued by Ministry of New & Renewable Energy provided for conversion of surplus into equity and not for payment of dividend. Since payment of dividend was in deviation of guidelines, this fact needed disclosure.
2. Bengal Chemicals & Pharmaceuticals Limited
The fact regarding provision of interest on defaulted amount of principal of loans payable to Government of India at normal rate instead of penal rate and non-provision of interest on defaulted amount of interest on such loans, was not disclosed in the financial statements for 2019-20 though the fact was disclosed in the financial statements for 2017-18 and 2018-19.
3. Bharat Broadband Network Limited
The company did not depict gross block of assets along with reconciliation with net block which was contrary to the requirements of Schedule III of the Companies Act 2013.
4. BSNL Limited In contravention of Ind AS 7, the company did not disclose, together with management commentary, the amount of significant cash and cash equivalent balances held by it that was not available for use other than the purpose for which the same were earmarked.
The Company did not disclose the method used in preparation of Statement of Cash Flow.
5. Electronics Corporation of India Limited (Standalone and Consolidated Financial Statements)
Board of Directors of the Company in their Meeting dated 17.03.2020 after deliberating on the future of M/s ECIL-Rapiscan Limited a joint venture with M/s OSI Systems Inc., USA decided that the joint venture may be continued until the Company came out with its own products in the segment of container scanners, cargo scanners etc. However, the disclosure in this regard, did not mention about the above decision of the Board of Directors.

Report No. 12 of 2021
59
Sl. No.
Name of the Company Comment
6. Fresh and Healthy Enterprises Limited
Loan and interest thereon amounting to `55.89 crore was converted to Equity during the year. The same was included in Cash Flow Statement which was not in line with Ind AS – 7 as the conversion did not involve actual cash flows.
7. Haridaspur Paradip Railway Company Limited
In the statement of Profit and Loss, the figure of Earnings Per Share "For Continuing Operation" and "For discontinued and continuing Operation" were in`, whereas all other figures in the financial statements were in ‘`in lakh’.
8. Hassan Mangalore Rail Development Company Limited
Note No 42 wherein it was stated that company has made a claim of `609.74 crore towards access charges from SWR for running passenger trains, over and above the number of trains permitted as per O&M Agreement was deficient to the extent that a clear methodology in the O&M agreement for verification/ reconciliation of the claims with SWR was not finalised and that the claim was pending with the Railway Board.
9. Hindustan Urvarak & Rasayan Limited
Relaxation was claimed from Ministry of Environment for relaxation of amount to be incurred towards Enterprise Social Commitment as per environment clearance received in July/ August 2017 for urea fertiliser project located at Sindri, Barauni and Gorakhpur. Since the relaxation was not granted by the Ministry of Environment, an amount of `490.81 crore corresponding to relaxation claimed should have been disclosed as contingent liability in the notes to the financial statement.
10. HLL Medipark Limited Company did not make disclosure regarding related party transactions as was required under Ind AS-24.
11. IRCON Davangere Haveri Highway Limited
Despite being commented last year, the Company again disclosed the working capital changes in Non-Current Financial Assets amounting to `120.48 crore under Cash Flow from Operating Activities instead of showing under Cash Flow from Investing Activities which was not in accordance with the provisions of Ind AS 7.
12. IRCON Vadodara Kim Expressway Limited
Interest accrued on Advances to Contractors amounting to `3.59 crore was not disclosed separately under Notes which was in violation of Para 29 of Ind AS 1.
13. Konkan Railway Corporation Limited
The Company classified an interest of `43.14 crore paid on borrowing costs as cash flow from investing activity instead of classifying the same as cash flow from financing activity which was in contravention of Ind AS 7.
There was understatement of cash inflows from operating

Report No. 12 of 2021
60
Sl. No.
Name of the Company Comment
activities to the tune of `14.49 crore and overstatement of cash outflow in investing activities to the same extent due to incorrect treatment of non-adjustable items which was a contravention of Ind AS 7.
The Company disbursed (February 2011) a loan of `27 crore to Konkan Railway Welfare Organisation which carried an interest rate of seven per cent to be repaid in seven years. The organisation, however, failed to repay the loan as per the stipulated tenure and substantial amount of loan and interest was outstanding. The Company did not disclose the information in notes to accounts which was in contravention of Ind AS 24.
14. Mumbai Metro Rail Corporation Limited
Capital Work in Progress included an amount of around `454 crores towards construction of Car Shed Depot for the Metro Line-3 at Aarey. The activities inside Car Depot at Aarey Colony, however, were stopped vide Urban Development Department of Government of Maharashtra letter dated 29.11.2019. As per the Minutes of the meeting dated 28.08.2020 conducted under the Chairmanship of the Hon’ble Chief Minister of Maharashtra State regarding Metro line 3 and Metro Line 6, it was decided that to explore alternative route options. The said developments with tentative cost estimate of `2,800 crore were placed were placed in the meeting of the Board of Directors Meeting held in September 2020. Though an important event occurring between the date of financial statements and the date when the financial statements were approved, no disclosure in this regard was made in Notes on accounts.
15. National Industrial Corridor Development Corporation Limited (Consolidated Financial Statement)
The company did not recognise the value of equipments of a Project after its completion in July 2019 which was contrary to the Memorandum of Understanding entered into with New Energy and Industrial Technology Development Organization, Japan which provided for such transfer on completion of the project. The Company neither made any accounting policy in this regard not made any disclosure in notes to the financial statements.
16. Oriental Insurance Company Limited (Standalone and Consolidated Financial Statements)
The Company deviated from its accounting policy regarding creation of provisions for Gross claims incurred but not reported (IBNR) and provisions for claims incurred but not enough reported (IBNER) and out of gross IBNR of `5,656.26 crore in Motor Third party (non-pool) line of business, `196.18 crore was less ceded to ‘Excess of Loss treaty recoverable against IBNR/ IBNER’ considering the past trend of recoverable from ‘Excess of Loss Treaty’. As a result, the net retention of IBNR/ IBNER in Motor TP (non-pool) line of business and loss for the year has
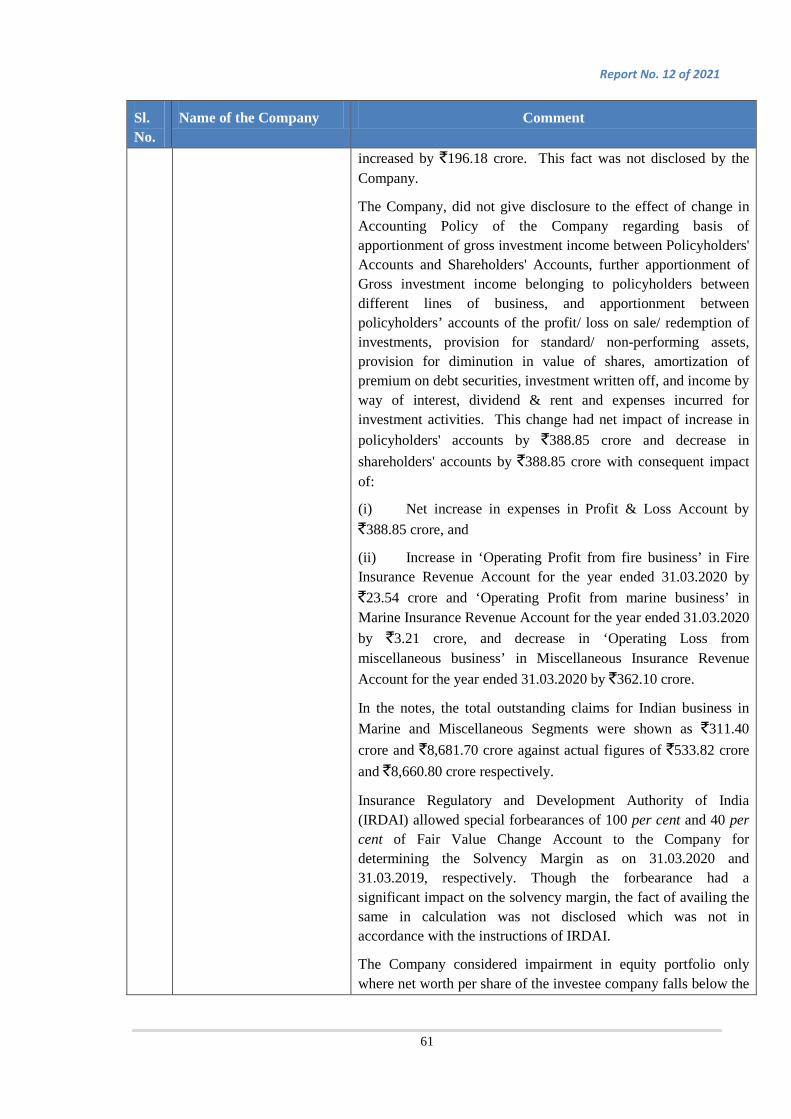
Report No. 12 of 2021
61
Sl. No.
Name of the Company Comment
increased by `196.18 crore. This fact was not disclosed by the Company.
The Company, did not give disclosure to the effect of change in Accounting Policy of the Company regarding basis of apportionment of gross investment income between Policyholders' Accounts and Shareholders' Accounts, further apportionment of Gross investment income belonging to policyholders between different lines of business, and apportionment between policyholders’ accounts of the profit/ loss on sale/ redemption of investments, provision for standard/ non-performing assets, provision for diminution in value of shares, amortization of premium on debt securities, investment written off, and income by way of interest, dividend & rent and expenses incurred for investment activities. This change had net impact of increase in policyholders' accounts by `388.85 crore and decrease in shareholders' accounts by `388.85 crore with consequent impact of:
(i) Net increase in expenses in Profit & Loss Account by `388.85 crore, and
(ii) Increase in ‘Operating Profit from fire business’ in Fire Insurance Revenue Account for the year ended 31.03.2020 by `23.54 crore and ‘Operating Profit from marine business’ in Marine Insurance Revenue Account for the year ended 31.03.2020 by `3.21 crore, and decrease in ‘Operating Loss from miscellaneous business’ in Miscellaneous Insurance Revenue Account for the year ended 31.03.2020 by `362.10 crore.
In the notes, the total outstanding claims for Indian business in Marine and Miscellaneous Segments were shown as `311.40 crore and `8,681.70 crore against actual figures of `533.82 crore and `8,660.80 crore respectively.
Insurance Regulatory and Development Authority of India (IRDAI) allowed special forbearances of 100 per cent and 40 per cent of Fair Value Change Account to the Company for determining the Solvency Margin as on 31.03.2020 and 31.03.2019, respectively. Though the forbearance had a significant impact on the solvency margin, the fact of availing the same in calculation was not disclosed which was not in accordance with the instructions of IRDAI.
The Company considered impairment in equity portfolio only where net worth per share of the investee company falls below the
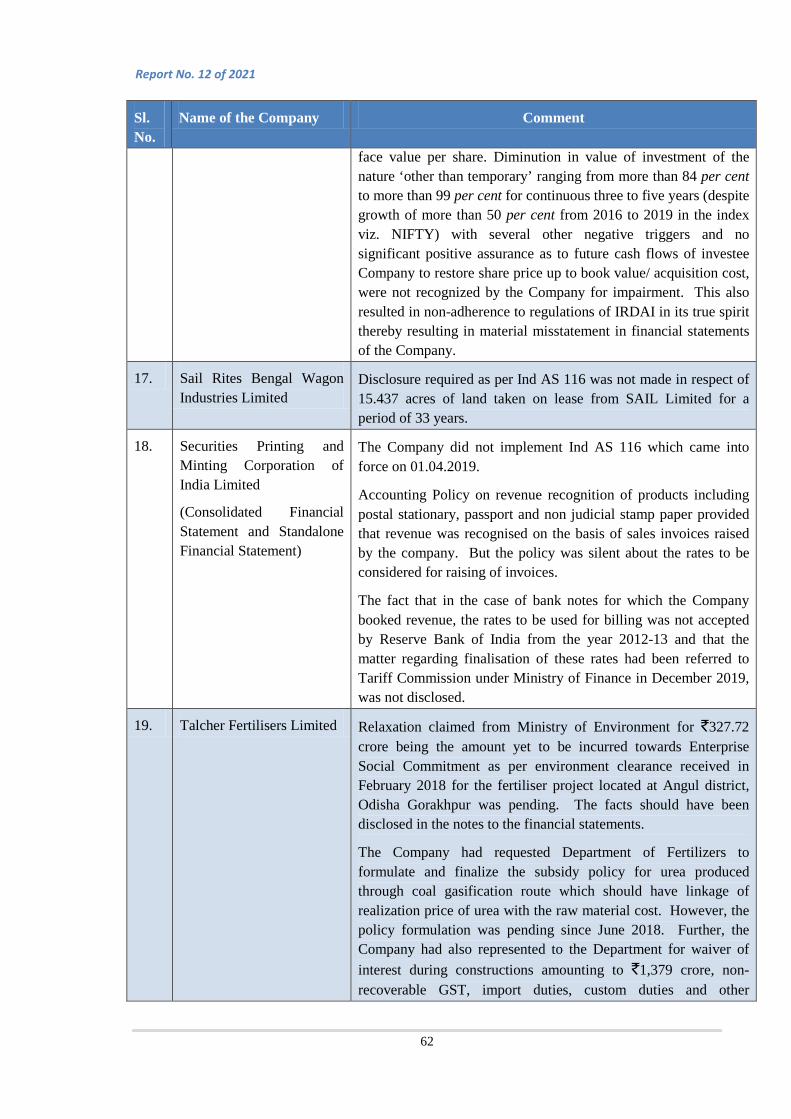
Report No. 12 of 2021
62
Sl. No.
Name of the Company Comment
face value per share. Diminution in value of investment of the nature ‘other than temporary’ ranging from more than 84 per cent to more than 99 per cent for continuous three to five years (despite growth of more than 50 per cent from 2016 to 2019 in the index viz. NIFTY) with several other negative triggers and no significant positive assurance as to future cash flows of investee Company to restore share price up to book value/ acquisition cost, were not recognized by the Company for impairment. This also resulted in non-adherence to regulations of IRDAI in its true spirit thereby resulting in material misstatement in financial statements of the Company.
17. Sail Rites Bengal Wagon Industries Limited
Disclosure required as per Ind AS 116 was not made in respect of 15.437 acres of land taken on lease from SAIL Limited for a period of 33 years.
18. Securities Printing and Minting Corporation of India Limited
(Consolidated Financial Statement and Standalone Financial Statement)
The Company did not implement Ind AS 116 which came into force on 01.04.2019.
Accounting Policy on revenue recognition of products including postal stationary, passport and non judicial stamp paper provided that revenue was recognised on the basis of sales invoices raised by the company. But the policy was silent about the rates to be considered for raising of invoices.
The fact that in the case of bank notes for which the Company booked revenue, the rates to be used for billing was not accepted by Reserve Bank of India from the year 2012-13 and that the matter regarding finalisation of these rates had been referred to Tariff Commission under Ministry of Finance in December 2019, was not disclosed.
19. Talcher Fertilisers Limited Relaxation claimed from Ministry of Environment for `327.72 crore being the amount yet to be incurred towards Enterprise Social Commitment as per environment clearance received in February 2018 for the fertiliser project located at Angul district, Odisha Gorakhpur was pending. The facts should have been disclosed in the notes to the financial statements.
The Company had requested Department of Fertilizers to formulate and finalize the subsidy policy for urea produced through coal gasification route which should have linkage of realization price of urea with the raw material cost. However, the policy formulation was pending since June 2018. Further, the Company had also represented to the Department for waiver of interest during constructions amounting to `1,379 crore, non-recoverable GST, import duties, custom duties and other

Report No. 12 of 2021
63
Sl. No.
Name of the Company Comment
applicable levies to make the project viable, but the same was pending. Considering significance attached with these facts, the same should have been disclosed in the notes to the financial statements.
b.iv. Comments on Auditors’ Report
Sl. No.
Name of the Company Comment
1. Bharat Broadband Network Limited
The Statutory Auditor failed to disclose the fact that the Company utilised `890.83 crore as operational expenditure out of the funds received for capital expenditure. Non-disclosure was not in compliance to the specific direction issued by the CAG under section 143(5) of Companies Act, 2013.
2. BSNL Limited Revenue grant and capital grant were not included while commenting about the total income amounting to `263 crore in the Auditors’ Report.
3. Health Insurance TPA of India Limited
In the independent auditor report regarding other legal and regulatory requirements, auditor inter-alia stated that the Financial Statements comply with Ind AS whereas the Company prepared its financial statements under the Accounting Standards prescribed under section 133 of the Act, read with Rule 7 of the Companies (Accounts) Rules, 2014.
4. IFCI Infrastructure Development Limited
The Statutory Auditor issued an addendum dated 10.08.2020 to the Auditors’ Report. However, there were no guidelines of the Institute of Chartered Accountants of India or any provision in the Companies Act, 2013 to issue Addendum. Accordingly, the Auditors’ Report was deficient to that extent.
5. National Highways & Infrastructure Development Corporation Limited
The Statutory Auditor in violation of section 143(5) of the Companies Act 2013, failed to provide its comments on directions issued by the C&AG of India in the Independent Auditors’ Report. Further, the Statutory Auditor issued Annexure-2 dated 17.09.2020 to the Independent Auditors’ Report incorporating the comments on the directions issued by the C&AG of India. However, there is no provision in the Companies Act, 2013 or any guidelines of the Institute of Chartered Accountants of India for subsequent issue of Annexure to the Independent Auditors’ Report. Accordingly, the Independent Auditors’ Report was deficient to that extent.
6. Oriental Insurance In the qualified opinion paragraph, furnishing of unaudited

Report No. 12 of 2021
64
Sl. No.
Name of the Company Comment
Company Limited (Standalone and Consolidated Financial Statements)
accounts of one foreign branch was brought out. However, the said branch had been closed by the Company. The said fact was not brought out in the opinion.
Emphasis of Matter paragraph regarding Rashtriya Swasthya Bima Yojna was factually incorrect as the amount include recoverable both from Central and State Governments rather than Government of India alone.
Auditors’ report did not include matter specified in para 3 of the schedule C of the IRDAI (Preparation of Financial Statements and Auditors’ Report of Insurance Companies) Regulations 2002.
7. Securities Printing & Minting Corporation of India Limited
Non-availability of title deed of immovable property at Sector-1, Noida on the Balance Sheet date was not brought out in the Auditors’ Report.
c. Listed Government controlled other companies
c.i. Comments on financial position
Sl. No.
Name of the Company Comment
1. Dredging Corporation of India Limited
Advances on Capital Assets were overstated by `29.51 crore due to inclusion of above amount which was paid towards part completed work to Central Public Works Department for the work of construction of office building at Seethammadhara. Consequently, Capital Work in Progress was also understated by the said amount.
Inventories were overstated and Power and Fuel under Other Expenses were understated by `13.93 crore due to accounting of fuel as per inventory statement which reflected closing balance of 5,289.59 MT as against the daily utilisation reports of the Dredgers which reflected a closing balance of 2,965.39 MT. Consequently, the Profit before tax was overstated by `13.93 crore.
2. The Orissa Minerals Development Company Limited
Provision for an amount of `27.15 crore deposited with Government of Odisha in December 2017 and November 2018 towards compensation payable under Mines and Minerals Development Regulation Act, 1957 was not created even though the same was deposited in pursuance of Supreme Court of India judgement (August 2017) and was appropriated as well by the Government of Odisha. This resulted in overstatement of Other
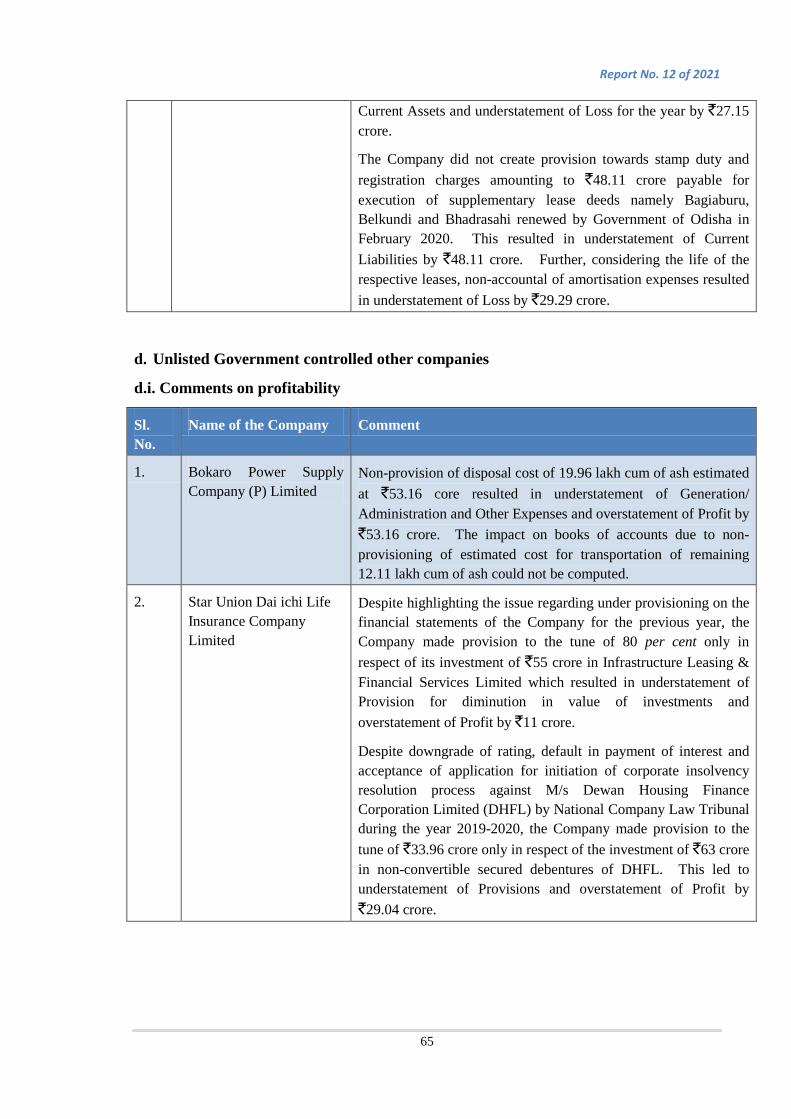
Report No. 12 of 2021
65
Current Assets and understatement of Loss for the year by `27.15 crore.
The Company did not create provision towards stamp duty and registration charges amounting to `48.11 crore payable for execution of supplementary lease deeds namely Bagiaburu, Belkundi and Bhadrasahi renewed by Government of Odisha in February 2020. This resulted in understatement of Current Liabilities by `48.11 crore. Further, considering the life of the respective leases, non-accountal of amortisation expenses resulted in understatement of Loss by `29.29 crore.
d. Unlisted Government controlled other companies
d.i. Comments on profitability
Sl. No.
Name of the Company Comment
1. Bokaro Power Supply Company (P) Limited
Non-provision of disposal cost of 19.96 lakh cum of ash estimated at `53.16 core resulted in understatement of Generation/ Administration and Other Expenses and overstatement of Profit by `53.16 crore. The impact on books of accounts due to non-provisioning of estimated cost for transportation of remaining 12.11 lakh cum of ash could not be computed.
2. Star Union Dai ichi Life Insurance Company Limited
Despite highlighting the issue regarding under provisioning on the financial statements of the Company for the previous year, the Company made provision to the tune of 80 per cent only in respect of its investment of `55 crore in Infrastructure Leasing & Financial Services Limited which resulted in understatement of Provision for diminution in value of investments and overstatement of Profit by `11 crore.
Despite downgrade of rating, default in payment of interest and acceptance of application for initiation of corporate insolvency resolution process against M/s Dewan Housing Finance Corporation Limited (DHFL) by National Company Law Tribunal during the year 2019-2020, the Company made provision to the tune of `33.96 crore only in respect of the investment of `63 crore in non-convertible secured debentures of DHFL. This led to understatement of Provisions and overstatement of Profit by `29.04 crore.

Report No. 12 of 2021
66
d.ii. Comments on financial position
Sl. No.
Name of the Company Comment
1. Agricultural Insurance Company of India Limited
Advances and Other Assets included `200 crore being adhoc payment made out of retained profits/ reserves to the Consolidated Fund of India (GoI’s share for meeting additional expenditure on Crop Insurance – National Agriculture Insurance Scheme) as per the directions (December 2009) of the Ministry of Finance. There were no indications in the instructions that the above said amount was refundable by the Government and the Ministry did not refund the same even after lapse of 10 years. This resulted in overstatement of Advances and Other Assets as well as Reserves and Surplus of the Company by `200 crore.
2. Pipavav Railway Corporation Limited
Fixed Deposits of `174.72 crore having a maturity within 12 months as on 31.03.2020 were classified as Non-Current Financial Assets instead of Current Financial Assets which was not in accordance with Schedule-III of the Companies Act, 2013.
d.iii. Comments on disclosure
Sl. No.
Name of the Company Comment
1. DMICDC Neemrana Solar Power Company Limited
The company did not recognise the value of equipments of a Project after its completion in July 2019 which was contrary to the Memorandum of Understanding entered into with New Energy and Industrial Technology Development Organization, Japan which provided for such transfer on completion of the project. The Company neither made any accounting policy in this regard nor made any disclosure in notes to the financial statements.
2. NABKISAN Finance Limited
The correct amount of loan commitments pending disbursal was `80.76 crore instead of `20.31 crore as included in Contingent Liabilities.
The Board of Directors of the Company approved (July 2019) proposal for entering into MoU with the Department of Agricultural Marketing and Agriculture Business, Government of Tamil Nadu for implementing three schemes including Interest Subvention Support to provide concessional credit to Farmer Producer Companies. The contribution from Government of Tamil Nadu was `166.70 crore and Company was to provide `333.30 crore of credit in phased manner upto the year 2022-23. Though Government of Tamil Nadu had issued administrative
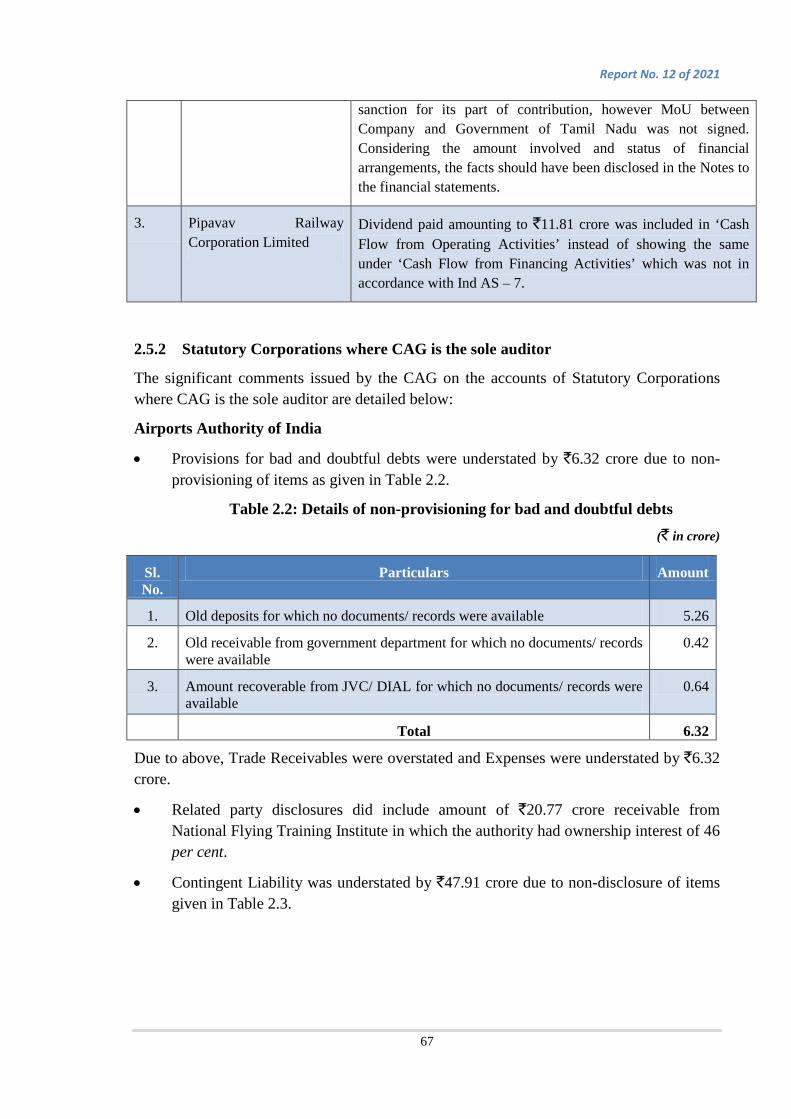
Report No. 12 of 2021
67
sanction for its part of contribution, however MoU between Company and Government of Tamil Nadu was not signed. Considering the amount involved and status of financial arrangements, the facts should have been disclosed in the Notes to the financial statements.
3. Pipavav Railway Corporation Limited
Dividend paid amounting to `11.81 crore was included in ‘Cash Flow from Operating Activities’ instead of showing the same under ‘Cash Flow from Financing Activities’ which was not in accordance with Ind AS – 7.
2.5.2 Statutory Corporations where CAG is the sole auditor
The significant comments issued by the CAG on the accounts of Statutory Corporations where CAG is the sole auditor are detailed below:
Airports Authority of India
• Provisions for bad and doubtful debts were understated by `6.32 crore due to non-provisioning of items as given in Table 2.2.
Table 2.2: Details of non-provisioning for bad and doubtful debts (` in crore)
Sl. No.
Particulars Amount
1. Old deposits for which no documents/ records were available 5.26
2. Old receivable from government department for which no documents/ records were available
0.42
3. Amount recoverable from JVC/ DIAL for which no documents/ records were available
0.64
Total 6.32
Due to above, Trade Receivables were overstated and Expenses were understated by `6.32 crore.
• Related party disclosures did include amount of `20.77 crore receivable from National Flying Training Institute in which the authority had ownership interest of 46 per cent.
• Contingent Liability was understated by `47.91 crore due to non-disclosure of items given in Table 2.3.

Report No. 12 of 2021
68
Table 2.3: Details of non-disclosure of items (` in crore)
Sl. No. Particulars Amount
1. Non-disclosure of Arbitration for the work of construction of boundary wall situated at Techno Farm at Gaya Airport and arbitration for the work of re-carpeting of runway, taxiway & apron and allied works at Gaya Airport.
10.23
2. Non-disclosure of damages and compensation claimed by M/s Graphic Ads Private Limited
12.17
3. Interest on arbitration cases between ITD CEM JV vs AAI 25.51
Total 47.91
• During test check of records, it was observed that claims were raised to the State Governments for the provision of security and fire service at airports operated by the Authority at Karnataka, Tamil Nadu, Andhra Pradesh, Puducherry, and Jaisalmer during the year 2019-20 under the Regional Connectivity Scheme of the Ministry of Civil Aviation, however, the same was not included as income in the year 2019-20. The Authority stated that claim from State Government was accounted for on receipt basis. However, no disclosure in this regard was made in the books of accounts
Central Warehousing Corporation
• Provision for expenses was understated by `5.45 crore due to write back of an existing liability provided for office rent payable for earlier years despite non-withdrawal or waiver of the claim by the opposite party and the matter being under litigation. This resulted in understatement of outstanding liabilities by `5.45 crore and overstatement of Profit for the year by the same amount.
Inland Waterways Authority of India
• Ministry of External Affairs (MEA), Government of India through an agreement (March 2009) appointed the Authority as Project Development Consultant (PDC) for Kaladan Project being executed for implementation of multi-modal transit transport facility, on Kaladan River connecting Sittwe Port in Myanmar with the State of Mizoram in India. The work on the project was in progress.
As per the disclosure made in the notes to financial statements, the Authority upto 31.03.2020, had received `33.87 crore from MEA which included PDC fees of `29.05 crore, service tax of `2.11 crore, GST of `1.72 crore and reimbursement of hydrographic survey expenditure of `0.99 crore. Internal receipts of `2.56 crore including bank interest had also been generated in the project till 31.03. 2020. Out of the above an expenditure of `29.85 crore had been incurred upto 31.03.2020.
The facts and figures of the above note could not be vouched as Authority had prepared separate books of accounts of the Kaladan Project for the year 2019-20 and no impact of transactions of above project was included in the financial statements of
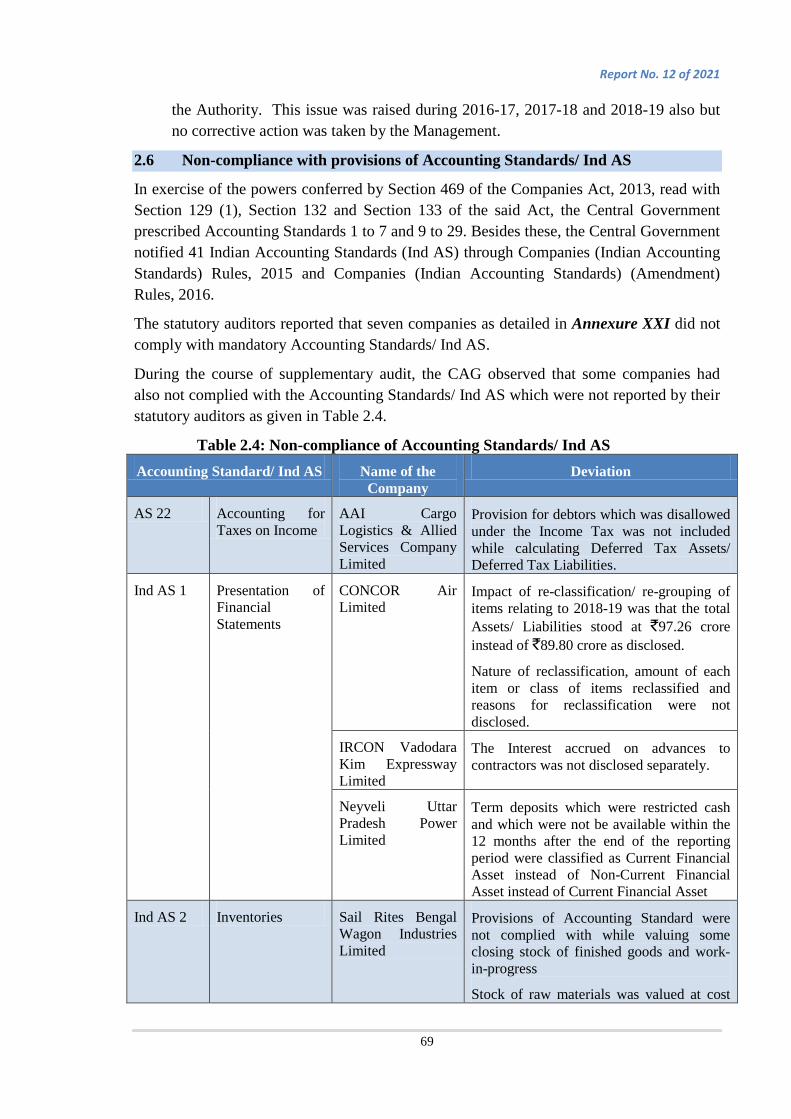
Report No. 12 of 2021
69
the Authority. This issue was raised during 2016-17, 2017-18 and 2018-19 also but no corrective action was taken by the Management.
2.6 Non-compliance with provisions of Accounting Standards/ Ind AS
In exercise of the powers conferred by Section 469 of the Companies Act, 2013, read with Section 129 (1), Section 132 and Section 133 of the said Act, the Central Government prescribed Accounting Standards 1 to 7 and 9 to 29. Besides these, the Central Government notified 41 Indian Accounting Standards (Ind AS) through Companies (Indian Accounting Standards) Rules, 2015 and Companies (Indian Accounting Standards) (Amendment) Rules, 2016.
The statutory auditors reported that seven companies as detailed in Annexure XXI did not comply with mandatory Accounting Standards/ Ind AS.
During the course of supplementary audit, the CAG observed that some companies had also not complied with the Accounting Standards/ Ind AS which were not reported by their statutory auditors as given in Table 2.4.
Table 2.4: Non-compliance of Accounting Standards/ Ind AS Accounting Standard/ Ind AS Name of the
Company Deviation
AS 22 Accounting for Taxes on Income
AAI Cargo Logistics & Allied Services Company Limited
Provision for debtors which was disallowed under the Income Tax was not included while calculating Deferred Tax Assets/ Deferred Tax Liabilities.
Ind AS 1 Presentation of Financial Statements
CONCOR Air Limited
Impact of re-classification/ re-grouping of items relating to 2018-19 was that the total Assets/ Liabilities stood at `97.26 crore instead of `89.80 crore as disclosed.
Nature of reclassification, amount of each item or class of items reclassified and reasons for reclassification were not disclosed.
IRCON Vadodara Kim Expressway Limited
The Interest accrued on advances to contractors was not disclosed separately.
Neyveli Uttar Pradesh Power Limited
Term deposits which were restricted cash and which were not be available within the 12 months after the end of the reporting period were classified as Current Financial Asset instead of Non-Current Financial Asset instead of Current Financial Asset
Ind AS 2 Inventories Sail Rites Bengal Wagon Industries Limited
Provisions of Accounting Standard were not complied with while valuing some closing stock of finished goods and work-in-progress
Stock of raw materials was valued at cost

Report No. 12 of 2021
70
Accounting Standard/ Ind AS Name of the Company
Deviation
and net realisable value was not considered.
Steel Authority of India Limited
Scrap which was not in existence was included in inventory
Valuation of iron ore fines as inventory was against the provision of the Ind AS 2.
Ind AS 7 Statement of Cash Flows
BSNL Limited The company did not disclose, together with management commentary, the amount of significant cash and cash equivalent balances held by it that was not available for use other than the purpose for which the same were earmarked.
CONCOR Air Limited
Accrued interest was included under cash flow from investing activities.
Fresh and Healthy Enterprises Limited
Loan and interest thereon was incorrectly included in Cash Flow Statement.
Haridaspur Paradip Railway company Limited
Cash Equivalents were overstated and Bank Balances other than cash and cash equivalent were understated due to incorrect classification of Fixed Deposit receipts having original maturity of more than three months.
IRCON Davangere Haveri Highway Limited
Working capital changes was disclosed in Non-Current Financial Assets under cash flow from operating activities instead of showing under cash flow from investing activities.
Accrued interest payable on mobilisation advance from client was included in cash flow from operating activities and also in cash flow from financing activities.
IRCON Vadodara Kim Expressway Limited
Cash flow from operating activities was overstated and cash flow from investing activities was understated due to incorrect adjustment of interest income.
Konkan Railway Corporation Limited
Interest paid on borrowing costs was classified as cash flow from investing activity instead of cash flow from financing activity.

Report No. 12 of 2021
71
Accounting Standard/ Ind AS Name of the Company
Deviation
Cash inflows from operating activities was understated and cash outflow from investing activities was overstated due to incorrect treatment of non-adjustable items.
Pipavav Railway Corporation Limited
Cash flow from operating activities was understated and cash flow from financing activities was understated due to non-inclusion dividend paid.
Punjab Logistic Infrastructure Limited
Accrued interest even though a non-cash item was added in cash flow from operating activities.
Rail Vikas Nigam Limited
Accrued interest which did not involve any cash flow was considered as cash flow from investing activities.
Ind AS 8 Accounting for Government. Grants and Disclosure of Government Assistance
Hindustan Urvarak & Rasayan Limited
Error regarding accounting of leasehold land in the previous year was not corrected by restating the comparative amounts of its previous year’s financial statement. i.e. of 2018-19.
IREL (India) Limited
Diminution in value of capital work in progress amounting relating to solid waste trench was not made.
Konkan Railway Corporation Limited
Prior period expenses relating to employee benefit were booked as current year expense instead of recasting the financial statements.
Ind AS 10 Events after the Reporting Period
Madras Fertilisers Limited
Non-consideration of revised rates before approval of the financial statements resulted in understatement of claims receivable and overstatement of loss.
Ind AS 24 Related Party Disclosures
HLL Medipark Limited
Related party transactions were not disclosed.
Konkan Railway Company Limited
Failure of a borrower to repay the loan as per the stipulated was not disclosed in notes to accounts.
Ind AS 36 Impairment of Assets
Container Corporation of India Limited
The Company did not disclose the events and circumstances that led to recognition of impairment loss in the investment in equity shares of Fresh & Healthy Enterprise Limited.
Ind AS 115 Revenue from Bharat Electronics Revenue was overstated due to inclusion of

Report No. 12 of 2021
72
Accounting Standard/ Ind AS Name of the Company
Deviation
Contracts with Customers
Limited sales for which deliveries were yet to be made.
Ind AS 116 Leases Hindustan Urvarak & Rasayan Limited
Note regarding adoption of the Accounting Standard to all lease contracts was factually incorrect as modified retrospective approach was not applied on the land taken on lease at Gorakhpur, Sindri and Barauni.
Sail Rites Bengal Wagon Industries Limited
Proper disclosures regarding land obtained on lease from Steel Authority of India Limited were not made.
Security Printing & Minting Corporation of India Limited
Accounting Standard which came into force on 01.04.2019 was not implemented.
2.7 Management Letters
One of the objectives of financial audit is to establish communication on audit matters arising from the audit of financial statements between the auditor and those charged with the responsibility of governance of the corporate entity.
The material observations on the financial statements of PSEs were reported as comments by the CAG under Section 143 (5) of the Companies Act, 2013. Besides these comments, irregularities or deficiencies observed by CAG in the financial reports or in the reporting process, were also communicated to the management through a ‘Management Letter’ for taking corrective action. These deficiencies generally related to
• application and interpretation of accounting policies and practices,
• adjustments arising out of audit that could have a significant effect on the financial statements and
• inadequate or non-disclosure of certain information on which management of the concerned PSE gave assurances that corrective action would be taken in the subsequent year.
During the year, CAG issued ‘Management Letters’ to 194 CPSEs (Annexure XXII).
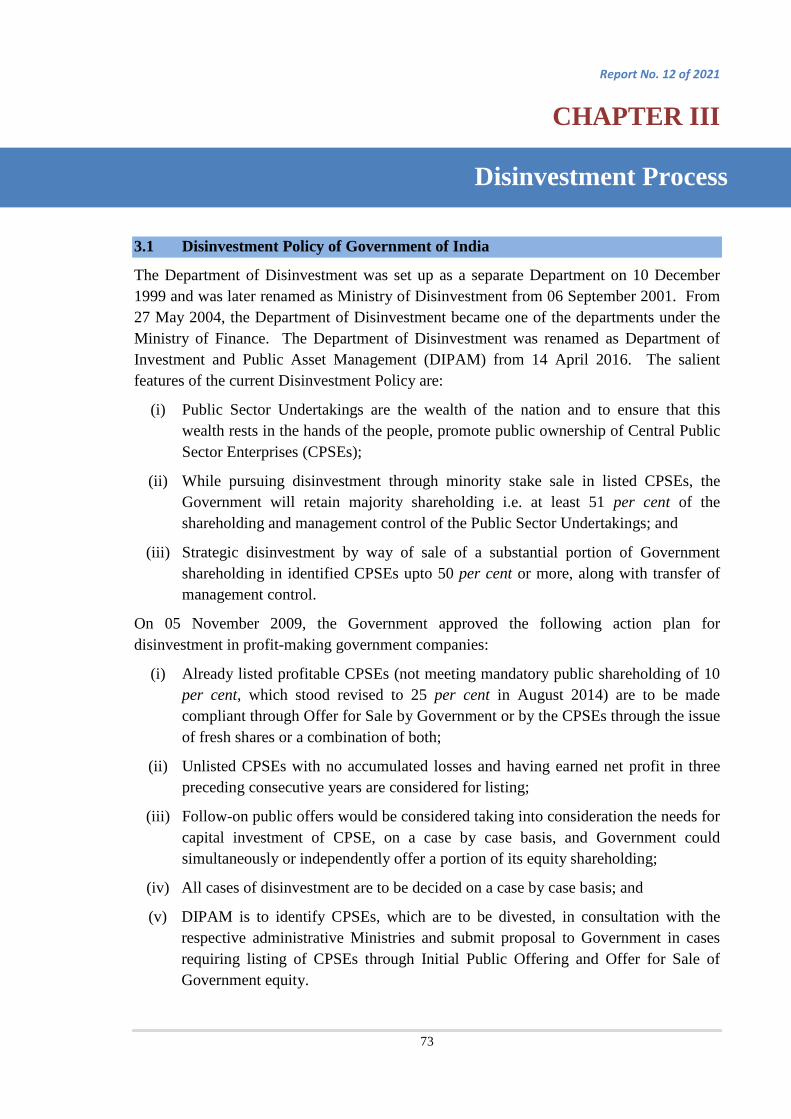
Report No. 12 of 2021
73
Disinvestment Process
CHAPTER III
3.1 Disinvestment Policy of Government of India
The Department of Disinvestment was set up as a separate Department on 10 December 1999 and was later renamed as Ministry of Disinvestment from 06 September 2001. From 27 May 2004, the Department of Disinvestment became one of the departments under the Ministry of Finance. The Department of Disinvestment was renamed as Department of Investment and Public Asset Management (DIPAM) from 14 April 2016. The salient features of the current Disinvestment Policy are:
(i) Public Sector Undertakings are the wealth of the nation and to ensure that this wealth rests in the hands of the people, promote public ownership of Central Public Sector Enterprises (CPSEs);
(ii) While pursuing disinvestment through minority stake sale in listed CPSEs, the Government will retain majority shareholding i.e. at least 51 per cent of the shareholding and management control of the Public Sector Undertakings; and
(iii) Strategic disinvestment by way of sale of a substantial portion of Government shareholding in identified CPSEs upto 50 per cent or more, along with transfer of management control.
On 05 November 2009, the Government approved the following action plan for disinvestment in profit-making government companies:
(i) Already listed profitable CPSEs (not meeting mandatory public shareholding of 10 per cent, which stood revised to 25 per cent in August 2014) are to be made compliant through Offer for Sale by Government or by the CPSEs through the issue of fresh shares or a combination of both;
(ii) Unlisted CPSEs with no accumulated losses and having earned net profit in three preceding consecutive years are considered for listing;
(iii) Follow-on public offers would be considered taking into consideration the needs for capital investment of CPSE, on a case by case basis, and Government could simultaneously or independently offer a portion of its equity shareholding;
(iv) All cases of disinvestment are to be decided on a case by case basis; and
(v) DIPAM is to identify CPSEs, which are to be divested, in consultation with the respective administrative Ministries and submit proposal to Government in cases requiring listing of CPSEs through Initial Public Offering and Offer for Sale of Government equity.
Report No. 12 of 2021
74
3.2 Mandate for Disinvestment
As per the present Allocation of Business Rules, the mandate of DIPAM, inter alia, is to deal with all matters relating to:
(i) management of Central Government investments in equity including disinvestment of equity in Central Public Sector Undertakings, and
(ii) sale of Central Government equity through offer for sale or private placement or any other mode in the erstwhile Central Public Sector Undertakings.
3.3 Modes of Disinvestment
The Government takes different routes for disinvestment, which are as follows:
(i) Initial/ Further Public Offer (IPO/ FPO)
When an unlisted company makes a fresh issue of shares for sale for the first time to the public, it is called an IPO. This paves the way for listing and trading of the issuer's shares on the Stock Exchanges. When an already listed company makes either a fresh issue of shares to the public or an offer for sale to the public, it is called an FPO.
(ii) Exchange Traded Fund (ETF)
An ETF is a basket of stocks that reflects the composition of an Index, like Nifty 50. ETFs trading value is based on the net asset value of the underlying stocks that it represents. ETFs can be bought and sold throughout the trading day like any stock.
(iii) Offer for Sale (OFS)
OFS is a simpler method of share sale through the exchange platform for listed companies. The mechanism was first introduced by SEBI in 2012, to make it easier for promoters of publicly traded companies to cut their holdings and comply with the minimum public shareholding norms by June 2013.
(iv) Buyback of shares
Buyback is the repurchase by a company of its shares from the existing shareholders that reduces the number of its shares in the open market.
(v) Strategic sale of CPSEs
Strategic disinvestment implies the sale of a substantial portion of the Government shareholding of a CPSE of up to 50 per cent or such a higher percentage, as the competent authority may determine, along with transfer of management control.
Apart from the other modes of disinvestment, during the year 2018-19, for the first time, the Union Cabinet authorized DIPAM to sell enemy shares46 (in various companies) kept
46 As per the Enemy Property Act, 1968, ‘enemy property’ means any property for the time being belonging
to or held or managed on behalf of an enemy, an enemy subject or an enemy firm. The enemy shares belong to persons who left India and settled in China or Pakistan after the wars in 1962 and 1965. Sale of enemy shares has been discussed in para 3.7.4.
Report No. 12 of 2021
75
under the custody of the Custodian of Enemy Property for India as per sub-section 1 of Section 8A of the Enemy Property Act, 1968.
3.4 Process of Disinvestment
The disinvestment process for Initial Public Offer/ Further Public Offer/ Offer for Sale involves the following steps:
(i) In principle consent by the Administrative Ministry of the CPSE concerned;
(ii) Approval of the proposal to disinvest by the Cabinet Committee on Economic Affairs (CCEA);
(iii) Constitution of Inter-Ministerial Group47 (IMG), with the approval of the Finance Minister, to guide and oversee the disinvestment process;
(iv) Appointment of Advisers by the IMG for the transaction, including Merchant Bankers, Book Running Lead Managers (BRLMs), Legal Advisers;
(v) Presentation by BRLMs before High Level Committee (HLC48) on valuation;
(vi) Recommendation by HLC on price band/ floor price to Empowered Group of Ministers49 (EGoM), taking into consideration the recommendation of the BRLMs; and
(vii) Approval by EGoM of recommended price band/ floor price, method of disinvestment, price discount for retail investors and employees, etc.
Following changes have been approved by CCEA in its meeting held on 6 August 2014:
(i) Alternative Mechanism50 to perform the functions of the erstwhile EGoM.
(ii) HLC to recommend the price band/ floor price; discount to retail investors and employees; change in the method/ mode of disinvestment (if required due to market conditions or due to change in SEBI Rules and Regulations etc.,); number of tranches and the number of shares to be allotted in each tranche; whether to accept the offer or cancel it depending on subscription; whether the oversubscribed amount is to be retained in case of oversubscription, deciding on the modalities in case of CPSE ETF, etc.
47 IMG comprises of Secretary, Joint Secretary and Financial Advisor of DIPAM; Secretary, Joint
Secretary and Financial Advisor of the Administrative Ministry; Secretary or a representative (not below the rank of Joint Secretary) from - Department of Public Enterprises, Department of Legal Affairs, Ministry of Corporate Affairs, Department of Economic Affairs and Department of Expenditure; CMD of CPSE and Director (Finance) of CPSE. IMG may co-opt any other member from any Ministry/ Department/ organisation, on a case to case basis, if needed.
48 HLC comprises of Secretary, Joint Secretary and Financial Advisor of DIPAM, and Secretary, Joint Secretary and Financial Advisor of the concerned Administrative Ministry.
49 EGoM comprises of Minister of Finance, Minister of Commerce and Industry, Minister of Textiles, Minister of Heavy Industries and Public Enterprises, Minister of Administrative Ministry and Deputy Chairman, Planning Commission.
50 Alternative Mechanism comprises of Finance Minister, Minister of Road Transport and Highways and Minister of Administrative Ministry of the concerned CPSE.

Report No. 12 of 2021
76
(iii) The recommendation of HLC would be put up for the approval of Finance Minister, Minister of Road Transport and Highways and the Minister of the Administrative Ministry of the concerned CPSE.
(iv) The Alternative Mechanism may be serviced by the DIPAM.
In case of strategic disinvestment, a three-tier decision-making mechanism was conceptualized with the CCEA at the Apex level, Core Group of Secretaries on Disinvestment (CGD) as the supervisory and recommendatory body and an Evaluation Committee (EC) for advising/ assisting CGD on issues such as valuation, reserve price and for making recommendations on final price and/ or strategic partner(s). NITI Aayog was mandated to identify the CPSEs for strategic disinvestment. The process involves selection of CPSEs for disinvestment by NITI Aayog which is further recommended by CGD and later approved by CCEA. After CCEA clears the proposal, selection and appointment of Transaction Adviser, Legal Adviser and Asset Valuer is done through a competitive bidding process by DIPAM/ Administrative Department/ CPSE. Transaction Adviser examines the eligibility of the prospective bidders based on terms and conditions of Expression of Interest (EoI). Details of all eligible bidders, price quoted, and other documents are presented to CGD. CGD makes appropriate recommendations to CCEA for approval of disinvestment.
3.5 Target and achievement for disinvestment of CPSEs for the last five years
Budget Estimates (BE) for the receipts through disinvestments in a financial year are fixed by the Department of Economic Affairs (DEA). During the course of budget discussions, DIPAM provides inputs on possible transactions that could be implemented in that year. On the basis of the progress made and probable transactions during the year, DIPAM communicates the Revised Estimates (RE) to DEA.
The BE fixed by DEA, RE communicated by DIPAM and actual realization made through disinvestment process for the years 2015-16 to 2019-20 are tabulated in Table 3.1:
Table 3.1: Target of disinvestment vis-a-vis actual realisation (` in crore)
Financial Year
Budget Estimate Revised Estimate
Realization Percentage variation between RE & actual
receipts
2015-16 41,000 25,313 23,997 (-)5
2016-17 56,500 40,000 46,247 16
2017-18 72,500 1,00,000 1,00,057 Negligible
2018-19 80,000 80,000 84,972 6
2019-20 1,05,000 65,000 50,299 (-)23
From the above table, it is evident that the actual receipts were less than the RE in two years viz. 2015-16 and 2019-20.
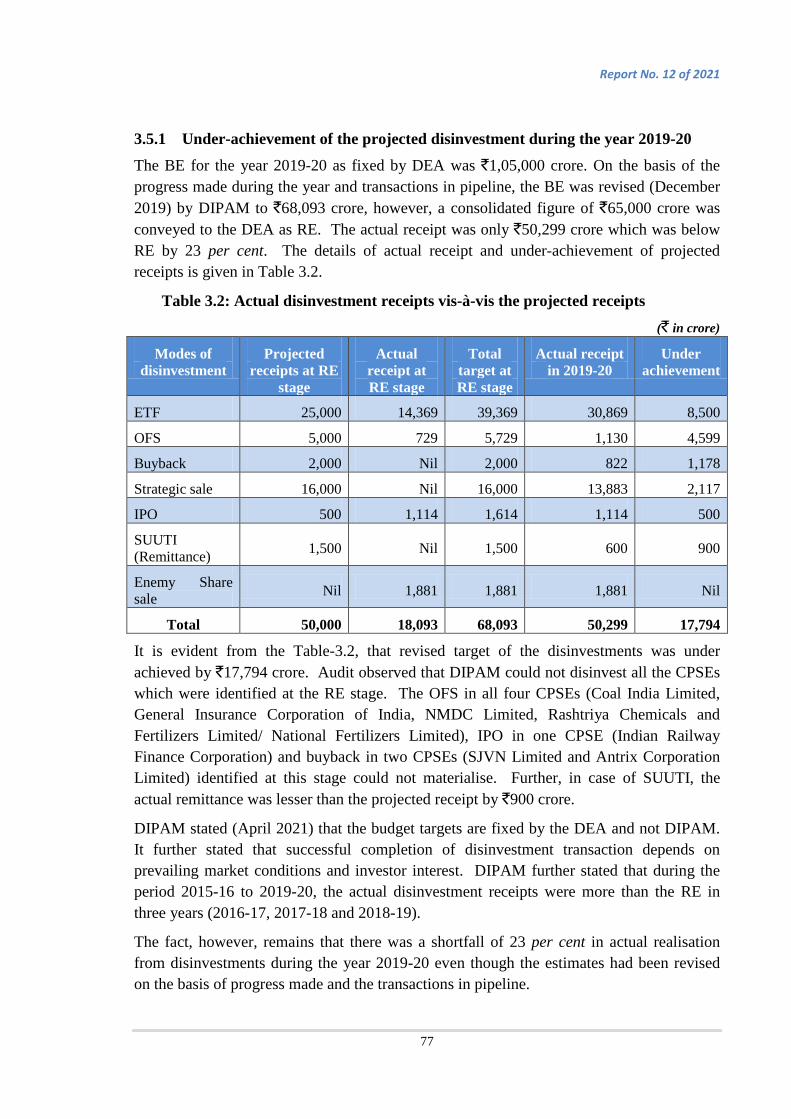
Report No. 12 of 2021
77
3.5.1 Under-achievement of the projected disinvestment during the year 2019-20
The BE for the year 2019-20 as fixed by DEA was `1,05,000 crore. On the basis of the progress made during the year and transactions in pipeline, the BE was revised (December 2019) by DIPAM to `68,093 crore, however, a consolidated figure of `65,000 crore was conveyed to the DEA as RE. The actual receipt was only `50,299 crore which was below RE by 23 per cent. The details of actual receipt and under-achievement of projected receipts is given in Table 3.2.
Table 3.2: Actual disinvestment receipts vis-à-vis the projected receipts (` in crore)
Modes of disinvestment
Projected receipts at RE
stage
Actual receipt at RE stage
Total target at RE stage
Actual receipt in 2019-20
Under achievement
ETF 25,000 14,369 39,369 30,869 8,500
OFS 5,000 729 5,729 1,130 4,599
Buyback 2,000 Nil 2,000 822 1,178
Strategic sale 16,000 Nil 16,000 13,883 2,117
IPO 500 1,114 1,614 1,114 500
SUUTI (Remittance) 1,500 Nil 1,500 600 900
Enemy Share sale Nil 1,881 1,881 1,881 Nil
Total 50,000 18,093 68,093 50,299 17,794
It is evident from the Table-3.2, that revised target of the disinvestments was under achieved by `17,794 crore. Audit observed that DIPAM could not disinvest all the CPSEs which were identified at the RE stage. The OFS in all four CPSEs (Coal India Limited, General Insurance Corporation of India, NMDC Limited, Rashtriya Chemicals and Fertilizers Limited/ National Fertilizers Limited), IPO in one CPSE (Indian Railway Finance Corporation) and buyback in two CPSEs (SJVN Limited and Antrix Corporation Limited) identified at this stage could not materialise. Further, in case of SUUTI, the actual remittance was lesser than the projected receipt by `900 crore.
DIPAM stated (April 2021) that the budget targets are fixed by the DEA and not DIPAM. It further stated that successful completion of disinvestment transaction depends on prevailing market conditions and investor interest. DIPAM further stated that during the period 2015-16 to 2019-20, the actual disinvestment receipts were more than the RE in three years (2016-17, 2017-18 and 2018-19).
The fact, however, remains that there was a shortfall of 23 per cent in actual realisation from disinvestments during the year 2019-20 even though the estimates had been revised on the basis of progress made and the transactions in pipeline.

Report No. 12 of 2021
78
3.6 Mode-wise realization from disinvestment during the last five years
Disinvestment proceeds realised through various modes of disinvestment during the last five years are mentioned in Table 3.3.
Table 3.3: Mode-wise realisation during the last five years (` in crore)
Mode of Disinvestment 2019-20 2018-19 2017-18 2016-17 2015-16 Total for 5
years
IPO 1,113.86 1,914.00 24,039.85 - - 27,067.71
ETFs 30,869.19 45,079.92 14,500.00 8,499.98 - 98,949.09
OFS 1,129.58 5,235.63 13,710.86 8,004.42 19,513.58 47,594.07
Buy Back 821.80 10,670.83 5,337.55 18,963.47 4,483.22 40,276.87
Strategic disinvestment 13,883.00 15,913.96 41,068.65 10,778.71 - 81,644.32
Remittances from SUUTI 600.00 5,378.66 1,400.00 - - 7,378.66
Enemy Shares sale 1,881.21 779.02 - - - 2,660.23
Total 50,298.64 84,972.02 1,00,056.91 46,246.58 23,996.80 305,570.95
As depicted in the Table-3.3, DIPAM realised proceeds of `50,298.64 crore through different modes of disinvestment during the year 2019-20. The major proceeds from disinvestment came from ETFs (61 per cent) and strategic disinvestment (28 per cent) during the year; a trend also seen in the last five years.
3.7 Implementation
DIPAM realised an amount of `50,298.64 crore during 2019-20 through 15 transactions, which have been discussed in succeeding paragraphs under four categories viz. (i) Disinvestment done through Minority Stake Sale, (ii) Strategic Disinvestment (iii) Capital Restructuring – Buyback of shares, and (iv) Asset monetisation – Sale of Enemy Shares.
3.7.1 Disinvestment through Minority stake sale
DIPAM finalized 10 transactions51 of IPO, OFS, ETF-Further Fund Offer (FFO), buyback of shares while disinvesting its minority stakes in CPSEs. While the buyback of shares has been discussed separately under Para 3.7.3, the disinvestments through IPO, OFS and ETF are discussed below:
51 IPO (Rail Vikas Nigam Limited and Indian Railway Catering & Tourism Corporation Limited), OFS (2 issues for RITES Limited), ETF (CPSE ETF FFO-5 & FFO-6 and Bharat 22 ETF FFO-2), Buyback (MOIL Limited, Mazagon Dock Shipbuilders Limited, and Security Printing & Minting Corporation of India Limited)
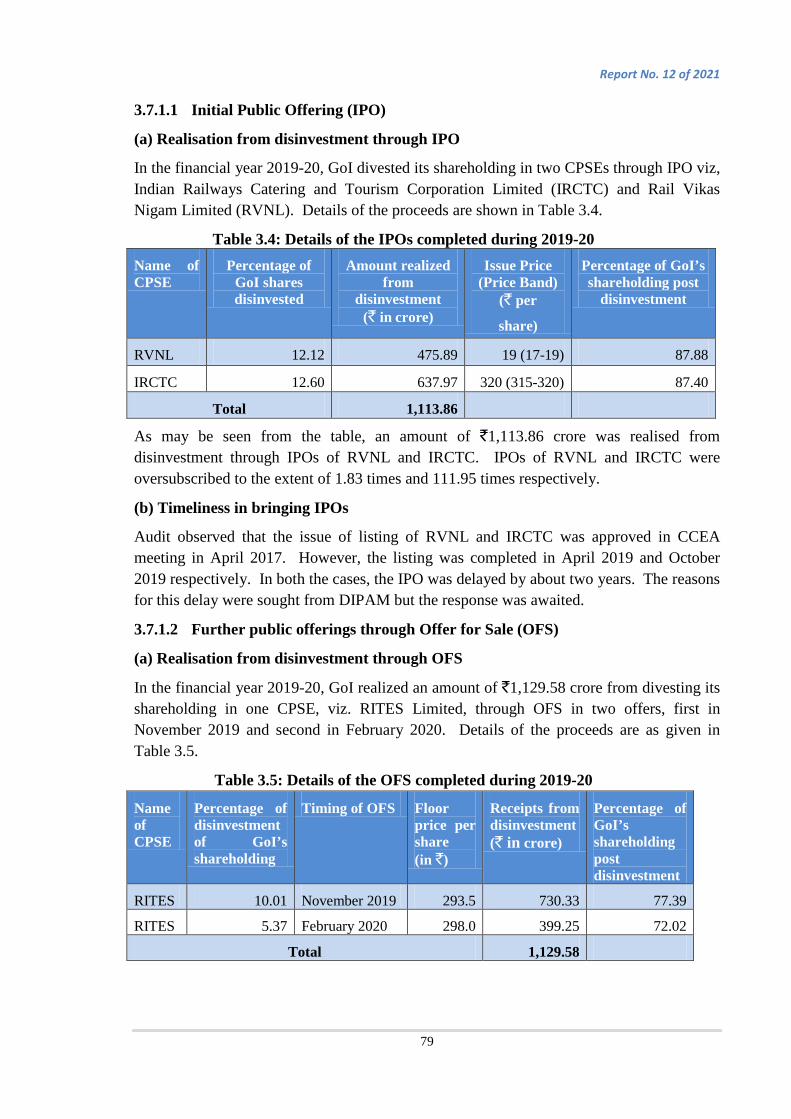
Report No. 12 of 2021
79
3.7.1.1 Initial Public Offering (IPO)
(a) Realisation from disinvestment through IPO
In the financial year 2019-20, GoI divested its shareholding in two CPSEs through IPO viz, Indian Railways Catering and Tourism Corporation Limited (IRCTC) and Rail Vikas Nigam Limited (RVNL). Details of the proceeds are shown in Table 3.4.
Table 3.4: Details of the IPOs completed during 2019-20 Name of CPSE
Percentage of GoI shares disinvested
Amount realized from
disinvestment (` in crore)
Issue Price (Price Band)
(` per
share)
Percentage of GoI’s shareholding post
disinvestment
RVNL 12.12 475.89 19 (17-19) 87.88
IRCTC 12.60 637.97 320 (315-320) 87.40
Total 1,113.86
As may be seen from the table, an amount of `1,113.86 crore was realised from disinvestment through IPOs of RVNL and IRCTC. IPOs of RVNL and IRCTC were oversubscribed to the extent of 1.83 times and 111.95 times respectively.
(b) Timeliness in bringing IPOs
Audit observed that the issue of listing of RVNL and IRCTC was approved in CCEA meeting in April 2017. However, the listing was completed in April 2019 and October 2019 respectively. In both the cases, the IPO was delayed by about two years. The reasons for this delay were sought from DIPAM but the response was awaited.
3.7.1.2 Further public offerings through Offer for Sale (OFS)
(a) Realisation from disinvestment through OFS
In the financial year 2019-20, GoI realized an amount of `1,129.58 crore from divesting its shareholding in one CPSE, viz. RITES Limited, through OFS in two offers, first in November 2019 and second in February 2020. Details of the proceeds are as given in Table 3.5.
Table 3.5: Details of the OFS completed during 2019-20
Name of CPSE
Percentage of disinvestment of GoI’s shareholding
Timing of OFS Floor price per share (in `)
Receipts from disinvestment (` in crore)
Percentage of GoI’s shareholding post disinvestment
RITES 10.01 November 2019 293.5 730.33 77.39
RITES 5.37 February 2020 298.0 399.25 72.02
Total 1,129.58

Report No. 12 of 2021
80
As may be seen from the table, an amount of `1,129.58 crore was realised from disinvestment through two OFS of RITES Limited. OFS-1 and OFS-2 were oversubscribed to the extent of 1.07 times and 1.073 times respectively.
(b) Under-achieved retail and employee participation
In the OFS of RITES Limited, 20 per cent of proposed OFS was reserved for retail investors. Audit, however, observed that the participation of retail investors in RITES OFS-1 and RITES OFS-2 was 11.43 per cent and 1.63 per cent, respectively. Further, the participation of employees was only 2.5 per cent of allocated quantity in the first OFS and Nil in the second OFS. DIPAM did not respond to the audit observation.
3.7.1.3 CPSEs Exchange Traded Fund (ETF)
(a) Realisation from disinvestment through ETFs
The Government, in 2019-20, realised `30,869.19 crore from the following Further Fund Offers (FFOs) of ETFs, as given in Table 3.6.
Table 3.6: Details of the ETFs launched during the year 2019-20 (FFO mode)
The details of the above-mentioned ETFs are as follows:
(i) CPSE ETF FFO-5: The FFO-5 of CPSE ETF comprising 10 CPSE stocks52 with a base size of the offer as `8,000 crore was launched in July 2019. Oversubscription was anticipated and it was decided that the maximum size of the offer may go upto `11,500 crore (43.75 per cent over the base size). It was also decided that the GoI holding in
52 NBCC (India) Limited, Bharat Electronics Limited, Coal India Limited, NLC India Limited, Oil India
Limited, Oil & Natural Gas Corporation Limited, Power Finance Corporation Limited, Indian Oil Corporation Ltd., NTPC Limited and SJVN Limited
Name of ETF
Percentage of GoI holding retained in the CPSEs constituting CPSE ETF Index
Base Size (` in crore)
Final offer size decided (` in crore)
Percentage increase over base size
Procurement of shares from open market by Asset Management Company to maintain Government shareholding (` in crore)
Receipts from disinvestment (` in crore)
CPSE ETF FFO-5
51.5 8,000 11,500 43.75 1,499.61 10,000.39
CPSE ETF FFO-6
51.01 10,000 20,000 100 - 16,500.00
Bharat 22 ETF FFO-2
51.5 2,000 6,000 200 1,373.2 4,368.80
Total 30,869.19

Report No. 12 of 2021
81
constituent CPSEs of the basket should not go below 51.5 per cent. Shares of Indian Oil Corporation Limited (IOCL) were purchased from open market by the Asset Management Company as GoI shareholding in IOCL had reached the threshold limit. A discount of three per cent on GoI divested shares was also offered to all the investors. (ii) CPSE ETF FFO-6: The FFO-6 of CPSE ETF consisting of 12 CPSE53 stocks was launched in January 2020 with base size of `10,000 crore. As above, the maximum size was decided as `20,000 crore (100 per cent over the base size). A discount of three per cent on GoI divested shares was also offered to all the investors. (iii) Bharat-22 ETF FFO-2: The FFO-2 of the Bharat 22 ETF consisting of 22 stocks (16 CPSE54 stocks, 3 PSU55 banks and 3 private sector56 stocks) was launched in October 2019 with a base size of the offer as `2,000 crore. Over-subscription was anticipated and it was decided that the maximum size of the offer may go up to `6,000 crore (200 per cent over the base size). It was also decided that the GoI holding in the non-financial CPSEs of the basket should not go below 51.5 per cent and in public sector banks shall not fall below 52 per cent. A discount of three per cent on GoI divested shares was also offered to all the investors.
As in the case of CPSE ETF FFO-5, where shares of Indian Oil Corporation Limited were bought from the open market, in case of Bharat-22 ETF FFO-2, shares of ITC Limited, REC Limited, Indian Oil Corporation Limited, National Aluminium Company Limited and Engineers India Limited were also bought from open market. As a result, Government netted 23 per cent less as compared to offer size due to buying stocks from the open market.
In case of CPSE ETF FFO-6, Audit had observed that rebalancing of the index57 had been carried out and a scenario analysis had been provided by the Asset Management Company. Audit further noted that in case of Bharat 22 ETF, annual rebalancing of the index was included in the criteria mentioned for selection of stock for the development of the index in the scheme document. Accordingly, Audit enquired into reasons for not carrying out rebalancing of the index.
DIPAM stated (June 2021) that in the case of CPSE ETF which constituted only CPSEs, rebalancing of index is required whenever a predefined threshold limit of GoI holding is reached. Whereas, in the case of Bharat-22 ETF which constitutes CPSEs, Public Sector
53 Oil & Natural Gas Corporation Limited, Coal India Limited, Oil India Limited, Bharat Electronics
Limited, NLC India Limited, NBCC (India) Limited, NTPC Limited, SJVN Limited, Cochin Shipyard Limited, NHPC Limited, NMDC Limited and Power Grid Corporation of India Limited
54 Power Finance Corporation Limited, REC Limited, NHPC Limited, SJVN Limited, NTPC Limited, Power Grid Corporation of India Limited, Oil & Natural Gas Corporation Limited, Indian Oil Corporation Limited, Bharat Petroleum Corporation Limited, GAIL (India) Limited, Engineers India Limited, Bharat Electronics Limited, NBCC (India) Limited, Coal India Limited, NLC (India) Limited and National Aluminium Company Limited
55 State Bank of India, Bank of Baroda and Indian Bank 56 Larsen & Toubro Limited, Axis Bank Limited and ITC Limited 57 Rebalancing of the index refers to adding or removing constituent securities or changing the weights of the existing index constituents.
Report No. 12 of 2021
82
Banks and private companies in which GoI has shareholding, the additions and deletions (rebalancing) to the index occur only where the GoI notifies the public of a change under its disinvestment program on their website. There is no parameter of predefined GoI shareholding limit in Bharat 22 ETF methodology as this ETF constitutes private companies also. Hence, at the time of launch of any offer, the Asset Management Company was informed by Government about the maximum limit of GoI holding in CPSEs upto which divestment could be made. In case such limit is crossed, the Asset Management Company was permitted to procure excess share over and above the shares offered by Government for disinvestment from open market. Government receives the proceeds to the extent of its shares divested during the offer.
Audit observed that a threshold limit of GoI holding in CPSEs (51.5 per cent) existed in respect of CPSEs in the Bharat 22 ETF basket. GoI shareholding in Engineers India Limited, National Aluminium Company Limited and Indian Oil Corporation Limited was 52 per cent, 52 per cent and 51.5 per cent respectively after the previous issue of ETF was brought out in the market, which was close to threshold shareholding limit. It was also known that GoI did not hold any shares of REC Limited, and could not undertake any more divestment of ITC Limited. In the documents provided to Audit, existence of certain transaction costs and disincentives to investors was mentioned in case rebalancing was required to be done with respect to REC Limited, but there was no comparative analysis or scenario analysis to support whether costs of rebalancing the basket in case of Bharat-22 ETF outweighed the cost of buying stocks from market.
Additionally, on Audit’s enquiry on whether further ETFs are planned, it was stated (February 2021) that Government had decided to pause in employing Equity ETFs as a tool for minority stake sale.
(b) Lesser retail participation in the offers of ETF
As per the Scheme Information Document prepared before the launch of ETF, maximum limit of allocation to retail investors was 25 per cent in Bharat-22 ETF FFO-2 and in case of CPSE ETF FFO-6, the combined limit of allocation to retail investors and qualified institutional bidders was 70 per cent. Audit, however, observed that the participation of retail investors in FFO-2 of Bharat 22 ETF, FFO-5 of CPSE ETF and FFO-6 of CPSE ETF was 10.17 per cent, 3.09 per cent and 13.09 per cent respectively. All of these issues were oversubscribed in total but the participation of the retail investors was very low.
Similar issues were pointed out in CAG’s Report No 18 of 2019 also, where poor response of retail investors to IPOs of CPSEs had been noticed.
3.7.2 Strategic Disinvestment (Sale of majority stake of GoI in CPSEs)
The current disinvestment policy includes strategic disinvestment by way of sale of substantial portion of government shareholding in identified CPSEs up to 50 per cent or more, along with transfer of management control.
The Cabinet Committee on Economic Affairs (CCEA), in its meeting held on 17 February 2016 approved the proposal of DIPAM relating to procedure and mechanism for strategic

Report No. 12 of 2021
83
disinvestment of CPSEs. The CCEA approved revised procedure and mechanism of strategic disinvestment in October 2019.
The Government has “in principle” approved strategic disinvestment in 31 cases since 2016, out of which strategic disinvestment in eight cases58 has been completed; in four cases59, the CPSEs were recommended to be closed and in two cases60, the transaction was deferred. The remaining 17 transactions61 are at various stages of implementation.
During the year 2019-20, three strategic transactions were completed as detailed below in Table 3.7.
Table 3.7: Strategic Disinvestments completed during 2019-20 Name of CPSE disinvested
Percentage holding of GoI prior to disinvestment
Name of the buyer Amount realised
(` in crore)
THDC India Limited (THDCIL)
74.50 NTPC Limited 7,500
North Eastern Electric Power Corporation Limited (NEEPCO)
100 NTPC Limited 4,000
Kamarajar Port Limited (KPL)
66.67 Chennai Port Trust 2,383
From the above table, it is evident that the stake of GoI in the aforesaid CPSEs was sold to another CPSE/ Government entity.
In respect of the strategic disinvestment carried out during the year 2019-20, Audit observed the following points:
3.7.2.1 Stake of GoI purchased in violation of the guidelines of Department of Public Enterprises (DPE)
As per the Maharatna scheme notified (February 2010) by the DPE, Maharatna CPSEs can make equity investment to establish financial joint ventures and wholly owned subsidiaries and undertake mergers and acquisitions subject to a ceiling of 15 per cent of the net worth
58 Hindustan Petroleum Corporation Limited: `36,915 crore, HSCC (India) Limited: `285 crore, National
Projects Construction Corporation Limited: `79.80 crore, Dredging Corporation of India Limited: `1,049 crore, REC Limited: `14,499.99 crore, THDC India Limited: `7,500 crore, North Eastern Electric Power Corporation Limited: `4,000 crore and Kamarajar Port Limited: `2,383 crore
59 Hindustan Prefab Limited, Hindustan Fluorocarbons Limited, Bharat Pumps & Compressors Limited and Scooters India Limited
60 Hindustan Newsprint Limited and Karnataka Antibiotics & Pharmaceuticals Limited 61 Projects & Development India Limited, Engineering Projects India Limited, Pawan Hans Limited,
Bridge & Roof Company Limited, Air India Limited, Central Electronics Limited, Cement Corporation of India Limited (Nayagaon unit), Steel Authority of India Limited (Salem Steel Plant, Bhadravati Steel Plant and Alloy Steel Plant, Durgapur), Ferro Scrap Nigam Limited, Nagarnar Steel Plant of NMDC Limited, Bharat Earth Movers Limited, HLL Lifecare Limited, Indian Medicines Pharmaceuticals Corporation Limited, Bharat Petroleum Corporation Limited, Shipping Corporation of India Limited, Container Corporation of India Limited and Neelachal Ispat Nigam Limited
Report No. 12 of 2021
84
of the CPSE, limited to `5,000 crore in one project. The overall ceiling in such investments in all projects put together will not exceed 30 per cent of the net worth of the concerned CPSE. In a communication to its Administrative Ministry i.e., the Ministry of Power, NTPC, a Maharatna CPSE expressed (February 2020) its view that acquisition of THDCIL and NEEPCO would breach the aforesaid overall ceiling of 30 per cent of net worth considering already committed equity investment/ participation in other JVs. Audit observed that NTPC Limited invested (March 2020) `11,500 crore for purchasing GoI’s stake in NEEPCO and THDCIL in violation of the aforesaid prescribed limit. In this regard, no exemption was sought from the DPE.
DIPAM replied (January 2021) that DPE was also a member of CCEA, therefore, the action did not seem to attract provisions contained in Maharatna Scheme delegating powers to the Boards of the CPSEs.
The reply of DIPAM is not tenable as the aforesaid issue of breach of limit was not addressed in the meeting.
3.7.2.2 Sector consolidation instead of disinvestment
DIPAM planned for listing of NEEPCO (in April 2017) and THDCIL (in April 2012 and December 2018) as approved by CCEA. In November 2019, in order to take power sector consolidation further, CCEA approved the acquisition of THDCIL by NTPC and of NEEPCO by NHPC62 respectively in modification of the earlier decision of listing. The acquisition of the aforesaid companies was done in March 2020. As a result, the two companies became subsidiaries of NTPC and remained Government companies.
Audit is of the view that the above acquisition is more in the nature of sector consolidation rather than disinvestment in true sense.
3.7.2.3 Acquisition of Kamarajar Port Limited by Chennai Port Trust The CCEA in its meeting in June 2017 had approved the strategic disinvestment of 100 per cent of GOI equity in Kamarajar Port Limited. NITI Aayog had recommended disinvestment of GOI’s equity through a two stage auction process. However, in view of certain strategic considerations, the proposal was dropped in 2017. In December 2018, the Ministry of Shipping proposed for sale of 100 per cent of GoI’s stake in Kamarajar Port Limited to Chennai Port Trust on arm’s length basis which was approved by CCEA on 28 February 2019. In March 2020, GOI sold its 66.67 per cent equity in Kamarajar Port Limited to Chennai Port Trust, taking the latter’s holding in Kamarajar Port Limited to 100 per cent.
The reserve price for the transaction was fixed as `2,383 crore in the meeting of Inter-Ministerial Group (IMG) held on 16 March 2020, which was later approved by the Core Group of Secretaries on Disinvestment and the Alternative Mechanism.
62 NEEPCO was finally acquired by NTPC

Report No. 12 of 2021
85
The reserve price was calculated on the basis of the valuation of equity of Kamarajar Port Limited as done by the Transaction Adviser appointed for the transaction. As per approval given by CCEA, the methods of valuation included Discounted cash flow, Asset valuation and Relative valuation methods. However, the weightage to be given to the various methods was not prescribed. The assigned weightages approved by the IMG and reserve price arrived at is as given in Table 3.8.
Table 3.8: Fixation of Reserve Price for Strategic Disinvestment of KPL
a) Stake Purchase from GoI, financed by loan by already financially stressed
Chennai Port Trust The Transaction Adviser appointed for the disinvestment of Kamarajar Port Limited apprised (November 2019) that the Chennai Port Trust, even after consolidation of Kamarajar Port Limited with Chennai Port Trust post the proposed transaction, may not have sufficient financial capacity to acquire the entire 66.67 per cent of shareholding of the GoI in Kamarajar Port Limited. Accordingly, the Alternative Mechanism decided (February 2020) that due to insufficient financial capacity of Chennai Port Trust to buy the entire GoI’s stake in Kamarajar Port Limited, the disinvestment was to be made in two tranches, i.e. 50 per cent of the GoI’s stake by March 2020 and the remaining stake within 12 months of the first tranche. However, the entire stake of GoI was sold to Chennai Port Trust for `2,383 crore. Due to poor financial condition, Chennai Port Trust (also a Government entity) had to raise a loan of `1,775 crore at a rate of interest of eight per cent per annum for purchasing the GoI’s stake in Kamarajar Port Limited. In addition to principal repayment, it put an additional interest burden of approximately `142 crore (per annum) on the Chennai Port Trust. DIPAM replied (June 2021) that in the Inter-Ministerial Group meeting of February 2020, the Ministry of Shipping highlighted that it seemed possible for Chennai Port Trust to bid for full GOI stake in one tranche by March 2020. This was agreed to and brought to the notice of the Alternative Mechanism in its meeting held in March 2020.
Method used for valuation Valuation (` in
crore)
Weightage assigned by IMG (in per
cent)
Value
(` in crore)
Discounted cash flow method 4,069 35 1,424
Market multiple method (Comparable Companies method)
3,438 20 688
Market multiple method (Comparable Transaction method)
3,474 15 521
Asset valuation method 3,140 30 942
Book Value 2,472 NIL -
Weighted value 100 3,575
Reserve Price (GoI’s stake in Kamarajar Port Limited )
66.67 2,383

Report No. 12 of 2021
86
Audit observed that approximately 74.5 per cent of the proceeds realised by GOI from disinvestment of Kamarajar Port Limited (`1,775 crore of total `2,383 crore), was actually borrowed from the market by Chennai Port Trust, given its constrained financial condition. The transaction defeated the very spirit of disinvestment.
(b) Impact of the assumptions made by the Transaction Advisor and other issues on reserve price for strategic disinvestment of Kamarajar Port Limited
The Guidance Note–II on Strategic Disinvestment issued by DIPAM in May 2018 states that the valuation assumptions ought to be validated along with justifications, especially in cases involving difference in opinion as regards projections, production parameters, business plan, etc. In case of valuation of Kamarajar Port Limited, the assumptions made by the Transaction Advisor (including, 20 per cent company specific discount and risk premium), in the aggregate, impacted reserve price by approximately `576.35 crore. However, adequate justification for applying the specific discounts/ premium, was not found on record. The details are discussed below:
(i) Company specific discount of 20 per cent applied in the valuation of port basin and entrance channel of Kamarajar Port Limited
The value of the Kamarajar Port Limited arrived at through Asset Valuation Method63 was `3,140 crore. As required under the method, the Asset Valuer calculated the market value of all the assets of Kamarajar Port Limited. Kamarajar Port Limited had port basin and entrance channel measuring 2,82,48,988 cubic feet (having highest carrying value among all the assets). For calculating the market value of this asset, Asset Valuer took a rate of `395 per cubic feet of dredging (average of the current rates i.e. `370 - `420 per cubic feet of dredging). However, a further discount of 20 per cent was applied, due to which the rate of dredging per cubic feet reduced to `316 per cubic feet. The Asset Valuer applied the discount on an assumption that considering the large quantity of the dredging (aggregate volumes over several years), the Port Authority may expect a discount of 20 per cent. However, no supporting justification was given in the valuation report for such a significant discount.
(ii) Difference in the value of the assets calculated by the Transaction Advisor and the value of the assets used for fixation of reserve price
The value of total assets of Kamarajar Port Limited as ascertained by the Asset valuer was `3,754.72 crore. However, the value of assets used for fixation of reserve price of the transaction was taken as `3,751.60 crore. This difference of `3.12 crore remained unexplained. After adjustment of notional capital gain tax of `612 crore, the asset value to be taken for fixation of reserve price should, therefore, have been `3,142.72 crore, instead of `3,139.60 crore.
63This method helps in arriving at the cost of replacing the tangible assets of the business. The replacement
cost takes into account the market value of various assets or the expenditure required to create the infrastructure exactly similar to that of a company being valued.

Report No. 12 of 2021
87
(iii) Company specific discount of 20 per cent applied on the EBITDA multiple to be used for valuation of Kamarajar Port Limited through Market Multiple Method (Comparable Company Method)
Under the Market Multiple Method (Comparable Company method), the EBITDA multiples (Enterprise Value of companies divided by their EBITDA) of two comparable port companies namely, Adani Ports and SEZ Limited and Gujarat Pipavav Port Limited were used to arrive at the Enterprise Value of Kamarajar Port Limited. The Enterprise Value so obtained was adjusted for debt, investments, cash and cash equivalents to get the equity value of Kamarajar Port Limited. The value of the Kamarajar Port Limited arrived through this method was `3,438 crore.
The EBITDA multiples of the companies were calculated as 13.01x and 7.15x. To arrive at the multiple applicable for Kamarajar Port Limited’s valuation under this method, average of the aforesaid two multiples i.e. 10.08x was taken by the Transaction Advisor. In addition, a discount of 20 per cent was applied to this multiple (10.08x) due to which the EBITDA multiple got reduced to 8.07x64. However, no supporting justification was given in the valuation report for such a significant discount.
(iv) Company specific discount of 20 per cent applied on the EBITDA multiple to be used for valuation of Kamarajar Port Limited through Market Multiple Method (Comparable Transaction Method)
To arrive at the valuation of Kamarajar Port Limited under this method, the Transaction Advisor considered a transaction involving acquisition of 75 per cent equity stake in Krishnapatnam Port (Acquiree) by Adani Ports and SEZ Limited (Acquirer). The Enterprise Value of the acquiree was divided by its EBITDA to arrive at an EBITDA multiple which was 10.17x. Audit observed that the Enterprise Value for the above transaction as intimated by the acquirer was `13,572 crore. However, the Enterprise Value considered by the Transaction Advisor for the valuation was `13,546 crore. The EBITDA multiple with Enterprise Value as `13,572 crore was 10.19x instead of 10.17x which was adopted.
Further, a discount of 20 per cent was applied to this multiple (10.17x) due to which the applicable multiple got reduced to 8.13x65. However, the rationale for this discount was not found in records.
(v) Company Specific Risk Premium of three per cent in calculation of cost of equity for valuation of Kamarajar Port Limited through Discounted Cash Flow method
To arrive at the cost of equity of Kamarajar Port Limited, the Transaction Adviser had considered a company specific risk premium of three per cent in addition to the equity risk premium of 7.08 per cent. However, no justification was given for applying this risk
64 80 per cent of 10.08. 65 80 per cent of 10.17

Report No. 12 of 2021
88
premium. As a result of this company specific risk premium, the WACC (Weighted Average Cost of Capital) increased by 2.4 per cent as shown in Annexure XXIII.
In view of the points (i) to (v) mentioned above, the reserve price of the transaction of strategic disinvestment of Kamarajar Port Limited got reduced by `576.35 crore (Annexure XXIII).
DIPAM in its reply (June 2021) confirmed the calculations but did not comment upon the rationale of considering above mentioned discounts in the valuation of Kamarajar Port Limited. DIPAM stated that the Company Specific Risk Premium is unique to any unlisted company. The estimate of the unlisted company’s unsystematic risk component captured through Company Specific Risk Premium in the Weighted Average Cost of Capital is a matter of Transaction Advisor’s professional judgement based on several factors including financial statements and comparative ratio analysis, and any other qualitative matters during the Transaction Advisor’s interaction with the management. The process is designed to benefit from the experience and judgement of the Transaction Advisor determining such discount rate.
Audit is of the view that given the significant discount rates and premium applied, explanations and/ or justification and underlying reasoning for the assumptions and judgement made should have been clearly documented as against references made to discussions in this regard. 3.7.2.4 Significant discount applied in the valuation of private land of THDCIL at
Dehradun As per DIPAM’s Guidance Note-III on Valuation for Strategic Disinvestment, “The realizable market value of real estate assets either owned by the company as freehold properties or on a lease/ rental basis may be determined, assuming a non-distress sale scenario.” It further states that “The value may be assessed after taking into account any defects/ restrictions/ encumbrances on the use/ lease/ sublease/ sales etc., of the properties or in the title deeds, etc”.
M/s Protocol Insurance Surveyors & Loss Assessors Pvt. Limited was appointed for carrying out asset valuation of THDCIL for strategic disinvestment. In respect of valuation of private land at Dehradun, the assessor stated that in order to determine the market value of land parcels, they had conducted specific enquiries about prevailing market rates in the vicinity of the subject property. However, while calculating the rates for private land at various places, a discount of 40 per cent for size was provided by the assessor as given in Annexure XXIV.
Audit observed that these land pieces were located in Dehradun and other nearby suburban areas of Uttarakhand and, hence, enquired into reasons regarding application of discount to the extent of 40 per cent.
DIPAM replied that to derive the market rate from smaller plots to larger plots, there is a discount on account of size. The reason for this discount is that larger land parcels have limited buyers in the market and since large land parcels are huge in size, the transaction
Report No. 12 of 2021
89
amount is large. The value of property per unit of rate goes down as the size of the property increases.
Justification for discount, especially large discounts, needs to be in line with the requirements of the guidance note mentioned above. Clear title to these land pieces vested with THDCIL. It would have been prudent to record whether land pieces that were used for comparison (Annexure XXIV) were comparable to the land pieces held by THDCIL, in terms of any defects, locational advantages/ disadvantages, topography, probable end use etc., to help validate significant discounts in valuation.
Recommendation 1
In order to validate the assumptions/ judgements made in the valuation process in strategic disinvestments, and to draw requisite assurance that the same were reasonable, the underlying justification and reasoning may be clearly articulated and consistently documented as they have a significant impact on the reserve price and valuation of assets.
3.7.2.5 Role of Independent External Monitor in the valuation process In line with the decision of CCEA (17 February 2016) with regard to the procedure and mechanism for strategic disinvestment of CPSEs, an Independent External Monitor (IEM) was constituted in June 2016 to act as an oversight committee for strategic disinvestment. The terms and reference for the IEM were to (a) vet the process of valuation of CPSEs/ units, (b) oversee the transaction process of strategic disinvestment of CPSEs/ units, (c) examine and address the grievances received, and (d) any other matter that is referred to IEM by the Government.
It was observed that since its constitution, only four meetings of the IEM were held on 21 April 2017, 23 November 2017, 18 April 2018 and 30 May 2019 till the close of financial year 2019-20. The frequency of meetings appears less, keeping in view the number and magnitude of the strategic disinvestments being carried out during these years. It was also observed from the minutes that inputs on valuation of CPSEs with respect to transaction process of strategic disinvestments undertaken were not sought consistently from IEM.
DIPAM stated (January 2021) that CCEA had approved the role of IEM as an oversight mechanism and not as part of decision-making mechanism.
The reply of DIPAM is not tenable as the vetting of process of valuation of CPSEs and overseeing the transaction process of strategic disinvestment of CPSEs/ units was mentioned in the terms and reference of IEM. In the meeting held in May 2019, IEM was informed about the approval of the CCEA, accorded in February 2019, regarding disinvestment of Kamarajar Port Limited. The disinvestment was carried out in March 2020 but after May 2019, until the close of financial year 2019-20, no meeting with the IEM took place.
DIPAM’s Guidance Note-II of May 2018 on ‘Steps involved in the process of Strategic Disinvestment’, also states that ‘IEM Members are apprised of the process and procedure
Report No. 12 of 2021
90
followed in strategic disinvestment transactions by DIPAM from time to time. The advice and guidance of IEM is duly considered and adopted on an on-going basis’.
Recommendation 2
The mechanism of IEM needs to function as per its terms of reference so that it can serve its intended purpose of overseeing the transaction process of strategic disinvestments as they are being undertaken, and vet the valuation of the CPSEs/ units, on a concurrent basis.
3.7.3 Capital Restructuring - Buyback of Shares
DIPAM issued (May 2016) guidelines on Capital Restructuring of CPSEs which describes the measures of capital restructuring in the CPSEs. Buyback of shares by CPSEs has also been mentioned as one of the measures to be adopted by CPSEs for their capital restructuring which helps the company to improve investors’ confidence in the company and is likely to help the company to raise capital in future when it requires funds for expansion/ diversification for growth. According to the provisions relating to buyback of shares as mentioned in the aforesaid guidelines, every CPSE with a net worth of at least `2,000 crore and cash balance of more than `1,000 crore shall exercise the option to buy back their shares.
As per the DPE Public Enterprises Survey Report for the year 2018-19, there were 26 CPSEs which fulfilled the aforesaid criteria for buyback of shares in the year 2019-20. Out of the eligible 26 CPSEs66, three CPSEs undertook buyback of shares realising an amount of `821.80 crore for the GoI, the details of which are given in Table 3.9.
Table 3.9: Realisation from buyback of shares CPSE Listed/
Unlisted at the time of buyback
Receipt (` in crore)
Percentage shareholding of GoI before buyback
Percentage shareholding of GoI after buyback
MOIL Limited Listed 250.47 56.01 53.84
Security Printing & Minting Corporation of India Limited
Unlisted 296.45 100 100
Mazagon Dock Shipbuilders Limited
Unlisted 277.88 100 100
66 NTPC Limited, Power Grid Corporation of India Limited, ONGC Videsh Limited, GAIL (India) Limited, Airports Authority of India, Oil India Limited NMDC Limited, South Eastern Coalfields Limited, SJVN Limited, National Aluminium Company Limited, Mahanadi Coalfields Limited, Northern Coalfields Limited, Central Coalfields Limited, Bharat Heavy Electricals Limited, NHDC Limited, Security Printing & Minting Corporation of India Limited, MOIL Limited, Mazagon Dock Shipbuilders Limited, Cochin Shipyard Limited, RITES Limited, REC Limited, Engineers India Limited, Indian Renewable Energy Development Agency Limited, India Infrastructure Finance Company Limited, IRCON International Limited and Power Finance Corporation Limited
Report No. 12 of 2021
91
From the above table, it is evident that out of three CPSEs which undertook buyback during 2019-20, two CPSEs were unlisted and wholly owned by GoI. These wholly owned unlisted CPSEs bought back shares from their sole shareholder i.e. GoI. Therefore, even though the capital of these CPSEs got restructured, the shareholding of GoI in these two CPSEs did not reduce and remained at 100 per cent.
3.7.4 Asset Monetisation – Sale of Enemy Shares
After the war with China and Pakistan in 1962 and 1965, respectively, the Government took over the properties, under the Defence of India Act, from persons who migrated to these countries. Enemy Property Act, 1968 was enacted to regulate such properties and these were entrusted with the Custodian of Enemy Property for India (CEPI), which is a statutory authority and a subordinate office under the Ministry of Home Affairs (MHA). The confiscated property included both movable and immovable properties. GoI made (March 2017) an enabling provision in the Enemy Property Act, allowing the Government to sell these properties.
The Cabinet approved (08 November 2018) the mechanism and procedure for sale of the enemy shares, and DIPAM was authorized under the provisions of sub-section 7 of Section 8A of the Enemy Property Act, 1968, to sell the same. CCEA delegated powers to the Alternative Mechanism to decide the quantum and price band for sale of enemy shares and also to decide the principle/ mechanism for quantum and price for sale of shares and the method of their selling in each case. Further, sale proceeds of such enemy shares were to be deposited as disinvestment proceeds in the Government account maintained by Ministry of Finance. Expenditure to be incurred for sale of shares was to be borne by DIPAM.
The procedure laid down in the Cabinet Note (dated 05 November 2018) for disposal of Enemy shares was as under:
(i) Shares under the custody of CEPI, are to be disposed off following Stock Exchange/ SEBI Rules and Regulations for listed shares and any other mechanism for unlisted shares, suitably adapting the process being followed in disinvestment of GoI shares of CPSEs.
(ii) The custody and upkeep of the Enemy Shares shall continue to be under the purview of MHA as per Allocation of Business Rules. The physical maintenance of the files and documents, dealing with court cases/ claims etc., relating to Enemy Shares shall be handled by MHA/ CEPI.
(iii) Similar to the process adopted for disinvestment of the shares of the CPSEs, the Enemy Shares shall be kept in the Demat account of the CEPI/ MHA. At the time of disposal of these shares, authorized signatory of CEPI/ MHA will transfer the shares to be transacted to the broker for transfer to the buyers.
(iv) High Level Committee (HLC) of officers co-chaired by the Secretary, DIPAM and Secretary, MHA shall deliberate and recommend to Alternative Mechanism the quantum and price/ price band for sale of shares and also the principles/ mechanism

Report No. 12 of 2021
92
for quantum and price for sale of shares and the method of selling the Enemy Shares in each case.
(v) An alternative mechanism under the Chairmanship of Finance Minister and comprising Minister of Road Transport and Highways and Home Minister may be constituted to decide the quantum and price band for sale of Enemy Shares and also decide the principles/ mechanism for quantum and price for sale of such shares and the method of sale in each case, based on the recommendations of HLC.
(vi) In respect of sale of Enemy Shares, the required advisors/ intermediaries like Merchant Bankers, Legal Advisers, Selling Brokers etc., will be appointed by DIPAM through open tender/ limited tender process. An Inter-Ministerial Group (IMG) will guide the process of sale of Enemy Shares as per SEBI Rules and Regulations for listed shares and any other mechanism for unlisted shares as per defined process.
As per the Cabinet Note (05 November 2018), 6,50,75,877 shares in 996 companies of 20,323 shareholders were under the custody of Custodian of Enemy Property for India (CEPI). Out of 996 companies, 588 companies were functional, 394 companies were in dormant stage and details of remaining 14 companies were stated to be shared by MHA in due course. Further, out of 588 functional companies, 139 were listed companies whose market value was around `2,291 crore. As per the approved time-frame for implementation, disposal of the Enemy Shares was likely to be done within one year from the CCEA approval (8 November 2018) depending on the market condition.
SBI Cap Securities Limited was appointed as adviser-cum-broker for sale of enemy shares through limited tender. The status as on 06 August 2020 of the enemy shares received from CEPI and sold by SBI Cap and reconciled during meeting with MHA is as given in Table 3.10.
Table 3.10: Status of sale of enemy shares
Description Status
Shares transferred to SBI Cap 7,50,99,134 shares
Shares received by SBI Cap 7,50,99,134 shares
Shares sold by SBI Cap 7,48,02,340 shares
Total gross sale proceeds from disposal of shares (`) `2665,78,52,481
Audit observed that:
• As per DIPAM’s Note dated 11 September 2019, Alternative Mechanism in its meetings held on 07 February 2019, 08 March 2019 and 27 March 2019, approved the methodology to be followed for sale of listed shares. Accordingly, the shares of 182 companies were transferred to SBI Cap Securities Limited for sale as per the methodology approved by Alternative Mechanism. Shares of 130 companies were sold and an amount of `2,653 crore was realised. Shares in respect of the remaining

Report No. 12 of 2021
93
52 companies could, however, not be sold. The reasons for the same were sought from DIPAM and their reply was awaited.
• MHA had informed (June 2020) the Ministry of Corporate Affairs that the share certificates of enemy shares in 45 listed companies67 and 145 unlisted companies68 were not available with CEPI and duplicate share certificates were to be issued. Further, the unlisted shares in the physical form were to be dematerialised for their transfer for disposal. However, the process of issue of duplicate shares and dematerialisation of shares was yet to be finalised even though the procedure and mechanism for sale of enemy shares had been approved by the Cabinet in November 2018.
Thus, share certificates of 45 listed and 145 unlisted companies were not available with the Custodian for which duplicate shares had not been issued till March 2021.
Recommendation 3
Steps may be taken expeditiously to finalise the process of issue of duplicate shares and dematerialisation of shares, towards monetisation of enemy shares within a specified timeframe.
3.8 Other Issues
3.8.1 Progress in listing of CPSEs
The Cabinet Committee on Economic Affairs (CCEA) approved (5 November 2009) the disinvestment policy which, inter alia, envisaged listing on the stock exchanges all the unlisted CPSEs having a positive net worth, no accumulated losses, and having earned net profits in three preceding years. Later, on 27 December 2018, CCEA modified criteria to ‘net profit in any one of the immediately three preceding financial years’ in place of ‘net profit for three preceding consecutive financial years’.
As per the revised criteria, the number of eligible CPSEs for listing was 133 (Annexure XXV). Out of these, 101 CPSEs had net worth of more than `100 crore as on 31 March 2019. In the financial year 2019-20, however, only two CPSEs were brought to market for listing after getting ‘in-principle’ approval from CCEA. The reason for slow progress was asked and response was awaited from DIPAM.
3.8.2 Monitoring on guidelines on Capital Restructuring
The guidelines issued (May 2016) by DIPAM on Capital Restructuring of CPSEs were in line with the focus of the Government on adopting a comprehensive approach for efficient management of its investment in CPSEs. As per the guidelines:
67 In respect of 45 listed companies, share certificates for 1,25,081 equity shares and 759 preference
shares having aggregate face value of `19.51 lakh were not available with CEPI. 68 In respect of 145 unlisted companies, share certificates of 2,01,804 equity shares and 3,498 preference
shares having aggregate face value of `34.99 lakh were not available with CEPI

Report No. 12 of 2021
94
(i) Declaration of dividend at reasonable rate on a regular interval boosts investor’s confidence and is a desirable parameter for increasing the investor’s confidence in the Company. Every CPSE would pay a minimum annual dividend of 30 per cent of Profit after tax or five per cent of the net-worth, whichever is higher subject to the maximum dividend permitted under the extant legal provisions. The report for exemption, if any, in this regard would be submitted by the CPSEs through their Administrative Ministry to the Department of Economic Affairs and DIPAM before the end of second quarter of the financial year.
(ii) Buy back supports CPSEs’ market capitalization, which is in the overall long-term interest of the company. Every CPSE having net-worth of at least `2,000 crore and cash and bank balance of over `1,000 crore shall exercise the option to buy-back their shares.
(iii) Every CPSE shall issue bonus shares if their defined reserves and surplus is equal to or more than 10 times of its paid up equity share capital.
(iv) It has been endeavour of the government to encourage participation of small investors in the capital market so as to increase the depth of the market, liquidity and trading volume of the shares. High price of the shares sometimes acts as a deterrent for the investors to invest in the company. Therefore, a CPSE where market price or book value of its share exceeds 50 times of its face value will split off its shares appropriately provided its existing face value of the share is equal to or more than `1.
(v) In case, any CPSE is not able to comply with any of the above guidelines, specific exemption has to be obtained from DIPAM through their Administrative Ministry.
DIPAM was asked if it had laid down any mechanism to ascertain (i) the CPSEs which did not give dividend to the investors despite being eligible to give dividend in a financial year, (ii) the CPSEs which were eligible to buy back their shares in a financial year but did not exercise the option, (iii) the CPSEs which were eligible to issue bonus shares in a financial year but did not exercise the option (iv) the CPSEs which were eligible for splitting of shares in a financial year but did not exercise the option.
DIPAM was also asked if any exemption had been requested by any CPSE/ Ministry in respect of these guidelines during 2019-20. Reply of DIPAM was awaited.
3.8.3 Participation of LIC and other Government entities in disinvestment proceeds
It is gathered from the records provided by DIPAM that LIC participated substantially in the disinvestments during previous three financial years as shown in Table 3.11.
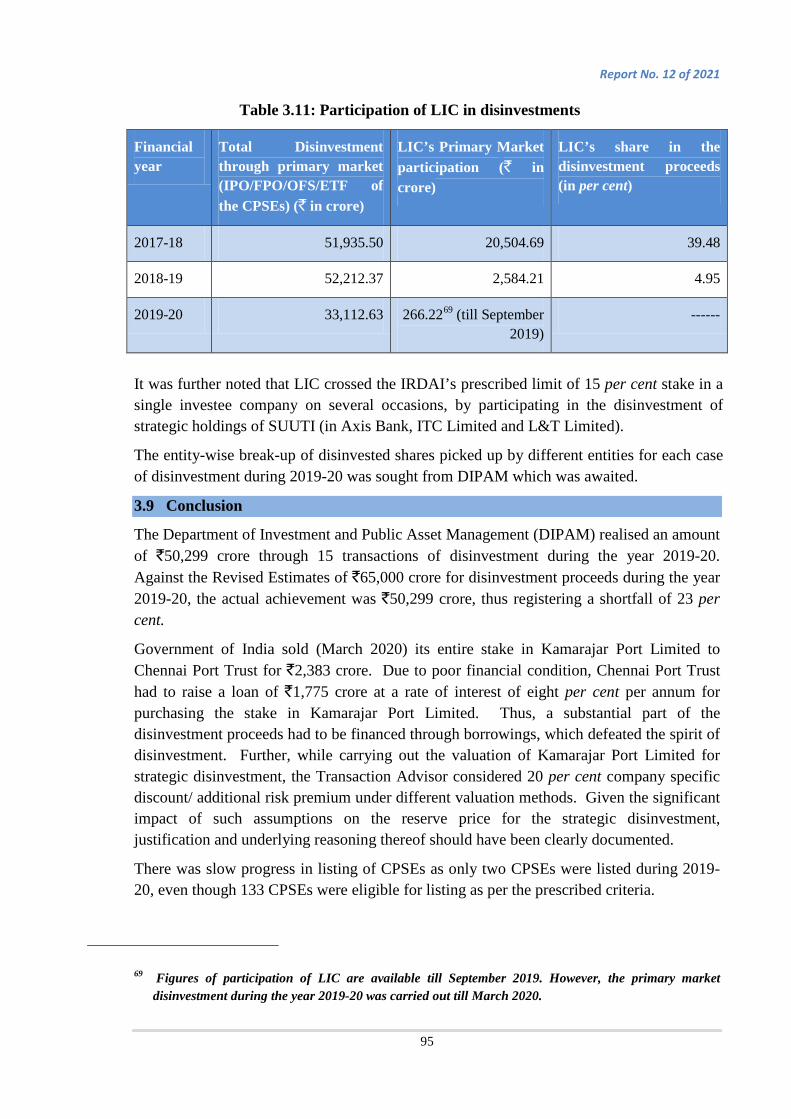
Report No. 12 of 2021
95
Table 3.11: Participation of LIC in disinvestments
Financial year
Total Disinvestment through primary market (IPO/FPO/OFS/ETF of the CPSEs) (` in crore)
LIC’s Primary Market participation (` in crore)
LIC’s share in the disinvestment proceeds (in per cent)
2017-18 51,935.50 20,504.69 39.48
2018-19 52,212.37 2,584.21 4.95
2019-20 33,112.63 266.2269 (till September 2019)
------
It was further noted that LIC crossed the IRDAI’s prescribed limit of 15 per cent stake in a single investee company on several occasions, by participating in the disinvestment of strategic holdings of SUUTI (in Axis Bank, ITC Limited and L&T Limited).
The entity-wise break-up of disinvested shares picked up by different entities for each case of disinvestment during 2019-20 was sought from DIPAM which was awaited.
3.9 Conclusion
The Department of Investment and Public Asset Management (DIPAM) realised an amount of `50,299 crore through 15 transactions of disinvestment during the year 2019-20. Against the Revised Estimates of `65,000 crore for disinvestment proceeds during the year 2019-20, the actual achievement was `50,299 crore, thus registering a shortfall of 23 per cent.
Government of India sold (March 2020) its entire stake in Kamarajar Port Limited to Chennai Port Trust for `2,383 crore. Due to poor financial condition, Chennai Port Trust had to raise a loan of `1,775 crore at a rate of interest of eight per cent per annum for purchasing the stake in Kamarajar Port Limited. Thus, a substantial part of the disinvestment proceeds had to be financed through borrowings, which defeated the spirit of disinvestment. Further, while carrying out the valuation of Kamarajar Port Limited for strategic disinvestment, the Transaction Advisor considered 20 per cent company specific discount/ additional risk premium under different valuation methods. Given the significant impact of such assumptions on the reserve price for the strategic disinvestment, justification and underlying reasoning thereof should have been clearly documented.
There was slow progress in listing of CPSEs as only two CPSEs were listed during 2019-20, even though 133 CPSEs were eligible for listing as per the prescribed criteria.
69 Figures of participation of LIC are available till September 2019. However, the primary market disinvestment during the year 2019-20 was carried out till March 2020.

Report No. 12 of 2021
96
Corporate Social Responsibility
CHAPTER IV
4.1 Introduction
The primary objective of Corporate Social Responsibility (CSR) is to promote responsible and sustainable business philosophy at a broad level and to encourage companies to come up with innovative ideas and robust management systems to address social and environment concerns of the country. Broadly, the CSR mandate has been aligned with the national priorities such as public health, education, livelihood, water conservation, natural resource management etc. CSR awareness and CSR consciousness has grown vividly among large and medium sized companies, which now look at CSR to build a strategic fit with the community and environment in which they operate.
The concept of CSR provides a robust framework for companies to collaborate in contributing to the country’s development challenges through its managerial skills, technology and innovation. Besides providing an overall guidance framework for the corporates to carry out their CSR initiatives, it also provides them with ample autonomy and flexibility to design and implement programmes. The monitoring is based on disclosures made by the company in
its annual report as per the prescribed format.
Legal Framework: Section 135 of Companies Act, 2013 (hereinafter called ‘the Act’) deals with the subject of CSR and lays down the qualifying criteria based on net worth, turnover and net profit during immediately preceding financial year for companies which are required to undertake CSR activities. This section inter alia specifies the broad modalities of selection, implementation and monitoring of CSR activities by the Board of Directors of the Company. The activities which may be included by the companies in their CSR policies are listed in Schedule VII of the Act. The Act makes it mandatory for a company to spend, annually at least two per cent of average net profit of three immediately preceding financial years towards CSR activities.
The compliance of the provisions of CSR under the Act i.e., constitution of CSR Committee, formulation of CSR Policy and spending of prescribed amount on CSR activities came into force from April, 2014. In February 2014, Ministry of Corporate Affairs (MCA) issued Companies (Corporate Social Responsibility Policy) Rules, 2014 (hereafter referred to as the Rules). The CSR Rules were made applicable to all companies including CPSEs with effect from 01 April 2014. Department of Public Enterprises (DPE) issued (August 2016) notification on observance of transparency and due diligence in selection and implementation of activities under CSR by CPSEs. In December 2018, DPE

Report No. 12 of 2021
97
issued guidelines related to utilisation of funds on theme-based approach. School education, health care and nutrition were taken up as themes for focussed intervention for the year 2019-20. The target for CSR expenditure on common theme was 60 per cent of annual CSR expenditure. The guidelines also directed that aspirational districts as identified by NITI Aayog may be given preference.
Amendments were issued to the Schedule VII of the Act during the year 2019-20 for inserting item (xii) 'disaster management, including relief and reconstruction activities' (30 May 2019) and substituting earlier provisions under item (ix) (11 October 2019).
4.2 Audit objective
Audit objective of compliance audit on CSR activities of the CPSEs was to ascertain whether the provisions of the Companies Act 2013, Companies (CSR Policy) Rules, 2014 and DPE guidelines were complied with by the CPSEs. The Audit generally covered the areas relating to constitution of CSR committee, formulation and compliance of CSR policy, incurrence of expenditure on CSR activities as per the provisions of the Act, consideration of needs of the local people while prioritizing the selection of activities/ projects, transparency and due diligence in selection and implementation of CSR activities and focus for incurring of the CSR expenditure on common theme.
4.3 Audit scope and coverage
Audit reviewed the CSR activities carried out by 95 CPSEs under the administrative control of various Ministries/ Departments during the year 2019-20. The selected 95 CPSEs included 10 Maharatnas, 11 Navratnas, 47 Miniratnas and 27 other companies (Annexure XXVI). Audit selected 95 CPSEs out of 154 CPSEs which earned profit for 2018-19 as published in the Survey Report of DPE, details of which is given in Table 4.1.
Table 4.1: Selection of CPSEs for review of CSR activities Net profit of CPSEs
No. of CPSEs
No. of CPSEs selected
Percentage of selected CPSEs
No. of CPSEs reviewed
Percentage of reviewed CPSEs
Above `100 crore
78 78 100 74 95
`50 - `100 crore
23 12 50 10 43
`10 - `50 crore
40 10 25 09 23
`10 - `5 crore
13 02 10 02 15
Total 154* 102* 95*
* The list of 154 and 102 CPSEs is given in Annexure XXVII. Out of 102 CPSEs selected based on percentage sampling, 14 CPSEs did not fulfil the criteria for incurring the CSR expenditure based on the net profit worked out under Section 198 of the Companies Act, 2013. Out of these, seven CPSEs (ONGC Videsh Limited, HMT Watches Limited,
Report No. 12 of 2021
98
Fertilizer Corporation of India Limited, Kanti Bijlee Utpadan Nigam Limited, HLL Lifecare Limited, Hindustan Fertilizer Corporation Limited and Prize Petroleum Company Limited) were not selected as they did not incur expenditure on CSR activities. Seven CPSEs (Steel Authority of India Limited, Bharat Coking Coal Limited, Fertilizers & Chemicals (Travancore) Limited, Eastern Coalfields Limited, India Infrastructure Finance Company Limited, Air India Express Limited and Western Coalfields Limited) despite negative net profit under Section 198 incurred expenditure on CSR activities and hence were selected.
4.4 Audit criteria
Audit analysis was carried out against the following criteria:
i. Provisions contained in Section 135 and Schedule VII of the Companies Act, 2013 (as amended upto 31 March 2020),
ii. Provisions of Companies (Corporate Social Responsibility Policy) Rules, 2014 (as amended upto 31 March 2020),
iii. DPE guidelines on CSR issued since 01 August 2016.
4.5 Audit findings
Audit findings on compliance of the provisions of the Act, Rules and DPE guidelines with regard to constitution of CSR Committee, formulation and compliance of policy, planning and execution of CSR activities and monitoring and reporting thereof by the CPSEs are brought out in the following paragraphs:
4.5.1 Planning:
4.5.1.1 Constitution of CSR Committee
As per Section 135(1) of the Act, every company having a net worth of `500 crore or more or turnover of `1,000 crore or more or a net profit of `5 crore or more during immediately preceding financial year shall constitute a CSR committee of the Board consisting of three or more Directors, out of which at least one Director shall be an Independent Director. Further, according to Rule 5(1)(i) of CSR Rules, 2014, an unlisted public company covered under Section 135(1) is not required to appoint an Independent Director pursuant to Section 149(4) of the Act and it shall have its CSR Committee without such Director.
Audit observed that all 95 CPSEs selected for Audit formed CSR committee as required under the Act except NMDC CSR Foundation which did not form CSR committee, being a Section 8 Company. However, there is no exemption to Section 8 companies vide MCA FAQs dated 12 January 2016. Reply of the company was awaited.
All CPSEs were having minimum of three Directors in the committee in accordance with Section 135(1) of the Act except for Cotton Corporation of India Limited, which had only two Directors. The company stated that the Independent Director was not appointed after completion of the tenure on 01 February 2020 by the Government, who owns 100 per cent shares of the company.
All the listed CPSEs had Independent Directors as required under the Act.

Report No. 12 of 2021
99
4.5.1.2 Framing of CSR policy
4.5.1.2.1 Formulation and approval of policy by the CPSEs
Section 135(3) of the Act requires that the CSR committee shall formulate and recommend a CSR policy for the company to the Board who shall, as per the Section 135(4) approve the same after taking into account the recommendations of the committee. All CPSEs had framed the CSR policy and the respective Board had approved the same.
4.5.1.2.2 Deviations noticed in the policies framed
CSR policies of Air India Express Limited and Hindustan Petroleum Corporation Limited indicate areas of activity in which CSR projects have to be undertaken by these companies. Section 135(4)(b) of the Act requires the Board to ensure that the activities as included in CSR policy of the company are undertaken by the company. However, the provisions of the CSR policy of Air India Express Limited and Hindustan Petroleum Corporation Limited allowed the CSR committee to approve any projects/ programs/ activities in the areas other than the activities/ areas indicated in the CSR policy. This provision was not in line with the Section 135(4)(b) of the Act which only allowed the Board the leeway to approve projects outside the areas indicated in the CSR policy. Air India Express Limited and Hindustan Petroleum Corporation Limited noted the observation for future compliance.
4.5.2 Financial component
4.5.2.1 Allocation of funds
As per Section 135(5) of the Act, the Board shall ensure that the company spends annually two per cent of average net profit of three immediate preceding financial years in pursuance of its CSR policy.
In this regard, Audit observed that the selected 95 CPSEs allocated `4,298.13 crore against the minimum `3,949.70 crore required in terms of two per cent of average net profit calculated as per Section 198 of the Act. Thus, there was excess allocation of `348.43 crore compared to the minimum requirement (Annexure XXVIII A). Twenty-nine CPSEs allocated more than the minimum two per cent, the excess allocation being `351.95 crore and three CPSEs allocated less than two per cent, the shortfall in allocation being `3.53 crore. Sixty CPSEs allocated the minimum required two per cent CSR funds (Annexure XXVIII B). Three CPSEs viz. Air India Express Limited, India Infrastructure Finance Company Limited and Fertilizers & Chemicals Travancore Limited did not allocate funds on account of negative net profit under Section 198 but incurred CSR expenditure. Audit noticed the following cases on improper determination of the CSR expenditure under Section 198 of the Act:
(a) Adding back of CSR expenditure while calculating the net profit under Section 198
Section 198 of the Act elaborates the manner of calculation of net profit which is adopted for determining CSR expenditure for a year. Audit observed that while the section mentions particularly the expenses and incomes which are allowed as deduction, it does not

Report No. 12 of 2021
100
explicitly state whether the CSR expenditure incurred in the preceding three years and already deducted while drawing the financial statements of the company is allowed to be deducted or not from the net profit. If it is not allowed as deduction, then it has to be added back while calculating net profit for the preceding three financial years.
Audit observed that CPSEs are following different practices in respect of CSR expenditure while calculating the net profit under Section 198 of the Act. As per the information received in respect of 26 CPSEs out of 95 CPSEs, nine CPSEs have added back the CSR expenditure while calculating the net profit resulting in allocation of CSR expenditure higher by `11.95 crore whereas, 17 CPSEs have not added back the CSR expenditure resulting in allocation of CSR expenditure less by `23.47 crore (Annexure XXIX). The clarification given by the CSR committee of the ICAI in April 2020 stated that the net profit is to be calculated after deducting CSR expenditure.
Recommendation 1
Ministry of Corporate Affairs may issue clarification to CPSEs for following uniform practice in calculating the net profit under Section 198 of the Companies Act, 2013 for determining the quantum of CSR allocation.
(b) Air India Express Limited adjusted accumulated losses incurred prior to 2014 in view of the amendment dated 12 September 2018 to Section 198(4)(l) of the Act relating to adjusting of the excess of expenditure over income. This resulted in non-allocation of CSR expenditure amounting to `28.46 crore by the company. Audit observed that adjusting of the losses incurred prior to 01 April 2014 while calculating net profit during the 2019-20 was in violation of the provisions of the Section 135(5) of the Act, which specifically provides for spending of at least two per cent of the average net profits of the company made during the three immediately preceding financial years. The company has earned net profit during the year 2016-17, 2017-18 and 2018-19, which should have been considered while calculating average net profit. The company stated that the amendment dated 12 September 2018 to Section 198(4)(l) of the Act enabled it not to allocate CSR expenditure during the year. The reply is not tenable as the amendment dated 12 September 2018 to Section 198(4)(l) of the Act cannot be applied retrospectively. The Company has adjusted accumulated losses incurred prior to 2014 while the Act was enacted in 2013. This has also been clarified by National Company Law Appellate Tribunal, New Delhi in its judgment passed on 1 July, 2019.
4.5.2.2 Utilisation of Funds
Section 135(5) of the Act states that the Board shall ensure that the company spends, in every financial year, at least two per cent of average net profit of preceding three years. DPE also advised (August 2016) that all efforts should be made by CPSEs to fully utilise the allocated CSR funds for the year.
Audit observed that against the prescribed two per cent amount of `3,949.70 crore and allocation of `4,298.13 crore, 95 CPSEs incurred CSR expenditure of `5,033.96 crore.

Report No. 12 of 2021
101
Thus, the CPSEs incurred additional `1,084.26 crore, over the prescribed minimum two per cent during the year. Sixty-seven CPSEs incurred `1,174.38 crore more than minimum required two per cent, of which four CPSEs viz. Coal India Limited (`163.24 crore), Bharat Petroleum Corporation Limited (`146.59 crore), Power Grid Corporation of India Limited (`136.29 crore) and Rural Electrification Company Limited (`101.71 crore) contributed `547.83 crore to the excess spending (Annexure XXVIII A).
• 10 CPSEs70 incurred prescribed minimum expenditure of two per cent CSR funds (`557.45 crore) during the financial year.
• Shortfall was reported by18 CPSEs71 amounting to `90.13 crore, which was in the range of 2.4 per cent to 100 per cent. Power Finance Corporation Consulting Limited did not spend the allocated amount of `1.17 crore (100 per cent shortfall). The Company replied that the shortfall in CSR expenditure was due to COVID 19 lockdown. Audit observed that the lockdown was imposed only at the end of the year 2019-20, which should not have impacted CSR expenditure for the entire year.
4.5.2.3 Sector wise CSR expenditure
Audit covered 95 CPSEs across various sectors. Highest expenditure on CSR was by petroleum sector (12 CPSEs, `2,110.28 crore) followed by power sector (21 CPSEs, `1,345.28 crore) and mining sector (18 CPSEs, `956.86 crore). Least CSR expenditure was by fertilizer sector (3 CPSEs, `9.19 crore). Sector wise CSR expenditure is given in Table 4.2.
Table 4.2: Sector wise CSR expenditure
70Balmer Lawrie Investments Limited, POWERGRID Vizag Transmission Limited, AAI Cargo Logistics &Allied Services Company Limited, HSCC (India) Limited, Chandigarh International Airports Limited, Indian Railway Catering and Tourism Corporation Limited, Indian Oil Corporation Limited, POWERGRID Parli Transmission Limited, POWERGRID Warora Transmission Limited and POWERGRID Jabalpur Transmission Limited. 71The Cotton Corporation of India Limited, Northern Coalfields Limited, National Fertilizers Limited, Central Warehousing Corporation Limited, NBCC (India) Limited, Indian Railway Finance Corporation Limited, Container Corporation of India Limited, IRCON Infrastructure & Services Limited, Hindustan Shipyard Limited, Kamarajar Port Limited, NLC Tamil Nadu Power Limited, MMTC Limited, Power Finance Corporation Limited, GAIL Gas Limited, PFC Consulting Limited, Security Printing & Minting Corporation of India Limited , Konkan Railway Corporation Limited and EDCIL (India) Limited.
Sl. No. Sector No. of CPSEs Actual expenditure (including carry forward)
(` in crore)
1 Aviation 04 128.74
2 Mining 18 956.86
3 Defence 08 175.25
4 Fertilizer 03 9.19
5 Petroleum 12 2,110.28

Report No. 12 of 2021
102
Petroleum, Aviation, Mining, Defence, Shipping, Power and sectors falling under other Ministries incurred expenditure more than required two per cent, highest being Mining sector with `347.02 crore. Shortfall was observed in Fertilizer and Railway sectors; the maximum was in Railway sector CPSEs of `14.23 crore (Annexure XXX).
4.5.2.4 CPSEs with highest expenditure
Total expenditure on CSR activities by 95 CPSEs in 2019-20 was `5,033.96 crore (Annexure XXVIII A). Oil & Natural Gas Corporation Limited incurred CSR expenditure of `606.97 crore, which amounted to 12.06 per cent of the total CSR expenditure. This was followed by Indian Oil Corporation Limited with `543.38 crore, Power Grid Corporation of India Limited: `346.21 crore, Bharat Petroleum Corporation Limited: `345.57 crore and NTPC Limited: `304.92 crore. As against total CSR expenditure of `5,033.96 crore, five CPSEs (three in petroleum sector and two in power sector) accounted for 42.65 per cent with total of `2,147.05 crore.
CSR expenditure by 10 Maharatnas was `2,688.59 crore (53.41 per cent), 11 Navratnas was `967.92 crore (19.23 per cent), 47 Miniratnas was `1,198.96 crore (23.82 per cent) and 27 other CPSEs was `178.49 crore (3.54 per cent). The Maharatnas, Navratnas and Miniratnas contributed `4,855.47 crore (96.46 per cent) out of the total CSR expenditure. Hence, in terms of the number of the CPSEs, 71.58 per cent of the CPSEs conferred Ratna status have contributed 96.46 per cent of the total CSR expenditure whereas 28.42 per cent other CPSEs contributed only 3.54 per cent CSR expenditure (Annexure XXXI).
Chart 4.1: Expenditure on CSR by CPSEs
53.41%
19.23%
23.82%
3.54% Maharatna
Navaratna
Miniratna
Others
6 Power/ transmission 21 1,345.28
7 Railway 09 111.10
8 Shipping 02 23.40
9 Others 18 173.86
Total 95 5,033.96
Report No. 12 of 2021
103
4.5.2.5 State wise CSR expenditure
The highest CSR expenditure was in Odisha with `702.06 crore (13.94 per cent) followed by Assam with `358.08 crore (7.11 per cent) and Uttar Pradesh: `288.56 crore (5.73 per cent). Maximum CSR expenditure in Odisha was by Indian Oil Corporation Limited (`205.97 crore), followed by Mahanadi Coalfields Limited (`165.50 crore). Maximum CSR expenditure in Assam was by Oil and Natural Gas Corporation Limited (`105.75 crore), followed by Oil India Limited (`96.68 crore). These three States accounted for 26.77 per cent of total CSR expenditure. The CSR expenditure was least in Daman & Diu (`0.12 crore) followed by Andaman and Nicobar Islands (`0.99 crore), Puducherry (`3.57 crore) and Chandigarh (`3.67 crore).
Audit observed that Odisha topped in terms of getting highest funding through CSR successively in the third year since 2017-18. During the year 2017-18 and 2018-19, `387.86 crore and `481.00 crore were incurred respectively. Out of the 37 CPSEs which contributed `702.06 crore in Odisha, nine oil and gas CPSEs alone contributed `350.75 crore i.e. around 50 per cent during the year 2019-20. Uttar Pradesh and Assam were also among the top three States in receipt of the maximum CSR funding during the years 2018-19 and 2019-20. Daman & Diu, Andaman & Nicobar, Chandigarh, Manipur, Nagaland and Mizoram were among the states which received least attention during the past three years.
As regards quantum of incurring of expenditure in any State, Audit observed that 112 relatively less developed districts (Aspirational Districts) in various States were identified to improve their socio economic indicator by considering 49 key performance indicators in six different sectors. NITI Aayog was involved in the identification process of these districts. The States which had maximum number of districts were Bihar (13 districts), Jharkhand (19 districts) and Chattisgarh (10 districts). Odisha which had 10 districts identified, got the maximum CSR funding during the last three years. The other two states (UP and Assam) which got the maximum CSR funding had eight and seven districts respectively.
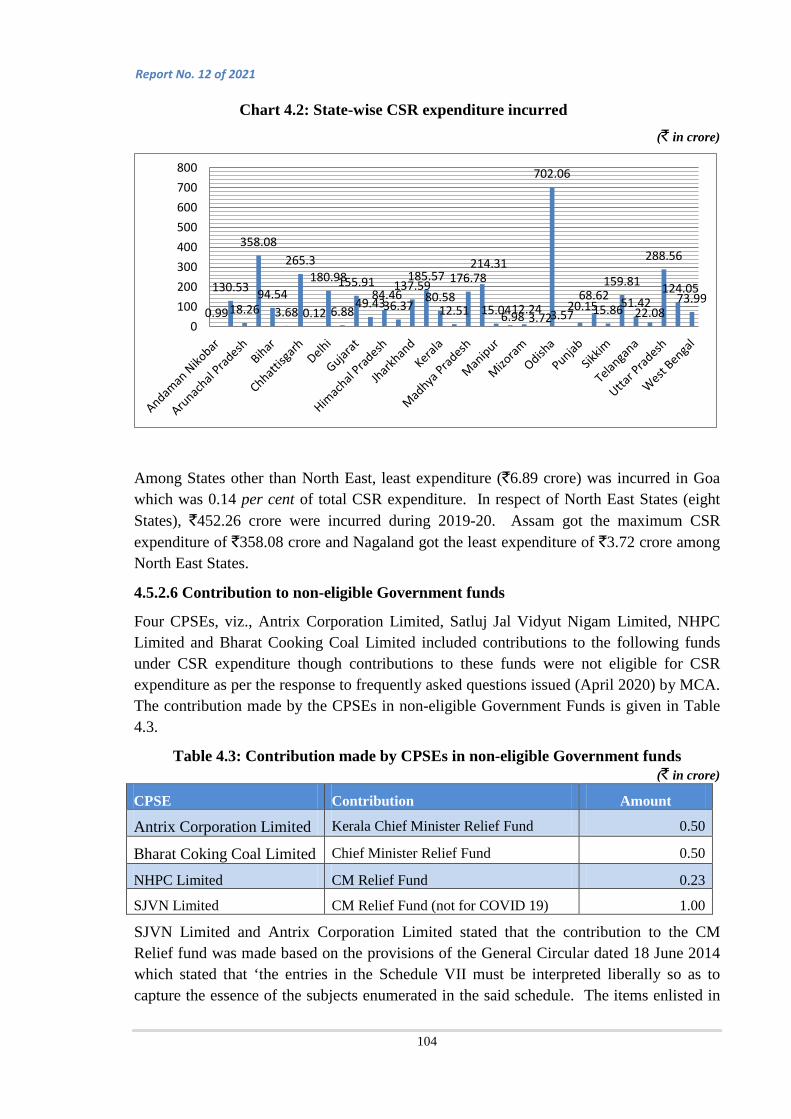
Report No. 12 of 2021
104
Chart 4.2: State-wise CSR expenditure incurred (` in crore)
Among States other than North East, least expenditure (`6.89 crore) was incurred in Goa which was 0.14 per cent of total CSR expenditure. In respect of North East States (eight States), `452.26 crore were incurred during 2019-20. Assam got the maximum CSR expenditure of `358.08 crore and Nagaland got the least expenditure of `3.72 crore among North East States.
4.5.2.6 Contribution to non-eligible Government funds
Four CPSEs, viz., Antrix Corporation Limited, Satluj Jal Vidyut Nigam Limited, NHPC Limited and Bharat Cooking Coal Limited included contributions to the following funds under CSR expenditure though contributions to these funds were not eligible for CSR expenditure as per the response to frequently asked questions issued (April 2020) by MCA. The contribution made by the CPSEs in non-eligible Government Funds is given in Table 4.3.
Table 4.3: Contribution made by CPSEs in non-eligible Government funds (` in crore)
CPSE Contribution Amount
Antrix Corporation Limited Kerala Chief Minister Relief Fund 0.50
Bharat Coking Coal Limited Chief Minister Relief Fund 0.50
NHPC Limited CM Relief Fund 0.23
SJVN Limited CM Relief Fund (not for COVID 19) 1.00
SJVN Limited and Antrix Corporation Limited stated that the contribution to the CM Relief fund was made based on the provisions of the General Circular dated 18 June 2014 which stated that ‘the entries in the Schedule VII must be interpreted liberally so as to capture the essence of the subjects enumerated in the said schedule. The items enlisted in
0.99
130.53
18.26
358.08
94.54 3.68
265.3
0.12
180.98
6.88
155.91
49.43 84.46 36.37
137.59 185.57
80.58 12.51
176.78 214.31
15.04 6.98 12.24 3.72
702.06
3.57 20.15
68.62 15.86
159.81
51.42 22.08
288.56
124.05 73.99
0100200300400500600700800
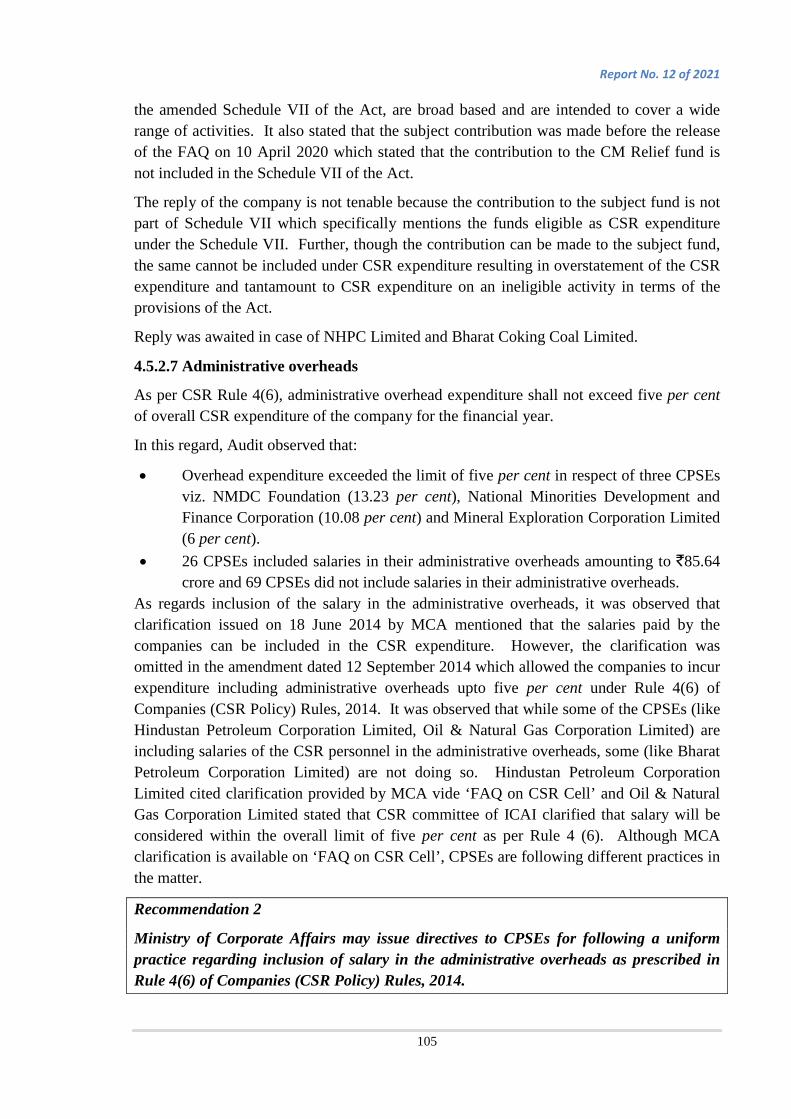
Report No. 12 of 2021
105
the amended Schedule VII of the Act, are broad based and are intended to cover a wide range of activities. It also stated that the subject contribution was made before the release of the FAQ on 10 April 2020 which stated that the contribution to the CM Relief fund is not included in the Schedule VII of the Act.
The reply of the company is not tenable because the contribution to the subject fund is not part of Schedule VII which specifically mentions the funds eligible as CSR expenditure under the Schedule VII. Further, though the contribution can be made to the subject fund, the same cannot be included under CSR expenditure resulting in overstatement of the CSR expenditure and tantamount to CSR expenditure on an ineligible activity in terms of the provisions of the Act.
Reply was awaited in case of NHPC Limited and Bharat Coking Coal Limited.
4.5.2.7 Administrative overheads
As per CSR Rule 4(6), administrative overhead expenditure shall not exceed five per cent of overall CSR expenditure of the company for the financial year.
In this regard, Audit observed that:
• Overhead expenditure exceeded the limit of five per cent in respect of three CPSEs viz. NMDC Foundation (13.23 per cent), National Minorities Development and Finance Corporation (10.08 per cent) and Mineral Exploration Corporation Limited (6 per cent).
• 26 CPSEs included salaries in their administrative overheads amounting to `85.64 crore and 69 CPSEs did not include salaries in their administrative overheads.
As regards inclusion of the salary in the administrative overheads, it was observed that clarification issued on 18 June 2014 by MCA mentioned that the salaries paid by the companies can be included in the CSR expenditure. However, the clarification was omitted in the amendment dated 12 September 2014 which allowed the companies to incur expenditure including administrative overheads upto five per cent under Rule 4(6) of Companies (CSR Policy) Rules, 2014. It was observed that while some of the CPSEs (like Hindustan Petroleum Corporation Limited, Oil & Natural Gas Corporation Limited) are including salaries of the CSR personnel in the administrative overheads, some (like Bharat Petroleum Corporation Limited) are not doing so. Hindustan Petroleum Corporation Limited cited clarification provided by MCA vide ‘FAQ on CSR Cell’ and Oil & Natural Gas Corporation Limited stated that CSR committee of ICAI clarified that salary will be considered within the overall limit of five per cent as per Rule 4 (6). Although MCA clarification is available on ‘FAQ on CSR Cell’, CPSEs are following different practices in the matter.
Recommendation 2
Ministry of Corporate Affairs may issue directives to CPSEs for following a uniform practice regarding inclusion of salary in the administrative overheads as prescribed in Rule 4(6) of Companies (CSR Policy) Rules, 2014.
Report No. 12 of 2021
106
4.5.2.8 Implementation of DPE guidelines on common theme
DPE issued (December 2018) guidelines for utilization of CSR funds in a focused manner towards national priorities by adopting theme based approach every year. The guidelines envisaged around 60 per cent of annual CSR expenditure on common theme and preference was to be given for incurring expenditure in the aspirational districts. DPE communicated common theme, ‘School Education, Health care and Nutrition’ for the year 2019-20 vide OM dated 29 May 2019.
While 53 CPSEs could achieve the prescribed target of 60 per cent CSR expenditure on common theme, 29 CPSEs incurred CSR expenditure less than the target and 8 CPSEs did not incur any amount on the common theme. Data for the remaining five CPSEs was not available. CPSEs incurred `3,052.75 crore on the common theme during the year (Annexure XXXII).
As regards preference while incurring CSR expenditure on common theme at aspirational districts, data in respect of 85 CPSEs was available, of which 34 CPSEs incurred less than 25 per cent in the aspirational districts, 19 CPSEs did not incur any amount and expenditure incurred by 32 CPSEs was above 25 per cent at the aspirational districts. Data in respect of 10 CPSEs was not furnished.
4.5.3 Project implementation
4.5.3.1 Selection of CSR projects/ activities
Conduct of base line survey and assessment: Out of 95 CPSEs, 50 CPSEs had undertaken baseline survey and need assessment studies for identifying the CSR project/ activity in respect of 8,264 projects. 37 CPSEs did not conduct baseline survey and need assessment studies and 8 CPSEs did not furnish the data (Annexure XXXIII).
4.5.3.2 Manner of implementation of CSR activities
Rule 4 of Companies (CSR) Rules, 2014 exclusively deals with the manner in which the CSR activity is to be undertaken under Section 135(1) of the Act. The Board may decide to undertake its CSR activities as recommended by CSR committee through a registered trust/ society or a company established by the CPSE or its holding, subsidiary, or associate company under Section 8 of the Act or otherwise. As per the information available for 80 CPSEs, the manner of implementation of 12,914 CSR projects (3,533 projects implemented directly/ in-house and 9,381 projects executed through Government/ external agencies, NGOs, Society) were as follows:
• 5 CPSEs undertook in-house projects only;
• 17 CPSEs outsourced CSR projects to external agencies;
• 58 CPSEs had undertaken both, in-house projects as well as outsourced CSR projects to external agencies; and
• 7 CPSEs did not undertake any projects but contributed entire amount to the funds.

Report No. 12 of 2021
107
Out of 9,381 projects implemented through external agencies, CPSEs had resorted to tendering in respect of 1,258 projects; 1,015 projects were undertaken on nomination basis and 7,108 projects were undertaken either through Government agencies/ institutions, local bodies/ community based organisations or on the basis of proposals received from NGOs/ implementing agencies etc. Remaining eight CPSEs did not furnish the information (Annexure XXXIV).
4.5.3.3 Focus areas
Chart 4.3: Focus Area wise CSR expenditure
As indicated in the chart, education received the maximum focus (32.89 per cent). Total expenditure by 95 CPSEs under this head was `1,655.66 crore. Next highest expenditure (`1,398.85 crore by 88 CPSEs) was on health care accounting for 27.79 per cent. Least focus areas were contributions/ funds provided to technology incubators located within academic institutions which are approved by the Central Government (`5.13 crore), measures undertaken for the development of slum area (`7.09 crore) and to fund set up by the Central Government for socio-economic development and relief and welfare of the Scheduled Castes, the Scheduled Tribes, other backward classes, minorities and women (`11.30 crore).
Among the top four heads of items i.e., promoting education (`1,655.66 crore), promoting health care (`1,398.85 crore), rural development (`387.82 crore) and environmental sustainability development (`423.47 crore) as per the schedule VII, Oil and Natural Gas Corporation Limited was the top spender in case of health care and of rural development (`217.84 crore and `44.28 crore) and Indian Oil Corporation Limited was the top spender in case of promoting education and environmental sustainability (`263.87 crore and `104.10 crore respectively). PFC Consulting Limited allocated a budget of `1.17 crore but did not incur any amount due to COVID-19 pandemic.
27.79
32.89
39.32(i) Healthcare
(ii) Education
(iii) Others

Report No. 12 of 2021
108
4.5.3.4 Local areas
Section 135(5) of the Act provides that the CPSE shall give preference to the local area and areas around it where it operates, for spending the amount earmarked for CSR activities. CPSEs are considering the arjea of presence/ operations as the local areas. As per the information available in respect of 95 CPSEs:
• 26 CPSEs did not define local area in its CSR policy, 64 CPSEs defined local area in its CSR policy. Operational activities of Indian Railway Finance Corporation Limited, REC Limited, RailTel Corporation India Limited and Power Finance Corporation Limited are spread across all the states. NMDCF did not furnish information about defining of the local area (Annexure XXXV A).
• As per the data available in respect of 38 CPSEs, expenditure in non-operational area was `623.89 crore. Six CPSEs incurred more than 50 per cent of CSR funds in non-operational area, of which three CPSEs spent 100 per cent in non-operational areas. 16 CPSEs incurred 100 per cent in local areas. Data in respect of 41 CPSEs was not furnished (Annexure XXXV B).
Thus, as per the information available in respect of the 54 CPSEs, 6 CPSEs did not comply with the provisions of the Act with regard to giving preference to the local area as these CPSEs have incurred expenditure of less than 50 per cent of CSR funds in local areas.
4.5.4 Monitoring framework
As per Rule 5(2) of CSR Rules 2014, the CSR committee shall institute a transparent monitoring mechanism for implementation of CSR projects/ programs/ activities undertaken by the CPSE. DPE vide OM dated 01 August 2016 instructed the CPSEs to have an institutionalised mechanism for monitoring, reporting and evaluation of CSR.
In respect of institutional mechanism for monitoring, reporting and evaluation of the CSR, Audit observed that out of 95 CPSEs, 5 CPSEs did annual monitoring, 25 CPSEs did monthly review, 23 CPSEs quarterly/ bimonthly, 6 CPSEs half yearly, 10 CPSEs held regular/ concurrent/ multiple/ frequent meetings as per the project requirement. For the remaining 26 CPSEs, specific data in this regard was not available (Annexure XXXVI).
4.5.5 Reporting and Disclosure
As per Section 135(2) read with Section 134(3)(o) of the Act, a Company is required to include an annual report on CSR in their Board of Directors’ Report and place it on the official website. According to Rule 9 of CSR Rules, 2014, the companies have to disclose the following in the prescribed format:
1. Contents of CSR policy and its web link, average net profit, composition of CSR committee, administrative overheads, prescribed amount, unspent amount, reasons for unspent amount.
2. Include a responsibility statement signed by the CSR committee that the implementation and monitoring of CSR policy was in compliance with the CSR objective and policy of the company.

Report No. 12 of 2021
109
It was observed that five CPSEs (Central Coalfields Limited, Uranium Corporation of India Limited, South Eastern Coalfields Limited, National Scheduled Caste Finance Development Corporation and Fertilizers & Chemicals Travancore Limited) did not indicate responsibility statement in the Annual Report as required under Rule 9 of Companies (CSR Policy) Rules 2014.
4.6 Conclusion
Audit observed that all the selected CPSEs had framed the CSR Policy and formed CSR Committee in pursuance of provisions of the Companies Act, 2013. Out of 95 CPSEs reviewed, 29 CPSEs allocated funds towards CSR more than the prescribed minimum two per cent of average net profit of three immediate preceding financial years in pursuance of its CSR Policy and 60 CPSEs allocated the required minimum two per cent. While three CPSEs allocated less than two per cent, three other CPSEs did not allocate funds on account of negative net profit under Section 198 of Companies Act, 2013. As against the prescribed two per cent amounting to `3,949.70 crore, 95 CPSEs allocated CSR fund of `4,298.13 crore and incurred expenditure of `5,033.96 crore. While 67 CPSEs incurred expenditure more than the required two per cent on CSR, 10 CPSEs incurred the prescribed minimum expenditure and 18 CPSEs incurred less than the minimum required expenditure on CSR.
Petroleum, Aviation, Mining, Shipping and Power sectors incurred expenditure more than the required two per cent, highest being the Mining sector. Shortfall was observed in Fertilizer and Railway sectors. Education received the maximum focus followed by health care in CSR expenditure by CPSEs.
In terms of CSR expenditure in the States, the highest CSR expenditure was in Odisha with `702.06 crore during 2019-20. It got the highest CSR funding successively for the third year since 2017-18. This amount of `702.06 crore was contributed by 37 CPSEs, of which nine oil and gas CPSEs alone contributed `350.75 crore during the year. Daman & Diu, Andaman & Nicobar, Chandigarh, Manipur, Nagaland and Mizoram were among the States which received least attention during the past three years.
Out of 95 CPSEs, 29 CPSEs incurred CSR expenditure less than the target of 60 per cent on common theme of school education, health care and nutrition, 53 CPSEs achieved the prescribed target while eight CPSEs did not incur any expenditure. Data for the remaining five CPSEs was not available. Similarly, data in respect of CSR expenditure on common theme at aspirational districts was available for 85 CPSEs, of which 34 CPSEs incurred expenditure less than 25 per cent in the aspirational districts, 32 CPSEs incurred expenditure in excess of 25 per cent and 19 CPSEs did not incur any expenditure in aspirational districts.
Department of Public Enterprises stated (August 2021) that they have no comments to offer on this Chapter.

Report No. 12 of 2021
110
Impact of Implementation of Indian Accounting Standards in Selected Non-Banking Financial Companies
CHAPTER V
5.1 Introduction
The era of globalisation and liberalisation has led to increased social mobility, cross border movement of finance, capital, and commodities, which in turn has necessitated a single set of high-quality global Accounting Standards. Ministry of Corporate Affairs, Government of India notified (16 February 2015) Indian Accounting Standards (Ind AS), converging the hitherto applicable Indian Generally Accepted Accounting Principles (IGAAP) with global standards, namely, International Financial Reporting Standards (IFRS). The Ind AS have been formulated keeping the Indian economic and legal environment in view and are different from the earlier IGAAP framework mainly in three key aspects i.e. fair valuation, substance over legal form and emphasis on the Balance Sheet. The Ind AS are mandatorily to be adopted by prescribed class of Companies w.e.f., 01 April 2016 in a phased manner. As on 31 March 2020, 39 Ind AS are applicable (Annexure XXXVII).
5.2 Implementation of Ind AS
The Companies (Indian Accounting Standards) Rules, 2015 laid down a roadmap for implementation of Ind AS and Non-Banking Financial Companies (NBFCs) came in the third and last phase of implementation, as detailed in Table 5.1.
Table 5.1: Roadmap for implementation of Ind AS Phase Financial/
Accounting Year
commencing
Category of Companies required to implement Ind AS*
Phase I 01.04.2016 Companies whose equity or debt securities are listed or are in the process of being listed on any stock exchange in India or outside India and having net worth of `500 crore or more.
Companies having net worth of `500 crore or more, other than those covered above.
Holding, subsidiary, joint venture or associate companies of companies covered above.
Phase II 01.04.2017 Companies whose equity or debt securities are listed or are in the process of being listed on any stock exchange in India or outside India and having net worth of less than `500 crore.

Report No. 12 of 2021
111
Phase Financial/ Accounting
Year commencing
Category of Companies required to implement Ind AS*
Unlisted Companies other than those covered in Phase I whose net worth is `250 crore or more but less than `500 crore.
Holding, subsidiary, joint venture or associate companies of companies covered above.
Phase III
01.04.2018 NBFCs having net worth of `500 crore or more.
Holding, subsidiary, joint venture or associate NBFCs of NBFCs covered above.
01.04.2019 NBFCs whose equity or debt securities are listed or are in the process of being listed on any stock exchange in India or outside India and having net worth of less than `500 Crore.
Unlisted NBFCs having net worth of `250 crore or more but less than `500 crore; and
Holding, subsidiary, joint venture or associate NBFCs of NBFCs covered above.
*Companies/ NBFCs not covered under the above provisions may continue to apply earlier standards (IGAAP) or voluntarily adopt Ind AS. However, once they started reporting as per Ind AS, they cannot revert to IGAAP.
As per notification dated 30 March 2016 of the Ministry of Corporate Affairs, duly notifying the Companies (Indian Accounting Standards) (Amendment) Rules, 2016, a ‘Non-Banking Financial Company’ has been defined under Rule 2(1)(g) as follows:
A ‘Non-Banking Financial Company’ means a Non-Banking Financial Company as defined in clause (f) of Section 45-I of the Reserve Bank of India Act, 1934 and includes Housing Finance Companies, Merchant Banking Companies, Micro Finance Companies, Mutual Benefit Companies, Venture Capital Fund Companies, Stock Broker or Sub Broker Companies, Nidhi Companies, Chit Companies, Securitization and Reconstruction Companies, Mortgage Guarantee Companies, Pension Fund Companies, Asset Management Companies and Core Investment Companies.
The implementation of Ind AS involved the following salient steps:
• In all cases, the date of transition to Ind AS was 1 April of previous year. For example, in the case of NBFCs which adopted Ind AS from 01 April 2018, the date of transition was 01 April 2017. Comparative period for the first Ind AS financial statements was 2017-18.
• The NBFCs were required to prepare three balance sheets viz. the opening Ind AS balance sheet as on 01 April 2017, the Ind AS Balance Sheet as on 31 March 2018 and the Ind AS Balance Sheet as on 31 March 2019.
Report No. 12 of 2021
112
• Two Profit and Loss Accounts were required to be prepared as per Ind AS i.e. for year ended 31 March 2018 and 31 March 2019.
• Statement of changes in equity was required to be prepared for year ended 31 March 2018 and 31 March 2019.
5.3 Objectives of Audit
The objectives of audit were to study the implementation of Ind AS in NBFCs to assess compliance of various provisions of Ind AS by the NBFCs and to assess the impact of implementation of Ind AS in the financial statements of NBFCs.
5.4 Scope of Audit
The study covered NBFCs in public sector under the administrative control of various Central Government ministries/ departments which were required to adopt Ind AS or voluntarily adopted Ind AS during 2018-19 and 2019-20. Out of 35 NBFCs which have adopted Ind AS, an audit sample of 19 NBFCs was selected across different sectors based on net worth, Profit After Tax (PAT) and turnover duly considering sector representation (Annexure XXXVIII).
Study of Phase I and Phase II of Ind AS implementation was undertaken by Audit in previous years and a Chapter on implementation of Ind AS was included in CAG Report No. 18 of 2018 and CAG Report No. 18 of 2019 (General Purpose Financial Report) respectively.
5.5 Audit Methodology
The correctness in application of Ind AS by the NBFCs was verified during the Supplementary Audit of the accounts of the NBFCs at the time of first year of adoption of Ind AS and subsequent years. In this Chapter, we have reported the impact of the changes brought out by the adoption of Ind AS on the financial statements of the selected NBFCs.
The standalone financial statements of 19 NBFCs in the audit sample, which have adopted Ind AS in Phase III for preparation of their financial statements either mandatorily or voluntarily have been reviewed in audit. Impact of implementation of Ind AS in these NBFCs on their PAT, revenues, net worth and total assets was analysed. The analysis was with reference to changes as a result of adoption of Ind AS in revenue recognition, valuation of financial instruments and Property, Plant and Equipment (PPE), calculation of employee benefits, accounting of business combinations and impairment of financial assets. Compliance of directions issued by Regulators for implementation of Ind AS, by the NBFCs was also examined.
5.6 Adoption of Ind AS after CAG’s comment
One of the NBFCs in the audit sample, SBI Pension Fund (P) Limited did not adopt Ind AS in the preparation of financial statements for 2018-19, though it was required to do so w.e.f. 01 April 2018 in Phase III, as per the implementation roadmap. However, after CAG’s comment was issued (08 July 2019) at the time of certification of accounts pointing
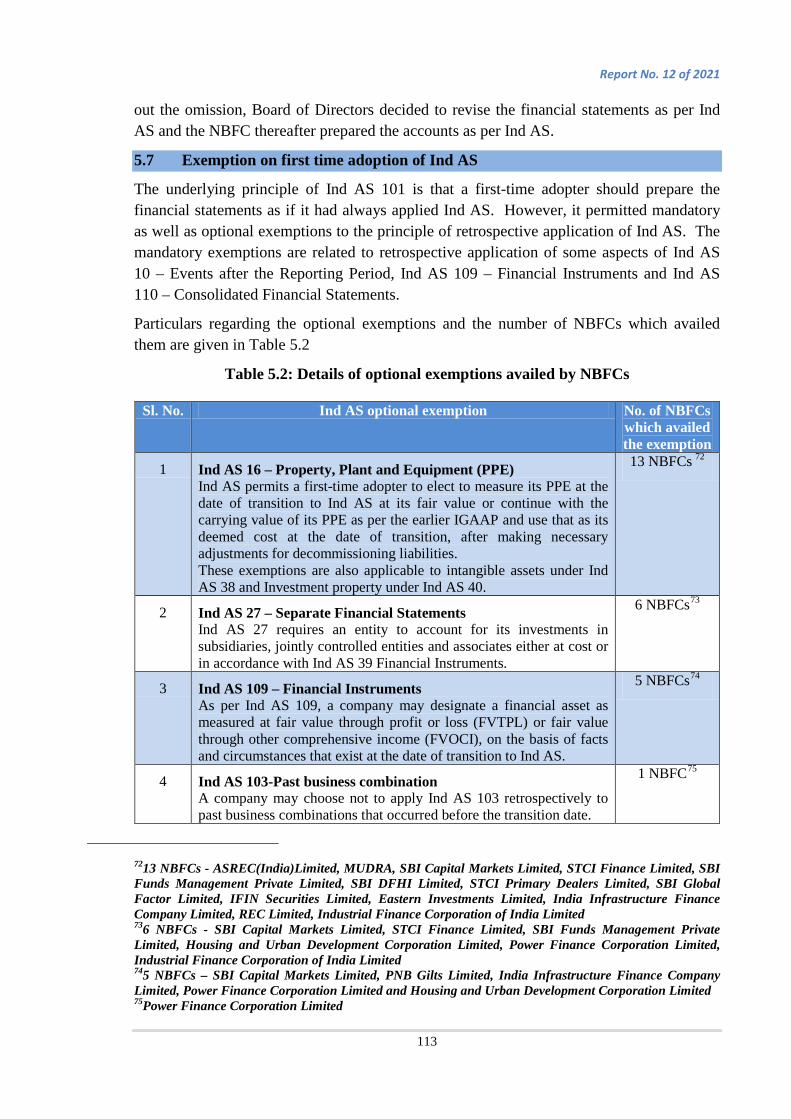
Report No. 12 of 2021
113
out the omission, Board of Directors decided to revise the financial statements as per Ind AS and the NBFC thereafter prepared the accounts as per Ind AS.
5.7 Exemption on first time adoption of Ind AS
The underlying principle of Ind AS 101 is that a first-time adopter should prepare the financial statements as if it had always applied Ind AS. However, it permitted mandatory as well as optional exemptions to the principle of retrospective application of Ind AS. The mandatory exemptions are related to retrospective application of some aspects of Ind AS 10 – Events after the Reporting Period, Ind AS 109 – Financial Instruments and Ind AS 110 – Consolidated Financial Statements.
Particulars regarding the optional exemptions and the number of NBFCs which availed them are given in Table 5.2
Table 5.2: Details of optional exemptions availed by NBFCs
Sl. No. Ind AS optional exemption No. of NBFCs which availed the exemption
1 Ind AS 16 – Property, Plant and Equipment (PPE) Ind AS permits a first-time adopter to elect to measure its PPE at the date of transition to Ind AS at its fair value or continue with the carrying value of its PPE as per the earlier IGAAP and use that as its deemed cost at the date of transition, after making necessary adjustments for decommissioning liabilities. These exemptions are also applicable to intangible assets under Ind AS 38 and Investment property under Ind AS 40.
13 NBFCs 72
2 Ind AS 27 – Separate Financial Statements Ind AS 27 requires an entity to account for its investments in subsidiaries, jointly controlled entities and associates either at cost or in accordance with Ind AS 39 Financial Instruments.
6 NBFCs73
3 Ind AS 109 – Financial Instruments As per Ind AS 109, a company may designate a financial asset as measured at fair value through profit or loss (FVTPL) or fair value through other comprehensive income (FVOCI), on the basis of facts and circumstances that exist at the date of transition to Ind AS.
5 NBFCs74
4 Ind AS 103-Past business combination A company may choose not to apply Ind AS 103 retrospectively to past business combinations that occurred before the transition date.
1 NBFC75
7213 NBFCs - ASREC(India)Limited, MUDRA, SBI Capital Markets Limited, STCI Finance Limited, SBI Funds Management Private Limited, SBI DFHI Limited, STCI Primary Dealers Limited, SBI Global Factor Limited, IFIN Securities Limited, Eastern Investments Limited, India Infrastructure Finance Company Limited, REC Limited, Industrial Finance Corporation of India Limited 736 NBFCs - SBI Capital Markets Limited, STCI Finance Limited, SBI Funds Management Private Limited, Housing and Urban Development Corporation Limited, Power Finance Corporation Limited, Industrial Finance Corporation of India Limited 745 NBFCs – SBI Capital Markets Limited, PNB Gilts Limited, India Infrastructure Finance Company Limited, Power Finance Corporation Limited and Housing and Urban Development Corporation Limited 75Power Finance Corporation Limited

Report No. 12 of 2021
114
5.8 Impact of implementation of Ind AS on selected key areas
The implementation of Ind AS impacted PAT, revenues, total assets, and net worth of NBFCs in the audit sample. The values increased or decreased due to difference in accounting treatment of various items and also depending on the exemptions availed by the NBFC at the time of adoption of Ind AS. The impact of implementation of Ind AS in respect of 19 NBFCs selected for review is discussed below:
5.8.1 Impact on Profit After Tax (PAT)
The impact on PAT on the 19 NBFCs is given in Annexure XXXIX. Out of 19 NBFCs in the audit sample;
• Seven NBFCs recorded increase in PAT.
• 10 NBFCs recorded decrease in PAT.
• There was no impact on PAT in respect of two NBFCs.
• In respect of seven NBFCs, there was a material impact of more than 50 per cent on PAT.
• In two NBFCs, profit increased by more than 100 per cent and in one NBFC loss turned into profit.
The factors contributing to changes in PAT in respect of 19 NBFCs reviewed in Audit are discussed in the subsequent paragraphs.
5.8.1.1 Factors contributing to change in PAT The main items which contributed to change in PAT were:
a. Valuation of liabilities towards post-employment benefits
Under IGAAP, differences accruing due to measurement of liabilities towards post-employment benefits formed part of the Profit and Loss Account. However, under Ind AS, such differences i.e., actuarial gains or losses were recognised under ‘Other Comprehensive Income’ and taken directly to Retained Earnings instead of recognizing them in Profit and Loss Account. While gains/ losses are taken to ‘other comprehensive income’, it affects profit/ loss earlier recognized in Profit and Loss Account under IGAAP by way of increase or decrease in profit in new Profit and Loss Account. Change in profit/ loss due to this treatment was noticed in seven out of 19 NBFCs viz.:
Increase in profit in one NBFC
• SBI DFHI Limited (`0.44 crore)
Decrease in profit in six NBFCs
• SBI Capital Markets Limited (`0.05 crore)
• STCI Finance Limited (`0.07 crore)
• SBI Funds Management (P) Limited (`0.61 crore)

Report No. 12 of 2021
115
• SBI Global Factors Limited (`0.01 crore)
• ASREC (India) Limited (`0.02 crore)
• Industrial Finance Corporation of India Limited (`2.97 crore)
b. Recognition/ reversal of deferred taxes
Ind AS 12 – Income Taxes, required recognition of deferred tax on new temporary differences between the carrying amount of an asset or liability in the balance sheet and its tax base. This was not a requirement under IGAAP. If the NBFC was already having deferred tax asset as per IGAAP, any further increase as a result of fair valuation under Ind AS would increase its profit and vice versa. Change in profit/ loss due to this treatment was noticed in 13 out of 19 NBFCs as detailed below:
Increase in Profit in six NBFCs
• Power Finance Corporation Limited (`1,025.67 crore)
• REC Limited (`740.83 crore)
• SBI DFHI Limited (`7.09 crore)
• SBI Capital Markets Limited (`4.48 crore)
• STCI Primary Dealers Limited (`2.68 crore)
• SBI Global Factors Limited(`1.51crore)
Decrease in Profit in seven NBFCs
• Industrial Finance Corporation of India Limited (`780.23 crore)
• Housing and Urban Development Corporation Limited (`107.01 crore)
• PNB Gilts Limited (`18.80 crore)
• MUDRA Limited (`4.06 crore)
• ASREC (India) Limited (`3.58 crore)
• SBI Funds Management (P) Limited (`2.51 crore)
• STCI Finance Limited (`2.25 crore)
c. Measurement of investments/ assets at fair value through profit and loss
All financial assets76 and financial liabilities are carried at cost under IGAAP whereas under Ind AS, certain financial assets and financial liabilities are subsequently measured at amortised cost by applying effective interest rate (EIR)77. Fair valuation may result in either increase or decrease of value of investments in assets which will further result in
76Financial instruments that give rise to either assets or liability through a contract. 77 EIR - Effective Interest Rate is the rate that discounts the estimated future cash payments or receipts over the expected life of the financial instrument.

Report No. 12 of 2021
116
either increase or decrease of profit. Change in profit/ loss due to this treatment was noticed in 15 out of 19 NBFCs as detailed below:
Increase in Profit in 10 NBFCs
• Industrial Finance Corporation of India Limited (`328.62 crore)
• PNB Gilts Limited (`57.05 crore)
• REC Limited (`37.70 crore)
• Housing and Urban Development Corporation Limited (`22.19 crore)
• India Infrastructure Finance Company Limited (`15.83 crore)
• ASREC (India) Limited (`12.89 crore)
• SBI Funds Management (P) Limited (`7.51 crore)
• STCI Primary Dealers Limited (`4.85 crore)
• IFIN Securities Finance Limited (`0.06 crore)
• MUDRA Limited (`0.26 crore)
Decrease in Profit in five NBFCs
• Power Finance Corporation Limited (`64.27 crore)
• SBI Capital Markets Limited (`14.76 crore)
• SBI DFHI Limited (`20.93 crore)
• STCI Finance Limited (`0.79 crore)
• Eastern Investments Limited (`0.31 crore)
d. Provision for impairment allowance and bad and doubtful debts
Under IGAAP, provision for impairment of loans to customers was made as per the guidelines specified by the regulator viz. Reserve Bank of India, National Housing Bank etc. Under Ind AS 109, impairment loss on loans as well as provision against trade receivables are to be determined based on Expected Credit Loss (ECL)78 method.
The ECL model adopted by the NBFCs under Ind AS framework may increase provision thereby reducing profit or decrease provision thereby increasing the profit. Due to recognition of provisions of bad and doubtful debts based on ECL method, change in profit/ loss was noticed in respect of eight out of 19 NBFCs as detailed below:
Increase in Profit in five NBFCs
• Industrial Finance Corporation of India Limited (`1,458.07 crore)
78 Expected Credit Loss (ECL)- ECL is the difference between all contractual cash flows that are due to the entity in accordance with the contract and all the cash flows that the entity expects to receive (i.e., all cash shortfalls), discounted at the original effective interest rate (EIR).

Report No. 12 of 2021
117
• STCI Finance Limited (`6.63 crore)
• MUDRA Limited (`6.42 crore)
• SBI Global Factors Limited (`5.07 crore)
• IFIN Securities Finance Limited (`0.62 crore)
Decrease in Profit in three NBFCs
• India Infrastructure Finance Company Limited (`387.52 crore)
• Power Finance Corporation Limited (`1,824.94 crore)
• REC Limited (`875.38 crore)
e. Recognition of upfront fees and income from loans
Under IGAAP, upfront fees from customers are recognised in Profit and Loss Account at the point of transaction while under Ind AS such costs are included in the initial recognition amount of financial asset and recognized as interest income using EIR method. Further, as per Ind AS, income on loans and financial assets/ liabilities/ borrowing costs were classified/ measured at amortised cost using EIR. Change in profit/ loss due to this treatment was noticed in five out of 19 NBFCs viz.
Increase in Profit in two NBFCs
• Industrial Finance Corporation of India Limited (`595.83 crore)
• MUDRA Limited (`1.46 crore)
Decrease in Profit in three NBFCs
• Power Finance Corporation Limited (`543.84 crore)
• REC Limited (`84.16 crore)
• STCI Primary Dealers Limited (`1.18 crore)
f. Other reasons for change in PAT
• Option regarding reclassification of income on Asset held at Fair Value through Other Comprehensive Income was exercised by NBFCs on fair valuation. Change in profit due to this treatment was noticed in STCI Finance Limited {(-)`5.07 crore}.
• Ind AS contains detailed requirements on measurement of financial assets and liabilities and classification from one category to another. Change in profit due to this was noticed in Housing and Urban Development Corporation Limited (`326.89 crore) and REC Limited {(-)`59.06 crore}.
5.8.2 Impact on Revenue
The definition of ‘revenue’ under Ind AS 18 covers all economic benefits that arise in the ordinary course of activities of an entity which results in increase in net worth, other than
Report No. 12 of 2021
118
increases relating to contributions from net worth participants. Revenue, as per IGAAP (AS 9 – Revenue recognition) is defined as gross inflow of cash, receivables or other consideration arising in the course of the ordinary activities of an enterprise from the sale of goods, from the rendering of services and from the use by others of the enterprise resources yielding interest, royalties and dividends.
The details of impact of revenue in 19 NBFCs are given in Annexure XL. Adoption of Ind AS by the 19 NBFCs in the audit sample resulted in
• Increase in revenue in 10 NBFCs;
• Decrease in revenue in six NBFCs;
• No change in the revenue of three NBFCs; and
• Material impact of more than 10 per cent in respect of four NBFCs.
The impact in revenue in respect of 19 NBFCs reviewed in Audit was mainly due to:
a. Net Gain/ Loss on fair value changes in case of ASREC (India) Limited (`5.77 crore), IFIN Securities Finance Limited (`0.07 crore), Eastern Investments Limited {(-)`0.31 crore} and Industrial Finance Corporation of India Limited (`329.52 crore).
b. Increase in interest income due to EIR as per Ind AS 109 in case of IFIN Securities Finance Limited (`0.20 crore), Power Finance Corporation Limited {(-)`588.92 crore}, REC Limited (`50.30 crore) and Industrial Finance Corporation of India Limited (`747.11 crore).
c. Provisions written back pertaining to ECL in case of IFIN Securities Finance Limited (`0.62 crore).
5.8.3 Impact on Total Assets
Total value of assets is impacted upon implementation of Ind AS due to difference in methods of accounting prescribed under Ind AS as compared to IGAAP viz. Ind AS 16 – Property, Plant and Equipment (PPE), Ind AS 38 – Intangible Assets, Ind AS 32 – Financial Instruments: Presentation, Ind AS 109 – Financial Instruments and Ind AS 40 – Investment Property.
Ind AS 101 permitted the first-time adopter to elect to continue with the carrying value for all its PPE as recognized in the Financial Statements prepared under IGAAP as at the date of transition to Ind AS. The carrying value is recognised as its deemed cost on the date of transition after making necessary adjustments for de-commissioning liabilities. This exemption could also be used for valuation of intangible assets under Ind AS 38 – Intangible assets and Ind AS 40 – Investment Property.
The details of impact of Assets in 19 NBFCs are given in Annexure XLI. Out of 19 NBFCs covered in the study:
• Eight NBFCs recorded increase in assets;
• Nine NBFCs recorded decrease in assets;
Report No. 12 of 2021
119
• There was no change in the assets of two NBFCs; and
• In respect of two NBFCs, the impact was more than five per cent.
5.8.3.1 Factors contributing to change in Assets
The change in value of total assets in respect of 19 NBFCs reviewed in Audit (Annexure XLI) was mainly due to:
a. Fair valuation of investments in respect of SBI Capital Markets Limited (`663.78 crore), STCI Primary Dealers Limited {(-)`20.28 crore}, SBI Fund Management (P) Limited (`48.92 crore), Power Finance Corporation Limited (`459.87 crore), REC Limited (`239.71 crore) and Industrial Finance Corporation of India Limited (`810.29 crore).
b. Increase in trade receivables in the case of SBI Capital Markets Limited (`13.29 crore).
c. Impairment Provision as per ECL model and inclusion of upfront fees in the initial recognition amount of financial asset with recognition of interest income using EIR method in respect of MUDRA Limited {(-)`30.36 crore}, Industrial Finance Corporation of India Limited {(-)`1,500.36 crore} and SBI Cards & Payments Services Limited {(-)`172.34 crore}.
d. Writing off of Preliminary Expenses in the case of MUDRA Limited {(-)`1.51 crore}.
e. Change in Deferred Tax Assets, reversal of earlier Deferred Tax Liability and/ or recognition of Net Deferred Tax Asset in respect of MUDRA Limited {(-)`10.87 crore}, STCI Primary Dealers Limited (`8.65 crore), SBI Global Factors Limited (`3.52 crore), STCI Finance Limited {(-)`21.53 crore}, PNB Gilts Limited (`12.99 crore), Power Finance Corporation Limited (`4,848.17 crore), REC Limited (`2,971.06 crore) and SBI Cards and Payments Services Limited {(-)`115.60 crore}.
f. Change in method of valuation of investment from Held to Maturity to Mark to Market in the case of PNB Gilts Limited {(-)`36.76 crore}.
g. Change in valuation of investments held for trading as per Ind AS 109 in case of SBI DFHI Limited (`110.29 crore).
h. Unrealized fair value gains booked due to investment measured at fair value through other comprehensive income in case of STCI Finance Limited (`325.20 crore).
i. Measurement of loan assets at amortized cost using EIR method in case of Power Finance Corporation Limited {(-)`8,504.81 crore} and REC Limited {(-)`6,467.37 crore}.
j. Amortization of Card Acquisition Cost under Ind AS 115 in case of SBI Cards & Payments Services Limited (`371.44 crore).

Report No. 12 of 2021
120
5.8.4 Impact on Net worth
Net worth is the difference between the value of assets and liabilities of a company. Net worth is arrived at by reducing from the aggregate value of the paid-up share capital, free reserves and securities premium account, the aggregate value of accumulated losses, deferred expenditure and miscellaneous expenditure not written off. Free reserves do not include reserves created out of revaluation of assets, write back of depreciation and amalgamation.
As per Ind AS 101 - First time adoption of Ind AS, an opening Ind AS balance sheet is to be prepared at the date of transition to Ind AS. Any differences between carrying amounts of assets and liabilities as at the transition date, as compared to the carrying amount under IGAAP, are to be recognised in net worth under retained earnings in the Ind AS balance sheet.
The details of impact on net worth in 19 NBFCs are given in Annexure XLII. Out of 19 NBFCs in the audit sample:
• Eight NBFCs recorded increase in net worth;
• Nine NBFCs recorded decrease in net worth;
• There was no change in net worth in the case of two NBFCs; and
• In respect of five NBFCs, the impact was more than 10 per cent.
5.8.4.1 Factors contributing to change in net worth:
The main factors that contributed to changes in net worth in respect of 19 NBFCs reviewed (Annexure XLII) in Audit were:
a. Fair Valuation/ change in valuation method of investments and gains/ loss thereon in cases of SBI Capital Markets Limited (`663.78 crore), SBI Funds Management (P) Limited (`48.92 crore), MUDRA Limited (`1.09 crore), SBI DFHI Limited (`17.49 crore), STCI Primary Dealers Limited {(-)`19.51 crore}, STCI Finance Limited (`325.20 crore), PNB Gilts Limited {(-)`24.44 crore}, Power Finance Corporation Limited (`236.77 crore), REC Limited (`239.71 crore) and ASREC (India) Limited (`6.75 crore).
b. Increase/ decrease in Trade Receivables due to change in Provisioning Policy as per Ind AS 109/ adoption of ECL model in cases of SBI Capital Market Limited (`13.29 crore), India Infrastructure Finance Company Limited {(-)`1,808.06 crore}, Power Finance Corporation Limited {(-)`8,393.91 crore} and REC Limited {(-)`6,405.99 crore}.
c. Amortization of Borrowing Cost using EIR method in case of SBI Global Factors Limited {(-)`0.08 crore}.
d. Recognition/ Reversal of Deferred Tax Assets/ Deferred Tax Liabilities in respect of STCI Finance Limited (`-70.32 crore), SBI Funds Management (P) Limited {(-)`5.55 crore}, SBI DFHI Limited {(-)`21.07 crore}, SBI Capital Market Limited {(-)`234.17 crore}, Power Finance Corporation Limited (`4,843.91 crore), REC Limited

Report No. 12 of 2021
121
(`2,979.61 crore), SBI Cards and Payments Services Limited {(-)`115.60 crore} and Industrial Finance Corporation of India Limited {(-)`628.43 crore}.
5.8.5 Impact on Borrowings
The impact of adoption of Ind AS on borrowings in respect of 19 NBFCs reviewed in Audit was marginal at 0.63 per cent, which was mainly due to reclassification and change in valuation/ measurement of borrowings in the case of eight NBFCs79.
5.8.6 Other impact
Implementation of Ind AS has impacted financial indicators and efficiency parameters of the NBFCs in the Audit sample, which is discussed below:
5.8.6.1 Change in financial ratios
Operating and financial ratios provide insight into a company's liquidity, operational efficiency and profitability. The NBFCs in the audit sample where key ratios were changed due to adoption of Ind AS are as detailed in Table 5.3.
Table 5.3: Impact of adoption of Ind AS on ratios
Ratio NBFCs where ratio increased
NBFCs where ratio decreased
NBFCs where there was no change
NBFCs where ratio changed >50 per cent
NBFCs where ratio increased/ decreased by> 50 per cent
Net Profit Ratio80
8 8 3 7 SBI Global Factors Limited
ASREC (India) Limited IFIN Securities Finance Limited
Eastern Investments Limited
SBI Cards and Payments Services Limited
PNB Gilts Limited Industrial Finance Corporation of India Limited
Return on Net Worth81
9 8 2 6 STCI Primary Dealers Limited
SBI Global Factors Limited
ASREC (India) Limited IFIN Securities Finance Limited
India Infrastructure Finance Co Limited
79 STCI Finance Limited, STCI Primary Dealers Limited, SBI Global Factors Limited, SBI Cards and Payments Services (P) Limited, Power Finance Corporation Limited, REC Limited, Housing and Urban Development Corporation Limited and Industrial Finance Corporation of India Limited 80Proportion of Net profit to Revenue. 81Profit to Net worth.

Report No. 12 of 2021
122
Ratio NBFCs where ratio increased
NBFCs where ratio decreased
NBFCs where there was no change
NBFCs where ratio changed >50 per cent
NBFCs where ratio increased/ decreased by> 50 per cent
Industrial Finance Corporation of India Limited
Debt Equity Ratio82
9 7 3
1 Eastern Investments Limited
Earnings Per Share (EPS)
7 10 2 7 SBI Global Factors Limited
ASREC (India) Limited IFIN Securities Finance Limited
Eastern Investments Limited
SBI Cards and Payments Services Limited
PNB Gilts Limited Industrial Finance Corporation of India Limited
Interest Coverage Ratio
6 7 6 3 SBI Global Factors Limited
ASREC (India) Limited IFIN Securities Finance Limited
The ratios changed due to changes in PAT and net worth as discussed in Para 5.8.1 and 5.8.4 above.
5.8.6.2 Ratings of NBFCs by credit rating agencies
NBFCs rate their products like Deposits, Commercial Paper, Debenture etc., through credit rating agencies. Different parameters like Capital and Leverage, Asset quality, Profitability, Liquidity, Management and Systems, Resource Profiles etc., are taken into consideration by the credit rating agencies. Audit noticed that rating was changed in respect of two83 NBFCs after transition to Ind AS. The change was, however, not due to Ind AS adjustments. Hence implementation of Ind AS did not have a negative impact on rating of these NBFCs.
5.9 Conclusion
Adoption of Ind AS resulted in changes in the financial reporting framework. Audit analysis of selected 19 NBFCs indicated that adoption of Ind AS by the NBFCs impacted Profit After Tax, revenue, total assets and net worth of the selected NBFCs. The impact was noticed across the financial statements of all the selected NBFCs.
82Debt of the Company to owned funds. 83ASREC (India) Limited and Industrial Finance Corporation of India Limited

Report No. 12 of 2021
123
It was noticed that adoption of Ind AS by the NBFCs had the cumulative impact of decrease in profit after tax (`201.62 crore), increase in revenue (`672.90 crore), decrease in total assets (`6,252.04 crore) and decrease in net worth (`7,921.73 crore). Major changes carried out pertained to fair valuation of financial instruments, accounting of deferred tax, application of Expected Credit Loss method and accounting of employee benefits through valuation of liabilities towards post-employment benefits. Adoption of Ind AS also impacted key operating and financial ratios which provide insight into a company's liquidity, operational efficiency and profitability.
Department of Public Enterprises stated (August 2021) that they have no comments to offer on this Chapter.
(R. G. Viswanathan)
New Delhi Deputy Comptroller and Auditor General Dated: and Chairman, Audit Board
Countersigned
New Delhi (Girish Chandra Murmu) Dated: Comptroller and Auditor General of India


Annexures


Report No. 12 of 2021
125
List of Government companies/ Government controlled other companies which came under/ went out from the purview of CAG Audit during 2019-20
Government companies came under purview of CAG Audit Sl. No. CPSE 1 Lanco Teesta Hydro Power Limited 2 NTPC Mining Limited 3 NAB Foundation 4 Kopal Narendra Transmission Limited 5 Karur Transmission Limited 6 Lakshadweep Tourism Development Corporation 7 Silvassa Smart City Limited 8 NTPC EDMC Waste Solution Private Limited 9 Bikaner-II Bhiwadi Transco Limited 10 Ananthpuram Kurnool Transmission Limited 11 Khetri-Narela Transmission Limited 12 Bhadla Sikar Transmission Limited 13 Sikar-II Aligarh Transmission Limited 14 POWERGRID Meerut Simbhavali Transmission Limited 15 Bharat Oman Refineries Limited 16 NSIC Venture Capital Fund Limited 17 MP Power Transmission Package –I Limited 18 MP Power Transmission Package –II Limited 19 Ludhiana International Airport Limited 20 TUSCO Limited 21 NTPC Renewable Energy 22 Kallam Transmission Limited 23 Rajgarh Transmission Limited 24 Sikar New Transmission Limited 25 Ramgarh New Transmission Limited 26 Gadag Transmission Limited 27 Bidar Transmission Limited 28 Fatehgarh-Bhadla Transmission Limited 29 Tebma Shipyards Limited 30 New Delhi Municipal Council Smart City Limited 31 National Highways Infra Investment Managers Private Limited 32 Diu Smart City Limited 33 Concor Last Mile Logistics Limited 34 Convergence Energy Services Private Limited 35 NPCI Bharat Billpay Limited 36 Coal Lignite Urja Vikas Private Limited 37 IRCON Gurgaon Rewari Highway Limited
Annexure I (As referred to in Para 1.1.3)
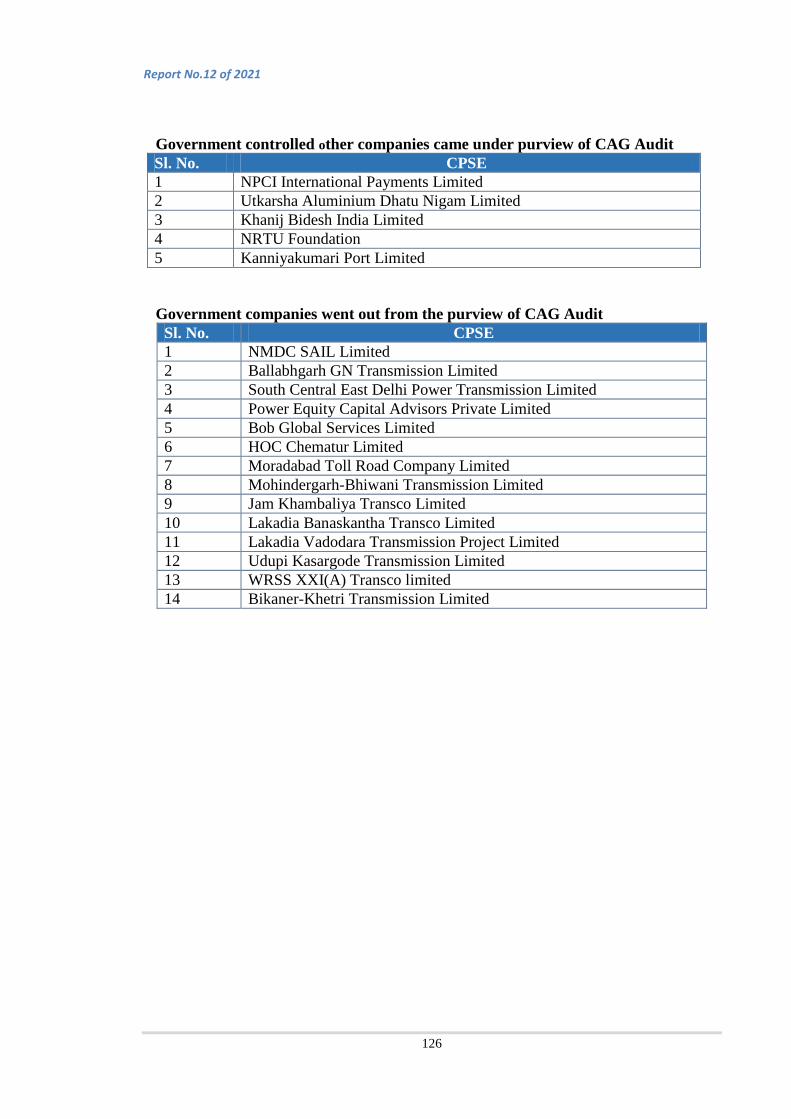
Report No.12 of 2021
126
Government controlled other companies came under purview of CAG Audit Sl. No. CPSE 1 NPCI International Payments Limited 2 Utkarsha Aluminium Dhatu Nigam Limited 3 Khanij Bidesh India Limited 4 NRTU Foundation 5 Kanniyakumari Port Limited
Government companies went out from the purview of CAG Audit Sl. No. CPSE 1 NMDC SAIL Limited 2 Ballabhgarh GN Transmission Limited 3 South Central East Delhi Power Transmission Limited 4 Power Equity Capital Advisors Private Limited 5 Bob Global Services Limited 6 HOC Chematur Limited 7 Moradabad Toll Road Company Limited 8 Mohindergarh-Bhiwani Transmission Limited 9 Jam Khambaliya Transco Limited 10 Lakadia Banaskantha Transco Limited 11 Lakadia Vadodara Transmission Project Limited 12 Udupi Kasargode Transmission Limited 13 WRSS XXI(A) Transco limited 14 Bikaner-Khetri Transmission Limited
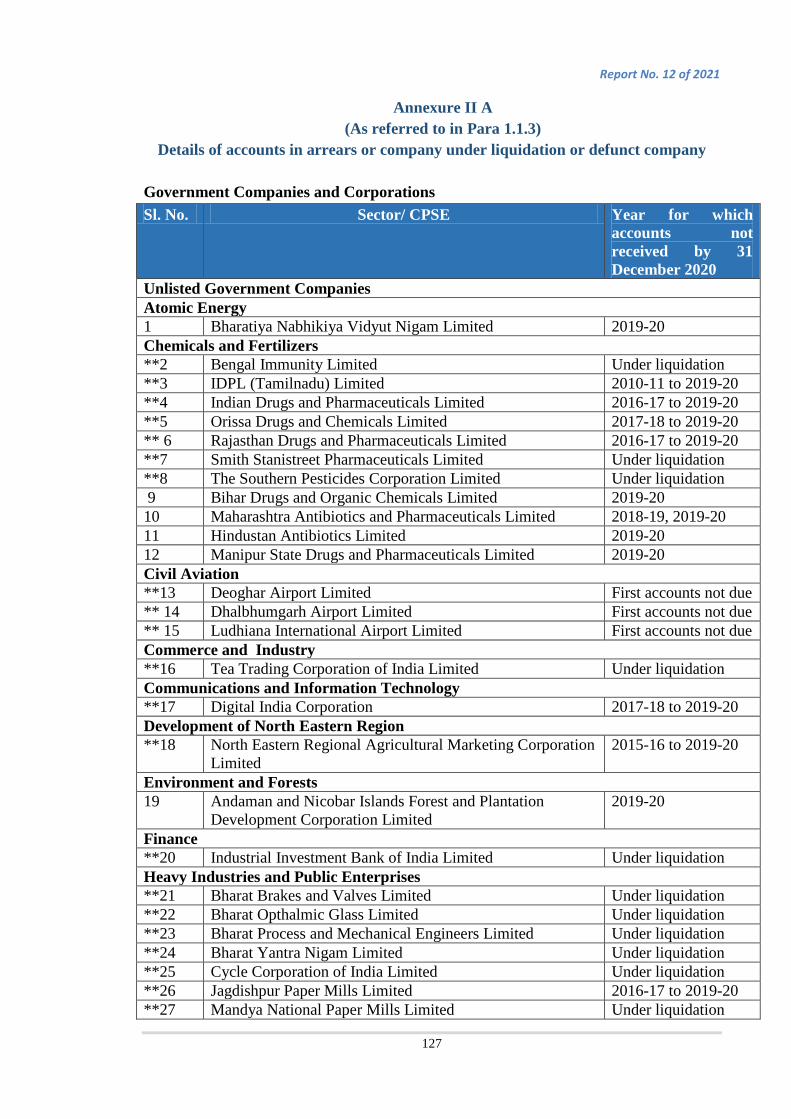
Report No. 12 of 2021
127
Annexure II A (As referred to in Para 1.1.3)
Details of accounts in arrears or company under liquidation or defunct company
Government Companies and Corporations Sl. No. Sector/ CPSE Year for which
accounts not received by 31 December 2020
Unlisted Government Companies Atomic Energy 1 Bharatiya Nabhikiya Vidyut Nigam Limited 2019-20 Chemicals and Fertilizers **2 Bengal Immunity Limited Under liquidation **3 IDPL (Tamilnadu) Limited 2010-11 to 2019-20 **4 Indian Drugs and Pharmaceuticals Limited 2016-17 to 2019-20 **5 Orissa Drugs and Chemicals Limited 2017-18 to 2019-20 ** 6 Rajasthan Drugs and Pharmaceuticals Limited 2016-17 to 2019-20 **7 Smith Stanistreet Pharmaceuticals Limited Under liquidation **8 The Southern Pesticides Corporation Limited Under liquidation 9 Bihar Drugs and Organic Chemicals Limited 2019-20 10 Maharashtra Antibiotics and Pharmaceuticals Limited 2018-19, 2019-20 11 Hindustan Antibiotics Limited 2019-20 12 Manipur State Drugs and Pharmaceuticals Limited 2019-20 Civil Aviation **13 Deoghar Airport Limited First accounts not due ** 14 Dhalbhumgarh Airport Limited First accounts not due ** 15 Ludhiana International Airport Limited First accounts not due Commerce and Industry **16 Tea Trading Corporation of India Limited Under liquidation Communications and Information Technology **17 Digital India Corporation 2017-18 to 2019-20 Development of North Eastern Region **18 North Eastern Regional Agricultural Marketing Corporation
Limited 2015-16 to 2019-20
Environment and Forests 19 Andaman and Nicobar Islands Forest and Plantation
Development Corporation Limited 2019-20
Finance **20 Industrial Investment Bank of India Limited Under liquidation Heavy Industries and Public Enterprises **21 Bharat Brakes and Valves Limited Under liquidation **22 Bharat Opthalmic Glass Limited Under liquidation **23 Bharat Process and Mechanical Engineers Limited Under liquidation **24 Bharat Yantra Nigam Limited Under liquidation **25 Cycle Corporation of India Limited Under liquidation **26 Jagdishpur Paper Mills Limited 2016-17 to 2019-20 **27 Mandya National Paper Mills Limited Under liquidation
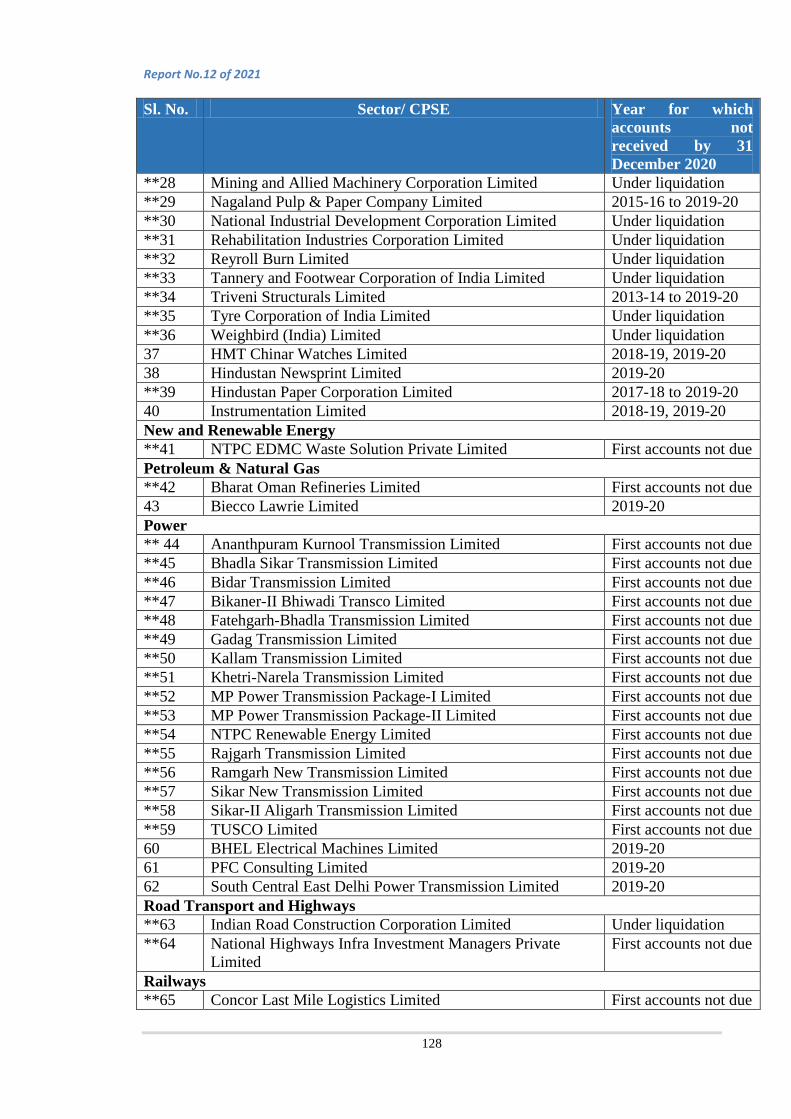
Report No.12 of 2021
128
Sl. No. Sector/ CPSE Year for which accounts not received by 31 December 2020
**28 Mining and Allied Machinery Corporation Limited Under liquidation **29 Nagaland Pulp & Paper Company Limited 2015-16 to 2019-20 **30 National Industrial Development Corporation Limited Under liquidation **31 Rehabilitation Industries Corporation Limited Under liquidation **32 Reyroll Burn Limited Under liquidation **33 Tannery and Footwear Corporation of India Limited Under liquidation **34 Triveni Structurals Limited 2013-14 to 2019-20 **35 Tyre Corporation of India Limited Under liquidation **36 Weighbird (India) Limited Under liquidation 37 HMT Chinar Watches Limited 2018-19, 2019-20 38 Hindustan Newsprint Limited 2019-20 **39 Hindustan Paper Corporation Limited 2017-18 to 2019-20 40 Instrumentation Limited 2018-19, 2019-20 New and Renewable Energy **41 NTPC EDMC Waste Solution Private Limited First accounts not due Petroleum & Natural Gas **42 Bharat Oman Refineries Limited First accounts not due 43 Biecco Lawrie Limited 2019-20 Power ** 44 Ananthpuram Kurnool Transmission Limited First accounts not due **45 Bhadla Sikar Transmission Limited First accounts not due **46 Bidar Transmission Limited First accounts not due **47 Bikaner-II Bhiwadi Transco Limited First accounts not due **48 Fatehgarh-Bhadla Transmission Limited First accounts not due **49 Gadag Transmission Limited First accounts not due **50 Kallam Transmission Limited First accounts not due **51 Khetri-Narela Transmission Limited First accounts not due **52 MP Power Transmission Package-I Limited First accounts not due **53 MP Power Transmission Package-II Limited First accounts not due **54 NTPC Renewable Energy Limited First accounts not due **55 Rajgarh Transmission Limited First accounts not due **56 Ramgarh New Transmission Limited First accounts not due **57 Sikar New Transmission Limited First accounts not due **58 Sikar-II Aligarh Transmission Limited First accounts not due **59 TUSCO Limited First accounts not due 60 BHEL Electrical Machines Limited 2019-20 61 PFC Consulting Limited 2019-20 62 South Central East Delhi Power Transmission Limited 2019-20 Road Transport and Highways **63 Indian Road Construction Corporation Limited Under liquidation **64 National Highways Infra Investment Managers Private
Limited First accounts not due
Railways **65 Concor Last Mile Logistics Limited First accounts not due

Report No. 12 of 2021
129
Sl. No. Sector/ CPSE Year for which accounts not received by 31 December 2020
**66 Ircon Gurgaon Rewari Highway Limited First accounts not due Science and Technology 67 NPCIL-NALCO Power Company Limited 2019-20 Shipping **68 Central Inland Water Transport Corporation Limited 2017-18 to 2019-20 **69 Kolkata Riverfront Development Private Limited 2017-18 to 2019-20 **70 Tebma Shipyards Limited First accounts not due 71 Hoogly Dock and Port Engineers Limited 2019-20 Small Scale Industries **72 NSIC Venture Capital Fund Limited First accounts not due Steel 73 SAIL-Bengal Alloy Castings Private Limited 2019-20 Textiles **74 Brushware Limited Under liquidation **75 Cawnpore Textiles Limited Defunct 76 The British India Corporation Limited 2018-19, 2019-20 ** 77 The Elgin Mills Company Limited Defunct 78 Central Cottage Industries Corporation Limited 2019-20 79 National Textile Corporation Limited 2019-20 Tourism **80 Lakshadweep Tourism Development Corporation Limited First accounts not due Union Territory Administration **81 Chandigarh Child and Woman Development Corporation
Limited 2011-12 to 2019-20
**82 Chandigarh Scheduled Caste Financial and Development Corporation Limited
2015-16 to 2019-20
83 Andaman Fisheries Limited 2019-20 84 Chandigarh Industrial and Tourism Development
Corporation Limited 2019-20
Urban Development **85 EPI Urban Infra Developers Limited 2017-18 to 2019-20 **86 Kavaratti Smart City Limited 2017-18 to 2019-20 **87 New Delhi Municipal Council Smart City Limited First accounts not due **88 Silvassa Smart City Limited First accounts not due Statutory Corporation Consumer Affairs, Food and Public Distribution 89 Food Corporation of India 2019-20 **CPSEs whose accounts were in arrears for three years or more or were defunct/ under
liquidation or first accounts were not due.
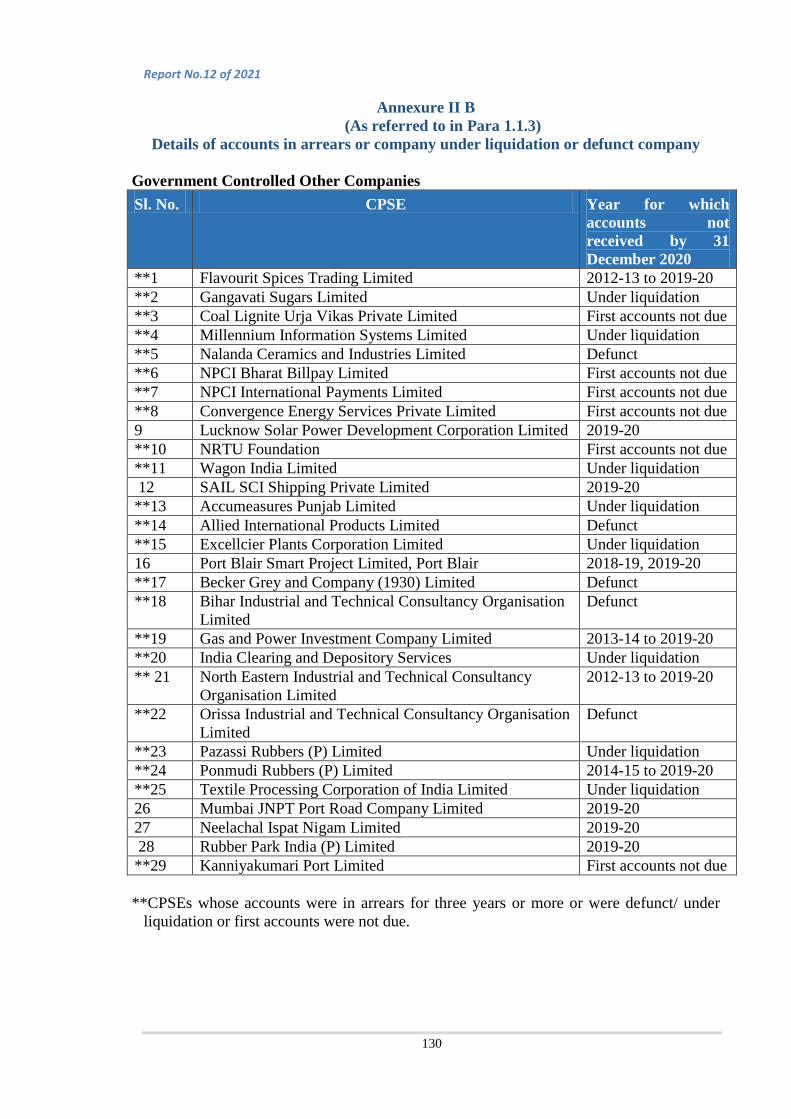
Report No.12 of 2021
130
Annexure II B (As referred to in Para 1.1.3)
Details of accounts in arrears or company under liquidation or defunct company
Government Controlled Other Companies Sl. No. CPSE Year for which
accounts not received by 31 December 2020
**1 Flavourit Spices Trading Limited 2012-13 to 2019-20 **2 Gangavati Sugars Limited Under liquidation **3 Coal Lignite Urja Vikas Private Limited First accounts not due **4 Millennium Information Systems Limited Under liquidation **5 Nalanda Ceramics and Industries Limited Defunct **6 NPCI Bharat Billpay Limited First accounts not due **7 NPCI International Payments Limited First accounts not due **8 Convergence Energy Services Private Limited First accounts not due 9 Lucknow Solar Power Development Corporation Limited 2019-20 **10 NRTU Foundation First accounts not due **11 Wagon India Limited Under liquidation 12 SAIL SCI Shipping Private Limited 2019-20 **13 Accumeasures Punjab Limited Under liquidation **14 Allied International Products Limited Defunct **15 Excellcier Plants Corporation Limited Under liquidation 16 Port Blair Smart Project Limited, Port Blair 2018-19, 2019-20 **17 Becker Grey and Company (1930) Limited Defunct **18 Bihar Industrial and Technical Consultancy Organisation
Limited Defunct
**19 Gas and Power Investment Company Limited 2013-14 to 2019-20 **20 India Clearing and Depository Services Under liquidation ** 21 North Eastern Industrial and Technical Consultancy
Organisation Limited 2012-13 to 2019-20
**22 Orissa Industrial and Technical Consultancy Organisation Limited
Defunct
**23 Pazassi Rubbers (P) Limited Under liquidation **24 Ponmudi Rubbers (P) Limited 2014-15 to 2019-20 **25 Textile Processing Corporation of India Limited Under liquidation 26 Mumbai JNPT Port Road Company Limited 2019-20 27 Neelachal Ispat Nigam Limited 2019-20 28 Rubber Park India (P) Limited 2019-20 **29 Kanniyakumari Port Limited First accounts not due
**CPSEs whose accounts were in arrears for three years or more or were defunct/ under
liquidation or first accounts were not due.
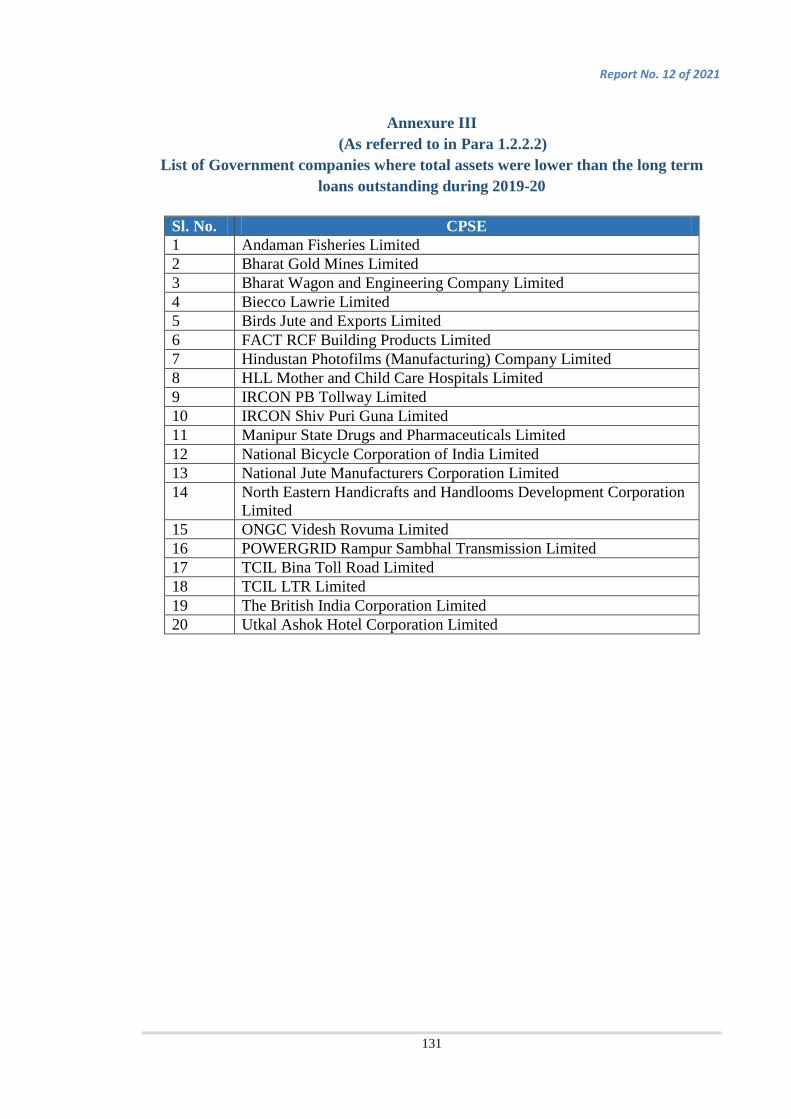
Report No. 12 of 2021
131
Annexure III
(As referred to in Para 1.2.2.2) List of Government companies where total assets were lower than the long term
loans outstanding during 2019-20
Sl. No. CPSE 1 Andaman Fisheries Limited 2 Bharat Gold Mines Limited 3 Bharat Wagon and Engineering Company Limited 4 Biecco Lawrie Limited 5 Birds Jute and Exports Limited 6 FACT RCF Building Products Limited 7 Hindustan Photofilms (Manufacturing) Company Limited 8 HLL Mother and Child Care Hospitals Limited 9 IRCON PB Tollway Limited 10 IRCON Shiv Puri Guna Limited 11 Manipur State Drugs and Pharmaceuticals Limited 12 National Bicycle Corporation of India Limited 13 National Jute Manufacturers Corporation Limited 14 North Eastern Handicrafts and Handlooms Development Corporation
Limited 15 ONGC Videsh Rovuma Limited 16 POWERGRID Rampur Sambhal Transmission Limited 17 TCIL Bina Toll Road Limited 18 TCIL LTR Limited 19 The British India Corporation Limited 20 Utkal Ashok Hotel Corporation Limited
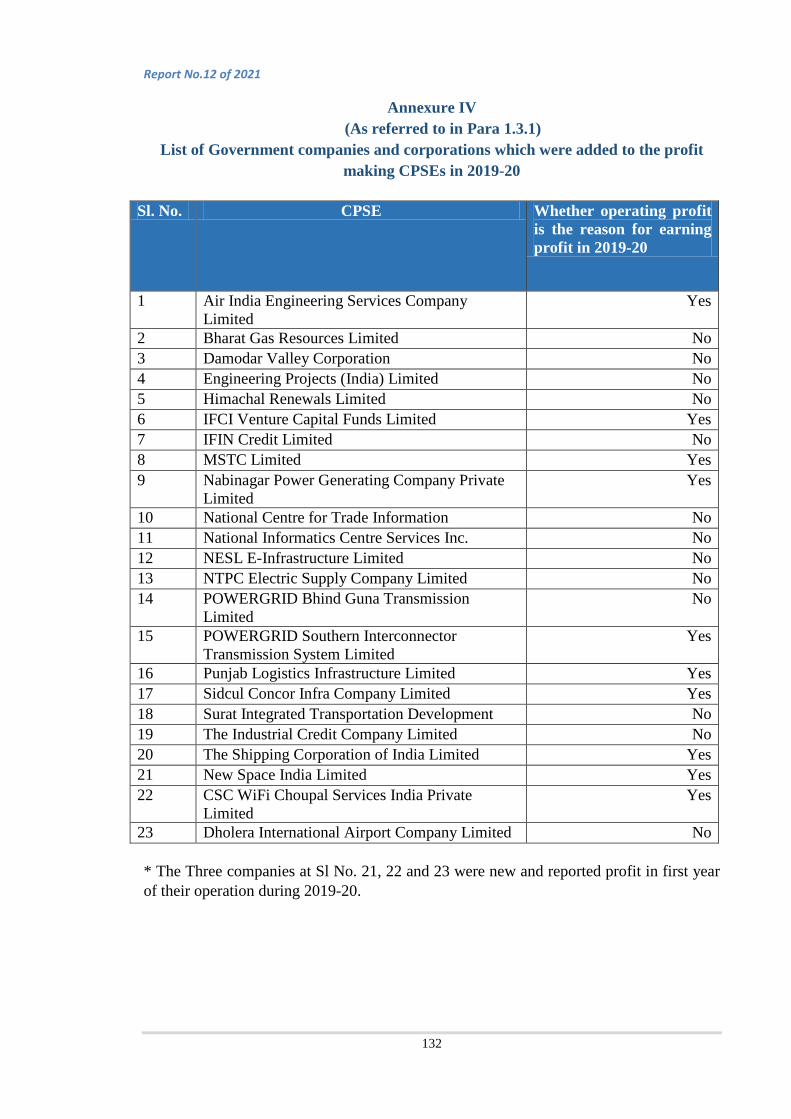
Report No.12 of 2021
132
Annexure IV (As referred to in Para 1.3.1)
List of Government companies and corporations which were added to the profit making CPSEs in 2019-20
Sl. No. CPSE Whether operating profit
is the reason for earning profit in 2019-20
1 Air India Engineering Services Company Limited
Yes
2 Bharat Gas Resources Limited No 3 Damodar Valley Corporation No 4 Engineering Projects (India) Limited No 5 Himachal Renewals Limited No 6 IFCI Venture Capital Funds Limited Yes 7 IFIN Credit Limited No 8 MSTC Limited Yes 9 Nabinagar Power Generating Company Private
Limited Yes
10 National Centre for Trade Information No 11 National Informatics Centre Services Inc. No 12 NESL E-Infrastructure Limited No 13 NTPC Electric Supply Company Limited No 14 POWERGRID Bhind Guna Transmission
Limited No
15 POWERGRID Southern Interconnector Transmission System Limited
Yes
16 Punjab Logistics Infrastructure Limited Yes 17 Sidcul Concor Infra Company Limited Yes 18 Surat Integrated Transportation Development No 19 The Industrial Credit Company Limited No 20 The Shipping Corporation of India Limited Yes 21 New Space India Limited Yes 22 CSC WiFi Choupal Services India Private
Limited Yes
23 Dholera International Airport Company Limited No * The Three companies at Sl No. 21, 22 and 23 were new and reported profit in first year of their operation during 2019-20.

Report No. 12 of 2021
133
Annexure V (As referred to in Para 1.3.1)
List of Government companies excluded from the list of profit making companies in 2019-20
Sl. No.
CPSE Whether operating loss is the reason for suffering loss in 2019-20
1 Andrew Yule and Company Limited Yes 2 Bharat Heavy Electricals Limited Yes 3 Broadcast Engineering Consultants India Limited No 4 Cement Corporation of India Limited Yes 5 Dedicated Freight Corridor Corporation Limited Yes 6 General Insurance Corporation of India Yes 7 Goa Antibiotics and Pharmaceuticals Limited Yes 8 Hindustan Copper Limited Yes 9 Hindustan Organic Chemicals Limited Yes 10 Hindustan Prefab Limited Yes 11 Hindustan Salts Limited No 12 IFCI Financial Services Limited Yes 13 IFIN Commodities Limited Yes 14 Inland Coastal Shipping Limited Yes 15 Mangalore Refinery and Petrochemicals Limited Yes 16 MMTC Limited Yes 17 Mumbai Metro Rail Corporation Limited Yes 18 National Fertilizers Limited No 19 National Jute Manufacturers Corporation Limited Yes 20 National Research Development Corporation of India
Limited No
21 National Safai Karmachari Finance and Development Corporation
Yes
22 NMDC CSR Foundation Limited Yes 23 NMDC-CMDC Limited Yes 24 ONGC Videsh Limited Yes 25 ONGC-Mangalore Petrochemicals Limited Yes 26 Pondicherry Ashok Hotel Corporation Limited Yes 27 Prize Petroleum Company Limited Yes 28 Rajasthan Electronics and Instruments Limited Yes 29 Rashtriya Ispat Nigam Limited Yes 30 SJVN Thermal Private Limited Yes 31 Western Coalfields Limited No 32 Zenith Securities and Investments Limited Yes
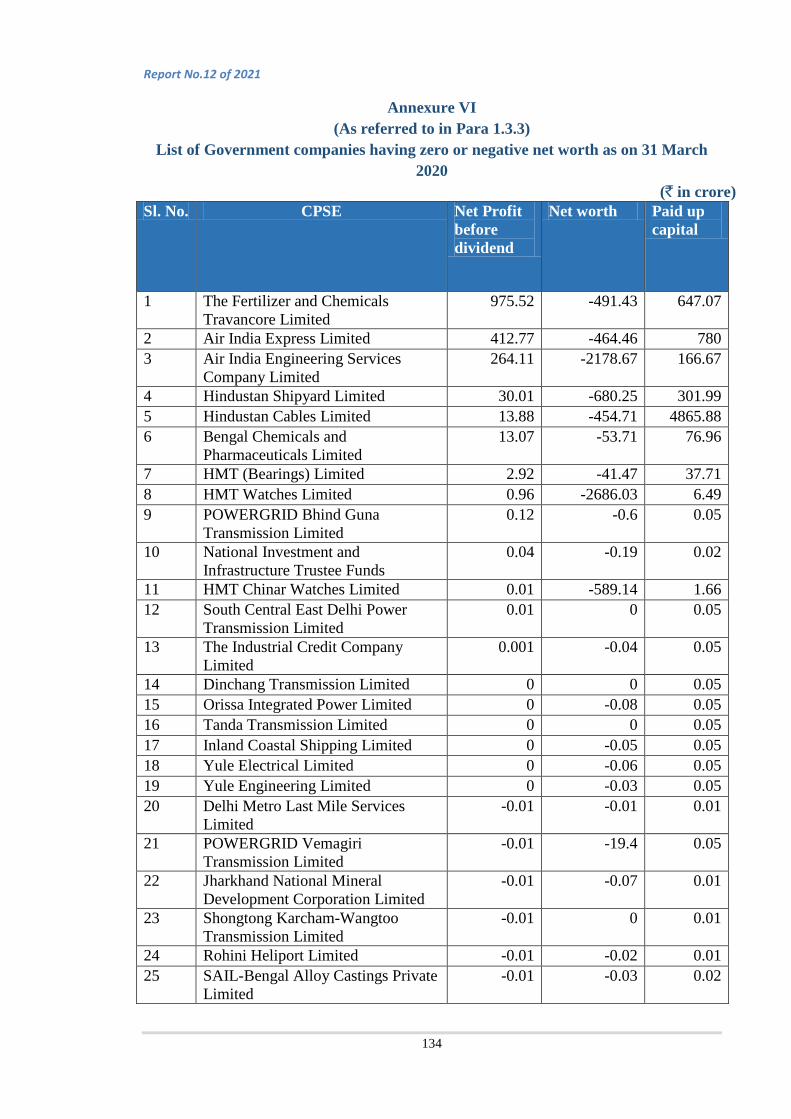
Report No.12 of 2021
134
Annexure VI (As referred to in Para 1.3.3)
List of Government companies having zero or negative net worth as on 31 March 2020
(` in crore) Sl. No. CPSE Net Profit
before dividend
Net worth Paid up capital
1 The Fertilizer and Chemicals Travancore Limited
975.52 -491.43 647.07
2 Air India Express Limited 412.77 -464.46 780 3 Air India Engineering Services
Company Limited 264.11 -2178.67 166.67
4 Hindustan Shipyard Limited 30.01 -680.25 301.99 5 Hindustan Cables Limited 13.88 -454.71 4865.88 6 Bengal Chemicals and
Pharmaceuticals Limited 13.07 -53.71 76.96
7 HMT (Bearings) Limited 2.92 -41.47 37.71 8 HMT Watches Limited 0.96 -2686.03 6.49 9 POWERGRID Bhind Guna
Transmission Limited 0.12 -0.6 0.05
10 National Investment and Infrastructure Trustee Funds
0.04 -0.19 0.02
11 HMT Chinar Watches Limited 0.01 -589.14 1.66 12 South Central East Delhi Power
Transmission Limited 0.01 0 0.05
13 The Industrial Credit Company Limited
0.001 -0.04 0.05
14 Dinchang Transmission Limited 0 0 0.05 15 Orissa Integrated Power Limited 0 -0.08 0.05 16 Tanda Transmission Limited 0 0 0.05 17 Inland Coastal Shipping Limited 0 -0.05 0.05 18 Yule Electrical Limited 0 -0.06 0.05 19 Yule Engineering Limited 0 -0.03 0.05 20 Delhi Metro Last Mile Services
Limited -0.01 -0.01 0.01
21 POWERGRID Vemagiri Transmission Limited
-0.01 -19.4 0.05
22 Jharkhand National Mineral Development Corporation Limited
-0.01 -0.07 0.01
23 Shongtong Karcham-Wangtoo Transmission Limited
-0.01 0 0.01
24 Rohini Heliport Limited -0.01 -0.02 0.01 25 SAIL-Bengal Alloy Castings Private
Limited -0.01 -0.03 0.02
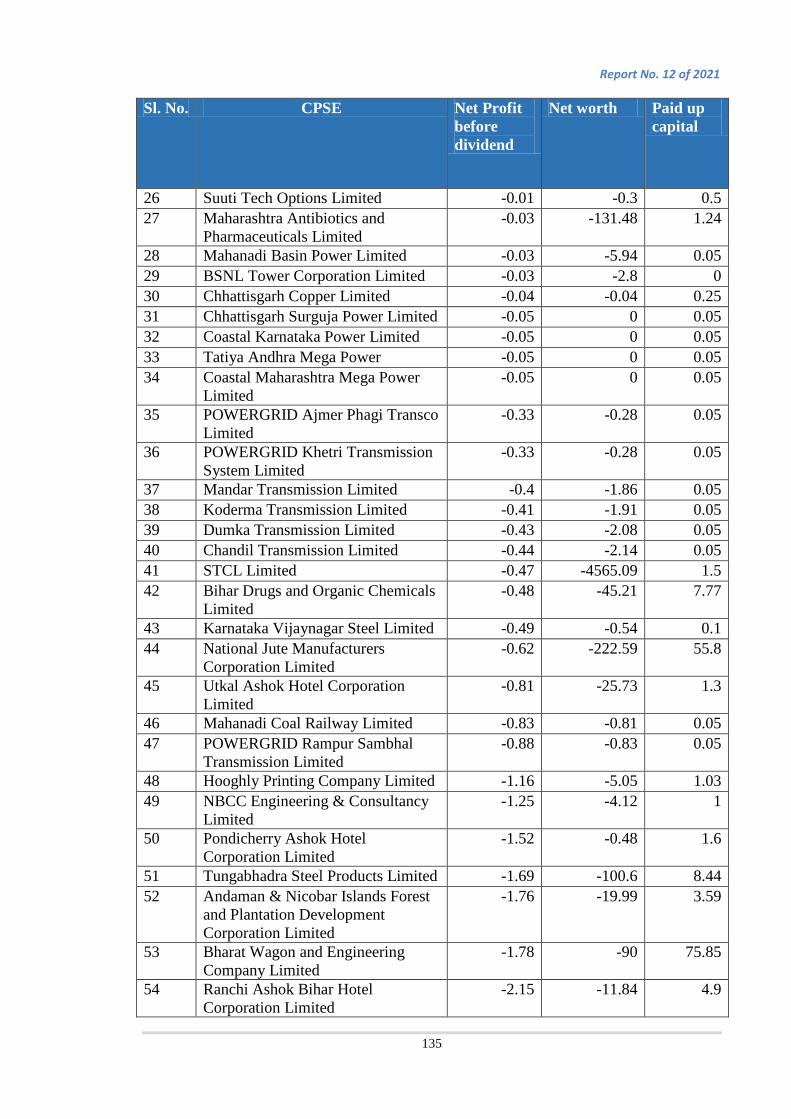
Report No. 12 of 2021
135
Sl. No. CPSE Net Profit before dividend
Net worth Paid up capital
26 Suuti Tech Options Limited -0.01 -0.3 0.5 27 Maharashtra Antibiotics and
Pharmaceuticals Limited -0.03 -131.48 1.24
28 Mahanadi Basin Power Limited -0.03 -5.94 0.05 29 BSNL Tower Corporation Limited -0.03 -2.8 0 30 Chhattisgarh Copper Limited -0.04 -0.04 0.25 31 Chhattisgarh Surguja Power Limited -0.05 0 0.05 32 Coastal Karnataka Power Limited -0.05 0 0.05 33 Tatiya Andhra Mega Power -0.05 0 0.05 34 Coastal Maharashtra Mega Power
Limited -0.05 0 0.05
35 POWERGRID Ajmer Phagi Transco Limited
-0.33 -0.28 0.05
36 POWERGRID Khetri Transmission System Limited
-0.33 -0.28 0.05
37 Mandar Transmission Limited -0.4 -1.86 0.05 38 Koderma Transmission Limited -0.41 -1.91 0.05 39 Dumka Transmission Limited -0.43 -2.08 0.05 40 Chandil Transmission Limited -0.44 -2.14 0.05 41 STCL Limited -0.47 -4565.09 1.5 42 Bihar Drugs and Organic Chemicals
Limited -0.48 -45.21 7.77
43 Karnataka Vijaynagar Steel Limited -0.49 -0.54 0.1 44 National Jute Manufacturers
Corporation Limited -0.62 -222.59 55.8
45 Utkal Ashok Hotel Corporation Limited
-0.81 -25.73 1.3
46 Mahanadi Coal Railway Limited -0.83 -0.81 0.05 47 POWERGRID Rampur Sambhal
Transmission Limited -0.88 -0.83 0.05
48 Hooghly Printing Company Limited -1.16 -5.05 1.03 49 NBCC Engineering & Consultancy
Limited -1.25 -4.12 1
50 Pondicherry Ashok Hotel Corporation Limited
-1.52 -0.48 1.6
51 Tungabhadra Steel Products Limited -1.69 -100.6 8.44 52 Andaman & Nicobar Islands Forest
and Plantation Development Corporation Limited
-1.76 -19.99 3.59
53 Bharat Wagon and Engineering Company Limited
-1.78 -90 75.85
54 Ranchi Ashok Bihar Hotel Corporation Limited
-2.15 -11.84 4.9

Report No.12 of 2021
136
Sl. No. CPSE Net Profit before dividend
Net worth Paid up capital
55 Hindustan Photofilms (Manufacturing) Company Limited
-2.35 -23736.7 206.87
56 Sambhar Salts Limited -2.59 -46.69 1 57 HLL Mother and Child Care
Hospitals Limited -2.79 -3 0.1
58 Hindustan Fluorocarbons Limited -3.63 -47.32 19.61 59 Andaman Fisheries Limited -4.04 -31.38 1 60 Bharat PetroResources JPDA
Limited -4.1 -68.44 60
61 North Eastern Handicrafts and Handlooms Development Corporation Limited
-4.39 -12.31 8.5
62 Vignyan Industries Limited -4.7 -0.01 2.79 63 Birds Jute and Exports Limited -4.71 -136.53 0.39 64 Central Cottage Industries
Corporation Limited -5.39 -5.09 10.85
65 BHEL Electrical Machines Limited -5.46 -13.73 10.5 66 Hoogly Dock and Port Engineers
Limited -9.33 -113.86 28.61
67 Instrumentation Limited -15.66 -561.07 146.05 68 TCIL Bina Toll Road Limited -21.04 -42.11 19.57 69 National Bicycle Corporation of
India Limited -21.34 -629.26 5.65
70 Bharat Pumps and Compressors Limited
-26.99 -213.61 53.53
71 Biecco Lawrie Limited -36.5 -139.53 74.76 72 Cement Corporation of India
Limited -50.94 -377.52 455.98
73 Hotel Corporation of India Limited -55.55 -432.99 137.6 74 Hindustan Antibiotics Limited -71.1 -53.71 71.72 75 FACT RCF Building Products
Limited -71.49 -123.08 70.45
76 Bharat Gold Mines Limited -79.41 -2061.06 51.06 77 HPCL Bio Fuels Limited -85.55 -34.5 625.17 78 HMT Machine Tools Limited -98.72 -1408.05 276.6 79 The British India Corporation
Limited -106.2 -912.91 31.71
80 The State Trading Corporation of India Limited
-113.63 -61.51 60
81 Brahmaputra Valley Fertilizer Corporation Limited
-129.7 -113.53 365.83
82 Madras Fertilizers Limited -134.88 -630.89 162.14

Report No. 12 of 2021
137
Sl. No. CPSE Net Profit before dividend
Net worth Paid up capital
83 Hindustan Newsprint Limited -138.89 -146.42 100 84 PEC Limited -147.02 -1780.12 60 85 Airline Allied Services Limited -200.63 -2256.66 402.25 86 Manipur State Drugs and
Pharmaceuticals Limited -256.4 -182.82 0.85
87 Heavy Engineering Corporation Limited
-405.37 -400.73 606.08
88 ONGC Videsh Rovuma Limited -790.74 -103.04 4949.09 89 Mahanagar Telephone Nigam
Limited -3695.68 -13585.7 630
90 Air India Limited -7765.73 -52460.4 32665.22 Total -12,877.85 -1,15,828.72 49,422.06 Note: Though 90 CPSEs have zero or negative net worth as on 31 March 2020, 13 CPSEs
at Sl. No 1 to 13 have earned profits during the year 2019-20

Report No.12 of 2021
138
Annexure VII (As referred to in Para 1.3.4)
Shortfall in dividend declared by Government companies (` in crore)
Sl. No.
CPSE Net Worth
Profit after Tax
Dividend declared
5% of Net worth
30% of Profit after Tax
Minimum Dividend to be declared
Shortfall
1 NTPC Limited 113569 10113 3117 5678 3034 5678 2562 2 Oil and Natural Gas
Corporation Limited 194338 13445 7234 9717 4033 9717 2483
3 Steel Authority of India Limited
39777 2022 0 1989 606 1989 1989
4 Rail Vikas Nigam Limited
4500 786 19 225 236 236 217
5 Rashtriya Chemicals and Fertilizers Limited
3186 208 42 159 62 159 117
6 NBCC (India) Limited
1524 80 24 76 24 76 52
7 Oil India Limited 24387 2584 1166 1219 775 1219 54 8 Bharat Dynamics
Limited 2607 535 115 130 160 160 46
9 Mishra Dhatu Nigam Limited
958 160 28 48 48 48 20
10 India Tourism Development Corporation Limited
346 26 0 17 8 17 17
11 Hindustan Petroleum Corporation Limited
28962 2637 1432 1448 791 1448 16
12 Indian Railway Finance Corporation Limited
30962 3692 200 1548 1108 1548 1348
13 Nuclear Power Corporation of India Limited
34338 4459 850 1717 1338 1717 867
14 Brahmaputra Cracker and Polymer Limited
2073 1508 0 104 452 452 452
15 THDC India Limited 9532 879 126 477 264 477 351 16 Central Coalfields
Limited 6392 1848 294 320 554 554 260
17 Indraprastha Gas Limited
5062 1137 168 253 341 341 173
18 Uranium Corporation of India Limited
3208 482 64 160 145 160 96
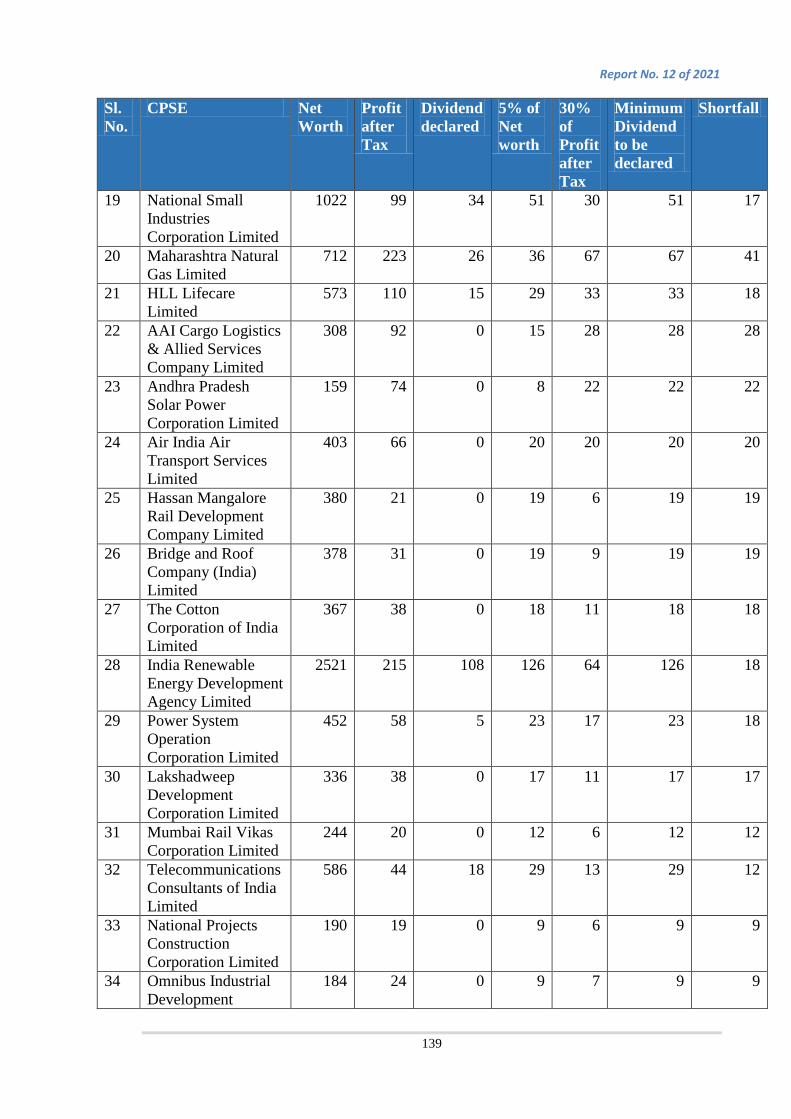
Report No. 12 of 2021
139
Sl. No.
CPSE Net Worth
Profit after Tax
Dividend declared
5% of Net worth
30% of Profit after Tax
Minimum Dividend to be declared
Shortfall
19 National Small Industries Corporation Limited
1022 99 34 51 30 51 17
20 Maharashtra Natural Gas Limited
712 223 26 36 67 67 41
21 HLL Lifecare Limited
573 110 15 29 33 33 18
22 AAI Cargo Logistics & Allied Services Company Limited
308 92 0 15 28 28 28
23 Andhra Pradesh Solar Power Corporation Limited
159 74 0 8 22 22 22
24 Air India Air Transport Services Limited
403 66 0 20 20 20 20
25 Hassan Mangalore Rail Development Company Limited
380 21 0 19 6 19 19
26 Bridge and Roof Company (India) Limited
378 31 0 19 9 19 19
27 The Cotton Corporation of India Limited
367 38 0 18 11 18 18
28 India Renewable Energy Development Agency Limited
2521 215 108 126 64 126 18
29 Power System Operation Corporation Limited
452 58 5 23 17 23 18
30 Lakshadweep Development Corporation Limited
336 38 0 17 11 17 17
31 Mumbai Rail Vikas Corporation Limited
244 20 0 12 6 12 12
32 Telecommunications Consultants of India Limited
586 44 18 29 13 29 12
33 National Projects Construction Corporation Limited
190 19 0 9 6 9 9
34 Omnibus Industrial Development
184 24 0 9 7 9 9

Report No.12 of 2021
140
Sl. No.
CPSE Net Worth
Profit after Tax
Dividend declared
5% of Net worth
30% of Profit after Tax
Minimum Dividend to be declared
Shortfall
Corporation of Daman,Diu & Dadra and Nagar Haveli Limited
35 EdCIL (India) Limited
149 41 4 7 12 12 9
36 India United Textile Mills Limited
163 10 0 8 3 8 8
37 IRCON Infrastructure Limited
154 12 0 8 3 8 8
38 Karnataka Antibiotics and Pharmaceuticals Limited
199 23 3 10 7 10 7
39 Cross Border Power Transmission Company Limited
110 21 0 5 6 6 6
40 Apollo Design Apparel Parks Limited
123 10 0 6 3 6 6
41 Goldmohur Design & Apparel Parks Limited
118 9 0 6 3 6 6
42 SAIL-RITES Bengal Wagon Industries Limited
58 16 0 3 5 5 5
43 Sidcul Concor Infra Compnay Limited
90 7 0 5 2 5 5
44 Kumarkruppa Frontier Hotels Private Limited
33 9 0 2 3 3 3
45 Jute Corporation of India Limited
148 15 5 7 5 7 3
46 NTPC Electric Supply Company Limited
50 7 0 2 2 2 2
47 SAIL Refractory Company Limited
139 14 5 7 4 7 2
48 HMT (International) Limited
36 3 0 2 1 2 2
49 NBCC Services Limited
23 4 0 1 1 1 1
Total 11,488
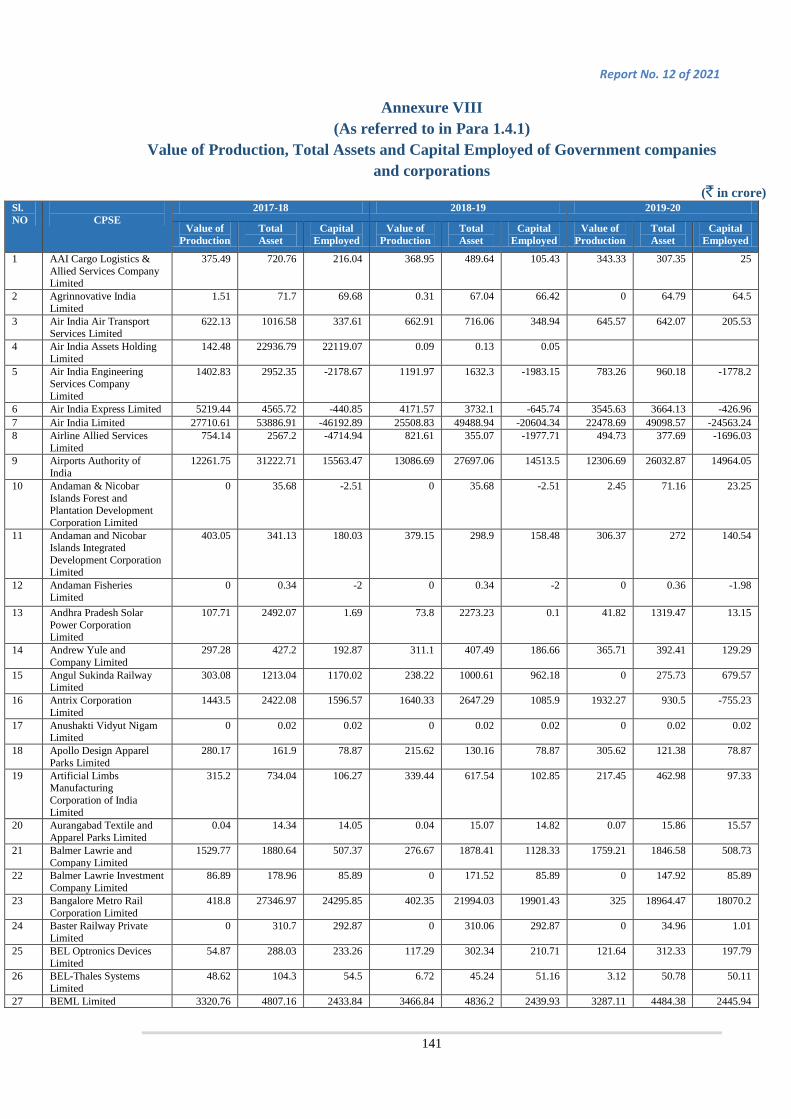
Report No. 12 of 2021
141
Annexure VIII (As referred to in Para 1.4.1)
Value of Production, Total Assets and Capital Employed of Government companies and corporations
(` in crore) Sl. NO
CPSE
2017-18 2018-19 2019-20
Value of Production
Total Asset
Capital Employed
Value of Production
Total Asset
Capital Employed
Value of Production
Total Asset
Capital Employed
1 AAI Cargo Logistics & Allied Services Company Limited
375.49 720.76 216.04 368.95 489.64 105.43 343.33 307.35 25
2 Agrinnovative India Limited
1.51 71.7 69.68 0.31 67.04 66.42 0 64.79 64.5
3 Air India Air Transport Services Limited
622.13 1016.58 337.61 662.91 716.06 348.94 645.57 642.07 205.53
4 Air India Assets Holding Limited
142.48 22936.79 22119.07 0.09 0.13 0.05
5 Air India Engineering Services Company Limited
1402.83 2952.35 -2178.67 1191.97 1632.3 -1983.15 783.26 960.18 -1778.2
6 Air India Express Limited 5219.44 4565.72 -440.85 4171.57 3732.1 -645.74 3545.63 3664.13 -426.96 7 Air India Limited 27710.61 53886.91 -46192.89 25508.83 49488.94 -20604.34 22478.69 49098.57 -24563.24 8 Airline Allied Services
Limited 754.14 2567.2 -4714.94 821.61 355.07 -1977.71 494.73 377.69 -1696.03
9 Airports Authority of India
12261.75 31222.71 15563.47 13086.69 27697.06 14513.5 12306.69 26032.87 14964.05
10 Andaman & Nicobar Islands Forest and Plantation Development Corporation Limited
0 35.68 -2.51 0 35.68 -2.51 2.45 71.16 23.25
11 Andaman and Nicobar Islands Integrated Development Corporation Limited
403.05 341.13 180.03 379.15 298.9 158.48 306.37 272 140.54
12 Andaman Fisheries Limited
0 0.34 -2 0 0.34 -2 0 0.36 -1.98
13 Andhra Pradesh Solar Power Corporation Limited
107.71 2492.07 1.69 73.8 2273.23 0.1 41.82 1319.47 13.15
14 Andrew Yule and Company Limited
297.28 427.2 192.87 311.1 407.49 186.66 365.71 392.41 129.29
15 Angul Sukinda Railway Limited
303.08 1213.04 1170.02 238.22 1000.61 962.18 0 275.73 679.57
16 Antrix Corporation Limited
1443.5 2422.08 1596.57 1640.33 2647.29 1085.9 1932.27 930.5 -755.23
17 Anushakti Vidyut Nigam Limited
0 0.02 0.02 0 0.02 0.02 0 0.02 0.02
18 Apollo Design Apparel Parks Limited
280.17 161.9 78.87 215.62 130.16 78.87 305.62 121.38 78.87
19 Artificial Limbs Manufacturing Corporation of India Limited
315.2 734.04 106.27 339.44 617.54 102.85 217.45 462.98 97.33
20 Aurangabad Textile and Apparel Parks Limited
0.04 14.34 14.05 0.04 15.07 14.82 0.07 15.86 15.57
21 Balmer Lawrie and Company Limited
1529.77 1880.64 507.37 276.67 1878.41 1128.33 1759.21 1846.58 508.73
22 Balmer Lawrie Investment Company Limited
86.89 178.96 85.89 0 171.52 85.89 0 147.92 85.89
23 Bangalore Metro Rail Corporation Limited
418.8 27346.97 24295.85 402.35 21994.03 19901.43 325 18964.47 18070.2
24 Baster Railway Private Limited
0 310.7 292.87 0 310.06 292.87 0 34.96 1.01
25 BEL Optronics Devices Limited
54.87 288.03 233.26 117.29 302.34 210.71 121.64 312.33 197.79
26 BEL-Thales Systems Limited
48.62 104.3 54.5 6.72 45.24 51.16 3.12 50.78 50.11
27 BEML Limited 3320.76 4807.16 2433.84 3466.84 4836.2 2439.93 3287.11 4484.38 2445.94

Report No.12 of 2021
142
Sl. NO
CPSE
2017-18 2018-19 2019-20
Value of Production
Total Asset
Capital Employed
Value of Production
Total Asset
Capital Employed
Value of Production
Total Asset
Capital Employed
28 Bengal Chemicals and Pharmaceuticals Limited
123.45 208.09 217.98 123.45 208.92 211.93 98.18 207.35 196.16
29 Bengal Gas Company Limited
0 63.6 48.91
30 Bharat Broadband Network Limited
22.14 14184.87 82.72 0.57 13307.44 68.46 0.35 12350.1 69.47
31 Bharat Coking Coal Limited
9047.04 11803.05 4438.65 9636.04 9761.92 4601.75 7176.35 9452.72 4003.99
32 Bharat Dynamics Limited 2591.53 5451.62 2414.64 3235.22 5252.15 2014.64 4622.38 6257.6 1784.64 33 Bharat Electronics
Limited 12348.33 22907.29 3713.38 11921.42 19521.49 3504.54 9705.95 17619.81 3182.46
34 Bharat Gas Resources Limited
273.35 379.31 299.74 0 163.9 158.22
35 Bharat Gold Mines Limited
0 14.52 -102.16 0 15.87 -132.69 0 15.51 -1652.27
36 Bharat Heavy Electricals Limited
21506.17 58436.6 31003.43 30422.37 60818.41 31495.31 27362.29 60071.96 32931.6
37 Bharat Immunologicals and Biologicals Corporation Limited
68.95 112.83 20.47 83.64 114.95 18.17 34.8 45.47 31.81
38 Bharat Petro Resources JPDA Limited
0 0.91 -196.89 0 0.5 -188.69 0 0.07 -183.88
39 Bharat Petro Resources Limited
63.17 6004.97 3981.19 60.64 4981.97 3937.32 69.83 4750.6 4909.16
40 Bharat Petroleum Corporation Limited
325936.84 126206.05 63311.7 334681.39 115398.6 62256.23 276721.49 100020.7 41490.32
41 Bharat Pumps and Compressors Limited
57.66 160.28 -60.01 48.1 178.03 -379.68 67.87 190.21 -53.71
42 Bharat Sanchar Nigam Limited
17886.09 137245.51 89071.18 341.7 129122.3 74333.11 22667.78 125825.5 67638.59
43 Bharat Wagon and Engineering Company Limited
0 67.95 54.18 0 69.62 44.93 4.78 25.37 -73.64
44 Bharatiya Nabhikiya Vidyut Nigam Limited
0 6443.33 5768.04 0 6443.33 5768.04 0 6157.54 5763.46
45 Bhartiya Rail Bijlee Company Limited
2293.61 9070.79 7852.89 1169.73 8722.25 7659.37 475.04 8061.17 7150.76
46 BHEL Electrical Machines Limited
17.82 12.96 -13.73 17.82 12.96 -13.73 11.89 15.41 -8.28
47 Biecco Lawrie Limited 9.05 1.71 -45.52 9.05 1.71 -45.52 0 0 -65.36 48 Bihar Drugs and Organic
Chemicals Limited 0 12.23 -45.21 0 12.23 -45.21 0 12.19 -44.72
49 Bihar Infra power Limited 0 0.07 0.05 0 0.07 0.06 0 0.11 0.05 50 Bihar Mega Power
Limited 0 48.78 48.62 0 48.19 47.36 0 45.56 0.05
51 Bijawar Vidarbha Transmission Limited
0 0.38 0.01 0 0.38 0.01 0 0.3 0.01
52 Biotechnology Industry Research Assistance Council
0 477.81 112.53 0 438.26 92.6 0 273.23 87.48
53 Birds Jute and Exports Limited
0.16 4.37 -109.4 0.19 4.38 -104.69 0.47 4.41 -100.35
54 BPCL- KIAL Fuel Farm Private Limited
8.41 49.44 13.35 1.26 19.69 16.22 0 10.56 9.7
55 Brahmaputra Cracker and Polymer Limited
2188.09 10375.8 3768.79 3232.96 8617.69 3298.3 1725.1 9190.64 3273.19
56 Brahmaputra Valley Fertilizer Corporation Limited
86.52 663.63 459.22 150.88 750.93 588.92 160.85 786.78 652.08
57 Braithwaite and Company Limited
571.64 258.5 93.86 309.5 214.55 74.11 124.79 146.57 -13.89
58 Braithwaite Burn and Jessop Construction Company Limited
129.02 730.83 139.48 104.99 734.44 141.76 72.28 730.33 235.15
59 Bridge and Roof Company (India) Limited
3246.61 3082.39 307.23 3076.29 2691.67 362.18 2053.41 2101.65 321.8
60 Broadcast Engineering Consultants India Limited
347.07 367.64 12.44 95.36 391.63 36.06 239.35 313.43 5.6

Report No. 12 of 2021
143
Sl. NO
CPSE
2017-18 2018-19 2019-20
Value of Production
Total Asset
Capital Employed
Value of Production
Total Asset
Capital Employed
Value of Production
Total Asset
Capital Employed
61 BSNL Tower Corporation Limited
0 0 -2.8 0 0 -2.77
62 Bundelkhand Sour Urja Limited
0.01 26.38 10.71 0 21.44 4 0 20.82 3.46
63 Burn Standard Company Limited
0 574.91 619.43 81.33 664.83 619.43 270.1 594.36 659.34
64 Cement Corporation of India Limited
243.22 523.49 -1009.18 276.66 576.19 179.75 338.88 617.94 180.1
65 Central Coalfields Limited 11516.27 15682.73 3186.09 11297.43 14671.83 3093.7 11586.43 14203.52 3008.48 66 Central Cottage Industries
Corporation Limited 68.09 72.15 -1.5 68.09 72.15 -1.5 71.23 79.17 8.03
67 Central Electronics Limited
249.09 283.49 74.49 229.73 266.38 76.68 214.04 255.29 87.44
68 Central Mine Planning and Design Institute Limited
1381.31 1256.43 79.02 1274.56 1311.37 69.65 1154.75 1366.96 366.94
69 Central Registry of Securitisation Asset Reconstruction and Security Interest of India
101.88 874.3 739.56 82.77 770.24 49 54.99 686.81 49
70 Central Warehousing Corporation
1612.3 3560.34 2789.26 1519.51 3160.15 2497.74 1502.09 3207.63 2529.03
71 Certification Engineers International Limited
49.21 90.51 78.6 52.91 86.56 76.74 50.29 87.08 75.15
72 Chandigarh Industrial and Tourism Development Corporation Limited
640.65 157.02 20.99 640.65 157.02 20.99 582.94 146.32 18.78
73 Chandil Transmission Limited
0 0.39 -2.14 0 0.3 -1.7
74 Chennai Metro Rail Limited
165.26 22910 18615.59 86.22 22147.64 16989.98 70.74 20255.21 16574.52
75 Chennai Petroleum Corporation Limited
35165.28 11491.52 7491.31 40507.74 15150.68 6021.7 32527.3 14140.7 5611.79
76 Cheyyur Infra Limited 0 0.1 0.08 0 0.09 0.08 0 0.12 0.05 77 Chhatisgarh Surguja
Power Limited 0 0 0 0 21.89 0.05 0 21.89 0.05
78 Chhattisgarh Copper Limited
0 0.05 -0.04 0 0.11 0
79 Chhattisgarh East Railway Limited
13.95 2370.56 2299.31 0 1732.85 1689.57 0 1169.43 1144.29
80 Chhattisgarh East West Railway Limited
0 695.72 671.92 0 645.66 615.93 0 591.81 557.62
81 Chhattisgarh Mega Steel Limited
0 0.02 -0.02 0 0.03 0.02 0 0.03 0.03
82 Coal India Limited 845.16 22359.42 11469.22 934.3 19001.41 11469.22 315.98 18464.48 11458.59 83 Coastal Karnataka Power
Limited 0 0 0 0 6.37 1.7 0 5.68 1.7
84 Coastal Maharashtra Mega Power Limited
0 0 0 0 69.69 40.05 0 66.92 40.05
85 Coastal Tamilnadu Power Limited
0 257.92 141.39 0 243.89 153.06 0 223.59 0.05
86 Cochin Shipyard Limited 3422.49 6298.61 3854.8 2962.16 5116.21 3455.08 2355.12 5361.45 3378.87 87 Concor Air Limited 50.35 66.01 36.84 66.54 85.83 53.49 4.5 227.28 66.2
88 Container Corporation of India Limited
6473.79 11548.48 10064.74 6881.91 12600.05 1452.48 6167.12 10637.87 1330.94
89 Creative Museum Designers
22.25 71.51 13.8 9.24 57.28 11.43 9.35 60.15 10.15
90 Cross Border Power Transmission Company Limited
6.58 267.03 222.86 6.62 268.92 195.66 4.47 267.74 208.46
91 CSC WiFi Choupal Services India Private Limited
191.99 75.17 26.34
92 Dadra & Nager Haveli,Daman and Diu SC/ST Financial and Development Corporation Limited
0.32 11.98 9.94 0.3 10.38 6.66 0.26 9.99 6.52
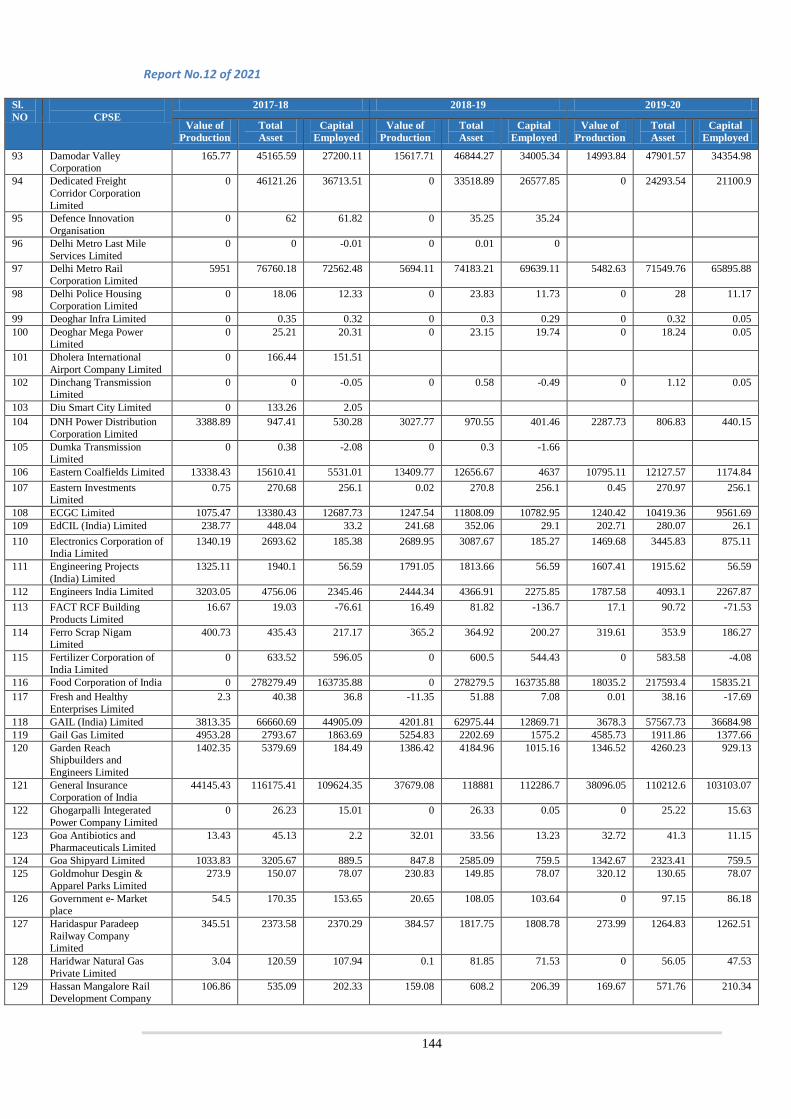
Report No.12 of 2021
144
Sl. NO
CPSE
2017-18 2018-19 2019-20
Value of Production
Total Asset
Capital Employed
Value of Production
Total Asset
Capital Employed
Value of Production
Total Asset
Capital Employed
93 Damodar Valley Corporation
165.77 45165.59 27200.11 15617.71 46844.27 34005.34 14993.84 47901.57 34354.98
94 Dedicated Freight Corridor Corporation Limited
0 46121.26 36713.51 0 33518.89 26577.85 0 24293.54 21100.9
95 Defence Innovation Organisation
0 62 61.82 0 35.25 35.24
96 Delhi Metro Last Mile Services Limited
0 0 -0.01 0 0.01 0
97 Delhi Metro Rail Corporation Limited
5951 76760.18 72562.48 5694.11 74183.21 69639.11 5482.63 71549.76 65895.88
98 Delhi Police Housing Corporation Limited
0 18.06 12.33 0 23.83 11.73 0 28 11.17
99 Deoghar Infra Limited 0 0.35 0.32 0 0.3 0.29 0 0.32 0.05 100 Deoghar Mega Power
Limited 0 25.21 20.31 0 23.15 19.74 0 18.24 0.05
101 Dholera International Airport Company Limited
0 166.44 151.51
102 Dinchang Transmission Limited
0 0 -0.05 0 0.58 -0.49 0 1.12 0.05
103 Diu Smart City Limited 0 133.26 2.05 104 DNH Power Distribution
Corporation Limited 3388.89 947.41 530.28 3027.77 970.55 401.46 2287.73 806.83 440.15
105 Dumka Transmission Limited
0 0.38 -2.08 0 0.3 -1.66
106 Eastern Coalfields Limited 13338.43 15610.41 5531.01 13409.77 12656.67 4637 10795.11 12127.57 1174.84 107 Eastern Investments
Limited 0.75 270.68 256.1 0.02 270.8 256.1 0.45 270.97 256.1
108 ECGC Limited 1075.47 13380.43 12687.73 1247.54 11808.09 10782.95 1240.42 10419.36 9561.69 109 EdCIL (India) Limited 238.77 448.04 33.2 241.68 352.06 29.1 202.71 280.07 26.1 110 Electronics Corporation of
India Limited 1340.19 2693.62 185.38 2689.95 3087.67 185.27 1469.68 3445.83 875.11
111 Engineering Projects (India) Limited
1325.11 1940.1 56.59 1791.05 1813.66 56.59 1607.41 1915.62 56.59
112 Engineers India Limited 3203.05 4756.06 2345.46 2444.34 4366.91 2275.85 1787.58 4093.1 2267.87 113 FACT RCF Building
Products Limited 16.67 19.03 -76.61 16.49 81.82 -136.7 17.1 90.72 -71.53
114 Ferro Scrap Nigam Limited
400.73 435.43 217.17 365.2 364.92 200.27 319.61 353.9 186.27
115 Fertilizer Corporation of India Limited
0 633.52 596.05 0 600.5 544.43 0 583.58 -4.08
116 Food Corporation of India 0 278279.49 163735.88 0 278279.5 163735.88 18035.2 217593.4 15835.21 117 Fresh and Healthy
Enterprises Limited 2.3 40.38 36.8 -11.35 51.88 7.08 0.01 38.16 -17.69
118 GAIL (India) Limited 3813.35 66660.69 44905.09 4201.81 62975.44 12869.71 3678.3 57567.73 36684.98 119 Gail Gas Limited 4953.28 2793.67 1863.69 5254.83 2202.69 1575.2 4585.73 1911.86 1377.66 120 Garden Reach
Shipbuilders and Engineers Limited
1402.35 5379.69 184.49 1386.42 4184.96 1015.16 1346.52 4260.23 929.13
121 General Insurance Corporation of India
44145.43 116175.41 109624.35 37679.08 118881 112286.7 38096.05 110212.6 103103.07
122 Ghogarpalli Integerated Power Company Limited
0 26.23 15.01 0 26.33 0.05 0 25.22 15.63
123 Goa Antibiotics and Pharmaceuticals Limited
13.43 45.13 2.2 32.01 33.56 13.23 32.72 41.3 11.15
124 Goa Shipyard Limited 1033.83 3205.67 889.5 847.8 2585.09 759.5 1342.67 2323.41 759.5 125 Goldmohur Desgin &
Apparel Parks Limited 273.9 150.07 78.07 230.83 149.85 78.07 320.12 130.65 78.07
126 Government e- Market place
54.5 170.35 153.65 20.65 108.05 103.64 0 97.15 86.18
127 Haridaspur Paradeep Railway Company Limited
345.51 2373.58 2370.29 384.57 1817.75 1808.78 273.99 1264.83 1262.51
128 Haridwar Natural Gas Private Limited
3.04 120.59 107.94 0.1 81.85 71.53 0 56.05 47.53
129 Hassan Mangalore Rail Development Company
106.86 535.09 202.33 159.08 608.2 206.39 169.67 571.76 210.34
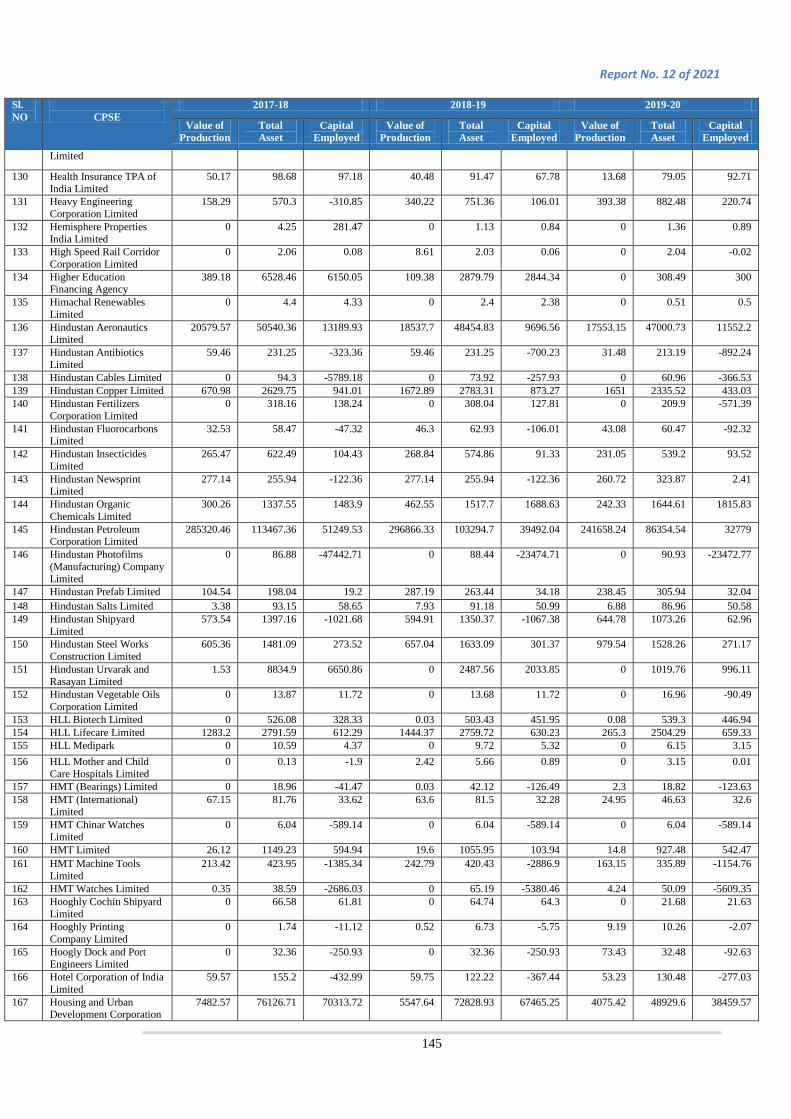
Report No. 12 of 2021
145
Sl. NO
CPSE
2017-18 2018-19 2019-20
Value of Production
Total Asset
Capital Employed
Value of Production
Total Asset
Capital Employed
Value of Production
Total Asset
Capital Employed
Limited
130 Health Insurance TPA of India Limited
50.17 98.68 97.18 40.48 91.47 67.78 13.68 79.05 92.71
131 Heavy Engineering Corporation Limited
158.29 570.3 -310.85 340.22 751.36 106.01 393.38 882.48 220.74
132 Hemisphere Properties India Limited
0 4.25 281.47 0 1.13 0.84 0 1.36 0.89
133 High Speed Rail Corridor Corporation Limited
0 2.06 0.08 8.61 2.03 0.06 0 2.04 -0.02
134 Higher Education Financing Agency
389.18 6528.46 6150.05 109.38 2879.79 2844.34 0 308.49 300
135 Himachal Renewables Limited
0 4.4 4.33 0 2.4 2.38 0 0.51 0.5
136 Hindustan Aeronautics Limited
20579.57 50540.36 13189.93 18537.7 48454.83 9696.56 17553.15 47000.73 11552.2
137 Hindustan Antibiotics Limited
59.46 231.25 -323.36 59.46 231.25 -700.23 31.48 213.19 -892.24
138 Hindustan Cables Limited 0 94.3 -5789.18 0 73.92 -257.93 0 60.96 -366.53 139 Hindustan Copper Limited 670.98 2629.75 941.01 1672.89 2783.31 873.27 1651 2335.52 433.03 140 Hindustan Fertilizers
Corporation Limited 0 318.16 138.24 0 308.04 127.81 0 209.9 -571.39
141 Hindustan Fluorocarbons Limited
32.53 58.47 -47.32 46.3 62.93 -106.01 43.08 60.47 -92.32
142 Hindustan Insecticides Limited
265.47 622.49 104.43 268.84 574.86 91.33 231.05 539.2 93.52
143 Hindustan Newsprint Limited
277.14 255.94 -122.36 277.14 255.94 -122.36 260.72 323.87 2.41
144 Hindustan Organic Chemicals Limited
300.26 1337.55 1483.9 462.55 1517.7 1688.63 242.33 1644.61 1815.83
145 Hindustan Petroleum Corporation Limited
285320.46 113467.36 51249.53 296866.33 103294.7 39492.04 241658.24 86354.54 32779
146 Hindustan Photofilms (Manufacturing) Company Limited
0 86.88 -47442.71 0 88.44 -23474.71 0 90.93 -23472.77
147 Hindustan Prefab Limited 104.54 198.04 19.2 287.19 263.44 34.18 238.45 305.94 32.04 148 Hindustan Salts Limited 3.38 93.15 58.65 7.93 91.18 50.99 6.88 86.96 50.58 149 Hindustan Shipyard
Limited 573.54 1397.16 -1021.68 594.91 1350.37 -1067.38 644.78 1073.26 62.96
150 Hindustan Steel Works Construction Limited
605.36 1481.09 273.52 657.04 1633.09 301.37 979.54 1528.26 271.17
151 Hindustan Urvarak and Rasayan Limited
1.53 8834.9 6650.86 0 2487.56 2033.85 0 1019.76 996.11
152 Hindustan Vegetable Oils Corporation Limited
0 13.87 11.72 0 13.68 11.72 0 16.96 -90.49
153 HLL Biotech Limited 0 526.08 328.33 0.03 503.43 451.95 0.08 539.3 446.94 154 HLL Lifecare Limited 1283.2 2791.59 612.29 1444.37 2759.72 630.23 265.3 2504.29 659.33 155 HLL Medipark 0 10.59 4.37 0 9.72 5.32 0 6.15 3.15 156 HLL Mother and Child
Care Hospitals Limited 0 0.13 -1.9 2.42 5.66 0.89 0 3.15 0.01
157 HMT (Bearings) Limited 0 18.96 -41.47 0.03 42.12 -126.49 2.3 18.82 -123.63 158 HMT (International)
Limited 67.15 81.76 33.62 63.6 81.5 32.28 24.95 46.63 32.6
159 HMT Chinar Watches Limited
0 6.04 -589.14 0 6.04 -589.14 0 6.04 -589.14
160 HMT Limited 26.12 1149.23 594.94 19.6 1055.95 103.94 14.8 927.48 542.47 161 HMT Machine Tools
Limited 213.42 423.95 -1385.34 242.79 420.43 -2886.9 163.15 335.89 -1154.76
162 HMT Watches Limited 0.35 38.59 -2686.03 0 65.19 -5380.46 4.24 50.09 -5609.35 163 Hooghly Cochin Shipyard
Limited 0 66.58 61.81 0 64.74 64.3 0 21.68 21.63
164 Hooghly Printing Company Limited
0 1.74 -11.12 0.52 6.73 -5.75 9.19 10.26 -2.07
165 Hoogly Dock and Port Engineers Limited
0 32.36 -250.93 0 32.36 -250.93 73.43 32.48 -92.63
166 Hotel Corporation of India Limited
59.57 155.2 -432.99 59.75 122.22 -367.44 53.23 130.48 -277.03
167 Housing and Urban Development Corporation
7482.57 76126.71 70313.72 5547.64 72828.93 67465.25 4075.42 48929.6 38459.57

Report No.12 of 2021
146
Sl. NO
CPSE
2017-18 2018-19 2019-20
Value of Production
Total Asset
Capital Employed
Value of Production
Total Asset
Capital Employed
Value of Production
Total Asset
Capital Employed
Limited
168 HPCL Bio Fuels Limited 207.38 737.63 262.97 278.84 827.87 296.99 268.99 797.63 393.67
169 HPCL Rajasthan Refinery Limited
0 3549.78 3269.63 0 1510.33 1190.88 0 406.29 243.29
170 HPOIL Gas Private Limited
2.18 152.44 116.73 0 17.29 9.54
171 HSCC (India) Limited 2125.09 3408.55 35.38 2063.27 3423.96 88.89 0 0 1.8 172 I T I Limited 2443 7325.78 6952.13 1904.82 6958.97 6551.94 1484.16 7007.55 6565.41 173 IFCI Factors Limited 38.18 362.44 311.76 47.29 414.27 326.61 60.13 497.71 346.95 174 IFCI Financial Services
Limited 13.64 88.29 71.72 13.42 94.98 71.72 16.97 99.01 71.42
175 IFCI Infrastructure Development Limited
38.93 551.38 495.23 76.21 556.74 495.23 38.83 637.5 594.03
176 IFCI Limited 2245.57 16495.97 16990.94 2157.23 20159.99 20578.01 2701.29 26246.41 25361.13 177 IFCI Venture Capital
Funds Limited 33.7 235.55 268.72 50.08 278.96 286.23 87.46 562.23 424.74
178 IFIN Commodities Limited
0.79 7.51 5.42 1.19 8.79 5.42 0.69 8.6 5.05
179 IFIN Credit Limited 0 1.96 1.43 0.14 2.09 1.39 0.15 2.09 1.41
180 IFIN Securities Finance Limited
1.58 29 29.86 5 29.1 30.44 4.97 35.1 34
181 IHB Private Limited 0 112.92 99.8 182 IIFCL Asset Management
Company Limited 3.92 24.75 22.42 6.85 24.47 12.5 7.31 21.7 12.5
183 IIFCL Projects Limited 7.45 18.03 14.66 7.16 16.45 5.64 7.61 16.71 4.78 184 India Infrastructure
Finance Company Limited 3813.09 52142.66 48599.76 3651.05 43538.97 6546.11 3568.14 43103.95 36739.85
185 India International Convention and Exhibition Centre Limited
0 2045.98 1920.32 0 1394.81 1194.99 0 658.9 497.45
186 India Post Payment Bank Limited
45.76 1366.06 613.92 46.42 669.64 613.01 39.53 811.76 799.31
187 India Renewable Energy Development Agency Limited
2367.32 27491.97 24374.86 2020.21 24461.02 21291.68 1779.13 20277.09 16931.3
188 India Tourism Development Corporation Limited
336.27 588.98 346.49 349.96 630.83 355.58 343.87 625.91 330.44
189 India Trade Promotion Organisation
204.86 2278.86 2264.73 180.06 1992.67 1961.3 247.48 1962.56 1829.64
190 India United Textile Mills Limited
56.11 165.94 140.89 176.75 179.88 140.86 383.27 221.96 140.86
191 Indian Catalyst Private Limited
0 6.45 6.45 0 6.46 6.45 0 6.46 6.46
192 Indian Medicines and Pharmaceuticals Corporation Limited
49.64 147.91 52.02 40.6 126.53 74.63 27.24 124.07 69.15
193 Indian Oil Corporation Limited
484698.4 309161.52 146827.77 523121.85 314331.1 146422.68 420768.15 279700.2 131626.49
194 Indian Railway Catering and Tourism Corporation Limited
1602.03 3184.11 1072.13 124.12 2496.68 1067.02 1468.18 2228.55 459.92
195 Indian Railway Finance Corporation Limited
13838.46 275934.13 258730.83 11132.32 206603.6 187112.31 11018.51 162332.1 128419.34
196 Indian Railway Station Development Corporation Limited
45.53 160.47 154.54 23.15 52.6 77.29 8.03 41.1 60
197 Indian Rare Earths Limited
1017.38 1403.07 168.48 738.68 1187.05 168.37 530.62 1042.56 168.37
198 Indian Strategic Petroleum Reserves Limited
0 4172.52 3441.03 0 3598.6 3542.66 0 3517.84 3519.62
199 Indian Vaccines Company Limited
0 9.84 -1.78 0.22 10.33 -0.86 0 10.7 1.15
200 Indo-Russian Helicopters LIMITED
0 8.71 8.71 0 9.04 9.05 0 9.82 9.55
201 Indradhanush Gas Grid 0 51.66 30.45 0 21.34 12.88

Report No. 12 of 2021
147
Sl. NO
CPSE
2017-18 2018-19 2019-20
Value of Production
Total Asset
Capital Employed
Value of Production
Total Asset
Capital Employed
Value of Production
Total Asset
Capital Employed
Limited
202 Indraprastha Gas Limited 3679.36 7032.08 443.5 3397.32 5927.79 443.5 2491.41 4911.68 443.5
203 Inland Coastal Shipping Limited
0 0.05 -0.05 0 0.05 -0.05 0 0.05 -0.14
204 Inland Waterways Authority of India
0 3142.1 2777.37 185.71 2828.21 2576.11 133.05 2237.51 1999.55
205 Instrumentation Limited 63.11 260.82 -1255.62 63.11 260.82 -1255.62 63.11 260.82 -1255.62 206 Ircon Davangere Haveri
Highway Limited 392.84 501.17 436.04 312.7 328.51 234.68 0 2.46 0.68
207 IRCON Infrastructure Limited
131.13 238.4 153.89 70.64 231.03 142.38 32.36 117.35 133.17
208 IRCON International Limited
4057.06 12051.22 5795.47 4415.1 12346.29 5992.69 3896.39 12556.23 6955.03
209 IRCON PB Tollway Limited
70.4 98.4 528.91 356.07 142.2 474.7 277.54 438.49 405.85
210 IRCON Shiv Puri Guna Limited
94.44 5.19 566.51 149.74 12.86 603.94 381.93 702.07 674.35
211 IRCON Vadodara Kim Expressway Limited
619.28 589.55 316.77 1.01 6.44 6.05
212 IREL IDCOL Limited 0 0.34 0.08 0 0.23 0.22 0 0 0 213 J&K Development
Finance Corporation Limited
2.11 168.63 80.42 1.35 157.59 80.42 0.9 168.21 80.41
214 J&K Mineral Development Corporation Limited
0 31.34 10.08 0 32.46 13.88 0 35.94 14.62
215 Jharkhand Central Railway Limited
0 243.54 55.1 0 192.14 55 0 228.21 49.33
216 Jharkhand Infra Power Limited
0 0.09 0.05 0 0.08 0.06 0 0.09 0.08
217 Jharkhand Kolhan Steel Limited
0 0.07 -0.03 0 0.01 -0.03 0 0 -0.03
218 Jharkhand National Mineral Development Corporation Limited
0 0 -0.07 0 0 -0.06 0 0 -0.05
219 Jute Corporation of India Limited
127.87 216.84 147.7 88.08 221.14 124.9 225.19 266.39 113.61
220 Kanti Bijlee Utpadan Nigam Limited
1690.83 5235.19 3698.46 1605.26 5123.92 3559.44 861.56 4792.07 3607.61
221 Karnataka Antibiotics and Pharmaceuticals Limited
489.57 357 201.71 388.63 348.25 184.82 366.82 319.64 173.27
222 Karnataka Trade Promotion Organisation
3.75 141.67 137.38 3.64 126.29 130.39 4 147.73 112.47
223 Karnataka Vijaynagar Steel Limited
0 641.29 -0.54 0 641.73 -0.05 0 639.61 -0.02
224 Karur Transmission Limited
0 1.87 0
225 Kerala GAIL Gas Limited 0 3.62 0.01 0 4.13 0.01 0 27.47 23.86 226 KIOCL Limited 1877.57 2379.44 1859.89 1568.93 2322.08 1993.96 1593.44 2532.67 2084.78 227 Kochi Metro Rail Limited 94.03 6548.06 6354.65 81.37 5982.44 5870.18 44.67 5338.78 5177.23 228 Koderma Transmission
Limited 0 0.35 -1.91 0 0.27 -1.5
229 Kolkata Metro Rail Corporation Limited
0 6977.13 5624.17 0 6016.07 4779.36 0 5100.13 3907.47
230 Konkan Railway Corporation Limited
2642.64 6904.51 3892.88 2898.68 6114.26 4007.17 2483.35 5644.49 284.79
231 Kopal Narendra Transmission Limited
0 1.86 0
232 Kumarkruppa Frontier Hotels Private Limited
10.42 57.18 23.6 11.87 59.89 23.04 9.75 58.12 23.04
233 Lakshadweep Development Corporation Limited
2.1 648.7 6.58 12.61 575.95 259.14 1.02 572.78 223.46
234 Lanco Teesta Hydro Power Limited
0 968.39 4605.58
235 Loktak Down Stream Hydroelectric Corporation Limited
0 148.36 143.17 0 144.63 137.08 0 144.8 136.44
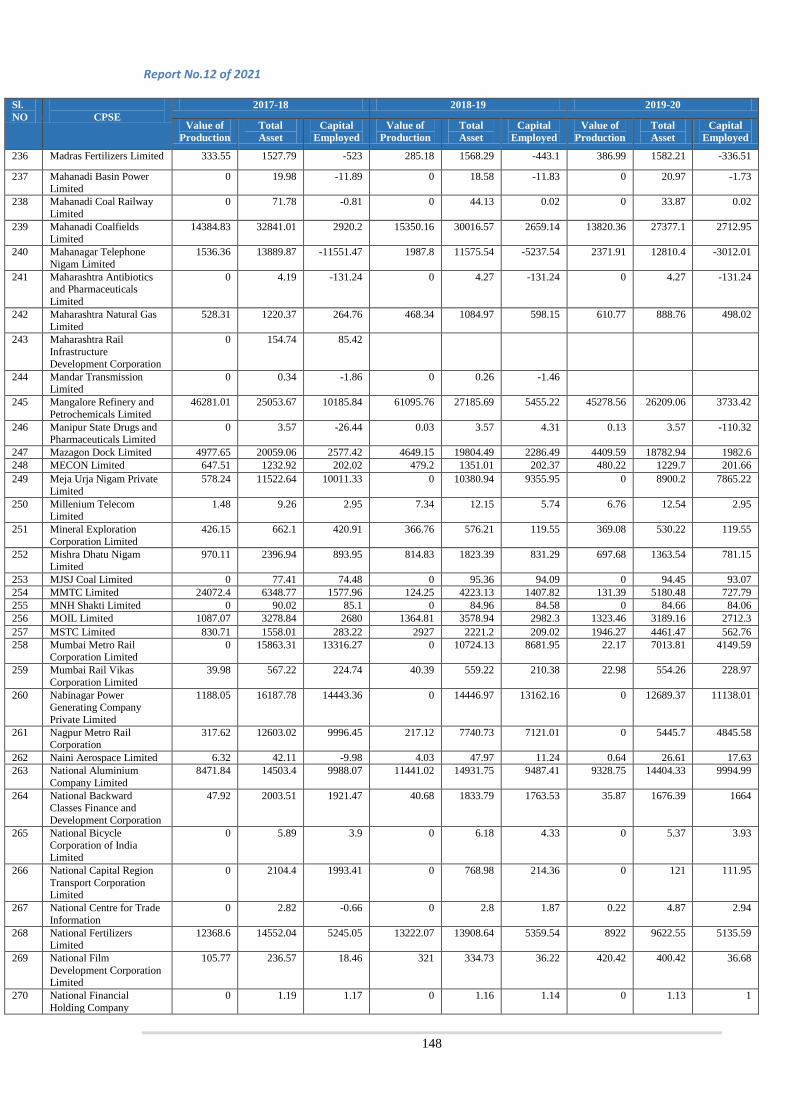
Report No.12 of 2021
148
Sl. NO
CPSE
2017-18 2018-19 2019-20
Value of Production
Total Asset
Capital Employed
Value of Production
Total Asset
Capital Employed
Value of Production
Total Asset
Capital Employed
236 Madras Fertilizers Limited 333.55 1527.79 -523 285.18 1568.29 -443.1 386.99 1582.21 -336.51
237 Mahanadi Basin Power Limited
0 19.98 -11.89 0 18.58 -11.83 0 20.97 -1.73
238 Mahanadi Coal Railway Limited
0 71.78 -0.81 0 44.13 0.02 0 33.87 0.02
239 Mahanadi Coalfields Limited
14384.83 32841.01 2920.2 15350.16 30016.57 2659.14 13820.36 27377.1 2712.95
240 Mahanagar Telephone Nigam Limited
1536.36 13889.87 -11551.47 1987.8 11575.54 -5237.54 2371.91 12810.4 -3012.01
241 Maharashtra Antibiotics and Pharmaceuticals Limited
0 4.19 -131.24 0 4.27 -131.24 0 4.27 -131.24
242 Maharashtra Natural Gas Limited
528.31 1220.37 264.76 468.34 1084.97 598.15 610.77 888.76 498.02
243 Maharashtra Rail Infrastructure Development Corporation
0 154.74 85.42
244 Mandar Transmission Limited
0 0.34 -1.86 0 0.26 -1.46
245 Mangalore Refinery and Petrochemicals Limited
46281.01 25053.67 10185.84 61095.76 27185.69 5455.22 45278.56 26209.06 3733.42
246 Manipur State Drugs and Pharmaceuticals Limited
0 3.57 -26.44 0.03 3.57 4.31 0.13 3.57 -110.32
247 Mazagon Dock Limited 4977.65 20059.06 2577.42 4649.15 19804.49 2286.49 4409.59 18782.94 1982.6 248 MECON Limited 647.51 1232.92 202.02 479.2 1351.01 202.37 480.22 1229.7 201.66 249 Meja Urja Nigam Private
Limited 578.24 11522.64 10011.33 0 10380.94 9355.95 0 8900.2 7865.22
250 Millenium Telecom Limited
1.48 9.26 2.95 7.34 12.15 5.74 6.76 12.54 2.95
251 Mineral Exploration Corporation Limited
426.15 662.1 420.91 366.76 576.21 119.55 369.08 530.22 119.55
252 Mishra Dhatu Nigam Limited
970.11 2396.94 893.95 814.83 1823.39 831.29 697.68 1363.54 781.15
253 MJSJ Coal Limited 0 77.41 74.48 0 95.36 94.09 0 94.45 93.07 254 MMTC Limited 24072.4 6348.77 1577.96 124.25 4223.13 1407.82 131.39 5180.48 727.79 255 MNH Shakti Limited 0 90.02 85.1 0 84.96 84.58 0 84.66 84.06 256 MOIL Limited 1087.07 3278.84 2680 1364.81 3578.94 2982.3 1323.46 3189.16 2712.3 257 MSTC Limited 830.71 1558.01 283.22 2927 2221.2 209.02 1946.27 4461.47 562.76 258 Mumbai Metro Rail
Corporation Limited 0 15863.31 13316.27 0 10724.13 8681.95 22.17 7013.81 4149.59
259 Mumbai Rail Vikas Corporation Limited
39.98 567.22 224.74 40.39 559.22 210.38 22.98 554.26 228.97
260 Nabinagar Power Generating Company Private Limited
1188.05 16187.78 14443.36 0 14446.97 13162.16 0 12689.37 11138.01
261 Nagpur Metro Rail Corporation
317.62 12603.02 9996.45 217.12 7740.73 7121.01 0 5445.7 4845.58
262 Naini Aerospace Limited 6.32 42.11 -9.98 4.03 47.97 11.24 0.64 26.61 17.63 263 National Aluminium
Company Limited 8471.84 14503.4 9988.07 11441.02 14931.75 9487.41 9328.75 14404.33 9994.99
264 National Backward Classes Finance and Development Corporation
47.92 2003.51 1921.47 40.68 1833.79 1763.53 35.87 1676.39 1664
265 National Bicycle Corporation of India Limited
0 5.89 3.9 0 6.18 4.33 0 5.37 3.93
266 National Capital Region Transport Corporation Limited
0 2104.4 1993.41 0 768.98 214.36 0 121 111.95
267 National Centre for Trade Information
0 2.82 -0.66 0 2.8 1.87 0.22 4.87 2.94
268 National Fertilizers Limited
12368.6 14552.04 5245.05 13222.07 13908.64 5359.54 8922 9622.55 5135.59
269 National Film Development Corporation Limited
105.77 236.57 18.46 321 334.73 36.22 420.42 400.42 36.68
270 National Financial Holding Company
0 1.19 1.17 0 1.16 1.14 0 1.13 1

Report No. 12 of 2021
149
Sl. NO
CPSE
2017-18 2018-19 2019-20
Value of Production
Total Asset
Capital Employed
Value of Production
Total Asset
Capital Employed
Value of Production
Total Asset
Capital Employed
Limited
271 National Handicapped Finance and Development Corporation
11.91 518.56 478.9 9.68 512.3 459.81 10.19 482.27 444.82
272 National Handloom Development Corporation Limited
745.82 575.19 88.42 949.66 599.56 99.73 2605.09 756.33 116.02
273 National High Speed Rail Corporation Limited
0 7770 7649.48 0 3257.91 3078.38 0 693.64 660.76
274 National Highways & Infrastructure Development Corporation Limited
178.29 3112.11 177.49 129.55 5982.95 143.29 94.37 10940.79 100.88
275 National Highways Authority of India
12.61 492804.6 430326.99 11.44 442115.9 386116.98 13.82 341547.6 300135.72
276 National Informatics Centre Servces Inc.
1156.29 2239.17 501.38 1149.53 2181.31 586.61 1258.36 2361.83 607.78
277 National Insurance Company Limited
15312.88 30898.25 -1272.8 15179.93 32434.08 1067.69 11266.55 34764.33 4927.37
278 National Investment and Infrastructure Trustee Funds
0.23 0.85 -0.19 0.3 0.92 -0.23
279 National Jute Manufacturers Corporation Limited
0 87.04 -270.13 0 87.88 13.21 0 286.77 211.2
280 National Minorities Development and Finance Corporation Limited
67.69 2712.08 2622.51 64.47 2488.27 2459.91 55.2 2253.88 2233.91
281 National Projects Construction Corporation Limited
1309.21 2010.52 189.66 1073.74 1726.5 190.68 1127.17 1435.38 173.81
282 National Research Development Corporation of India Limited
9.31 62.3 9.44 10.64 58.63 9.44 10.74 49.32 4.42
283 National Safai Karmachari Finance and Development Corporation
12.88 860.22 790.63 13.3 838.3 757.05 12.46 740.43 705.66
284 National Scheduled Castes Finance and Development Corporation
68.89 2139.14 2088.66 57.21 2059.42 2013.34 39.44 1901.72 1822.1
285 National Scheduled Tribes Finance and Development Corporation
37.34 1083.29 1077.55 35.07 972.17 966.22 30.95 887.22 881.1
286 National Seeds Corporation Limited
1078.22 1355.53 91.82 1054.49 1243.91 616.48 982.64 1187.34 623.93
287 National Small Industries Corporation Limited
1444.13 3119.15 690.21 2074.53 3101.71 617.88 2057.81 3443.37 638.23
288 National Textile Corporation Limited
1105.17 3317.77 5523.6 1105.17 3317.77 5523.6 1176.19 3569.93 5752.73
289 NBCC (India) Limited 5210.34 7462.44 547.25 7244.76 7898.21 541.24 5905.01 7534.34 556.43 290 NBCC Engineering &
Consultancy Limited 2.09 4.69 -4.12 4.6 4.89 -5.21 2.32 2.66 -1.34
291 NBCC Environment Engineering Limited
0 1.02 1 0 0.99 0.98 0 0.97 0.97
292 NBCC International Limited
0 1.02 1 0 0.99 0.98 0 0.96 0.96
293 NBCC Services Limited 120.57 72.62 2 126.69 84.89 14.76 86.37 77.03 7.8 294 NEPA Limited 3.43 545.41 103.86 11.88 364.99 -40.56 10.25 341.86 -1.89 295 NESL E-Infrastructure
Limited 0.45 1.9 1.05 0.66 1.57 1.01 0.6 1.76 0.98
296 New City of Bombay Manufacturing Mills Limited
0 93.27 66.35 0 96.85 66.35 36.11 98.21 66.35
297 New Space India Limited 316.44 217.96 10 298 Neyveli Uttar Pradesh
Power Limited 0 9310.86 8216.93 0 5898.6 4889.11 0 2253.23 902.4
299 NHDC Limited 1273.37 7243.54 4267.85 804.54 6604.35 5287.46 784.91 6827.75 2247.28 300 NHPC Limited 8735.41 57776.58 41030.78 8161.18 58702.71 41369.82 6934.03 48951.34 38009.44
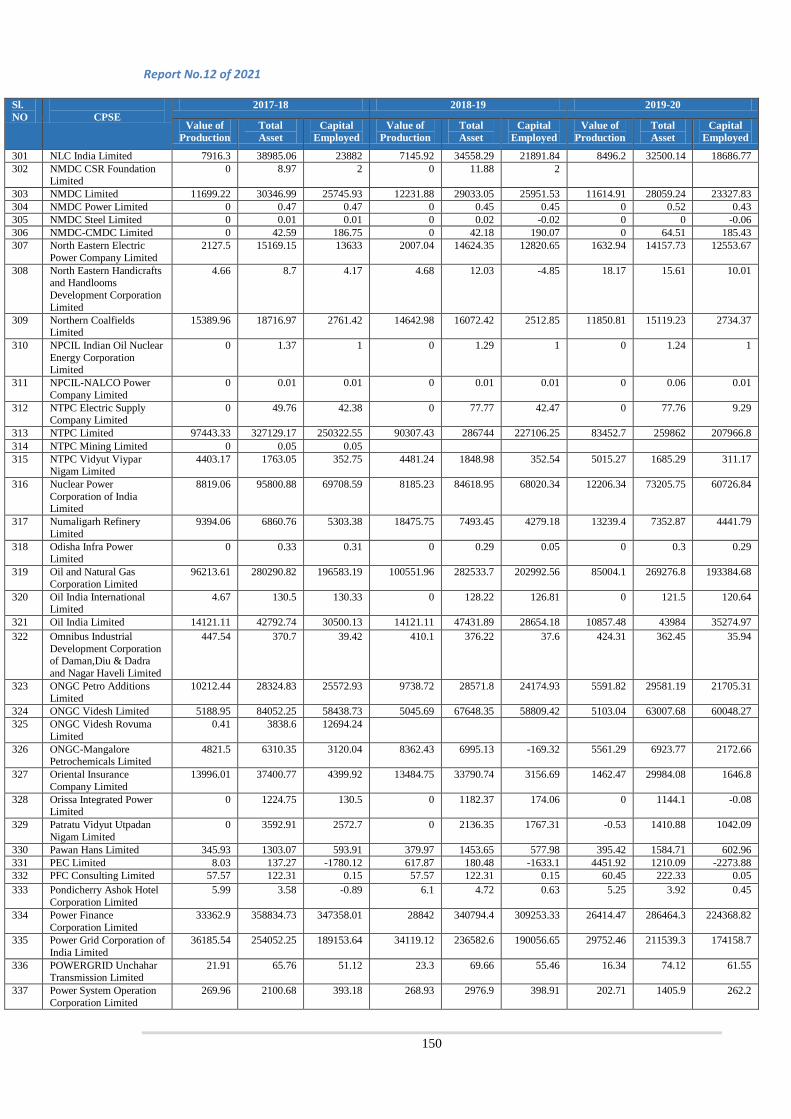
Report No.12 of 2021
150
Sl. NO
CPSE
2017-18 2018-19 2019-20
Value of Production
Total Asset
Capital Employed
Value of Production
Total Asset
Capital Employed
Value of Production
Total Asset
Capital Employed
301 NLC India Limited 7916.3 38985.06 23882 7145.92 34558.29 21891.84 8496.2 32500.14 18686.77 302 NMDC CSR Foundation
Limited 0 8.97 2 0 11.88 2
303 NMDC Limited 11699.22 30346.99 25745.93 12231.88 29033.05 25951.53 11614.91 28059.24 23327.83 304 NMDC Power Limited 0 0.47 0.47 0 0.45 0.45 0 0.52 0.43 305 NMDC Steel Limited 0 0.01 0.01 0 0.02 -0.02 0 0 -0.06 306 NMDC-CMDC Limited 0 42.59 186.75 0 42.18 190.07 0 64.51 185.43 307 North Eastern Electric
Power Company Limited 2127.5 15169.15 13633 2007.04 14624.35 12820.65 1632.94 14157.73 12553.67
308 North Eastern Handicrafts and Handlooms Development Corporation Limited
4.66 8.7 4.17 4.68 12.03 -4.85 18.17 15.61 10.01
309 Northern Coalfields Limited
15389.96 18716.97 2761.42 14642.98 16072.42 2512.85 11850.81 15119.23 2734.37
310 NPCIL Indian Oil Nuclear Energy Corporation Limited
0 1.37 1 0 1.29 1 0 1.24 1
311 NPCIL-NALCO Power Company Limited
0 0.01 0.01 0 0.01 0.01 0 0.06 0.01
312 NTPC Electric Supply Company Limited
0 49.76 42.38 0 77.77 42.47 0 77.76 9.29
313 NTPC Limited 97443.33 327129.17 250322.55 90307.43 286744 227106.25 83452.7 259862 207966.8 314 NTPC Mining Limited 0 0.05 0.05 315 NTPC Vidyut Viypar
Nigam Limited 4403.17 1763.05 352.75 4481.24 1848.98 352.54 5015.27 1685.29 311.17
316 Nuclear Power Corporation of India Limited
8819.06 95800.88 69708.59 8185.23 84618.95 68020.34 12206.34 73205.75 60726.84
317 Numaligarh Refinery Limited
9394.06 6860.76 5303.38 18475.75 7493.45 4279.18 13239.4 7352.87 4441.79
318 Odisha Infra Power Limited
0 0.33 0.31 0 0.29 0.05 0 0.3 0.29
319 Oil and Natural Gas Corporation Limited
96213.61 280290.82 196583.19 100551.96 282533.7 202992.56 85004.1 269276.8 193384.68
320 Oil India International Limited
4.67 130.5 130.33 0 128.22 126.81 0 121.5 120.64
321 Oil India Limited 14121.11 42792.74 30500.13 14121.11 47431.89 28654.18 10857.48 43984 35274.97 322 Omnibus Industrial
Development Corporation of Daman,Diu & Dadra and Nagar Haveli Limited
447.54 370.7 39.42 410.1 376.22 37.6 424.31 362.45 35.94
323 ONGC Petro Additions Limited
10212.44 28324.83 25572.93 9738.72 28571.8 24174.93 5591.82 29581.19 21705.31
324 ONGC Videsh Limited 5188.95 84052.25 58438.73 5045.69 67648.35 58809.42 5103.04 63007.68 60048.27 325 ONGC Videsh Rovuma
Limited 0.41 3838.6 12694.24
326 ONGC-Mangalore Petrochemicals Limited
4821.5 6310.35 3120.04 8362.43 6995.13 -169.32 5561.29 6923.77 2172.66
327 Oriental Insurance Company Limited
13996.01 37400.77 4399.92 13484.75 33790.74 3156.69 1462.47 29984.08 1646.8
328 Orissa Integrated Power Limited
0 1224.75 130.5 0 1182.37 174.06 0 1144.1 -0.08
329 Patratu Vidyut Utpadan Nigam Limited
0 3592.91 2572.7 0 2136.35 1767.31 -0.53 1410.88 1042.09
330 Pawan Hans Limited 345.93 1303.07 593.91 379.97 1453.65 577.98 395.42 1584.71 602.96 331 PEC Limited 8.03 137.27 -1780.12 617.87 180.48 -1633.1 4451.92 1210.09 -2273.88 332 PFC Consulting Limited 57.57 122.31 0.15 57.57 122.31 0.15 60.45 222.33 0.05 333 Pondicherry Ashok Hotel
Corporation Limited 5.99 3.58 -0.89 6.1 4.72 0.63 5.25 3.92 0.45
334 Power Finance Corporation Limited
33362.9 358834.73 347358.01 28842 340794.4 309253.33 26414.47 286464.3 224368.82
335 Power Grid Corporation of India Limited
36185.54 254052.25 189153.64 34119.12 236582.6 190056.65 29752.46 211539.3 174158.7
336 POWERGRID Unchahar Transmission Limited
21.91 65.76 51.12 23.3 69.66 55.46 16.34 74.12 61.55
337 Power System Operation Corporation Limited
269.96 2100.68 393.18 268.93 2976.9 398.91 202.71 1405.9 262.2

Report No. 12 of 2021
151
Sl. NO
CPSE
2017-18 2018-19 2019-20
Value of Production
Total Asset
Capital Employed
Value of Production
Total Asset
Capital Employed
Value of Production
Total Asset
Capital Employed
338 POWERGRID Ajmer Phagi Transco Limited
0 201.46 162.42
339 POWERGRID Bhind Guna Transmission Limited
0 56.29 46.69 0 0.17 -0.71
340 POWERGRID Bhuj Transmission Limited
0 93 83.02
341 POWERGRID Fategarh Transmission Limited
0 176.52 146.8
342 POWERGRID Jabalpur Transmission Limited
250.57 1426.85 1334.58 61.05 1445.6 1472.87 0 1179.67 967.15
343 POWERGRID Jawaharpur Firozabad Transmission Limited
0 269.84 211.39 0 6.37 4.65
344 POWERGRID Kala Amb Transmission Limited
73.23 290.67 234.29 57.26 301.69 257.04 37.58 334.07 303.22
345 POWERGRID Khetri Transmission System Limited
0 259.42 212.19
346 POWERGRID Medinipur Jirat Transmission Limited
0 2626.1 2371.58 0 1513.61 1269.78 0 329.27 252.58
347 POWERGRID Meerut Simbhavali Transmission Limited
0 37.85 30.99
348 POWERGRID Mithilanchal Transmission Limited
0 868.51 767.95 0 240.88 203.57 0 25.67 0.04
349 POWERGRID NM Transmission Limited
122.9 1196.27 1172.18 15.85 1249.46 1130.37 0.38 1143.5 1012.45
350 POWERGRID Parli Transmission Limited
327.29 1743.62 1548.76 282.97 1815.6 1611.18 0 1674.08 1476.69
351 POWERGRID Rampur Sambhal Transmission Limited
0 8.28 14.31
352 POWERGRID Southern Interconnector Transmission System Limited
186.08 3622.25 3488.08 33.01 3411.2 3221.48 0 2488.51 1823.64
353 POWERGRID Varanasi Transmission System Limited
0 760.14 661.3 0 226.37 202.23 0 15.25 0.04
354 POWERGRID Vemagiri Transmission System Limited
0 0 -38.85 0 0 -38.85 0 0 -38.82
355 POWERGRID Vizag Transmission Limited
312.93 1189.16 767.45 295.44 1223.79 1211.67 242.29 1285.36 1128.88
356 POWERGRID Warora Transmission Limited
360.26 2055.39 1850.86 280.44 2125.09 1949.77 63.7 2021.92 1834.55
357 Prize Petroleum Compnay Limited
8.23 115.23 -21.64 7.62 131.71 12.29 7.44 125.62 3.87
358 Projects and Development India Limited
133.02 221.86 26.43 116.5 189.56 26.43 68.2 149.08 29.84
359 Punjab Ashok Hotel Company Limited
0 3.13 2.11 0 3.1 2.09 0 3.07 2.14
360 Punjab Logistics Infrastructure Limited
31.52 241.8 215.74 20.25 252.12 233.03 11.16 272.34 249.04
361 Rail Vikas Nigam Limited 13415.82 11702.28 7995.41 10060.07 11298.33 6762.95 7556.56 5725.98 5681.63
362 RailTel Corporation of India Limited
1080.63 2248.27 1227.94 986.05 2151.59 1173.93 983.85 2244.88 1249.39
363 Railtel Enterprises Limited
53.44 159.4 15.34 17.98 84.29 13.54 3.29 71.85 10
364 Railway Energy Mangement Company Limited
78.56 223.24 198.87 81.48 207.7 186.16 65.63 199.42 163.5
365 Rajasthan Electronics and Instruments Limited
68.49 274.53 94.09 217.82 351.78 116.32 242.88 301.65 110.92
366 Ranchi Ashok Bihar Hotel Corporation Limited
0 5.56 -11.83 0 5.75 -9.63 0.88 6.14 -6.99

Report No.12 of 2021
152
Sl. NO
CPSE
2017-18 2018-19 2019-20
Value of Production
Total Asset
Capital Employed
Value of Production
Total Asset
Capital Employed
Value of Production
Total Asset
Capital Employed
367 Rashtriya Chemicals and Fertilizers Limited
8922.17 10297.88 3787.18 8604.38 8919.5 3363.01 7009.65 6419.13 3252.56
368 Rashtriya Ispat Nigam Limited
16521.75 33134.14 13031.55 20470.54 34027.99 16642.5 16124.67 30935.57 13766.12
369 Real Estate Development & Construction Corporation of Rajasthan Limited
0 3.67 3.59 0 3.82 2.66 0 3.66 2.46
370 REC Power Distribution Company limited
127.22 294.84 39.94 152.51 543.52 39.94 201.93 501.06 180.07
371 REC Transmission Projects Company Limited
66.43 259.07 112.6 28.7 286.29 13.3 41.73 348.1 13.3
372 Renewable Power Corporation of Kerala Limited
1.98 60.15 2.25 2.57 58.98 2.18 0.73 47.08 1
373 Richardson and Cruddas (1972) Limited
7.69 242.57 591.39 12.29 223.88 -678.93 13.29 40.43 -430.94
374 RITES Limited 446.61 5651.06 2383.83 302.3 5179.78 2383.83 172.07 4968.78 2191.66 375 Rohini Heliport Limited 0 0.01 -0.02 376 Rural Electrification
Corporation Limited 29791.06 344443.7 306401.79 25309.72 295348.9 225004.83 22358.27 246477.9 188076.02
377 Sagarmala Development Company Limited
0 612.25 540 0 353.77 343.11 0 222.1 214.66
378 SAIL RITES Bengal Wagon Industries Limited
232.66 176.95 71.74 214.31 169.61 70.27 82.96 120.42 7.17
379 SAIL Refractory Company Limited
223.92 234.57 56.45 196.67 201.62 55.03 127.17 158.64 52.85
380 SAIL-Bengal Alloy Castings Private Limited
0 0.91 -0.03 0 0.91 -0.03 0 0.91 -0.02
381 Sakhigopal Integrated Power Company Limited
0 28.22 0.05 0 32.81 21.43 0 31.47 21.27
382 Sambhar Salts Limited 22.76 37.45 -27.3 17.81 37.71 -22.03 20.62 43.88 -14.99 383 Scooters India Limited 52.25 84.95 62.07 66.93 107.29 78.1 31.18 111.03 79.64 384 Security Printing and
Minting Corporation of India Limited
1926.67 7382.68 4309.59 5711.34 7026.89 4369.56 2179.21 6257.53 1520.69
385 Sethusamudram Corporation Limited
0 910.71 813.34 0 952.87 810.92 0 860.56 809.04
386 Shongtong Karcham Wangtoo Transmission Limited
0 0 0 0 2.26 0.01 0 2.12 0.01
387 Sidcul Concor Infra Compnay Limited
12.84 109.58 81.38 8.51 97.6 71.69 6.78 108.42 89.57
388 SJVN Limited 2701.52 14425.48 11564.76 2630.34 14593.51 6077.21 2156.95 14003.15 11505.17
389 SJVN Thermal Private Limited
0 1097.24 996.29 0 628.63 436.66 0 499.47 436.37
390 Solar Energy Corporation of India
4625.72 4267.48 695.72 3235.13 3101.54 563.95 1158.18 2139.04 436.84
391 South Central East Delhi Power Transmission Limited
0 0 0 0 0 0 0 0.01 -0.01
392 South Eastern Coalfields Limited
15.05 28802.35 2734.14 15.73 25516.16 2647.39 14.47 24846.23 2893.09
393 STCL Limited 0 4.01 -9131.21 0 6.58 -9130.74 0 7.96 -4551.31 394 Steel Authority of India
Limited 59994.17 121575.4 45397.56 -2716.62 112088.5 42259.31 60460.64 108549.9 41580.36
395 Surat Integrated Transportation Development
0 7.24 4.56 0 6.93 6.88 0 0 0.63
396 Suuti Tech Options Limited
0 0.01 -1.1 0 0.02 -1.06 0 0.03 -1.01
397 Talcher Fertilizer Limited 0 552.36 456.79 0 48.61 18.63 0 15.95 15.05 398 Tamil Nadu Trade
Promotion Organisation 40.22 347.84 289.27 44.14 302.52 255.06 36.86 265.58 223.74
399 Tanda Transmission Limited
0 0 0 0 0.02 0 0 1.61 0.05
400 Tatiya Andhra Mega Power
0 0 0 0 22.6 0.05 0 21.99 0.05
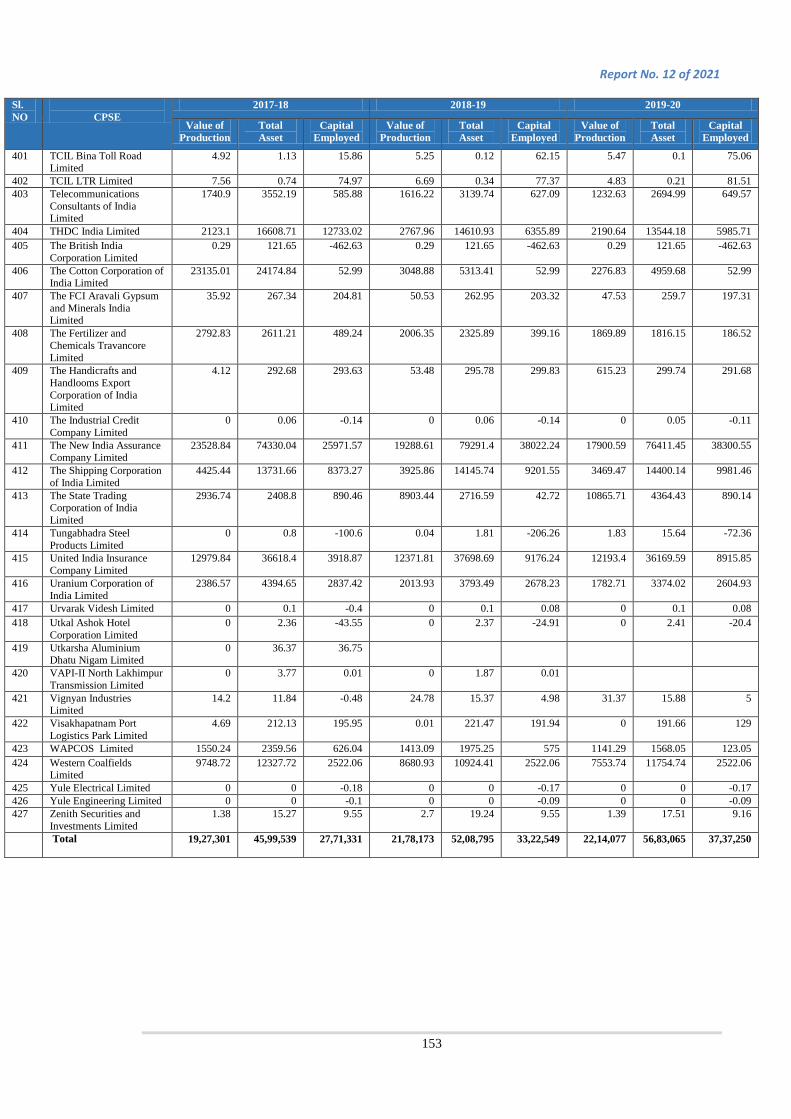
Report No. 12 of 2021
153
Sl. NO
CPSE
2017-18 2018-19 2019-20
Value of Production
Total Asset
Capital Employed
Value of Production
Total Asset
Capital Employed
Value of Production
Total Asset
Capital Employed
401 TCIL Bina Toll Road Limited
4.92 1.13 15.86 5.25 0.12 62.15 5.47 0.1 75.06
402 TCIL LTR Limited 7.56 0.74 74.97 6.69 0.34 77.37 4.83 0.21 81.51 403 Telecommunications
Consultants of India Limited
1740.9 3552.19 585.88 1616.22 3139.74 627.09 1232.63 2694.99 649.57
404 THDC India Limited 2123.1 16608.71 12733.02 2767.96 14610.93 6355.89 2190.64 13544.18 5985.71 405 The British India
Corporation Limited 0.29 121.65 -462.63 0.29 121.65 -462.63 0.29 121.65 -462.63
406 The Cotton Corporation of India Limited
23135.01 24174.84 52.99 3048.88 5313.41 52.99 2276.83 4959.68 52.99
407 The FCI Aravali Gypsum and Minerals India Limited
35.92 267.34 204.81 50.53 262.95 203.32 47.53 259.7 197.31
408 The Fertilizer and Chemicals Travancore Limited
2792.83 2611.21 489.24 2006.35 2325.89 399.16 1869.89 1816.15 186.52
409 The Handicrafts and Handlooms Export Corporation of India Limited
4.12 292.68 293.63 53.48 295.78 299.83 615.23 299.74 291.68
410 The Industrial Credit Company Limited
0 0.06 -0.14 0 0.06 -0.14 0 0.05 -0.11
411 The New India Assurance Company Limited
23528.84 74330.04 25971.57 19288.61 79291.4 38022.24 17900.59 76411.45 38300.55
412 The Shipping Corporation of India Limited
4425.44 13731.66 8373.27 3925.86 14145.74 9201.55 3469.47 14400.14 9981.46
413 The State Trading Corporation of India Limited
2936.74 2408.8 890.46 8903.44 2716.59 42.72 10865.71 4364.43 890.14
414 Tungabhadra Steel Products Limited
0 0.8 -100.6 0.04 1.81 -206.26 1.83 15.64 -72.36
415 United India Insurance Company Limited
12979.84 36618.4 3918.87 12371.81 37698.69 9176.24 12193.4 36169.59 8915.85
416 Uranium Corporation of India Limited
2386.57 4394.65 2837.42 2013.93 3793.49 2678.23 1782.71 3374.02 2604.93
417 Urvarak Videsh Limited 0 0.1 -0.4 0 0.1 0.08 0 0.1 0.08 418 Utkal Ashok Hotel
Corporation Limited 0 2.36 -43.55 0 2.37 -24.91 0 2.41 -20.4
419 Utkarsha Aluminium Dhatu Nigam Limited
0 36.37 36.75
420 VAPI-II North Lakhimpur Transmission Limited
0 3.77 0.01 0 1.87 0.01
421 Vignyan Industries Limited
14.2 11.84 -0.48 24.78 15.37 4.98 31.37 15.88 5
422 Visakhapatnam Port Logistics Park Limited
4.69 212.13 195.95 0.01 221.47 191.94 0 191.66 129
423 WAPCOS Limited 1550.24 2359.56 626.04 1413.09 1975.25 575 1141.29 1568.05 123.05 424 Western Coalfields
Limited 9748.72 12327.72 2522.06 8680.93 10924.41 2522.06 7553.74 11754.74 2522.06
425 Yule Electrical Limited 0 0 -0.18 0 0 -0.17 0 0 -0.17 426 Yule Engineering Limited 0 0 -0.1 0 0 -0.09 0 0 -0.09 427 Zenith Securities and
Investments Limited 1.38 15.27 9.55 2.7 19.24 9.55 1.39 17.51 9.16
Total 19,27,301 45,99,539 27,71,331 21,78,173 52,08,795 33,22,549 22,14,077 56,83,065
37,37,250

Report No.12 of 2021
154
Annexure IX
(As referred to in Para 1.4.2) Return on Capital Employed of Government companies and corporations
2017-18 2018-19 2019-20 Sl. No.
CPSE EBIT (` in crore)
Capital Employed (` in
crore)
ROCE (in %)
EBIT (` in crore)
Capital Employed
(` in crore)
ROCE (in %)
EBIT (` in crore)
Capital Employed
(` in crore)
ROCE (in %)
1 AAI Cargo Logistics & Allied Services Company Limited
234.00 25.00 935.98 60.89 105.43 57.76 132.77 216.04 61.46
2 Agrinnovative India Limited
2.21 64.50 3.43 2.70 66.42 4.06 3.77 69.68 5.40
3 Air India Air Transport Services Limited
114.00 205.53 55.47 130.78 348.94 37.48 134.30 337.61 39.78
4 Air India Assets Holding limited
0.00 0.05 3.64 187.67 22119.07 0.85
5 Air India Engineering Services Company Limited
-334.58 -1778.20 18.82 -35.37 -1983.15 1.78 119.85 -2178.67 -5.50
6 Air India Express Limited
547.14 -426.96 -128.15 460.92 -645.74 -71.38 686.25 -440.85 -155.67
7 Air India Limited -884.08 -24563.24 3.60 -3845.06 -20604.34 18.66 -3846.47 -46192.89 8.33 8 Airline Allied
Services Limited -125.67 -1696.03 7.41 -147.84 -1977.71 7.48 -200.63 -4714.94 4.26
9 Airports Authority of India
4461.09 14964.05 29.81 3690.49 14513.50 25.43 3821.67 15563.47 24.56
10 Andaman & Nicobar Islands Forest and Plantation Development Corporation Limited
-7.98 23.25 -34.30 -1.76 -2.51 70.20 -1.76 -2.51 70.20
11 Andaman and Nicobar Islands Integrated Development Corporation Limited
31.17 140.54 22.18 43.17 158.48 27.24 46.71 180.03 25.95
12 Andaman Fisheries Limited
-0.05 -1.98 2.74 -0.03 -2.00 1.30 -0.03 -2.00 1.30
13 Andhra Pradesh Solar Power Corporation Limited
45.89 13.15 349.05 78.75 0.10 78749.10 88.03 1.69 5195.60
14 Andrew Yule and Company Limited
32.21 129.29 24.91 16.66 186.66 8.93 -12.80 192.87 -6.64
15 Angul Sukinda Railway Limited
16.82 679.57 2.47 4.66 962.18 0.48 0.02 1170.02 0.00
16 Antrix Corporation Limited
318.58 -755.23 -42.18 419.25 1085.90 38.61 297.27 1596.57 18.62
17 Anushakti Vidyut Nigam Limited
0.00 0.02 -9.91 0.00 0.02 -14.21 0.00 0.02 -9.76
18 Apollo Design 12.87 78.87 16.32 12.79 78.87 16.22 13.59 78.87 17.23

Report No. 12 of 2021
155
2017-18 2018-19 2019-20 Sl. No.
CPSE EBIT (` in crore)
Capital Employed (` in
crore)
ROCE (in %)
EBIT (` in crore)
Capital Employed
(` in crore)
ROCE (in %)
EBIT (` in crore)
Capital Employed
(` in crore)
ROCE (in %)
Apparel Parks Limited
19 Artificial Limbs Manufacturing Corporation of India Limited
50.79 97.33 52.19 75.30 102.85 73.21 85.68 106.27 80.62
20 Aurangabad Textile and Apparel Parks Limited
-0.67 15.57 -4.33 -0.77 14.82 -5.20 -0.79 14.05 -5.61
21 Balmer Lawrie and Company Limited
265.34 508.73 52.16 290.14 1128.33 25.71 233.90 507.37 46.10
22 Balmer Lawrie Investment Company Limited
55.46 85.89 64.57 78.19 85.89 91.04 85.80 85.89 99.90
23 Bangalore Metro Rail Corporation Limited
-239.25 18070.20 -1.32 -384.85 19901.43 -1.93 -486.70 24295.85 -2.00
24 Baster Railway Private Limited
-2.41 1.01 -238.96 1.77 292.87 0.60 1.44 292.87 0.49
25 BEL Optronics Devices Limited
17.65 197.79 8.92 22.75 210.71 10.80 4.79 233.26 2.05
26 BEL-Thales Systems Limited
-2.48 50.11 -4.96 1.04 51.16 2.04 4.64 54.50 8.51
27 BEML Limited 103.82 2445.94 4.24 170.05 2439.93 6.97 15.55 2433.84 0.64 28 Bengal Chemicals
and Pharmaceuticals Limited
19.11 196.16 9.74 27.71 211.93 13.07 15.14 217.98 6.95
29 Bengal Gas Company Limited
-1.09 48.91 -2.22
30 Bharat Broadband Network Limited
4.50 69.47 6.47 4.81 68.46 7.03 3.21 82.72 3.88
31 Bharat Coking Coal Limited
-1935.41 4003.99 -48.34 757.71 4601.75 16.47 1212.95 4438.65 27.33
32 Bharat Dynamics Limited
777.10 1784.64 43.54 675.60 2014.64 33.53 747.11 2414.64 30.94
33 Bharat Electronics Limited
1949.11 3182.46 61.25 2715.40 3504.54 77.48 2482.43 3713.38 66.85
34 Bharat Gas Resources Limited
-14.65 158.22 -9.26 3.64 299.74 1.21
35 Bharat Gold Mines Limited
-8.78 -1652.27 0.53 -3.78 -132.69 2.85 34.87 -102.16 -34.14
36 Bharat Heavy Electricals Limited
1922.87 32931.60 5.84 2225.61 31495.31 7.07 -155.16 31003.43 -0.50
37 Bharat Immunologicals and Biologicals Corporation Limited
-7.23 31.81 -22.72 -7.37 18.17 -40.57 -9.46 20.47 -46.21
38 Bharat Petro Resources JPDA Limited
-0.33 -183.88 0.18 -2.40 -188.69 1.27 -4.06 -196.89 2.06
39 Bharat Petro Resources Limited
-18.15 4909.16 -0.37 16.09 3937.32 0.41 -798.95 3981.19 -20.07
40 Bharat Petroleum 12031.26 41490.32 29.00 11758.58 62256.23 18.89 4852.90 63311.70 7.67
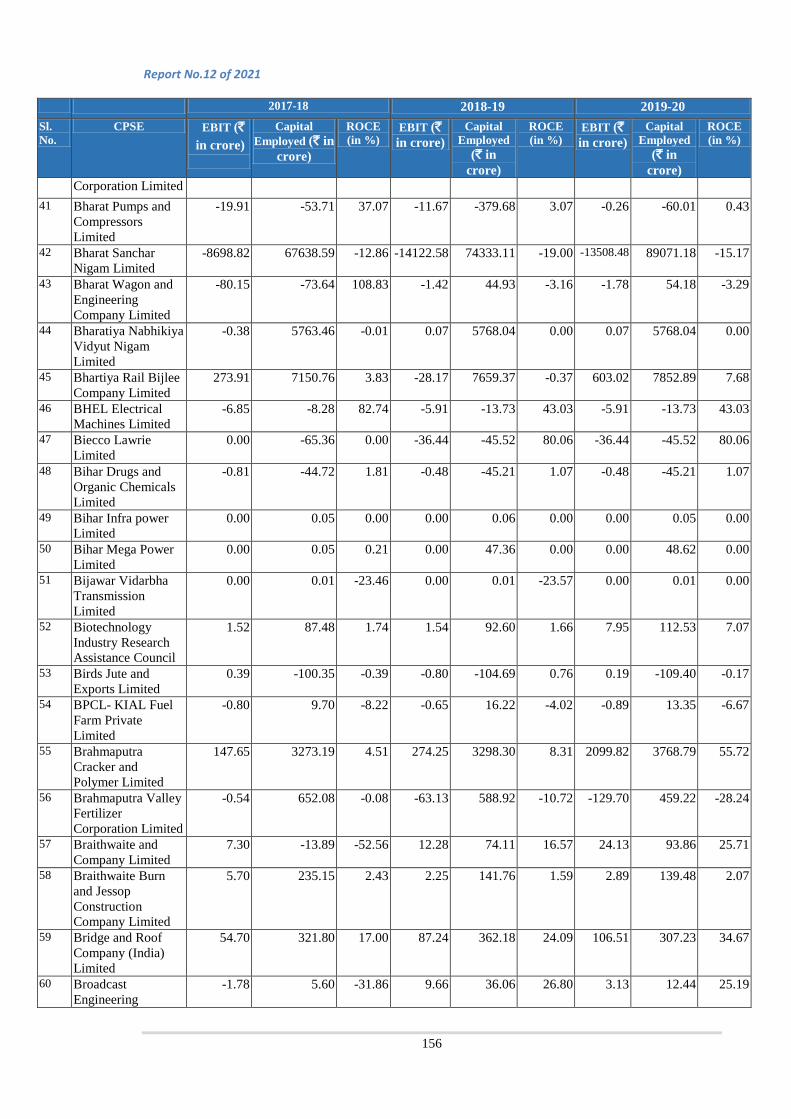
Report No.12 of 2021
156
2017-18 2018-19 2019-20 Sl. No.
CPSE EBIT (` in crore)
Capital Employed (` in
crore)
ROCE (in %)
EBIT (` in crore)
Capital Employed
(` in crore)
ROCE (in %)
EBIT (` in crore)
Capital Employed
(` in crore)
ROCE (in %)
Corporation Limited 41 Bharat Pumps and
Compressors Limited
-19.91 -53.71 37.07 -11.67 -379.68 3.07 -0.26 -60.01 0.43
42 Bharat Sanchar Nigam Limited
-8698.82 67638.59 -12.86 -14122.58 74333.11 -19.00 -13508.48 89071.18 -15.17
43 Bharat Wagon and Engineering Company Limited
-80.15 -73.64 108.83 -1.42 44.93 -3.16 -1.78 54.18 -3.29
44 Bharatiya Nabhikiya Vidyut Nigam Limited
-0.38 5763.46 -0.01 0.07 5768.04 0.00 0.07 5768.04 0.00
45 Bhartiya Rail Bijlee Company Limited
273.91 7150.76 3.83 -28.17 7659.37 -0.37 603.02 7852.89 7.68
46 BHEL Electrical Machines Limited
-6.85 -8.28 82.74 -5.91 -13.73 43.03 -5.91 -13.73 43.03
47 Biecco Lawrie Limited
0.00 -65.36 0.00 -36.44 -45.52 80.06 -36.44 -45.52 80.06
48 Bihar Drugs and Organic Chemicals Limited
-0.81 -44.72 1.81 -0.48 -45.21 1.07 -0.48 -45.21 1.07
49 Bihar Infra power Limited
0.00 0.05 0.00 0.00 0.06 0.00 0.00 0.05 0.00
50 Bihar Mega Power Limited
0.00 0.05 0.21 0.00 47.36 0.00 0.00 48.62 0.00
51 Bijawar Vidarbha Transmission Limited
0.00 0.01 -23.46 0.00 0.01 -23.57 0.00 0.01 0.00
52 Biotechnology Industry Research Assistance Council
1.52 87.48 1.74 1.54 92.60 1.66 7.95 112.53 7.07
53 Birds Jute and Exports Limited
0.39 -100.35 -0.39 -0.80 -104.69 0.76 0.19 -109.40 -0.17
54 BPCL- KIAL Fuel Farm Private Limited
-0.80 9.70 -8.22 -0.65 16.22 -4.02 -0.89 13.35 -6.67
55 Brahmaputra Cracker and Polymer Limited
147.65 3273.19 4.51 274.25 3298.30 8.31 2099.82 3768.79 55.72
56 Brahmaputra Valley Fertilizer Corporation Limited
-0.54 652.08 -0.08 -63.13 588.92 -10.72 -129.70 459.22 -28.24
57 Braithwaite and Company Limited
7.30 -13.89 -52.56 12.28 74.11 16.57 24.13 93.86 25.71
58 Braithwaite Burn and Jessop Construction Company Limited
5.70 235.15 2.43 2.25 141.76 1.59 2.89 139.48 2.07
59 Bridge and Roof Company (India) Limited
54.70 321.80 17.00 87.24 362.18 24.09 106.51 307.23 34.67
60 Broadcast Engineering
-1.78 5.60 -31.86 9.66 36.06 26.80 3.13 12.44 25.19

Report No. 12 of 2021
157
2017-18 2018-19 2019-20 Sl. No.
CPSE EBIT (` in crore)
Capital Employed (` in
crore)
ROCE (in %)
EBIT (` in crore)
Capital Employed
(` in crore)
ROCE (in %)
EBIT (` in crore)
Capital Employed
(` in crore)
ROCE (in %)
Consultants India Limited
61 BSNL Tower Corporation Limited
-2.77 -2.77 100.06 -0.03 -2.80 1.21
62 Bundelkhand Sour Urja Limited
-0.15 3.46 -4.22 -0.01 4.00 -0.14 -0.01 10.71 -0.06
63 Burn Standard Company Limited
-15.37 659.34 -2.33 197.01 619.43 31.81 0.48 619.43 0.08
64 Cement Corporation of India Limited
20.60 180.10 11.44 6.35 179.75 3.53 -50.94 -1009.18 5.05
65 Central Coalfields Limited
1515.61 3008.48 50.38 2767.45 3093.70 89.45 3008.34 3186.09 94.42
66 Central Cottage Industries Corporation Limited
-9.46 8.03 -117.78 -5.39 -1.50 358.31 -5.39 -1.50 358.31
67 Central Electronics Limited
20.34 87.44 23.26 7.16 76.68 9.34 11.96 74.49 16.06
68 Central Mine Planning and Design Institute Limited
121.07 366.94 32.99 263.96 69.65 378.98 312.82 79.02 395.87
69 Central Registry of Securitisation Asset Reconstruction and Security Interest of India
71.64 49.00 146.19 99.94 49.00 203.96 114.90 739.56 15.54
70 Central Warehousing Corporation
56.96 2529.03 2.25 226.46 2497.74 9.07 410.49 2789.26 14.72
71 Certification Engineers International Limited
17.97 75.15 23.91 13.21 76.74 17.21 13.98 78.60 17.78
72 Chandigarh Industrial and Tourism Development Corporation Limited
-15.13 18.78 -80.53 -2.40 20.99 -11.43 -2.40 20.99 -11.43
73 Chandil Transmission Limited
-1.75 -1.70 102.94 -0.19 -2.14 8.87
74 Chennai Metro Rail Limited
-185.88 16574.52 -1.12 -338.86 16989.98 -1.99 -396.93 18615.59 -2.13
75 Chennai Petroleum Corporation Limited
1779.10 5611.79 31.70 121.74 6021.70 2.02 -2602.78 7491.31 -34.74
76 Cheyyur Infra Limited
0.00 0.05 0.00 0.00 0.08 0.00 0.00 0.08 0.00
77 Chhatisgarh Surguja Power Limited
0.00 0.05 0.00 0.00 0.05 0.00 -0.05 0.00 1983.33
78 Chhattisgarh Copper Limited
-0.25 0.00 -11804.76
-0.04 -0.04 105.62
79 Chhattisgarh East Railway Limited
-0.16 1144.29 -0.01 -0.15 1689.57 -0.01 8.79 2299.31 0.38
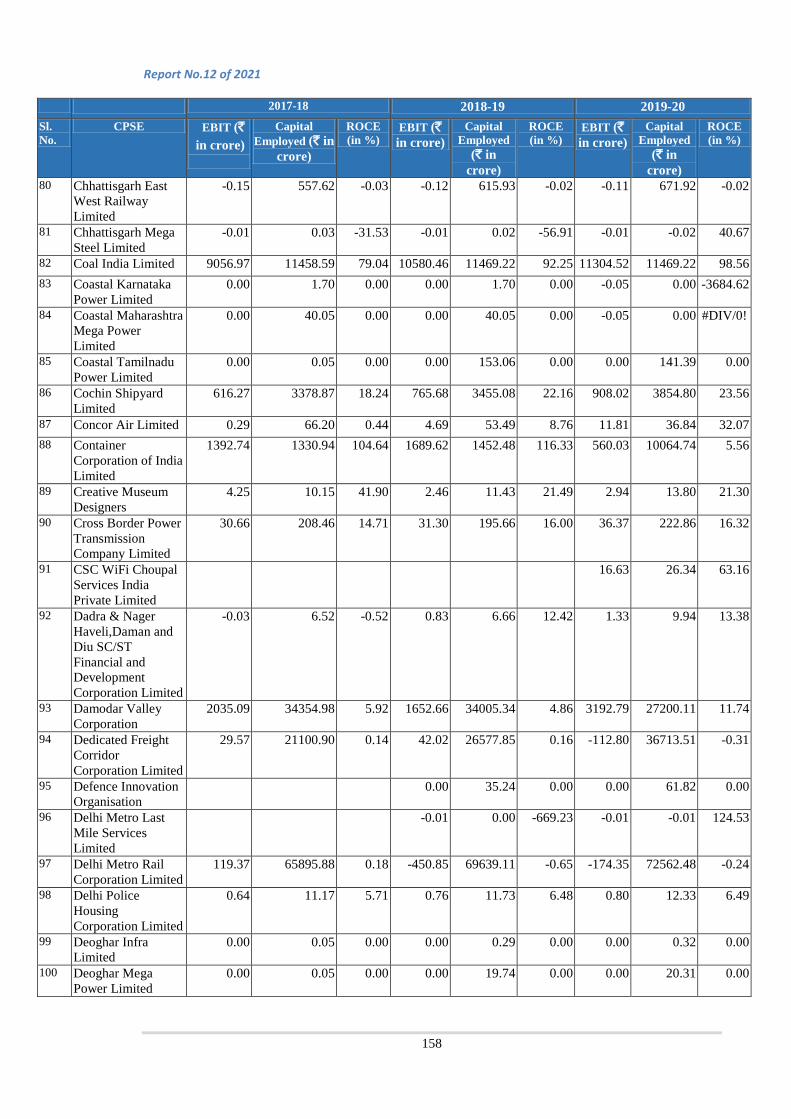
Report No.12 of 2021
158
2017-18 2018-19 2019-20 Sl. No.
CPSE EBIT (` in crore)
Capital Employed (` in
crore)
ROCE (in %)
EBIT (` in crore)
Capital Employed
(` in crore)
ROCE (in %)
EBIT (` in crore)
Capital Employed
(` in crore)
ROCE (in %)
80 Chhattisgarh East West Railway Limited
-0.15 557.62 -0.03 -0.12 615.93 -0.02 -0.11 671.92 -0.02
81 Chhattisgarh Mega Steel Limited
-0.01 0.03 -31.53 -0.01 0.02 -56.91 -0.01 -0.02 40.67
82 Coal India Limited 9056.97 11458.59 79.04 10580.46 11469.22 92.25 11304.52 11469.22 98.56 83 Coastal Karnataka
Power Limited 0.00 1.70 0.00 0.00 1.70 0.00 -0.05 0.00 -3684.62
84 Coastal Maharashtra Mega Power Limited
0.00 40.05 0.00 0.00 40.05 0.00 -0.05 0.00 #DIV/0!
85 Coastal Tamilnadu Power Limited
0.00 0.05 0.00 0.00 153.06 0.00 0.00 141.39 0.00
86 Cochin Shipyard Limited
616.27 3378.87 18.24 765.68 3455.08 22.16 908.02 3854.80 23.56
87 Concor Air Limited 0.29 66.20 0.44 4.69 53.49 8.76 11.81 36.84 32.07 88 Container
Corporation of India Limited
1392.74 1330.94 104.64 1689.62 1452.48 116.33 560.03 10064.74 5.56
89 Creative Museum Designers
4.25 10.15 41.90 2.46 11.43 21.49 2.94 13.80 21.30
90 Cross Border Power Transmission Company Limited
30.66 208.46 14.71 31.30 195.66 16.00 36.37 222.86 16.32
91 CSC WiFi Choupal Services India Private Limited
16.63 26.34 63.16
92 Dadra & Nager Haveli,Daman and Diu SC/ST Financial and Development Corporation Limited
-0.03 6.52 -0.52 0.83 6.66 12.42 1.33 9.94 13.38
93 Damodar Valley Corporation
2035.09 34354.98 5.92 1652.66 34005.34 4.86 3192.79 27200.11 11.74
94 Dedicated Freight Corridor Corporation Limited
29.57 21100.90 0.14 42.02 26577.85 0.16 -112.80 36713.51 -0.31
95 Defence Innovation Organisation
0.00 35.24 0.00 0.00 61.82 0.00
96 Delhi Metro Last Mile Services Limited
-0.01 0.00 -669.23 -0.01 -0.01 124.53
97 Delhi Metro Rail Corporation Limited
119.37 65895.88 0.18 -450.85 69639.11 -0.65 -174.35 72562.48 -0.24
98 Delhi Police Housing Corporation Limited
0.64 11.17 5.71 0.76 11.73 6.48 0.80 12.33 6.49
99 Deoghar Infra Limited
0.00 0.05 0.00 0.00 0.29 0.00 0.00 0.32 0.00
100 Deoghar Mega Power Limited
0.00 0.05 0.00 0.00 19.74 0.00 0.00 20.31 0.00

Report No. 12 of 2021
159
2017-18 2018-19 2019-20 Sl. No.
CPSE EBIT (` in crore)
Capital Employed (` in
crore)
ROCE (in %)
EBIT (` in crore)
Capital Employed
(` in crore)
ROCE (in %)
EBIT (` in crore)
Capital Employed
(` in crore)
ROCE (in %)
101 Dholera International Airport Company Limited
9.87 151.51 6.52
102 Dinchang Transmission Limited
0.00 0.05 0.00 0.49 -0.49 -100.00 0.00 -0.05 0.00
103 Diu Smart City Limited
0.00 2.05 0.15
104 DNH Power Distribution Corporation Limited
-2.62 440.15 -0.59 20.14 401.46 5.02 23.32 530.28 4.40
105 Dumka Transmission Limited
-1.71 -1.66 103.02 -0.43 -2.08 20.52
106 Eastern Coalfields Limited
-1312.35 1174.84 -111.70 1545.29 4637.00 33.33 1679.56 5531.01 30.37
107 Eastern Investments Limited
0.67 256.10 0.26 0.10 256.10 0.04 -0.72 256.10 -0.28
108 ECGC Limited 129.29 9561.69 1.35 313.20 10782.95 2.90 399.97 12687.73 3.15 109 EdCIL (India)
Limited 54.91 26.10 210.43 43.79 29.10 150.48 56.19 33.20 169.27
110 Electronics Corporation of India Limited
104.25 875.11 11.91 389.77 185.27 210.38 89.86 185.38 48.47
111 Engineering Projects (India) Limited
6.57 56.59 11.61 -24.61 56.59 -43.49 16.47 56.59 29.10
112 Engineers India Limited
568.67 2267.87 25.08 568.74 2275.85 24.99 677.25 2345.46 28.87
113 FACT RCF Building Products Limited
0.79 -71.53 -1.11 7.61 -136.70 -5.56 -71.49 -76.61 93.31
114 Ferro Scrap Nigam Limited
13.11 186.27 7.04 41.96 200.27 20.95 47.28 217.17 21.77
115 Fertilizer Corporation of India Limited
147.25 -4.08 -3608.30 183.18 544.43 33.65 53.90 596.05 9.04
116 Food Corporation of India
8906.61 15835.21 56.25 0.00 163735.88 0.00 0.00 163735.88 0.00
117 Fresh and Healthy Enterprises Limited
-7.66 -17.69 43.30 -22.95 7.08 -324.15 -5.88 36.80 -15.97
118 GAIL (India) Limited
7233.48 36684.98 19.72 9223.36 12869.71 71.67 8051.86 44905.09 17.93
119 Gail Gas Limited 139.98 1377.66 10.16 127.76 1575.20 8.11 212.84 1863.69 11.42 120 Garden Reach
Shipbuilders and Engineers Limited
135.44 929.13 14.58 184.07 1015.16 18.13 225.15 184.49 122.04
121 General Insurance Corporation of India
3668.26 103103.07 3.56 3433.82 112286.70 3.06 -445.97 109624.35 -0.41
122 Ghogarpalli Integerated Power Company Limited
0.00 15.63 0.00 0.00 0.05 0.00 0.00 15.01 0.00
123 Goa Antibiotics and 2.61 11.15 23.39 49.67 13.23 375.42 -6.11 2.20 -277.25
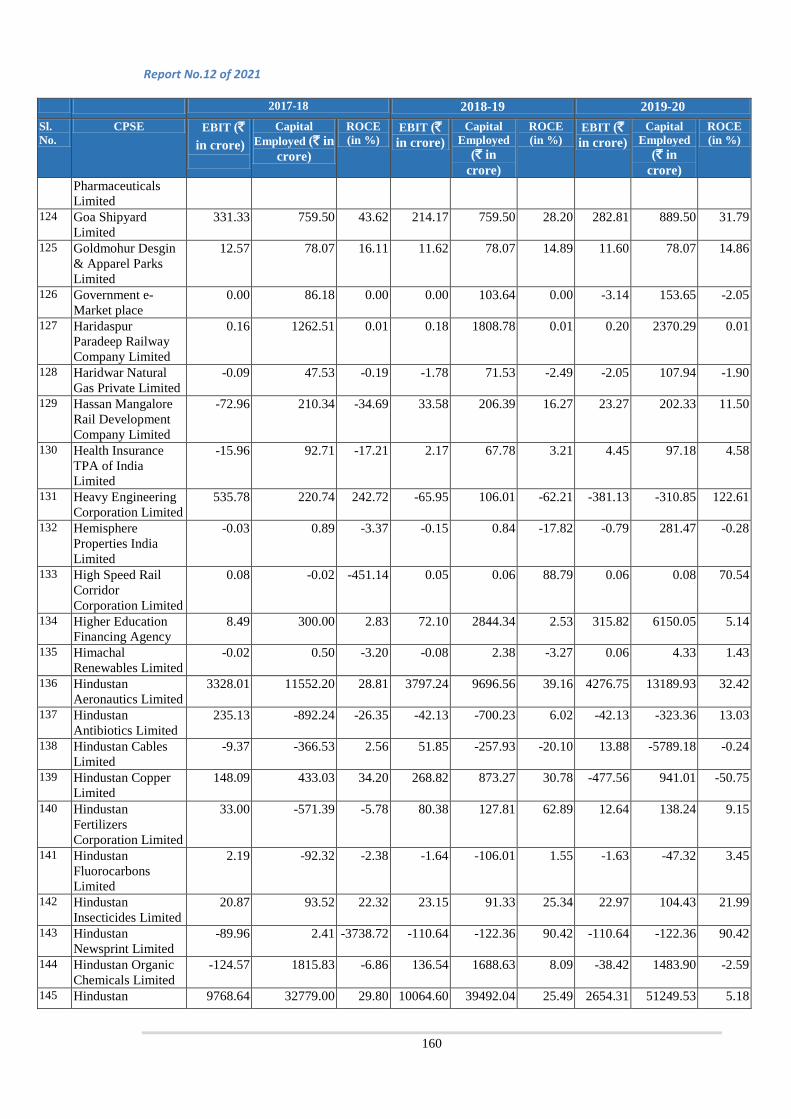
Report No.12 of 2021
160
2017-18 2018-19 2019-20 Sl. No.
CPSE EBIT (` in crore)
Capital Employed (` in
crore)
ROCE (in %)
EBIT (` in crore)
Capital Employed
(` in crore)
ROCE (in %)
EBIT (` in crore)
Capital Employed
(` in crore)
ROCE (in %)
Pharmaceuticals Limited
124 Goa Shipyard Limited
331.33 759.50 43.62 214.17 759.50 28.20 282.81 889.50 31.79
125 Goldmohur Desgin & Apparel Parks Limited
12.57 78.07 16.11 11.62 78.07 14.89 11.60 78.07 14.86
126 Government e- Market place
0.00 86.18 0.00 0.00 103.64 0.00 -3.14 153.65 -2.05
127 Haridaspur Paradeep Railway Company Limited
0.16 1262.51 0.01 0.18 1808.78 0.01 0.20 2370.29 0.01
128 Haridwar Natural Gas Private Limited
-0.09 47.53 -0.19 -1.78 71.53 -2.49 -2.05 107.94 -1.90
129 Hassan Mangalore Rail Development Company Limited
-72.96 210.34 -34.69 33.58 206.39 16.27 23.27 202.33 11.50
130 Health Insurance TPA of India Limited
-15.96 92.71 -17.21 2.17 67.78 3.21 4.45 97.18 4.58
131 Heavy Engineering Corporation Limited
535.78 220.74 242.72 -65.95 106.01 -62.21 -381.13 -310.85 122.61
132 Hemisphere Properties India Limited
-0.03 0.89 -3.37 -0.15 0.84 -17.82 -0.79 281.47 -0.28
133 High Speed Rail Corridor Corporation Limited
0.08 -0.02 -451.14 0.05 0.06 88.79 0.06 0.08 70.54
134 Higher Education Financing Agency
8.49 300.00 2.83 72.10 2844.34 2.53 315.82 6150.05 5.14
135 Himachal Renewables Limited
-0.02 0.50 -3.20 -0.08 2.38 -3.27 0.06 4.33 1.43
136 Hindustan Aeronautics Limited
3328.01 11552.20 28.81 3797.24 9696.56 39.16 4276.75 13189.93 32.42
137 Hindustan Antibiotics Limited
235.13 -892.24 -26.35 -42.13 -700.23 6.02 -42.13 -323.36 13.03
138 Hindustan Cables Limited
-9.37 -366.53 2.56 51.85 -257.93 -20.10 13.88 -5789.18 -0.24
139 Hindustan Copper Limited
148.09 433.03 34.20 268.82 873.27 30.78 -477.56 941.01 -50.75
140 Hindustan Fertilizers Corporation Limited
33.00 -571.39 -5.78 80.38 127.81 62.89 12.64 138.24 9.15
141 Hindustan Fluorocarbons Limited
2.19 -92.32 -2.38 -1.64 -106.01 1.55 -1.63 -47.32 3.45
142 Hindustan Insecticides Limited
20.87 93.52 22.32 23.15 91.33 25.34 22.97 104.43 21.99
143 Hindustan Newsprint Limited
-89.96 2.41 -3738.72 -110.64 -122.36 90.42 -110.64 -122.36 90.42
144 Hindustan Organic Chemicals Limited
-124.57 1815.83 -6.86 136.54 1688.63 8.09 -38.42 1483.90 -2.59
145 Hindustan 9768.64 32779.00 29.80 10064.60 39492.04 25.49 2654.31 51249.53 5.18
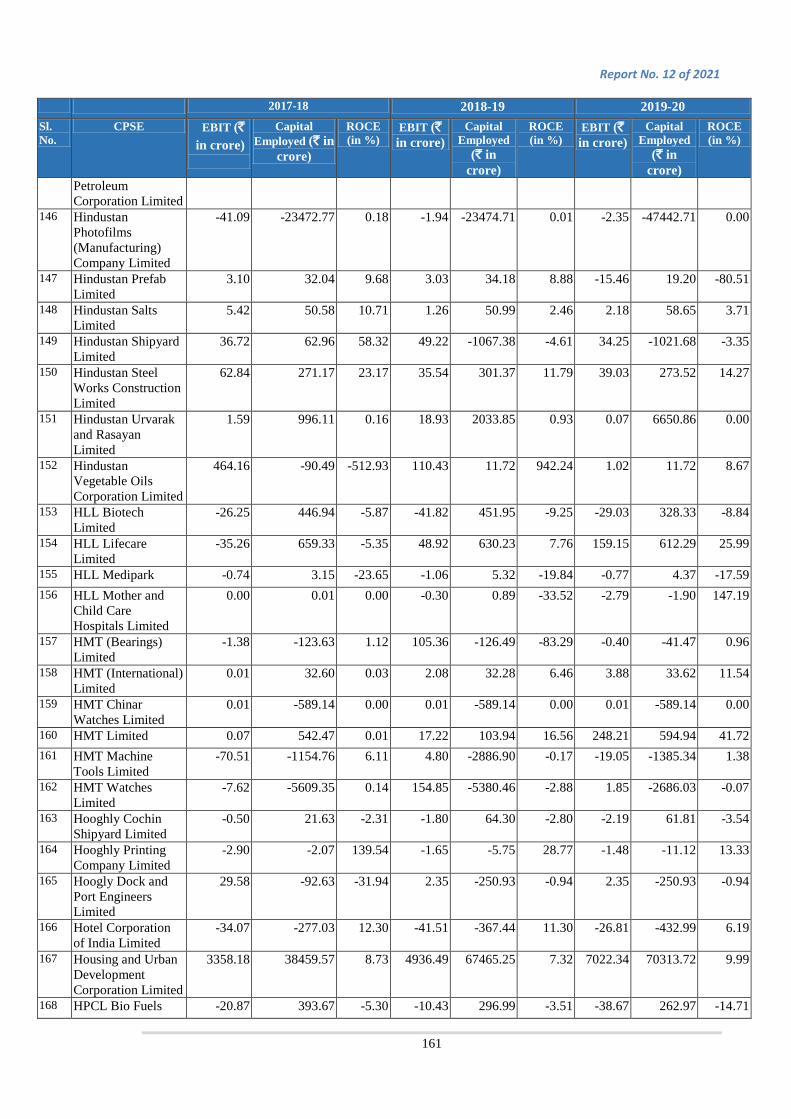
Report No. 12 of 2021
161
2017-18 2018-19 2019-20 Sl. No.
CPSE EBIT (` in crore)
Capital Employed (` in
crore)
ROCE (in %)
EBIT (` in crore)
Capital Employed
(` in crore)
ROCE (in %)
EBIT (` in crore)
Capital Employed
(` in crore)
ROCE (in %)
Petroleum Corporation Limited
146 Hindustan Photofilms (Manufacturing) Company Limited
-41.09 -23472.77 0.18 -1.94 -23474.71 0.01 -2.35 -47442.71 0.00
147 Hindustan Prefab Limited
3.10 32.04 9.68 3.03 34.18 8.88 -15.46 19.20 -80.51
148 Hindustan Salts Limited
5.42 50.58 10.71 1.26 50.99 2.46 2.18 58.65 3.71
149 Hindustan Shipyard Limited
36.72 62.96 58.32 49.22 -1067.38 -4.61 34.25 -1021.68 -3.35
150 Hindustan Steel Works Construction Limited
62.84 271.17 23.17 35.54 301.37 11.79 39.03 273.52 14.27
151 Hindustan Urvarak and Rasayan Limited
1.59 996.11 0.16 18.93 2033.85 0.93 0.07 6650.86 0.00
152 Hindustan Vegetable Oils Corporation Limited
464.16 -90.49 -512.93 110.43 11.72 942.24 1.02 11.72 8.67
153 HLL Biotech Limited
-26.25 446.94 -5.87 -41.82 451.95 -9.25 -29.03 328.33 -8.84
154 HLL Lifecare Limited
-35.26 659.33 -5.35 48.92 630.23 7.76 159.15 612.29 25.99
155 HLL Medipark -0.74 3.15 -23.65 -1.06 5.32 -19.84 -0.77 4.37 -17.59 156 HLL Mother and
Child Care Hospitals Limited
0.00 0.01 0.00 -0.30 0.89 -33.52 -2.79 -1.90 147.19
157 HMT (Bearings) Limited
-1.38 -123.63 1.12 105.36 -126.49 -83.29 -0.40 -41.47 0.96
158 HMT (International) Limited
0.01 32.60 0.03 2.08 32.28 6.46 3.88 33.62 11.54
159 HMT Chinar Watches Limited
0.01 -589.14 0.00 0.01 -589.14 0.00 0.01 -589.14 0.00
160 HMT Limited 0.07 542.47 0.01 17.22 103.94 16.56 248.21 594.94 41.72 161 HMT Machine
Tools Limited -70.51 -1154.76 6.11 4.80 -2886.90 -0.17 -19.05 -1385.34 1.38
162 HMT Watches Limited
-7.62 -5609.35 0.14 154.85 -5380.46 -2.88 1.85 -2686.03 -0.07
163 Hooghly Cochin Shipyard Limited
-0.50 21.63 -2.31 -1.80 64.30 -2.80 -2.19 61.81 -3.54
164 Hooghly Printing Company Limited
-2.90 -2.07 139.54 -1.65 -5.75 28.77 -1.48 -11.12 13.33
165 Hoogly Dock and Port Engineers Limited
29.58 -92.63 -31.94 2.35 -250.93 -0.94 2.35 -250.93 -0.94
166 Hotel Corporation of India Limited
-34.07 -277.03 12.30 -41.51 -367.44 11.30 -26.81 -432.99 6.19
167 Housing and Urban Development Corporation Limited
3358.18 38459.57 8.73 4936.49 67465.25 7.32 7022.34 70313.72 9.99
168 HPCL Bio Fuels -20.87 393.67 -5.30 -10.43 296.99 -3.51 -38.67 262.97 -14.71

Report No.12 of 2021
162
2017-18 2018-19 2019-20 Sl. No.
CPSE EBIT (` in crore)
Capital Employed (` in
crore)
ROCE (in %)
EBIT (` in crore)
Capital Employed
(` in crore)
ROCE (in %)
EBIT (` in crore)
Capital Employed
(` in crore)
ROCE (in %)
Limited 169 HPCL Rajasthan
Refinery Limited -19.36 243.29 -7.96 7.40 1190.88 0.62 1.90 3269.63 0.06
170 HPOIL Gas Private Limited
-0.58 9.54 -6.12 -2.76 116.73 -2.37
171 HSCC (India) Limited
0.00 1.80 0.00 79.49 88.89 89.43 64.25 35.38 181.60
172 I T I Limited 388.54 6565.41 5.92 217.33 6551.94 3.32 291.52 6952.13 4.19 173 IFCI Factors
Limited -9.65 346.95 -2.78 31.16 326.61 9.54 22.50 311.76 7.22
174 IFCI Financial Services Limited
1.30 71.42 1.82 0.56 71.72 0.78 -1.13 71.72 -1.58
175 IFCI Infrastructure Development Limited
10.25 594.03 1.73 10.25 495.23 2.07 16.15 495.23 3.26
176 IFCI Limited 570.18 25361.13 2.25 1064.85 20578.01 5.17 -140.91 16990.94 -0.83 177 IFCI Venture
Capital Funds Limited
56.63 424.74 13.33 7.40 286.23 2.58 7.51 268.72 2.80
178 IFIN Commodities Limited
-0.27 5.05 -5.30 0.48 5.42 8.79 -0.27 5.42 -4.96
179 IFIN Credit Limited -0.01 1.41 -0.78 -0.02 1.39 -1.34 0.04 1.43 2.86 180 IFIN Securities
Finance Limited 1.07 34.00 3.14 -3.80 30.44 -12.48 -0.22 29.86 -0.74
181 IHB Private Limited -5.20 99.80 -5.21 182 IIFCL Asset
Management Company Limited
4.25 12.50 33.97 4.48 12.50 35.82 1.09 22.42 4.87
183 IIFCL Projects Limited
3.21 4.78 67.17 3.12 5.64 55.21 2.10 14.66 14.31
184 India Infrastructure Finance Company Limited
1153.77 36739.85 3.14 2750.51 6546.11 42.02 -291.48 48599.76 -0.60
185 India International Convention and Exhibition Centre Limited
-3.27 497.45 -0.66 6.73 1194.99 0.56 8.14 1920.32 0.42
186 India Post Payment Bank Limited
-0.82 799.31 -0.10 -222.13 613.01 -36.24 -432.87 613.92 -70.51
187 India Renewable Energy Development Agency Limited
1585.97 16931.30 9.37 1395.85 21291.68 6.56 1740.97 24374.86 7.14
188 India Tourism Development Corporation Limited
28.36 330.44 8.58 60.55 355.58 17.03 39.67 346.49 11.45
189 India Trade Promotion Organisation
134.62 1829.64 7.36 73.35 1961.30 3.74 87.21 2264.73 3.85
190 India United Textile Mills Limited
12.29 140.86 8.72 12.95 140.86 9.19 13.27 140.89 9.42

Report No. 12 of 2021
163
2017-18 2018-19 2019-20 Sl. No.
CPSE EBIT (` in crore)
Capital Employed (` in
crore)
ROCE (in %)
EBIT (` in crore)
Capital Employed
(` in crore)
ROCE (in %)
EBIT (` in crore)
Capital Employed
(` in crore)
ROCE (in %)
191 Indian Catalyst Private Limited
-0.01 6.46 -0.09 -0.01 6.45 -0.08 -0.01 6.45 -0.08
192 Indian Medicines and Pharmaceuticals Corporation Limited
10.98 69.15 15.87 7.79 74.63 10.44 0.46 52.02 0.89
193 Indian Oil Corporation Limited
36012.72 131626.49 27.36 29437.95 146422.68 20.10 13590.00 146827.77 9.26
194 Indian Railway Catering and Tourism Corporation Limited
344.39 459.92 74.88 475.93 1067.02 44.60 751.51 1072.13 70.09
195 Indian Railway Finance Corporation Limited
10902.06 128419.34 8.49 11084.65 187112.31 5.92 13772.21 258730.83 5.32
196 Indian Railway Station Development Corporation Limited
0.34 60.00 0.57 13.81 77.29 17.86 4.29 154.54 2.77
197 Indian Rare Earths Limited
124.81 168.37 74.13 197.56 168.37 117.34 402.98 168.48 239.19
198 Indian Strategic Petroleum Reserves Limited
-59.97 3519.62 -1.70 -67.17 3542.66 -1.90 -100.34 3441.03 -2.92
199 Indian Vaccines Company Limited
-1.53 1.15 -133.42 -0.48 -0.86 55.69 -0.45 -1.78 25.18
200 Indo-Russian Helicopters Limited
-0.45 9.55 -4.75 -0.50 9.05 -5.47 -0.34 8.71 -3.89
201 Indradhanush Gas Grid Limited
-12.12 12.88 -94.13 -7.18 30.45 -23.57
202 Indraprastha Gas Limited
1034.18 443.50 233.19 1202.06 443.50 271.04 1423.77 443.50 321.03
203 Inland Coastal Shipping Limited
0.00 -0.14 0.98 0.00 -0.05 -0.43 0.00 -0.05 1.71
204 Instrumentation Limited
-12.52 -1255.62 1.00 -12.52 -1255.62 1.00 -12.52 -1255.62 1.00
205 Ircon Davangere Haveri Highway Limited
1.26 0.68 185.68 3.26 234.68 1.39 18.71 436.04 4.29
206 IRCON Infrastructure Limited
13.93 133.17 10.46 17.24 142.38 12.11 14.92 153.89 9.70
207 IRCON International Limited
533.31 6955.03 7.67 619.61 5992.69 10.34 690.98 5795.47 11.92
208 IRCON PB Tollway Limited
17.88 405.85 4.40 22.39 474.70 4.72 2.78 528.91 0.53
209 IRCON Shiv Puri Guna Limited
0.02 674.35 0.00 12.97 603.94 2.15 22.12 566.51 3.90
210 IRCON Vadodara Kim Expressway Limited
0.07 6.05 1.11 7.75 316.77 2.45
211 IREL IDCOL Limited
0.00 0.00 #DIV/0! -0.04 0.22 -16.19 -0.01 0.08 -16.69

Report No.12 of 2021
164
2017-18 2018-19 2019-20 Sl. No.
CPSE EBIT (` in crore)
Capital Employed (` in
crore)
ROCE (in %)
EBIT (` in crore)
Capital Employed
(` in crore)
ROCE (in %)
EBIT (` in crore)
Capital Employed
(` in crore)
ROCE (in %)
212 J&K Development Finance Corporation Limited
8.66 80.41 10.77 8.76 80.42 10.90 8.49 80.42 10.56
213 J&K Mineral Development Corporation Limited
1.41 14.62 9.64 -0.74 13.88 -5.33 -3.65 10.08 -36.18
214 Jharkhand Central Railway Limited
-0.03 49.33 -0.05 1.78 55.00 3.23 1.86 55.10 3.37
215 Jharkhand Infra Power Limited
0.00 0.08 0.00 0.00 0.06 0.00 0.00 0.05 0.00
216 Jharkhand Kolhan Steel Limited
-0.03 -0.03 92.49 -0.04 -0.03 155.20 -0.01 -0.03 36.80
217 Jharkhand National Mineral Development Corporation Limited
-0.01 -0.05 16.67 -0.01 -0.06 19.23 -0.01 -0.07 12.25
218 Jute Corporation of India Limited
28.95 113.61 25.48 21.62 124.90 17.31 21.36 147.70 14.46
219 Kanti Bijlee Utpadan Nigam Limited
50.23 3607.61 1.39 376.73 3559.44 10.58 378.13 3698.46 10.22
220 Karnataka Antibiotics and Pharmaceuticals Limited
24.01 173.27 13.86 27.17 184.82 14.70 32.86 201.71 16.29
221 Karnataka Trade Promotion Organisation
19.95 112.47 17.74 6.99 130.39 5.36 6.79 137.38 4.94
222 Karnataka Vijaynagar Steel Limited
-0.01 -0.02 36.10 -0.12 -0.05 239.28 -0.49 -0.54 90.68
223 Karur Transmission Limited
-0.01 0.00 -117.39
224 Kerala GAIL Gas Limited
1.66 23.86 6.96 0.65 0.01 6452.00 0.10 0.01 1049.00
225 KIOCL Limited 86.08 2084.78 4.13 184.92 1993.96 9.27 73.65 1859.89 3.96 226 Kochi Metro Rail
Limited -123.80 5177.23 -2.39 -206.12 5870.18 -3.51 -148.87 6354.65 -2.34
227 Koderma Transmission Limited
-1.55 -1.50 103.33 -0.41 -1.91 21.38
228 Kolkata Metro Rail Corporation Limited
16.10 3907.47 0.41 -34.97 4779.36 -0.73 -236.89 5624.17 -4.21
229 Konkan Railway Corporation Limited
256.83 284.79 90.18 236.40 4007.17 5.90 137.85 3892.88 3.54
230 Kopal Narendra Transmission Limited
-0.01 0.00 -117.39
231 Kumarkruppa Frontier Hotels Private Limited
12.70 23.04 55.13 14.65 23.04 63.59 12.41 23.60 52.60
232 Lakshadweep Development
40.55 223.46 18.14 42.85 259.14 16.54 42.50 6.58 645.63
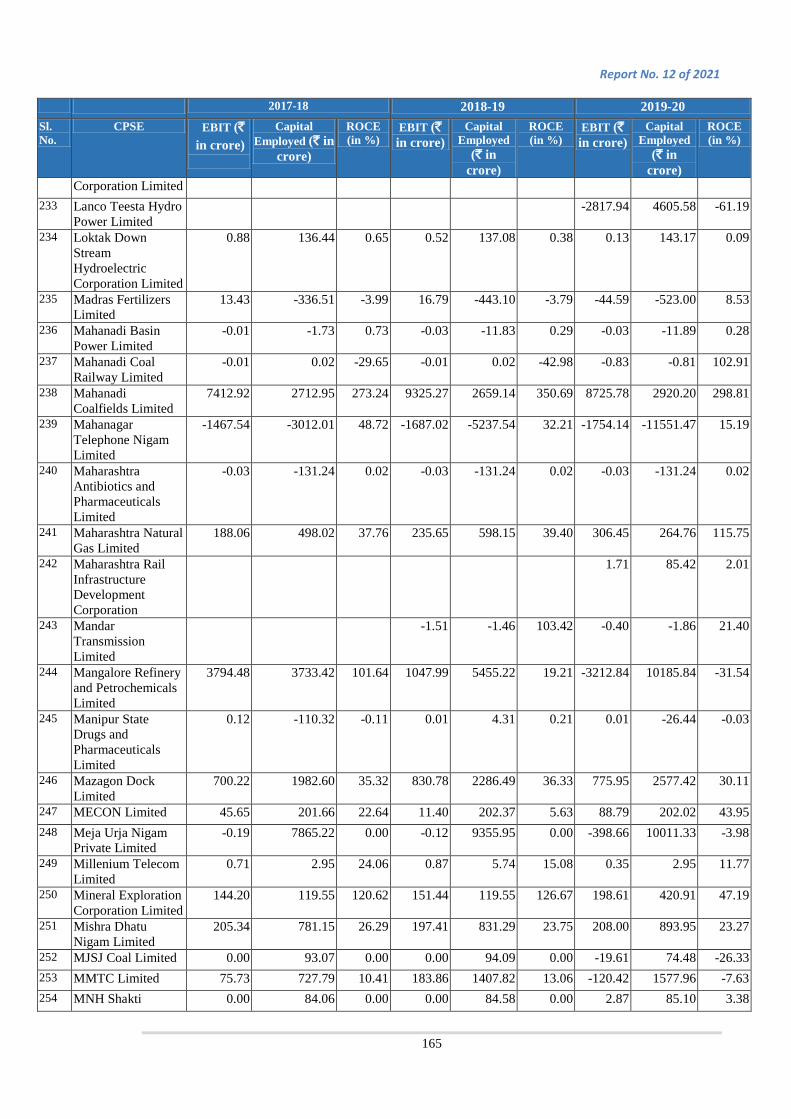
Report No. 12 of 2021
165
2017-18 2018-19 2019-20 Sl. No.
CPSE EBIT (` in crore)
Capital Employed (` in
crore)
ROCE (in %)
EBIT (` in crore)
Capital Employed
(` in crore)
ROCE (in %)
EBIT (` in crore)
Capital Employed
(` in crore)
ROCE (in %)
Corporation Limited 233 Lanco Teesta Hydro
Power Limited -2817.94 4605.58 -61.19
234 Loktak Down Stream Hydroelectric Corporation Limited
0.88 136.44 0.65 0.52 137.08 0.38 0.13 143.17 0.09
235 Madras Fertilizers Limited
13.43 -336.51 -3.99 16.79 -443.10 -3.79 -44.59 -523.00 8.53
236 Mahanadi Basin Power Limited
-0.01 -1.73 0.73 -0.03 -11.83 0.29 -0.03 -11.89 0.28
237 Mahanadi Coal Railway Limited
-0.01 0.02 -29.65 -0.01 0.02 -42.98 -0.83 -0.81 102.91
238 Mahanadi Coalfields Limited
7412.92 2712.95 273.24 9325.27 2659.14 350.69 8725.78 2920.20 298.81
239 Mahanagar Telephone Nigam Limited
-1467.54 -3012.01 48.72 -1687.02 -5237.54 32.21 -1754.14 -11551.47 15.19
240 Maharashtra Antibiotics and Pharmaceuticals Limited
-0.03 -131.24 0.02 -0.03 -131.24 0.02 -0.03 -131.24 0.02
241 Maharashtra Natural Gas Limited
188.06 498.02 37.76 235.65 598.15 39.40 306.45 264.76 115.75
242 Maharashtra Rail Infrastructure Development Corporation
1.71 85.42 2.01
243 Mandar Transmission Limited
-1.51 -1.46 103.42 -0.40 -1.86 21.40
244 Mangalore Refinery and Petrochemicals Limited
3794.48 3733.42 101.64 1047.99 5455.22 19.21 -3212.84 10185.84 -31.54
245 Manipur State Drugs and Pharmaceuticals Limited
0.12 -110.32 -0.11 0.01 4.31 0.21 0.01 -26.44 -0.03
246 Mazagon Dock Limited
700.22 1982.60 35.32 830.78 2286.49 36.33 775.95 2577.42 30.11
247 MECON Limited 45.65 201.66 22.64 11.40 202.37 5.63 88.79 202.02 43.95 248 Meja Urja Nigam
Private Limited -0.19 7865.22 0.00 -0.12 9355.95 0.00 -398.66 10011.33 -3.98
249 Millenium Telecom Limited
0.71 2.95 24.06 0.87 5.74 15.08 0.35 2.95 11.77
250 Mineral Exploration Corporation Limited
144.20 119.55 120.62 151.44 119.55 126.67 198.61 420.91 47.19
251 Mishra Dhatu Nigam Limited
205.34 781.15 26.29 197.41 831.29 23.75 208.00 893.95 23.27
252 MJSJ Coal Limited 0.00 93.07 0.00 0.00 94.09 0.00 -19.61 74.48 -26.33 253 MMTC Limited 75.73 727.79 10.41 183.86 1407.82 13.06 -120.42 1577.96 -7.63 254 MNH Shakti 0.00 84.06 0.00 0.00 84.58 0.00 2.87 85.10 3.38
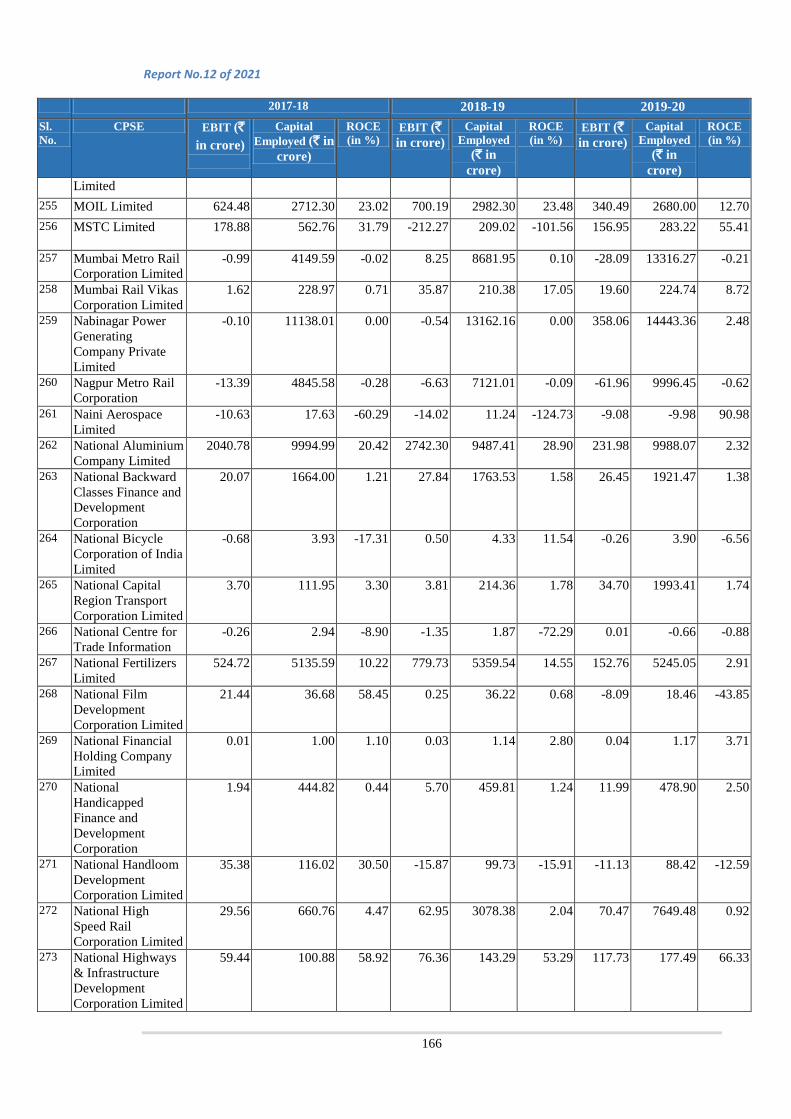
Report No.12 of 2021
166
2017-18 2018-19 2019-20 Sl. No.
CPSE EBIT (` in crore)
Capital Employed (` in
crore)
ROCE (in %)
EBIT (` in crore)
Capital Employed
(` in crore)
ROCE (in %)
EBIT (` in crore)
Capital Employed
(` in crore)
ROCE (in %)
Limited 255 MOIL Limited 624.48 2712.30 23.02 700.19 2982.30 23.48 340.49 2680.00 12.70 256 MSTC Limited 178.88 562.76 31.79 -212.27 209.02 -101.56 156.95 283.22 55.41
257 Mumbai Metro Rail Corporation Limited
-0.99 4149.59 -0.02 8.25 8681.95 0.10 -28.09 13316.27 -0.21
258 Mumbai Rail Vikas Corporation Limited
1.62 228.97 0.71 35.87 210.38 17.05 19.60 224.74 8.72
259 Nabinagar Power Generating Company Private Limited
-0.10 11138.01 0.00 -0.54 13162.16 0.00 358.06 14443.36 2.48
260 Nagpur Metro Rail Corporation
-13.39 4845.58 -0.28 -6.63 7121.01 -0.09 -61.96 9996.45 -0.62
261 Naini Aerospace Limited
-10.63 17.63 -60.29 -14.02 11.24 -124.73 -9.08 -9.98 90.98
262 National Aluminium Company Limited
2040.78 9994.99 20.42 2742.30 9487.41 28.90 231.98 9988.07 2.32
263 National Backward Classes Finance and Development Corporation
20.07 1664.00 1.21 27.84 1763.53 1.58 26.45 1921.47 1.38
264 National Bicycle Corporation of India Limited
-0.68 3.93 -17.31 0.50 4.33 11.54 -0.26 3.90 -6.56
265 National Capital Region Transport Corporation Limited
3.70 111.95 3.30 3.81 214.36 1.78 34.70 1993.41 1.74
266 National Centre for Trade Information
-0.26 2.94 -8.90 -1.35 1.87 -72.29 0.01 -0.66 -0.88
267 National Fertilizers Limited
524.72 5135.59 10.22 779.73 5359.54 14.55 152.76 5245.05 2.91
268 National Film Development Corporation Limited
21.44 36.68 58.45 0.25 36.22 0.68 -8.09 18.46 -43.85
269 National Financial Holding Company Limited
0.01 1.00 1.10 0.03 1.14 2.80 0.04 1.17 3.71
270 National Handicapped Finance and Development Corporation
1.94 444.82 0.44 5.70 459.81 1.24 11.99 478.90 2.50
271 National Handloom Development Corporation Limited
35.38 116.02 30.50 -15.87 99.73 -15.91 -11.13 88.42 -12.59
272 National High Speed Rail Corporation Limited
29.56 660.76 4.47 62.95 3078.38 2.04 70.47 7649.48 0.92
273 National Highways & Infrastructure Development Corporation Limited
59.44 100.88 58.92 76.36 143.29 53.29 117.73 177.49 66.33

Report No. 12 of 2021
167
2017-18 2018-19 2019-20 Sl. No.
CPSE EBIT (` in crore)
Capital Employed (` in
crore)
ROCE (in %)
EBIT (` in crore)
Capital Employed
(` in crore)
ROCE (in %)
EBIT (` in crore)
Capital Employed
(` in crore)
ROCE (in %)
274 National Informatics Centre Services Inc.
50.65 607.78 8.33 -97.87 586.61 -16.68 132.99 501.38 26.53
275 National Insurance Company Limited
-2107.78 4927.37 -42.78 -1621.55 1067.69 -151.87 -4036.11 -1272.80 317.10
276 National Investment and Infrastructure Trustee Funds
0.10 -0.23 -45.11 0.04 -0.19 -21.56
277 National Jute Manufacturers Corporation Limited
9.52 211.20 4.51 1.78 13.21 13.50 -0.29 -270.13 0.11
278 National Minorities Development and Finance Corporation Limited
54.33 2233.91 2.43 50.11 2459.91 2.04 64.18 2622.51 2.45
279 National Projects Construction Corporation Limited
30.09 173.81 17.31 18.21 190.68 9.55 45.64 189.66 24.06
280 National Research Development Corporation of India Limited
0.62 4.42 14.09 0.10 9.44 1.06 0.45 9.44 4.79
281 National Safai Karmachari Finance and Development Corporation
18.04 705.66 2.56 21.61 757.05 2.85 -1.41 790.63 -0.18
282 National Scheduled Castes Finance and Development Corporation
49.51 1822.10 2.72 51.51 2013.34 2.56 60.99 2088.66 2.92
283 National Scheduled Tribes Finance and Development Corporation
25.50 881.10 2.89 28.45 966.22 2.94 37.52 1077.55 3.48
284 National Seeds Corporation Limited
34.83 623.93 5.58 53.61 616.48 8.70 68.69 91.82 74.80
285 National Small Industries Corporation Limited
285.46 638.23 44.73 220.08 617.88 35.62 258.49 690.21 37.45
286 National Textile Corporation Limited
-247.25 5752.73 -4.30 -256.86 5523.60 -4.65 -256.86 5523.60 -4.65
287 NBCC (India) Limited
502.83 556.43 90.37 559.07 541.24 103.29 247.94 547.25 45.31
288 NBCC Engineering & Consultancy Limited
-2.64 -1.34 196.84 -1.97 -5.21 37.85 -0.15 -4.12 3.67
289 NBCC Environment Engineering Limited
-0.05 0.97 -4.70 0.03 0.98 3.37 0.03 1.00 3.29
290 NBCC International Limited
-0.05 0.96 -5.13 0.04 0.98 3.59 0.04 1.00 3.65
291 NBCC Services Limited
11.22 7.80 143.88 11.44 14.76 77.48 6.69 2.00 334.46
292 NEPA Limited 56.77 -1.89 -2996.67 -50.76 -40.56 125.14 -42.32 103.86 -40.74 293 NESL E- 0.05 0.98 5.10 -0.01 1.01 -0.99 0.06 1.05 5.71
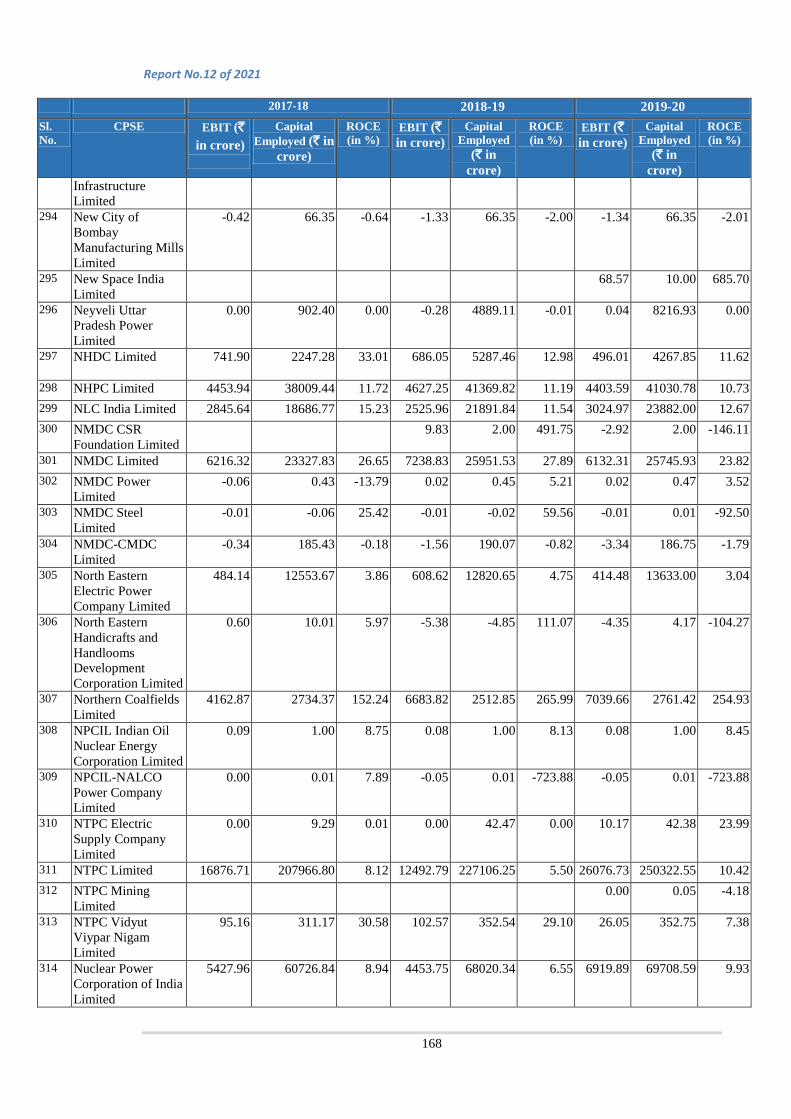
Report No.12 of 2021
168
2017-18 2018-19 2019-20 Sl. No.
CPSE EBIT (` in crore)
Capital Employed (` in
crore)
ROCE (in %)
EBIT (` in crore)
Capital Employed
(` in crore)
ROCE (in %)
EBIT (` in crore)
Capital Employed
(` in crore)
ROCE (in %)
Infrastructure Limited
294 New City of Bombay Manufacturing Mills Limited
-0.42 66.35 -0.64 -1.33 66.35 -2.00 -1.34 66.35 -2.01
295 New Space India Limited
68.57 10.00 685.70
296 Neyveli Uttar Pradesh Power Limited
0.00 902.40 0.00 -0.28 4889.11 -0.01 0.04 8216.93 0.00
297 NHDC Limited 741.90 2247.28 33.01 686.05 5287.46 12.98 496.01 4267.85 11.62
298 NHPC Limited 4453.94 38009.44 11.72 4627.25 41369.82 11.19 4403.59 41030.78 10.73 299 NLC India Limited 2845.64 18686.77 15.23 2525.96 21891.84 11.54 3024.97 23882.00 12.67 300 NMDC CSR
Foundation Limited 9.83 2.00 491.75 -2.92 2.00 -146.11
301 NMDC Limited 6216.32 23327.83 26.65 7238.83 25951.53 27.89 6132.31 25745.93 23.82 302 NMDC Power
Limited -0.06 0.43 -13.79 0.02 0.45 5.21 0.02 0.47 3.52
303 NMDC Steel Limited
-0.01 -0.06 25.42 -0.01 -0.02 59.56 -0.01 0.01 -92.50
304 NMDC-CMDC Limited
-0.34 185.43 -0.18 -1.56 190.07 -0.82 -3.34 186.75 -1.79
305 North Eastern Electric Power Company Limited
484.14 12553.67 3.86 608.62 12820.65 4.75 414.48 13633.00 3.04
306 North Eastern Handicrafts and Handlooms Development Corporation Limited
0.60 10.01 5.97 -5.38 -4.85 111.07 -4.35 4.17 -104.27
307 Northern Coalfields Limited
4162.87 2734.37 152.24 6683.82 2512.85 265.99 7039.66 2761.42 254.93
308 NPCIL Indian Oil Nuclear Energy Corporation Limited
0.09 1.00 8.75 0.08 1.00 8.13 0.08 1.00 8.45
309 NPCIL-NALCO Power Company Limited
0.00 0.01 7.89 -0.05 0.01 -723.88 -0.05 0.01 -723.88
310 NTPC Electric Supply Company Limited
0.00 9.29 0.01 0.00 42.47 0.00 10.17 42.38 23.99
311 NTPC Limited 16876.71 207966.80 8.12 12492.79 227106.25 5.50 26076.73 250322.55 10.42 312 NTPC Mining
Limited 0.00 0.05 -4.18
313 NTPC Vidyut Viypar Nigam Limited
95.16 311.17 30.58 102.57 352.54 29.10 26.05 352.75 7.38
314 Nuclear Power Corporation of India Limited
5427.96 60726.84 8.94 4453.75 68020.34 6.55 6919.89 69708.59 9.93
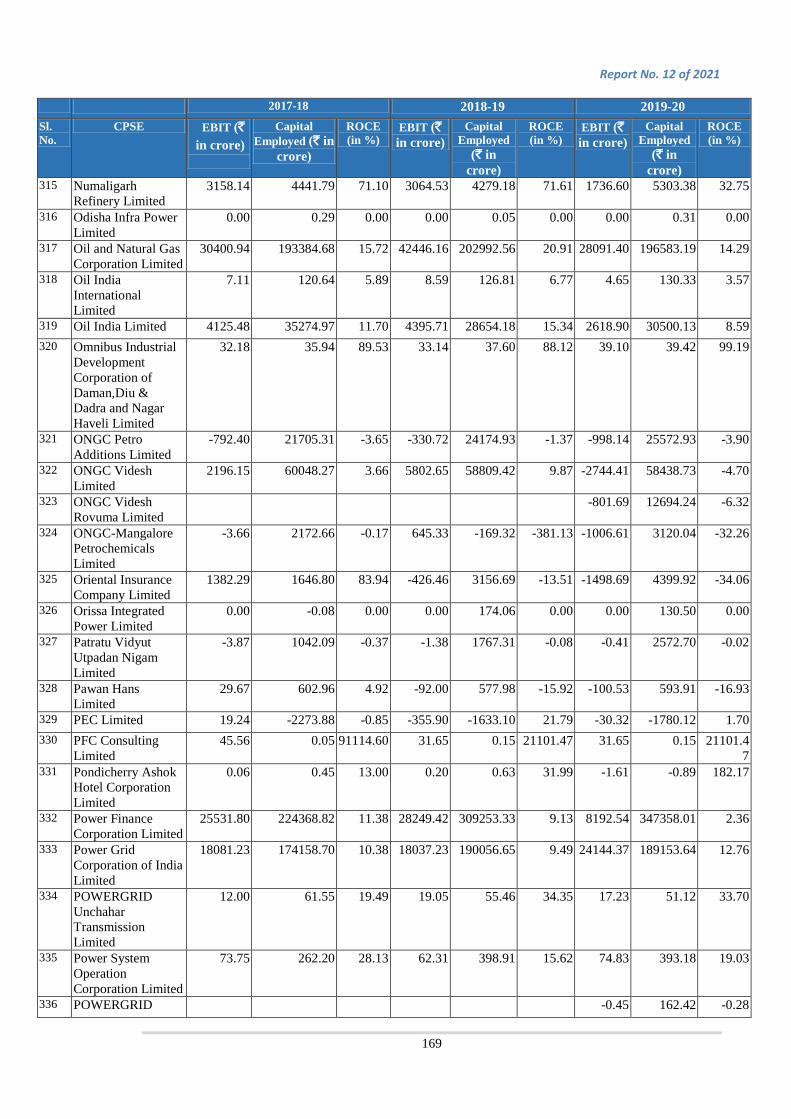
Report No. 12 of 2021
169
2017-18 2018-19 2019-20 Sl. No.
CPSE EBIT (` in crore)
Capital Employed (` in
crore)
ROCE (in %)
EBIT (` in crore)
Capital Employed
(` in crore)
ROCE (in %)
EBIT (` in crore)
Capital Employed
(` in crore)
ROCE (in %)
315 Numaligarh Refinery Limited
3158.14 4441.79 71.10 3064.53 4279.18 71.61 1736.60 5303.38 32.75
316 Odisha Infra Power Limited
0.00 0.29 0.00 0.00 0.05 0.00 0.00 0.31 0.00
317 Oil and Natural Gas Corporation Limited
30400.94 193384.68 15.72 42446.16 202992.56 20.91 28091.40 196583.19 14.29
318 Oil India International Limited
7.11 120.64 5.89 8.59 126.81 6.77 4.65 130.33 3.57
319 Oil India Limited 4125.48 35274.97 11.70 4395.71 28654.18 15.34 2618.90 30500.13 8.59 320 Omnibus Industrial
Development Corporation of Daman,Diu & Dadra and Nagar Haveli Limited
32.18 35.94 89.53 33.14 37.60 88.12 39.10 39.42 99.19
321 ONGC Petro Additions Limited
-792.40 21705.31 -3.65 -330.72 24174.93 -1.37 -998.14 25572.93 -3.90
322 ONGC Videsh Limited
2196.15 60048.27 3.66 5802.65 58809.42 9.87 -2744.41 58438.73 -4.70
323 ONGC Videsh Rovuma Limited
-801.69 12694.24 -6.32
324 ONGC-Mangalore Petrochemicals Limited
-3.66 2172.66 -0.17 645.33 -169.32 -381.13 -1006.61 3120.04 -32.26
325 Oriental Insurance Company Limited
1382.29 1646.80 83.94 -426.46 3156.69 -13.51 -1498.69 4399.92 -34.06
326 Orissa Integrated Power Limited
0.00 -0.08 0.00 0.00 174.06 0.00 0.00 130.50 0.00
327 Patratu Vidyut Utpadan Nigam Limited
-3.87 1042.09 -0.37 -1.38 1767.31 -0.08 -0.41 2572.70 -0.02
328 Pawan Hans Limited
29.67 602.96 4.92 -92.00 577.98 -15.92 -100.53 593.91 -16.93
329 PEC Limited 19.24 -2273.88 -0.85 -355.90 -1633.10 21.79 -30.32 -1780.12 1.70 330 PFC Consulting
Limited 45.56 0.05 91114.60 31.65 0.15 21101.47 31.65 0.15 21101.4
7 331 Pondicherry Ashok
Hotel Corporation Limited
0.06 0.45 13.00 0.20 0.63 31.99 -1.61 -0.89 182.17
332 Power Finance Corporation Limited
25531.80 224368.82 11.38 28249.42 309253.33 9.13 8192.54 347358.01 2.36
333 Power Grid Corporation of India Limited
18081.23 174158.70 10.38 18037.23 190056.65 9.49 24144.37 189153.64 12.76
334 POWERGRID Unchahar Transmission Limited
12.00 61.55 19.49 19.05 55.46 34.35 17.23 51.12 33.70
335 Power System Operation Corporation Limited
73.75 262.20 28.13 62.31 398.91 15.62 74.83 393.18 19.03
336 POWERGRID -0.45 162.42 -0.28
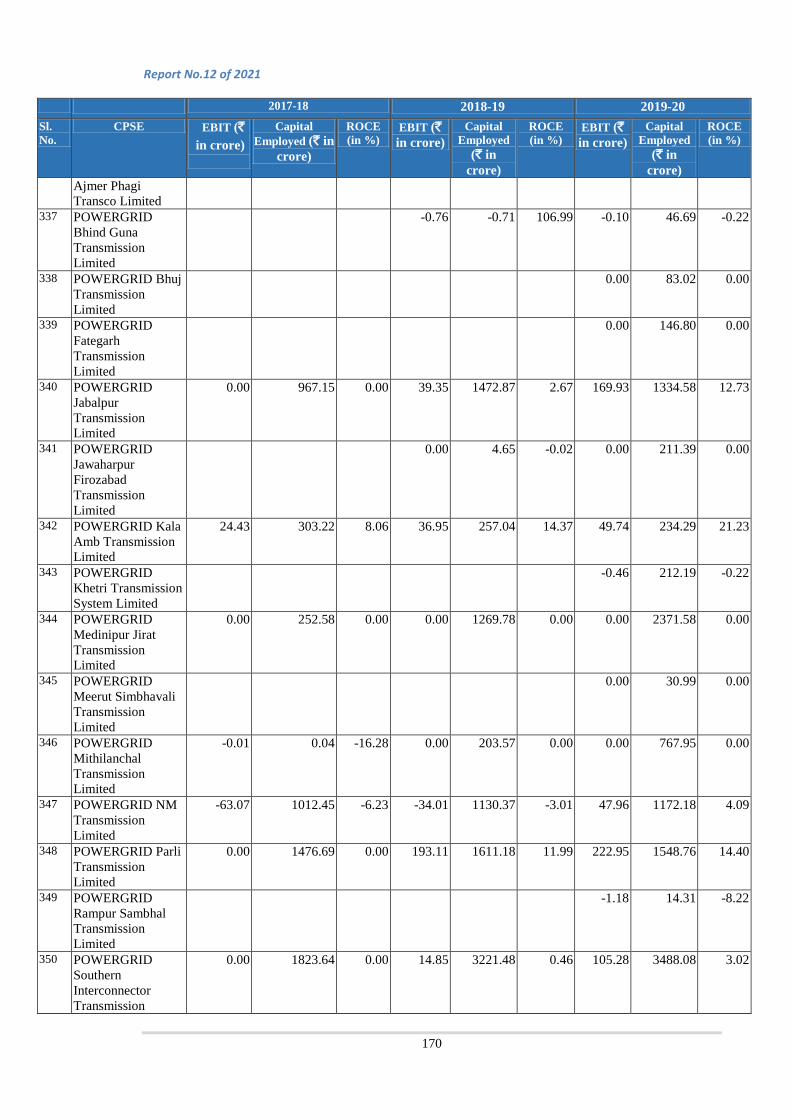
Report No.12 of 2021
170
2017-18 2018-19 2019-20 Sl. No.
CPSE EBIT (` in crore)
Capital Employed (` in
crore)
ROCE (in %)
EBIT (` in crore)
Capital Employed
(` in crore)
ROCE (in %)
EBIT (` in crore)
Capital Employed
(` in crore)
ROCE (in %)
Ajmer Phagi Transco Limited
337 POWERGRID Bhind Guna Transmission Limited
-0.76 -0.71 106.99 -0.10 46.69 -0.22
338 POWERGRID Bhuj Transmission Limited
0.00 83.02 0.00
339 POWERGRID Fategarh Transmission Limited
0.00 146.80 0.00
340 POWERGRID Jabalpur Transmission Limited
0.00 967.15 0.00 39.35 1472.87 2.67 169.93 1334.58 12.73
341 POWERGRID Jawaharpur Firozabad Transmission Limited
0.00 4.65 -0.02 0.00 211.39 0.00
342 POWERGRID Kala Amb Transmission Limited
24.43 303.22 8.06 36.95 257.04 14.37 49.74 234.29 21.23
343 POWERGRID Khetri Transmission System Limited
-0.46 212.19 -0.22
344 POWERGRID Medinipur Jirat Transmission Limited
0.00 252.58 0.00 0.00 1269.78 0.00 0.00 2371.58 0.00
345 POWERGRID Meerut Simbhavali Transmission Limited
0.00 30.99 0.00
346 POWERGRID Mithilanchal Transmission Limited
-0.01 0.04 -16.28 0.00 203.57 0.00 0.00 767.95 0.00
347 POWERGRID NM Transmission Limited
-63.07 1012.45 -6.23 -34.01 1130.37 -3.01 47.96 1172.18 4.09
348 POWERGRID Parli Transmission Limited
0.00 1476.69 0.00 193.11 1611.18 11.99 222.95 1548.76 14.40
349 POWERGRID Rampur Sambhal Transmission Limited
-1.18 14.31 -8.22
350 POWERGRID Southern Interconnector Transmission
0.00 1823.64 0.00 14.85 3221.48 0.46 105.28 3488.08 3.02

Report No. 12 of 2021
171
2017-18 2018-19 2019-20 Sl. No.
CPSE EBIT (` in crore)
Capital Employed (` in
crore)
ROCE (in %)
EBIT (` in crore)
Capital Employed
(` in crore)
ROCE (in %)
EBIT (` in crore)
Capital Employed
(` in crore)
ROCE (in %)
System Limited 351 POWERGRID
Varanasi Transmission System Limited
-0.01 0.04 -15.47 0.00 202.23 0.00 0.00 661.30 0.00
352 POWERGRID Vemagiri Transmission System Limited
-0.01 -38.82 0.02 -0.01 -38.85 0.02 -0.01 -38.85 0.02
353 POWERGRID Vizag Transmission Limited
168.51 1128.88 14.93 221.67 1211.67 18.29 239.47 767.45 31.20
354 POWERGRID Warora Transmission Limited
51.36 1834.55 2.80 185.10 1949.77 9.49 234.41 1850.86 12.67
355 Prize Petroleum Company Limited
-1.57 3.87 -40.51 5.02 12.29 40.86 -16.95 -21.64 78.34
356 Projects and Development India Limited
0.61 29.84 2.05 37.22 26.43 140.83 45.86 26.43 173.49
357 Punjab Ashok Hotel Company Limited
-0.02 2.14 -1.01 -0.01 2.09 -0.57 -0.01 2.11 -0.39
358 Punjab Logistics Infrastructure Limited
-7.15 249.04 -2.87 -5.45 233.03 -2.34 -1.79 215.74 -0.83
359 Rail Vikas Nigam Limited
564.15 5681.63 9.93 810.29 6762.95 11.98 1028.37 7995.41 12.86
360 RailTel Corporation of India Limited
204.71 1249.39 16.38 178.65 1173.93 15.22 230.44 1227.94 18.77
361 Railtel Enterprises Limited
4.51 10.00 45.10 5.20 13.54 38.41 6.75 15.34 44.00
362 Railway Energy Mangement Company Limited
46.76 163.50 28.60 53.85 186.16 28.92 53.58 198.87 26.94
363 Rajasthan Electronics and Instruments Limited
7.82 110.92 7.05 15.44 116.32 13.27 -28.05 94.09 -29.81
364 Ranchi Ashok Bihar Hotel Corporation Limited
-1.74 -6.99 24.85 -2.03 -9.63 21.03 -1.75 -11.83 14.80
365 Rashtriya Chemicals and Fertilizers Limited
190.94 3252.56 5.87 391.10 3363.01 11.63 440.75 3787.18 11.64
366 Rashtriya Ispat Nigam Limited
-973.12 13766.12 -7.07 952.50 16642.50 5.72 -2789.28 13031.55 -21.40
367 Real Estate Development & Construction Corporation of Rajasthan Limited
0.12 2.46 4.79 0.18 2.66 6.86 0.21 3.59 5.96
368 REC Power Distribution Company limited
57.66 180.07 32.02 41.01 39.94 102.70 20.87 39.94 52.25

Report No.12 of 2021
172
2017-18 2018-19 2019-20 Sl. No.
CPSE EBIT (` in crore)
Capital Employed (` in
crore)
ROCE (in %)
EBIT (` in crore)
Capital Employed
(` in crore)
ROCE (in %)
EBIT (` in crore)
Capital Employed
(` in crore)
ROCE (in %)
369 REC Transmission Projects Company Limited
47.38 13.30 356.21 32.51 13.30 244.46 70.70 112.60 62.79
370 Renewable Power Corporation of Kerala Limited
0.89 1.00 89.46 0.58 2.18 26.63 2.11 2.25 93.42
371 Richardson and Cruddas (1972) Limited
16.46 -430.94 -3.82 22.09 -678.93 -3.25 24.07 591.39 4.07
372 RITES Limited 490.76 2191.66 22.39 679.76 2383.83 28.52 825.65 2383.83 34.64 373 Rohini Heliport
Limited -0.01 -0.02 55.84
374 Rural Electrification Corporation Limited
20681.61 188076.02 11.00 23681.50 225004.83 10.52 6983.29 306401.79 2.28
375 Sagarmala Development Company Limited
4.89 214.66 2.28 9.86 343.11 2.87 8.95 540.00 1.66
376 SAIL RITES Bengal Wagon Industries Limited
3.27 7.17 45.63 17.86 70.27 25.42 24.01 71.74 33.47
377 SAIL Refractory Company Limited
21.73 52.85 41.12 31.20 55.03 56.70 20.34 56.45 36.03
378 SAIL-Bengal Alloy Castings Private Limited
-0.01 -0.02 29.71 -0.01 -0.03 26.91 -0.01 -0.03 26.91
379 Sakhigopal Integrated Power Company Limited
0.00 21.27 0.00 0.00 21.43 0.00 0.00 0.05 0.00
380 Sambhar Salts Limited
3.70 -14.99 -24.71 -3.42 -22.03 15.55 5.13 -27.30 -18.80
381 Scooters India Limited
-18.03 79.64 -22.64 -5.36 78.10 -6.87 -15.73 62.07 -25.33
382 Security Printing and Minting Corporation of India Limited
665.24 1520.69 43.75 815.18 4369.56 18.66 1057.79 4309.59 24.54
383 Sethusamudram Corporation Limited
3.27 809.04 0.40 3.64 810.92 0.45 2.60 813.34 0.32
384 Shongtong Karcham Wangtoo Transmission Limited
0.00 0.01 -23.46 0.00 0.01 0.00 -0.01 0.00 426.32
385 Sidcul Concor Infra Company Limited
-11.23 89.57 -12.54 -4.49 71.69 -6.26 -0.65 81.38 -0.80
386 SJVN Limited 1720.25 11505.17 14.95 2027.87 6077.21 33.37 2227.43 11564.76 19.26 387 SJVN Thermal
Private Limited -0.17 436.37 -0.04 0.29 436.66 0.07 -0.31 996.29 -0.03
388 Solar Energy Corporation of India
102.38 436.84 23.44 203.17 563.95 36.03 235.75 695.72 33.89
389 South Central East Delhi Power Transmission Limited
-0.01 -0.01 125.49 0.01 0.00 #DIV/0! 0.01 0.00 #DIV/0!
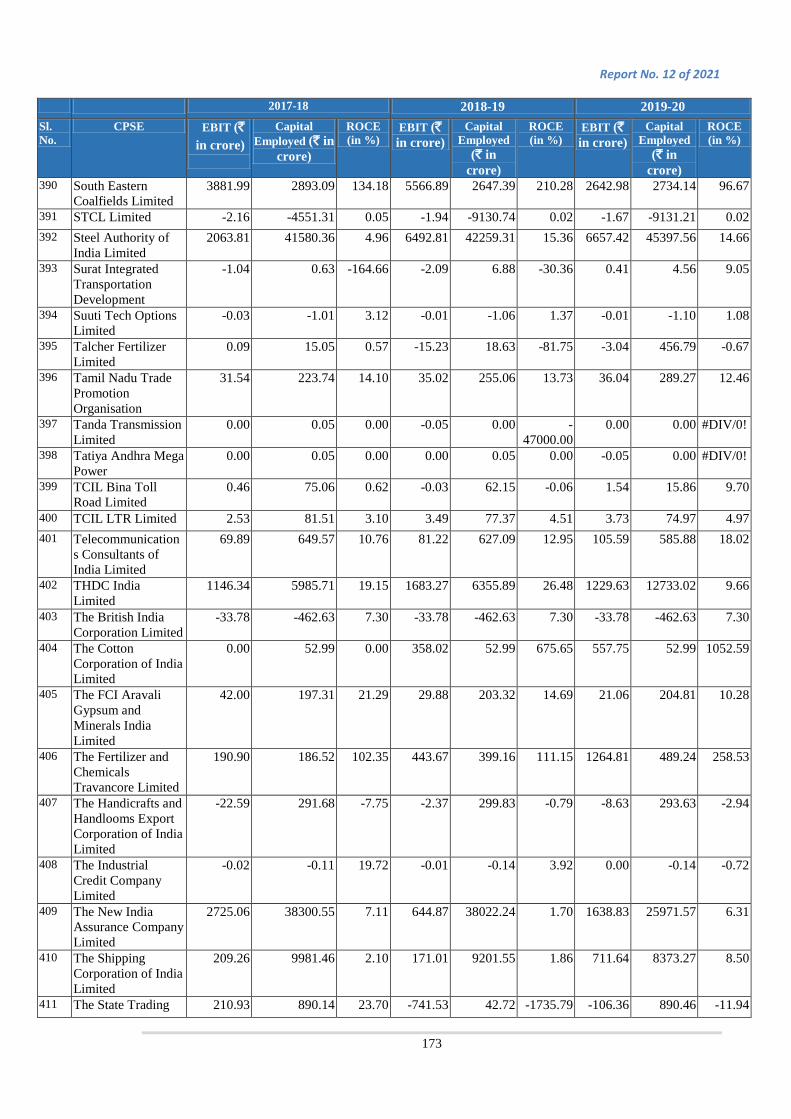
Report No. 12 of 2021
173
2017-18 2018-19 2019-20 Sl. No.
CPSE EBIT (` in crore)
Capital Employed (` in
crore)
ROCE (in %)
EBIT (` in crore)
Capital Employed
(` in crore)
ROCE (in %)
EBIT (` in crore)
Capital Employed
(` in crore)
ROCE (in %)
390 South Eastern Coalfields Limited
3881.99 2893.09 134.18 5566.89 2647.39 210.28 2642.98 2734.14 96.67
391 STCL Limited -2.16 -4551.31 0.05 -1.94 -9130.74 0.02 -1.67 -9131.21 0.02 392 Steel Authority of
India Limited 2063.81 41580.36 4.96 6492.81 42259.31 15.36 6657.42 45397.56 14.66
393 Surat Integrated Transportation Development
-1.04 0.63 -164.66 -2.09 6.88 -30.36 0.41 4.56 9.05
394 Suuti Tech Options Limited
-0.03 -1.01 3.12 -0.01 -1.06 1.37 -0.01 -1.10 1.08
395 Talcher Fertilizer Limited
0.09 15.05 0.57 -15.23 18.63 -81.75 -3.04 456.79 -0.67
396 Tamil Nadu Trade Promotion Organisation
31.54 223.74 14.10 35.02 255.06 13.73 36.04 289.27 12.46
397 Tanda Transmission Limited
0.00 0.05 0.00 -0.05 0.00 -47000.00
0.00 0.00 #DIV/0!
398 Tatiya Andhra Mega Power
0.00 0.05 0.00 0.00 0.05 0.00 -0.05 0.00 #DIV/0!
399 TCIL Bina Toll Road Limited
0.46 75.06 0.62 -0.03 62.15 -0.06 1.54 15.86 9.70
400 TCIL LTR Limited 2.53 81.51 3.10 3.49 77.37 4.51 3.73 74.97 4.97 401 Telecommunication
s Consultants of India Limited
69.89 649.57 10.76 81.22 627.09 12.95 105.59 585.88 18.02
402 THDC India Limited
1146.34 5985.71 19.15 1683.27 6355.89 26.48 1229.63 12733.02 9.66
403 The British India Corporation Limited
-33.78 -462.63 7.30 -33.78 -462.63 7.30 -33.78 -462.63 7.30
404 The Cotton Corporation of India Limited
0.00 52.99 0.00 358.02 52.99 675.65 557.75 52.99 1052.59
405 The FCI Aravali Gypsum and Minerals India Limited
42.00 197.31 21.29 29.88 203.32 14.69 21.06 204.81 10.28
406 The Fertilizer and Chemicals Travancore Limited
190.90 186.52 102.35 443.67 399.16 111.15 1264.81 489.24 258.53
407 The Handicrafts and Handlooms Export Corporation of India Limited
-22.59 291.68 -7.75 -2.37 299.83 -0.79 -8.63 293.63 -2.94
408 The Industrial Credit Company Limited
-0.02 -0.11 19.72 -0.01 -0.14 3.92 0.00 -0.14 -0.72
409 The New India Assurance Company Limited
2725.06 38300.55 7.11 644.87 38022.24 1.70 1638.83 25971.57 6.31
410 The Shipping Corporation of India Limited
209.26 9981.46 2.10 171.01 9201.55 1.86 711.64 8373.27 8.50
411 The State Trading 210.93 890.14 23.70 -741.53 42.72 -1735.79 -106.36 890.46 -11.94
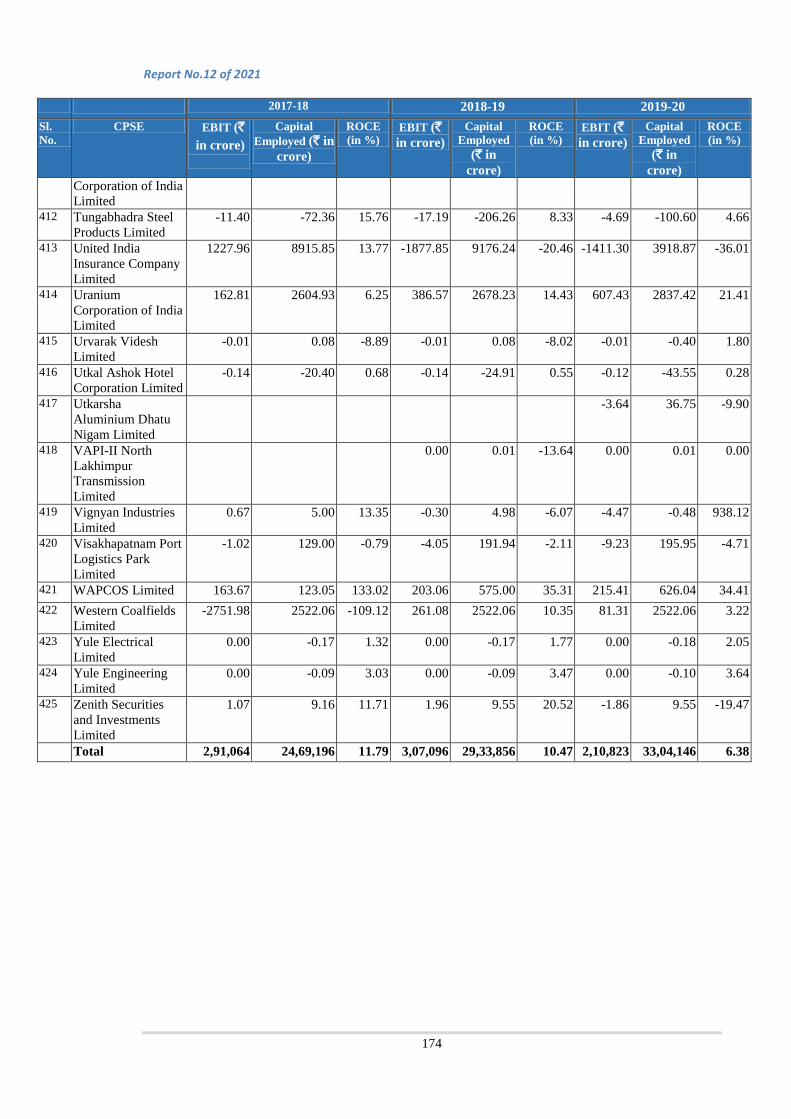
Report No.12 of 2021
174
2017-18 2018-19 2019-20 Sl. No.
CPSE EBIT (` in crore)
Capital Employed (` in
crore)
ROCE (in %)
EBIT (` in crore)
Capital Employed
(` in crore)
ROCE (in %)
EBIT (` in crore)
Capital Employed
(` in crore)
ROCE (in %)
Corporation of India Limited
412 Tungabhadra Steel Products Limited
-11.40 -72.36 15.76 -17.19 -206.26 8.33 -4.69 -100.60 4.66
413 United India Insurance Company Limited
1227.96 8915.85 13.77 -1877.85 9176.24 -20.46 -1411.30 3918.87 -36.01
414 Uranium Corporation of India Limited
162.81 2604.93 6.25 386.57 2678.23 14.43 607.43 2837.42 21.41
415 Urvarak Videsh Limited
-0.01 0.08 -8.89 -0.01 0.08 -8.02 -0.01 -0.40 1.80
416 Utkal Ashok Hotel Corporation Limited
-0.14 -20.40 0.68 -0.14 -24.91 0.55 -0.12 -43.55 0.28
417 Utkarsha Aluminium Dhatu Nigam Limited
-3.64 36.75 -9.90
418 VAPI-II North Lakhimpur Transmission Limited
0.00 0.01 -13.64 0.00 0.01 0.00
419 Vignyan Industries Limited
0.67 5.00 13.35 -0.30 4.98 -6.07 -4.47 -0.48 938.12
420 Visakhapatnam Port Logistics Park Limited
-1.02 129.00 -0.79 -4.05 191.94 -2.11 -9.23 195.95 -4.71
421 WAPCOS Limited 163.67 123.05 133.02 203.06 575.00 35.31 215.41 626.04 34.41 422 Western Coalfields
Limited -2751.98 2522.06 -109.12 261.08 2522.06 10.35 81.31 2522.06 3.22
423 Yule Electrical Limited
0.00 -0.17 1.32 0.00 -0.17 1.77 0.00 -0.18 2.05
424 Yule Engineering Limited
0.00 -0.09 3.03 0.00 -0.09 3.47 0.00 -0.10 3.64
425 Zenith Securities and Investments Limited
1.07 9.16 11.71 1.96 9.55 20.52 -1.86 9.55 -19.47
Total 2,91,064 24,69,196 11.79 3,07,096 29,33,856 10.47 2,10,823 33,04,146 6.38

Report No. 12 of 2021
175
Annexure X (As referred to in Para 1.4.3)
Return on Equity of Government companies and corporations
2017-18 2018-19 2019-20 Sl No.
CPSE Equity (` in crore)
Net Profit after Tax and Pref Dividend
(` in crore)
ROE (in %)
Equity (` in crore)
Net Profit after Tax and Pref Dividend
(` in crore)
ROE (in %)
Equity (` in crore)
Net Profit after Tax and Pref Dividend
(` in crore)
ROE (in %)
1 AAI Cargo Logistics & Allied Services Company Limited
25.00 152.40 609.62 105.43 60.89 57.76 216.04 92.37 42.75
2 Agrinnovative India Limited
64.50 1.58 2.46 66.42 1.92 2.89 69.68 2.81 4.03
3 Air India Air Transport Services Limited
138.42 62.90 45.44 348.94 67.17 19.25 337.61 66.21 19.61
4 Air India Assets Holding limited
0.00 0.00 0.00 0.05 0.00 0.76 134.07 134.02 99.96
5 Air India Engineering Services Company Limited
-1778.20 -444.44 24.99 -1983.15 -180.87 9.12 -2178.67 264.11 -12.12
6 Air India Express Limited
-886.94 262.05 -29.54 -848.65 161.59 -19.04 -440.85 412.77 -93.63
7 Air India Limited -24205.84 -5348.17 22.09 -29466.36 -8556.36 29.04 -52460.39 -7765.73 14.80
8 Airline Allied Services Limited
-1696.03 -263.76 15.55 -2000.52 -296.57 14.82 -4714.94 -200.63 4.26
9 Airports Authority of India
9029.93 2801.64 31.03 8051.13 2271.44 28.21 8692.32 1985.09 22.84

Report No.12 of 2021
176
2017-18 2018-19 2019-20 Sl No.
CPSE Equity (` in crore)
Net Profit after Tax and Pref Dividend
(` in crore)
ROE (in %)
Equity (` in crore)
Net Profit after Tax and Pref Dividend
(` in crore)
ROE (in %)
Equity (` in crore)
Net Profit after Tax and Pref Dividend
(` in crore)
ROE (in %)
10 Andaman & Nicobar Islands Forest and Plantation Development Corporation Limited
-0.75 -7.98 1067.79 -2.51 -1.76 70.20 -2.51 -1.76 70.20
11 Andaman and Nicobar Islands Integrated Development Corporation Limited
140.54 19.94 14.19 158.48 19.66 12.40 180.03 33.77 18.76
12 Andaman Fisheries Limited
-27.34 -3.52 12.87 -31.38 -4.04 12.87 -31.38 -4.04 12.87
13 Andhra Pradesh Solar Power Corporation Limited
13.15 34.18 259.95 0.10 57.57 57565.20 0.10 73.70 73704.00
14 Andrew Yule and Company Limited
97.79 19.17 19.61 97.79 8.70 8.90 161.38 -20.52 -12.72
15 Angul Sukinda Railway Limited
600.00 11.84 1.97 669.57 2.25 0.34 714.41 0.28 0.04
16 Antrix Corporation Limited
-768.34 211.51 -27.53 1085.90 180.49 16.62 1596.06 220.69 13.83
17 Anushakti Vidyut Nigam Limited
0.02 0.00 -11.79 0.02 0.00 -16.39 0.02 0.00 -11.59

Report No. 12 of 2021
177
2017-18 2018-19 2019-20 Sl No.
CPSE Equity (` in crore)
Net Profit after Tax and Pref Dividend
(` in crore)
ROE (in %)
Equity (` in crore)
Net Profit after Tax and Pref Dividend
(` in crore)
ROE (in %)
Equity (` in crore)
Net Profit after Tax and Pref Dividend
(` in crore)
ROE (in %)
18 Apollo Design Apparel Parks Limited
9.86 8.42 85.41 9.86 8.28 84.05 9.86 10.39 105.37
19 Artificial Limbs Manufacturing Corporation of India Limited
54.10 50.79 93.88 54.10 75.30 139.18 54.10 85.68 158.38
20 Aurangabad Textile and Apparel Parks Limited
15.57 -0.64 -4.13 14.82 -0.75 -5.08 14.05 -0.76 -5.42
21 Balmer Lawrie and Company Limited
470.04 184.82 39.32 1085.06 194.52 17.93 470.04 170.65 36.31
22 Balmer Lawrie Investment Company Limited
75.36 53.64 71.18 75.36 75.91 100.73 75.36 83.58 110.91
23 Bangalore Metro Rail Corporation Limited
4055.18 -351.10 -8.66 2601.62 -496.55 -19.09 3852.25 -595.67 -15.46
24 Baster Railway Private Limited
1.10 -2.41 -219.29 292.87 1.77 0.60 292.87 1.19 0.41
25 BEL Optronics Devices Limited
176.65 11.70 6.62 197.78 14.18 7.17 232.27 3.01 1.30
26 BEL-Thales Systems Limited
50.11 -2.59 -5.16 51.16 1.04 2.04 54.50 3.34 6.14
27 BEML Limited 1453.34 58.78 4.04 1448.86 50.28 3.47 1544.23 24.80 1.61 28 Bengal Chemicals
and Pharmaceuticals
-14.05 10.06 -71.56 11.20 25.26 225.44 24.27 13.07 53.84
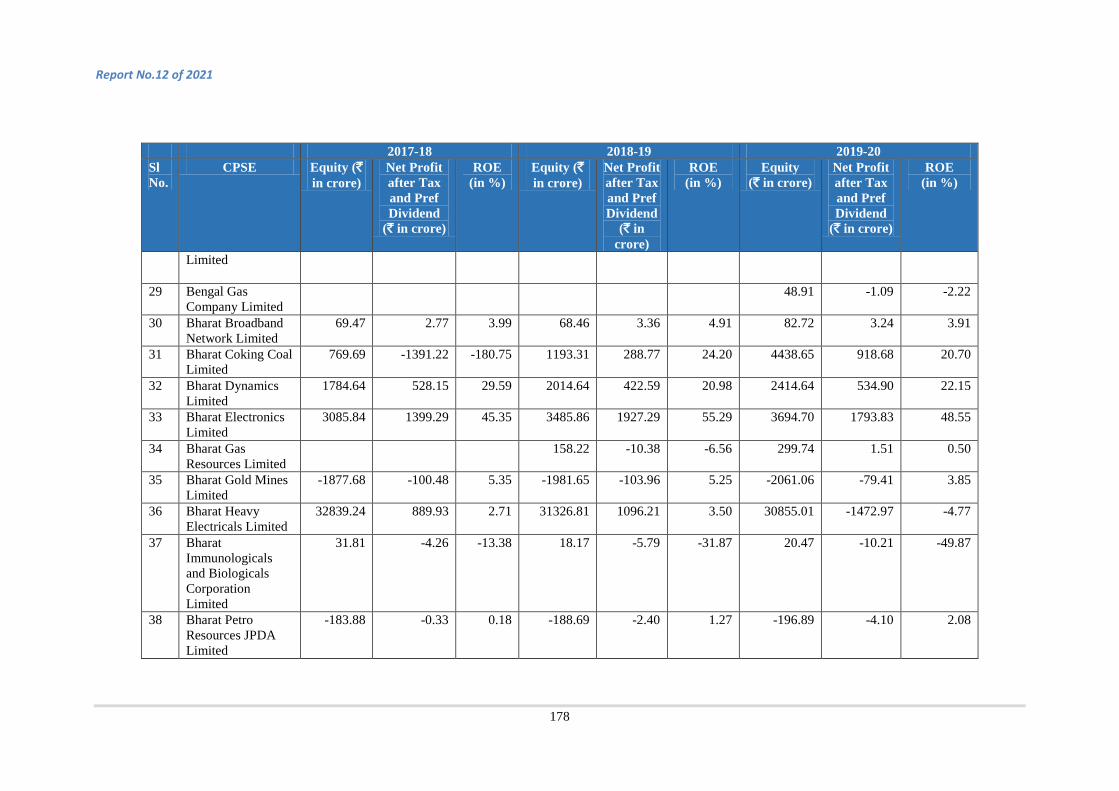
Report No.12 of 2021
178
2017-18 2018-19 2019-20 Sl No.
CPSE Equity (` in crore)
Net Profit after Tax and Pref Dividend
(` in crore)
ROE (in %)
Equity (` in crore)
Net Profit after Tax and Pref Dividend
(` in crore)
ROE (in %)
Equity (` in crore)
Net Profit after Tax and Pref Dividend
(` in crore)
ROE (in %)
Limited
29 Bengal Gas Company Limited
48.91 -1.09 -2.22
30 Bharat Broadband Network Limited
69.47 2.77 3.99 68.46 3.36 4.91 82.72 3.24 3.91
31 Bharat Coking Coal Limited
769.69 -1391.22 -180.75 1193.31 288.77 24.20 4438.65 918.68 20.70
32 Bharat Dynamics Limited
1784.64 528.15 29.59 2014.64 422.59 20.98 2414.64 534.90 22.15
33 Bharat Electronics Limited
3085.84 1399.29 45.35 3485.86 1927.29 55.29 3694.70 1793.83 48.55
34 Bharat Gas Resources Limited
158.22 -10.38 -6.56 299.74 1.51 0.50
35 Bharat Gold Mines Limited
-1877.68 -100.48 5.35 -1981.65 -103.96 5.25 -2061.06 -79.41 3.85
36 Bharat Heavy Electricals Limited
32839.24 889.93 2.71 31326.81 1096.21 3.50 30855.01 -1472.97 -4.77
37 Bharat Immunologicals and Biologicals Corporation Limited
31.81 -4.26 -13.38 18.17 -5.79 -31.87 20.47 -10.21 -49.87
38 Bharat Petro Resources JPDA Limited
-183.88 -0.33 0.18 -188.69 -2.40 1.27 -196.89 -4.10 2.08
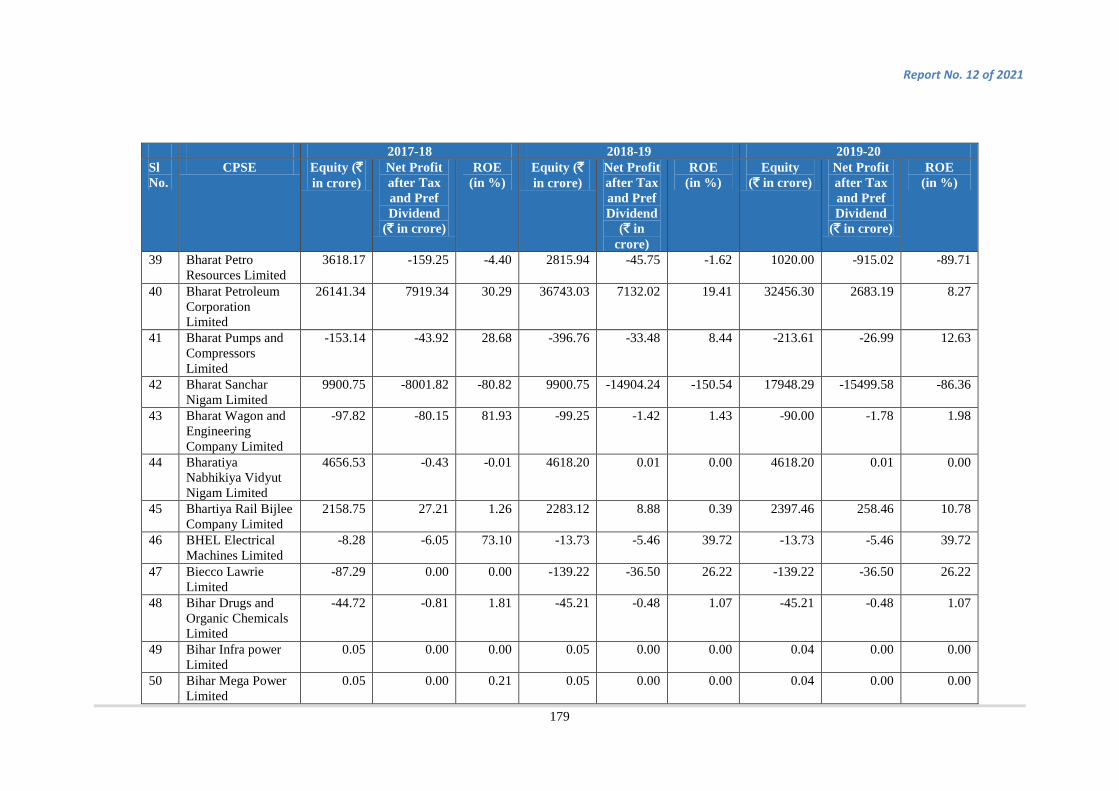
Report No. 12 of 2021
179
2017-18 2018-19 2019-20 Sl No.
CPSE Equity (` in crore)
Net Profit after Tax and Pref Dividend
(` in crore)
ROE (in %)
Equity (` in crore)
Net Profit after Tax and Pref Dividend
(` in crore)
ROE (in %)
Equity (` in crore)
Net Profit after Tax and Pref Dividend
(` in crore)
ROE (in %)
39 Bharat Petro Resources Limited
3618.17 -159.25 -4.40 2815.94 -45.75 -1.62 1020.00 -915.02 -89.71
40 Bharat Petroleum Corporation Limited
26141.34 7919.34 30.29 36743.03 7132.02 19.41 32456.30 2683.19 8.27
41 Bharat Pumps and Compressors Limited
-153.14 -43.92 28.68 -396.76 -33.48 8.44 -213.61 -26.99 12.63
42 Bharat Sanchar Nigam Limited
9900.75 -8001.82 -80.82 9900.75 -14904.24 -150.54 17948.29 -15499.58 -86.36
43 Bharat Wagon and Engineering Company Limited
-97.82 -80.15 81.93 -99.25 -1.42 1.43 -90.00 -1.78 1.98
44 Bharatiya Nabhikiya Vidyut Nigam Limited
4656.53 -0.43 -0.01 4618.20 0.01 0.00 4618.20 0.01 0.00
45 Bhartiya Rail Bijlee Company Limited
2158.75 27.21 1.26 2283.12 8.88 0.39 2397.46 258.46 10.78
46 BHEL Electrical Machines Limited
-8.28 -6.05 73.10 -13.73 -5.46 39.72 -13.73 -5.46 39.72
47 Biecco Lawrie Limited
-87.29 0.00 0.00 -139.22 -36.50 26.22 -139.22 -36.50 26.22
48 Bihar Drugs and Organic Chemicals Limited
-44.72 -0.81 1.81 -45.21 -0.48 1.07 -45.21 -0.48 1.07
49 Bihar Infra power Limited
0.05 0.00 0.00 0.05 0.00 0.00 0.04 0.00 0.00
50 Bihar Mega Power Limited
0.05 0.00 0.21 0.05 0.00 0.00 0.04 0.00 0.00

Report No.12 of 2021
180
2017-18 2018-19 2019-20 Sl No.
CPSE Equity (` in crore)
Net Profit after Tax and Pref Dividend
(` in crore)
ROE (in %)
Equity (` in crore)
Net Profit after Tax and Pref Dividend
(` in crore)
ROE (in %)
Equity (` in crore)
Net Profit after Tax and Pref Dividend
(` in crore)
ROE (in %)
51 Bijawar Vidarbha Transmission Limited
0.01 0.00 -23.46 0.01 0.00 -23.57 0.01 0.00 0.00
52 Biotechnology Industry Research Assistance Council
1.00 1.52 152.39 1.00 1.54 154.13 112.53 7.95 7.07
53 Birds Jute and Exports Limited
-126.25 -3.27 2.59 -130.59 -5.57 4.26 -135.30 -4.71 3.48
54 BPCL- KIAL Fuel Farm Private Limited
5.25 -0.82 -15.62 7.22 -1.20 -16.59 5.26 -1.97 -37.37
55 Brahmaputra Cracker and Polymer Limited
497.97 -80.39 -16.14 566.94 69.37 12.24 1417.67 1507.60 106.34
56 Brahmaputra Valley Fertilizer Corporation Limited
79.33 0.79 0.99 16.17 -63.15 -390.49 -113.53 -129.70 114.24
57 Braithwaite and Company Limited
-24.39 2.60 -10.67 63.72 7.86 12.34 83.47 19.78 23.69
58 Braithwaite Burn and Jessop Construction Company Limited
228.85 2.39 1.04 137.10 0.36 0.26 131.62 1.96 1.49
59 Bridge and Roof Company (India) Limited
321.80 16.57 5.15 362.18 33.33 9.20 307.23 31.42 10.23

Report No. 12 of 2021
181
2017-18 2018-19 2019-20 Sl No.
CPSE Equity (` in crore)
Net Profit after Tax and Pref Dividend
(` in crore)
ROE (in %)
Equity (` in crore)
Net Profit after Tax and Pref Dividend
(` in crore)
ROE (in %)
Equity (` in crore)
Net Profit after Tax and Pref Dividend
(` in crore)
ROE (in %)
60 Broadcast Engineering Consultants India Limited
5.55 -4.28 -77.02 12.39 0.05 0.37 12.40 -4.85 -39.15
61 BSNL Tower Corporation Limited
-2.77 -2.77 100.06 -2.80 -0.03 1.21
62 Bundelkhand Sour Urja Limited
3.46 -0.15 -4.22 4.00 -0.20 -4.93 5.00 -0.17 -3.43
63 Burn Standard Company Limited
619.43 -22.86 -3.69 619.43 192.52 31.08 619.43 0.47 0.08
64 Cement Corporation of India Limited
22.95 17.99 78.39 28.85 6.35 22.01 -1160.08 -50.94 4.39
65 Central Coalfields Limited
3008.48 789.54 26.24 3093.70 1704.47 55.09 3186.09 1847.75 57.99
66 Central Cottage Industries Corporation Limited
4.51 -21.76 -482.67 -5.09 -5.39 105.82 -5.09 -5.39 105.82
67 Central Electronics Limited
72.30 21.71 30.02 69.22 1.69 2.44 70.87 3.13 4.41
68 Central Mine Planning and Design Institute Limited
42.12 80.83 191.90 50.78 173.27 341.22 60.45 193.39 319.92
69 Central Registry of Securitisation Asset Reconstruction and
49.00 238.58 486.89 49.00 70.65 144.18 739.56 85.77 11.60

Report No.12 of 2021
182
2017-18 2018-19 2019-20 Sl No.
CPSE Equity (` in crore)
Net Profit after Tax and Pref Dividend
(` in crore)
ROE (in %)
Equity (` in crore)
Net Profit after Tax and Pref Dividend
(` in crore)
ROE (in %)
Equity (` in crore)
Net Profit after Tax and Pref Dividend
(` in crore)
ROE (in %)
Security Interest of India
70 Central Warehousing Corporation
1923.23 56.82 2.95 2032.36 163.61 8.05 2365.73 372.32 15.74
71 Certification Engineers International Limited
75.15 12.45 16.57 76.74 9.36 12.20 78.35 10.08 12.87
72 Chandigarh Industrial and Tourism Development Corporation Limited
15.97 -16.51 -103.36 18.38 -0.05 -0.25 18.38 -0.05 -0.25
73 Chandil Transmission Limited
-1.70 -1.75 102.94 -2.14 -0.44 20.41
74 Chennai Metro Rail Limited
4802.23 -229.64 -4.78 5041.43 -714.75 -14.18 5100.08 -525.20 -10.30
75 Chennai Petroleum Corporation Limited
3685.85 912.93 24.77 3728.06 -213.36 -5.72 3688.41 -2077.58 -56.33
76 Cheyyur Infra Limited
0.05 0.00 0.00 0.05 0.00 0.00 0.04 0.00 0.00
77 Chhatisgarh Surguja Power Limited
0.05 0.00 0.00 0.05 0.00 0.00 0.00 -0.05 1983.33

Report No. 12 of 2021
183
2017-18 2018-19 2019-20 Sl No.
CPSE Equity (` in crore)
Net Profit after Tax and Pref Dividend
(` in crore)
ROE (in %)
Equity (` in crore)
Net Profit after Tax and Pref Dividend
(` in crore)
ROE (in %)
Equity (` in crore)
Net Profit after Tax and Pref Dividend
(` in crore)
ROE (in %)
78 Chhattisgarh Copper Limited
0.00 -0.25 -11804.76 -0.04 -0.04 105.62
79 Chhattisgarh East Railway Limited
305.43 -0.16 -0.05 440.29 -0.15 -0.03 539.27 -22.48 -4.17
80 Chhattisgarh East West Railway Limited
503.59 -0.15 -0.03 503.47 -0.12 -0.02 503.36 -0.11 -0.02
81 Chhattisgarh Mega Steel Limited
0.03 -0.01 -31.53 0.02 -0.01 -56.91 -0.02 -0.01 40.67
82 Coal India Limited 10445.46 9293.42 88.97 10411.41 10469.67 100.56 10411.41 11280.88 108.35 83 Coastal Karnataka
Power Limited 0.05 0.00 0.00 0.05 0.00 0.00 0.00 -0.05 0.00
84 Coastal Maharashtra Mega Power Limited
0.05 0.00 0.14 0.05 0.00 0.00 0.00 -0.05 0.00
85 Coastal Tamilnadu Power Limited
0.05 0.00 0.00 0.05 0.00 0.00 0.08 0.00 0.00
86 Cochin Shipyard Limited
3134.09 396.75 12.66 3205.90 481.18 15.01 3605.62 637.69 17.69
87 Concor Air Limited 36.65 0.12 0.33 36.65 0.04 0.10 36.84 7.20 19.55 88 Container
Corporation of India Limited
243.72 1049.04 430.43 1452.48 1215.41 83.68 10064.74 375.78 3.73
89 Creative Museum Designers
0.00 4.25 0.00 0.00 2.45 0.00 0.00 2.94 0.00
90 Cross Border Power Transmission Company Limited
48.51 12.95 26.70 48.51 15.23 31.39 88.50 21.47 24.26

Report No.12 of 2021
184
2017-18 2018-19 2019-20 Sl No.
CPSE Equity (` in crore)
Net Profit after Tax and Pref Dividend
(` in crore)
ROE (in %)
Equity (` in crore)
Net Profit after Tax and Pref Dividend
(` in crore)
ROE (in %)
Equity (` in crore)
Net Profit after Tax and Pref Dividend
(` in crore)
ROE (in %)
91 CSC WiFi Choupal Services India Private Limited
26.34 12.26 46.57
92 Dadra & Nager Haveli, Daman and Diu SC/ST Financial and Development Corporation Limited
6.52 -0.03 -0.52 5.83 0.83 14.18 9.94 1.33 13.38
93 Damodar Valley Corporation
9323.42 -847.33 -9.09 9108.48 -1115.08 -12.24 8352.64 185.32 2.22
94 Dedicated Freight Corridor Corporation Limited
11020.87 18.19 0.17 11274.37 24.53 0.22 14256.29 -90.52 -0.63
95 Defence Innovation Organisation
0.01 0.00 0.00 0.01 0.00 0.00
96 Delhi Metro Last Mile Services Limited
0.00 -0.01 -669.23 -0.01 -0.01 124.53
97 Delhi Metro Rail Corporation Limited
19438.12 -93.14 -0.48 19526.25 -462.24 -2.37 20421.56 -468.27 -2.29
98 Delhi Police Housing Corporation Limited
11.17 0.45 4.00 11.73 0.56 4.79 12.33 0.60 4.87
99 Deoghar Infra Limited
0.05 0.00 0.00 0.05 0.00 0.00 0.04 0.00 0.00
100 Deoghar Mega Power Limited
0.05 0.00 0.00 0.05 0.00 0.00 0.04 0.00 0.00

Report No. 12 of 2021
185
2017-18 2018-19 2019-20 Sl No.
CPSE Equity (` in crore)
Net Profit after Tax and Pref Dividend
(` in crore)
ROE (in %)
Equity (` in crore)
Net Profit after Tax and Pref Dividend
(` in crore)
ROE (in %)
Equity (` in crore)
Net Profit after Tax and Pref Dividend
(` in crore)
ROE (in %)
101 Dholera International Airport Company Limited
151.51 7.39 4.88
102 Dinchang Transmission Limited
0.05 0.00 0.00 -0.49 0.49 -100.00 -0.05 0.00 0.00
103 Diu Smart City Limited
2.05 -0.09 -4.44
104 DNH Power Distribution Corporation Limited
91.72 -12.46 -13.59 91.72 13.54 14.77 530.28 11.40 2.15
105 Dumka Transmission Limited
-1.66 -1.71 103.02 -2.08 -0.43 20.52
106 Eastern Coalfields Limited
-523.52 -931.17 177.87 1960.43 827.98 42.23 2715.59 997.65 36.74
107 Eastern Investments Limited
10.16 0.35 3.44 10.16 -0.02 -0.22 10.16 -0.56 -5.54
108 ECGC Limited 3737.11 74.29 1.99 4391.08 244.38 5.57 5514.92 323.84 5.87
109 EdCIL (India) Limited
26.10 35.95 137.78 28.65 30.08 104.97 32.75 40.92 124.97
110 Electronics Corporation of India Limited
875.11 52.72 6.02 183.94 242.51 131.84 183.94 50.43 27.42
111 Engineering Projects (India) Limited
56.57 0.14 0.24 56.57 -33.03 -58.38 56.57 0.92 1.63
112 Engineers India 2236.47 377.87 16.90 2243.31 322.68 14.38 2347.77 430.24 18.33

Report No.12 of 2021
186
2017-18 2018-19 2019-20 Sl No.
CPSE Equity (` in crore)
Net Profit after Tax and Pref Dividend
(` in crore)
ROE (in %)
Equity (` in crore)
Net Profit after Tax and Pref Dividend
(` in crore)
ROE (in %)
Equity (` in crore)
Net Profit after Tax and Pref Dividend
(` in crore)
ROE (in %)
Limited 113 FACT RCF
Building Products Limited
-158.69 -9.52 6.00 -178.35 -2.71 1.52 -123.08 -71.49 58.08
114 Ferro Scrap Nigam Limited
185.89 8.07 4.34 199.89 26.69 13.35 216.79 30.58 14.10
115 Fertilizer Corporation of India Limited
398.82 113.95 28.57 543.67 164.78 30.31 581.63 52.77 9.07
116 Food Corporation of India
2835.21 0.00 0.00 3398.18 0.00 0.00 3398.18 0.00 0.00
117 Fresh and Healthy Enterprises Limited
-17.69 -10.62 60.03 7.08 -26.03 -367.66 36.80 -6.45 -17.53
118 GAIL (India) Limited
6506.28 4618.41 70.98 7108.85 6025.67 84.76 39175.59 6620.63 16.90
119 Gail Gas Limited 1239.54 61.94 5.00 1420.48 80.94 5.70 1707.85 156.25 9.15 120 Garden Reach
Shipbuilders and Engineers Limited
919.84 86.80 9.44 1005.88 109.94 10.93 175.20 163.48 93.31
121 General Insurance Corporation of India
17968.66 3233.58 18.00 20792.91 1040.09 5.00 19006.17 -359.09 -1.89
122 Ghogarpalli Integerated Power Company Limited
0.05 0.00 0.00 0.05 0.00 0.00 0.05 0.00 0.00
123 Goa Antibiotics and Pharmaceuticals Limited
11.10 1.14 10.27 12.72 50.57 397.46 0.80 -5.43 -678.65
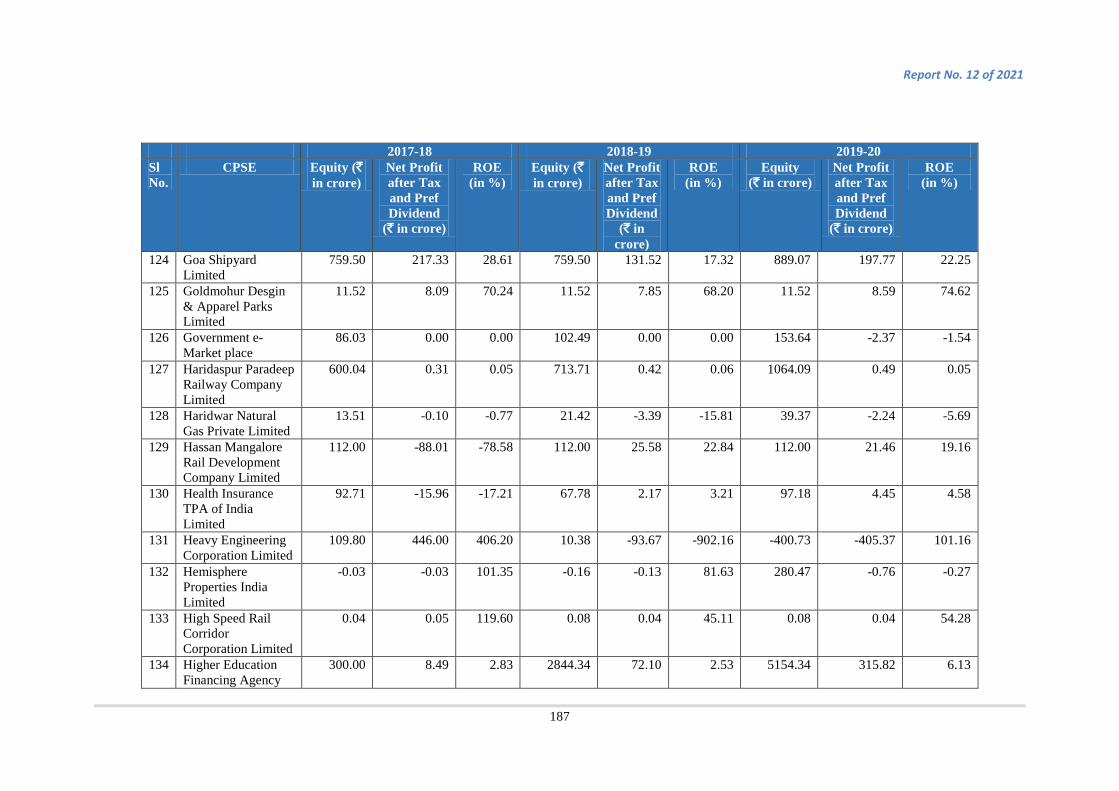
Report No. 12 of 2021
187
2017-18 2018-19 2019-20 Sl No.
CPSE Equity (` in crore)
Net Profit after Tax and Pref Dividend
(` in crore)
ROE (in %)
Equity (` in crore)
Net Profit after Tax and Pref Dividend
(` in crore)
ROE (in %)
Equity (` in crore)
Net Profit after Tax and Pref Dividend
(` in crore)
ROE (in %)
124 Goa Shipyard Limited
759.50 217.33 28.61 759.50 131.52 17.32 889.07 197.77 22.25
125 Goldmohur Desgin & Apparel Parks Limited
11.52 8.09 70.24 11.52 7.85 68.20 11.52 8.59 74.62
126 Government e- Market place
86.03 0.00 0.00 102.49 0.00 0.00 153.64 -2.37 -1.54
127 Haridaspur Paradeep Railway Company Limited
600.04 0.31 0.05 713.71 0.42 0.06 1064.09 0.49 0.05
128 Haridwar Natural Gas Private Limited
13.51 -0.10 -0.77 21.42 -3.39 -15.81 39.37 -2.24 -5.69
129 Hassan Mangalore Rail Development Company Limited
112.00 -88.01 -78.58 112.00 25.58 22.84 112.00 21.46 19.16
130 Health Insurance TPA of India Limited
92.71 -15.96 -17.21 67.78 2.17 3.21 97.18 4.45 4.58
131 Heavy Engineering Corporation Limited
109.80 446.00 406.20 10.38 -93.67 -902.16 -400.73 -405.37 101.16
132 Hemisphere Properties India Limited
-0.03 -0.03 101.35 -0.16 -0.13 81.63 280.47 -0.76 -0.27
133 High Speed Rail Corridor Corporation Limited
0.04 0.05 119.60 0.08 0.04 45.11 0.08 0.04 54.28
134 Higher Education Financing Agency
300.00 8.49 2.83 2844.34 72.10 2.53 5154.34 315.82 6.13
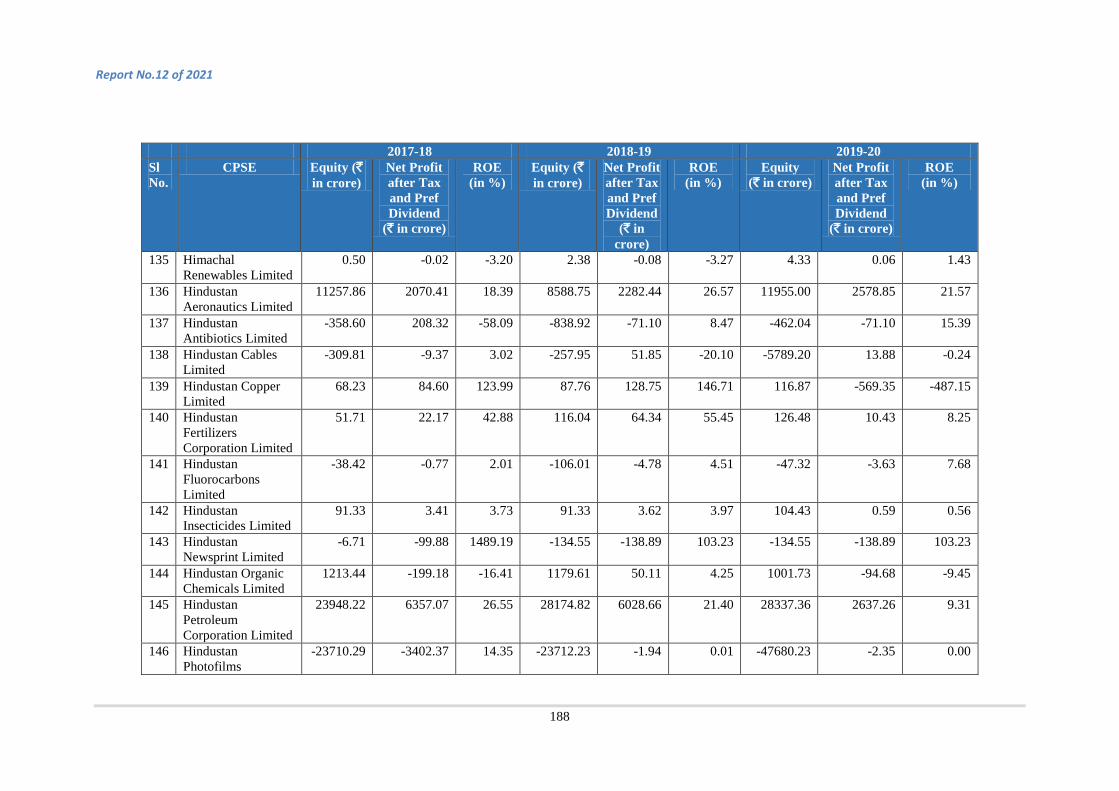
Report No.12 of 2021
188
2017-18 2018-19 2019-20 Sl No.
CPSE Equity (` in crore)
Net Profit after Tax and Pref Dividend
(` in crore)
ROE (in %)
Equity (` in crore)
Net Profit after Tax and Pref Dividend
(` in crore)
ROE (in %)
Equity (` in crore)
Net Profit after Tax and Pref Dividend
(` in crore)
ROE (in %)
135 Himachal Renewables Limited
0.50 -0.02 -3.20 2.38 -0.08 -3.27 4.33 0.06 1.43
136 Hindustan Aeronautics Limited
11257.86 2070.41 18.39 8588.75 2282.44 26.57 11955.00 2578.85 21.57
137 Hindustan Antibiotics Limited
-358.60 208.32 -58.09 -838.92 -71.10 8.47 -462.04 -71.10 15.39
138 Hindustan Cables Limited
-309.81 -9.37 3.02 -257.95 51.85 -20.10 -5789.20 13.88 -0.24
139 Hindustan Copper Limited
68.23 84.60 123.99 87.76 128.75 146.71 116.87 -569.35 -487.15
140 Hindustan Fertilizers Corporation Limited
51.71 22.17 42.88 116.04 64.34 55.45 126.48 10.43 8.25
141 Hindustan Fluorocarbons Limited
-38.42 -0.77 2.01 -106.01 -4.78 4.51 -47.32 -3.63 7.68
142 Hindustan Insecticides Limited
91.33 3.41 3.73 91.33 3.62 3.97 104.43 0.59 0.56
143 Hindustan Newsprint Limited
-6.71 -99.88 1489.19 -134.55 -138.89 103.23 -134.55 -138.89 103.23
144 Hindustan Organic Chemicals Limited
1213.44 -199.18 -16.41 1179.61 50.11 4.25 1001.73 -94.68 -9.45
145 Hindustan Petroleum Corporation Limited
23948.22 6357.07 26.55 28174.82 6028.66 21.40 28337.36 2637.26 9.31
146 Hindustan Photofilms
-23710.29 -3402.37 14.35 -23712.23 -1.94 0.01 -47680.23 -2.35 0.00
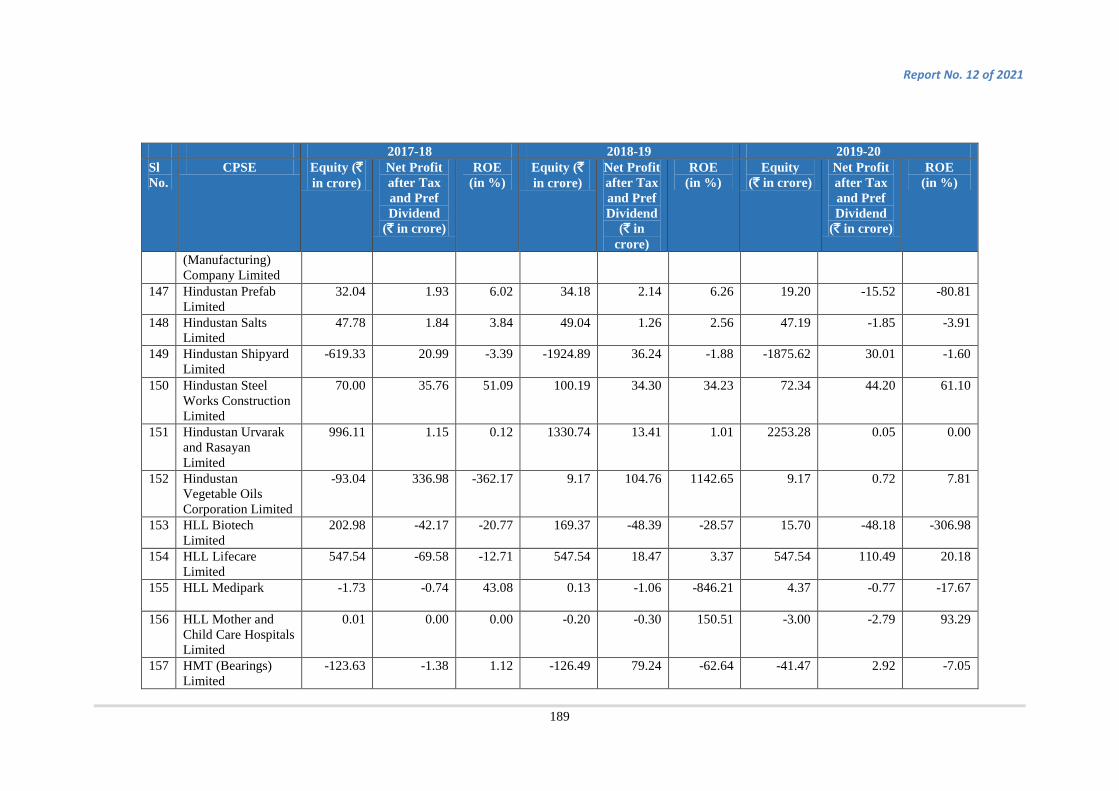
Report No. 12 of 2021
189
2017-18 2018-19 2019-20 Sl No.
CPSE Equity (` in crore)
Net Profit after Tax and Pref Dividend
(` in crore)
ROE (in %)
Equity (` in crore)
Net Profit after Tax and Pref Dividend
(` in crore)
ROE (in %)
Equity (` in crore)
Net Profit after Tax and Pref Dividend
(` in crore)
ROE (in %)
(Manufacturing) Company Limited
147 Hindustan Prefab Limited
32.04 1.93 6.02 34.18 2.14 6.26 19.20 -15.52 -80.81
148 Hindustan Salts Limited
47.78 1.84 3.84 49.04 1.26 2.56 47.19 -1.85 -3.91
149 Hindustan Shipyard Limited
-619.33 20.99 -3.39 -1924.89 36.24 -1.88 -1875.62 30.01 -1.60
150 Hindustan Steel Works Construction Limited
70.00 35.76 51.09 100.19 34.30 34.23 72.34 44.20 61.10
151 Hindustan Urvarak and Rasayan Limited
996.11 1.15 0.12 1330.74 13.41 1.01 2253.28 0.05 0.00
152 Hindustan Vegetable Oils Corporation Limited
-93.04 336.98 -362.17 9.17 104.76 1142.65 9.17 0.72 7.81
153 HLL Biotech Limited
202.98 -42.17 -20.77 169.37 -48.39 -28.57 15.70 -48.18 -306.98
154 HLL Lifecare Limited
547.54 -69.58 -12.71 547.54 18.47 3.37 547.54 110.49 20.18
155 HLL Medipark -1.73 -0.74 43.08 0.13 -1.06 -846.21 4.37 -0.77 -17.67
156 HLL Mother and Child Care Hospitals Limited
0.01 0.00 0.00 -0.20 -0.30 150.51 -3.00 -2.79 93.29
157 HMT (Bearings) Limited
-123.63 -1.38 1.12 -126.49 79.24 -62.64 -41.47 2.92 -7.05

Report No.12 of 2021
190
2017-18 2018-19 2019-20 Sl No.
CPSE Equity (` in crore)
Net Profit after Tax and Pref Dividend
(` in crore)
ROE (in %)
Equity (` in crore)
Net Profit after Tax and Pref Dividend
(` in crore)
ROE (in %)
Equity (` in crore)
Net Profit after Tax and Pref Dividend
(` in crore)
ROE (in %)
158 HMT (International) Limited
32.46 0.14 0.42 32.28 1.51 4.68 33.62 2.71 8.07
159 HMT Chinar Watches Limited
-589.14 0.01 0.00 -589.14 0.01 0.00 -589.14 0.01 0.00
160 HMT Limited 234.82 -2.05 -0.87 -121.17 16.92 -13.97 490.13 248.18 50.64
161 HMT Machine Tools Limited
-1207.64 -129.25 10.70 -2909.61 -63.83 2.19 -1408.05 -98.72 7.01
162 HMT Watches Limited
-2808.27 -8.49 0.30 -5380.46 121.28 -2.25 -2686.03 0.96 -0.04
163 Hooghly Cochin Shipyard Limited
21.63 -0.37 -1.71 20.30 -1.33 -6.56 17.81 -2.49 -13.97
164 Hooghly Printing Company Limited
-2.69 -3.54 131.69 -5.75 -1.82 31.58 -11.12 -1.16 10.41
165 Hoogly Dock and Port Engineers Limited
-104.53 9.71 -9.29 -256.70 -9.33 3.63 -256.70 -9.33 3.63
166 Hotel Corporation of India Limited
-277.03 -55.29 19.96 -367.44 -71.20 19.38 -432.99 -55.55 12.83
167 Housing and Urban Development Corporation Limited
3285.73 799.06 24.32 7702.17 1175.69 15.26 3406.98 1708.42 50.14
168 HPCL Bio Fuels Limited
-39.09 -77.85 199.16 44.63 -67.55 -151.35 -34.50 -85.55 247.96
169 HPCL Rajasthan Refinery Limited
233.66 -19.36 -8.29 1189.26 7.40 0.62 1742.87 1.81 0.10
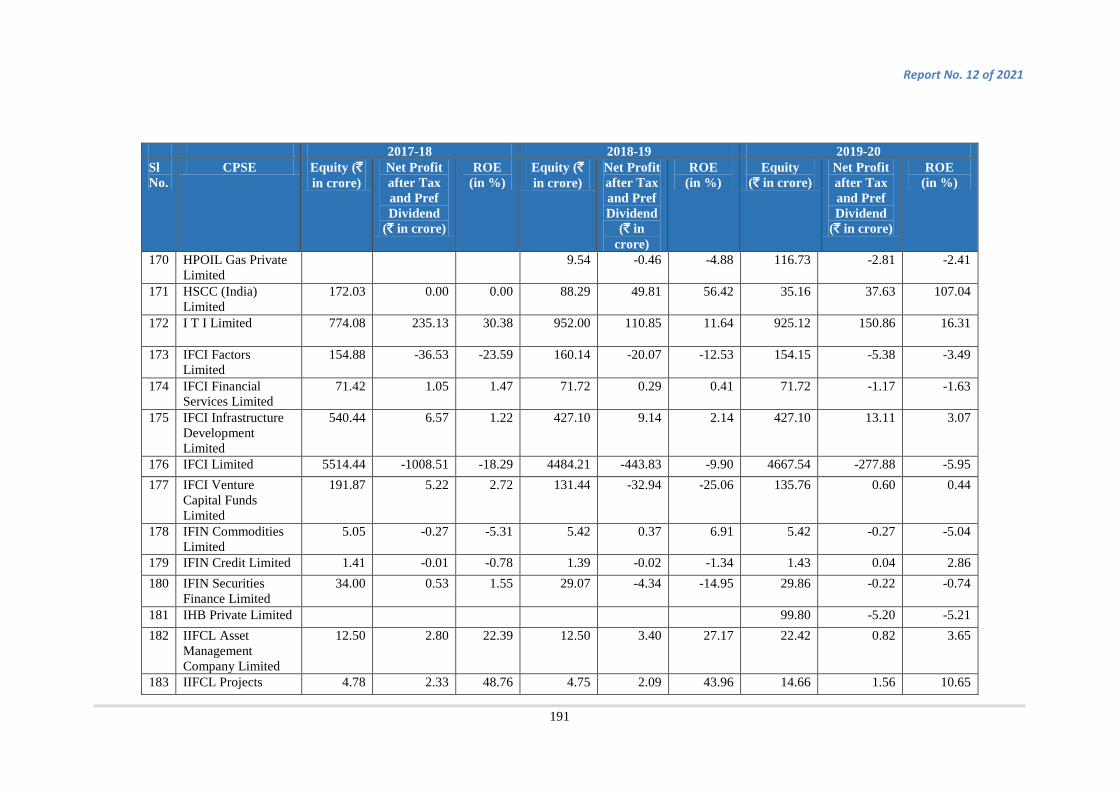
Report No. 12 of 2021
191
2017-18 2018-19 2019-20 Sl No.
CPSE Equity (` in crore)
Net Profit after Tax and Pref Dividend
(` in crore)
ROE (in %)
Equity (` in crore)
Net Profit after Tax and Pref Dividend
(` in crore)
ROE (in %)
Equity (` in crore)
Net Profit after Tax and Pref Dividend
(` in crore)
ROE (in %)
170 HPOIL Gas Private Limited
9.54 -0.46 -4.88 116.73 -2.81 -2.41
171 HSCC (India) Limited
172.03 0.00 0.00 88.29 49.81 56.42 35.16 37.63 107.04
172 I T I Limited 774.08 235.13 30.38 952.00 110.85 11.64 925.12 150.86 16.31
173 IFCI Factors Limited
154.88 -36.53 -23.59 160.14 -20.07 -12.53 154.15 -5.38 -3.49
174 IFCI Financial Services Limited
71.42 1.05 1.47 71.72 0.29 0.41 71.72 -1.17 -1.63
175 IFCI Infrastructure Development Limited
540.44 6.57 1.22 427.10 9.14 2.14 427.10 13.11 3.07
176 IFCI Limited 5514.44 -1008.51 -18.29 4484.21 -443.83 -9.90 4667.54 -277.88 -5.95 177 IFCI Venture
Capital Funds Limited
191.87 5.22 2.72 131.44 -32.94 -25.06 135.76 0.60 0.44
178 IFIN Commodities Limited
5.05 -0.27 -5.31 5.42 0.37 6.91 5.42 -0.27 -5.04
179 IFIN Credit Limited 1.41 -0.01 -0.78 1.39 -0.02 -1.34 1.43 0.04 2.86 180 IFIN Securities
Finance Limited 34.00 0.53 1.55 29.07 -4.34 -14.95 29.86 -0.22 -0.74
181 IHB Private Limited 99.80 -5.20 -5.21 182 IIFCL Asset
Management Company Limited
12.50 2.80 22.39 12.50 3.40 27.17 22.42 0.82 3.65
183 IIFCL Projects 4.78 2.33 48.76 4.75 2.09 43.96 14.66 1.56 10.65

Report No.12 of 2021
192
2017-18 2018-19 2019-20 Sl No.
CPSE Equity (` in crore)
Net Profit after Tax and Pref Dividend
(` in crore)
ROE (in %)
Equity (` in crore)
Net Profit after Tax and Pref Dividend
(` in crore)
ROE (in %)
Equity (` in crore)
Net Profit after Tax and Pref Dividend
(` in crore)
ROE (in %)
Limited 184 India Infrastructure
Finance Company Limited
4102.32 -1154.61 -28.15 4202.32 101.66 2.42 9999.92 50.92 0.51
185 India International Convention and Exhibition Centre Limited
497.45 -2.55 -0.51 1194.99 4.14 0.35 1859.44 5.91 0.32
186 India Post Payment Bank Limited
799.31 -0.98 -0.12 613.01 -165.10 -26.93 613.92 -334.01 -54.41
187 India Renewable Energy Development Agency Limited
1526.79 393.20 25.75 1847.05 244.13 13.22 1747.57 214.55 12.28
188 India Tourism Development Corporation Limited
275.46 19.14 6.95 304.11 42.16 13.86 302.68 26.12 8.63
189 India Trade Promotion Organisation
1819.26 134.62 7.40 1950.92 73.35 3.76 2032.50 87.21 4.29
190 India United Textile Mills Limited
140.86 7.83 5.56 140.86 8.23 5.84 140.89 10.08 7.15
191 Indian Catalyst Private Limited
6.46 -0.01 -0.09 6.45 -0.01 -0.08 6.45 -0.01 -0.08
192 Indian Medicines and Pharmaceuticals Corporation Limited
69.15 7.66 11.08 74.59 5.58 7.48 51.98 0.45 0.87

Report No. 12 of 2021
193
2017-18 2018-19 2019-20 Sl No.
CPSE Equity (` in crore)
Net Profit after Tax and Pref Dividend
(` in crore)
ROE (in %)
Equity (` in crore)
Net Profit after Tax and Pref Dividend
(` in crore)
ROE (in %)
Equity (` in crore)
Net Profit after Tax and Pref Dividend
(` in crore)
ROE (in %)
193 Indian Oil Corporation Limited
88987.90 21346.12 23.99 89009.63 16894.15 18.98 84401.04 1313.23 1.56
194 Indian Railway Catering and Tourism Corporation Limited
459.92 222.02 48.27 1067.02 303.58 28.45 1072.13 527.46 49.20
195 Indian Railway Finance Corporation Limited
8266.25 2007.31 24.28 12420.00 2254.75 18.15 29289.98 3692.42 12.61
196 Indian Railway Station Development Corporation Limited
40.00 1.14 2.85 63.09 10.06 15.94 94.54 3.07 3.25
197 Indian Rare Earths Limited
168.37 82.11 48.77 168.37 114.44 67.97 168.48 251.74 149.42
198 Indian Strategic Petroleum Reserves Limited
3519.42 -59.97 -1.70 3542.66 -67.17 -1.90 3441.03 -101.60 -2.95
199 Indian Vaccines Company Limited
-0.76 -1.53 201.21 -2.77 -0.48 17.33 -1.78 -0.45 24.95
200 Indo-Russian Helicopters Limited
9.55 -0.45 -4.75 9.05 -0.50 -5.47 8.71 -0.34 -3.89
201 Indradhanush Gas Grid Limited
12.88 -12.12 -94.13 30.45 -5.31 -17.44
202 Indraprastha Gas Limited
443.50 670.77 151.24 443.50 786.67 177.38 443.50 1136.54 256.27
203 Inland Coastal Shipping Limited
-0.05 0.00 3.04 -0.05 0.00 -0.35 -0.05 0.00 1.71

Report No.12 of 2021
194
2017-18 2018-19 2019-20 Sl No.
CPSE Equity (` in crore)
Net Profit after Tax and Pref Dividend
(` in crore)
ROE (in %)
Equity (` in crore)
Net Profit after Tax and Pref Dividend
(` in crore)
ROE (in %)
Equity (` in crore)
Net Profit after Tax and Pref Dividend
(` in crore)
ROE (in %)
204 Instrumentation Limited
-1269.21 -15.66 1.23 -1269.21 -15.66 1.23 -1269.21 -15.66 1.23
205 Ircon Davangere Haveri Highway Limited
0.68 0.63 92.65 104.05 2.14 2.06 166.82 0.77 0.46
206 IRCON Infrastructure Limited
128.35 8.29 6.46 142.38 14.03 9.85 153.89 11.51 7.48
207 IRCON International Limited
3427.76 390.86 11.40 3432.69 436.89 12.73 3949.55 489.79 12.40
208 IRCON PB Tollway Limited
165.00 0.83 0.50 165.00 -2.12 -1.29 149.62 -17.18 -11.48
209 IRCON Shiv Puri Guna Limited
148.53 -0.07 -0.04 87.28 -30.63 -35.09 25.64 -30.82 -120.23
210 IRCON Vadodara Kim Expressway Limited
6.00 0.05 0.83 135.77 0.24 0.18
211 IREL IDCOL Limited
0.00 0.00 0.00 0.22 -0.03 -13.07 0.08 -0.02 -18.93
212 J&K Development Finance Corporation Limited
80.41 6.24 7.76 80.42 6.38 7.94 80.42 6.13 7.63
213 J&K Mineral Development Corporation Limited
14.62 1.41 9.64 13.88 -0.74 -5.33 10.08 -3.80 -37.65
214 Jharkhand Central Railway Limited
49.33 -0.03 -0.05 55.00 1.17 2.13 55.10 1.33 2.42

Report No. 12 of 2021
195
2017-18 2018-19 2019-20 Sl No.
CPSE Equity (` in crore)
Net Profit after Tax and Pref Dividend
(` in crore)
ROE (in %)
Equity (` in crore)
Net Profit after Tax and Pref Dividend
(` in crore)
ROE (in %)
Equity (` in crore)
Net Profit after Tax and Pref Dividend
(` in crore)
ROE (in %)
215 Jharkhand Infra Power Limited
0.05 0.00 0.00 0.05 0.00 0.00 0.05 0.00 0.00
216 Jharkhand Kolhan Steel Limited
-0.03 -0.03 92.49 -0.03 -0.04 155.20 -0.03 -0.01 36.80
217 Jharkhand National Mineral Development Corporation Limited
-0.05 -0.01 16.67 -0.06 -0.01 19.23 -0.07 -0.01 12.25
218 Jute Corporation of India Limited
5.00 17.68 353.64 124.90 10.52 8.42 147.70 15.40 10.42
219 Kanti Bijlee Utpadan Nigam Limited
1182.68 -181.09 -15.31 1356.42 98.74 7.28 1561.01 103.98 6.66
220 Karnataka Antibiotics and Pharmaceuticals Limited
149.67 14.55 9.72 174.16 15.82 9.08 193.87 22.99 11.86
221 Karnataka Trade Promotion Organisation
112.47 19.95 17.74 130.39 6.99 5.36 137.38 2.68 1.95
222 Karnataka Vijaynagar Steel Limited
-0.02 -0.01 36.10 -0.05 -0.12 239.28 -0.54 -0.49 90.68
223 Karur Transmission Limited
0.00 -0.01 -117.39
224 Kerala GAIL Gas Limited
23.86 1.23 5.17 0.01 0.51 5059.00 0.01 0.07 744.00
225 KIOCL Limited 2084.78 81.48 3.91 1981.37 111.86 5.65 1847.30 43.48 2.35

Report No.12 of 2021
196
2017-18 2018-19 2019-20 Sl No.
CPSE Equity (` in crore)
Net Profit after Tax and Pref Dividend
(` in crore)
ROE (in %)
Equity (` in crore)
Net Profit after Tax and Pref Dividend
(` in crore)
ROE (in %)
Equity (` in crore)
Net Profit after Tax and Pref Dividend
(` in crore)
ROE (in %)
226 Kochi Metro Rail Limited
1507.46 -167.34 -11.10 2916.85 -281.23 -9.64 3125.78 -309.80 -9.91
227 Koderma Transmission Limited
-1.50 -1.55 103.33 -1.91 -0.41 21.38
228 Kolkata Metro Rail Corporation Limited
1403.00 11.52 0.82 1422.04 -34.97 -2.46 1204.12 -236.92 -19.68
229 Konkan Railway Corporation Limited
1831.28 125.82 6.87 2068.09 101.88 4.93 1911.31 5.96 0.31
230 Kopal Narendra Transmission Limited
0.00 -0.01 -117.39
231 Kumarkruppa Frontier Hotels Private Limited
16.76 8.92 53.25 16.76 10.48 62.51 17.32 9.23 53.31
232 Lakshadweep Development Corporation Limited
223.46 35.55 15.91 259.14 39.02 15.06 6.50 37.78 580.82
233 Lanco Teesta Hydro Power Limited
920.50 -2955.75 -321.10
234 Loktak Down Stream Hydroelectric Corporation Limited
136.44 0.64 0.47 137.08 0.39 0.28 143.17 0.10 0.07
235 Madras Fertilizers Limited
-479.64 -61.96 12.92 -562.88 -83.24 14.79 -618.50 -134.88 21.81
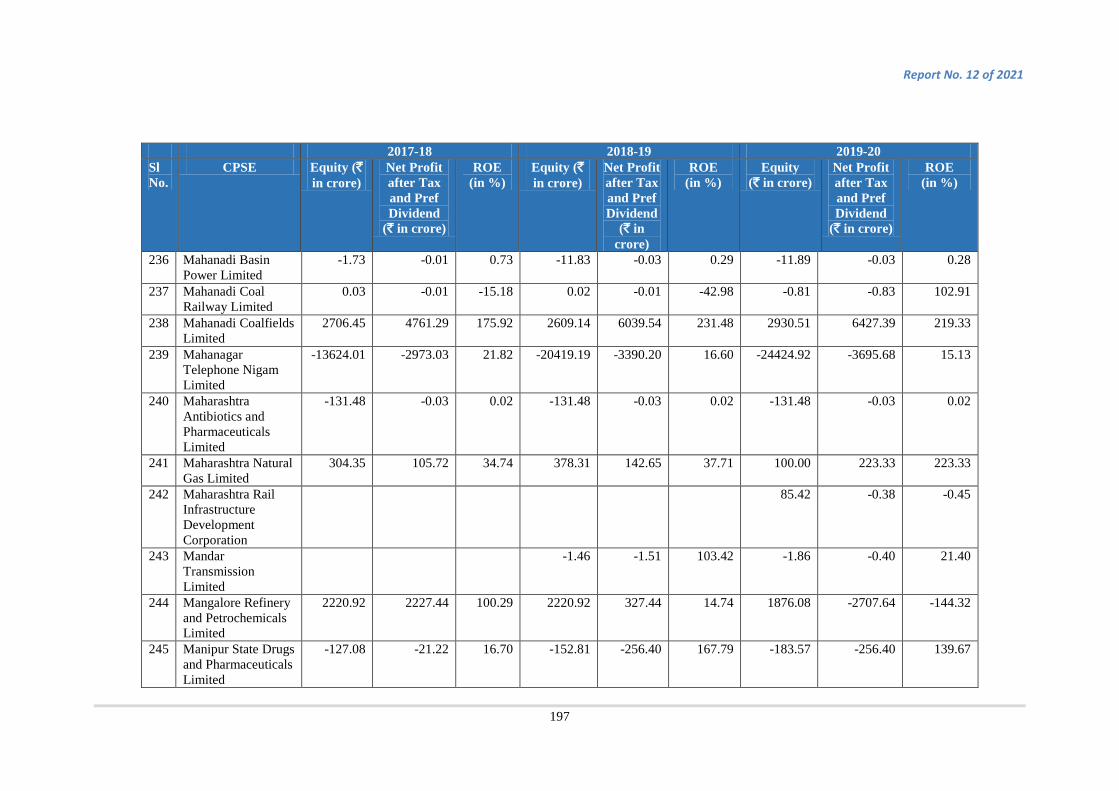
Report No. 12 of 2021
197
2017-18 2018-19 2019-20 Sl No.
CPSE Equity (` in crore)
Net Profit after Tax and Pref Dividend
(` in crore)
ROE (in %)
Equity (` in crore)
Net Profit after Tax and Pref Dividend
(` in crore)
ROE (in %)
Equity (` in crore)
Net Profit after Tax and Pref Dividend
(` in crore)
ROE (in %)
236 Mahanadi Basin Power Limited
-1.73 -0.01 0.73 -11.83 -0.03 0.29 -11.89 -0.03 0.28
237 Mahanadi Coal Railway Limited
0.03 -0.01 -15.18 0.02 -0.01 -42.98 -0.81 -0.83 102.91
238 Mahanadi Coalfields Limited
2706.45 4761.29 175.92 2609.14 6039.54 231.48 2930.51 6427.39 219.33
239 Mahanagar Telephone Nigam Limited
-13624.01 -2973.03 21.82 -20419.19 -3390.20 16.60 -24424.92 -3695.68 15.13
240 Maharashtra Antibiotics and Pharmaceuticals Limited
-131.48 -0.03 0.02 -131.48 -0.03 0.02 -131.48 -0.03 0.02
241 Maharashtra Natural Gas Limited
304.35 105.72 34.74 378.31 142.65 37.71 100.00 223.33 223.33
242 Maharashtra Rail Infrastructure Development Corporation
85.42 -0.38 -0.45
243 Mandar Transmission Limited
-1.46 -1.51 103.42 -1.86 -0.40 21.40
244 Mangalore Refinery and Petrochemicals Limited
2220.92 2227.44 100.29 2220.92 327.44 14.74 1876.08 -2707.64 -144.32
245 Manipur State Drugs and Pharmaceuticals Limited
-127.08 -21.22 16.70 -152.81 -256.40 167.79 -183.57 -256.40 139.67

Report No.12 of 2021
198
2017-18 2018-19 2019-20 Sl No.
CPSE Equity (` in crore)
Net Profit after Tax and Pref Dividend
(` in crore)
ROE (in %)
Equity (` in crore)
Net Profit after Tax and Pref Dividend
(` in crore)
ROE (in %)
Equity (` in crore)
Net Profit after Tax and Pref Dividend
(` in crore)
ROE (in %)
246 Mazagon Dock Limited
1982.60 439.80 22.18 2187.62 519.40 23.74 2445.75 415.02 16.97
247 MECON Limited 138.66 58.00 41.83 138.66 13.74 9.91 202.02 69.00 34.16 248 Meja Urja Nigam
Private Limited 2418.66 -0.19 -0.01 2571.65 -2.15 -0.08 2657.27 -607.68 -22.87
249 Millenium Telecom Limited
2.95 0.53 17.84 5.74 0.64 11.16 2.95 0.26 8.71
250 Mineral Exploration Corporation Limited
119.55 93.77 78.44 119.55 97.40 81.47 420.91 146.13 34.72
251 Mishra Dhatu Nigam Limited
778.10 130.30 16.75 828.10 130.56 15.77 893.10 159.73 17.89
252 MJSJ Coal Limited 93.07 0.00 0.00 94.09 0.00 0.00 74.48 -19.61 -26.33 253 MMTC Limited 726.63 48.84 6.72 1410.47 81.43 5.77 1434.91 -259.42 -18.08 254 MNH Shakti
Limited 84.06 0.00 0.00 84.58 0.00 0.00 85.10 1.41 1.66
255 MOIL Limited 2703.54 398.55 14.74 2973.54 454.32 15.28 2650.95 248.22 9.36 256 MSTC Limited 35.20 76.63 217.70 208.08 -324.47 -155.93 279.83 75.20 26.87 257 Mumbai Metro Rail
Corporation Limited 589.85 -33.04 -5.60 2290.76 4.24 0.19 3383.15 -20.19 -0.60
258 Mumbai Rail Vikas Corporation Limited
228.97 1.62 0.71 210.38 35.87 17.05 224.74 19.60 8.72
259 Nabinagar Power Generating Company Private Limited
3517.80 -0.10 0.00 3987.16 -3.21 -0.08 4417.01 85.11 1.93
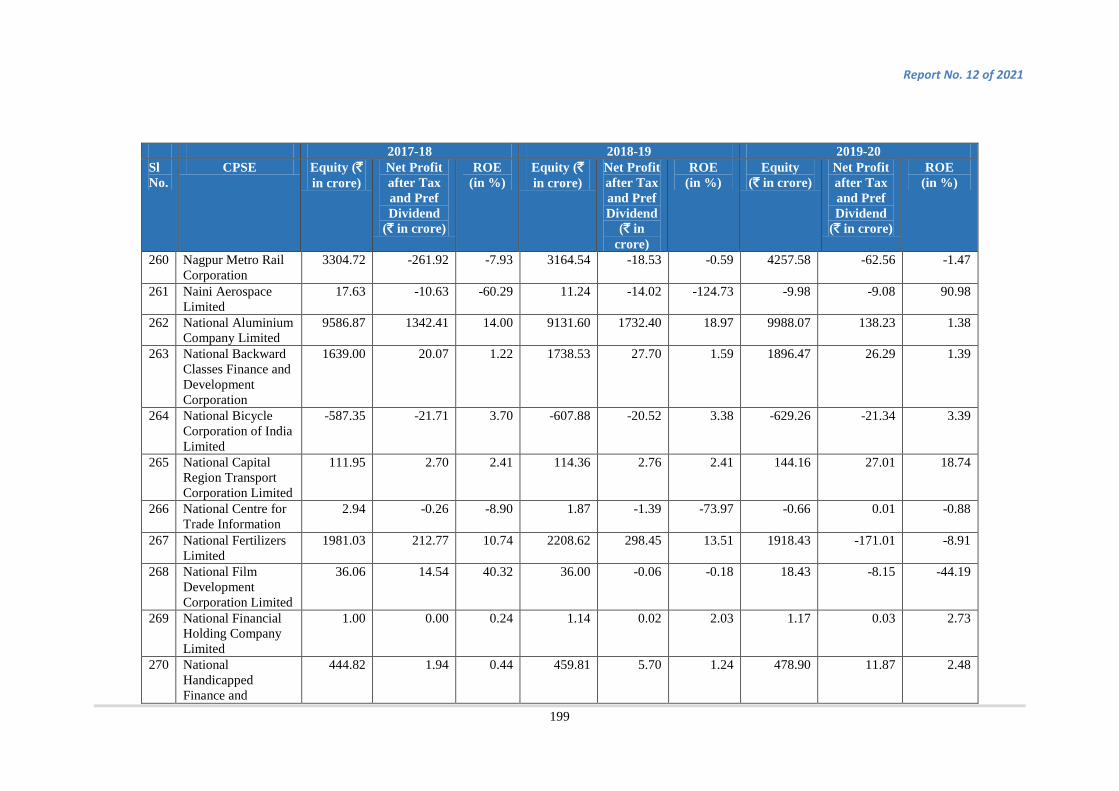
Report No. 12 of 2021
199
2017-18 2018-19 2019-20 Sl No.
CPSE Equity (` in crore)
Net Profit after Tax and Pref Dividend
(` in crore)
ROE (in %)
Equity (` in crore)
Net Profit after Tax and Pref Dividend
(` in crore)
ROE (in %)
Equity (` in crore)
Net Profit after Tax and Pref Dividend
(` in crore)
ROE (in %)
260 Nagpur Metro Rail Corporation
3304.72 -261.92 -7.93 3164.54 -18.53 -0.59 4257.58 -62.56 -1.47
261 Naini Aerospace Limited
17.63 -10.63 -60.29 11.24 -14.02 -124.73 -9.98 -9.08 90.98
262 National Aluminium Company Limited
9586.87 1342.41 14.00 9131.60 1732.40 18.97 9988.07 138.23 1.38
263 National Backward Classes Finance and Development Corporation
1639.00 20.07 1.22 1738.53 27.70 1.59 1896.47 26.29 1.39
264 National Bicycle Corporation of India Limited
-587.35 -21.71 3.70 -607.88 -20.52 3.38 -629.26 -21.34 3.39
265 National Capital Region Transport Corporation Limited
111.95 2.70 2.41 114.36 2.76 2.41 144.16 27.01 18.74
266 National Centre for Trade Information
2.94 -0.26 -8.90 1.87 -1.39 -73.97 -0.66 0.01 -0.88
267 National Fertilizers Limited
1981.03 212.77 10.74 2208.62 298.45 13.51 1918.43 -171.01 -8.91
268 National Film Development Corporation Limited
36.06 14.54 40.32 36.00 -0.06 -0.18 18.43 -8.15 -44.19
269 National Financial Holding Company Limited
1.00 0.00 0.24 1.14 0.02 2.03 1.17 0.03 2.73
270 National Handicapped Finance and
444.82 1.94 0.44 459.81 5.70 1.24 478.90 11.87 2.48
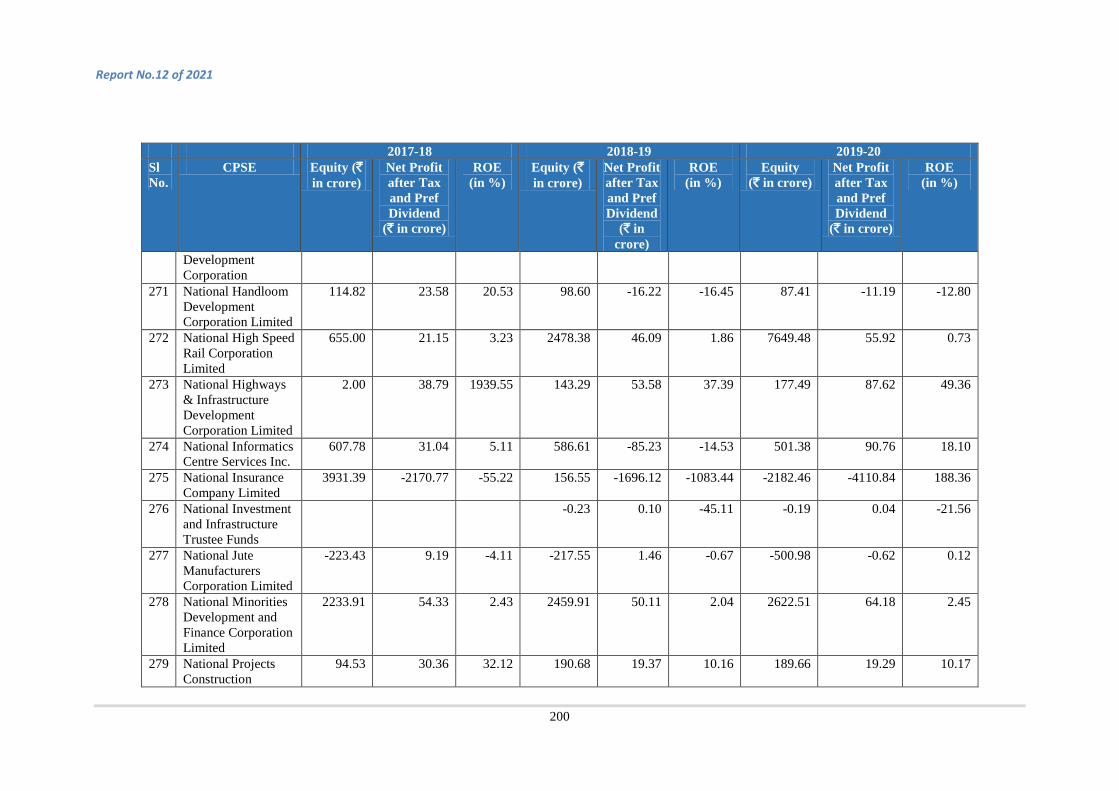
Report No.12 of 2021
200
2017-18 2018-19 2019-20 Sl No.
CPSE Equity (` in crore)
Net Profit after Tax and Pref Dividend
(` in crore)
ROE (in %)
Equity (` in crore)
Net Profit after Tax and Pref Dividend
(` in crore)
ROE (in %)
Equity (` in crore)
Net Profit after Tax and Pref Dividend
(` in crore)
ROE (in %)
Development Corporation
271 National Handloom Development Corporation Limited
114.82 23.58 20.53 98.60 -16.22 -16.45 87.41 -11.19 -12.80
272 National High Speed Rail Corporation Limited
655.00 21.15 3.23 2478.38 46.09 1.86 7649.48 55.92 0.73
273 National Highways & Infrastructure Development Corporation Limited
2.00 38.79 1939.55 143.29 53.58 37.39 177.49 87.62 49.36
274 National Informatics Centre Services Inc.
607.78 31.04 5.11 586.61 -85.23 -14.53 501.38 90.76 18.10
275 National Insurance Company Limited
3931.39 -2170.77 -55.22 156.55 -1696.12 -1083.44 -2182.46 -4110.84 188.36
276 National Investment and Infrastructure Trustee Funds
-0.23 0.10 -45.11 -0.19 0.04 -21.56
277 National Jute Manufacturers Corporation Limited
-223.43 9.19 -4.11 -217.55 1.46 -0.67 -500.98 -0.62 0.12
278 National Minorities Development and Finance Corporation Limited
2233.91 54.33 2.43 2459.91 50.11 2.04 2622.51 64.18 2.45
279 National Projects Construction
94.53 30.36 32.12 190.68 19.37 10.16 189.66 19.29 10.17

Report No. 12 of 2021
201
2017-18 2018-19 2019-20 Sl No.
CPSE Equity (` in crore)
Net Profit after Tax and Pref Dividend
(` in crore)
ROE (in %)
Equity (` in crore)
Net Profit after Tax and Pref Dividend
(` in crore)
ROE (in %)
Equity (` in crore)
Net Profit after Tax and Pref Dividend
(` in crore)
ROE (in %)
Corporation Limited 280 National Research
Development Corporation of India Limited
4.42 0.32 7.18 9.44 0.01 0.11 9.44 -0.17 -1.83
281 National Safai Karmachari Finance and Development Corporation
695.66 18.04 2.59 747.05 21.39 2.86 780.63 -1.41 -0.18
282 National Scheduled Castes Finance and Development Corporation
1782.46 48.62 2.73 1965.95 51.27 2.61 2032.35 60.98 3.00
283 National Scheduled Tribes Finance and Development Corporation
881.10 25.50 2.89 966.22 28.45 2.94 1049.78 37.52 3.57
284 National Seeds Corporation Limited
592.21 24.98 4.22 584.16 41.32 7.07 57.32 29.92 52.20
285 National Small Industries Corporation Limited
532.99 99.41 18.65 532.99 18.90 3.55 532.99 99.19 18.61
286 National Textile Corporation Limited
5585.50 -306.94 -5.50 5353.95 -314.65 -5.88 5353.95 -314.65 -5.88
287 NBCC (India) Limited
180.00 333.61 185.34 541.24 384.11 70.97 547.25 79.87 14.59
288 NBCC Engineering & Consultancy
-1.34 -2.09 155.62 -2.87 -1.53 53.31 -4.12 -1.25 30.33

Report No.12 of 2021
202
2017-18 2018-19 2019-20 Sl No.
CPSE Equity (` in crore)
Net Profit after Tax and Pref Dividend
(` in crore)
ROE (in %)
Equity (` in crore)
Net Profit after Tax and Pref Dividend
(` in crore)
ROE (in %)
Equity (` in crore)
Net Profit after Tax and Pref Dividend
(` in crore)
ROE (in %)
Limited 289 NBCC Environment
Engineering Limited 0.97 -0.03 -3.49 0.98 0.01 1.50 1.00 0.02 2.42
290 NBCC International Limited
0.96 -0.04 -3.81 0.98 0.02 1.55 1.00 0.03 2.82
291 NBCC Services Limited
7.80 6.97 89.36 2.00 8.63 431.54 2.00 4.13 206.49
292 NEPA Limited -19.29 30.12 -156.16 -47.54 -77.79 163.63 62.16 -71.26 -114.64 293 NESL E-
Infrastructure Limited
1.00 0.02 2.00 1.01 -0.01 -0.99 1.05 0.05 4.76
294 New City of Bombay Manufacturing Mills Limited
66.35 -0.34 -0.51 66.35 -1.33 -2.01 15.84 -1.29 -8.13
295 New Space India Limited
10.00 51.29 512.95
296 Neyveli Uttar Pradesh Power Limited
902.40 0.00 0.00 1690.75 -0.28 -0.02 3039.16 -1.28 -0.04
297 NHDC Limited 2207.01 553.66 25.09 5276.08 490.72 9.30 5409.38 919.97 17.01 298 NHPC Limited 17110.27 2764.53 16.16 19876.13 2618.14 13.17 15860.56 3007.17 18.96 299 NLC India Limited 10627.36 1848.78 17.40 11569.30 1266.97 10.95 11658.86 1413.85 12.13 300 NMDC CSR
Foundation Limited 2.00 9.83 491.74 2.00 -2.92 -146.11
301 NMDC Limited 23290.18 3805.88 16.34 25903.81 4641.98 17.92 25773.25 3610.12 14.01
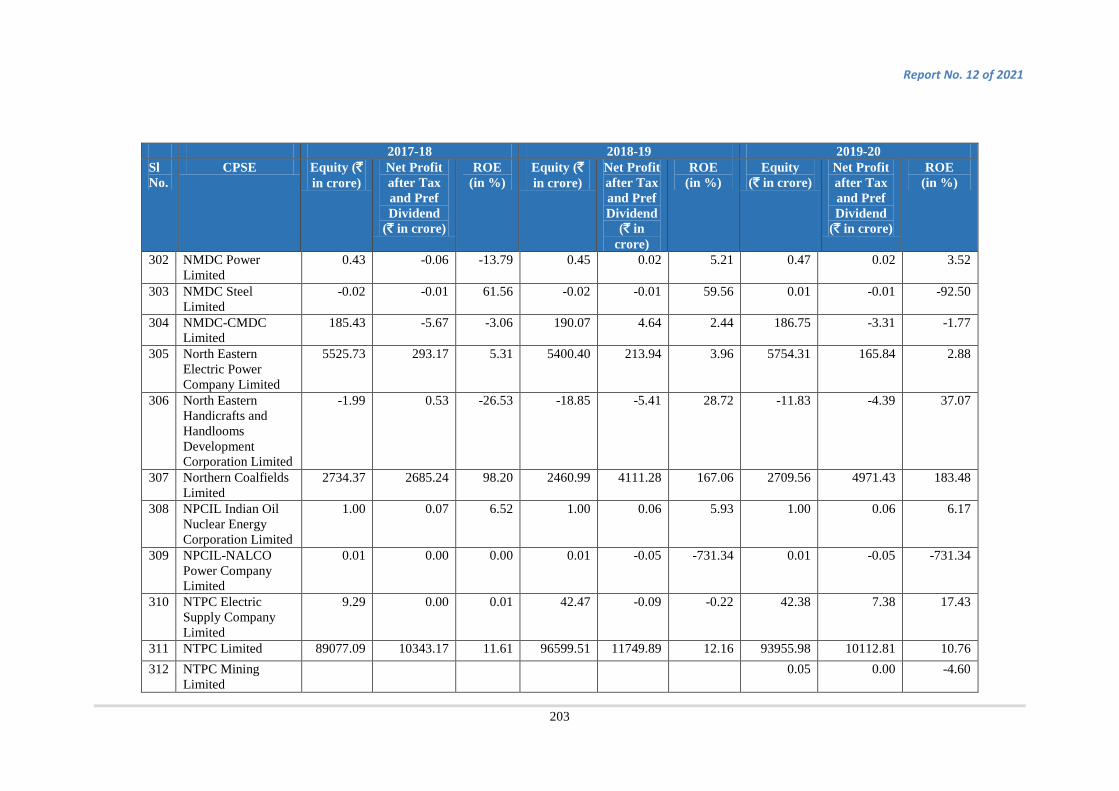
Report No. 12 of 2021
203
2017-18 2018-19 2019-20 Sl No.
CPSE Equity (` in crore)
Net Profit after Tax and Pref Dividend
(` in crore)
ROE (in %)
Equity (` in crore)
Net Profit after Tax and Pref Dividend
(` in crore)
ROE (in %)
Equity (` in crore)
Net Profit after Tax and Pref Dividend
(` in crore)
ROE (in %)
302 NMDC Power Limited
0.43 -0.06 -13.79 0.45 0.02 5.21 0.47 0.02 3.52
303 NMDC Steel Limited
-0.02 -0.01 61.56 -0.02 -0.01 59.56 0.01 -0.01 -92.50
304 NMDC-CMDC Limited
185.43 -5.67 -3.06 190.07 4.64 2.44 186.75 -3.31 -1.77
305 North Eastern Electric Power Company Limited
5525.73 293.17 5.31 5400.40 213.94 3.96 5754.31 165.84 2.88
306 North Eastern Handicrafts and Handlooms Development Corporation Limited
-1.99 0.53 -26.53 -18.85 -5.41 28.72 -11.83 -4.39 37.07
307 Northern Coalfields Limited
2734.37 2685.24 98.20 2460.99 4111.28 167.06 2709.56 4971.43 183.48
308 NPCIL Indian Oil Nuclear Energy Corporation Limited
1.00 0.07 6.52 1.00 0.06 5.93 1.00 0.06 6.17
309 NPCIL-NALCO Power Company Limited
0.01 0.00 0.00 0.01 -0.05 -731.34 0.01 -0.05 -731.34
310 NTPC Electric Supply Company Limited
9.29 0.00 0.01 42.47 -0.09 -0.22 42.38 7.38 17.43
311 NTPC Limited 89077.09 10343.17 11.61 96599.51 11749.89 12.16 93955.98 10112.81 10.76 312 NTPC Mining
Limited 0.05 0.00 -4.60
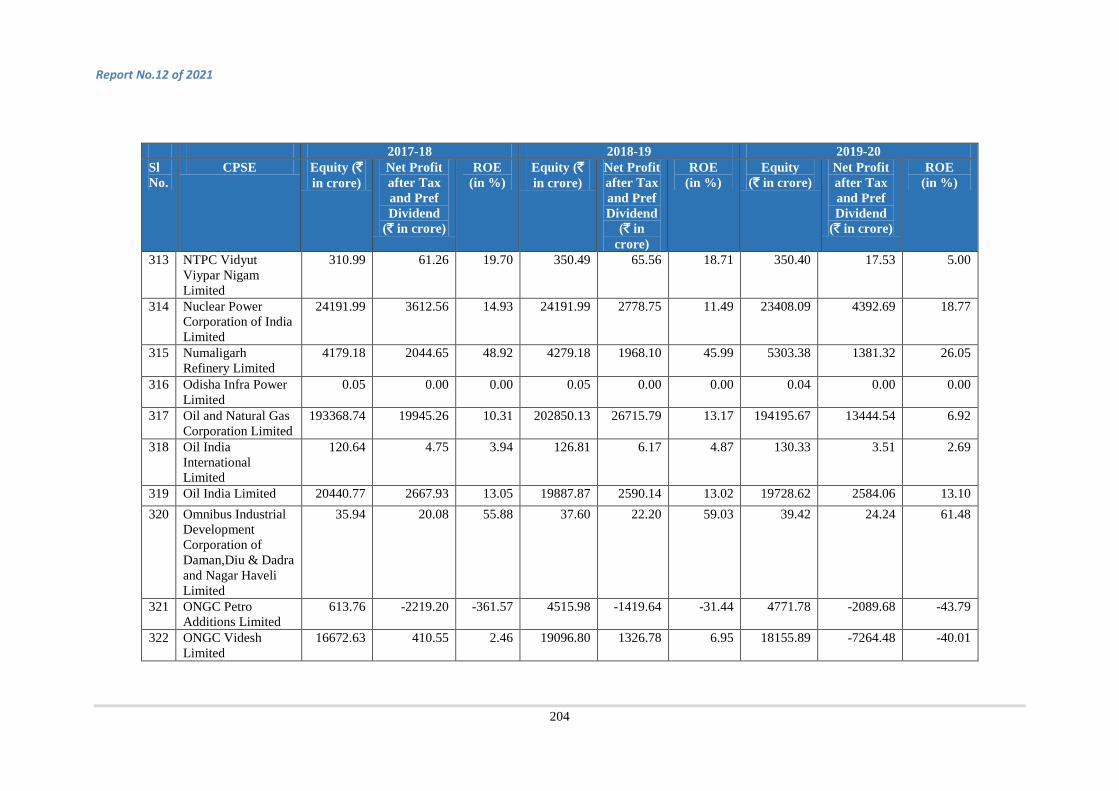
Report No.12 of 2021
204
2017-18 2018-19 2019-20 Sl No.
CPSE Equity (` in crore)
Net Profit after Tax and Pref Dividend
(` in crore)
ROE (in %)
Equity (` in crore)
Net Profit after Tax and Pref Dividend
(` in crore)
ROE (in %)
Equity (` in crore)
Net Profit after Tax and Pref Dividend
(` in crore)
ROE (in %)
313 NTPC Vidyut Viypar Nigam Limited
310.99 61.26 19.70 350.49 65.56 18.71 350.40 17.53 5.00
314 Nuclear Power Corporation of India Limited
24191.99 3612.56 14.93 24191.99 2778.75 11.49 23408.09 4392.69 18.77
315 Numaligarh Refinery Limited
4179.18 2044.65 48.92 4279.18 1968.10 45.99 5303.38 1381.32 26.05
316 Odisha Infra Power Limited
0.05 0.00 0.00 0.05 0.00 0.00 0.04 0.00 0.00
317 Oil and Natural Gas Corporation Limited
193368.74 19945.26 10.31 202850.13 26715.79 13.17 194195.67 13444.54 6.92
318 Oil India International Limited
120.64 4.75 3.94 126.81 6.17 4.87 130.33 3.51 2.69
319 Oil India Limited 20440.77 2667.93 13.05 19887.87 2590.14 13.02 19728.62 2584.06 13.10 320 Omnibus Industrial
Development Corporation of Daman,Diu & Dadra and Nagar Haveli Limited
35.94 20.08 55.88 37.60 22.20 59.03 39.42 24.24 61.48
321 ONGC Petro Additions Limited
613.76 -2219.20 -361.57 4515.98 -1419.64 -31.44 4771.78 -2089.68 -43.79
322 ONGC Videsh Limited
16672.63 410.55 2.46 19096.80 1326.78 6.95 18155.89 -7264.48 -40.01
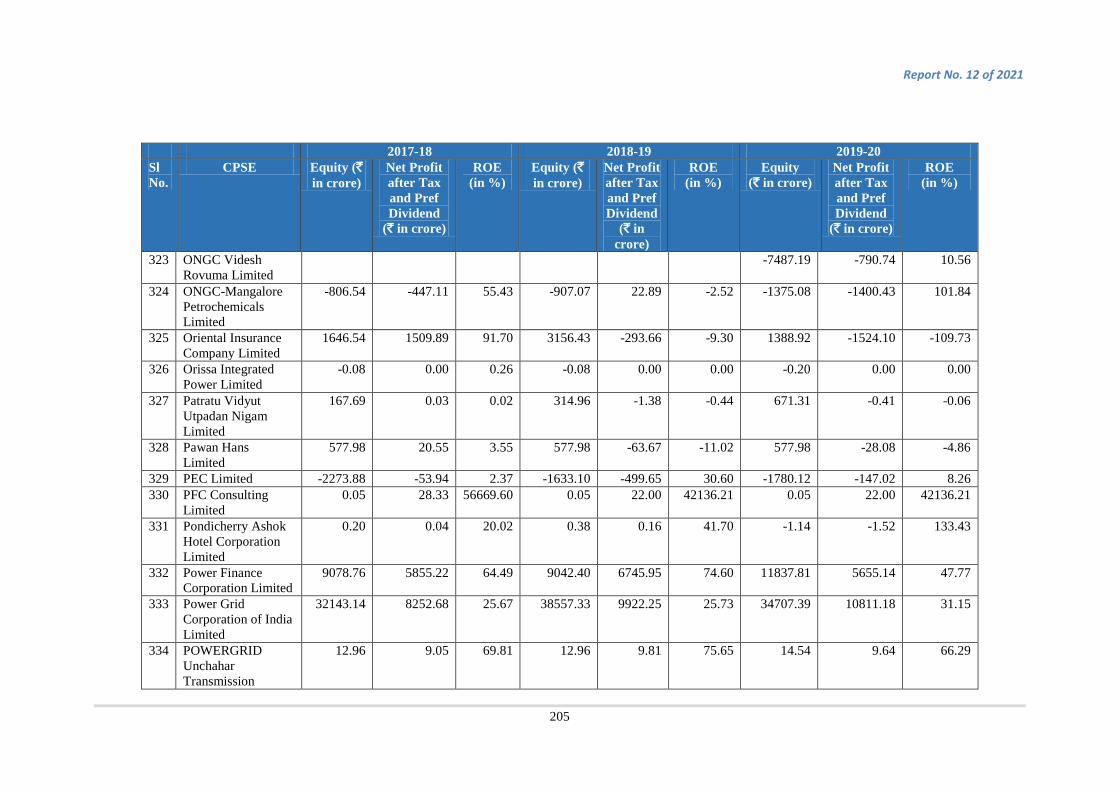
Report No. 12 of 2021
205
2017-18 2018-19 2019-20 Sl No.
CPSE Equity (` in crore)
Net Profit after Tax and Pref Dividend
(` in crore)
ROE (in %)
Equity (` in crore)
Net Profit after Tax and Pref Dividend
(` in crore)
ROE (in %)
Equity (` in crore)
Net Profit after Tax and Pref Dividend
(` in crore)
ROE (in %)
323 ONGC Videsh Rovuma Limited
-7487.19 -790.74 10.56
324 ONGC-Mangalore Petrochemicals Limited
-806.54 -447.11 55.43 -907.07 22.89 -2.52 -1375.08 -1400.43 101.84
325 Oriental Insurance Company Limited
1646.54 1509.89 91.70 3156.43 -293.66 -9.30 1388.92 -1524.10 -109.73
326 Orissa Integrated Power Limited
-0.08 0.00 0.26 -0.08 0.00 0.00 -0.20 0.00 0.00
327 Patratu Vidyut Utpadan Nigam Limited
167.69 0.03 0.02 314.96 -1.38 -0.44 671.31 -0.41 -0.06
328 Pawan Hans Limited
577.98 20.55 3.55 577.98 -63.67 -11.02 577.98 -28.08 -4.86
329 PEC Limited -2273.88 -53.94 2.37 -1633.10 -499.65 30.60 -1780.12 -147.02 8.26 330 PFC Consulting
Limited 0.05 28.33 56669.60 0.05 22.00 42136.21 0.05 22.00 42136.21
331 Pondicherry Ashok Hotel Corporation Limited
0.20 0.04 20.02 0.38 0.16 41.70 -1.14 -1.52 133.43
332 Power Finance Corporation Limited
9078.76 5855.22 64.49 9042.40 6745.95 74.60 11837.81 5655.14 47.77
333 Power Grid Corporation of India Limited
32143.14 8252.68 25.67 38557.33 9922.25 25.73 34707.39 10811.18 31.15
334 POWERGRID Unchahar Transmission
12.96 9.05 69.81 12.96 9.81 75.65 14.54 9.64 66.29
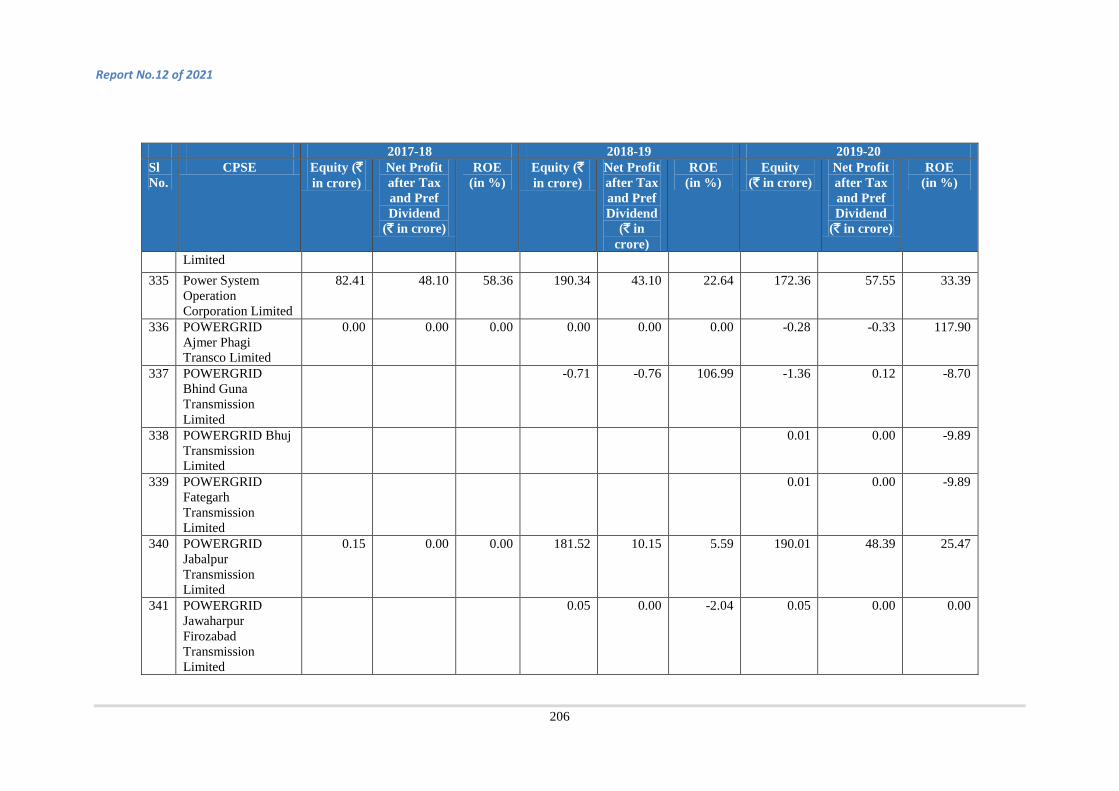
Report No.12 of 2021
206
2017-18 2018-19 2019-20 Sl No.
CPSE Equity (` in crore)
Net Profit after Tax and Pref Dividend
(` in crore)
ROE (in %)
Equity (` in crore)
Net Profit after Tax and Pref Dividend
(` in crore)
ROE (in %)
Equity (` in crore)
Net Profit after Tax and Pref Dividend
(` in crore)
ROE (in %)
Limited 335 Power System
Operation Corporation Limited
82.41 48.10 58.36 190.34 43.10 22.64 172.36 57.55 33.39
336 POWERGRID Ajmer Phagi Transco Limited
0.00 0.00 0.00 0.00 0.00 0.00 -0.28 -0.33 117.90
337 POWERGRID Bhind Guna Transmission Limited
-0.71 -0.76 106.99 -1.36 0.12 -8.70
338 POWERGRID Bhuj Transmission Limited
0.01 0.00 -9.89
339 POWERGRID Fategarh Transmission Limited
0.01 0.00 -9.89
340 POWERGRID Jabalpur Transmission Limited
0.15 0.00 0.00 181.52 10.15 5.59 190.01 48.39 25.47
341 POWERGRID Jawaharpur Firozabad Transmission Limited
0.05 0.00 -2.04 0.05 0.00 0.00

Report No. 12 of 2021
207
2017-18 2018-19 2019-20 Sl No.
CPSE Equity (` in crore)
Net Profit after Tax and Pref Dividend
(` in crore)
ROE (in %)
Equity (` in crore)
Net Profit after Tax and Pref Dividend
(` in crore)
ROE (in %)
Equity (` in crore)
Net Profit after Tax and Pref Dividend
(` in crore)
ROE (in %)
342 POWERGRID Kala Amb Transmission Limited
56.00 7.52 13.44 61.00 13.08 21.44 56.89 23.37 41.08
343 POWERGRID Khetri Transmission System Limited
-0.28 -0.33 117.66
344 POWERGRID Medinipur Jirat Transmission Limited
0.01 0.00 0.00 0.01 0.00 0.00 289.33 0.00 0.00
345 POWERGRID Meerut Simbhavali Transmission Limited
0.01 0.00 -11.11
346 POWERGRID Mithilanchal Transmission Limited
0.04 -0.01 -16.28 0.04 0.00 0.00 119.99 0.00 0.00
347 POWERGRID NM Transmission Limited
90.95 -83.14 -91.41 98.35 -63.56 -64.63 83.27 -29.48 -35.40
348 POWERGRID Parli Transmission Limited
0.10 0.00 0.00 228.50 65.01 28.45 274.88 79.22 28.82
349 POWERGRID Rampur Sambhal Transmission Limited
-0.83 -0.88 106.03

Report No.12 of 2021
208
2017-18 2018-19 2019-20 Sl No.
CPSE Equity (` in crore)
Net Profit after Tax and Pref Dividend
(` in crore)
ROE (in %)
Equity (` in crore)
Net Profit after Tax and Pref Dividend
(` in crore)
ROE (in %)
Equity (` in crore)
Net Profit after Tax and Pref Dividend
(` in crore)
ROE (in %)
350 POWERGRID Southern Interconnector Transmission System Limited
0.03 0.00 0.00 513.92 -1.56 -0.30 703.06 8.68 1.23
351 POWERGRID Varanasi Transmission System Limited
0.04 -0.01 -15.47 0.04 0.00 0.00 125.04 0.00 0.00
352 POWERGRID Vemagiri Transmission System Limited
-19.39 -0.01 0.04 -38.85 -0.01 0.02 -38.85 -0.01 0.02
353 POWERGRID Vizag Transmission Limited
209.73 77.67 37.03 245.87 139.44 56.71 310.09 151.75 48.94
354 POWERGRID Warora Transmission Limited
176.30 28.94 16.42 379.76 59.67 15.71 397.23 76.09 19.16
355 Prize Petroleum Compnay Limited
123.63 -1.57 -1.27 12.29 5.02 40.83 -21.64 -16.96 78.36
356 Projects and Development India Limited
26.43 2.69 10.17 26.43 30.36 114.87 26.43 31.83 120.43
357 Punjab Ashok Hotel Company Limited
2.14 -0.02 -1.01 2.09 -0.01 -0.57 2.11 -0.01 -0.39

Report No. 12 of 2021
209
2017-18 2018-19 2019-20 Sl No.
CPSE Equity (` in crore)
Net Profit after Tax and Pref Dividend
(` in crore)
ROE (in %)
Equity (` in crore)
Net Profit after Tax and Pref Dividend
(` in crore)
ROE (in %)
Equity (` in crore)
Net Profit after Tax and Pref Dividend
(` in crore)
ROE (in %)
358 Punjab Logistics Infrastructure Limited
186.71 -12.13 -6.50 174.84 -11.87 -6.79 152.11 0.95 0.62
359 Rail Vikas Nigam Limited
3351.48 469.66 14.01 3738.78 606.59 16.22 3738.76 786.40 21.03
360 RailTel Corporation of India Limited
1248.17 156.18 12.51 1172.84 109.80 9.36 1227.94 138.35 11.27
361 Railtel Enterprises Limited
10.00 1.59 15.90 13.54 1.80 13.26 15.34 2.70 17.59
362 Railway Energy Mangement Company Limited
115.84 30.28 26.14 146.23 41.34 28.27 166.28 35.02 21.06
363 Rajasthan Electronics and Instruments Limited
108.84 4.54 4.17 114.48 10.28 8.98 93.48 -17.07 -18.26
364 Ranchi Ashok Bihar Hotel Corporation Limited
-6.99 -2.15 30.81 -9.63 -2.40 24.86 -11.84 -2.15 18.13
365 Rashtriya Chemicals and Fertilizers Limited
551.69 78.81 14.28 2892.37 139.17 4.81 3132.24 208.16 6.65
366 Rashtriya Ispat Nigam Limited
4283.49 -1369.01 -31.96 4395.77 77.67 1.77 334.32 -3910.17 -1169.60
367 Real Estate Development & Construction Corporation of Rajasthan Limited
3.27 0.09 2.67 2.66 0.14 5.09 3.59 0.18 5.08
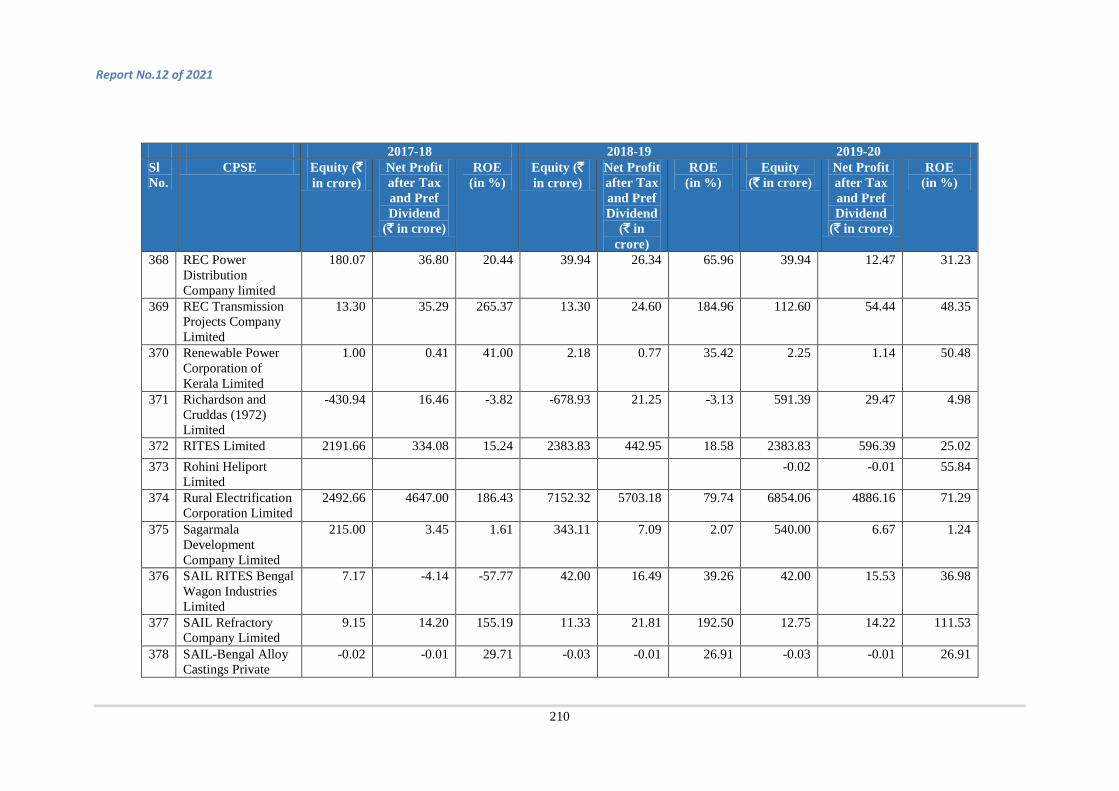
Report No.12 of 2021
210
2017-18 2018-19 2019-20 Sl No.
CPSE Equity (` in crore)
Net Profit after Tax and Pref Dividend
(` in crore)
ROE (in %)
Equity (` in crore)
Net Profit after Tax and Pref Dividend
(` in crore)
ROE (in %)
Equity (` in crore)
Net Profit after Tax and Pref Dividend
(` in crore)
ROE (in %)
368 REC Power Distribution Company limited
180.07 36.80 20.44 39.94 26.34 65.96 39.94 12.47 31.23
369 REC Transmission Projects Company Limited
13.30 35.29 265.37 13.30 24.60 184.96 112.60 54.44 48.35
370 Renewable Power Corporation of Kerala Limited
1.00 0.41 41.00 2.18 0.77 35.42 2.25 1.14 50.48
371 Richardson and Cruddas (1972) Limited
-430.94 16.46 -3.82 -678.93 21.25 -3.13 591.39 29.47 4.98
372 RITES Limited 2191.66 334.08 15.24 2383.83 442.95 18.58 2383.83 596.39 25.02 373 Rohini Heliport
Limited -0.02 -0.01 55.84
374 Rural Electrification Corporation Limited
2492.66 4647.00 186.43 7152.32 5703.18 79.74 6854.06 4886.16 71.29
375 Sagarmala Development Company Limited
215.00 3.45 1.61 343.11 7.09 2.07 540.00 6.67 1.24
376 SAIL RITES Bengal Wagon Industries Limited
7.17 -4.14 -57.77 42.00 16.49 39.26 42.00 15.53 36.98
377 SAIL Refractory Company Limited
9.15 14.20 155.19 11.33 21.81 192.50 12.75 14.22 111.53
378 SAIL-Bengal Alloy Castings Private
-0.02 -0.01 29.71 -0.03 -0.01 26.91 -0.03 -0.01 26.91

Report No. 12 of 2021
211
2017-18 2018-19 2019-20 Sl No.
CPSE Equity (` in crore)
Net Profit after Tax and Pref Dividend
(` in crore)
ROE (in %)
Equity (` in crore)
Net Profit after Tax and Pref Dividend
(` in crore)
ROE (in %)
Equity (` in crore)
Net Profit after Tax and Pref Dividend
(` in crore)
ROE (in %)
Limited 379 Sakhigopal
Integrated Power Company Limited
0.05 0.00 0.00 0.05 0.00 0.00 0.05 0.00 0.00
380 Sambhar Salts Limited
-33.25 -2.58 7.76 -45.26 -10.83 23.93 -46.69 -2.59 5.55
381 Scooters India Limited
69.70 -18.62 -26.72 66.05 -5.36 -8.12 50.02 -15.73 -31.44
382 Security Printing and Minting Corporation of India Limited
1064.24 663.77 62.37 4369.56 527.87 12.08 3776.40 527.59 13.97
383 Sethusamudram Corporation Limited
809.04 1.88 0.23 810.92 2.41 0.30 760.00 1.65 0.22
384 Shongtong Karcham Wangtoo Transmission Limited
0.01 0.00 -23.46 0.01 0.00 0.00 0.00 -0.01 426.32
385 Sidcul Concor Infra Company Limited
89.57 -11.10 -12.39 71.69 -4.68 -6.52 81.26 6.60 8.13
386 SJVN Limited 9263.00 1212.94 13.09 3929.80 1364.29 34.72 9385.74 1651.89 17.60 387 SJVN Thermal
Private Limited 436.37 -0.17 -0.04 436.66 0.29 0.07 996.29 -0.37 -0.04
388 Solar Energy Corporation of India
436.84 64.72 14.82 563.95 129.40 22.94 695.72 178.94 25.72
389 South Central East Delhi Power Transmission
-0.01 -0.01 125.49 0.00 0.01 0.00 0.00 0.01 0.00

Report No.12 of 2021
212
2017-18 2018-19 2019-20 Sl No.
CPSE Equity (` in crore)
Net Profit after Tax and Pref Dividend
(` in crore)
ROE (in %)
Equity (` in crore)
Net Profit after Tax and Pref Dividend
(` in crore)
ROE (in %)
Equity (` in crore)
Net Profit after Tax and Pref Dividend
(` in crore)
ROE (in %)
Limited
390 South Eastern Coalfields Limited
2893.09 2370.25 81.93 2598.39 3611.55 138.99 2685.14 1734.92 64.61
391 STCL Limited -4552.67 -656.86 14.43 -9136.45 -1.94 0.02 -4565.09 -0.47 0.01 392 Steel Authority of
India Limited 9225.66 -481.71 -5.22 9225.66 2178.82 23.62 9225.66 2021.54 21.91
393 Surat Integrated Transportation Development
-5.91 -1.04 17.55 6.88 -2.09 -30.36 4.56 0.41 9.05
394 Suuti Tech Options Limited
-1.01 -0.03 3.12 -1.06 -0.01 1.37 -1.10 -0.01 1.08
395 Talcher Fertilizer Limited
15.05 0.07 0.46 18.63 -15.24 -81.78 456.79 -3.02 -0.66
396 Tamil Nadu Trade Promotion Organisation
198.61 31.54 15.88 230.04 35.02 15.22 264.52 36.04 13.62
397 Tanda Transmission Limited
0.05 0.00 0.00 0.00 -0.05 -47000.00 0.00 0.00 0.00
398 Tatiya Andhra Mega Power
0.05 0.00 0.00 0.05 0.00 0.00 0.00 -0.05 0.00
399 TCIL Bina Toll Road Limited
-15.85 -5.11 32.22 -56.49 -5.22 9.24 -82.75 -21.04 25.43
400 TCIL LTR Limited 16.63 -1.59 -9.56 10.10 -0.06 -0.58 2.48 -7.56 -304.99
401 Telecommunications Consultants of India Limited
617.90 37.51 6.07 627.09 43.90 7.00 585.88 44.43 7.58

Report No. 12 of 2021
213
2017-18 2018-19 2019-20 Sl No.
CPSE Equity (` in crore)
Net Profit after Tax and Pref Dividend
(` in crore)
ROE (in %)
Equity (` in crore)
Net Profit after Tax and Pref Dividend
(` in crore)
ROE (in %)
Equity (` in crore)
Net Profit after Tax and Pref Dividend
(` in crore)
ROE (in %)
402 THDC India Limited
3536.96 778.74 22.02 3654.88 1251.60 34.24 8737.06 879.19 10.06
403 The British India Corporation Limited
-912.40 -106.20 11.64 -912.40 -106.20 11.64 -912.40 -106.20 11.64
404 The Cotton Corporation of India Limited
52.99 0.00 0.00 52.99 50.99 96.24 52.99 38.07 71.85
405 The FCI Aravali Gypsum and Minerals India Limited
197.31 27.03 13.70 203.32 20.47 10.07 204.81 14.91 7.28
406 The Fertilizer and Chemicals Travancore Limited
-1640.18 -130.51 7.96 -1457.71 163.14 -11.19 -491.43 975.52 -198.51
407 The Handicrafts and Handlooms Export Corporation of India Limited
13.82 -23.61 -170.81 13.82 -4.00 -28.97 13.82 -10.27 -74.31
408 The Industrial Credit Company Limited
-0.11 -0.02 19.72 -0.14 -0.01 3.92 -0.14 0.00 -0.72
409 The New India Assurance Company Limited
35248.23 2200.92 6.24 34797.11 579.79 1.67 14000.03 1417.75 10.13
410 The Shipping Corporation of India Limited
6001.07 253.75 4.23 6001.07 -121.99 -2.03 6001.07 302.35 5.04
411 The State Trading Corporation of India Limited
119.88 37.52 31.30 -849.38 -881.08 103.73 -1.64 -113.63 6928.66
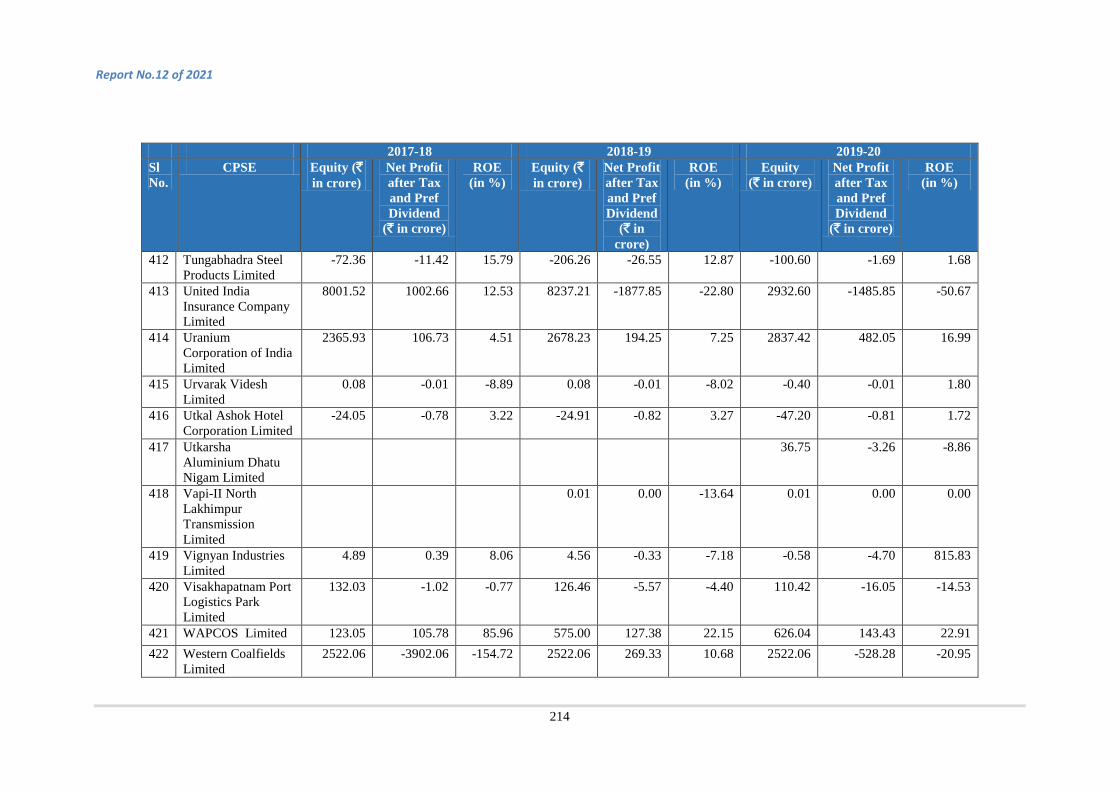
Report No.12 of 2021
214
2017-18 2018-19 2019-20 Sl No.
CPSE Equity (` in crore)
Net Profit after Tax and Pref Dividend
(` in crore)
ROE (in %)
Equity (` in crore)
Net Profit after Tax and Pref Dividend
(` in crore)
ROE (in %)
Equity (` in crore)
Net Profit after Tax and Pref Dividend
(` in crore)
ROE (in %)
412 Tungabhadra Steel Products Limited
-72.36 -11.42 15.79 -206.26 -26.55 12.87 -100.60 -1.69 1.68
413 United India Insurance Company Limited
8001.52 1002.66 12.53 8237.21 -1877.85 -22.80 2932.60 -1485.85 -50.67
414 Uranium Corporation of India Limited
2365.93 106.73 4.51 2678.23 194.25 7.25 2837.42 482.05 16.99
415 Urvarak Videsh Limited
0.08 -0.01 -8.89 0.08 -0.01 -8.02 -0.40 -0.01 1.80
416 Utkal Ashok Hotel Corporation Limited
-24.05 -0.78 3.22 -24.91 -0.82 3.27 -47.20 -0.81 1.72
417 Utkarsha Aluminium Dhatu Nigam Limited
36.75 -3.26 -8.86
418 Vapi-II North Lakhimpur Transmission Limited
0.01 0.00 -13.64 0.01 0.00 0.00
419 Vignyan Industries Limited
4.89 0.39 8.06 4.56 -0.33 -7.18 -0.58 -4.70 815.83
420 Visakhapatnam Port Logistics Park Limited
132.03 -1.02 -0.77 126.46 -5.57 -4.40 110.42 -16.05 -14.53
421 WAPCOS Limited 123.05 105.78 85.96 575.00 127.38 22.15 626.04 143.43 22.91 422 Western Coalfields
Limited 2522.06 -3902.06 -154.72 2522.06 269.33 10.68 2522.06 -528.28 -20.95

Report No. 12 of 2021
215
2017-18 2018-19 2019-20 Sl No.
CPSE Equity (` in crore)
Net Profit after Tax and Pref Dividend
(` in crore)
ROE (in %)
Equity (` in crore)
Net Profit after Tax and Pref Dividend
(` in crore)
ROE (in %)
Equity (` in crore)
Net Profit after Tax and Pref Dividend
(` in crore)
ROE (in %)
423 Yule Electrical Limited
-0.06 0.00 3.79 -0.17 0.00 1.77 -0.18 0.00 2.05
424 Yule Engineering Limited
-0.02 0.00 13.85 -0.09 0.00 3.47 -0.10 0.00 3.64
425 Zenith Securities and Investments Limited
5.06 0.97 19.21 5.06 1.66 32.75 5.06 -1.86 -36.74
Total 9,02,640 1,24,450 13.79 9,63,594 1,35,660 14.08 9,58,191 72,182 7.54

Report No.12 of 2021
216
Annexure XI (As referred to in Para 1.4.4)
RORR of selected CPSEs during 2017-18 to 2019-20
Sl. No.
CPSE RORR 2017-18
RORR 2018-19
RORR 2019-20
Overall consolidated RORR 25.34
22.75 11.68
Consolidated RORR of 54 listed CPSEs 53.43 53.06 33.59 Consolidated RORR of 82 unlisted
CPSEs -2.52 -5.82 -7.46
1. Power Grid Corporation of India Limited 60.69 53.52 54.51 2. Scooters India Limited -5.48 -1.39 -4 3. SJVNL Limited 11.18 11.63 13.55 4. Bharat Heavy Electricals Limited 76.63 89.36 -112.38 5. Engineers India Limited 98.77 89.76 98.04 6. Housing and Urban Development
Corporation Limited 13.98 15.15 20.53
7. IFCI Limited 13.98 15.15 -16.17 8. MOIL Limited 188.15 199 -1034.77 9. National Fertilizers Limited 12.26 15.96 -8.56 10. NHPC Limited 8.29 7.33 7.93 11. NTPC Limited 39.72 42.71 35.08 12. Power Finance Corporation Limited 122.1 135.65 108.18 13. Bharat Dynamics Limited 98.6 73.2 86.72 14. NMDC Limited 456.55 521.56 383.09 15. Bharat Electronics Limited 381.31 514.47 -112.68 16. Balmer Lawrie Investment Company
Limited 125.94 165.36 170.39
17. BEML Limited 13.09 10.39 4.8 18. Container Corporation of India Limited 39.96 42.69 233.25 19. HMT Limited -0.05 0.44 5.98 20. KIOCL Limited 3.32 4.25 1.55 21. Mishra Dhatu Nigam Limited 22.55 20.96 23.77 22. Hindustan Aeronautics Limited 266.11 272.18 316.11 23. Mahanagar Telephone Nigam Limited -214.88 -227.35 -231.94 24. Coal India Limited 39.96 42.69 43.57 25. Steel Authority of India Limited -3.65 15.33 13.08 26. Andrew Yule and Company Limited 2.32 0.98 -2.16 27. Hindustan Copper Limited 6.02 8.5 -35.2 28. MSTC Limited 134.8 -76.84 166.69 29. National Aluminium Company Limited 53.5 66.63 4.98
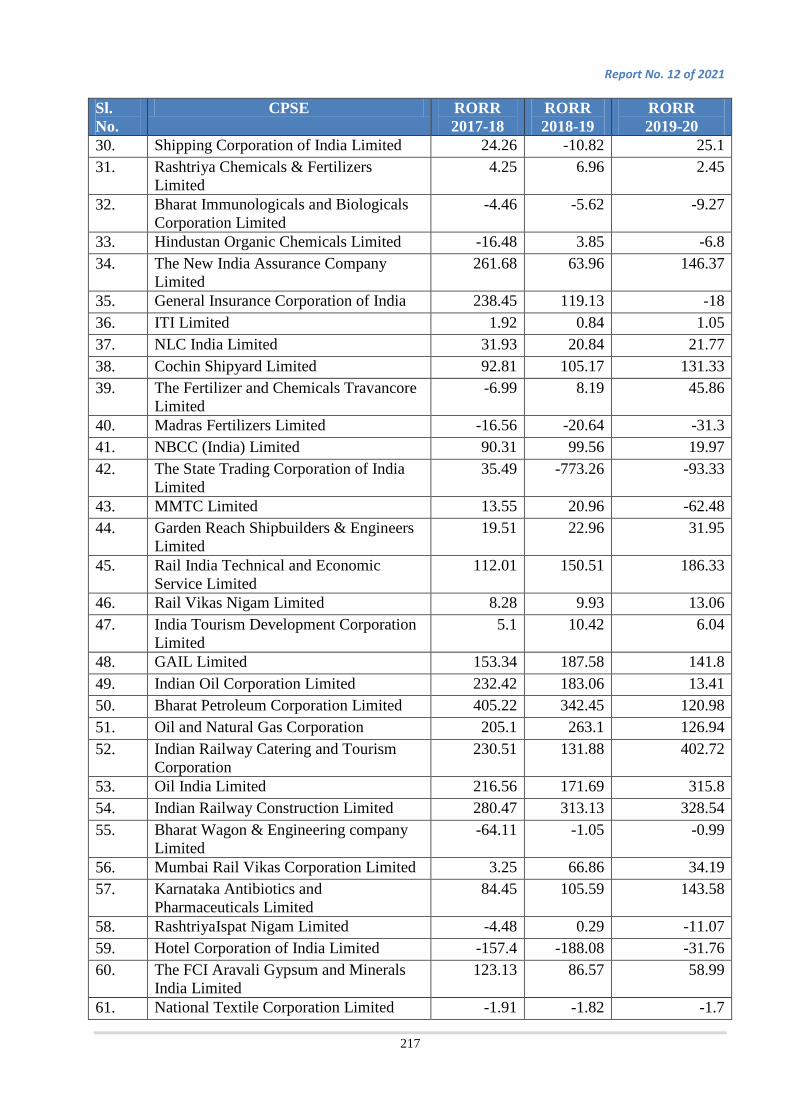
Report No. 12 of 2021
217
Sl. No.
CPSE RORR 2017-18
RORR 2018-19
RORR 2019-20
30. Shipping Corporation of India Limited 24.26 -10.82 25.1 31. Rashtriya Chemicals & Fertilizers
Limited 4.25 6.96 2.45
32. Bharat Immunologicals and Biologicals Corporation Limited
-4.46 -5.62 -9.27
33. Hindustan Organic Chemicals Limited -16.48 3.85 -6.8 34. The New India Assurance Company
Limited 261.68 63.96 146.37
35. General Insurance Corporation of India 238.45 119.13 -18 36. ITI Limited 1.92 0.84 1.05 37. NLC India Limited 31.93 20.84 21.77 38. Cochin Shipyard Limited 92.81 105.17 131.33 39. The Fertilizer and Chemicals Travancore
Limited -6.99 8.19 45.86
40. Madras Fertilizers Limited -16.56 -20.64 -31.3 41. NBCC (India) Limited 90.31 99.56 19.97 42. The State Trading Corporation of India
Limited 35.49 -773.26 -93.33
43. MMTC Limited 13.55 20.96 -62.48 44. Garden Reach Shipbuilders & Engineers
Limited 19.51 22.96 31.95
45. Rail India Technical and Economic Service Limited
112.01 150.51 186.33
46. Rail Vikas Nigam Limited 8.28 9.93 13.06 47. India Tourism Development Corporation
Limited 5.1 10.42 6.04
48. GAIL Limited 153.34 187.58 141.8 49. Indian Oil Corporation Limited 232.42 183.06 13.41 50. Bharat Petroleum Corporation Limited 405.22 342.45 120.98 51. Oil and Natural Gas Corporation 205.1 263.1 126.94 52. Indian Railway Catering and Tourism
Corporation 230.51 131.88 402.72
53. Oil India Limited 216.56 171.69 315.8 54. Indian Railway Construction Limited 280.47 313.13 328.54 55. Bharat Wagon & Engineering company
Limited -64.11 -1.05 -0.99
56. Mumbai Rail Vikas Corporation Limited 3.25 66.86 34.19 57. Karnataka Antibiotics and
Pharmaceuticals Limited 84.45 105.59 143.58
58. RashtriyaIspat Nigam Limited -4.48 0.29 -11.07 59. Hotel Corporation of India Limited -157.4 -188.08 -31.76 60. The FCI Aravali Gypsum and Minerals
India Limited 123.13 86.57 58.99
61. National Textile Corporation Limited -1.91 -1.82 -1.7

Report No.12 of 2021
218
Sl. No.
CPSE RORR 2017-18
RORR 2018-19
RORR 2019-20
62. Goa Shipyard Limited 315.05 176.9 248.96 63. Hindustan Shipyard Limited 0.87 1.39 1.08 64. Mazagon Dock Shipbuilders Limited 44.42 67.67 50.6 65. Bharat Gold Mines Limited -6.37 -6.1 -4.35 66. Tungabhadra Steel Products Limited 1344.14 1472.83 -4.48 67. The Cotton Corporation of India Limited 9.56 48.47 1.82 68. ECGC Limited 1.91 5.16 5.79 69. Nagpur Metro Rail Corporation 69.52 352.53 4.39 70. National Credit Guarantee Trustee
Company Limited 0.15 1.36 1.76
71. United India Insurance Company Limited 194.76 -338.44 -229.9 72. Braithwaite and Company Limited 1.1 2.54 5.99 73. MECON Limited 56.16 12.34 58.01 74. Heavy Engineering Corporation Limited 17.78 -3.46 -14.02 75. Bhartiya Rail Bijlee Company Limited 3.28 0.99 27.02 76. Rajasthan Electronics and Instruments
Limited 30.51 72.43 -112.55
77. Richardson and Cruddas (1972) Limited 7.69 9.94 11.95 78. Hindustan Antibiotics Limited 93.07 -29.47 -27.58 79. Oriental Insurance Company Limited 275.15 -49.65 -222.37 80. Bharat Pumps and Compressors Limited -21.01 -14.86 -11.21 81. BharatiyaNabhikiya Vidyut Nigam
Limited 0 0 0
82. Higher Education Financing Agency 3.17 2.64 6.12 83. HLL Lifecare Limited -14.95 2.37 20.63 84. India Renewable Energy Development
Agency Limited 24.38 32.37 75.21
85. Central Railside Warehouse Company Limited
16.39 14.76 15.15
86. Indian Medicines and Pharmaceuticals Corporation Limited
8.6 5.81 0.44
87. Biotechnology Industry Research Assistance Council
0.91 0.72 3.48
88. India Renewable Energy Development Agency Limited
17.57 10.74 8.83
89. Solar Energy Corporation of India 14.75 27.36 35.4 90. Central Electronics Limited 10.59 0.76 1.31 91. Lucknow Solar Power Development
Corporation Limited 122.81 251.28 235.17
92. Bharat Sanchar Nigam Limited -16.38 -28.34 -27.58 93. Bharat Broadband Network Limited 0.37 0.56 0.23 94. Telecommunications Consultants of India
Limited 31.33 27.69 26.23

Report No. 12 of 2021
219
Sl. No.
CPSE RORR 2017-18
RORR 2018-19
RORR 2019-20
95. India Infrastructure Finance Company Limited
-21.01 1.28 0.6
96. NEPA Limited 9.57 -22.62 -13.38 97. Mineral Exploration Corporation Limited 19.21 18.51 25.99 98. National Informatics Centre Services Inc. 397.55 -1012.76 1009.32 99. India Post Payment Bank Limited -0.11 -13 -19.47 100. Bengal Chemicals and Pharmaceuticals
Limited 4.96 11.56 5.6
101. Brahmaputra Valley Fertilizer Corporation Limited
0.03 -2.18 -4.19
102. Fertilizer Corporation of India Limited 3.88 5.21 1.56 103. Hindustan Fertilizers Corporation
Limited 0.8 2.14 0.33
104. Hoogly Dock and Port Engineers Limited 1.17 -1.04 -0.97 105. National Insurance Company Limited -559.01 -403.07 -136.39
106. National Investment and Infrastructure Trustee Funds
9079.53 387.72 142.53
107. Projects and Development India Limited 0.58 6.09 5.97 108. Hindustan Prefab Limited 0.64 0.64 -4.49 109. Hindustan Salts Limited 1.39 0.87 -1.2 110. Rail Vikas Nigam Limited 8.28 9.93 13.06 111. Indian Railway Finance Corporation 20.32 16.13 20.97 112. RTCIL 17.23 11.24 13.25 113. Antrix Corporation Limited 1935.99 2254.65 1754.03 114. Chandigarh Child and Woman
Development Corporation Limited -0.87 -0.64 -0.6
115. Chandigarh Schedule Castes, Backward Classes & Minorities Financial & Development Corporation
0.5 0.45 0.42
116. National Scheduled Castes Finance and Development Corporation
1.68 1.6 1.78
117. National Safai Karmachari Finance and Development Corporation
1.4 1.5 -0.09
118. National Scheduled Tribes Finance and Development Corporation
1.62 1.62 1.92
119. Delhi Police Housing Corporation Limited
3.88 4.52 4.52
120. National Minorities Development and Finance Corporation Limited
1.84 1.49 1.65
121. National Backward Classes Finance and Development Corporation
0.7 0.88 0.75
122. Central Registry of Securitisation Asset Reconstruction and Security Interest of India
557.61 153.21 174.06

Report No.12 of 2021
220
Sl. No.
CPSE RORR 2017-18
RORR 2018-19
RORR 2019-20
123. Kochi Metro Rail Limited -12.86 -20.06 -20.68 124. Bangalore Metro Rail Corporation
Limited -5.31 -6.36 -6.55
125. Mumbai Metro Rail Corporation Limited -3.52 0.22 -0.72 126. Maha Metro Rail Corporation Limited -1.52 -0.77 -1.87 127. Chennai Metro Rail Limited -3.61 -6.57 -8.86 128. Sethusamudram Corporation Limited 0.15 0.14 0.12 129. Konkan Railway Corporation Limited 1.01 0.76 0.04 130. Sagarmala Development Company
Limited 1.46 1.74 1.06
131. National Handloom Development Corporation Limited
20.59 -20.58 -13.29
132. The Handicrafts and Handlooms Export Corporation of India Limited
-43.75 -6.88 -16.53
133. Dedicated Freight Corridor Corporation Limited
0.12 0.15 -0.44
134. Pipavav Railway Corporation Limited 25.01 26.42 23.76 135. National High Speed Rail Corporation
Limited 2.65 1.41 0.63
136. Railway Energy Management Company Limited
69.39 87.9 69.68
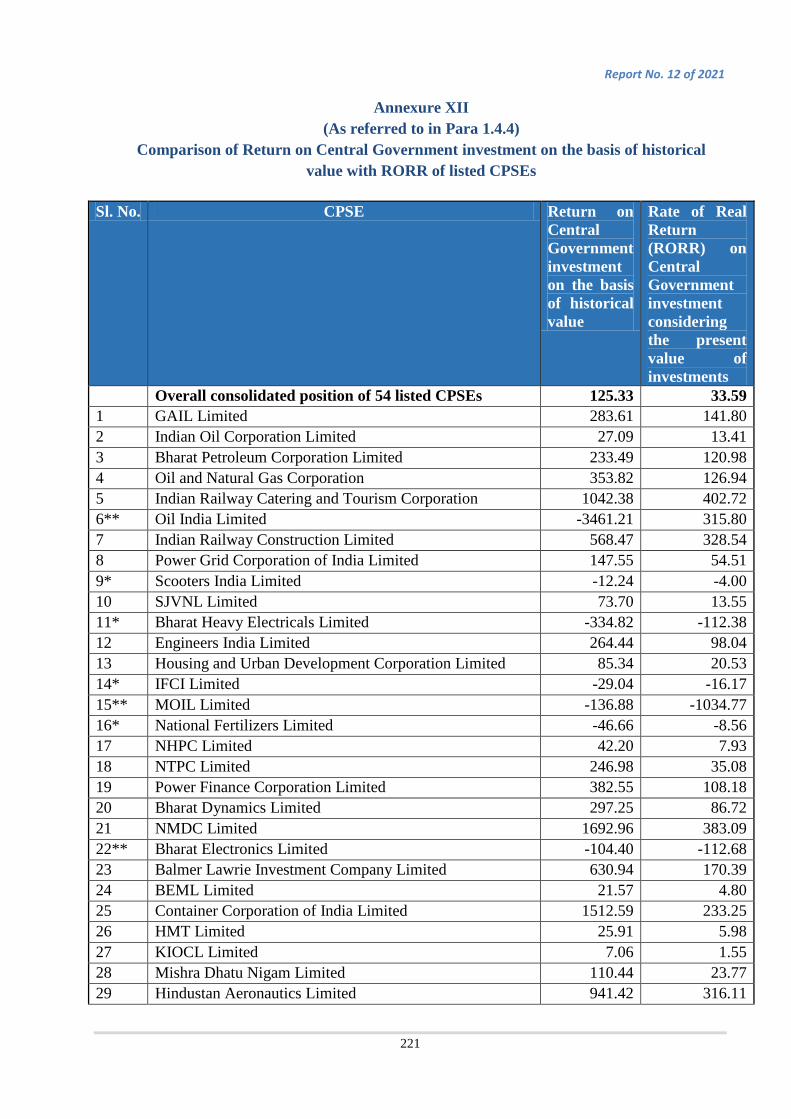
Report No. 12 of 2021
221
Annexure XII (As referred to in Para 1.4.4)
Comparison of Return on Central Government investment on the basis of historical value with RORR of listed CPSEs
Sl. No. CPSE Return on
Central Government investment on the basis of historical value
Rate of Real Return (RORR) on Central Government investment considering the present value of investments
Overall consolidated position of 54 listed CPSEs 125.33 33.59 1 GAIL Limited 283.61 141.80 2 Indian Oil Corporation Limited 27.09 13.41 3 Bharat Petroleum Corporation Limited 233.49 120.98 4 Oil and Natural Gas Corporation 353.82 126.94 5 Indian Railway Catering and Tourism Corporation 1042.38 402.72 6** Oil India Limited -3461.21 315.80 7 Indian Railway Construction Limited 568.47 328.54 8 Power Grid Corporation of India Limited 147.55 54.51 9* Scooters India Limited -12.24 -4.00 10 SJVNL Limited 73.70 13.55 11* Bharat Heavy Electricals Limited -334.82 -112.38 12 Engineers India Limited 264.44 98.04 13 Housing and Urban Development Corporation Limited 85.34 20.53 14* IFCI Limited -29.04 -16.17 15** MOIL Limited -136.88 -1034.77 16* National Fertilizers Limited -46.66 -8.56 17 NHPC Limited 42.20 7.93 18 NTPC Limited 246.98 35.08 19 Power Finance Corporation Limited 382.55 108.18 20 Bharat Dynamics Limited 297.25 86.72 21 NMDC Limited 1692.96 383.09 22** Bharat Electronics Limited -104.40 -112.68 23 Balmer Lawrie Investment Company Limited 630.94 170.39 24 BEML Limited 21.57 4.80 25 Container Corporation of India Limited 1512.59 233.25 26 HMT Limited 25.91 5.98 27 KIOCL Limited 7.06 1.55 28 Mishra Dhatu Nigam Limited 110.44 23.77 29 Hindustan Aeronautics Limited 941.42 316.11

Report No.12 of 2021
222
Sl. No. CPSE Return on Central Government investment on the basis of historical value
Rate of Real Return (RORR) on Central Government investment considering the present value of investments
30* Mahanagar Telephone Nigam Limited -1042.86 -231.94 31 Coal India Limited 276.67 43.57 32 Steel Authority of India Limited 60.38 13.08 33* Andrew Yule and Company Limited -6.44 -2.16 34* Hindustan Copper Limited -161.84 -35.20 35 MSTC Limited 331.21 166.69 36 National Aluminium Company Limited 28.50 4.98 37 Shipping Corporation of India Limited 101.83 25.10 38 Rashtriya Chemicals & Fertilizers Limited 3.27 2.45 39* Bharat Immunologicals and Biologicals Corporation
Limited -39.91 -9.27
40* Hindustan Organic Chemicals Limited -30.59 -6.80 41 The New India Assurance Company Limited 389.49 146.37 42* General Insurance Corporation of India -47.72 -18.00 43 ITI Limited 2.25 1.05 44 NLC India Limited 124.47 21.77 45 Cochin Shipyard Limited 665.34
131.33
46 The Fertilizer and Chemicals Travancore Limited 167.51 45.86 47* Madras Fertilizers Limited -140.72 -31.30 48 NBCC (India) Limited 81.59 19.97 49* The State Trading Corporation of India Limited -425.69 -93.33 50* MMTC Limited -300.09 -62.48 51 Garden Reach Shipbuilders & Engineers Limited 191.56 31.95 52 Rail India Technical and Economic Service Limited 331.24 186.33 53 Rail Vikas Nigam Limited 48.87 13.06 54 India Tourism Development Corporation Limited 20.19 6.04 * The negative return on Central Government investment on the basis of historical value/ RORR
is the result of negative earnings during the year 2019-20. The negative sign may be treated as ignored for the purpose of comparison between Return on Central Government investment on the basis of historical value and RORR.
** The negative return on Central Government investment on the basis of historical value/ RORR
is the result of investment turning negative mainly due to disinvestment. The negative sign may be treated as ignored for the purpose of comparison between Return on Central Government investment on the basis of historical value and RORR.

Report No. 12 of 2021
223
Annexure XIII (As referred to in Para 1.4.6)
Listed CPSEs where ROE is less than that of private companies in same sector for 3 or more years during last 5 years
Sl. No.
CPSE 2019-20 2018-19 2017-18 2016-17 2015-16 Private Company 2019-20 2018-19 2017-18 2016-17 2015-16
1 Balmer Lawrie and Company Limited
36.31 17.93 14.72 14.62 16.36 GULF oil Lubricants India Limited
26.60 30.3 33.92 33.2 40.36
2 Bharat Heavy Electricals Limited -4.77 3.5 2.73 1.53 -2.76 Larsen & Toubro Limited 12.80 12.71 10.96 11.85 13.04 3 Bharat Immunologicals and
Biologicals Corporation Limited -49.87 -31.87 -11.35 16.12 -17.69 Sun Pharmaceutical Industries
Limited 13.16 3.57 -2.5 -0.11 -5
4 The Fertilizer and Chemicals Travancore Limited
-198.51 -11.19 7.96 12.5 34.55 Coromandel International Limited
24.13 20.79 20.79 16.96 15.18
5 Hindustan Copper Limited -487.15 146.71 8.11 5.55 3.95 Arcotech Limited -53.71 -5723.88
1.72 12.04 18.28
6 Hindustan Fluorocarbons Limited 7.68 4.51 2.01 7.13 17.46 Coromandel International Limited
24.13 20.79 20.79 16.96 15.18
7 HMT Limited 50.64 -13.97 -2.04 -10.5 -6.96 Escorts Limited 13.95 16.04 13.53 8.06 4.77 8 Hindustan Organic Chemicals
Limited -9.45 4.25 -383.44 -173.19 -43.25 Coromandel International
Limited 24.13 20.79 20.79 16.96 15.18
9 IFCI Limited -5.95 -9.9 -17.45 -6.81 4.69 IDFC Limited 0.69 1.31 1.52 0.58 -12.11 10 Madras Fertilizers Limited 21.81 14.79 12.59 4.2 35.62 Coromandel International
Limited 24.13 20.79 20.79 16.96 15.18
11 MMTC Limited -18.08 5.77 3.37 3.98 3.98 Vedanta Limited -9.63 6.52 9.15 13.88 12.46 12 National Fertilizers Limited -8.91 13.51 4.29 4.28 4.11 Coromandel International
Limited 24.13 20.79 20.79 16.96 15.18
13 Oil and Natural Gas Corporation Limited
6.92 13.17 10.31 9.65 10.6 Reliance Industries Limited 7.28 8.68 10.68 10.9 11.42
14 Rashtriya Chemicals and Fertilizers Limited
6.65 4.81 2.69 6.13 6.76 Coromandel International Limited
24.13 20.79 20.79 16.96 15.18
15 Steel Authority of India Limited 21.91 23.62 -1.35 -8.85 -6.12 Tata Steel Limited 8.78 14.48 6.54 6.63 6.95 16 Scooters India Limited -31.44 -8.12 -26.72 -11.62 5.56 Atul Auto Limited 17.28 20.54 21.05 20.11 30.66

Report No.12 of 2021
224
Annexure XIV (As referred to in Para 1.4.6)
Listed CPSEs where ROCE is less than that of private companies in same sector for 3 or more years during last 5 years
Sl. No.
CPSE 2019-20 2018-19 2017-18 2016-17 2015-16 Private Company 2019-20 2018-19 2017-18 2016-17 2015-16
1 Balmer Lawrie and Company Limited
35.46 17.75 14.72 14.62 16.36 GULF oil Lubricants India Limited
26.20 30.06 33.92 33.19562 40.36014
2 Bharat Heavy Electricals Limited
-4.76 3.49 2.72 1.53 -2.75 Larsen & Toubro Limited
11.25 12.14 10.11 11.28549 10.82919
3 Bharat Immunologicals and Biologicals Corporation Limited
-49.87 -31.87 -11.35 16.12 -17.69 Sun Pharmaceutical Industries Limited
12.51 3.37 -2.32 -0.1 -4.58
4 The Fertilizer and Chemicals Travancore Limited
235.51 48.96 -100.16 -68.08 -142.09 Coromandel International Limited
22.22 20.64 20.79 16.95561 14.98785
5 Hindustan Copper Limited -75.61 19.55 7.07 4.63 3.33 Arcotech Limited -52.65 -4836.95 1.29 9.250008 12.80503 6 Hindustan Fluorocarbons
Limited 7.68 4.51 2.21 7.9 20.82 Coromandel
International Limited 22.22 20.64 20.79 16.95561 14.98785
7 HMT Limited 40.53 16.28 -0.49 -4.01 -5.82 Escorts Limited 13.79 15.77 13.46 7.836242 4.560623 8 Hindustan Organic
Chemicals Limited -6.38 2.97 -30.44 -63.36 -19.68 Coromandel
International Limited 22.22 20.64 20.79 16.95561 14.98785
9 IFCI Limited -1.64 -2.16 -3.94 -1.55 0.99 IDFC Limited 0.69 1.31 1.52 0.577703 -12.1127 10 I T I Limited 12.31 8.85 11.02 17.11 6.35 Bharati Infratel
Limited 10.99 17.04 13.62 16.65938 7.12532
11 Madras Fertilizers Limited 25.79 18.79 17.76 5.56 51.78 Coromandel International Limited
22.22 20.64 20.79 16.95561 14.98785
12 MMTC Limited -16.2 5.77 3.37 3.98 3.98 Vedanta Limited -7.36 5.14 7.71 10.85 8.14 13 Mahanagar Telephone
Nigam Limited 31.13 37.89 -75.16 -80.7 -25.59 Bharti Airtel Limited -20.99 -1.13 0.05 -6.54942 5.982306
14 National Fertilizers Limited -6.36 11.7 4.14 3.56 3.41 Coromandel International Limited
22.22 20.64 20.79 16.95561 14.98785
15 Rashtriya Chemicals and Fertilizers Limited
5.58 4.2 2.43 5.9 6.41 Coromandel International Limited
22.22 20.64 20.79 16.95561 14.98785
16 Steel Authority of India Limited
4.62 5.44 -0.74 -5.78 -4.95 Tata Steel Limited 6.23 10.58 4.71 4.5 5.22
17 Scooters India Limited -25.35 -6.87 -23.4 -10.04 4.7 Atul Auto Limited 17.26 20.54 21.05 20.10964 30.66175
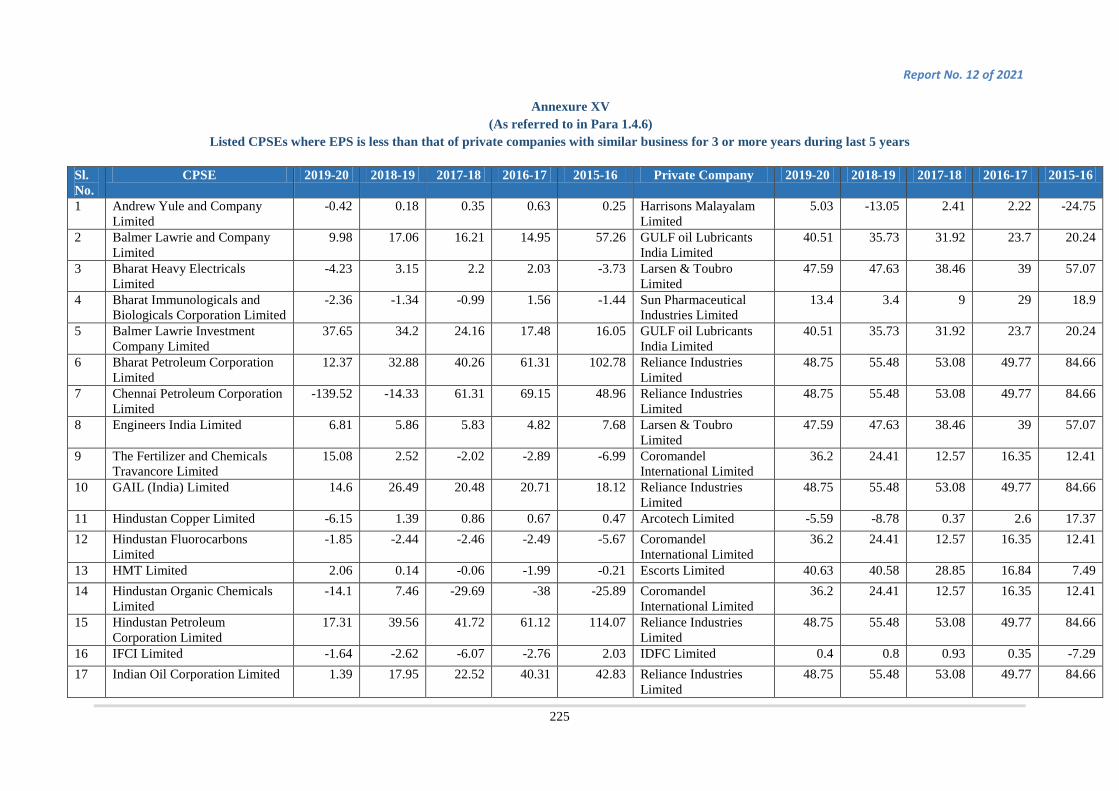
Report No. 12 of 2021
225
Annexure XV (As referred to in Para 1.4.6)
Listed CPSEs where EPS is less than that of private companies with similar business for 3 or more years during last 5 years
Sl. No.
CPSE 2019-20 2018-19 2017-18 2016-17 2015-16 Private Company 2019-20 2018-19 2017-18 2016-17 2015-16
1 Andrew Yule and Company Limited
-0.42 0.18 0.35 0.63 0.25 Harrisons Malayalam Limited
5.03 -13.05 2.41 2.22 -24.75
2 Balmer Lawrie and Company Limited
9.98 17.06 16.21 14.95 57.26 GULF oil Lubricants India Limited
40.51 35.73 31.92 23.7 20.24
3 Bharat Heavy Electricals Limited
-4.23 3.15 2.2 2.03 -3.73 Larsen & Toubro Limited
47.59 47.63 38.46 39 57.07
4 Bharat Immunologicals and Biologicals Corporation Limited
-2.36 -1.34 -0.99 1.56 -1.44 Sun Pharmaceutical Industries Limited
13.4 3.4 9 29 18.9
5 Balmer Lawrie Investment Company Limited
37.65 34.2 24.16 17.48 16.05 GULF oil Lubricants India Limited
40.51 35.73 31.92 23.7 20.24
6 Bharat Petroleum Corporation Limited
12.37 32.88 40.26 61.31 102.78 Reliance Industries Limited
48.75 55.48 53.08 49.77 84.66
7 Chennai Petroleum Corporation Limited
-139.52 -14.33 61.31 69.15 48.96 Reliance Industries Limited
48.75 55.48 53.08 49.77 84.66
8 Engineers India Limited 6.81 5.86 5.83 4.82 7.68 Larsen & Toubro Limited
47.59 47.63 38.46 39 57.07
9 The Fertilizer and Chemicals Travancore Limited
15.08 2.52 -2.02 -2.89 -6.99 Coromandel International Limited
36.2 24.41 12.57 16.35 12.41
10 GAIL (India) Limited 14.6 26.49 20.48 20.71 18.12 Reliance Industries Limited
48.75 55.48 53.08 49.77 84.66
11 Hindustan Copper Limited -6.15 1.39 0.86 0.67 0.47 Arcotech Limited -5.59 -8.78 0.37 2.6 17.37 12 Hindustan Fluorocarbons
Limited -1.85 -2.44 -2.46 -2.49 -5.67 Coromandel
International Limited 36.2 24.41 12.57 16.35 12.41
13 HMT Limited 2.06 0.14 -0.06 -1.99 -0.21 Escorts Limited 40.63 40.58 28.85 16.84 7.49 14 Hindustan Organic Chemicals
Limited -14.1 7.46 -29.69 -38 -25.89 Coromandel
International Limited 36.2 24.41 12.57 16.35 12.41
15 Hindustan Petroleum Corporation Limited
17.31 39.56 41.72 61.12 114.07 Reliance Industries Limited
48.75 55.48 53.08 49.77 84.66
16 IFCI Limited -1.64 -2.62 -6.07 -2.76 2.03 IDFC Limited 0.4 0.8 0.93 0.35 -7.29 17 Indian Oil Corporation Limited 1.39 17.95 22.52 40.31 42.83 Reliance Industries
Limited 48.75 55.48 53.08 49.77 84.66
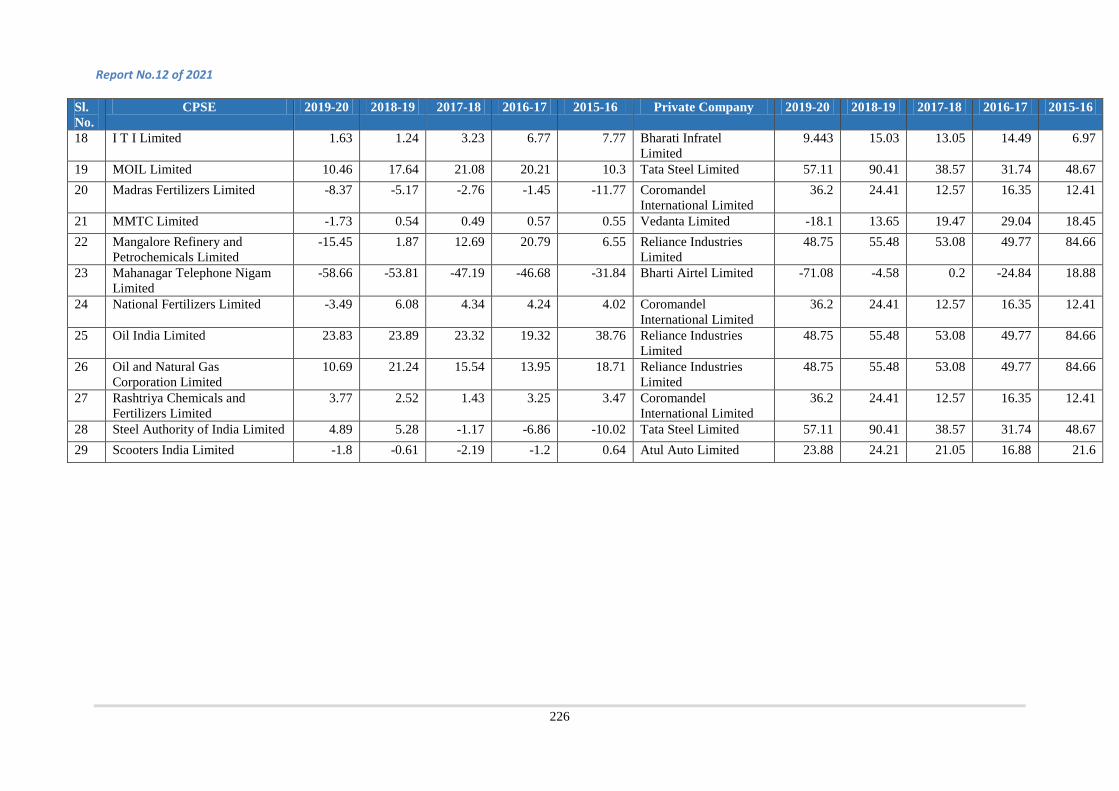
Report No.12 of 2021
226
Sl. No.
CPSE 2019-20 2018-19 2017-18 2016-17 2015-16 Private Company 2019-20 2018-19 2017-18 2016-17 2015-16
18 I T I Limited 1.63 1.24 3.23 6.77 7.77 Bharati Infratel Limited
9.443 15.03 13.05 14.49 6.97
19 MOIL Limited 10.46 17.64 21.08 20.21 10.3 Tata Steel Limited 57.11 90.41 38.57 31.74 48.67 20 Madras Fertilizers Limited -8.37 -5.17 -2.76 -1.45 -11.77 Coromandel
International Limited 36.2 24.41 12.57 16.35 12.41
21 MMTC Limited -1.73 0.54 0.49 0.57 0.55 Vedanta Limited -18.1 13.65 19.47 29.04 18.45 22 Mangalore Refinery and
Petrochemicals Limited -15.45 1.87 12.69 20.79 6.55 Reliance Industries
Limited 48.75 55.48 53.08 49.77 84.66
23 Mahanagar Telephone Nigam Limited
-58.66 -53.81 -47.19 -46.68 -31.84 Bharti Airtel Limited -71.08 -4.58 0.2 -24.84 18.88
24 National Fertilizers Limited -3.49 6.08 4.34 4.24 4.02 Coromandel International Limited
36.2 24.41 12.57 16.35 12.41
25 Oil India Limited 23.83 23.89 23.32 19.32 38.76 Reliance Industries Limited
48.75 55.48 53.08 49.77 84.66
26 Oil and Natural Gas Corporation Limited
10.69 21.24 15.54 13.95 18.71 Reliance Industries Limited
48.75 55.48 53.08 49.77 84.66
27 Rashtriya Chemicals and Fertilizers Limited
3.77 2.52 1.43 3.25 3.47 Coromandel International Limited
36.2 24.41 12.57 16.35 12.41
28 Steel Authority of India Limited 4.89 5.28 -1.17 -6.86 -10.02 Tata Steel Limited 57.11 90.41 38.57 31.74 48.67 29 Scooters India Limited -1.8 -0.61 -2.19 -1.2 0.64 Atul Auto Limited 23.88 24.21 21.05 16.88 21.6

Report No. 12 of 2021
227
Annexure XVI (As referred to in Para 1.4.6)
Listed CPSEs where P/E Ratio is less than that of private companies with similar business for 3 or more years during last 5 years
Sl. No.
CPSE 2019-20 2018-19 2017-18 2016-17 2015-16 Private Company 2019-20 2018-19 2017-18 2016-17 2015-16
1 Balmer Lawrie and Company Limited
7.96 10.88 13.40 15.76 10.01 GULF oil Lubricants India Limited
12.85 23.20 28.48 29.68 25.05
2 Bharat Heavy Electricals Limited
-4.92 23.78 -19.90 14.49 -12.81 Larsen & Toubro Limited 16.95 29.06 34.11 40.45 21.31
3 Bharat Immunologicals and Biologicals Corporation Limited
-2.47 -5.74 16.46 21.83 17.56 Sun Pharmaceutical Industries Limited
26.28 140.96 55.04 23.71 43.36
4 Balmer Lawrie Investment Company Limited
7.75 11.38 24.92 23.55 21.56 GULF oil Lubricants India Limited
12.85 23.20 28.48 29.68 25.05
5 Bharat Petroleum Corporation Limited
25.55 12.05 10.63 10.58 8.77 Reliance Industries Limited 22.82 24.57 16.63 26.51 12.35
6 Container Corporation of India Limited
53.72 26.3 5.36 5.25 4.07 SICAL LOGISTICS -0.44 25.55 42.02 32.04 39.28
7 Coal India Limited 7.65 13.94 18.94 12.66 11.29 Adani Enterprises 21.66 33.26 87.40 53.59 16.33 8 Engineers India Limited 8.82 19.97 27.12 29.95 22.17 Larsen & Toubro Limited 16.95 29.06 34.11 40.45 21.31 9 The Fertilizer and Chemicals
Travancore Limited 2.14 14.5 11.81 26.12 8.03 Coromandel International
Limited 15.02 20.45 23.24 19.13 15.30
10 GAIL (India) Limited 5.24 13.11 -25.27 -14.34 -3.02 Reliance Industries Limited 22.82 24.57 16.63 26.51 12.35 11 Hindustan Copper Limited -3.46 35.22 16.04 18.18 19.67 Arcotech Limited -0.16 -0.64 89.96 201.73 22.17 12 HMT Limited 4.18 133.57 -0.78 -0.65 -0.64 Escorts Limited 16.32 19.64 29.10 32.00 18.56 13 Hindustan Organic Chemicals
Limited -0.7 3.08 -4.32 -6.87 -1.00 Coromandel International
Limited 15.02 20.45 23.24 19.13 15.30
14 Hindustan Petroleum Corporation Limited
10.98 7.17 -475.83 -19.02 -213.33 Reliance Industries Limited 22.82 24.57 16.63 26.51 12.35
15 IFCI Limited -2.48 -5.26 -3.25 -10.76 12.12 IDFC Limited 37.13 58.00 52.31 155.71 -5.54 16 India Tourism Development
Corporation Limited 42.62 56.92 7.83 9.59 9.19 Indian hotels company
Limited 22.16 69.53 95.04 92.70 40.70
17 I T I Limited 38.4 77.18 8.25 8.60 6.89 Bharati Infratel Limited 16.95 20.86 25.76 22.46 54.81 18 Madras Fertilizers Limited -1.47 -3.96 35.02 10.49 3.09 Coromandel International
Limited 15.02 20.45 23.24 19.13 15.30

Report No.12 of 2021
228
Sl. No.
CPSE 2019-20 2018-19 2017-18 2016-17 2015-16 Private Company 2019-20 2018-19 2017-18 2016-17 2015-16
19 Mangalore Refinery and Petrochemicals Limited
-1.5 39.84 -11.63 -13.34 -0.99 Reliance Industries Limited 22.82 24.57 16.63 26.51 12.35
20 National Aluminium Company Limited
39.39 5.96 -0.40 -0.51 -0.56 Hindalco Industries Limited 34.28 37.96 33.21 25.81 -137.34
21 National Fertilizers Limited -5.24 5.81 9.62 25.50 13.96 Coromandel International Limited
15.02 20.45 23.24 19.13 15.30
22 NTPC Limited 8.24 11.39 11.23 9.08 8.43 Tata Power Company Limited
410.63 12.51 -6.59 85.38 27.39
23 Oil India Limited 3.47 7.76 12.31 13.72 12.07 Reliance Industries Limited 22.82 24.57 16.63 26.51 12.35 24 Oil and Natural Gas
Corporation Limited 6.39 7.51 9.86 18.43 12.82 Reliance Industries Limited 22.82 24.57 16.63 26.51 12.35
25 Rashtriya Chemicals and Fertilizers Limited
7.52 23.21 11.44 13.27 11.48 Coromandel International Limited
15.02 20.45 23.24 19.13 15.30
26 Steel Authority of India Limited
4.71 10.17 -60.00 -8.92 -4.29 Tata Steel Limited 0.29 5.76 14.80 15.21 6.56
27 The Shipping Corporation of India Limited
5.79 -14.48 -27.60 -33.33 40.23 Essar Shipping Limited -0.04 -0.14 10.06 -4.12 -4.53
28 Scooters India Limited -9.17 -54.26 51.19 25.15 11.18 Atul Auto Limited 5.92 14.21 20.98 27.57 24.04

Report No. 12 of 2021
229
Annexure XVII (As referred to in Para 1.4.6)
Listed CPSEs where Interest Coverage Ratio is less than that of private companies in same sector for 3 or more years during last 5 years
Sl. No.
CPSE 2019-20 2018-19 2017-18 2016-17 2015-16 Private Company 2019-20 2018-19 2017-18 2016-17 2015-16
1 Bharat Heavy Electricals Limited
-1.74 5.29 7.55 2.79 -54.22 Larsen & Toubro Limited 4.37 6.62 6.07 6.13 5.62
2 Bharat Immunologicals and Biologicals Corporation Limited
-1.15 NA -9.94 3.75 -2.72 Sun Pharmaceutical Industries Limited
8.97 2.33 -0.34 0.92 -1.01
3 Chennai Petroleum Corporation Limited
-4.03 0.63 5.54 5.98 3.55 Reliance Industries Limited
4.33 8.21 10.82 15.98 15.35
4 The Fertilizer and Chemicals Travancore Limited
4.37 1.58 0.59 0.39 -0.74 Coromandel International Limited
6.83 5.33 6.62 4.18 3.43
5 Hindustan Fluorocarbons Limited
-0.82 -0.52 0.74 -0.5 -2.22 Coromandel International Limited
6.83 5.33 6.62 4.18 3.43
6 HMT Limited 10428.89 59.1 0.03 -13.39 0.02 Escorts Limited 42.32 40.09 18.81 8.59 3.04 7 Hindustan Organic
Chemicals Limited -0.68 1.76 -1.67 -1.66 -1.63 Coromandel International
Limited 6.83 5.33 6.62 4.18 3.43
8 Indian Oil Corporation Limited
1.38 5.38 10.44 8.64 6.28 Reliance Industries Limited
4.33 8.21 10.82 15.98 15.35
9 I T I Limited NA 2.04 2.53 3 1.52 Bharati Infratel Limited 8.24 70.28 70.4 85.66 3969.6 10 Madras Fertilizers
Limited -0.49 0.17 0.18 0.68 -1.3 Coromandel International
Limited 6.83 5.33 6.62 4.18 3.43
11 Mangalore Refinery and Petrochemicals Limited
-2.65 1.77 8.61 11.69 3.03 Reliance Industries Limited
4.33 8.21 10.82 15.98 15.35
12 Mahanagar Telephone Nigam Limited
-0.9 -0.99 -0.97 -1.03 -1.17 Bharti Airtel Limited -3.45 0.72 0.88 -0.86 3.82
13 National Fertilizers Limited
0.58 1.94 2.76 2.71 2.24 Coromandel International Limited
6.83 5.33 6.62 4.18 3.43
14 Oil India Limited 6.66 6.86 9.92 6.41 17.74 Reliance Industries Limited
4.33 8.21 10.82 15.98 15.35
15 Rashtriya Chemicals and Fertilizers Limited
1.91 1.94 3.05 3.65 3.18 Coromandel International Limited
6.83 5.33 6.62 4.18 3.43

Report No.12 of 2021
230
Sl. No.
CPSE 2019-20 2018-19 2017-18 2016-17 2015-16 Private Company 2019-20 2018-19 2017-18 2016-17 2015-16
16 Steel Authority of India Limited
1.58 1.7 0.73 -1.06 -2.5 Tata Steel Limited 3.18 6.75 3.36 2.99 5.2
17 Scooters India Limited NA NA -30.47 -11.39 5.27 Atul Auto Limited 66.0776699 95.75 165.69 97.77 92.56

Report No. 12 of 2021
231
Annexure XVIII (As referred to in Para 2.5.1.1)
List of CPSEs which amended their financial statements
Sl. No. CPSE Government company (GC)/ Government controlled other company (GCOC)
1. BOI Merchant Bankers Limited GCOC 2. Chennai Metro Rail Limited GC 3. Hindustan Aeronautics Limited GC 4. Karnataka Solar Power Development Corporation Limited GCOC
5. New Space of India Limited GC

Report No.12 of 2021
232
Annexure XIX (As referred to in Para 2.5.1.2)
List of CPSEs where Auditors’ Report revised Sl. No. CPSE Government
company (GC) / Government controlled other company (GCOC)
1. APITCO Limited GCOC 2. BEL-Thales Systems Limited GC 3. BEML Limited GC 4. Bhagyanagar Gas Limited GCOC 5. Bharat Dynamics Limited GC 6. Bharat Electronics Limited GC 7. Bharat Petro Resources JPDA Limited GC 8. Bharat Petro Resources Limited GC 9. Bharat Pumps & Compressors Limited GC 10. Bharatiya Reserve Bank Note Mudran Private Limited GC 11. BOI Merchant Bankers Limited GCOC 12. Central Coalfields Limited GC 13. Chandigarh International Airport Limited GCOC 14. Chennai Metro Rail Limited GC 15. Chennai Petroleum Corporation Limited GC 16. Coal India Limited GC 17. Dholera International Airport Company Limited GC 18. Eastern Coalfields Limited GC 19. Engineering Projects India Limited GC 20. Fresh and Healthy Enterprises Limited GC 21. Government E-Marketplace GC 22. HIL (India) Limited GC 23. Hindustan Aeronautics Limited GC 24. HMT Limited GC 25. HMT Machine Tools Limited GC 26. Hooghly Cochin Shipyard Limited GC 27. Hoogly Dock & Port Engineers Limited GC 28. Hotel Corporation of India Limited GC 29. IFIN Credit Limited GC 30. IIFCL Asset Management Company Limited GC 31. IIFCL Projects Limited GC 32. India Tourism Development Corporation Limited GC 33. J&K Industrial and Technical Consultancy Organisation Limited GCOC 34. Jharkhand Central Railway Limited GC 35. Karnataka Solar Power Development Corporation Limited GCOC

Report No. 12 of 2021
233
Sl. No. CPSE Government company (GC) / Government controlled other company (GCOC)
36. Kutch Railway Company Limited GCOC 37. Mahanadi Coalfields Limited GC 38. Mishra Dhatu Nigam Limited GC 39. National Investment and Infrastructure Fund Trustee Limited GC 40. New Space of India Limited GC 41. Northern Coalfields Limited GC
42. NTPC Tamil Nadu Energy Company Limited GCOC 43. Oil India International Limited GC 44. Pondicherry Ashok Hotel Corporation Limited GC 45. Rajasthan Electronics and Instruments Limited GC 46. Ratnagiri Refinery and Petrochemicals Limited GCOC 47. Rewa Ultra Mega Solar Limited GCOC 48. Sail Rites Bengal Wagon Industries Limited GC 49. Tungbhadra Steel Products Limited GCOC 50. Uranium Corporation of India Limited GC 51. Utkarsha Aluminium Dhatu Nigam Limited GC 52. Vignyan Industries Limited GC

Report No.12 of 2021
234
Annexure XX (As referred to in Para 2.5.1.3)
List of CPSEs where comments were issued by CAG
Sl. No. CPSE Government company (GC) / Government controlled other company (GCOC)
1. AAI Cargo Logistics & Allied Services Company Limited GC 2. Agricultural Insurance Company of India Limited GCOC 3. Andhra Pradesh Solar Power Corporation GC 4. Bengal Chemicals & Pharmaceuticals Limited GC 5. Bharat Broadband Network Limited GC 6. Bharat Electronics Limited GC 7. Bokaro Power Supply Company (P) Limited GCOC 8. BSNL Limited GC 9. Central Coalfields Limited GC 10. CONCOR Air Limited GC 11. Container Corporation of India Limited GC 12. Dedicated Freight Corridor Corporation of India Limited. GC 13. DMICDC Neemrana Solar Power Company Limited GCOC 14. Dredging Corporation of India Limited GCOC 15. Electronics Corporation of India Limited GC 16. FACT RCF Building Products Limited GC 17. Fresh and Healthy Enterprises Limited GC 18. General Insurance Corporation of India GC 19. Goa Antibiotics and Pharmaceuticals Limited GC 20. Haridaspur Paradip Railway company Limited GC 21. Hassan Mangalore Rail Development Company Limited GC 22. Health Insurance TPA of India Limited GC 23. Hemisphere Properties India Limited GC 24. Higher Education Financing Agency GC 25. Hindustan Urvarak & Rasayan Limited GC 26. HLL Medipark Limited GC 27. IFCI Infrastructure Development Limited GC 28. IFCI Limited GC 29. India Infrastructure Finance Company Limited GC 30. Indian Railway Catering and Tourism Corporation Limited GC 31. Ircon Davangere Haveri Highway Limited GC 32. Ircon Vadodara Kim Expressway Limited GC 33. IREL (India) Limited GC 34. ITI Limited GC 35. Kolkata Metro Rail Corporation Limited GC 36. Konkan Railway Corporation Limited GC

Report No. 12 of 2021
235
Sl. No. CPSE Government company (GC) / Government controlled other company (GCOC)
37. Madras Fertilizers Limited GC 38. Mahanagar Telephone Nigam Limited GC 39. MMTC Limited GC 40. Mumbai Metro Rail Corporation Limited GC 41. NABARD Consultancy Services Private Limited GCOC 42. NABKISAN Finance Limited GCOC 43. National Backward Classes Finance & Development
Corporation GC
44. National Highways & Infrastructure Development Corporation Limited
GC
45. National Industrial Corridor Development Corporation Limited
GC
46. National Informatics Centre Services Inc. GC 47. National Insurance Company Limited GC 48. National Seeds Corporation Limited GC 49. Neyveli Uttar Pradesh Power Limited GC 50. North Eastern Electric Power Corporation Limited GC 51. Oil & Natural Gas Corporation Limited GC 52. Oriental Insurance Company Limited GC 53. Pawan Hans Limited GC 54. Pipavav Railway Corporation Limited GCOC 55. Punjab Logistic Infrastructure Limited GC 56. Rail Vikas Nigam Limited GC 57. Ramagundam Fertilisers and Chemicals Limited GCOC 58. Richardson & Cruddas (1972) Limited GC 59. Sail Rites Bengal Wagon Industries Limited GC 60. Securities Printing & Minting Corporation of India Limited GC 61. Star Union Dai ichi Life Insurance Company Limited GCOC 62. Steel Authority of India Limited GC 63. Talcher Fertilisers Limited GC 64. The Fertilizer and Chemicals Travancore Limited GC 65. The New India Assurance Company Limited GC 66. The Orissa Minerals Development Company Limited GCOC 67. Tungabhadra Steel Products Limited GC 68. United India Insurance Company Limited GC

Report No.12 of 2021
236
Annexure XXI (As referred to in Para 2.6)
Details of CPSEs where there were non-compliances with Accounting Standards as reported by the Statutory Auditors
Sl. No. CPSE Category (listed/
unlisted)
Government company (GC)/ Government controlled other company (GCOC)
Number of Accounting Standard (AS)/Ind AS
1. APITCO Limited Unlisted GCOC AS 3, AS 15 and AS 9 2. Bangalore Metro Rail
Corporation Limited Unlisted GC Ind AS 101 and Ind AS 109
3. Bharat Immunologicals & Biologicals Corporation Limited
Listed GC Ind AS 20, Ind AS 36 and Ind AS 116
4. Hindustan Fluorocarbons Limited
Listed GC Ind AS 105
5. HMT Limited Listed GC Ind AS 19, Ind AS 36 and Ind AS 109
HMT Limited (Consolidated Financial Statement)
Ind AS 2, Ind AS 8, Ind AS 19, Ind AS 36, Ind AS 40 and Ind AS 109
6. HMT Machine Tools Limited
Unlisted GC Ind AS 2, Ind AS 8, Ind AS 36 and Ind AS 40
7. HMT Watches Limited Unlisted GC Ind AS 8, Ind AS 36 and Ind AS 109

Report No. 12 of 2021
237
Annexure XXII (As referred to in Para 2.7)
List of CPSEs where Management Letters were issued by CAG
Sl. No. CPSE 1. Acuite Ratings & Research Limited 2. Agriculture Insurance Company of India Limited 3. Agrinovate India Limited 4. Air India Express Limited 5. Andhra Pradesh Solar Power Corporation Private Limited 6. APITCO Limited 7. Aravali Power Company Private Limited 8. Artificial Limbs Manufacturing Corporation of India 9. Balmer & Lawrie Company Limited 10. Bangalore Metro Rail Corporation Limited 11. Bhagyanagar Gas Limited 12. Bharat Broadband Network Limited 13. Bharat Coking Coal Limited 14. Bharat Dynamics Limited 15. Bharat Electronics Limited 16. Bharat Heavy Electricals Limited 17. Bharat Immunological and Biologicals Corporation Limited 18. Bharat Petro Resources Limited 19. Bharat Petroleum Corporation Limited 20. Bharat Pumps and Compressors Limited 21. Bharat Sanchar Nigam Limited 22. Bharatiya Reserve Bank Note Mudran Private Limited 23. Bharuch Dahej Rail Company Limited 24. Canara Bank Securities Limited 25. Canara Robeco Asset Management Company Limited 26. Canbank Financial Services Limited 27. Centbank Financial Services Limited 28. Central Coalfields Limited 29. Central Mine Planning and Design Institute Limited 30. Central Railside Warehouse Company Limited 31. Central Warehousing Corporation 32. Chennai Petroleum Corporation Limited 33. Coal India Limited 34. Cochin Shipyard Limited 35. CONCOR Air Limited 36. Container Corporation of India Limited

Report No.12 of 2021
238
Sl. No. CPSE 37. Cotton Corporation of India Limited 38. Cross Border Power Transmission Company Limited 39. CSE e-Governance Services India Limited 40. Dedicated Freight Corridor Corporation of India Limited 41. Delhi Police Housing Corporation Limited 42. DNH Power Distribution Corporation Limited 43. Dredging Corporation of India Limited 44. Eastern Coalfields Limited
45. ECGC Limited 46. Electronics Corporation of India Limited 47. FCI Aravali Gypsum and Minerals India Limited 48. Fresh & Healthy Enterprises Limited 49. Garden Reach Shipbuilders & Engineers Limited 50. General Insurance Corporation of India Limited 51. Goa Natural Gas Limited 52. Haridwar Natural Gas Private Limited 53. Higher Education Financing Agency 54. Hindustan Cables Limited 55. Hindustan Fluorocarbons Limited 56. Hindustan Organic Chemicals Limited 57. Hindustan Petroleum Corporation Limited 58. Hindustan Salts Limited 59. Hindustan Shipyard Limited 60. Hindustan Urvarak & Rasayan Limited 61. HLL Infra Tech Services Limited 62. HLL Medipark Limited 63. HMT (International) Limited 64. HMT Limited 65. HMT Machine Tools Limited 66. HMT Watches Limited 67. Hooghly Dock & Port Engineers Limited 68. Hotel Corporation of India Limited 69. HPOIL Gas Limited 70. HUDCO Limited 71. IDBI Asset Management Limited 72. IDBI MF Trustee Company Limited 73. IDBI Trusteeship Services Limited 74. IHB Private Limited 75. India Infrastructure Finance Company Limited

Report No. 12 of 2021
239
Sl. No. CPSE 76. India Tourism Development Corporation Limited 77. IndiaFirst Life Insurance Company Limited 78. Indian Oil Corporation Limited 79. Indian Railway Catering and Tourism Corporation Limited 80. Indian Railway Finance Corporation Limited 81. Indian Rare Earths Limited 82. Indian Renewable Energy Development Agency Limited 83. Indian Strategic Petroleum Reserves Limited 84. Indian Vaccines Corporation Limited 85. Ircon Davangere Haveri Highway Limited 86. Ircon International Limited 87. ITI Limited 88. Karnataka Antibiotics and Pharmaceuticals Limited 89. Karnataka Solar Power Development Corporation Limited 90. KIOCL Limited 91. Kochi Metro Rail Limited 92. Kolkata Metro Rail Corporation Limited 93. Konkan LNG Private Limited 94. Krishnapatnam Rail Company Limited 95. Kutch Railway Company Limited 96. LIC Pension Fund Limited 97. Madras Fertilizers Limited 98. Mahanadi Coalfields Limited 99. Mahanagar Telephone Nigam Limited 100. Maharashtra Executor & Trustee Company Private Limited 101. Maharashtra Metro Rail Corporation Limited 102. Maharashtra Natural Gas Limited 103. Mangalore Refinery and Petrochemicals Limited 104. Mazagon Dock Shipbuilders Limited 105. Meja Urja Nigam Private Limited 106. Micro Units Development & Refinance Agency Limited 107. MMTC Limited 108. MOIL Limited 109. Mumbai Aviation Fuel Farm Facility Private Limited 110. Mumbai Metro Rail Corporation Limited 111. NAB Ventures Limited 112. NABARD Consultancy Services Private Limited 113. National Aluminium Company Limited 114. National Backward Classes Finance & Development Corporation

Report No.12 of 2021
240
Sl. No. CPSE 115. National Capital Region Transport Corporation Limited 116. National Handicapped Finance & Development Corporation 117. National Informatics Centre Services Inc 118. National Insurance Company Limited 119. National Investment and Infrastructure Fund Trustee Limited 120. National Minority Finance & Development Corporation 121. National Safai Karamcharis Finance & Development Corporation 122. National Scheduled Castes Finance & Development Corporation 123. National Scheduled Tribes Finance & Development Corporation 124. New Space of India Limited 125. Neyveli Uttar Pradesh Power Limited 126. NHDC Limited 127. NHPC Limited 128. NLC India Limited 129. NMDC Limited 130. NMDC-CMDC Limited 131. North East Transmission Company Limited 132. Northern Coalfields Limited 133. NTPC BHEL Power Projects Limited 134. NTPC Limited 135. NTPC Tamilnadu Energy Company Limited 136. NTPC-SAIL Power Company Limited 137. Nuclear Power Corporation of India Limited 138. Oil & Natural Gas Corporation Limited 139. Oil India International Limited 140. ONGC Mangalore Petrochemicals Limited 141. ONGC Petro Additions Limited 142. Patratu Vidyut Utpadan Nigam Limited 143. Pondicherry Ashok Hotel Limited 144. Power System Operations Corporation Limited 145. Power Grid Corporation of India Limited 146. POWERGRID Parli Transmission Limited 147. POWERGRID Southern Interconnector Transmission System Limited 148. POWERGRID Warora Transmission Limited 149. Punjab Logistic Infrastructure Limited 150. Railtel Corporation of India Limited 151. Railtel Enterprises Limited 152. Rajasthan Electronics & Instruments Limited 153. Ramagundam Fertilizers and Chemicals Limited

Report No. 12 of 2021
241
Sl. No. CPSE 154. Rashtriya Chemicals and Fertilizers Limited 155. Rashtriya Ispat Nigam Limited 156. Ratnagiri Gas & Power Private Limited 157. Ratnagiri Refinery and Petrochemicals Limited 158. REC Limited 159. REC Transmission Projects Company Limited 160. Richardson and Cruddas Limited (1972) 161. SBI Cards and Payment Services Limited 162. SBI DFHI Limited 163. SBI Funds Managements Private Limited 164. SBI General Insurance Company Limited 165. SBI Global Factors Limited 166. SBI Life Insurance Company Limited 167. SBICAP Trustee Company Limited 168. Securities Printing and Minting Corporation of India Limited 169. SHCIL Services Limited 170. Shipping Corporation of India Limited 171. SIDBI Trustee Company Limited 172. SIDBI Venture Capital Limited 173. SJVN Limited 174. Solar Energy Corporation of India Limited 175. South Eastern Coalfields Limited 176. STCI Primary Dealer Limited
177. Steel Authority of India Limited 178. SUUTI Tech Options Limited 179. Telecommunications Consultant India Limited 180. THDC India Limited 181. The New India Assurance Company Limited 182. The State Trading Corporation of India Limited 183. Tungabhadra Steel Products Limited 184. Ujjwala Plus Foundation 185. Union Asset Management Company Limited 186. Union Trustee Company Private Limited 187. United India Insurance Company Limited 188. UP Industrial Consultants Limited 189. Uranium Corporation of India Limited 190. UTI Asset Management Company Limited 191. UTI Infrastructure Technology and Services Limited 192. UTI Retirement Solutions Limited
Report No.12 of 2021
242
Sl. No. CPSE 193. Visakhapatnam Port Road Company Limited 194. Western Coalfields Limited
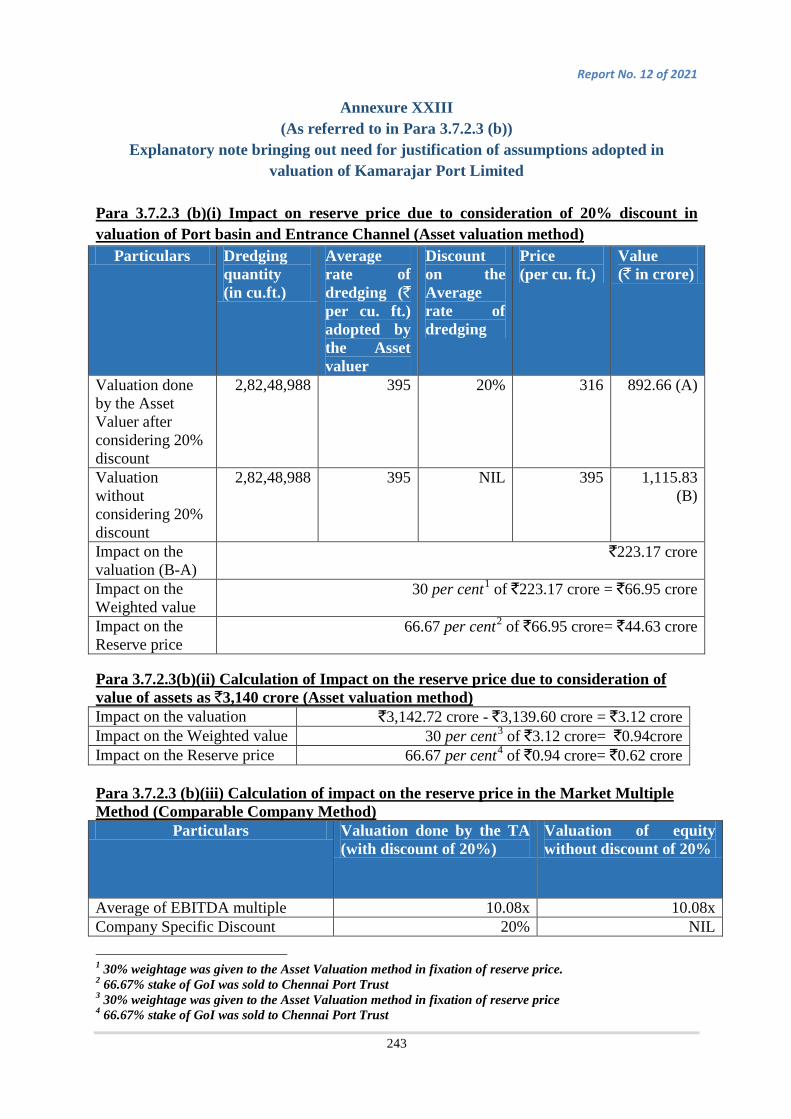
Report No. 12 of 2021
243
Annexure XXIII (As referred to in Para 3.7.2.3 (b))
Explanatory note bringing out need for justification of assumptions adopted in valuation of Kamarajar Port Limited
Para 3.7.2.3 (b)(i) Impact on reserve price due to consideration of 20% discount in valuation of Port basin and Entrance Channel (Asset valuation method)
Particulars Dredging quantity (in cu.ft.)
Average rate of dredging (` per cu. ft.) adopted by the Asset valuer
Discount on the Average rate of dredging
Price (per cu. ft.)
Value (` in crore)
Valuation done by the Asset Valuer after considering 20% discount
2,82,48,988 395 20% 316 892.66 (A)
Valuation without considering 20% discount
2,82,48,988 395 NIL 395 1,115.83 (B)
Impact on the valuation (B-A)
`223.17 crore
Impact on the Weighted value
30 per cent1 of `223.17 crore = `66.95 crore
Impact on the Reserve price
66.67 per cent2 of `66.95 crore= `44.63 crore
Para 3.7.2.3(b)(ii) Calculation of Impact on the reserve price due to consideration of value of assets as `3,140 crore (Asset valuation method) Impact on the valuation `3,142.72 crore - `3,139.60 crore = `3.12 crore Impact on the Weighted value 30 per cent3 of `3.12 crore= `0.94crore Impact on the Reserve price 66.67 per cent4 of `0.94 crore= `0.62 crore Para 3.7.2.3 (b)(iii) Calculation of impact on the reserve price in the Market Multiple Method (Comparable Company Method)
Particulars Valuation done by the TA (with discount of 20%)
Valuation of equity without discount of 20%
Average of EBITDA multiple 10.08x 10.08x Company Specific Discount 20% NIL 1 30% weightage was given to the Asset Valuation method in fixation of reserve price. 2 66.67% stake of GoI was sold to Chennai Port Trust 3 30% weightage was given to the Asset Valuation method in fixation of reserve price 4 66.67% stake of GoI was sold to Chennai Port Trust
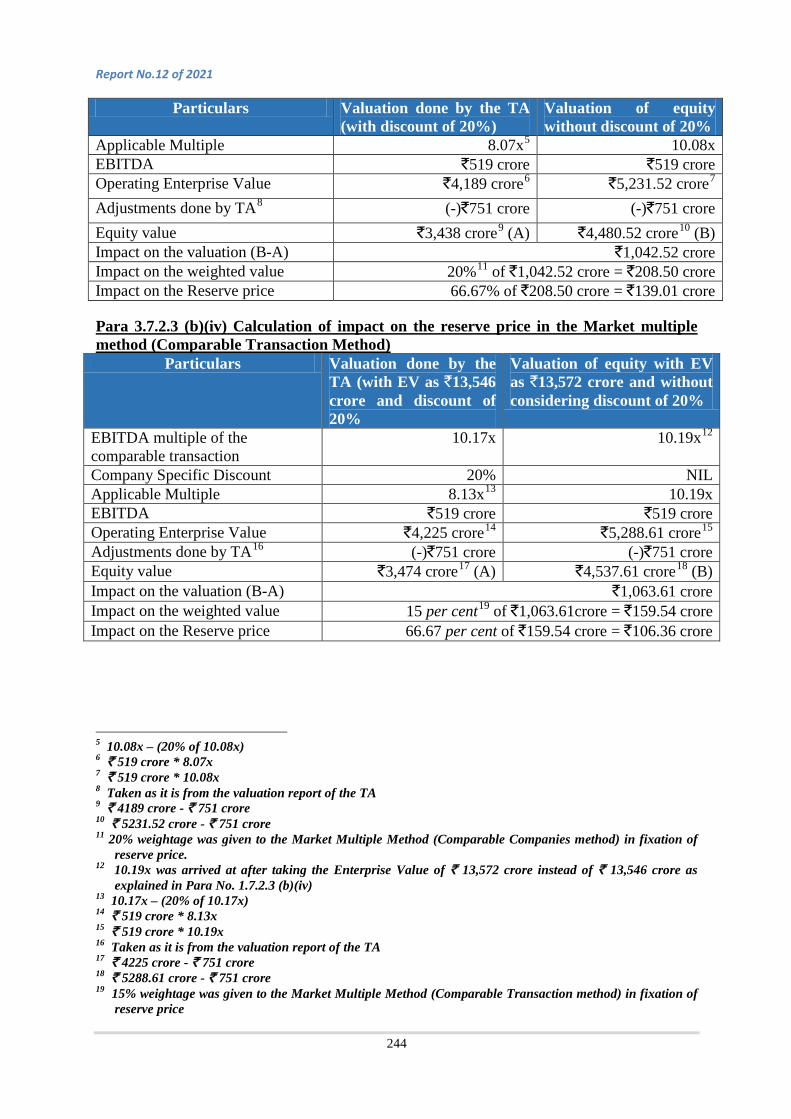
Report No.12 of 2021
244
Particulars Valuation done by the TA (with discount of 20%)
Valuation of equity without discount of 20%
Applicable Multiple 8.07x5 10.08x EBITDA `519 crore `519 crore Operating Enterprise Value `4,189 crore6 `5,231.52 crore7 Adjustments done by TA8 (-)`751 crore (-)`751 crore Equity value `3,438 crore9 (A) `4,480.52 crore10 (B) Impact on the valuation (B-A) `1,042.52 crore Impact on the weighted value 20%11 of `1,042.52 crore = `208.50 crore Impact on the Reserve price 66.67% of `208.50 crore = `139.01 crore
Para 3.7.2.3 (b)(iv) Calculation of impact on the reserve price in the Market multiple method (Comparable Transaction Method)
Particulars Valuation done by the TA (with EV as `13,546 crore and discount of 20%
Valuation of equity with EV as `13,572 crore and without considering discount of 20%
EBITDA multiple of the comparable transaction
10.17x 10.19x12
Company Specific Discount 20% NIL Applicable Multiple 8.13x13 10.19x EBITDA `519 crore `519 crore Operating Enterprise Value `4,225 crore14 `5,288.61 crore15 Adjustments done by TA16 (-)`751 crore (-)`751 crore Equity value `3,474 crore17 (A) `4,537.61 crore18 (B) Impact on the valuation (B-A) `1,063.61 crore Impact on the weighted value 15 per cent19 of `1,063.61crore = `159.54 crore Impact on the Reserve price 66.67 per cent of `159.54 crore = `106.36 crore
5 10.08x – (20% of 10.08x) 6 ` 519 crore * 8.07x 7 ` 519 crore * 10.08x 8 Taken as it is from the valuation report of the TA 9 ` 4189 crore - ` 751 crore 10 ` 5231.52 crore - ` 751 crore 11 20% weightage was given to the Market Multiple Method (Comparable Companies method) in fixation of
reserve price. 12 10.19x was arrived at after taking the Enterprise Value of ` 13,572 crore instead of ` 13,546 crore as
explained in Para No. 1.7.2.3 (b)(iv) 13 10.17x – (20% of 10.17x) 14 ` 519 crore * 8.13x 15 ` 519 crore * 10.19x 16 Taken as it is from the valuation report of the TA 17 ` 4225 crore - ` 751 crore 18 ` 5288.61 crore - ` 751 crore 19 15% weightage was given to the Market Multiple Method (Comparable Transaction method) in fixation of
reserve price
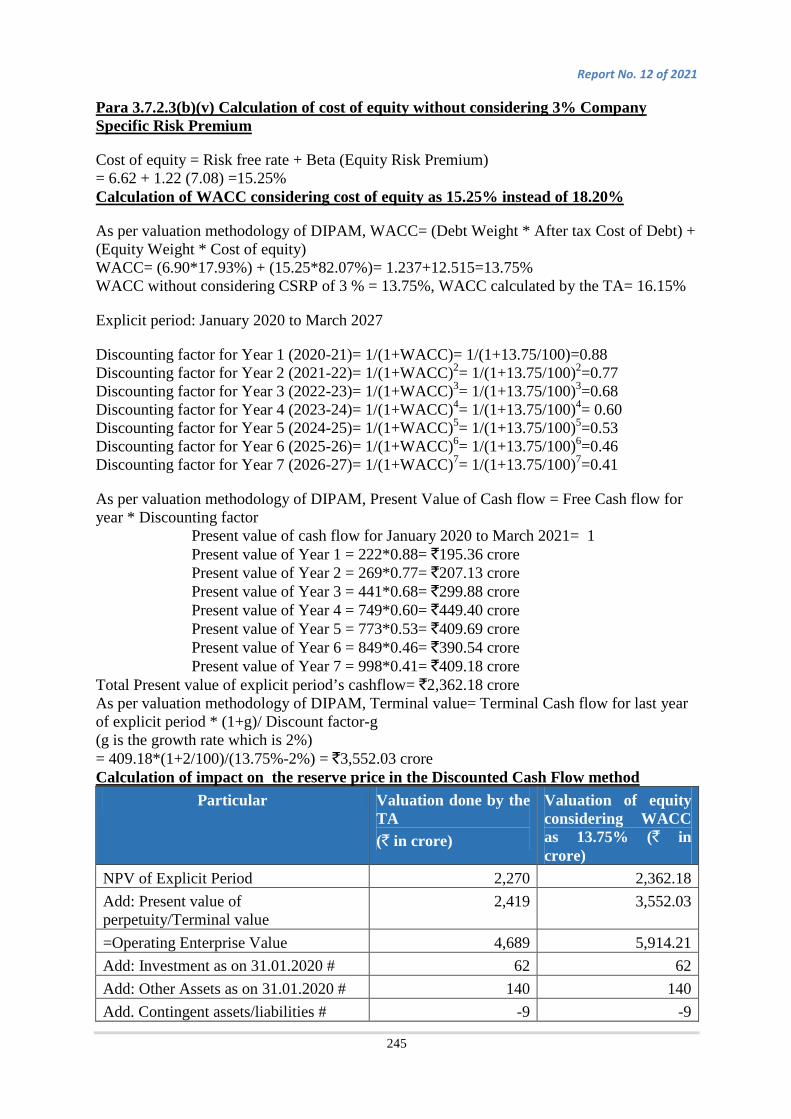
Report No. 12 of 2021
245
Para 3.7.2.3(b)(v) Calculation of cost of equity without considering 3% Company Specific Risk Premium
Cost of equity = Risk free rate + Beta (Equity Risk Premium) = 6.62 + 1.22 (7.08) =15.25% Calculation of WACC considering cost of equity as 15.25% instead of 18.20%
As per valuation methodology of DIPAM, WACC= (Debt Weight * After tax Cost of Debt) + (Equity Weight * Cost of equity) WACC= (6.90*17.93%) + (15.25*82.07%)= 1.237+12.515=13.75% WACC without considering CSRP of 3 % = 13.75%, WACC calculated by the TA= 16.15%
Explicit period: January 2020 to March 2027
Discounting factor for Year 1 (2020-21)= 1/(1+WACC)= 1/(1+13.75/100)=0.88 Discounting factor for Year 2 (2021-22)= 1/(1+WACC)2= 1/(1+13.75/100)2=0.77 Discounting factor for Year 3 (2022-23)= 1/(1+WACC)3= 1/(1+13.75/100)3=0.68 Discounting factor for Year 4 (2023-24)= 1/(1+WACC)4= 1/(1+13.75/100)4= 0.60 Discounting factor for Year 5 (2024-25)= 1/(1+WACC)5= 1/(1+13.75/100)5=0.53 Discounting factor for Year 6 (2025-26)= 1/(1+WACC)6= 1/(1+13.75/100)6=0.46 Discounting factor for Year 7 (2026-27)= 1/(1+WACC)7= 1/(1+13.75/100)7=0.41
As per valuation methodology of DIPAM, Present Value of Cash flow = Free Cash flow for year * Discounting factor
Present value of cash flow for January 2020 to March 2021= 1 Present value of Year 1 = 222*0.88= `195.36 crore Present value of Year 2 = 269*0.77= `207.13 crore Present value of Year 3 = 441*0.68= `299.88 crore Present value of Year 4 = 749*0.60= `449.40 crore Present value of Year 5 = 773*0.53= `409.69 crore Present value of Year 6 = 849*0.46= `390.54 crore Present value of Year 7 = 998*0.41= `409.18 crore
Total Present value of explicit period’s cashflow= `2,362.18 crore As per valuation methodology of DIPAM, Terminal value= Terminal Cash flow for last year of explicit period * (1+g)/ Discount factor-g (g is the growth rate which is 2%) = 409.18*(1+2/100)/(13.75%-2%) = `3,552.03 crore Calculation of impact on the reserve price in the Discounted Cash Flow method
Particular Valuation done by the TA (` in crore)
Valuation of equity considering WACC as 13.75% (` in crore)
NPV of Explicit Period 2,270 2,362.18 Add: Present value of perpetuity/Terminal value
2,419 3,552.03
=Operating Enterprise Value 4,689 5,914.21 Add: Investment as on 31.01.2020 # 62 62 Add: Other Assets as on 31.01.2020 # 140 140 Add. Contingent assets/liabilities # -9 -9

Report No.12 of 2021
246
Particular Valuation done by the TA (` in crore)
Valuation of equity considering WACC as 13.75% (` in crore)
=Business Enterprise Value 4,882 6,107.21 Less: Debt as on 31.01.2020 # 904 904 Add: Cash and Cash equivalents as on 31.01.2020 #
90 90
Add: Net Cash Flow from 01.02.2020 to 15.02.2020 #
0.3 0.3
=Equity value 4,069 (A) 5,293.51(B) Impact on the valuation (B-A) `1,224.51crore Weighted value 35%20 of `1,224.51 crore = `428.58 crore Impact on the Reserve price 66.67% of `428.58 crore =`285.73 crore
# The above stated values of investment as on 31.01.2020, other assets as on 31.01.2020, contingent assets/ liabilities, debt as on 31.01.2020, cash and cash equivalents as on 31.01.2020 and net cash flow from 01.02.2020 to 15.02.2020 have been taken as it is from the TA’s valuation report. Total impact on the reserve price considering the impact as calculated in aforesaid methods: `44.63 crore + `0.62 crore + `139.01 crore + `106.36 crore + `285.73 crore=`576.35 crore.
20 35 % weightage was given to the discounted cash flow method in fixation of reserve price.

Report No. 12 of 2021
247
Annexure XXIV (As referred to in Para 3.7.2.4)
Details of estimated valuation done on the basis of market inquiries Sl. No.
Particulars of Land parcels used for comparative assessment
Area in Square Meters (SMT)
Negotiated price
Rate `/ SMT
1 A Land parcel available for sale at EC road Dehradun
503 2,20,50,000 43,837
2 A Land parcel available for sale at Rajpur road Dehradun
4013 15,96,00,000 39,767
Average negotiated price 42,000 3 A Land parcel available
for sale at Dehrakhas 154.68 54,00,000 34,910
4 A Land structure available for sale at Dehrakhas
117.05 36,57,500 31246
5 A Land parcel available for sale at Dehrakhas
83.61 26,60,000 31,814
Average negotiated price 32,656 Discount for size 40% 20,000 6 A Land parcel available
for sale at Selaqui 4,85,623 1,07,80,00,000 2,220
7 A Land structure available for sale at Ramshahwale
7,149 1,71,00,000 2,392
8 A Land structure available for sale at Kanswali Kodari
167 9,90,000 5,920
Average negotiated price 3500 9 A Land parcel available
for sale at Banjarwala 194.8160535 52,42,500 26,910
10 A Land parcel available for sale at MadhuVihar
136.9379413 41,40,000 30,233
11 A Land parcel available for sale at Jogiwala
810.2006689 2,61,00,000 32,214
Average negotiated price 29,786 Discount for size 40% 18,000

Report No.12 of 2021
248
Annexure XXV (As referred to in Para 3.8.1)
CPSEs eligible for listing as per the revised criteria laid down by CCEA (` in crore)
Sl. No. CPSE Profit (2018-19)
Profit (2017-18)
Profit (2016-17)
Net worth
1. Pondicherry Ashok Hotel Corporation Limited
0.18 0.02 0.35 1.2
2. Vignyan Industries Limited -0.33 0.39 0.48 4.66
3. Millennium Telecom Limited 0.64 0.53 0.4 5.74
4. BPCL-KIAL Fuel Farm Private Limited
-1.19 -0.14 0 7.23
5. National Research Development Corporation
0.01 0.32 0.86 9.44
6. Heavy Engineering Corporation Limited
-93.67 446 -82.27 10.38
7. Broadcast Engineering Consultants India Limited
0.05 -4.28 2.04 12.44
8. Goa Antibiotics & Pharmaceuticals Limited
-2.62 1.14 7.87 12.72
9. J & K Mineral Development Corporation Limited
-0.74 1.41 -0.85 13.88
10. IIFCL Projects Limited 1.78 2.29 1.41 14.91
11. Railtel Enterprises Limited 1.79 1.59 1.34 15.33
12. HLL Infra Tech Services Limited 21.86 8.01 2.78 15.4
13. Brahmaputra Valley Fertilizer Corporation Limited
-63.15 0.79 7.5 16.18
14. IIFCL Asset Management Company Limited
3.4 2.8 1.01 22.51
15. NBCC Services Limited 8.63 6.97 6.81 23.39
16. HMT (International) Limited 1.51 0.14 0.06 33.79
17. Kumarakruppa Frontier Hotels Private Limited
10.47 8.92 7.45 33.83
18. Hindustan Prefab Limited 2.14 1.93 5.7 34.18
19. National Film Development Corporation Limited
-0.06 14.54 -1.91 36
20. Hindustan Salts Limited 1.26 1.84 0.4 49.04
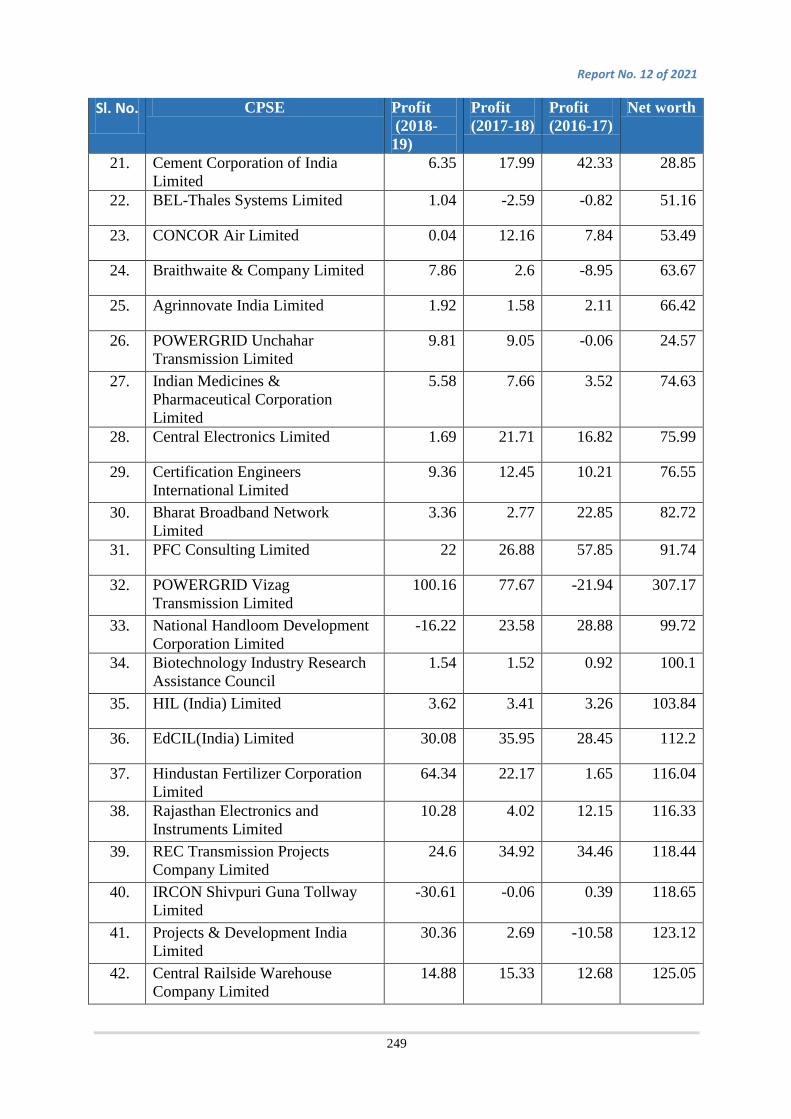
Report No. 12 of 2021
249
Sl. No. CPSE Profit (2018-19)
Profit (2017-18)
Profit (2016-17)
Net worth
21. Cement Corporation of India Limited
6.35 17.99 42.33 28.85
22. BEL-Thales Systems Limited 1.04 -2.59 -0.82 51.16
23. CONCOR Air Limited 0.04 12.16 7.84 53.49
24. Braithwaite & Company Limited 7.86 2.6 -8.95 63.67
25. Agrinnovate India Limited 1.92 1.58 2.11 66.42
26. POWERGRID Unchahar Transmission Limited
9.81 9.05 -0.06 24.57
27. Indian Medicines & Pharmaceutical Corporation Limited
5.58 7.66 3.52 74.63
28. Central Electronics Limited 1.69 21.71 16.82 75.99
29. Certification Engineers International Limited
9.36 12.45 10.21 76.55
30. Bharat Broadband Network Limited
3.36 2.77 22.85 82.72
31. PFC Consulting Limited 22 26.88 57.85 91.74
32. POWERGRID Vizag Transmission Limited
100.16 77.67 -21.94 307.17
33. National Handloom Development Corporation Limited
-16.22 23.58 28.88 99.72
34. Biotechnology Industry Research Assistance Council
1.54 1.52 0.92 100.1
35. HIL (India) Limited 3.62 3.41 3.26 103.84
36. EdCIL(India) Limited 30.08 35.95 28.45 112.2
37. Hindustan Fertilizer Corporation Limited
64.34 22.17 1.65 116.04
38. Rajasthan Electronics and Instruments Limited
10.28 4.02 12.15 116.33
39. REC Transmission Projects Company Limited
24.6 34.92 34.46 118.44
40. IRCON Shivpuri Guna Tollway Limited
-30.61 -0.06 0.39 118.65
41. Projects & Development India Limited
30.36 2.69 -10.58 123.12
42. Central Railside Warehouse Company Limited
14.88 15.33 12.68 125.05
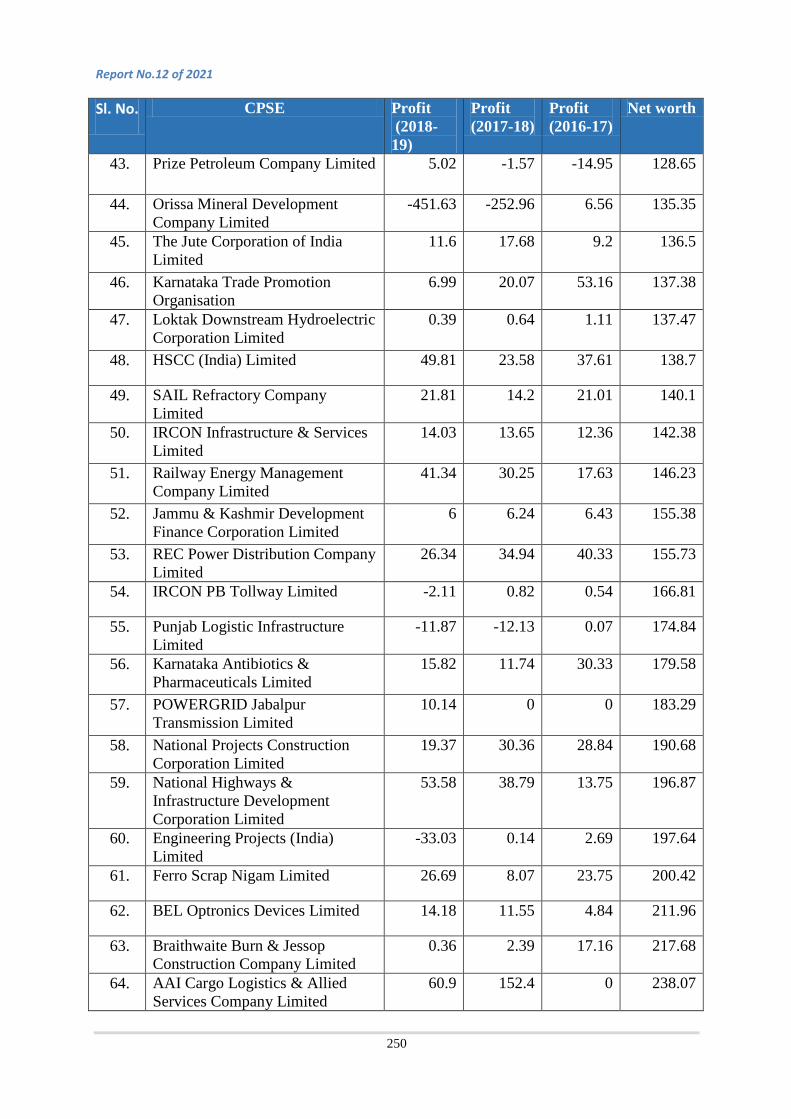
Report No.12 of 2021
250
Sl. No. CPSE Profit (2018-19)
Profit (2017-18)
Profit (2016-17)
Net worth
43. Prize Petroleum Company Limited 5.02 -1.57 -14.95 128.65
44. Orissa Mineral Development Company Limited
-451.63 -252.96 6.56 135.35
45. The Jute Corporation of India Limited
11.6 17.68 9.2 136.5
46. Karnataka Trade Promotion Organisation
6.99 20.07 53.16 137.38
47. Loktak Downstream Hydroelectric Corporation Limited
0.39 0.64 1.11 137.47
48. HSCC (India) Limited 49.81 23.58 37.61 138.7
49. SAIL Refractory Company Limited
21.81 14.2 21.01 140.1
50. IRCON Infrastructure & Services Limited
14.03 13.65 12.36 142.38
51. Railway Energy Management Company Limited
41.34 30.25 17.63 146.23
52. Jammu & Kashmir Development Finance Corporation Limited
6 6.24 6.43 155.38
53. REC Power Distribution Company Limited
26.34 34.94 40.33 155.73
54. IRCON PB Tollway Limited -2.11 0.82 0.54 166.81
55. Punjab Logistic Infrastructure Limited
-11.87 -12.13 0.07 174.84
56. Karnataka Antibiotics & Pharmaceuticals Limited
15.82 11.74 30.33 179.58
57. POWERGRID Jabalpur Transmission Limited
10.14 0 0 183.29
58. National Projects Construction Corporation Limited
19.37 30.36 28.84 190.68
59. National Highways & Infrastructure Development Corporation Limited
53.58 38.79 13.75 196.87
60. Engineering Projects (India) Limited
-33.03 0.14 2.69 197.64
61. Ferro Scrap Nigam Limited 26.69 8.07 23.75 200.42
62. BEL Optronics Devices Limited 14.18 11.55 4.84 211.96
63. Braithwaite Burn & Jessop Construction Company Limited
0.36 2.39 17.16 217.68
64. AAI Cargo Logistics & Allied Services Company Limited
60.9 152.4 0 238.07

Report No. 12 of 2021
251
Sl. No. CPSE Profit (2018-19)
Profit (2017-18)
Profit (2016-17)
Net worth
65. FCI Aravali Gypsum & Minerals (India) Limited
20.49 27.03 36.03 251.07
66. Eastern Investment Limited -0.02 0.35 0.85 270.01
67. Nuclear Power Corporation of India Ltd
2818.85 3613.27 2544.36 36179.41
68. ONGC Videsh Ltd 1679.67 979.62 753.78 36141.94
69. POWERGRID Parli Transmission Limited
65.01 0 0 274.35
70. Tamil Nadu Trade Promotion Organisation
35.02 31.43 31.56 290.09
71. Mumbai Railway Vikas Corporation Limited
35.87 1.62 23.38 246.25
72. Hindustan Steelworks Constructions Limited
34.3 35.76 -29.02 301.37
73. Patratu Vidyut Utpadan Nigam Limited
-1.38 0.03 -0.07 314.95
74. MECON Limited 13.74 58.02 -73.05 340.46
75. Air India Air Transport Services Limited
63.81 53.85 33.44 348.93
76. NTPC Vidyut Vyapar Nigam Limited
65.56 61.26 76.44 352.75
77. The Cotton Corporation of India Limited
51 4.18 -4.55 353.57
78. Bridge & Roof Company (India) Limited
33.33 16.57 18.25 362.18
79. POWERGRID Warora Transmission Limited
59.67 28.95 1.32 382.77
80. Power System Operation Corporation Limited
44.26 47.62 35.97 398.91
81. Artificial Limbs Mfg. Corporation of India
76.11 50.79 55.74 399.86
82. HLL Lifecare Limited 18.47 -69.58 -25.38 461.12
83. National Handicapped Finance & Development Corporation
5.75 4.53 1.09 464.27
84. Central Mine Planning & Design Institute Limited
173.27 80.83 39.64 466.82
85. Mineral Exploration Corporation Limited
100.6 98.37 104.79 475.39
86. National Informatics Centre Services Incorporated
-85.23 31.04 64.41 501.38
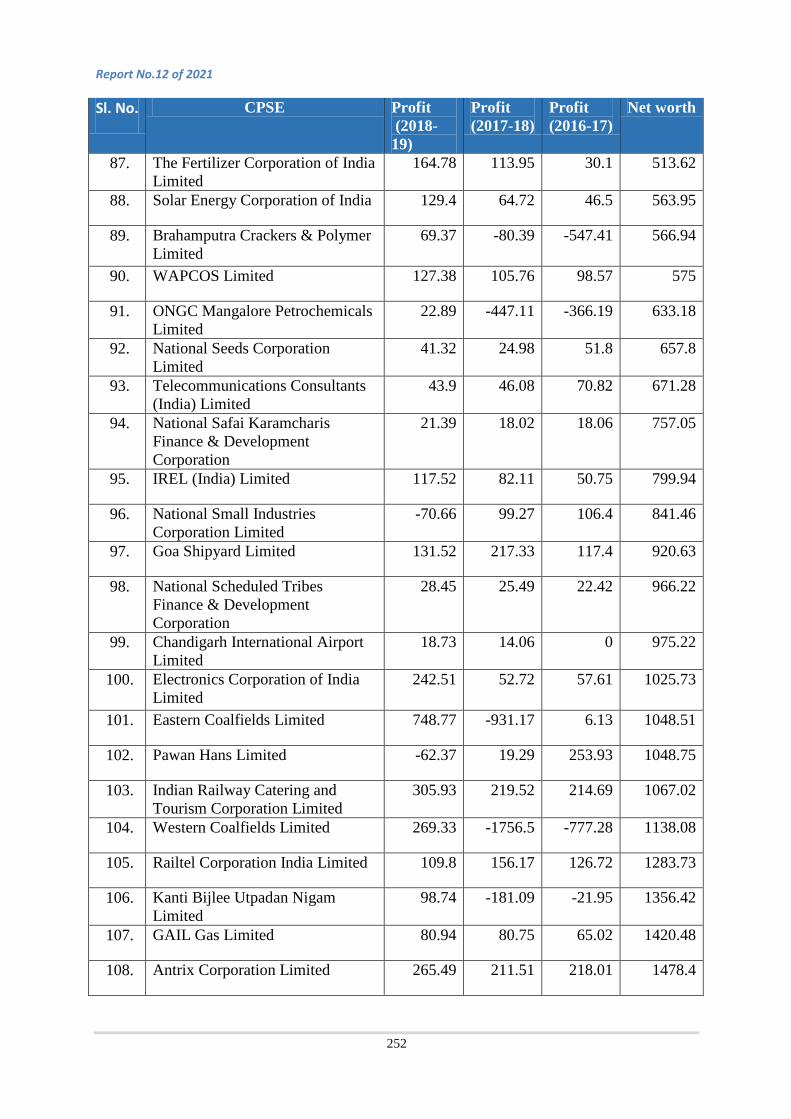
Report No.12 of 2021
252
Sl. No. CPSE Profit (2018-19)
Profit (2017-18)
Profit (2016-17)
Net worth
87. The Fertilizer Corporation of India Limited
164.78 113.95 30.1 513.62
88. Solar Energy Corporation of India 129.4 64.72 46.5 563.95
89. Brahamputra Crackers & Polymer Limited
69.37 -80.39 -547.41 566.94
90. WAPCOS Limited 127.38 105.76 98.57 575
91. ONGC Mangalore Petrochemicals Limited
22.89 -447.11 -366.19 633.18
92. National Seeds Corporation Limited
41.32 24.98 51.8 657.8
93. Telecommunications Consultants (India) Limited
43.9 46.08 70.82 671.28
94. National Safai Karamcharis Finance & Development Corporation
21.39 18.02 18.06 757.05
95. IREL (India) Limited 117.52 82.11 50.75 799.94
96. National Small Industries Corporation Limited
-70.66 99.27 106.4 841.46
97. Goa Shipyard Limited 131.52 217.33 117.4 920.63
98. National Scheduled Tribes Finance & Development Corporation
28.45 25.49 22.42 966.22
99. Chandigarh International Airport Limited
18.73 14.06 0 975.22
100. Electronics Corporation of India Limited
242.51 52.72 57.61 1025.73
101. Eastern Coalfields Limited 748.77 -931.17 6.13 1048.51
102. Pawan Hans Limited -62.37 19.29 253.93 1048.75
103. Indian Railway Catering and Tourism Corporation Limited
305.93 219.52 214.69 1067.02
104. Western Coalfields Limited 269.33 -1756.5 -777.28 1138.08
105. Railtel Corporation India Limited 109.8 156.17 126.72 1283.73
106. Kanti Bijlee Utpadan Nigam Limited
98.74 -181.09 -21.95 1356.42
107. GAIL Gas Limited 80.94 80.75 65.02 1420.48
108. Antrix Corporation Limited 265.49 211.51 218.01 1478.4
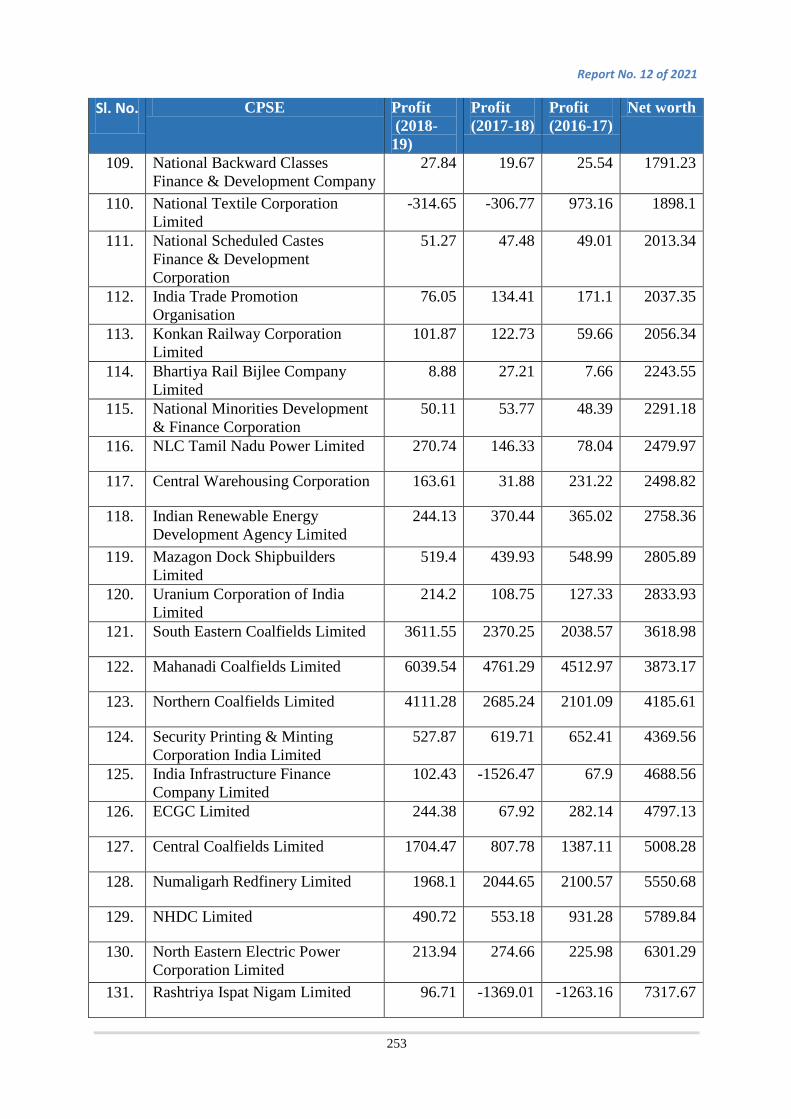
Report No. 12 of 2021
253
Sl. No. CPSE Profit (2018-19)
Profit (2017-18)
Profit (2016-17)
Net worth
109. National Backward Classes Finance & Development Company
27.84 19.67 25.54 1791.23
110. National Textile Corporation Limited
-314.65 -306.77 973.16 1898.1
111. National Scheduled Castes Finance & Development Corporation
51.27 47.48 49.01 2013.34
112. India Trade Promotion Organisation
76.05 134.41 171.1 2037.35
113. Konkan Railway Corporation Limited
101.87 122.73 59.66 2056.34
114. Bhartiya Rail Bijlee Company Limited
8.88 27.21 7.66 2243.55
115. National Minorities Development & Finance Corporation
50.11 53.77 48.39 2291.18
116. NLC Tamil Nadu Power Limited 270.74 146.33 78.04 2479.97
117. Central Warehousing Corporation 163.61 31.88 231.22 2498.82
118. Indian Renewable Energy Development Agency Limited
244.13 370.44 365.02 2758.36
119. Mazagon Dock Shipbuilders Limited
519.4 439.93 548.99 2805.89
120. Uranium Corporation of India Limited
214.2 108.75 127.33 2833.93
121. South Eastern Coalfields Limited 3611.55 2370.25 2038.57 3618.98
122. Mahanadi Coalfields Limited 6039.54 4761.29 4512.97 3873.17
123. Northern Coalfields Limited 4111.28 2685.24 2101.09 4185.61
124. Security Printing & Minting Corporation India Limited
527.87 619.71 652.41 4369.56
125. India Infrastructure Finance Company Limited
102.43 -1526.47 67.9 4688.56
126. ECGC Limited 244.38 67.92 282.14 4797.13
127. Central Coalfields Limited 1704.47 807.78 1387.11 5008.28
128. Numaligarh Redfinery Limited 1968.1 2044.65 2100.57 5550.68
129. NHDC Limited 490.72 553.18 931.28 5789.84
130. North Eastern Electric Power Corporation Limited
213.94 274.66 225.98 6301.29
131. Rashtriya Ispat Nigam Limited 96.71 -1369.01 -1263.16 7317.67
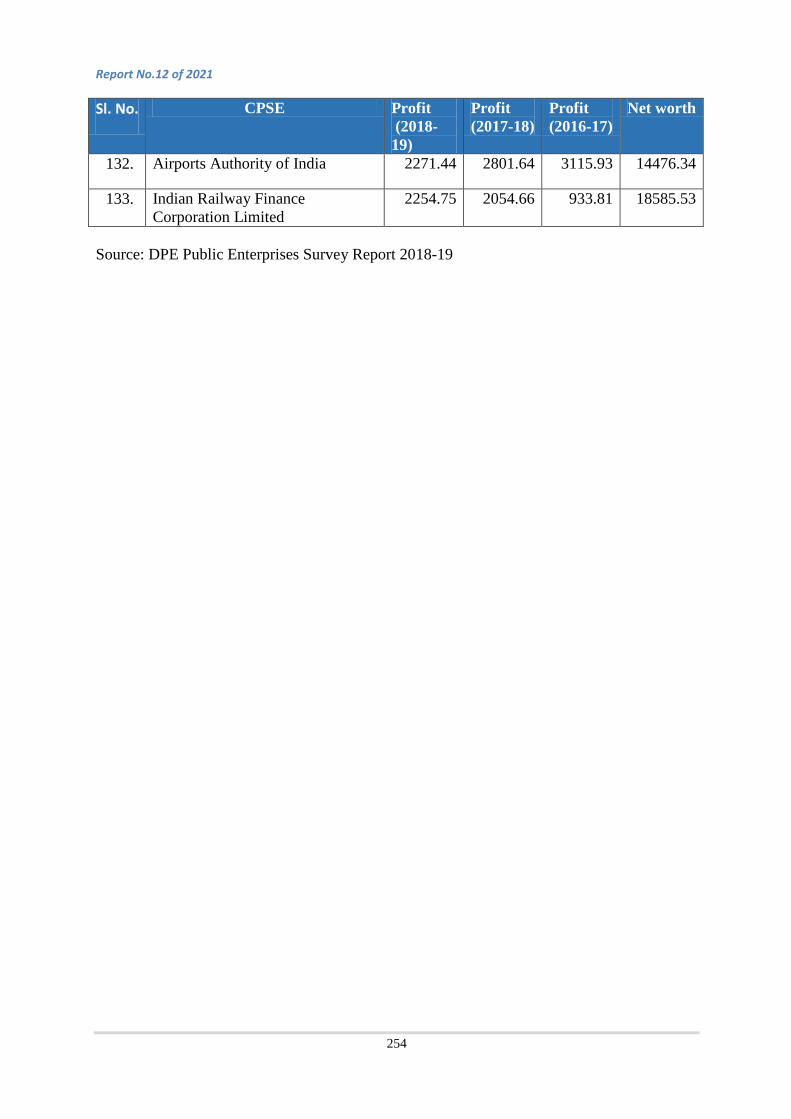
Report No.12 of 2021
254
Source: DPE Public Enterprises Survey Report 2018-19
Sl. No. CPSE Profit (2018-19)
Profit (2017-18)
Profit (2016-17)
Net worth
132. Airports Authority of India 2271.44 2801.64 3115.93 14476.34
133. Indian Railway Finance Corporation Limited
2254.75 2054.66 933.81 18585.53

Report No. 12 of 2021
255
Annexure XXVI (As referred to in Para 4.3) List of 95 reviewed CPSEs
Sl. No. Name of the CPSE Abbreviation Section 198
Profit (` in Lakh)
Maharatna CPSEs 1 Oil & Natural Gas Corporation Limited ONGC 2859070 2 Indian Oil Corporation Limited IOCL 2716878.00 3 NTPC Limited NTPC 1263385.00 4 Coal India Limited CIL 40422.37 5 Power Grid Corporation of India Limited PGCIL 1049592.99 6 Bharat Petroleum Corporation Limited BPCL 994882.00 7 Steel Authority of India Limited SAIL -701.89 8 Bharat Heavy Electricals Limited BHEL 143999.00 9 Hindustan Petroleum Corporation Limited HPCL 910671.67 10 GAIL (India) Limited GAIL 623937.00 Navratna CPSEs 11 REC Limited RECL 783397.00 12 National Aluminium Company Limited NALCO 191731.00 13 NMDC Limited NMDC 589011.00 14 NBCC (India) Limited NBCC 51617.75 15 Container Corporation of India Limited CONCOR 140674.67 16 Bharat Electronics Limited BEL 215517.85 17 NLC India Limited NLCI 233887.00 18 Engineers India Limited EIL 53909.61 19 Oil India Limited OIL 278363.00 20 Hindustan Aeronautics Limited HAL 348335.67 21 Power Finance Corporation Limited PFCL 679289.00 Miniratna CPSEs 22 Numaligarh Refinery Limited NRL 311268.93 23 The Cotton Corporation of India Limited CCIL 3273.47 24 Mahanadi Coalfields Limited MCL 782515.33 25 Central Coalfields Limited CCL 213647.00 26 SJVN Limited SJVN 177161.00 27 Northern Coalfields Limited NCL 461332.00 28 THDC India Limited THDC 107417.66 29 South Eastern Coalfields Limited SECL 419274.00 30 Airports Authority of India AAI 418927.67 31 Housing & Urban Development
Corporation Limited HUDCO 138355.33
32 NHPC Limited NHPC 298700.00 33 Rail Vikas Nigam Limited RVNL 60128.12
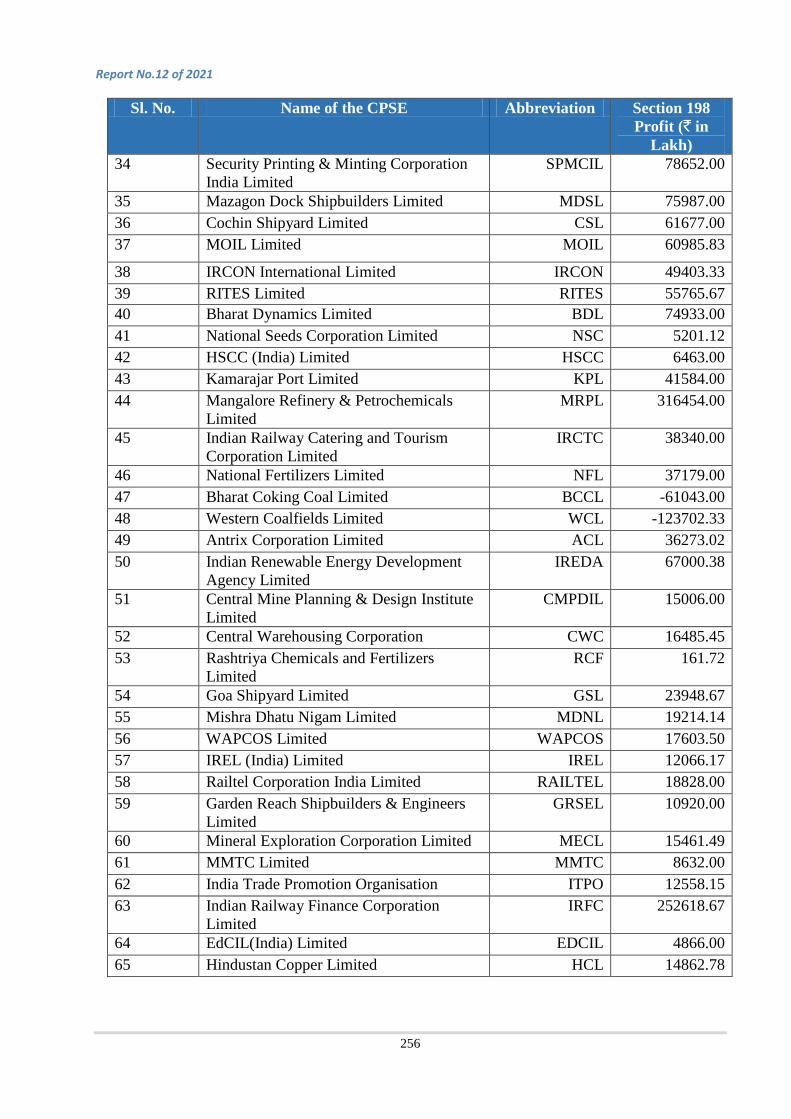
Report No.12 of 2021
256
Sl. No. Name of the CPSE Abbreviation Section 198 Profit (` in
Lakh) 34 Security Printing & Minting Corporation
India Limited SPMCIL 78652.00
35 Mazagon Dock Shipbuilders Limited MDSL 75987.00 36 Cochin Shipyard Limited CSL 61677.00 37 MOIL Limited MOIL 60985.83
38 IRCON International Limited IRCON 49403.33 39 RITES Limited RITES 55765.67 40 Bharat Dynamics Limited BDL 74933.00 41 National Seeds Corporation Limited NSC 5201.12 42 HSCC (India) Limited HSCC 6463.00 43 Kamarajar Port Limited KPL 41584.00 44 Mangalore Refinery & Petrochemicals
Limited MRPL 316454.00
45 Indian Railway Catering and Tourism Corporation Limited
IRCTC 38340.00
46 National Fertilizers Limited NFL 37179.00 47 Bharat Coking Coal Limited BCCL -61043.00 48 Western Coalfields Limited WCL -123702.33 49 Antrix Corporation Limited ACL 36273.02 50 Indian Renewable Energy Development
Agency Limited IREDA 67000.38
51 Central Mine Planning & Design Institute Limited
CMPDIL 15006.00
52 Central Warehousing Corporation CWC 16485.45 53 Rashtriya Chemicals and Fertilizers
Limited RCF 161.72
54 Goa Shipyard Limited GSL 23948.67 55 Mishra Dhatu Nigam Limited MDNL 19214.14 56 WAPCOS Limited WAPCOS 17603.50 57 IREL (India) Limited IREL 12066.17 58 Railtel Corporation India Limited RAILTEL 18828.00 59 Garden Reach Shipbuilders & Engineers
Limited GRSEL 10920.00
60 Mineral Exploration Corporation Limited MECL 15461.49 61 MMTC Limited MMTC 8632.00 62 India Trade Promotion Organisation ITPO 12558.15 63 Indian Railway Finance Corporation
Limited IRFC 252618.67
64 EdCIL(India) Limited EDCIL 4866.00 65 Hindustan Copper Limited HCL 14862.78

Report No. 12 of 2021
257
Sl. No. Name of the CPSE Abbreviation Section 198 Profit (` in
Lakh) 66 Balmer Lawrie & Company Limited BLCL 23532.21 67 North Eastern Electric Power Corporation
Limited NEEPCO 40897.86
68 KIOCL Limited KOICL 10047.47 Other CPSEs 69 Air India Express Limited AIEL 0.00 70 Solar Energy Corporation of India SECI 12500.49 71 India Infrastructure Finance Company
Limited IIFCL -7288.55
72 Konkan Railway Corporation Limited KRCL 9655.00 73 Eastern Coalfields Limited ECL (-)52.23 74 ECGC Limited ECGCL 28389.00 75 POWERGRID Vizag Transmission
Limited PGVTL 6335.16
76 GAIL Gas Limited GAILGAS 11467.00 77 Balmer Lawrie Investments Limited BLIL 650.98 78 POWERGRID Parli Transmission Limited PGPTL 3057.57 79 AAI Cargo Logistics & Allied Services
Company Limited AAICLASC 10061.91
80 Nuclear Power Corporation of India Limited NPCIL 380404.00 81 POWERGRID Warora Transmission
Limited PGWTL 4129.66
82 National Scheduled Castes Finance & Development Corporation
NSFDC 4925.04
83 Electronics Corporation of India Limited ECIL 17819.06 84 NHDC Limited NHDC 87947.33 85 National Minorities Development &
Finance Corporation NMDFC 5087.00
86 NLC Tamil Nadu Power Limited NLCTPL 25980.16 87 Uranium Corporation of India Limited UCIL 24267.45 88 Hindustan Shipyard Limited HSL 3699.98 89 National Scheduled Tribes Finance &
Development Corporation NSTFDC 2552.97
90 PFC Consulting Limited PFCCL 5866.13 91 Chandigarh International Airport Limited CHIAL 814.70 92 IRCON Infrastructure & Services Limited IRCON I&S 1023.59 93 POWERGRID Jabalpur Transmission
Limited PGJTL 476.96
94 NMDC CSR Foundation NMDCF 983.50 95 Fertilizers & Chemicals (Travancore)
Limited FACT -22098.00

Report No.12 of 2021
258
Annexure XXVII (As referred to in Para 4.3)
List of 154 CPSEs and 102 CPSEs considered for selection of CPSEs for review
List of 154 Profit making CPSEs in 2018-19 as per survey on DPE website
List of 102 CPSEs selected for CSR Review as per criteria
Sl. No. CPSE Profit (` in lakh)
Sl. No. CPSE Profit (` in lakh)
Above `100 crore 1 Oil & Natural Gas
Corporation Limited 2671579 1 Oil & Natural Gas
Corporation Limited 2671579
2 Indian Oil Corporation Limited
1689415 2 Indian Oil Corporation Limited
1689415
3 NTPC Limited 1174989 3 NTPC Limited 1174989 4 Coal India Limited 1046967 4 Coal India Limited 1046967 5 Power Grid Corporation
of India Limited 993855 5 Power Grid Corporation of
India Limited 993855
6 Bharat Petroleum Corporation Limited
713202 6 Bharat Petroleum Corporation Limited
713202
7 power finance corporation Limited
695292 7 Power Finance Corporation Limited
695292
8 Mahanadi Coalfields Limited
603954 8 Mahanadi Coalfields Limited
603954
9 Hindustan Petroleum Corporation Limited
602866 9 Hindustan Petroleum Corporation Limited
602866
10 GAIL (India) Limited 602567 10 GAIL (India) Limited 602567 11 REC Limited 576372 11 REC Limited 576372 12 NMDC Limited 464211 12 NMDC Limited 464211 13 Northern Coalfields
Limited 411128 13 Northern Coalfields Limited 411128
14 South Eastern Coalfields Limited
361155 14 South Eastern Coalfields Limited
361155
15 Nuclear Power Corporation of India Limited
281885 15 Nuclear Power Corporation of India Limited
281885
16 NHPC Limited 263055 16 NHPC Limited 263055 17 OIL India Limited 259014 17 OIL India Limited 259014 18 Hindustan Aeronautics
Limited 228244 18 Hindustan Aeronautics
Limited 228244
19 Airports Authority of India
227144 19 Airports Authority of India 227144
20 Indian Railway Finance Corporation Limited
225475 20 Indian Railway Finance Corporation Limited
225475
21 Steel Authority of India Limited
217882 21 Steel Authority of India Limited
217882
22 Numaligarh Refinery Limited
196810 22 Numaligarh Refinery Limited
196810

Report No. 12 of 2021
259
List of 154 Profit making CPSEs in 2018-19 as per survey on DPE website
List of 102 CPSEs selected for CSR Review as per criteria
Sl. No. CPSE Profit (` in lakh)
Sl. No. CPSE Profit (` in lakh)
23 Bharat Electronics Limited 192729 23 Bharat Electronics Limited 192729 24 National Aluminium
Company Limited 173240 24 National Aluminium
Company Limited 173240
25 Central Coalfields Limited 170447 25 Central Coalfields Limited 170447 26 ONGC Videsh Limited 167967 26 ONGC Videsh Limited 167967 27 SJVN Limited 136429 27 SJVN Limited 136429 28 NLC India Limited 126697 28 NLC India Limited 126697 29 THDC India Limited 125563 29 THDC India Limited 125563 30 Container Corporation of
India Limited 121541 30 Container Corporation of
India Limited 121541
31 Bharat Heavy Electricals Limited
121539 31 Bharat Heavy Electricals Limited
121539
32 Housing & Urban Development Corporation Limited
118015 32 Housing & Urban Development Corporation Limited
118015
33 Eastern Coalfields Limited 74877 33 Eastern Coalfields Limited 74877 34 Rail Vikas Nigam Limited 60659 34 Rail Vikas Nigam Limited 60659 35 Security Printing &
Minting Corporation India Limited
52787 35 Security Printing & Minting Corporation India Limited
52787
36 Mazagon Dock Shipbuilders Limited
51940 36 Mazagon Dock Shipbuilders Limited
51940
37 NHDC Limited 49072 37 NHDC Limited 49072 38 Cochin Shipyard Limited 48118 38 Cochin Shipyard Limited 48118 39 MOIL Limited 47389 39 MOIL Limited 47389 40 IRCON International
Limited 44468 40 IRCON International
Limited 44468
41 RITES Limited 44465 41 RITES Limited 44465 42 Bharat Dynamics Limited 42259 42 Bharat Dynamics Limited 42259 43 NBCC (India) Limited 38411 43 NBCC (India) Limited 38411 44 Engineers India Limited 37007 44 Engineers India Limited 37007 45 Kamarajar Port Limited 34035 45 Kamarajar Port Limited 34035 46 Mangalore Refinery &
Petrochemicals Limited 33196 46 Mangalore Refinery &
Petrochemicals Limited 33196
47 Indian Railway Catering and Tourism Corporation Limited
30593 47 Indian Railway Catering and Tourism Corporation Limited
30593
48 National Fertilizers Limited
29845 48 National Fertilizers Limited 29845
49 Bharat Coking Coal Limited
28877 49 Bharat Coking Coal Limited 28877
50 NLC Tamil Nadu Power Limited
27074 50 NLC Tamil Nadu Power Limited
27074

Report No.12 of 2021
260
List of 154 Profit making CPSEs in 2018-19 as per survey on DPE website
List of 102 CPSEs selected for CSR Review as per criteria
Sl. No. CPSE Profit (` in lakh)
Sl. No. CPSE Profit (` in lakh)
51 Western Coalfields Limited
26933 51 Western Coalfields Limited 26933
52 Antrix Corporation Limited
26549 52 Antrix Corporation Limited 26549
53 ECGC Limited 24438 53 ECGC Limited 24438 54 Indian Renewable Energy
Development Agency Limited
24413 54 Indian Renewable Energy Development Agency Limited
24413
55 Electronics Corporation of India Limited
24251 55 Electronics Corporation of India Limited
24251
56 Uranium Corporation of India Limited
21420 56 Uranium Corporation of India Limited
21420
57 North Eastern Electric Power Corporation Limited
21394 57 North Eastern Electric Power Corporation Limited
21394
58 Balmer Lawrie & Company Limited
18850 58 Balmer Lawrie & Company Limited
18850
59 Central Mine Planning & Design Institute Limited
17327 59 Central Mine Planning & Design Institute Limited
17327
60 The Fertilizer Corporation of India Limited
16478 60 The Fertilizer Corporation of India Limited
16478
61 Air India Express Limited 16439 61 Air India Express Limited 16439 62 Central Warehousing
Corporation 16361 62 Central Warehousing
Corporation 16361
63 Fertilizers & Chemicals (Travancore) Limited
16314 63 Fertilizers & Chemicals (Travancore) Limited
16314
64 Hindustan Copper Limited 14551 64 Hindustan Copper Limited 14551 65 Rashtriya Chemicals and
Fertilizers Limited 13917 65 Rashtriya Chemicals and
Fertilizers Limited 13917
66 Goa Shipyard Limited 13152 66 Goa Shipyard Limited 13152 67 Mishra Dhatu Nigam
Limited 13056 67 Mishra Dhatu Nigam
Limited 13056
68 Solar Energy Corporation of India
12940 68 Solar Energy Corporation of India
12940
69 WAPCOS Limited 12738 69 WAPCOS Limited 12738 70 HMT Watches Limited 12128 70 HMT Watches Limited 12128 71 IREL (India) Limited 11752 71 IREL (India) Limited 11752 72 KIOCL Limited 11186 72 KIOCL Limited 11186 73 Garden Reach
Shipbuilders & Engineers Limited
10994 73 Garden Reach Shipbuilders & Engineers Limited
10994
74 Railtel Corporation India Limited
10980 74 Railtel Corporation India Limited
10980

Report No. 12 of 2021
261
List of 154 Profit making CPSEs in 2018-19 as per survey on DPE website
List of 102 CPSEs selected for CSR Review as per criteria
Sl. No. CPSE Profit (` in lakh)
Sl. No. CPSE Profit (` in lakh)
75 India Infrastructure Finance Company Limited
10243 75 India Infrastructure Finance Company Limited
10243
76 Konkan Railway Corporation Limited
10187 76 Konkan Railway Corporation Limited
10187
77 Mineral Exploration Corporation Limited
10060 77 Mineral Exploration Corporation Limited
10060
78 POWERGRID Vizag Transmission Limited
10016 78 POWERGRID Vizag Transmission Limited
10016
79 Kanti Bijlee Utpadan Nigam Limited
9874 Between `50 crore and `100 crore
80 Rashtriya Ispat Nigam Limited
9671 79 Kanti Bijlee Utpadan Nigam Limited
9874
81 I T I Limited 9254 80 MMTC Limited 8143 82 MMTC Limited 8143 81 GAIL Gas Limited 8094 83 GAIL Gas Limited 8094 82 India Trade Promotion
Organisation 7605
84 HMT Bearings Limited 7924 83 Balmer Lawrie Investments Limited
7590
85 Artificial Limbs Mfg. Corporation of India
7611 84 POWERGRID Parli Transmission Limited
6501
86 India Trade Promotion Organisation
7605 85 Hindustan Fertilizer Corporation Limited
6434
87 Balmer Lawrie Investments Limited
7590 86 AAI Cargo Logistics & Allied Services Company Limited
6090
88 Brahamputra Crackers & Polymer Limited
6937 87 POWERGRID Warora Transmission Limited
5967
89 NTPC Vidyut Vyapar Nigam Limited
6556 88 National Scheduled Castes Finance & Development Corporation
5127
90 POWERGRID Parli Transmission Limited
6501 89 The Cotton Corporation of India Limited
5100
91 Hindustan Fertilizer Corporation Limited
6434 90 National Minorities Development & Finance Corporation
5011
92 Air India Air Transport Services Limited
6381 Between `10 crore and `50 crore
93 BEML Limited 6349 91 HSCC (India) Limited 4981 94 AAI Cargo Logistics &
Allied Services Company Limited
6090 92 National Seeds Corporation Limited
4132
95 POWERGRID Warora Transmission Limited
5967 93 Hindustan Shipyard Limited 3624

Report No.12 of 2021
262
List of 154 Profit making CPSEs in 2018-19 as per survey on DPE website
List of 102 CPSEs selected for CSR Review as per criteria
Sl. No. CPSE Profit (` in lakh)
Sl. No. CPSE Profit (` in lakh)
96 National Highways & Infrastructure Development Corporation Limited
5358 94 EdCIL(India) Limited 3008
97 Hindustan Cables Limited 5186 95 National Scheduled Tribes Finance & Development Corporation
2845
98 National Scheduled Castes Finance & Development Corporation
5127 96 PFC Consulting Limited 2200
99 The Cotton Corporation of India Limited
5100 97 Chandigarh International Airport Limited
1873
100 Hindustan Organic Chemicals Limited
5011 98 HLL Lifecare Limited 1847
101 National Minorities Development & Finance Corporation
5011 99 Ircon Infrastructure & Services Limited
1403
102 HSCC (India) Limited 4981 100 POWERGRID Jabalpur Transmission Limited
1014
103 Bengal Chemicals & Pharmaceuticals Limited
4438 Between `5 crore and `10 crore
104 Power System Operation Corporation Limited
4426 101 NMDC CSR Foundation 983
105 Telecommunications Consultants (India) Limited
4390 102 Prize Petroleum Company Limited
502
106 India Tourism Development Corporation Limited
4216
107 Railway Energy Management Company Limited
4134
108 National Seeds Corporation Limited
4132
109 Hindustan Shipyard Limited
3624
110 Mumbai Railway Vikas Corporation Limited
3587
111 Tamil Nadu Trade Promotion Organisation
3502
112 Hindustan Steelworks Construction Limited
3430
113 Bridge & Roof Company (India) Limited
3333
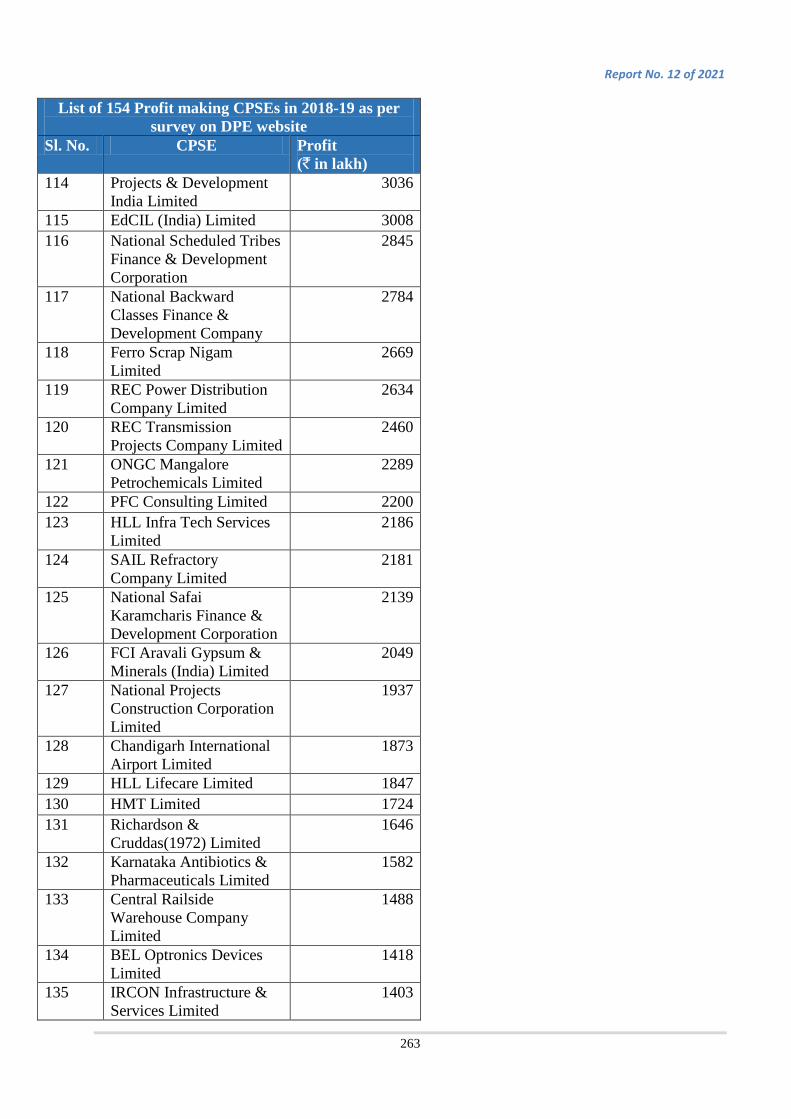
Report No. 12 of 2021
263
List of 154 Profit making CPSEs in 2018-19 as per survey on DPE website
Sl. No. CPSE Profit (` in lakh)
114 Projects & Development India Limited
3036
115 EdCIL (India) Limited 3008 116 National Scheduled Tribes
Finance & Development Corporation
2845
117 National Backward Classes Finance & Development Company
2784
118 Ferro Scrap Nigam Limited
2669
119 REC Power Distribution Company Limited
2634
120 REC Transmission Projects Company Limited
2460
121 ONGC Mangalore Petrochemicals Limited
2289
122 PFC Consulting Limited 2200 123 HLL Infra Tech Services
Limited 2186
124 SAIL Refractory Company Limited
2181
125 National Safai Karamcharis Finance & Development Corporation
2139
126 FCI Aravali Gypsum & Minerals (India) Limited
2049
127 National Projects Construction Corporation Limited
1937
128 Chandigarh International Airport Limited
1873
129 HLL Lifecare Limited 1847 130 HMT Limited 1724 131 Richardson &
Cruddas(1972) Limited 1646
132 Karnataka Antibiotics & Pharmaceuticals Limited
1582
133 Central Railside Warehouse Company Limited
1488
134 BEL Optronics Devices Limited
1418
135 IRCON Infrastructure & Services Limited
1403
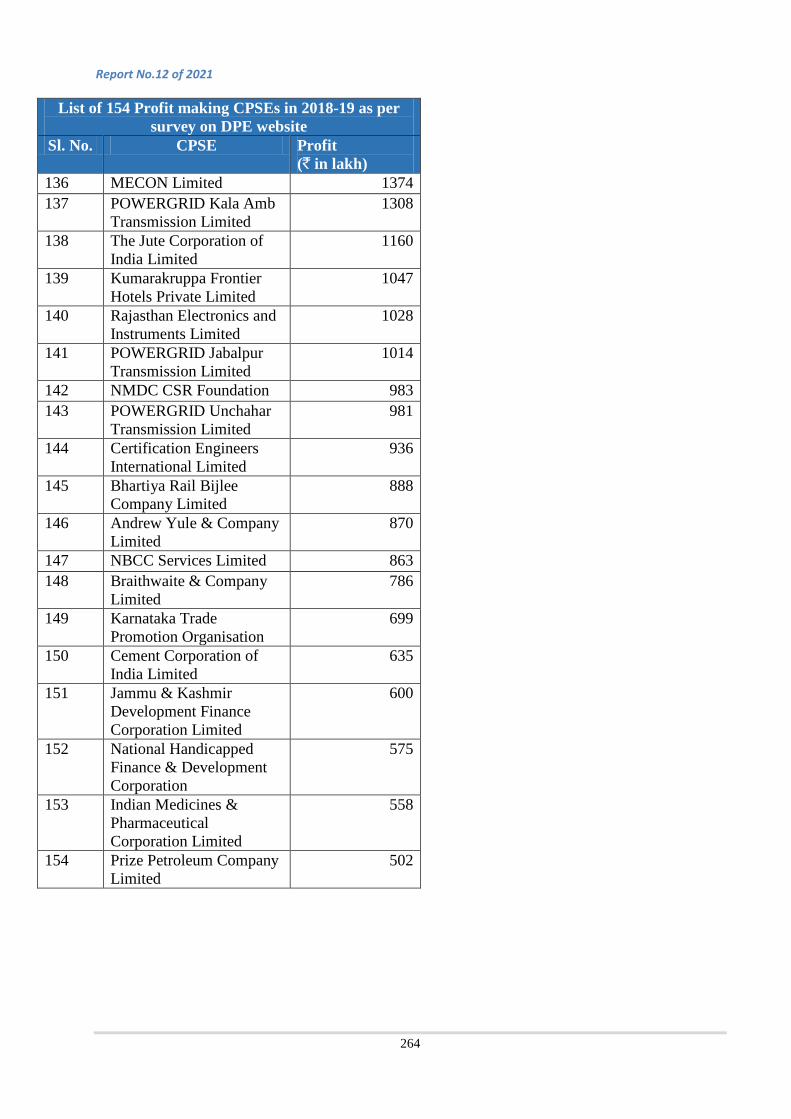
Report No.12 of 2021
264
List of 154 Profit making CPSEs in 2018-19 as per survey on DPE website
Sl. No. CPSE Profit (` in lakh)
136 MECON Limited 1374 137 POWERGRID Kala Amb
Transmission Limited 1308
138 The Jute Corporation of India Limited
1160
139 Kumarakruppa Frontier Hotels Private Limited
1047
140 Rajasthan Electronics and Instruments Limited
1028
141 POWERGRID Jabalpur Transmission Limited
1014
142 NMDC CSR Foundation 983 143 POWERGRID Unchahar
Transmission Limited 981
144 Certification Engineers International Limited
936
145 Bhartiya Rail Bijlee Company Limited
888
146 Andrew Yule & Company Limited
870
147 NBCC Services Limited 863 148 Braithwaite & Company
Limited 786
149 Karnataka Trade Promotion Organisation
699
150 Cement Corporation of India Limited
635
151 Jammu & Kashmir Development Finance Corporation Limited
600
152 National Handicapped Finance & Development Corporation
575
153 Indian Medicines & Pharmaceutical Corporation Limited
558
154 Prize Petroleum Company Limited
502
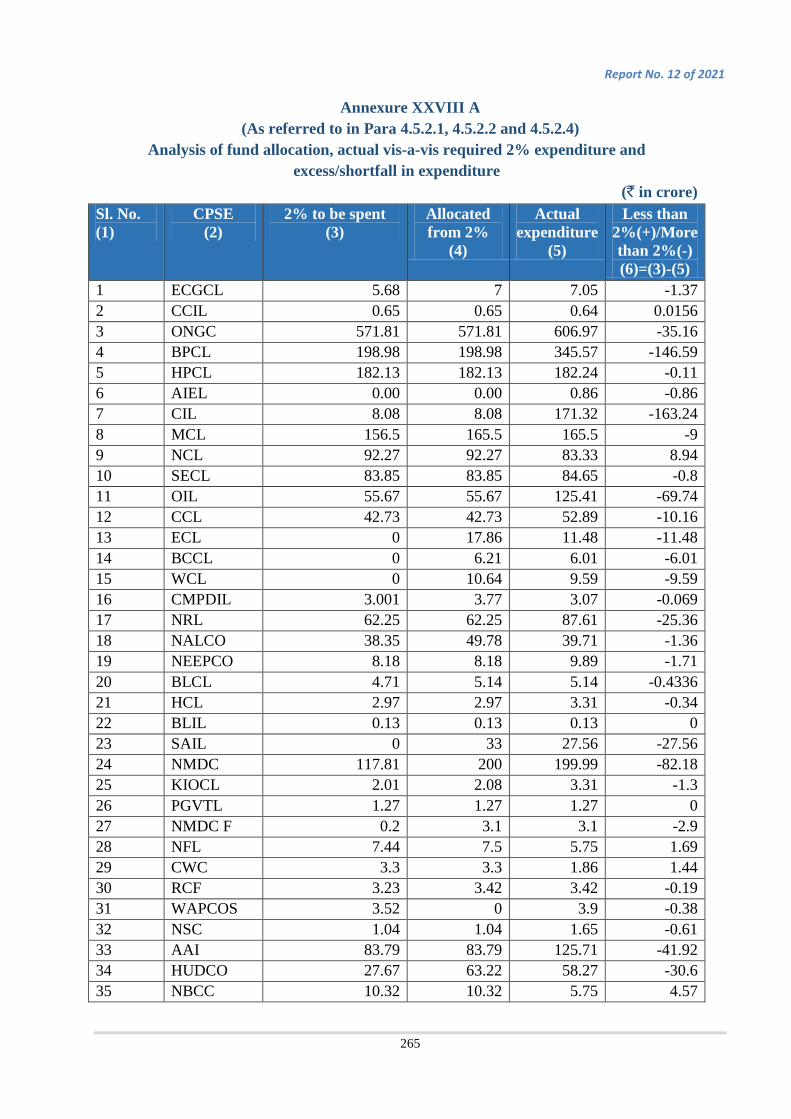
Report No. 12 of 2021
265
Annexure XXVIII A (As referred to in Para 4.5.2.1, 4.5.2.2 and 4.5.2.4)
Analysis of fund allocation, actual vis-a-vis required 2% expenditure and excess/shortfall in expenditure
(` in crore) Sl. No. (1)
CPSE (2)
2% to be spent (3)
Allocated from 2%
(4)
Actual expenditure
(5)
Less than 2%(+)/More than 2%(-) (6)=(3)-(5)
1 ECGCL 5.68 7 7.05 -1.37 2 CCIL 0.65 0.65 0.64 0.0156 3 ONGC 571.81 571.81 606.97 -35.16 4 BPCL 198.98 198.98 345.57 -146.59 5 HPCL 182.13 182.13 182.24 -0.11 6 AIEL 0.00 0.00 0.86 -0.86 7 CIL 8.08 8.08 171.32 -163.24 8 MCL 156.5 165.5 165.5 -9 9 NCL 92.27 92.27 83.33 8.94 10 SECL 83.85 83.85 84.65 -0.8 11 OIL 55.67 55.67 125.41 -69.74 12 CCL 42.73 42.73 52.89 -10.16 13 ECL 0 17.86 11.48 -11.48 14 BCCL 0 6.21 6.01 -6.01 15 WCL 0 10.64 9.59 -9.59 16 CMPDIL 3.001 3.77 3.07 -0.069 17 NRL 62.25 62.25 87.61 -25.36 18 NALCO 38.35 49.78 39.71 -1.36 19 NEEPCO 8.18 8.18 9.89 -1.71 20 BLCL 4.71 5.14 5.14 -0.4336 21 HCL 2.97 2.97 3.31 -0.34 22 BLIL 0.13 0.13 0.13 0 23 SAIL 0 33 27.56 -27.56 24 NMDC 117.81 200 199.99 -82.18 25 KIOCL 2.01 2.08 3.31 -1.3 26 PGVTL 1.27 1.27 1.27 0 27 NMDC F 0.2 3.1 3.1 -2.9 28 NFL 7.44 7.5 5.75 1.69 29 CWC 3.3 3.3 1.86 1.44 30 RCF 3.23 3.42 3.42 -0.19 31 WAPCOS 3.52 0 3.9 -0.38 32 NSC 1.04 1.04 1.65 -0.61 33 AAI 83.79 83.79 125.71 -41.92 34 HUDCO 27.67 63.22 58.27 -30.6 35 NBCC 10.32 10.32 5.75 4.57

Report No.12 of 2021
266
Sl. No. (1)
CPSE (2)
2% to be spent (3)
Allocated from 2%
(4)
Actual expenditure
(5)
Less than 2%(+)/More than 2%(-) (6)=(3)-(5)
36 AAICLASC 2.01 2.01 2.01 0 37 HSCC 1.29 1.29 1.29 0 38 CHIAL 0.16 0.16 0.16 0 39 IRFC 50.52 50.53 34.1 16.42 40 CONCOR 28.13 28.13 22.16 5.97 41 RVNL 12.03 12.03 19.05 -7.02 42 IRCON 9.88 10.04 10.04 -0.16 43 RITES 11.2 11.2 11.21 -0.01 44 IRCTC 7.67 7.67 7.67 0 45 RTCI 3.77 3.77 5.11 -1.34 46 IRCON I&S 0.2 0.2 0.14 0.06 47 HAL 69.67 78.34 82 -3.66 48 BEL 43.1 43.1 50.42 -7.32 49 MDSL 15.2 15.2 15.63 -0.43 50 BDL 14.99 14.99 15.56 -0.57 51 GSL 4.79 4.79 5.06 -0.27 52 MDNL 3.84 3.84 3.95 -0.11 53 GRSEL 2.18 2.18 2.21 -0.03 54 HSL 0.74 0.74 0.42 0.32 55 NLCI 46.78 119.92 75.66 -28.88 56 CSL 12.33 12.33 15.29 -2.96 57 KPL 8.31 8.31 8.11 0.2 58 MRPL 63.29 63.29 76.09 -12.8 59 NLCTPL 5.2 5.2 4.16 1.04 60 IIFCL 0 0 25 -25 61 MMTC 1.73 1.77 0.8 0.93 62 ITPO 2.52 2.52 4.74 -2.22 63 IOCL 543.38 543.38 543.38 0 64 NTPC 252.68 252.68 304.92 -52.24 65 PGCIL 209.92 258.46 346.21 -136.29 66 PFCL 135.86 141.99 97.15 38.71 67 GAIL 124.79 125.29 125.3 -0.51 68 RECL 156.68 156.68 258.39 -101.71 69 NHPC 59.74 59.74 126.44 -66.7 70 SJVN 35.43 35.43 36.35 -0.92 71 THDC 21.48 21.51 21.62 -0.14 72 BHEL 28.8 28.8 35.12 -6.32 73 NHDC 17.59 17.59 25.58 -7.99 74 MOIL 12.2 12.5 12.74 -0.54 75 EIL 10.78 11.28 11.28 -0.5
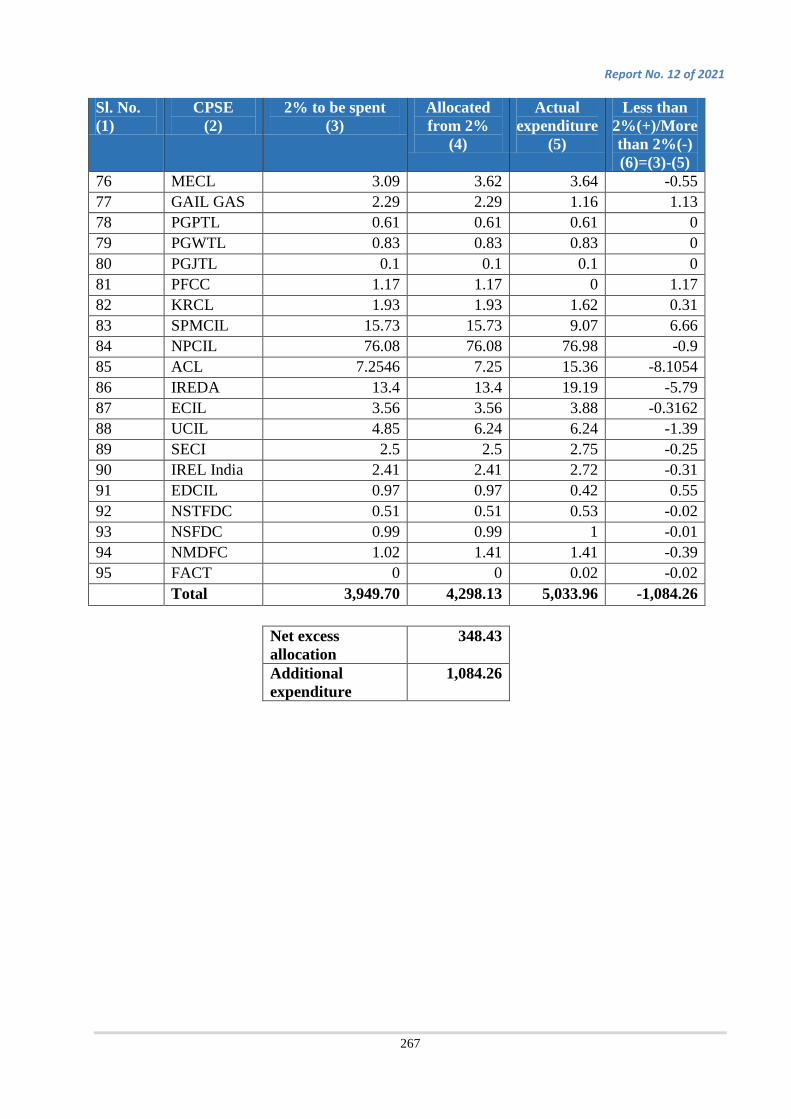
Report No. 12 of 2021
267
Sl. No. (1)
CPSE (2)
2% to be spent (3)
Allocated from 2%
(4)
Actual expenditure
(5)
Less than 2%(+)/More than 2%(-) (6)=(3)-(5)
76 MECL 3.09 3.62 3.64 -0.55 77 GAIL GAS 2.29 2.29 1.16 1.13 78 PGPTL 0.61 0.61 0.61 0 79 PGWTL 0.83 0.83 0.83 0 80 PGJTL 0.1 0.1 0.1 0 81 PFCC 1.17 1.17 0 1.17 82 KRCL 1.93 1.93 1.62 0.31 83 SPMCIL 15.73 15.73 9.07 6.66 84 NPCIL 76.08 76.08 76.98 -0.9 85 ACL 7.2546 7.25 15.36 -8.1054 86 IREDA 13.4 13.4 19.19 -5.79 87 ECIL 3.56 3.56 3.88 -0.3162 88 UCIL 4.85 6.24 6.24 -1.39 89 SECI 2.5 2.5 2.75 -0.25 90 IREL India 2.41 2.41 2.72 -0.31 91 EDCIL 0.97 0.97 0.42 0.55 92 NSTFDC 0.51 0.51 0.53 -0.02 93 NSFDC 0.99 0.99 1 -0.01 94 NMDFC 1.02 1.41 1.41 -0.39 95 FACT 0 0 0.02 -0.02
Total 3,949.70 4,298.13 5,033.96 -1,084.26
Net excess allocation
348.43
Additional expenditure
1,084.26
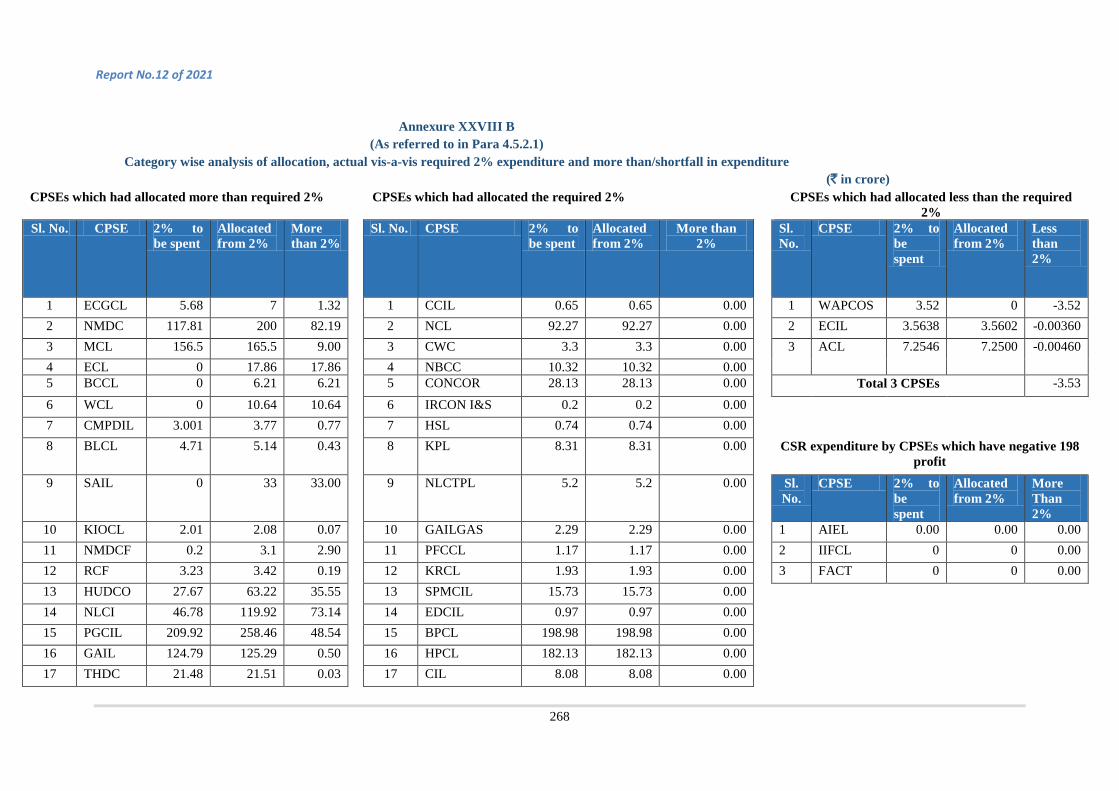
Report No.12 of 2021
268
Annexure XXVIII B
(As referred to in Para 4.5.2.1)
Category wise analysis of allocation, actual vis-a-vis required 2% expenditure and more than/shortfall in expenditure (` in crore)
CPSEs which had allocated more than required 2% CPSEs which had allocated the required 2% CPSEs which had allocated less than the required 2%
Sl. No. CPSE 2% to be spent
Allocated from 2%
More than 2%
Sl. No. CPSE 2% to be spent
Allocated from 2%
More than 2%
Sl. No.
CPSE 2% to be spent
Allocated from 2%
Less than 2%
1 ECGCL 5.68 7 1.32 1 CCIL 0.65 0.65 0.00 1 WAPCOS 3.52 0 -3.52 2 NMDC 117.81 200 82.19 2 NCL 92.27 92.27 0.00 2 ECIL 3.5638 3.5602 -0.00360 3 MCL 156.5 165.5 9.00 3 CWC 3.3 3.3 0.00 3 ACL 7.2546 7.2500 -0.00460 4 ECL 0 17.86 17.86 4 NBCC 10.32 10.32 0.00 5 BCCL 0 6.21 6.21 5 CONCOR 28.13 28.13 0.00 Total 3 CPSEs -3.53 6 WCL 0 10.64 10.64 6 IRCON I&S 0.2 0.2 0.00 7 CMPDIL 3.001 3.77 0.77 7 HSL 0.74 0.74 0.00 8 BLCL 4.71 5.14 0.43 8 KPL 8.31 8.31 0.00 CSR expenditure by CPSEs which have negative 198
profit 9 SAIL 0 33 33.00 9 NLCTPL 5.2 5.2 0.00 Sl.
No. CPSE 2% to
be spent
Allocated from 2%
More Than 2%
10 KIOCL 2.01 2.08 0.07 10 GAILGAS 2.29 2.29 0.00 1 AIEL 0.00 0.00 0.00 11 NMDCF 0.2 3.1 2.90 11 PFCCL 1.17 1.17 0.00 2 IIFCL 0 0 0.00 12 RCF 3.23 3.42 0.19 12 KRCL 1.93 1.93 0.00 3 FACT 0 0 0.00 13 HUDCO 27.67 63.22 35.55 13 SPMCIL 15.73 15.73 0.00 14 NLCI 46.78 119.92 73.14 14 EDCIL 0.97 0.97 0.00 15 PGCIL 209.92 258.46 48.54 15 BPCL 198.98 198.98 0.00 16 GAIL 124.79 125.29 0.50 16 HPCL 182.13 182.13 0.00 17 THDC 21.48 21.51 0.03 17 CIL 8.08 8.08 0.00

Report No. 12 of 2021
269
Sl. No. CPSE 2% to be spent
Allocated from 2%
More than 2%
Sl. No. CPSE 2% to be spent
Allocated from 2%
More than 2%
18 MOIL 12.2 12.5 0.30 18 SECL 83.85 83.85 0.00 19 EIL 10.78 11.28 0.50 19 OIL 55.67 55.67 0.00 20 MECL 3.09 3.62 0.53 20 CCL 42.73 42.73 0.00 21 UCIL 4.85 6.24 1.39 21 NRL 62.25 62.25 0.00 22 NMDFC 1.02 1.41 0.39 22 NEEPCO 8.18 8.18 0.00 23 NFL 7.44 7.5 0.06 23 HCL 2.97 2.97 0.00 24 IRFC 50.52 50.53 0.01 24 ONGC 571.81 571.81 0.00 25 MMTC 1.73 1.77 0.04 25 NSC 1.04 1.04 0.00 26 NALCO 38.35 49.78 11.43 26 AAI 83.79 83.79 0.00 27 PFCL 135.86 141.99 6.13 27 RVNL 12.03 12.03 0.00 28 IRCON 9.88 10.04 0.16 28 RITES 11.2 11.2 0.00 29 HAL 69.67 78.34 8.67 29 RAILTEL 3.77 3.77 0.00
Total 29 CPSEs 351.95 30 BEL 43.1 43.1 0.00 31 MDSL 15.2 15.2 0.00 32 BDL 14.99 14.99 0.00 33 GSL 4.79 4.79 0.00 34 MDNL 3.84 3.84 0.00 35 GRSEL 2.18 2.18 0.00 36 CSL 12.33 12.33 0.00 37 MRPL 63.29 63.29 0.00 38 ITPO 2.52 2.52 0.00 39 NTPC 252.68 252.68 0.00 40 RECL 156.68 156.68 0.00 41 SJVN 35.43 35.43 0.00 42 BHEL 28.8 28.8 0.00
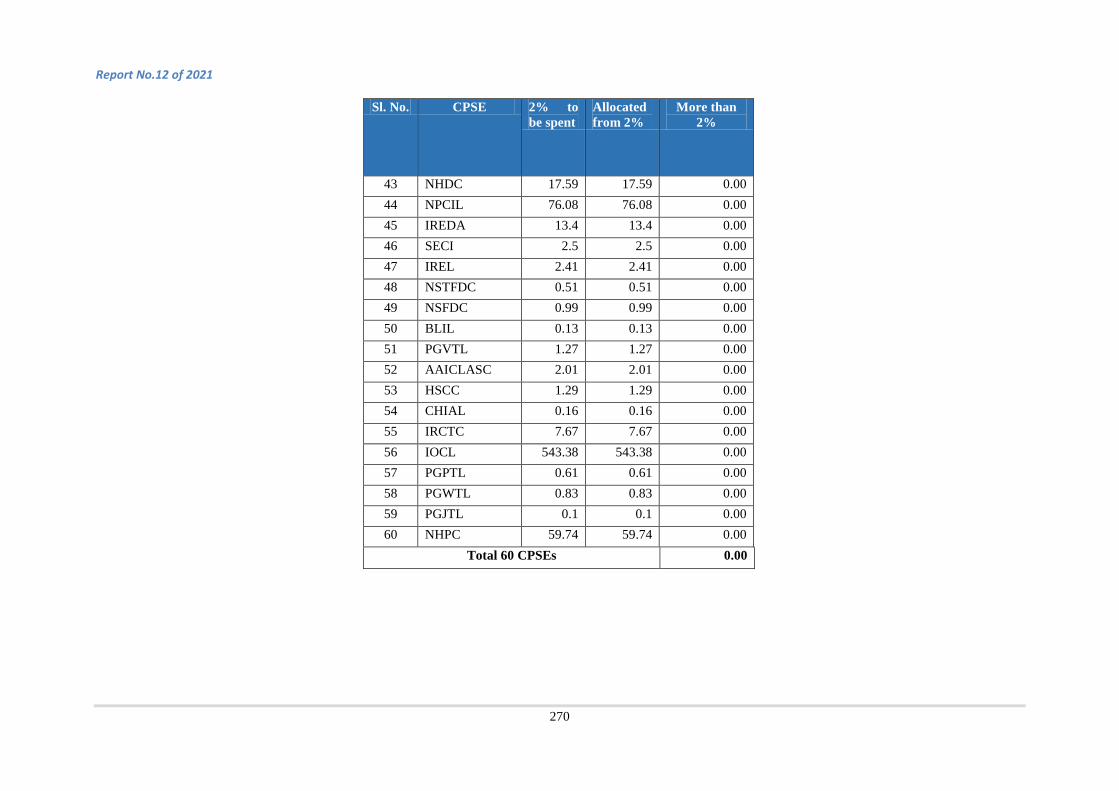
Report No.12 of 2021
270
Sl. No. CPSE 2% to be spent
Allocated from 2%
More than 2%
43 NHDC 17.59 17.59 0.00 44 NPCIL 76.08 76.08 0.00 45 IREDA 13.4 13.4 0.00 46 SECI 2.5 2.5 0.00 47 IREL 2.41 2.41 0.00 48 NSTFDC 0.51 0.51 0.00 49 NSFDC 0.99 0.99 0.00 50 BLIL 0.13 0.13 0.00 51 PGVTL 1.27 1.27 0.00 52 AAICLASC 2.01 2.01 0.00 53 HSCC 1.29 1.29 0.00 54 CHIAL 0.16 0.16 0.00 55 IRCTC 7.67 7.67 0.00 56 IOCL 543.38 543.38 0.00 57 PGPTL 0.61 0.61 0.00 58 PGWTL 0.83 0.83 0.00 59 PGJTL 0.1 0.1 0.00 60 NHPC 59.74 59.74 0.00 Total 60 CPSEs 0.00
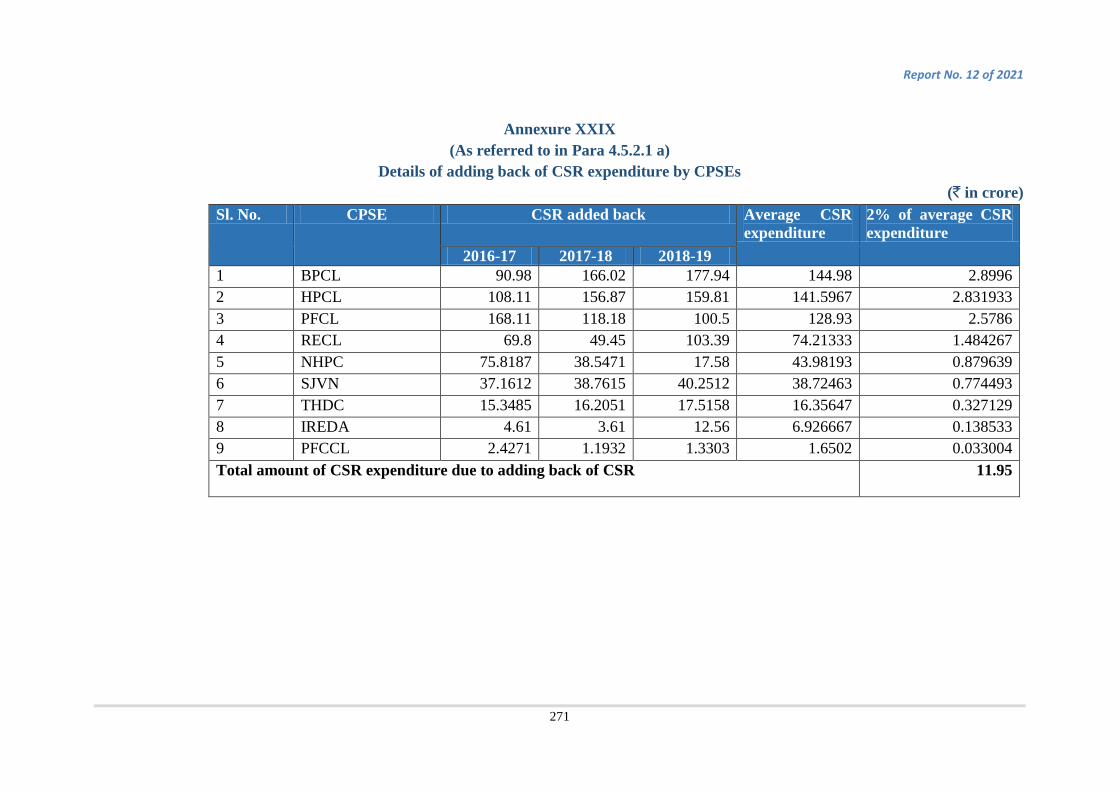
Report No. 12 of 2021
271
Annexure XXIX
(As referred to in Para 4.5.2.1 a) Details of adding back of CSR expenditure by CPSEs
(` in crore) Sl. No. CPSE CSR added back Average CSR
expenditure 2% of average CSR expenditure
2016-17 2017-18 2018-19 1 BPCL 90.98 166.02 177.94 144.98 2.8996 2 HPCL 108.11 156.87 159.81 141.5967 2.831933 3 PFCL 168.11 118.18 100.5 128.93 2.5786 4 RECL 69.8 49.45 103.39 74.21333 1.484267 5 NHPC 75.8187 38.5471 17.58 43.98193 0.879639 6 SJVN 37.1612 38.7615 40.2512 38.72463 0.774493 7 THDC 15.3485 16.2051 17.5158 16.35647 0.327129 8 IREDA 4.61 3.61 12.56 6.926667 0.138533 9 PFCCL 2.4271 1.1932 1.3303 1.6502 0.033004 Total amount of CSR expenditure due to adding back of CSR 11.95
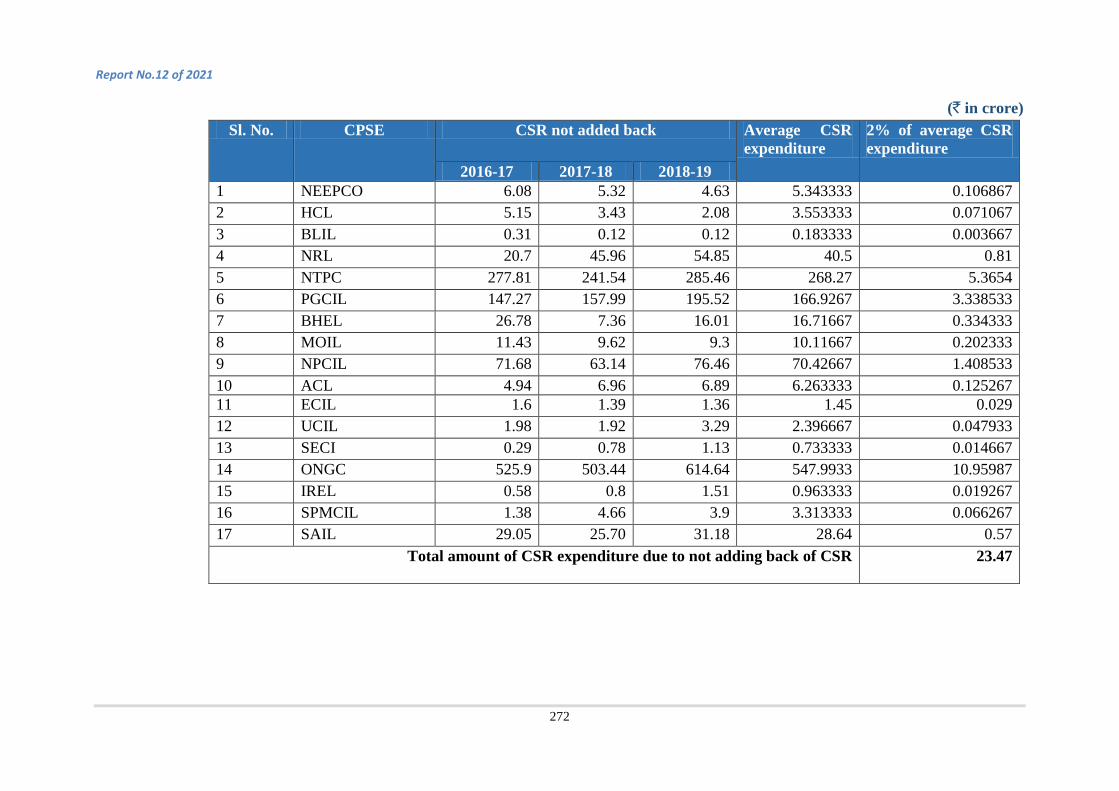
Report No.12 of 2021
272
(` in crore) Sl. No. CPSE CSR not added back Average CSR
expenditure 2% of average CSR expenditure
2016-17 2017-18 2018-19 1 NEEPCO 6.08 5.32 4.63 5.343333 0.106867 2 HCL 5.15 3.43 2.08 3.553333 0.071067 3 BLIL 0.31 0.12 0.12 0.183333 0.003667 4 NRL 20.7 45.96 54.85 40.5 0.81 5 NTPC 277.81 241.54 285.46 268.27 5.3654 6 PGCIL 147.27 157.99 195.52 166.9267 3.338533 7 BHEL 26.78 7.36 16.01 16.71667 0.334333 8 MOIL 11.43 9.62 9.3 10.11667 0.202333 9 NPCIL 71.68 63.14 76.46 70.42667 1.408533 10 ACL 4.94 6.96 6.89 6.263333 0.125267 11 ECIL 1.6 1.39 1.36 1.45 0.029 12 UCIL 1.98 1.92 3.29 2.396667 0.047933 13 SECI 0.29 0.78 1.13 0.733333 0.014667 14 ONGC 525.9 503.44 614.64 547.9933 10.95987 15 IREL 0.58 0.8 1.51 0.963333 0.019267 16 SPMCIL 1.38 4.66 3.9 3.313333 0.066267 17 SAIL 29.05 25.70 31.18 28.64 0.57
Total amount of CSR expenditure due to not adding back of CSR
23.47
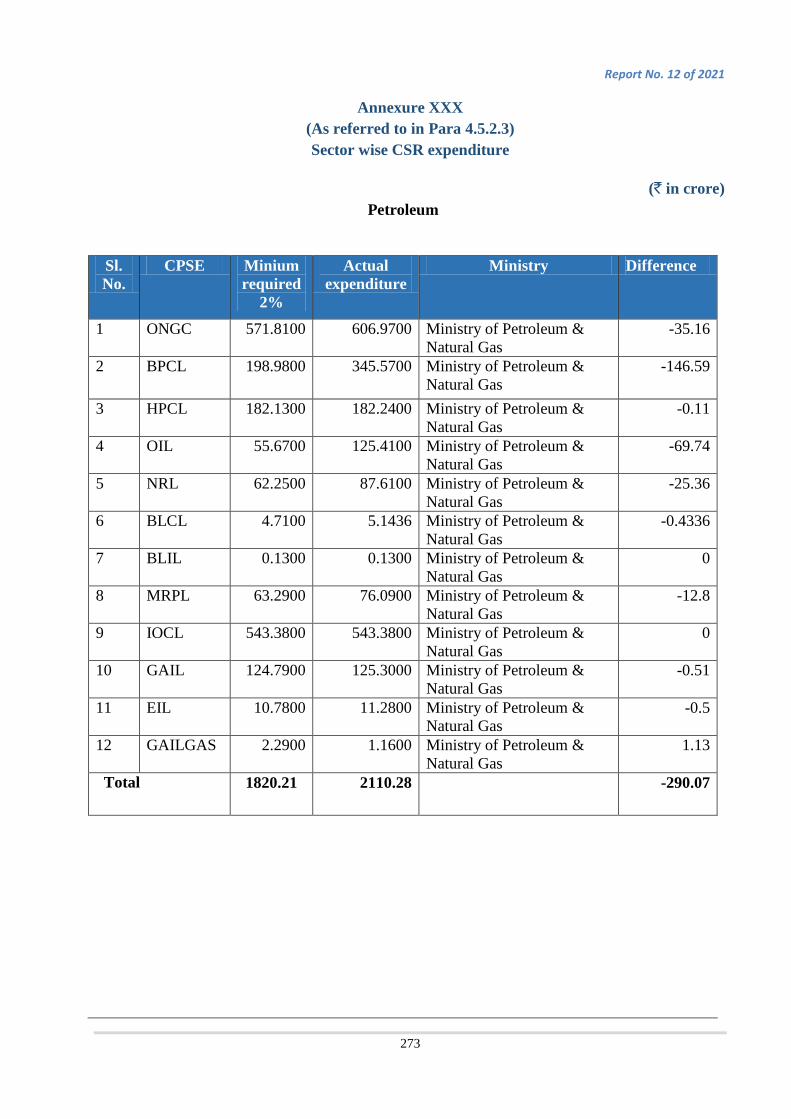
Report No. 12 of 2021
273
Annexure XXX (As referred to in Para 4.5.2.3) Sector wise CSR expenditure
(` in crore)
Petroleum
Sl. No.
CPSE Minium required
2%
Actual expenditure
Ministry Difference
1 ONGC 571.8100 606.9700 Ministry of Petroleum & Natural Gas
-35.16
2 BPCL 198.9800 345.5700 Ministry of Petroleum & Natural Gas
-146.59
3 HPCL 182.1300 182.2400 Ministry of Petroleum & Natural Gas
-0.11
4 OIL 55.6700 125.4100 Ministry of Petroleum & Natural Gas
-69.74
5 NRL 62.2500 87.6100 Ministry of Petroleum & Natural Gas
-25.36
6 BLCL 4.7100 5.1436 Ministry of Petroleum & Natural Gas
-0.4336
7 BLIL 0.1300 0.1300 Ministry of Petroleum & Natural Gas
0
8 MRPL 63.2900 76.0900 Ministry of Petroleum & Natural Gas
-12.8
9 IOCL 543.3800 543.3800 Ministry of Petroleum & Natural Gas
0
10 GAIL 124.7900 125.3000 Ministry of Petroleum & Natural Gas
-0.51
11 EIL 10.7800 11.2800 Ministry of Petroleum & Natural Gas
-0.5
12 GAILGAS 2.2900 1.1600 Ministry of Petroleum & Natural Gas
1.13
Total 1820.21 2110.28 -290.07
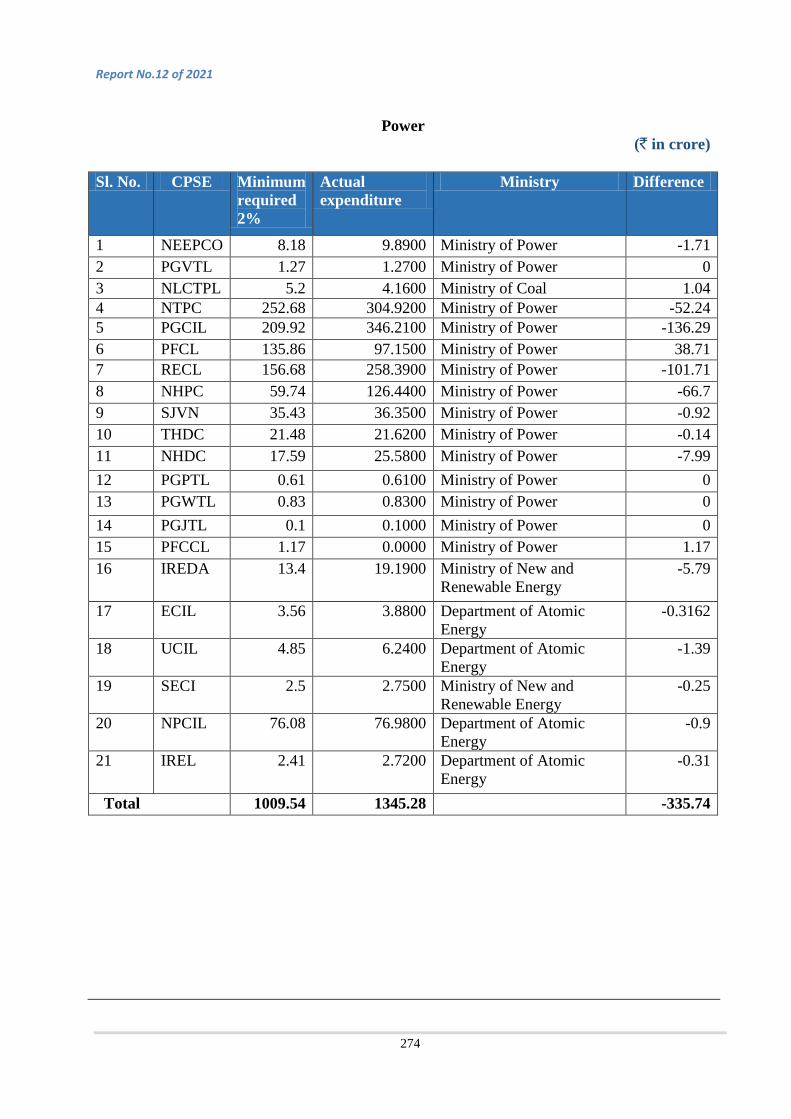
Report No.12 of 2021
274
Power
(` in crore)
Sl. No. CPSE Minimum required 2%
Actual expenditure
Ministry Difference
1 NEEPCO 8.18 9.8900 Ministry of Power -1.71 2 PGVTL 1.27 1.2700 Ministry of Power 0 3 NLCTPL 5.2 4.1600 Ministry of Coal 1.04 4 NTPC 252.68 304.9200 Ministry of Power -52.24 5 PGCIL 209.92 346.2100 Ministry of Power -136.29 6 PFCL 135.86 97.1500 Ministry of Power 38.71 7 RECL 156.68 258.3900 Ministry of Power -101.71 8 NHPC 59.74 126.4400 Ministry of Power -66.7 9 SJVN 35.43 36.3500 Ministry of Power -0.92 10 THDC 21.48 21.6200 Ministry of Power -0.14 11 NHDC 17.59 25.5800 Ministry of Power -7.99 12 PGPTL 0.61 0.6100 Ministry of Power 0 13 PGWTL 0.83 0.8300 Ministry of Power 0 14 PGJTL 0.1 0.1000 Ministry of Power 0 15 PFCCL 1.17 0.0000 Ministry of Power 1.17 16 IREDA 13.4 19.1900 Ministry of New and
Renewable Energy -5.79
17 ECIL 3.56 3.8800 Department of Atomic Energy
-0.3162
18 UCIL 4.85 6.2400 Department of Atomic Energy
-1.39
19 SECI 2.5 2.7500 Ministry of New and Renewable Energy
-0.25
20 NPCIL 76.08 76.9800 Department of Atomic Energy
-0.9
21 IREL 2.41 2.7200 Department of Atomic Energy
-0.31
Total 1009.54 1345.28 -335.74
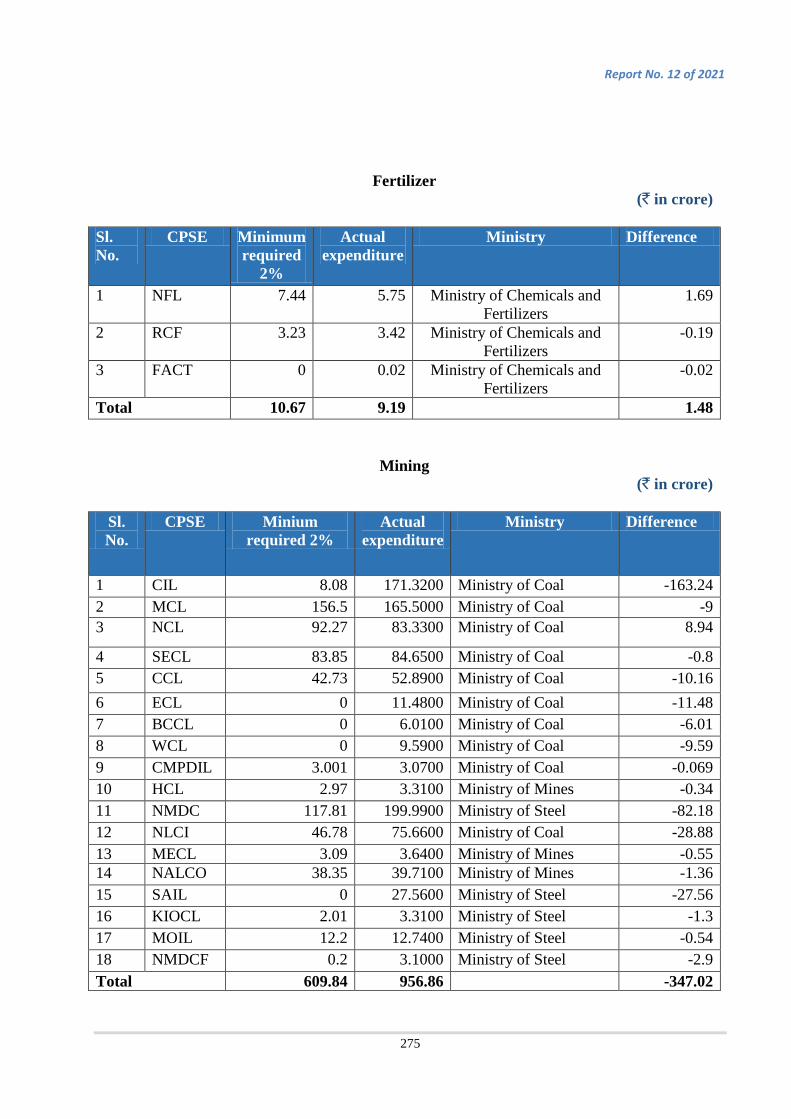
Report No. 12 of 2021
275
Fertilizer (` in crore)
Sl. No.
CPSE Minimum required
2%
Actual expenditure
Ministry Difference
1 NFL 7.44 5.75 Ministry of Chemicals and Fertilizers
1.69
2 RCF 3.23 3.42 Ministry of Chemicals and Fertilizers
-0.19
3 FACT 0 0.02 Ministry of Chemicals and Fertilizers
-0.02
Total 10.67 9.19 1.48
Mining (` in crore)
Sl. No.
CPSE Minium required 2%
Actual expenditure
Ministry Difference
1 CIL 8.08 171.3200 Ministry of Coal -163.24 2 MCL 156.5 165.5000 Ministry of Coal -9 3 NCL 92.27 83.3300 Ministry of Coal 8.94
4 SECL 83.85 84.6500 Ministry of Coal -0.8 5 CCL 42.73 52.8900 Ministry of Coal -10.16 6 ECL 0 11.4800 Ministry of Coal -11.48 7 BCCL 0 6.0100 Ministry of Coal -6.01 8 WCL 0 9.5900 Ministry of Coal -9.59 9 CMPDIL 3.001 3.0700 Ministry of Coal -0.069 10 HCL 2.97 3.3100 Ministry of Mines -0.34 11 NMDC 117.81 199.9900 Ministry of Steel -82.18 12 NLCI 46.78 75.6600 Ministry of Coal -28.88 13 MECL 3.09 3.6400 Ministry of Mines -0.55 14 NALCO 38.35 39.7100 Ministry of Mines -1.36 15 SAIL 0 27.5600 Ministry of Steel -27.56 16 KIOCL 2.01 3.3100 Ministry of Steel -1.3 17 MOIL 12.2 12.7400 Ministry of Steel -0.54 18 NMDCF 0.2 3.1000 Ministry of Steel -2.9 Total 609.84 956.86 -347.02

Report No.12 of 2021
276
Aviation (` in crore)
Sl. No. CPSE Minium
required 2%
Actual expenditure
Ministry Difference
1 AIEL 0.00 0.86 Ministry of Civil Aviation Transport Services
-0.86
2 AAI 83.79 125.71 Ministry of Civil Aviation -41.92 3 AAICLASC 2.01 2.01 Ministry of Civil Aviation 0
4 CHIAL 0.16 0.16 Ministry of Civil Aviation 0 Total 85.96 128.74 -42.78
Defence (` in crore)
Sl. No. CPSE Minium
required 2%
Actual expenditure
Ministry Difference
1 HAL 69.67 82.0000 Ministry of Defence -12.33 2 BEL 43.1 50.4200 Ministry of Defence -7.32
3 MDSL 15.2 15.6300 Ministry of Defence -0.43 4 BDL 14.99 15.5600 Ministry of Defence -0.57 5 GSL 4.79 5.0600 Ministry of Defence -0.27
6 MDNL 3.84 3.9500 Ministry of Defence -0.11 7 GRSEL 2.18 2.2100 Ministry of Defence -0.03 8 HSL 0.74 0.4200 Ministry of Defense 0.32 Total 154.51 175.25 -20.74
Railways
(` in crore)
Sl. No. CPSE Minium required
2%
Actual expenditure
Ministry Difference
1 IRFC 50.52 34.1000 Ministry of Railway 16.42
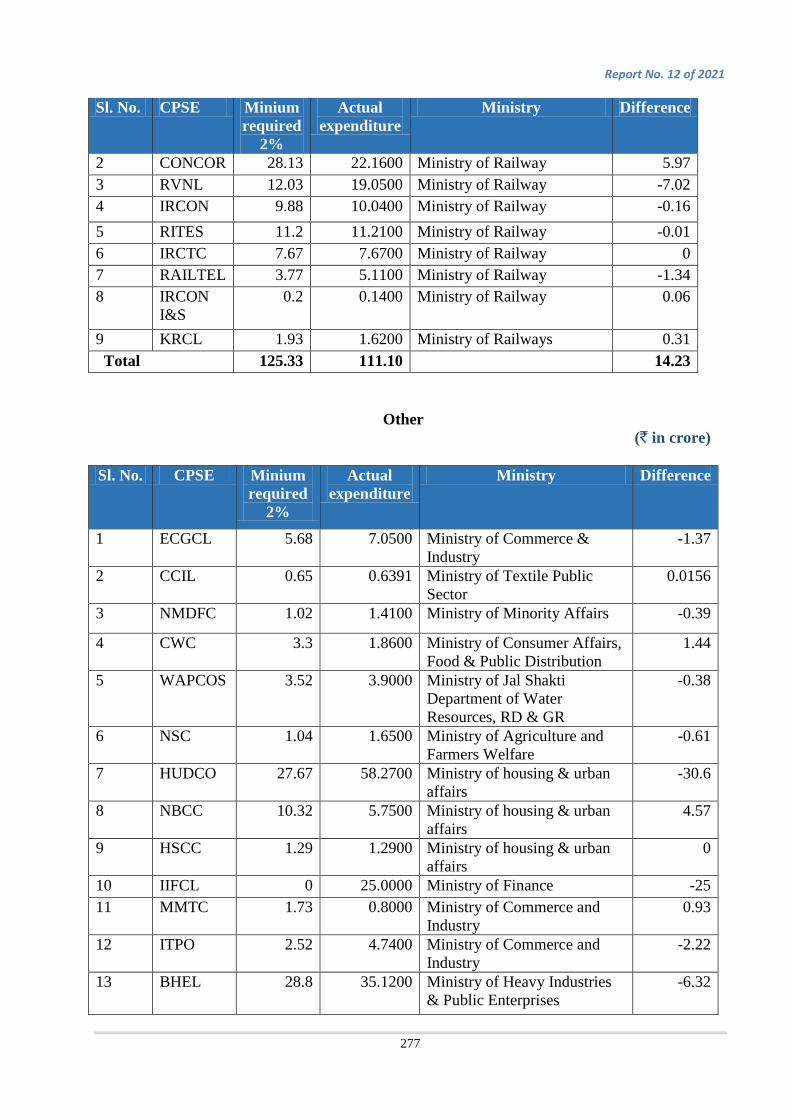
Report No. 12 of 2021
277
Sl. No. CPSE Minium required
2%
Actual expenditure
Ministry Difference
2 CONCOR 28.13 22.1600 Ministry of Railway 5.97 3 RVNL 12.03 19.0500 Ministry of Railway -7.02 4 IRCON 9.88 10.0400 Ministry of Railway -0.16 5 RITES 11.2 11.2100 Ministry of Railway -0.01 6 IRCTC 7.67 7.6700 Ministry of Railway 0 7 RAILTEL 3.77 5.1100 Ministry of Railway -1.34 8 IRCON
I&S 0.2 0.1400 Ministry of Railway 0.06
9 KRCL 1.93 1.6200 Ministry of Railways 0.31 Total 125.33 111.10 14.23
Other
(` in crore)
Sl. No. CPSE Minium required
2%
Actual expenditure
Ministry Difference
1 ECGCL 5.68 7.0500 Ministry of Commerce & Industry
-1.37
2 CCIL 0.65 0.6391 Ministry of Textile Public Sector
0.0156
3 NMDFC 1.02 1.4100 Ministry of Minority Affairs -0.39
4 CWC 3.3 1.8600 Ministry of Consumer Affairs, Food & Public Distribution
1.44
5 WAPCOS 3.52 3.9000 Ministry of Jal Shakti Department of Water Resources, RD & GR
-0.38
6 NSC 1.04 1.6500 Ministry of Agriculture and Farmers Welfare
-0.61
7 HUDCO 27.67 58.2700 Ministry of housing & urban affairs
-30.6
8 NBCC 10.32 5.7500 Ministry of housing & urban affairs
4.57
9 HSCC 1.29 1.2900 Ministry of housing & urban affairs
0
10 IIFCL 0 25.0000 Ministry of Finance -25 11 MMTC 1.73 0.8000 Ministry of Commerce and
Industry 0.93
12 ITPO 2.52 4.7400 Ministry of Commerce and Industry
-2.22
13 BHEL 28.8 35.1200 Ministry of Heavy Industries & Public Enterprises
-6.32
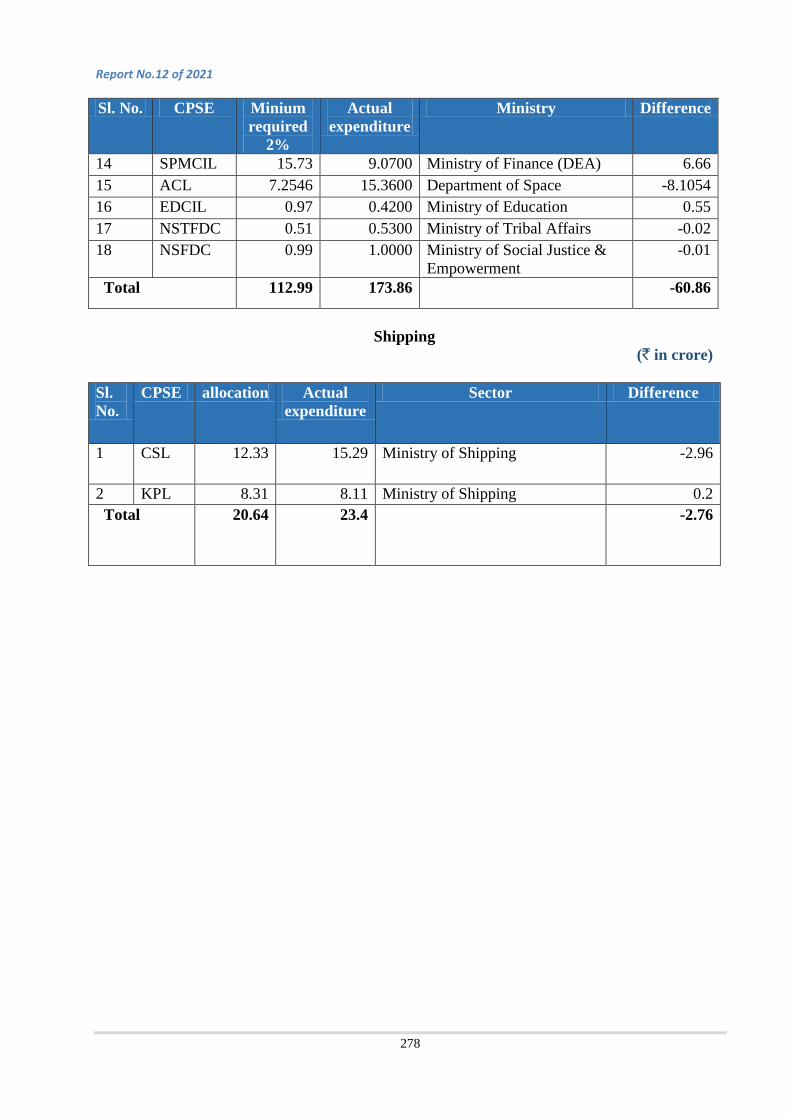
Report No.12 of 2021
278
Sl. No. CPSE Minium required
2%
Actual expenditure
Ministry Difference
14 SPMCIL 15.73 9.0700 Ministry of Finance (DEA) 6.66 15 ACL 7.2546 15.3600 Department of Space -8.1054 16 EDCIL 0.97 0.4200 Ministry of Education 0.55 17 NSTFDC 0.51 0.5300 Ministry of Tribal Affairs -0.02 18 NSFDC 0.99 1.0000 Ministry of Social Justice &
Empowerment -0.01
Total 112.99 173.86 -60.86
Shipping
(` in crore)
Sl. No.
CPSE allocation Actual expenditure
Sector Difference
1 CSL 12.33 15.29 Ministry of Shipping -2.96
2 KPL 8.31 8.11 Ministry of Shipping 0.2 Total 20.64 23.4 -2.76

Report No. 12 of 2021
279
Annexure XXXI (As referred to in Para 4.5.2.4)
CSR expenditure by Ratna companies
Category Number of CPSEs
Category-wise CSR actual expenditure by CPSEs (` in crore)
Percentage
Maharatna 10 2688.59 53.41 Navaratna 11 967.92 19.23 Miniratna 47 1198.96 23.82 Total of all Ratnas (A)
68 4855.47 96.46
Others (B) 27 178.49 3.54 Total 95 5,033.96 100.00
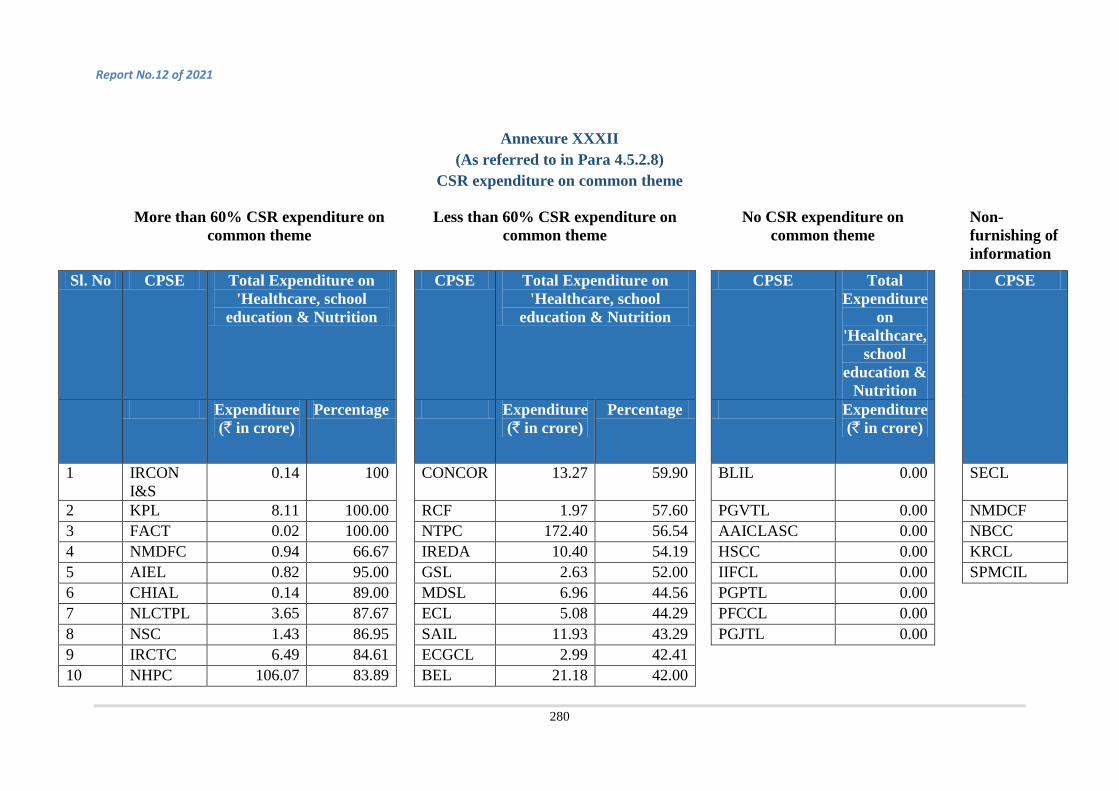
Report No.12 of 2021
280
Annexure XXXII (As referred to in Para 4.5.2.8)
CSR expenditure on common theme
More than 60% CSR expenditure on common theme
Less than 60% CSR expenditure on common theme
No CSR expenditure on common theme
Non-furnishing of information
Sl. No CPSE Total Expenditure on 'Healthcare, school
education & Nutrition
CPSE Total Expenditure on 'Healthcare, school
education & Nutrition
CPSE Total Expenditure
on 'Healthcare,
school education &
Nutrition
CPSE
Expenditure (` in crore)
Percentage Expenditure (` in crore)
Percentage Expenditure (` in crore)
1 IRCON I&S
0.14 100 CONCOR 13.27 59.90 BLIL 0.00 SECL
2 KPL 8.11 100.00 RCF 1.97 57.60 PGVTL 0.00 NMDCF 3 FACT 0.02 100.00 NTPC 172.40 56.54 AAICLASC 0.00 NBCC 4 NMDFC 0.94 66.67 IREDA 10.40 54.19 HSCC 0.00 KRCL 5 AIEL 0.82 95.00 GSL 2.63 52.00 IIFCL 0.00 SPMCIL 6 CHIAL 0.14 89.00 MDSL 6.96 44.56 PGPTL 0.00 7 NLCTPL 3.65 87.67 ECL 5.08 44.29 PFCCL 0.00 8 NSC 1.43 86.95 SAIL 11.93 43.29 PGJTL 0.00 9 IRCTC 6.49 84.61 ECGCL 2.99 42.41 10 NHPC 106.07 83.89 BEL 21.18 42.00

Report No. 12 of 2021
281
Sl. No CPSE Total Expenditure on 'Healthcare, school
education & Nutrition
CPSE Total Expenditure on 'Healthcare, school
education & Nutrition
Expenditure (` in crore)
Percentage Expenditure (` in crore)
Percentage
11 IOCL 455.22 83.78 MECL 1.53 42.00
12 CCIL 0.53 83.00 HCL 1.36 41.08 Total expenditure by 82 CPSEs
13 KIOCL 2.72 82.12 IRCON 3.76 37.45 Expenditure by 53 CPSEs
2,625.27
14 BCCL 4.87 81.00 BLCL 1.90 36.90 Expenditure by 29 CPSEs
427.48
15 HAL 66.03 80.52 SJVN 12.50 34.39 Total expenditure by 82 CPSEs
3,052.75
16 SECI 2.20 80 BDL 5.22 33.55 17 NHDC 19.98 78.11 HSL 0.13 32.00 18 NSTFDC 0.41 77.03 IREL 0.82 30 19 MCL 127.02 76.75 OIL 36.63 29.21 20 NALCO 30.42 76.60 PGWTL 0.22 26.51 21 NSFDC 0.76 75.62 PFCL 22.91 23.58 22 BPCL 259.18 75.00 ACL 3.61 23.50 23 NLCI 56.50 74.67 RAILTEL 1.16 22.70 24 NMDC 147.27 73.64 RECL 56.98 22.05

Report No.12 of 2021
282
Sl. No CPSE Total Expenditure on 'Healthcare, school
education & Nutrition
CPSE Total Expenditure on 'Healthcare, school
education & Nutrition
Expenditure (` in crore)
Percentage Expenditure (` in crore)
Percentage
25 UCIL 4.53 72.60 MMTC 0.14 17.84 26 WAPCOS 2.82 72.29 HUDCO 8.27 14.19 27 NCL 59.46 71.36 CIL 14.80 8.64 28 BHEL 24.88 70.84 EIL 6.54 57.98 29 NFL 4.05 70.46 EDCIL 0.18 42.00 30 ONGC 422.27 69.57 29
CPSEs spending less than 60%
427.48
31 GAIL 85.45 68.20 32 MRPL 51.74 68.00 33 ITPO 3.20 67.51 34 IRFC 23.01 67.49 35 PGCIL 232.51 67.16 36 RVNL 12.76 67.00 37 MOIL 8.53 66.95 38 GAILGAS 0.77 66.06 39 AAI 82.40 65.55 40 HPCL 118.80 65.19 41 ECIL 2.52 65

Report No. 12 of 2021
283
Sl. No CPSE Total Expenditure on 'Healthcare, school
education & Nutrition
Expenditure (` in crore)
Percentage
42 CMPDIL 1.99 64.69 43 CWC 1.20 64.38 44 NPCIL 48.73 63.30 45 CCL 33.44 63.22 46 GRSEL 1.40 63.18 47 RITES 7.05 62.88 48 MDNL 2.46 62.32 49 NRL 54.02 61.66 50 NEEPCO 6.07 61.37 51 CSL 9.36 61.21 52 THDC 13.16 60.86 53 WCL 5.77 60.18 53 CPSEs
spending more than 60%
2,625.27
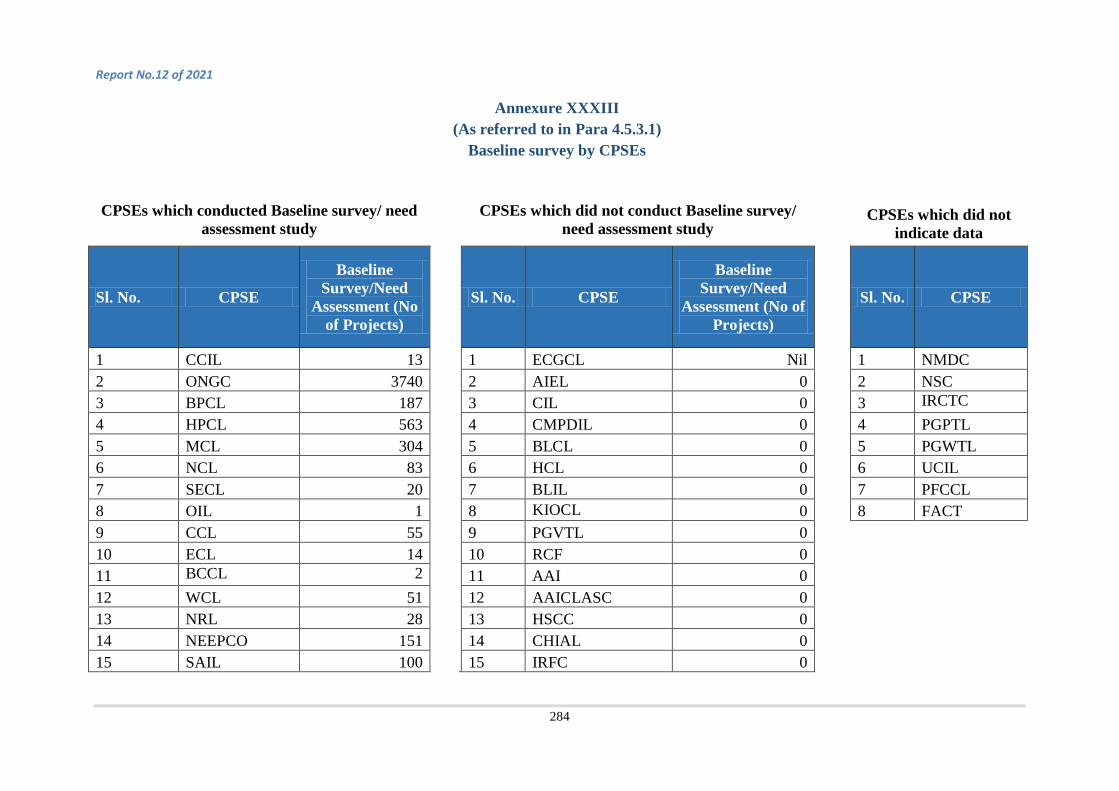
Report No.12 of 2021
284
Annexure XXXIII (As referred to in Para 4.5.3.1)
Baseline survey by CPSEs
CPSEs which conducted Baseline survey/ need assessment study
CPSEs which did not conduct Baseline survey/ need assessment study
CPSEs which did not indicate data
Sl. No. CPSE
Baseline Survey/Need
Assessment (No of Projects)
Sl. No. CPSE
Baseline Survey/Need
Assessment (No of Projects)
Sl. No. CPSE
1 CCIL 13
1 ECGCL Nil
1 NMDC 2 ONGC 3740
2 AIEL 0
2 NSC
3 BPCL 187
3 CIL 0
3 IRCTC 4 HPCL 563
4 CMPDIL 0
4 PGPTL
5 MCL 304
5 BLCL 0
5 PGWTL 6 NCL 83
6 HCL 0
6 UCIL
7 SECL 20
7 BLIL 0
7 PFCCL 8 OIL 1
8 KIOCL 0
8 FACT
9 CCL 55
9 PGVTL 0 10 ECL 14
10 RCF 0
11 BCCL 2
11 AAI 0 12 WCL 51
12 AAICLASC 0
13 NRL 28
13 HSCC 0 14 NEEPCO 151
14 CHIAL 0
15 SAIL 100
15 IRFC 0
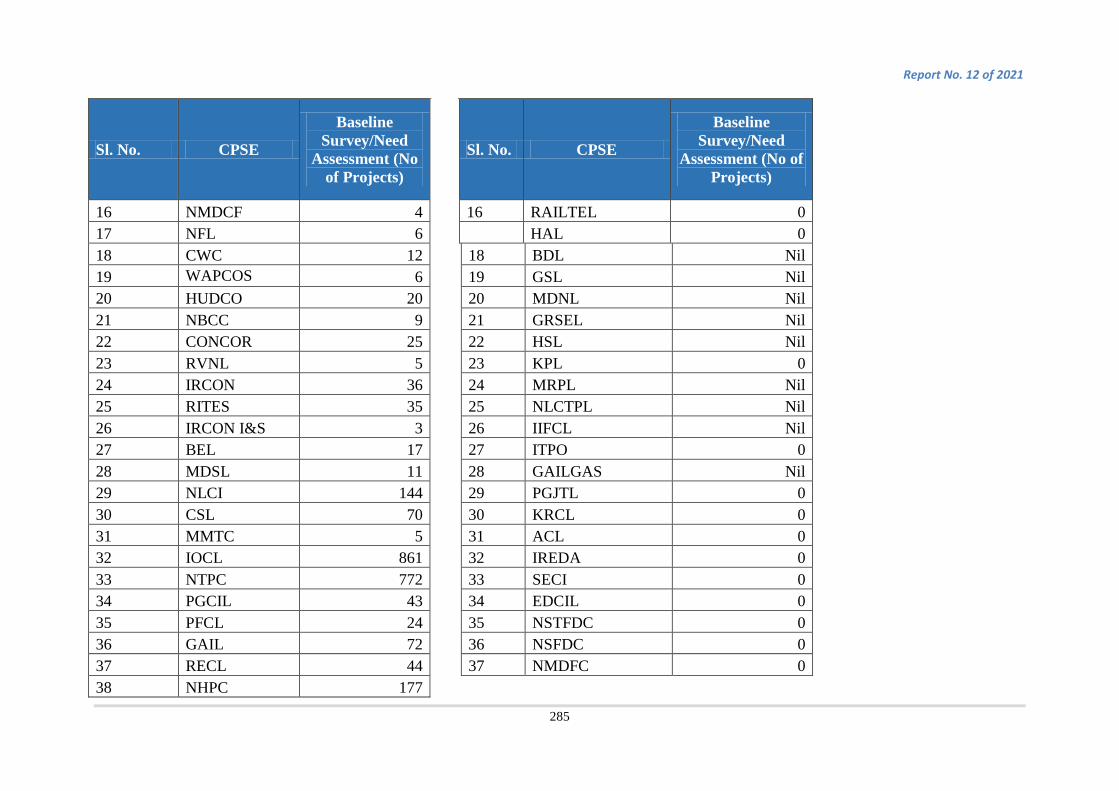
Report No. 12 of 2021
285
Sl. No. CPSE
Baseline Survey/Need
Assessment (No of Projects)
Sl. No. CPSE
Baseline Survey/Need
Assessment (No of Projects)
16 NMDCF 4 16 RAILTEL 0
17 NFL 6
HAL 0 18 CWC 12
18 BDL Nil
19 WAPCOS 6
19 GSL Nil 20 HUDCO 20
20 MDNL Nil
21 NBCC 9
21 GRSEL Nil 22 CONCOR 25
22 HSL Nil
23 RVNL 5
23 KPL 0 24 IRCON 36
24 MRPL Nil
25 RITES 35
25 NLCTPL Nil 26 IRCON I&S 3
26 IIFCL Nil
27 BEL 17
27 ITPO 0 28 MDSL 11
28 GAILGAS Nil
29 NLCI 144
29 PGJTL 0 30 CSL 70
30 KRCL 0
31 MMTC 5
31 ACL 0 32 IOCL 861
32 IREDA 0
33 NTPC 772
33 SECI 0 34 PGCIL 43
34 EDCIL 0
35 PFCL 24
35 NSTFDC 0 36 GAIL 72
36 NSFDC 0
37 RECL 44
37 NMDFC 0 38 NHPC 177

Report No.12 of 2021
286
Sl. No. CPSE
Baseline Survey/Need
Assessment (No of Projects)
39 SJVN 30
40 THDC 106 41 BHEL 139 42 NHDC 40 43 MOIL 24 44 EIL 12 45 MECL 16 46 SPMCIL 22 47 NPCIL 113 48 ECIL 16 49 IREL 7 50 NALCO 26 Total 8,264

Report No. 12 of 2021
287
Annexure XXXIV (As referred to in Para 4.5.3.2)
Manner of implementation of CSR activities
CPSEs where activities were out-sourced to external agencies only
Sl. No.
CPSE Activities implemented in-house only
Sl. No. CPSEs where data was not
furnished
Sl. No.
CPSEs Tender Nomination Other Total
1 NEEPCO 161 1 NSC 1 CCIL 8 5 0 13 2 BEL 51 2 NTPC 2 BLCL 0 13 0 13 3 EDCIL 5 3 PGPTL 3 WAPCOS 0 0 26 26 4 CHIAL 3 4 PGWTL 4 HUDCO Not
indicated Not
indicated 21 21
5 KIOCL 26 5 KRCL 5 NBCC 1 0 3 4 Total 246 6 UCIL 6 IRFC 0 3 0 3 7 AIEL 7 IRCON
I&S 0 2 2 4
8 FACT 8 HSL 0 0 2 2 9 CSL 0 0 116 116 10 PFCL 0 24 0 24 11 THDC 18 88 0 106 12 EIL 0 25 0 25 13 ACL 0 36 0 36 14 NSTFDC Not
indicated Not
indicated 3 3
15 NMDFC Not indicated
Not indicated
11 11
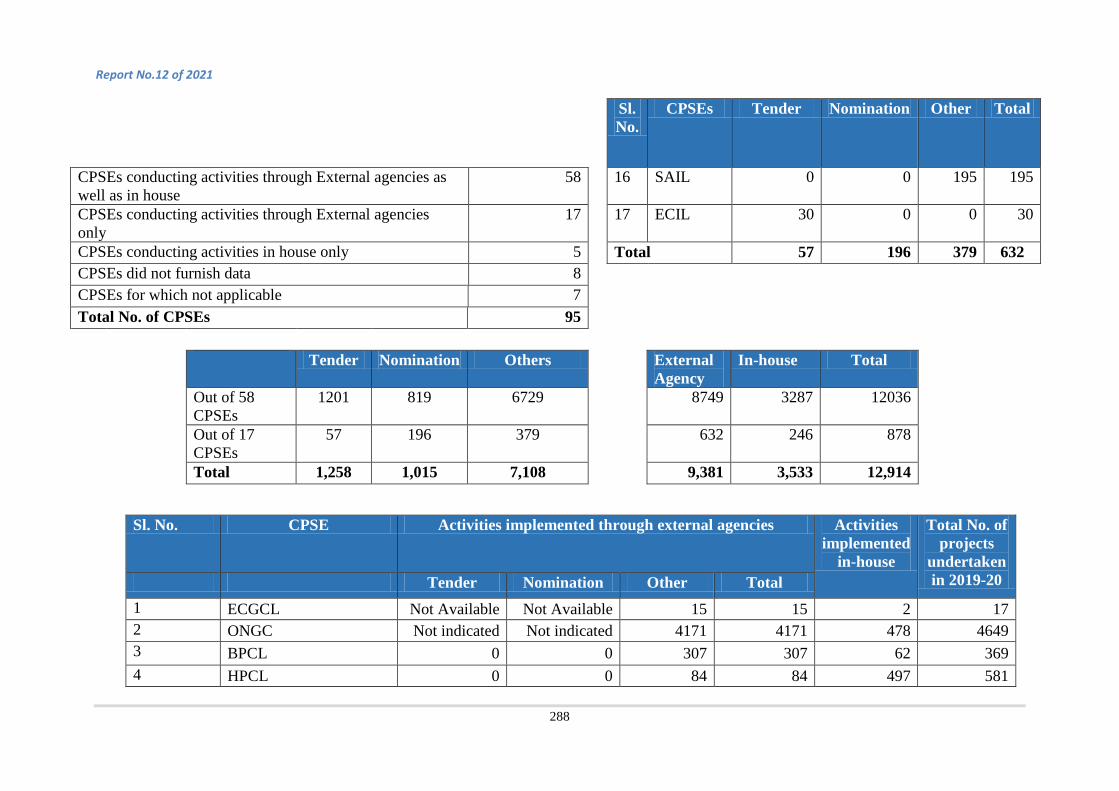
Report No.12 of 2021
288
Sl. No.
CPSEs Tender Nomination Other Total
CPSEs conducting activities through External agencies as well as in house
58 16 SAIL 0 0 195 195
CPSEs conducting activities through External agencies only
17 17 ECIL 30 0 0 30
CPSEs conducting activities in house only 5 Total 57 196 379 632 CPSEs did not furnish data 8 CPSEs for which not applicable 7 Total No. of CPSEs 95 Tender Nomination Others External
Agency In-house Total
Out of 58 CPSEs
1201 819 6729 8749 3287 12036
Out of 17 CPSEs
57 196 379 632 246 878
Total 1,258 1,015 7,108 9,381 3,533 12,914
Sl. No. CPSE Activities implemented through external agencies Activities implemented
in-house
Total No. of projects
undertaken in 2019-20 Tender Nomination Other Total
1 ECGCL Not Available Not Available 15 15 2 17 2 ONGC Not indicated Not indicated 4171 4171 478 4649 3 BPCL 0 0 307 307 62 369 4 HPCL 0 0 84 84 497 581

Report No. 12 of 2021
289
Sl. No. CPSE Activities implemented through external agencies Activities implemented
in-house
Total No. of projects
undertaken in 2019-20 Tender Nomination Other Total
5 CIL 0 0 24 24 3 27 6 MCL 0 0 415 415 52 467 7 NCL 0 46 0 46 262 308 8 SECL 0 1 38 39 9 48 9 OIL 9 10 0 19 2 21 10 CCL 211 0 8 219 9 228 11 ECL 18 0 8 26 14 40 12 BCCL 0 0 5 5 10 15 13 WCL 0 0 15 15 172 187 14 CMPDIL 0 2 0 2 74 76 15 NRL 0 0 19 19 59 78 16 HCL 10 24 0 34 23 57 17 NMDC 0 2 580 582 205 787 18 NMDCF 0 4 0 4 1 5 19 NFL 7 11 0 18 16 34 20 CWC 0 10 0 10 4 14 21 RCF 2 17 0 19 9 28 22 AAI 25 98 0 123 22 145 23 CONCOR 0 49 0 49 1 50 24 RVNL 0 11 0 11 8 19 25 IRCON 0 46 0 46 13 59 26 RITES 0 40 0 40 1 41 27 RAILTEL 0 0 8 8 4 12
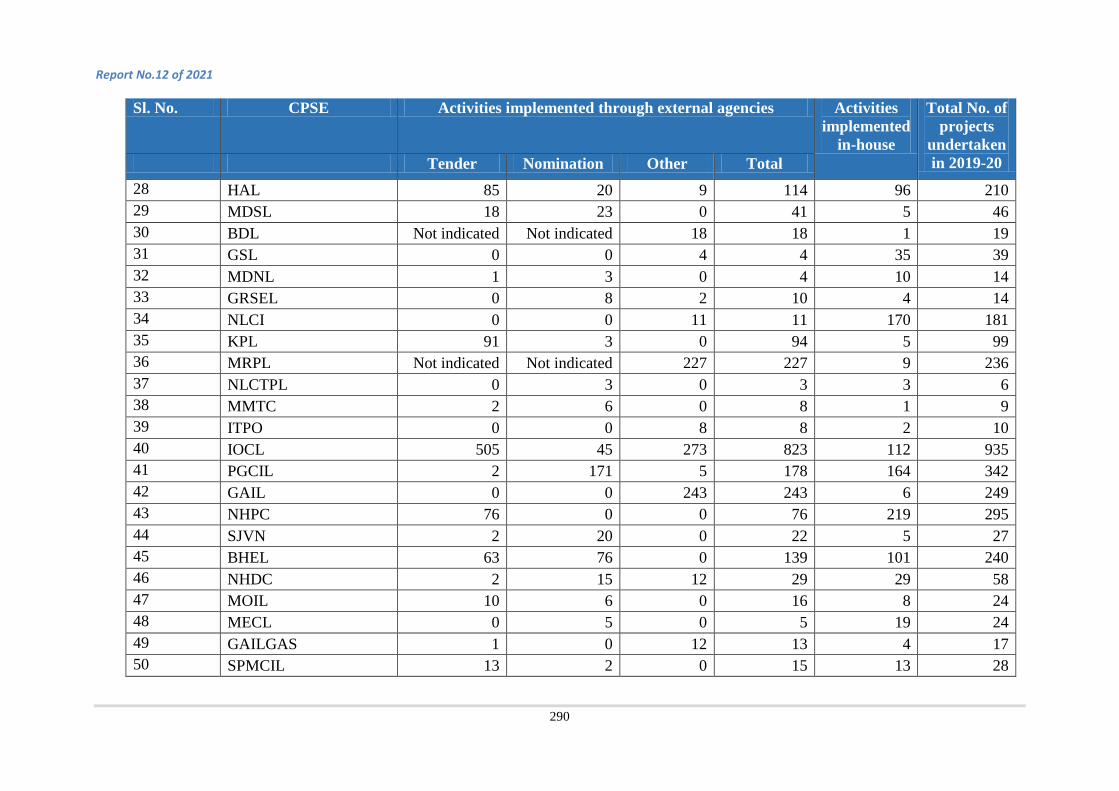
Report No.12 of 2021
290
Sl. No. CPSE Activities implemented through external agencies Activities implemented
in-house
Total No. of projects
undertaken in 2019-20 Tender Nomination Other Total
28 HAL 85 20 9 114 96 210 29 MDSL 18 23 0 41 5 46 30 BDL Not indicated Not indicated 18 18 1 19 31 GSL 0 0 4 4 35 39 32 MDNL 1 3 0 4 10 14 33 GRSEL 0 8 2 10 4 14 34 NLCI 0 0 11 11 170 181 35 KPL 91 3 0 94 5 99 36 MRPL Not indicated Not indicated 227 227 9 236 37 NLCTPL 0 3 0 3 3 6 38 MMTC 2 6 0 8 1 9 39 ITPO 0 0 8 8 2 10 40 IOCL 505 45 273 823 112 935 41 PGCIL 2 171 5 178 164 342 42 GAIL 0 0 243 243 6 249 43 NHPC 76 0 0 76 219 295 44 SJVN 2 20 0 22 5 27 45 BHEL 63 76 0 139 101 240 46 NHDC 2 15 12 29 29 58 47 MOIL 10 6 0 16 8 24 48 MECL 0 5 0 5 19 24 49 GAILGAS 1 0 12 13 4 17 50 SPMCIL 13 2 0 15 13 28

Report No. 12 of 2021
291
Sl. No. CPSE Activities implemented through external agencies Activities implemented
in-house
Total No. of projects
undertaken in 2019-20 Tender Nomination Other Total
51 NPCIL 25 0 22 47 229 276 52 IREDA 2 2 4 4 8 53 SECI Not indicated Not indicated 3 3 3 6 54 IREL 6 0 0 6 1 7 55 NSFDC 0 20 20 3 23 56 NALCO 15 20 15 50 11 61 57 IRCTC 0 0 21 21 2 23 58 RECL 0 0 147 147 1 148 Total 1,201 819 6,729 8,749 3,287 12,036 CPSEs which did not undertake any
project but contributed to funds
Sl. No. Name of the CPSE 1 BLIL 2 HSCC 3 IIFCL 4 PGJTL 5 PGVTL 6 AAICLASC 7 PFCCL
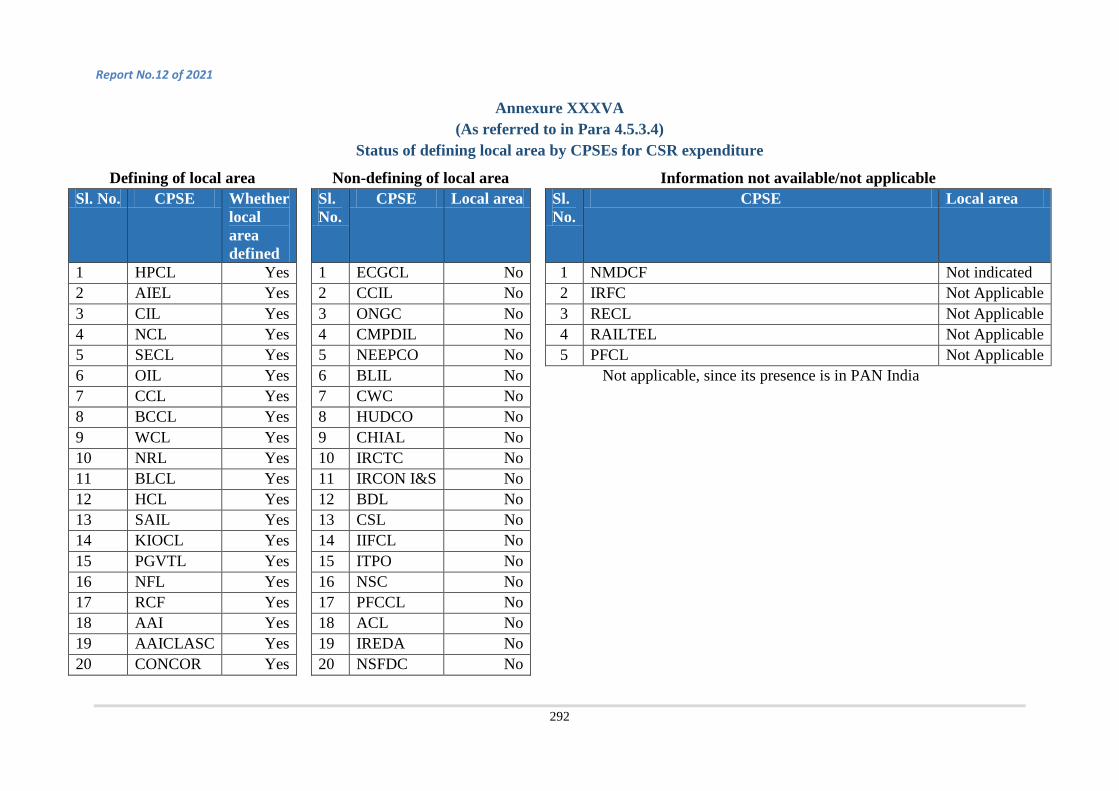
Report No.12 of 2021
292
Annexure XXXVA (As referred to in Para 4.5.3.4)
Status of defining local area by CPSEs for CSR expenditure
Defining of local area Non-defining of local area Information not available/not applicable Sl. No. CPSE Whether
local area defined
Sl. No.
CPSE Local area Sl. No.
CPSE Local area
1 HPCL Yes 1 ECGCL No 1 NMDCF Not indicated 2 AIEL Yes 2 CCIL No 2 IRFC Not Applicable 3 CIL Yes 3 ONGC No 3 RECL Not Applicable 4 NCL Yes 4 CMPDIL No 4 RAILTEL Not Applicable 5 SECL Yes 5 NEEPCO No 5 PFCL Not Applicable 6 OIL Yes 6 BLIL No Not applicable, since its presence is in PAN India 7 CCL Yes 7 CWC No 8 BCCL Yes 8 HUDCO No 9 WCL Yes 9 CHIAL No 10 NRL Yes 10 IRCTC No 11 BLCL Yes 11 IRCON I&S No 12 HCL Yes 12 BDL No 13 SAIL Yes 13 CSL No 14 KIOCL Yes 14 IIFCL No 15 PGVTL Yes 15 ITPO No 16 NFL Yes 16 NSC No 17 RCF Yes 17 PFCCL No 18 AAI Yes 18 ACL No 19 AAICLASC Yes 19 IREDA No 20 CONCOR Yes 20 NSFDC No
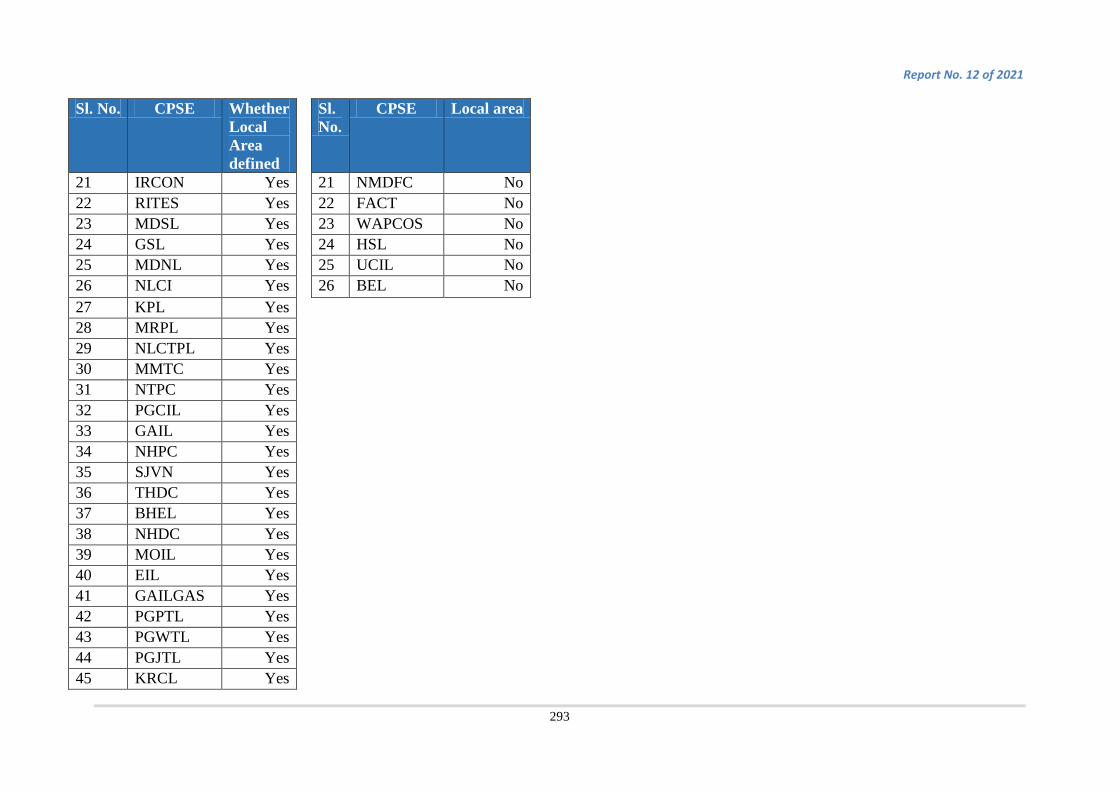
Report No. 12 of 2021
293
Sl. No. CPSE Whether Local Area defined
Sl. No.
CPSE Local area
21 IRCON Yes 21 NMDFC No 22 RITES Yes 22 FACT No 23 MDSL Yes 23 WAPCOS No 24 GSL Yes 24 HSL No 25 MDNL Yes 25 UCIL No 26 NLCI Yes 26 BEL No 27 KPL Yes 28 MRPL Yes 29 NLCTPL Yes 30 MMTC Yes 31 NTPC Yes 32 PGCIL Yes 33 GAIL Yes 34 NHPC Yes 35 SJVN Yes 36 THDC Yes 37 BHEL Yes 38 NHDC Yes 39 MOIL Yes 40 EIL Yes 41 GAILGAS Yes 42 PGPTL Yes 43 PGWTL Yes 44 PGJTL Yes 45 KRCL Yes

Report No.12 of 2021
294
Sl. No. CPSE Whether Local Area defined
46 NPCIL Yes 47 ECIL Yes 48 SECI Yes 49 IREL Yes 50 EDCIL Yes 51 NALCO Yes 52 MCL Yes 53 BPCL Yes 54 ECL Yes 55 NMDC Yes 56 NBCC Yes 57 HSCC Yes 58 RVNL Yes 59 SPMCIL Yes 60 NSTFDC Yes 61 IOCL yes 62 HAL Yes 63 GRSEL Yes 64 MECL Yes
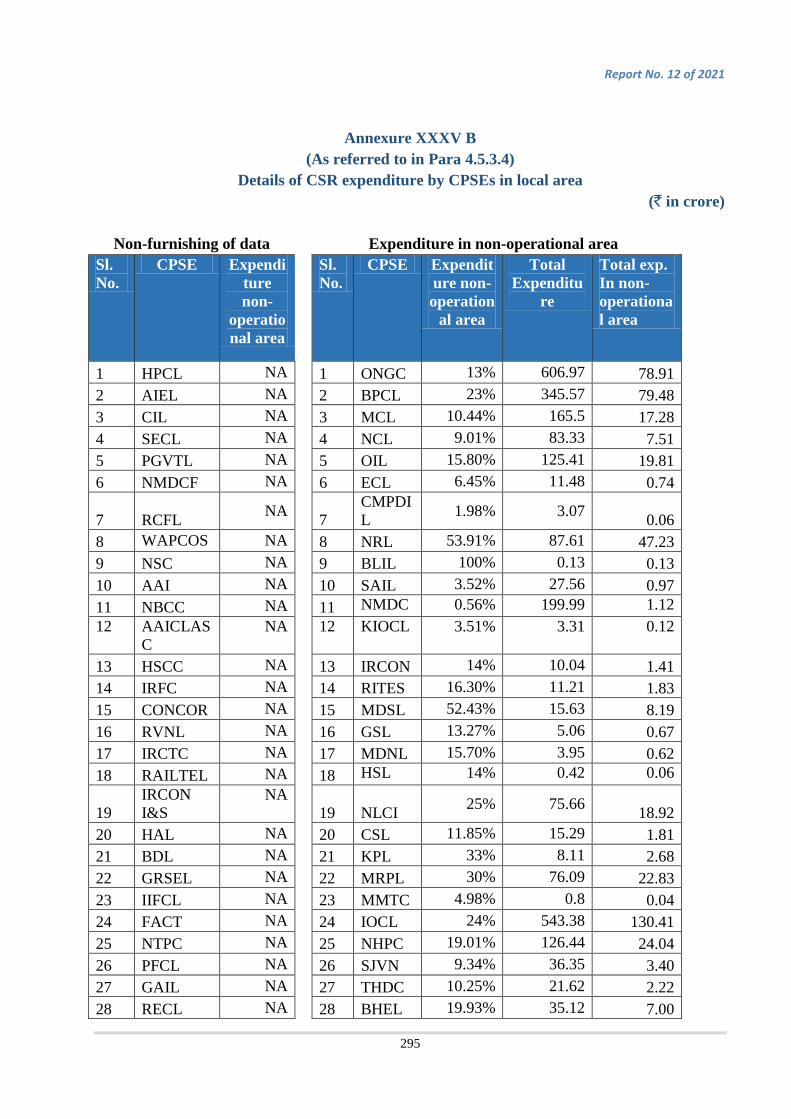
Report No. 12 of 2021
295
Annexure XXXV B (As referred to in Para 4.5.3.4)
Details of CSR expenditure by CPSEs in local area (` in crore)
Non-furnishing of data Expenditure in non-operational area
Sl. No.
CPSE Expenditure non-
operational area
Sl. No.
CPSE Expenditure non-operation
al area
Total Expenditu
re
Total exp. In non-operational area
1 HPCL NA 1 ONGC 13% 606.97 78.91 2 AIEL NA 2 BPCL 23% 345.57 79.48 3 CIL NA 3 MCL 10.44% 165.5 17.28 4 SECL NA 4 NCL 9.01% 83.33 7.51 5 PGVTL NA 5 OIL 15.80% 125.41 19.81 6 NMDCF NA 6 ECL 6.45% 11.48 0.74
7 RCFL NA 7
CMPDIL 1.98% 3.07 0.06
8 WAPCOS NA 8 NRL 53.91% 87.61 47.23 9 NSC NA 9 BLIL 100% 0.13 0.13 10 AAI NA 10 SAIL 3.52% 27.56 0.97 11 NBCC NA 11 NMDC 0.56% 199.99 1.12 12 AAICLAS
C NA 12 KIOCL 3.51% 3.31 0.12
13 HSCC NA 13 IRCON 14% 10.04 1.41 14 IRFC NA 14 RITES 16.30% 11.21 1.83 15 CONCOR NA 15 MDSL 52.43% 15.63 8.19 16 RVNL NA 16 GSL 13.27% 5.06 0.67 17 IRCTC NA 17 MDNL 15.70% 3.95 0.62 18 RAILTEL NA 18 HSL 14% 0.42 0.06
19 IRCON I&S
NA 19 NLCI 25% 75.66 18.92
20 HAL NA 20 CSL 11.85% 15.29 1.81 21 BDL NA 21 KPL 33% 8.11 2.68 22 GRSEL NA 22 MRPL 30% 76.09 22.83 23 IIFCL NA 23 MMTC 4.98% 0.8 0.04 24 FACT NA 24 IOCL 24% 543.38 130.41 25 NTPC NA 25 NHPC 19.01% 126.44 24.04 26 PFCL NA 26 SJVN 9.34% 36.35 3.40 27 GAIL NA 27 THDC 10.25% 21.62 2.22 28 RECL NA 28 BHEL 19.93% 35.12 7.00

Report No.12 of 2021
296
Sl. No.
CPSE Expenditure non-
operational area
Sl. No.
CPSE Expenditure non-operation
al area
Total Expenditu
re
Total exp. In non-operational area
29 PGPTL NA 29 NHDC 21.61% 25.58 5.53 30 PGWTL NA 30 EIL 44.19% 11.28 4.98 31 PGJTL NA 31 MECL 10% 3.64 0.36
32 PFCC NA 32 GAILGAS 1.03% 1.16 0.01
33 SPMCIL NA 33 NPCIL 8% 76.98 6.16 34 UCIL NA 34 ACL 86% 15.36 13.23 35 SECI NA 35 EDCIL 100% 0.42 0.42
36 IREL NA 36 NALCO 17.34% 39.71 0.07
37 NSTFDC NA 37 PGCIL 27.29% 346.21 94.47 38 NSFDC NA 38 IREDA 100% 19.19 19.19 39 NMDFC NA Total 623.89 40 NEEPCO NA 41 ITPO NA
100% expenditure in local area More than 50% expenditure in non-operational area
Sl. No.
CPSE Expenditure non-
operational area
Total Expenditure
Sl. No.
CPSE Expenditure non-operation
al area
Total Expenditure
Total exp. In non-operational area
1 ECGCL 0 7.05 1 NRL 53.91% 87.61 47.23 2 CCIL 0 0.64 2 BLIL 100% 0.13 0.13 3 CCL 0% 52.89 3 MDSL 52.43% 15.63 8.19 4 BCCL 0% 6.01 4 ACL 86% 15.36 13.21 5 WCL 0% 9.59 5 EDCIL 100% 0.42 0.42
6 NFL 0 5.75
6 IREDA 100% 19.19 19.19
7 CWC 0 1.86 8 BEL 0 50.42
9 NLCTPL 0% 4.16
10 MOIL 0.00% 12.74 11 ECIL 0% 3.88 12 HUDCO 0% 58.27
13 BLCL 0% 5.14
14 HCL 0% 3.31 15 KRCL 0% 1.62 16 CHIAL 0% 0.16
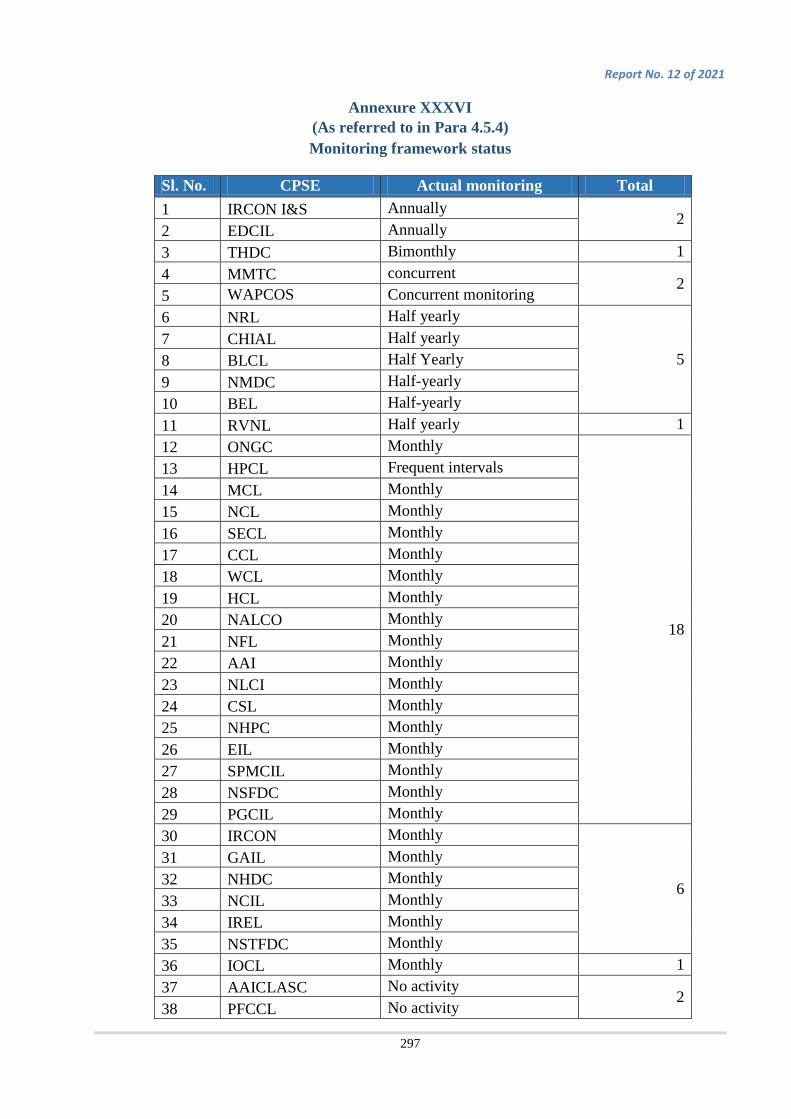
Report No. 12 of 2021
297
Annexure XXXVI (As referred to in Para 4.5.4) Monitoring framework status
Sl. No. CPSE Actual monitoring Total 1 IRCON I&S Annually
2
2 EDCIL Annually 3 THDC Bimonthly 1 4 MMTC concurrent
2
5 WAPCOS Concurrent monitoring 6 NRL Half yearly
5
7 CHIAL Half yearly 8 BLCL Half Yearly 9 NMDC Half-yearly 10 BEL Half-yearly 11 RVNL Half yearly 1 12 ONGC Monthly
18
13 HPCL Frequent intervals 14 MCL Monthly 15 NCL Monthly 16 SECL Monthly 17 CCL Monthly 18 WCL Monthly 19 HCL Monthly 20 NALCO Monthly 21 NFL Monthly 22 AAI Monthly 23 NLCI Monthly 24 CSL Monthly 25 NHPC Monthly 26 EIL Monthly 27 SPMCIL Monthly 28 NSFDC Monthly 29 PGCIL Monthly 30 IRCON Monthly
6
31 GAIL Monthly 32 NHDC Monthly 33 NCIL Monthly 34 IREL Monthly 35 NSTFDC Monthly 36 IOCL Monthly 1 37 AAICLASC No activity
2 38 PFCCL No activity

Report No.12 of 2021
298
Sl. No. CPSE Actual monitoring Total
39 IIFCL Not Applicable since no projects 1
40 NTPC Not mentioned 1 41 PGPTL Not specific
21
42 PGWTL Not specific 43 PGJTL Not specific 44 CIL Not specific 45 BCCL Not specific 46 BLIL Not specific 47 PGVTL Not specific 48 NSC Not specific 49 HUDCO Not specific 50 IRFC Not specific 51 RITES Not specific 52 IRCTC Not specific 53 HAL Not specific 54 HSL Not specific 55 KPL Not specific 56 PFCL Not specific 57 RECL Not specific 58 BHEL Not specific 59 ACL Not specific 60 NMDFC Not specific 61 FACT Not specific 62 NEEPCO On Regular basis
6
63 KIOCL Regular basis 64 MDNL Regular basis 65 GRSEL Regular basis 66 MECL Regularly 67 SECI Regularly 68 ECGCL Quarterly
24
69 CCIL Quarterly 70 BPCL Monthly 71 AIEL Regular meeting 72 OIL Quarterly 73 ECL Quarterly 74 CMPDIL Quarterly 75 SAIL Quarterly 76 NMDCF Not Applicable 77 RCF Quarterly 78 NBCC Quarterly
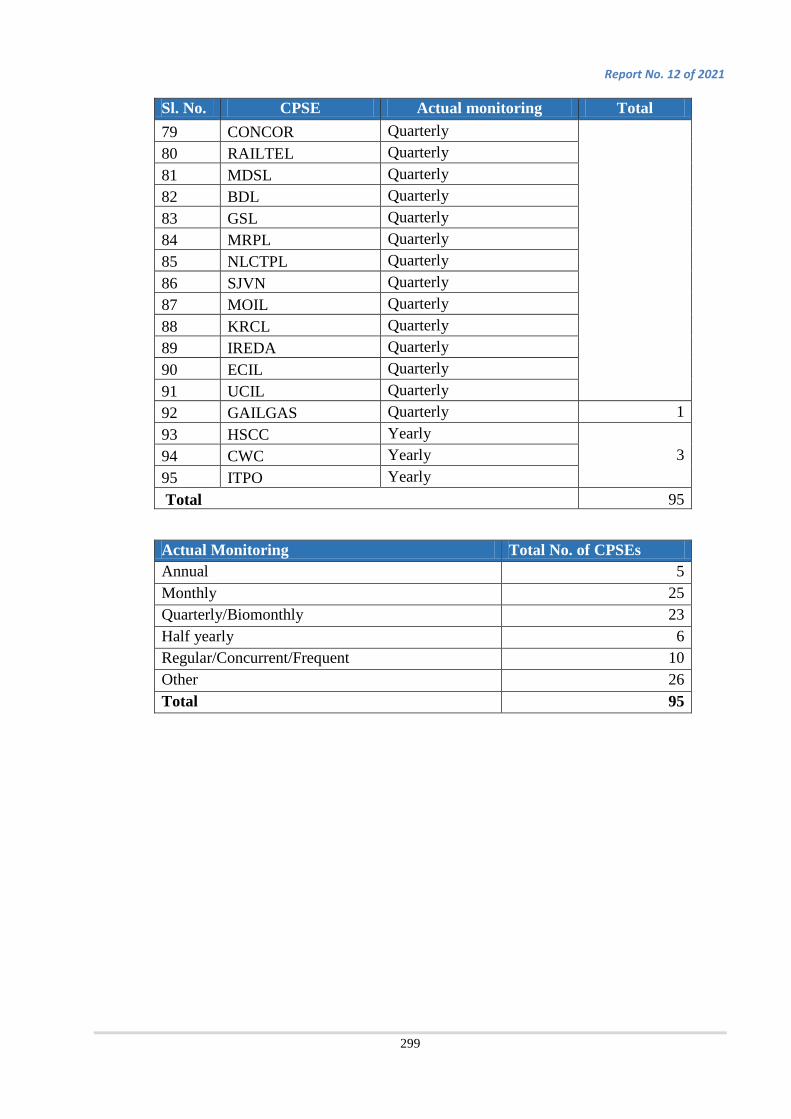
Report No. 12 of 2021
299
Sl. No. CPSE Actual monitoring Total 79 CONCOR Quarterly 80 RAILTEL Quarterly 81 MDSL Quarterly 82 BDL Quarterly 83 GSL Quarterly 84 MRPL Quarterly 85 NLCTPL Quarterly 86 SJVN Quarterly 87 MOIL Quarterly 88 KRCL Quarterly 89 IREDA Quarterly 90 ECIL Quarterly 91 UCIL Quarterly 92 GAILGAS Quarterly 1 93 HSCC Yearly
3 94 CWC Yearly 95 ITPO Yearly Total 95
Actual Monitoring Total No. of CPSEs Annual 5 Monthly 25 Quarterly/Biomonthly 23 Half yearly 6 Regular/Concurrent/Frequent 10 Other 26 Total 95

Report No.12 of 2021
300
Annexure XXXVII (As referred to in Para 5.1) List of Ind AS applicable
Sl. No Reference no. Description 1 Ind AS 101 First-time Adoption of Indian Accounting Standards 2 Ind AS 102 Share-based Payment 3 Ind AS 103 Business Combinations 4 Ind AS 104 Insurance Contracts 5 Ind AS 105 Non-current Assets Held for Sale and Discontinued Operations 6 Ind AS 106 Exploration for and Evaluation of Mineral Resources 7 Ind AS 107 Financial Instruments Disclosures 8 Ind AS 108 Operating Segments 9 Ind AS 109 Financial Instruments 10 Ind AS 110 Consolidated Financial Statements 11 Ind AS 111 Joint Arrangements 12 Ind AS 112 Disclosure of Interests in Other Entities 13 Ind AS 113 Fair Value Measurement 14 Ind AS 114 Regulatory Deferral Accounts 15 Ind AS 115 Revenue from Contracts with Customers 16 Ind AS 116 Leases 17 Ind AS 1 Presentation of Financial Statements 18 Ind AS 2 Inventories 19 Ind AS 7 Statement of Cash Flows 20 Ind AS 8 Accounting Policies, Changes in Accounting Estimates and
Errors 21 Ind AS 10 Events after the reporting period 22 Ind AS 12 Income Taxes 23 Ind AS 16 Property, Plant and Equipment 24 Ind AS 19 Employee Benefits 25 Ind AS 20 Accounting for Government Grants and Disclosure of
Government Assistance
26 Ind AS 21 The Effects of Changes in Foreign Exchange Rates 27 Ind AS 23 Borrowing Costs 28 Ind AS 24 Related Party Disclosures 29 Ind AS 27 Separate Financial Statements 30 Ind AS 28 Investments in Associates and Joint Ventures 31 Ind AS 29 Financial Reporting in Hyperinflationary Economies 32 Ind AS 32 Financial Instruments Presentation
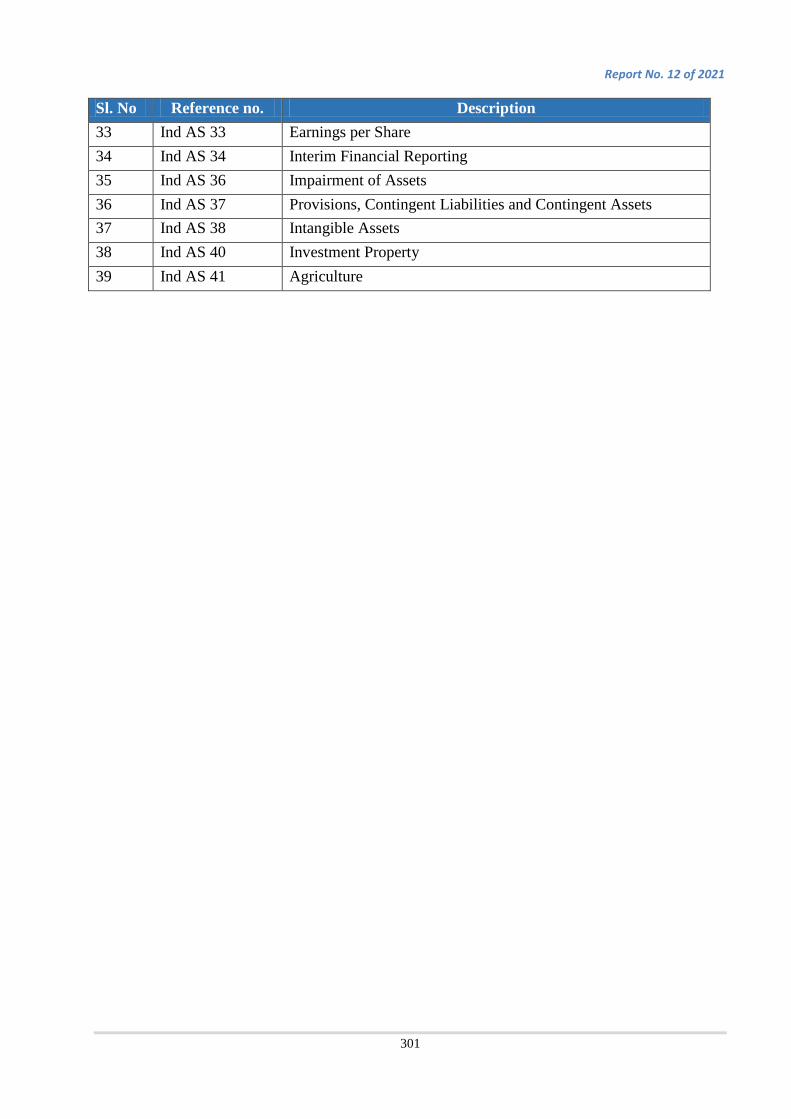
Report No. 12 of 2021
301
Sl. No Reference no. Description 33 Ind AS 33 Earnings per Share 34 Ind AS 34 Interim Financial Reporting 35 Ind AS 36 Impairment of Assets 36 Ind AS 37 Provisions, Contingent Liabilities and Contingent Assets 37 Ind AS 38 Intangible Assets 38 Ind AS 40 Investment Property 39 Ind AS 41 Agriculture
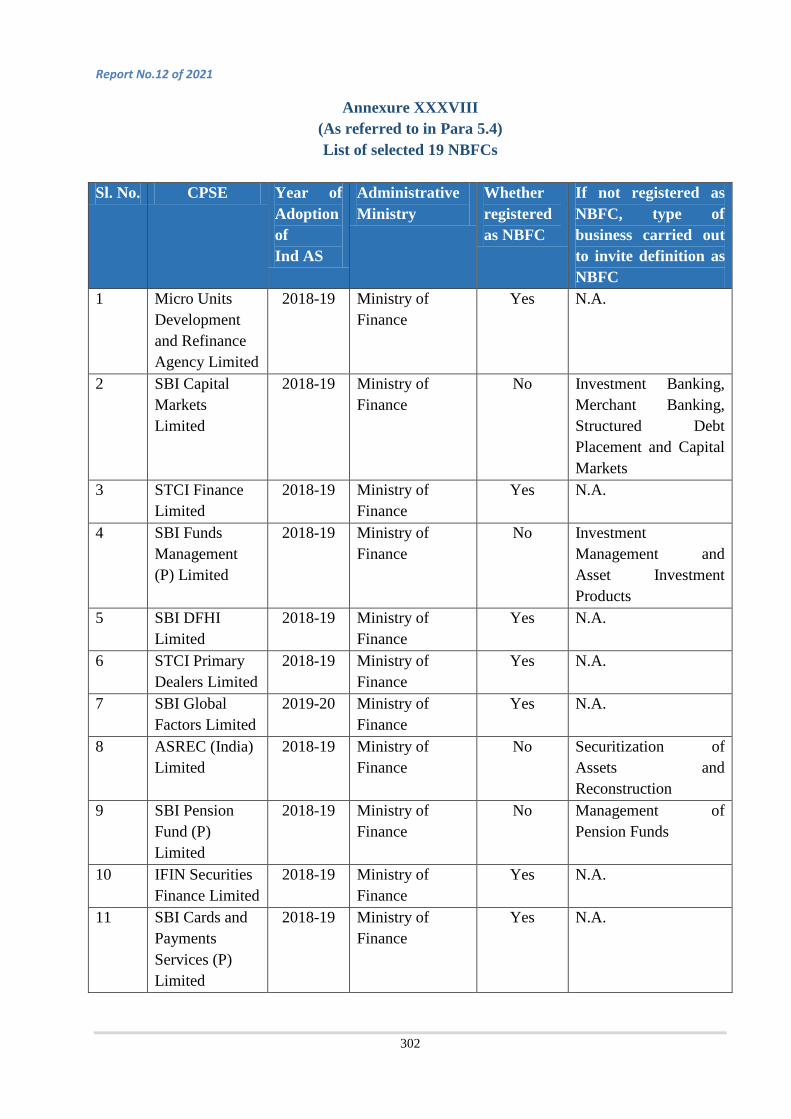
Report No.12 of 2021
302
Annexure XXXVIII (As referred to in Para 5.4) List of selected 19 NBFCs
Sl. No. CPSE Year of
Adoption of Ind AS
Administrative Ministry
Whether registered as NBFC
If not registered as NBFC, type of business carried out to invite definition as NBFC
1 Micro Units Development and Refinance Agency Limited
2018-19 Ministry of Finance
Yes N.A.
2 SBI Capital Markets Limited
2018-19 Ministry of Finance
No Investment Banking, Merchant Banking, Structured Debt Placement and Capital Markets
3 STCI Finance Limited
2018-19 Ministry of Finance
Yes N.A.
4 SBI Funds Management (P) Limited
2018-19 Ministry of Finance
No Investment Management and Asset Investment Products
5 SBI DFHI Limited
2018-19 Ministry of Finance
Yes N.A.
6 STCI Primary Dealers Limited
2018-19 Ministry of Finance
Yes N.A.
7 SBI Global Factors Limited
2019-20 Ministry of Finance
Yes N.A.
8 ASREC (India) Limited
2018-19 Ministry of Finance
No Securitization of Assets and Reconstruction
9 SBI Pension Fund (P) Limited
2018-19 Ministry of Finance
No Management of Pension Funds
10 IFIN Securities Finance Limited
2018-19 Ministry of Finance
Yes N.A.
11 SBI Cards and Payments Services (P) Limited
2018-19 Ministry of Finance
Yes N.A.

Report No. 12 of 2021
303
Sl. No. CPSE Year of Adoption of Ind AS
Administrative Ministry
Whether registered as NBFC
If not registered as NBFC, type of business carried out to invite definition as NBFC
12 Eastern Investments Limited
2019-20 Ministry of Steel Yes N.A.
13 India Infrastructure Finance Company Limited
2018-19 Ministry of Finance
Yes N.A.
14 PNB Gilts Limited
2018-19 Ministry of Finance
Yes N.A.
15 Power Finance Corporation Limited
2018-19 Ministry of Power
Yes N.A.
16 REC Limited 2018-19 Ministry of Power
Yes N.A.
17 Housing and Urban Development Corporation Limited
2018-19 Ministry of Housing and Urban Affairs
No Housing Finance
18 IFCI Limited 2018-19 Ministry of Finance
Yes N.A.
19 Balmer Lawrie Investments Limited
2019-20 Ministry of Petroleum & Natural Gas
No Company stated that it is an NBFC as defined under RBI Act and based on application got exempted from registration as NBFC from RBI
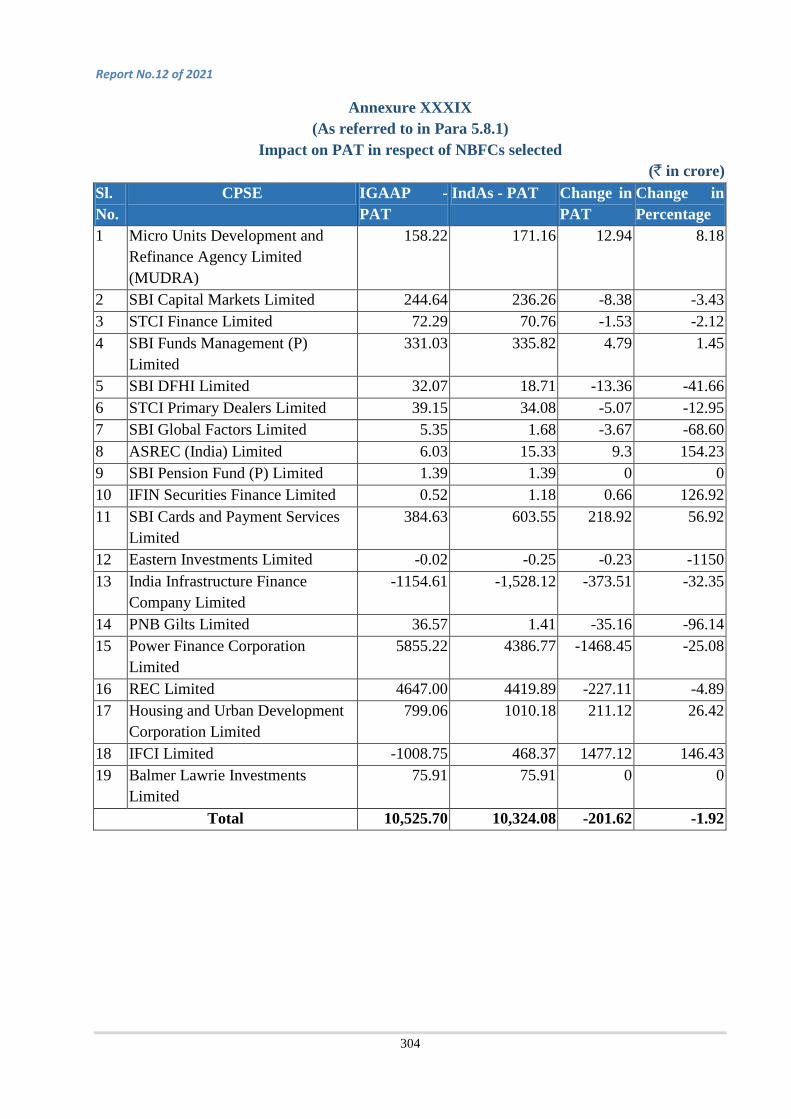
Report No.12 of 2021
304
Annexure XXXIX (As referred to in Para 5.8.1)
Impact on PAT in respect of NBFCs selected (` in crore)
Sl. No.
CPSE IGAAP -PAT
IndAs - PAT Change in PAT
Change in Percentage
1 Micro Units Development and Refinance Agency Limited (MUDRA)
158.22 171.16 12.94 8.18
2 SBI Capital Markets Limited 244.64 236.26 -8.38 -3.43 3 STCI Finance Limited 72.29 70.76 -1.53 -2.12 4 SBI Funds Management (P)
Limited 331.03 335.82 4.79 1.45
5 SBI DFHI Limited 32.07 18.71 -13.36 -41.66 6 STCI Primary Dealers Limited 39.15 34.08 -5.07 -12.95 7 SBI Global Factors Limited 5.35 1.68 -3.67 -68.60 8 ASREC (India) Limited 6.03 15.33 9.3 154.23 9 SBI Pension Fund (P) Limited 1.39 1.39 0 0 10 IFIN Securities Finance Limited 0.52 1.18 0.66 126.92 11 SBI Cards and Payment Services
Limited 384.63 603.55 218.92 56.92
12 Eastern Investments Limited -0.02 -0.25 -0.23 -1150 13 India Infrastructure Finance
Company Limited -1154.61 -1,528.12 -373.51 -32.35
14 PNB Gilts Limited 36.57 1.41 -35.16 -96.14 15 Power Finance Corporation
Limited 5855.22 4386.77 -1468.45 -25.08
16 REC Limited 4647.00 4419.89 -227.11 -4.89 17 Housing and Urban Development
Corporation Limited 799.06 1010.18 211.12 26.42
18 IFCI Limited -1008.75 468.37 1477.12 146.43 19 Balmer Lawrie Investments
Limited 75.91 75.91 0 0
Total 10,525.70 10,324.08 -201.62 -1.92

Report No. 12 of 2021
305
Annexure XL (As referred to in Para 5.8.2)
Impact on Revenue in respect of NBFCs selected (`in crore)
Sl. No
CPSE IGAAP- Revenue
Ind AS - Revenue
Change in Revenue
Change in Revenue in percentage
1 Micro Units Development and Refinance Agency Limited
803.45 805.17 1.72 0.21
2 SBI Capital Markets Limited 504.85 511.12 6.27 1.24 3 STCI Finance Limited 347.06 355.28 8.22 2.37 4 SBI Funds Management (P) Limited 1236.73 1236.73 0 0 5 SBI DFHI Limited 230588.68 230567.75 -20.93 -0.01 6 STCI Primary Dealers Limited 451.83 442.58 -9.25 -2.05 7 SBI Global Factors Limited 123.27 117.70 -5.57 -4.52 8 ASREC (India) Limited 25.19 30.96 5.77 22.91 9 SBI Pension Fund (P) Limited 7.99 7.99 0 0 10 IFIN Securities Finance Limited 4.97 5.73 0.76 15.29 11 SBI Cards and Payment Services
Limited 5150.43 5370.19 219.76 4.26
12 Eastern Investments Limited 0.82 0.51 -0.31 -37.80 13 India Infrastructure Finance Company
Limited 3836.44 3838.84 2.4 0.06
14 PNB Gilts Limited 402.70 402.45 -0.25 -0.06 15 Power Finance Corporation Limited 26569.67 25975.85 -593.82 -2.23 16 REC Limited 22426.97 22467.35 40.38 0.18 17 Housing and Urban Development
Corporation Limited 4172.84 4234.14 61.3 1.47
18 IFCI Limited 2783.54 3739.99 956.45 34.36 19 Balmer Lawrie Investments Limited 79.03 79.03 0 0
Total 2,99,516.46 3,00,189.36 672.90 0.22

Report No.12 of 2021
306
Annexure XLI (As referred to in Para 5.8.3)
Impact on Assets in respect of NBFCs selected (` in crore)
Sl. No.
CPSE IGAAP - Total Assets
IndAs - Total Assets
Change in Assets
Change in Assets in percentage
1 Micro Units Development and Refinance Agency Limited
17273.57 17253.59 -19.98 -0.12
2 SBI Capital Markets Limited 1657.02 2280.26 623.24 37.61 3 STCI Finance Limited 3810.09 4070.66 260.57 6.84 4 SBI Funds Management (P) Limited 1290.96 1334.30 43.34 3.36 5 SBI DFHI Limited 5659.45 5769.53 110.08 1.95 6 STCI Primary Dealers Limited 7899.11 7887.47 -11.64 -0.15 7 SBI Global Factors Limited 1294.41 1285.88 -8.53 -0.66 8 ASREC (India) Limited 188.27 193.88 5.61 2.98 9 SBI Pension Funds (P) Limited 37.09 37.09 0 0 10 IFIN Securities Finance Limited 35.1 34.14 -0.96 -2.74 11 SBI Cards and Payments Services
Limited 15706.76 15582.64 -124.12 -0.79
12 Eastern Investments Limited 270.82 272.39 1.57 0.58 13 India Infrastructure Finance
Company Limited 43105.57 43146.51 40.94 0.09
14 PNB Gilts Limited 5268.42 5252.3 -16.12 -0.31 15 Power Finance Corporation Limited 282925.85 279908.45 -3017.4 -1.07 16 REC Limited 244960.92 241669.19 -3291.73 -1.34 17 Housing and Urban Development
Corporation Limited 48800.8 48914.88 114.08 0.23
18 IFCI Limited 27965.52 27004.53 -960.99 -3.44 19 Balmer Lawrie Investments Limited 171.52 171.52 0 0
Total 7,08,321.25 7,02,069.21 -6,252.04 -0.88
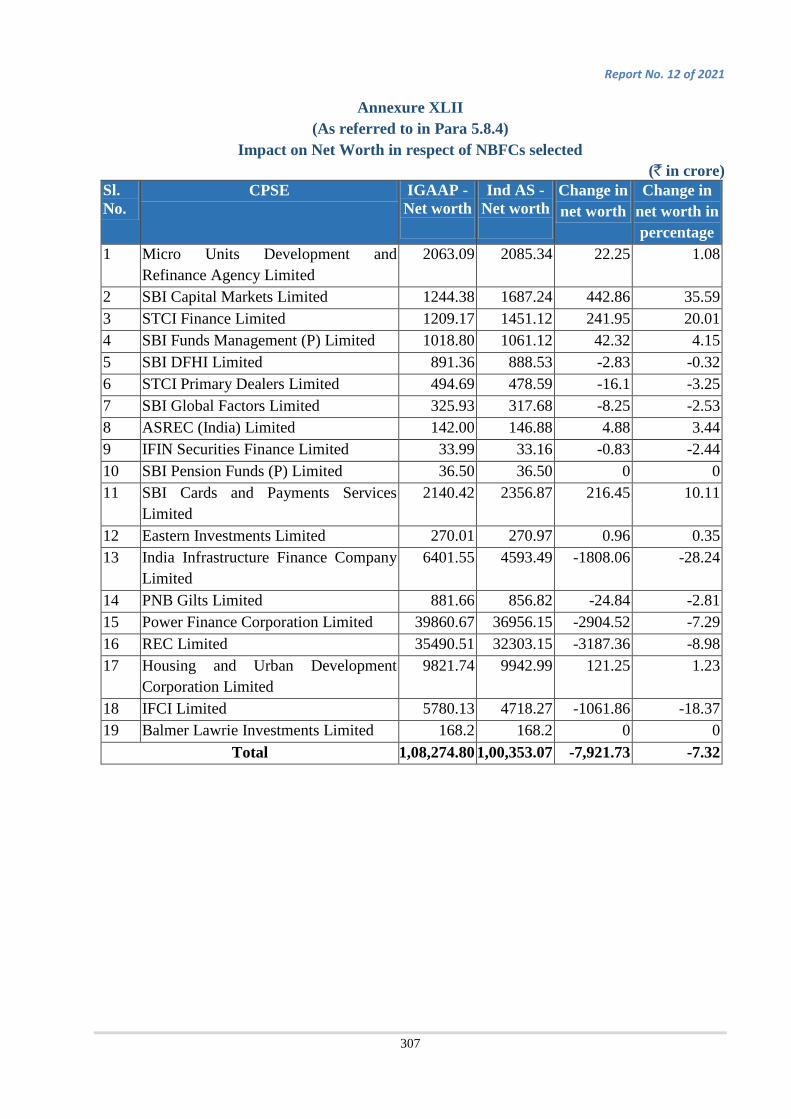
Report No. 12 of 2021
307
Annexure XLII (As referred to in Para 5.8.4)
Impact on Net Worth in respect of NBFCs selected (` in crore)
Sl. No.
CPSE IGAAP - Net worth
Ind AS - Net worth
Change in net worth
Change in net worth in percentage
1 Micro Units Development and Refinance Agency Limited
2063.09 2085.34 22.25 1.08
2 SBI Capital Markets Limited 1244.38 1687.24 442.86 35.59 3 STCI Finance Limited 1209.17 1451.12 241.95 20.01 4 SBI Funds Management (P) Limited 1018.80 1061.12 42.32 4.15 5 SBI DFHI Limited 891.36 888.53 -2.83 -0.32 6 STCI Primary Dealers Limited 494.69 478.59 -16.1 -3.25 7 SBI Global Factors Limited 325.93 317.68 -8.25 -2.53 8 ASREC (India) Limited 142.00 146.88 4.88 3.44 9 IFIN Securities Finance Limited 33.99 33.16 -0.83 -2.44 10 SBI Pension Funds (P) Limited 36.50 36.50 0 0 11 SBI Cards and Payments Services
Limited 2140.42 2356.87 216.45 10.11
12 Eastern Investments Limited 270.01 270.97 0.96 0.35 13 India Infrastructure Finance Company
Limited 6401.55 4593.49 -1808.06 -28.24
14 PNB Gilts Limited 881.66 856.82 -24.84 -2.81 15 Power Finance Corporation Limited 39860.67 36956.15 -2904.52 -7.29 16 REC Limited 35490.51 32303.15 -3187.36 -8.98 17 Housing and Urban Development
Corporation Limited 9821.74 9942.99 121.25 1.23
18 IFCI Limited 5780.13 4718.27 -1061.86 -18.37 19 Balmer Lawrie Investments Limited 168.2 168.2 0 0
Total 1,08,274.80 1,00,353.07 -7,921.73 -7.32


Copyright © 2022 FDOKUMEN