Comptroller & Auditor General's Manual of Standing Orders ...
Upload
khangminh22Category
view
0download
0
Report of the Comptroller and Auditor General of India
ON
GENERAL AND SOCIAL (NON-PSUs) SECTORS
for the year ended 31 March 2013
Government of Madhya Pradesh Report No.3 of the year 2014
i
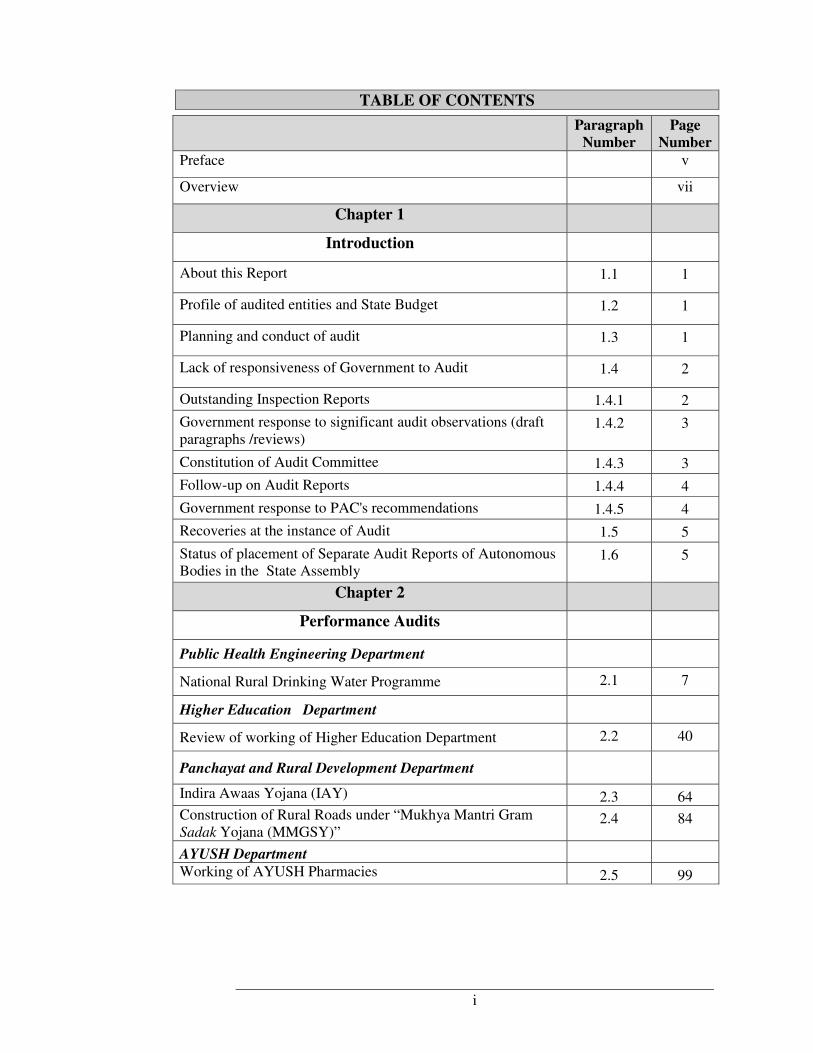
TABLE OF CONTENTS
Paragraph Number
Page Number
Preface v
Overview vii
Chapter 1
Introduction
About this Report 1.1 1
Profile of audited entities and State Budget 1.2 1
Planning and conduct of audit 1.3 1
Lack of responsiveness of Government to Audit 1.4 2
Outstanding Inspection Reports 1.4.1 2
Government response to significant audit observations (draft paragraphs /reviews)
1.4.2 3
Constitution of Audit Committee 1.4.3 3
Follow-up on Audit Reports 1.4.4 4
Government response to PAC's recommendations 1.4.5 4
Recoveries at the instance of Audit 1.5 5
Status of placement of Separate Audit Reports of Autonomous Bodies in the State Assembly
1.6 5
Chapter 2
Performance Audits
Public Health Engineering Department
National Rural Drinking Water Programme 2.1 7
Higher Education Department
Review of working of Higher Education Department 2.2 40
Panchayat and Rural Development Department
Indira Awaas Yojana (IAY) 2.3 64 Construction of Rural Roads under “Mukhya Mantri Gram Sadak Yojana (MMGSY)”
2.4 84
AYUSH Department Working of AYUSH Pharmacies 2.5 99
Audit Report on General and Social (Non-PSUs) Sector for the year ended 31 March 2013
ii
Paragraph Number
Page Number
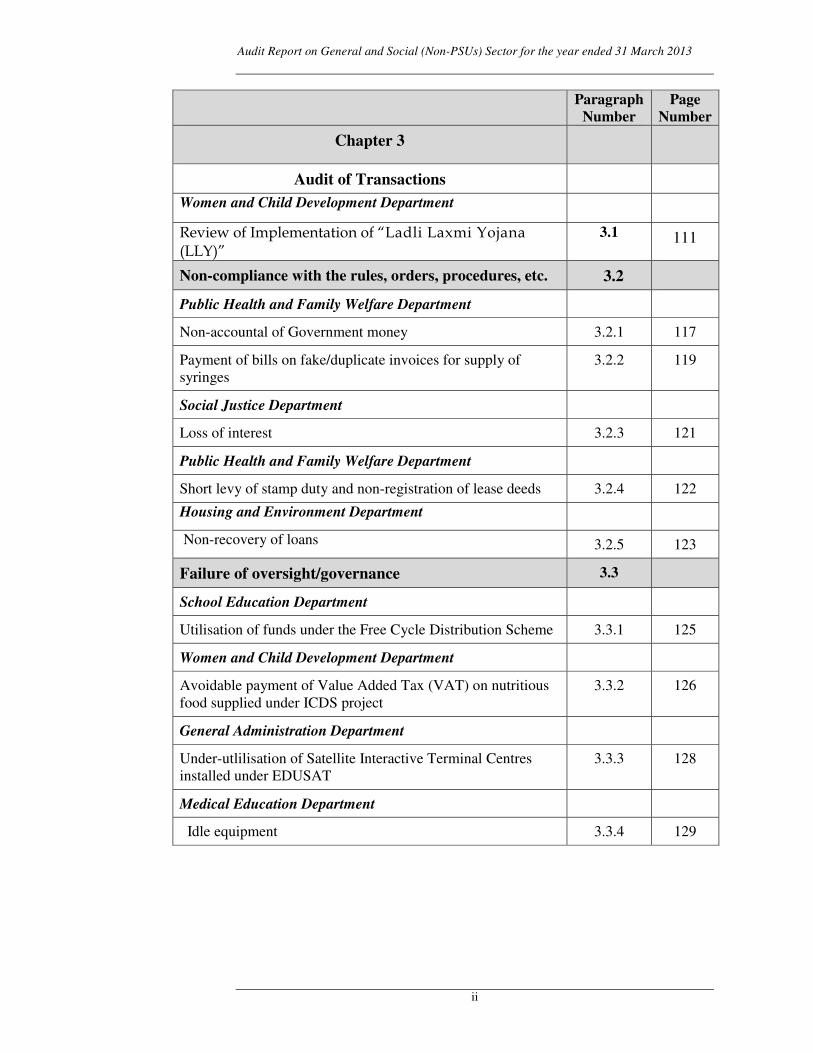
Chapter 3
Audit of Transactions Women and Child Development Department
Review of Implementation of “Ladli Laxmi Yojana (LLY)”
3.1 111
Non-compliance with the rules, orders, procedures, etc. 3.2
Public Health and Family Welfare Department
Non-accountal of Government money 3.2.1 117
Payment of bills on fake/duplicate invoices for supply of syringes
3.2.2 119
Social Justice Department
Loss of interest 3.2.3 121
Public Health and Family Welfare Department
Short levy of stamp duty and non-registration of lease deeds 3.2.4 122
Housing and Environment Department
Non-recovery of loans 3.2.5 123
Failure of oversight/governance 3.3
School Education Department
Utilisation of funds under the Free Cycle Distribution Scheme 3.3.1 125
Women and Child Development Department
Avoidable payment of Value Added Tax (VAT) on nutritious food supplied under ICDS project
3.3.2 126
General Administration Department
Under-utlilisation of Satellite Interactive Terminal Centres installed under EDUSAT
3.3.3 128
Medical Education Department
Idle equipment 3.3.4 129
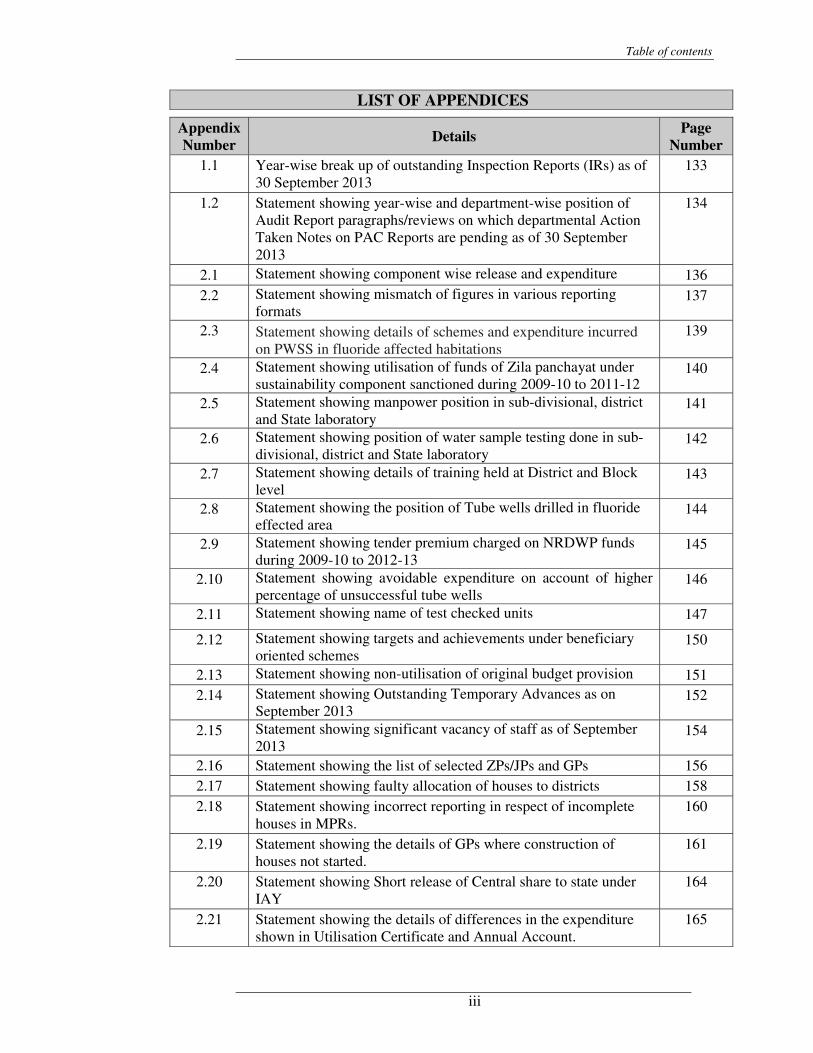
Table of contents
iii
LIST OF APPENDICES
Appendix Number
Details Page Number
1.1 Year-wise break up of outstanding Inspection Reports (IRs) as of 30 September 2013
133
1.2 Statement showing year-wise and department-wise position of Audit Report paragraphs/reviews on which departmental Action Taken Notes on PAC Reports are pending as of 30 September 2013
134
2.1 Statement showing component wise release and expenditure 136 2.2 Statement showing mismatch of figures in various reporting
formats 137
2.3 Statement showing details of schemes and expenditure incurred on PWSS in fluoride affected habitations
139
2.4 Statement showing utilisation of funds of Zila panchayat under sustainability component sanctioned during 2009-10 to 2011-12
140
2.5 Statement showing manpower position in sub-divisional, district and State laboratory
141
2.6 Statement showing position of water sample testing done in sub-divisional, district and State laboratory
142
2.7 Statement showing details of training held at District and Block level
143
2.8 Statement showing the position of Tube wells drilled in fluoride effected area
144
2.9 Statement showing tender premium charged on NRDWP funds during 2009-10 to 2012-13
145
2.10 Statement showing avoidable expenditure on account of higher percentage of unsuccessful tube wells
146
2.11 Statement showing name of test checked units 147
2.12 Statement showing targets and achievements under beneficiary oriented schemes
150
2.13 Statement showing non-utilisation of original budget provision 151 2.14 Statement showing Outstanding Temporary Advances as on
September 2013 152
2.15 Statement showing significant vacancy of staff as of September 2013
154
2.16 Statement showing the list of selected ZPs/JPs and GPs 156 2.17 Statement showing faulty allocation of houses to districts 158 2.18 Statement showing incorrect reporting in respect of incomplete
houses in MPRs. 160
2.19 Statement showing the details of GPs where construction of houses not started.
161
2.20 Statement showing Short release of Central share to state under IAY
164
2.21 Statement showing the details of differences in the expenditure shown in Utilisation Certificate and Annual Account.
165
Audit Report on General and Social (Non-PSUs) Sector for the year ended 31 March 2013
iv
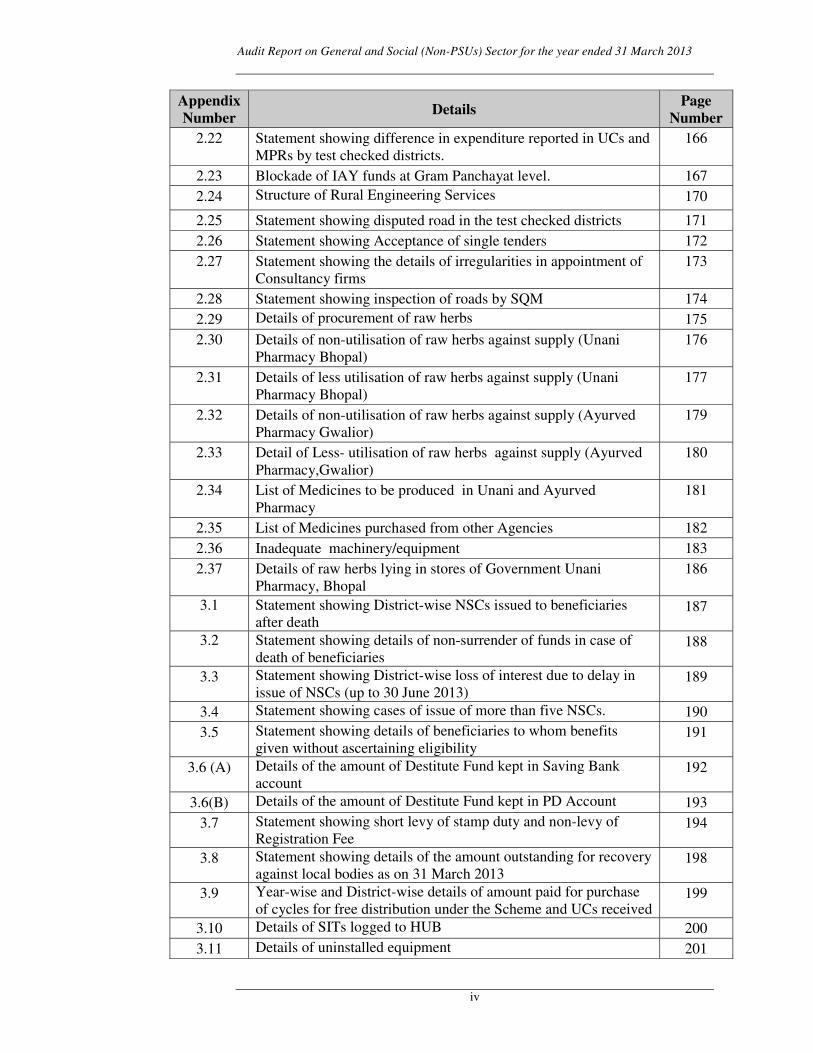
Appendix Number Details
Page Number
2.22 Statement showing difference in expenditure reported in UCs and MPRs by test checked districts.
166
2.23 Blockade of IAY funds at Gram Panchayat level. 167 2.24 Structure of Rural Engineering Services 170
2.25 Statement showing disputed road in the test checked districts 171 2.26 Statement showing Acceptance of single tenders 172 2.27 Statement showing the details of irregularities in appointment of
Consultancy firms 173
2.28 Statement showing inspection of roads by SQM 174 2.29 Details of procurement of raw herbs 175 2.30 Details of non-utilisation of raw herbs against supply (Unani
Pharmacy Bhopal) 176
2.31 Details of less utilisation of raw herbs against supply (Unani Pharmacy Bhopal)
177
2.32 Details of non-utilisation of raw herbs against supply (Ayurved Pharmacy Gwalior)
179
2.33 Detail of Less- utilisation of raw herbs against supply (Ayurved Pharmacy,Gwalior)
180
2.34 List of Medicines to be produced in Unani and Ayurved Pharmacy
181
2.35 List of Medicines purchased from other Agencies 182 2.36 Inadequate machinery/equipment 183 2.37 Details of raw herbs lying in stores of Government Unani
Pharmacy, Bhopal 186
3.1 Statement showing District-wise NSCs issued to beneficiaries after death
187
3.2 Statement showing details of non-surrender of funds in case of death of beneficiaries
188
3.3 Statement showing District-wise loss of interest due to delay in issue of NSCs (up to 30 June 2013)
189
3.4 Statement showing cases of issue of more than five NSCs. 190 3.5 Statement showing details of beneficiaries to whom benefits
given without ascertaining eligibility 191
3.6 (A) Details of the amount of Destitute Fund kept in Saving Bank account
192
3.6(B) Details of the amount of Destitute Fund kept in PD Account 193 3.7 Statement showing short levy of stamp duty and non-levy of
Registration Fee 194
3.8 Statement showing details of the amount outstanding for recovery against local bodies as on 31 March 2013
198
3.9 Year-wise and District-wise details of amount paid for purchase of cycles for free distribution under the Scheme and UCs received
199
3.10 Details of SITs logged to HUB 200 3.11 Details of uninstalled equipment 201

Chapter 1: Introduction
1.1 About this Report
This Report of the Comptroller and Auditor General of India (C&AG) relates to matters arising from performance audit of selected programmes and activities and compliance audit of Government departments and autonomous bodies falling under General and Social Sectors in the State.
1.2 Profile of audited entities and State Budget
There are 56 departments in the State at the Secretariat level, headed by Additional Chief Secretaries/Principal Secretaries/Secretaries, who are assisted by Commissioners/Directors and subordinate officers under them. Of these, 36 departments and the PSUs/Autonomous bodies under the control of these departments are under the audit jurisdiction of the Principal Accountant General (General and Social Sector Audit).
The summary of the State Government’s fiscal transactions during the current year (2012-13) vis-à-vis the previous year is given in Table 1.
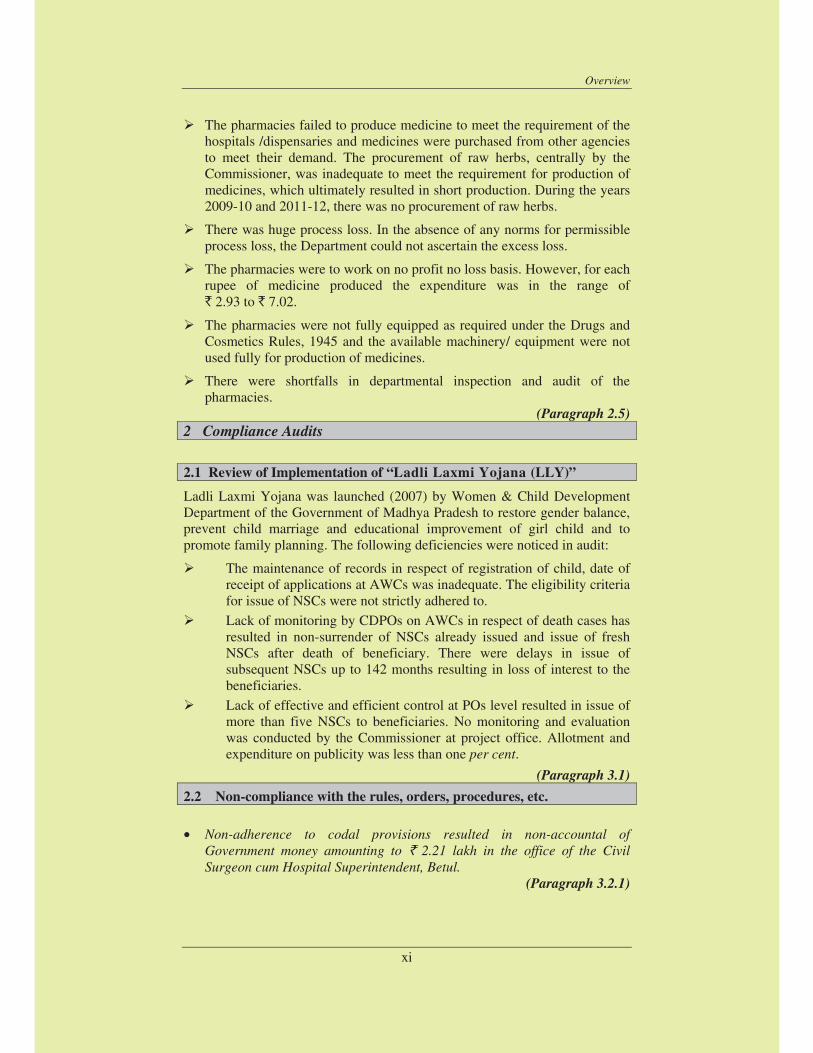
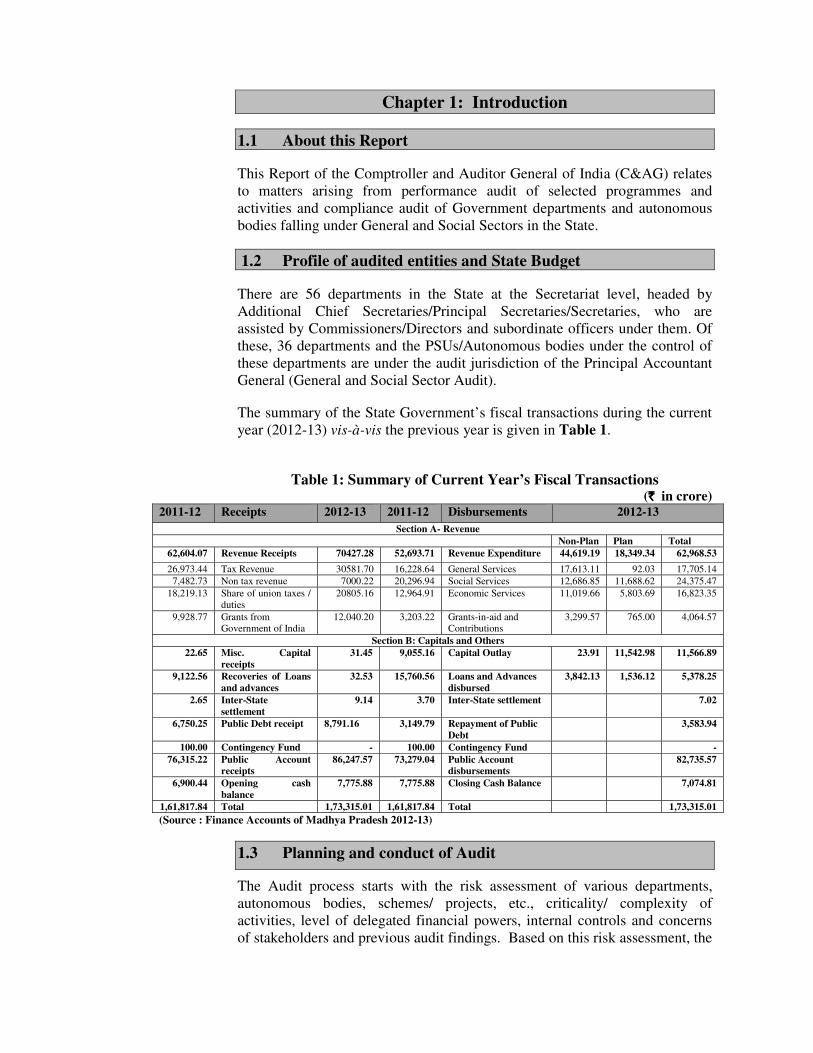
Table 1: Summary of Current Year’s Fiscal Transactions (`̀̀̀ in crore)
2011-12 Receipts 2012-13 2011-12 Disbursements 2012-13 Section A- Revenue
Non-Plan Plan Total 62,604.07 Revenue Receipts 70427.28 52,693.71 Revenue Expenditure 44,619.19 18,349.34 62,968.53
26,973.44 Tax Revenue 30581.70 16,228.64 General Services 17,613.11 92.03 17,705.14 7,482.73 Non tax revenue 7000.22 20,296.94 Social Services 12,686.85 11,688.62 24,375.47
18,219.13 Share of union taxes / duties
20805.16 12,964.91 Economic Services 11,019.66 5,803.69 16,823.35
9,928.77 Grants from Government of India
12,040.20 3,203.22 Grants-in-aid and Contributions
3,299.57 765.00 4,064.57
Section B: Capitals and Others 22.65 Misc. Capital
receipts31.45 9,055.16 Capital Outlay 23.91 11,542.98 11,566.89
9,122.56 Recoveries of Loans and advances
32.53 15,760.56 Loans and Advances disbursed
3,842.13 1,536.12 5,378.25
2.65 Inter-State settlement
9.14 3.70 Inter-State settlement 7.02
6,750.25 Public Debt receipt 8,791.16 3,149.79 Repayment of Public Debt
3,583.94
100.00 Contingency Fund - 100.00 Contingency Fund - 76,315.22 Public Account
receipts 86,247.57 73,279.04 Public Account
disbursements 82,735.57
6,900.44 Opening cash balance
7,775.88 7,775.88 Closing Cash Balance 7,074.81
1,61,817.84 Total 1,73,315.01 1,61,817.84 Total 1,73,315.01 (Source : Finance Accounts of Madhya Pradesh 2012-13)
1.3 Planning and conduct of Audit
The Audit process starts with the risk assessment of various departments, autonomous bodies, schemes/ projects, etc., criticality/ complexity of activities, level of delegated financial powers, internal controls and concerns of stakeholders and previous audit findings. Based on this risk assessment, the
Audit Report on General and Social (Non-PSUs) Sectors for the year ended 31 March 2013
�
�
frequency and extent of audit are decided and an Annual Audit Plan is formulated.
After completion of audit, Inspection Report containing audit findings is issued to the head of the office with request to furnish replies within one month. Whenever replies are received, audit findings are either settled/ or further action for compliance is advised. The important audit observations pointed out in these Inspection Reports are processed for inclusion in the Audit Reports of the Comptroller and Auditor General of India, which are submitted to the Governor of Madhya Pradesh under Article 151 of the Constitution of India.
During 2012-13, audit of 844 units (compliance audit and performance audit) of various departments/organisations of the State was conducted by the office of the Principal Accountant General (General and Social Sectors Audit).�
1.4 Lack of responsiveness of Government to Audit �
1.4.1 Outstanding Inspection Reports
The Principal Accountant General (General and Social Sectors Audit), Madhya Pradesh, Gwalior (PAG) conducts periodical inspection of Government Departments by test-check of transactions and verify the maintenance of important accounting and other records as per the prescribed rules and procedures. These inspections are followed by issue of Audit Inspection Reports (IRs). When important irregularities, etc., detected during audit inspection, are not settled on the spot, these IRs are issued to the heads of offices inspected, with a copy to the next higher authorities.
The heads of offices and next higher authorities are required to report their compliance to the PAG within four weeks of receipt of IRs. Serious irregularities are also brought to the notice of the Heads of the departments by the office of the PAG.
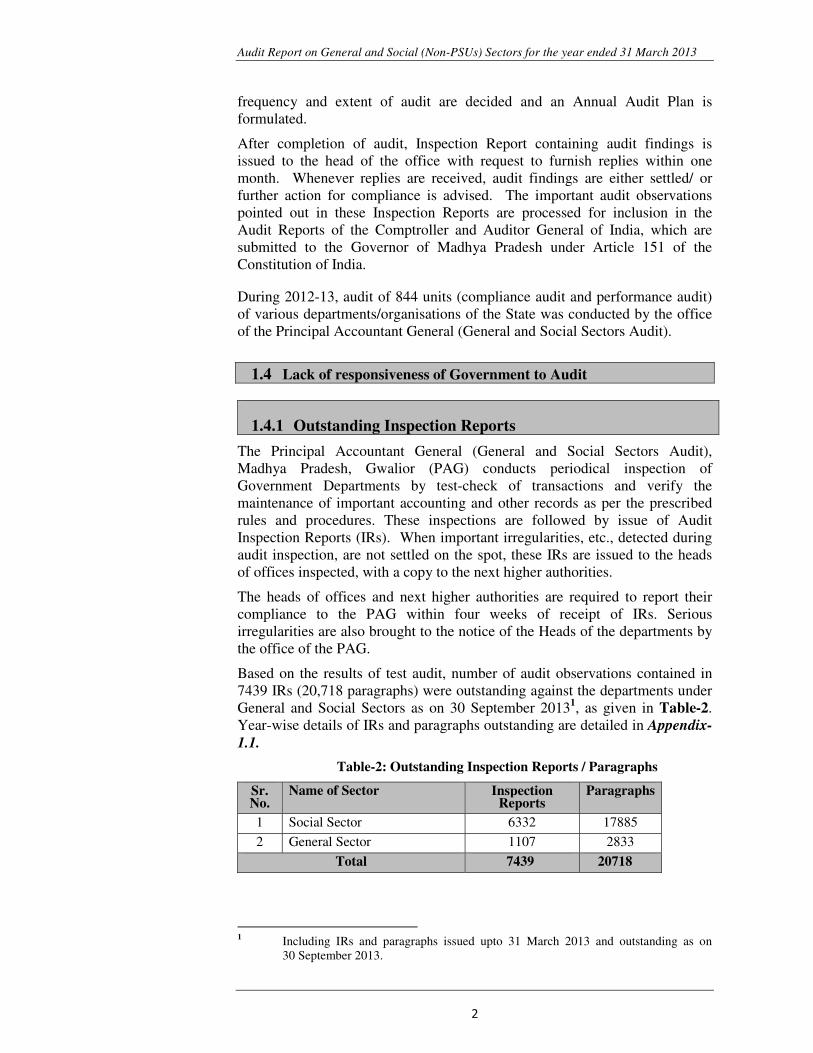
Based on the results of test audit, number of audit observations contained in 7439 IRs (20,718 paragraphs) were outstanding against the departments under General and Social Sectors as on 30 September 20131, as given in Table-2. Year-wise details of IRs and paragraphs outstanding are detailed in Appendix-1.1.
Table-2: Outstanding Inspection Reports / Paragraphs
Sr. No.
Name of Sector Inspection Reports
Paragraphs
1 Social Sector 6332 17885
2 General Sector 1107 2833
Total 7439 20718
���������������������������������������� �������������������1 Including IRs and paragraphs issued upto 31 March 2013 and outstanding as on
30 September 2013.
Chapter 1: Introduction�
��
�
The departmental officers failed to take action on observations contained in IRs within the prescribed time frame resulting in erosion of accountability.
It is recommended that the Government may look into the matter to ensure prompt and proper response to audit observations.
1.4.2 Government response to significant audit observations (draft paragraphs /reviews)
In the last few years, Audit has reported on several significant deficiencies in implementation of various programmes/ activities as well as on the quality of internal controls in selected departments, which have negative impact on the success of programmes and functioning of the departments. The focus was on auditing the specific programmes/ schemes and to offer suitable recommendations to the executive for taking corrective action and improving service delivery to the citizens.
As per the provision of Comptroller and Auditor General of India’s Regulations on Audit and Accounts, 2007, the departments are required to send their responses to draft performance audit reports/ draft paragraphs proposed for inclusion in the Comptroller and Auditor General of India’s Audit Reports within six weeks. It was brought to their personal attention that in view of likely inclusion of such paragraphs in the Reports of the Comptroller and Auditor General of India, to be placed before the State Legislature, it would be desirable to include their comments in the matter. They were also advised to have meeting with the Principal Accountant General to discuss the draft reports of Performance Audits and draft audit paragraphs. These draft reports and paragraphs proposed for inclusion in the Report were also forwarded to the Additional Chief Secretaries/ Principal Secretaries/ Secretaries concerned for seeking their replies. For the present Audit Report, draft reports on six Performance Audits, 10 draft paragraphs were forwarded to the concerned Administrative Secretaries. But Government reply has been received in four Performance Audits and three draft audit paragraphs.
1.4.3 Constitution of Audit Committee
The Government while accepting the recommendations of Shakdher Committee (High Powered Committee) constituted a High Powered Committee (May 2000) for monitoring the follow-up action on audit report paragraphs, one meeting of the High Powered Committee was held during 2012-13. The Government constituted an Apex Level Committee (April 2009) and 24 Departmental Audit Committees (DAC) for speedy settlement of audit observations. But no periodicity of meetings of the Apex Committee was prescribed in the order. However DAC are required to meet once in three months. No meetings of DAC and Apex Committee were held during the year.
Audit Report on General and Social (Non-PSUs) Sectors for the year ended 31 March 2013
�
�
1.4.4 Follow-up on Audit Reports
According to the Rules of procedure for the internal working of the Committee on Public Accounts, the Administrative Departments were to initiate, suo motuaction on all Audit Paragraphs and Reviews featuring in the Comptroller and Auditor General’s Audit Reports (ARs) regardless of whether these are taken up for examination by the Public Accounts Committee (PAC) or not. They were also to furnish detailed notes, duly vetted by audit indicating the remedial action taken or proposed to be taken by them within three months of the presentation of the ARs to the State Legislature.
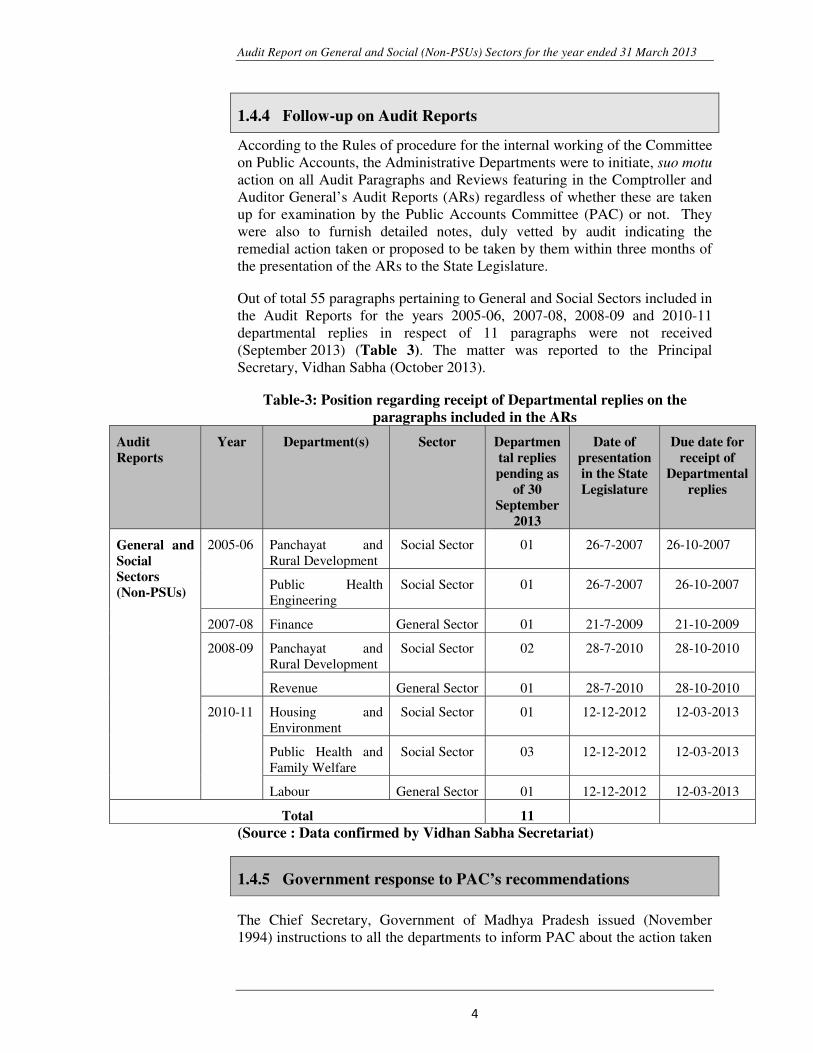
Out of total 55 paragraphs pertaining to General and Social Sectors included in the Audit Reports for the years 2005-06, 2007-08, 2008-09 and 2010-11 departmental replies in respect of 11 paragraphs were not received (September 2013) (Table 3). The matter was reported to the Principal Secretary, Vidhan Sabha (October 2013).
Table-3: Position regarding receipt of Departmental replies on the paragraphs included in the ARs
Audit Reports
Year Department(s) Sector Departmental replies pending as
of 30 September
2013
Date of presentation in the State Legislature
Due date for receipt of
Departmental replies
General and Social Sectors (Non-PSUs)
2005-06 Panchayat and Rural Development
Social Sector 01 26-7-2007 26-10-2007
Public Health Engineering
Social Sector 01 26-7-2007 26-10-2007
2007-08 Finance General Sector 01 21-7-2009 21-10-2009
2008-09 Panchayat and Rural Development
Social Sector 02 28-7-2010 28-10-2010
Revenue General Sector 01 28-7-2010 28-10-2010
2010-11 Housing and Environment
Social Sector 01 12-12-2012 12-03-2013
Public Health and Family Welfare
Social Sector 03 12-12-2012 12-03-2013
Labour General Sector 01 12-12-2012 12-03-2013
Total 11 (Source : Data confirmed by Vidhan Sabha Secretariat)
1.4.5 Government response to PAC’s recommendations
The Chief Secretary, Government of Madhya Pradesh issued (November 1994) instructions to all the departments to inform PAC about the action taken
Chapter 1: Introduction�
��
�
or the action proposed by them in respect of PAC’s recommendations within six months of presentation of PAC’s report in the State Legislature. The copies of action taken notes (ATNs) are also to be endorsed to the Principal Accountant General for his comments.
As of September 2013, 23 departments did not furnish ATNs on PAC's recommendations made on 217 Audit Report paragraphs. ATNs had not been furnished on the recommendations made as early as 1986-87. Department-wise and year-wise details are given in Appendix-1.2. The pending position of ATN was brought to the notice of the Chief Secretary (October 2013) with a request to issue suitable instructions to the departments concerned.
1.5 Recoveries at the instance of Audit
Test check of records (October 2012) of Project Officer, District Urban Development Agency (DUDA), Ujjain revealed that an amount of ` 4.90 crore was sanctioned (November 2011) by DUDA to Nagar Palika
Nigam, Ujjain (NPNU) as loan for construction of 1320 houses under Slum Rehabilitation Scheme. An agreement was executed (November 2011) between Collector cum Chairman, DUDA Ujjain and Commissioner, NPNU and the DUDA, Ujjain remitted ` 4.90 crore (November to December 2011) to NPNU. As per the agreement the loan was to be utilised only as margin money for obtaining loan from financial institutions for completion of the houses. We observed (July 2013) that the DUDA, Ujjain sanctioned loans without ensuring utilisation of the funds as margin money for obtaining loan from financial institutions. The NPNU did not utilise the funds as margin money for obtaining loan and spent the amount for payment of bills. After being pointed out by Audit (October 2012), the matter was taken up by the DUDA with the NPNU and the entire loan amount was refunded (November 2013) by NPNU to DUDA, Ujjain.
1.6 Status of placement of Separate Audit Reports of Autonomous Bodies in the State Assembly
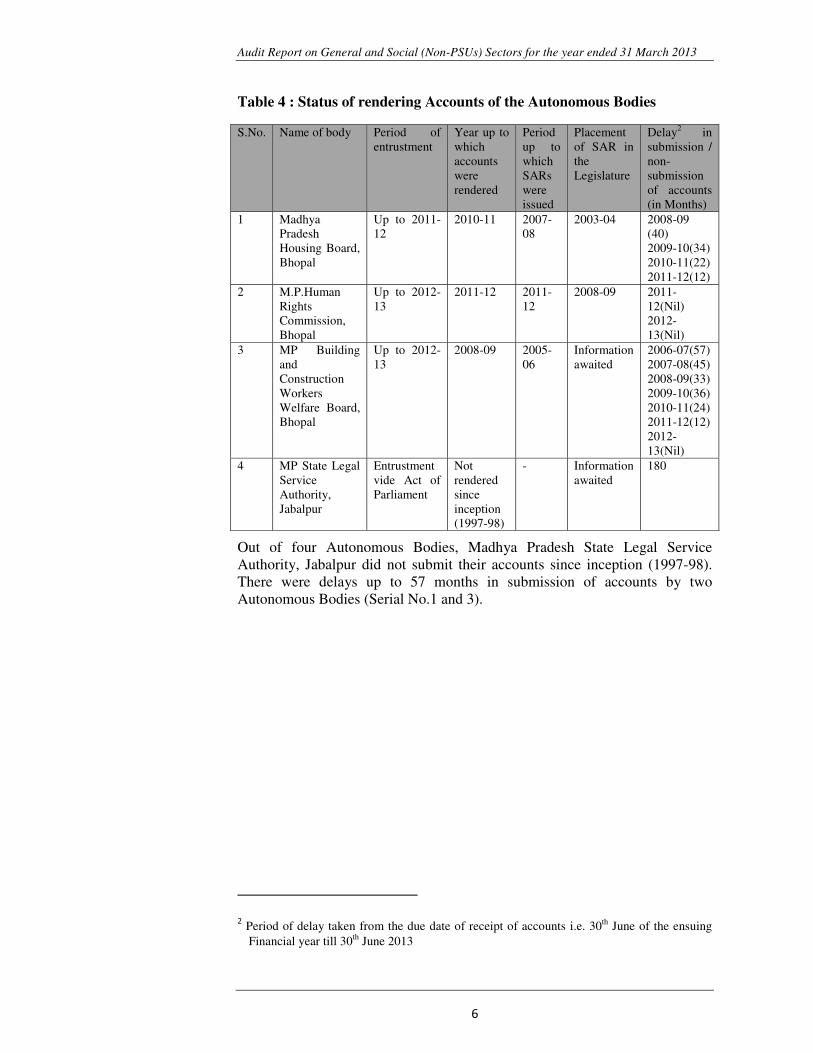
Several Autonomous Bodies have been set up by the State Government. A large number of these bodies are audited by the Comptroller and Auditor General of India for verification of their transactions, operational activities and accounts, regulatory compliance audit, review of internal management, financial control and review of systems and procedure, etc. The audit of accounts of four autonomous bodies (pertaining to General and Social Sectors) in the State has been entrusted to the Comptroller and Auditor General of India. The status of entrustment of audit, rendering of accounts to Audit, issuance of Separate Audit Report and its placement in the Legislature is indicated in Table 4.
Audit Report on General and Social (Non-PSUs) Sectors for the year ended 31 March 2013
�
�
Table 4 : Status of rendering Accounts of the Autonomous Bodies
Out of four Autonomous Bodies, Madhya Pradesh State Legal Service Authority, Jabalpur did not submit their accounts since inception (1997-98). There were delays up to 57 months in submission of accounts by two Autonomous Bodies (Serial No.1 and 3).
� �
�
�
�
�
�
�
�
���������������������������������������� �������������������
��Period of delay taken from the due date of receipt of accounts i.e. 30th June of the ensuing
Financial year till 30th June 2013
S.No. Name of body Period of entrustment
Year up to which accounts were rendered
Period up to which SARs were issued
Placement of SAR in the Legislature
Delay2 in submission / non-submission of accounts (in Months)
1 Madhya Pradesh Housing Board, Bhopal
Up to 2011-12
2010-11 2007-08
2003-04 2008-09 (40) 2009-10(34) 2010-11(22) 2011-12(12)
2 M.P.Human Rights Commission, Bhopal
Up to 2012-13
2011-12 2011-12
2008-09 2011-12(Nil) 2012-13(Nil)
3 MP Building and Construction Workers Welfare Board, Bhopal
Up to 2012-13
2008-09 2005-06
Information awaited
2006-07(57) 2007-08(45) 2008-09(33) 2009-10(36) 2010-11(24) 2011-12(12) 2012-13(Nil)
4 MP State Legal Service Authority, Jabalpur
Entrustment vide Act of Parliament
Not rendered since inception (1997-98)
- Information awaited
180
Chapter 2: Performance Audit
7
Chapter 2: Performance Audit
Public Health Engineering Department
2.1 National Rural Drinking Water Programme
Executive Summary
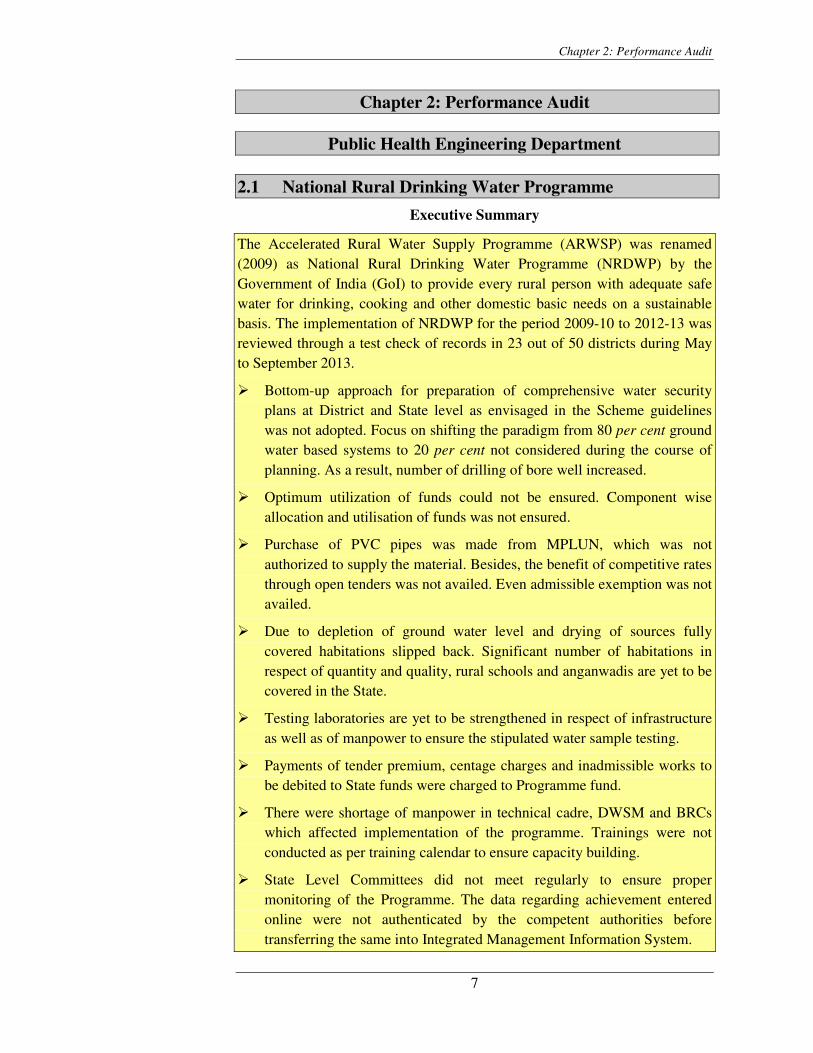
The Accelerated Rural Water Supply Programme (ARWSP) was renamed (2009) as National Rural Drinking Water Programme (NRDWP) by the Government of India (GoI) to provide every rural person with adequate safe water for drinking, cooking and other domestic basic needs on a sustainable basis. The implementation of NRDWP for the period 2009-10 to 2012-13 was reviewed through a test check of records in 23 out of 50 districts during May to September 2013.
� Bottom-up approach for preparation of comprehensive water security plans at District and State level as envisaged in the Scheme guidelines was not adopted. Focus on shifting the paradigm from 80 per cent ground water based systems to 20 per cent not considered during the course of planning. As a result, number of drilling of bore well increased.
� Optimum utilization of funds could not be ensured. Component wise allocation and utilisation of funds was not ensured.
� Purchase of PVC pipes was made from MPLUN, which was not authorized to supply the material. Besides, the benefit of competitive rates through open tenders was not availed. Even admissible exemption was not availed.
� Due to depletion of ground water level and drying of sources fully covered habitations slipped back. Significant number of habitations in respect of quantity and quality, rural schools and anganwadis are yet to be covered in the State.
� Testing laboratories are yet to be strengthened in respect of infrastructure as well as of manpower to ensure the stipulated water sample testing.
� Payments of tender premium, centage charges and inadmissible works to be debited to State funds were charged to Programme fund.
� There were shortage of manpower in technical cadre, DWSM and BRCs which affected implementation of the programme. Trainings were not conducted as per training calendar to ensure capacity building.
� State Level Committees did not meet regularly to ensure proper monitoring of the Programme. The data regarding achievement entered online were not authenticated by the competent authorities before transferring the same into Integrated Management Information System.
Audit Report on General and Social (Non-PSUs) Sectors for the year ended 31 March 2013
8
2.1.1 Introduction
The first three phases1 of rural water supply programme were scheduled during 1972-2009. The focus in the fourth phase (2009-12) was for ensuring sustainability of water availability, support activities and Water Quality Monitoring and Surveillance Programme (WQMSP). Since April 2009 the Rural Water Supply Programme is named as National Rural Drinking Water Programme (NRDWP) (the Programme) sponsored by the Government of India (GoI) with a vision of providing safe drinking water for all, at all times, in rural areas. The Programme has six components and the GoI and State Government provided 50 per cent share each on three components and on three components 100 per cent funding is done by GoI. However, the Programme is still continuing and the funds were provided both by GoI and State Government in year 2012-13. These six components were earmarked under NRDWP viz. Coverage, Water Quality, Operation and Maintenance (O&M), Sustainability, Support Activity and WQMSP for implementation of the Programme. The main objectives of the Programme were as under:
� To ensure permanent drinking water security in rural areas and to ensure that the quality of water is in conformity with the prescribed standards at both the supply and consumption points.
� To see that the issues of potability, reliability, sustainability, convenience, equity and consumers preference are the guiding principles while planning for a community based water supply system.
� To enable communities to manage, monitor and maintain surveillance of their drinking water sources;
� To provide access to information through online reporting mechanism with information placed in public domain to bring in transparency, accountability and informed decision making.
In Madhya Pradesh, the Public Health Engineering Department (PHED) is responsible for implementation of the Programme covering 51,541 villages (1.27 lakh habitations). At the beginning of 2009-10 there was no uncovered habitation. However, there were 78,377 partially covered habitations which remained to be fully covered by the end of Eleventh Plan Period i.e. March 2012. At the end of 2012-13, 43,632 habitations being 34 per cent of total habitations remained to be fully covered. Out of the six components, three components i.e. Coverage, Water Quality and Operation and Maintenance were on 50:50 cost sharing basis and Sustainability, Support Activity and WQMSP components were fully funded by GoI. During the period 2009-13, GoI and State Government released their shares of ` 3046.18 crore for the Programme against which expenditure of ` 2861.79 crore was incurred.
1 First Phase (1972-86) ARWSP – To ensure provision of adequate drinking water supply of rural community; Second Phase (1986-99): Technology Mission – emphasis on water quality, technology intervention, human resource development support etc; Third Phase (1999-2009): Project to involve community in planning, implementation and management of drinking water scheme.
Chapter 2: Performance Audit
9
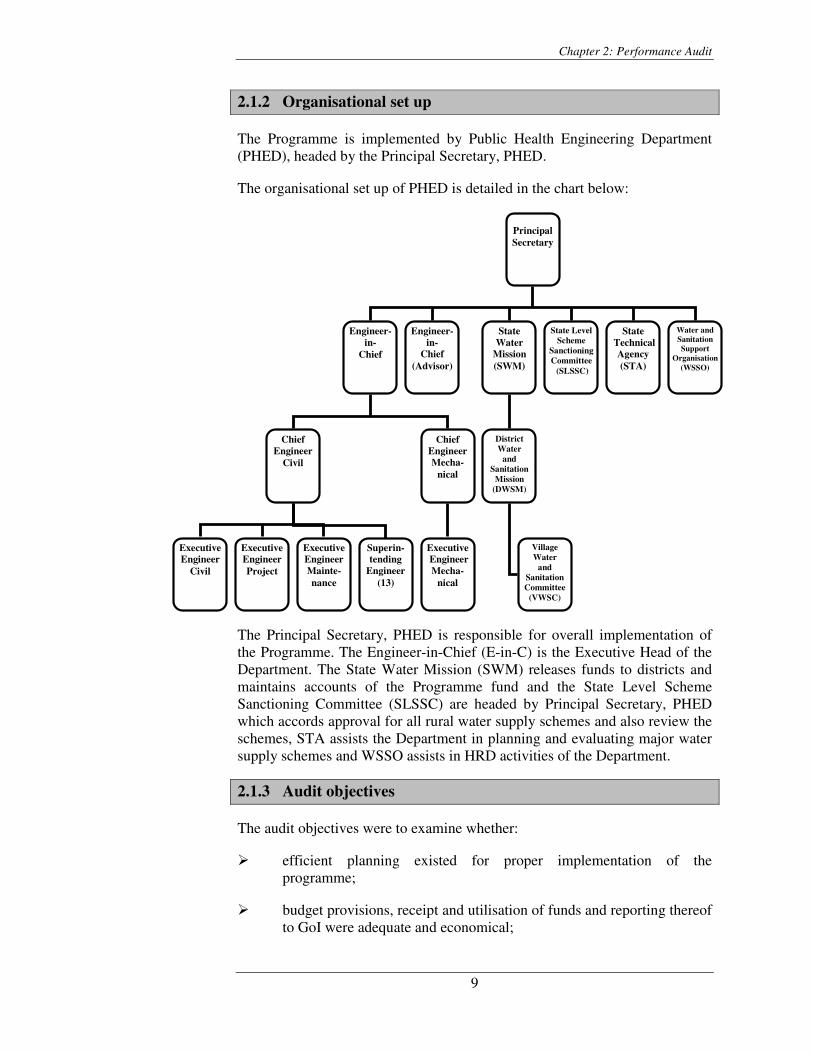
2.1.2 Organisational set up
The Programme is implemented by Public Health Engineering Department (PHED), headed by the Principal Secretary, PHED.
The organisational set up of PHED is detailed in the chart below:
The Principal Secretary, PHED is responsible for overall implementation of the Programme. The Engineer-in-Chief (E-in-C) is the Executive Head of the Department. The State Water Mission (SWM) releases funds to districts and maintains accounts of the Programme fund and the State Level Scheme Sanctioning Committee (SLSSC) are headed by Principal Secretary, PHED which accords approval for all rural water supply schemes and also review the schemes, STA assists the Department in planning and evaluating major water supply schemes and WSSO assists in HRD activities of the Department.
2.1.3 Audit objectives
The audit objectives were to examine whether:
� efficient planning existed for proper implementation of the programme;
� budget provisions, receipt and utilisation of funds and reporting thereof to GoI were adequate and economical;
Principal Secretary
Engineer-in-
Chief
Engineer-in-
Chief (Advisor)
State Water
Mission(SWM)
Water and Sanitation Support
Organisation (WSSO)
State Technical Agency (STA)
State Level Scheme
Sanctioning Committee (SLSSC)
Chief Engineer
Civil
Chief EngineerMecha-
nical
Executive EngineerMecha-
nical
ExecutiveEngineer
Civil
Executive EngineerProject
ExecutiveEngineerMainte-nance
District Water
and Sanitation
Mission (DWSM)
Village Water
and Sanitation Committee
(VWSC)
Superin-tending
Engineer (13)
Audit Report on General and Social (Non-PSUs) Sectors for the year ended 31 March 2013
10
� the programme was executed in accordance with the provisions of the NRDWP including quality control of drinking water;
� ground water recharging for rural areas was effective;
� human resource management for implementation of programme was adequate; and
� monitoring and evaluation was effective.
2.1.4 Audit criteria
The audit criteria were derived from the following sources:
� NRDWP guidelines and administrative orders issued by the GoI and the State Government on the Programme;
� Provisions of Unified Schedule of Rates of PHED, the MP Public Works Department (MPPWD) Manual;
� Project Reports, estimates and sanction orders of individual schemes projects; and
� General Financial Rules, Madhya Pradesh Treasury Code, Madhya Pradesh Financial Code and orders of the Department of Finance.
2.1.5 Scope and methodology of audit
The implementation of NRDWP for the period 2009-10 to 2012-13 was reviewed through a test check of records in 232 out of 50 districts (May to September 2013) and in the offices of E-in-C. An entry conference was held on 20th May 2013 with the Secretary, PHED and E-in-C wherein the audit objectives and audit criteria were appraised to the Department. Exit conference was held with Additional Secretary, PHED on 27th December 2013 the views/replies of the Department have been incorporated suitably.
Audit findings
2.1.6 Planning
In order to achieve the goal of NRDWP, Village Water Security Plans (VWSPs) were to be prepared, which inter-alia, included the demographic and physical features, water sources, the basic minimum requirement at household level for drinking and other household needs, infrastructure gaps and the proposed work to augment the existing infrastructure and water sources. The VWSPs were also to have details of management, operation and maintenance
2 Alirajpur, Anuppur, Balaghat, Barwani, Betul, Dhar, Dindori, Hoshangabad, Jabalpur,
Jhabua, Khargone, Mandla, Mandsaur, Rajgarh, Raisen, Ratlam, Sagar, Satna, Sehore, Seoni, Shajapur, Ujjain and Umaria
Chapter 2: Performance Audit
11
of the water supply schemes. Based on all the VWSPs, the District Water Security Plans (DWSPs) were to be prepared. At State level, an Annual Comprehensive Water Security Action Plan (AAP) for each financial year and a five-year rolling plan were to be prepared. The Annual Action Plan for the next financial year was to be submitted to GoI by February of each year.
We observed that in the 11th (2007-12) and 12th (2012-17) Five-Year Plans, no year-wise targets were set. As such, it could not be ascertained whether the Annual Action Plans (AAPs) prepared were in consonance with the Five-Year Plans. The AAPs were prepared every year, except in 2009-10. We observed that the AAPs were submitted to the GoI between March to May, i.e. with delay up to three months. However, the dates of approval by GoI were not furnished to Audit.
The scrutiny of records of planning process revealed the followings:
2.1.6.1 Village Water Security Plan and District Water Security Plan
Bottom-up approach was to be followed in planning process under which Village Water Security Plans (VWSP) as envisaged under the Programme were to be prepared by VWSC for ensuring drinking water security by the village community with the help of NGOs. Based on all VWSPs of the district, the District Water Security Plans (DWSPs) were to be prepared.
We noticed that VWSPs were not prepared in 23 test checked districts. None of the EEs could furnish the DWSP for NRDWP. Instead, they produced the Plan for the entire district, which included the Plan for PHED for the District. Thus, there was no separate plan for NRDWP. However, the District Plan did not have the data of habitations already covered, partially covered, remained to be covered, slip back habitations, plan on Information Education and Communication (IEC) and Human Resource Development (HRD). Impact of climate changes on availability of water resources was not taken into consideration during the planning process.
In the absence of the necessary inputs from grass root level i.e. Gram Panchayats and Village Water and Sanitation Committees, the Programme was implemented without ascertaining the needs of the villages. Thus, the objective of bottom-up approach was not achieved.
The Department in the exit conference (December 2013) accepted the lapses in preparation of the Plans and stated that two pilot projects for developing model VWSP were being implemented as per GoI instructions; based on which all other VWSPs would be prepared. Thereafter, the State plans would be prepared incorporating the VWSPs and DWSPs.
2.1.6.2 Shift in policy framework to prevent decline in ground water
As per Annexure-II of NRDWP guidelines (2009), with a view to arrest rapid decline in ground water, the Department was to shift the focus from 80 per cent ground-water based systems to 20 per cent and the remaining by
The objective of bottom-up approach in planning was not achieved, since no action Plan was prepared at village level
Audit Report on General and Social (Non-PSUs) Sectors for the year ended 31 March 2013
12
combination of roof-water harvesting, ground water recharge and surface water harvesting as conjunctive use.
There were no records to show that specific programmes were chalked out or targets set during 2009-13 for achieving the objective of reducing dependency on ground water. It was also noticed that the number of drilling of bore wells had an increasing trend during 2009-13.
The Department in the exit conference (December 2013) stated that the State formed Madhya Pradesh Jal Nigam Maryadit (June 2012) to focus on shifting from ground water to surface water based piped water supply schemes. During the year 2013-14, the Nigam has taken-up 25 multi-village piped water supply schemes from river sources. Allocation on coverage of habitations through handpumps has also been reduced.
2.1.6.3 Convergence with other Departments
As envisaged in the guidelines, convergence with the National Rural Employment Guarantee Scheme (NREGS), Watershed Projects and Irrigation Schemes were to be carried out during the planning process for construction of sustainability structures.
We noticed in the AAPs and DWSPs that the aspect of convergence with similar schemes was not considered in the Plans. Further, we noticed in 113
out of 23 districts that payment of ` 44.06 lakh was made from NRDWP Fund on account of labour component in sustainability works, expenditure on which was to be charged to Mahatma Gandhi National Rural Employment Guarantee Scheme (MGNREGS) indicating lack of convergence of NRDWP with other departments/schemes.
The Department in the exit conference (December 2013) accepted the fact and stated that instructions had been issued (September 2013) to the field offices for implementing sustainability schemes through convergence with other line departments.
2.1.7 Financial Management
2.1.7.1 Funding pattern
The Programme is funded by the Central and State Governments on cost-sharing basis. Out of the six components, three components i.e. Coverage, Water Quality and Operation and Maintenance were on 50:50 cost sharing basis and three other components viz. Sustainability, Support Activity and WQMSP components were fully funded by GoI. The component-wise funding pattern is as under:
3 Anuppur: ` 1.08 lakh, Barwani: ` 1.77 lakh, Betul: ` 7.33 lakh, Dhar: ` 3.83 lakh, Jhabua:
` 11.05 lakh, Raisen: ` 9.17 lakh, Sagar: ` 1.81 lakh, Satna: ` 1.47 lakh, Seoni: ` 0.56 lakh, Shajapur: ` 3.30 lakh and Umaria: ` 2.69 lakh.
Number of drilling of bore wells increased during 2009-13, defeating the objective of reducing dependency on ground water
Convergence with other schemes/ departments was ignored
Chapter 2: Performance Audit
13
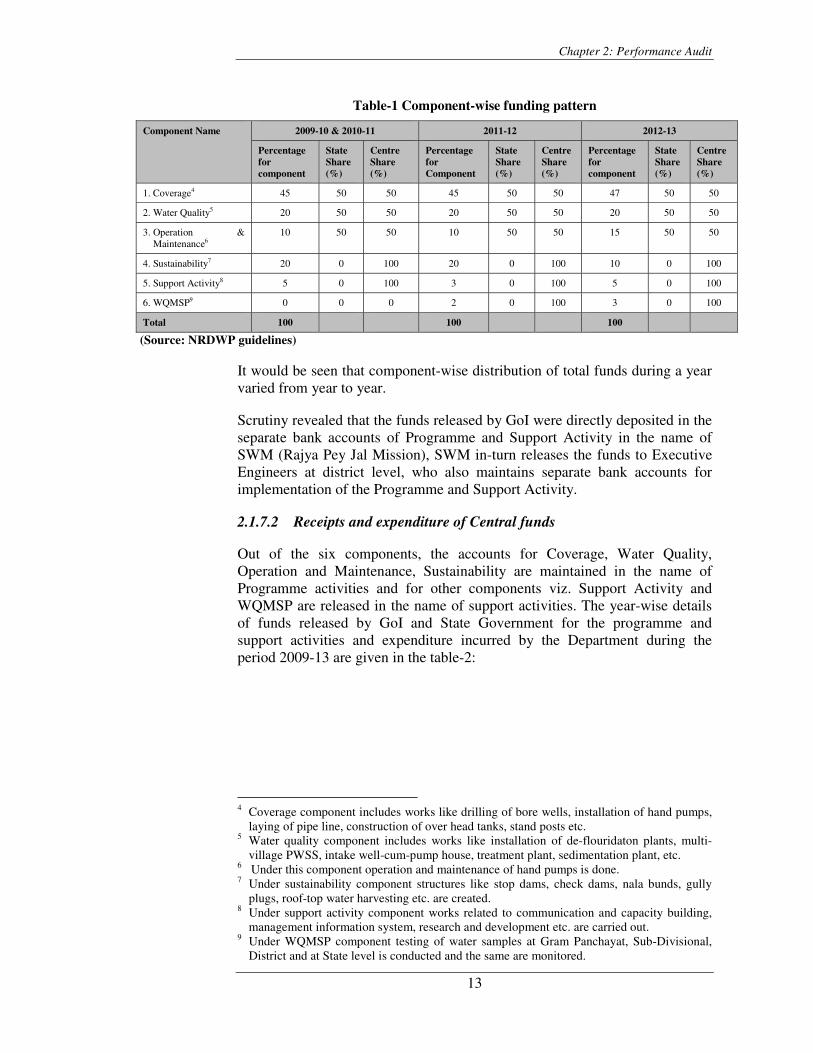
Table-1 Component-wise funding pattern
Component Name 2009-10 & 2010-11 2011-12 2012-13
Percentage for component
State Share (%)
Centre Share (%)
Percentage for Component
State Share (%)
Centre Share (%)
Percentage for component
State Share (%)
Centre Share (%)
1. Coverage4 45 50 50 45 50 50 47 50 50
2. Water Quality5 20 50 50 20 50 50 20 50 50
3..Operation & Maintenance6
10 50 50 10 50 50 15 50 50
4. Sustainability7 20 0 100 20 0 100 10 0 100
5. Support Activity8 5 0 100 3 0 100 5 0 100
6. WQMSP9 0 0 0 2 0 100 3 0 100
Total 100 100 100
(Source: NRDWP guidelines)
It would be seen that component-wise distribution of total funds during a year varied from year to year.
Scrutiny revealed that the funds released by GoI were directly deposited in the separate bank accounts of Programme and Support Activity in the name of SWM (Rajya Pey Jal Mission), SWM in-turn releases the funds to Executive Engineers at district level, who also maintains separate bank accounts for implementation of the Programme and Support Activity.
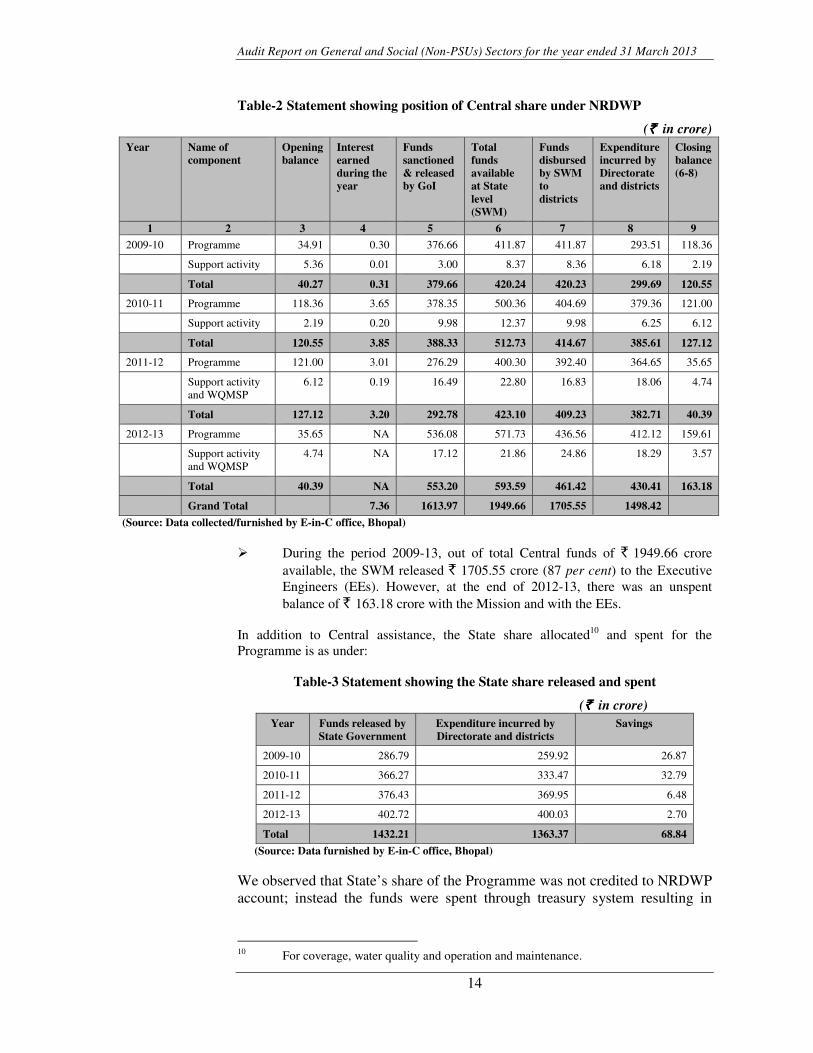
2.1.7.2 Receipts and expenditure of Central funds
Out of the six components, the accounts for Coverage, Water Quality, Operation and Maintenance, Sustainability are maintained in the name of Programme activities and for other components viz. Support Activity and WQMSP are released in the name of support activities. The year-wise details of funds released by GoI and State Government for the programme and support activities and expenditure incurred by the Department during the period 2009-13 are given in the table-2:
4 Coverage component includes works like drilling of bore wells, installation of hand pumps,
laying of pipe line, construction of over head tanks, stand posts etc. 5 Water quality component includes works like installation of de-flouridaton plants, multi-
village PWSS, intake well-cum-pump house, treatment plant, sedimentation plant, etc. 6 Under this component operation and maintenance of hand pumps is done. 7 Under sustainability component structures like stop dams, check dams, nala bunds, gully
plugs, roof-top water harvesting etc. are created. 8 Under support activity component works related to communication and capacity building,
management information system, research and development etc. are carried out. 9 Under WQMSP component testing of water samples at Gram Panchayat, Sub-Divisional,
District and at State level is conducted and the same are monitored.
Audit Report on General and Social (Non-PSUs) Sectors for the year ended 31 March 2013
14
Table-2 Statement showing position of Central share under NRDWP
(` ` ` ` in crore) Year Name of
component Opening balance
Interest earned during the year
Funds sanctioned & released by GoI
Total funds available at State level (SWM)
Funds disbursed by SWM to districts
Expenditure incurred by Directorate and districts
Closing balance(6-8)
1 2 3 4 5 6 7 8 9
2009-10 Programme 34.91 0.30 376.66 411.87 411.87 293.51 118.36
Support activity 5.36 0.01 3.00 8.37 8.36 6.18 2.19
Total 40.27 0.31 379.66 420.24 420.23 299.69 120.55
2010-11 Programme 118.36 3.65 378.35 500.36 404.69 379.36 121.00
Support activity 2.19 0.20 9.98 12.37 9.98 6.25 6.12
Total 120.55 3.85 388.33 512.73 414.67 385.61 127.12
2011-12 Programme 121.00 3.01 276.29 400.30 392.40 364.65 35.65
Support activity and WQMSP
6.12 0.19 16.49 22.80 16.83 18.06 4.74
Total 127.12 3.20 292.78 423.10 409.23 382.71 40.39
2012-13 Programme 35.65 NA 536.08 571.73 436.56 412.12 159.61
Support activity and WQMSP
4.74 NA 17.12 21.86 24.86 18.29 3.57
Total 40.39 NA 553.20 593.59 461.42 430.41 163.18
Grand Total 7.36 1613.97 1949.66 1705.55 1498.42
(Source: Data collected/furnished by E-in-C office, Bhopal)
� During the period 2009-13, out of total Central funds of ` 1949.66 crore available, the SWM released ` 1705.55 crore (87 per cent) to the Executive Engineers (EEs). However, at the end of 2012-13, there was an unspent balance of ` 163.18 crore with the Mission and with the EEs.
In addition to Central assistance, the State share allocated10 and spent for the Programme is as under:
Table-3 Statement showing the State share released and spent
(` ` ` ` in crore) Year Funds released by
State Government Expenditure incurred by Directorate and districts
Savings
2009-10 286.79 259.92 26.87
2010-11 366.27 333.47 32.79
2011-12 376.43 369.95 6.48
2012-13 402.72 400.03 2.70
Total 1432.21 1363.37 68.84
(Source: Data furnished by E-in-C office, Bhopal)
We observed that State’s share of the Programme was not credited to NRDWP account; instead the funds were spent through treasury system resulting in
10 For coverage, water quality and operation and maintenance.
Chapter 2: Performance Audit
15
lapse of programme fund. Due to lapse of Programme fund, the Programme activities suffered.
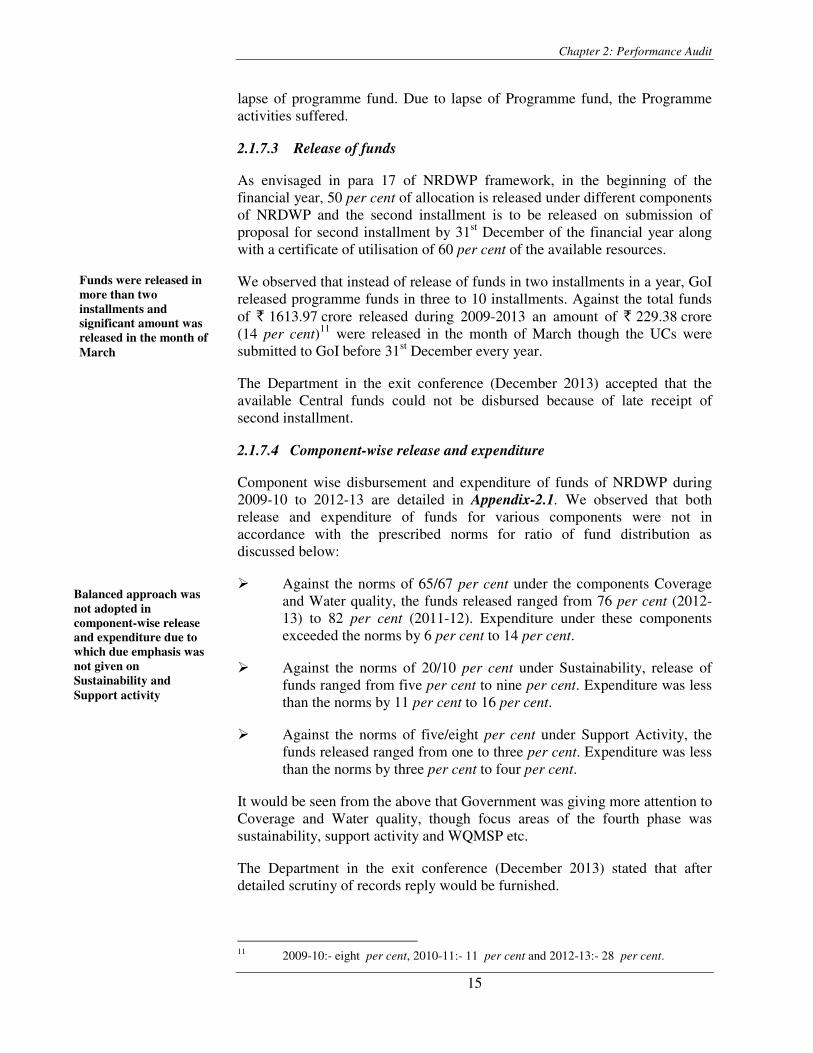
2.1.7.3 Release of funds
As envisaged in para 17 of NRDWP framework, in the beginning of the financial year, 50 per cent of allocation is released under different components of NRDWP and the second installment is to be released on submission of proposal for second installment by 31st December of the financial year along with a certificate of utilisation of 60 per cent of the available resources.
We observed that instead of release of funds in two installments in a year, GoI released programme funds in three to 10 installments. Against the total funds of ` 1613.97 crore released during 2009-2013 an amount of ` 229.38 crore (14 per cent)11 were released in the month of March though the UCs were submitted to GoI before 31st December every year.
The Department in the exit conference (December 2013) accepted that the available Central funds could not be disbursed because of late receipt of second installment.
2.1.7.4 Component-wise release and expenditure
Component wise disbursement and expenditure of funds of NRDWP during 2009-10 to 2012-13 are detailed in Appendix-2.1. We observed that both release and expenditure of funds for various components were not in accordance with the prescribed norms for ratio of fund distribution as discussed below:
� Against the norms of 65/67 per cent under the components Coverage and Water quality, the funds released ranged from 76 per cent (2012-13) to 82 per cent (2011-12). Expenditure under these components exceeded the norms by 6 per cent to 14 per cent.
� Against the norms of 20/10 per cent under Sustainability, release of funds ranged from five per cent to nine per cent. Expenditure was less than the norms by 11 per cent to 16 per cent.
� Against the norms of five/eight per cent under Support Activity, the funds released ranged from one to three per cent. Expenditure was less than the norms by three per cent to four per cent.
It would be seen from the above that Government was giving more attention to Coverage and Water quality, though focus areas of the fourth phase was sustainability, support activity and WQMSP etc.
The Department in the exit conference (December 2013) stated that after detailed scrutiny of records reply would be furnished.
11 2009-10:- eight per cent, 2010-11:- 11 per cent and 2012-13:- 28 per cent.
Funds were released in more than two installments and significant amount was released in the month of March
Balanced approach was not adopted in component-wise release and expenditure due to which due emphasis was not given on Sustainability and Support activity
Audit Report on General and Social (Non-PSUs) Sectors for the year ended 31 March 2013
16
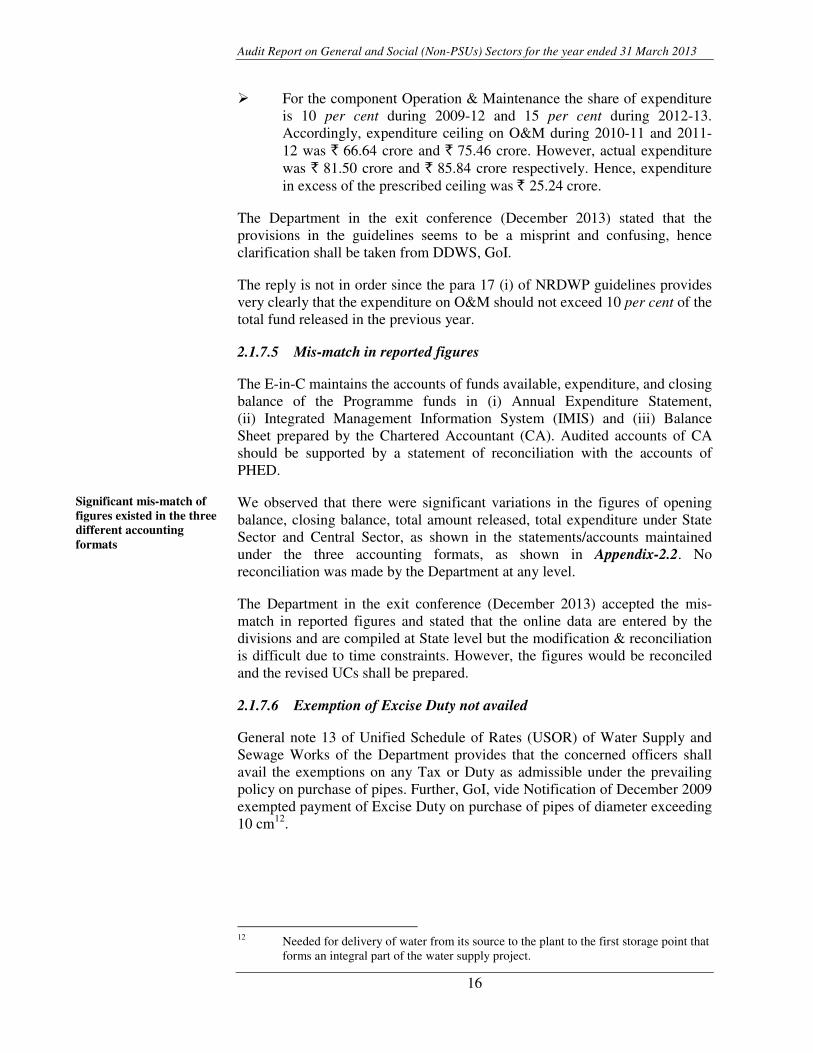
� For the component Operation & Maintenance the share of expenditure is 10 per cent during 2009-12 and 15 per cent during 2012-13. Accordingly, expenditure ceiling on O&M during 2010-11 and 2011-12 was ` 66.64 crore and ` 75.46 crore. However, actual expenditure was ` 81.50 crore and ` 85.84 crore respectively. Hence, expenditure in excess of the prescribed ceiling was ` 25.24 crore.
The Department in the exit conference (December 2013) stated that the provisions in the guidelines seems to be a misprint and confusing, hence clarification shall be taken from DDWS, GoI.
The reply is not in order since the para 17 (i) of NRDWP guidelines provides very clearly that the expenditure on O&M should not exceed 10 per cent of the total fund released in the previous year.
2.1.7.5 Mis-match in reported figures
The E-in-C maintains the accounts of funds available, expenditure, and closing balance of the Programme funds in (i) Annual Expenditure Statement, (ii) Integrated Management Information System (IMIS) and (iii) Balance Sheet prepared by the Chartered Accountant (CA). Audited accounts of CA should be supported by a statement of reconciliation with the accounts of PHED.
We observed that there were significant variations in the figures of opening balance, closing balance, total amount released, total expenditure under State Sector and Central Sector, as shown in the statements/accounts maintained under the three accounting formats, as shown in Appendix-2.2. No reconciliation was made by the Department at any level.
The Department in the exit conference (December 2013) accepted the mis-match in reported figures and stated that the online data are entered by the divisions and are compiled at State level but the modification & reconciliation is difficult due to time constraints. However, the figures would be reconciled and the revised UCs shall be prepared.
2.1.7.6 Exemption of Excise Duty not availed
General note 13 of Unified Schedule of Rates (USOR) of Water Supply and Sewage Works of the Department provides that the concerned officers shall avail the exemptions on any Tax or Duty as admissible under the prevailing policy on purchase of pipes. Further, GoI, vide Notification of December 2009 exempted payment of Excise Duty on purchase of pipes of diameter exceeding 10 cm12.
12 Needed for delivery of water from its source to the plant to the first storage point that forms an integral part of the water supply project.
Significant mis-match of figures existed in the three different accounting formats
Chapter 2: Performance Audit
17
During scrutiny of records related to purchase of these pipes in five13 test checked divisions, it was noticed that benefit of exemption of Excise Duty amounting to ` 18.43 lakh was not availed on purchase of PVC pipes worth ` 2.03 crore by the divisions during February 2010 to May 2013.
The Department in the exit conference (December 2013) stated that information has been sought from concerned Chief Engineers. Appropriate action would be taken after receipt of the information.
2.1.7.7 Avoidable payment of service charges on purchases of pipes
Annexure-B attached to Rule-14 of Store Purchase Rules prescribed in MPFC Part-2 provides that, the items, which are reserved to be purchased from Madhya Pradesh Laghu Udyog Nigam (MPLUN) shall only be purchased through MPLUN. PVC pipes were not a reserve item to be purchased through MPLUN. Hence, PVC pipes were to be purchased through open tenders.
During scrutiny of purchase records in 18 divisions for the period 2009-13, it was noticed that PVC pipes worth ` 43.76 crore were procured through MPLUN instead of through open tenders. We observed that payment of ` 87.52 lakh14 was made as service charges to MPLUN, which could have been avoided if the purchases were made directly by PHED.
The Department in the exit conference (December 2013) stated that MPLUN is a Government agency which is a specialist in procurement of materials.
Reply was not acceptable as the item was not reserved for MPLUN under Store Purchase Rules and a substantial amount of ` 87.52 lakh was paid as service charges to MPLUN.
2.1.7.8 Inadmissible works executed out of NRDWP funds
As per Para 16.5 of NRDWP guidelines, expenses which are not found eligible under NRDWP were to be met by the State Government and shall be credited to the Programme funds to that extent.
During scrutiny of records we observed that in 13 divisions out of 23 test checked divisions, an expenditure of ` 2.72 crore15 was incurred during the period 2009-13 from NRDWP fund on various items which were beyond the scope of any of the components of NRDWP, such as repairing, renovation 13 Anuppur- ` 6.11 lakh Sardarpur (Dhar)- ` 7.41 lakh, Satna- ` 1.32 lakh, Seoni ` 0.90 lakh
and Umaria- ` 2.69 lakh. 14 Anuppur ` 1.61 lakh, Barwarni ` 2.28 lakh, Betul ` 1.89 lakh, Bhopal (Mech) ` 4.74 lakh,
Dhar ` 1.41 lakh, Dindori ` 18.28 lakh, Hoshangabad ` 2.87 lakh, Jhabua ` 0.74 lakh, Mandla ` 24.56 lakh, Mandsaur ` 9.61 lakh, Raisen ` 0.54 lakh, Rajgarh ` 0.48 lakh, Sagar (Civil) ` 12.79 lakh, Sagar (Mech) `3.01 lakh, Satna ` 0.29 lakh, Seoni ` 0.20 lakh, Umaria ` 0.32 lakh, Ujjain (Mech) ` 1.90 lakh.
15 Barwani ` 78.03 lakh (106), Dhar ` 57.01 lakh (24), Dhar (Sardarpur) ` 26.94 lakh (13), Hoshangabad ` 4.76 lakh (103), Jabalpur (Civil) ` 6.86 lakh (60), Jabalpur (Mech) ` 0.80 lakh (02), Jhabua ` 33 lakh (03), Raisen ` 12.70 lakh (219), Ratlam ` 16.71 lakh (11), Sagar (Civil) ` 14.06 lakh (117), Sagar (Mech) ` 1.13 lakh (03), Sehore ` 8.60 lakh (07) and Ujjain ` 11.42 lakh (10).
Exemption of Excise Duty was not availed by the divisions in purchase of pipes for the Programme
Avoidable payment of ` 87.52 lakh was made as service charges to MPLUN on purchase of PVC pipes
Expenditure of ` 2.72 crore was made from NRDWP funds which were not found eligible
Audit Report on General and Social (Non-PSUs) Sectors for the year ended 31 March 2013
18
works of office and residential buildings, payment of telephone bills, electricity bills etc. As the items were not pertaining to NRDWP the expenditure incurred was not admissible.
The Department in the exit conference (December 2013) stated that comments have been sought from the concerned Chief Engineers.
2.1.8 Programme Management
The goal of NRDWP is to provide the rural people with adequate safe water for drinking, cooking and other domestic needs on a sustainable basis. This basic requirement should meet minimum water quality standards and be conveniently accessible at all times. This goal was to be achieved by the XIth
Plan period i.e. by March 2012. The component-wise implementation of the Programme is discussed in the succeeding paragraphs.
2.1.8.1 Coverage and water quality
Coverage means providing safe and adequate drinking water supply by handpumps and Piped Water Supply Scheme to unserved, partially served and slipped back habitations.
2.1.8.2 Coverage of habitations
There were 1.27 lakh habitations as on 1 April 2009 of which 0.49 lakh habitations were fully covered as per norms of 40 litre per capita per day (lpcd) and remaining 0.78 lakh habitations were partially covered. After launching of NRDWP, the flexibility to assess the basic minimum requirement of water to the rural population was assigned to the State Government. Apex Committee of the State for NRDWP recommended (December 2009) norms for fully covered habitations. According to the norms rural habitations fulfilling the criteria of 55 lpcd to every household within the radius of 500 metres comes under fully covered habitations.
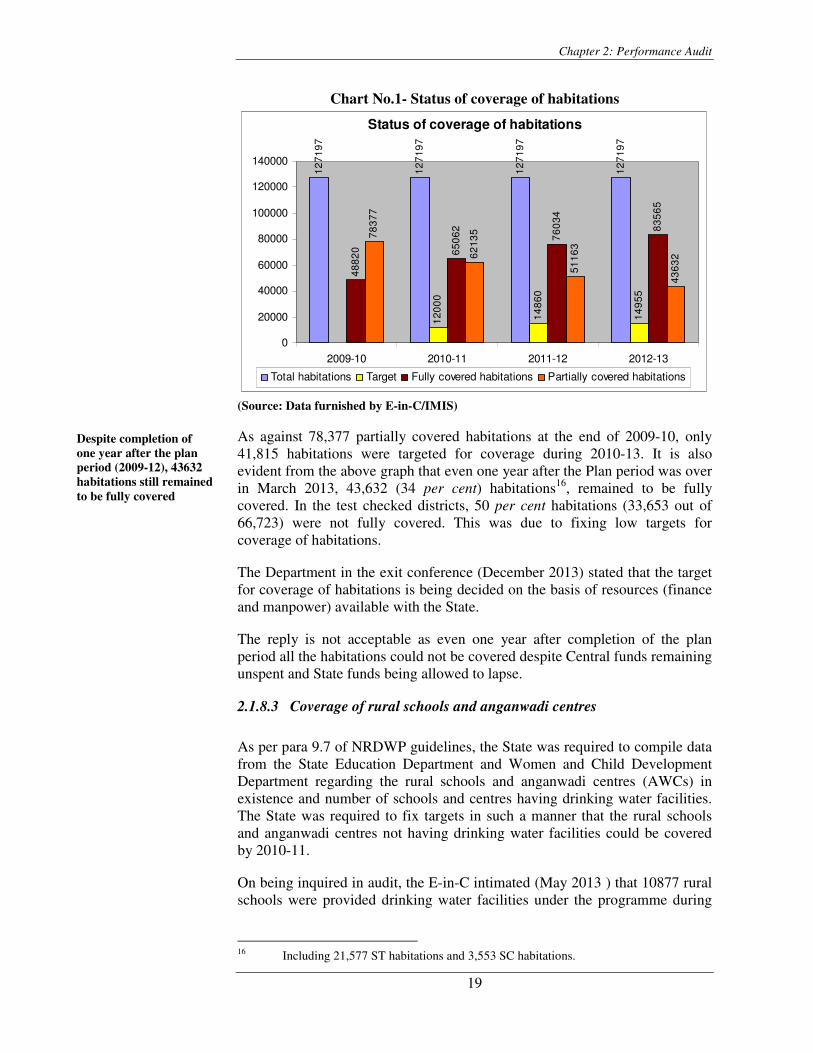
The status of coverage of habitations during the period 2009-13 in the State is given in the chart below:
Chapter 2: Performance Audit
19
Chart No.1- Status of coverage of habitations
Status of coverage of habitations
12
719
7
12
719
7
12
719
7
12
719
7
120
00
14
860
14
955
488
20 650
62
76
034
835
65
78
377
62
135
511
63
436
32
0
20000
40000
60000
80000
100000
120000
140000
2009-10 2010-11 2011-12 2012-13
Total habitations Target Fully covered habitations Partially covered habitations
(Source: Data furnished by E-in-C/IMIS)
As against 78,377 partially covered habitations at the end of 2009-10, only 41,815 habitations were targeted for coverage during 2010-13. It is also evident from the above graph that even one year after the Plan period was over in March 2013, 43,632 (34 per cent) habitations16, remained to be fully covered. In the test checked districts, 50 per cent habitations (33,653 out of 66,723) were not fully covered. This was due to fixing low targets for coverage of habitations.
The Department in the exit conference (December 2013) stated that the target for coverage of habitations is being decided on the basis of resources (finance and manpower) available with the State.
The reply is not acceptable as even one year after completion of the plan period all the habitations could not be covered despite Central funds remaining unspent and State funds being allowed to lapse.
2.1.8.3 Coverage of rural schools and anganwadi centres
As per para 9.7 of NRDWP guidelines, the State was required to compile data from the State Education Department and Women and Child Development Department regarding the rural schools and anganwadi centres (AWCs) in existence and number of schools and centres having drinking water facilities. The State was required to fix targets in such a manner that the rural schools and anganwadi centres not having drinking water facilities could be covered by 2010-11.
On being inquired in audit, the E-in-C intimated (May 2013 ) that 10877 rural schools were provided drinking water facilities under the programme during
16 Including 21,577 ST habitations and 3,553 SC habitations.
Despite completion of one year after the plan period (2009-12), 43632 habitations still remained to be fully covered
Audit Report on General and Social (Non-PSUs) Sectors for the year ended 31 March 2013
20
2009-13. He also stated that 5174 rural schools and 5794 AWCs remained to be covered under the Programme.
At the exit conference (December 2013) the Additional Secretary, PHED stated that out of 5794 AWCs targeted during 2013-14, 2206 were provided drinking water facilities. He also stated that the remaining schools would be covered during 2013-14.
The fact remains that the rural schools and AWCs could not be covered under the Programme within the stipulated schedule i.e. by 2010-11, as envisaged in the Programme guideline.
2.1.8.4 Coverage of habitations with Piped Water Supply Scheme (PWSS)
NRDWP gives thrust on Coverage of habitations for supply of drinking water through PWSS instead of hand pumps. Further, the State Government decided (2010) to implement PWSS to such villages having population of more than one thousand.
During scrutiny of records and data obtained from E-in-C, we observed that against the targets of 3750 PWSS in the AAPs, 3575 PWSS were completed during the period 2009-13. As of September 2013, there were 10,664 PWSS of which 1053 PWSS17 (10 per cent) were not functioning. In the test checked districts, out of 1635 PWSS completed, 270 were not functioning due to drying of sources, non-payment of electricity bills, lack of interest by panchayats in operation and maintenance.
2.1.8.5 Coverage of habitations with handpumps
In terms of provisions of Annexure-VIII of NRDWP guidelines, the norms for lpcd and distance for coverage of population may be decided by the respective State Government. Accordingly the Department fixed criteria for coverage of habitations through handpumps having population less than one thousand which are not covered under PWSS18.
As per data furnished by E-in-C/IMIS the number of handpumps installed in the State was 5.29 lakh (May 2013), of which 4.85 lakh were functioning.
The status of closed handpumps at the end of the years 2009-10 to 2012-13 is as under:
17 (276 and 777 not functioning due to drying of sources and problems in electrical connection/non-maintenance by panchayats respectively). 18 PWSS implemented in habitations having more than 1000 population.
1053 (10 per cent) PWSS were not functioning due to drying of sources, electrical problems and non-maintenance by panchayats
Chapter 2: Performance Audit
21
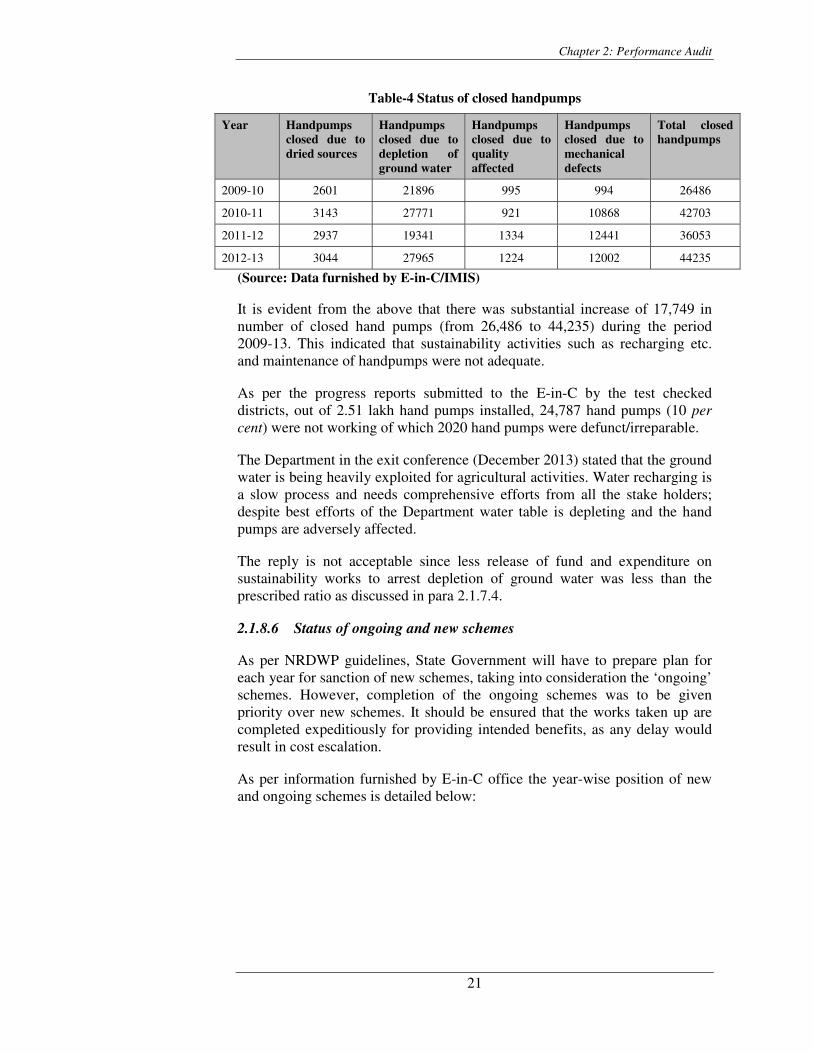
Table-4 Status of closed handpumps
Year Handpumps closed due to dried sources
Handpumps closed due to depletion of ground water
Handpumps closed due to quality affected
Handpumps closed due to mechanical defects
Total closed handpumps
2009-10 2601 21896 995 994 26486
2010-11 3143 27771 921 10868 42703
2011-12 2937 19341 1334 12441 36053
2012-13 3044 27965 1224 12002 44235
(Source: Data furnished by E-in-C/IMIS)
It is evident from the above that there was substantial increase of 17,749 in number of closed hand pumps (from 26,486 to 44,235) during the period 2009-13. This indicated that sustainability activities such as recharging etc. and maintenance of handpumps were not adequate.
As per the progress reports submitted to the E-in-C by the test checked districts, out of 2.51 lakh hand pumps installed, 24,787 hand pumps (10 per cent) were not working of which 2020 hand pumps were defunct/irreparable.
The Department in the exit conference (December 2013) stated that the ground water is being heavily exploited for agricultural activities. Water recharging is a slow process and needs comprehensive efforts from all the stake holders; despite best efforts of the Department water table is depleting and the hand pumps are adversely affected.
The reply is not acceptable since less release of fund and expenditure on sustainability works to arrest depletion of ground water was less than the prescribed ratio as discussed in para 2.1.7.4.
2.1.8.6 Status of ongoing and new schemes
As per NRDWP guidelines, State Government will have to prepare plan for each year for sanction of new schemes, taking into consideration the ‘ongoing’ schemes. However, completion of the ongoing schemes was to be given priority over new schemes. It should be ensured that the works taken up are completed expeditiously for providing intended benefits, as any delay would result in cost escalation.
As per information furnished by E-in-C office the year-wise position of new and ongoing schemes is detailed below:
Audit Report on General and Social (Non-PSUs) Sectors for the year ended 31 March 2013
22
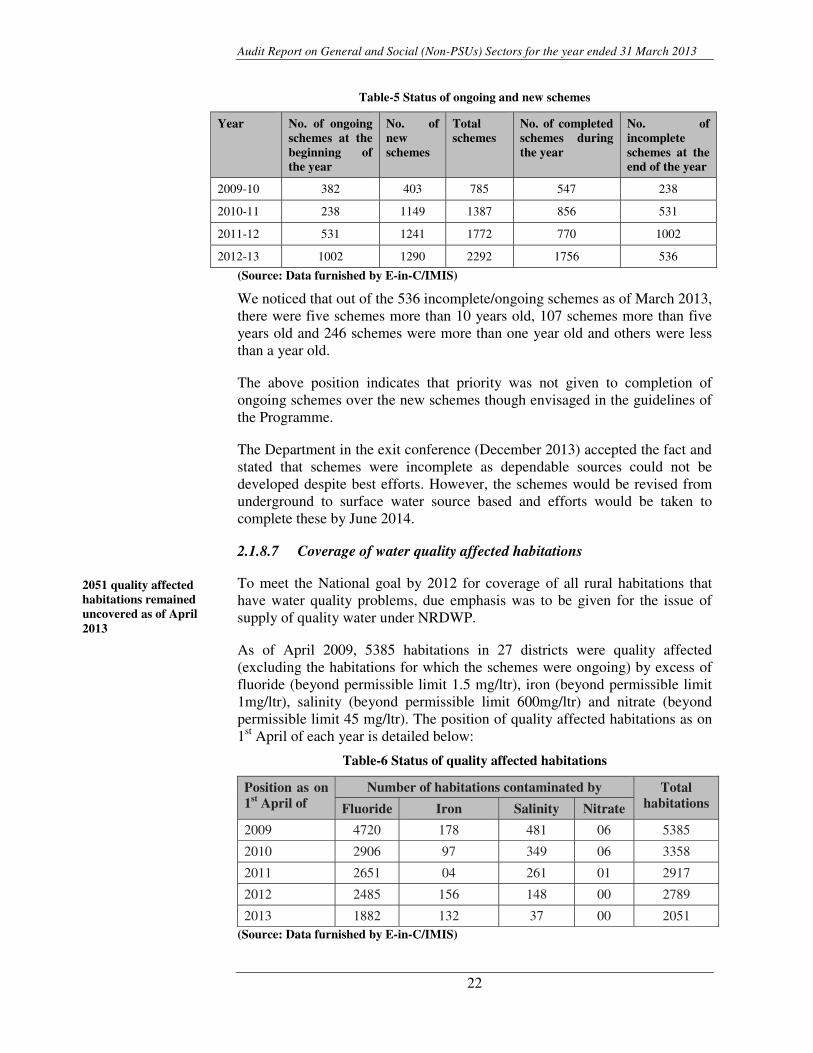
Table-5 Status of ongoing and new schemes
Year No. of ongoing schemes at the beginning of the year
No. of new schemes
Total schemes
No. of completed schemes during the year
No. of incomplete schemes at the end of the year
2009-10 382 403 785 547 238
2010-11 238 1149 1387 856 531
2011-12 531 1241 1772 770 1002
2012-13 1002 1290 2292 1756 536
(Source: Data furnished by E-in-C/IMIS)
We noticed that out of the 536 incomplete/ongoing schemes as of March 2013, there were five schemes more than 10 years old, 107 schemes more than five years old and 246 schemes were more than one year old and others were less than a year old.
The above position indicates that priority was not given to completion of ongoing schemes over the new schemes though envisaged in the guidelines of the Programme.
The Department in the exit conference (December 2013) accepted the fact and stated that schemes were incomplete as dependable sources could not be developed despite best efforts. However, the schemes would be revised from underground to surface water source based and efforts would be taken to complete these by June 2014.
2.1.8.7 Coverage of water quality affected habitations
To meet the National goal by 2012 for coverage of all rural habitations that have water quality problems, due emphasis was to be given for the issue of supply of quality water under NRDWP.
As of April 2009, 5385 habitations in 27 districts were quality affected (excluding the habitations for which the schemes were ongoing) by excess of fluoride (beyond permissible limit 1.5 mg/ltr), iron (beyond permissible limit 1mg/ltr), salinity (beyond permissible limit 600mg/ltr) and nitrate (beyond permissible limit 45 mg/ltr). The position of quality affected habitations as on 1st April of each year is detailed below:
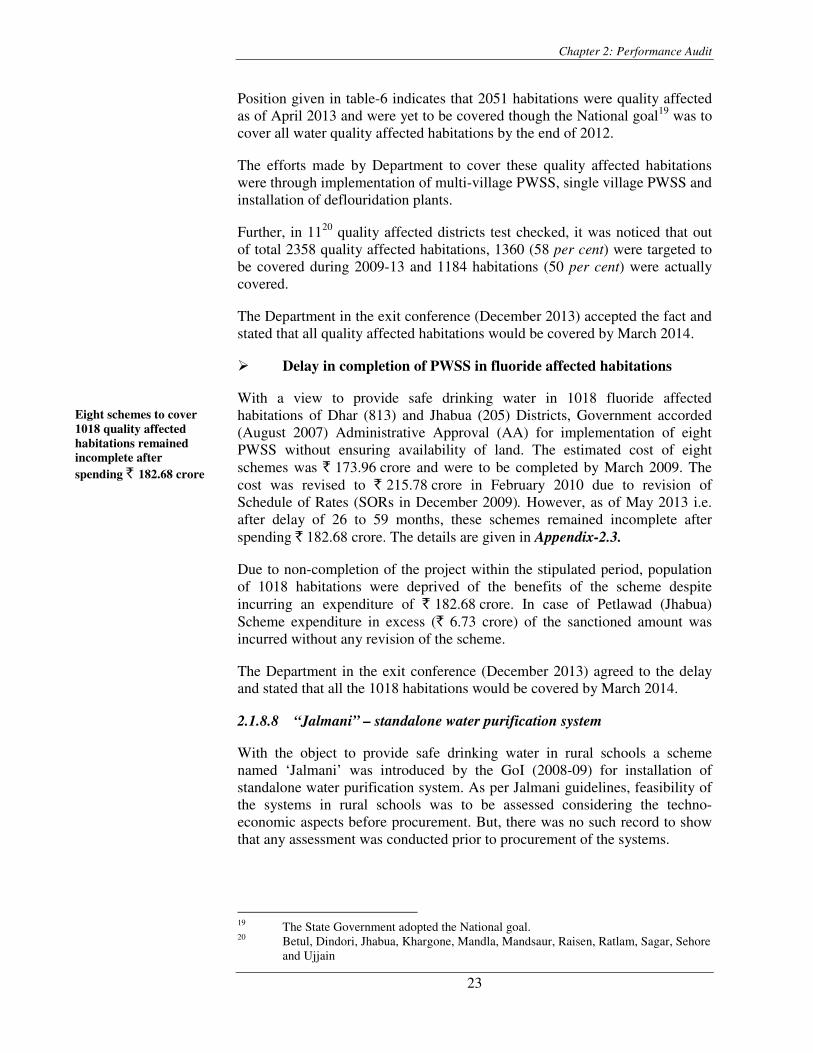
Table-6 Status of quality affected habitations
Position as on 1st April of
Number of habitations contaminated by Total habitations Fluoride Iron Salinity Nitrate
2009 4720 178 481 06 5385
2010 2906 97 349 06 3358
2011 2651 04 261 01 2917
2012 2485 156 148 00 2789
2013 1882 132 37 00 2051 (Source: Data furnished by E-in-C/IMIS)
2051 quality affected habitations remained uncovered as of April 2013
Chapter 2: Performance Audit
23
Position given in table-6 indicates that 2051 habitations were quality affected as of April 2013 and were yet to be covered though the National goal19 was to cover all water quality affected habitations by the end of 2012.
The efforts made by Department to cover these quality affected habitations were through implementation of multi-village PWSS, single village PWSS and installation of deflouridation plants.
Further, in 1120 quality affected districts test checked, it was noticed that out of total 2358 quality affected habitations, 1360 (58 per cent) were targeted to be covered during 2009-13 and 1184 habitations (50 per cent) were actually covered.
The Department in the exit conference (December 2013) accepted the fact and stated that all quality affected habitations would be covered by March 2014.
� Delay in completion of PWSS in fluoride affected habitations
With a view to provide safe drinking water in 1018 fluoride affected habitations of Dhar (813) and Jhabua (205) Districts, Government accorded (August 2007) Administrative Approval (AA) for implementation of eight PWSS without ensuring availability of land. The estimated cost of eight schemes was ` 173.96 crore and were to be completed by March 2009. The cost was revised to ` 215.78 crore in February 2010 due to revision of Schedule of Rates (SORs in December 2009). However, as of May 2013 i.e. after delay of 26 to 59 months, these schemes remained incomplete after spending ` 182.68 crore. The details are given in Appendix-2.3.
Due to non-completion of the project within the stipulated period, population of 1018 habitations were deprived of the benefits of the scheme despite incurring an expenditure of ` 182.68 crore. In case of Petlawad (Jhabua) Scheme expenditure in excess (` 6.73 crore) of the sanctioned amount was incurred without any revision of the scheme.
The Department in the exit conference (December 2013) agreed to the delay and stated that all the 1018 habitations would be covered by March 2014.
2.1.8.8 “Jalmani” – standalone water purification system
With the object to provide safe drinking water in rural schools a scheme named ‘Jalmani’ was introduced by the GoI (2008-09) for installation of standalone water purification system. As per Jalmani guidelines, feasibility of the systems in rural schools was to be assessed considering the techno-economic aspects before procurement. But, there was no such record to show that any assessment was conducted prior to procurement of the systems.
19 The State Government adopted the National goal. 20 Betul, Dindori, Jhabua, Khargone, Mandla, Mandsaur, Raisen, Ratlam, Sagar, Sehore and Ujjain
Eight schemes to cover 1018 quality affected habitations remained incomplete after spending ` 182.68 crore
Audit Report on General and Social (Non-PSUs) Sectors for the year ended 31 March 2013
24
We observed that ` 5.47 crore was released (January 2009) by GoI to PHED. PHED placed orders (February 2010) for 273421 system valuing ` 6.05 crore, which were installed in the rural schools during 2010-11.
Further, as per terms and conditions of supply orders and E-in-C’s instructions (January 2011), payment of 75 per cent to the supplier was to be made by EEs only after installation of the systems and the rest 25 per cent was to be paid during next five years, at 5 per cent every year after successful installation and functioning of standalone systems. We observed that immediately after installation, payment of ` 5.46 crore (90 per cent) was made by the EEs up to June 2013. The position of installed and working of standalone systems in four Zones of the State is detailed below:-
Table-7 Status of working standalone systems (as of December 2013)
Sl. No. Zone Installed Working Not-working (percentage)
1. Bhopal 500 115 385 (77)
2. Indore 835 418 417 (50)
3. Gwalior 300 183 117 (39)
4. Jabalpur 1099 84 1015 (92)
Total 2734 800 1934 (71) (Source: Data furnished by Department)
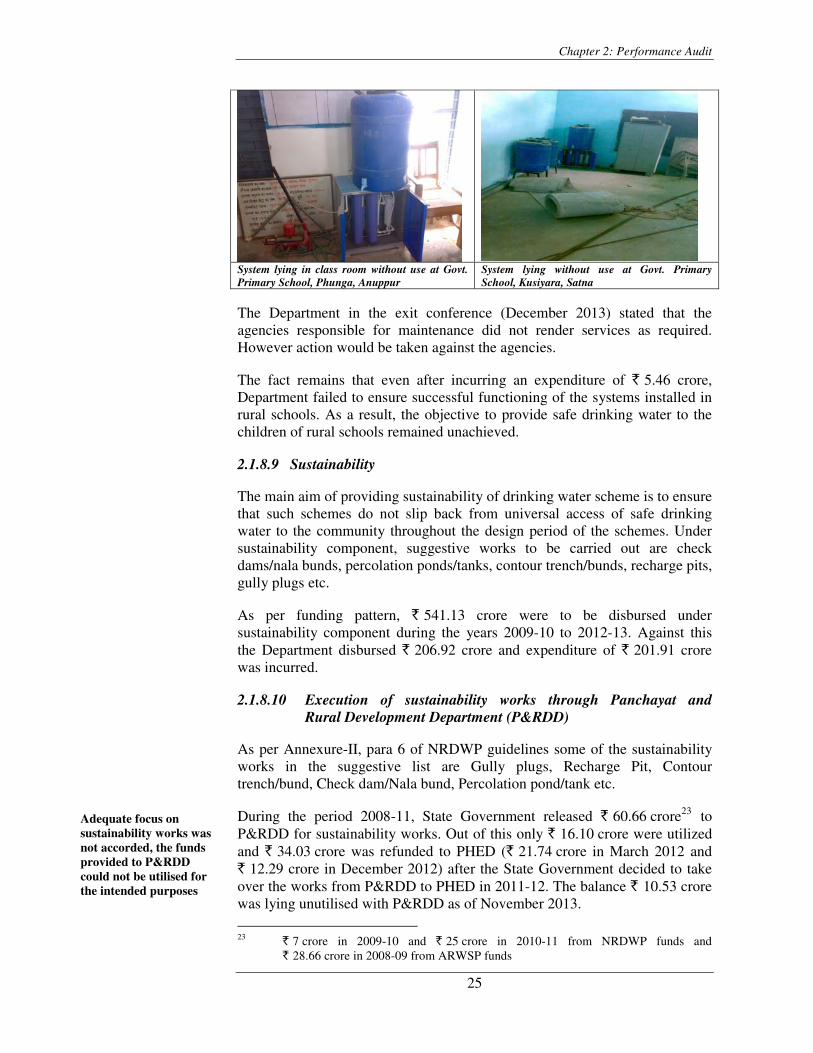
During the scrutiny of records related to Jalmani system in 23 test checked districts, it was noticed that proper training and service after sales was not provided by the suppliers at the user’s end, due to which significant number of systems were found defunct.
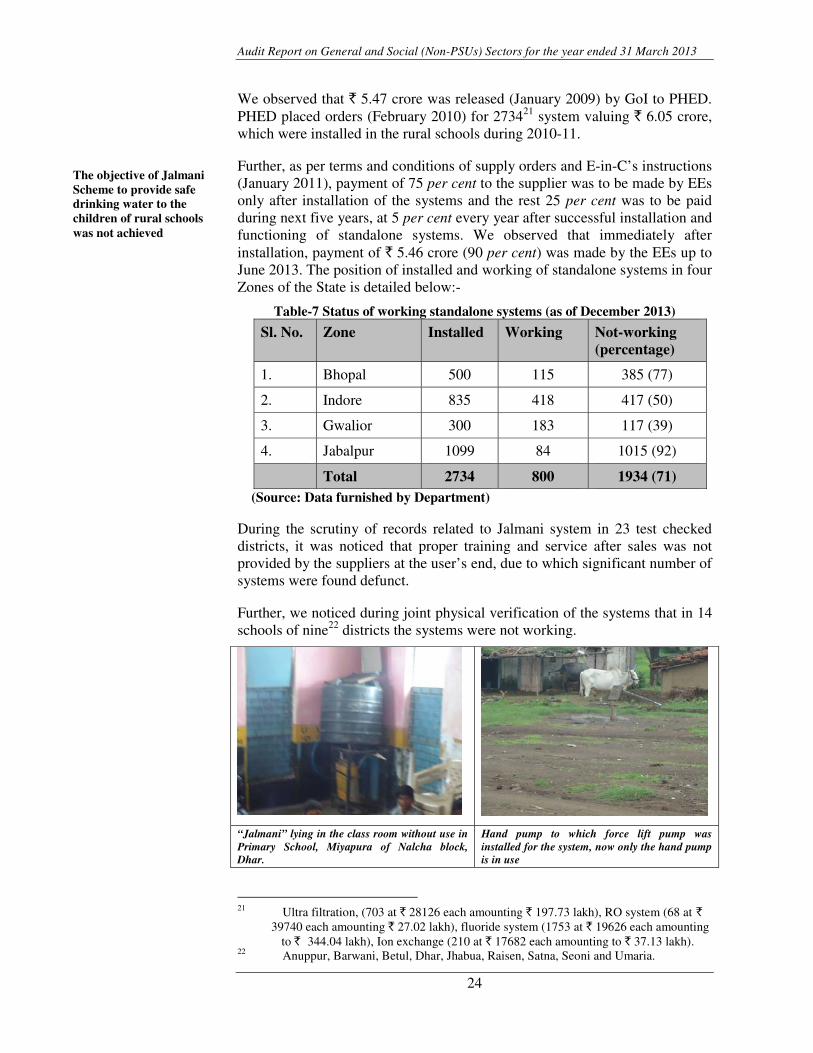
Further, we noticed during joint physical verification of the systems that in 14 schools of nine22 districts the systems were not working.
“Jalmani” lying in the class room without use in Primary School, Miyapura of Nalcha block, Dhar.
Hand pump to which force lift pump was installed for the system, now only the hand pump is in use
21 Ultra filtration, (703 at ` 28126 each amounting ` 197.73 lakh), RO system (68 at `
39740 each amounting ` 27.02 lakh), fluoride system (1753 at ` 19626 each amounting to ` 344.04 lakh), Ion exchange (210 at ` 17682 each amounting to ` 37.13 lakh). 22 Anuppur, Barwani, Betul, Dhar, Jhabua, Raisen, Satna, Seoni and Umaria.
The objective of Jalmani Scheme to provide safe drinking water to the children of rural schools was not achieved
Chapter 2: Performance Audit
25
System lying in class room without use at Govt. Primary School, Phunga, Anuppur
System lying without use at Govt. Primary School, Kusiyara, Satna
The Department in the exit conference (December 2013) stated that the agencies responsible for maintenance did not render services as required. However action would be taken against the agencies.
The fact remains that even after incurring an expenditure of ` 5.46 crore, Department failed to ensure successful functioning of the systems installed in rural schools. As a result, the objective to provide safe drinking water to the children of rural schools remained unachieved.
2.1.8.9 Sustainability
The main aim of providing sustainability of drinking water scheme is to ensure that such schemes do not slip back from universal access of safe drinking water to the community throughout the design period of the schemes. Under sustainability component, suggestive works to be carried out are check dams/nala bunds, percolation ponds/tanks, contour trench/bunds, recharge pits, gully plugs etc.
As per funding pattern, ` 541.13 crore were to be disbursed under sustainability component during the years 2009-10 to 2012-13. Against this the Department disbursed ` 206.92 crore and expenditure of ` 201.91 crore was incurred.
2.1.8.10 Execution of sustainability works through Panchayat and Rural Development Department (P&RDD)
As per Annexure-II, para 6 of NRDWP guidelines some of the sustainability works in the suggestive list are Gully plugs, Recharge Pit, Contour trench/bund, Check dam/Nala bund, Percolation pond/tank etc.
During the period 2008-11, State Government released ` 60.66 crore23 to
P&RDD for sustainability works. Out of this only ` 16.10 crore were utilized and ` 34.03 crore was refunded to PHED (` 21.74 crore in March 2012 and ` 12.29 crore in December 2012) after the State Government decided to take over the works from P&RDD to PHED in 2011-12. The balance ` 10.53 crore was lying unutilised with P&RDD as of November 2013.
23 ` 7 crore in 2009-10 and ` 25 crore in 2010-11 from NRDWP funds and ` 28.66 crore in 2008-09 from ARWSP funds
Adequate focus on sustainability works was not accorded, the funds provided to P&RDD could not be utilised for the intended purposes
Audit Report on General and Social (Non-PSUs) Sectors for the year ended 31 March 2013
26
We observed that in seven24 test checked districts ` 17.47 crore were released, of which ` 16.80 crore were utilized. Out of the sustainability works carried out in these districts, 57 inadmissible works costing to ` 3.14 crore viz. drilling of tube wells, spot sources, handpumps and PWSS through Over Head Tank (OHT) were carried out during 2009-12, as shown in Appendix-2.4.
The Department in the exit conference (December 2013) stated that the decision to carry out the sustainability work through P&RDD was taken at Government level. Due to low progress, the works were transferred back to PHED. However, the P&RDD has been requested to furnish the details of works executed and utilisation certificates.
The fact remains that the funds were not utilised for the intended purposes.
2.1.8.11 Slip back of habitations
The main aim of providing sustainability of drinking water schemes is to ensure that such schemes do not slip back from universal access of safe drinking water to the community throughout the design period of the schemes.
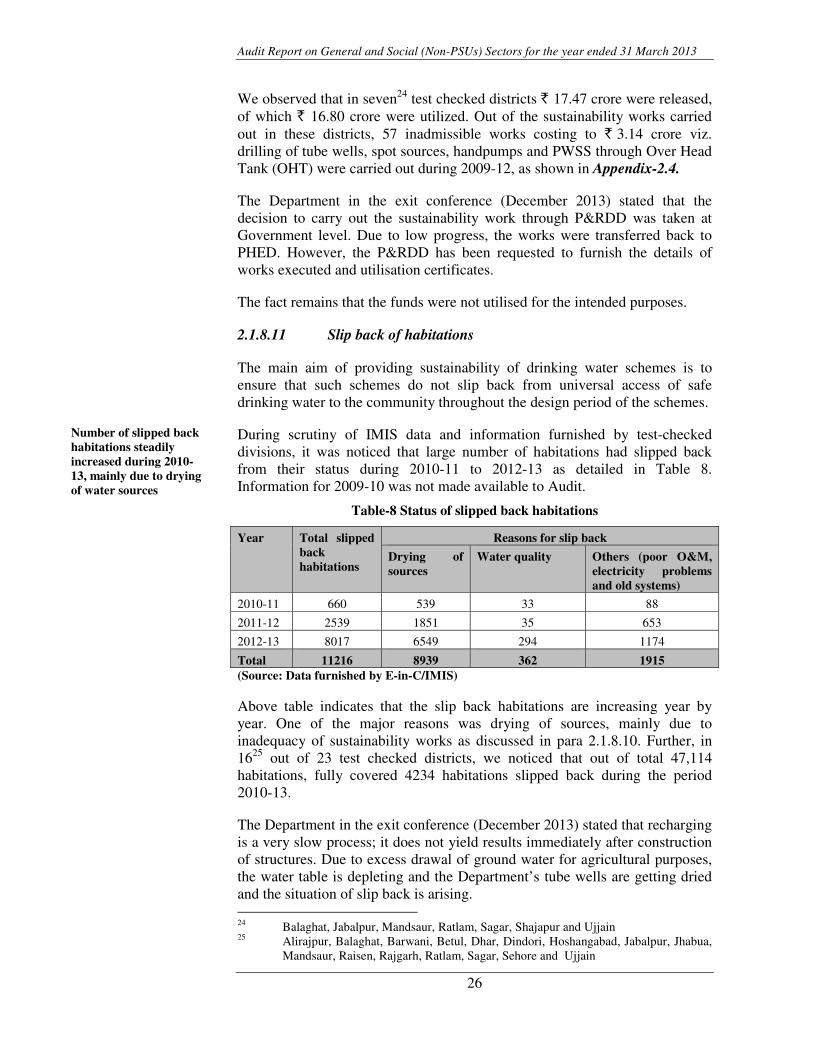
During scrutiny of IMIS data and information furnished by test-checked divisions, it was noticed that large number of habitations had slipped back from their status during 2010-11 to 2012-13 as detailed in Table 8. Information for 2009-10 was not made available to Audit.
Table-8 Status of slipped back habitations
Year Total slipped back habitations
Reasons for slip back
Drying of sources
Water quality Others (poor O&M, electricity problems and old systems)
2010-11 660 539 33 88
2011-12 2539 1851 35 653
2012-13 8017 6549 294 1174
Total 11216 8939 362 1915 (Source: Data furnished by E-in-C/IMIS)
Above table indicates that the slip back habitations are increasing year by year. One of the major reasons was drying of sources, mainly due to inadequacy of sustainability works as discussed in para 2.1.8.10. Further, in 1625 out of 23 test checked districts, we noticed that out of total 47,114 habitations, fully covered 4234 habitations slipped back during the period 2010-13.
The Department in the exit conference (December 2013) stated that recharging is a very slow process; it does not yield results immediately after construction of structures. Due to excess drawal of ground water for agricultural purposes, the water table is depleting and the Department’s tube wells are getting dried and the situation of slip back is arising. 24 Balaghat, Jabalpur, Mandsaur, Ratlam, Sagar, Shajapur and Ujjain 25 Alirajpur, Balaghat, Barwani, Betul, Dhar, Dindori, Hoshangabad, Jabalpur, Jhabua, Mandsaur, Raisen, Rajgarh, Ratlam, Sagar, Sehore and Ujjain
Number of slipped back habitations steadily increased during 2010-13, mainly due to drying of water sources
Chapter 2: Performance Audit
27
The fact remains that number of slipped back habitations increased though the focus of fourth phase was on sustainability of availability of water.
2.1.8.12 Roof-top water harvesting
Roof-top water harvesting for community structures like schools, anganwadis, GP office, hostels, health care centres, hospitals and other Government buildings was to be planned as per NRDWP guidelines.
There was nothing on record to show whether any consolidated information/details of Government buildings were available with the Department. However, as per information provided by 22 out of 23 test-checked districts only 289 schools, 269 hostels, 25 anganwadis and 32 government buildings were provided with roof-top water harvesting during 2009-13. Considering the broad spectrum of Government and community buildings in the districts, coverage under roof-top water harvesting was inadequate.
The Department in the exit conference (December 2013) stated that the roof top rain water harvesting structures constructed by the Department are handed over to concerned authorities, who did not maintain the same. Priority for construction of other types of recharge structures over the roof top water harvesting was also being considered apart from generating awareness among the people.
2.1.8.13 Support activity
The activities viz. water quality monitoring and surveillance programme, water testing laboratories, supply of field test kits, HRD in the sector, training etc. are undertaken in support activities.
2.1.8.14 Quality control
Water is defined as safe if it is free from biological contamination and the chemical contamination is within the permissible limits. Water sample testing deserves scrupulous care to bring out meaningful and reliable results that assures correct laboratory results. Hence the most important need of a water testing laboratory is availability of competent manpower and required infrastructure for quality tests, preparing data-base and analytical work.
2.1.8.15 Manpower and infrastructure in laboratories
Scrutiny of data regarding available manpower for laboratories revealed significant shortfall in manpower at State, District and Sub-divisional laboratories as detailed in Appendix-2.5:
� Against requirement of skilled manpower envisaged in the scheme guidelines, 33 per cent shortage was noticed in the State Laboratory. The posts of Bacteriologist, Lab Technician, Analyst, Sample Collector and Analyst were neither sanctioned nor posted at State level laboratory.
Coverage under roof- top water harvesting in Government buildings was inadequate
Significant shortfall was noticed in manpower at State, District and Sub-divisional laboratories
Audit Report on General and Social (Non-PSUs) Sectors for the year ended 31 March 2013
28
� In the District laboratories there was 76 per cent shortage of skilled manpower. The posts of Senior Chemist, Bacteriologist, Analyst, Sample Collector and Data Entry Operator were neither sanctioned nor posted.
� At Sub-Divisional Labs against requirement of 208 Chemist and 104 Lab Attendants only 127 and 62 posts were filled respectively.
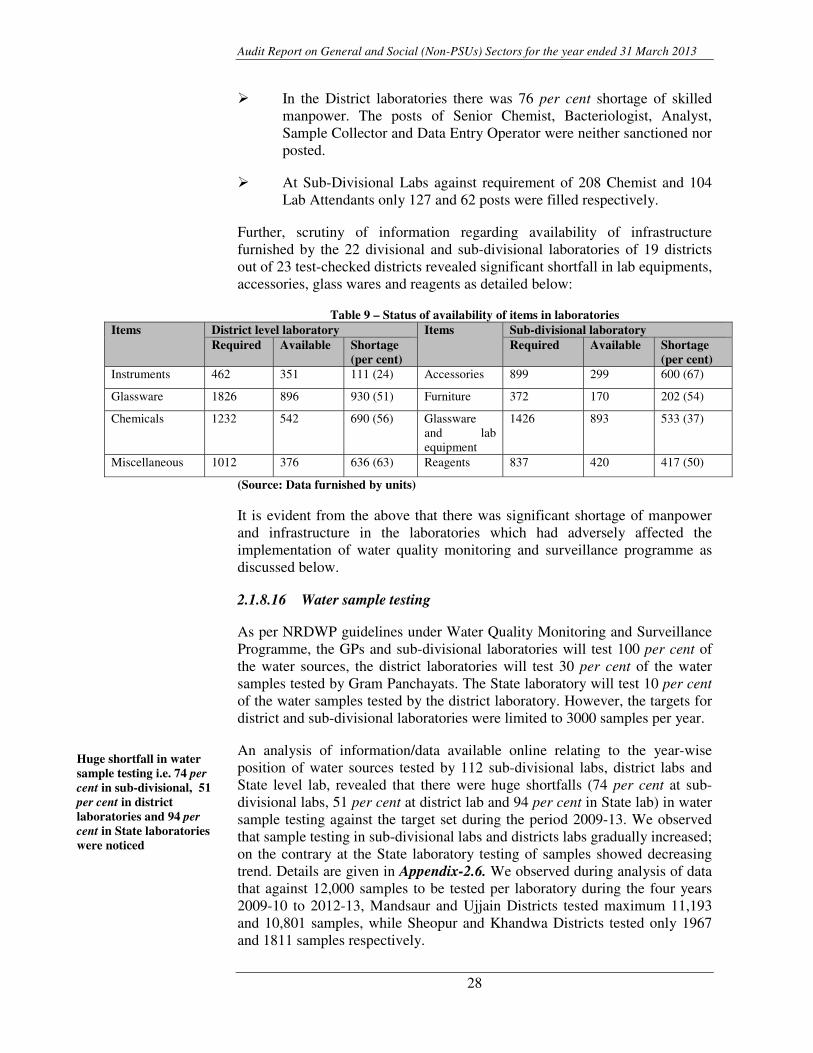
Further, scrutiny of information regarding availability of infrastructure furnished by the 22 divisional and sub-divisional laboratories of 19 districts out of 23 test-checked districts revealed significant shortfall in lab equipments, accessories, glass wares and reagents as detailed below:
Table 9 – Status of availability of items in laboratories Items District level laboratory Items Sub-divisional laboratory
Required Available Shortage (per cent)
Required Available Shortage (per cent)
Instruments 462 351 111 (24) Accessories 899 299 600 (67)
Glassware 1826 896 930 (51) Furniture 372 170 202 (54)
Chemicals 1232 542 690 (56) Glassware and lab equipment
1426 893 533 (37)
Miscellaneous 1012 376 636 (63) Reagents 837 420 417 (50)
(Source: Data furnished by units)
It is evident from the above that there was significant shortage of manpower and infrastructure in the laboratories which had adversely affected the implementation of water quality monitoring and surveillance programme as discussed below.
2.1.8.16 Water sample testing
As per NRDWP guidelines under Water Quality Monitoring and Surveillance Programme, the GPs and sub-divisional laboratories will test 100 per cent of the water sources, the district laboratories will test 30 per cent of the water samples tested by Gram Panchayats. The State laboratory will test 10 per centof the water samples tested by the district laboratory. However, the targets for district and sub-divisional laboratories were limited to 3000 samples per year.
An analysis of information/data available online relating to the year-wise position of water sources tested by 112 sub-divisional labs, district labs and State level lab, revealed that there were huge shortfalls (74 per cent at sub-divisional labs, 51 per cent at district lab and 94 per cent in State lab) in water sample testing against the target set during the period 2009-13. We observed that sample testing in sub-divisional labs and districts labs gradually increased; on the contrary at the State laboratory testing of samples showed decreasing trend. Details are given in Appendix-2.6. We observed during analysis of data that against 12,000 samples to be tested per laboratory during the four years 2009-10 to 2012-13, Mandsaur and Ujjain Districts tested maximum 11,193 and 10,801 samples, while Sheopur and Khandwa Districts tested only 1967 and 1811 samples respectively.
Huge shortfall in water sample testing i.e. 74 per cent in sub-divisional, 51 per cent in district laboratories and 94 per cent in State laboratories were noticed
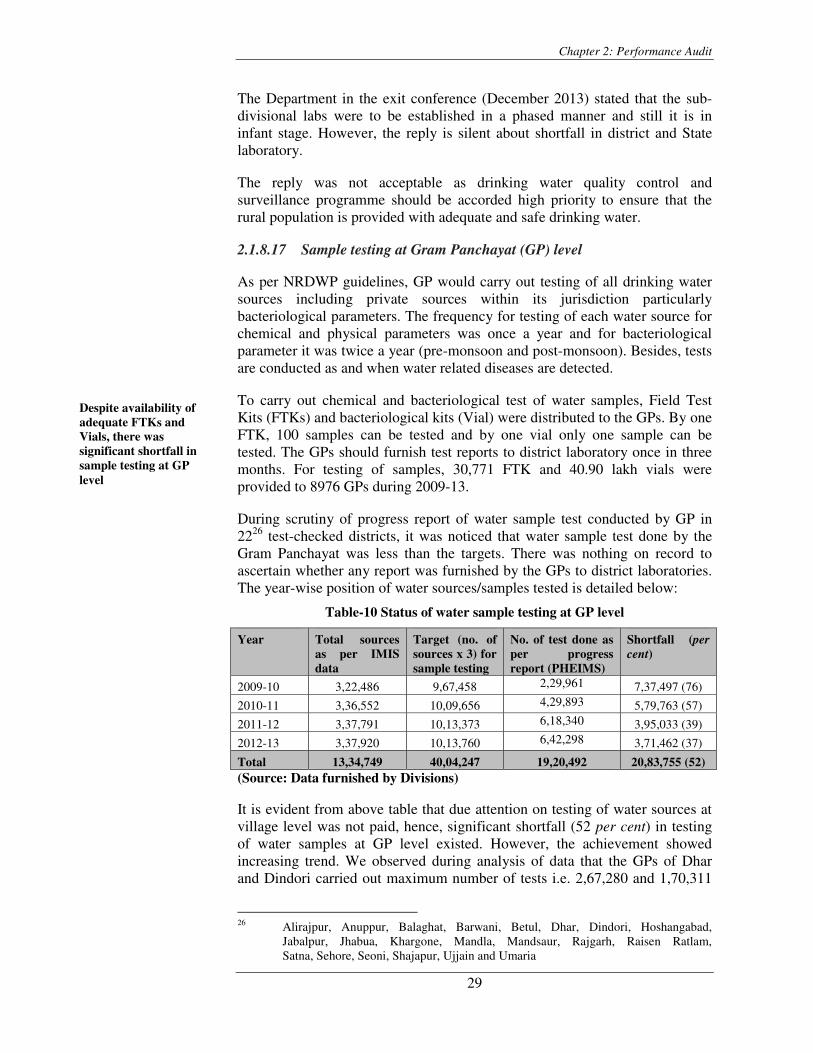
Chapter 2: Performance Audit
29
The Department in the exit conference (December 2013) stated that the sub-divisional labs were to be established in a phased manner and still it is in infant stage. However, the reply is silent about shortfall in district and State laboratory.
The reply was not acceptable as drinking water quality control and surveillance programme should be accorded high priority to ensure that the rural population is provided with adequate and safe drinking water.
2.1.8.17 Sample testing at Gram Panchayat (GP) level
As per NRDWP guidelines, GP would carry out testing of all drinking water sources including private sources within its jurisdiction particularly bacteriological parameters. The frequency for testing of each water source for chemical and physical parameters was once a year and for bacteriological parameter it was twice a year (pre-monsoon and post-monsoon). Besides, tests are conducted as and when water related diseases are detected.
To carry out chemical and bacteriological test of water samples, Field Test Kits (FTKs) and bacteriological kits (Vial) were distributed to the GPs. By one FTK, 100 samples can be tested and by one vial only one sample can be tested. The GPs should furnish test reports to district laboratory once in three months. For testing of samples, 30,771 FTK and 40.90 lakh vials were provided to 8976 GPs during 2009-13.
During scrutiny of progress report of water sample test conducted by GP in 2226 test-checked districts, it was noticed that water sample test done by the Gram Panchayat was less than the targets. There was nothing on record to ascertain whether any report was furnished by the GPs to district laboratories. The year-wise position of water sources/samples tested is detailed below:
Table-10 Status of water sample testing at GP level
Year Total sources as per IMIS data
Target (no. of sources x 3) for sample testing
No. of test done as per progress report (PHEIMS)
Shortfall (per cent)
2009-10 3,22,486 9,67,458 2,29,961 7,37,497 (76)
2010-11 3,36,552 10,09,656 4,29,893 5,79,763 (57)
2011-12 3,37,791 10,13,373 6,18,340 3,95,033 (39)
2012-13 3,37,920 10,13,760 6,42,298 3,71,462 (37)
Total 13,34,749 40,04,247 19,20,492 20,83,755 (52) (Source: Data furnished by Divisions)
It is evident from above table that due attention on testing of water sources at village level was not paid, hence, significant shortfall (52 per cent) in testing of water samples at GP level existed. However, the achievement showed increasing trend. We observed during analysis of data that the GPs of Dhar and Dindori carried out maximum number of tests i.e. 2,67,280 and 1,70,311
26 Alirajpur, Anuppur, Balaghat, Barwani, Betul, Dhar, Dindori, Hoshangabad, Jabalpur, Jhabua, Khargone, Mandla, Mandsaur, Rajgarh, Raisen Ratlam, Satna, Sehore, Seoni, Shajapur, Ujjain and Umaria
Despite availability of adequate FTKs and Vials, there was significant shortfall in sample testing at GP level
Audit Report on General and Social (Non-PSUs) Sectors for the year ended 31 March 2013
30
respectively, whereas GPs of Satna and Umaria conducted only 23,106 and 40,100 tests respectively.
The Department in the exit conference (December 2013) accepted and stated that the FTKs and bacteriological kits were distributed to GPs which were not under the direct control of the Department.
As regard ensuring testing of water samples by GPs, reply of the department that GPs are not under their direct control is not acceptable as NRDWP emphasizes on WQMSP and the PHED is responsible for ensuring this, since testing kits are purchased from the Programme fund.
2.1.8.18 Shortfall in training
Based on the need assessment, the Department was to develop training modules on different related subjects. Every year a Capacity Building Plan was to be prepared for training at village, block, district and State level.
We noticed that the State Water Support Organization conducted the training need assessment only for 2011-12 and 2012-13, though training calendar was prepared for the years 2010-11 to 2012-13 and was circulated to all circles/divisions. However, no training calendar was prepared for the year 2009-10 and there was nothing on record to ascertain in audit whether training was imparted during 2009-10.
During the years 2010-11 to 2012-13, in 1127 out of 23 test-checked districts shortfall in training ranged from 82 to 97 per cent under district level and 90 to 96 per cent under block levels, as detailed in Appendix-2.7.
Huge shortfall against the target set for training indicates that capacity building of human resources at field levels was not given due attention.
The Department accepted (December 2013) that trainings in the year 2010-11 to 2012-13 could not be done as desired, as HRD consultants could be recruited in 2012-13.
2.1.9 Programme execution
2.1.9.1 Drilling of tube wells in fluoride affected areas
As per NRDWP guidelines, areas where concentration of fluoride is more than 1.5 mg/ltr would be considered as fluoride affected. A detailed survey was conducted in 2003 by the Department in which numbers of habitations in different districts were identified as fluoride affected.
The Department issued (April 2006) instructions to drill bore wells only in fluoride free zones. We observed that in four28 out of 23 test-checked districts 223 bore wells were drilled in identified fluoride affected habitations in 27 Balaghat, Barwani, Betul, Bhopal, Dhar, Jhabua, Raisen, Sagar, Sehore, Shajapur
and Ujjain. 28 Betul, Dhar, Jhabua and Sagar
Significant shortfall in training was noticed in district and block level
Despite clear instruction by the Department, bore well were drilled in fluoride affected habitations incurring an expenditure of`̀̀̀ 1.59 crore
Chapter 2: Performance Audit
31
violation of Government order (April 2006) during the period 2009-13. An amount of ` 1.59 crore was incurred on these bore wells as detailed in Appendix-2.8.
The Department in the exit conference (December 2013) stated that the tests were conducted for fluoride contamination by the EEs after drilling of bore wells and no fluoride was found in results and also stated that detailed report from concerning EEs is being sought.
The reply was not tenable as drilling was done in identified fluoride affected habitations in violation of instructions issued by the Department and no test reports were furnished to Audit to authenticate the reply.
2.1.9.2 Inflated estimates
Para 17 (m) of NRDWP guidelines provides that the State Government has to furnish a certificate to GoI declaring that no centage charges have been levied on NRDWP works and paid from Programme fund. In case any State levies the centage charges on NRDWP funds, double the amount charged will be deducted while releasing the last installment of funds.
Scrutiny of the estimates, Notice Inviting Tenders (NITs), agreements and final bills in respect of 96 electric works in six29 out of 23 test-checked districts revealed that the estimates for these works were got prepared by Madhya Pradesh Paschim Kshetriya Vidyut Vitaran Company Limited (MPPKVVCL) based on their Schedules of Rates (SORs). The MPPKVVCL levied centage charges at 11.5 per cent on these estimates which executes only deposit works. The PHE invited tenders from contractors by adopting these estimates in which centage charges of 11.5 per cent was included in the NITs. Since these were not deposit works the centage charges were not leviable. Thus, the NITs contained inflated estimate.
Scrutiny of bills in respect of these works for the period 2009-13 revealed that the contractors claimed the centage charges at 11.5 per cent and a total of ` 37.44 lakh was paid to the contractors. The levy of centage charges in NITs and payment made to contractor was irregular and also in violation of the guidelines of NRDWP. Besides, the centage charges were not at all leviable on NRDWP funds.
The Department in the exit conference (December 2013) agreed and stated that instructions are being issued to concerned EEs to recover the unauthorized payment of centage charges.
2.1.9.3 Payment of tender premium from NRDWP Fund
As per para 16.5 of NRDWP guidelines, tender premium were to be met by the State Government and it shall credit the programme funds to that extent.
29 Alirajpur (4 works-` 1.30 lakh), Dhar (26 works-` 8.62 lakh), Jhabua (9 works- ` 5.24 lakh), Rajgarh (11 works-` 2.32 lakh), Ratlam (42 works-` 1.50 lakh) and Sardarpur (4 works-` 18.46 lakh)
Estimates were inflated and centages charges of `̀̀̀ 37.44 lakh was made by the divisions to the contractors
Audit Report on General and Social (Non-PSUs) Sectors for the year ended 31 March 2013
32
On scrutiny of agreements, work orders and final/running bills, we noticed that in 1630 out of 23 test-checked districts, tender premium ranging between 0.05 per cent and 183.30 per cent amounting to ` 43.54 crore was charged during 2009-13 on 5654 works on the estimated cost, as detailed in Appendix-2.9. We observed that the State Government did not credit the programme fund with additional funds towards the cost of tender premium.
The Department in the exit conference (December 2013) accepted and stated that due to pending revisions of SORs, the tenders were sanctioned with premium and appropriate action was being taken. The Department is taking action to revise the applicable SORs every year so that recurrence of such incidences does not occur in future.
The reply was not in order since SORs were revised in December 2009, April 2012 and in March 2013.
2.1.9.4 Loss to Government due to negligence
A PWS scheme to provide potable water in 205 habitations of 74 quality affected villages of five blocks in Jhabua District along the Kukshi-Bagh-Jobat State Highway was under progress since 2007. The work was being executed by Sadarpur Division (Dhar District). In October 2010, Madhya Pradesh Road Development Corporation (MPRDC) approved the widening of the Kukshi-Bagh-Jobat State Highway whereunder the work of PWSS was under progress. Accordingy, MPRDC requested (December 2010) the EEs, PHED of Jhabua, Alirajpur and Dhar divisions to move away the water supply pipelines laid along the road side. However, the Sardarpur Division under which the work of PWSS was being carried out was not informed.
In April 2012, an agency selected by the MPRDC started the work of widening of road and during the course of widening, 2300 metre pipeline of 150 mm dia and 1000 metre pipeline of 200 mm dia was excavated.
Scrutiny of records of Sardarpur Division revealed that the pipes which were lying on the road side, i.e. 2300 metre pipes of 150 mm and 800 metre pipes of 200 mm costing ` 52.90 lakh were stolen in March 2013 as reported by the Sub-Engineer in March 2013.
As the PWSS was an ongoing project, regular supervision should have been carried out by the division. Lack of supervision led to delayed detection of excavation leading to loss of the material.
The Department in the exit conference (December 2013) stated that explanation and details in this matter have been sought from Chief Engineer, Indore. After detailed investigation of the case reply shall be furnished.
30 Alirajpur, Barwani, Betul, Dhar, Dindori, Hoshangabad, Jabalpur, Jhabua, Raisen,
Ratlam, Sagar, Sehore, Seoni, Shajapur, Ujjain and Umaria.
Tender premium amounting to ` 43.54 crore was incurred from NRDWP funds, which was to be met by the State Government
Lack of supervision in detection of excavated pipes led to loss of material
Chapter 2: Performance Audit
33
2.1.9.5 Unsuccessful bore wells in excess of permissible limit
According to guidelines issued by Government regarding drilling of tube wells, use of scientific technology for identification of sources viz. resistivity survey, remote sensing, use of hydro fracturing maps, hand water prospect maps etc. should be resorted to before drilling of tube wells. The Department directed (July 1988) that the EEs are required to submit an annual statement to E-in-C justifying the reasons for failure of bore wells in excess of 10 per cent(permissible limit) and if the percentage of failure exceeds 15 per cent, comments of SE are also to be submitted.
It was noticed that in 1031 out of 23 divisions, a total of 20,417 bore wells were drilled, out of which the percentage of unsuccessful ranged from 12 to 52 per cent. There was nothing on record to show that annual statements were submitted to E-in-C by the EEs. The division-wise status of unsuccessful bore wells valued ` 7.65 crore is detailed in Appendix-2.10.
Neither the EEs nor the SEs offered any justification for failure of bore wells beyond the permissible limit. E-in-C was thus not given the opportunity to analyse/supervise the reasons of failure of bore wells and the failure percentage beyond the permissible limit persisted during 2009-13.
The Department in the exit conference (December 2013) stated that comments have been sought from concerned Chief Engineers, thereafter reply would be furnished.
2.1.10 Human Resources Management
2.1.10.1 Shortage of manpower in the Department
Availability of required manpower is a prerequisite for successful implementation and monitoring of any scheme.
We noticed significant shortfall against sanctioned strength in technical staff in the cadres of Assistant Engineer (28), Sub-Engineer (307) and Draught Man/Assistant Draught Man (51). However, supervising staff for monitoring such as Superintending Engineer (SE) were 62 per cent in excess of sanctioned strength.
The Department stated (December 2013) that the Professional Examination Board have selected (December 2013) 187 Sub-Engineers and requirement of 35 AEs was sent to M P Public Service Commission. In regard to excess SEs, Department stated that some of them are on deputation in other departments.
The fact remains that during the Plan period, shortage of technical and field staff adversely affected implementation of the programmes as reflected from
31 Bhopal-Civil ` 43.53 lakh, Bhopal-Mech ` 53.40 lakh, Dhar ` 15.70 lakh,
Dindori ` 25.25 lakh, Jabalpur-Mech ` 204.80 lakh, Khargone ` 43.01 lakh, Mandla ` 99.27 lakh, Rajgarh ` 11.79 lakh, Sagar ` 240.00 lakh and Ujjain (Mech) ` 28.68 lakh.
Failure of bore wells beyond the permissible limit led to unfruitful expenditure of ` 7.65 crore. Reasons were also not intimated to next higher authorities for failure of bore wells
Significant shortfall of manpower existed in technical cadre
Audit Report on General and Social (Non-PSUs) Sectors for the year ended 31 March 2013
34
shortfall in coverage of habitations (para 2.1.8.2), coverage of rural schools and anganwadis (para 2.1.8.3), non-completion of PWSS (para 2.1.8.4 and 2.1.8.6), operation and maintenance of hand pumps (para 2.1.8.5), etc.
2.1.10.2 Manpower of District Water and Sanitation Mission
As envisaged in the Programme guidelines, a District Water & Sanitation Mission (DWSM) was to be constituted at district level for effective implementation of NRDWP (2009-2012). The posts prescribed and men-in-position in the DWSMs as on December 2013 are detailed below:
Table-11 Status of manpower in DWSMs
Name of post Required one each for 50 district
Manpower posted in the district
Shortfall (percentage)
IEC and Equity consultant 50 50 Nil
Monitoring, Evaluation-cum-MIS consultant
50 18 32 (64)
HRD consultant 50 50 Nil
Hydro Geologist 50 27 23 (46) (Source: Information furnished by E-in-C)
The posts of Monitoring-cum-MIS consultant and Hydro Geologist still remained vacant. Inadequate manpower adversely affected the implementation of Programme and support activities in respect of formulation of plans, management, monitoring, surveillance and awareness at grass root level.
The Department in the exit conference (December 2013) accepted and stated that the remaining posts are lying vacant due to non-availability of suitable candidates as per the norms which shall be filled up shortly.
2.1.10.3 Shortage of manpower in Block Resource Centres (BRC)
GoI issued (August 2010) instructions to set-up the BRC before 31st March 2011 to serve as an extended delivery arm of the DWSM and to act as a link with the GPs/VWSCs/village communities. The functionaries of BRC could be hired by the DWSM through an NGO or an outsourcing agency to provide specific services on contract basis. As per the norms, one Block Co-ordinator and one to three32 Cluster Co-ordinators were to be provided according to population at each block.
We observed that as of December 2013, 313 BRCs were established against which 294 Block Co-ordinators were posted. Against the requirement of 807 Cluster Co-ordinators, none were posted. Hence, activities like awareness generation, motivation, mobilization and training to the village communities, GPs and VWSCs could not be done.
The Department stated (December 2013) that no post of Cluster Co-ordinator was sanctioned by SWM and remaining 19 posts of Block Co-ordinator shall
32 one for 70000 or less, two for 70000 to 1.5 lakh and three for more than 1.5 lakh
population
Cluster co-ordinators were not posted despite clear instructions from GoI

Chapter 2: Performance Audit
35
be filled shortly. However, reasons for non-sanction of posts of Cluster Co-ordinator have not been intimated.
The fact remains that in the absence of block coordinator and cluster Co-ordinator the gap in linkage between districts and village levels still existed.
2.1.11 Monitoring
2.1.11.1 State Level Scheme Sanctioning Committee (SLSSC)
SLSSC should ensure that all the approved projects are entered on the central online MIS for accounting of habitations covered during particular financial year. In a year, meeting of the Committee should be held at least twice, wherein apart from sanctioning new schemes, progress, completion and commissioning of the schemes approved earlier by the committee should be reviewed.
It was noticed that the SLSSC was constituted in January 2010 and against eight meetings due only five meetings were held during the period 2009 to 2013. It was noticed from the minutes of the meetings that no review was conducted for implementation of the PWS schemes. The issues discussed were district wise physical and financial targets, rejuvenation of dry sources in dried/over-exploited areas, water conservation plan, and technical assistance in site selection from M P Science & Technology Council. Approval of Annual Action Plans, schemes for quality affected habitation, revised sanction of schemes due to cost escalation, change in site etc. was also accorded in these meetings every year.
The Department in the exit conference (December 2013) stated that SLSSC meetings are being conducted regularly in 2013-14.
2.1.11.2 Apex Committee
Apex Committee for providing guidance for implementation of the Programme was constituted (June 2009) which was headed by the Chief Secretary and Secretaries in charge of PHED, Rural Development (RD), Panchayati Raj (PR), Finance, Health, Education, Information and Public Relations (I&PR) as members. Secretary (PHED) shall be the nodal Secretary responsible for all the Mission’s activities.
It was noticed that against eight meetings of the Apex Committee due during 2009-10 to 2012-13 as per guidelines, only two meetings were held, one in December 2009 and second in March 2011.
The Department in the exit conference (December 2013) stated that the Apex Committee meetings are conducted as and when needed to take decisions on the policy matters.
Audit Report on General and Social (Non-PSUs) Sectors for the year ended 31 March 2013
36
As the Apex Committee met only twice, it is evident that proper guidance could not be provided in implementation of NRDWP. Lapses in implementation of NRDWP have already been discussed33.
2.1.11.3 Integrated Management Information System (IMIS)
2.1.11.3(a) Inclusion of Census 2011 villages in IMIS
As per Para 19.2 of NRDWP guidelines, IMIS is maintained by Department of Drinking Water Supply (DDWS) of GoI, which is an important mechanism for monitoring the Programme implementation. To this end, the officials are required to furnish the data online, as prescribed by DDWS. The release of funds is made based on the data furnished online by the State.
Scrutiny of online data revealed that information about increase of new villages as per the Census 2011 was not reported by the Department for incorporation in the IMIS. The difference in number of villages incorporated in IMIS and those indicated in Census 2011 is as under;
Total no. of Census 2011 village 52093Total no. of IMIS village 51541Difference in IMIS and Census villages 552
Due to non-inclusion of Census 2011 villages in the IMIS, 552 villages were deprived of the benefits of NRDWP.
The Department in the exit conference (December 2013) accepted the fact and stated that efforts were being made to rectify the data mismatch.
2.1.11.3(b) Incorrect data entry in IMIS
The PHED every year enters various data online in the Department of Drinking Water Supply (DDWS) website (indiawater.gov.in) regarding fully covered habitations, partially covered habitations etc. In the data entered by the State, GoI identifies the duplicate data entered and alerts the State Government in this regard.
On scrutiny of online data entered by PHED we noticed that 1773 habitations which were fully covered were again taken for coverage and 2276 already covered habitations were marked as target during 2009-13. The duplication was identified by GoI and was reflected in the alerts column of the website.
The PHED did not take any notice of this duplicate data entered online neither at the district level nor at State level. The date entered online should have been authenticated by district and State level authorities.
The Department in the exit conference (December 2013) stated that the district officers were instructed to mend the ways regarding online data entries and concerning data operators are also being trained to avoid such mistakes.
The reply itself confirms lack of monitoring at appropriate levels.
33 Para 2.1.6.1, 2.1.6.3, 2.1.7.4, 2.1.7.8, 2.1.8.2, 2.1.8.7, 2.1.8.8 etc.
552 villages were not included in the IMIS and were deprived of the benefits of NRDWP
Data entered online should be authenticated by competent authorities to avoid duplicity
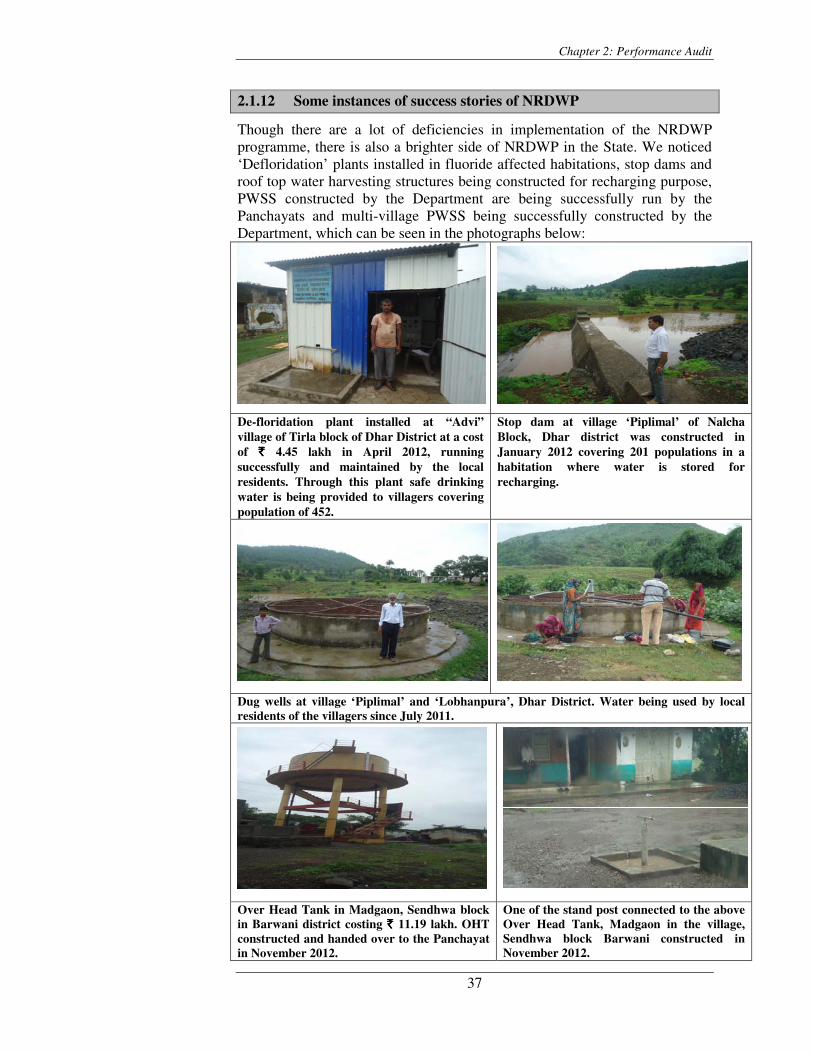
Chapter 2: Performance Audit
37
2.1.12 Some instances of success stories of NRDWP
Though there are a lot of deficiencies in implementation of the NRDWP programme, there is also a brighter side of NRDWP in the State. We noticed ‘Defloridation’ plants installed in fluoride affected habitations, stop dams and roof top water harvesting structures being constructed for recharging purpose, PWSS constructed by the Department are being successfully run by the Panchayats and multi-village PWSS being successfully constructed by the Department, which can be seen in the photographs below:
De-floridation plant installed at “Advi” village of Tirla block of Dhar District at a cost of ` ` ` ` 4.45 lakh in April 2012, running successfully and maintained by the local residents. Through this plant safe drinking water is being provided to villagers covering population of 452.
Stop dam at village ‘Piplimal’ of Nalcha Block, Dhar district was constructed in January 2012 covering 201 populations in a habitation where water is stored for recharging.
Dug wells at village ‘Piplimal’ and ‘Lobhanpura’, Dhar District. Water being used by local residents of the villagers since July 2011.
Over Head Tank in Madgaon, Sendhwa block in Barwani district costing ` ` ` ` 11.19 lakh. OHT constructed and handed over to the Panchayat in November 2012.
One of the stand post connected to the above Over Head Tank, Madgaon in the village, Sendhwa block Barwani constructed in November 2012.
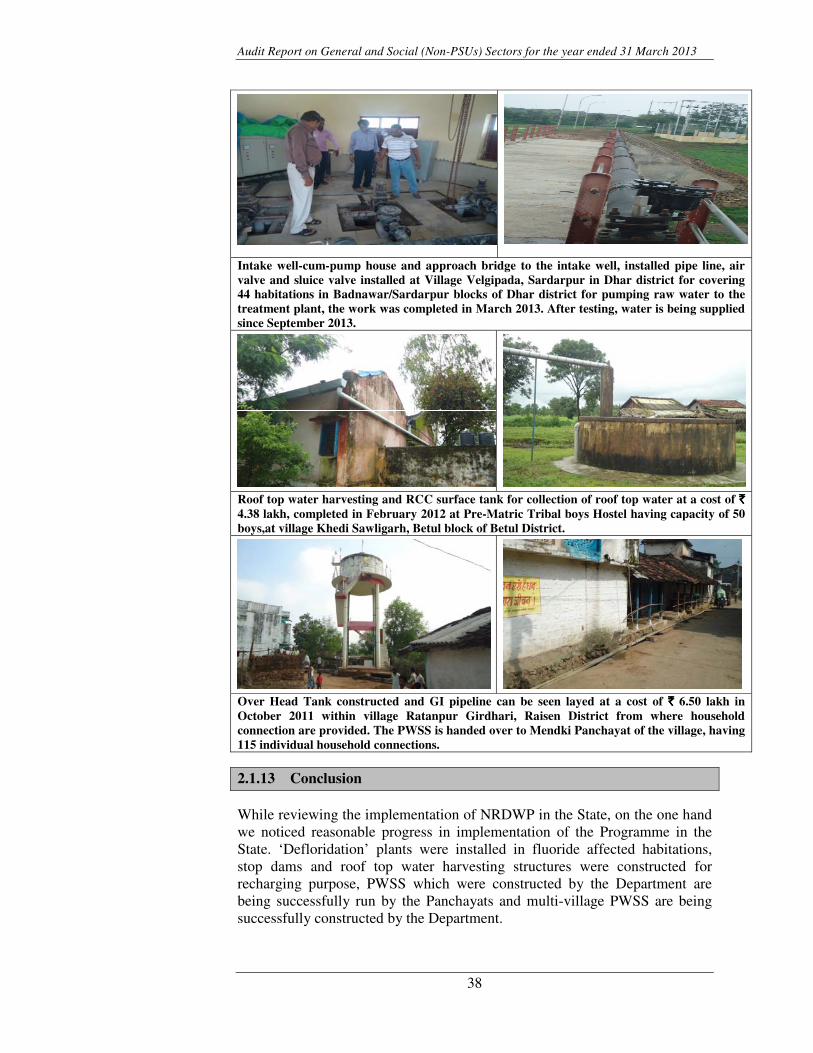
Audit Report on General and Social (Non-PSUs) Sectors for the year ended 31 March 2013
38
Intake well-cum-pump house and approach bridge to the intake well, installed pipe line, air valve and sluice valve installed at Village Velgipada, Sardarpur in Dhar district for covering 44 habitations in Badnawar/Sardarpur blocks of Dhar district for pumping raw water to the treatment plant, the work was completed in March 2013. After testing, water is being supplied since September 2013.
Roof top water harvesting and RCC surface tank for collection of roof top water at a cost of `̀̀̀4.38 lakh, completed in February 2012 at Pre-Matric Tribal boys Hostel having capacity of 50 boys,at village Khedi Sawligarh, Betul block of Betul District.
Over Head Tank constructed and GI pipeline can be seen layed at a cost of `̀̀̀ 6.50 lakh in October 2011 within village Ratanpur Girdhari, Raisen District from where household connection are provided. The PWSS is handed over to Mendki Panchayat of the village, having 115 individual household connections.
2.1.13 Conclusion
While reviewing the implementation of NRDWP in the State, on the one hand we noticed reasonable progress in implementation of the Programme in the State. ‘Defloridation’ plants were installed in fluoride affected habitations, stop dams and roof top water harvesting structures were constructed for recharging purpose, PWSS which were constructed by the Department are being successfully run by the Panchayats and multi-village PWSS are being successfully constructed by the Department.
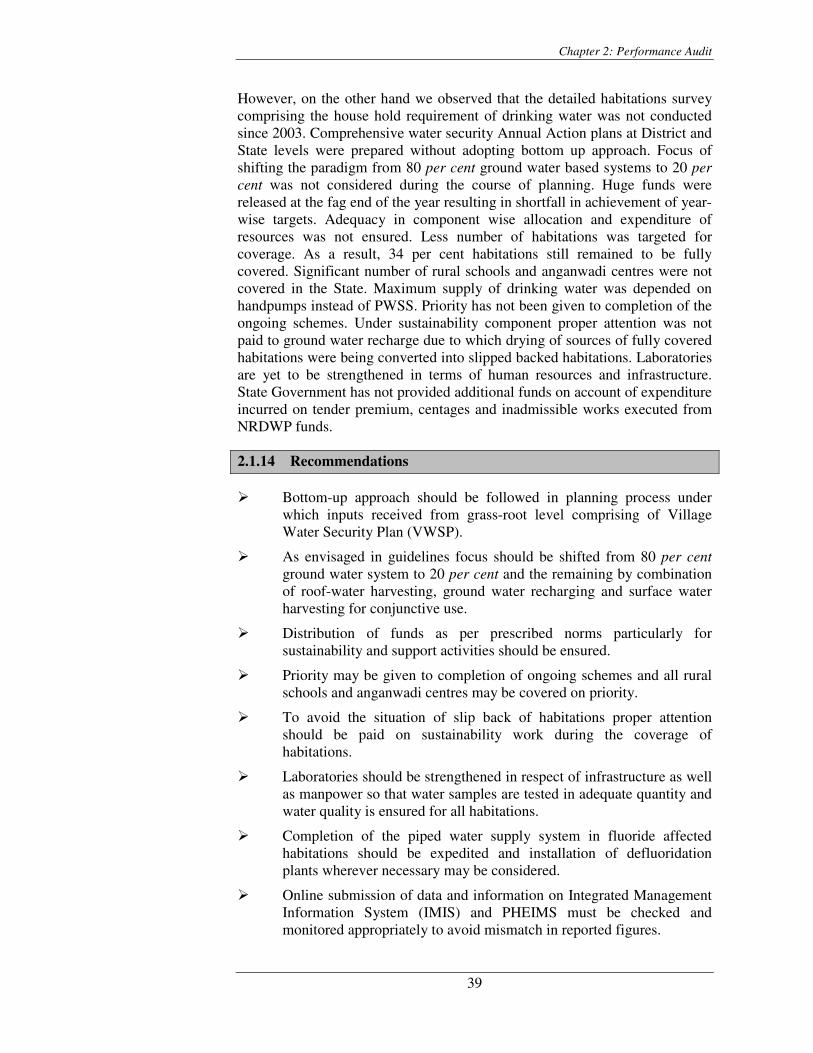
Chapter 2: Performance Audit
39
However, on the other hand we observed that the detailed habitations survey comprising the house hold requirement of drinking water was not conducted since 2003. Comprehensive water security Annual Action plans at District and State levels were prepared without adopting bottom up approach. Focus of shifting the paradigm from 80 per cent ground water based systems to 20 per cent was not considered during the course of planning. Huge funds were released at the fag end of the year resulting in shortfall in achievement of year-wise targets. Adequacy in component wise allocation and expenditure of resources was not ensured. Less number of habitations was targeted for coverage. As a result, 34 per cent habitations still remained to be fully covered. Significant number of rural schools and anganwadi centres were not covered in the State. Maximum supply of drinking water was depended on handpumps instead of PWSS. Priority has not been given to completion of the ongoing schemes. Under sustainability component proper attention was not paid to ground water recharge due to which drying of sources of fully covered habitations were being converted into slipped backed habitations. Laboratories are yet to be strengthened in terms of human resources and infrastructure. State Government has not provided additional funds on account of expenditure incurred on tender premium, centages and inadmissible works executed from NRDWP funds.
2.1.14 Recommendations
� Bottom-up approach should be followed in planning process under which inputs received from grass-root level comprising of Village Water Security Plan (VWSP).
� As envisaged in guidelines focus should be shifted from 80 per centground water system to 20 per cent and the remaining by combination of roof-water harvesting, ground water recharging and surface water harvesting for conjunctive use.
� Distribution of funds as per prescribed norms particularly for sustainability and support activities should be ensured.
� Priority may be given to completion of ongoing schemes and all rural schools and anganwadi centres may be covered on priority.
� To avoid the situation of slip back of habitations proper attention should be paid on sustainability work during the coverage of habitations.
� Laboratories should be strengthened in respect of infrastructure as well as manpower so that water samples are tested in adequate quantity and water quality is ensured for all habitations.
� Completion of the piped water supply system in fluoride affected habitations should be expedited and installation of defluoridation plants wherever necessary may be considered.
� Online submission of data and information on Integrated Management Information System (IMIS) and PHEIMS must be checked and monitored appropriately to avoid mismatch in reported figures.
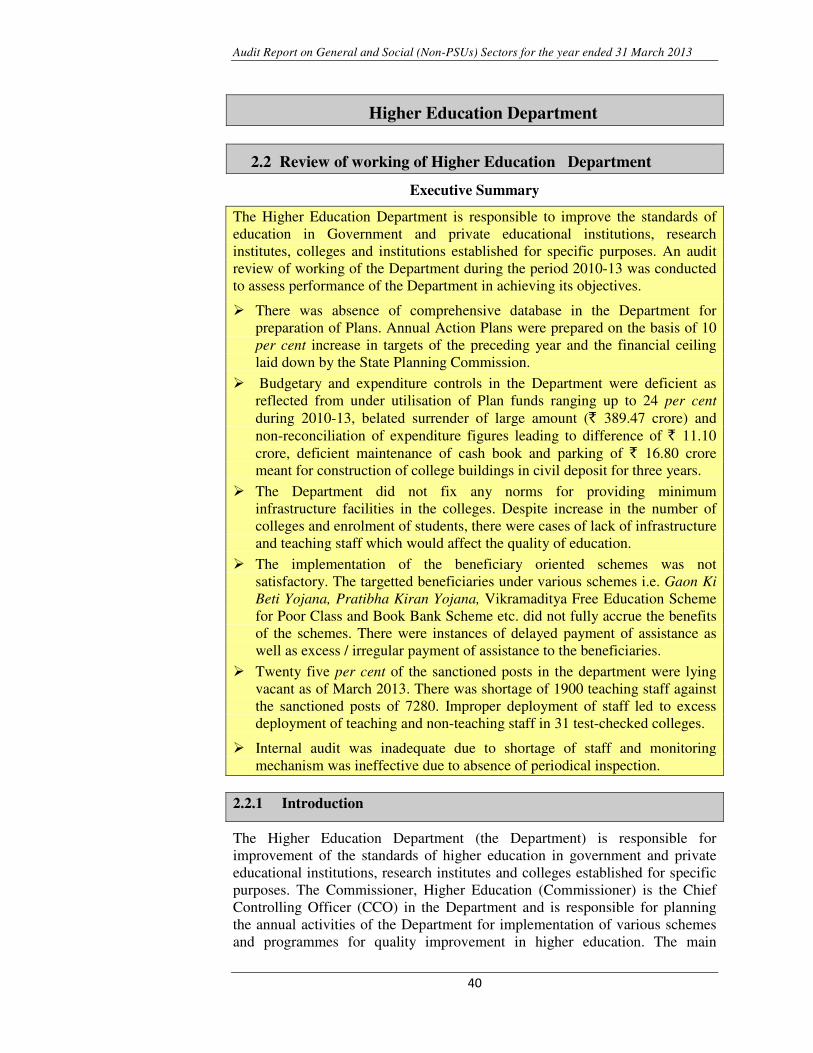
Audit Report on General and Social (Non-PSUs) Sectors for the year ended 31 March 2013
�
�
���
�
Higher Education Department� �
2.2 Review of working of Higher Education Department
Executive Summary
The Higher Education Department is responsible to improve the standards of education in Government and private educational institutions, research institutes, colleges and institutions established for specific purposes. An audit review of working of the Department during the period 2010-13 was conducted to assess performance of the Department in achieving its objectives.
� There was absence of comprehensive database in the Department for preparation of Plans. Annual Action Plans were prepared on the basis of 10 per cent increase in targets of the preceding year and the financial ceiling laid down by the State Planning Commission.
� Budgetary and expenditure controls in the Department were deficient as reflected from under utilisation of Plan funds ranging up to 24 per centduring 2010-13, belated surrender of large amount (` 389.47 crore) and non-reconciliation of expenditure figures leading to difference of ` 11.10 crore, deficient maintenance of cash book and parking of ` 16.80 crore meant for construction of college buildings in civil deposit for three years.
� The Department did not fix any norms for providing minimum infrastructure facilities in the colleges. Despite increase in the number of colleges and enrolment of students, there were cases of lack of infrastructure and teaching staff which would affect the quality of education.
� The implementation of the beneficiary oriented schemes was not satisfactory. The targetted beneficiaries under various schemes i.e. Gaon Ki Beti Yojana, Pratibha Kiran Yojana, Vikramaditya Free Education Scheme for Poor Class and Book Bank Scheme etc. did not fully accrue the benefits of the schemes. There were instances of delayed payment of assistance as well as excess / irregular payment of assistance to the beneficiaries.
� Twenty five per cent of the sanctioned posts in the department were lying vacant as of March 2013. There was shortage of 1900 teaching staff against the sanctioned posts of 7280. Improper deployment of staff led to excess deployment of teaching and non-teaching staff in 31 test-checked colleges.
� Internal audit was inadequate due to shortage of staff and monitoring mechanism was ineffective due to absence of periodical inspection.
2.2.1 Introduction
The Higher Education Department (the Department) is responsible for improvement of the standards of higher education in government and private educational institutions, research institutes and colleges established for specific purposes. The Commissioner, Higher Education (Commissioner) is the Chief Controlling Officer (CCO) in the Department and is responsible for planning the annual activities of the Department for implementation of various schemes and programmes for quality improvement in higher education. The main
Chapter 2: Performance Audit
�
�
���
�
objectives of the Department are to ensure quality of learning and teaching, promote academic and research works, create job oriented courses and develop cultural and sports activities within the Department by providing basic infrastructures in colleges, physical and financial resources, sanction and fill up the vacant posts. The main activities carried out by the Department are to run the Government colleges, give assistance for running of private colleges, opening of new institutions/subjects/courses and providing grants to Universities and other Institutions. The Department implements 1034 major schemes/activities including one Centrally sponsored scheme. Besides Government and private colleges, seven Universities established under University Act 1973, 16 Universities under Private Universities Act, 2007 and separate Acts and five other Aided Institutions are working under the Department.
2.2.2 Organisational set-up
The Department is headed by the Principal Secretary at the State level and is responsible for implementation of Government policies/programmes/schemes. The overall financial and administrative control of the Department is vested with the Commissioner, Higher Education. The Commissioner is assisted by Additional Directors (ADs), Joint Directors and Deputy Directors at headquarter and seven Regional Additional Directors at the divisional level. Fifty Government colleges identified as Lead colleges by the Department, one in each district are responsible for co-ordinating other colleges in the respective district, compilation of information and performing other works as directed by the higher authorities. They are also responsible for payment of grants made available by the commissioner for private aided colleges and to monitor utilisation of the grants. There are 352 Post Graduate and Degree colleges headed by Principals. The Department also controls the Universities.
The Madhya Pradesh Ashaskiya Shikshan Sansthan (Anudan Ka Praday) Adhiniyam 1978 regulates the payment of salaries to teachers and other employees of non-government educational institutions for higher education (77 Numbers) receiving grants from the Government. The registered private bodies/institutions fulfilling the norms/conditions required by the Department open new colleges after getting permission from the Department and affiliation from concerned University.
2.2.3 Audit objectives
The audit objectives were to assess whether:
� the planning of the Department was effective;
� the financial management was efficient, effective and economical;
34� (1) National Service Scheme(Centrally sponsored), (2) Pratibha Kiran Yojana, (3) Vikramaditya Free Education Scheme for Poor Class, (4) Swami Vivekanand Career Guidance Scheme, (5) Gaon Ki Beti Yojana, (6) Employment Oriented Vocational Training Scheme for Youths, (7) Conveyance Facilities for Girls, (8) Scholarship to Helpless Students, (9) Assistance to Ph.D. Students and (10) Supply of Books/Stationery for SC/ST Students.��
Audit Report on General and Social (Non-PSUs) Sectors for the year ended 31 March 2013
�
�
���
�
� the schemes were implemented effectively and quality management was adequate;
� the human resource management was appropriate for better academic performance; and
� the monitoring and internal controls mechanism were effective.
2.2.4 Audit criteria
The audit criteria were derived from the following sources:
� Perspective Plan, Annual Action Plans and directives issued by State Planning Commission.
� Provisions of Budget Manual, General Financial Rules (GFR), Delegation of Financial Power, Madhya Pradesh Treasury Code (MPTC) and Madhya Pradesh Financial Code (MPFC) and Madhya Pradesh Store Purchase Rules.
� Guidelines for implementation of State and Centrally Sponsored Schemes,
� Acts, Rules, notifications and instructions issued by Government of India (GoI)/State Government relating to working of the Department.
2.2.5 Audit coverage and methodology
The review of the ‘Working of Higher Education Department’ covers only the aspects of collegiate education excluding the technical education, medical education and Universities. The records relating to the period 2010-13 of 90 units35 (Appendix-2.11) out of 360 units were test checked (November 2012 to September 2013) in audit. An entry conference was held with the Principal Secretary, Higher Education Department on 12 March 2013 wherein the audit objectives, criteria and audit coverage were discussed. In the exit conference held in January 2014 audit findings were discussed with the Principal Secretary, and their views have been incorporated in the review.
Audit findings
2.2.6 Planning
The State Planning Commission prepares the Perspective Plan and Annual Plans of the State and decides the Plan ceiling for preparation of Five-Year and Annual Plans for each department. Accordingly, the Department prepared a Perspective Plan for the period 2012-17. Annual Plans were also prepared and targets for each year were fixed. The following observations were made:
35��Two units of Directorate and 88 Government colleges including 31 Lead colleges; �
Chapter 2: Performance Audit
�
�
���
�
� The Department did not have the database in respect of physical infrastructure36 and basic facilities in the colleges to facilitate preparation of the Perspective Plan and Annual Plans. Though a database of college-wise students and subject-wise sanctioned strength and working strength of teaching staff and benefitted students was prepared, the same was not used in the preparation of the Plans.
� The Annual Plans were prepared on the basis of financial ceiling fixed for the Department by the State Planning Commission. The Commissioner stated that the Annual plans were prepared on the basis of previous year’s achievement and current year requirement and by increasing 10 per cent over the previous year’s target.
� There was no analysis available on records showing the reasons for shortfall in achievement of targets in the preceding years and the remedial measures taken for such shortfalls in the succeeding years.
We observed shortfalls in targets fixed under various activities which ranged between 35 per cent to 100 per cent during the period 2010-12 (Appendix-2.12). Deficiencies in the planning adversely affected the achievement of the targets fixed in the annual plans for various activities of the Department as discussed in paragraph 2.2.7.1
In the exit conference, the Principal Secretary admitted the audit observations and noted the points for future observance.
2.2.7 Financial Management
2.2.7.1 Budget Provision and Expenditure
The State Budget Manual provides that the Budget Estimates (BEs) should be as close and accurate as possible. Rule 192 of MPFC provides that budget estimates (BEs) should be furnished to Finance Department (FD) before the dates fixed by FD through the Administrative Department.
We observed that the Department sent the BEs to the FD with delays ranging between 33 to 70 days from the dates prescribed by the FD during 2011-13.
Details of budget provision and expenditure under three grants37 during the period 2010-13 were as shown in Table-1:
36 College building, construction of staff room, Library development, Laboratory upgradation
and modernisation 37�Grant no. 44-Higher Education, 41- Tribal Areas Sub-Plan and 64- Scheduled Castes Sub-Plan.�
Annual Plans were deficient due to absence of comprehensive database of available resources, adversely affecting the achievement of targets fixed by the Department
Budget estimates were submitted with delays ranging from 33 to 70 days
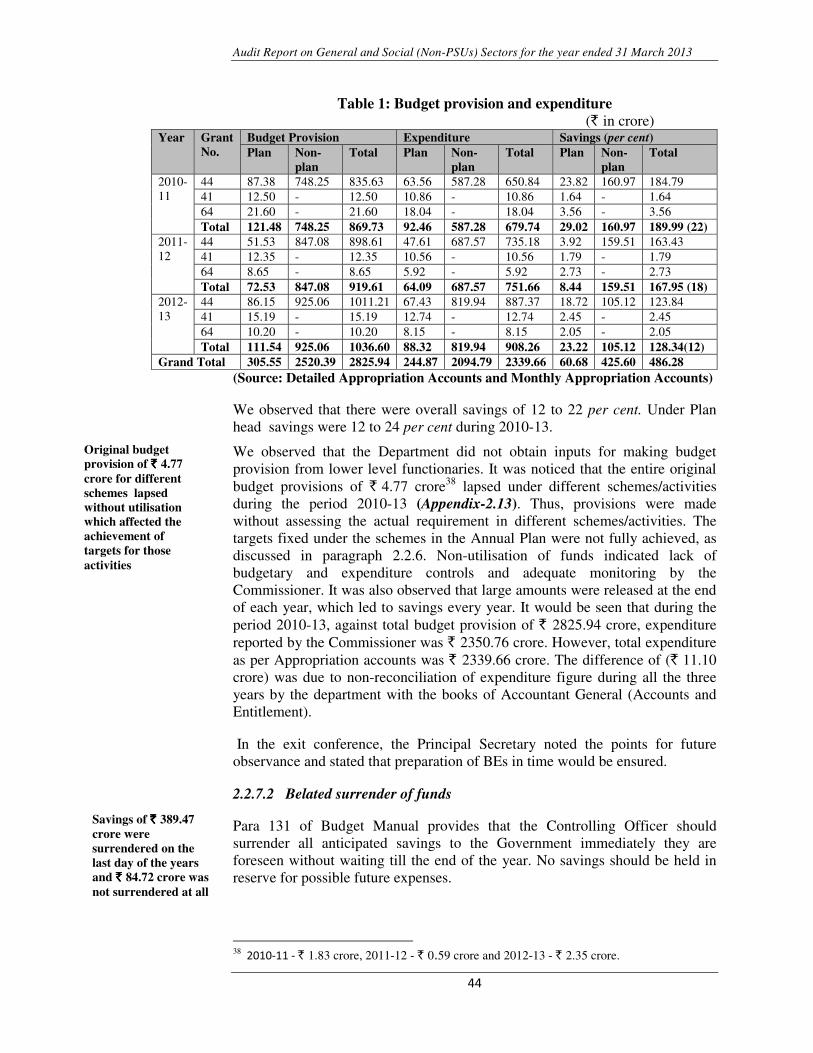
Audit Report on General and Social (Non-PSUs) Sectors for the year ended 31 March 2013
�
�
���
�
Table 1: Budget provision and expenditure (` in crore)
Year Grant No.
Budget Provision Expenditure Savings (per cent) Plan Non-
plan Total Plan Non-
plan Total Plan Non-
plan Total
2010-11
44 87.38 748.25 835.63 63.56 587.28 650.84 23.82 160.97 184.79 41 12.50 - 12.50 10.86 - 10.86 1.64 - 1.64 64 21.60 - 21.60 18.04 - 18.04 3.56 - 3.56 Total 121.48 748.25 869.73 92.46 587.28 679.74 29.02 160.97 189.99 (22)
2011-12
44 51.53 847.08 898.61 47.61 687.57 735.18 3.92 159.51 163.43 41 12.35 - 12.35 10.56 - 10.56 1.79 - 1.79 64 8.65 - 8.65 5.92 - 5.92 2.73 - 2.73 Total 72.53 847.08 919.61 64.09 687.57 751.66 8.44 159.51 167.95 (18)
2012-13
44 86.15 925.06 1011.21 67.43 819.94 887.37 18.72 105.12 123.84 41 15.19 - 15.19 12.74 - 12.74 2.45 - 2.45 64 10.20 - 10.20 8.15 - 8.15 2.05 - 2.05 Total 111.54 925.06 1036.60 88.32 819.94 908.26 23.22 105.12 128.34(12)
Grand Total 305.55 2520.39 2825.94 244.87 2094.79 2339.66 60.68 425.60 486.28 (Source: Detailed Appropriation Accounts and Monthly Appropriation Accounts)
We observed that there were overall savings of 12 to 22 per cent. Under Plan head savings were 12 to 24 per cent during 2010-13.
We observed that the Department did not obtain inputs for making budget provision from lower level functionaries. It was noticed that the entire original budget provisions of ` 4.77 crore38 lapsed under different schemes/activities during the period 2010-13 (Appendix-2.13). Thus, provisions were made without assessing the actual requirement in different schemes/activities. The targets fixed under the schemes in the Annual Plan were not fully achieved, as discussed in paragraph 2.2.6. Non-utilisation of funds indicated lack of budgetary and expenditure controls and adequate monitoring by the Commissioner. It was also observed that large amounts were released at the end of each year, which led to savings every year. It would be seen that during the period 2010-13, against total budget provision of ` 2825.94 crore, expenditure reported by the Commissioner was ` 2350.76 crore. However, total expenditure as per Appropriation accounts was ` 2339.66 crore. The difference of (` 11.10 crore) was due to non-reconciliation of expenditure figure during all the three years by the department with the books of Accountant General (Accounts and Entitlement).
In the exit conference, the Principal Secretary noted the points for future observance and stated that preparation of BEs in time would be ensured.
2.2.7.2 Belated surrender of funds
Para 131 of Budget Manual provides that the Controlling Officer should surrender all anticipated savings to the Government immediately they are foreseen without waiting till the end of the year. No savings should be held in reserve for possible future expenses.
38����������` 1.83 crore, 2011-12 - ` 0.59 crore and 2012-13 - ` 2.35 crore.
Original budget provision of ` ` ` ` 4.77 crore for different schemes lapsed without utilisation which affected the achievement of targets for those activities
Savings of ` ` ` ` 389.47 crore were surrendered on the last day of the years and ` ` ` ` 84.72 crore was not surrendered at all
Chapter 2: Performance Audit
�
�
���
�
It was observed that during the years 2010-11 to 2012-13 the Department surrendered ` 389.47 crore39 out of total savings of ` 486.28 crore on the last day of financial years, leaving little scope for utilising the fund for other development purposes. Further, savings of ` 84.72 crore at the end of respective financial years were not surrendered by the DDOs, which resulted in lapse of the amount. This indicated lack of budgetary and expenditure control. In the exit conference, the Principal Secretary stated (January 2014) that surrender of budget would be made in time and lapses would be avoided.
2.2.7.3 Irregular parking in Civil Deposits to avoid lapse of budget
Rule 284 of MPTC Vol.-I prohibits drawal of funds from treasury unless required for immediate disbursement.
We noticed that during 2009-10, the Commissioner, drew (March 2010) ` 17.60 crore from treasury for construction of buildings (` 16.80 crore) and establishment of new Maharaja Chhatrasal Bundelkhand University (` 0.80 crore) and kept in Civil Deposit after obtaining (March 2010) permission from Finance Department. Only ` 16.80 crore meant for construction was released to three colleges40 during 2012-13 i.e. after three years and the amount of ` 0.80 crore was allowed to lapse to State revenue due to non-utilisation within three years after deposit. Parking of funds in Civil Deposit was irregular and also led to overstatement/understatement of expenditure. Out of ` 16.80 crore, ` 4.85 crore for two colleges were transferred to the construction agency and ` 11.95 crore was available with the college as of December 2013.
The Commissioner stated (August 2013) that funds could not be utilised due to non-allotment of land by the State Government for the University which was under process. The reply is not acceptable as the funds should not have been drawn before allotment of land for construction of buildings.
In the exit conference, the Principal Secretary admitted the audit observation.
2.2.7.4 Non-refunded caution money not deposited in Government account
As per provision contained in paragraph 66 of Pracharya Margdarshika,41
caution money deposits received from students, which were not refunded to them after three years of leaving the college should be remitted into the treasury as lapsed deposits.
We noticed that in 64 out of 88 colleges, caution money deposits amounting to ` 1.68 crore of 2.12 lakh students pertaining to the period 1983-84 to 2008-09 were kept in PD account. The amounts were neither refunded to the students nor were deposited into the treasury. The Principals stated (May to September 2013) that the caution money would be deposited in Government account.
39��������` 136.51 crore, 2011-12, ` 136.13 crore and in 2012-13, ` 116.83 crore
40 Govt. College, Dobi, Sehore (` 2.43 crore), Govt. College Baktara, Sehore (` 2.42 crore), Govt. Girls’ P.G. College, Rewa (` 11.95 crore)�
41�A document which provides guidelines to the Principals for running of the colleges���
`̀̀̀ 17.60 crore was parked in civil deposit without requirement and ` ` ` ` 0.80 crore allowed to lapse
Caution money of `̀̀̀ 1.68 crore not refunded to the students were not deposited in Government account
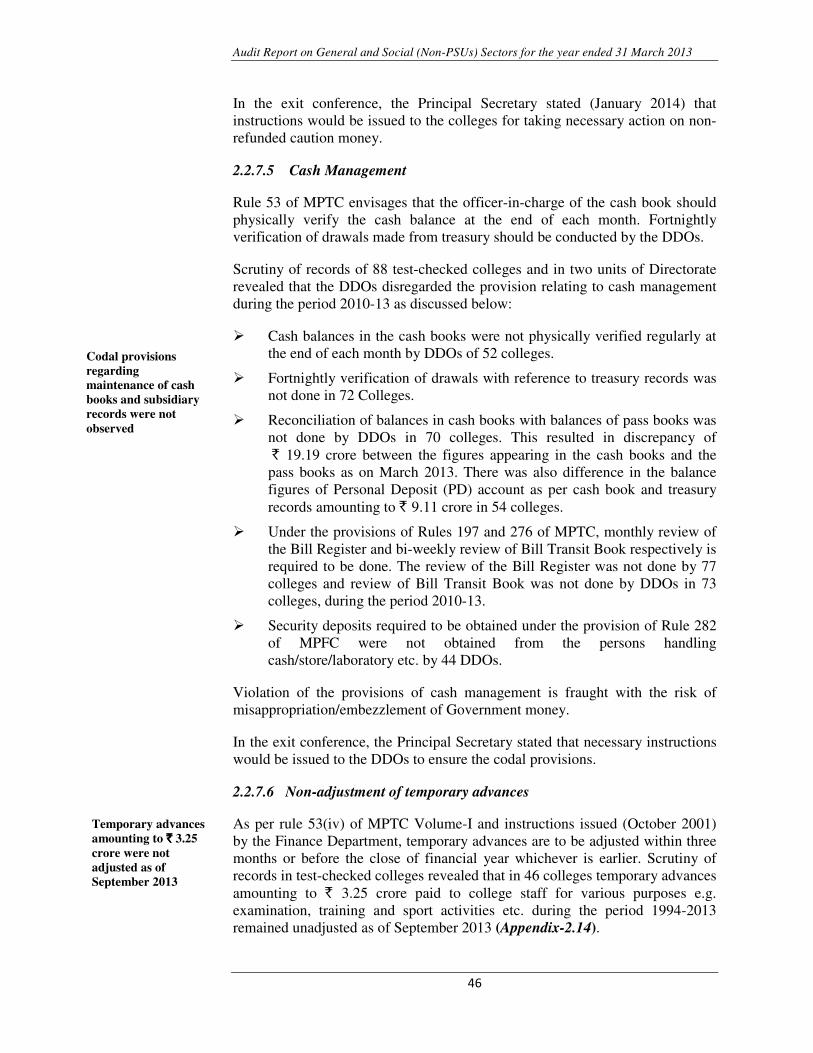
Audit Report on General and Social (Non-PSUs) Sectors for the year ended 31 March 2013
�
�
���
�
In the exit conference, the Principal Secretary stated (January 2014) that instructions would be issued to the colleges for taking necessary action on non-refunded caution money.
2.2.7.5 Cash Management
Rule 53 of MPTC envisages that the officer-in-charge of the cash book should physically verify the cash balance at the end of each month. Fortnightly verification of drawals made from treasury should be conducted by the DDOs.
Scrutiny of records of 88 test-checked colleges and in two units of Directorate revealed that the DDOs disregarded the provision relating to cash management during the period 2010-13 as discussed below:
� Cash balances in the cash books were not physically verified regularly at the end of each month by DDOs of 52 colleges.
� Fortnightly verification of drawals with reference to treasury records was not done in 72 Colleges.
� Reconciliation of balances in cash books with balances of pass books was not done by DDOs in 70 colleges. This resulted in discrepancy of ` 19.19 crore between the figures appearing in the cash books and the
pass books as on March 2013. There was also difference in the balance figures of Personal Deposit (PD) account as per cash book and treasury records amounting to ` 9.11 crore in 54 colleges.
� Under the provisions of Rules 197 and 276 of MPTC, monthly review of the Bill Register and bi-weekly review of Bill Transit Book respectively is required to be done. The review of the Bill Register was not done by 77 colleges and review of Bill Transit Book was not done by DDOs in 73 colleges, during the period 2010-13.
� Security deposits required to be obtained under the provision of Rule 282 of MPFC were not obtained from the persons handling cash/store/laboratory etc. by 44 DDOs.
Violation of the provisions of cash management is fraught with the risk of misappropriation/embezzlement of Government money.
In the exit conference, the Principal Secretary stated that necessary instructions would be issued to the DDOs to ensure the codal provisions.
2.2.7.6 Non-adjustment of temporary advances
As per rule 53(iv) of MPTC Volume-I and instructions issued (October 2001) by the Finance Department, temporary advances are to be adjusted within three months or before the close of financial year whichever is earlier. Scrutiny of records in test-checked colleges revealed that in 46 colleges temporary advances amounting to ` 3.25 crore paid to college staff for various purposes e.g. examination, training and sport activities etc. during the period 1994-2013 remained unadjusted as of September 2013 (Appendix-2.14).
Codal provisions regarding maintenance of cash books and subsidiary records were not observed
Temporary advances amounting to `̀̀̀ 3.25 crore were not adjusted as of September 2013 �
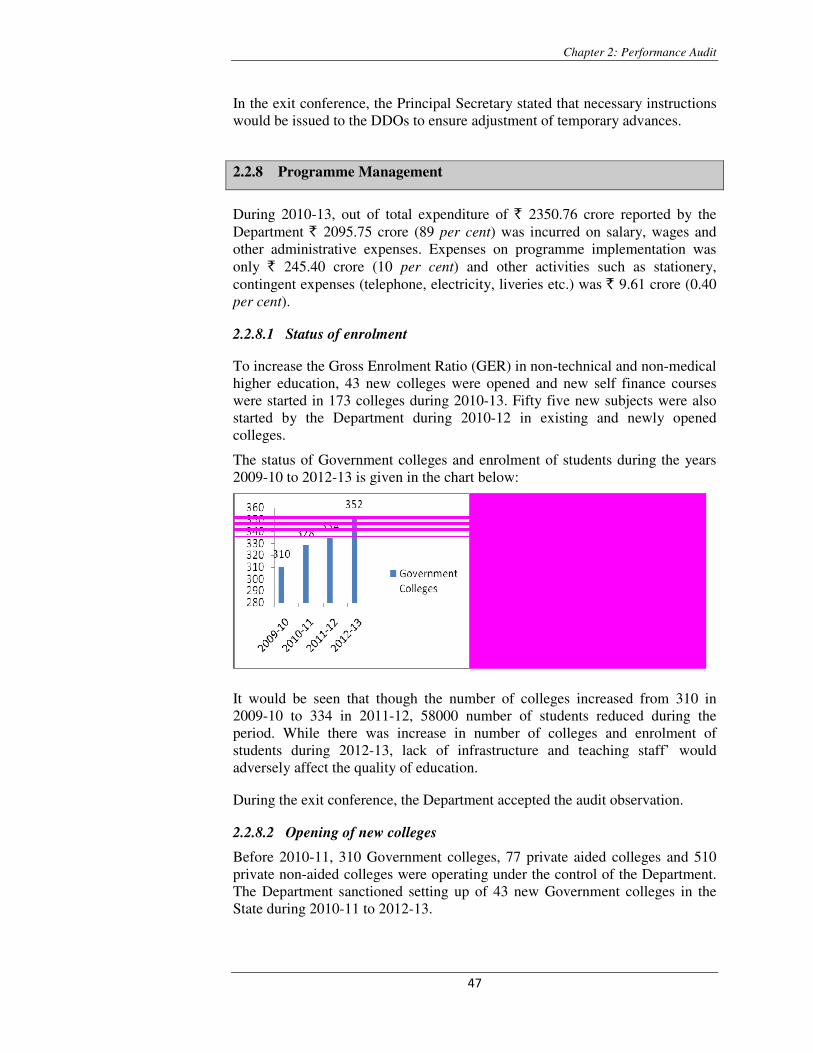
Chapter 2: Performance Audit
�
�
���
�
In the exit conference, the Principal Secretary stated that necessary instructions would be issued to the DDOs to ensure adjustment of temporary advances.
2.2.8 Programme Management
During 2010-13, out of total expenditure of ` 2350.76 crore reported by the Department ` 2095.75 crore (89 per cent) was incurred on salary, wages and other administrative expenses. Expenses on programme implementation was only ` 245.40 crore (10 per cent) and other activities such as stationery, contingent expenses (telephone, electricity, liveries etc.) was ` 9.61 crore (0.40 per cent).
2.2.8.1 Status of enrolment
To increase the Gross Enrolment Ratio (GER) in non-technical and non-medical higher education, 43 new colleges were opened and new self finance courses were started in 173 colleges during 2010-13. Fifty five new subjects were also started by the Department during 2010-12 in existing and newly opened colleges.
The status of Government colleges and enrolment of students during the years 2009-10 to 2012-13 is given in the chart below:
It would be seen that though the number of colleges increased from 310 in 2009-10 to 334 in 2011-12, 58000 number of students reduced during the period. While there was increase in number of colleges and enrolment of students during 2012-13, lack of infrastructure and teaching staff’ would adversely affect the quality of education.
During the exit conference, the Department accepted the audit observation.
2.2.8.2 Opening of new colleges
Before 2010-11, 310 Government colleges, 77 private aided colleges and 510 private non-aided colleges were operating under the control of the Department. The Department sanctioned setting up of 43 new Government colleges in the State during 2010-11 to 2012-13.
Audit Report on General and Social (Non-PSUs) Sectors for the year ended 31 March 2013
�
�
� �
�
For the 43 new Government colleges, the Department sanctioned 399 posts of teaching staff and 539 post of non-teaching staff. We observed that out of newly sanctioned post of 399 teaching staff, 292 (73 per cent) posts were not filled in as of December 201242. We noticed that in 18 new colleges (2010-11: 3 colleges, 2011-12: 8 colleges and 2012-13: 7 colleges) no teaching staff was posted against 138 sanctioned post, though the number of total students enrolled in these colleges was 1720. In 13 colleges having 2253 students, there was only 22 teaching staff against 113 sanctioned posts, i.e. one to three teachers for each college. Thus, the student to teacher ratio was 1:102 against the norm of 1:30 prescribed by UGC for Arts stream at UG level. Details of buildings for running of colleges, posting of non-teaching staff and other facilities available for running the new colleges, though called for, was not made available to Audit. The sanctioned capacity of students was also not available with the Directorate. The Commissioner did not furnish any reply regarding variable student to teacher ratio in different colleges and stated that alternative arrangements were made by engaging guest faculties for fulfilling the vacant posts.
Scrutiny of records of one of the newly opened (2010-11) college at Vidisha revealed the following:
� Government Navin College, Vidisha, started in July 2010 in an old hospital building was situated five km away from the Vidisha city. Initially, only Arts stream was introduced in the college with three subjects. In 2011-12, two more streams Commerce & Science were introduced. No lab facility was available in the college. Only two Assistant Professors one each in Chemistry and Botany subjects were working and the other posts (Physics, Zoology and Mathematics) were vacant as of June 2013. As reported by the Principal, the students attended the classes of other subjects in Girls’ College, Vidisha. The teacher and student position of the college during 2010-13 is given in Table-2:
Table-2: Status of students enrolment and teaching staff in Government college Vidisha
Year Science Arts Commerce Students enrolled
Teacher Students enrolled
Teacher Student enrolled
Teacher Sanctioned Working Sanctioned Working Sanctioned Working
2010-11 - - - 13 5 4 - - - 2011-12 4 5 1 24 5 5 6 3 1 2012-13 31 5 2 120 5 5 18 3 1
It would be seen that number of students enrolled in Science and Commerce stream was very low. Stream-wise capacity of the students in the college had not been intimated to Audit. The non-availability of educational facilities indicates poor study environment which might hinder the quality and standard of education and enrolment.
In the exit conference, the Principal Secretary stated (January 2014) that corrective measures for man-power and for providing basic facilities in the newly opened colleges would be taken.
42��The status as on March 2013 was not made available to Audit�
Inadequate man-power and physical infrastructure noticed in 43 newly opened colleges. In 18 colleges no teaching staff was posted
Chapter 2: Performance Audit
�
�
���
�
2.2.8.3 Library Development and Automation
As per instructions issued (May 1987) by Directorate Education regarding set up of each college, there should be one Librarian and separate study room for students as well as teachers. The library automation system was introduced by the Government in 2003-04. We observed that the Commissioner had no information about the number of colleges in which automation work had been completed and in operation. Scrutiny of records of 88 colleges revealed the following:
� In 23 colleges, the post of Librarian was vacant and in 14 colleges the post was not sanctioned.
� Separate study room for teachers and students was not available in 56colleges.
� Physical verification of library stock was not conducted in 13 colleges.
� Library automation was operated in 40 out of 88 colleges.
In the exit conference, the Principal Secretary stated (January 2014) that necessary steps would be taken for library development and automation.
2.2.8.4 Management of private colleges
The Department accords permission for setting up of new colleges by the private bodies/institutions subject to fulfilment of prescribed conditions. Then the University concerned issues affiliation to the colleges after ensuring the availability of staff as required under the College Code and submission of audit report by Chartered Accountant. Similar procedure is prescribed for opening of new faculties and new subjects.
During the period 2010-13, the Department issued ‘No Objection Certificates’ to set up 177 new private colleges, with Arts stream in 97 colleges, Commerce stream in 141 colleges and Science stream in 100 colleges. But, on an audit enquiry, the Department could not furnish the information about the number of colleges set up and actually in operation and their current status about courses and subjects. This indicates lack of monitoring mechanism to regulate the private non-aided colleges. However, the Department issued (July 2013) instructions to the Principal of Lead Government colleges to gather information on various aspects about the private colleges running in the State.
In the exit conference, the Principal Secretary stated that the current status of private colleges running in the State alongwith the streams and courses/subjects offered by them would be ensured and a database would also be prepared.
(i) Monitoring the utilisation of block grant given to aided non-government colleges
The grants released to aided non-government colleges is regulated by Madhya Pradesh Ashasakiya Shikshan Sansthan (Anudan ka Pradaya) Adhiniyam 1978and instructions issued (July 2000) by Government. Section 5 of the Act provides formation of a separate Fund by the aided colleges called as Institutional Fund for which a separate bank account was to be opened in a nationalised bank. In the Institutional Fund, the Block Grant (50 per cent of pay
There was lack of monitoring over functioning of private aided and non-aided colleges
Audit Report on General and Social (Non-PSUs) Sectors for the year ended 31 March 2013
�
�
���
�
and allowances) provided by the Department and fees collected from the students were to be deposited. In the budget allotment orders for grants released by the Commissioner, it was directed that the Principals of Lead colleges would ensure the deposit of fees in this Fund by the institutions. The utilisation certificates of the grants released were to be obtained by the Commissioner before release of next year’s grants. The accounts of the colleges are to be audited by the Director, Local Fund Audit, Government of Madhya Pradesh. The said Act also provides that the Principals of Lead colleges may at any time inspect any such institution with regard to payment of salaries and ancillary matters.
Scrutiny of records of Commissioner revealed the following:
� During the period 2010-13, the Department incurred expenditure of ` 86.88 crore against the budget provision of ` 118.39 crore on Block grant to 77 private aided colleges running in the State. However, the utilisation certificates pertaining to the years 2010-11 and 2011-12 and number of colleges audited by the Director, Local Fund Audit were not made available to Audit.
� No inspection was conducted by the Commissioner office. Out of 64 aided colleges under 14 Lead colleges test-checked, only 11 aided colleges were inspected by the Principals of five Lead colleges. Thus, they were not in a position to monitor the functioning of the colleges.
In the absence of inspection and audit, actual men-in-position and actual requirement of grants for payment of pay & allowances to them could not be ascertained. This indicates lack of monitoring of the utilisation of grant.
During scrutiny of records of 14 Lead Colleges, it was observed that grants amounting ` 77.25 crore released through the Lead colleges were paid to the 64 aided institutions during 2010-13. But, the Principals of Lead colleges did not ensure the deposit of fees by the institution in their Institutional Fund.
In the exit conference, the Principal Secretary stated that instructions would be issued for regular inspection of aided colleges by the Principals of Lead colleges and to conduct audit by the Director, Local Fund. Deposit of 50 per cent share by the private aided colleges would also be ensured and proper records of release and utilisation of grant would be maintained.
2.2.8.5 Departmental Manual not prepared
Each Department needs to have its own manual for streamlining its activities. The Commissioner recommended to follow the provision of ‘Pracharya Margdarshika’ for proper functioning and management of collegiate administration. The Department had not prepared office procedure as well as Departmental manual for its functioning. The rules, instructions and circulars issued by the Department from time to time were not in compiled form for effective functioning of the Department. The Department stated (January 2014) that action for preparation of Departmental Manual would be taken.
Departmental Manual was not prepared
Chapter 2: Performance Audit
�
�
���
�
2.2.9 Implementation of Schemes
The major schemes reviewed and laxity found in the implementation of the schemes by the Department are discussed in the succeeding paragraphs.
2.2.9.1 Gaon Ki Beti Yojana
The Scheme was started during 2005-06 to promote higher education among meritorious girl students of villages. The girls passed in 12th class in first division from village school and who are resident of village are eligible for assistance under the scheme. The prescribed application alongwith the required documents are to be produced by the students in the college. The students are to be provided ` 500 per month for 10 months in an academic session.
Under the Scheme, the Principal, Lead college is authorised to provide assistance to students of aided and non aided private colleges. The students of aided private colleges would be benefited provided their fee structure is equivalent to fee structure of Government colleges. But, in case of non-aided colleges, they would produce the certificate relating to non-functioning of government /aided institutions within five km area. From 2012-13, the students of non-aided institutions would also be benefitted subject to the fulfillment of conditions prescribed for aided colleges. The number of students benefitted under the scheme were 32,226 in 2010-11, 33,532 in 2011-12 and 34,206 in 2012-13.
We observed the following:
� The budget estimates are sent by the colleges in mudra software43 based on which the Commissioner prepares the budget. In the year 2010-11 allotment of ` 16 crore were made, of which ` 0.75 crore was surrendered. However, in the next year 2011-12, ` 4.41 crore was released for making payment of arrears for the year 2010-11 under the Scheme. Thus, neither the Budget Estimate was realistic nor the surrender of fund was judicious. No periodical physical and financial progress report on the Scheme was prescribed. Thus, the Commissioner could not monitor the progress of expenditure, funds available and excess/saving.
� The Principals were responsible to ensure payment of assistance to the beneficiaries in time. But, it was noticed that in 145 cases assistance of ` 7.78 lakh for the year 2010-13 was not paid to the students of 12 out of 88 colleges as of September 2013 due to lack of funds.
� In the test checked colleges, assistance of ` 73.61 lakh for the year 2010-11 was paid in the subsequent years 2011-12 to 2223 students in 16 colleges. Also, ` 1.40 lakh for 2011-12 was paid out of funds received for 2012-13 in three colleges to 28 students and ` 2.20 lakh for 2012-13 was paid to 44 students in 2013-14 in two colleges due to non-availability of budget and late receipt of applications. The Principal did not send the demand for additional budget to Commissioner and the students were deprived of getting the benefits on time.
43��Software developed by Finance Department for budget preparation.�
Assistance of ` ` ` ` 77.21 lakh was delayed disbursed to 2295 students and ` ` ` ` 7.78 lakh was not paid to 145 students
Due to short provision of funds in 2010-11,` ` ` ` 4.41 crore was released in 2011-12 for payment of arrears �
Audit Report on General and Social (Non-PSUs) Sectors for the year ended 31 March 2013
�
�
���
�
� The Principal of lead college was responsible for disbursement of assistance to the students of aided and non-aided private colleges. The applications of students of private colleges were sent to Lead colleges for sanctioning the assistance. However, seven Lead colleges paid assistance of ` 96.87 lakh to 1842 students of 79 private aided and non-aided colleges without ascertaining the fee structure of these colleges during 2010-13. Similarly, assistance of ` 12.58 lakh was also paid by four Lead colleges to 233 students of 37 non-aided institutions during 2010-12 without getting certificate from the colleges relating to non-functioning of government or aided institutions within five km area.
� There was no provision for regular/periodical reporting by the colleges/ Lead colleges to the higher authorities. In the absence of periodical reporting and close monitoring of schemes, effective implementation could not be ensured and cases of delayed payment or non-payment of assistance to students could not be detected by the Department.
The Commissioner stated (August 2013) that during 2010-12 funds were not released to some colleges as per their demands due to short provision under the Scheme which was met out in the next years.
In the exit conference, the Principal Secretary stated that necessary modifications would be made in the scheme guidelines and instructions would be issued to colleges for ensuring proper implementation of the scheme.
2.2.9.2 Pratibha Kiran Yojana
As per the provisions prescribed in the Scheme guidelines, the girl students of urban BPL families who completed 12th standard from urban area schools and passed the examination in first class were eligible to get benefit under the scheme. The Scheme is applicable for under graduate level students. The girl students of Government as well as non-Government aided colleges are to be provided financial assistance of ` 500 per month for ten months in the academic session. The benefit of the Scheme was also extended to non-aided private colleges from 2012-13. The applications of the students are scrutinised by the Pratibha Kiran Samiti headed by Principal of the college constituted at college level. The Lead colleges were responsible for making payment to students of non-government colleges. The number of students benefitted under the scheme were 2278 in 2010-11, 2594 in 2011-12 and 2733 in 2012-13.
� During the years 2010-11 and 2011-12, expenditure of ` 92.50 lakh and ` 1.33 crore was incurred against the budget provision of ` 98.07 lakh and ` 1.50 crore respectively under the Scheme. We observed that ` 30.74 lakh was released in 2011-12 to 37 colleges to meet the pending cases of 2010-11. In 2011-12, due to inadequate release of funds, ` 1.05 lakh were released to two colleges in 2012-13 for providing assistance to students of 2011-12 even though funds were not utilised fully during 2011-12. This showed that before close of financial years, the Commissioner did not ensure payment of assistance to all the eligible students due to absence of submission of periodical progress report of the scheme by the Lead colleges/concerned colleges.
Scrutiny of records in the test-checked colleges revealed the following:
Assistance of ` ` ` ` 1.09 crore paid to students of private colleges without observing the conditions prescribed
There were short provisions of funds. Arrears in financial assistance was paid in subsequent year �
Chapter 2: Performance Audit
�
�
���
�
� The Principals of the colleges were responsible to ensure timely payment of assistance to students. We observed that students were not paid assistance on time. In eight colleges, assistance amounting to ` 7.68 lakh payable to 169 students during the years 2010-11 and 2011-12 were actually paid during the subsequent years 2011-12 and 2012-13.
� During 2010-13, 67 students were not paid ` 1.79 lakh by five colleges due to non-availability of fund.
In the exit conference, the Principal Secretary stated that necessary modifications would be made in the scheme guidelines and instructions would be issued to colleges for ensuring proper implementation of the Scheme.
2.2.9.3 Vikramaditya free education scheme for students of poor class
The objective of Vikramaditya free education Scheme for poor class is to provide free education (free from tuition fees) to poor meritorious boy students of general category who had secured 60 per cent or more marks in 12th class examination. The students residing in the State and having annual parental income below ` 42,000 (revised in January 2012 to ` 54,000) are eligible for benefits under the Scheme. Under the Scheme, the amount of tuition fees deposited by the students was to be reimbursed by the Department to students of Government and private aided colleges up to under graduate level. From 2012-13, the Department decided to reimburse total fees collected from the students subject to maximum of ` 2500 per annum.
Scrutiny of records of the scheme revealed the following:
� The Principals of the colleges did not ensure timely reimbursement of fees to students. In seven colleges ` 5.63 lakh for 2011-12 was paid to 117 students in the subsequent year 2012-13. In seven colleges ` 1.58 lakh was not paid to 134 students during 2010-13. On this being pointed out, the Principals stated that the main reasons for delayed/non payment were non-availability of fund and non-production of bank account number by the students.
� We noticed that in 14 colleges instead of making reimbursement of tuition fees of ` 2.11 lakh, the entire fees including development fees, library fees, laboratory fees etc. amounting to ` 22.88 lakh were paid to 395 students resulting in excess payment of ` 20.77 lakh during 2010-12.
� The girl students are not entitled for any type of payment under the Scheme. However, it was noticed that irregular payment of ` 10.70 lakh was made to 275 girls in 21 colleges during 2010-13.
In the exit conference, the Principal Secretary stated (January 2014) that suitable instructions would be issued to the colleges for ensuring proper implementation of the scheme.
2.2.9.4 Book Bank Scheme for SC/ST students
Under Book Bank Scheme, the Scheduled Caste/Scheduled Tribe (SC/ST) students of Under Graduate (UG) level and Post Graduate (PG) level are
Improper implementation of the Scheme led to delayed/non-payment of assistance to students
Excess payment of `̀̀̀ 20.77 lakh made to 395 students during 2010-12 and ` ` ` ` 10.70 lakh paid to 275 girls irregularly during 2010-13 in test-checked colleges
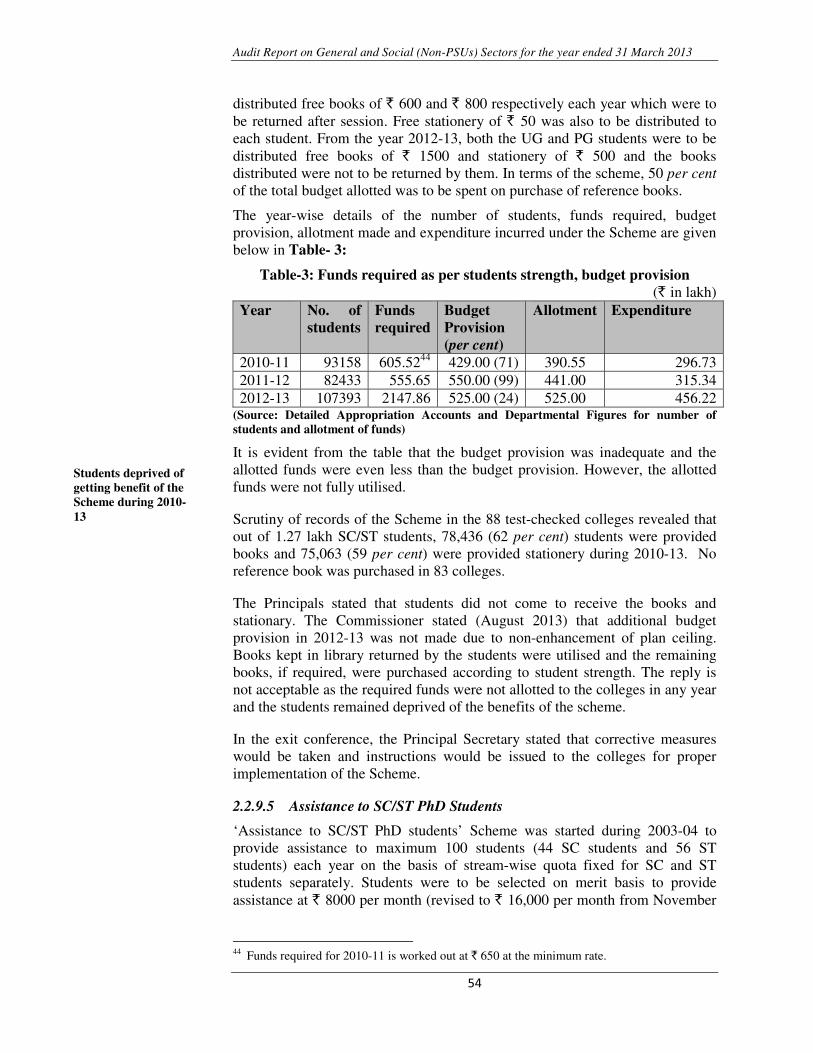
Audit Report on General and Social (Non-PSUs) Sectors for the year ended 31 March 2013
�
�
���
�
distributed free books of ` 600 and ` 800 respectively each year which were to be returned after session. Free stationery of ` 50 was also to be distributed to each student. From the year 2012-13, both the UG and PG students were to be distributed free books of ` 1500 and stationery of ` 500 and the books distributed were not to be returned by them. In terms of the scheme, 50 per centof the total budget allotted was to be spent on purchase of reference books.
The year-wise details of the number of students, funds required, budget provision, allotment made and expenditure incurred under the Scheme are given below in Table- 3:
Table-3: Funds required as per students strength, budget provision (` in lakh)
Year No. of students
Funds required
Budget Provision (per cent)
Allotment Expenditure
2010-11 93158 605.5244 429.00 (71) 390.55 296.73 2011-12 82433 555.65 550.00 (99) 441.00 315.342012-13 107393 2147.86 525.00 (24) 525.00 456.22
(Source: Detailed Appropriation Accounts and Departmental Figures for number of students and allotment of funds)
It is evident from the table that the budget provision was inadequate and the allotted funds were even less than the budget provision. However, the allotted funds were not fully utilised.
Scrutiny of records of the Scheme in the 88 test-checked colleges revealed that out of 1.27 lakh SC/ST students, 78,436 (62 per cent) students were provided books and 75,063 (59 per cent) were provided stationery during 2010-13. No reference book was purchased in 83 colleges.
The Principals stated that students did not come to receive the books and stationary. The Commissioner stated (August 2013) that additional budget provision in 2012-13 was not made due to non-enhancement of plan ceiling. Books kept in library returned by the students were utilised and the remaining books, if required, were purchased according to student strength. The reply is not acceptable as the required funds were not allotted to the colleges in any year and the students remained deprived of the benefits of the scheme.
In the exit conference, the Principal Secretary stated that corrective measures would be taken and instructions would be issued to the colleges for proper implementation of the Scheme.
2.2.9.5 Assistance to SC/ST PhD Students
‘Assistance to SC/ST PhD students’ Scheme was started during 2003-04 to provide assistance to maximum 100 students (44 SC students and 56 ST students) each year on the basis of stream-wise quota fixed for SC and ST students separately. Students were to be selected on merit basis to provide assistance at ` 8000 per month (revised to ` 16,000 per month from November
44��Funds required for 2010-11 is worked out at ` 650 at the minimum rate.
Students deprived of getting benefit of the Scheme during 2010-13
Chapter 2: Performance Audit
�
�
���
�
2012) for three years from the date of registration or the completion of PhD whichever is earlier.
As per Government orders (June 2003), quota for ST students were to be fixed stream-wise viz. Arts (18), Science (19) and Commerce (19). However, the Commissioner fixed the quota for few subjects under the streams in contravention of the Government order. As a result, the students could apply only for those subjects for which the quota was fixed and the meritorious students of other subjects remained deprived of getting benefit of the Scheme. As a result, only 40 ST students applied against the quota of 168 and only 28 of them were benefitted under the Scheme during 2010-13.
The Commissioner stated (August 2013) that from the year 2013-14, the wait listed candidate of any stream would be benefited on merit basis against the vacant seats of other streams. The reply is not acceptable as the directives issued by the Government for fixing stream-wise quota were not followed.
In the exit conference, the Principal Secretary stated (January 2014) that corrective measures would be taken after complete review of the Scheme.
2.2.9.6 Swami Vivekanand Career Guidance Scheme
The ‘Swami Vivekanand Career Guidance Scheme’ was started in 2005-06 with the objective to guide the students to develop a prospective career through career counselling, organising training and job fare/career camps and to set up career library to provide career oriented information to students and each cell should have computer with internet facility. The activities and job oriented training programmes were to be conducted as per the instructions received from State level Coordinator (Director), Indore.
Scrutiny of records related to scheme and information furnished to Audit by the State level Coordinator revealed that during the period 2010-13, expenditure of ` 1.33 crore was incurred by the colleges against the allotment of ` 1.47 crore and 11.79 lakh students were benefited under the Scheme. Job oriented training programme was organised in 335 out of 350 colleges and 31,403 students attended the training during the period 2011-13. During 2011-13, 60 job fares were organised in which 6095 students got placement in the State. The information pertaining to 2010-11 was not furnished to Audit by the Department.
We observed that the job orientation training programmes were organised in 62 test checked colleges and training was imparted to 29,824 students. Of these, job fare was also organised in 35 test checked colleges.
2.2.10 Quality Management
2.2.10.1 Remedial Coaching for SC/ST/OBC and minorities students
In order to enable students belonging to SC/ST/OBC/Minority communities who need remedial coaching to come up to the level necessary for pursuing higher studies efficiently and to reduce their failure and dropout rates, the UGC provided funds during the 11th Plan directly to the colleges for conducting special classes outside the regular time table. Scrutiny of records in the test-
Only 28 ST students were selected against the fixed quota of 168 due to fixation of subject-wise quota instead of fixing stream- wise quota
Students were deprived of getting Remedial Coaching due to non-utilisation of funds
Audit Report on General and Social (Non-PSUs) Sectors for the year ended 31 March 2013
�
�
���
�
checked 88 colleges revealed that in 52 colleges, against ` 2.88 crore provided, ` 1.84 crore was utilised. Out of 36,756 eligible students in these colleges, 27,163 students were benefited. Four45 colleges did not utilise entire provision of ` 13.64 lakh. The remaining colleges did not receive any fund.
In the exit conference, the Principal Secretary stated (January 2014) that necessary instructions would be issued to the colleges for carrying out the programme.
2.2.10.2 Education Satellite Programme
The Ministry of Human Resource Development (GoI), in collaboration with Indian Space Research Organisation (ISRO) launched (September 2004) a project for enabling satellite communication network for supporting extensive reach of quality education at all schools and colleges through the EDUSAT. ISRO was to provide 10 Satellite Interactive Terminals (SIT) to each State and the additional SITs were to be procured by State Governments. The Government of MP decided (May 2005) to create a pool fund for collecting funds from colleges in Government Sarojini Naidu Girls’ PG College, Bhopal. We observed that ` 1.36 crore collected during 2005-08 was transferred (May 2008) to University Coordination Cell account as per decision (May 2008) in Monitoring Committee meeting. The amount was lying with the cell as of September 2013. The Department decided (June 2008, September 2011) to use the money on development of library automation works since the cost of equipments demanded by ISRO was too high and the technique to be facilitated by ISRO was also old. Since the Department failed to implement the Programme, the benefits of the Scheme could not be accrued by the students.
In the exit conference, the Principal Secretary admitted the audit observations and stated that action would be taken for utilisation of the fund deposited in bank account.
2.2.11 Human Resource Management
2.2.11.1 Sanctioned strength and men-in-position
As reported by Commissioner, one post of teaching staff in each subject is created at the time of opening of new college. But, no norms were framed for creation of number of post in different faculties at UG and PG level by the Department. There was nothing on records to show that the requirement of teaching staff in proportion to student strength was assessed. We observed that, the posts of non-teaching staff required in the colleges as per norms46 prescribed (May 1987) by the Department were not sanctioned. The details of shortage in certain non-teaching posts required for smooth functioning of colleges in 352 colleges are given in Table-4:
45 Govt. Girls’ College, Vidisha (` 6 lakh) and Panna (` 3.20 lakh), Govt. P.G. College, Morena
(` 2.83 lakh) and Chhindwara (` 1.61 lakh).�46� Registrar-1 post (more than 1000 students), Accountant – 1 post (up to 1000 students),
Librarian – 1 post, Sports Officer-1 post
The Department failed to implement EDUSAT programme in the State and ` ` ` ` 1.36 crore collected from colleges remained unutilised
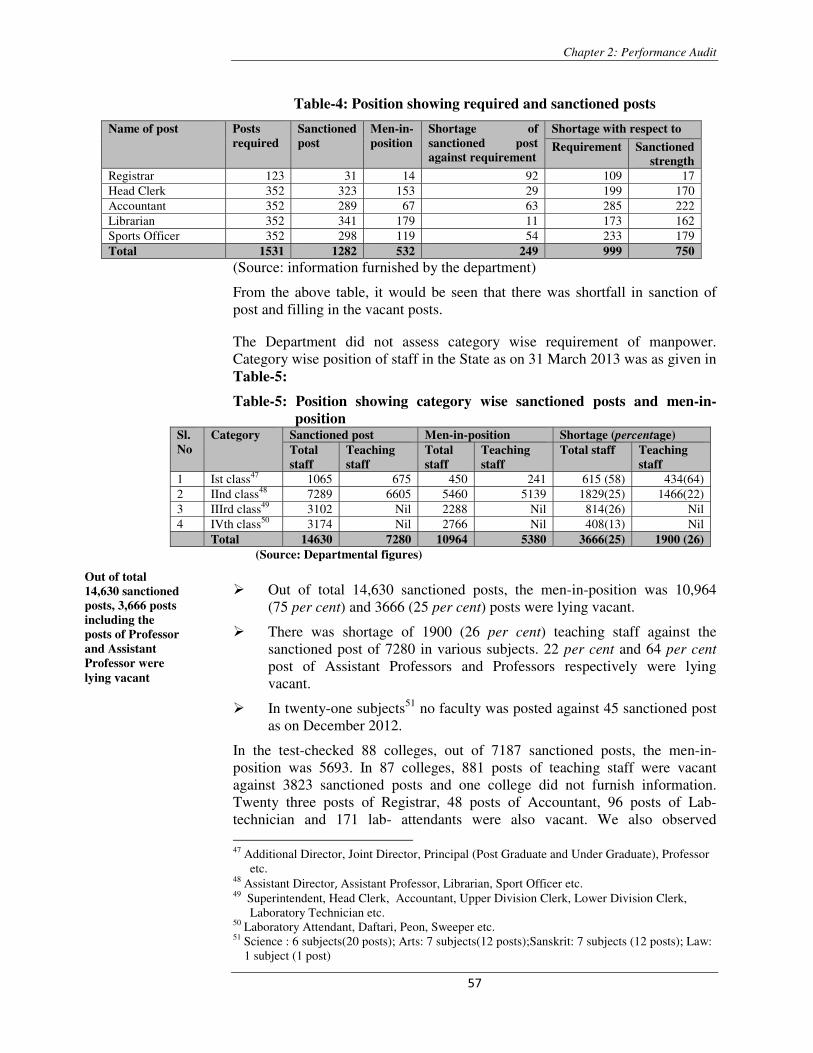
Chapter 2: Performance Audit
�
�
���
�
Table-4: Position showing required and sanctioned posts
Name of post Posts required
Sanctioned post
Men-in-position
Shortage of sanctioned post against requirement
Shortage with respect to
Requirement Sanctioned strength
Registrar 123 31 14 92 109 17 Head Clerk 352 323 153 29 199 170 Accountant 352 289 67 63 285 222 Librarian 352 341 179 11 173 162 Sports Officer 352 298 119 54 233 179 Total 1531 1282 532 249 999 750
(Source: information furnished by the department)
From the above table, it would be seen that there was shortfall in sanction of post and filling in the vacant posts.
The Department did not assess category wise requirement of manpower. Category wise position of staff in the State as on 31 March 2013 was as given in Table-5:
Table-5: Position showing category wise sanctioned posts and men-in-position
Sl. No
Category Sanctioned post Men-in-position Shortage (percentage) Total staff
Teaching staff
Total staff
Teaching staff
Total staff Teaching staff
1 Ist class47 1065 675 450 241 615 (58) 434(64) 2 IInd class48 7289 6605 5460 5139 1829(25) 1466(22) 3 IIIrd class49 3102 Nil 2288 Nil 814(26) Nil 4 IVth class50 3174 Nil 2766 Nil 408(13) Nil
Total 14630 7280 10964 5380 3666(25) 1900 (26) (Source: Departmental figures)
� Out of total 14,630 sanctioned posts, the men-in-position was 10,964 (75 per cent) and 3666 (25 per cent) posts were lying vacant.
� There was shortage of 1900 (26 per cent) teaching staff against the sanctioned post of 7280 in various subjects. 22 per cent and 64 per centpost of Assistant Professors and Professors respectively were lying vacant.
� In twenty-one subjects51 no faculty was posted against 45 sanctioned post as on December 2012.
In the test-checked 88 colleges, out of 7187 sanctioned posts, the men-in-position was 5693. In 87 colleges, 881 posts of teaching staff were vacant against 3823 sanctioned posts and one college did not furnish information. Twenty three posts of Registrar, 48 posts of Accountant, 96 posts of Lab- technician and 171 lab- attendants were also vacant. We also observed 47�Additional Director, Joint Director, Principal (Post Graduate and Under Graduate), Professor
etc. 48�Assistant Director�Assistant Professor, Librarian, Sport Officer etc.
49� Superintendent, Head Clerk, Accountant, Upper Division Clerk, Lower Division Clerk,
Laboratory Technician etc. 50�Laboratory Attendant, Daftari, Peon, Sweeper etc.�
51�Science : 6 subjects(20 posts); Arts: 7 subjects(12 posts);Sanskrit: 7 subjects (12 posts); Law: 1 subject (1 post)�
Out of total 14,630 sanctioned posts, 3,666 posts including the posts of Professor and Assistant Professor were lying vacant
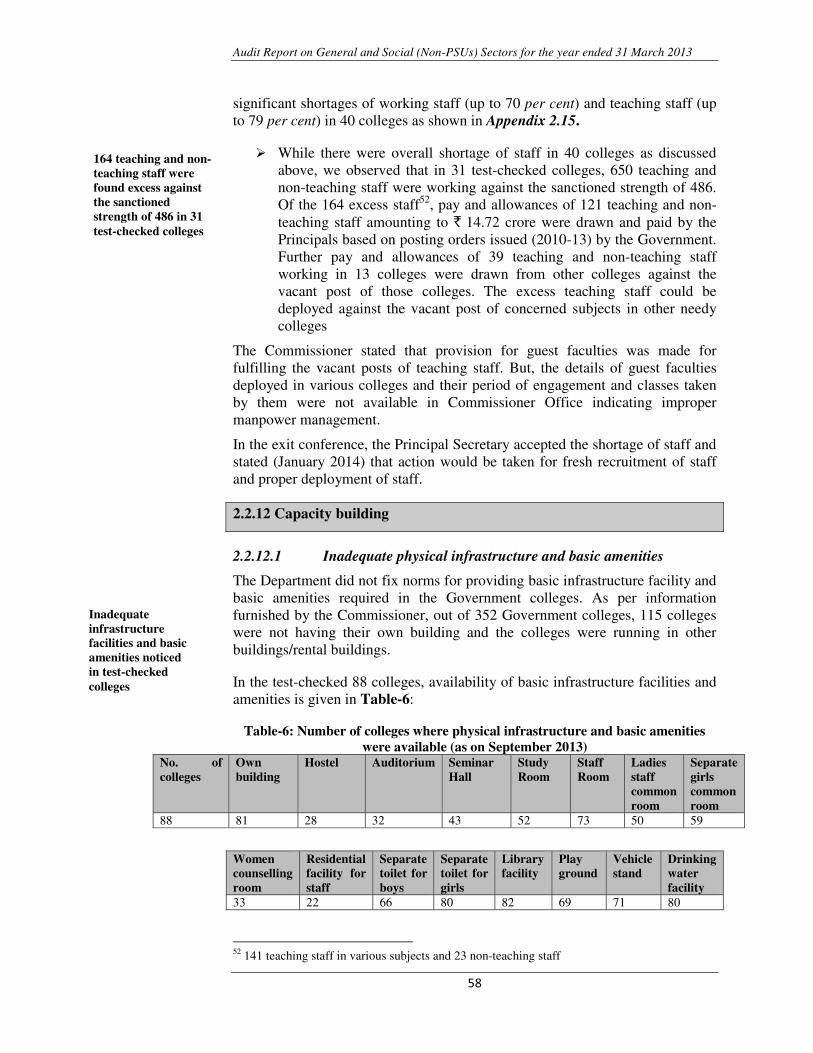
Audit Report on General and Social (Non-PSUs) Sectors for the year ended 31 March 2013
�
�
� �
�
significant shortages of working staff (up to 70 per cent) and teaching staff (up to 79 per cent) in 40 colleges as shown in Appendix 2.15.
� While there were overall shortage of staff in 40 colleges as discussed above, we observed that in 31 test-checked colleges, 650 teaching and non-teaching staff were working against the sanctioned strength of 486. Of the 164 excess staff52, pay and allowances of 121 teaching and non-teaching staff amounting to ` 14.72 crore were drawn and paid by the Principals based on posting orders issued (2010-13) by the Government. Further pay and allowances of 39 teaching and non-teaching staff working in 13 colleges were drawn from other colleges against the vacant post of those colleges. The excess teaching staff could be deployed against the vacant post of concerned subjects in other needy colleges�
The Commissioner stated that provision for guest faculties was made for fulfilling the vacant posts of teaching staff. But, the details of guest faculties deployed in various colleges and their period of engagement and classes taken by them were not available in Commissioner Office indicating improper manpower management.
In the exit conference, the Principal Secretary accepted the shortage of staff and stated (January 2014) that action would be taken for fresh recruitment of staff and proper deployment of staff.
2.2.12 Capacity building
2.2.12.1 Inadequate physical infrastructure and basic amenities
The Department did not fix norms for providing basic infrastructure facility and basic amenities required in the Government colleges. As per information furnished by the Commissioner, out of 352 Government colleges, 115 colleges were not having their own building and the colleges were running in other buildings/rental buildings.
In the test-checked 88 colleges, availability of basic infrastructure facilities and amenities is given in Table-6:
Table-6: Number of colleges where physical infrastructure and basic amenities were available (as on September 2013)
No. of colleges
Own building
Hostel Auditorium Seminar Hall
Study Room
Staff Room
Ladies staff common room
Separate girls common room
88 81 28 32 43 52 73 50 59
Women counselling room
Residential facility for staff
Separate toilet for boys
Separate toilet for girls
Library facility
Play ground
Vehicle stand
Drinking water facility
33 22 66 80 82 69 71 80
52�141 teaching staff in various subjects and 23 non-teaching staff�
Inadequate infrastructure facilities and basic amenities noticed in test-checked colleges
164 teaching and non-teaching staff were found excess against the sanctioned strength of 486 in 31 test-checked colleges
Chapter 2: Performance Audit
�
�
���
�
� Government Nirbhay Singh Patel Science (NSPS) College, Indore was running in the campus of Holker Science College, Indore since July1989. We observed that though 11.68 acre land was allotted (December 2005) by the District Collector to the NSPS College, the work could not be started, due to encroachment. In October 2007, the Principal, Holker Science College paid ` 1.00 core from its own fund for construction work of NSPS College based on Government orders. The amount could not be utilised by the college even after expiry of six years due to stay orders issued by the High Court (October 2008) regarding construction of the building in that land. However, a proposal of ` 90 lakh was sent (June 2013) to Government by the college for construction of building on the vacant land in the campus of Holker Science College for utilisation of available funds. Sanction was awaited as of September 2013. As reported by the Principal, the enrolment was less than 50 per cent of the sanctioned seats which was mainly due to lack of infrastructural facilities.
In the exit conference, the Principal Secretary stated (January 2014) that necessary steps would be taken for providing the basic facilities.
2.2.12.2 Construction Works
� Scrutiny of records of Commissioner, Higher Education revealed that during the period 2011-13, different types of 231 construction works were sanctioned with total estimated cost of ` 148.74 crore. Against this, ` 85.77crore was released and only 21 works were completed and other works remained incomplete. Further, it was observed that time limit for construction works was not fixed by the Commissioner.
� In the test-checked colleges, we noticed that 345 construction/repair works with estimated cost of ` 85.86 crore for which ` 65.84 crore was paid to different agencies remained incomplete in 69 colleges as of September 2013. The period of completion of works was not fixed and intimated to the agency.
In the exit conference, the Principal Secretary stated (January 2014) that necessary action would be taken.
2.2.12.3 Increase in upgradation cost of colleges equivalent to National Premiere Institute
The Government of MP decided in 2008-09 to upgrade three colleges53 of MP to the level of Premiere National Institutes for which additional Central assistance of ` 5 crore per institute amounting to ` 15 crore was received from GoI. As per the detailed project reports (DPRs) of the colleges, the works like infrastructure developments, construction of library, hostels and auditorium were to be constructed in these colleges. Budget provision of ` 15 crore was made during 2008-09 and the amount was drawn (March 2009) and kept in Civil Deposit due to late release of funds by GoI. The Government of MP, accorded administrative and financial approval of ` 15 crore only in January 2010 and the amount was released in February and March 2012. In addition, 53 Govt. Atal Bihari Vajpayee Arts & Commerce College, Indore; Govt. Maharani Laxmibai
Girls’ College, Bhopal; Govt. Maharani Laxmibai College, Gwalior�
345 construction/ repair works were found incomplete in 69 colleges and ` ` ` `
65.84 crore were lying with the construction agencies
Upgradation of colleges equivalent to National Premiere Institute not achieved despite availability of funds ` ` ` ` 18.20 crore
Audit Report on General and Social (Non-PSUs) Sectors for the year ended 31 March 2013
�
�
���
�
` 3.20 crore was drawn during 2009-12 from State budget. Due to inordinate delays in according the administrative approval and release of funds, the upgradation cost of two colleges (Bhopal and Gwalior) was revised (November 2011 and August 2012) from ` 10 crore to ` 12.39 crore. Thus, there was cost over run of ` 2.39 crore.
We further noticed that out of ` 18.20 crore made available to these colleges, ` 11.77 crore54 was paid to construction agencies and ` 6.43 crore were lying in bank account of two colleges (Indore, ` 5 crore and Gwalior, ` 1.43 crore). The works of Indore and Gwalior were not started as of September 2013 while the work of Bhopal College started in February 2011. The works were still in progress and intended upgradation was not yet achieved. Thus, the Central funds received was not utilised after expiry of five years.
The Commissioner stated that status would be intimated after obtaining the progress of work from the colleges. In the exit conference, the Principal Secretary stated that necessary action would be taken.
2.2.12.4 Colleges of Excellence
The Commissioner, Higher Education accorded (February 2009) administrative and financial sanction of ` 30 crore to develop three55 colleges in MP as Colleges of Excellence. The Department released ` 19.06 crore56 to these colleges during 2008-12 for infrastructure development, library, hostel, etc.
During test check of records of two colleges, we observed in Kalidas Girls’ College, Ujjain, required land was handed over to the Principal in July 1989. The Principal, however, paid ` 6.14 crore to the construction agency (MP Housing Board) during 2008-12 without obtaining the necessary clearance from Town and Country Planning Department. This resulted in lying of funds with the construction agency. In PG College, Tikamgarh, ` 6.04 crore was drawn and paid (2009-12) to the construction agency MP Housing Board. The work was under progress.
The Commissioner stated (August 2013) that the progress of works would be intimated after compilation of information. This showed lack of monitoring on the part of the Commissioner. In the exit conference, the Principal Secretary stated (January 2014) that necessary action would be taken.
2.2.12.5 Training of staff
The proposals of training programme of teaching and non-teaching staff are prepared by the Commissioner and sent to Administrative Academy, Bhopal. The Additional Regional Directors send the list of nominated persons to the training centre for getting training. The Commissioner is to pay the training charges prescribed by the Administrative Academy for minimum number of
54
` 1.21 crore to Indore, ` 6.08 crore to Bhopal and ` 4.48 crore to Gwalior�55 Government P.G. College, Datia (` 10 crore), Govt. P.G. College, Tikamgarh (` 10 crore)
and Govt. Kalidas Girls’ College, Ujjain (` 10 crore).�56��` 6.37 crore to College of Datia, ` 6.35 crore to Tikamgarh and ` 6.34 Crore to Ujjain.�
Three colleges were not developed as Colleges of Excellence after expiry of five years
Chapter 2: Performance Audit
�
�
���
�
trainees (General training: 30 trainees and Computer training: 24 trainees) in the training programmes.
During 2010-13, 35 training programmes were organised by the Administrative Academy for imparting trainings to minimum 972 persons for whom the training charges (` 28.63 lakh) were deposited in the Academy. However, only 464 persons in 2010-11, 62 in 2011-12 and 129 in 2012-13 attended the trainings. Thus, 317 (33 per cent) persons could not attend the trainings in the Academy though training charges were paid for them.
The shortfall was attributed by the Commissioner to absence of officials due to local problems, University examination and State Assembly session. The fact remains that required number of persons have not attended the training despite the payment made.
In the exit conference, the Principal Secretary stated to take corrective measures for improvement in the training programme.
2.2.13 Status of information technology in the Department
A Departmental website (www.mp.gov.in.highereducationmp) was created under the directions of State Government and was being utilised for publishing Departmental orders, circulars and other important information. The Department developed various application softwares for implementation of schemes i.e. Gaon Ki Beti Yojana, Pratibha Kiran Yojana, Guest Faculties etc. and softwares relating to budget monitoring system, personal information system, payroll system and gradation list. The Department also developed online modules relating to posting, pay fixation, sanctioned and working strength and free uploading the website of 250 Government colleges in NIC server with the help of NIC. Each college has its own website and e-mail identification. Information related to students and staff viz. time table, course details, enrolment, result, vacant post, staff details, infrastructure facilities etc are available on the college web site. The Department started centralised online admission of students from the year 2012-13. No work plan was, however, prepared at college level to promote IT facilities. During the years 2010 and 2011, IT utilisation of the department was awarded best application software in the State by the State Government.
The Commissioner stated that no specific work plan was prepared to promote e-governance but steps were taken as per requirement.
2.2.14 Monitoring and internal audit
2.2.14.1 Departmental Inspection
Periodic inspections by Departmental officers are an important and effective tool with the management to ensure proper functioning of the Department. The Department did not develop any mechanism/system for inspection of government colleges to ensure adherence to the educational standards. Rule 291 of MPTC Vol-I provides that every DDO should make the monthly inspection
Department did not develop any mechanism/system for Departmental inspection
Information Technology initiative of the Department was commendable
317 out of 972 trainees could not attend the training programmes despite payment of training charges to the Administrative Academy
Audit Report on General and Social (Non-PSUs) Sectors for the year ended 31 March 2013
�
�
���
�
of account of his office and quarterly report should be sent to higher authorities stating therein the corrective steps taken. Scrutiny of records in 88 test-checked colleges revealed that DDOs of 56 colleges did not carry out the inspection during 2010-13. The Commissioner stated that the preparation of norms and procedure for inspection of college is under process.
2.2.14.2 Weakness in system of internal audit
Internal audit (IA) examines and evaluates compliance to the Departmental rules and procedures and statutory provisions so as to provide independent assurance to the management at senior levels on the adequacy of the internal control frame work in the Department and implementation thereof. A separate Internal Audit Wing was formed under the supervision of Drawing and Disbursing Officer comprising of 47 Senior/Junior Auditors. As reported by the Commissioner only two Accountants were working in IA Wing. During 2010-11 and 2012-13, out of 70 colleges proposed for audit, 19 units were audited. No unit was selected for audit during 2011-12. The Commissioner attributed the shortfall in audit to shortage of staff. But, the reply is not acceptable as 28 Senior / Junior Auditors were engaged in other works in the Directorate as stated by the Commissioner. In the exit conference, the Principal Secretary stated to take suitable action.
2.2.14.3 Departmental Enquiry and Legal cases
A Departmental Legal Cell was functioning at the Directorate level. We observed that 615 court cases were pending at the end of March 2013. In 288 cases, first replies were still to be submitted by the Department. The reason for non-submission of first reply was not furnished to Audit. As of September 2013, 12 out of 13 Departmental enquiry cases, 4 family pension cases were pending at directorate level. In the exit conference, the Principal Secretary stated that action would be taken for disposal of pending case.
2.2.14.4 Response to Audit
The Principal Accountant General (General and Social Sector Audit), Madhya Pradesh conducts statutory audit of the Department and its subordinate offices. The shortcomings are brought to notice through Inspections Reports (IRs). As of August 2013, 1055 paragraphs of 416 IRs issued to various offices under the Department up to March 2013 were pending for settlement. Of these, 786 paragraphs of 353 IRs were outstanding for more than five years (2000-01 to 2007-08). This showed lack of response to control mechanisms prescribed for close monitoring and timely action on audit observations. In the exit conference, the Principal Secretary stated to take necessary action.
2.2.15 Conclusion
While the Department has achieved the objectives of providing job placements for students, increase in enrolment and utilisation of IT software application, there were certain deficiencies in the functioning of the Department. There was no database with the Department for preparing Plans. Annual plans were prepared keeping in view the financial ceiling laid down by the State Planning Commission and 10 per cent increase in targets of the preceding year.
Internal Audit Wing was deficient
Poor response to settlement of outstanding audit para
Chapter 2: Performance Audit
�
�
���
�
Budgetary and expenditure controls were weak as reflected from under utilisation of plan funds, last day surrender of savings and keeping of funds in Civil Deposit. Reconciliation of balances of PD accounts as per cash books and treasury records were not done by the DDOs. Monitoring and regulating the functions of non-government colleges was not adequate. Beneficiary oriented schemes were not implemented successfully which resulted in delayed/non payment of financial assistance to the targeted students. Inadequate infrastructure facilities were noticed despite increase in number of colleges and enrolment of students. There was no scientific assessment of manpower requirement and 25 per cent of sanctioned posts were lying vacant in the Department. Besides, improper deployment of staff led to excess or short deployment of staff in test checked colleges. Internal Audit was inadequate since the wing was under-staffed. Monitoring was not satisfactory since norms for Departmental inspections were not prescribed and no inspection was conducted by the Directorate.
2.2.16 Recommendations
� The Department should prepare a database of availability / shortage of infrastructure facilities for preparation of Annual plan.
� Budgetary and expenditure controls should be improved to ensure optimum utilisation of plan funds. Discrepancies in expenditure figures should be reconciled with the books of Accountant General (Accounts and Entitlement).
� The Department should ensure timely payment of assistance to students and proper reporting system for achieving the objectives of the schemes. Efforts should be made to provide adequate infrastructure and basic facilities in government colleges to attain high standards in education..
� Vacancies in the key posts like Professor, Assistant Professor and Registrar etc. should be filled up for improvement in the quality of education.
� The monitoring mechanism including internal audit should be strengthened for better performance of the Department.
Audit Report on General and Social (Non-PSUs) Sectors for the year ended 31 March 2013
�
�
���
�
�
Panchayat and Rural Development Department �
2.3 Indira Awaas Yojana (IAY) �
Executive Summary
Realising the importance of housing in society, the Government of India (GoI) introduced (January 1996) Indira Awaas Yojana (IAY) for providing financial assistance to BPL household of all sections for construction of houses in rural areas. A Performance Audit of implementation of the IAY in the State during 2008-13 revealed deficiencies in implementation.
� Annual Plans were not prepared by any of the test-checked districts. Allocation of targets of houses was done without proper weightage for housing shortage and SC/ST population, though envisaged in the Scheme guidelines.
� Nineteen per cent of the total targets of 2.40 lakh new houses and 17 per cent of total targets of 0.26 lakh upgradation of houses during the period 2008-13 remained incomplete as of March 2013.
� Quality of construction of IAY houses was not ensured. During construction technical guidance and supervision was not provided to IAY beneficiaries.
� Since convergence of the scheme Total Sanitation Campaign was not ensured with IAY scheme, the IAY beneficiaries were deprived of the benefits of sanitary latrines during the years 2008-09 to 2012-13.
� Due to slow spending by the Zilla Panchayats (ZPs) GoI short released ` 61.78 crore during the period 2008-13.
� Providing assistance through DRI loan scheme to the beneficiaries was not arranged by the ZPs.
� The inventory of IAY houses was not maintained at district and block level.
� Inspections of IAY houses by district and block level officials were not conducted as per prescribed schedule, indicating lack of monitoring.
2.3.1 Introduction
Realising the importance of housing in society, the Government of India (GoI) introduced (January 1996) a Centrally Sponsored Scheme, Indira Awaas Yojana (the Scheme) to provide houses to the poor in rural areas funded on cost sharing basis in the ratio of 75:25 with the State Government. Central share was released directly to the Zila Panchayat (ZPs) in two installments. Under the Scheme, funds were transferred in the accounts of beneficiaries
Chapter 2: Performance Audit
�
�
���
�
through Gram Panchayat (GPs) in 2008-09 and 2009-10. Thereafter funds were transferred to beneficiaries directly by the ZPs. Payment of assistance to beneficiaries were to be linked with physical progress of work. The financial assistance of ` 35,000 for construction of a new house (`45,000 since 2010-11) and ` 15,000 for upgradation of kutcha house was admissible to Below Poverty Line (BPL) house holders of all sections living in rural areas. In addition, beneficiary can avail a loan up to ` 20,000 under differential rate of interest (DRI) scheme at an interest rate of four per cent per annum for construction of new house. Under the Scheme, the allocation of both financial and physical targets for SC/ST BPL household and Non SC/ST BPL household was to be done at the ratio of 60:40. However, three per cent of the houses were to be allocated to physically and mentally challenged persons. The IAY houses were to be converged with Total Sanitation Compaign (TSC), Rajiv Gandhi Gramin Vidyutikaran Yojana (RGGVY), and National Rural Drinking Water Programme (NRDWP) for providing sanitary latrine, electric connection and drinking water respectively. The Homestead Scheme was launched for providing house site to those rural BPL household who have neither agricultural land nor house site as part of IAY since August 2009.
2.3.2 Organisational set-up
The Panchayat and Rural Development Department (PRDD) is the nodal Department for implementing the Scheme at the State level. The Principal Secretary (PS) of the PRDD oversees implementation of the Scheme in the State, who is assisted by the Development Commissioner (DC). At the district level, the Scheme is implemented by Chief Executive Officers (CEOs) of Zila Panchayat (ZP) who are assisted by Project Officers (POs). At Block level, CEOs of Janpad Panchayats (JPs)/ Assistant Extension Development Officers (AEDOs) were responsible for implementing the Scheme with the assistance of Gram Panchayats (GPs) at field level.
2.3.3 Audit objectives
The objectives of the performance audit were to assess whether:
� the physical performance under IAY in terms of number of houses constructed and upgraded was planned and targeted and that the constructions corresponded to the quality and financial parameters set out in the Scheme guidelines;
� the systems and procedures in place for identification and selection of the target groups and the processes for allotment, construction and upgradation of dwelling units were adequate and conformed to the Scheme provisions;
� the convergence of the IAY activities with other programmes as envisaged in the guidelines was effectively achieved and ensured availability of a complete functional dwelling unit;
Audit Report on General and Social (Non-PSUs) Sectors for the year ended 31 March 2013
�
�
���
�
� the allocation and release of funds under IAY were made in an adequate and timely manner and that these were utilised economically and efficiently in accordance with the Scheme provisions;
� the mechanism in place for monitoring and evaluation of the outcomes of the Scheme was adequate and effective.
2.3.4 Audit criteria
The audit criteria were derived from the following sources:
� The guidelines of IAY issued by the Ministry of Rural Development (MoRD), Department of Rural Development;
� Annual targets fixed by GoI;
� Periodical reports/returns prescribed by the State Government;
� Circulars/instructions issued by the PRDD, GoI and State Government;
2.3.5 Audit coverage and methodology
Performance Audit of implementation of the Scheme during the period 2008-13 was conducted (May to September 2013) by test-check of records of the office of the DC, and other implementing agencies viz. ZP, JP and GP of 20 districts. Out of 50 districts in the State, 13 districts57 (25 per cent) were selected. Further, additional seven districts58 were selected on the basis of expenditure incurred. In 20 selected districts, 40 blocks were randomly selected and ten GPs (total 400 GPs) in each block were selected. (Appendix-2.16).
An entry conference was held with Additional Chief Secretary, PRDD on 29 April 2013, wherein the audit objectives and methodology were discussed.
The methodology adopted was mainly test-check of files and records maintained by the selected units, collection of data through audit enquiry, beneficiary survey questionnaire, and joint physical verification of 3956 IAY dwelling units (200 in each district) at village level of test checked 389 GPs. An exit conference was held on 05 December 2013 with Additional Chief Secretary, PRDD, wherein the audit findings were discussed. The replies of the Department have been incorporated in appropriate places.
57 Balaghat, Barwani, Dhar, Dindori, Jabalpur, Katni, Khandwa, Mandla,Narsinghpur, Raisen,
Rajgarh, Shajapur and Ujjain.�58���Betul, Damoh, Khargone, Ratlam, Shahdol, Tikamgarh and Umariya.�
Chapter 2: Performance Audit
�
�
���
�
2.3.6 Planning and beneficiary selection
2.3.6.1 Non-preparation of Annual Plan
Para 4.2 of the Scheme guidelines provides that the Annual Plan was to be prepared by the CEO, ZP in each district and should got approved by the Zila Parishad or the Governing Body of the DRDA as the case may be. The same was to be submitted to GoI along with request for release of second installment.
We noticed that neither the test checked ZPs prepared the Annual Plan nor any instruction was issued by the DC for preparation of Annual Plan at district level.
The Government accepted the facts and stated (December 2013) that the targets allocated by GoI were not adequate considering number of BPL households of the district. Hence, preparation of annual plan by the district was not feasible.
The reply was not acceptable since annual plan was required to be prepared to ensure that the district wise allocation of houses are according to the norms envisaged in the scheme guidelines.
2.3.6.2 Allocation of houses
As per Para 4.1 of IAY guidelines, Central assistance under IAY will be allocated among the States/UTs giving 75 per cent weightage to rural housing shortage as per Census data and 25 per cent weightage to poverty ratio. Similarly, inter-district allocations within a State/UT were to be made by giving 75 per cent weightage to housing shortage and 25 per cent weightage to rural SC/ST population of the concerned districts. The targets for the blocks within a District were to be decided on the same principles. Para 2.1 of guidelines stipulates that as far as possible, the State should follow the cluster approach to facilitate better supervision, convergence of schemes and economy in purchase. For this purpose, all the villages in a district/block should be divided into three groups and each group of villages should be provided funds every year.
2.3.6.2(a) Allocation of targets to districts/blocks.
(i) As per the State Government (GoMP) assessment (BPL survey 2002), total housing shortage was 37.15 lakh and as per census data (2001), SC/ST population was 2.14 crore in the State. During the period 2008-13, the GoI allotted 5.71 lakh houses59 to the State. District-wise targets were allocated by the GoI. We observed that the number of houses allocated for the districts based on the housing shortage assessed by the GoMP and the census data of SC/ST population was different from the number actually allocated by the
59 Including 1.05 lakh under homestead
Annual plan was not prepared by any test checked district
Number of BPL household as desired in a particular district not benefited due to injudicious allocation of houses among districts�
Audit Report on General and Social (Non-PSUs) Sectors for the year ended 31 March 2013
�
�
� �
�
GoI. We observed that 1,22,901 houses were allocated in six districts60 against requirement of 62,206 houses. On the other hand 1,11,743 houses were allocated in 12 districts61 against requirement of 1,73,321 houses. Thus, there were disproportionate allocation of houses among the districts. Details are given in (Appendix-2.17).
The Government stated (December2013) that targets were allocated by GoI to districts directly.
(ii) We observed that out of 20 test-checked districts, only in Rajgarh District, the targets were allocated to JP/GPs by giving weightage to housing shortage and SC/ST population of respective JP/GPs as per the norms of guidelines. However, the cluster approach was not adopted in the District. CEOs ZPs, of 17 districts62 allocated targets/funds to Block/GPs on the basis of the total rural population (including non BPL) of the respective Blocks/ GPs for selection of beneficiaries. Further, the cluster approach i.e. division of villages in three groups to ensure providing fund for each group every year was also not adopted by the CEOs.
In Katni District, the targets were allocated village-wise, while in Khargone District, the targets were allocated GP wise. In both districts weightage was given only to housing shortage of the respective Village/GP and the weightage to SC/ST population was ignored in allocation of the targets. Thus, the norms of guidelines in allocation of target were also not adhered to in these districts.
The Government accepted and stated (December 2013) that targets were not allocated to block/GPs as per the norms of guidelines due to inadequate allocation of targets to ZPs.
The fact remains that the allocation of targets was not conforming to the norms of guidelines. This may result in excess or short allocation of houses at block/GPs levels.
2.3.6.3 Selection of beneficiaries
Para 2.1 of the Scheme guidelines stipulates that the beneficiaries were to be selected from the permanent IAY waitlist in order of their seniority in the list. The permanent IAY waitlist was to be displayed at a prominent place either in the Gram Panchayat office or any other suitable place in the village.
We observed that CEOs, ZPs of all the test checked districts allocated the targets in the ratio of 60:40 for SC/ST and non SC/ST households to JP/GPs. Also allocation of houses was made for the physically and mentally challenged person as per norms.
During the joint physical verification, we noticed the following: 60 Dindori, Khandwa ,Rajgarh,Ratlam,Tikamgarh and Umariya�
61 Balaghat, Barwani,Damoh, Dhar, Jabalpur, Katni, Mandla,Narsinghpur, Raisen,Shahdol, Shajapur and Ujjain�
62 Balaghat, Barwani, Betul, Damoh, Dhar, Dindori,Jabalpur, Khandwa, Mandla,Narsinghpur, Raisen, Ratlam, Shahdol, Shajapur,Tikamgarh, Ujjain and Umariya�
Targets for JPs/ GPs were allocated without giving weightage to housing shortage and SC/ST population �
Selection of beneficiaries was not done as per seniority in 79 GPs. Permanent IAY waitlist was not available in 18 GPs
Chapter 2: Performance Audit
�
�
���
�
� Out of 389 test checked GPs permanent IAY waitlist was not available in 18 GPs and beneficiaries were selected from the BPL list.
� Beneficiaries were not selected as per their seniority in waitlist in 79 GPs and selection was done on ad hoc basis.
� Permanent IAY waitlist was not displayed in 53 GPs.
2.3.6.4 Targets and achievement
Under the Scheme the houses were to be constructed by the beneficiaries themselves within two years from sanction of houses. The details of year-wise targets allotted by MoRD (GoI) for construction of new houses and upgradation of houses, completed houses and incomplete houses in 20 test checked districts during 2008-13 are given below:
Table-1 (A): New houses
Year Incomplete houses in the beginning of the year
Houses sanctioned
during the year
Total houses sanctioned for construction
Houses completed during the year
Incomplete houses at the end of the year
2008-09 9,935 48,982 58,917 36,903 22,014 2009-10 22,014 51,807 73,821 41,657 32,164 2010-11 32,164 41,326 73,490 39,361 34,129 2011-12 34,129 42,146 76,275 38,670 37,605 2012-13 37,605 46,335 83,940 38,758 45,182
Total -- OB+2,30,596 -- 1,95,349 --
Table-1 (B): Upgradation of houses
Year Incomplete houses in the beginning of the year
Houses sanctioned
during the year
Total houses sanctioned for
upgradation
Houses completed during the year
Incomplete houses at the end of the year
2008-09 2,158 11,623 13,781 8,995 4,786 2009-10 4,786 12,310 17,096 8,829 8,267 2010-11 8,267 Nil 8,267 3,827 4,440 2011-12 4,440 Nil 4,440 119 4,321 2012-13 4,321 Nil 4,321 Nil 4,321
Total -- OB+23,933 -- 21,770 -- (Source: MPRs prepared by CEO, ZP of 20 test checked districts)
� It would be seen from the above that during the period 2008-13, against 2,40,531 of new houses and 26,091of upgradation of houses, 45,182 new houses (19 per cent) and 4,321 upgradation of houses (17 per cent) remained incomplete as of March 2013.
� It was noticed in the test checked ZPs that the MPRs did not contain information about the number of new houses and upgradation of houses due for completion during the year. As such, the status of age-wise pendency in completion of houses was not recorded in MPRs or in any other records.
� The number of incomplete houses at the end of the year increased from 22,014 to 45,182 despite decrease in allocation of targets of new houses from 51807 to 41326 during the period 2010-13. It is indicative of slow implementation of the Scheme.
� No targets were set for upgradation of houses after 2009-10. However, upgradation of 4321 houses sanctioned up to 2009-10 remained outstanding for completion as of March 2013. There was nothing on record that the ZPs kept watch on completion of upgradation of houses.
4321 houses sanctioned for upgradation during 2009-10 remained incomplete as of March 2013 and assistance of ` 6.48 crore was rendered unfruitful
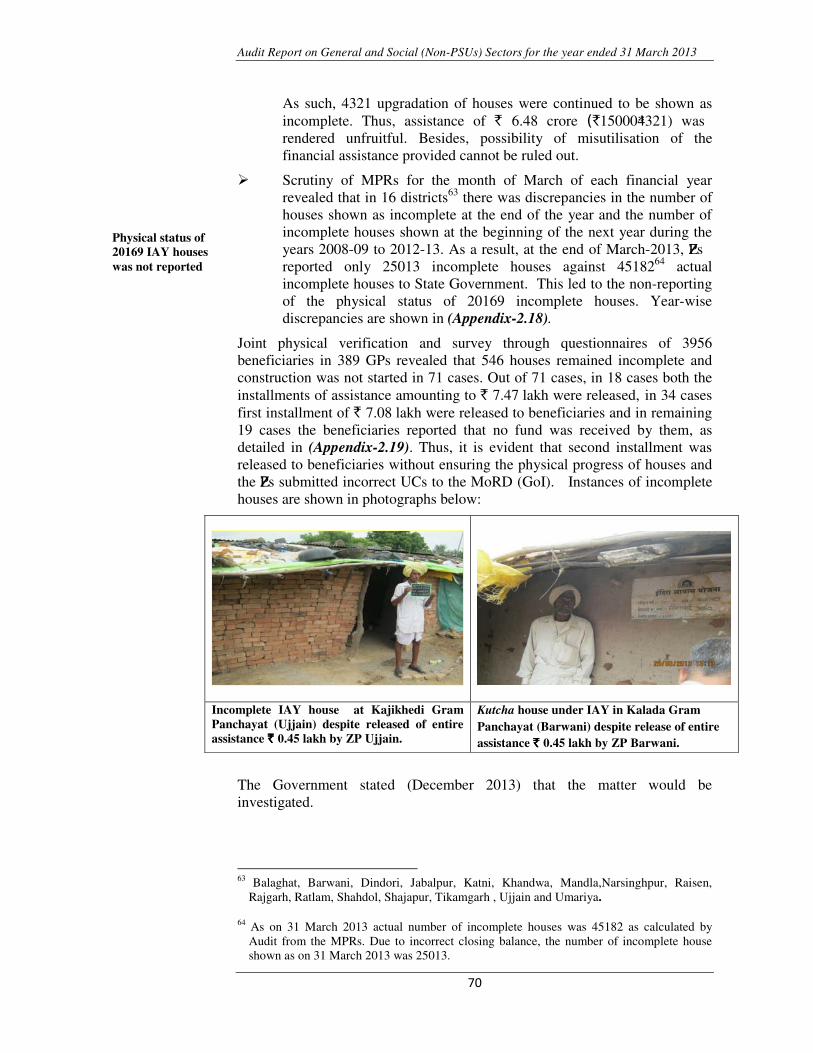
Audit Report on General and Social (Non-PSUs) Sectors for the year ended 31 March 2013
�
�
���
�
As such, 4321 upgradation of houses were continued to be shown as incomplete. Thus, assistance of ` 6.48 crore (`15000*4321) was rendered unfruitful. Besides, possibility of misutilisation of the financial assistance provided cannot be ruled out.
� Scrutiny of MPRs for the month of March of each financial year revealed that in 16 districts63 there was discrepancies in the number of houses shown as incomplete at the end of the year and the number of incomplete houses shown at the beginning of the next year during the years 2008-09 to 2012-13. As a result, at the end of March-2013, ZPs reported only 25013 incomplete houses against 4518264 actual incomplete houses to State Government. This led to the non-reporting of the physical status of 20169 incomplete houses. Year-wise discrepancies are shown in (Appendix-2.18).
Joint physical verification and survey through questionnaires of 3956 beneficiaries in 389 GPs revealed that 546 houses remained incomplete and construction was not started in 71 cases. Out of 71 cases, in 18 cases both the installments of assistance amounting to ` 7.47 lakh were released, in 34 cases first installment of ` 7.08 lakh were released to beneficiaries and in remaining 19 cases the beneficiaries reported that no fund was received by them, as detailed in (Appendix-2.19). Thus, it is evident that second installment was released to beneficiaries without ensuring the physical progress of houses and the ZPs submitted incorrect UCs to the MoRD (GoI). Instances of incomplete houses are shown in photographs below:
Incomplete IAY house at Kajikhedi Gram Panchayat (Ujjain) despite released of entire assistance `̀̀̀ 0.45 lakh by ZP Ujjain.
Kutcha house under IAY in Kalada Gram Panchayat (Barwani) despite release of entire assistance `̀̀̀ 0.45 lakh by ZP Barwani.
The Government stated (December 2013) that the matter would be investigated.
63� Balaghat, Barwani, Dindori, Jabalpur, Katni, Khandwa, Mandla,Narsinghpur, Raisen, Rajgarh, Ratlam, Shahdol, Shajapur, Tikamgarh , Ujjain and Umariya.
�64�As on 31 March 2013 actual number of incomplete houses was 45182 as calculated by Audit from the MPRs. Due to incorrect closing balance, the number of incomplete house shown as on 31 March 2013 was 25013.�
Physical status of 20169 IAY houses was not reported
Chapter 2: Performance Audit
�
�
���
�
2.3.6.5 Convergence of other Schemes/ Departments with IAY
As per Para 3.2 and 5.11 of the Scheme guidelines, all efforts were required to be made by ZPs to ensure that every IAY house was provided with a sanitary latrine, smokeless chulhas and drinking water facility, which were to be dovetailed with other government schemes such as the Total Sanitation Campaign (TSC), National Rural Drinking Water Programme (NRDWP) and provision of free electricity under Rajiv Gandhi GraminVidyutikaranYojana (RGGVY). For effective monitoring of the convergence of the above programmes/schemes a Monthly Progress Report (MPR-3) was devised by MoRD, (GoI). The ZPs were required to liaison with all the nodal agencies implementing the aforesaid schemes in the district. In order to bring about the actual convergence of these programmes at the field level, CEO, ZP will capture the data and furnish the same to MoRD, (GoI) online every month in prescribed format.
2.3.6.5(a) Convergence activities
� We noticed that to ensure the convergence of other schemes/departments with IAY, the Development Commissioner, of Panchayat and Rural Development Department issued instructions in January 2010 to the CEOs ZPs. On audit enquiry CEOs, ZPs of 17 districts65 stated that sanitary latrines were not sanctioned in IAY houses under TSC. However, in Mandla District out of 8328 IAY houses, sanitary latrine was sanctioned (2011-12) in 1,185 IAY houses under TSC. In Betul and Damoh Districts out of 28,162 IAY houses (Betul 13,866 Damoh 14,296) sanitary latrine was sanctioned in 3,941 IAY houses (Betul-782 Damoh-3169) under TSC during 2011-13.
Joint physical verification and beneficiary survey of 3956 IAY houses conducted (May to September 2013) revealed that only 239 beneficiaries received TSC funds and constructed latrines. Of the remaining 3717 beneficiaries 1053 beneficiaries constructed latrines from their own sources.
� The convergence of RGGVY with IAY was not ensured in any of the test checked ZPs as no record of convergence of RGGVY with IAY house was found maintained in any of the test checked ZPs. Out of 3956 houses visited during joint verification electricity connection was available in 2947 houses. However, 1830 IAY houses were electrified in RGGVY as stated by the beneficiaries.
� The convergence of IAY with the activities of National Rural Drinking Water Programme (NRDWP) was also not ensured in any of the test checked districts and no record of convergence of NRDWP with IAY house was found maintained in ZPs. However, drinking water was provided to 291 IAY houses under NRDWP as stated by the beneficiaries out of 3956 houses visited during joint verification.
65 Balaghat, Barwani, Dhar,Dindori,Jabalpur, Katni, Khandwa, Khargone Narsinghpur,
Raisen, Rajgarh, Ratlam, Shahdol,Shajapur,Tikamgarh, Ujjain and Umariya.�
Convergence of other schemes was not done with IAY houses
Audit Report on General and Social (Non-PSUs) Sectors for the year ended 31 March 2013
�
�
���
�
� MPR-3 devised for monitoring of the convergence of other schemes was to be furnished every month to MoRD (GoI) by CEO, ZP. On being enquired about furnishing of MPR-3 to MoRD (GoI), out of 20 test checked districts, CEOs, ZPs of 16 districts66 stated that, MPR-3 was not sent by them. However, CEOs, ZPs of four districts reported that the reports were sent.
Thus, it is evident that large number of IAY beneficiaries were deprived from the benefits of the sanitary latrine, electric connection and availability of drinking water through identified schemes.
The DC confirmed the above facts and stated (September 2013) that MPR-3 was not sent to MoRD (GoI) as no initiative for convergence with IAY was taken by the districts. However, no reason was stated for non-convergence of other schemes with IAY.
The Government accepted and stated (December 2013) that the instructions had been issued (June 2013) to districts for convergence.
2.3.6.5(b) Installation of smokeless chulhas
Para 5.4 of guidelines stipulates that each IAY dwelling unit is provided with a smokeless chulha, which is a fuel-efficient alternative, smoke free, healthy for clean environment and more convenient to use.
Smokeless chulhas were to be installed in IAY houses from the assistance amount under IAY. Installation of smokeless chulha in each completed IAY house was reported by CEO of all the test checked ZPs to the State Government through MPRs. Joint Physical Verification of 3956 IAY houses, however, revealed that smokeless chulha was not installed in 3860 houses (98 per cent) as reported by the beneficiaries. It is evident that reporting to State Government regarding installation of smokeless chulha was incorrect/inflated.
The Government stated (December 2013) that instructions are being issued to CEOs of ZPs and District Collectors in this regard.
2.3.6.6 IAY houses constructed with less than prescribed area
Para 5.3 of guidelines stipulates that the State Government has to finalise the type design for houses assisted under IAY having plinth area not less than 20 square metres.
On enquiry about finalisation of any type design for houses assisted under IAY, the Government and CEOs, ZPs of all the test checked districts stated that no type design was finalised for houses assisted under IAY. We observed that no instruction was issued to ensure, that construction of IAY houses has the minimum prescribed plinth area of 20 square metres.
During the joint physical verification, out of 3956 houses covered in audit, the beneficiary of 273 IAY houses reported that their houses were constructed on less than 20 square metres area.
66 Balaghat, Barwani, Betul, Damoh, Dhar, Jabalpur, Katni, Narsinghpur, Raisen, Rajgarh,
Ratlam, Shahdol, Shajapur, Tikamgarh, Ujjain and Umariya�
Incorrect reporting of installation of smokeless chulhas in IAY houses
Prescribed minimum plinth area for IAY houses not ensured
Chapter 2: Performance Audit
�
�
���
�
The Government stated (December 2013) that the type design of IAY houses was not required. However, construction of IAY houses not on less than 20 square metre area was mandatory.
The reply of Government was not relevant as no records were maintained by AEDO at JP level.
2.3.7 Financial Management
IAY is a Centrally Sponsored Scheme, funded on cost sharing basis in the ratio of 75:25 with the State Government. Central share was released directly to ZPs in two installments. The first installment up to 50 per cent of the total allocation for a particular year was released in the beginning of the financial year. The second installment for the district was released on receipt of request from the DRDAs on fulfillment of certain prescribed conditions e.g. utilisation of 60 per cent of the total available funds, submission of Audit Report of Chartered Accountant (CA) of last year, submission of utilisation certificate for the previous year and submission of utilisation regarding non-diversion and non-embezzlement. Zila Parishads/ DRDAs were to follow the accounting procedures prescribed by the MoRD, (GoI). Audit Report as accepted by the General Body of the concerned DRDA shall be sent to the State Government and Central Government on or before 30th September. IAY funds were transferred in the accounts of beneficiaries through GPs in 2008-09 and 2009-10. The GOMP, PRDD issued orders (January 2010) for transferring scheme fund directly in the accounts of beneficiaries by ZPs from 2010-11 on staggered basis. Installment of payment was to be linked to the progress of work and the assistance was to be released in two installments, first installment with the sanction of houses and second installment when the construction reaches the lintel level.
The Scheme funds comprised of three components i.e. Central share, State share and other receipts (interest on Scheme fund)
Against the total available fund of ` 2310.45 crore (including Homestead), the department spent ` 1984.14 crore (86 per cent) during 2008-13.The details are given below:
Table -2: Allocation, release and expenditure of IAY funds at the State level (`̀̀̀ In crore)
(Source: Sanction orders and MPRs of DC)
67�Total available fund ` 2310.45 crore = Opening balance ` 4.54 crore + Central share
`1702.34 crore + share ` 586.56 crore+ Other receipt ` 17.01 crore�
Year Opening Balance
Central Share
State Share
Other Receipt (Interest on
Scheme fund)
Total Available Fund (TAF)
Expenditure Unspent Balance (Percentage on
TAF) 2008-09 4.54 234.36 75.01 0.30 314.21 289.00 25.21(8.02) 2009-10 25.21 240.86 84.72 0.80 351.59 321.06 30.53(8.68) 2010-11 30.53 440.36 152.80 2.74 626.43 331.70 294.73(47.04) 2011-12 294.73 404.29 128.63 5.62 833.27 624.89 208.38(25.00) 2012-13 208.38 382.47 145.40 7.55 743.80 417.49 326.31(43.87)
Total - 1702.34 586.56 17.01 2310.4567 1984.14 -
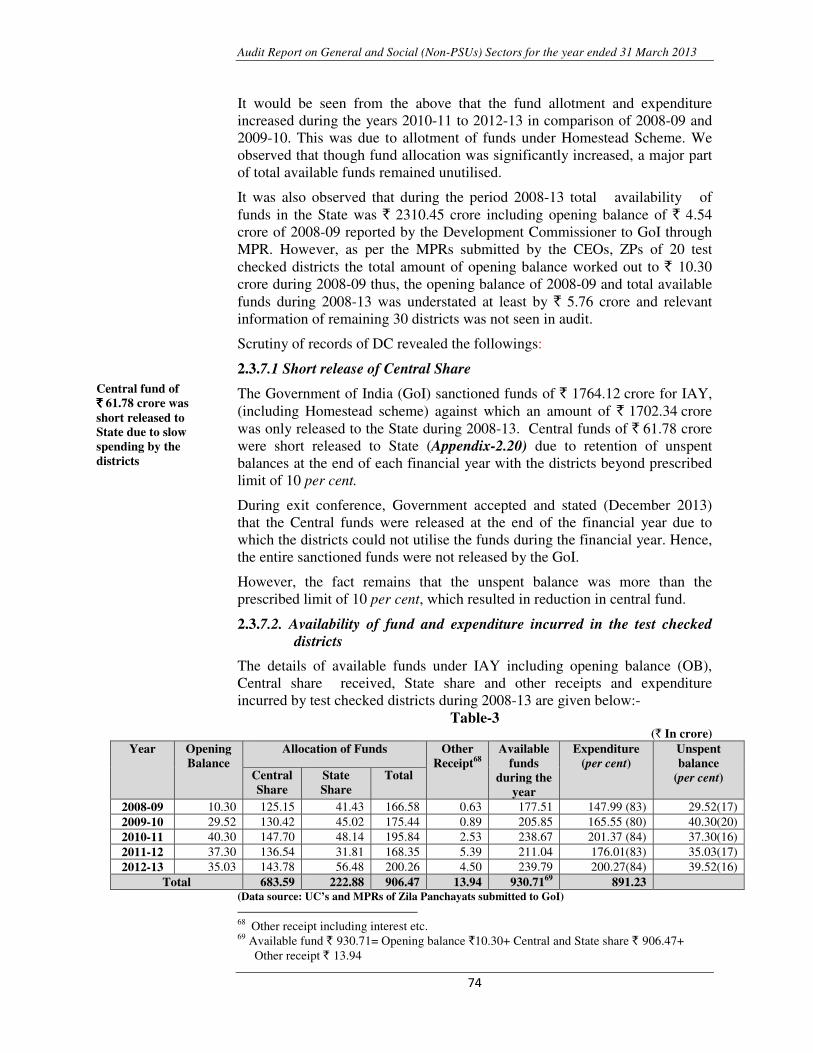
Audit Report on General and Social (Non-PSUs) Sectors for the year ended 31 March 2013
�
�
���
�
It would be seen from the above that the fund allotment and expenditure increased during the years 2010-11 to 2012-13 in comparison of 2008-09 and 2009-10. This was due to allotment of funds under Homestead Scheme. We observed that though fund allocation was significantly increased, a major part of total available funds remained unutilised.
It was also observed that during the period 2008-13 total availability of funds in the State was ` 2310.45 crore including opening balance of ` 4.54 crore of 2008-09 reported by the Development Commissioner to GoI through MPR. However, as per the MPRs submitted by the CEOs, ZPs of 20 test checked districts the total amount of opening balance worked out to ` 10.30 crore during 2008-09 thus, the opening balance of 2008-09 and total available funds during 2008-13 was understated at least by ` 5.76 crore and relevant information of remaining 30 districts was not seen in audit.
Scrutiny of records of DC revealed the followings:
2.3.7.1 Short release of Central Share
The Government of India (GoI) sanctioned funds of ` 1764.12 crore for IAY, (including Homestead scheme) against which an amount of ` 1702.34 crore was only released to the State during 2008-13. Central funds of ` 61.78 crore were short released to State (Appendix-2.20) due to retention of unspent balances at the end of each financial year with the districts beyond prescribed limit of 10 per cent.
During exit conference, Government accepted and stated (December 2013) that the Central funds were released at the end of the financial year due to which the districts could not utilise the funds during the financial year. Hence, the entire sanctioned funds were not released by the GoI.
However, the fact remains that the unspent balance was more than the prescribed limit of 10 per cent, which resulted in reduction in central fund.
2.3.7.2. Availability of fund and expenditure incurred in the test checked districts
The details of available funds under IAY including opening balance (OB), Central share received, State share and other receipts and expenditure incurred by test checked districts during 2008-13 are given below:-
Table-3 (` In crore)
Year Opening Balance
Allocation of Funds Other Receipt68
Available funds
during the year
Expenditure (per cent)
Unspent balance
(per cent) Central Share
State Share
Total
2008-09 10.30 125.15 41.43 166.58 0.63 177.51 147.99 (83) 29.52(17) 2009-10 29.52 130.42 45.02 175.44 0.89 205.85 165.55 (80) 40.30(20) 2010-11 40.30 147.70 48.14 195.84 2.53 238.67 201.37 (84) 37.30(16) 2011-12 37.30 136.54 31.81 168.35 5.39 211.04 176.01(83) 35.03(17) 2012-13 35.03 143.78 56.48 200.26 4.50 239.79 200.27(84) 39.52(16)
Total 683.59 222.88 906.47 13.94 930.7169 891.23 (Data source: UC’s and MPRs of Zila Panchayats submitted to GoI) 68��Other receipt including interest etc.�
69 Available fund ` 930.71= Opening balance `10.30+ Central and State share ` 906.47+ Other receipt ` 13.94�
Central fund of `̀̀̀ 61.78 crore was short released to State due to slow spending by the districts
Chapter 2: Performance Audit
�
�
���
�
It would be seen from the above that the unspent balances in the test checked districts ranged between 16 per cent and 20 per cent which was beyond the prescribed limit of ten per cent. As a result, MoRD (GoI) deducted ` 6.77 crore from the second installment of four districts70.
The Government stated (December 2013) that the second installment was released by GoI at the end of financial year to the districts with delays ranging from four to six months. The districts could not utilise the entire amount during the year, which resulted in unspent balance lying more than prescribed limit.
Further, scrutiny of audit reports of Chartered Accountant (CA), Utilisation Certificates (UCs), Monthly Progress Reports (MPRs), Cash Book, Bank Statements and Ledger etc. of the test checked districts revealed the followings:
� IAY fund of ` 5 lakh was diverted by the CEO ZP Damoh to Pradhan Mantri Gramin Sadak Yojana during 2008-09. The refund of the amount into IAY could not be ascertained from the available records. However, no instance of diversion of IAY fund was noticed in the remaining test checked districts.
� In Janpad Panchayats Mehadwani and Dindori of Dindori district, Scheme funds of ` 18 lakh71 were deposited, without any recorded reason, in another bank account of JPs and not utilised on implementation of the Scheme as of March 2013.
� Against the expenditure of ` 191.66 crore shown in audit reports of Charterd Accountant for various years during 2008-09 to 2011-12 in report of the test checked ZPs72, UCs of ` 205.29 crore were sent to GoI by these districts. Thus, inflated expenditure of `13.64 crore was reported in the UCs as detailed in (Appendix-2.21). However, no difference was noticed in the remaining seven districts.
� The test checked districts reported an expenditure of ` 709.41 crore during the period 2008-12 in MPRs but submitted the UCs of ` 690.93 crore as of September 2013. Thus, there was a difference of ` 18.49 crore in the figures of MPRs and UCs (Appendix-2.22).
The Government stated (December 2013) that the clarification would be sought from the ZPs and action would be taken on the above
� CEOs, ZPs of all the test checked ZPs stated that they got their annual accounts prepared from the CAs, but not got it approved by the General Body of the DRDA during 2008-13.
70 Damoh(`3.37 crore), Dindori(`0.26 crore),,Katni(`2.27 crore) and Ujjain (`0.87crore)�71 Dindori -13 lakh ( 8 lakh in March 2011 & 5 lakh in March 2012), Mehadwani-
5 lakh(May-2012)�72 Balaghat, Betul, Damoh, Dindori, Jabalpur, Katni, Khandwa, Mandla, Raisen ,Rajgarh,
Shahdol, Tikamgarh and Umaria
Central share ` ` ` ` 6.77 crore was deducted from second installment released in four districts
Diversion of IAY fund `̀̀̀ 5 lakh to PMGSY
Inflated UCs of `̀̀̀ 13.64 crore sent to GoI by 13 districts
Annual Accounts of ZPs not got approved by general bodies of DRDA
Audit Report on General and Social (Non-PSUs) Sectors for the year ended 31 March 2013
�
�
���
�
The Government stated (December 2013) that action would be taken in this regard.
During the period 2008-10 funds were transferred in accounts of beneficiary through GPs. In January 2010 the GOMP, PRDD issued orders for transferring the IAY fund directly in the accounts of beneficiaries by ZPs from 2010-11.
We observed that IAY funds of ` 40 lakh pertaining to the period 2008-10 were lying (March 2013) unutilised in the bank accounts of 112 GPs out of 389 test checked GPs due to non-release of full assistance to beneficiaries and less selection of beneficiaries. Details shown in (Appendix-2.23).
We also noticed from the cash book for IAY that ` 12.73 lakh for the year 2007-08 was kept in separate bank account of JP Kasrawad and lying unutilised as of March 2013.
Further we noticed that IAY funds of ` 30.94 crore were transferred in beneficiaries’ account through JPs in three ZPs73 during 2011-12 and 2012-13, in contravention of the order issued (January 2010) by State Government which would affect timely disbursement of assistance. In other test-checked districts assistance was directly transferred to beneficiaries accounts.
In contravention of provisions of the scheme guidelines and orders issued by State Government, CEO, Narsinghpur ZP released (2010-12) entire assistance of ` 2.45 crore in single installment to 545 beneficiaries instead of release of assistance in two installments.
On the above observations pointed out in audit the Government stated (December 2013) that the clarification will be sought from the districts and action would be taken.
2.3.7.3 Loan under DRI Scheme not sanctioned
As per para 3.1.2 of IAY guidelines, ZPs were to facilitate availing of loan under DRI scheme to the IAY beneficiaries. Loan applications were to be obtained by CEOs, ZPs from beneficiaries while sanctioning IAY houses and the same were to be submitted to banks. The CEOs, ZPs of 17 districts74 out of 20 test checked districts stated that they did not take any initiative in this regard. However, CEOs of two ZPs (Khandwa and Mandla) stated that DRI scheme was being advertised through JP/GPs of the districts and the CEO, Dindori District replied that initiatives were taken at ZP level. However, no relevant record was produced by these districts to Audit for verification.
During exit conference the Government accepted the facts and stated that the loan was facilitated under State sponsored housing schemes. However, loan were not arranged for the beneficiaries under IAY.
73�Dindori (`11.74 crore),Raisen (`7.70 crore) and Umariya(`11.50crore)�
74 Balaghat,Barwani, Betul,Damoh, Dhar, Jabalpur, Katni, Khargone, Narsinghpur, Raisen, Rajgarh, Ratlam, Shahdol, Shajapur, Tikamgarh, Ujjain and Umariya
Loan under DRI Scheme not facilitated to IAY beneficiaries
Scheme fund of ` ` ` ` 52.73 lakh remained blocked with JP/GP
Chapter 2: Performance Audit
�
�
���
�
Joint physical verification also revealed that none of the 3956 selected beneficiaries applied for loan under DRI loan scheme.
2.3.8 Programme management
2.3.8.1 Cost effectiveness and quality of material not ensured
Para 5.2 of guidelines stipulates that effort should be made to utilise, to the maximum possible extent, local materials and cost effective disaster resistant and environment friendly technologies developed by various institutions. Zila Parishad/DRDA should contact various organisations/institutions for seeking expertise information on innovative technologies, materials, designs and method to help beneficiaries in the construction/upgradation of durable, cost effective houses and disaster resistant houses. The State Government may also arrange to make available information on cost-effective environment friendly technologies, materials, design etc. at district and block levels.
The DC stated that no committee was formed at State level to coordinate economy in cost and quality of construction of IAY house and nor any initiative was taken by State for providing local materials, cost effective disaster resistant and environment friendly technologies.
The CEOs, ZPs of all the test checked districts stated that no technical supervision was provided to beneficiaries for construction of IAY house nor any initiative was taken for creation of awareness among beneficiaries about the disaster resistant and environment friendly technologies.
There was no system in place at State/district level to ensure adherence to quality parameters for construction.
The Government stated (December 2013) that the districts were instructed to ensure construction of pucca IAY house with sanitary latrine.
Reply of DC and CEOs, ZPs confirms that quality aspect of the houses built under IAY was not ensured.
2.3.8.2 Quality inspection of IAY houses
Para 5.7.1 of guidelines stipulates that technical supervision should be provided for construction of IAY houses. Foundation laying and lintel level are critical stages for maintaining the quality of the house. Therefore, technical supervision should be provided at least at these two stages.
On enquiry about providing of technical supervision for construction of IAY houses, CEO, ZP of 14 districts75 out of 20 test checked districts stated that no technical guidance and supervision was provided to beneficiaries during the construction of houses at foundation or lintel level. However, CEO, ZP of six
75 Balaghat, Barwani,Damoh, Dhar, Jabalpur, Katni, Khandwa,Khargone, Narsinghpur,
Raisen, Rajgarh,Ratlam ,Shahdol and Shajapur �
Quality of Construction of IAY house not ensured
Technical guidance and supervision was not provided to IAY beneficiaries during construction
Audit Report on General and Social (Non-PSUs) Sectors for the year ended 31 March 2013
�
�
� �
�
districts76 stated that technical guidance and supervision was provided by engineering staff of the Department.
The Government stated (December 2013) that since IAY houses were to be constructed by beneficiary as per provisions of the guidelines, quality inspection of IAY houses was not required.
The reply confirms that GoMP did not put in place a mechanism to ensure that technical guidance and supervision was provided to beneficiary of IAY house.
2.3.8.3 Non-preparation of inventory of houses
As per Para 5.9 of IAY guidelines, the IAY implementing agencies were required to prepare a complete inventory of houses completed and upgraded giving details of the date of commencement and completion, name of villages in which these were located, names, address, occupations and categories of beneficiaries etc.
On being enquired about preparation of inventory of houses as envisaged in guidelines, the CEOs of all the test checked ZPs and JPs stated that they did not prepare the inventory of houses. In absence of such records, the correctness of reported physical progress of IAY houses could not be ascertained.
The Government stated (December 2013) that the districts would be directed to maintain inventory of houses.
2.3.8.4 Training not imparted to officers dealing with the IAY
Para 5.7 of guidelines stipulates that officers dealing with the IAY at the State, district and block levels must be trained in various disaster resistant features to be adopted in the houses and they should ensure that this is complied with during their field visits. The awareness among the beneficiaries must be created about the disaster resistant and environment friendly technology through exhibition of low cost technologies at the district and block level, seminars, workshop etc.
We noticed that neither any action plan was prepared nor funds were provided to impart the training and spread the awareness among the beneficiaries about the disaster resistant and environment friendly technology. As such no training on disaster resistant features was imparted to the officers. Seminar and workshop were also not organised for awareness of beneficiaries about low cost technologies.
The Government stated (December 2013) that the action would be taken.
76 Betul,Dindori,Mandla,Tikamgarh Ujjain and Umariya�
Authenticity����physical progress of IAY houses could not be ascertained due to non maintenance of Inventory at ZP/JP level�
No funds were provided for imparting training and generation of awareness regarding disaster resistant and environment friendly technology
Chapter 2: Performance Audit
�
�
���
�
2.3.9 Homestead scheme
Scheme for providing homestead site to those rural BPL household who have neither agricultural land nor house site was launched as part of IAY from 24 August 2009. For the purpose of allotting homestead sites, the beneficiaries were to be selected from Permanent IAY waitlist. In the first instance the State Government has to regularise the land acquired by beneficiary as per the existing Acts and Rules. If this is not the case, State Government will allot suitable Government land as homestead site. In case suitable Government land is not available, private land should be purchased or acquired for this purpose. Financial assistance of ` 10000 per beneficiary or actual, whichever is less, was to be provided for purchase/acquisition of homestead site of an area around 100-250 sq.metres. Assistance of ` 45,000 was to be provided to beneficiary for the construction of house under the homestead scheme.
Under Homestead Scheme, out of 1.39 lakh identified beneficiaries in the State, houses were sanctioned to 1.05 lakh beneficiaries during 2011-12. For this, Central fund of ` 362.29 crore was released to the State Government up to December 2012. Out of total fund of ` 471.62 crore (including State matching share ` 109.33 crore) ` 378.61crore was released to homestead beneficiaries and ` 93.01 crore was remained with districts up to December 2012. We noticed that no private land was purchased/occupied for providing housesite to beneficiaries in the test-checked districts, consequently no expenditure was incurred on land.
The DC stated (September 2013) that Homestead sites were to be regularised under the provision of Madhya Pradesh Land Revenue Code 1959, by way of issuing Bhoo Adhikar Praman Patra to beneficiaries by Teshsildar in case of Government land and by Sarpanch in case of Panchayat's land.
On being enquired about regularisation of land for homestead scheme, out of 20 test checked districts, CEO, ZPs of nine districts77 stated that Bhoo Adhikar Praman Patra was issued for regularisation of occupied land. Accordingly, assistance for construction was released to 21300 beneficiaries under homestead. The CEOs, ZPs of nine other districts78 stated that occupied land was regularised on the basis of recommendation of concerned JP/GPs and accordingly assistance for construction was released to 21,600 beneficiaries. CEOs of two ZPs (Jabalpur and Narsinghpur) stated that occupied land was regularised through survey conducted by team formed by ZP at JP level and assistance was released to 4500 benficiaries (Jabalpur-2400 and Narsinghpur-2100) accordingly. But no record of survey was produced to Audit for verification.
During joint physical verification and beneficiary survey ( May to September 2013) in villages of 389 test checked GPs, out of 493 Homestead beneficiaries,
77Betul(2700),Dhar(3200),Katni(1800),Khargone(3000),Mandla(2800),Ratlam(2900),Shahdol (1800), Tikamgarh(1500) and Ujjain(1600) 78Balaghat(3500),Barwani(1800),Damoh(2500),Dindori(2700),Khandwa(3000),Raisen (2600), Rajgarh(2800) , Shajapur (1200)and Umariya(1500).�
Regularisation of land as required for Homestead beneficiaries was not done and normal IAY beneficiaries were benefited under Homestead Scheme�
Audit Report on General and Social (Non-PSUs) Sectors for the year ended 31 March 2013
�
�
��
�
291 beneficiaries stated that Bhoo Adhikar Praman Patra was not issued to them by Teshsildar/ Sarpanch and 42 beneficiaries also stated that their houses were not constructed despite releasing entire assistance to them. The remaining 160 beneficiaries stated that houses were constructed after issue of Bhoo Adhikar Praman Patra.
The National Level Monitors (NLM) appointed by MoRD, GoI visited (2010-11) four districts of the State including Dhar, one of the test checked Districts. In their report the NLM pointed out that there was no difference between the IAY beneficiaries and Homestead beneficiaries as IAY beneficiaries of the district were benefited under Homestead Scheme.
The Government stated (December 2013) that the matter will be investigated and action would be taken.
2.3.10 Monitoring and Evaluation
As per Para 6.1 of the Scheme guidelines, officers dealing with the IAY at the State Headquarter were required to visit districts regularly to ascertain whether the programme was being implemented satisfactorily and construction of houses was in accordance with the prescribed procedure. Similarly, officers at the district and block levels were required to monitor all aspects of the IAY through visits to work sites. A schedule of inspection which prescribes a minimum number of field visits for each supervisory level functionary from the State level to the Block levels should be drawn up and strictly adhered to.
The Department prescribed (January 2010) the monthly schedule of inspection of IAY houses by the officials at District/Block level to ensure completion of the IAY houses and submission of inspection reports. According to the schedule five houses each by District Collector and CEO ZP, ten houses by CEO JP, 15 houses by Block Development Officer and cent per cent houses were to be inspected by AEDOs at block level every month. A comprehensive report based on these inspection reports was also to be sent by district authority to departmental headquarter latest by 5th of next month.
On enquiry about State level monitoring of the Scheme, the DC stated (September 2013) that no officer was nominated for State level monitoring of the programme due to shortage of staff.
The CEOs, ZPs of all the test checked districts stated that no records of monitoring such as inspection register/inspection reports were maintained. However, the CEOs, ZPs of four districts79 stated that inspection of IAY houses were being conducted along with other rural schemes.
During Joint physical verification and survey through beneficiaries questionnaire, out of 3956 IAY beneficiaries, 2154 beneficiaries (54 per cent) stated that their houses were inspected by AEDOs.
79 Katni, Khandwa, Mandla and Shajapur�
No records maintained for monitoring of the Scheme
Inspection of IAY houses not done as per prescribed schedule
Chapter 2: Performance Audit
�
�
��
�
During exit conference, the Government stated (December 2013) that District authorities were being instructed to strictly observe the inspection schedule. State Level Monitoring Committee will also be constituted.
2.3.10.1 Meetings of Vigilance and Monitoring Committee
As per the guidelines issued by MoRD, the monitoring of IAY is the responsibility of Vigilance and Monitoring Committee (VMC) of State and district levels. The VMCs were required to play a crucial role in monitoring the implementation of rural development programmes. As per provisions of the guidelines, the meetings of State and District level VMCs were to be held quarterly.
� DC stated that only four meetings of VMCs were held at the State level during the period 2008-13 against the required 20 meetings.
� It was observed from the information furnished by CEOs, ZPs of test checked districts that at the district level, only 164 meetings of VMCs were held during 2008-13 in test checked districts against the required 400 meetings80 and nominee of MoRD was not present in 34 of the above meetings.
� We further noticed that no VMC meetings were held in six test checked districts81during last one to three years.
The Government stated (December 2013) that instructions would be issued to districts for holding regular meetings of VMCs and review the IAY scheme properly.
2.3.10.2 Transparency and Accountability
A web-based MIS Programme Software Awaas Soft to capture beneficiary-wise data to monitor the IAY Scheme was launched in July 2010. This is a tool for management, generate all reports, funds released, progress in construction of houses and tracks convergence of all benefit. States were told to upload 100 per cent data on Awaas Soft as release of second installment was connected with expenditure generated through software.
� On being enquired through questionaire about capturing beneficiary-wise data in Awaas Soft, the CEOs, ZPs of five districts82 reported (May to September 2013) that database of beneficiaries was uploaded in Awaas Soft. The CEOs, of eight ZPs83 reported that database of beneficiaries was not prepared and the CEOs of six districts84 reported that database of beneficiaries was being uploaded.
80��4 meetings x 5 years x 20 districts�
81��Ratlam -3(2009-10,2011-12 &2012-13), Mandla-3 (2008-09,2009-10 &2012-13), Dindori-
2 (2008-09 &2012-13), Khandwa-1 (2009-10), Jabalpur-1(2009-10) and Khargone-2 (2008-09 &2009-10)
82 Damoh, Dhar,Khandwa Mandla, and Tikamgarh�83 Balaghat, Barwani,Katni, Ratlam, Shahdol,Shajapur, Ujjain and Umariya�84 Betul, Dindori,Jabalpur,Narsinghpur,Raisen and Rajgarh�
There were shortfalls in VMC meetings of State and district levels. In six districts no meetings were held during last one to three years
Audit Report on General and Social (Non-PSUs) Sectors for the year ended 31 March 2013
�
�
��
�
� CEO of all the test checked ZPs stated that there was no mechanism in place to ensure the correctness of data uploaded in websites. They also stated that there was no separate complaint cell for IAY and complaints related to IAY were being entertained with other complaints.
� Out of 20 districts, CEOs, ZPs of eleven districts85 stated that there was no mechanism/ system in place to ensure that selected beneficiary was not previously benefited under IAY or any other rural housing scheme. However the CEOs, ZPs of eight districts86 stated that it was ensured through JP/GPs.
The Government accepted the fact and stated (December 2013) that the action would be taken.
2.3.10.3 Social audit
As per para 6.3.5 of guidelines system of social auditing of the Scheme was to be followed. On being enquired about social auditing of the scheme, CEO, ZP of nine districts87 reported that social audit was not conducted, CEO, ZP of three districts88 reported that social audit was conducted with other schemes in Gram Sabha, CEO, ZP of three districts89 reported that social audit was conducted and reports were uploaded on website and CEO, ZP of four districts90 reported that social audit of IAY houses was conducted during 2012-13.
2.3.10.4 Evaluation study
As per para 6.2 of IAY guidelines the State conduct evaluation studies on the implementation and impact of the programme in the State. On enquiry about evaluation study on implementation of programme carried out in the State, DC stated since there was no provision for expenses under administrative head under the Scheme, the evaluation study was not conducted.
The Government also accepted (December 2013) the audit observation.
2.3.11 Conclusion
Annual Plans were not prepared by the CEOs of the test checked Zila Panchayats. No instruction was issued by Development Commissioner for ZPs in this regard. The allocation of targets of houses at any level was not conforming to the prescribed norms. The selection of IAY beneficiaries was not in accordance with the Scheme guidelines. Upgradation of 4321 houses 85 Balaghat, Dhar, Jabalpur, Katni, Narsinghpur,Raisen, Rajgarh, Ratlam,Shahdol, Shajapur
and Ujjain�86 Barwani ,Betul,Damoh, Dindori, Khandwa , Mandla.Tikamgarh and Umariya�87 Balaghat,Barwani, Damoh,Dindori,Jabalpur,Narsinghpur,Raisen, Shahdol and Umariya.�88 Katni, Ratlam and Shajapur�89 Dhar, Tikamgarh and Ujjain�90 Betul, Khandwa Mandla and Rajgarh,�
Chapter 2: Performance Audit
�
�
��
�
was not done for three years despite availability of funds. Convergence of IAY with other schemes for water and power supply and providing sanitary latrines was not ensured. The IAY funds were not fully utilised. Since the unspent balances in the districts were more than the prescribed limit of ten per cent, GoI short released ` 61.78 crore during 2008-13. The annual accounts in ZPs were got prepared from the CAs, but none of the district got those approved from the General Body of the ZPs. Providing assistance through DRI loan were not arranged to the IAY beneficiaries. No initiative was taken at any level to ensure cost effectiveness and quality of material. The inventory of houses was not prepared at ZP and JP level. Instances of irregular issuance of Bhoo Adhikar Praman Patra to beneficiaries having home site and agricultural land under homestead scheme were noticed. There was lack of monitoring at every level, inspections of IAY dwelling units by State, district and block officials were not carried out as per prescribed schedule.
2.3.12 Recommendations
� Allocation of targets for houses at each level as per prescribed norms should be ensured.
� Convergence with other schemes should be ensured to extend the benefits of basic amenities to the beneficiaries.
� Optimum utilisation of funds under the scheme should be ensured.
� Beneficiaries should be educated to avail loan under the DRI scheme.
� Providing technical guidance and supervision to IAY beneficiaries should be ensured.
� Preparation of Inventory of houses should be ensured.
� For effective monitoring, conducting the inspections as prescribed may be ensured.
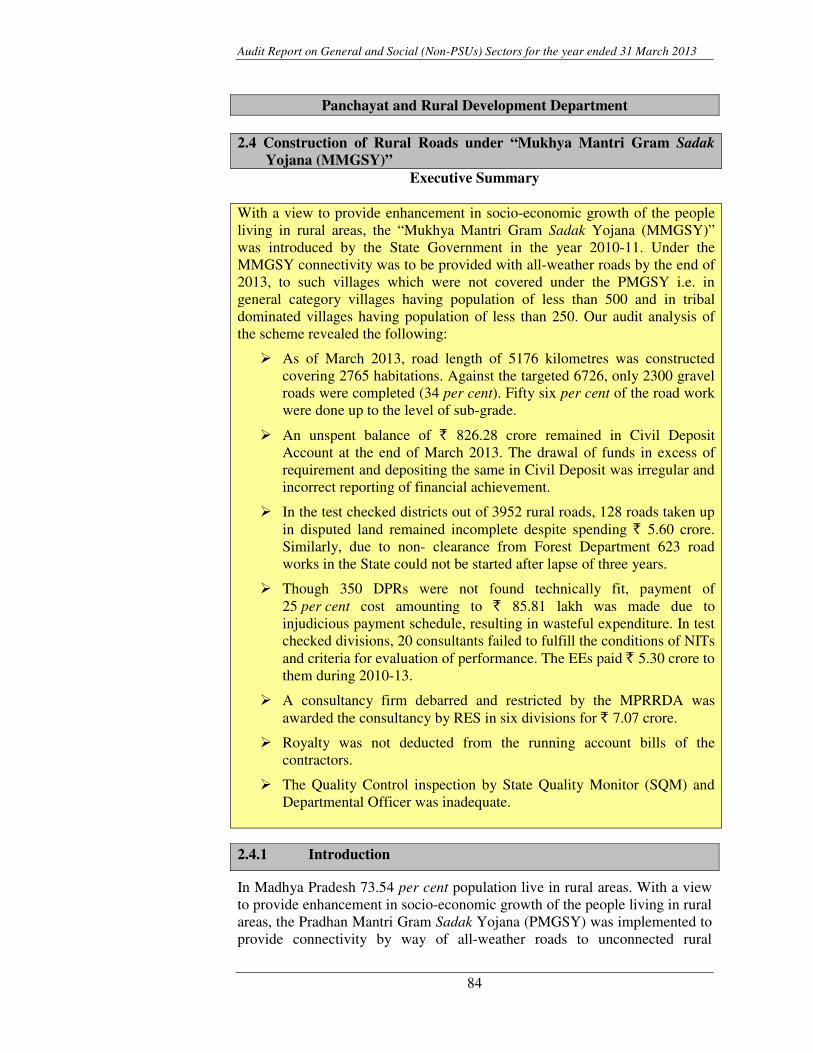
Audit Report on General and Social (Non-PSUs) Sectors for the year ended 31 March 2013
84
Panchayat and Rural Development Department
2.4 Construction of Rural Roads under “Mukhya Mantri Gram Sadak Yojana (MMGSY)”
Executive Summary
With a view to provide enhancement in socio-economic growth of the people living in rural areas, the “Mukhya Mantri Gram Sadak Yojana (MMGSY)” was introduced by the State Government in the year 2010-11. Under the MMGSY connectivity was to be provided with all-weather roads by the end of 2013, to such villages which were not covered under the PMGSY i.e. in general category villages having population of less than 500 and in tribal dominated villages having population of less than 250. Our audit analysis of the scheme revealed the following:
� As of March 2013, road length of 5176 kilometres was constructed covering 2765 habitations. Against the targeted 6726, only 2300 gravel roads were completed (34 per cent). Fifty six per cent of the road work were done up to the level of sub-grade.
� An unspent balance of ` 826.28 crore remained in Civil Deposit Account at the end of March 2013. The drawal of funds in excess of requirement and depositing the same in Civil Deposit was irregular and incorrect reporting of financial achievement.
� In the test checked districts out of 3952 rural roads, 128 roads taken up in disputed land remained incomplete despite spending ` 5.60 crore. Similarly, due to non- clearance from Forest Department 623 road works in the State could not be started after lapse of three years.
� Though 350 DPRs were not found technically fit, payment of 25 per cent cost amounting to ` 85.81 lakh was made due to injudicious payment schedule, resulting in wasteful expenditure. In test checked divisions, 20 consultants failed to fulfill the conditions of NITs and criteria for evaluation of performance. The EEs paid ` 5.30 crore to them during 2010-13.
� A consultancy firm debarred and restricted by the MPRRDA was awarded the consultancy by RES in six divisions for ` 7.07 crore.
� Royalty was not deducted from the running account bills of the contractors.
� The Quality Control inspection by State Quality Monitor (SQM) and Departmental Officer was inadequate.
2.4.1 Introduction
In Madhya Pradesh 73.54 per cent population live in rural areas. With a view to provide enhancement in socio-economic growth of the people living in rural areas, the Pradhan Mantri Gram Sadak Yojana (PMGSY) was implemented to provide connectivity by way of all-weather roads to unconnected rural
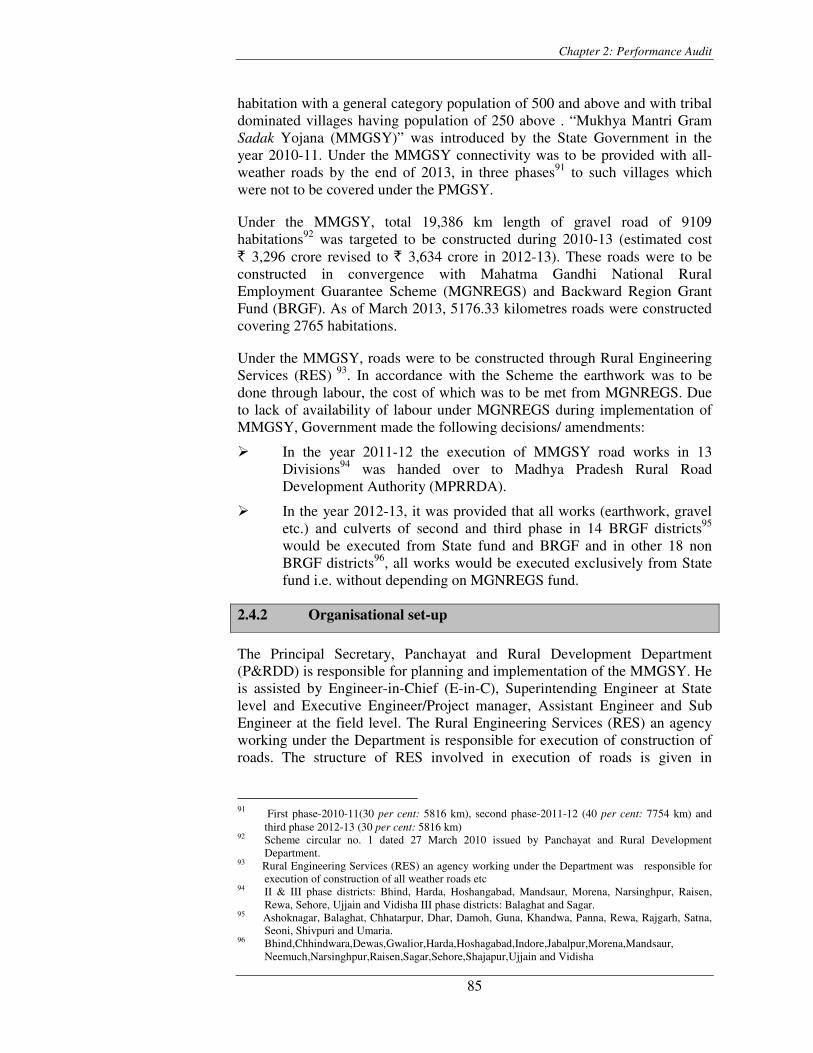
Chapter 2: Performance Audit
85
habitation with a general category population of 500 and above and with tribal dominated villages having population of 250 above . “Mukhya Mantri Gram Sadak Yojana (MMGSY)” was introduced by the State Government in the year 2010-11. Under the MMGSY connectivity was to be provided with all-weather roads by the end of 2013, in three phases91 to such villages which were not to be covered under the PMGSY.
Under the MMGSY, total 19,386 km length of gravel road of 9109 habitations92 was targeted to be constructed during 2010-13 (estimated cost ` 3,296 crore revised to ` 3,634 crore in 2012-13). These roads were to be constructed in convergence with Mahatma Gandhi National Rural Employment Guarantee Scheme (MGNREGS) and Backward Region Grant Fund (BRGF). As of March 2013, 5176.33 kilometres roads were constructed covering 2765 habitations.
Under the MMGSY, roads were to be constructed through Rural Engineering Services (RES) 93. In accordance with the Scheme the earthwork was to be done through labour, the cost of which was to be met from MGNREGS. Due to lack of availability of labour under MGNREGS during implementation of MMGSY, Government made the following decisions/ amendments:
� In the year 2011-12 the execution of MMGSY road works in 13 Divisions94 was handed over to Madhya Pradesh Rural Road Development Authority (MPRRDA).
� In the year 2012-13, it was provided that all works (earthwork, gravel etc.) and culverts of second and third phase in 14 BRGF districts95
would be executed from State fund and BRGF and in other 18 non BRGF districts96, all works would be executed exclusively from State fund i.e. without depending on MGNREGS fund.
2.4.2 Organisational set-up
The Principal Secretary, Panchayat and Rural Development Department (P&RDD) is responsible for planning and implementation of the MMGSY. He is assisted by Engineer-in-Chief (E-in-C), Superintending Engineer at State level and Executive Engineer/Project manager, Assistant Engineer and Sub Engineer at the field level. The Rural Engineering Services (RES) an agency working under the Department is responsible for execution of construction of roads. The structure of RES involved in execution of roads is given in
91 First phase-2010-11(30 per cent: 5816 km), second phase-2011-12 (40 per cent: 7754 km) and
third phase 2012-13 (30 per cent: 5816 km) 92 Scheme circular no. 1 dated 27 March 2010 issued by Panchayat and Rural Development
Department. 93 Rural Engineering Services (RES) an agency working under the Department was responsible for
execution of construction of all weather roads etc 94 II & III phase districts: Bhind, Harda, Hoshangabad, Mandsaur, Morena, Narsinghpur, Raisen,
Rewa, Sehore, Ujjain and Vidisha III phase districts: Balaghat and Sagar. 95 Ashoknagar, Balaghat, Chhatarpur, Dhar, Damoh, Guna, Khandwa, Panna, Rewa, Rajgarh, Satna,
Seoni, Shivpuri and Umaria. 96 Bhind,Chhindwara,Dewas,Gwalior,Harda,Hoshagabad,Indore,Jabalpur,Morena,Mandsaur,
Neemuch,Narsinghpur,Raisen,Sagar,Sehore,Shajapur,Ujjain and Vidisha
Audit Report on General and Social (Non-PSUs) Sectors for the year ended 31 March 2013
86
Appendix-2.24. The MPRRDA is responsible for execution of the roads handed over to them.
2.4.3 Scope and methodology of audit
Audit of implementation of the MMGSY was conducted between February and August 2013 covering the period from 2010-11 to 2012-13. Records maintained in the office of the Engineer in Chief (E-in-C) and 22 divisions/districts97 out of 50 divisions/districts under Rural Engineering Services were test checked. However, execution of roads by MPRRDA has not been covered in audit. Audit methodology included collection of information from the Department by issue of questionnaire, examination of records, communication of audit observations by issuing audit memos and obtaining their replies. The exit conference was held in December 2013 with the Additional Chief Secretary (ACS) & Development Commissioner and the replies of Government/Department were incorporated at appropriate places.
2.4.4 Audit objectives
The audit objectives were to assess whether:
� the financial management was adequate and efficient;
� proper surveys were conducted for selection of roads and the planning was adequate for connectivity of rural habitations;
� execution of work was efficient to achieve the MMGSY objectives;
� the contract management was efficient and effective: and
� the quality control mechanism was adequate and efficient.
2.4.5 Audit criteria
The audit criteria were derived from the following sources:
� The Circular/instructions/orders related to implementation of the MMGSY;
� Madhya Pradesh Works Department Manual (MPWDM), Madhya Pradesh Treasury Code (MPTC) and Madhya Pradesh Financial Code (MPFC) ;
� Rural Road Plans, Detailed Project Reports, Estimates, Sanctions and approved specifications; and
� Contract documents of the works and consultant services.
97….. Anuppur, Ashoknagar, Badwani, Balaghat, Chhindwara, Damoh, Dewas, Guna, Gwalior,
Hoshangabad, Jabalpur, Katni, Mandsaur, Narsinghpur, Raisen, Rajgarh, Rewa, Sehore, Shajapur, Umaria, Ujjain and Vidisha ( One RES division in each district)
Chapter 2: Performance Audit
87
2.4.6 Audit findings
2.4.6.1 Financial management
2.4.6.1(a) Funding for the Scheme
Under the MMGSY, the funds were to be provided as under:
Through MGNREGS: The wage part for the construction of road was to be executed through the Job Card holders under MGNREGS. Expenditure on wages and material under transportation of soil, watering and rolling for road construction was to be bifurcated in the ratio of 60:40, as per norms of MGNREGS. Payment for preparation of DPRs, supervision and quality control of construction work was to be made to the consultant from administrative head of MGNREGS. Through BRGF: The construction of culverts in 29 BRGF districts98 was to be done on contractual basis and was to be funded by BRGF. State (MMGSY) Fund:
(i) The expenditure for construction of base course, surface course and gravel was to be made from State fund (after preparation and formation of earthwork from MGNREGS).
(ii) In case of excess expenditure incurred on material exceeding the prescribed ratio of 60:40, the cost in excess of the ratio was to be charged from State fund.
(iii) The construction of culverts was also to be done through contractors in 21 districts99 (other than those covered under BRGF) and the expenditure was to be met from State fund.
(iv) The expenditure on culverts of more than 6 meter up to 10 meter was to be met from State fund in all the districts. For this purpose, the funds were borrowed from Mandi Nidhi 100by the State Government.
We observed that under the Scheme, the estimated cost of roads and culverts amounting to ` 3296 crore (2010-11) included ` 2050 crore from MGNREGS. The estimates were revised to ` 3634 crore101 in 2012-13. The fund from MGNREGS were reduced by ` 1555 crore i.e. from ` 2050 crore to ` 495 crore due to non availability of labour for earth work. The additional provision of ` 1893 crore (` 1555 crore + ` 338 crore) was made from the State Fund. The facts indicate that no proper study was made by the Department for the utilisation of MGNREGS fund before providing the estimated expenditure under the MMGSY and put extra financial burden on state exchequer.
98 Ashoknagar, Anuppur, Alirajpur, Betul, Badwani, Burhanpur, Balaghat, Chhatarpur, Dhar,
Dindori, Damoh, Guna, Jhabua, Katni, Khargone, Khandwa, Mandla, Panna, Rewa, Rajgarh, Shahdol, Sidhi, Seopur, Singhroli, Satna, Seoni, Shivpuri, Tikamgarh and Umaria,
99 Bhopal, Bhind, Chhindwara, Dewas, Datia, Gwalior, Harda, Hoshangabad, Indore, Jabalpur, Morena,Mandsaur, Neemuch, Narsinghpur, Ratlam, Raisen, Sagar, Sehore, Shajapur Ujjain and Vidisha
100 Kisan Mandi Sadak Nidhi is created for the construction of rural roads.101 Increase of ` 338 crore was due to coverage of culvert more than six meters under MMGSY
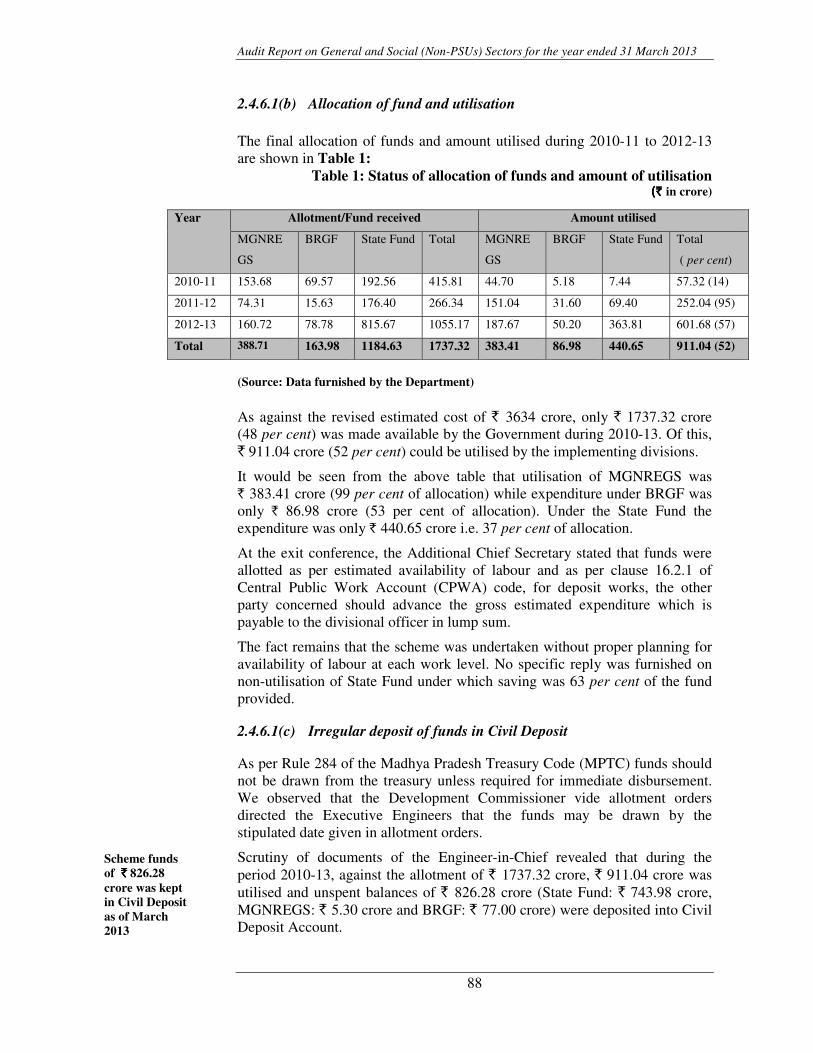
Audit Report on General and Social (Non-PSUs) Sectors for the year ended 31 March 2013
88
2.4.6.1(b) Allocation of fund and utilisation
The final allocation of funds and amount utilised during 2010-11 to 2012-13 are shown in Table 1:
Table 1: Status of allocation of funds and amount of utilisation (` (` (` (` in crore)
(Source: Data furnished by the Department)
As against the revised estimated cost of ` 3634 crore, only ` 1737.32 crore (48 per cent) was made available by the Government during 2010-13. Of this, ` 911.04 crore (52 per cent) could be utilised by the implementing divisions.
It would be seen from the above table that utilisation of MGNREGS was ` 383.41 crore (99 per cent of allocation) while expenditure under BRGF was only ` 86.98 crore (53 per cent of allocation). Under the State Fund the expenditure was only ` 440.65 crore i.e. 37 per cent of allocation.
At the exit conference, the Additional Chief Secretary stated that funds were allotted as per estimated availability of labour and as per clause 16.2.1 of Central Public Work Account (CPWA) code, for deposit works, the other party concerned should advance the gross estimated expenditure which is payable to the divisional officer in lump sum.
The fact remains that the scheme was undertaken without proper planning for availability of labour at each work level. No specific reply was furnished on non-utilisation of State Fund under which saving was 63 per cent of the fund provided.
2.4.6.1(c) Irregular deposit of funds in Civil Deposit
As per Rule 284 of the Madhya Pradesh Treasury Code (MPTC) funds should not be drawn from the treasury unless required for immediate disbursement. We observed that the Development Commissioner vide allotment orders directed the Executive Engineers that the funds may be drawn by the stipulated date given in allotment orders.
Scrutiny of documents of the Engineer-in-Chief revealed that during the period 2010-13, against the allotment of ` 1737.32 crore, ` 911.04 crore was utilised and unspent balances of ` 826.28 crore (State Fund: ` 743.98 crore, MGNREGS: ` 5.30 crore and BRGF: ` 77.00 crore) were deposited into Civil Deposit Account.
Year Allotment/Fund received Amount utilised
MGNRE
GS
BRGF State Fund Total MGNRE
GS
BRGF State Fund Total
( per cent)
2010-11 153.68 69.57 192.56 415.81 44.70 5.18 7.44 57.32 (14)
2011-12 74.31 15.63 176.40 266.34 151.04 31.60 69.40 252.04 (95)
2012-13 160.72 78.78 815.67 1055.17 187.67 50.20 363.81 601.68 (57)
Total 388.71 163.98 1184.63 1737.32 383.41 86.98 440.65 911.04 (52)
Scheme funds of `̀̀̀ 826.28 crore was kept in Civil Deposit as of March 2013
Chapter 2: Performance Audit
89
Thus, the expenditure shown at the end of each year did not depict the true picture of utilisation of funds. In the test checked divisions, ` 387.98 crore102
were drawn from the treasury in excess of expenditure, which was kept in the Civil Deposit. Drawal of funds at the end of the year and keeping of the same in Civil Deposit was irregular. In February 2013 Finance Department issued instruction that the process adopted by various Department of State Government to draw fund and keep in civil deposit account during the financial year was not in accordance with the rules and appropriate financial management.
At the exit conference the Additional Chief Secretary stated that from 1 April 2014 electronic fund management system for RES will be adopted and action would be taken to ensure that such excess drawls do not occur in future.
2.4.7 Planning
2.4.7.1 Selection of roads
The MMGSY guidelines were issued in October 2009 for those unconnected habitations which are not covered under PMGSY. The district-wise/block-wise information pertaining to number of roads, proposed length and benefited population, was issued (October 2009) by Chief Engineer, Madhya Pradesh Rural Road Development Authority, Bhopal. On the basis of aforesaid information, the Chief Engineer (NREGS) Council intimated (October 2009) the Collector/CEO that Executive Engineer, Assistant Engineer and Sub- Engineer MGNREGS/RES may be directed to collect information regarding selection of roads by walk-through-survey103. In March 2010, P&RRD issuedinstructions that under the MMGSY road length of each cluster104 should be of a minimum of 20 km and maximum of 25 km. In the last cluster the length can be of less than 20 km. In exceptional circumstances approval for derivation was to be obtained from the Development Commissioner.
Scrutiny of records of test checked Divisions revealed the following:
� In 131 clusters105 of 19 divisions, road length was less than 20 km size and in 45 clusters106 of 13 divisions it was more than 25 km. The
102 Anuppur ` 696.74 lakh, Ashoknagar ` 2263.07 lakh, Badwani ` 564.65 lakh, Balaghat
` 1588.36 lakh, Chhindwara ` 4721.42 lakh, Damoh ` 5172.31 lakh, Dewas ` 1555.45 lakh , Guna ` 358.00 lakh, Gwalior ` 1631.87 lakh, Hoshangabad ` 1076.26 lakh, Jabalpur ` 6148.52 lakh, Katni ` 1530.11 lakh, Mandsaur ` 219.88 lakh, Narsinghpur ` 666.10 lakh , Raisen ` 217.58 lakh, Rajgarh ` 5532.75 lakh, Rewa ` 866.60 lakh, Sehore ` 10.80 lakh , Umaria ` 2408.39 lakh and vidisha ` 1568.77 lakh
103 Walk through Survey- A survey of roads to identify the actual facts of roads, walk through survey from traditional method conducted by departmental officers.
104 Cluster: Cluster is a group of roads. 105 Anuppur 08 clusters, Ashoknagar 3 clusters, Badwani 04 cluster, Balaghat 6 clusters,
Chhindwara 2 Cluster, Dewas 5 clusters, Guna 34 clusters, Gwalior 1 cluster, Hoshangabad 1 cluster, Jabalpur 5 clusters, Katni 12 clusters, Mandsaur 2 cluster, Narsinghpur 7 clusters, Raisen 13 clusters, Rajgarh 4 clusters, Sehore 4 clusters, Shajapur 9 clusters, Ujjain 4 clusters and Vidisha 7 cluster.
106 Anuppur-1 cluster, Ashoknagar-6 clusters, Balaghat-5 clusters, Damoh-6clusters, Dewas-2 clusters, Guna-1 cluster, Hoshangabad-3 clusters, Jabalpur 3 clusters, Katni-6 clusters, Raisen-4 clusters, Rajgarh-2 clusters, Shajapur 5 clusters, and vidisha-1 cluster.
Audit Report on General and Social (Non-PSUs) Sectors for the year ended 31 March 2013
90
Department did not obtain approval for the deviation from the Development Commissioner.
� Roads were sanctioned on the basis of walk-through survey. In the test checked divisions, we noticed that out of 3952 rural roads sanctioned during 2010-13, site for 128 roads costing ` 47.99 crore were disputed due to encroachment, personal land and roads covered under other schemes. The Department, however, incurred expenditure of ` 5.60 crore during the period 2010-13 on the incomplete roads. This indicated that walk-through-surveys were conducted without prescribing any specific procedure for walk-through-survey in the area. No records relating to conduct of walk-through survey were produced to Audit. The details are shown in Appendix-2.25.
At the exit conference, the Additional Chief Secretary accepted the facts and stated that approval for variation would be taken and efforts are still continuing to get the private land donated to MMGSY roads.
2.4.8 Programme Execution
The responsibility of execution of the MMGSY roads is with the Evaluation Committee headed by the Chief Engineer which also evaluates the technical proposals of the road work.
2.4.8.1 Habitations connected
Under the MMGSY, the road connectivity to each village, (in general category villages having less than 500 population and in tribal dominated villages having less than 250 population) was to be provided with all weather roads by the end of 2013.
We observed that as per core network107, there were 9992 eligible habitations unconnected with the road network at the time of launching the MMGSY. Out of which 9109 unconnected habitations (road length 19,386 km) were to be covered under the MMGSY by the end of 2013. During the period 2010-13, 226 roads connecting desert villages and 167 roads under IAP (Integrated Action Plan) district were transferred/ handed over to MPRRDA. Due to this total 393 roads were not planned under the MMGSY. At the end of March 2013, 2765 habitations (158 Tribal and 2607 General) were connected under MMGSY.
At the exit conference, the Additional Chief Secretary stated that as per data collected from core net work (2004) of MPRRDA the roads were included in MMGSY. Between 2004 and March 2010, i.e. before introduction of MMGSY some roads were constructed by other departments under different heads/scheme hence, some habitations were connected during this period. Also, 167 roads have been transferred under IAP to MPRRDA. Hence, the targets were revised (2012-13) to 7182 habitations covering distance of 17,765 km under the MMGSY. 107 The Core Network is the network of all the Rural Roads that are necessary to provide basic
access to all the Habitations.
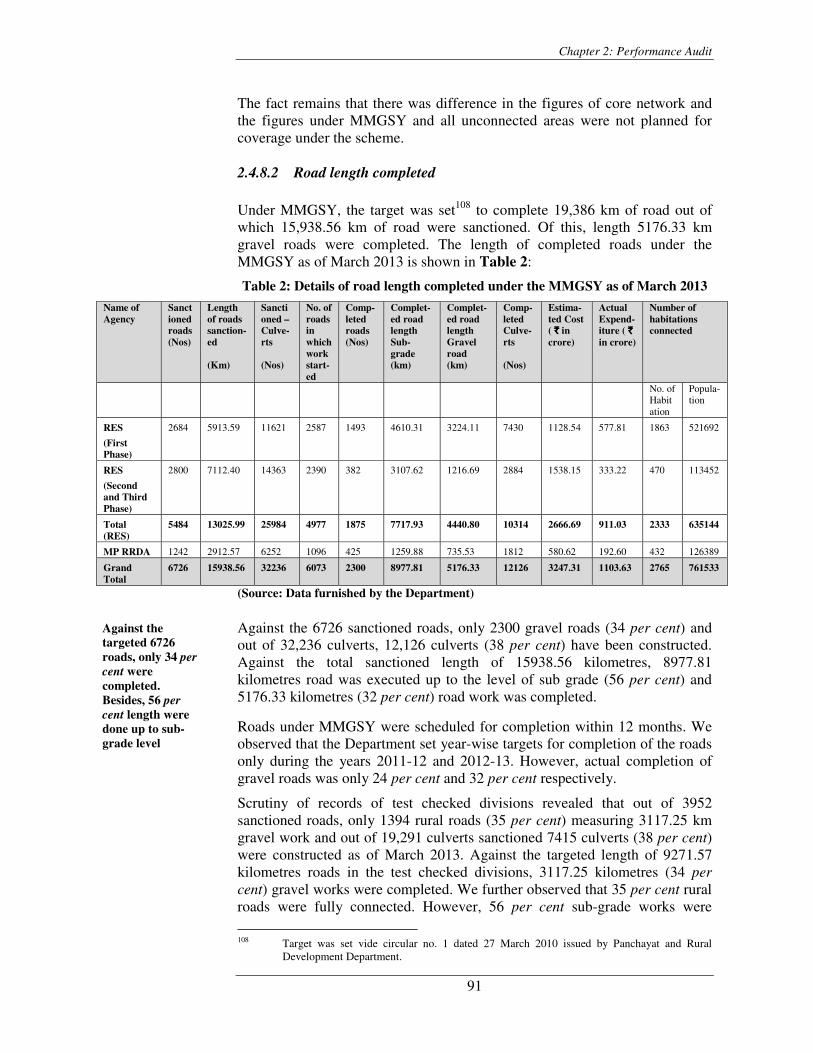
Chapter 2: Performance Audit
91
The fact remains that there was difference in the figures of core network and the figures under MMGSY and all unconnected areas were not planned for coverage under the scheme.
2.4.8.2 Road length completed
Under MMGSY, the target was set108 to complete 19,386 km of road out of which 15,938.56 km of road were sanctioned. Of this, length 5176.33 km gravel roads were completed. The length of completed roads under the MMGSY as of March 2013 is shown in Table 2:
Table 2: Details of road length completed under the MMGSY as of March 2013
Name of Agency
Sanctioned roads (Nos)
Length of roads sanction-ed
(Km)
Sanctioned –Culve-rts
(Nos)
No. of roads in which work start-ed
Comp-leted roads (Nos)
Complet-ed road length Sub-grade (km)
Complet-ed road length Gravel road (km)
Comp-leted Culve-rts
(Nos)
Estima-ted Cost ( `̀̀̀ in crore)
Actual Expend-iture ( `̀̀̀in crore)
Number of habitations connected
No. of Habitation
Popula- tion
RES
(First Phase)
2684 5913.59 11621 2587 1493 4610.31 3224.11 7430 1128.54 577.81 1863 521692
RES
(Second and Third Phase)
2800 7112.40 14363 2390 382 3107.62 1216.69 2884 1538.15 333.22 470 113452
Total (RES)
5484 13025.99 25984 4977 1875 7717.93 4440.80 10314 2666.69 911.03 2333 635144
MP RRDA 1242 2912.57 6252 1096 425 1259.88 735.53 1812 580.62 192.60 432 126389
Grand Total
6726 15938.56 32236 6073 2300 8977.81 5176.33 12126 3247.31 1103.63 2765 761533
(Source: Data furnished by the Department)
Against the 6726 sanctioned roads, only 2300 gravel roads (34 per cent) and out of 32,236 culverts, 12,126 culverts (38 per cent) have been constructed. Against the total sanctioned length of 15938.56 kilometres, 8977.81 kilometres road was executed up to the level of sub grade (56 per cent) and 5176.33 kilometres (32 per cent) road work was completed.
Roads under MMGSY were scheduled for completion within 12 months. We observed that the Department set year-wise targets for completion of the roads only during the years 2011-12 and 2012-13. However, actual completion of gravel roads was only 24 per cent and 32 per cent respectively.
Scrutiny of records of test checked divisions revealed that out of 3952 sanctioned roads, only 1394 rural roads (35 per cent) measuring 3117.25 km gravel work and out of 19,291 culverts sanctioned 7415 culverts (38 per cent) were constructed as of March 2013. Against the targeted length of 9271.57 kilometres roads in the test checked divisions, 3117.25 kilometres (34 per cent) gravel works were completed. We further observed that 35 per cent rural roads were fully connected. However, 56 per cent sub-grade works were
108 Target was set vide circular no. 1 dated 27 March 2010 issued by Panchayat and Rural
Development Department.
Against the targeted 6726 roads, only 34 per cent were completed. Besides, 56 per cent length were done up to sub-grade level
Audit Report on General and Social (Non-PSUs) Sectors for the year ended 31 March 2013
92
completed. Out of 1242 road works handed over to MPRRDA, 425 roads (34 per cent) were completed as of March 2013.
At the exit conference, the Additional Chief Secretary accepted that due to non-availability of labour in time under MGNREGS, earth work could not be completed in time which resulted in delay of work. All works under the scheme except the disputed roads are likely to be completed by June 2014.
The fact remain that there was shortfall in achievement of targets, due to lack of planning of availability of labour, incorrect selection of roads, land disputes and forest clearance as discussed in paragraphs 2.4.7.1, 2.4.8.2, and 2.4.8.3.
2.4.8.3 Non-execution of road works in forest areas
The Panchayat and Rural Development Department has laid down the following instructions issued in May 2011 in regard to construction of gravel road in the forest areas:
(i) Where the work to be done as per existing width of way, the sanction shall be given by officer in-charge of the Forest Division. Where the existing way is required to be widened, the permission shall be obtained from the Central Government under Forest Conservation Act, 1980.
(ii) Where the total length of new proposed road falls under forest area, the sanction shall be obtained from State Forest Department under Forest Conservation Act, 1980.
We observed that out of 2408.89 km road length (623 roads) to be covered under forest area during 2010-13, road length of 1864.37 km could not be executed as of March 2013 due to delay in forest clearance and these roads could not be started after lapse of three years. In the test checked divisions, 170 roads having length of 510.61 km (value ` 61.72 crore109) were falling in forest areas, which were not started though scheduled for completion by March 2013. No record relating to conduct of walk-through–survey were produced to Audit. Therefore, the beneficiaries living in the forest areas were deprived from the benefits of the MMGSY.
At the exit conference, the Additional Chief Secretary accepted that due to non clearance of forest land from department, work could not be started in time. However efforts are being made for obtaining clearance from Forest Department.
109 Anuppur-5 roads 21.30 km length amount ` 298.47 lakh, Ashoknagar-15 roads 40.70 km length
amount ` 915.11 lakh, Badwani 8 roads 22 km amount ` 839.61 lakh, Dewas-3 roads 6.64 km amount ` 88.60 lakh, Guna 68 roads 173.31 km, Gwalior-10 roads 53.58 km length ` 987.22 lakh, Hoshangabad-13 roads 71.40 km length amount ` 711.39 lakh, Katni-2 roads 8.10 km length amount ` 245.49 lakh, Narsinghpur-4 roads 9.70 km length amount ` 149.96 lakh, Raisen 6 roads 12.67 km amount ` 264.49 lakh, Rajgarh-25 roads 64.33 km length amount ` 1231.21 lakh, Sehore-6 roads,14.48 km length amount ` 221.77 lakh, Umaria-3 roads 8.50 km length amount `
142.79 lakh and Vidisha-2 roads 3.90 km length amount ` 75.76 lakh.
Due to delay in forest clearance 623 road works could not started after lapse of three years
Chapter 2: Performance Audit
93
This confirms Department’s lack of initiative to obtain timely forest clearance even from the State Forest Department before sanction of the road works which were to be done after walk through survey.
2.4.9 Contract management
As per Government order dated 27 March 2010, keeping in view the overload and special kind of work, for the help of executive agency (RES) consultants were to be appointed for preparation of Detailed Project Report (DPR) supervision and quality control of road works. For appointing the consultants two-way bid system i.e. technical and financial was to be followed. The technical bids were to be finalised at RES Division level by the Executive Engineer and Superintending Engineer. The financial bids were obtained and finalised centrally in the office of the Development Commissioner Bhopal.Consultants were appointed in 50 divisions in first phase, 33 divisions in second phase and 27 in the third phase. The following deficiencies were noticed in the appointment of consultants and consultancy work:
2.4.9.1 Acceptance of single tender
According to Paragraphs 2.086 (2) and (4) of the MPWD Manual, single tender is not to be accepted in the first call.
Scrutiny of tender document revealed that during the period 2010-13, 13 single tenders for consultants (6 in 1st phase, 3 in 2nd phase and 4 in 3rd phase) for works aggregating ` 320.40 crore were accepted in the first call. The works were awarded in violation of the provisions of the Manual and benefit of competition also could not be ensured due to acceptance of single tender in first call. We observed that in seven cases of acceptance of single tender, the rates sanctioned were 17 to 57 per cent higher than the estimated rates quoted in the Notice Inviting Tender (NIT), as detailed in Appendix-2.26.
At the exit conference, the Additional Chief Secretary accepted the facts that the rates were higher than the estimated rates. Order was issued by Government in November 2012 regarding non-opening the single tender in the first invitation. Thereafter no single tender was accepted in the first invitation.
2.4.9.2 Irregular payment to consultants for preparation of inaccurate DPR
As per clause 14 of terms of reference, the Consultants shall be responsible for the accuracy of the data collected, designs, drawings and estimates prepared by them while preparation of the DPRs as a part of the project. They shall indemnify the Client against any inaccuracies in the work which might surface out at the time of ground implementation of the project, including stacking out. For this purpose, five per cent amount as performance security of DPR preparation and setting out (putting up sign board etc.) amount shall be held deposited till successful completion of project. During implementation of project, consultant shall be responsible to correct the drawings/ design including resurvey investigation as required or directed by the Executive Engineer/ Project Manager concerned. If the required corrections are not done
Due to acceptance of single tender in first call the benefit of competitive rates could not be ensured
Audit Report on General and Social (Non-PSUs) Sectors for the year ended 31 March 2013
94
by the consultants in the given time frame, the Executive Engineer or Project Manager shall have liberty for getting the corrections done by other means and recover the cost of correction from the consultant from the amount due to consultant.
During test check of records of ten divisions110 out of 22 test checked divisions it was noticed that the estimates prepared by five consultants were not accurate and deviations were more than 30 per cent in all cases. As a result, the quantity of items of works was increased/decreased during execution of work and nine items of five road works, which were not included in the estimates, were executed. Thus, it is clear that the estimates were not prepared by the consultant in accordance with clause 14 of agreement. In Gwalior Division the DPRs were got revised by the Departmental officers or by consultants of next phase which necessitated payment of ` 0.42 lakh which could be avoided if the DPRs were got revised by the consultants who prepared them.
� Further, the payment schedule to the consultant provided for payment of 25 per cent of total amount before technical approval of the DPR. During scrutiny of records in five test checked Divisions, it was found that out of 1534 DPRs, 350 DPRs were not technically approved till March 2013 though 25 per cent payment for issue of DPRs amounting to ` 85.81 lakh111 was made to the consultants .
� In Hoshangabad Division estimates were signed by the Departmental officers. Hence, it could not be ensured whether the estimates were prepared by the consultants. But, the payment of ` 32.18 lakh was made to the consultant.
At the exit conference, the Additional Chief Secretary accepted the facts and stated that the DPRs would be checked and if similar points are repeated responsibility would be fixed and amount would be recovered from the consultants/ Executive Engineers.
2.4.9.3 Irregularities in appointment of consultancy firms As per para 6.1.2 of Letter of Invitation, the Evaluation Committee for evaluation of the technical proposals shall be appointed by the client. The Committee will carry out its evaluation applying the criteria for evaluation prescribed in para 6.1.1112. The consultants were required to fulfill the conditions of NITs/contract. In test check of records of ten divisions113 we observed the following:
110 Annuppur, Chhindwara, Damoh, Dewas, Gwalior, Hoshangabad , Jabalpur, Raisen, Rajgarh and
Umaria 111 Chhindwara ` 9.02 lakh, Dewas ` 8.01 lakh, Jabalpur ` 11.31 lakh, Raisen ` 24.47 lakh and
Rajgarh ` 33.00 lakh 112 Consultants should have experience of providing consultancy services for supervision and quality
control of road and bridge construction work at least for three preceding years.113 Annuppur, Chhindwara, Damoh, Dewas, Gwalior, Hoshangabad, Rajgarh, Raisen, Sehore and
Umaria
Irregular payment ` ` ` ` 85.81 lakh was paid to consultant for preparation of inaccurate DPRs
Chapter 2: Performance Audit
95
� The Department appointed the consultants without verification of their experience, as prescribed in para 6.1.1 of Letter of Invitation.
� Though the consultant was required to appoint the staff after getting approval from the executing agency, the staff was appointed by the consultant without their approval resulting in deployment of unqualified/inexperienced staff.
� The consultants also did not arrange vehicles for staff to facilitate visit from headquarter to project sites and to ensure regular and timely presence at site.
We observed that in 10 districts 20 consultant failed to fulfill the conditions prescribed in the NITs and criteria for evaluation of performance. During the period 2010-13 ` 5.30 crore114 was paid to 20 ineligible consultants, no deduction was made from the consultant for not fulfilling the prescribed conditions of staff. Details of violation of the conditions are given in Appendix-2.27.
At the exit conference the Additional Chief Secretary stated that this will be reviewed and necessary action would be taken.
2.4.9.4 Appointment of debarred firm
The MPRRDA and RES are the work executing agencies under the P&RDD. Krishna Techno Consultant Pvt. Ltd. Bhopal was debarred (September 2010) and restricted by the MPRRDA, as the firm could not provide the services as per agreement. The firm was however, awarded consultancy work in six divisions for eight packages valued ` 7.07 crore115 by RES (between 2011-12 and 2012-13)
As per agreement conditions mentioned in para 4.3 and 4.4, sufficient and experienced staff was to be engaged by the consultants. We observed in the test checked Chhindwara Division that against required 22, only six field engineers were deployed and no Assistant Material Engineer was appointed by the consultant. Thus, the work performed by the consultant was deficient and the Executive Engineer Chhindwara pointed out (May 2012) many other deficiencies116 in preparation of DPR and supervision and quality control work. In spite of this, the consultant was allowed to continue work and ` 10.84 lakh was paid to consultant during 2011-13. The RES awarded consultancy service without verifying the track record of the firms. Since the MPRRDA and RES are functioning under the same Department (P&RDD) allotment of work to a debarred firm by the RES was incorrect.
114 Annuppur ` 3.05 lakh (2 consultants), Chhindwara ` 31.37 lakh (3), Damoh ` 129.66 lakh (3),
Dewas ` 18.68 lakh (3), Gwalior ` 32.99 lakh (2), Hoshangabad ` 43.00 lakh (1), Raisen ` 30.82 lakh (1), Rajgarh `150.43 lakh (3), Sehore ` 36.07 lakh (1) and Umaria ` 53.50 lakh (1).
115 Chhatarpur-II phase- ` 55.69 lakh , Chhatarpur and Panna- III phase- ` 52.58 lakh, Chhindwara- II phase ` 195.95 lakh, Neemuch- II phase ` 99.25 lakh III phase-` 86.70 lakh, Seoni-III phase ` 69.74 lakh, Tikamgarh-I phase ` 91.07 lakh and II Phase ` 55.69 lakh.
116 Provisions for some items not made in DPRs, Design life of roads was not taken as per MMGSY norms, Width of forest roads was not taken as per Scheme guidelines and Estimates were prepared on the basis of District SOR while DPRs should have been prepared on the basis of State SOR.
20 consultants failed to fulfill the conditions of NITs and ` 5.30 crore was paid to them
Payment of ` ` ` ` 10.84 lakh
was made to a debarred firm
Audit Report on General and Social (Non-PSUs) Sectors for the year ended 31 March 2013
96
At the exit conference the Additional Chief Secretary stated that audit point has been noted; in future, care would be taken to make appropriate provisions in the bid document.
2.4.9.5 Non-deduction of Royalty
As per clause 36 of the agreement on Form ‘A’ as prescribed in MPPWD manual, the Executive Engineer of the division concerned is responsible for making deduction of amount of royalty from the contractor’s running account bill at the prevailing rates at that time, if clearance certificate from the Collector is not submitted.
Scrutiny of records revealed that royalty of ` 1.39 crore117 deducted from the
running account bills of contractors was not deposited into the Government account of Mining Department. Royalty of ` 14.90 lakh was deposited (December 2011 to March 2013) in the Mining Department as against the deducted amount of ` 16.98 lakh in the Mandsaur Division. In Badwani Division, an amount of ` 81.51 lakh was paid to three contractors towards value of works done. However, lumpsum amount of ` 0.57 lakh was recovered (between July 2011 to March 2013) as royalty from only two contractors. Further, ` 45.69 crore (Ashoknagar ` 43.83 crore and Ujjain `
1.86 crore) was paid to contractors during 2010-13 by the divisions. However, no royalty was deducted from the contractors. The amount of royalty to be deducted in these cases could not be ascertained by Audit due to non-preparation of consumption statement of material actually used by the contractors.
At the exit conference, the Additional Chief Secretary stated that royalty would be deducted from the final bills of the contractor and the same would be deposited in the Government account.
The reply was not acceptable as royalty was to be deducted from running account bills as per rate fixed by the Mining Department. Consumption statement of material used by the contractor was also not worked out by the consultants.
2.4.9.6 Non-deduction of tax at source at prescribed rate
As per section 194 (J) of the Income Tax Act, tax deducted at source (TDS) was to be made at 10 per cent on the amount paid as fees for professional services or technical services.
Scrutiny of records of test checked Damoh Division revealed that TDS on payment made to various consultancy firms has either not been deducted or deducted at lower rate (2.24 per cent), which resulted in non/short deduction of TDS of ` 40.22 lakh118.
117 Dewas- ` 20.50 lakh , Guna ` 64.97 lakh, Katni-` 0.77 lakh and Shajapur ` 52.99 lakh118 Ashoknagar- Beocon RVS associate ` 17.19 lakh, Chhindwara-Sharp engineer
` 0.95 lakh, Krishna techno ` 1.34 lakh, Pipely ` 0.34 lakh, Damoh-PKS infra engineer ` 1.18 lakh, Krishna Consultant ` 8.43 lakh, Anushka infrastructure ` 1.58 lakh,Katni-L.N.Malvia ` 0.63 lakh, Icon consultant ` 1.11 lakh, Raisen-Manglam
Chapter 2: Performance Audit
97
At the exit conference the Additional Chief Secretary stated that the TDS amount would be recovered from the pending bills of the contractor.
The reply itself suggests that TDS was not deducted from the payment made to contractors at prescribed rates in violation of the provision of the Income Tax Act.
2.4.10 Inspection of roads
MMGSY guidelines envisage that all works were to be effectively supervised since quality of work is very important. For this purpose, the consultants, departmental officers and the State Quality Monitor (SQM) are required to inspect the MMGSY roads regularly.
Test check of records revealed that SQM started the work of inspection of roads from January 2013 only i.e. towards the end of the period scheduled for completion of work. Out of 542 roads (76 completed and 466 work in progress) inspected by the SQM during the period January 2013, 356 roads were found satisfactory (S), 157 roads were satisfactory but require improvement (SRI) and quality of work was deficient in 29 roads. Action taken reports have not been submitted by the divisions to SQM. Notices were issued by the EEs (March 2013) to contractors and consultant concerned to rectify the deficiencies.
As per Government orders of March 2010, 100 per cent roads were to be inspected by the Assistant Engineers, the Executive Engineers were to inspect at least 10 per cent items of each work and the Superintending Engineer was to inspect at least two per cent of the road works.
We observed in test checked divisions, there were no records to show that any inspection of work was conducted by the Departmental officers above the rank of Assistant Engineer. In the 13 test checked Divisions, 24 unsatisfactory, 47 satisfactory but require improvement (SRI) roads were identified by the SQM, on which an expenditure of ` 16.39 crore was incurred as given in Appendix-2.28.
At the exit conference, the Additional Chief Secretary stated that this shall be ensured as per the prescribed norms and in order to streamline the inspection system, the Department is working to start electronic measurement system.
2.4.11 Conclusion
During the period 2010-13, against total allotment of ` 1,737.32 crore for the Scheme there was unspent balance of ` 826.28 crore, which was kept in Civil Deposit Account as of March 2013. Due to deficient planning about availability of labour through MGNREGS, ` 1555 crore originally provided under MGNREGS, was later provided from the State budget, which has put
associate ` 0.11 lakh, Rajgarh-M/s Scape associate ` 2.64 lakh, Rewa- PKS infra engineer ltd ` 1.08 lakh, Sehore-M/s Nayak syndicate ` 0.19 lakh, Umaria- Mahamaya ` 2.35 lakh and Ujjain-M/s Redicon pvt.ltd ` 1.10 lakh
Inspection of road works by the departmental officers and the SQM was inadequate
Audit Report on General and Social (Non-PSUs) Sectors for the year ended 31 March 2013
98
extra burden on the State exchequer. The planning for selection of roads was deficient since large number of roads taken up in disputed land (forest land, encroachment land, etc.) remained incomplete. At the end of 2012-13 only 2300 gravel roads (34 per cent) were completed and road work up to the level of sub grade was done in 56 per cent of road length. Thus, the intended benefit for the targeted beneficiaries could not be fully achieved. There were irregularities in appointment of consultants by accepting single bid thereby not availing the competitive rates. There were instances of engagement of ineligible firms, awarding work to debarred firm, non deduction of royalty/TDS and payment for preparation of DPRs before those are technically approved. The quality control inspection by State Quality Monitor and Departmental Officers was inadequate.
2.4.12 Recommendations
The Government may consider the following:
� Ensure optimum utilisation of funds and compliance with the financial rules to avoid drawal of funds in excess of required and keeping the unspent funds in Civil Deposits beyond a financial year.
� Expedite completion of all the road works so that connectivity can be provided to the targeted habitations.
� Ensure strict compliance with the conditions of contracts agreement to avoid irregular/unauthorised payment.
� Ensure action taken in the cases where the road work was found deficient by the State Quality monitoring and conduct of inspections of roads by the EEs as per prescribed norms.
Chapter 2 : Performance Audit
99
AYUSH Department (Ayurved, Yoga & Naturopathy, Unani, Siddha and Homeopathy)
2.5 Working of AYUSH Pharmacies
Executive Summary
The Indian System of Medicine and Homeopathy Department was renamed as AYUSH with the objectives to provide treatment under the Ayurved, Yoga & Naturopathy, Unani, Siddha and Homeopathy systems of medicine. Two pharmacies i.e. Unani Pharmacy, Bhopal and Ayurved pharmacy, Gwalior were set up to manufacture and supply quality medicines to Ayush hospitals and dispensaries.
� There was no working plan for optimum utilisation of production capacity of the pharmacies. Also there was absence of working manual. No yearly target was fixed except once in 2005.
� The pharmacies failed to produce medicines to meet the requirement of the hospitals /dispensaries and medicines were purchased from other agencies to meet their demand. The procurement of raw herbs was inadequate to meet the requirement for production of medicines, which ultimately resulted in short production. During the years 2009-10 and 2011-12, there was no procurement of raw herbs.
� There was huge process loss. In the absence of any norms for permissible process loss, the Department could not ascertain the excess loss.
� The pharmacies were to work on no profit no loss basis. However, for each rupee of medicine produced the expenditure was in the range of ` 2.93 to ` 7.02.
� The pharmacies were not fully equipped as required under the Drugs and Cosmetics Rules, 1945 and the available machinery/ equipment were not used fully for production of medicines.
� There were shortfalls in departmental inspection and internal audit of the pharmacies.
Thus, the objective of setting up the pharmacies for supply of quality medicine was not achieved.
2.5.1 Introduction
The Indian System of Medicine and Homeopathy (ISM&H) Department (Department) was established in the year 1977-78 for providing alternative healthcare facilities to the people of the State. The Department was renamed in September 2008 as AYUSH (Ayurved, Yoga & Naturopathy, Unani, Siddha and Homeopathy). As per the information made available by the Commissioner, the medical facilities were made available to 4.44 crore (January 2010 to December 2012) patients through hospitals attached with nine Ayush Colleges, 24 Ayush Hospitals, 1773 Ayush Dispensaries and 36 Ayush wing in allopathic hospitals.
Audit Report on General and Social (Non-PSUs) Sectors for the year ended 31 March 2013
100
There are two Ayush pharmacies viz Government Unani Pharmacy, Bhopal and Government Ayurved Pharmacy, Gwalior headed by Superintendents and under the administrative control of Commissioner cum Director (Commissioner). The Ayush pharmacies manufacture and supply medicines to Ayush hospitals/ dispensaries on receipt of demand from them.
The audit of these pharmacies was conducted to assess whether planning process of the Department / Pharmacies for production of quality medicines was effective; operational controls were adequate, the process loss was realistic; inventory controls were adequate; quality controls were effective; and internal controls was effective. The audit was conducted (March to October 2013) by test check of records maintained in the offices of the Commissioner, Superintendent Government Unani Pharmacy, Bhopal and Superintendent Government Ayurved Pharmacy, Gwalior covering the period from 2010-13. The audit was conducted with reference to the existing rules119.
Audit findings
2.5.2 Planning 2.5.2.1 Working Manual of the Pharmacies.
There is no Departmental manual for operation of the Pharmacies. In absence of manual, the duties and accountabilities at different level cannot be fixed and justified. Similarly, process loss in manufacturing of medicines, method of valuation of medicines prepared in pharmacies are also not manualised.
2.5.2.2 Planning for production of medicines
A Committee was set up in April 2004 to assess the production capacity of pharmacies and to recommend targets of production. The Committee recommended (April 2005) manufacturing of Unani and Ayurved medicines with yearly production targets after taking into consideration the demand for special medicines and availability of human and technical resources of the pharmacies. The same were approved by the Commissioner in May 2005.
2.5.2.3 Non-fixation of yearly targets for production
We observed that the Commissioner fixed yearly targets of medicine-wise production only once in May 2005. Thereafter, the targets were not fixed or revised by the Department. On audit enquiry about the details of yearly requirement of medicines, the Commissioner stated (May 2013) that demand was received from Ayush hospitals and dispensaries, but the same were not consolidated at Directorate level. The Central Purchase Committee recommends the quantities for purchase of raw material for medicines as per the available budget allotment.
119 Provisions of the Madhya Pradesh Treasury Code (MPTC), Madhya Pradesh Financial
Code (MPFC) and MP Store Purchase Rules, targets set for production of medicines by the Department, Drugs and Cosmetics Act, 1940 and Drugs and Cosmetics Rules, 1945.
No yearly target for production of medicines fixed by the Commissioner
Chapter 2 : Performance Audit
101
It is evident from the above that there was no working plan for production of medicines in pharmacies based on regular assessment of production capacity and need of the hospitals and dispensaries. As a result, the pharmacies could not fulfil the requirement of the hospitals and dispensaries.
It is suggested that the Government should consider fixing of yearly targets of production for the pharmacies based on requirement.
2.5.2.4 Budget and Expenditure
During the period 2010-13, expenditure incurred in Government Unani Pharmacy was ` 256.65 lakh120 against allotment of ` 374 lakh. Similarily, in Government Ayurved Pharmacy, the expenditure incurred during the period was ` 740.12 lakh121 against allotment of ` 1087.75 lakh.
We observed that during the period 2010-13, fund utilisation by the pharmacies under pay & allowances was 79 to 82 per cent of allotment, while it was only 49 to 57 per cent in case of purchase of raw material. We also observed that fund allocation for raw material was insignificant (40 to 43 per cent of total allocation) while actual expenditure was further low (29 to 35 per cent of total expenditure) during 2010-13.
The Commissioner stated (June 2013 and October 2013) that during discussion of Departmental budget by the Secretary with the Finance Department, allocation for raw material was increased during the year 2011-12.
2.5.3 Operational control
2.5.3.1 Annual requirement of raw herbs
The pharmacies stated that the requirement of raw herbs is worked out as per Government order of May 2005 on the basis of the following norms:
(i) target and minimum quantities fixed by the directorate, (ii) prepared medicines supplied during the last year, and (iii) stock in hand.
The requirement for a year is worked out in the previous year. Thus, sufficient time is available for finalising purchase orders by the Commissioner and supplies to be made by the suppliers. The Superintendents send the requirement to the Commissioner who in turn calls for tenders and places the purchase orders. After placing the purchase orders the copy of the purchase orders are sent to the concerned pharmacy for receiving the supplies and making the payment to the suppliers. In case of delay in supplies, the penalty would be levied on the suppliers. As already discussed in para 2.5.2.3, there was no plan for production of medicines or procurement of raw material.
120 Pay and allowances ` 165.23 lakh, machinery and equipment ` 0.82 lakh and purchase of
raw material ` 90.60 lakh. 121 Pay and allowances ` 528.09 lakh, machinery and equipment ` 0.34 lakh and purchase of
raw material ` 211.69 lakh.
Audit Report on General and Social (Non-PSUs) Sectors for the year ended 31 March 2013
102
2.5.3.1(a) Procurement of raw herbs
We observed that the items and quantity of herbs for which supply orders were issued by the Commissioner were in variation with the requirement assessed and intimated by the Superintendents. This resulted in excess or shortage of supply as detailed in Appendix 2.29. Besides, no purchase order were issued during the years 2009-10 and 2011-12 for production in 2010-11 and 2012-13.
We observed that for Government Unani Pharmacy, Bhopal against the requirement for the year 2011-12, supply orders for 1498 kg and 64 litre consisting of 22 herbs were not placed in previous year. During 2010-11, supply orders were placed for lesser quantities of 10158 kg and 765 litre of 20 raw herbs while supply orders for excess quantity of 15 kg of one raw herb and 100 kg of one raw herb were placed without requirement for 2011-12.
Similarly, for Government Ayurved Pharmacy, Gwalior against the requirement for the year 2011-12, supply orders of 12291.640 kg (49 solid herbs) and 1892.500 litre (3 liquid herbs) were not placed in the year 2010-11. During 2010-11, supply orders were placed for lesser quantities of 15066.490 kg of 38 raw herbs while supply orders were placed for excess quantities of 743.900 kg of 9 raw herbs and 400 kg of one raw herb without any requirement for 2011-12.
The Commissioner stated (June 2013/October 2013) that central purchase was cancelled in 2009-10 as the purchase procedure could not be completed up to the end of the year 2009-10. For the year 2011-12 the supply order could not be issued, as proceedings of tender opening committee were not approved by the Commissioner. Thus the supply order could not be placed for requirement for the years 2010-11 and 2012-13. Further the supply orders for lesser quantities were placed due to limited budget provision.
The reply confirms that the purchase procedure of the Directorate needs to be strengthened and the Commissioner needs to take adequate action for supply of raw herbs for production of medicines. However, the reply was silent about the excess purchases made. The argument of limited budget provision does not hold good since the Department failed to utilise the funds amounting to ` 69.40 lakh in Unani Pharmacy and ` 2.21 crore in Ayurved Pharmacy for purchase of raw material for medicines during 2010-13. Government may consider decentralisation of purchase of raw herbs.
2.5.3.1(b) Under-utilisation of raw herbs
An analysis of the stock in hand and the purchases made during the period 2010-13 revealed that the Unani Pharmacy, Bhopal placed demand for 1128 kg of 10 herbs in the year 2010-11 for meeting requirement for the year 2011-12. Against this, herbs received were 945 kg. There was opening balance of 2174 kg of these herbs. During that year, only 1450 kg of raw herbs was used and the closing balance was 1669 kg. as shown in Appendix-2.30. This indicates that the assessment of requirement and purchase was not judicious. Further, supplies of 5494 kg and 750 litre of 34 raw herbs were received in 2010-11 against demand of 6389 kg and 1515 litre for the year 2011-12 out of which only 3344 kg and 600 litre were consumed in the year 2011-12 which
Raw herbs purchased centrally by the Commissioner were in variations with the requirement of the pharmacies resulting in shortages or excess of raw material
Purchases of raw herbs were made without considering huge stock in hand resulting in idling of stock
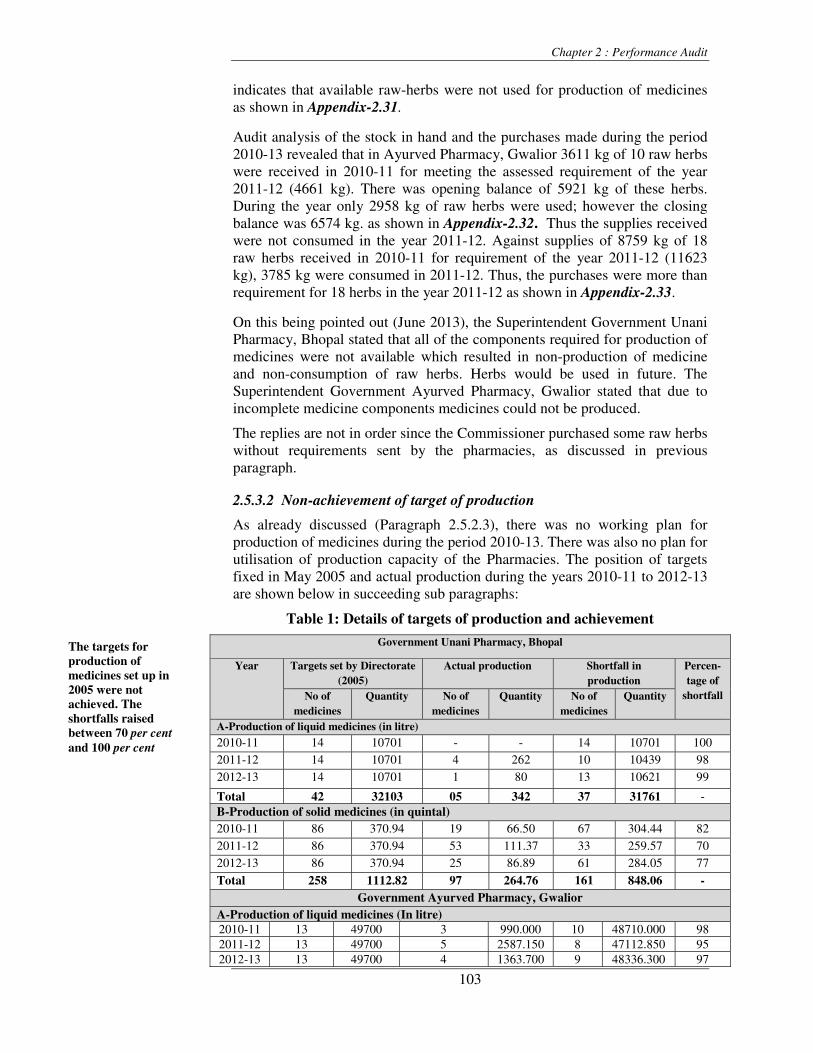
Chapter 2 : Performance Audit
103
indicates that available raw-herbs were not used for production of medicines as shown in Appendix-2.31.
Audit analysis of the stock in hand and the purchases made during the period 2010-13 revealed that in Ayurved Pharmacy, Gwalior 3611 kg of 10 raw herbs were received in 2010-11 for meeting the assessed requirement of the year 2011-12 (4661 kg). There was opening balance of 5921 kg of these herbs. During the year only 2958 kg of raw herbs were used; however the closing balance was 6574 kg. as shown in Appendix-2.32. Thus the supplies received were not consumed in the year 2011-12. Against supplies of 8759 kg of 18 raw herbs received in 2010-11 for requirement of the year 2011-12 (11623 kg), 3785 kg were consumed in 2011-12. Thus, the purchases were more than requirement for 18 herbs in the year 2011-12 as shown in Appendix-2.33.
On this being pointed out (June 2013), the Superintendent Government Unani Pharmacy, Bhopal stated that all of the components required for production of medicines were not available which resulted in non-production of medicine and non-consumption of raw herbs. Herbs would be used in future. The Superintendent Government Ayurved Pharmacy, Gwalior stated that due to incomplete medicine components medicines could not be produced.
The replies are not in order since the Commissioner purchased some raw herbs without requirements sent by the pharmacies, as discussed in previous paragraph.
2.5.3.2 Non-achievement of target of production
As already discussed (Paragraph 2.5.2.3), there was no working plan for production of medicines during the period 2010-13. There was also no plan for utilisation of production capacity of the Pharmacies. The position of targets fixed in May 2005 and actual production during the years 2010-11 to 2012-13 are shown below in succeeding sub paragraphs:
Table 1: Details of targets of production and achievement
Government Unani Pharmacy, Bhopal
Year Targets set by Directorate (2005)
Actual production Shortfall in production
Percen-tage of
shortfall No of medicines
Quantity No of medicines
Quantity No of medicines
Quantity
A-Production of liquid medicines (in litre)
2010-11 14 10701 - - 14 10701 100 2011-12 14 10701 4 262 10 10439 98 2012-13 14 10701 1 80 13 10621 99
Total 42 32103 05 342 37 31761 - B-Production of solid medicines (in quintal) 2010-11 86 370.94 19 66.50 67 304.44 82 2011-12 86 370.94 53 111.37 33 259.57 70 2012-13 86 370.94 25 86.89 61 284.05 77
Total 258 1112.82 97 264.76 161 848.06 - Government Ayurved Pharmacy, Gwalior
A-Production of liquid medicines (In litre) 2010-11 13 49700 3 990.000 10 48710.000 98 2011-12 13 49700 5 2587.150 8 47112.850 95 2012-13 13 49700 4 1363.700 9 48336.300 97
The targets for production of medicines set up in 2005 were not achieved. The shortfalls raised between 70 per centand 100 per cent
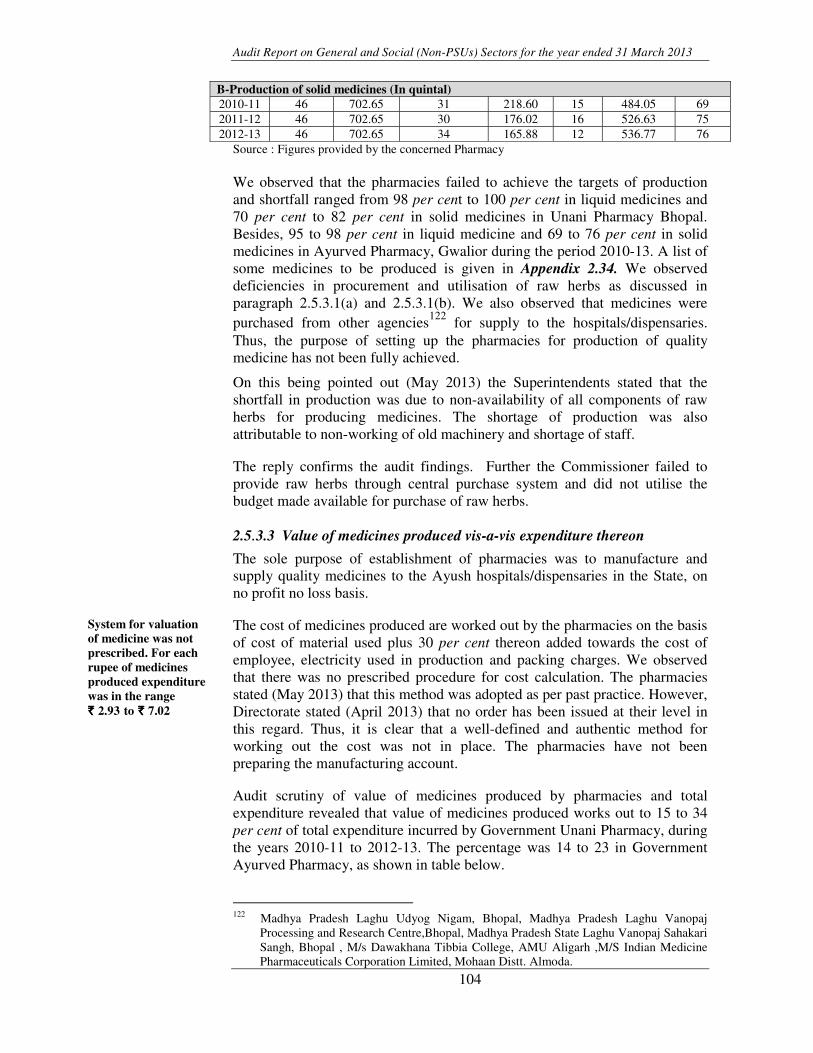
Audit Report on General and Social (Non-PSUs) Sectors for the year ended 31 March 2013
104
B-Production of solid medicines (In quintal) 2010-11 46 702.65 31 218.60 15 484.05 69 2011-12 46 702.65 30 176.02 16 526.63 75 2012-13 46 702.65 34 165.88 12 536.77 76
Source : Figures provided by the concerned Pharmacy
We observed that the pharmacies failed to achieve the targets of production and shortfall ranged from 98 per cent to 100 per cent in liquid medicines and 70 per cent to 82 per cent in solid medicines in Unani Pharmacy Bhopal. Besides, 95 to 98 per cent in liquid medicine and 69 to 76 per cent in solid medicines in Ayurved Pharmacy, Gwalior during the period 2010-13. A list of some medicines to be produced is given in Appendix 2.34. We observed deficiencies in procurement and utilisation of raw herbs as discussed in paragraph 2.5.3.1(a) and 2.5.3.1(b). We also observed that medicines were purchased from other agencies122 for supply to the hospitals/dispensaries. Thus, the purpose of setting up the pharmacies for production of quality medicine has not been fully achieved.
On this being pointed out (May 2013) the Superintendents stated that the shortfall in production was due to non-availability of all components of raw herbs for producing medicines. The shortage of production was also attributable to non-working of old machinery and shortage of staff.
The reply confirms the audit findings. Further the Commissioner failed to provide raw herbs through central purchase system and did not utilise the budget made available for purchase of raw herbs.
2.5.3.3 Value of medicines produced vis-a-vis expenditure thereon
The sole purpose of establishment of pharmacies was to manufacture and supply quality medicines to the Ayush hospitals/dispensaries in the State, on no profit no loss basis.
The cost of medicines produced are worked out by the pharmacies on the basis of cost of material used plus 30 per cent thereon added towards the cost of employee, electricity used in production and packing charges. We observed that there was no prescribed procedure for cost calculation. The pharmacies stated (May 2013) that this method was adopted as per past practice. However, Directorate stated (April 2013) that no order has been issued at their level in this regard. Thus, it is clear that a well-defined and authentic method for working out the cost was not in place. The pharmacies have not been preparing the manufacturing account.
Audit scrutiny of value of medicines produced by pharmacies and total expenditure revealed that value of medicines produced works out to 15 to 34 per cent of total expenditure incurred by Government Unani Pharmacy, during the years 2010-11 to 2012-13. The percentage was 14 to 23 in Government Ayurved Pharmacy, as shown in table below.
122 Madhya Pradesh Laghu Udyog Nigam, Bhopal, Madhya Pradesh Laghu Vanopaj
Processing and Research Centre,Bhopal, Madhya Pradesh State Laghu Vanopaj Sahakari Sangh, Bhopal , M/s Dawakhana Tibbia College, AMU Aligarh ,M/S Indian Medicine Pharmaceuticals Corporation Limited, Mohaan Distt. Almoda.
System for valuation of medicine was not prescribed. For each rupee of medicines produced expenditure was in the range ` ` ` ` 2.93 to ` ` ` ` 7.02
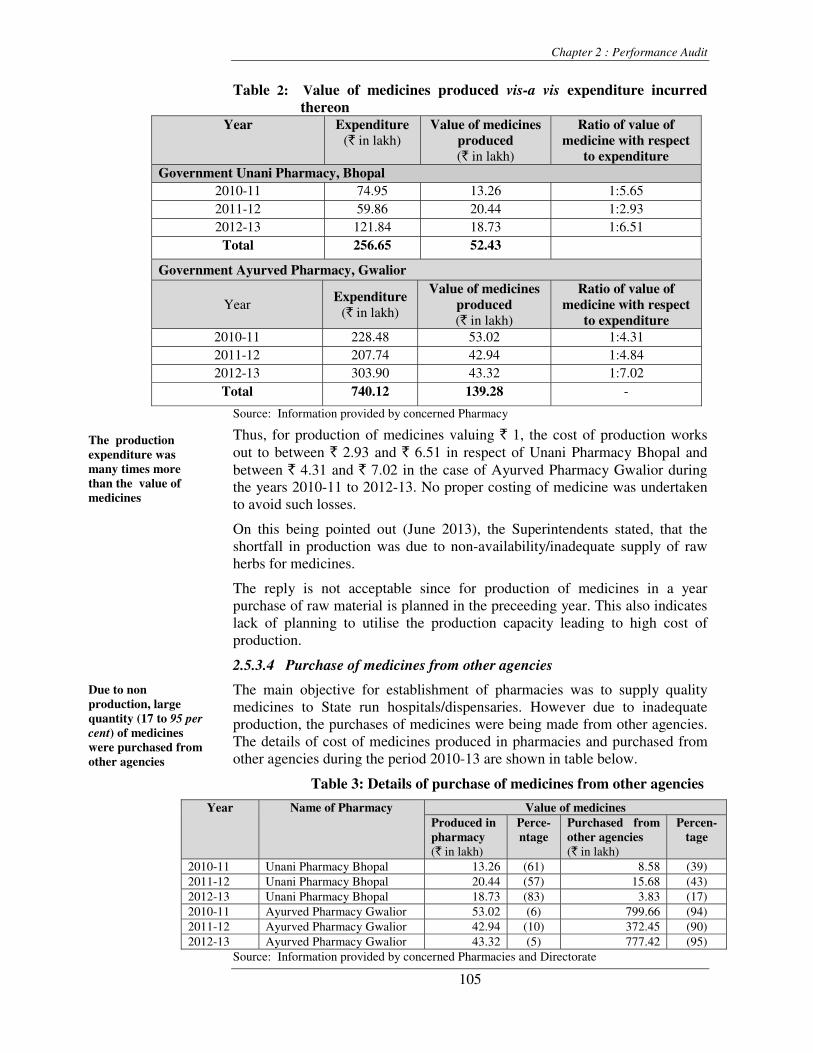
Chapter 2 : Performance Audit
105
Table 2: Value of medicines produced vis-a vis expenditure incurred thereon
Year Expenditure (` in lakh)
Value of medicines produced (` in lakh)
Ratio of value of medicine with respect
to expenditure Government Unani Pharmacy, Bhopal
2010-11 74.95 13.26 1:5.65 2011-12 59.86 20.44 1:2.93 2012-13 121.84 18.73 1:6.51
Total 256.65 52.43
Government Ayurved Pharmacy, Gwalior
Year Expenditure
(` in lakh)
Value of medicines produced (` in lakh)
Ratio of value of medicine with respect
to expenditure 2010-11 228.48 53.02 1:4.31 2011-12 207.74 42.94 1:4.84 2012-13 303.90 43.32 1:7.02
Total 740.12 139.28 -
Source: Information provided by concerned Pharmacy
Thus, for production of medicines valuing ` 1, the cost of production works out to between ` 2.93 and ` 6.51 in respect of Unani Pharmacy Bhopal and between ` 4.31 and ` 7.02 in the case of Ayurved Pharmacy Gwalior during the years 2010-11 to 2012-13. No proper costing of medicine was undertaken to avoid such losses.
On this being pointed out (June 2013), the Superintendents stated, that the shortfall in production was due to non-availability/inadequate supply of raw herbs for medicines.
The reply is not acceptable since for production of medicines in a year purchase of raw material is planned in the preceeding year. This also indicates lack of planning to utilise the production capacity leading to high cost of production.
2.5.3.4 Purchase of medicines from other agencies
The main objective for establishment of pharmacies was to supply quality medicines to State run hospitals/dispensaries. However due to inadequate production, the purchases of medicines were being made from other agencies. The details of cost of medicines produced in pharmacies and purchased from other agencies during the period 2010-13 are shown in table below.
Table 3: Details of purchase of medicines from other agencies
Year Name of Pharmacy Value of medicines Produced in pharmacy (` in lakh)
Perce-ntage
Purchased from other agencies (` in lakh)
Percen-tage
2010-11 Unani Pharmacy Bhopal 13.26 (61) 8.58 (39) 2011-12 Unani Pharmacy Bhopal 20.44 (57) 15.68 (43)2012-13 Unani Pharmacy Bhopal 18.73 (83) 3.83 (17) 2010-11 Ayurved Pharmacy Gwalior 53.02 (6) 799.66 (94) 2011-12 Ayurved Pharmacy Gwalior 42.94 (10) 372.45 (90) 2012-13 Ayurved Pharmacy Gwalior 43.32 (5) 777.42 (95)
Source: Information provided by concerned Pharmacies and Directorate
The production expenditure was many times more than the value of medicines
Due to non production, large quantity (17 to 95 per cent) of medicines were purchased from other agencies
Audit Report on General and Social (Non-PSUs) Sectors for the year ended 31 March 2013
106
It is evident from above table that major portion of medicines particularly Ayurved medicines were being procured from other agencies. An illustrative list of medicines purchased from other agencies is shown in Appendix-2.35.Thus, the main objective of supply of quality medicines produced by the Government pharmacies was not fulfilled.
2.5.3.5 Machinery / equipment
2.5.3.5(a) Inadequate machinery and equipment
The schedule T under rule 157 of Drugs and Cosmetics Rule, 1945 provides the list of machinery/equipment recommended for manufacturing of various categories of Ayurvedic and Unani systems of medicines. Audit noticed that out of 45 machinery/equipment recommended for Unani Pharmacy, 28 machinery/equipment were not available since inception. Similarly, 48 machinery /equipment were recommended under the rules for Ayurved Pharmacy, of which 28 were not available with the pharmacy, as shown in Appendix-2.36.
On this being pointed out (May 2013), the Superintendent, Unani Pharmacy, stated (May 2013) that the proposal would be sent to Government for purchase of machinery/equipment. He further stated (October 2013) that the matter was brought to the notice of higher authorities. He also accepted that production is naturally obstructed due to non-availability of machines. As regards the Ayurved Pharmacy the Superintendent stated (May 2013) that capsules were not prepared in the pharmacy and Gutika/Vati were prepared by hand.
Inadequate machinery/equipment in pharmacies adversely impact the quality and quantity of production. The fund provided for purchase of machinery was also underutilised during the period 2010-13.
2.5.3.5(b) Idle machinery and equipment
We observed that five machines123 and equipment worth ` 13.10 lakh procured during March 2004 to January 2005 were lying idle since 2010-11 onwards in Unani Pharmacy and 12 machines124 and equipment worth ` 16.58 lakh procured during June 2004 to April 2005 were not utilised between June 2004 and October 2011 and were lying idle in Ayurved Pharmacy as of October 2013.
On this being pointed out (March 2013), the Superintendent ,Unani Pharmacy stated (March 2013) that the machines were lying idle due to non-posting of technical officials, non-availability of packing material. The Superintendent , Ayurved Pharmacy stated (May 2013) that the machineries were lying idle due to low capacity, non-purchase of packing material, use of plastic bottle in place of glass bottle, non-posting of technical official, non-making of capsules, availability of electricity etc.
123 1. Steam Distillation plant ` 3.20 lakh. 2. Tube Crimping with tube filling machine
` 0.22 lakh. 3. Generator ` 7.51 lakh. 4. Avaleh filling machine ` 1.06 lakh. 5. Tablet coating and polishing machine ` 1.11 lakh.
124 1. 6-Kharal ` 5.54 lakh 2. Tube crimping and filling machine ` 0.23 lakh 3. Horizontal Auto clave ` 2.16 lakh 4. Hygrometer ` 0.03 lakh 5. De-humidifier ` 0.43 lakh 6. Generator ` 7.45 lakh. 7. Automatic twin head liquid filling machine ` 0.74 lakh.
There were shortage of 28 machines each in Unani Pharmacy and Ayurved pharmacy against the norms recommended under Drugs and Cosmetics Rules
Plants and machineries were lying idle in both pharmacies affecting the quality and quantity of production
Chapter 2 : Performance Audit
107
The replies indicated lack of initiatives to ensure optimum utilisation of machines for improvement in quality and quantity in production of medicines.
It is suggested that the Government may consider providing adequate machinery and equipment for improving production.
2.5.3.6 Norms for process loss not laid down
The Government/Department did not fix any norm for processing loss125
during manufacturing of medicines. Audit scrutiny revealed that 19 to 57 types of shastrokta (Classical) medicines were produced in Government Unani Pharmacy Bhopal and 34 to 38 types in Government Ayurved Pharmacy, Gwalior during the period 2010-13. The cases of process loss (10 per cent and above) in manufacturing of medicines are shown in table below:
Table 4: Process loss in manufacturing of medicines
Sl. No. Name of medicines Produced Percentage of process loss incurred Government Unani Pharmacy, Bhopal
1 Itrifal Shahtra 32 2 marham A Rall 28 3 Rogan A Sooranjan 57 4 Dawa A Surfa Syah 23 5 Sufuf Abyaj 20 6 Sufuf Chutki 10 7 Rogan A Turb 72 8 Dawa A Surfa jard 13
Government Ayurved Pharmacy, Gwalior 1. Kamdudha Ras 21 2. Astang Lavan Churna 10 3. Sudh Tankan 43 4. Sudh Sfatika Churna 48 5. Godanti Bhasm 22 6. Mukta Sukti Bhasm 13
Source: Information provided by concerned Pharmacies
In the absence of prescribed norms, optimum utilisation of the herbs and the reasons for excess process loss could not be ascertained.
On this being pointed out (March and May 2013), the Department and theSuperintendents stated that the norms for process loss in manufacturing of medicines were not laid down by the Department. Government may consider fixing norms for manufacturing loss.
125 Process loss is the difference between input quantity of raw material and output
quantity of produced medicine.
There was no prescribed norm for process loss. Actual process loss ranged up to 72 per cent
Audit Report on General and Social (Non-PSUs) Sectors for the year ended 31 March 2013
108
2.5.4 Inventory Control
2.5.4.1 Excessive stock of raw herbs
The year-wise value of stock position of raw herbs and consumption in the pharmacies during the period 2010-13 were as under:
Stock position of raw herbs is shown in the table below:
Table 5:- Details of Stock position of raw herbs (`̀̀̀ in lakh)
Year Opening Stock
Purchased during the
year
Total Consumption during the
year
Closing Stock
Percentage of
consumption Government Unani Pharmacy, Bhopal2010-11 29.53 18.58 48.11 10.28 37.83 21 2011-12 37.83 0.50 38.33 15.81 22.52 41 2012-13 22.52 52.03 74.55 13.64 60.91 18
Government Ayurved Pharmacy, Gwalior (as per average126 rate)2010-11 42.40 52.91 95.31 35.54 59.77 37 2011-12 59.77 2.91 62.68 26.92 35.76 43
2012-13 35.76 113.27 149.03 30.04 118.99 20 Source: Information provided by concerned Pharmacies
It may be seen from the above table that despite sufficient stock of raw herbs, purchases were made without ensuring consumption of stock in hand.
We also noticed that raw herbs valuing ` 60.91 lakh and ` 118.99 lakh (as per average rate) were lying in stock at the end of 2012-13.
We further noticed that 29 items valuing ` 3.72 lakh were lying in stock for more than three to 10 years in Unani Pharmacy as shown in Appendix-2.37.Similarly in Ayurved Pharmacy five items127 valuing ` 0.75 lakh were lying in stock for more than seven to 10 years and were time expired for use as medicines. The physical verification of raw material was not done in Unani Pharmacy, Bhopal during the period 2010-11 to 2012-13. In Ayurved Pharmacy, Gwalior physical verification was done only in 2010-11. Hence, both Superintendents were not aware of the situation during the current years.
On this being pointed out (June 2013 and May 2013), the Superintendents stated that the balance raw herbs would be consumed in manufacturing of medicines in future. As regard time expired stock, action would be taken according to guidance of Directorate.
126 Average rate = Total Value / Total Quantity, where (Total Value = Value of old stock +
Value of new purchases during the year) and (Total quantity = Quantity of old stock + Quantity of new purchase). Ayurvedic Pharmacy maintains stock account as per Average rate.
127 Jaypatri ` 5,050, Tel Sarso ` 62,964, Padhal ki chhal ` 2,090, Podina Sukha ` 2,616,Laksha ` 2,684.
In Unani Pharmacy , 29 items of raw herbs were lying in stock from 3 to 10 years
Chapter 2 : Performance Audit
109
The reply is silent about the reasons for under-utilisation of raw herbs purchased. Besides, there was no laid down procedure for physical verification of stock.
2.5.5 Quality Control
2.5.5.1 Non-testing of raw material and medicines produced
As per provision of Schedule T part-I 1.1 General requirement 1.1 (F) (A) of Cosmetics Rule 1945, all raw material shall be sampled and got tested either by the in-house Ayurvedic, Siddha and Unani experts (Quality control technical person) or by the laboratories approved by the Government and shall be used only after approved verification. Records of the receipt, testing, approval or rejection and use of raw material shall be maintained. As per Schedule T part I 1.1(N) Quality control, every licensee is required to provide facility for quality control section in his own premises or through Government approved testing laboratory for testing of produced medicines. Quality control section shall have the equipment as recommended in Part II C.
We observed that the Commissioner, appointed Inward Committees consisting of experts in the field of Ayurved and Unani medicines for verification of receipt of raw material with reference to approved samples.
Audit scrutiny revealed that in the Pharmacies the samples of raw material were taken and tested either in-house by Ayurved and Unani experts or by the approved laboratories. No records were produced to Audit regarding testing, approval or rejection of samples of raw herbs. Scrutiny of records of pharmacies revealed that the pharmacies have neither drug testing laboratory in its premises with equipment recommended for in-house quality control of the medicine produced nor got them tested from the Government approved laboratory.
On this being pointed out (June 2013), both Superintendents stated that raw material was inwarded after approval by the Inward Committee after matching with the sample received from the Directorate. On non-checking of quality control of medicines produced, the Superintendents and Directorate stated (April 2013) that drug testing laboratories were not available in the premises and due to non-operation of Government drug testing laboratory, the medicines were not got tested for quality control.
Thus, the provisions of the Drugs and Cosmetics Rule 1945 were ignored. In the absence of quality testing the process of purchase of raw material and production of quality medicines becomes questionable and may have adverse effect on human health.
2.5.6 Internal Control
2.5.6.1 Inspection by departmental officers and internal audit
Periodic inspections by departmental officers are an important and effective tool to ensure proper functioning of the Department according to laid down procedures. There is no prescribed internal control system for the functioning of the pharmacies.
Inadequate quality control of raw herbs and absence of quality control of medicines produced
There were shortfalls in inspection and internal audit
Audit Report on General and Social (Non-PSUs) Sectors for the year ended 31 March 2013
110
Scrutiny revealed that neither any inspection of the Pharmacies was conducted by the departmental authorities except one visit of Commissioner, in Ayurved Pharmacy at Gwalior nor any audit was conducted by Internal Audit Wing of the Directorate during 2010-13 except in Government Unani Pharmacy Bhopal once for the period January 2009 to April 2011.
The above position shows that the system of inspection/internal audit was largely ignored.
It is suggested that the Government may consider strengthening control mechanism and inspections.
2.5.6.2 Maintaining report/return for monitoring
The information essential for exercising control over the production were not maintained through reports/returns by the Superintendents. Thus the details of material issued from store to production section in a month and quantity produced by the section in that month were not readily available. Hence, it could not be ensured that production was made in accordance with material issued to section. We further noticed that no monitoring mechanism was evolved for reporting the monthly or periodical details of production to the Directorate. On being pointed out, it was confirmed (June 2013) that no report of production etc. was sent to the Directorate by the Superintendent Government Unani Pharmacy Bhopal. However, though the Gwalior Ayurved pharmacy was sending the reports, no action on non-achievement of targets was taken by the Commissioner.
2.5.7 Conclusion
The objective of establishment of Ayush pharmacies was to supply the quality medicines to all Ayush hospitals and dispensaries. However, there was general apathy towards working of pharmacies as there was lack of planning for optimum utilisation of production capacity of pharmacies. There was no working manual and the need based yearly targets of production of medicines were not fixed. The pharmacies failed to produce medicine to meet the requirement and medicines were purchased from other agencies. The central purchase system for procurement of raw herbs for production of medicines have failed to purchase and provide sufficient quantity of raw herbs to the pharmacies. Norms for process loss were not in place and there were huge losses in production. The pharmacies were to work on no profit no loss basis. However, for each rupee of medicine produced the expenditure was in the range of ` 2.93 to ` 7.02. The pharmacies were not fully equipped as required under the Drugs and Cosmetics Rules, 1945. Idle machinery / equipment were noticed. There was shortfall in inspection and internal audit by departmental authorities. Thus, the objective of setting up the pharmacies could not be achieved.
The matter was reported to the Government in August 2013 with reminders issued in October and November 2013; their reply has not been received (November 2013).
Absence of monitoring mechanism
v
PREFACE
This Report of the Comptroller and Auditor General of India has been prepared for submission to the Governor under Article 151 of the Constitution for being laid before the State Legislature.
The Report, covering the year 2012-13, contains significant results of the compliance audits and performance audits of the departments of the Government of Madhya Pradesh under General and Social (Non-PSUs) Sectors. The departments under the Economic Sector and Revenue Sector are covered in the Audit Report on the Economic Sector (Non-PSUs) and Audit Report on Revenue Sector respectively.
The cases mentioned in the Report are among those which came to notice in the course of test audit of accounts during the year 2012-13 as well as those which came to notice in earlier years but could not be reported in previous Audit Reports. Matters relating to the period subsequent to 2012-13 have also been included, wherever necessary.
Audit has been conducted in conformity with the Auditing Standards prescribed for the Indian Audit and Accounts Department.
Chapter 1 of this report narrates the planning and conduct of audit, responses of the departments to draft audit paragraphs and the Audit Reports. Chapter 2 deals with the findings of Performance Audit on National Rural Drinking Water Programme, Working of Higher Education Department, Indira Awaas Yojana, Construction of Rural Roads under Mukhya Mantri Gram Sadak Yojana and Working of AYUSH Pharmacies. Chapter 3 deals with review of Implementation of Ladli Laxmi Yojana and audit findings of compliance audit in various Departments, autonomous bodies, societies, etc.
Chapter 3: Audit of Transactions
111
Chapter 3 : Audit of Transactions
Audit of transactions of the Government departments, their field formations as well as that of the autonomous bodies brought out instances of lapses in management of resources and failures in the observance of the norms of regularity, propriety and economy. These have been presented in the succeeding paragraphs under broad objective heads.
Women and Child Development Department (WCD)
3.1 Review of Implementation of Ladli Laxmi Yojana
Executive summary
The Ladli Laxmi Yojana (the Scheme) was launched by Government of Madhya Pradesh in April 2007 with the objective of promoting family planning, restore gender balance, prevent child marriage and education improvement of girl child. Under the Scheme financial assistance is provided to a girl child or her parents by issue of National Savings Certificates (NSCs). We observed deficiencies in implementation during the period 2010-13.
In the Anganwadi Centres, the maintenance of records in respect of registration numbers, date of receipt of application forms in respect of the beneficiaries at AWCs was inadequate. The eligibility criteria for issue of NSCs were not strictly adhered to.
Lack of control by CDPOs on AWCs in respect of death cases resulted in non-surrender of NSCs already issued. There were delays in issue of subsequent NSCs up to 142 months resulting in loss of interest to the beneficiaries. The NSCs were issued even after death of the beneficiaries.
Lack of effective and efficient control at Project Offices level resulted in issue of more than five NSCs to beneficiaries. Monitoring of Scheme implementation at project office was not conducted by the Commissioner.
3.1.1 Introduction
In order to promote family planning, restore gender balance, prevent child marriage and educational improvement, State Government launched (April 2007) Ladli Laxmi Yojana (the Scheme). The Scheme, being operated in the State by Women and Child Development Department, envisaged that female child born after 01 January 2006 would be eligible for registration with concerned anganwadi centres (AWCs) for receiving benefits of the Scheme provided their parents are domicile of the State, having two or less than two children with adoption of family planning and are not income tax payers. The registration should be within one year of the birth of female child. The Scheme
Audit Report on General and Social (Non-PSUs) Sectors for the year ended 31 March 2013
112
also provided for registration of first female child within one year of birth of the second child in case registration of first child could not be made earlier.
At Government level, the Principal Secretary Women and Child Department is responsible for overall implementation of the Scheme. The Scheme is implemented by the Commissioner at State level, 50 District Programme Officers (up to March 2012)/District Women Empowerment Officer (since April 2012) at district level, 453 Child Development Project Officers at project level and 80160 Anganwadi Workers at anganwadi centres level.
The financial assistance of ` 6000 per year for five years in the shape of National Saving Certificate (NSC) was to be provided to the girl child issued in her name. She in turn will receive more than ` one lakh at the age of 21 years provided she remained unmarried till the age of 18 years and appeared in 12th standard examination. In addition to above she would be entitled for ` 2000, ` 4000 and ` 7500 at the time of admission in 6th, 9th and 11th standards respectively. Further, scholarship of ` 200 per month would also be disbursed while studying in 11th and 12th standards. After maturity of the NSCs, the interim payment would be paid to girl child from maturity amount and remaining amount would be reinvested in the shape of NSC.
During the years 2010-11, 2011-12 and 2012-13 expenditure incurred under the Scheme was ` 316.34 crore, ` 691.60 crore and ` 892.33 crore against allotment of ` 323.46 crore, ` 694.60 crore and ` 897.24 crore respectively.
The audit of the implementation of the Scheme was conducted to assess whether the benefits under the Scheme accrued to the eligible targeted girl child and the operational controls as well as monitoring of the Scheme implementation were adequate. The review was conducted for the period 2010-13 by test check of records in 127 Project Offices1 (PO) covering 7508 Anganwadi Centers (AWC2) in 15 districts out of 453 POs having 80,160 AWCs in the State. Out of total expenditure of ` 1900.27 crore incurred on the Scheme during the period 2010-13 in the State, expenditure of ` 638.16 crore (34 per cent) was covered in audit.
1 Jabalpur:-13 POs, Chhindwada:-14 POs, Ujjain:-14 POs, Betul:-12 POs, Dhar:-16 POs,
Indore:-15 POs, Balaghat:-11 POs, Bhopal:-10 POs, Sagar:-16 POs, Chhatarpur:-1 PO (Chhatrpur gramin), Guna:-1 PO( Aaron), Rajgarh:-1 PO(Byavara), Alirajpur:-1PO ( Alirajpur), Narsinghpur:-1 PO( Narsinghpur), Shivpuri:- 1PO( Pichhore).
2 Jabalpur:-405,Chhindwada:-1274, Ujjain:-713, Betul:-1256, Dhar:-1322, Indore:-594 , Balaghat:-532, Bhopal:- 524, Sagar:- 539, Chhatarpur:-49 ( Chhatrpur gramin), Guna:-50 (Aaron), Rajgarh:-50 (Byavara), Alirajpur:-50 ( Alirajpur),Narsinghpur:-50( Narsinghpur), Shivpuri:-50 ( Pichhor),Khachrod-50.
Chapter 3: Audit of Transactions
113
Audit findings
3.1.2 Ascertaining of eligibility of applicants
3.1.2.1 Improper record maintenance for selection of beneficiary
Directorate of Woman and Child Welfare Department issued instructions (March 2007) that the girl child should be registered with the AWCs within one year from her date of birth. The Anganwadi workers (AWW) were to receive the application forms and register the eligible beneficiaries by recording the date of registration. After scrutiny of the application form by the AWW, it was to be sent to the Child Development Project Officer (CDPO) recommending the eligible beneficiaries. The forms of ineligible applicant and their list were to be kept in the AWCs and parents or guardian of the girl was to be informed in writing regarding ineligibility of applicant.
(i) Scrutiny of the applications3 in the selected POs revealed (July 2013) that in all cases, the registration number and date of receipt of application forms were not recorded by the AWCs on the application forms/register. Thus, it was not possible to ascertain fulfilment of the eligibility condition of beneficiaries and whether the registration of beneficiary was done by the AWCs within the stipulated period i.e. within one year from date of birth of the child.
(ii) In 7,508 AWCs, we observed (July 2013) that in respect of ineligible applicants neither the application forms were retained nor their records were maintained at AWC. Thus, it was not possible to ascertain the grounds on which applications were rejected and whether parents were duly informed about girl’s ineligibility as envisaged in the Scheme.
On this being pointed out, CDPOs stated (July 2013) that instructions would be issued to AWWs and Supervisors in this regard.
The reply of CDPOs confirms that proper records were not maintained at AWCs and the possibility of issuing of NSCs without ascertaining eligibility of beneficiary could not be ruled out.
Proper records should be maintained in order to ensure that no eligible girl child is deprived of the benefit of the Scheme.
3.1.2.2 Issue of NSCs without ascertaining eligibility of beneficiaries
As per the Scheme guidelines, the CDPOs sanction /approve each case after scrutiny based on documents sent by AWCs and they maintain a register (LLY-II) for watching timely sanction and issue of NSCs and educational benefits, etc. Thus, CDPOs were to sanction and send the list of eligible cases to the District Programme Officers (DPOs). Thereafter, the DPOs were to send
3 Jabalpur:-7758, Chhindwada:-21518, Ujjain:-15647, Betul:-18171, Dhar:-14103,
Indore:-24678, Balaghat:-12383, Bhopal:-12468, Sagar:-9516, Chhatarpur:-889 (Chhatrpur gramin), Guna:-984 (Aaron), Rajgarh:-494 (Byavara), Alirajpur:-654 (Alirajpur), Narsinghpur:-1304 (Narsinghpur), Shivpuri:-841 ( Pichhor), Khachrod-795, Total 1,42,203.
The maintenance of records in respect of registration of beneficiaries was inadequate
Records were not maintained/ retained in respect of the rejected applications
Audit Report on General and Social (Non-PSUs) Sectors for the year ended 31 March 2013
114
the list of eligible cases and amount for purchase of NSCs by cheque to the concern Post Offices. The Post Offices issue the NSCs in favour of the beneficiaries. The NSCs are distributed by AWCs to the parents of girls. The CDPOs, before issuing the second and the subsequent NSC were to ascertain compliance with the eligibility conditions on the basis of the information provided by AWW.
Scrutiny of records maintained at 126 POs and 7458 AWCs revealed that in 2,60,574 cases (except Bairasia-2), the second and subsequent NSCs were issued to the beneficiaries without obtaining information about eligibility of beneficiary from the AWWs. Further, we observed that in 89 POs4, 1125 NSCs valued ` 67.50 lakh were issued in respect of 7075 beneficiaries who were actually dead before issue of second and subsequent NSCs (Appendix 3.1). We also observed that the number of NSCs issued after death of beneficiaries was one NSC to all the five NSCs. The irregularities occurred as fulfilment of eligibility criteria for issue of the second and subsequent NSCs were not ascertained by the CDPOs before issue of the second and subsequent NSCs.
On this being pointed out, the CDPOs stated (July 2013) that instances of death cases were not timely intimated by AWWs to POs.
The reply was not acceptable as it was the responsibility of the CDPOs to obtain the report from AWWs and ensure eligibility of beneficiaries before issuing the second and subsequent NSCs.
CDPOs should maintain proper records by obtaining the information/ records from AWCs to ensure that the benefit is given only to the eligible beneficiaries.
3.1.2.3 Non surrender of funds in case of death of beneficiary
As per the provisions of the Scheme, on receipt of intimation of death of beneficiaries from AWWs, the CDPO should credit the amount of NSC to the Government Account. Scrutiny of AWC records in respect of birth/death of beneficiaries revealed that during the period 2007-2013, in 98 test-checked POs 1330 beneficiaries6 had died to whom 2457 NSCs amounting to ` 1.47 crore were issued (Appendix-3.2). However, no action was initiated by the CDPO to cancel the NSCs and credit the amount of ` 1.47 crore to the Government Account.
On this being pointed out, the CDPOs stated (July 2013) that action would be taken in this regard.
4 Jabalpur:-13, Chhindwada:-14, Ujjain:-4, Betul:-2, Dhar:-16, Indore:-15, Balaghat:-11, Bhopal & Sagar:-11 ,Rajgarh:-1(Byavara), Alirajpur:-1(Alirajpur), Shivpuri:-1(Pichhore).
5 Details of NSCs issued after death of beneficiaries No of NSCs issued I II III IV V Total No of Beneficiaries 425 178 75 26 3 707 Total No of NSCs issued after Death 425 356 225 104 15 1125
6 Including 707 beneficiaries mentioned in para 3.1.2.2
No action was taken to credit the amount of NSCs (` ` ` ` 1.47 crore) in case of death of beneficiary in Government account
Without ascertaining compliance with the eligibility conditions of beneficiaries, second and subsequent NSCs (value: `67.50 lakh) were issued
Chapter 3: Audit of Transactions
115
The reply confirms that there was no monitoring by the CDPOs through the reports/returns of death cases from the AWCs, which resulted in non surrender of NSCs.
The CDPOs should ensure that the amount of NSC in case of expired beneficiaries is credited to the Government Account.
3.1.3 Issue of NSC
3.1.3.1 Delay in issue of subsequent NSCs As per the scheme guidelines, subsequent NSCs (2nd, 3rd, 4th and 5th) to the beneficiary was to be issued after 12 months, 24 months, 36 months and 48 months from the date of issue of first NSC. As per investment plan of the Scheme it was estimated that eligible beneficiaries would receive an assured amount of `1,18,177 (including interim payment) on completion of 21 years of her age if all NSCs are issued on time.
Scrutiny of records in 127 POs7 revealed (July 2013) that in 3053 cases (out of 4320 test checked) 7508 selected AWCs, there were delays8 ranging from 02 days to 142 months in issuance of subsequent NSCs. This would result in loss of interest to the tune of ` 25.95 lakh (as detailed in Appendix-3.3). As a result, the beneficiary will be denied assured benefit (`1,18,177) of the Scheme.
On this being pointed out, the Commissioner stated (December 2013) that its main attention was to attend the new cases as a result there was delay in issuance of subsequent NSCs.
The reply confirms the indifferent attitude of the Department in monitoring the cases of the beneficiaries already covered under the Programme. Resultantly, the beneficiaries would not receive the assured amount envisaged in the Scheme.
It is suggested that the second and subsequent NSCs should be issued within the due date to avoid loss of interest.
3.1.3.2 Issue of more than five NSC to the beneficiaries
As per the provision of the scheme, the beneficiaries were to be issued NSCs of ` 6000 each year for five years by the POs from the date of registration of application.
Scrutiny of records (April to August 2013) in test checked 127 POs revealed that the CDPOs did not check LLY-II9 register and also did not obtain eligibility details from AWCs. We also observed that in 30 POs10, 231 NSCs
7 Jabalpur:-13 POs, Chhindwada:-14 POs, Ujjain:-14 POs Betul:-12 POs, Dhar:-16 POs,
Indore:-15 POs, Balaghat:-11 POs, Bhopal:-10 POs, Sagar:-16 POs, Chhatarpur:-1 PO (Chhatrpur gramin), Guna:-1 PO ( Aaron), Rajgarh:-1 PO (Byavara), Alirajpur:-1 PO ( Alirajpur), Narsinghpur:-1 PO ( Narsinghpur), Shivpuri:-1 PO ( Pichhore).
8 Due dates considered from the date of issue of first NSC. 9 LLY-II register is maintained at POs with details of beneficiaries and NSCs issued to them. 10 Chhindwada:-07, Betul:-05, Indore:-11, Balaghat:- 04, Bhopal& Sagar:-2, Alirajpur:-1
( Alirajpur).
Loss of interest (` ` ` ` 0.26 crore) due to delay in issuance of subsequent NSCs to beneficiaries
Audit Report on General and Social (Non-PSUs) Sectors for the year ended 31 March 2013
116
were issued in excess of maximum five NSCs to 185 beneficiaries11
amounting to ` 13.86 lakh (231 NSC x ` 6000) during the period (2010-13) as detailed district wise in the Appendix 3.4.
On this being pointed out, Department stated (December 2013), that the amount of excess NSCs would be deposited in Government Account.
The reply confirms poor monitoring and record keeping which resulted in issue of more than five NSC to the beneficiaries against the provision of the Scheme.
3.1.3.3 Benefits given without ascertaining eligibility
As per provision of the Scheme, in case the second girl child is benefited under this Scheme, the parents should adopt family planning within one yearafter birth of second girl child. The second and subsequent NSCs for the child will not be issued if parents do not fulfil the condition. However, in 24 POs12, we observed that in cases of 208 second girl child beneficiaries, second and subsequent NSCs, (426 NSCs worth ` 25.56 lakh as detailed in Appendix-3.5) were sanctioned without obtaining the requisite certificate from the AWC, regarding fulfilment of condition of family planning by the parents, as envisaged in the Scheme.
On this being pointed out, Department stated (December 2013) that the family planning condition was only for second girl child.
The reply does not address the audit observation.
3.1.4 Monitoring and controls
3.1.4.1 Lack of monitoring and supervision
As per the Scheme guidelines, the Head of the Department (HOD) was required to conduct verification of five per cent cases from the registered cases at POs as per the procedure formulated by Commissioner.
In the test check of records of 127 POs we observed that there was nothing on records to show that such verification was conducted at the Project Offices. Besides, ineffectiveness of monitoring and control was evident from the instances of improper record keeping, non-reporting of death cases of beneficiaries, delay in issue of NSCs, issue of more than five NSCs and issue of NSC to ineligible girl child, as already discussed in earlier paragraphs.
On this being pointed out, the Department stated (December- 2013) that the verification of the sanctioned cases is being continuously done by the senior officers of the Directorate.
11 6th NSC -152 beneficiaries, 6th &7th NSC-23 beneficiaries ,6th,7th & 8th NSC-7
beneficiaries, 6th ,7th , 8th & 9th NSC-3 beneficiaries. 12 Jabalpur:-1 POs, Chhindwada:-8 POs, Betul:-2 POs, Indore:-1,Balaghat:-03 POs, Bhopal &
Sagar:-5 POs, Chhatarpur:-1 ( Chhatrpur gramin), Guna:-1 ( Aaron), Alirajpur:-1 (Alirajpur),Narsinghpur:-1( Narsinghpur).
Against the provision of issuing five NSCs, more than five NSCs (value:` ` ` ` 0.14 crore) were issued
Benefits were continued without ascertaining whether the parents adopted family planning
There was no record to show that the head of Department conducted verification of registered cases
Chapter 3: Audit of Transactions
117
The reply was not acceptable because no such record was found in field offices.
The effective monitoring of the Scheme should be ensured at all levels for successful implementation of the scheme.
3.1.4.2 Action plan for publicity
As per guidelines, out of total provision for the Scheme, provision of one per cent for publicity of the Scheme was to be made separately. During the period 2010-13, ` 19.15 crore was due for publicity (one per cent of ` 1915.30 crore provided under the Scheme). Against this, only ` 6.50 crore was allotted and ` 3.11 crore was spent. However, publicity plan of the Scheme was not made available to audit.
3.1.5 Conclusion
Under the Ladli Laxmi Yojna, the maintenance of records in respect of registration numbers, date of receipt of application forms at AWCs was inadequate. Lack of monitoring by CDPOs on AWCs in respect of death cases resulted in non-surrender of NSC already issued. There were delays in issue of subsequent NSCs up to 142 months resulting in loss of interest to the beneficiaries. Lack of effective and efficient control at POs level resulted in issue of more than five NSCs to beneficiaries and issue of NSCs after the beneficiary expired. Monitoring as prescribed under the Scheme was not conducted by the Commissioner at Project Office.
3.2 Non-compliance with the rules, orders, procedures, etc.
For sound financial administration and financial control, it is essential that expenditure conforms to financial rules, regulations and orders issued by the competent authority. This not only prevents irregularities, misappropriation and frauds, but helps in maintaining good financial discipline. Some of the audit findings on non-compliance with rules and regulations are as under:
Public Health and Family Welfare Department
3.2.1 Non-accountal of Government money
Non-adherence to codal provisions resulted in non-accountal of Government money amounting to `̀̀̀ 2.21 lakh in the office of the Civil Surgeon cum Hospital Superintendent, Betul.
Rule 58(1) of the Madhya Pradesh Treasury Code (MPTC) provides that the head of an office where money is received on behalf of the government must give the payer a receipt duly signed by him after he has satisfied himself, before signing the receipt and initialing its counterfoil, that the amount has been entered properly in the cash books. If the circumstances
The expenditure for publicity was meagre
Audit Report on General and Social (Non-PSUs) Sectors for the year ended 31 March 2013
118
so justify, he may at the discretion authorise any other officer sub-ordinate to him, whether gazetted or non-gazetted, to sign such receipts for him. Rule 59 ibid provides that standard form (MPTC-6) shall be used by all Government servants receiving money on behalf of the government unless any special form of receipt is prescribed by departmental regulations to suit the convenience of any particular department or office. Rule 53(2) ibid provides that all monetary transactions should be entered in the cash book as soon as they occur and attested by the officer in charge of the cash book in token of check.
The Public Health and Family Welfare Department of Government of Madhya Pradesh revised (April 2006) the District Medical Board fee to `̀̀̀ 75 for medical examination in each case. Out of `̀̀̀ 75, an amount of `̀̀̀ 19 being Government’s share was to be deposited in the Government account and `̀̀̀ 56 was to be distributed13 among the members of District Medical Board. As per the codal provision, the fees so received through money receipt (MPTC-6) amount paid to Board members and amount deposited in the treasury were required to be entered in the cash book.
Test check of records (December 2012) viz. money receipt books (MPTC-6), and cash book of Civil Surgeon cum Hospital Superintendent (Civil Surgeon) Betul, revealed that for collection of Medical Board fees receipt books (MPTC-6) were issued to an official other than Cashier, Shri Shankar Lal Dhurve, Assistant Grade II and the fees collected by him was to be handed over to Cashier for proper accounting. During the period 14 December 2010 to 18 September 2012 total amount of `̀̀̀ 1,81,57214 was realised by him through 24 receipt books15 of MPTC-6. We noticed that out of `̀̀̀ 1,81,572 only `̀̀̀ 26,505 were deposited into treasury through challans and enteries were made in the cash book. However an amount of `̀̀̀ 56,546 were paid to the Board members by obtaining receipts from them, but the amount was not entered in the cash book. There was no accounting of entries in cash book as regard the balance amount of `̀̀̀ 98,521.
On this being pointed out in audit (December 2012) Civil Surgeon stated that the amount of medical board fee would be deposited into treasury and distributed to members of the medical board.
Further verification revealed (July 2013) that out of `̀̀̀ 98,521 only `̀̀̀ 3,800 was deposited in treasury through challans on 14 December 2012. The Civil Surgeon Betul intimated (July 2013) that `̀̀̀ 17,234 was distributed to members of the medical board, however, the relevant documents in support of disbursement were not submitted. The reply was silent about the balance amount of `̀̀̀ 77,487.
13 ` 14 each among the Chairman and three member doctors as fees of the doctors 14 Medical board fee (` 1,79,550), cost of tender form (` 2,000) and Right to Information fee
(` 22) 15 Each of 100 leafs
Chapter 3: Audit of Transactions
119
We also noticed (July 2013) that despite non-accountal having been pointed out by Audit (December 2012), an amount of `̀̀̀ 1,43,32516 was further realised during the period from 6 November 2012 to 2 July 2013 but not entered in cash book. There was no record to show that the amount was deposited into treasury or disbursed among the members of the medical board.
Thus non-adherance with codal provisions regarding handling and accounting of cash receipts of Government money and non-entering of cash in the cash book resulted in the non-accountal of the Government receipts amounting to `̀̀̀ 2.21 lakh (`̀̀̀ 77,487 + `̀̀̀ 1,43,325).
On this being pointed out (July 2013), the Civil Surgeon stated (July 2013) that as the amount was not handed over by the concerned official to account section of the office, the amount could not be taken as receipt in the cash book. The reply confirms that the compliance with codal provisions for handling cash were not ensured by Civil Surgeon which resulted in non accountal of government money amounting to ` ` ` ` 2.21 lakh.
The matter was reported (July 2013) with reminders (August 2013, October 2013 and January 2014) to the Government; their reply has not been received (January 2014).
3.2.2 Payment of bills on fake/duplicate invoices for supply of syringes
Failure to observe the codal provisions facilitated payment of `̀̀̀ 10.62 lakh on fake/duplicate invoices in the office of the Civil Surgeon cum Hospital Superintendent, Dhar.
In terms of Rule 121 of Madhya Pradesh Financial Rules all material received should be examined, counted, measured or weighed as the case may be, when delivery is taken and they should be taken in charge by a responsible Government servant who should see that the quantities are correct and their quality is good. He should also record a certificate to that effect on the bill. The Government servant receiving the stores should also be required to give a certificate that he has actually received the material and recorded them in the appropriate stock register. Further, in terms of Rule 193 of Madhya Pradesh Treasury Code each voucher should contain signature of the responsible drawing and disbursing officer and the order for payment should be indicated in ink both in figures and words. All payment orders should bear his signature.
During test check of records relating to purchases made in the office of Civil Surgeon cum Hospital Superintendent (CS), Dhar we observed
16 ` 52,800 received through MPTC-6 and ` 90,525 received by making enteries in register
without issuing MPTC-6 on account of medical board fees ` 1,41,825 and cost of tender form ` 1500
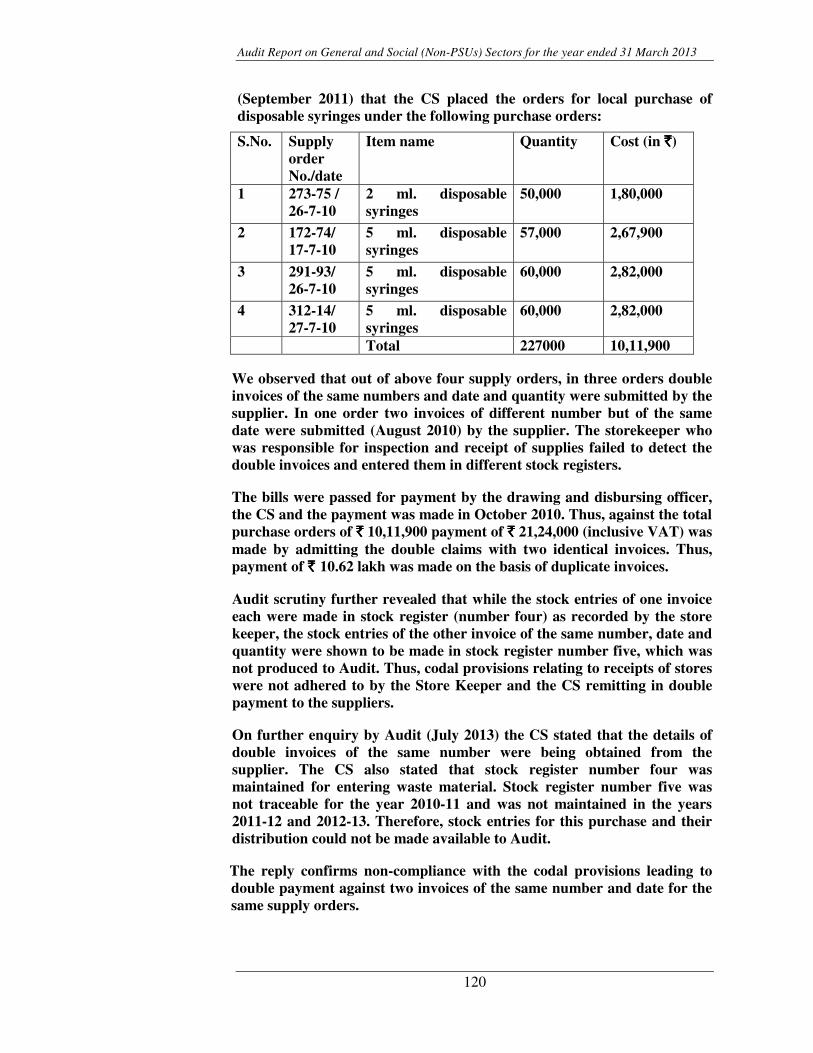
Audit Report on General and Social (Non-PSUs) Sectors for the year ended 31 March 2013
120
(September 2011) that the CS placed the orders for local purchase of disposable syringes under the following purchase orders:
S.No. Supply order No./date
Item name Quantity Cost (in `̀̀̀)
1 273-75 / 26-7-10
2 ml. disposable syringes
50,000 1,80,000
2 172-74/ 17-7-10
5 ml. disposable syringes
57,000 2,67,900
3 291-93/ 26-7-10
5 ml. disposable syringes
60,000 2,82,000
4 312-14/ 27-7-10
5 ml. disposable syringes
60,000 2,82,000
Total 227000 10,11,900
We observed that out of above four supply orders, in three orders double invoices of the same numbers and date and quantity were submitted by the supplier. In one order two invoices of different number but of the same date were submitted (August 2010) by the supplier. The storekeeper who was responsible for inspection and receipt of supplies failed to detect the double invoices and entered them in different stock registers.
The bills were passed for payment by the drawing and disbursing officer, the CS and the payment was made in October 2010. Thus, against the total purchase orders of `̀̀̀ 10,11,900 payment of `̀̀̀ 21,24,000 (inclusive VAT) was made by admitting the double claims with two identical invoices. Thus, payment of ` ` ` ` 10.62 lakh was made on the basis of duplicate invoices.
Audit scrutiny further revealed that while the stock entries of one invoice each were made in stock register (number four) as recorded by the store keeper, the stock entries of the other invoice of the same number, date and quantity were shown to be made in stock register number five, which was not produced to Audit. Thus, codal provisions relating to receipts of stores were not adhered to by the Store Keeper and the CS remitting in double payment to the suppliers.
On further enquiry by Audit (July 2013) the CS stated that the details of double invoices of the same number were being obtained from the supplier. The CS also stated that stock register number four was maintained for entering waste material. Stock register number five was not traceable for the year 2010-11 and was not maintained in the years 2011-12 and 2012-13. Therefore, stock entries for this purchase and their distribution could not be made available to Audit.
The reply confirms non-compliance with the codal provisions leading to double payment against two invoices of the same number and date for the same supply orders.
Chapter 3: Audit of Transactions
121
The matter was reported in September 2013 to Government and reminders issued in October 2013 and January 2014, their reply has not been received (January 2014).
Social Justice Department
3.2.3 Loss of interest
Violation of government instructions regarding deposit of the amount of Destitute Fund in treasury as “Local Fund” resulted into loss of interest of ` ` ` ` 2.46 crore.
In Madhya Pradesh Nirashrit Evam Nirdhan Vyoktion ki Sahayata Adhiniyam1970 (Act) came into force from 5 February 1970. The objectives of the Act were to provide help to Nirashrit and poor persons. The Rules (Rules) to implement the provisions of the Act were notified on 30 March 1999. According to these, the amount for Destitute Fund was to be collected from Krishi Upaj Mandi Samitees and other sources in each district. In terms of Rule 20 sub-rule 2-A, the amount collected for the Fund was to be deposited in nationalised banks as fixed deposit. The interest earned from the fixed deposit should be deposited in the saving/current account. The Social Justice Department of the State Government issued instructions to Collectors in November 2006 to deposit the entire amount of Destitute Fund in Treasury as Local Fund Deposit, since the Finance Department had given concurrence to pay the interest at seven per cent on such deposits.
We noticed that bank accounts for deposit of Destitute Fund were opened in the name of Collector of the concerned Districts and Deputy Directors (DD) of Department of Social Justice, who were operating and maintaining these accounts. On scrutiny of records (Bank Statement, Cash Book) of four DDs17
and information further collected (June 2013), we observed that Destitute Funds were kept in banks in savings account at an interest rate of four per centeven after issue of Government orders. Depositing of amounts of destitute fund in savings bank account instead of Local Fund Deposit in Treasury (interest at 7 per cent) resulted into loss of interest of ` 1.46 crore in four District18 (Appendix 3.6 A).
Further, in Morena District the amount of Destitute Fund collected was kept in PD Account (number four) of District Treasury Morena opened in February 2002. We observed that no transaction was made in this PD account after March 2007. The accumulated balance of `1.31 crore as on 31 March 2007 remained idle in the said PD account till October 2012. Thereafter, the amount lapsed to government account in revenue head (November 2012). While no
17 DD, Dhar (June 2012, DD, Harda (August 2012), DD, Mandla (February 2012), DD,
Ratlam (October 2011) 18 Dhar, Mandla,Harda ,Ratlam
Audit Report on General and Social (Non-PSUs) Sectors for the year ended 31 March 2013
122
interest was payable on PD Account, interest that could be earned under Local Fund Deposit works out to ` 99.77 lakh (Appendix 3.6 B).
Thus non-compliance with the provisions of the Rules and Government directions of November 2006 resulted in loss of interest of ` 2.46 crore on Destitute Fund.
On this being pointed out the Deputy Directors of Dhar, Mandla, Harda and Ratlam Districts (October 2011 to August 2012) stated that the interest was also received in saving account and action would be taken according to Rules. The reply is not acceptable, as instructions issued by the Government in November 2006 were not followed which resulted into loss of interest. Further verification by Audit (June 2013) revealed that amount of Destitute Fund was still kept by these DDs in saving accounts of banks.
It is recommended that the Government may issue suitable instructions to all the Collectors in the State for following the provisions of the Rule so that more interest can be earned on the Fund, which can be utilised for Social Welfare of the people of the State.
On this being pointed out Government accepted (September 2013) the facts and recommendations of Audit and stated that the Collectors of the concerned districts have been directed to take suitable action against the authority responsible for loss of interest and for ensuring strict compliance with all the rules/ orders relating to maintenance of Destitute Fund.
Public Health and Family Welfare Department
3.2.4 Short levy of stamp duty and non-registration of lease deeds
Government was deprived of revenue of `̀̀̀ 47.01 lakh due to short levy of stamp duty and non-registration of lease deeds executed by Civil Surgeons, Katni and Chhindwara.
Section 33 (c) of Schedule 1-A of Indian Stamp Act (IS Act), 1899, provides for levy of stamp duty at 8 per cent19 on conveyance on a lease deed where the lease is granted for a premium in addition to rent fixed at the rates prescribed from time to time therein. Further, as per Article II of Table of Registration Fees annexed to the Registration Act, 1908, Registration Fee is leviable at three fourth of the stamp duty. Section 17(d) of the Registration Act, 1908 provides that the registration of documents of leases of immovable property from year to year, or for any term exceeding one year, or reserving a yearly rent is compulsory. Besides, Section 33 of the IS Act provides that it would be obligatory on every person in charge of a public office to impound cases which are unduly stamped and initiate action to get it duly stamped.
We noticed from scrutiny (January 2013 and May 2013) of records of Civil Surgeon cum Hospital Superintendents (CS) who are also Ex-officio 19 Revised to 7.5 per cent w.e.f. 1 April, 2008.
Chapter 3: Audit of Transactions
123
Secretaries of Rogi Kalyan Samities (RKS) Chhindwara and Katni, that 93 shops20 constructed by the RKS in the District Hospitals of Chhindwara and Katni were rented out between January 2002 and January 2011 to private individuals for 3 years and 30 years. In these cases, the allotments were done on premium/offset price in addition to rent fixed which was revisable from time to time. According to Section 33 (c) ibid, Stamp Duty of ` 26.90 lakh was payable on these instruments (Appendix 3.7). We however, noticed that only ` 7300 was levied after execution of instruments on stamp paper of ` 100 by the Secretary, Rogi Kalyan Samitis and for 20 shops in Chhindwara, no stamp paper was used. This resulted in short levy of Stamp Duty of ` 26.83 lakh. We further observed that the lease deeds were not got registered, which resulted in non-levy of Registration fee of ` 20.18 lakh. Thus, the Government was deprived of total revenue of ` 47.01 lakh as detailed in the Appendix 3.7. This indicated failure of the Civil Surgeons, Katni and Chhindwara in discharging their duties as Secretary, RKS for the purpose of the IS Act.
On this being pointed out, the CS, Chhindwara and the CS, Katni accepted the above facts (January 2013 and May 2013) and stated that notices were issued to the allottees of shops. During further verification (October 2013) we observed that on the matter being referred by CS,Katni, the Registrar Katni initiated action for recovery of requisite Stamp Duty and Registration Fees (SDRF). Civil Surgeon, Chhindwara also requested (September, 2013) Registrar, Chhindwara to take required action for recovery of requisite SDRF from the allotees of the shops.
The matter was reported (June 2013) with reminders in August 2013, October 2013 and January 2014 to Government; their reply has not been received (January 2014).
Housing and Environment Department
3.2.5 Non-recovery of loans
Due to non-observance of conditions appended in the sanctions of the loans, `̀̀̀ 106.12 crore remained unrecovered from various organizations on account of loans, interest and penal interest.
According to Rule 220 of Madhya Pradesh Financial Code (MPFC) loans sanctioned to the Local bodies etc. and their recoveries should be regulated by the conditions appended with the sanction. In terms of instructions of the Finance Department issued from time to time, it was the responsibility of administrative departments to maintain the records in the prescribed format for recovery of installments of principal, interest and penal interest and to submit annual return to the Finance Department.
20 68 shops by RKS, Chhindwara ` 1000 per month per shop and 25 shops by RKS, Katni at
` 500 per month per shop.
Audit Report on General and Social (Non-PSUs) Sectors for the year ended 31 March 2013
124
Test check of loan sanction files and loan registers (June 2012) of Director, Town and Country Planning Bhopal (Director) revealed that the Madhya Pradesh Housing & Environment Department provided loans of ` 60.86 crore to 79 organisations21, Bodies and Authorities between 1959 to 2000 for implementation of eight schemes22. The loans alongwith interest/penal interest thereon were recoverable in 20/25 years. However, the principal, interest/penal interest amounting to ` 106.12 crore23 was outstanding against these organisations for recovery as on 31st March 2013 as given in Appendix 3.8.We also observed that instructions were being issued to the concerned local bodies to pay the outstanding loans alongwith interest and penal interest thereon only after 2009-10.
On further audit enquiry (June 2013) regarding submission of annual returns of outstanding loans and interest by the Administrative Department to the Finance Department, the Department sought (June 2013) information from Commissioner cum Director Town and Country Planning. Thus, the Administrative Department did not maintain the requisite records for monitoring recovery of installments of principal and interest and did not submit annual return to the Finance Department. Further there was no monitoring on the part of the Finance Department to ensure that the prescribed returns are submitted by the Administrative Departments.
Thus lack of continuous pursuance by the Directorate with the loanees and no monitoring on the part of the Administrative Department and Finance Department resulted in non-recovery of outstanding principal amount of loan along with interest and penal interest thereon amounting to ` 106.12 crore.
The matter was reported (July 2013 and October 2013) with reminder in January 2014 to the Government; their reply has not been received (January 2014).
3.3 Failure of oversight/governance
The Government has an obligation to improve the quality of life of the people for which it works towards fulfillment of certain goals in the area of health, education, development and upgradation of infrastructure and public service etc. However, Audit noticed instances where the funds released by Government for creating public assets for the benefit of the community remained unutilised/ blocked and/or proved unfruitful /unproductive due to indecisiveness, lack of administrative oversight and concerted action at various levels. A few such cases have been discussed below:
21 Nagar Palika, Nagar Nigam (61), Nagar Panchayats(06), Housing Board(03), Development
Authorities(07), Special Area Development Authorities (SADA)(01), TIT Rewa(01). 22 Destruction of Slum Area, Urban Land Development, Special Employment Programme, Land
Acquisition Development, Economical Weaker Section, Integrated Urban development Programme, Block Loan, and Integrated Development of Small and Medium Towns (IDSMT) schemes
23 Principal (` 27.93 crore), Interest (` 55.32 crore) and Penal Interest (` 22.87crore).
Chapter 3: Audit of Transactions
125
School Education Department
3.3.1 Utilisation of funds under the Free Cycle Distribution Scheme
In the Free Cycle Distribution Scheme the laid down control mechanism to ensure utilisation of funds for purchases of cycles worth ` ` ` ` 34.94 crore was not adhered to.
School Education Department (Department) introduced (October 2004) the Free Cycle Distribution Scheme to girl students of 9th to 12th class of Government Schools, in whose villages high schools or higher secondary schools were not established and as such they were studying in schools situated in other villages. The cycles were purchased under the Scheme, by the Department through Madhya Pradesh Laghu Udyog Nigam (MPLUN) and distributed to students. According to the modifications made in June 2008 the Scheme funds were provided to the bank account of Parent Teacher Association (PTA) and the cycles were to be purchased by PTA, by organizing cycle Mela wherein the cycles of the manufacturing companies were to be made available to ascertain the quality and rate of the cycle. As per para 3.12 of modified Scheme, effective from 2008-09 an officer was to be nominated by District Education Officer (DEO) for verification of cycle distribution in the schools who in turn will submit a report in prescribed format (Proforma-4) block-wise and the verification reports of all the blocks were to be consolidated by DEOs and submitted to the Director Public Instructions (DPI). From the year 2011-12 onwards, the amount of ` 2400 per beneficiary for purchase of cycle was to be paid to the student or their parents by account payee cheques through School Management and Development Committee. The benefit of the Scheme was also extended to the boy students from 2011-12.
During test check (May 2013) of records relating to allotment of funds, cash book and records relating to the Scheme with the DEO Bhopal and further verification (June 2013) of similar records for the period 2009-13 of the five DEOs of Datia, Indore, Raisen, Rewa and Umaria revealed that during the period 2009-13, a total amount of ` 37.75 crore was distributed to PTA or directly to the beneficiary students through crossed cheques for 1,57,282 students. The district-wise and year-wise distribution of funds and number of students benefited are given in Appendix 3.9. We observed that as against 1,57,282 beneficiary students, only 231 utilisation certificates amounting to `5.55 lakh (Bhopal 94, Datia 105 and Umaria 32) supported with vouchers of purchase showing therein the cycle chassis number etc. were available with the concerned DEOs. We further, noticed that 11,479 utilisation certificates (Raisen 9670 and Indore 1809) amounting to ` 2.75 crore were received by DEOs from School authorities without supporting vouchers of purchase of cycles. Thus, 11,710 UCs (7.4 per cent) were received against 1,57,282. However, in none of the cases, the DEOs got the purchase of cycles physically verified by nominating an officer as was envisaged in the modified scheme.

Audit Report on General and Social (Non-PSUs) Sectors for the year ended 31 March 2013
126
Thus, the control mechanism as envisaged in the Scheme was not adhered to and utilisation of the funds involving ` 34.94 crore distributed to 1,45,572 students where, neither vouchers nor UCs were received. Thus, purchase of cycles was not ensured by the Department.
On this being pointed out, the DEOs stated (May-June 2013) that the instructions were being issued to the Principals of the schools to furnish the UCs with supported vouchers for purchase of cycles. DEOs Indore and Raisen also stated (June 2013) that the vouchers containing the details of purchase of cycles were being kept by the schools concerned. The replies of the DEOs are not in order. The Scheme provides for verification of purchase of cycle by them and submission of report to the DPI.
The matter was referred to DPI (June 2013). The DPI stated (June 2013) that the provisions for verification of purchase of cycles by the beneficiaries were applicable up to the year 2007-08. Presently instead of distribution of cycle, the Government is ensuring that money is transferred to the eligible beneficiary. The responsibility to ensure the utilisation of fund by the beneficiary for the intended purpose is of the DEOs and all the details of funds and other records are to be maintained at that level.
The reply of the DPI is not acceptable as in the Scheme for the year 2008-09, the provisions of verification and submission of report to the DPI by the DEOs were provided vide para 3.12 of Scheme. The Schemes for the year 2009-10 and 2010-11 were issued bearing reference of scheme for the year 2008-09. It was also prescribed that after distribution of cycle, the satisfaction and proper utilisation certificate from parents may also be obtained by the DEO offices. In these years, the verification and proper utilisation report was to be sent to the DPI in the prescribed format. The DEOs neither sent the report and nor any action was taken by the DPI.
Thus due to non-compliance of the provisions of the Scheme, utilisation of funds for the intended purpose was not ascertained by the DEOs and the DPI also failed to monitor the utilisation of funds by obtaining the reports from DEOs.
The matter was reported (June 2013) with reminders (August 2013, October 2013 and January 2014) to Government; their reply has not been received. (January 2014).
Women and Child Development Department
3.3.2 Avoidable payment of VAT on nutritious food supplied under ICDS project
Avoidable payment of Value Added Tax (VAT) on nutritious food for distribution under Integrated Child Development Services (ICDS) resulted in reduction of fund to the extent of `̀̀̀ 196.56 crore.
The Scheme for supply of nutritious food for distribution under Integrated Child Development Services (ICDS) is funded by Central Government and
Chapter 3: Audit of Transactions
127
State Government with the share of 50 per cent each. In terms of Rule 21(i) of MP Financial Code, the terms of a contract must be precise and definite and there must be no room for ambiguity or mis-construction therein. Rule 21 (iv) ibid further provides that terms of contract once entered into should not be materially varied without the previous consent of the authority competent to enter into the contracts as so varied. No payments to contractors by way of compensation, or otherwise, outside the strict terms of the contract or in excess of the contract rates may be authorised without the previous approval of the Finance Department.
Test check of records (April 2012) of the Commissioner, Integrated Child Development Services (Commissioner) and further information collected (February and June 2013) revealed that in pursuance with the decision taken by the Cabinet and the Committee constituted (March 2008) by the Chief Minister, the Commissioner executed (4 June 2008) an agreement with MP Agro Industry Development Corporation (Corporation) for supply of nutritious food up to March 2012. The food items supplied were to be distributed as Take Home Ration (THR) to Supplementary Nutrition Programme (SNP) beneficiaries24 at Aanganwadi Centres. As per agreement, the Women and Child Development (WCD) Department is to provide wheat and rice at Below Poverty Line (BPL) rate to the Corporation and the rate of food items to be supplied would be fixed per beneficiary per day by the Department with the consent of Corporation, which would not exceed the limit fixed by the Government of India (GOI) and State Government in any condition. However, no conditions regarding payment of any tax was included in the agreement. The Corporation in May 2009, intimated the WCD Department that VAT at 12.5 per cent would be applicable on all material supplied by them. The Corporation also stated that proposal for exemption of VAT has already been sent (May 2009) by them to the Commercial Tax Department as per decision taken (April 2009) in the meeting headed by Principal Secretary.
We observed that against the supply orders issued by the Commissioner during April 2010 to March 2013, the Corporation supplied 4.60 lakh MT of THR at a cost of ` 1708.56 crore including VAT at 13 per cent25 amounting to ` 196.56 crore which was paid by the Commissioner. We observed that, the department did not take proper initiative for claiming exemption on the food items supplied for children and women under a welfare scheme, which is similar to the scheme for supply of cooked food by Self Help Groups (SHGs) in Aanganwadis under the SNP scheme and is exempted from VAT. As a result, Programme fund was deprived of ` 196.56 crore.
On this being pointed out, the Principal Secretary stated (August 2013) that the VAT was applicable on the Central share also and was paid accordingly as per instructions issued (July 2010) by Commissioner Commercial Tax Department. However, in the light of audit objection the decision of exemption of VAT on the food items supplied by MP Agro under welfare scheme was under consideration.
24 Children up to 3 years and pregnant women and lactating mothers 25 Effective from 1 April 2010 applicable on residual (unclassified) items.
Audit Report on General and Social (Non-PSUs) Sectors for the year ended 31 March 2013
128
The reply of Principal Secretary that VAT was applicable on Central share does not address the audit observation that VAT was being collected by the State Government and therefore effectively the VAT collection reduced the availability of Programme funds to that extent.
General Administration Department
3.3.3 Under-utlilisation of Satellite Interactive Terminal Centres installed under EDUSAT
Under utilisation of Satellite Interactive Terminal (SIT) Centres for distant education resulted into non-achievement of objectives of distant education to difficult-to-reach target groups despite incurring an expenditure of ` ` ` ` 3.82 crore on establishment of SITs.
The Government of India, Ministry of Human Resource Development (HRD) suggested (October 2004) Government of Madhya Pradesh to utilise EDUSAT (a dedicated satellite for education) as the State was already having a satellite uplink in K Band/Extended C Band and have a substantial network of receiving terminals. The objective of EDUSAT was to promote education with special focus on Elementary Education, Teachers Training and Literacy to difficult-to-reach target groups. Educational programmes were to be broadcasted from teaching end set up at School Education Department and Tribal Welfare Department. The programme were to be transmitted to Satellite Interactive Terminals (SITs) established by the concerned department in schools/institutions through HUB at Administrative Academy26, which is the Nodal Agency. Accordingly, Rajya Shiksha Kendra (RSK) under School Education Department established (February 2008) 65 SITs at a cost of ` 1.85 crore. Tribal Welfare Department established (February 2009) 50 SITs at a cost of ` 1.97 crore (including maintenance).
To initiate utilisation of EDUSAT, a steering committee was formed (September 2005) under the Chairmanship of Chief Secretary and officers from concerned Departments as Members including representatives of Indian Space Research Organisation (ISRO)27 with the objective that all the concerned departments of the State will formulate policies for use of EDUSAT, prepare state level action plan for effective utilisation of EDUSAT, coordination with ISRO and time bound implementation and monitoring of EDUSAT programme. The nodal agency Academy was to coordinate with ISRO and two user departments. The hub was installed in the Academy (2006) to link satellite and teaching ends. The log records showing the number of SITs functional on each day were maintained in the Academy.
Audit scrutiny of the log reports obtained from the Academy revealed that the SITs in RSK functioned for the period from May 2008 to September 2010 and
26 RCVP Noronha Academy, Bhopal (under the control of General Administrative
Department) 27 The national agency for Satellite Service
Chapter 3: Audit of Transactions
129
from August 2012 to June 2013. Similarly, in Tribal Welfare Department the SITs functioned from March 2009 to September 2010 and again from August 2012 to June 2013. The system was not functional from October 2010 to July 2012 because of Satellite failure which was confirmed by ISRO. We observed that during the entire period (excluding 11 months of Satellite failure) the number of days on which the SITs were used was only 3 per cent to 19 per cent of the total days in operation by the HUB (Academy). Details are given in Appendix 3.10. Thus, utilisation of SITs for imparting education to difficult-to-reach target group was negligible leading to denial of education through EDUSAT despite spending ` 3.82 crore. We also observed that the General Administration Department did not have the information about the use of SITs and implementation of the programme.
On this being pointed out the Tribal Welfare Department and RSK replied (July 2013) that SITs were not operated due to non-availability of regular electricity, technical defects and administrative reasons. The reply is not acceptable, as under the scheme UPS were part of the equipment and, therefore, uninterrupted power supply arrangements were in existence. The Government should have put in place the arrangements for functioning of SITs in the event of technical defects and persons on leave. General Administration Department stated (June 2013) that the information regarding use of EDUSAT would be obtained from the Academy. The Academy stated (June 2013) that they were only maintaining the log records and other information may be available with the concerned departments. Thus, no monitoring for evaluating the use of EDUSAT was done at Government level.
The School Education Department replied (December 2013) that all the SITs were never required to be logged for all the programmes. The SITs were logged by the user according to the type of target population and topic of the programme. All the SITs are logged only when a State level programme is organised. The reply of School Education Department is not in order since the Coordinator (IEC) RSK had already admitted the facts of shortfall and attributed the shortfall to technical faults, non-availability of electricity and other administrative reasons.
The matter was reported (July and August 2013) to Government; replies from General Administration Department and Tribal Welfare Department are still awaited (January 2014).
Medical Education Department
3.3.4 Idle equipment
Machinery and equipment amounting to `̀̀̀ 3.18 crore purchased by Dean Medical College, Sagar, without ensuring completion of building, lying idle without installation for one to two years.
Rule 118 of Madhya Pradesh Financial Code Volume I provides that purchases must be made in most economical manner in accordance with the definite requirement of the public service. Requirements of the year should be
Audit Report on General and Social (Non-PSUs) Sectors for the year ended 31 March 2013
130
estimated as far as they can be foreseen and as far as possible sufficient stock should be purchased during the cheapest season. At the same time, care should be taken not to purchase stores much in advance of actual requirement if such purchase is likely to prove unprofitable to Government.
For purchase of equipment and machinery required for medical colleges and hospitals attached thereto, the funds are placed at the disposal of Deans Medical Colleges (DMC). The Director Medical Education (DME) accords permission for purchase of equipment and machinery costing more than ` 1 lakh on the proposals submitted by the DMC indicating the requirements
of machinery and equipment, which are approved by the DME. The machines and equipment are purchased at the rates and as per terms and conditions finalised by the Central Purchase Committee in the DMC. Since, purchase orders are issued by the DMC and payments are also made by them, the responsibility of compliance of conditions of purchase orders, therefore, lies with the DMC.
Scrutiny (May 2013) of records relating to stores and purchases of the Dean, Bundelkhand Medical College, Sagar (Dean) revealed that the Dean submitted proposals for purchase of machineries and equipment to DME, Bhopal for administrative / financial sanction. After obtaining sanctions from the DME, the Dean purchased 289 machineries and equipment worth ` 6.74 crore during 2011-12 (233 equipment valued ` 4.79 crore) and 2012-13 (56 equipment valued ` 1.95 crore) as detailed in Appendix 3.11. As per terms and conditions of the purchase orders for the year 2011-12 (` 4.79 crore), 90 per centpayment was to be made on receipt of the machinery and equipment and 10 per cent payment was to be made after successful installation and providing the training for operating these machineries. However, full payment was made between July 2011 to July 2012 without ensuring installation of equipment. Further, verification of records (June 2013) revealed that 191 equipment were installed and 42 equipment worth ` 2.07 crore were lying uninstalled as of June 2013.
Similarly, out of 56 equipment purchased at ` 1.95 crore during 2012-13, 30 machinery and equipment costing ` 1.11 crore were also lying uninstalled as of June 2013 due to non-completion of building though the DMC was instructed (February 2011) by DME to expedite the construction of Medical College building on war footing so that the construction could be completed by March 2011.
We also observed that in the proposals submitted to DME the facts regarding non-availability of required space/accommodation for installation of machinery and equipments proposed to be purchased were not mentioned by the DMC. The DME also did not assess the actual requirement of funds before releasing the funds to the DMC.
On this being pointed out, the Dean stated (May and June 2013) that the machineries would be installed after completion of the Medical College building.
Matter was referred to the Government (July 2013) and the Government stated (November 2013) that this situation arose due to non-completion of Medical
Chapter 3: Audit of Transactions
131
College building by MP Housing Board in time. The DMC, Sagar has been instructed to install the equipment and impart training to subordinate staff. It was further stated that out of uninstalled equipment worth ` 3.18 crore equipment valued ` 1.75 crore had been installed and equipment amounting to ` 1.43 crore (` 1.16 crore + ` 0.27 crore) were still lying uninstalled.
The fact remains that since the Dean was aware of the status of construction work of Medical College building, he should have synchronized procurement of machinery and equipment to avoid idling of the machines without installation for one to two years.
Gwalior (K.K. SRIVASTAVA) The Principal Accountant General
(General and Social Sector Audit) Madhya Pradesh
Countersigned
New Delhi (SHASHI KANT SHARMA)The Comptroller and Auditor General of India

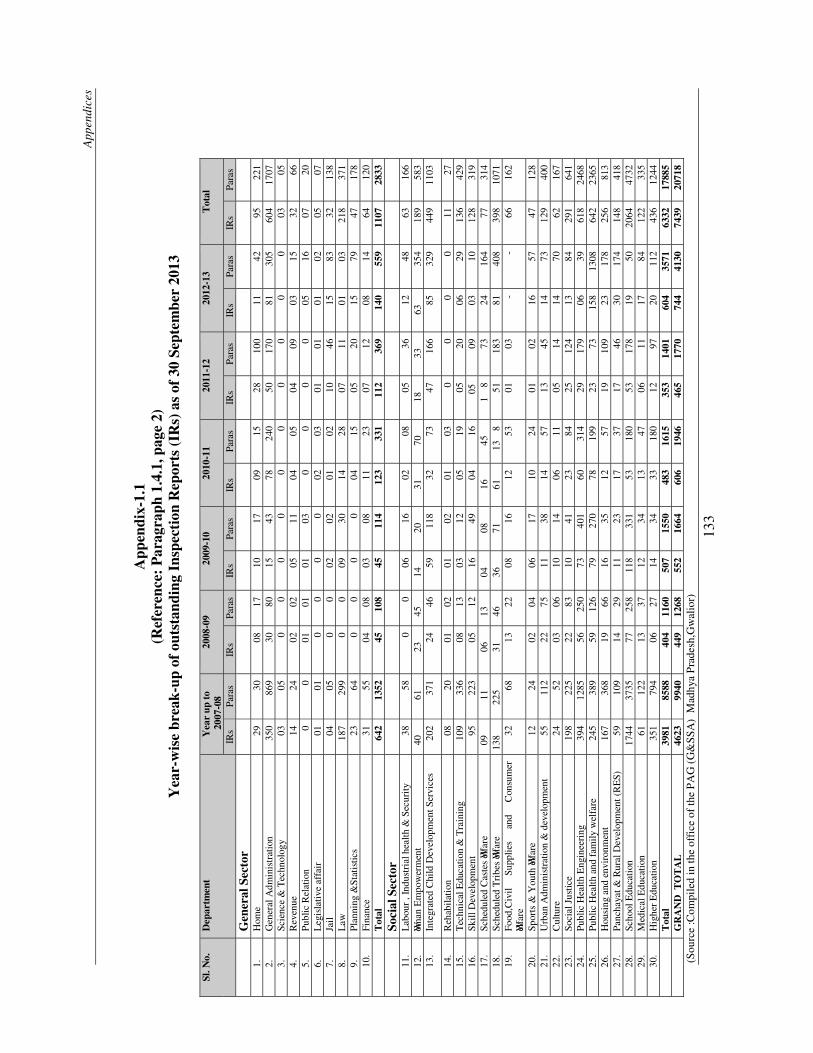
App
endi
ces
133
App
endi
x-1.
1 (R
efer
ence
: P
arag
raph
1.4
.1, p
age
2)
Yea
r-w
ise
brea
k-up
of
outs
tand
ing
Insp
ecti
on R
epor
ts (
IRs)
as
of 3
0 Se
ptem
ber
2013
Sl. N
o.
Dep
artm
ent
Yea
r up
to
200
7-08
20
08-0
9 20
09-1
0 20
10-1
1 20
11-1
2 20
12-1
3 T
otal
IRs
Para
s IR
s Pa
ras
IRs
Para
s IR
s Pa
ras
IRs
Para
s IR
s Pa
ras
IRs
Para
s
Gen
eral
Sec
tor
1.
Hom
e 29
30
08
17
10
17
09
15
28
10
0 11
42
95
22
1 2.
G
ener
al A
dmin
istr
atio
n
350
869
30
80
15
43
78
240
50
170
81
305
604
1707
3.
Sc
ienc
e &
Tec
hnol
ogy
03
05
0
0 0
0 0
0 0
0 0
0 03
05
4.
R
even
ue
14
24
02
02
05
11
04
05
04
09
03
15
32
66
5.
Publ
ic R
elat
ion
0 0
01
01
01
03
0 0
0 0
05
16
07
20
6.
Leg
isla
tive
aff
air
01
01
0 0
0 0
02
03
01
01
01
02
05
07
7.
Jail
04
05
0
0 02
02
01
02
10
46
15
83
32
13
8 8.
L
aw
187
299
0 0
09
30
14
28
07
11
01
03
218
371
9.
Plan
ning
&St
atis
tics
23
64
0 0
0 0
04
15
05
20
15
79
47
178
10.
Fi
nanc
e 31
55
04
08
03
08
11
23
07
12
08
14
64
12
0
Tot
al
642
1352
45
10
8 45
11
4 12
3 33
1 11
2 36
9 14
0 55
9 11
07
2833
Soci
al S
ecto
r
11.
L
abou
r , I
ndus
tria
l hea
lth &
Sec
urit
y 38
58
0
0 06
16
02
08
05
36
12
48
63
16
6 12
.
Woman
Em
pow
erm
ent
40
61
23
45
14
20
31
70
18
33
63
354
189
583
13.
In
tegr
ated
Chi
ld D
evel
opm
ent S
ervi
ces
202
371
24
46
59
118
32
73
47
166
85
329
449
1103
14.
R
ehab
ilati
on
08
20
01
02
01
02
01
03
0 0
0 0
11
27
15.
T
echn
ical
Edu
catio
n &
Tra
inin
g 10
9 33
6 08
13
03
12
05
19
05
20
06
29
13
6 42
9 16
.
Skill
Dev
elop
men
t 95
22
3 05
12
16
49
04
16
05
09
03
10
128
319
17.
Sc
hedu
led
Cas
tes
Welfa
re
09
11
06
13
04
08
16
45
18
73
24
164
77
314
18.
Sc
hedu
led
Tri
bes
Welfa
re
138
225
31
46
36
71
61
138
51
183
81
408
398
1071
19
.
Food
,Civ
il Su
pplie
s an
d C
onsu
mer
Wel
fare
32
68
13
22
08
16
12
53
01
03
-
- 66
16
2
20.
Sp
orts
& Y
outh
Welf
are
12
24
02
04
06
17
10
24
01
02
16
57
47
128
21.
U
rban
Adm
inis
trat
ion
& d
evel
opm
ent
55
112
22
75
11
38
14
57
13
45
14
73
129
400
22.
C
ultu
re
24
52
03
06
10
14
06
11
05
14
14
70
62
167
23.
So
cial
Jus
tice
19
8 22
5 22
83
10
41
23
84
25
12
4 13
84
29
1 64
1 24
.
Publ
ic H
ealth
Eng
inee
ring
39
4 12
85
56
250
73
401
60
314
29
179
06
39
618
2468
25
.
Publ
ic H
ealth
and
fam
ily w
elfa
re
245
389
59
126
79
270
78
199
23
73
158
1308
64
2 23
65
26.
H
ousi
ng a
nd e
nvir
onm
ent
167
368
19
66
16
35
12
57
19
109
23
178
256
813
27.
Pa
ncha
yat &
Rur
al D
evel
opm
ent (
RE
S)
59
109
14
29
11
23
17
37
17
46
30
174
148
418
28.
Sc
hool
Edu
cati
on
1744
37
35
77
258
118
331
53
180
53
178
19
50
2064
47
32
29.
M
edic
al E
duca
tion
61
12
2 13
37
12
34
13
47
06
11
17
84
12
2 33
5 30
.
Hig
her
Edu
catio
n 35
1 79
4 06
27
14
34
33
18
0 12
97
20
11
2 43
6 12
44
Tot
al
3981
85
88
404
1160
50
7 15
50
483
1615
35
3 14
01
604
3571
63
32
1788
5 G
RA
ND
TO
TA
L
4623
99
40
449
1268
55
2 16
64
606
1946
46
5 17
70
744
4130
74
39
2071
8 (S
ourc
e : C
ompi
led
in th
e of
fice
of
the
PA
G (
G&
SS
A)
Mad
hya
Pra
desh
,Gw
alio
r)
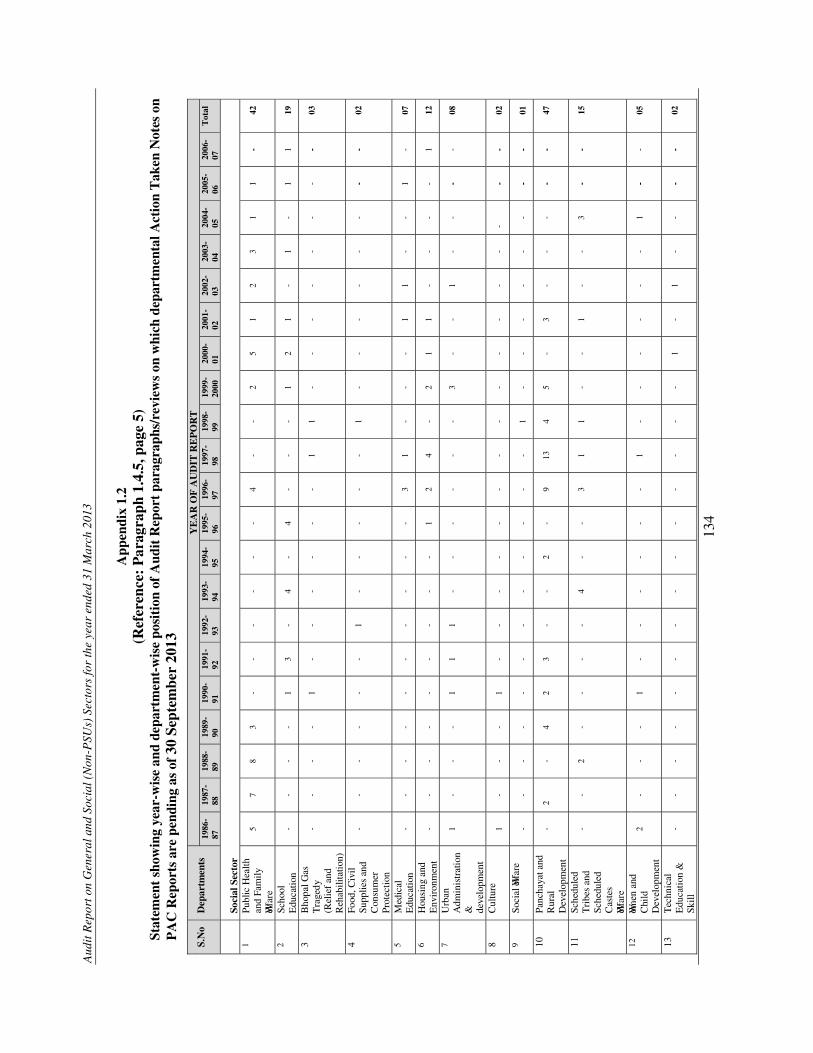
Aud
it R
epor
t on
Gen
eral
and
Soc
ial (
Non
-PSU
s) S
ecto
rs fo
r th
e ye
ar e
nded
31
Mar
ch 2
013
134
App
endi
x 1.
2 (R
efer
ence
: P
arag
raph
1.4
.5, p
age
5)
Stat
emen
t sh
owin
g ye
ar-w
ise
and
depa
rtm
ent-
wis
e po
siti
on o
f A
udit
Rep
ort p
arag
raph
s/re
view
s on
whi
ch d
epar
tmen
tal A
ctio
n T
aken
Not
es o
n P
AC
Rep
orts
are
pen
ding
as
of 3
0 Se
ptem
ber
2013
S.N
o D
epar
tmen
tsY
EA
R O
F A
UD
IT R
EP
OR
T19
86-
87
1987
-88
19
88-
89
1989
-90
19
90-
91
1991
-92
19
92-
93
1993
-94
19
94-
95
1995
-96
19
96-
97
1997
-98
19
98-
99
1999
-20
00
2000
-01
20
01-
02
2002
-03
20
03-
04
2004
-05
20
05-
06
2006
-07
T
otal
So
cial
Sec
tor
1 Pu
blic
Hea
lth
and
Fam
ily
Welfa
re
5 7
8 3
- -
- -
- -
4 -
- 2
5 1
2 3
1 1
- 42
2 Sc
hool
E
duca
tion
-
- -
- 1
3 -
4 -
4 -
- -
1 2
1 -
1 -
1 1
19
3 B
hopa
l Gas
T
rage
dy
(Rel
ief
and
Reh
abili
tatio
n)
- -
- -
1 -
- -
- -
- 1
1 -
- -
- -
- -
- 03
4 Fo
od, C
ivil
Supp
lies
and
Con
sum
er
Prot
ecti
on
- -
- -
- -
1 -
- -
- -
1 -
- -
- -
- -
- 02
5 M
edic
al
Edu
cati
on
- -
- -
- -
- -
- -
3 1
- -
- 1
1 -
- 1
- 07
6 H
ousi
ng a
nd
Env
iron
men
t -
- -
- -
- -
- -
1 2
4 -
2 1
1 -
- -
- 1
12
7 U
rban
A
dmin
istr
atio
n &
de
velo
pmen
t
1 -
- -
1 1
1 -
- -
- -
- 3
- -
1 -
- -
- 08
8 C
ultu
re
1 -
- -
1 -
- -
- -
- -
- -
- -
- -
- -
- 02
9 So
cial
Welf
are
-
- -
- -
- -
- -
- -
- 1
- -
- -
- -
- -
01
10
Panc
haya
t and
R
ural
D
evel
opm
ent
- 2
- 4
2 3
- -
2 -
9 13
4
5 -
3 -
- -
- -
47
11
Sche
dule
d T
ribe
s an
d Sc
hedu
led
Cas
tes
Welfa
re
- -
2 -
- -
- 4
- -
3 1
1 -
- 1
- -
3 -
- 15
12
Women
and
C
hild
D
evel
opm
ent
2 -
- -
1 -
- -
- -
- 1
- -
- -
- -
1 -
- 05
13
Tec
hnic
al
Edu
cati
on &
Sk
ill
- -
- -
- -
- -
- -
- -
- -
1 -
1 -
- -
- 02
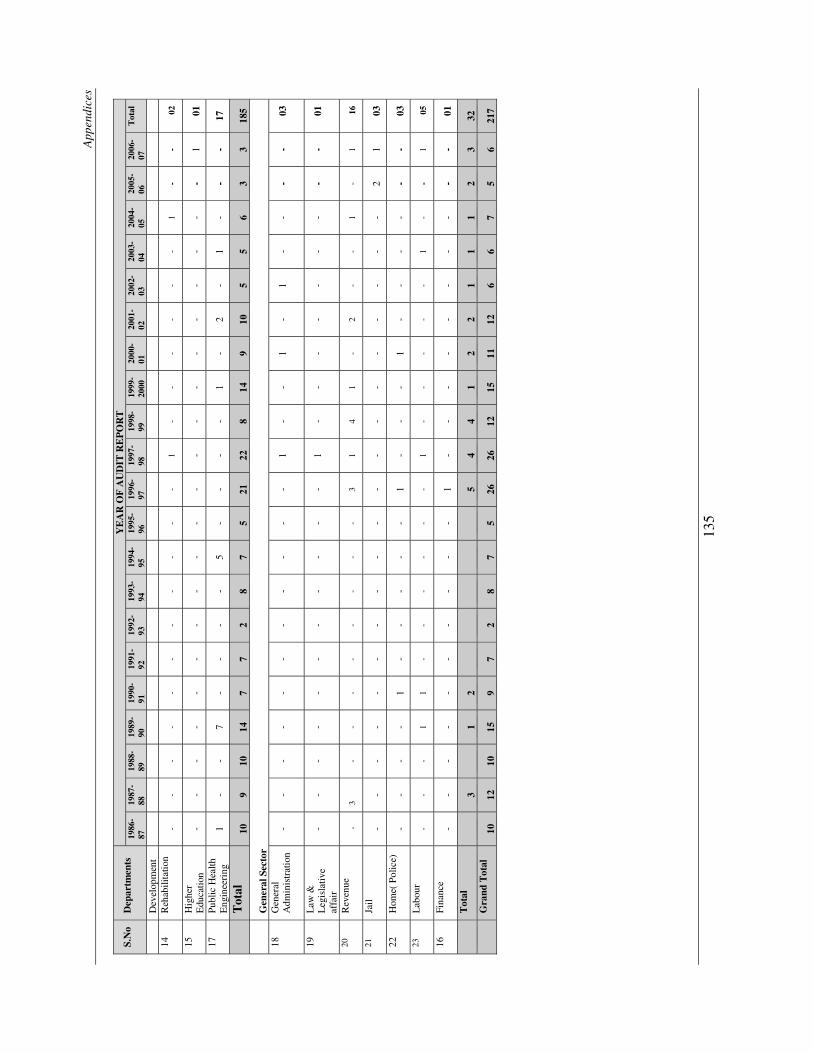
App
endi
ces
135
S.N
o D
epar
tmen
tsY
EA
R O
F A
UD
IT R
EP
OR
T19
86-
87
1987
-88
19
88-
89
1989
-90
19
90-
91
1991
-92
19
92-
93
1993
-94
19
94-
95
1995
-96
19
96-
97
1997
-98
19
98-
99
1999
-20
00
2000
-01
20
01-
02
2002
-03
20
03-
04
2004
-05
20
05-
06
2006
-07
T
otal
Dev
elop
men
t 14
R
ehab
ilita
tion
- -
- -
- -
- -
- -
- 1
- -
- -
- -
1 -
- 02
15
Hig
her
Edu
cati
on
- -
- -
- -
- -
- -
- -
- -
- -
- -
- -
1 01
17
Publ
ic H
ealth
E
ngin
eeri
ng
1 -
- 7
- -
- -
5 -
- -
- 1
- 2
- 1
- -
- 17
Tot
al
10
9 10
14
7
7 2
8 7
5 21
22
8
14
9 10
5
5 6
3 3
185
G
ener
al S
ecto
r 18
G
ener
al
Adm
inis
trat
ion
- -
- -
- -
- -
- -
- 1
- -
1 -
1 -
- -
- 03
19
Law
&
Leg
isla
tive
af
fair
- -
- -
- -
- -
- -
- 1
- -
- -
- -
- -
- 01
20
Rev
enue
- 3
- -
- -
- -
- -
3 1
4 1
- 2
- -
1 -
1 16
21
Jail
-
- -
- -
- -
- -
- -
- -
- -
- -
- -
2 1
03
22
Hom
e( P
olic
e)
- -
- -
1 -
- -
- -
1 -
- -
1 -
- -
- -
- 03
23
Lab
our
-
- -
1 1
- -
- -
- -
1 -
- -
- -
1 -
- 1
05
16
Fina
nce
- -
- -
- -
- -
- -
1 -
- -
- -
- -
- -
- 01
Tot
al
3 1
2 5
4 4
1 2
2 1
1 1
2 3
32
Gra
nd T
otal
10
12
10
15
9
7 2
8 7
5 26
26
12
15
11
12
6
6 7
5 6
217
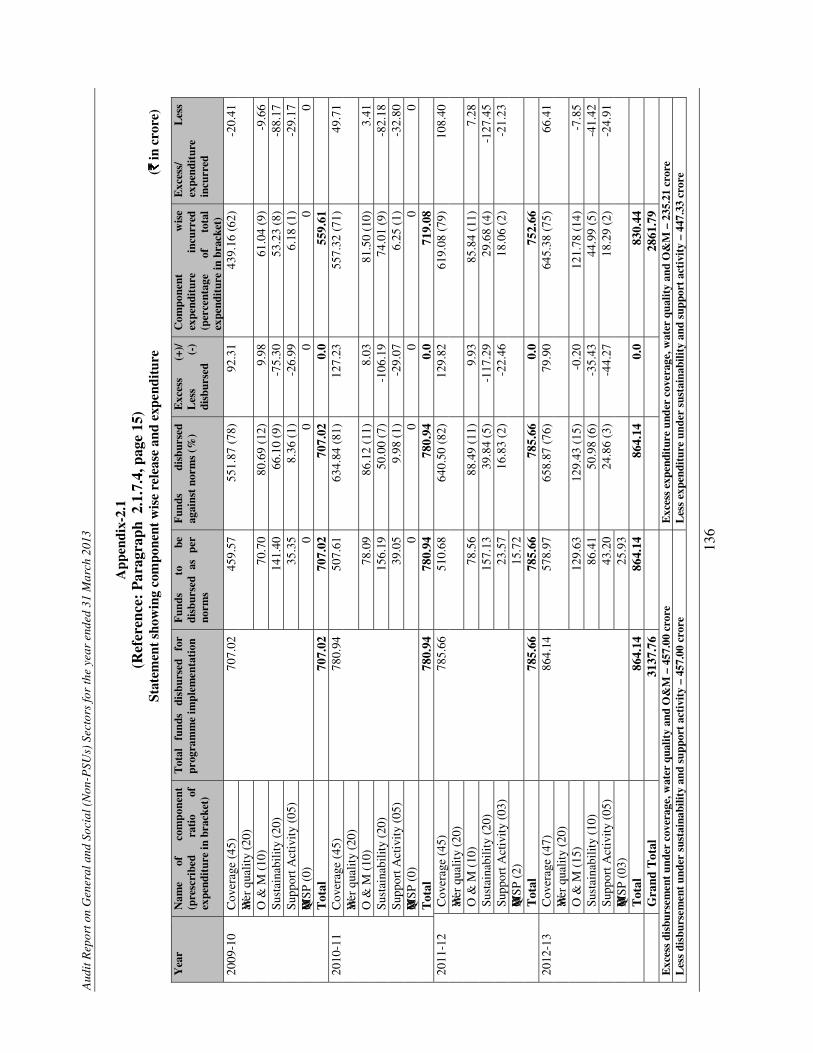
Aud
it R
epor
t on
Gen
eral
and
Soc
ial (
Non
-PSU
s) S
ecto
rs fo
r th
e ye
ar e
nded
31
Mar
ch 2
013
136
App
endi
x-2.
1 (R
efer
ence
: P
arag
raph
2.1
.7.4
, pag
e 15
)
St
atem
ent s
how
ing
com
pone
nt w
ise
rele
ase
and
expe
ndit
ure
(`̀̀̀ in
cro
re)
Yea
r N
ame
of
com
pone
nt
(pre
scri
bed
rati
o of
ex
pend
itur
e in
bra
cket
)
Tot
al
fund
s di
sbur
sed
for
prog
ram
me
impl
emen
tati
on
Fun
ds
to
be
disb
urse
d as
pe
r no
rms
Fun
ds
disb
urse
d ag
ains
t no
rms
(%)
Exc
ess
(+)/
L
ess
(-)
disb
urse
d
Com
pone
nt
wis
e ex
pend
itur
e in
curr
ed
(per
cent
age
of
tota
l ex
pend
itur
e in
bra
cket
)
Exc
ess/
L
ess
expe
ndit
ure
incu
rred
2009
-10
Cov
erag
e (4
5)
707.
02
459.
57
551.
87 (
78)
92.3
1 43
9.16
(62
) -2
0.41
Wat
er q
uali
ty (
20)
O &
M (
10)
70.7
0 80
.69
(12)
9.
98
61.0
4 (9
) -9
.66
Sust
aina
bili
ty (
20)
141.
40
66.1
0 (9
) -7
5.30
53
.23
(8)
-88.
17
Supp
ort A
ctiv
ity
(05)
35
.35
8.36
(1)
-2
6.99
6.
18 (
1)
-29.
17
WQMSP
(0)
0
0 0
0 0
Tot
al
707.
02
707.
02
707.
02
0.0
559.
61
20
10-1
1 C
over
age
(45)
78
0.94
50
7.61
63
4.84
(81
) 12
7.23
55
7.32
(71
) 49
.71
Water
qua
lity
(20
) O
& M
(10
) 78
.09
86.1
2 (1
1)
8.03
81
.50
(10)
3.
41
Sust
aina
bili
ty (
20)
156.
19
50.0
0 (7
) -1
06.1
9 74
.01
(9)
-82.
18
Supp
ort A
ctiv
ity
(05)
39
.05
9.98
(1)
-2
9.07
6.
25 (
1)
-32.
80
WQMSP
(0)
0
0 0
0 0
Tot
al
780.
94
780.
94
780.
94
0.0
719.
08
20
11-1
2 C
over
age
(45)
78
5.66
51
0.68
64
0.50
(82
) 12
9.82
61
9.08
(79
) 10
8.40
Wat
er q
uali
ty (
20)
O &
M (
10)
78.5
6 88
.49
(11)
9.
93
85.8
4 (1
1)
7.28
Su
stai
nabi
lity
(20
) 15
7.13
39
.84
(5)
-117
.29
29.6
8 (4
) -1
27.4
5 Su
ppor
t Act
ivit
y (0
3)
23.5
7 16
.83
(2)
-22.
46
18.0
6 (2
) -2
1.23
WQM
SP (
2)
15.7
2 T
otal
78
5.66
78
5.66
78
5.66
0.
0 75
2.66
2012
-13
Cov
erag
e (4
7)
864.
14
578.
97
658.
87 (
76)
79.9
0 64
5.38
(75
) 66
.41
Water
qua
lity
(20
) O
& M
(15
) 12
9.63
12
9.43
(15
) -0
.20
121.
78 (
14)
-7.8
5 Su
stai
nabi
lity
(10
) 86
.41
50.9
8 (6
) -3
5.43
44
.99
(5)
-41.
42
Supp
ort A
ctiv
ity
(05)
43
.20
24.8
6 (3
) -4
4.27
18
.29
(2)
-24.
91
WQMSP
(03
) 25
.93
Tot
al
864.
14
864.
14
864.
14
0.0
830.
44
G
rand
Tot
al
3137
.76
28
61.7
9
Exc
ess
disb
urse
men
t un
der
cove
rage
, wat
er q
ualit
y an
d O
&M
– 4
57.0
0 cr
ore
Exc
ess
expe
ndit
ure
unde
r co
vera
ge, w
ater
qua
lity
and
O&
M –
235
.21
cror
e L
ess
disb
urse
men
t un
der
sust
aina
bilit
y an
d su
ppor
t ac
tivi
ty –
457
.00
cror
e L
ess
expe
ndit
ure
unde
r su
stai
nabi
lity
and
supp
ort
acti
vity
– 4
47.3
3 cr
ore
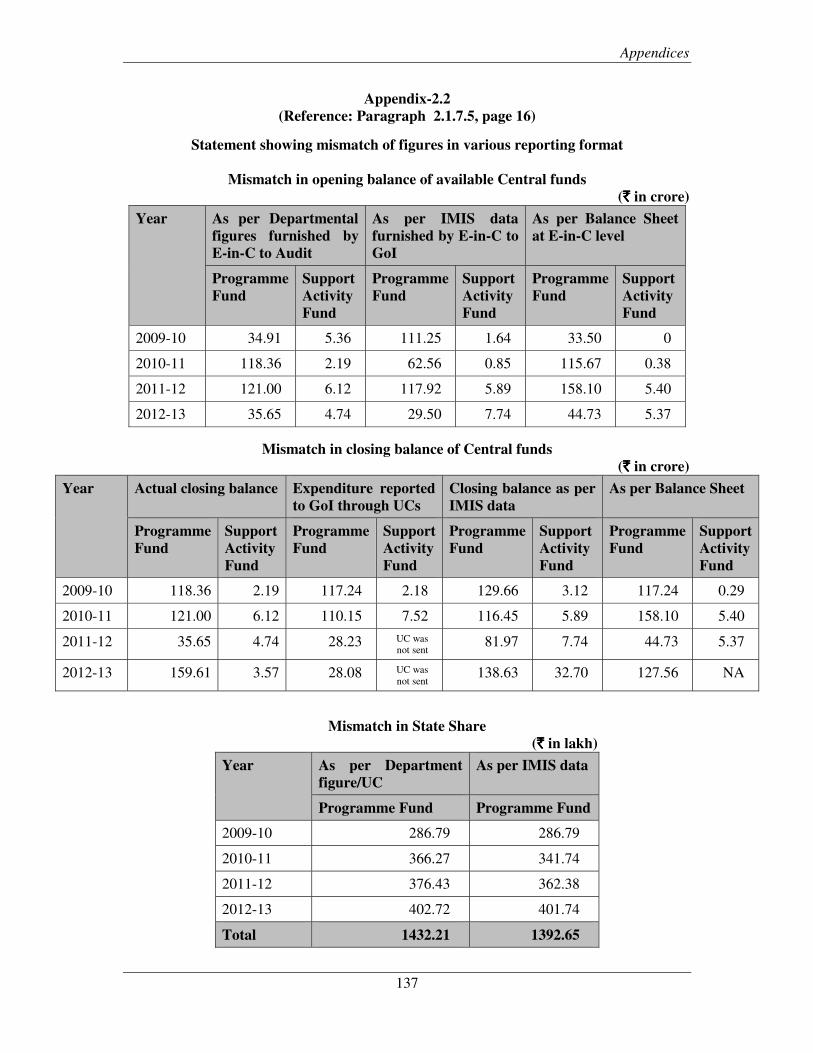
Appendices
137
Appendix-2.2 (Reference: Paragraph 2.1.7.5, page 16)
Statement showing mismatch of figures in various reporting format
Mismatch in opening balance of available Central funds (`̀̀̀ in crore)
Year As per Departmental figures furnished by E-in-C to Audit
As per IMIS data furnished by E-in-C to GoI
As per Balance Sheet at E-in-C level
Programme Fund
Support Activity Fund
Programme Fund
Support Activity Fund
Programme Fund
Support Activity Fund
2009-10 34.91 5.36 111.25 1.64 33.50 0
2010-11 118.36 2.19 62.56 0.85 115.67 0.38
2011-12 121.00 6.12 117.92 5.89 158.10 5.40
2012-13 35.65 4.74 29.50 7.74 44.73 5.37
Mismatch in closing balance of Central funds (`̀̀̀ in crore)
Year Actual closing balance Expenditure reported to GoI through UCs
Closing balance as per IMIS data
As per Balance Sheet
Programme Fund
Support Activity Fund
Programme Fund
Support Activity Fund
Programme Fund
Support Activity Fund
Programme Fund
Support Activity Fund
2009-10 118.36 2.19 117.24 2.18 129.66 3.12 117.24 0.29
2010-11 121.00 6.12 110.15 7.52 116.45 5.89 158.10 5.40
2011-12 35.65 4.74 28.23 UC was not sent
81.97 7.74 44.73 5.37
2012-13 159.61 3.57 28.08 UC was not sent
138.63 32.70 127.56 NA
Mismatch in State Share (`̀̀̀ in lakh)
Year As per Department figure/UC
As per IMIS data
Programme Fund Programme Fund
2009-10 286.79 286.79
2010-11 366.27 341.74
2011-12 376.43 362.38
2012-13 402.72 401.74
Total 1432.21 1392.65
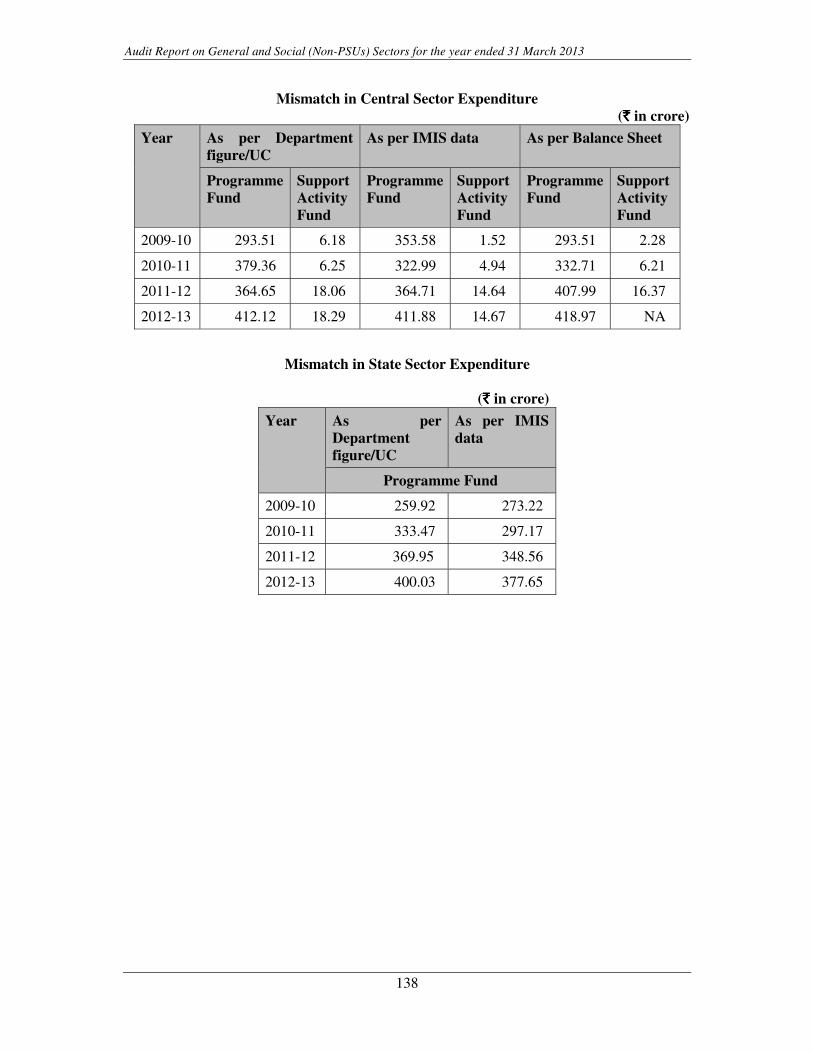
Audit Report on General and Social (Non-PSUs) Sectors for the year ended 31 March 2013
138
Mismatch in Central Sector Expenditure (`̀̀̀ in crore)
Year As per Department figure/UC
As per IMIS data As per Balance Sheet
Programme Fund
Support Activity Fund
Programme Fund
Support Activity Fund
Programme Fund
Support Activity Fund
2009-10 293.51 6.18 353.58 1.52 293.51 2.28
2010-11 379.36 6.25 322.99 4.94 332.71 6.21
2011-12 364.65 18.06 364.71 14.64 407.99 16.37
2012-13 412.12 18.29 411.88 14.67 418.97 NA
Mismatch in State Sector Expenditure
(`̀̀̀ in crore)
Year As per Department figure/UC
As per IMIS data
Programme Fund
2009-10 259.92 273.22
2010-11 333.47 297.17
2011-12 369.95 348.56
2012-13 400.03 377.65
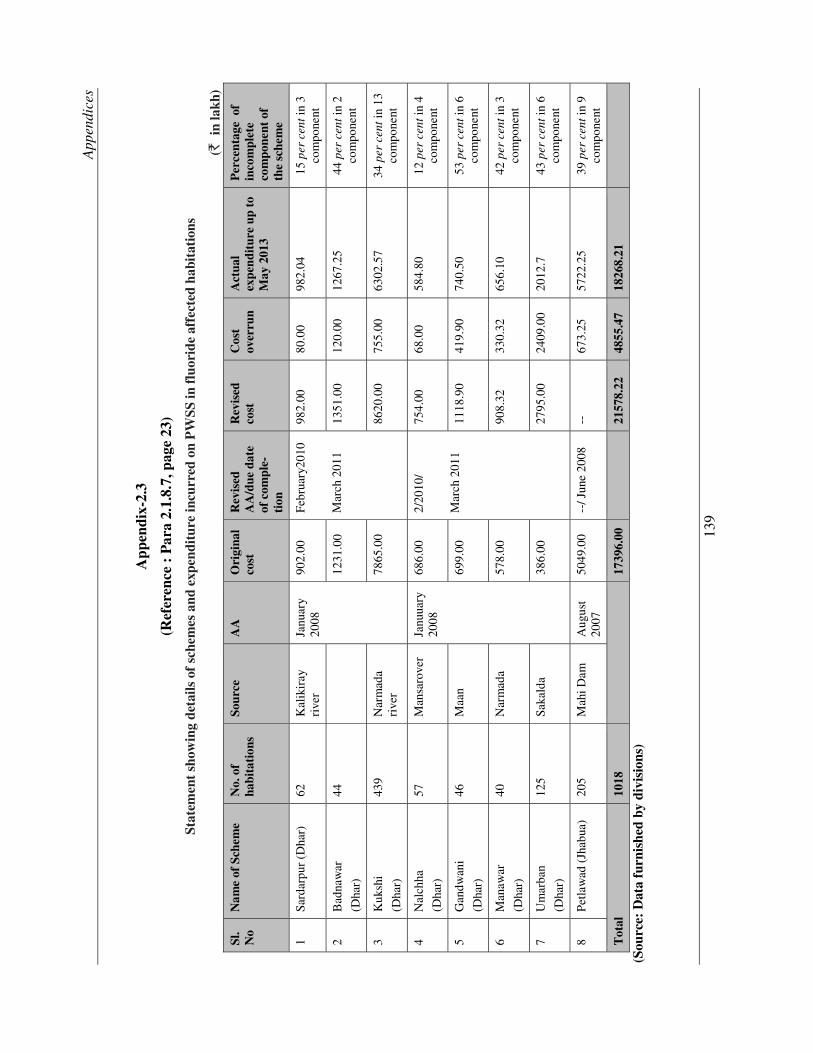
App
endi
ces
139
App
endi
x-2.
3
(Ref
eren
ce :
Par
a 2.
1.8.
7, p
age
23)
Stat
emen
t sh
owin
g de
tails
of
sche
mes
and
exp
endi
ture
incu
rred
on
PW
SS in
fluo
ride
aff
ecte
d ha
bita
tion
s
(`
in la
kh)
Sl.
No
Nam
e of
Sch
eme
No.
of
habi
tati
ons
Sour
ce
AA
O
rigi
nal
cost
R
evis
ed
AA
/due
dat
e of
com
ple-
tion
Rev
ised
co
st
Cos
t ov
erru
n A
ctua
l ex
pend
itur
e up
to
May
201
3
Per
cent
age
of
inco
mpl
ete
com
pone
nt o
f th
e sc
hem
e
1 Sa
rdar
pur
(Dha
r)
62
Kal
ikir
ay
rive
r Ja
nuar
y 20
08
902.
00
Febr
uary
2010
Mar
ch 2
011
982.
00
80.0
0 98
2.04
15
per
cen
t in
3 co
mpo
nent
2 B
adna
war
(Dha
r)
44
12
31.0
0 13
51.0
0 12
0.00
12
67.2
5 44
per
cen
t in
2 co
mpo
nent
3 K
uksh
i
(Dha
r)
439
Nar
mad
a ri
ver
7865
.00
8620
.00
755.
00
6302
.57
34 p
er c
ent i
n 13
co
mpo
nent
4 N
alch
ha
(Dha
r)
57
Man
saro
ver
Janu
uary
2008
68
6.00
2/
2010
/
Mar
ch 2
011
754.
00
68.0
0 58
4.80
12
per
cen
t in
4 co
mpo
nent
5 G
andw
ani
(Dha
r)
46
Maa
n 69
9.00
11
18.9
0 41
9.90
74
0.50
53
per
cen
t in
6 co
mpo
nent
6 M
anaw
ar
(Dha
r)
40
Nar
mad
a 57
8.00
90
8.32
33
0.32
65
6.10
42
per
cen
t in
3 co
mpo
nent
7 U
mar
ban
(Dha
r)
125
Saka
lda
386.
00
2795
.00
2409
.00
2012
.7
43 p
er c
ent i
n 6
com
pone
nt
8 P
etla
wad
(Jh
abua
) 20
5 M
ahi D
am
Aug
ust
2007
50
49.0
0 --
/ Jun
e 20
08
--
673.
25
5722
.25
39 p
er c
ent i
n 9
com
pone
nt
Tot
al
1018
17
396.
00
2157
8.22
48
55.4
7 18
268.
21
(Sou
rce:
Dat
a fu
rnis
hed
by d
ivis
ions
)
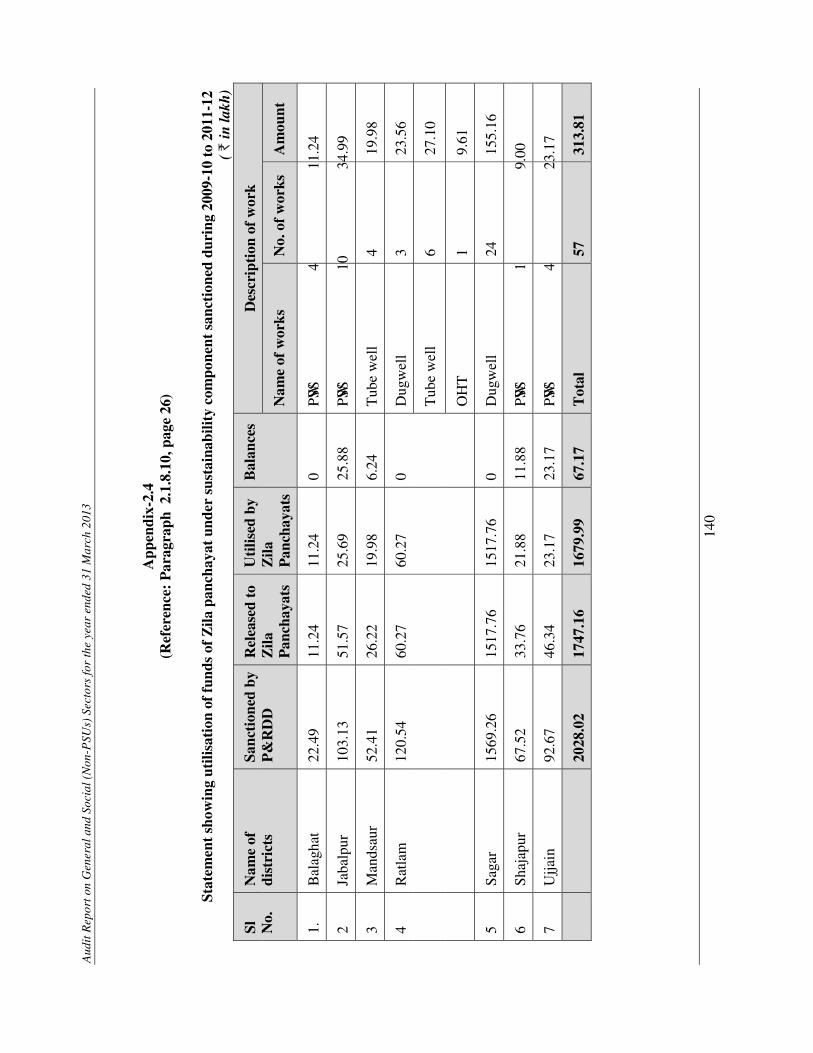
Aud
it R
epor
t on
Gen
eral
and
Soc
ial (
Non
-PSU
s) S
ecto
rs fo
r th
e ye
ar e
nded
31
Mar
ch 2
013
140
App
endi
x-2.
4 (R
efer
ence
: P
arag
raph
2.1
.8.1
0, p
age
26)
S
tate
men
t sh
owin
g ut
ilisa
tion
of
fund
s of
Zila
pan
chay
at u
nder
sus
tain
abili
ty c
ompo
nent
san
ctio
ned
duri
ng 2
009-
10 t
o 20
11-1
2 ( ` i
n la
kh)
Sl
No.
Nam
e of
di
stri
cts
Sanc
tion
edby
P
&R
DD
R
elea
sed
to
Zila
P
anch
ayat
s
Uti
lised
by
Zila
P
anch
ayat
s
Bal
ance
sD
escr
ipti
on o
f w
ork
Nam
e of
wor
ks
No.
of
wor
ks
Am
ount
1.
Bal
agha
t 22
.49
11.2
4 11
.24
0 PW
SS
4 11
.24
2 Ja
balp
ur
103.
13
51.5
7 25
.69
25.8
8 PW
SS
10
34.9
9
3 M
ands
aur
52.4
1 26
.22
19.9
8 6.
24
Tub
e w
ell
4 19
.98
4
Rat
lam
12
0.54
60
.27
60.2
7 0
Dug
wel
l 3
23.5
6
Tub
e w
ell
6 27
.10
OH
T
1 9.
61
5
Saga
r 15
69.2
6 15
17.7
6 15
17.7
6 0
Dug
wel
l 24
15
5.16
6 Sh
ajap
ur
67.5
2 33
.76
21.8
8 11
.88
PWSS
1
9.00
7 U
jjain
92
.67
46.3
4 23
.17
23.1
7 PW
SS
4 23
.17
2028
.02
1747
.16
1679
.99
67.1
7 T
otal
57
31
3.81
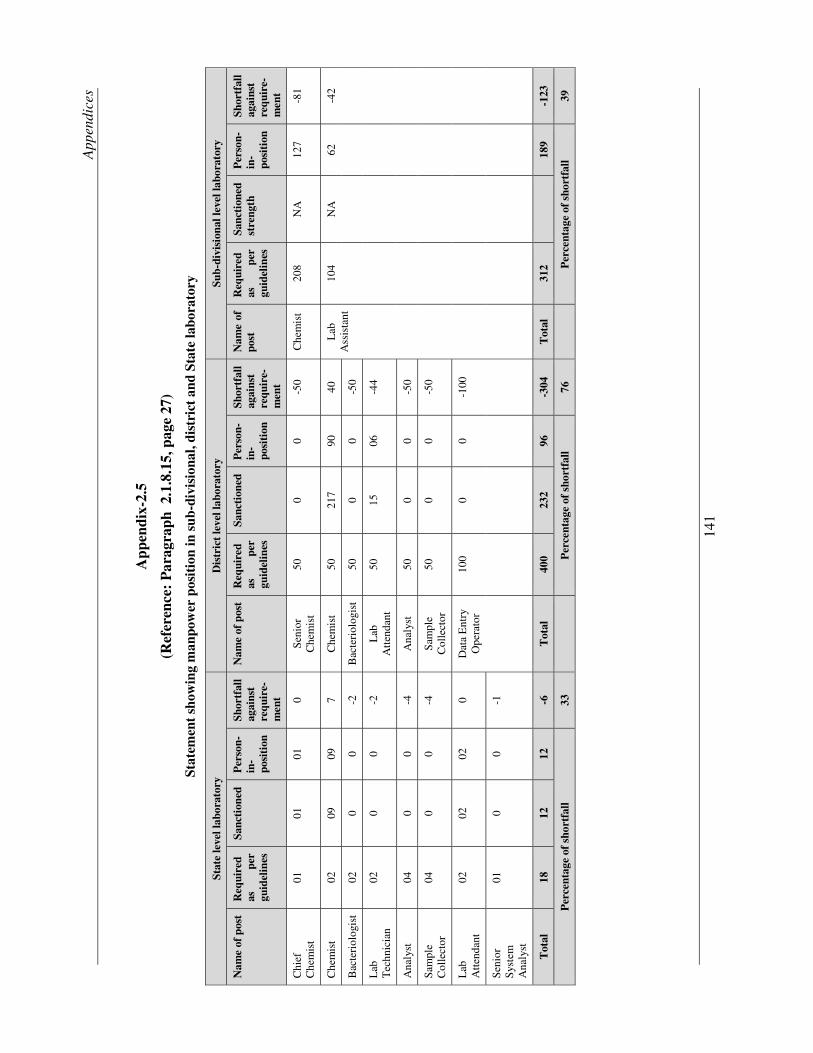
App
endi
ces
141
App
endi
x-2.
5
(Ref
eren
ce:
Par
agra
ph 2
.1.8
.15,
pag
e 27
)
Stat
emen
t sh
owin
g m
anpo
wer
pos
itio
n in
sub
-div
isio
nal,
dist
rict
and
Sta
te la
bora
tory
Stat
e le
vel l
abor
ator
y D
istr
ict
leve
l lab
orat
ory
Sub-
divi
sion
al le
vel l
abor
ator
y
Nam
e of
pos
t R
equi
red
as
per
guid
elin
es
Sanc
tion
ed
Per
son-
in-
posi
tion
Shor
tfal
l ag
ains
t re
quir
e-m
ent
Nam
e of
pos
t R
equi
red
as
per
guid
elin
es
Sanc
tion
ed
Per
son-
in-
posi
tion
Shor
tfal
l ag
ains
t re
quir
e-m
ent
Nam
e of
po
st
Req
uire
d as
pe
r gu
idel
ines
Sanc
tion
ed
stre
ngth
P
erso
n-in
-po
siti
on
Shor
tfal
l ag
ains
t re
quir
e-m
ent
Chi
ef
Che
mis
t 01
01
01
0
Sen
ior
Che
mis
t 50
0
0 -5
0 C
hem
ist
208
NA
12
7 -8
1
Che
mis
t 02
09
09
7
Che
mis
t 50
21
7 90
40
L
ab
Ass
ista
nt
104
NA
62
-4
2
Bac
teri
olog
ist
02
0 0
-2
Bac
teri
olog
ist
50
0 0
-50
Lab
T
echn
icia
n 02
0
0 -2
L
ab
Att
enda
nt
50
15
06
-44
Ana
lyst
04
0
0 -4
A
naly
st
50
0 0
-50
Sam
ple
Col
lect
or
04
0 0
-4
Sam
ple
Col
lect
or
50
0 0
-50
Lab
A
tten
dant
02
02
02
0
Dat
a E
ntry
O
pera
tor
100
0 0
-100
Sen
ior
Sys
tem
A
naly
st
01
0 0
-1
Tot
al
18
12
12
-6
Tot
al
400
232
96
-304
T
otal
31
2 18
9 -1
23
Per
cent
age
of s
hort
fall
33
Per
cent
age
of s
hort
fall
76
Per
cent
age
of s
hort
fall
39
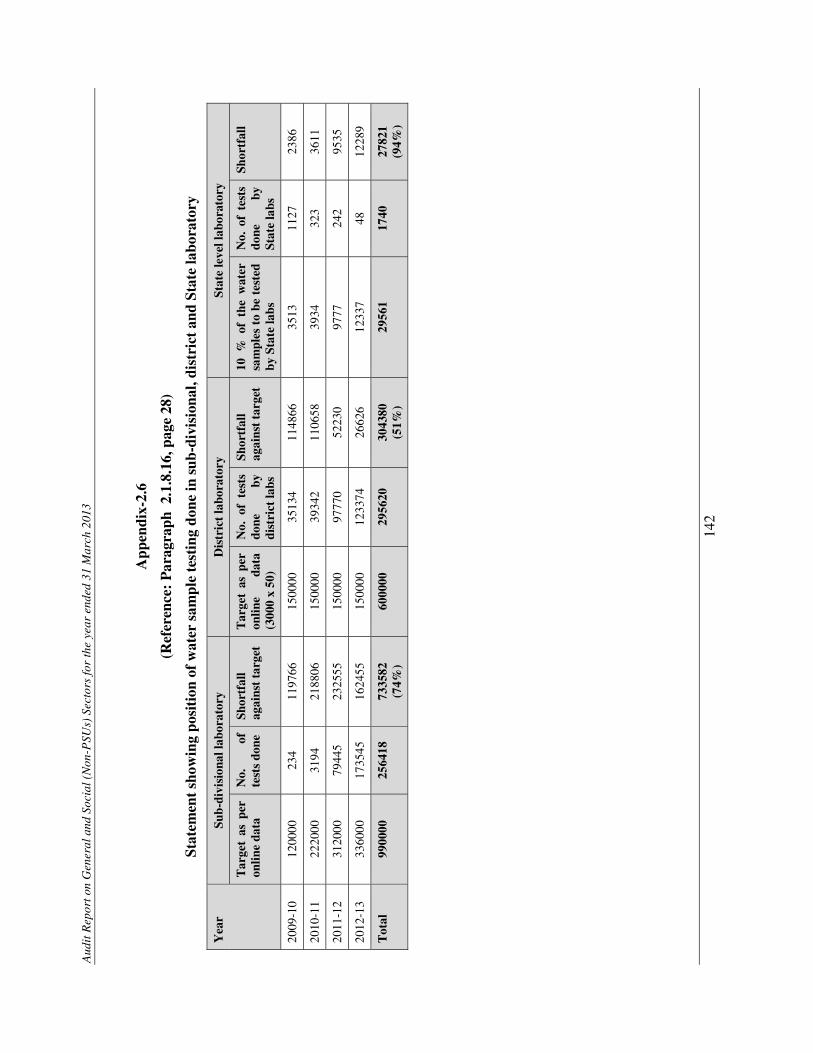
Aud
it R
epor
t on
Gen
eral
and
Soc
ial (
Non
-PSU
s) S
ecto
rs fo
r th
e ye
ar e
nded
31
Mar
ch 2
013
142
App
endi
x-2.
6
(Ref
eren
ce:
Par
agra
ph 2
.1.8
.16,
pag
e 28
)
Stat
emen
t sh
owin
g po
siti
on o
f wat
er s
ampl
e te
stin
g do
ne in
sub
-div
isio
nal,
dist
rict
and
Sta
te la
bora
tory
Yea
r Su
b-di
visi
onal
labo
rato
ry
Dis
tric
t la
bora
tory
St
ate
leve
l lab
orat
ory
Tar
get
as p
er
onlin
e da
ta
No.
of
te
sts
done
Sh
ortf
all
agai
nst
targ
et
Tar
get
as p
er
onlin
e da
ta
(300
0 x
50)
No.
of
test
s do
ne
by
dist
rict
labs
Shor
tfal
l ag
ains
t ta
rget
10
% o
f th
e w
ater
sa
mpl
es t
o be
tes
ted
by S
tate
labs
No.
of
test
s do
ne
by
Stat
e la
bs
Shor
tfal
l
2009
-10
1200
00
234
1197
66
1500
00
3513
4 11
4866
35
13
1127
23
86
2010
-11
2220
00
3194
21
8806
15
0000
39
342
1106
58
3934
32
3 36
11
2011
-12
3120
00
7944
5 23
2555
15
0000
97
770
5223
0 97
77
242
9535
2012
-13
3360
00
1735
45
1624
55
1500
00
1233
74
2662
6 12
337
48
1228
9
Tot
al
9900
00
2564
18
7335
82
(74%
) 60
0000
29
5620
30
4380
(5
1%)
2956
1 17
40
2782
1 (9
4%)
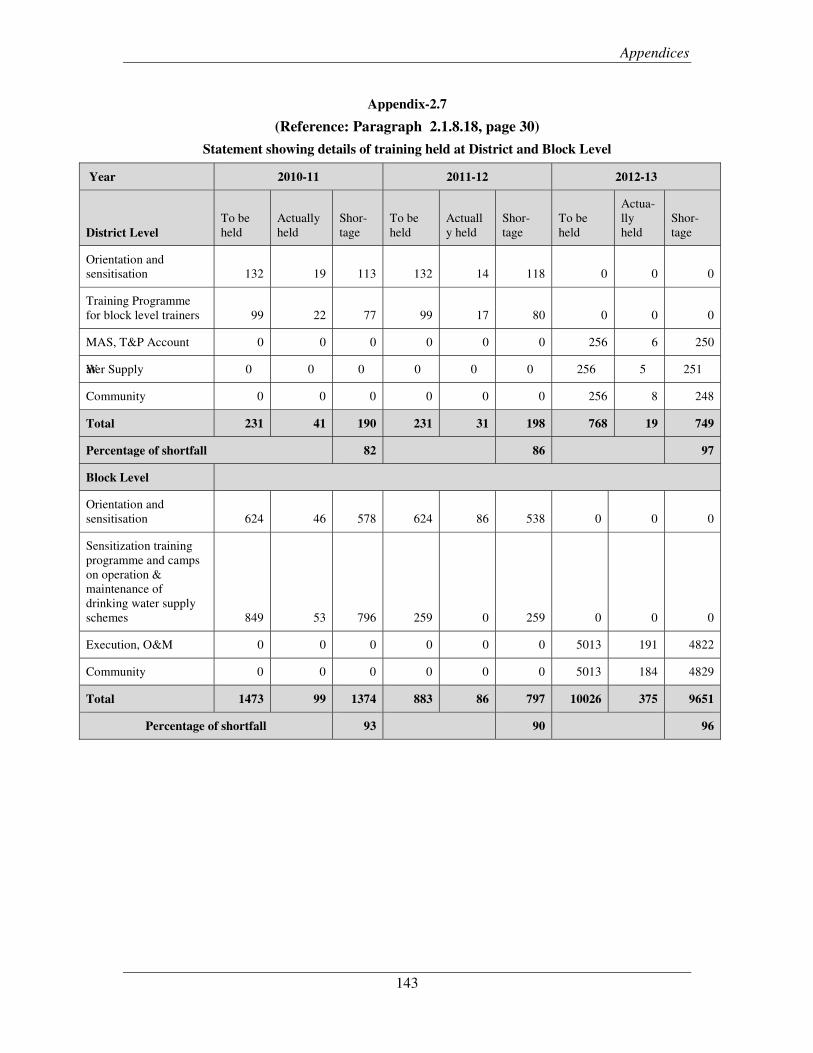
Appendices
143
Appendix-2.7
(Reference: Paragraph 2.1.8.18, page 30)
Statement showing details of training held at District and Block Level
Year 2010-11 2011-12 2012-13
District Level To be held
Actually held
Shor-tage
To be held
Actually held
Shor-tage
To be held
Actua-lly held
Shor-tage
Orientation and sensitisation 132 19 113 132 14 118 0 0 0
Training Programme for block level trainers 99 22 77 99 17 80 0 0 0
MAS, T&P Account 0 0 0 0 0 0 256 6 250
Water Supply 0 0 0 0 0 0 256 5 251
Community 0 0 0 0 0 0 256 8 248
Total 231 41 190 231 31 198 768 19 749
Percentage of shortfall 82 86 97
Block Level
Orientation and sensitisation 624 46 578 624 86 538 0 0 0
Sensitization training programme and camps on operation & maintenance of drinking water supply schemes 849 53 796 259 0 259 0 0 0
Execution, O&M 0 0 0 0 0 0 5013 191 4822
Community 0 0 0 0 0 0 5013 184 4829
Total 1473 99 1374 883 86 797 10026 375 9651
Percentage of shortfall 93 90 96
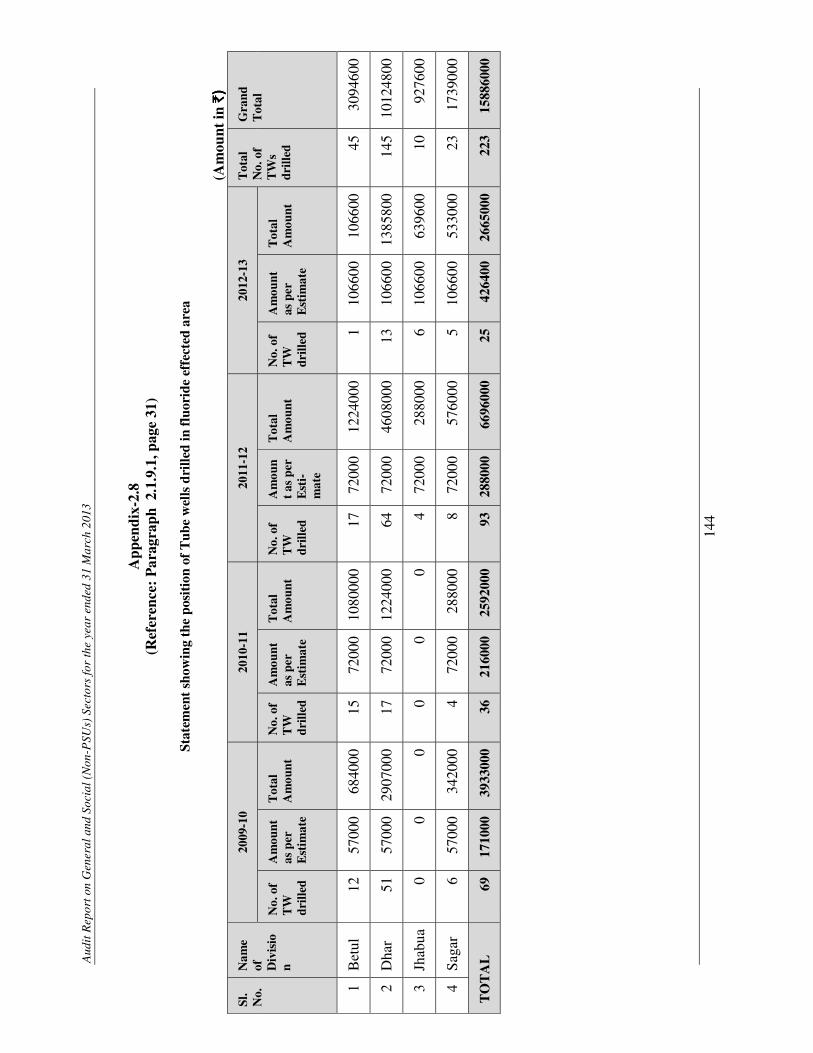
Aud
it R
epor
t on
Gen
eral
and
Soc
ial (
Non
-PSU
s) S
ecto
rs fo
r th
e ye
ar e
nded
31
Mar
ch 2
013
144
App
endi
x-2.
8 (R
efer
ence
: P
arag
raph
2.1
.9.1
, pag
e 31
)
Stat
emen
t sh
owin
g th
e po
siti
on o
f T
ube
wel
ls d
rille
d in
fluo
ride
eff
ecte
d ar
ea
(Am
ount
in `̀̀̀
) )))
Sl.
No.
N
ame
of
Div
isio
n
2009
-10
2010
-11
2011
-12
2012
-13
Tot
al
No.
of
TW
s dr
illed
Gra
nd
Tot
al
No.
of
TW
dr
illed
Am
ount
as
per
E
stim
ate
Tot
al
Am
ount
N
o. o
f T
W
drill
ed
Am
ount
as
per
E
stim
ate
Tot
al
Am
ount
N
o. o
f T
W
drill
ed
Am
oun
t as
per
E
sti-
mat
e
Tot
al
Am
ount
N
o. o
f T
W
drill
ed
Am
ount
as
per
E
stim
ate
Tot
al
Am
ount
1B
etul
12
5700
068
4000
1572
000
1080
000
1772
000
1224
000
110
6600
1066
0045
3094
600
2D
har
5157
000
2907
000
1772
000
1224
000
6472
000
4608
000
1310
6600
1385
800
145
1012
4800
3Jh
abua
00
00
00
472
000
2880
006
1066
0063
9600
1092
7600
4S
agar
6
5700
034
2000
472
000
2880
008
7200
057
6000
510
6600
5330
0023
1739
000
TO
TA
L
6917
1000
3933
000
3621
6000
2592
000
9328
8000
6696
000
2542
6400
2665
000
223
1588
6000
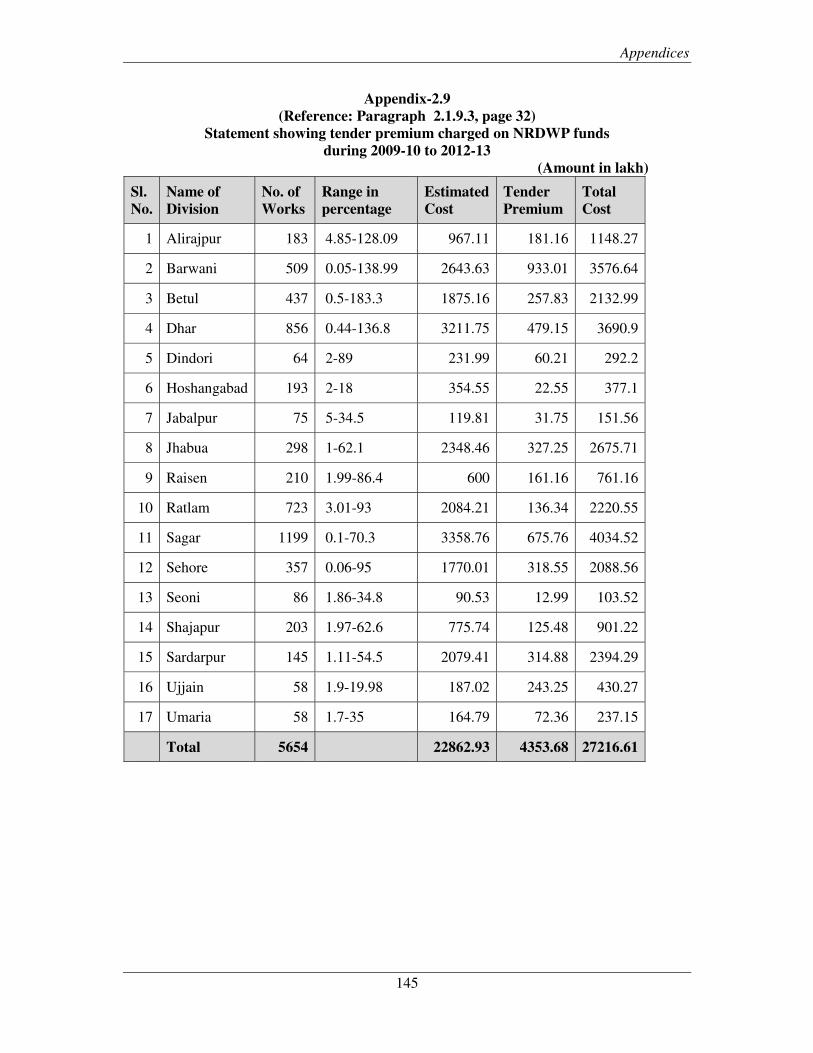
Appendices
145
Appendix-2.9 (Reference: Paragraph 2.1.9.3, page 32)
Statement showing tender premium charged on NRDWP funds during 2009-10 to 2012-13
(Amount in lakh)
Sl. No.
Name of Division
No. of Works
Range in percentage
Estimated Cost
Tender Premium
Total Cost
1 Alirajpur 183 4.85-128.09 967.11 181.16 1148.27
2 Barwani 509 0.05-138.99 2643.63 933.01 3576.64
3 Betul 437 0.5-183.3 1875.16 257.83 2132.99
4 Dhar 856 0.44-136.8 3211.75 479.15 3690.9
5 Dindori 64 2-89 231.99 60.21 292.2
6 Hoshangabad 193 2-18 354.55 22.55 377.1
7 Jabalpur 75 5-34.5 119.81 31.75 151.56
8 Jhabua 298 1-62.1 2348.46 327.25 2675.71
9 Raisen 210 1.99-86.4 600 161.16 761.16
10 Ratlam 723 3.01-93 2084.21 136.34 2220.55
11 Sagar 1199 0.1-70.3 3358.76 675.76 4034.52
12 Sehore 357 0.06-95 1770.01 318.55 2088.56
13 Seoni 86 1.86-34.8 90.53 12.99 103.52
14 Shajapur 203 1.97-62.6 775.74 125.48 901.22
15 Sardarpur 145 1.11-54.5 2079.41 314.88 2394.29
16 Ujjain 58 1.9-19.98 187.02 243.25 430.27
17 Umaria 58 1.7-35 164.79 72.36 237.15
Total 5654 22862.93 4353.68 27216.61
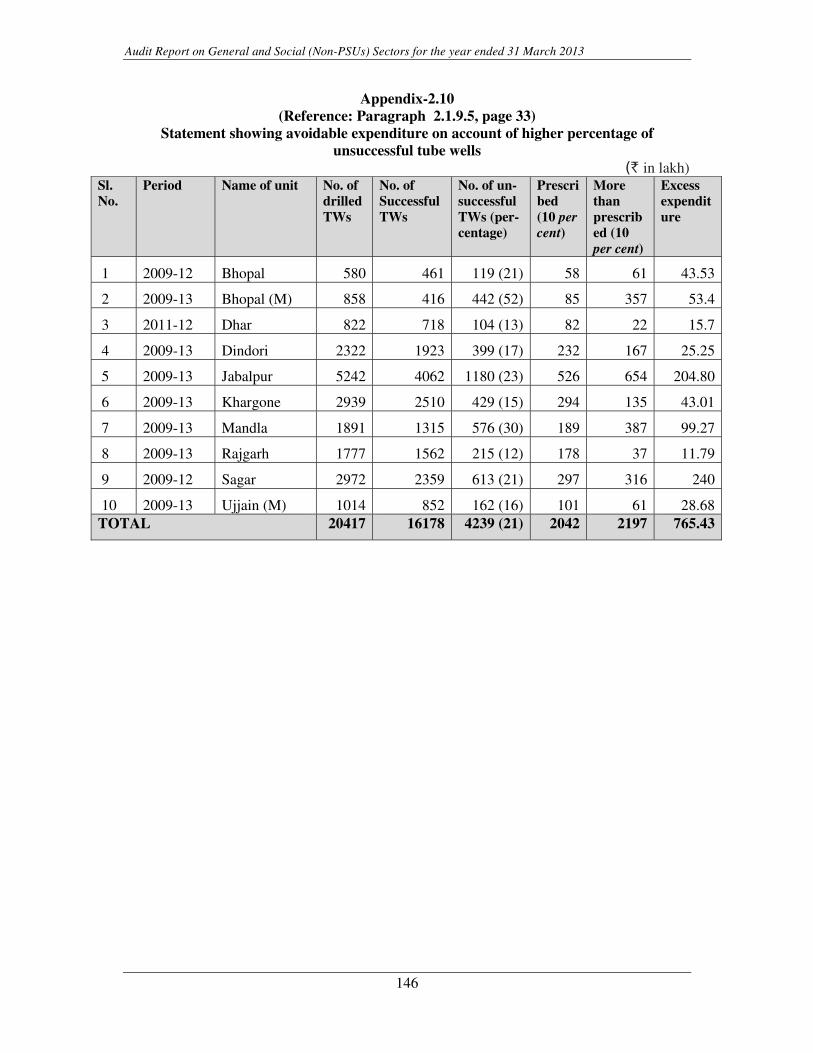
Audit Report on General and Social (Non-PSUs) Sectors for the year ended 31 March 2013
146
Appendix-2.10 (Reference: Paragraph 2.1.9.5, page 33)
Statement showing avoidable expenditure on account of higher percentage of unsuccessful tube wells
(` in lakh)Sl. No.
Period Name of unit No. of drilled TWs
No. of Successful TWs
No. of un-successful TWs (per-centage)
Prescribed (10 per cent)
More than prescribed (10 per cent)
Excess expenditure
1 2009-12 Bhopal 580 461 119 (21) 58 61 43.53
2 2009-13 Bhopal (M) 858 416 442 (52) 85 357 53.4
3 2011-12 Dhar 822 718 104 (13) 82 22 15.7
4 2009-13 Dindori 2322 1923 399 (17) 232 167 25.25
5 2009-13 Jabalpur 5242 4062 1180 (23) 526 654 204.80
6 2009-13 Khargone 2939 2510 429 (15) 294 135 43.01
7 2009-13 Mandla 1891 1315 576 (30) 189 387 99.27
8 2009-13 Rajgarh 1777 1562 215 (12) 178 37 11.79
9 2009-12 Sagar 2972 2359 613 (21) 297 316 240
10 2009-13 Ujjain (M) 1014 852 162 (16) 101 61 28.68TOTAL 20417 16178 4239 (21) 2042 2197 765.43
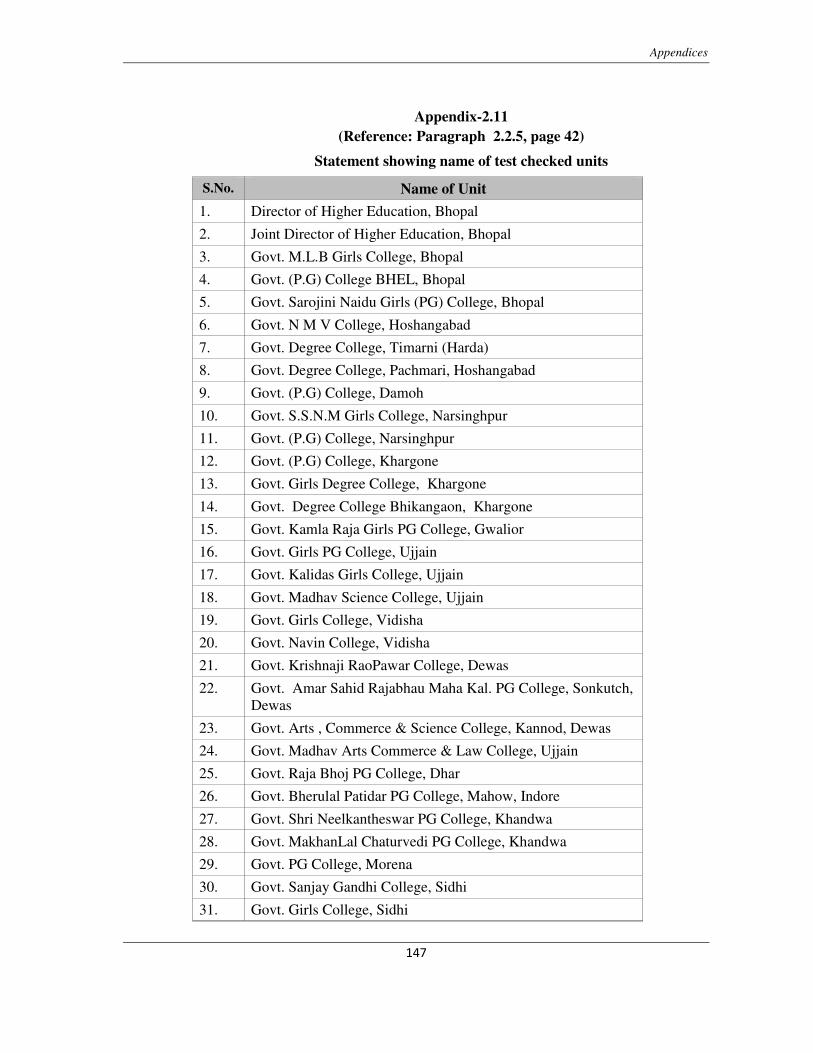
Appendices
�
����
�
Appendix-2.11 (Reference: Paragraph 2.2.5, page 42)
Statement showing name of test checked units
S.No. Name of Unit
1. Director of Higher Education, Bhopal
2. Joint Director of Higher Education, Bhopal
3. Govt. M.L.B Girls College, Bhopal
4. Govt. (P.G) College BHEL, Bhopal
5. Govt. Sarojini Naidu Girls (PG) College, Bhopal
6. Govt. N M V College, Hoshangabad
7. Govt. Degree College, Timarni (Harda)
8. Govt. Degree College, Pachmari, Hoshangabad
9. Govt. (P.G) College, Damoh
10. Govt. S.S.N.M Girls College, Narsinghpur
11. Govt. (P.G) College, Narsinghpur
12. Govt. (P.G) College, Khargone
13. Govt. Girls Degree College, Khargone
14. Govt. Degree College Bhikangaon, Khargone
15. Govt. Kamla Raja Girls PG College, Gwalior
16. Govt. Girls PG College, Ujjain
17. Govt. Kalidas Girls College, Ujjain
18. Govt. Madhav Science College, Ujjain
19. Govt. Girls College, Vidisha
20. Govt. Navin College, Vidisha
21. Govt. Krishnaji RaoPawar College, Dewas
22. Govt. Amar Sahid Rajabhau Maha Kal. PG College, Sonkutch, Dewas
23. Govt. Arts , Commerce & Science College, Kannod, Dewas
24. Govt. Madhav Arts Commerce & Law College, Ujjain
25. Govt. Raja Bhoj PG College, Dhar
26. Govt. Bherulal Patidar PG College, Mahow, Indore
27. Govt. Shri Neelkantheswar PG College, Khandwa
28. Govt. MakhanLal Chaturvedi PG College, Khandwa
29. Govt. PG College, Morena
30. Govt. Sanjay Gandhi College, Sidhi
31. Govt. Girls College, Sidhi
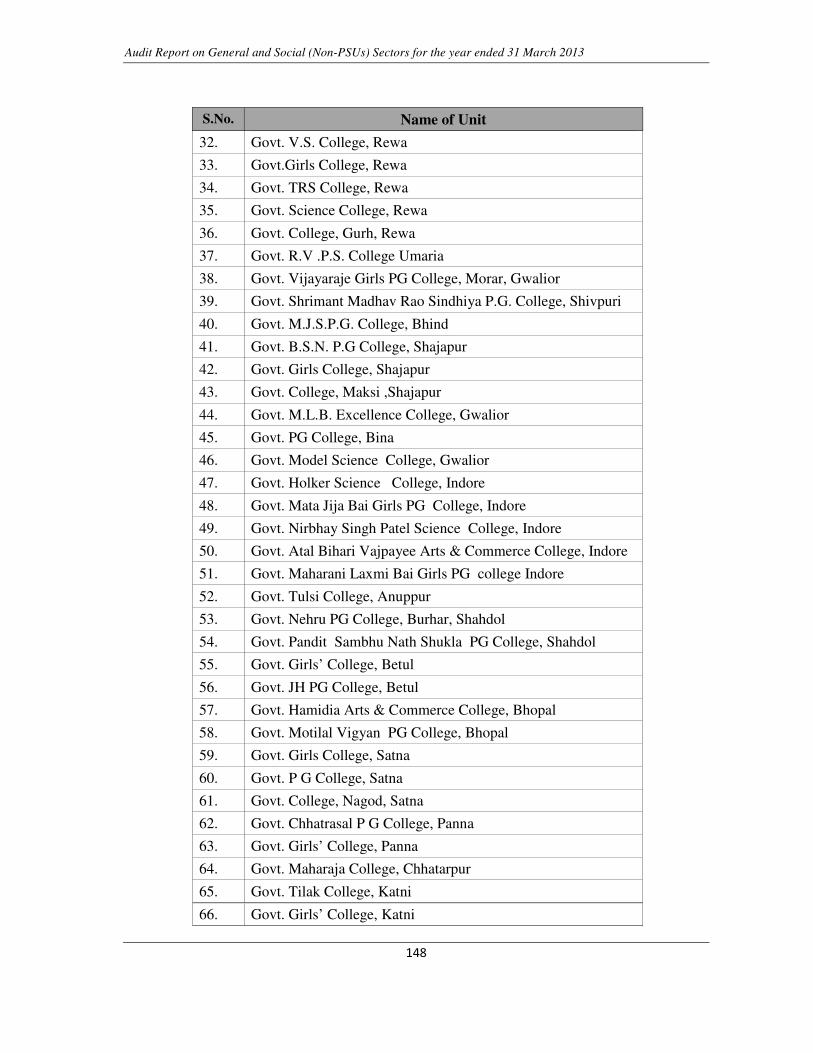
Audit Report on General and Social (Non-PSUs) Sectors for the year ended 31 March 2013
�
�� �
�
S.No. Name of Unit
32. Govt. V.S. College, Rewa
33. Govt.Girls College, Rewa
34. Govt. TRS College, Rewa
35. Govt. Science College, Rewa
36. Govt. College, Gurh, Rewa
37. Govt. R.V .P.S. College Umaria
38. Govt. Vijayaraje Girls PG College, Morar, Gwalior
39. Govt. Shrimant Madhav Rao Sindhiya P.G. College, Shivpuri
40. Govt. M.J.S.P.G. College, Bhind
41. Govt. B.S.N. P.G College, Shajapur
42. Govt. Girls College, Shajapur
43. Govt. College, Maksi ,Shajapur
44. Govt. M.L.B. Excellence College, Gwalior
45. Govt. PG College, Bina
46. Govt. Model Science College, Gwalior
47. Govt. Holker Science College, Indore
48. Govt. Mata Jija Bai Girls PG College, Indore
49. Govt. Nirbhay Singh Patel Science College, Indore
50. Govt. Atal Bihari Vajpayee Arts & Commerce College, Indore
51. Govt. Maharani Laxmi Bai Girls PG college Indore
52. Govt. Tulsi College, Anuppur
53. Govt. Nehru PG College, Burhar, Shahdol
54. Govt. Pandit Sambhu Nath Shukla PG College, Shahdol
55. Govt. Girls’ College, Betul
56. Govt. JH PG College, Betul
57. Govt. Hamidia Arts & Commerce College, Bhopal
58. Govt. Motilal Vigyan PG College, Bhopal
59. Govt. Girls College, Satna
60. Govt. P G College, Satna
61. Govt. College, Nagod, Satna
62. Govt. Chhatrasal P G College, Panna
63. Govt. Girls’ College, Panna
64. Govt. Maharaja College, Chhatarpur
65. Govt. Tilak College, Katni
66. Govt. Girls’ College, Katni
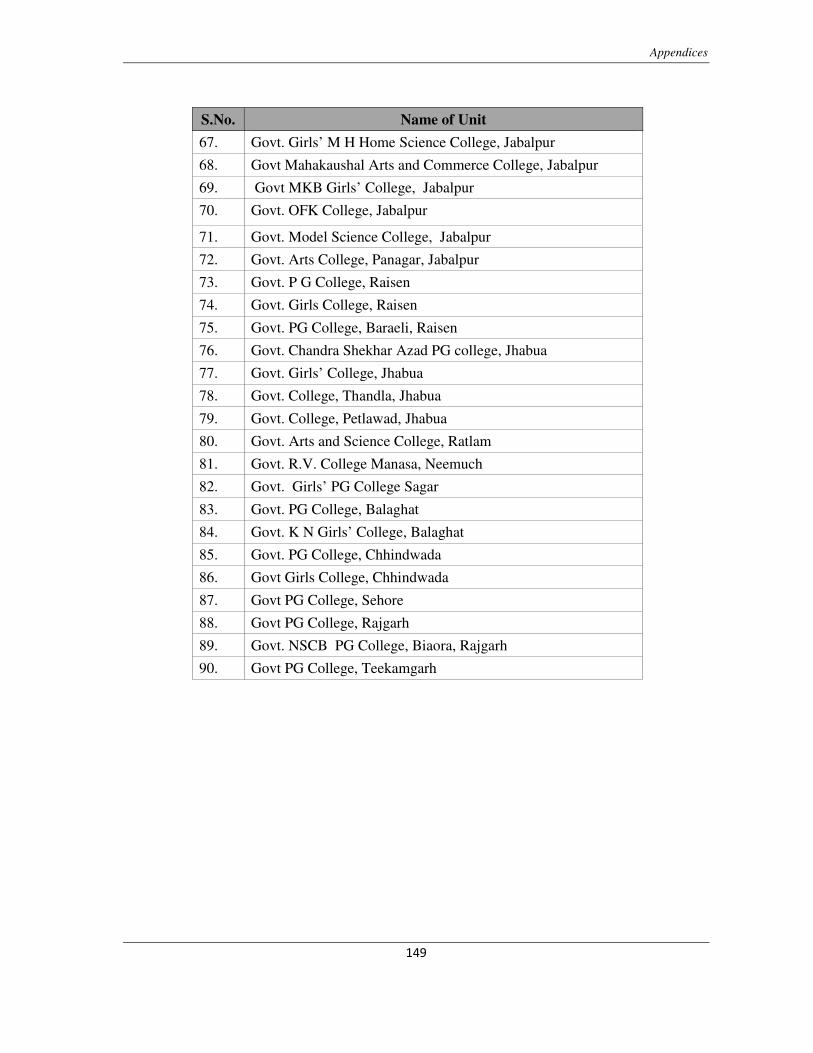
Appendices
�
����
�
S.No. Name of Unit
67. Govt. Girls’ M H Home Science College, Jabalpur
68. Govt Mahakaushal Arts and Commerce College, Jabalpur
69. Govt MKB Girls’ College, Jabalpur
70. Govt. OFK College, Jabalpur
71. Govt. Model Science College, Jabalpur
72. Govt. Arts College, Panagar, Jabalpur
73. Govt. P G College, Raisen
74. Govt. Girls College, Raisen
75. Govt. PG College, Baraeli, Raisen
76. Govt. Chandra Shekhar Azad PG college, Jhabua
77. Govt. Girls’ College, Jhabua
78. Govt. College, Thandla, Jhabua
79. Govt. College, Petlawad, Jhabua
80. Govt. Arts and Science College, Ratlam
81. Govt. R.V. College Manasa, Neemuch
82. Govt. Girls’ PG College Sagar
83. Govt. PG College, Balaghat
84. Govt. K N Girls’ College, Balaghat
85. Govt. PG College, Chhindwada
86. Govt Girls College, Chhindwada
87. Govt PG College, Sehore
88. Govt PG College, Rajgarh
89. Govt. NSCB PG College, Biaora, Rajgarh
90. Govt PG College, Teekamgarh
�
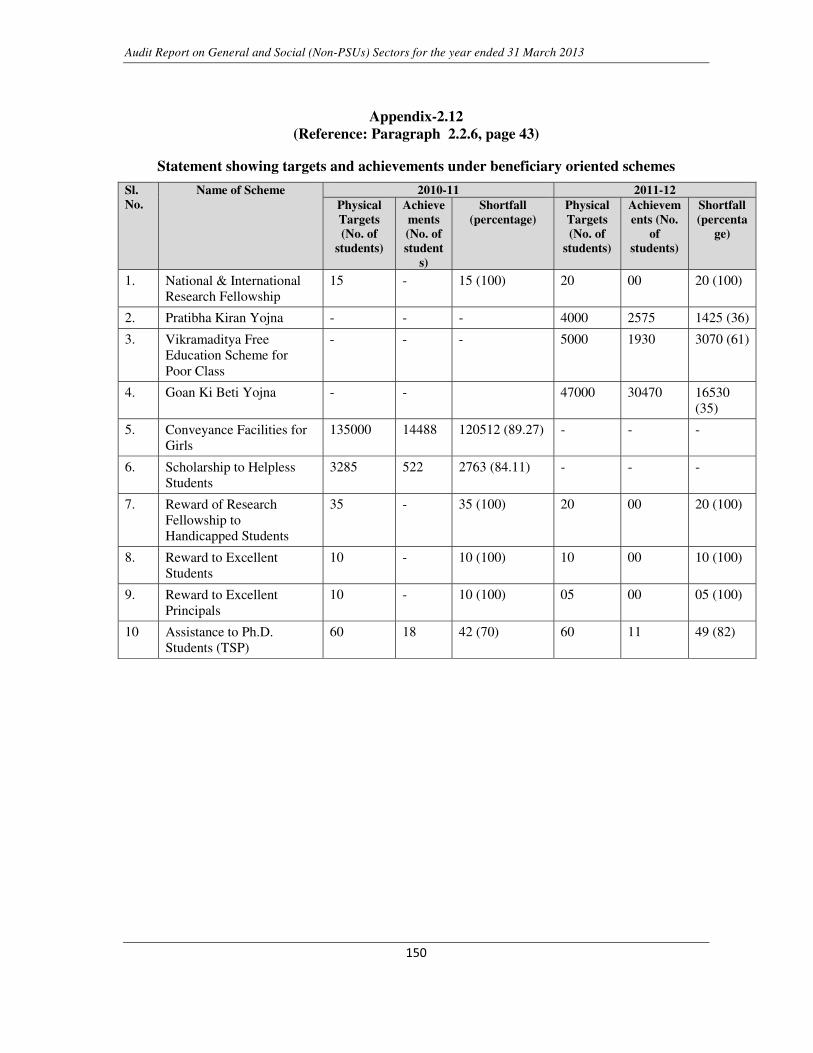
Audit Report on General and Social (Non-PSUs) Sectors for the year ended 31 March 2013
�
����
�
Appendix-2.12 (Reference: Paragraph 2.2.6, page 43)
Statement showing targets and achievements under beneficiary oriented schemes
Sl. No.
Name of Scheme 2010-11 2011-12 Physical Targets (No. of
students)
Achievements (No. of student
s)
Shortfall (percentage)
Physical Targets (No. of
students)
Achievements (No.
of students)
Shortfall (percenta
ge)
1. National & International Research Fellowship
15 - 15 (100) 20 00 20 (100)
2. Pratibha Kiran Yojna - - - 4000 2575 1425 (36)
3. Vikramaditya Free Education Scheme for Poor Class
- - - 5000 1930 3070 (61)
4. Goan Ki Beti Yojna - - 47000 30470 16530 (35)
5. Conveyance Facilities for Girls
135000 14488 120512 (89.27) - - -
6. Scholarship to Helpless Students
3285 522 2763 (84.11) - - -
7. Reward of Research Fellowship to Handicapped Students
35 - 35 (100) 20 00 20 (100)
8. Reward to Excellent Students
10 - 10 (100) 10 00 10 (100)
9. Reward to Excellent Principals
10 - 10 (100) 05 00 05 (100)
10 Assistance to Ph.D. Students (TSP)
60 18 42 (70) 60 11 49 (82)
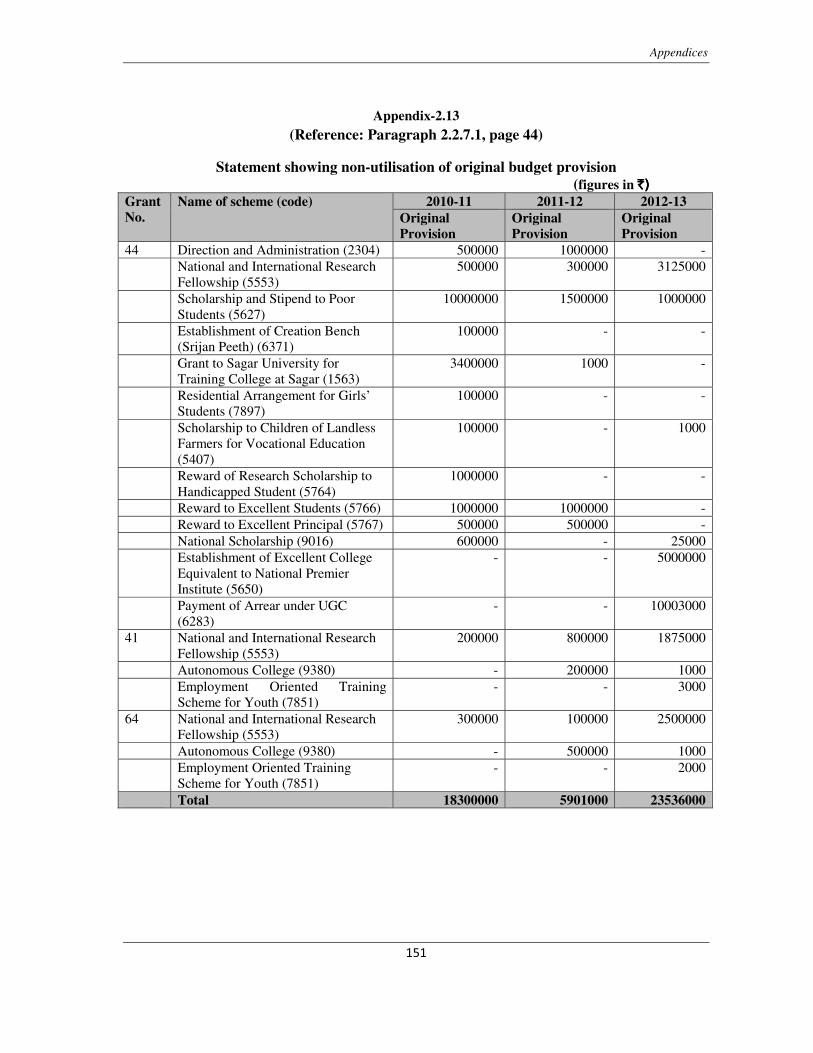
Appendices
�
����
�
Appendix-2.13 (Reference: Paragraph 2.2.7.1, page 44)
Statement showing non-utilisation of original budget provision (figures in `)`)`)`)
Grant No.
Name of scheme (code) 2010-11 2011-12 2012-13 Original Provision
Original Provision
Original Provision
44 Direction and Administration (2304) 500000 1000000 - National and International Research
Fellowship (5553) 500000 300000 3125000
Scholarship and Stipend to Poor Students (5627)
10000000 1500000 1000000
Establishment of Creation Bench (Srijan Peeth) (6371)
100000 - -
Grant to Sagar University for Training College at Sagar (1563)
3400000 1000 -
Residential Arrangement for Girls’ Students (7897)
100000 - -
Scholarship to Children of Landless Farmers for Vocational Education (5407)
100000 - 1000
Reward of Research Scholarship to Handicapped Student (5764)
1000000 - -
Reward to Excellent Students (5766) 1000000 1000000 - Reward to Excellent Principal (5767) 500000 500000 - National Scholarship (9016) 600000 - 25000 Establishment of Excellent College
Equivalent to National Premier Institute (5650)
- - 5000000
Payment of Arrear under UGC (6283)
- - 10003000
41 National and International Research Fellowship (5553)
200000 800000 1875000
Autonomous College (9380) - 200000 1000 Employment Oriented Training
Scheme for Youth (7851) - - 3000
64 National and International Research Fellowship (5553)
300000 100000 2500000
Autonomous College (9380) - 500000 1000 Employment Oriented Training
Scheme for Youth (7851) - - 2000
Total 18300000 5901000 23536000
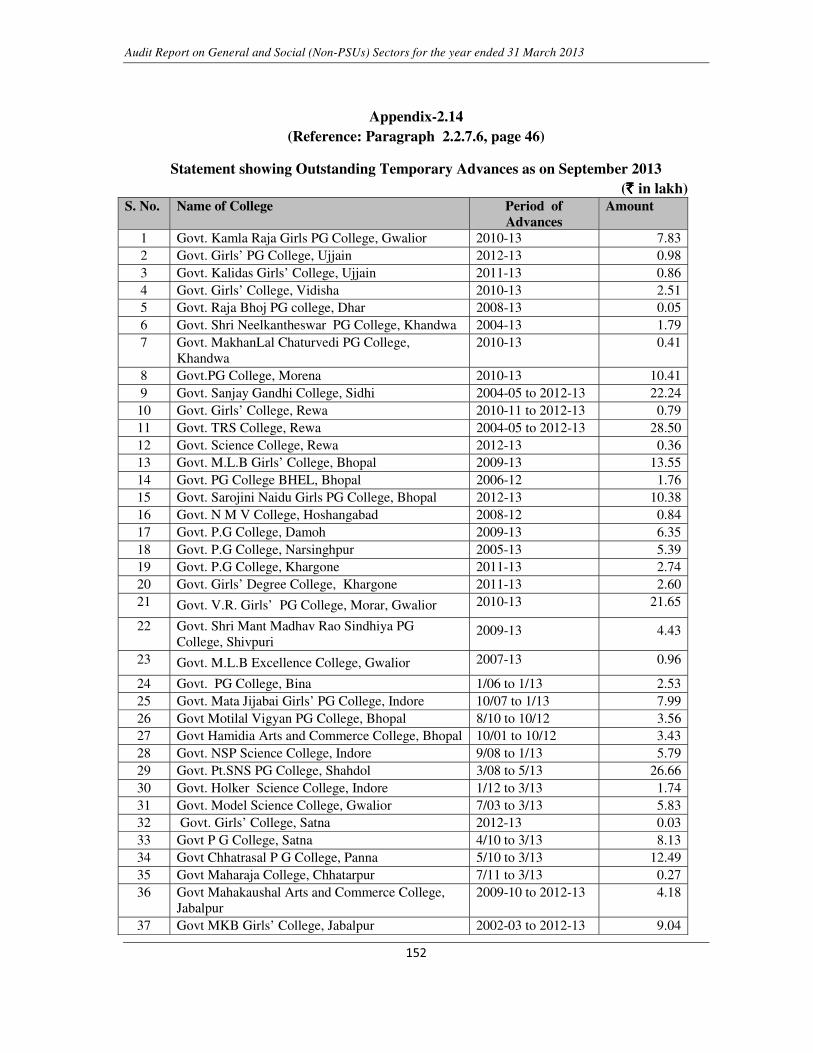
Audit Report on General and Social (Non-PSUs) Sectors for the year ended 31 March 2013
�
����
�
Appendix-2.14 (Reference: Paragraph 2.2.7.6, page 46)
Statement showing Outstanding Temporary Advances as on September 2013 (` ` ` ` in lakh)
S. No. Name of College Period of Advances
Amount
1 Govt. Kamla Raja Girls PG College, Gwalior 2010-13 7.832 Govt. Girls’ PG College, Ujjain 2012-13 0.983 Govt. Kalidas Girls’ College, Ujjain 2011-13 0.864 Govt. Girls’ College, Vidisha 2010-13 2.515 Govt. Raja Bhoj PG college, Dhar 2008-13 0.056 Govt. Shri Neelkantheswar PG College, Khandwa 2004-13 1.797 Govt. MakhanLal Chaturvedi PG College,
Khandwa 2010-13 0.41
8 Govt.PG College, Morena 2010-13 10.419 Govt. Sanjay Gandhi College, Sidhi 2004-05 to 2012-13 22.24
10 Govt. Girls’ College, Rewa 2010-11 to 2012-13 0.7911 Govt. TRS College, Rewa 2004-05 to 2012-13 28.5012 Govt. Science College, Rewa 2012-13 0.3613 Govt. M.L.B Girls’ College, Bhopal 2009-13 13.5514 Govt. PG College BHEL, Bhopal 2006-12 1.7615 Govt. Sarojini Naidu Girls PG College, Bhopal 2012-13 10.3816 Govt. N M V College, Hoshangabad 2008-12 0.8417 Govt. P.G College, Damoh 2009-13 6.3518 Govt. P.G College, Narsinghpur 2005-13 5.3919 Govt. P.G College, Khargone 2011-13 2.7420 Govt. Girls’ Degree College, Khargone 2011-13 2.6021 Govt. V.R. Girls’ PG College, Morar, Gwalior 2010-13 21.65
22 Govt. Shri Mant Madhav Rao Sindhiya PG College, Shivpuri
2009-13 4.43
23 Govt. M.L.B Excellence College, Gwalior 2007-13 0.96
24 Govt. PG College, Bina 1/06 to 1/13 2.5325 Govt. Mata Jijabai Girls’ PG College, Indore 10/07 to 1/13 7.9926 Govt Motilal Vigyan PG College, Bhopal 8/10 to 10/12 3.5627 Govt Hamidia Arts and Commerce College, Bhopal 10/01 to 10/12 3.4328 Govt. NSP Science College, Indore 9/08 to 1/13 5.7929 Govt. Pt.SNS PG College, Shahdol 3/08 to 5/13 26.6630 Govt. Holker Science College, Indore 1/12 to 3/13 1.7431 Govt. Model Science College, Gwalior 7/03 to 3/13 5.8332 Govt. Girls’ College, Satna 2012-13 0.0333 Govt P G College, Satna 4/10 to 3/13 8.1334 Govt Chhatrasal P G College, Panna 5/10 to 3/13 12.4935 Govt Maharaja College, Chhatarpur 7/11 to 3/13 0.2736 Govt Mahakaushal Arts and Commerce College,
Jabalpur 2009-10 to 2012-13 4.18
37 Govt MKB Girls’ College, Jabalpur 2002-03 to 2012-13 9.04
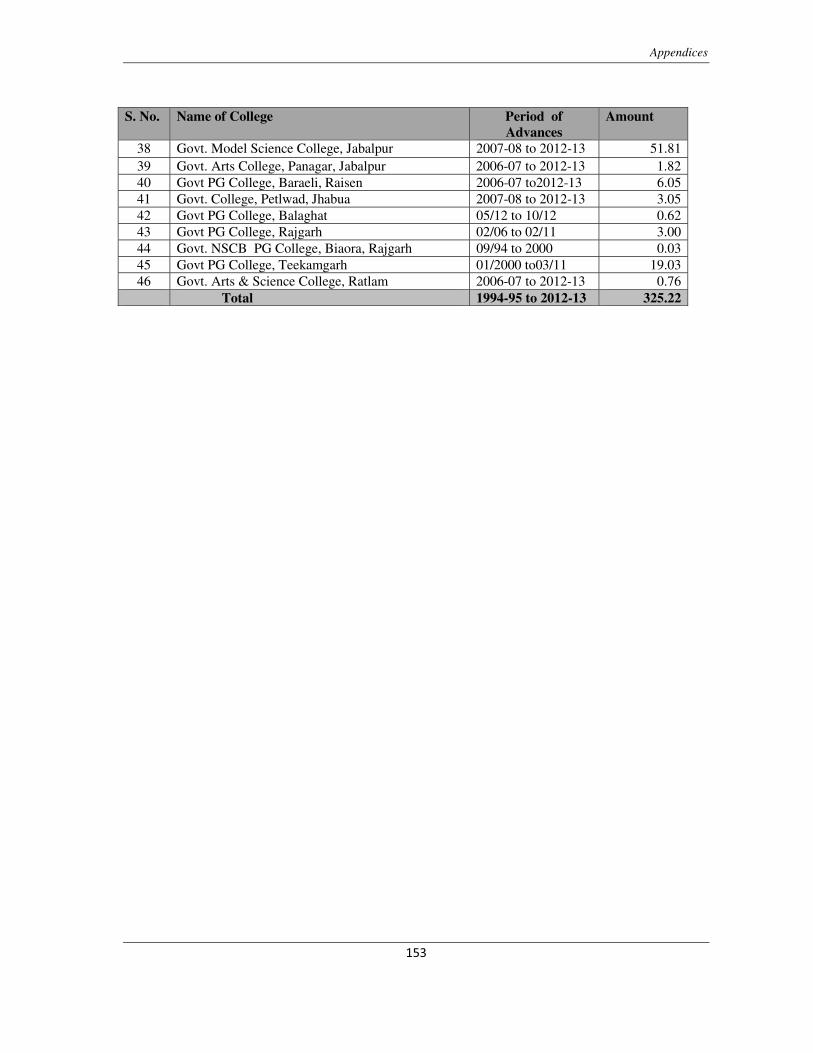
Appendices
�
����
�
S. No. Name of College Period of Advances
Amount
38 Govt. Model Science College, Jabalpur 2007-08 to 2012-13 51.8139 Govt. Arts College, Panagar, Jabalpur 2006-07 to 2012-13 1.8240 Govt PG College, Baraeli, Raisen 2006-07 to2012-13 6.0541 Govt. College, Petlwad, Jhabua 2007-08 to 2012-13 3.0542 Govt PG College, Balaghat 05/12 to 10/12 0.6243 Govt PG College, Rajgarh 02/06 to 02/11 3.0044 Govt. NSCB PG College, Biaora, Rajgarh 09/94 to 2000 0.0345 Govt PG College, Teekamgarh 01/2000 to03/11 19.0346 Govt. Arts & Science College, Ratlam 2006-07 to 2012-13 0.76
� Total 1994-95 to 2012-13 325.22
�
�
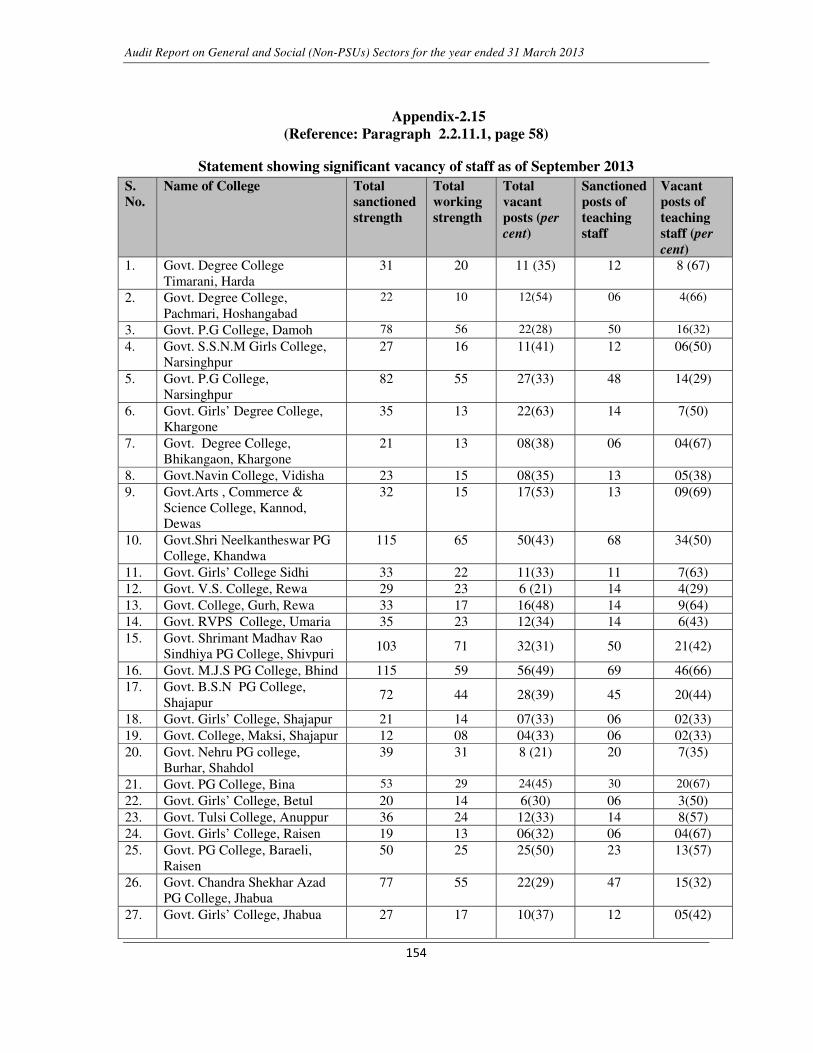
Audit Report on General and Social (Non-PSUs) Sectors for the year ended 31 March 2013
�
����
�
Appendix-2.15 (Reference: Paragraph 2.2.11.1, page 58)
Statement showing significant vacancy of staff as of September 2013 S. No.
Name of College Total sanctioned strength
Total working strength
Total vacant posts (per cent)
Sanctioned posts of teaching staff
Vacant posts of teaching staff (per cent)
1. Govt. Degree College Timarani, Harda
31 20 11 (35) 12 8 (67)
2. Govt. Degree College, Pachmari, Hoshangabad
22 10 12(54) 06 4(66)
3. Govt. P.G College, Damoh 78 56 22(28) 50 16(32)
4. Govt. S.S.N.M Girls College, Narsinghpur
27 16 11(41) 12 06(50)
5. Govt. P.G College, Narsinghpur
82 55 27(33) 48 14(29)
6. Govt. Girls’ Degree College, Khargone
35 13 22(63) 14 7(50)
7. Govt. Degree College, Bhikangaon, Khargone
21 13 08(38) 06 04(67)
8. Govt.Navin College, Vidisha 23 15 08(35) 13 05(38) 9. Govt.Arts , Commerce &
Science College, Kannod, Dewas
32 15 17(53) 13 09(69)
10. Govt.Shri Neelkantheswar PG College, Khandwa
115 65 50(43) 68 34(50)
11. Govt. Girls’ College Sidhi 33 22 11(33) 11 7(63) 12. Govt. V.S. College, Rewa 29 23 6 (21) 14 4(29) 13. Govt. College, Gurh, Rewa 33 17 16(48) 14 9(64)14. Govt. RVPS College, Umaria 35 23 12(34) 14 6(43) 15. Govt. Shrimant Madhav Rao
Sindhiya PG College, Shivpuri 103 71 32(31) 50 21(42)
16. Govt. M.J.S PG College, Bhind 115 59 56(49) 69 46(66) 17. Govt. B.S.N PG College,
Shajapur 72 44 28(39) 45 20(44)
18. Govt. Girls’ College, Shajapur 21 14 07(33) 06 02(33) 19. Govt. College, Maksi, Shajapur 12 08 04(33) 06 02(33) 20. Govt. Nehru PG college,
Burhar, Shahdol 39 31 8 (21) 20 7(35)
21. Govt. PG College, Bina 53 29 24(45) 30 20(67)
22. Govt. Girls’ College, Betul 20 14 6(30) 06 3(50) 23. Govt. Tulsi College, Anuppur 36 24 12(33) 14 8(57) 24. Govt. Girls’ College, Raisen 19 13 06(32) 06 04(67) 25. Govt. PG College, Baraeli,
Raisen 50 25 25(50) 23 13(57)
26. Govt. Chandra Shekhar Azad PG College, Jhabua
77 55 22(29) 47 15(32)
27. Govt. Girls’ College, Jhabua 27 17 10(37) 12 05(42)
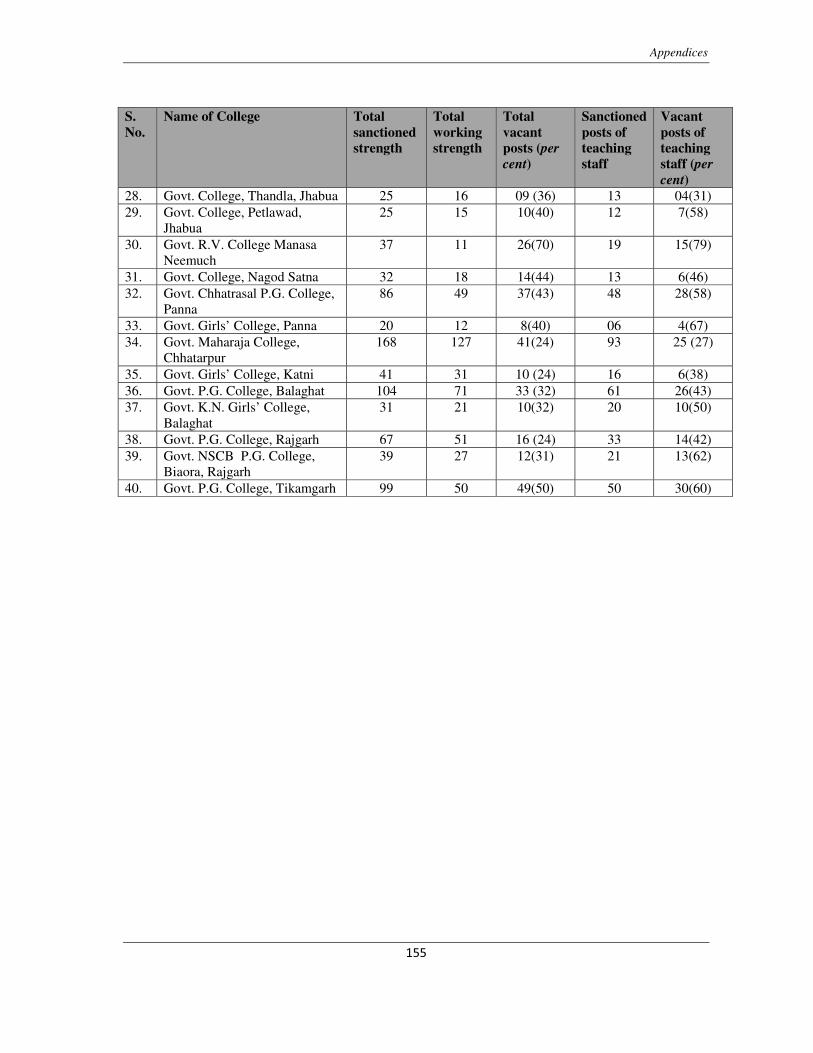
Appendices
�
����
�
S. No.
Name of College Total sanctioned strength
Total working strength
Total vacant posts (per cent)
Sanctioned posts of teaching staff
Vacant posts of teaching staff (per cent)
28. Govt. College, Thandla, Jhabua 25 16 09 (36) 13 04(31) 29. Govt. College, Petlawad,
Jhabua 25 15 10(40) 12 7(58)
30. Govt. R.V. College Manasa Neemuch
37 11 26(70) 19 15(79)
31. Govt. College, Nagod Satna 32 18 14(44) 13 6(46) 32. Govt. Chhatrasal P.G. College,
Panna 86 49 37(43) 48 28(58)
33. Govt. Girls’ College, Panna 20 12 8(40) 06 4(67) 34. Govt. Maharaja College,
Chhatarpur 168 127 41(24) 93 25 (27)
35. Govt. Girls’ College, Katni 41 31 10 (24) 16 6(38) 36. Govt. P.G. College, Balaghat 104 71 33 (32) 61 26(43) 37. Govt. K.N. Girls’ College,
Balaghat 31 21 10(32) 20 10(50)
38. Govt. P.G. College, Rajgarh 67 51 16 (24) 33 14(42) 39. Govt. NSCB P.G. College,
Biaora, Rajgarh 39 27 12(31) 21 13(62)
40. Govt. P.G. College, Tikamgarh 99 50 49(50) 50 30(60) �
�
�
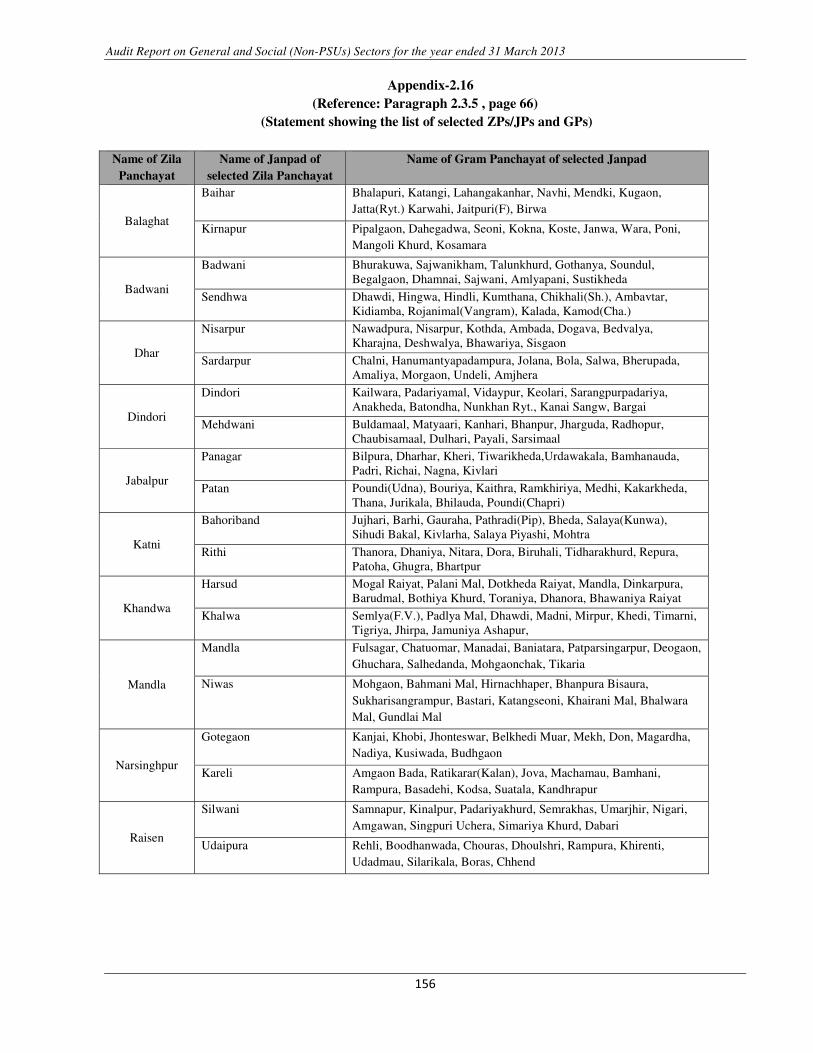
Audit Report on General and Social (Non-PSUs) Sectors for the year ended 31 March 2013
�
����
�
Appendix-2.16 (Reference: Paragraph 2.3.5 , page 66)
�(Statement showing the list of selected ZPs/JPs and GPs)
�
�
Name of Zila Panchayat
Name of Janpad of selected Zila Panchayat
Name of Gram Panchayat of selected Janpad
Balaghat
Baihar Bhalapuri, Katangi, Lahangakanhar, Navhi, Mendki, Kugaon, Jatta(Ryt.) Karwahi, Jaitpuri(F), Birwa
Kirnapur Pipalgaon, Dahegadwa, Seoni, Kokna, Koste, Janwa, Wara, Poni, Mangoli Khurd, Kosamara
Badwani
Badwani Bhurakuwa, Sajwanikham, Talunkhurd, Gothanya, Soundul, Begalgaon, Dhamnai, Sajwani, Amlyapani, Sustikheda
Sendhwa Dhawdi, Hingwa, Hindli, Kumthana, Chikhali(Sh.), Ambavtar, Kidiamba, Rojanimal(Vangram), Kalada, Kamod(Cha.)
Dhar
Nisarpur Nawadpura, Nisarpur, Kothda, Ambada, Dogava, Bedvalya, Kharajna, Deshwalya, Bhawariya, Sisgaon
Sardarpur Chalni, Hanumantyapadampura, Jolana, Bola, Salwa, Bherupada, Amaliya, Morgaon, Undeli, Amjhera
Dindori
Dindori Kailwara, Padariyamal, Vidaypur, Keolari, Sarangpurpadariya, Anakheda, Batondha, Nunkhan Ryt., Kanai Sangw, Bargai
Mehdwani Buldamaal, Matyaari, Kanhari, Bhanpur, Jharguda, Radhopur, Chaubisamaal, Dulhari, Payali, Sarsimaal
Jabalpur
Panagar Bilpura, Dharhar, Kheri, Tiwarikheda,Urdawakala, Bamhanauda, Padri, Richai, Nagna, Kivlari
Patan Poundi(Udna), Bouriya, Kaithra, Ramkhiriya, Medhi, Kakarkheda, Thana, Jurikala, Bhilauda, Poundi(Chapri)
Katni
Bahoriband Jujhari, Barhi, Gauraha, Pathradi(Pip), Bheda, Salaya(Kunwa), Sihudi Bakal, Kivlarha, Salaya Piyashi, Mohtra
Rithi Thanora, Dhaniya, Nitara, Dora, Biruhali, Tidharakhurd, Repura, Patoha, Ghugra, Bhartpur
Khandwa
Harsud Mogal Raiyat, Palani Mal, Dotkheda Raiyat, Mandla, Dinkarpura, Barudmal, Bothiya Khurd, Toraniya, Dhanora, Bhawaniya Raiyat
Khalwa Semlya(F.V.), Padlya Mal, Dhawdi, Madni, Mirpur, Khedi, Timarni, Tigriya, Jhirpa, Jamuniya Ashapur,
Mandla
Mandla Fulsagar, Chatuomar, Manadai, Baniatara, Patparsingarpur, Deogaon, Ghuchara, Salhedanda, Mohgaonchak, Tikaria
Niwas Mohgaon, Bahmani Mal, Hirnachhaper, Bhanpura Bisaura, Sukharisangrampur, Bastari, Katangseoni, Khairani Mal, Bhalwara Mal, Gundlai Mal
Narsinghpur
Gotegaon Kanjai, Khobi, Jhonteswar, Belkhedi Muar, Mekh, Don, Magardha, Nadiya, Kusiwada, Budhgaon
Kareli Amgaon Bada, Ratikarar(Kalan), Jova, Machamau, Bamhani, Rampura, Basadehi, Kodsa, Suatala, Kandhrapur
Raisen
Silwani Samnapur, Kinalpur, Padariyakhurd, Semrakhas, Umarjhir, Nigari, Amgawan, Singpuri Uchera, Simariya Khurd, Dabari
Udaipura Rehli, Boodhanwada, Chouras, Dhoulshri, Rampura, Khirenti, Udadmau, Silarikala, Boras, Chhend
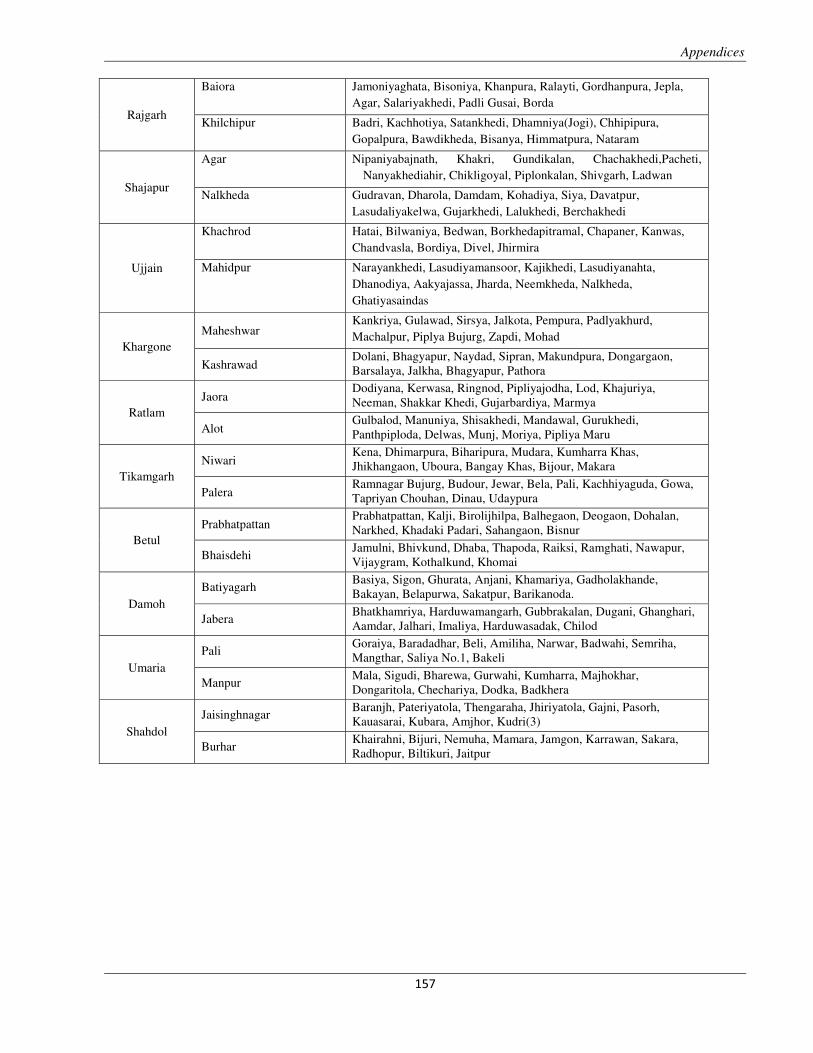
Appendices �
����
�
�
Rajgarh
Baiora Jamoniyaghata, Bisoniya, Khanpura, Ralayti, Gordhanpura, Jepla, Agar, Salariyakhedi, Padli Gusai, Borda
Khilchipur Badri, Kachhotiya, Satankhedi, Dhamniya(Jogi), Chhipipura, Gopalpura, Bawdikheda, Bisanya, Himmatpura, Nataram
Shajapur
Agar Nipaniyabajnath, Khakri, Gundikalan, Chachakhedi,Pacheti, Nanyakhediahir, Chikligoyal, Piplonkalan, Shivgarh, Ladwan
Nalkheda Gudravan, Dharola, Damdam, Kohadiya, Siya, Davatpur, Lasudaliyakelwa, Gujarkhedi, Lalukhedi, Berchakhedi
Ujjain
Khachrod Hatai, Bilwaniya, Bedwan, Borkhedapitramal, Chapaner, Kanwas, Chandvasla, Bordiya, Divel, Jhirmira
Mahidpur Narayankhedi, Lasudiyamansoor, Kajikhedi, Lasudiyanahta, Dhanodiya, Aakyajassa, Jharda, Neemkheda, Nalkheda, Ghatiyasaindas
Khargone Maheshwar
Kankriya, Gulawad, Sirsya, Jalkota, Pempura, Padlyakhurd, Machalpur, Piplya Bujurg, Zapdi, Mohad
Kashrawad Dolani, Bhagyapur, Naydad, Sipran, Makundpura, Dongargaon, Barsalaya, Jalkha, Bhagyapur, Pathora
Ratlam Jaora
Dodiyana, Kerwasa, Ringnod, Pipliyajodha, Lod, Khajuriya, Neeman, Shakkar Khedi, Gujarbardiya, Marmya
Alot Gulbalod, Manuniya, Shisakhedi, Mandawal, Gurukhedi, Panthpiploda, Delwas, Munj, Moriya, Pipliya Maru
Tikamgarh Niwari
Kena, Dhimarpura, Biharipura, Mudara, Kumharra Khas, Jhikhangaon, Uboura, Bangay Khas, Bijour, Makara
Palera Ramnagar Bujurg, Budour, Jewar, Bela, Pali, Kachhiyaguda, Gowa, Tapriyan Chouhan, Dinau, Udaypura
Betul Prabhatpattan
Prabhatpattan, Kalji, Birolijhilpa, Balhegaon, Deogaon, Dohalan, Narkhed, Khadaki Padari, Sahangaon, Bisnur
Bhaisdehi Jamulni, Bhivkund, Dhaba, Thapoda, Raiksi, Ramghati, Nawapur, Vijaygram, Kothalkund, Khomai
Damoh Batiyagarh
Basiya, Sigon, Ghurata, Anjani, Khamariya, Gadholakhande, Bakayan, Belapurwa, Sakatpur, Barikanoda.
Jabera Bhatkhamriya, Harduwamangarh, Gubbrakalan, Dugani, Ghanghari, Aamdar, Jalhari, Imaliya, Harduwasadak, Chilod
Umaria Pali
Goraiya, Baradadhar, Beli, Amiliha, Narwar, Badwahi, Semriha, Mangthar, Saliya No.1, Bakeli
Manpur Mala, Sigudi, Bharewa, Gurwahi, Kumharra, Majhokhar, Dongaritola, Chechariya, Dodka, Badkhera
Shahdol Jaisinghnagar
Baranjh, Pateriyatola, Thengaraha, Jhiriyatola, Gajni, Pasorh, Kauasarai, Kubara, Amjhor, Kudri(3)
Burhar Khairahni, Bijuri, Nemuha, Mamara, Jamgon, Karrawan, Sakara, Radhopur, Biltikuri, Jaitpur
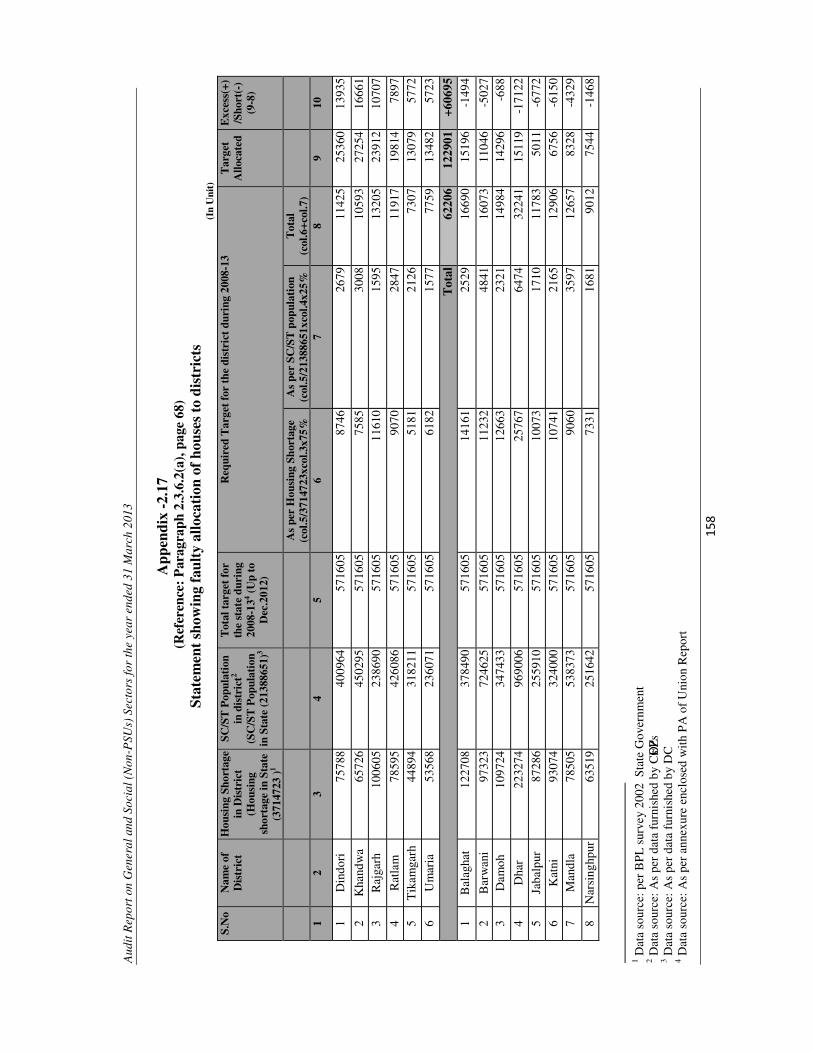
Aud
it R
epor
t on
Gen
eral
and
Soc
ial (
Non
-PSU
s) S
ecto
rs fo
r th
e ye
ar e
nded
31
Mar
ch 2
013
�
�� �
�
App
endi
x -2
.17
(Ref
eren
ce: P
arag
raph
2.3
.6.2
(a),
pag
e 68
) St
atem
ent
show
ing
faul
ty a
lloca
tion
of
hous
es t
o di
stri
cts
(In
Uni
t)
S.N
oN
ame
of
Dis
tric
t H
ousi
ng S
hort
age
in D
istr
ict
(H
ousi
ng
shor
tage
in S
tate
(3
7147
23 )1
SC/S
T P
opul
atio
n in
dis
tric
t2
(S
C/S
T P
opul
atio
n in
Sta
te (
2138
8651
)3
Tot
al t
arge
t fo
r th
e st
ate
duri
ng
2008
-134 (
Up
to
Dec
.201
2)
Req
uire
d T
arge
t fo
r th
e di
stri
ct d
urin
g 20
08-1
3 T
arge
t A
lloca
ted
Exc
ess(
+)
/Sho
rt(-
)
(9-8
)
As
per
Hou
sing
Sho
rtag
e (c
ol.5
/371
4723
xcol
.3x7
5%A
s pe
r SC
/ST
pop
ulat
ion
(col
.5/2
1388
651x
col.4
x25%
Tot
al
(col
.6+c
ol.7
) 1
2 3
4 5
6 7
8 9
10
1 D
indo
ri
7578
840
0964
5716
0587
4626
7911
425
2536
013
935
2 K
hand
wa
6572
645
0295
5716
0575
8530
0810
593
2725
416
661
3 R
ajga
rh
1006
0523
8690
5716
0511
610
1595
1320
523
912
1070
7
4 R
atla
m
7859
542
6086
5716
0590
7028
4711
917
1981
478
975
Tik
amga
rh44
894
3182
1157
1605
5181
2126
7307
1307
957
72
6 U
mar
ia
5356
823
6071
5716
0561
8215
7777
5913
482
5723
Tot
al62
206
1229
01+6
0695
1 B
alag
hat
1227
0837
8490
5716
0514
161
2529
1669
015
196
-149
4
2 B
arw
ani
9732
372
4625
5716
0511
232
4841
1607
311
046
-502
73
Dam
oh
1097
2434
7433
5716
0512
663
2321
1498
414
296
-688
4 D
har
2232
7496
9006
5716
0525
767
6474
3224
115
119
-171
22
5 Ja
balp
ur
8728
625
5910
5716
0510
073
1710
1178
350
11-6
772
6 K
atni
93
074
3240
0057
1605
1074
121
6512
906
6756
-615
07
Man
dla
7850
553
8373
5716
0590
6035
9712
657
8328
-432
9
8 N
arsi
nghp
ur63
519
2516
4257
1605
7331
1681
9012
7544
-146
8
�����������������������������������������������������������
1 Dat
a so
urce
: per
BP
L s
urve
y 20
02 S
tate
Gov
ernm
ent
2 Dat
a so
urce
: As
per
data
fur
nish
ed b
y C
EOs ZP
s 3 D
ata
sour
ce: A
s pe
r da
ta f
urni
shed
by
DC
4 D
ata
sour
ce: A
s pe
r an
nexu
re e
nclo
sed
wit
h P
A o
f U
nion
Rep
ort
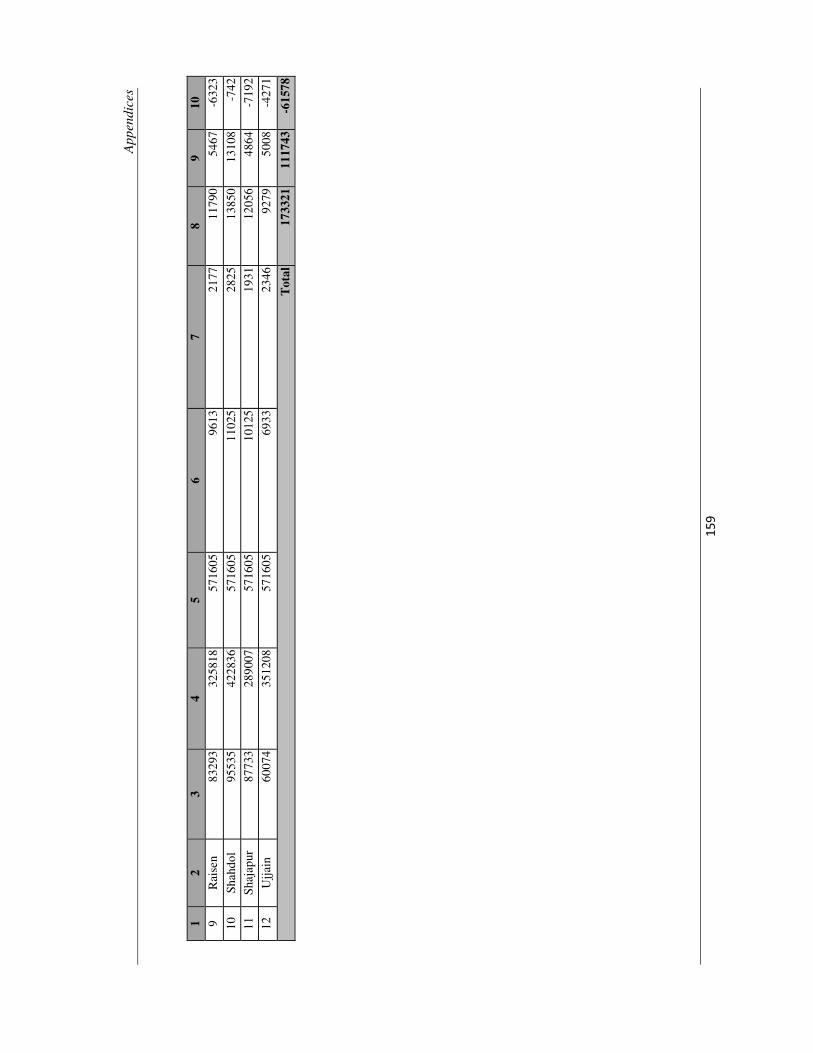
App
endi
ces
�
����
��
1 2
3 4
5 6
7 8
9 10
9
Rai
sen
8329
332
5818
5716
0596
1321
7711
790
5467
-632
3
10
Shah
dol
9553
542
2836
5716
0511
025
2825
1385
013
108
-742
11
Shaj
apur
87
733
2890
0757
1605
1012
519
3112
056
4864
-719
2
12
Ujj
ain
6007
435
1208
5716
0569
3323
4692
7950
08-4
271
Tot
al17
3321
1117
43-6
1578
�
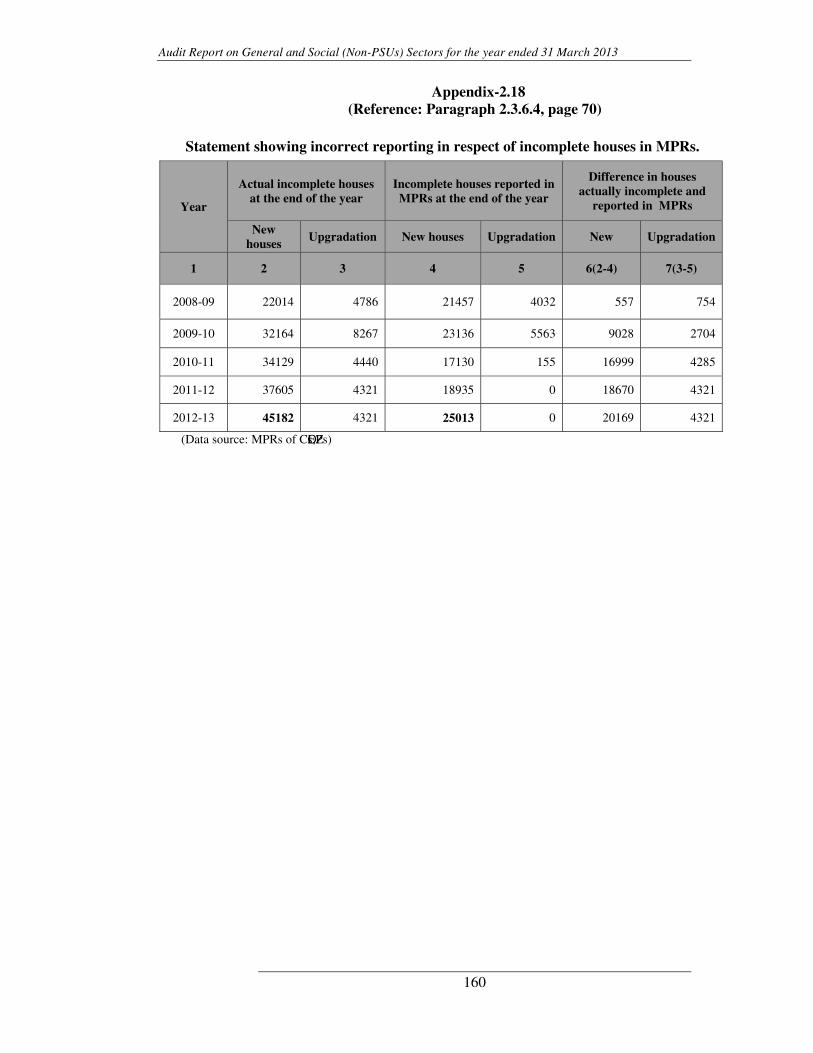
Audit Report on General and Social (Non-PSUs) Sectors for the year ended 31 March 2013
160
(Data source: MPRs of CEOs, ZPs)
Appendix-2.18 (Reference: Paragraph 2.3.6.4, page 70)
Statement showing incorrect reporting in respect of incomplete houses in MPRs.
Year
Actual incomplete houses at the end of the year
Incomplete houses reported in MPRs at the end of the year
Difference in houses actually incomplete and
reported in MPRs
New houses
Upgradation New houses Upgradation New Upgradation
1 2 3 4 5 6(2-4) 7(3-5)
2008-09 22014 4786 21457 4032 557 754
2009-10 32164 8267 23136 5563 9028 2704
2010-11 34129 4440 17130 155 16999 4285
2011-12 37605 4321 18935 0 18670 4321
2012-13 45182 4321 25013 0 20169 4321
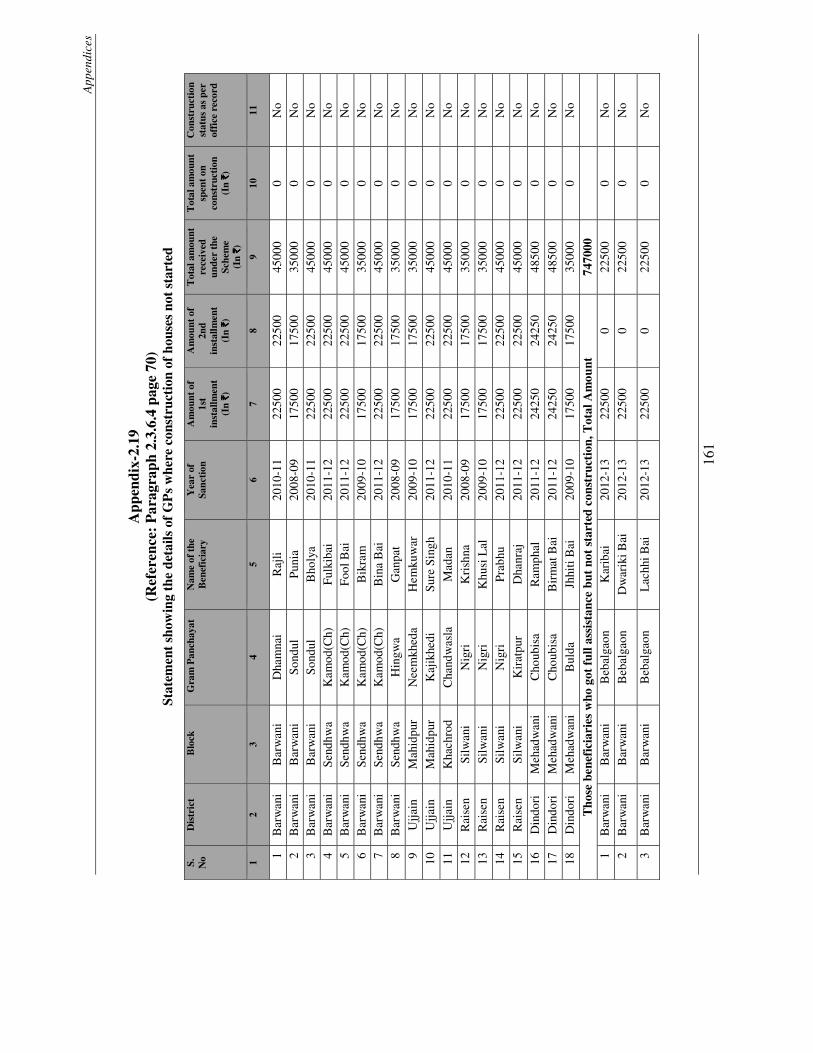
App
endi
ces
161
App
endi
x-2.
19
(Ref
eren
ce:
Par
agra
ph 2
.3.6
.4 p
age
70)
St
atem
ent
show
ing
the
deta
ils o
f G
Ps
whe
re c
onst
ruct
ion
of h
ouse
s no
t sta
rted
S.
No
Dis
tric
t B
lock
G
ram
Pan
chay
at
Nam
e of
the
B
enef
icia
ry
Yea
r of
Sa
ncti
on
Am
ount
of
1st
inst
allm
ent
(In
`̀̀̀)
Am
ount
of
2nd
inst
allm
ent
(In
`̀̀̀)
Tot
al a
mou
nt
rece
ived
un
der
the
Sche
me
(In
`̀̀̀)
Tot
al a
mou
nt
spen
t on
co
nstr
ucti
on
(I
n `̀̀̀)
Con
stru
ctio
n st
atus
as
per
offi
ce r
ecor
d
1 2
3 4
5 6
7 8
9 10
11
1 B
arw
ani
Bar
wan
i D
ham
nai
Raj
li 20
10-1
1 22
500
2250
0 45
000
0 N
o 2
Bar
wan
i B
arw
ani
Sond
ul
Pun
ia
2008
-09
1750
0 17
500
3500
0 0
No
3 B
arw
ani
Bar
wan
i So
ndul
B
holy
a 20
10-1
1 22
500
2250
0 45
000
0 N
o 4
Bar
wan
i Se
ndhw
a K
amod
(Ch)
Fu
lkib
ai
2011
-12
2250
0 22
500
4500
0 0
No
5 B
arw
ani
Send
hwa
Kam
od(C
h)
Fool
Bai
20
11-1
2 22
500
2250
0 45
000
0 N
o 6
Bar
wan
i Se
ndhw
a K
amod
(Ch)
B
ikra
m
2009
-10
1750
0 17
500
3500
0 0
No
7 B
arw
ani
Send
hwa
Kam
od(C
h)
Bin
a B
ai
2011
-12
2250
0 22
500
4500
0 0
No
8 B
arw
ani
Send
hwa
Hin
gwa
Gan
pat
2008
-09
1750
0 17
500
3500
0 0
No
9 U
jjai
n M
ahid
pur
Nee
mkh
eda
Hem
kuw
ar
2009
-10
1750
0 17
500
3500
0 0
No
10
Ujj
ain
Mah
idpu
r K
ajik
hedi
Su
re S
ingh
20
11-1
2 22
500
2250
0 45
000
0 N
o
11
Ujj
ain
Kha
chro
d C
hand
was
la
Mad
an
2010
-11
2250
0 22
500
4500
0 0
No
12
Rai
sen
Silw
ani
Nig
ri
Kri
shna
20
08-0
9 17
500
1750
0 35
000
0 N
o
13
Rai
sen
Silw
ani
Nig
ri
Khu
si L
al
2009
-10
1750
0 17
500
3500
0 0
No
14
Rai
sen
Silw
ani
Nig
ri
Pra
bhu
2011
-12
2250
0 22
500
4500
0 0
No
15
Rai
sen
Silw
ani
Kir
atpu
r D
hanr
aj
2011
-12
2250
0 22
500
4500
0 0
No
16
Din
dori
M
ehad
wan
i C
houb
isa
Ram
phal
20
11-1
2 24
250
2425
0 48
500
0 N
o
17
Din
dori
M
ehad
wan
i C
houb
isa
Bir
mat
Bai
20
11-1
2 24
250
2425
0 48
500
0 N
o
18
Din
dori
M
ehad
wan
i B
ulda
Jh
hiti
Bai
20
09-1
0 17
500
1750
0 35
000
0 N
o
Tho
se b
enef
icia
ries
who
got
ful
l ass
ista
nce
but
not
star
ted
cons
truc
tion
, Tot
al A
mou
nt
7470
00
1
Bar
wan
i B
arw
ani
Beb
alga
on
Kar
ibai
20
12-1
3 22
500
0 22
500
0 N
o
2 B
arw
ani
Bar
wan
i B
ebal
gaon
D
war
iki B
ai
2012
-13
2250
0 0
2250
0 0
No
3 B
arw
ani
Bar
wan
i B
ebal
gaon
L
achh
i Bai
20
12-1
3 22
500
0 22
500
0 N
o
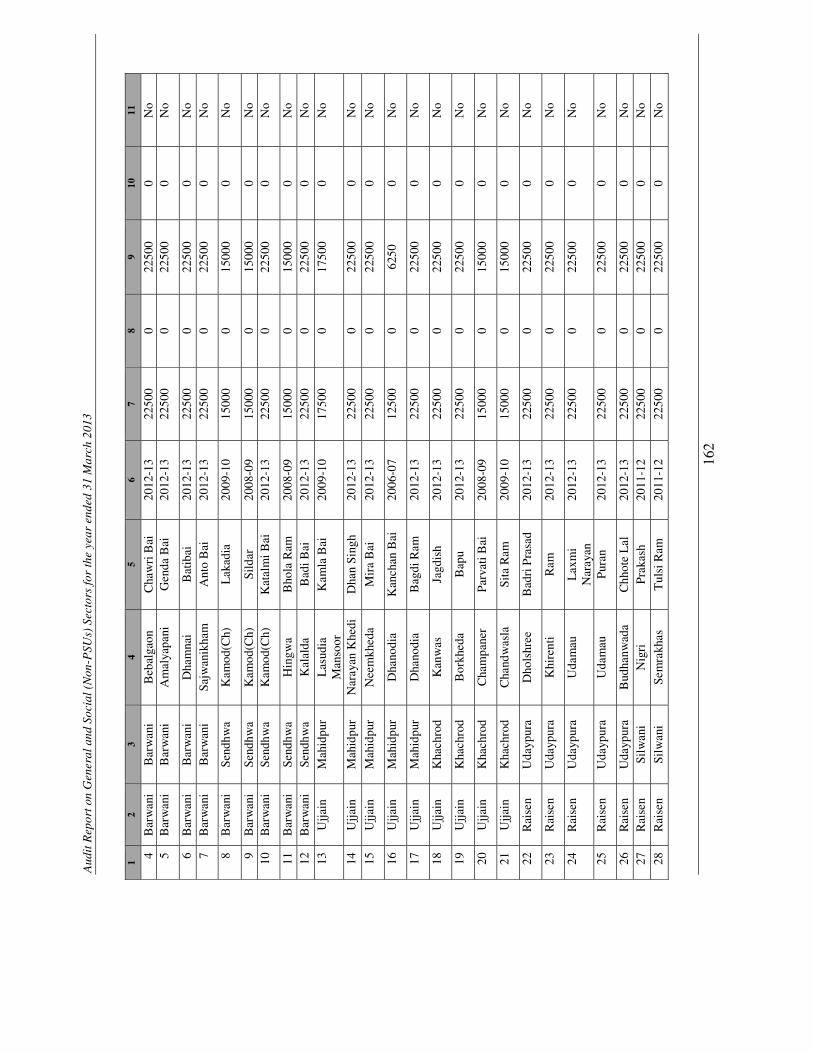
Aud
it R
epor
t on
Gen
eral
and
Soc
ial (
Non
-PSU
s) S
ecto
rs fo
r th
e ye
ar e
nded
31
Mar
ch 2
013
162
1 2
3 4
5 6
7 8
9 10
11
4 B
arw
ani
Bar
wan
i B
ebal
gaon
C
haw
ri B
ai
2012
-13
2250
0 0
2250
0 0
No
5 B
arw
ani
Bar
wan
i A
mal
yapa
ni
Gen
da B
ai
2012
-13
2250
0 0
2250
0 0
No
6 B
arw
ani
Bar
wan
i D
ham
nai
Bat
ibai
20
12-1
3 22
500
0 22
500
0 N
o 7
Bar
wan
i B
arw
ani
Sajw
anik
ham
A
nto
Bai
20
12-1
3 22
500
0 22
500
0 N
o
8 B
arw
ani
Send
hwa
Kam
od(C
h)
Lak
adia
20
09-1
0 15
000
0 15
000
0 N
o
9 B
arw
ani
Send
hwa
Kam
od(C
h)
Sild
ar
2008
-09
1500
0 0
1500
0 0
No
10
Bar
wan
i Se
ndhw
a K
amod
(Ch)
K
atal
mi B
ai
2012
-13
2250
0 0
2250
0 0
No
11
Bar
wan
i Se
ndhw
a H
ingw
a B
hola
Ram
20
08-0
9 15
000
0 15
000
0 N
o 12
B
arw
ani
Send
hwa
Kal
alda
B
adi B
ai
2012
-13
2250
0 0
2250
0 0
No
13
Ujj
ain
Mah
idpu
r L
asud
ia
Man
soor
K
amla
Bai
20
09-1
0 17
500
0 17
500
0 N
o
14
Ujj
ain
Mah
idpu
r N
aray
an K
hedi
D
han
Sing
h 20
12-1
3 22
500
0 22
500
0 N
o
15
Ujj
ain
Mah
idpu
r N
eem
khed
a M
ira
Bai
20
12-1
3 22
500
0 22
500
0 N
o
16
Ujj
ain
Mah
idpu
r D
hano
dia
Kan
chan
Bai
20
06-0
7 12
500
0 62
50
0 N
o
17
Ujj
ain
Mah
idpu
r D
hano
dia
Bag
di R
am
2012
-13
2250
0 0
2250
0 0
No
18
Ujj
ain
Kha
chro
d K
anw
as
Jagd
ish
2012
-13
2250
0 0
2250
0 0
No
19
Ujj
ain
Kha
chro
d B
orkh
eda
Bap
u 20
12-1
3 22
500
0 22
500
0 N
o
20
Ujj
ain
Kha
chro
d C
ham
pane
r P
arva
ti B
ai
2008
-09
1500
0 0
1500
0 0
No
21
Ujj
ain
Kha
chro
d C
hand
was
la
Sita
Ram
20
09-1
0 15
000
0 15
000
0 N
o
22
Rai
sen
Uda
ypur
a D
hols
hree
B
adri
Pra
sad
2012
-13
2250
0 0
2250
0 0
No
23
Rai
sen
Uda
ypur
a K
hire
nti
Ram
20
12-1
3 22
500
0 22
500
0 N
o
24
Rai
sen
Uda
ypur
a U
dam
au
Lax
mi
Nar
ayan
20
12-1
3 22
500
0 22
500
0 N
o
25
Rai
sen
Uda
ypur
a U
dam
au
Pur
an
2012
-13
2250
0 0
2250
0 0
No
26
Rai
sen
Uda
ypur
a B
udha
nwad
a C
hhot
e L
al
2012
-13
2250
0 0
2250
0 0
No
27
Rai
sen
Silw
ani
Nig
ri
Pra
kash
20
11-1
2 22
500
0 22
500
0 N
o
28
Rai
sen
Silw
ani
Sem
rakh
as
Tul
si R
am
2011
-12
2250
0 0
2250
0 0
No
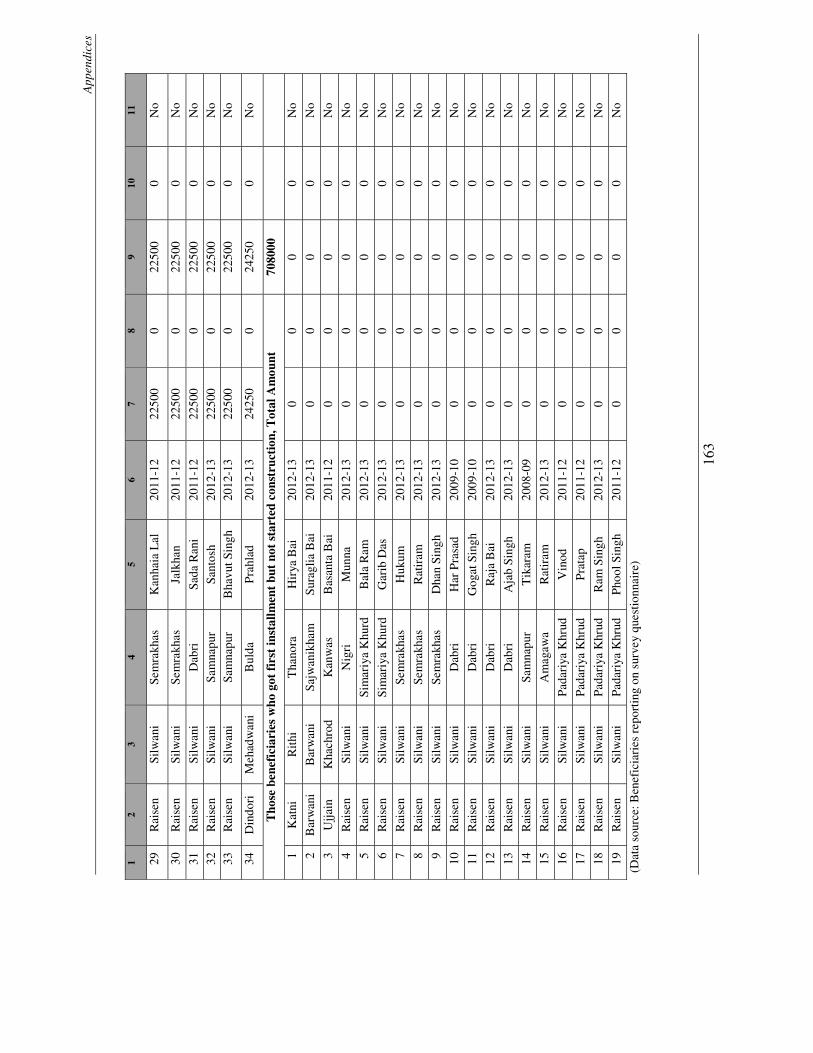
App
endi
ces
163
1 2
3 4
5 6
7 8
9 10
11
29
Rai
sen
Silw
ani
Sem
rakh
as
Kan
haia
Lal
20
11-1
2 22
500
0 22
500
0 N
o
30
Rai
sen
Silw
ani
Sem
rakh
as
Jalk
han
2011
-12
2250
0 0
2250
0 0
No
31
Rai
sen
Silw
ani
Dab
ri
Sada
Ran
i 20
11-1
2 22
500
0 22
500
0 N
o
32
Rai
sen
Silw
ani
Sam
napu
r Sa
ntos
h 20
12-1
3 22
500
0 22
500
0 N
o 33
R
aise
n Si
lwan
i Sa
mna
pur
Bha
vut S
ingh
20
12-1
3 22
500
0 22
500
0 N
o
34
Din
dori
M
ehad
wan
i B
ulda
P
rahl
ad
2012
-13
2425
0 0
2425
0 0
No
Tho
se b
enef
icia
ries
who
got
fir
st in
stal
lmen
t bu
t no
t st
arte
d co
nstr
ucti
on, T
otal
Am
ount
7080
00
1 K
atni
R
ithi
T
hano
ra
Hir
ya B
ai
2012
-13
0 0
0 0
No
2 B
arw
ani
Bar
wan
i Sa
jwan
ikha
m
Sura
glia
Bai
20
12-1
3 0
0 0
0 N
o
3 U
jjai
n K
hach
rod
Kan
was
B
asan
ta B
ai
2011
-12
0 0
0 0
No
4 R
aise
n Si
lwan
i N
igri
M
unna
20
12-1
3 0
0 0
0 N
o
5 R
aise
n Si
lwan
i Si
mar
iya
Khu
rd
Bal
a R
am
2012
-13
0 0
0 0
No
6 R
aise
n Si
lwan
i Si
mar
iya
Khu
rd
Gar
ib D
as
2012
-13
0 0
0 0
No
7 R
aise
n Si
lwan
i Se
mra
khas
H
ukum
20
12-1
3 0
0 0
0 N
o
8 R
aise
n Si
lwan
i Se
mra
khas
R
atir
am
2012
-13
0 0
0 0
No
9 R
aise
n Si
lwan
i Se
mra
khas
D
han
Sing
h 20
12-1
3 0
0 0
0 N
o
10
Rai
sen
Silw
ani
Dab
ri
Har
Pra
sad
2009
-10
0 0
0 0
No
11
Rai
sen
Silw
ani
Dab
ri
Gog
at S
ingh
20
09-1
0 0
0 0
0 N
o
12
Rai
sen
Silw
ani
Dab
ri
Raj
a B
ai
2012
-13
0 0
0 0
No
13
Rai
sen
Silw
ani
Dab
ri
Aja
b Si
ngh
2012
-13
0 0
0 0
No
14
Rai
sen
Silw
ani
Sam
napu
r T
ikar
am
2008
-09
0 0
0 0
No
15
Rai
sen
Silw
ani
Am
agaw
a R
atir
am
2012
-13
0 0
0 0
No
16
Rai
sen
Silw
ani
Pad
ariy
a K
hrud
V
inod
20
11-1
2 0
0 0
0 N
o
17
Rai
sen
Silw
ani
Pad
ariy
a K
hrud
P
rata
p 20
11-1
2 0
0 0
0 N
o
18
Rai
sen
Silw
ani
Pad
ariy
a K
hrud
R
am S
ingh
20
12-1
3 0
0 0
0 N
o
19
Rai
sen
Silw
ani
Pad
ariy
a K
hrud
P
hool
Sin
gh
2011
-12
0 0
0 0
No
(Dat
a so
urce
: Ben
efic
iari
es r
epor
ting
on s
urve
y qu
estio
nnai
re)
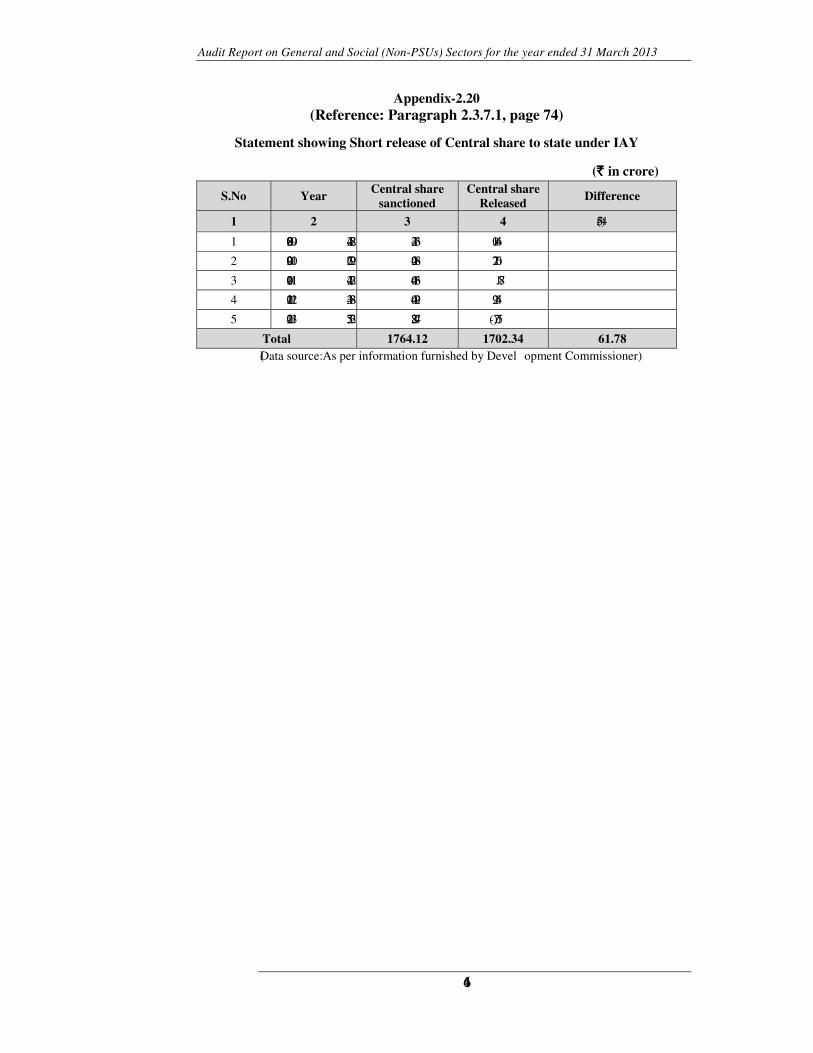
Audit Report on General and Social (Non-PSUs) Sectors for the year ended 31 March 2013
164
Appendix-2.20 (Reference: Paragraph 2.3.7.1, page 74)
Statement showing Short release of Central share to state under IAY
(`̀̀̀ in crore)
S.No Year Central share
sanctioned Central share
Released Difference
1 2 3 4 5(3-4)
1 2008-09 244.82 234.36 10.46
2 2009-10 267.92 240.86 27.06
3 2010-11 442.23 440.36 1.87
4 2011-12 433.83 404.29 29.54
5 2012-13 375.32 382.47 (-)7.15
Total 1764.12 1702.34 61.78 (Data source: As per information furnished by Devel opment Commissioner)
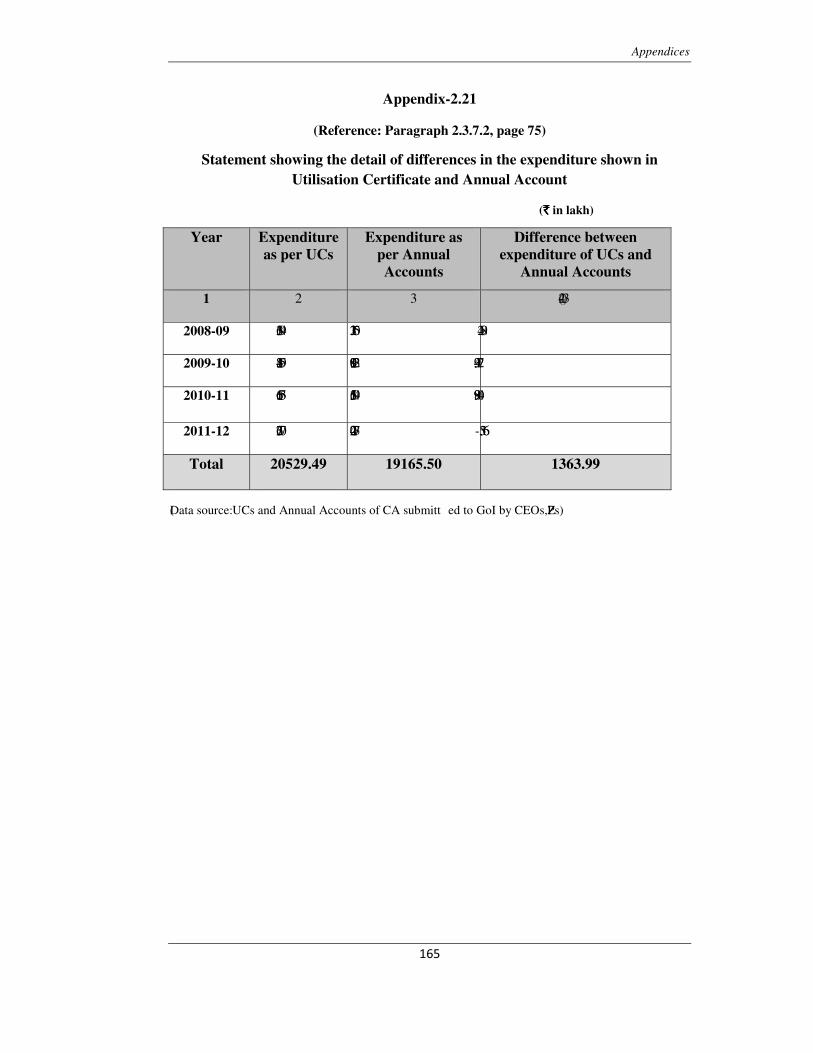
Appendices
����
�
Appendix-2.21
(Reference: Paragraph 2.3.7.2, page 75)
Statement showing the detail of differences in the expenditure shown in Utilisation Certificate and Annual Account
(`̀̀̀ in lakh)
(Data source: UCs and Annual Accounts of CA submitt ed to GoI by CEOs,ZPs)
Year Expenditure as per UCs
Expenditure as per Annual Accounts
Difference between expenditure of UCs and
Annual Accounts
1 2 3 4(2-3)
2008-09 3136.94 3112.05 24.89
2009-10 8413.95 8019.23 394.72
2010-11 6611.53 5613.49 998.04
2011-12 2367.07 2420.73 -53.66
Total 20529.49 19165.50 1363.99
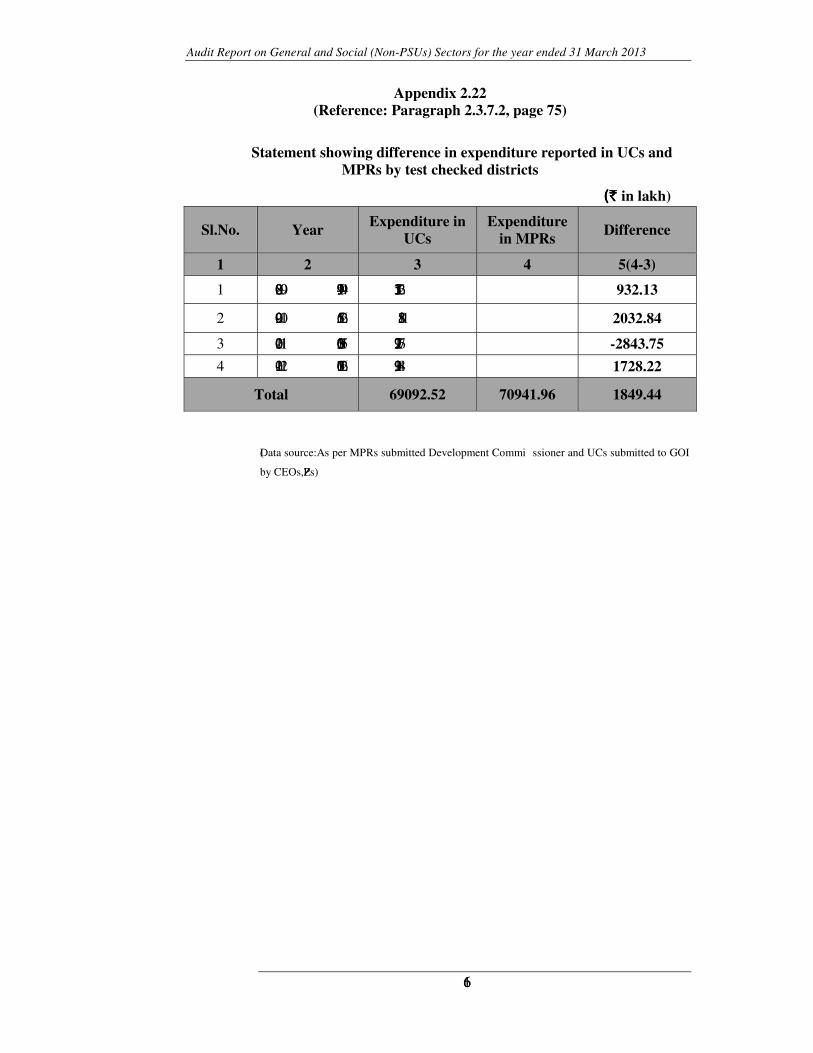
Audit Report on General and Social (Non-PSUs) Sectors for the year ended 31 March 2013
166
(Data source: As per MPRs submitted Development Commi ssioner and UCs submitted to GOI
by CEOs,ZPs)
Appendix 2.22 (Reference: Paragraph 2.3.7.2, page 75)
Statement showing difference in expenditure reported in UCs and MPRs by test checked districts
(` (` (` (` in lakh)
Sl.No. Year Expenditure in UCs
Expenditure in MPRs
Difference
1 2 3 4 5(4-3)
1 2008-09 14799.49 15731.62 932.13
2 2009-10 16555.26 18588.1 2032.84
3 2010-11 20136.51 17292.76 -2843.75
4 2011-12 17601.26 19329.48 1728.22
Total 69092.52 70941.96 1849.44
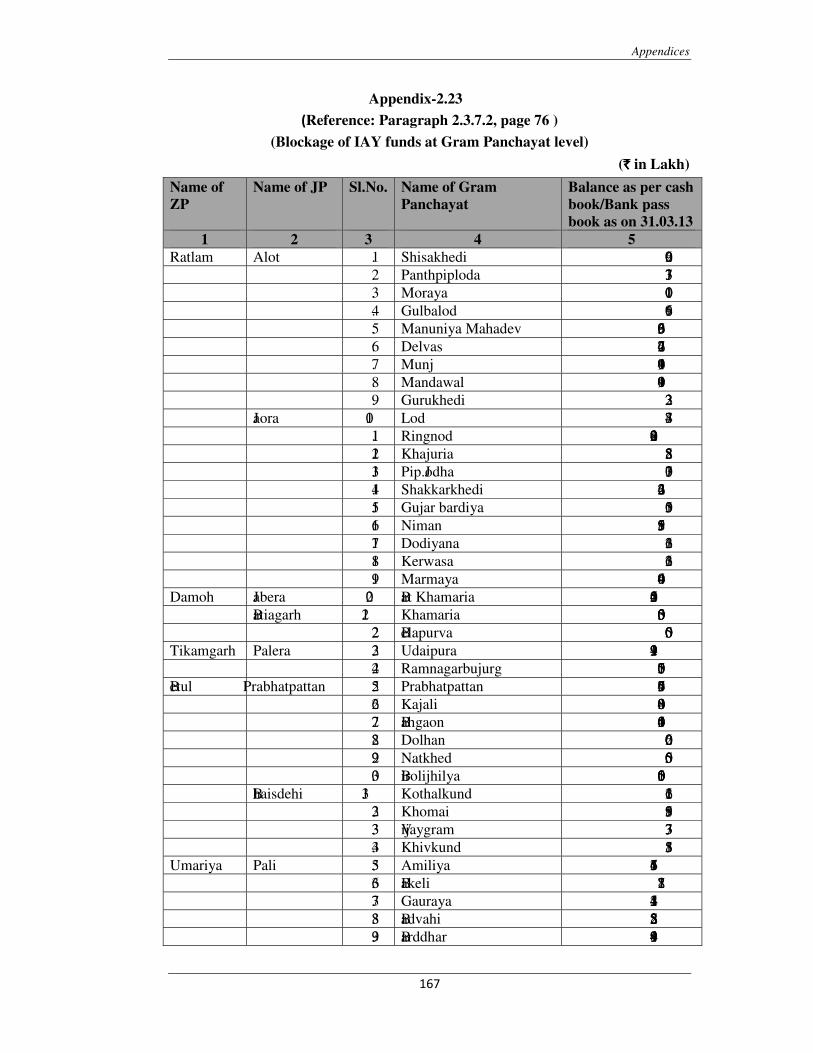
Appendices
�
����
�
Appendix-2.23 �Reference: Paragraph 2.3.7.2, page 76 )
(Blockage of IAY funds at Gram Panchayat level)
(`̀̀̀ in Lakh)
Name of ZP
Name of JP Sl.No. Name of Gram Panchayat
Balance as per cash book/Bank pass book as on 31.03.13
1 2 3 4 5Ratlam Alot 1. Shisakhedi 6029 2. Panthpiploda 1337 3. Moraya 1100 4. Gulbalod 1669 5. Manuniya Mahadev 33669 6. Delvas 24276 7. Munj 16994 8. Mandawal 49019 9. Gurukhedi 2233 Jaora 10. Lod 3478 11. Ringnod 208492 12. Khajuria 2858 13. Pip.Jodha 3710 14. Shakkarkhedi 64232 15. Gujar bardiya 3510 16. Niman 81955 17. Dodiyana 2631 18. Kerwasa 6213 19. Marmaya 40649Damoh Jabera 20. Bat Khamaria 145250 Batiagarh 21. Khamaria 35000 22. Belapurva 5000Tikamgarh Palera 23. Udaipura 219491 24. Ramnagarbujurg 17500Betul Prabhatpattan 25. Prabhatpattan 49657 26. Kajali 34800 27. Bahgaon 51400 28. Dolhan 6200 29. Natkhed 5500 30. Birolijhilya 15000 Bhaisdehi 31. Kothalkund 6121 32. Khomai 1958 33. Vijaygram 7333 34. Khivkund 5831Umariya Pali 35. Amiliya 116745 36. Bakeli 71821 37. Gauraya 121445 38. Badvahi 235582 39. Barddhar 819494�
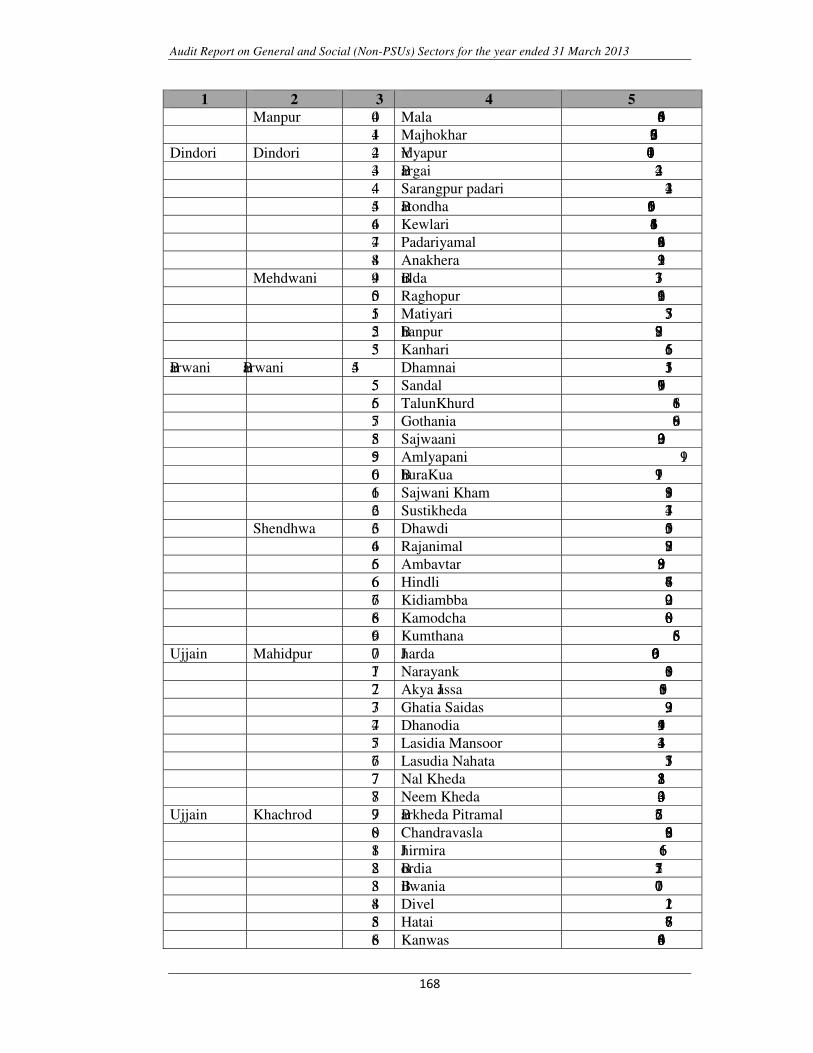
Audit Report on General and Social (Non-PSUs) Sectors for the year ended 31 March 2013
�
�� �
�
1 2 3 4 5 Manpur 40. Mala 50846 41. Majhokhar 239667Dindori Dindori 42. Vidyapur 10470 43. Bargai 2423 44. Sarangpur padari 1432 45. Batondha 15096 46. Kewlari 141863 47. Padariyamal 98246 48. Anakhera 12931 Mehdwani 49. Bulda 1733 50. Raghopur 26119 51. Matiyari 3573 52. Bhanpur 8927 53. Kanhari 1665Barwani Barwani 54. Dhamnai 1531 55. Sandal 19679 56. TalunKhurd 618 57. Gothania 869 58. Sajwaani 23039 59. Amlyapani 19 60. BhuraKua 1971 61. Sajwani Kham 1983 62. Sustikheda 1374 Shendhwa 63. Dhawdi 3150 64. Rajanimal 2978 65. Ambavtar 38939 66. Hindli 8476 67. Kidiambba 2092 68. Kamodcha 8800 69. Kumthana 568Ujjain Mahidpur 70. Jharda 60903 71. Narayank 1830 72. Akya Jassa 1805 73. Ghatia Saidas 2399 74. Dhanodia 15419 75. Lasidia Mansoor 14334 76. Lasudia Nahata 5731 77. Nal Kheda 18283 78. Neem Kheda 40333Ujjain Khachrod 79. Barkheda Pitramal 2576 80. Chandravasla 2698 81. Jhirmira 1666 82. Bordia 2715 83. Bilwania 1700 84. Divel 1112 85. Hatai 7768 86. Kanwas 38046
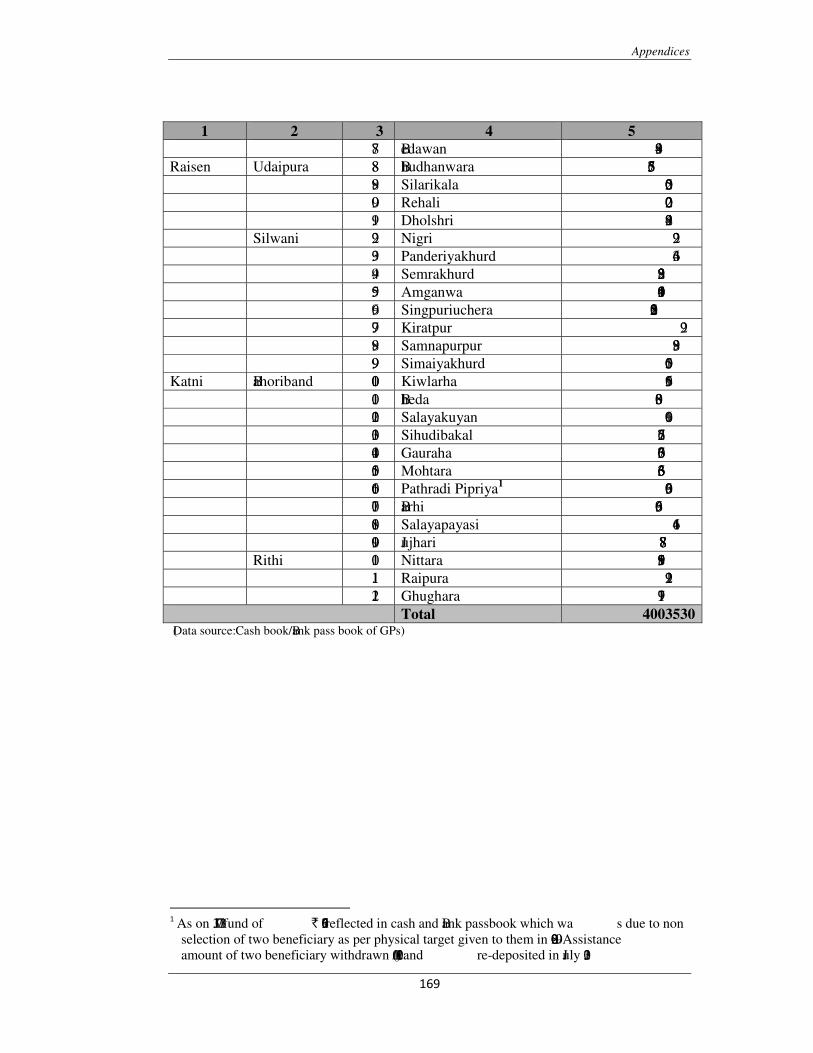
Appendices
�
����
�
�
1 2 3 4 5 87. Bedawan 3849Raisen Udaipura 88. Bhudhanwara 37655 89. Silarikala 2500 90. Rehali 2200 91. Dholshri 4982 Silwani 92. Nigri 292 93. Panderiyakhurd 346 94. Semrakhurd 23983 95. Amganwa 49105 96. Singpuriuchera 158220 97. Kiratpur 29 98. Samnapurpur 938 99. Simaiyakhurd 1050Katni Bahoriband 100. Kiwlarha 6159 101. Bheda 8083 102. Salayakuyan 9061 103. Sihudibakal 27756 104. Gauraha 33076 105. Mohtara 36633 106. Pathradi Pipriya1 3690 107. Barhi 3696 108. Salayapayasi 614 109. Jujhari 7888 Rithi 110. Nittara 91958 111. Raipura 2219 112. Ghughara 11971
Total 4003530 (Data source: Cash book/Bank pass book of GPs)
���������������������������������������� ���������������������As on 31.07.13 fund of ` 76369 reflected in cash and Bank passbook which wa s due to non
selection of two beneficiary as per physical target given to them in 2008-09. Assistance amount of two beneficiary withdrawn (10/2011) and re-deposited in July 2013. �
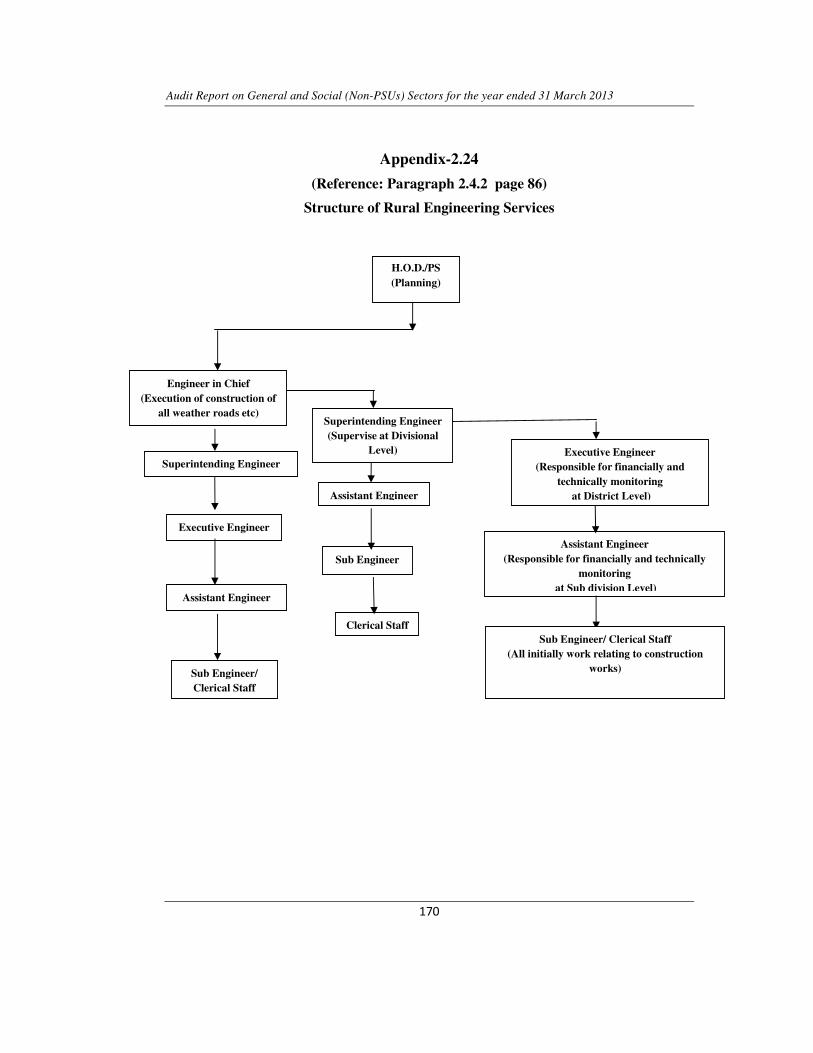
Audit Report on General and Social (Non-PSUs) Sectors for the year ended 31 March 2013
�
����
�
Appendix-2.24
(Reference: Paragraph 2.4.2 page 86)
Structure of Rural Engineering Services � � � �
�
�
�
�
�
� �
H.O.D./PS (Planning)
Engineer in Chief (Execution of construction of
all weather roads etc) Superintending Engineer (Supervise at Divisional
Level) Superintending Engineer
Assistant Engineer
Executive Engineer
Sub Engineer
Assistant Engineer
Clerical Staff
Sub Engineer/ Clerical Staff
Executive Engineer (Responsible for financially and
technically monitoring at District Level)
Assistant Engineer (Responsible for financially and technically
monitoring at Sub division Level)
Sub Engineer/ Clerical Staff (All initially work relating to construction
works)
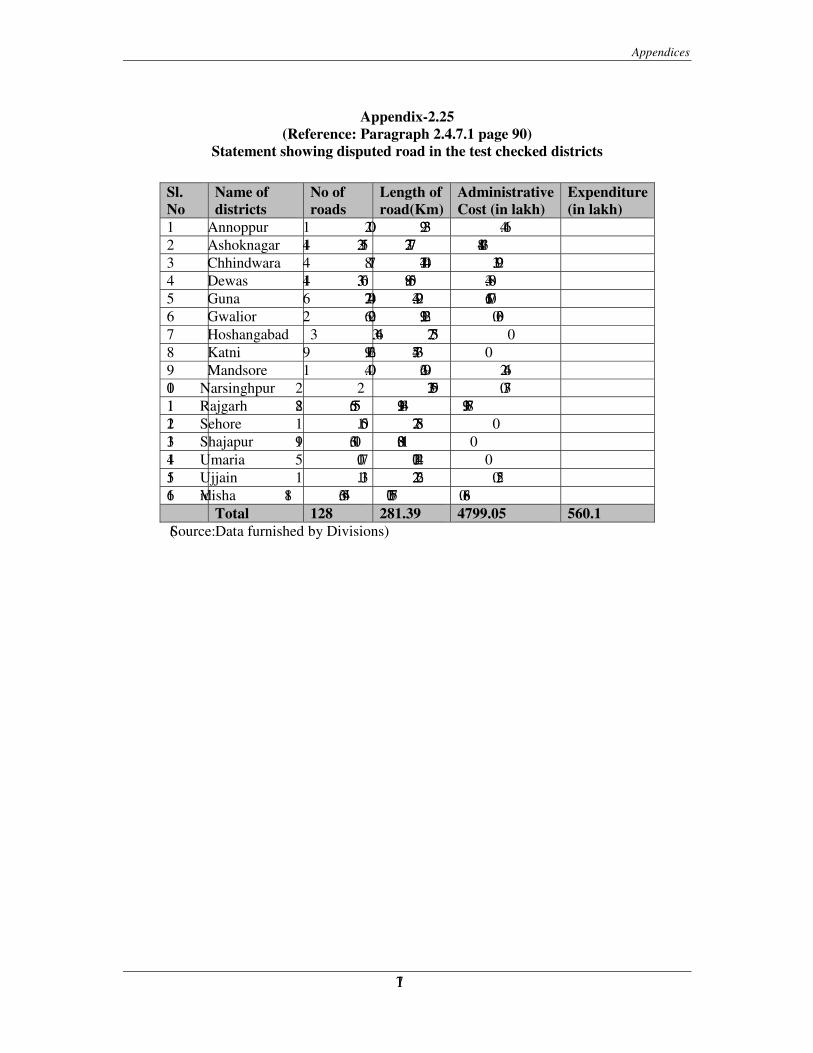
Appendices
171
Appendix-2.25 (Reference: Paragraph 2.4.7.1 page 90)
Statement showing disputed road in the test checked districts
Sl. No
Name of districts
No of roads
Length of road(Km)
Administrative Cost (in lakh)
Expenditure(in lakh)
1 Annoppur 1 2.00 29.33 4.16 2 Ashoknagar 14 32.15 732.77 184.13 3 Chhindwara 4 8.71 174.04 31.92 4 Dewas 14 33.60 89.50 34.08 5 Guna 6 27.04 443.92 161.70 6 Gwalior 2 6.20 139.23 0.30 7 Hoshangabad 3 3.64 72.53 0 8 Katni 9 19.62 475.33 0 9 Mandsore 1 4.00 62.90 2.64 10 Narsinghpur 2 2 137.59 0.37 11 Rajgarh 28 56.55 1139.43 139.87 12 Sehore 1 1.50 27.58 0 13 Shajapur 19 36.10 380.11 0 14 Umaria 5 10.7 170.42 0 15 Ujjain 1 1.13 22.62 0.25 16 Vidisha 18 36.45 701.75 0.68
Total 128 281.39 4799.05 560.1 (Source: Data furnished by Divisions)
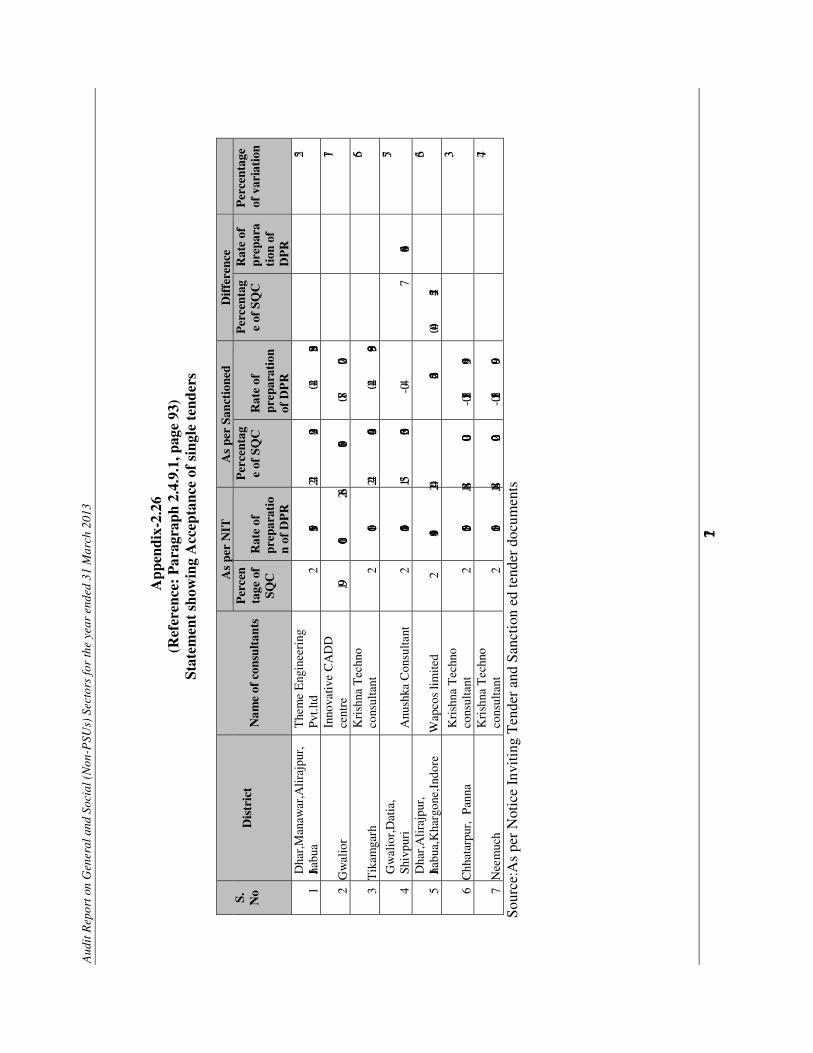
Aud
it R
epor
t on
Gen
eral
and
Soc
ial (
Non
-PSU
s) S
ecto
rs fo
r th
e ye
ar e
nded
31
Mar
ch 2
013
172
App
endi
x-2.
26
(Ref
eren
ce:
Par
agra
ph 2
.4.9
.1, p
age
93)
Stat
emen
t sh
owin
g A
ccep
tanc
e of
sin
gle
tend
ers
S.
No
Dis
tric
t N
ame
of c
onsu
ltan
ts
As
per
NIT
A
s pe
r Sa
ncti
oned
D
iffe
renc
e P
erce
nta
ge o
f SQ
C
Rat
e of
pr
epar
atio
n of
DP
R
Per
cent
age
of S
QC
R
ate
of
prep
arat
ion
of D
PR
Per
cent
age
of S
QC
R
ate
of
prep
ara
tion
of
DP
R
Per
cent
age
of v
aria
tion
1 D
har,
Man
awar
,Ali
rajp
ur,
Jhabu
a T
hem
e E
ngin
eeri
ng
Pvt
.ltd
2 15998
2.42 24293
0.42 8295
52
2 G
wal
ior
Inno
vativ
e C
AD
D
cent
re
1.99 16000
2.86 18700
0.87 2700
17
3 T
ikam
garh
K
rish
na T
echn
o co
nsul
tant
2
16001 2.42
24960 0.42
8959 56
4 G
wal
ior,
Dat
ia,
Shiv
puri
A
nush
ka C
onsu
ltant
2
15004 1.53
23500 -0.
47
8496
57
5 D
har,
Ali
rajp
ur,
Jhabu
a,K
harg
one,
Indo
re
Wap
cos
limite
d 2
14998 2.04
20425 0.04
5427 36
6 C
hhat
arpu
r, P
anna
K
rish
na T
echn
o co
nsul
tant
2
15005 1.848
20000 -0.
152 4995
33
7 N
eem
uch
Kri
shna
Tec
hno
cons
ulta
nt
2 15001
1.848 22000
-0.152
6999 47
So
urce
: As
per
Not
ice
Invi
ting
Ten
der
and
Sanc
tion
ed te
nder
doc
umen
ts
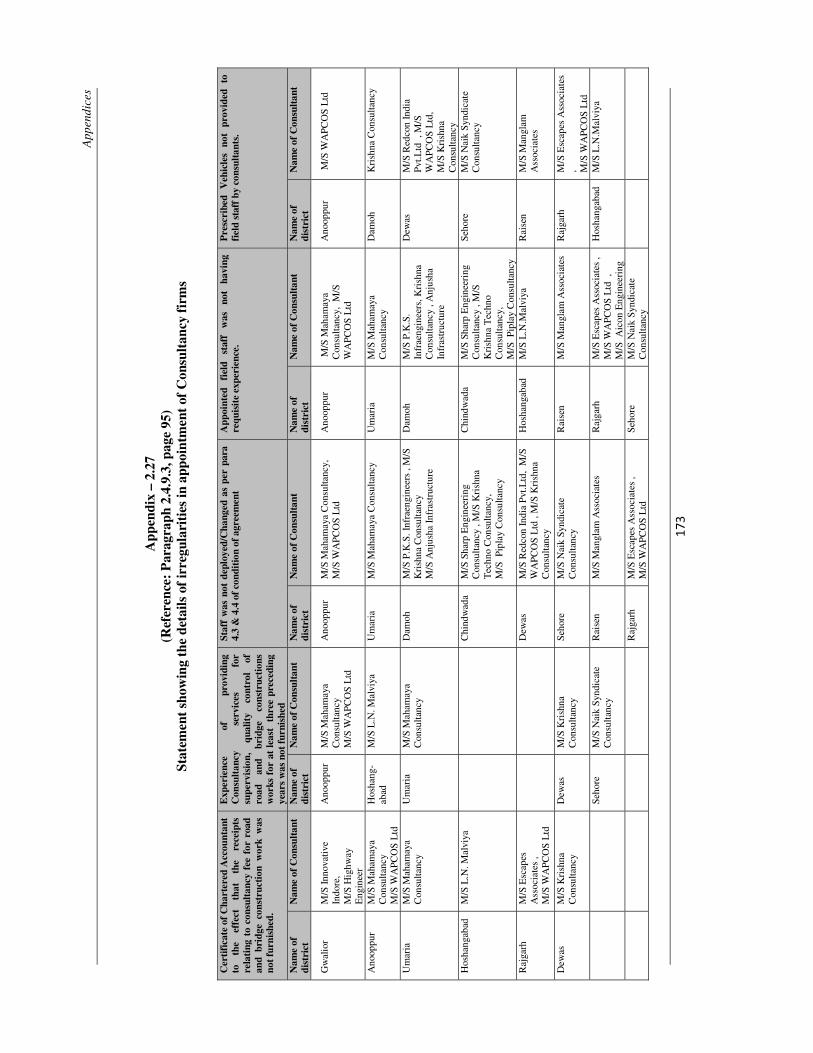
App
endi
ces
�
����
�
App
endi
x –
2.27
(R
efer
ence
: Par
agra
ph 2
.4.9
.3, p
age
95)
Stat
emen
t sh
owin
g th
e de
tails
of
irre
gula
riti
es in
app
oint
men
t of
Con
sult
ancy
fir
ms
Cer
tifi
cate
of
Cha
rter
ed A
ccou
ntan
t to
th
e ef
fect
th
at
the
rece
ipts
re
lati
ng t
o co
nsul
tanc
y fe
e fo
r ro
ad
and
brid
ge c
onst
ruct
ion
wor
k w
as
not f
urni
shed
.
Exp
erie
nce
of
prov
idin
g C
onsu
ltan
cy
serv
ices
fo
r su
perv
isio
n,
qual
ity
cont
rol
of
road
an
d br
idge
co
nstr
ucti
ons
wor
ks f
or a
t le
ast
thr
ee p
rece
ding
ye
ars
was
not
fur
nish
ed
Staf
f w
as n
ot d
eplo
yed/
Cha
nged
as
per
para
4.
3 &
4.4
of
cond
itio
n of
agr
eem
ent
App
oint
ed
fiel
d st
aff
was
no
t ha
ving
re
quis
ite
expe
rien
ce.
Pre
scri
bed
Veh
icle
s no
t pr
ovid
ed
to
fiel
d st
aff
by c
onsu
ltan
ts.
Nam
e of
di
stri
ct
Nam
e of
Con
sult
ant
Nam
e of
di
stri
ct
Nam
e of
Con
sult
ant
Nam
e of
di
stri
ct
Nam
e of
Con
sult
ant
Nam
e of
di
stri
ct
Nam
e of
Con
sult
ant
Nam
e of
di
stri
ct
Nam
e of
Con
sult
ant
Gw
alio
r M
/S In
nova
tive
In
dore
, M
/S H
ighw
ay
Eng
inee
r
Ano
oppu
r M
/S M
aham
aya
Con
sulta
ncy
M/S
WA
PCO
S L
td
Ano
oppu
r M
/S M
aham
aya
Con
sulta
ncy,
M
/S W
APC
OS
Ltd
A
noop
pur
M/S
Mah
amay
a C
onsu
ltanc
y, M
/S
WA
PCO
S L
td
Ano
oppu
r M
/S W
APC
OS
Ltd
Ano
oppu
r M
/S M
aham
aya
Con
sulta
ncy
M/S
WA
PCO
S L
td
Hos
hang
-ab
ad
M/S
L.N
. Mal
viya
U
mar
ia
M/S
Mah
amay
a C
onsu
ltanc
y U
mar
ia
M/S
Mah
amay
a C
onsu
ltanc
y D
amoh
K
rish
na C
onsu
ltanc
y
Um
aria
M
/S M
aham
aya
Con
sulta
ncy
Um
aria
M
/S M
aham
aya
Con
sulta
ncy
Dam
oh
M/S
P.K
.S. I
nfra
engi
neer
s , M
/S
Kri
shna
Con
sulta
ncy
M
/S A
njus
ha I
nfra
stru
ctur
e
Dam
oh
M/S
P.K
.S.
Infr
aeng
inee
rs, K
rish
na
Con
sulta
ncy
, Anj
usha
In
fras
truc
ture
Dew
as
M/S
Red
con
Indi
a Pv
t.Ltd
, M
/S
WA
PCO
S L
td,
M/S
Kri
shna
C
onsu
ltanc
y H
osha
ngab
ad
M/S
L.N
. Mal
viya
C
hind
wad
a M
/S S
harp
Eng
inee
ring
C
onsu
ltanc
y , M
/S K
rish
na
Tec
hno
Con
sulta
ncy,
M
/S P
ipla
y C
onsu
ltanc
y
Chi
ndw
ada
M/S
Sha
rp E
ngin
eeri
ng
Con
sulta
ncy
, M/S
K
rish
na T
echn
o C
onsu
ltanc
y,
M/S
Pip
lay
Con
sulta
ncy
Seho
re
M/S
Nai
k Sy
ndic
ate
Con
sulta
ncy
Raj
garh
M
/S E
scap
es
Ass
ocia
tes
, M
/S W
APC
OS
Ltd
Dew
as
M/S
Red
con
Indi
a Pv
t.Ltd
, M
/S
WA
PCO
S L
td ,
M/S
Kri
shna
C
onsu
ltanc
y
Hos
hang
abad
M
/S L
.N.M
alvi
ya
Rai
sen
M/S
Man
glam
A
ssoc
iate
s
Dew
as
M/S
Kri
shna
C
onsu
ltanc
y D
ewas
M
/S K
rish
na
Con
sulta
ncy
Seho
re
M/S
Nai
k Sy
ndic
ate
Con
sulta
ncy
R
aise
n M
/S M
angl
am A
ssoc
iate
s R
ajga
rh
M/S
Esc
apes
Ass
ocia
tes
, M/S
WA
PCO
S L
td
Seho
re
M/S
Nai
k Sy
ndic
ate
Con
sulta
ncy
R
aise
n M
/S M
angl
am A
ssoc
iate
s R
ajga
rh
M/S
Esc
apes
Ass
ocia
tes
, M
/S W
APC
OS
Ltd
,
M/S
Aic
on E
ngin
eeri
ng
Hos
hang
abad
M
/S L
.N.M
alvi
ya
Raj
garh
M
/S E
scap
es A
ssoc
iate
s ,
M/S
WA
PCO
S L
td
Seho
re
M/S
Nai
k Sy
ndic
ate
Con
sulta
ncy
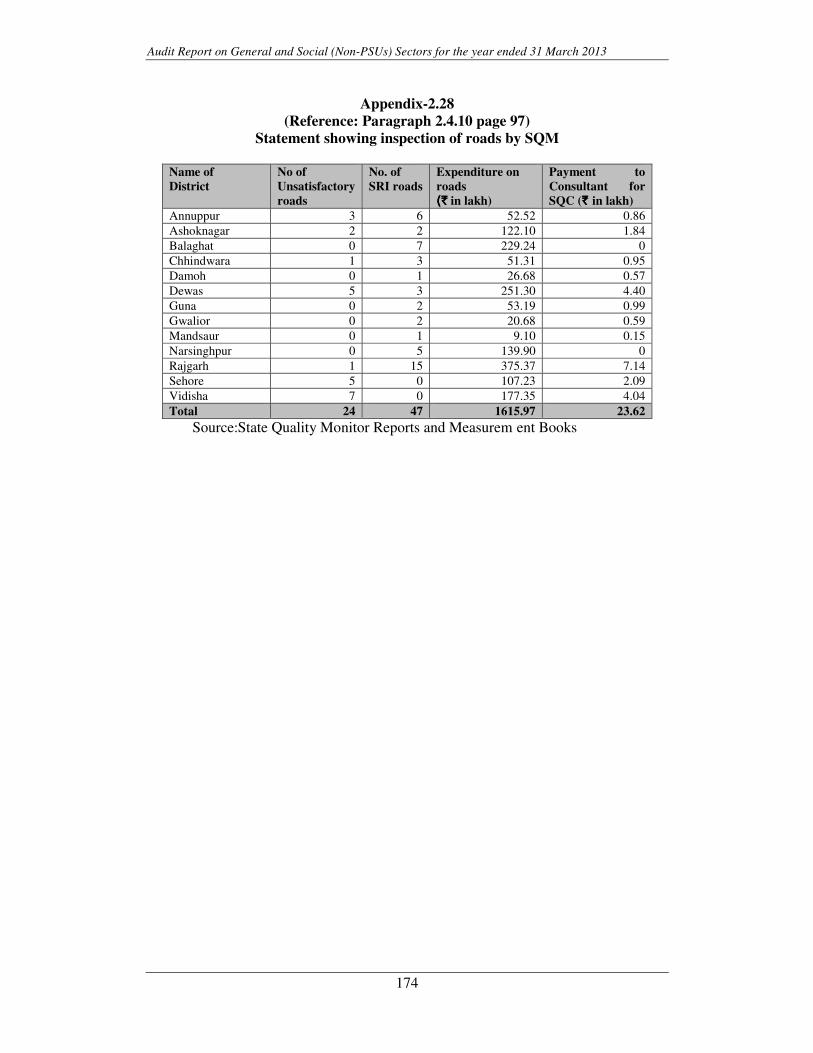
Audit Report on General and Social (Non-PSUs) Sectors for the year ended 31 March 2013
174
Appendix-2.28 (Reference: Paragraph 2.4.10 page 97)
Statement showing inspection of roads by SQM
Name of District
No of Unsatisfactory roads
No. of SRI roads
Expenditure on roads (`(`(`(` in lakh)
Payment to Consultant for SQC (` ` ` ` in lakh)
Annuppur 3 6 52.52 0.86 Ashoknagar 2 2 122.10 1.84 Balaghat 0 7 229.24 0 Chhindwara 1 3 51.31 0.95 Damoh 0 1 26.68 0.57 Dewas 5 3 251.30 4.40 Guna 0 2 53.19 0.99 Gwalior 0 2 20.68 0.59 Mandsaur 0 1 9.10 0.15 Narsinghpur 0 5 139.90 0 Rajgarh 1 15 375.37 7.14 Sehore 5 0 107.23 2.09 Vidisha 7 0 177.35 4.04 Total 24 47 1615.97 23.62
Source: State Quality Monitor Reports and Measurem ent Books
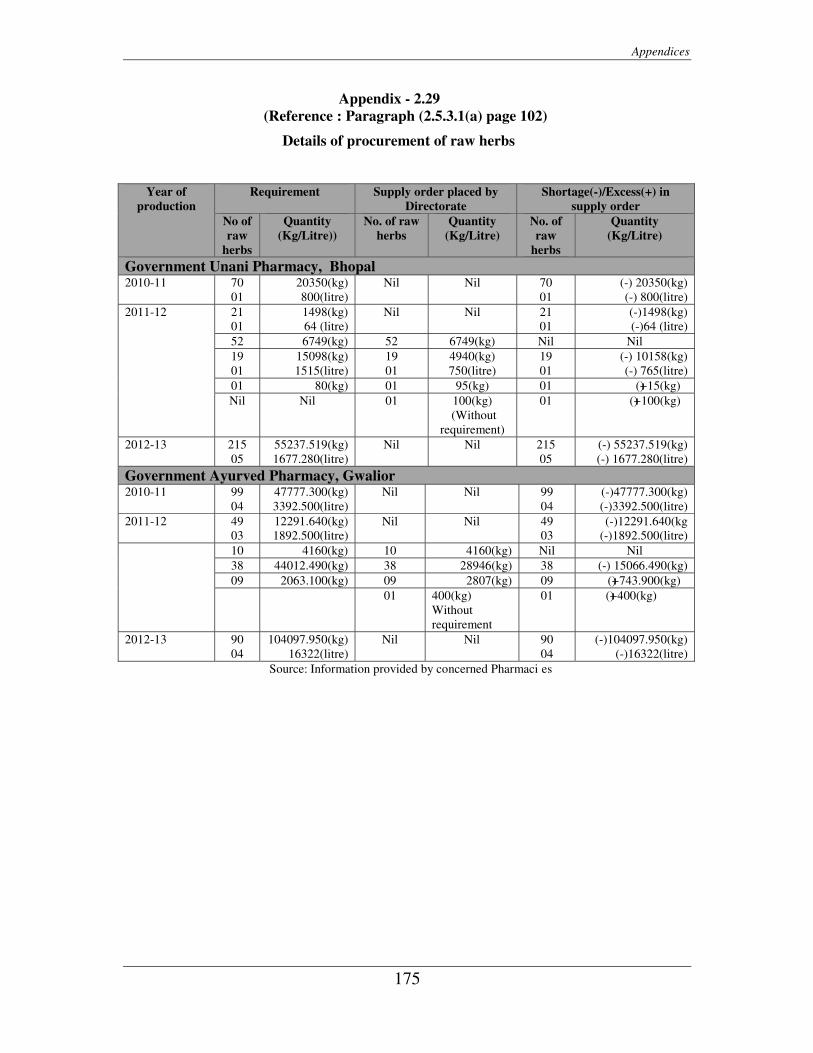
Appendices
175
Appendix - 2.29 (Reference : Paragraph (2.5.3.1(a) page 102)
Details of procurement of raw herbs
Year of
production Requirement Supply order placed by
Directorate Shortage(-)/Excess(+) in
supply order No of raw
herbs
Quantity (Kg/Litre))
No. of raw herbs
Quantity (Kg/Litre)
No. of raw
herbs
Quantity (Kg/Litre)
Government Unani Pharmacy, Bhopal2010-11 70
01 20350(kg) 800(litre)
Nil Nil 70 01
(-) 20350(kg) (-) 800(litre)
2011-12 21 01
1498(kg) 64 (litre)
Nil Nil 21 01
(-)1498(kg) (-)64 (litre)
52 6749(kg) 52 6749(kg) Nil Nil19 01
15098(kg) 1515(litre)
19 01
4940(kg) 750(litre)
19 01
(-) 10158(kg) (-) 765(litre)
01 80(kg) 01 95(kg) 01 (+) 15(kg) Nil Nil 01 100(kg)
(Without requirement)
01 (+) 100(kg)
2012-13 215 05
55237.519(kg) 1677.280(litre)
Nil Nil 215 05
(-) 55237.519(kg) (-) 1677.280(litre)
Government Ayurved Pharmacy, Gwalior2010-11 99
04 47777.300(kg) 3392.500(litre)
Nil Nil 99 04
(-)47777.300(kg) (-)3392.500(litre)
2011-12 49 03
12291.640(kg) 1892.500(litre)
Nil Nil 49 03
(-)12291.640(kg (-)1892.500(litre)
10 4160(kg) 10 4160(kg) Nil Nil 38 44012.490(kg) 38 28946(kg) 38 (-) 15066.490(kg) 09 2063.100(kg) 09 2807(kg) 09 (+) 743.900(kg)
01 400(kg) Without requirement
01 (+) 400(kg)
2012-13 90 04
104097.950(kg) 16322(litre)
Nil Nil 90 04
(-)104097.950(kg) (-)16322(litre)
Source: Information provided by concerned Pharmaci es
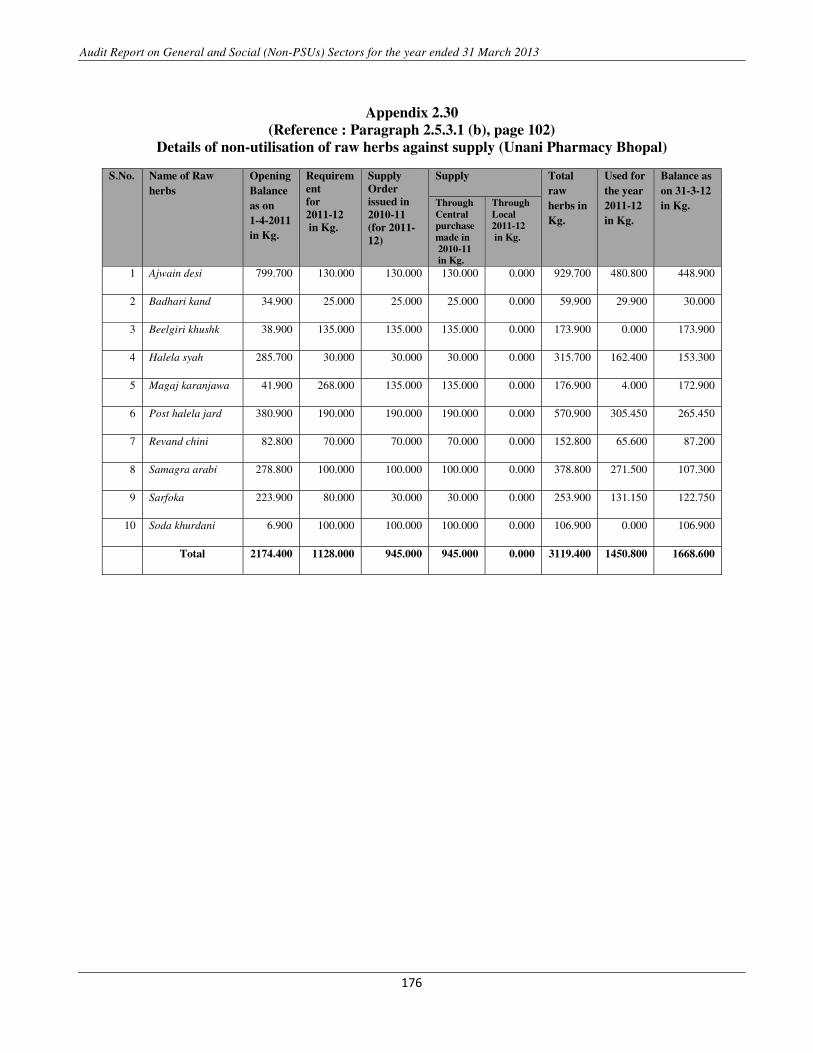
Audit Report on General and Social (Non-PSUs) Sectors for the year ended 31 March 2013
����
�
�
�
� �
�
Appendix 2.30 (Reference : Paragraph 2.5.3.1 (b), page 102)
Details of non-utilisation of raw herbs against supply (Unani Pharmacy Bhopal)
S.No. Name of Raw herbs
Opening Balance as on 1-4-2011 in Kg.
Requirement for 2011-12 in Kg.
Supply Order issued in 2010-11 (for 2011-12)
Supply Total raw herbs in Kg.
Used for the year 2011-12 in Kg.
Balance as on 31-3-12 in Kg. Through
Central purchase made in 2010-11 in Kg.
Through Local 2011-12 in Kg.
1 Ajwain desi 799.700 130.000 130.000 130.000 0.000 929.700 480.800 448.900
2 Badhari kand 34.900 25.000 25.000 25.000 0.000 59.900 29.900 30.000
3 Beelgiri khushk 38.900 135.000 135.000 135.000 0.000 173.900 0.000 173.900
4 Halela syah 285.700 30.000 30.000 30.000 0.000 315.700 162.400 153.300
5 Magaj karanjawa 41.900 268.000 135.000 135.000 0.000 176.900 4.000 172.900
6 Post halela jard 380.900 190.000 190.000 190.000 0.000 570.900 305.450 265.450
7 Revand chini 82.800 70.000 70.000 70.000 0.000 152.800 65.600 87.200
8 Samagra arabi 278.800 100.000 100.000 100.000 0.000 378.800 271.500 107.300
9 Sarfoka 223.900 80.000 30.000 30.000 0.000 253.900 131.150 122.750
10 Soda khurdani 6.900 100.000 100.000 100.000 0.000 106.900 0.000 106.900
Total 2174.400 1128.000 945.000 945.000 0.000 3119.400 1450.800 1668.600
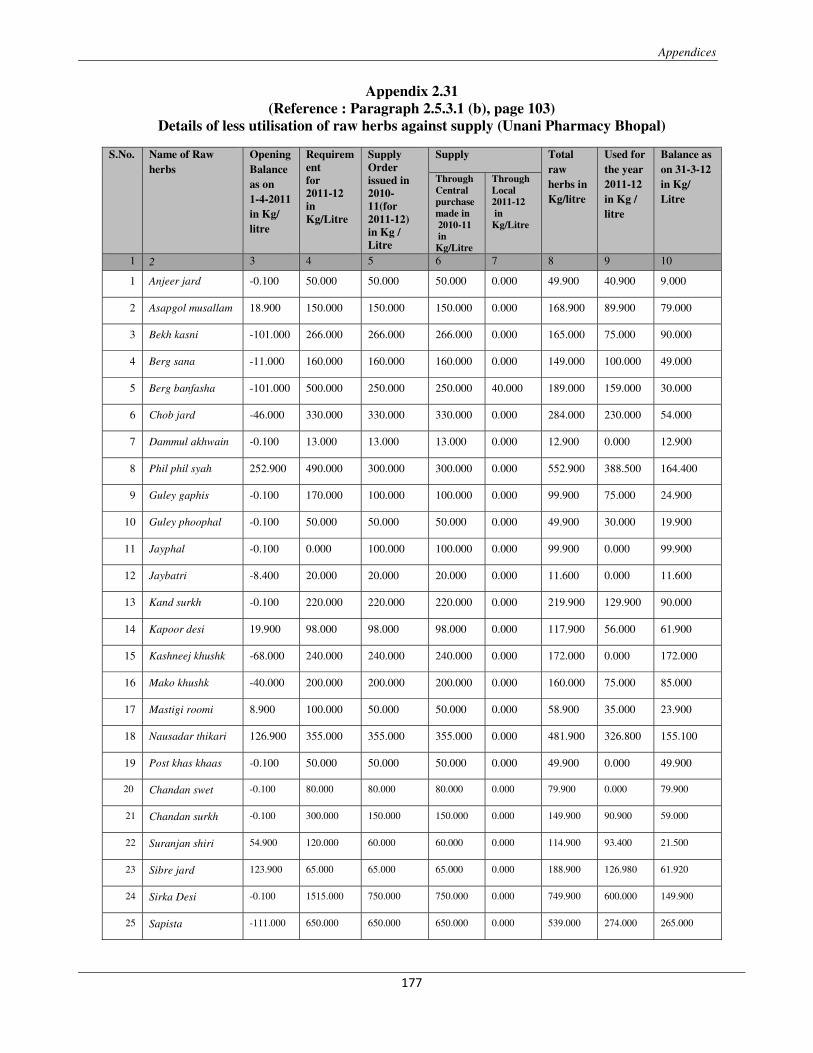
Appendices
�
����
�
Appendix 2.31 (Reference : Paragraph 2.5.3.1 (b), page 103)
Details of less utilisation of raw herbs against supply (Unani Pharmacy Bhopal)
S.No. Name of Raw herbs
Opening Balance as on 1-4-2011 in Kg/ litre
Requirement for 2011-12 in Kg/Litre
Supply Order issued in 2010-11(for 2011-12) in Kg / Litre
Supply Total raw herbs in Kg/litre
Used for the year 2011-12 in Kg / litre
Balance as on 31-3-12 in Kg/ Litre
Through Central purchase made in 2010-11 in Kg/Litre
Through Local 2011-12 in Kg/Litre
1 2 3 4 5 6 7 8 9 10
1 Anjeer jard -0.100 50.000 50.000 50.000 0.000 49.900 40.900 9.000
2 Asapgol musallam 18.900 150.000 150.000 150.000 0.000 168.900 89.900 79.000
3 Bekh kasni -101.000 266.000 266.000 266.000 0.000 165.000 75.000 90.000
4 Berg sana -11.000 160.000 160.000 160.000 0.000 149.000 100.000 49.000
5 Berg banfasha -101.000 500.000 250.000 250.000 40.000 189.000 159.000 30.000
6 Chob jard -46.000 330.000 330.000 330.000 0.000 284.000 230.000 54.000
7 Dammul akhwain -0.100 13.000 13.000 13.000 0.000 12.900 0.000 12.900
8 Phil phil syah 252.900 490.000 300.000 300.000 0.000 552.900 388.500 164.400
9 Guley gaphis -0.100 170.000 100.000 100.000 0.000 99.900 75.000 24.900
10 Guley phoophal -0.100 50.000 50.000 50.000 0.000 49.900 30.000 19.900
11 Jayphal -0.100 0.000 100.000 100.000 0.000 99.900 0.000 99.900
12 Jaybatri -8.400 20.000 20.000 20.000 0.000 11.600 0.000 11.600
13 Kand surkh -0.100 220.000 220.000 220.000 0.000 219.900 129.900 90.000
14 Kapoor desi 19.900 98.000 98.000 98.000 0.000 117.900 56.000 61.900
15 Kashneej khushk -68.000 240.000 240.000 240.000 0.000 172.000 0.000 172.000
16 Mako khushk -40.000 200.000 200.000 200.000 0.000 160.000 75.000 85.000
17 Mastigi roomi 8.900 100.000 50.000 50.000 0.000 58.900 35.000 23.900
18 Nausadar thikari 126.900 355.000 355.000 355.000 0.000 481.900 326.800 155.100
19 Post khas khaas -0.100 50.000 50.000 50.000 0.000 49.900 0.000 49.900
20 Chandan swet -0.100 80.000 80.000 80.000 0.000 79.900 0.000 79.900
21 Chandan surkh -0.100 300.000 150.000 150.000 0.000 149.900 90.900 59.000
22 Suranjan shiri 54.900 120.000 60.000 60.000 0.000 114.900 93.400 21.500
23 Sibre jard 123.900 65.000 65.000 65.000 0.000 188.900 126.980 61.920
24 Sirka Desi -0.100 1515.000 750.000 750.000 0.000 749.900 600.000 149.900
25 Sapista -111.000 650.000 650.000 650.000 0.000 539.000 274.000 265.000
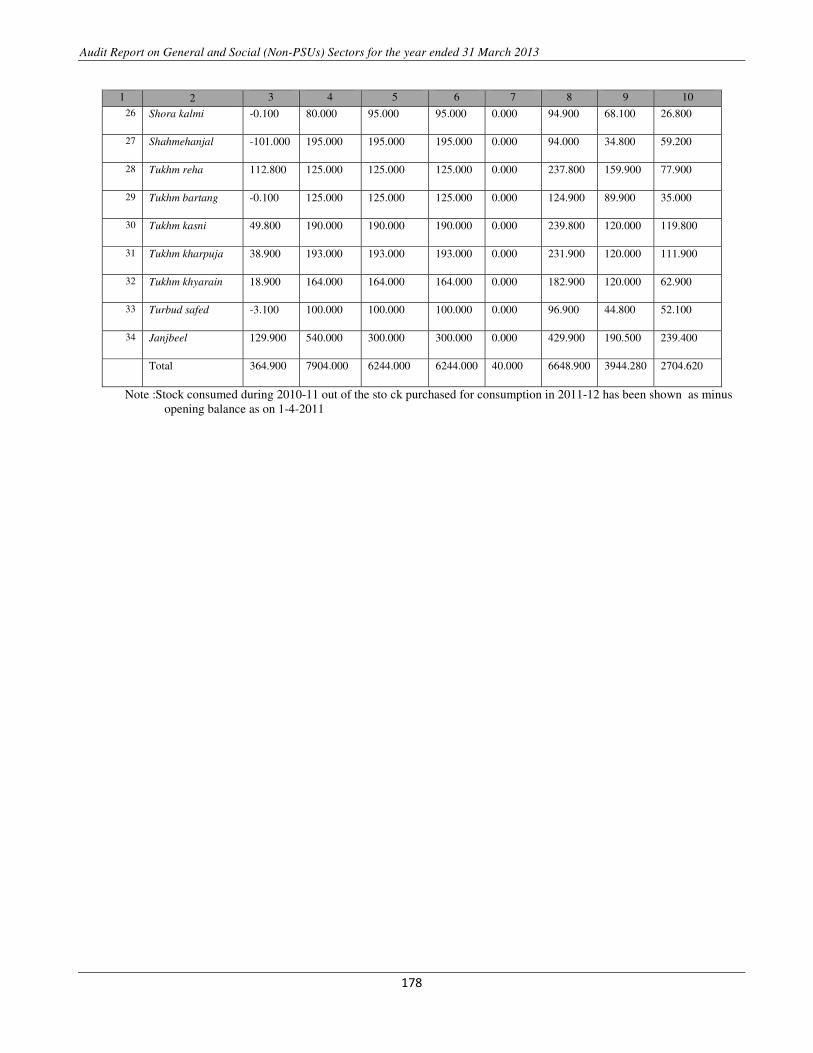
Audit Report on General and Social (Non-PSUs) Sectors for the year ended 31 March 2013
�
�� �
�
Note : Stock consumed during 2010-11 out of the sto ck purchased for consumption in 2011-12 has been shown as minus opening balance as on 1-4-2011
�
� �
1 2 3 4 5 6 7 8 9 10 26 Shora kalmi -0.100 80.000 95.000 95.000 0.000 94.900 68.100 26.800
27 Shahmehanjal -101.000 195.000 195.000 195.000 0.000 94.000 34.800 59.200
28 Tukhm reha 112.800 125.000 125.000 125.000 0.000 237.800 159.900 77.900
29 Tukhm bartang -0.100 125.000 125.000 125.000 0.000 124.900 89.900 35.000
30 Tukhm kasni 49.800 190.000 190.000 190.000 0.000 239.800 120.000 119.800
31 Tukhm kharpuja 38.900 193.000 193.000 193.000 0.000 231.900 120.000 111.900
32 Tukhm khyarain 18.900 164.000 164.000 164.000 0.000 182.900 120.000 62.900
33 Turbud safed -3.100 100.000 100.000 100.000 0.000 96.900 44.800 52.100
34 Janjbeel 129.900 540.000 300.000 300.000 0.000 429.900 190.500 239.400
Total 364.900 7904.000 6244.000 6244.000 40.000 6648.900 3944.280 2704.620
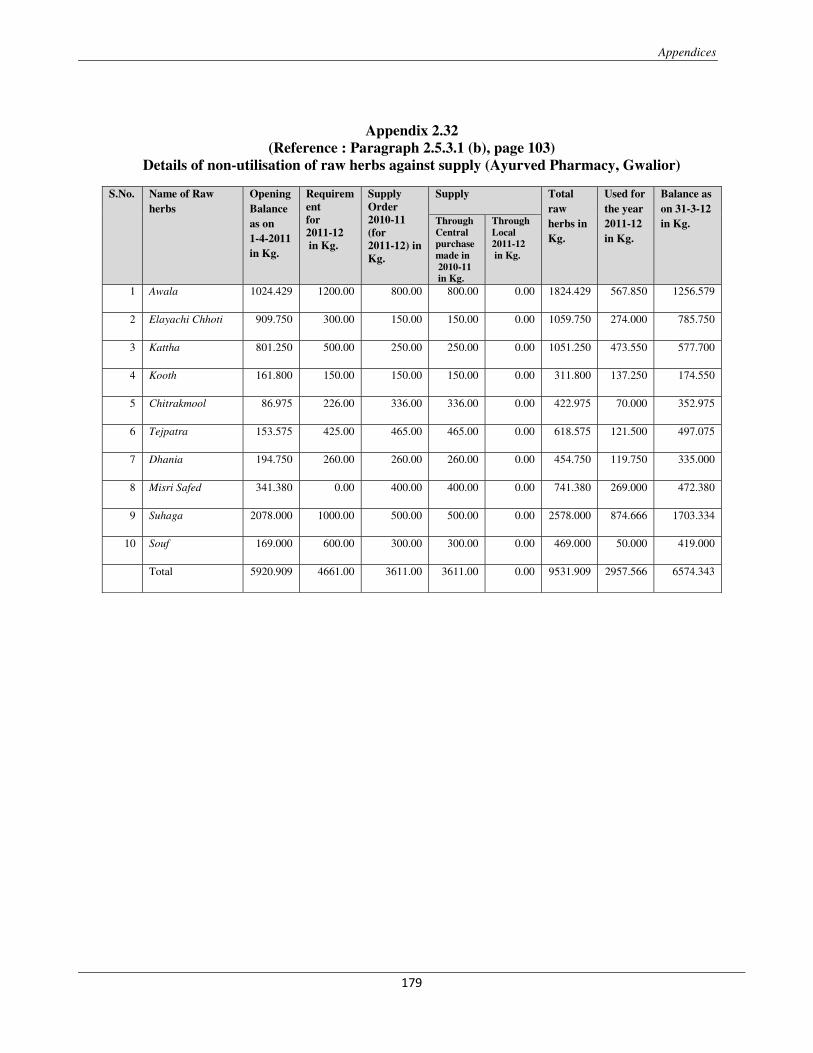
Appendices
�
����
�
�
�
� �
Appendix 2.32 (Reference : Paragraph 2.5.3.1 (b), page 103)
Details of non-utilisation of raw herbs against supply (Ayurved Pharmacy, Gwalior)
S.No. Name of Raw herbs
Opening Balance as on 1-4-2011 in Kg.
Requirement for 2011-12 in Kg.
Supply Order 2010-11 (for 2011-12) in Kg.
Supply Total raw herbs in Kg.
Used for the year 2011-12 in Kg.
Balance as on 31-3-12 in Kg. Through
Central purchase made in 2010-11 in Kg.
Through Local 2011-12 in Kg.
1 Awala 1024.429 1200.00 800.00 800.00 0.00 1824.429 567.850 1256.579
2 Elayachi Chhoti 909.750 300.00 150.00 150.00 0.00 1059.750 274.000 785.750
3 Kattha 801.250 500.00 250.00 250.00 0.00 1051.250 473.550 577.700
4 Kooth 161.800 150.00 150.00 150.00 0.00 311.800 137.250 174.550
5 Chitrakmool 86.975 226.00 336.00 336.00 0.00 422.975 70.000 352.975
6 Tejpatra 153.575 425.00 465.00 465.00 0.00 618.575 121.500 497.075
7 Dhania 194.750 260.00 260.00 260.00 0.00 454.750 119.750 335.000
8 Misri Safed 341.380 0.00 400.00 400.00 0.00 741.380 269.000 472.380
9 Suhaga 2078.000 1000.00 500.00 500.00 0.00 2578.000 874.666 1703.334
10 Souf 169.000 600.00 300.00 300.00 0.00 469.000 50.000 419.000
Total 5920.909 4661.00 3611.00 3611.00 0.00 9531.909 2957.566 6574.343
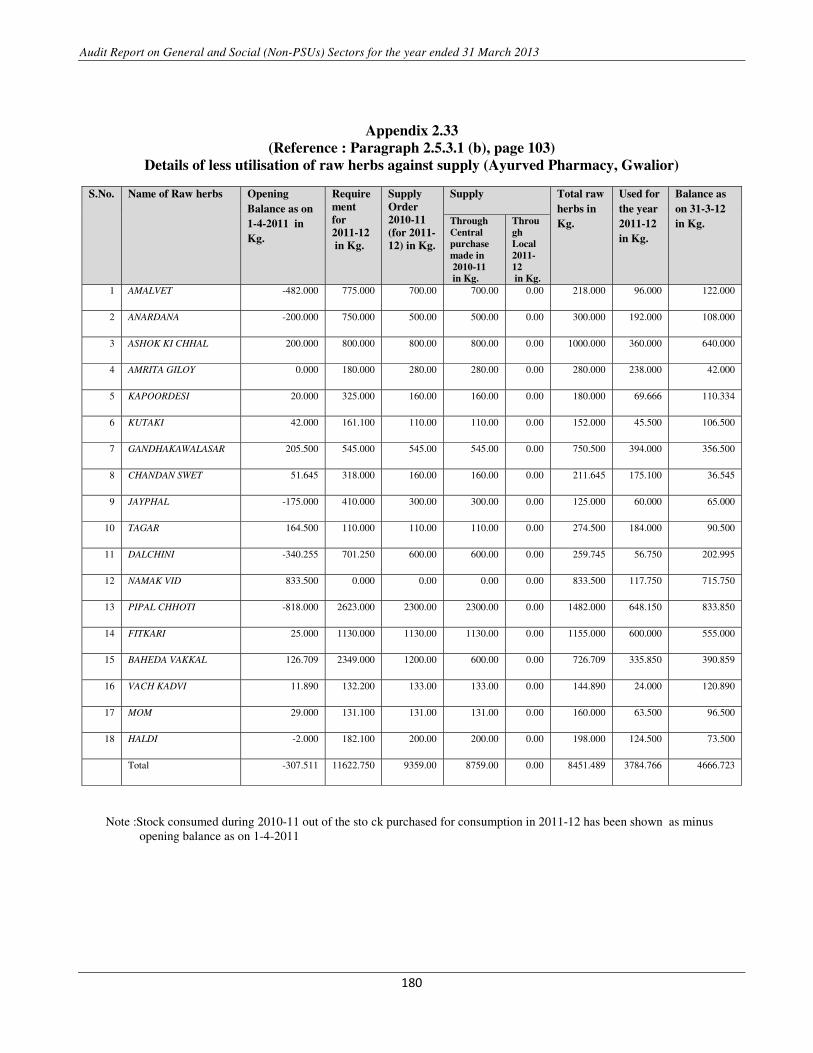
Audit Report on General and Social (Non-PSUs) Sectors for the year ended 31 March 2013
�
� ��
�
�
Appendix 2.33 (Reference : Paragraph 2.5.3.1 (b), page 103)
Details of less utilisation of raw herbs against supply (Ayurved Pharmacy, Gwalior)
S.No. Name of Raw herbs Opening Balance as on 1-4-2011 in Kg.
Requirement for 2011-12 in Kg.
Supply Order 2010-11 (for 2011-12) in Kg.
Supply Total raw herbs in Kg.
Used for the year 2011-12 in Kg.
Balance as on 31-3-12 in Kg. Through
Central purchase made in 2010-11 in Kg.
Through Local 2011-12 in Kg.
1 AMALVET -482.000 775.000 700.00 700.00 0.00 218.000 96.000 122.000
2 ANARDANA -200.000 750.000 500.00 500.00 0.00 300.000 192.000 108.000
3 ASHOK KI CHHAL 200.000 800.000 800.00 800.00 0.00 1000.000 360.000 640.000
4 AMRITA GILOY 0.000 180.000 280.00 280.00 0.00 280.000 238.000 42.000
5 KAPOORDESI 20.000 325.000 160.00 160.00 0.00 180.000 69.666 110.334
6 KUTAKI 42.000 161.100 110.00 110.00 0.00 152.000 45.500 106.500
7 GANDHAKAWALASAR 205.500 545.000 545.00 545.00 0.00 750.500 394.000 356.500
8 CHANDAN SWET 51.645 318.000 160.00 160.00 0.00 211.645 175.100 36.545
9 JAYPHAL -175.000 410.000 300.00 300.00 0.00 125.000 60.000 65.000
10 TAGAR 164.500 110.000 110.00 110.00 0.00 274.500 184.000 90.500
11 DALCHINI -340.255 701.250 600.00 600.00 0.00 259.745 56.750 202.995
12 NAMAK VID 833.500 0.000 0.00 0.00 0.00 833.500 117.750 715.750
13 PIPAL CHHOTI -818.000 2623.000 2300.00 2300.00 0.00 1482.000 648.150 833.850
14 FITKARI 25.000 1130.000 1130.00 1130.00 0.00 1155.000 600.000 555.000
15 BAHEDA VAKKAL 126.709 2349.000 1200.00 600.00 0.00 726.709 335.850 390.859
16 VACH KADVI 11.890 132.200 133.00 133.00 0.00 144.890 24.000 120.890
17 MOM 29.000 131.100 131.00 131.00 0.00 160.000 63.500 96.500
18 HALDI -2.000 182.100 200.00 200.00 0.00 198.000 124.500 73.500
Total -307.511 11622.750 9359.00 8759.00 0.00 8451.489 3784.766 4666.723
Note : Stock consumed during 2010-11 out of the sto ck purchased for consumption in 2011-12 has been shown as minus opening balance as on 1-4-2011
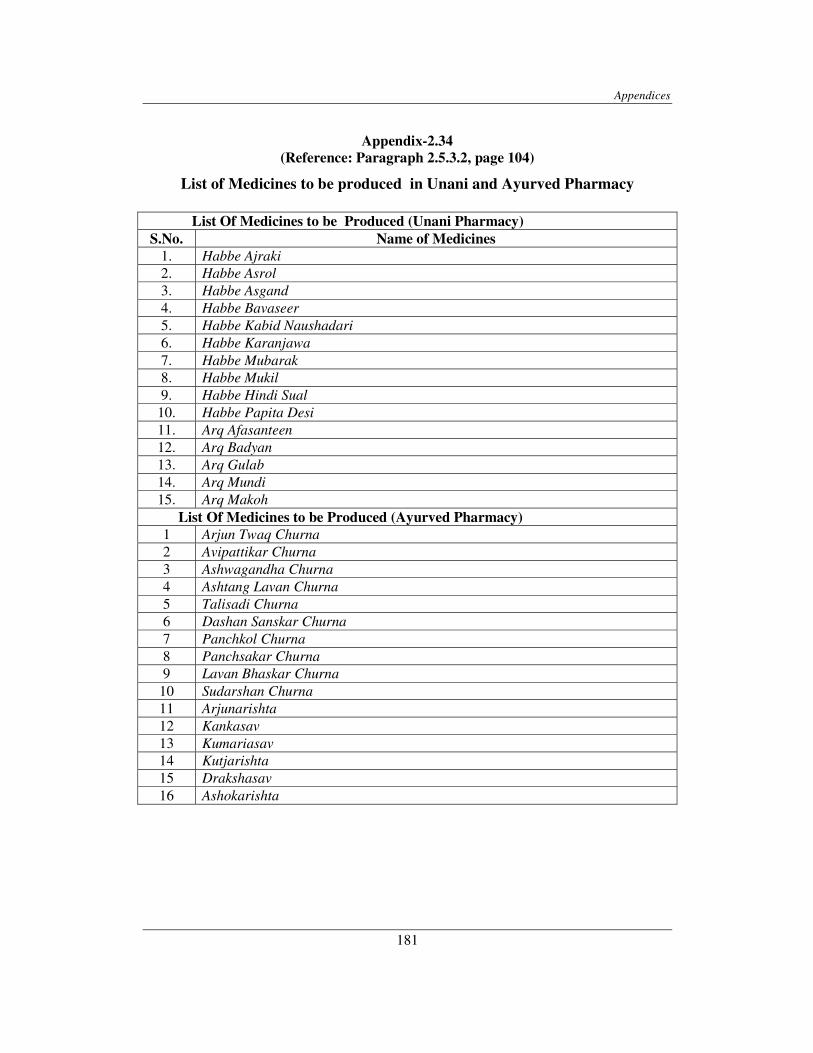
Appendices
181
Appendix-2.34 (Reference: Paragraph 2.5.3.2, page 104)
List of Medicines to be produced in Unani and Ayurved Pharmacy
List Of Medicines to be Produced (Unani Pharmacy) S.No. Name of Medicines
1. Habbe Ajraki 2. Habbe Asrol 3. Habbe Asgand 4. Habbe Bavaseer 5. Habbe Kabid Naushadari 6. Habbe Karanjawa 7. Habbe Mubarak 8. Habbe Mukil 9. Habbe Hindi Sual 10. Habbe Papita Desi 11. Arq Afasanteen 12. Arq Badyan 13. Arq Gulab 14. Arq Mundi 15. Arq Makoh
List Of Medicines to be Produced (Ayurved Pharmacy)1 Arjun Twaq Churna 2 Avipattikar Churna 3 Ashwagandha Churna 4 Ashtang Lavan Churna 5 Talisadi Churna 6 Dashan Sanskar Churna 7 Panchkol Churna 8 Panchsakar Churna 9 Lavan Bhaskar Churna
10 Sudarshan Churna 11 Arjunarishta 12 Kankasav 13 Kumariasav 14 Kutjarishta 15 Drakshasav 16 Ashokarishta
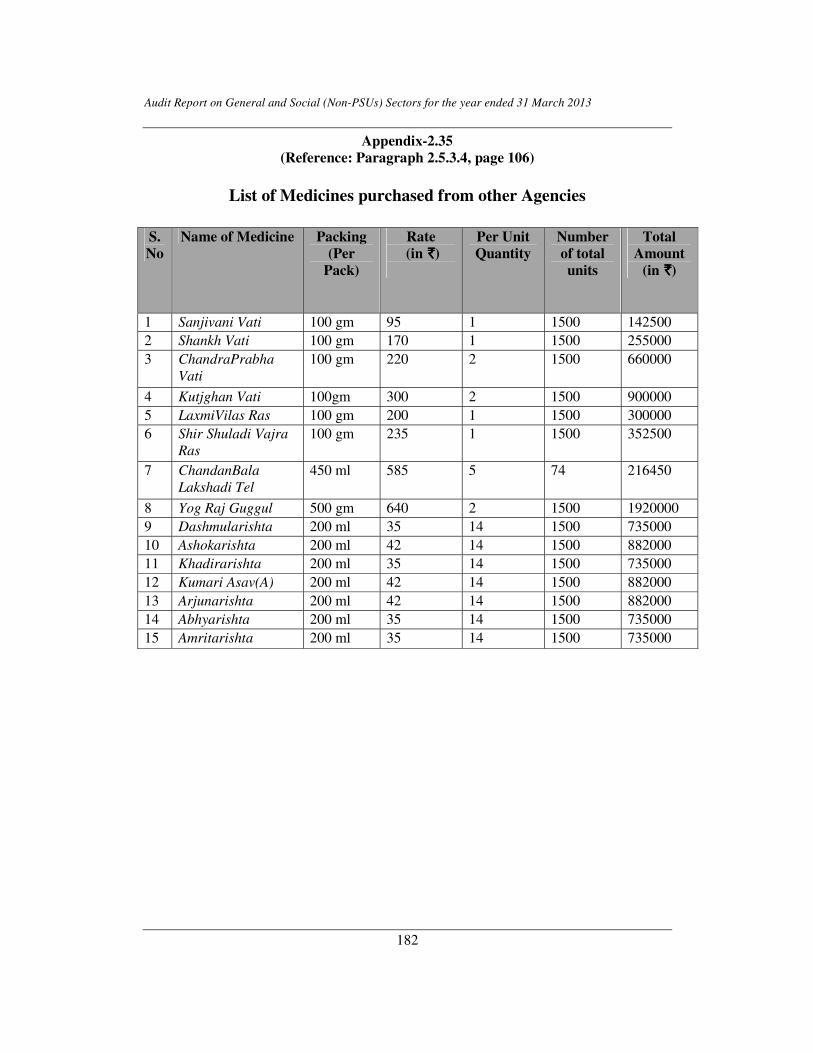
Audit Report on General and Social (Non-PSUs) Sectors for the year ended 31 March 2013
182
Appendix-2.35 (Reference: Paragraph 2.5.3.4, page 106)
List of Medicines purchased from other Agencies
S. No
Name of Medicine Packing (Per
Pack)
Rate (in `̀̀̀)
Per Unit Quantity
Number of total units
Total Amount
(in `̀̀̀)
1 Sanjivani Vati 100 gm 95 1 1500 142500 2 Shankh Vati 100 gm 170 1 1500 255000 3 ChandraPrabha
Vati 100 gm 220 2 1500 660000
4 Kutjghan Vati 100gm 300 2 1500 900000 5 LaxmiVilas Ras 100 gm 200 1 1500 300000 6 Shir Shuladi Vajra
Ras 100 gm 235 1 1500 352500
7 ChandanBala Lakshadi Tel
450 ml 585 5 74 216450
8 Yog Raj Guggul 500 gm 640 2 1500 1920000 9 Dashmularishta 200 ml 35 14 1500 735000 10 Ashokarishta 200 ml 42 14 1500 882000 11 Khadirarishta 200 ml 35 14 1500 735000 12 Kumari Asav(A) 200 ml 42 14 1500 882000 13 Arjunarishta 200 ml 42 14 1500 882000 14 Abhyarishta 200 ml 35 14 1500 735000 15 Amritarishta 200 ml 35 14 1500 735000
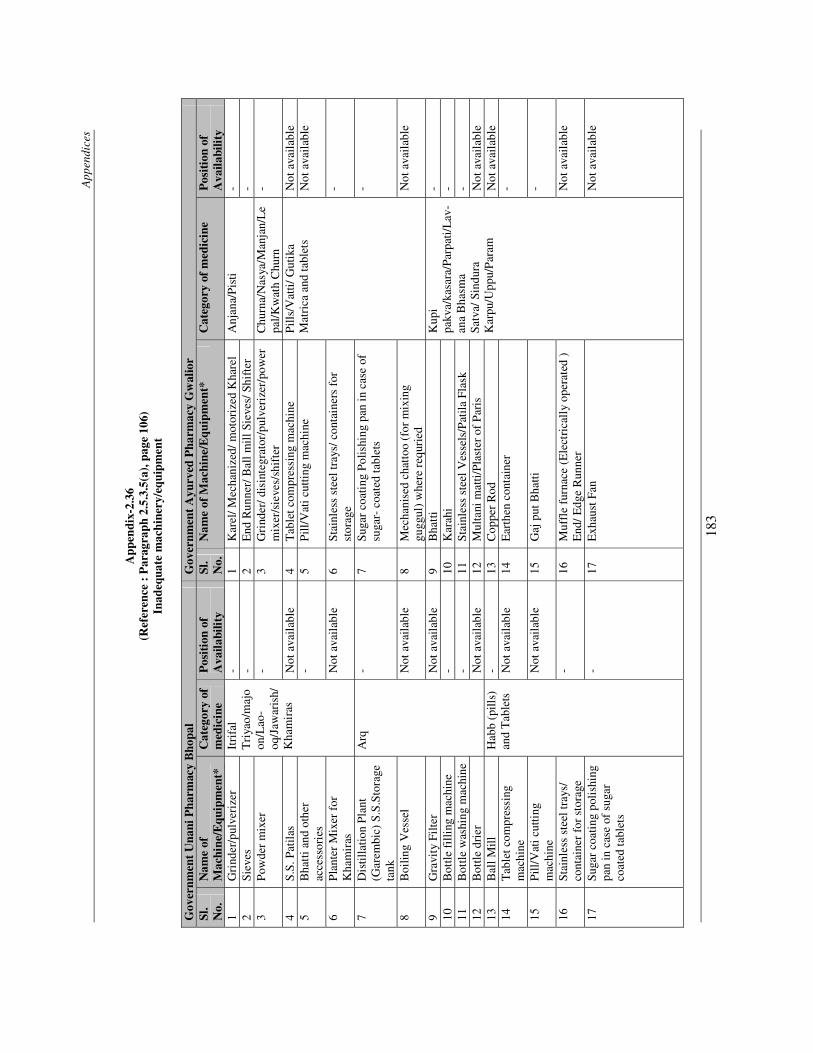
App
endi
ces
183
App
endi
x-2.
36
(Ref
eren
ce :
Par
agra
ph 2
.5.3
.5(a
), p
age
106)
In
adeq
uate
mac
hine
ry/e
quip
men
t
Gov
ernm
ent
Una
ni P
harm
acy
Bho
pal
Gov
ernm
ent
Ayu
rved
Pha
rmac
y G
wal
ior
Sl.
No.
N
ame
of
Mac
hine
/Equ
ipm
ent*
C
ateg
ory
of
med
icin
e P
osit
ion
of
Ava
ilabi
lity
Sl.
No.
N
ame
of M
achi
ne/E
quip
men
t*C
ateg
ory
of m
edic
ine
Pos
itio
n of
A
vaila
bilit
y 1
Gri
nder
/pul
veri
zer
Itri
fal
Tri
yao/
maj
oon
/Lao
-oq
/Jaw
aris
h/K
ham
iras
- 1
Kar
el/ M
echa
nize
d/ m
otor
ized
Kha
rel
Anj
ana/
Pist
i -
2 Si
eves
-
2 E
nd R
unne
r/ B
all m
ill S
ieve
s/ S
hift
er
- 3
Pow
der
mix
er
- 3
Gri
nder
/ dis
inte
grat
or/p
ulve
rize
r/po
wer
m
ixer
/sie
ves/
shif
ter
Chu
rna/
Nas
ya/M
anja
n/L
epa
l/Kw
ath
Chu
rn
-
4 S.
S. P
atil
as
Not
ava
ilab
le
4 T
able
t com
pres
sing
mac
hine
P
ills/
Vat
ti/ G
utik
a M
atri
ca a
nd ta
blet
s N
ot a
vail
able
5
Bha
tti a
nd o
ther
ac
cess
orie
s -
5 P
ill/V
ati c
utti
ng m
achi
ne
Not
ava
ilab
le
6 P
lant
er M
ixer
for
K
ham
iras
N
ot a
vail
able
6
Stai
nles
s st
eel t
rays
/ con
tain
ers
for
stor
age
-
7 D
istil
latio
n Pl
ant
(Gar
embi
c) S
.S.S
tora
ge
tank
Arq
-
7 Su
gar
coat
ing
Polis
hing
pan
in c
ase
of
suga
r- c
oate
d ta
blet
s -
8 B
oilin
g V
esse
l N
ot a
vail
able
8
Mec
hani
sed
chat
too
(for
mix
ing
gugg
ul)
whe
re r
equr
ied
Not
ava
ilab
le
9 G
ravi
ty F
ilte
r N
ot a
vail
able
9
Bha
tti
Kup
i pa
kva/
kasa
ra/P
arpa
ti/L
av-
ana
Bha
sma
Sa
tva/
Sin
dura
K
arpu
/Upp
u/P
aram
- 10
B
ottle
fil
ling
mac
hine
-
10
Kar
ahi
- 11
B
ottle
was
hing
mac
hine
-
11
Stai
nles
s st
eel V
esse
ls/P
atila
Fla
sk
- 12
B
ottle
dri
er
Not
ava
ilab
le
12
Mul
tani
mat
ti/Pl
aste
r of
Par
is
Not
ava
ilab
le
13
Bal
l Mill
H
abb
(pill
s)
and
Tab
lets
-
13
Cop
per
Rod
N
ot a
vail
able
14
T
able
t com
pres
sing
m
achi
ne
Not
ava
ilab
le
14
Ear
then
con
tain
er
-
15
Pill
/Vat
i cut
ting
m
achi
ne
Not
ava
ilab
le
15
Gaj
put
Bha
tti
-
16
Stai
nles
s st
eel t
rays
/ co
ntai
ner
for
stor
age
- 16
M
uffl
e fu
rnac
e (E
lect
rica
lly
oper
ated
)
End
/ Edg
e R
unne
r N
ot a
vail
able
17
Suga
r co
atin
g po
lishi
ng
pan
in c
ase
of s
ugar
co
ated
tabl
ets
- 17
E
xhau
st F
an
Not
ava
ilab
le
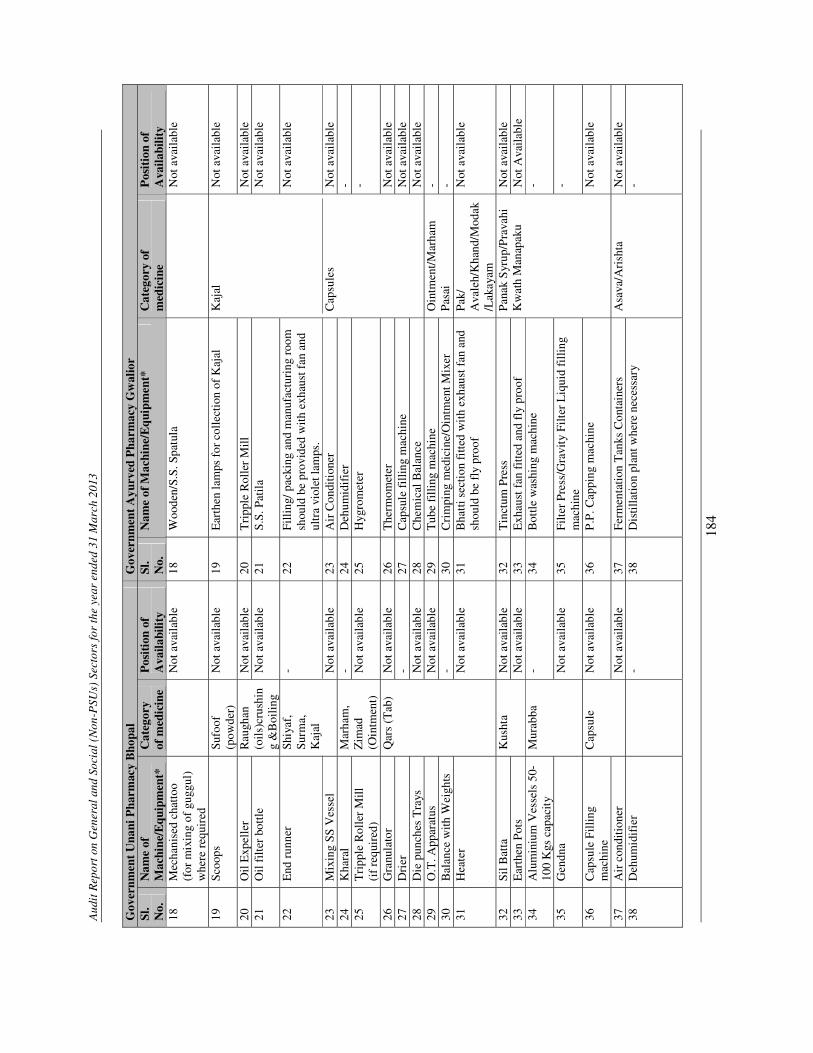
Aud
it R
epor
t on
Gen
eral
and
Soc
ial (
Non
-PSU
s) S
ecto
rs fo
r th
e ye
ar e
nded
31
Mar
ch 2
013
184
Gov
ernm
ent
Una
ni P
harm
acy
Bho
pal
Gov
ernm
ent
Ayu
rved
Pha
rmac
y G
wal
ior
Sl.
No.
N
ame
of
Mac
hine
/Equ
ipm
ent*
C
ateg
ory
of
med
icin
e P
osit
ion
of
Ava
ilabi
lity
Sl.
No.
N
ame
of M
achi
ne/E
quip
men
t*
Cat
egor
y of
m
edic
ine
Pos
itio
n of
A
vaila
bilit
y 18
M
echa
nise
d ch
atto
o (f
or m
ixin
g of
gug
gul)
w
here
req
uire
d
N
ot a
vail
able
18
W
oode
n/S.
S. S
patu
la
N
ot a
vail
able
19
Scoo
ps
Sufo
of
(pow
der)
N
ot a
vail
able
19
E
arth
en la
mps
for
col
lect
ion
of K
ajal
K
ajal
Cap
sule
s
Not
ava
ilab
le
20
Oil
Exp
elle
r R
augh
an
(oils
)cru
shin
g &
Boi
ling
Not
ava
ilab
le
20
Tri
pple
Rol
ler
Mill
N
ot a
vail
able
21
O
il f
ilter
bot
tle
Not
ava
ilab
le
21
S.S.
Pat
ila
Not
ava
ilab
le
22
End
run
ner
Shiy
af,
Surm
a,
Kaj
al
- 22
Fi
lling
/ pac
king
and
man
ufac
turi
ng r
oom
sh
ould
be
prov
ided
with
exh
aust
fan
and
ul
tra
viol
et la
mps
.
Not
ava
ilab
le
23
Mix
ing
SS V
esse
l N
ot a
vail
able
23
A
ir C
ondi
tion
er
Not
ava
ilab
le
24
Kha
ral
Mar
ham
, Z
imad
(O
intm
ent)
- 24
D
ehum
idif
ier
-
25
T
ripp
le R
olle
r M
ill
(if
requ
ired
) N
ot a
vail
able
25
H
ygro
met
er
-
26
Gra
nula
tor
Qar
s (T
ab)
Not
ava
ilab
le
26
The
rmom
eter
N
ot a
vail
able
27
D
rier
-
27
Cap
sule
fil
ling
mac
hine
N
ot a
vail
able
28
D
ie p
unch
es T
rays
N
ot a
vail
able
28
C
hem
ical
Bal
ance
N
ot a
vail
able
29
O
.T. A
ppar
atus
N
ot a
vail
able
29
T
ube
filli
ng m
achi
ne
Oin
tmen
t/M
arha
m
Pas
ai
- 30
B
alan
ce w
ith W
eigh
ts
- 30
C
rim
ping
med
icin
e/O
intm
ent M
ixer
-
31
Hea
ter
Not
ava
ilab
le
31
Bha
tti s
ecti
on f
itte
d w
ith
exha
ust f
an a
nd
shou
ld b
e fl
y pr
oof
Pak
/ A
vale
h/K
hand
/Mod
ak/L
akay
am
Not
ava
ilab
le
32
Sil B
atta
K
usht
a N
ot a
vail
able
32
T
inct
um P
ress
P
anak
Syr
up/P
rava
hi
Kw
ath
Man
apak
u N
ot a
vail
able
33
E
arth
en P
ots
Not
ava
ilab
le
33
Exh
aust
fan
fit
ted
and
fly
proo
f N
ot A
vaila
ble
34
Alu
min
ium
Ves
sels
50-
100
Kgs
cap
acit
y M
urab
ba
- 34
B
ottle
was
hing
mac
hine
-
35
Gen
dna
Not
ava
ilab
le
35
Filt
er P
ress
/Gra
vity
Fil
ter
Liq
uid
filli
ng
mac
hine
-
36
Cap
sule
Fill
ing
mac
hine
C
apsu
le
Not
ava
ilab
le
36
P.P
. Cap
ping
mac
hine
N
ot a
vail
able
37
Air
con
diti
oner
N
ot a
vail
able
37
Fe
rmen
tati
on T
anks
Con
tain
ers
Asa
va/A
rish
ta
Not
ava
ilab
le
38
Deh
umid
ifie
r
- 38
D
istil
latio
n pl
ant w
here
nec
essa
ry
-
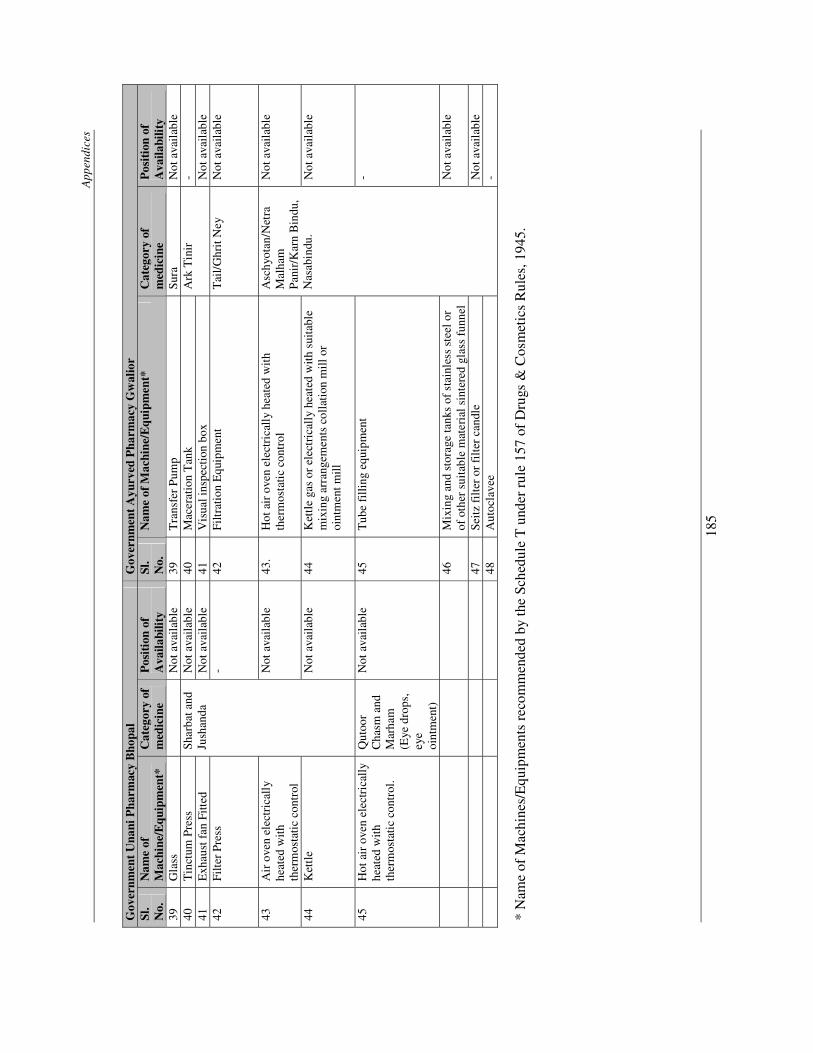
App
endi
ces
185
Gov
ernm
ent
Una
ni P
harm
acy
Bho
pal
Gov
ernm
ent
Ayu
rved
Pha
rmac
y G
wal
ior
Sl.
No.
N
ame
of
Mac
hine
/Equ
ipm
ent*
C
ateg
ory
of
med
icin
e P
osit
ion
of
Ava
ilabi
lity
Sl.
No.
N
ame
of M
achi
ne/E
quip
men
t*
Cat
egor
y of
m
edic
ine
Pos
itio
n of
A
vaila
bilit
y 39
G
lass
Not
ava
ilab
le
39
Tra
nsfe
r P
ump
Sura
N
ot a
vail
able
40
T
inct
um P
ress
Sh
arba
t and
Ju
shan
da
Not
ava
ilab
le
40
Mac
erat
ion
Tan
k A
rk T
inir
-
41
Exh
aust
fan
Fitt
ed
Not
ava
ilab
le
41
Vis
ual i
nspe
ctio
n bo
x N
ot a
vail
able
42
Fi
lter
Pre
ss
- 42
Fi
ltra
tion
Equ
ipm
ent
Tai
l/G
hrit
Ney
N
ot a
vail
able
43
Air
ove
n el
ectr
ical
ly
heat
ed w
ith
ther
mos
tati
c co
ntro
l
Not
ava
ilab
le
43.
Hot
air
ove
n el
ectr
ical
ly h
eate
d w
ith
ther
mos
tati
c co
ntro
l A
schy
otan
/Net
ra
Mal
ham
P
anir
/Kar
n B
indu
, N
asab
indu
.
Not
ava
ilab
le
44
Ket
tle
Not
ava
ilab
le
44
Ket
tle
gas
or e
lect
rica
lly
heat
ed w
ith s
uita
ble
mix
ing
arra
ngem
ents
col
lati
on m
ill o
r oi
ntm
ent m
ill
Not
ava
ilab
le
45
Hot
air
ove
n el
ectr
ical
ly
heat
ed w
ith
ther
mos
tati
c co
ntro
l.
Qut
oor
Cha
sm a
nd
Mar
ham
(E
ye d
rops
, ey
e oi
ntm
ent)
Not
ava
ilab
le
45
Tub
e fi
lling
equ
ipm
ent
-
46
Mix
ing
and
stor
age
tank
s of
sta
inle
ss s
teel
or
of o
ther
sui
tabl
e m
ater
ial s
inte
red
glas
s fu
nnel
N
ot a
vail
able
47
Seit
z fi
lter
or
filt
er c
andl
e
Not
ava
ilab
le
48
Aut
ocla
vee
-
* N
ame
of M
achi
nes/
Equ
ipm
ents
rec
omm
ende
d by
the
Sche
dule
T u
nder
rul
e 15
7 of
Dru
gs &
Cos
met
ics
Rul
es, 1
945.
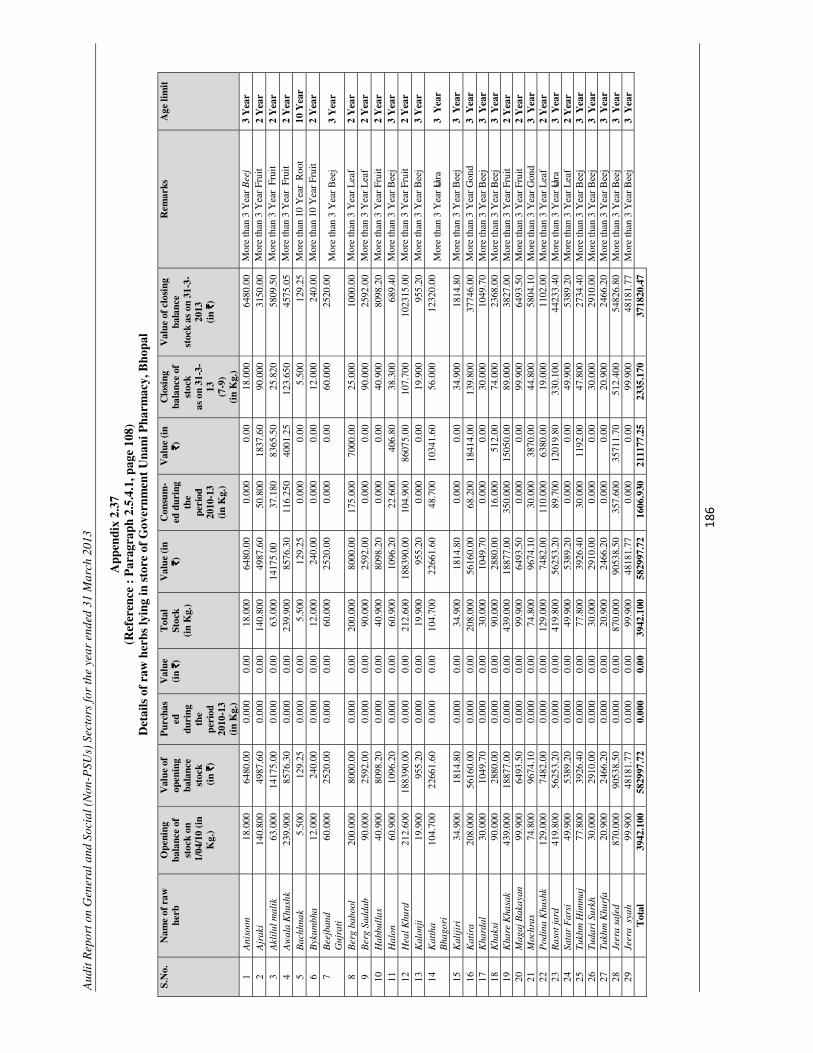
Aud
it R
epor
t on
Gen
eral
and
Soc
ial (
Non
-PSU
s) S
ecto
rs fo
r th
e ye
ar e
nded
31
Mar
ch 2
013
�
� ��
��
App
endi
x 2.
37
(Ref
eren
ce :
Par
agra
ph 2
.5.4
.1, p
age
108)
Det
ails
of
raw
her
bs ly
ing
in s
tore
of
Gov
ernm
ent
Una
ni P
harm
acy,
Bho
pal
S.N
o.
Nam
e of
raw
he
rb
Ope
ning
ba
lanc
e of
st
ock
on
1/0
4/10
(in
K
g.)
Val
ue o
f op
enin
g
bala
nce
stoc
k (
in `̀̀̀
)
Pur
chas
ed
duri
ng
the
peri
od
2010
-13
(in
Kg.
)
Val
ue
(in
`̀̀̀)
Tot
al
Stoc
k
(in
Kg.
)
Val
ue (
in
`̀̀̀)
C
onsu
m-
ed d
urin
g th
e pe
riod
20
10-1
3 (i
n K
g.)
Val
ue (
in
`̀̀̀)
C
losi
ng
bala
nce
of
stoc
k as
on
31-3
-13
(7
-9)
(in
Kg.
)
Val
ue o
f cl
osin
g ba
lanc
e st
ock
as o
n 31
-3-
2013
(i
n `̀̀̀)
Rem
arks
A
ge li
mit
1 A
niso
on
18.0
00
6480
.00
0.00
0 0.
00
18.0
00
6480
.00
0.00
0 0.
00
18.0
00
6480
.00
Mor
e th
an 3
Yea
r B
eej
3 Y
ear
2 A
jrak
i 14
0.80
0 49
87.6
0 0.
000
0.00
14
0.80
0 49
87.6
0 50
.800
18
37.6
0 90
.000
31
50.0
0 M
ore
than
3 Y
ear
Frui
t�2
Yea
r 3
Akl
ilul
mal
ik
63.0
00
1417
5.00
0.
000
0.00
63
.000
14
175.
00
37.1
80
8365
.50
25.8
20
5809
.50
Mor
e th
an 3
Yea
r F
ruit�
2 Y
ear
4 A
wal
a K
hush
k 23
9.90
0 85
76.3
0 0.
000
0.00
23
9.90
0 85
76.3
0 11
6.25
0 40
01.2
5 12
3.65
0 45
75.0
5 M
ore
than
3 Y
ear
Fru
it �2
Yea
r 5
Bac
hhna
k 5.
500
129.
25
0.00
0 0.
00
5.50
0 12
9.25
0.
000
0.00
5.
500
129.
25
Mor
e th
an 1
0 Y
ear
Roo
t 10
Yea
r 6
Byk
umbh
a 12
.000
24
0.00
0.
000
0.00
12
.000
24
0.00
0.
000
0.00
12
.000
24
0.00
M
ore
than
10
Yea
r Fr
uit
2 Y
ear
7 B
eejb
and
Guj
rati
60.0
00
2520
.00
0.00
0 0.
00
60.0
00
2520
.00
0.00
0 0.
00
60.0
00
2520
.00
Mor
e th
an 3
Yea
r B
eej
3 Y
ear
8 B
erg
babo
ol
200.
000
8000
.00
0.00
0 0.
00
200.
000
8000
.00
175.
000
7000
.00
25.0
00
1000
.00
Mor
e th
an 3
Yea
r L
eaf
2 Y
ear
9 B
erg
Sadd
ab
90.0
00
2592
.00
0.00
0 0.
00
90.0
00
2592
.00
0.00
0 0.
00
90.0
00
2592
.00
Mor
e th
an 3
Yea
r L
eaf
2 Y
ear
10
Hab
bull
as
40.9
00
8098
.20
0.00
0 0.
00
40.9
00
8098
.20
0.00
0 0.
00
40.9
00
8098
.20
Mor
e th
an 3
Yea
r Fr
uit
2 Y
ear
11
Hal
on
60.9
00
1096
.20
0.00
0 0.
00
60.9
00
1096
.20
22.6
00
406.
80
38.3
00
689.
40
Mor
e th
an 3
Yea
r B
eej
3 Y
ear
12
Hea
l Khu
rd
212.
600
1883
90.0
0 0.
000
0.00
21
2.60
0 18
8390
.00
104.
900
8607
5.00
10
7.70
0 10
2315
.00
Mor
e th
an 3
Yea
r Fr
uit
2 Y
ear
13
Kal
onji
19.9
00
955.
20
0.00
0 0.
00
19.9
00
955.
20
0.00
0 0.
00
19.9
00
955.
20
Mor
e th
an 3
Yea
r B
eej
3 Y
ear
14
Kat
tha
B
hago
ri
104.
700
2266
1.60
0.
000
0.00
10
4.70
0 22
661.
60
48.7
00
1034
1.60
56
.000
12
320.
00
Mor
e th
an 3
Yea
r Usa
ra
3 Y
ear
15
Kal
ijir
i 34
.900
18
14.8
0 0.
000
0.00
34
.900
18
14.8
0 0.
000
0.00
34
.900
18
14.8
0 M
ore
than
3 Y
ear
Bee
j 3
Yea
r 16
K
atir
a 20
8.00
0 56
160.
00
0.00
0 0.
00
208.
000
5616
0.00
68
.200
18
414.
00
139.
800
3774
6.00
M
ore
than
3 Y
ear
Gon
d 3
Yea
r 17
K
hard
al
30.0
00
1049
.70
0.00
0 0.
00
30.0
00
1049
.70
0.00
0 0.
00
30.0
00
1049
.70
Mor
e th
an 3
Yea
r B
eej
3 Y
ear
18
Kha
ksi
90.0
00
2880
.00
0.00
0 0.
00
90.0
00
2880
.00
16.0
00
512.
00
74.0
00
2368
.00
Mor
e th
an 3
Yea
r B
eej
3 Y
ear
19
Kha
re K
hasa
k
439.
000
1887
7.00
0.
000
0.00
43
9.00
0 18
877.
00
350.
000
1505
0.00
89
.000
38
27.0
0 M
ore
than
3 Y
ear
Frui
t 2
Yea
r 20
M
agaj
Bak
ayan
99
.900
64
93.5
0 0.
000
0.00
99
.900
64
93.5
0 0.
000
0.00
99
.900
64
93.5
0 M
ore
than
3 Y
ear
Frui
t 2
Yea
r 21
M
ochr
as
74.8
00
9674
.10
0.00
0 0.
00
74.8
00
9674
.10
30.0
00
3870
.00
44.8
00
5804
.10
Mor
e th
an 3
Yea
r G
ond
3 Y
ear
22
Pod
ina
Khu
shk
129.
000
7482
.00
0.00
0 0.
00
129.
000
7482
.00
110.
000
6380
.00
19.0
00
1102
.00
Mor
e th
an 3
Yea
r L
eaf
2 Y
ear
23
Ras
ot ja
rd
419.
800
5625
3.20
0.
000
0.00
41
9.80
0 56
253.
20
89.7
00
1201
9.80
33
0.10
0 44
233.
40
Mor
e th
an 3
Yea
r Usa
ra
3 Y
ear
24
Sata
r F
arsi
49
.900
53
89.2
0 0.
000
0.00
49
.900
53
89.2
0 0.
000
0.00
49
.900
53
89.2
0 M
ore
than
3 Y
ear
Lea
f 2
Yea
r 25
T
ukhm
Him
maj
77
.800
39
26.4
0 0.
000
0.00
77
.800
39
26.4
0 30
.000
11
92.0
0 47
.800
27
34.4
0 M
ore
than
3 Y
ear
Bee
j 3
Yea
r 26
Tu
dari
Sur
kh
30.0
00
2910
.00
0.00
0 0.
00
30.0
00
2910
.00
0.00
0 0.
00
30.0
00
2910
.00
Mor
e th
an 3
Yea
r B
eej
3 Y
ear
27
Tuk
hm K
hurf
a
20.9
00
2466
.20
0.00
0 0.
00
20.9
00
2466
.20
0.00
0 0.
00
20.9
00
2466
.20
Mor
e th
an 3
Yea
r B
eej
3 Y
ear
28
Jeer
a sa
fed
870.
000
9053
8.50
0.
000
0.00
87
0.00
0 90
538.
50
357.
600
3571
1.70
51
2.40
0 54
826.
80
Mor
e th
an 3
Yea
r B
eej
3 Y
ear
29
Jeer
a s
yah
99.9
00
4818
1.77
0.
000
0.00
99
.900
48
181.
77
0.00
0 0.
00
99.9
00
4818
1.77
M
ore
than
3 Y
ear
Bee
j 3
Yea
r
Tot
al
3942
.100
58
2997
.72
0.00
0 0.
00
3942
.100
58
2997
.72
1606
.930
21
1177
.25
2335
.170
37
1820
.47
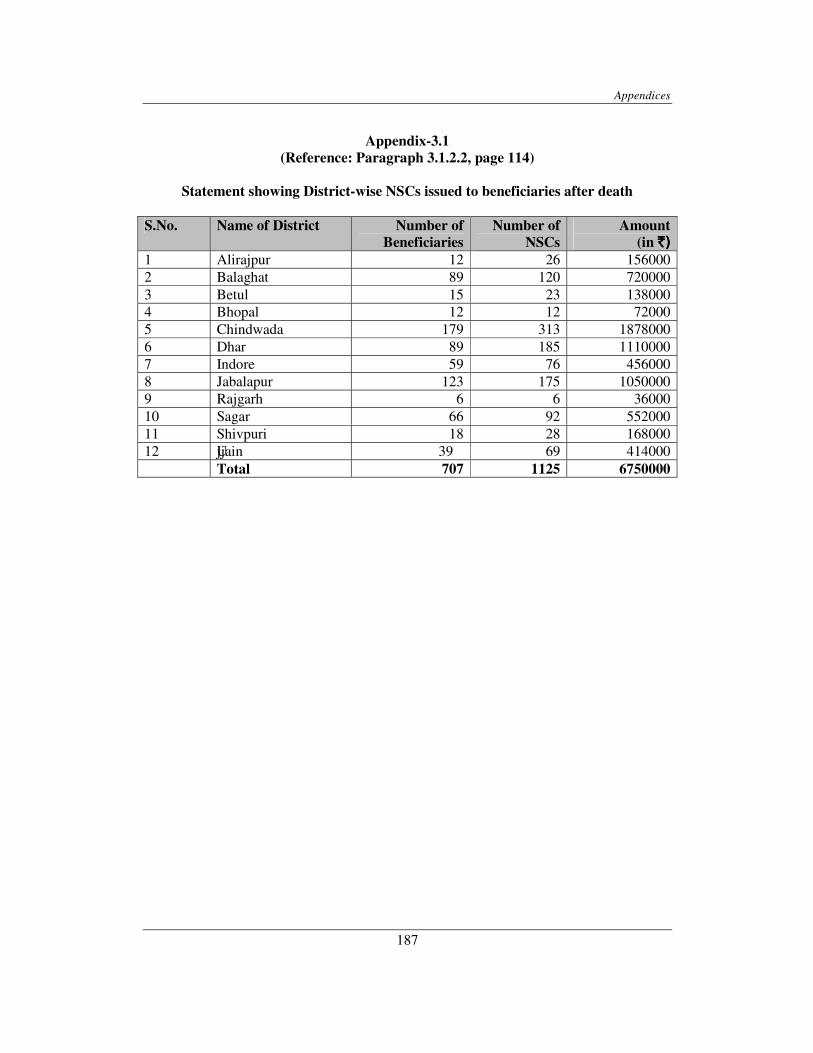
Appendices
187
Appendix-3.1 (Reference: Paragraph 3.1.2.2, page 114)
Statement showing District-wise NSCs issued to beneficiaries after death
S.No. Name of District Number of Beneficiaries
Number of NSCs
Amount(in `)`)`)`)
1 Alirajpur 12 26 1560002 Balaghat 89 120 7200003 Betul 15 23 1380004 Bhopal 12 12 720005 Chindwada 179 313 18780006 Dhar 89 185 11100007 Indore 59 76 4560008 Jabalapur 123 175 10500009 Rajgarh 6 6 3600010 Sagar 66 92 55200011 Shivpuri 18 28 16800012 Ujjain 39 69 414000 Total 707 1125 6750000
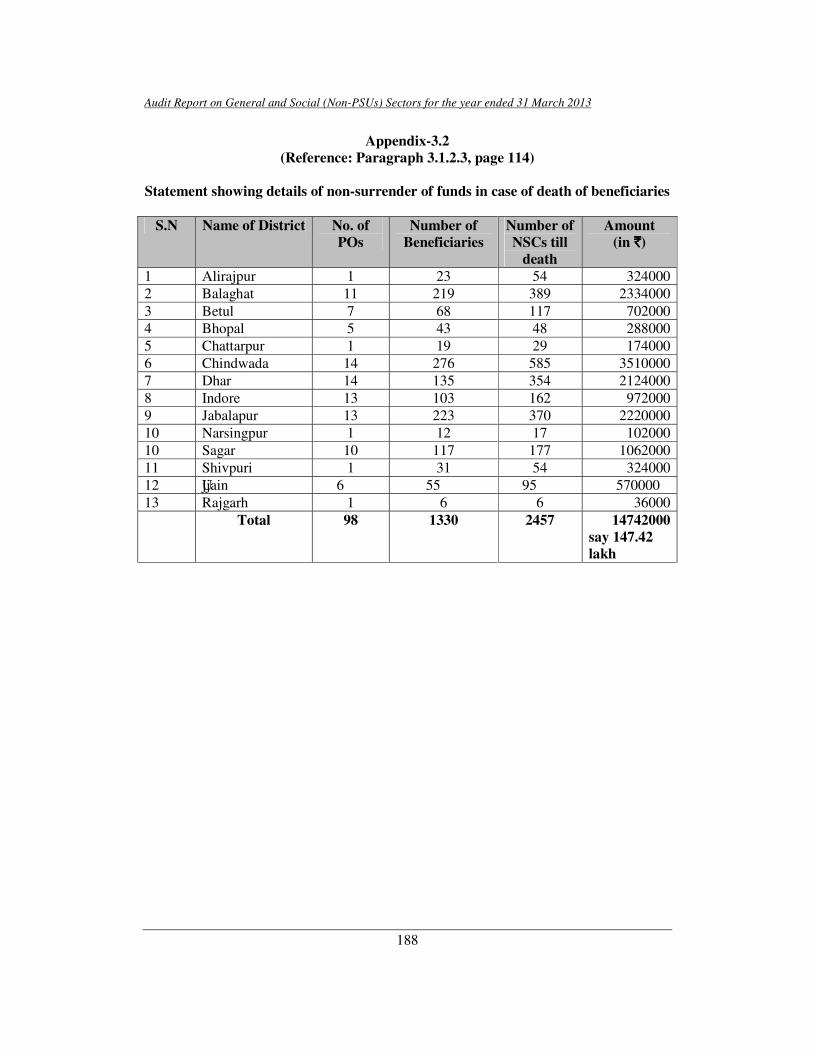
Audit Report on General and Social (Non-PSUs) Sectors for the year ended 31 March 2013
188
Appendix-3.2 (Reference: Paragraph 3.1.2.3, page 114)
Statement showing details of non-surrender of funds in case of death of beneficiaries
S.N Name of District No. of POs
Number of Beneficiaries
Number of NSCs till
death
Amount (in `̀̀̀)
1 Alirajpur 1 23 54 3240002 Balaghat 11 219 389 23340003 Betul 7 68 117 7020004 Bhopal 5 43 48 2880005 Chattarpur 1 19 29 1740006 Chindwada 14 276 585 35100007 Dhar 14 135 354 21240008 Indore 13 103 162 9720009 Jabalapur 13 223 370 222000010 Narsingpur 1 12 17 10200010 Sagar 10 117 177 106200011 Shivpuri 1 31 54 32400012 Ujjain 6 55 95 57000013 Rajgarh 1 6 6 36000 Total 98 1330 2457 14742000
say 147.42 lakh
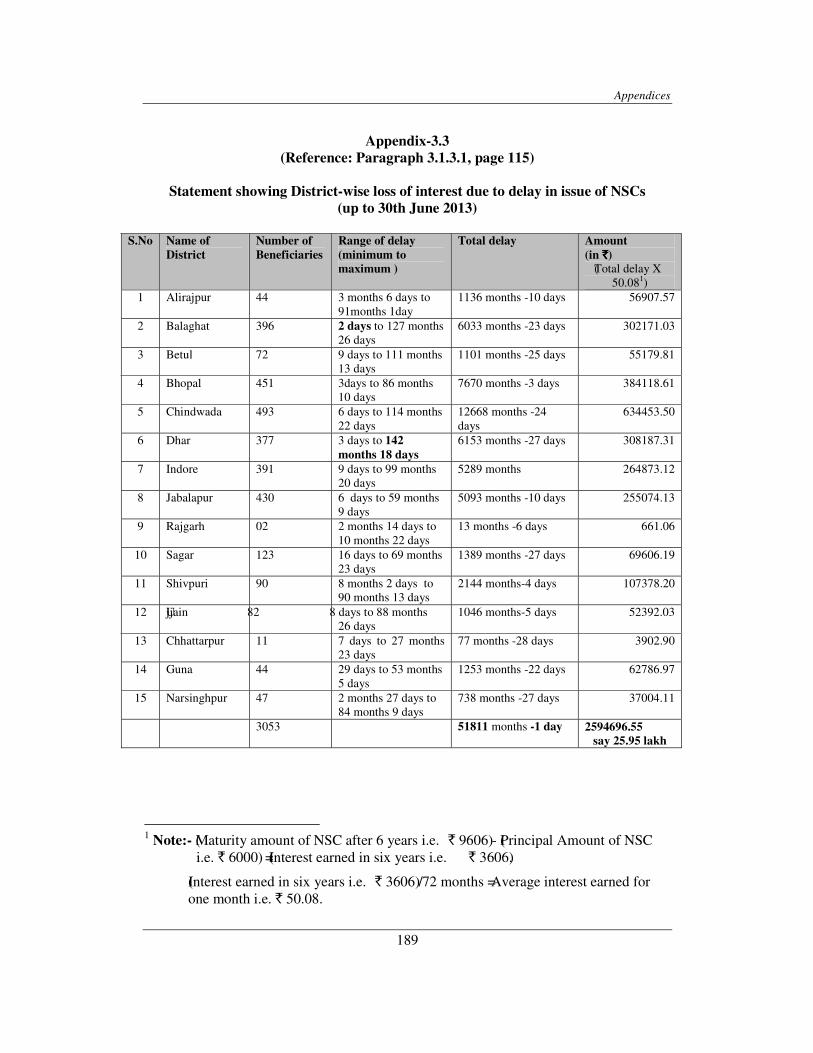
Appendices
189
Appendix-3.3 (Reference: Paragraph 3.1.3.1, page 115)
Statement showing District-wise loss of interest due to delay in issue of NSCs (up to 30th June 2013)
S.No Name of District
Number of Beneficiaries
Range of delay (minimum to maximum )
Total delay Amount (in `̀̀̀)
(Total delay X 50.081)
1 Alirajpur 44 3 months 6 days to 91months 1day
1136 months -10 days 56907.57
2 Balaghat 396 2 days to 127 months 26 days
6033 months -23 days 302171.03
3 Betul 72 9 days to 111 months 13 days
1101 months -25 days 55179.81
4 Bhopal 451 3days to 86 months 10 days
7670 months -3 days 384118.61
5 Chindwada 493 6 days to 114 months 22 days
12668 months -24 days
634453.50
6 Dhar 377 3 days to 142 months 18 days
6153 months -27 days 308187.31
7 Indore 391 9 days to 99 months 20 days
5289 months 264873.12
8 Jabalapur 430 6 days to 59 months 9 days
5093 months -10 days 255074.13
9 Rajgarh 02 2 months 14 days to 10 months 22 days
13 months -6 days 661.06
10 Sagar 123 16 days to 69 months 23 days
1389 months -27 days 69606.19
11 Shivpuri 90 8 months 2 days to 90 months 13 days
2144 months-4 days 107378.20
12 Ujjain 82 8 days to 88 months 26 days
1046 months-5 days 52392.03
13 Chhattarpur 11 7 days to 27 months 23 days
77 months -28 days 3902.90
14 Guna 44 29 days to 53 months 5 days
1253 months -22 days 62786.97
15 Narsinghpur 47 2 months 27 days to 84 months 9 days
738 months -27 days 37004.11
3053 51811 months -1 day 2594696.55 say 25.95 lakh
1 Note:- (Maturity amount of NSC after 6 years i.e. ` 9606) - (Principal Amount of NSC
i.e. ` 6000) = (Interest earned in six years i.e. ` 3606).
(Interest earned in six years i.e. ` 3606) / 72 months = Average interest earned for one month i.e. ` 50.08.
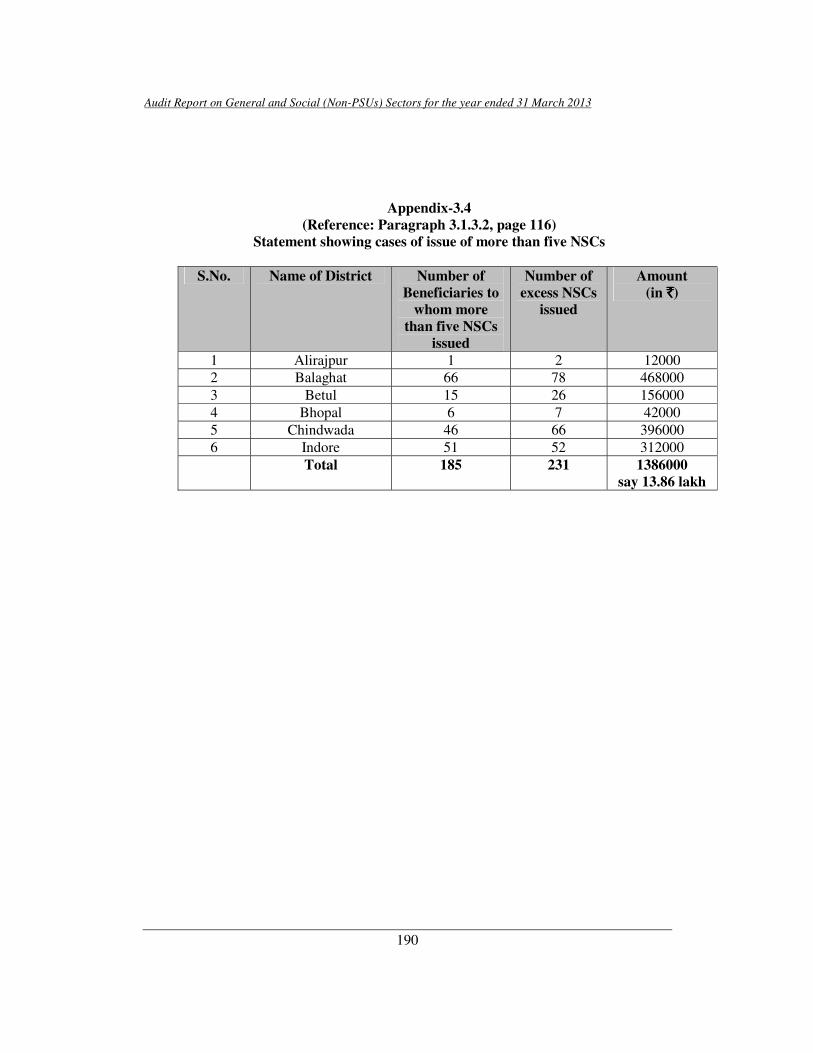
Audit Report on General and Social (Non-PSUs) Sectors for the year ended 31 March 2013
190
Appendix-3.4 (Reference: Paragraph 3.1.3.2, page 116)
Statement showing cases of issue of more than five NSCs
S.No. Name of District Number of Beneficiaries to
whom more than five NSCs
issued
Number of excess NSCs
issued
Amount (in `̀̀̀)
1 Alirajpur 1 2 12000 2 Balaghat 66 78 468000 3 Betul 15 26 156000 4 Bhopal 6 7 42000 5 Chindwada 46 66 396000 6 Indore 51 52 312000 Total 185 231 1386000
say 13.86 lakh
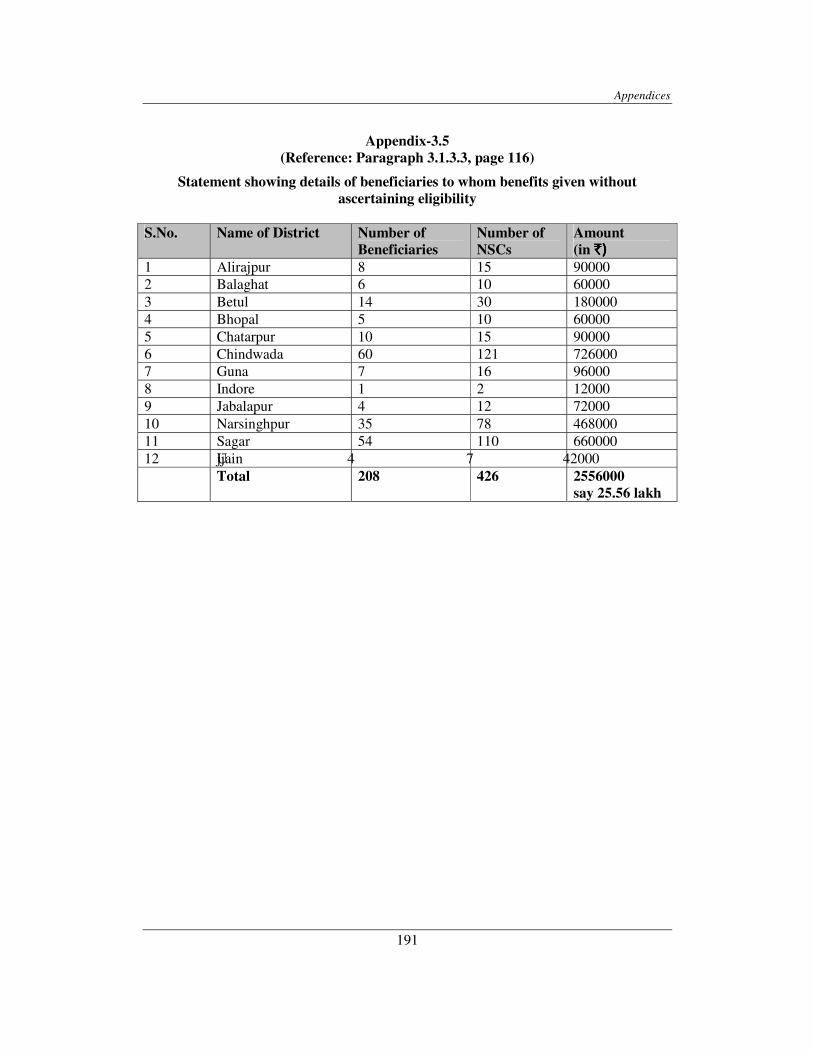
Appendices
191
Appendix-3.5 (Reference: Paragraph 3.1.3.3, page 116)
Statement showing details of beneficiaries to whom benefits given without ascertaining eligibility
S.No. Name of District Number of Beneficiaries
Number of NSCs
Amount (in `)`)`)`)
1 Alirajpur 8 15 90000 2 Balaghat 6 10 60000 3 Betul 14 30 180000 4 Bhopal 5 10 60000 5 Chatarpur 10 15 90000 6 Chindwada 60 121 726000 7 Guna 7 16 96000 8 Indore 1 2 12000 9 Jabalapur 4 12 72000 10 Narsinghpur 35 78 468000 11 Sagar 54 110 660000 12 Ujjain 4 7 42000 Total 208 426 2556000
say 25.56 lakh
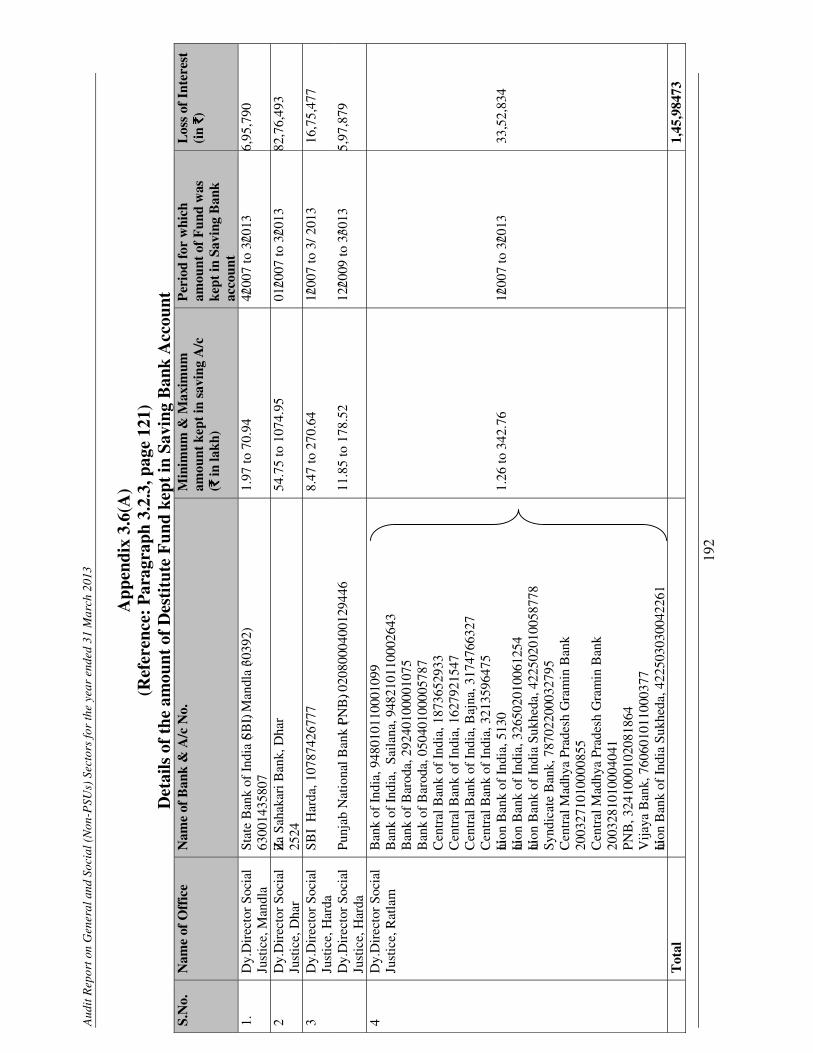
Aud
it R
epor
t on
Gen
eral
and
Soc
ial (
Non
-PSU
s) S
ecto
rs fo
r th
e ye
ar e
nded
31
Mar
ch 2
013
192
App
endi
x 3.
6(A
) (R
efer
ence
: P
arag
raph
3.2
.3, p
age
121)
D
etai
ls o
f th
e am
ount
of
Des
titu
te F
und
kept
in S
avin
g B
ank
Acc
ount
S.
No.
N
ame
of O
ffic
e N
ame
of B
ank
& A
/c N
o.
Min
imum
& M
axim
um
amou
nt k
ept i
n sa
ving
A/c
(`̀̀̀
in la
kh)
Per
iod
for
whi
ch
amou
nt o
f F
und
was
ke
pt in
Sav
ing
Ban
k ac
coun
t
Los
s of
Int
eres
t (i
n `̀̀̀)
1.
Dy.
Dir
ecto
r So
cial
Ju
stic
e, M
andl
a St
ate
Ban
k of
Ind
ia (S
BI).
Man
dla
(3039
2) 63
0014
3580
7 1.
97 to
70.
94
4/200
7 to
3/20
13
6,95
,790
2 D
y.D
irec
tor
Soci
al
Just
ice,
Dha
r Zila
Sah
akar
i Ban
k, D
har
2524
54
.75
to 1
074.
95
01/20
07 to
3/20
13
82,7
6,49
3
3 D
y.D
irec
tor
Soci
al
Just
ice,
Har
da
SBI
Har
da, 1
0787
4267
77
8.47
to 2
70.6
4 1/2
007
to 3
/20
13
16,7
5,47
7
D
y.D
irec
tor
Soci
al
Just
ice,
Har
da
Punj
ab N
atio
nal B
ank
(PNB
), 020
8000
4001
2944
6 11
.85
to 1
78.5
2 12
/2009
to 3
/3013
5,
97,8
79
4 D
y.D
irec
tor
Soci
al
Just
ice,
Rat
lam
B
ank
of I
ndia
, 948
0101
1000
1099
B
ank
of I
ndia
, Sa
ilana
, 948
2101
1000
2643
B
ank
of B
arod
a, 2
9240
1000
0107
5 B
ank
of B
arod
a, 0
5040
1000
0578
7 C
entr
al B
ank
of I
ndia
, 187
3652
933
Cen
tral
Ban
k of
Ind
ia, 1
6279
2154
7 C
entr
al B
ank
of I
ndia
, Baj
na, 3
1747
6632
7 C
entr
al B
ank
of I
ndia
, 321
3596
475
Union
Ban
k of
Ind
ia, 5
130
Union
Ban
k of
Ind
ia, 3
2650
2010
0612
54
Union
Ban
k of
Ind
ia S
ukhe
da, 4
2250
2010
0587
78
Synd
icat
e B
ank,
787
0220
0032
795
Cen
tral
Mad
hya
Prad
esh
Gra
min
Ban
k 20
0327
1010
0008
55
Cen
tral
Mad
hya
Prad
esh
Gra
min
Ban
k 20
0328
1010
0040
41
PNB
, 324
1000
1020
8186
4 V
ijaya
Ban
k, 7
6060
1011
0003
77
Union
Ban
k of
Ind
ia S
ukhe
da, 4
2250
3030
0422
61
1.26
to 3
42.7
6 1/2
007
to 3
/2013
33
,52,
834
T
otal
1,45
,984
73
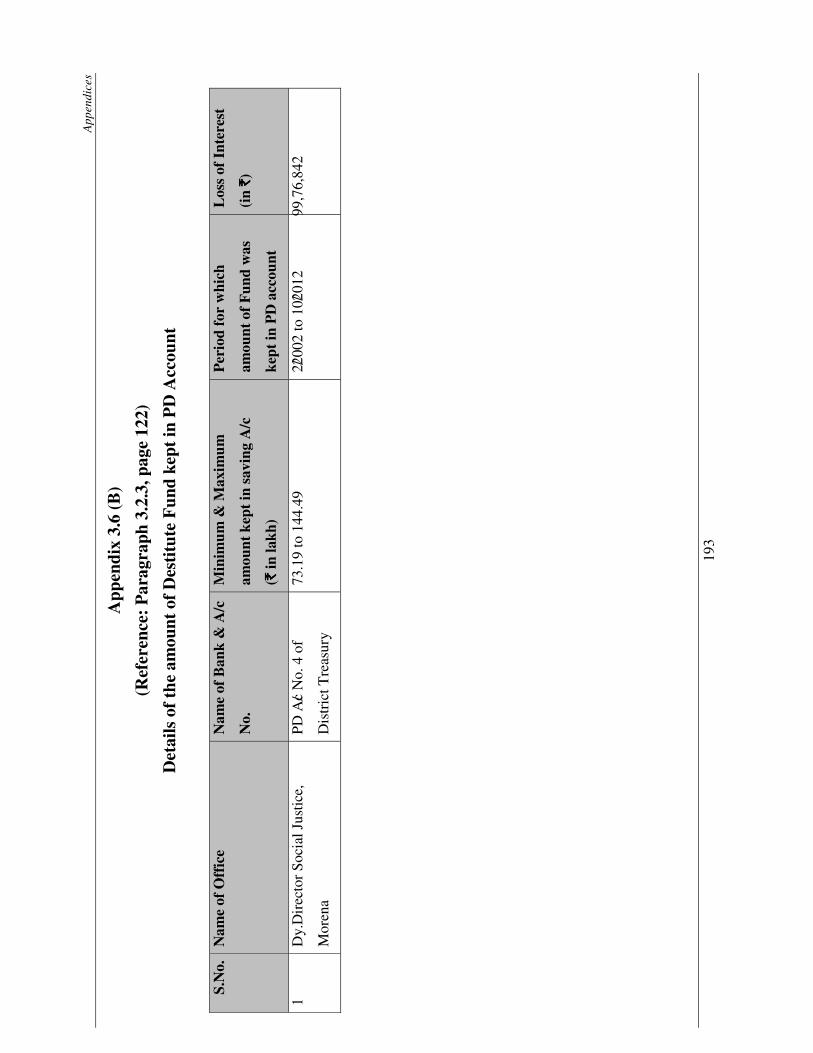
App
endi
ces
193
App
endi
x 3.
6 (B
)
(Ref
eren
ce:
Par
agra
ph 3
.2.3
, pag
e 12
2)
Det
ails
of
the
amou
nt o
f D
esti
tute
Fun
d ke
pt in
PD
Acc
ount
S.N
o.N
ame
of O
ffic
e N
ame
of B
ank
& A
/c
No.
Min
imum
& M
axim
um
amou
nt k
ept
in s
avin
g A
/c
(`̀̀̀ in
lakh
)
Per
iod
for
whi
ch
amou
nt o
f F
und
was
kept
in P
D a
ccou
nt
Los
s of
Int
eres
t
(in
`̀̀̀)
1 D
y.D
irec
tor
Soc
ial J
usti
ce,
Mor
ena
PD
A/c
No.
4 o
f
Dis
tric
t Tre
asur
y
73.1
9 to
144
.49
2/2
002
to 1
0/201
2 99
,76,
842
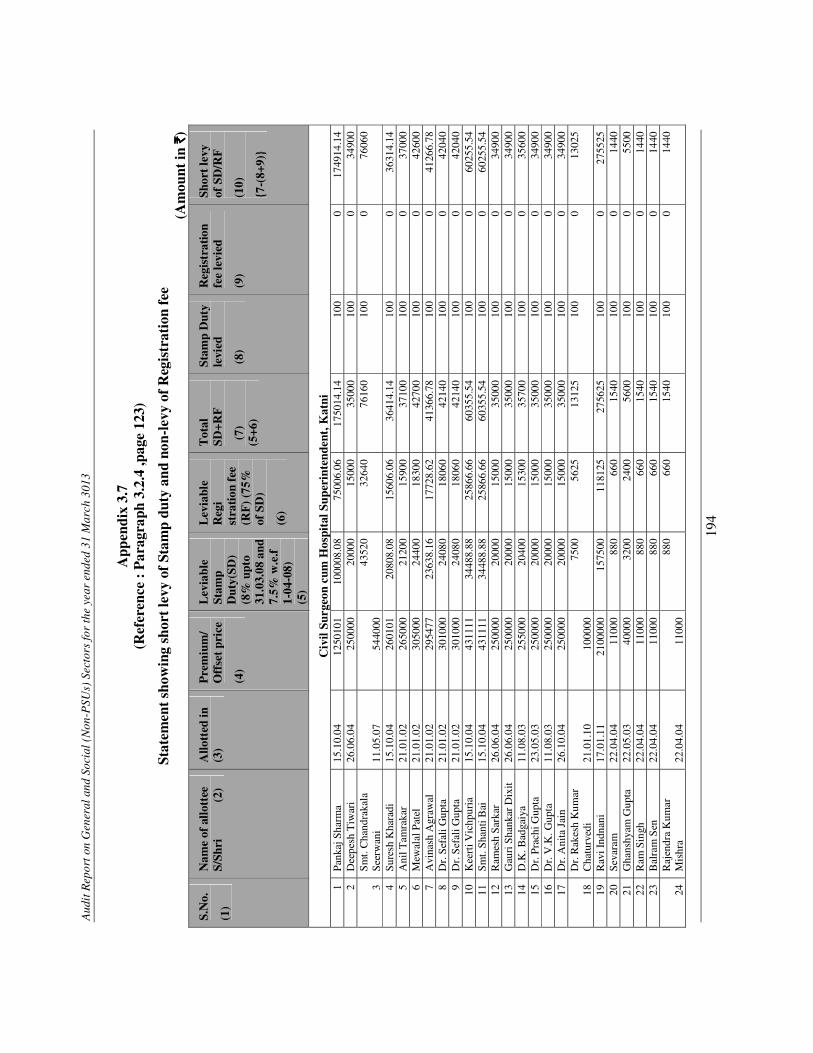
Aud
it R
epor
t on
Gen
eral
and
Soc
ial (
Non
-PSU
s) S
ecto
rs fo
r th
e ye
ar e
nded
31
Mar
ch 3
013
194
App
endi
x 3.
7 (R
efer
ence
: P
arag
raph
3.2
.4 ,p
age
123)
Stat
emen
t sho
win
g sh
ort
levy
of
Stam
p du
ty a
nd n
on-l
evy
of R
egis
trat
ion
fee
(Am
ount
in `̀̀̀
)
S.N
o.
(1)
Nam
e of
allo
ttee
S/
Shri
(2)
Allo
tted
in
(3
) P
rem
ium
/ O
ffse
t pri
ce
(4)
Lev
iabl
e St
amp
Dut
y(SD
) (8
% u
pto
31.0
3.08
and
7.
5% w
.e.f
1-
04-0
8)
(5
)
Lev
iabl
e R
egi
stra
tion
fee
(R
F)
(75%
of
SD
)
(6)
Tot
al
SD+R
F
(7)
(5+6
)
Stam
p D
uty
levi
ed
(8)
Reg
istr
atio
n fe
e le
vied
(9)
Shor
t le
vy
of S
D/R
F
(10)
{7-(
8+9)
}
Civ
il Su
rgeo
n cu
m H
ospi
tal S
uper
inte
nden
t, K
atni
1
Pan
kaj S
harm
a 15
.10.
04
1250
101
1000
08.0
8 75
006.
06
1750
14.1
4 10
0 0
1749
14.1
4 2
Dee
pesh
Tiw
ari
26.0
6.04
2500
0020
000
1500
035
000
100
034
900
3 S
mt.
Cha
ndra
kala
S
eerw
ani
11.0
5.07
54
4000
43
520
3264
0 76
160
100
0 76
060
4 S
ures
h K
hara
di
15.1
0.04
26
0101
20
808.
08
1560
6.06
36
414.
14
100
0 36
314.
14
5 A
nil T
amra
kar
21.0
1.02
26
5000
21
200
1590
0 37
100
100
0 37
000
6M
ewal
al P
atel
21.0
1.02
3050
0024
400
1830
042
700
100
042
600
7 A
vina
sh A
graw
al
21.0
1.02
29
5477
23
638.
16
1772
8.62
41
366.
78
100
0 41
266.
78
8D
r. S
efal
i Gup
ta21
.01.
0230
1000
2408
018
060
4214
010
00
4204
09
Dr.
Sef
ali G
upta
21
.01.
02
3010
00
2408
0 18
060
4214
0 10
0 0
4204
0 10
K
eert
i Vic
hpur
ia
15.1
0.04
43
1111
34
488.
88
2586
6.66
60
355.
54
100
0 60
255.
54
11S
mt.
Sha
nti B
ai15
.10.
0443
1111
3448
8.88
2586
6.66
6035
5.54
100
060
255.
5412
R
ames
h S
arka
r 26
.06.
04
2500
00
2000
0 15
000
3500
0 10
0 0
3490
0 13
Gau
ri S
hank
ar D
ixit
26.0
6.04
2500
0020
000
1500
035
000
100
034
900
14
D.K
. Bad
gaiy
a 11
.08.
03
2550
00
2040
0 15
300
3570
0 10
0 0
3560
0 15
D
r. P
rach
i Gup
ta
23.0
5.03
25
0000
20
000
1500
0 35
000
100
0 34
900
16D
r. V
.K. G
upta
11.0
8.03
2500
0020
000
1500
035
000
100
034
900
17
Dr.
Ani
ta J
ain
26.1
0.04
25
0000
20
000
1500
0 35
000
100
0 34
900
18
Dr.
Rak
esh
Kum
ar
Cha
turv
edi
21.0
1.10
10
0000
75
00
5625
13
125
100
0 13
025
19
Rav
i Ind
nani
17
.01.
11
2100
000
1575
00
1181
25
2756
25
100
0 27
5525
20
Sev
aram
22.0
4.04
1100
088
066
015
4010
00
1440
21
Gha
nshy
am G
upta
22
.05.
03
4000
0 32
00
2400
56
00
100
0 55
00
22R
am S
ingh
22.0
4.04
1100
088
066
015
4010
00
1440
23
Bal
ram
Sen
22
.04.
04
1100
0 88
0 66
0 15
40
100
0 14
40
24R
ajen
dra
Kum
ar
Mis
hra
22.0
4.04
1100
088
0 66
0 15
40
100
0 14
40
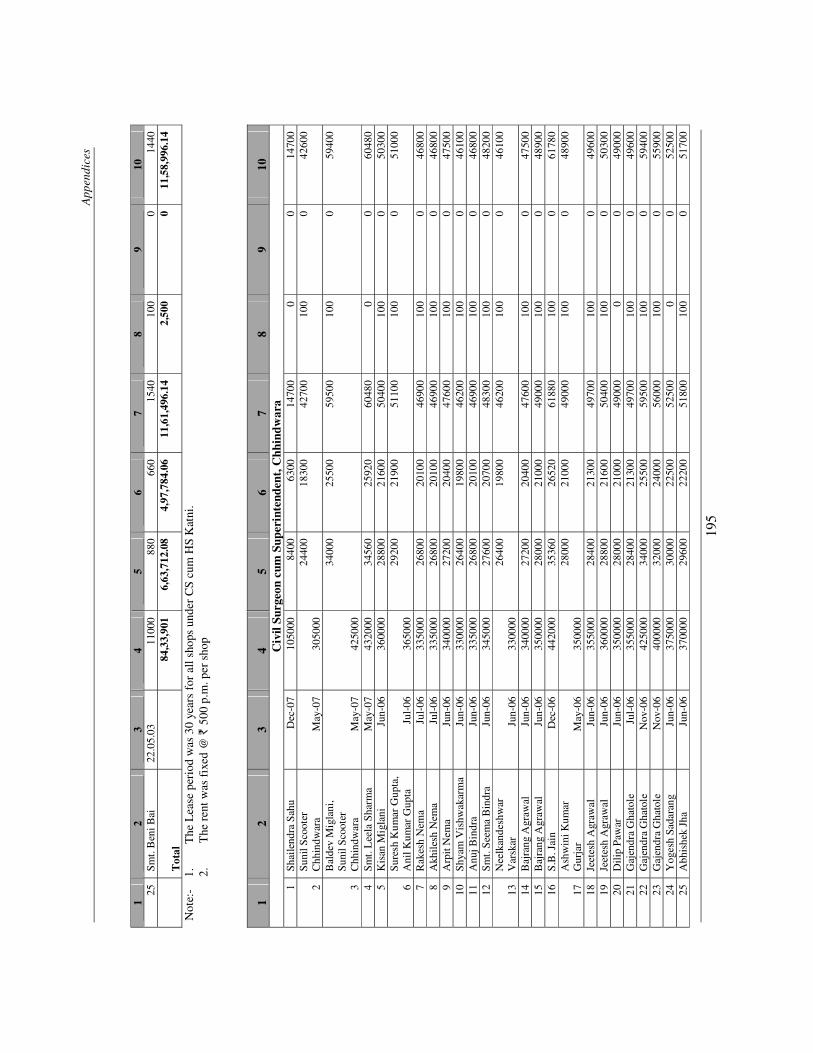
App
endi
ces
195
12
34
56
78
910
25
Sm
t. B
eni B
ai
22.0
5.03
11
000
880
660
1540
10
0 0
1440
Tot
al84
,33,
901
6,63
,712
.08
4,97
,784
.06
11,6
1,49
6.14
2,
500
0 11
,58,
996.
14
Not
e:-
1.
The
Lea
se p
erio
d w
as 3
0 ye
ars
for
all s
hops
und
er C
S cu
m H
S K
atni
.
2.
T
he r
ent w
as f
ixed
@ `
500
p.m
. per
sho
p
1 2
3 4
5 6
7 8
9 10
C
ivil
Surg
eon
cum
Sup
erin
tend
ent,
Chh
indw
ara
1S
hail
endr
a S
ahu
Dec
-07
1050
0084
0063
0014
700
00
1470
0
2 S
unil
Sco
oter
C
hhin
dwar
a M
ay-0
7 30
5000
24
400
1830
0 42
700
100
0 42
600
3
Bal
dev
Mig
lani
, S
unil
Sco
oter
C
hhin
dwar
a M
ay-0
7 42
5000
3400
0 25
500
5950
0 10
0 0
5940
0
4S
mt.
Lee
la S
harm
aM
ay-0
743
2000
3456
025
920
6048
00
060
480
5 K
isan
Mig
lani
Ju
n-06
36
0000
28
800
2160
0 50
400
100
0 50
300
6 S
ures
h K
umar
Gup
ta,
Ani
l Kum
ar G
upta
Ju
l-06
36
5000
29
200
2190
0 51
100
100
0 51
000
7 R
akes
h N
ema
Jul-
06
3350
00
2680
0 20
100
4690
0 10
0 0
4680
0 8
Akh
iles
h N
ema
Jul-
0633
5000
2680
020
100
4690
010
00
4680
09
Arp
it N
ema
Jun-
06
3400
00
2720
0 20
400
4760
0 10
0 0
4750
0 10
S
hyam
Vis
hwak
arm
a Ju
n-06
33
0000
26
400
1980
0 46
200
100
0 46
100
11
Anu
j Bin
dra
Jun-
06
3350
00
2680
0 20
100
4690
0 10
0 0
4680
0 12
S
mt.
See
ma
Bin
dra
Jun-
06
3450
00
2760
0 20
700
4830
0 10
0 0
4820
0
13
Nee
lkan
desh
war
V
arsk
ar
Jun-
06
3300
00
2640
0 19
800
4620
0 10
0 0
4610
0
14B
ajra
ng A
graw
alJu
n-06
3400
0027
200
2040
047
600
100
047
500
15
Baj
rang
Agr
awal
Ju
n-06
35
0000
28
000
2100
0 49
000
100
0 48
900
16
S.B
. Jai
n D
ec-0
6 44
2000
35
360
2652
0 61
880
100
0 61
780
17
Ash
win
i Kum
ar
Gur
jar
May
-06
3500
00
2800
0 21
000
4900
0 10
0 0
4890
0
18Je
etes
h A
graw
alJu
n-06
3550
0028
400
2130
049
700
100
049
600
19Je
etes
h A
graw
alJu
n-06
3600
0028
800
2160
050
400
100
050
300
20
Dil
ip P
awar
Ju
n-06
35
0000
28
000
2100
0 49
000
0 0
4900
0 21
G
ajen
dra
Gha
tole
Ju
l-06
35
5000
28
400
2130
0 49
700
100
0 49
600
22
Gaj
endr
a G
hato
le
Nov
-06
4250
00
3400
0 25
500
5950
0 10
0 0
5940
0 23
Gaj
endr
a G
hato
leN
ov-0
640
0000
3200
024
000
5600
010
00
5590
024
Y
oges
h Sa
dara
ng
Jun-
06
3750
00
3000
0 22
500
5250
0 0
0 52
500
25
Abh
ishe
k Jh
a Ju
n-06
37
0000
29
600
2220
0 51
800
100
0 51
700
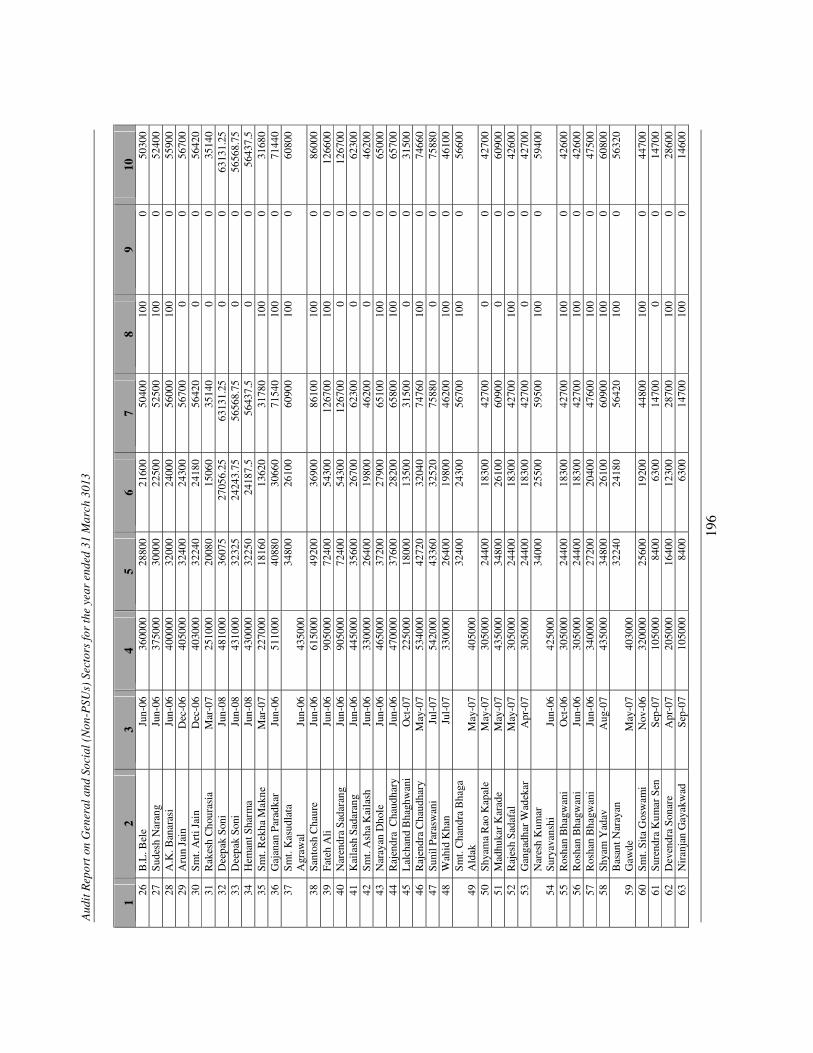
Aud
it R
epor
t on
Gen
eral
and
Soc
ial (
Non
-PSU
s) S
ecto
rs fo
r th
e ye
ar e
nded
31
Mar
ch 3
013
196
1 2
3 4
5 6
7 8
9 10
26
B.L
. Bel
eJu
n-06
3600
0028
800
2160
050
400
100
050
300
27
Sud
esh
Nar
ang
Jun-
06
3750
00
3000
0 22
500
5250
0 10
0 0
5240
0 28
A.K
. Ban
aras
iJu
n-06
4000
0032
000
2400
056
000
100
055
900
29
Aru
n Ja
in
Dec
-06
4050
00
3240
0 24
300
5670
0 0
0 56
700
30
Sm
t. A
rti J
ain
Dec
-06
4030
00
3224
0 24
180
5642
0 0
0 56
420
31R
akes
h C
hour
asia
Mar
-07
2510
0020
080
1506
035
140
00
3514
032
D
eepa
k So
ni
Jun-
08
4810
00
3607
5 27
056.
25
6313
1.25
0
0 63
131.
25
33D
eepa
k So
niJu
n-08
4310
0032
325
2424
3.75
5656
8.75
00
5656
8.75
34
Hem
ant S
harm
a Ju
n-08
43
0000
32
250
2418
7.5
5643
7.5
0 0
5643
7.5
35S
mt.
Rek
ha M
akne
Mar
-07
2270
0018
160
1362
031
780
100
031
680
36G
ajan
anP
arad
kar
Jun-
0651
1000
4088
030
660
7154
010
00
7144
037
S
mt.
Kas
udla
ta
Agr
awal
Jun-
0643
5000
3480
0 26
100
6090
0 10
0 0
6080
0
38
San
tosh
Cha
ure
Jun-
06
6150
00
4920
0 36
900
8610
0 10
0 0
8600
0 39
F
ateh
Ali
Ju
n-06
90
5000
72
400
5430
0 12
6700
10
0 0
1266
00
40N
aren
dra
Sad
aran
gJu
n-06
9050
0072
400
5430
012
6700
00
1267
0041
K
aila
sh S
adar
ang
Jun-
06
4450
00
3560
0 26
700
6230
0 0
0 62
300
42S
mt.
Ash
a K
aila
shJu
n-06
3300
0026
400
1980
046
200
00
4620
043
N
aray
an D
hole
Ju
n-06
46
5000
37
200
2790
0 65
100
100
0 65
000
44R
ajen
dra
Cha
udha
ryJu
n-06
4700
0037
600
2820
065
800
100
065
700
45L
alch
and
Bha
ghw
ani
Oct
-07
2250
0018
000
1350
031
500
00
3150
046
R
ajen
dra
Cha
udha
ry
May
-07
5340
00
4272
0 32
040
7476
0 10
0 0
7466
0 47
Sun
il P
aras
wan
iJu
l-07
5420
0043
360
3252
075
880
00
7588
048
W
ahid
Kha
n Ju
l-07
33
0000
26
400
1980
0 46
200
100
0 46
100
49S
mt.
Cha
ndra
Bha
ga
Ald
akM
ay-0
740
5000
3240
0 24
300
5670
0 10
0 0
5660
0
50
Shy
ama
Rao
Kap
ale
May
-07
3050
00
2440
0 18
300
4270
0 0
0 42
700
51M
adhu
kar
Kar
ade
May
-07
4350
0034
800
2610
060
900
00
6090
052
R
ajes
h S
adaf
al
May
-07
3050
00
2440
0 18
300
4270
0 10
0 0
4260
0 53
Gan
gadh
ar W
adek
arA
pr-0
730
5000
2440
018
300
4270
00
042
700
54
Nar
esh
Kum
ar
Sur
yava
nshi
Ju
n-06
42
5000
34
000
2550
0 59
500
100
0 59
400
55R
osha
n B
hagw
ani
Oct
-06
3050
0024
400
1830
042
700
100
042
600
56
Ros
han
Bha
gwan
i Ju
n-06
30
5000
24
400
1830
0 42
700
100
0 42
600
57
Ros
han
Bha
gwan
i Ju
n-06
34
0000
27
200
2040
0 47
600
100
0 47
500
58S
hyam
Yad
avA
ug-0
743
5000
3480
026
100
6090
010
00
6080
0
59B
asan
t Nar
ayan
G
awde
May
-07
4030
0032
240
2418
0 56
420
100
0 56
320
60S
mt.
Sit
a G
osw
ami
Nov
-06
3200
0025
600
1920
044
800
100
044
700
61
Sur
endr
a K
umar
Sen
S
ep-0
7 10
5000
84
00
6300
14
700
0 0
1470
0 62
Dev
endr
a S
onar
eA
pr-0
720
5000
1640
012
300
2870
010
00
2860
063
N
iran
jan
Gay
akw
ad
Sep
-07
1050
00
8400
63
00
1470
0 10
0 0
1460
0
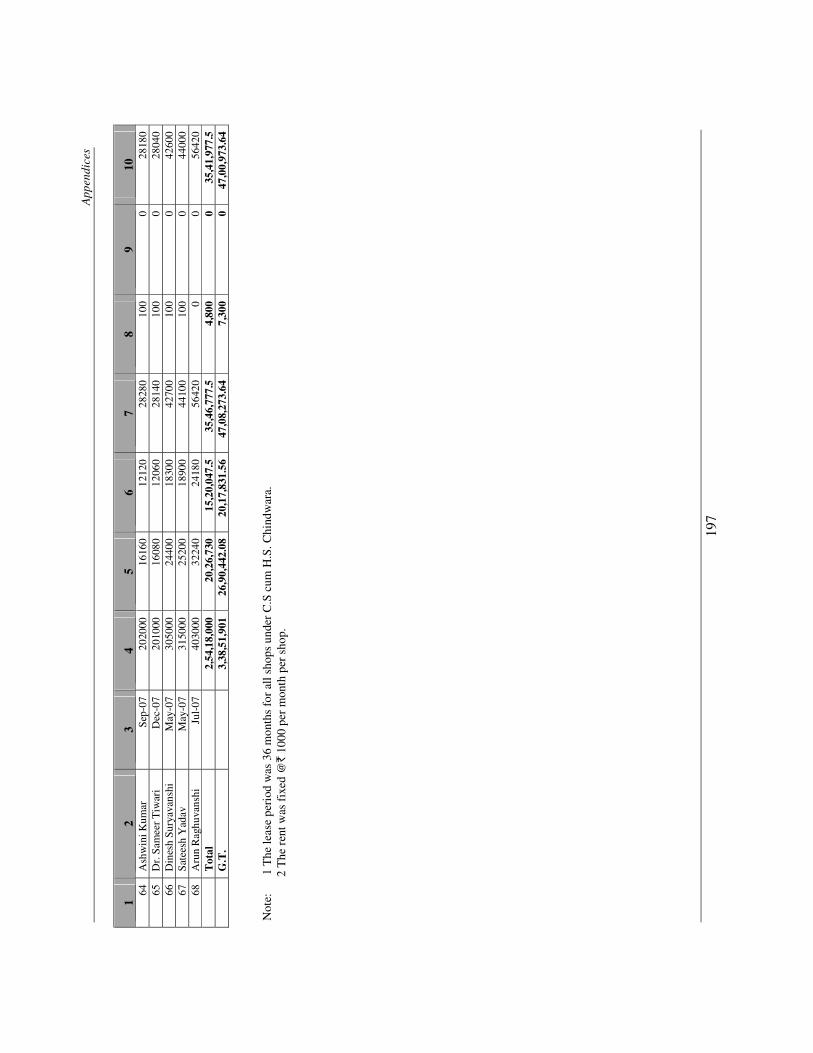
App
endi
ces
197
1 2
3 4
5 6
7 8
9 10
64
Ash
win
i Kum
arS
ep-0
720
2000
1616
012
120
2828
010
00
2818
065
D
r. S
amee
r T
iwar
i D
ec-0
7 20
1000
16
080
1206
0 28
140
100
0 28
040
66D
ines
h S
urya
vans
hiM
ay-0
730
5000
2440
018
300
4270
010
00
4260
067
S
atee
sh Y
adav
M
ay-0
7 31
5000
25
200
1890
0 44
100
100
0 44
000
68
Aru
n R
aghu
vans
hi
Jul-
07
4030
00
3224
0 24
180
5642
0 0
0 56
420
Tot
al2,
54,1
8,00
020
,26,
730
15,2
0,04
7.5
35,4
6,77
7.5
4,80
00
35,4
1,97
7.5
G.T
.
3,38
,51,
901
26,9
0,44
2.08
20
,17,
831.
56
47,0
8,27
3.64
7,
300
0 47
,00,
973.
64
Not
e:
1
The
leas
e pe
riod
was
36
mon
ths
for
all s
hops
und
er C
.S c
um H
.S. C
hind
war
a.
2 T
he r
ent w
as f
ixed
@`
100
0 pe
r m
onth
per
sho
p.
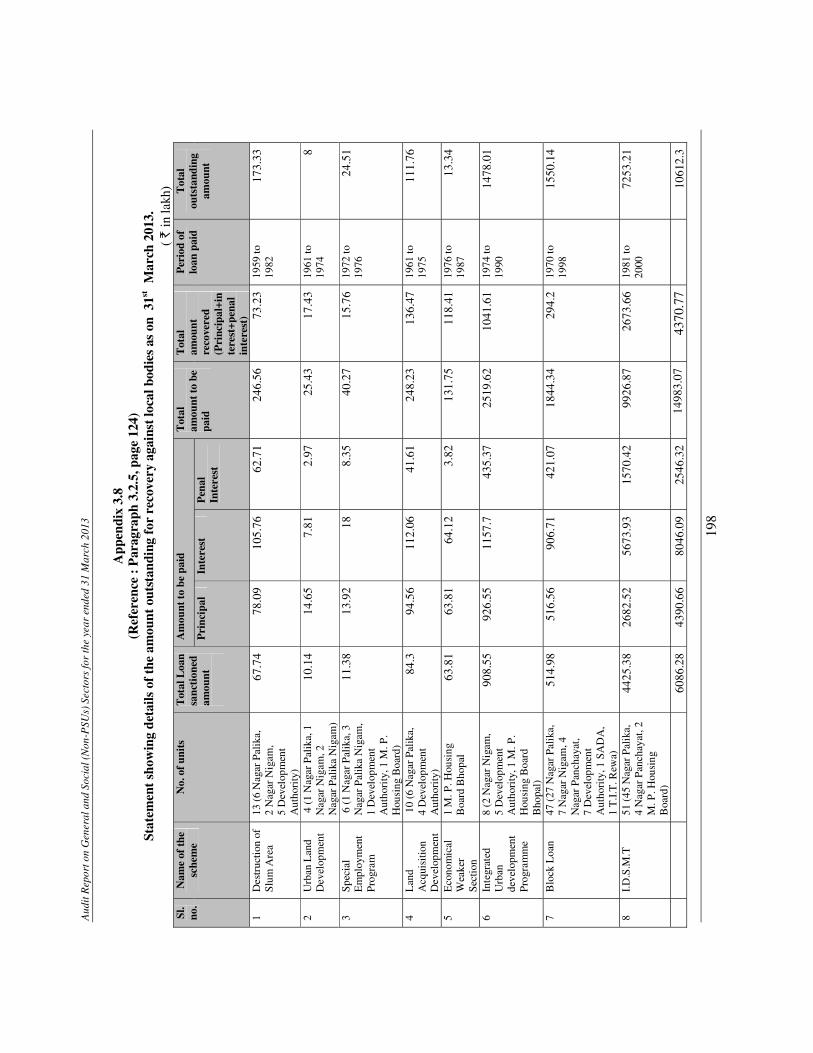
Aud
it R
epor
t on
Gen
eral
and
Soc
ial (
Non
-PSU
s) S
ecto
rs fo
r th
e ye
ar e
nded
31
Mar
ch 2
013
198
App
endi
x 3.
8 (R
efer
ence
: P
arag
raph
3.2
.5, p
age
124)
St
atem
ent
show
ing
deta
ils o
f th
e am
ount
out
stan
ding
for
rec
over
y ag
ains
t loc
al b
odie
s as
on
31st
Mar
ch 2
013.
( ` i
n la
kh)
Sl.
no.
Nam
e of
the
sche
me
No.
of u
nits
T
otal
Loa
n sa
ncti
oned
am
ount
Am
ount
to b
e pa
id
Tot
al
amou
nt to
be
paid
Tot
al
amou
nt
reco
vere
d (P
rinc
ipal
+in
tere
st+p
enal
in
tere
st)
Per
iod
of
loan
pai
d T
otal
ou
tsta
ndin
g am
ount
P
rinc
ipal
Inte
rest
P
enal
In
tere
st
1 D
estr
ucti
on o
f S
lum
Are
a 13
(6
Nag
ar P
alik
a,
2 N
agar
Nig
am,
5
Dev
elop
men
t A
utho
rity
)
67.7
4 78
.09
105.
76
62.7
1 24
6.56
73
.23
1959
to
1982
17
3.33
2 U
rban
Lan
d D
evel
opm
ent
4 (
1 N
agar
Pal
ika,
1
Nag
ar N
igam
, 2
Nag
ar P
alik
a N
igam
)
10.1
4 14
.65
7.81
2.
97
25.4
3 17
.43
1961
to
1974
8
3 S
peci
al
Em
ploy
men
t P
rogr
am
6 (
1 N
agar
Pal
ika,
3
Nag
ar P
alik
a N
igam
, 1
Dev
elop
men
t A
utho
rity
, 1 M
. P.
Hou
sing
Boa
rd)
11.3
8 13
.92
18
8.35
40
.27
15.7
6 19
72 to
19
76
24.5
1
4 L
and
Acq
uisi
tion
Dev
elop
men
t
10
(6 N
agar
Pal
ika,
4
Dev
elop
men
t A
utho
rity
)
84.3
94
.56
112.
06
41.6
1 24
8.23
13
6.47
19
61 to
19
75
111.
76
5 E
cono
mic
al
Wea
ker
Sec
tion
1 M
. P. H
ousi
ng
Boa
rd B
hopa
l 63
.81
63.8
1 64
.12
3.82
13
1.75
11
8.41
19
76 to
19
87
13.3
4
6 In
tegr
ated
U
rban
de
velo
pmen
t P
rogr
amm
e
8 (2
Nag
ar N
igam
,
5 D
evel
opm
ent
Aut
hori
ty, 1
M. P
. H
ousi
ng B
oard
B
hopa
l)
908.
55
926.
55
1157
.7
435.
37
2519
.62
1041
.61
1974
to
1990
14
78.0
1
7 B
lock
Loa
n 47
(27
Nag
ar P
alik
a,
7 N
agar
Nig
am, 4
N
agar
Pan
chay
at,
7 D
evel
opm
ent
Aut
hori
ty, 1
SA
DA
, 1
T.I
.T. R
ewa)
514.
98
516.
56
906.
71
421.
07
1844
.34
294.
2 19
70 to
19
98
1550
.14
8 I.
D.S
.M.T
51
(45
Nag
ar P
alik
a,
4 N
agar
Pan
chay
at, 2
M
. P. H
ousi
ng
Boa
rd)
4425
.38
2682
.52
5673
.93
1570
.42
9926
.87
2673
.66
1981
to
2000
72
53.2
1
60
86.2
8 43
90.6
6 80
46.0
9 25
46.3
2 14
983.
07
4370
.77
1061
2.3
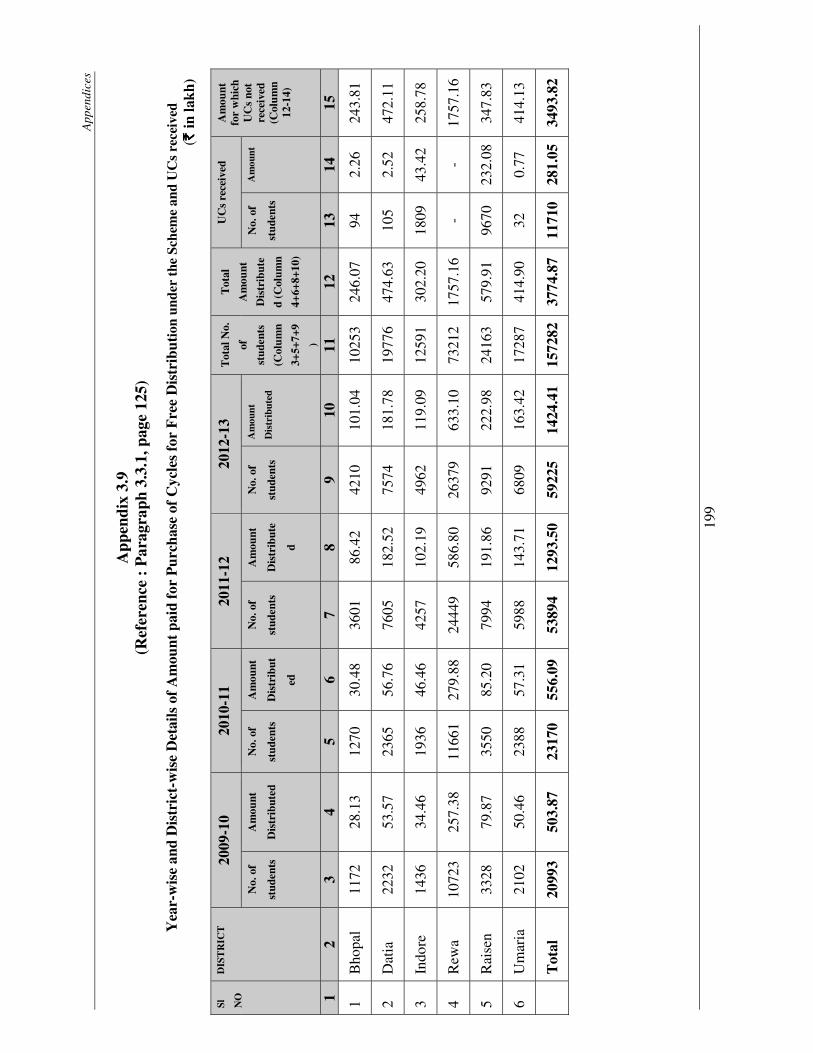
App
endi
ces
199
App
endi
x 3.
9 (R
efer
ence
: P
arag
raph
3.3
.1, p
age
125)
Yea
r-w
ise
and
Dis
tric
t-w
ise
Det
ails
of
Am
ount
pai
d fo
r P
urch
ase
of C
ycle
s fo
r F
ree
Dis
trib
utio
n un
der
the
Sche
me
and
UC
s re
ceiv
ed
(`
`
`
` i
n la
kh)
Sl
NO
DIS
TR
ICT
20
09-1
0 20
10-1
1 20
11-1
2 20
12-1
3 T
otal
No.
of
stud
ents
(Col
umn
3+5+
7+9
)
Tot
al
Am
ount
Dis
trib
ute
d (C
olum
n
4+6+
8+10
)
UC
s re
ceiv
ed
Am
ount
fo
r w
hich
U
Cs
not
rece
ived
(C
olum
n 12
-14)
No.
of
stud
ents
Am
ount
Dis
trib
uted
No.
of
stud
ents
Am
ount
Dis
trib
ut
ed
No.
of
stud
ents
Am
ount
Dis
trib
ute
d
No.
of
stud
ents
Am
ount
Dis
trib
uted
No.
of
stud
ents
Am
ount
1 2
3 4
5 6
7 8
9 10
11
12
13
14
15
1 B
hopa
l 11
72
28.1
3 12
70
30.4
8 36
01
86.4
2 42
10
101.
04
1025
3 24
6.07
94
2.
26
243.
81
2 D
atia
22
32
53.5
7 23
65
56.7
6 76
05
182.
52
7574
18
1.78
19
776
474.
63
105
2.52
47
2.11
3 In
dore
14
36
34.4
6 19
36
46.4
6 42
57
102.
19
4962
11
9.09
12
591
302.
20
1809
43
.42
258.
78
4 R
ewa
1072
3 25
7.38
11
661
279.
88
2444
9 58
6.80
26
379
633.
10
7321
2 17
57.1
6 -
- 17
57.1
6
5 R
aise
n 33
28
79.8
7 35
50
85.2
0 79
94
191.
86
9291
22
2.98
24
163
579.
91
9670
23
2.08
347.
83
6 U
mar
ia
2102
50
.46
2388
57
.31
5988
14
3.71
68
09
163.
42
1728
7 41
4.90
32
0.
77
414.
13
T
otal
20
993
503.
87
2317
0 55
6.09
53
894
1293
.50
5922
5 14
24.4
1 15
7282
3774
.87
1171
0 28
1.05
3493
.82
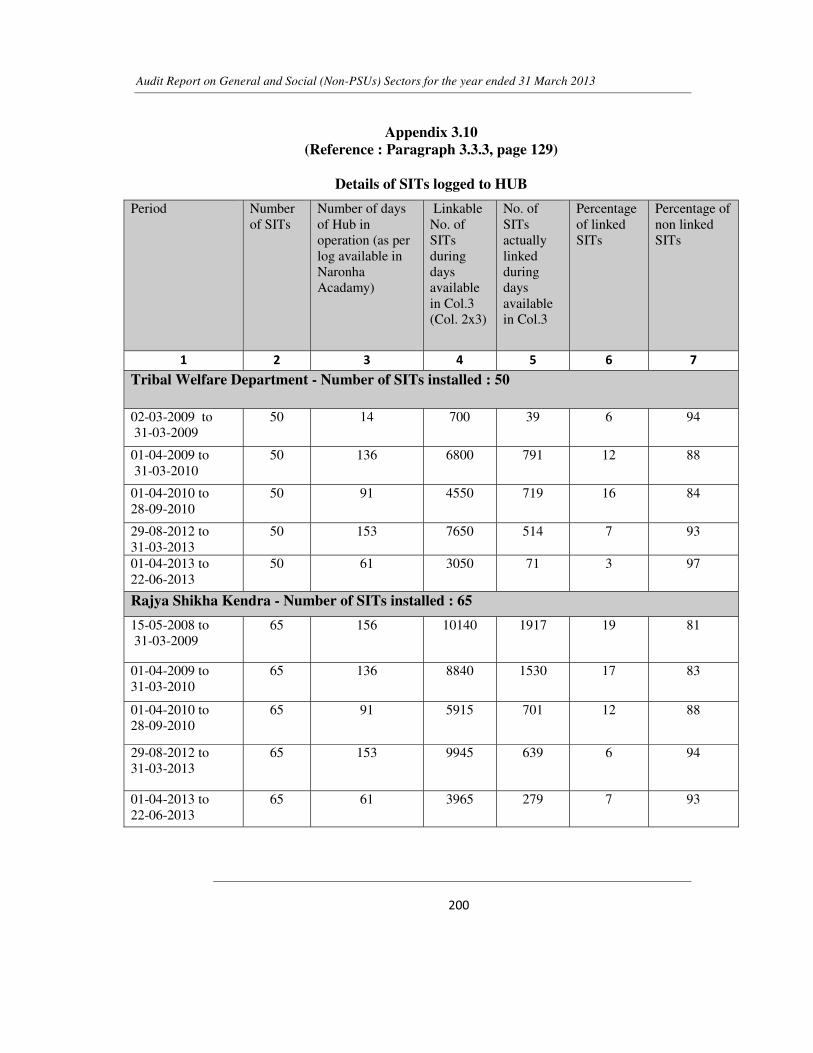
Audit Report on General and Social (Non-PSUs) Sectors for the year ended 31 March 2013
�������������������������������������������������������������������������������
�
Appendix 3.10 (Reference : Paragraph 3.3.3, page 129)
Details of SITs logged to HUB�
Period Number of SITs
Number of days of Hub in operation (as per log available in Naronha Acadamy)
Linkable No. of SITs during days available in Col.3 (Col. 2x3)
No. of SITs actually linked during days available in Col.3
Percentage of linked SITs
Percentage of non linked SITs
� � � � �
Tribal Welfare Department - Number of SITs installed : 50�
02-03-2009 to 31-03-2009
50 14 700 39 6 94
01-04-2009 to 31-03-2010
50 136 6800 791 12 88
01-04-2010 to 28-09-2010
50 91 4550 719 16 84
29-08-2012 to 31-03-2013
50 153 7650 514 7 93
01-04-2013 to 22-06-2013
50 61 3050 71 3 97
Rajya Shikha Kendra - Number of SITs installed : 65
15-05-2008 to 31-03-2009
65 156 10140 1917 19 81
01-04-2009 to 31-03-2010
65 136 8840 1530 17 83
01-04-2010 to 28-09-2010
65 91 5915 701 12 88
29-08-2012 to 31-03-2013
65 153 9945 639 6 94
01-04-2013 to 22-06-2013
65 61 3965 279 7 93
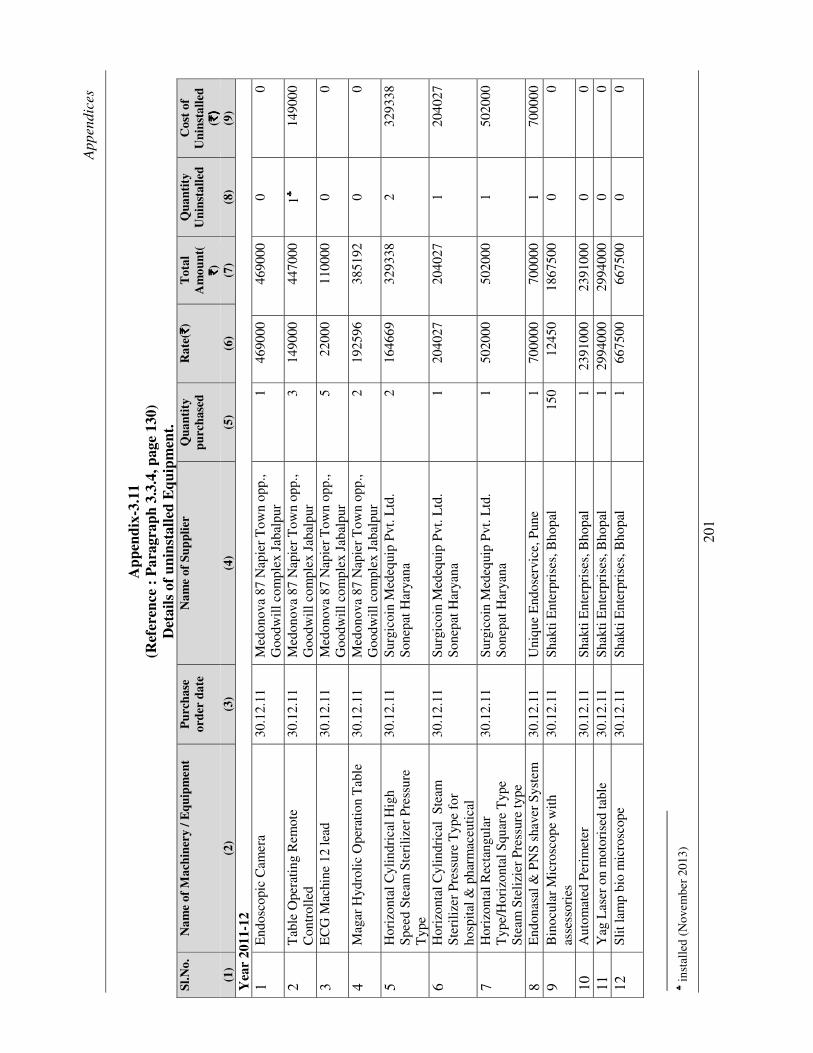
App
endi
ces
201
App
endi
x-3.
11
(Ref
eren
ce :
Par
agra
ph 3
.3.4
, pag
e 13
0)
Det
ails
of
unin
stal
led
Equ
ipm
ent.
Sl
.No.
N
ame
of M
achi
nery
/ E
quip
men
t P
urch
ase
orde
r da
te
Nam
e of
Sup
plie
r Q
uant
ity
purc
hase
d R
ate(
`̀̀̀)
Tot
al
Am
ount
(`̀̀̀)
Qua
ntit
y U
nins
talle
d C
ost
of
Uni
nsta
lled
(`)
`)
`)
`)
(1)
(2)
(3)
(4)
(5)
(6)
(7)
(8)
(9)
Yea
r 20
11-1
2 1
End
osco
pic
Cam
era
30.1
2.11
M
edon
ova
87 N
apie
r T
own
opp.
, G
oodw
ill c
ompl
ex J
abal
pur
146
9000
4690
000
0
2 T
able
Ope
ratin
g R
emot
e C
ontr
olle
d 30
.12.
11
Med
onov
a 87
Nap
ier
Tow
n op
p.,
Goo
dwill
com
plex
Jab
alpu
r 3
1490
0044
7000
1♣14
9000
3 E
CG
Mac
hine
12
lead
30
.12.
11
Med
onov
a 87
Nap
ier
Tow
n op
p.,
Goo
dwill
com
plex
Jab
alpu
r 5
2200
011
0000
0 0
4 M
agar
Hyd
rolic
Ope
ratio
n T
able
30
.12.
11
Med
onov
a 87
Nap
ier
Tow
n op
p.,
Goo
dwill
com
plex
Jab
alpu
r 2
1925
9638
5192
0 0
5 H
oriz
onta
l Cyl
indr
ical
Hig
h
Spee
d St
eam
Ste
riliz
er P
ress
ure
Typ
e
30.1
2.11
Su
rgic
oin
Med
equi
p Pv
t. L
td.
Sone
pat H
arya
na
216
4669
3293
382
3293
38
6 H
oriz
onta
l Cyl
indr
ical
Ste
am
Ste
riliz
er P
ress
ure
Typ
e fo
r ho
spita
l & p
harm
aceu
tical
30.1
2.11
Su
rgic
oin
Med
equi
p Pv
t. L
td.
Sone
pat H
arya
na
120
4027
2040
271
2040
27
7 H
oriz
onta
l Rec
tang
ular
T
ype/
Hor
izon
tal S
quar
e T
ype
Stea
m S
teli
zier
Pre
ssur
e ty
pe
30.1
2.11
Su
rgic
oin
Med
equi
p Pv
t. L
td.
Sone
pat H
arya
na
150
2000
5020
001
5020
00
8 E
ndon
asal
& P
NS
shav
er S
yste
m
30.1
2.11
U
niqu
e E
ndos
ervi
ce, P
une
170
0000
7000
001
7000
009
Bin
ocul
ar M
icro
scop
e w
ith
asse
ssor
ies
30.1
2.11
Sh
akti
Ent
erpr
ises
, Bho
pal
150
1245
018
6750
00
0
10
Aut
omat
ed P
erim
eter
30
.12.
11
Shak
ti E
nter
pris
es, B
hopa
l 1
2391
000
2391
000
0 0
11
Yag
Las
er o
n m
otor
ised
tabl
e 30
.12.
11
Shak
ti E
nter
pris
es, B
hopa
l 1
2994
000
2994
000
0 0
12
Slit
lam
p bi
o m
icro
scop
e 30
.12.
11
Shak
ti E
nter
pris
es, B
hopa
l 1
6675
0066
7500
0 0
♣
inst
alle
d (N
ovem
ber
2013
)
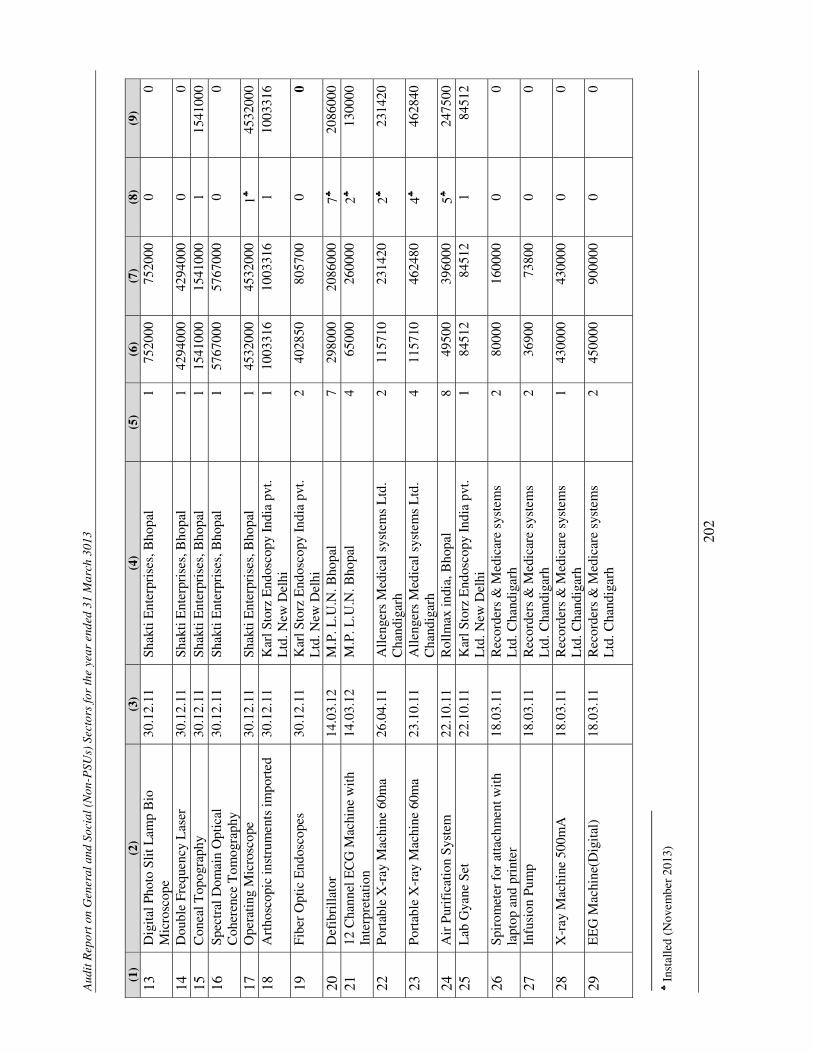
Aud
it R
epor
t on
Gen
eral
and
Soc
ial (
Non
-PSU
s) S
ecto
rs fo
r th
e ye
ar e
nded
31
Mar
ch 3
013 20
2
(1
) (2
) (3
) (4
) (5
) (6
) (7
) (8
) (9
) 13
D
igit
al P
hoto
Slit
Lam
p B
io
Mic
rosc
ope
30.1
2.11
Sh
akti
Ent
erpr
ises
, Bho
pal
175
2000
7520
000
0
14
Dou
ble
Freq
uenc
y L
aser
30
.12.
11
Shak
ti E
nter
pris
es, B
hopa
l 1
4294
000
4294
000
0 0
15
Con
eal T
opog
raph
y 30
.12.
11
Shak
ti E
nter
pris
es, B
hopa
l 1
1541
000
1541
000
1 15
4100
016
Sp
ectr
al D
omai
n O
ptic
al
Coh
eren
ce T
omog
raph
y 30
.12.
11
Shak
ti E
nter
pris
es, B
hopa
l 1
5767
000
5767
000
0 0
17
Ope
ratin
g M
icro
scop
e 30
.12.
11
Shak
ti E
nter
pris
es, B
hopa
l 1
4532
000
4532
000
1♣45
3200
018
A
rtho
scop
ic in
stru
men
ts im
port
ed
30.1
2.11
K
arl S
torz
End
osco
py I
ndia
pvt
. L
td. N
ew D
elhi
1
1003
316
1003
316
1 10
0331
6
19
Fibe
r O
ptic
End
osco
pes
30.1
2.11
K
arl S
torz
End
osco
py I
ndia
pvt
. L
td. N
ew D
elhi
2
4028
5080
5700
0 0
20
Def
ibri
llato
r
14.0
3.12
M
.P. L
.U.N
. Bho
pal
729
8000
2086
000
7♣20
8600
021
12
Cha
nnel
EC
G M
achi
ne w
ith
Inte
rpre
tatio
n 14
.03.
12
M.P
. L.U
.N. B
hopa
l 4
6500
026
0000
2♣13
0000
22
Port
able
X-r
ay M
achi
ne 6
0ma
26.0
4.11
A
llen
gers
Med
ical
sys
tem
s L
td.
Cha
ndig
arh
211
5710
2314
202♣
2314
20
23
Port
able
X-r
ay M
achi
ne 6
0ma
23.1
0.11
A
llen
gers
Med
ical
sys
tem
s L
td.
Cha
ndig
arh
411
5710
4624
804♣
4628
40
24
Air
Pur
ific
atio
n Sy
stem
22
.10.
11
Rol
lmax
indi
a, B
hopa
l 8
4950
039
6000
5♣24
7500
25
Lab
Gya
ne S
et
22.1
0.11
K
arl S
torz
End
osco
py I
ndia
pvt
. L
td. N
ew D
elhi
1
8451
284
512
1 84
512
26
Spi
rom
eter
for
atta
chm
ent w
ith
lapt
op a
nd p
rint
er
18.0
3.11
R
ecor
ders
& M
edic
are
syst
ems
Ltd
. Cha
ndig
arh
280
000
1600
000
0
27
Infu
sion
Pum
p 18
.03.
11
Rec
orde
rs &
Med
icar
e sy
stem
s L
td. C
hand
igar
h 2
3690
073
800
0 0
28
X-r
ay M
achi
ne 5
00m
A
18.0
3.11
R
ecor
ders
& M
edic
are
syst
ems
Ltd
. Cha
ndig
arh
143
0000
4300
000
0
29
EE
G M
achi
ne(D
igit
al)
18.0
3.11
R
ecor
ders
& M
edic
are
syst
ems
Ltd
. Cha
ndig
arh
245
0000
9000
000
0
♣
Ins
talle
d (N
ovem
ber
2013
) ♣
♣
♣
♣
♣
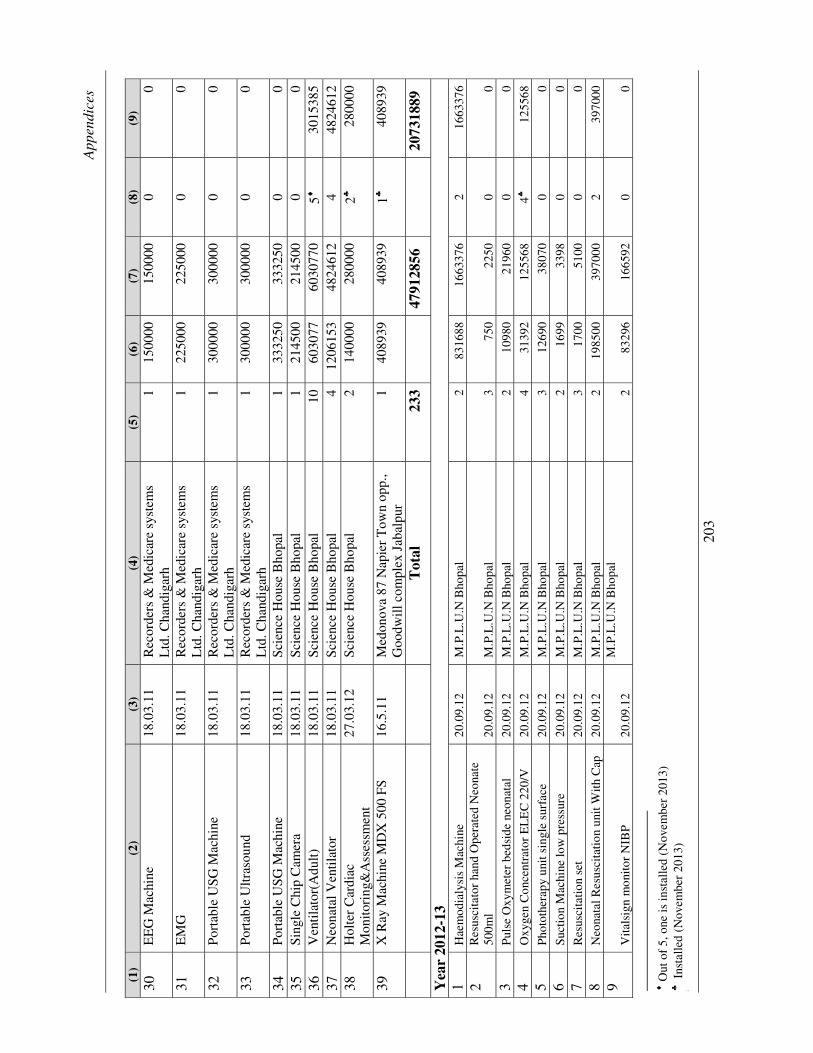
App
endi
ces
203
(1)
(2)
(3)
(4)
(5)
(6)
(7)
(8)
(9)
30
EE
G M
achi
ne
18.0
3.11
R
ecor
ders
& M
edic
are
syst
ems
Ltd
. Cha
ndig
arh
115
0000
1500
000
0
31
EM
G
18.0
3.11
R
ecor
ders
& M
edic
are
syst
ems
Ltd
. Cha
ndig
arh
122
5000
2250
000
0
32
Por
tabl
e U
SG M
achi
ne
18.0
3.11
R
ecor
ders
& M
edic
are
syst
ems
Ltd
. Cha
ndig
arh
130
0000
3000
000
0
33
Port
able
Ultr
asou
nd
18.0
3.11
R
ecor
ders
& M
edic
are
syst
ems
Ltd
. Cha
ndig
arh
130
0000
3000
000
0
34
Port
able
USG
Mac
hine
18
.03.
11
Scie
nce
Hou
se B
hopa
l 1
3332
5033
3250
0 0
35
Sing
le C
hip
Cam
era
18.0
3.11
Sc
ienc
e H
ouse
Bho
pal
121
4500
2145
000
036
V
entil
ator
(Adu
lt)
18.0
3.11
Sc
ienc
e H
ouse
Bho
pal
1060
3077
6030
770
5♦30
1538
537
N
eona
tal V
entil
ator
18
.03.
11
Scie
nce
Hou
se B
hopa
l 4
1206
153
4824
612
4 48
2461
238
H
olte
r C
ardi
ac
Mon
itori
ng&
Ass
essm
ent
27.0
3.12
Sc
ienc
e H
ouse
Bho
pal
214
0000
2800
002♣
2800
00
39
X R
ay M
achi
ne M
DX
500
FS
16
.5.1
1 M
edon
ova
87 N
apie
r T
own
opp.
, G
oodw
ill c
ompl
ex J
abal
pur
140
8939
4089
391♣
4089
39
T
otal
23
3
4791
2856
2073
1889
Yea
r 20
12-1
31
Hae
mod
ialy
sis
Mac
hine
20
.09.
12
M.P
.L.U
.N B
hopa
l 2
8316
88
1663
376
2 16
6337
6 2
Res
usci
tato
r ha
nd O
pera
ted
Neo
nate
50
0ml
20.0
9.12
M
.P.L
.U.N
Bho
pal
3 75
0 22
50
0 0
3 P
ulse
Oxy
met
er b
edsi
de n
eona
tal
20.0
9.12
M
.P.L
.U.N
Bho
pal
2 10
980
2196
0 0
0 4
Oxy
gen
Con
cent
rato
r E
LE
C 2
20/V
20
.09.
12
M.P
.L.U
.N B
hopa
l 4
3139
2 12
5568
4♣
1255
68
5 P
hoto
ther
apy
unit
sing
le s
urfa
ce
20.0
9.12
M
.P.L
.U.N
Bho
pal
3 12
690
3807
0 0
0 6
Suct
ion
Mac
hine
low
pre
ssur
e 20
.09.
12
M.P
.L.U
.N B
hopa
l 2
1699
33
98
0 0
7 R
esus
cita
tion
set
20.0
9.12
M
.P.L
.U.N
Bho
pal
3 17
00
5100
0
0 8
Neo
nata
l Res
usci
tatio
n un
it W
ith C
ap
20.0
9.12
M
.P.L
.U.N
Bho
pal
2 19
8500
39
7000
2
3970
00
9 V
itals
ign
mon
itor
NIB
P 20
.09.
12
M.P
.L.U
.N B
hopa
l 2
8329
6 16
6592
0
0
♦
Out
of
5, o
ne is
inst
alle
d (N
ovem
ber
2013
) ♣
Ins
talle
d (N
ovem
ber
2013
) ♣ ♣
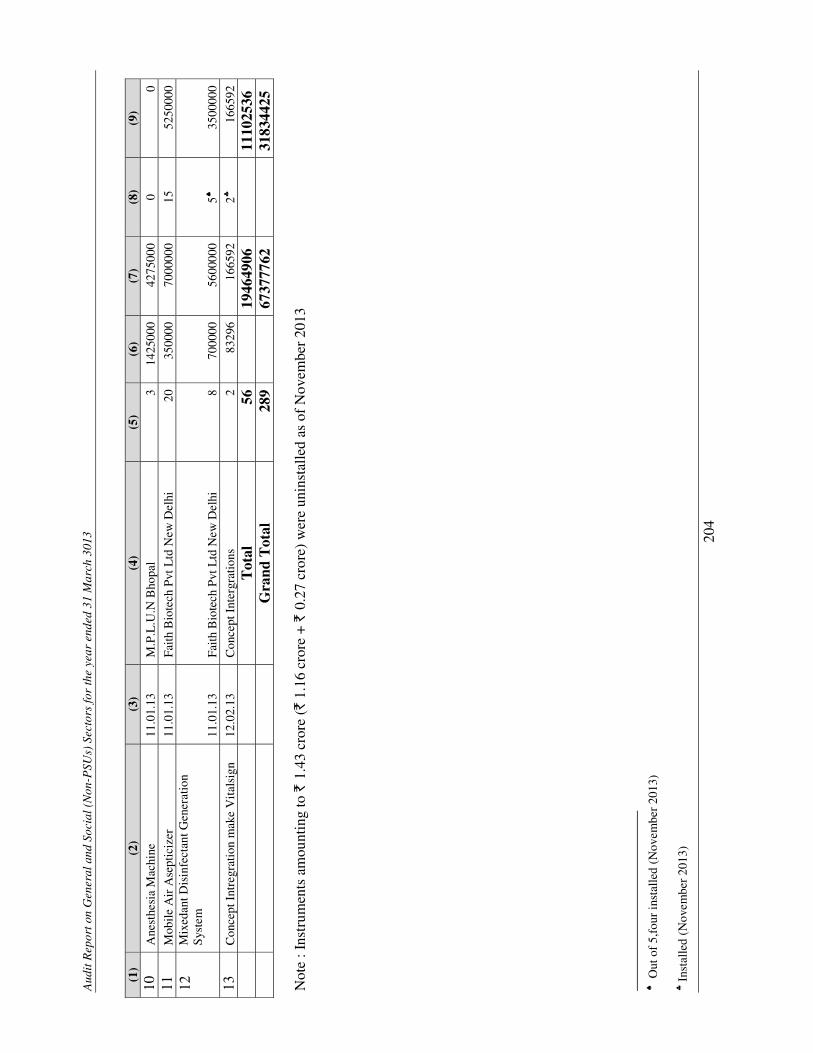
Aud
it R
epor
t on
Gen
eral
and
Soc
ial (
Non
-PSU
s) S
ecto
rs fo
r th
e ye
ar e
nded
31
Mar
ch 3
013 20
4
(1)
(2)
(3)
(4)
(5)
(6)
(7)
(8)
(9)
10
Ane
sthe
sia
Mac
hine
11
.01.
13
M.P
.L.U
.N B
hopa
l 3
1425
000
4275
000
0 0
11
Mob
ile A
ir A
sept
iciz
er
11.0
1.13
Fa
ith B
iote
ch P
vt L
td N
ew D
elhi
20
35
0000
70
0000
0 15
52
5000
0 12
M
ixed
ant D
isin
fect
ant G
ener
atio
n S
yste
m
11.0
1.13
Fa
ith B
iote
ch P
vt L
td N
ew D
elhi
8
7000
00
5600
000
5♠
3500
000
13
Con
cept
Int
regr
atio
n m
ake
Vit
alsi
gn
12.0
2.13
C
once
pt I
nter
grat
ions
2
8329
6 16
6592
2♣
1665
92
T
otal
56
1946
4906
1110
2536
Gra
nd T
otal
28
967
3777
62
31
8344
25
Not
e : I
nstr
umen
ts a
mou
ntin
g to
` 1
.43
cror
e (`
1.1
6 cr
ore
+ `
0.2
7 cr
ore)
wer
e un
inst
alle
d as
of
Nov
embe
r 20
13
♠
Out
of
5,fo
ur in
stal
led
(Nov
embe
r 20
13)
♣
Ins
talle
d (N
ovem
ber
2013
)
Copyright © 2022 FDOKUMEN