
replication and scale-up of innovation in Europe - Smart Cities ...
60
Energy The making of a smart city: replication and scale-up of innovation in Europe www.smartcities-infosystem.eu EMPOWERING SMART SOLUTIONS FOR BETTER CITIES
-
Upload
khangminh22 -
Category
Documents
-
view
1 -
download
0
Transcript of replication and scale-up of innovation in Europe - Smart Cities ...

Energy
The making of a smart city: replication and scale-up of innovation in Europe
www.smartcities-infosystem.eu
EMPOWERING SMART SOLUTIONS FOR BETTER CITIES

Written and prepared on behalf of SCIS by: Jorge Nunez Ferrer and Igor Taranic of the Centre for European Policy Studies (CEPS); Karina Veum and Paul van den Oosterkamp of the Energy Research Centre (ECN) of the Netherlands, under the supervision and review of Cordelia Wilson, GOPA Com.

The making of a smart city: replication and scale-up of innovation in Europe
www.smartcities-infosystem.eu
EMPOWERING SMART SOLUTIONS FOR BETTER CITIES

2
Table of Contents
ABOUT THE MAKING OF A SMART CITY: Replication and scale-up of innovation in europe 5
PART 1: FACTORS FOR REPLICATON 7
From strategic planning of urban areas to the specific replication of projects 8
From high objectives to selecting specific innovative solutions 9
Replicating successful innovations in the local context 12
TECHNOLOGICAL FACTORS 13
Factors affecting the technology choice 13
Performing an impact assessment and project selection 14
Characteristics of factors affecting technology choices 17
FINANCIAL AND ECONOMIC FACTORS 20
Financial costs 20
Hidden and unforeseen costs 20
Financial risks 20
Considering financial solutions 21
Public Financial support 21
EU Funding Support 22
Project Financing 23
REGULATORY AND ADMINISTRATIVE FACTORS 26
Administrative burdens 26
SOCIAL AND STAKEHOLDER UPTAKE FACTORS 27
What stakeholders do we need to engage? 28
When do we need to engage the stakeholders? 28
A common stakeholder dilemma 28
T h e m a k i n g o f a s m a r t c i t y : r e p l i c a t i o n a n d s c a l e - u p o f i n n o v a t i o n i n E u r o p e
3
PART 2. SCIS PROJECT EXAMPLES 29
IMPLEMENTATION OF TECHNOLOGIES FOR SELECTIVE TECHNOLOGY GROUPS 30
A ‘low tech’ example of retrofitting historical buildings: the RIBuild project on thermal insulation 30
The GEOCOM project on the application of geothermal energy 31
Near zero-energy buildings: the NEXT-Buildings project in Houthaven (Amsterdam) 32
A combination of innovative technological ideas 33
Advanced monitoring 33
FINANCIAL & ECONOMIC CHALLENGES AND SOLUTIONS 34
San Sebastián, Spain | REPLICATE 34
Florence, Italy | REPLICATE 35
Bristol, UK | REPLICATE 36
REGULATORY AND ADMINISTRATIVE CHALLENGES & SOLUTIONS 37
Vitoria-Gasteiz, Spain | SmartEnCity 37
Drammen, Norway | SCHOOL OF THE FUTURE 38
SOCIAL AND STAKEHOLDER UPTAKE CHALLENGES & SOLUTIONS 39
Nottingham, UK | REMOURBAN 39
VALLADOLID, Spain | REMOURBAN 40
PART 3: CASE STUDY: THE CELSIUS PROJECT 41
REFERENCE LIST 47
ANNEX: TECHNOLOGY GROUPS, FACTORS AND SAVINGS PER EUR 1 000 INVESTMENT 51

T h e m a k i n g o f a s m a r t c i t y : r e p l i c a t i o n a n d s c a l e - u p o f i n n o v a t i o n i n E u r o p e
4

5
This report is directed at city planners and project developers and focuses on the steps to be undertaken when seeking to replicate successful innovations in a city. Contrary to a single innovation for consumers that may be in demand to enter the market, city solutions are generally capital intensive, are made of numerous integrated separate technologies and in general need to be altered to fit local needs. In addition, the local administrative and regulatory framework may pose considerable non-technical burdens. The particularity of the EU, where smart cities need to be developed in existing and often historical urban conglom-erations, creates a new level of complexity.
A considerable challenge is that smart cities will have to be increasingly integrated, to reduce greenhouse gas emissions, save energy and be more resource efficient. In this case, patchwork sectoral changes will not be successful enough. Spatial planning gains in importance, such as e.g. mixed commercial, residential and public areas to reduce the transport needs and increase access to goods and services, thus increasing ‘mobility’ for citizens in terms of ability to reach those areas while simultaneously reducing ́ transport’ needs. Developments
have to be looking at their ´fit’ in a larger urban reality. This is a deviation from past city planning, where the provision of services and infrastructures often ´reacted’ to the expanding cities rather than being part of a planned process, solving punctual needs. Utilities, for example have often not coordinated their infrastructure development and many cities do not have a full picture of the e.g. water, electric cables or fibre optics networks underground for example.1
Thus, the choice of solutions and planning processes needs to carefully identify possible pitfalls and ensure that those will be analysed before a decision is taken. In addition, bringing innovations to cities faces particular public procurement challenges, as by definition they do not have a long history of proven use and are not least cost solutions in terms of initial capital expenditure. These factors challenge traditional public procurement rules. With the need to reduce emissions in cities, procurement rules have been reforming accordingly, not least thanks to the intense and pioneering work of ICLEI2 and also efforts by the European Commission through the European Innovation Partnership on Smart Cities and Communities.
ABOUT THE MAKING OF A SMART CITY:
Replication and scale-up of innovation
in Europe
Testing and developing new innovations to transform the energy and transport landscape of cities is undoubtedly complex, highlighted by the challenging experiences of the numerous projects financed by the EU. Once the arduous path of finding a successful new innovative solution is completed, the road is far from over. Innovations in general face a day of reckoning, the moment where the costs of entering the market and upscaling simply cannot be overcome. Lack of venture capital, market failures and other barriers can bring the process to a halt. This is not only a reality for smart city solutions, but because of their nature, the number of barriers are often far higher than in many other areas of innovation.
1 Orchestrating infrastructure for sustainable smart cities www.iec.ch/whitepaper/pdf/iecWP-smartcities-LR-en.pdf 2 The work can be found in www.iclei-europe.org/topics/sustainable-procurement

6
T h e m a k i n g o f a s m a r t c i t y : r e p l i c a t i o n a n d s c a l e - u p o f i n n o v a t i o n i n E u r o p e
This publication presents a checklist of planning steps with illustrative lessons from projects, which overcame barriers to deployment encountered on those or references for further information. It starts presenting the necessary preceding steps before the selection of a project, based on insights from publications by bodies focusing on modern approaches to the design of Smart Cities. These approaches help determine the needs and individual projects to undertake.
This publication is designed to help project developers and planners to use the latest thinking on the steps to develop integrated projects, consider potential barriers and select the right solutions from all the many innovations emerging from EU funded Smart City projects and beyond. There is no single approach, but there are proven paths of planning which help adapting to the increasingly complex needs of modern cities. It first addresses the strategic considera-tions to think through before selecting a solution, before focusing on the selection of individual technologies. The report also can offer an insight for city authorities on the impact of unintended barriers generated by administrative procedures and legal processes. A particular focus is also given to softer aspects of city planning, such as stakeholder engagement, which for innovations requiring a change in habits by citizens is essential.
The publication is based on several main sources of information:
• Technological, policy and financial analysis of the Seventh Framework Programme (FP7) and Horizon 2020 projects in the areas of energy, mobility and transport and ICT, co-financed by the European Commission;
• Insights, shared by smart city project coordinators during dedicated workshops;
• Insights from other smart city platforms, such as the Smart Cities Marketplace of the European Innovation Partnership on Smart Cities and Communities ;
• Literature review and other sources.
The Smart Cities Information System (SCIS) experience outlines four main clusters that need to be taken into systematic consideration when approaching a replication project:
• Technical
• Financial & Economic
• Regulatory & Administrative
• Social (with specific attention to stakeholders’ uptake issues).
3 European Innovation Partnership on Smart Cities and Communities: https://eu-smartcities.eu/about

PART 1
FACTORS FOR REPLICATON
7

8
T h e m a k i n g o f a s m a r t c i t y : r e p l i c a t i o n a n d s c a l e - u p o f i n n o v a t i o n i n E u r o p e
From strategic planning of
urban areas to the specific
replication of projects
Without decarbonising cities energy and climate objectives cannot be achieved. Cities account directly and indirectly for approximately two thirds of energy consumption and emissions. It is essential that replication and deployment of solutions are part of a well thought through city vision and plan. One of the most important initiatives in this respect has been initiated by the European Commission with the Covenant of Mayors initiative, which has brought together thousands of cities in Europe and also beyond to sign up to achieve greenhouse gas emission reductions by at least 20% by 2020. This commitment is accompanied by a Strategic Energy Action Plan (SEAP) highlighting the sectors where those emissions can be achieved. The SEAP, however, does not specify a specific technological approach or precise plan. The making of a SEAP, however, helped to raise awareness of potential approaches as well as on the aspects where city authorities have direct influence and where they do not. The SEAP approach was inspired by the well-known McKinsey (2009) approach to calculate costs abatement curves for emission reductions, which clarifies where the emissions are and the relative costs of mitigation in each sector.
The question addressed in this publication is how can ‘piloted innovations’ such as those highlighted by SCIS be replicated and scaled up. Typically, smart city pilots involve developing and/or testing technologies and new approaches, which are geared towards improving the quality of life and efficiency of services offered to city inhabitants. To avoid the situation where pilot schemes are a ‘one-off’ exercise, opportunities to scale-up or replicate successful and innovative pilots are often sought.
The terms ‘scalability’ and ‘replication’ often mean different things to different people, depending on the context in which these terms are used. Consequently, before exploring this subject in more detail in this publication, we begin with a clarification of these two terms, depending on the context in which they are used.
• Scalability refers to expanding the piloted technol-ogies and approaches in the geographical area where it was successfully implemented. Reasons for expanding could be to meet growing demand or to offer better services to a larger segment of the population. Normally scaling up takes place in the region where the same boundary conditions prevail.
• Replicability refers to the possibility of transporting or ‘copying’ results from a pilot case to other geograph-ical areas, albeit with potentially different boundary conditions. In other words, if a pilot was proven to work in one community or region, it could be exported to other communities or regions (indigenously or abroad), but taking into account that the boundary conditions could be quite different from those in the piloted community or region. Replication may also encompass the management process that was used in the pilot scheme or the cooperation structure between critical stakeholders.
At the moment of selecting pilot innovations to replicate or scale up with the aim to tackle emissions, it is not advisable to just address each sector as a silo, ultimately decisions on infrastructures are long lived and inefficient weakly integrated projects will not harness all the benefits that a city can derive from a well-planned coherent strategy. It is important to keep in mind that near full decarbonisation by 2050 is a central objective of the EU leaving little space for errors along the way, particularly for long lived infrastructures.
The complexity, but also the opportunities of correctly ‘orches-trating’ a smart city is well explained in the International Electrotechnical Commission (2014) report, a document aimed at city authorities and planners. Other organisations, such as ICLEI or standardisation bodies, such as the British Standards Institute have put considerable effort in identifying how to better design city changes to ensure an efficient use of resources and the best outcome through standardisation of procedures. For the IEC (ibid) a successful strategy cannot be built only on reducing emissions or saving energy, but ‘creating value’ for the city and citizens though taking correct advantage of the technologies on offer and rapidly growing opportunities created by digitalisation. Cities can address many socio-economic challenges if their mitigation (and climate adaptation) plan is well managed. This is easier said than done, as it requires a new way to prepare strategies based on holistic plans, procurement of innovative solutions, integrating cross sectoral considerations, developing new business models, and last but not least collaborating with the private sector and citizens. This is important for replication of innovations developed by EU projects and beyond, as they have to fit a wider plan. This is also the reason for the Horizon 2020 Smart City lighthouse projects, which aim at integrated coherent large transformations of whole districts.
This publication will not attempt to replicate the extensive work by specialised bodies, but will distil the main elements, make reference to them and draw on the lessons from SCIS and other initiatives on best practices and solutions in technology replication. Hopefully it will help those involved in seeking solutions for their city, particularly in framing options under wider considerations.

9
From high objectives to selecting
specific innovative solutions
Cities are complex organisms, partially planned, but to a large extent the outcome of numerous decisions by private individuals and organisations. Any plan needs to consider how innovations will affect the city and citizens, and what preconditions will ensure the successful impact of the individual innovation. City authorities, planners and project developers should not neglect potential rebound effects, or unintended indirect impacts, such as traffic. The
number of considerations and planning varies depending on the kind of action to be undertaken. A simple energy efficiency in buildings project, based on retrofitting requires less strategic considerations than the design of a new public transport system, the building of shopping centres or the development of a new district. Cities have to be seen as a multi-layered structure of services and infrastructures aimed ultimately at helping citizens to live and work with high standards of living while reducing their environmental footprint. Innovations should aim at improving and fitting these city layers (Figure 1). Thus once the wider strategy for the city is clear, the kinds of solutions to be implemented should be clarified, what solution where, how and for whom.
It is beyond the scope of this report to present a full strategic planning approach, but the new challenges of planning city developments should be considered, especially by city authorities, this could also include co-creation approaches with citizens on long-term priorities or new developments. In the numerous SCIS projects there are many approaches to citizen engagement, but the CITIZEN project exclusively designed to connect citizens to selecting smart solutions stands out for its approach, dedicated engagement and success. Outside the sphere of SCIS other projects explore new ways to involve stakeholders, such as for example the FP7 POCACITO (www.pocacito.eu) project, which has been concluded, but where the approach is being implemented in some cities including outside Europe.
A stepwise approach to city planning is presented in the European Commission (2016) report on the governance tools to manage integrated smart cities and communities’ solutions (SCC) solutions. The approach presented in the report is elaborated on work by PWC’s strategy toolbox and presents the steps as follows in Figure 2.
Figure 1: Three-layer model of city functions4
4 Orchestrating infrastructure for sustainable smart cities www.iec.ch/whitepaper/pdf/iecWP-smartcities-LR-en.pdf
Wide-area infrastructure
Life Service Applications
HousesOffices
Facilities
Schools
Quality of Life, efficiency...
Energy Water,waste Mobility ICT, and
Others
123
Life service layer
Facility layer
Infrastructure layers
Urban infrastructure layer
Residents

10
T h e m a k i n g o f a s m a r t c i t y : r e p l i c a t i o n a n d s c a l e - u p o f i n n o v a t i o n i n E u r o p e
The approach presented includes all the main steps and needs, but the sequence may not necessarily be the same. In the case of the POCACITO approach to city planning, the SWOT analysis has to be performed first, including in addition an analysis of external pressures the city may face from external factors. This would allow the informing of key stakeholders that would then develop a vision and strategy based on solid information. This would reverse point 1 and 2 and make the process less top down.
There are two main warnings to the all-encompassing planning approach. The result would still be mainly a wish list even at the road map stage. Cities will most likely be restricted on how many solutions they can implement and during the implementation of the plan conditions and technologies will continue to change and develop. As a result, the selection of which technologies and innovations to choose will need to be taking into account their ability to fit with other solutions over time. For this, the role of technical standards is key, to avoid locking in the city to a single provider and solutions that cannot evolve.
On the implementation of the programme, the EC (2016) report identifies three main governance approaches to implementing integrated SCC development, each of them with strengths and weaknesses, again making clear that there is no one size fits all approach. Interesting is also that the most important factor identified by experts for implementing SCC solutions is stakeholder participation (Figure 3). It is remarkable how stakeholder participation is listed as essential, but is also separated from Citizen and Community participation, a distinction that is often not made sufficiently. Stakeholder participation means for the overall strategy involving experts and representatives responsible for implementing the strategy in practice and representatives of the main walks in society affected. Citizen and Community participation is core to the selec-tion and implementation of specific projects, in response to the overall strategy. Representatives may be involved in the roadmap development, but have less weight than those stakeholders holding important responsibilities in later implementing the strategy.
Figure 2: Comprehensive planning and strategy for SCC solutions integrated in urban development5
Strategic vision of the city’s development
Smart City Roadmap containing a list of initiatives and their description
SWOT analysis of the city(strengths, weaknesses, opportunities, threats)
Defining strategic goals to develop the City(including leveraging the benefits of existing “Smart” technologies)
Measurable indicators of city development(according to leading international city ratings)
Priorities andschedule
Technologies andIT solutions
Regulatorysupport
Project Management
OfficeIT, utilities and
transportation infrastructure
Scope of initiatives Stakeholders Social-economic effect assesment
Budget & attractinginvestors and partners
Smart City Roadmap containing a list of initiatives and their description
12
34
5
5 Analysing the potential for wide scale roll out of integrated Smart Cities and Communities solutions (p. 31) https://ec.europa.eu/energy/sites/ener/files/documents/d2_final_report_v3.0_no_annex_iv.pdf

11
In a nutshell, developers of solutions encounter increasing challenges when seeking solutions and aiming to develop a ‘smart city’. No longer is the process one of procuring existing solutions to a specific problem at lowest costs through tendering, i.e. providing transport to cover demand from point A and B in a city, a large array of other objectives should fit the choice. Below in the Table is a list of strategic guidance documentation on developing an overall strategy.
The next section will discuss the steps and challenges for selecting specific solutions aiming to address the needs of the city in line with the vision, roadmap and context in the city, again followed with a list of resources for further information.
Figure 3: Most important factors for implementation and SCC solution sustainability6
Stakeholder Participation
Sectoral leadership(Energy, Transport, Environment)
Sustainable Business Model
Financing
Citizen & Community participation
Personal Sponsorship
Other
0% 10% 20% 30%
6 European Commission (2016), p.33, https://ec.europa.eu/energy/sites/ener/files/documents/d2_final_report_v3.0_no_annex_iv.pdf7 JRC, European Energy Efficiency Platform (E3P) https://e3p.jrc.ec.europa.eu
Identifying the main sectors to apply mitigation solutions.
The Covenant of Majors in collaboration with the Joint Research Centre (JRC) have produced several methodologies to develop Strategic Energy Action Plans (SEAPs) for cities in Europe and beyond, which can be found in the European Energy Efficiency Platform (E3P) of the (JRC).7
Publications addressing methodologies to build a vision and roadmap for cities. It also includes a recent result of a co-creation methodology with stakeholders.
There are a considerable number of publication on developing a vision and roadmap for cities. The following three approach this issue with some differences on the approach:
European Commission (2016), Analysing the potential for wide scale roll-out of integrated SCC solutions, Final report, European Union, June 2016
European Commission (2013), ‘Guidance Document, Integrated Action Plan, Report Process and Guidelines for Smart Cities’, Finance Working Group, Smart Cities Stakeholder Platform.
POCACITO (2016), ‘POCACITO Roadmap, A policy framework for post carbon cities’, FP7 project document, available at http://pocacito.eu/result/eu-roadmap/pocacito-roadmap, last accessed 5 October 2017.

12
T h e m a k i n g o f a s m a r t c i t y : r e p l i c a t i o n a n d s c a l e - u p o f i n n o v a t i o n i n E u r o p e
Replicating successful innovations
in the local context
The number of technologies and approaches addressing city challenges is very large and defining a vision and roadmap, while complex, is a minor step compared to the challenge of finding the right approaches and combining technologies efficiently. It may also be the case that stakeholders having to choose technical solutions are not the city authorities, an aspect often overseen in discussions on choices for smart city developments. The retrofitting of existing buildings is not a matter of the city authorities unless the buildings are municipal, or at the limit for social housing. The same is true in areas of transport or services where those are not provided by public authorities. Thus, ensuring the right solutions for a city are taken also requires the right incen-tives for the private sector to play its role.
In the area of buildings, much will depend on the incentives created for the private sector to modernise their building stock. For this, business models with the right incentives have to be designed. The models will be influenced by the competences of the local authorities in terms of setting financial incentives and their regulatory powers.
The following sections present the potential challenges and solutions for city planners or those actors having to select a project. It follows four important areas influencing the decisions on the choice of solution:
• Factors affecting the technology choice
• Financial and Economic Factors
• Regulatory and administrative factors
• Social – Stakeholder uptake factors

13
For public infrastructures and services the city authorities will be able to consider options which integrate well a city strategy and decisions on standards and links to other sectors and future plans for the city will be feasible. Less clear is with services provided by the private sector, or even bodies not under the control of the municipal authorities. The national rail service, for example, may influence the mobility in a city, but decisions on the operation of the rail system are not in the area of competence of the city. City authorities will be challenged with complex needs of coordination and collaboration.
The city authorities should be setting standards and requirements to ensure that developments performed by the private sector or operators beyond the influence of the city authorities choose the solutions that are in line with the wider objectives.
At the level of technologies, the project developers will need to perform an impact assessment taking into account the following aspects:
• The characteristics of the technology groups which the solution is using
• Developing the appropriate funding, business models and procurement approaches
• Taking into account the stakeholder engagement needs
TECHNOLOGICAL FACTORS
Factors affecting the technology choice
Each solution applied to a city consists of a combination of technologies adapted to the need of the specific city and affected by many factors, from simple financial and cost considerations based on number of users expected and cost recovery options, down to climatic conditions and uptake by stakeholders. The selection of the right technologies to replicate is thus a process which requires more than just buying an existing solution and implanting it in another city. With the growing need to achieve efficiency though integration, cities increasingly need to shift from procuring for a specific technology, but to consider the holistic systemic needs of the city across sectors. The process will thus involve several stages – from formulating a clear desired outcome and benefits for the stakeholders, to detailed investigation of suitable technologies and definition of factors to assess the applicability of a specific technology group in a certain geographical or policy context of the city.

14
T h e m a k i n g o f a s m a r t c i t y : r e p l i c a t i o n a n d s c a l e - u p o f i n n o v a t i o n i n E u r o p e
Performing an impact assessment
and project selection
At the moment of selecting a project, it is important to ensure that the decision fits the wider objectives of the city, including decisions by the private sector. This is particularly important for projects that may affect traffic flows, or have significant impacts on energy demand or citizen behaviour. The city should have some clear guidelines for developers to follow and be accessible for project developers to discuss any options. How the project may affect the choices of future projects is an issue that needs to be addressed whenever possible and when permissions are requested for urbanisation projects, the projects have to be assessed with such considerations in mind.
Impact assessments or feasibility studies should be performed taking into account externalities and the fit of the project in the overall objectives of the city. While there are reviews on this issue, project assessment methodolo-gies specifically incorporating the ‘smartness’ of a specific solution being selected are not abundant. Feasibility studies often remain very site specific, focused on checking compli-ance with regulatory standards and checking the financial viability. In this, the European Investment Bank institute has required the drafting of smart city project specific assess-ment guidelines. This year a methodology with special focus on Mediterranean cities has been published (EIB Institute, 2017). It proposes a very detailed and compre-hensive assessment. This methodology is focused on the EIB’s methods to assess if the project should be financed by the EIB, but includes factors well beyond bankability. It goes into detail on the impacts expected on the city to score its ‘fit’ to smart city objectives and the public benefits.
The assessment should be carried out before a project is undertaken (independently of it being an innovation, a replication of an innovation, or a well-known solution), with the aim of determining whether the project creates value to the city, i.e. it is in line with wider city, energy and climate objectives, and it if it is viable. A feasibility study should aim to uncover the strengths, weaknesses, opportunities and threats of the proposed project, in this case the replication of a smart city project. In doing so, it is important to have a thorough understanding of, among others, the barriers and enablers of a technology replication, which will have come to light in the feasibility study and from the experience of the projects when it was first tested. An important starting point for discussing these barriers and enablers in a smart city context is the fact that successful implementation
of technologies is highly contingent on local boundary conditions. Local conditions can have a strong impact on barriers and enablers. Therefore, a feasibility study should include an analysis of similarities and differences between local conditions affecting the pilot project and the planned project for replication.
In terms of replication, technology is seldom the limiting factor in itself8, thus a close analysis of barriers and enablers in terms of regulatory, financial and behavioural aspects need to be performed. In addition, the presence (or absence) of support services that allow a certain technology to function in a given environment is essential. Also, the availability of renewable energy sources and demand for energy are important factors.
The European Commission (2016) report presents a summary list of assessment criteria that should be addressed for the roll out of new technologies, summarising all aspects to consider (Table 1).
The impact assessment can be performed for several alternative options helping to select the most promising solution.
The selection of specific projects can also be assessed through a multi-criteria scoring process, this is presented in the European Commission (2013) document on impact assessments for Smart Cities. Here a scoring process is proposed for solutions developed by specialists partici-pating in the Smart Cities Stakeholder Platform (Table 2).
8 Pezzutto S., R. Fazeli, M. De Felice (2016) demonstrate that factors beyond the quality of the projects are three times more likely to lead to failure of a smart city project in Europe.

15
Dimension Roll-out potential evaluation criteria
Technology
• Is the technology well-established?• Is the technology standardised and/or interoperable with different IT systems?• How big and complex is the netting support required to sustain the project
from a technological perspective?
Socio-cultural• How relevant is the involvement of the society for the solution to work?• Is the solution responding to a pressing need (general perspective)?• Would the solutionrequire a radical change in the users’ habit?
Political-institutional• Is the project requiring strong political commitment to be developed (general perspective)?• Would the administration need to be directly involved?
Economic / Business
• Is the project able to achive economies of scale if its size is increased?• Can the project benefit economically from international implementation (e.g. standardisation of
technology / equipment / solutions, etc.)?• Is the business model flexible to changes?
Source: European Commission9
CriterionScoring
1 2 3 4 5
Potential for CO2 emission reduction
Slight reduction of CO2 emissions (<10%)
Moderate reduction of CO2 emissions (10-50%)
Significant reduction of CO2 emissions (>50%)
Zero CO2 emissions
Negative CO2 emissions
Potential for increasing share of renewables
No integration of renewables
Integration of less than 10% of renewables*
Integration of less than 20% of renewables
Integration of less than 50% of renewables
Integration of over 50% of renewables
Increasing energy efficiency
Slight reduction of energy / fuel consumption (<10%)
Moderate reduction of energy / fuel consumption (10-50%)
Significant reduction of energy / fuel consumption (>50%)
Zero energy performance
Excess energy returned to the energy system
Affordability (estimated increasing energy costs for end users)
Significant cost increase (>20%)
Moderate cost increase for end users (10-20%)
Slight cost increase for end users (0-10%)
No increasing costs
Cost reduction
Economic viability (period for return of capital)
Over 20 years Up to 20 years Up to 15 years Up to 10 years Up to 5 years
Table 1: Assessment criteria for roll-out potential
Table 2: Assessment criteria for roll-out potential
9 Analysing the potential for wide scale roll out of integrated Smart Cities and Communities solutions (p. 63) https://ec.europa.eu/energy/sites/ener/files/documents/d2_final_report_v3.0_no_annex_iv.pdf

16
T h e m a k i n g o f a s m a r t c i t y : r e p l i c a t i o n a n d s c a l e - u p o f i n n o v a t i o n i n E u r o p e
CriterionScoring
1 2 3 4 5
Innovative nature/ progress beyond the state-of-the-art
No elements of innovation
Low smartness of: • energy
conversion,• materials, • power
matching.
Moderate smartness of: • energy
conversion,• materials, • power
matching.
High smartness of:• energy
conversion,• materials, • power
matching.
Exceptional smartness of:• energy
conversion,• materials,• power
matching.
Multidisciplinary/ multi technology approach
Integration aspects not addressed
Low potential for multi-layer integration within and between sectors*
Moderate potential for multi-layer integration within and between sectors*
High potential for multi-layer integration within and between sectors*
Proven record of multi-level integration within and between sectors
Flexibility
Extreme sensitivity to internal and external disturbances
Significant sensitivity to internal and external disturbances
Moderate sensitivity to internal and external disturbances
Low sensitivity to internal and external disturbances
No sensitivity to internal and external disturbances
Integration into the existing urban energy system (facilities and infrastructures)
No possibility to integrate with existing facilities and infrastructures
Significant problems to integrate with existing facilities and infrastructures
Moderate problems to integrate with existing facilities and infrastructures
Some problems to integrate with existing facilities and infrastructures
No problems to integrate with existing facilities and infrastructures
Potential for scale-up and replication
No modularity and applicability in a very specific city context
No modularity and applicability in a specific city context
Modularity and applicability in a specific city context
Modularity and wide applicability
Modularity and applicability in any city context
Barriers to market entry (e.g. vendor lock-in or non-inter-operable protocols and rules)
No demand and new business models required
Low demand and no possibility to apply existing business models
Low demand and possibility to apply existing business models
Moderate demand and possibility to apply existing business models
High demand and possibility to apply existing business models
Regulatory requirements
Additional regulation that imply significant costs to the society required
Additional regulation that imply bearable costs to the society required
Additional regulation required with slight complexity of implementation
Additional regulation required which is easy to implement
No requirements for additional regulation
Potential for involving stake-holders (user friendly technology)
Interaction with stakeholders requires additional measures which are difficult to implement and involves additional high costs to society
Interaction with stakeholders requires additional measures which are difficult to implement and involves additional but affordable costs to society
Interaction with stakeholders requires additional measures with slight complexity of implementation that involves additional but affordable costs to society
Interaction with stakeholders requires - easy to implement - additional measures to improve the acceptability with no costs to the society
Easy interaction with stakeholders - no additional measures required
Source: European Commission10
10 Financing Model for Smart Cities’, Finance Working Group, Guidance Document, Smart Cities and Communities, Brussels, p. 14 https://eu-smartcities.eu/sites/all/files/Guideline-%20Financing%20Models%20for%20smart%20cities-january.pdf

17
Characteristics of factors affecting
technology choices
In the context of smart cities, we propose to distinguish between different market sectors of technology appli-cations, as the associated markets are quite different. Understanding the characteristic of the markets in which the technology groups fall is important. It is also necessary in projects to understand how the different technologies and their markets interact. ICT for example, is a key enabler for many solutions, but energy systems, combined with ICT, also create new conditions for new technologies. ICT solutions, combined with new grid hardware, enables the existence of prosumers. This means that, for example, an apparently stand-alone building retrofitting project can easily become part of an integrated subsequent change in the grid which allows the dwellers to become prosumers, if the project incorporated energy producing technolo-gies, such as PV. Understanding the characteristics of the different technologies is central to the development of integrated solutions.
Presently, and following the SCIS approach, we have three sectors:
• Energy, divided into:a. Energy efficiency in buildings
(residential and non-residential sectors);b. Energy system integration
(energy sources and use, including heating).
• Mobility and transport
• ICT
In these three sectors, however, different measures and specific technologies can be applied for implementation of energy-efficient sustainable solutions:
• InsulationThis includes insulation of floor, roof, cavity wall, exterior facade.
• Renewable heat This includes heat pump, heat pump with boiler, solar heating device.
• Renewable electricityThis includes solar photovoltaic (PV) (individual, collective).
• Energy managementThis includes, among others, a self-learning, modulating thermostat for central heating.
(A modulating thermostat represents the higher end of control positioning. In modulating/proportional control the output varies continuously and is not limited to being fully open or fully closed, such as with an on/off or a floating control thermostat. Self-learning capabilities are also included).
• Efficient appliancesThis includes labelling of equipment (e.g. A++ for a washing machine).
• Efficient ventilationThis includes ventilation with heat recovery, demand-response ventilation.
• Efficient lightingThis includes LED lighting.
• Other installationsFor example, water-reduced shower, heat recovery shower system.
• Technologies or performance measures in relation to nearly zero-energy buildings (NZEBs)For example, all electric houses (no gas supply).
• Electric transportElectric charging facilities.
• Grids and ICT-related measures or technologies (linked with energy management)Smart meters, demand response.
For any project, it is important to define the technology groups that fit the purpose of the replication, as well as understanding their ‘fit’ into other city technologies to which the project may be related or connected.
In most smart city concepts, an overall objective is present that implies the integration of several different technolo-gies. As an example, in the Netherlands, several ‘all electric’ or ‘zero on the measuring device’ concepts are realised, both in newly built dwellings and in renovation projects. In these concepts a combination of a high degree of insula-tion (insulations of walls, floors, cavity walls, HR++ glass in windows) is combined with an air/water heat pump to provide heating and cooling and with rooftop PV to provide electricity.

18
T h e m a k i n g o f a s m a r t c i t y : r e p l i c a t i o n a n d s c a l e - u p o f i n n o v a t i o n i n E u r o p e
When examining the implementation of different technology groups, a number of factors need to be defined in order to assess the applicability of a specific technology group in a certain geographical or policy context.
These factors include:
• Sector of the application: this is the market sector of the application, for example service buildings, residential sector, public transport, private or public ICT applications (smart meters vs. city management and control tools);
• Lifespan of a technology or measure: this relates to the actual lifetime of a measure or technology. For example, the typical lifespan of a wall insulation measure is 40 years;
• Estimated annual savings, expressed as GJ/year per EUR 1 000 investment;
• Cost-efficiency, expressed in payback time (in years) or internal rate of return (IRR);
• Applicability: is the technology or the measure appli-cable to the proposed context? For example, where a building is situated in a wooded area with abundant shadow, a rooftop PV technology will not be feasible;
The different technology groups have their own characteristics with regard to lifespan (typically, insulation measures have about a 40-year lifespan; new appliances have a lifespan of around 10 to 20 years). Also, the annual savings per €1 000 of investment can range from 1 to 50 GJ/year. Therefore, the selection of measures and choice of technologies is a case-specific combination for every project, which will also depend on the local policy regime (for example, state subsidies for insulation, net metering of solar energy, etc.).
In every technology group there are a number of options. For example, when deciding on a PV roof solution for an office building, the available surface may dictate the use of highly efficient solar panels of 20 % (which are more expen-sive), or for lower efficiency (16 %) solar panels, depending on whether the surface area available has no limiting factor. As in this case, there is an optimised solution for every specific situation. This makes a top-bottom integral approach important.
Replication is therefore dependent on a number of criteria. Initially, in most cases, a local optimisation and choice of applicable technologies will be made. This is then followed by a more detailed investigation of suitable technologies to see if there is a similar project elsewhere, which may be suitable for replication.
A required action for replication is to analyse the different technology factors and how they fit to the purpose of the replication.
The Table 3 and Table 4 are primarily focused on (energy) technology in buildings, and are based on available data in the Netherlands. The complete list (Annex 2) also includes data on ICT (energy management, data management, advanced control), but does not include specific data on mobility and transport (other main themes in SCIS), as these data are scarce in the context of smart cities.

19
Technology group LED lightingsingle glass to HR++
glass -Implementation user times
Registration energy use
Sector Non-Residential Non- Residential Non- Residential
a. Lifespan (year) 7 20 5
b. Annual savings (GJ/yr per 1,000 € investment)
8,8 1,4 142
c. Cost Efficiency-Payback time
< 1 year 5-7 years < 1 year
d. Applicability no constraints no constraints no constraints
Technology groupSingle
glass to HR ++
PV solar rooftop (indivi-
dual)
Heat Pump
Replace- ment
washing machine
to A+++
Insulation of cavity
wall
Insulation of roof
Sector Residential Residential Residential Residential Residential Residential
a. Lifespan (year) 25 15 20 20 40 25
b. Annual savings (GJ/yr per 1,000 € investment)
3.9 1.2 2,7 1,6 9,4 1,6
c. Cost Efficiency-Payback time
5-7 years 5-7 years 10-15 years
5-7 years 3-4 years Pay-back 5-7 years
d. Applicability
No limit for new
buildings, case to
case for old buildings/
renovation
depends on location
and local radiation
profile
case dependant,
heat demand is
leading
no constraints
no constraints
no constraints
Table 3: Technology group assessment in the case of buildings
Table 4: Technology group assessment in the the case of buildings, cont
Choosing the right technological approach is a prerequisite for replication, but it does not ensure success. Many projects do not succeed or do not reach their full technological
potential due to non-technological factors. We will present three key types of those factors: financial & economic, regulatory & administrative and social & stakeholder uptake.

20
T h e m a k i n g o f a s m a r t c i t y : r e p l i c a t i o n a n d s c a l e - u p o f i n n o v a t i o n i n E u r o p e
The financial and economic aspects of the project are naturally crucial elements for replication. A sound project’s financing analysis should be based on the evaluation, inter alia, of the following elements: financial costs, financial risks, hidden and unforeseen costs, and financial solutions. Energy-efficiency projects have a specific economic profile as the return on investment is ensured, in most cases, through energy savings (and hence on energy price levels) and not through an increase in revenues.11
Financial costs
The project’s financial analysis assesses the economic viability of the investment plan. With this purpose, the analysis should provide an accurate estimation of the financial costs associated to the project in order to make a proper evaluation of the overall level of profitability of the investment.
Financial costs entail initial capital expenditures (CAPEX), necessary for the realisation of the project, and operational expenditures (OPEX), essential for a smooth development of the project. A sound analysis of OPEX should also focus on variable costs and the probability associated to price volatility in the investment area. This is an important element to take into account in any investment project. It becomes an even more important and relevant issue when it comes to assess the possibility to replicate an investment project in another geographical area.
Hidden and unforeseen costs
Smart city projects require the participation of a large number of stakeholders. Accordingly, changes in some of the stakeholders’ behaviour may affect the overall profita-bility of the investment. This section takes in consideration three main factors.
Firstly, the so-called ‘rebound effect’ is a well-documented phenomenon, according to which when energy efficiency improves, consumption tends to increase as a consequence. Therefore, due to a modification in consumers’ behaviour, a gap arises between the potential and the actual annual energy net saving. This might consequently increase the initial project’s cost estimations.12
Secondly, an additional source of uncertainty regards projects relying on public subsidies, as they might experi-ence a change in the regulatory environment. The recent changes occurred in RES financing rules in Spain is a clear example.
Finally, timing is crucial in energy efficiency projects. As energy efficiency technology is, at present, a fast-moving technology, investments completed before the project-spe-cific technology has reached its final stage of development may generate a relative lower ROI.
Financial risks
Financial risks are associated to the level of returns that the project might generate. Nevertheless, estimating the returns on the investment (ROI) on the basis of annual energy net saving is a more difficult exercise than deter-mining the expected cash flow generated by a project. The annual energy net saving, indeed, depends on other factors, such as stakeholders’ behaviour (see next section). For this reason, a certain level of uncertainty is embedded in energy efficiency projects.
In addition, energy-efficiency measures tend to ensure ROI on a relatively longer lifespan, increasing therefore the level of risk associated to the project. Additional finan-cial risk comes from insufficient knowledge of energy efficiency in buildings and other smart city technology types. In combination with a relatively small market size for high energy-efficient technologies, those are among the most relevant concerns for financiers, which contribute to increase difficulty in finding private funds ready to invest in energy efficiency projects.
FINANCIAL AND
ECONOMIC FACTORS
11 Bullier, A. and Milin, C. (2013): Alternative financing schemes for energy in buildings, ECEEE Summer Proceedings, p.795-805.12 ‘There is clear evidence for direct rebound effects for household energy efficiency for space heating/ cooling, personal transport, white goods and lighting which are estimated in the range 10-30%’ for developed countries, in Maxwell et al (2011). See http://ec.europa.eu/environment/eussd/pdf/rebound_effect_report.pdf
21
Considering financial solutions
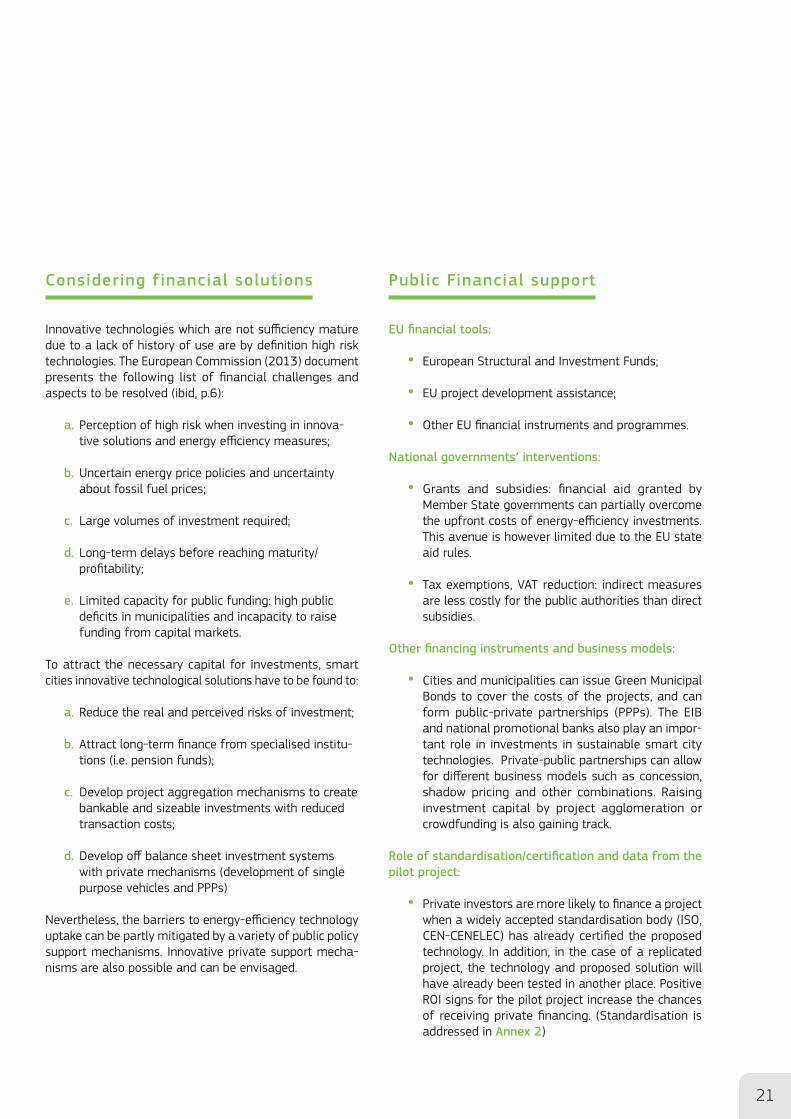
Innovative technologies which are not sufficiency mature due to a lack of history of use are by definition high risk technologies. The European Commission (2013) document presents the following list of financial challenges and aspects to be resolved (ibid, p.6):
a. Perception of high risk when investing in innova-tive solutions and energy efficiency measures;
b. Uncertain energy price policies and uncertainty about fossil fuel prices;
c. Large volumes of investment required;
d. Long-term delays before reaching maturity/profitability;
e. Limited capacity for public funding: high public deficits in municipalities and incapacity to raise funding from capital markets.
To attract the necessary capital for investments, smart cities innovative technological solutions have to be found to:
a. Reduce the real and perceived risks of investment;
b. Attract long-term finance from specialised institu-tions (i.e. pension funds);
c. Develop project aggregation mechanisms to create bankable and sizeable investments with reduced transaction costs;
d. Develop off balance sheet investment systems with private mechanisms (development of single purpose vehicles and PPPs)
Nevertheless, the barriers to energy-efficiency technology uptake can be partly mitigated by a variety of public policy support mechanisms. Innovative private support mecha-nisms are also possible and can be envisaged.
Public Financial support
EU financial tools:
• European Structural and Investment Funds;
• EU project development assistance;
• Other EU financial instruments and programmes.
National governments’ interventions:
• Grants and subsidies: financial aid granted by Member State governments can partially overcome the upfront costs of energy-efficiency investments. This avenue is however limited due to the EU state aid rules.
• Tax exemptions, VAT reduction: indirect measures are less costly for the public authorities than direct subsidies.
Other financing instruments and business models:
• Cities and municipalities can issue Green Municipal Bonds to cover the costs of the projects, and can form public-private partnerships (PPPs). The EIB and national promotional banks also play an impor-tant role in investments in sustainable smart city technologies. Private-public partnerships can allow for different business models such as concession, shadow pricing and other combinations. Raising investment capital by project agglomeration or crowdfunding is also gaining track.
Role of standardisation/certification and data from the pilot project:
• Private investors are more likely to finance a project when a widely accepted standardisation body (ISO, CEN-CENELEC) has already certified the proposed technology. In addition, in the case of a replicated project, the technology and proposed solution will have already been tested in another place. Positive ROI signs for the pilot project increase the chances of receiving private financing. (Standardisation is addressed in Annex 2)

22
T h e m a k i n g o f a s m a r t c i t y : r e p l i c a t i o n a n d s c a l e - u p o f i n n o v a t i o n i n E u r o p e
Financing models depend on a large scale of aspects and there is no “one size fits all” solution for all the cities, even for exactly the same technology. For instance, in some countries, infrastructure could be publicly financed and then covered by taxation/service fees on a local or national level. In some other countries, charges for services may not be legally permitted; hence impacting different types of project financing.
EU Funding Support
The European Commission places high importance in urban regeneration in deployment of urban innovations. This goes beyond the EIP for Smart Cities and Communities initiative and key to replication of urban solutions. In 2014, the EC published new guidelines on how to combine different sources of EU funding support.13
European Structural and Investment Funds, Cohesion Policy, the EU’s Competitiveness and Innovation Funds Horizon 2020 and COSME, and to some extent the Connecting Europe Facility can support the development, implemen-tation and running of integrated energy, transport and ICT investments. The EU is also expanding the set of financial instruments which can complement EU budget and attract private investment.
Besides, the EIB has already a number of specific funding instruments, active in supporting transition towards energy efficient technologies with the Marguerite Fund , the European Energy Efficiency Fund (EEEF) and the European Fund for Strategic Investments (EFSI).
An array of programmes and financial instruments are available at EU level for cities and communities that wish to move towards more sustainable low-carbon scenarios and develop and adopt innovative technologies. European Structural and Investment Funds, Cohesion Policy, the EU’s Competitiveness and Innovation Funds Horizon 2020 and COSME, and to some extent the Connecting Europe Facility can support the development, implementation and running of integrated energy, transport and ICT investments.
The Covenant of Mayors has a concise yet comprehen-sive ‘quick reference guide’ of financing opportunities of relevance for cities published in their website for the programming period 2014-2020.16
The integration of projects may require the creation of synergies between EU funds. This is not easy due to a number of realities that prevail, namely:
a. The compartmentalisation of EU funds, where different departments are in charge of different funds at national and even at EU level. The admin-istrative procedures and interests of different departments can create a real barrier to develop the full potential of combined funds.
b. Complexity of the projects, requiring knowledge that exceeds the area of competence of the funding and planning administration.
c. Legal barriers, which limit the use of certain funds. Local authorities have been unable to use EFSI funds due to the budgetary limitations.
d. EU and EIB rules that may limit or hamper the use of funds or their combination.
e. Lack of the right institutions to manage complex funding programmes and projects.
In such a landscape, the impact of EU financial resources can be limited. Synergies should not only be regarded as the possibility to combine different funds in single projects; the scaling of SCIS initiatives depends on how synergies can ensure complementarity between different projects and programmes. Complementarity can be highly beneficial to accelerate and secure the impact of SCIS initiatives; the latter can take advantage from “parallel financing”, when projects that complement each other are backed by different EU funds or from “consecutive financing”, when EU programmes intervene in a project lifecycle at different point in time. E.g. large innovation projects in a city may need supporting infrastructure which can be financed by specific EU funds, either from the budget, from the EIB or a combination of both.
The impact of EU funding on smart city development and replication of solutions will largely depend on the national, regional and local authorities. EU funding mechanisms from the structural funds and some other sources offer cities and regions an opportunity to set their priorities in line with the development of smart regions and smart cities. It is thus mainly in the hands of the national and regional authorities to design the right framework, involving local authorities and the municipalities to work to design a coherent smart
13 European Commission (2014) ‘Enabling synergies between European Structural and Investment Funds, Horizon 2020 and other research, innovation and competitiveness-related Union programmes”, guidance for policy-makers and implementing bodies, DG Regio, Brussels. http://ec.europa.eu/regional_policy/sources/docgener/guides/synergy/synergies_en.pdf14 For more information see www.marguerite.com.15 For more information see www.eeef.eu.16 Covenant of Mayors quick reference guide, Financing Opportunities for Local Climate and energy Actions: www.covenantofmayors.eu/IMG/pdf/Quick_Reference_Guide_-_Financing_Opportunities_updated2016.pdf

23
economy. This requires a strong local engagement and integrated approaches to planning.
For any financial model not based on full direct grants, the monetisation of the benefits of new technologies is required. This will be the case the majority of replication cases. The returns can be categorised as follows (European Commission, 2013, p.10):
a. economic returns resulting from national and international financial mechanisms that encourage the use of renewable energy sources and the reduction of CO2 emissions, for example through new market mechanisms such as White Certificates, Green Certificates or Emission Trading17;
b. economic returns resulting from the sale of new services such as distributed energy management, telemedicine, broadband availability, essentially achieved because of SMART infrastructures;
c. economic returns resulting from the sale of energy produced or saved and fed into the grid;
d. economic returns arising from the cost reduction of existing urban services, for both businesses and citizens;
e. Efficiency returns generated by the increase in the quality and efficiency of urban infrastructures.
f. Image returns: projects with strong implications of social nature can attract the interest of Impact Investors,that is those who are looking for initia-tives able to generate blended returns (mixed of financial and social returns).
The examples below may all contribute to promoting the introduction of new technologies if well designed.
Project Financing
Project financing means that the financial burden is partially or wholly born by private capital, it could thus also be a public private partnership. This requires a financial plan able to ensure self-financing for the project.
There are a large number of actions which can be under-taken with project financing, as long as there is a cash flow. For some investments, there may be a strong cultural reticence to have them financed by contributions of users, if the activity invested in has a high public value. This public acceptance is an important issue to consider. It is also possible to consider that the income for the project is generated fully or partially by public payments based on performance. While the taxpayers pay, the payment is subject to levels of goods provisions. The operators are thus behaving according to private incentives and the project still has to be ‘viable’.
Project financing can be used for a broad variety of projects; one of its particularly interesting applications is the financing of large-scale infrastructure-related projects.
A number of models are being developed in the area of smart cities, such as the ESCO model or the setting up of urban funds of funds.
ESCO model
The monetisation of benefits from energy investments can take a number of forms; one of the most well-known methods is the creation of ESCOs, i.e. a fund manager with the expertise to charge for the benefits of energy invest-ments, particularly in the areas of energy efficiency. ESCOS have been of central importance to coordinate and manage energy efficiency in buildings programmes, agglomerating projects in dwellings to allow the emergence of a critical mass of operations, reducing costs through efficiencies of scale and transforming the modest returns of individual operations into a sizeable investment opportunity. ESCOs are thus able to charge for the energy savings generated by individual beneficiaries and provide returns to inves-tors allowing the financing of the often considerable initial CAPEX (see Figure 4).
17 White Certificates, or more properly Energy Efficiency Certificates (EEC), are titles that certify the energy savings achieved by various parties through the implementation of specific interventions (e.g. energy efficiency improvements) which have a financial value. Green certificates are a form of incentive through issuance of bank bonds towards the production of electricity from renewable sources. Emissions Trading is an adminis-trative tool used to control emissions of pollutants and greenhouse gases at EU and international level through the monetary evaluation of these emissions and the trade of emission allowances.

24
T h e m a k i n g o f a s m a r t c i t y : r e p l i c a t i o n a n d s c a l e - u p o f i n n o v a t i o n i n E u r o p e
While successful as a model, setting up of ESCOs requires the appropriate regulatory framework and skills.
Urban Development Funds and Holding Funds
Holding Funds (HF) and Urban Development Funds (UDF) are funds created to finance a variety of projects in cities. Holding Funds are set up to invest in different UDF, thus is it is a fund of funds. Authorities can create those funds to delegate them the achievements of specific goals. UDF can create PPPs aimed at realising urban sustainable develop-ment projects.
The EU has been promoting such structures under the Jessica programme (Joint European Support for Sustainable Investment in City Areas)18. The funds aim to invest money in urban projects and the concept is for the projects to be able to be sustainable and recover the investment. The funds are recovered and revolving allowing for a continued stream of projects.
Crowdfunding
Another innovative solution gaining interest but difficult to implement in practice is crowdfunding. Crowd funding raised and pools funding from individuals to support projects. The difficulty of such an approach is the need for the project to be of interest to a large constituency. Nevertheless, crowdfunding has spread and according to Crowdfunding Industry figures it has grown globally from US$ 2.7 billion in 2012 to US$ 34.4 billion in 2015, of which US$ 6.48 billion in Europe.19 Nevertheless only a small fraction has focused in the areas relevant for smart cities.
Crowdfunding can take many forms and may be in the form of donations, equity or loans. Formats may be very innovative, but the design can be complex and also presents number of regulatory challenges. The European Commission supported by a stakeholder forum is examining the strengths and pitfalls of crowdfunding20.
Figure 4: The role of an ESCO for energy efficiency
Equity
Mezzanine
Loans or loan guarantee
Sponsors
Repayments/dividends
Payments basedon savings
Energy servicesagreements
ESCO
Energy end user
Financing mechanisms
Source: Medarova et. al, 2013
18 For more information please refer to http://ec.europa.eu/regional_policy/en/funding/special-support-instruments/jessica/19 Data source www.crowdexpert.com, Crowdfunding industry 2015 101620 More information can be found at https://ec.europa.eu/info/business-economy-euro/growth-and-investment/financing-investment/crowdfunding_en

25
Smart Bond
Authorities may have the ability to issue Smart Bonds, which are real Purpose Bonds. These bonds are paid off following the completion of projects, i.e. achievement of a stated goal, and their return is based on the financial returns of the initiatives covered by the bond. The bond offers a fixed interest rate.
It could also be used for social targets such as the Social Impact Bonds in the UK, where an investment with a social target is financed by bond holders. The bond and interest is repaid based on the returns or savings to the public sector of the investment. The OECD (2016) has performed a study of such bonds.
Spread Shareholding
The spread shareholding mechanism is an interesting alternative to Smart Bonds, but the investors do not by bonds, but shares in the ownership of the infrastructures and services they are financing. This involves a higher level of risk, but the potential of a higher profit and a more active involvement as ‘owners’ of the projects. Investors may finance projects from which they are partially benefi-ciaries. This can be particularly useful for projects such as district heating, which in itself is often resisted by individual households. Shareholding of the district heating system has been a way to align the interests of the individuals to the goals of the collective. For example, collective ownership of district heating systems is common for smaller towns in Denmark.21
Fiscal incentives
Direct funding is not the only possible incentive for invest-ments in cities. Returns to investment are affected by the fiscal regime and tax incentives have been widely used in many sectors to affect behaviour. An area where such incentives can be used is in property related taxation and energy efficiency. This opportunity is rarely used, for example on taxes on the purchase value of properties linked to their level of energy efficiency.
Tax and congestion charges exemptions for electric cars, such as in London or Rome provide incentives to switch to electric mobility, but also may reduce incentives to use the public transport.22
21 A list practical considerations when running a district heating systems owned by the users is presented by the Danish District heating Association in a downloadable presentation: www.smartreflex.eu/fileadmin/user_upload/2__Danish_examples.pdf22 The European Automobile Manufacturers association recently published an overview of measures across the EU., but unfortunately does not cover
solutions at local level: https://www.acea.be/uploads/publications/EV_incentives_overview_2017.pdf

26
T h e m a k i n g o f a s m a r t c i t y : r e p l i c a t i o n a n d s c a l e - u p o f i n n o v a t i o n i n E u r o p e
Among the main enablers and barriers for project imple-mentation is the regulatory environment, which might vary between the different EU Member States. Many of the regulatory/legal factors are based on the different local and regional regulations, and national laws of the Member States; also the EU Directives are implemented with varying nationally developed tools. A regulatory feasibility check should therefore be conducted as a pre-condition before launching a project that is planned to be replicated from another EU Member State or even from another city in the same country.
Smart city projects, whether they are concerning renew-able energy source (RES) generation, retrofitting build-ings or introducing innovative mobility solutions, must comply with numerous rules and regulations, at times by different governance levels – European, national, city, etc. The analysis of the viability of the project, the period for return on investment (ROI) and other factors are strongly influenced by the regulatory situation all stages of planning and implementation. Any major changes in the regulatory environment might pose major challenges for a project’s implementation and its success and such eventualities should be factored in the risk analysis of a project.
Administrative burdens
Administrative burdens very often represent a significant inhibiting factor for the development of low-carbon, RES and energy efficiency projects. One such problem is the number of permits and approvals that must be obtained before the initiation of a project. In some cases, the processing of permits and approvals involves numerous different state agencies. Depending on the location and on the technologies used, energy efficiency project developers can be required to apply for noise, visual, spatial, ecological, heritage and drilling approvals, which can cause major delays.
The administrative burden for project developers can become even more intense when faced with a lack of coordination among the different responsible governmental bodies, and when there is confusion about each body’s responsibilities. This can lead to inconsistencies between the planning and approval processes of different local government authorities.
REGULATORY AND
ADMINISTRATIVE FACTORS
27
The social impact of projects and stakeholder behaviour are becoming central aspects of feasibility studies for Smart City projects. There is a good reason for this. Many projects are affected by stakeholder reactions to new developments, and these can change from location to location due to local customs and preferences. A successful project in one location may result in much smaller benefits in another due to the behaviour of the stakeholders. Experiences from projects show that if the stakeholders are not engaged in the project process itself, there may be a significantly fall in the chances for a project’s success. Similar to choosing the right technology and examining the regulatory environ-ment, stakeholder uptake is a pre-requisite for a successful project implementation. It is common for all projects in SCIS to have a strong stakeholder engagement process included, but a central part of the projects in a number of them, such as CITY-ZEN, SMARTER TOGETHER or REMOURBAN.
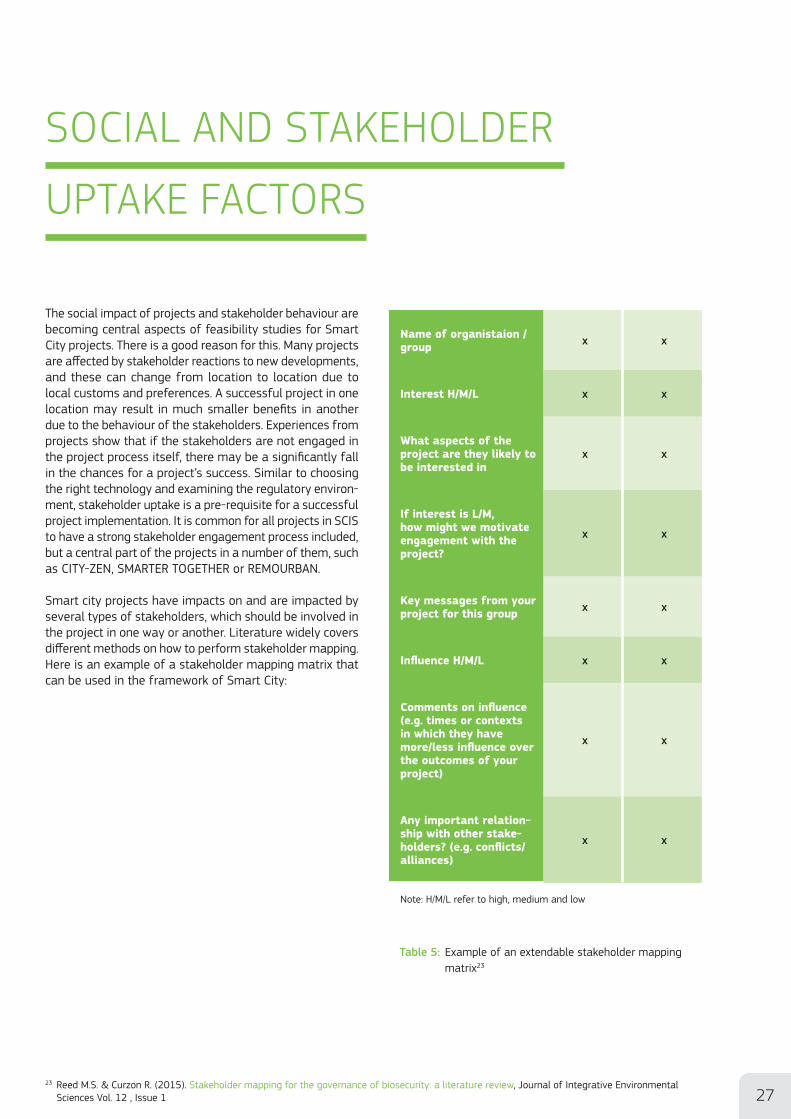
Smart city projects have impacts on and are impacted by several types of stakeholders, which should be involved in the project in one way or another. Literature widely covers different methods on how to perform stakeholder mapping. Here is an example of a stakeholder mapping matrix that can be used in the framework of Smart City:
SOCIAL AND STAKEHOLDER
UPTAKE FACTORS
Name of organistaion / group x x
Interest H/M/L x x
What aspects of the project are they likely to be interested in
x x
If interest is L/M, how might we motivate engagement with the project?
x x
Key messages from your project for this group x x
Influence H/M/L x x
Comments on influence (e.g. times or contexts in which they have more/less influence over the outcomes of your project)
x x
Any important relation-ship with other stake-holders? (e.g. conflicts/alliances)
x x
Note: H/M/L refer to high, medium and low
Table 5: Example of an extendable stakeholder mapping matrix23
23 Reed M.S. & Curzon R. (2015). Stakeholder mapping for the governance of biosecurity: a literature review, Journal of Integrative Environmental Sciences Vol. 12 , Issue 1

28
T h e m a k i n g o f a s m a r t c i t y : r e p l i c a t i o n a n d s c a l e - u p o f i n n o v a t i o n i n E u r o p e
There are three key questions to ask in order to begin ensuring the stakeholder uptake.
What stakeholders do we need
to engage?
Stakeholder mapping needs to be performed in order to identify the relevant stakeholders and their level of impor-tance. It varies from case to case, depending on the nature of the project, local administrative culture, social structures, etc. Below is an illustration of a stakeholder mapping for municipal government.
When do we need to engage
the stakeholders?
This depends on the specificity of the project and the stake-holder mapping. Not surprisingly, SCIS experience shows that the earlier the stakeholders are involved in the project, the better, especially those organisations that have the power of delaying or stopping the implementation of the project. These are usually organisations that issue permits, utilities that need to connect the new developments to the grid, etc. No less important is the involvement of the actual users of the projects – the tenants of the retrofitted buildings, dwelling owners, urban transport passengers, etc. Without them, the project’s aims, which are often associated with environmental benefits (reducing energy consumption, reducing CO2 emissions, etc.), are much less likely to be achieved.
A common stakeholder dilemma
A common barrier to the uptake of innovations in build-ings is the split incentive for tenants and owners. Energy efficiency measures are generally the responsibility of the landlord, while the utility bills are the responsibility of the tenant. The landlord’s incentive is to install the cheapest technologies (often inefficient) because the tenant does not incur the energy consumption costs. The tenant, on the other hand, is generally not interested in energy efficient solutions, because they have no certainty of recovering their investment. Benefits generated through savings tend to require long periods of time.
Another common problem is the rebound effect. The stake-holders may not adapt their behaviour in line with the requirements of the new technology. Many benefits of the new technologies may thus be lost.
Figure 5: Preliminary visualisation of actor networks24
Owner of Infrastructure
or buildingor land
ICTconsultants
Municipality,Local gouvernment
Solutionsproviders
Knowledgeproviders
Investor/ funder
Advisors,consultants
Localbusinesses
Citizens
Nations
Regions
Developer
User
24 Borsboom-van Beurden J., Kallaos J.,Gindroz B., Riegler J., Noll M., Costa S. & Maio R. (2017), Smart City guidance package for integrated planning and management, EIP SCC (intermediate version June 2017); adopted from Nijman, H. (2014), Dynamic roles in smart city development (MSc Philosophy of Science, Technology and Society). University of Twente, Twente, NL

29
PART 2
SCIS PROJECT EXAMPLES

30
T h e m a k i n g o f a s m a r t c i t y : r e p l i c a t i o n a n d s c a l e - u p o f i n n o v a t i o n i n E u r o p e
A ‘low tech’ example of retrofitting
historical buildings: the RIBuild
project on thermal insulation
Historic buildings built prior to 1945 make up a significant part of the European building stock. Many of these buildings have great architectonic and cultural value, but they also consume more than 30 % of the total energy consumption of buildings in Europe. Therefore historic buildings are an important focus area in order to reach the ambitious EU climate and energy targets.
Energy-efficient internal insulation of the external walls is a key factor as the architectural and cultural value of the historic buildings must not be compromised. Potentially, 15-20 % of the energy consumption can be saved by installing internal insulation on external walls. However, installing internal insulation in historic buildings without compromising the buildings’ cultural and architectural heritage can also be subject to a certain risk of failure and high costs. From 2015 till the end of 2019 the EU research
project RIBuild will investigate how internal thermal insula-tion can be employed in a secure and robust way.
The RIBuild project25 provides data that can be used for replication in similar buildings in other cities. The general objective of RIBuild is to develop effective, comprehensive decision guidelines to improve the energy performance of historic buildings by investigating internal insulation measures. The conservation of historic buildings’ cultural values and the improvement of their energy performance can be first seen as rather contradictory. Indeed, a thermal insulation cannot always be applied on the external walls e.g., due to the preservation of the façade. In that case, internal insulation measures should be investigated and currently represent the most difficult retrofit measure in historic buildings.
Consequently, RIBuild will develop guidelines on how to install internal thermal insulation in historic buildings while maintaining their architectural and cultural heritage. The purpose is to reduce energy consumption in historic build-ings in order to meet the EU 2020 climate and energy targets.
IMPLEMENTATION OF
TECHNOLOGIES FOR SELECTIVE
TECHNOLOGY GROUPS
25 http://ribuild.eu/about

31
The GEOCOM project on the
application of geothermal energy
This project is replicable in areas with access to geothermal energy sources.
The GEOCOM project26 was launched in 2010 with a vision to increase the visibility of direct heat applications of geothermal energy throughout Europe. This EUR 11 million project, funded under FP7, demonstrates a wide array of research and demonstration components to provide not only first-hand experience for the communities involved in the project, but also to feed the international scien-tific community with valuable results related to currently pressing geothermal matters, such as reinjection into sandstone reservoirs and transboundary utilisation of geothermal aquifers.
The main objective of the GEOCOM project is to implement pilot-scale demonstration of geothermal energy use on 3 selected demo-sites, Morahalom*1 (Hungary), Galanta*2 (Slovakia) and Montieri*3 (Italy):
Demonstration activities are complemented by applied research tasks on:
1. the technological background of geothermal resources including system optimisation and system integration;
2. the socio-economic aspects of current and future investments.
One of the key elements of the project are the efficient dissemination and training activities that will raise public awareness on RES application and help transfer the project technology and approach to other communities in the region and beyond.
The objective of the project is to demonstrate successful, innovative and inspiring examples for the use of geothermal energy for heat generation that employs cutting-edge, environmentally sustainable and cost competitive technol-ogies combined with innovative energy efficiency measures and retrofitting. All three pilot projects should be considered as in an intermediary phase between ongoing investments and planned projects in the future to take into consid-eration the lessons learned from the current phase. The project results and approach facilitates future investment on regional geothermal resources and will encourage better understanding and perception amongst investors, local and regional decision makers, the public and stakeholders.
On the GEOCOM website a handbook of best practices of geothermal resources management is available.
2
1
3
26 www.geothermalcommunities.eu

32
T h e m a k i n g o f a s m a r t c i t y : r e p l i c a t i o n a n d s c a l e - u p o f i n n o v a t i o n i n E u r o p e
Near zero-energy buildings:
the NEXT-Buildings project
in Houthaven (Amsterdam)
The Houthaven project of Next-Buildings (www.next-build-ings.eu) is a near zero-energy building project that fits the local policy of the city of Amsterdam, which aims at all new developments being carbon neutral by 2015. The Houthaven in Amsterdam West (Stadsdeel West) is one of the carbon neutral pilot projects, setting the standard for cost-effective carbon neutral development in Amsterdam after 2015.
Houthaven used to be a timber handling area where many wood factories and related companies were located. After a long history of industrial activities, Houthaven is being transformed into a residential area. A total of seven islands are under development, providing space for 2 200 dwellings, 70 houseboats and 50 000 m2 of facilities. In the NEXT-Buildings project, 30 000 m2 of net zero-energy buildings have been realised.
The breakdown for Houthaven to become energy neutral will be approximately:
• Energy saving (low energy buildings): 70 %;
• Local renewable energy (PV panels): 22 %;
• Extra savings on electricity by behaviour and ICT solutions: 8 %.
The Houthaven project includes an advanced system of data gathering at households, thereby realizing a demand response mechanism. This generates a local energy market of supply and demand, enabled by smart control:
This integrated approach with ICT and smart control technologies serves as an example for future replication.
Energy systems components at Houthaven project Amsterdam(Source: B. Tubben, EUSEW, June 2014)

33
A combination of
innovative technological ideas
In most smart city concepts, an overall objective is present that implies the integration of several different technolo-gies. As an example, in the Netherlands, several ‘all electric’ or ‘zero on the measuring device’ concepts are realised, both in newly built dwellings and in renovation projects. In these concepts a combination of a high degree of insula-tion (insulations of walls, floors, cavity walls, HR++ glass in windows) is combined with an air/water heat pump to provide heating and cooling and with rooftop PV to provide electricity. Figure 6 shows a possible concept for a house that is energy neutral.
Advanced monitoring
Whereas the above example is an integration of different, relatively high-tech concepts; on a more modest scale, advanced monitoring of energy use is being used to alert users more to their energy consumption profile and to stimulate the energy savings in that way. For example, in the Direction project27, the focus was on the development of new control algorithms in order to improve the ‘intelligence’ of the building energy management system (BEMS), using hardware devices on the market and a large number of sensors, but as simply and cheaply as possible, coupled with system identification techniques.
One of the key lessons of the DIRECTION project is the contribution potential of effective and less expensive energy efficiency solutions in new buildings. There is a tendency to believe that achieving high efficiency or low energy build-ings requires brand new and expensive measures. It is true that not all potential measures are cheap, and some are currently quite expensive indeed. Different solutions do however exist that can be implemented at low additional costs of a building construction. The key to selecting the most appropriate solution depends on the context of the building and the availability of natural resources. To find the best solutions, a pre-analysis phase is necessary to achieve good results and the use of simulations can make a significant difference. This confirms the approach that was articulated in the design steps to be considered (chapter “How to choose the right technology for replication”).
The above examples are illustrative; The SCIS website with its associated database contains many more examples (over 130) that can be filtered to generate the projects that are in the specific scope of interest.
27 www.direction-fp7.eu
Figure 6: Concept of an energy-neutral houseSource: Mitsubishi electric

34
T h e m a k i n g o f a s m a r t c i t y : r e p l i c a t i o n a n d s c a l e - u p o f i n n o v a t i o n i n E u r o p e
The project in San Sebastián focuses on housing retrofitting and District Heating (DH). The former primarily involves the retrofit of private sector housing. As a consequence, the homeowner only will bear the financial cost of approxi-mately € 20.000, which might be partly covered by public grants, and receive ROI, which is estimated to fully payback after 8-9 years. Concerning District Heating, its full instal-lation would require a total investment of approximately € 4 million, taken on by Fomento San Sebastian, and the payback is estimated to take 20 years.
As the installation of District Heating is part of a larger scale urban development of the neighbourhood, the main financial risk related to its implementation is the scarce availability of public and private funds. Nonetheless, the complexity of retrieving funding for the project has been successfully overcome. Regarding retrofitting of private homes, funds were raised at local, regional and national level, thanks to a variety of grants.
FINANCIAL & ECONOMIC
CHALLENGES AND SOLUTIONS
San Sebastián, Spain | REPLICATE

35
In Florence, REPLICATE consists of an energy efficiency project and an e-taxi measure. The total cost of the energy efficiency programme is estimated to be more than € 5 million, divided in three phases: the first, the current phase, with a cost of € 1.6 million; the second, of € 1.5 million; and the third still in processing. The first two phases are expected to receive national contributions for up to 40% of the taxable cost of the project (in the case of the first phase, the taxable cost is around € 1 million).
From a first analysis, the payback of the energy efficiency project is approximately 17 years, without taking incentives into account. Public administrations can access incentives for thermal insulation: they can claim up to 40% of the costs incurred for wall and ceiling insulation, replacement of window enclosures, installation of solar shades, indoor lighting, building automation technologies, and conden-sation boilers. The risk related to this source of financing is that the conditions of the incentive framework can be reviewed by national authorities. Indeed, they were last updated in 2016, after the presentation of the project. This trend could negatively affect the economic sustainability of the project as the administrations that implement energy efficiency interventions may no more fulfil the conditions to claim a contribution.
The e-taxi measure needs an infrastructure investment of approximately € 150.000, which will be funded by private investment and EU funds (75% and 25% respectively). Taxi drivers will benefit from a 30% reduction on the licence fee and favourable offers from e-vehicles producers. The
major financial risk in this case arises from the need to create the infrastructure before the circulation of e-taxi begins. Thus, the investment may not be successful if the e-taxi business sector does not develop as expected, once the adequate infrastructure is set up.
To finance the REPLICATE project, the City of Florence intends to apply for the national contribution of the “Conto Termico (CT) 2.0 “, which funds 40% of the insulation, although with some limitations in the case where incentives are available. However, as mentioned earlier, the public administration need to take into account the regulatory risk related to potential policy changes which can take place if governments face problems in the implementation of the project or if results do not correspond to expectations.
Furthermore, to improve Florence’s resilience to climate change, the city’s Municipality has requested the support of the European Investment Bank (EIB) and a TA agree-ment with the Advisory Hub (Advisory Agreement) has already been signed. The bank’s support will take the form of advisory assistance to support the city in reviewing existing feasibility studies and/or developing Climate Risk and Vulnerability Assessments (if existing). These efforts will lead to the identification of viable adaptation options for existing or future urban infrastructure projects.
Florence, I taly | REPLICATE

36
In Bristol, the REPLICATE project takes the form of invest-ment for housing retrofitting, District Heating (DH) and Electric Vehicle (EV) promotion. As for retrofitting in San Sebastián, the project concerns private sector housing. Consequently, both the financial cost, estimated at £5,000, and the ROI are held with the homeowner. Payback is estimated to be 11 years. For energy efficient retrofitting a number of subsidies exist, including those related to the energy efficiency obligations, feed-in tariffs and renewable heat incentives.
Concerning District Heating, the Council is investing £1.4 million in the connection in the Bristol Pilot, as part of a wider initiative worth more than £13 million. The Council operates on an indicative ROI of 8% per year. The same return is expected for the investment in EV charge points, which is funded with more than £ 2.5 million. The UK government has funded the installation of EV charge points with the regional ‘Go Ultra Low’ project.
The major financial risks are related to fluctuations in energy prices which can make investment in renewables less attractive. Additionally, ROI can be negatively impacted by rising inflation and/or cost of borrowing. As identified in the case of Florence, the risk related to EV is the long-term non-viability of the charging network in the case of a limited uptake of electric vehicles.
In Bristol, the European Commission’s and EIB joint instru-ment ELENA was used as a precursor to a number of initiatives. ELENA is a technical assistance instrument for cities to develop projects worth over € 30 million to reduce emissions by increasing energy efficiency and adopting low carbon technologies. ELENA has been successfully used in a large number of projects28.
Bristol , United Kingdom | REPLICATE
28 For more information please visit: www.eib.org/products/advising/elena/index.htm

37
T h e m a k i n g o f a s m a r t c i t y : r e p l i c a t i o n a n d s c a l e - u p o f i n n o v a t i o n i n E u r o p e
Vitoria-Gasteiz is the capital of the Basque Country and one of leading European cities investing in green economy. The city, which was the European Green Capital in 2012, has 240 000 inhabitants and a high proportion of green public areas, ensuring that the entire population lives within 300 metres of an open green space. Numerous tangible measures are in place to assist and increase biodiversity and ecosystems services. Vitoria-Gasteiz is committed to becoming smarter, using modern technologies to improve the quality of life of the citizens. Citizens play a key role in the definition of strategies covering ICT, mobility, energy and urban environment, working together with public bodies, the private sector and research agents.
The implementation area of the SmartEnCity project in Vitoria-Gasteiz is the Coronación neighbourhood, which is a highly vulnerable area from a social and energy-efficiency point of view. With focus on neighbourhood regeneration, the actions in the demo site cover three main areas:
• Energy rehabilitation of facade and building roofs in 1313 homes;
• Installation of a central heating system and a wood fired hot water boiler;
• Rehabilitation of public spaces (streets, squares, pavement, benches, landscaping, etc.);
Changing regulatory framework
In Spain there was a change to the photovoltaic and auto-consumption legislation. Controversial changes in the support schemes in Spain in the years 2010, 2013 and 2014 first abolished the feed-in tariff and later introduced an access toll to the electricity grid. Over-production is no longer a revenue-generating option and it has affected the project’s viability. In addition, in 2016, Spanish Government introduced a new tariff deficit reduction measure that increases the costs for self-generated solar power, largely based around photovoltaic (PV) technology. The new law requires self-consumption PV system owners to pay the same grid fees that all electricity consumers in Spain pay, plus a popularly called additional ‘sun tax‘. This regulation does not affect the SmartEnCity project directly but it has reduced the value of PV technology.
The lesson from this example is that future public subsidies should not be taken for granted, and the planning stage of project replication should include a preparation of ‘plan B’, in case there is a change to the regulatory environment that may impact the economic viability of the project.
REGULATORY AND
ADMINISTRATIVE CHALLENGES &
SOLUTIONS
Vitor ia-Gasteiz , Spain | SmartEnCity

38
The aim of this project in Norway was to design, realise and communicate good examples of future high-performance buildings. Both the energy and the indoor environment performance of the demonstration buildings under different European climates were greatly improved by holistic retro-fits of the building envelope, the service systems, and the integration of renewables and management systems.
Brandengen School has been a listed building since 1914 so the technical solutions were limited due to the historical value of the building. Drammen Municipality emphasised the need to restore the facades as close to the original as possible, in accordance with the request from the conservation authorities. The need to keep to the historical appearance led to difficulties to install windows reaching passive house standards, as the cost became too high. A special agreement between the contractor and the window developer was needed to manage to reach a mutually acceptable agreement. For cases of retrofitting, the need to develop tailor made components to preserve the histor-ical appearance of buildings causing additional costs and complications which are unique for each case, adding costs, but also making cost estimations difficult.
This example demonstrates the need to take into consideration the specific conditions of the planned replication project.
Drammen, Norway | SCHOOL OF THE FUTURE

39
T h e m a k i n g o f a s m a r t c i t y : r e p l i c a t i o n a n d s c a l e - u p o f i n n o v a t i o n i n E u r o p e
Nottingham is one of the major cities in East Midlands and is situated 130 miles north of London and has an official population of 305,750. The area around Sneinton Road, Sneinton is considered as the most appropriate for the development of REMOURBAN, which is very close to the existing district heating area. There is substantial Nottingham City Council (NCC) housing in the area that needs upgrading to a much more energy efficient state. Technological actions include district heating, energy efficiency in buildings and mobility.29
Stakeholder engagement
The Nottingham project coordination process has included the establishment of monthly team meetings, engaging with all local partners working within the project. It has been noted how important it is to ensure good communication and overall project understanding.
Owners/tenants have been consulted throughout the project, both in planning and implementation stages. Good relation-ships with the residents have been developed, consultations held within homes in the area and encouraging community champions to support with the developments.
The financial costs and benefits have always been discussed with the residents and their opinions sought. Permission
is regularly sought to be able to move ahead with the implementation. It has been essential to provide open and honest consultation throughout the project. This has been achieved through community consultation meetings as well as printed information.
An interesting outcome from the introduction of the electric bus scheme has been the impact on the working relation-ship between the bus drivers. It seems that the capacity for each vehicle to be driven in a way that can maximise emission savings has stimulated a healthy and positive competition between drivers to see which of them can drive the most efficient and save the most energy. This has been good for team building and employee relationships.
Constant communication was kept through utilising the Nottingham City Homes organisational resources and service support. This is the day to day service provided by NCH as part of their management contract for the residences.
SOCIAL AND STAKEHOLDER
UPTAKE CHALLENGES &
SOLUTIONS
Nott ingham, United Kingdom | REMOURBAN
29 Technological interventions: Buildings: 1) An intensive retrofitting program in order to achieve a low energy district (23.318 m2 of conditioned area); 2) The district heating intervention will extend the existing district heating network (4.700 homes) by using the low temperature return heating with additional onsite generation from renewables (Photo Voltaic); 3) Mobile application for home energy control.
Sustainable mobility actions: Multi-modality transport system, including 50 electric buses and charging infrastructure, and crowd-sourcing data connection for traffic.

40
Valladolid is the capital of the autonomous region of Castile and Leon in the north-west part of Spain, and with a population of 307 052 people, it is the biggest city in the region. The demonstration site of the REMOURBAN project in Valladolid covers the FASA district, which has a surface area of 3.5 km2 and is part of the Delicias neighbour-hood, located in the south-east of Valladolid. The district was designed and built at the beginning of the 1960s for workers of the FASA Company. It consists of 19 blocks, a tower, a building for the central boilers, a park, some sports facilities and two car parks. With a total number of 398 dwellings, the FASA district has around 1 180 inhabitants. The buildings in the area are of medium-poor constructive quality and progressively ageing. Its location at the tradi-tional south entrance to the city makes the district part of a strategic area of the city regarding mobility.
The district is also characterized by its high construction density (135 DU/ha) and high population density (340 inhabitants/ha).
Technological interventions include actions of low energy districts, sustainable mobility and integrated ICT with about 5.700 citizens directly involved.
Stakeholder engagement
The demo-site has a stakeholder engagement plan that includes:
• Identify stakeholders;
• Prepare communication and dissemination activities tailored to different stakeholders;
• Design an action plan to carry out the different actions designed for engaging stakeholders during different phases.
The financial benefits are a key incentive to engage tenants in the project. A lot of efforts of the whole local consortium were put into this activity, evaluating different scenarios to raise awareness of the financial and environmental benefits of the project. A specified leaflet, a local webpage and a Frequently Asked Questions section were some of the actions carried out to ensure a better understanding of the benefits of the project.
Constant channels of communication were established. Tenants communicate directly by phone/email and through the relevant webpage with different partners of the consor-tium. The distribution of the local leaflet reached the tenants with information. Tenants use these communication channels intensely.
Valladol id , Spain | REMOURBAN30
30 REMOURBAN is a lighthouse project whose ultimate goal is to design and validate a urban regeneration model in the cities of Nottingham (United Kingdom), Valladolid (Spain) and Tepebasi/Eskisehir (Turkey), while maximising its replication potential in two follower cities, Seraing (Belgium) and Miskolc (Hungary). The model leverages the convergence between energy, mobility and ICT to improve quality of life, ensure social acceptance and empower citizens. REMOURBAN will test a range of technical innovations and solutions as well as new business models for city renovation and strategies addressing non-technical barriers.
www.smartcities-infosystem.eu/sites-projects/projects/remourban

41
PART 3
CASE STUDY: THE CELSIUS PROJECT

42
T h e m a k i n g o f a s m a r t c i t y : r e p l i c a t i o n a n d s c a l e - u p o f i n n o v a t i o n i n E u r o p e
The CELSIUS smart city project
in a nutshell
The CELSIUS smart city project31 aims to increase the deployment and operation of intelligent district heating and cooling systems across Europe, and to support cities in developing secure, affordable and low-carbon heat supplies for its citizens and businesses. Co-funded under the European Commission’s FP7 programme, CELSIUS coordinates with partners throughout the whole spectrum of planning, implementing and optimising new and existing smart infrastructure solutions for heating and cooling. The project includes more than 10 demonstrators, which focus on a full range of innovations and solutions covering at least five categories with regard to the development of district heating and cooling, namely end-user, infrastructure, storage, sustainable production and system integration.
Through the creation of a widespread platform of networking and knowledge, CELSIUS has taken a holistic approach to overcoming technical, social, financial and political barriers to district heating and cooling solutions. As such, the project focuses on maximising the use of waste or
secondary heat that is produced within a city by capturing and then using it in its district heating systems. Starting with five partner cities (London, Rotterdam, Gothenburg, Cologne and Genoa), it has now successfully attracted no less than 66 European cities, which have joined the project as member cities (also referred to as follower cities).
A separate work package in the CELSIUS project is responsible for the recruitment of CELSIUS member cities (followers). In particular, a node group, which includes repre-sentatives from each partner city (Gothenburg, Cologne, London, Rotterdam and Genoa), was established. The node group has worked with participation at events (conferences, seminars, workshops, etc.) to create visibility and spread information about CELSIUS, as well as recruiting CELSIUS member cities. The CELSIUS project team has communi-cated with contacts in their existing networks and generated new contacts at external events. In order to attract cities interested in planning, developing or optimising district heating and cooling systems, the CELSIUS project offers workshops, webinars, study visits to demonstration projects, an expert group, a ’district heating and cooling’ Wikipedia, and a ’district heating and cooling’ network with many different kinds of stakeholders engaged so that the distance to the next collaboration step is not far away.
CASE STUDY:
The CELSIUS project
Here we present the CELSIUS smart city project as a case study to help visualise the replication approach outline above. The CELSIUS smart city project is a relevant and interesting project to present as a case study in that it has attracted numerous follower cities. Replication aspects from a follower city perspective are examined closely, focusing particularly on technology, regulatory and financial aspects, as well as aspects relating to processes to ensure stakeholder engagement and acceptance in the implementation/further development of district heating systems in cities. This is done through a combination of a desk study of the CELSIUS follower cities and in-depth interviews with stakeholders associated with three cities connected to the CELSIUS project, i.e. an interview with Warmtebedrijf Rotterdam, which was responsible for the Rotterdam demonstrator in the CELSIUS project, as well as interviewing representatives from Tilburg and The Hague.
31 See: http://celsiuscity.eu

43
Why cities are interested in follow-
ing the CELSIUS project
A common driving force for developing district heating and cooling systems in many of the CELSIUS follower cities32 is an overarching goal to achieve carbon neutrality within a specified timeframe, often by 2040 or 2045.
The main reason by far as to why cities have chosen to become a follower city of the CELSIUS project is to exploit the opportunity to exchange knowledge and information pertaining to the development of district heating and cooling systems in cities. In some cases, regional cooperation has also been mentioned. Information sought and shared through the CELSIUS project by the various cities differs and is largely dependent on local conditions for developing district heating and cooling systems, in particular historical, political and demographic conditions. Some cities are very specific on what knowledge they wish to gain from inter-acting with other cities. For example, some cities wish to gain knowledge on consumer interfaces and how to educate consumers so that they can benefit from the district heating system, whilst others highlight that they wish to learn from cities that have a more developed district heating system. For some cities, knowledge on district cooling solutions is of interest as this is new to their city and knowledge is required. Some cities are interested in obtaining new and innovative ideas from other cities and also hope to inspire others from their own technological and strategic work. Others would like to share information and experiences with cities facing the same challenges in order to speed up processes, and to look at ways to increase cooperation with other cities.
32 CELSIUS’ follower cities are cities that sign a letter of intent stating that they agree to collaborate with CELSIUS to support its cities in the development of their district energy.
Cooling with river water, Rotterdam
CHP and biofuels, Gothenburg
Waste heat recovery, Cologne

44
T h e m a k i n g o f a s m a r t c i t y : r e p l i c a t i o n a n d s c a l e - u p o f i n n o v a t i o n i n E u r o p e
Technology related challenges
The CELSIUS project focuses on one particular technology, namely sustainable district heating and cooling systems. From a technology perspective, one important aspect is that cities would like to increase the efficiency of their systems, for example by better balancing the heat supply and heat demand. The Rotterdam demonstrator within the CELSIUS project has included the development of an ICT solution to enable a better balance of heat supply and demand. However, in order to replicate this, the ICT solutions need to be adapted to the specific supply and demand profiles of the city that wishes to implement it, as these can differ quite significantly between cities. In developing systems and replicating technological solutions, several cities have raised the challenge of combining heat sources with different temperatures. This tends to be a common challenge which many cities face. Finding the right solutions with regard to combining heat sources into a district heating system will require specific feasibility studies.
Regulatory & administrative
challenges
Most cities highlight that the development of district heating and cooling systems need to be looked at in a long-term perspective, i.e. 40 years, and that investments will need to be taken in incremental steps. This is, of course, challenging for cities when considering the dynamic changes taking place in society and the speed at which innovative solutions are being taken up in the market. These continuous changes influence the business case of district heating and cooling systems. Hence, authorities face challenges in creating a stable regulatory framework on the one hand; yet, on the other, the regulatory framework must adapt to dynamic changes in the market.
Another common challenge for many cities is that the district heating market, unlike the electricity and gas markets, is still a monopoly with vertical integration between network and heat suppliers in most countries. Tariffs are not regulated and often unclear for end-con-sumers, thus creating confidence issues. End-users are suspicious of this, as they do not wish to be dependent on one party. But at the end of the day, customers want
improved heating solutions, and not higher energy bills. Some cities have pointed out that legislation governing the heat market at national level is not appropriate, thus creating barriers, which therefore needs to be changed.
Challenges related
to stakeholder engagement
In some cities, district heating is still an emerging market. People are sceptical about trying something ‘new’ and ‘different’ to what they are used to. Changing the percep-tions of people can be extra challenging if, for example, the heat market is unregulated (as mentioned above) and has previously earned a bad reputation as being inefficient, expensive and unreliable. Generally, engaging (potential) customers as well as other important stakeholders in the further expansion of district heating and cooling systems at an early stage is important. Here, municipalities tend to play a key role in facilitating successful processes, and often look to other cities to learn ‘best practices’.
Financing & economic challenges
From a financial perspective, viability of investments in district heating and cooling systems is contingent on suffi-cient customers being connected to the district heating system. It has been pointed out that a decrease in volumes of demand, due to energy savings, will influence the viability of existing infrastructure as well as new investments in district heating. Energy savings will trigger the need for a re-evaluation and optimisation of the system as a whole. In other words, the viability of new district heating and cooling projects is influenced by other policies, such as policies to induce energy savings. Again, policies and legislation at national level need to account for multiple objectives.

45
Lessons learned
from the CELSIUS case study
We can draw some important conclusions concerning repli-cation opportunities from using the CELSIUS project as a case study. The CELSIUS project covers one technology group, namely district heating and cooling, and it focuses on aspects related to end-users, infrastructure, storage, sustainable production and system integration. The main reason why cities have chosen to become a follower city of CELSIUS is to exploit the opportunity to exchange knowl-edge and information pertaining to the development of district heating and cooling systems in cities. However, the opportunity to replicate solutions is hampered by the fact that cities face different challenges, which are often historically and politically determined.
Several cities have a target to becoming CO2 neutral within the next 20 to 30 years. This is an important driving force for developing district heating (and cooling) systems in cities. But cities are at very different stages of developing their systems; some have several hundreds of kilometres of pipeline, others only a few or they are at a very early stage of developing district heating and/or cooling systems. Long-term and stable political decarbonisation goals and a supportive legislation are crucial elements for the imple-mentation of bankable and sustainable district heating projects.
The issues described above represent some of the key features that influence the development of district heating and cooling systems. These are not exhaustive, but repre-sent a handful of important aspects. What we tend to see is that there is a diversity of challenges; some are similar for all cities, such as the dynamic changes in society and emerging technologies. All cities face similar challenges in adapting the regulatory framework to these changes, yet are trying to ensure a long-term stable framework for the development of district heating systems. On the other hand, the developing district heating and cooling systems and the ability for replication can also be hampered by very local conditions, which are often historically or even politically determined. All the same, the majority of the project’s follower cities have highlighted that CELSIUS provides a great platform for exchanging information and sharing experiences on how to address the different challenges in developing district heating and cooling systems.

46
T h e m a k i n g o f a s m a r t c i t y : r e p l i c a t i o n a n d s c a l e - u p o f i n n o v a t i o n i n E u r o p e

47
REFERENCE LIST

48
T h e m a k i n g o f a s m a r t c i t y : r e p l i c a t i o n a n d s c a l e - u p o f i n n o v a t i o n i n E u r o p e
Borsboom-van Beurden J., Kallaos J.,Gindroz B., Riegler J., Noll M., Costa S. & Maio R. (2017), Smart City guidance package for integrated planning and management, EIP SCC (intermediate version June 2017); adopted from Nijman, H. (2014), Dynamic roles in smart city development (MSc Philosophy of Science, Technology and Society). University of Twente, Twente, NL
Bullier, A. and Milin, C. (2013). Alternative financing schemes for energy in buildings, ECEEE Summer Proceedings, p.795-805.
European Commission (2013) ‘Financing Model for Smart Cities’, Finance Working Group, Guidance Document, Smart Cities and Communities, Brussels.https://eu-smartcities.eu/sites/all/files/Guideline-%20Financing%20Models%20for%20smart%20cities-january.pdf
European Commission (2013a), ‘Guidance Document, Integrated Action Plan, Report Process and Guidelines for Smart Cities’, Finance Working Group, Smart Cities Stakeholder Platform.
European Commission (2014) ‘Enabling synergies between European Structural and Investment Funds, Horizon 2020 and other research, innovation and competitiveness-related Union programmes”, guidance for policy-makers and implementing bodies, DG Regio, Brussels http://ec.europa.eu/regional_policy/sources/docgener/guides/synergy/synergies_en.pdf
European Commission (2016), Report on “Analysing the potential for wide scale roll out of integrated Smart Cities and Communities solutions”, Final Report written for DG Energy. https://ec.europa.eu/energy/sites/ener/files/documents/d2_final_report_v3.0_no_annex_iv.pdf
European Innovation Partnership on Smart Cities and Communities: https://eu-smartcities.eu/about
IEC (2014), ‘Orchestrating Infrastructure for Smart Cities’, White paper by the International Electrotechnical Commission.
Maxwell, D., Owen, P., McAndrew, L., Muehmel, K. and Neubauer, A. (2011). Addressing the Rebound Effect, a report for the European Commission DG Environment. See http://ec.europa.eu/environment/eussd/pdf/rebound_effect_report.pdf
Planning and management, Action Cluster Integrated Planning/Policy and Regulation of EIP-SCC (European Innovation Partnership Smart Cities and Communities), Intermediate version June 2017.
McKinsey (2009), Pathways to a low-carbon economy: Version 2 of the global greenhouse gas abatement cost curve. Tech. rep., McKinsey & Company.
Medarova K.,Volkery A., R. Sauter, I. Skinner, S. Withana , J. Núnez Ferrer (2013), ‘Study on the optimal use of EU grants and financial instruments in the next Multiannual Financial Framework to address the climate objective’, report for DG CLIMA, http://tinyurl.com/q8lljw5
OECD (2016), ‘Understanding Social Impact Bonds’, OCED, Paris, www.oecd.org/cfe/leed/UnderstandingSIBsLux-WorkingPaper.pdf
Pezzutto S., R. Fazeli, M. De Felice (2016): “Smart City Projects Implementation in Europe: Assessment of Barriers and Drivers”, pp. 46–55
POCACITO (2016), ‘POCACITO Roadmap, A policy framework for post carbon cities’, FP7 project document, available at http://pocacito.eu/result/eu-roadmap/pocacito-roadmap, last accessed 5 October 2017.

49
Reed M.S. & Curzon R. (2015). Stakeholder mapping for the governance of biosecurity: a literature review, Journal of Integrative Environmental Sciences Vol. 12 , Issue 1
Tigchelaar, C. (2017), Smart City Guidance Package for Integrated planning and management, ECN Policy Studies. intermediate version (June 2017)
Exploring trends and developments in project management today. See https://www.projectsmart.co.uk
Website of the ISO organisation: https://www.iso.org/home.html
A brief introduction to standards: www.din.de/en/about-standards/a-brief-introduction-to-standards
Cooperation between major standardisation organisations in the area of smart cities:www.etsi.org/component/content/article/9-news-events/news/1118-2016-08-news-significant-milestone-for-smart-city-development-major-standards-organizations-from-around-the-world-agree-to-work-together-to-help-move-cities-faster-to-greater-smartness
Sustainable development of communities — Indicators for city services and quality of life. See https://www.iso.org/obp/ui/#iso:std:iso:37120:ed-1:v1:en
Warmtebedrijf Rotterdam transports heat from Rotterdam port to Rotterdam: www.warmtebedrijfrotterdam.nl
CELSIUS demonstrator industrial ecology: http://media.celsiuscity.eu/2015/09/Rotterdam-Wouter-Verhoeven.pdf
SCIS Website – information on projects: www.smartcities-infosystem.eu

50
T h e m a k i n g o f a s m a r t c i t y : r e p l i c a t i o n a n d s c a l e - u p o f i n n o v a t i o n i n E u r o p e

51
ANNEX:
TECHNOLOGY GROUPS,
FACTORS AND SAVINGS
PER EUR 1 000 INVESTMENT

52
T h e m a k i n g o f a s m a r t c i t y : r e p l i c a t i o n a n d s c a l e - u p o f i n n o v a t i o n i n E u r o p e
Annual savings per 1000 euro investments Annual renewable generation per 1000 euros investments
Sector OptionLifespan
YearCategory Investment Total
(GJ/a)Natural gas
(GJ/a)Electricity
(GJ/a)Delivered heat
(GJ/a)
Renewable electricity
(GJ/a)
Renewable heat(GJ/a)
Residential Floor insulation 40 Insulation 1000 2.0 2.0 - 0.0 - -
Residential Cavity wall insulation 40 Insulation 1000 9.4 9.4 - - - -
Residential External wall insulation 40 Insulation 1000 3.7 3.7 - - - -
Residential Roof insulation 25 Insulation 1000 1.6 1.6 - 0.0 - -
Residential Single glazing to HR++ glazing 25 Insulation 1000 3.9 3.8 - 0.1 - -
Residential Double glazing to HR++ glazing 25 Insulation 1000 1.1 1.1 0.0 0.0 - -
Residential Heat pump 20 Renewable heat 1000 2.7 3.8 -1.1 0.0 - 2
Residential Heat pump boiler 15 Renewable heat 1000 2.2 - 2.2 - - -
Residential Selection of Hybrid heat pump in case of replacement 15 Renewable heat 1000 3.8 5.1 -1.3 - - -
Residential Solar boiler 15 Renewable heat 1000 2.5 2.4 0.1 - - 1
Residential Solar PV individual systems 15 Renewable electricity 1000 1.2 - 1.2 - 1 -
Residential Solar OV collective systems 15 Rnewable electricity 1000 1.2 - 1.2 - 1 -
ResidentialModulating, self-learning room thermostat with condensing adjustment of high efficiency boiler
15 Energy management 1000 4.5 4.5 - - - -
Residential Active feedback systems 15 Energy management 1000 3.4 2.8 0.6 - - -
Residential Selection of A+++ in case of replacement of refrigerator 15 Efficient appliances 1000 7.3 - 7.3 - - -
Residential Selection of A+++ in case of replacement of tumble dryer 15 Efficient appliances 1000 4.8 - 4.8 - - -
ResidentialSelection of A+++ in case of replacement of washing machine
20 Efficient appliances 1000 1.6 - 1.6 - - -
Residential Selection of A+++ in case of replacement of freezer 20 Efficient applainces 1000 2.6 - 2.6 - - -
ResidentialDemand driven decentralized ventilation with heat recovery - purchase
20 Efficient ventilation 1000 1.5 1.7 -0.3 0.1 - -
ResidentialDemand driven decentralized ventilation with heat recovery - rental
20 Efficient ventilation 1000 1.1 1.3 -0.2 0.1 - -
Residential DC fans 20 Other installations 1000 0.8 - 0.8 - - -
Residential Shower with heat recovery 20 Other installations 1000 1.6 1.6 - - - -
Residential Balancing of installation 3 Energy management 1000 1.3 1.3 - - - -
Residential Hydraulic balancing 3 Energy management 1000 1.2 1.2 - - - -
Residential Pump switch floor heating 20 Other installations 1000 60.7 - 60.7 - - -
Residential Near zero energy homes – all-electric instead of gas 26 Nearly Zero Energy Buildings 1000 4.3 7.8 -3.5 - - 5
Residential Near zero energy homes – heat supply instead of gas 28 Nearly Zero Energy Buildings 1000 0.7 3.9 - -3.3 - -
ResidentialNOM (‘zero on the meter’) renovation (1.5 mln owner-occupied homes)
50 Nearly Zero Energy Buildings 1000 1.0 1.5 -0.4 - 0 1
Non-residential Near zero energy homes – all-electric 26 Nearly Zero Energy Buildings 1000 5.2 7.8 -2.6 - - 5
Non-residential Near zero energy homes – heat supply 28 Nearly Zero Energy Buildings 1000 0.2 4.4 - -4.1 - -
Non-residential Registration of energy use and taking action 5 Energy management 1000 142.3 70.2 72.2 - - -
Non-residentialChecking if indoor and outdoor sensors have been installed in representative places
5 Energy management 1000 54.8 54.0 0.8 - - -
Non-residential Setting user times 5 Energy management 1000 261.8 185.6 76.2 - - -
Non-residential Optimising settings 15 Energy management 1000 33.5 33.0 0.5 - - -
Non-residential Free cooling 15 Efficient ventilation 1000 24.9 - 24.9 - - -
Non-residential Water balancing 5 Energy management 1000 54.6 53.8 0.8 - - -
Non-residential Weather dependent setting 15 Energy management 1000 94.6 93.2 1.4 - - -
Non-residential Presence detection 10 Energy management 1000 7.0 - 7.0 - - -

53
Annual savings per 1000 euro investments Annual renewable generation per 1000 euros investments
Sector OptionLifespan
YearCategory Investment Total
(GJ/a)Natural gas
(GJ/a)Electricity
(GJ/a)Delivered heat
(GJ/a)
Renewable electricity
(GJ/a)
Renewable heat(GJ/a)
Residential Floor insulation 40 Insulation 1000 2.0 2.0 - 0.0 - -
Residential Cavity wall insulation 40 Insulation 1000 9.4 9.4 - - - -
Residential External wall insulation 40 Insulation 1000 3.7 3.7 - - - -
Residential Roof insulation 25 Insulation 1000 1.6 1.6 - 0.0 - -
Residential Single glazing to HR++ glazing 25 Insulation 1000 3.9 3.8 - 0.1 - -
Residential Double glazing to HR++ glazing 25 Insulation 1000 1.1 1.1 0.0 0.0 - -
Residential Heat pump 20 Renewable heat 1000 2.7 3.8 -1.1 0.0 - 2
Residential Heat pump boiler 15 Renewable heat 1000 2.2 - 2.2 - - -
Residential Selection of Hybrid heat pump in case of replacement 15 Renewable heat 1000 3.8 5.1 -1.3 - - -
Residential Solar boiler 15 Renewable heat 1000 2.5 2.4 0.1 - - 1
Residential Solar PV individual systems 15 Renewable electricity 1000 1.2 - 1.2 - 1 -
Residential Solar OV collective systems 15 Rnewable electricity 1000 1.2 - 1.2 - 1 -
ResidentialModulating, self-learning room thermostat with condensing adjustment of high efficiency boiler
15 Energy management 1000 4.5 4.5 - - - -
Residential Active feedback systems 15 Energy management 1000 3.4 2.8 0.6 - - -
Residential Selection of A+++ in case of replacement of refrigerator 15 Efficient appliances 1000 7.3 - 7.3 - - -
Residential Selection of A+++ in case of replacement of tumble dryer 15 Efficient appliances 1000 4.8 - 4.8 - - -
ResidentialSelection of A+++ in case of replacement of washing machine
20 Efficient appliances 1000 1.6 - 1.6 - - -
Residential Selection of A+++ in case of replacement of freezer 20 Efficient applainces 1000 2.6 - 2.6 - - -
ResidentialDemand driven decentralized ventilation with heat recovery - purchase
20 Efficient ventilation 1000 1.5 1.7 -0.3 0.1 - -
ResidentialDemand driven decentralized ventilation with heat recovery - rental
20 Efficient ventilation 1000 1.1 1.3 -0.2 0.1 - -
Residential DC fans 20 Other installations 1000 0.8 - 0.8 - - -
Residential Shower with heat recovery 20 Other installations 1000 1.6 1.6 - - - -
Residential Balancing of installation 3 Energy management 1000 1.3 1.3 - - - -
Residential Hydraulic balancing 3 Energy management 1000 1.2 1.2 - - - -
Residential Pump switch floor heating 20 Other installations 1000 60.7 - 60.7 - - -
Residential Near zero energy homes – all-electric instead of gas 26 Nearly Zero Energy Buildings 1000 4.3 7.8 -3.5 - - 5
Residential Near zero energy homes – heat supply instead of gas 28 Nearly Zero Energy Buildings 1000 0.7 3.9 - -3.3 - -
ResidentialNOM (‘zero on the meter’) renovation (1.5 mln owner-occupied homes)
50 Nearly Zero Energy Buildings 1000 1.0 1.5 -0.4 - 0 1
Non-residential Near zero energy homes – all-electric 26 Nearly Zero Energy Buildings 1000 5.2 7.8 -2.6 - - 5
Non-residential Near zero energy homes – heat supply 28 Nearly Zero Energy Buildings 1000 0.2 4.4 - -4.1 - -
Non-residential Registration of energy use and taking action 5 Energy management 1000 142.3 70.2 72.2 - - -
Non-residentialChecking if indoor and outdoor sensors have been installed in representative places
5 Energy management 1000 54.8 54.0 0.8 - - -
Non-residential Setting user times 5 Energy management 1000 261.8 185.6 76.2 - - -
Non-residential Optimising settings 15 Energy management 1000 33.5 33.0 0.5 - - -
Non-residential Free cooling 15 Efficient ventilation 1000 24.9 - 24.9 - - -
Non-residential Water balancing 5 Energy management 1000 54.6 53.8 0.8 - - -
Non-residential Weather dependent setting 15 Energy management 1000 94.6 93.2 1.4 - - -
Non-residential Presence detection 10 Energy management 1000 7.0 - 7.0 - - -

54
T h e m a k i n g o f a s m a r t c i t y : r e p l i c a t i o n a n d s c a l e - u p o f i n n o v a t i o n i n E u r o p e
Annual savings per 1000 euro investments Annual renewable generation per 1000 euros investments
Sector OptionLifespan
YearCategory Investment Total
(GJ/a)Natural gas
(GJ/a)Electricity
(GJ/a)Delivered heat
(GJ/a)
Renewable electricity
(GJ/a)
Renewable heat(GJ/a)
Non-residential Daylight dependent setting 10 Energy management 1000 2.5 - 2.5 - - -
Non-residential LED lighting 7 Efficient lighting 1000 8.8 - 8.8 - - -
Non-residential Timed lighting sweep 15 Efficient lighting 1000 50.5 - 50.5 - - -
Non-residential Cavity wall insulation 20 Insulation 1000 4.6 4.6 0.1 - - -
Non-residential Single glazing to HR++ glazing 20 Insulation 1000 1.4 1.4 0.0 - - -
Non-residential Balanced ventilation with heat recovery 15 Efficient ventilation 1000 8.1 8.0 0.1 - - -
Non-residential Heat pump air-water large (10-70 kW) 15 Renewable heat 1000 11.3 17.8 -6.5 - - 10
Non-residential Floor insulation 20 Insulation 1000 0.2 0.2 0.0 - - -
Non-residential External wall insulation 20 Insulation 1000 0.3 0.3 0.0 - - -
Non-residential Roof insulation 20 Insulation 1000 3.4 3.3 0.1 - - -
Non-residential Double glazing to HR++ glazing 20 Insulation 1000 0.7 0.6 0.0 - - -
Non-residential Solar boiler 15 Renewable heat 1000 3.2 3.2 - - - 2
Non-residential Solar PV individual systems 20 Renewable electricity 1000 7.0 - 7.0 - 7 -
Non-residential Demand driven ventilation based on CO2 15 Efficient ventilation 1000 1.9 1.4 0.5 - - -
Non-residential Thermal storage (heat/cold) 15 Renewable heat 1000 3.8 4.7 -0.8 - - 4
Annual savings per 1000 euro investments Annual renewable generation per 1000 euros investments
Sector OptionLifespan
YearCategory Investment Total
(GJ/a)Natural gas
(GJ/a)Electricity
(GJ/a)Delivered heat
(GJ/a)
Renewable electricity
(GJ/a)
Renewable heat(GJ/a)
Residential Insulation 33 Insulation 1000 3.63 3.60 0.00 0.03 - -
Residential Renewable heat 16 Renewable heat 1000 2.81 2.81 0.00 0.00 - 0.93
Residential Renewable electricity 15 Renewable electricity 1000 1.18 - 1.18 - 1.18 -
Residential Energy management 9 Energy management 1000 2.59 2.43 1.16 - - -
Residential Efficient appliances 20 Efficient appliances 1000 2.55 - 2.55 - - -
Residential Efficient ventilation 20 Efficient ventilation 1000 1.30 1.50 (0.25) 0.06 - -
Residential Other installations 20 Other installations 1000 21.03 0.53 20.50 - - -
Residential Nearly Zero Energy Buildings 35 Nearly Zero Energy Buildings 1000 1.99 4.39 (1.31) (1.10) 0.16 1.96
Non-residential Insulation 20 Insulation 1000 1.75 1.72 0.03 - - -
Non-residential Renewable heat 15 Renewable heat 1000 6.11 8.54 (2.43) - - 5.39
Non-residential Renewable electricity 20 Renewable electricity 1000 6.98 - 6.98 - 6.98 -
Non-residential Energy management 9 Energy management 1000 81.39 61.21 20.18 - - -
Non-residential Efficient ventilation 15 Efficient ventilation 1000 11.64 3.14 8.50 - - -
Non-residential Nearly Zero Energy Buildings 27 Nearly Zero Energy Buildings 1000 2.70 6.07 (1.31) (2.06) - 2.36
Non-residential Efficient lighting 11 Efficient lighting 1000 29.66 - 29.66 - - -
Residential Average 21 * 1000 4.78 2.15 2.73 (0.11) 0.10 0.34
Non-residential Average 15 * 1000 31.46 21.89 9.74 (0.16) 0.28 0.84

55
Annual savings per 1000 euro investments Annual renewable generation per 1000 euros investments
Sector OptionLifespan
YearCategory Investment Total
(GJ/a)Natural gas
(GJ/a)Electricity
(GJ/a)Delivered heat
(GJ/a)
Renewable electricity
(GJ/a)
Renewable heat(GJ/a)
Non-residential Daylight dependent setting 10 Energy management 1000 2.5 - 2.5 - - -
Non-residential LED lighting 7 Efficient lighting 1000 8.8 - 8.8 - - -
Non-residential Timed lighting sweep 15 Efficient lighting 1000 50.5 - 50.5 - - -
Non-residential Cavity wall insulation 20 Insulation 1000 4.6 4.6 0.1 - - -
Non-residential Single glazing to HR++ glazing 20 Insulation 1000 1.4 1.4 0.0 - - -
Non-residential Balanced ventilation with heat recovery 15 Efficient ventilation 1000 8.1 8.0 0.1 - - -
Non-residential Heat pump air-water large (10-70 kW) 15 Renewable heat 1000 11.3 17.8 -6.5 - - 10
Non-residential Floor insulation 20 Insulation 1000 0.2 0.2 0.0 - - -
Non-residential External wall insulation 20 Insulation 1000 0.3 0.3 0.0 - - -
Non-residential Roof insulation 20 Insulation 1000 3.4 3.3 0.1 - - -
Non-residential Double glazing to HR++ glazing 20 Insulation 1000 0.7 0.6 0.0 - - -
Non-residential Solar boiler 15 Renewable heat 1000 3.2 3.2 - - - 2
Non-residential Solar PV individual systems 20 Renewable electricity 1000 7.0 - 7.0 - 7 -
Non-residential Demand driven ventilation based on CO2 15 Efficient ventilation 1000 1.9 1.4 0.5 - - -
Non-residential Thermal storage (heat/cold) 15 Renewable heat 1000 3.8 4.7 -0.8 - - 4
Annual savings per 1000 euro investments Annual renewable generation per 1000 euros investments
Sector OptionLifespan
YearCategory Investment Total
(GJ/a)Natural gas
(GJ/a)Electricity
(GJ/a)Delivered heat
(GJ/a)
Renewable electricity
(GJ/a)
Renewable heat(GJ/a)
Residential Insulation 33 Insulation 1000 3.63 3.60 0.00 0.03 - -
Residential Renewable heat 16 Renewable heat 1000 2.81 2.81 0.00 0.00 - 0.93
Residential Renewable electricity 15 Renewable electricity 1000 1.18 - 1.18 - 1.18 -
Residential Energy management 9 Energy management 1000 2.59 2.43 1.16 - - -
Residential Efficient appliances 20 Efficient appliances 1000 2.55 - 2.55 - - -
Residential Efficient ventilation 20 Efficient ventilation 1000 1.30 1.50 (0.25) 0.06 - -
Residential Other installations 20 Other installations 1000 21.03 0.53 20.50 - - -
Residential Nearly Zero Energy Buildings 35 Nearly Zero Energy Buildings 1000 1.99 4.39 (1.31) (1.10) 0.16 1.96
Non-residential Insulation 20 Insulation 1000 1.75 1.72 0.03 - - -
Non-residential Renewable heat 15 Renewable heat 1000 6.11 8.54 (2.43) - - 5.39
Non-residential Renewable electricity 20 Renewable electricity 1000 6.98 - 6.98 - 6.98 -
Non-residential Energy management 9 Energy management 1000 81.39 61.21 20.18 - - -
Non-residential Efficient ventilation 15 Efficient ventilation 1000 11.64 3.14 8.50 - - -
Non-residential Nearly Zero Energy Buildings 27 Nearly Zero Energy Buildings 1000 2.70 6.07 (1.31) (2.06) - 2.36
Non-residential Efficient lighting 11 Efficient lighting 1000 29.66 - 29.66 - - -
Residential Average 21 * 1000 4.78 2.15 2.73 (0.11) 0.10 0.34
Non-residential Average 15 * 1000 31.46 21.89 9.74 (0.16) 0.28 0.84

56
T h e m a k i n g o f a s m a r t c i t y : r e p l i c a t i o n a n d s c a l e - u p o f i n n o v a t i o n i n E u r o p e


@SmartCitiesSCIS
@SmartCitiesInformationSystem
youtube.com/SmartCitiesInformationSystem
Find us on:www.smartcities-infosystem.eu