Mammalian Faunal Change in Eocene Asia and the Pondaung Mammal Fauna of Myanmar
Upload
independentCategory
view
5download
0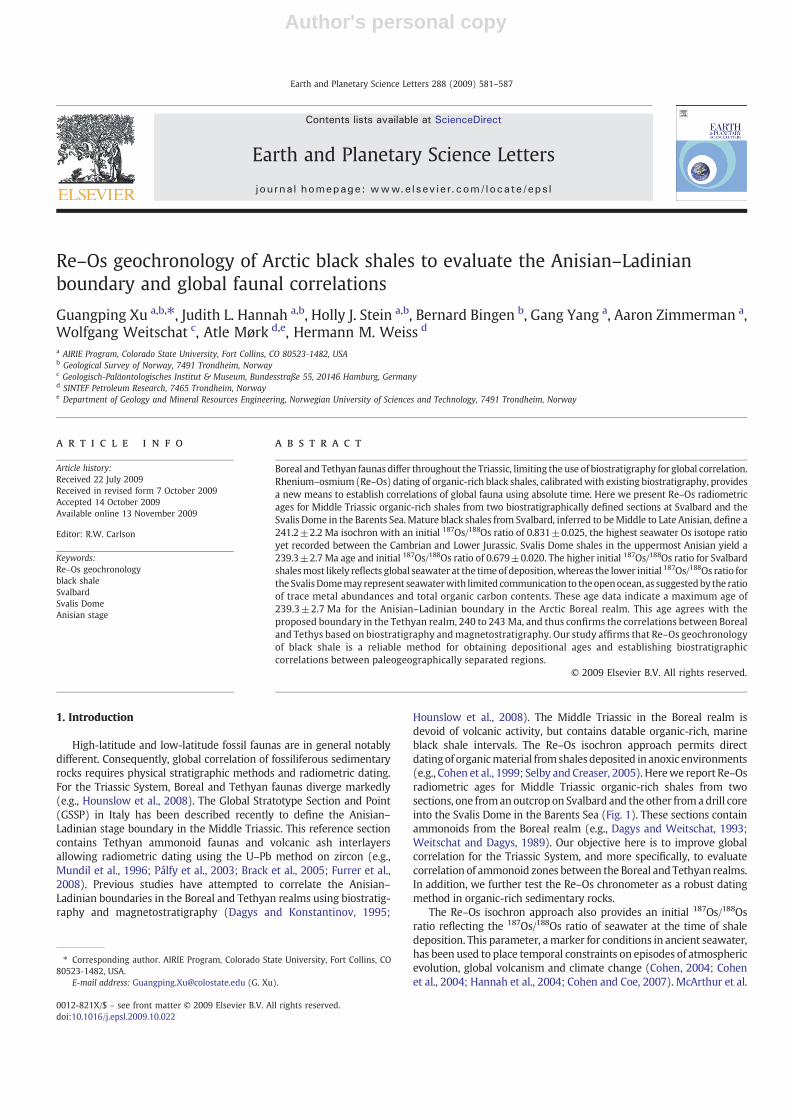
Author's personal copy
Re–Os geochronology of Arctic black shales to evaluate the Anisian–Ladinianboundary and global faunal correlations
Guangping Xu a,b,⁎, Judith L. Hannah a,b, Holly J. Stein a,b, Bernard Bingen b, Gang Yang a, Aaron Zimmerman a,Wolfgang Weitschat c, Atle Mørk d,e, Hermann M. Weiss d
a AIRIE Program, Colorado State University, Fort Collins, CO 80523‐1482, USAb Geological Survey of Norway, 7491 Trondheim, Norwayc Geologisch‐Paläontologisches Institut & Museum, Bundesstraße 55, 20146 Hamburg, Germanyd SINTEF Petroleum Research, 7465 Trondheim, Norwaye Department of Geology and Mineral Resources Engineering, Norwegian University of Sciences and Technology, 7491 Trondheim, Norway
a b s t r a c ta r t i c l e i n f o
Article history:Received 22 July 2009Received in revised form 7 October 2009Accepted 14 October 2009Available online 13 November 2009
Editor: R.W. Carlson
Keywords:Re–Os geochronologyblack shaleSvalbardSvalis DomeAnisian stage
Boreal and Tethyan faunas differ throughout the Triassic, limiting the use of biostratigraphy for global correlation.Rhenium–osmium (Re–Os) dating of organic-rich black shales, calibratedwith existing biostratigraphy, providesa new means to establish correlations of global fauna using absolute time. Here we present Re–Os radiometricages for Middle Triassic organic-rich shales from two biostratigraphically defined sections at Svalbard and theSvalis Dome in the Barents Sea.Mature black shales from Svalbard, inferred to beMiddle to Late Anisian, define a241.2±2.2 Ma isochron with an initial 187Os/188Os ratio of 0.831±0.025, the highest seawater Os isotope ratioyet recorded between the Cambrian and Lower Jurassic. Svalis Dome shales in the uppermost Anisian yield a239.3±2.7 Ma age and initial 187Os/188Os ratio of 0.679±0.020. The higher initial 187Os/188Os ratio for Svalbardshalesmost likely reflects global seawater at the time of deposition,whereas the lower initial 187Os/188Os ratio forthe SvalisDomemay represent seawaterwith limited communication to theopenocean, as suggestedby the ratioof trace metal abundances and total organic carbon contents. These age data indicate a maximum age of239.3±2.7 Ma for the Anisian–Ladinian boundary in the Arctic Boreal realm. This age agrees with theproposed boundary in the Tethyan realm, 240 to 243 Ma, and thus confirms the correlations between Borealand Tethys based on biostratigraphy andmagnetostratigraphy. Our study affirms that Re–Os geochronologyof black shale is a reliable method for obtaining depositional ages and establishing biostratigraphiccorrelations between paleogeographically separated regions.
© 2009 Elsevier B.V. All rights reserved.
1. Introduction
High-latitude and low-latitude fossil faunas are in general notablydifferent. Consequently, global correlation of fossiliferous sedimentaryrocks requires physical stratigraphic methods and radiometric dating.For the Triassic System, Boreal and Tethyan faunas diverge markedly(e.g., Hounslow et al., 2008). The Global Stratotype Section and Point(GSSP) in Italy has been described recently to define the Anisian–Ladinian stage boundary in the Middle Triassic. This reference sectioncontains Tethyan ammonoid faunas and volcanic ash interlayersallowing radiometric dating using the U–Pb method on zircon (e.g.,Mundil et al., 1996; Pálfy et al., 2003; Brack et al., 2005; Furrer et al.,2008). Previous studies have attempted to correlate the Anisian–Ladinian boundaries in the Boreal and Tethyan realms using biostratig-raphy and magnetostratigraphy (Dagys and Konstantinov, 1995;
Hounslow et al., 2008). The Middle Triassic in the Boreal realm isdevoid of volcanic activity, but contains datable organic-rich, marineblack shale intervals. The Re–Os isochron approach permits directdatingof organicmaterial fromshalesdeposited in anoxic environments(e.g., Cohen et al., 1999; Selby and Creaser, 2005). Herewe report Re–Osradiometric ages for Middle Triassic organic-rich shales from twosections, one fromanoutcrop on Svalbard and the other froma drill coreinto the Svalis Dome in the Barents Sea (Fig. 1). These sections containammonoids from the Boreal realm (e.g., Dagys and Weitschat, 1993;Weitschat and Dagys, 1989). Our objective here is to improve globalcorrelation for the Triassic System, and more specifically, to evaluatecorrelation of ammonoid zones between the Boreal and Tethyan realms.In addition, we further test the Re–Os chronometer as a robust datingmethod in organic-rich sedimentary rocks.
The Re–Os isochron approach also provides an initial 187Os/188Osratio reflecting the 187Os/188Os ratio of seawater at the time of shaledeposition. This parameter, amarker for conditions in ancient seawater,has been used to place temporal constraints on episodes of atmosphericevolution, global volcanism and climate change (Cohen, 2004; Cohenet al., 2004; Hannah et al., 2004; Cohen and Coe, 2007). McArthur et al.
Earth and Planetary Science Letters 288 (2009) 581–587
⁎ Corresponding author. AIRIE Program, Colorado State University, Fort Collins, CO80523‐1482, USA.
E-mail address: [email protected] (G. Xu).
0012-821X/$ – see front matter © 2009 Elsevier B.V. All rights reserved.doi:10.1016/j.epsl.2009.10.022
Contents lists available at ScienceDirect
Earth and Planetary Science Letters
j ourna l homepage: www.e lsev ie r.com/ locate /eps l
Author's personal copy
(2008), however, argued that initial 187Os/188Os ratios in water-massrestricted sectionsmay not accurately reflect global seawater ratios.Wecan test this argument, as the Svalis Dome section was deposited in anembayment far from the Panthalassic Ocean, most likely underconditions of restricted water circulation, at least in the narrow apexof the embayment. In contrast, the Svalbard section was much closer to
the open ocean (Mørk et al., 1999; Mørk and Elvebakk, 1999; Riis et al.,2008).
2. Samples and analytical methods
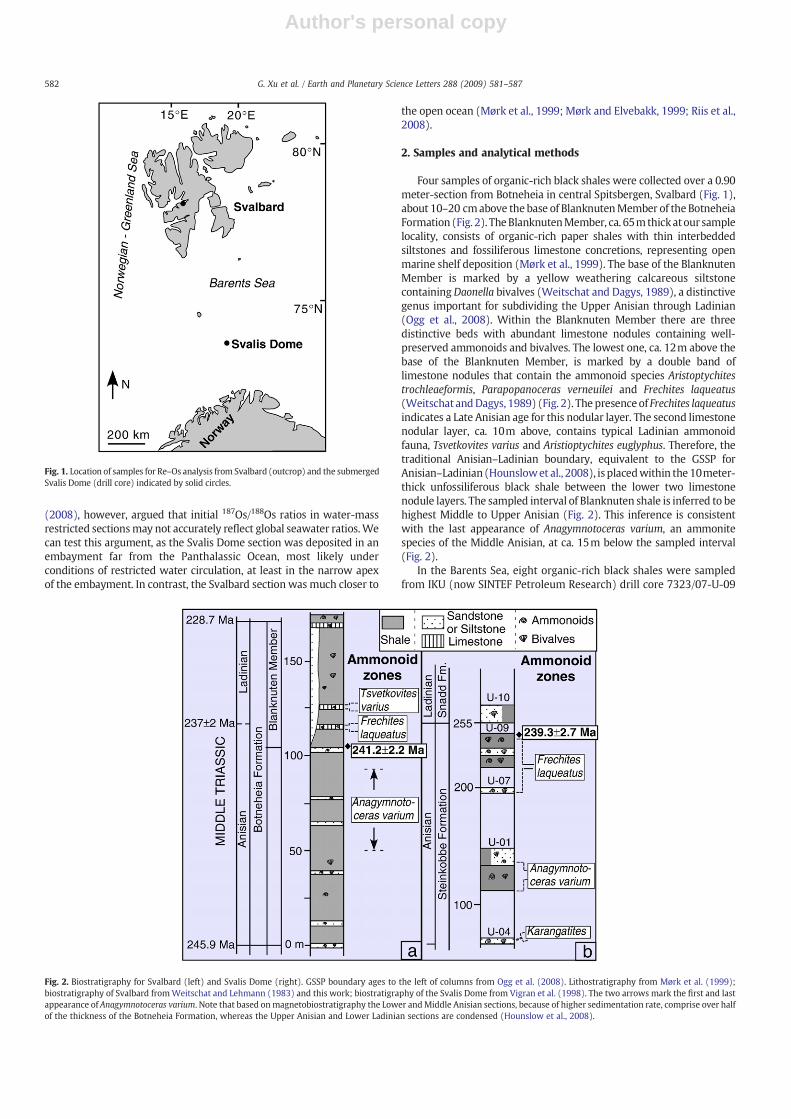
Four samples of organic-rich black shales were collected over a 0.90meter-section from Botneheia in central Spitsbergen, Svalbard (Fig. 1),about 10–20 cmabove the base of BlanknutenMember of the BotneheiaFormation (Fig. 2). TheBlanknutenMember, ca. 65mthickatour samplelocality, consists of organic-rich paper shales with thin interbeddedsiltstones and fossiliferous limestone concretions, representing openmarine shelf deposition (Mørk et al., 1999). The base of the BlanknutenMember is marked by a yellow weathering calcareous siltstonecontainingDaonella bivalves (Weitschat and Dagys, 1989), a distinctivegenus important for subdividing the Upper Anisian through Ladinian(Ogg et al., 2008). Within the Blanknuten Member there are threedistinctive beds with abundant limestone nodules containing well-preserved ammonoids and bivalves. The lowest one, ca. 12m above thebase of the Blanknuten Member, is marked by a double band oflimestone nodules that contain the ammonoid species Aristoptychitestrochleaeformis, Parapopanoceras verneuilei and Frechites laqueatus(Weitschat andDagys, 1989) (Fig. 2). The presenceof Frechites laqueatusindicates a Late Anisian age for this nodular layer. The second limestonenodular layer, ca. 10m above, contains typical Ladinian ammonoidfauna, Tsvetkovites varius and Aristioptychites euglyphus. Therefore, thetraditional Anisian–Ladinian boundary, equivalent to the GSSP forAnisian–Ladinian (Hounslowet al., 2008), is placedwithin the10meter-thick unfossiliferous black shale between the lower two limestonenodule layers. The sampled interval of Blanknuten shale is inferred to behighest Middle to Upper Anisian (Fig. 2). This inference is consistentwith the last appearance of Anagymnotoceras varium, an ammonitespecies of the Middle Anisian, at ca. 15m below the sampled interval(Fig. 2).
In the Barents Sea, eight organic-rich black shales were sampledfrom IKU (now SINTEF Petroleum Research) drill core 7323/07-U-09
Fig. 1. Location of samples for Re–Os analysis from Svalbard (outcrop) and the submergedSvalis Dome (drill core) indicated by solid circles.
Fig. 2. Biostratigraphy for Svalbard (left) and Svalis Dome (right). GSSP boundary ages to the left of columns from Ogg et al. (2008). Lithostratigraphy from Mørk et al. (1999);biostratigraphy of Svalbard fromWeitschat and Lehmann (1983) and this work; biostratigraphy of the Svalis Dome from Vigran et al. (1998). The two arrows mark the first and lastappearance of Anagymnotoceras varium. Note that based onmagnetobiostratigraphy the Lower andMiddle Anisian sections, because of higher sedimentation rate, comprise over halfof the thickness of the Botneheia Formation, whereas the Upper Anisian and Lower Ladinian sections are condensed (Hounslow et al., 2008).
582 G. Xu et al. / Earth and Planetary Science Letters 288 (2009) 581–587
Author's personal copy
over a 1.23m interval in the Steinkobbe Formation at the Svalis Dome(Mørk and Elvebakk, 1999). The basal beds of the Steinkobbe Formationwere dated as early Olenekian stage by palynomorphs, and the entireformation spans Olenekian to Anisian based on both ammonoids andpalynomorphs (Vigran et al., 1998). The Steinkobbe Formation wasdeposited in a deep shelf environment with restrictedwater circulation(Mørk andElvebakk, 1999). The eight sampleswere taken3mabove theLate Anisian Frechites laqueatus ammonoid zone in the uppermost partof the Steinkobbe Formation, near the Anisian‐Ladinian transition(Vigran et al., 1998; Mørk and Elvebakk, 1999) (Fig. 2).
To prepare each sample for analysis, about 20–30 g of shale chips freeof any weathered surfaces were selected from gently crushed samples,and pulverized in an agate mill to create homogenized whole-rockpowders. Contact with metal was avoided at every step, and sampleswerenever heated above about 40°C. Total organic carbon (TOC) content(asweight percent)was determinedwith a LECO® SC-444 instrument atthe Geological Survey of Norway. Mo abundances were measured byinductively coupled plasma atomic emission spectrometry (ICP-AES) atSGS Laboratories in Toronto after digestion by aqua regia. Pyrolysis wasperformed using a Rock-Eval 6 instrument at Geolab Nor (Fugro) inTrondheim, Norway. Tmax is the temperature at which the maximumrelease of hydrocarbons from cracking of kerogen occurs during heatingat 25 °C/min under an inert atmosphere (e.g., Peters, 1986).
Re and Os concentrations and isotopic compositions were measuredby isotope dilution-negative thermal ionization mass spectrometry (ID-NTIMS) on a Triton® (Table 1). Aliquants (100–600 mg) of the homoge-nized powders mixed with 185Re and 190Os spikes were digested by 10–15 mLCrO3–H2SO4 solution (0.2 g of CrO3 permL in 4 NH2SO4) in Cariustubes at 240°C for 48h. Chemical separation and purification of Re andOs follow the protocols outlined in Azmy et al. (2008) and Turgeon andCreaser (2008). Re andOswere dissolved by6 NHNO3 and concentratedHBr, respectively, before loading onto Pt filaments. Re was equallyloaded onto three Pt filaments andmeasured by total evaporation usingFaraday cups. The isobaric interference of BaCl3− on mass 249 (i.e.,185ReO4
−) was monitored at mass 243 during the measurement. The
uncertainties for Re measurement are the standard errors of the threeindependent measurements which generally agree within 1‰. Osisotopic compositions were measured using the single collector peak-hoppingmode.Measured ratios of Oswere corrected for isobaric oxygeninterferences and subsequently corrected for instrumental massfractionation for Os using 190Os/188Os of 3.08271 (Platzner, 1999).Measured 185Re/187Re ratios were only corrected for isobaric oxygeninferences and subsequently 187Re was calculated using 185Re/187Re of0.59739 (Rosman and Taylor, 1998). The 2σ uncertainties for Re and Osabundances, 187Re/188Os and 187Os/188Os isotope ratios, and error corre-lations (rho) are determined by numerical error propagation of uncer-tainties from Re and Os measurements, weighing, spikes and blank. Thein-house standards for Re (RR-4) and Os (C-2) are 0.59751±0.00016(2σ, n=5) for 185Re/187Re and 0.10808±0.00005 (2σ, n=4) for 187Os/188Os, respectively. Regression is based on Isoplot/Ex v3.6.3 (Ludwig,2003), using the 187Re decay constant with uncertainty of 0.31% fromSmoliar et al. (1996). The 2σ errors on the isochron ages were propa-gated from the regression slope, decay constant and their uncertainties.
3. Results
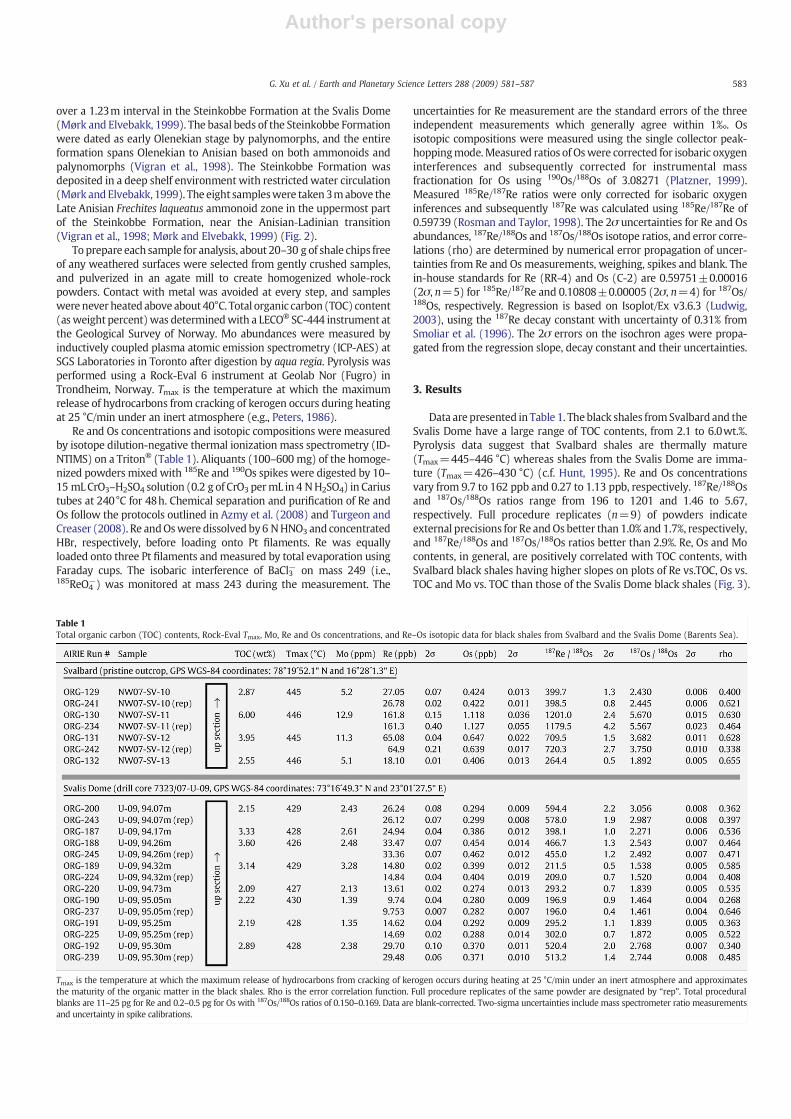
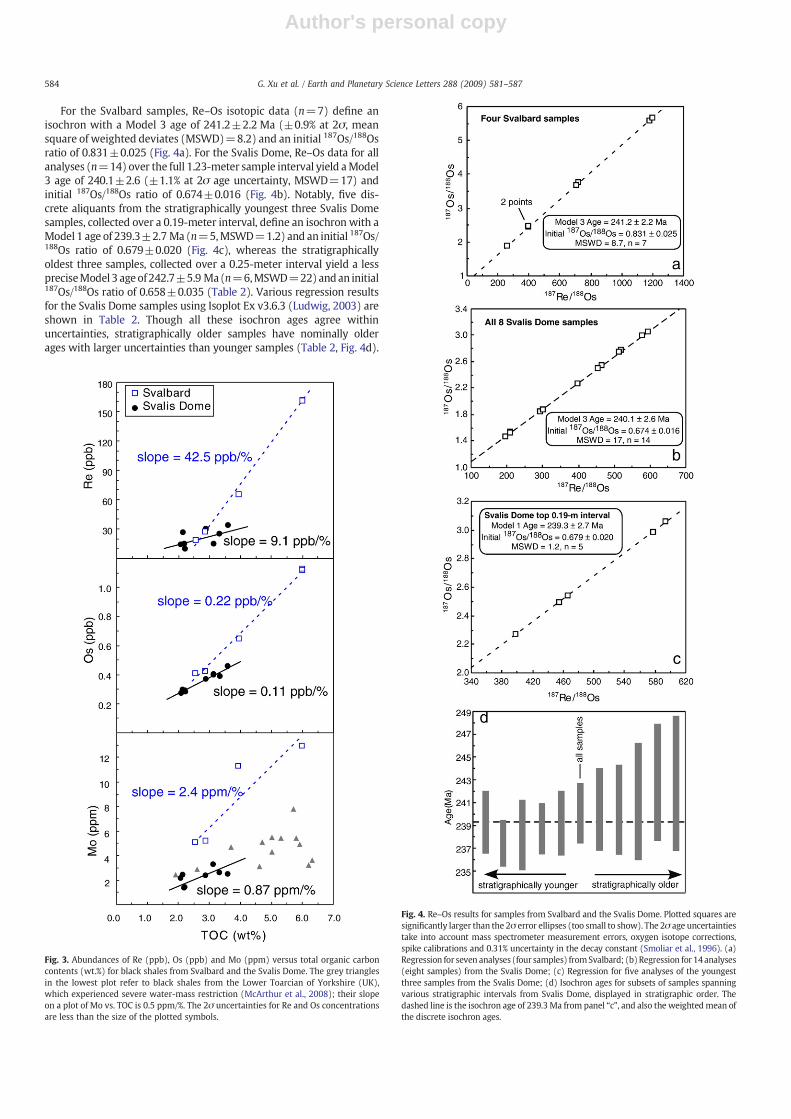
Data are presented in Table 1. Theblack shales fromSvalbard and theSvalis Dome have a large range of TOC contents, from 2.1 to 6.0wt.%.Pyrolysis data suggest that Svalbard shales are thermally mature(Tmax=445–446 °C) whereas shales from the Svalis Dome are imma-ture (Tmax=426–430 °C) (c.f. Hunt, 1995). Re and Os concentrationsvary from 9.7 to 162 ppb and 0.27 to 1.13 ppb, respectively. 187Re/188Osand 187Os/188Os ratios range from 196 to 1201 and 1.46 to 5.67,respectively. Full procedure replicates (n=9) of powders indicateexternal precisions for Re andOs better than 1.0% and 1.7%, respectively,and 187Re/188Os and 187Os/188Os ratios better than 2.9%. Re, Os and Mocontents, in general, are positively correlated with TOC contents, withSvalbard black shales having higher slopes on plots of Re vs.TOC, Os vs.TOC and Mo vs. TOC than those of the Svalis Dome black shales (Fig. 3).
Table 1Total organic carbon (TOC) contents, Rock-Eval Tmax, Mo, Re and Os concentrations, and Re–Os isotopic data for black shales from Svalbard and the Svalis Dome (Barents Sea).
Tmax is the temperature at which the maximum release of hydrocarbons from cracking of kerogen occurs during heating at 25 °C/min under an inert atmosphere and approximatesthe maturity of the organic matter in the black shales. Rho is the error correlation function. Full procedure replicates of the same powder are designated by “rep”. Total proceduralblanks are 11–25 pg for Re and 0.2–0.5 pg for Os with 187Os/188Os ratios of 0.150–0.169. Data are blank-corrected. Two-sigma uncertainties include mass spectrometer ratio measurementsand uncertainty in spike calibrations.
583G. Xu et al. / Earth and Planetary Science Letters 288 (2009) 581–587
Author's personal copy
For the Svalbard samples, Re–Os isotopic data (n=7) define anisochron with a Model 3 age of 241.2±2.2 Ma (±0.9% at 2σ, meansquare of weighted deviates (MSWD)=8.2) and an initial 187Os/188Osratio of 0.831±0.025 (Fig. 4a). For the Svalis Dome, Re–Os data for allanalyses (n=14) over the full 1.23-meter sample interval yield aModel3 age of 240.1±2.6 (±1.1% at 2σ age uncertainty, MSWD=17) andinitial 187Os/188Os ratio of 0.674±0.016 (Fig. 4b). Notably, five dis-crete aliquants from the stratigraphically youngest three Svalis Domesamples, collected over a 0.19-meter interval, define an isochron with aModel 1 age of 239.3±2.7 Ma (n=5,MSWD=1.2) and an initial 187Os/188Os ratio of 0.679±0.020 (Fig. 4c), whereas the stratigraphicallyoldest three samples, collected over a 0.25-meter interval yield a lesspreciseModel 3 ageof242.7±5.9 Ma(n=6,MSWD=22) andan initial187Os/188Os ratio of 0.658±0.035 (Table 2). Various regression resultsfor the Svalis Dome samples using Isoplot Ex v3.6.3 (Ludwig, 2003) areshown in Table 2. Though all these isochron ages agree withinuncertainties, stratigraphically older samples have nominally olderages with larger uncertainties than younger samples (Table 2, Fig. 4d).
Fig. 3. Abundances of Re (ppb), Os (ppb) and Mo (ppm) versus total organic carboncontents (wt.%) for black shales from Svalbard and the Svalis Dome. The grey trianglesin the lowest plot refer to black shales from the Lower Toarcian of Yorkshire (UK),which experienced severe water-mass restriction (McArthur et al., 2008); their slopeon a plot of Mo vs. TOC is 0.5 ppm/%. The 2σ uncertainties for Re and Os concentrationsare less than the size of the plotted symbols.
Fig. 4. Re–Os results for samples from Svalbard and the Svalis Dome. Plotted squares aresignificantly larger than the 2σ error ellipses (too small to show). The 2σ age uncertaintiestake into account mass spectrometer measurement errors, oxygen isotope corrections,spike calibrations and 0.31% uncertainty in the decay constant (Smoliar et al., 1996). (a)Regression for seven analyses (four samples) fromSvalbard; (b)Regression for 14analyses(eight samples) from the Svalis Dome; (c) Regression for five analyses of the youngestthree samples from the Svalis Dome; (d) Isochron ages for subsets of samples spanningvarious stratigraphic intervals from Svalis Dome, displayed in stratigraphic order. Thedashed line is the isochron age of 239.3 Ma from panel “c”, and also the weightedmean ofthe discrete isochron ages.
584 G. Xu et al. / Earth and Planetary Science Letters 288 (2009) 581–587
Author's personal copy
The high MSWDs for isochrons constructed from the older samplessuggest some isotopic disturbance in the samples from the lower part ofthe sampled interval (Fig. 4b, c and d).
4. Discussion
4.1. Significance of the Re–Os shale ages
Two precise Re–Os isochrons provide radiometric ages for sedimen-tation near the Anisian–Ladinian boundary in the Boreal realm. Ages of239.3±2.7 Ma for shale near the Anisian–Ladinian boundary at theSvalis Dome and 241.2±2.2 Ma for shale which is ca. 12–22m belowthe proposed Anisian–Ladinian boundary at Botneheia, Svalbard, areboth consistent with existing biostratigraphic data (Fig. 2). These ages,both late Late Anisian, fully support correlation of the Botneheia andSteinkobbe Formations, which are more than 600km apart (Fig. 1).Since the Svalbard samples are thermally mature and the Svalis Domeshales are immature (Table 1), our results confirm the suggestion byCreaser et al. (2002) that hydrocarbon maturation does not affect theRe–Os isotope system.
McArthur et al. (2008) propose that some isochrons with largeuncertainties and large MSWDs might be caused by water-massrestriction. They argue that small freshwater inputs into stagnantbasins, where Os may be depleted by drawdown into basin sedimentwithout continuous input from the open sea, would lead to localvariation in initial 187Os/188Os ratios and thus introduce geologic scatteron the isochron. Awater-restricted setting is implied for the SteinkobbeFormation from the Svalis Dome, both by the very low slope on the plotof Mo vs. TOC (Fig. 3), and its paleogeographic position at the apex of anarrow, triangular embayment of the Panthalassa ocean (Fig. 5).Therefore, variable initial 187Os/188Os ratios might contribute to theimprecise isochron for the full suite of samples from the Svalis Domespanning the 1.23-meter interval (Fig. 4b).
For an isochron regression, geologic scatter is implied by a highMSWD. The relatively high MSWD for the isochron based on samplesfrom the Botneheia (Svalbard) may reflect the relatively large sam-ple interval (0.9 m), which might include some variability in initial187Os/188Os ratio. Similarly, these data necessitate a Model 3 ratherthan Model 1 fit for the regression. The Model 3 fit assumes that thereal geologic variations in initial 187Os/188Os ratio result in scatter of thedata points beyond analytical uncertainty (Ludwig, 2003). Table 2 andFig. 4c show that a Model 1 fit and acceptable MSWD are achieved forthe Svalis Dome samples only by restricting the sampled interval to theuppermost 19 cm. As samples from lower parts of the interval are
included in the regression, the isochron ages are systematically older, asexpected. The MSWDs and age uncertainties also increase, however,suggesting true geologic scatter in the lower part of the section. Thismaybe the result of variable initial 187Os/188Os ratios because of eitherwater-mass restriction or a very low sedimentation rate. Interestingly, the 2σuncertainties on the initial ratios are relatively low (0.01 to 0.03), and theintercepts for the various regressions do not differ outside of uncertain-ties. Given the many possible causes for small variations in the 187Os/188Os ratio of marine muds, we suggest that minor scatter and highMSWDswill be common for shale isochrons. Our data affirm that scattercan be minimized by sampling a very narrow stratigraphic interval(Cohen et al., 1999).
The weighted mean of ages for isochrons constructed from varioussample intervals from Svalis Dome agrees with the isochron age forthe top 19-cm interval (Fig. 4d). This suggests that, despite thestatistics for many of the isochrons, the ages are accurate within theirstated uncertainties. The isochron age of 239.3±2.7 Ma bestrepresents the age for the uppermost Anisian at the Svalis Dome,and thus the age of the Anisian–Ladinian boundary at this locality.
4.2. Age of the Anisian–Ladinian boundary
The GSSP for the Anisian–Ladinian boundary is defined by thefirst appearance of the ammonoid genus Eoprotrachyceras in theTethyan realm (Brack et al., 2005). Since none of the western Tethys
Table 2Isochron regression results for Svalis Dome samples based on discrete subsets ofsamples spanning selected stratigraphic intervals.
Samples in isochronregression
n Interval Model1 or 3
Age 2σ Initial187Os
2σ MSWD(cm) (Ma)
188Os
Youngest 3 samples 5 19 1 239.3 2.7 0.679 0.020 1.2Youngest 4 samples 7 25 3 237.4 2.0 0.694 0.013 2.8Youngest 5 samples 8 66 3 238.2 3.0 0.687 0.020 12Youngest 6 samples 10 98 3 238.7 2.2 0.683 0.013 11Youngest 7 samples 12 118 3 239.2 2.8 0.677 0.016 17All 8 samples 14 123 3 240.1 2.6 0.674 0.016 17Oldest 7 samples 12 113 3 240.4 3.6 0.672 0.021 20Oldest 6 samples 11 104 3 240.4 3.9 0.672 0.022 22Oldest 5 samples 9 98 3 241.1 5.1 0.670 0.027 29Oldest 4 samples 7 57 3 242.8 5.1 0.657 0.029 20Oldest 3 samples 6 25 3 242.7 5.9 0.658 0.035 22
Model 1 regression assumes that the assignederrors are the only reason for thedatapoint’sscatter from the linewhereasModel 3 regression treats the scatter as a combination of theassigned errors and variations in initial 187Os/188Os ratios. The age uncertainties includethedecay constant uncertainty; interval stands for the range in vertical stratigraphy for thesamples used in the regression.
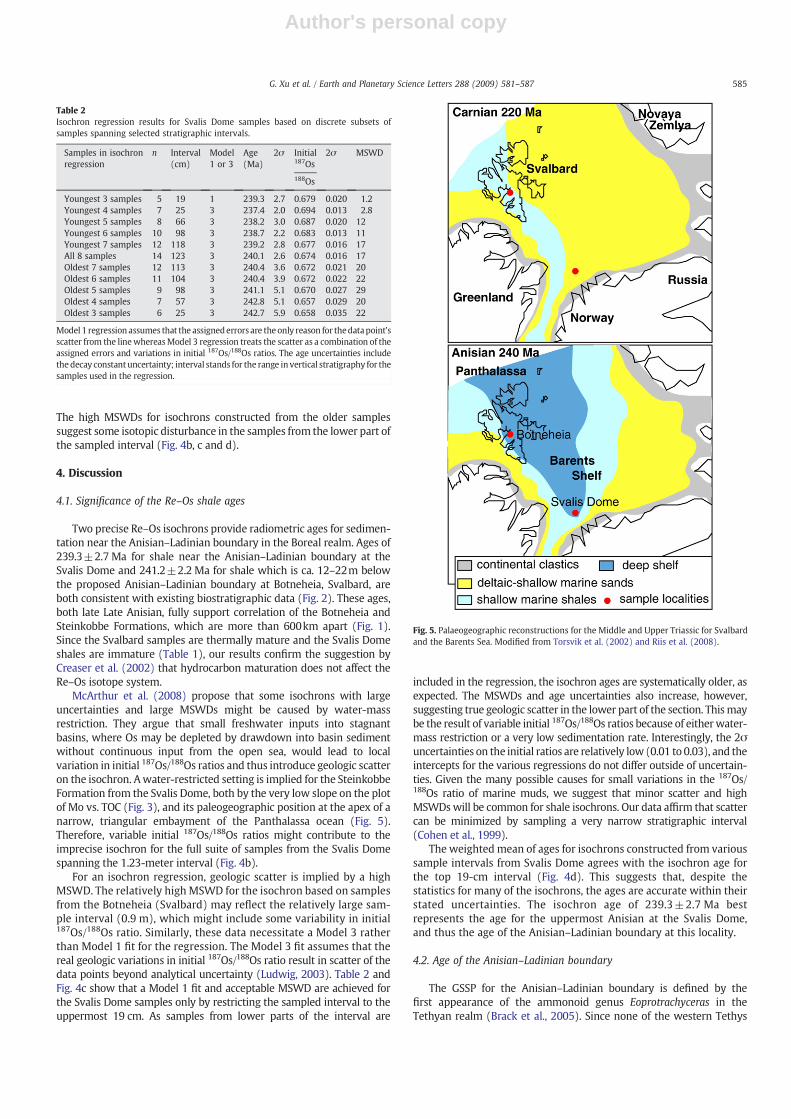
Fig. 5. Palaeogeographic reconstructions for the Middle and Upper Triassic for Svalbardand the Barents Sea. Modified from Torsvik et al. (2002) and Riis et al. (2008).
585G. Xu et al. / Earth and Planetary Science Letters 288 (2009) 581–587
Author's personal copy
ammonoid species, with the possible exception of Anagymnotocerasavisianum, are recorded in the Boreal realm (Pálfy and Vörös, 1998;Gradstein et al., 2004), the age of the Anisian–Ladinian boundary atlocations outside of the Tethyan realm must be determined by eitherradiometric dating or lateral correlation of magnetostratigraphy and/orchronostratigraphy. TheAnisian–Ladinian boundary atMilne Edwardsf-jellet on Svalbard, 28 km from our studied locality, is located in thereversepolaritymagnetochronofMF8 that spans a 12-m thick section ofblack shale, and is interpreted to correlate to chron 8 on the globalcomposites in the Tethys (Hounslow et al., 2008).
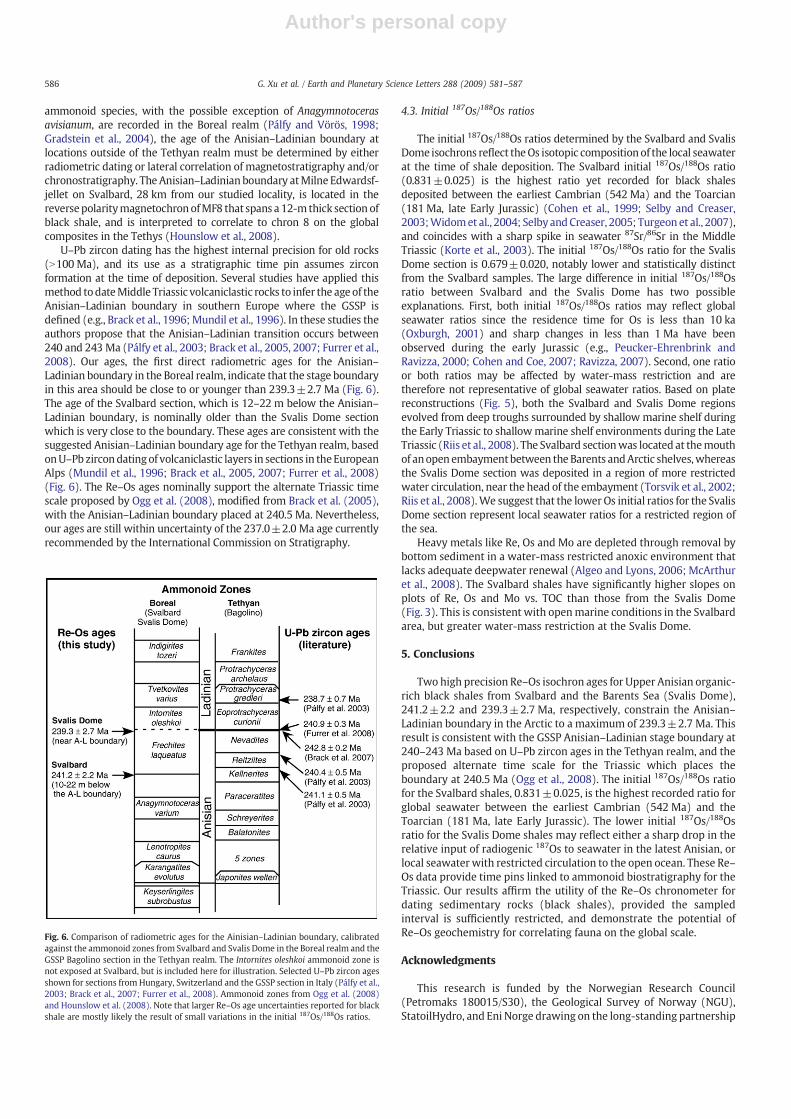
U–Pb zircon dating has the highest internal precision for old rocks(N100 Ma), and its use as a stratigraphic time pin assumes zirconformation at the time of deposition. Several studies have applied thismethod todateMiddle Triassic volcaniclastic rocks to infer the age of theAnisian–Ladinian boundary in southern Europe where the GSSP isdefined (e.g., Brack et al., 1996;Mundil et al., 1996). In these studies theauthors propose that the Anisian–Ladinian transition occurs between240 and 243 Ma (Pálfy et al., 2003; Brack et al., 2005, 2007; Furrer et al.,2008). Our ages, the first direct radiometric ages for the Anisian–Ladinian boundary in the Boreal realm, indicate that the stage boundaryin this area should be close to or younger than 239.3±2.7 Ma (Fig. 6).The age of the Svalbard section, which is 12–22 m below the Anisian–Ladinian boundary, is nominally older than the Svalis Dome sectionwhich is very close to the boundary. These ages are consistent with thesuggested Anisian–Ladinian boundary age for the Tethyan realm, basedonU–Pb zircondatingof volcaniclastic layers in sections in theEuropeanAlps (Mundil et al., 1996; Brack et al., 2005, 2007; Furrer et al., 2008)(Fig. 6). The Re–Os ages nominally support the alternate Triassic timescale proposed by Ogg et al. (2008), modified from Brack et al. (2005),with the Anisian–Ladinian boundary placed at 240.5 Ma. Nevertheless,our ages are still within uncertainty of the 237.0±2.0 Ma age currentlyrecommended by the International Commission on Stratigraphy.
4.3. Initial 187Os/188Os ratios
The initial 187Os/188Os ratios determined by the Svalbard and SvalisDome isochrons reflect theOs isotopic composition of the local seawaterat the time of shale deposition. The Svalbard initial 187Os/188Os ratio(0.831±0.025) is the highest ratio yet recorded for black shalesdeposited between the earliest Cambrian (542 Ma) and the Toarcian(181Ma, late Early Jurassic) (Cohen et al., 1999; Selby and Creaser,2003;Widomet al., 2004; SelbyandCreaser, 2005; Turgeon et al., 2007),and coincides with a sharp spike in seawater 87Sr/86Sr in the MiddleTriassic (Korte et al., 2003). The initial 187Os/188Os ratio for the SvalisDome section is 0.679±0.020, notably lower and statistically distinctfrom the Svalbard samples. The large difference in initial 187Os/188Osratio between Svalbard and the Svalis Dome has two possibleexplanations. First, both initial 187Os/188Os ratios may reflect globalseawater ratios since the residence time for Os is less than 10 ka(Oxburgh, 2001) and sharp changes in less than 1 Ma have beenobserved during the early Jurassic (e.g., Peucker-Ehrenbrink andRavizza, 2000; Cohen and Coe, 2007; Ravizza, 2007). Second, one ratioor both ratios may be affected by water-mass restriction and aretherefore not representative of global seawater ratios. Based on platereconstructions (Fig. 5), both the Svalbard and Svalis Dome regionsevolved from deep troughs surrounded by shallow marine shelf duringthe Early Triassic to shallowmarine shelf environments during the LateTriassic (Riis et al., 2008). The Svalbard sectionwas located at themouthof anopenembaymentbetween the Barents andArctic shelves,whereasthe Svalis Dome section was deposited in a region of more restrictedwater circulation, near the head of the embayment (Torsvik et al., 2002;Riis et al., 2008).We suggest that the lower Os initial ratios for the SvalisDome section represent local seawater ratios for a restricted region ofthe sea.
Heavy metals like Re, Os and Mo are depleted through removal bybottom sediment in a water-mass restricted anoxic environment thatlacks adequate deepwater renewal (Algeo and Lyons, 2006; McArthuret al., 2008). The Svalbard shales have significantly higher slopes onplots of Re, Os and Mo vs. TOC than those from the Svalis Dome(Fig. 3). This is consistent with openmarine conditions in the Svalbardarea, but greater water-mass restriction at the Svalis Dome.
5. Conclusions
Two high precision Re–Os isochron ages for Upper Anisian organic-rich black shales from Svalbard and the Barents Sea (Svalis Dome),241.2±2.2 and 239.3±2.7 Ma, respectively, constrain the Anisian–Ladinian boundary in the Arctic to a maximum of 239.3±2.7 Ma. Thisresult is consistent with the GSSP Anisian–Ladinian stage boundary at240–243 Ma based on U–Pb zircon ages in the Tethyan realm, and theproposed alternate time scale for the Triassic which places theboundary at 240.5 Ma (Ogg et al., 2008). The initial 187Os/188Os ratiofor the Svalbard shales, 0.831±0.025, is the highest recorded ratio forglobal seawater between the earliest Cambrian (542 Ma) and theToarcian (181 Ma, late Early Jurassic). The lower initial 187Os/188Osratio for the Svalis Dome shales may reflect either a sharp drop in therelative input of radiogenic 187Os to seawater in the latest Anisian, orlocal seawater with restricted circulation to the open ocean. These Re–Os data provide time pins linked to ammonoid biostratigraphy for theTriassic. Our results affirm the utility of the Re–Os chronometer fordating sedimentary rocks (black shales), provided the sampledinterval is sufficiently restricted, and demonstrate the potential ofRe–Os geochemistry for correlating fauna on the global scale.
Acknowledgments
This research is funded by the Norwegian Research Council(Petromaks 180015/S30), the Geological Survey of Norway (NGU),StatoilHydro, and Eni Norge drawing on the long-standing partnership
Fig. 6. Comparison of radiometric ages for the Ainisian–Ladinian boundary, calibratedagainst the ammonoid zones from Svalbard and Svalis Dome in the Boreal realm and theGSSP Bagolino section in the Tethyan realm. The Intornites oleshkoi ammonoid zone isnot exposed at Svalbard, but is included here for illustration. Selected U–Pb zircon agesshown for sections from Hungary, Switzerland and the GSSP section in Italy (Pálfy et al.,2003; Brack et al., 2007; Furrer et al., 2008). Ammonoid zones from Ogg et al. (2008)and Hounslow et al. (2008). Note that larger Re–Os age uncertainties reported for blackshale are mostly likely the result of small variations in the initial 187Os/188Os ratios.
586 G. Xu et al. / Earth and Planetary Science Letters 288 (2009) 581–587
Author's personal copy
between NGU and the AIRIE Program at Colorado State University.SINTEF Petroleum Research provided access to drill core from theSvalis Dome. Sven Egenhoff and Greg Ravizza are thanked for helpfuldiscussions. We express gratitude to two anonymous reviewersand editor Richard Carlson for their valuable comments on thismanuscript.
References
Algeo, T.J., Lyons, T.W., 2006. Mo-total organic carbon covariation in modern anoxicmarine environments: implications for analysis of paleoredox and paleohydro-graphic conditions. Paleoceanography 21. doi:10.1029/2004PA001112.
Azmy, K., Kendall, B., Creaser, R.A., Heaman, L., de Oliveira, T.F., 2008. Global correlationof the Vazante Group, Sao Francisco Basin, Brazil: Re–Os and U–Pb radiometric ageconstraints. Precambrian Res. 164, 160–172.
Brack, P., Mundil, R., Oberli, F., Meier, M., Rieber, H., 1996. Biostratigraphic andradiometric age data question the Milankovitch characteristics of the Latemarcycles (Southern Alps, Italy). Geology 24, 371–375.
Brack, P., Rieber, H., Nicora, A., Mundil, R., 2005. The Global boundary Stratotype Sectionand Point (GSSP) of the Ladinian Stage (Middle Triassic) at Bagolino (SouthernAlps, Northern Italy) and its implications for the Triassic time scale. Episodes 28,233–244.
Brack, P., Rieber, H., Mundil, R., Blendinger, W., Maurer, F., 2007. Geometry andchronology of growth and drowning of Middle Triassic carbonate platforms(Cernera and Bivera/Clapsavon) in the Southern Alps (northern Italy). Swiss J.Geosci. 100, 327–348.
Cohen, A.S., 2004. The rhenium–osmium isotope system: applications to geochrono-logical and palaeoenvironmental problems. J. Geol. Soc. 161, 729–734.
Cohen, A.S., Coe, A.L., 2007. The impact of the Central Atlantic Magmatic Province onclimate and on the Sr- and Os-isotope evolution of seawater. Palaeogeogr.Palaeoclimatol. Palaeoecol. 244, 374–390.
Cohen, A.S., Coe, A.L., Bartlett, J.M., Hawkesworth, C.J., 1999. Precise Re–Os ages oforganic-rich mudrocks and the Os isotope composition of Jurassic seawater. EarthPlanet. Sci. Lett. 167, 159–173.
Cohen, A.S., Coe, A.L., Harding, S.M., Schwark, L., 2004. Osmium isotope evidence for theregulation of atmospheric CO2 by continental weathering. Geology 32, 157–160.
Creaser, R.A., Sannigrahi, P., Chacko, T., Selby, D., 2002. Further evaluation of the Re–Osgeochronometer in organic-rich sedimentary rocks: a test of hydrocarbonmaturation effects in the Exshaw Formation, Western Canada Sedimentary Basin.Geochim. Cosmochim. Acta 66, 3441–3452.
Dagys, A.S., Konstantinov, A.G., 1995. New zonation scheme of the Ladinian Stage fornortheastern Asia. Stratigr. Geol. Correl. 3, 121–127.
Dagys, A.S., Weitschat, W., 1993. Correlation of the Boreal Triassic. Mitt. Geol.-Paläontol.Inst. Univ. Hambg. 75, 249–256.
Furrer, H., Schaltegger, U., Ovtcharova, M., Meister, P., 2008. U–Pb zircon age ofvolcaniclastic layers in Middle Triassic platform carbonates of the AustroalpineSilvretta nappe (Switzerland). Swiss J. Geosci. 101, 595–603.
Gradstein, F., Ogg, J., Smith, A., 2004. A Geologic Time Scale 2004. Cambridge UniversityPress, Cambridge, UK.
Hannah, J.L., Bekker, A., Stein, H.J., Markey, R.J., Holland, H.D., 2004. Primitive Os and2316 Ma age for marine shale: implications for Paleoproterozoic glacial events andthe rise of atmospheric oxygen. Earth Planet. Sci. Lett. 225, 43–52.
Hounslow, M.W., Hu, M., Mørk, A., Weitschat, W., Vigran, J.O., Karloukovski, V., Orchard,M.J., 2008. Intercalibration of Boreal and Tethyan time scales: the magnetobios-tratigraphy of the Middle Triassic and the latest Early Triassic from Spitsbergen,Arctic Norway. Polar Res. 27, 469–490.
Hunt, J.M., 1995. Petroleum Geochemistry and Geology. W. H. Freeman and Company,New York.
Korte, C., Kozur, H.W., Bruckschen, P., Veizer, J., 2003. Strontium isotope evolution ofLate Permian and Triassic seawater. Geochim. Cosmochim. Acta 67, 47–62.
Ludwig, K., 2003. Isoplot/Ex, version 3.6.3: A geochronological toolkit for MicrosoftExcel. Berkeley Geochronology Center, Berkeley, California.
McArthur, J.M., Algeo, T.J., van de Schootbrugge, B., Li, Q., Howarth, R.J., 2008. Basinalrestriction, black shales, Re-Os dating, and the Early Toarcian (Jurassic) oceanicanoxic event. Paleoceanography 23, PA4217. doi:10.1029/2008PA001607.
Mørk, A., Elvebakk, G., 1999. Lithological description of subcropping Lower and MiddleTriassic rocks from the Svalis Dome, Barents Sea. Polar Res. 18, 83–104.
Mørk, A., Dallmann, W.K., Dypvik, H., Johannessen, E.P., Larssen, G.B., Nagy, J., Nøttvedt,A., Olaussen, S., Pčelina, T.M., Worsley, D., 1999. Mesozoic lithostratigraphy. In:Dallmann, W.K. (Ed.), Lithostratigraphic Lexicon of Svalbard: Review andrecommendations for nomenclature use. Norwegian Polar Institute, Tromsø.
Mundil, R., Brack, P., Meier, M., Rieber, H., Oberli, F., 1996. High resolution U–Pb datingof Middle Triassic volcaniclastics: time-scale calibration and verification of tuningparameters for carbonate sedimentation. Earth Planet. Sci. Lett. 141, 137–151.
Ogg, J.G., Ogg, G., Gradstein, F.M., 2008. The Concise Geological Time Scale. CambridgeUniversity Press.
Oxburgh, R., 2001. Residence time of osmium in the oceans. Geochem. Geophys.Geosyst. 2. doi:10.1029/2000GC000104.
Pálfy, J., Vörös, A., 1998. Quantitative ammonoid biochronological assessment of theAnisian–Ladinian (Middle Triassic) stage boundary proposals. Albertiana 21, 19–26.
Pálfy, J., Parrish, R.R., David, K., Vörös, A., 2003. Mid-Triassic integrated U–Pbgeochronology and ammonoid biochronology from the Balaton Highland (Hungary).J. Geol. Soc. 160, 271–284.
Peters, K.E., 1986. Guidelines for evaluating petroleum source rock using programmedpyrolysis. AAPG Bull. 70, 318–329.
Peucker-Ehrenbrink, B., Ravizza, G., 2000. The marine osmium isotope record. TerraNova 12, 205–219.
Platzner, I., 1999. Modern isotope ratio mass spectrometry. Wiley, Chichester, UK.Ravizza, G., 2007. Reconstructing the marine Os-187/Os-188 record and the particulate
flux of meteoritic osmium during the late Cretaceous. Geochim. Cosmochim. Acta71, 1355–1369.
Riis, F., Lundschien, B.A., Høy, T., Mørk, A., Mørk, M.B.E., 2008. Evolution of the Triassicshelf in the northern Barents Sea region. Polar Res. 27, 318–338.
Rosman, K.J.R., Taylor, P.D.P., 1998. Isotopic compositons of the elements 1997. PureAppl. Chem. 70, 217–235.
Selby, D., Creaser, R.A., 2003. Re–Os geochronology of organic rich sediments: anevaluation of organic matter analysis methods. Chem. Geol. 200, 225–240.
Selby, D., Creaser, R.A., 2005. Direct radiometric dating of the Devonian–Mississippiantime-scale boundary using the Re–Os black shale geochronometer. Geology 33,545–548.
Smoliar, M.I., Walker, R.J., Morgan, J.W., 1996. Re–Os ages of group IIA, IIIA, IVA, and IVBiron meteorites. Science 271, 1099–1102.
Torsvik, T.H., Carlos, D., Mosar, J., Cocks, L.R.M., Malme, T.N., 2002. Global reconstructionsand North Atlantic palaeogeography 400 Ma to Recent. In: Eide, E.A. (Ed.), BATLAS –
MidNorwayplate reconstructions atlaswith global andAtlantic perspectives. NorwayGeological Survey, Trondheim, Norway.
Turgeon, S.C., Creaser, R.A., 2008. Cretaceous oceanic anoxic event 2 triggered by amassive magmatic episode. Nature 454, 323–326.
Turgeon, S.C., Creaser, R.A., Algeo, T.J., 2007. Re–Os depositional ages and seawater Osestimates for the Frasnian–Famennian boundary: implications for weatheringrates, land plant evolution, and extinction mechanisms. Earth Planet. Sci. Lett. 261,649–661.
Vigran, J.O., Mangerud, G., Mørk, A., Bugge, T., Weitschat, W., 1998. Biostratigraphy andsequence stratigraphy of the Lower and Middle Triassic deposits from the SvalisDome, central Barents Sea, Norway. Palynology 22, 89–141.
Weitschat, W., Dagys, A.S., 1989. Triassic biostratigraphy of Svalbard and a comparisonwith NE-Siberia. Mitt. Geol.-Paläontol. Inst. Univ. Hambg. 68, 179–213.
Weitschat, W., Lehmann, U., 1983. Stratigraphy and ammonoids from the Middle TriassicBotneheia Formation (Daonella Shales) of Spitsbergen. Mitt. Geol.-Paläontol. Inst.Univ. Hambg. 54, 27–54.
Widom, E., Gaddis, S.J., Wells, N.E., 2004. Re–Os isotope systematics in carbonatesfrom Serpent Mound, Ohio: implications for Re–Os dating of crustal rocks and theosmium isotopic composition of Ordovician seawater. Geochem. Geophys. Geosyst. 5.doi:10.1029/2002GC000444.
587G. Xu et al. / Earth and Planetary Science Letters 288 (2009) 581–587
Copyright © 2022 FDOKUMEN