RENOVATION OF WASTEWATER FOR DIRECT RE-USE IN ...
73
RENOVATION OF WASTEWATER FOR DIRECT RE-USE IN AN ABATTOIR MASTER OF SCIENCE WATER UTILISATION. Department of Chemical and Environmental Engineering Faculty of Engineering University of Pretoria © University of Pretoria
-
Upload
khangminh22 -
Category
Documents
-
view
1 -
download
0
Transcript of RENOVATION OF WASTEWATER FOR DIRECT RE-USE IN ...

RENOVATION OF WASTEWATER FOR
DIRECT RE-USE IN AN ABATTOIR
MASTER OF SCIENCEWATER UTILISATION.
Department of Chemical and Environmental EngineeringFaculty of EngineeringUniversity of Pretoria
©© UUnniivveerrssiittyy ooff PPrreettoorriiaa

RENOVATION OF WASTEWATER FOR DIRECT RE-USE IN AN ABATTOIR
byAnnalie Roux. BSc(Hons) u.P.
Study Leader: ProfW A PretoriusDepartment of Chemical and Environmental Engineering
Master of Science (Water Utilisation)
Tertiary treatment methods were tested on secondary effluent from an abattoir biological
wastewater treatment plant with the purpose of renovating it for re-use in the abattoir. The colour
and dissolved organic matter could be removed to such an extent that the water would comply with
water of insignificant health risk (Department of Health). The treatment process sequence proven
to be effective in upgrading this water to insignificant health risk standard were coagulation with a
polymer blend, separation, ozonation, filtration and activated carbon filtration. The development of
biologically activated carbon in practice was accepted as inevitable and desirable for optimum
water quality, but not tested. A deciding factor in the selection of an appropriate treatment was that
the final water would also have acceptable corrosion properties.
Abattoir, recycle, secondary effluent, humic acids, colour, coagulation, ozonation, activated
carbon, biologically activated carbon
Tersiere behandelingsmetodes op sekondere uitvloeisel vanaf 'n biologiese suiweringsaanleg op 'n
abattoir is getoets vir die moontlikheid om hierdie water op te gradeer vir hergebruik in die
abattoir. Die water kon gesuiwer word om te voldoen aan waterkwaliteit met 'n onbeduidende
gesondheidsrisiko (Departement van Gesondheid). Die proses volgorde wat gebruik was is
koagulasie met 'n polimeer produk, skeiding deur sedimentasie, ozonering, filtrasie en adsorpsie
met geaktiveerde koolstof. Die ontwikkeling van biologiese geaktiveerde koolstof word verwag
indien die proses op volskaal gebruik word en was in aanmerking gebring in die finale aanbeveling.

Die korrosiwiteit van die gesuiwerde water was 'n belangrike faktor in die keuse van die finale
proses stappe.
Sleutelwoorde:
Abattoir, hergebruik,sekondere uitvloeisel, humus sure, kleur, koagulasie, ozonering, geaktiveerde
koolstof, biologiese geaktiveerde koolstof.
Abattoir water balanceRequired water qualityExpected quality of secondary effluentTertiary treatment for re-useCoagulationColour as indicator for organic materialOzonation for colour removalActivated carbon adsorptionRemoval of mim-organismsTerminal disinfection with chlorineChemical qualityObjectives of this research
2.2.2.3.4.4.6.7.8.10.11.13.14.

Water has always been a scarce resource in South Africa (Die Departement van Waterwese,
1984). The demand for fresh water supplies by the turn of the century would exceed the maximum
water delivery predicted by the current runoff and rainfall patt,~ms. Population growth predictions
in the Gauteng Province (Schutte and Pretorius, 1995) indicate that this shortage would become
critical in this region. The cost of water is set to increase significantly (Pretorius et al., 1995) as
more strain is put on present water supply systems and new sources developed. Statutory water
restrictions and the financial implications will force industries to investigate ways of reducing their
fresh water demand.
Water demand can be reduced by optimising the use of water in the industry and by renovating and
re-using the effluent (Funke, 1969). Industries with a low consumptive water use (Cowan and
Steenveld, 1990) such as abattoirs, could benefit most from implementing such strategies. The
Johannesburg Abattoir has already reduced their water demand by optimising the use. This done,
the volume of effluent generated is still more than half of the firesh water demand. This effluent is
treated with a protein recovery biological treatment system (Pretorius et al., 1995). It could be
renovated for re-use to replace part of the daily fresh water intake.
The technology for water renovation for re-use of biologically treated effluents is well established
in South Africa (Taljard, 1981) and was successfully implemented by the City of Windhoek,
Namibia. Tertiary treatment processes such a coagulation, filtration, oxidation, activated carbon
adsorption, membrane processes, chemical stabilisation and disinfection are commonly found (Van
Vuuren and Taljard, 1979) as part of such renovation plants.
The purpose of this research was to evaluate tertiary treatment processes for effectiveness in
renovating the secondary effluent from an abattoir single cell protein recovery effluent plant to a
quality that can be re-used in part of that abattoir. The final water quality should conform to
health, aesthetic and economic criteria for the designated use (Pretorius et al., 1995).

This survey covers the expected quantity and quality of secondary effiuent from Johannesburg
Abattoir available for re-use, the required quantity and quality and the treatment methods that
could be used to purify the secondary effiuent to this quality.
Optimisation of water usage's in the Johannesburg abattoir has led to a reduction in water demand
from 3.5 m3lhead to 1 m3lhead (Pretorius, 1996). The average total water demand of the abattoir is
currently 2000 m3/day. Surveys (Figure 2, appendix 1 (Van Heerden, 1995» have shown that
around 1500 m3/day of secondary effiuent is available for re-us\.:.
The water demand for use in lairage washdown, offal washing and by-product manufacturing (PPF
main) averages around 1250 m3/day (Figure 3, appendix 1). This water does not come into contact
with products intended for human consumption. The quality of water required in these processes
need not be of general drinking water standard (Cowan and Stt:enveld, 1990). Part of the 1500 m3
renovated secondary effiuent could be re-used to supply this demand.
In an abattoir, water of drinking quality is required for all prOCGssesthat bring it into contact with
products for human consumption. This excludes areas of lairage washdown, cooling and
refrigeration, general washing, vehicle washing and yard washing and gardening (Cowan and
Steenveld, 1990). This "second grade" water should still be of good enough quality not to adversely
affect health (1), be aesthetically acceptable (2) and not have all adverse impact on economics (3)
(Funke, 1969).
1. The water should not be unhygienic or promote unhygienic conditions. The Director of
Meat Hygiene, or any person he may delegate, is empowered to prevent the use of water in
an abattoir if he suspects that water is "impure, unhygienic or not fit for its purpose"
(Abattoir Hygiene Act, 1992). Table 1 in Appendix 1 represents proposed drinking water

guidelines considered for application in South AfriCl by the Department of National
Health (Pieterse, 1989). Water of an insignificant h::alth risk quality is acceptable for
supply as drinking water for limited periods and should be suitable for the "second grade"
water in the abattoir.
2. Water should be free from material that will settle to lorm objectionable sludge deposits,
free from floating materials, oil and scum and other fl,lating materials and also free from
materials causing colour and odour to such a degree a;; to cause a nuisance (Krenkel and
Novotny, 1980). Odour could change taste and smell IMeiring and Cohen, 1981) of food
products.
3. The prevention of deposits and bacterial growths in pi pes, containers and process kettles
(Cowan and Steenveld, 1990) is necessary to prevent U1mecessary maintenance. Corrosion
and aggression would lead to failure of heat exchan,;~ers and conduits and increase in
maintenance (Funke, 1969).
Secondary effluents from industrial and domestic biological wastewater treatment plants are
generally not suitable for direct re-use. Although most of the organic matter should be removed
(90-95% in the abattoir) these effluents still contain micro-oqanisms, some suspended material
and dissolved organic matter (DOM) which (Manka et aI., i 974) can cause colour, taste and
odour.
The DOM in secondary effluent from biological treatment of <omestic and industrial wastewater
would be similar (Rebhun et aI., 1969; Narkis and Rebhun, 1983) to that in highly coloured
surface water. About 45% of DOM in secondary effluents are humic matter (Manka et al.,1974)
where this percentage is approximately 50% (Sierka et al., 989) in coloured surface waters.
Humic matter is formed by biological degradation processes (Boero et al., 1996). It consists
mainly of anionic, highly unsaturated macromolecules (Christmc n and Ghassemi, 1966).

Organic matter in secondary eflluents would increase disinfedant demand (Rogers et al., 1987)
and decrease disinfection efficiency (EI-Rehaili and Weber. r, 1987). It will also lead to the
formation of disinfectant by-products (Vik et al., 1985). Th~ organic matter would also be the
cause of objectionable colour and odour in the secondary effluent (Sierka et al., 1989). It may
cause bacterial growth in the distribution systems and equiprrent that can cause obstruction and
other undesirable effects on the process (Krenkel and Novotny, 1980). For these reasons the DOM
and specifically the humic matter (Constantine, 1982), has bee I identified as priority pollutants in
drinking water purification (Rogers et al., 1987).
The removal of humic matter as the primary constituent of DC M has been identified as a priority
in drinking water purification (Grozes et aI., 1995) and in wast.:water treatment for re-use (Rogers
et al.)987). Processes used for removal of humic matter frOJil coloured surface water has been
extensively researched and includes coagulation, oxidation, activated carbon adsorption and
membrane processes such as reverse osmosis and ultra- and nanofiltration (Taljard, 1981) and
combinations of these.
Conventional treatment (Fettig and Ratnaweera, 1993) for hWlllc matter (colour) removal would
involve coagulation with alum or ferric chloride, stabilisation aileddisinfection. Ozonation followed
by biologically activated filtration (with either activated (arbon or sand as medium) and
disinfection has been proved (Juby and Botha, 1994) to be an e:fective alternative. The capital and
operating cost (Constantine, 1982) is equal or less than require I! with conventional treatment with
reduced sludge disposal and filter maintenance. Latest research (Juby and Botha, 1994) has found
membrane processes still less econorrlical than either of the prev ous two processes mentioned.
Coagulation is the process that removes pollutants from water ly chemical addition, rapid rrlixing
and flocculation. The mechanisms for humic matter removal ·vould be charge neutralisation by
precipitation or by co-precipitation with the coagulant. Humi< matter could also adsorb on the
surface of an aluminium- or ferric hydroxide precipitate (Jacang .:10 et al., 1995).

Characterisation of organics functional groups can provide im ight into the type of coagulant and
conditions that would be effective in organic matter removal Owen et al., 1995). Humic matter
consists of negatively charged macromolecules (Semmens ard Field, 1980) with the degree of
ionisation or charge density depending on pH (Grozes et al.,19'15). A higher charge density at high
pH would result in molecules which are difficult to chemically coagulate by charge neutralisation
and also less easily adsorbed (Kuo and Amy, 1988).
When a metal salt like ferric chloride or alum is added to watl ir, a series of polymeric hydrolysis
intermediates is rapidly formed (Hong-Xiao and Stumm, 198 7) before aluminium- or ferric tri-
hydroxide precipitates. Semmens and Field (1980) and E.lwards and Amirtharajah (1985)
concluded that these intermediate species actually complexes and precipitate humic matter. The
charge densities of these intermediates are influenced by pH (C,'rozes et al., 1995) and increase at
low pH.
Commercially prepared polymers of aluminium or iron like pol) -aluminium chloride (PACI) would
have the same charge neutralisation effect as the hydrolysis intermediates. Their reaction rate
(Dempsey et al., 1985) may be faster since the polymerisati0l11 step is bypassed. Organic poly-
electrolytes are often used in conjunction with metal salts fOI added complexing and bridging
ability (Mortimer, 1991). The charge densities (Scheuch and Ed.twald, 1981) on PACI and organic
poly-electrolytes are controlled by the manufacturing process and they are often synthesised with a
charge separation that is higher than found on the hydrolysis ntermediates. The total coagulant
demand in joint systems is often lower than the sum of half of e.~h coagulant on its own (Edwards
et al., 1994). Blends between poly-amine and PAC I attemp to take advantage of this fact.
Kerdachi et al. (1994) found very good removal of humic matter with such a product.
When choosing a poly-electrolyte for coagulation of humic mater, it is useful to be aware of the
different classes and characteristics of polymers that are avai labIe. Poly-metal electrolytes like
aluminium chloride is generally formulated as Aln(OH)mChn-m(Iiraraghavan and Wimmer, 1988)
or similar ferric polymers. Organic poly-electrolytes can be divi led into coagulants and coagulant
aids for water treatment. Coagulants generally fall in a moleculal weight range of 50000 g/mol and
can be natural tannins or synthetic branched or straight chains of poly-amine (Mallevaille et al.,

1984). Coagulant aids are generally synthetic polymers with acr~late as monomer. They fall in the
molecular weight range of > 1000000 glmol. These can ~e grouped according to charge
distribution into cationic, non-ionic and anionic polymers. Anio~c and non-ionic poly-acrylamides
are used as flocculant aids with coagulants such as metal s4s or poly-amines. Cationic poly-
acrylamides are generally used as sludge conditioning and de~atering aids (Carns and Parker,
1985). They are sometimes used as primary coagulants in w~stewater with a very high solids
content.
The more hydrophilic fraction of organic matter (low moleculat weight, high charge) may not be
removed by precipitation with any polymers, but can be re~oved by adsorption on a metal
hydroxide precipitate (Edwards et ai., 1994). Organic matter ¥th a high hydrophilic componenti
(Yao and O'Melia, 1989) may be more effectively coagulated Iwith metal salts. Oxidation could
potentially increase the low molecular weight fraction of humic J~tter while increasing the polarity
and acidity of the fraction at the same time and could mak~ it less amenable to removal by
coagulation (Owen et ai., 1995).
The nature of colour in biological wastewater is often organi~ (Black and Willems, 1961) and
caused by humic-, fulvic- and hymathomelanic acids (Sierka etlai., 1989). The basic structure of
humic matter is a chain built up with phenolic nuclei (Christma~ and Ghassemi, 1966). The chain
is characterised by alternating double and single bonds that a* termed chromophores (Rice and
Bollyky, 1981). These absorb UV and visible light, causing colour. UV absorbance at 254 nm is
normally used to measure humic matter (Sierka et ai., 198~. Colour measurements and UV
absorbance correlated (Vik et ai., 1985) with coefficients varyin~ between 0.93 and 0.97.
In practice, coagulant dose on a plant is often determined ~y colour intensity (Johnson and
Amirtharajah, 1983). Removal of organic matter by adsorption ~an also be monitored using colour
(Van Breemen et ai., 1979) as long as the ratio between the ~olour causing and other DOM is
known. When establishing the efficiency of these two processes I for removal of DOM, only colour
removal could be monitored.

Oxidation would attack double bonds and reduce conjugation (Eaton, 1995), thereby reducing
colour and UV absorbance. Humic acids are oxidised into simpler acids (Constantine, 1982) but
not removed. Colour cannot be used as an indicator for organic matter removal when oxidation is
used.
The reduction in the ultraviolet absorbance and colour of water containing organic compounds
when samples are ozonated is caused (Sierka et ai., 1989) by the oxidation of unsaturated
structures. The conjugation responsible for colour and UV absorbance is removed (Rice and
Bollyky, 1981). Water containing 525 mg/l humic acids tested by (Symons, 1980) required 100
mg/l ozone to destroy 95% of the colour. About 4-5 mg/l Pt-Co (1 mg/l Pt-Co = 1 hazen) are
removed per 1 mg/l ozone but reduction is normally non-linear (Tan and Amy, 1991) with
significant reductions at low ozone dosages with a refractory fraction remaining. Colour removal
was enhanced with longer retention times (Juby and Botha, 1994).
H03- + OH- ~ 2H0
2"
o + 2HO" ~ HO" + 03 2 2
oxidants while molecular ozone reacts more specifically and is reactive towards high molecular
weight organics. The products of reaction of molecular ozone with double bonds are olefin
ozonides (Razumovski and Zaikov, 1984) which would decay into bipolar ion and carbonyl
compound such as aldehydes and ketones. The reaction products of unsaturated organics with
radicals (Goel et al., 1995) are alcohols and carboxylic acids. Humic acids are normally oxidised
to acetic, formic and oxalic acids (Edwards and Benjamin, 1992), therefore the reaction mechanism

is probably with the radicals. Radical attack would predominate at low ozone dosages, high pH and
on less aromatic organics.
These products of the reaction between humic matter and ozone would be more biodegradable than
the humic matter. This is confirmed by Millamena (1992) who observed a decrease in chemical
oxygen demand (COD) of a sample of water containing humic acids and increase in biological
oxygen demand (BOD) while the total organic carbon (TOC) stayed constant. Bacterial regrowth is
likely (Symons, 1980) if ozonation is used as a terminal step in a water treatment progranune.
Increase in biodegradability is, however, an advantage when biologically activated carbon is used
(Constantine, 1982) to reduce organic matter after ozonation (McCarthy and Smith, 1974).
Low ozone dosage on water containing organics and turbidity sometimes improved removal of
turbidity through filters (Rice and Bollyky, 1981) and decrease coagulant demand. DOM adsorb
onto particle surfaces and increase surface charge and electrophoretic mobility and stability of the
particle. Ozonation could lead to the desorption of the organic matter because of oxidation of the
latter, therefore destabilising the colloid (Chang and Singer, 1991). Ozonation could also lead to
the formation of metastable organic polymers from the DOM and lyse algal cells, releasing
biopolymers, both of which can act as bridges between particles and improve coagulation (Grasso
and Weber, 1988). Ozone can neutralise negative colloids and turbidity can be oxidised and
neutralised (McCarthy and Smith, 1974).
Ozone could also decrease removal of turbidity due to the formation of low molecular weight more
oxygenated compounds like carboxylic acids (Grasso and Weber, 1988) which can complex with
metal ions and keep them in solution. Higher ozone dosages (Chang and Singer, 1991) as well as
suboptimal dosages can increase turbidity in final water (Rice and Bollyky, 1981).
Activated carbon adsorption is widely used in wastewater treatment, especially in industry where
coloured organic pollutants such as dyes and hazardous organic matter needs to be removed
(Albanese et ai., 1981). It can be used in both powdered (95-100% pass through a 100-mesh sieve)
and granular form, graded according to size (Weber, 1984). Different types of granular activated

carbon may perform differently with respect to adsorption capacity of a system (Benefield et al.,
1982; Weber, 1984). The pore size distribution of the activated carbon will impact on the
effectiveness ofDOM removal since this will influencepenetration of the larger organic matter (El-
Rehaili and Weber Jr, 1987).
A reasonable understanding of the adsorption mechanics of trihalomethanes (THM) by activated
carbon exists, but less is known of the adsorption behaviour of humic substances (Weber Jr et al.,
1981). Most experiments to obtain adsorption and similar data is conducted on analytical grade
humic acid of known composition. The variability of humic acids in nature limits the applicability
of this data to complex systems.
Particles of low molecular weight and polar nature are generally not adsorbed well, while high
molecular weight less polar organics like aromatic and substituted aromatic species are generally
strongly adsorbed (Weber, 1984). Ozone would tend to convert low polarity aromatic compounds
to polar aliphatic compounds (Van Leeuwen et al., 1981) which would not be as well adsorbed by
activated carbon as the less polar humic matter (Rogers et al., 1987).
The equilibrium capacity of carbon for uptake of a compound as well as the rate of approach to
equilibrium must be known and can be determined by batch adsorption tests (Crittenden and
Weber, 1978). In order to design a fix-bed adsorber, the shape of the breakthrough curve and the
time of breakpoint must be estimated as well. These breakthrough curves would be specific to a
particular application (Weber, 1984).
Reactivation of activated carbon is normally conducted by adding controlled quantities of water to
an oxidant atmosphere. About 11 kJ/kg of carbon is consumed for reactivation, but burning of the
off-gas consumes about 5000 kJ/kg of carbon (Masschelein, 1992).
Catalytic and biological degradation of DOM can take place in granular activated carbon
adsorption columns (Weber Jr et al., 1981). The surfaces of the carbon provide very good
colonisation sites that are sheltered from shear forces (Van Leeuwen et al., 1981) and the

adsorptive properties of the carbon lead to substrate and oxygen enrichment on the carbon surfaces
(Qi et al., 1992). The deliberate use of bacterial growths on granular activated carbon to DOM
from water has been studied as a process and is termed biologically activated carbon (BAC) (Van
Leeuwen et a!., 1981).
BAC is often enhanced by pre-ozonation (Millamena, 1992) because of the increase in
biodegradability of most organic water soluble polymers (Dowbiggin and Singer, 1989). The water
would be enriched with oxygen which further promotes growth (Van Leeuwen et al., 1981). The
ozone dose necessary to improve biodegradability of humic matter was found to be 1-2 mg/mg
TOC (Juby and Botha, 1994).
It was found with pre-ozonation of water containing humic matter that it takes about 2 months for
biological activated carbon to develop. A steady state was achieved without regenerations with
removal of 59% (Rogers et al., 1987) to 60% (Juby and Botha, 1994) of dissolved organics
originating from humic and fulvic acids after ozonation. Bio-activity would depend on the CINIP
ratios in the water and temperature. Nutrient addition may be necessary for optimum operation of
biologically activated carbon (Juby and Botha, 1994).
The carbon is effectively regenerated by the biological assimilation of pre-absorbed organic matter
(Masschelein, 1992). Therefore, it is found that the periods between required physical regeneration
of activated carbon can be prolonged for example from 70 days to 480 days (Netzer et al., 1984).
Results from coagulation studies on raw eftluent from abattoirs suggest that a better removal of
micro-organisms is obtained at low pH (De Zutter and Van Hoof, 1981). Primary lime clarification
seems to be more effective in the removal of micro-organisms than coagulation with other
coagulants due to the biocidal effect of high pH.

The first application for ozone treatment of water had disinfection as its objective. Ozone has
proved very efficient in removal of viruses and parasites as well as bacteria (Masschelein, 1992).
The concentration-time (CT) concept is normally the principle for applying ozone by the EPA in
the USA, but this factor normally includes the chemical ozone demand of a specific water.
The ozone demand of a water needs to be met first before any disinfection with ozone can take
place (Rice and Bollyky, 1981). Adequate disinfection can be obtained with ozone residuals of 0.5
to 1.5 mgll after the demand has been met. For the same bacterial kill, water with a COD of 74
mgll needed a dosage of3 times that needed for water with a COD of30 mg/I. Ozone demand does
not follow a breakpoint demand pattern and is influenced by the value of the residual (National
Institute for Water Research, 1981). Ozone demand in secondary effluent would consist of matter
that is readily oxidised by ozone such as humic matter (Venosa and Meckes, 1983). The high
dosages needed to obtain the CT values required for adequate disinfection may be detrimental for
other purification processes like flocculation and increase in biodegradability (Wilczak et ai.,
1992). Ozone would not be a cost effective disinfectant in high ozone demand waters.
Micro-organisms may attach to an activated carbon column to form biologically activated carbon
(Masschelein, 1992). However, activated carbon columns often have large interspatial areas and
are not good filters for colloidal matter (Benefield et al., 1982). If biologically activated carbon
develops the micro-organism count in the final water may increase due to organisms periodically
being washed off the carbon (Masschelein, 1992).
When chlorine is used as a disinfectant, it should be ensured that enough of the active disinfecting
species is maintained for the desired contact time to achieve bacterial kill (White, 1992). The type
of chlorine residual being measured should be established, since products like chloramines contain
available chlorine and can be measured as residuals

Organic impurities and nitrogen compounds in water destroy the active chlorine by substitution to
form chlorinated organics and chloramines (American Public Health Association et al., 1991). This
constitutes the chlorine demand. The chlorine demand of a water can be defined as the difference
between the added chlorine dose and the residual chlorine concentration, measured after a
prescribed contact time at a given time and temperature. Coagulation and ozonation are often used
to reduce chlorine demand by removing and oxidising organics and ammonia nitrogen (Krasner et
al., 1989).
Chlorine reacts with ammonia-nitrogen ill water to form mono-, dichloramine and nitrogen
trichloride, which can be measured as combined residual chlorine. The reaction of increasing
chlorine dosages with the ammonia in water to form these species produce the breakpoint
phenomenon (White, 1992). The reaction of chlorine with ammonia will proceed with increasing
chlorine dose from the formation of monochloramine, to dichloramine and nitrogen trichloride until
free nitrogen is formed. Until this point (the breakpoint), most of the total chlorine residual
measured would be mono- or dichloramines. From this point, with increasing chlorine dose, free
residual chlorine will appear and increase in the water.
Free residual chlorination as a process is commonly used as a disinfection regime to produce
drinking water since it provides water with low taste and odour (White, 1992). In the free residual
process, sufficient chlorine is provided to destroy all ammonia nitrogen present (the breakpoint).
This destruction occurs at a ratio of chlorine to ammonia nitrogen of 10:1 by weight.
Chloramination can also be practised to maintain a chlorine residual for longer and prevent
trihalomethane formation. Chloramines require longer contact times for similar bacterial kills than
free residual chlorine (HOCl). Chloramination plants normally operate at a chlorine to ammonia
nitrogen ration of 3:1 by weight (Krasner et al., 1989). Chloramination is often practised when
there is already ammonia present in the water, but can also be effected by adding ammonia when
chlorinating (National Institute for Water Research, 1981).
Although chloramination can be employed as a disinfectant method, the most efficient disinfection
will be obtained by free residual chlorination. For this process to be effective, the oxidation of
ammonia-N to nitrogen gas at the breakpoint should be employed (White, 1992).

Breakpoint chlorination for a water can be determined graphically by determining chlorine
residuals at different contact times and plotting these against chlorine dose rwestrick and Cohen,
1976). The chlorine demand at any contact time would be the difference between the free available
chlorine and the chlorine dose. Coagulation and ozonation could reduce demand and breakpoint by
oxidising some matter that would have formed part of the demand (Ross et al., 1976).
Electrochemical reactions between water and metal components may give rise to dissolution of
metal and precipitation of metal salts (Loewenthal et al., 1986). Water can also accelerate galvanic
corrosion between two dissimilar metals by increasing the electrical conductivity between the
metals with a high dissolved solids content (Asano et aI., 1988). Aggressive water would dissolve
away the cement matrix in asbestos cement and concrete conduits causing destruction of the
integrity of the material (Benefield et al.,1982). An excess of calcium or magnesium ions in the
water can precipitate to form scale. The presence of micro-organisms and DOM can cause
bacterial build-up in pipes and equipment (Benefield et al., 1982).
The principle of controlling aggression, corrosion and scale in water systems is by controlling the
saturation of state of calcium carbonate in the water (Loewenthal et al., 1986). The acidity and
precipitation potential can be calculated by the Stasoft Computer programme designed by
Loewenthal et al., (1988). Regrowth of organisms can be prevented by minimising DOM and
adequate disinfection (Funke, 1969).
Apart from these guidelines, a few other parameters need to be observed to control corrosion and
aggression:
1. Water should have a sulphate content of less than 350 mg/l - otherwise the structure of
cement should be altered (Loewenthal et al., 1986).
2. The presence of DOM can cause a decrease in dissolution and precipitation rates of
calcium carbonate and should be minimised (Loewenthal et al., 1986).
3. Resultant alkalinity above 35 mg/l (Loewenthal et al., 1986).
4. Limit TDS increase to prevent galvanic corrosion (Asano et al., 1988).

5. Maintaining chloride and sulphate ions to below 50 mg/l each or maintaining the Larson-
cr +80/- . ~ ·thindex ----- (Loewenthal et al., 1986) to below 0.2 to prevent mteuerence WIAlkalinity
Lowering the pH to optimum for coagulation is easily done in waters of low alkalinity. Water with
a high alkalinity would require high volumes of acid to reduce pH, adding chloride or sulphate ions
to the water (Moyers and Wu, 1985). This increase will increase the Larson index. The use of a
coagulant such as alum or ferric chloride may reduce pH. This is due to the consumption of
hydroxide in forming metal hydrolysis intermediate species and trihydroxide precipitate during
coagulation. About 0.5 mg/l alkalinity in the water is consumed for every 1 mg/l alum added
(Ogedengbe, 1984). This is beneficial to the coagulation of colour, but the amount of coagulant
required in high alkalinity waters will increase the chloride or sulphate concentration and the
Larson index.
The secondary effluent from the Johannesburg Abattoir would be sampled on several selected days
to establish the quality and variation. This would be compared with water quality for insignificant
health risk in order to establish its suitability for re-use in the "second grade demand".
Coagulation would be examined for effectiveness of colour removal:
1. Different coagulants would be compared for colour removal against each other at varying
dosage.
2. Appropriate dosages of the three best performing coagulants would be selected according
to their impact on corrosivity and health criteria. These three would also be tested for
effectiveness for turbidity removal.
3. These dosages would be used for comparing coagulants at different pH against each other.
4. The corrosivity would be determined for optimum pH and dosages to select the appropriate
coagulation conditions
Ozonation would be evaluated before and after coagulation to establish:
1. Ozone demand
2. Ozone needed for colour removal.
Adsorption on activated carbon would be performed on coagulated and ozonated water to establish
capacity for removal of colour.
Breakpoint chlorination would be performed to establish effect of purification steps on disinfection
with chlorine.
The effective treatment sequence would be tested on a sample of secondary effluent and the results
compared with water of insignificant health risk quality and corrosion parameters.

Sample collection and testing
Twenty-five litre samples of secondary effluent from Johannesburg Abattoir were collected
every second to third day during the experimental period. The samples were preserved at 4 °cbetween test runs, but allowed to reach ambient temperatures before any experiments were
performed. The samples were shaken before aliquots for experimental procedures were drawn.
Each sample of raw water was tested for total dissolved solids (TDS), chloride, sulphate, total
alkalinity, total hardness, turbidity, colour, dissolved organic carbon (DOC), and total
heterotrophic plate counts were performed.
Comparison of coagulants for colour removal
Initially a range of metal salt and poly-electrolyte coagulant blends were screened for their
ability to remove colour. Of these, alum (AI2(S04h.18H20), ferric chloride (FeCI3.6H20) a
Polyamine/poly aluminium chloride blend (hereafter refered to as PACI-blend) gave the best
results. These were used for comparison of colour removal. Testing consisted of varying the
chemical dosage without adjusting pH, and varying pH while keeping dosages constant as
shown in Table 1. Metal ion concentrations is reported in mmol/l to compare reaction sites
available.
CoamIlant Dosal!e Metal ion Counter ion oHVarvinlJ dosal!eAlum 30 - 400 0.1 - 1.8 mmol/l 13 - 173 ml!/l SO/- 7.6Ferric 30- 400 mg/l 0.11 - 2,2 12 - 157 mg/l cr 7.6PACI-blend 30 - 120 7.6Varvinl! oHAlum 100 mg/l 0.3 mmolll 43 mg/l SO/ 4 - 7.6Ferric 120 mg/l 0.4 mmol/l 47 mg/l cr 4 -7.6PACI-blend 60 mg/l 4 -7.6
For the varying pH testing, pH was adjusted with 5 N H2S04 or 0.25 N NaOH solutions prior
to coagulant addition and recorded after flocculation. Loewenthal et al.(1986) advised that the
individual concentrations of chloride and sulphate concentrations should not exceed 50 mg/l

each to limit corrosion. The counter ion contribution is noted in Table I. Products containing
polyamine generally have health limitations for use in drinking water (Mallevaille, et ai.,
1984).
Comparing the colour removal at varying pH were therefore limited to:
100 mg/I AI2(S04)3.18H20.
120 mgll FeCI3.6H20.
60 mgll PACI-blend - health limitation of 66 mg/I.
To identify the coagulant that gave consistently the best results for colour and turbidity
removal at these dosages, the mean and standard deviation (Wine, R.L., 1964) was calculated
for percentage removal obtained at constant pH for alum, ferric chloride and PACI-blend.
Coagulation were performed with the jar test method as recommended by Dental et al.(1988)
and Lai et ai. (1975). The best results were obtained by rapid mixing for 2 minutes at 295 rpm
(G-value of 199.5s-1) after coagulant addition, followed by 20 minutes at 50 rpm (G-value of
12.6s-1) which was determined as the optimum mixing speed for colour removal (see Figure 5
in Appendix 2). 500 ml samples to 1 litre round glass beakers were used and the G-values were
obtained using calibration of G in round beakers by Botha (1995). After 20 minutes settling,
samples of supernatant was drawn for pH and colour measurement.
Chemical quality
Stabilisation dosage requirements were calculated for coagulant dosages and pH, using the
Stasoft computer programme (Loewenthal et ai.,1988). The corrosivity according to Larson:
cr + SO~- I I d . h h . I Ik I" ft b·lo. . b S ft---- were ca cu ate usmg t e t eoretlca a a mlty a er sta I IsatlOngiven y taso .Alkalinity
Ozonation
Ozone was generated with a LN 103 ozone generator (Ozonia, Switzerland) with oxygen as a
feed gas. The ozone generator was calibrated by bubbling ozone through a diffuser at the
bottom of a 75 mm diameter contact column containing 1 litre of a 2% potassium iodide (Kl)

solution. Ozone dosage was varied according to the time of ozonation at constant voltage and
gas flow. After each time period, the KI solution was transferred and titrated to a clear
endpoint using 0.1 N sodium thiosulphate (NaZSZ03.5HzO) with starch as indicator as was
described by Toerien, (1988) and Razumovski and Zaikov (1984), thereby measuring the
amount of ozone transferred during each time interval. The ozone production rate was
determined from these data.
The ozone demand of water (National Institute for Water Research, 1981) is defined as the
amount of ozone consumed before a ozone residual is observed for a given time period. The
readily oxidisable organic matter in water will deplete ozone (Venosa and Meckes, 1983; Rice
and BoUyky, 1981) and constitute this demand. Since the unsaturated bonds on humic matter
would be preferred sites for ozone attack, the demand would also represent the amount of
ozone needed for colour removal (Grasso and Weber, 1988). Ozone demand was determined
by applying ozone to distilled water and the sample at increasing dosages and measuring the
ozone in the off-gas by trapping it in 2% KI and titrating with NaZSZ03 (Toerien, 1988). The
ozone absorbed by the sample and contact system would be the mass of ozone applied minus
mass of ozone in off-gas per litre of sample.
The relationship between ozone absorbed and colour removal was determined by measuring the
percentage colour removal with increasing applied ozone dose. Absorbed ozone was
determined in the same manner as described for ozone demand.
Sample Applied Ozone Dosage Relationship
Distilled water 0-80 mg/l Reference curve
Secondary effluent 0- 80 mg/l Ozone demand curve
Flocculated Secondary effluent 0- 60 mg/l Ozone demand curve
Secondary Effluent 0- 20 mg/l Colour removal curve

Activated carbon adsorption
Activated carbon were added to treated secondary effluent water to compare the effect of
ozonation on the removal of colour by adsorption. Amounts added is shown in Table 3.
Sample Activated Carbon Added
Flocculated Secondary effluent 50 -1000 mg/150 ml
Flocculated and Ozonated Secondary effluent 50 - 1000 mg/150 ml
Granular activated carbon type PHO 12/40 was supplied by Montan (Johannesburg) and added
to 150 ml of sample and shaken for 12 hours before colour measurements were made.
Breakpoint chlorination
Breakpoint chlorination (White, 1992) was performed on secondary effluent and samples that
were coagulated as well as samples that were coagulated and ozonated. Appropriate amounts of
300 mgll sodium hypochlorite (NaOCI) solution were added to 50 ml samples and left for a
contact time of 2 minutes. Additions were staggered in one minute intervals (American Public
Health Association et ai., 1991). Total residual chlorine were determined in each sample after
the contact time.
Comparison with guideline
The most effective treatment sequence was performed on a sample of secondary effluent. The
product water quality after each treatment step was analysed for TDS, chloride, sulphate,
alkalinity, hardness, pH, turbidity, colour and DOC. These were compared to the guidelines
for health, aesthetic and economic criteria.
-Organic matter removal with coagulation was measured by colour removal as was mentioned
by Edwards and Amirtharajah (1985) and Van Breemen et ai.(1979). This relationship between
colour and COD removal was confirmed in this study (see Figure 3 in Appendix 2).

-COD was measured by the Merck Spectroquant photometer SQ 118 (E.Merck, Darmstadt)
-DOC was measured by the Rand Water Board Scientific Services.
-Samples were corrected to pH 7 and centrifuged before colour measurement (Crowther and
Evans, 1981) with a Merck Spectroquant photometer SQl18 (E.Merck, Darmstadt), relating it
to hazen units. TDS was determined gravimetrically on the centrifuged samples (American
Public Health Association et aI., 1989).
-Samples were filtered through Whatman 4 filter papers before turbidity measurements. The
nephelometric turbidity (Dental et al., 1988) was measured with a Hach turbidimeter model
2100 A (Hach,USA.).
-Total hardness was determined as in American Public Health Association et al. (1989) method
no 2340C, alkalinity by method 2320, chloride with method 4500-CI B, total heterotrophic
plate counts with method 9215 B and total residual chlorine with method 4500-CI F.

Sample Collection and Testing
The secondary effluent quality is compared to water of no and insignificant health risk in Table
4.
Table 4: Secondary effluent quality compared to requirements for water of no and insignificant
health risks
Parameter Secondary Effluent No health risk Insignificant health risk
TDS (mg/l) 664 - 1000 470 2000
Chloride (mg/l) 100 - 120 250 600
Sulphate (mg/l) 35 200 600
Total Hardness (mg/l as 120 20-300 650
CaC03)
pH 7.65 - 7.8 5.5-9.3
Turbidity (NTU) 2.7 - 5.2 (29) 1 5
Colour (Hazen) 176 - 220 20 20
DOC (mg/l) 91 10 20
Total heterotrophic plate 2 X 10⁶ <100 <1000
count (cfu/l00ml)
The TDS, chloride, sulphate, hardness and pH of the secondary effluent water were all within
the limits of water quality of insignificant health risk (Pieterse, 1989). The chloride
concentration is double the recommended 50 mg/l. The Larson index was calculated and
averaged around 0.49, which is higher than the recommended 0.2 (Loewenthal et aI., 1986).
The variation in turbidity was dependant on the operation of the secondary effluent plant and is
illustrated in Figure 1, Appendix 1. Anaerobic conditions developed in the secondary clarifier
over weekends and caused increase in turbidity up to 29 NTU. These conditions could be
prevented by emptying the secondary clarifier over weekends

The colour, dissolved organic carbon (DOC) and microbiological quality (total heterotrophic
plate count) of the secondary effluent did not comply with the requirement for water of
insignificant health risk. These parameters were not influenced by anaerobic conditions in the
clarifier.
Comparison of coagulants
Ferric chloride, alum, lime and a range of commercial coagulants from Ultrafloc, Floccotan
and Zetachem were tested for colour removal. Figure 1 illustrates that ferric chloride, alum
and Ultrafloc 3500 (U35OO) performed the best for colour removal.
The effectiveness of alum, ferric chloride and U3500 for coagulating and removing colour is
compared in Figure 2. No adjustments for pH were made.

I-£..... • FoCI .PACl"lE""i
Dosages of 120 mg/l PACt-blend gave far superior colour removal (+/-68%) than similar
dosages of alum and ferric chloride (+/-30%). To obtain 68% colour removal with alum and
ferric chloride dosages of 400 mg/l are needed. At these dosages pH was reduced to < 6. In
Photo 1 the colour removal from secondary effluent by 60 mgll PACI-blend and 500 mgll alum
is compared.
Big increases in colour removal were obtained with small increases in PACt-blend addition,
while increase in colour removal was more gradual with alum and ferric chloride. That these
two coagulants gave similar removal of colour was confirmed by plotting the percentage
removals by alum and ferric chloride at selected dosages against each other (Figure 5,
Appendix 2.). A straight line with gradient of 1 was obtained with r2 =0.97.

PHOTO 1: From Left: Secondary effluent: Seconuary effluent + 60 mgll PACI-blend
Secondary effluent + 500 mg/I alum
Corrosion requirements limit the dosages of alum and ferric chloride to 100 mgll and 120 mgll
respectively and health requirements limit the PACI-blend dose to 60 mg/1. The mean and
standard deviation (0") for percentage removals obtained at these dosages at pH 7.6 was
calculated and is reported in Table 5.
Alum at 100 mgll Mean- 26.2% 0"- 3.8 %
Ferric chloride at 120 mg/I Mean - 25.5 % 0"- 13.2 %
PACI-blend at 60 mg/I: Mean-37.6% 0"-2.7 %
Dosing PACI-blend at 60 mgll gave better colour removal than dosing alum at 100 mgll and
ferric chloride at 120 mg/1. The difference between colour removal obtained with alum and
ferric chloride was marginal.

Comparison of removal of turbidity is reported in Table 6.
Table 6: Mean and standard deviation of turbidity removal with 3 coagulants
Alum at 100 mgll Mean- 35.57% cr - 36.3 %
Ferric chloride at 120 mg/l Mean - 32.2 % cr- 14 %
PAC I-blend at 60 mg/l: Mean - 39.41 % cr - 13.14 %
The difference in removal of turbidity is not as big as with colour removal, but 60 mgll PACl-blend
removes turbidity slightly better than 100 mg/l Alum or 120 mg/l ferric chloride.
Varying pH
The influence of pH on the efficiency of colour removal is compared for the three coagulants at
constant dosages in Figure 3.
~ ...50 ,c=~--~=::..:::=.:::-~--:.:~:::----- ------ --- -------- -- --- ---- -------- --
',,- -.'''-
~..------------:~~'-s~~-~::-::~-~~C-=~-----i'~ . .-~, -- ...-~ ~ '---------------------------~~::------',r_--~-~,:::~---~ 20 ----------------------------------------------------------------
10 ----------------------------------------------------------------[
IoL- --.:.. --l
~ ~ ~ ~ ~ ~ ~ ~
I %ALUMAT100mgll ., PACe -aLE>[) AT 60 MGIL I
Figure 3: Comparison of the influence of pH on colour removal between three coagulants

Better removal was obtained with 60 mg/l PACI-blend than with 100 mg/l alum or 120 mg/l
ferric chloride at all pH values. Similar removal efficiencies were again obtained with alum
and ferric chloride. Colour removal was at least 20% higher at pH of around 5 than at pH 7.6
for all three coagulants.
pH 7.65
Temperature 25°C
H2C03 alkalinity 260 mg/l as CaC03
H2C03 acidity 282 mg/l as CaC03
Total Calcium 70 mg/l as CaC03
Total Magnesium 70 mg/l as CaC03
Total Chloride 100 mg/l as CI
Total Sulphate 35 mg/l as S04
TDS 664 mg/l
Conductivity 100 mS/m
Precipitation potential -0.91 mg/l
The acidity and precipitation potential were calculated by the Stasoft Computer programme
(Loewenthal et aI., 1988). The negative precipitation potential indicates the water is slightly
aggressive and corrosive. The stabilisation dosage for a calcium carbonate precipitation
potential of 4 mg/l was calculated for lime and was found to be 2.2 mg/l as Ca(OH)z. Table 8
shows the resultant theoretical water characteristics after stabilisation.

pH 7.78
Temperature 25°C
H2C03 alkalinity 263 mg/l as CaC03
H2C03 acidity 279 mg/l as CaC03
Total Calcium 73 mg/l as CaC03
Total Magnesium 70 mg/l as CaC03
Total Chloride 100 mg/l as CI
Total Sulphate 35 mg/l as S04
TDS 664 mgll
Conductivity 100 mS/m
Ionic Strength 0.016
Precipitation potential 4 mg/ I
The pH for optimum coagulation was 5. pH correction with sulphuric acid to reach this value
increased the water sulphate content to 250 mg/l and decreased alkalinity to 20 mg/I. At
dosages of 400 mg/l ferric chloride or alum the pH is reduced to <6, alkalinity to around 70
mg/l and chloride increased to around 260 mg/l (sulphate to about 150 mg/l). Coagulation with
poly-electrolytes like poly-aluminium chloride and poly-amine had a comparatively small effect
on chloride concentrations (Table 11).
Stabilisation with NaOH or Ca(OH)z would be needed to correct pH after coagulation with
high metal dosages or pH correction. The lime dosage necessary to stabilise the water after each
treatment to a calcium carbonate precipitation potential of 4 mg/l was determined by using the
. (CI+S04) .Stasoft programme. The Larson mdex ( ..) (Loewenthalet ai., 1986)was determmedforAlkalInity
each coagulant dosage and pH using alkalinity theoretically achieved after stabilisation. Lime
stabilisationdosages and Larson index is reported in Table 9.

Table 9: Lime dosages calculated for stabilisationafter each coagulationmethod. as well as Larson
index values compared to removal efficienciesobtained.
Alum FeCl3 mg!l PACI-blend Larson index % Colour Lime mg!l pH
mg!l mg!l removal
400 1.1 81 130 5.4
100 0.75 31 300 4.7
400 1.38 78 147 5
120 0.75 59 284 5.7
100 0.56 44.4 2 7.3
60 0.5 41.9 2 7.3
60 0.75 41 300 4.8
The Larson index increased from 0.49 to 0.5 with the dosage of 60 mg!l PACI-blend. The
Larson index, after restabilisation with lime, of a water treated with 400 mg!l ferric chloride is
1.4 and 400 mg!l alum is 1.1. Dosages of alum and ferric chloride to these levels are not
recommended.
The choice of coagulant
Coagulation with 60 mg!l PACI-blend is recommended as an initial tertiary treatment step. At 60
mg!l PACI-blend the water still contains 62.4% of the original colour and organic matter and needs
to be treated with further processes before it will comply with the insignificant health risk standard.
An average of 5.86 mg ozone per minute was generated with the ozone generator at 0.5 A and
0.7 bar oxygen pressure. This value was used to determine applied ozone dosage for ozone
demand and colour removal.

The ozone demand of secondary effluent and secondary effluent coagulated with 60 mg/l PACI-
blend can be seen in Figure 4.
0,24Ezfa 18CD0:::o(J)
~12wzo~ 6
oo 20 30
APPLIED OZONE IN mg/I
A - SECONDARY EFFLUENT OZONE DEMAND 8 - FLOCCULATED OZONE DEMAND
___ REFERENCE CURVE -+- SECONDARY EFFLUENT...•...• FLOCCULATED CURVE
Figure 4: Reference and ozone demand curves for secondary effluent and effluent flocculated
with 60 m~/l PACI-blend
The influence of the amount of dead space in the ozone transfer system on the apparent ozone
absorbed by the water is represented by the first straight line portion where all three curves
coincide. The difference between the reference and sample curves when the ozone absorbed
becomes maximum in each case would give the ozone demand of the sample (Toerien, 1988).
The ozone demand was about 8 mg/l for secondary effluent and 5.5 mg/l for flocculated water
as shown in Figure 4. The difference in ozone demand between secondary effluent and

coagulated effluent means that coagulation would reduce ozone dose. Another advantage is that
it may absorb variations in raw water quality, avoiding continual adjustment of ozone dose.
The reduction of colour from secondary effluent with ozone was non-linear, as reported by
Juby and Botha (1994), with significant reductions at low ozone dosages. The removal values
were fitted to a power curve with the following formula: y =23.6 XO.43
~ = 0.989. The
observed values are plotted with the theoretical curve in Figure 5.
80 ,-----------------------------
rol +-.oJ 60 I:; "~50w
~40 I'
~30 I~20 I
10 Io 1----------------
o 6 8 10OZONE ABSORBED
Figure 5: Comparison of theoretical and actual reduction in colour with increase in ozone
absorbed for secondary effluent
Fitting the colour removal efficiency to a theoretical formula would enable predictions to be
made on the ozone dose necessary should the colour in the secondary effluent vary. The colour

reduction rate decreased with higher dosages. According to Tan and Amy (1991) a refractory
fraction of colour will remain.
The colour removal obtained at the secondary effluent ozone demand dose of 8 mgll is shown
in Photo 2 along with secondary effluent colour and colour after ozonation followed with
coagulation.
PHOTO 2: From left: Secondary effluent; Secondary effluent + 8 mg/l ozone; Secondary
effluent + 8mgll ozone + 60 mgll PACI-blend

Activated carbon adsorptionIn Figure 6 the colour reduction in coagulated and ozonated secondary effluent by adsorption
on increasing dosages of activated carbon is shown.
80....J
~o~ 70w0:::0:::=>060....J
ou"#.
0.0 100.0 200.0 400.0 800.0 1000.0ACTIVATED CARBON DOSE mg/150 ml
Figure 6: Comparison of colour removal with carbon adsomtion of flocculated and flocculated
plus ozonated secondary effluent
The colour removal in the flocculated sample was increased from 40% to 64% by the maximum
activated carbon added. The increase in removal was 20% at 400 mg/150 mI, but the slope of this
curve decreased at higher dosages. The carbon probably reached its adsorption capacity for the
coloured matter around this dosage. Colour removal from the ozonated water was increased from
77% to 81% by the maximum activated carbon added. The gradient of this curve shows adsorption
capacity for colour from this water is very low.
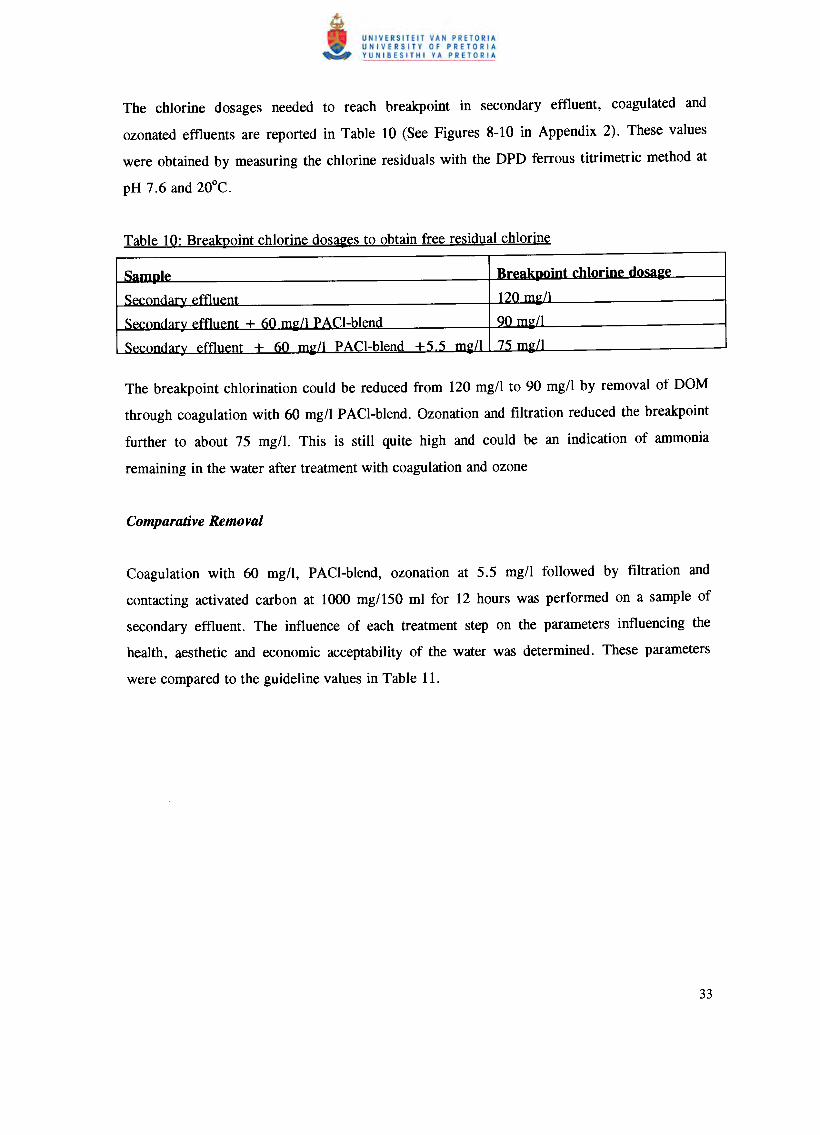
The chlorine dosages needed to reach breakpoint in secondary effluent, coagulated and
ozonated effluents are reported in Table 10 (See Figures 8-10 in Appendix 2). These values
were obtained by measuring the chlorine residuals with the DPD ferrous titrimetric method at
pH 7.6 and 20°C.
The breakpoint chlorination could be reduced from 120 mg/l to 90 mg/l by removal of DOM
through coagulation with 60 mg/l PACI-blend. Ozonation and filtration reduced the breakpoint
further to about 75 mg/I. This is still quite high and could be an indication of ammonia
remaining in the water after treatment with coagulation and ozone
Coagulation with 60 mg/l, PACI-blend, ozonation at 5.5 mg/l followed by filtration and
contacting activated carbon at 1000 mgl150 ml for 12 hours was performed on a sample of
secondary effluent. The influence of each treatment step on the parameters influencing the
health, aesthetic and economic acceptability of the water was determined. These parameters
were compared to the guideline values in Table 11.

Table 11: The water quality produced by the selected treatment processes. compared to
guidelines for insignificant health risk and corrosion
Guideline Secondary PACI-blend Ozonation 5.5 Activated Carb.
values effluent at 60mg!1 mg!l+ filter 1000mgl150ml
TDS-mgll 2000 664 664 664 664
Alkalinity-mgll CaC03 300 300 300 300
Chloride-mg!l 600 110 112 112 112
Larson- index 0.2 0.49 0.5 0.5 0.5
Hardness- mgll CaC03 200 120 120 120 120
pH 5.5-9.3 7.65 7.65 7.8 7.5
Turbidity-NTU 5 5.2 3.6 1.9 1.9
Colour- Hazen 20 176 110 41 33
DOC-mg!l 20 91 76 50 38
Plate count cfu!lOOml 1000 2000000 1000000 ooסס5 Not Done
The TDS, alkalinity, hardness and sulphate concentrations were not affected significantly by
any of the treatment processes. A slight increase in chloride ion concentration was due to the
addition of PACI-blend that released a small amount of counter ions. This increased the Larson
index by 0.01.
The dosage of 60 mg!l PACl-blend reduced turbidity from 5.2 NTU to 3.6 NTU (by 30%).
Small pin flocs appeared in the coagulated sample after ozonation. This increase in turbidity
was not measured before filtration. After filtration, the turbidity was improved from 3.6 NTU
to 1.9 NTU. This shows that ozonation has a positive effect on turbidity removal if a filtration
can be included after ozonation. Batch contacting the granular activated carbon in beakers did
not increase turbidity.
DOC was reduced from 91 mg!l to 76 mg!l by coagulation (16%). Ozonation and filtration
reduced the DOC by a further 29% to 50 mg!I. DOC removal with activated carbon adsorption
for 1000 mg!150 ml was 13%. The DOC was reduced by a total of 58% by all three steps. The
total DOC removal with this dosage of activated carbon was 61% when coagulated but
unozonated water was used. The unozonated DOM therefore appears to adsorb better on the

activated carbon. This is possibly due to the oxidation of organic matter to smaller more polar
entities that does not adsorb well on activated carbon (Weber, 1984).
The biodegradability of the organic matter and the development of BAC was not examined in
this study. The dosage ratio in this experiment of about 0.8 mg 03/mg DOC may have to be
increased to the recommended 1-2 mg ozone/mg TOC. This value was reported (Juby and
Botha, 1994; Goel et ai., 1995) to be necessary to increase biodegradability of humic matter.
Coagulation reduced colour, approximately by the percentage predicted in Table 5, to 110
Hazen. Ozonation reduced this colour to 41 Hazen. Adsorption on activated carbon reduced
this value to 33 Hazen which is still higher than the recommended 20. This colour could
possibly be reduced further if BAC develops. Photo 3 shows the reduction in colour from
secondary effluent with flocculation and ozonation.
PHOTO 3: From Left: Secondary effluent; Secondary effluent + 60 mg/l PACl-blend;Secondary effluent + 60 mgll PACI-blend + 5.5 mgll Ozone

Bacteria reduction was 50% after coagulation and 95.26% after ozonation. Ozonation was not
employed as a disinfecting step however. Bacteria levels could increase in the final water if
BAC develops. A terminal disinfectant step is necessary.

Better removals of colour and turbidity were obtained at 60 mgll PACl-blend than with alum or
ferric cWoride at 100 and 120 mg/l respectively. Optimum dosages for colour removal were also
found to be optimum for turbidity removal in this experiment as was predicted by Semmens and
Field (1980) and Dempsey et ai., (1985).
The superior performance by PACl-blend (tables 5 and 6) can be explained by the fact that
stoichiometric metal coagulant and polymer coagulant dosages are normally required with
precipitation ofDOM (Vik et ai., 1985). The amount of coagulant added would be proportional to
the amount of reaction sites on the organic matter (Amirtharajah et ai., 1993). The charge density
provided by the poly-aluminium cWoride and poly-amine blend, PACl-blend, is high (Dempsey et
ai., 1985), therefore less is needed to reach the optimum charge addition than with ferric chloride
or alum. Secondly, different fractions of the humic matter could be more amenable to removal by
different coagulants (Randtke and McCarty, 1979). A blend like PACl-blend could incorporate the
coagulation effect of both poly-amine and poly-aluminium cWoride and could therefore be more
effective for colour removal.
The pH was reduced when ferric cWoride and alum were used due to depletion of hydroxide to
form hydrolysis intermediates and hydroxide precipitate (Hong-Xiao and Stumm, 1987). This
reduction in pH could play a role in the increase in colour removal obtained at higher dosages of

metal salts. The length and charge distribution of the hydrolysis intermediates-metal species formed
with metal coagulants (Stephenson and Duff, 1996) would be determined by pH and would not
necessarily always be consistent or optimum. This would explain high variability in results
obtained with colour removal with ferric chloride.
Optimum removal under pH conditions of around 5 was found by several authors like Edzwald et
al. (1977), Narkis and Rebhun (1983) and Christman and Ghassemi (1966). This can be explained
by the destabilising effect of reducing pH on organic matter (Kuo and Amy, 1988). Reducing the
pH of solutions before addition of all coagulants improved removal of colour (Figure 3).
The humic matter would be partially or completely dissolved due to negatively charged groups
(Vik et al., 1985). The stoichiometry of the precipitation reaction could be altered by decreasing
the negative sites on the molecules by protonation when the pH was reduced to 5 (Amirtharajah et
al., 1993). Less coagulant was needed to destabilise the same amount ofDOM.
The colour causing humic matter in the secondary effluent from Johannesburg abattoir appeared to
react in a charge neutralisation and precipitation reaction with the coagulants. Polymeric hydroxyl
intermediates, formed when metal salts are added to water, as well as synthetic polymers could
precipitate the humic matter (Dempsey et. aI., 1985). Higher molecular weight, less oxygenated
compounds such as humic matter is primarily removed by precipitation, while smaller highly
charged DOM by sorption onto a hydroxide precipitate (Edwards et al., 1994). That pre-formed
polymers could remove colour better than the metal species indicated that the sorption reaction did
not playa big role and most of the DOM would be longer chain humic matter.
The buffer capacity of the secondary effluent is high (alkalinity-Table 4) and this increased the
stability of the humic matter (Moyers and Wu, 1985). Very high acid dosages were needed to
overcome this alkalinity to reduce pH to 5. This increased the chlorine or sulphate ion
concentrations to unacceptable levels for corrosion control (Table 9).
Poly-aluminium chloride and poly-amine molecules both have only one counter ion (Cl-) per
polymer, while metal salts have to release up to three chloride ions per monomer to form poly-
hydroxyl entities. The impact on the corrosivity of the water is far greater to obtain the similar
colour removal shown in Figure 2. The pH would be lowered with high dosages of
metal coagulants, requiring restabilisation of the water at a later stage, which would need another
filtration and sludge disposal stage (Constantine, 1982).
Colour and DOM matter can be removedby adjusting the pH to 5 or by very high dosages of ferric
chloride, alum or PACl-blend. Adjusting the pH and coagulating with the first two options would
lead to water that is unacceptable for economic reasons. The last coagulant would be dosed in
excess of health recommendations. Additional treatment methods are necessary to reduce
colour and DOM to within guideline levels.
Ozonation was investigated for its effectiveness in reducing colour. Satisfactory reduction in colour
(Figure 5) can be achieved with ozonation alone. This colour removal would be due to the
destruction of double bonds and chromophores (Razumovski and Zaikov, 1984). Ozonation to this

level will also possibly enhance turbidity removal with coagulation (Figure 7, Appendix 2).
However, DOM would not necessarily be reduced as well (Constantine, 1982).
The products of ozonation would of lower molecular weight and more charged than humic matter
(McCarthy and Smith, 1974). The efficiency of coagulating this DOM would be reduced.
Therefore, the bulk of the DOM should be removed with coagulation before ozonation. This was
done by coagulation with 60 mg/l PACI-blend. Furthermore, ozonation is costly and reducing the
ozone demand by removing DOM will reduce this cost. Removing turbidity before ozonation would
also facilitate any disinfection by ozone by reducing any shielding effect by suspended particles
(Train, 1979).
The pin floc formation seen after ozonation of flocculated water (Table 11) could be explained by
ozone neutralising negative colloids, thereby destabilising them and enhancing coagulation
(McCarthy and Smith, 1974). Ozonation can also destabilise organic matter adsorbed on colloids,
thereby also decreasing their stability (Grasso and Weber, 1988; Edwards et al., 1994). When the
secondary effluent was coagulated and then ozonated, the resultant turbidity could easily be
removed by filtration only and turbidity was improved from 3.6 NTU in the flocculated water to
1.9 NTU.
The DOC was simultaneously reduced from 75mg/1 to 50 mg/l with ozonation and filtration (Table
11).This removal of DOM could be due to the destabilisation of organic colloidal matter, pin floc
formation and subsequent removal with filtration. It could also be due to polymerisation of organic

matter due to ozonation that could create some hydrophobic molecules that could coagulate (Chang
and Singer, 1991). Constantine (1982) and Edwards et al. (1994) reported that significant fractions
of organic matter would be oxidised to C02 only when very high ozone dosages and long reaction
periods are applied. The ozone concentrations used in this study is not high enough to reduce DOM
in this manner
The DOM would be in a more biodegradable form than before ozonation (Juby and Botha,
1994). This could cause bacterial regrowth (Symons, 1980). The oxidised orgaruc matter IS
also very reactive towards forming chlorinated hydrocarbons (Moyers and Wu, 1985). These
compounds are normally volatile and can cause odours
It was shown that a different fraction of DOM may be more amenable to adsorption removal than
removal with coagulation. Pre-precipitation altered the relative percentages of most adsorb able and
less adsorbable (Weber and Jodellah, 1985). Ozonation seemed to have had a negative effect on
adsorption of DOC (Table 11). Ozonation should have oxidised particles to low molecular weight,
polar entities that are generally not adsorbed well (Symons, 1980).
Because of the increase in biodegradability, ozonation should enhance the development of BAC
(Weber, 1984). This process should be utili sed, rather than suppressed, since it has proved to give
much higher organic matter removal from coloured water than adsorption without biological
activation (Constantine, 1982). BAC could theoretically increase DOC removal from coagulated

and ozonated secondary effluent from 13% to a possible 60% (Juby and Botha, 1994). This would
reduce the DOC to <20 mg/l which is within the guideline value in Table 11.
Coagulation and ozonation reduced the breakpoint chlorination from 120 to 70 mgll. This would be
the amount necessary to obtain a free residual chlorine for disinfection after these two steps.
Adsorption on activated carbon and BAC would reduce this breakpoint further by reducing DOM
that constitutes chlorine demand (Krasner et al., 1989).
The high breakpoint of 75 mg/l is probably due to the presence of ammonia (Hart, 1978). Ozone
does not reduce ammonia unless the pH is above 9 (Grachok et al., 1990). This ammonia would be
stripped by chlorinating to breakpoint, where the stable monochloramine should form.
Consideration could be given to employing chloramination as a disinfection step (National Institute
for Water Research, 1981). Longer contact times would be necessary, but disinfectant residuals
would be more stable.

Comparison between alum, ferric chloride and PACI-blend as coagulants for colour removal
showed that PACI-blend resulted in a better colour removal at half the dosages of the other
two coagulants (Table 5). Furthermore, PACI-blend does not impact on the pH of the water
and release significantly less (Table 6) amounts of counter ions than alum and ferric chloride
(Table 1).
1. Coagulation with PACI-blend at 60 mg/l and settlement should be an initial treatment step.
Either ferric chloride or alum could be used as a second choice since their performance
was similar.
Reducing the coagulating pH from 7.6 to 5 increased colour removal with coagulation by 20%
at constant coagulant dosages. The high acid dosages needed to overcome the buffer capacity of
the water to achieve this increased the chloride and sulphate ion concentration to 3 or 4 times
the recommended values for corrosion control.
2. Due to the high buffer capacity, adjusting the pH to optimise coagulation is not advisable.
Ozonation and filtration improved colour and organic matter removal to levels attained by very
high dosages of coagulants or better. The relationship defined in this study could be used in
practice to adjust ozone dosages for variations in colour of the secondary effluent. DOM was
also reduced after filtration. The chemical quality of the water was not affected by ozonation.
3. Ozonation and filtration should be included in the treatment sequence to reduce colour and
organic material and increase the biodegradability of the DOM
Activated carbon adsorption was slightly less effective in DOM removal after ozonation than
after just flocculation. However, colour removal was better with the ozonation step included.
4. DOM levels could possibly be reduced to within the guideline values with ozone and
activated carbon if BAC is allowed to develop.
The tertiary treatment recommended to renovate the secondary effluent from Johannesburg
abattoir to comply with water quality of insignificant health risk should consist of:

• Coagulation with 60 mgll PACI-blend and flocculation at ambient pH.
• Settlement.
• Ozonation at 5.5 mg/l (or higher to increase biodegradability).
• Filtration.
• Activated carbon adsorption with provision for biologically activated carbon to develop.
• Disinfection with either free residual chlorination or chloramination.

Albanese, P., D'Olimpio, P., Lavatelli, P. and Agamennone, M. (1981). Colour removal from
industrial wastewater by granular activated carbon. Proceedings of the 5th European Sewage
and Refuse Symposium EAS, Munich, 22-26 June 1981, Munich: Abwassertech Verein, p. 125-
141.
Amirtharajah, A., Dennett, K.A. and Studstill, A. (1993). Ferric chloride coagulation for
removal of dissolved organic matter and trihalomethane precursors. Water Science and
Technology 27,11:113-121.
American Public Health Association, American Water Works Association and Water Pollution
Control Federation. (1991). Standard methods for the examination of water and wastewater:
Supplement to the 1Tth edition, Washington:American Public Health Association. Ed. 17.
American Public Health Association, American Water Works Association and Water Pollution
Contol Federation. (1989). Standard methods for the examination of water and wastewater,
Washington:American Public Health Association. Ed. 17.
Asano, T., Mujeriego, R. and Parker, J.D. (1988). Evaluation of industrial cooling systems
using reclaimed municipal wastewater. Water Science and Technology 20,10: 163-174.
Benefield, L.D., Judkins, J.F. and Weand, B.L. (1982). Process chemistry for water and
wastewater treatment, Englewood Cliffs:Prentice-Hall,Inc.
Botha, J. (1995). Department of Chemical and Environmental Engineering, University of
Pretoria: Personal Communication.

Black, A.P. and Willems, D.G. (1961). Electrophoretic studies of coagulation for removal of
organic color. Journal American Water Works Association. 53,5:589-605.
Boero, V.J., Eckenfelder, W.W.Jr and Bowers, A.R. (1996). Soluble microbial product
formation in biological systems. Water Science and Technology 23: 1067-1079.
Carns, K.E. and Parker, J.D. (1985). Using polymers with direct filtration. JournaLAmerican
Water Works Association. 77,3:44-49.
Chang, S.D. and Singer, P.C. (1991). The impact of ozonation on particle stability and the
removal of TOC and THM precursors. JournaLAmerican Water Works Association. 83,3:71-
79.
Christman, R.F. and Ghassemi, M. (1966). Chemical nature of organic color in water.
JournaLAmerican Water Works Association. 58,6:723-741.
Constantine, A. (1982). Advanced water treatment for color and organics removal.
JournaLAmerican Water Works Association. 74,6:310-313,.
Cornwell, D.A. and Bishop, M.M. (1995). Determining velocity gradients in laboratory and
full-scale systems. Journal American Water Works Association. 75,9:470-475.
Cowan, J.A.C. and Steenveld, G.N. (1990). A guide to water and waste-water management in
the red-meat abattoir industry, Pretoria:Water Research Commission.
Crittenden, J.C. and Weber, W.J.Jr. (1978). Predictive model for design of fixed-bed
adsorbers: Parameter estimation and model development. Journal of the Environmental
Engineering Division, ASCE 104:185-197.
Crowther, J and Evans, J (1981). Estimation of color in Hazen units by spectrophotometry.
JournaLAmerican Water Works Association. 73,5:497-502.

De Zutter, L. and Van Hoof, J. (1981). Removal of indicator organisms by chemical treatment
of wastewater. Zentrablat fur Bakteriologie und Hygiene 173:166-272.
Dempsey, B.A., Sheu, H., Tanzeer Ahmed, T.M. and Mentink, J. (1985). Polyaluminium
chloride and alum coagulation of clay-fulvic acid suspensions. Journal American Water Works
Association. 77,3 :74-80.
Dental, S.K., Resta, J.J., Shetty, P.V. and Bober, T.A. (1988). Selecting coagulant, filtration
and sludge conditioning aids. Journal American Water Works Association. 80: 72-84.
Die Departement van Waterwese. (1984). Bestuur van die waterhulpbronne van die Republiek
van Suid Afrika. Pretoria: Die Departement van Waterwese.
Dowbiggin, W.B. and Singer, P.C. (1989). Effects of natural organic matter and calcium on
ozone-induced particle destabilisation. Journal American Water Works Association. 81,6:77-
84.
Eaton, A. (1995). Measuring UV-absorbing organics: a standard method. JournalAmerican
Water Works Association. 87,2:86-90.
Edwards, G.A. and Amirtharajah, A. (1985). Removing Color caused by humic acids. Journal
American Water Works Association. 77,3:50-57.
Edwards, M. and Benjamin, M. (1992). Transformation of NOM by ozone and its effect on
iron and aluminium solubility. Journal American Water Works Association 84,6:56-66.
Edwards, M., Benjamin, M.M. and Tobiason, J.E. (1994). Effects of ozonation on coagulation
of NOM using polymer alone and polymer/metal salt mixtures. Journal American Water Works
Association. 86,1:105-116.
Edzwald, J.K., Haff, J.D. and Boak, J.W. (1977). Polymer coagulation of humic acid waters.
Journal.Environmental Engineering Division,ASCE, 103:989-1000.
EI-Rehaili, A.M. and Weber, W.J. (1987).Correlation of humic substance trihalomethane
formation potential and adsorption behavior to molecular weight distribution in raw and
chemically treated waters. Water Research 21,5:573-582.
Fettig, J. and Ratnaweera,. H. (1993). Influence of dissolved organic matter on
coagulationlflocculation of wastewater by alum. Water Science and Technology 27,11: 103-112.
Funke, J.W. (1969). A guide to water conservation and water reclamation in industry.
Pretoria:Council for Scientific and Industrial Research.
Goel, S., Hozalski, R.M. and Bouwer, E.J. (1995). Biodegradation of NOM: effect of NOM
source and ozone dose. Journal American Water Works Association. 87,1 :90-105.
Grasso, D. and Weber, W.J.Jr (1988). Ozone-induced particle destabilisation.
JournalAmerican Water Works Association. 80,8:73-81.
Grachok, M.A., Prokudina, S.A. and Shulat'ev, M.I. (1990). Ozone purification of ammonia-
containing trap waters from nuclear power plant. Soviet Journal of Water Chemistry and
Technology. 12,9:75-79.
Grozes, G., White, P. and Marshall, M. (1995). Enhanced coagulation:Its effect on NOM
removal and chemical costs. Journal American Water Works Association. 87,1:78-89.
Hart, 0.0. (1978). An introduction to water renovation and reclamation. In: Manual for water
renovation and reclamation, edited by National Institute for Water Research, CSIR. Pretoria:
Council for Scientific and Industrial Research.
Healy, K.J., Richards, W.N. and Smith, B.N.T. (1987). The use of organic polymers as
primary coagulants in water treatment and the role of bentonite as coagulant aid. Proceedings
of the Biennial Conference and Exhibition of the IWPC Southern African Branch, Port
Elizabeth, 12-15 May 1987.

Hong-Xiao, T. and Stumm, W. (1987). The coagulating behaviors of Fe(III) polymeric species
- II. Water Research 21,1:123-128.
Jacangelo, J.G., DeMarco, J., Owen, D.M. and Randtke, S.J. (1995). Selected processes for
removing NOM: An overview. Journal American Water Works Association. 87,1:1995.
Johnson, P.A. and Amirtharajah, A. (1983). Ferric chloride and Alum as single and dual
coagulants. Journal American Water Works Association. 75,5:232-239.
Juby, G.J.G. and Botha, G.R. (1994). Removal of colour from Cape waters using ozonation
and membrane filtration, Pretoria: Water Research Commission, 445/1/94.
Kerdachi, D.A., Smith, B.N. and Hardouin, D. (1994). The use of blended
polyaminelpolyaluminium chloride as a primary coagulant for Durban's water supply.
Chemical Technology Feb, 1994:19-21.
Krasner, S.W., Barrett, S.E., Dale, M.S. and Hwang, C.J. (1989). Free chlorine versus
monochloramine for controlling off-tastes and off-odors. Journal American Water Works
Association. 81,2:86-93.
Krenkel, P.A. and Novotny, V. (1980). Water quality management, New York:Academic
Press: 112-155.
Kuo, C.J. and Amy, G.L. (1988). Factors affecting coagulation with aluminium sulfate - II.
Water Research. 22,7: 863-872.
Lai, R.I., Hudson Jr, H.E. and Singley, J.E. (1975). Velocity gradient calibration of jar-test
equipment. Journal American Water Works Association. 67: 553-557.
Letterman, R.D., Quon, J.E. and Gemmel, R.S. (1973). Influence of rapid mix parameters on
flocculation. Journal American Water Works Association. 65,11:716-725.

Loewenthal, R.E., Ekama, G.A. and Marais, G.v.R. (1988). Stasoft: An interactive computer
program for softening and stabilisation of municipal waters, Pretoria:Water Research
Commisson. Ed. 2
Loewenthal, R.E., Wiechers, H.N.S. and Marais, G.v.R. (1986). Softening and stabilization
of municipal waters, Pretoria: Water Research Commission.
Mallevaille, J., Bruchet, A. and Fiessinger, F. (1984). How safe are organic polymers in water
treatment? Journal American Water Works Association. 76,6:87-93.
Manka, J., Rebhun, M., Mandelbaum, A. and Bortinger, A. (1974). Characterization of
organics in secondary effluents. Environmental Science and Technology. 8,12:1017-1020.
Masschelein, W .(1992). Unit processes in drinking water treatment:Environmental science
and pollution series, Marcel Dekker Inc.
McCarthy, J.J. and Smith, C.H. (1974). A review of ozone and 18 application to domestic
wastewater treatment. Journal American Water Works Association. 66,12:718-725.
Meiring, P.J.G.en Vennote. and Cohen, Bahr, Lindsell en Vennote. (1981). Afvalwater
behandelingsaanleg, Cato Ridge Abattoir. Construction in Southern Africa. August 1981:56-
67.
Millamena, O.M. (1992). Ozone treatment of slaughterhouse and laboratory wastewater.
Aquaculture Engineering. 11,1:23-31.
Mortimer, D.A. (1991). Synthetic polyeleetrolytes - A review. Polymer International. 25:29-
40.
Morrison, I. (1996). An overview of treatment options for colour removal. Seminar on
treatment of coloured water for potable use.21-23 October 1996. Unpub.

Moyers, B. and Wu, J.S. (1985). Removal of organic precursors by permanganate oxidation
and alum coagulation. Water Research. 19, 3:309-314.
Narkis, N. and Rebhun, M. (1983). Inhibition of flocculation processes in systems containing
organic matter. Journal Water Purification Control Federation. 55,7:947-955.
National Institute for Water Research (1981). Manual for water renovation and reclamation,
Pretoria:Water Research Commission. Ed. 2
Netzer, A., McNutt, J.L. and Smith, R.P. (1984). Ozone and activated carbon for tertiary
wastewater treatment. In: IOA/NIWR International Conference on Ozone or Alternative
Oxidants and Activated Carbon on Water, Pretoria: CSIR, p. 1-14.
Ogedengbe, O. (1984). Alkalinity consumption during water coagulation. Journal of
Environmental Engineering (New-York). 110,1:290-295.
Owen, D.M., Amy, G.L., Chowdhury, Z.K., Paode, R., McCoy, G. and Viscosil, K. (1995).
NOM characterization and treatability. Journal American Water Works Association. 87,1 :46-
63.
Pieterse, M.J. (1989). Drinking-water quality criteria with special reference to the South
African experience. Water SA. 15,3:169-177.
Pretorius, W.A., Roux, A. and Van der Merwe, G.D. (1995). Johannesburg abattoir
uitvloeisel: Opgradering van uitvloeisel vir hergebruik. (UnPub).
Pretorius, W.A. (1996). Department of Chemical and Environmental Engineering, University
of Pretoria: Personal communication.

Qi, S., Snoeyink, V.L., Beck, E.A., Koffskey, W.E. and Lykins, B.W.Jr. (1992). Using
isotherms to predict GAC1s capacity for synthetic organics. Journal American Water Works
Association. 84: 113-119.
Randtke, S.J. and McCarty, P.L. (1979). Removal of soluble secondary effluent organics.
Journal.Environmental Engineering Division,ASCE. 105,4:727-743.
Razumovski, S.D. and Zaikov, G.E. (1984). Ozone and its reactions with organic compounds,
Amsterdam: Elsevier .
Rebhun, M., Narkis, N. and Wachs, A.M. (1969). Effect of polyelectrolyte in conjunction
with bentonite clay on contaminants removal from secondary effluents. Water Research. 3:345-
355.
Rice, R.G. and Bollyky, L.J. (1981). Fundamental aspects of ozone technology. In: Ozone
treatment of water for cooling applications. edited by Rice, R.G. Virginia: The International
Ozone Association: 1-20.
Rogers, S.E., Peterson, D.L. and Lauer, W.C. (1987). Organic contaminants removal for
potable reuse. Journal Water Purification Federation. 59,7:722-731.
Ross, W.R., Van Leeuwen, J. and Grabow, W.O.K. (1976). Studies on disinfection and
chemical oxidation with ozone and chlorine in water reclamation. Water SA. 2,1:25-32.
Scheuch, L.E. and Edzwald, J.K. (1981). Removing color and chloroform precursors from low
turbidity waters by direct filtration. Journal American Water Works Association. 73,9:497-502.
Schutte, C.F. and Pretorius, W.A. (1995). Draft repon: Population growth/minimum RDP
lifestyle water requirements. (UnPub).
Semmens, J.M. and Field, T.K. (1980). Coagulation: Experiences in organics removal.
Journal American Water Works Association. 72,8:476-483.

Sierka, R.A., Amy, G.L. and Renna, J. (1989). Molecular weight characterisation of color
constituents and subsequent removal by ozone and activated carbon adsorption. Proceedings:
9th Ozone world congress, 1989, New York.Vol 1.Ozone in water treatment.New York:1-14.
Stephenson, K.F. and Duff, S.J.B. (1996). Coagulation and precipitation of a mechanical
pulping effluent -I: Removal of carbon, colour and turbidity. Water Research. 30,4:781-792.
Symons, J.M. (1980). Ozone chlorine dioxide and chloramines as alternatives to chlorine
disinfection of drinking water. In: Ozone and chlorine dioxide technology for disinfection of
drinking water, edited by Katz, J. Noyes Data Corporation.
Taljard, M.P. (1981). The integration of physico-chemical processes for the production of
reclaimed water. 1MIESA. July 1981:45-49.
Tambo, N. and Hozumi, H. (1979). Physical characteristics of flocs - II: Strength of floc.
Water Research. 13:421-427.
Tambo, N. and Wantanabe, Y. (1979). Physical aspects of the flocculation process - I:
Fundamental treatise. Water Research. 13:429-439.
Tan, L. and Amy, G.L. (1991). Comparing ozonation and membrane separation for color
removal and disinfection by-product control. Journal American Water Works Association.
83,5:74-79.
Toerien, A. (1988). 'n Ondersoek na osonering as voorbehandeling vir drinkwater.
Potchefstroom: University of Pothefstroom for Christian Higher Education.
Train, R.E. (1979). Quality criteria for water, Washington:Castle House Publications, Ltd:
205-212.

Van Breemen, A.N., Nieuwstad, Th.J. and Van der Meent-Olieman, G.C. (1979). The fate of
fulvic acids during water treatment. Water Research. 13:771-779.
Van Leeuwen, J., Prinsloo, J., Van Steenderen, R.A. and Melekus, W. (1981). The effect of
various oxidants on the performance of activated carbon used in water reclamation. Ozone:
Science and engineering. 3:225-237.
Van Vuuren, L.R.J. and Taljard, M.P. (1979). The reclamation of industrial/domestic
wastewaters. In: Water Reuse Symposium, March 1979, Washington DC. Volume 2, edited by
American Water Works Associationy Research Foundation, Washington DC: American Water
Works Association Research Foundation:907-924.
Venosa, A.D. and Meckes, M.C. (1983). Control of ozone disinfection by exhaust gas
monitoring. Journal Water Pollution Contol Federation. 55,9:1163-1167.
Vik, E.A., Carlson, D.A., Eikum, A.S. and Gjessing, E.T. (1985). Removing aquatic humus
from Norwegian lakes. JournaLAmerican Water Works Association. 77,3:58-66.
Viraraghavan, T. and Wimmer, C.H. (1988). Polyaluminium chloride as an alternative to alum
coagulation -a case study. Aqua. 1988,6:316-321.
Weber, W.J. (1984). Activated carbon systems for treatment of waters and wastewaters.
IOA/NIWR International Conference on Ozone or Alternative Oxidants and Activated Carbon
on Water and Wastewater Treatment, Pretoria: CSIR: 1-26.
Weber, W.J. and Jodellah, A.M. (1985). Removing humic substances by chemical treatment
and adsorption. Journal American Water Works Association. 77,4:132-137.
Weber Jr, W.J., Pirbazari, M., Long, J.B. and Barton, D.A. (1981). Potential mechanisms for
removal of humic acids from water by activated carbon. In: Activated carbon adsorption of

organics from the aqeous phase, Volume 1, edited by Suffet, tH. and McGuire, M.J. Ann
Arbor Science.
Westrick, J.J. and Cohen, J.M. (1976). Comparative effects of chemical pretreatment on
carbon adsorption. Journal Water Pollution Contol Federation. 48,2:323-338.
White, G.C. (1992). Handbook of chlorination and alternative disinfectants, New York:Van
Nostrand Rheinhold.
Wilczak, A., Howe, E.W., Aieta, E.M. and Lee, R.G. (1992). How preoxidation affects
particle removal during clarification and filtration. Journal American Water Works Association.
84,12:85-94.
Yao, C. and O'Melia, C.R. (1989). Comparison of aluminium preparations as coagulants in
water treatment. Aqua. 38:339-344.
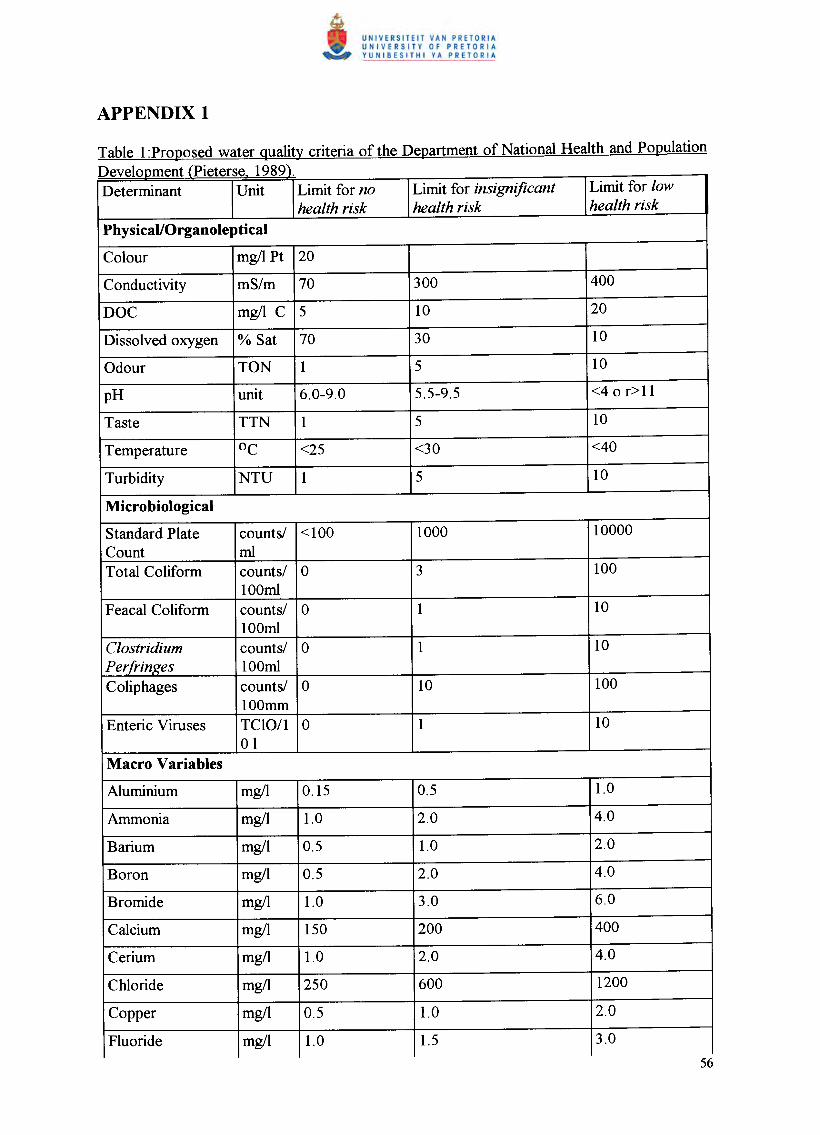
Develooment (Pieterse 1989),Determinant Unit Limit for no Limit for insignificant Limit for low
health risk health risk health riskPhysicaVQrganoleptical
Colour mg/l Pt 20
Conductivity mS/m 70 300 400
DOC mg/l C 5 10 20
Dissolved oxygen % Sat 70 30 10
Odour TON 1 5 10
pH unit 6.0-9.0 5.5-9.5 <40 r>l1
Taste TTN 1 5 10
Temperature °C <25 <30 <40
Turbidity NTU 1 5 10
Microbiological
Standard Plate counts/ <100 1000 10000Count mlTotal Coliform counts/ 0 3 100
100mlFeacal Coliform counts/ 0 1 10
100mlClostridium counts/ 0 1 10PerfrinKes 100mlColiphages counts/ 0 10 100
100mmEnteric Viruses TCIO/1 0 1 10
01Macro Variables
Aluminium mg/l 0.15 0.5 1.0
Ammonia mg/l 1.0 2.0 4.0
Barium mg/l 0.5 1.0 2.0
Boron mg/l 0.5 2.0 4.0
Bromide mg/l 1.0 3.0 6.0
Calcium mg/1 150 200 400
Cerium mg/l 1.0 2.0 4.0
Chloride mg/l 250 600 1200
Copper mg/l 0.5 1.0 2.0
Fluoride mg/l 1.0 1.5 3.0

Hardness mg/I 20-300 650 1300Iodide mg/I 0.5 1.0 2.0Iron mg/I 0.1 1.0 2.0Lithium mg/I 2.5 5.0 10.0Magnesium mg/I 70 100 200Manganese mg/I 0.05 1.0 2.0Nitrates mg/I 6.0 10.0 20.0Potassium mg/I 200 400 800Sodium mg/I 100 400 800Sulphate mg/I 200 600 1200Uranium mg/I 1 4 8Zinc mg/I 1 5 10
In Figure 1, the variation in turbidity of the secondary eflluent is compared with turbidityrequirements for water with no, insigniiicant and low health risks.
TURBIDITY IN NTU30
10 13 15 17DATES/MARCH 1995
FIGURE 1: The variation in turbidity against guideline limits for water of no-, insignificantand low health risks.The dates of 13 March and dates in April, June and September were on Mondays, whenclarifier was anaerobic

CITY DEEP ABATTOIR 02/08PPF (J12), Offal! (J16) & Lairages(J4}
2500 - --
"Ii
':1······
::2000 -
t:~:::
1500 - :.~~
:~.- -~::---
~::
I
--_._----- :: ---
~1:
..... :)
:_illl
I.:!.:!.:! ..:i.:I ..:'!:-
:/ :::'11
............... i.:
__ _ II:
.... : : : :,1.1: :.:
1: ::: 1·1
. :1: 1·1
II I:1

Figure3:
Effluent
productionby
thedifferent
sectionsof
theJohannesburg
abattoirand
resultanteffluent
availablefor
re-use(V
anH
eerden,1994).
0';0
B'0
i0.0.
0-t·,
••••.••.-..
•.••••..••.•.•••.•••_
.-••..••.••.•
_••••_
._.....
~.._
._•••.-
•••••••_.~
••-••"••••-
•••.•_.-
Ie1°I°
v.
I0
III
Bo
~-.."__
~.._"
-·······i··--····-'"-._::
1°010...0..
·~
·..
••~f.'
·.'~•.¢
.,;,..,t
;,~,
\iLJ
iIIt•.···••••·•·••·••·
I
0.'0.
G.e.

.The nature of secondary effluent DOM. .The predominantly humic nature of the DOM in the secondary effluent was proven by
performing a UV absorption analysis (Department of Microbiology, University of Pretoria).
An absorption profile (Figure 1) was obtained by Morrison (1996) on a coloured surface water
from the Southern Cape. The waters from this area contains high colour and humic material
concentrations. This profile was similar to the absorption profile drawn on secondary effluent
(Figure 2).
ULTRAVIOLET ABSORPTION SPECTRUM
OF BROWN WATERS
1.6
1.4
(/J 1.2Q)(.)
EE 1.00•....w 0.8uz<OJ 0.6c::0CJ)OJ 0.4<
0.2
----, _.. _.--------_.--~ --------.-- --- .~--_.-------. -----:' ----_.. -- -----'1' _ -------~--------- -------: -_ --- -- ---_.." ," ," ," ,
, , I , I I ,
:..:..\\.'.!r:;~::::;- _. - - -_. - - - -~.\. ~ • ~ oJ. ~ • - ~ ~ oJ. _. ,',.~. :
: -..: ....-- - - -- - - -- - - - -- -~-- - - - -~~. , '
: :-. --~ _.-- -":" --_._.. _.-'" -'f' -- -_ :. _ ~ ·1··········· - ., I " II I , I .••. _ • I
I , I " ,.................•.....·········!!··r········
- - - - - - - - . - - - .. - j_ - - - - ~ -. _ .. _. j- - -- -- _ .. - --t - -- _. --. - - -- .. - '1"- ·r·· .. ·.. ·· _.----.r" ------_ -_., ,, ,
0.0200 350 400 450
WAVELENGTH, nm
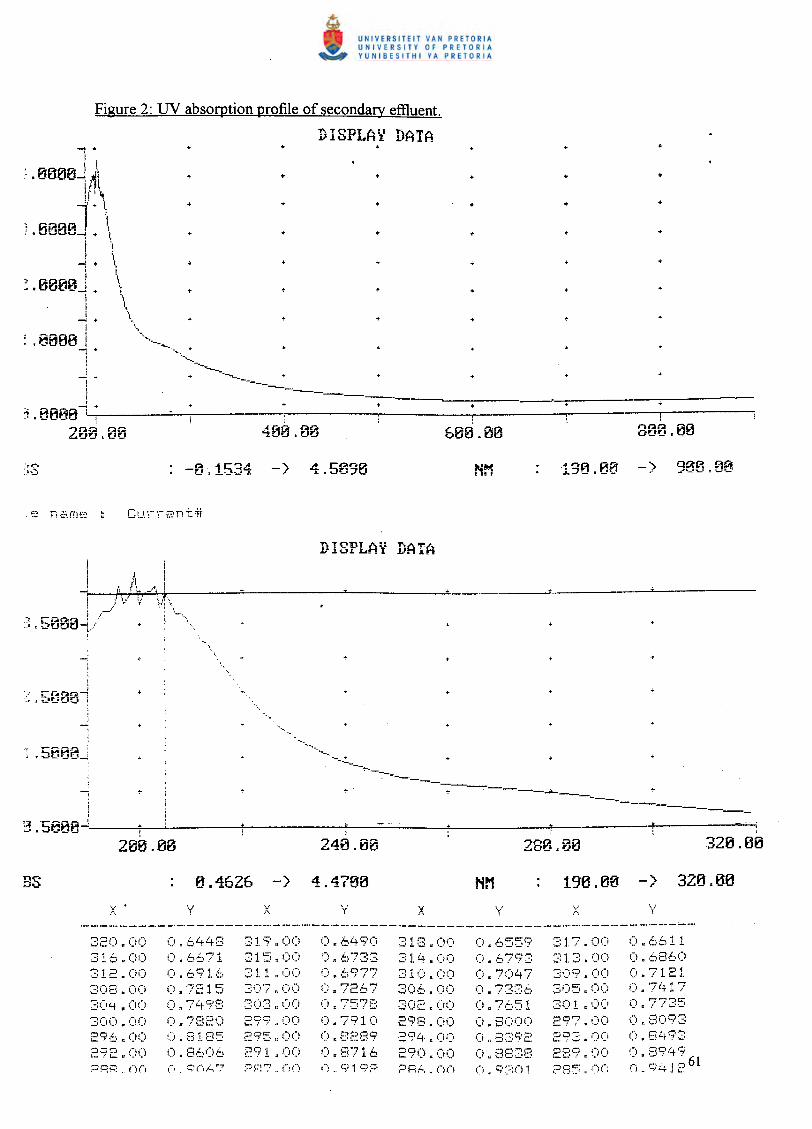
""1 •: I: t1lAPl~ ! ..Jl
.• _0_'0""1 mIi'; .~
-4'. 'I.
; .B0eu~J. \i !:, I1+ liI .,
: .0008J + \I \I I", "
-l + \,! '''t.e ••
; . BEma I ..._-_.......-; .•. .
......_._---_._-------~------_.--~----
;--::. .•.!,i
.., H~H~-{ +:1 •••....•t!.....t! II~!------=--,-------;,-·-----,-------i------.------..,..-----;
200~08 480.00 600.00 800~e0
I,ji\ ..l"th _.''\l.
_.) .?'. 'T' ·Vj\,.:;,5000~ ../i- ..
,
;
.~~:5000-1
M_M •• __
.•_-.:._--,.._--------
-.~-----~----------------
.I200.00
(i • 6 S:' 1. t:.(: II ;'215(;" '7{+i=;8(i It '7E{c~()
31~·. (i(i31(::l (j() 3():'? ()(;
3(:5 I: (l(i
(;::7121O.'7t+17
2:()"· II i:)()
:3()() If ()()
2'7't. ~(l::)
2'7'2 u (:(;
29LJ· I: (;(;
29() I: (it:)

UV absorbance of a sample at 254 nm usually indicates the presence of conjugated and
cumulative double bonds (Juby and Botha, 1994). A high percentage of the absorbance could
be due to conjugation due to the presence of humic material.
The correlation between colour removal and organic material removal with coagulation is
shown in Figure 3. Since similar colour removal could be achieved with dosages of 120 mg/l
U3500 and 400-500 mg/l alum or ferric chloirde similar organic material removal should be
obtained.
...J
~o~ 40w0::-oR
o100
I % %COLOUR REMOVAL
Figure 3: The relationship between removal of colour and COD from secondary eftluent with
coagulation with alum.
Humic material, being long chain organic molecules with only some charged groups, could be
slightly hydophobic and therefore easily destabilised by complexation of the charged gorups
and precipitated. Therefore the colour containing DOM are removed with coagulation and
results in a reduction of both colour and organic matter.

The relationship between colour and COD removal with activated carbon adsorption is not as
strong as in the case of coagulation (Figure 4).
80--l«>0:2:w 600::W<.9«I-Z 40w()0::wa...
20
oo 500 1000 1500
mg ACTIVATED CARBON ADDED to 200ml
I ~ % COLOUR REMOVAL % COD REMOVAL
Figure 4: The relationship between colour and COD removal from secondary etlluent with
adsorption on activated carbon
This could be due to activated carbon adsorbing some organic molecules with no colour
constituents to a greater extent than the humic molecules. The pore size distribution of the
activated carbon could have influenced removal of the larger organic molecules (Sierka et ai,
1989; EI-Rehaili and Weber, 1987). PHO 12/40 is a coconut based activated carbon with a
small pore size and low capacity for adsorption of humic matter. Colour removal would be
improved using a peat-, wood- or bitumen-coal based activated carbon (Nel, 1996)
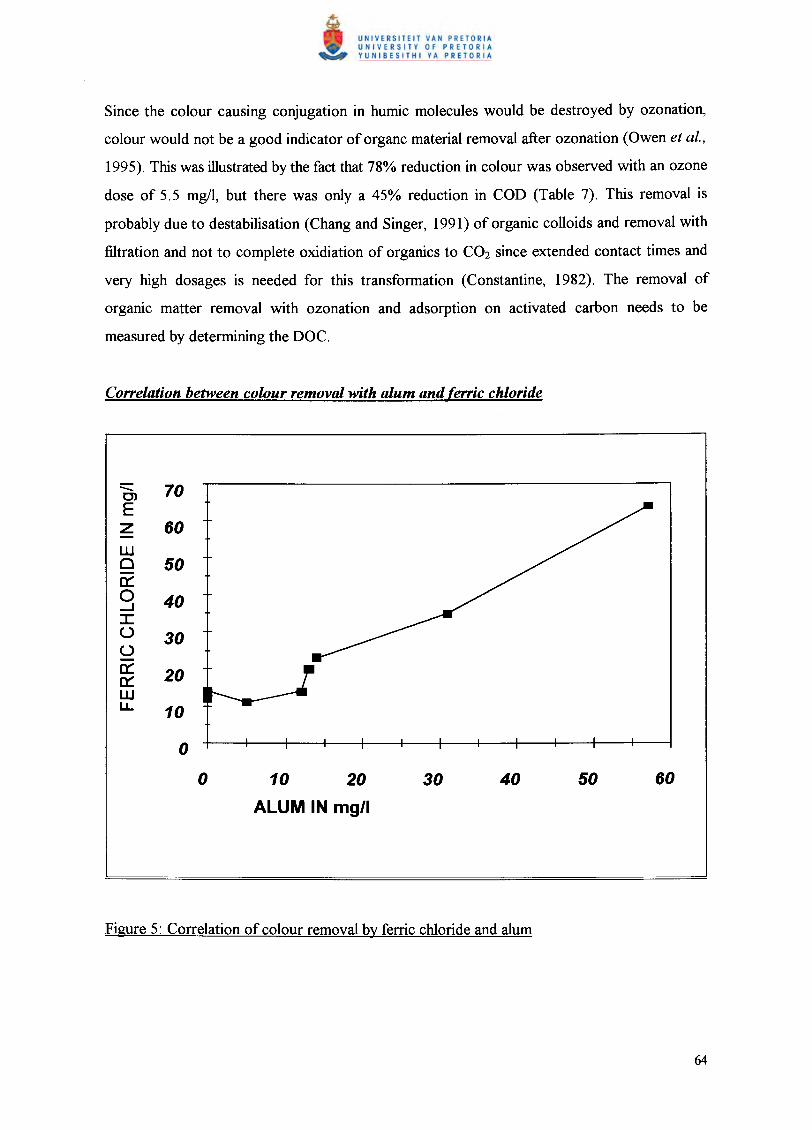
Since the colour causing conjugation in humic molecules would be destroyed by ozonation,
colour would not be a good indicator of organc material removal after ozonation (Owen et aI.,
1995). This was illustrated by the fact that 78% reduction in colour was observed with an ozone
dose of 5.5 mg/l, but there was only a 45% reduction in COD (Table 7). This removal is
probably due to destabilisation (Chang and Singer, 1991) of organic colloids and removal with
filtration and not to complete oxidiation of organics to CO2 since extended contact times and
very high dosages is needed for this transformation (Constantine, 1982). The removal of
organic matter removal with ozonation and adsorption on activated carbon needs to be
measured by determining the DOC.
::::::::: 70C)Ez 60w0 500::0 40...J
:c0 3000:: 200::wu. 10
0
0 10 20 30 40 50 60ALUM IN mg/l

For effective coagulation on bench scale and in practice, two mixing stages are required. Rapid
mix enables the distribution of coagulant throughout the water. The slow mix enables floc
growth. When the predominant mechanism of coagulation is adsorption-destabilisation,
occurring at low pH, the rapid mix intensity (Healy et ai., 1987) will affect effectiveness of
coagulation and removal. The time required for destabilisation is in the order of a fraction of a
second (Letterman et ai., 1973) and inefficient mixing may lead to restabilisation in some areas
and insufficient destabilisation in others. Floc strength is also dependant on the energy input
Tambo and Hozumi, 1979) at the rapid mixing. Floc size distributions also were more
favourable for settling at high mixing intensities (Leu and Ghosh, 1988). Slow mixing times
was found not to influence organics removal (Semmens and Field, 1980).
Early theories of flocculation kinetics were developed by Von Smuluchowski and Camp
(Tambo and Wantanabe, 1979) and proposed the mean velocity gradient G and Gt (t=time)
values as criteria for desgn of coagulating systems. The effective Gt values for rapid mixing
should be reported in coagulation studies in order to design for optimu conditions on the plant.
The optimum Gt value for polymers are generally given at 100000 (Tambo and Hozumi,
1979).
Jar stirrer aparratus are commonly used (Semmens and Field, 1980) for evaluation of
coagulation efficiency. In order to determine Gt obtained in a jar stirrer the system should be
characterised. Round glass beakers stirred with flat paddles often form vortexes which limits
attainable power input to the water and makes full-scale correlating difficult (Cornwell and
Bishop, 1995). However, exponential relationships were defined for mean velocity gradients
applicable to jar stirrers with a flat paddle using round one litre beakers by Botha (1995).
Estimation of the approximate G-values achieved during the tests with round glass beakers
was obtained for 800 ml of fluid in a tall one litre glass beaker: G = 0.042N 1.549 where N is
the revolutions per minute.
Rapid mixing speed was tested for optimum colour removal. There was no difference in colour
removal for speeds over 200 rpm. Colour removal was greatly enhanced, however, when the

slow mixing speed (flocculation) was increased from the normal 20-30 rpm to 50 rpm (Figure
6) (Narkis and Rebhun, 1983, Weber and Jodellah, 1985). Flocculation time above 10 minutes
was not critical for colour removal
% COLOUR REMOVAL
95
50MIXING SPEED IN RPM
Turbidity removal was improved with pre-ozonation of secondary effluent. Ozonation after
coagulation increased tubidity due to micro floc formation. This turbidity was easily removed with
dosages of coagulant which would have been inefficient without ozonation Figure 7.

60
50-'~ 40~wa:~ 30isiOa: 20=>I-w
~10
zw 00a:wa.
-10
-200 20 30 40
FERRI CHLORIDE DOSAGE
Figure 7: Comparison between removal of turbidity with coagulation with ferric chloirdebefore and after ozonation.
160
140--l
:3 120oen 100w~w 80zir 60o--li3 40
20o
20 80 100 120CHLORINE DOSE

...J 120«::JQ 100(J)W0:::W 80z~ 60...J
Io 40
o20 80 100 120
CHLORINE DOSE
...J 150«::>Cl(jjw~ 100zii:o...J:I:o 50
100CHLORINE DOSE
Figure 10: Breakpoint cWorination for secondary effluent coagulated with 60 fig/I U3500 andozonated with 5.5 fig/I ozone.

APPENDIX 3: PLANT DESIGN AND RESULTS~ ~
A full scale efiluent reclamation plant treating 1500 m3/day was commissioned in January 1996. .at the Johannesburg Abattoir. The process steps are coagulation, sedimentation, ozonation,
sand filtration, activated carbon filtration and chlorination. A schematic diagram of the process
is presented in Figure 1.
Figure 1. Process diagram of the full scale efiluent reclamation plant at the Johannesburg
Abattoir (Van Heerden. 1995)