Chaos and chaos control in biology. - The Journal of Clinical ...
Upload
khangminh22Category
view
0download
0
THE ACCURACY OF DIRECT DETERMINATIONS OF OXYGENAND CARBON DIOXIDE TENSIONS IN HUMAN BLOOD IN VITRO
Giles F. Filley, … , Esther Gay, George W. Wright
J Clin Invest. 1954;33(4):510-516. https://doi.org/10.1172/JCI102921.
Research Article
Find the latest version:
https://jci.me/102921/pdf

THE ACCURACYOF DIRECT DETERMINATIONSOF OXYGENANDCARBONDIOXIDE TENSIONS IN HUMANBLOOD
IN VITRO 1
By GILES F. FILLEY, ESTHERGAY, ANDGEORGEW. WRIGHT
(From the Department of Physiology, the Edwtvard L. Trudeau Foundation, Saranac Lake,New York)
(Submitted for publication November 16, 1953; accepted December 2, 1953)
The need for an accurate yet clinically practicalmeans of determining the tensions of the respira-tory gases in human blood has been recognizedsince Krogh (1) perfected equilibration tech-niques for in vivo 2 studies on experimental ani-mals. Several methods (2-7) based on Krogh'sprinciples have been used for analyzing humanblood in vitro but as has been pointed out (6) suchmethods are "fraught with numerous potentialsources of error." Indirect estimations of the par-tial pressure of oxygen in human blood from thehemoglobin dissociation curve can be subject tolarge (usually random) errors (2, 4) and calcula-tion of the carbon dioxide tension of blood dependsupon measurement of the plasma CO2content andpH by methods that are not as reliable or con-venient as one might desire.
The development by Riley, Proemmel, andFranke (5) of a rapid direct technique for deter-mining arterial blood gas tensions in man permitsapproximately in vivo conditions to be maintainedwithout sacrificing clinical utility. The principleof the method depends upon the equilibration of agas bubble at atmospheric pressure with blood at370 C. in the barrel of a Roughton-Scholander(R-S) syringe and the subsequent analysis of thegas bubble in the capillary portion of the samesyringe. Riley evaluated the precision of hismethod by comparing the tensions of oxygen andcarbon dioxide in the blood and gas phase of to-nometers equilibrated at 37° C. The mean of thedifference for both gases between the tensions inthe two phases was 2 to 3 mm. Hg necessitating theuse of correction factors. These correction factors
1 These studies were aided by a contract between theOffice of Naval Research, Department of the Navy and theTrudeau Foundation (NR 112-214).
2 In Krogh's method flowing blood enters the equilibra-tion chamber at 37° C. within a few seconds after itleaves the artery.
have required revision over a period of severalyears (6) and vary depending upon the analyst.
Wehave introduced modifications of the Rileytechnique which have led to increased precisionand clinical applicability.
METHODSOF STUDY
Two independent approaches for assessing the accuracyof directly determined blood oxygen and carbon dioxidetensions were used. In the first (Table I), human venousblood was equilibrated at 37.20 C. for one hour in atonometer containing mixtures of oxygen, carbon dioxide,and nitrogen, the gas phase being analyzed in duplicateon the Haldane apparatus and the blood phase in dupli-cate by the Riley technique or one of our modifications.The tonometer technique described by Riley, Proemmel,and Franke (5) was used in Series 1. Double-chamberedtonometers (8) were used in Series 2 and 3. In the sec-ond approach (Table II) each sample of human arterialblood, in addition to being analyzed for Po. and Pco2directly, was simultaneously analyzed (9) in duplicate inthe Van Slyke apparatus for oxygen and carbon dioxidecontent within an hour after blood sampling. Duplicateanalyses were accepted only if agreement within 0.2 vol-umes per cent was obtained. Saturation of the blood withoxygen was carried out in the chamber of the Van Slykeapparatus and analysis was performed by the method ofSendroy 8 (10). Plasma pH was determined by themethod of Hastings and Sendroy (11) immediately afterblood was drawn. From the hemoglobin dissociationcurves of Dill (12) and the nomograms of Van Slyke andSendroy (13) the blood oxygen and carbon dioxide ten-sions were calculated. In this manner one can comparethe tensions obtained by direct and indirect measurementin the same blood sample.
In each of these two approaches, blood gas tensionswere determined directly by the Riley technique or byone of our modifications. In the first series of measure-ments (Series 1, Table I) blood was analyzed for oxygen
3 Modified only to the following extent: Instead of us-ing 0.3 cc. of 23 per cent ferricyanide reagent, we use 1.0cc. of a 1.8 per cent ferricyanide reagent. Instead of 2.5cc. of saline to wash in the 0.5 cc. of blood, only 2.0 cc. isused so that the final volume of liquid in the Van Slykechamber before gas absorption is 3.5 cc.
510
DIRECT DETERMINATIONSOF 02 AND C0, TENSIONS IN BLOOD
TABLE I
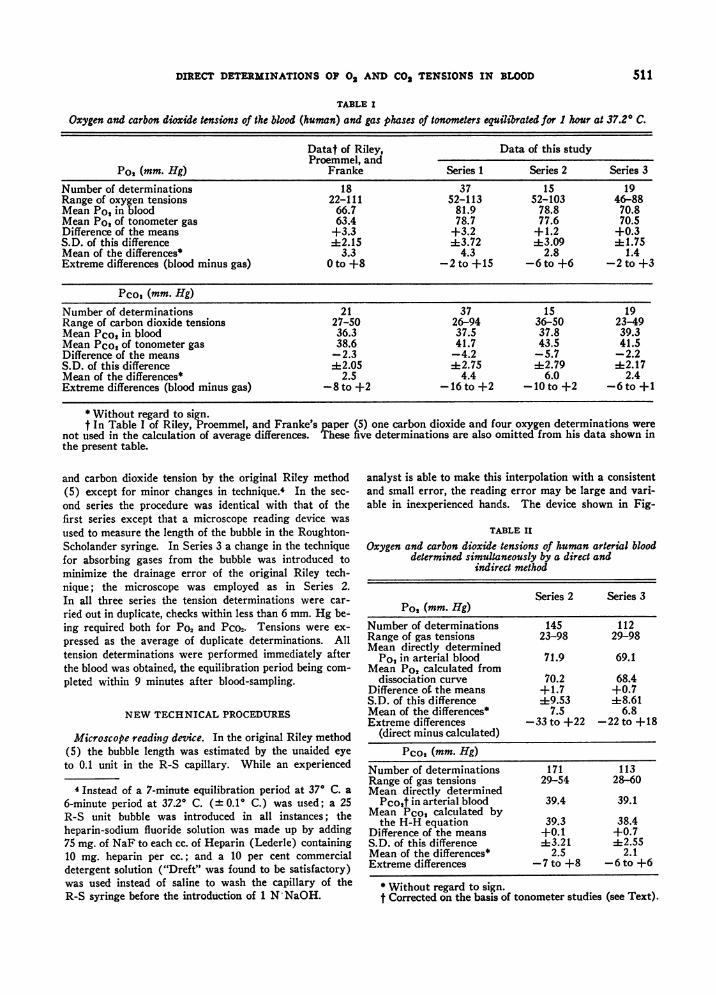
Oxygen and carbon dioxide tensions of the blood (human) and gas phases of tonometers equilibrated for 1 hour at 37.20 C.
Datat of Riley, Data of this studyProemmel, and
Pot (mm. Hg) Franke Series 1 Series 2 Series 3
Number of determinations 18 37 15 19Range of oxygen tensions 22-111 52-113 52-103 46-88Mean Po, in blood 66.7 81.9 78.8 70.8Mean Po, of tonometer gas 63.4 78.7 77.6 70.5Difference of the means +3.3 +3.2 +1.2 +0.3S.D. of this difference 4:2.15 1:3.72 =13.09 1:1.75Mean of the differences* 3.3 4.3 2.8 1.4Extreme differences (blood minus gas) 0 to +8 -2 to +15 -6 to +6 -2 to +3
Pco, (mm. Hg)Number of determinations 21 37 15 19Range of carbon dioxide tensions 27-50 26-94 36-50 23-49Mean Pco, in blood 36.3 37.5 37.8 39.3Mean Pco2 of tonometer gas 38.6 41.7 43.5 41.5Difference of the means -2.3 -4.2 -5.7 -2.2S.D. of this difference -42.05 -42.75 :1:2.79 4:2.17Mean of the differences* 2.5 4.4 6.0 2.4Extreme differences (blood minus gas) -8 to +2 -16 to +2 -10 to +2 -6 to +1
* Without regard to sign.t In Table I of Riley, Proemmel, and Franke's paper (5) one carbon dioxide and four oxygen determinations were
not used in the calculation of average differences. These five determinations are also omitted from his data shown inthe present table.
and carbon dioxide tension by the original Riley method(5) except for minor changes in technique.4 In the sec-
ond series the procedure was identical with that of thefirst series except that a microscope reading device was
used to measure the length of the bubble in the Roughton-Scholander syringe. In Series 3 a change in the techniquefor absorbing gases from the bubble was introduced tominimize the drainage error of the original Riley tech-nique; the microscope was employed as in Series 2.In all three series the tension determinations were car-
ried out in duplicate, checks within less than 6 mm. Hg be-ing required both for Po2 and Pco2. Tensions were ex-
pressed as the average of duplicate determinations. Alltension determinations were performed immediately afterthe blood was obtained, the equilibration period being com-
pleted within 9 minutes after blood-sampling.
NEWTECHNICALPROCEDURES
Microscope reading device. In the original Riley method(5) the bubble length was estimated by the unaided eyeto 0.1 unit in the R-S capillary. While an experienced
4 Instead of a 7-minute equilibration period at 370 C. a
6-minute period at 37.20 C. (± 0.1° C.) was used; a 25R-S unit bubble was introduced in all instances; theheparin-sodium fluoride solution was made up by adding75 mg. of NaF to each cc. of Heparin (Lederle) containing10 mg. heparin per cc.; and a 10 per cent commercialdetergent solution ("Dreft" was found to be satisfactory)was used instead of saline to wash the capillary of theR-S syringe before the introduction of 1 N-NaOH.
analyst is able to make this interpolation with a consistentand small error, the reading error may be large and vari-able in inexperienced hands. The device shown in Fig-
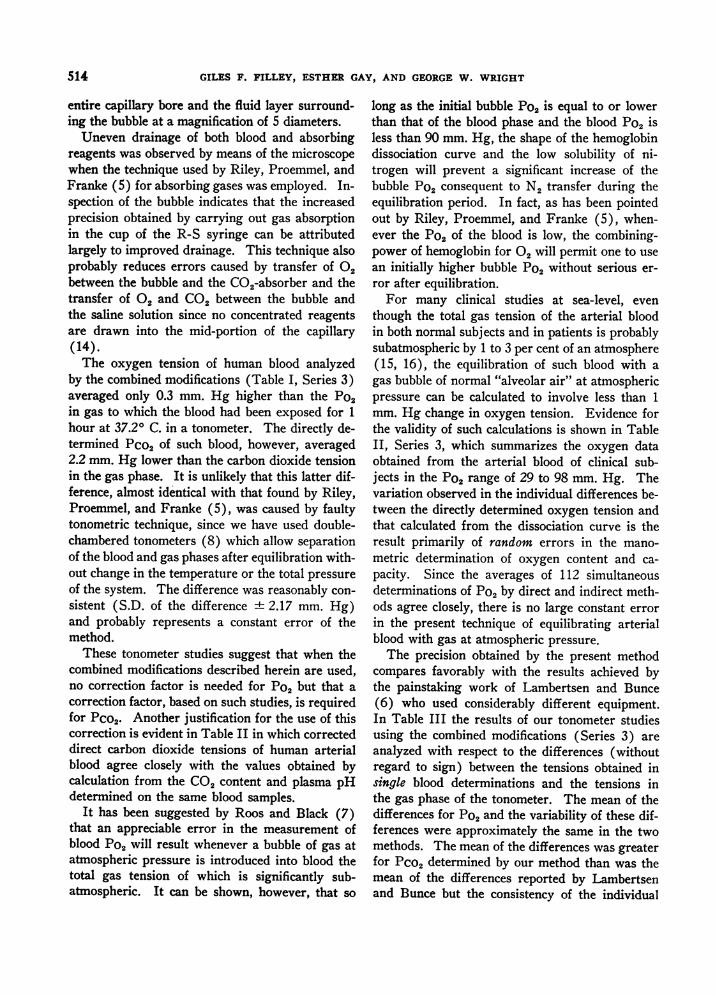
TABLE II
Oxygen and carbon dioxide tensions of human arterial blooddetermined simultaneously by a direct and
indirect method
Series 2 Series 3Po, (mm. Hg)
Number of determinations 145 112Range of gas tensions 23-98 29-98Mean directly determined
Po, in arterial blood 71.9 69.1Mean Po, calculated from
dissociation curve 70.2 68.4Difference of. the means +1.7 +0.7S.D. of this difference :1:9.53 418.61Mean of the differences* 7.5 6.8Extreme differences -33 to +22 -22 to +18
(direct minus calculated)Pco, (mm. Hg)
Number of determinations 171 113Range of gas tensions 29-54 28-60Mean directly determined
Pco,f in arterial blood 39.4 39.1Mean Pco, calculated by
the H-H equation 39.3 38.4Difference of the means +0.1 +0.7S.D. of this difference :4:3.21 :2.55Mean of the differences* 2.5 2.1Extreme differences -7 to +8 -6 to +6
* Without regard to sign.t Corrected on the basis of tonometer studies (see Text).
511

GIES F. FILLEY, ESTHER GAY, AND GEORGEW. WRIGHT
FIG. 1.
The R-S syringe, A., rests in the sliding carriage, B.,20 mm. below the water level, C., in the constant tem-perature bath. The menisci of the bubble in the R-Scapillary can be brought to a hair-line in the eye-piece ofthe microscope, D., and the distance between them meas-ured to the nearest 0.1 mm. along the scale, E., by meansof the vernier adjustment.
0.
ure 1 (used in both Series 2 and 3) permits visualizationat 5 X magnification of the entire capillary portion of theR-S syringe and eliminates parallax. By means of thesliding carriage and vernier adjustment 5 the bubblelength may be determined directly to the nearest 0.1 mm.The error in partial pressure which results from measure-ments with the microscope and vernier can be calculatedto be less than 1 mm. Hg both for oxygen and carbondioxide.
Absorption of gases in the cup of the R-S syringe. Thefollowing procedure (used only in Series 3) was adoptedto avoid the introduction of viscous alkaline reagents intothe mid-portion of the capillary where the bubble lengthis measured. This maneuver was devised in an attempt tolessen the error caused by uneven drainage of the capillarywall.
After the bubble has been introduced into the R-S syr-inge and equilibrated at 37.20 C. for 6 minutes, the mer-cury and most of the blood are ejected under water andthe bubble pushed into the capillary as described in theoriginal Riley method (5). Following the reading of theinitial bubble length, the syringe is removed from the bathand held vertically with the cup-end up while the bubble isadvanced till the distal end is about 8 mm. from the cup(Figure 2a). The cup is then emptied of blood by aspira-tion and wiped clean with a toothpick swab. It is then
5 Part of a conventional graduated mechanical stage.
c.
FIG. 2. POSITIONS OF THE ROUGHTON-SCHOLANDERSYRINGE DURING THRESTAGESOF BUBBLEMANIPULATION ANDANALYSIS
In a, the syringe is held upright after the cup has been emptied of bloodwith a "waste" syringe and wiped clean; it is then filled with saline andinverted, b, the residual blood being expelled into the saline. The invertedposition allows manipulation and absorption of the bubble to be carried outwithout losing the bubble. In c, gas absorption is accomplished without inti-mate contact between blood and alkaline reagents.
512

DIRECT DETERMINATIONSOF 02 AND CO2 TENSIONS IN BLOOD
filled with physiological saline, the syringe inverted, andthe residual blood at the distal end of the bubble expelledinto the saline-filled cup by advancing the bubble untilit reaches the end of the capillary (Figure 2b). Thebubble is then withdrawn into the capillary again so thatthe distal end of the bubble is 8 mm. from the cup whichis then emptied and refilled with 2 N KOH.6
Absorption of CO, is carried out with the syringe heldcup-end down by advancing the bubble so that it pro-trudes into the alkali until the proximal end is 8 mm.from the cup (Figure 2c), allowing it to remain therefor about 1 second, withdrawing it and repeating this pro-cedure five times. The KOHin the cup is then replacedwith saline while the distal end of the bubble is 8 mm. fromthe cup. The bubble is next pulled back followed by salineto the mid-portion of the capillary for the second reading.The proximal end of the bubble is now bathed in blood, thedistal end in saline containing a small amount of KOH.
Absorption of 0, is carried out as for CO2, the bubblebeing again protruded into the cup which has been filledwith alkaline hyposulfite solution (5); advance and retrac-tion of the bubble is repeated five times; on the last timethe protruded bubble and the hyposulfite are allowed about4 seconds of contact. After the hyposulfite has beenwashed out with saline (distal end of bubble 8 mm. fromthe cup), the bubble followed by saline is again drawn intothe capillary for the final reading.
During the manipulation of the bubble from capillaryto cup and back, the syringe must be held with the cuppointed downward in order to avoid losing the bubble.The use of detergents is not necessary. A 25 R-S unitbubble is introduced in all instances. Duplicate analysescan be completed within 30 minutes after blood is sampled.
RESULTS
As shown in Table I we have confirmed the ob-servation of Riley, Proemmel, and Franke (5) thaton the average the determined Po2 was higher andthe Pco2 lower in the blood than in the gas phaseof the tonometer. When the microscope readingdevice was used (Series 2) the difference of themeans was reduced for oxygen and increased forcarbon dioxide. Measurements made with gasabsorption being performed in the cup (Series 3)showed a further reduction in the difference foroxygen to 0.3 mm. Hg. With this modification thedifference of the means for CO2was 2.2 mm. Hg.
In our hands measurement by the originalmethod of Riley, Proemmel, and Franke (Series1) produced greater variability in the differencesbetween the tensions of the blood and gas phase ofthe tonometer than he reported (5). The use ofthe microscope device in carrying out the determi-
6 The surface tension of KOHis less than that of NaOH.The solubility of oxygen is less in 2 N than in 1 N KOH.
nations of Series 2 did not significantly 7 diminishthe variability as shown in Series 1, in which read-ings were made by a single experienced technician(E. G.) with the unaided eye. However, the modi-fication of absorbing gases in the cup in Series 3reduced the standard deviation of the difference ofthe means to 1.75 mm. Hg for oxygen and 2.17mm. Hg for carbon dioxide.
In Table II are shown the directly determinedtensions (corrected on the basis of the tonometerstudies of Series 2 and 3) as compared with thetensions determined indirectly from the standardhemoglobin dissociation curve and the Henderson-Hasselbach equation. Using the Riley techniquemodified by the use of the microscope and vernier(Series 2, Table II), we found that the mean oxy-gen tension was 1.7 mm. Hg higher than that cal-culated from the hemoglobin dissociation curve andthat the individual differences between the two val-ues varied widely; the mean direct and calculatedvalues for Pco2 agreed more closely and there wasless scatter in the individual differences. Themodification of absorbing gases in the cup of theR-S syringe (Series 3) resulted in less than amillimeter of Hg difference between the meansof the direct and calculated blood tensions and thevariability of the differences was also reduced.
In all three series of direct tension determina-tions the mean of the difference between duplicateswas 2 mm. Hg with a standard deviation of + 1.5mm. Hg.
DISCUSSION
The major sources of error in micro-tonometrictechniques for determining blood gas tensionswere pointed out by Krogh (14) who emphasizedthe importance of exact readings of the bubblelength, scrupulous cleanliness of the capillary andavoidance of any distortion of the menisci at theends of the gas bubble. The microscopic devicedescribed in the present report, although not greatlyaffecting the precision of the Riley method as car-ried out by us, has two advantages. In the firstplace, it reduces dependence on technical skill byshortening the training period required for ananalyst to develop a consistent reading error.Secondly, the device permits visualization of the
7 Although the S.D. of the difference of the means foroxygen in Series 1 and 2 differ by 0.63 mm. Hg, the stand-ard error of this difference is 0.71 mm. Hg.
513
GILES F. FILLEY, ESTHER GAY, AND GEORGEW. WRIGHT
entire capillary bore and the fluid layer surround-ing the bubble at a magnification of 5 diameters.
Uneven drainage of both blood and absorbingreagents was observed by means of the microscopewhen the technique used by Riley, Proemmel, andFranke (5) for absorbing gases was employed. In-spection of the bubble indicates that the increasedprecision obtained by carrying out gas absorptionin the cup of the R-S syringe can be attributedlargely to improved drainage. This technique alsoprobably reduces errors caused by transfer of 02between the bubble and the CO2-absorber and thetransfer of 02 and CO2 between the bubble andthe saline solution since no concentrated reagentsare drawn into the mid-portion of the capillary(14).
The oxygen tension of human blood analyzedby the combined modifications (Table I, Series 3)averaged only 0.3 mm. Hg higher than the Po2in gas to which the blood had been exposed for 1hour at 37.20 C. in a tonometer. The directly de-termined Pco2 of such blood, however, averaged2.2 mm. Hg lower than the carbon dioxide tensionin the gas phase. It is unlikely that this latter dif-ference, almost identical with that found by Riley,Proemmel, and Franke (5), was caused by faultytonometric technique, since we have used double-chambered tonometers (8) which allow separationof the blood and gas phases after equilibration with-out change in the temperature or the total pressureof the system. The difference was reasonably con-sistent (S.D. of the difference + 2.17 mm. Hg)and probably represents a constant error of themethod.
These tonometer studies suggest that when thecombined modifications described herein are used,no correction factor is needed for Po2 but that acorrection factor, based on such studies, is requiredfor Pco2. Another justification for the use of thiscorrection is evident in Table II in which correcteddirect carbon dioxide tensions of human arterialblood agree closely with the values obtained bycalculation from the CO2 content and plasma pHdetermined on the same blood samples.
It has been suggested by Roos and Black (7)that an appreciable error in the measurement ofblood Po2 will result whenever a bubble of gas atatmospheric pressure is introduced into blood thetotal gas tension of which is significantly sub-atmospheric. It can be shown, however, that so
long as the initial bubble Po2 is equal to or lowerthan that of the blood phase and the blood Po2 isless than 90 mm. Hg, the shape of the hemoglobindissociation curve and the low solubility of ni-trogen will prevent a significant increase of thebubble Po2 consequent to N2 transfer during theequilibration period. In fact, as has been pointedout by Riley, Proemmel, and Franke (5), when-ever the Po2 of the blood is low, the combining-power of hemoglobin for 02 will permit one to usean initially higher bubble Po2 without serious er-ror after equilibration.
For many clinical studies at sea-level, eventhough the total gas tension of the arterial bloodin both normal subjects and in patients is probablysubatmospheric by 1 to 3 per cent of an atmosphere(15, 16), the equilibration of such blood with agas bubble of normal "alveolar air" at atmosphericpressure can be calculated to involve less than 1mm. Hg change in oxygen tension. Evidence forthe validity of such calculations is shown in TableII, Series 3, which summarizes the oxygen dataobtained from the arterial blood of clinical sub-jects in the Po2 range of 29 to 98 mm. Hg. Thevariation observed in the individual differences be-tween the directly determined oxygen tension andthat calculated from the dissociation curve is theresult primarily of random errors in the mano-metric determination of oxygen content and ca-pacity. Since the averages of 112 simultaneousdeterminations of Po2 by direct and indirect meth-ods agree closely, there is no large constant errorin the present technique of equilibrating arterialblood with gas at atmospheric pressure.
The precision obtained by the present methodcompares favorably with the results achieved bythe painstaking work of Lambertsen and Bunce(6) who used considerably different equipment.In Table III the results of our tonometer studiesusing the combined modifications (Series 3) areanalyzed with respect to the differences (withoutregard to sign) between the tensions obtained insingle blood determinations and the tensions inthe gas phase of the tonometer. The mean of thedifferences for Po2 and the variability of these dif-ferences were approximately the same in the twomethods. The mean of the differences was greaterfor PCo2 determined by our method than was themean of the differences reported by Lambertsenand Bunce but the consistency of the individual
514

DIRECT DETERMINATIONSOF 02 AND C02 TENSIONS IN BLOOD
TABLE IIIComparison of the results of the present tonometer studies of Series 3 and the data of Lambertsen and Bunce (6) as regards
individual differences between the tensions of the blood and gas phase in singledeterminations without regard to sign
Data of Lambertsen and Bunce
Our data of Series 3
Range of gastensionsmm. Hg
Po, Pco,64-74 50-6297-98 37-39
45-90 23-49
Number ofanalyses
1613
Mean of theindividualdifferences
mm. Hg
Po0 Pco21.7 1.51.3 1.7
38 1.66 2.82
Standard deviationof the mean of the
individual differencesmm. Hg
Po, Pco,-42.1 41.8=1.2 -2.1
i1.31 41.93
Pco2 differences is entirely comparable. Whena correction factor of + 2 mm. Hg is applied toour CO2 tension determinations, the precision ofthe two methods becomes virtually identical.
It is questionable whether or not the use of anyin vitro technique can give arterial blood gas ten-sion values identical to those existing in the bloodin vivo. Evidence on the time rate of decline ofoxygen tension in shed human arterial bloodtreated with sodium fluoride is conflicting (5-7,17) but may be of the order of 0.3 mm. Hg perminute at 370 C. during the first hour after bloodis sampled. The present method requires 9 min-utes for the completion of the blood-gas equilibriumafter blood sampling (a slightly shorter periodthan that needed in Lambertsen's technique [18] ).Unless there is a very rapid change in gas tensionsof shed blood during the first few minutes (Krogh[17] could demonstrate none at all in rabbit bloodduring the first minute), the oxygen tension de-termined in vitro by our modification of Riley'smethod is within a few millimeters of the tensionin vivo.
SUMMARY
1. The accuracy of the original Riley bubblemethod for the direct determination of blood gastensions in man has been examined by tonometerstudies.
2. Two modifications of the method have re-duced dependence on technical skill and have ledto greater precision.
3. After these modifications were instituted thedifference between the means of actual blood gastensions (tonometer values) and determined ten-sions was 0.3 mm. Hg (S.D. ± 1.75) for oxygenand 2.2 mm. Hg (S.D. + 2.17) for carbon dioxide.
4. With the present modified technique the dif-ference between the mean gas tensions of humanarterial blood calculated from the hemoglobin dis-sociation curve and the Henderson-Hasselbachequation and the gas tensions determined directlywas 0.7 mm. Hg (S.D. + 8.61) for oxygen and0.7 mm. Hg (S.D. ± 2.55) for carbon dioxide.
ACKNOWLEDGMENT
We wish to acknowledge the technical assistance ofDorothy Proemmel, Leroy Grinnell, and FrederickMader, Jr.
REFERENCES
1. Krogh, A., Some new methods for the tonometricdetermination of gas-tensions in fluids. Skand.Arch. f. Physiol., 1908, 20, 259.
2. Barcroft, J., and Nagahashi, M., The direct measure-ment of the partial pressure of oxygen in humanblood. J. Physiol., 1921, 55, 339.
3. Hick, F. K., Partial pressure of oxygen in arterialblood of patients: description of an aerotonometermethod. Proc. Soc. Exper. Biol. & Med., 1936, 33,582.
4. Comroe, J. H., Jr., and Dripps, R. D., Jr., The oxy-gen tension of arterial blood and alveolar air innormal human subjects. Am. J. Physiol., 1944,142, 700.
5. Riley, R. L., Proemmel, D. D., and Franke, R. E.,A direct method for determination of oxygen andcarbon dioxide tensions in blood. J. Biol. Chem.,1945, 161, 621.
6. Lambertsen, C. J., and Bunce, P. L., Modification ofRiley's method in Methods in Medical Research,Chicago, Ill., The Yearbook Publishers, 1950, vol.II, p. 165.
7. Roos, A., and Black, H., Direct determination of par-tial and total tensions of respiratory gases in blood.Am. J. Physiol., 1950, 160, 163.
8. Austin, J. H., Cullen, G. E., Hastings, A. B., McLean,F. C., Peters, J. P., and Van Slyke, D. D., Studies
515

GILES F. FILLEY, ESTHER GAY, AND GEORGEW. WRIGHT
of gas and electrolyte equilibria in blood. I. Tech-nique for collection and analysis of blood, and forits saturation with gas mixtures of known com-position. J. Biol. Chem., 1922, 54, 121.
9. Van Slyke, D. D., and Neill, J. M., The determinationof gases in blood and other solutions by vacuum ex-traction and manometric measurement. J. Biol.Chem., 1924, 61, 523.
10. Sendroy, J., Jr., Manometric determination of hemo-globin by the oxygen capacity method. J. Biol.Chem., 1931, 91, 307.
11. Hastings, A. B., and Sendroy, J., Jr., Studies of aci-dosis. XX. The colorimetric determination of theblood pH at body temperature without bufferstandards. J. Biol. Chem., 1924, 61, 695.
12. Handbook of Respiratory Data in Aviation, Commit-tee on Medical Research, Office of Scientific Re-
search and Development, National Research Coun-cil, Washington, D. C., 1944.
13. Van Slyke, D. D., and Sendroy, J., Jr., Studies ofgas and electrolyte equilibria in blood. XV. Linecharts for graphic calculations- by the Henderson-Hasselbalch equation, and for calculating plasmacarbon dioxide content from whole blood content.J. Biol. Chem., 1928, 79, 781.
14. Krogh, A., On microanalysis of gases. Skand. Arch.f. Physiol., 1908, 20, 279.
15. Krogh, A., and Krogh, M., On the tensions of gasesin the arterial blood. Skand. Arch. f. Physiol.,1910, 23, 179.
16. Branscomb, B. V., Unpublished data from this labora-tory.
17. Krogh, A., On the oxygen-metabolism of the blood.Skand. Arch. f. Physiol., 1910, 23, 193.
18. Lambertsen, C. J., Personal communication.
SPECIAL NOTICE TO SUBSCRIBERSPost Offices will no longer forward the Journal when you move.Please notify The Journal of Clinical Investigation, Business
Office, 622 West 168th Street, New York 32, N. Y. at once whenyou have a change of address, and do not omit the zone number ifthere is one.
516
Copyright © 2022 FDOKUMEN