Removal of subject-dependent and activity-dependent variation in physiological measures of stress
8
2012 6th Inteational Conference on Pervasive Computing Technologies for Healthcare (PervasiveHealth) and Workshops Removal of Subject-Dependent and Activity-Dependent Variation in Physiological Measures of Stress F. Alamudun, J. Choi and R. Gutieez-Osuna* Dept. of Computer Science and Engineering Texas A&M University College Station, TX 77840, United States {fola, goonyong, rgutier}@cse.tamu.edu Abstract-The ability to monitor stress levels in daily life can provide valuable information to patients and their caretakers, help identify potential stressors, determine appropriate interventions, and monitor their effectiveness. Wearable sensor technology makes it now possible to measure non-invasively a number of physiological correlates of stress, from skin conductance to heart rate variability. These measures, however, show large individual differences and are also correlated with the physical activity of the subject. In this paper, we propose two multivariate signal processing techniques to reduce the effect of both forms of interference. The first method is an unsupervised technique that removes any systematic variation that is orthogonal to the dependent variable, in this case physiological stress. In contrast, the second method is a supervised technique that first projects the data into a subspace that emphasizes these systematic variations, and then removes them from the data. The two methods were validated on an experimental dataset containing physiological recordings from multiple subjects performing physical and/or mental activities. When compared to z-score normalization, the standard method for removing individual differences, our methods can reduce stress prediction errors by as much as 50%. Kwords- Wearable sensors, electrodermal activi, hea rate variabi, mental stress, indivial dferences, noise cancellation I. INTRODUCTION The increased occurrence of stress-related illnesses in the United States has resulted in an increased demand for diagnosis, treatment, and management om hospitals d healthcare practitioners [1]. Unfortunately, this trend is unsustainable given traditional healthcare models. For is reason, there has been a push for proactive healthcare tecologies that reduce the burden on the healthcare system [2]. This is particully important in stress management due to its nature: stress monitoring requires extensive patient observation (in hislher natural environment) in order to identi stress triggers and effective interventions. Towards this end, recent advances in wearable sensors allow capturing of various biosignals non-invasively with minimal impact on patients' routines. Such biosensors provide health-management options, extending observation and diagnosis beyond the confines of clinical facilities. 115 H. Khan and B. Ahmed Department of Electrical and Computer Engineering Texas A&M University at Qatar Education City, Doha, Qatar {hira.khan, beena.ahmed}@qatar.tamu.edu A variety of physiological signals have been shown to coelate with stress levels [3, 4], including electrodeal activity (EDA), heart rate (HR), vious indices of heart rate variability (HRV), blood volume pressure (BVP), pupil dilation, muscle tension, and respiration. However, much of this work has been performed under controlled laboratory settings, and only a few studies have investigated ambulatory stress monitoring [5-7]. When monitoring in ambulatory domains, subtle physiological responses to psychological stress can be easily masked by various interferences, om changes in posture and physical activity (e.g., walking) to environmental factors (e.g., temperature). An added challenge: physiological baselines and physiological responses to stressors are highly individual. As a result, mapping physiological signals into stress indices may require substantial calibration data om each patient. To address these issues, the work presented here explores two multivariate techniques to reduce the effects that physical activity and individual differences have on physiological stress responses. The first technique is based on an orthogonal signal coection (OSC) algorithm originally developed by Wold et al. [8] to remove systematic noise in near-ined (NIR) spectroscopy. The second method is based on the classical Fisher's linear discriminant analysis (LDA). In this method, we use LDA to identi the main directions of variance for each interference (individual difference or physical activity), and then subtract them om the original data matrix through least squares. The paper is organized as follows. Section II provides a brief background review of biosignals and prior work on wearable platforms. In Section III, we describe the two signal- denoising methods. Section IV covers our experimental protocol for eliciting psychophysiological responses under physical and mental stressors. Results om the experimental comparison of the two denoising methods are provided in Section V, followed by a discussion of results and directions for ture work in section VI. 978-1-936968-43-5 © 2012 ICST DOl 10.4108/icst.pervasivehealth.2012.248722
-
Upload
independent -
Category
Documents
-
view
0 -
download
0
Transcript of Removal of subject-dependent and activity-dependent variation in physiological measures of stress
2012 6th International Conference on Pervasive Computing Technologies for Healthcare (PervasiveHealth) and Workshops
Removal of Subject-Dependent and Activity-Dependent Variation
in Physiological Measures of Stress
F. Alamudun, J. Choi and R. Gutierrez-Osuna* Dept. of Computer Science and Engineering
Texas A&M University College Station, TX 77840, United States {fola, goonyong, rgutier}@cse.tamu.edu
Abstract-The ability to monitor stress levels in daily life can
provide valuable information to patients and their caretakers,
help identify potential stressors, determine appropriate
interventions, and monitor their effectiveness. Wearable sensor
technology makes it now possible to measure non-invasively a
number of physiological correlates of stress, from skin
conductance to heart rate variability. These measures, however,
show large individual differences and are also correlated with the
physical activity of the subject. In this paper, we propose two
multivariate signal processing techniques to reduce the effect of
both forms of interference. The first method is an unsupervised
technique that removes any systematic variation that is
orthogonal to the dependent variable, in this case physiological
stress. In contrast, the second method is a supervised technique
that first projects the data into a subspace that emphasizes these
systematic variations, and then removes them from the data. The
two methods were validated on an experimental dataset
containing physiological recordings from multiple subjects
performing physical and/or mental activities. When compared to
z-score normalization, the standard method for removing
individual differences, our methods can reduce stress prediction
errors by as much as 50%.
Keywords- Wearable sensors, electrodermal activity, heart rate variability, mental stress, individual differences, noise cancellation
I. INTRODUCTION
The increased occurrence of stress-related illnesses in the United States has resulted in an increased demand for diagnosis, treatment, and management from hospitals and healthcare practitioners [1]. Unfortunately, this trend is unsustainable given traditional healthcare models. For this reason, there has been a push for proactive healthcare technologies that reduce the burden on the healthcare system [2]. This is particularly important in stress management due to its nature: stress monitoring requires extensive patient observation (in hislher natural environment) in order to identify stress triggers and effective interventions. Towards this end, recent advances in wearable sensors allow capturing of various biosignals non-invasively with minimal impact on patients' routines. Such biosensors provide health-management options, extending observation and diagnosis beyond the confines of clinical facilities.
115
H. Khan and B. Ahmed Department of Electrical and Computer Engineering
Texas A&M University at Qatar Education City, Doha, Qatar
{hira.khan, beena.ahmed}@qatar.tamu.edu
A variety of physiological signals have been shown to correlate with stress levels [3, 4], including electrodermal activity (EDA), heart rate (HR), various indices of heart rate variability (HRV), blood volume pressure (BVP), pupil dilation, muscle tension, and respiration. However, much of this work has been performed under controlled laboratory settings, and only a few studies have investigated ambulatory stress monitoring [5-7]. When monitoring in ambulatory domains, subtle physiological responses to psychological stress can be easily masked by various interferences, from changes in posture and physical activity (e.g., walking) to environmental factors (e.g., temperature). An added challenge: physiological baselines and physiological responses to stressors are highly individual. As a result, mapping physiological signals into stress indices may require substantial calibration data from each patient.
To address these issues, the work presented here explores two multivariate techniques to reduce the effects that physical activity and individual differences have on physiological stress responses. The first technique is based on an orthogonal signal correction (OSC) algorithm originally developed by Wold et al. [8] to remove systematic noise in near-infrared (NIR) spectroscopy. The second method is based on the classical Fisher's linear discriminant analysis (LDA). In this method, we use LDA to identify the main directions of variance for each interference (individual difference or physical activity), and then subtract them from the original data matrix through least squares.
The paper is organized as follows. Section II provides a brief background review of biosignals and prior work on wearable platforms. In Section III, we describe the two signaldenoising methods. Section IV covers our experimental protocol for eliciting psychophysiological responses under physical and mental stressors. Results from the experimental comparison of the two denoising methods are provided in Section V, followed by a discussion of results and directions for future work in section VI.
978-1-936968-43-5 © 2012 ICST DOl 10.4108/icst.pervasivehealth.2012.248722
II. BACKGROUND
A. Stress and the human body Stress describes the physiological changes that occur in
response to a category of perceived physical or psychological threats. Under normal conditions, stress helps to keep the body alert and composed to avert any threats. However, if the frequency or the duration of the stressor is excessive brief or prolonged, stress responses can lead to long-te� health complications for an individual [3]. Stress has been linked to numerous cardiovascular diseases, immunosuppression and h?'Pertension a?d. to . psychological disorders such as anxiety, dIfficulty assImdatmg new information and increased dependence on and abuse of alcohol and drugs [10-12].
There are two elements involved in the human reaction to stress, the
. hypothalamic-pituitary-adrenal (HPA) axis, and the
sympathetIc nervous system (SNS), which along with the parasympathetic nervous system (PNS) form branches of the autonomic nervous system (ANS) [3]. The ANS is that part of the nervous system that controls involuntary functions. The parasympathetic and sympathetic branches counteract each other and serve to balance each other at the same time: the sympathetic branch controls the activation of stress or 'flight or fight' response, whereas the parasympathetic branch promotes relaxation and energy conservation.
B. PhYSiological stress response The organs of the body (including cardiac and respiratory
organs) are connected to both autonomic branches with the exception of the skin. Skins blood vessels and eccrine sweat glands are exclusively enervated by the sympathetic nervous system [4]. For this reason, changes in the active and passive electrical properties of the skin are an ideal measure of sympathetic activation and therefore of stress. These changes are commonly referred to as electrodermal activity (EDA). There exists a large body of research on EDA, including its use as a measure of stress [13-16]. However, relying solely on measures of skin conductance as a sole marker for sympathetic nervous system activation is insufficient for stress monitoring. For example, skin conductance also increases in response to physical exertion due to increased eccrine sweat gland activation [17]. Other physiological measures, such as cardiac activation and respiration rate, although influenced by both autonomic branches, provide complementary information that may be useful in discriminating the stress response in an organism [18-23].
C. Factors affecting physiological stress response With a few exceptions [16, 24, 25], most previous research
on stress detection has focused on controlled laboratory env�ronment or semi-controlled ambulatory settings, where subjects are constrained to a sedentary posture. While these studies provide the fundamentals for understanding the psychophysiology of stress, they do not account for factors that are encountered in real-world scenarios where subjects seldom maintain the same posture or have restricted movement. In ambulatory settings, an individual adapts internally in response to changes in level of physical exertion and posture. According to Olufsen et al. [26], the cardiovascular responses to postural change from sitting to standing and from standing to varied
116
levels of movement involve interactions between the autonomic nervous system, which regulates heart rate, perspiration and pupil dilation, and cerebral autoregulation.
Van Steenis et al. quantified posture-related changes in ?eart rate. [27]. In this work, the authors reported a significant mcrease m heart rate as a subject transitions from supine to sitting; from sitting to standing, and from standing to walking. In theIr work on long-term monitoring using EDA, KappelerSetz et al. [15] measured the effect of movement in a single limb on skin conductance response on fingers and feet, and concluded that these effects were minor. However, in a study on the effect of full body movement on EDA, Schumm et al. [28] concluded that the faster a person is walking the more the peak distribution of skin conductance response approaches a uniform
. distribution. They also concluded that at walking
speed� m exce�s of 6 km/h (3.72 mph) the probability of detectmg EDA m response to specific events is significantly decreased.
A number of research studies [18, 20, 29] have concluded that these differences make it difficult to translate information from one subject to inferences about the state of another subj:ct: As an example, Wu et al. [29] reported a 61.8% drop in predIctIve accuracy, from 96.5% for subject-dependent models down to 36.9% for subject-independent models when classifying arousal levels using a set of biosignais (skin conductance level, respiration, ECG, and EEG).
In summary, changes in physical activity and individual differences across subjects can mask the effect of psychological stress on physiological signals. To address these issues, the work presented here describes two multivariate methods that may be used to subtract these interferences from raw physiological signals. If successful, these methods may pave the way towards the development of subject-independent stress monitoring in ambulatory settings.
III. REDUCING INDIVIDUAL DIFFERENCES AND THE EFFECTS
FROM PHYSICAL ACTIVITY
In real-world scenarios two sources of variance can
�0ll:�inate t�e physiologi�al signals during stress monitoring: mdlVldual dIfferences m physiological baseline and physiological stress response, and physiological responses due to physical activity. The methods proposed in this work assume that both influences can be treated as systematic noise sources that are independent from the observation of interest. Specifically, we propose two multivariate filtering strategies: orthogonal signal correction (OSC) and linear discriminant correction (LDC). The first method (OSC) assumes that systematic noise components are orthogonal to the variation of interest (stress response) and applies a filter to remove all components orthogonal to the latter. The second method (LDC) uses Fisher's linear discriminant analysis (LDA) to model each individual systematic noise component iteratively and then subtracts it from the raw physiological response. The result of both methods is a physiological signal where psychological stress is more salient.
A. Orthogonal signal correction The concept of orthogonal signal correction (OSC) was
originally introduced by Wold et al. [8] as a preprocessing step
for removal of systematic noise such as baseline variation and multiplicative scatter effects in near-infrared (NIR) spectra. The method was later generalized by Fearn [9] to other NIR applications. In our work, OSC is applied to remove sources of systematic variation from physiological response data that are uncorrelated with (orthogonal to) the applied stress stimuli. Thus, by treating variation introduced by sources other than stress stimuli as structured noise, an OSC filter can be used as a preprocessing step to remove such noise.
This process is accomplished by constraining the removal of components from the physiological response data to only those components that are orthogonal to the applied stress stimuli. For this purpose, we decompose the physiological response data into correlated and uncorrelated factors:
X= Xc+Xc (1)
where X is a matrix of physiological responses, Y is a vector of target variables (applied stress stimuli), Xc is the physiological response correlated with the applied stress stimuli and Xc is the physiological response uncorrelated with the applied stress stimuli (Xc .1 V).
The OSC algorithm expresses the data matrix X in bilinear form:
X = tpT + E (2)
where X is the (N x K) matrix of unfiltered data, E is the (N x K) matrix of noise (in our case the 'filtered' data), t is a (N x L) score matrix, and p is a (K x L) matrix of loadings. The number of samples and variables of the 'training set' (calibration set) are N and K respectively, and L is the number of components (latent variables).
The objective of OSC is to find t and p subject to the orthogonality constraint:
t .1 Y (3)
Wold et al. [8] use an iterative procedure to calculate t:
t = (1 -y(yTY)-lyT)t (4)
which is orthogonal to Y since:
yTt = yT(1-y(yTY)-lyT)t (5)
(6)
where t is initialized using the first principal component of X. After each iteration, the convergence is checked by comparing the difference between the newly predicted t and the previous t. The target value for t is obtained when this difference converges to a value below a predetermined threshold. From here, the loading vector p is calculated as:
(7)
After convergence, the uncorrelated (i.e., noise) and correlated (i.e., signal) components can be obtained by eq. (1) and (2) as:
Xc = tpT
Xc =X-Xc
(8)
(9)
117
B. Linear discriminant correction Fisher's linear discriminant analysis (LDA) is a
transformation that seeks to determine a low-dimensional projection where the separation between two or more classes is maximized [30]. Thus, LDA can be used to fmd a projection where subject-to-subject differences (or effects from physical activity) are maximized. Once this low-dimensional projection is found, it can be subtracted in a multivariate fashion from the full data matrix by means of least-squares regression. As a result, the "deflated" data matrix will not contain any of the variability in the LDA projection. This process is applied iteratively to each noise source. We refer to the resulting algorithm as the linear discriminant correction (LDC) method.
In what follows, we describe the process of removing subject-to-subject differences; the process for removing physical activity is identical. As before, assume that the physiological response matrix X (for multiple subjects) can be decomposed as:
X = Xc+Xc (10)
where Xc is the filtered physiological response that is
correlated with the applied stimuli (the stressor) and Xc is the physiological response uncorrelated with the applied stimuli (e.g., individual differences across subjects). To estimate Xc' we apply LDA to matrix X using the subjects' identity WID = {l,2, ... m} as class labels (m being the number of subjects):
LDA (X, WID ) � twID, PWID (11)
where PWID is a matrix of loadings (or eigenvectors) and tWID denotes the score matrix (projection of the data onto the eigenvectors): tWID = XPWID. The score matrix is a subspace in which individual differences across subjects are maximized.
Next, we predict the full data matrix X from twm as:
X = �wIDtwlD (12)
where �WID is a vector of regression coefficients, which can be estimated by:
�WID = arg minllX - �wIDtwlDll (13) �
(14)
Hence, Xc becomes:
X- - (I. Xp C - "'WID WID
(15)
By subtracting Xc from X, we then obtain a matrix Xc where individual differences across subjects have been minimized:
Xc = X-Xc (16)
The same process is repeated to remove the effect of physical activity: we perform LDA to project Xc onto a subspace in which physical activity differences are maximized, and then subtract this information as we did in eqs. (11 )-(16).
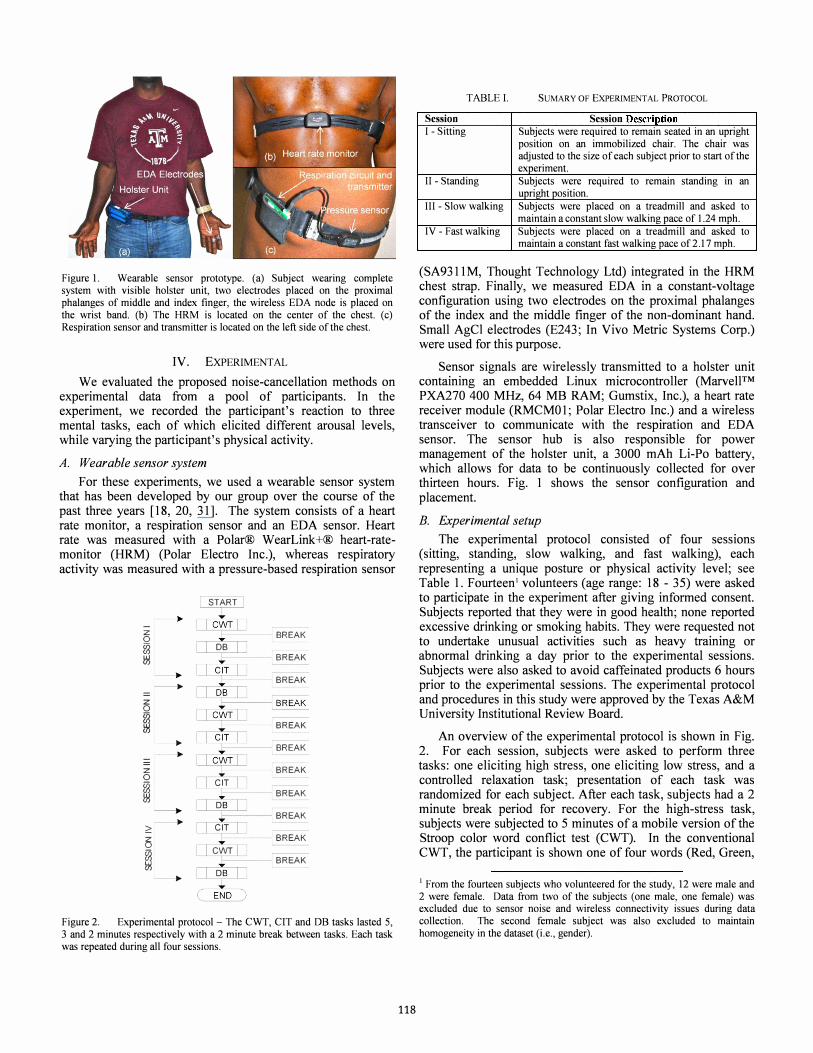
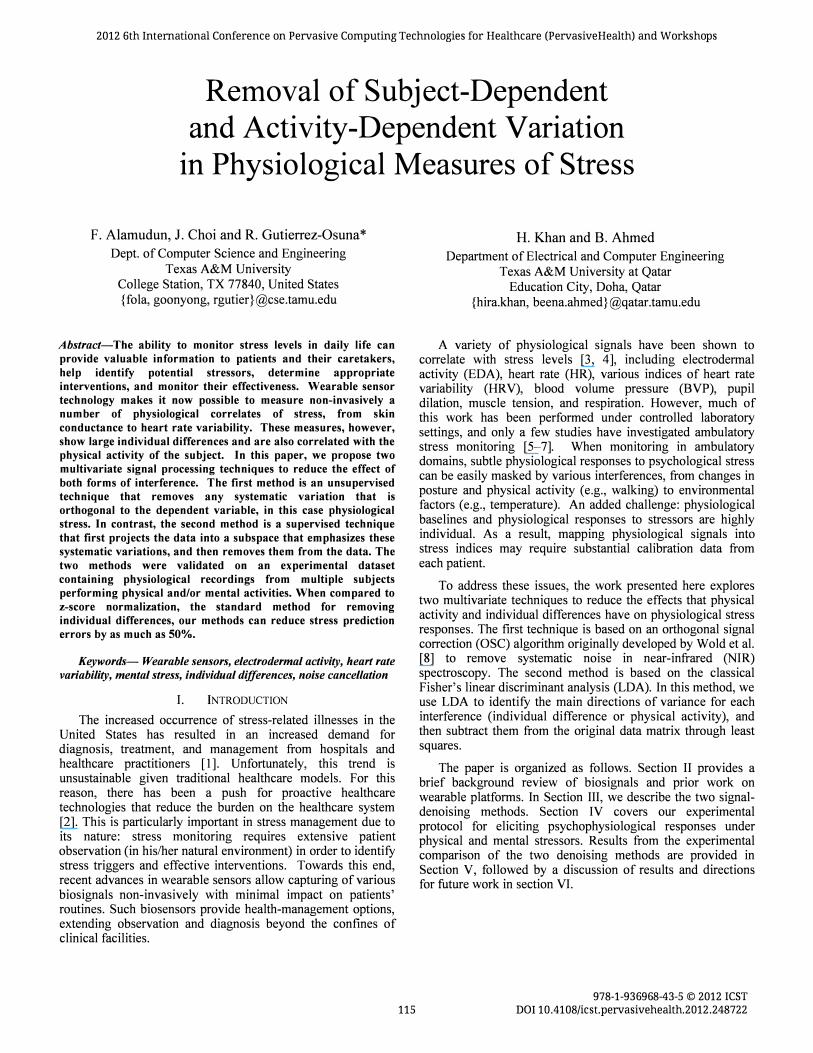
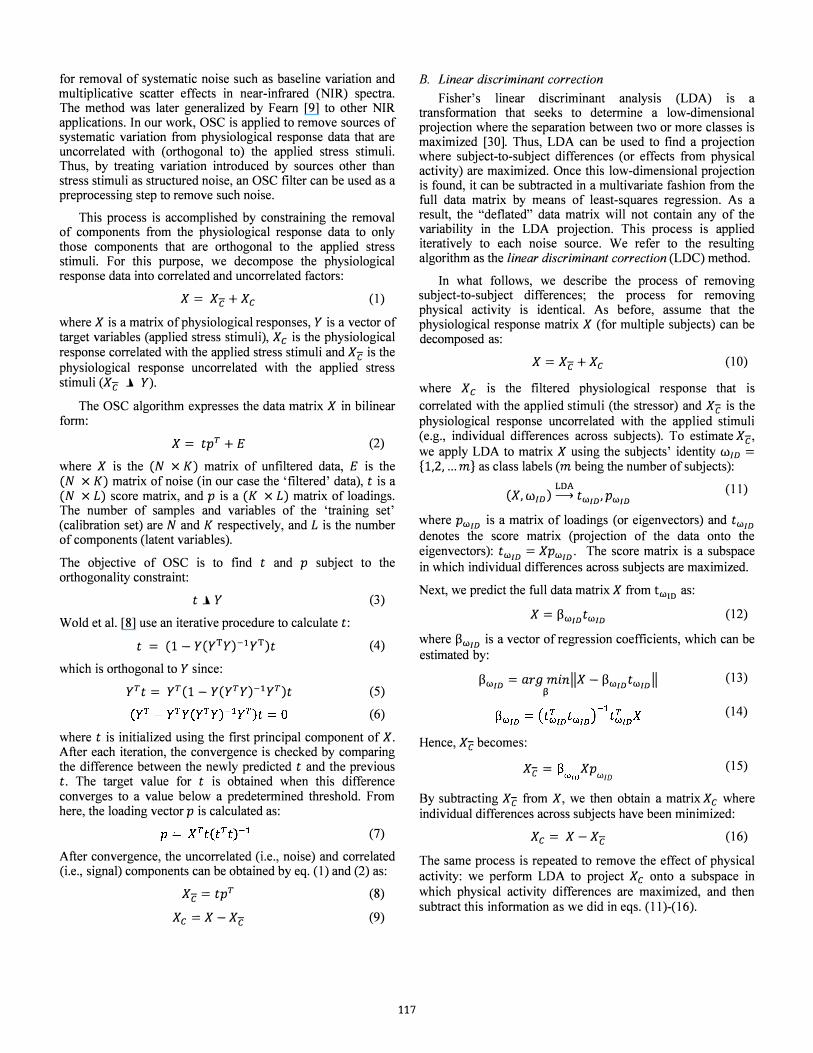
Figure 1. Wearable sensor prototype. (a) Subject wearing complete system with visible holster unit, two electrodes placed on the proximal phalanges of middle and index finger, the wireless EDA node is placed on the wrist band. (b) The HRM is located on the center of the chest. (c) Respiration sensor and transmitter is located on the left side of the chest.
IV. EXPERIMENTAL
We evaluated the proposed noise-cancellation methods on experimental data from a pool of participants. In the experiment, we recorded the participant's reaction to three mental tasks, each of which elicited different arousal levels, while varying the participant's physical activity.
A. Wearable sensor system For these experiments, we used a wearable sensor system
that has been developed by our group over the course of the past three years [18, 20, 31]. The system consists of a heart rate monitor, a respiration sensor and an EDA sensor. Heart rate was measured with a Polar® WearLink+® heart-ratemonitor (HRM) (Polar Electro Inc.), whereas respiratory activity was measured with a pressure-based respiration sensor
--� z 0 ill lH
� �
Z 0
� � �
z 0 �
� � ?:
0 �
�
START
I I cm-:-... � DB
[c�T � .... -� DB
!
[C� I.C"' � __ CIT ,
,
t=:Q"'� , cm , ... CIT ... DB r .... -� CIT
� ... cm [TD"'B� CE�
BREAK BREAK BREAK
r----�K BREAK BREAK BREAK
BREAK BREAK BREAK BREAK
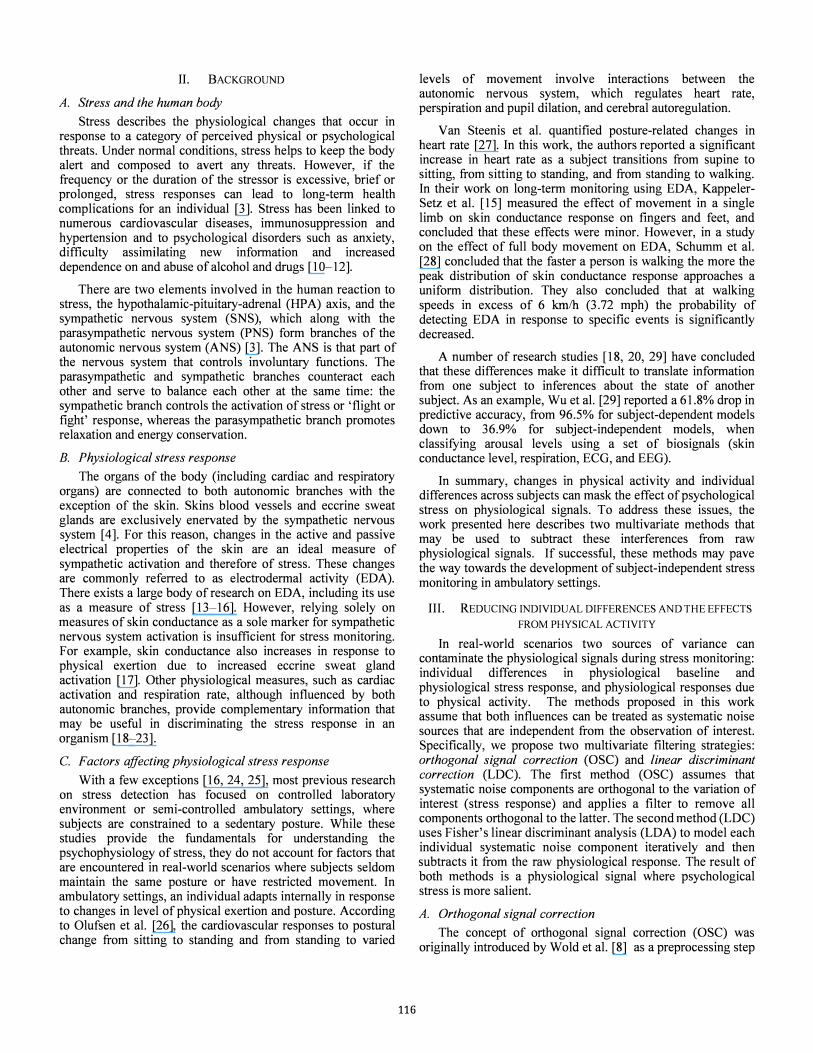
Figure 2. Experimental protocol - The CWT, CIT and DB tasks lasted 5, 3 and 2 minutes respectively with a 2 minute break between tasks. Each task was repeated during all four sessions.
118
TABLE I. SUMARY OF EXPERIMENTAL PROTOCOL Session Session Description I - Sitting Subjects were required to remain seated in an upright
position on an immobilized chair. The chair was adjusted to the size of each subject prior to start of the experiment.
II - Standing Subjects were required to remain standing in an upright position.
III - Slow walking Subjects were placed on a treadmill and asked to maintain a constant slow walking pace of 1.24 mph.
IV - Fast walking Subjects were placed on a treadmill and asked to maintain a constant fast walking pace of 2.17 mph.
(SA9311 M, Thought Technology Ltd) integrated in the HRM chest strap. Finally, we measured EDA in a constant-voltage configuration using two electrodes on the proximal phalanges of the index and the middle finger of the non-dominant hand. Small AgCI electrodes (E243; In Vivo Metric Systems Corp.) were used for this purpose.
Sensor signals are wirelessly transmitted to a holster unit containing an embedded Linux microcontroller (Marvell™ PXA270 400 MHz, 64 MB RAM; Gumstix, Inc.), a heart rate receiver module (RMCMOl; Polar Electro Inc.) and a wireless transceiver to communicate with the respiration and EDA sensor. The sensor hub is also responsible for power management of the holster unit, a 3000 mAh Li-Po battery, which allows for data to be continuously collected for over thirteen hours. Fig. 1 shows the sensor configuration and placement.
B. Experimental setup The experimental protocol consisted of four sessions
(sitting, standing, slow walking, and fast walking), each representing a unique posture or physical activity level; see Table 1. Fourteen! volunteers (age range: 18 - 35) were asked to participate in the experiment after giving informed consent. Subjects reported that they were in good health; none reported excessive drinking or smoking habits. They were requested not to undertake unusual activities such as heavy training or abnormal drinking a day prior to the experimental sessions. Subjects were also asked to avoid caffeinated products 6 hours prior to the experimental sessions. The experimental protocol and procedures in this study were approved by the Texas A&M University Institutional Review Board.
An overview of the experimental protocol is shown in Fig. 2. For each session, subjects were asked to perform three tasks: one eliciting high stress, one eliciting low stress, and a controlled relaxation task; presentation of each task was randomized for each subject. After each task, subjects had a 2 minute break period for recovery. For the high-stress task, subjects were subjected to 5 minutes of a mobile version of the Stroop color word conflict test (CWT). In the conventional CWT, the participant is shown one of four words (Red, Green,
! From the fourteen subjects who volunteered for the study, 12 were male and 2 were female. Data from two of the subjects (one male, one female) was excluded due to sensor noise and wireless connectivity issues during data collection. The second female subject was also excluded to maintain homogeneity in the dataset (i.e., gender).

Figure 3. Android smartphone platform based tasks. (a) CWT task word name prompt. (b) CWT task ink color prompt. (c) CIT task. (d) DB task.
Blue, Yellow) displayed in a different ink color, and asked !o respond based on the ink color; e.g., in the example shown m Fig. 3(b) the correct answer is "Green". w.e introduc.e� �o variations to make the CWT more challengmg and mInimiZe learning effects [32]. First, rather than alway� asking participants to respond to the ink color, 50% of the times they had to respond to the word; see Fig. 3(a). This forces participants to switch strategies and makes the test significantly more challenging, Second, the location of the answer buttons at the bottom of the screen is randomized with each word presentation, and a loud bell is played. every time the participant choose an incorrect answer. ThiS CWT task was administered via an Android™ mobile device (Fig. 3). The second task was designed to elicit a lower stress reaction in comparison to the first task. Subjects were subje.cted t? three minutes of a color identification test (CIT). DurIng thiS task, subjects were asked to confirm a displayed.c�l?r; se� Fig. 3�c). This task was also presented on an Android mobile deVice. For the third task, participants were asked to perform a deep breathing (DB) relaxation exercise for two minutes; instructions were provided as shown in Fig 3( d).
Upon completion of each task, subjects were asked to provide a self-reported evaluation of arousal level. All other factors such as room temperature, humidity and sunlight/light intensity were kept constant for all subjects throughout the experimental procedure.
Using data collected from 11 subjects who pa�icipat�d in the experiment, we extracted a total of 7 features mclu?mg 2 features from EDA and 5 features from HRV [29]. RespIratory features were not included in the study since they provide a misleadingly high discrimination between deep breathing and CWT. A summary of each feature is provided in table 2. Each feature was calculated using a 60s moving window with a lOs
TABLE II. FEATURES EXTRACTED FROM PHYSIOLOGICAL SENSORS Sensor Feature Description
EDA /lSCL Average skin conductance level
asCL Standard deviation in skin conductance level
LFflRV Low frequency power in HRV (0.04 - 0.15 Hz)
HFHRV High frequency power in HRV (0.15 - 0.5 Hz)
Heart rate LF: HFHRV Ratio of LF to HF power content in HRV
AVNN Average of R-R intervals
SDNN Standard deviation of successive R-R intervals
119
(a) Average NN interval
� ° l"·ik--�_-+i-k '" g -1 "E o � -2!� __ � __ � __ �� __ ����� __ � __ ��� ijj 51 52 53 54 55 59 510 511
Subjects
Figure 4. Comparison of (a) average NN interval (A VNN) and (b) average skin conductance level (SCL) averaged across all seSSIOns.
shift. All features were normalized to z-scores, the standard method for handling individual differences in skin conductivity [33].
V. RESULTS
As a first step in analyzing the physiological responses, we compared the average skin conductance level (SCL) and the average R-R intervals (A VNN) for each of the performed tasks. Results are shown in Fig. 4. As anticipated, (1) the CWT invoked an increase in heart rate (a reduction in R-R interval) and a significant increase in average skin conductance, (2) the CIT task invoked a lower response in comparison with the CWT task and (3) the DB relaxation task invoked a reduction in heart r�te (an increase in R-R interval) and a reduction in average skin conductance. These results provide evidence for the validity of our experimental protocol.
To analyze the effect of physical activity on a subject.'s physiological response to each task, we compared the skm conductance level (SCL) and R-R intervals (A VNN) for each of the performed tasks. Results shown in Fig. 5 indicate that
� 1 Q) � z 0 z Q) �-1 � �----�----�----�----�----�-----�
e 8 .i1 Q) � 0 u
(b) Average skin conductance level
-E 8 -1!r---__ .h.I.-c: :i1 C/) Silting Slow walking Fast walking
Figure 5. Comparison of (a) average NN interval (A VNN) and (b) average skin conductance level (SCL) across all subjects.
l06 o · �05 c
�04
1 ::l 0.3 '" U 0.2
0. 1
o
�redictive accur�cy s�bject�inde�endent cas:.::e�_�
s 1 s2 s3 s4 s5 s6 s7 s8 s9 s10 s11 Subjects
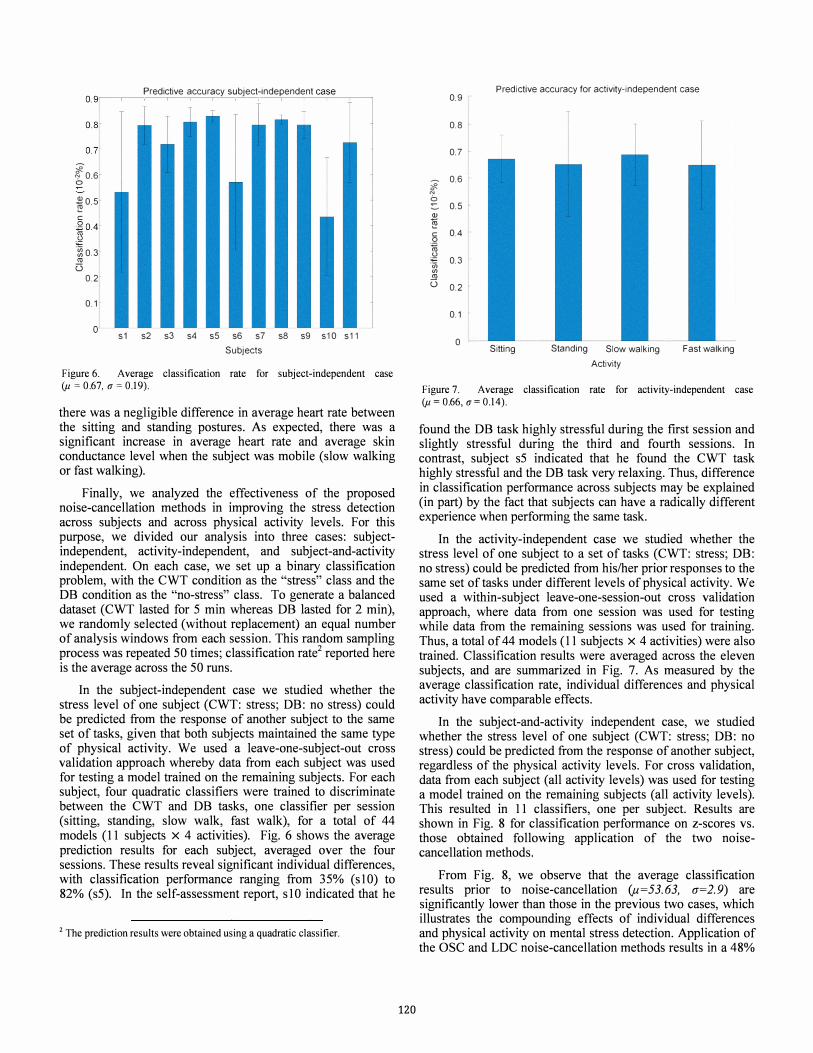
Figure 6. Average classification rate for subject-independent case (;.t =0.67, u=0.19).
there was a negligible difference in average heart rate between the sitting and standing postures. As expected, there was a significant increase in average heart rate and average skin conductance level when the subject was mobile (slow walking or fast walking).
Finally, we analyzed the effectiveness of the proposed noise-cancellation methods in improving the stress detection across subjects and across physical activity levels. For this purpose, we divided our analysis into three cases: subjectindependent, activity-independent, and subject-and-activity independent. On each case, we set up a binary classification problem, with the CWT condition as the "stress" class and the DB condition as the "no-stress" class. To generate a balanced dataset (CWT lasted for 5 min whereas DB lasted for 2 min), we randomly selected (without replacement) an equal number of analysis windows from each session. This random sampling process was repeated 50 times; classification rate2 reported here is the average across the 50 runs.
In the subject-independent case we studied whether the stress level of one subject (CWT: stress; DB: no stress) could be predicted from the response of another subject to the same set of tasks, given that both subjects maintained the same type of physical activity. We used a leave-one-subject-out cross validation approach whereby data from each subject was used for testing a model trained on the remaining subjects. For each subject, four quadratic classifiers were trained to discriminate between the CWT and DB tasks, one classifier per session (sitting, standing, slow walk, fast walk), for a total of 44 models (11 subjects x 4 activities). Fig. 6 shows the average prediction results for each subject, averaged over the four sessions. These results reveal significant individual differences, with classification performance ranging from 35% (slO) to 82% (s5). In the self-assessment report, s 10 indicated that he
2 The prediction results were obtained using a quadratic classifier.
120
0.9
0.8
0.7
� 0.6 "i a ::. 0.5 Q) � c 04 0 � \;::: 0.3 ·iii III '" U 0.2
0. 1
0
Predictive accuracy for activity-independent case
Sitting Standing Slow walking
Activity
Fast walking
Figure 7. Average classification rate for activity-independent case (;.t = 0.66, u = 0.14).
found the DB task highly stressful during the first session and slightly stressful during the third and fourth sessions. In contrast, subject s5 indicated that he found the CWT task highly stressful and the DB task very relaxing. Thus, difference in classification performance across subjects may be explained (in part) by the fact that subjects can have a radically different experience when performing the same task.
In the activity-independent case we studied whether the stress level of one subject to a set of tasks (CWT: stress; DB: no stress) could be predicted from his/her prior responses to the same set of tasks under different levels of physical activity. We used a within-subject leave-one-session-out cross validation approach, where data from one session was used for testing while data from the remaining sessions was used for training. Thus, a total of 44 models (11 subjects x 4 activities) were also trained. Classification results were averaged across the eleven subjects, and are summarized in Fig. 7. As measured by the average classification rate, individual differences and physical activity have comparable effects.
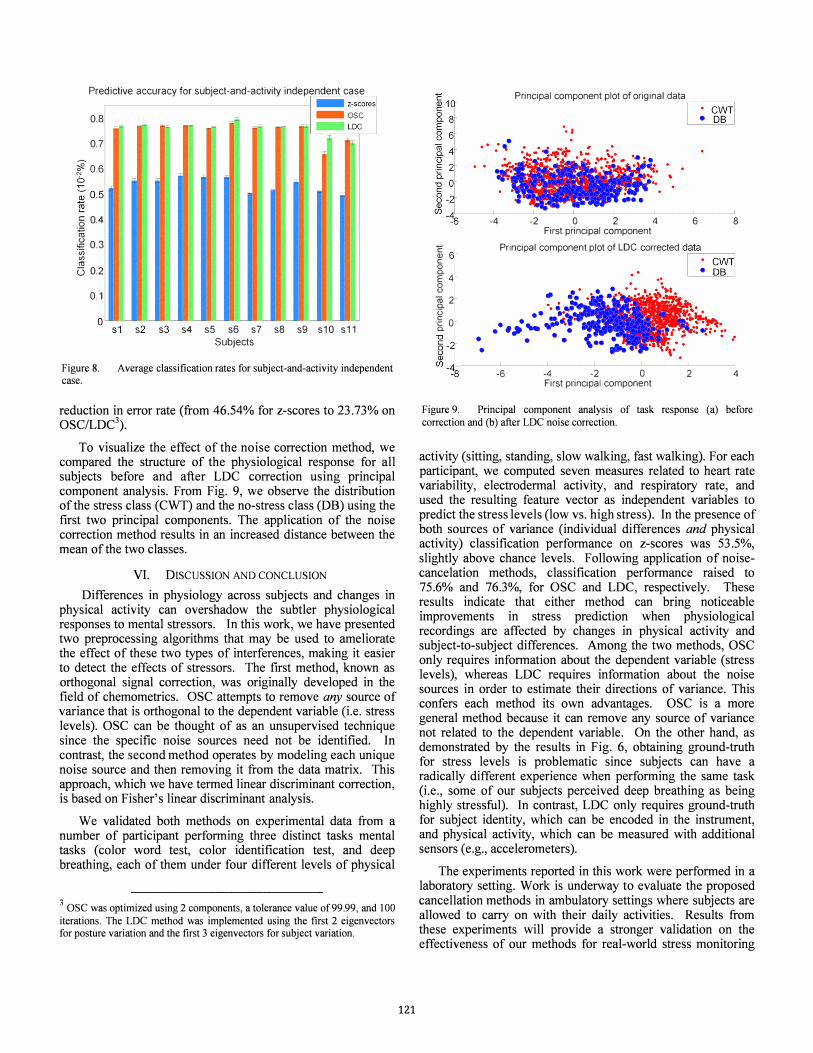
In the subject-and-activity independent case, we studied whether the stress level of one subject (CWT: stress; DB: no stress) could be predicted from the response of another subject, regardless of the physical activity levels. For cross validation, data from each subject (all activity levels) was used for testing a model trained on the remaining subjects (all activity levels). This resulted in 11 classifiers, one per subject. Results are shown in Fig. 8 for classification performance on z-scores vs. those obtained following application of the two noisecancellation methods.
From Fig. 8, we observe that the average classification results prior to noise-cancellation {J1=53.63, (1=2.9) are significantly lower than those in the previous two cases, which illustrates the compounding effects of individual differences and physical activity on mental stress detection. Application of the OSC and LDC noise-cancellation methods results in a 48%
Predictive accuracy for subject-and-activity independent case .--- _ z-scoresl
0.8 _osc
0.7
l a.6 b
.§ 0.4 n; .g 0.3 ·en V) m U 0.2
0.1
-n -I L- �DC
�i [.1 r·1
J .... __ 0 �-S1
�-2�.w
3--�--��� ����� --LU
S S s4 s5 s6 s7 s8 s9 s10 s11 Subjects
Figure 8. Average classification rates for subject-and-activity independent case.
reduction in error rate (from 46.54% for z-scores to 23.73% on OSC/LDC3).
To visualize the effect of the noise correction method we compared the structure of the physiological response fo� all subjects before and after LDC correction using principal component analysis. From Fig. 9, we observe the distribution of the stress class (CWT) and the no-stress class (DB) using the first two principal components. The application of the noise correction method results in an increased distance between the mean of the two classes.
VI. DISCUSSION AND CONCLUSION
Differences in physiology across subjects and changes in physical activity can overshadow the subtler physiological responses to mental stressors. In this work, we have presented two preprocessing algorithms that may be used to ameliorate the effect of these two types of interferences, making it easier to detect the effects of stressors. The first method, known as orthogonal signal correction, was originally developed in the field of chemometrics. OSC attempts to remove any source of variance that is orthogonal to the dependent variable (i.e. stress I�vels). OSC c�n be t�ought of as an unsupervised technique smce the specific nOise sources need not be identified. In co�trast, the second method operates by modeling each unique nOise source and then removing it from the data matrix. This approach, which we have termed linear discriminant correction is based on Fisher's linear discriminant analysis.
'
We validated both methods on experimental data from a number of participant performing three distinct tasks mental tasks .(color word test, color identification test, and deep breathmg, each of them under four different levels of physical
3 OSC was optimized using 2 components, a tolerance value of 99.99, and 100
iterations. The LDC method was implemented using the first 2 eigenvectors for posture variation and the first 3 eigenvectors for subject variation.
121
� 6-e 8. E 4 8 �2 ·0 § 0 Q.
Principal component plot of original data
Ir--;-�WT-B�I .. ,
-4 -2 0 2 4 6 8 First principal component
Principal component plot of LOC corrected data .r=---
•• • .··11 '-
. .
• • •
-6 -4 -2 0 First principal component
2 4
Figure 9. Principal component analysis of task response (a) before correction and (b) after LDC noise correction.
activity (sitting, standing, slow walking, fast walking). For each participant, we computed seven measures related to heart rate variability, electrodermal activity, and respiratory rate, and used the resulting feature vector as independent variables to predict the stress levels (low vs. high stress). In the presence of both sources of variance (individual differences and physical a�tivity) classification performance on z-scores was 53.5%, slightly above chance levels. Following application of noisecancelation methods, classification performance raised to 75.6% and 76.3%, for OSC and LDC, respectively. These
�esuIts indicate that either method can bring noticeable Impro�ements in stress prediction when physiological recordmgs are affected by changes in physical activity and subject-to-subject differences. Among the two methods, OSC only requires information about the dependent variable (stress levels), whereas LDC requires information about the noise sources in order to estimate their directions of variance. This confers each method its own advantages. OSC is a more general method because it can remove any source of variance not related to the dependent variable. On the other hand, as demonstrated by the results in Fig. 6, obtaining ground-truth for stress levels is problematic since subjects can have a radically different experience when performing the same task (i:e., some of our subjects perceived deep breathing as being hIghly stressful). In contrast, LDC only requires ground-truth for subject identity, which can be encoded in the instrument, and physical activity, which can be measured with additional sensors (e.g., accelerometers).
The experiments reported in this work were performed in a laboratory setting. Work is underway to evaluate the proposed cancellation methods in ambulatory settings where subjects are allowed to carry on with their daily activities. Results from these experiments will provide a stronger validation on the effectiveness of our methods for real-world stress monitoring
applications. In this paper, we have focused on individual differences and physical activity. Additional research is required to investigate the effect of additional sources of variance that influence physiological stress response such as age, gender, body composition, circadian rhythms etc. Accounting for these and other sources of variance will also need to be considered for real-world applications.
ACKNOWLEDGMENT
This work was made possible by NPRP grant # [08-125-2-03] from the Qatar National Research Fund (a member of Qatar Foundation). The statements made herein are solely the responsibility of the authors.
REFERENCES
[I] A. Baum and D. M. Poslusmy, "Health psychology: mapping biobehavioral contributions to health and illness," Annual Review of Psychology, vol. 50, no. I, pp. 137-163, 1999.
[2] S. Park and S. Jayaraman, "Enhancing the quality of life through wearable technology," Engineering in Medicine and Biology Magazine, IEEE, vol. 22, no. 3, pp. 41-48, 2003.
[3] 1. T. Cacioppo, L. G. Tassinary, and G. G. Berntson, Handbook of psychophySiology, 3rd ed. Cambridge, U.K.: Cambridge Univ. Press, 2007.
[4] W. Boucsein, Electrodermal Acitivity, 2nd ed. New York: Springer, 2012.
[5] 1. A. Healey and R. W. Picard, "Detecting stress during real-world driving tasks using physiological sensors," Intelligent Transportation Systems, IEEE Transactions on, vol. 6, no. 2, pp. 156-166,2005.
[6] M. Sung, "Non-Invasive Wearable Sensing Systems for Continuous Health Monitoring and Long-Term Behavior Modeling ", Ph.D. Thesis MIT, Department of Electrical Engineering, October 2005.
[7] C. D. Katsis, N. Katertsidis, G. Ganiatsas, and D. I. Fotiadis, "Toward emotion recognition in car-racing drivers: A biosignal processing approach," Systems, Man and Cybernetics, Part A: Systems and Humans, IEEE Transactions on, vol. 38, no. 3, pp. 502-512,2008.
[8] S. Wold, H. Antti, F. Lindgren, and J. Ohman, "Orthogonal signal correction of near-infrared spectra," Chemometrics and Intelligent Laboratory Systems, vol. 44, no. 1-2, pp. 175-185, 1998.
[9] T. Fearn, "On orthogonal signal correction," Chemometrics and Intelligent Laboratory Systems, vol. 50, no. I, pp. 47-52, 2000.
[10] 1. L. Hocking Schuler and W. H. O'BRIEN, "Cardiovascular recovery from stress and hypertension risk factors: A meta-analytic review," Psychophysiology, vol. 34, no. 6, pp. 649-659, 1997.
[II] B. S. McEwen and E. Stellar, "Stress and the individual: mechanisms leading to disease," Archives of internal medicine, vol. 153, no. 18, p. 2093,1993.
[12] 1. Tulen, P. Moleman, H. Van Steenis, and F. Boomsma, "Characterization of stress reactions to the Stroop Color Word Test," Pharmacology Biochemistry and Behavior, vol. 32, no. I, pp. 9-15, 1989.
[13] R. W. Picard and 1. Scheirer, "The galvactivator: A glove that senses and communicates skin conductivity," Proceedingsfrom the 9th International Coriference on Human-Computer Interaction, New Orleans, 2001.
[14] C. Setz, B. Amrich, J. Schumm, R. La Marca, G. Troster, and U. Ehlert, "Discriminating stress from cognitive load using a wearable EDA device," Iriformation Technology in Biomedicine, IEEE Transactions on, vol. 14, no. 2, pp. 410-417, 2010.
[IS] C. Kappeler-Setz, F. Gravenhorst, 1. Schumm, B. Amrich, and G. Troster, "Towards long term monitoring of electrodermal activity in daily life," Personal and Ubiquitous Computing, pp. 1-11,2010.
122
[16] M. Z. Poh, N. C. Swenson, and R. W. Picard, "A wearable sensor for unobtrusive, long-term assessment of electrodermal activity," Biomedical Engineering, IEEE Transactions on, vol. 57, no. 5, pp. 1243-1252,2010.
[17] K. Sato and F. Sato, "Individual variations in structure and function of human eccrine sweat gland," American Journal of PhysiologyRegulatory, Integrative and Comparative PhYSiology, vol. 245, no. 2, p. R203-R208, 1983.
[18] 1. Choi, B. Ahmed, and R. Gutierrez-Osuna, "Ambulatory Stress Monitoring with Minimally-Invasive Wearable Sensors," in press.
[19] A. Haarmann, W. Boucsein, and F. Schaefer, "Combining electrodermal responses and cardiovascular measures for probing adaptive automation during simulated flight," Applied Ergonomics, vol. 40, no. 6, pp. 1026-1040,2009.
[20] J. Choi and R. Gutierrez-Osuna, "Using heart rate monitors to detect mental stress," Wearable and Implantable Body Sensor Networks, 2009. BSN 2009. Sixth International Workshop on, pp. 219-223, 2009.
[21] V. Vuksanovic and V. Gal, "Heart rate variability in mental stress aloud," Medical engineering & physics, vol. 29, no. 3, pp. 344-349, 2007.
[22] K. Plarre et aI., "Continuous inference of psychological stress from sensory measurements collected in the natural environment," Information Processing in Sensor Networks (IPSN), 2011 10th International Coriference on, pp. 97-108, 20 II.
[23] T. G. M. Vrijkotte, L. 1. P. van Doornen, and E. 1. C. de Geus, "Effects of work stress on ambulatory blood pressure, heart rate, and heart rate variability," Hypertension, vol. 35, no. 4, pp. 880-886,2000.
[24] L. Salahuddin, 1. Cho, M. G. Jeong, and D. Kim, "Ultra short term analysis of heart rate variability for monitoring mental stress in mobile settings," Engineering in Medicine and Biology SOCiety, 2007. EMBS 2007. 29th Annual International Coriference of the IEEE, pp. 4656-4659,2007.
[25] 1. C. Sriram, M. Shin, T. Choudhury, and D. Kotz, "Activity-aware ECG-based patient authentication for remote health monitoring," Proceedings of the 2009 international conference on Multimodal interfaces, pp. 297-304, 2009.
[26] M. S. Olufsen, 1. T. Ottesen, H. T. Tran, L. M. Ellwein, L. A. Lipsitz, and V. Novak, "Blood pressure and blood flow variation during postural change from sitting to standing: model development and validation," Journal of Applied Physiology, vol. 99, no. 4, p. 1523,2005.
[27] H. G. Van Steenis and 1. H. M. Tulen, "The effects of physical activities on cardiovascular variability in ambulatory situations," Engineering in Medicine and Biology SOCiety, 1997. Proceedings of the 19th Annual International Conference of the IEEE, vol. I, pp. 105 -108 voU, 1997.
[28] 1. Schumm, M. Bachlin, C. Setz, B. Amrich, D. Roggen, and G. Troster, "Effect of movements on the electrodermal response after a startle event," Pervasive Computing Technologies for Healthcare, 2008. PervasiveHealth 2008. Second International Conference on, pp. 315-318,2008.
[29] D. Wu et aI., "Optimal Arousal Identification and Classification for Affective Computing Using Physiological Signals: Virtual Reality Stroop Task," Affective Computing, IEEE Transactions on, vol. 1, no. 2, pp. 109-118,2010.
[30] R. O. Duda, P. E. Hart, and D. G. Stork, "Pattern classification," John Willey & Sons, 2001.
[31] J. Choi and R. Gutierrez-Osuna, "Estimating mental stress using a wearable cardio-respiratory sensor," Sensors, 2010 IEEE, pp. 150-154, 2010.
[32] W. Van der Elst, M. P. 1. Van Boxtel, G. 1. P. Van Breukelen, and 1. Jolles, "The Stroop color-word test," Assessment, vol. 13, no. 1, pp. 62-79,2006.
[33] G. Ben-Shakhar, "Standardization Within Individuals: A Simple Method to Neutralize Individual Differences in Skin Conductance ", Psychophysiology, 22(3), 1469-8986.