Social Exclusion: Residential Segregation in Bolivian Cities
Environment and Planning A 2013, volume 45, pages 872 – 891
doi:10.1068/a4515
Religious residential segregation and internal
migration: the British Muslim case
Richard Gale
School of Planning and Geography, Cardiff University, Glamorgan Building, King Edward VII Avenue, Cardiff CF10 4RG, Wales; e-mail: [email protected] 12 January 2012; in revised form 7 July 2012
Abstract. Concerns over British Muslim integration have been to the fore of public debate
over much of the last decade, with Muslim segregation constituting a key issue. Recent
analyses have usefully shown that current concerns over segregation levels in the UK are
exaggerated. However, these analyses continue to rely on census ethnicity data, which
are used as proxy for religion to draw inferences about Muslim residential phenomena.
Focusing on Birmingham, this paper redresses this tendency by using religion data to
explore religious segregation directly. Adopting established measures of segregation and
Special Migration Statistics (SMS) by religion for the year 2000/01, the paper shows that,
whilst Muslim segregation in Birmingham is high, there has been a significant if spatially
constrained movement away from concentrated inner urban areas.
Keywords: Muslims, religion, ethnicity, segregation, migration, Birmingham, Census
1 IntroductionOver the last decade British Muslims have been the focus of sustained public attention in the UK, animated by the events of September 11 2001 and the London bombings of 7 July 2005. Much of this attention has coalesced around a few recurrent themes, including racialised representations of young Muslim men, who are frequently perceived to be at risk of radicalisation, and Muslim residential segregation, construed as a communal rejection of morally cohesive national values. Moreover, these themes have become mutually com-pounding, with segregation and its alleged intensification being cited as a factor underlying some young Muslims’ tendency to affiliate to extremist organisations. This paper contributes to a growing body of critical geographical analyses of these themes, which decompose them into their positive and normative constituents, showing how value-laden pronouncements concerning British Muslims frequently rest upon distorted or erroneous empirical claims (Finney and Simpson, 2008; Peach, 2006a; 2010; Phillips, 2006; Simpson, 2004; Simpson and Finney, 2009). Specifically, it tests the hypothesis that, contrary to public perceptions, there is an overall tendency for Muslims to gravitate away from, rather than towards, established community concentrations and that there is a corresponding movement away from poorer inner-city areas to suburbs of less deprivation. Its major contribution to segregation debates is its focus on religious, rather than exclusively ethnic, residential patterns.
Recent concern with Muslim radicalisation has reinforced prevailing Islamophobic stereotypes, placing Muslim young men at the epicentre of a ‘moral panic’ over the incompatibility of Islam with ‘core British values’ (Dwyer et al, 2008; Hopkins, 2006; 2007a). Using approaches that stress the intersectional relationships between strands of social identity and forces of marginalisation, recent work in geography and neighbouring disciplines reveals how the gendered racialisation of Islam obscures the varied ways in which (particularly young) Muslims reconcile local and national identification with strong faith commitment (Archer, 2001; Hopkins, 2006; 2007a; 2007b). This work constitutes a trenchant critique of the prevailing discourses of ‘patriarchy’, ‘aggression’, and ‘academicism’ that

Religious residential segregation and internal migration 873
have governed unduly narrow constructions of Asian and Muslim young men’s identities, enabling more complex negotiations of race, religion, place, and masculinity to come to light (Dwyer et al, 2008; Hopkins, 2006; 2007a; 2007b). This complements a longer standing interest in Muslim women’s identities, dress codes, and embodiment, which counteracts the reification of Muslim women’s veiling practices as a symbol of cultural ‘inwardness’ and resistance to social and political integration (Dwyer, 1999; 2000; Mohammad, 1999).
These entanglements of gender, religion, and racialisation in representations of British Muslims have an inherent spatiality, and have become intertwined with anxiety over Muslim residential segregation, likewise driven by the presumed failure of Muslims to integrate socially and culturally (Hopkins and Smith, 2008; Phillips, 2006). Debates over segregation in Britain are far from novel, having been a focus of controversy since the era of postcolonial mass immigration in the 1960s (Peach, 1966). Nevertheless, the urban disturbances that took place in northern cities and towns in the summer of 2001 reignited the British segregation debate which in the post 9/11 era has become infused with references to religion and Islam. As shown by Phillips (2006, pages 24–31), segregation constituted a prominent theme in the official reports on the 2001 disturbances (Cantle, 2001; Denham, 2001; Ouseley, 2001), conveying the impression that minority ethnic residential concentrations resulted from these groups’ self-willed social isolation. This impression was compounded by the attacks on London in July 2005, prompting fears that Britain was drifting into North-American-style ghettoisation and enabling the sociospatial conditions for Muslim political extremism to flourish (Phillips, 2005). These concerns jointly formed the backdrop to New Labour’s controversial Community Cohesion and Prevent agendas, which survived the transition from Labour to Coalition governments. Indeed, the themes of segregation, radicalisation, and ‘parallel living’ were explicitly conjoined by Prime Minister David Cameron in a speech given in Munich in February 2011, in which he characterised the British experience in terms of the mistaken encouragement given to “different cultures to live separate lives, apart from each other and apart from the mainstream”, as well as the failure to provide “a vision of society to which they [Muslim young men] feel they want to belong”. Correspondingly, he referred to the “toleration” given to “segregated communities behaving in ways that run completely counter to our [sic] values”.(1)
This reinvigoration of public policy concern with segregation has stimulated significant debate among British academics over the most meaningful way to measure segregation levels, and whether segregation can be effectively assessed through the use of index measures (Kalra and Kapoor, 2009; Phillips, 2007, pages 1144–1147; 2010). In the background of the British debate is the seminal methodological research of the US segregation scholars, Massey and Denton (1988). These authors distinguished five dimensions of residential segregation: evenness (two groups’ relative distribution across areas within a city), exposure (the likelihood of social contact and interaction), concentration (the amount of space a group inhabits), centralisation (a group’s relative proximity to the centre of an urban location), and clustering (the degree of contiguity between areas in which a group is concentrated) (Massey and Denton, 1988, pages 283–297). Work by Johnston et al (2002) adapted these concepts and related multidimensional understandings of segregation (Boal, 1999; Peach, 1996) to an analysis of the British scenario, resulting in a classification of segregated areas according to the relative presence of different ethnic groups, and hence differences in the degree of group ‘exposure’ (Johnston et al, 2002, pages 596–597). This work drew attention to areas of British cities experiencing growing concentrations of particular ethnic groups (Johnston et al, 2005), and was a point of reference in the pronouncement by Trevor Phillips,
(1) A transcript of David Cameron’s Munich speech is available on the Number 10 Downing Street website, http:// www.number10.gov.uk/news/pms-speech-at-munich-security-conference/

874 R Gale
then Chair of the Commission for Racial Equality, that Britain is witnessing the emergence of ‘fully fledged ghettos’ (Peach, 2010; Phillips, 2005: cf Phillips, 2007).
Other contributions to this debate, however, approach segregation in terms of the process by which a given morphology is produced (Simpson, 2004; 2005; 2007a). This shift from a static to a dynamic perspective has led to a fruitful emphasis on population movement as an element of the overall segregation mosaic, in recognition that summary index values elide the independent effects of natural population change and migration on the changing ethnoreligious composition of neighbourhoods (Simpson, 2004; Stillwell, 2010; Stillwell and Hussain, 2010). Given the recent sensationalisation of Muslim residential patterns, this concern with movement has proven politically as well as scientifically important, since migration reflects choices over where households wish to live (Simpson and Finney, 2009). As such, this body of work on migration, and related studies of changing segregation (Peach, 1996; 2006a; Phillips, 1998; 2006; Phillips et al, 2007), has been well placed to inform public debate, revealing how internal movement contributes to overall desegregation and increasing residential intermixture.
This paper makes a twofold contribution to this debate, the first being its explicit focus on religion. With few exceptions (Peach, 2006a), segregation analyses continue to rely on census ethnicity data, even where the aim is to counter public representation of religious, and specifically Muslim, groups. Given the absence of a question on religion in the 1991 Census, this approach is defensible for the purposes of making cross-census comparisons where religious and ethnic categories broadly coincide. Indeed, this approach is adopted of necessity in the first part of the analysis presented below. However, there are drawbacks with this practice that have been obviated in existing research, the most salient being a tendency to reduce religion to an epiphenomenon of ethnicity, rather than regard it as an important social category sui generis.
This is not to suggest that ethnicity is a defunct mode of identification that is eclipsed by religion. In the case of Pakistanis and Bangladeshis, for example, who constitute the largest ethnic groups within the British Muslim population, the social reproduction of ethnicity as an identity marker has considerable continuity due to the persistence of endogamous marriage practices (Peach, 2006b; Shaw, 2001) and honour-based forms of familial respect and reciprocity (Ballard, 1994). Nevertheless, it is well established that ethnic identity is highly contextual, cross-cut by other forms of social identity, such as class and gender (Brah, 1996), as well as by changing generational relationships (Hopkins, 2006). Moreover, whilst religion is likewise not an immutable container of identity, it has come to play a prominent role in the reconstitution of ethnic boundaries. Not only does religion form a central component of the way in which many members of minority groups in Britain live their lives (Modood et al, 1997, page 301), for Muslims, religious commitment also constitutes a basis for mobilisation over issues at local, national, and global scales, transcending ties of ethnic particularity (Birt, 2009). In addition, numerous studies report on the ways in which religious commitment and piety amongst young Muslims provides a source of challenge to cultural practices forming part of parentally inscribed ethnic heritages (Jacobson, 1997; Nielsen, 2000). Together, these considerations render existing ethnic categorisations less stable than their census-driven institutionalisation would suggest (Ballard, 1998). Given that much of the recent politicisation of segregation has coalesced around religion and Islam, it is time to take seriously Peach’s (2006a, page 353) proposition that religion may have become a more significant variable in social geographical analysis than either race or ethnicity, and to make more substantive use of available religion data.
The second contribution of this paper is its focus on Birmingham. Birmingham constitutes a critical case here due to the size of its Muslim population: according to the 2001 Census, Birmingham was second only to London among British cities as regards the absolute size of its Muslim contingent (Gale and Hopkins, 2009, page 8). Moreover, Birmingham is

Religious residential segregation and internal migration 875
significant from the point of view of intellectual archaeology: in past decades, the city was a major conduit for developments in British studies of race and ethnicity, hosting Birmingham University’s erstwhile Centre for Contemporary Cultural Studies and providing the substantive focus of Rex and his collaborators’ urban sociological work on the racialisation of housing, employment, and urban politics (Rex and Moore, 1967; Rex and Tomlinson, 1979; see also Henderson and Karn, 1984; 1987; Ratcliffe, 1981). This was complemented throughout the 1970s and 1980s by studies rooted in geography’s ‘quantitative revolution’, concerning the ecology of ‘nonwhite’ settlement around Birmingham’s inner urban core (Jones, 1970; 1976; Woods, 1977; 1981). However, there has been a dearth of segregation-related research on Birmingham since these foundational works appeared, with most recent contributions focused upon either London or the northern mill towns. Accordingly, this paper fills a decades-long gap in research on segregation in Birmingham, preparing the ground for analyses of forthcoming outputs from the 2011 Census.
The remainder of the paper is divided into three sections. Section 2 provides an overview of the sociospatial characteristics of Muslims in Birmingham, whilst section 3 examines the changing morphology of segregation in Birmingham between 1991 and 2001, using the Indices of Segregation (IS), Dissimilarity (ID), and Isolation (P*). In both sections, comparisons across time use the Pakistani and Bangladeshi populations as proxy for the Muslim total.(2) Section 4 explores ward-level religious migration within Birmingham and how this relates to the existing geography of ethnoreligious settlement.(3) In the conclusion I reflect on the implications of the findings, arguing the case for paying greater attention to religion as a feature of segregated space in future.
2 Muslims in BirminghamAccording to the 2001 Census, Muslims in Birmingham constituted 14.3% of a local population of approximately 1 million. In terms of ethnic composition, table 1 shows that Muslims in Birmingham were overwhelmingly of South Asian heritage, with Pakistanis accounting for 70%, Bangladeshis 14%, Indians 4%, and ‘Other Asians’ 5% of the total. There were also smaller groups of Muslims of other ethnicities, including 2% who self-identified as ‘Black British’.(4)
The distinct geography of Muslim settlement in Birmingham has long been noted in academic studies (Joly, 1995). Already by the 1960s Desai (1963) and Dahya (1974) had remarked on the tendency for immigrants from the Indian subcontinent, Caribbean Islands, and Yemen to settle in a discernable band around the central city area, and to sort themselves into distinct residential clusters. To account for this spatial pattern, Rex and Moore (1967) produced their classic work on ‘housing classes’, arguing that racial discrimination woven into the workings of the city council’s housing-allocation system constrained migrants to live in rundown, private sector housing within the inner city. Subsequently, the clustering of minority groups became politicised by the council’s attempts to fragment ethnic enclaves (2) It should be noted that, whilst the Pakistani and Bangladeshi totals constitute a reasonable approximation of the Muslim population total in Birmingham in 2001, they do not provide a similarly good match in other cities, nor necessarily in Birmingham in later periods. (3) Wards are a problematic unit of spatial analysis on account of variations in population and areal size. Moreover, wards in Birmingham have considerably larger than average populations (ranging from 16 500 to 35 090, compared with a mean average of 6195 for English wards in the 2001 Census). Nevertheless, they are used pragmatically as the finest scale at which the specified migration data could be released without excessive distortion through small cell adjustment.(4) The question on religion in the 2001 Census was voluntary, and estimates of religious populations based on other sources provide evidence of undercounting of some groups (Graham and Waterman, 2005). Whilst there was some variation in the proportions of ethnic groups who completed the religion question, a full evaluation of the effects of ethnic bias on religious-group counts lies beyond the scope of this paper.

876 R Gale
Tabl
e 1.
Per
cent
age
ethn
icity
by
relig
ion
in B
irmin
gham
(sou
rce:
200
1 C
ensu
s, Ta
ble
ST10
4).
All
peop
leC
hris
tian
Bud
dhis
tH
indu
Jew
ish
Mus
limSi
khA
ny o
ther
re
ligio
nN
o re
ligio
nR
elig
ion
not s
tate
d
Whi
te70
.489
.525
.51.
093
.92.
61.
356
.885
.470
.8B
ritis
h65
.683
.122
.60.
983
.71.
41.
252
.682
.766
.0Ir
ish
3.2
4.8
1.4
0.0
1.2
0.0
0.0
1.3
0.8
2.9
Oth
er1.
51.
51.
60.
19.
01.
10.
12.
91.
81.
9M
ixed
2.9
2.5
2.4
0.6
2.0
2.0
0.4
4.8
5.5
4.3
Whi
te a
nd B
lack
Car
ibbe
an1.
61.
70.
50.
00.
20.
10.
02.
53.
12.
5W
hite
and
Bla
ck A
fric
an0.
10.
10.
10.
00.
30.
10.
00.
20.
30.
2W
hite
and
Asi
an0.
60.
40.
80.
40.
61.
20.
30.
71.
30.
8O
ther
0.5
0.3
1.0
0.1
0.9
0.5
0.1
1.4
0.9
0.8
Asia
n19
.50.
413
.098
.02.
691
.898
.016
.21.
013
.2In
dian
5.7
0.3
7.6
94.2
0.3
3.6
93.4
14.3
0.7
3.4
Paki
stan
i10
.60.
00.
50.
11.
469
.60.
20.
20.
17.
4B
angl
ades
hi2.
10.
00.
20.
40.
413
.80.
00.
00.
11.
6O
ther
Asi
an1.
00.
14.
83.
30.
44.
84.
41.
70.
10.
8Bl
ack
or B
lack
Bri
tish
6.1
7.2
1.8
0.2
0.9
1.7
0.1
19.4
5.5
10.5
Bla
ck C
arib
bean
4.9
6.0
1.4
0.1
0.7
0.2
0.0
15.0
4.5
8.6
Bla
ck A
fric
an0.
60.
60.
20.
10.
11.
30.
12.
00.
20.
8O
ther
Bla
ck0.
60.
60.
20.
00.
00.
20.
02.
40.
71.
1C
hine
se o
r oth
er e
thni
c gr
oup
1.1
0.4
57.3
0.2
0.6
1.9
0.1
2.8
2.6
1.3
Chi
nese
0.5
0.1
31.3
0.0
0.0
0.0
0.0
1.7
2.2
0.7
Oth
er e
thni
c gr
oup
0.6
0.3
26.0
0.2
0.6
1.9
0.1
1.1
0.4
0.6
All
peop
le10
010
010
010
010
010
010
010
010
010
0
Bas
e97
7 086
577 7
832 9
7719
358
2 342
140 0
3328
593
2 500
121 5
4181
959

Religious residential segregation and internal migration 877
through policies of residential dispersal (Flett et al, 1979). Muslim residential patterns were further politicised by planning policies governing the location of mosques, madrasas, and other community facilities (Gale, 2005; 2008), whilst their persistence has become an element of the cognitive geography underlying the political activism of young Muslims (O’Toole and Gale, 2010). The extent of the inner-urban concentration of Muslims in Birmingham at the time of the 2001 Census is shown in figure 1. Worthy of comment is the extent to which this pattern of concentration corresponds to the geography of relative material deprivation in the city: according to the 2001 Carstairs scores, approximately 64.5% of Muslims in Birmingham lived in areas within the quintile of most deprived wards in the city, compared with 26.5% of Sikhs, 28.0% of Hindus, and 10.5% of Christians.(5) I return to the theme of ward-level deprivation in section 4.
For all these signs of an enduring Muslim residential pattern in the city, however, the processes underlying it are far from static. A key issue in changing segregation levels is how an
(5) The Carstairs index is an unweighted area-based measure of deprivation combining scores on four census variables: unemployment, overcrowding, car ownership, and social class (Morgan and Baker, 2006). Carstairs data reported in this paper are based on the Birmingham, rather than national, range of scores to capture local variation in deprivation. Scores in Birmingham ranged from −3.23 to 15.45.
Figure 1. Muslim population of Birmingham by census output areas and ward-level percentage net migration (source: 2001 Census, Tables KS007, C0757, and C1315).
Muslim percentage net migration2000–01 (2001 Census wards)
Muslims in Birmingham, 2001 CensusPercentage by census output areas
0.25
0.125 0.025−0.025−0.125
−0.25
75–90 (81)60–75 (129)45–60 (105)30–45 (116)15–30 (232) 3–15 (874)all others (898)

878 R Gale
apparently settled morphology is in fact a dynamic balance between a group’s size and spatial distribution (Simpson, 2004). As regards size, the growth rates of the main ethnic groups within the Muslim total in Birmingham are noteworthy. Table 2 shows that the Pakistani and Bangladeshi populations grew significantly between the 1991 and 2001 Censuses, both in absolute and in relative terms: by 2001 both groups had increased to approximately 1.5 times their 1991 sizes, whilst their respective shares of the city population also grew substantially, by 3.6% in the case of Pakistanis and 0.8% in the case of Bangladeshis.(6) In contrast, there was a marked drop in the White group’s share of the local population, which fell by 6.6%. Uniquely among the minority ethnic populations, the Black Caribbean population also fell, by 0.5%. [The ‘Other ethnic’ category is included in table 2 for completeness. As Sabater and Simpson (2009a, page 1466) point out, however, this residual category is unstable over time, and is hence left out of detailed comparisons in the remainder of this paper.]
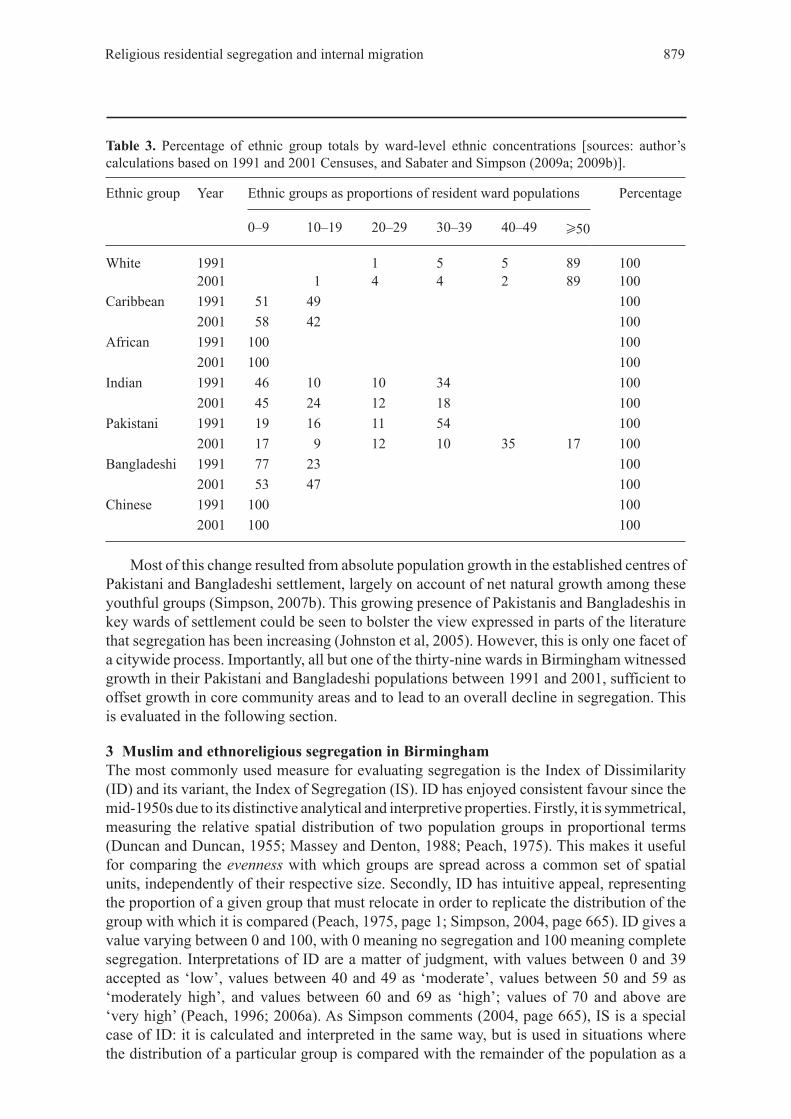
The spatiality of these changes in the ethnic make-up of the city is revealed in table 3. Focusing again on the Pakistani and Bangladeshi populations, it is clear that greater proportions of both groups lived in areas of higher concentration in 2001 than in 1991. In 1991, 54% of Pakistanis lived in areas where they constituted over 30% of the ward-level population; by 2001, this proportion had risen to 62%. Moreover, in 1991 there were no areas in which Pakistanis formed an absolute majority; in 2001 there was one ward (Small Heath) in which Pakistanis made up slightly more than 50% of the local population, this ward alone accounting for 17% of the Pakistani total. The Bangladeshis, although a much smaller population, exhibited a similar pattern of spatial change. In 1991, 77% of Bangladeshis lived in wards where they made up less than 10% of the population; by 2001 this proportion had fallen to 53%, with a corresponding 24% rise in the proportion living in areas where they formed between 10% and 19%.
(6) To overcome the difficulties of changing census geographies and ethnic categories, data presented in tables 2, 3, and 4 are derived from 1991 and 2001 Census estimates produced at Manchester University’s Cathie Marsh Centre for Census and Survey Research by Sabater and Simpson (2009a; 2009b). These recalculated 2001 ethnic populations to 1991 ethnic categories and census boundaries. Following them, the various ‘mixed ethnic’ categories unique to the 2001 Census are included in the residual ‘Other ethnic’ category. For an alternative method of cross-census harmonisation with regard to these categories, see Rees and Butt (2004).
Table 2. Ethnic population change in Birmingham [sources: author’s calculations based on 1991 and 2001 Censuses, and Sabater and Simpson (2009a; 2009b)].
Ethnic group Population Change 1991–2001
1991 2001
number % number % number %
White 771 710 76.83 691 952 70.27 −79 758 −6.55Black Caribbean 53 790 5.35 48 075 4.88 −5 715 −0.47Black African 3 633 0.36 6 430 0.65 2 797 0.29Indian 55 537 5.53 56 245 5.71 707 0.18Pakistani 71 254 7.09 105 137 10.68 33 883 3.58Bangladeshi 13 740 1.37 21 062 2.14 7 322 0.77Chinese 3 966 0.39 5 230 0.53 1 265 0.14Other ethnic 30 872 3.07 50 511 5.13 19 639 2.06
Totals 1 004 502 100 984 642 100 19 860
Religious residential segregation and internal migration 879
Most of this change resulted from absolute population growth in the established centres of Pakistani and Bangladeshi settlement, largely on account of net natural growth among these youthful groups (Simpson, 2007b). This growing presence of Pakistanis and Bangladeshis in key wards of settlement could be seen to bolster the view expressed in parts of the literature that segregation has been increasing (Johnston et al, 2005). However, this is only one facet of a citywide process. Importantly, all but one of the thirty-nine wards in Birmingham witnessed growth in their Pakistani and Bangladeshi populations between 1991 and 2001, sufficient to offset growth in core community areas and to lead to an overall decline in segregation. This is evaluated in the following section.
3 Muslim and ethnoreligious segregation in Birmingham The most commonly used measure for evaluating segregation is the Index of Dissimilarity (ID) and its variant, the Index of Segregation (IS). ID has enjoyed consistent favour since the mid-1950s due to its distinctive analytical and interpretive properties. Firstly, it is symmetrical, measuring the relative spatial distribution of two population groups in proportional terms (Duncan and Duncan, 1955; Massey and Denton, 1988; Peach, 1975). This makes it useful for comparing the evenness with which groups are spread across a common set of spatial units, independently of their respective size. Secondly, ID has intuitive appeal, representing the proportion of a given group that must relocate in order to replicate the distribution of the group with which it is compared (Peach, 1975, page 1; Simpson, 2004, page 665). ID gives a value varying between 0 and 100, with 0 meaning no segregation and 100 meaning complete segregation. Interpretations of ID are a matter of judgment, with values between 0 and 39 accepted as ‘low’, values between 40 and 49 as ‘moderate’, values between 50 and 59 as ‘moderately high’, and values between 60 and 69 as ‘high’; values of 70 and above are ‘very high’ (Peach, 1996; 2006a). As Simpson comments (2004, page 665), IS is a special case of ID: it is calculated and interpreted in the same way, but is used in situations where the distribution of a particular group is compared with the remainder of the population as a
Table 3. Percentage of ethnic group totals by ward-level ethnic concentrations [sources: author’s calculations based on 1991 and 2001 Censuses, and Sabater and Simpson (2009a; 2009b)].
Ethnic group Year Ethnic groups as proportions of resident ward populations Percentage
0–9 10–19 20–29 30–39 40–49 H50
White 1991 1 5 5 89 1002001 1 4 4 2 89 100
Caribbean 1991 51 49 1002001 58 42 100
African 1991 100 1002001 100 100
Indian 1991 46 10 10 34 1002001 45 24 12 18 100
Pakistani 1991 19 16 11 54 1002001 17 9 12 10 35 17 100
Bangladeshi 1991 77 23 1002001 53 47 100
Chinese 1991 100 1002001 100 100

880 R Gale
whole, rather than another population subgroup (Peach, 1996; Simpson, 2004). Both indexes are used in this section.
Overall levels of ethnic segregation are reflected in IS values in columns 1 and 2 of table 4. The central message here is that segregation in Birmingham fell between 1991 and 2001 for all ethnic groups, including Pakistanis and Bangladeshis. However, there are also important differences. At the lower end of the distribution were the Black Africans and Chinese, who already exhibited ‘low’ levels of segregation in 1991: IS values for these groups fell from 37.5 to 30.3, and from 29.6 to 28.2, respectively, between the two censuses. In the middle of the distribution were the Black Caribbean and Indian groups: the Black Caribbean IS fell from a ‘moderate’ value of 40.4 to a ‘low’ value of 36.3, whilst the Indian IS fell from a ‘moderately high’ value of 50.2 to a ‘moderate’ value of 43.9. The only groups which exhibited persistently ‘high’ levels of segregation in both censuses were the Pakistanis and Bangladeshis, although here again IS fell for both groups from values in the mid to the low 60s. The next most highly segregated group after Pakistanis and Bangladeshis were Whites, with ‘moderately high’ IS scores of 57.2 in 1991 and 54.4 in 2001.
Given the changing sizes and geography of different ethnic populations in Birmingham indicated in tables 2 and 3, it is necessary to consider the evenness of the groups’ spatial distribution in relation to their degrees of spatial isolation (Massey and Denton, 1988). The key measure used to evaluate this dimension of segregation is the Index of Isolation (P*) (Lieberson, 1981; Massey and Denton, 1988). The key feature of P* is that, unlike ID and IS, it is asymmetrical: whereas the other measures factor out differences of size to evaluate the pairwise spread of population groups, P* is explicitly designed to take absolute differences of group size into account. Mathematically, P* returns the probability that for a randomly selected member of a given group within a specified geographical area, the next person chosen randomly from within the same area will also be a member of that group. As with ID, P* has an intuitive interpretation, expressing the likelihood that the next person an individual will meet in their local area will be someone from their own background (Lieberson, 1981, page 66; Simpson, 2007a, page 409). The key point, as Massey and Denton (1988, page 287) stress, is that “rather than measuring segregation as departure from some abstract idea of ‘evenness’, exposure indices attempt to measure the experience of segregation as felt by the average minority or majority member” (original emphasis). Some scholars argue that P* should be standardised to mitigate the effects of group-size variation on the values taken by the index (Burgess and Wilson, 2005; Cutler et al, 1999). However, as some commentators point out (Massey and Denton, 1988; Simpson, 2007a), to do so defeats the primary purpose
Table 4. Ethnic segregation in Birmingham at ward scale, 1991 and 2001 [sources: author’s calculations based on 1991 and 2001 Censuses and Sabater and Simpson (2009a; 2009b)].
Ethnic group Index of segregation (IS) Index of isolation (P*)
1991 2001 1991–2001 change
1991 2001 1991–2001 change
White 57.2 54.5 −2.7 84.0 80.0 −4.0Black Caribbean 40.4 36.3 −4.1 10.7 9.1 −1.6Black African 37.5 30.3 −7.2 0.7 1.0 +0.3Indian 50.2 43.9 −6.3 17.0 15.3 −1.7Pakistani 65.5 63.6 −1.9 24.8 31.8 +7.0Bangladeshi 65.4 60.3 −5.1 6.3 8.1 +1.8Chinese 29.6 28.2 −1.4 0.7 1.0 +0.3

Religious residential segregation and internal migration 881
of P* as an explicitly asymmetric measure. In this paper, P* is used in unstandardised form to maintain the distinction between evenness and exposure as dimensions of segregation.
Values of P* for different ethnic groups in Birmingham are presented in columns 4 and 5 of table 4 and show that, for some groups, including Whites, Black Caribbeans, and Indians, changes in P* moved in the same downward direction as IS (columns 3 and 6 in table 4). In sociospatial terms, this means there has been movement of these groups into new residential areas, ‘hollowing out’ their core areas of concentration. For other groups, however, including Pakistanis, Bangladeshis, Black Africans, and Chinese, the relationship between the indexes is reversed. Most importantly, the effects of this change were largest in the case of Pakistanis and Bangladeshis: as IS for these groups fell, P* increased, by approximately 7 points for Pakistanis and 2 for Bangladeshis. These findings illuminate the observation in the preceding section that significant numbers of Pakistanis and Bangladeshis have simultaneously moved into new areas as their core concentrations have grown. These group-specific patterns of falling segregation and increasing values of P* for Black Africans, Pakistanis, Bangladeshis, and Chinese mirror the national trends recently reported by Sabater (2010).
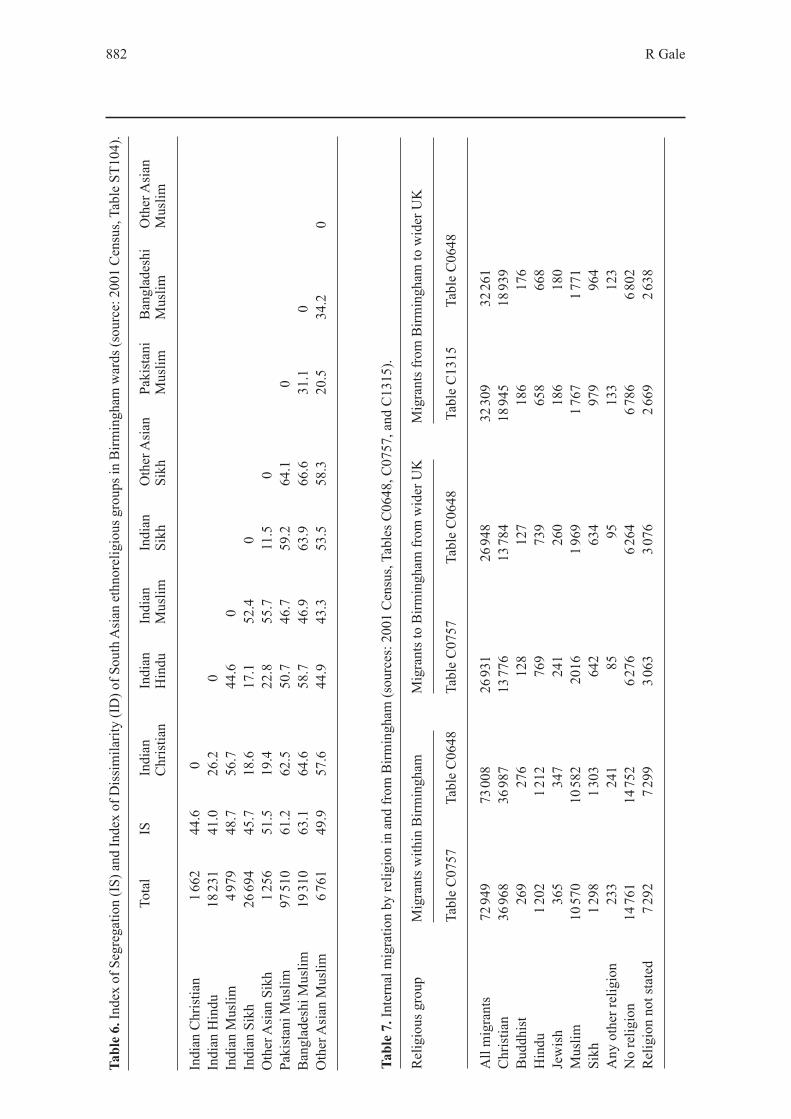
Turning to religion, column 1 in table 5 shows ward-level IS values for the major religious groups in Birmingham; the triangular matrix shows group-by-group IDs. The IS values closely match those in table 4. In particular, the Muslim IS of 62.5 corresponds to the ‘high’ value for the Pakistani and Bangladeshi constituents of this group. This contrasts with Peach’s (2006a, page 359) findings on London, which showed the Muslim population to have the lowest segregation of all the minority religious groups. The ID values for the Sikh and Hindu populations likewise follow the Indian ethnic pattern revealed in table 4, with a ‘moderate’ IS and a correlatively low intergroup ID of 17.1. Exploring the relationship between religion and ethnicity further, table 6 presents IDs for different South Asian ethnoreligious groups, and show additional points of contrast with Peach’s work on London. In Birmingham, Pakistani and Bangladeshi Muslims are either ‘highly’ or ‘moderately highly’ segregated from every non-Muslim group, yet exhibit low segregation between one another (ID = 31). Moreover, whereas Peach reported a low ID (27) between Pakistani and Indian Muslims in the London context, the ID for these groups in Birmingham is substantially higher (47). Indeed, in Birmingham the Indian Muslim group is spatially distinctive, with ‘moderate’ or ‘moderately high’ segregation levels from every other South Asian religious group, including other Indian groups. This is partly due to the Indian Muslims’ degree of ward concentration, with 40% of them residing in a single ward, Handsworth, to the northwest of the city centre.
The index values presented in tables 4–6 are useful for identifying overall segregation patterns. As Simpson (2004) notes, however, these summary measures are by their nature insensitive to the relative importance of the different components of neighbourhood population change. Hence, the following section considers internal migration in isolation, evaluating the relationship between religious migration and the established geography of the various religious communities.
Table 5. Ward-level Index of Segregation (IS) and Index of Dissimilarity (ID) of major religious groups in Birmingham (source: 2001 Census, Table ST104).
Ward IS Christian Muslim Sikh Hindu Jewish
Christian 33.9 0Muslim 62.5 66.2 0Sikh 45.9 52.4 57.1 0Hindu 40.4 48.5 48.9 17.1 0Jewish 54.3 55.8 73.5 61.5 57.6 0
882 R Gale
Tabl
e 6.
Inde
x of
Seg
rega
tion
(IS)
and
Inde
x of
Dis
sim
ilarit
y (I
D) o
f Sou
th A
sian
eth
nore
ligio
us g
roup
s in
Birm
ingh
am w
ards
(sou
rce:
200
1 C
ensu
s, Ta
ble
ST10
4).
Tota
lIS
Indi
an
Chr
istia
nIn
dian
H
indu
Indi
an
Mus
limIn
dian
Si
khO
ther
Asi
an
Sikh
Paki
stan
i M
uslim
Ban
glad
eshi
M
uslim
Oth
er A
sian
M
uslim
Indi
an C
hris
tian
1 66
244
.60
Indi
an H
indu
18 23
141
.026
.20
Indi
an M
uslim
4 97
948
.756
.744
.60
Indi
an S
ikh
26 69
445
.718
.617
.152
.40
Oth
er A
sian
Sik
h 1
256
51.5
19.4
22.8
55.7
11.5
0Pa
kist
ani M
uslim
97 51
061
.262
.550
.746
.759
.264
.10
Ban
glad
eshi
Mus
lim19
310
63.1
64.6
58.7
46.9
63.9
66.6
31.1
0O
ther
Asi
an M
uslim
6 76
149
.957
.644
.943
.353
.558
.320
.534
.20
Tabl
e 7.
Inte
rnal
mig
ratio
n by
relig
ion
in a
nd fr
om B
irmin
gham
(sou
rces
: 200
1 C
ensu
s, Ta
bles
C06
48, C
0757
, and
C13
15).
Rel
igio
us g
roup
Mig
rant
s with
in B
irmin
gham
Mig
rant
s to
Birm
ingh
am fr
om w
ider
UK
Mig
rant
s fro
m B
irmin
gham
to w
ider
UK
Tabl
e C
0757
Tabl
e C
0648
Tabl
e C
0757
Tabl
e C
0648
Tab
le C
1315
Tabl
e C
0648
All
mig
rant
s72
949
73 00
826
931
26 94
832
309
32 26
1C
hris
tian
36 96
836
987
13 77
613
784
18 94
518
939
Bud
dhis
t26
927
612
812
718
617
6H
indu
1 202
1 212
769
739
658
668
Jew
ish
365
347
241
260
186
180
Mus
lim
10 57
010
582
2016
1 969
1 767
1 771
Sikh
1 298
1 303
642
634
979
964
Any
oth
er re
ligio
n23
324
185
9513
312
3N
o re
ligio
n14
761
14 75
26 2
766 2
646 7
866 8
02R
elig
ion
not s
tate
d7 2
927 2
993 0
633 0
762 6
692 6
38

Religious residential segregation and internal migration 883
4 Migration of Muslims within and to Birmingham, 2000–2001The data used in this section are drawn from two commissioned tables of 2001 Census SMS, tabulating religious migrants to, from, and within Birmingham in the year 2000/01. The first, Table C0757, covers movement between all wards within Birmingham; movement to Birmingham from elsewhere in the UK, broken down according to Government Office Regions (GORs); and migration to the city from outside the UK. The second, Table C1315, contains data on migrants from Birmingham to GORs. Following Stillwell (2010, page 1448), these data were used to derive two sets of net migration balances for Birmingham wards, which are calculated separately for each religious group: ‘internal’ migration, referring to movement within Birmingham, and ‘external’ migration, referring to movement between Birmingham and elsewhere in the UK. As in the work of Simpson (2004) and Simpson and Finney (2009), however, these migration balances are expressed as percentages of the respective religious group in the city to provide group-specific migration rates and hence facilitate cross-group comparisons. ‘Internal’ and ‘external’ migration rates are treated separately and together in different parts of the analysis. Evaluations of the relationships between religious residential concentrations and migration make use of the ‘same address’ category in Table C0757 to separate out the ‘resident’ and ‘migrant’ populations for each ward, to avoid migrants being double-counted. To maintain robustness, the analysis concentrates on the four largest religious groups in the city (namely Christians, Muslims, Sikhs, and Hindus) for which gross migrants were in excess of 1000. Immigration is addressed separately below, given that the absence of data on emigration prevents calculation of net international migration balances.
All tables derived from the census are subject to confidentiality checks by the Office for National Statistics, with small cells being randomly adjusted to ensure that the data do not disclose personal information (Stillwell and Duke-Williams, 2007). Given the fineness of spatial scale specified for Tables C0757 and C1315, table 7 checks for the effects of adjustment procedures on overall data quality. Specifically, ward totals for migrants of different religious groups in Tables C0757 and C1315 are aggregated against values taken from another source of 2001 Census migration data, Table C0648, which includes data on migration by religion at the scale of the district.(7) These comparisons are not watertight, since Table C0648 will also have been subject to rigorous confidentiality checks, but are nevertheless of heuristic value in testing for significant differences of magnitude. Overall the comparisons show that cell
(7) Table C0648 was accessed from Centre for Interaction Data Estimation and Research (CIDER) website http://cider.census.ac.uk/cider/
Table 8. Migration within, to, and from Birmingham as a percentage of religious group (source: 2001 Census, Tables C0757 and C1315).
Religious group Migrants withinBirmingham aspercentage of religiousgroup
Migrants toBirmingham as percentage of religious group
Migrants from Birmingham as percentage of religious group
Christian 6.4 2.44 3.35Buddhist 9.0 4.40 6.35Hindu 6.2 3.97 3.41Jewish 15.4 10.42 8.11Muslim 7.5 1.44 1.28Sikh 4.5 2.25 3.43Any other religion 9.4 3.52 6.00No religion 12.1 5.27 5.72Religion not stated 8.9 3.80 3.30
884 R Gale
adjustments have had some aggregate effect, but that these are slight and unlikely to have significantly impaired the results.
Relevant data from the two commissioned tables are presented in table 8 in the form of percentages of the respective groups in the city as a whole. The comparatively large percentages for Buddhists and Jews are the result of small group size. However, for the larger groups (Christians, Hindus, Muslims, and Sikhs), the percentages are more meaningful, and allow important comparisons. Notably, whilst for all groups the proportion of migrants moving within Birmingham exceeded those moving to or from the city, the proportion of Muslims moving within Birmingham is somewhat larger than that of all other groups. Conversely, the proportion of Muslims migrating to or from Birmingham was appreciably smaller.
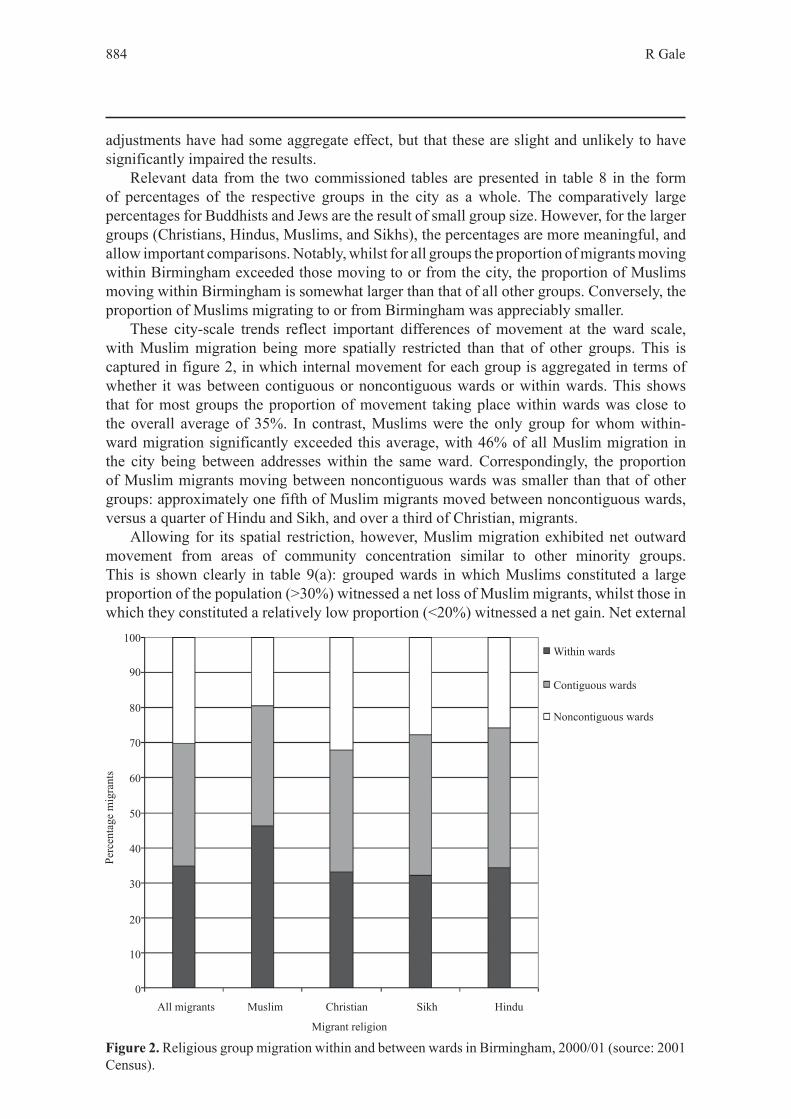
These city-scale trends reflect important differences of movement at the ward scale, with Muslim migration being more spatially restricted than that of other groups. This is captured in figure 2, in which internal movement for each group is aggregated in terms of whether it was between contiguous or noncontiguous wards or within wards. This shows that for most groups the proportion of movement taking place within wards was close to the overall average of 35%. In contrast, Muslims were the only group for whom within-ward migration significantly exceeded this average, with 46% of all Muslim migration in the city being between addresses within the same ward. Correspondingly, the proportion of Muslim migrants moving between noncontiguous wards was smaller than that of other groups: approximately one fifth of Muslim migrants moved between noncontiguous wards, versus a quarter of Hindu and Sikh, and over a third of Christian, migrants.
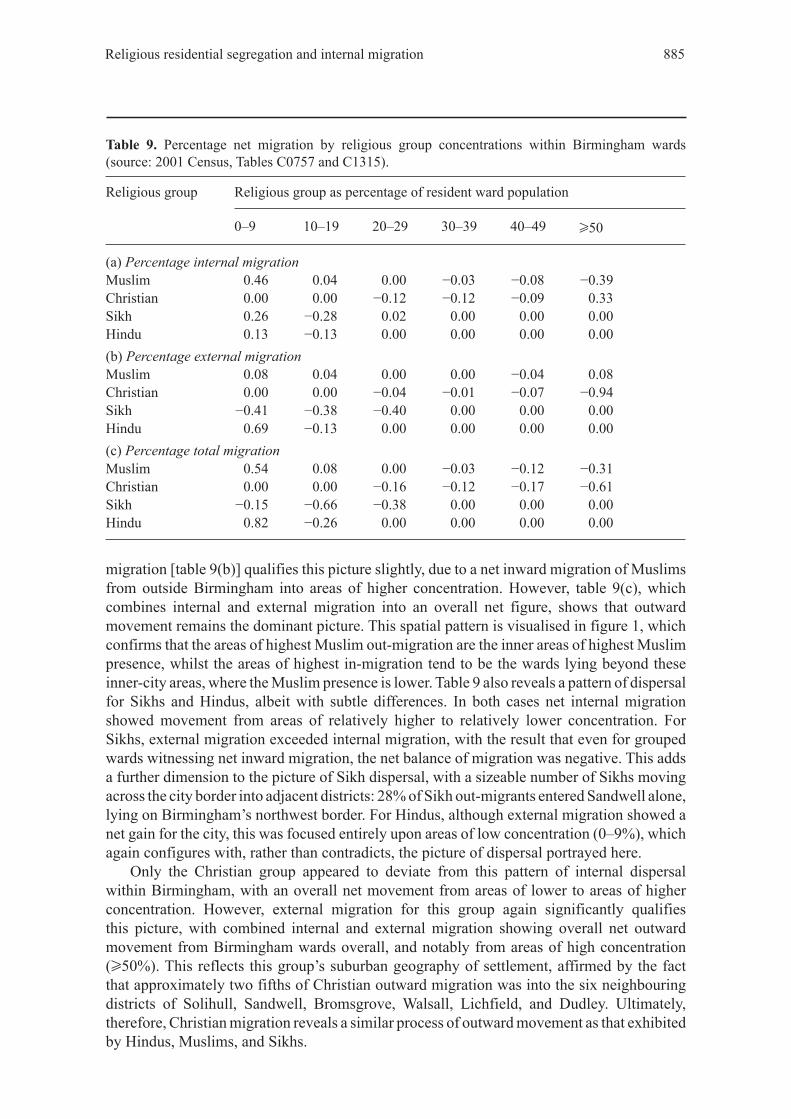
Allowing for its spatial restriction, however, Muslim migration exhibited net outward movement from areas of community concentration similar to other minority groups. This is shown clearly in table 9(a): grouped wards in which Muslims constituted a large proportion of the population (>30%) witnessed a net loss of Muslim migrants, whilst those in which they constituted a relatively low proportion (<20%) witnessed a net gain. Net external
Figure 2. Religious group migration within and between wards in Birmingham, 2000/01 (source: 2001 Census).
100
90
80
70
60
50
40
30
20
10
0
Perc
enta
ge m
igra
nts
All migrants Muslim Christian Sikh Hindu
Migrant religion
Within wards
Contiguous wards
Noncontiguous wards
Religious residential segregation and internal migration 885
migration [table 9(b)] qualifies this picture slightly, due to a net inward migration of Muslims from outside Birmingham into areas of higher concentration. However, table 9(c), which combines internal and external migration into an overall net figure, shows that outward movement remains the dominant picture. This spatial pattern is visualised in figure 1, which confirms that the areas of highest Muslim out-migration are the inner areas of highest Muslim presence, whilst the areas of highest in-migration tend to be the wards lying beyond these inner-city areas, where the Muslim presence is lower. Table 9 also reveals a pattern of dispersal for Sikhs and Hindus, albeit with subtle differences. In both cases net internal migration showed movement from areas of relatively higher to relatively lower concentration. For Sikhs, external migration exceeded internal migration, with the result that even for grouped wards witnessing net inward migration, the net balance of migration was negative. This adds a further dimension to the picture of Sikh dispersal, with a sizeable number of Sikhs moving across the city border into adjacent districts: 28% of Sikh out-migrants entered Sandwell alone, lying on Birmingham’s northwest border. For Hindus, although external migration showed a net gain for the city, this was focused entirely upon areas of low concentration (0–9%), which again configures with, rather than contradicts, the picture of dispersal portrayed here.
Only the Christian group appeared to deviate from this pattern of internal dispersal within Birmingham, with an overall net movement from areas of lower to areas of higher concentration. However, external migration for this group again significantly qualifies this picture, with combined internal and external migration showing overall net outward movement from Birmingham wards overall, and notably from areas of high concentration (H50%). This reflects this group’s suburban geography of settlement, affirmed by the fact that approximately two fifths of Christian outward migration was into the six neighbouring districts of Solihull, Sandwell, Bromsgrove, Walsall, Lichfield, and Dudley. Ultimately, therefore, Christian migration reveals a similar process of outward movement as that exhibited by Hindus, Muslims, and Sikhs.
Table 9. Percentage net migration by religious group concentrations within Birmingham wards (source: 2001 Census, Tables C0757 and C1315).
Religious group Religious group as percentage of resident ward population
0–9 10–19 20–29 30–39 40–49 H50
(a) Percentage internal migrationMuslim 0.46 0.04 0.00 −0.03 −0.08 −0.39Christian 0.00 0.00 −0.12 −0.12 −0.09 0.33Sikh 0.26 −0.28 0.02 0.00 0.00 0.00Hindu 0.13 −0.13 0.00 0.00 0.00 0.00(b) Percentage external migrationMuslim 0.08 0.04 0.00 0.00 −0.04 0.08Christian 0.00 0.00 −0.04 −0.01 −0.07 −0.94Sikh −0.41 −0.38 −0.40 0.00 0.00 0.00Hindu 0.69 −0.13 0.00 0.00 0.00 0.00(c) Percentage total migrationMuslim 0.54 0.08 0.00 −0.03 −0.12 −0.31Christian 0.00 0.00 −0.16 −0.12 −0.17 −0.61Sikh −0.15 −0.66 −0.38 0.00 0.00 0.00Hindu 0.82 −0.26 0.00 0.00 0.00 0.00

886 R Gale
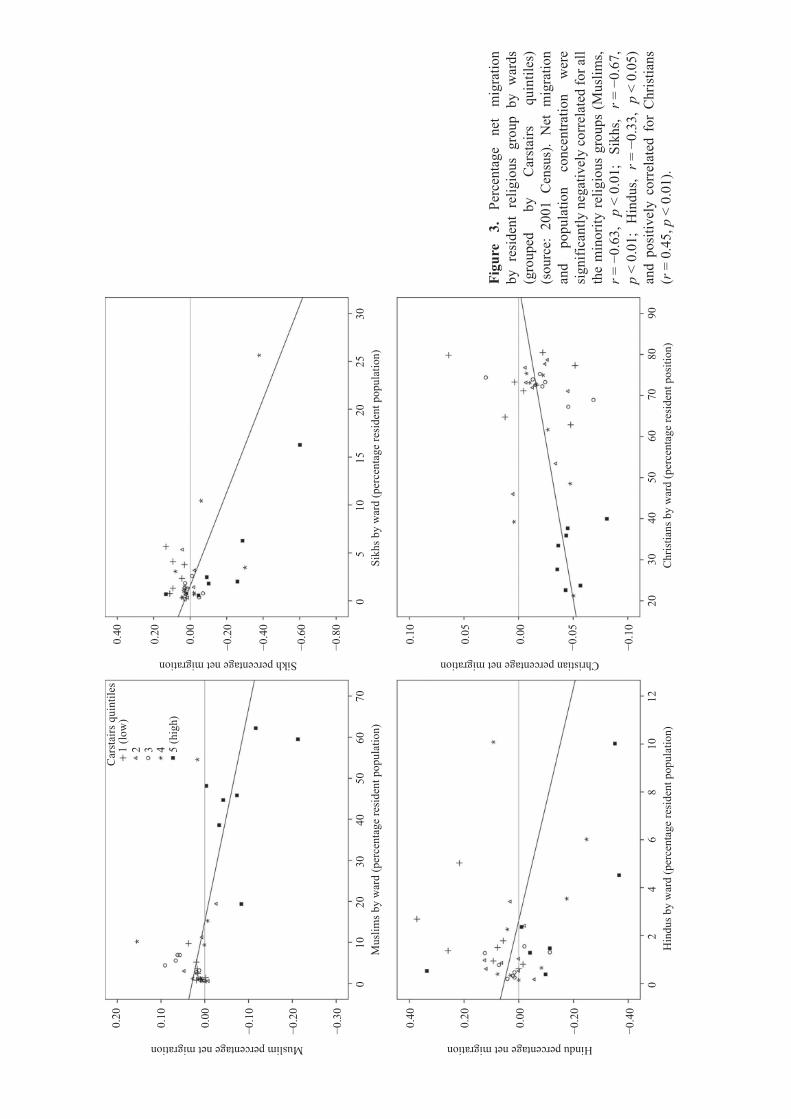
The aggregate patterns for grouped wards set out in table 9 obscure important ward-level details that are more clearly apparent from the plots in figure 3. Combining internal and external migration into an overall ward-level migration variable, these show more clearly the strongly inverse relationships between net migration and population concentration for Muslims and Sikhs, and a similar, though weaker, relationship for Hindus. Here again, the relatively strong positive relationship between net migration and population concentration for Christians is apparent. However, as before, these seemingly different patterns of movement (dispersal in the case of Muslims, Hindus, and Sikhs; and convergence in the case of Christians) are qualified by the different starting points from which migration begins and the overall direction of travel. To capture this further, the values in each plot were grouped into quintiles of ward-level deprivation. In most cases, these plots reveal movement from areas of higher to lower material deprivation, with symbols for higher deprivation quintiles lying below the line through zero, and those for lower quintiles generally lying above. The deviation of the Christian group from this pattern is more apparent than real, since very few wards in Birmingham received net inward migration of this group. Even here, higher rates of outmigration generally correspond to the wards with the highest levels of material deprivation.
Importantly, data on immigration included in 2001 Census Table C0757 provide further confirmation of the main line of argument presented in this paper, concerning how Muslim residential patterns in Birmingham display an overall trend towards dispersal rather than consolidation. On the one hand, table 10 reveals that well over half of Muslim immigrants (56%) gravitated towards areas of higher Muslim concentration (>30%). On the other hand, the table also reveals that over a quarter of Muslim immigrants settled in wards in which Muslims formed less than 10% of the existing population, with a further 17% entering areas where Muslims formed between 10% and 19% of the population. This point is brought home starkly by the fact that Muslim immigrants made up over 3% of the Muslim population in
Table 10. Immigration by religious group and religious-group concentrations within grouped wards (Source: 2001 Census, Table C0757).
Immigration by religion Religious group as percentage of resident ward population
0–9 10–19 20–29 30–39 40–49 H50
MuslimsNumber 581 374 0 143 422 635Percent immigrants 26.96 17.35 0.00 6.64 19.58 29.47Percent ward population 3.17 1.85 0.00 1.40 1.16 1.16
ChristiansNumber 0 0 173 427 299 1953Percent immigrants 0.00 0.00 6.07 14.97 10.48 68.48Percent ward population 0.00 0.00 0.62 1.09 0.92 0.41
SikhsNumber 41 29 13 0 0 0Percent immigrants 49.40 34.94 15.66 0.00 0.00 0.00Percent ward population 0.26 0.48 0.20 0.00 0.00 0.00
HindusNumber 293 34 0 0 0 0Percent immigrants 89.60 10.40 0.00 0.00 0.00 0.00Percent ward population 2.06 0.66 0.00 0.00 0.00 0.00
0.20
0.10
0.00
−0.1
0
−0.2
0
−0.3
0
−0.4
0
−0.2
0
0.00
0.20
0.40
1210
86
42
0
7060
5040
3020
100
05
1015
2025
30
2030
4050
6070
8090
0.40
−0.8
0
−0.6
0
−0.4
0
−0.2
0
0.00
0.20
0.10
0.05
0.00
−0.0
5
−0.1
0
Mus
lims b
y w
ard
(per
cent
age
resi
dent
pop
ulat
ion)
Sikh
s by
war
d (p
erce
ntag
e re
side
nt p
opul
atio
n)
Hin
dus b
y w
ard
(per
cent
age
resi
dent
pop
ulat
ion)
Chr
istia
ns b
y w
ard
(per
cent
age
resi
dent
pos
ition
)
Hindu percentage net migrationMuslim percentage net migration
Christian percentage net migrationSikh percentage net migration
Car
stai
rs q
uint
iles
1 (lo
w)
2 3 4
Figu
re
3.
Perc
enta
ge
net
mig
ratio
n by
res
iden
t re
ligio
us g
roup
by
war
ds
(gro
uped
by
C
arst
airs
qu
intil
es)
(sou
rce:
200
1 C
ensu
s).
Net
mig
ratio
n an
d po
pula
tion
conc
entra
tion
wer
e si
gnifi
cant
ly n
egat
ivel
y co
rrel
ated
for a
ll th
e m
inor
ity r
elig
ious
gro
ups
(Mus
lims,
r = −
0.63
, p
< 0.
01;
Sikh
s, r =
−0.
67,
p <
0.01
; H
indu
s, r =
−0.
33,
p <
0.05
) an
d po
sitiv
ely
corr
elat
ed f
or C
hris
tians
(r
= 0
.45,
p <
0.0
1).
5 (h
igh)

888 R Gale
areas of lower concentration in 2001, as against slightly more than 1% in areas of higher concentration. Although the numbers involved are much smaller, immigration for Sikhs and Hindus reveals a similar pattern of settlement in areas of lower concentration. This contrasts markedly with the Christian group: over two thirds of Christian immigrants gravitated to areas in which Christians formed 50% or more of the local population.
5 ConclusionBirmingham is a key centre of the British Muslim population and is characterised by considerable ethnic and religious diversity. In the past the city served as a fulcrum for innovation in the study of segregation and related theorisations of race and ethnicity. Recently, however, it has been largely absent from academic engagement with segregation issues. In this paper, I have sought to make up for this absence through an analysis of changing ethnic and religious residential patterns at the time of the 1991 and 2001 Censuses, showing that the Pakistani and Bangladeshi groups constituting the majority of the city’s Muslim population exhibited high yet falling segregation levels. Importantly, this decline in segregation occurred in spite of the growth of the Pakistani and Bangladeshi groups, much of which centred upon existing areas of concentration. Exploring these trends further, the paper has provided important evidence on the contribution of population movement to this process of decline. Based on one year of migration data, the evidence shows clearly that there has been a net outward movement of Muslims from areas of high community concentration. Whilst the geographical scope of this movement is more limited for Muslims than for other groups and is relatively more constrained to areas of deprivation, the overall trend of outward movement is again common to all.
These findings have important implications for longstanding segregation debates in the UK, which have taken on a significant religious dimension in recent years. Since the London bombings of 7 July 2005 the notions of segregation and young Muslim radicalisation have become closely interlinked in these debates. Moreover, this linkage has proven remarkably durable, transcending the changeover between the New Labour and Coalition governments in the 2010 General Election, in spite of countervailing evidence that the geography of police investigations into Muslim radicalisation does not correlate with the geography of Muslim settlement (Finney and Simpson, 2009, pages 108–110). More generally, the findings presented in this paper are consistent with the evidence of much recent segregation research, which critiques the popular characterisation of Muslims as living ‘separate lives’.
Finally, this paper has furnished important findings through its explicit focus on religion. Given the heightened attention paid to religion in recent discussion, it is curious to note how little use has hitherto been made of data on religion from the 2001 Census. Indeed, segregation-related research has remained committed to the use of ethnic categories, despite the manifest efforts of segregation researchers to respond to public discussion of religious residential patterns. In part, this reflects the need to make comparisons across time in the absence of a question on religion in the 1991 Census. Here, however, a conscious attempt has been made to alter the terms of reference from ethnicity to religion. This does not privilege religious over ethnic categories per se, but positions the findings so as to mount a direct rather than oblique critical challenge to the politicisation of the categories ‘Muslim’ and ‘Islam’ in recent public debate. By paying closer attention to the value of religious vis-à-vis ethnic categories in this context, one guards against unexamined discursive shifts in how segregation and its presumed consequences are discussed. More generally, the paper acknowledges that religion is a key feature of the relationships forged both within and between ethnic groupings in British and other national contexts, and is likely to become more so in future. The availability of a second round of religion data from the 2011 Census will enhance efforts to keep pace with these changes in the coming years.

Religious residential segregation and internal migration 889
Acknowledgements and dedication. I express sincere thanks to Ceri Peach, Debbie Phillips, and three anonymous referees for their insightful comments on drafts of this paper. The paper is dedicated to the late John Rex, formerly Professor of Sociology at the University of Warwick, whose work on ethnic relations in Birmingham remains a major source of inspiration.
ReferencesArcher L, 2001, “ ‘Muslim brothers, black lads, traditional Asians’: British Muslim young men’s
constructions of race, religion and masculinity” Feminism and Psychology 11 79–105Ballard R, 1994, “Introduction—the emergence of desh pardesh”, in Desh Pardesh: The South Asian
Presence in Britain Ed. R Ballard (Hurst and Company, London) pp 1–34Ballard R, 1998, “Asking ethnic questions: some hows, whys, and wherefores” Patterns of Prejudice
32(2) 15–37Birt J, 2009, “Islamophobia in the construction of British Muslim identity politics”, in Muslims
in Britain: Race, Place and Identities Eds P Hopkins, R Gale (Edinburgh University Press, Edinburgh) pp 210–227
Boal F W, 1999, “From undivided cities to undivided cities: assimilation to ethnic cleansing” Housing Studies 14 585–600
Brah A, 1996 Cartographies of Diaspora: Contesting Identities (Routledge, London)Burgess S, Wilson D, 2005, “Ethnic segregation in England’s schools” Transactions of the Institute
of British Geographers, New Series 30 20–36Cantle T, 2001 Community Cohesion: A Report of the Independent Review Team Home Office, LondonCutler D M, Glaeser E L, Vidgor J L, 1999, “The rise and decline of the American ghetto” Journal of
Political Economy 107 455–506Dahya B, 1974, “The nature of Pakistani ethnicity in industrial cities in Britain”, in Urban Ethnicity
Ed. A Cohen (Tavistock, London) pp 77–118 Denham J, 2001 Building Cohesive Communities: A Report of the Independent Review Team Home
Office, LondonDesai R, 1963 Indian Immigrants in Britain (Oxford Univesity Press, London)Duncan O D, Duncan B, 1955, “A methodological analysis of segregation indexes” American
Sociological Review 20 210–217Dwyer C, 1999, “Veiled meanings: young British Muslim women and the negotiation of differences”
Gender, Place and Culture 6 5–26Dwyer C, 2000, “Negotiating diasporic identities: young British South Asian Muslim women”
Women’s Studies International Forum 23 475–486Dwyer C, Shah B, Sanghera G, 2008, “ ‘From cricket lover to terror suspect’—challenging
representations of British Muslim men” Gender, Place and Culture 15 117–136Finney N, Simpson L, 2008, “Internal migration and ethnic groups: evidence for Britain from the
2001 Census” Population, Space and Place 14 63–83Finney N, Simpson L, 2009 ‘Sleepwalking to Segregation’? Challenging Myths about Race and
Migration (Policy Press, Bristol)Flett H, Henderson J, Brown B, 1979, “The practice of residential dispersal in Birmingham
1969–1975” Journal of Social Policy 8 289–309Gale R, 2004, “The multicultural city and the politics of religious architecture” Built Environment
30 18–32Gale R, 2005, “Representing the city: mosques and the planning process in Birmingham, UK”
Journal of Ethnic and Migration Studies 31 1161–1179Gale R, 2008, “Locating religion in urban planning: beyond ‘race’ and ethnicity?” Planning,
Practice and Research 23 19–39Gale R, Hopkins P, 2009, “Introduction: Muslims in Britain: race, place and the spatiality of
identities”, in Muslims in Britain: Race, Place and Identities Eds P Hopkins, R Gale (Edinburgh University Press, Edinburgh) pp 1–22
Graham D, Waterman S, 2005, “Underenumeration of the Jewish population in the UK 2001 Census” Population, Space and Place 11 2 89–102
Henderson J, Karn V, 1984, “Race, class and the allocation of public housing in Britain” Urban Studies 21 115–128

890 R Gale
Henderson J, Karn V, 1987 Race, Class and State Housing: Inequality and the Allocation of Public Housing in Britain (Gower, Aldershot, Hants)
Hopkins P, 2006, “Youthful Muslim masculinities: gender and generational relations” Transactions of the Institute of British Geographers, New Series 31 337–352
Hopkins P, 2007a, “Global events, national politics, local lives: young Muslim men in Scotland” Environment and Planning A 39 1119–1133
Hopkins P, 2007b, “Young people, masculinities, religion and race: new social geographies” Progress in Human Geography 31 163–177
Hopkins P, Smith S, 2008, “Scaling segregation; racialising fear”, in Fear: Critical Geopolitics and Everyday Life Eds R Pain, S Smith (Ashgate, Aldershot, Hants) pp 103–116
Jacobson J, 1997, “Religion and ethnicity: dual and alternative sources of identity among young British Pakistanis” Ethnic and Racial Studies 20 238–256
Johnston R, Forrest J, Poulsen M, 2002, “Are there ethnic enclaves/ghettos in English cities?” Urban Studies 39 591–618
Johnston R, Poulsen M, Forrest J, 2005, “On the measurement and meaning of residential segregation: a response to Simpson” Urban Studies 42 1221–1227
Joly D, 1995 Britannia’s Crescent: Making a Place for Muslims in British Society (Avebury, Aldershot, Hants)
Jones P N, 1970, “Some aspects of the changing distribution of coloured immigrants in Birmingham, 1961–66” Transactions of the Institute of British Geographers, New Series 50 199–219
Jones P N, 1976, “Colored minorities in Birmingham, England” Annals of the Association of American Geographers 66 89–103
Kalra V, Kapoor N, 2009, “Interrogating segregation, integration and the community cohesion agenda” Journal of Ethnic and Migration Studies 35 1397–1415
Lieberson S, 1981, “An asymmetrical approach to segregation”, in Ethnic Segregation in Cities Eds C Peach, V Robinson, S Smith (Croom Helm, London) pp 61–82
Massey D S, Denton N A, 1988, “The dimensions of residential segregation” Social Forces67 281–315
Modood T, Berthoud R, Lakey J, Nazroo J Y, Smith P, Virdee S, Beishon S, 1997 Ethnic Minorities in Britain: Diversity and Disadvantage (Policy Studies Institute, London)
Mohammad R, 1999, “Marginalisation, Islamism and the production of the ‘other’s’ ‘other’ ” Gender, Place and Culture 6 221–240
Morgan O, Baker A, 2006, “Measuring deprivation in England and Wales using 2001 Carstairs scores” Health Statistics Quarterly, Autumn, 28–33
Nielsen J, 2000, “Muslims in Britain: ethnic minorities, community or Ummah?”, in The South Asian Diaspora in Britain, Canada and the United States Eds H Coward, J R Hinnells, R B Williams (State University of New York Press, Albany, NY) pp 109–125
O’Toole T, Gale R, 2010, “Contemporary grammars of political action among ethnic minority young activists” Ethnic and Racial Studies 33 126–143
Ouseley H, 2001 Community Pride not Prejudice Bradford Race Review, BradfordPeach G C K, 1966, “Factors affecting the distribution of West Indians in Great Britain”
Transactions of the Institute of British Geographers, New Series 38 151–163Peach C, 1975 Urban Social Segregation (Longman, London)Peach C, 1996, “Does Britain have ghettos?” Transactions of the Institute of British Geographers,
New Series 21 216–235Peach C, 2006a, “Islam, ethnicity and South Asian religions in the London 2001 Census”
Transactions of the Institute of British Geography, New Series 31 353–370Peach C, 2006b, “Muslim in the 2001 Census of England and Wales: gender and economic
disadvantage” Ethnic and Racial Studies 29 629–655Peach C, 2009, “Slippery segregation: discovering or manufacturing ghettos?” Journal of Ethnic and
Migration Studies 35 1381–1395Peach C, 2010, “ ‘Ghetto-lite’ or missing the G-Spot? A reply to Johnston, Poulsen and Forrest”
Journal of Ethnic and Migration Studies 36 1519–1526Phillips D, 1998, “Black minority ethnic concentration, segregation and dispersal in Britain” Urban
Studies 35 1681–1702
Religious residential segregation and internal migration 891
Phillips D, 2006, “Parallel lives? Challenging discourses of British Muslim self-segregation” Environment and Planning D: Society and Space 24 25–40
Phillips D, 2007, “Ethnic and racial segregation: a critical perspective” Geography Compass 1 1138–1159
Phillips D, 2010, “Minority ethnic segregation, integration and citizenship: a European perspective” Journal of Ethnic and Migration Studies 36 209–225
Phillips D, Davis C, Ratcliffe P, 2007, “British Asian narratives of urban space” Transactions of the Institute of British Geography, New Series 32 217–234
Phillips T, 2005, “After 7/7: sleepwalking to segregation” speech to the Manchester Council for Community Relations, 22 September, http://www.equalityhumanrights.com
Ratcliffe P, 1981 Racism and Reaction: A Profile of Handsworth (Routledge and Kegan Paul, London)Rees P, Butt F, 2004, “Ethnic change and diversity in England, 1981–2001” Area 36 174–186Rex J, Moore R, 1967 Race, Community and Conflict: A Study of Sparkbrook (Oxford University
Press, Oxford)Rex J, Tomlinson S, 1979 Colonial Immigrants in a British City (Routledge and Kegan Paul, London)Sabater A, 2010, “Ethnic residential segregation change in England and Wales”, in Ethnicity and
Integration: Understanding Population Trends and Processes Volume 3, Eds J Stillwell, … Van Ham (Springer, Dordrecht) pp 47–62
Sabater A, Simpson L, 2009a, “Enhancing the population census: a time series for sub-national areas with age, sex and ethnic group dimensions in England and Wales, 1991–2001” Journal of Ethnic and Migration Studies 35 1461–1477
Sabater A, Simpson L, 2009b, “Population estimates by single year of age, sex and ethnic group for sub-national areas in England and Wales, 1991–2001” , computer file, Office of Population Censuses and Surveys, Office for National Statistics [original data producer(s)]. Colchester, Essex: UK Data Archive [distributor], SN: 6043, http://dx.doi.org/10.5255/UKDA-SN-6043-1
Shaw A, 2001, “Kinship, cultural preference and immigration: consanguineous marriage among British Pakistanis” Journal of the Royal Anthropological Institute 7 315–334
Simpson L, 2004, “Statistics of racial segregation: measures, evidence and policy” Urban Studies 41 661–681
Simpson L, 2005, “On the measurement and meaning of residential segregation: a reply to Johnston, Poulsen and Forrest” Urban Studies 42 1229–1230
Simpson L, 2007a, “Ghettos of the mind: the empirical behaviour of indices of segregation and diversity” Journal of the Royal Statistical Society Series A 170 405–424
Simpson L, 2007b Population Forecasts for Birmingham, with an Ethnic Group Dimension Cathie Marsh Centre for Census and Survey Research, Manchester University, Manchester
Simpson L, Finney N, 2009, “Spatial patterns of internal migration: evidence for ethnic groups in Britain” Population, Space and Place 15 37–56
Stillwell J, 2010, “Ethnic population concentration and net migration in London” Environment and Planning A 42 1439–1456
Stillwell J, Duke-Williams O, 2007, “Understanding the 2001 Census interaction data: the impact of small cell adjustment and problems of comparison with 1991” Journal of the Royal Statistical Society Series A 170 425–445
Stillwell J, Hussain S, 2010, “Exploring the ethnic dimensions of internal migration in Great Britain using migration effectiveness and spatial connectivity” Journal of Ethnic and Migration Studies 36 1381–1403
Woods R I, 1977, “Population turnover, tipping and Markov Chains” Transactions of the Institute of British Geographers, New Series 2 473–489
Woods R I, 1981, “Spatiotemporal models of ethnic segregation and their implications for housing policy” Environment and Planning A 13 1415–1433
Copyright © 2022 FDOKUMEN