Relative importance of service attributes and atmospheric factors
56
Master thesis Course code: MST-80433 Relative importance of service attributes and atmospheric factors - The selection of fast-food restaurants according to different consumer groups Submitted on: 05.12.2018 Submitted by: Justus Funke Supervisor: Dr. Gerben van der Velde Second Supervisor. Dr. Herman Kok
-
Upload
khangminh22 -
Category
Documents
-
view
0 -
download
0
Transcript of Relative importance of service attributes and atmospheric factors
Master thesis
Course code: MST-80433
Relative importance of service attributes and atmospheric factors -
The selection of fast-food restaurants according to different consumer groups
Submitted on: 05.12.2018
Submitted by: Justus Funke
Supervisor: Dr. Gerben van der Velde
Second Supervisor. Dr. Herman Kok
Abstract
I
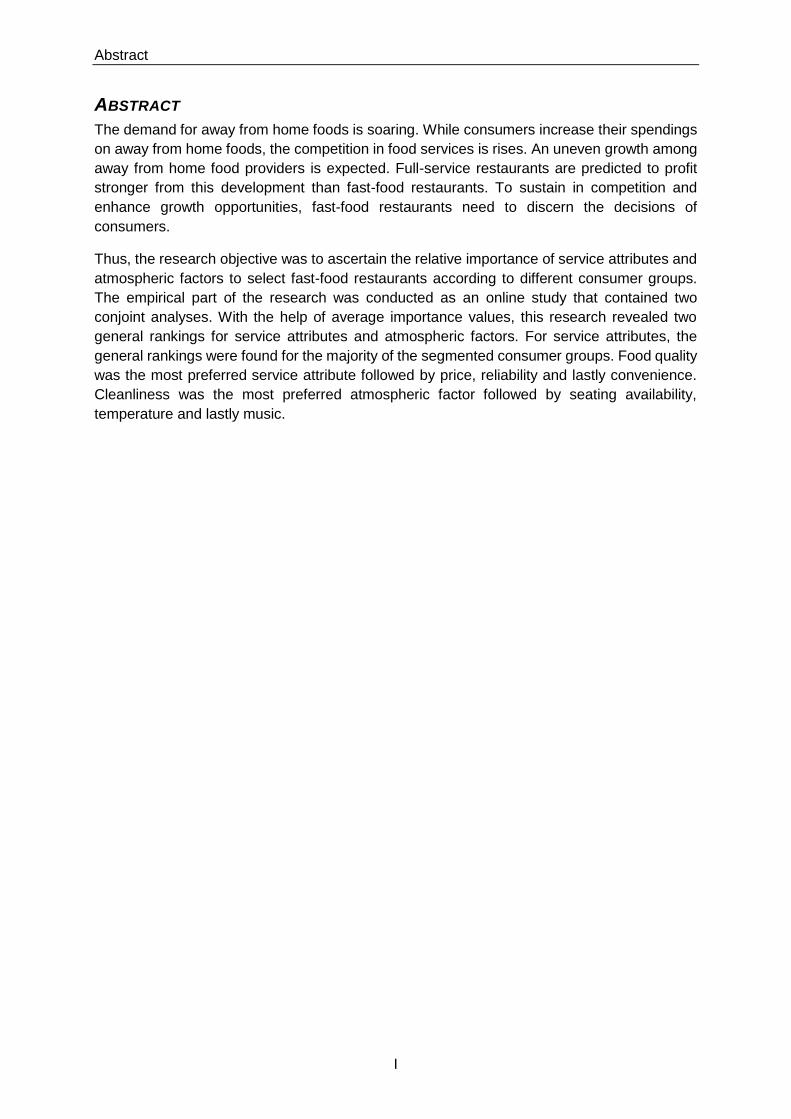
ABSTRACT
The demand for away from home foods is soaring. While consumers increase their spendings
on away from home foods, the competition in food services is rises. An uneven growth among
away from home food providers is expected. Full-service restaurants are predicted to profit
stronger from this development than fast-food restaurants. To sustain in competition and
enhance growth opportunities, fast-food restaurants need to discern the decisions of
consumers.
Thus, the research objective was to ascertain the relative importance of service attributes and
atmospheric factors to select fast-food restaurants according to different consumer groups.
The empirical part of the research was conducted as an online study that contained two
conjoint analyses. With the help of average importance values, this research revealed two
general rankings for service attributes and atmospheric factors. For service attributes, the
general rankings were found for the majority of the segmented consumer groups. Food quality
was the most preferred service attribute followed by price, reliability and lastly convenience.
Cleanliness was the most preferred atmospheric factor followed by seating availability,
temperature and lastly music.
Management summary
II
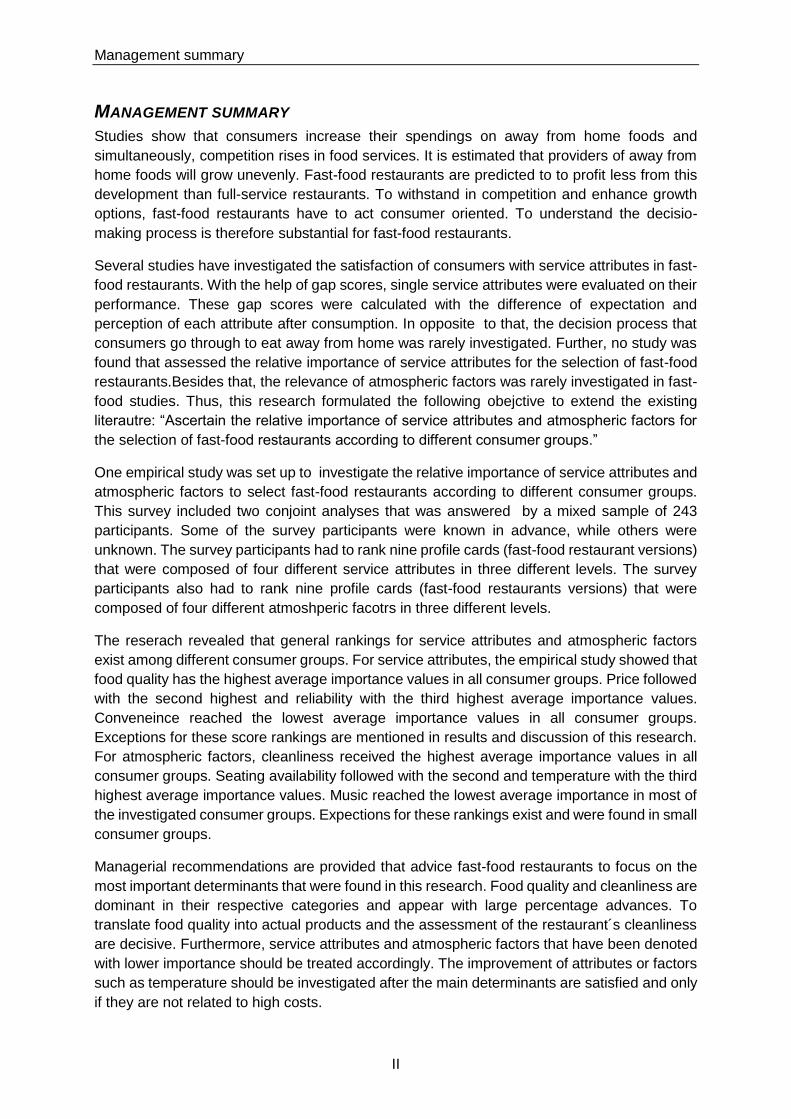
MANAGEMENT SUMMARY
Studies show that consumers increase their spendings on away from home foods and
simultaneously, competition rises in food services. It is estimated that providers of away from
home foods will grow unevenly. Fast-food restaurants are predicted to to profit less from this
development than full-service restaurants. To withstand in competition and enhance growth
options, fast-food restaurants have to act consumer oriented. To understand the decisio-
making process is therefore substantial for fast-food restaurants.
Several studies have investigated the satisfaction of consumers with service attributes in fast-
food restaurants. With the help of gap scores, single service attributes were evaluated on their
performance. These gap scores were calculated with the difference of expectation and
perception of each attribute after consumption. In opposite to that, the decision process that
consumers go through to eat away from home was rarely investigated. Further, no study was
found that assessed the relative importance of service attributes for the selection of fast-food
restaurants.Besides that, the relevance of atmospheric factors was rarely investigated in fast-
food studies. Thus, this research formulated the following obejctive to extend the existing
literautre: “Ascertain the relative importance of service attributes and atmospheric factors for
the selection of fast-food restaurants according to different consumer groups.”
One empirical study was set up to investigate the relative importance of service attributes and
atmospheric factors to select fast-food restaurants according to different consumer groups.
This survey included two conjoint analyses that was answered by a mixed sample of 243
participants. Some of the survey participants were known in advance, while others were
unknown. The survey participants had to rank nine profile cards (fast-food restaurant versions)
that were composed of four different service attributes in three different levels. The survey
participants also had to rank nine profile cards (fast-food restaurants versions) that were
composed of four different atmoshperic facotrs in three different levels.
The reserach revealed that general rankings for service attributes and atmospheric factors
exist among different consumer groups. For service attributes, the empirical study showed that
food quality has the highest average importance values in all consumer groups. Price followed
with the second highest and reliability with the third highest average importance values.
Conveneince reached the lowest average importance values in all consumer groups.
Exceptions for these score rankings are mentioned in results and discussion of this research.
For atmospheric factors, cleanliness received the highest average importance values in all
consumer groups. Seating availability followed with the second and temperature with the third
highest average importance values. Music reached the lowest average importance in most of
the investigated consumer groups. Expections for these rankings exist and were found in small
consumer groups.
Managerial recommendations are provided that advice fast-food restaurants to focus on the
most important determinants that were found in this research. Food quality and cleanliness are
dominant in their respective categories and appear with large percentage advances. To
translate food quality into actual products and the assessment of the restaurant´s cleanliness
are decisive. Furthermore, service attributes and atmospheric factors that have been denoted
with lower importance should be treated accordingly. The improvement of attributes or factors
such as temperature should be investigated after the main determinants are satisfied and only
if they are not related to high costs.
List of tables
III
LIST OF TABLES
Table 1 Relevant service attributes for the research ............................................................ 11 Table 2 Relevant atmospheric factors for the research ........................................................ 15 Table 3 Suitability of measurement tools for the research context ....................................... 16 Table 4 Operationalization table .......................................................................................... 21 Table 5: Atmospheric factors - entire population sample ..................................................... 24 Table 6: Atmospheric factors - female survey participants ................................................... 24 Table 7: Atmospheric factors - male survey participants .................................................... 24 Table 8: Atmospheric factors - primary education ................................................................ 24 Table 9: Atmospheric factors - lower vocational education .................................................. 25 Table 10: Atmospheric factors - secondary vocational education ....................................... 25 Table 11: Atmospheric factors - higher vocational education ............................................... 25 Table 12: Atmopsheric factors - university education .......................................................... 25 Table 13: Atmospheric factors – 18-29 year olds ................................................................. 26 Table 14: Atmospheric factors – 30-39 year olds ................................................................. 26 Table 15: Atmospheric factors – 40-49 year olds ................................................................. 26 Table 16: Atmospheric factors – 50-59 year olds ................................................................. 26 Table 17: Atmospheric factors – 60 years and older ............................................................ 27 Table 18: Atmospheric factors – income below 19.999€ ...................................................... 27 Table 19 : Atmospheric factors – income 20.000€ - 39.999€ ............................................... 27 Table 20: Atmospheric factors – income 40.000€ - 59.999€ ............................................... 27 Table 21: Atmospheric factors – income 60.000€ and above............................................... 28 Table 22 : Atmospheric factors – Less than once a month .................................................. 28 Table 23: Atmospheric factors - Once a month .................................................................... 28 Table 24: Atmospheric factors – Once a week .................................................................... 28 Table 25: Service attributes - the entire population .............................................................. 29 Table 26: Service attributes - female survey participants ..................................................... 29 Table 27: Service attributes – male survey participants ....................................................... 29 Table 28: Service attributes – primary education ................................................................. 29 Table 29: Service attributes - lower vocational education .................................................... 30 Table 30: Service attributes - secondary vocational education ........................................... 30 Table 31: Service attributes - higher vocational education ................................................... 30 Table 32: Service attributes - university education ............................................................... 30 Table 33: Service attributes - 18-29 years of age ................................................................ 31 Table 34: Service attributes – 30-39 years of age ................................................................ 31 Table 35: Service attributes – 40-49 years of age ................................................................ 31 Table 36: Service attributes – 50-59 years of age ................................................................ 31 Table 37: Service attributes - 60 years and older................................................................. 32 Table 38: Service attributes - income below 19.999€ .......................................................... 32 Table 39: Service attributes - income between 20.000€ - 39.999€ ...................................... 32 Table 40: Service attributes - income 40.000€-59.9999€ ..................................................... 32 Table 41: Service attributes - income of 60.0000€ and above ............................................. 33 Table 42: Service attributes - less than once a month ......................................................... 33 Table 43: Service attributes - once a month ........................................................................ 33 Table 44: Service attributes - once a week .......................................................................... 33

List of figures
IV
LIST OF FIGURES
Figure 1 illustrates the research framework ........................................................................... 4 Figure 2: Theoretical framework .......................................................................................... 17

Table of contents
V
TABLE OF CONTENTS
ABSTRACT I
MANAGEMENT SUMMARY II
LIST OF TABLES III
LIST OF FIGURES IV
1. INTRODUCTION 1
1.1 RESEARCH CONTEXT 1
1.2 PROBLEM ANALYSIS 2
1.3 RESEARCH PURPOSE 2
1.4 CONCEPTUAL DESIGN 3
1.4.1 RESEARCH OBJECTIVE 3
1.4.2 RESEARCH QUESTION AND SUB QUESTIONS 3
1.4.3 RESEARCH FRAMEWORK 4
1.4.4 KEY CONCEPTS 5
1.5 RESEARCH DESIGN 6
1.5.1 RESEARCH STRATEGY 6
1.5.2 OUTLINE OF THE REPORT 6
2. THEORY 7
2.1 SERVICE ATTRIBUTES IN FAST-FOOD RESTAURANTS 7
2.1.1 THE IMPORTANCE OF SERVICE QUALITY 7
2.1.2 RELIABILITY 8
2.1.3 FOOD QUALITY 8
2.1.4 PRICE 9
2.1.5 CONVENIENCE 10
2.1.6 CONCLUDING REMARKS FOR SERVICE ATTRIBUTES IN FAST-FOOD RESTAURANTS 11
2.2 ATMOSPHERIC FACTORS IN SERVICE INDUSTRIES 12
2.2.1 THE IMPORTANCE OF ATMOSPHERIC FACTORS IN SERVICE INDUSTRIES 12
2.2.2 LIMITATIONS FOR ATMOSPHERIC FACTORS IN THE RESEARCH CONTEXT 12
2.3 ATMOSPHERIC FACTORS IN FAST-FOOD RESTAURANTS 13
2.3.1 CLEANLINESS 13
2.3.2 TEMPERATURE 13
2.3.3 MUSIC 13
2.3.4 SEATING AVAILABILITY 14
2.3.5 CONCLUDING REMARKS FOR ATMOSPHERIC FACTORS IN FAST-FOOD RESTAURANTS 14
2.4 MEASUREMENT TOOLS TO DETERMINE RELATIVE IMPORTANCE OF SERVICE ATTRIBUTES 15
2.4.1 SERVQUAL-MODEL WITH GAP ANALYSIS 15
2.4.2 CONJOINT ANALYSIS 16
2.4.3 CONCLUDING REMARKS 16
Table of contents
VI
2.5 THEORETICAL FRAMEWORK 17
3 METHODOLOGY 19
3.1 LITERATURE RESEARCH 19
3.2 OPERATIONALIZATION 19
3.2.1 SERVICE ATTRIBUTES 20
3.2.2 ATMOSPHERIC FACTORS 20
3.2.3 DEMOGRAPHIC VARIABLES 20
3.2.4 CONTROL VARIABLES 21
3.3 METHODS OF SAMPLING AND DATA COLLECTION 22
3.4 ANALYSIS OF DATA 23
4 RESULTS 24
4.1 ATMOSPHERIC FACTORS 24
4.2 SERVICE ATTRIBUTES 29
5. DISCUSSION AND CONCLUSION 35
5.1 DISCUSSION 35
5.1.1 CONTRIBUTION TO EXTANT LITERATURE 35
5.1.2 RELIABILITY AND VALIDITY OF THE RESEARCH 35
5.1.3 LIMITATIONS AND FUTURE RESEARCH 36
5.2 CONCLUSION 37
5.2.3 CONCLUSION RESEARCH OBJECTIVE 37
5.2.2 MANAGERIAL RECOMMENDATIONS 38
REFERENCES 39
APPENDIX: 44
Introduction
1
1. INTRODUCTION
1.1 introduces the context and the practical relevance of this research 1.2 analyses the
research problem and shows how the topic of the study is embedded in literature. 1.3 depicts
the conceptual design of this study and explains how the objective of the research is obtained
and mentions the key concepts of the study.
1.1 RESEARCH CONTEXT
To consume food away from home gets more accepted in society (French, Story, Neumark-
Sztainer, Fulkerson & Hannan, 2001). The spending on foods away from home are estimated
to increase in the USA by 8,1 percent from 2000 to 2020. American fast-food restaurants gain
from the popularity of away from home foods as they are estimated to grow by 6 percent from
2000 to 2020. Compared to that, full-service restaurants are projected to grow by 18 percent
in the same period (Blisard, Variyam & Cromartie, 2003). These numbers show that many
consumers rely on fast-food restaurants. However, other food away from home options grow
stronger. A lack of knowledge exists for the decision process that consumers go through when
they select a fast-food restaurant. (Garza, Ding, Owensby and Zizza, 2015). Consequently,
companies want to find out which attributes and factors are decisive for consumers (Azevedo,
Moura & Souki, 2017).
The fast-food industry offers quick, convenient and cheap services for consumers (Sahagun &
Vasquez-Parraga, 2014). Researchers have stated that fast-food restaurants are equipped
with at least two of the following traits: Takeaway opportunity, payment done before food is
received, limited amount or no waiters, quick food service (Block, Scribner & DeSalvo, 2004).
Throughout past decades, the expenditure for meals that are consumed outside from home
have risen. At the same time, the competition among fast-food restaurants has increased and
led to slim profit margins within the fast-food restaurant industry. Consumers impact the food
marketplace because of the decision-making power they own. It is essential for managements
of restaurants to understand consumer choices, to establish a better quality of their services.
Among marketing and management theorists, it is affirmed that high service quality leads to
business success (Zeithaml, Berry & Parasuraman, 1996). Fast-food restaurants try to adjust
themselves to consumer requirements (Min & Min, 2011).
Furthermore, fast-food restaurants cannot limit themselves on providing good services and
products because of the expanding options of foods and food outlets (Edwards, 2013). The
place of product purchase and consumption, especially its atmosphere plays a relevant role
for the decision-making process of consumers (Kotler, 1973) Atmospheric factors can
transform intentions into actual behaviour. For some service industries these atmospheric
factors are more important than for others (Kotler, 1973).
Introduction
2
1.2 PROBLEM ANALYSIS
Previous studies in the fast-food sector focussed on the relationship between service quality
dimensions and satisfaction of visitors. (Caldwell & Hibbert, 2002; Etemad-Sajadi & Rizzuto,
2013; Brady, Robertson & Cronin, 2001; Gilbert, Veloutsou, Goode & Moutinho, 2004; Law,
Hui & Zhao, 2004; Qin & Prybutok, 2008; Namin, 2017).
The service quality dimensions were often taken from the SERVQUAL model and partly added
with attributes which are suitable for fast-food restaurants. The SERVQUAL model
Parasuraman et al. (1988) was established to define service quality and set service quality
dimensions with multiple attributes across a wide range of industries. Five service quality
dimensions can be evaluated by consumers. These are reliability, responsiveness, empathy,
assurance and tangibility. The value of each service quality dimension is assessed by a gap
score (Parasuraman et al., 1988). Studies found that the SERVQUAL scale was not usable
across all service settings with the basic service quality dimensions. Instead, adjustments are
needed to apply the model in specified environments (Carman, 1990).
Survey participants of the abovementioned studies assessed service attributes after
consumption in fast-food restaurants. The design of previous studies led to the evaluation of
single service dimensions. Evaluations between the service attributes were not made. The
relative importance of service attributes for different consumers was not examined. However,
satisfaction scores were used to make a statement about the importance of service attributes
in fast-food restaurants. Survey participants did not rank the different service attributes in an
order. In addition to that, the relevance of atmospheric factors for fast-food restaurant were not
largely investigated before.
1.3 RESEARCH PURPOSE
This research aims to close the research gap that has become apparent after consultation of
literature. It intends to examine the relative importance of service attributes and atmospheric
factors for the selection of fast-food restaurants. For that, survey participants rank fast-food
restaurant versions which are composed of service attributes and atmospheric factors in
different importance levels. The service attributes and atmospheric factors that are used for
this research are selected from extant literature. The research has the purpose to add
information to the existing literature as the research wants to shed light on the initial decision
to select a fast-food restaurant. Furthermore, it intends to provide importance rankings for the
chosen service attributes and atmospheric factor according to different consumer groups.
It is assumed that service attributes which have an influence on consumer satisfaction are
relevant for the initial decision to select fast-food restaurants. Further, it is assumed that some
atmospheric factors from full service restaurant are relevant for the selection of fast-food
restaurants, too.
Introduction
3
1.4 CONCEPTUAL DESIGN
In 1.4, the conceptual design of the research is presented. Section 1.4.1 includes the objective
of this study. In 1.4.2 the main research question and sub- research questions are presented
that will guide this study. In section 1.4.3, the research framework is depicted. 1.4.4 defines
the key concepts of the study.
1.4.1 RESEARCH OBJECTIVE
The research objective is determined “Ascertain the relative importance of service
attributes and atmospheric factors for the selection of fast-food restaurants according
to different consumer groups”.
The methodological base to reach this research objective stems from an empirical study. This
empirical study is built on two conjoint analysis to deliver repetitive and transparent results.
Thus, relative importance of service attributes and atmospheric factors can be determined
quantitatively.
1.4.2 RESEARCH QUESTION AND SUB QUESTIONS
This section states the main and sub-questions of this research, which are formulated to
logically derive the objective of this study.
1.4.2.1 Main research question:
What importance do consumers denote to different service attributes and atmospheric
factors for the selection of fast-food restaurants?
1.4.2.2 Sub research questions:
1. How can service attributes of fast food restaurants be conceptualized and
measured?
2. How can atmospheric factors of fast-food restaurants be conceptualized and
measured?
3. What are the perceived importance of the service attributes of fast food restaurants
according to different consumer groups?
4. What are the perceived importance of the atmospheric factors of fast-food
restaurants according to different consumer groups
Research sub questions one and two are answered with the findings from the literature study.
The third and fourth research sub-question are directly connected to the results of the empirical
part of the study. The main research question can be answered after the analysis of the
empirical results and delivers insights to complete the research objective.
Introduction
4
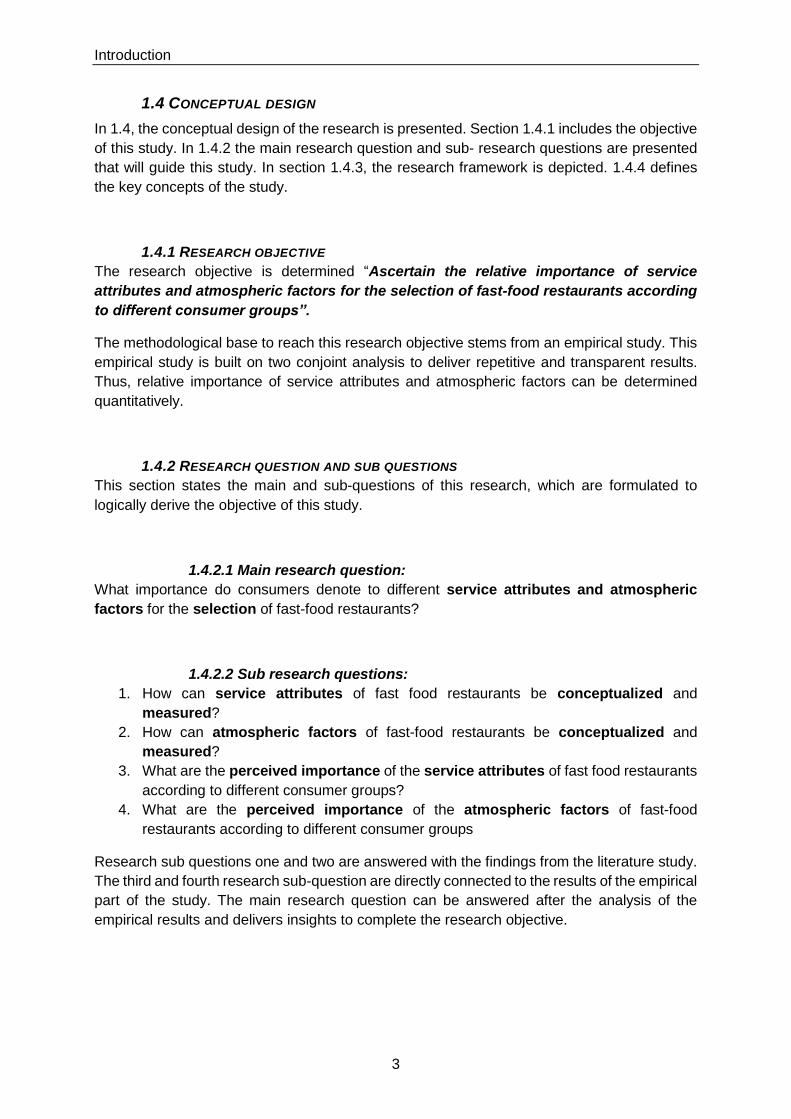
1.4.3 RESEARCH FRAMEWORK
Figure 1 illustrates the research framework
Introduction
5
(1) Literature study
At the beginning, a literature study is conducted to identify significant service attributes and
atmospheric factors in fast-food restaurants. Further, a literature study on suitable
measurement techniques for the empirical study to determine relative importance is performed.
(2) Empirical study of the research
Then, the empirical study takes place that is equipped with selected service attributes and
atmospheric factors from the literature study. Survey participants have the task to select their
preferred fast-food restaurant versions.
(3) Results section
This section describes the empirical results of this research. The relative importance of service
attributes and atmospheric factors for the selection of fast-food restaurants according to
different consumer groups are identified.
(4) Analysis of the results
The analysis builds the final stage of this research. In comparison to the results section, this
stage discusses the empirical results and generates conclusions. Besides that, managerial
recommendations for fast-food restaurants are provided.
1.4.4 KEY CONCEPTS
Service attributes: The terminology service attributes is used as a substitute for the word
service quality dimensions from the SERVQUAL model (Parasuraman et al., 1988). The word
service attributes reveal concepts that are important in the fast-food environment.
Atmospheric factors: The terminology atmospheric factors reveal important concepts of the
physical surrounding that influence consumers´ purchase behaviour. Kotler´s work (1973), was
investigated to generate a theoretical basis for the relevance of the physical surrounding in
fast-food restaurants.
Selection of fast-food restaurants: This research intends to investigate the relative
importance of service attributes and atmospheric factors for the selection of fast-food
restaurants. Alternatives to consumption at fast-food restaurants are eating at home or other
restaurants. Therefore, the selection of a fast-food restaurant describes a decision that occurs
prior to the actual purchase.
Introduction
6
1.5 RESEARCH DESIGN
The section research design describes how research activities are carried out to reach the
objective of the underlying research. It also provides the course of the conducted research.
1.5.1 reveals the research strategy and 1.5.2 uncovers the outline of this report.
1.5.1 RESEARCH STRATEGY
In this research, primary and secondary data are used. Desk research is conducted to gather
insights for the theoretical part. It also provides a base for the empirical part of this research.
The desk research offers extensive data to gain knowledge about relevant service attributes
and atmospheric factors in fast-food restaurants. This knowledge about service attributes and
atmospheric provides input for the empirical study of this research. Secondly, the most suitable
measurement tool is determined to define the relative importance of service attributes and
atmospheric factors. With the desk research, research sub question one and two are
answered.
The empirical study gathers primary data for the underlying research. The relative importance
of service attributes and atmospheric factors which were selected from literature study are
determined. Analysis and conclusions of the empirical results enable this research to answer
sub research questions three and four as well as the main research question. These answers
from the analysis part contribute to the main objective of this research.
1.5.2 OUTLINE OF THE REPORT
This part explains the structure of the research conducted. The first chapter provided the
context, problem analysis and purpose of this research.
The second chapter presents literature study insights for service attributes, atmospheric and
suitable measurement techniques for this research. It consists of service attributes that were
relevant in previous studies for satisfaction in fast-food restaurants. Additionally, atmospheric
factors are mentioned, which were relevant for purchase behaviour in restaurant
environments. Besides that, the selection of a measurement technique for this research is
explained. Thus, the second chapter provides the theoretical base for the research. The third
chapter presents the methodology that is used in this research and clarifies the procedure how
the empirical study collects data. In the fourth chapter, the collected results of this research
are presented and described. In the fifth and last chapter, the empirical results are discussed
and concluded. In addition, managerial recommendations that are taken from the empirical
results are provide

Theory
7
2. THEORY
The following chapter provides literature insights that conceptualize service attributes and
atmospheric factors in fast-food restaurants and shows how the relative importance of these
determinants can be measured. 2.1 introduces service quality in service industries and
mentions relevant service attributes for this research. 2.2 introduces atmospheric factors in
service industries and 2.3 mentions atmospheric factors that are relevant for this research. 2.4
reveals the suitable technique to measure the relative importance of service attributes and
atmospheric factors for the selection of fast-food restaurants. 2.5 shows the theoretical
framework
2.1 SERVICE ATTRIBUTES IN FAST-FOOD RESTAURANTS
The section 2.1.1. underlines the importance of service quality. Further, service attributes
which are considered as relevant in fast-food restaurants after literature study are presented.
In 2.1.2 the relevance of the service attribute reliability is underlined. 2.1.3 shows the
importance of food quality as service attribute for the research context. 2.1.4 emphasizes
reasons to include the service attribute price into the study. 2.1.5 shows the relevance of the
service attribute convenience for the selection of fast-food restaurants. 2.1.6 closes the section
with concluding remarks.
2.1.1 THE IMPORTANCE OF SERVICE QUALITY
Multiple scholars have investigated the importance of service quality in service industries and
point out the benefits for ventures. In business environments with increased market
competition, service quality showed the capability to differentiate one venture from competitors
(Parasuraman, Zeithaml & Berry et al., 1998). Besides that, the impact of service quality on
performance indicators of companies was investigated. The respective outcomes showed that
service quality is relevant for the financial success of companies (Zeithaml, 2000). Research
also found, that the improvement of service quality often leads to behaviour patterns, that are
desirable for the businesses (Zeithaml, Berry & Parasuraman, 1996). Therefore, to understand
the choices and desired level of service quality of consumers was stated to be important for
service providers in different service industries (Parasuraman et al., 1988). The consumers
perceive differences between the service quality of competing ventures and make purchase
decisions according to these perceptions (Berry, Parasuraman & Zeithaml, 1988).
For fast-food restaurants, the increased demand for away from home foods offer growth
opportunities. (French et al., 2001). However, intensive competition exists because of an
expanding number of food outlets (Edwards, 2013). It is therefore assumed that service quality
is very important for fast-food restaurants. The relevant service attributes are introduced in the
following abstracts.
Theory
8
2.1.2 RELIABILITY
In the following abstract, studies are reviewed that point out the relevance of reliability for fast-
food restaurant consumers. Reliability was stated to be a relevant variable by many studies for
return intention and/or satisfaction of consumers in fast-food restaurants. The literature study
provides results of previous studies and underlines the relevance of this service attribute.
According to Parasuraman et al. (1988), reliability describes the ability to deliver services in an
accurate and independent and independent manner. Cao & Kim (2015) reviewed the perceived
service quality of consumers in licensed and franchised fast-food restaurants in the US. Their
population sample showed high levels of importance for the service dimension reliability across
different age and income groups (Cao & Kim, 2015). Tat, Sook-Min, Ai-Chin, Rasli & Hamid
(2011) examined the key dimensions that influence satisfaction of fast-food consumers in
Malaysia. The population sample consisted of undergraduate students and tested the five
basic dimensions of the SERVQUAL model. Reliability turned out to have an effect on
satisfaction (Tat et al., 2011). Etemad-Sajadi & Rizzuto (2013) compared the perception and
satisfaction of consumers in China and Switzerland with service attributes in fast-food
restaurants. The study underlined that reliability is substantial to fast-food consumers for
consumers of both countries. Markovic, Raspor, Jankovic & Dorcic (2011) empirically explored
the key service attributes in different city restaurants. According to the study, consumers
choose their place of food consumption with help of multiple service attributes. The results of
the study show that reliability is important to consumers (Markovic et al., 2011).
The results of the abovementioned studies show that reliability is a key variable in fast-food
restaurants. Consumers emphasize the significance of accurate and independent service
performance to be satisfied. Consequently, this study will include reliability as a service
attribute that is tested on the relative importance for the selection of fast-food restaurants.
2.1.3 FOOD QUALITY
In the following abstract, studies are reviewed that point out the relevance of food quality in
fast-food restaurant. Food quality was stated to be decisive for return intention and/or
satisfaction of consumers. The literature study provides results of previous studies and
underlines the relevance of this service attribute.
In literature, no coherent definition for the term food quality in fast-food restaurants was found.
Grunert (2005) states that food quality depends on the individual preference and the type of
food that is served. Anyhow, safety, appeal and dietary acceptability can be stated as general
traits of food quality that are assessed by every individual (Sulek & Hensley, 2004). Food safety
cannot always be recognized by consumers but, undercooking, unusual taste or foreign
materials can be sensed. Food appeal aims at the traits which fall into the consumers eye by
looking at the product. Presentation of the product, taste, the dish temperature, portion size
and colours belong to food appeal. Dietary acceptability describes the content of different
ingredients such as fat and carbohydrates and specific product characteristics such as vegan
or vegetarian (Sulek & Hensley, 2004).
American college students identified food quality to be one of the most important variables for
the assessment of fast-food restaurants. These students would select respective restaurants
of their environment more often if the food quality was improved (Lee & Ulgado, 1997). Law et
al. (2004), investigated the influence of different factors on satisfaction of consumers and
repurchase frequency in fast-food restaurants. The study exposed, that food quality
Theory
9
significantly satisfies consumers in fast-food restaurants and also influences the repurchase
intentions. Goyal & Singh (2007), measured the perception of fast-food in India according to
young Indian consumers. Outcomes of the study showed that the survey participant perceived
the food at home has a substantially better quality than the food that is served at fast-food
restaurants. The study concludes that acceptance of food quality is crucial factor for the growth
of fast-food restaurants (Goyal & Singh, 2007).
Qin & Prybutok (2009) explored that food quality counts to the most important factors for
satisfaction of consumers in fast-food restaurants. In this study, satisfaction and behavioural
intentions of consumers in Chinese fast-food restaurants was investigated. Min & Min (2011)
assessed the service quality of American fast-food ventures of fast food restaurants in the US.
The study showed that taste of food, which counts to food quality, is an important variable for
consumers. Tan, Oriade & Fallon (2014) investigated the perception of service quality
according to consumers in Chinese fast-food restaurants. The findings of the study revealed
that food quality has an impact on the satisfaction of consumers. According to Namin (2017),
food quality was perceived as relevant for consumers to revisit fast-food restaurants. The
research investigated consumers of fast-food restaurants in major US cities and came to the
result that the improvement of food quality can lead to higher satisfaction of consumers
(Namin, 2017).
Numerous studies exist that show relevance of food quality on consumer satisfaction in fast-
food restaurants. Therefore, food quality is used as a service attribute in this research and is
tested on its relative importance for the selection of fast-food restaurants.
2.1.4 PRICE
The following section shows literature insights that emphasize the relevance of the service
attribute price in fast-food restaurants. Differing results in research call for clarification
regarding the relevance of price in fast-food restaurants. Consumers of convenience products
are less price sensitivity in comparison to non-convenience consumers (Swoboda & Morschett,
2001). This indicates that convenience consumers are inclined to pay more for their product
choices (Brunner, van der Horst & Siegrist, 2010). However, numerous studies that were
conducted for prices in the fast-food industry came to different results.
According to Brown (1990), the price sensitivity of fast-food restaurant consumers is higher
than the price sensitivity of regular restaurant consumers. Reasons for that are the large
number of substitution opportunities when it comes to fast-food restaurants in comparison to
regular restaurants. Further, consumers feel that fast-food products can be substituted with
grocery products. Therefore, fast-food restaurants need to decrease their product prices to sell
more units (Brown, 1990). Law et al. (2004) tested different attributes on their influence on
repurchase frequency and consumer satisfaction. The study came to the result that price has
a significant influence on the repurchase behaviour and satisfaction of survey participants. The
study concludes that managers need to offer low prices to increase the number of consumers
(Law et al., 2004). Goyal & Singh (2007) tested different factors on their influence of fast-food
restaurant choice in India. The tested sample showed that pricing plays an important role when
consumers decide between eating at a fast-food restaurant or staying at home (Goyal & Singh,
2007). Jekanowski, Binkley & Eales (2001) analysed determinants that lead to growth of the
fast-food sector. The study revealed that price influences the demand for fast-food. Further,
the price sensitivity for fast-food increased over time and might cause a growing number of

Theory
10
convenience products which can easily be prepared at home (Jekanowski et al., 2001).
Etemad-Sajadi & Rizzuto (2013) examined the antecedents in the fast-food sector which lead
to consumer satisfaction and loyalty. For this study, two population samples were used to
compare between consumers from China and Switzerland. Consumers of both countries
perceived price as relevant attribute that can influence the satisfaction in the fast-food
environment.
The abovementioned results from the literature study highlight the impact that the service
attribute price could have on the selection of fast-food restaurants. Thus, the underlying study
includes price as service attribute to clarify the relative importance for the selection of fast-food
products.
2.1.5 CONVENIENCE
In the following abstract, studies are reviewed that point out the relevance of convenience for
fast-food restaurant consumers. Convenience was stated to be an important variable by many
studies for return intention and/or satisfaction of consumers in fast-food restaurants. The
literature study provides results of previous studies and underlines the relevance of this service
attribute.
Shepherd & Raats (2006) defined convenience to be related with the actual time and physical
involvement of acquiring, preparing, consuming and cleaning up after food consumption.
Multiple studies have defined convenience for the food context. These studies point out the
outsourced preparation process. The meal preparation does not take place at home because
food producer and distributor take care of the process. The concept does not only entail time
and energy saving but also the shift of culinary skills (Richardson, Pearson & Capps, 1985).
Another factor of convenience that turned out to be very important for fast-food restaurants is
accessibility. The total number of fast-food restaurant is correlated with the amount of products
sold. Companies of the fast-food industry have therefore aim to increase the availability in
various locations (Jekanowski et al., 2001).
Convenience belongs to recent trends in the food sector and experiences a constant increase
in demand. For that reason, researchers are interested on the impact that convenience has on
the food choices of consumers (Botonaki & Mattas, 2010). Glanz, Basil, Maibach, Goldberg &
Snyder (1998) investigated the dietary choices of Americans. Convenience turned out to be a
key determinant for consumers to eat at fast-food restaurants (Glanz et al., 1998). Similarly,
Jekanowski et al, (2001) found that convenience is the driving force for fast-food demand. The
study claims that even if inexpensive restaurants offered meals with higher food quality for the
same prices as fast-food restaurants do, it would not greatly influence the fast-food sales
(Jekanowski et al., 2001). American consumers indicated that convenience is a key driver for
them regarding decisions to eat away from home (Stewart, Blisard & Jolliffe, 2006). The study
found that consumers who emphasize the relevance of convenience are likely to purchase
more often at fast-food restaurants. Convenience also increases the general willingness of
consumers to eat out (Stewart et al., 2006). Rydell et al. (2008) found that a majority of frequent
fast-food restaurant users strongly emphasize the importance of the quick and easy
characteristics. Additionally, a significant number of survey participants claimed that they do
not like the preparation process of meals at home (Rydell et al., 2008).
Theory
11
Several studies underline the impact that convenience has on fast-food restaurant consumers.
Further, research shows that convenience influences the decision to eat at fast-food
restaurants. The results make it inevitable to add convenience as service attribute to this study.
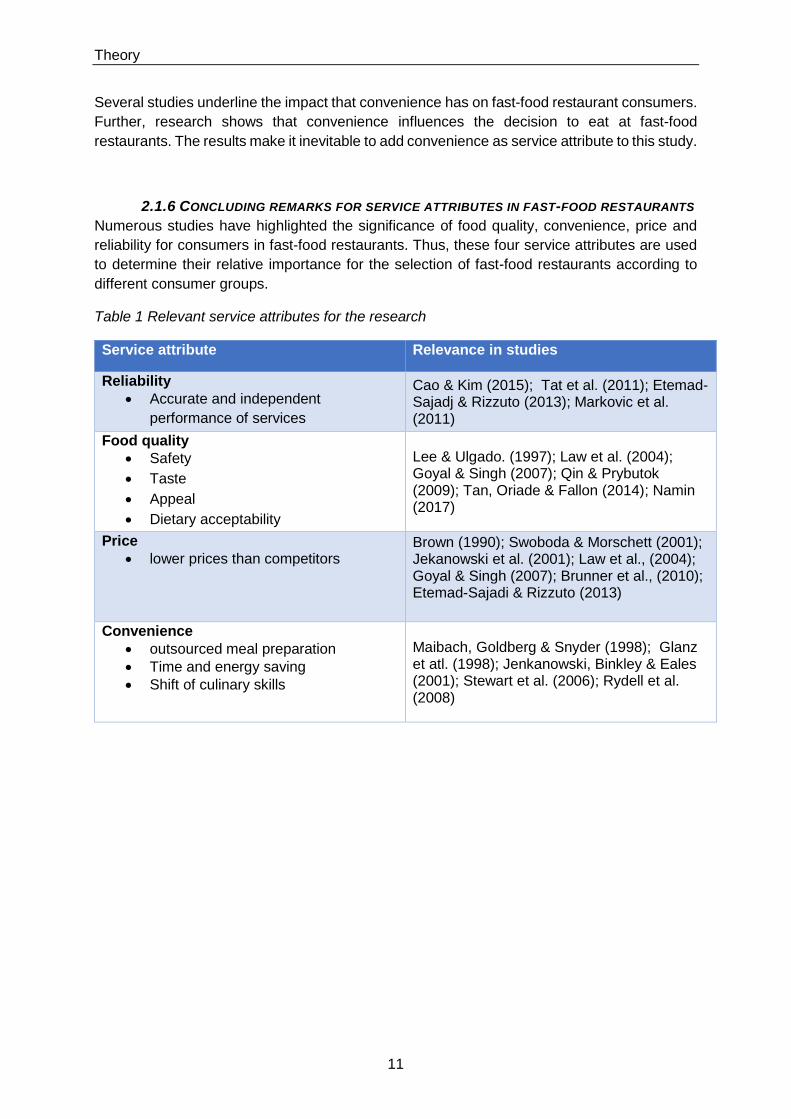
2.1.6 CONCLUDING REMARKS FOR SERVICE ATTRIBUTES IN FAST-FOOD RESTAURANTS
Numerous studies have highlighted the significance of food quality, convenience, price and
reliability for consumers in fast-food restaurants. Thus, these four service attributes are used
to determine their relative importance for the selection of fast-food restaurants according to
different consumer groups.
Table 1 Relevant service attributes for the research
Service attribute
Relevance in studies
Reliability
• Accurate and independent
performance of services
Cao & Kim (2015); Tat et al. (2011); Etemad-Sajadj & Rizzuto (2013); Markovic et al. (2011)
Food quality
• Safety
• Taste
• Appeal
• Dietary acceptability
Lee & Ulgado. (1997); Law et al. (2004); Goyal & Singh (2007); Qin & Prybutok (2009); Tan, Oriade & Fallon (2014); Namin (2017)
Price
• lower prices than competitors
Brown (1990); Swoboda & Morschett (2001); Jekanowski et al. (2001); Law et al., (2004); Goyal & Singh (2007); Brunner et al., (2010); Etemad-Sajadi & Rizzuto (2013)
Convenience
• outsourced meal preparation
• Time and energy saving
• Shift of culinary skills
Maibach, Goldberg & Snyder (1998); Glanz et atl. (1998); Jenkanowski, Binkley & Eales (2001); Stewart et al. (2006); Rydell et al. (2008)
Theory
12
2.2 ATMOSPHERIC FACTORS IN SERVICE INDUSTRIES
This section investigates the relevance of atmospheric factors in service industries. 2.2.1
reviews the influence of atmospheric factors for purchase behaviour in service industries
according to Kotler (1973). Concepts that include psychographic and social factors are not
considered to limit the scope of this research. 2.2.2 examines previous studies that tested
atmospheric cues in the restaurant environment to select relevant factors for this study.
2.2.1 THE IMPORTANCE OF ATMOSPHERIC FACTORS IN SERVICE INDUSTRIES
Kotler (1973) first stated that when consumers make the decisions between different retail
stores, they more is considered than products and services which are offered. The place of
product purchase is highlighted as a significant part of the total product. In some industries,
the atmosphere of the place can take a more dominant role for the purchase intention of
consumers than the actual product. Companies of service industries aim to create a pleasant
shopping atmosphere for their consumers (Kotler, 1973). The venture´s environment could be
essential for purchase behaviour of consumers. Companies need to consider the demands
that the targeted consumer is seeking and find the critical atmospheric cues that lead to
spending. (Kotler, 1973).
Kotler (1973) stated three propositions that explain in which environment atmospheres are key
factors for business success. First off, places that offer the opportunity to buy and consume in
one physical entity. Secondly, atmospherics are relevant when the total amount of competing
outlets increases. The consumers give more value to atmospheric factors once they have the
choice to go to different places to purchase a particular product. Thirdly, the relevance of
atmospherics rises in industries in which competitors only differ slightly with their products and
prices. Buyers then require advantages that differentiates one retailer from the other. Lastly,
the relevance of atmospherics rises when particular social classes are targeted.
2.2.2 LIMITATIONS FOR ATMOSPHERIC FACTORS IN THE RESEARCH CONTEXT
The abovementioned theoretical concept was introduced for retail stores of different service
industries (Kotler, 1973). No theory was found that conceptualizes atmospheric factors in fast-
food restaurants. Consequently, atmospheric factors need to be determined for the
assessment in the underlying research via literature study. To limit the scope, the influence of
the external environment of a fast-food restaurant is not considered to be relevant for the eating
space. Further, human variables that fall under social interaction with other guests and
psychographics are neglected. Andaleeb & Conway (2006) stated, that a fast food consumer
expects the staff members to process the orders quickly and reliable. The consumer does not
expect special interaction with the staff members (Andaleeb & Conway, 2006).
To derive relevant atmospheric factors for fast-food restaurants, extant literature is
investigated. The challenge for this investigation is constituted by the fact, that no study was
found that focused on atmospheric factors in fast-food restaurants. However, studies were
found that included single atmospheric factors and examined their importance in the fast-food
environment. Besides that, studies in other restaurant types were taken as indicator to derive
critical atmospheric determinants
Theory
13
2.3 ATMOSPHERIC FACTORS IN FAST-FOOD RESTAURANTS
The literature study showed cleanliness, temperature, music and seating availability to be
relevant in the research context. 2.3.1 reveals literature insight for cleanliness, 2.3.2 for
temperature, 2.3.3 for music and 2.3.4 for seating availability
2.3.1 CLEANLINESS
In the following abstract, studies are reviewed that point out the relevance of the atmospheric
factor cleanliness in fast-food restaurant.
Pettijohn, Pettijohn & Luke (1997) found that consumers value multiple factors as relevant for
their satisfaction in fast-food restaurants. Cleanliness was among the three most important
determinants in this study. Min & Min (2011) assessed the service quality of American fast-
food ventures. The researchers found out, that cleanliness is the second most important factor
for satisfaction in fast-food restaurants (Min & Min, 2011). Tan et al. (2014) investigated the
relevant determinants in Chinese fast-food restaurants for the satisfaction of consumers. The
results show that cleanliness in fast-food restaurants is a relevant contributor to satisfaction.
Cao & Kim (2015) reviewed the perceived service quality of American consumers in licensed
and franchised fast-food restaurants. The results revealed that after taste of food, cleanliness
is the largest contributor to satisfaction of fast-food restaurant consumers. The findings of the
abovementioned studies show the relevance of cleanliness in fast-food restaurants. Thus,
cleanliness is added to this research as relevant atmospheric factor.
2.3.2 TEMPERATURE
In the following abstract, studies are reviewed that point out the relevance of the atmospheric
factor temperature in restaurants.
Heung & Gu (2012) assessed the effect of atmospheric factors on satisfaction and actions of
restaurant visitors. The empirical study uncovered that temperature as atmospheric factor is
relevant for the satisfaction of restaurant visitors (Heung & Gu, 2012). Han & Ryu (2009)
investigated the influence of the place of purchase on satisfaction and return intention of
restaurant consumers. The study revealed that ambience factors such as temperature are
relevant for satisfaction in restaurants (Han & Ryu, 2009). Ryu & Jang (2007) investigated the
influence of environmental factors on the consumer behaviour in upscale restaurant. The
results show that temperature as an ambient factor is relevant to increase the perceived
restaurant quality (Ryu & Jang, 2007) . The findings of the abovementioned studies show the
relevance of temperature in restaurants. Thus, temperature is added to this research as
relevant atmospheric factor
2.3.3 MUSIC
In the following abstract, studies are reviewed that point out the relevance of the atmospheric
factor temperature in fast-food restaurants.
The type of music that was played in the background lead to different results in research.
(Warnsink & Van Ittersum, 2012) investigated environmental for the satisfaction of consumers
in fast-food restaurants. The results show that music contributes to satisfaction of consumers
during a fast-food restaurant visit. Stroebele & de Castro (2006) investigated the influence of
ambience on the food choices of consumers in eating places. The study found that
Theory
14
background music increases the food consumption during a restaurant visit. Further,
background music belongs to relevant ambience factors in restaurants (Stroebele & de Castro,
2006). Milliman (1986) assessed the influence that background music takes on the restaurant
consumer. The results show that background music can lead to an extended restaurant stay
(Milliman, 1986). Besides that Caldwell & Hibbert (2002) investigated the effect that musical
preference has on the behaviour of the restaurant consumer. It was shown that the preferred
music can lead to an increased stay at restaurants (Caldwell & Hibbert, 2002). The findings
of the abovementioned studies show the relevance of music in restaurants. Thus, music is
added as added to this research as relevant atmospheric factor.
2.3.4 SEATING AVAILABILITY
In the following abstract, studies are reviewed that point out the relevance of the atmospheric
factor seating availability in fast-food restaurants.
Seating availability belongs to the physical surrounding of the purchasing environment and
showed major influence on consumers in the fast-food sector. Kara, Kaynak & Kucukemiroglu
(1995) found out that the seating capacity influences the fast-food restaurant choice of
Canadians. Canadian fast-food consumers that were older than 60 years indicated seating
capacity as their most important factor for the selection of fast-food restaurant (Kara et al.
1995). Goyal and Singh (2007), measured the perception of fast-food restaurants in India
according to young Indian consumers. The outcomes revealed that seating availability affects
the choice of fast-food restaurants (Goyal and Singh, 2007). Law et al. (2004), investigated
the influence of different factors on satisfaction and repurchase frequency of consumers in
fast-food restaurants. The study highlighted that seating availability in fast-food restaurant has
a significant influence for return behaviour of consumers.
The findings of the abovementioned studies show the relevance of seating availability in fast-
food restaurants. Thus, seating availability is added as added to this research as relevant
atmospheric factor.
2.3.5 CONCLUDING REMARKS FOR ATMOSPHERIC FACTORS IN FAST-FOOD
RESTAURANTS
Numerous studies have highlighted the significance of cleanliness, temperature, music and
seating availability for consumers in fast-food restaurants. Thus, these four service
atmospheric factors are used to determine their relative importance for the selection of fast-
food restaurants according to various consumer groups.
Theory
15
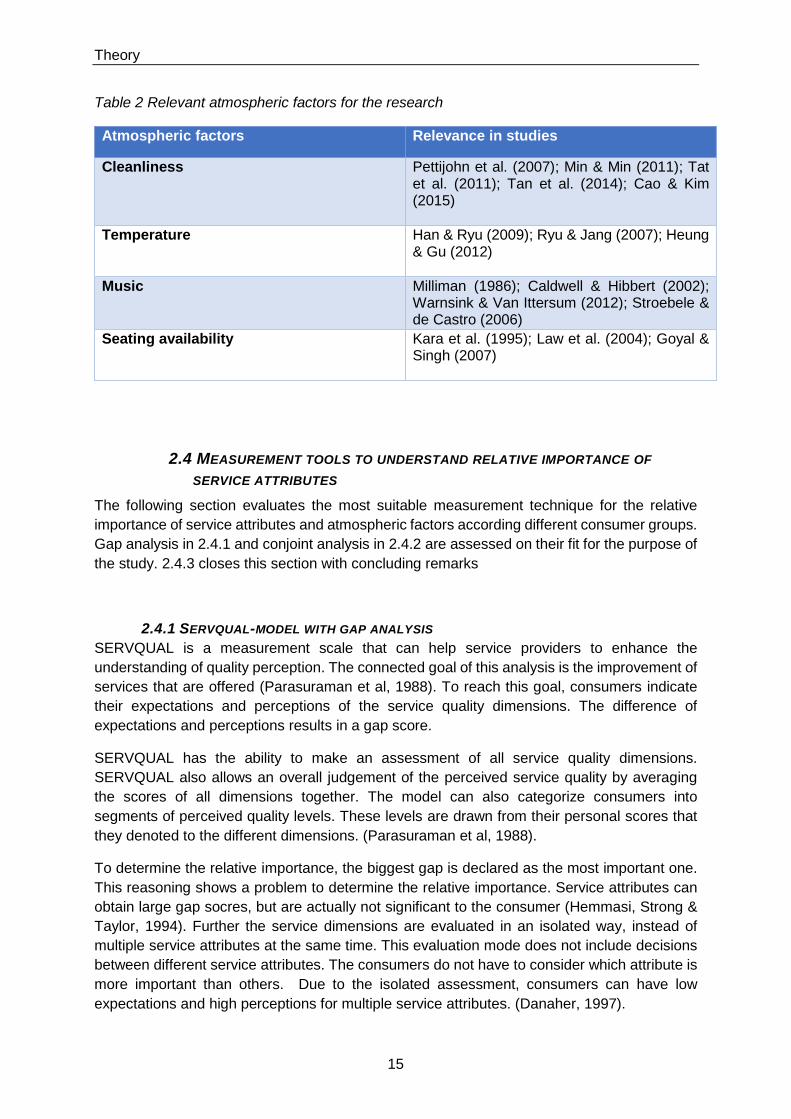
Table 2 Relevant atmospheric factors for the research
Atmospheric factors
Relevance in studies
Cleanliness
Pettijohn et al. (2007); Min & Min (2011); Tat et al. (2011); Tan et al. (2014); Cao & Kim (2015)
Temperature
Han & Ryu (2009); Ryu & Jang (2007); Heung & Gu (2012)
Music
Milliman (1986); Caldwell & Hibbert (2002); Warnsink & Van Ittersum (2012); Stroebele & de Castro (2006)
Seating availability
Kara et al. (1995); Law et al. (2004); Goyal & Singh (2007)
2.4 MEASUREMENT TOOLS TO UNDERSTAND RELATIVE IMPORTANCE OF
SERVICE ATTRIBUTES
The following section evaluates the most suitable measurement technique for the relative
importance of service attributes and atmospheric factors according different consumer groups.
Gap analysis in 2.4.1 and conjoint analysis in 2.4.2 are assessed on their fit for the purpose of
the study. 2.4.3 closes this section with concluding remarks
2.4.1 SERVQUAL-MODEL WITH GAP ANALYSIS
SERVQUAL is a measurement scale that can help service providers to enhance the
understanding of quality perception. The connected goal of this analysis is the improvement of
services that are offered (Parasuraman et al, 1988). To reach this goal, consumers indicate
their expectations and perceptions of the service quality dimensions. The difference of
expectations and perceptions results in a gap score.
SERVQUAL has the ability to make an assessment of all service quality dimensions.
SERVQUAL also allows an overall judgement of the perceived service quality by averaging
the scores of all dimensions together. The model can also categorize consumers into
segments of perceived quality levels. These levels are drawn from their personal scores that
they denoted to the different dimensions. (Parasuraman et al, 1988).
To determine the relative importance, the biggest gap is declared as the most important one.
This reasoning shows a problem to determine the relative importance. Service attributes can
obtain large gap socres, but are actually not significant to the consumer (Hemmasi, Strong &
Taylor, 1994). Further the service dimensions are evaluated in an isolated way, instead of
multiple service attributes at the same time. This evaluation mode does not include decisions
between different service attributes. The consumers do not have to consider which attribute is
more important than others. Due to the isolated assessment, consumers can have low
expectations and high perceptions for multiple service attributes. (Danaher, 1997).

Theory
16
2.4.2 CONJOINT ANALYSIS
The conjoint analysis enables the evaluation of multiple service attributes by survey
participants at the same time. Trade-offs and preference considerations between different
attributes have to be made by the survey participant. Thus, the relative importance can be
calculated for each service attribute (Danaher, 1997)
Further, the conjoint analysis with orthogonal design avoids correlation between different
attributes. Thus, the conjoint analysis is suited for the preference measurement of consumers
for products that exist with different attribute levels. The relative importance can be calculated
for each service attribute. Further, part-worth functions can be measured for the individual
level. Researchers that use conjoint analysis can therefore find preference differences among
survey participants (Green & Krieger, 1991). The conjoint analysis can be applied in various
contexts. In the private sector, conjoint analysis can be carried out to simulate consumer
choices. The measurement tool can determine which share of consumer would make their
choice between hypothetical service scenarios. Conjoint analysis can be used to define the
best new product or service version through the comparison of scenarios or attributes. Another
application possibility of conjoint analysis is market segmentation. Heterogeneous population
groups can be divided into more homogenous ones. Tailored marketing strategies for the new
established consumer groups can result (Green & Sirinivasan, 1978).
2.4.3 CONCLUDING REMARKS
Table 3 Suitability of measurement tools for the research context
GAP Analysis: Example SERVQUAL Conjoint analysis
• Evaluation of single service scenarios/ No trade-offs
• Evaluation of service scenario before and after consumption
• Largest gap is interpreted as most
important: Wrong conclusions can follow.
• Evaluation of multiple service scenarios/ Trade-offs included.
• Assessment of service scenarios not connected to consumption
• Decisions between service scenarios lead to reliable average importance scores
As table 3 indicates, the conjoint analysis is more suitable for the context of the study. The
SERVQUAL model with gap analysis offers room for wrong interpretations of the empirical
results. Large gaps between expectation and actual satisfaction do not necessarily reflect the
importance of an attribute or factor (Danaher, 1997).
In contrast to that, the conjoint analysis lets the survey participant decide between multiple
scenarios. Trade-offs and preference indications have to be made. Therefore, the conjoint
analysis is taken as measurement tool to assess service attributes based on the relative
importance to select fast-food restaurants. Consequently, a survey was set up in which survey
participant had to select their preferences between different profile cards. These profile cards
were generated by SPSS as conjoint analysis with orthogonal design.
Theory
17
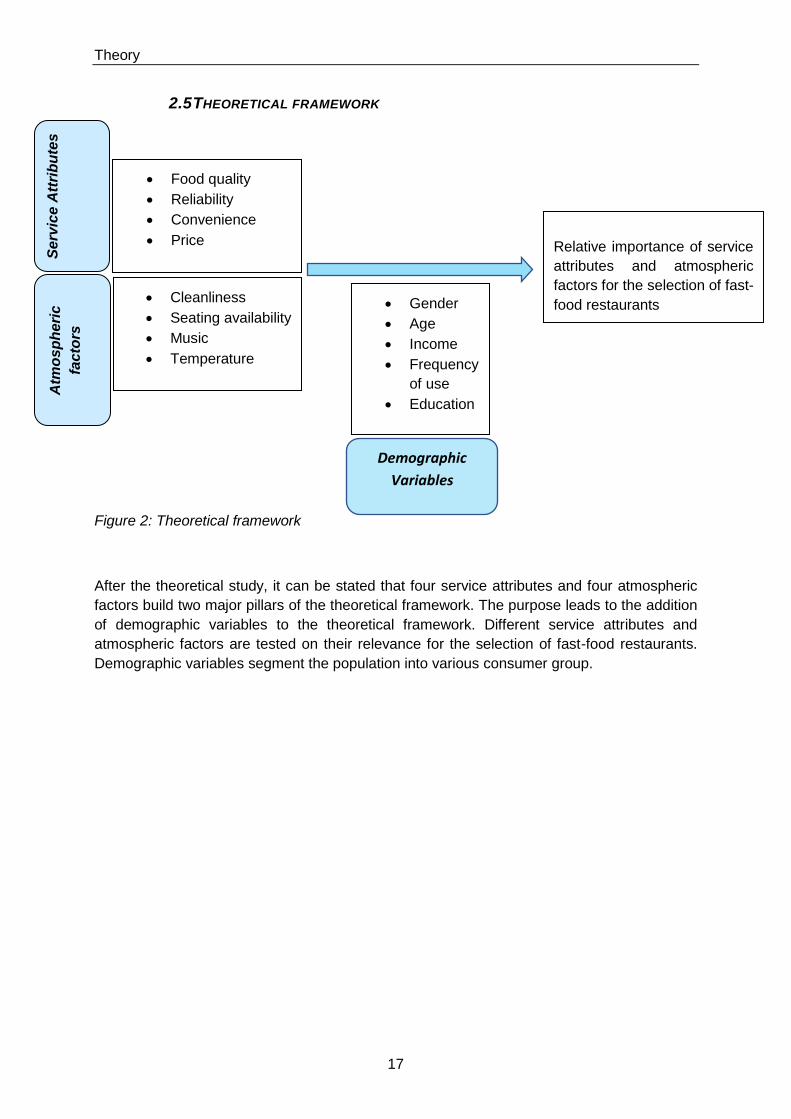
2.5 THEORETICAL FRAMEWORK
Figure 2: Theoretical framework
After the theoretical study, it can be stated that four service attributes and four atmospheric
factors build two major pillars of the theoretical framework. The purpose leads to the addition
of demographic variables to the theoretical framework. Different service attributes and
atmospheric factors are tested on their relevance for the selection of fast-food restaurants.
Demographic variables segment the population into various consumer group.
Relative importance of service
attributes and atmospheric
factors for the selection of fast-
food restaurants
• Food quality
• Reliability
• Convenience
• Price
• Cleanliness
• Seating availability
• Music
• Temperature
• Gender
• Age
• Income
• Frequency
of use
• Education
Se
rvic
e A
ttri
bu
tes
Atm
os
ph
eri
c
facto
rs
Demographic
Variables

Methodology
19
3 METHODOLOGY
In this section the methods are presented which are used to generate results for the following
research objective: ”Ascertain the relative importance of service attributes and
atmospheric factors for the selection of fast-food restaurants according to different
consumer groups”.
The chapter is introduced with insights into the literature research in section 3.1. The
operationalization of the items from the theoretical model to obtain data follows in 3.2. Further,
the chapter delivers information about the used sample for the data generation. The procedure
to get to the established research design and type of survey are depicted in 3.3. The chapter
closes with the analytical methods that are explained in section 3.4.
3.1 LITERATURE RESEARCH
The literature research is conducted with standard search engines such as Elsevier database,
Web of Science, Science direct, research gate and the WUR-library, using and/or Boolean
logic. At first, focused questions are set up. Key search terms are consumers of fast food
restaurants, service qualities or service attributes. Synonyms will be used for the key search
terms to get access to studies that examine service attributes in the fast food industry. The
Boolean operator AND/OR are taken to narrow down results of search questions or find a
larger number of search results. To locate evidence, articles that mostly stem from academic
journals are used for the specific topic of the study. To ensure the quality of evidence,
systematic reviews are preferred over case studies to obtain information for the theoretical
questions.
To increase the efficiency of the literature selection, the abstract of the scientific articles are
scanned. Then, the statistical results lead to the decision whether this article will be
investigated in more detail. For the statistical part significant F-, t- and p- values for the
relationship between service attributes, atmospheric factors and the dependent variables are
relevant for the underlying research.
3.2 OPERATIONALIZATION
In this section, determinants from the theoretical model are operationalized. 3.2.1 and 3.2.2
operationalizes service attributes and atmospheric factors. For that, research sub-question
one and two are considered. 3.2.3 shows which demographic variables that appear in the
empirical study and 3.2.4 explains the control variable that was implemented in the empirical
study.
Table 1 and Table 2 show the relevant service attributes and atmospheric factors. These
service attributes and atmospheric factors are extracted from the table for the empirical study
of this research. Table 3 shows the suitable technique to measure the relative importance of
the chosen factors and attributes. Table 4 is developed from the relevant determinants and the
suitable measurement technique and is used as operationalization table.
Methodology
20
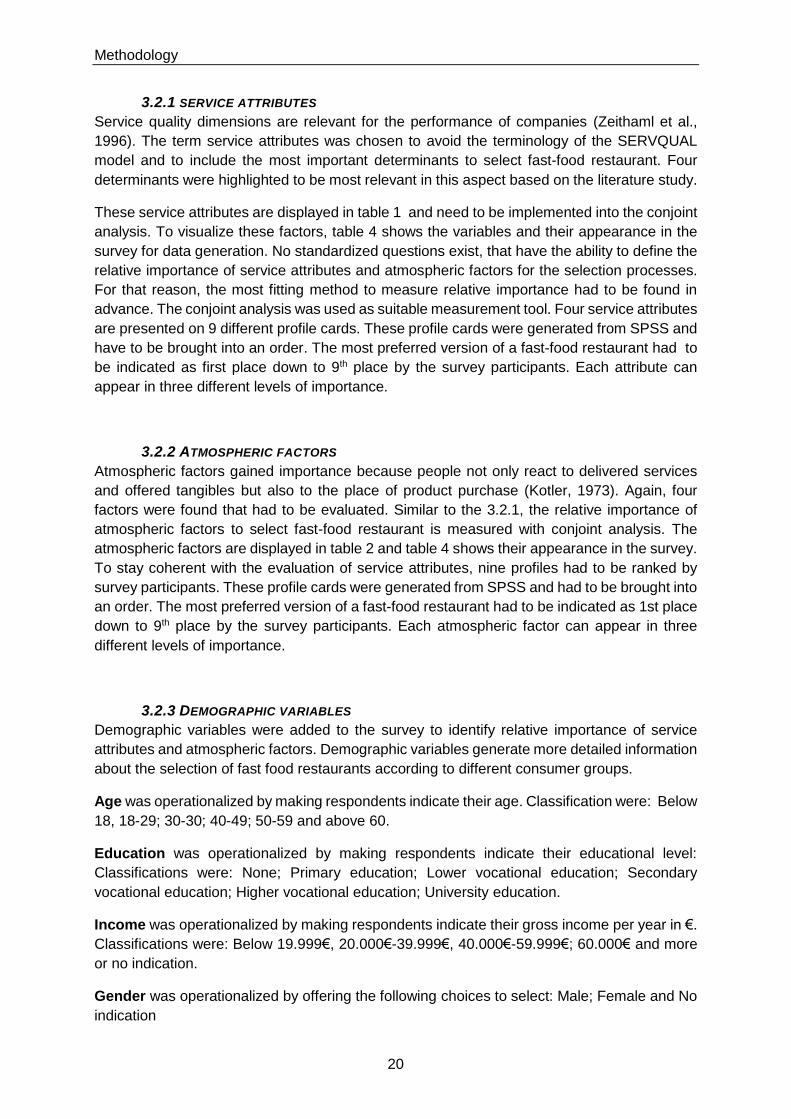
3.2.1 SERVICE ATTRIBUTES
Service quality dimensions are relevant for the performance of companies (Zeithaml et al.,
1996). The term service attributes was chosen to avoid the terminology of the SERVQUAL
model and to include the most important determinants to select fast-food restaurant. Four
determinants were highlighted to be most relevant in this aspect based on the literature study.
These service attributes are displayed in table 1 and need to be implemented into the conjoint
analysis. To visualize these factors, table 4 shows the variables and their appearance in the
survey for data generation. No standardized questions exist, that have the ability to define the
relative importance of service attributes and atmospheric factors for the selection processes.
For that reason, the most fitting method to measure relative importance had to be found in
advance. The conjoint analysis was used as suitable measurement tool. Four service attributes
are presented on 9 different profile cards. These profile cards were generated from SPSS and
have to be brought into an order. The most preferred version of a fast-food restaurant had to
be indicated as first place down to 9th place by the survey participants. Each attribute can
appear in three different levels of importance.
3.2.2 ATMOSPHERIC FACTORS
Atmospheric factors gained importance because people not only react to delivered services
and offered tangibles but also to the place of product purchase (Kotler, 1973). Again, four
factors were found that had to be evaluated. Similar to the 3.2.1, the relative importance of
atmospheric factors to select fast-food restaurant is measured with conjoint analysis. The
atmospheric factors are displayed in table 2 and table 4 shows their appearance in the survey.
To stay coherent with the evaluation of service attributes, nine profiles had to be ranked by
survey participants. These profile cards were generated from SPSS and had to be brought into
an order. The most preferred version of a fast-food restaurant had to be indicated as 1st place
down to 9th place by the survey participants. Each atmospheric factor can appear in three
different levels of importance.
3.2.3 DEMOGRAPHIC VARIABLES
Demographic variables were added to the survey to identify relative importance of service
attributes and atmospheric factors. Demographic variables generate more detailed information
about the selection of fast food restaurants according to different consumer groups.
Age was operationalized by making respondents indicate their age. Classification were: Below
18, 18-29; 30-30; 40-49; 50-59 and above 60.
Education was operationalized by making respondents indicate their educational level:
Classifications were: None; Primary education; Lower vocational education; Secondary
vocational education; Higher vocational education; University education.
Income was operationalized by making respondents indicate their gross income per year in €.
Classifications were: Below 19.999€, 20.000€-39.999€, 40.000€-59.999€; 60.000€ and more
or no indication.
Gender was operationalized by offering the following choices to select: Male; Female and No
indication
Methodology
21
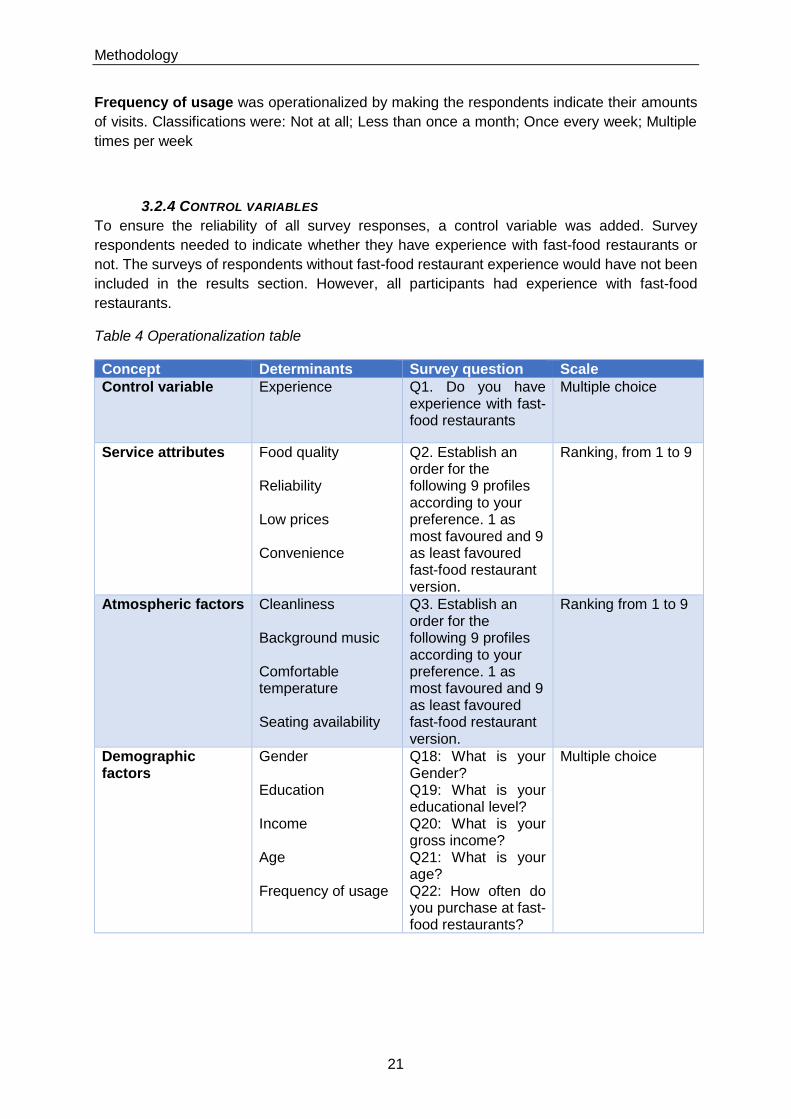
Frequency of usage was operationalized by making the respondents indicate their amounts
of visits. Classifications were: Not at all; Less than once a month; Once every week; Multiple
times per week
3.2.4 CONTROL VARIABLES
To ensure the reliability of all survey responses, a control variable was added. Survey
respondents needed to indicate whether they have experience with fast-food restaurants or
not. The surveys of respondents without fast-food restaurant experience would have not been
included in the results section. However, all participants had experience with fast-food
restaurants.
Table 4 Operationalization table
Concept Determinants Survey question Scale
Control variable Experience
Q1. Do you have experience with fast-food restaurants
Multiple choice
Service attributes Food quality Reliability Low prices Convenience
Q2. Establish an order for the following 9 profiles according to your preference. 1 as most favoured and 9 as least favoured fast-food restaurant version.
Ranking, from 1 to 9
Atmospheric factors Cleanliness Background music Comfortable temperature Seating availability
Q3. Establish an order for the following 9 profiles according to your preference. 1 as most favoured and 9 as least favoured fast-food restaurant version.
Ranking from 1 to 9
Demographic factors
Gender Education Income Age Frequency of usage
Q18: What is your Gender? Q19: What is your educational level? Q20: What is your gross income? Q21: What is your age? Q22: How often do you purchase at fast-food restaurants?
Multiple choice

Methodology
22
3.3 METHODS OF SAMPLING AND DATA COLLECTION
This section describes the methods that were taken to get data from the targeted respondents
to find answers for the main research question. The design of this research and the methods
of sampling are outlined. The necessary data was not available before and could not be
collected with available secondary sources. For that reason, primary sources were used to
gather data for this research. One online survey was distributed via social media and email.
The advantage of finding survey respondents via social media is found in the low costs.
Further, a large number of respondents from different backgrounds can be targeted. However,
the use of social media incurs the shortcoming of a low response motivation of potential survey
participants. As a reaction to this disadvantage, the targeted sample was directly contacted
per message and formatively asked to take a few minutes of their time to help with this
research. Besides that, one reminder was sent out to increase the response rate among the
targeted population sample. To ensure correct answers, timers and click counters were
implemented for the conjoint tasks. Since all respondents were known in advance or
participated because of snowball effects, the data stems from a convenience sample. The
responses were collected without additional costs. The data gathering process ended with 243
respondents that completed the distributed survey. Incomplete answers were recorded and
deleted later.
The survey was composed with the supposition that respondents only answer if questions are
directly clear to them. According to (Krosnick, 1999) it is substantial that surveys have a low
difficulty level for the underlying tasks. The used language should be understandable for
everyone to avoid frustration among survey participants (Krosnick 1999). For that reason, it
was particularly aimed at short and easy understandable sentences within the survey. Further,
it was important that the survey could be carried out in a way that respondents are not
overwhelmed with information and do not spend more than 10 minutes on it. The survey was
established in German and English to ease the completion process.
Two conjoint analyses with orthogonal design were conducted to investigate the relative
importance of service attributes and atmospheric for the selection of fast-food restaurants. The
conjoint analysis can structure preferences of consumers according to their evaluations of
different sets of attributes (Green & Srinivasan, 1990). Further, it is the most frequently applied
research tool when consumer trade-offs are analysed (Green, Krieger & Wind, 2001).
Service attributes and atmospheric factors are called factors in both conjoint analyses and can
appear in three different levels on nine different profiles for each conjoint analysis. Namely,
the levels are “not important”, “mediocrely important” and “very important”. The profiles depict
different service and atmosphere scenarios of fast-food restaurants. The mentioned levels
indicate the importance of different service attributes and atmospheric factors in different
scenarios (fast-food restaurant versions). The survey participant then states his preferences
for the different factors and levels of factors through the ranking of the profiles (service and
atmospheric scenarios of fast-food restaurants).
The orthogonal design is used to minimize the number of combinations for the survey
participant. Four attributes with three levels each would lead to 81 profiles in the full profile
method which is impossible to rank twice in one survey. Therefore, the orthogonal design
generated 18 profile cards in total, nine for service attributes and nine for atmospheric factors.
To ensure reliable survey results and avoid an information overload of the participants, it is
important to keep the number of choices in a conjoint analysis low. When preferences are
examined, this restriction is especially important (Green & Srinivasan, 1990).

Methodology
23
At the beginning of the conjoint analysis, an introduction is presented to the participant that
explains the following study. Separate introductions are assembled for the ranking tasks of
service attributes and atmospheric factors. Survey participants also have to rank all profiles
before they can proceed with the survey. Options such as only rank partly or “don´t know” were
not included. The danger exist that respondents click “don´t know” to increase the speed of
the process instead of delivering valid information (Krosnick, Presser, Fealing, Ruggles &
Vannette, 2015).
The survey was pre-tested twice before starting the actual data collection to identify problems
that would lead to increased rates of incomplete responses and faulty data. Especially the time
frame and complexity for potential respondents was investigated throughout the pre-tests. In
the last week of July 2018, the survey was distributed to the targeted population sample via
social media.
3.4 ANALYSIS OF DATA
This part of the methods section reveals how the gathered responses are analysed. After the
collection of data through the use of a conjoint analysis with orthogonal design, checks for
consistency and completeness were carried out. The analyzation page of the survey tool
Qualtrics was used to check the answers of each respondent. All incomplete surveys were
deleted. Then, SPSS served as analyzation tool for the processed data to find out how the
fast-food restaurant versions were ranked by the population sample. SPSS produced outputs
for the average importance scores of atmospheric factors and service attributes for the
selection of fast-food restaurants according to the survey participants. The goal was to
generate rankings for the independent variables, in our case service attribute and atmospheric
factor that is rated by fast-food consumers. The average importance score of service attributes
and atmospheric factors is calculated with the utility estimates. Following formula is used: The
difference of utility maximum and utility minimum of a factor is divided by the difference of utility
maximum and minimum of all factors (Bellmann, 2007). The demographic analysis divides the
participants into different groups. Gender, age, income and education lead to consumer groups
that can be tested on differences regarding relative importance of service attributes and
atmospheric factors to select fast-food restaurants.
Results
24
4 RESULTS
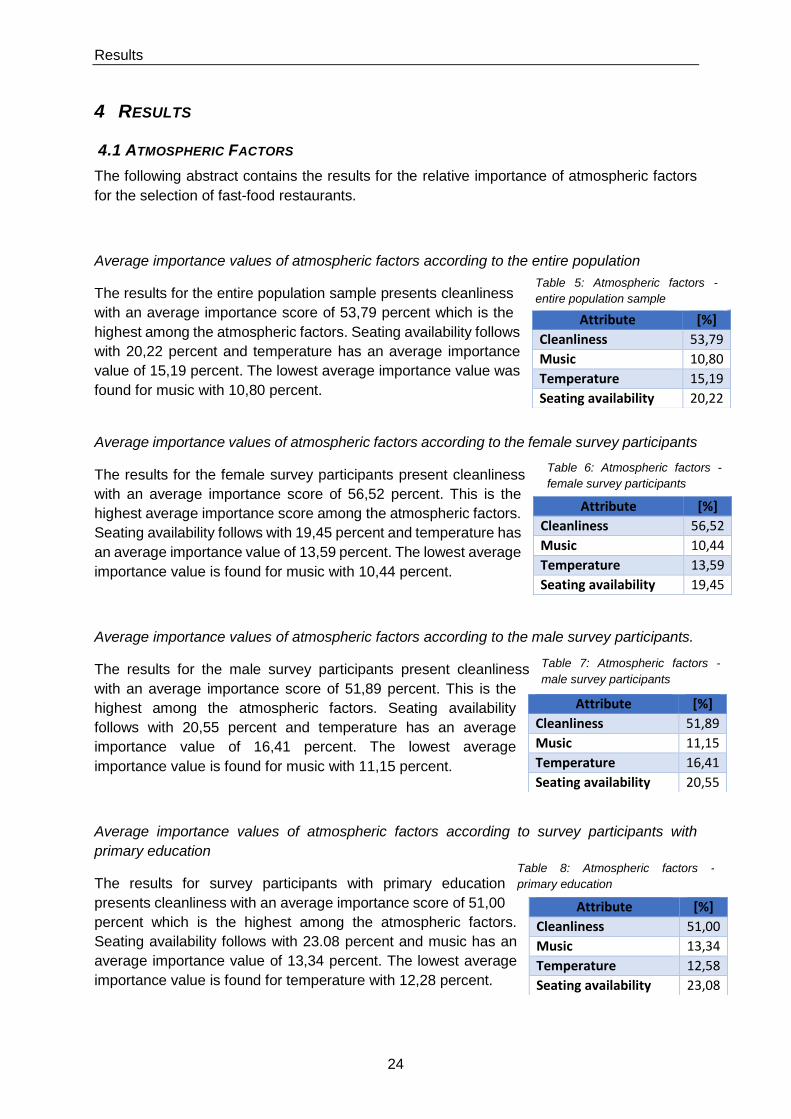
4.1 ATMOSPHERIC FACTORS
The following abstract contains the results for the relative importance of atmospheric factors
for the selection of fast-food restaurants.
Average importance values of atmospheric factors according to the entire population
The results for the entire population sample presents cleanliness
with an average importance score of 53,79 percent which is the
highest among the atmospheric factors. Seating availability follows
with 20,22 percent and temperature has an average importance
value of 15,19 percent. The lowest average importance value was
found for music with 10,80 percent.
Average importance values of atmospheric factors according to the female survey participants
The results for the female survey participants present cleanliness
with an average importance score of 56,52 percent. This is the
highest average importance score among the atmospheric factors.
Seating availability follows with 19,45 percent and temperature has
an average importance value of 13,59 percent. The lowest average
importance value is found for music with 10,44 percent.
Average importance values of atmospheric factors according to the male survey participants.
The results for the male survey participants present cleanliness
with an average importance score of 51,89 percent. This is the
highest among the atmospheric factors. Seating availability
follows with 20,55 percent and temperature has an average
importance value of 16,41 percent. The lowest average
importance value is found for music with 11,15 percent.
Average importance values of atmospheric factors according to survey participants with
primary education
The results for survey participants with primary education
presents cleanliness with an average importance score of 51,00
percent which is the highest among the atmospheric factors.
Seating availability follows with 23.08 percent and music has an
average importance value of 13,34 percent. The lowest average
importance value is found for temperature with 12,28 percent.
Attribute [%]
Cleanliness 53,79
Music 10,80
Temperature 15,19
Seating availability 20,22
Attribute [%]
Cleanliness 56,52
Music 10,44
Temperature 13,59
Seating availability 19,45
Attribute [%]
Cleanliness 51,89
Music 11,15
Temperature 16,41
Seating availability 20,55
Attribute [%]
Cleanliness 51,00
Music 13,34
Temperature 12,58
Seating availability 23,08
Table 5: Atmospheric factors -
entire population sample
Table 6: Atmospheric factors -
female survey participants
Table 7: Atmospheric factors -
male survey participants
Table 8: Atmospheric factors -
primary education

Results
25
Average importance values of atmospheric factors according to survey participants with lower
vocational education
The results for survey participants with lower vocational education
present cleanliness with an average importance score of 50,11
which is the highest among the atmospheric factors. Seating
availability follows with 19,67 percent and temperature with an
average importance value of 13,35. The lowest average
importance value is found for music with 16,87 percent.
Average importance values of atmospheric factors according to survey participants with
secondary vocational education
The results for survey participants with secondary vocational
education present cleanliness with average importance score of
51,88 which is the highest among the atmospheric factors. Seating
availability follows with 21,43 percent and temperature with an
average importance value of 15,95. The lowest average
importance value is found for music with 10,74 percent.
Average importance values of atmospheric factors according to survey participants with higher
vocational education.
The results for survey participants with higher vocational
education show cleanliness with the highest average importance
value of 54,86 percent. This is the highest average importance
score among the atmospheric factors. Seating availability follows
with 19,98 percent. Temperature scored an average importance
score of 16,14 percent and music reached the lowest average
importance with 9,12 percent.
Average importance values of atmospheric factors according to survey participants with
university education
The results for university education show cleanliness with the
highest average importance score of 57,25 percent, followed by
seating availability with 19,05 percent. Temperature scored an
average importance score of 14,39 and music reached the lowest
average importance score with 9,30 percent.
Attribute [%]
Cleanliness 50,11
Music 13,35
Temperature 16,87
Seating availability 19,67
Attribute [%]
Cleanliness 51,88
Music 10,74
Temperature 15,95
Seating availability 21,43
Attribute [%]
Cleanliness 54,86
Music 9,12
Temperature 16,14
Seating availability 19,98
Attribute [%]
Cleanliness 57,25
Music 9,30
Temperature 14,30
Seating availability 19,05
Table 9: Atmospheric factors - lower
vocational education
Table 10: Atmospheric factors -
secondary vocational education
Table 11: Atmospheric factors -
higher vocational education
Table 12: Atmopsheric factors-
university education
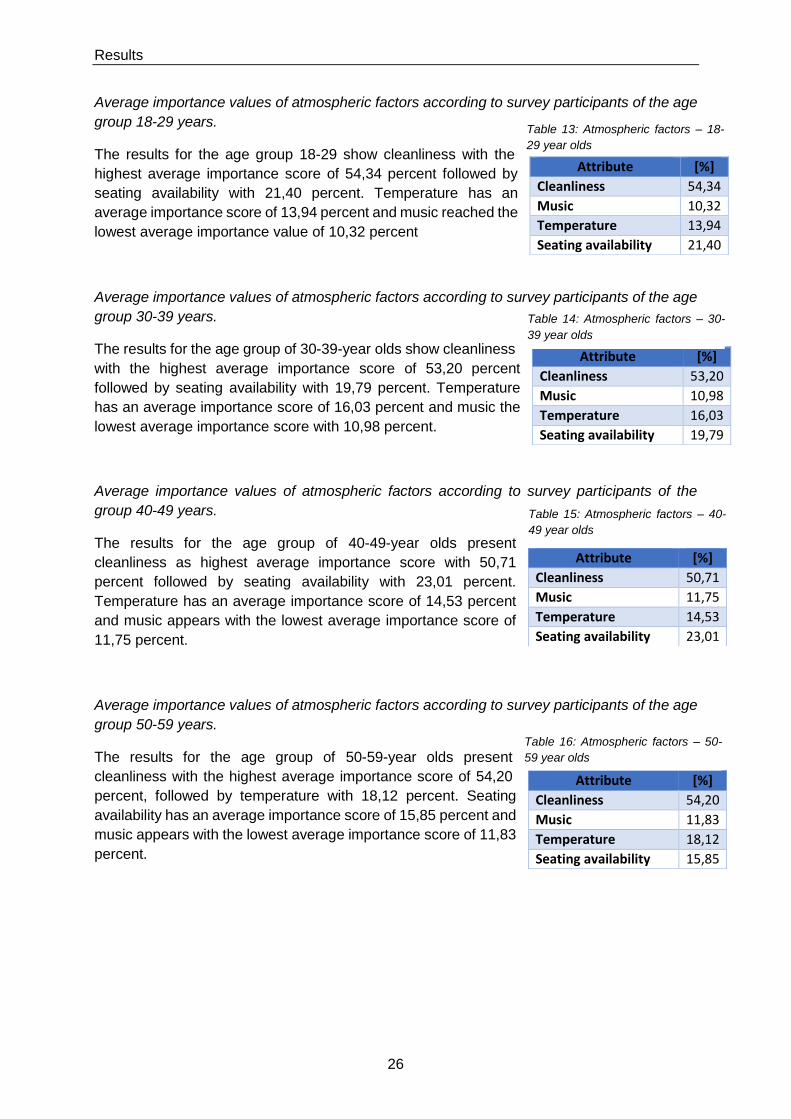
Results
26
Average importance values of atmospheric factors according to survey participants of the age
group 18-29 years.
The results for the age group 18-29 show cleanliness with the
highest average importance score of 54,34 percent followed by
seating availability with 21,40 percent. Temperature has an
average importance score of 13,94 percent and music reached the
lowest average importance value of 10,32 percent
Average importance values of atmospheric factors according to survey participants of the age
group 30-39 years.
The results for the age group of 30-39-year olds show cleanliness
with the highest average importance score of 53,20 percent
followed by seating availability with 19,79 percent. Temperature
has an average importance score of 16,03 percent and music the
lowest average importance score with 10,98 percent.
Average importance values of atmospheric factors according to survey participants of the
group 40-49 years.
The results for the age group of 40-49-year olds present
cleanliness as highest average importance score with 50,71
percent followed by seating availability with 23,01 percent.
Temperature has an average importance score of 14,53 percent
and music appears with the lowest average importance score of
11,75 percent.
Average importance values of atmospheric factors according to survey participants of the age
group 50-59 years.
The results for the age group of 50-59-year olds present
cleanliness with the highest average importance score of 54,20
percent, followed by temperature with 18,12 percent. Seating
availability has an average importance score of 15,85 percent and
music appears with the lowest average importance score of 11,83
percent.
Attribute [%]
Cleanliness 54,34
Music 10,32
Temperature 13,94
Seating availability 21,40
Attribute [%]
Cleanliness 53,20
Music 10,98
Temperature 16,03
Seating availability 19,79
Attribute [%]
Cleanliness 50,71
Music 11,75
Temperature 14,53
Seating availability 23,01
Attribute [%]
Cleanliness 54,20
Music 11,83
Temperature 18,12
Seating availability 15,85
Table 13: Atmospheric factors – 18-
29 year olds
Table 14: Atmospheric factors – 30-
39 year olds
Table 15: Atmospheric factors – 40-
49 year olds
Table 16: Atmospheric factors – 50-
59 year olds
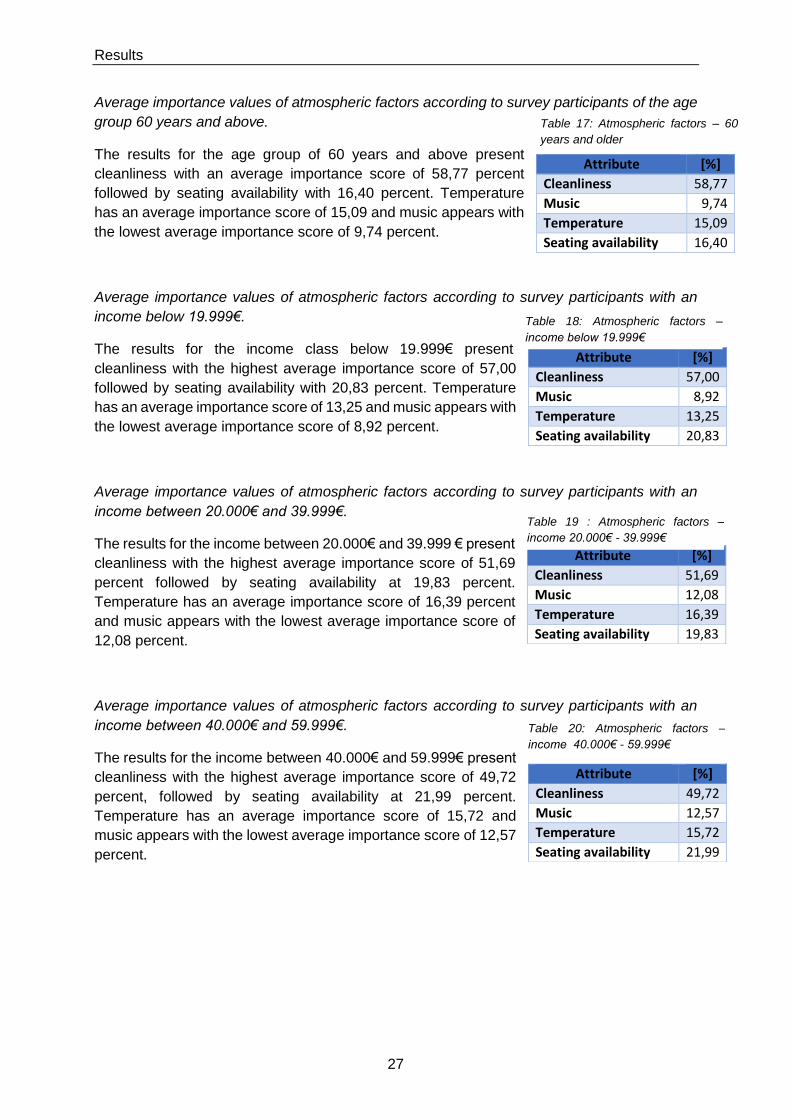
Results
27
Average importance values of atmospheric factors according to survey participants of the age
group 60 years and above.
The results for the age group of 60 years and above present
cleanliness with an average importance score of 58,77 percent
followed by seating availability with 16,40 percent. Temperature
has an average importance score of 15,09 and music appears with
the lowest average importance score of 9,74 percent.
Average importance values of atmospheric factors according to survey participants with an
income below 19.999€.
The results for the income class below 19.999€ present
cleanliness with the highest average importance score of 57,00
followed by seating availability with 20,83 percent. Temperature
has an average importance score of 13,25 and music appears with
the lowest average importance score of 8,92 percent.
Average importance values of atmospheric factors according to survey participants with an
income between 20.000€ and 39.999€.
The results for the income between 20.000€ and 39.999 € present
cleanliness with the highest average importance score of 51,69
percent followed by seating availability at 19,83 percent.
Temperature has an average importance score of 16,39 percent
and music appears with the lowest average importance score of
12,08 percent.
Average importance values of atmospheric factors according to survey participants with an
income between 40.000€ and 59.999€.
The results for the income between 40.000€ and 59.999€ present
cleanliness with the highest average importance score of 49,72
percent, followed by seating availability at 21,99 percent.
Temperature has an average importance score of 15,72 and
music appears with the lowest average importance score of 12,57
percent.
Attribute [%]
Cleanliness 58,77
Music 9,74
Temperature 15,09
Seating availability 16,40
Attribute [%]
Cleanliness 57,00
Music 8,92
Temperature 13,25
Seating availability 20,83
Attribute [%]
Cleanliness 51,69
Music 12,08
Temperature 16,39
Seating availability 19,83
Attribute [%]
Cleanliness 49,72
Music 12,57
Temperature 15,72
Seating availability 21,99
Table 17: Atmospheric factors – 60
years and older
Table 18: Atmospheric factors –
income below 19.999€
Table 19 : Atmospheric factors –
income 20.000€ - 39.999€
Table 20: Atmospheric factors –
income 40.000€ - 59.999€

Results
28
Average importance values of atmospheric factors according to survey participants with an
income 60.000€ and above.
The results for the survey participants with an income of
60.000€ and above present cleanliness with the highest
average importance score of 56,19 percent. Seating
availability follows with 17,51 percent. Temperature has an
average importance score of 16,07 percent and music appears
the lowest average importance score of 10,22 percent.
Average importance values of atmospheric factors according to survey participants that visit
fast-food restaurants less than once a month.
The results for survey participants that go to fast-food
restaurants less than one time per month present cleanliness
with the highest average importance score of 58,38. Seating
availability follows with 17,860 percent. Temperature has an
average importance score of 13,84 percent and music
appears with the lowest average importance score of 9,92
percent.
Average importance values of atmospheric factors according to survey participants that visit
fast-food restaurants once a month.
The results for survey participants that visit fast-food
restaurants once a month present cleanliness with the
highest average importance score of 55,49 percent. Seating
availability follows with 18,40 percent. Temperature has an
average importance score of 15,51 percent and music
appears with the lowest average importance score of 10,60
percent.
Average importance values of atmospheric factors according to survey participants that visit
fast-food restaurants once a week.
The results for survey participants that visit fast-food
restaurants once a week present cleanliness with the highest
average importance score of 45,61 percent. Seating
availability follows with 24,85 percent and temperature has an
average importance score of 17,19 percent. The lowest
average importance value is found for music at 12,35 percent.
Attribute [%]
Cleanliness 56,19
Music 10,22
Temperature 16,07
Seating availability 17,51
Attribute [%]
Cleanliness 58,38
Music 9,92
Temperature 13,84
Seating availability 17,86
Attribute [%]
Cleanliness 55,49
Music 10,60
Temperature 15,51
Seating availability 18,40
Attribute [%]
Cleanliness 45,61
Music 12,35
Temperature 17,19
Seating availability 24,85
Table 21: Atmospheric factors –
income 60.000€ and above
Table 22 : Atmospheric factors – Less
than once a month
Table 23: Atmospheric factors - Once
a month
Table 24: Atmospheric factors – Once
a week
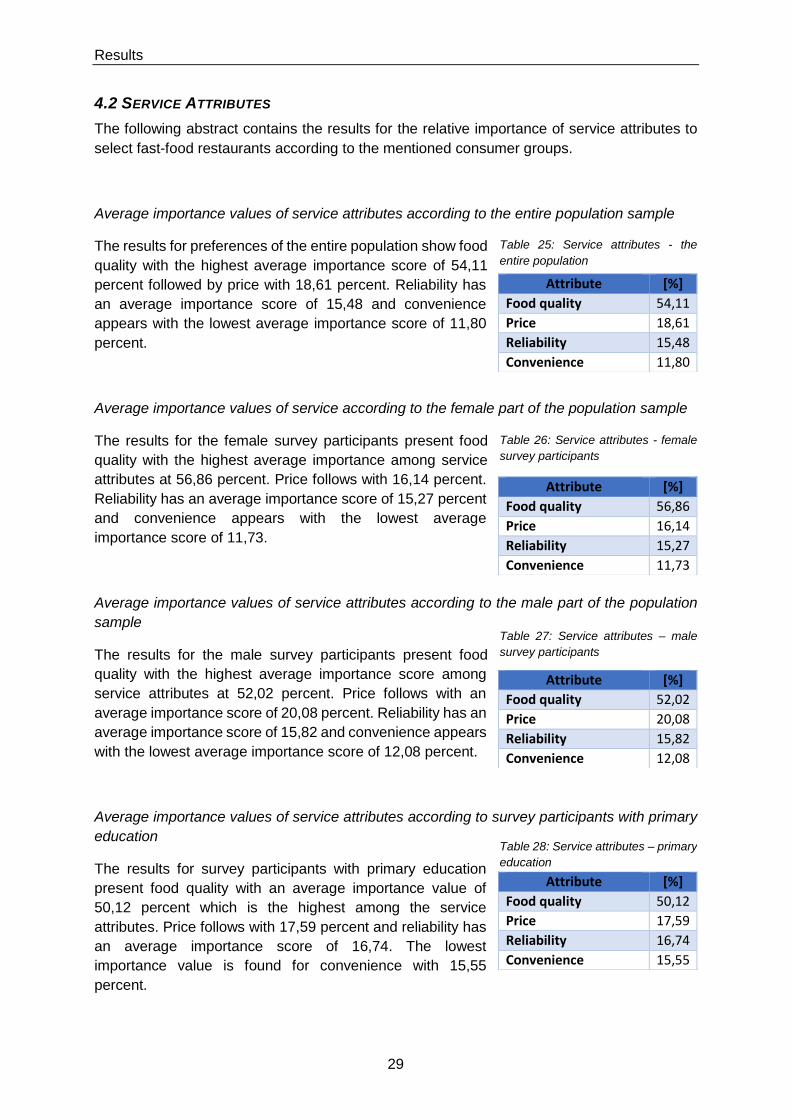
Results
29
4.2 SERVICE ATTRIBUTES
The following abstract contains the results for the relative importance of service attributes to
select fast-food restaurants according to the mentioned consumer groups.
Average importance values of service attributes according to the entire population sample
The results for preferences of the entire population show food
quality with the highest average importance score of 54,11
percent followed by price with 18,61 percent. Reliability has
an average importance score of 15,48 and convenience
appears with the lowest average importance score of 11,80
percent.
Average importance values of service according to the female part of the population sample
The results for the female survey participants present food
quality with the highest average importance among service
attributes at 56,86 percent. Price follows with 16,14 percent.
Reliability has an average importance score of 15,27 percent
and convenience appears with the lowest average
importance score of 11,73.
Average importance values of service attributes according to the male part of the population
sample
The results for the male survey participants present food
quality with the highest average importance score among
service attributes at 52,02 percent. Price follows with an
average importance score of 20,08 percent. Reliability has an
average importance score of 15,82 and convenience appears
with the lowest average importance score of 12,08 percent.
Average importance values of service attributes according to survey participants with primary
education
The results for survey participants with primary education
present food quality with an average importance value of
50,12 percent which is the highest among the service
attributes. Price follows with 17,59 percent and reliability has
an average importance score of 16,74. The lowest
importance value is found for convenience with 15,55
percent.
Attribute [%]
Food quality 54,11
Price 18,61
Reliability 15,48
Convenience 11,80
Attribute [%]
Food quality 56,86
Price 16,14
Reliability 15,27
Convenience 11,73
Attribute [%]
Food quality 52,02
Price 20,08
Reliability 15,82
Convenience 12,08
Attribute [%]
Food quality 50,12
Price 17,59
Reliability 16,74
Convenience 15,55
Table 25: Service attributes - the
entire population
Table 26: Service attributes - female
survey participants
Table 27: Service attributes – male
survey participants
Table 28: Service attributes – primary
education
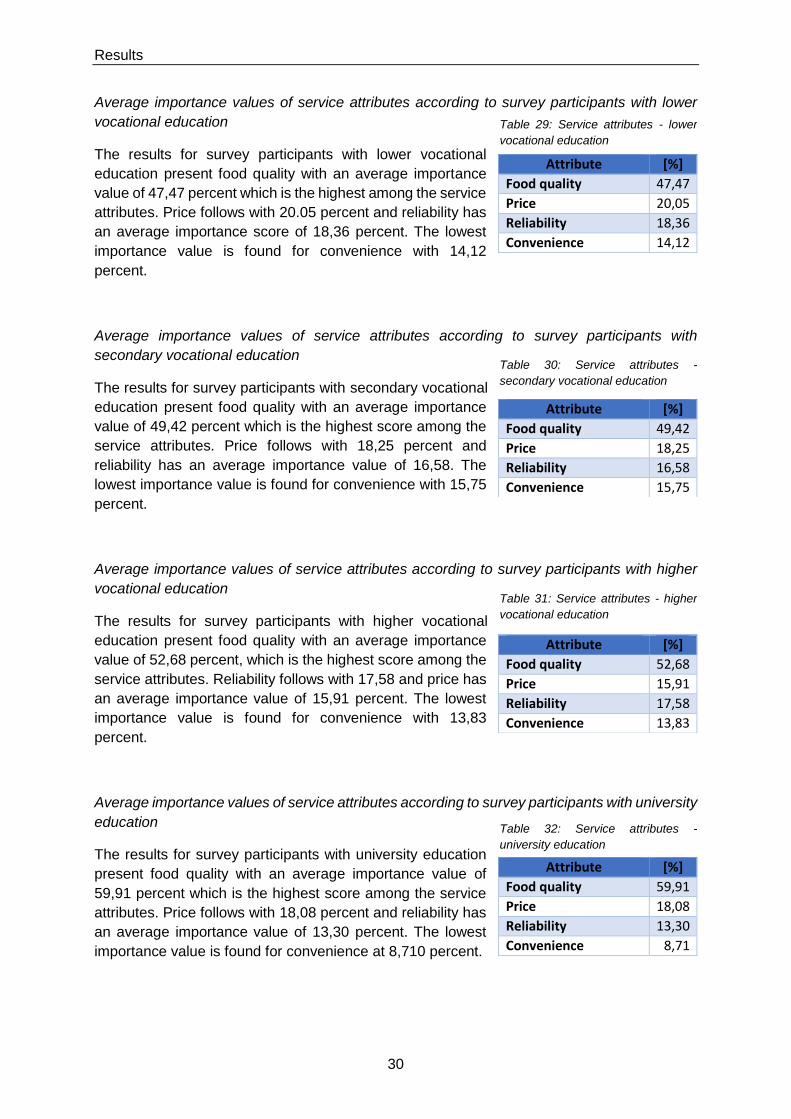
Results
30
Average importance values of service attributes according to survey participants with lower
vocational education
The results for survey participants with lower vocational
education present food quality with an average importance
value of 47,47 percent which is the highest among the service
attributes. Price follows with 20.05 percent and reliability has
an average importance score of 18,36 percent. The lowest
importance value is found for convenience with 14,12
percent.
Average importance values of service attributes according to survey participants with
secondary vocational education
The results for survey participants with secondary vocational
education present food quality with an average importance
value of 49,42 percent which is the highest score among the
service attributes. Price follows with 18,25 percent and
reliability has an average importance value of 16,58. The
lowest importance value is found for convenience with 15,75
percent.
Average importance values of service attributes according to survey participants with higher
vocational education
The results for survey participants with higher vocational
education present food quality with an average importance
value of 52,68 percent, which is the highest score among the
service attributes. Reliability follows with 17,58 and price has
an average importance value of 15,91 percent. The lowest
importance value is found for convenience with 13,83
percent.
Average importance values of service attributes according to survey participants with university
education
The results for survey participants with university education
present food quality with an average importance value of
59,91 percent which is the highest score among the service
attributes. Price follows with 18,08 percent and reliability has
an average importance value of 13,30 percent. The lowest
importance value is found for convenience at 8,710 percent.
Attribute [%]
Food quality 47,47
Price 20,05
Reliability 18,36
Convenience 14,12
Attribute [%]
Food quality 49,42
Price 18,25
Reliability 16,58
Convenience 15,75
Attribute [%]
Food quality 52,68
Price 15,91
Reliability 17,58
Convenience 13,83
Attribute [%]
Food quality 59,91
Price 18,08
Reliability 13,30
Convenience 8,71
Table 29: Service attributes - lower
vocational education
Table 30: Service attributes -
secondary vocational education
Table 31: Service attributes - higher
vocational education
Table 32: Service attributes -
university education
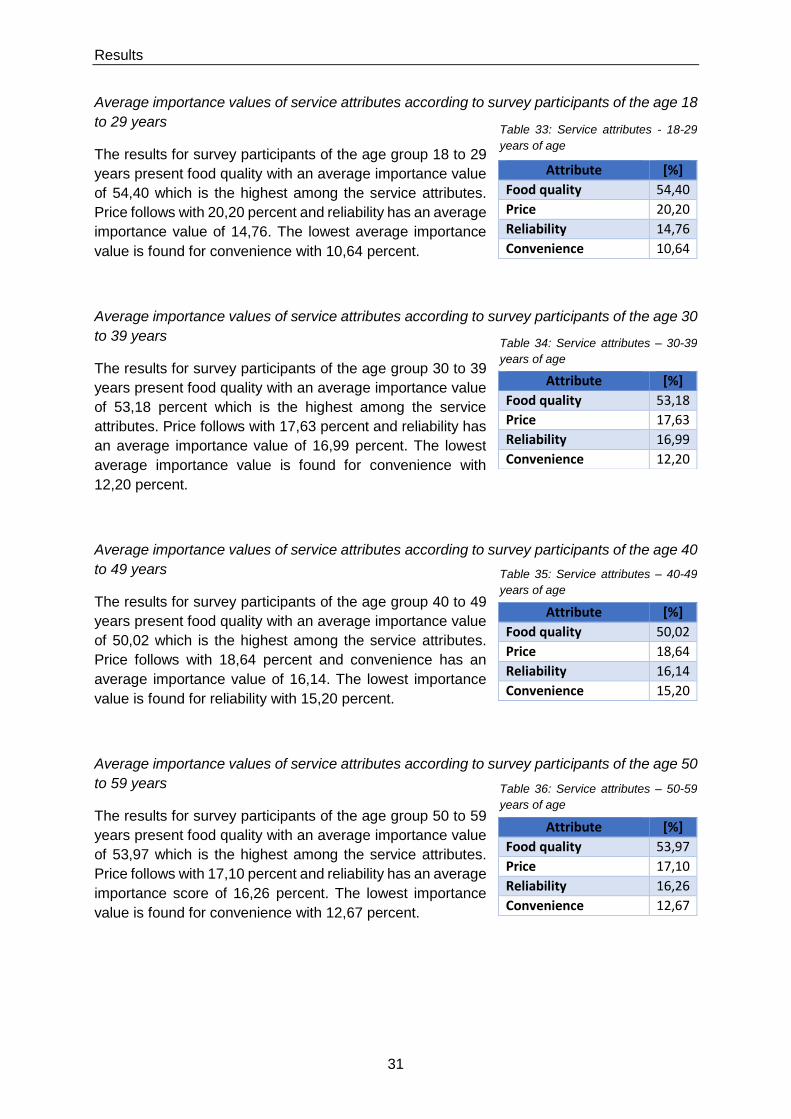
Results
31
Average importance values of service attributes according to survey participants of the age 18
to 29 years
The results for survey participants of the age group 18 to 29
years present food quality with an average importance value
of 54,40 which is the highest among the service attributes.
Price follows with 20,20 percent and reliability has an average
importance value of 14,76. The lowest average importance
value is found for convenience with 10,64 percent.
Average importance values of service attributes according to survey participants of the age 30
to 39 years
The results for survey participants of the age group 30 to 39
years present food quality with an average importance value
of 53,18 percent which is the highest among the service
attributes. Price follows with 17,63 percent and reliability has
an average importance value of 16,99 percent. The lowest
average importance value is found for convenience with
12,20 percent.
Average importance values of service attributes according to survey participants of the age 40
to 49 years
The results for survey participants of the age group 40 to 49
years present food quality with an average importance value
of 50,02 which is the highest among the service attributes.
Price follows with 18,64 percent and convenience has an
average importance value of 16,14. The lowest importance
value is found for reliability with 15,20 percent.
Average importance values of service attributes according to survey participants of the age 50
to 59 years
The results for survey participants of the age group 50 to 59
years present food quality with an average importance value
of 53,97 which is the highest among the service attributes.
Price follows with 17,10 percent and reliability has an average
importance score of 16,26 percent. The lowest importance
value is found for convenience with 12,67 percent.
Attribute [%]
Food quality 54,40
Price 20,20
Reliability 14,76
Convenience 10,64
Attribute [%]
Food quality 53,18
Price 17,63
Reliability 16,99
Convenience 12,20
Attribute [%]
Food quality 50,02
Price 18,64
Reliability 16,14
Convenience 15,20
Attribute [%]
Food quality 53,97
Price 17,10
Reliability 16,26
Convenience 12,67
Table 33: Service attributes - 18-29
years of age
Table 34: Service attributes – 30-39
years of age
Table 35: Service attributes – 40-49
years of age
Table 36: Service attributes – 50-59
years of age
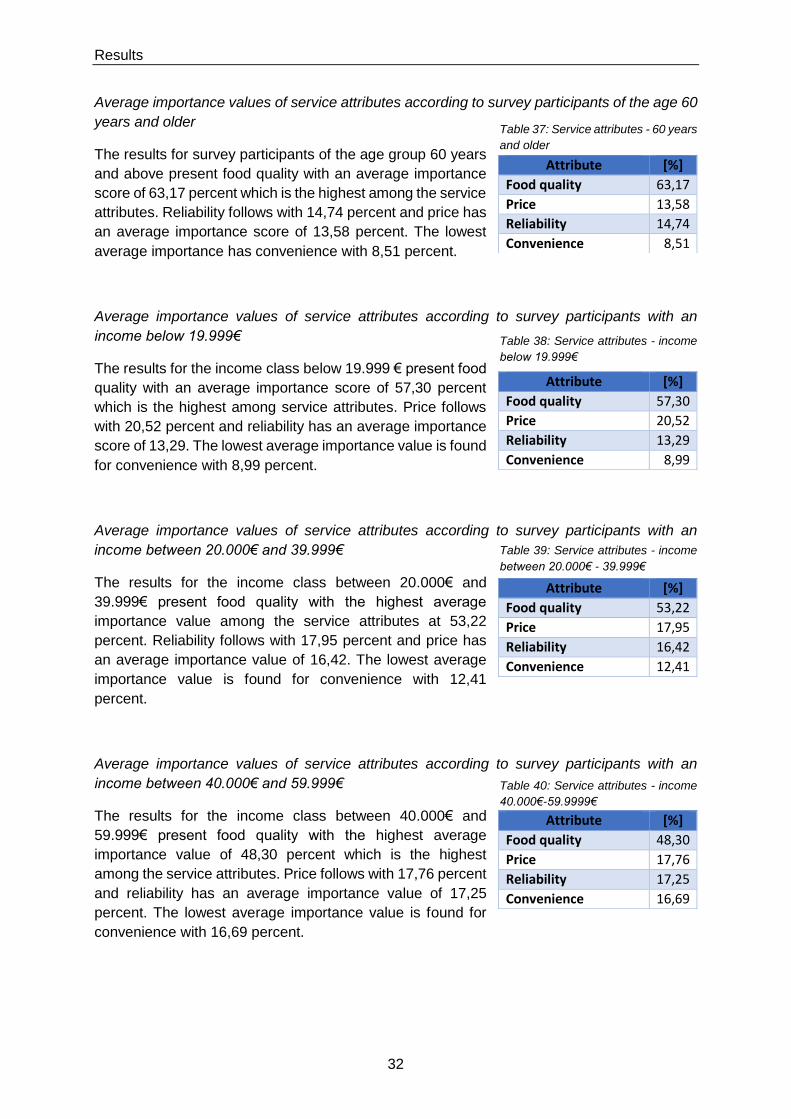
Results
32
Average importance values of service attributes according to survey participants of the age 60
years and older
The results for survey participants of the age group 60 years
and above present food quality with an average importance
score of 63,17 percent which is the highest among the service
attributes. Reliability follows with 14,74 percent and price has
an average importance score of 13,58 percent. The lowest
average importance has convenience with 8,51 percent.
Average importance values of service attributes according to survey participants with an
income below 19.999€
The results for the income class below 19.999 € present food
quality with an average importance score of 57,30 percent
which is the highest among service attributes. Price follows
with 20,52 percent and reliability has an average importance
score of 13,29. The lowest average importance value is found
for convenience with 8,99 percent.
Average importance values of service attributes according to survey participants with an
income between 20.000€ and 39.999€
The results for the income class between 20.000€ and
39.999€ present food quality with the highest average
importance value among the service attributes at 53,22
percent. Reliability follows with 17,95 percent and price has
an average importance value of 16,42. The lowest average
importance value is found for convenience with 12,41
percent.
Average importance values of service attributes according to survey participants with an
income between 40.000€ and 59.999€
The results for the income class between 40.000€ and
59.999€ present food quality with the highest average
importance value of 48,30 percent which is the highest
among the service attributes. Price follows with 17,76 percent
and reliability has an average importance value of 17,25
percent. The lowest average importance value is found for
convenience with 16,69 percent.
Attribute [%]
Food quality 63,17
Price 13,58
Reliability 14,74
Convenience 8,51
Attribute [%]
Food quality 57,30
Price 20,52
Reliability 13,29
Convenience 8,99
Attribute [%]
Food quality 53,22
Price 17,95
Reliability 16,42
Convenience 12,41
Attribute [%]
Food quality 48,30
Price 17,76
Reliability 17,25
Convenience 16,69
Table 37: Service attributes - 60 years
and older
Table 38: Service attributes - income
below 19.999€
Table 39: Service attributes - income
between 20.000€ - 39.999€
Table 40: Service attributes - income
40.000€-59.9999€
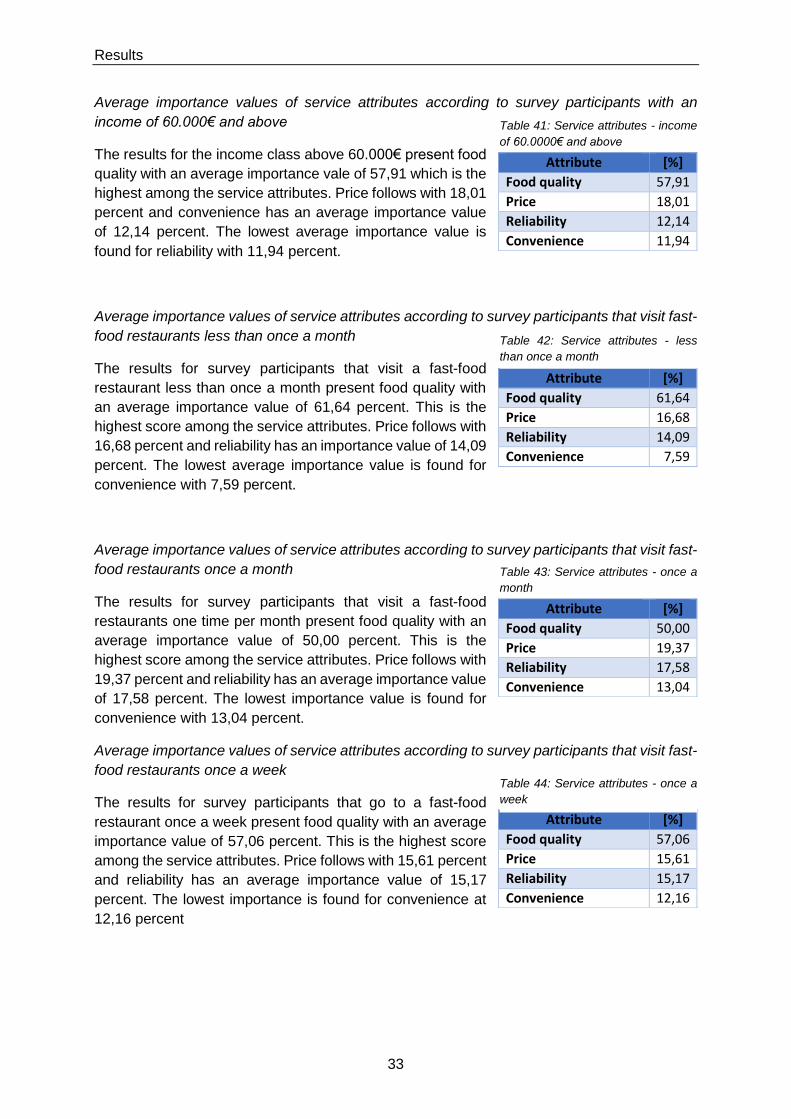
Results
33
Average importance values of service attributes according to survey participants with an
income of 60.000€ and above
The results for the income class above 60.000€ present food
quality with an average importance vale of 57,91 which is the
highest among the service attributes. Price follows with 18,01
percent and convenience has an average importance value
of 12,14 percent. The lowest average importance value is
found for reliability with 11,94 percent.
Average importance values of service attributes according to survey participants that visit fast-
food restaurants less than once a month
The results for survey participants that visit a fast-food
restaurant less than once a month present food quality with
an average importance value of 61,64 percent. This is the
highest score among the service attributes. Price follows with
16,68 percent and reliability has an importance value of 14,09
percent. The lowest average importance value is found for
convenience with 7,59 percent.
Average importance values of service attributes according to survey participants that visit fast-
food restaurants once a month
The results for survey participants that visit a fast-food
restaurants one time per month present food quality with an
average importance value of 50,00 percent. This is the
highest score among the service attributes. Price follows with
19,37 percent and reliability has an average importance value
of 17,58 percent. The lowest importance value is found for
convenience with 13,04 percent.
Average importance values of service attributes according to survey participants that visit fast-
food restaurants once a week
The results for survey participants that go to a fast-food
restaurant once a week present food quality with an average
importance value of 57,06 percent. This is the highest score
among the service attributes. Price follows with 15,61 percent
and reliability has an average importance value of 15,17
percent. The lowest importance is found for convenience at
12,16 percent
Attribute [%]
Food quality 57,91
Price 18,01
Reliability 12,14
Convenience 11,94
Attribute [%]
Food quality 61,64
Price 16,68
Reliability 14,09
Convenience 7,59
Attribute [%]
Food quality 50,00
Price 19,37
Reliability 17,58
Convenience 13,04
Attribute [%]
Food quality 57,06
Price 15,61
Reliability 15,17
Convenience 12,16
Table 41: Service attributes - income
of 60.0000€ and above
Table 42: Service attributes - less
than once a month
Table 43: Service attributes - once a
month
Table 44: Service attributes - once a
week
Discussion and conclusion
35
5. DISCUSSION AND CONCLUSION
The last chapter of this research contains the results for the relative importance of service
attributes and atmospheric factors for the selection of fast-food restaurants. 5.1 discusses the
outcomes of this research. 5.2 concludes this research as it answers the main research
question: “What importance do consumers denote to different service attributes and
atmospheric factors for the selection of fast-food restaurants?”
5.1 DISCUSSION
This section debates the findings of the report. 5.1.1 explains the contribution to extant
literature and 5.1.2 sheds light on reliability and validity. In 5.1.3 limitations of this research are
shown and supplemented with indications for future research.
5.1.1 CONTRIBUTION TO EXTANT LITERATURE
In contrast to previous satisfaction analyses, this research aimed at the relative importance of
service attributes and atmospheric factors for the selection of fast-food restaurants. The survey
participants had the task to rank fast-food restaurant versions that consisted of service
attributes and atmospheric factors. Therefore, it is difficult to compare the results of this
research with previous literature in which satisfaction studies were conducted. However, the
results of extant literature indicate that comparable preferences of service attributes and
atmospheric factors were found in extant literature. Pettijohn et al. (1997) stated that food
quality and cleanliness lead to the highest satisfaction values of fast-food restaurant
consumers. This research can extend the investigated literature because rankings that were
established with the relative importance of service attributes and atmospheric factors did not
exist before. In studies with satisfaction analysis, it was not conclusive which service attributes
and atmospheric factors were the most preferred ones as single attribute evaluations without
trade-offs were made.
5.1.2 RELIABILITY AND VALIDITY OF THE RESEARCH
The research was built on an empirical study that intends to reveal the relative importance of
service attributes and atmospheric factors for the selection of fast-food restaurant according
to different consumer groups. Reliability and validity are quality measures to appraise
quantitative research (Heale & Twycross, 2015)
Reliability describes the degree of which stable and repeatable results can be established in
the research (Jack & Clarke, 1998). To get reliable results, the researcher tried to spread the
questionnaire to a large population. The researcher was able to gather 243 answers. The size
of conjoint samples usually has a spectrum of 150 to more than 1000 respondents (Orme,
2010). Thus, it can be assumed that a certain degree of reliability was achieved for this
research. However, the underlying empirical study did not include standard errors. This
circumstance decreases the quality of the results.
Validity is subdivided into internal and external validity. Internal validity describes the capability
of the research to deliver the results that it claims (De Vaus, 2001). The provided research
framework reveals the steps that this research followed to achieve internal validity. The
Discussion and conclusion
36
literature studies delivered the theoretical base for the empirical study. Due to this structure,
the researcher assumes that internal validity was established.
External validity refers to degree of which research results are to generalize and applicable on
different populations (Winter, 2000). This research gathered answers from a large population
without case specific constraints. Therefore, a certain degree of external validity was
generated. Anyhow, this research does not claim generalisability because the population
sample was not randomized and the demographic groups not equally large. Orme (2010)
recommends 200 respondents for each group that is segmented. This research found general
rankings for service attributes and atmospheric factors which are mentioned in the conclusions
section. Exceptions for the general rankings of service attributes and atmospheric factors
appear in small consumer groups (Tables: 8,16,29,32,37). These exceptions could stem from
the lack of respondents for the respective group and decrease the validity of this research.
Furthermore, no hold out tasks were implemented into this study. Hold out sets are additional
cards that appear in the conjoint analysis. These hold out cards deliver Kendall Tau scores
that are used to check the validity of the empirical study (Bellmann, 2007). Thus, this research
cannot be verified with Kendall Tau scores which lead to decreased validity of the research
results.
5.1.3 LIMITATIONS AND FUTURE RESEARCH
In this research, the investigated service attributes are assessed on their relative importance.
However, the relative importance of service attributes does not tell fast-food restaurants which
exact product is demanded by consumers. Therefore, determinants such as food quality and
price need to be translated into actual products and price levels. Future research should
include ingredients and prices to translate preferences into actual products and offerings. The
estimated utilities of the levels can then be taken to derive at the most demanded products by
individual users or selected groups.
Besides that, only a restricted amount of service attributes and atmospheric factors was
investigated in this research. The information overload of survey participants inhibited to add
more factors to the study. The selection of the atmospheric factors and service attributes for
this research was conducted with a literature study. Due to the limited time, not the entire
relevant literature was investigated as it would happen in a literature review. This research
cannot assure that relevant service attributes or atmospheric factors from extant literature were
missed out. Furthermore, studies might exist that already examined the relative importance of
service attributes and atmospheric factors for the selection fast-food restaurants. The claimed
research gap cannot be assured and could turn out to be false.
Future research should set requirements for the size of each consumer group. With that,
researches can obtain more reliability and validity for the empirical section. Besides that, future
research should include hold out sets when conjoint analysis is used. These hold out sets can
measure validity and increase the quality of the research.
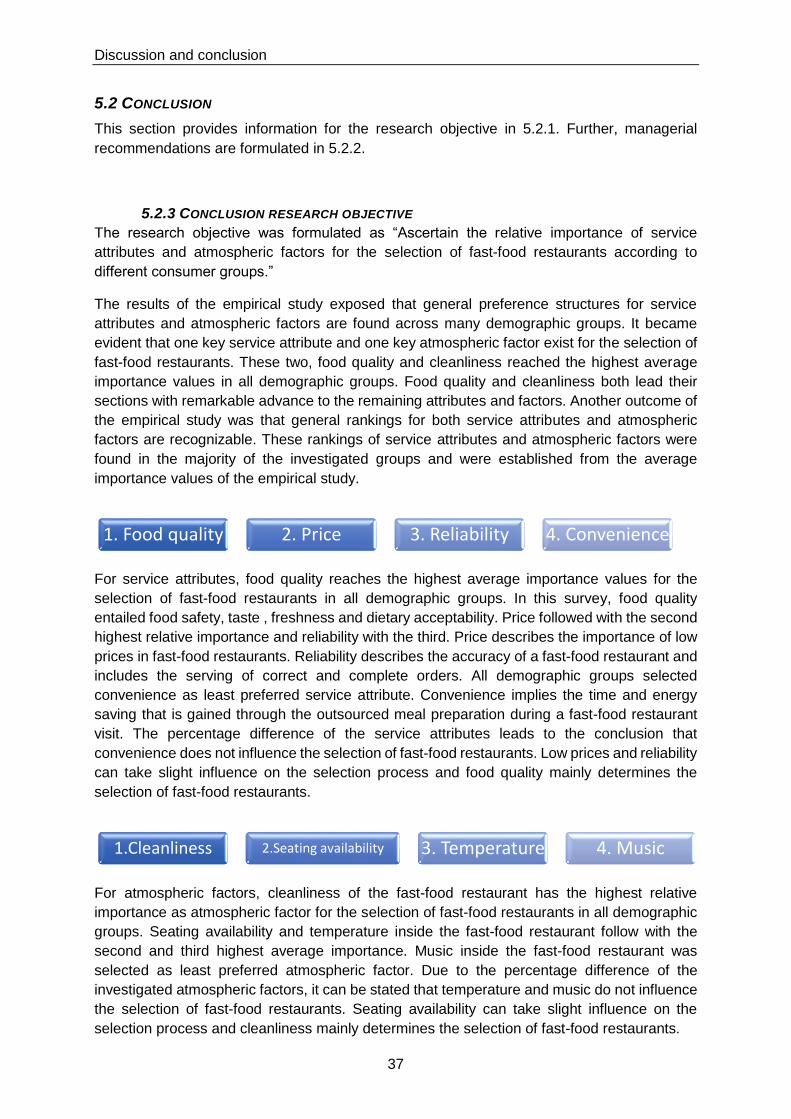
Discussion and conclusion
37
5.2 CONCLUSION
This section provides information for the research objective in 5.2.1. Further, managerial
recommendations are formulated in 5.2.2.
5.2.3 CONCLUSION RESEARCH OBJECTIVE
The research objective was formulated as “Ascertain the relative importance of service
attributes and atmospheric factors for the selection of fast-food restaurants according to
different consumer groups.”
The results of the empirical study exposed that general preference structures for service
attributes and atmospheric factors are found across many demographic groups. It became
evident that one key service attribute and one key atmospheric factor exist for the selection of
fast-food restaurants. These two, food quality and cleanliness reached the highest average
importance values in all demographic groups. Food quality and cleanliness both lead their
sections with remarkable advance to the remaining attributes and factors. Another outcome of
the empirical study was that general rankings for both service attributes and atmospheric
factors are recognizable. These rankings of service attributes and atmospheric factors were
found in the majority of the investigated groups and were established from the average
importance values of the empirical study.
For service attributes, food quality reaches the highest average importance values for the
selection of fast-food restaurants in all demographic groups. In this survey, food quality
entailed food safety, taste , freshness and dietary acceptability. Price followed with the second
highest relative importance and reliability with the third. Price describes the importance of low
prices in fast-food restaurants. Reliability describes the accuracy of a fast-food restaurant and
includes the serving of correct and complete orders. All demographic groups selected
convenience as least preferred service attribute. Convenience implies the time and energy
saving that is gained through the outsourced meal preparation during a fast-food restaurant
visit. The percentage difference of the service attributes leads to the conclusion that
convenience does not influence the selection of fast-food restaurants. Low prices and reliability
can take slight influence on the selection process and food quality mainly determines the
selection of fast-food restaurants.
For atmospheric factors, cleanliness of the fast-food restaurant has the highest relative
importance as atmospheric factor for the selection of fast-food restaurants in all demographic
groups. Seating availability and temperature inside the fast-food restaurant follow with the
second and third highest average importance. Music inside the fast-food restaurant was
selected as least preferred atmospheric factor. Due to the percentage difference of the
investigated atmospheric factors, it can be stated that temperature and music do not influence
the selection of fast-food restaurants. Seating availability can take slight influence on the
selection process and cleanliness mainly determines the selection of fast-food restaurants.
1. Food quality 2. Price 3. Reliability 4. Convenience
1.Cleanliness 2.Seating availability 3. Temperature 4. Music

Discussion and conclusion
38
5.2.2 MANAGERIAL RECOMMENDATIONS
5.2.2.1 Translate key attributes into products and actions
Fast-food restaurants can extract managerial recommendations from the conducted research.
The rankings reveal the relative importance of service attributes and atmospheric factors to
select fast-food restaurants according to different consumer groups. Two general rankings
exist, which were described before. These already imply that food quality as service attribute
and cleanliness as atmospheric factor are key for the consumers to select fast-food
restaurants. The strong preference for food quality and cleanliness result in the
recommendation to focus on these two determinants. Fast-food restaurant must understand
how the term food quality is translated into actual products. The section future research further
elaborates on this matter. Cleanliness is the most important atmospheric factor for the
selection of fast-food restaurant by different consumer groups. Fast-food restaurant could
practically react to this demand by increasing the amount of cleaning services. Dependent on
the location of the restaurant, the number of consumers per day varies. Restaurants with
different numbers of consumers might require additional cleaning throughout the day. The
demand for additional cleaning could be determined by satisfaction analysis.
5.2.2.2 Postpone actions for attributes and factors of low importance
Another managerial recommendation stems from the low average importance score of the
service attributes reliability and convenience. Compared to food quality, the correct fulfilment
of orders as well as the time advantage that is gained through the outsourced meal preparation
is not important for the selection of fast-food restaurant. Managerial actions to improve
reliability and convenience such as an increased amount of checkouts should be considered
after food quality and prices are determined. Seating availability is the second most important
atmospheric factor and can be increased if shortages exist. However, the difference between
the average importance score cleanliness and seating is large and implies to focus on the
cleanliness of the restaurant, first. Comfortable room temperature is less important than
cleanliness and seating availability. The atmospheric factor temperature is not decisive for the
selection of fast-food restaurants and complex evaluations about preferred room temperatures
can be neglected. Music is the least important atmospheric factor for fast-food consumers. The
results imply that fast-food restaurants do not need to invest in music or sound systems to
influence the selection process of consumers.
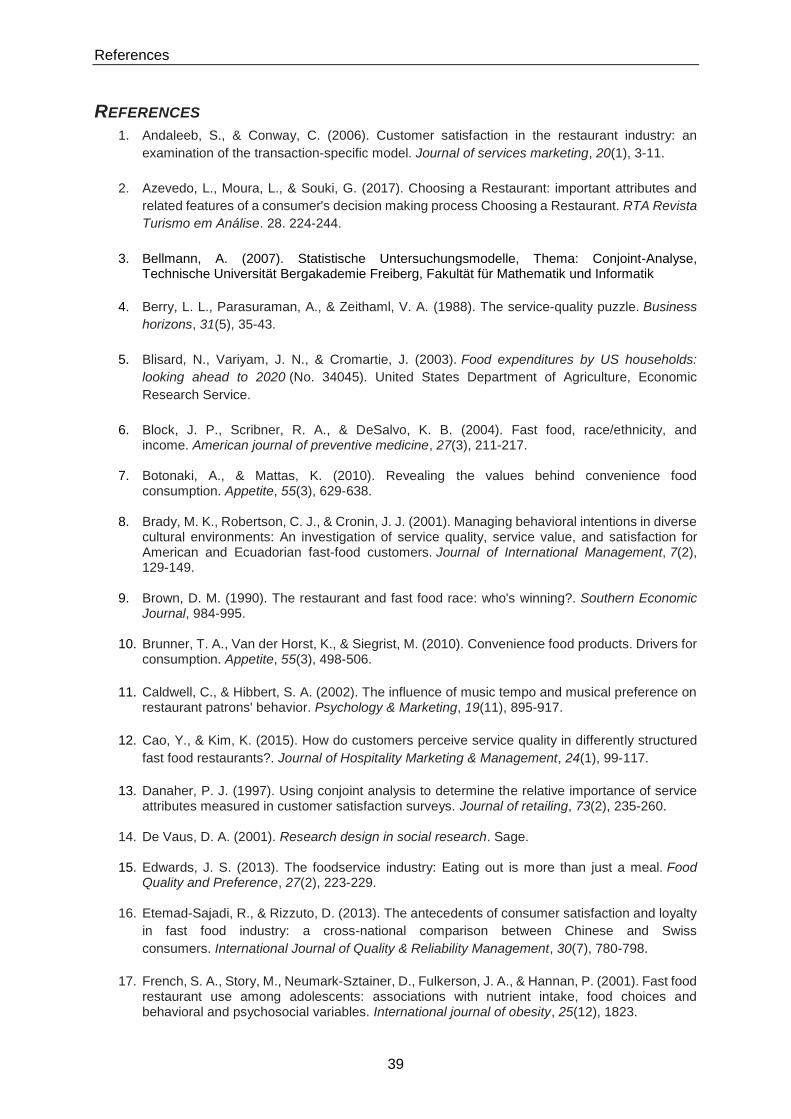
References
39
REFERENCES
1. Andaleeb, S., & Conway, C. (2006). Customer satisfaction in the restaurant industry: an
examination of the transaction-specific model. Journal of services marketing, 20(1), 3-11.
2. Azevedo, L., Moura, L., & Souki, G. (2017). Choosing a Restaurant: important attributes and
related features of a consumer's decision making process Choosing a Restaurant. RTA Revista
Turismo em Análise. 28. 224-244.
3. Bellmann, A. (2007). Statistische Untersuchungsmodelle, Thema: Conjoint-Analyse, Technische Universität Bergakademie Freiberg, Fakultät für Mathematik und Informatik
4. Berry, L. L., Parasuraman, A., & Zeithaml, V. A. (1988). The service-quality puzzle. Business
horizons, 31(5), 35-43.
5. Blisard, N., Variyam, J. N., & Cromartie, J. (2003). Food expenditures by US households:
looking ahead to 2020 (No. 34045). United States Department of Agriculture, Economic
Research Service.
6. Block, J. P., Scribner, R. A., & DeSalvo, K. B. (2004). Fast food, race/ethnicity, and income. American journal of preventive medicine, 27(3), 211-217.
7. Botonaki, A., & Mattas, K. (2010). Revealing the values behind convenience food consumption. Appetite, 55(3), 629-638.
8. Brady, M. K., Robertson, C. J., & Cronin, J. J. (2001). Managing behavioral intentions in diverse cultural environments: An investigation of service quality, service value, and satisfaction for American and Ecuadorian fast-food customers. Journal of International Management, 7(2), 129-149.
9. Brown, D. M. (1990). The restaurant and fast food race: who's winning?. Southern Economic Journal, 984-995.
10. Brunner, T. A., Van der Horst, K., & Siegrist, M. (2010). Convenience food products. Drivers for consumption. Appetite, 55(3), 498-506.
11. Caldwell, C., & Hibbert, S. A. (2002). The influence of music tempo and musical preference on restaurant patrons' behavior. Psychology & Marketing, 19(11), 895-917.
12. Cao, Y., & Kim, K. (2015). How do customers perceive service quality in differently structured
fast food restaurants?. Journal of Hospitality Marketing & Management, 24(1), 99-117.
13. Danaher, P. J. (1997). Using conjoint analysis to determine the relative importance of service
attributes measured in customer satisfaction surveys. Journal of retailing, 73(2), 235-260.
14. De Vaus, D. A. (2001). Research design in social research. Sage.
15. Edwards, J. S. (2013). The foodservice industry: Eating out is more than just a meal. Food Quality and Preference, 27(2), 223-229.
16. Etemad-Sajadi, R., & Rizzuto, D. (2013). The antecedents of consumer satisfaction and loyalty
in fast food industry: a cross-national comparison between Chinese and Swiss
consumers. International Journal of Quality & Reliability Management, 30(7), 780-798.
17. French, S. A., Story, M., Neumark-Sztainer, D., Fulkerson, J. A., & Hannan, P. (2001). Fast food
restaurant use among adolescents: associations with nutrient intake, food choices and behavioral and psychosocial variables. International journal of obesity, 25(12), 1823.

References
40
18. Garza, K. B., Ding, M., Owensby, J. K., & Zizza, C. A. (2016). Impulsivity and fast-food consumption: a cross-sectional study among working adults. Journal of the Academy of Nutrition and Dietetics, 116(1), 61-68.
19. Gilbert, G. R., Veloutsou, C., Goode, M. M., & Moutinho, L. (2004). Measuring customer
satisfaction in the fast food industry: a cross-national approach. Journal of Services
Marketing, 18(5), 371-383.
20. Glanz, K., Basil, M., Maibach, E., Goldberg, J., & Snyder, D. A. N. (1998). Why Americans eat
what they do: taste, nutrition, cost, convenience, and weight control concerns as influences on food consumption. Journal of the American Dietetic Association, 98(10), 1118-1126.
21. Goyal, A., & Singh, N. P. (2007). Consumer perception about fast food in India: an exploratory study. British Food Journal, 109(2), 182-195.
22. Green, P. E., & Krieger, A. M. (1991). Segmenting markets with conjoint analysis. The Journal of Marketing, 20-31.
23. Green, P. E., Krieger, A. M., & Wind, Y. (2001). Thirty years of conjoint analysis: Reflections
and prospects. Interfaces, 31(3_supplement), S56-S73.
24. Green, P. E., & Srinivasan, V. (1978). Conjoint analysis in consumer research: issues and
outlook. Journal of consumer research, 5(2), 103-123.
25. Green, P. E., & Srinivasan, V. (1990). Conjoint analysis in marketing: new developments with
implications for research and practice. The journal of marketing, 3-19.
26. Grunert, K. G. (2005). Food quality and safety: consumer perception and demand. European review of agricultural economics, 32(3), 369-391.
27. Han, H., & Ryu, K. (2009). The roles of the physical environment, price perception, and customer satisfaction in determining customer loyalty in the restaurant industry. Journal of hospitality & tourism research, 33(4), 487-510.
28. Heale, R., & Twycross, A. (2015). Validity and reliability in quantitative studies. Evidence-based nursing, ebnurs-2015
29. Hemmasi, M., Strong, K. C., & Taylor, S. A. (1994). Measuring service quality for strategic planning and analysis in service firms. Journal of Applied Business Research, 10(4), 24.
30. Heung, V. C., & Gu, T. (2012). Influence of restaurant atmospherics on patron satisfaction and behavioral intentions. International Journal of Hospitality Management, 31(4), 1167-1177.
31. Jack, B., & Clarke, A. M. (1998). The purpose and use of questionnaires in
research. Professional nurse (London, England), 14(3), 176-179.
32. Jekanowski, M. D., Binkley, J. K., & Eales, J. (2001). Convenience, accessibility, and the demand for fast food. Journal of Agricultural and Resource Economics, 58-74.
33. Kara, A., Kaynak, E., & Kucukemiroglu, O. (1995). Marketing strategies for fast-food restaurants: a customer view. International Journal of Contemporary Hospitality Management, 7(4), 16-22.
34. Kotler, P. (1973). Atmospherics as a marketing tool. Journal of retailing, 49(4), 48-64.
35. Krosnick, J. A. (1999). Survey research. Annual review of psychology, 50(1), 537-567.
36. Krosnick, J. A., Presser, S., Fealing, K. H., Ruggles, S., & Vannette, D. (2015). The future of
survey research: Challenges and opportunities. The National Science Foundation Advisory
References
41
Committee for the Social, Behavioral and Economic Sciences Subcommittee on Advancing SBE Survey Research.
37. Law, A. K., Hui, Y. V., & Zhao, X. (2004). Modelling repurchase frequency and customer satisfaction for fast food outlets. International journal of quality & reliability management, 21(5), 545-563.
38. Lee, M., & Ulgado, F. M. (1997). Consumer evaluations of fast-food services: a cross-national
comparison. Journal of Services Marketing, 11(1), 39-52.
39. Markovic, S., Raspor Jankovic, S., & Dorcic, J. (2011). What are the key dimensions of
restaurant service quality? An empirical study in the city restaurant settings.
40. Milliman, R. E. (1986). The influence of background music on the behavior of restaurant patrons. Journal of consumer research, 13(2), 286-289.
41. Min, H., & Min, H. (2011). Benchmarking the service quality of fast-food restaurant franchises
in the USA: A longitudinal study. Benchmarking: An International Journal, 18(2), 282-300.
42. Namin, A. (2017). Revisiting customers' perception of service quality in fast food
restaurants. Journal of Retailing and Consumer Services, 34, 70-81
43. Orme, B. (2010). Interpreting the results of conjoint analysis. Getting Started with Conjoint
Analyis: Strategies for Product Design and Pricing Research, 2, 77-88.
44. Parasuraman, A., Zeithaml, V. A., & Berry, L. L. (1988). Servqual: A multiple-item scale for measuring consumer perc. Journal of retailing, 64(1), 12.
45. Pettijohn, L. S., Pettijohn, C. E., & Luke, R. H. (1997). An evaluation of fast food restaurant satisfaction: determinants, competitive comparisons and impact on future patronage. Journal of Restaurant & Foodservice Marketing, 2(3), 3-20.
46. Qin, H., & Prybutok, V. R. (2008). Determinants of customer-perceived service quality in fast-
food restaurants and their relationship to customer satisfaction and behavioral intentions. The
Quality Management Journal, 15(2), 35.
47. Rydell, S. A., Harnack, L. J., Oakes, J. M., Story, M., Jeffery, R. W., & French, S. A. (2008).
Why eat at fast-food restaurants: reported reasons among frequent consumers. Journal of the
American Dietetic Association, 108(12), 2066-2070.
48. Ryu, K., & Jang, S. S. (2007). The effect of environmental perceptions on behavioral intentions
through emotions: The case of upscale restaurants. Journal of Hospitality & Tourism Research, 31(1), 56-72.
49. Richardson, S., Pearson, J. M., & Capps, O. (1985). Convenience and Nonconvenience Food Use in Single‐Person and Multi‐Person Households. Family and Consumer Sciences Research Journal, 14(1), 11-20.
50. Sahagun, M. A., & Vasquez-Parraga, A. Z. (2014). Can fast-food consumers be loyal customers, if so how? Theory, method and findings. Journal of Retailing and Consumer Services, 21(2), 168-174.
51. Shepherd, R., & Raats, M. (Eds.). (2006). The psychology of food choice (Vol. 3). Cabi.
52. Sulek, J. M., & Hensley, R. L. (2004). The relative importance of food, atmosphere, and fairness of wait: The case of a full-service restaurant. Cornell Hotel and Restaurant Administration Quarterly, 45(3), 235-247.
References
42
53. Swoboda, B., & Morschett, D. (2001). Convenience-oriented shopping: a model from the perspective of consumer research. In Food, People and Society (pp. 177-196). Springer, Berlin, Heidelberg.
54. Stewart, H., Blisard, N., & Jolliffe, D. (2006). Let's eat out: Americans weigh taste, convenience,
and nutrition (No. 59411). United States Department of Agriculture, Economic Research Service.
55. Stroebele, N., & de Castro, J. M. (2006). Listening to music while eating is related to increases
in people's food intake and meal duration. Appetite, 47(3), 285-289.
56. Tan, Q., Oriade, A., & Fallon, P. (2014). Service quality and customer satisfaction in Chinese
fast food sector: a proposal for CFFRSERV. Advances in Hospitality and Tourism Research
(AHTR), 2(1), 30-53.
57. Tat, H. H., Sook-Min, S., Ai-Chin, T., Rasli, A., & Hamid, A. B. A. (2011). Consumers’ purchase
intentions in fast food restaurants: An empirical study on undergraduate students. International
Journal of Business and Social Science, 2(5), 214-221.
58. Wansink, B., & Van Ittersum, K. (2012). Fast food restaurant lighting and music can reduce
calorie intake and increase satisfaction. Psychological Reports, 111(1), 228-232.
59. Winter, G. (2000). A comparative discussion of the notion of'validity'in qualitative and quantitative research. The qualitative report, 4(3), 1-14.
60. Zeithaml, V. A., Berry, L. L., & Parasuraman, A. (1996). The behavioral consequences of service
quality. the Journal of Marketing, 31-46.
61. Zeithaml, V. A. (2000). Service quality, profitability, and the economic worth of customers: what we know and what we need to learn. Journal of the academy of marketing science, 28(1), 67-85.

Appendix
44
APPENDIX: Online Survey
Survey page 1

Appendix
45
Survey page 2
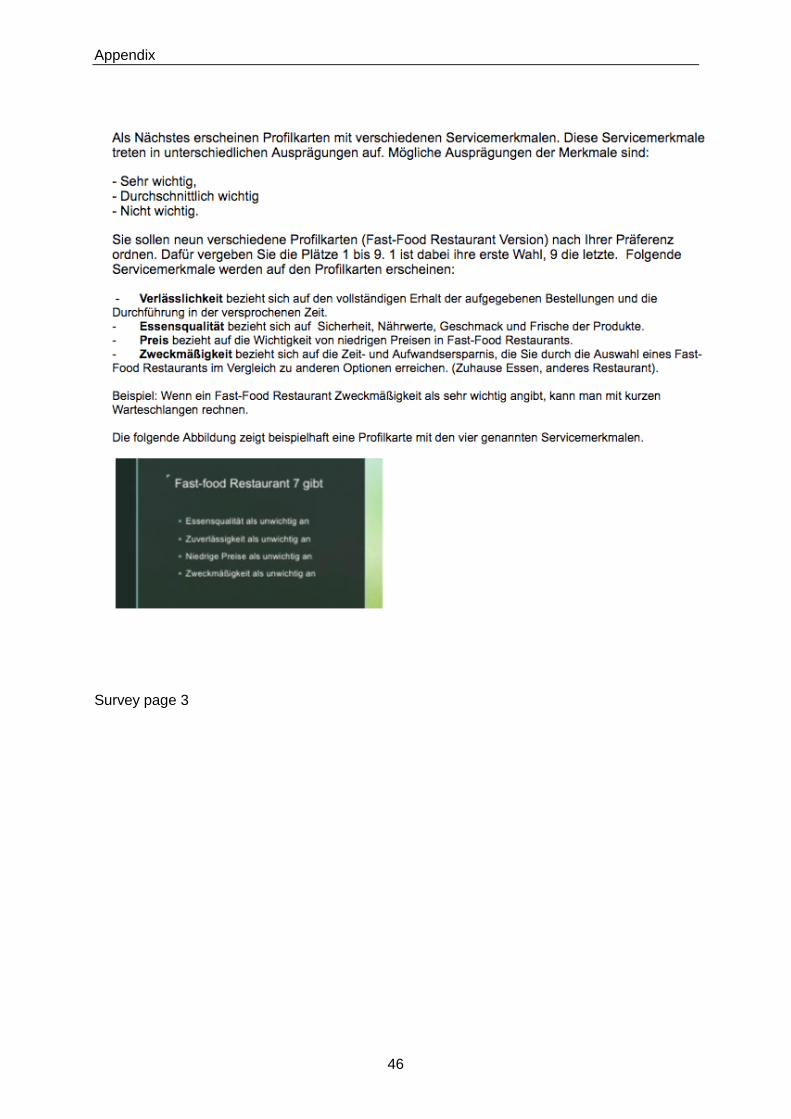
Appendix
46
Survey page 3

Appendix
47
Ordnen Sie die 9 Fast-food Restaurants nach Ihrer Präferenz 1 bis 9. Hierzu klicken Sie auf
die einzelnen Profilkarten und ziehen diese an die gewünschte Position.
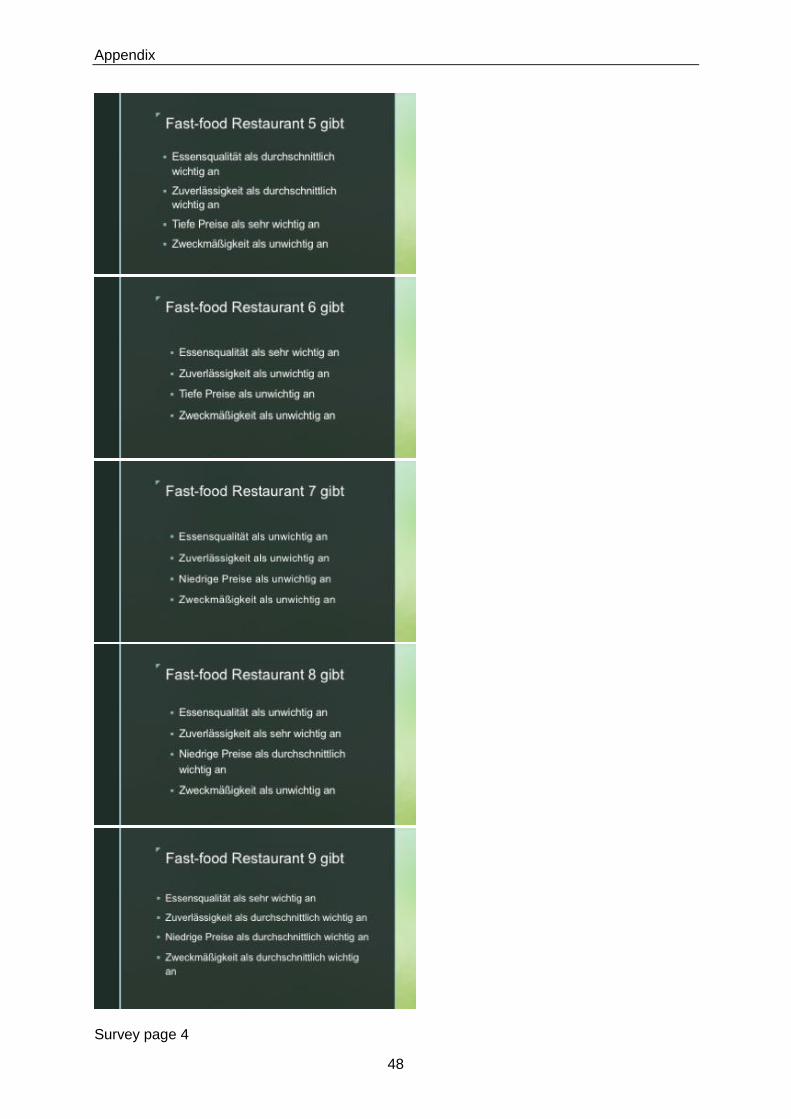
Appendix
48
Survey page 4

Appendix
49
Survey page 5
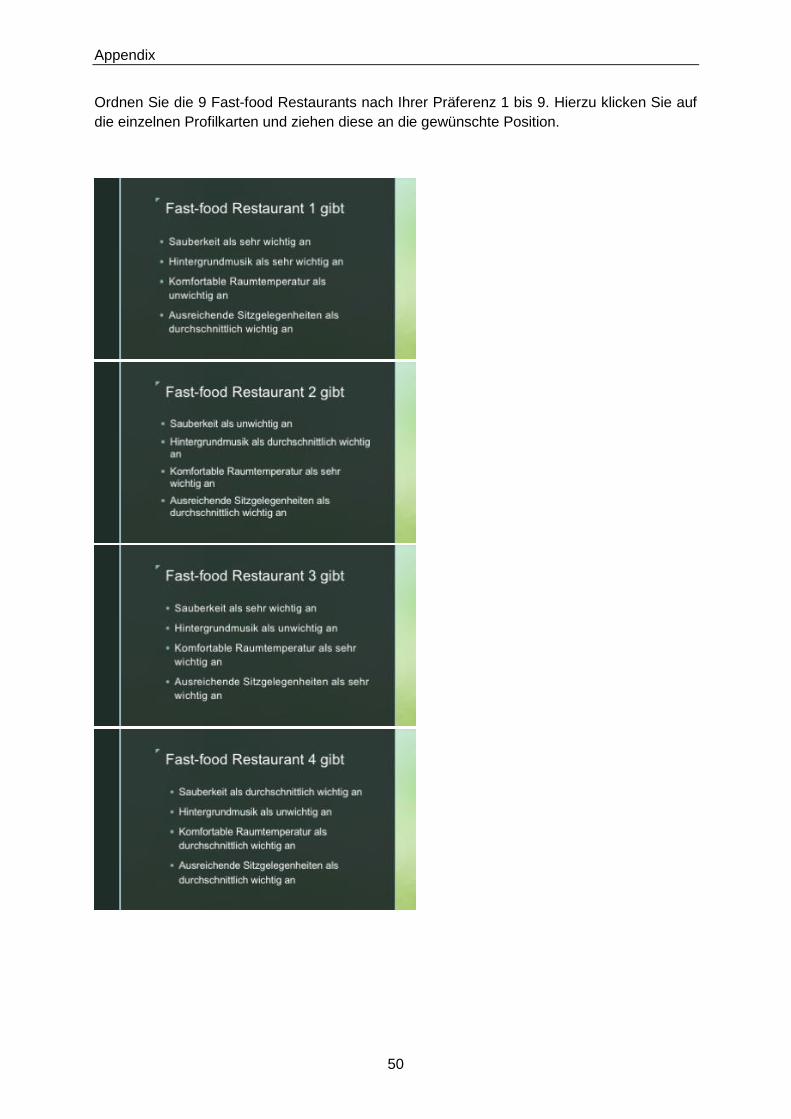
Appendix
50
Ordnen Sie die 9 Fast-food Restaurants nach Ihrer Präferenz 1 bis 9. Hierzu klicken Sie auf
die einzelnen Profilkarten und ziehen diese an die gewünschte Position.
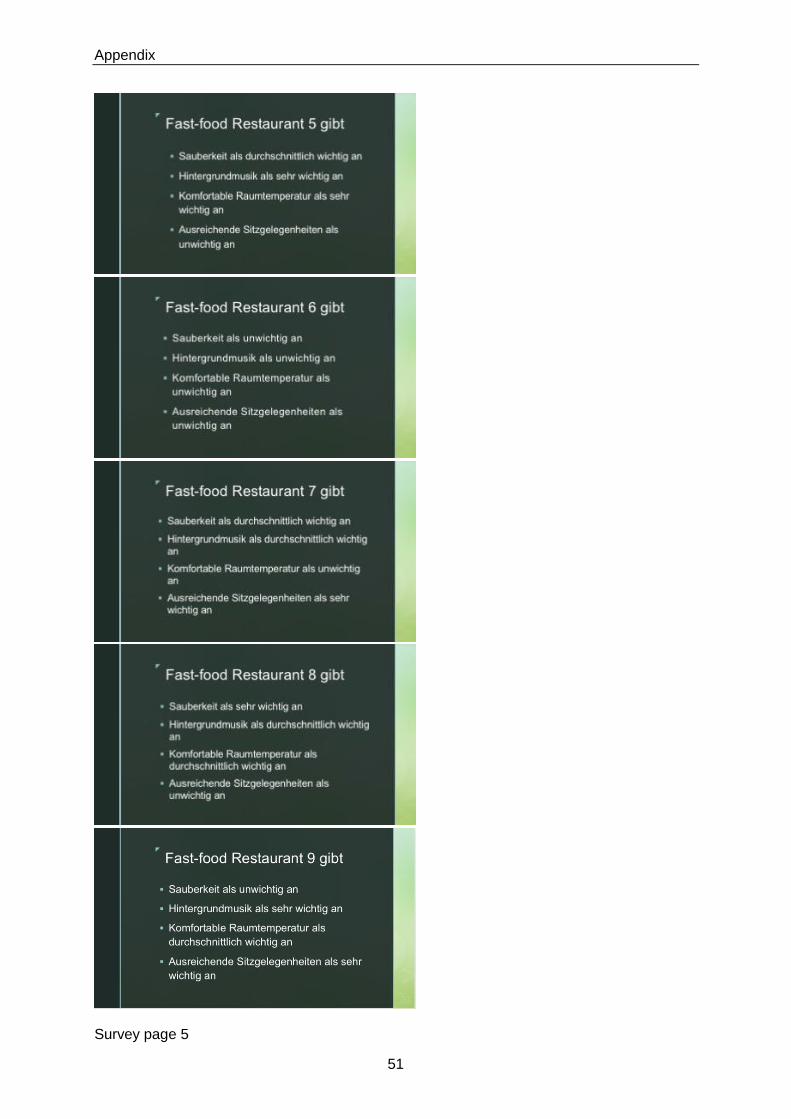
Appendix
51
Survey page 5
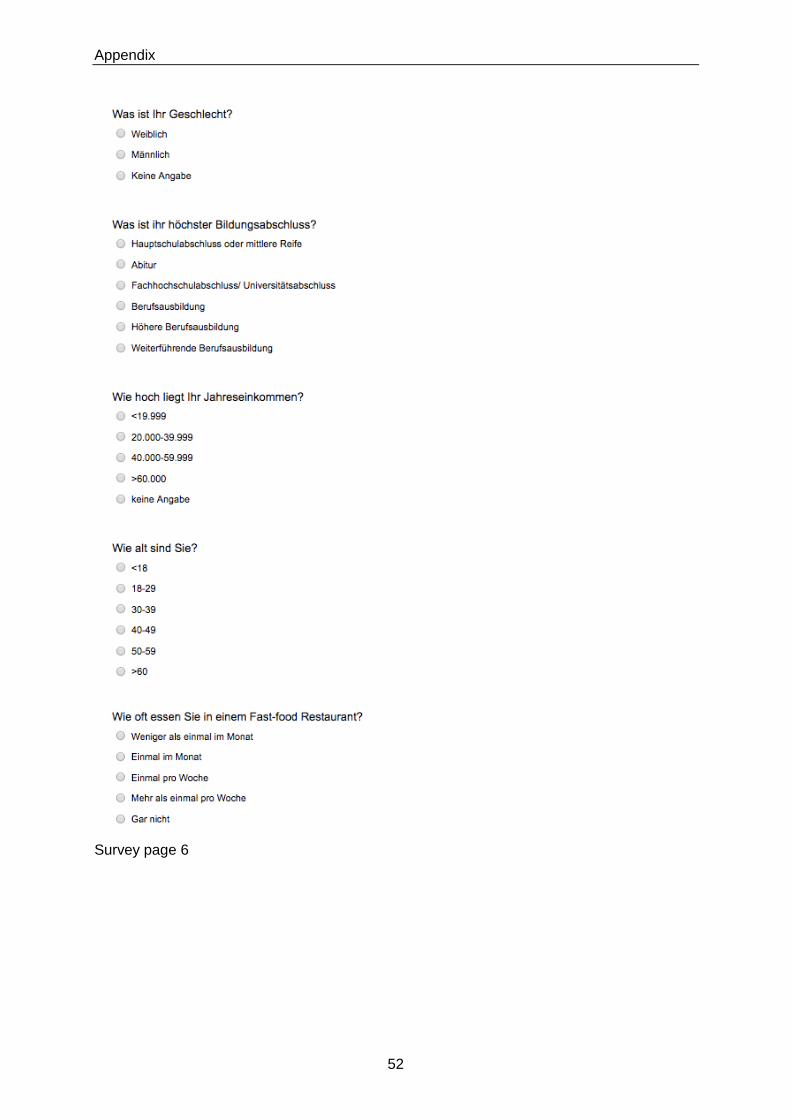
Appendix
52
Survey page 6