Time series forecasting: Obtaining long term trends with self-organizing maps
Upload
agriculturalathensuCategory
view
0download
0
Relative Efficiencies of the Maximum Parsimony and Distance-Matrix Methods in Obtaining the Correct Phylogenetic Tree’
John Sourdis2 and Masatoshi Nei Center for Demographic and Population Genetics, The University of Texas Health Science Center at Houston
The relative efficiencies of the maximum parsimony (MP) and distance-matrix methods in obtaining the correct tree (topology) were studied by using computer simulation. The distance-matrix methods examined are the neighbor-joining, dis- tance-Wagner, Tateno et al. modified Farris, Faith, and Li methods. In the computer simulation, six or eight DNA sequences were assumed to evolve following a given model tree, and the evolutionary changes of the sequences were followed. Both constant and varying rates of nucleotide substitution were considered. From the sequences thus obtained, phylogenetic trees were constructed using the six tree- making methods and compared with the model (true) tree. This process was repeated 300 times for each different set of parameters. The results obtained indicate that when the number of nucleotide substitutions per site is small and a relatively small number of nucleotides are used, the probability of obtaining the correct topology (P,) is generally lower in the MP method than in the distance-matrix methods. The Pi value for the MP method increases with increasing number of nucleotides but is still generally lower than the value for the NJ or DW method. Essentially the same conclusion was obtained whether or not the rate of nucleotide substitution was constant or whether or not a transition bias in nucleotide substitution existed. The relatively poor performance of the MP method for these cases is due to the fact that information from singular sites is not used in this method. The MP method also showed a relatively low Pi value when the model of varying rate of nucleotide substitution was used and the number of substitutions per site was large. However, the MP method often produced cases in which the correct tree was one of several equally parsimonious trees. When these cases were included in the class of “success,” the MP method performed better than the other methods, provided that the number of nucleotide substitutions per site was small.
Introduction
One of the most widely used methods of phylogenetic construction is the max- imum parsimony (MP) method. It is particularly popular among molecular evolu- tionists probably because of its simple logic-minimum evolution. However, the evo- lutionary change of a character does not necessarily occur parsimoniously. DNA and
1. Key words: maximum parsimony method, neighbor-joining method, distance-matrix methods.
2. Current address: Department of Genetics, Agricultural College of Athens, Iera Odos, Athens 11855, Greece.
Address for correspondence and reprints: Masatoshi Nei, Center for Demographic and Population Genetics, Graduate School of Biomedical Sciences, The University of Texas Health Science Center at Houston, P.O. Box 20334, Houston, Texas 77225.
Mol. Biol. Evol. 5(3):298-311. 1988. 0 1988 by The University of Chicago. All rights reserved. 0737-4038/88/0503-5307$02.00
298

Maximum Parsimony Method 299
amino acid sequences are particularly subject to backward and parallel substitutions, so that this method may produce an erroneous tree.
Another argument in favor of the MP method is that distance-matrix methods of tree making are inherently weaker than the MP method because information is lost in converting the original data into distances (see, e.g., Penny 1982). Some information is surely lost in the conversion of data, since the original data cannot be recovered from distances. However, the MP method also does not utilize all information available, because so-called singular sites (sites where all differences are unique; Fitch 1977) are discarded in the process of tree making. Saitou and Nei’s semianalytical study with four and five DNA sequences has shown that the MP method is not always superior to distance-matrix methods. To obtain a general conclusion on this problem, however, a more detailed study is necessary.
One way to study this problem is to set up a model tree, simulate the evolutionary changes of nucleotide or amino acid sequences following this model tree, and compare the tree reconstructed from the simulated sequences with the model tree. If this sim- ulation is repeated many times, it is possible to evaluate the probability of obtaining the correct tree for any particular tree-making method. This approach has been used to test various tree-making methods based on distance matrices (see, e.g., Peacock and Boulter 1975; Blanken et al. 1982; Tateno et al. 1982; Sourdis and Krimbas 1987). Unfortunately it is not easy to use this method to study the efficiency of the MP method, because it requires an enormous amount of computer time.
The reason why an enormous amount of computer time is required for the MP method is that the number of possible trees (topologies) to be examined is very large even for a small number of sequences and for each of these trees one has to evaluate the minimum number of substitutions required. In theoretical works, however, we know the true topology, so that if we examine a reasonable number of trees that are close to the true tree, we can almost always identify the topology with the minimum number of nucleotide substitutions. It is therefore possible to evaluate the accuracy of a reconstructed tree within a reasonable amount of computer time.
The purpose of the present paper is to examine the reliability of the MP method by using this approach. The results obtained will be compared with those of five different distance-matrix methods. The distance-matrix methods considered are Farris’s ( 1972) distance-Wagner (DW) method, Li’s ( 198 1) transformed-distance (LI) method, Tateno et al.‘s (1982) modified Farris (TA) method, Faith’s (1985) (FA) method, and Saitou and Nei’s (1987) neighbor-joining (NJ) method. The LI method is essentially the same as Farris’s ( 1977) or Klotz and Blanken’s ( 198 1) transformed-distance method (see Nei 1987, pp. 302-305) but is easier to use for the present purpose. The algorithms for these methods (except for the LI method) examine various possible topologies, but only one final tree is produced. Therefore, it is easy to study the reliabilities of the trees produced by these methods. In the present paper we will consider only the standard MP method that is routinely applied to molecular data (Eck and Dayhoff 1966, pp. 162-168; Fitch 197 1). We will also be concerned only with unrooted trees, because the MP method is designed to produce these trees.
Models and Methods of Simulation
Our scheme of computer simulation was similar to that of Tateno et al. ( 1982), Saitou and Nei ( 1987), and Sourdis and Krimbas ( 1987). The model trees used consisted of either six or eight DNA sequences. We considered two different topologies for each case (figs. 1, 2). One has a symmetric branching pattern or topology (A and B), and

(B) 6a
(C) 1: 4a
a-’
FIG. l.-Model trees used for computer simulation for the case of six sequences. A and C represent the cases of constant rate of substitution, and B and D represent the cases of varying rate of substitution. In trees A and C, the expected number of nucleotide substitutions from the ancestral sequence to an extant sequence is U (= 8a)/site. In trees B and D, the branch lengths are proportional to the expected number of nucleotides substitutions.
7 8
cc>
03
2 3
:
4 5
6 7
FIG. 2.-Model trees used for computer simulation for the case of eight sequences. A and C represent the cases of constant rate of substitution, and B and D represent the cases of varying rate of substitution. In trees A and C, the expected number of nucleotide substitutions from the ancestral sequence to an extant sequence is U (= lOa)/site. In trees B and D, the branch lengths are proportional to the expected number of nucleotide substitutions.

Maximum Parsimony Method 301
the other has an asymmetric one (C and D). We also considered constant and varying rates of nucleotide substitution for each of the two topologies. In figures 1 and 2, the branch lengths of each tree are proportional to the expected number of nucleotide substitutions. In all trees, the ratio of the lengths of internal branches to those of external branches is considerably smaller than that of the trees used by Tateno et al. (1982). This makes it more difficult to reconstruct the correct tree. In the case of constant rate of substitution (A and C), the expected number of substitutions per site from the ancestral sequence to the extant sequence is denoted by U, and the length of each branch was expressed as multiples of a, which is related to U as specified in each figure. We examined two different values of U, i.e., 0.05 and 0.5.
In the case of varying rate of nucleotide substitution, the expected number of substitutions for a branch was determined under the assumption that a follows a gamma distribution (see Tateno et al. [ 19821 for details of the procedure). The branch lengths of model trees C and D in figures 1 and 2 are proportional to the expected numbers thus obtained. Once the expected length of a particular branch was deter- mined, the actual number of nucleotide substitutions for that branch was obtained by using the Poisson distribution.
The ancestral sequence for each replicate simulation was generated by using pseudorandom numbers under the assumption that the four nucleotides A, T, C, and G are equally frequent. The ancestral sequence was duplicated at each branching point of the model tree and subjected to nucleotide substitution. We used two types of nucleotide substitution. One was random substitution among the four nucleotides (a one-parameter model), and the other was Kimura’s (1980) two-parameter model, in which transitional changes occur more frequently than transversional changes. In the latter case, we assumed that the rate of transitional changes is 20 times greater than the rate of transversional changes, following Brown et al.‘s (1982) observation in mi- tochondrial DNA (see Saitou and Nei [ 19861 for mathematical details). At the end of the evolutionary process considered, all nucleotide sequences were recorded.
These nucleotide sequences were then used for constructing a tree by the MP method as well as by each of the five different distance-matrix methods. For the dis- tance-matrix methods, the evolutionary distance between a pair of sequences was measured in terms of the proportion (p) of different nucleotides rather than in terms of the Jukes-Cantor estimate (d) of nucleotide substitutions. We did this because our previous studies (Saitou and Nei 1987; Sourdis and Krimbas 1987) showed that p is slightly better than d for estimating the topology of a tree. The reconstructed tree was then compared with the model tree.
As mentioned earlier, the number of trees to be examined by the MP method is very large even for a small number of sequences. For example, the number of possible unrooted trees for six and eight sequences is 105 and 10,395, respectively. However, many of these possible trees have a topology quite different from that of the model tree, and these trees may require a large number of nucleotide substitutions. If this is the case, we do not have to examine all the topologies to obtain the maximum par- simony tree.
To see whether this is true, we conducted a preliminary study, using model trees C and D in figure 1. Following the simulation scheme mentioned above and using U = 0.05, we generated six nucleotide sequences in each replication. Each sequence had 600 nucleotides. Using this set of sequences, we computed the minimum number of nucleotide substitutions required for each of the 105 possible topologies and related it to the topological distance between the model tree and the tree under consideration.
302 Sourdis and Nei
Table 1 Numbers of Trees Showing Various &‘s from the Model (Correct) Tree
Dt No. OF
SEQUENCES MODEL TREE 0 2 4 6 8 10 TOTAL
6 . . . . . . Fig. 1 (A and B) 1 6 24 74 105 6 . . . . . . . Fig. 1 (C and D) 1 6 24 74 105 8 8 :::::I:
Fig. 2 (A and B) 1 10 76 512 2,708 7,088 10,395 Fig. 2 (C and D) 1 10 64 350 1,808 8,162 10,395
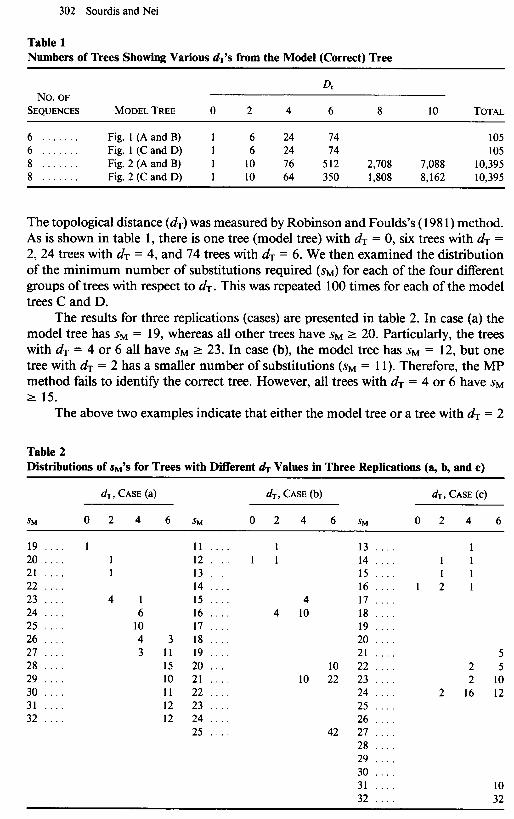
The topological distance (dr) was measured by Robinson and Foulds’s ( 198 1) method. As is shown in table 1, there is one tree (model tree) with & = 0, six trees with dT = 2, 24 trees with & = 4, and 74 trees with & = 6. We then examined the distribution of the minimum number of substitutions required (So) for each of the four different groups of trees with respect to & . This was repeated 100 times for each of the model trees C and D.
The results for three replications (cases) are presented in table 2. In case (a) the model tree has s M = 19, whereas all other trees have SM 2 20. Particularly, the trees with dr = 4 or 6 all have SM 2 23. In case (b), the model tree has SM = 12, but one tree with & = 2 has a smaller number of substitutions (SM = 11). Therefore, the MP method fails to identify the correct tree. However, all trees with & = 4 or 6 have SM r 15.
The above two examples indicate that either the model tree or a tree with & = 2
Table 2 Distributions of S~‘S for Trees with Different & Values in Three Replications (a, b, and c)
dT, CASE (a) dT, CASE (b) dT, CASE (c)
%4 0 2 4 6 sM 0 2 4 6 sM 024 6
19 . . . . 20 . . . . 21 . . . . 22 . . . . 23 . . . . 24 . . . . 25 . . . . 26 . . . . 27 . . . . 28 . . . . 29 . . . . 30 . . . . 31 . . . . 32 . . . .
1 1 1
4 1 6
10 4 3
11 . . . . 12 . . . . 13 . . . . 14 . . . . 15 . . . . 16 . . . . 17 . . . .
3 18 . . . . 11 19 . . . . 15 20 . . . . 10 21 . . . . 11 22 . . . . 12 23 . . . . 12 24 . . . .
25 . . . .
1 13 . . . . 1 1 14 . . . .
15 . . . . 16 . . . .
4 17 . . . . 4 10 18 . . . .
19 . . . . 20 . . . . 21 . . . .
10 22 . . . . 10 22 23 . . . .
24 . . . 25 . . . . 26 . . . .
42 27 . . . . 28 . . . . 29 . . . . 30 . . . . 31 . . . . 32 . . . .
1 1
1 2
2
5 2 5 2 10
16 12
10 32
Maximum Parsimony Method 303
has the smallest number of substitutions required and that in these two cases the MP tree can be identified without examining the trees with dT 2 4. Our computer simulation has shown that this is indeed the case with most replications. Only in two of 200 replicate simulations did a tree with & = 4 or 6 show the smallest number of substi- tutions (e.g., case [cl), and the result obtained was essentially the same for the cases of constant and varying rates of nucleotide substitution. A similar result was also obtained for the case of eight sequences in another set of 200 replicate simulations, though in this case trees with & = 6, 8, and 10 were not considered. We therefore decided to examine only trees with & = 0 or 2, to save computer time. This strategy makes the comparison of different tree-making methods favorable to the MP method, but the extent of the error introduced seems to be small.
Tateno et al. ( 1982) used two quantities to measure the relative efficiencies of different tree-making methods. One was the empirical probability of obtaining the correct topology (P) and the other was the average topological distance (&) from the model tree. Since there is a high correlation between P and &, in the present paper we have decided to use only the probability of obtaining the correct topology. The MP method, however, often produces two or more parsimonious trees, one of which is usually the correct tree. We have therefore classified our simulation results into three different cases: ( 1) the correct tree obtained, (2) the correct tree and some other trees showing the same minimum number of substitutions obtained, and (3) an in- correct tree obtained. The relative frequencies of these three cases will be denoted by P, , P2, and P3, respectively.
The distance-matrix methods considered here are all designed to produce a single final tree, as mentioned earlier. However, when these methods are applied to data on the proportions of nucleotide differences, they sometimes produce two or more different trees from a single distance matrix. This occurs because some pairs of sequences have the same distance value. These trees can easily be identified by changing the order of sequences in tree construction (Sourdis and Krimbas 1987). We followed this method in the present paper, and whenever the correct tree together with one or more other trees was obtained, we regarded this as a tie situation corresponding to event (2) in the MP method.
Results Symmetric Model Trees with Six Sequences
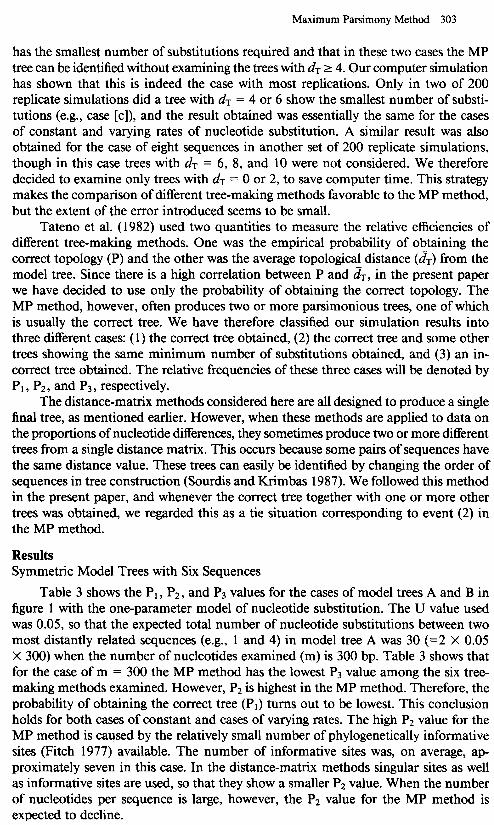
Table 3 shows the P1, P2, and P3 values for the cases of model trees A and B in figure 1 with the one-parameter model of nucleotide substitution. The U value used was 0.05, so that the expected total number of nucleotide substitutions between two most distantly related sequences (e.g., 1 and 4) in model tree A was 30 (=2 X 0.05 X 300) when the number of nucleotides examined (m) is 300 bp. Table 3 shows that for the case of m = 300 the MP method has the lowest P3 value among the six tree- making methods examined. However, P2 is highest in the MP method. Therefore, the probability of obtaining the correct tree (PI) turns out to be lowest. This conclusion holds for both cases of constant and cases of varying rates. The high P2 value for the MP method is caused by the relatively small number of phylogenetically informative sites (Fitch 1977) available. The number of informative sites was, on average, ap- proximately seven in this case. In the distance-matrix methods singular sites as well as informative sites are used, so that they show a smaller P2 value. When the number of nucleotides per sequence is large, however, the P2 value for the MP method is expected to decline.

304 Sourdis and Nei
Table 3 PI, Pz, and P3 Values Obtained in 300 Replications) for Model Trees A and C in Figure 1”
METHOD
CONSTANTRATE (ModelTree A) VARYINGRATE (Model Tree B)
PI PZ p3 PI p2 p3
300 bp: MP . . NJ . . DW . TA . . FA . . LI . . .
600 bp: MP . . NJ . . DW . TA . . FA . . LI . . .
1,200 bp: MP . . NJ . . DW . TA . . FA . . LI . . .
0.463 0.407 0.130 0.167 0.517 0.317 0.587 0.050 0.363 0.300 0.057 0.643 0.477 0.160 0.363 0.192 0.157 0.650 0.473 0.100 0.427 0.233 0.073 0.693 0.527 0.097 0.377 0.273 0.077 0.650 0.547 0.110 0.343 0.253 0.087 0.660
0.790 0.167 0.043 0.393 0.363 0.243 0.820 0.023 0.157 0.467 0.047 0.487 0.720 0.107 0.173 0.350 0.123 0.527 0.667 0.033 0.300 0.383 0.077 0.540 0.787 0.047 0.167 0.423 0.093 0.483 0.820 0.040 0.140 0.423 0.077 0.500
0.970 0.017 0.013 0.580 0.187 0.233 0.953 0.017 0.030 0.633 0.020 0.347 0.920 0.027 0.053 0.520 0.093 0.387 0.910 0.010 0.080 0.510 0.060 0.430 0.953 0.007 0.040 0.577 0.070 0.353 0.950 0.020 0.030 0.623 0.030 0.347
’ Six sequences; U = 0.05; one-parameter model.
That this is so is clear from the case of m = 600 bp. In both cases of constant and cases of varying rates, the P2 value for the MP method is substantially reduced, and the P1 value is now as high as that for some distance-matrix methods. Yet the MP method does not show the highest Pi value among the six tree-making methods examined. However, the P3 for the MP method is again smallest.
When a sequence of m = 1,200 bp is used and the substitution rate is constant, the Pi for the MP method (0.970) is now slightly higher than the highest value (0.953) among the distance-matrix methods, though the difference is not statistically significant, particularly when we know that our simulation is favorable for the MP method. In the case of varying rate, the Pi for the MP method is not the highest and the P2 still remains highest among the six tree-making methods examined.
On the basis of the results presented in table 3, it is clear that the MP method is inferior to the distance-matrix methods when m is small but that its relative perfor- mance improves substantially as m increases. However, for all the methods examined the P, value increases as m increases, and for m = 00 all of them are expected to produce the correct tree as long as U is relatively small and the rate of nucleotide substitution is constant. Saitou and Nei ( 1986) previously reached the same conclusion, but these authors considered only the problem of resolving a trichotomy in the presence of one or two outgroup sequences.
Table 3 includes the Pi, P2, and P3 values for the distance-matrix methods. In general, the NJ, FA, and LI methods show a higher Pi value than do the other two

Maximum Parsimony Method 305
Table 4 PI, P2, and Ps Values Obtained in 300 Replications for Model Trees A and C in Figure 1’
METHOD
CONSTANT RATE (Model tree A) VARYING RATE (Model tree B)
PI p2 p3 Pl p2 p3
300 bp: MP . . . . NJ . . . . DW . . . TA . . . . FA . . . . LI . . . . .
600 bp: MP . . . . NJ . . . . DW . . . TA . . . . FA . . . . LI . . . . .
1,200 bp: MP . . . . NJ . . . . DW . . . TA . . . . FA . . . . LI . . . . .
0.447 0.087 0.467 0.167 0.100 0.733 0.627 0.020 0.353 0.250 0.007 0.743 0.490 0.047 0.463 0.160 0.027 0.813 0.487 0.027 0.487 0.180 0.017 0.803 0.610 0.023 0.367 0.190 0.017 0.793 0.643 0.027 0.330 0.250 0.023 0.727
0.693 0.090 0.217 0.223 0.090 0.687 0.843 0.007 0.150 0.347 0.013 0.640 0.730 0.027 0.243 0.307 0.017 0.677 0.680 0.017 0.303 0.297 0.013 0.690 0.797 0.020 0.183 0.360 0.010 0.630 0.843 0.007 0.150 0.330 0.017 0.653
0.840 0.040 0.120 0.310 0.057 0.633 0.970 0.000 0.030 0.493 0.003 0.503 0.913 0.003 0.083 0.400 0.030 0.570 0.853 0.003 0.143 0.373 0.033 0.593 0.957 0.003 0.040 0.450 0.037 0.513 0.960 0.000 0.040 0.483 0.007 0.5 10
’ Six sequences; U = 0.5; one-parameter model.
methods. The NJ method is particularly good and shows the highest P1 value in all cases examined. It is also better than the MP method in all cases except one. When the rate of nucleotide substitution is not constant, the P, value declines considerably for all tree-making methods. However, the relative P1 values for the different tree- making methods are nearly the same as those for the case of constant rate.
Table 4 shows the PI, P2, and P3 values for the case of large expected number of nucleotide substitutions per site (U = 0.5) with the same model trees as those in table 3. In most distance-matrix methods, the P, values are slightly higher than those for the case of U = 0.05 when the substitution rate is constant (tree A). This is of course due to the fact that more nucleotide substitutions have occurred per sequence. However, the MP method shows a P1 value slightly lower than that for the case of U = 0.05. This indicates that, unlike the distance-matrix methods, the MP method suffers con- siderably from parallel and backward substitutions, which are expected to occur fre- quently in the present case. The performance of distance-matrix methods is also affected by parallel and backward mutations, but their effects are apparently smaller than those for the MP method because of the use of information on singular sites as well as that on informative sites. When U = 0.5, P3 is not necessarily smaller for the MP method than for the distance-matrix methods. Particularly, the P3 values for the NJ, FA, and LI methods are always smaller than the value for the MP method.
In all tree-making methods, when the expected rate of nucleotide substitution varies from evolutionary lineage to evolutionary lineage (model tree B in fig. l), the

306 Sourdis and Nei
Table 5 PI Values Obtained in 300 Replications for Model Trees A and B of Figure 1’
METHOD
CONSTANT RATE (Model Tree A) VARYING RATE (Model Tree B)
300 bp 600 bp 1,200 bp 300 bp 600 bp 1,200 bp
u = 0.05: MP . . . . NJ . . . . . DW . . . . TA . . . . FA . . . . LI . . . . .
u = 0.5: MP . . . . NJ . . . . . DW . . . , TA . . . . FA . . . . LI . . . . .
0.337 0.640 0.890 0.147 0.273 0.410 0.443 0.720 0.910 0.200 0.380 0.480 0.360 0.627 0.863 0.150 0.253 0.410 0.333 0.623 0.813 0.170 0.260 0.457 0.397 0.690 0.900 0.190 0.327 0.490 0.420 0.703 0.910 0.190 0.343 0.470
0.277 0.403 0.350 0.557 0.233 0.430 0.233 0.440 0.297 0.537 0.340 0.537
b . . .
b . . .
0.120 0.127
b . . .
b . . .
b . . .
b . . .
0.100 0.097 0.110 0.137
0.140 0.190
0.157 0.167 0.190 0.170
b . . .
b . . .
b . . . b
. . . b
. . . b
. . .
l Six sequences; two-parameter model. b The simulation for the case of 1,200 bp was not conducted because of the enormous amount of computer time
required.
Pr value is lower than that for the case of U = 0.05. It is only - 125% for m = 300 - 136% for m = 600. Therefore, a tree reconstructed from 1600 bp is not very reliable when the number of substitutions per site is large and the substitution rate varies with evolutionary lineage. The Pr value increases with increasing m, but it is still ~0.5 when m = 1,200. In the distance-matrix methods Pr is expected to be close to 1 when m = co. Particularly when m = co and the Jukes-Cantor distance is used, the tree becomes additive, and in this case at least the NJ method always gives the correct tree (see Saitou and Nei [ 19871 for mathematical proof). The PI for the MP method is also expected to increase with increasing m up to a certain point. When the substitution rate is not constant, however, increase in m does not necessarily lead to the correct tree (Felsenstein 1978). When m = 300, the P3 value for the MP method tends to be smaller than that for the other methods, but as m increases it becomes larger (table 4).
At this point, one might argue that, in comparing the efficiencies of different tree- making methods, P, + P2 rather than Pr should be used as a criterion because P2 includes the cases in which the correct tree was obtained. If we use this criterion, the MP method is superior to any of the distance-matrix methods in the case of U = 0.05 (table 3), though it is often inferior to them in the case of U = 0.5 (table 4). However, since we are interested in obtaining a unique final tree in the present paper, we shall use Pr as the criterion. This problem will be taken up again in the Discussion section.
Another factor that is expected to reduce the accuracy of a reconstructed tree is the transition bias in nucleotide substitution. The rate of transitional substitution is known to be considerably higher than that of transversional substitution in both nuclear and mitochondrial DNA (see Nei 1987, pp. 26-29, for a review). This bias is expected to result in a high frequency of parallel and backward changes for a given total number of substitutions and thus produce an erroneous tree more often than in the case of no transition bias. The results of computer simulation, given in table 5, confirm this

Maximum Parsimony Method 307
Table 6 PI Values Obtained in 300 Replications for Model Trees C and D of Figure 1’
METHOD
CONSTANT RATE (Model Tree C) VARYING RATE (Model Tree D)
u = 0.05 u = 0.5 u = 0.05 u = 0.5
300 bp 600 bp 300 bp 600 bp 300 bp 600 bp 300 bp 600 bp
MP NJ . DW TA . FA . LI . .
. . 0.437 0.820 0.603 0.813 0.347 0.553 0.383 0.627
. . 0.500 0.823 0.660 0.867 0.460 0.573 0.327 0.503
. . 0.473 0.810 0.700 0.873 0.440 0.597 0.440 0.653
. . 0.497 0.820 0.673 0.870 0.477 0.607 0.387 0.597
. . 0.473 0.797 0.623 0.847 0.440 0.563 0.337 0.533
. . 0.463 0.790 0.610 0.840 0.430 0.553 0.257 0.410
’ Six sequences; two-parameter model.
expectation; the Pi value is considerably lower in this case than in the case of no transition bias. Even if a sequence of 1,200 bp is used and the substitution rate is constant with U = 0.05, Pi 10.9 1. The MP method again shows a Pi value lower than that of the NJ method in all cases of m = 300, 600, and 1,200. When the rate of nucleotide substitution varies with evolutionary branch, the P1 value again declines substantially for all tree-making methods. The Pi value is also smaller when U = 0.5 than when U = 0.05.
Asymmetric Model Trees with Six Sequences
Table 6 shows the results when the asymmetric model trees (C and D) in figure 1 are used with the one-parameter model of nucleotide substitution. In the case of m = 300 bp, the P, value is again lower for the MP method than for the distance-matrix methods, except for the case of tree D and U = 0.5; but in the case of m = 600, Pi is nearly the same for both types of tree-making methods. Among the distance-matrix methods, the FA and LI methods tend to show a lower Pi value than do the other methods, in contrast to the case of the symmetric model trees, in which the DW and TA methods showed a lower P1 value than did the FA and LI methods. The NJ method again shows a relatively good performance, except in the case of varying rate with U = 0.5; in the latter case the DW method shows the highest Pi value. In general, however, the differences in Pi among different tree-making methods are smaller in the present case than in the case of symmetric model trees.
When the two-parameter model of nucleotide substitution was used, the PI value again declined for all cases, but the relative P1 values for different tree-making methods were nearly the same as those of table 6 (data not shown).
Model Trees with Eight Sequences
If we consider a given evolutionary time and assume that U remains the same, the P1 value is expected to decrease as the number of sequences increases. This is because the number of branching points in the tree increases. To see the effect of the number of sequences on the Pi value, we examined the case of eight sequences.
The results obtained for the case of model trees A and B of figure 2 with the one- parameter model of nucleotide substitution are presented in table 7. Comparison of this table with tables 3 and 4 indicates that the Pi value is almost always lower for the

308 Sourdis and Nei
Table 1 PI Values Obtained in 300 Replications for Model Trees A and B of Figure 2’
METHOD
CONSTANT RATE (Model Tree A) VARYING RATE (Model Tree B)
u = 0.05 u = 0.5 u = 0.05 u = 0.5
300 bp 600 bp 300 bp 600 bp 300 bp 600 bp 300 bp 600 bp
MP . . . . . 0.427 0.697 0.403 0.650 0.090 0.257 0.097 0.130 NJ . . . . . . 0.487 0.763 0.557 0.847 0.170 0.350 0.193 0.270 DW . . . . . 0.293 0.580 0.197 0.537 0.087 0.227 0.067 0.107 TA . . . . . . 0.320 0.473 0.130 0.303 0.113 0.263 0.067 0.110 FA . . . . . . 0.383 0.683 0.380 0.700 0.137 0.263 0.083 0.123 LI . . . . . . . 0.407 0.723 0.520 0.813 0.147 0.353 0.097 0.070
’ Eight sequences; one-parameter model.
case of eight sequences than for the case of six sequences. (In the present case the trees for 1,200 bp were not studied because of the enormous amount of computer time required.) However, the amount of decrease in P1 varies with tree-making method. In general, the amount of decrease is high in the TA method and low in the NJ and MP methods. The Pr value for the MP method is no longer smallest among the six tree-making methods examined, even for the case of U = 0.05 and m = 300. Yet it is always lower than the value for the NJ method.
Table 8 shows the P, value for model trees C and D of figure 2 with the one- parameter model of nucleotide substitution. Comparison of this table and table 6 shows that the Pr value for the case of eight sequences is again generally smaller than that for the case of six sequences. The NJ method shows the highest Pr value for the case of U = 0.05, but in the case of U = 0.5 the TA method shows the highest value. The P1 value for the MP method is often lowest among the six tree-making methods.
When the two-parameter model of nucleotide substitution was used, the Pr value further declined in all tree-making methods, but the relative values of P1 for different tree-making methods remained nearly the same (data not shown).
Table 8 PI Values Obtained in 300 Replications for Model Trees C and D of Figure 2”
METHOD
CONSTANT RATE (Model Tree C) VARYING RATE (Model Tree D)
u = 0.05 u = 0.5 u = 0.05 u = 0.5
300 bp 600 bp 300 bp 600 bp 300 bp 600 bp 300 bp 600 bp
MP . . 0.157 0.523 0.323 0.673 0.127 0.323 0.253 0.327 NJ . . . 0.267 0.617 0.410 0.740 0.213 0.443 0.250 0.387 DW . . 0.183 0.567 0.430 0.790 0.160 0.360 0.260 0.357 TA . . . 0.233 0.557 0.480 0.800 0.200 0.417 0.343 0.420 FA . . . 0.213 0.533 0.357 0.690 0.187 0.397 0.243 0.390 LI . . . . 0.210 0.497 0.343 0.690 0.193 0.390 0.210 0.277
’ Eight sequences; one-parameter model.
Maximum Parsimony Method 309
Discussion
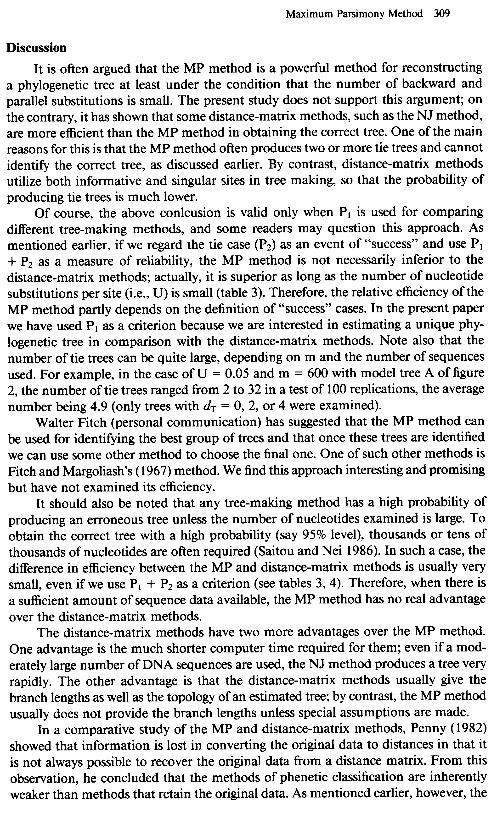
It is often argued that the MP method is a powerful method for reconstructing a phylogenetic tree at least under the condition that the number of backward and parallel substitutions is small. The present study does not support this argument; on the contrary, it has shown that some distance-matrix methods, such as the NJ method, are more efficient than the MP method in obtaining the correct tree. One of the main reasons for this is that the MP method often produces two or more tie trees and cannot identify the correct tree, as discussed earlier. By contrast, distance-matrix methods utilize both informative and singular sites in tree making, so that the probability of producing tie trees is much lower.
Of course, the above conlcusion is valid only when Pi is used for comparing different tree-making methods, and some readers may question this approach. As mentioned earlier, if we regard the tie case (Pz) as an event of “success” and use P, + P2 as a measure of reliability, the MP method is not necessarily inferior to the distance-matrix methods; actually, it is superior as long as the number of nucleotide substitutions per site (i.e., U) is small (table 3). Therefore, the relative efficiency of the MP method partly depends on the definition of “success” cases. In the present paper we have used P1 as a criterion because we are interested in estimating a unique phy- logenetic tree in comparison with the distance-matrix methods. Note also that the number of tie trees can be quite large, depending on m and the number of sequences used. For example, in the case of U = 0.05 and m = 600 with model tree A of figure 2, the number of tie trees ranged from 2 to 32 in a test of 100 replications, the average number being 4.9 (only trees with & = 0, 2, or 4 were examined).
Walter Fitch (personal communication) has suggested that the MP method can be used for identifying the best group of trees and that once these trees are identified we can use some other method to choose the final one. One of such other methods is Fitch and Margoliash’s ( 1967) method. We find this approach interesting and promising but have not examined its efficiency.
It should also be noted that any tree-making method has a high probability of producing an erroneous tree unless the number of nucleotides examined is large. To obtain the correct tree with a high probability (say 95% level), thousands or tens of thousands of nucleotides are often required (Saitou and Nei 1986). In such a case, the difference in efficiency between the MP and distance-matrix methods is usually very small, even if we use P, + P2 as a criterion (see tables 3, 4). Therefore, when there is a sufficient amount of sequence data available, the MP method has no real advantage over the distance-matrix methods.
The distance-matrix methods have two more advantages over the MP method. One advantage is the much shorter computer time required for them; even if a mod- erately large number of DNA sequences are used, the NJ method produces a tree very rapidly. The other advantage is that the distance-matrix methods usually give the branch lengths as well as the topology of an estimated tree; by contrast, the MP method usually does not provide the branch lengths unless special assumptions are made.
In a comparative study of the MP and distance-matrix methods, Penny (1982) showed that information is lost in converting the original data to distances in that it is not always possible to recover the original data from a distance matrix. From this observation, he concluded that the methods of phenetic classification are inherently weaker than methods that retain the original data. As mentioned earlier, however, the

3 10 Sourdis and Nei
MP method does not utilize all information contained in the original data. Furthermore, the original data themselves do not contain all information on the evolutionary change of DNA molecules. Therefore, Penny’s observation does not really support the su- periority of the MP method. It should also be noted that all distance-matrix methods considered here are intended to reconstruct the evolutionary history of macromolecules or organisms. Therefore, it is not proper to call them phenetic methods.
Our computer simulation has shown that the NJ method is generally more efficient than the other distance-matrix methods in obtaining the correct tree. This is consistent with Saitou and Nei’s (1987) previous observation. The NJ method is a special type of least-squares estimation, and it is probably this property that makes the method advantageous compared with others. However, it should also be noted that simulation results are always dependent on the model tree used. Although our conclusion is based on two extremely different types of model trees, it is desirable to examine the generality of the conclusion by using some additional different types of trees.
Acknowledgments
We thank Clay Stephens and David Penny for their comments on an earlier version of this paper. This study was supported by research grants from the National Institutes of Health and the National Science Foundation.
LITERATURE CITED
BLANKEN, R. L., L. C. KLOTZ, and A. G. HINNEBUSCH. 1982. Computer comparison of new and existing criteria for constructing evolutionary trees from sequence data. J. Mol. Evol. 19:9-19.
BROWN, W. M., E. M. PRAGER, A. WANG, and A. C. WILSON. 1982. Mitochondrial DNA sequences of primates: tempo and mode of evolution. J. Mol. Evol. 22:323-333.
ECK, R. V., and M. 0. DAYHOFF. 1966. Atlas of protein sequence and structure. National Biomedical Research Foundation, Silver Spring, Md.
FAITH, D. P. 1985. Distance methods and the approximation of most-parsimonious trees. Syst. Zool. 34:3 12-325.
FARRIS, J. S. 1972. Estimating phylogenetic trees from distance matrices. Am. Nat. 106:645- 668.
- 1977. On the phenetic approach to vertebrate classification. Pp. 823-850 in M. K. . HECHT, P. C. GOODY, and B. M. HECHT, eds., Major patterns in vertebrate evolution. Plenum, New York.
FELSENSTEIN, J. 1978. Cases in which parsimony or compatibility methods will be positively misleading. Syst. Zool. 27:40 l-4 10.
FITCH, W. M. 197 1. Toward defining the course of evolution: minimum change for a specific tree topology. Syst. Zool. 20:406-4 16.
- 1977. On the problem of discovering the most parsimonious tree. Am. Nat. 111:223- . 257.
FITCH, W. M., and E. MARGOLIASH. 1967. Construction of phylogenetic trees. Science 155: 279-284.
KIMURA, M. 1980. A simple method for estimating evolutionary rates of base substitutions through comparative studies of nucleotide sequences. J. Mol. Evol. 16: 1 1 l- 120.
KLOTZ, L. C., and R. L. BLANKEN. 198 1. A practical method for calculating evolutionary trees from sequence data. J. Theor. Biol. 91:261-272.
LI, W.-H. 198 1. Simple method for constructing phylogenetic trees from distance matrices. Proc. Natl. Acad. Sci. USA 78:1085-1089.
NEI, M. 1987. Molecular evolutionary genetics. Columbia University Press, New York.

Maximum Parsimony Method 3 11
PEACOCK, D., and D. BOULTER. 1975. Use of amino acid sequence data in phylogeny and evaluation of methods using computer simulation. J. Mol. Biol. 95:5 13-527.
PENNY, D. 1982. Towards a basis for classification: the incompleteness of distance measures, incompatibility analysis, and phenetic classification. J. Theor. Biol. 96: 129- 142.
ROBINSON, D. F., and L. R. FOULDS. 198 1. Comparison of phylogenetic trees. Math. Biosci. 53:131-147.
SAITOU, N., and M. NEI. 1986. The number of nucleotides required to determine the branching order of three species with special reference to the human-chimpanzee-gorilla divergence. J. Mol. Evol. 24: 189-204.
. 1987. The neighbor-joining method: a new method for reconstructing phylogenetic trees. Mol. Biol. Evol. 4:406-425.
SOURDIS, J., and C. KRIMBAS. 1987. Accuracy of phylogenetic trees estimated from DNA se- quence data. Mol. Biol. Evol. 4: 159-166.
TATENO, Y., M. NEI, and F. TAJIMA. 1982. Accuracy of estimated phylogenetic trees from molecular data. I. Distantly related species. J. Mol. Evol. l&387-404.
WALTER M. FITCH, reviewing editor
Received June 25, 1987; revision received December 8, 1987
Copyright © 2022 FDOKUMEN