Relationships of Selected CYP and ABCB1
377
Relationships of Selected CYP and ABCB1 Single Nucleotide Polymorphisms and Patient Characteristics with the Pharmacokinetics of Twice Daily Tacrolimus and Advagraf® in Renal Transplant Recipients By Toqa Mohamed El Nahhas BSc MSc This Thesis is submitted for the degree of Doctor of Philosophy of the Queen Mary University of London Clinical Pharmacology 2 London EC1M 6BQ January 2016
-
Upload
khangminh22 -
Category
Documents
-
view
1 -
download
0
Transcript of Relationships of Selected CYP and ABCB1
Relationships of Selected CYP and ABCB1
Single Nucleotide Polymorphisms and Patient
Characteristics with the Pharmacokinetics of
Twice Daily Tacrolimus and Advagraf® in
Renal Transplant Recipients
By
Toqa Mohamed El Nahhas BSc MSc
This Thesis is submitted for the degree of Doctor
of Philosophy of the Queen Mary University of
London
Clinical Pharmacology
2
London EC1M 6BQ
January 2016

Page 2 of 377
To My Parents, Husband
and My Daughter
Statement of Originality
Page 3 of 377
Statement of Originality
This is entirely my own work and all the quotations, illustrations and
source materials have been appropriately acknowledged.
Toqa El-Nahhas, January 2016
Abstract
Page 4 of 377
Abstract
Tacrolimus is one of the most potent immunosuppressive agents. It has almost replaced
ciclosporin (CsA) as the drug of first choice for the prevention of graft rejection after
kidney transplantation (Bouamar et al, 2013). Tacrolimus was initially available as a
preparation requiring twice daily administration: Prograf®. A prolonged release
preparation, Advagraf®, has become available recently with proven efficacy and safety
following once daily dosing. Tacrolimus has a narrow therapeutic window and its high
pharmacokinetic variability renders dose selection challenging. Therefore, therapeutic
drug monitoring (TDM) is used routinely to direct tacrolimus dosing. To some extent,
this variability is influenced by genetic factors. Enzymes in the cytochrome P4503A
family (CYP3A) and the drug transporter P-glycoprotein (P-gp) play important roles in
the absorption and metabolism of tacrolimus (MacPhee et al, 2002). The influence of
the CYP3A5*3 and ABCB1 3435C>T genotypes on the pharmacokinetics of immediate
release tacrolimus; Prograf® is well-defined. However, it is unclear for prolonged
release tacrolimus; Advagraf®. Recently identified polymorphisms CYP3A4*22 and
P450 Oxidoreductase (POR*28) were reported to have additional effects on tacrolimus
pharmacokinetics and dose requirement (Jonge et al., 2011; Elens et al., 2013).
Recently, 4β-hydroxycholesterol (4β-OHC) has been shown to be an endogenous
marker of P450 3A activity in clinical practice (Diczfalusy et al., 2011). Prednisolone is
a known inducer of both CYP3A and P-gp. The role of CYP3A4*22 and POR*28 in
prednisolone metabolism is unknown. An inverse correlation between corticosteroid
daily dose and tacrolimus exposure was demonstrated in renal transplant recipients
(Anglicheau et al., 2003a). Achieving therapeutic trough concentration is of vital
importance during the period immediately after transplantation. Therefore, the
identification of parameters predictive of the optimal tacrolimus dosage would be a
great clinical asset in the determination of adequate tacrolimus administration.
Furthermore, high within-patient variability (WPV) in tacrolimus exposure is
considered as a risk factor for allograft loss and late acute rejection (Wu, et al. 2011).
The causes of this variability are not completely understood.

Abstract
Page 5 of 377
The studies outlined in this thesis were carried out on stable renal transplant patients
treated with twice daily tacrolimus (Prograf®or Adoport®) and were switched to the
same total daily dose of Advagraf®. 24 hours pharmacokinetic profiles were performed
before and two weeks after the change. In order to exclude the use of prednisolone as a
confounding factor, only patients on not more than 5 mg prednisolone daily were
included. The within-patient variability (WPV) was calculated based on the dose-
normalized tacrolimus trough blood concentrations (C0). Analysis of C0 was also made
during periods of stable tacrolimus doses. This study was designed to assess the
influence of genetic polymorphisms CYP3A5*3 and ABCB1 3435C >T on tacrolimus
pharmacokinetics of immediate- and prolonged- release tacrolimus formulations and
their correlation with tacrolimus dosing in 64 stable renal transplant recipients.
Genotyping at CYP3A4*22 and POR*28 loci in this study was undertaken to ascertain
any influence of these genes on the pharmacokinetics of twice and once daily tacrolimus
formulations. The influence of switching stable renal transplant patients to once daily
tacrolimus formulation (Advagraf®) on WPV was investigated. In a secondary
exploratory study to investigate the potential utility of 4β-OHC as a CYP3A biomarker
in informing tacrolimus dosing, 4β-OHC concentrations in plasma samples was
measured and the relationship between 4β-OHC, CYP3A5*3 genotype and tacrolimus
exposure was examined. As another secondary exploratory study, prednisolone plasma
concentrations were measured to explore the relationship between the above mentioned
genetic polymorphisms and prednisolone exposure and its effect on tacrolimus dose.
A significantly lower tacrolimus exposure was observed in CYP3A5 expressers
compared with CYP3A5 non-expressers for both formulations. In contrast to CYP3A5*3
genotype, ABCB1 3435C>T gene had a minor influence on tacrolimus exposure
irrespective of tacrolimus formulation. When combined, tacrolimus pharmacokinetics
and dose requirements were significantly correlated with the combined-genotype
grouping. The CYP3A4*22 CT genotype was associated with significantly greater
tacrolimus exposure (AUC0-24, Cmax) compared with the CYP3A4*22 CC genotype.
POR*28 CT/TT genotype was associated with significantly lower tacrolimus exposure
compared with the POR*28 CC genotype in CYP3A5 non-expressing subjects.
Abstract
Page 6 of 377
Switching from immediate to prolonged release tacrolimus formulations in kidney
transplant patients was associated with a significantly lower tacrolimus trough
concentration (C0), but had no influence on WPV. CYP3A5 genotype had no impact on
WPV. Plasma concentration of 4β-OHC was greater in CYP3A5 expressers. The 4β-
OHC/C ratio was significantly correlated with tacrolimus exposure and dose
requirement. Prednisolone exposure was not influenced by CYP3A5*3, CYP3A4*22,
ABCB1 3435C>T or POR*28 genotype.
Our results indicate that CYP3A5*3, ABCB1 3435C>T and CYP3A4*22 polymorphisms
are important determinants of tacrolimus disposition and may explain part of the
clinically observed high between-individual variability in tacrolimus pharmacokinetics.
POR*28 is associated with tacrolimus dose requirement in CYP3A5 non-expressers.
Thus, genotyping at these loci before renal transplantation may provide important
information about the optimal initial dose of tacrolimus. Pharmacogenetic dosing
strategies based on these genotypes are likely to be equally applicable to prescribing the
once daily tacrolimus formulation, Advagraf®, as to twice daily formulations.
Moreover, switching from immediate to prolonged release tacrolimus formulations had
no influence on WPV. 4β-OHC/C ratio may be a useful biomarker for tacrolimus dosing
in renal transplanted patients. Genotyping at CYP3A5*3, CYP3A4*22, POR*28 and
ABCB1 3435C>T loci is unlikely to allow individualization of prednisolone dose.

Publications
Page 7 of 377
Publications
Abstracts
1. Elnahhas.T., Popoola.J., Ramkhelawon. R., MacPhee. I and Johnston. A.
Tacrolimus intra-patient variability: The impact of conversion from immediate
(Prograf®) to prolonged release (Advagraf®) tacrolimus formulations in stable
renal transplant patients. BPS Winter Meeting, December 2012. London, UK.
2. T. El-Nahhas, J. Popoola, R. Ramkhelawon, A. Johnston, I. MacPhee. Intra-
Patient Variability In Tacrolimus Trough Concentrations And Conversion Of
Stable Renal Transplant Patients From Twice Daily (Prograf®) To Once Daily
(Advagraf®). BTS Meeting, March 2013. Bournemouth, UK.
3. Toqa El-Nahhas, Michelle Moreton, Terry Lee, Denise McKeown, Joyce
Popoola, Rajeshwar Ramkhelawon, Iain MacPhee, Atholl Johnston. CYP3A4*22
as Pharmacogenomic Predictor of Tacrolimus Pharmacokinetics in Renal
Transplant Recipients. BPS Winter Meeting, December 2013. London, UK.
4. Toqa El-Nahhas, Michelle Moreton, Terry Lee, Denise McKeown, Joyce
Popoola, Rajeshwar Ramkhelawon, Iain MacPhee, Atholl Johnston. The
Influence of P450 Oxidoreductase*28 Polymorphism on the Pharmacokinetics
of Tacrolimus in Stable Renal Transplant Patients. BPS Winter Meeting,
December 2013. London, UK.
5. Toqa El-Nahhas, Michelle Moreton, Terry Lee, Denise McKeown, Joyce
Popoola, Rajeshwar Ramkhelawon, Atholl Johnston, Iain MacPhee.
CYP3A5/ABCB1 Combined Genotype Has Similar Influence on
Pharmacokinetics of Immediate and Prolonged Release Tacrolimus in Renal
Transplant Recipients. BTS Meeting, February 2014. Glasgow, UK.
6. Toqa El-Nahhas, Michelle Moreton, Terry Lee, Denise McKeown, Joyce
Popoola, Rajeshwar Ramkhelawon, Atholl Johnston, Iain MacPhee. Impact of
CYP3A5 and ABCB1 Genotype on the Pharmacokinetics of Prednisolone in
Renal Transplant Recipients. BTS Meeting, February 2014. Glasgow, UK.
7. Toqa El-Nahhas, Terry Lee, Michelle Moreton, Denise McKeown, Joyce
Popoola, Rajeshwar Ramkhelawon, Iain MacPhee, Atholl Johnston. Impact of
CYP3A5 and ABCB1 Polymorphisms on the Pharmacokinetics of immediate and
prolonged release Tacrolimus Formulations in Renal Transplant Recipients. BPS
Winter Meeting, December 2014. London, UK.

Publications
Page 8 of 377
8. Toqa El-Nahhas, Evert de Jonge, Terry Lee, Bertrand van Zelst, Joyce Popoola,
Rajeshwar Ramkhelawon, Ron van Schaik, Iain MacPhee, Atholl Johnston. The
Association of plasma 4β-hydroxycholesterol measurement as a potential
biomarker for CYP3A5 activity in informing tacrolimus dosing. BPS Winter
Meeting, December 2014. London, UK.
9. Toqa El-Nahhas, Michelle Moreton, Joyce Popoola, ShariRose Abat, Atholl
Johnston and Iain MacPhee. Conversion From Immediate To Prolonged Release
Tacrolimus Did Not Change Intra-Patient Variability In Renal Transplant
Patients. BTS Meeting, March 2015. Bournemouth, UK.
10. Toqa El-Nahhas, Terry Lee, Michelle Moreton, Denise McKeown, Joyce
Popoola , Rajeshwar Ramkhelawon , Atholl Johnston and Iain MacPhee.
Influence of CYP3A5 and ABCB1 Genotypes on Pharmacokinetics of Immediate
and Prolonged Release Tacrolimus Preparations. BTS Meeting, March 2015.
Bournemouth, UK.
11. Toqa El-Nahhas, Evert de Jonge, Terry Lee, Bertrand D van Zelst, Joyce
Popoola, Rajeshwar Ramkhelawon, Ron H. N. van Schaik, Atholl Johnston and
Iain MacPhee. Plasma 4β-Hydroxycholesterol Measurement as a Potential
Biomarker for CYP3A5 Activity in Informing Tacrolimus Dosing. BTS
Meeting, March 2015. Bournemouth, UK.
12. T. El-Nahhas, M. Moreton,J. Popoola, S. Abat, A. Johnston, I. MacPhee.
Conversion from Immediate to Prolonged Release Tacrolimus Did Not Change
Intra-Patient Variability in Renal Transplant Patients. American Transplant
Congress 2015. Philadelphia, USA.
13. El-Nahhas T, de Jonge E, Lee T, van Zelst B, Popoola J, Ramkhelawon R, van
Schaik R, Johnston A, MacPhee I. Plasma 4β-Hydroxycholesterol Measurement
as a Potential Biomarker for CYP3A5 Activity in Informing Tacrolimus Dosing
[abstract]. Am J Transplant. 2015. Philadelphia, USA.
14. T. El-Nahhas, T. Lee, M. Moreton, D. McKeown, J. Popoola, R. Ramkhelawon,
A. Johnston, I. MacPhee. Influence of CYP3A5 and ABCB1 Genotypes on
Pharmacokinetics of Immediate and Prolonged Release Tacrolimus
Preparations. American Transplant Congress 2015. Philadelphia, USA.
Acknowledgement
Page 9 of 377
Acknowledgements
First of all, my humble praise and gratitude to almighty Allah; the most gracious, the
most merciful, for granting me all the blessing throughout my life
Thanks to the government of the Arab Republic of Egypt for giving me the opportunity
and full support to study PhD in London.
My great thanks go to my supervisors Prof. Atholl Johnston and Dr. Iain MacPhee for
providing me the opportunity to complete my PhD thesis and to make my thesis work
possible. They have been actively interested in my work and have always been available
to advise me. I am very grateful for their patience, motivation, enthusiasm, and
immense knowledge in the field of drug pharmacokinetics in renal medicine.
My sincere thanks also to my colleagues at analytical service international (ASI), St
George’s hospital, especially Terry Lee, Denise Mckeown, and Michelle Moreton for
providing me with the necessary technical support whilst carrying out my research.
From all of them, I learnt many things; they have been so kind to help, assist and
support me during different phases of the work. It has been great working with you all.
Special thanks to the Renal Clinic staff at St George’s hospital, especially Dr Joyce
Popoola for their kind assistance and support who enable this research to be performed.
I am also thankful to Jose Antonio from Cardiological Sciences, St George’s hospital
for helping me with the DNA sequencing. Also, thanks to all the patients, whom
without their participation this research would’ve been impossible.
I would like to profusely thank Professor Ron van Schaik from Erasmus MC University
of Netherlands who provided me an opportunity to join his team, and access to the
laboratory and research facilities. Without his team kind help and support it would not
have been possible to conduct an important part of my research.
Acknowledgement
Page 10 of 377
Warmest thanks to all my friends and colleagues at the Clinical Pharmacology
Department at William Harvey Research Institute for their help and support. It has been
a pleasure working with you all.
I take this opportunity to express my greatest regards to my parents for their support and
constant encouragement. Also, I would like to deeply thank my beloved sincere
husband for all his patience, cooperation, understanding, motivation and support during
my entire PhD study. My thanks are also due to my brother, sister and my brothers- and
sisters-in-law for their continued support and encouragement.
Table of Contents
Page 11 of 377
Table of Contents
Statement of Originality ...................................................................................................... 3
Abstract................................................................................................................................ 4
Publications ......................................................................................................................... 7
Acknowledgements ............................................................................................................. 9
Table of Contents .............................................................................................................. 11
List of Tables ..................................................................................................................... 19
List of Figures.................................................................................................................... 25
List of Abbreviations ......................................................................................................... 31
Chapter 1. General Introduction and Thesis Summary ..................................................... 35
Chapter 2. Background ...................................................................................................... 38
2.1 Renal Failure and Immunosuppression Therapy .............................................. 38
2.1.1 Renal Failure ............................................................................................. 38
2.1.1.1 Epidemiology of Chronic Kidney Disease ........................................ 38
2.1.1.2 Risk Factors for Chronic Kidney Disease.......................................... 39
2.1.2 Renal Replacement Therapy ..................................................................... 42
2.1.3 The Role of the Immune System in Transplantation ................................ 42
2.1.3.1 Innate Immune Response ................................................................... 43
2.1.3.2 Adaptive Immune Systems ................................................................ 44
2.1.3.3 Mechanism of Alloimmune Responses ............................................. 47
2.1.4 Immunosuppressive Therapy .................................................................... 48
2.1.4.1 Corticosteroids ................................................................................... 52
2.1.4.2 Calcineurin Inhibitor (CNI) ............................................................... 53
2.1.4.3 Antiproliferative Agents .................................................................... 55
2.1.4.4 Sirolimus ............................................................................................ 57
2.1.4.5 Antibody Immunosuppressive Therapy ............................................. 58
Table of Contents
Page 12 of 377
2.1.4.6 Belatacept........................................................................................... 59
2.1.5 Therapeutic Index and Therapeutic Drug Monitoring .............................. 60
2.1.5.1 Trough Concentration Monitoring (C0) ............................................. 62
2.1.5.2 Area under the Curve (AUC) Monitoring.......................................... 62
2.1.5.3 Abbreviated Area under the Curve Monitoring ................................. 62
2.1.5.4 C2 Monitoring.................................................................................... 62
2.2 Introduction on Bioequivalence and Genotyping Studies ................................ 63
2.2.1 Bioequivalence-Narrow Therapeutic Index Drugs ................................... 63
2.2.2 Genotyping Procedure ............................................................................... 65
2.2.2.1 Polymerase Chain Reaction (PCR) and DNA Sequencing ................ 66
Chapter 3. Pharmacokinetics and Pharmacogenomics of Tacrolimus: A Review ............ 74
3.1 Tacrolimus Pharmacokinetics .......................................................................... 77
3.1.1 Absorption ................................................................................................. 77
3.1.2 Distribution ............................................................................................... 79
3.1.3 Metabolism ................................................................................................ 80
3.1.4 Elimination ................................................................................................ 80
3.2 Tacrolimus Pharmacogenomics ....................................................................... 81
3.2.1 Cytochrome P450 (CYP450) 3A .............................................................. 81
3.2.1.1 CYP3A5 .............................................................................................. 82
3.2.1.2 CYP3A4 .............................................................................................. 93
3.2.1.3 POR*28 .............................................................................................. 95
3.2.2 PXR ........................................................................................................... 97
3.2.3 ABCB1 ....................................................................................................... 98
3.3 Prednisolone Influence on Tacrolimus Pharmacokinetics ............................. 101
3.4 Tacrolimus Within-Patient Variability ........................................................... 103
3.5 4β-hydroxycholesterol as a Potential Biomarker for CYP3A5 Activity ........ 108
Table of Contents
Page 13 of 377
Chapter 4. Comparative Pharmacokinetics Assessments of Immediate- and Prolonged-
Release Tacrolimus: Associations with CYP3A5 and ABCB1 Genotypes. ..................... 110
4.1 Objective of the Study .................................................................................... 110
4.2 Materials & Methods ...................................................................................... 110
4.2.1 Eligibility Criteria ................................................................................... 110
4.2.1.1 Inclusion Criteria ............................................................................. 110
4.2.1.2 Exclusion Criteria ............................................................................ 111
4.2.2 Study Design ........................................................................................... 111
4.2.3 Study Treatments .................................................................................... 113
4.2.4 Genotyping Determination ...................................................................... 113
4.2.4.1 Materials and Methods..................................................................... 113
4.2.4.2 DNA Extraction and Purification Procedure ................................... 113
4.2.4.3 CYP3A5*3 and ABCB1 3435C>T Genotyping ............................... 114
4.2.5 Determination of Ethnicity ...................................................................... 115
4.2.6 Study Procedure ...................................................................................... 115
4.2.6.1 Tacrolimus Analysis ........................................................................ 117
4.2.7 Statistical and Pharmacokinetic Analysis ............................................... 121
4.3 Results ............................................................................................................ 121
4.3.1 Pharmacokinetics and Bioequivalence of Tacrolimus Preparations in
Stable Renal Transplant Patients. .......................................................................... 121
4.3.1.1 Patient Population ............................................................................ 122
4.3.1.2 Efficacy and Safety .......................................................................... 123
4.3.1.3 Tacrolimus Pharmacokinetics .......................................................... 123
4.3.2 Associations of CYP3A5 and ABCB1 3435C>T Genotypes with Doses and
Pharmacokinetics of Tacrolimus Formulations. .................................................... 137
4.3.2.1 CYP3A5*3 and ABCB1 3435C>T Genotype Analysis and Their
Frequencies ..................................................................................................... 137
4.3.2.2 Association of CYP3A5 Genotypes with Tacrolimus Pharmacokinetic
Profiles ......................................................................................................... 139

Table of Contents
Page 14 of 377
4.3.2.3 Associations between ABCB1 3435C>T Variants and Tacrolimus
Pharmacokinetic Profiles ................................................................................ 146
4.3.2.4 Associations between CYP3A5*3 and ABCB1 3435C>T Combined
Genotypes and Tacrolimus Pharmacokinetic Profiles .................................... 153
4.3.2.5 Factors Associated with Dose Requirements of Tacrolimus ........... 163
4.4 Discussion ...................................................................................................... 166
4.4.1 Pharmacokinetics and Bioequivalence of Once- and Twice-Daily
Tacrolimus Preparations in Stable Renal Transplant Patients. .............................. 166
4.4.2 CYP3A5*3 and ABCB1 3435C>T Associations with Tacrolimus
Preparations Pharmacokinetics and Dose Requirements. ...................................... 168
Chapter 5. Associations of CYP3A4*22 and POR*28 Genotypes with Pharmacokinetics
of Immediate and Prolonged Release Tacrolimus Preparations. ..................................... 172
5.1 Rapid Genotyping Methods for CYP3A4*22 and POR*28 Polymorphisms with
Real-time Polymerase Chain Reaction Fluorescence Resonance Energy Transfer
Assays. ....................................................................................................................... 172
5.1.1 Introduction ............................................................................................. 172
5.1.2 Materials and Methods ............................................................................ 173
5.1.2.1 CYP3A4*22 and POR*28 Genotyping with Real-time PCR ........... 174
5.1.2.2 CYP3A4*22 and POR*28 Genotyping with DNA Sequencing ....... 175
5.1.2.3 Statistical Analysis ........................................................................... 178
5.1.3 Results ..................................................................................................... 178
5.1.4 Discussion and Conclusions .................................................................... 181
5.2 CYP3A4*22 and POR*28 Genotype Associations with Tacrolimus
Pharmacokinetics and Dose Requirements in Twice-Daily Tacrolimus and
Advagraf®. ................................................................................................................. 182
5.2.1 Objective of the Study ............................................................................. 182
5.2.2 Materials and Methods ............................................................................ 182
5.2.2.1 Study Design .................................................................................... 182
5.2.2.2 Pharmacokinetic and Statistical Analysis ........................................ 182

Table of Contents
Page 15 of 377
5.2.3 Results ..................................................................................................... 183
5.2.3.1 Patient Characteristics...................................................................... 183
5.2.3.2 CYP3A4*22 & Tacrolimus Disposition ........................................... 185
5.2.3.3 CYP3A5*3-CYP3A4*22 Combined Genotypes & Tacrolimus
Disposition ...................................................................................................... 190
5.2.3.4 The Relationship between POR*28 Polymorphism and Tacrolimus
Pharmacokinetics ............................................................................................ 196
5.2.3.5 POR*28 Polymorphism Association with Tacrolimus
Pharmacokinetics in CYP3A5 Expressers and Non-Expressers. .................... 200
5.2.3.6 Factors Associated with Dose Requirements of Tacrolimus. .......... 208
5.2.4 Discussion ............................................................................................... 208
Chapter 6. 4β-hydroxycholesterol Measurement as a Potential Biomarker for CYP3A4
and CYP3A5 Activity in Informing Tacrolimus Dosing. ............................................... 211
6.1 Introduction .................................................................................................... 211
6.2 Objective of the Study .................................................................................... 211
6.3 Materials and Methods ................................................................................... 211
6.3.1 Patients and Study Design ....................................................................... 211
6.3.2 4β-hydroxycholesterol Analysis ............................................................. 212
6.3.2.1 Instrumentation ................................................................................ 212
6.3.2.2 Chemicals and Reagents .................................................................. 213
6.3.2.3 Stock Solutions ................................................................................ 213
6.3.2.4 Extraction Procedure........................................................................ 213
6.3.2.5 Chromatographic Condition: ........................................................... 214
6.3.3 Tacrolimus Blood Concentration Measurement ..................................... 217
6.3.4 Determination of CYP3A5 Genotype. ..................................................... 217
6.3.5 Statistical Analysis .................................................................................. 217
6.4 Results ............................................................................................................ 218
6.4.1 Demographic Data. ................................................................................. 218
6.4.2 CYP3A5 Genotype Relationship with 4β-OHC and 4β-OHC/C Ratio ... 219
Table of Contents
Page 16 of 377
6.4.3 CYP3A5 Genotype Association with Tacrolimus Pharmacokinetics and
Dose Requirement.................................................................................................. 224
6.4.4 The Relationship of 4β-OHC with Tacrolimus Exposure and Dose
Requirement ........................................................................................................... 226
6.5 Discussion ...................................................................................................... 229
Chapter 7. Tacrolimus Within-Patient Variability: the Impact of Conversion from
Immediate (Prograf® or Adoport®) to Prolonged Release (Advagraf®) Tacrolimus
Formulations in Stable Renal Transplant Patients........................................................... 231
7.1 Objective of the Study .................................................................................... 231
7.2 Materials and Methods ................................................................................... 231
7.2.1 Patients and Study Design: ..................................................................... 231
7.2.2 Within-Patient Variability (WPV) Calculation: ...................................... 232
7.2.3 Statistical Analysis .................................................................................. 233
7.3 Results ............................................................................................................ 233
7.3.1 Patients’ Characteristics at Baseline (Pre-Conversion Patient
Characteristics) ...................................................................................................... 233
7.3.2 Post-conversion Follow-Up .................................................................... 235
7.3.2.1 Graft Renal Function: One Year Follow-Up ................................... 235
7.3.2.2 One Year Follow-Up of Tacrolimus Exposure and Dosing after
Conversion to Advagraf® ................................................................................ 236
7.3.3 Effect of the Switch to Advagraf® during Stable Dosing Periods and the
Entire Time Pre- and Post- Conversion. ................................................................ 237
7.3.3.1 Tacrolimus Exposure and Daily Dosing during Stable Dosing Periods
and the Entire Time Pre- and Post- Conversion.............................................. 238
7.3.3.2 Effect of Conversion to OD-Tac on Tacrolimus WPV during Stable
Dosing Periods and the Entire Time Pre- and Post- Conversion .................... 240
7.3.4 Genetic Polymorphisms and WPV ......................................................... 244
7.3.4.1 The Relationship between CYP3A5*3 Genotype and WPV ............ 244

Table of Contents
Page 17 of 377
7.4 Discussion and Conclusion ............................................................................ 250
Chapter 8. Pharmacogenetic Association with Prednisolone and Prednisone Exposure 254
8.1 Validation of Liquid Chromatography – Mass Spectrometry (LC-MS/MS)
Method for the Analysis of Prednisolone and Its Metabolite in Human Plasma. ..... 255
8.1.1 Introduction ............................................................................................. 255
8.1.2 Materials and Methods ............................................................................ 255
8.1.2.1 Prednisolone-Prednisone Analysis .................................................. 255
8.1.2.2 Method Development and Validation .............................................. 260
8.1.3 Results ..................................................................................................... 265
8.1.3.1 Specificity ........................................................................................ 267
8.1.3.2 Matrix Effect .................................................................................... 269
8.1.3.3 Calibration ....................................................................................... 271
8.1.3.4 Accuracy and Precision ................................................................... 272
8.1.3.5 Recovery .......................................................................................... 277
8.1.3.6 Short-Term Stability in Matrix ........................................................ 279
8.1.3.7 Autosampler Stability ...................................................................... 283
8.1.4 Discussion and Conclusion ..................................................................... 286
8.2 The Genetic Association between CYP3A5*3, CYP3A4*22, POR*28 and
ABCB1 3435 and the Pharmacokinetics of Prednisolone and Prednisone. ............... 288
8.2.1 Introduction ............................................................................................. 288
8.2.2 Objective of the Study ............................................................................. 288
8.2.3 Materials and Methods ............................................................................ 288
8.2.3.1 Patients and Study Design ............................................................... 288
8.2.3.2 Genotyping....................................................................................... 289
8.2.3.3 Prednisolone and Prednisone Analysis in Plasma ........................... 289
8.2.3.4 Pharmacokinetic and Statistical Analysis ........................................ 289
8.2.4 Results ..................................................................................................... 290
8.2.4.1 Patient Population ............................................................................ 290

Table of Contents
Page 18 of 377
8.2.4.2 Sample Analysis .............................................................................. 290
8.2.4.3 The Relationship between CYP3A5*3 Genotype and Prednisolone-
Prednisone Pharmacokinetics. ........................................................................ 302
8.2.4.4 The Association between ABCB1 3435 Genotype and Prednisolone -
Prednisone Pharmacokinetics. ........................................................................ 304
8.2.4.5 Association of CYP3A5*3 and ABCB1 3435 Combined Genotypes
with Prednisolone and Prednisone Pharmacokinetics. .................................... 306
8.2.4.6 The Relationship between POR*28 and Prednisolone and Prednisone
Pharmacokinetics. ........................................................................................... 309
8.2.4.7 Non-genetic Factors Associated with Prednisolone and Prednisone
Plasma Concentrations. ................................................................................... 311
8.2.5 Discussion ............................................................................................... 313
Chapter 9. General Discussion & Conclusions ............................................................... 318
Chapter 10. Future Options ............................................................................................. 326
References ....................................................................................................................... 329
Appendices ...................................................................................................................... 351
Appendix 1. Patient Information Sheet and Consent Form ....................................... 351
Appendix 2. Case Report Form ................................................................................. 357
Appendix 3. List of the Concomitant Medications ................................................... 376

List of Tables
Page 19 of 377
List of Tables
Table 1: Stages of Chronic Kidney Disease. ................................................................... 38
Table 2: Classification and Mechanisms of Action of Drugs Commonly Used in
Transplantation. ............................................................................................................... 50
Table 3: Pharmacogenetic Studies of Tacrolimus in Kidney Transplant Recipients ...... 87
Table 4: Study Genotype Groups of CYP3A5 and ABCB1 Alleles. .............................. 116
Table 5: Population Characteristics and Immunosuppression Therapy ........................ 122
Table 6: Prograf® and Adoport® Tacrolimus Pharmacokinetic Parameters. ................ 124
Table 7: Ratios of Geometric Means and 90% CI for AUC0–24, Cmax, for Prograf® and
Adoport® ....................................................................................................................... 124
Table 8: Tacrolimus Pharmacokinetic Parameters for Tacrolimus Preparations. ......... 128
Table 9: Tacrolimus Dose-Normalized Pharmacokinetic Parameters for Tacrolimus
Preparations. .................................................................................................................. 130
Table 10: Pharmacokinetic Parameters Comparison between Twice-Daily Tacrolimus
(TD-Tac) and Advagraf® (OD-Tac). ............................................................................. 132
Table 11: Ratios of Geometric Means and 90% CI for AUC0–24, Cmax, Dose-Normalized
AUC0–24 and Dose-Normalized Cmax for Advagraf® to Twice-Daily Tacrolimus ........ 132
Table 12: Quality Control (QC) Samples Achieved During Tacrolimus Analysis. ...... 135
Table 13: Calibration Curve Parameters Data Achieved During Tacrolimus Analysis.
....................................................................................................................................... 136
Table 14: Genotype Frequencies for CYP3A5 and ABCB1 in Renal Transplant Patients
....................................................................................................................................... 138
Table 15: Demographic Characteristics of Patients, According to CYP3A5
Polymorphism ............................................................................................................... 139

List of Tables
Page 20 of 377
Table 16: Tacrolimus PK Parameters According to Their CYP3A5*3 Genotypes for the
Whole Data of Once-and Twice-Daily Tacrolimus. ..................................................... 140
Table 17: Associations between CYP3A5*3 Polymorphism and Form and Dose-
Normalized Tacrolimus Pharmacokinetic Parameters. ................................................. 143
Table 18: Ratios of Geometric Means and 90% CI for AUC0–24 and Cmax for Tacrolimus
Formulations in CYP3A5 Genotype Groups ................................................................. 143
Table 19: Demographic Characteristics of Patients, According to ABCB1 3435C>T
Polymorphism ............................................................................................................... 146
Table 20: Tacrolimus Dose-Normalized PK Parameters According to ABCB1 3435C>T
Genotypes for the Whole Data of Once-and Twice-Daily Tacrolimus......................... 147
Table 21: Relationship of ABCB1 3435C>T Polymorphism and Tacrolimus Formulation
with Dose-normalized Tacrolimus Pharmacokinetic Parameters. ................................ 150
Table 22: Ratios of Geometric Means and 90% CI for AUC0–24 and Cmax for Tacrolimus
Formulations in ABCB1 3435C>T Genotype Groups. ................................................. 150
Table 23: Patients Demographic Characteristics According to CYP3A5 and ABCB1
3435C>T Genotypes. .................................................................................................... 155
Table 24: Tacrolimus Dose-Normalized PK Parameters According to CYP3A5*3 and
ABCB1 3435C>T Genotypes for the Whole Data of Once-and Twice-Daily Tacrolimus.
....................................................................................................................................... 156
Table 25: Tacrolimus Dose-Normalized Pharmacokinetic Parameters for Different
Combination of CYP3A5*3 and ABCB1 3435C>T Genotypes in Both Once- and Twice-
Daily Tacrolimus. .......................................................................................................... 159
Table 26: Ratios of Geometric Means and 90% CI for AUC0–24 and Cmax for Tacrolimus
Formulations in CYP3A5 and ABCB1 3435C>T Genotype Groups ............................ 160
Table 27: Factors Associated with Tacrolimus Exposure and Dose Requirements...... 165
Table 28: Genotype Frequencies for CYP3A4*22 and POR*28 in Renal Transplant
Patients .......................................................................................................................... 180
List of Tables
Page 21 of 377
Table 29: Patients Demographic Characteristics and Immunosuppression Therapy. ... 184
Table 30: Tacrolimus Dose-Normalized PK Parameters According to CYP3A4*22
Genotypes for the Whole Data of Once-and Twice-Daily Tacrolimus......................... 185
Table 31: CYP3A4*22 Polymorphism Relationship with Dose-Normalized Tacrolimus
Pharmacokinetic Parameters in Different Tacrolimus Formulation (Twice-Daily
Tacrolimus; TD-Tac, and Advagraf®). .......................................................................... 188
Table 32: Bioequivalence Statistics for AUC 0–24 and Cmax for Twice-Daily Tacrolimus
(TD-Tac) and Once-Daily Tacrolimus (OD-Tac) in CYP3A4*22 CC Carriers. ........... 188
Table 33: CYP3A5*3 and CYP3A4*22 Combined Genotypes and Dose-Normalized
Tacrolimus Exposure and Dose for the Whole Data of Once-and Twice-Daily
Tacrolimus..................................................................................................................... 193
Table 34: Tacrolimus Dose-Normalized Pharmacokinetic Parameters for Twice-Daily
Tacrolimus (TD-Tac) and Advagraf® in CYP3A Combined Genotype Groups ........... 195
Table 35: Bioequivalence Statistics for AUC 0–24 and Cmax for Twice-Daily Tacrolimus
(TD-Tac) and Once-Daily Tacrolimus OD-Tac in CYP3A Combined Genotype Groups.
....................................................................................................................................... 195
Table 36: Dose-Normalized Pharmacokinetics of Tacrolimus in Renal Transplant
Recipients with Different POR*28 Genotypes for the Whole Data of Once-and Twice-
Daily Tacrolimus. .......................................................................................................... 196
Table 37: Correlation of POR*28 Polymorphism and Tacrolimus Formulation with
Dose-Normalized Tacrolimus Pharmacokinetic Parameters. ....................................... 198
Table 38: Bioequivalence Statistics for AUC 0–24 and Cmax for TD-Tac and OD-Tac in
POR*28 Genotypes. ...................................................................................................... 198
Table 39: Patients Demographic Characteristics According to CYP3A5 and POR*28
Genotypes. ..................................................................................................................... 201
Table 40: Dose-Normalized Tacrolimus PK Parameters According to CYP3A5*3 and
POR*28 Genotypes for the Whole Data of Once-and Twice-Daily Tacrolimus. ......... 202
List of Tables
Page 22 of 377
Table 41: Dose-Normalized Tacrolimus Pharmacokinetic Parameters for Different
Combination of CYP3A5*3 and POR*28 Genotypes in Both Once- and Twice-Daily
Tacrolimus..................................................................................................................... 205
Table 42: Ratios of Geometric Means and 90% CI for AUC0–24 and Cmax for Tacrolimus
Formulations in CYP3A5 and POR*28 Genotype Groups ............................................ 206
Table 43: Demographic Characteristics of Kidney Transplant Recipients. .................. 218
Table 44: Plasma Concentrations of 4β-hydroxycholesterol in Stable Kidney Transplant
Recipients with Different Ethnic Backgrounds and CYP3A5*3 Genotypes. ................ 220
Table 45: CYP3A5*3 Genotype Relationship with Dose-Normalized Tacrolimus PK
Parameters and Dose Requirement. .............................................................................. 224
Table 46: Stepwise Regression Equation of Tacrolimus Dose (mg/kg) Requirement after
Renal Transplantation. .................................................................................................. 228
Table 47: Patient Demographics and Baseline Characteristics. .................................... 234
Table 48: Patient Clinical Parameters during the 12 Months after Conversion from TD-
Tac to OD-Tac............................................................................................................... 235
Table 49: The Mean Trough Concentration (Tac C0) and Dose of Twice-Daily (TD-Tac)
and Once-Daily Tacrolimus (OD-Tac). ........................................................................ 239
Table 50: The Individual Change of Tacrolimus WPV in High and Low Variability
Patients before and after Conversion from Twice-Daily Tacrolimus to Advagraf®. .... 242
Table 51: Patient Demographics and Baseline Characteristics. .................................... 245
Table 52: Within-Patient Variability in Dose-Normalized Tacrolimus Trough
Concentration (Tac WPV) and CYP3A5 Genotype. ..................................................... 248
Table 53: High and Low Within-Patient Variability in Dose-Normalized Tacrolimus
Trough Concentration and CYP3A5*3 Genotype. ........................................................ 249
Table 54: Analyte Mass Transitions ............................................................................. 266
Table 55: Matrix Effect for Prednisolone, Prednisone and the Internal Standard. ....... 270
Table 56: Prednisolone Calibration Curve Parameters ................................................. 271

List of Tables
Page 23 of 377
Table 57: Prednisone Calibration Curve Parameters .................................................... 271
Table 58: Prednisolone Within and Between-Assay Repeatability. ............................. 273
Table 59: Prednisone Within and Between-Assay Repeatability. ................................ 275
Table 60: Prednisolone, Prednisone and Internal Standard Relative Recovery. ........... 277
Table 61: Prednisolone Short-Term Stability Data. ...................................................... 280
Table 62: Prednisone Short-Term Stability Data. ......................................................... 282
Table 63: Prednisolone Autosampler Stability Data ..................................................... 284
Table 64: Prednisone Autosampler Stability Data ........................................................ 285
Table 65: Population Characteristics and Immunosuppression Therapy ...................... 290
Table 66: Quality Control (QC) Samples Achieved During Prednisolone Analysis. ... 291
Table 67: Quality Control (QC) Samples Achieved During Prednisone Analysis. ...... 293
Table 68: Calibration Curve Parameters Data Achieved During Prednisolone Analysis.
....................................................................................................................................... 295
Table 69: Calibration Curve Parameters Data Achieved During Prednisone Analysis.
....................................................................................................................................... 295
Table 70: Prednisolone-Prednisone Pharmacokinetic Parameters for Individual Patients
Treated with 5mg Prednisolone. ................................................................................... 298
Table 71: Pharmacokinetic Parameters of Prednisolone-Prednisone in CYP3A5
Genotype Groups .......................................................................................................... 302
Table 72: Pharmacokinetic Parameters of Prednisolone- Prednisone in ABCB1 3435
Genotype Groups. ......................................................................................................... 304
Table 73: Pharmacokinetic Parameters of Prednisolone- Prednisone in CYP3A5-ABCB1
Genotype Groups. ......................................................................................................... 307
Table 74: Pharmacokinetic Parameters of Prednisolone- Prednisone in POR*28
Genotype Groups. ......................................................................................................... 309
List of Tables
Page 24 of 377
Table 75: Prednisolone and Prednisone Pharmacokinetic Parameters in Renal
Transplant Recipients in Relation to Ethnicity and Sex. .............................................. 312

List of Figures
Page 25 of 377
List of Figures
Figure 1: The Main Components of the Innate and Adaptive Immune Systems ............ 44
Figure 2: Mechanisms of Action of Immunosuppressive Drugs .................................... 49
Figure 3: Therapeutic Index. ........................................................................................... 60
Figure 4: Two-period Crossover Design. ........................................................................ 63
Figure 5: The Different Steps of Polymerase Chain Reaction ........................................ 68
Figure 6: Chain Termination Sequencing Showing the Different Lengths of Labeled
DNA strands .................................................................................................................... 69
Figure 7: An Electropherogram Showing a Sequence of Data Produced by an
Automated DNA Sequencing Machine ........................................................................... 70
Figure 8: Hybridization Probes. ...................................................................................... 72
Figure 9: Melting Curve Analysis for Hybridization Probes Designed for Wild Type
DNA Sequence. ............................................................................................................... 73
Figure 10: Structure of Tacrolimus. ................................................................................ 74
Figure 11: Mechanism of Action of Tacrolimus ............................................................. 75
Figure 12: Effect of Food on Tacrolimus Absorption after Administration of 5mg
Prograf® ........................................................................................................................... 78
Figure 13: Effect of Time of Meal Consumption on Tacrolimus Absorption after
Administration of 5mg Prograf®. .................................................................................... 78
Figure 14: Structure of 4β-hydroxycholesterol ............................................................. 108
Figure 15: Study Flow Chart of Twice-Daily Tacrolimus and Advagraf®
Pharmacokinetic Profiles using Crossover Design. ...................................................... 112
Figure 16: Twice-Daily Tacrolimus – Advagraf® Study Design. ................................. 116
Figure 17: Blood Sampling Schedule Following Administration of Twice-Daily
Tacrolimus Formulations and Advagraf®. .................................................................... 117

List of Figures
Page 26 of 377
Figure 18: Schematic Diagram of the Tacrolimus Extraction Procedure. .................... 120
Figure 19: Time – Mean Concentration Profiles for Tacrolimus Formulations. (A) for
Prograf® and Adoport® and (B) for Twice-Daily Tacrolimus and Advagraf®. ............ 126
Figure 20: Whole-Blood Tacrolimus Concentration-Time Profiles in 64 Stable Kidney
Transplant Recipients on Twice-Daily Tacrolimus (A) and Advagraf® (B). ................ 127
Figure 21: Plot of Test for Equal Variance with 95% Confidence Interval for Cmax of
Once- and Twice-Daily Tacrolimus. ............................................................................. 133
Figure 22: Plot of Test for Equal Variance with 95% Confidence Interval for AUC0-24 of
Once-(OD-Tac) and Twice-Daily (TD-Tac) Tacrolimus. ............................................. 133
Figure 23: Scatter Plot of Individual Calculated Tacrolimus Exposure (AUC0–24) vs
Tacrolimus Trough Concentration (C0) Represents the Correlation of Tacrolimus
Exposure and Trough Concentration for Twice and Once-Daily Tacrolimus. ............. 134
Figure 24: Derivative Melting Curve Plots for CYP3A5*3 and ABCB1 3435C>T
Genotyping using Specific Primers and Probes. ........................................................... 138
Figure 25: Associations between CYP3A5 Genotype and Tacrolimus Dose and
Pharmacokinetic Parameters for the Whole Data of Once-and Twice-Daily Tacrolimus.
....................................................................................................................................... 141
Figure 26: Associations between CYP3A5*3 Genotype and Tacrolimus Dose-
Normalized Pharmacokinetic Parameters of Twice-Daily Tacrolimus (TD-Tac) and
Advagraf®. ..................................................................................................................... 144
Figure 27: Summary of Blood Tacrolimus Concentration Time Profiles in Stable Adult
Kidney Transplant Recipients on Twice-Daily Tacrolimus (before the Switch) and
Advagraf® (after the Switch) for CYP3A5 *1 allele carriers (A) and CYP3A5 *3*3
carriers (B). ................................................................................................................... 145
Figure 28: Associations between ABCB1 3435C>T Polymorphisms and Tacrolimus
Dose and Dose-Normalized Pharmacokinetic Parameters for the Whole Data of Once-
and Twice-Daily Tacrolimus. ....................................................................................... 148
List of Figures
Page 27 of 377
Figure 29: Associations between ABCB1 3435C>T Polymorphism and Tacrolimus
Dose-Normalized Pharmacokinetic Parameters of Twice-Daily Tacrolimus (TD-Tac)
and Advagraf®. .............................................................................................................. 151
Figure 30: Summary of Blood Tacrolimus Concentration Time Profiles in Stable Adult
Kidney Transplant Recipients on Twice-Daily Tacrolimus (before the Switch) and
Advagraf (after the Switch) for ABCB1 CC (A) and ABCB1 CT/TT (B) Groups. ........ 152
Figure 31: CYP3A5 and ABCB1 3435C>T Combined Genotypes and Dose-Normalized
Tacrolimus Exposure and Dose Requirement for the Whole Data of Once-and Twice-
Daily Tacrolimus. .......................................................................................................... 157
Figure 32: Associations of CYP3A5 and ABCB1 3435C>T Genotypes with Tacrolimus
Dose-Normalized Pharmacokinetic Parameters of Twice-Daily Tacrolimus and
Advagraf®. ..................................................................................................................... 161
Figure 33: Summary of Blood Tacrolimus Concentration Time Profiles for CYP3A5
Expressers (CYP3A5*1/*1 and *1/*3) / ABCB1 3435 CC (A), CYP3A5 Expressers
(CYP3A5*1/*1 and *1/*3) /ABCB1 CT/TT (B) and CYP3A5 non-Expressers
(CYP3A5*3/*3) /ABCB1 CT/TT (C). ............................................................................ 162
Figure 34: Derivative Melting Curve Plots for CYP3A4*22 and POR*28 Genotyping
using Specific Primers and Probes. ............................................................................... 179
Figure 35: Sequencing of Representative Samples of CYP3A4*22 and POR*28 SNPs
Showing the Sequencing Results of the Representative Wild Type, Heterozygous and
Homozygous Mutants of CYP3A4*22 and POR*28 Polymorphisms........................... 180
Figure 36: CYP3A4*22 Genotype Associations with Tacrolimus Dose and Dose-
Normalized Pharmacokinetic Parameters for the Whole Data of Once-and Twice-Daily
Tacrolimus..................................................................................................................... 187
Figure 37: CYP3A4*22 Genotype and Tacrolimus Pharmacokinetic Parameters of
Twice-daily Tacrolimus (TD-Tac) and Advagraf®. ...................................................... 189
List of Figures
Page 28 of 377
Figure 38: CYP3A5*3 and CYP3A4*22 Combined Genotypes and Dose-Normalized
Tacrolimus Exposure and Dose Requirement for the Whole Data of Once-and Twice-
Daily Tacrolimus. .......................................................................................................... 192
Figure 39: CYP3A5*3 and CYP3A4*22 Genotypes Relationship with Dose-Normalized
Tacrolimus Exposure and Dose Requirement in Both Tacrolimus Formulations. ....... 194
Figure 40: The Dose-Normalized Mean Pharmacokinetic Parameters of Tacrolimus in
Renal Transplant Recipients with Different POR*28 Genotypes for the Whole Data of
Once-and Twice-Daily Tacrolimus. .............................................................................. 197
Figure 41: Dose-Normalized Mean Pharmacokinetic Parameters of Tacrolimus with
Different POR*28 Genotypes in Once- and Twice-Daily Tacrolimus. ........................ 199
Figure 42: Dose-Normalized Mean Pharmacokinetic Parameters of Tacrolimus in
Different CYP3A5 and POR*28 Combined Genotypes for the Whole Data of Once-and
Twice-Daily Tacrolimus. .............................................................................................. 203
Figure 43: Dose-Normalized Mean Pharmacokinetic Parameters of Tacrolimus with
Different CYP3A5*3 and POR*28 Combined Genotypes in Twice-Daily Tacrolimus
(TD-Tac) and Advagrf®. ............................................................................................... 207
Figure 44: Schematic Diagram of the 4β-hydroxycholesterol Extraction Procedure. .. 216
Figure 45: The Relationship of Different CYP3A5*3 Genotypes with 4β-
hydroxycholesterol Plasma Concentrations (A & C) and 4β-hydroxycholesterol /
Cholesterol Ratio (B & D) in Stable Kidney Transplant Recipients. ........................... 221
Figure 46: Ethnicity Relationship with 4β-OHC Concentration and 4β-OHC/C Ratio.
....................................................................................................................................... 222
Figure 47: 4β-hydroxycholesterol Plasma Concentrations in Stable Non-black Kidney
Transplant Recipients with Different CYP3A5*3 Genotypes. ...................................... 223
Figure 48: CYP3A5*3 Genotype Relationship with Tacrolimus Pharmacokinetic
Parameters and Dose Requirement. .............................................................................. 225
Figure 49: The Fitted Line Plot for 4β-OHC/C Ratio Effect on Dose-Normalized
Tacrolimus Pharmacokinetic Parameters and Dose Requirement. ............................... 227

List of Figures
Page 29 of 377
Figure 50: Tacrolimus Trough Concentrations before Conversion and in 0.5, 1, 3, 6, 9
and 12 Months after Conversion. .................................................................................. 236
Figure 51: Tacrolimus Daily Dose before Conversion and in 0.5, 1, 3, 6, 9 and 12
Months after Conversion. .............................................................................................. 237
Figure 52: Percentage Change in Tacrolimus Dose after Conversion from Twice to
Once-Daily Tacrolimus during Stable Dosing Periods. ................................................ 238
Figure 53: The Individual Change of Percent Coefficient of Variation (CV %) During
Periods of Stable Tacrolimus Dose before and after Conversion from Twice-Daily
Tacrolimus (TD-Tac) to Advagraf®. ............................................................................. 240
Figure 54: The Individual Change of Percent Coefficient of Variation (CV %) During
the Whole Period before and after Conversion from Twice-Daily Tacrolimus (TD-Tac)
to Advagraf®. ................................................................................................................ 241
Figure 55: The Individual Change of Percent Coefficient of Variation (CV%) During
Periods of Stable Tacrolimus Dose before and after Conversion from Twice-Daily
Tacrolimus (TD-Tac) to Advagraf® in Patients with High and Low WPV before
Conversion. ................................................................................................................... 243
Figure 56: The Individual Change of Percent Coefficient of Variation (CV%) During
the Whole Period before and after Conversion from Twice-Daily Tacrolimus (TD-Tac)
to Advagraf® in Patients with High and Low WPV before Conversion. ...................... 243
Figure 57: Structure of Prednisolone and Prednisone. .................................................. 254
Figure 58: Schematic Diagram of the Prednisolone and Prednisone Extraction
Procedure....................................................................................................................... 259
Figure 59: Molecular Structure and Molecular Weight of Separated Steroids. ............ 266
Figure 60: Chromatogram Displayed Separation of Steroids. ...................................... 267
Figure 61: Chromatograms Obtained from Extracted Blank Plasma Free from
Prednisolone and Prednisone (a), Blank Plasma Spiked with 2.5µg/L Prednisolone and
0.5µg/L Prednisone (b) and Blank Plasma Spiked with 375µg/L Prednisolone and
75µg/L Prednisone (c). .................................................................................................. 268
List of Figures
Page 30 of 377
Figure 62: Chromatograms Obtained from Extracted Blank Plasma (a) and Blank
Plasma Spiked with 50 µg/L Dexamethasone (b). ........................................................ 269
Figure 63: Mean Blood Concentration-Time Profiles for Prednisolone (A) and
Prednisone (B) in 27 Stable Kidney Transplant Recipients. ......................................... 296
Figure 64: Whole-Blood Concentration-Time Profiles for Prednisolone (A) and
Prednisone (B) in 27 Stable Kidney Transplant Recipients. ......................................... 297
Figure 65: Individual Value Plot of Prednisolone and Prednisone AUC0–24, Cmax and C0
for Patients Treated with 5mg Prednisolone. ................................................................ 299
Figure 66: Correlation between Prednisolone (A) and Prednisone (B) Exposure and
Trough Concentration using Regression Analysis. ....................................................... 300
Figure 67: Correlation between Prednisolone (A) and Prednisone (B) Exposure and
Maximum Concentration using Regression Analysis. .................................................. 301
Figure 68: The Mean Prednisolone-Prednisone Pharmacokinetic Parameters in Renal
Transplant Recipients with Different CYP3A5*3 Genotypes. ...................................... 303
Figure 69: The Mean Prednisolone-Prednisone Pharmacokinetic Parameters in Renal
Transplant Recipients with Different ABCB1 Genotypes. ............................................ 305
Figure 70: The Mean Prednisolone-Prednisone Pharmacokinetic Parameters in Renal
Transplant Recipients with Combined CYP3A5*3-ABCB1 Genotypes. ....................... 308
Figure 71: The Mean Prednisolone-Prednisone Pharmacokinetic Parameters in Renal
Transplant Recipients with POR*28 Different Genotypes. .......................................... 310
Figure 72: The Interval Plot of the Mean Prednisolone Cmax in Renal Transplant
Recipients in Accordance with Patient Sex. ................................................................. 313
List of Abbreviations
Page 31 of 377
List of Abbreviations
ABCB1 ATP Binding Cassette Subfamily B Member 1
Acc (%) Accuracy
ADME Drug Absorption, Distribution, Metabolism, and Elimination
amu Atomic Mass Unit
ANOVA Analysis of Variance
APC Antigen-Presenting Cell
ATP Adenosine Triphosphate
AUC Area Under the Concentration versus Time Curve
AZA Azathioprine
4β-OHC 4β-Hydroxycholesterol
4β-OHC/C 4β-Hydroxycholesterol/ Cholesterol
BP Blood Pressure
C/D Concentration/Dose
C0 Trough Blood Concentrations
ºC Degree Celsius
CaN Calcineurin
CCD Charge Coupled Device
CD4+ Helper T Lymphocytes
CD8+ Cytotoxic T Lymphocytes
CDK Cyclin-Dependent Kinase
CE Capillary Electrophoresis
CI Confidence Interval
CKD Chronic Kidney Disease
CKD-EPI Chronic Kidney Disease Epidemiology Collaboration
CL/F Apparent Total Clearance Of The Drug After Oral Administration
Cmax Maximum Concentration
Cmin Minimum Concentration
CNI Calcineurin Inhibitor
CRF Chronic Renal Failure
CsA Ciclosporin
%CV Coefficient Of Variation
CYP3A Cytochrome P450, Family 3, Subfamily A
DBP Diastolic Blood Pressure
ddNTPs Dideoxynucleotide Triphosphates
dF/Dt Rate Of Change In Fluorescence

List of Abbreviations
Page 32 of 377
dH2O Deionised Water
DNA Deoxyribonucleic Acid
dNTP Deoxynucleotide Triphosphates
EDTA Ethylenediaminetetraacetic Acid
eGFR Estimated Glomerular Filtration Rate
EMEA or EMA European Medical Agency
ESI Electrospray Ionization
ESRD End Stage Renal Disease
EWP Efficacy Working Party
FDA Food And Drug Administration
FKBP FK506-Binding Protein
FRET Fluorescence Resonance Energy Transfer
g Gram
GFR Glomerular Filtration Rate
GIT Gastrointestinal Tract
μg Microgram
h Hour
Hb Haemoglobin
HLA Human Leukocyte Antigens
HPLC High Performance Liquid Chromatography
ICAM-1 Intercellular Adhesion Molecule-1
IL-2 Interleukin (IL) -2
IL-2R Interleukin (IL) -2 Receptors
IQR Interquartile Range
IS Internal Standard
kDa Kilo Daltons
kg Kilogram
L Litre
LC-MS/MS High Performance Liquid Chromatography/Mass Spectrometry
LED Light-Emitting Diode
LightCycler® Gene-Expression and Melting Curve-Based Mutation Analysis
System
LLOQ Lower Limit Of Quantification
Log Logarithm
LSS Limiting Sampling Strategy
m Month
M Molar
m/z Mass/Charge Ratio
List of Abbreviations
Page 33 of 377
mAbs Monoclonal Antibodies
mbar Megabar
MDR-1 Multi -Drug Resistance Gene-1
MEB Medicines Evaluation Board in the Netherlands
mg Milligram
MHC Major Histocompatibility Complex
Millipore Water Purification System
mL Millilitre
mm Millimetre
MMF Mycophenolate Mofetil
MMS Mycophenolate Sodium
MPA Mycophenolic Acid
MPAG 7-O-Mpa-Glucuronide
MRM Multiple Reaction Monitoring
mRNA Messenger RNA
msec Millisecond
MTBE Methyl-Tert-Butyl Ether
Mut Mutant (Variant) Allele
Mwt Molecular Weight
NFAT Nuclear Factor Of Activated T Lymphocytes
NF-ATc Nuclear Factor of Activated T Lymphocytes (Inside the Cytoplasm)
NF-ATn Nuclear Factor of Activated T Lymphocytes (Inside the Nucleus)
ng Nanogram
NK Natural Killer Cells
NODAT New Onset Diabetes After Transplantation
NTI Narrow Therapeutic Index
OD-Tac Once-Daily Tacrolimus
PCR Polymerase Chain Reaction
PCR-RFLP Restriction Fragment Length Polymorphism Analysis of PCR-
Amplified Fragments
P-gp P-Glycoprotein
PK Pharmacokinetics
pmoL Picomole
pmp Per Million Population
POR P450 Oxidoreductase
PXR Pregnane X Receptor
Q1 Parent Ion Scan
Q3 Product Ion Scan
List of Abbreviations
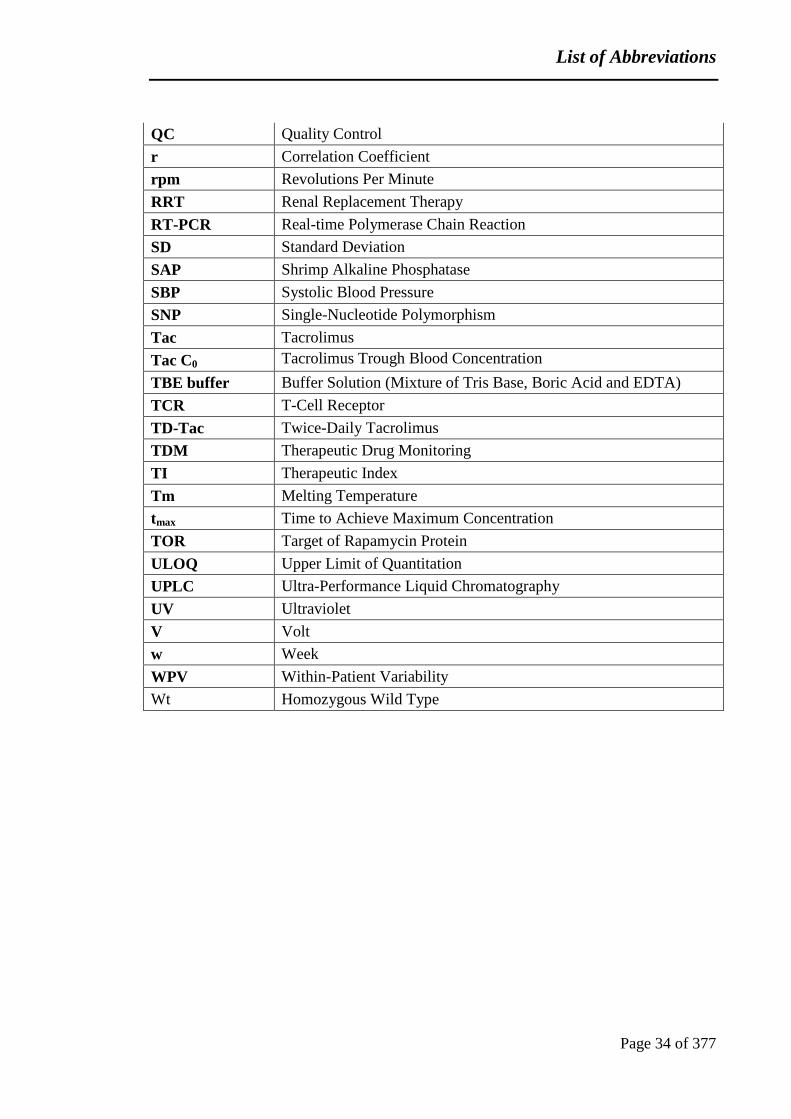
Page 34 of 377
QC Quality Control
r Correlation Coefficient
rpm Revolutions Per Minute
RRT Renal Replacement Therapy
RT-PCR Real-time Polymerase Chain Reaction
SD Standard Deviation
SAP Shrimp Alkaline Phosphatase
SBP Systolic Blood Pressure
SNP Single-Nucleotide Polymorphism
Tac Tacrolimus
Tac C0 Tacrolimus Trough Blood Concentration
TBE buffer Buffer Solution (Mixture of Tris Base, Boric Acid and EDTA)
TCR T-Cell Receptor
TD-Tac Twice-Daily Tacrolimus
TDM Therapeutic Drug Monitoring
TI Therapeutic Index
Tm Melting Temperature
tmax Time to Achieve Maximum Concentration
TOR Target of Rapamycin Protein
ULOQ Upper Limit of Quantitation
UPLC Ultra-Performance Liquid Chromatography
UV Ultraviolet
V Volt
w Week
WPV Within-Patient Variability
Wt Homozygous Wild Type
General Introduction and Thesis Summary
Page 35 of 377
1 Chapter 1. General Introduction and Thesis Summary
The immunosuppressive drug tacrolimus is widely used to prevent the rejection of renal
transplants. Tacrolimus was initially available as a preparation requiring twice daily
administration: Prograf®. A modified-release formulation of tacrolimus (once-daily;
Advagraf®) has been developed to provide more consistent exposure and facilitate better
adherence. Tacrolimus has a narrow therapeutic index with wide variation between
individuals in the blood concentration achieved by a given dose. To some extent, this is
influenced by genetic factors. The influence of the CYP3A5*3 and ABCB1 3435
genotypes on the pharmacokinetics of immediate release tacrolimus; Prograf® is well-
defined. However, the influence is unclear for prolonged release tacrolimus; Advagraf®.
High within-patient tacrolimus trough concentration variability is a risk factor for long
term chronic allograft nephropathy and graft loss. Therapeutic drug monitoring is used
routinely to direct tacrolimus dosing within a defined therapeutic range of whole blood
concentrations. Maintenance of the target blood concentration of immunosuppressive
drugs is one of the main factors determining transplant function. Finding the optimal
dose that gives the right balance between efficacy and toxicity remains the challenge for
immunosuppressive drugs, especially during the period immediately after
transplantation. Therefore, the identification of parameters predictive of the optimal
initial tacrolimus dose has the potential to improve clinical outcomes. In chapter 2 of
this thesis, a description of renal failure stages, epidemiology and risk factors leading to
its development are included. An overview of the role of the immune system in
transplant rejection and the importance of use and monitoring immunosuppressive drugs
is described. Following this general background, the concept of bioequivalence and
genotyping studies is given. In chapter 3, an overview of tacrolimus and its
pharmacokinetics is covered. Tacrolimus exposure has been related to clinical outcome
and therapeutic drug monitoring is often applied in clinical practice to guide
personalized dosing. Tacrolimus has a large between- and within-patient variability in
its exposure. Factors considered to cause this variability are outlined in this chapter. In
chapter 4 and 5 genetic markers that are related to between-patient variability in
General Introduction and Thesis Summary
Page 36 of 377
tacrolimus exposure are determined. The influence of CYP3A5*3, CYP3A4*22,
POR*28 and ABCB13435C>T SNPs on the pharmacokinetics of immediate release
tacrolimus; Prograf® or Adoport® and prolonged release; Advagraf® was carried out
within individual patients. Moreover, in chapter 4, genes encoding for CYP3A5
(CYP3A5*3), ABCB1 gene 3435C>T functional polymorphism and their combination
were analysed in relation to tacrolimus pharmacokinetics in 64 adult renal transplant
patients for both immediate and prolonged release formulations. In this study a strong
association of CYP3A5*3 genotype (rs776746) with tacrolimus exposure for Advagraf®
as well as for Prograf®/Adoport® was observed. CYP3A5 expression had a major
influence and ABCB1 3435 genotype had a minor influence on tacrolimus exposure for
both formulations. Tacrolimus exposure and dose requirement were significantly
associated with the combined-genotype grouping. The daily doses for CYP3A5
expressers/Pg-p high-expressers and CYP3A5 expressers/Pg-p intermediate- and poor-
expressers were 2.6- and.1.8-fold higher than CYP3A5 non-expressers/Pg-p
intermediate- and poor-expressers, respectively. In chapter 5, a comprehensive
pharmacogenetic analysis was performed for recently identified genes encoding for
CYP3A4 (CYP3A4*22) and for POR*28 in relation to tacrolimus exposure for both
immediate and prolonged release formulations. In this study, novel methods were
developed for genotyping CYP3A4*22 and POR*28 SNP using real time PCR;
LightCycler® based technique. In this study only CYP3A4*22 SNP was significantly
associated with tacrolimus exposure. POR*28 genotype was only associated with
tacrolimus exposure in CYP3A5 non-expressers. The influence of the CYP3A4*22 and
POR*28 genotype on tacrolimus exposure was the same for the prolonged release
preparation Advagraf® as for the immediate release preparation, Prograf® or Adoport®.
In chapter 6, the study was conducted with the intention of exploring the relationship
between 4β-hydroxycholesterol, a plasma biomarker of cytochrome P4503A activity,
and CYP3A5*3 genotype and tacrolimus exposure. In this study CYP3A5*3 allele was
found to have a significant effect on the plasma 4β-OHC concentration in stable kidney
transplant recipients. The 4β-OHC/C ratio was significantly correlated with CYP3A5*3
and tacrolimus dose requirement. Chapter 7 focuses on tacrolimus within-patient
variability in 100 stable kidney transplant recipients. Only few studies have focused on
General Introduction and Thesis Summary
Page 37 of 377
comparing within-patient variability of tacrolimus trough concentration after conversion
from immediate to prolonged tacrolimus formulations in stable renal transplant
recipients. In this study, switching from immediate to prolonged release tacrolimus
formulations had no influence on within-patient variability. This study also investigated
the correlation between tacrolimus within-patient variability and CYP3A5*3 genotype in
stable kidney transplant recipients for twice daily tacrolimus (Prograf® or Adoport®)
and once daily tacrolimus, Advagraf®. Very few studies have focused on the relation
between within-patient variability and genetic polymorphisms, particularly CYP3A5*3
polymorphism in twice daily tacrolimus formulation. In this study, CYP3A5*3 genotype
was not related to the within-patient variability of tacrolimus trough concentration in
both immediate and prolonged tacrolimus formulations. In chapter 8 a new simple and
rapid bioanalytical method for measurement of prednisolone and its metabolite in
plasma using LC-MS/MS was developed and validated. This method provides the
opportunity to assess prednisolone and prednisone pharmacokinetics in a large cohort of
renal transplant patients. In this study the relationship between the CYP3A5*3, ABCB1,
CYP3A4*22 and POR*28 SNPs and prednisolone exposure was investigated. None of
the investigated SNPs were associated with prednisolone pharmacokinetics. In chapter
9, the results presented in the studies described earlier were analysed with reference to
findings of previous research in the same area of interest or using similar techniques.
Discussion of the genotype–phenotype associations with Advagraf® daily dose
requirements was then made. The discussion focuses on evaluating the effects of
conversion from immediate to prolonged released tacrolimus formulation from three
perspectives: 1) Genetic influence on tacrolimus pharmacokinetics, 2) Within-patient
variability differences, and 3) Suggestions for a pharmacogenetic strategy to guide
individualisation of twice daily tacrolimus and Advagraf® dose. Chapter 10 will
describe briefly the potential studies that will be performed in the future.
Background
Page 38 of 377
2 Chapter 2. Background
2.1 Renal Failure and Immunosuppression Therapy
2.1.1 Renal Failure
Chronic kidney disease (CKD) is a public health problem with a growing prevalence
worldwide. Glomerular filtration rate (GFR) is considered the best general guide of
deteriorating renal function. Low GFR is associated with an increased risk of kidney
failure requiring dialysis and complications such as cardiovascular disease,
hypertension, anaemia, and other metabolic complications (Himmelfarb and Sayegh,
2010). Renal failure is defined as the loss of renal function leading to a fall of GFR
below 90 mL/min and to an accumulation of creatinine, urea and other nitrogenous
wastes. Based on the level of estimated GFR normalized to body surface area, CKD has
been classified into five stages (Table 1), with stage 1 being the mildest and stage 5 the
most severe (NHS, 2010).
Table 1: Stages of Chronic Kidney Disease.
Stage Description GFR*
mL/min/1.73m2
1 Slight kidney damage with normal or increased GFR ≥ 90
2 Mild decrease in kidney function 60-89
3a Moderate decrease in kidney function
45–59
3b 30–44
4 Severe decrease in kidney function 15-29
5 Kidney failure < 15
*All GFR values are normalized to an average surface area (size) of 1.73m2
2.1.1.1 Epidemiology of Chronic Kidney Disease
The number of patients with CKD is increasing worldwide and it reflects the increase in
end stage renal disease (ESRD) patients treated by renal replacement therapy (RRT)
including dialysis or transplantation. In the UK, in 2013 the annual incidence of ESRD
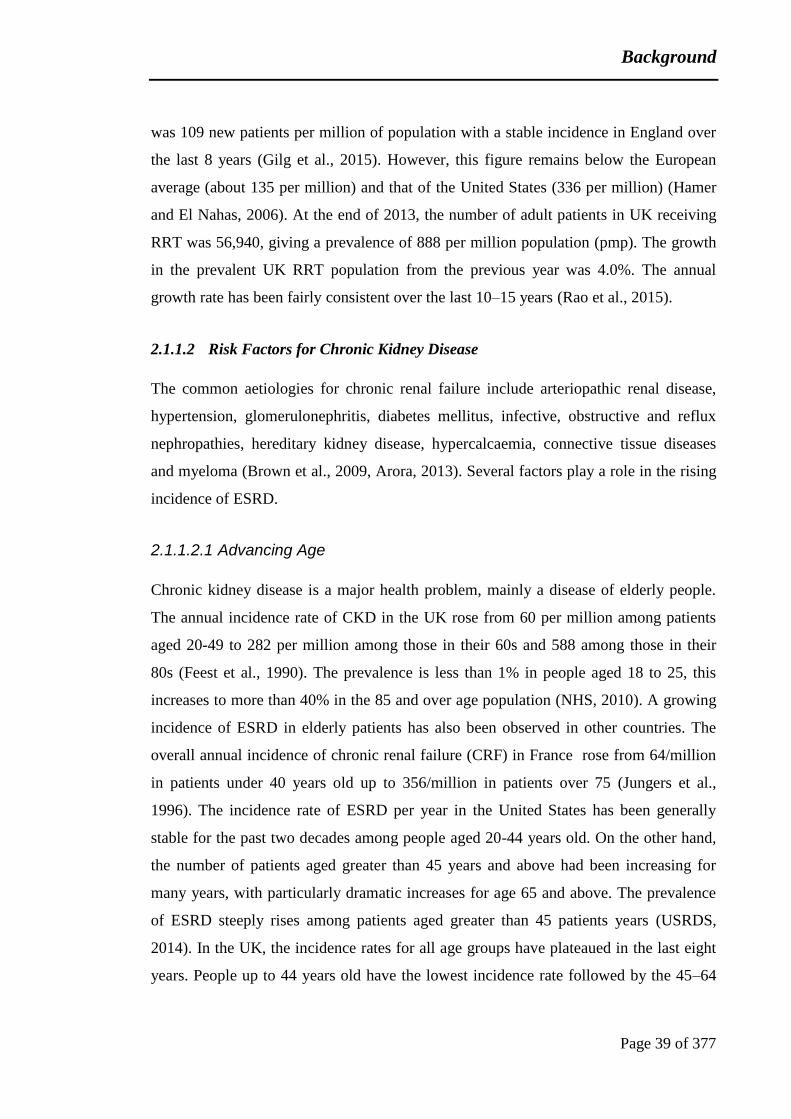
Background
Page 39 of 377
was 109 new patients per million of population with a stable incidence in England over
the last 8 years (Gilg et al., 2015). However, this figure remains below the European
average (about 135 per million) and that of the United States (336 per million) (Hamer
and El Nahas, 2006). At the end of 2013, the number of adult patients in UK receiving
RRT was 56,940, giving a prevalence of 888 per million population (pmp). The growth
in the prevalent UK RRT population from the previous year was 4.0%. The annual
growth rate has been fairly consistent over the last 10–15 years (Rao et al., 2015).
2.1.1.2 Risk Factors for Chronic Kidney Disease
The common aetiologies for chronic renal failure include arteriopathic renal disease,
hypertension, glomerulonephritis, diabetes mellitus, infective, obstructive and reflux
nephropathies, hereditary kidney disease, hypercalcaemia, connective tissue diseases
and myeloma (Brown et al., 2009, Arora, 2013). Several factors play a role in the rising
incidence of ESRD.
2.1.1.2.1 Advancing Age
Chronic kidney disease is a major health problem, mainly a disease of elderly people.
The annual incidence rate of CKD in the UK rose from 60 per million among patients
aged 20-49 to 282 per million among those in their 60s and 588 among those in their
80s (Feest et al., 1990). The prevalence is less than 1% in people aged 18 to 25, this
increases to more than 40% in the 85 and over age population (NHS, 2010). A growing
incidence of ESRD in elderly patients has also been observed in other countries. The
overall annual incidence of chronic renal failure (CRF) in France rose from 64/million
in patients under 40 years old up to 356/million in patients over 75 (Jungers et al.,
1996). The incidence rate of ESRD per year in the United States has been generally
stable for the past two decades among people aged 20-44 years old. On the other hand,
the number of patients aged greater than 45 years and above had been increasing for
many years, with particularly dramatic increases for age 65 and above. The prevalence
of ESRD steeply rises among patients aged greater than 45 patients years (USRDS,
2014). In the UK, the incidence rates for all age groups have plateaued in the last eight
years. People up to 44 years old have the lowest incidence rate followed by the 45–64
Background
Page 40 of 377
age group. However, over 65 years old population have the highest incidence rate (Gilg
et al., 2015). The considerable increase in the incidence of CRF with advanced age is
mainly due to the presence of additional factors and / or complications that might be
linked with a reduction in the number or the function of nephrons. The high incidence
of chronic renal failure in elderly patients is probably due to the high prevalence of
renal vascular disease in this age group (Jungers et al., 1996).
2.1.1.2.2 Sex
Although, the increase in the incidence of CRF with age was similar in both males and
females, the incidence of CRF was strikingly higher in male as compared to female
patients. The annual incidence was twice as high in males compared to females up to 75
years and three times as high in patients above 75 years (Jungers et al., 1996). End stage
renal disease prevalence rate in males exceeded that of females for all age groups,
reaching the highest point in the age group 75–79 years at 3,010 pmp in men and for
women at 1,560 pmp (Rao et al., 2015). Typically, renal replacement populations are
around 60% male and 40% female.
2.1.1.2.3 Ethnicity
Some ethnic groups have higher rates of CKD than others. For example, in the UK and
USA, the incidence of RRT in African-Caribbean and South Asian populations in any
age group is 3 to 5 times higher than in Caucasians. In addition, in the USA, Black
Americans have at least 4 to 5 times higher RRT rate than whites. The annual incidence
is 256/1 000 000 among white people compared with 982/1 000 000 in African-
Americans (Hamer and El Nahas, 2006, El Nahas and Bello, 2005). Moreover, in the
year 2012, the prevalence rate per million in the USA remains much higher in
blacks/African Americans than in other ethnic groups, at approximately 2.5-fold higher
as compared to Asians, and 4-fold higher compared to Whites. The prevalence rate was
5,671 per million in black/African Americans, 2,272 per million in Asians, and 1,432
per million in Whites (USRDS, 2014).

Background
Page 41 of 377
2.1.1.2.4 Diabetes
Impaired kidney function is a common and serious complication of diabetes mellitus.
Estimates indicate that 25–40% of patients with Type 1 or Type 2 diabetes develop
diabetic nephropathy within 20–25 years of disease onset (New et al., 2007). Several
studies have highlighted that diabetes is strongly associated with the increased risk for
CKD. The prevalence of a reduced GFR 60 ml/min per 1.73 m2 was threefold higher in
those with diabetes mellitus compared with those without (Chadban et al., 2003). A
linear relationship was reported between hyperglycemia and both the development and
progression of diabetic nephropathy in type 1 and type 2 diabetes patients (Hall, 2006).
In 2013, the UK Renal Registry found that diabetes accounted for 15.9% of renal
disease in prevalent patients on RRT, and it was more common among patients aged 65
than among younger patients (Rao et al., 2015). It has been reported that Type 1 and
Type 2 diabetes patients had more than twice the risk of ESRD compared with non-
diabetic patients and the highest risks of moderate-severe CKD occurred with Type 1
diabetes (Hippisley-Cox and Coupland, 2010). Another study demonstrated that diabetic
patients had 1.5 fold higher chances for developing CKD than individuals without
diabetes after adjustment for age (Hallan et al., 2006).
2.1.1.2.5 Hypertension
High blood pressure (BP) is strongly associated with CKD in men and women (Haroun
et al., 2003). Several studies have shown that hypertension is a risk factor for CKD. The
prevalence of proteinuria and reduced GFR <60 ml/min per 1.73 m2
were fivefold
higher in hypertensive participants compared with those without hypertension (Chadban
et al., 2003). Hallan et al. (2006) found that individuals with hypertension had five-
times more prevalence of CKD than those with normal BP and after adjustment for age
the risk ratio was 1.5. A recent UK study showed that hypertensive patients had more
than double the risk of ESRD compared with patients without hypertension (Hippisley-
Cox and Coupland, 2010). In the USA, the incidence rates of ESRD due to hypertension
in all age groups are dramatically greater in Blacks/African Americans compared with
the other ethnic groups. Incidence rates in Blacks/African Americans are over ten-fold

Background
Page 42 of 377
higher than in Whites in the young population and 2.5 times more than whites in the age
group 70 and over (USRDS, 2014).
2.1.2 Renal Replacement Therapy
In chronic renal failure, the loss of renal function is slow and progressive and in most
cases the damage is irreversible. Eventually, the kidneys cease to function. This
condition is referred to as end-stage renal failure (ESRF) (Abuelo, 1995). In this case,
renal replacement therapy is required. Treatment methods cannot cure the renal failure.
However, it is possible to replace renal function through the use of alternative methods
that include dialysis and kidney transplantation (Stein and Wild, 2002). The process of
dialysis bypasses the kidneys, in order to remove metabolic wastes and foreign
compounds artificially. This maintains fluid and electrolyte balance within acceptable
limits and removes toxins. However, the plasma cleansing technique does not make up
for the kidneys’ reduced ability to produce hormones such as erythropoietin and renin
and to activate vitamin D (Sherwood, 2008). Additionally, there is a considerable time
commitment for patients undergoing dialysis. Consequently, kidney transplantation is
the replacement therapy of choice for end-stage renal disease. Quality of life is greatly
enhanced by renal transplantation and survival is probably better than that for patients
on dialysis (Wolfe et al., 1999). It is also the most cost-effective mode of renal
replacement therapy (Singh and Bhandari, 2004).
Early graft survival has improved markedly in recent years, but long-term survival
remains a significant challenge (Chandraker et al., 2011). The risk of acute renal
allograft rejection is greatest during the first three months following transplantation.
Therefore, developing protocols that optimise immunosuppression during the high
immunologic risk period has the potential to limit damage to the graft that has an
adverse influence on long term graft function (Velia, 2005).
2.1.3 The Role of the Immune System in Transplantation
The immune system defends the body from harmful substances by distinguishing and
reacting to antigens that include toxins, viruses, bacteria, transferred blood cells, and

Background
Page 43 of 377
transplanted organs (Male et al., 2006). A transplanted kidney is recognized by the
immune system as an antigen and this triggers the immune response and the subsequent
rejection of the organ. Based on the speed and specificity of the response, the immune
system is divided into two main parts; innate and the adaptive immunity (Parkin and
Cohen, 2001).
2.1.3.1 Innate Immune Response
It is a series of nonspecific defence mechanisms to protect the body against infection.
These defence mechanisms are natural, do not require exposure to a specific antigen and
work immediately or within few hours after exposure to an inflammatory stimulus. The
components of the innate immune system include anatomical barriers, secretory
molecules and cellular components. The mechanical anatomical barriers comprise the
mechanical, chemical and biological elements. Mechanical barriers are well-known as
skin, mucous membrane and ciliated epithelial cells while chemical barriers include the
low pH of sweat and gastric secretions, lysozymes, phospholipase, and interferons and
biological barriers contain the normal microbial flora of the skin and in the
gastrointestinal tract. Innate immunity also has some cellular barriers, which are the
primary defence line of the immune system. The cells can be divided into granulocytes
(neutrophils, basophils and eosinophils), monocytes which develop into macrophages
and lymphocytes (B, T and natural killer (NK) cells), see Figure 1. Monocytes and
macrophages attract, engulf, and ingest foreign bodies. Basophils release histamine and
they are important in defence against parasites. Once activated, eosinophils produce a
range of highly toxic proteins and free radicals that are extremely efficient in destroying
bacteria and parasites. Natural killer cells and lymphokine activated killer cells can non-
specifically kill virus infected and tumour cells. The complement system is the major
humoral non-specific defence mechanism. Upon activation, complement can lead to
increased vascular permeability, recruitment of phagocytic cells, and lysis and
opsonization of bacteria. Some coagulation system products can participate in the non-
specific defences, as they have the ability to increase vascular permeability and act as
chemotactic agents for phagocytic cells (Mayer, 2011, Williams et al., 2012).

Background
Page 44 of 377
Figure 1: The Main Components of the Innate and Adaptive Immune Systems
(Dranoff, 2004). The innate immune response is the short-term reaction. It
consists of granulocytes (basophils, eosinophils and neutrophils), mast cells,
macrophages, dendritic cells, complement proteins and natural killer cells.
The adaptive immune response is the longer-term reaction. It consists of
antibodies, B lymphocytes, and helper (CD4+) and cytotoxic (CD8+) T
lymphocytes. Natural killer T lymphocytes and gammadelta T lymphocytes
are cytotoxic lymphocytes that straddle the interface of innate and adaptive
immunity.
2.1.3.2 Adaptive Immune Systems
The adaptive immunity is an antigen-specific immune reaction. It is more complex than
innate immunity. The antigen first must be processed and identified. Once an antigen
has been recognized, the adaptive immune system stimulates potent mechanisms for
neutralizing or killing pathogens. The adaptive immune system components are
normally silent and require activation with the innate immune response promoting
activation initially. In transplantation the surgery promotes an inflammatory response
that is an important factor in triggering the adaptive immune response to cause
transplant rejection. The response is slower compared with the innate immune response
but it is much more potent. There are two categories of adaptive immune responses:
humoral immunity, which mediated by B-lymphocytes producing antibodies, and cell-
mediated immunity which mediated by T lymphocytes, see Figure 1 (Alberts et al.,
2002). The acquired immune system also plays a fundamental role in the rejection of

Background
Page 45 of 377
transplanted organs and destroying the graft. After maturation, mature T lymphocytes
move through the circulation to lymph nodes, mucosa-associated lymphoid tissue or the
spleen. B lymphocytes on the other hand, pass through the circulation to various sites
throughout the body.
Once activated with a foreign antigen, B lymphocytes develop to mature antibody
secreting cells called plasma cells and start producing antibodies, which contribute to
the immunity in three different mechanisms: neutralisation via binding to antigens and
preventing them from invading cells and directly neutralize them; opsonisation
stimulates pathogens elimination by phagocytic cells and complement fixation where
antigen-antibody complex triggers cascade complement activation and consequently
antigen lysis. Antibodies are also known as immunoglobulins and they are divided into
5 major types IgA, IgE, IgG, IgM and IgD. B lymphocytes are important in the fight
against pyogenic bacteria and facilitate hyper acute rejection and can destroy a graft by
producing antibodies (Atluri et al., 2006).
Unlike B lymphocytes, T lymphocytes do not recognize antigens directly. Instead, there
are receptors located in their surfaces that identify peptide fragments of antigens
associated with major histocompatibility complex (MHC) molecules on the surfaces of
infected or cancerous cells. The major histocompatibility complex is a set of genes that
encodes a group of proteins that are located on the cell surface. There are several types
of T lymphocytes: T helper lymphocytes (Th or CD4+), cytotoxic T (Tc or CD8+)
lymphocytes, memory T (Tm) lymphocytes and suppressor T (Ts) or regulatory T
(Treg) lymphocytes. Cytotoxic T lymphocytes (Tc) and memory T lymphocytes (Tm)
lymphocytes are the effector cells, whereas helper lymphocytes (Th) and suppressor
lymphocytes (Ts) are regulatory cells. T lymphocytes contribute to the immune
defences in two major ways: some direct and regulate immune responses, whereas
others directly attack infected or cancerous cells. Th lymphocytes are divided into Th1
and Th2, where Th1 produces cytokines and lymphokines (IL-2, IL-12 and gamma-
interferon) that activate macrophages and participate in the production of cytotoxic
lymphocytes. In contrast cytokines produced by Th2 lymphocytes help to activate B
lymphocytes, resulting in antibody production. Cytotoxic T (Tc) lymphocytes directly

Background
Page 46 of 377
attack and destroy infected cells. Two main proteins, granzymes and perforin are stored
in cytoplasmic vacuoles within the resting Tc lymphocytes. When a Tc lymphocyte
encounters an infected cell presenting on its surface MHC-bound antigenic peptide, it is
stimulated to release perforin into the intracellular space between the Tc and the target
cell, which form holes in the surface membrane of the target cell and this results not
only in direct cell damage, but also provide means for granzymes to enter the cell.
Granzymes induce target cells to undergo apoptosis. Regulatory T (Treg) lymphocytes
inhibit immune response after invading organisms are destroyed by release chemicals
that decrease B- and T- lymphocytes activity and division. Memory T lymphocytes
remain in the body for several years. Once they have encountered an antigen and cloned
to remember it, they are responsible for defence on repeated exposure (Atluri et al.,
2006).
The antigen can only be recognized by T lymphocytes if one of the body’s own MHC
molecules carries it on the cell surface. In humans, MHC antigens are called human
leukocyte antigens, or HLA and the genes are located in the short arm of chromosome
6. T lymphocytes recognize MHC molecules when they differentiate between self and
non-self. A self-MHC molecule provides an identifiable scaffolding to display a foreign
antigen to the T lymphocytes. MHC Class I proteins are found on all nucleated cell
surfaces and they present antigens to cytotoxic T lymphocytes (Tc). In the resting state
MHC Class II proteins are found only on B lymphocytes, macrophages, and other
antigen presenting cells. Inflammatory cytokines promote the expression of MHC class
II molecules by other tissues. There is a wide diversity between individuals in the
protein sequence of the MHC molecules expressed on the cell surface which has
probably minimised the risks of microbial evolution to evade the immune response. A
consequence of this is that MHC moleules on transplanted organs are recognised as
being ‘foreign’ triggering an immune response against the organ (Penn, 2002).
Consequently, organ donors should ideally have the closest MHC match with recipients
to minimise the risk of graft rejection.
Background
Page 47 of 377
2.1.3.3 Mechanism of Alloimmune Responses
The transplanted organ is a permanent source of antigens and it can induce rejection at
any time following transplantation. The immune system establishes effective
mechanisms to fight the transplanted organ, which are recognized by the immune
system as a foreign agent and is termed transplant rejection. Rejection is an acquired
immune response via cellular immunity (mediated by T-lymphocytes) and this involves
the production of cytotoxic T-lymphocytes, activated macrophages, activated NK cells,
and cytokines in response to the foreign antigen inducing apoptosis of target cells. It
also involves humoral immunity, which includes the production of antibody molecules
in response to the transplanted organ and is mediated by B-lymphocytes though the
action is joined by components of innate immune response (phagocytes and soluble
immune proteins). The degree to which allografts undergo rejection depends partly on
the degree of similarity or histocompatibility between the donor and the recipient
(Malhotra et al., 2013).
Following organ transplantation, a series of immunological reactions occurs, which
comprise inflammation, immunity, and tissue repair, as well as structural reinforcement
of damaged cells. Inflammation occurs at the site of transplantation and is mediated by
macrophages, T lymphocytes and pro-inflammatory mediators (eg, IL-2). Complement
activation results in the elaboration of bioactive intermediates such as C3a and C5a.
Once the immune system destroys the antigens, macrophages, endothelial cells, smooth
muscle cells, and fibroblasts begin to promote tissue repair and reinforcement.
However, rejection takes place when a strong inflammatory response develops or when
tissue repair and remodeling fail (Prescilla, 2013).
Rejection is classified into 3 broad categories according to the timing of the rejection.
The first category is termed hyperacute rejection, which may develop within minutes to
hours of graft implantation because of the presence of pre-formed anti-donor antibody.
The antigen-antibody complexes activate the complement system, causing massive
thrombosis in the capillaries, resulting in ischemic damage of the graft. However, this
condition is rare nowadays as a routine pre-transplant anti-donor antibody screen is

Background
Page 48 of 377
introduced. The second type of rejection is acute rejection which most commonly
occurs during the first 3 months after transplantation. The reaction is unusual before 1
week after transplantation, the typical time lag for development of a primary immune
response. Once T lymphocytes encounter the graft alloantigens, they stimulate the
release of cytokines and consequently results in tissue distortion, vascular insufficiency,
and cell damage. However, this reaction can be prevented by the use of
immunosuppressant drugs, allowing tissue repair to progress. The third rejection
category is termed chronic rejection, where pathologic tissue remodelling and
reinforcement takes place. Blood flow is reduced, which contribute to regional tissue
ischaemia, fibrosis, and cell death. This type of rejection cannot be cured as there is no
treatment available (Prescilla, 2013). There is increasing recognition of the importance
of alloantibody in chronic allograft rejection (Sellares et al., 2012).
2.1.4 Immunosuppressive Therapy
Rejection is the main barrier to successful transplantation. Therefore, the use of
immunosuppressive drugs is very important in order to suppress the immune system and
to prevent rejection of the transplanted organ. Large doses are used immediately after
the transplantation and reduced over time as the risk of acute rejection reduces.
Immunosuppressive drugs have many unpleasant adverse effects both due to inhibition
of protective immune responses leading to increased risk of infection and malignancy
and a number of drug-specific complications, including nephrotoxicity and weight gain.
The use of combination immunosuppressive therapy has developed over a number of
years in order to maximise synergistic effect and to minimize side effects and toxicity
(Meier-Kriesche et al., 2011). In current practice, most patients are given an induction
antibody that either depletes or blocks the activation of lymphocytes at the time of
transplantation and maintenance immunosuppression that is generally orally
administered small molecule drugs. The mechanisms of action of the most commonly
used immunosuppressive drugs in organ transplantation are shown in Figure 2 and
summarized in Table 2.

Background
Page 49 of 377
Figure 2: Mechanisms of Action of Immunosuppressive Drugs (modified from
(Kobashigawa and Patel, 2006).
Immunosuppressive drugs inhibit a number of steps in the mechanisms leading to T-
lymphocytes proliferation. Steroids inhibit antigen presentation, cytokine production.
Ciclosporin and tacrolimus inhibit calcineurin activation and interleukin-2 production that
resulted from donor peptide presentation by antigen-presenting cells in conjunction with
the major histocompatibility complex class II and B7 complex. Interleukin-2 production
leads to cell proliferation by a pathway involving target of rapamycin and cyclin/cyclin-
dependent kinase that known for their role in regulating the cell cycle. IL-2R Ab blocks
Interleukin (IL)-2 receptors and inhibits IL-2-induced T- lymphocytes proliferation.
Sirolimus and everolimus inhibit target of rapamycin and interleukin-2-driven T-
lymphocytes proliferation. Mycophenolate and Azathioprine inhibit synthesis of the
purine building blocks of DNA and prevent T lymphocytes proliferation. Belatacept
inhibits the CD28-CD80/CD86 (B7) interaction resulting in the blockade of T-
lymphocyte activation.
APC, antigen-presenting cell; CDK, cyclin-dependent kinase; IL-2, interleukin-2; IL-
2R, interleukin-2 receptor; IL-2R Ab, interleukin-2-receptor antibody; MHC, major
histocompatibility complex; MMF, mycophenolate mofetil; mRNA, messenger RNA;
NFAT, nuclear factor of activated T lymphocytes; TCR, T-cell receptor; TOR, target
of rapamycin protein. G1 (first growth phase), S (synthesis of DNA), G2 (second
growth phase) and M (cell division) represent the phases of the cell cycle.

Background
Page 50 of 377
Table 2: Classification and Mechanisms of Action of Drugs Commonly Used in
Transplantation.
Drug Class/ Drug Mechanism of Action
Corticosteroid
Prednisone/Prednisolone
Corticosteroids inhibit antigen presentation and cytokine
production. They are potent inhibitors of tissue damaging
inflammation.
Calcineurin inhibitor
(CNI) CNIs block the intracellular T- lymphocytes signals responsible
for the production of cytokines CNIs block the intracellular T-
lymphocytes signals responsible for the production of cytokines
(in particular IL-2, interferon-gamma and tumour necrosis factor
alpha).
Ciclosporin (CsA) CsA binds to cyclophilin; complex inhibits calcineurin
phosphatase and T- lymphocytes activation.
Tacrolimus (TAC) TAC binds to FKBP12; complex inhibits calcineurin phosphatase
and T- lymphocytes activation.
Antimetabolite Antimetabolites inhibit synthesis of the purine building blocks of
DNA, namely guanine and adenine.
Azathioprine (AZA) AZA is converted to 6-mercaptopurine and then to 6-thioinosine
monophosphate – a precursor of thioguanine nucleotides that
inhibit purine synthesis and interfere with DNA and RNA
replication.
Mycophenolate
(MMF & MPS) Mycophenolic acid (mycophenolate) inhibits synthesis of
guanosine monophosphate nucleotides and blocks purine
synthesis, preventing proliferation of T and B lymphocytes.
Mammalian target of
rapamycin (mTOR) mTOR inhibitors act by blocking the serine-threonine kinase
mTOR.
Sirolimus (SRL) SRL binds to FKBP12; complex inhibits target of rapamycin and
interleukin-2-driven T- lymphocytes proliferation.
Everolimus (ERL) ERL binds to FKBP12; complex inhibits target of rapamycin and
interleukin-2-driven T- lymphocytes proliferation.
Interleukin (IL)-2
receptor antagonist The anti-IL-2R mAbs are specific for the alpha subunit (CD25) of
IL-2Rs on activated T lymphocytes. They saturate IL-2Rs and,
thus, are competitive antagonists of IL-2-induced T- lymphocytes
proliferation.
Basiliximab Basiliximab binds to and blocks the IL-2R alpha chain (CD25
antigen) on activated T lymphocytes, inhibiting IL-2-induced T-
cell activation.
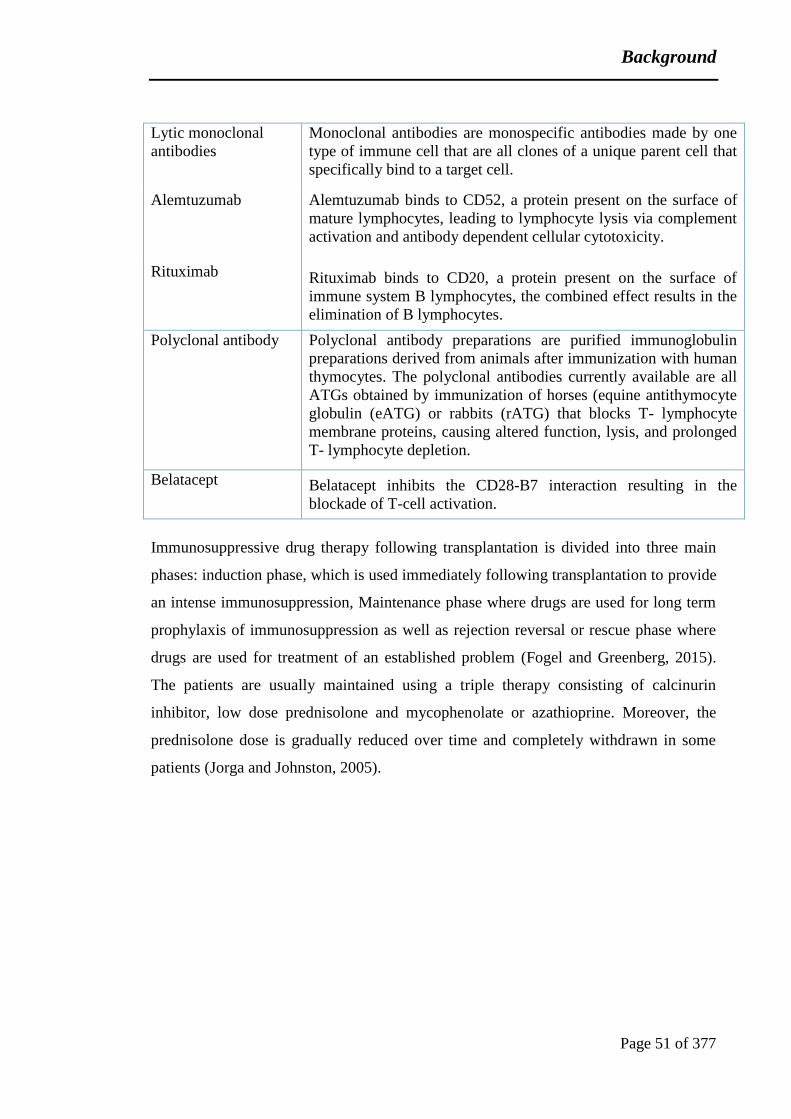
Background
Page 51 of 377
Lytic monoclonal
antibodies
Monoclonal antibodies are monospecific antibodies made by one
type of immune cell that are all clones of a unique parent cell that
specifically bind to a target cell.
Alemtuzumab Alemtuzumab binds to CD52, a protein present on the surface of
mature lymphocytes, leading to lymphocyte lysis via complement
activation and antibody dependent cellular cytotoxicity.
Rituximab Rituximab binds to CD20, a protein present on the surface of
immune system B lymphocytes, the combined effect results in the
elimination of B lymphocytes.
Polyclonal antibody Polyclonal antibody preparations are purified immunoglobulin
preparations derived from animals after immunization with human
thymocytes. The polyclonal antibodies currently available are all
ATGs obtained by immunization of horses (equine antithymocyte
globulin (eATG) or rabbits (rATG) that blocks T- lymphocyte
membrane proteins, causing altered function, lysis, and prolonged
T- lymphocyte depletion.
Belatacept Belatacept inhibits the CD28-B7 interaction resulting in the
blockade of T-cell activation.
Immunosuppressive drug therapy following transplantation is divided into three main
phases: induction phase, which is used immediately following transplantation to provide
an intense immunosuppression, Maintenance phase where drugs are used for long term
prophylaxis of immunosuppression as well as rejection reversal or rescue phase where
drugs are used for treatment of an established problem (Fogel and Greenberg, 2015).
The patients are usually maintained using a triple therapy consisting of calcinurin
inhibitor, low dose prednisolone and mycophenolate or azathioprine. Moreover, the
prednisolone dose is gradually reduced over time and completely withdrawn in some
patients (Jorga and Johnston, 2005).

Background
Page 52 of 377
2.1.4.1 Corticosteroids
Corticosteroids interrupt multiple steps in immune activation because of the ubiquitous
expression of corticosteroid receptors. Prednisolone is a synthetic adrenocortical steroid
derivative with predominantly glucocorticoid properties possessing anti-inflammatory
and immunosuppressive action (Adcock and Ito, 2000). Its anti-inflammatory properties
are apparent through preventing or suppressing the tissue response to the inflammatory
process. Complications of corticosteroid therapy are numerous and virtually any organ
system in the body may be affected. Short-term or acute adverse effects, which usually
occur with initiation of therapy, include central nervous system effects, psychosis,
pseudotumor cerebri, impaired glucose tolerance, and retention of sodium and fluid.
This may exacerbate congestive heart disease and may aggravate preexisting diabetes
mellitus. Long-term adverse effects can lead to the development of iatrogenic Cushing
syndrome with truncal obesity. It also increases the susceptability to infections of
certain species including Aspergillus species, Pneumocystis jiroveci, and Herpes virus
species (Stanbury and Graham, 1998). Prednisolone is readily absorbed from the
gastrointestinal tract. It is extensively bound to plasma proteins and has a usual plasma
half-life of 2 to 3 hours. Prednisolone is excreted in the urine as free and conjugated
metabolites together with a considerable proportion of unchanged prednisolone
(Martindale and Reynolds, 1996). Prednisolone is metabolised by enzymes in the
CYP3A family (CYP3A4/CYP3A5) and it is a substrate of the efflux transporter P-
glycoprotein. Prednisolone is a CYP3A and P-glycoprotein inducer with consequent
impact on the metabolism of other drugs (Miura et al., 2008).

Background
Page 53 of 377
2.1.4.2 Calcineurin Inhibitor (CNI)
Calcineurin inhibitors block the intracellular T-cell signals responsible for the
production of cytokines. This group of drugs includes ciclosporin (CsA) and tacrolimus
(TAC).
2.1.4.2.1 Ciclosporin (CsA)
Ciclosporin CsA is a cyclic nonribosomal peptide of 11 amino acids and contains a
single D-amino acid, which are rarely encountered in nature. It was initially isolated
from a fungus called Tolypocladium inflatum (Beauveria nivea). It is the first
calcineurin inhibitor used in transplantation and was approved by the US Food and
Drug Administration in 1983. It remains the primary agent in immunosuppressive
regimens in many transplant programmes worldwide. Ciclosporin acts through the
production of a complex with cyclophilin that inhibits calcineurin phosphatase activity.
Consequently, CsA inhibits translocation of the nuclear factor of activated T
lymphocytes (NFAT) family of transcription factors from the cytoplasm to the nucleus
of activated T lymphocytes. It also inhibits lymphokine production and interleukin
release (in particular IL-2, interferon gamma and tumour necrosis factor alpha) and,
therefore, inhibits T cell activation and proliferation (Finkel et al., 2009). The common
adverse effects of CsA include nephrotoxicity, hypercholesterolaemia, systemic
hypertension, gingival hyperplasia, hirsutism hypertrichosis, and neurotoxicity.
Impairment of glucose tolerance is an important complication of the CNIs resulting in
New Onset Diabetes After Transplantation (NODAT). In addition, it increases
vulnerability to opportunistic fungal and viral infections and displays a possible role in
promoting cancer progression and tumour cell invasion as well as metastasis (Prescilla,
2013).
Ciclosporin is available for intravenous or oral administration. It is provided as soft
gelatin capsules and oral solutions. The absorption of the original soft gelatin capsule
(SANDIMMUNE®) is slow, with 20% to 50% bioavailability. However, the modified
microemulsion formulation (NEORAL®) has a slightly increased bioavailability
compared to SANDIMMUNE®. After oral administration, Ciclosporin absorption is
Background
Page 54 of 377
incomplete and varies among the individual patient and the formulation used.
Ciclosporin reaches its peak blood concentration within 1.5 to 2 hours and its absorption
is greatly decreased by food. Ciclosporin is extensively metabolized by CYP3A in the
liver. It is mainly excreted through the bile into the faeces and only 0.1% of ciclosporin
is excreted unchanged in the urine (Goodman et al., 2006).
2.1.4.2.2 Tacrolimus (TAC)
Tacrolimus is the most widely used calcineurin inhibitor in renal transplant recipients in
the United Kingdom. It is a macrolide lactone antibiotic produced by Streptomyces
tsukubaensis discovered in 1984 from the fermentation broth of a Japanese soil sample.
Tacrolimus was first approved by the Food and Drug Administration in 1994 for use in
liver transplantation and later also for use in kidney transplantation. Tacrolimus is
considered as one of the most potent immunosuppressive agents used in managing
rejection following renal transplantation and belongs, together with CsA to a unique
class of immunosuppressive natural products known as Calcineurin inhibitors (Bekersky
et al., 2001a, Pirsch et al., 1997). Tacrolimus binds to an immunophilin, FK506 binding
protein (FKBP) which binds to and blocks CaN. This complex inhibits the activation of
NF-ATc, thus preventing its entrance into the nucleus and T-cell activation (Fleischer,
1999). Tacrolimus has demonstrated efficacy both as primary immunosuppressive
therapy in patients undergoing various transplantation procedures and as a rescue
therapy for patients with refractory acute allograft rejection after liver or kidney
transplantation. It is up to 100 times more potent than CsA and clinically, it is
associated with a greater reduction in the incidence of acute and chronic rejection and
better long term graft survival (Tsunoda and Aweeka, 2000). The common adverse
events of tacrolimus are nephrotoxicity, neurotoxicity, and diabetogenicity, which
correlate with trough blood concentrations of tacrolimus. Hypertension, hyperkalemia,
and thrombotic microangiopathy have also been reported. Neurotoxicity, alopecia, and
NODAT develop more frequently with tacrolimus than with ciclosporin. However,
tacrolimus is less likely to cause hyperlipidaemia, hypertrichosis and gingival
hypertrophy compared with ciclosporin (Prescilla, 2013).
Background
Page 55 of 377
Tacrolimus gastrointestinal absorption is incomplete and variable with an oral
bioavailability of approximately 25%. The rate and extent of tacrolimus absorption is
greatly affected by food. Tacrolimus binds extensively to erythrocytes in blood and
approximately 99% of tacrolimus partitioned into plasma is bound to plasma proteins,
mainly albumin and alpha-1-acid glycoprotein. The unbound fraction of tacrolimus,
comprising less than 0.1% of total blood concentration, is responsible for its
pharmacological activity. Tacrolimus is extensively distributed in the body and at
steady state the majority of tacrolimus exists in the tissue. Tacrolimus is predominantly
metabolized by CYP 3A enzymes in the liver and the intestinal wall, with a half-life of
approximately 12 hours. Most of the tacrolimus dose is ultimately excreted in faeces
(Goodman et al., 2006).
2.1.4.3 Antiproliferative Agents
2.1.4.3.1 Azathioprine (AZA)
Azathioprine (AZA) is an immunosuppressive drug used in organ transplantation and
autoimmune diseases and belongs to the chemical class of purine analogues.
Azathioprine acts as a pro-drug for 6-mercaptopurine, inhibiting an enzyme that is
required for the synthesis of DNA. Thus, it most strongly affects proliferating cells,
such as the T lymphocytes and B lymphocytes of the immune system (Maltzman and
Koretzky, 2003). AZA is converted to 6-mercatopurine and then to 6-thioinosine
monophosphate – a precursor of thioguanine nucleotides which particularly inhibit the
synthesis of purines required for DNA and RNA replication . Thus it most strongly
affects proliferating cells, such as the T lymphocytes and B lymphocytes of the immune
system. Moreover, azathioprine blocks the downstream effects of CD28 co-stimulation,
a process required for T cell activation. The main adverse effect of azathioprine is bone
marrow suppression. Azathioprine can also result in a decrease in the number of blood
cells in the bone marrow, which may cause serious or life-threatening infections.
Although not very common, hepatotoxicity has been found to be associated with
azathioprine therapy (Patel et al., 2006). Additionally, azathioprine may increase the
risk of developing certain types of cancers, especially skin cancer and lymphoma and
Background
Page 56 of 377
has therefore been listed as a human carcinogen in the 12th Report on Carcinogens by
the National Toxicology Program of U.S. Department of Health and Human Services
(NTV, 2011).
Azathioprine undergoes extensive metabolism to mercaptopurine, which is subsequently
metabolized to 6-thioguanine nucleotides that are the presumed active moiety. The
maximum concentration is reached within about 1-2 hours after administration and it is
moderately bound to plasma protein. The half-life of azathioprine is about 10 minutes
and that of the metabolite is 1 hour (Goodman et al., 2006). Thiopurine S-
methyltransferase (TPMT) contributes to the metabolism of all thiopurines and is
responsible for inactivation of mercaptopurine. TPMT shows genetic polymorphism
causing null or decreased enzyme activity. Patients who have two nonfunctional TPMT
alleles commonly experience life-threatening myelosuppression. TPMT genotyping or
phenotyping prior to starting treatment with azathioprine may help in identifying
patients at increased risk for toxicity and is recommended by several guidelines (Dean,
2012 ).
2.1.4.3.2 Mycophenolate Mofetil (MMF)
Mycophenolate mofetil (MMF), a prodrug of mycophenolic acid which is also available
as an enteric-coated sodium salt (MPS), is used extensively in transplant medicine
(Meier-Kriesche et al., 2011). MMF is an organic synthetic derivative of the natural
fermentation product mycophenolic acid (MPA) that causes non-competitive reversible
inhibition of inosine monophosphate dehydrogenase, a key enzyme in the de novo
guanosine nucleotide synthesis pathway in B and T lymphocytes. This interferes with
purine synthesis and prevents proliferation of T and B lymphocytes (Allison and Eugui,
2000). One of the essential properties of mycophenolate is that it lacks cardiovascular
risks and chronic nephrotoxic adverse effects. The most common adverse events are
primarily gastrointestinal such as nausea and/or vomiting, diarrhoea, gastritis,
duodenitis, oesophagitis and ulcers. Other adverse effects are related to bone marrow
suppression, including leukopaenia, anaemia, and thrombocytopaenia (Prescilla, 2013).

Background
Page 57 of 377
Mycophenolate mofetil is rapidly absorbed from the gastrointestinal tract after oral
administration and it is rapidly and completely metabolized to mycophenolic acid.
MPA, in turn, is metabolized in the liver, gastrointestinal tract and kidney to the inactive
metabolite, 7-O-MPA-glucuronide (MPAG) with a small proportion metabolysed to an
acyl-glucuronide. MPAG is actively transported into bile and passes into urine. MPAG
is de-conjugated back to MPA by the bacteria in the gut and then reabsorbed in the
colon resulting in a second peak of absorption. MPA is highly bound to serum albumin
and it reaches its maximum concentration within 1–2 hours (Staatz and Tett, 2007).
2.1.4.4 Sirolimus
Sirolimus is a potent immunosuppressive drug widely used in organ transplantation. It is
a macrocyclic triene antibiotic produced by Streptomyces hygroscopicus. Sirloimus was
first isolated as an antifungal drug. However, further studies showed its remarkable
antitumor and immunosuppressive activities. Sirolimus has a potent inhibitory effect on
antigen-induced proliferation of T and B lymphocytes, and inhibits antibody production.
Sirolimus binds to the same intracellular protein as tacrolimus, FKBP12. The sirolimus:
FKPB12 complex interacts with and blocks the activation of an essential cell-cycle
kinase named mTOR (mammalian target of rapamycin). By interfering with the mTOR
function, sirolimus prevents the mTOR-mediated signal-transduction pathways and
consequently, this results in the blockage of cell-cycle progression in G1 phase (Sehgal,
2003). The most common adverse effects attributed to sirolimus were hyperlipidemia,
infection, lymphopenia, anemia, thrombocytopenia, mouth ulcers, peripheral oedema
and diarrhoea. Sirolimus -induced pneumonitis has also been reported. In contrast to
CNIs, sirolimus is not associated with nephrotoxicity. Therefore, it can be used as an
alternative immunosuppressive agent for transplant recipients who develop renal
impairment with ciclosporin or tacrolimus therapy (Knechtle, 2014). Sirolimus is
rapidly absorbed from the gastrointestinal tract following oral administration and
reaches its peak concentration in 1-2 hours. After absorption, sirolimus is extensively
bound to red blood cells and less than 5% of the drug remains free in the plasma.
Sirolimus has a relatively low bioavailability (around 25%). It is metabolized in the
liver and the intestinal wall by the CYP3A enzyme subfamily (CYP3A4 and CYP3A5)
Background
Page 58 of 377
and to a minor extent by CYP2C8. Sirolimus has a long elimination half-life of about 60
hours in renal transplant recipients. It has a narrow therapeutic index and theraputic
drug monitoring of blood concentrations is essential to ensure safe and effective
treatment (Knechtle, 2014).
2.1.4.5 Antibody Immunosuppressive Therapy
2.1.4.5.1 Monoclonal Antibody
A series of monoclonal antibodies (mAbs) are commonly used as induction therapy in
renal transplantation. Monoclonal antibodies have different mechanisms of action. They
target specific CD proteins on the T or B lymphocyte surface, including mAbs against
CD3, CD20 and CD52.
Alemtuzumab (also known as Campath) binds to CD52, a protein present on the surface
of mature lymphocytes, leading to lymphocyte lysis via complement activation and
antibody dependent cellular cytotoxicity, leading to depletion of T and B lymphocytes
in the peripheral circulation for several months after administration. Infusion related
side effects can occur during or shortly after alemtuzumab infusion, including pyrexia,
chills/rigors, nausea, hypotension, urticaria, dyspnoea, rash, emesis, and bronchospasm.
Rituximab binds to CD20, a protein present on the surface of immune system B
lymphocytes, the combined effect results in the elimination of B lymphocytes.The most
common complications occurring with rituximab therapy is infection, pulmonary
toxicity, neutropenia and thrombocytopenia (Mahmud et al., 2010, Zaza et al., 2014).
2.1.4.5.2 Polyclonal Antibody
The polyclonal antibodies are produced by immunizing animals with human
lymphocytes and the created antilymphocyte serum is then purified to isolate
antithymocyte globulins (ATGs) from horses (equine antithymocyte globulin (eATG))
or rabbits (rabbit-derived antithymocyte globulin (rATG)). Polyclonal antibodies
prevent T lymphocyte activation and proliferation by its broad spectrum activity against
T lymphocytes activation markers, including CD2, CD3, CD4, CD8, CD11a, CD18,

Background
Page 59 of 377
CD25, CD44, CD45, human leukocyte antigen (HLA). Polyclonal antibodies block T-
lymphocytes membrane proteins, causing alteration of the function, lysis, and prolonged
T- lymphocyte depletion. By using ATGs, the body identified the transplanted organ as
non-foreign. In the last decade, rATG has been used as by more transplant centres as an
induction agent. The elimination half-life is 2 to 3 days for rATG and 1.5 to 12 days for
eATG. The most common side effects of polyclonal antibodies with first-dose infusion
are fever, chills and rashes. Repeated doses are associated with myelosuppression,
thrombocytopenia and leukopenia. However, these side effects generally diminish after
lowering the dose or terminating the treatment (Mahmud et al., 2010).
2.1.4.6 Belatacept
Belatacept is the first biologic agent approved by FDA for maintenance
immunosuppression in kidney transplantation combined with other immunosuppressants
such as basiliximab, mycophenolate mofetil and corticosteroids in adult patients.
Belatacept has comparable short-term outcomes to the CNIs, while avoiding their
nephrotoxic potential and their cardiovascular and metabolic toxicities. It is a selective
T-lymphocyte costimulation blocker. Belatacept binds to the B7-1/CD80 and B7-
2/CD86 receptors of antigen-stimulating cells and thereby prevents the CD28-mediated
T-lymphocyte costimulation resulting in the inhibition of IL-2 expression and hence the
blockade of T- lymphocyte activation. The most common adverse effects of belatacept
include infection, hypophosphatemia, diarrhoea, and cough. The most serious side
effect during belatacept therapy are post-transplant lymphoproliferative disorder and
progressive multifocal leukoencephalopathy. Belatacept is administered as an
intravenous infusion over 30 minutes. It exhibits linear pharmacokinetics. Belatacept
has a consistent and predictable pharmacokinetic profile and the serum elimination half-
life is approximately 8-10 days. Belatacept has low variability in its exposure and
therefore therapeutic drug monitoring is not required (Melvin et al., 2012).
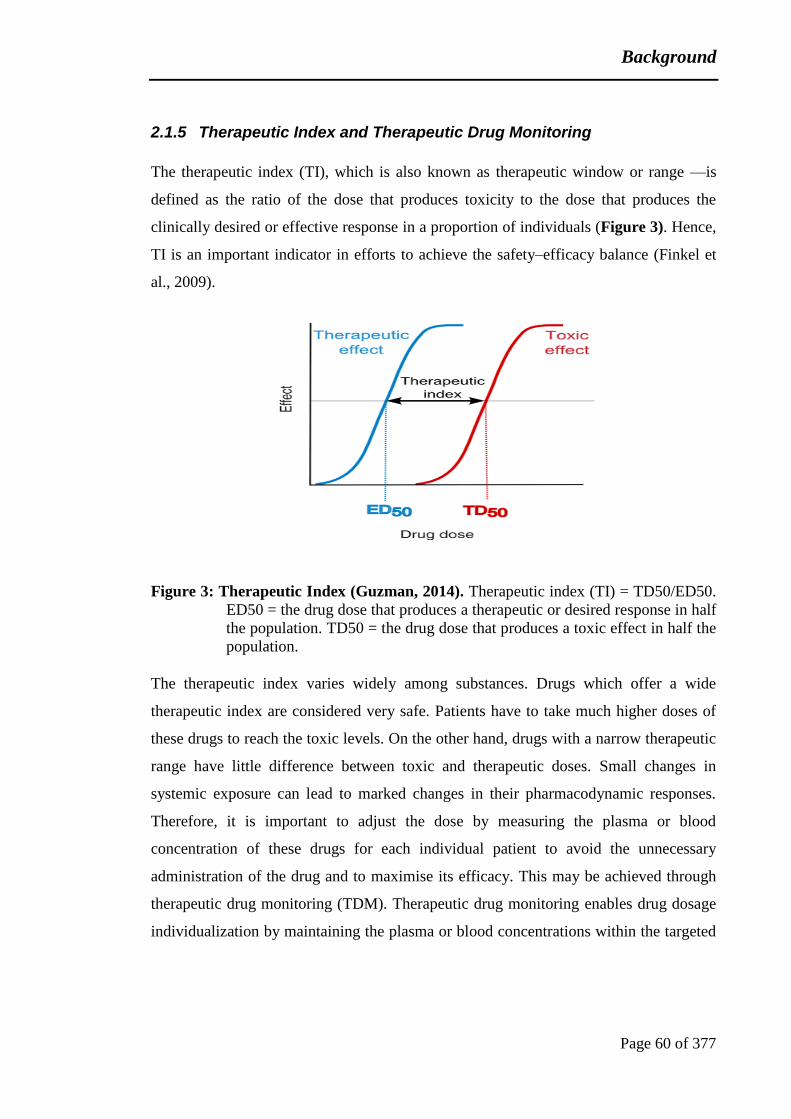
Background
Page 60 of 377
2.1.5 Therapeutic Index and Therapeutic Drug Monitoring
The therapeutic index (TI), which is also known as therapeutic window or range —is
defined as the ratio of the dose that produces toxicity to the dose that produces the
clinically desired or effective response in a proportion of individuals (Figure 3). Hence,
TI is an important indicator in efforts to achieve the safety–efficacy balance (Finkel et
al., 2009).
Figure 3: Therapeutic Index (Guzman, 2014). Therapeutic index (TI) = TD50/ED50.
ED50 = the drug dose that produces a therapeutic or desired response in half
the population. TD50 = the drug dose that produces a toxic effect in half the
population.
The therapeutic index varies widely among substances. Drugs which offer a wide
therapeutic index are considered very safe. Patients have to take much higher doses of
these drugs to reach the toxic levels. On the other hand, drugs with a narrow therapeutic
range have little difference between toxic and therapeutic doses. Small changes in
systemic exposure can lead to marked changes in their pharmacodynamic responses.
Therefore, it is important to adjust the dose by measuring the plasma or blood
concentration of these drugs for each individual patient to avoid the unnecessary
administration of the drug and to maximise its efficacy. This may be achieved through
therapeutic drug monitoring (TDM). Therapeutic drug monitoring enables drug dosage
individualization by maintaining the plasma or blood concentrations within the targeted

Background
Page 61 of 377
therapeutic window and consequently, achieving the maximum efficacy and safety of a
particular medication (Kang and Lee, 2009).
Most immunosuppressant drugs are critical dose drugs with a large between- and
within- individual variability in their pharmacokinetics (PK) and systemic exposure.
The between-patient variability is the variation between individuals in the blood
concentration achieved by a given dose. On the other hand, the within-patient variability
is visualized by fluctuating concentration of the immunosuppressive drug within a
certain period of time during which drug dosage was unchanged. High within-patient
variability complicates therapeutic drug monitoring as the drug concentrations will
frequently be above or below the therapeutic window, putting the patient at risk for
toxicity in the case of overexposure or for acute rejection in the case of drug
concentrations below the lower threshold of the therapeutic window.
The between-patient variability of calcineurin inhibitor concentrations can lead to
under- or over-immunosuppression putting some patients at risk for rejection or toxicity
and hence it is an important risk factor for poor kidney allograft outcomes and to some
extent this is influenced by genetic factors (Staatz and Tett, 2004). For both CNIs, most
of the between- and within-patient variability occurs in the absorption phase rather than
in the elimination phase. Individual variation in response to these drugs is a major
medical issue and to a certain extent it is genetically related (Schiff et al., 2007).
Therefore, regular monitoring and regulation of immunosuppressant drug doses is a
crucial indicator to prevent possible rejection events and major adverse effects
associated with toxic and sub-therapeutic drug concentrations. Efficacy and side effects
of immunosuppressive drugs are highly correlated with the area under the concentration
time curve (AUC). Recording a complete pharmacokinetic profile for every patient is
not feasible in clinical practice (Op den Buijsch et al., 2007). Limited sampling strategy
(LSS) including a limited number of samples such as trough and time points within a
short time post-dose, offers a practical approach to investigate the potential of drug
AUC monitoring in routine clinical application (Mathew et al., 2008). Some of the
common TDM techniques include the following:

Background
Page 62 of 377
2.1.5.1 Trough Concentration Monitoring (C0)
In this method, the drug concentration that is achieved just before the administration of
the subsequent dose is measured. This method is the oldest and, most commonly used
method applied in TDM. Despite the simplicity of this method, it provides just an
approximate estimate of the drug exposure throughout the dosing interval which is
considered as the major downsides of this technique (Norman and Turka, 2001).
Whereas the advantages of C0 monitoring are that it requires only one sample and
eliminates the patients need to stay long time in the hospital for multiple samples to be
taken.
2.1.5.2 Area under the Curve (AUC) Monitoring
This method provides a more accurate measure of drug extent. AUC0-12 is a good
indicator for measuring drug exposure but the main disadvantages of AUC monitoring
are that it is expensive and requires multiple blood samples and patient requires to
spend long hours in the hospital which is impracticable for both the clinician and the
patient.
2.1.5.3 Abbreviated Area under the Curve Monitoring
The AUC monitoring method can be modified by targeting the blood concentration in
the first four hours after dosing. This abbreviated AUC is a limited sampling (2-4)
strategy over the dosing interval, making it more convenient and economical than the
standard AUC monitoring (Norman and Turka, 2001).
2.1.5.4 C2 Monitoring
This method further limits the number of collected samples to one, 2 hours following
the drug administration. It is a more accurate predictor of ciclosporin exposure and
clinical events as compared to C0 monitoring as most of the between patient variability
is in the absorption rather than the elimination phase (Jorga et al., 2004).
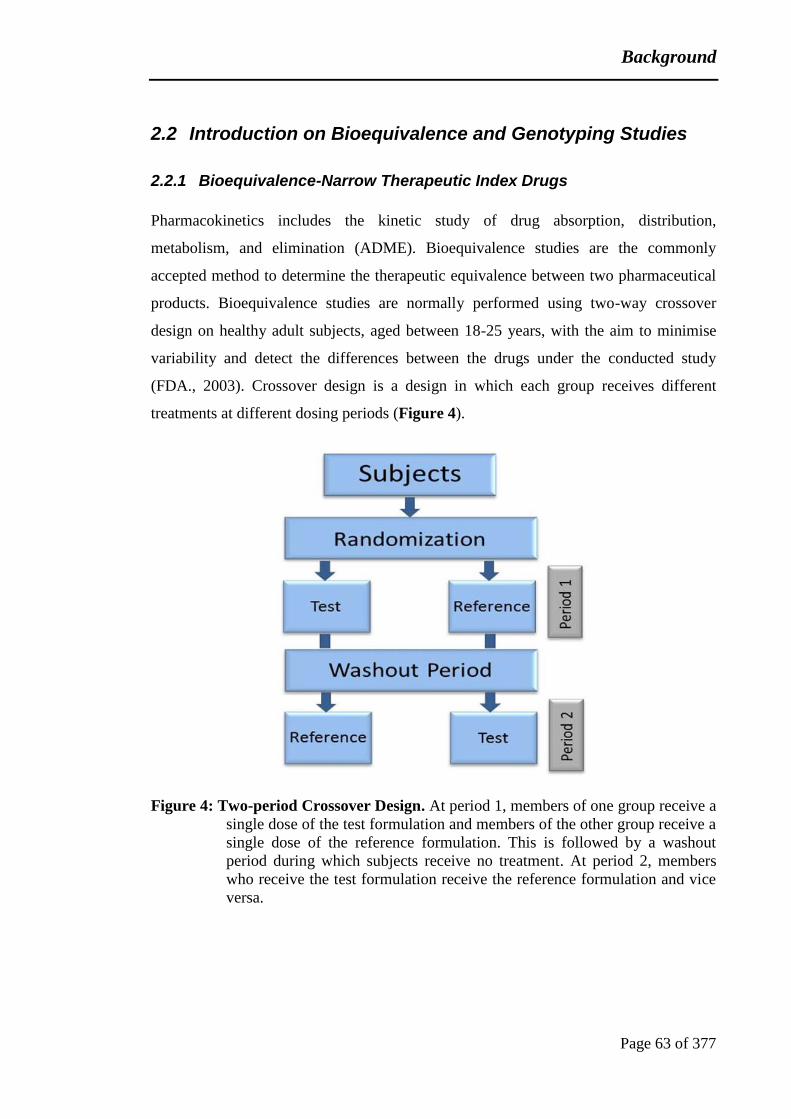
Background
Page 63 of 377
2.2 Introduction on Bioequivalence and Genotyping Studies
2.2.1 Bioequivalence-Narrow Therapeutic Index Drugs
Pharmacokinetics includes the kinetic study of drug absorption, distribution,
metabolism, and elimination (ADME). Bioequivalence studies are the commonly
accepted method to determine the therapeutic equivalence between two pharmaceutical
products. Bioequivalence studies are normally performed using two-way crossover
design on healthy adult subjects, aged between 18-25 years, with the aim to minimise
variability and detect the differences between the drugs under the conducted study
(FDA., 2003). Crossover design is a design in which each group receives different
treatments at different dosing periods (Figure 4).
Figure 4: Two-period Crossover Design. At period 1, members of one group receive a
single dose of the test formulation and members of the other group receive a
single dose of the reference formulation. This is followed by a washout
period during which subjects receive no treatment. At period 2, members
who receive the test formulation receive the reference formulation and vice
versa.
Background
Page 64 of 377
The advantage of the crossover design is that it decreases the influence of between-
subject variability as each patient serves as his own control. There are two
disadvantages of this design. The first disadvantage is that the treatment order may
affect the outcomes. The second disadvantage, which is of the main concern, is the
carry-over effect between the treatments that can be avoided with a sufficiently long
"wash-out" period (Wang and Bakhai, 2006). This washout period should be equal to or
more than five times of the drug elimination half-life, to ensure that drug concentrations
are below the lower limit of bioanalytical quantification in all subjects at the beginning
of the second period (FDA., 2003).
Bioequivalence of two formulations of the same drug includes equivalence with respect
to the rate and extent of absorption. The area under the concentration time curve (AUC)
reflects the extent of exposure. The maximum plasma concentration (Cmax) and the time
to maximum plasma concentration (tmax,) are parameters that are influenced by the
absorption rate. FDA guidelines states that the 90% confidence intervals for the ratios
(test: reference) of the areas under the drug concentration versus time curves (AUC
ratio) and the maximum plasma drug concentrations (Cmax ratio) must fall between 0.8-
1.25, which is the bioequivalence acceptable range applied for any bioequivalence study
(FDA., 2003).
Many countries have established guidelines for the bioequivalence studies and
formulated requirements for their design, conduct, and evaluation. However, all of these
bioequivalence guidelines approved that the acceptable bioequivalence range for the
bioavailability measures (AUC and Cmax) is 0.8-1.25. However, in recent years there
have been large debates regarding the validity of this target interval for products with a
narrow therapeutic index. It is sometimes claimed that the 80 to 125% limit means there
can be a wide variation between the generic and the reference product (Birkett, 2003).
Drugs with a narrow therapeutic index (NTI-drugs) are drugs with small differences
between therapeutic and toxic doses. Moreover, there is a risk of clinically relevant
difference in efficacy or safety between two NTI drug formulations even when the
conventional criteria for bioequivalence (i.e. 90% confidence interval for test / reference
Background
Page 65 of 377
ratio for AUC and Cmax within 80-125%) are met (Borgheini, 2003, Burns, 1999).
Several immunosuppressive drugs, including tacrolimus are considered to be examples
of NTI drugs (Johnston and Holt, 1999, MacPhee et al., 2002). For this reason, the
Health Canada guidelines were changed for critical dose drugs so that 90% confidence
interval of relative mean AUC of the test to reference formulation were reduced to 90.0
to 112.0%, but it is still 80.0 to 125.0% for relative mean Cmax. European Medical
Agency guideline (EMA) was recently changed to recommend that in specific cases of
products with a narrow therapeutic index, the acceptance interval for AUC should be
tightened to 90.00-111.11%. Where Cmax is of particular importance for safety, efficacy
or drug level monitoring the 90.00-111.11% acceptance interval should also be applied
for this parameter (EMA, 2010a). In June 2015, the Efficacy Working Party (EWP)
recommended that the bioequivalence acceptance criteria for tacrolimus should be [90-
111%] for AUC and [80-125%] for Cmax. This is because they considered the total drug
exposure (AUC) is the key parameter of importance for tacrolimus dose titration; in
comparison peak whole blood concentration does not seem to be critical for either
safety or efficacy (EMA, 2015). Furthermore, NTI drugs often have steep concentration
response relationships for efficacy, toxicity, or both. Dosing generally needs to be
individualised based on blood/plasma concentration monitoring and there may be
potentially serious clinical consequences in the event of concentrations outside the
therapeutic window. Remarkably, it is not possible to define a set of criteria to
categorize drugs as either NTIDs or not and a judgment must be made in each
individual case. Likewise, the need for narrowing the acceptance interval for both AUC
and Cmax or for AUC only should be determined on a case by case basis (NTV, 2011).
2.2.2 Genotyping Procedure
A gene is a chromosomal DNA sequence that is required for the making of a functional
product (polypeptide or functional RNA molecule). An ''allele'' is one variant of the
gene. SNPs or single nucleotide polymorphisms are alterations in a single base in the
gene sequence and may code for a different protein altogether creating genetic mutation.
Mutations of genes that are important for functions in the body can lead to a genetic
condition that may affect the individual growth or health (Mandal, 2014). Some genes
Background
Page 66 of 377
are highly polymorphic, resulting in enzyme variants that may have variable drug-
metabolizing capacities among individuals. Many of the recorded polymorphisms relate
to differences in the expression of drug metabolizing enzymes and transporters, and
hence drug disposition (Flanagan et al., 2007).
Genotyping is the process of determining differences in an individual genetic make-up
by examining the individual's DNA sequence using biological assays and comparing it
to another individual's sequence or a reference sequence. Two steps are required for
single nucleotide polymorphisms (SNPs) genotyping. The first step is DNA region
amplification, approximately 200 base pairs around the SNP, millions to billions of
times by means of a PCR. Then the PCR product has to be sequenced or digested by an
enzyme and followed by gel electrophoresis in order to genotype the polymorphic
regions.
2.2.2.1 Polymerase Chain Reaction (PCR) and DNA Sequencing
2.2.2.1.1 Principle of PCR
Polymerase chain reaction (PCR) is a biochemical technology in molecular biology and
it is used to amplify a specific region of a DNA strand in a cyclic process to make a
huge number of identical copies that can readily be analysed. This is necessary to have
enough starting template for sequencing. PCR is commonly carried out in a thermal
cycler. The thermal cycler heats and cools the reaction tubes to achieve the temperatures
required at each step of the reaction in a very short time.
I. Initialization Step: This step consists of heating the reaction to a temperature of
94–96°C (or 98°C if extremely thermostable polymerases are used), which is
held for 1–9 minutes. It is only required for DNA polymerases that require heat
activation by hot-start PCR (Sharkey et al., 1994).

Background
Page 67 of 377
II. The Cycling Reactions:
There are three major steps in a PCR, which are repeated for 30 or 40 cycles (Figure 5).
Denaturation Step: This step is the first regular cycling step and consists of
heating the reaction to 94–98 C for 20–30 seconds. During the denaturation, the
double strand DNA and primers melt to a single stranded DNA by disrupting the
hydrogen bonds between complementary bases and all enzymatic reactions stop.
Annealing Step: During this step, the reaction temperature is lowered to 50–
65°C for 20–40 seconds and this allows annealing of the primers to the single-
stranded DNA template. The primers are moving randomly and stable DNA-
DNA hydrogen bonds are only formed when the primer sequence very closely
matches the template sequence. The polymerase binds to the primer-template
hybrid and begins DNA formation.
Extension/Elongation Step: The temperature at this step depends on the DNA
polymerase used and commonly a temperature of 72°C is used with this enzyme.
At this step the DNA polymerase synthesizes a new DNA strand complementary
to the DNA template strand by adding dNTPs (deoxynucleotide triphosphates)
that are complementary to the template in 5' to 3' direction, condensing the 5'-
phosphate group of the dNTPs with the 3'-hydroxyl group at the end of the
nascent (extending) DNA strand (Chien et al., 1976). The extension time depends
both on the DNA polymerase used and on the length of the DNA fragment to be
amplified. Normally, at its optimum temperature, the DNA polymerase will
polymerize a thousand bases per minute. At each extension step, the amount of
DNA target is doubled, leading to exponential (geometric) amplification of the
specific DNA fragment.
Final Elongation: This single step is occasionally performed at a temperature of
70–74°C for 5–15 minutes after the last PCR cycle to ensure that any remaining
single-stranded DNA is fully extended.

Background
Page 68 of 377
Figure 5: The Different Steps of Polymerase Chain Reaction (Lee et al., 2007). The
double strand DNA is denatured by heating to 94-98°C. At approximately
55°C, the primers anneal to the single-stranded DNA template. At 72°C
DNA polymerase extends the single-stranded DNA and synthesizes a new
DNA strand complementary to the DNA template. This process is repeated
for 30 or 40 cycles.
In order to check whether the PCR generated the anticipated DNA fragment, agarose gel
electrophoresis is employed for size separation of the PCR products. The size of PCR
products is commonly determined by a comparison with a DNA ladder (a molecular
weight marker), which contains DNA fragments of known size; run on the gel alongside
the PCR products. The products with brighter fluorescence are the ones that are likely to
produce the best sequences.
2.2.2.1.2 Principle of Sequencing
The purpose of sequencing is to determine the order of the nucleotides of a gene from
PCR fragments or cloned genes. There are three major steps in a sequencing reaction
(like in PCR), which are repeated for 30 or 40 cycles.
Denaturation Step at 94-98°C: During the denaturation, the double strand DNA and
primers melt to a single stranded DNA by disrupting the hydrogen bonds between
complementary bases and inhibiting enzymatic reactions.
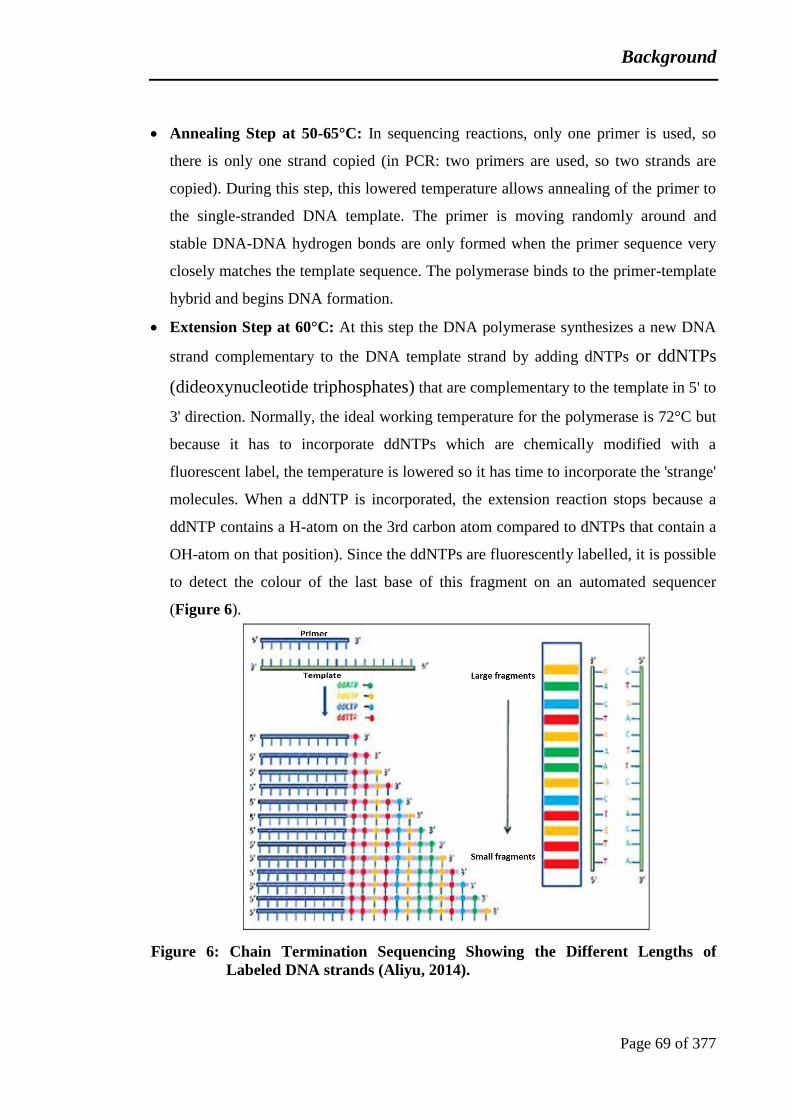
Background
Page 69 of 377
Annealing Step at 50-65°C: In sequencing reactions, only one primer is used, so
there is only one strand copied (in PCR: two primers are used, so two strands are
copied). During this step, this lowered temperature allows annealing of the primer to
the single-stranded DNA template. The primer is moving randomly around and
stable DNA-DNA hydrogen bonds are only formed when the primer sequence very
closely matches the template sequence. The polymerase binds to the primer-template
hybrid and begins DNA formation.
Extension Step at 60°C: At this step the DNA polymerase synthesizes a new DNA
strand complementary to the DNA template strand by adding dNTPs or ddNTPs
(dideoxynucleotide triphosphates) that are complementary to the template in 5' to
3' direction. Normally, the ideal working temperature for the polymerase is 72°C but
because it has to incorporate ddNTPs which are chemically modified with a
fluorescent label, the temperature is lowered so it has time to incorporate the 'strange'
molecules. When a ddNTP is incorporated, the extension reaction stops because a
ddNTP contains a H-atom on the 3rd carbon atom compared to dNTPs that contain a
OH-atom on that position). Since the ddNTPs are fluorescently labelled, it is possible
to detect the colour of the last base of this fragment on an automated sequencer
(Figure 6).
Figure 6: Chain Termination Sequencing Showing the Different Lengths of
Labeled DNA strands (Aliyu, 2014).

Background
Page 70 of 377
Sequencing reactions need to be cleaned up prior to injection on the ABI sequencer in
order to remove both the unincorporated dideoxynucleotides as well as salts from the
reaction buffers. This is achieved by filtration on sephadex column (Hutchison et al.,
2005). Addition of reagents such as formamide may increase the specificity and the
yield of PCR (Sarkar et al., 1990).
After the sequencing reactions, a mixture of strands with different length and ending on
a fluorescently labelled ddNTP has to be separated. This can be done with gel
electrophoresis using a fluorescence-based capillary electrophoresis (CE) system. When
the DNA passes through the detection cell, the capillaries are simultaneously
illuminated from both sides of the array by a laser beam. The fluorescent molecule
sends out a light of a distinct colour. The emitted fluorescent light is collected,
separated by wavelength, and focused onto a charge coupled device (CCD). This is
followed by data transfer to the instrument computer where they are transformed by
chemometric algorithmic processing into 4- or 5-dye electropherograms. Each base has
its own colour, so the sequencer can detect the order of the bases in the sequenced gene,
see Figure 7.
Figure 7: An Electropherogram Showing a Sequence of Data Produced by an
Automated DNA Sequencing Machine (Abouzeid et al., 2012). The four
dideoxy nucleotides (A, G, C and T) have different fluorescent colours. A
base =green colour, C base= blue colour, G base = black colour and T base=
red colour. The DNA sequence can easily be identified by using these
colour codes.

Background
Page 71 of 377
2.2.2.1.3 Real-time PCR (RT-PCR)
Real-time PCR is a quantitative PCR technique in molecular genetics that follows the
principle of PCR with simultaneous amplification and detection of specific DNA-
sequences. It is an established method for DNA quantification that measures the
accumulation of DNA product after each round of PCR amplification and it monitors
the progress as it occurs, in real time (Higuchi et al., 1992, Higuchi et al., 1993).
Consequently, it allows quantification of the target polymorphic DNA regions and
genotyping of single nucleotide polymorphisms (SNPs) in one single PCR run. RT-PCR
facilitates a high speed PCR analysis, about one hour/run. It also minimizes the risk of
contamination during analysis, since no post PCR steps are involved and the PCR
product remains in the machine for genotyping (Reuter et al., 2005).
Melting curve analysis can only be implemented with real-time PCR detection
technologies where the fluorophore, a fluorescent compound, remains linked to the
target DNA sequence. Hybridization probes, sequence-specific oligonucleotides, are
required for DNA amplification process and genotyping using melting curve analysis.
The probes are usually 100-1000 bases long, labelled by fluorescence dyes; one probe is
labelled on the 3’ end and the other is labelled on the 5’ end. The 3’ end contains a
phosphorylation modification so that the probe is not participating in extension (Figure
8). The probe that binds to the DNA strand and covers the polymorphic region, the
predicted site of mutation, is called the sensor hybridisation probe and the probe that
binds to a site with only 1–5 bases distance from the sensor probes is called the anchor
probe that produces the fluorescent signal. The sensor probe is labelled by donor
fluorophore and the anchor probe by acceptor fluorophore (Reuter et al., 2005, Broude,
2002).

Background
Page 72 of 377
Figure 8: Hybridization Probes. During annealing the two probes bind to their target
sequences and an energy transfer occurs within the donor - acceptor pair.
The increase in fluorescent activity of acceptor fluorophore is measured and
the fluorescence signal is directly proportional to the target DNA amount.
The primers amplify the target sequence and these two allele-specific probes are
designed to hybridize to the target sequence only if they are perfectly matched. When
the probes hybridize to their target sequence, they become fluorescent. During
amplification the hybridisation probes anneal to the amplified DNA segment in a head
to tail configuration and this separates the two fluorophores from each other. A
fluorescence resonance energy transfer (FRET) can occur between them, providing real-
time monitoring of the amplification process. By means of a light-emitting diode
(LED), energy transfer begins when the light source excites the donor fluorophore, the
fluorescent dye of the sensor probe which then emits fluorescent light. Through FRET,
the energy of that light in turn excites the acceptor reporter fluorophore in the anchor
probe which then emits another fluorescent light. The optical unit of RT-PCR machine
measures the intensity of the emitted light. The energy transfer is referred to as FRET.
The FRET signal becomes stronger when more new copies of the target DNA sequences
are produced and more probes hybridise to the DNA. Consequently, the FRET signal
represents the amount of DNA copies in a PCR run. During the PCR elongation phase,
the hybridization probes set free from the DNA as the temperature increases. After PCR
completion, melting-curve analysis can be used to detect the point mutations.
Fluorescence can be monitored as the temperature slowly elevated from 40°C to 75°C
through the melting temperature (Tm), where the hybridization probes are melted off
the DNA strand and the presence or absence of a mutation can be detected by the
obtained characteristic melting profile for each genotype. If the sensor probe is

Background
Page 73 of 377
completely annealed to the DNA strand, it melts off at a higher temperature than the
lower temperature required to melt off a probe with a mismatch of one base, single
nucleotide mutation. The melting curve analysis can show three characteristic curves: a
curve with a single early peak (homozygous mutant, Mut), a curve with a single late
peak (homozygous wild type, Wt) and a curve with two peaks (heterozygous genotype,
Wt/Mut); see Figure 9 (Reuter et al., 2005).
Figure 9: Melting Curve Analysis for Hybridization Probes Designed for Wild
Type DNA Sequence. The early and late single peaks indicate homozygous
mutant (Mut/Mut) and homozygous wild (Wt/Wt) samples, respectively.
The dual peak indicates heterozygous samples (Wt/Mut).

Pharmacokinetics and Pharmacogenomics of Tacrolimus
Page 74 of 377
3 Chapter 3. Pharmacokinetics and Pharmacogenomics of Tacrolimus: A Review
Tacrolimus is a natural macrolide lactone antibiotic with potent immunosuppressive
properties (Figure 10). Its molecular formula is C44H69NO12 with a molecular weight of
804.02 g/moL. Although structurally unrelated to Ciclosporin (CsA), its mode of action
is similar. Tacrolimus is considered as one of the most potent immunosuppressive
agents used in the prevention of rejection following renal transplantation (Pirsch et al.,
1997).
Figure 10: Structure of Tacrolimus.
Tacrolimus acts as an immunosuppressant via inhibiting the proliferation and activation
of CD4+ T helper cells through binding to a cellular receptor known as FK506-binding
protein (FKBP). The tacrolimus-FKBP complex further binds to calcineurin (CaN),
preventing the dephosphorylation of the nuclear factor of activated T cells (NF-ATc).
The cascade of cytokine gene transcription is then blocked by inhibiting NF-ATc
transport to the nucleus and preventing its binding to the nuclear component of the
nuclear factor of activated T cells (NF-ATn). Consequently, T cells do not produce IL-
2, which is necessary for full T-cell activation (Figure 11). The net result is the
inhibition of T-lymphocyte activation: immunosuppression (Fleischer, 1999).

Pharmacokinetics and Pharmacogenomics of Tacrolimus
Page 75 of 377
Figure 11: Mechanism of Action of Tacrolimus (Stepkowski, 2000). In the
cytoplasm, tacrolimus (FK506) binds to FK506-binding protein (FKBP).
The FK506–FKBP complex binds to and blocks the function of the enzyme
calcineurin (CaN), which has a serine/threonine phosphatase activity.
Accordingly the FK506–FKBP–CaN complex prevents the cytoplasmic
nuclear factor of activated T cells (NF-ATc) dephosphorylation and its
transport to the nucleus. Consequently, it inhibits IL-2 production, which is
necessary for full T-cell activation. FKBP: FK506-binding protein; CaN:
Calcineurin; Ca2+: Calcium; NF-ATc: The nuclear factor of activated T
cells (Inside the cytoplasm); NF-ATn: The nuclear factor of activated T
cells (Inside the nucleus).
Moreover, tacrolimus also has important anti-inflammatory properties that are apparent
through inhibiting the release of mast cell and basophil preformed mediators, down
regulating IL-8 receptor expression, decreasing intercellular adhesion molecule-1
(ICAM-1) and E-selectin lesional blood vessel expression. This broad range of the
inflammatory inhibition mechanism may reduce antigen recognition and down regulate
the entire inflammatory cascade leading to clinical disease (Fleischer, 1999).
Tacrolimus was initially available for over 10 years as a preparation requiring twice
daily administration: Prograf®; 0.5, 1 and 5 mg capsules (Pirsch et al., 1997). The initial
tacrolimus dosage is usually between 0.1 to 0.2 mg/ kg of body weight per day, given in
two divided doses. The maintenance tacrolimus dosing is based on a standard protocol

Pharmacokinetics and Pharmacogenomics of Tacrolimus
Page 76 of 377
employing therapeutic drug monitoring with the target whole blood 12 hour post-dose
(trough) concentrations, depending on the time since transplantation.
The therapeutic range for tacrolimus trough blood concentrations (C0) lies between 5
and 15 µg/L with a recent trend towards lower target concentrations based on the
SYMPHONY study where the target was 3-7 µg/L and the achieved range was 5-10
µg/L (Ekberg et al., 2007). The current regimen for tacrolimus at St George’s employs a
target range of 8-12 µg/L during the first 3 months after renal transplantation when the
risk of rejection is greatest, dropping to 5-8 µg/L thereafter. A number of generic twice
daily tacrolimus preparations have become available recently. A prolonged release
preparation, Advagraf®, has been available in the UK since 2007. Advagraf® has
equivalent efficacy and safety to Prograf® following once daily dosing. This preparation
is licensed in the UK for the prevention of renal allograft rejection and it is available in
0.5, 1, 3, and 5 mg capsules. The aim of developing a once daily preparation was to
reduce the frequency of dosing and simplify dosing regimens for kidney, liver, and heart
transplant recipients currently using the twice daily tacrolimus formulation (Alloway et
al., 2007, Silva et al., 2007). A study assessing the adherence to immunosuppressant
regimens in kidney transplant patients demonstrated that once-daily tacrolimus dosing
improved patients’ compliance (Kuypers et al., 2013). Tacrolimus adherence was
improved in the majority of liver transplant patients after switching to once-daily
tacrolimus and mainly caused by the lack of the evening dose (Beckebaum et al., 2011).
Upon change from Prograf® to Advagraf®, the same total daily dose is given as a single
dose in the morning with adjustment of the dose to maintain exposure within the range
specified above. Prograf® and Advagraf® should be taken on an empty stomach, either
one hour before or two hours after a meal. In Phase II studies on Advagraf, a given dose
of Advagraf delivered 90% of the area under the concentration-time curve (AUC)
obtained with Prograf (EMEA, 2007).
Pharmacokinetics and Pharmacogenomics of Tacrolimus
Page 77 of 377
3.1 Tacrolimus Pharmacokinetics
3.1.1 Absorption
After oral administration, tacrolimus is absorbed rapidly in most patients and reaches its
peak plasma/blood concentration in 30 minutes to one hour. While in some patients it is
absorbed slowly over a prolonged period, resulting in a flat absorption profile.
Tacrolimus has a large variability in the rate of absorption and absolute bioavailability
between individuals. It ranges from 5%–93% and approximately 25% of the oral dose is
bioavailable due to an active barrier to drug absorption (Venkataramanan et al., 1995).
The poor water solubility of tacrolimus and reduced gut motility in transplant recipients
is responsible for the poor and erratic absorption of tacrolimus. Since tacrolimus is well-
known as a substrate of CYP3A iso-enzymes, its poor bioavailability is to a large extent
caused by presystemic metabolism of tacrolimus in the gut wall and liver (Tuteja et al.,
2001). Tacrolimus is also known as a substrate of P-glycoprotein (P-gp), a multidrug
efflux transporter. P-glycoprotein lowers the intracellular concentration of tacrolimus by
pumping the absorbed tacrolimus back out into the intestinal lumen, it is repeatedly
transported out of the intestinal mucosa cells and then passively reabsorbed. This
extensive presystemic metabolism limits the oral bioavailability of tacrolimus to ~25%.
Therefore, it is very likely that the poor and the variable bioavailability of tacrolimus is
at least partly caused by the activity of this efflux pump in the intestine and genetic
polymorphism of the P-glycoprotein (Hoffmeyer et al., 2000). Polymorphisms, or
genetic variations, of these isoenzymes affect the dosage requirement and trough levels
of tacrolimus in stable transplant patients (Haufroid et al., 2006). The impact of genetic
variations in expression of CYP3A and P-glycoprotein will be discussed in detail below.
Tacrolimus absorption is significantly inhibited by food. A study comparing the
influence of food on both the rate and extent of Prograf® absorption in healthy
volunteers showed that food in general significantly decreases the rate and extent of
tacrolimus absorption and slows it down compared with the fasting state. Relative to the
fat content of the food, high-fat meals had more pronounced effect than low-fat meals,
see Figure 12 (Bekersky et al., 2001b).

Pharmacokinetics and Pharmacogenomics of Tacrolimus
Page 78 of 377
Figure 12: Effect of Food on Tacrolimus Absorption after Administration of 5mg
Prograf® (Bekersky et al., 2001b). Food in general and fat in particular,
has a clinically significant effect on tacrolimus absorption.
Another study demonstrated that tacrolimus ingestion in the fasting state (10 hours)
provides the greatest relative bioavailability in comparison to taking the drug one hour
prior to a meal, which had a relatively minor impact on the relative bioavailability
extent (~12%). Furthermore, ingestion of tacrolimus immediately after a meal or 1.5
hours subsequent to a meal had a more pronounced influence (Figure 13). Hence, the
standard recommendation is that tacrolimus must be taken either 1 hour before or 2
hours after eating (Bekersky et al., 2001a).
Figure 13: Effect of Time of Meal Consumption on Tacrolimus Absorption after
Administration of 5mg Prograf® (Bekersky et al., 2001a). Timing of
meals has a significant effect on the rate and extent of drug absorption.
Pharmacokinetics and Pharmacogenomics of Tacrolimus
Page 79 of 377
As will be seen in the pharmacokinetic profiles above, while food impacts significantly
on the absorption phase and area under the concentration-time curve (AUC), it has
relatively little impact on 12 hour post-dose trough concentrations. This is an important
practical point as trough concentration monitoring in patients taking tacrolimus along
with food may result in false reassurance on drug exposure. Standard guidance is to
take tacrolimus either at least one hour before or at least two hours after a meal.
Variable compliance with this advice may be one of the factors contributing to within-
patient variability in tacrolimus exposure.
Prograf® is predominantly absorbed in the upper part of the gastrointestinal tract;
around the stomach and proximal small intestine. Advagraf® is modified to release
tacrolimus slowly. Ethylcellulose, hypromellose, and lactose monohydrate was added in
order to control water penetration and produce a protective polymer layer around the
drug. Due to different dissolution properties, Advagraf® is typically released further
along the gut, which provides a more distal area of tacrolimus absorption and this
increases the contact interval with the absorption site (Barraclough et al., 2011a).
3.1.2 Distribution
After absorption, tacrolimus is extensively bound to both red blood cells and plasma
proteins. In the systemic circulation, tacrolimus binds strongly to erythrocytes in the
region of 95% because of its high affinity for the FK-binding proteins which are found
abundantly in erythrocytes and lymphocytes. In plasma, approximately 99% is bound to
plasma proteins, mainly albumin and alpha-1-acid glycoprotein. The mean tacrolimus
whole blood concentration is about 20 times higher than that of plasma. Tacrolimus
distribution between plasma and erythrocytes is dependent on several factors including;
haematocrit, tacrolimus concentration, plasma protein concentration and temperature at
the time of plasma separation (Nagase et al., 1994, Venkataramanan et al., 1995). Less
than 0.1% of the unbound fraction of tacrolimus is responsible for its pharmacological
activity. Whole blood concentrations of tacrolimus, which consists of both bound and
unbound fractions of tacrolimus, are routinely monitored to ensure appropriate exposure
to the drug. Tacrolimus is distributed extensively in the body with most partitioned
outside the blood compartment (Undre, 2003). Lipophilic drugs such as tacrolimus

Pharmacokinetics and Pharmacogenomics of Tacrolimus
Page 80 of 377
readily cross membranes and are taken up by adipose tissue. In animal studies
tacrolimus is widely distributed in tissues; lung, spleen, kidney, heart, pancreas, brain,
muscle with liver exposed to the greatest accumulation (Burton, 2006)
3.1.3 Metabolism
Tacrolimus undergoes O-demethylation, hydroxylation, or oxidative metabolic
reactions. The CYP 3A enzyme system is mainly responsible for tacrolimus
metabolism. The CYP3A subfamily consists of four genes, CYP3A4, CYP3A5,
CYP3A7, and CYP3A43. Tacrolimus is metabolized predominantly by CYP3A4 and
CYP3A5 in the liver and the intestinal wall, with <1% of the parent drug is excreted
unchanged in the urine or faeces. CYP3A4 in the gastrointestinal epithelium is
responsible for presystemic elimination of approximately 50% of the absorbed dose,
whereas first-pass metabolism by CYP3A4 in the liver accounts for an additional 10%
of elimination. When CYP3A5 is expressed, it accounts for 50% of the total hepatic
CYP3A content (Burton, 2006, Undre, 2003). An in-vitro study revealed that CYP3A5
contribution in tacrolimus conversion to its metabolite (13-O-demethyltacrolimus) was
higher than CYP3A4 contribution (Kamdem et al., 2005). Another in-vitro study
reported that CYP3A5 is a more efficient enzyme for tacrolimus metabolism than
CYP3A4 (Dai et al., 2006). Moreover, P-glycoprotein inhibits drug absorption from the
gut by promoting efflux into the lumen of the intestine; it also has a role in systemic
clearance of drugs by promoting efflux into the bile for excretion (Burton, 2006, Undre,
2003).
3.1.4 Elimination
The metabolites of tacrolimus are mainly eliminated via the biliary route and more than
95% of the oral dose was recovered in faeces. Only an average of 2.4% of tacrolimus
dose was excreted in urine. However, less than 1% of tacrolimus appears unchanged in
urine and stool indicating that tacrolimus metabolism plays a major role in its
elimination (Burton, 2006, Dalal et al., 2010).

Pharmacokinetics and Pharmacogenomics of Tacrolimus
Page 81 of 377
3.2 Tacrolimus Pharmacogenomics
Genetic differences in drug response may arise from differences in pharmacodynamics
or in drug disposition. Many of the recorded polymorphisms relate to differences in the
expression of drug metabolizing enzymes and transporters, and hence drug disposition.
Some genes are highly polymorphic, resulting in enzyme variants that may have
variable drug-metabolizing capacities among individuals. A single-nucleotide
polymorphism (SNP) is a DNA sequence variation occurring when a single nucleotide
(A, T, C or G ) in the genome differs between individuals (Flanagan et al., 2007).
Despite tacrolimus success in improving graft survival, tacrolimus therapeutic use is
complicated by its narrow therapeutic index (between 5 and 15 µg/L). The routine
therapeutic monitoring of tacrolimus reveals a large between individual variability in
tacrolimus pharmacokinetics and dose requirement. Many studies have focused on the
possible causes of this variability in tacrolimus pharmacokinetics. Among various
factors investigated, genes coding polymorphisms in biotransformation enzymes
(CYP3A4/5 isoenzymes) and drug transporters (ABCB1, previously known as MDR1)
have received much attention (Patel et al., 2012, Haufroid et al., 2006). These genetic
polymorphisms may explain the observed variability in tacrolimus pharmacokinetics.
They have been studied in relation to tacrolimus dosing and shown to be the most
promising. In addition to these genes, a number of recently identified variants have been
reported to have a potential influence in tacrolimus pharmacokinetics and dose
requirement.
3.2.1 Cytochrome P450 (CYP450) 3A
The cytochrome P450 family (CYP450) is a super-family of related, but distinct, drug-
metabolizing enzymes. CYP450s are proteins bound to heme (membrane-bound heme-
containing proteins). They are classified on the basis of cDNA cloning according to
similarities in amino acid sequence. Members of a subfamily (denoted by a letter) must
have at least 55% identity (Flanagan et al., 2007). The most important cytochrome P450
isoforms responsible for drug metabolism are the CYP3A family and mainly present in
critical tissues such as liver and the gastrointestinal tract.

Pharmacokinetics and Pharmacogenomics of Tacrolimus
Page 82 of 377
The CYP3A family is composed of four enzymes: CYP 3A4, CYP 3A43, CYP 3A5,
and CYP 3A7. The expression of CYP3A43 in adult livers is at very low levels, only
0.1–0.2% of CYP 3A transcripts. It does not play a major role in drug metabolism.
CYP3A7 is mainly expressed in the foetal liver, but it is expressed in small amounts in
some adult livers and extrahepatically. The participation of CYP3A43 and CYP3A7 in
CYP3A substrates metabolism in adults is therefore regarded to be negligible (Burk et
al., 2002). CYP3A4 and CYP3A5 are highly expressed in the liver as well as extra-
hepatic tissues, including the gastrointestinal tract and they have an important role in
first-pass metabolism (Flanagan et al., 2007). CYP3A enzymes are estimated to
contribute to the metabolism of 40 to 60% of all medicines. In particular, they play a
fundamental role in the oxidative, peroxidative, and reductive metabolism of numerous
clinically useful therapeutic agents (Burk et al., 2002).
The CYP3A5 and CYP3A4 genes are part of a cluster of CYP3A genes located on
chromosome 7q22.1 along with other CYP3A family members. The CYP3A4 gene
spans 13 exons covering 27 kb sequence and encodes 502 amino acids with a molecular
weight of 57 kDa. CYP3A5 is a 52.5 kDa protein made up of 502 amino acids and
encoded by the CYP3A5*1 allele. CYP3A5*3 allele is the most common CYP3A5
variant. CYP3A5 shares 85% sequence similarity with CYP3A4. Both CYP3A4 and
CYP3A5 are expressed in the liver and intestine, with CYP3A5 being the predominant
form expressed in extrahepatic tissues. CYP3A4 and CYP3A5 have similar substrates
(Lamba et al., 2012).
3.2.1.1 CYP3A5
The most frequent variant of functional importance in the CYP3A5 gene is CYP3A5*3.
The functional SNP located in CYP3A5 intron 3 (rs776746 A>G), for which A and G
nucleotides are designated as CYP3A5*1 (wild-type) and CYP3A5*3 (mutant-type)
alleles, respectively. The CYP3A5*1 allele expresses large amounts of CYP3A5, while
the CYP3A5*3 allele creates a cryptic splice site, resulting in a premature stop codon
and the absence of functional CYP3A5 (Kuehl et al., 2001). The distribution of
CYP3A5*1 wild type allele is different among ethnic groups and varies in frequency of
5%-15% in Caucasians, 15%-35% in Asians, 25% in Mexicans, and 45%-73% in

Pharmacokinetics and Pharmacogenomics of Tacrolimus
Page 83 of 377
African-Americans (Provenzani et al., 2013). The influence of CYP3A5*3 variant on
tacrolimus (Prograf®) metabolism has been extensively studied. It has been reported that
CYP3A5 activity explains 29–35% of the variability in the studied tacrolimus
pharmacokinetic parameter (de Jonge et al., 2012).
Originally, MacPhee et al. (2002) reported that the variable dose requirement of
tacrolimus in kidney transplant recipients was associated with the CYP3AP1
pseudogene. At 3 months after transplantation, patients with a CYP3AP1*1 allele had
twofold lower dose-normalized tacrolimus concentrations than CYP3AP1*3/*3
homozygotes to achieve target blood concentrations. They also showed that there is an
association between CYP3AP1 pseudogene and CYP3A5 expression. CYP3AP1*1
genotype is tightly linked with CYP3A5*1, indicating CYP3A5 expression. While
CYP3AP1*3 allele is in tight linkage with CYP3A5*3 with no CYP3A5 expression. The
authors further confirmed these findings during the first 2 weeks after transplantation in
a single centre retrospective study involving data from 178 kidney transplant patients
between 1995 and 2001, suggesting a link between the variability in tacrolimus
pharmacokinetics and the CYP3A5genotype (MacPhee et al., 2004). Since then many
studies have been conducted to study the effect of CYP3A5 genotype on tacrolimus dose
and dose-corrected tacrolimus concentration in heart, liver and most extensively in
kidney transplantation including healthy volunteers and adult and paediatric patients.
In healthy individuals, a pharmacokinetic study, involving 22 healthy Korean subjects,
demonstrated that CYP3A5 expressers yield much lower AUC0–∞ and Cmax
concentrations than the CYP3A5 non-expressers (Choi et al., 2007). This was
confirmed by another study in 20 healthy Japanese subjects and the study showed that
subjects with CYP3A5*3/*3 achieved 1.8-fold higher tacrolimus AUC0-8h than
CYP3A5*1 carriers. Besides, the estimated tacrolimus apparent clearance (CL/F) in
CYP3A5*1 carriers was 1.5 times higher than CYP3A5 non-expressers (Suzuki et al.,
2008).
In kidney transplantation, the influence of CYP3A5 genotype on tacrolimus dose and
dose-adjusted concentration has been extensively studied in either adult or paediatric
patients. Table 3 summarises the key tacrolimus pharmacogenetic studies conducted in
Pharmacokinetics and Pharmacogenomics of Tacrolimus
Page 84 of 377
renal transplant recipients. It has been consistently demonstrated that recipients carrying
at least one CYP3A5*1 allele have significantly lower tacrolimus dose-adjusted trough
concentrations and required 1.5 to 2 times the tacrolimus dose to achieve the same
target blood concentrations than those carrying CYP3A5*3/*3 genotype. These findings
have been demonstrated in renal transplant patients with different ethnic backgrounds
(Caucasian, African, Japanese, Chinese and Mexican).
In heart transplant patients, the CYP3A5*3 genotype effect on tacrolimus dose and
concentration was similar to that obtained from kidney transplant patients. A study in 65
heart transplant recipients demonstrated that CYP3A5 expressers required higher
tacrolimus doses compared with CYP3A5 non-expressers (Díaz-Molina et al, 2012).
This was confirmed by a retrospective observational study in 52 heart transplant
patients during the first year after transplantation and again showed that CYP3A5
expressers had lower dose-adjusted trough concentrations throughout the study period
and required 2.2- to 2.6-fold higher tacrolimus dose to reach the target concentration
compared with CYP3A5 non-expressers (Lesche et al., 2014). However, a paediatric
study in 38 Jordanian patients found no significant differences in tacrolimus dose, C0 or
C0/dose among each genotype group of CYP3A5 polymorphisms in either the early or
the maintenance phase after transplantation (Shilbayeh et al, 2013).
Furthermore, CYP3A5*3 genotype has a strong association with tacrolimus dose and
dose-adjusted concentration in liver transplant patients. A study in 216 Chinese liver
transplant patients revealed that recipient with CYP3A5*1/*1 genotype required a
higher tacrolimus dose than patients with CYP3A5*3/*3 allele. Besides, the
concentration/dose (C/D) ratio of tacrolimus was lowest in the CYP3A5*1/*1 than the
CYP3A5*1/*3 and *3/*3 genotypes, indicating that the enzymatic activity of CYP3A5
increased proportionally with the number of CYP3A5*1 allele (Shi et al., 2013). A
retrospective study in 90 Chinese pediatric liver transplant patients showed that despite
using the same induction and initial dose of tacrolimus, CYP3A5 non-expressers had a
significantly higher C/D ratio than CYP3A5 expressers. CYP3A5 expressers required
larger doses during the late induction and the maintained phases to reach the target
trough concentration (Chen et al., 2014).

Pharmacokinetics and Pharmacogenomics of Tacrolimus
Page 85 of 377
Despite that the CYP3A5*3 genotype effect on tacrolimus dose and dose-adjusted
concentration may differ from that obtained from kidney transplant patients. The reason
for this is that the CYP3A5 genotype of the grafted liver in some cases may differ from
the CYP3A5 genotype of the recipient intestine with the consequences of the relative
effect of the donor and recipient genotypes on tacrolimus disposition and when it
appears post transplantation.
In all studies where the donor and recipient genotypes are different, the donors' CYP3A5
gene polymorphisms significantly influence tacrolimus dose and dose-adjusted C0 and
its effect can be found very early from the first week after transplantation or can begin
later after transplantation. The recipient genotype effect on tacrolimus dose and dose-
adjusted C0 appears only in some of these studies. Ji et al. (2012) studied 58 Korean
adult liver transplant recipients on tacrolimus-based immunosuppression therapy for 4
years of follow-up and reported that throughout the entire study period, CYP3A5
expresser recipients grafted from CYP3A5 expresser donors consistently had the least
concentration/dose (C/D) ratio. Whereas CYP3A5 expressed recipients grafted from
CYP3A5 non-expresser donors had an intermediate C/D ratio, and CYP3A5 non-
expresser recipients grafted from CYP3A5 non-expresser donors had the largest C/D
ratio. Another study again showed that CYP3A5 non-expresser recipients who received
organs from CYP3A5*1 allele carriers have a significantly lower C/D ratio than those
who received organs from CYP3A5*3/*3 carriers over 6 months. CYP3A5 expresser
recipients who received organs from CYP3A5*3/*3 carriers have a significantly lower
C/D ratio than CYP3A5 non-expresser recipients who received organs from
CYP3A5*3/*3 carriers from 2 weeks through 6 months (Muraki et al., 2011). A
retrospective study in 70 Chinese liver transplant recipients and donors during the first
three weeks after transplantation found a strong association between tacrolimus C/D
ratio and CYP3A5*3 variant in donors from the first week post-transplant. Tacrolimus
C/D ratio was significantly lower in patients engrafted with CYP3A5*1 carrier liver than
those engrafted with CYP3A5*3/*3 genotype liver (Li et al., 2007). In a study on 50
Chinese liver transplant patients, Wei-lin et al. (2006) reported that at 2 weeks and at
one month after transplantation, patients receiving CYP3A5*1 allele–carrying livers had
a higher tacrolimus daily dose or lower tacrolimus C/D ratios compared with patients
Pharmacokinetics and Pharmacogenomics of Tacrolimus
Page 86 of 377
receiving the CYP3A5*3/*3 genotype livers. A study in 60 de novo Japanese liver
transplant recipients early after transplantation found that the CYP3A5*1 allele in both
donors and recipients had a significant effect on tacrolimus dose and C/D on day 7
posttransplant. After the first month, the CYP3A5*1 allele in donors, but not in
recipients had a significant effect on tacrolimus dose and C/ D ratio. Moreover, patients
having the CYP3A5*3/*3 allele in their native intestine and in the graft liver, showed a
1.47 times lower tacrolimus oral clearance (CL/F) recovery with time compared with
patients carrying at least one CYP3A5*1 allele in their native intestine (Fukudo et al.,
2008). In another study involving 51 Caucasian liver transplant recipients confirmed
that tacrolimus dose requirements were dominantly influenced by the donors’ CYP3A5
gene polymorphisms. At 1, 3 and 6 months post transplantation, patients receiving a
liver with at least one copy of CYP3A5*1 allele had a significantly higher tacrolimus
dose to reach the target trough concentrations compared to the patients receiving a liver
homozygous for CYP3A5*3 allele (Provenzani et al., 2011).

Pharmacokinetics and Pharmacogenomics of Tacrolimus
Page 87 of 377
Table 3: Pharmacogenetic Studies of Tacrolimus in Kidney Transplant Recipients
Study
reference Recipient age Study
population
Patients
Number
Posttransplant
timeline Major findings
(MacPhee et al.,
2004)
adult Black
Caucasian
South Asian
Middle Eastern
178 2 Weeks Patients with a CYP3A5*1 allele had 2-fold lower dose-
normalized tacrolimus concentrations than
CYP3A5*3/*3 homozygotes to achieve target blood
concentrations
(Hesselink et
al., 2003)
adult Asian
Black
Caucasian
64 12 Months CYP3A5*1 allele carriers require higher tacrolimus dose
to reach target trough concentrations than patients with
the CYP3A5*3/*3 genotype
(Thervet et al.,
2003)
adult Caucasian 80 1 Month The weight-adjusted tacrolimus dose was significantly
lower in patients with the CYP3A5*3/*3 genotype than
in those with the CYP3A5*1/*1 genotype
CYP3A5*1 allele carriers showed a significantly lower
C0 /D ratio compared to CYP3A5 non-expressers
(Tsuchiya et al.,
2004)
adult Japanese 30 28 Days The dose-adjusted Cmax, AUC0-12 and C0 in CYP3A5*1
carriers had a significantly lower value than the
CYP3A5*3/*3 carriers, though the daily dose of
tacrolimus was significantly higher
(Macphee et al.,
2005)
adult Black
Caucasian
South Asian
Middle Eastern
180 3 Months CYP3A5 expressers require two fold higher doses of
tacrolimus to achieve target blood concentration than
non-expressers

Pharmacokinetics and Pharmacogenomics of Tacrolimus
Page 88 of 377
(Zhao et al.,
2005)
adult Chinese 30 3, 6, 12 Months Patients with the CYP3A5*1/*3 required more
tacrolimus to achieve the same target blood
concentrations than those with the CYP3A5*3/*3
(Tada et al.,
2005)
adult Japanese 39 28 Day Recipients who were CYP3A5*1 carriers had a
significantly lower tacrolimus dose-adjusted AUC0-12
and required a higher tacrolimus dose than
CYP3A5*3/*3 carriers
(Zhang et al.,
2005)
adult Chinese 118 1 Week;
1 , 3 Months
CYP3A5 expressers had a 2.2–4.3 times higher
tacrolimus dose-adjusted C0 than the CYP3A5 non-
expressers.
Patients with CYP3A5*1*1 genotype had the lowest
dose-adjusted C0 compared to CYP3A5*3/*3 carriers
(Roy et al.,
2006)
adult Asian
Black
Caucasian
44 3 Months CYP3A5 expressers required a higher daily tacrolimus
dose compared to non-expressers and achieved lower
tacrolimus dose-adjusted trough blood concentrations
compared to CYP3A5*3/*3 allele carriers.
(Ferraresso et
al., 2007)
paediatric Caucasian 30 12 Months Patients with CYP3A5*1/*3 genotype required almost
twice the daily dose of tacrolimus to achieve the target
blood trough concentration and had lower tacrolimus
trough blood concentrations than those with CYP3A5
*3/*3 genotype
(Quteineh et al.,
2008)
adult Asian
African
Caucasian
136 1 Week;
1, 6, 12 Months
Patients possessing at least one CYP3A5*1 allele
(CYP3A5 expressers) needed significantly higher
tacrolimus doses to achieve the same target trough
concentration compared to patients with CYP3A5*3/*3
genotype

Pharmacokinetics and Pharmacogenomics of Tacrolimus
Page 89 of 377
(Lopez-
Montenegro
Soria et al.,
2010)
adult Spanish 35 6 Weeks Patients with the heterozygote CYP3A5*1/*3 genotype
showed a lower tacrolimus concentration/dose ratios
compared to the homozygote CYP3A5*3/*3 genotype
patients and required higher tacrolimus doses to achieve
the target blood concentrations
(Glowacki et
al., 2011a)
adult African
Caucasian
209 2 Weeks;
1, 3, 12 Months
Patients with at least one CYP3A5*1 allele had
significantly higher dose requirements and lower blood
C0 and C0/daily dose ratio than patients homozygous for
the *3 allele
(Provenzani et
al., 2011)
adult Caucasian 50 1, 3, 6 Months The tacrolimus dose required to reach and maintain the
desired trough concentrations was lower in the patients
homozygous for CYP3A5*3 allele compared to the
heterozygous patients
(Ferraris et al.,
2011)
paediatric Caucasian 48 12 Months Tacrolimus dose requirement was more than twofold
higher in CYP3A5*1/*3 than in CYP3A5*3/*3 patients.
CYP3A5*3/*3 patients displayed higher C0 and dose-
normalized C0 than CYP3A5*1/*3 patients
(Garcia-Roca et
al., 2012)
167 paediatric
124 adult
African
Caucasian
South Asian
291 6 Months Both homozygous CYP3A5*1/*1 and heterozygous
CYP3A5*1*3 expressers required higher tacrolimus
doses than non-expressers CYP3A5*3/*3.
No significant difference in tacrolimus dose was
observed when comparing children with adults.
(Chen et al.,
2013)
adult Chinese 120 2 Week;
6, 18 Months
CYP3A5 expressers required significantly more
tacrolimus than non-expressers to reach a comparable
C0 concentration. Although no significant difference in
dose-adjusted C0 , Cmax, and AUC0–12h t was observed

Pharmacokinetics and Pharmacogenomics of Tacrolimus
Page 90 of 377
(Vannaprasaht
et al., 2013)
adult Asian 68 6 Months The induction dose of tacrolimus required for patients
with CYP3A5*1/*1 was 1.46- and 1.84-fold greater than
that required in the CYP3A5*1/*3 and in the
CYP3A5*3/*3 patients.
The tacrolimus dose required for the maintenance phase
was 1.3-fold higher than that in the CYP3A5*1/*3
genotype and 2.4-fold higher than in the CYP3A5*3/*3
genotype
(Li et al., 2014) adult Chinese 240 40 Days Tacrolimus C0/D of the patients with CYP3A5*3/*3 was
highest among the different CYP3A5*1 allele genotype
groups
(Cusinato et al.,
2014)
adult African
Caucasian
Amerindians
108 12 Months The presence of the CYP3A5*1 allele was strongly
associated with lower dose-normalized concentration
CYP3A5*1 carriers and required a higher tacrolimus
dose than CYP3A5 non-expressers
(Lunde et al.,
2014)
adult Caucasian 177 2, 7 Weeks Heterozygous CYP3A5*1 recipients had 42 % lower
mean C0/D ratio compared with homozygote carriers of
CYP3A5*3
(Kuypers et al.,
2014)
adult Asian
African
Hispanic
Caucasian
298 12 Months Tacrolimus dose requirements were significantly higher
in recipients carrying at least one CYP3A5*1 allele as
compared with homozygous CYP3A5*3/*3 patients
(Xing et al.,
2015)
adult Chinese 96 1 Month Patients carrying at least one the CYP3A5*1 allele
showed a significantly lower C0/D ratio compared to
CYP3A5 non-expressers

Pharmacokinetics and Pharmacogenomics of Tacrolimus
Page 91 of 377
CYP3A5 could be useful to predict the optimal tacrolimus dose prior to transplantation
for rapid achievement of therapeutic tacrolimus concentrations. This was illustrated in a
clinical trial by Thervet et al. (2008) who found that tacrolimus dosing based on the
CYP3A5 genotype allows earlier attainment of target blood concentrations. A
randomized controlled study showed that kidney transplant recipients using tacrolimus
doses according to the CYP3A5 genotype reached the target C0 significantly earlier than
recipients used a standard regimen. Although more patients were within the desired
tacrolimus target range early after transplantation, the improvement was modest with
29% of patients in target on the third day of tacrolimus dosing in the control group and
43% in the genetically adjusted group (Thervet et al., 2010). The study did not have
sufficient statistical power to address clinically significant markers of efficacy failure
and toxicity.
Twice daily tacrolimus, Prograf® (TD-Tac) and once a day tacrolimus (OD-Tac),
Advagraf® have different dissolution properties. The prolonged release formulation of
tacrolimus, Advagraf® is typically released further along the gastrointestinal tract. The
immediate release formulation of tacrolimus, Prograf® is absorbed primarily in the
jejunum and duodenum. The CYP3A protein expression may be higher in the jejunum
than ileum. Consequently, CYP3A5 expression in the gastrointestinal tract may have
less effect on the pharmacokinetics of OD-Tac than TD-Tac among both switching and
de novo transplant patients (MacPhee, 2012).
Black subjects have a higher prevalence of CYP3A5 expression in comparison to
individuals from other ethnic groups. In the Phase III study comparing Advagraf® to
Prograf®, black subjects achieved approximately 70% of the trough blood concentration
achieved by Caucasians for a given dose of both the Prograf® and Advagraf®
preparations (Silva et al., 2007).
To date, few studies have focused on the impact of CYP3A5 polymorphisms on the
pharmacokinetics of conversion from twice- to once- daily tacrolimus formulations in
renal transplant recipients. For the first time, Wehland et al. (2011) studied the
pharmacogenetic effect of CYP3A5*3 on two different tacrolimus formulations in a
Pharmacokinetics and Pharmacogenomics of Tacrolimus
Page 92 of 377
cohort of 41 renal transplant patients over a period of 1 year before and after
conversion. They reported that after conversion from Prograf® to Advagraf®, patients
with CYP3A5*3/*3 genotype required significantly lower tacrolimus doses to reach the
target trough concentrations compared with patients with *1/*3 genotype in both
formulations. Tacrolimus trough and dose-normalized trough concentrations of *3/*3
patients declined significantly after conversion to identical Advagraf® doses. However,
they remained almost constant in *1/*3 patients. Conversely, a prospective single-centre
study in stable kidney transplant recipients reported that the daily tacrolimus dose was
significantly higher and the dose-adjusted AUC0-24 was significantly lower in the
CYP3A5 expressers for both Prograf® and Advagraf®. Additionally, the tacrolimus
dose-adjusted AUC0-24 and C0 decreased significantly after the switch from TD-Tac to
OD-Tac in CYP3A5 expressers (Glowacki et al., 2011b).
Again for the first time, Niioka et al. (2012) conducted a study in de-novo Japanese
kidney transplant patients to investigate the pharmacokinetic and pharmacogenetic
differences between once a day (OD-Tac) and twice-daily (TD-Tac) tacrolimus
formulations. Twenty five patients received Tac-OD and 75 patients received TD-Tac.
The authors found that despite no difference in the dose-adjusted AUC0-24 and C0
between the two formulations, CYP3A5 expressers had lower dose-adjusted AUC0-24
and C0 compared to non-expressers for each formulation. Among CYP3A5 expressers,
but not non-expressers, the dose-adjusted AUC0-24 and C0 values were lower for OD-Tac
than for TD-Tac. Another study in 34 Korean stable paediatric kidney transplant
recipients showed that conversion from TD-Tac to OD-Tac did not affect the mean C0
and AUC0–24 in patients carrying CYP3A5*1 allele but patients with CYP3A5*3/*3 had a
significantly lower C0, Cmax and AUC0–24 after conversion (Min et al., 2013). Finally, a
more recent study in paediatric kidney transplant recipients demonstrated that in
CYP3A5 non-expressers dose normalized C0 levels were higher compared to CYP3A5
expressers with TD-Tac, but not with OD-Tac (Lapeyraque et al., 2014). Further
investigations into this controversial influence of CYP3A5 polymorphisms during
formulation switching are required.

Pharmacokinetics and Pharmacogenomics of Tacrolimus
Page 93 of 377
3.2.1.2 CYP3A4
CYP3A4 is the most abundant cytochrome P450 expressed in the liver and the intestine.
It accounts for approximately 60% of the total hepatic cytochrome P450 content.
CYP3A4 is the most important drug-metabolizing cytochrome P450 enzyme in humans,
it is involved in the metabolism of 45–60% of all currently used drugs (Danielson,
2002). CYP3A4 activity and protein content vary widely in the population, with a 10–
100-fold between-individual variability. Most of the CYP3A4 polymorphisms have
very low frequencies, and the phenotypic effects are weak and often controversial.
Currently known genetic variants of CYP3A4 that change amino acids are rare and
therefore can only explain a small portion of the observed variability (Elens et al.,
2012). The most common CYP3A4 polymorphism is CYP3A4*1B. The frequency of
CYP3A4*1B allele is 2%-10% of Caucasians, 4.2%-11% of Hispanics, 35%-67% of
African-Americans, and about 0% of Asians (Chinese, Taiwanese and Japanese). The
functional significance of this SNP is debatable and generally in-vivo studies are unable
to prove an association between this polymorphism and the transformation of various
drugs (Provenzani et al., 2013). Extrahepatic metabolism of tacrolimus by CYP3A4 in
the gastrointestinal epithelium is responsible for the presystemic elimination of about
half of the absorbed dose, whereas first-pass metabolism by CYP3A4 in the liver
accounts for an additional 10% of elimination (Undre, 2003). Up to recently only one
study has shown an association between the CYP3A4*1B allele and the required
tacrolimus dose. It reported that dose-adjusted tacrolimus trough levels were lower in
patients with the CYP3A4*1B allele than those with the CYP3A4*1/*1 genotype (wild-
type), however, this effect was not observed when the analysis was made only in the
Caucasian population (Hesselink et al., 2003). A more recent study confirmed the
relationship between CYP3A4*1/*1B genotype and tacrolimus dose-adjusted trough
concentration. Among CYP3A5 non-expressers, a significant decrease in dose
normalized tacrolimus concentrations was observed in CYP3A4*1B allele carriers
compared to CYP3A4*1*1 carriers at 6 months post-transplantation. However, in
CYP3A5 expressers, the difference was not statistically significant. Therefore,
CYP3A4*1B allele appears to be responsible for the decrease in dose normalized
tacrolimus concentrations although the numbers were very small (Tavira et al., 2013).
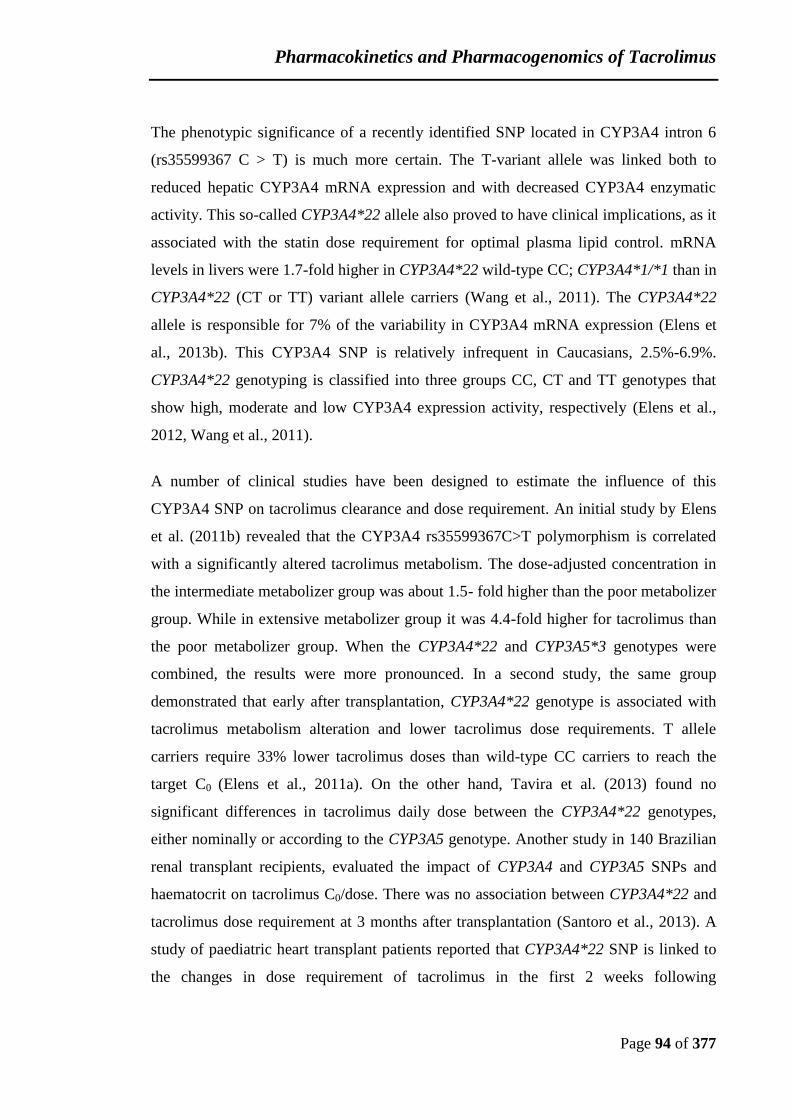
Pharmacokinetics and Pharmacogenomics of Tacrolimus
Page 94 of 377
The phenotypic significance of a recently identified SNP located in CYP3A4 intron 6
(rs35599367 C > T) is much more certain. The T-variant allele was linked both to
reduced hepatic CYP3A4 mRNA expression and with decreased CYP3A4 enzymatic
activity. This so-called CYP3A4*22 allele also proved to have clinical implications, as it
associated with the statin dose requirement for optimal plasma lipid control. mRNA
levels in livers were 1.7-fold higher in CYP3A4*22 wild-type CC; CYP3A4*1/*1 than in
CYP3A4*22 (CT or TT) variant allele carriers (Wang et al., 2011). The CYP3A4*22
allele is responsible for 7% of the variability in CYP3A4 mRNA expression (Elens et
al., 2013b). This CYP3A4 SNP is relatively infrequent in Caucasians, 2.5%-6.9%.
CYP3A4*22 genotyping is classified into three groups CC, CT and TT genotypes that
show high, moderate and low CYP3A4 expression activity, respectively (Elens et al.,
2012, Wang et al., 2011).
A number of clinical studies have been designed to estimate the influence of this
CYP3A4 SNP on tacrolimus clearance and dose requirement. An initial study by Elens
et al. (2011b) revealed that the CYP3A4 rs35599367C>T polymorphism is correlated
with a significantly altered tacrolimus metabolism. The dose-adjusted concentration in
the intermediate metabolizer group was about 1.5- fold higher than the poor metabolizer
group. While in extensive metabolizer group it was 4.4-fold higher for tacrolimus than
the poor metabolizer group. When the CYP3A4*22 and CYP3A5*3 genotypes were
combined, the results were more pronounced. In a second study, the same group
demonstrated that early after transplantation, CYP3A4*22 genotype is associated with
tacrolimus metabolism alteration and lower tacrolimus dose requirements. T allele
carriers require 33% lower tacrolimus doses than wild-type CC carriers to reach the
target C0 (Elens et al., 2011a). On the other hand, Tavira et al. (2013) found no
significant differences in tacrolimus daily dose between the CYP3A4*22 genotypes,
either nominally or according to the CYP3A5 genotype. Another study in 140 Brazilian
renal transplant recipients, evaluated the impact of CYP3A4 and CYP3A5 SNPs and
haematocrit on tacrolimus C0/dose. There was no association between CYP3A4*22 and
tacrolimus dose requirement at 3 months after transplantation (Santoro et al., 2013). A
study of paediatric heart transplant patients reported that CYP3A4*22 SNP is linked to
the changes in dose requirement of tacrolimus in the first 2 weeks following

Pharmacokinetics and Pharmacogenomics of Tacrolimus
Page 95 of 377
transplantation. However, tacrolimus trough concentration (C0) and C0/dose ratio didn’t
change. CYP3A combined genotypes have a strong correlation with tacrolimus
disposition. During the follow-up period, CYP3A poor metabolizers required
approximately 20% and 50% less tacrolimus dose than intermediate and extensive
metabolizers, respectively (Gijsen et al., 2013). Another study showed that steady-state
oral clearance of tacrolimus was reduced in CYP3A4*22 T-allele carriers compared with
CC carriers, resulting in 50% lower tacrolimus daily dose requirements (de Jonge et al.,
2014). It was confirmed that CYP3A4*22 allele has a significant impact on tacrolimus
pharmacokinetics by altering dose-adjusted blood concentrations of tacrolimus in renal
transplant patients (Kurzawski et al., 2014). Pallet et al. (2015) in a brief
communication reported that CYP3A4*22 polymorphism is related to a slower
metabolism of tacrolimus and a higher systemic exposure early after transplantation.
Patients carrying CYP3A4*22 variant may require 30% less tacrolimus dose than
patients with the CYP3A4 *1/*1 genotype. They also revealed that CYP3A4*22 allele
was predominantly found in CYP3A5 non-expressers and suggested that combining
CYP3A4 and CYP3A5 genotypes might result in a better prediction of the optimal
tacrolimus starting dose. However, a study by Lunde et al. (2014) found no association
between CYP3A4*22 polymorphism and tacrolimus C0/D ratios. Furthermore, CYP3A
combined allelic status did not give any additional information. Another study of 298
de-novo renal transplant recipient demonstrated that the dose requirements of tacrolimus
were significantly lower in CYP3A5 non-expressers carrying at least one CYP3A4*22
allele (slow metabolizers) compared with homozygous CYP3A4*1/*1 CYP3A5 non-
expressers (Kuypers et al., 2014). Moreover, Bruckmueller et al. (2014) reported that
CYP3A extensive metabolizers (CYP3A5 expressers combined with CYP3A4*1/*1)
required 2.1-fold higher doses than intermediate CYP3A metabolizers (CYP3A5*3/*3
combined with CYP3A4*1/*1) or 2.7-fold higher doses than CYP3A poor metabolizers
(CYP3A5*3/*3 combined with CYP3A4*1/*22 or *22/*22).
3.2.1.3 POR*28
P450 oxidoreductase (POR) is essential for cytochrome P450 activity in humans. It
transfers electrons from NADPH to microsomal cytochrome P450 enzymes, enabling

Pharmacokinetics and Pharmacogenomics of Tacrolimus
Page 96 of 377
their activity and has been associated with increased in vivo CYP3A activity (de Jonge
et al., 2011). POR mutations could alter the distribution of charge in the electron-
donating domain, which might have quite different effects on the interaction of POR
with different P450 enzymes (Flück et al., 2007). Consequently, POR might be a
general limiting factor for drug metabolizing capacity. The POR*28 (rs1057868C>T)
mutation was the most common allelic variant on approximately 28% of all alleles.
POR*28 Genotype is classified into three allelic categories with high, moderate and low
POR protein production, that are represented as TT, CT and CC, respectively (Zhang et
al., 2013). POR*28T allele is also referred to as POR*28 and POR*28CC allele is also
known as POR*1/*1 (Gijsen et al., 2014). POR*28 SNP varies in frequency:19.1 % in
African Americans, 26.4 % in Caucasian Americans, 36.7 % in Chinese Americans, and
31.0 % in Mexican Americans (de Jonge et al., 2011). In vitro studies showed that the
POR*28 C>T mutation affected CYP3A4 activity and the impact of this variant on
catalysis by CYP3A4 was substrate-specific (Agrawal et al., 2010). Up to date, very few
studies were carried out to explore the influence of genetic variations in the POR gene
on tacrolimus metabolism. A study in healthy Chinese volunteers reported that no
significant difference in tacrolimus pharmacokinetics was observed between POR*28
CC and POR*28 CT/TT genotypes. However, the POR*28 CT genotype had a
significantly lower level of tacrolimus exposure (AUC, Cmax) compared to the POR*28
CC genotype in CYP3A5-expressing subjects (Zhang et al., 2013). Another study in 298
adult renal transplant recipients showed that POR*28T allele carriers had significantly
higher tacrolimus dosing requirements compared with POR*28CC homozygous
patients. Additionally, the POR*28 SNP is associated with significant increases in early
tacrolimus dose-requirements in patients carrying a CYP3A5*1 allele (CYP3A5
expressers) and did not affect tacrolimus trough blood concentrations and daily dose
requirements in CYP3A5 non-expressers (de Jonge et al., 2011). A retrospective
observational study in 52 heart transplant patients during the first year after
transplantation found that the POR*28 variant carriers had higher dose-adjusted trough
concentrations with significant differences at 3 and 6 months after transplantation
(Lesche et al., 2014). Another retrospective pilot study in 43 paediatric kidney
transplant recipients in the first two weeks post-transplantation demonstrated that

Pharmacokinetics and Pharmacogenomics of Tacrolimus
Page 97 of 377
CYP3A5 expressers carrying at least one POR*28 allele had lower tacrolimus trough
concentrations and lower concentration/dose ratios compared with CYP3A5 expressers
with POR*1/*1 genotype. In CYP3A5 non-expressers, tacrolimus disposition did not
significantly change between POR genotypes. They also observed no significant
differences in the tacrolimus dosing requirements between the POR genotype groups,
neither in the CYP3A5 expressers nor in the CYP3A5 non-expressers (Gijsen et al.,
2014). In a cohort of 298 de-novo renal transplant recipients, Kuypers et al. (2014)
demonstrated that the CYP3A5 expressers with at least one variant POR*28 T allele
(high metabolizers) had a significantly higher tacrolimus dose requirements than
POR*28 CC homozygous patients, to maintain tacrolimus target C0. This was from day
2 onward and continued throughout the first year after transplantation.
3.2.2 PXR
Pregnane X receptor (PXR), also known as steroid X receptor (SXR) or nuclear receptor
subfamily 1, group I, member 2 (NR1I2) is a protein encoded by the NR1I2 gene. It is
highly expressed in the liver and the intestine. A variety of endogenous ligands such as
steroids and bile acid salts, and exogenous ligands including drugs activate PXR, which
alters their metabolism and regulates CYP450 and the ABCB1 gene expression (di Masi
et al., 2009). The most frequent PXR polymorphisms are -25385C>T (rs 3814055) and
7635A > G (rs 6785049) single nucleotide polymorphisms. A study in 32 renal
transplant recipients showed that PXR −25385C>T single nucleotide polymorphism was
identified as a significant covariate for apparent oral clearance of tacrolimus. However,
it was not clinically relevant in estimating the individual pharmacokinetic parameters of
tacrolimus (Benkali et al., 2009). Moreover, Miura et al. (2008) reported that
PXR 7635A>G SNP had no effect on tacrolimus pharmacokinetics, but was strongly
associated with prednisolone pharmacokinetics. Conversely, a study in 31 de-novo renal
transplant recipients reported an increase in tacrolimus clearance in subjects with the
PXR 7635GG genotype (Press et al., 2009). An observational study in 35 renal
transplant recipients found no effect of PXR −25385C>T polymorphisms on tacrolimus
concentration/ dose ratio between heterozygote and homozygote genotypes (Lopez-
Montenegro Soria et al., 2010). The clinical relevance of the influence of PXR receptor

Pharmacokinetics and Pharmacogenomics of Tacrolimus
Page 98 of 377
genetic variants on tacrolimus metabolism is still unclear, especially immediately after
transplantation where high doses of steroids are used.
3.2.3 ABCB1
P-glycoprotein (PGP) (1280 amino acids) is an efflux ‘pump’ that transports substances
from the intracellular to the extracellular side of the cell membrane. It is a member of
adenosine triphosphate (ATP)-binding cassette family of transport proteins (ABC
transporters). The energy required for PGP to function is derived from its binding with
ATP. The human gene encoding PGP is known as the ABCB1gene, previously known as
MDR1 (multidrug resistance protein 1). It is highly expressed in the apical membrane of
enterocytes lining the gastrointestinal tract, renal proximal tubular cells, the canalicular
membrane of hepatocytes and other important blood-tissue barriers such as those of the
brain, testes and placenta (Flanagan et al., 2007). The most commonly studied ABCB1
SNP is the 3435C>T polymorphism with a C to T substitution at position 3435 on exon
26 (rs1045642). According to P-gp expression, ABCB1 genotyping is classified into
three groups CC, CT and TT genotypes that show high, moderate and low P-gp
expression activity, respectively (Li et al., 2006b). Consequently, The ABCB1 CC
genotype is associated with a higher P-gp function compared with the CT and TT
genotypes. The homozygous T-allele had more than 2-fold lower MDR-1 expression
levels compared with homozygous CC genotype. The gastrointestinal absorption of P-
gp substrates is inversely proportional to the P-gp expression level in the gut
(Hoffmeyer et al., 2000). The variation in the oral bioavailability of tacrolimus is
primarily caused by heterogeneity in the level of intestinal P-gp expression (MacPhee et
al., 2002). However, this relationship is not confirmed in some studies (Tsuchiya et al.,
2004, Haufroid et al., 2004). The frequency of ABCB1 3435 T allele occurs in 5% of
African-Americans, 27% of Asians, 32% of Caucasians and 35% of Mexicans
(Provenzani et al., 2013).
Some studies have reported a correlation between ABCB1 3435 polymorphism and
tacrolimus pharmacokinetics. Originally, MacPhee et al. (2002) in a study including 180
kidney transplant recipients found a significant association between the ABCB1 3435
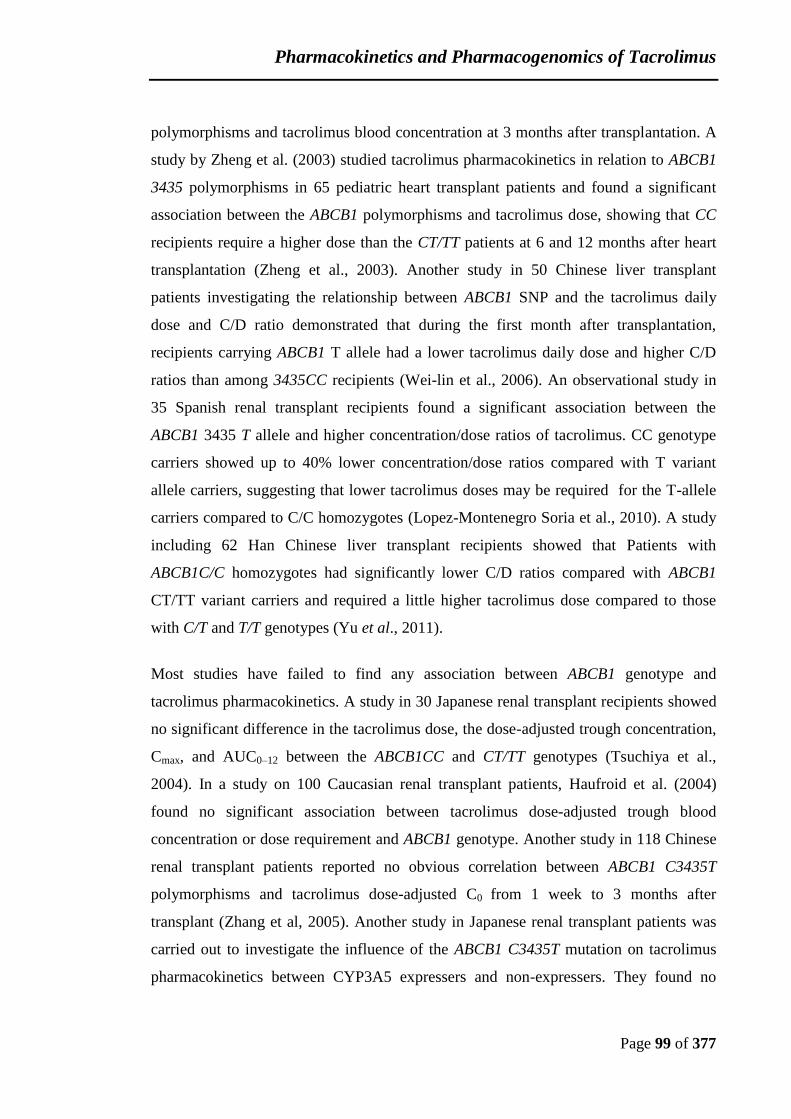
Pharmacokinetics and Pharmacogenomics of Tacrolimus
Page 99 of 377
polymorphisms and tacrolimus blood concentration at 3 months after transplantation. A
study by Zheng et al. (2003) studied tacrolimus pharmacokinetics in relation to ABCB1
3435 polymorphisms in 65 pediatric heart transplant patients and found a significant
association between the ABCB1 polymorphisms and tacrolimus dose, showing that CC
recipients require a higher dose than the CT/TT patients at 6 and 12 months after heart
transplantation (Zheng et al., 2003). Another study in 50 Chinese liver transplant
patients investigating the relationship between ABCB1 SNP and the tacrolimus daily
dose and C/D ratio demonstrated that during the first month after transplantation,
recipients carrying ABCB1 T allele had a lower tacrolimus daily dose and higher C/D
ratios than among 3435CC recipients (Wei-lin et al., 2006). An observational study in
35 Spanish renal transplant recipients found a significant association between the
ABCB1 3435 T allele and higher concentration/dose ratios of tacrolimus. CC genotype
carriers showed up to 40% lower concentration/dose ratios compared with T variant
allele carriers, suggesting that lower tacrolimus doses may be required for the T-allele
carriers compared to C/C homozygotes (Lopez-Montenegro Soria et al., 2010). A study
including 62 Han Chinese liver transplant recipients showed that Patients with
ABCB1C/C homozygotes had significantly lower C/D ratios compared with ABCB1
CT/TT variant carriers and required a little higher tacrolimus dose compared to those
with C/T and T/T genotypes (Yu et al., 2011).
Most studies have failed to find any association between ABCB1 genotype and
tacrolimus pharmacokinetics. A study in 30 Japanese renal transplant recipients showed
no significant difference in the tacrolimus dose, the dose-adjusted trough concentration,
Cmax, and AUC0–12 between the ABCB1CC and CT/TT genotypes (Tsuchiya et al.,
2004). In a study on 100 Caucasian renal transplant patients, Haufroid et al. (2004)
found no significant association between tacrolimus dose-adjusted trough blood
concentration or dose requirement and ABCB1 genotype. Another study in 118 Chinese
renal transplant patients reported no obvious correlation between ABCB1 C3435T
polymorphisms and tacrolimus dose-adjusted C0 from 1 week to 3 months after
transplant (Zhang et al, 2005). Another study in Japanese renal transplant patients was
carried out to investigate the influence of the ABCB1 C3435T mutation on tacrolimus
pharmacokinetics between CYP3A5 expressers and non-expressers. They found no

Pharmacokinetics and Pharmacogenomics of Tacrolimus
Page 100 of 377
association between the ABCB1 C3435T polymorphisms and tacrolimus
pharmacokinetic parameter in either group (Tada et al., 2005). Moreover, Quteineh et
al. (2008) in a study on 136 renal transplant recipients demonstrated that ABCB1
polymorphisms did not have a significant association with tacrolimus daily dose and
concentration/dose ratio. A Korean study in 321 livers and 185 kidney transplant
patients demonstrated that ABCB1 genotype had no correlation with tacrolimus
concentration to adjusted-dose ratios in both liver and kidney transplant recipients (Jun
et al., 2009). Gijsen et al. (2011) also demonstrated that, in 30 Canadian paediatric heart
transplant patients, none of the ABCB1 3435C>T genotypes were associated with
tacrolimus dosing requirements, tacrolimus trough concentrations, or concentration/dose
ratio. This was supported by Provenzani et al. (2011) in a study on 51 liver and 50
kidney transplant Caucasian recipients and they found that during the first 6 months
after transplantation, the ABCB1 C3435>T polymorphism had no effect on the dosage
or the level / dose ratio. A retrospective study in 68 kidney transplant recipients also
confirmed that no statistically significant correlation was noticed between the
tacrolimus doses required for the induction and maintenance phases and ABCB1
polymorphism (Vannaprasaht et al., 2013). A Chinese study in 216 liver transplant
recipients confirmed these results and showed no obvious correlation of ABCB1
polymorphisms with tacrolimus dose-adjusted C0 and daily dose after transplant (Shi et
al., 2013). Another retrospective study involving 90 paediatric de novo liver graft
recipients also evidenced that the variants of ABCB1 has minimal impact on tacrolimus
disposition. They found no significant difference of the C/D ratios among the recipients
with ABCB1 polymorphisms (Chen et al., 2014). Further supporting these results,
Lapeyraque et al. (2014) found no association between the concentration/dose ratio and
ABCB1 genotypes for either tacrolimus formulations (Prograf® and Advagraf®) in 19
stable paediatric renal transplant recipients.
Some other studies have reported the same outcome when combined between ABCB1
variants and CYP3A5 genotypes. MacPhee et al. (2002) reported that a minor
association was found in the ABCB1 allele variants on tacrolimus trough concentrations
in CYP3A5 non-expressers. A Japanese study involving 39 kidney transplant recipients

Pharmacokinetics and Pharmacogenomics of Tacrolimus
Page 101 of 377
showed that the ABCB1 CC and the CT/TT genotype subgroups had no significant
differences in tacrolimus bioavailability in both CYP3A5*1/*1+*1/*3 and
CYP3A5*3/*3 genotype groups (Tada et al., 2005). Furthermore, Loh et al. (2008), in a
study on 18 Asian renal transplant recipients, found that upon evaluating the 2
genotypes for CYP3A5 and ABCB1 in combination, significant differences in tacrolimus
Concentration/Dose ratios for the various groups reflected mainly the CYP3A5
polymorphism. A French study in 136 renal transplant recipients investigating the
combined effect of CYP3A5 and ABCB1 polymorphisms on tacrolimus daily dose and
concentration/dose ratio showed that the significant effect of CYP3A5 on tacrolimus
daily requirements was not modified by the allelic variants of ABCB1 3435C>T
polymorphisms (Quteineh et al., 2008). Another study in 63 Chinese renal transplant
recipients was made by Rong et al. (2010) to investigate the influence of the ABCB1
3435C>T polymorphism on tacrolimus pharmacokinetics between CYP3A5*1 carriers
vs CYP3A5*3/*3 carriers. They concluded that no obvious influence on tacrolimus
pharmacokinetics was observed between ABCB1 CC and CT/TT genotype subgroups in
both CYP3A5 expressers and non-expressers. In summary, a minor influence of the
ABCB1 3435C>T genotype on tacrolimus pharmacokinetics has been identified in
studies with sufficient statistical power that has not been detected in smaller studies.
3.3 Prednisolone Influence on Tacrolimus Pharmacokinetics
Corticosteroids are an important component of clinical immunosuppressive therapy
during induction and maintenance of immunosuppression. Corticosteroids are also very
effective when used at high doses to treat episodes of acute rejection. Prednisolone, a
synthetic corticosteroid, is widely used immunosuppressive agent and is commonly
used to treat and prevent acute rejection after organ transplantation. Prednisolone
mechanism of action involves the inhibition of neutrophil, leukocyte and monocyte-
macrophage accumulation at the site of inflammation. Prednisolone suppresses cell-
mediated immunity through inhibiting genes that code for the cytokines, especially IL-
2, which help T lymphocyte proliferation. Furthermore, prednisolone suppresses
humoral immunity, causing B lymphocytes to express smaller amounts of IL-2 and IL-2
receptors. This diminishes both B lymphocyte clone expansion and antibody synthesis
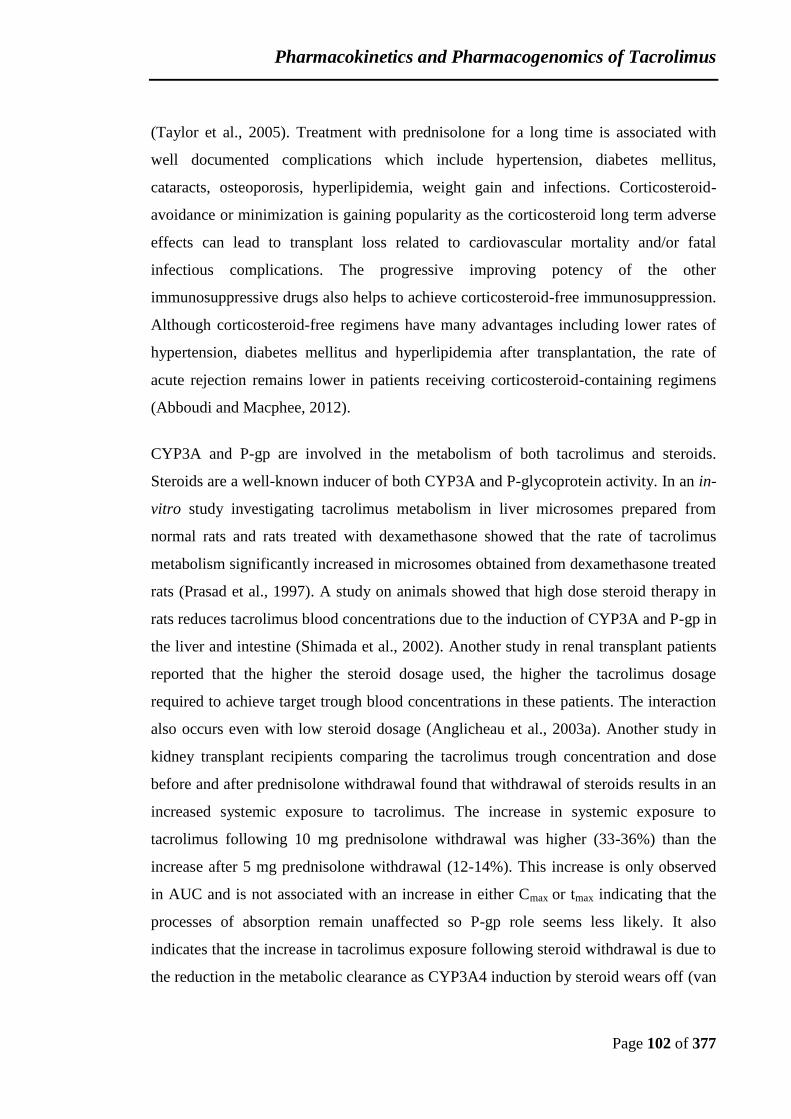
Pharmacokinetics and Pharmacogenomics of Tacrolimus
Page 102 of 377
(Taylor et al., 2005). Treatment with prednisolone for a long time is associated with
well documented complications which include hypertension, diabetes mellitus,
cataracts, osteoporosis, hyperlipidemia, weight gain and infections. Corticosteroid-
avoidance or minimization is gaining popularity as the corticosteroid long term adverse
effects can lead to transplant loss related to cardiovascular mortality and/or fatal
infectious complications. The progressive improving potency of the other
immunosuppressive drugs also helps to achieve corticosteroid-free immunosuppression.
Although corticosteroid-free regimens have many advantages including lower rates of
hypertension, diabetes mellitus and hyperlipidemia after transplantation, the rate of
acute rejection remains lower in patients receiving corticosteroid-containing regimens
(Abboudi and Macphee, 2012).
CYP3A and P-gp are involved in the metabolism of both tacrolimus and steroids.
Steroids are a well-known inducer of both CYP3A and P-glycoprotein activity. In an in-
vitro study investigating tacrolimus metabolism in liver microsomes prepared from
normal rats and rats treated with dexamethasone showed that the rate of tacrolimus
metabolism significantly increased in microsomes obtained from dexamethasone treated
rats (Prasad et al., 1997). A study on animals showed that high dose steroid therapy in
rats reduces tacrolimus blood concentrations due to the induction of CYP3A and P-gp in
the liver and intestine (Shimada et al., 2002). Another study in renal transplant patients
reported that the higher the steroid dosage used, the higher the tacrolimus dosage
required to achieve target trough blood concentrations in these patients. The interaction
also occurs even with low steroid dosage (Anglicheau et al., 2003a). Another study in
kidney transplant recipients comparing the tacrolimus trough concentration and dose
before and after prednisolone withdrawal found that withdrawal of steroids results in an
increased systemic exposure to tacrolimus. The increase in systemic exposure to
tacrolimus following 10 mg prednisolone withdrawal was higher (33-36%) than the
increase after 5 mg prednisolone withdrawal (12-14%). This increase is only observed
in AUC and is not associated with an increase in either Cmax or tmax indicating that the
processes of absorption remain unaffected so P-gp role seems less likely. It also
indicates that the increase in tacrolimus exposure following steroid withdrawal is due to
the reduction in the metabolic clearance as CYP3A4 induction by steroid wears off (van
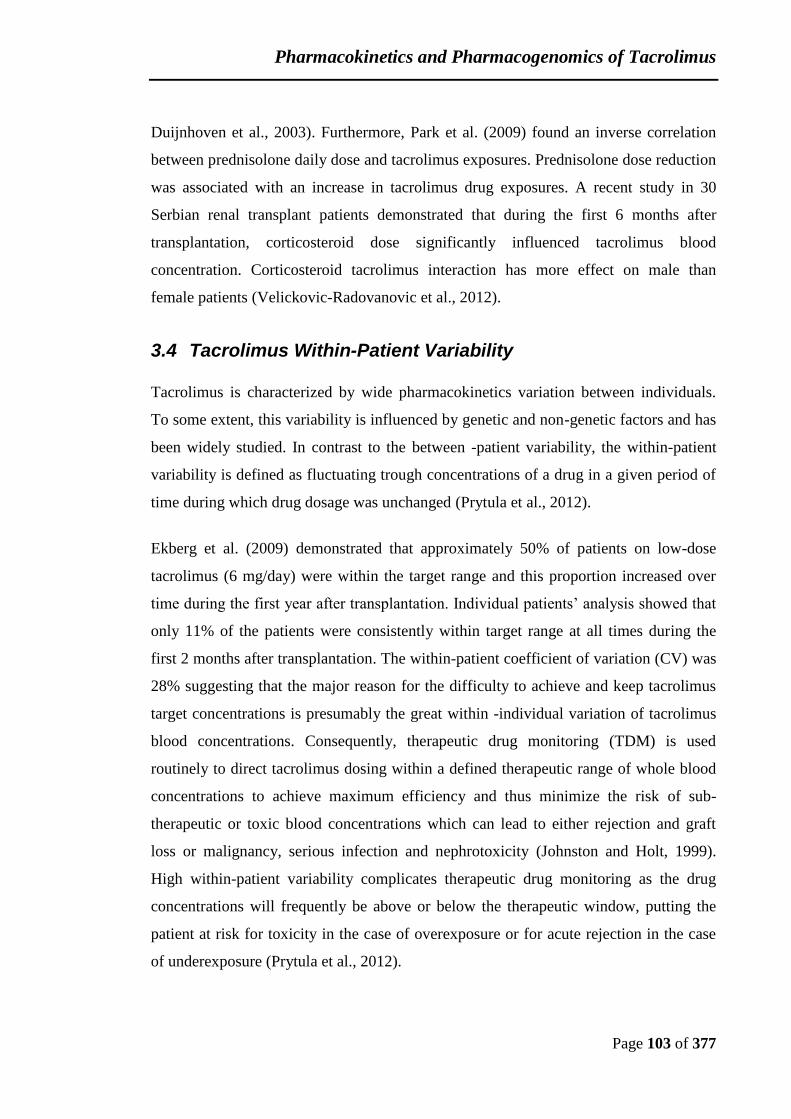
Pharmacokinetics and Pharmacogenomics of Tacrolimus
Page 103 of 377
Duijnhoven et al., 2003). Furthermore, Park et al. (2009) found an inverse correlation
between prednisolone daily dose and tacrolimus exposures. Prednisolone dose reduction
was associated with an increase in tacrolimus drug exposures. A recent study in 30
Serbian renal transplant patients demonstrated that during the first 6 months after
transplantation, corticosteroid dose significantly influenced tacrolimus blood
concentration. Corticosteroid tacrolimus interaction has more effect on male than
female patients (Velickovic-Radovanovic et al., 2012).
3.4 Tacrolimus Within-Patient Variability
Tacrolimus is characterized by wide pharmacokinetics variation between individuals.
To some extent, this variability is influenced by genetic and non-genetic factors and has
been widely studied. In contrast to the between -patient variability, the within-patient
variability is defined as fluctuating trough concentrations of a drug in a given period of
time during which drug dosage was unchanged (Prytula et al., 2012).
Ekberg et al. (2009) demonstrated that approximately 50% of patients on low-dose
tacrolimus (6 mg/day) were within the target range and this proportion increased over
time during the first year after transplantation. Individual patients’ analysis showed that
only 11% of the patients were consistently within target range at all times during the
first 2 months after transplantation. The within-patient coefficient of variation (CV) was
28% suggesting that the major reason for the difficulty to achieve and keep tacrolimus
target concentrations is presumably the great within -individual variation of tacrolimus
blood concentrations. Consequently, therapeutic drug monitoring (TDM) is used
routinely to direct tacrolimus dosing within a defined therapeutic range of whole blood
concentrations to achieve maximum efficiency and thus minimize the risk of sub-
therapeutic or toxic blood concentrations which can lead to either rejection and graft
loss or malignancy, serious infection and nephrotoxicity (Johnston and Holt, 1999).
High within-patient variability complicates therapeutic drug monitoring as the drug
concentrations will frequently be above or below the therapeutic window, putting the
patient at risk for toxicity in the case of overexposure or for acute rejection in the case
of underexposure (Prytula et al., 2012).

Pharmacokinetics and Pharmacogenomics of Tacrolimus
Page 104 of 377
Borra et al. (2010) previously reported that high within-patient tacrolimus trough
concentration variability was a risk factor long term chronic allograft nephropathy and
graft loss in adult renal transplant recipients. Furthermore, an observational retrospective
study performed in two Dutch pediatric nephrology centres reported that children and
adolescents treated for late acute rejection have significantly higher within-patient
variability in tacrolimus exposure than those who do not experience late acute rejection
(Prytula et al., 2012).
Tacrolimus was initially introduced to the market as an immediate-release formulation,
(Prograf®; Astellas Pharma Europe Ltd) that is administered twice a day. Recently, a
prolonged -release formulation of tacrolimus (Advagraf®; Astellas Pharma Europe Ltd)
has been developed to provide once-daily dosing with a similar efficacy and safety
profile to twice-daily tacrolimus formulation, Advagraf®. Equivalent exposure is
achieved at steady state with similar areas under the concentration/time curve (AUC),
trough concentrations (C0), and reduced peak concentrations (Cmax). There is a good
correlation between trough blood concentration and AUC allowing trough
concentrations to be used for therapeutic drug monitoring, as is routine for twice-daily
tacrolimus preparations (Alloway et al., 2005).
High within-patient variability in tacrolimus exposure is considered as a risk factor for
allograft loss and late acute rejection. The reasons for this variability within individual
patients are still unclear. Some factors, such time of tacrolimus dosing and interaction
with food and medication noncompliance could be the reasons for this variability. The
impact of food and the adherence rate seem to be significantly lower in Prograf®
evening versus the morning dose. The presence of food in the gastrointestinal tract,
particularly its fat content, significantly influences both the rate and extent of drug
absorption. Bekersky et al. (2001b) demonstrated that food had a clinically significant
influence in reducing tacrolimus relative bioavailability, as well as slowing its
absorption. The effect on the rate of tacrolimus absorption was more pronounced in
high-fat meals relative to low-fat meals. They also found that, taking tacrolimus one
hour prior to a meal provides minor influence in tacrolimus relative bioavailability
extent compared to taking tacrolimus in the fasting state. Additionally, the ingestion of

Pharmacokinetics and Pharmacogenomics of Tacrolimus
Page 105 of 377
tacrolimus immediately after a meal or 1.5 hours subsequent to a meal had a more
pronounced influence (Bekersky et al., 2001a). Accordingly, tacrolimus should be taken
at least 1 hour before or 2 hours after eating and at the same time every day and any
small deviations in the timing of drug intake may cause fluctuation in tacrolimus blood
concentrations outside the therapeutic window with increased risk for episodes of acute
rejection or toxicity.
Medication compliance remains a serious problem after transplantation. Non-adherence
to medical treatment in transplant recipients is considered a major risk factor for graft
rejection episodes and associated with graft loss. Even small deviations from the
prescribed regimen (ie, <95% adherence) are associated with worse outcomes and
significant financial implications (Laederach-Hofmann and Bunzel, 2000, Takemoto et
al., 2007). Dosing complexity, including frequency of drug dosing and tablet or capsule
burden for organ transplant patients may provide a motive for noncompliance to the
therapeutic regimen (O'Grady et al., 2010). Claxton et al. (2001) confirmed that the
prescribed number of doses per day is inversely related to compliance and reported that
simpler, less frequent dosing regimens resulted in better compliance across a variety of
therapeutic classes. In this situation drugs providing once a day administration can
improve adherence ensuring appropriate drug blood concentration. Ichimaru et al.
(2008) performed a study to survey the actual treatment adherence status of patients to
Prograf® that need to be taken twice daily (morning and evening). They found that the
adherence rate decreased over time following transplantation and this was more
pronounced with the evening doses. Weng et al. (2005) demonstrated a significant
association between dosing frequency (once-daily vs twice-daily) and adherence among
adult transplant recipients.
A change from Prograf® to Advagraf® reduces ‘pill-burden’, simplifies the once daily
regimen and results in only having to coordinate one meal per day around drug
administration. The recommended dose for conversion from Prograf to Advagraf is
considered to be on 1:1 mg basis. Simpler dosing regimens have been shown to
facilitate better adherence performance. Doesch et al. (2010) demonstrated a significant
improvement in heart transplant patient adherence after a switch to modified-release

Pharmacokinetics and Pharmacogenomics of Tacrolimus
Page 106 of 377
tacrolimus, Advagraf® which was generally safe and well tolerated. Another study in
kidney transplant recipient found that compliance was improved among patients treated
with once-daily tacrolimus compared with twice-daily tacrolimus (Alloway et al.,
2007). A more recent study reported an improvement in patients’ adherence after switch
to OD-Tac due to lack of the evening dose associated with a higher rate of missed doses
than the morning dose (Kuypers et al., 2013).
In contrast to between-patient variability, only few studies have investigated the
differences in within-patient variability (WPV) when Prograf® was changed to
Advagraf®. A study by Wehland et al. (2011) investigating the impact of Prograf® to
Advagraf® conversion on 41 stable Caucasian renal transplant recipients showed that
both drugs exhibited similar within-patient variability of dose-normalized trough levels.
However, a retrospective, single-centre, polish study in 52 renal transplant patients
examined the impact of switching from Prograf to Advagraf on daily drug dose and
blood concentration variability, showed that conversion from twice daily to once-daily
tacrolimus late after transplantation ensure greater stability of drug blood concentrations
compared to the standard tacrolimus form (Kurnatowska et al., 2011). Another
prospective, single-centre study was performed to investigate the change of within-
patient variability in 129 stable Taiwanese kidney transplant recipients after conversion
from twice-daily Prograf® to the same daily dose of once-daily Advagraf®. They found
that conversion from Prograf to Advagraf® is associated with a significantly lower
within-patient variability of tacrolimus C0 (Wu et al., 2011). Additionally, a multi-centre,
prospective study performed in stable adult kidney transplant recipients showed that
between- and within-subject variability in systemic exposure to tacrolimus (%CV for
AUC0–24) were similar for both once and twice a day tacrolimus (van Hooff et al.,
2012). Recently, Shuker et al. (2014) studied two hundred and forty seven ethnically
different stable renal transplant recipients and found that conversion from once to twice a
day tacrolimus significantly reduces tacrolimus exposure and it does not reduce WPV in
tacrolimus exposure. However, another recent mixed race study showed a significant
reduction in within-patient variability on conversion to once daily, modified-release
Pharmacokinetics and Pharmacogenomics of Tacrolimus
Page 107 of 377
tacrolimus in a subgroup of 58 liver transplant recipients in the late conversion cohort
(Considine et al., 2015).
Another explanation for this within-patient variability could be an individual’s
cytochrome P450 3A (CYP3A) genotype. Very few studies have focused on the relation
between within-patient variability and genetic polymorphism, particularly CYP3A5
polymorphism in twice daily tacrolimus formulation. Recently, a bioequivalence study
in healthy Korean volunteers suggested that not only between-individual variability, but
also WPV is correlated with the CYP3A5 genotype (Yong Chung et al., 2010). In a
single-centre retrospective study involving 249 Korean renal transplant patients
concluded that within-individual variability in tacrolimus clearance is not related to
CYP3A5 genotype and suggested a strong association between WPV of tacrolimus
trough concentrations and the development of acute rejection (Ro et al., 2012). It has
been recently reported that a significant reduction in within-patient variability (%CV) of
tacrolimus C0 on conversion to once-daily tacrolimus among Taiwanese kidney
transplant recipients. They also found that the %CV of tacrolimus C0 decreased
significantly in patients with at least CYP3A5*1 allele and that there was no difference
in tacrolimus trough concentration %CV between CYP3A5 expressers and non-
expressers in both Prograf and Advagraf® (Wu et al., 2014). However, another study of
non-Asian transplant patients with mixed ethnic background reported that within-patient
variability of tacrolimus clearance is not associated with CYP3A5 genotype (Pashaee et
al., 2011). These results were recently supported by Spierings et al. (2013) in a study of
118 ethnically different renal transplant recipients, which concluded that within-patient
variability of tacrolimus clearance was not associated with CYP3A5 genotype in stable
renal transplant recipients. Further research is required to provide more clear vision into
what are the causes of this within-patient variability of tacrolimus clearance in patients
treated with different tacrolimus formulations.

Pharmacokinetics and Pharmacogenomics of Tacrolimus
Page 108 of 377
3.5 4β-hydroxycholesterol as a Potential Biomarker for
CYP3A5 Activity
Phenotyping of CYP3A catalytic activity, determines to a large extent the substantial
between-individual variation with respect to drug metabolic clearance and consequently,
their bioavailability, elimination, and interaction with other drugs. Thus, having a
marker for this activity seems to be of special importance for proper dose adjustments
and induction potential screening of new drugs (Suzuki et al., 2013a). Furthermore,
CYP3A enzymes are responsible for the metabolism of endogenous compounds such as
cholesterol, steroid hormones (e.g., testosterone), bile acids and vitamin D (van
Waterschoot and Schinkel, 2011). 4β-hydroxycholesterol (4β-OHC) is found in the
human circulation and is produced from the enzymatic conversion of cholesterol by
members of the P450 3A subfamily (Figure 14).
Cholesterol 4β-hydroxycholesterol
Figure 14: Structure of 4β-hydroxycholesterol
Several studies showed that patients treated with CYP3A4 inducers had a marked
increase in 4β-hydroxycholesterol concentrations, while patients treated with CYP3A4
inhibitors were shown to have markedly decreased levels of 4β-hydroxycholesterol
(Josephson et al., 2008, Goodenough et al., 2011, Diczfalusy et al., 2009, Lutjohann et
al., 2009). A study by Diczfalusy et al. (2008) found that the concentration of 4β-OHC
increased with the number of active CYP3A5*1 alleles. They suggested that 4β-OHC is
not only formed by CYP3A4, but also by CYP3A5. Recently, 4β-hydroxycholesterol
(4β-OHC) has been shown to be an endogenous marker of P450 3A activity in clinical
CYP3A4/5
Pharmacokinetics and Pharmacogenomics of Tacrolimus
Page 109 of 377
practice (Diczfalusy et al., 2011). Moreover, it has been reported that 4β-OHC
concentration is associated with cholesterol plasma concentration which might be
affected by some drugs. Therefore, 4β-OHC: cholesterol ratio may be more suitable to
use as an alternative to 4β-OHC itself as a CYP3A measure (Diczfalusy et al., 2011).
The immunosuppressive drug, tacrolimus has a narrow therapeutic index and its
pharmacokinetics shows wide between- and within-individual variability (Amundsen et
al., 2012). CYP3A5 has been identified as the major enzyme responsible for tacrolimus
metabolism. It has been reported that CYP3A5 polymorphisms have a remarkable
influence on tacrolimus trough blood concentration and dose requirements in stable
kidney transplant patients (Glowacki et al., 2011a, Shi et al., 2013, Hesselink et al.,
2003). Estimation of CYP3A activity before transplantation or starting tacrolimus
treatment may help to prevent the possibility of rejection or toxicity. Moreover, 4β-
OHC has been reported to be a potent and useful endogenous biomarker for CYP3A
activity especially in kidney transplant patients. Therefore, 4β-OHC may be a useful
biomarker for prediction of tacrolimus dosing in renal transplant patients.

Comparative Pharmacokinetics Assessments of Tacrolimus Preparations
Page 110 of 377
4 Chapter 4. Comparative Pharmacokinetics Assessments of Immediate- and Prolonged-Release Tacrolimus: Associations with CYP3A5 and ABCB1 Genotypes.
4.1 Objective of the Study:
1. To compare the pharmacokinetics of tacrolimus, measured by a validated
LC/MSMS method, using two tacrolimus formulations: immediate-release Prograf®
or Adoport® and prolonged-release Advagraf®.
2. To study the Associations between CYP3A5*3 and ABCB1 3435C>T SNPs and the
pharmacokinetics of these formulations within patients.
4.2 Materials & Methods
This study was sponsored and monitored by the Joint Research and Enterprise Office,
St. George’s University of London and it has been supported by an unrestricted research
grant from Astellas Pharma Ltd. The study protocol was approved by National Research
Ethics Service Committee (REC Number: 09/H0707/91). The study is an open-label
pharmacokinetic study with a crossover design.
4.2.1 Eligibility Criteria
4.2.1.1 Inclusion Criteria
1) Renal transplant recipient at least 6 weeks after transplantation on treatment with
twice daily tacrolimus with planned change in treatment to once daily Advagraf®
(prolonged release tacrolimus) as part of standard care.
2) Aged at least 18 years.
3) Treatment with no more than 5 mg prednisolone daily.
4) Signed and dated informed consent obtained before screening and before the
performance of any protocol-specific tests.

Comparative Pharmacokinetics Assessments of Tacrolimus Preparations
Page 111 of 377
4.2.1.2 Exclusion Criteria
1) Unstable renal transplant patients.
2) Aged less than 18 years old.
3) Treatment with more than 5 mg prednisolone daily.
4) Treatment with potent cytochrome P4503A and P-glycoprotein inducers (such as
carbamazepine, phenytoin, and rifampicin) inhibitors (such as diltiazem,
erythromycin, fluconazole, and verapamil) or any less commonly prescribed
potent inducer or inhibitor.
5) Development of intolerance to tacrolimus preparations.
6) Inability to obtain satisfactory venous access.
7) In the event of an adverse event where study continuation is considered to be
inappropriate by the investigator.
8) Withdrawal of consent.
4.2.2 Study Design
Stable adult renal transplant patients in follow-up at three sites of the local transplant
network (St. George’s, St. Helier and Brighton Hospitals) were invited to participate in
the study. At the time of enrolment, patients were informed of the purpose, duration and
risks of the study, and they were requested to sign a written informed consent form
(Appendix 1). After signing the consent form, patients were checked for their eligibility
to participate in the study based on the inclusion and exclusion criteria. Eligible subjects
were genotyped using DNA prepared from peripheral blood samples collected at a time
when undergoing venepuncture as part of routine care as shown in Figure 15. The
evaluations and tests performed also included:
Taking patient demographic data, including (Weight, Sex, Ethnic group, Age
and date of birth, Original renal disease)
Recording any significant past medical history
Carrying out a physical examination
Checking vital signs (including Pulse rate, Blood pressure)
Recording all concurrent medications
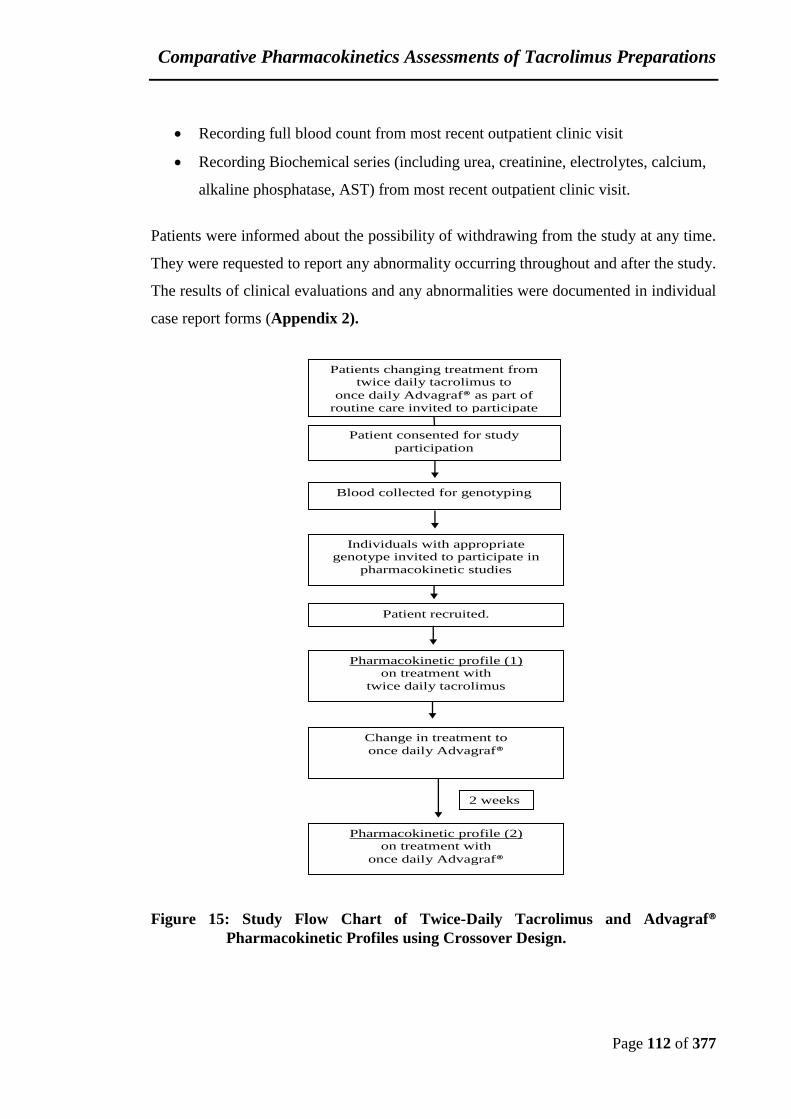
Comparative Pharmacokinetics Assessments of Tacrolimus Preparations
Page 112 of 377
Recording full blood count from most recent outpatient clinic visit
Recording Biochemical series (including urea, creatinine, electrolytes, calcium,
alkaline phosphatase, AST) from most recent outpatient clinic visit.
Patients were informed about the possibility of withdrawing from the study at any time.
They were requested to report any abnormality occurring throughout and after the study.
The results of clinical evaluations and any abnormalities were documented in individual
case report forms (Appendix 2).
Figure 15: Study Flow Chart of Twice-Daily Tacrolimus and Advagraf®
Pharmacokinetic Profiles using Crossover Design.
Patients changing treatment from
twice daily tacrolimus to
once daily Advagraf® as part of
routine care invited to participate
Individuals with appropriate
genotype invited to participate in
pharmacokinetic studies
Pharmacokinetic profile (1)
on treatment with
twice daily tacrolimus
Change in treatment to
once daily Advagraf®
Pharmacokinetic profile (2)
on treatment with
once daily Advagraf®
Blood collected for genotyping
2 weeks
Patient consented for study
participation
Patient recruited.

Comparative Pharmacokinetics Assessments of Tacrolimus Preparations
Page 113 of 377
4.2.3 Study Treatments
This study measured drug concentrations for patients’ standard therapy. During twice
daily tacrolimus treatment, tacrolimus dose is usually adjusted to achieve 12 hour post-
dose whole blood concentrations of 8-12 µg/L up until three months after
transplantation and thereafter 5-8 µg/L. When the treatment was changed from twice
daily tacrolimus to Advagraf® the same total daily dose was administered and adjusted
to maintain trough blood concentrations within the target range. In order to standardise
prednisolone CYP3A inducing effect, only patients treated with no more than 5 mg
prednisolone daily were recruited.
4.2.4 Genotyping Determination
DNA was extracted from peripheral blood samples using QIAamp DNA Blood Mini Kit
(QIAGEN®, West Sussex, UK). CYP3A5*1/*3 and ABCB1 3435C>T polymorphisms
were genotyped using real time polymerase chain reaction (PCR), a LightCycler® based
technique. The samples were amplified using specific primer sequences.
4.2.4.1 Materials and Methods
QIAamp DNA Blood Mini Kit was obtained from QIAGEN® (West Sussex, UK). The
LightCycler FastStart DNA Master Hybridisation Probe kit was supplied from Roche®
(West Sussex, UK). Custom-made primers and probes were purchased from Tib
Molbiol® (Berlin, Germany). PCR was performed using LightCycler® 1.0 supplied from
Roche® (Lewes, UK). Ethanol was supplied by VWR. Deionised water was prepared on
site (Millipore).
4.2.4.2 DNA Extraction and Purification Procedure
Ethylenediaminetetraacetic acid anticoagulated whole blood samples were collected and
stored at –20°C until DNA isolation. QIAamp DNA Blood Mini Kits were used to
extract and purify DNA from 200 μl of stored EDTA anticoagulated whole blood
according to the manufacturer instructions. The extracted DNA samples were stored at –
20°C until analysis.

Comparative Pharmacokinetics Assessments of Tacrolimus Preparations
Page 114 of 377
4.2.4.3 CYP3A5*3 and ABCB1 3435C>T Genotyping
4.2.4.3.1 CYP3A5*3 Genotyping
FastStart DNA master Hybridization Probe kits was used for DNA amplification using
two specific primers, forward and reverse primer. The forward primer sequence was
ACTGCCCTTGCAGCATTTAG and the reverse primer sequence was
CATACCCCTAGTTGTACGAC. Two hybridization probes were used, the anchor and
sensor probes. The sequence of the Anchor probe was 5′-LCRed640-
GTTTGGACCACATTACCCTTCATC-3′- Phosphate and the sensor probe sequence
was 5′-CTTTTGTCTTTCAATATCTCTTCCC-3′-fluorescein. The reaction mixture
made up of 0.5 µM of each primer and 0.3 µM of the probe. The final Mg2+
concentration in the reaction mixture was adjusted to 3 mM. 2 µL of DNA samples
were loaded into composite glass capillaries (Roche Molecular Biochemicals)
containing 18µL of the reaction mixture, centrifuged, and placed in the LightCycler
sample carousel. Three control samples were included in each LightCycler run, two
positive controls and one negative control (Deionized water).
The programme was designed as follows: pre- incubation phase at 95°C for 10 min to
activate the Taq polymerase enzyme, followed by amplification phase, which includes
45 cycles of denaturation (95°C, 10s), annealing (55°C, 5 s) and extension (72°C, 15 s).
Then this was followed by melting curve analysis stage, which involved annealing at
40°C for 50s, followed by an increase in temperature at a rate of 0.1°C/s, with continual
fluorescence detection up to 95°C. F2 mode was used for fluorescence display. Light
Cycler Software was used to convert melting curves into melting peaks by plotting the
negative derivatives of fluorescence against temperature (-dF/dT) (Fredericks et al.,
2005).
4.2.4.3.2 ABCB1 3435C>T Genotyping
FastStart DNA master Hybridization Probe kits were used for DNA amplification using
two specific primers, forward and reverse primer. The forward primer sequence was
TGTTTTCAGCTGCTTGATGG and the sequence of the reverse primer was

Comparative Pharmacokinetics Assessments of Tacrolimus Preparations
Page 115 of 377
AAGGCATGTATGTTGGCCTC. Two hybridization probes were used. The sensor
probe sequence was LC640-GGAAGAGATCGTGAGGGCAG--PH. The 3′-
fluorescein-labeled anchor probe sequence was GACAACAGCCGGGTGGTGTCA--
FL. PCR was performed in a reaction volume of 20μL with 0.2 μmoL each primer, 0.2
μmoL anchor and sensor probes, and 2μL of genomic DNA. The final Mg2+
concentration in the reaction mixture was adjusted to 3 mM. The samples were loaded
into composite glass capillaries (Roche Molecular Biochemicals), centrifuged, and
placed in the LightCycler sample carousel. After an initial denaturation step at 95°C for
10.0 min, amplification was performed using 45 cycles of denaturation (95°C for 5 s),
annealing (55°C for 10 s), and extension (72°C for 20 s). After amplification was
complete, a final melting curve was recorded by annealing at 40°C for 20s, followed by
an increase in temperature at a rate of 0.1°C/s, with continual fluorescence detection up
to 85°C. F2 mode was used for fluorescence display. Light Cycler Software was used to
convert melting curves into melting peaks by plotting the negative derivatives of
fluorescence against temperature (-dF/dT) (Nauck et al., 2000).
4.2.5 Determination of Ethnicity
Patients were classified by ethnicity based on the patient’s transplant assessment records
or their self-report as follows:
White: any Caucasians, white British and any other white background
Black: any ancestry from sub-saharan Africa or any other black background
including Caribbean
Asian: ancestry from India and any other south Asian background, not including
any East Asians (Koreans, Chinese and Japanese).
4.2.6 Study Procedure
Subjects were divided into four groups according to their genotype, as shown in Table
4. The target size for each group was 30 patients. The sample size required was
calculated using an anticipated CV of 20% and a power of 80%, within each of the four
cohorts individually. From previous data, tacrolimus systemic exposure (AUC0-24) for

Comparative Pharmacokinetics Assessments of Tacrolimus Preparations
Page 116 of 377
Prograf® was slightly higher than that for Advagraf® [ratio 1.10]. In order that the 90%
confidence interval for the treatment ratio lies entirely within 0.8 – 1.25, the total
number of subjects required in each group was 30. The sample size calculation was
performed using nQuery Advisor 5.0 [table MTE3-1].
Table 4: Study Genotype Groups of CYP3A5 and ABCB1 Alleles.
CYP3A5 genotype ABCB1 genotype Number of patients
*1/*1 or *1/*3 CYP3A5 expressers
CC 30
*1/*1 or *1/*3 CT/TT 30
*3/*3 CYP3A5 non-expressers
CC 30
*3/*3 CT/TT 30
Total
120
Patients involved in the study adopted a dosing schedule for one week prior to the study
where the current dose of twice daily tacrolimus was administered twice daily at 08:00
and 20:00. An initial pharmacokinetic profile of the twice daily dose tacrolimus was
measured. Treatment was then changed to the same daily dose of Advagraf®, which was
administered once daily at 08:00 and then two weeks later, a further pharmacokinetic
profile was measured after a single morning dose of Advagraf®, as shown Figure 16.
Figure 16: Twice-Daily Tacrolimus – Advagraf® Study Design.
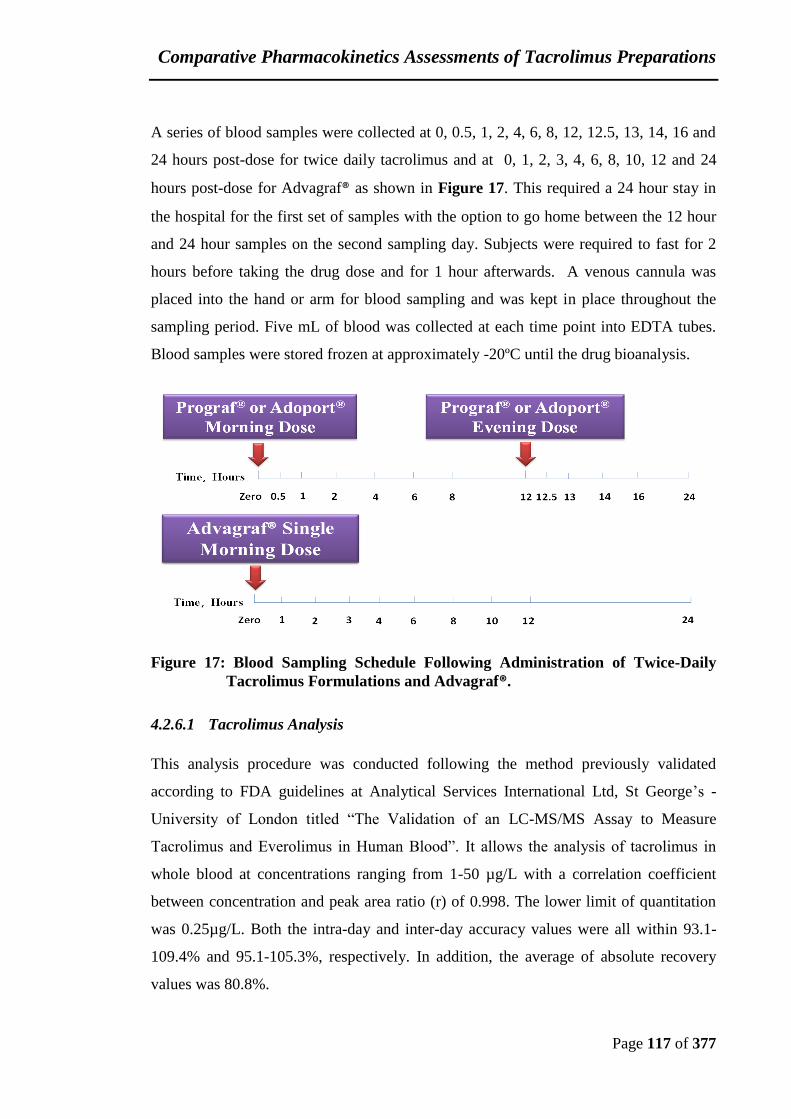
Comparative Pharmacokinetics Assessments of Tacrolimus Preparations
Page 117 of 377
A series of blood samples were collected at 0, 0.5, 1, 2, 4, 6, 8, 12, 12.5, 13, 14, 16 and
24 hours post-dose for twice daily tacrolimus and at 0, 1, 2, 3, 4, 6, 8, 10, 12 and 24
hours post-dose for Advagraf® as shown in Figure 17. This required a 24 hour stay in
the hospital for the first set of samples with the option to go home between the 12 hour
and 24 hour samples on the second sampling day. Subjects were required to fast for 2
hours before taking the drug dose and for 1 hour afterwards. A venous cannula was
placed into the hand or arm for blood sampling and was kept in place throughout the
sampling period. Five mL of blood was collected at each time point into EDTA tubes.
Blood samples were stored frozen at approximately -20ºC until the drug bioanalysis.
Figure 17: Blood Sampling Schedule Following Administration of Twice-Daily
Tacrolimus Formulations and Advagraf®.
4.2.6.1 Tacrolimus Analysis
This analysis procedure was conducted following the method previously validated
according to FDA guidelines at Analytical Services International Ltd, St George’s -
University of London titled “The Validation of an LC-MS/MS Assay to Measure
Tacrolimus and Everolimus in Human Blood”. It allows the analysis of tacrolimus in
whole blood at concentrations ranging from 1-50 µg/L with a correlation coefficient
between concentration and peak area ratio (r) of 0.998. The lower limit of quantitation
was 0.25µg/L. Both the intra-day and inter-day accuracy values were all within 93.1-
109.4% and 95.1-105.3%, respectively. In addition, the average of absolute recovery
values was 80.8%.
Comparative Pharmacokinetics Assessments of Tacrolimus Preparations
Page 118 of 377
4.2.6.1.1 Chemicals and Reagents
Tacrolimus was supplied by Enzo Life Sciences and ascomycin (IS) was supplied by
Sigma-Aldrich, together with Zinc sulfate heptahydrate. HPLC-grade methanol and
Methyl-tert-butyl ether (MTBE) were obtained from Rathburn Chemicals Limited.
Acetonitrile (HPLC grade) was supplied by VWR. Ammonium acetate, Sodium
hydroxide, ethanol and ethanediol, were purchased from VWR. EDTA anticoagulated
tacrolimus -free human whole blood was supplied from Biological Specialty Corp,
Colmar, Pennsylvania, USA. Deionised water was prepared on site (Millipore).
4.2.6.1.2 Stock Solutions
Calibrators and control samples were prepared in EDTA-anticoagulated whole blood,
using separate stock solutions prepared in methanol. Six non-zero calibrators (nominal
values of 1.0, 2.5, 5.0, 10.0, 25.0, and 50.0 µg/L) and three control samples (nominal
values of 3.0, 15.0, and 30.0 µg/L) were prepared. Calibrators and controls were
aliquoted and stored at approximately 20°C before use. A stock solution of ascomycin
(internal standard) was prepared in ethanol-ethanediol-water (50:25:25) to give a
concentration of 50 µg/L.
4.2.6.1.3 Extraction Procedure
For sample preparation, 50µL of calibrators, quality control, or patient samples; 50µL
of internal standard, 1 mL of precipitating solution (500 mL zinc sulphate solution (25
g/L); 200 mL of acetonitrile; and 300 mL methanol) were pipetted into 2-mL Eppendorf
vials. The vials were mixed for 5 min and then centrifuged at; 13,200 rpm for 5 min
using Eppendorf 5415D Centrifuge (Eppendorf, England, UK). The supernatant was
decanted into 4.5-mL polypropylene tubes with 100 µL of 0.1 mol/L sodium hydroxide
and 2 mL of MTBE. After mixing for 5 min, the tubes were centrifuged at 3000rpm for
5 min. The organic solvent was then transferred to 4.5-mL conical polypropylene tubes,
placed in a Savant SpeedVac Sc200 (Thermo Life Sciences) at 60°C, and evaporated to
dryness. The dried extracts were reconstituted with 250 µL of 80% methanol, mixed for
5 min, and then transferred to autosampler vials, which were placed in an autosampler

Comparative Pharmacokinetics Assessments of Tacrolimus Preparations
Page 119 of 377
tray set at ambient temperature. The autosampler injected a 10µL aliquot of each extract
onto the analytical column (Figure 18).
4.2.6.1.4 Chromatographic and Mass Spectrometric conditions:
Validated LC-MS/MS method was used for the analysis of tacrolimus in the whole
blood. The instrument used composed of Agilent HPLC comprises Pump, auto-sampler
(Model: 1100 series) and auto injector coupled with Triple quadrupole AB Sciex API-
4000 LC-MS/MS system. The reverse phase Alltech Alltima C18, 5µm, 150×2.1 mm
column (Merck (BDH) Limited, Poole, Dorset, England) was used for the separation of
tacrolimus and internal standard at temperature of 65°C using an Agilent series 1100
column oven. The mobile phase was pumped isocratically at a flow rate of 0.4 mL/min
and consisted of a mixture of mobile phase A (Methanol) and mobile phase B (De-
ionized water + 5mL/L 2M ammonium acetate) at a ratio of 82:18 respectively. The
retention times were 2.9 for tacrolimus and 2.8 for ascomycin and the total run time was
4 min. The sample injection volume was 10 µL. Tandem mass spectrometric detection
and quantification was performed in the positive electrospray ionization mode using
multiple reaction monitoring (MRM) mode. The transitions selected were m/z
821.5/768.5 for tacrolimus and m/z 809.5/756.5 for ascomycin. Nitrogen was used as
the collision gas. The NM20ZA high purity nitrogen and air generators were supplied
by Peak Scientific Instruments, Scotland. Gas settings in ml/min were: Collision gas: 8,
curtain gas: 10, ion source gas 1: 35, ion source gas 2: 30. Ion spray voltage: 5500 V,
and temperature: 450°C. Entrance potential (EP), collision energy (CE), and collision
cell exit potential (CXP) in voltage were 10, 29 and 18 V, respectively for all
compounds. The dwell times were set at 300 msec. Declustering Potential (DP) was 81
for tacrolimus and 76 for ascomycin. A Windows PC running Analyst 1.3.2 software
was used to control the LC-MS/MS, record the output from the detector, perform
integration of peak areas and calculate the tacrolimus concentrations. The Analyst
software was supplied by Applied Biosystems, England (Figure 18).
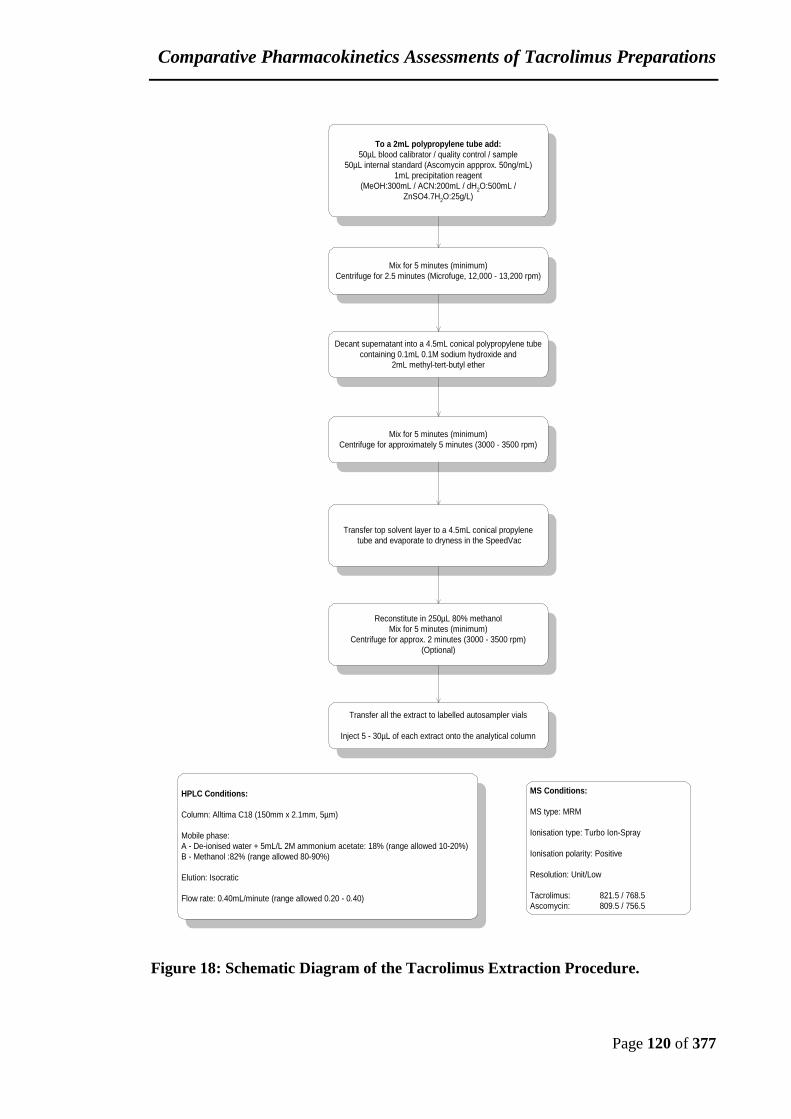
Comparative Pharmacokinetics Assessments of Tacrolimus Preparations
Page 120 of 377
Figure 18: Schematic Diagram of the Tacrolimus Extraction Procedure.
To a 2mL polypropylene tube add:
50µL blood calibrator / quality control / sample
50µL internal standard (Ascomycin appprox. 50ng/mL)
1mL precipitation reagent
(MeOH:300mL / ACN:200mL / dH2O:500mL /
ZnSO4.7H2O:25g/L)
Mix for 5 minutes (minimum)
Centrifuge for 2.5 minutes (Microfuge, 12,000 - 13,200 rpm)
Decant supernatant into a 4.5mL conical polypropylene tube
containing 0.1mL 0.1M sodium hydroxide and
2mL methyl-tert-butyl ether
Mix for 5 minutes (minimum)
Centrifuge for approximately 5 minutes (3000 - 3500 rpm)
Transfer top solvent layer to a 4.5mL conical propylene
tube and evaporate to dryness in the SpeedVac
Reconstitute in 250µL 80% methanol
Mix for 5 minutes (minimum)
Centrifuge for approx. 2 minutes (3000 - 3500 rpm)
(Optional)
Transfer all the extract to labelled autosampler vials
Inject 5 - 30µL of each extract onto the analytical column
HPLC Conditions:
Column: Alltima C18 (150mm x 2.1mm, 5µm)
Mobile phase:
A - De-ionised water + 5mL/L 2M ammonium acetate: 18% (range allowed 10-20%)
B - Methanol :82% (range allowed 80-90%)
Elution: Isocratic
Flow rate: 0.40mL/minute (range allowed 0.20 - 0.40)
MS Conditions:
MS type: MRM
Ionisation type: Turbo Ion-Spray
Ionisation polarity: Positive
Resolution: Unit/Low
Tacrolimus: 821.5 / 768.5
Ascomycin: 809.5 / 756.5
Comparative Pharmacokinetics Assessments of Tacrolimus Preparations
Page 121 of 377
4.2.7 Statistical and Pharmacokinetic Analysis
Statistical analysis was performed using Minitab statistical software (Minitab 17).
According to the FDA and EMA guidelines patients’ data were log transformed (FDA.,
2003, EMA, 2010a). Then the log-transformed data were analysed using analysis of
variance (ANOVA) with factors for genotype group and treatment. 90% confidence
intervals around the ratio in means for twice-daily tacrolimus Prograf® and Adoport®:
Advagraf® within each genotyping group was compared to the FDA bioequivalence
margin of 0.8-1.25 where the differences in systemic drug exposure up to 20% are not
clinically significant (FDA., 2003). EMA guidelines tightened the bioequivalence
margin for tacrolimus AUC to 0.9-1.11, where the differences in systemic drug
exposure up to 10% are not clinically significant (EMA, 2010a). See Section 2.2.1 page
63. The area under the plasma concentration-time curve (AUC) was calculated using the
linear trapezoidal method. The peak plasma concentration (Cmax) and tmax (the time to
achieve Cmax) were obtained from direct visual inspection of plasma concentration
versus time curves. The allele and genotype frequencies of the CYP3A5*3 and ABCB1
3435C>T polymorphisms were assessed for deviation from the Hardy–Weinberg
equilibrium using the chi-square test.
4.3 Results
4.3.1 Pharmacokinetics and Bioequivalence of Tacrolimus Preparations
in Stable Renal Transplant Patients.
The study was designed to compare the standard practice tacrolimus (Prograf®) versus
Advagraf®. On the way through the study, the renal unit changed their standard practice
tacrolimus to Adoport®. So we started with Prograf® and then we had to continue with
Adoport®. Based on FDA guidelines and EMA guidelines both formulations were
considered bioequivalent (Alloway et al., 2012, MEB, 2012). This had been checked in
our study cohort and we confirmed that both formulations were bioequivalent according
to FDA guidelines but not EMA criteria and therefore all patients treated with both
formulations were combined in one group, twice daily tacrolimus group.
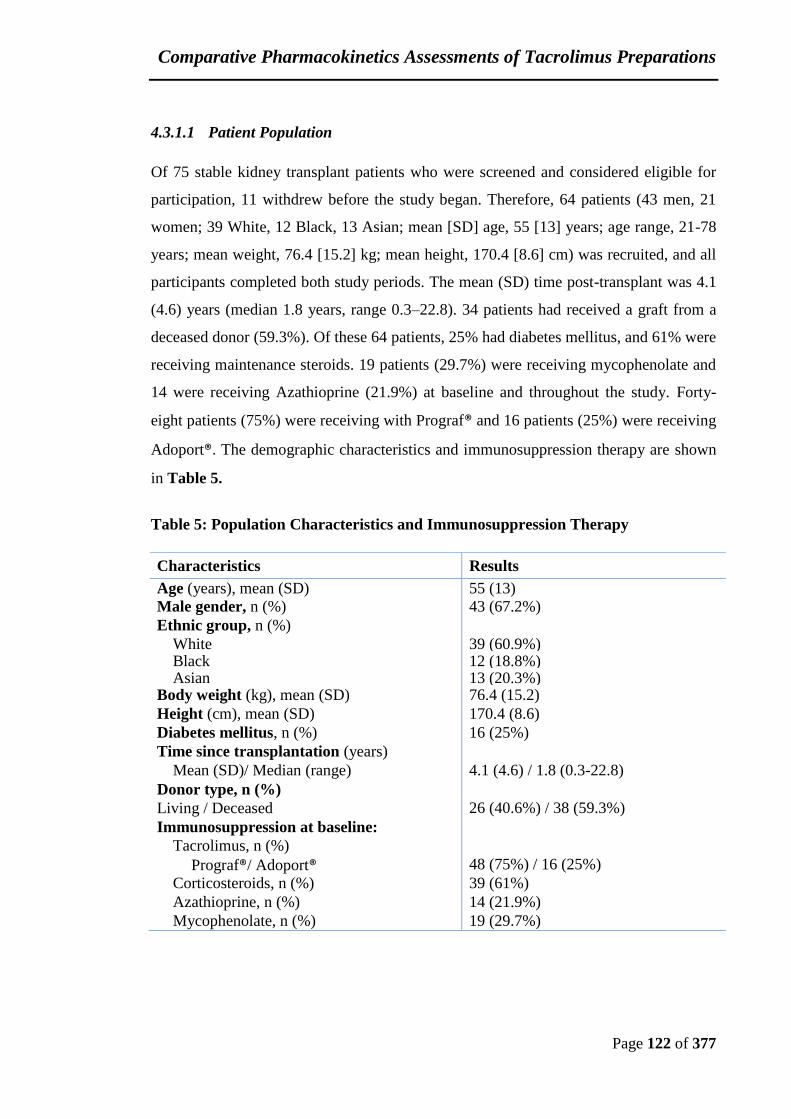
Comparative Pharmacokinetics Assessments of Tacrolimus Preparations
Page 122 of 377
4.3.1.1 Patient Population
Of 75 stable kidney transplant patients who were screened and considered eligible for
participation, 11 withdrew before the study began. Therefore, 64 patients (43 men, 21
women; 39 White, 12 Black, 13 Asian; mean [SD] age, 55 [13] years; age range, 21-78
years; mean weight, 76.4 [15.2] kg; mean height, 170.4 [8.6] cm) was recruited, and all
participants completed both study periods. The mean (SD) time post-transplant was 4.1
(4.6) years (median 1.8 years, range 0.3–22.8). 34 patients had received a graft from a
deceased donor (59.3%). Of these 64 patients, 25% had diabetes mellitus, and 61% were
receiving maintenance steroids. 19 patients (29.7%) were receiving mycophenolate and
14 were receiving Azathioprine (21.9%) at baseline and throughout the study. Forty-
eight patients (75%) were receiving with Prograf® and 16 patients (25%) were receiving
Adoport®. The demographic characteristics and immunosuppression therapy are shown
in Table 5.
Table 5: Population Characteristics and Immunosuppression Therapy
Characteristics Results
Age (years), mean (SD) 55 (13)
Male gender, n (%) 43 (67.2%)
Ethnic group, n (%)
White 39 (60.9%) Black 12 (18.8%) Asian 13 (20.3%)
Body weight (kg), mean (SD) 76.4 (15.2)
Height (cm), mean (SD) 170.4 (8.6)
Diabetes mellitus, n (%) 16 (25%)
Time since transplantation (years)
Mean (SD)/ Median (range) 4.1 (4.6) / 1.8 (0.3-22.8)
Donor type, n (%)
Living / Deceased 26 (40.6%) / 38 (59.3%)
Immunosuppression at baseline:
Tacrolimus, n (%)
Prograf®/ Adoport® 48 (75%) / 16 (25%)
Corticosteroids, n (%) 39 (61%)
Azathioprine, n (%) 14 (21.9%)
Mycophenolate, n (%) 19 (29.7%)
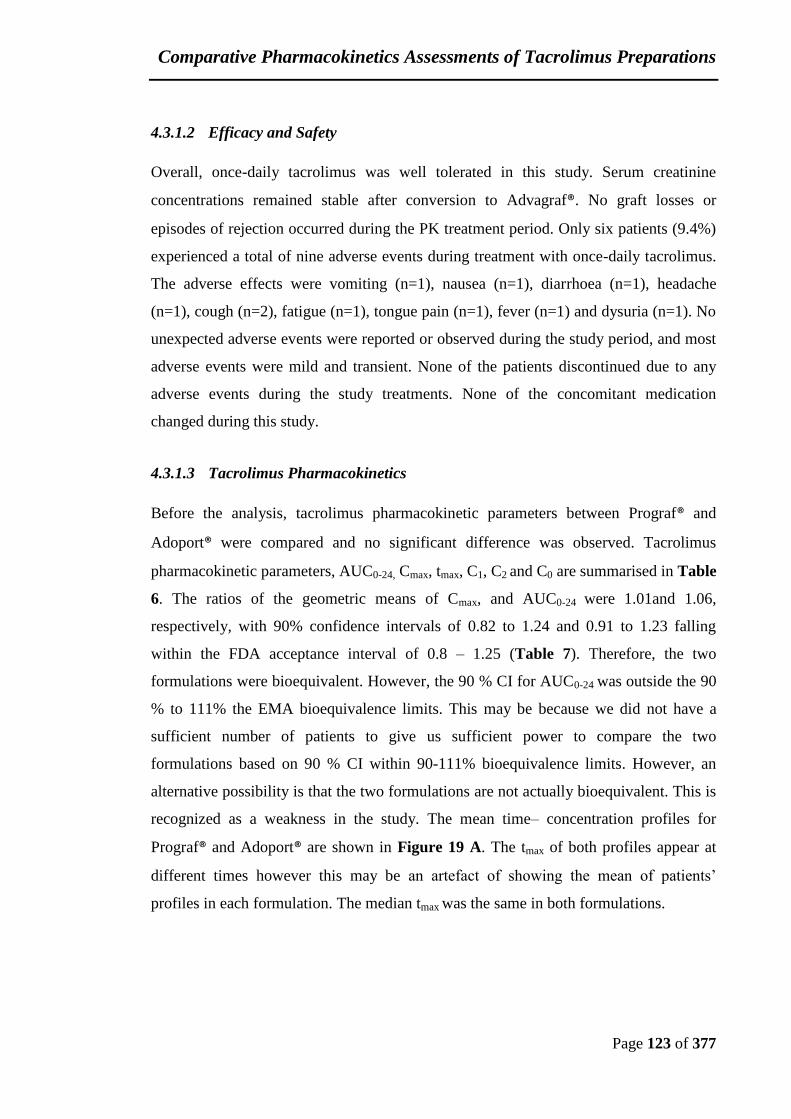
Comparative Pharmacokinetics Assessments of Tacrolimus Preparations
Page 123 of 377
4.3.1.2 Efficacy and Safety
Overall, once-daily tacrolimus was well tolerated in this study. Serum creatinine
concentrations remained stable after conversion to Advagraf®. No graft losses or
episodes of rejection occurred during the PK treatment period. Only six patients (9.4%)
experienced a total of nine adverse events during treatment with once-daily tacrolimus.
The adverse effects were vomiting (n=1), nausea (n=1), diarrhoea (n=1), headache
(n=1), cough (n=2), fatigue (n=1), tongue pain (n=1), fever (n=1) and dysuria (n=1). No
unexpected adverse events were reported or observed during the study period, and most
adverse events were mild and transient. None of the patients discontinued due to any
adverse events during the study treatments. None of the concomitant medication
changed during this study.
4.3.1.3 Tacrolimus Pharmacokinetics
Before the analysis, tacrolimus pharmacokinetic parameters between Prograf® and
Adoport® were compared and no significant difference was observed. Tacrolimus
pharmacokinetic parameters, AUC0-24, Cmax, tmax, C1, C2 and C0 are summarised in Table
6. The ratios of the geometric means of Cmax, and AUC0-24 were 1.01and 1.06,
respectively, with 90% confidence intervals of 0.82 to 1.24 and 0.91 to 1.23 falling
within the FDA acceptance interval of 0.8 – 1.25 (Table 7). Therefore, the two
formulations were bioequivalent. However, the 90 % CI for AUC0-24 was outside the 90
% to 111% the EMA bioequivalence limits. This may be because we did not have a
sufficient number of patients to give us sufficient power to compare the two
formulations based on 90 % CI within 90-111% bioequivalence limits. However, an
alternative possibility is that the two formulations are not actually bioequivalent. This is
recognized as a weakness in the study. The mean time– concentration profiles for
Prograf® and Adoport® are shown in Figure 19 A. The tmax of both profiles appear at
different times however this may be an artefact of showing the mean of patients’
profiles in each formulation. The median tmax was the same in both formulations.

Comparative Pharmacokinetics Assessments of Tacrolimus Preparations
Page 124 of 377
Table 6: Prograf® and Adoport® Tacrolimus Pharmacokinetic Parameters.
Parameter Prograf® (n=48) Adoport® (n=16) P-value
Cmax (µg/L) 16.6 ± 7.7 16.6 ± 7.5 1.0
AUC0-24 (µg∗h/L) 191.2 ± 63.2 198.3 ± 56.3 0.5
C0 (µg/L) 6.1 ± 1.9 6.3 ± 2.1 0.7
C1 (µg/L) 13.6 ± 8.0 12.5 ± 8.6 0.2
C2 (µg/L) 13.3 ± 6.7 14.7 ± 4.9 0.8
tmax* 2 (1-16) 2 (1-16) 0.6
Values were compared using ANOVA, general linear model (variables with a normal
distribution) or the Kruskal–Wallis test (variables non-normally distributed).
*median
Table 7: Ratios of Geometric Means and 90% CI for AUC0–24, Cmax, for Prograf®
and Adoport®
Parameter Ratio of geometric means (%) 90% CI
AUC0–24 106% (91% – 123%)
Cmax 101% (82% – 124%)
90% CI for geometric mean are based on the ANOVA model (General linear model).
Switching from Prograf® or Adoport® to Advagraf® was made on a 1mg: 1mg basis.
One hundred and twenty-eight 24-h tacrolimus PK profiles were obtained from 64
patients. The TD-Tac and OD-Tac pharmacokinetic parameters, AUC0-24, Cmax, tmax and
C0 are summarised in Table 8. Based on the mean values of non-dose-normalized data
obtained on days 1 and 14, the mean tacrolimus Cmax and C0 were lower for Advagraf®
compared to twice-daily tacrolimus. There was a significant reduction in tacrolimus
Cmax (p = 0.028). The mean tacrolimus Cmax concentration fell from 16.6 µg/L SD 7.6 to
14.8 µg/L SD 5.6 with a 10% reduction [90%CI 3 to 16%]. The difference in tacrolimus
C0 was highly significant (p = 0.009) with a 10% reduction [90%CI 4 to 16%].
However, no significant differences were observed for AUC0-24 between the two
formulations in this population (p > 0.05, Table 10). The mean concentration-time
profiles for tacrolimus preparations are shown in Figure 19 B. The individual time–
concentration profiles of the 64 patients are presented in Figure 20. The median tmax
was the same for both formulations. At 90% confidence intervals (CI), the mean of Cmax
and AUC0-24 ratio between the twice-daily tacrolimus and Advagraf® were restricted
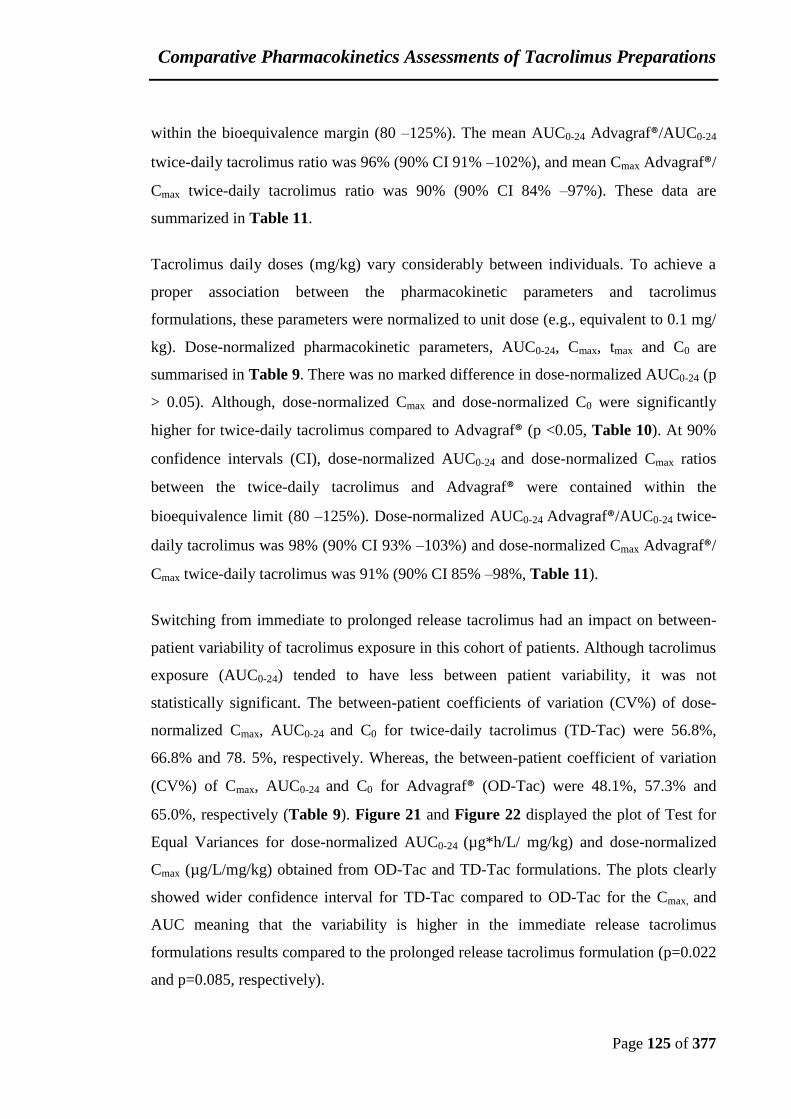
Comparative Pharmacokinetics Assessments of Tacrolimus Preparations
Page 125 of 377
within the bioequivalence margin (80 –125%). The mean AUC0-24 Advagraf®/AUC0-24
twice-daily tacrolimus ratio was 96% (90% CI 91% –102%), and mean Cmax Advagraf®/
Cmax twice-daily tacrolimus ratio was 90% (90% CI 84% –97%). These data are
summarized in Table 11.
Tacrolimus daily doses (mg/kg) vary considerably between individuals. To achieve a
proper association between the pharmacokinetic parameters and tacrolimus
formulations, these parameters were normalized to unit dose (e.g., equivalent to 0.1 mg/
kg). Dose-normalized pharmacokinetic parameters, AUC0-24, Cmax, tmax and C0 are
summarised in Table 9. There was no marked difference in dose-normalized AUC0-24 (p
> 0.05). Although, dose-normalized Cmax and dose-normalized C0 were significantly
higher for twice-daily tacrolimus compared to Advagraf® (p <0.05, Table 10). At 90%
confidence intervals (CI), dose-normalized AUC0-24 and dose-normalized Cmax ratios
between the twice-daily tacrolimus and Advagraf® were contained within the
bioequivalence limit (80 –125%). Dose-normalized AUC0-24 Advagraf®/AUC0-24 twice-
daily tacrolimus was 98% (90% CI 93% –103%) and dose-normalized Cmax Advagraf®/
Cmax twice-daily tacrolimus was 91% (90% CI 85% –98%, Table 11).
Switching from immediate to prolonged release tacrolimus had an impact on between-
patient variability of tacrolimus exposure in this cohort of patients. Although tacrolimus
exposure (AUC0-24) tended to have less between patient variability, it was not
statistically significant. The between-patient coefficients of variation (CV%) of dose-
normalized Cmax, AUC0-24 and C0 for twice-daily tacrolimus (TD-Tac) were 56.8%,
66.8% and 78. 5%, respectively. Whereas, the between-patient coefficient of variation
(CV%) of Cmax, AUC0-24 and C0 for Advagraf® (OD-Tac) were 48.1%, 57.3% and
65.0%, respectively (Table 9). Figure 21 and Figure 22 displayed the plot of Test for
Equal Variances for dose-normalized AUC0-24 (µg*h/L/ mg/kg) and dose-normalized
Cmax (µg/L/mg/kg) obtained from OD-Tac and TD-Tac formulations. The plots clearly
showed wider confidence interval for TD-Tac compared to OD-Tac for the Cmax, and
AUC meaning that the variability is higher in the immediate release tacrolimus
formulations results compared to the prolonged release tacrolimus formulation (p=0.022
and p=0.085, respectively).
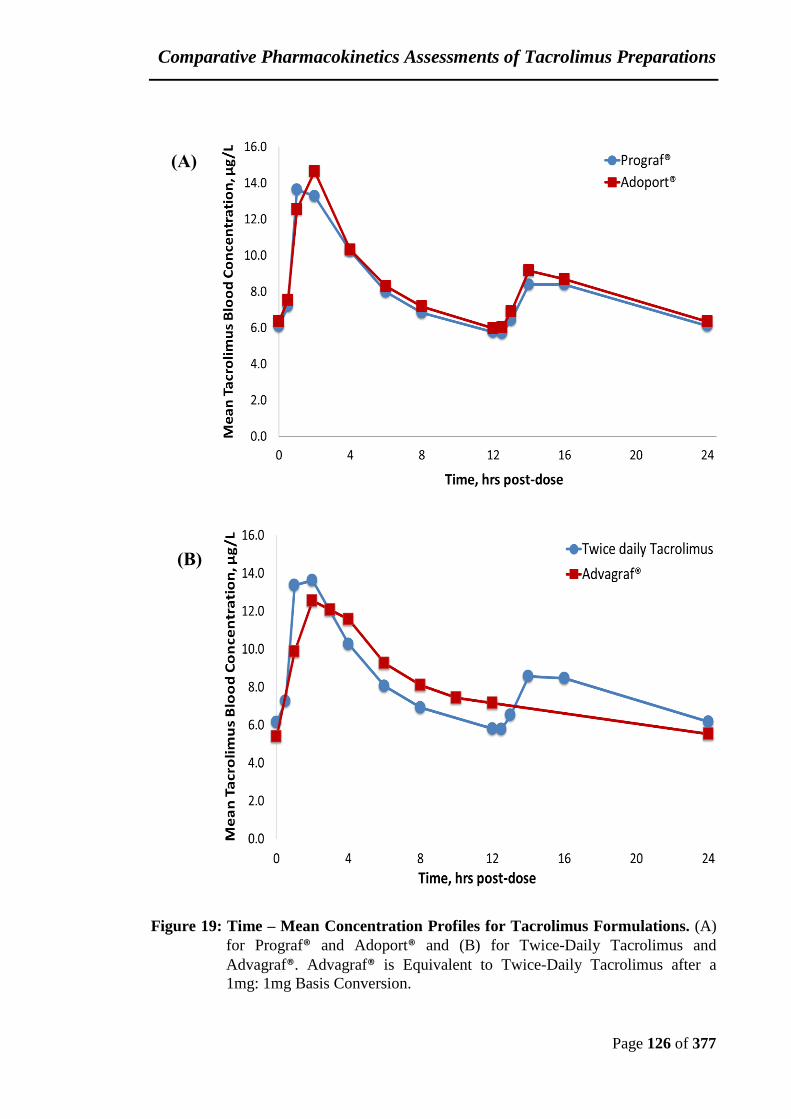
Comparative Pharmacokinetics Assessments of Tacrolimus Preparations
Page 126 of 377
Figure 19: Time – Mean Concentration Profiles for Tacrolimus Formulations. (A)
for Prograf® and Adoport® and (B) for Twice-Daily Tacrolimus and
Advagraf®. Advagraf® is Equivalent to Twice-Daily Tacrolimus after a
1mg: 1mg Basis Conversion.
(A)
(B)
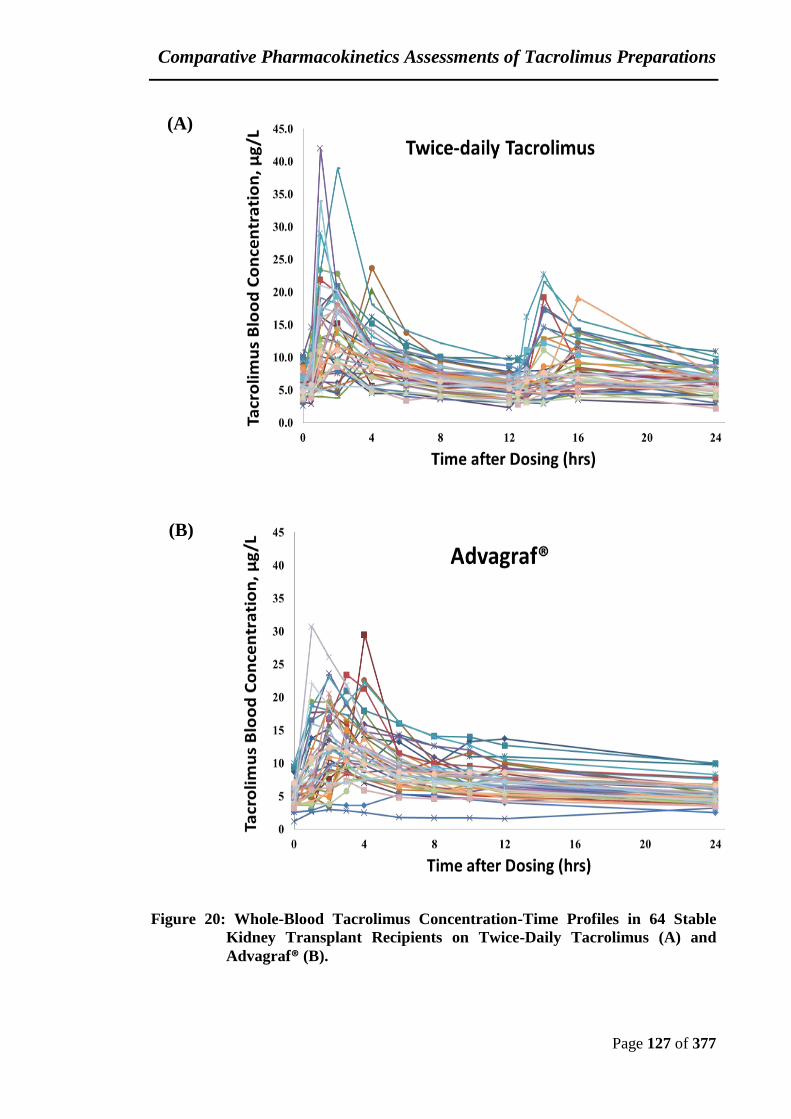
Comparative Pharmacokinetics Assessments of Tacrolimus Preparations
Page 127 of 377
Figure 20: Whole-Blood Tacrolimus Concentration-Time Profiles in 64 Stable
Kidney Transplant Recipients on Twice-Daily Tacrolimus (A) and
Advagraf® (B).
(A)
(B)

Comparative Pharmacokinetics Assessments of Tacrolimus Preparations
Page 128 of 377
Table 8: Tacrolimus Pharmacokinetic Parameters for Tacrolimus Preparations.
Patient Cmax (µg/L) AUC0-24 (µg∗h/L) *tmax (h) C0 (µg/L)
TD-Tac OD-Tac TD-Tac OD-Tac TD-Tac OD-Tac TD-Tac OD-Tac
1 16.3 15.3 239 282 1 2 8.40 9.90
2 15.2 29.5 180 212 2 4 5.90 6.10
3 20.2 19.1 203 220 4 3 6.20 5.40
4 12.1 10.6 101 125 1 2 2.70 5.20
5 16.2 14.3 281 258 4 6 10.90 9.80
6 23.7 22.6 237 243 4 4 6.20 5.90
7 11.3 13.8 140 188 4 1 3.80 5.00
8 20.6 17.8 211 199 2 2 6.80 4.30
9 9.2 17.6 111 177 4 4 4.10 5.40
10 11.6 15.9 144 207 4 4 5.80 4.70
11 20.9 21.0 300 324 2 3 9.30 10.00
12 8.0 8.6 133 135 16 3 3.70 3.80
13 11.2 3.2 113 54 1 24 3.00 3.20
14 7.6 9.1 140 129 2 2 5.90 3.80
15 23.4 19.3 274 218 1 1 7.30 6.80
16 13.1 10.1 176 154 1 3 6.10 4.50
17 39.0 18.7 371 245 2 1 10.10 7.60
18 18.1 18.8 231 211 2 2 6.50 5.00
19 7.9 5.3 112 90 2 6 4.10 2.50
20 21.9 23.4 232 255 1 3 6.00 7.80
21 13.8 7.7 201 138 2 4 8.50 4.10
22 42.0 23.6 290 265 1 2 7.50 6.50
23 29.0 23.0 290 309 1 2 7.60 8.30
24 14.3 15.1 202 159 2 3 6.80 4.80
25 19.1 12.3 270 167 1 2 8.50 4.90
26 10.9 8.8 168 138 2 2 6.30 4.60
27 12.5 9.4 174 137 1 3 6.40 4.60
28 16.0 17.0 145 170 1 2 5.00 4.40
29 19.3 11.9 241 199 2 2 7.20 6.10
30 19.1 13.8 246 142 16 4 7.20 3.50
31 9.8 12.0 150 175 2 4 6.40 5.60
32 18.3 20.5 187 206 2 2 7.30 6.60
33 11.8 11.1 158 130 1 4 4.30 3.90
34 17.3 14.3 216 191 2 2 8.90 5.40
35 33.9 16.0 189 182 1 1 4.74 3.69
36 9.1 10.3 115 141 2 3 4.99 4.99
37 17.7 12.6 213 199 1 3 7.29 6.36
38 9.6 7.4 104 110 1 3 2.20 3.50
39 9.4 12.8 105 162 2 2 3.96 4.57
40 17.3 30.7 219 241 2 1 6.69 5.57
41 6.6 8.4 137 162 16 6 5.24 5.03

Comparative Pharmacokinetics Assessments of Tacrolimus Preparations
Page 129 of 377
42 11.1 12.4 165 205 2 2 5.11 6.62
43 21.0 22.1 195 184 1 1 5.56 4.25
44 19.3 19.3 318 272 14 2 10.60 8.70
45 20.6 15.4 251 154 1 2 6.50 4.20
46 11.0 10.9 167 137 2 2 5.80 4.30
47 15.1 15.8 204 208 4 2 7.30 6.16
48 11.3 10.5 177 147 2 3 7.56 3.90
49 8.2 7.2 103 126 1 2 3.10 3.87
50 15.7 11.6 147 154 1 4 5.30 3.50
51 23.8 23.6 242 279 1 2 6.72 8.00
52 39.5 16.0 321 239 1 1 9.68 6.00
53 18.9 12.1 195 157 2 3 5.70 4.20
54 16.3 11.0 194 177 2 1 5.40 5.70
55 16.3 12.3 171 90 1 1 4.70 4.80
56 25.4 15.2 246 234 2 1 8.30 6.80
57 6.2 10.8 118 143 2 2 3.90 4.30
58 15.7 13.1 144 227 1 2 4.90 11.70
59 13.1 16.2 163 165 2 1 4.30 4.80
60 15.7 8.2 219 132 0.5 3 9.20 4.10
61 13.5 15.4 134 169 1 2 4.80 5.00
62 9.5 13.9 149 196 16 2 4.20 5.70
63 16.2 21.4 198 235 2 2 5.40 6.80
64 16.6 19.1 192 205 2 2 4.90 5.70
Mean 16.6 14.8 193.0 185.6 2.0 2.0 6.2 5.5
SD 7.6 5.6 61.2 54.4 3.8 2.9 1.9 1.8
CV% 45.7 37.6 31.7 29.3 - - 31.4 32.8 *median

Comparative Pharmacokinetics Assessments of Tacrolimus Preparations
Page 130 of 377
Table 9: Tacrolimus Dose-Normalized Pharmacokinetic Parameters for
Tacrolimus Preparations.
Patient Cmax
(µg/L/mg/kg)
AUC0-24
(µg*h/L/ mg/kg)
*tmax
(h)
C0
(µg/L/mg/kg)
TD-Tac OD-Tac TD-Tac OD-Tac TD-Tac OD-Tac TD-Tac OD-Tac
1 39.7 37.2 581 687 1 2 20.4 24.1
2 30.0 58.3 356 419 2 4 11.7 12.0
3 15.8 15.0 159 172 4 3 4.9 4.2
4 9.3 8.1 77 96 1 2 2.1 4.0
5 63.3 55.8 1097 1008 4 6 42.6 38.3
6 11.5 11.0 115 118 4 4 3.0 2.9
7 12.0 14.6 148 199 4 1 4.0 5.3
8 29.1 25.2 298 281 2 2 9.6 6.1
9 6.9 11.9 83 120 4 4 3.1 3.7
10 10.5 14.4 130 187 4 4 5.2 4.3
11 27.3 27.4 391 423 2 3 12.1 13.1
12 8.8 9.4 145 148 16 3 4.1 4.2
13 21.0 6.0 211 101 1 24 5.6 6.0
14 25.5 30.5 469 433 2 2 19.8 12.7
15 18.6 15.3 218 173 1 1 5.8 5.4
16 21.1 16.3 283 249 1 3 9.8 7.3
17 45.1 26.0 429 339 2 1 11.7 10.5
18 9.1 9.4 115 106 2 2 3.3 2.5
19 62.6 42.0 883 713 2 6 32.5 19.8
20 17.5 18.7 185 204 1 3 4.8 6.2
21 73.4 41.0 1067 732 2 4 45.2 21.8
22 28.1 15.8 194 177 1 2 5.0 4.3
23 38.5 30.6 385 410 1 2 10.1 11.0
24 33.1 34.9 466 368 2 3 15.7 11.1
25 58.2 37.5 822 508 1 2 25.9 14.9
26 47.1 38.1 725 597 2 2 27.2 19.9
27 69.2 52.0 963 756 1 3 35.4 25.5
28 43.5 46.2 394 462 1 2 13.6 12.0
29 24.3 18.7 303 313 2 2 9.1 9.6
30 23.6 17.1 304 175 16 4 8.9 4.3
31 19.2 23.5 294 342 2 4 12.5 11.0
32 25.8 28.9 263 291 2 2 10.3 9.3
33 25.6 24.1 342 283 1 4 9.3 8.5
34 46.2 38.2 577 509 2 2 23.8 14.4
35 36.0 17.0 200 193 1 1 5.0 3.9
36 16.6 18.9 210 258 2 3 9.1 9.1
37 47.4 33.7 571 533 1 3 19.5 17.0
38 26.6 20.5 289 305 1 3 6.1 9.8
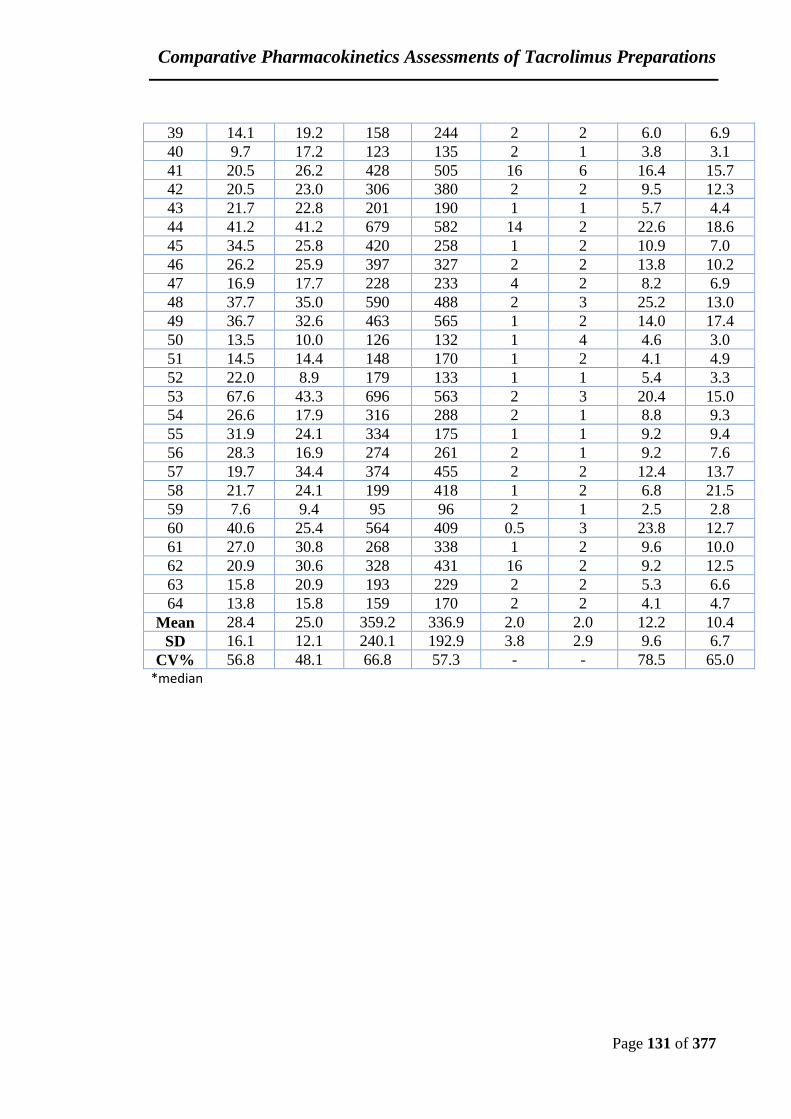
Comparative Pharmacokinetics Assessments of Tacrolimus Preparations
Page 131 of 377
39 14.1 19.2 158 244 2 2 6.0 6.9
40 9.7 17.2 123 135 2 1 3.8 3.1
41 20.5 26.2 428 505 16 6 16.4 15.7
42 20.5 23.0 306 380 2 2 9.5 12.3
43 21.7 22.8 201 190 1 1 5.7 4.4
44 41.2 41.2 679 582 14 2 22.6 18.6
45 34.5 25.8 420 258 1 2 10.9 7.0
46 26.2 25.9 397 327 2 2 13.8 10.2
47 16.9 17.7 228 233 4 2 8.2 6.9
48 37.7 35.0 590 488 2 3 25.2 13.0
49 36.7 32.6 463 565 1 2 14.0 17.4
50 13.5 10.0 126 132 1 4 4.6 3.0
51 14.5 14.4 148 170 1 2 4.1 4.9
52 22.0 8.9 179 133 1 1 5.4 3.3
53 67.6 43.3 696 563 2 3 20.4 15.0
54 26.6 17.9 316 288 2 1 8.8 9.3
55 31.9 24.1 334 175 1 1 9.2 9.4
56 28.3 16.9 274 261 2 1 9.2 7.6
57 19.7 34.4 374 455 2 2 12.4 13.7
58 21.7 24.1 199 418 1 2 6.8 21.5
59 7.6 9.4 95 96 2 1 2.5 2.8
60 40.6 25.4 564 409 0.5 3 23.8 12.7
61 27.0 30.8 268 338 1 2 9.6 10.0
62 20.9 30.6 328 431 16 2 9.2 12.5
63 15.8 20.9 193 229 2 2 5.3 6.6
64 13.8 15.8 159 170 2 2 4.1 4.7
Mean 28.4 25.0 359.2 336.9 2.0 2.0 12.2 10.4
SD 16.1 12.1 240.1 192.9 3.8 2.9 9.6 6.7
CV% 56.8 48.1 66.8 57.3 - - 78.5 65.0 *median

Comparative Pharmacokinetics Assessments of Tacrolimus Preparations
Page 132 of 377
Table 10: Pharmacokinetic Parameters Comparison between Twice-Daily
Tacrolimus (TD-Tac) and Advagraf® (OD-Tac).
Parameter TD-Tac OD-Tac P-
value Prograf® or Adoport® Advagraf®
Cmax (µg/L) 16.6 ± 7.6 14.8 ± 5.6 0.028
AUC0-24 (µg∗h/L) 193.0 ± 61.2 185.6 ± 54.3 0.278
C0 (µg/L) 6.2 ± 1.9 5.5 ± 1.8 0.009
Dose-normalized Cmax (µg/L/mg/kg) 28.4 ± 16.1 25.0 ± 12.1 0.044
Dose-normalized AUC0-24 (µg ∗h/L/
mg/kg) 359.2 ± 240.1 336.9 ± 192.9 0.475
Dose-normalized C0 (µg/L/mg/kg) 12.2 ± 9.6 10.4 ± 6.7 0.024
Values were compared using ANOVA (General linear model).
Table 11: Ratios of Geometric Means and 90% CI for AUC0–24, Cmax, Dose-
Normalized AUC0–24 and Dose-Normalized Cmax for Advagraf® to
Twice-Daily Tacrolimus
Parameter Ratio of geometric means (%) 90% CI
AUC0–24 96% (91% – 102%)
Cmax 90% (84% – 97%)
Dose-normalized AUC0-24 98% (93% – 103%)
Dose-normalized Cmax 91% (85% – 98%)
90% CI for geometric mean are based on the ANOVA model (General linear model).
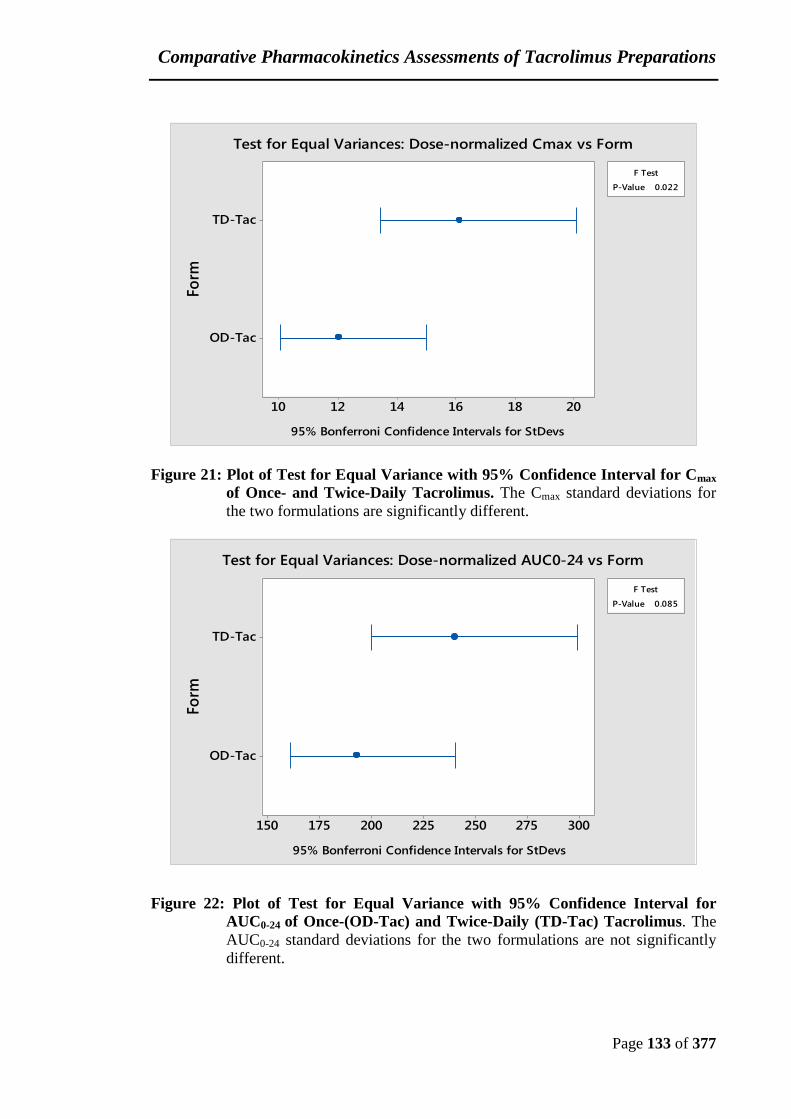
Comparative Pharmacokinetics Assessments of Tacrolimus Preparations
Page 133 of 377
Figure 21: Plot of Test for Equal Variance with 95% Confidence Interval for Cmax
of Once- and Twice-Daily Tacrolimus. The Cmax standard deviations for
the two formulations are significantly different.
Figure 22: Plot of Test for Equal Variance with 95% Confidence Interval for
AUC0-24 of Once-(OD-Tac) and Twice-Daily (TD-Tac) Tacrolimus. The
AUC0-24 standard deviations for the two formulations are not significantly
different.
OD-Tac
TD-Tac
201816141210
P-Value 0.022
F Test
Form
95% Bonferroni Confidence Intervals for StDevs
Test for Equal Variances: Dose-normalized Cmax vs Form
OD-Tac
TD-Tac
300275250225200175150
P-Value 0.085
F Test
Form
95% Bonferroni Confidence Intervals for StDevs
Test for Equal Variances: Dose-normalized AUC0-24 vs Form
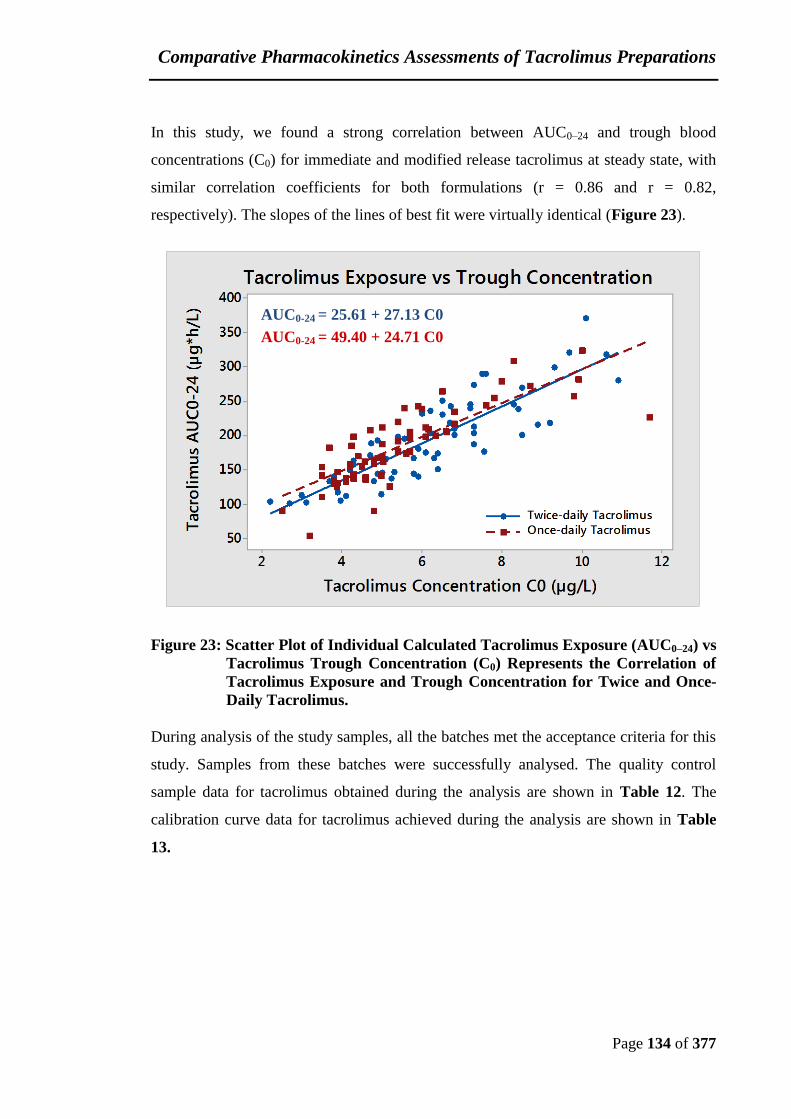
Comparative Pharmacokinetics Assessments of Tacrolimus Preparations
Page 134 of 377
In this study, we found a strong correlation between AUC0–24 and trough blood
concentrations (C0) for immediate and modified release tacrolimus at steady state, with
similar correlation coefficients for both formulations (r = 0.86 and r = 0.82,
respectively). The slopes of the lines of best fit were virtually identical (Figure 23).
Figure 23: Scatter Plot of Individual Calculated Tacrolimus Exposure (AUC0–24) vs
Tacrolimus Trough Concentration (C0) Represents the Correlation of
Tacrolimus Exposure and Trough Concentration for Twice and Once-
Daily Tacrolimus.
During analysis of the study samples, all the batches met the acceptance criteria for this
study. Samples from these batches were successfully analysed. The quality control
sample data for tacrolimus obtained during the analysis are shown in Table 12. The
calibration curve data for tacrolimus achieved during the analysis are shown in Table
13.
AUC0-24 = 25.61 + 27.13 C0
AUC0-24 = 49.40 + 24.71 C0

Comparative Pharmacokinetics Assessments of Tacrolimus Preparations
Page 135 of 377
Table 12: Quality Control (QC) Samples Achieved During Tacrolimus Analysis.
Quality Control Levels QC1 QC2 QC3
Nominal Concentrations (µg/L) 3 15 30
Batch ID Measured Concentration (µg/L)
Batch1 2.9 14.9 29.2
Batch2 3.0 14.7 29.5
Batch3 3.0 14.5 29.9
Batch4 3.0 15.6 31.5
Batch5 2.9 14.7 31.4
Batch6 3.0 14.2 29.5
Batch7 2.9 15.5 32.2
Batch8 3.0 14.0 29.2
Batch9 2.9 14.8 29.2
Batch10 2.9 14.9 30.9
Batch11 3.0 15.0 30.6
Batch12 3.0 15.2 31.9
Batch13 3.0 15.3 31.1
Batch14 3.0 15.4 30.5
Batch15 2.9 15.3 31.3
Batch16 3.1 15.3 31.0
Batch17 2.9 14.8 30.4
Batch18 2.8 14.7 30.6
Batch19 2.8 15.0 29.4
Batch20 3.1 15.7 29.8
Batch21 3.0 16.1 32.5
Batch22 3.1 15.5 30.8
Batch23 3.1 15.7 31.0
Batch24 2.9 15.1 30.6
Batch25 2.8 14.1 27.2
Batch26 3.0 15.8 31.9
Mean 3.0 15.1 30.5
Standard Dev. 0.1 0.7 1.5
%CV 4.9 4.7 4.8
% Inaccuracy -1.7 0.3 1.7
N= 111 of 111 121of 122 117 of 117

Comparative Pharmacokinetics Assessments of Tacrolimus Preparations
Page 136 of 377
Table 13: Calibration Curve Parameters Data Achieved During Tacrolimus
Analysis.
Batch ID Curve parameters (y = A*x + B)
Slope (A) Intercept (B) Correlation Coefficient (r)
Batch1 0.016 -0.00169 0.9994
Batch2 0.0155 -0.000433 0.9996
Batch3 0.0156 -0.00129 0.9989
Batch4 0.0144 -0.000228 0.999
Batch5 0.0157 -0.00108 0.9996
Batch6 0.016 -0.00181 0.9991
Batch7 0.0153 -0.0004 0.9991
Batch8 0.0164 -0.000264 0.9992
Batch9 0.0156 -0.00087 0.9994
Batch10 0.016 -0.000864 0.9992
Batch11 0.0165 -0.00173 0.9993
Batch12 0.0158 -0.00166 0.9988
Batch13 0.0165 -0.00173 0.9993
Batch14 0.0157 -0.000523 0.9994
Batch15 0.0159 -0.000914 0.9996
Batch16 0.0156 -0.000979 0.999
Batch17 0.0153 -0.000397 0.9981
Batch18 0.0159 -0.00167 0.9981
Batch19 0.0161 -0.00206 0.9981
Batch20 0.0158 -0.000591 0.9989
Batch21 0.0142 -0.00146 0.9991
Batch22 0.0147 -0.00219 0.999
Batch23 0.016 -0.00149 0.999
Batch24 0.0161 -0.000717 0.9962
Batch25 0.0193 0.00361 0.9943
Batch26 0.0158 0.00271 0.9986
Mean 0.0158 -0.00080 0.9987
Range 0.0142 – 0.0193 -0.00219 – 0.00361 0.9943 – 0.9987
Comparative Pharmacokinetics Assessments of Tacrolimus Preparations
Page 137 of 377
4.3.2 Associations of CYP3A5 and ABCB1 3435C>T Genotypes with
Doses and Pharmacokinetics of Tacrolimus Formulations.
Patients were recruited from 2010 to 2014 in the transplant Clinic at St. George’s
Hospital (London, United Kingdom). 64 patients who had received twice-daily
tacrolimus were converted to Advagraf® on a mg: mg basis. The patients’ general
demographics were shown previously in Table 5 Page.122. The list of the concomitant
medications for 64 renal transplant patients included in the study is summarized in
Appendix 3.
4.3.2.1 CYP3A5*3 and ABCB1 3435C>T Genotype Analysis and Their Frequencies
For CYP3A5 A6986G polymorphism, the melting point of the sensor probe was
approximately 55°C and 61°C when hybridised to the CYP3A5 *3/*3 (G/G) and *1/*1
(A/A) genotypes respectively. In the heterozygote polymorphism CYP3A5*1/*3 (A/G),
both melting peaks appeared (Figure 24.A). Moreover, for the ABCB1 3435C>T
polymorphism, the melting point of the sensor probe was 64°C and 57°C when
hybridised to ABCB1 CC and TT genotypes respectively. The heterozygote
polymorphism ABCB1 CT presented both melting peaks (Figure 24.B). Twenty PCR
products were randomly selected from the three genotypes melting profiles for DNA
sequencing conformation. CYP3A5*3 and ABCB1 allelic variants results obtained by
real time PCR were confirmed by sequencing these genes.
CYP3A5*3 and ABCB1 3435C>T Genotypes and allele frequencies are presented in
Table 14. In our study cohort, the CYP3A5 *3/*3 genotype was observed in thirty-four
patient (53.1%) and were thus classified as CYP3A5 non-expressers. The CYP3A5*1/*1
and *1/*3 genotypes were observed in eighteen patients (28.1%) and twelve patients
(18.8%), respectively and were classified as CYP3A5 expressers. The frequencies of the
ABCB1 CC, CT, and TT genotypes were 15 (23.4%), 30 (46.9%), and 19 (29.7%),
respectively. The ABCB1 genotype frequency of the recipients was consistent with
Hardy-Weinberg equilibrium (p > 0.05). Whereas, CYP3A5*3 allele frequency deviated
from Hardy–Weinberg equilibrium (p < 0.05).

Comparative Pharmacokinetics Assessments of Tacrolimus Preparations
Page 138 of 377
Figure 24: Derivative Melting Curve Plots for CYP3A5*3 and ABCB1 3435C>T
Genotyping using Specific Primers and Probes. A. The Derivative
Melting Curve for the CYP3A5 Genotypes. Samples with the Homozygous
*3 Allele ( ; Tm 55°C); Homozygous *1 Allele ( ; Tm 61°C) and
Heterozygous *1/*3 Genotype ( ; Tm 55°C and 61°C). B. The
Derivative Melting Curve for the ABCB1 Genotypes. Samples with the
Homozygous T Allele ( ; Tm 57°C); Homozygous C Allele ( ; Tm
64°C) and Heterozygous C/T genotype ( ; Tm 57°C and 64°C). The
Melting Curve of a no Template Control in Both Assays ( ).
Table 14: Genotype Frequencies for CYP3A5 and ABCB1 in Renal Transplant
Patients
Gene Variant Genotype n (%) Genotype
frequency (%)
Allele
frequency
CYP3A5 6986A>G *1/*1 12 18.8% *1 = 0.33
*1/*3 18 28.1% *3 = 0.67
*3/*3 34 53.1%
ABCB1 3435C>T C/C 15 23.4% C = 0.47
C/T 30 46.9% T = 0.53
T/T 19 29.7%

Comparative Pharmacokinetics Assessments of Tacrolimus Preparations
Page 139 of 377
4.3.2.2 Association of CYP3A5 Genotypes with Tacrolimus Pharmacokinetic
Profiles
Thirty patients were recruited into the CYP3A5 expressers group and 34 in the CYP3A5
non-expressers group. The baseline characteristics of the recipients are summarized in
(Table 15). We observed no differences in these characteristics between CYP3A5
expressers and non-expressers, except for sex, diabetic status and ethnicity. In line with
previous observations, the CYP3A5*1 allele was more prevalent among black transplant
recipients compared with that among white patients (Table 15).
Table 15: Demographic Characteristics of Patients, According to CYP3A5
Polymorphism
Characteristic CYP3A5 Expressers
*1/*1 (n = 12) &
*1/*3(n = 18)
CYP3A5 Non-expressers
3/*3
(n = 34)
Sex
Male/female 17/13 26/8
Age (y), mean (SD) 54.8 ± 13.3 54.4 ± 12.4
Ethnic group, n (%)
White 10 (33.3%) 29 (85.3%)
14.7
Black 12 (40.0%) -
-
Asian 8 (26.7%) 5 (14.7%)
14.7
Body weight (kg), mean (SD) 74.5 ± 12.1 78.0 ± 17.5
Height (cm), mean (SD) 170.3 ± 8.7 170.0 ± 8.5
Diabetes mellitus, n (%) 11 (36.7%) 4 (11.8%)
Time since transplantation (years)
Mean (SD) 4.3 ± 3.8 3.9 ± 5.3
Donor type, n (%)
Living / Deceased 7 (23.3%) / 23 (76.7%) 19 (55.9%) / 15 (44.1%)
Serum creatinine (µmol/L) 119.2 ± 39.1 127.6 ± 39.9
Serum albumin (g/L) 38.4 ± 2.7 38.8 ± 3.4
Haemoglobin (g/L) 127.7 ± 15.6 131.3 ± 27.0
Immunosuppression therapy
Tacrolimus, n (%)
Prograf®/ Adoport® 23 (76.7%) / 7 (23.3%) 24 (70.6%) / 10 (29.4%)
Corticosteroids, n (%) 20 (66.7%) 19 (55.9%)
Azathioprine, n (%) 7 (23.3%) 7 (20.6%)
Mycophenolate mofetil, n (%) 6 (20.0%) 13 (38.2%)

Comparative Pharmacokinetics Assessments of Tacrolimus Preparations
Page 140 of 377
The analysis has been done on 128 24-h PK profiles obtained from 64 patients, pooling
the data for TD-Tac and OD-Tac. Tacrolimus blood concentrations Cmax, AUC0-24 and
C0 showed a log-normal distribution, and the data were therefore log-transformed before
analysis. The CYP3A5 SNP was a significant predictor of tacrolimus dose. Individuals
possessing at least one CYP3A5*1 allele (CYP3A5-expressers) required higher
tacrolimus doses compared with CYP3A5*3/*3 carriers (CYP3A5 non-expressers). The
mean required daily dose of tacrolimus per body weight was 0.05 ± 0.03 mg/kg in the
CYP3A5*3/*3 allele carriers. This amount was significantly lower than the 0.11 ± 0.05
mg/kg (P< 0.001) of dose for CYP3A5*1carriers. Furthermore, we observed that the
presence of the CYP3A5*1 allele was strongly associated with lower dose-normalized
tacrolimus blood concentration. CYP3A5-expressers achieved 1.8-fold lower dose-
normalized tacrolimus Cmax (19.1 ± 10.6 µg/L/mg/kg) than CYP3A5 non-expressers
(33.5 ± 13.8 µg/L/mg/kg, P<0.001). In addition, CYP3A5*1 carriers showed a
significant reduction in tacrolimus dose-normalized AUC0-24 and C0 than CYP3A5 non-
expressers. The dose-normalized AUC0–24 (µg*h/L per mg/kg) was significantly lower
among the CYP3A5 expresser patients than CYP3A5*3/*3 carriers (223.4 ± 140.3 vs.
458.0 ± 214.2, P<0.001). The dose-normalized C0 was significantly lower in CYP3A5
expressers compared with that in CYP3A5 non-expressers: 6.9 ± 5.1 vs. 15.1 ± 8.7 µg/L
per mg/kg, respectively (Table 16, Figure 25).
Table 16: Tacrolimus PK Parameters According to Their CYP3A5*3 Genotypes
for the Whole Data of Once-and Twice-Daily Tacrolimus.
PK-parameter
CYP3A5 Expressers
(*1/*1 & *1/*3)
(n= 60)
CYP3A5 Non-expressers
(*3/*3)
(n= 64)
p-value
Dose (mg/Kg/day) 0.11 ± 0.05 0.05 ± 0.03 <0.001
Cmax (µg/L/mg/Kg) 19.1 ± 10.6 33.5 ± 13.8 <0.001
AUC0-24 (µg*h/L/mg/Kg) 223.4 ± 140.3 458.0 ± 214.2 <0.001
C0 (µg/L/mg/Kg) 6.9 ± 5.1 15.1 ± 8.7 <0.001
Values were compared using ANOVA (General linear model).

Comparative Pharmacokinetics Assessments of Tacrolimus Preparations
Page 141 of 377
Figure 25: Associations between CYP3A5 Genotype and Tacrolimus Dose and Pharmacokinetic Parameters for the Whole Data of
Once-and Twice-Daily Tacrolimus. Boxes represent the interquartile range, line in the box represents the median value,
symbol in the box represents the mean value, outer lines represent the minimal and maximal value and the values beyond the
whiskers (asterisks) are outliers.
*3/*3*1/*1/*1/*3
80
70
60
50
40
30
20
10
0
CYP3A5*3
Mea
n C
max
(µ
g/L
)/ 0
.1 m
g/k
g d
ose
Dose-normalized Cmax
*3/*3*1/*1/*1/*3
1200
1000
800
600
400
200
0
CYP3A5*3
Mea
n A
UC
0-24
(h*
µg
/L)/
0.1
mg
/kg
do
se Dose-normalized AUC0-24
*3/*3*1/*1/*1/*3
50
40
30
20
10
0
CYP3A5*3
Mea
n C
0 (µ
g/L
)/ 0
.1 m
g/k
g d
ose
Dose-normalized C0
*3/*3*1/*1/*1/*3
0.20
0.15
0.10
0.05
0.00
CYP3A5*3
Mea
n D
ose
mg
/kg
Dose mg/kg

Comparative Pharmacokinetics Assessments of Tacrolimus Preparations
Page 142 of 377
Tacrolimus pharmacokinetic parameters following administration of twice-daily
Prograf® or Adoport® and once-daily Advagraf® in CYP3A5 expresser and non-
expresser patients are summarized in Table 17.
After the switch from twice to once daily tacrolimus, a slight decrease in the mean dose-
normalized Cmax and AUC0-24 was observed, regardless of the CYP3A5 genotype. The
mean dose-normalized Cmax and AUC0-24 were comparable between tacrolimus
formulations in CYP3A5 expresser and non-expresser groups. In the CYP3A5 expresser
group the mean dose-normalized C0 was comparable for both formulations; however, in
the CYP3A5 non-expresser patients, there was a significant reduction in the mean dose-
normalized C0 after the switch to once daily tacrolimus (twice daily tacrolimus: 16.6 ±
10.2 µg/L/mg/Kg vs Advagraf®: 13.6 ± 6.7 µg/L/mg/Kg; P < 0.05; Table 17, Figure
26). The blood concentration-time profiles of tacrolimus in stable kidney transplant
recipients are presented in Figure 27.
In CYP3A5 Expressers, AUC0-24 OD-Tac /AUC0-24 TD-Tac was 101% (90% CI 93% –
110%) and Cmax OD-Tac/ Cmax TD-Tac was 92.5% (90% CI 81.8% –104.7%). In
CYP3A5 Non-expressers, AUC0-24 OD-Tac /AUC0-24 TD-Tac was 92.5% (90% CI
86.1% –99%) and Cmax OD-Tac/ Cmax TD-Tac was 88.3% (90% CI 80.1% –97.4%,
Table 18). The confidence intervals of the ratios were within the bioequivalence limits
(80-125%). Therefore, the two formulations were bioequivalent. According to EMA
guidelines, the confidence intervals of the AUC0-24 ratios were within the
bioequivalence margin (90-111%) in CYP3A5 Expresser group. Consequently, the two
formulations were bioequivalent only in CYP3A5 Expressers.
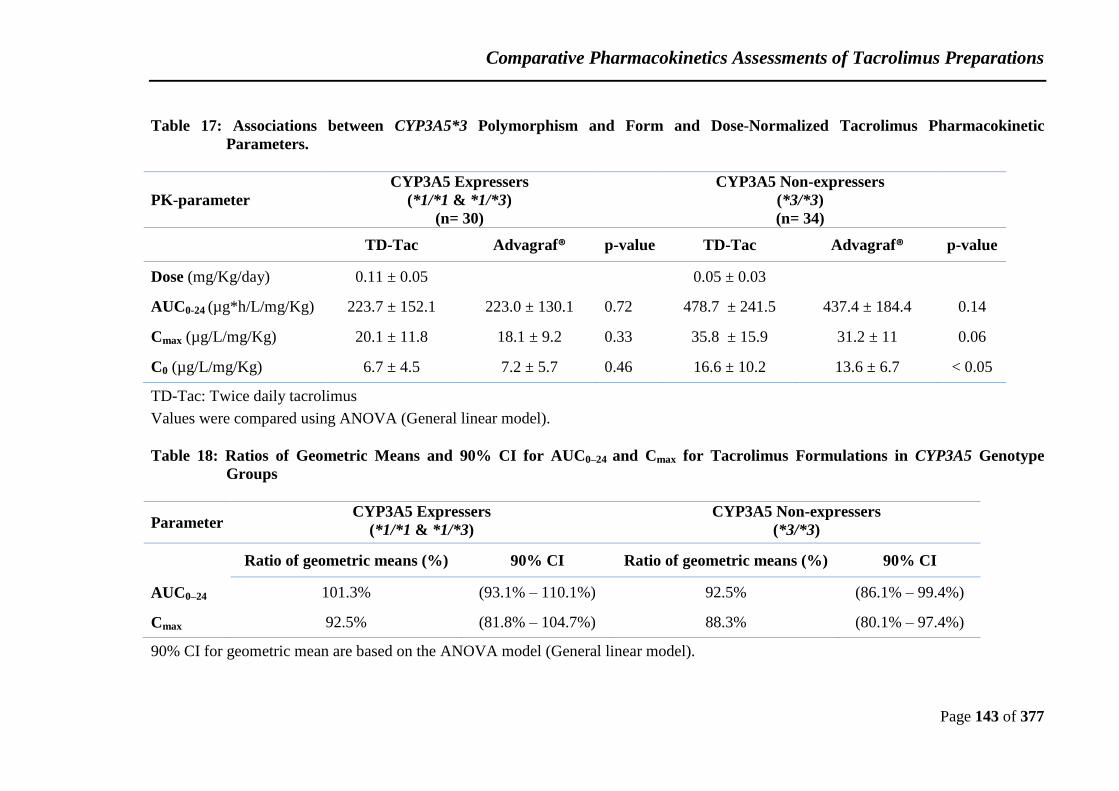
Comparative Pharmacokinetics Assessments of Tacrolimus Preparations
Page 143 of 377
Table 17: Associations between CYP3A5*3 Polymorphism and Form and Dose-Normalized Tacrolimus Pharmacokinetic
Parameters.
PK-parameter
CYP3A5 Expressers
(*1/*1 & *1/*3)
(n= 30)
CYP3A5 Non-expressers
(*3/*3)
(n= 34)
TD-Tac Advagraf® p-value TD-Tac Advagraf® p-value
Dose (mg/Kg/day) 0.11 ± 0.05 0.05 ± 0.03
AUC0-24 (µg*h/L/mg/Kg) 223.7 ± 152.1 223.0 ± 130.1 0.72 478.7 ± 241.5 437.4 ± 184.4 0.14
Cmax (µg/L/mg/Kg) 20.1 ± 11.8 18.1 ± 9.2 0.33 35.8 ± 15.9 31.2 ± 11 0.06
C0 (µg/L/mg/Kg) 6.7 ± 4.5 7.2 ± 5.7 0.46 16.6 ± 10.2 13.6 ± 6.7 < 0.05
TD-Tac: Twice daily tacrolimus
Values were compared using ANOVA (General linear model).
Table 18: Ratios of Geometric Means and 90% CI for AUC0–24 and Cmax for Tacrolimus Formulations in CYP3A5 Genotype
Groups
Parameter CYP3A5 Expressers
(*1/*1 & *1/*3)
CYP3A5 Non-expressers
(*3/*3)
Ratio of geometric means (%) 90% CI Ratio of geometric means (%) 90% CI
AUC0–24 101.3% (93.1% – 110.1%) 92.5% (86.1% – 99.4%)
Cmax 92.5% (81.8% – 104.7%) 88.3% (80.1% – 97.4%)
90% CI for geometric mean are based on the ANOVA model (General linear model).

Comparative Pharmacokinetics Assessments of Tacrolimus Preparations
Page 144 of 377
Figure 26: Associations between CYP3A5*3 Genotype and Tacrolimus Dose-Normalized Pharmacokinetic Parameters of Twice-
Daily Tacrolimus (TD-Tac) and Advagraf®. Boxes represent the interquartile range, line in the box represents the median
value, symbol in the box represents the mean value, outer lines represent the minimal and maximal value and the values beyond
the whiskers (asterisks) are outliers.
CYP3A5*3
Form
*3/*3*1/*1/*1/*3
AdvagrafTD-TacAdvagrafTD-Tac
80
70
60
50
40
30
20
10
0Mea
n C
max
(µ
g/L
)/ 0
.1 m
g/k
g d
ose
Dose-Normalized Cmax
CYP3A5*3
Form
*3/*3*1/*1/*1/*3
AdvagrafTD-TacAdvagrafTD-Tac
1200
1000
800
600
400
200
0
Mea
n A
UC
0-24
(h
*µg
/L)/
0.1
mg
/kg
do
se Dose-Normalized AUC0-24
CYP3A5*3
Form
*3/*3*1/*1/*1/*3
AdvagrafTD-TacAdvagrafTD-Tac
50
40
30
20
10
0Mea
n C
0 (µ
g/L
)/ 0
.1 m
g/k
g d
ose
Dose-Normalized C0
CYP3A5*3
Form
*3/*3*1/*1/*1/*3
AdvagrafTD-TacAdvagrafTD-Tac
0.20
0.15
0.10
0.05
0.00
Mea
n d
ose
mg
/kg
Dose mg/kg
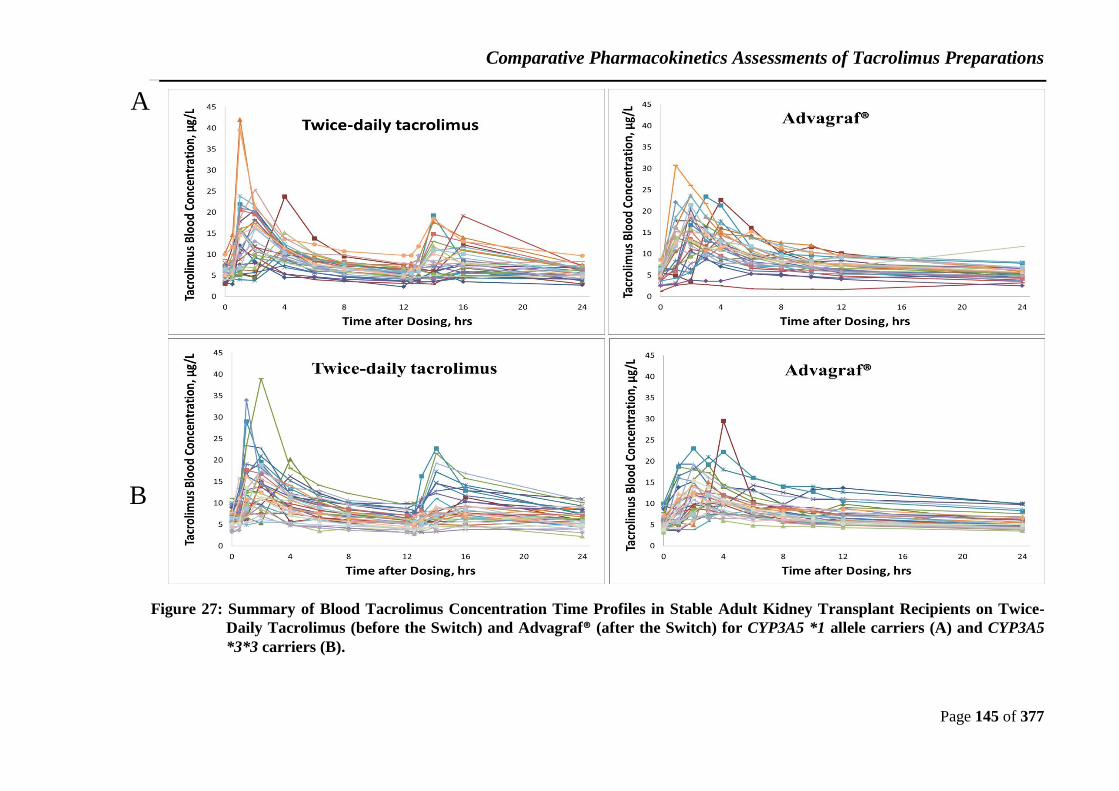
Comparative Pharmacokinetics Assessments of Tacrolimus Preparations
Page 145 of 377
Figure 27: Summary of Blood Tacrolimus Concentration Time Profiles in Stable Adult Kidney Transplant Recipients on Twice-
Daily Tacrolimus (before the Switch) and Advagraf® (after the Switch) for CYP3A5 *1 allele carriers (A) and CYP3A5
*3*3 carriers (B).
A
B

Comparative Pharmacokinetics Assessments of Tacrolimus Preparations
Page 146 of 377
4.3.2.3 Associations between ABCB1 3435C>T Variants and Tacrolimus
Pharmacokinetic Profiles
A total of 64 patients was included. The demographic characteristics of the ABCB1 CC
as well as the ABCB1 CT/TT carriers included in our study are presented in Table 19.
There were no significant differences between the ABCB1 CC carriers and ABCB1
CT/TT carriers, except for haemoglobin content, ethnicity and the proportion of the
donor type.
Table 19: Demographic Characteristics of Patients, According to ABCB1 3435C>T
Polymorphism
Characteristic ABCB1 CC carriers
(n= 16)
ABCB1 CT/TT carriers
CT (n= 29) & TT (n= 19)
Sex
Male/female 10/6 33/15
Age (y), mean (SD) 55.4 ± 13.1 54.3 ± 12.7
Ethnic group, n (%)
White 5 (31.3%) 34 (73%)
Black 9 (56.3%) 3 (6%)
Asian 2 (12.5%) 11 (23%)
Body weight (kg), mean (SD) 77.2 ± 16.5 76.1 ± 14.9
Height (cm), mean (SD) 173.3 ± 8.8 169.0 ± 8.2
Diabetes mellitus, n (%) 3 (18.8%) 12 (25%)
Time since transplantation
(years) Mean (SD) 3.3 ± 2.7
4.4 ± 5.1
Donor type, n (%)
Living / Deceased 4/12 22/26
Serum creatinine (µmol/L) 125.3 ± 48.9 124.2 ± 36.8
Serum albumin (g/L) 38.1 ± 1.9 39.1 ± 3.4
Haemoglobin (g/L) 123.7 ± 20.9 131.6 ± 22.6
Immunosuppression therapy
Tacrolimus, n (%)
Prograf®/ Adoport® 14 (81.3%) / 2 (12.5%) 33 (69%) / 15 (31%)
Corticosteroids, n (%) 11 (69%) 28 (58%)
Azathioprine, n (%) 1 (6%) 13 (27%)
Mycophenolate mofetil, n (%) 7 (44%) 12 (25%)

Comparative Pharmacokinetics Assessments of Tacrolimus Preparations
Page 147 of 377
The analysis has been done on 128 24-h PK profiles obtained from 64 patients pooling
the data for TD-Tac and OD-Tac. The tacrolimus pharmacokinetic parameters
according to ABCB1 3435C>T polymorphisms are shown in Table 20. A significant
difference was observed at dose-normalized tacrolimus pharmacokinetic parameters
(Cmax, AUC0-24 and C0) between the ABCB1 CC and the CT/TT genotypes. The dose-
normalized Cmax (µg/L/mg/kg) was significantly lower among the ABCB1 CC genotype
than the ABCB1 T allele carriers (20.9 ± 14.2 vs. 28.7 ± 13.9, P<0.001). ABCB1 CC
patients showed reduced dose-normalized AUC0-24 than ABCB1 CT/TT patients (248.6 ±
184.7 vs. 381.2 ± 218.0 µg*h/L/mg/kg, P<0.001). A significantly lower dose-
normalized C0 was achieved in patients homozygous for CC genotype (7.4 ± 5.9
µg/L/mg/kg) compared with patients carrying at least one T allele (12.5 ± 8.6
µg/L/mg/kg, P<0.001). Moreover, we found that recipients with CC genotype required a
higher tacrolimus dose compared to those with CT/TT genotypes (0.10 ± 0.05 vs. 0.07 ±
0.04, P<0.001, Table 20 & Figure 28).
Table 20: Tacrolimus Dose-Normalized PK Parameters According to ABCB1
3435C>T Genotypes for the Whole Data of Once-and Twice-Daily
Tacrolimus.
PK-parameter ABCB1 CC
(n= 32)
ABCB1 CT/TT
(n= 96) p-value
Dose (mg/Kg/day) 0.10 ± 0.05 0.07 ± 0.04 <0.001
Cmax (µg/L/mg/Kg) 20.9 ± 14.2 28.7 ± 13.9 <0.001
AUC0-24 (µg*h/L/mg/Kg) 248.6 ± 184.7 381.2 ± 218.0 <0.001
C0 (µg/L/mg/Kg) 7.4 ± 5.9 12.5 ± 8.6 <0.001
Values were compared using ANOVA (General linear model).

Comparative Pharmacokinetics Assessments of Tacrolimus Preparations
Page 148 of 377
Figure 28: Associations between ABCB1 3435C>T Polymorphisms and Tacrolimus Dose and Dose-Normalized Pharmacokinetic
Parameters for the Whole Data of Once-and Twice-Daily Tacrolimus. Boxes represent the interquartile range, line in the
box represents the median value, symbol in the box represents the mean value, outer lines represent the minimal and maximal
value and the values beyond the whiskers (asterisks) are outliers.
CT/TTCC
80
70
60
50
40
30
20
10
0
ABCB1
Mea
n C
max
(µ
g/L
)/ 0
.1 m
g/k
g d
ose
Dose-normalized Cmax
CT/TTCC
1200
1000
800
600
400
200
0
ABCB1Mea
n A
UC
0-24
(h*
µg
/L)/
0.1
mg
/kg
do
se Dose-normalized AUC0-24
CT/TTCC
50
40
30
20
10
0
ABCB1
Mea
n C
0 (µ
g/L
)/ 0
.1 m
g/k
g d
ose
Dose-normalized C0
CT/TTCC
0.20
0.15
0.10
0.05
0.00
ABCB1
Mea
n d
ose
mg
/kg
Dose mg/kg
Comparative Pharmacokinetics Assessments of Tacrolimus Preparations
Page 149 of 377
Table 21 shows tacrolimus exposure parameters following administration of twice-daily
tacrolimus and once-daily Advagraf® in ABCB1 CC and ABCB1 CT/TT groups. In both
ABCB1 groups, there was a slight decrease in tacrolimus dose-normalized Cmax, AUC0-
24 and C0 after the switch to once-daily tacrolimus. Regardless of the ABCB1 3435C>T
genotype group, the mean dose-normalized Cmax, as well as mean dose-normalized
AUC0-24 and C0 were comparable for both tacrolimus formulations (P >0.05; Table 21,
Figure 29). The blood concentration-time profiles of tacrolimus in stable kidney
transplant recipients are presented in Figure 30.
The ratio of means (90% CI) of AUC0–24 for OD-Tac versus TD-Tac was as follows:
ABCB1 CC carriers, 94.3% (82.1% –108.2 %); ABCB1 CT/TT carriers, 97.3% (91.7% –
103.2%). While the ratio of means (90% CI) of Cmax for OD-Tac versus TD-Tac was as
follows: ABCB1 CC carriers, 85.4% (70.0% –104.3%); ABCB1 CT/TT carriers, 92.0%
(84.9% –99.7%). As the OD-Tac/TD-Tac Cmax ratio in the ABCB1 CC group is outside
the 90% CI of 80, 125, the two formulations were not bioequivalent. According to EMA
guidelines, the confidence intervals of the AUC0-24 ratios were within the
bioequivalence margin (90-111%) in ABCB1 CT/TT genotype group. Consequently, the
two formulations were bioequivalent only in ABCB1 CT/TT carriers. These data are
summarized in Table 22.
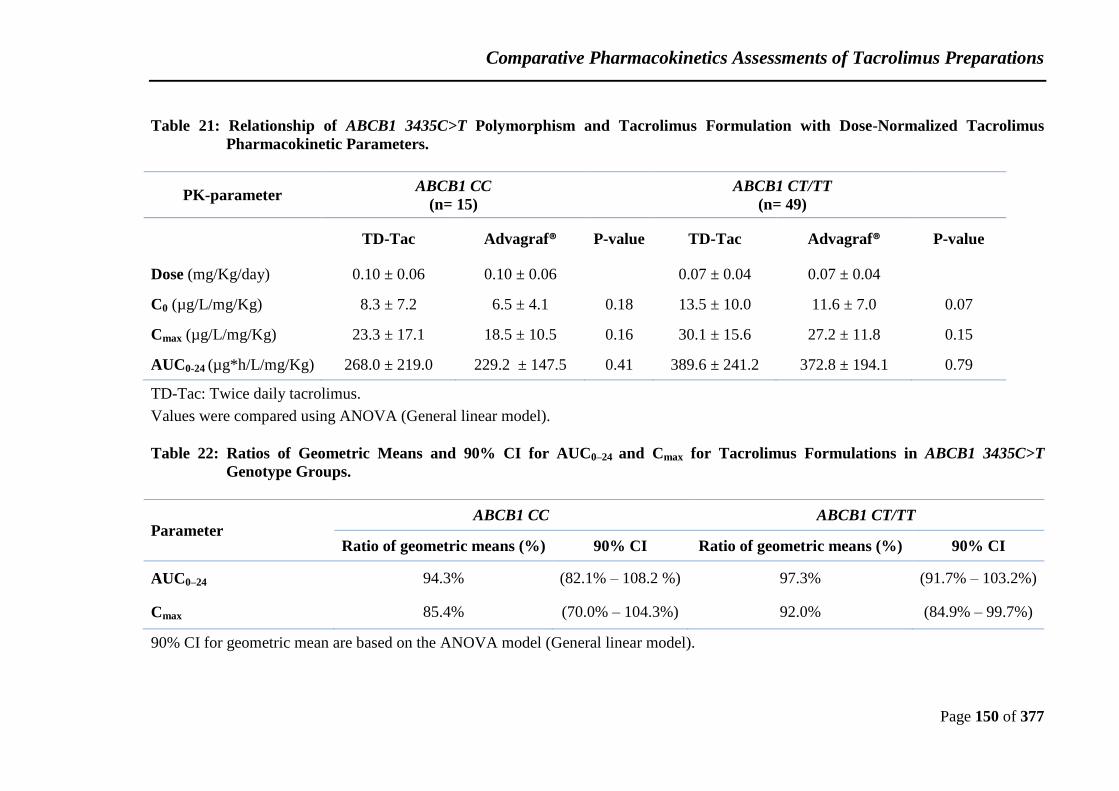
Comparative Pharmacokinetics Assessments of Tacrolimus Preparations
Page 150 of 377
Table 21: Relationship of ABCB1 3435C>T Polymorphism and Tacrolimus Formulation with Dose-Normalized Tacrolimus
Pharmacokinetic Parameters.
PK-parameter ABCB1 CC
(n= 15)
ABCB1 CT/TT
(n= 49)
TD-Tac Advagraf® P-value TD-Tac Advagraf® P-value
Dose (mg/Kg/day) 0.10 ± 0.06 0.10 ± 0.06 0.07 ± 0.04 0.07 ± 0.04
C0 (µg/L/mg/Kg) 8.3 ± 7.2 6.5 ± 4.1 0.18 13.5 ± 10.0 11.6 ± 7.0 0.07
Cmax (µg/L/mg/Kg) 23.3 ± 17.1 18.5 ± 10.5 0.16 30.1 ± 15.6 27.2 ± 11.8 0.15
AUC0-24 (µg*h/L/mg/Kg) 268.0 ± 219.0 229.2 ± 147.5 0.41 389.6 ± 241.2 372.8 ± 194.1 0.79
TD-Tac: Twice daily tacrolimus.
Values were compared using ANOVA (General linear model).
Table 22: Ratios of Geometric Means and 90% CI for AUC0–24 and Cmax for Tacrolimus Formulations in ABCB1 3435C>T
Genotype Groups.
Parameter ABCB1 CC ABCB1 CT/TT
Ratio of geometric means (%) 90% CI Ratio of geometric means (%) 90% CI
AUC0–24 94.3% (82.1% – 108.2 %) 97.3% (91.7% – 103.2%)
Cmax 85.4% (70.0% – 104.3%) 92.0% (84.9% – 99.7%)
90% CI for geometric mean are based on the ANOVA model (General linear model).

Comparative Pharmacokinetics Assessments of Tacrolimus Preparations
Page 151 of 377
Figure 29: Associations between ABCB1 3435C>T Polymorphism and Tacrolimus Dose-Normalized Pharmacokinetic Parameters
of Twice-Daily Tacrolimus (TD-Tac) and Advagraf®. Boxes represent the interquartile range, line in the box represents the
median value, symbol in the box represents the mean value, outer lines represent the minimal and maximal value and the values
beyond the whiskers (asterisks) are outliers.
Form
ABCB1
AdvagrafTD_Tac
CT/TTCCCT/TTCC
80
70
60
50
40
30
20
10
0
Mea
n C
max
(µ
g/L
)/ 0
.1 m
g/k
g d
ose
Dose-normalized Cmax
Form
ABCB1
AdvagrafTD_Tac
CT/TTCCCT/TTCC
1200
1000
800
600
400
200
0
Mea
n A
UC
0-24
(h
*µg
/L)/
0.1
mg
/kg
do
se
Dose-normalized AUC0-24
Form
ABCB1
AdvagrafTD-Tac
CT/TTCCCT/TTCC
50
40
30
20
10
0Mea
n C
0 (µ
g/L
)/ 0
.1 m
g/k
g d
ose
Dose-normalized C0
Form
ABCB1
AdvagrafTD-Tac
CT/TTCCCT/TTCC
0.20
0.15
0.10
0.05
0.00
Mea
n d
ose
mg
/kg
Dose mg/kg

Comparative Pharmacokinetics Assessments of Tacrolimus Preparations
Page 152 of 377
Figure 30: Summary of Blood Tacrolimus Concentration Time Profiles in Stable Adult Kidney Transplant Recipients on Twice-
Daily Tacrolimus (before the Switch) and Advagraf® (after the Switch) for ABCB1 CC (A) and ABCB1 CT/TT (B)
Groups.
(A)
(B)

Comparative Pharmacokinetics Assessments of Tacrolimus Preparations
Page 153 of 377
4.3.2.4 Associations between CYP3A5*3 and ABCB1 3435C>T Combined
Genotypes and Tacrolimus Pharmacokinetic Profiles
On the basis of the results described above, we subsequently divided all the patients,
according to both CYP3A5*3 and ABCB1 3435C>T genotypes. 4 genotype
combinations were identified in our study population: CYP3A5 expresser recipients
(CYP3A5*1allele carriers) with ABCB1 CC genotype (n=12); CYP3A5 expresser
recipients with ABCB1 CT/TT genotype (n=18); CYP3A5 non-expresser recipients
(CYP3A5*3/*3 carriers) with ABCB1 CC genotype (n=4) and CYP3A5 non-expresser
recipients with ABCB1 CT/TT genotype (n=30). CYP3A5*3*3 and ABCB1 CC genotype
group, with 4 patients only, was excluded from the statistical analysis. The demographic
and baseline clinical characteristics of the study participants are presented in Table 23.
Demographic characteristics, except ethnicity (p< 0.001), donor type (p< 0.05) and
diabetic status (p< 0.01) were not significantly different between the genotype groups.
The analysis has been done on 128 24-h PK profiles obtained from 64 patients with data
for TD-Tac and OD-Tac pooled.
After excluding the four subjects with CYP3A *3*3 and ABCB1 CC genotype from the
analysis, significant differences in tacrolimus pharmacokinetic parameters were
observed between groups. The difference in these parameters increased progressively
from CYP3A5 expresser /ABCB1CC group to CYP3A5 non-expresser/ABCB1 CT/TT
group. No significant difference was noted in CYP3A5 non-expressers between ABCB1
CT/TT and ABCB1CC carriers (the excluded group). When CYP3A5 non-
expresser/ABCB1 CT/TT group compared with CYP3A5 expressers/ABCB1CC and
CT/TT genotype subgroup, significant differences in tacrolimus dose requirements,
dose-normalized AUC0–24, dose-normalized Cmax and dose-normalized C0 were evident.
CYP3A5 non-expresser/ABCB1 CT/TT group required significantly lower tacrolimus
dose 0.05 mg/kg/day (SD: 0.02) compared with CYP3A5 expresser/ABCB1 CT/TT
group who needed 0.10 (SD: 0.05) mg/kg/day (P<0.001) and CYP3A5
expresser/ABCB1 CC, who needed 0.12 (SD: 0.05) mg/kg/day (P<0.001). In CYP3A5
expresser/ABCB1 CT/TT group, tacrolimus dose was significantly lower than CYP3A5
expresser/ABCB1 CC group (P=0.03). CYP3A5 non-expresser /ABCB1 CT/TT carriers

Comparative Pharmacokinetics Assessments of Tacrolimus Preparations
Page 154 of 377
developed a significantly higher dose-normalized C0 than CYP3A5 expresser /ABCB1
CT/TT carriers (p<0.001) and then CYP3A5 expresser /ABCB1 CC carriers (p<0.001).
CYP3A5 expresser/ABCB1 CC group had a significantly lower tacrolimus dose-
normalized C0 compared with CYP3A5 expresser/ABCB1 CT/TT group (P<0.01). A
significant difference was observed in tacrolimus dose-normalized Cmax in CYP3A5
non-expresser/ABCB1 CT/TT group compared with CYP3A5 expresser/ABCB1 CT/TT
(p<0.001) and CYP3A5 expresser/ABCB1 CC groups (p<0.001). Tacrolimus dose
increase significantly in CYP3A5 expresser/ABCB1 CT/TT group compared with
CYP3A5 expresser/ABCB1 CC group (P=0.02). In addition, CYP3A5 non- expresser
/ABCB1 CT/TT carriers achieved 2.6-fold higher dose-normalized AUC0-24 compared
with CYP3A5 expresser/ABCB1 CT/TT and 1.8-fold higher dose-normalized AUC0-24
than CYP3A5 expresser /ABCB1 CC carriers. A significant difference was observed in
tacrolimus dose-normalized AUC0–24 between the ABCB1 CC and the CT/TT genotype
subgroup (P<0.05; Figure 31; Table 24).
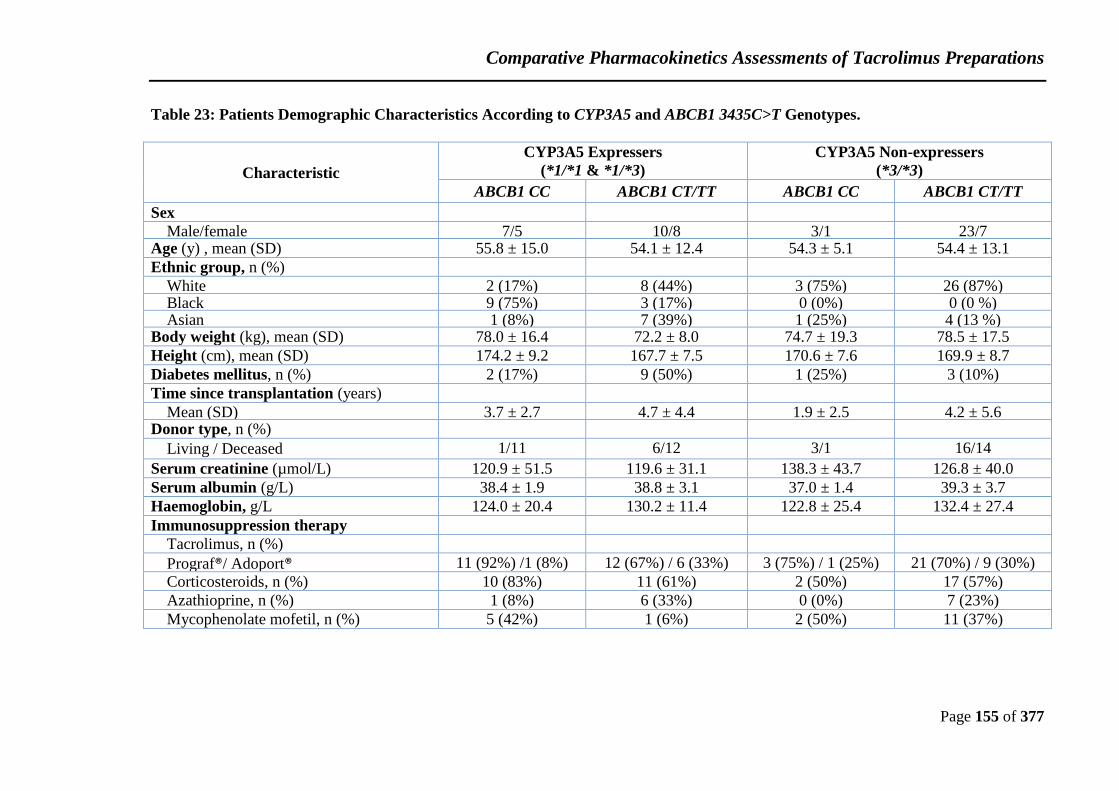
Comparative Pharmacokinetics Assessments of Tacrolimus Preparations
Page 155 of 377
Table 23: Patients Demographic Characteristics According to CYP3A5 and ABCB1 3435C>T Genotypes.
Characteristic
CYP3A5 Expressers
(*1/*1 & *1/*3)
CYP3A5 Non-expressers
(*3/*3)
ABCB1 CC ABCB1 CT/TT ABCB1 CC ABCB1 CT/TT
Sex
Male/female 7/5 10/8 3/1 23/7 Age (y) , mean (SD) 55.8 ± 15.0 54.1 ± 12.4 54.3 ± 5.1 54.4 ± 13.1
Ethnic group, n (%)
White 2 (17%) 8 (44%) 3 (75%) 26 (87%) Black 9 (75%) 3 (17%) 0 (0%) 0 (0 %) Asian 1 (8%) 7 (39%) 1 (25%) 4 (13 %)
Body weight (kg), mean (SD) 78.0 ± 16.4 72.2 ± 8.0 74.7 ± 19.3 78.5 ± 17.5
Height (cm), mean (SD) 174.2 ± 9.2 167.7 ± 7.5 170.6 ± 7.6 169.9 ± 8.7
Diabetes mellitus, n (%) 2 (17%) 9 (50%) 1 (25%) 3 (10%)
Time since transplantation (years)
Mean (SD) 3.7 ± 2.7 4.7 ± 4.4 1.9 ± 2.5 4.2 ± 5.6 Donor type, n (%)
Living / Deceased 1/11 6/12 3/1 16/14
Serum creatinine (µmol/L) 120.9 ± 51.5 119.6 ± 31.1 138.3 ± 43.7 126.8 ± 40.0
Serum albumin (g/L) 38.4 ± 1.9 38.8 ± 3.1 37.0 ± 1.4 39.3 ± 3.7
Haemoglobin, g/L 124.0 ± 20.4 130.2 ± 11.4 122.8 ± 25.4 132.4 ± 27.4
Immunosuppression therapy
Tacrolimus, n (%)
Prograf®/ Adoport® 11 (92%) /1 (8%) 12 (67%) / 6 (33%) 3 (75%) / 1 (25%) 21 (70%) / 9 (30%)
Corticosteroids, n (%) 10 (83%) 11 (61%) 2 (50%) 17 (57%)
Azathioprine, n (%) 1 (8%) 6 (33%) 0 (0%) 7 (23%)
Mycophenolate mofetil, n (%) 5 (42%) 1 (6%) 2 (50%) 11 (37%)
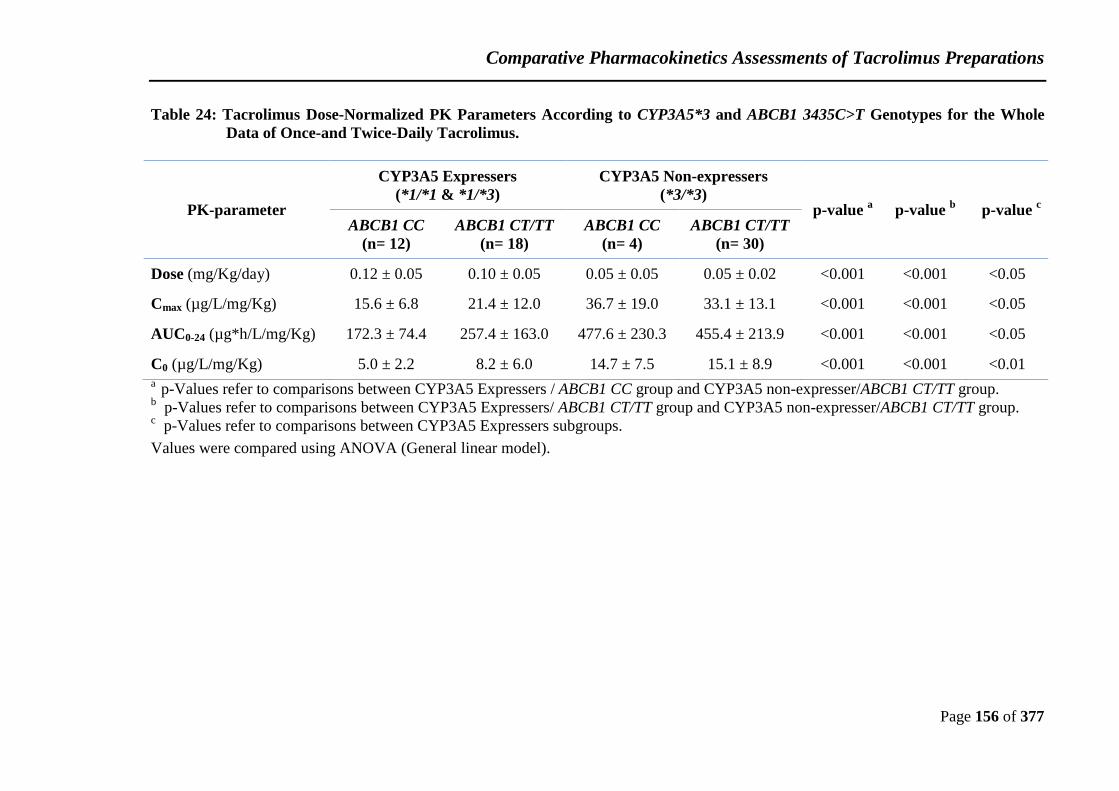
Comparative Pharmacokinetics Assessments of Tacrolimus Preparations
Page 156 of 377
Table 24: Tacrolimus Dose-Normalized PK Parameters According to CYP3A5*3 and ABCB1 3435C>T Genotypes for the Whole
Data of Once-and Twice-Daily Tacrolimus.
PK-parameter
CYP3A5 Expressers
(*1/*1 & *1/*3)
CYP3A5 Non-expressers
(*3/*3) p-value
a p-value
b p-value
c
ABCB1 CC
(n= 12)
ABCB1 CT/TT
(n= 18)
ABCB1 CC
(n= 4)
ABCB1 CT/TT
(n= 30)
Dose (mg/Kg/day) 0.12 ± 0.05 0.10 ± 0.05 0.05 ± 0.05 0.05 ± 0.02 <0.001 <0.001 <0.05
Cmax (µg/L/mg/Kg) 15.6 ± 6.8 21.4 ± 12.0 36.7 ± 19.0 33.1 ± 13.1 <0.001 <0.001 <0.05
AUC0-24 (µg*h/L/mg/Kg) 172.3 ± 74.4 257.4 ± 163.0 477.6 ± 230.3 455.4 ± 213.9 <0.001 <0.001 <0.05
C0 (µg/L/mg/Kg) 5.0 ± 2.2 8.2 ± 6.0 14.7 ± 7.5 15.1 ± 8.9 <0.001 <0.001 <0.01 a
p-Values refer to comparisons between CYP3A5 Expressers / ABCB1 CC group and CYP3A5 non-expresser/ABCB1 CT/TT group. b
p-Values refer to comparisons between CYP3A5 Expressers/ ABCB1 CT/TT group and CYP3A5 non-expresser/ABCB1 CT/TT group. c
p-Values refer to comparisons between CYP3A5 Expressers subgroups.
Values were compared using ANOVA (General linear model).
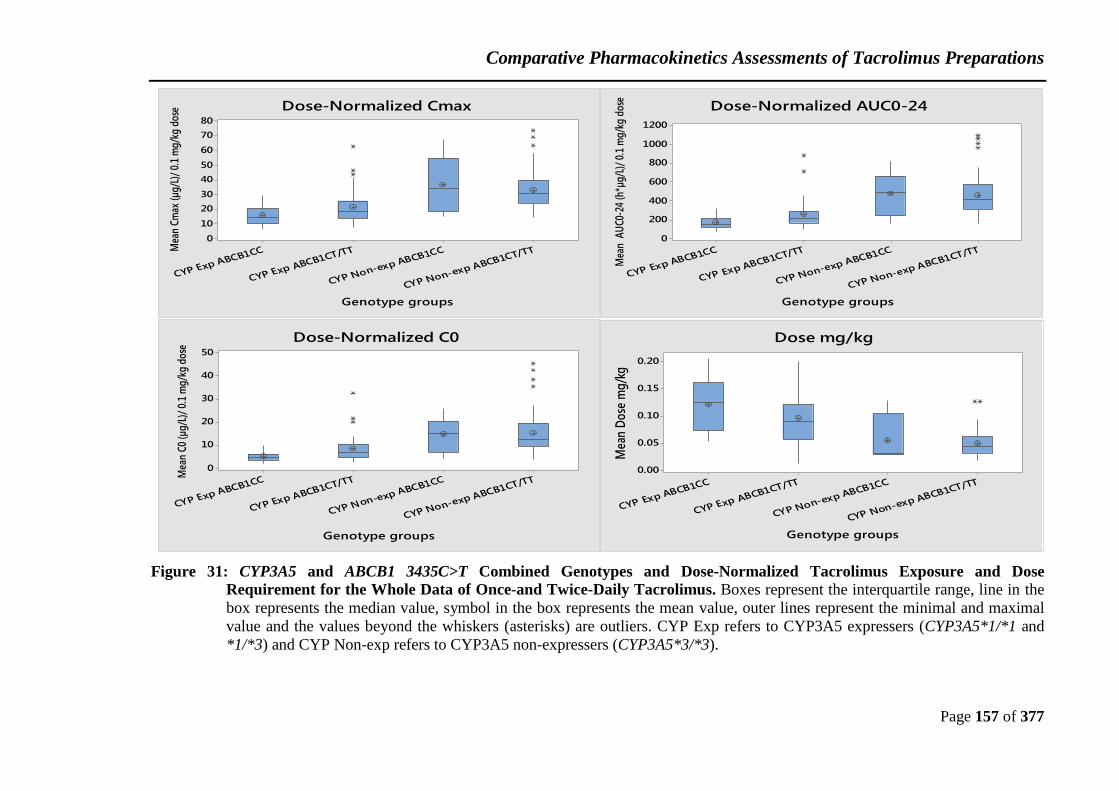
Comparative Pharmacokinetics Assessments of Tacrolimus Preparations
Page 157 of 377
Figure 31: CYP3A5 and ABCB1 3435C>T Combined Genotypes and Dose-Normalized Tacrolimus Exposure and Dose
Requirement for the Whole Data of Once-and Twice-Daily Tacrolimus. Boxes represent the interquartile range, line in the
box represents the median value, symbol in the box represents the mean value, outer lines represent the minimal and maximal
value and the values beyond the whiskers (asterisks) are outliers. CYP Exp refers to CYP3A5 expressers (CYP3A5*1/*1 and
*1/*3) and CYP Non-exp refers to CYP3A5 non-expressers (CYP3A5*3/*3).
CYP Non-exp ABCB1CT/TT
CYP Non-exp ABCB1CC
CYP Exp ABCB1CT/TT
CYP Exp ABCB1CC
1200
1000
800
600
400
200
0
Genotype groups
Mea
n A
UC0
-24
(h*µ
g/L)
/ 0.
1 m
g/kg
dos
e
Dose-Normalized AUC0-24
CYP Non-exp ABCB1CT/TT
CYP Non-exp ABCB1CC
CYP Exp ABCB1CT/TT
CYP Exp ABCB1CC
80
70
60
50
40
30
20
10
0
Genotype groups
Mea
n Cm
ax (µ
g/L)
/ 0.
1 m
g/kg
dos
e Dose-Normalized Cmax
CYP Non-exp ABCB1CT/TT
CYP Non-exp ABCB1CC
CYP Exp ABCB1CT/TT
CYP Exp ABCB1CC
50
40
30
20
10
0
Genotype groups
Mea
n C
0 (µ
g/L
)/ 0
.1 m
g/k
g d
ose
Dose-Normalized C0
CYP Non-exp ABCB1CT/TT
CYP Non-exp ABCB1CC
CYP Exp ABCB1CT/TT
CYP Exp ABCB1CC
0.20
0.15
0.10
0.05
0.00
Genotype groups
Mea
n D
ose
mg
/kg
Dose mg/kg
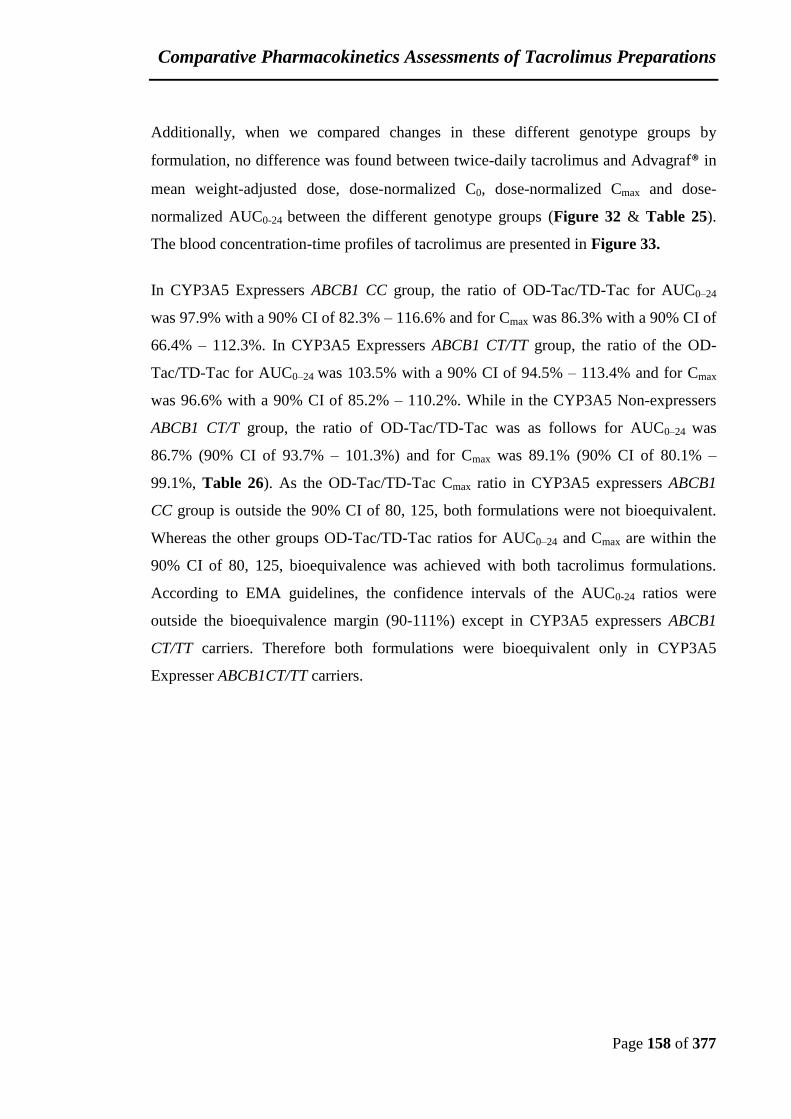
Comparative Pharmacokinetics Assessments of Tacrolimus Preparations
Page 158 of 377
Additionally, when we compared changes in these different genotype groups by
formulation, no difference was found between twice-daily tacrolimus and Advagraf® in
mean weight-adjusted dose, dose-normalized C0, dose-normalized Cmax and dose-
normalized AUC0-24 between the different genotype groups (Figure 32 & Table 25).
The blood concentration-time profiles of tacrolimus are presented in Figure 33.
In CYP3A5 Expressers ABCB1 CC group, the ratio of OD-Tac/TD-Tac for AUC0–24
was 97.9% with a 90% CI of 82.3% – 116.6% and for Cmax was 86.3% with a 90% CI of
66.4% – 112.3%. In CYP3A5 Expressers ABCB1 CT/TT group, the ratio of the OD-
Tac/TD-Tac for AUC0–24 was 103.5% with a 90% CI of 94.5% – 113.4% and for Cmax
was 96.6% with a 90% CI of 85.2% – 110.2%. While in the CYP3A5 Non-expressers
ABCB1 CT/T group, the ratio of OD-Tac/TD-Tac was as follows for AUC0–24 was
86.7% (90% CI of 93.7% – 101.3%) and for Cmax was 89.1% (90% CI of 80.1% –
99.1%, Table 26). As the OD-Tac/TD-Tac Cmax ratio in CYP3A5 expressers ABCB1
CC group is outside the 90% CI of 80, 125, both formulations were not bioequivalent.
Whereas the other groups OD-Tac/TD-Tac ratios for AUC0–24 and Cmax are within the
90% CI of 80, 125, bioequivalence was achieved with both tacrolimus formulations.
According to EMA guidelines, the confidence intervals of the AUC0-24 ratios were
outside the bioequivalence margin (90-111%) except in CYP3A5 expressers ABCB1
CT/TT carriers. Therefore both formulations were bioequivalent only in CYP3A5
Expresser ABCB1CT/TT carriers.

Comparative Pharmacokinetics Assessments of Tacrolimus Preparations
Page 159 of 377
Table 25: Tacrolimus Dose-Normalized Pharmacokinetic Parameters for Different Combination of CYP3A5*3 and ABCB1
3435C>T Genotypes in Both Once- and Twice-Daily Tacrolimus.
PK-parameter
CYP3A5 Expressers
(*1/*1 & *1/*3)
ABCB1 CC
(n= 12)
ABCB1 CT/TT
(n= 18)
TD-Tac Advagraf® P-value TD-Tac Advagraf® P-value
Dose (mg/Kg/day) 0.12 ± 0.05 0.12 ± 0.05
0.10 ± 0.05 0.10 ± 0.05
C0 (µg/L/mg/Kg) 5.3 ± 2.6 4.7 ± 1.8 0. 7 8.5 ± 6.8 8.0 ± 5.4 0. 6
Cmax (µg/L/mg/Kg) 17.2 ±8.0 14.1 ± 5.2 0.3 22.0 ± 13.7 20.8 ±10.4 0.8
AUC0-24 (µg*h/L/mg/Kg) 178.0 ± 86.0 166.0 ± 64.0 0.8 253.8±179.6 261.0 ± 9.7 0.4
PK-parameter
CYP3A5 Non-expressers
(*3/*3)
ABCB1 CC
(n= 4)
ABCB1 CT/TT
(n= 30)
TD-Tac Advagraf® P-value TD-Tac Advagraf® P-value
Dose (mg/Kg/day) 0.05 ± 0.05 0.05 ± 0.05 0.05 ± 0.02 0.05 ± 0.02
C0 (µg/L/mg/Kg) 17.7 ± 9.0 11.7 ± 5.1 0.03 16.4 ± 10.5 13.9 ± 6.9 0.06
Cmax (µg/L/mg/Kg) 41.8 ± 25.0 31.6 ± 12.2 0.3 35.0 ± 14.8 31.1±11.0 0.1
AUC0-24 (µg*h/L/mg/Kg) 536 ± 291 418.8 ± 172.8 0.2 471.0 ± 238.9 439.9 ± 188.5 0.3
Values were compared using ANOVA (General linear model).
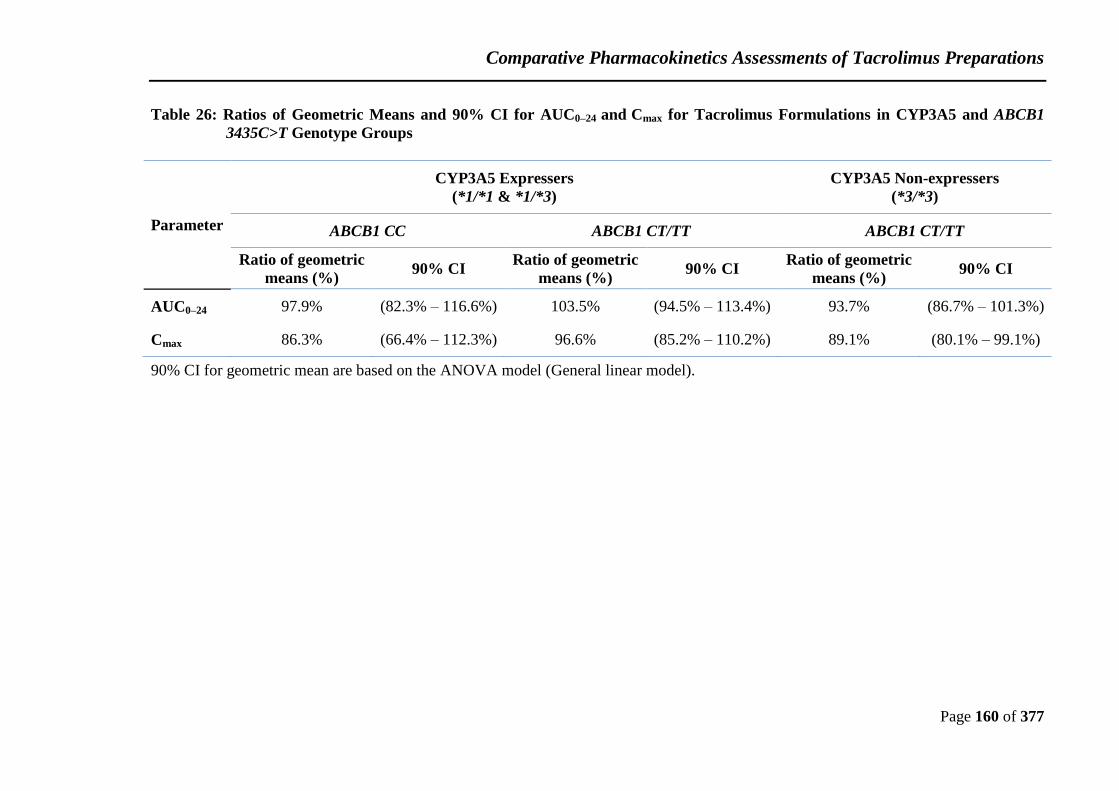
Comparative Pharmacokinetics Assessments of Tacrolimus Preparations
Page 160 of 377
Table 26: Ratios of Geometric Means and 90% CI for AUC0–24 and Cmax for Tacrolimus Formulations in CYP3A5 and ABCB1
3435C>T Genotype Groups
Parameter
CYP3A5 Expressers
(*1/*1 & *1/*3)
CYP3A5 Non-expressers
(*3/*3)
ABCB1 CC ABCB1 CT/TT ABCB1 CT/TT
Ratio of geometric
means (%) 90% CI
Ratio of geometric
means (%) 90% CI
Ratio of geometric
means (%) 90% CI
AUC0–24 97.9% (82.3% – 116.6%) 103.5% (94.5% – 113.4%) 93.7% (86.7% – 101.3%)
Cmax 86.3% (66.4% – 112.3%) 96.6% (85.2% – 110.2%) 89.1% (80.1% – 99.1%)
90% CI for geometric mean are based on the ANOVA model (General linear model).

Comparative Pharmacokinetics Assessments of Tacrolimus Preparations
Page 161 of 377
Figure 32: Associations of CYP3A5 and ABCB1 3435C>T Genotypes with Tacrolimus Dose-Normalized Pharmacokinetic
Parameters of Twice-Daily Tacrolimus and Advagraf®. Boxes represent the interquartile range, line in the box represents
the median value, symbol in the box represents the mean value, outer lines represent the minimal and maximal value and the
values beyond the whiskers (asterisks) are outliers. CYP Exp refers to CYP3A5 expressers (CYP3A5*1/*1 and *1/*3) and CYP
Non-exp refers to CYP3A5 non-expressers (CYP3A5*3/*3).
AdvagrafTD-Tac CYP Non-exp ABCB1CT/TT
CYP Non-exp ABCB1CC
CYP Exp ABCB1CT/TT
CYP Exp ABCB1CC
CYP Non-exp ABCB1CT/TT
CYP Non-exp ABCB1CC
CYP Exp ABCB1CT/TT
CYP Exp ABCB1CC
80
70
60
50
40
30
20
10
0
Mea
n Cm
ax (µ
g/L)
/0.1
mg/
kg d
ose
Dose-Normalized Cmax
AdvagrafTD-Tac CYP Non-exp ABCB1CT/TT
CYP Non-exp ABCB1CC
CYP Exp ABCB1CT/TT
CYP Exp ABCB1CC
CYP Non-exp ABCB1CT/TT
CYP Non-exp ABCB1CC
CYP Exp ABCB1CT/TT
CYP Exp ABCB1CC
1200
1000
800
600
400
200
0
Mea
n A
UC
0-24
(µ
g*h
/L)/
0.1
mg
/kg
do
se Dose-Normalized AUC0-24
AdvagrafTD-Tac CYP Non-exp ABCB1CT/TT
CYP Non-exp ABCB1CC
CYP Exp ABCB1CT/TT
CYP Exp ABCB1CC
CYP Non-exp ABCB1CT/TT
CYP Non-exp ABCB1CC
CYP Exp ABCB1CT/TT
CYP Exp ABCB1CC
50
40
30
20
10
0Mea
n C0
(µg/
L)/
0.1
mg/
kg d
ose
Dose-Normalized C0
AdvagrafTD-Tac CYP Non-exp ABCB1CT/TT
CYP Non-exp ABCB1CC
CYP Exp ABCB1CT/TT
CYP Exp ABCB1CC
CYP Non-exp ABCB1CT/TT
CYP Non-exp ABCB1CC
CYP Exp ABCB1CT/TT
CYP Exp ABCB1CC
0.20
0.15
0.10
0.05
0.00
Mea
n D
ose
mg
/kg
Dose mg/kg
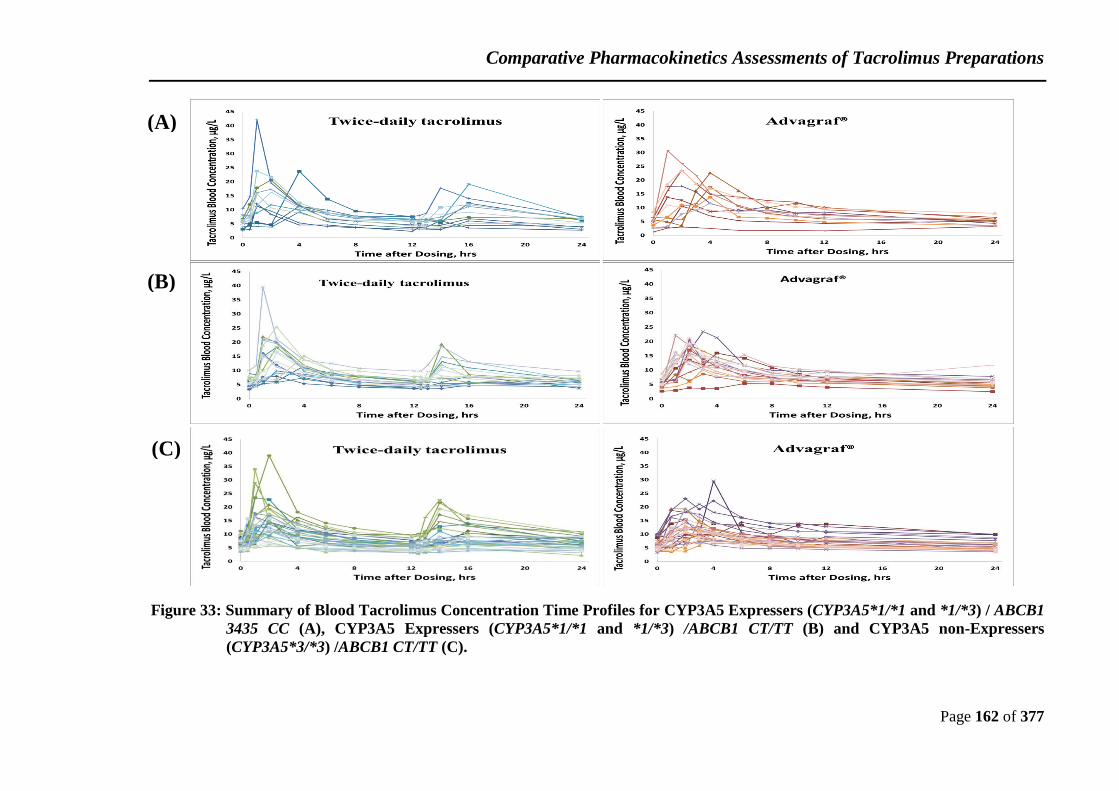
Comparative Pharmacokinetics Assessments of Tacrolimus Preparations
Page 162 of 377
Figure 33: Summary of Blood Tacrolimus Concentration Time Profiles for CYP3A5 Expressers (CYP3A5*1/*1 and *1/*3) / ABCB1
3435 CC (A), CYP3A5 Expressers (CYP3A5*1/*1 and *1/*3) /ABCB1 CT/TT (B) and CYP3A5 non-Expressers
(CYP3A5*3/*3) /ABCB1 CT/TT (C).
(A)
(B)
(C)

Comparative Pharmacokinetics Assessments of Tacrolimus Preparations
Page 163 of 377
4.3.2.5 Factors Associated with Dose Requirements of Tacrolimus
Factors associated with dose requirements of tacrolimus were studied using univariate
regression analysis. The analysis has been done on 128 24-h PK profiles obtained from
64 patients with data for TD-Tac and OD-Tac pooled. The P value was highly
significant with ethnicity, sex, CYP3A5*3 genotype and the combined CYP3A5 and
ABCB1 genotype (p<0.001 for each) and haematocrit and ABCB1 genotype (p=0.001
for each). The P values for age and time since transplant were less than 0.05. Although
diabetic patients had higher tacrolimus dose-normalized Cmax and required lower
tacrolimus dose than non-diabetic patients, the difference was not statistically
significant. The p-value was 0.098 and 0.056, respectively. The CYP3A5*3 genotype
explains 33.9% of the variability in tacrolimus dose requirements. Similarly, the
combined CYP3A5 and ABCB1 genotype accounts for 36.9% of the between-individual
variability in tacrolimus dose requirements.
Multiple regression analysis by stepwise selection identified the combined CYP3A5*3
and ABCB1 genotype, age, sex, ethnicity, haematocrit, corticosteroids treatment and
diabetic status as independent variables associated with tacrolimus dose (Table 27).
These factors explain 59.9% of the variability in tacrolimus dose requirements. After
adjusting for these independent predictors of tacrolimus dose, CYP3A5/ABCB1
combined genotype remained strongly associated with tacrolimus dose (p <0.001) and
accounts for 36.9% of tacrolimus dose requirements variability. Moreover, patient
diabetic status became strongly associated with tacrolimus dose (p=0.001) and
responsible for 9.0% of the variability in tacrolimus dose requirements. Besides, patient
sex effect was not statistically significant (P >0.05, Table 27).
Regarding dose-normalized C0, multiple regression analysis by stepwise selection
identified the combined CYP3A5*3 and ABCB1 genotype, haematocrit, tacrolimus
formulation and diabetic status as independent variables associated with tacrolimus C0
(Table 27). These factors explain 40.1% of the variability in tacrolimus trough
concentration. The contributions of the individual variables are shown in Table 27.
Comparative Pharmacokinetics Assessments of Tacrolimus Preparations
Page 164 of 377
CYP3A5/ABCB1 combined genotype had a strong relationship with tacrolimus dose (p
<0.001) and accounts for 26.0% of the variability in tacrolimus trough concentration.
For dose-normalized AUC0-24, multiple regression analysis by stepwise selection
identified the combined CYP3A5*3 and ABCB1 genotype, sex, age, Time since
transplantation, donor type and diabetic status as independent variables associated with
tacrolimus AUC0-24 (Table 27). These factors explain 49.4% of the variability in
tacrolimus exposure (AUC0-24). The contributions of the individual variables are shown
in Table 27. CYP3A5/ABCB1 combined genotype had a strong association with
tacrolimus dose (p <0.001) and accounts for 31.1% of tacrolimus exposure (AUC0-24)
variability.
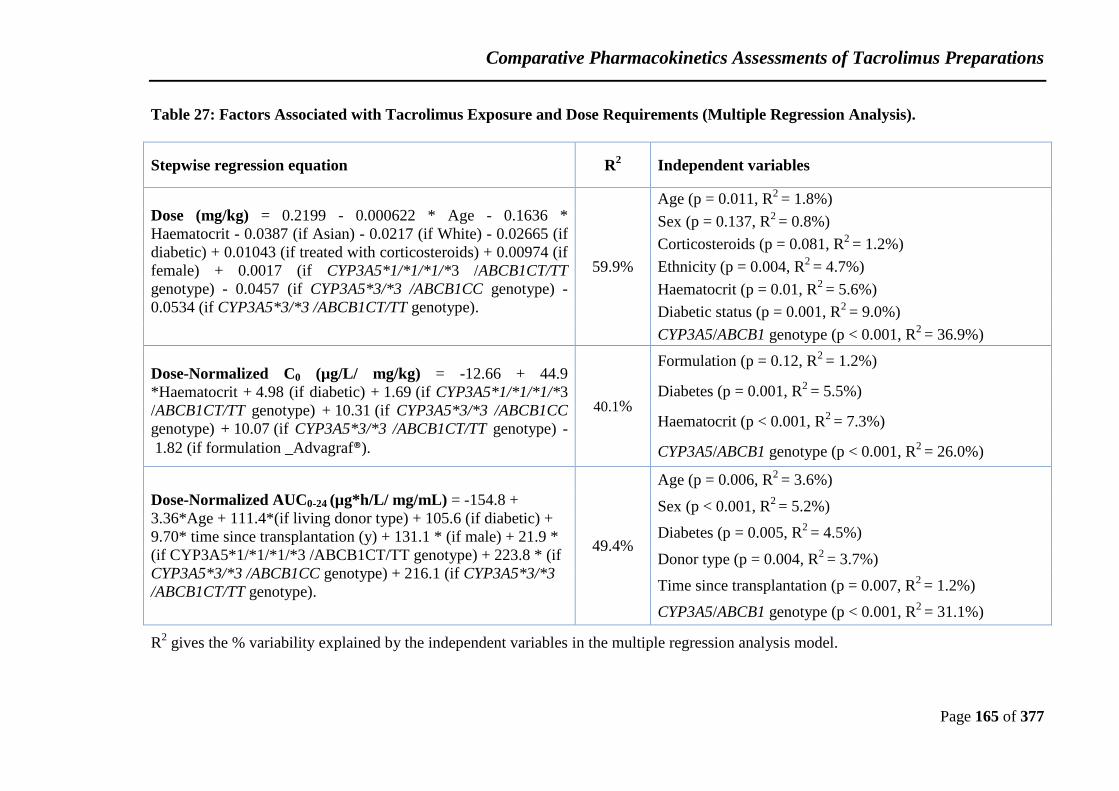
Comparative Pharmacokinetics Assessments of Tacrolimus Preparations
Page 165 of 377
Table 27: Factors Associated with Tacrolimus Exposure and Dose Requirements (Multiple Regression Analysis).
Stepwise regression equation R2 Independent variables
Dose (mg/kg) = 0.2199 - 0.000622 * Age - 0.1636 *
Haematocrit - 0.0387 (if Asian) - 0.0217 (if White) - 0.02665 (if
diabetic) + 0.01043 (if treated with corticosteroids) + 0.00974 (if
female) + 0.0017 (if CYP3A5*1/*1/*1/*3 /ABCB1CT/TT
genotype) - 0.0457 (if CYP3A5*3/*3 /ABCB1CC genotype) -
0.0534 (if CYP3A5*3/*3 /ABCB1CT/TT genotype).
59.9%
Age (p = 0.011, R2
= 1.8%)
Sex (p = 0.137, R2 = 0.8%)
Corticosteroids (p = 0.081, R2
= 1.2%)
Ethnicity (p = 0.004, R2
= 4.7%)
Haematocrit (p = 0.01, R2
= 5.6%)
Diabetic status (p = 0.001, R2
= 9.0%)
CYP3A5/ABCB1 genotype (p < 0.001, R2
= 36.9%)
Dose-Normalized C0 (µg/L/ mg/kg) = -12.66 + 44.9
*Haematocrit + 4.98 (if diabetic) + 1.69 (if CYP3A5*1/*1/*1/*3
/ABCB1CT/TT genotype) + 10.31 (if CYP3A5*3/*3 /ABCB1CC
genotype) + 10.07 (if CYP3A5*3/*3 /ABCB1CT/TT genotype) -
1.82 (if formulation _Advagraf®).
40.1%
Formulation (p = 0.12, R2
= 1.2%)
Diabetes (p = 0.001, R2
= 5.5%)
Haematocrit (p < 0.001, R2
= 7.3%)
CYP3A5/ABCB1 genotype (p < 0.001, R2
= 26.0%)
Dose-Normalized AUC0-24 (µg*h/L/ mg/mL) = -154.8 +
3.36*Age + 111.4*(if living donor type) + 105.6 (if diabetic) +
9.70* time since transplantation (y) + 131.1 * (if male) + 21.9 *
(if CYP3A5*1/*1/*1/*3 /ABCB1CT/TT genotype) + 223.8 * (if
CYP3A5*3/*3 /ABCB1CC genotype) + 216.1 (if CYP3A5*3/*3
/ABCB1CT/TT genotype).
49.4%
Age (p = 0.006, R2
= 3.6%)
Sex (p < 0.001, R2 = 5.2%)
Diabetes (p = 0.005, R2
= 4.5%)
Donor type (p = 0.004, R2
= 3.7%)
Time since transplantation (p = 0.007, R2
= 1.2%)
CYP3A5/ABCB1 genotype (p < 0.001, R2
= 31.1%)
R2 gives the % variability explained by the independent variables in the multiple regression analysis model.

Comparative Pharmacokinetics Assessments of Tacrolimus Preparations
Page 166 of 377
4.4 Discussion
4.4.1 Pharmacokinetics and Bioequivalence of Once- and Twice-Daily
Tacrolimus Preparations in Stable Renal Transplant Patients.
Advagraf® showed a comparable pharmacokinetic profile to twice-daily tacrolimus, as
assessed by comparing AUC0–24 and Cmax concentrations. The obtained data from 64
renal transplant recipients confirm that once-daily tacrolimus, Advagraf® is
bioequivalent to twice-daily tacrolimus preparations in kidney transplant patients
according to the FDA and EMA guidelines. At 90% CI values for the ratios of the
geometric means of AUC0–24 OD-Tac/TD-Tac (91% –102%) and of Cmax OD-Tac/TD-
Tac (84% –97%) were each within the stipulated range of 80–125%, which meets the
FDA bioequivalence acceptable range applied for any bioequivalence study. These
criteria allow no more than 20% higher or lower changes in AUC0–24 and Cmax ratios
between the generic and the reference drugs (FDA., 2003). EMA guidelines which
tighten the bioequivalence acceptable margin for AUC geometric mean ratio to 90.00 –
111.11% for narrow therapeutic index drugs including tacrolimus (EMA, 2010b) were
also met. Our analysis showed that the Advagraf® was bioequivalent to twice-daily
tacrolimus; however, it attained a lower Cmax and a lower systemic profile of tacrolimus
than twice-daily tacrolimus preparations. The results obtained supported a safe mg: mg
conversion from twice a day to modified release tacrolimus, Advagraf®. These results
are in agreement with the previously published data, which showed that the steady state
tacrolimus pharmacokinetics of modified release tacrolimus is equivalent to Prograf®
after mg: mg daily dose conversion in stable kidney transplant patients regardless of sex
or race. The ratio of the OD-Tac/TD-Tac for AUC0–24 was 95.0% with a 90% CI of
90.7% –99.4%. The ratio of the OD-Tac/TD-Tac for Cmax was 88.2% with a 90% CI of
82.7% –94.0% (Alloway et al., 2005).This is contained within the 90% CI of 80% –
125%. Our results confirm previous results obtained from a steady-state study in stable
kidney transplant recipients and found an equivalence of exposure at steady-state.
Likewise, the 90% CI values for the ratios of geometric means of AUC0–24 for days 14
and 21 once-daily tacrolimus versus days 1 and 7 twice-daily tacrolimus were 91% and
99%. They also demonstrate that kidney transplant recipients can be safely converted to

Comparative Pharmacokinetics Assessments of Tacrolimus Preparations
Page 167 of 377
once-daily tacrolimus and tacrolimus concentration can be maintained using the same
therapeutic monitoring and patient care techniques used for twice-daily tacrolimus
(Alloway et al., 2007). Our results similar to the results obtained by van Hooff et al
(2012).who found that tacrolimus AUC0–24 for both formulations are comparable after
mg: mg conversion from Prograf® to Advagraf®. At 90% CIs, the AUC0–24 ratio was
92.9% (89.8%–96.0%), within the FDA bioequivalence acceptance range of 80%–
125%. However, the treatment ratio (90% CI) for tacrolimus Cmax was 73.2% (67.7%–
78.7%), outside the range. Our results are in agreement with the AUC0–24 ratio results
obtained from once-daily tacrolimus PK study in paediatric kidney recipients. The ratio
of the geometric means for AUC0–24 was 90.8 %, with 90 % CI limits of 85.3%–96.7 %,
falling within 80 % to 125 % the FDA bioequivalence limits. In contrast to our results,
their Cmax did not significantly differ between both formulations in the investigated
study population. They demonstrated that the two formulations were bioequivalent
(Lapeyraque et al., 2014). In contrast to our results, Min et al (2013) found that at
steady state, the tacrolimus exposure was not equivalent between both formulations in
paediatric transplant patients. The ratio of lnAUC0–24 for OD-Tac/TD-Tac was 84.7 with
90% CI of 79.1%–90.8% after mg: mg conversion. lnCmax was also not equivalent; the
90% CIs was 70.7%–89.1%. Despite that the dose was adjusted, the ratio of lnAUC0–24
was 87.8 (90% CI: 78.1%–98.9%) on day 28 of the study. In addition, there was a good
correlation between AUC0–24 and C0 for immediate and modified release tacrolimus
hence; it allows therapeutic monitoring via the same system as twice-daily Tacrolimus.
Similar findings were noted in previous studies (Alloway et al., 2005, van Hooff et al.,
2012).

Comparative Pharmacokinetics Assessments of Tacrolimus Preparations
Page 168 of 377
4.4.2 CYP3A5*3 and ABCB1 3435C>T Associations with Tacrolimus
Preparations Pharmacokinetics and Dose Requirements.
The present study assessed whether the well-defined association of the CYP3A5*3 and
ABCB1 genotypes on the pharmacokinetics of immediate release tacrolimus also applies
for the prolonged release preparation, Advagraf®.
Based on the analysis of the data obtained from 64 stable renal transplant recipients, it
can be demonstrated that CYP3A5 expressers (CYP3A5*1 allele carriers) required
higher doses of tacrolimus than CYP3A5 non-expressers (CYP3A5*3/*3). In addition,
tacrolimus dose-normalized C0, Cmax and AUC0-24 are significantly lower in CYP3A5
expresser patients than CYP3A5 non-expressers. This is in agreement with the
previously published data which showed that the CYP3A5 expressers required a higher
daily tacrolimus dose compared to non-expressers (Roy et al., 2006). Moreover, it was
reported that tacrolimus pharmacokinetics were heavily dependent on CYP3A5 allelic
status. Subjects carrying at least one functional CYP3A5*1 allele (CYP3A5 expressers)
metabolize tacrolimus more rapidly and require higher doses to reach target
concentrations (MacPhee et al., 2002). Our findings confirmed the results obtained from
a previous study in Japanese renal transplant recipients showing that the dose-adjusted
Cmax (µg/L/mg/kg), AUC0-12 (µg*h/L per mg/kg) and tacrolimus trough blood
concentrations in CYP3A5*1 carriers had a significantly lower value than the *3/*3
carriers, though the daily dose of tacrolimus mg/kg/day was significantly higher
(Tsuchiya et al., 2004). Our results are in conformity with these studies. This is in
agreement with the fact that the CYP3A5*3 allele decreases CYP3A5 production and
results in the loss of hepatic CYP3A5 activity (Hustert et al., 2001, Kuehl et al., 2001).
CYP3A5 could be useful to predict the optimal tacrolimus dose prior to transplantation.
A recent study showed that kidney transplant recipients using tacrolimus doses
according to the CYP3A5 genotype reached the target C0 significantly earlier than
recipients used a standard regimen (Thervet et al., 2010). Although more patients were
within the desired tacrolimus target range early after transplantation, a considerable
proportion of patients still did not have tacrolimus C0 levels within the target range

Comparative Pharmacokinetics Assessments of Tacrolimus Preparations
Page 169 of 377
indicating that CYP3A5 genotype alone is unlikely to be sufficient for successful
individualisation of initial tacrolimus dose.
With regards to ABCB1 3435C>T, we found that the patients with the ABCB1 3435 CC
allele have a significantly higher tacrolimus dose mg/kg/day and lower tacrolimus dose-
adjusted AUC0–24, dose-adjusted Cmax and dose-adjusted trough levels post
transplantation compared to those with ABCB1 T variant homozygotes. Similarly, some
studies have reported a correlation between ABCB1 3435C>T polymorphism and
tacrolimus pharmacokinetics. Zheng et al. (2003) for instance, analysed tacrolimus
pharmacokinetics in relation to ABCB1 3435C>T polymorphisms and found a
significant association between the ABCB1 3435C>T polymorphisms and the dose of
tacrolimus per day, showing that CC recipients require a higher dose than the CT/TT
patients at 6 and 12 months after heart transplantation. Similarly, Patients with C/C
homozygotes of ABCB1 3435C>T showed significantly lower dose-adjusted tacrolimus
trough concentrations compared with ABCB1 CT/TT variant carriers in liver transplant
recipients (Yu et al., 2011). In contrast, other studies have reported a weak correlation
with ABCB1 3435C>T polymorphism and high tacrolimus blood concentrations (Diaz-
Molina et al., 2012, Fredericks et al., 2006, Singh et al., 2011), whereas others found no
effect (Jun et al., 2009, Quteineh et al., 2008). Other studies showed that there was no
association of any tacrolimus parameter, such as tacrolimus dose/kg/day, dose-adjusted
AUC0–12, dose-adjusted Cmax and trough concentration with ABCB1 CC and CT/TT
genotype subgroups, indicating that ABCB1 3435C>T polymorphism was not an
important factor in tacrolimus pharmacokinetics (Rong et al., 2010, Tada et al., 2005).
Furthermore, Goto et al. (2002) found that none of the ABCB1 3435C>T variants
studied showed a significant effect on tacrolimus concentration/dose ratio in the first
week after transplantation.
After categorizing the renal transplant patients in different groups based on their
CYP3A5*3 and ABCB1 3435C>T genotype, no significant difference was observed in
CYP3A5*3 carriers with any of ABCB1 3435C>T variant alleles. However, significant
differences in tacrolimus pharmacokinetic parameters were evident between ABCB1
3435C>T polymorphisms in CYP3A5*1 allele carriers. This suggests that CYP3A5

Comparative Pharmacokinetics Assessments of Tacrolimus Preparations
Page 170 of 377
expression had a major influence on tacrolimus exposure and that ABCB1 3435C>T
polymorphism was an important factor in tacrolimus pharmacokinetics particularly in
case of CYP3A5 expressers. In contrast to our results, a minor association was found
between the ABCB1 3435C>T polymorphisms and tacrolimus blood concentration in
CYP3A5 non-expressers suggesting that the variation in tacrolimus oral bioavailability
is primarily produced by heterogeneity in the level of intestinal P-glycoprotein
expression (MacPhee et al., 2002). Some studies are in agreement with our findings
showing no significant differences in tacrolimus bioavailability between the ABCB1 CC
and the CT/TT genotype subgroups in the non-expresser group (Rong et al., 2010, Tada
et al., 2005). Likewise, these studies have reported the same outcome between ABCB1
3435C>T variants and CYP3A5 expressers which contrast with our findings.
Furthermore, another study found that upon evaluating the 2 genotypes for CYP3A5*3
and ABCB1 3435C>T in combination, significant differences in tacrolimus
Concentration/Dose ratios for the various groups reflected mainly the CYP3A5
polymorphism (Loh et al., 2008). This is in agreement with our finding.
The role of CYP3A5*3 and ABCB1 3435C>T genotypes in metabolism and dose
requirements of Advagraf® in renal transplant patients is currently unknown. It was
reported that expression of CYP3A decreases and expression of P-gp increases along
the length of the small intestine (Zhang and Benet, 2001). Theoretically, it cannot be
assumed that the genetic factors known to influence the pharmacokinetics of the
Prograf® preparation of tacrolimus will apply to the prolonged release preparation,
Advagraf®, which is absorbed more distally. Contrary to expectations, however, the
influence of the CYP3A5*3 and ABCB1 3435C>T genotype on tacrolimus exposure is
the same for the prolonged release preparation Advagraf® as for immediate release
preparation of tacrolimus. This means that any pharmacogenetic algorithms based on
these genotypes can be applied to both preparations.
When data were analysed based on the presence or absence of diabetes, we did not find
any statistically significant differences (p = 0.056). However, another recent study
showed that diabetic patients have significantly higher dose adjusted tacrolimus levels
compared to non-diabetic patients (Chitnis et al., 2013) and our study is likely to have
Comparative Pharmacokinetics Assessments of Tacrolimus Preparations
Page 171 of 377
been statistically underpowered to pick this up. Age appeared to be associated with
tacrolimus dosing requirements. Our findings demonstrated that tacrolimus dosing
requirements were higher in younger than older patients. This is in line with previous
reports showed that age correlated significantly with tacrolimus dose in both adults
(Kim et al., 2012) and paediatric patients (Gijsen et al., 2011). In addition, patient sex
greatly affected tacrolimus dose requirements. Tacrolimus dose was significantly lower
in males compared to females. This is in accordance with the results of a recent study
identified male sex as a significant risk factor for being slower tacrolimus metabolizers
(Stratta et al., 2012). Similarly, our results also confirm a minor role of the ABCB1
3435C>T variant allele. In contrast, CYP3A5*3 allele is a key factor in the
interpretation of tacrolimus blood concentrations and dose requirement. Furthermore,
the haematocrit value was significantly associated with tacrolimus dose requirements,
consistent with previous reports (de Jonge et al., 2012, Stratta et al., 2012). Previous
report has described higher tacrolimus dose requirement in black patients (Macphee et
al., 2005), which is consistent with our findings.
Finally, multiple regression analysis by stepwise selection identified the combined
CYP3A5*3 and ABCB1 3435C>T genotype, sex, age, haematocrit value, ethnicity,
corticosteroids treatment and diabetic status as independent variables associated with
tacrolimus dose requirements. We found that the combined CYP3A5*3 and ABCB1
3435C>T genotype may explain 36.9% of the variability in tacrolimus dose
requirements. Age, sex, haematocrit value, ethnicity, corticosteroids treatment and
diabetic status may partially explain the gap in the variability in tacrolimus dose
requirement that cannot be explained by genetic factors in renal transplant patients. Our
findings suggest that taking all these aforementioned factors into consideration may
account for 59.9% of the between-individual variability in tacrolimus dose
requirements. These findings may have potential clinical application for initiation and
adjustment of tacrolimus therapy.

Associations of CYP3A4*22 and POR*28 Genotypes with Tacrolimus PK
Page 172 of 377
5 Chapter 5. Associations of CYP3A4*22 and POR*28 Genotypes with Pharmacokinetics of Immediate and Prolonged Release Tacrolimus Preparations.
This study is part of a larger pharmacokinetic study; detailed information on the study
participants and procedure can be found in Chapter 4. The objectives of the study were:
1. To develop new methods for genotyping CYP3A4*22 and POR*28 SNPs using a
LightCycler based technique.
2. To study the relationship between CYP3A4*22 and POR*28 SNPs and the
pharmacokinetics of immediate release tacrolimus; Prograf® and Adoport® and
prolonged release; Advagraf® within individual patients.
5.1 Rapid Genotyping Methods for CYP3A4*22 and POR*28
Polymorphisms with Real-time Polymerase Chain Reaction
Fluorescence Resonance Energy Transfer Assays.
5.1.1 Introduction
The cytochrome P450 family (CYP450) represents a family of proteins that have an
important role in first-pass metabolism. The most important cytochrome P450 isoforms
responsible for drug metabolism are the CYP3A family and mainly present in tissues
such as the gastrointestinal tract and liver. CYP3A enzymes are involved in the
oxidative biotransformation of numerous clinically useful therapeutic agents
(Wilkinson, 1996). Within this subfamily, CYP3A4 is the most abundant CYP enzyme
and involved in the metabolism of 45–60% of all currently used drugs (Danielson,
2002). CYP3A4 activity shows 10- to 100-fold variation between individuals (Wang et
al., 2011). Recently, a mutation associated with reduced CYP3A4 activity has been
described: CYP3A4*22 rs35599367C>T. The CYP3A4*22 SNP was correlated with the
dose requirements of some drugs, including statins and tacrolimus (Elens et al., 2011a,
Wang et al., 2011).

Associations of CYP3A4*22 and POR*28 Genotypes with Tacrolimus PK
Page 173 of 377
Cytochrome P450 reductase also known as NADPH: P450 oxidoreductase (POR),a
membrane-bound enzyme, serves as the electron donor to almost all cytochromes P450
(Jensen and Møller, 2010). It supplies electrons to all microsomal P450s for catalytic
activity and the POR*28 (rs1057868C>T) SNP is the most common sequence variant. It
was reported that POR*28 was associated with CYP3A activity (Oneda et al., 2009).
Recently, some studies showed a significant association between POR*28 and
tacrolimus pharmacokinetics and dose requirement. CYP3A5 expressers carrying at
least one POR*28 allele have shown higher tacrolimus dose requirements than CYP3A5
expressers carrying no POR*28 alleles (de Jonge et al., 2011). RT-PCR allows
quantification of the target polymorphic DNA regions and genotyping of single
nucleotide polymorphisms (SNPs) in one single PCR run. It facilitates a high speed
PCR analysis and minimizes the risk of contamination during analysis.
5.1.2 Materials and Methods
Ethylenediaminetetraacetic acid anticoagulated whole blood samples were collected
from 22 patients and stored at –20°C until DNA isolation. DNA was isolated from
200μl EDTA anticoagulated blood using QIAamp DNA Blood Mini Kit (QIAGEN®,
West Sussex, UK). PCR was performed using LightCycler® 2.0 supplied from Roche®
(Lewes, UK). The LightCycler FastStart DNA Master Hybridisation Probe kit was
supplied from Roche® (West Sussex, UK). The primers and the fluorogenic probes used
were designed and synthesised by TIB MOLBIOL (Berlin, Germany). Two primers and
probes were received from TIB MOLBIOL for each SNP and several fluorescence
resonance energy transfer (FRET) designs have been tested to get the best peak intensity
and then Mg2+
concentration in the reaction mixture was also adjusted and optimized to
get much better resolution.
Restriction Fragment Length Polymorphism Analysis of PCR-Amplified Fragments
(PCR-RFLP) for the CYP3A4*22 and POR*28 polymorphisms was used to confirm the
results obtained by the real-time PCR FRET assays. In order to validate FRET
genotyping methods, samples of different CYP3A4*22 and POR*28 polymorphisms
were sequenced. PCR was performed using PTC 100 Peltier thermal cycler (Bio-Rad

Associations of CYP3A4*22 and POR*28 Genotypes with Tacrolimus PK
Page 174 of 377
Laboratories Ltd, Hertfordshire, UK) and a Mastercycler pro S vapo.protect Thermal
Cycler (Eppendorf, USA). PCR products were electrophoresed on a 5% agarose gel
(Sigma Aldrich, UK) containing 0.3 mg/l ethidium bromide at 75V for 1 hour and
examined under ultraviolet illumination. The PCR products were sequenced according
to a direct sequence procedure performed with the capillary sequencer ABI 3130xL
Genetic Analyser (Applied Biosystems, Warrington, UK) using BigDye® Terminator
v3. 1 Cycle Sequencing Kit was supplied from Applied Biosystems® (Warrington, UK).
5.1.2.1 CYP3A4*22 and POR*28 Genotyping with Real-time PCR
5.1.2.1.1 CYP3A4*22 C >T Genotyping
In this method we used two primers, forward and reverse and one single probe. The
sequence of the forward primer was TgATAgTgggTCTCTgTCTTCC and of the reverse
primer AgCCACAgACTTTCAgATCTACTAg while the sequence of the probe was
CTACACTgggTgTgA XI TggAgACACT—PH. The reaction mixture made up of 0.5
µM of each primer and 0.3 µM of the probe. 2 µL of DNA samples was added to each
reaction. Three control samples were included in each LightCycler run, two positive
controls and one negative control (Deionized water). The samples were loaded into
composite glass capillaries (Roche Molecular Biochemicals) containing 18µL of the
reaction mixture, centrifuged, and placed in the LightCycler sample carousel. The
program was designed using 60°C annealing temperature. After an initial denaturation
step at 95°C for 10.0 min, amplification was performed using 45 cycles of denaturation
(95°C for 5 s), annealing (55°C for 10 s), and extension (72°C for 20 s). After
amplification was complete, a final melting curve was recorded by annealing at 40°C
for 20s, followed by an increase in temperature at a rate of 0.1°C/s, with continual
fluorescence detection up to 85°C. The florescence display was at F1 mode for
fluorescence display. Melting curves were converted into melting peaks using the
LightCycler Software by plotting the negative derivatives of fluorescence against
temperature (- dF/dT).
Associations of CYP3A4*22 and POR*28 Genotypes with Tacrolimus PK
Page 175 of 377
5.1.2.1.2 POR*28 C >T Genotyping
The sequence of the forward primer was CACAggTCCACCCCAACTCT and of the
reverse primer CAggCggAACTgggACTT while the sequence of the probe was
ggAgCCTgCCggggA XI AACg--PH. The method used for POR*28 was the same as
CYP3A4*22. The reaction mixture consisted of 0.1 µM (2 pmoL in 20 µL) of the
forward primer with 0.5 µM (10 pmoL) of the reverse primer and 0.5 µM probe. Three
control samples were included in each LightCycler run, two positive controls and one
negative control (Deionized water). 2 µL of DNA samples were loaded into composite
glass capillaries (Roche Molecular Biochemicals) containing 18µL of the reaction
mixture, centrifuged, and placed in the LightCycler sample carousel. The PCR protocol
included the following steps: pre- incubation phase at 95°C for 10 min to activate the
Taq polymerase enzyme, followed by amplification phase, which includes 45 cycles of
denaturation (95°C, 10s), annealing (55°C, 5 s) and extension (72°C, 15 s). Then this
was followed by melting curve analysis stage, which involved annealing at 60°C for
50s, followed by an increase in temperature at a rate of 0.1C/s, with continual
fluorescence detection up to 95°C. The florescence display was at F1 mode for
fluorescence display. Melting curves were converted into melting peaks using the
LightCycler Software by plotting the negative derivatives of fluorescence against
temperature (- dF/dT).
5.1.2.2 CYP3A4*22 and POR*28 Genotyping with DNA Sequencing
The PCR products of twenty two patients’ DNA samples were sequenced by the
capillary sequencer ABI 3130xL Genetic Analyser® (Applied Biosystems, Warrington,
UK) using BigDye® Terminator v3. 1 Cycle Sequencing Kit supplied from Applied
Biosystems® (Warrington, UK). Electropherograms of each PCR fragment were
obtained containing the SNPs of interest. DNA samples were amplified using the same
primers used with the LightCycler for those four SNPs. These samples were analysed to
confirm the genotypes obtained using the LightCycler. Each sequence of PCR fragment
was confirmed in both directions, forward and reverse directions. The genotyping
assays consisted of the following five steps.
Associations of CYP3A4*22 and POR*28 Genotypes with Tacrolimus PK
Page 176 of 377
5.1.2.2.1 PCR Amplification
Each PCR was performed in a reaction volume of 20μL containing DNA master mix,
MgCl2, forward and reverse primers, with the same protocol mentioned in its
LightCycler method, and 2μL of genomic DNA. The DNA master mix (Roche®, UK)
consisted of Taq DNA polymerase, reaction buffer, dNTP mix (with dUTP instead of
dTTP) and 10mM MgCl2. The PCR cycle protocol was done for the 2 SNPs and
consists of the following steps, initial denaturation step at 95°C for 10.0 min,
amplification was performed using 40 cycles of denaturation (95°C for 10 s), annealing
(65°C for 10 s), and extension (72°C for 20 s), followed by a final extension at 72°C for
10.0 min.
In order to check whether the PCR generated the anticipated DNA fragment, agarose gel
electrophoresis was employed. PCR products were electrophoresed on a 5% agarose
gel (Sigma Aldrich, UK) containing 0.3 mg/l ethidium bromide covered with TBE
buffer, buffer solution containing a mixture of Tris base, boric acid and EDTA, at 75V
for 1 hour and examined under ultraviolet illumination. TBE buffer was obtained from
Sigma Aldrich, UK.
5.1.2.2.2 Shrimp Alkaline Phosphatase (SAP) and Exonuclease I Treatment.
In order to remove unincorporated deoxynucleotide triphosphates and primers from the
PCR amplification step, the PCR products were treated with Fermantas® shrimp
alkaline phosphatase and exonuclease I (Thermo Scientific®, UK). A 3.2 µL aliquot of a
mixture of shrimp alkaline phosphatase (240 µL of 1unit/µL), exonuclease I (12 µL of
20 unit/µL) and diluted SAP buffer (120 µL) was added to the PCR product and the
mixture was incubated at 37°C for 120 min, followed by an incubation at 85°C for 20
min (to denaturate the enzymes), in the pro S vapo.protect Thermal Cycler. The treated
PCR products were then kept at -20°C until use.
Associations of CYP3A4*22 and POR*28 Genotypes with Tacrolimus PK
Page 177 of 377
5.1.2.2.3 DNA Sequencing using Dye-Terminator Cycle-Sequencing.
To sequence the PCR product, BigDye-terminator cycle-sequencing kit (Applied
Biosystems, UK) was used. In the cycle-sequencing process, 2µL of the PCR template
was added to 1 µL of the primer (forward or reverse), 0.5 µL of BigDye mix to each
tube, and was brought to a final volume of 10 µL with dH2O (6.5µL). ABI-supplied
BigDye mix consisted of Taq DNA polymerase, dNTPs (deoxy nucleotide
triphosphates) in large concentration and ddNTPs (dideoxy nucleotide triphosphates)
with fluorescent dyes in low concentration. In this reaction only one primer is used so
we did one forward and one reverse reaction. After an initial denaturation step at 96°C
for 5.0 min, amplification was performed using 30 cycles of denaturation (96°C for 10
s), annealing (57°C for 5 s), and extension (60°C for 4.0 min), followed by termination
at 4°C for 10.0 min.
5.1.2.2.4 Reaction Clean Up
Sequencing reactions need to be cleaned up prior to injection on the ABI sequencer in
order to remove salts from the reaction buffers, unincorporated nucleotides, and dye
terminators that can interfere with electrophoretic dynamics and laser function. Such
cleaning was done by filtering through the sephadex column. The sephadex mixture was
prepared using 10g of sephadex beads (Sigma Aldrich, UK) and 150 mL distilled water,
the solution was microwaved with a normal setting for 1 minute, and then the solution
was allowed to cool using magnetic stirrer and spinner for a few hours. Sephadex
mixture (500 µL) was loaded on each tube and spun at 1000 x g to get rid of excess
water. Then the sephadex columns were placed on top of a clean PCR plate. Following
this step, 10 µL of the mixture was loaded directly into the centre of each sephadex well
and it was spun again at 1000 x g to obtain the filtered sample. The filtrate was then left
in the PCR plate, and was placed in a PCR machine at 90°C till dryness. It was then
reconstituted with 12 µL of formamide (Sigma Aldrich, UK), and the plate was covered
with an adhesive PCR film (Thermo Scientific, UK), heated at 95°C for 5.0 min, and
fast frozen at -20°C until use.

Associations of CYP3A4*22 and POR*28 Genotypes with Tacrolimus PK
Page 178 of 377
5.1.2.2.5 Genotype Determination on the Sequencer
The labelled sequencing products were sequenced on the Applied Biosystems 3130xL
Genetic Analyser. After the sequencing reactions, the plate was placed in the sequence
analyser and linked with standard method. The first run took 45 min and the run after
that took 30 min. The created raw files were analysed with sequencing analysis 5.3.1
program to create the electropherograms. These electropherograms were visualized with
FinchTV program to obtain the genotyping.
5.1.2.3 Statistical Analysis
The genotype distribution for each polymorphism was assessed for deviation from
Hardy–Weinberg equilibrium, and differences in genotype frequency and in allele
frequency between the groups were assessed using the Chi-squared test.
5.1.3 Results
For CYP3A4 rs35599367C>T polymorphism, the melting point of the sensor probe was
61°C when hybridised to CYP3A4*22 CC genotype. While the heterozygote
polymorphism CYP3A4*22CT presented two melting peaks, at 61ºC and 66ºC (Figure
34 A). In our study population, there were no CYP3A4*22 TT homozygotes which
would be anticipated to have a melting peak at 66ºC. For the POR*28 polymorphism,
the melting peak for POR*28 CC homozygotes was at 62ºC, whereas melting peaks for
POR*28 TT homozygotes were at approximately 50ºC. While in the heterozygote
polymorphism POR*28 CT, both melting peaks appeared (Figure 34 B). Twenty PCR
products were randomly selected from the genotype melting profiles for DNA
sequencing conformation. CYP3A4*22 and POR*28 allelic variants and results obtained
by real time PCR were confirmed by sequencing these genes. 100% concordance was
obtained between the genotype and SNPs assessed by LightCycler. The DNA
sequencing results for CYP3A4*22 and POR*28 are displayed in (Figure 35).

Associations of CYP3A4*22 and POR*28 Genotypes with Tacrolimus PK
Page 179 of 377
Figure 34: Derivative Melting Curve Plots for CYP3A4*22 and POR*28
Genotyping using Specific Primers and Probes. A. The Derivative
Melting Curve for the CYP3A4*22 Genotypes. Samples with the
Homozygous C Allele ( ; Tm 61°C) and Heterozygous C/T genotype
( ; Tm 61°C and 66°C). B. The Derivative Melting Curve for the
POR*28 Genotypes. Samples with the Homozygous T Allele ( ; Tm
50°C); Homozygous C Allele ( ; Tm 62°C) and Heterozygous C/T
Genotype ( ; Tm 50 °C and 62°C). The Melting Curve of a No
Template Control in Both Assays ( ).

Associations of CYP3A4*22 and POR*28 Genotypes with Tacrolimus PK
Page 180 of 377
Figure 35: Sequencing of Representative Samples of CYP3A4*22 and POR*28
SNPs Showing the Sequencing Results of the Representative Wild Type,
Heterozygous and Homozygous Mutants of CYP3A4*22 and POR*28
Polymorphisms.
CYP3A4*22 and POR*28 genotypes and allele frequencies are presented in Table 28.
The genotype frequencies of the recipients were consistent with Hardy-Weinberg
equilibrium (p > 0.05).
Table 28: Genotype Frequencies for CYP3A4*22 and POR*28 in Renal Transplant
Patients
Gene Variant Genotype n (%) Genotype
frequency (%)
Allele
frequency
CYP3A4*22 c.522-191 C>T C/C 59 92.2% C = 0.96
C/T 5 7.8% T = 0.04
T/T 0 0.0%
POR*28 A503V C/C 30 46.9% *1 = 0.71
C/T 31 48.4% *3 = 0.29
T/T 3 4.7%

Associations of CYP3A4*22 and POR*28 Genotypes with Tacrolimus PK
Page 181 of 377
5.1.4 Discussion and Conclusions
In this study, we developed new methods for genotyping CYP3A4*22 and POR*28
SNPs uses a LightCycler based technique. Recently, some studies explored the
relationship between CYP3A4*22 and POR*28 alleles and tacrolimus exposure (Elens
et al., 2011a, Elens et al., 2013a). These studies demonstrated that there is an effect of
these genotypes on daily doses required for renal transplant patients. In our study, we
determined the genotypes of CYP3A4*22 and POR*28 using the LightCycler method
for 22 patients. The genotypes of patients’ samples were conducted using DNA
sequence analysis. There was 100% concordance between the genotypes of the samples
determined by sequencing and the genotypes determined by the LightCycler method.
We present here a single-step method for homogeneous genotyping of the
polymorphisms of the CYP3A4*22 and POR*28 genes that combines rapid-cycle PCR
and fluorescent probe melting point analysis. Capillary PCR using the LightCycler is a
reliable, convenient and simple method for genotyping CYP3A4*22 and POR*28
polymorphisms. It shows excellent correlation with genotype determination by DNA
sequencing. This is a rapid method and because of its robustness, speed, and accuracy,
this assay is suitable to determine the CYP3A4*22 and POR*28 polymorphisms in small
and large number of samples.

Associations of CYP3A4*22 and POR*28 Genotypes with Tacrolimus PK
Page 182 of 377
5.2 CYP3A4*22 and POR*28 Genotype Associations with
Tacrolimus Pharmacokinetics and Dose Requirements in
Twice-Daily Tacrolimus and Advagraf®.
5.2.1 Objective of the Study:
The aim of this study is investigating the relationship between CYP3A4*22 and
POR*28 SNPs and the pharmacokinetics of immediate release tacrolimus, Prograf® and
Adoport® and prolonged release, Advagraf® within individual patients.
5.2.2 Materials and Methods
5.2.2.1 Study Design
Tacrolimus pharmacokinetic data obtained from the previous study for 64 stable kidney
transplant recipients were used in this study. Patients were genotyped for CYP3A4*22 C
>T and POR*28 C >T polymorphisms using the same DNA samples extracted for
CYP3A5*3 and ABCB1 3435 genotyping. The C and T alleles of POR*28 variant and in
intron 6 of CYP3A4*22 variant were identified by the new developed RT-PCR using
LightCycler as described previously. For each gene, subjects were divided into two
groups according to their genotype. For CYP3A4*22, patients were divided into
CYP3A4*22 CC and CYP3A4*22 CT/TT genotype groups and for POR*28, it was
POR*28 CC and POR*28 CT/TT genotype groups.
5.2.2.2 Pharmacokinetic and Statistical Analysis
Statistical analysis was performed using Minitab statistical software (Minitab 17).
Tacrolimus individual pharmacokinetic parameters were determined for each genotype
group. The log-transformed data were analysed using analysis of variance (ANOVA)
with factors for genotype group and treatment.

Associations of CYP3A4*22 and POR*28 Genotypes with Tacrolimus PK
Page 183 of 377
5.2.3 Results
5.2.3.1 Patient Characteristics
The characteristics of the 64 patients included in the study are reported in Table 29.
According to CYP3A4*22 genotypes, 59 patients were homozygous for the C wild-type
allele, while five patients carried one copy of the T-variant allele for the CYP3A4 intron
6 SNP. This corresponds to a calculated allelic frequency of 7.8% in our study
population. No significant differences were found between the CYP3A4 genotype
groups except for the patients’ age (p = 0.014) and ethnicity (p = 0.015). All
CYP3A4*22 CT carriers were CYP3A5 non-expressers and they were all from White
ethnic background.
Concerning POR*28 genotypes, 30 patients had the CC genotype, 31 patients had CT
genotype and three were homozygous TT. We found no significant difference between
the POR*28 genotype groups concerning the patients’ age (p = 0.123) and sex (p =
0.387; Table 29).

Associations of CYP3A4*22 and POR*28 Genotypes with Tacrolimus PK
Page 184 of 377
Table 29: Patients Demographic Characteristics and Immunosuppression Therapy.
Characteristic CYP3A4*22 CC
carriers (n = 59)
CYP3A4*22 CT
carriers (n = 5)
POR*28 CC carriers
(n = 30)
POR*28 CT/TT carriers
CT (n = 31) & TT (n = 3)
Sex
Male/female 39/20 4/1 19/11 24/10
Age (y), mean (SD) 55.4 ± 12.2 45.2 ± 16.7 56.4 ± 13.3 52.9 ± 12.2
Race, n (%)
White 34 (58%) 5 (100%) 19 (63%) 20 (59%) Black 12 (20%) - 6 (20%) 6 (18%) Asian 13 (22%) - 5 (17%) 8 (24%)
Body weight (kg), mean (SD) 76.5 ± 15.2 75.1 ± 16.5 77.5 ± 16.0 75.4 ± 14.6
Height (cm), mean (SD) 169.7 ± 8.5 175.5 ± 8.1 170.9 ± 10.2 169.4 ± 6.7
Diabetes, n (%) 14 (24%) 1 (20%) 9 (30%) 6 (18%)
Time since transplantation (years)
Mean (SD) 4.2 ± 4.6 3.4 ± 5.0 4.0 ± 4.1 4.2 ± 5.1 Median 2.2 1.3 2.2 1.8
Donor type, n
Living / Deceased 22/37 4/1 12/18 14/20
Serum creatinine (µmol/L) 125.3 ± 41.5 114.6 ± 11.5 120.1 ± 41.4 128.5 ± 38.8
Serum albumin(g/L) 38.8 ± 2.9 38.5 ± 5.2 38.8 ± 3.1 38.8 ± 3.1
Haemoglobin, (g/L) 128.9 ± 22 137.8 ± 27.3 129.4 ± 15.8 129.8 ± 27.0
Immunosuppression therapy
Tacrolimus, n (%)
Prograf®/ Adoport® 44 (75%) / 15 (25%) 3 (60%) / 2 (40%) 20 (67%) / 10 (33%) 27 (79%) / 7 (21%)
Corticosteroids, n (%) 36 (61.0%) 3 (60%) 17 (57%) 22 (65%)
Azathioprine, n (%) 12 (20%) 2 (40%) 7 (23%) 7 (21%)
Mycophenolate, n (%) 19 (32%) - 9 (30%) 10 (29%)
CYP3A5 Polymorphism
CYP3A5 *1/*1/ *1/*3 30 (12/18) - 17 (6/11) 13 (6/7)
CYP3A5 *3/*3 29 5 13 21

Associations of CYP3A4*22 and POR*28 Genotypes with Tacrolimus PK
Page 185 of 377
5.2.3.2 CYP3A4*22 & Tacrolimus Disposition
The analysis has been done on 128 24-h PK profiles obtained from 64 patients with
pooling of data for OD-Tac and TD-Tac. Tacrolimus blood concentrations Cmax, AUC0-
24 and C0 showed a log-normal distribution, and the data were therefore log-transformed
before analysis. As shown in Table 30, a significant difference in dose-normalized C0
was observed according to the patients CYP3A4*22 allelic status. Patients carrying a T
variant allele had 1.8 fold higher dose-normalized C0 compared to homozygous CC
allele carriers (P= 0.006). The dose-normalized Cmax was higher for the T variant
carriers than for CC patients: 37.2 ±15.4µg/L vs 25.8 ±13.9µg/L (P=0.015). Moreover,
a significant difference was observed in AUC0-24 between the two genotypes;
CYP3A4*22CC and CYP3A4*22CT carriers (329.9 ± 198.6 vs. 562.0 ± 313.3, p =
0.006). Despite that the T allele carriers required significantly lower tacrolimus doses
than CC patients to reach this C0. The mean daily dose requirement of tacrolimus per
body weight was 38.2% lower for T-variant allele carriers compared to CC allele
carriers (p = 0.006; see Figure 36).
Table 30: Tacrolimus Dose-Normalized PK Parameters According to CYP3A4*22
Genotypes for the Whole Data of Once-and Twice-Daily Tacrolimus.
PK-parameter CYP3A4*22 CC
(n= 118)
CYP3A4*22 CT
(n= 10) P-value
Dose (mg/Kg/day) 0.08 ± 0.05 0.05 ± 0.04 <0.01
Cmax (µg/L/mg/Kg) 25.8 ± 13.9 37.2 ± 15.4 <0.05
AUC0-24 (µg*h/L/mg/Kg) 329.9 ± 198.6 562.0 ± 313.3 <0.01
C0 (µg/L/mg/Kg) 10.6 ± 7.4 19.5 ± 13.0 <0.01
Values were compared using ANOVA (General linear model).
Upon comparing the influence of CYP3A4*22 polymorphism on both tacrolimus
formulations, we found no association between CYP3A4*22 genotypes and tacrolimus
dose-normalized AUC0–24, Cmax and C0 (p > 0.05), see Table 31 and Figure 37. In
CYP3A4*22 CC group, the ratio of OD-Tac/TD-Tac AUC0–24 was 98% and its 90 % CI
(82%–117%). In addition, the ratio of the OD-Tac/TD-Tac for Cmax was 90% (90% CI
Associations of CYP3A4*22 and POR*28 Genotypes with Tacrolimus PK
Page 186 of 377
79% –103%), falling outside 80% to 125% bioequivalence limits. Therefore, the two
formulations were not bioequivalent. According to EMA guidelines, the confidence
interval of the AUC0-24 ratio was outside the bioequivalence margin (90-111%).
Therefore both formulations were not bioequivalent. These data are summarized in
Table 32.

Associations of CYP3A4*22 and POR*28 Genotypes with Tacrolimus PK
Page 187 of 377
Figure 36: CYP3A4*22 Genotype Associations with Tacrolimus Dose and Dose-Normalized Pharmacokinetic Parameters for the
Whole Data of Once-and Twice-Daily Tacrolimus. Boxes represent the interquartile range, line in the box represents the
median value, symbol in the box represents the mean value, outer lines represent the minimal and maximal value and the values
beyond the whiskers (asterisks) are outliers.
CTCC
80
70
60
50
40
30
20
10
0
CYP3A4*22
Mea
n C
max
(µ
g/L
)/ 0
.1 m
g/k
g d
ose
Dose-Normalized Cmax
CTCC
1200
1000
800
600
400
200
0
CYP3A4*22Mea
n A
UC
0-24
(hr
*µg
/L)/
0.1
mg
/kg
do
se Dose-Normalized AUC0-24
CTCC
50
40
30
20
10
0
CYP3A4*22
Mea
n C
0 (µ
g/L
)/ 0
.1 m
g/k
g d
ose
Dose-Normalized C0
CTCC
0.20
0.15
0.10
0.05
0.00
CYP3A4*22
Mea
n d
ose
mg
/kg
Tacrolimus Daily Dose
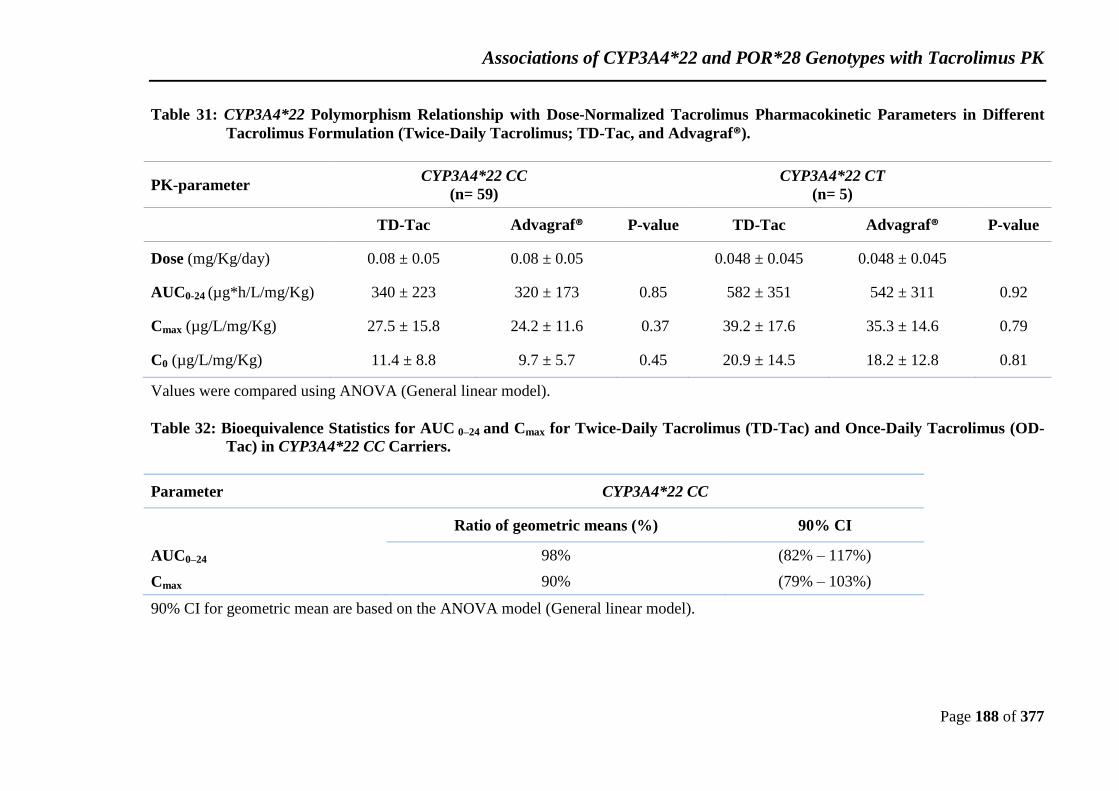
Associations of CYP3A4*22 and POR*28 Genotypes with Tacrolimus PK
Page 188 of 377
Table 31: CYP3A4*22 Polymorphism Relationship with Dose-Normalized Tacrolimus Pharmacokinetic Parameters in Different
Tacrolimus Formulation (Twice-Daily Tacrolimus; TD-Tac, and Advagraf®).
PK-parameter CYP3A4*22 CC
(n= 59)
CYP3A4*22 CT
(n= 5)
TD-Tac Advagraf® P-value TD-Tac Advagraf® P-value
Dose (mg/Kg/day) 0.08 ± 0.05 0.08 ± 0.05 0.048 ± 0.045 0.048 ± 0.045
AUC0-24 (µg*h/L/mg/Kg) 340 ± 223 320 ± 173 0.85 582 ± 351 542 ± 311 0.92
Cmax (µg/L/mg/Kg) 27.5 ± 15.8 24.2 ± 11.6 0.37 39.2 ± 17.6 35.3 ± 14.6 0.79
C0 (µg/L/mg/Kg) 11.4 ± 8.8 9.7 ± 5.7 0.45 20.9 ± 14.5 18.2 ± 12.8 0.81
Values were compared using ANOVA (General linear model).
Table 32: Bioequivalence Statistics for AUC 0–24 and Cmax for Twice-Daily Tacrolimus (TD-Tac) and Once-Daily Tacrolimus (OD-
Tac) in CYP3A4*22 CC Carriers.
Parameter CYP3A4*22 CC
Ratio of geometric means (%) 90% CI
AUC0–24 98% (82% – 117%)
Cmax 90% (79% – 103%)
90% CI for geometric mean are based on the ANOVA model (General linear model).

Associations of CYP3A4*22 and POR*28 Genotypes with Tacrolimus PK
Page 189 of 377
Figure 37: CYP3A4*22 Genotype and Tacrolimus Pharmacokinetic Parameters of Twice-daily Tacrolimus (TD-Tac) and
Advagraf®. Boxes represent the interquartile range, line in the box represents the median value, symbol in the box represents
the mean value, outer lines represent the minimal and maximal value and the values beyond the whiskers (asterisks) are
outliers.
CYP3A4*22
Form
CTCC
AdvagrafTD-TacAdvagrafTD-Tac
80
70
60
50
40
30
20
10
0Mea
n C
max
(µ
g/L
)/ 0
.1 m
g/k
g d
ose Dose-Normalized Cmax
CYP3A4*22
Form
CTCC
AdvagrafTD-TacAdvagrafTD-Tac
1200
1000
800
600
400
200
0
Mea
n
AU
C0-
24 (
hr*
µg
/L)/
0.1
mg
/kg
do
se
Dose-Normalized AUC0-24
CYP3A4*22
Form
CTCC
AdvagrafTD-TacAdvagrafTD-Tac
50
40
30
20
10
0
Mea
n C
0 (µ
g/L
)/ 0
.1 m
g/k
g d
ose
Dose-Normalized C0
CYP3A4*22
Form
CTCC
AdvagrafTD-TacAdvagrafTD-Tac
0.20
0.15
0.10
0.05
0.00
Mea
n d
ose
mg
/kg
Tacrolimus Daily Dose
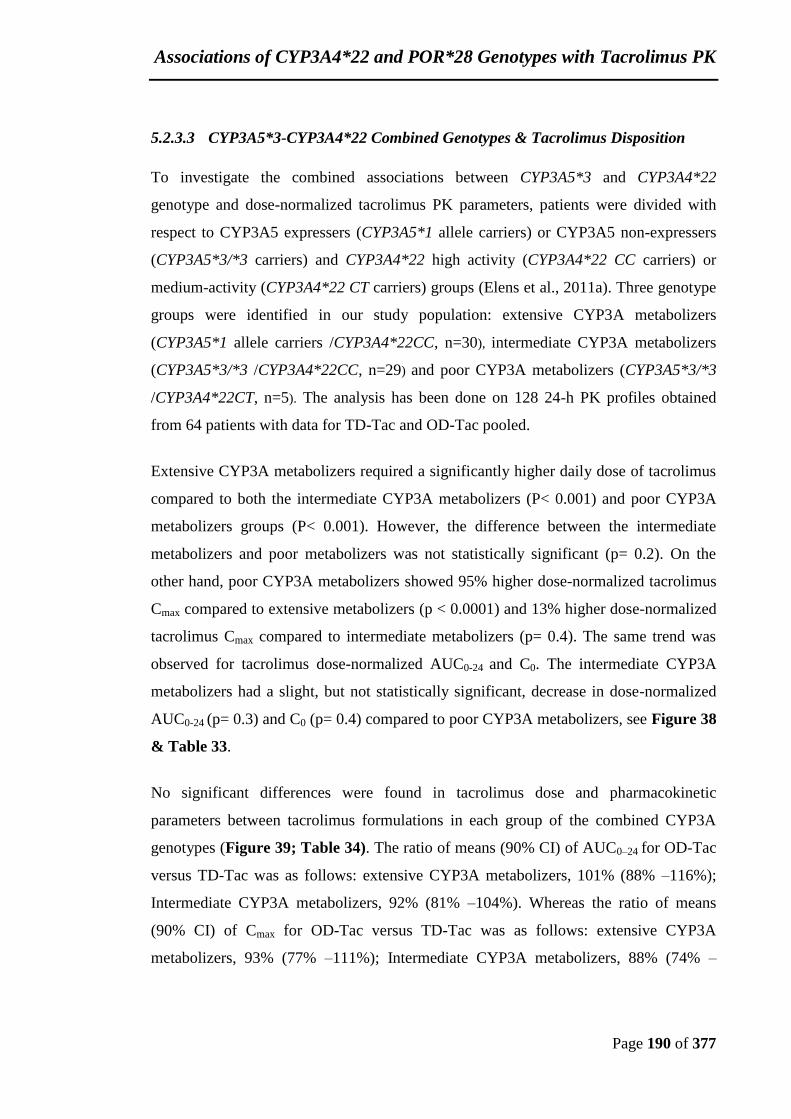
Associations of CYP3A4*22 and POR*28 Genotypes with Tacrolimus PK
Page 190 of 377
5.2.3.3 CYP3A5*3-CYP3A4*22 Combined Genotypes & Tacrolimus Disposition
To investigate the combined associations between CYP3A5*3 and CYP3A4*22
genotype and dose-normalized tacrolimus PK parameters, patients were divided with
respect to CYP3A5 expressers (CYP3A5*1 allele carriers) or CYP3A5 non-expressers
(CYP3A5*3/*3 carriers) and CYP3A4*22 high activity (CYP3A4*22 CC carriers) or
medium-activity (CYP3A4*22 CT carriers) groups (Elens et al., 2011a). Three genotype
groups were identified in our study population: extensive CYP3A metabolizers
(CYP3A5*1 allele carriers /CYP3A4*22CC, n=30), intermediate CYP3A metabolizers
(CYP3A5*3/*3 /CYP3A4*22CC, n=29) and poor CYP3A metabolizers (CYP3A5*3/*3
/CYP3A4*22CT, n=5). The analysis has been done on 128 24-h PK profiles obtained
from 64 patients with data for TD-Tac and OD-Tac pooled.
Extensive CYP3A metabolizers required a significantly higher daily dose of tacrolimus
compared to both the intermediate CYP3A metabolizers (P< 0.001) and poor CYP3A
metabolizers groups (P< 0.001). However, the difference between the intermediate
metabolizers and poor metabolizers was not statistically significant (p= 0.2). On the
other hand, poor CYP3A metabolizers showed 95% higher dose-normalized tacrolimus
Cmax compared to extensive metabolizers (p < 0.0001) and 13% higher dose-normalized
tacrolimus Cmax compared to intermediate metabolizers (p= 0.4). The same trend was
observed for tacrolimus dose-normalized AUC0-24 and C0. The intermediate CYP3A
metabolizers had a slight, but not statistically significant, decrease in dose-normalized
AUC0-24 (p= 0.3) and C0 (p= 0.4) compared to poor CYP3A metabolizers, see Figure 38
& Table 33.
No significant differences were found in tacrolimus dose and pharmacokinetic
parameters between tacrolimus formulations in each group of the combined CYP3A
genotypes (Figure 39; Table 34). The ratio of means (90% CI) of AUC0–24 for OD-Tac
versus TD-Tac was as follows: extensive CYP3A metabolizers, 101% (88% –116%);
Intermediate CYP3A metabolizers, 92% (81% –104%). Whereas the ratio of means
(90% CI) of Cmax for OD-Tac versus TD-Tac was as follows: extensive CYP3A
metabolizers, 93% (77% –111%); Intermediate CYP3A metabolizers, 88% (74% –

Associations of CYP3A4*22 and POR*28 Genotypes with Tacrolimus PK
Page 191 of 377
104%). These ratios did not achieve bioequivalence limits of 80–125%. Based on Cmax
results, TD-Tac and OD-Tac are no longer bioequivalent on a 1:1 conversion (Table
35). According to EMA guidelines, the confidence intervals of the AUC0-24 ratios were
outside the bioequivalence margin (90-111%). Therefore both formulations were not
bioequivalent in all the genotype groups.
Associations of CYP3A4*22 and POR*28 Genotypes with Tacrolimus PK
Page 192 of 377
Figure 38: CYP3A5*3 and CYP3A4*22 Combined Genotypes and Dose-Normalized Tacrolimus Exposure and Dose Requirement
for the Whole Data of Once-and Twice-Daily Tacrolimus. Boxes represent the interquartile range, line in the box represents
the median value, symbol in the box represents the mean value, outer lines represent the minimal and maximal value and the
values beyond the whiskers (asterisks) are outliers Extensive CYP3A metabolizers are CYP3A5*1 allele /CYP3A4*22CC
carriers. Intermediate CYP3A metabolizers are CYP3A5*3/*3 /CYP3A4*22CC carriers. Poor CYP3A metabolizers are
CYP3A5*3/*3 /CYP3A4*22CT carriers.
Poor CYP3A metabolizers
Intermediate CYP3A metabolizers
Extensive CYP3A metabolizers
80
70
60
50
40
30
20
10
0
Mea
n Cm
ax (µ
g/L)
/ 0.1
mg/
kg d
ose Dose-Normalized Cmax
Poor CYP3A metabolizers
Intermediate CYP3A metabolizers
Extensive CYP3A metabolizers
1200
1000
800
600
400
200
0
Mea
n A
UC0
-24
(h*µ
g/L)
/ 0.
1 m
g/kg
dos
e Dose-Normalized AUC0-24
Poor CYP3A metabolizers
Intermediate CYP3A metabolizers
Extensive CYP3A metabolizers
50
40
30
20
10
0
Mea
n C0
(µg/
L)/
0.1
mg/
kg d
ose
Dose-Normalized C0
Poor CYP3A metabolizers
Intermediate CYP3A metabolizers
Extensive CYP3A metabolizers
0.20
0.15
0.10
0.05
0.00
Mea
n do
se m
g/kg
Dose mg/kg
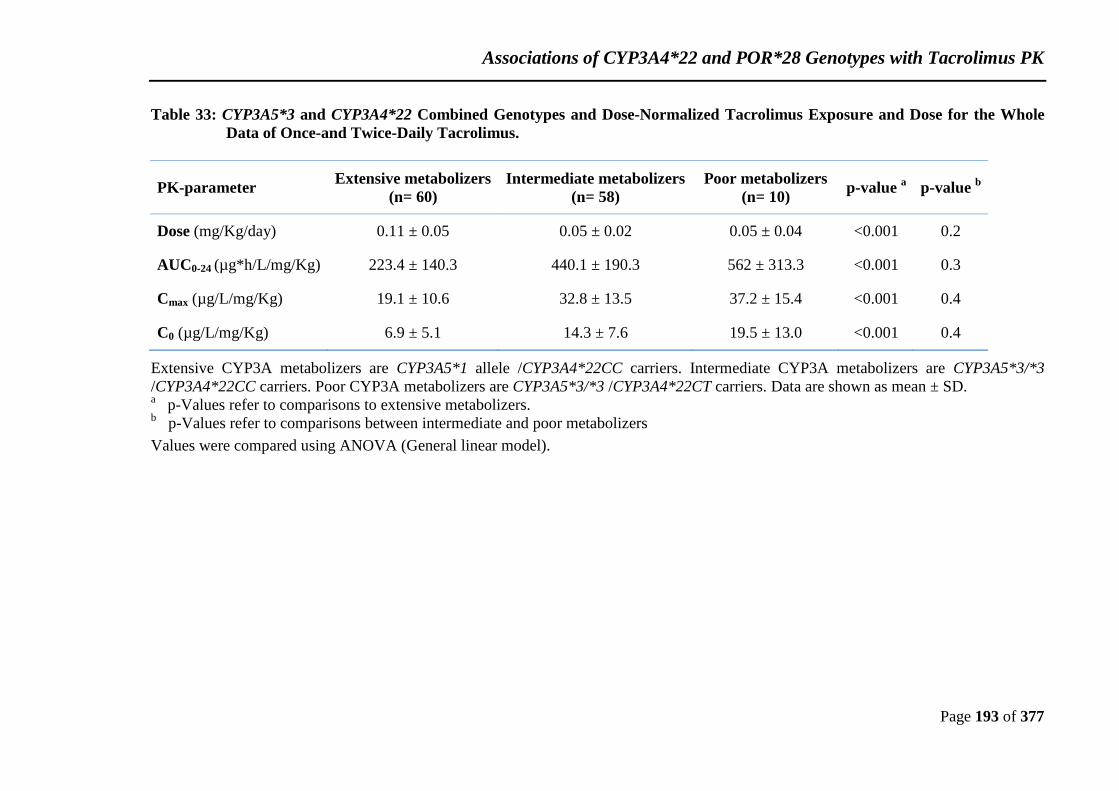
Associations of CYP3A4*22 and POR*28 Genotypes with Tacrolimus PK
Page 193 of 377
Table 33: CYP3A5*3 and CYP3A4*22 Combined Genotypes and Dose-Normalized Tacrolimus Exposure and Dose for the Whole
Data of Once-and Twice-Daily Tacrolimus.
PK-parameter Extensive metabolizers
(n= 60)
Intermediate metabolizers
(n= 58)
Poor metabolizers
(n= 10) p-value
a p-value
b
Dose (mg/Kg/day) 0.11 ± 0.05 0.05 ± 0.02 0.05 ± 0.04 <0.001 0.2
AUC0-24 (µg*h/L/mg/Kg) 223.4 ± 140.3 440.1 ± 190.3 562 ± 313.3 <0.001 0.3
Cmax (µg/L/mg/Kg) 19.1 ± 10.6 32.8 ± 13.5 37.2 ± 15.4 <0.001 0.4
C0 (µg/L/mg/Kg) 6.9 ± 5.1 14.3 ± 7.6 19.5 ± 13.0 <0.001 0.4
Extensive CYP3A metabolizers are CYP3A5*1 allele /CYP3A4*22CC carriers. Intermediate CYP3A metabolizers are CYP3A5*3/*3
/CYP3A4*22CC carriers. Poor CYP3A metabolizers are CYP3A5*3/*3 /CYP3A4*22CT carriers. Data are shown as mean ± SD. a p-Values refer to comparisons to extensive metabolizers.
b p-Values refer to comparisons between intermediate and poor metabolizers
Values were compared using ANOVA (General linear model).
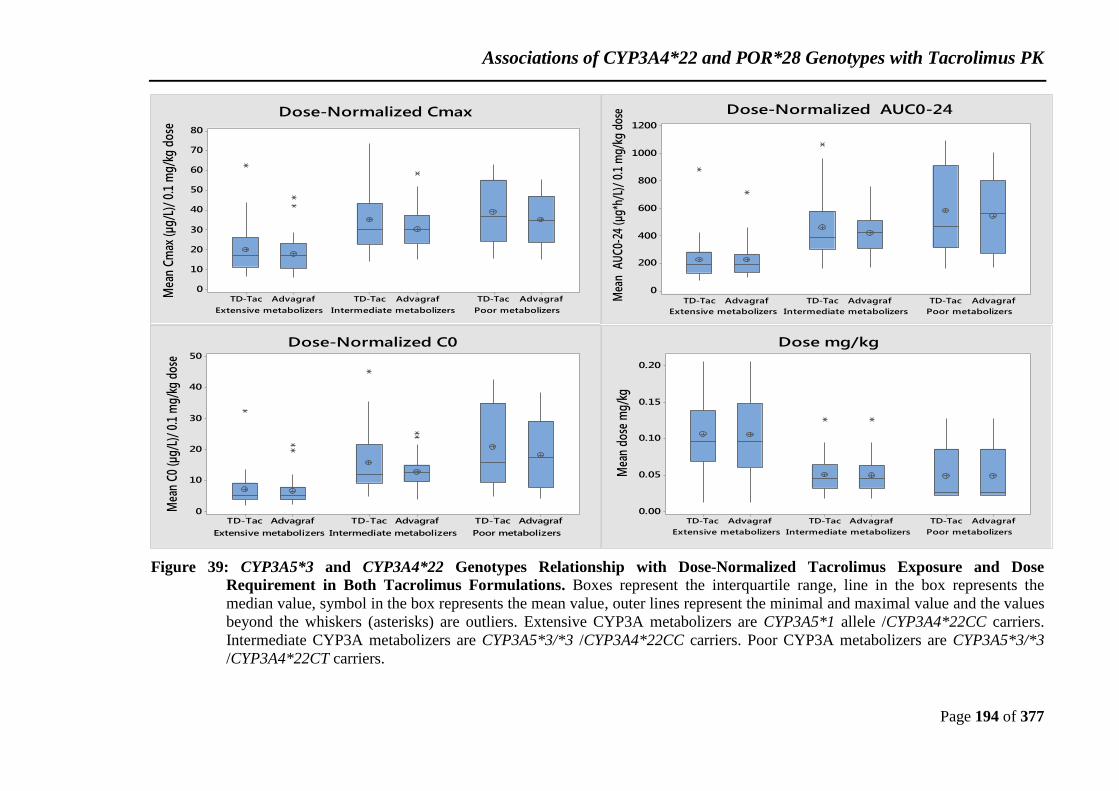
Associations of CYP3A4*22 and POR*28 Genotypes with Tacrolimus PK
Page 194 of 377
Figure 39: CYP3A5*3 and CYP3A4*22 Genotypes Relationship with Dose-Normalized Tacrolimus Exposure and Dose
Requirement in Both Tacrolimus Formulations. Boxes represent the interquartile range, line in the box represents the
median value, symbol in the box represents the mean value, outer lines represent the minimal and maximal value and the values
beyond the whiskers (asterisks) are outliers. Extensive CYP3A metabolizers are CYP3A5*1 allele /CYP3A4*22CC carriers.
Intermediate CYP3A metabolizers are CYP3A5*3/*3 /CYP3A4*22CC carriers. Poor CYP3A metabolizers are CYP3A5*3/*3
/CYP3A4*22CT carriers.
Poor metabolizersIntermediate metabolizersExtensive metabolizers
AdvagrafTD-TacAdvagrafTD-TacAdvagrafTD-Tac
80
70
60
50
40
30
20
10
0Mea
n Cm
ax (µ
g/L)
/ 0.
1 m
g/kg
dos
e
Dose-Normalized Cmax
Poor metabolizersIntermediate metabolizersExtensive metabolizers
AdvagrafTD-TacAdvagrafTD-TacAdvagrafTD-Tac
1200
1000
800
600
400
200
0
Mea
n A
UC
0-24
(µg
*h/L
)/ 0
.1 m
g/kg
dos
e Dose-Normalized AUC0-24
Poor metabolizersIntermediate metabolizersExtensive metabolizers
AdvagrafTD-TacAdvagrafTD-TacAdvagrafTD-Tac
50
40
30
20
10
0Mea
n C0
(µg/
L)/
0.1
mg/
kg d
ose
Dose-Normalized C0
Poor metabolizersIntermediate metabolizersExtensive metabolizers
AdvagrafTD-TacAdvagrafTD-TacAdvagrafTD-Tac
0.20
0.15
0.10
0.05
0.00
Mea
n do
se m
g/kg
Dose mg/kg

Associations of CYP3A4*22 and POR*28 Genotypes with Tacrolimus PK
Page 195 of 377
Table 34: Tacrolimus Dose-Normalized Pharmacokinetic Parameters for Twice-Daily Tacrolimus (TD-Tac) and Advagraf® in
CYP3A Combined Genotype Groups
PK-parameter Extensive metabolizers
(n= 30)
Intermediate metabolizers
(n= 29)
Poor metabolizers
(n= 5)
TD-Tac Advagraf® p-value TD-Tac Advagraf® p-value TD-Tac Advagraf® p-value
Dose (mg/Kg/day) 0.11 ± 0.05 0.11 ± 0.05
0.05 ± 0.02 0.05 ± 0.02
0.05 ± 0.05 0.05 ± 0.05
AUC0-24 (µg*h/L/mg/Kg) 223 ± 130 224 ± 152 0.9 419 ± 155 461 ± 221 0.6 542 ± 311 582 ± 351 0.9
Cmax (µg/L/mg/Kg) 18.1 ± 9.2 20.1 ± 11.8 0.6 30.5 ± 10.4 35.2 ± 15.9 0.3 35.3 ± 14.6 39.2 ± 17.6 0.8
C0 (µg/L/mg/Kg) 6.7 ± 4.5 7.2 ± 5.7 0.7 12.8 ± 5.1 15.8 ± 9.4 0.3 18.2 ± 12.8 20.9 ± 14.5 0.8
Extensive CYP3A metabolizers are CYP3A5*1 allele /CYP3A4*22CC carriers. Intermediate CYP3A metabolizers are CYP3A5*3/*3
/CYP3A4*22CC carriers. Poor CYP3A metabolizers are CYP3A5*3/*3 /CYP3A4*22CT carriers. Data are shown as mean ± SD. Values
were compared using ANOVA (General linear model).
Table 35: Bioequivalence Statistics for AUC 0–24 and Cmax for Twice-Daily Tacrolimus (TD-Tac) and Once-Daily Tacrolimus OD-
Tac in CYP3A Combined Genotype Groups.
Parameter Extensive metabolizers Intermediate metabolizers
Ratio of geometric means (%) 90% CI Ratio of geometric means (%) 90% CI
AUC0–24 101% (88% – 116%) 92% (81% – 104%)
Cmax 93% (77% – 111%) 88% (74% – 104%)
Extensive CYP3A metabolizers are CYP3A5*1 allele /CYP3A4*22CC carriers. Intermediate CYP3A metabolizers are CYP3A5*3/*3
/CYP3A4*22CC carriers.
90% CI for geometric mean are based on the ANOVA model (General linear model).
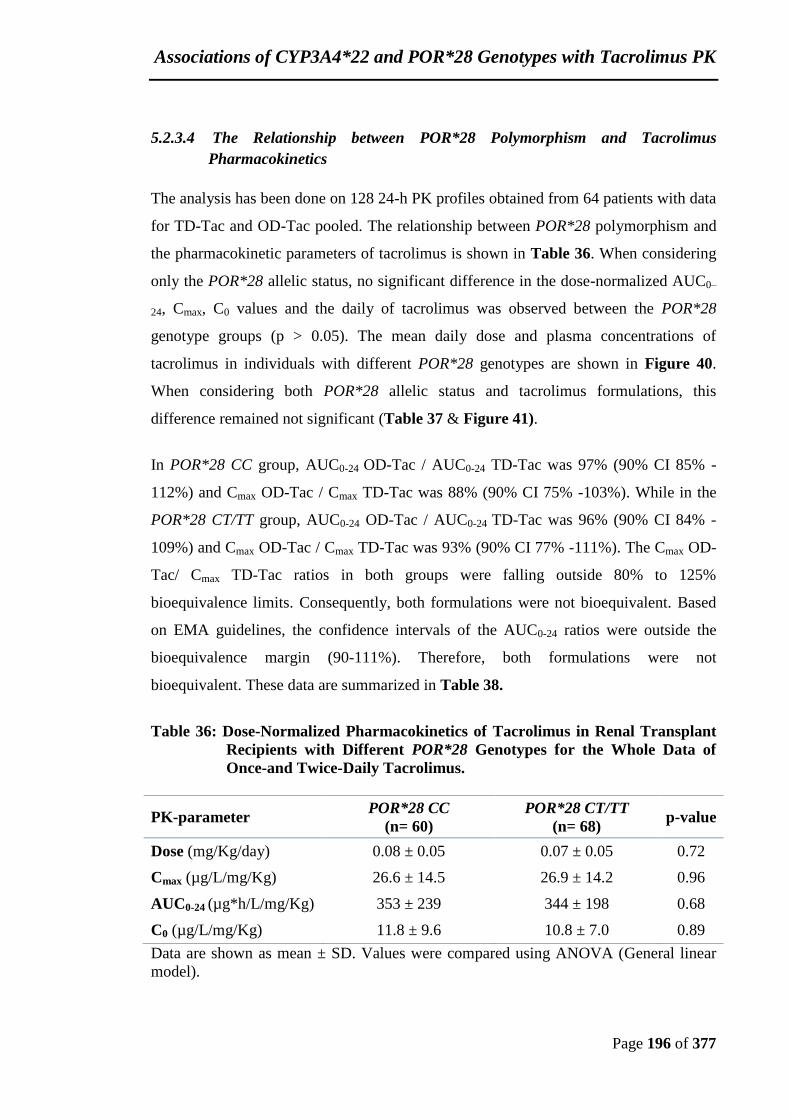
Associations of CYP3A4*22 and POR*28 Genotypes with Tacrolimus PK
Page 196 of 377
5.2.3.4 The Relationship between POR*28 Polymorphism and Tacrolimus
Pharmacokinetics
The analysis has been done on 128 24-h PK profiles obtained from 64 patients with data
for TD-Tac and OD-Tac pooled. The relationship between POR*28 polymorphism and
the pharmacokinetic parameters of tacrolimus is shown in Table 36. When considering
only the POR*28 allelic status, no significant difference in the dose-normalized AUC0–
24, Cmax, C0 values and the daily of tacrolimus was observed between the POR*28
genotype groups (p > 0.05). The mean daily dose and plasma concentrations of
tacrolimus in individuals with different POR*28 genotypes are shown in Figure 40.
When considering both POR*28 allelic status and tacrolimus formulations, this
difference remained not significant (Table 37 & Figure 41).
In POR*28 CC group, AUC0-24 OD-Tac / AUC0-24 TD-Tac was 97% (90% CI 85% -
112%) and Cmax OD-Tac / Cmax TD-Tac was 88% (90% CI 75% -103%). While in the
POR*28 CT/TT group, AUC0-24 OD-Tac / AUC0-24 TD-Tac was 96% (90% CI 84% -
109%) and Cmax OD-Tac / Cmax TD-Tac was 93% (90% CI 77% -111%). The Cmax OD-
Tac/ Cmax TD-Tac ratios in both groups were falling outside 80% to 125%
bioequivalence limits. Consequently, both formulations were not bioequivalent. Based
on EMA guidelines, the confidence intervals of the AUC0-24 ratios were outside the
bioequivalence margin (90-111%). Therefore, both formulations were not
bioequivalent. These data are summarized in Table 38.
Table 36: Dose-Normalized Pharmacokinetics of Tacrolimus in Renal Transplant
Recipients with Different POR*28 Genotypes for the Whole Data of
Once-and Twice-Daily Tacrolimus.
PK-parameter POR*28 CC
(n= 60)
POR*28 CT/TT
(n= 68) p-value
Dose (mg/Kg/day) 0.08 ± 0.05 0.07 ± 0.05 0.72
Cmax (µg/L/mg/Kg) 26.6 ± 14.5 26.9 ± 14.2 0.96
AUC0-24 (µg*h/L/mg/Kg) 353 ± 239 344 ± 198 0.68
C0 (µg/L/mg/Kg) 11.8 ± 9.6 10.8 ± 7.0 0.89
Data are shown as mean ± SD. Values were compared using ANOVA (General linear
model).

Associations of CYP3A4*22 and POR*28 Genotypes with Tacrolimus PK
Page 197 of 377
Figure 40: The Dose-Normalized Mean Pharmacokinetic Parameters of Tacrolimus in Renal Transplant Recipients with Different
POR*28 Genotypes for the Whole Data of Once-and Twice-Daily Tacrolimus. Boxes represent the interquartile range, line
in the box represents the median value, symbol in the box represents the mean value, outer lines represent the minimal and
maximal value and the values beyond the whiskers (asterisks) are outliers.
CT/TTCC
80
70
60
50
40
30
20
10
0
POR*28
Mea
n C
max
(µ
g/L
)/ 0
.1 m
g/k
g d
ose
Dose-Normalized Cmax
CT/TTCC
1200
1000
800
600
400
200
0
POR*28Mea
n A
UC
0-24
(h*
µg
/L)/
0.1
mg
/kg
do
se Dose-Normalized AUC0-24
CT/TTCC
50
40
30
20
10
0
POR*28
Mea
n C
0 (µ
g/L
)/ 0
.1 m
g/k
g d
ose
Dose-Normalized C0
CT/TTCC
0.20
0.15
0.10
0.05
0.00
POR*28
Mea
n d
ose
mg
/kg
Dose mg/kg

Associations of CYP3A4*22 and POR*28 Genotypes with Tacrolimus PK
Page 198 of 377
Table 37: Correlation of POR*28 Polymorphism and Tacrolimus Formulation with Dose-Normalized Tacrolimus Pharmacokinetic
Parameters.
PK-parameter
POR*28 CC
(n= 30)
POR*28 CT/TT
(n= 34)
TD-Tac Advagraf® p-value TD-Tac Advagraf® p-value
Dose (mg/Kg/day) 0.08 ± 0.05 0.08 ± 0.05
0.07 ± 0.05 0.07 ± 0.05
AUC0-24 (µg*h/L/mg/Kg) 361 ± 260 344 ± 221 0.94 357 ± 226 331 ± 168 0.81
Cmax (µg/L/mg/Kg) 28.7 ± 16.4 24.5 ± 12.3 0.44 28.2 ± 16.2 25.5 ± 12.0 0.59
C0 (µg/L/mg/Kg) 12.5 ± 10.9 11.0 ± 8.1 0.76 11.9 ± 8.4 9.8 ± 5.3 0.40
TD-Tac: Twice daily tacrolimus.
Values were compared using ANOVA (General linear model).
Table 38: Bioequivalence Statistics for AUC 0–24 and Cmax for TD-Tac and OD-Tac in POR*28 Genotypes.
Parameter POR*28 CC POR*28 CT/TT
Ratio of geometric means (%) 90% CI Ratio of geometric means (%) 90% CI
AUC0–24 97% (85% – 112%) 96% (84% – 109%)
Cmax 88% (75% – 103%) 93% (77% – 111%)
90% CI for geometric mean are based on the ANOVA model (General linear model).
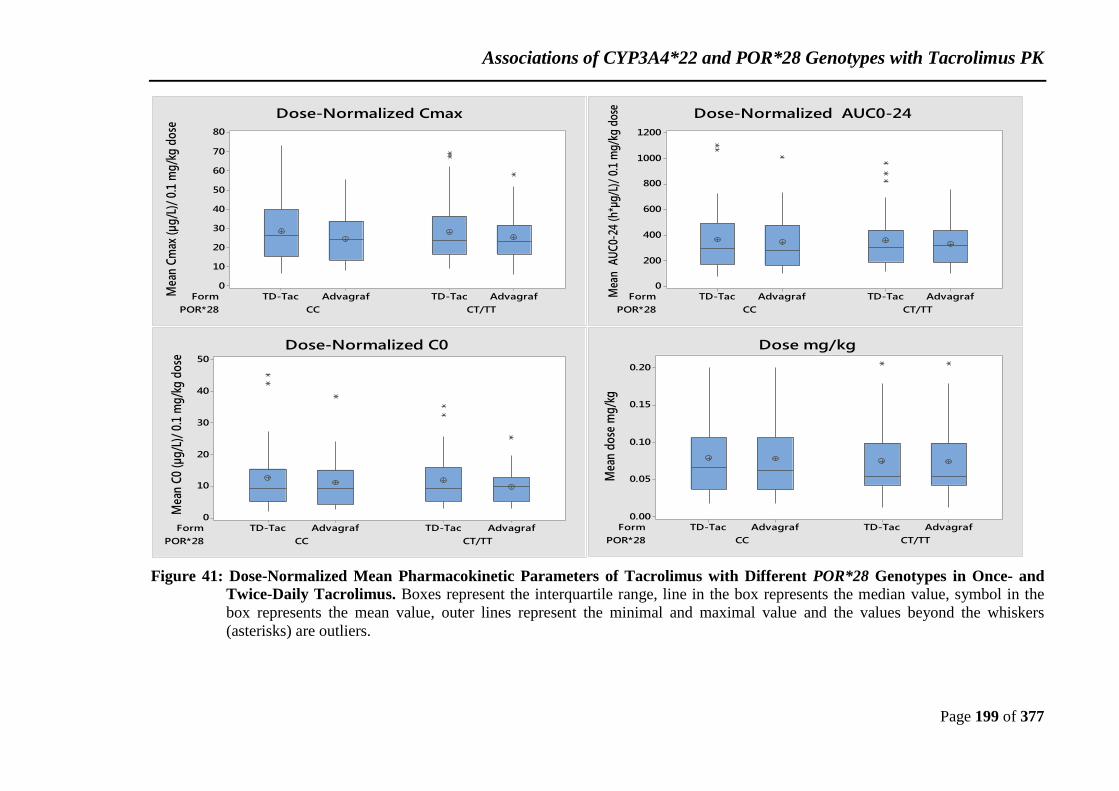
Associations of CYP3A4*22 and POR*28 Genotypes with Tacrolimus PK
Page 199 of 377
Figure 41: Dose-Normalized Mean Pharmacokinetic Parameters of Tacrolimus with Different POR*28 Genotypes in Once- and
Twice-Daily Tacrolimus. Boxes represent the interquartile range, line in the box represents the median value, symbol in the
box represents the mean value, outer lines represent the minimal and maximal value and the values beyond the whiskers
(asterisks) are outliers.
POR*28
Form
CT/TTCC
AdvagrafTD-TacAdvagrafTD-Tac
80
70
60
50
40
30
20
10
0
Mea
n C
max
(µ
g/L
)/ 0
.1 m
g/k
g d
ose
Dose-Normalized Cmax
POR*28
Form
CT/TTCC
AdvagrafTD-TacAdvagrafTD-Tac
1200
1000
800
600
400
200
0
Mea
n A
UC
0-24
(h*
µg/L
)/ 0
.1 m
g/kg
dos
e
Dose-Normalized AUC0-24
POR*28
Form
CT/TTCC
AdvagrafTD-TacAdvagrafTD-Tac
50
40
30
20
10
0
Mea
n C
0 (µ
g/L
)/ 0
.1 m
g/k
g d
ose
Dose-Normalized C0
POR*28
Form
CT/TTCC
AdvagrafTD-TacAdvagrafTD-Tac
0.20
0.15
0.10
0.05
0.00
Mea
n d
ose
mg
/kg
Dose mg/kg
Associations of CYP3A4*22 and POR*28 Genotypes with Tacrolimus PK
Page 200 of 377
5.2.3.5 POR*28 Polymorphism Association with Tacrolimus Pharmacokinetics in
CYP3A5 Expressers and Non-Expressers.
According to the likely level of CYP3A5 expression, subjects were divided into
CYP3A5 expressers (CYP3A5*1 allele carriers) and CYP3A5 non-expressers
(CYP3A5*3/*3 carriers). The effect of the POR*28 polymorphism on the
pharmacokinetics of tacrolimus was studied in each group. The demographic
characteristics of each subgroup are shown in Table 39. We observed no differences in
these characteristics between POR*28 genotypes in both CYP3A5 expressers and non-
expressers. The analysis has been done on 128 24-h PK profiles obtained from 64
patients with data for TD-Tac and OD-Tac pooled.
CYP3A5 non-expressers carrying at least one POR*28 T allele had a significant
increase in tacrolimus daily dose compared to CYP3A5 non-expressers carrying the
POR*28CC genotype [median (IQR): 0.05 (0.02 – 0.13) mg/Kg/day vs. 0.04 (0.02 –
0.08) mg/Kg/day; P < 0.01). In CYP3A5 non-expressers, the dose-normalized
tacrolimus C0 was significantly higher in POR*28 CC carriers than POR*28 T variant
allele carriers (18.7 ± 10.3 vs. 12.9 ± 6.7, P<0.01). There was no statistically significant
association between POR*28 genotype and the CYP3A5 expresser group. The dose-
normalized tacrolimus AUC0-24 for POR*28 T allele carriers expressing CYP3A5 was
not significantly different to that in POR*28 CC homozygote patients (P = 0.41). By
contrast to the CYP3A5 expresser group, POR*28 CT/TT individuals not expressing
CYP3A5 had a 24% reduction in the dose-normalized AUC0-24 (90%CI 4 to 40%;
p<0.01). Moreover, no significant difference was found in tacrolimus dose-normalized
Cmax between the POR*28 genotype groups, neither in the CYP3A5 expresser group (P
= 0.72) nor in the CYP3A5 non-expresser group (P = 0.16); See Figure 42 & Table 40.

Associations of CYP3A4*22 and POR*28 Genotypes with Tacrolimus PK
Page 201 of 377
Table 39: Patients Demographic Characteristics According to CYP3A5 and POR*28 Genotypes.
Characteristic
CYP3A5 Expressers
(*1/*1 & *1/*3)
CYP3A5 Non-expressers
(*3/*3)
POR*28 CC (n=17) POR*28 CT/TT ( n=13) POR*28 CC (n=13) POR*28 CT/TT ( n= 21)
Sex
Male/female 10/7 8/5 9/4 16/5
Age (y) , mean (SD) 51.7 ± 11.1 54.8 ± 14.2 57.2 ± 15.5 55.0 ± 11.5
Race, n (%)
White 10 (59%) 9 (69%) 7 (54%) 13 (62%) Black 4 (24%) 2 (15%) 3 (23%) 3 (14 %) Asian 3 (18%) 2 (15%) 3 (23%) 5 (24 %)
Body weight (kg), mean (SD) 83.4 ± 19.5 73.6±9.4 72.1 ± 9.1 75.1 ± 16.1
Height (cm), mean (SD) 171.7 ± 9.5 168.4±8.6 173.0 ± 9.9 168.2 ± 6.5
Diabetes, n (%) 3 (18%) 3 (23%) 3 (23%) 6 (29%) Time since transplantation (years)
Mean (SD) 3.6 ± 5.7 6.2 ± 4.2 3.8 ± 4.0 3.4 ± 4.2 Median (interquartile range, QR) 1.3 6.1 1.1 1.7
Donor type, n
Living / Deceased 10/7 4/9 5/8 10/11
Serum creatinine (µmol/L) 125.1 ± 33.4 112 ± 27 122.2 ± 61.9 132.9 ± 33.2 Serum albumin(g/L) 38.7 ± 2.6 38.4 ± 3.2 38.3 ± 2.4 39.4 ± 3.8
Haemoglobin, (g/L) 129.3 ± 14.1 140.2 ± 18.1 127.5 ± 13.5 124.5 ± 31.6
Immunosuppression therapy
Tacrolimus, n (%)
Prograf®/ Adoport® 10 (59%) / 7 (41%) 11 (85%) / 2 (15%) 10 (77%) / 3 (23%) 16 (76%) / 5 (24%)
Corticosteroids, n (%) 5 (29%) 13 (100%) 10 (77%) 11 (52%)
Azathioprine, n (%) 6 (35%) _ 3 (23%) 5 (24%)
Mycophenolate mofetil, n (%) 7 (41%) 2 (6%) 4 (31%) 6 (29%)
CYP3A4*22 Polymorphism
CYP3A4*22 CC 17 (100%) 13 (100%) 10 (77%) 19 (90%) CYP3A4*22 CT 0 (0%) 0 (0%) 3 (23%) 2 (10%)
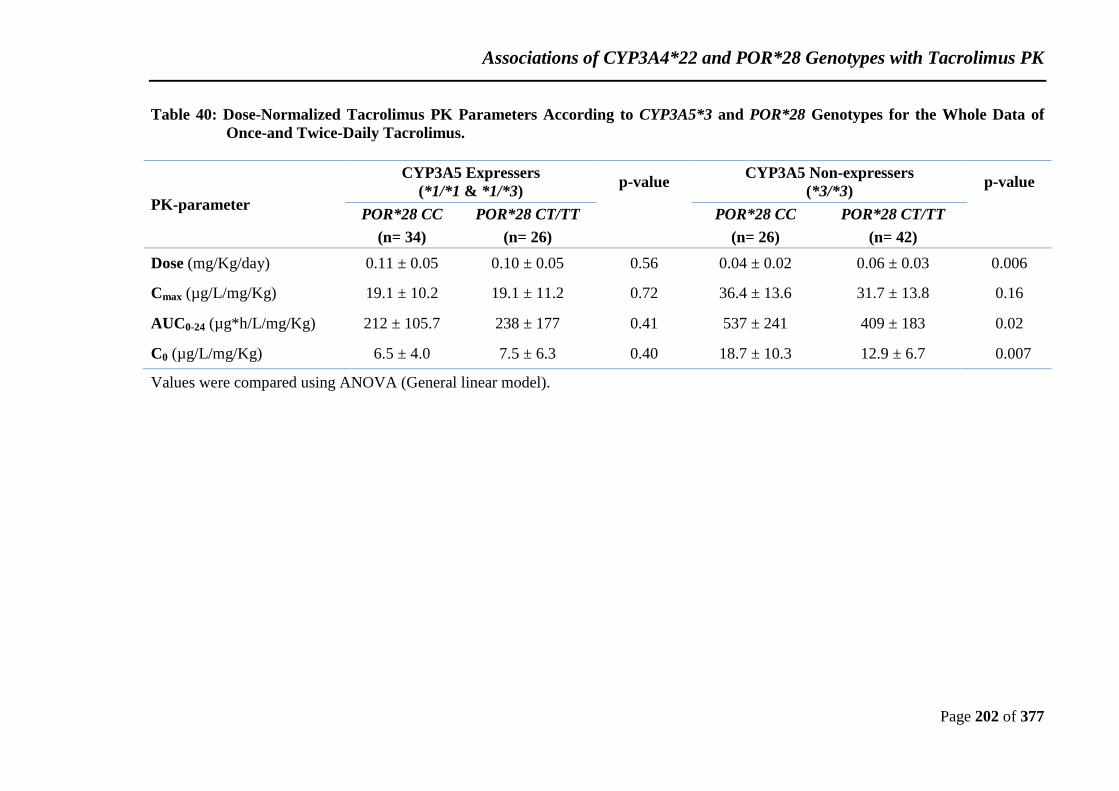
Associations of CYP3A4*22 and POR*28 Genotypes with Tacrolimus PK
Page 202 of 377
Table 40: Dose-Normalized Tacrolimus PK Parameters According to CYP3A5*3 and POR*28 Genotypes for the Whole Data of
Once-and Twice-Daily Tacrolimus.
PK-parameter
CYP3A5 Expressers
(*1/*1 & *1/*3) p-value
CYP3A5 Non-expressers
(*3/*3) p-value
POR*28 CC POR*28 CT/TT
POR*28 CC POR*28 CT/TT
(n= 34) (n= 26)
(n= 26) (n= 42)
Dose (mg/Kg/day) 0.11 ± 0.05 0.10 ± 0.05 0.56 0.04 ± 0.02 0.06 ± 0.03 0.006
Cmax (µg/L/mg/Kg) 19.1 ± 10.2 19.1 ± 11.2 0.72 36.4 ± 13.6 31.7 ± 13.8 0.16
AUC0-24 (µg*h/L/mg/Kg) 212 ± 105.7 238 ± 177 0.41 537 ± 241 409 ± 183 0.02
C0 (µg/L/mg/Kg) 6.5 ± 4.0 7.5 ± 6.3 0.40 18.7 ± 10.3 12.9 ± 6.7 0.007
Values were compared using ANOVA (General linear model).
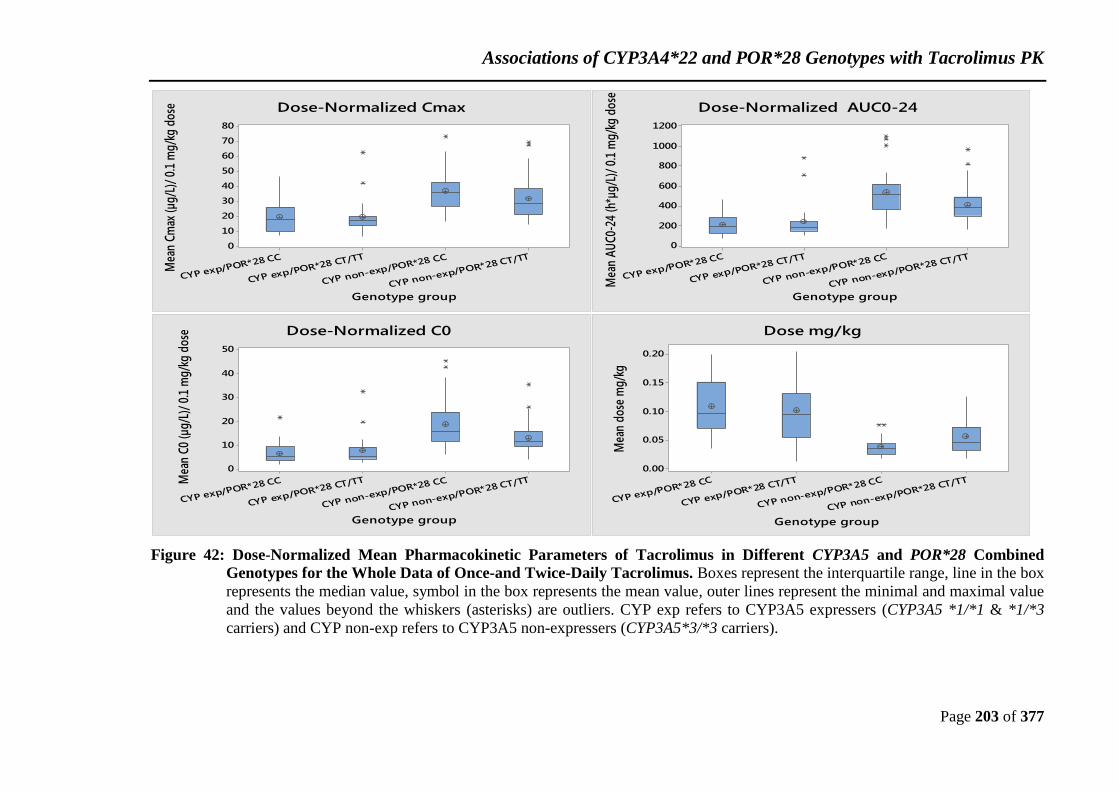
Associations of CYP3A4*22 and POR*28 Genotypes with Tacrolimus PK
Page 203 of 377
Figure 42: Dose-Normalized Mean Pharmacokinetic Parameters of Tacrolimus in Different CYP3A5 and POR*28 Combined
Genotypes for the Whole Data of Once-and Twice-Daily Tacrolimus. Boxes represent the interquartile range, line in the box
represents the median value, symbol in the box represents the mean value, outer lines represent the minimal and maximal value
and the values beyond the whiskers (asterisks) are outliers. CYP exp refers to CYP3A5 expressers (CYP3A5 *1/*1 & *1/*3
carriers) and CYP non-exp refers to CYP3A5 non-expressers (CYP3A5*3/*3 carriers).
CYP non-exp/POR*28 CT/TT
CYP non-exp/POR*28 CC
CYP exp/POR*28 CT/TT
CYP exp/POR*28 CC
80
70
60
50
40
30
20
10
0
Genotype group
Mea
n Cm
ax (µ
g/L)
/ 0.
1 m
g/kg
dos
e Dose-Normalized Cmax
CYP non-exp/POR*28 CT/TT
CYP non-exp/POR*28 CC
CYP exp/POR*28 CT/TT
CYP exp/POR*28 CC
1200
1000
800
600
400
200
0
Genotype group
Mea
n A
UC0
-24
(h*µ
g/L)
/ 0.
1 m
g/kg
dos
e
Dose-Normalized AUC0-24
CYP non-exp/POR*28 CT/TT
CYP non-exp/POR*28 CC
CYP exp/POR*28 CT/TT
CYP exp/POR*28 CC
50
40
30
20
10
0
Genotype group
Mea
n C0
(µg/
L)/
0.1
mg/
kg d
ose Dose-Normalized C0
CYP non-exp/POR*28 CT/TT
CYP non-exp/POR*28 CC
CYP exp/POR*28 CT/TT
CYP exp/POR*28 CC
0.20
0.15
0.10
0.05
0.00
Genotype group
Mea
n do
se m
g/kg
Dose mg/kg

Associations of CYP3A4*22 and POR*28 Genotypes with Tacrolimus PK
Page 204 of 377
Additionally, when considering both the combined effects of CYP3A5*3 and POR*28
allelic status and tacrolimus formulations, no significant difference in tacrolimus dose-
normalized pharmacokinetic parameters and dose was found between the POR*28
genotypes within both the CYP3A5 expressers and non-expressers (P >0.05; Table 41
& Figure 43).
In CYP3A5 expressers carrying POR*28 CC genotype, the ratios of geometric means
were 104% (90% CI of 88 –123%, p = 0.77) for AUC0–24 and 92% (90% CI 74 –115%,
p = 0.71) for Cmax. For POR*28 CT/TT carriers the ratios of geometric means were 98%
(90% CI of 71 –136%, p = 0.92) for AUC0–24 and 93% (90% CI 59 –146%, p = 0.70) for
Cmax. While in CYP3A5 non-expressers carrying POR*28 CC genotype, the ratios of
geometric means were 98% (90% CI of 71% –136%, p = 0.21 for AUC0–24 and 82%
(90% CI 64–106%, p = 0. 57) for Cmax. For POR*28 CT/TT carriers the ratios of
geometric means were 94% (90% CI of 80–112%, p = 0.64) for AUC0–24 and 92% (90%
CI 73 –117%%, p = 0.78) for Cmax. The confidence intervals of AUC0-24 OD-Tac /
AUC0-24 TD-Tac ratios were within the bioequivalence limits in CYP3A5 expressers
having POR*28 CC genotype and CYP3A5 non-expressers having POR*28 CT/TT
genotype. Whereas the confidence intervals of the other ratios were falling outside 80%
to 125% bioequivalence limits. As a result, both formulations were not bioequivalent in
all the genotype groups. Based on EMA guidelines, the confidence intervals of the
AUC0-24 ratios were outside the bioequivalence margin (90-111%) in all the genotype
groups. Consequently, the two formulations were not bioequivalent. These data are
summarized in Table 42.

Associations of CYP3A4*22 and POR*28 Genotypes with Tacrolimus PK
Page 205 of 377
Table 41: Dose-Normalized Tacrolimus Pharmacokinetic Parameters for Different Combination of CYP3A5*3 and POR*28
Genotypes in Both Once- and Twice-Daily Tacrolimus.
PK-parameter
CYP3A5 Expressers
(*1/*1 & *1/*3)
POR*28 CC
(n=17)
POR*28 CT/TT
(n=13)
TD-Tac Advagraf® P-value TD-Tac Advagraf® P-value
Dose (mg/Kg/day) 0.11 ± 0.05 0.11 ± 0.05
0.10 ± 0.05 0.10 ± 0.05
C0 (µg/L/mg/Kg) 6.4 ± 3.4 6.6 ± 4.7 0.96 8.2 ± 7.8 6.8 ± 4.5 0. 66
Cmax (µg/L/mg/Kg) 19.9 ± 10.5 18.3 ± 10.0 0. 71 20.2 ± 13.8 17.9 ± 8.3 0.70
AUC0-24 (µg*h/L/mg/Kg) 207 ± 105 216 ± 110 0. 77 245 ± 201 232 ± 158 0.92
PK-parameter
CYP3A5 Non-expressers
(*3/*3)
POR*28 CC
(n=13)
POR*28 CT/TT
(n=21)
TD-Tac Advagraf® P-value TD-Tac Advagraf® P-value
Dose (mg/Kg/day) 0.04 ± 0.02 0.04 ± 0.02
0.06 ± 0.03 0.06 ± 0.03
C0 (µg/L/mg/Kg) 20.5 ± 12.2 16.8 ± 8.1 0.51 14.1 ± 8.1 11.6 ± 4.9 0.38
Cmax (µg/L/mg/Kg) 40.1 ± 15.8 32.7 ± 10.3 0.21 33.1 ± 15.8 30.2 ± 11.6 0.64
AUC0-24 (µg*h/L/mg/Kg) 563 ± 266 511 ± 220 0.57 427 ± 216 392 ± 146 0.78
TD-Tac: Twice daily tacrolimus.
Values were compared using ANOVA (General linear model).

Associations of CYP3A4*22 and POR*28 Genotypes with Tacrolimus PK
Page 206 of 377
Table 42: Ratios of Geometric Means and 90% CI for AUC0–24 and Cmax for Tacrolimus Formulations in CYP3A5 and POR*28
Genotype Groups
Parameter
CYP3A5 Expressers
(*1/*1 & *1/*3)
POR*28 CC POR*28 CT/TT
Ratio of geometric means (%) 90% CI Ratio of geometric means (%) 90% CI
AUC0–24 104% (88% – 123%) 98% (71% – 136%)
Cmax 92% (74% – 115%) 93% (59% – 146%)
Parameter
CYP3A5 Non-expressers
(*3/*3)
POR*28 CC POR*28 CT/TT
Ratio of geometric means (%) 90% CI Ratio of geometric means (%) 90% CI
AUC0–24 98% (71% – 136%) 94% (80% – 112%)
Cmax 82% (64% – 106%) 92% (73% – 117%)
90% CI for geometric mean are based on the ANOVA model (General linear model).

Associations of CYP3A4*22 and POR*28 Genotypes with Tacrolimus PK
Page 207 of 377
Figure 43: Dose-Normalized Mean Pharmacokinetic Parameters of Tacrolimus with Different CYP3A5*3 and POR*28 Combined
Genotypes in Twice-Daily Tacrolimus (TD-Tac) and Advagrf®. Boxes represent the interquartile range, line in the box
represents the median value, symbol in the box represents the mean value, and outer lines represent the minimal and maximal
value and the values beyond the whiskers (asterisks) are outliers. CYP exp refers to CYP3A5 expressers (CYP3A5 *1/*1 &
*1/*3 carriers) and CYP non-exp refers to CYP3A5 non-expressers (CYP3A5*3/*3 carriers).
CYP non-exp/POR*28 CT/TT
CYP non-exp/POR*28 CC
CYP exp/POR*28 CT/TT
CYP exp/POR*28 CC
AdvagrafTD-Tac
AdvagrafTD-Tac
AdvagrafTD-Tac
AdvagrafTD-Tac
80
70
60
50
40
30
20
10
0
Mea
n Cm
ax (µ
g/L)
/ 0.
1 m
g/kg
dos
e Dose-Normalized Cmax
CYP non-exp/POR*28 CT/TT
CYP non-exp/POR*28 CC
CYP exp/POR*28 CT/TT
CYP exp/POR*28 CC
AdvagrafTD-Tac
AdvagrafTD-Tac
AdvagrafTD-Tac
AdvagrafTD-Tac
1200
1000
800
600
400
200
0
Mea
n A
UC0
-24
(h*µ
g/L)
/ 0.
1 m
g/kg
dos
e
Dose-Normalized AUC0-24
CYP non-exp/POR*28 CT/TT
CYP non-exp/POR*28 CC
CYP exp/POR*28 CT/TT
CYP exp/POR*28 CC
AdvagrafTD-Tac
AdvagrafTD-Tac
AdvagrafTD-Tac
AdvagrafTD-Tac
50
40
30
20
10
0
Mea
n C
0 (µ
g/L
)/ 0
.1 m
g/k
g d
ose
Dose-Normalized C0
CYP non-exp/POR*28 CT/TT
CYP non-exp/POR*28 CC
CYP exp/POR*28 CT/TT
CYP exp/POR*28 CC
AdvagrafTD-Tac
AdvagrafTD-Tac
AdvagrafTD-Tac
AdvagrafTD-Tac
0.20
0.15
0.10
0.05
0.00
Mea
n d
ose
mg
/kg
Dose mg/kg

Associations of CYP3A4*22 and POR*28 Genotypes with Tacrolimus PK
Page 208 of 377
5.2.3.6 Factors Associated with Dose Requirements of Tacrolimus.
The analysis has been done on 128 24-h PK profiles obtained from 64 patients with data
for TD-Tac and OD-Tac pooled. As we mentioned before, univariate regression analysis
showed that age, sex, haematocrit, ethnicity, time since transplant, ABCB1 3435 and
CYP3A5*3 are factors associated with tacrolimus dose requirements. However,
CYP3A4*22 served as a borderline significant factor (p= 0.06) and POR*28 had no
association with tacrolimus dose requirement.
In multiple regression analysis by stepwise selection, neither CYP3A4*22 nor POR*28
had any association with tacrolimus dose requirement. Whereas multiple regression
analysis identified the combined CYP3A5*3/ ABCB1 3435 genotypes, age, sex,
ethnicity, haematocrit, corticosteroids treatment and diabetic status as independent
variables associated with tacrolimus dose (Table 27) as mentioned before in chapter 4.
Therefore, these independent factors explain exactly the same percentage of variability
in tacrolimus dose requirements (59.9%) as shown in chapter 4.
5.2.4 Discussion
In addition to CYP3A5 activity which explains 29–35% of the variability in the studied
tacrolimus pharmacokinetic parameter. CYP3A4 activity, explains an additional 23–
29% of the variability in the studied tacrolimus pharmacokinetic parameters (de Jonge
et al., 2012). In line with recent studies that demonstrated increased tacrolimus daily
dose and dose-adjusted concentrations in renal transplant recipients carrying a
CYP3A4*22 T variant allele (Elens et al., 2011b) , we found that there was a significant
reduction in tacrolimus adjusted dose in CYP3A4*22 CT than CC genotype. Similarly,
we found that tacrolimus dose-normalized C0, Cmax and AUC0-24 were significantly
lower in CYP3A4*22 CC in comparison with CYP3A4*22 CT variant. Those results
were also confirmed by Elens colleague in another study in kidney transplant patients.
They found that CYP3A4*22 polymorphism significantly altered tacrolimus metabolism
and dose requirement early after transplantation, T allele carriers require 33% lower
tacrolimus doses than wild-type CC carriers to reach the target C0 (Elens et al., 2011a).
Furthermore, de Jonge et al. (2014) reported that steady-state oral clearance of
Associations of CYP3A4*22 and POR*28 Genotypes with Tacrolimus PK
Page 209 of 377
tacrolimus was reduced in CYP3A4*22 T-allele carriers compared with CC carriers,
resulting in 50% lower tacrolimus daily dose requirements. However, different results
were reported by Santoro et al. (2013) who did not find any association between
CYP3A4*22 and tacrolimus C0/dose, Beatriz et al. (2013) who found no significant
differences between the CYP3A4*22 genotypes and daily dose requirement and dose-
normalized C0 and Tavira et al. (2013) who reported no association between
CYP3A4*22 variant and tacrolimus dose at 1week and 6 month after transplantation. It
is not clear why these authors found no association, but sample size may have played a
part.
CYP3A4 mRNA level and enzyme activity in livers with CC genotype were reported as
1.7- and 2.5-fold, respectively, greater than in CT and TT carriers (Wang et al., 2011).
CYP3A4 variants that result in higher enzymatic activities could be linked to reduced
tacrolimus blood concentration. The discrepancy between our results and other studies,
might be due to the absence of CYP3A4*22 TT variants or could be attributed to the
very high CYP3A4*22 CC and low CYP3A4*22 CT allelic frequencies in our subjects
population. However, statistical power is not likely to be a key limiting factor in the
current study. A confounding factor is the fact that none of the CT heterozygotes were
CYP3A5 expressers. When combining CYP3A5 and CYP3A4*22, we found a
significantly higher daily dose of tacrolimus in extensive CYP3A metabolizers
compared to the intermediate CYP3A metabolizers and poor CYP3A metabolizers.
After excluding CYP3A5 expressers having CYP3A4*22 CC carriers (Extensive
CYP3A metabolizers) from the analysis we found no significant differences in
tacrolimus dose and pharmacokinetics between the CYP3A4*22 CC (intermediate
CYP3A metabolizers) and the CT (poor CYP3A metabolizers) genotype subgroups in
CYP3A5 non-expresser group, suggesting that the significant difference in tacrolimus
pharmacokinetics between CYP3A4*22 CC and CYP3A4*22 CT was due to the fact that
all CYP3A4*22T allele carriers are CYP3A5 non-expressers. Similar findings were
obtained by Gijsen et al. (2013) showing no significant difference between poor and
intermediate metabolites. In contrast to our findings, Elens et al. (2011b) reported a
strong correlation between CYP3A combined genotypes and tacrolimus disposition.
CYP3A poor metabolizer group presented dose-adjusted tacrolimus concentration 1.6-

Associations of CYP3A4*22 and POR*28 Genotypes with Tacrolimus PK
Page 210 of 377
and 4.1-fold higher than the intermediate metabolizer and extensive metabolizer groups,
respectively. This was confirmed by another study showing that CYP3A extensive
metabolizers required 2.1-fold higher doses than intermediate CYP3A metabolizers or
2.7-fold higher doses than CYP3A poor metabolizers (Bruckmueller et al., 2014).
It is well-known that P450 oxidoreductase (POR) is essential for cytochrome P450
(CYP) activity in humans and it has been associated with increased in vivo CYP3A
activity (de Jonge et al., 2011). In this work, we studied the effect of the POR*28
genetic polymorphism on the pharmacokinetics of tacrolimus. Up to date, very few
studies were carried out to explore the influence of genetic variations in the POR gene
on tacrolimus metabolism. Our findings showed that there were no significant
differences in the pharmacokinetics between the POR*28 CC genotype and the POR*28
CT/TT genotype with respect to dose-adjusted Cmax, AUC0-24, tacrolimus trough blood
concentrations and the daily dose (mg/kg). This confirms the previous results obtained
after a single dose tacrolimus in a cohort of healthy Chinese volunteers (Zhang et al.,
2013). Conversely, another study demonstrated that the POR*28 SNP was associated
with significant increases in early tacrolimus dose-requirements in patients carrying a
CYP3A5*1 allele (CYP3A5 expressers) and had no effect on tacrolimus trough blood
concentrations and daily dose requirements in CYP3A5 non-expressers (de Jonge et al.,
2011). However, our findings were in line with previous observations by Elens et al.
(2014) who found that in the CYP3A5 expresser group, POR*28 carriers (POR*1/*28
and POR*28/*28) had low tacrolimus dose-adjusted C0 when compared with POR*1/*1
patients. They also found a significant decrease in dose-adjusted C0 in POR*28/*28
individuals not expressing CYP3A5 compared to POR*1/*28 and POR*1/*1carriers.
The inconsistency between these results and our findings might be due to our relatively
small study population. The inconsistency in the POR*28 influence makes it a poor
candidate for inclusion in pharmacogenetic algorithms based on currently available
data. More powerful studies are needed to reach a definitive conclusion.

4β-Hydroxycholesterol as A Biomarker for CYP3A Activity in Informing
Tacrolimus Dosing
Page 211 of 377
6 Chapter 6. 4β-hydroxycholesterol Measurement as a Potential Biomarker for CYP3A4 and CYP3A5 Activity in Informing Tacrolimus Dosing.
6.1 Introduction
CYP3A enzymes exhibit a large variation in hepatic expression and biological activity
between different individuals (Diczfalusy et al., 2009). 4β-hydroxycholesterol (4β-
OHC) concentration increases with the number of active CYP3A5*1 alleles. Recently,
4β-HC has been shown to be an endogenous marker of P450 3A activity in clinical
practice and it is appropriate for the assessment of CYP3A activity in stable kidney
transplant recipients (Diczfalusy et al., 2011).
6.2 Objective of the Study:
The aim of this study was to investigate the relationship between genetically determined
variation in CYP3A expression in comparison to the phenotypic marker 4β-OHC and
tacrolimus pharmacokinetics and dose requirement in adult renal transplantation
recipients.
6.3 Materials and Methods
6.3.1 Patients and Study Design
This study is part of a larger pharmacokinetic study; detailed information on the study
participants and procedure can be found in Chapter 4. None of the patients were treated
with any medications known to inhibit or induce CYP3A activity. All the study samples
were collected at 12.5 hour post-dose for twice daily tacrolimus. Five mL of EDTA
anticoagulated blood was collected for 4β-hydroxycholesterol measurement. Plasma
samples were prepared by centrifugation for 10 minutes at 2500 g at room temperature
and stored frozen at approximately -20ºC until analysis.

4β-Hydroxycholesterol as A Biomarker for CYP3A Activity in Informing
Tacrolimus Dosing
Page 212 of 377
6.3.2 4β-hydroxycholesterol Analysis
This study has been conducted in collaboration with Professor Ron van Schaik’s team,
in Rotterdam. As we had some difficulty in establishing this new method in our
laboratory, I had to travel to Professor Ron van Schaik’s laboratory at Erasmus MC
University of Netherlands in Rotterdam asking for the assistance from his team who
validated the method. I have been trained by Evert de Jonge on this analytical method
and he supervised me while doing the analysis of my samples.
This analysis procedure was conducted following the method previously validated at
Clinical Chemistry Department; Erasmus MC University of Netherlands titled
“Quantification of endogenous CYP3A marker 4β-hydroxycholesterol in human plasma
by LC-ESI-MS/MS using picolinyl derivatisation.” It allows the analysis of the plasma
4β-hydroxycholesterol at concentrations ranging from 4.3-137 µg/L with a correlation
coefficient of 0.999. The lower limit of quantitation was 1.8 µg/L. Both the within-day
and between-day precision values were all < 15%.
6.3.2.1 Instrumentation
Solvent delivery was achieved using a Waters AcquityTM
binary solvent manager set at
0.3mL/minute. Sample injection was performed using Waters AcquityTM
sample
organizer and sample manager which adjusted to keep samples at 15ºC.
Chromatography was on an Acquity ultra-performance liquid chromatography (UPLC®)
BEH phenyl, 1.7µm, 2.1×100 mm column (Waters, Etten-Leur, The Netherlands)
maintained at 27ºC with Waters AcquityTM
column manager. Detection was by a Waters
Quattro Premier XETM
Mass spectrometer (Waters, Etten-Leur, The Netherlands).
MassLynx 4.1 software was used to control the UPLC/MS, record the output from the
detector and for the data acquisition, processing and quantification. The MassLynx
software was supplied by Waters, The Netherlands. The calibration curves were
generated using 4β- OHC to 4β- OHC-d7 peak area ratio versus the nominal 4β-OHC
concentrations with linear regression weighting 1/x. MS Settings: A Waters Quattro
Premier XE tandem quadrupole mass spectrometer equipped with Z spray interface was

4β-Hydroxycholesterol as A Biomarker for CYP3A Activity in Informing
Tacrolimus Dosing
Page 213 of 377
used to introduce the sample into the mass spectrometer. Argon was used as the
collision gas.
6.3.2.2 Chemicals and Reagents
4β-hydroxycholesterol was supplied by Steraloids Inc., Newport, USA and 4β-
hydroxycholesterol-d7 (I.S) was obtained from Toronto Research Chemical (North
York, Canada), while 4α-hydroxycholesterol was synthesized by SYNCOM,
Groningen, The Netherlands. LC-MS-grade methanol, acetonitrile and water were
obtained from Biosolve BV (Valkenswaard, The Netherlands). Ethanol and n-hexane
were supplied by Sigma-Aldrich (Darmstadt, Germany). Sodium hydroxide, formic
acid, picolinic acid, pyridine, triethylamine, 2-methyl-6-nitrobenzoic anhydride and 4-
dimethylaminopyridine were purchased from sigma-aldrich (Zwijndrecht, The
Netherlands). Deionised water was prepared on site (Millipore).
6.3.2.3 Stock Solutions
Calibrators and control samples were prepared in EDTA-anticoagulated plasma, using
separate stock solutions prepared in ethanol. Six non-zero calibrators (nominal values of
4.3, 8.6, 17.2, 34.5, 68.9, and 137.8 µg/L) and two control samples (nominal values of
14.5, and 50.4 µg/L) were prepared. Calibrators and controls were aliquoted and stored
at approximately -80°C until the day of analysis. Stock solution of 4β-
hydroxycholesterol-d7 (internal standard) was prepared in ethanol to give a
concentration of 20 mg/mL and then stored at -20°C until use. On the day of the
analysis, 250µL of the stock solution was freshly diluted with 50 ml of deionized water
to give a concentration of 100 µg/L.
6.3.2.4 Extraction Procedure
For sample preparation, 50µL of calibrators, quality control, or patient samples; 50µL
of internal standard and 500µL of 1 M ethanolic potassium hydroxide (5.61 g KOH/100
mL ethanol) were pipetted into a 4.5-mL glass tube. After mixing and incubation at
37°C for 30 minutes, 300µL of deionized water was added and samples were extracted

4β-Hydroxycholesterol as A Biomarker for CYP3A Activity in Informing
Tacrolimus Dosing
Page 214 of 377
twice by the addition of 1 mL n-hexane to each tube. In each extraction step the tubes
were vigorously shaken for 15 minutes using Denley Reciprocal Mixer (Denley
Instruments Ltd) and centrifuged at 800g for 3 minutes. The organic layers were then
transferred to 4.5-mL glass tubes, placed in a Savant SpeedVac Plus Model Sc210A
(Thermo Life Sciences) at 60°C, and evaporated to dryness. 170 µL of freshly prepared
derivatization mixture (10mg 2-methyl-6-nitrobenzoic anhydride, 3mg 4-
dimethylaminopyridine, 8mg picolinic acid, 150µL pyridine and 20 µL triethylamine
per reaction) was added to the dried residues and after mixing and incubation at 37°C
for 45 minutes, 500µL of LC-MS grade water and 1 mL n-hexane were added to each
tube. The tubes then were vigorously shaken for 15 minutes and centrifuged at 800g for
3 minutes. The organic layers were then transferred to 1.1mL polypropylene vials,
placed in a Savant SpeedVac Plus Model Sc210A (Thermo Life Sciences) at 60°C, and
evaporated to dryness. The dried extracts were reconstituted with 200 µL of the mobile
phase mixture (LC-MS grade Water: methanol/acetonitrile (2:1), 2:8) mixed for 1 min,
and then transferred to autosampler tray set at 15°C temperature. The autosampler
injected a 10µL aliquot of each extract onto the analytical column (Figure 44). To
correct 4β-hydroxycholesterol levels, total cholesterol was measured on Roche Modular
P800 analyzer.
6.3.2.5 Chromatographic Condition:
Validated LC-MS/MS method was used for the analysis of 4β-hydroxycholesterol in
plasma. The Acquity UPLC® BEH phenyl, 1.7µm, 2.1×100 mm column (Waters,
Etten-Leur, The Netherlands) was used for the separation of 4β-hydroxycholesterol and
internal standard at temperature of 27°C. The mobile phase was pumped isocratically at
a flow rate of 0.3 mL/min and consisted of a mixture of mobile phase A (LC-MS water
+ 1 mL/L formic acid) and mobile phase B (Methanol/Acetonitrile (2:1 (w/w)) at a ratio
of 21:79 respectively. The sample injection volume was 10 µL. Tandem mass
spectrometric detection and quantification was performed in the positive electrospray
ionization mode using multiple reaction monitoring (MRM) mode. Mass transitions
selected were m/z 635/146 and 613/490 for 4β-OHC quantifier and qualifier ions,

4β-Hydroxycholesterol as A Biomarker for CYP3A Activity in Informing
Tacrolimus Dosing
Page 215 of 377
respectively and m/z 642/146 for 4β-OHC-d7. Ms Settings were optimized manually.
The source temperature was set at 130°C and the desolvation temperature was
maintained at 350°C. The desolvation gas flow and cone gas flow were set at 800L/hr
and 150L/hr, respectively. The capillary voltage and cone voltage were kept at 1.5kV
and 38V, respectively for all compounds. The dwell times were set at 100 msec. The
collision cell was set at 7.42 e-3 mbar with argon gas. The collision energy was 25eV
for both 4β-OHC and 4β-OHC-d7. A Windows PC running MassLynx software was
used to control the LC-MS/MS, record the output from the detector and integrate the
peak areas of the drug and the internal standard. For quantitative calculation of 4β-
hydroxycholesterol, an excel sheet was generated using 4β- OHC to 4β- OHC-d7 peak
area ratio versus the nominal 4β- OHC concentrations with linear regression weighting
1/x (Figure 44).

4β-Hydroxycholesterol as A Biomarker for CYP3A Activity in Informing
Tacrolimus Dosing
Page 216 of 377
Figure 44: Schematic Diagram of the 4β-hydroxycholesterol Extraction Procedure.
4β-Hydroxycholesterol as A Biomarker for CYP3A Activity in Informing
Tacrolimus Dosing
Page 217 of 377
6.3.3 Tacrolimus Blood Concentration Measurement
Blood concentration of tacrolimus was determined using the liquid chromatography-
mass spectrometry (LC - MS - MS) method according to the procedures that described
previously (Chapter 4). Both the within-day and between-day accuracy values were
within 93.1-109.4% and 95.1-105.3%, respectively. The lower limit of quantitation was
250ng/L.
6.3.4 Determination of CYP3A5 Genotype.
DNA was extracted from peripheral blood samples using QIAamp DNA Blood Mini Kit
(QIAGEN®, West Sussex, UK). CYP3A5*1/*3 polymorphism was genotyped using real
time polymerase chain reaction (PCR), a LightCycler based technique, as described in
detail in Chapter 4.
6.3.5 Statistical Analysis
4β-hydroxycholesterol and cholesterol individual plasma concentrations were
determined for each genotype. Statistical analysis was performed using Minitab
statistical software (Minitab17) to assess the statistical significance of differences in 4β-
hydroxycholesterol and 4β-hydroxycholesterol: cholesterol ratios in tacrolimus kinetics
between different genotype groups. The log-transformed data was analysed using
analysis of variance (ANOVA). Data are expressed as mean ± standard deviation (S.D.).
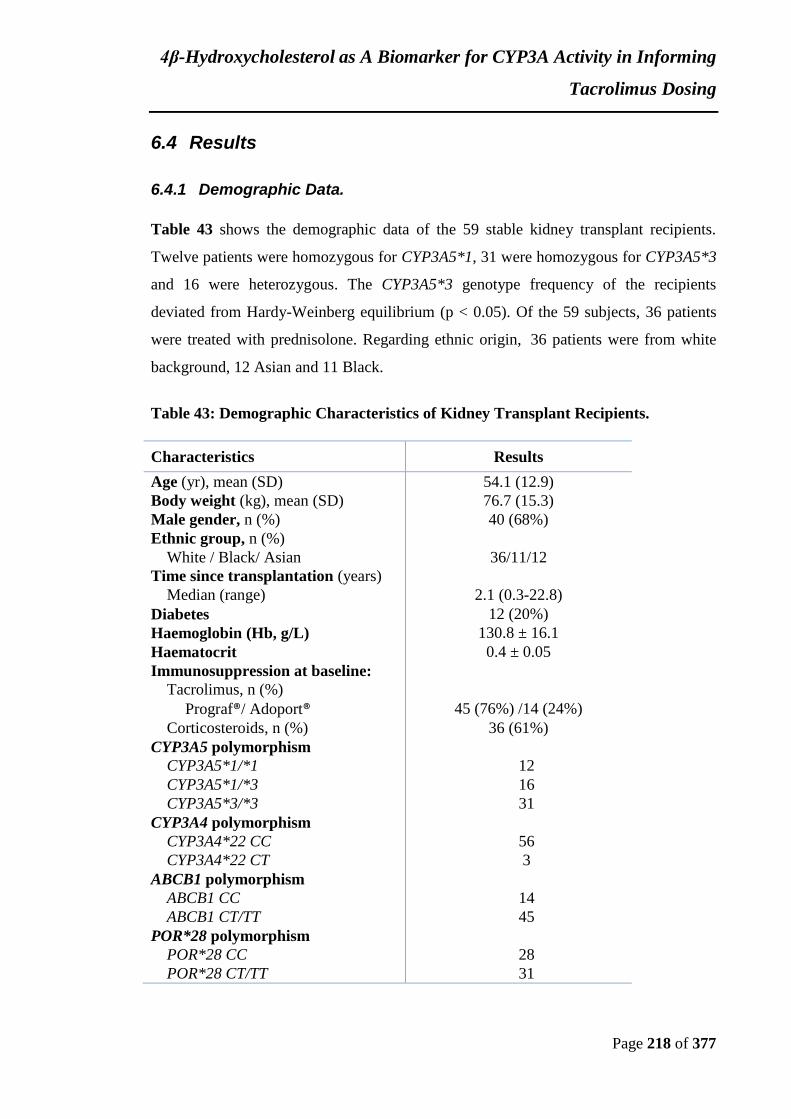
4β-Hydroxycholesterol as A Biomarker for CYP3A Activity in Informing
Tacrolimus Dosing
Page 218 of 377
6.4 Results
6.4.1 Demographic Data.
Table 43 shows the demographic data of the 59 stable kidney transplant recipients.
Twelve patients were homozygous for CYP3A5*1, 31 were homozygous for CYP3A5*3
and 16 were heterozygous. The CYP3A5*3 genotype frequency of the recipients
deviated from Hardy-Weinberg equilibrium (p < 0.05). Of the 59 subjects, 36 patients
were treated with prednisolone. Regarding ethnic origin, 36 patients were from white
background, 12 Asian and 11 Black.
Table 43: Demographic Characteristics of Kidney Transplant Recipients.
Characteristics Results
Age (yr), mean (SD) 54.1 (12.9)
Body weight (kg), mean (SD) 76.7 (15.3)
Male gender, n (%) 40 (68%)
Ethnic group, n (%)
White / Black/ Asian 36/11/12
Time since transplantation (years)
Median (range) 2.1 (0.3-22.8)
Diabetes 12 (20%)
Haemoglobin (Hb, g/L) 130.8 ± 16.1
Haematocrit 0.4 ± 0.05
Immunosuppression at baseline:
Tacrolimus, n (%)
Prograf®/ Adoport® 45 (76%) /14 (24%)
Corticosteroids, n (%) 36 (61%)
CYP3A5 polymorphism
CYP3A5*1/*1 12
CYP3A5*1/*3 16
CYP3A5*3/*3 31
CYP3A4 polymorphism
CYP3A4*22 CC 56
CYP3A4*22 CT 3
ABCB1 polymorphism
ABCB1 CC 14
ABCB1 CT/TT 45
POR*28 polymorphism
POR*28 CC 28
POR*28 CT/TT 31

4β-Hydroxycholesterol as A Biomarker for CYP3A Activity in Informing
Tacrolimus Dosing
Page 219 of 377
6.4.2 CYP3A5 Genotype Relationship with 4β-OHC and 4β-OHC/C Ratio
The plasma 4β-OHC concentrations and 4ß-OHC/C ratios showed a log-normal
distribution, and the data were therefore log-transformed before analysis. As shown in
Table 44, a significant difference in 4β-OHC and 4β-OHC/C ratios was observed
between CYP3A5*1/*1 and *1/*3 in comparison with the *3/*3 carriers (p<0.01).
However, there was no corresponding significant difference in 4β-OHC and 4β-OHC/C
ratios between CYP3A5*1/*1 and *1/*3 genotypes (p>0.05). Plasma concentrations of
4β-hydroxycholesterol were 32.1 ± 12.6, 28.2 ± 16.5 and 20.9 ± 8.7 µg/L in patients
with CYP3A5*1/*1, *1/*3 and *3/*3 genotypes, respectively (Figure 45 A). The same
trend was found in 4β-OHC/C ratio. The mean 4β-OHC/C for CYP3A5*1/*1, *1/*3
compared to *3/*3 genotypes were 7.64 ± 2.3, 7.09 ± 4.1 and 5.03 ± 2.0, respectively
(p<0.01 by ANOVA, general linear model) and no difference was observed between
CYP3A5*1 variant allele carriers (Figure 45 B). Based on the above mentioned results
patients were divided into two groups CYP3A5 expressers (CYP3A5*1/*1 and *1/*3)
and CYP3A5 non-expressers (CYP3A5*3/*3). Plasma concentrations of 4β-
hydroxycholesterol were 29.9 ±14.8 and 20.9 ± 8.7 µg/L in recipients with CYP3A5*1
allele (n =28) and recipients with *3/*3 (n = 31) genotype, respectively (P<0.01, Figure
45 C). Additionally, there was a significant increase in 4β-OHC/C ratio in the CYP3A5
expresser group (*1/*3 and *1/*1, n = 28) in comparison with the CYP3A5 non-
expresser group (*3/*3, n = 31). The mean 4β-OHC/C ratio for CYP3A5*1 carriers and
*3/*3 genotype were 7.3 ± 3.4 and 5.0 ± 2.0 µg/L, respectively (P<0.001, Figure 45 D).

4β-Hydroxycholesterol as A Biomarker for CYP3A Activity in Informing Tacrolimus Dosing
Page 220 of 377
Table 44: Plasma Concentrations of 4β-hydroxycholesterol in Stable Kidney Transplant Recipients with Different Ethnic
Backgrounds and CYP3A5*3 Genotypes.
4β-OHC (µg/L) p-value 4β-OHC/C Ratio p-value
CYP3A5*3
All patients
*1/*1 (n = 12) 32.1 ± 12.6 7.6 ± 2.3
*1/*3 (n = 16) 28.2 ± 16.5 0.25 7.1 ± 4.1 0.33
*3/*3 (n = 31) 20.9 ± 8.7 0.01 5.0 ± 2.0 0.007
*1/*1 + *1/*3 (n =28) 29.9 ±14.8 7.3 ± 3.4
*3/*3 (n =31) 20.9 ± 8.7 0.001 5.0 ± 2.0 <0.001
Non-black patients
*1/*1 + *1/*3 (n = 3) 25.3 ± 7.0 6.4 ± 2.1
*3/*3 (n = 14) 20.9 ± 8.7 0.02 5.0 ± 2.0 <0.01
Black patients
*1/*1 (n = 9) 34.0 ± 13.6 8.0 ± 2.6
*1/*3 (n = 2) 50.6 ± 47.8 0.71 12.1±11.3 0.70
Ethnicity
Black (n = 11) 36.9 ± 6.2 8.8 ± 4.6
White (n = 36) 22.7 ± 1.4 <0.01 5.4± 1.9 <0.01
Asian (n = 12) 21.5 ± 2.6 <0.05 5.8 ± 2.7 <0.05
Ethnicity in CYP3A5 Expressers (*1*1/*1*3)
Black (n = 9) 37.0 ± 20.6 8.8 ± 4.6
White (n = 11) 26.0 ± 4.7 0.23 6.1 ± 1.3 0.13
Asian (n = 8) 24.5 ± 9.3 0.07 6.7 ± 2.8 0.20
The results were compared with the top group in each sub-table. Values were compared using ANOVA (General linear model).
Data are shown as mean ± SD.

4β-Hydroxycholesterol as A Biomarker for CYP3A Activity in Informing Tacrolimus Dosing
Page 221 of 377
Figure 45: The Relationship of Different CYP3A5*3 Genotypes with 4β-hydroxycholesterol Plasma Concentrations (A & C) and
4β-hydroxycholesterol / Cholesterol Ratio (B & D) in Stable Kidney Transplant Recipients. Boxes represent the
interquartile range, line in the box represents the median value, symbol in the box represents the mean value, outer lines
represent the minimal and maximal value and the values beyond the whiskers (asterisks) are outliers.
*3/*3*1/*3*1/*1
20
15
10
5
0
CYP3A5*3
4B-O
HC
/C R
atio
4β-OHC/C Ratio
*3/*3*1/*3*1/*1
90
80
70
60
50
40
30
20
10
0
CYP3A5*3
Pla
sma
4β-O
HC
(n
g/m
L)
4β-OHCA B
*3/*3*1/*1/*1/*3
90
80
70
60
50
40
30
20
10
0
CYP3A5*3
Pla
sma
4β-O
HC
(n
g/m
L)
4β-OHCC
*3/*3*1/*1/*1/*3
20
15
10
5
0
CYP3A5*3
4B-O
HC
/C R
atio
4β-OHC/C RatioD
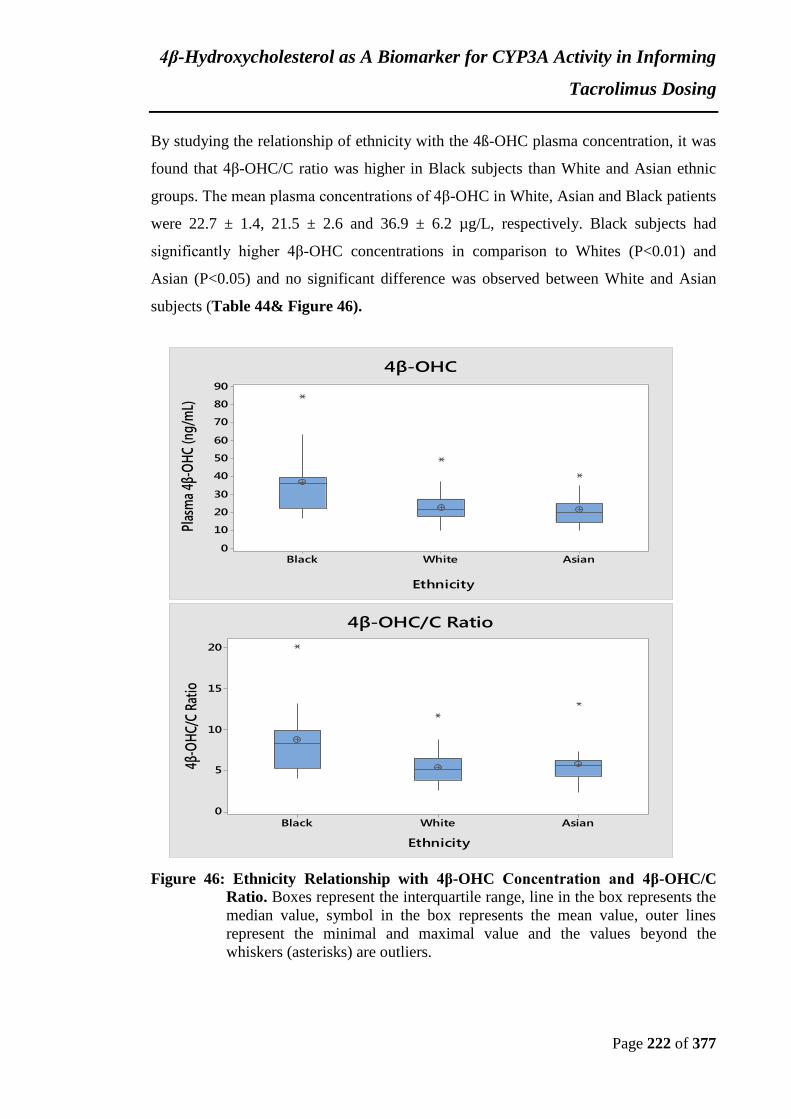
4β-Hydroxycholesterol as A Biomarker for CYP3A Activity in Informing
Tacrolimus Dosing
Page 222 of 377
By studying the relationship of ethnicity with the 4ß-OHC plasma concentration, it was
found that 4β-OHC/C ratio was higher in Black subjects than White and Asian ethnic
groups. The mean plasma concentrations of 4β-OHC in White, Asian and Black patients
were 22.7 ± 1.4, 21.5 ± 2.6 and 36.9 ± 6.2 µg/L, respectively. Black subjects had
significantly higher 4β-OHC concentrations in comparison to Whites (P<0.01) and
Asian (P<0.05) and no significant difference was observed between White and Asian
subjects (Table 44& Figure 46).
Figure 46: Ethnicity Relationship with 4β-OHC Concentration and 4β-OHC/C
Ratio. Boxes represent the interquartile range, line in the box represents the
median value, symbol in the box represents the mean value, outer lines
represent the minimal and maximal value and the values beyond the
whiskers (asterisks) are outliers.
AsianWhiteBlack
90
80
70
60
50
40
30
20
10
0
Ethnicity
Plas
ma
4β-O
HC
(ng/
mL)
4β-OHC
AsianWhiteBlack
20
15
10
5
0
Ethnicity
4β-O
HC/
C Ra
tio
4β-OHC/C Ratio

4β-Hydroxycholesterol as A Biomarker for CYP3A Activity in Informing
Tacrolimus Dosing
Page 223 of 377
The analysis was repeated excluding black patients. Again, CYP3A5 expressers (*1/*1,
n=3 and *1/*3, n = 14) demonstrated a significant increase in 4β-OHC/C ratio
compared with the CYP3A5 non-expressers (*3/*3, n = 31). The mean 4β-OHC/C ratio
was 6.4 ± 2.1 for CYP3A5*1 carriers and 5.0 ± 2.0 for CYP3A5 non-expresser (P<0.05,
Figure 47). In addition, we observed no differences in the mean of 4β-OHC/C ratio
between CYP3A5*1/*1 (n=9) versus CYP3A5*1/*3 (n=2) genotypes in black patients (P
= 0.7; Table 44 ). By repeating the analysis in CYP3A5 expressers only, no significant
difference was observed between Black (n=11), white (n=9) and Asian (n=8) subjects
(Table 44).
Figure 47: 4β-hydroxycholesterol Plasma Concentrations in Stable Non-black
Kidney Transplant Recipients with Different CYP3A5*3 Genotypes.
Boxes represent the interquartile range, line in the box represents the
median value, symbol in the box represents the mean value, outer lines
represent the minimal and maximal value and the values beyond the
whiskers (asterisks) are outliers.
*3/*3*1/*1/*1/*3
50
40
30
20
10
CYP3A5*3
Plas
ma
4β-O
HC
(ng/
mL)
4B-OHC in Non-Black patients
*3/*3*1/*1/*1/*3
14
12
10
8
6
4
2
CYP3A5*3
4β-O
HC
Rati
o
4B-OHC/C Ratio in Non-Black patients

4β-Hydroxycholesterol as A Biomarker for CYP3A Activity in Informing
Tacrolimus Dosing
Page 224 of 377
6.4.3 CYP3A5 Genotype Association with Tacrolimus Pharmacokinetics
and Dose Requirement
As shown in Table 45, highly significant differences in tacrolimus exposure and dose
requirements were observed between CYP3A5 expresser and CYP3A5 non-expresser
patients. CYP3A5*1 allele carriers have a significant decrease in dose-normalized
AUC0-24, Cmax and C0 compared to CYP3A5*3 carriers (P<0.001). On the other hand,
there was a significant increase in tacrolimus dose requirement between the two
genotype groups (P<0.001, Figure 48). Similar results were obtained from a larger
cohort of patients in Chapter 4.
Table 45: CYP3A5*3 Genotype Relationship with Dose-Normalized Tacrolimus PK
Parameters and Dose Requirement.
PK-parameter
CYP3A5 Expressers
(*1/*1 & *1/*3)
(n= 28)
CYP3A5 Non-expressers
(*3/*3)
(n= 31)
p-value
Dose (mg/Kg/day) 0.11 ± 0.05 0.05 ± 0.02 < 0.001
Cmax (µg/L/mg/Kg) 20.4 ± 12.2 34.5 ± 14.3 < 0.001
AUC0-24 (µg*h/L/mg/Kg) 227 ± 157 462 ± 215 < 0.001
C0 (µg/L/mg/Kg) 7.4 ± 5.8 16.0 ± 9.3 < 0.001
Values were compared using ANOVA (General linear model).
Data are shown as mean ± SD.
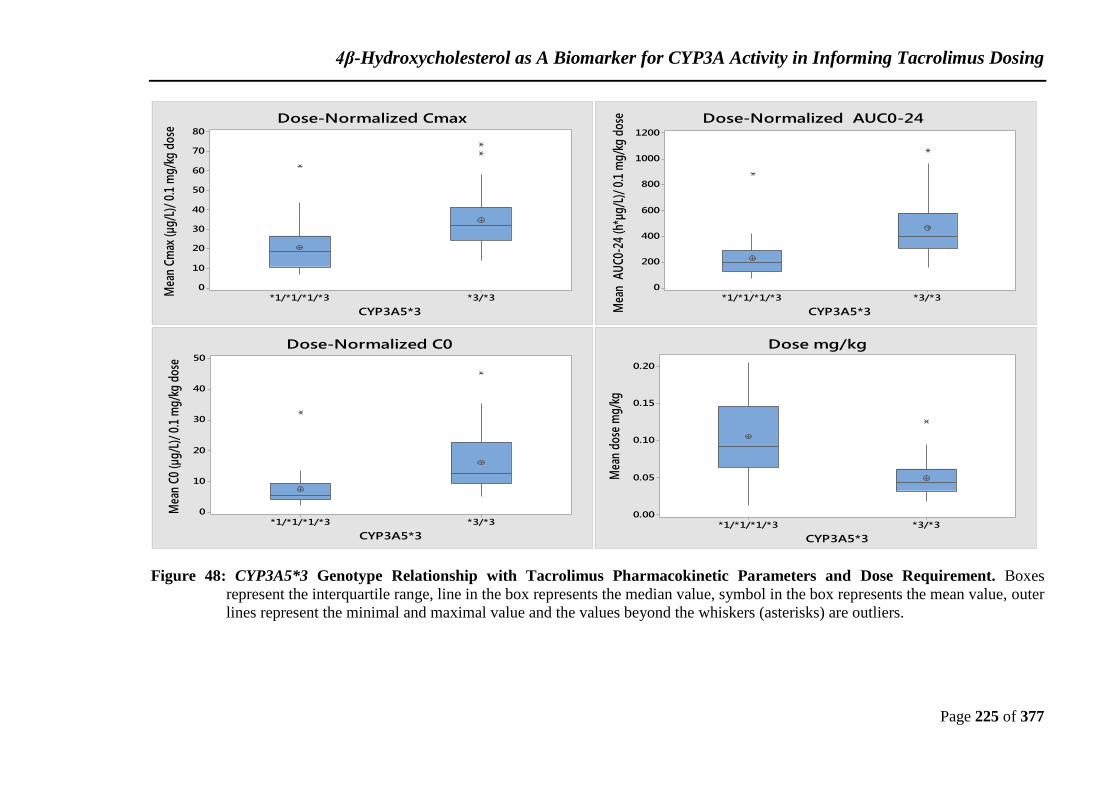
4β-Hydroxycholesterol as A Biomarker for CYP3A Activity in Informing Tacrolimus Dosing
Page 225 of 377
Figure 48: CYP3A5*3 Genotype Relationship with Tacrolimus Pharmacokinetic Parameters and Dose Requirement. Boxes
represent the interquartile range, line in the box represents the median value, symbol in the box represents the mean value, outer
lines represent the minimal and maximal value and the values beyond the whiskers (asterisks) are outliers.
*3/*3*1/*1/*1/*3
80
70
60
50
40
30
20
10
0
CYP3A5*3
Mea
n Cm
ax (µ
g/L)
/ 0.
1 m
g/kg
dos
e
Dose-Normalized Cmax
*3/*3*1/*1/*1/*3
1200
1000
800
600
400
200
0
CYP3A5*3Mea
n A
UC0
-24
(h*µ
g/L)
/ 0.
1 m
g/kg
dos
e Dose-Normalized AUC0-24
*3/*3*1/*1/*1/*3
50
40
30
20
10
0
CYP3A5*3
Mea
n C0
(µg/
L)/
0.1
mg/
kg d
ose
Dose-Normalized C0
*3/*3*1/*1/*1/*3
0.20
0.15
0.10
0.05
0.00
CYP3A5*3
Mea
n do
se m
g/kg
Dose mg/kg

4β-Hydroxycholesterol as A Biomarker for CYP3A Activity in Informing
Tacrolimus Dosing
Page 226 of 377
6.4.4 The Relationship of 4β-OHC with Tacrolimus Exposure and Dose
Requirement
A significant positive correlation was observed between log 4β-OHC/C ratio and
tacrolimus dose (r = 0.45, p < 0.001). On the other hand, A significant negative
correlation was observed between log 4β-OHC/C ratio and tacrolimus pharmacokinetic
parameters, dose-normalized Cmax (r = -0.35, p < 0.01), dose-normalized AUC0-24 (r = -
0.41, p < 0.01) and dose-normalized C0 (r = -0.41, p < 0.01). The relationships of
tacrolimus dose and PK parameters with 4β-OHC/C ratio in stable kidney transplant
recipients are shown in Figure 49. Factors associated with dose requirements of
tacrolimus were studied using univariate regression analysis. The P value was highly
significant with ethnicity, CYP3A5*3 genotype and log-transformed 4β-OHC/C ratio (p
< 0.001 for each) and ABCB1 3435 genotype (p<0.01). The P values for sex and
haematocrit were < 0.05 and it was 0.071 for age and 0.09 for CYP3A4*22 genotype.
Multiple regression analysis by stepwise selection; alpha to enter or remove was 0.15;
identified 4β-OHC/C ratio, CYP3A5*3 genotype, age, ethnicity, haematocrit and
CYP3A4*22 genotype, as independent variables associated with tacrolimus dose and
this explains 62.5% of the variability in tacrolimus dose. The contributions of the
individual variables are shown in Table 46. After adjusting for these independent
predictors of tacrolimus dose, CYP3A5*3 genotype had a strong association with
tacrolimus dose (p <0.001) and accounts for 34.1% of the variability in tacrolimus dose
requirement. Patient age became strongly associated with tacrolimus dose (P <0.05,
Table 46). Furthermore, when we repeat the multiple regression analysis by using the
CYP3A5*3/ABCB1combined genotype instead of CYP3A5*3 and ABCB1 separately, the
percentage of tacrolimus dose variability explained by these variables increased to be
63.4%, Table 46. After adjusting for these independent predictors of tacrolimus dose,
patient age became strongly associated with tacrolimus dose (P <0.05). The log-
transformed 4β-OHC/C Ratio, CYP3A5/ABCB1 Genotype and haematocrit were
responsible for 23.2%, 19.7% and 10.4%, respectively, of the variability in tacrolimus
dose requirements. The contributions of the individual variables are shown in Table 46.
r = -0.32
p = 0.014
r = 0.46
p <0.00
1
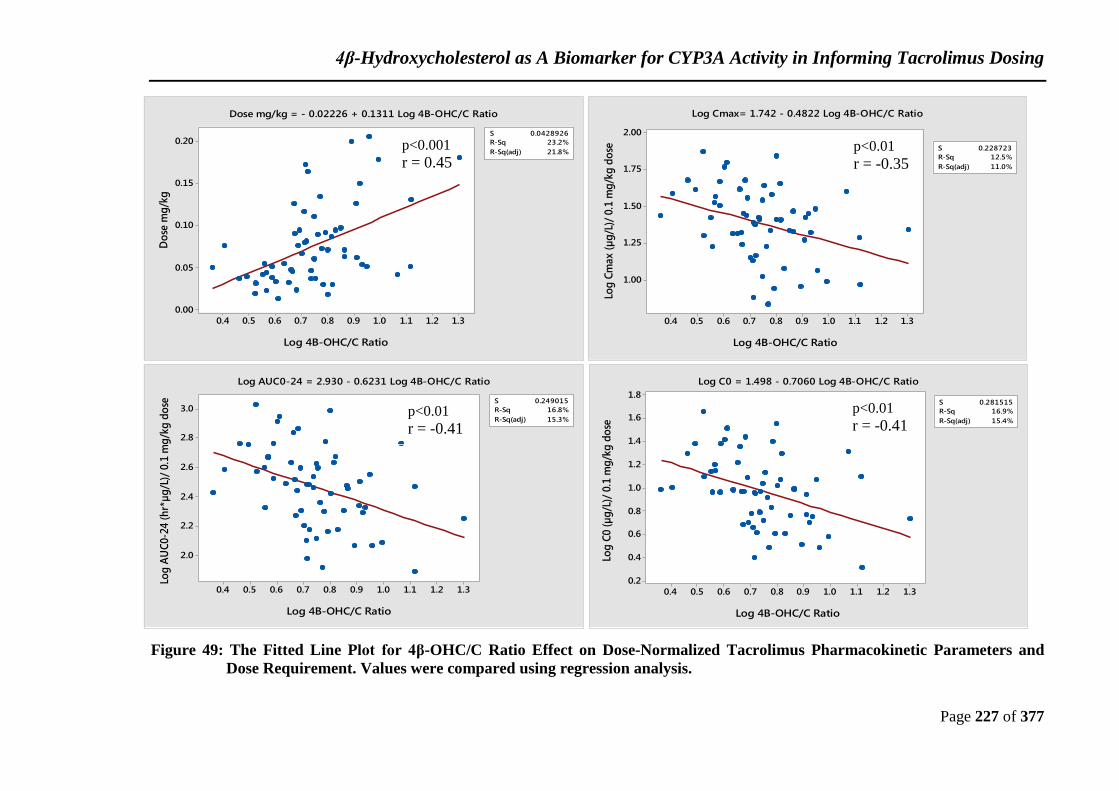
4β-Hydroxycholesterol as A Biomarker for CYP3A Activity in Informing Tacrolimus Dosing
Page 227 of 377
Figure 49: The Fitted Line Plot for 4β-OHC/C Ratio Effect on Dose-Normalized Tacrolimus Pharmacokinetic Parameters and
Dose Requirement. Values were compared using regression analysis.
1.31.21.11.00.90.80.70.60.50.4
0.20
0.15
0.10
0.05
0.00
S 0.0428926
R-Sq 23.2%
R-Sq(adj) 21.8%
Log 4B-OHC/C Ratio
Do
se m
g/k
g
Dose mg/kg = - 0.02226 + 0.1311 Log 4B-OHC/C Ratio
1.31.21.11.00.90.80.70.60.50.4
2.00
1.75
1.50
1.25
1.00
S 0.228723
R-Sq 12.5%
R-Sq(adj) 11.0%
Log 4B-OHC/C Ratio
Log
Cm
ax (
µg
/L)/
0.1
mg
/kg
do
se
Log Cmax= 1.742 - 0.4822 Log 4B-OHC/C Ratio
1.31.21.11.00.90.80.70.60.50.4
3.0
2.8
2.6
2.4
2.2
2.0
S 0.249015
R-Sq 16.8%
R-Sq(adj) 15.3%
Log 4B-OHC/C Ratio
Log
AU
C0-2
4 (
hr*
µg
/L)/
0.1
mg
/kg
do
se
Log AUC0-24 = 2.930 - 0.6231 Log 4B-OHC/C Ratio
1.31.21.11.00.90.80.70.60.50.4
1.8
1.6
1.4
1.2
1.0
0.8
0.6
0.4
0.2
S 0.281515
R-Sq 16.9%
R-Sq(adj) 15.4%
Log 4B-OHC/C RatioLo
g C
0 (
µg
/L)/
0.1
mg
/kg
do
se
Log C0 = 1.498 - 0.7060 Log 4B-OHC/C Ratio
p<0.01
r = -0.35
p<0.01
r = -0.41 p<0.01
r = -0.41
p<0.001
r = 0.45
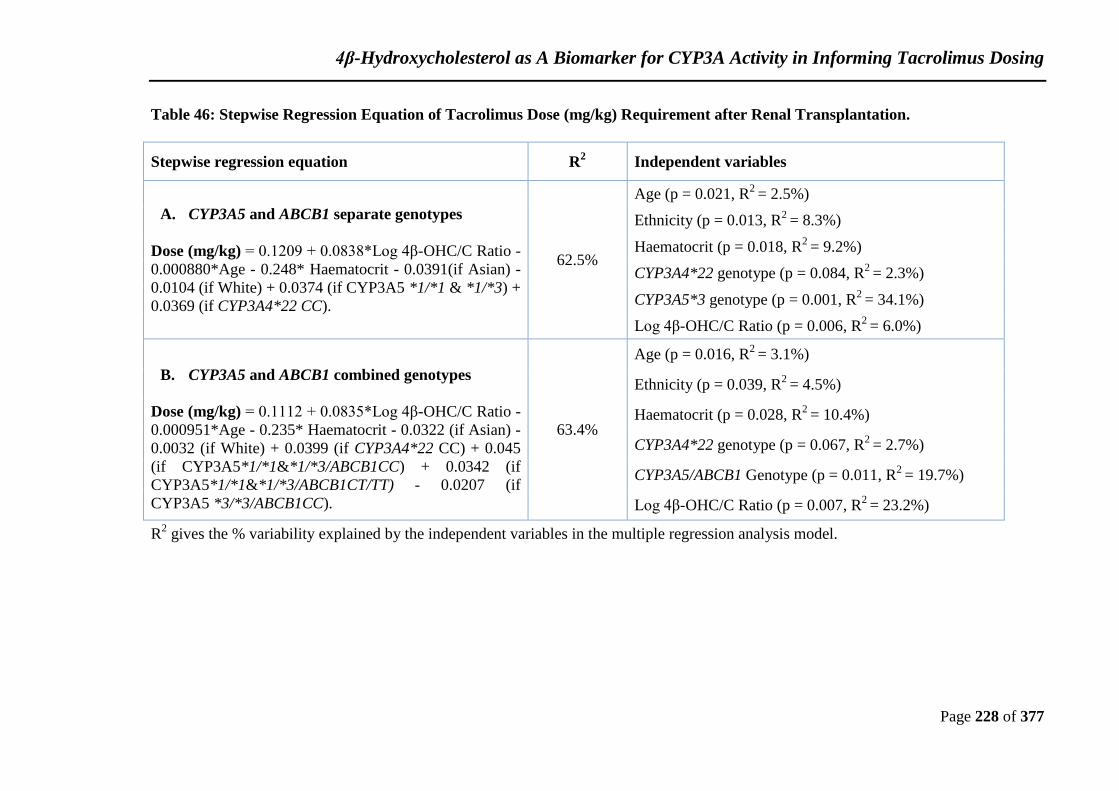
4β-Hydroxycholesterol as A Biomarker for CYP3A Activity in Informing Tacrolimus Dosing
Page 228 of 377
Table 46: Stepwise Regression Equation of Tacrolimus Dose (mg/kg) Requirement after Renal Transplantation.
Stepwise regression equation R2 Independent variables
A. CYP3A5 and ABCB1 separate genotypes
Dose (mg/kg) = 0.1209 + 0.0838*Log 4β-OHC/C Ratio -
0.000880*Age - 0.248* Haematocrit - 0.0391(if Asian) -
0.0104 (if White) + 0.0374 (if CYP3A5 *1/*1 & *1/*3) +
0.0369 (if CYP3A4*22 CC).
62.5%
Age (p = 0.021, R2
= 2.5%)
Ethnicity (p = 0.013, R2
= 8.3%)
Haematocrit (p = 0.018, R2
= 9.2%)
CYP3A4*22 genotype (p = 0.084, R2
= 2.3%)
CYP3A5*3 genotype (p = 0.001, R2
= 34.1%)
Log 4β-OHC/C Ratio (p = 0.006, R2
= 6.0%)
B. CYP3A5 and ABCB1 combined genotypes
Dose (mg/kg) = 0.1112 + 0.0835*Log 4β-OHC/C Ratio -
0.000951*Age - 0.235* Haematocrit - 0.0322 (if Asian) -
0.0032 (if White) + 0.0399 (if CYP3A4*22 CC) + 0.045
(if CYP3A5*1/*1&*1/*3/ABCB1CC) + 0.0342 (if
CYP3A5*1/*1&*1/*3/ABCB1CT/TT) - 0.0207 (if
CYP3A5 *3/*3/ABCB1CC).
63.4%
Age (p = 0.016, R2
= 3.1%)
Ethnicity (p = 0.039, R2
= 4.5%)
Haematocrit (p = 0.028, R2
= 10.4%)
CYP3A4*22 genotype (p = 0.067, R2
= 2.7%)
CYP3A5/ABCB1 Genotype (p = 0.011, R2
= 19.7%)
Log 4β-OHC/C Ratio (p = 0.007, R2
= 23.2%)
R2 gives the % variability explained by the independent variables in the multiple regression analysis model.

4β-Hydroxycholesterol as A Biomarker for CYP3A Activity in Informing
Tacrolimus Dosing
Page 229 of 377
6.5 Discussion
4β-hydroxycholesterol has been reported as a marker of CYP3A activity and it is
suitable for CYP3A activity evaluation in stable kidney transplant recipients; 4β-OHC
was stable 90 days after kidney transplantation (Suzuki et al., 2013b). Additionally,
tacrolimus is known as CYP3A5 substrate and CYP3A5 polymorphisms influence
tacrolimus trough blood concentration and dose requirements in stable kidney transplant
patients (Macphee et al., 2005). In this study, we investigated the changes in tacrolimus
dose in relation to CYP3A activity and 4β-OHC/C ratio in stable kidney transplant
patients.
First, our study showed that there was a reduction in 4β-OHC concentration with
increasing number of the CYP3A5*3 allele. However, this decrease was not significant
between CYP3A5 expressers subgroups (*1/*1 and *1/*3), this was different from the
previous reports which showed that 4β-OHC concentration decreased significantly with
increasing number of the CYP3A5*3 allele (Diczfalusy et al., 2008, Suzuki et al., 2014).
After excluding black patients from the analysis, we still found a significant difference
between CYP3A5 expressers and non-expressers. CYP3A4*22 was not included in this
study because the low frequency of this genotypes in our population. In addition,
ABCB1 polymorphism had a significant effect on 4β-OHC/C ratio. Moreover, POR*28
had no significant effect on 4β-OHC/C ratio.
Second, we found that Black subjects had significantly higher 4β-OHC concentrations
in comparison to White and Asian subjects. The majority of our population were of
Caucasian ethnic background and mainly males. This is different from previously
published report showing that Tanzanian subjects (Black-Africans) had the lowest mean
4β-hydroxycholesterol concentration followed by Swedes (Caucasians) and Koreans
(Asians) who had the highest 4β-hydroxycholesterol concentration (Diczfalusy et al.,
2008). The discrepancy between the results may be due to the genetic difference in both
studies’ populations. In our study, Black patients were North African, whereas in the
other study they were Western African. They also found a significant difference in the
mean 4β-hydroxycholesterol concentration between the three ethnic groups in women.
4β-Hydroxycholesterol as A Biomarker for CYP3A Activity in Informing
Tacrolimus Dosing
Page 230 of 377
In contrast, no difference was observed between Swedish (Caucasians) and Korean
(Asians) men (Diczfalusy et al., 2008). However, it is likely that the ethnic difference is
simply a reflection of the distribution of the CYP3A5 genotype. After excluding
CYP3A5 non-expressers from the analysis, we didn’t find any significant difference in
4β-OHC concentration and 4β-OHC/C ratio among the Black, White and Asian ethnic
groups.
Third, we confirmed that CYP3A5*3 allele had a significant impact on tacrolimus
disposition and dose requirement in this patient sample. Patients carrying at least one
CYP3A5*1 allele had a significantly lower dose-normalized tacrolimus Cmax, AUC0-24
and C0 compared to CYP3A5*3/*3 and required a higher tacrolimus dose than CYP3A5
non-expressers (MacPhee et al., 2004, Tada et al., 2005, Cusinato et al., 2014).
Fourth, a significant correlation was observed between plasma concentrations of 4β-
hydroxycholesterol or 4β-OHC/C ratio and tacrolimus dose requirement, suggesting that
the higher 4β-hydroxycholesterol levels, indicating high CYP3A activity and increase
tacrolimus dose requirement in stable kidney transplant recipients.
Finally, multiple regression analysis by stepwise selection identified CYP3A5*3
genotype (or CYP3A5*3/ ABCB1 combined genotype), log 4β-OHC/C ratio, age,
ethnicity, haematocrit and CYP3A4*22 genotype as independent variables associated
with the required tacrolimus dose. Our findings suggest that these independent variables
may explain 62.48% to 63.37% of the between-patient variability in tacrolimus dose.
This is the first report of plasma 4β-hydroxycholesterol concentration as a biomarker of
CYP3A activity in addition to CYP3A5*3 polymorphism to predict the required
tacrolimus dose in stable kidney transplant recipients. These findings may help to
explain the variability in tacrolimus dose between individuals which cannot be
explained only by the genetic factors. Further studies are required to validate the clinical
importance and utility of these findings.
Tacrolimus Within-Patient Variability
Page 231 of 377
7 Chapter 7. Tacrolimus Within-Patient Variability: the Impact of Conversion from
Immediate (Prograf® or Adoport®) to Prolonged
Release (Advagraf®) Tacrolimus Formulations
in Stable Renal Transplant Patients.
7.1 Objective of the Study:
1. To study the effect of switching stable renal transplant patients from a twice
daily formulation of tacrolimus (Prograf® or Adoport®) to once daily
formulation (Advagraf®) on within patient variability in pre-dose blood
tacrolimus concentration.
2. To investigate tacrolimus within-patient variability correlation to CYP3A5
genotype in stable kidney transplant recipients for twice a day tacrolimus
(Prograf® or Adoport®) and once a day tacrolimus, Advagraf®.
7.2 Materials and Methods
7.2.1 Patients and Study Design:
A retrospective, cross-sectional study was performed for 100 renal transplant recipients
attending routine follow-up clinical evaluations at the kidney transplant clinic, St
George’s Hospital. Clinically stable patients underwent scheduled switching from
twice- to once- daily tacrolimus between January 2010 and March 2014. As part of St
George’s Hospital routine care, patients only switched to once-daily tacrolimus if they
had a stable graft function without evidence of acute rejection episodes over the
previous 3 months. Patients qualified for the study if they were above 18 years old, had
completed at least 3 months of transplantation, had a stable graft function for at least 6
weeks, and were treated with no more than 5 mg prednisolone daily at the beginning of
the study period and were followed-up for at least 12 months. Exclusion criteria
included patients under 18 years old or treated with more than 5 mg prednisolone daily.
Conversion from tacrolimus twice-daily to once-daily was made on a 1mg: 1mg basis of
the total daily dose with target tacrolimus trough concentration 5-8 µg/L) during both
Tacrolimus Within-Patient Variability
Page 232 of 377
periods (pre-conversion and post-conversion). For each patient, demographic and
transplant characteristics, relevant clinical data, all tacrolimus dose changes, all
tacrolimus trough blood concentrations and co-medications were obtained
retrospectively from medical records. Estimated glomerular filtration rate (eGFR) was
calculated using Chronic Kidney Disease Epidemiology Collaboration (CKD-EPI)
Equation among OD-Tac converted patients (Levey et al., 2009).
7.2.2 Within-Patient Variability (WPV) Calculation:
During the study period, Tacrolimus trough concentrations obtained as a component of
routine care were determined using the Dade-Behring immunoassay (Thermo Scientific,
2011). The limit of detection was 2.0 ng /mL and the total imprecision of the method
was < 16.5% coefficient of variation. The accuracy and precision were evaluated by the
International Tacrolimus Proficiency Testing Scheme. All tacrolimus concentration
measurements and time of blood sampling were obtained from the electronic hospital
database. Dose-normalized trough concentrations were calculated to obtain comparable
values that are independent of the individual dose and body weight. Analysis of dose-
normalized tacrolimus trough blood concentrations (Tac C0) was made during periods
of stable tacrolimus doses and over the periods before and after conversion. The
duration of follow-up was 12 months after conversion. For all the patients, at least three
daily tacrolimus doses and their corresponding trough blood concentrations were
collected from the electronic patient records at St George’s Hospital. The mean number
of samples per patient was 6.3 ± 2.7 for periods of tacrolimus stable dose. The mean
number of samples per patient was 13.4 ± 10.6 and 14.3 ± 6.5 for twice- and once-daily
tacrolimus, respectively, over the periods before and after conversion, including the
whole period and not just periods of stable dosing. Within-patient variability (WPV) of
dose-normalized tacrolimus trough blood concentrations was calculated using the
following equation:
%CV = (SD x 100) / X
Where, SD is the standard deviation and X is the mean value of all the analysed
tacrolimus concentration samples.
Tacrolimus Within-Patient Variability
Page 233 of 377
Patients were characterized as having a high or low WPV using the median value of
WPV as the cutoff value, the approach used previously by Borra et al. (2010). Analysis
of WPV of tacrolimus trough blood concentrations (Tac C0) after conversion to
Advagraf® was made during periods of stable tacrolimus doses and additionally, another
analysis was made over the whole periods before and after conversion. To investigate
the relation between within-patient variability and CYP3A5 polymorphisms in both
tacrolimus formulations, all patients who participated in our previous studies and whose
CYP3A5 genotype was known (n=72) were included in this study.
7.2.3 Statistical Analysis
The WPV was calculated using Microsoft Excel 2010. Statistical analysis was
performed using Minitab statistical software (Minitab 17). Data on patients’ baseline
characteristics were expressed as mean or range. Differences in WPV between the
treatment periods were assessed using ANOVA. The log-transformed data were
analysed using analysis of variance (ANOVA) with factors for genotype group and
treatment. Kruskal–Wallis test was also used to compare medians of CV% between
different treatments and CYP3A5 genotypes when the values were non-normally
distributed.
7.3 Results
7.3.1 Patients’ Characteristics at Baseline (Pre-Conversion Patient
Characteristics)
This study of tacrolimus formulation conversion included 100 patients (60 men and 40
women) in the period January 2010 to March 2014. The baseline characteristics of the
study population are shown in Table 47. All recipients had at least 1-year follow-up.
The mean age of recipients at the time of conversion from twice-daily to once-daily
tacrolimus was 52.9 ± 12.6 years. The median [range] interval post-transplant at
conversion was 2.9 (0.3-22.8) years. Fifty-seven patients were cases of deceased donor
kidney transplantation. The concomitant immunosuppression included prednisolone
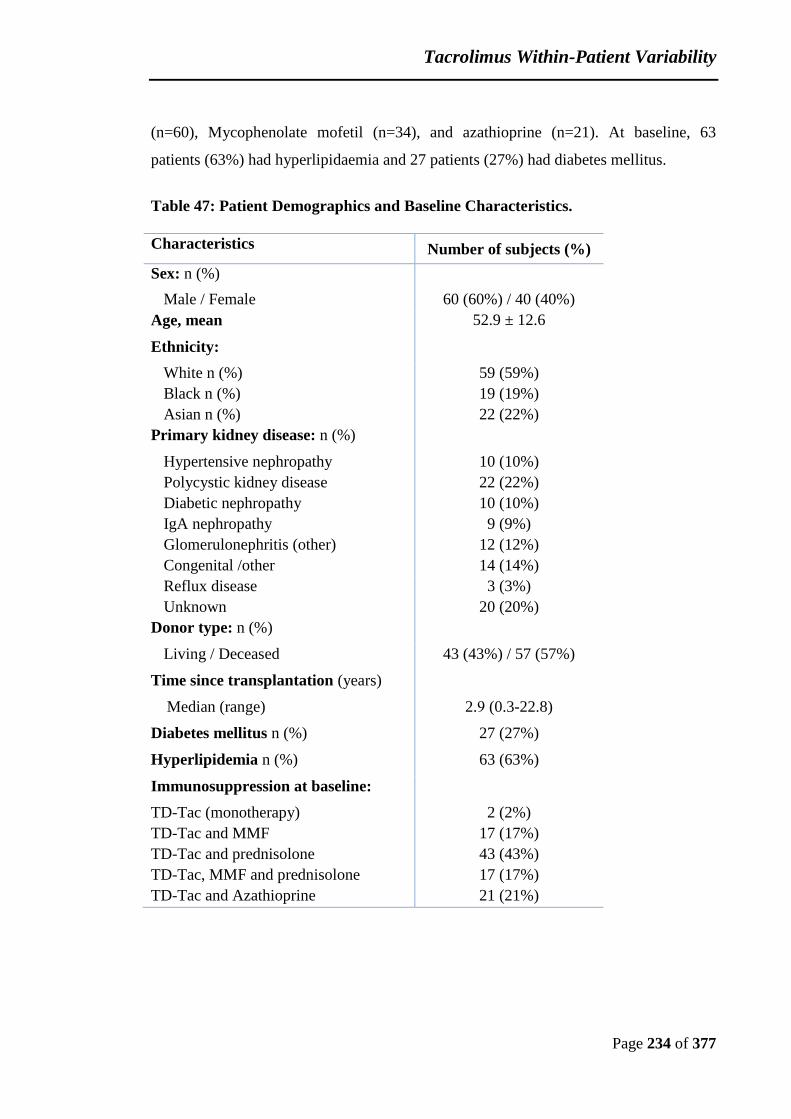
Tacrolimus Within-Patient Variability
Page 234 of 377
(n=60), Mycophenolate mofetil (n=34), and azathioprine (n=21). At baseline, 63
patients (63%) had hyperlipidaemia and 27 patients (27%) had diabetes mellitus.
Table 47: Patient Demographics and Baseline Characteristics.
Characteristics
Number of subjects (%)
Sex: n (%)
Male / Female 60 (60%) / 40 (40%)
Age, mean 52.9 ± 12.6
Ethnicity:
White n (%) 59 (59%)
Black n (%) 19 (19%)
Asian n (%) 22 (22%)
Primary kidney disease: n (%)
Hypertensive nephropathy 10 (10%)
Polycystic kidney disease 22 (22%)
Diabetic nephropathy 10 (10%)
IgA nephropathy 9 (9%)
Glomerulonephritis (other) 12 (12%)
Congenital /other 14 (14%)
Reflux disease 3 (3%)
Unknown 20 (20%)
Donor type: n (%)
Living / Deceased 43 (43%) / 57 (57%)
Time since transplantation (years)
Median (range) 2.9 (0.3-22.8)
Diabetes mellitus n (%) 27 (27%)
Hyperlipidemia n (%) 63 (63%)
Immunosuppression at baseline:
TD-Tac (monotherapy) 2 (2%)
TD-Tac and MMF 17 (17%)
TD-Tac and prednisolone 43 (43%)
TD-Tac, MMF and prednisolone 17 (17%)
TD-Tac and Azathioprine 21 (21%)
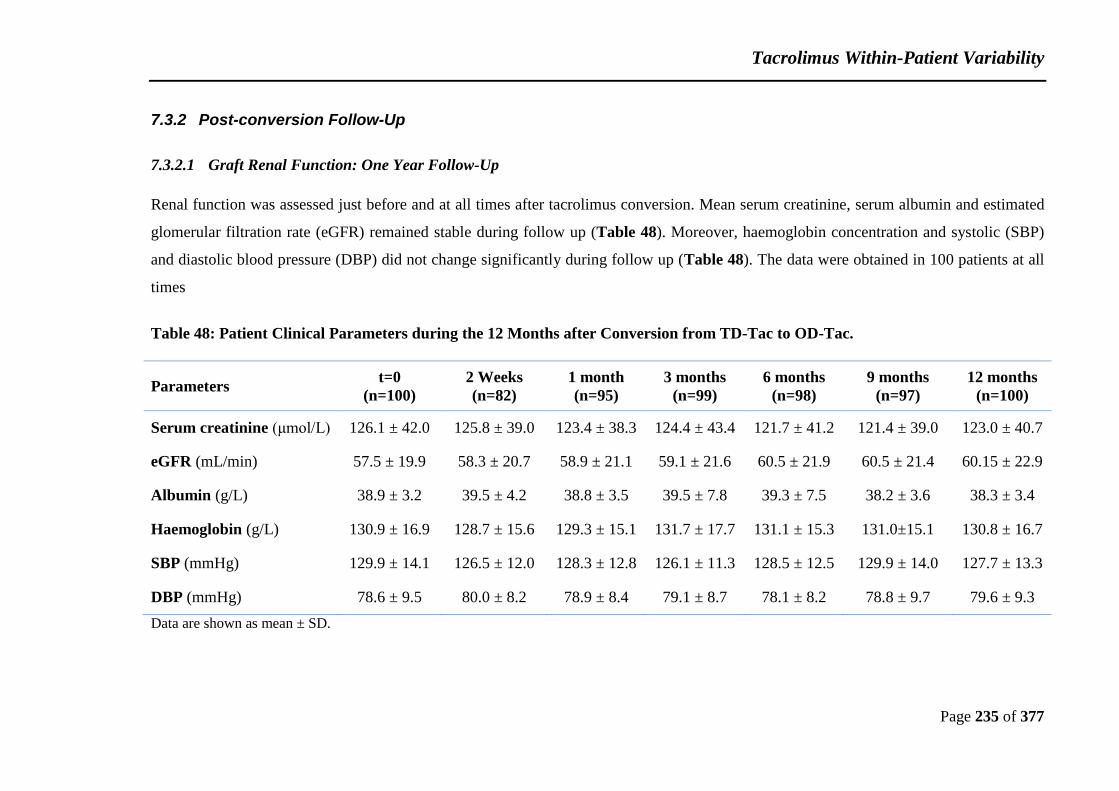
Tacrolimus Within-Patient Variability
Page 235 of 377
7.3.2 Post-conversion Follow-Up
7.3.2.1 Graft Renal Function: One Year Follow-Up
Renal function was assessed just before and at all times after tacrolimus conversion. Mean serum creatinine, serum albumin and estimated
glomerular filtration rate (eGFR) remained stable during follow up (Table 48). Moreover, haemoglobin concentration and systolic (SBP)
and diastolic blood pressure (DBP) did not change significantly during follow up (Table 48). The data were obtained in 100 patients at all
times
Table 48: Patient Clinical Parameters during the 12 Months after Conversion from TD-Tac to OD-Tac.
Parameters t=0
(n=100)
2 Weeks
(n=82)
1 month
(n=95)
3 months
(n=99)
6 months
(n=98)
9 months
(n=97)
12 months
(n=100)
Serum creatinine (μmol/L) 126.1 ± 42.0 125.8 ± 39.0 123.4 ± 38.3 124.4 ± 43.4 121.7 ± 41.2 121.4 ± 39.0 123.0 ± 40.7
eGFR (mL/min) 57.5 ± 19.9 58.3 ± 20.7 58.9 ± 21.1 59.1 ± 21.6 60.5 ± 21.9 60.5 ± 21.4 60.15 ± 22.9
Albumin (g/L) 38.9 ± 3.2 39.5 ± 4.2 38.8 ± 3.5 39.5 ± 7.8 39.3 ± 7.5 38.2 ± 3.6 38.3 ± 3.4
Haemoglobin (g/L) 130.9 ± 16.9 128.7 ± 15.6 129.3 ± 15.1 131.7 ± 17.7 131.1 ± 15.3 131.0±15.1 130.8 ± 16.7
SBP (mmHg) 129.9 ± 14.1 126.5 ± 12.0 128.3 ± 12.8 126.1 ± 11.3 128.5 ± 12.5 129.9 ± 14.0 127.7 ± 13.3
DBP (mmHg) 78.6 ± 9.5 80.0 ± 8.2 78.9 ± 8.4 79.1 ± 8.7 78.1 ± 8.2 78.8 ± 9.7 79.6 ± 9.3
Data are shown as mean ± SD.

Tacrolimus Within-Patient Variability
Page 236 of 377
7.3.2.2 One Year Follow-Up of Tacrolimus Exposure and Dosing after Conversion
to Advagraf®
For evaluation, one tacrolimus trough blood concentration and its coinciding tacrolimus
dose were retrieved from the clinic database just before conversion and at 0.5, 1, 3, 6, 9
and 12 months after conversion. Before conversion, the mean morning trough blood
concentration of tacrolimus (TD-Tac) was 6.6 ± 1.9 µg/L and the mean total daily dose
of tacrolimus was 5.2 ± 3.4 mg. At 0.5, 1, 3 and 6 months after conversion, mean
tacrolimus trough concentrations were 6.0 ± 2.3, 6.0 ± 1.8, 6.1 ±1. 9 and 5.9 ± 2.0 µg/L,
respectively, with mean OD-Tac doses (mg) of 5.2 ± 3.4, 5.2 ± 3.4, 5.2 ± 3.3 and 5.2 ±
3.2, respectively. Then, in the following months, the trough blood concentrations of
tacrolimus were kept at 6.2 ± 2.0 and 6.2 ± 1.8 µg/L at 9 and 12 months, respectively,
with mean OD-Tac doses (mg) of 5.2 ± 3.2, 5.1 ± 3.2, respectively (Figure 50 &
Figure 51).
Figure 50: Tacrolimus Trough Concentrations before Conversion and in 0.5, 1, 3,
6, 9 and 12 Months after Conversion (Pre= Pre-Conversion, w=week
and m=month).
12m9m6m3m1m2wPre
6.00
5.75
5.50
5.25
5.00
4.75
4.50
Time
Me
an t
acro
lim
us
dai
ly d
ose
(m
g)
Tacrolimus Daily Dose

Tacrolimus Within-Patient Variability
Page 237 of 377
Despite no change in the OD-Tac dose during follow-up period, Tac C0 were slightly
reduced in the majority of the patients with a significant decrease in tacrolimus blood
concentrations after 6 months and then it reached initial levels at 9 and 12 months post-
conversion. The daily doses of TD-Tac and OD-Tac doses in the analysed period are
shown in Figure 50.
Figure 51: Tacrolimus Daily Dose before Conversion and in 0.5, 1, 3, 6, 9 and 12
Months after Conversion (Pre= Pre-Conversion, w=week and
m=month). Values were compared using ANOVA (General linear model).
* Significantly Different from Pre-Conversion.
7.3.3 Effect of the Switch to Advagraf® during Stable Dosing Periods and
the Entire Time Pre- and Post- Conversion.
Conversion of tacrolimus from twice-daily to once-daily formulation was based on 1: 1
mg. For all patients, at least 3 samples were available for calculation of the within-
patient variability of Tac C0. Tacrolimus trough concentrations were analysed for WPV
in this ethnically diverse population during periods of stable tacrolimus doses. For each
patient, only one stable dosing period was used for each formulation. Additionally, the
analysis was repeated for the whole periods before and after conversion. The
relationship between within-patient variability and CYP3A5 polymorphisms in both
tacrolimus formulations was also studied.
12m9m6m3m1m2wPre
7.00
6.75
6.50
6.25
6.00
5.75
5.50
Time
Me
an t
acro
lim
us
C0
(µ
g/L
)
Tacrolimus Trough Concentration (C0)
*
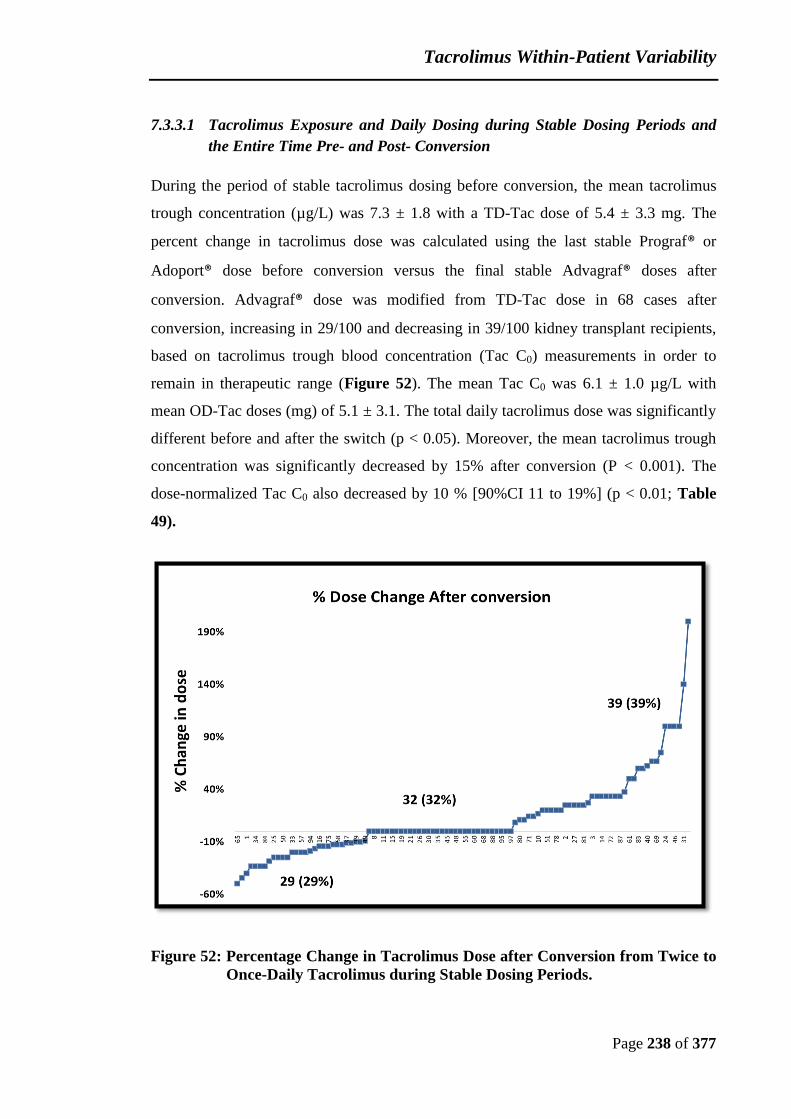
Tacrolimus Within-Patient Variability
Page 238 of 377
7.3.3.1 Tacrolimus Exposure and Daily Dosing during Stable Dosing Periods and
the Entire Time Pre- and Post- Conversion
During the period of stable tacrolimus dosing before conversion, the mean tacrolimus
trough concentration (µg/L) was 7.3 ± 1.8 with a TD-Tac dose of 5.4 ± 3.3 mg. The
percent change in tacrolimus dose was calculated using the last stable Prograf® or
Adoport® dose before conversion versus the final stable Advagraf® doses after
conversion. Advagraf® dose was modified from TD-Tac dose in 68 cases after
conversion, increasing in 29/100 and decreasing in 39/100 kidney transplant recipients,
based on tacrolimus trough blood concentration (Tac C0) measurements in order to
remain in therapeutic range (Figure 52). The mean Tac C0 was 6.1 ± 1.0 µg/L with
mean OD-Tac doses (mg) of 5.1 ± 3.1. The total daily tacrolimus dose was significantly
different before and after the switch (p < 0.05). Moreover, the mean tacrolimus trough
concentration was significantly decreased by 15% after conversion (P < 0.001). The
dose-normalized Tac C0 also decreased by 10 % [90%CI 11 to 19%] (p < 0.01; Table
49).
Figure 52: Percentage Change in Tacrolimus Dose after Conversion from Twice to
Once-Daily Tacrolimus during Stable Dosing Periods.
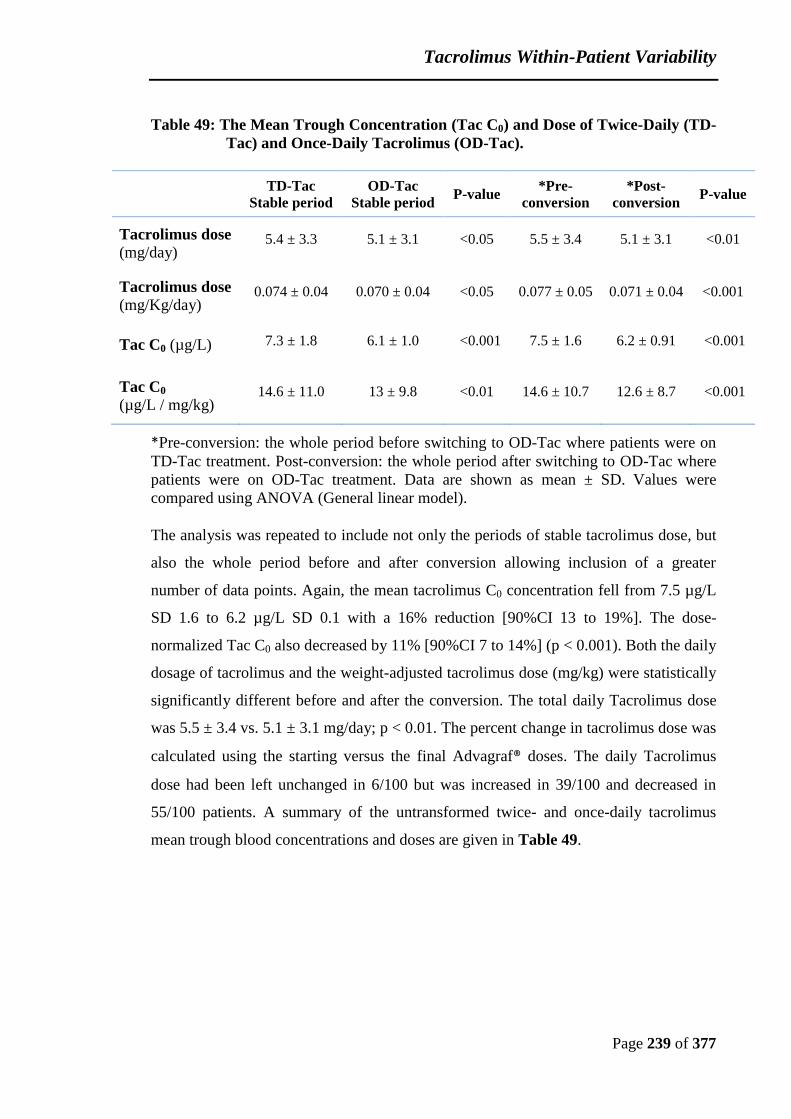
Tacrolimus Within-Patient Variability
Page 239 of 377
Table 49: The Mean Trough Concentration (Tac C0) and Dose of Twice-Daily (TD-
Tac) and Once-Daily Tacrolimus (OD-Tac).
TD-Tac
Stable period
OD-Tac
Stable period P-value
*Pre-
conversion
*Post-
conversion P-value
Tacrolimus dose (mg/day)
5.4 ± 3.3 5.1 ± 3.1 <0.05 5.5 ± 3.4 5.1 ± 3.1 <0.01
Tacrolimus dose (mg/Kg/day)
0.074 ± 0.04 0.070 ± 0.04 <0.05 0.077 ± 0.05 0.071 ± 0.04 <0.001
Tac C0 (µg/L) 7.3 ± 1.8 6.1 ± 1.0 <0.001 7.5 ± 1.6 6.2 ± 0.91 <0.001
Tac C0 (µg/L / mg/kg)
14.6 ± 11.0 13 ± 9.8 <0.01 14.6 ± 10.7 12.6 ± 8.7 <0.001
*Pre-conversion: the whole period before switching to OD-Tac where patients were on
TD-Tac treatment. Post-conversion: the whole period after switching to OD-Tac where
patients were on OD-Tac treatment. Data are shown as mean ± SD. Values were
compared using ANOVA (General linear model).
The analysis was repeated to include not only the periods of stable tacrolimus dose, but
also the whole period before and after conversion allowing inclusion of a greater
number of data points. Again, the mean tacrolimus C0 concentration fell from 7.5 µg/L
SD 1.6 to 6.2 µg/L SD 0.1 with a 16% reduction [90%CI 13 to 19%]. The dose-
normalized Tac C0 also decreased by 11% [90%CI 7 to 14%] (p < 0.001). Both the daily
dosage of tacrolimus and the weight-adjusted tacrolimus dose (mg/kg) were statistically
significantly different before and after the conversion. The total daily Tacrolimus dose
was 5.5 ± 3.4 vs. 5.1 ± 3.1 mg/day; p < 0.01. The percent change in tacrolimus dose was
calculated using the starting versus the final Advagraf® doses. The daily Tacrolimus
dose had been left unchanged in 6/100 but was increased in 39/100 and decreased in
55/100 patients. A summary of the untransformed twice- and once-daily tacrolimus
mean trough blood concentrations and doses are given in Table 49.
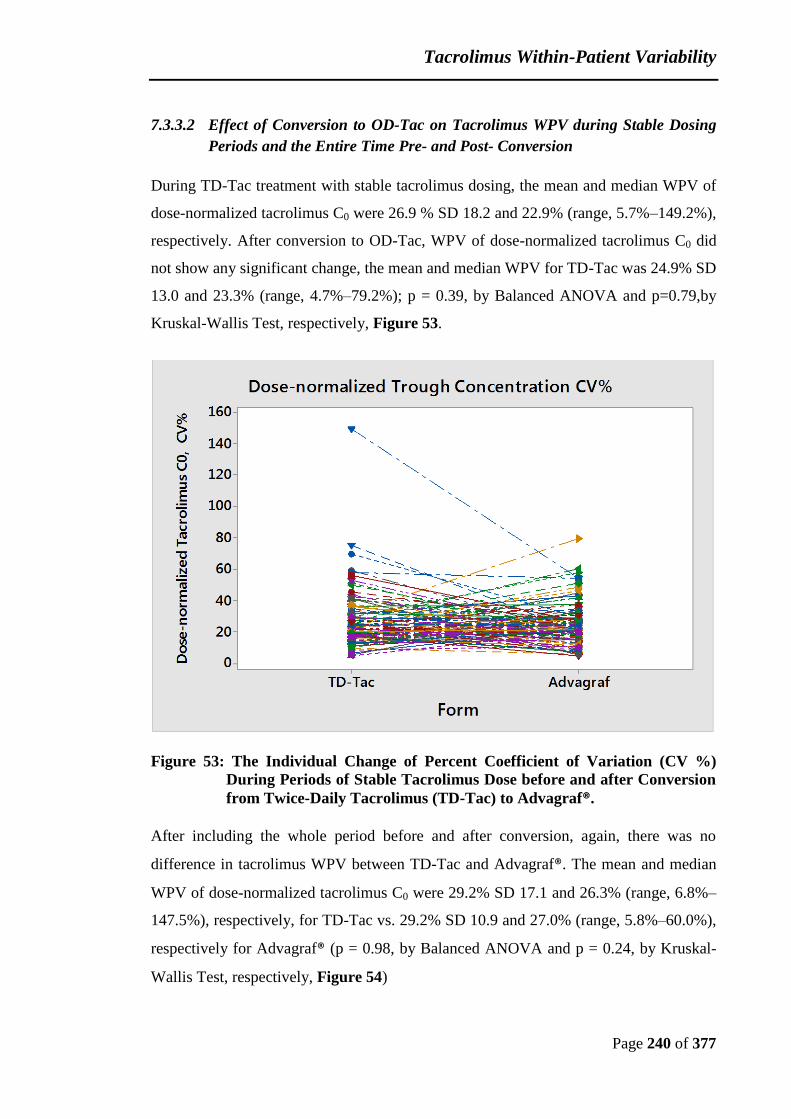
Tacrolimus Within-Patient Variability
Page 240 of 377
7.3.3.2 Effect of Conversion to OD-Tac on Tacrolimus WPV during Stable Dosing
Periods and the Entire Time Pre- and Post- Conversion
During TD-Tac treatment with stable tacrolimus dosing, the mean and median WPV of
dose-normalized tacrolimus C0 were 26.9 % SD 18.2 and 22.9% (range, 5.7%–149.2%),
respectively. After conversion to OD-Tac, WPV of dose-normalized tacrolimus C0 did
not show any significant change, the mean and median WPV for TD-Tac was 24.9% SD
13.0 and 23.3% (range, 4.7%–79.2%); p = 0.39, by Balanced ANOVA and p=0.79,by
Kruskal-Wallis Test, respectively, Figure 53.
Figure 53: The Individual Change of Percent Coefficient of Variation (CV %)
During Periods of Stable Tacrolimus Dose before and after Conversion
from Twice-Daily Tacrolimus (TD-Tac) to Advagraf®.
After including the whole period before and after conversion, again, there was no
difference in tacrolimus WPV between TD-Tac and Advagraf®. The mean and median
WPV of dose-normalized tacrolimus C0 were 29.2% SD 17.1 and 26.3% (range, 6.8%–
147.5%), respectively, for TD-Tac vs. 29.2% SD 10.9 and 27.0% (range, 5.8%–60.0%),
respectively for Advagraf® (p = 0.98, by Balanced ANOVA and p = 0.24, by Kruskal-
Wallis Test, respectively, Figure 54)
Tacrolimus Within-Patient Variability
Page 241 of 377
Figure 54: The Individual Change of Percent Coefficient of Variation (CV %)
During the Whole Period before and after Conversion from Twice-
Daily Tacrolimus (TD-Tac) to Advagraf®.
The patients then were divided into low and high tacrolimus variability groups based
upon their variability using the median as the cutoff value.
The analysis was first conducted during the periods of stable tacrolimus dose. Although
no significant difference in the WPV was observed in the whole population after
conversion, patients with low-variability before conversion demonstrated a significant
increase in WPV after conversion, WPV increased from 16.2 ± 4.6% and 17.4%
(range,4.7% – 22.9%) to 21.6 ± 9.8% and 21.3% (range, 4.7% – 48.6%, p <0.001 for
each). The reverse was observed in high-variability group, WPV decreased significantly
from 37.7 ± 20.4 % and 31.6% (range, 22.9% – 149.2%) to 28.2 ± 15.9% and 25.9%
(range, 5.1% – 79.2%, p < 0.01 for each; Table 50 & Figure 55. In the whole period
analysis again patients with low variability before conversion demonstrated a significant
increase in WPV after conversion: the mean within-patient %CV of tacrolimus C0
increased significantly from 19.3% ± 4.7% and 20.8% (range, 6.8% – 26.2%) to 26.9 %
± 9.9% and 26.6% (range, 5.8% – 57.8%, p <0.001 for each). In contrast patients with
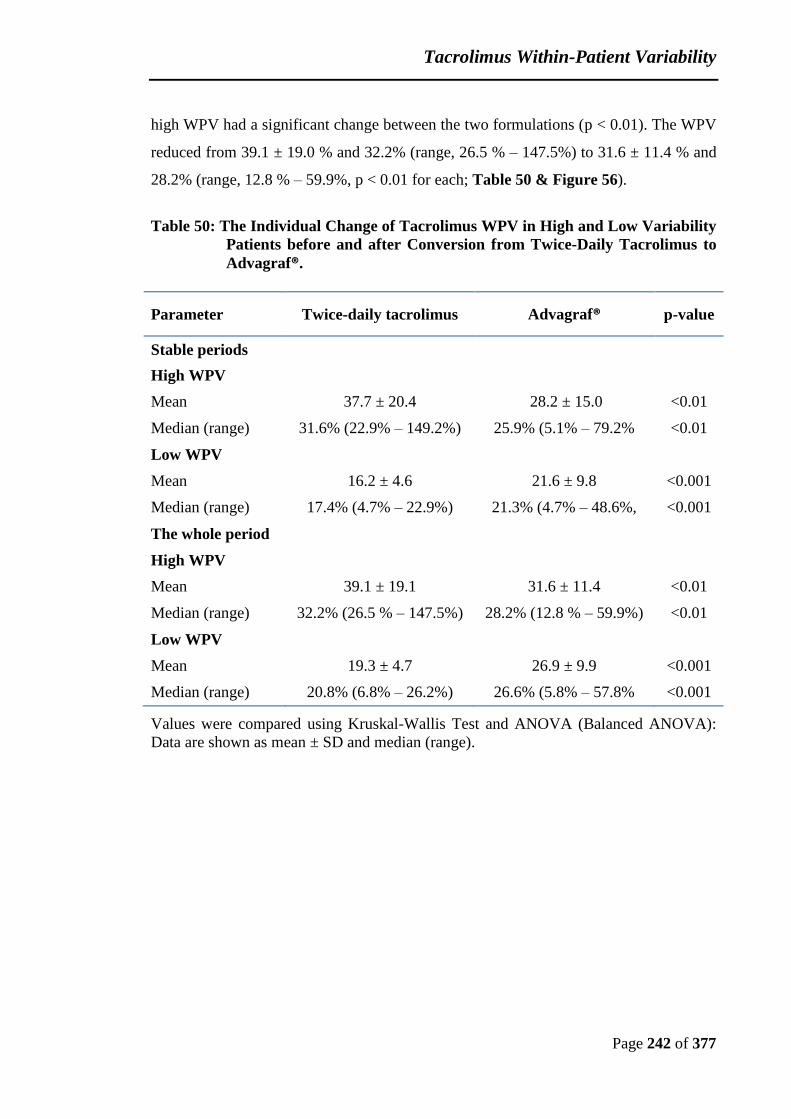
Tacrolimus Within-Patient Variability
Page 242 of 377
high WPV had a significant change between the two formulations (p < 0.01). The WPV
reduced from 39.1 ± 19.0 % and 32.2% (range, 26.5 % – 147.5%) to 31.6 ± 11.4 % and
28.2% (range, 12.8 % – 59.9%, p < 0.01 for each; Table 50 & Figure 56).
Table 50: The Individual Change of Tacrolimus WPV in High and Low Variability
Patients before and after Conversion from Twice-Daily Tacrolimus to
Advagraf®.
Parameter Twice-daily tacrolimus Advagraf® p-value
Stable periods
High WPV
Mean 37.7 ± 20.4 28.2 ± 15.0 <0.01
Median (range) 31.6% (22.9% – 149.2%) 25.9% (5.1% – 79.2% <0.01
Low WPV
Mean 16.2 ± 4.6 21.6 ± 9.8 <0.001
Median (range) 17.4% (4.7% – 22.9%) 21.3% (4.7% – 48.6%, <0.001
The whole period
High WPV
Mean 39.1 ± 19.1 31.6 ± 11.4 <0.01
Median (range) 32.2% (26.5 % – 147.5%) 28.2% (12.8 % – 59.9%) <0.01
Low WPV
Mean 19.3 ± 4.7 26.9 ± 9.9 <0.001
Median (range) 20.8% (6.8% – 26.2%) 26.6% (5.8% – 57.8% <0.001
Values were compared using Kruskal-Wallis Test and ANOVA (Balanced ANOVA):
Data are shown as mean ± SD and median (range).
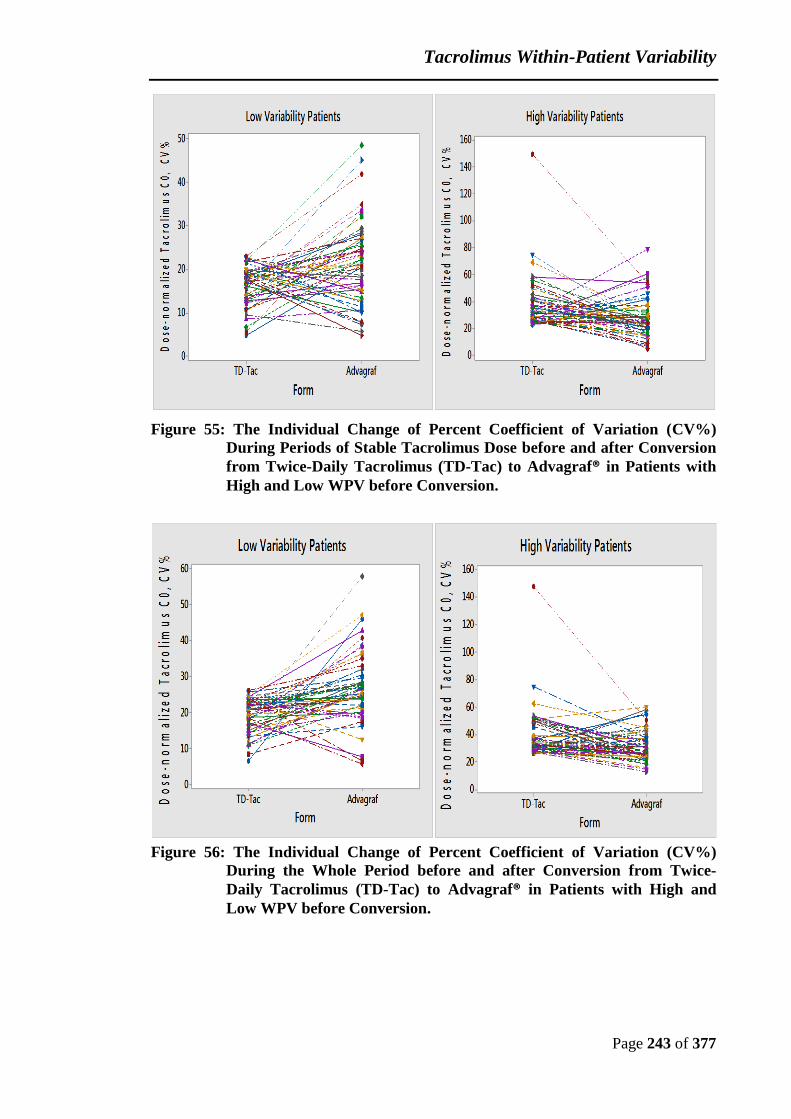
Tacrolimus Within-Patient Variability
Page 243 of 377
Figure 55: The Individual Change of Percent Coefficient of Variation (CV%)
During Periods of Stable Tacrolimus Dose before and after Conversion
from Twice-Daily Tacrolimus (TD-Tac) to Advagraf® in Patients with
High and Low WPV before Conversion.
Figure 56: The Individual Change of Percent Coefficient of Variation (CV%)
During the Whole Period before and after Conversion from Twice-
Daily Tacrolimus (TD-Tac) to Advagraf® in Patients with High and
Low WPV before Conversion.

Tacrolimus Within-Patient Variability
Page 244 of 377
7.3.4 Genetic Polymorphisms and WPV
7.3.4.1 The Relationship between CYP3A5*3 Genotype and WPV
Of the 100 patients included in our original study cohort, CYP3A5 genotyping was
available for 72 patients. For all patients, at least three C0 results were used to calculate
the within-patient variability of dose-normalized Tac C0. Analysis of tacrolimus trough
blood concentrations (C0) was made during periods of stable tacrolimus doses and over
the whole periods before and after conversion.
The wild-type genotype CYP3A5*1/*1 was observed in 13 patients (18.1%), whereas 18
(25.0%) were heterozygous (CYP3A5*1/*3) and 41 (56.9%) homozygous
(CYP3A5*3/*3) for the variant allele. The subjects were grouped according to CYP3A5
genotype based on the presence or absence of the CYP3A5*1 allele into 2 groups
CYP3A5 expressers (n= 31); CYP3A5*1/*1 (n = 13, male = 9: female = 4) +
CYP3A5*1/*3 (n = 18, male = 11: female = 7) and CYP3A5 non-expressers;
CYP3A5*3/*3 (n = 41, male = 25: female = 16). The baseline characteristics of these 72
patients are shown in Table 51. Demographic characteristics, except ethnicity were not
significantly different between the genotype groups. The CYP3A5*1 allele was more
prevalent among black transplant recipients compared with that among white patients
and CYP3A5*3 allele was more prevalent in white patients than in black patients, which
is in line with previous observations.

Tacrolimus Within-Patient Variability
Page 245 of 377
Table 51: Patient Demographics and Baseline Characteristics.
Characteristics
CYP3A5 expressers
(*1/*1 plus *1/*3)
(n=31)
CYP3A5 non-expressers
(*3/*3)
(n=41)
Sex:
Male / Female 20/11 25/16
Age 55.2 ± 11.2 55.2 ± 12.9
Body weight (kg) 73.0 ± 14.4 74.7 ± 14.8
Ethnicity:
White 11 33
Black 12 3
Asian 8 5
Donor type:
Living / Deceased 11/20 19/23
Primary kidney disease:
Hypertensive nephropathy 2 3
Polycystic kidney disease 9 7
Diabetic nephropathy 4 5
IgA nephropathy 4 3
Glomerulonephritis (other) 3 7
Congenital / Reflux disease 2 2
other 2 5
Unknown 5 9
All values are shown in mean ± SD
Within-individual coefficients of variation (CV %) were calculated from analysis of
variation in CYP3A5 expresser and CYP3A5 non-expresser groups were compared.
Patients in each group were then divided into low and high within-individual variability
subgroups using the WPV median as the cutoff value. Out the 72 patients included, 36
were considered as a low within-patient variability group, whereas 36 patients were
considered as a high within-patient variability group.
During the entire pre-conversion period, the mean twice-daily tacrolimus (TD-Tac) dose
was 5.6 ± 3.6 mg with dose normalized Tac C0 of 14.5 ± 10.5 µg/L. Tacrolimus dose
requirement was 1.8-fold higher in CYP3A5 expressers compared with that in CYP3A5

Tacrolimus Within-Patient Variability
Page 246 of 377
non-expressers (Table 52). The mean Tacrolimus dose and dose-normalized trough C0
changed considerably between both genotype groups (P<0.001). Moreover, the mean of
tacrolimus WPV did not differ between CYP3A5 expressers and non-expressers (28.7%
± 12.3% versus 26.3% ± 12.0%, P = 0.41, Table 52). Almost exactly half of CYP3A5
expresser (n = 31) and non-expressers (n = 41) exhibited low variability and the other
half exhibited high variability. There was no significant difference in CV% within
patients with low or high variability in each group; p= 0.26 and p= 0.43, respectively
(Table 53).
The analysis was repeated in periods of stable tacrolimus dose. The mean of twice-daily
tacrolimus dose was 5.5±3.5 mg with dose-normalized Tac C0 of 14.4 ±10.7 µg/L.
Again CYP3A5 expressers required 1.8-fold higher tacrolimus dose than CYP3A5 non-
expressers. There was a significant difference in tacrolimus dose and dose-normalized
trough C0 between CYP3A5 expressers and CYP3A5 non-expressers; P<0.001, Table
52). The %CV of tacrolimus trough blood concentrations was significantly lower in
CYP3A5 non-expressers in comparison with CYP3A5 expressers (22.4 ± 10.9% to 30.0
± 14.5%; P =0.014). Analysis of patients with low variability demonstrated significantly
lower WPV for CYP3A5 non-expressers in comparison with CYP3A5 expressers: 19.5
± 5.9% vs. 15.5 ± 3.2 % (p < 0.05; Table 52). This effect was even stronger in high
variability patients (41.2 ±12. 4% vs. 29.8 ±11.4%, p<0.01; Table 53).
During the Advagraf® post-conversion period, the results were similar to the period
under twice-daily tacrolimus treatment. The mean Tacrolimus dose was 5.2 ± 3.3 mg
with dose-normalized Tac C0 of 12.9 ± 9.0 µg/L. CYP3A5 non-expressers required
significantly lower Advagraf® doses (-50%, P<0.001) compared with CYP3A5 non-
expressers (Table 52). No significant difference was observed in WPV of dose-
normalized Tac C0 between CYP3A5 expressers and CYP3A5 non-expressers (29.4% ±
11.1% versus 28.9% ± 9.6%, P = 0.82; Table 52). When comparing CYP3A5
expressers with non-expressers in low–variability patients no differences in the within-
patient variability of dose-normalized Tac C0 were observed (p=0.94). The same is
evident for the high–variability patients (p= 0.65; Table 53).
Tacrolimus Within-Patient Variability
Page 247 of 377
The analysis was repeated in periods of stable tacrolimus dose, Advagraf® mean
Tacrolimus dose was 5.1 ± 3.3 mg with dose-normalized Tac C0 of 13.4 ± 10.2 µg/L.
Again Tacrolimus dose requirement was 2.1-fold higher in CYP3A5 expressers
compared with that in CYP3A5 non-expressers. A significant difference in Tacrolimus
dose and dose-normalized trough C0 was observed in both genotype groups (p<0.001).
We observed no differences in tacrolimus WPV between CYP3A5 expressers and non-
expressers in Advagraf® treatment (28.1% ± 17.4% versus 23.3% ± 9.2%, P = 0.13;
Table 52). Only patients with high variability demonstrated a significant reduction in
WPV in CYP3A5 non-expressers compared with CYP3A5 expressers: WPV decreased
from 41.4 ± 15.7% to 30.3 ± 6.9% (p < 0.01). Additionally, no differences were
observed in the within-individual variability of dose-normalized Tac C0 between low
variability patients with the CYP3A5*1/*1 or *1/*3 versus CYP3A5*3/*3 genotypes (P
= 0.59; Table 53).
Conversion from TD-Tac to Advagraf® did not show any significant difference in
tacrolimus dose requirement and WPV in both genotype groups either in periods of
stable tacrolimus dose or periods pre-conversion or post-conversion. Additionally, WPV
did not change in either CYP3A5 expressers or CYP3A5 non-expressers in both high
and low variability patients after the switch.
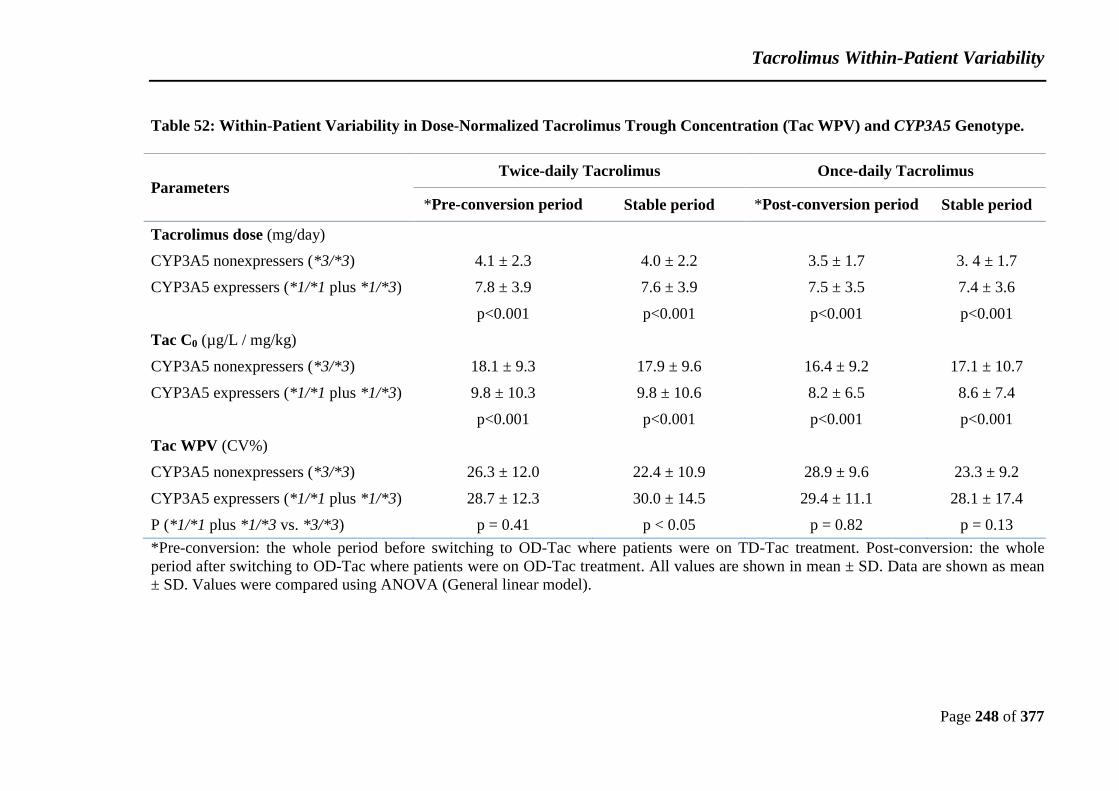
Tacrolimus Within-Patient Variability
Page 248 of 377
Table 52: Within-Patient Variability in Dose-Normalized Tacrolimus Trough Concentration (Tac WPV) and CYP3A5 Genotype.
Parameters Twice-daily Tacrolimus Once-daily Tacrolimus
*Pre-conversion period Stable period *Post-conversion period Stable period
Tacrolimus dose (mg/day)
CYP3A5 nonexpressers (*3/*3) 4.1 ± 2.3 4.0 ± 2.2 3.5 ± 1.7 3. 4 ± 1.7
CYP3A5 expressers (*1/*1 plus *1/*3) 7.8 ± 3.9 7.6 ± 3.9 7.5 ± 3.5 7.4 ± 3.6
p<0.001 p<0.001 p<0.001 p<0.001
Tac C0 (µg/L / mg/kg)
CYP3A5 nonexpressers (*3/*3) 18.1 ± 9.3 17.9 ± 9.6 16.4 ± 9.2 17.1 ± 10.7
CYP3A5 expressers (*1/*1 plus *1/*3) 9.8 ± 10.3 9.8 ± 10.6 8.2 ± 6.5 8.6 ± 7.4
p<0.001 p<0.001 p<0.001 p<0.001
Tac WPV (CV%)
CYP3A5 nonexpressers (*3/*3) 26.3 ± 12.0 22.4 ± 10.9 28.9 ± 9.6 23.3 ± 9.2
CYP3A5 expressers (*1/*1 plus *1/*3) 28.7 ± 12.3 30.0 ± 14.5 29.4 ± 11.1 28.1 ± 17.4
P (*1/*1 plus *1/*3 vs. *3/*3) p = 0.41 p < 0.05 p = 0.82 p = 0.13
*Pre-conversion: the whole period before switching to OD-Tac where patients were on TD-Tac treatment. Post-conversion: the whole
period after switching to OD-Tac where patients were on OD-Tac treatment. All values are shown in mean ± SD. Data are shown as mean
± SD. Values were compared using ANOVA (General linear model).

Tacrolimus Within-Patient Variability
Page 249 of 377
Table 53: High and Low Within-Patient Variability in Dose-Normalized
Tacrolimus Trough Concentration and CYP3A5*3 Genotype.
CYP3A5 Genotype
Dose-normalized Tac trough
Concentration CV%
Low Variability
(n=36)
High Variability
(n=36)
Pre-conversion period
CYP3A5 nonexpressers (*3/*3) 18.0 ± 4.5 35.0 ± 11.2
CYP3A5 expressers (*1/*1 plus *1/*3) 20.0 ± 6.1 38.0 ± 10.3
p= 0.26 p= 0.43
Post-conversion period
CYP3A5 nonexpressers (*3/*3) 22.1 ± 4.8 35.9 ± 8.1
CYP3A5 expressers (*1/*1 plus *1/*3) 22.0 ± 4.9 37.4 ± 10.3
p=0.94 p= 0.65
TD-Tac Stable period
CYP3A5 nonexpressers (*3/*3) 15.5 ± 3.2 29.8 ± 11.4
CYP3A5 expressers (*1/*1 plus *1/*3) 19. 5 ± 5.9 41.2 ± 12.4
p < 0.05 p<0.01
OD-Tac Stable period
CYP3A5 nonexpressers (*3/*3) 16.7 ± 5.5 30.3 ± 6.9
CYP3A5 expressers (*1/*1 plus *1/*3) 15.7 ± 5.6 41.4 ± 15.7
p =0.59 p < 0.01
High variability refers to patients having high within-patient variability and Low
variability refers to patients having low within-patient variability using the median as
the cutoff value. All values are shown in mean ± SD. Values were compared using
ANOVA (One way ANOVA).
Tacrolimus Within-Patient Variability
Page 250 of 377
7.4 Discussion and Conclusion
This retrospective analysis studied stable patients switched from TD-Tac to OD-Tac
after kidney transplantation. There were no adverse events associated with conversion
with stable graft function. The serum creatinine and estimated glomerular filtration rate
did not show any significant change after conversion. Stable function after conversion
has been reported by other studies (Guirado et al., 2011, Kurnatowska et al., 2011,
Shuker et al., 2014). However, the study by Tinti et al. (2010) showed an improvement
in the renal graft function after conversion from TD-Tac to OD-Tac. Serum creatinine
and GFR showed significant improvements after conversion.
In this study, we found a significant decrease in Tac C0 by 16% and in Tacrolimus dose-
normalized C0 by 11% after conversion and almost all the recipients required dose
adjustments. This is in line with the previous observations showing that conversion
from TD-Tac to OD-Tac on a 1:1 (mg: mg) basis, resulted in considerably lower Tac C0
concentrations and sometimes required dose adjustments (Shuker et al., 2014, Tinti et
al., 2010, Wehland et al., 2011). During periods of stable tacrolimus doses, the
reduction was 15% in Tac C0 and 10% in dose-normalized Tac C0 and the majority of
the recipients required dose changes. This supports our findings of the whole period
analysis in which the dose-normalized Tac C0 and dose reduced significantly after
switching from TD-Tac to OD-Tac. In contrast to what would be expected from the
published literature, tacrolimus C0 concentration actually increased in a significant
proportion of patients leading to dose reduction on conversion from twice daily
tacrolimus to Advagraf®.
Regarding WPV, our patients converted to Advagraf® did not show any significant
decrease in WPV of dose-normalized Tac C0 compared to a twice-daily tacrolimus and
the same results were obtained during analysis of periods of stable tacrolimus dose.
Similar observations were made in other conversion studies where they failed to show
any change in Tac WPV after conversion either in small populations (van Hooff et al.,
2012, Wehland et al., 2011) or large populations (Shuker et al., 2014). However, other
reports demonstrate that conversion from Prograf® to Advagraf® was associated with a

Tacrolimus Within-Patient Variability
Page 251 of 377
significantly lower within-patient variability of tacrolimus trough concentration. A
study by Alloway et al. (2005) reported a greater decrease in within patient variability
of tacrolimus exposure with modified release tacrolimus versus Prograf® for African-
American patients compared to Caucasian patients, although only limited data were
provided. It has been reported that the conversion from twice-daily Prograf® to once-
daily Advagraf® was associated with a significant decrease of within-patient variability
of tacrolimus C0 (Wu et al., 2011). The discrepancy in the results may be due to
differences in the study design, sample size and the inclusion and exclusion criteria of
these studies. In the study by Wu et al. (2011), all patients were from a Chinese
background (Taiwanese) and only patients with stable renal function and tacrolimus C0
were included. In addition, an important limitation of their study is that the study was
not randomized or double blind so patients may improve or modify their behaviour in
response to the fact that they are being studied, not in response to any particular
experimental manipulation.
In addition, we found that patients with low variability before conversion demonstrated
a significant increase in WPV after conversion and patients with high variability before
conversion associated with a significant decrease in WPV after conversion. The same
results were obtained in a recent study (Shuker et al., 2014). It can be argued that the
changes observed in Tac WPV after conversion is not clinically relevant. This is likely
to be due to regression to the mean. From the available published data, there is certainly
no clear indication that WPV is reduced on conversion from twice daily to once daily
tacrolimus preparations.
In this study, we investigated the influence of CYP3A5 genotype on tacrolimus WPV
Tac C0 in stable kidney transplant patients at least 3 months after transplantation. In this
population, only 10 patients were less than 6 months post-transplantation. Our findings
showed that patients treated with twice daily tacrolimus did not show any significant
association between WPV of dose-normalized Tac C0 and CYP3A5 genotype.
Moreover, no difference in CV% was observed between low or high variability patients
in each group. This is in line with the previous studies investigating the impact of
CYP3A5 genotype on the Tac WPV. Pashaee et al. (2011) on mixed ethnicity patients

Tacrolimus Within-Patient Variability
Page 252 of 377
found no association between within-patient variability of TD-Tac clearance and
CYP3A5 genotype. A study in Korean patients demonstrated that CYP3A5
polymorphism had no impact on TD-Tac within- patient variability (Ro et al., 2012). In
both studies, they used data between 6 and 12 months post transplantation to calculate
tacrolimus WPV. Additionally, these results parallel those obtained by Wu et al. (2014)
who found no significant difference in TD-Tac WPV between CYP3A5 high- and low-
expression.
However, during periods of stable tacrolimus dose the WPV of dose-normalized Tac C0
was significantly lower in CYP3A5 expressers compared to CYP3A5 non-expressers.
Furthermore, low and high variability patients demonstrated the same significant
difference in WPV for both genotype groups. Our findings are in agreement with the
observations of Yong Chung et al. (2010) who reported an association between CYP3A5
genotype and the within individual variability of tacrolimus PK parameters in healthy
volunteers of two way crossover bioequivalent study. They are in contrast with the
findings of Spierings et al. (2013) study on TD-Tac using 3 coinciding tacrolimus doses
and showing that the within-patient variability of tacrolimus clearance was not
associated with CYP3A5 genotype in stable renal transplant recipients. This discrepancy
may be due to the difference in sample size as they used only 3 tacrolimus blood
concentrations and 3 coinciding tacrolimus doses and in our study at least 3 doses and 3
concentrations were used for each patient.
For once-daily tacrolimus only one study addressed the effect of CYP3A5 genotype on
Tac WPV (Wu et al., 2014). In our study, patients treated with once- daily tacrolimus,
no differences in the within-patient variability of dose-normalized Tac C0 were
observed between CYP3A5 expressers and non-expressers. For high- and low-
variability patients, we found no significant difference in WPV between CYP3A5
expressers and non-expressers. This is similar to results obtained from a recent study
showing no significant difference in %CV of tacrolimus trough concentration between
high- and low-expressers (Wu et al., 2014). During periods of stable Advagraf® dose,
we observed no differences in the WPV between CYP3A5 expressers and non-
expressers. We also found that only patients with high variability demonstrated a

Tacrolimus Within-Patient Variability
Page 253 of 377
significant reduction in WPV in CYP3A5 non-expressers compared with CYP3A5
expressers.
Conversion from TD-Tac to Advagraf® did not show any significant difference in
tacrolimus WPV in both genotype groups. Additionally, WPV did not change between
CYP3A5 expressers and CYP3A5 non-expressers in both high-and low-variability
patients after the switch. This is partially in line with the Wu et al. (2014) study
showing a specific reduction in %CV of tacrolimus trough level in patients with high-
expression CYP3A5 genotype when they converted to once-daily Advagraf®. Our study
has some limitations, including the retrospective nature of the study and lack of
compliance data.

Pharmacogenetic Associations with Prednisolone and Prednisone Exposure
Page 254 of 377
8 Chapter 8. Pharmacogenetic Associations with Prednisolone and Prednisone Exposure
Prednisolone Prednisone
Figure 57: Structure of Prednisolone and Prednisone.
Corticosteroids are an important component of clinical immunosuppressive therapy, and
they have been used from the advent of transplantation in the 1960s. Prednisolone, a
synthetic corticosteroid, is a widely used immunosuppressive agent and is commonly
used to treat and prevent acute rejection after organ transplantation (Figure 57).
Prednisone is the main metabolite of prednisolone and they are integral components of
induction and maintenance immunosuppressive regimens in solid organ transplantation
(Bergmann et al., 2012). Evaluating the plasma concentration of prednisolone,
endogenous cortisol and their inactive metabolites, prednisone and cortisone, may help
in the assessment of therapeutic response to corticosteroids or their side-effects. CYP3A
and P-glycoprotein (P-gp) are involved in the metabolism of both tacrolimus and
steroids. Steroids are a well-known inducer of both CYP3A and P-glycoprotein activity.
It has been reported that the higher the steroid dosage used, the higher the tacrolimus
dosage required to achieve target trough blood concentration (Anglicheau et al., 2003a).
Objectives of the Study
1. To develop and validate a new method for measurement of prednisolone and its
metabolite prednisone in plasma using HPLC-MS/MS.
2. To explore the relationship between the CYP3A5*3, ABCB1 3435, CYP3A4*22
and POR*28 SNPs and prednisolone- prednisone exposure.
Pharmacogenetic Associations with Prednisolone and Prednisone Exposure
Page 255 of 377
8.1 Validation of Liquid Chromatography – Mass Spectrometry
(LC-MS/MS) Method for the Analysis of Prednisolone and
Its Metabolite in Human Plasma.
8.1.1 Introduction
Several high performance liquid chromatography (HPLC) methods were reported in the
published literature for determination of prednisolone and prednisone in plasma. The
disadvantage of these HPLC methods is that they consume large volumes of plasma
(Gai et al., 2005, Cheng et al., 1988) and are less sensitive (Gai et al., 2005, Huber et
al., 1990, Alvinerie et al., 1990) and have long run times (Cheng et al., 1988, Lasic et
al., 1989). Ionita and Akhlaghi (2010) described an LC-MS/MS method that achieved a
good sensitivity for determination of unbound prednisolone and prednisone. The
samples were separated by the ultrafiltration of plasma using Microcon centrifugal filter
devices. Methlie et al. (2013) developed an LC–MS/MS method that quantifies
endogenous and synthetic corticosteroid as prednisolone and prednisone in serum using
long extraction method. Evaluating the plasma concentration of prednisolone,
endogenous cortisol and their inactive metabolites, prednisone and cortisone, may help
in the assessment of therapeutic response to corticosteroids or their side-effects.
8.1.2 Materials and Methods
8.1.2.1 Prednisolone-Prednisone Analysis
Prednisolone and prednisone plasma concentration were measured using validated
HPLC based assay with tandem mass spectrometry detection. The analytical method
was based on using the following
8.1.2.1.1 Instrumentation
Solvent delivery was achieved using an Agilent series 1100 pump. Sample injection was
performed by using an Agilent series 1100 auto injector. The column temperature was
adjusted using an Agilent series 1100 column oven. Detection was by an API4000 Mass
spectrometer (AB Sciex, England). A Windows PC computer running Analyst 1.3.2
Pharmacogenetic Associations with Prednisolone and Prednisone Exposure
Page 256 of 377
software was used to control the HPLC/MS, record the output from the detector,
perform integration of peak areas and calculate the prednisolone and prednisone
concentrations. The Analyst software was supplied by Applied Biosystems, England.
The NM20ZA high purity nitrogen and air generators were supplied by Peak Scientific
Instruments, Scotland.
8.1.2.1.2 Chemicals & Reagents
Prednisolone, prednisone, cortisol, cortisone, dexamethasone (internal standard) and
orange G were supplied by Sigma-Aldrich. Plasma samples containing EDTA
anticoagulant were obtained from Biological Specialty Corp. HPLC-graded ethyl
acetate and acetic acid (100%) were purchased from VWR together with sodium
hydroxide. HPLC-graded methyl-tert-butyl ether and methanol (HPLC grade) were
obtained from Rathburn Chemicals Ltd. Sodium chloride was supplied by BDH
Prolabo. De-ionised water was prepared on site using Millipore (water purification
system).
8.1.2.1.3 Stock Solutions
Stock solutions of prednisolone (1 mg/L) and prednisone (200.0µg/mL) were prepared
in methanol and a combined sub-stock of prednisolone and prednisone stocks was
prepared by further dilution in drug-free human plasma to obtain calibration and quality
control (QC) stocks.
Calibration standards were spiked with prednisolone-prednisone calibration stock
solution to give final concentrations of 2.5, 5.0, 12.5, 50.0, 125.0, 250.0 and 375.0 µg/L
for prednisolone and 0.5, 1.0, 2.5, 10.0, 25.0, 50.0 and 75.0 µg/L for prednisone.
Aliquots of these standard solutions were then stored at -20°C until analysis. Three QC
samples were prepared by using the same procedure at concentrations of 25.0, 125.0 and
250.0 µg/L for prednisolone and 5.0, 25.0 and 50.0 µg/L for prednisone in human
plasma. Dexamethasone stock solutions (1000 mg/L) was prepared in methanol and the
internal standard stock solution of dexamethasone was prepared by further dilution in
deionized water at a concentration of 1 mg/L and stored at approximately 4ºC.

Pharmacogenetic Associations with Prednisolone and Prednisone Exposure
Page 257 of 377
8.1.2.1.4 Extraction Procedure:
Calibrators / Controls / Patients samples (100µL), internal standard solution (50µL),
alkaline sodium chloride solution (250µL) and 1mL extracting solvent (ethyl acetate:
methyl-tert-butyl ether 1:1) were pipetted into pre-labelled 2mL polypropylene tubes.
The alkaline sodium chloride solution consists of sodium chloride (23g), 1ml of sodium
hydroxide solution 40% (w/w), orange G (10 mg) and de-ionized water (100ml) The
contents of the tubes were mixed for 5 min and then centrifuged at; 13,200 rpm for 2.5
min using Eppendorf 5415D Centrifuge (Eppendorf, England, UK). The entire top
solvent layer was then transferred to a 4.5 mL conical polypropylene tube and
transferred to the SpeedVac and evaporated to dryness at high heat setting. The dried
extracts were reconstituted with 1 mL of 25% methanol, vortex mixed for 20 seconds
and then centrifuged at approximately 3500 RPM for approximately 2 minutes using
Heraeus Megafuge 11 Centrifuge (Thermo Scientific, England, UK). The extract was
then transferred to labelled auto-sampler tubes and a 10µL aliquot of each extract was
injected onto the column (Figure 58).
8.1.2.1.5 Chromatographic and Mass Spectrometric Conditions
LC-MS/MS method was validated for the analysis of prednisolone and its metabolite
prednisone in plasma. The separation was performed using an analytical Hypercarb
30mm x 3mm, 5µm column (Thermo Scientific, UK) at temperature of 50°C. The
mobile phase was pumped isocratically at a flow rate of 0.6 mL/min and consisted of
0.1% acetic acid in methanol. The sample injection volume was 10 µL. Tandem mass
spectrometric detection and quantification was performed in the negative electrospray
ionization mode using multiple-reaction monitoring (MRM) mode. The transition
selected were m/z 419.3/329 for prednisolone, 417.13 /327 for prednisone and m/z
451.2/361.1 for dexamethasone (Figure 58). MS Settings: An API4000 triple quadruple
mass spectrometer equipped with a turbo-ion spray (heated electro-spray, ESI) was used
to introduce the sample into the mass spectrometer. Nitrogen was used as the collision
gas. Gas settings in ml/min were: Collision gas: 4, curtain gas: 10, ion source gas 1: 40,
ion source gas 2: 40. Ion spray voltage: 4200 V, and temperature: 500°C. Entrance
Pharmacogenetic Associations with Prednisolone and Prednisone Exposure
Page 258 of 377
potential (EP) and collision energy (CE) in voltage were 10 and 22 V, respectively for
all compounds and the dwell times were set at 300 ms. Declustering Potential (DP) was
50 for both prednisolone and prednisone and 20 for dexamethasone. The collision cell
exit potential (CXP) in voltage was 7, 9 and 15 V, for prednisolone, prednisone and
dexamethasone, respectively.
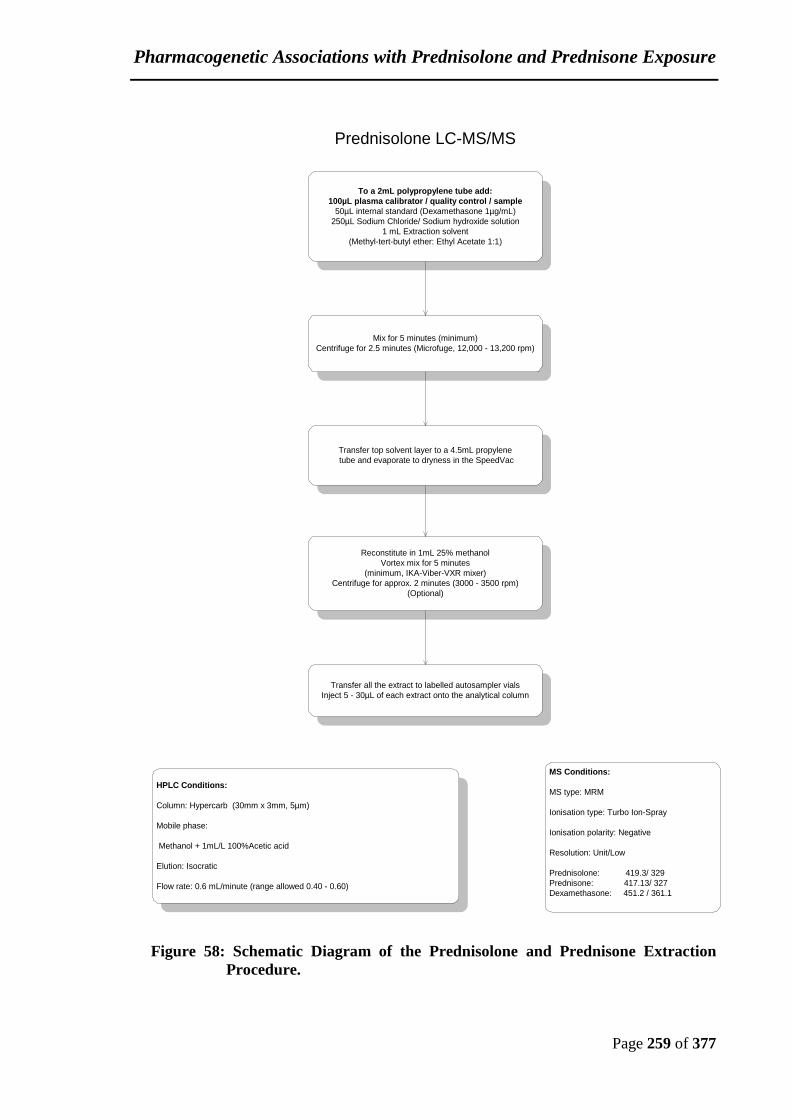
Pharmacogenetic Associations with Prednisolone and Prednisone Exposure
Page 259 of 377
Figure 58: Schematic Diagram of the Prednisolone and Prednisone Extraction
Procedure.
To a 2mL polypropylene tube add:
100µL plasma calibrator / quality control / sample
50µL internal standard (Dexamethasone 1µg/mL)
250µL Sodium Chloride/ Sodium hydroxide solution
1 mL Extraction solvent
(Methyl-tert-butyl ether: Ethyl Acetate 1:1)
Mix for 5 minutes (minimum)
Centrifuge for 2.5 minutes (Microfuge, 12,000 - 13,200 rpm)
Transfer top solvent layer to a 4.5mL propylene
tube and evaporate to dryness in the SpeedVac
Reconstitute in 1mL 25% methanol
Vortex mix for 5 minutes
(minimum, IKA-Viber-VXR mixer)
Centrifuge for approx. 2 minutes (3000 - 3500 rpm)
(Optional)
Transfer all the extract to labelled autosampler vials
Inject 5 - 30µL of each extract onto the analytical column
Prednisolone LC-MS/MS
HPLC Conditions:
Column: Hypercarb (30mm x 3mm, 5µm)
Mobile phase:
Methanol + 1mL/L 100%Acetic acid
Elution: Isocratic
Flow rate: 0.6 mL/minute (range allowed 0.40 - 0.60)
MS Conditions:
MS type: MRM
Ionisation type: Turbo Ion-Spray
Ionisation polarity: Negative
Resolution: Unit/Low
Prednisolone: 419.3/ 329
Prednisone: 417.13/ 327
Dexamethasone: 451.2 / 361.1
Pharmacogenetic Associations with Prednisolone and Prednisone Exposure
Page 260 of 377
8.1.2.2 Method Development and Validation
An analytical method for determination of prednisolone and prednisone plasma
concentration was developed and validated according to FDA guidelines. The method
included determination of accuracy, precision, selectivity, sensitivity, reproducibility,
and stability (FDA., 2001).
8.1.2.2.1 Specificity
The specificity and selectivity of the assay were investigated by comparing the retention
times of prednisolone and prednisone detected in an assay of six drug-free and four
prednisolone and prednisone spiked plasma samples. These samples were extracted
using the above mentioned extraction method. The signal to noise ratio should be more
than 5.
8.1.2.2.2 Matrix Effect
The matrix effect of the method was evaluated by analysis of 6 different batches of
human plasma. Matrix effects were assessed by comparison of peak area measurements
obtained from human plasma extracts spiked with prednisolone and prednisone at the
QC2 level after extraction with those obtained from aqueous solutions.
8.1.2.2.3 Calibration/Linearity
Linearity was assessed by analysis of 7 non-zero calibrators of prednisolone and
prednisone calibration curve in duplicate over a range 2.5 – 375.0 µg/L for prednisolone
and 0.5 – 75.0 µg/L for prednisone with the internal standard (Dexamethasone). The
concentrations of these calibrators were 2.5, 5.0, 12.5, 50.0, 125.0, 250.0 and 375.0
µg/L for prednisolone and 0.5, 1.0, 2.5, 10.0, 25.0, 50.0 and 75.0 µg/L for prednisone.
The calibration curve also consisted of a blank sample (plasma sample analysed with
internal standard), double blank sample (plasma sample analysed without internal
standard). The correlation coefficient (r) between concentration and peak area ratio
should be equivalent to, or better than 0.98.

Pharmacogenetic Associations with Prednisolone and Prednisone Exposure
Page 261 of 377
The following conditions were met in developing a calibration curve for the back
calculated concentrations for calibration standards:
• No more than ±20% deviation of the lower limit of quantitation (LLOQ) from actual
concentration
• No more than ±15% deviation of calibrators other than LLOQ from actual
concentration.
At least 75% of the non-zero standards should meet the above criteria, including the
LLOQ and the calibration standard at the highest concentration, upper limit of
quantitation (ULOQ). Excluding the standards should not change the regression model
used.
8.1.2.2.4 Accuracy and Precision
Accuracy was determined by analysis of low, medium and high quality control samples.
The low, medium and high quality control values were 25.0, 125.0 and 250.0 µg/L,
respectively, for prednisolone and 5.0, 25.0 and 50.0 µg/L, respectively, for prednisone.
Accuracy should be measured using a minimum of five determinations per
concentration. The mean values should be within 15% of the actual value.
The precision or repeatability were measured both within-batch and between-batch by
the analysis of three quality control (QC) samples. Within-run, intra-batch precision
assesses precision during a single analytical run. While between-run, inter-batch
precision measures precision with time, and may involve different analysts, equipment,
reagents, and laboratories. Precision should be measured using a minimum of five
determinations per concentration so the QCs were assayed six times in five separate
essays on separate days. The precision determined at each concentration level should
not exceed 15% of the coefficient of variation (CV), the ratio of the standard deviation
to the mean. For calculating accuracy and precision the following formulae were used:
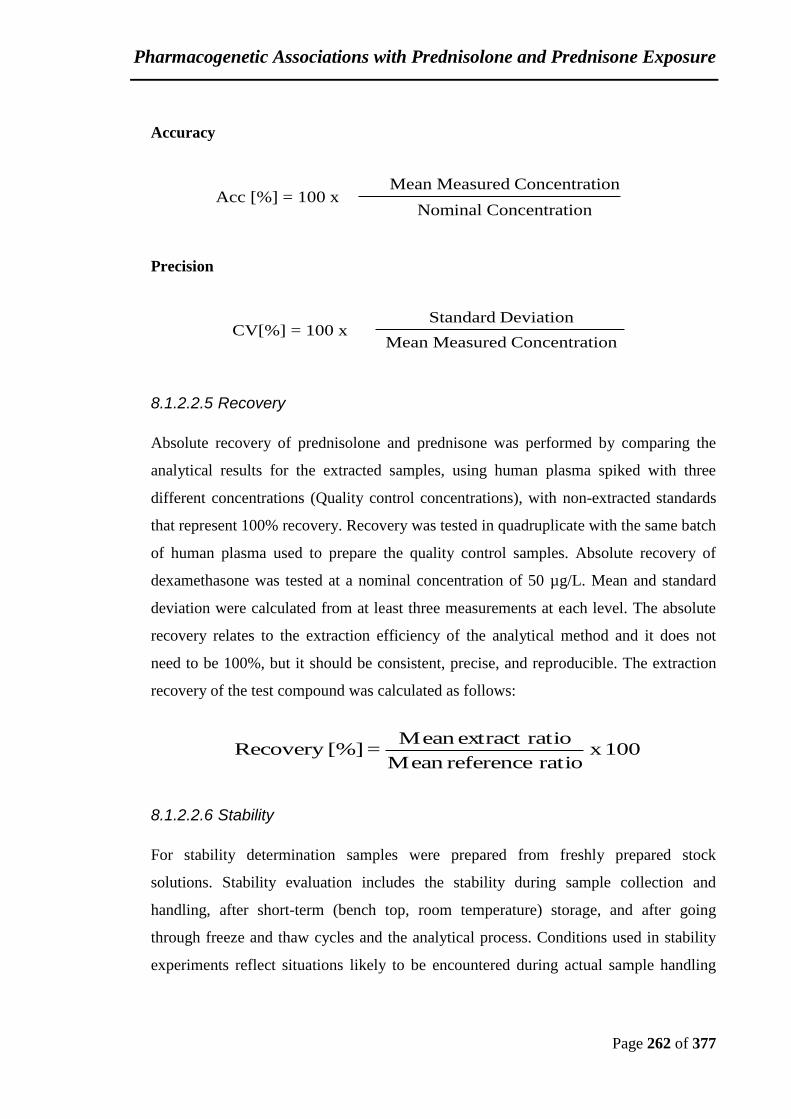
Pharmacogenetic Associations with Prednisolone and Prednisone Exposure
Page 262 of 377
Accuracy
Precision
8.1.2.2.5 Recovery
Absolute recovery of prednisolone and prednisone was performed by comparing the
analytical results for the extracted samples, using human plasma spiked with three
different concentrations (Quality control concentrations), with non-extracted standards
that represent 100% recovery. Recovery was tested in quadruplicate with the same batch
of human plasma used to prepare the quality control samples. Absolute recovery of
dexamethasone was tested at a nominal concentration of 50 µg/L. Mean and standard
deviation were calculated from at least three measurements at each level. The absolute
recovery relates to the extraction efficiency of the analytical method and it does not
need to be 100%, but it should be consistent, precise, and reproducible. The extraction
recovery of the test compound was calculated as follows:
8.1.2.2.6 Stability
For stability determination samples were prepared from freshly prepared stock
solutions. Stability evaluation includes the stability during sample collection and
handling, after short-term (bench top, room temperature) storage, and after going
through freeze and thaw cycles and the analytical process. Conditions used in stability
experiments reflect situations likely to be encountered during actual sample handling
Acc [%] = 100 xMean Measured Concentration
Nominal Concentration
CV[%] = 100 xStandard Deviation
Mean Measured Concentration
100 x ratio referenceMean
ratioextract Mean = [%]Recovery

Pharmacogenetic Associations with Prednisolone and Prednisone Exposure
Page 263 of 377
and analysis. The procedure also includes an evaluation of analyte stability in stock
solution.
8.1.2.2.6.1 Short term temperature stability
The stability of three quality control samples was examined at ambient temperature,
approximately 20ºC and at approximately 4ºC for a period of 24 hours. Four
measurements were made at each concentration of these QC samples.
Sets of stability samples subjected to 3 freeze and thaw cycles at nominal –20°C were
determined against freshly prepared calibration standards. Four measurements were
made at each concentration of these QC samples.
8.1.2.2.6.2 Stability of Extracted Samples
The stability of processed samples’ extracts, including the resident time in the auto-
sampler, was measured in quality control samples. These quality control samples were
kept in the auto-sampler at room temperature. The run was injected at t0 and
approximately 16 h later. Each sample was quantified with the calibration curve injected
at the same time. For each level, the mean value, the standard deviation, the precision
and the accuracy were calculated at t0 and t16 h.
Acceptance criteria:
At t0 and t16 h, the precision should be equal to or less than 15% and the accuracy
should be between 85% and 115% of the nominal concentration for each level to
demonstrate the stability of the compound. Moreover, for each level, at least 4 replicates
out of 6 should have a relative error within 15%.
8.1.2.2.7 Batch analysis and data reporting
Each analytical batch contained seven, non-zero, calibrators, assayed in duplicate. The
three quality control samples, assayed in duplicate, were dispersed throughout the
analytical batch. A minimum of two sets of quality control samples at each
concentration was included in each full analytical batch.
Pharmacogenetic Associations with Prednisolone and Prednisone Exposure
Page 264 of 377
The calibration curves and calculation of prednisolone and prednisone concentrations
used 1/x2 weighted least-squares regression to describe the concentration-response
relationship. The peak area ratio, correlation coefficient (r) and the slope of the
calibration line were calculated using the peak area data by the Analyst 1.3.2 software.
Assay Acceptance Criteria
For study sample results to be accepted the following acceptance criteria must be met
for the analytical batch. In the case of a rejected analytical batch, all study samples of
that analytical batch should be re-analysed.
A. Calibration Curve
The correlation coefficient (r) between concentration and peak area ratio should be
equivalent to, or better than, 0.98.
B. Calibration Standards
The following conditions should be met in developing a calibration curve for the back
calculated concentrations for calibration standards:
no more than ±20% deviation of the LLOQ from actual concentration
no more than ±15% deviation of calibrators other than LLOQ from actual
concentration
At least 75% of the non-zero standards should meet the above criteria, including the
LLOQ and the calibration standard at the highest concentration. Excluding the standards
should not change the regression model used.
C. Quality Control Samples
The concentrations of both the quality control samples and the patient samples were
calculated by using the peak areas of each analyte with respect to the peak areas of the
appropriate internal standard.

Pharmacogenetic Associations with Prednisolone and Prednisone Exposure
Page 265 of 377
The following conditions should be met for batch acceptance:
no more than ±15% deviation of quality controls from their actual concentration
At least 67% of the controls must meet the above criteria.
8.1.3 Results
Optimization of detector parameters for tandem mass spectrometric detection of the
analytes (prednisolone and prednisone) was determined through direct infusion of each
analyte or internal standard (Dexamethasone) at a flow rate of 0.6 mL/min. Each of the
drugs was dissolved in 10% acetic acid: methanol (50:50) with a concentration of
1µg/mL.
The molecular structure and molecular weight of prednisolone, prednisone,
dexamethasone and endogenous steroids (Cortisone and Cortisol) is shown in Figure
59. Parent ion scan (Q1 scan) and product ion scan (Q3). The fragment ions selected for
the assay are shown in Table 54. Endogenous steroids (Cortisone and Cortisol) were
tested to make sure there is no interfering peak at the retention times for prednisone and
prednisolone (Figure 60).

Pharmacogenetic Associations with Prednisolone and Prednisone Exposure
Page 266 of 377
Prednisolone MWt: 360.44
Prednisone MWt: 358.43
Dexamethasone MWt: 392.461
Cortisone MWt: 360.44
Cortisol MWt: 362.460
Figure 59: Molecular Structure and Molecular Weight of Separated Steroids.
Table 54: Analyte Mass Transitions
Analyte Name Prednisolone Prednisone Dexamethasone Cortisone Cortisol
Initial ion (m/z)
Q1 Mass (amu) 419.25 417.25 451.22 419.3 421.1
Product ion (m/z)
Q3 Mass (amu) 329.00 327.00 361.10 329.0 331.0
Ionisation mode Negative Negative Negative Negative Negative
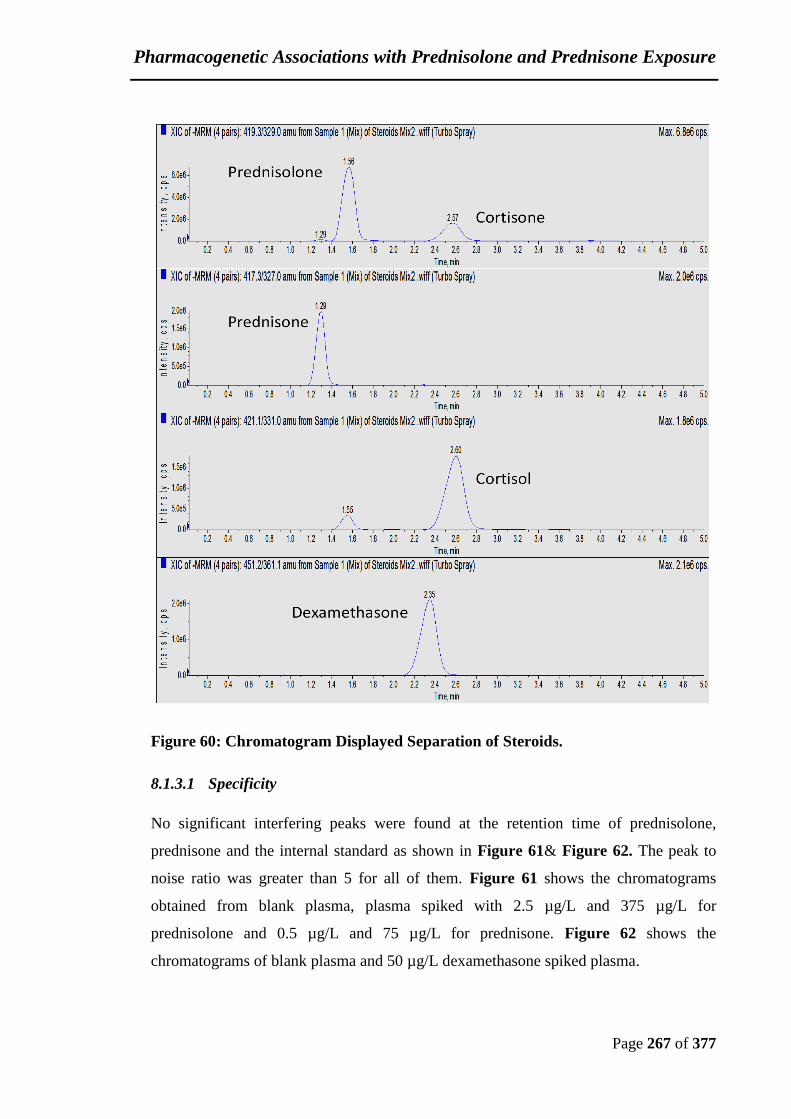
Pharmacogenetic Associations with Prednisolone and Prednisone Exposure
Page 267 of 377
Figure 60: Chromatogram Displayed Separation of Steroids.
8.1.3.1 Specificity
No significant interfering peaks were found at the retention time of prednisolone,
prednisone and the internal standard as shown in Figure 61& Figure 62. The peak to
noise ratio was greater than 5 for all of them. Figure 61 shows the chromatograms
obtained from blank plasma, plasma spiked with 2.5 µg/L and 375 µg/L for
prednisolone and 0.5 µg/L and 75 µg/L for prednisone. Figure 62 shows the
chromatograms of blank plasma and 50 µg/L dexamethasone spiked plasma.
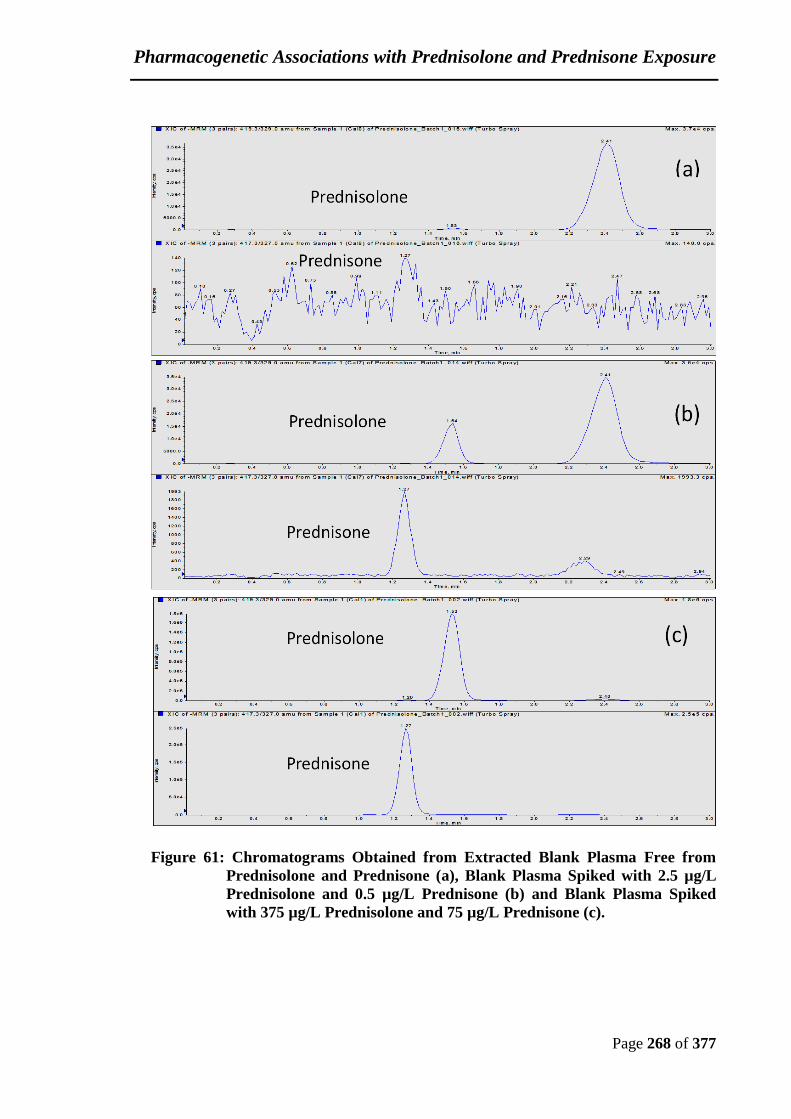
Pharmacogenetic Associations with Prednisolone and Prednisone Exposure
Page 268 of 377
Figure 61: Chromatograms Obtained from Extracted Blank Plasma Free from
Prednisolone and Prednisone (a), Blank Plasma Spiked with 2.5 µg/L
Prednisolone and 0.5 µg/L Prednisone (b) and Blank Plasma Spiked
with 375 µg/L Prednisolone and 75 µg/L Prednisone (c).
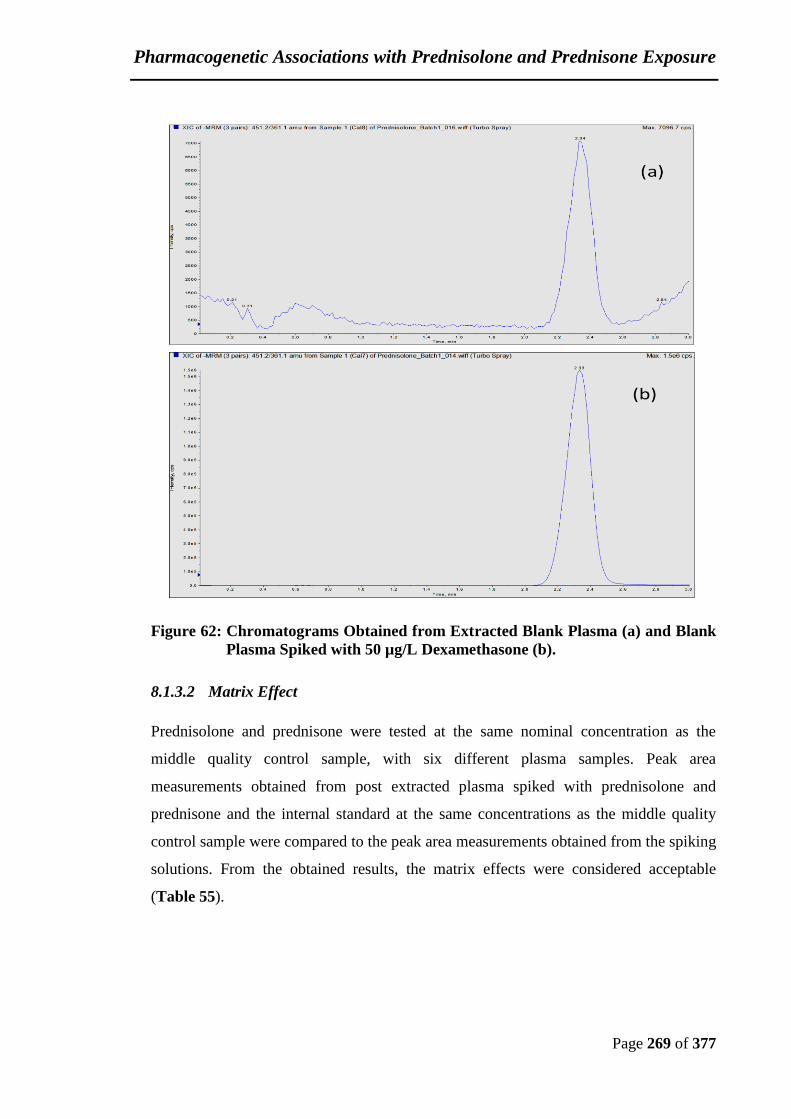
Pharmacogenetic Associations with Prednisolone and Prednisone Exposure
Page 269 of 377
Figure 62: Chromatograms Obtained from Extracted Blank Plasma (a) and Blank
Plasma Spiked with 50 µg/L Dexamethasone (b).
8.1.3.2 Matrix Effect
Prednisolone and prednisone were tested at the same nominal concentration as the
middle quality control sample, with six different plasma samples. Peak area
measurements obtained from post extracted plasma spiked with prednisolone and
prednisone and the internal standard at the same concentrations as the middle quality
control sample were compared to the peak area measurements obtained from the spiking
solutions. From the obtained results, the matrix effects were considered acceptable
(Table 55).
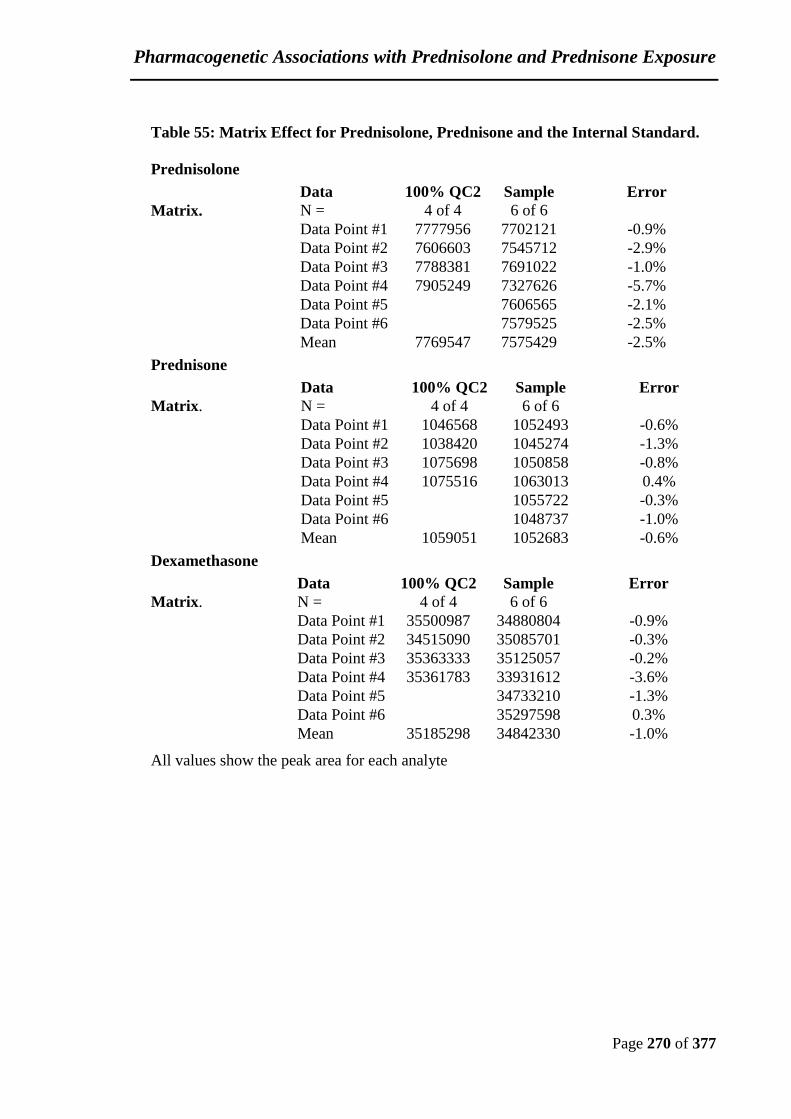
Pharmacogenetic Associations with Prednisolone and Prednisone Exposure
Page 270 of 377
Table 55: Matrix Effect for Prednisolone, Prednisone and the Internal Standard.
Prednisolone
Data 100% QC2
(Area)
Sample
(Area)
Error
Matrix. N = 4 of 4 6 of 6
Data Point #1 7777956 7702121 -0.9%
Data Point #2 7606603 7545712 -2.9%
Data Point #3 7788381 7691022 -1.0%
Data Point #4 7905249 7327626 -5.7%
Data Point #5 7606565 -2.1%
Data Point #6 7579525 -2.5%
Mean 7769547 7575429 -2.5%
Prednisone
Data 100% QC2
(Area)
Sample
(Area)
Error
Matrix. N = 4 of 4 6 of 6
Data Point #1 1046568 1052493 -0.6%
Data Point #2 1038420 1045274 -1.3%
Data Point #3 1075698 1050858 -0.8%
Data Point #4 1075516 1063013 0.4%
Data Point #5 1055722 -0.3%
Data Point #6 1048737 -1.0%
Mean 1059051 1052683 -0.6%
Dexamethasone
Data 100% QC2
(Area)
Sample
(Area)
Error
sample / mean
100%
Matrix. N = 4 of 4 6 of 6
Data Point #1 35500987 34880804 -0.9%
Data Point #2 34515090 35085701 -0.3%
Data Point #3 35363333 35125057 -0.2%
Data Point #4 35361783 33931612 -3.6%
Data Point #5 34733210 -1.3%
Data Point #6 35297598 0.3%
Mean 35185298 34842330 -1.0%
All values show the peak area for each analyte

Pharmacogenetic Associations with Prednisolone and Prednisone Exposure
Page 271 of 377
8.1.3.3 Calibration
The calibration curves contained seven, non-zero, calibrators, containing both
prednisolone and prednisone, assayed in duplicate. Nominal values for prednisolone
were 2.5, 5.0, 12.5, 50.0, 125.0, 250.0 and 375.0 µg/L. Nominal values for prednisone
were 0.5, 1.0, 2.5, 10.0, 25.0, 50.0 and 75.0 µg/L. Two prednisolone and prednisone-
free samples were analysed, one with the internal standard and one without the internal
standard; neither were included when fitting the calibration line.
The peak area ratios, regression coefficients and the slopes of the calibration lines, etc.
were calculated from the peak area data by the Analyst program. The correlation
coefficient (r) between concentration and peak area ratio is ≥ 0.9976 for all curves. This
meets the acceptance criteria that the correlation coefficient (r) should be equivalent to,
or better than, 0.98. Table 56 & Table 57 summarised the mean of the results obtained
from five curves.
Table 56: Prednisolone Calibration Curve Parameters
Analytical run a0 a1 a2 Correlation coefficient (r)
Batch1 0.000233 0.00237 -0.000000967 0.9998
Batch2 0.001510 0.00235 -0.000000929 0.9997
Batch3 0.000448 0.00249 -0.000001150 0.9997
Batch4 0.000508 0.00245 -0.000001120 0.9997
Batch5 0.000746 0.00234 -0.000000973 0.9992
y=a2x2+a1x+a0
Table 57: Prednisone Calibration Curve Parameters
Analytical run Slope Intercept Correlation coefficient (r)
Batch1 0.0000335 0.00116 0.9989
Batch2 0.0001740 0.00108 0.9993
Batch3 0.0000765 0.00106 0.9993
Batch4 0.0000596 0.00107 0.9997
Batch5 0.0001470 0.00117 0.9976
y= a1x+a0
Pharmacogenetic Associations with Prednisolone and Prednisone Exposure
Page 272 of 377
8.1.3.4 Accuracy and Precision
The three quality control samples were, initially, each extracted six times in three
batches. Subsequently, the three quality control samples were each extracted six times
in two additional batches. On each occasion a separate calibration curve was extracted.
The criteria for the acceptance of the quality control samples were that both the
precision and the mean measured concentration should be within ±15% of the expected
value. Using these criteria, accuracy of the quality control samples for both
prednisolone and prednisone were well within the ranges allowed (Table 58 & Table
59).
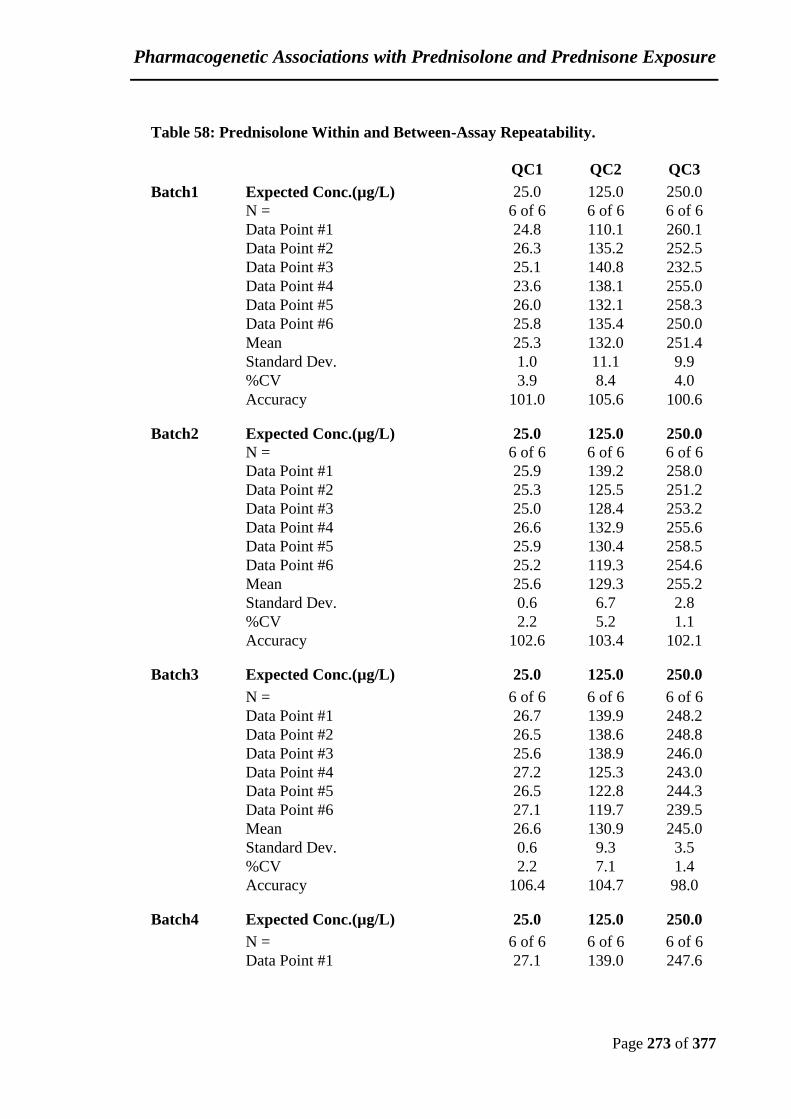
Pharmacogenetic Associations with Prednisolone and Prednisone Exposure
Page 273 of 377
Table 58: Prednisolone Within and Between-Assay Repeatability.
QC1 QC2 QC3
Batch1 Expected Conc.(µg/L) 25.0 125.0 250.0
N = 6 of 6 6 of 6 6 of 6
Data Point #1 24.8 110.1 260.1
Data Point #2 26.3 135.2 252.5
Data Point #3 25.1 140.8 232.5
Data Point #4 23.6 138.1 255.0
Data Point #5 26.0 132.1 258.3
Data Point #6 25.8 135.4 250.0
Mean 25.3 132.0 251.4
Standard Dev. 1.0 11.1 9.9
%CV 3.9 8.4 4.0
Accuracy 101.0 105.6 100.6
Batch2 Expected Conc.(µg/L) 25.0 125.0 250.0
N = 6 of 6 6 of 6 6 of 6
Data Point #1 25.9 139.2 258.0
Data Point #2 25.3 125.5 251.2
Data Point #3 25.0 128.4 253.2
Data Point #4 26.6 132.9 255.6
Data Point #5 25.9 130.4 258.5
Data Point #6 25.2 119.3 254.6
Mean 25.6 129.3 255.2
Standard Dev. 0.6 6.7 2.8
%CV 2.2 5.2 1.1
Accuracy 102.6 103.4 102.1
Batch3 Expected Conc.(µg/L) 25.0 125.0 250.0
N = 6 of 6 6 of 6 6 of 6
Data Point #1 26.7 139.9 248.2
Data Point #2 26.5 138.6 248.8
Data Point #3 25.6 138.9 246.0
Data Point #4 27.2 125.3 243.0
Data Point #5 26.5 122.8 244.3
Data Point #6 27.1 119.7 239.5
Mean 26.6 130.9 245.0
Standard Dev. 0.6 9.3 3.5
%CV 2.2 7.1 1.4
Accuracy 106.4 104.7 98.0
Batch4 Expected Conc.(µg/L) 25.0 125.0 250.0
N = 6 of 6 6 of 6 6 of 6
Data Point #1 27.1 139.0 247.6

Pharmacogenetic Associations with Prednisolone and Prednisone Exposure
Page 274 of 377
Data Point #2 26.0 136.3 240.9
Data Point #3 25.3 137.3 243.1
Data Point #4 26.8 126.7 242.1
Data Point #5 26.8 123.7 249.1
Data Point #6 26.6 121.2 245.1
Mean 26.4 130.7 244.7
Standard Dev. 0.7 7.7 3.2
%CV 2.5 5.9 1.3
Accuracy 105.7 104.5 97.9
Batch5 Expected Conc.(µg/L) 25.0 125.0
0
250.0
N = 6 of 6 6 of 6 6 of 6
Data Point #1 24.5 121.3 247.3
Data Point #2 24.9 117.6 233.0
Data Point #3 23.1 114.4 232.3
Data Point #4 25.5 123.5 260.0
Data Point #5 25.0 121.6 241.9
Data Point #6 24.9 118.0 239.6
Mean 24.6 119.4 242.4
Standard Dev. 0.8 3.4 10.3
%CV 3.4 2.8 4.3
Accuracy 98.6 95.5 96.9
Within-assay repeatability
QC1 QC2 QC3
Expected Conc.(µg/L) 25.0 125.0 250.0
N = 30 of 30 30 of 30 30 of 30
Mean 25.7 128.4 247.7
Standard Dev. 1.0 8.8 8.0
%CV 4.0 6.9 3.2
Accuracy 102.9 102.8 99.1
Between-assay repeatability
QC1 QC2 QC3
Expected Conc.(µg/L) 25.0 125.0
250.0
N = 5 of 5 5 of 5 5 of 5
Mean 25.7 128.4 247.7
Standard Dev. 0.8 5.1 5.4
%CV 3.2 4.0 2.2
Accuracy 102.9 102.8 99.1
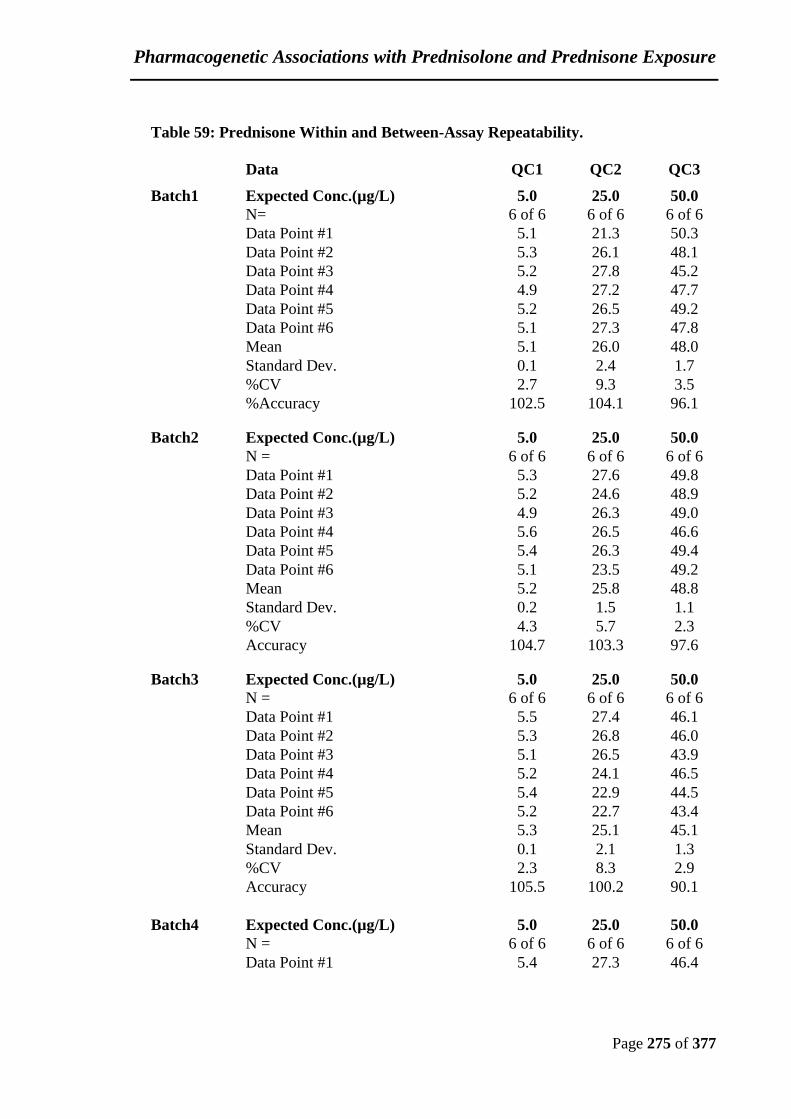
Pharmacogenetic Associations with Prednisolone and Prednisone Exposure
Page 275 of 377
Table 59: Prednisone Within and Between-Assay Repeatability.
Data QC1 QC2 QC3
Batch1 Expected Conc.(µg/L) 5.0 25.0
0
50.0
N= 6 of 6 6 of 6 6 of 6
Data Point #1 5.1 21.3 50.3
Data Point #2 5.3 26.1 48.1
Data Point #3 5.2 27.8 45.2
Data Point #4 4.9 27.2 47.7
Data Point #5 5.2 26.5 49.2
Data Point #6 5.1 27.3 47.8
Mean 5.1 26.0 48.0
Standard Dev. 0.1 2.4 1.7
%CV 2.7 9.3 3.5
%Accuracy 102.5 104.1 96.1
Batch2 Expected Conc.(µg/L) 5.0 25.0
0
50.0
N = 6 of 6 6 of 6 6 of 6
Data Point #1 5.3 27.6 49.8
Data Point #2 5.2 24.6 48.9
Data Point #3 4.9 26.3 49.0
Data Point #4 5.6 26.5 46.6
Data Point #5 5.4 26.3 49.4
Data Point #6 5.1 23.5 49.2
Mean 5.2 25.8 48.8
Standard Dev. 0.2 1.5 1.1
%CV 4.3 5.7 2.3
Accuracy 104.7 103.3 97.6
Batch3 Expected Conc.(µg/L) 5.0 25.0
0
50.0
N = 6 of 6 6 of 6 6 of 6
Data Point #1 5.5 27.4 46.1
Data Point #2 5.3 26.8 46.0
Data Point #3 5.1 26.5 43.9
Data Point #4 5.2 24.1 46.5
Data Point #5 5.4 22.9 44.5
Data Point #6 5.2 22.7 43.4
Mean 5.3 25.1 45.1
Standard Dev. 0.1 2.1 1.3
%CV 2.3 8.3 2.9
Accuracy 105.5 100.2 90.1
Batch4 Expected Conc.(µg/L) 5.0 25.0
0
50.0
N = 6 of 6 6 of 6 6 of 6
Data Point #1 5.4 27.3 46.4

Pharmacogenetic Associations with Prednisolone and Prednisone Exposure
Page 276 of 377
Data Point #2 5.1 26.7 45.1
Data Point #3 5.1 26.2 43.3
Data Point #4 5.0 24.3 45.9
Data Point #5 5.4 23.4 45.5
Data Point #6 5.2 23.5 43.5
Mean 5.2 25.2 44.9
Standard Dev. 0.2 1.7 1.3
%CV 3.4 6.8 2.9
Accuracy 104.4 100.9 89.9
Batch5 Expected Conc.(µg/L) 5.0 25.0
0
50.0
N = 6 of 6 6 of 6 6 of 6
Data Point #1 5.7 23.0 47.7
Data Point #2 5.2 24.7 43.7
Data Point #3 4.5 23.9 44.4
Data Point #4 4.8 23.3 53.8
Data Point #5 4.9 25.5 52.8
Data Point #6 4.7 24.7 45.1
Mean 5.0 24.2 47.9
Standard Dev. 0.4 0.9 4.4
%CV 8.4 3.9 9.2
Accuracy 99.3 96.8 95.8
Within-assay repeatability
QC1 QC2 QC3
Expected Conc.(µg/L) 5.0 25.0
0
50.0
N = 30 of 30 30 of 30 30 of 30
Mean 5.2 25.3 47.0
Standard Dev. 0.3 1.8 2.7
%CV 4.9 7.1 5.8
Accuracy 103.3 101.1 93.9
Between-assay repeatability
QC1 QC2 QC3
Expected Conc.(µg/L) 5.0 25.0
0
50.0
N = 5 of 5 5 of 5 5 of 5
Mean 5.2 25.3 47.0
Standard Dev. 0.1 0.7 1.8
%CV 2.4 2.9 3.9
Accuracy 103.3 101.1 93.9

Pharmacogenetic Associations with Prednisolone and Prednisone Exposure
Page 277 of 377
8.1.3.5 Recovery
Recovery was assessed by comparison of peak area measurements obtained from human
plasma spiked prior to extraction with those obtained from human plasma extracts
spiked after extraction. The recovery percentage was 77.7% to 79.2% for prednisolone
and 72.9% to 73.5% for prednisone (Table 60). The extraction recovery for
dexamethasone was 82.1%. The recovery for all three analytes was acceptable.
Table 60: Prednisolone, Prednisone and Internal Standard Relative Recovery.
Prednisolone
QC1 100% QC1 Ext Recovery
N = 4 of 4 4 of 4
Data Point #1 1908337 1465785 76.8%
Data Point #2 1819192 1440493 79.2%
Data Point #3 1816171 1410251 77.7%
Data Point #4 1805942 1412439 78.2%
Mean 1837411 1432242 78.0%
QC2 100% QC2 Ext Recovery
N = 4 of 4 4 of 4
Data Point #1 8157898 6290393 77.1%
Data Point #2 8054867 6494499 80.6%
Data Point #3 8111873 6089051 75.1%
Data Point #4 8163250 6355247 77.9%
Mean 8121972 6307298 77.7%
QC3 100% QC3 Ext Recovery
N = 4 of 4 4 of 4
Data Point #1 14466815 11297546 78.1%
Data Point #2 14439308 11113930 77.0%
Data Point #3 14583767 11712547 80.3%
Data Point #4 14740886 12006762 81. 5%
Mean 14557694 11532696 79.2%

Pharmacogenetic Associations with Prednisolone and Prednisone Exposure
Page 278 of 377
Prednisone
QC1 100% QC1 Ext Recovery
N = 4 of 4 4 of 4
Data Point #1 230571 167942 72.8%
Data Point #2 222306 164727 74.1%
Data Point #3 228459 166724 73.0%
Data Point #4 223172 165728 74.3%
Mean 226127 166280 73.5%
QC2 100% QC2 Ext Recovery
N = 4 of 4 4 of 4
Data Point #1 1055920 782741 74.1%
Data Point #2 1040078 801541 77.1%
Data Point #3 1054412 753180 71.4%
Data Point #4 1060692 760615 71.7%
Mean 1052776 774519 73.6%
QC3 100% QC3 Ext Recovery
N = 4 of 4 4 of 4
Data Point #1 1988749 1424481 71.6%
Data Point #2 2005401 1408663 70.2%
Data Point #3 2014388 1487534 73.9%
Data Point #4 1989498 1512129 76.0%
Mean 1999509 1458202 72.9%
Dexamethasone
IS 100% IS Ext Recovery
N= 12 of 12 12 of 12
Data Point #1 37532289 30566385 81.4%
Data Point #2 36384499 30401293 83.6%
Data Point #3 36717119 30194001 82.2%
Data Point #4 36230810 30282588 83.6%
Data Point #5 37200017 29458118 79.2%
Data Point #6 37112266 30783098 83.0%
Data Point #7 36588946 29154129 79.7%
Data Point #8 36481255 29946647 82.1%
Data Point #9 36467918 29159559 80.0%
Data Point #10 36049318 29567495 82.0%
Data Point #11 36078791 30029494 83.2%
Data Point #12 35970806 30701427 85.4%
Mean 36567836 30020353 82.1%
All values show the peak area for each analyte

Pharmacogenetic Associations with Prednisolone and Prednisone Exposure
Page 279 of 377
8.1.3.6 Short-Term Stability in Matrix
The stability of prednisolone and prednisone in the three control samples was evaluated
by the analysis of 6 replicates at each level. A set at each level was analysed as follows:
• On the day of preparation, t0
• After a minimum of 24 hours at ambient temperature.
• After a minimum of 24 hours at approximately 4°C.
• After three freeze-thaw cycles at nominal –20°C.
Prednisolone and prednisone stability data show that they are stable in these
circumstances (Table 61 & Table 62). All the results were in the acceptable range
(within ±15%).

Pharmacogenetic Associations with Prednisolone and Prednisone Exposure
Page 280 of 377
Table 61: Prednisolone Short-Term Stability Data.
QC1 t0 QC2 t0 QC3 t0
Batch1 Expected Conc.(µg/L) 25.0 125.0 250.0
N = 6 of 6 6 of 6 6 of 6
Data Point #1 24.8 110.1 260.1
Data Point #2 26.3 135.2 252.5
Data Point #3 25.1 140.8 232.5
Data Point #4 23.6 138.1 255
Data Point #5 26.0 132.1 258.3
Data Point #6 25.8 135.4 250
Mean 25.3 132 251.4
Standard Dev. 1.0 11.1 9.9
%CV 3.9 8.4 4.0
Accuracy 101.0 105.6 100.6
QC1 Rt QC2 Rt QC3 Rt
Batch2 Expected Conc.(µg/L) 25.0 125.0 250.0
N = 4 of 4 4 of 4 4 of 4
Data Point #1 26.6 127.8 262.9
Data Point #2 26.2 124.9 263.1
Data Point #3 25.9 131.2 264.2
Data Point #4 25.5 131 267
Mean 26.1 128.8 264.3
Standard Dev. 0.5 3.0 1.9
%CV 2.0 2.3 0.7
Accuracy 104.2 103.0 105.7
QC1 4°C QC2 4°C QC3 4°C
Batch2 Expected Conc.(µg/L) 25.0 125.0 250.0
N = 4 of 4 4 of 4 4 of 4
Data Point #1 25 126 263.6
Data Point #2 23.8 128.9 268
Data Point #3 24.8 129.9 271.3
Data Point #4 25.3 127.5 274.5
Mean 24.7 128.1 269.4
Standard Dev. 0.6 1.7 4.7
%CV 2.6 1.3 1.7
Accuracy 99.0 102.5 107.7
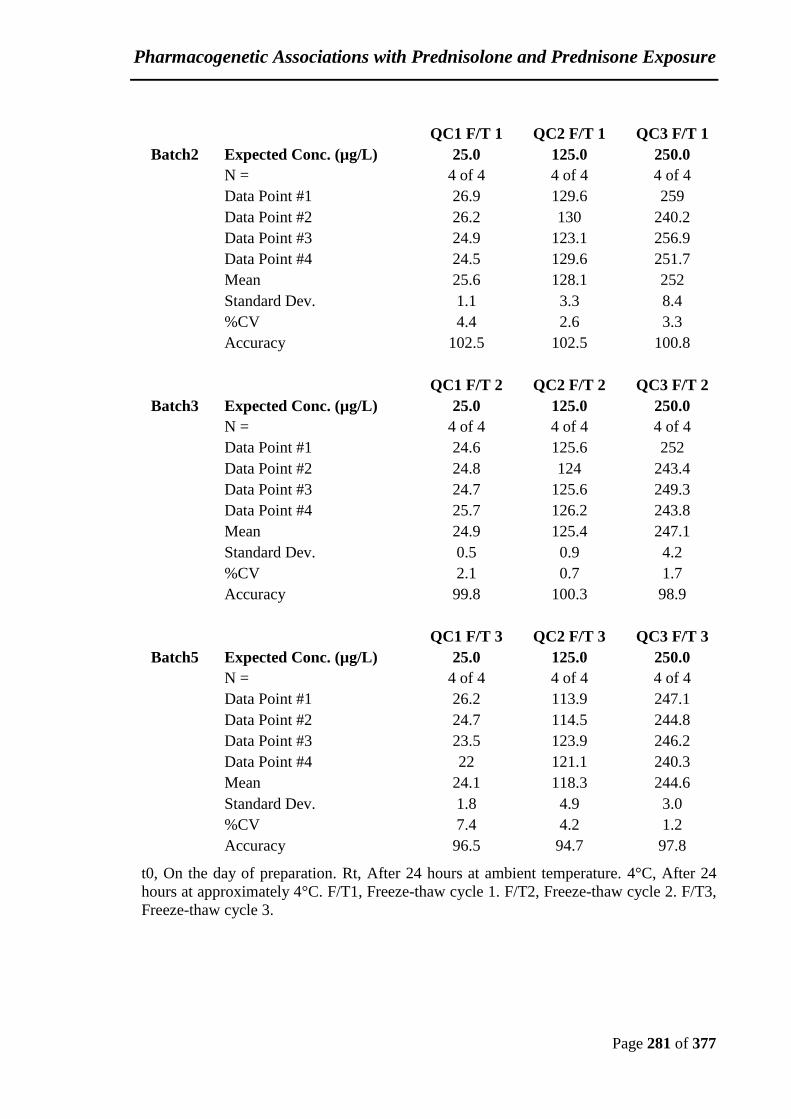
Pharmacogenetic Associations with Prednisolone and Prednisone Exposure
Page 281 of 377
QC1 F/T 1 QC2 F/T 1 QC3 F/T 1
Batch2 Expected Conc. (µg/L) 25.0 125.0 250.0
N = 4 of 4 4 of 4 4 of 4
Data Point #1 26.9 129.6 259
Data Point #2 26.2 130 240.2
Data Point #3 24.9 123.1 256.9
Data Point #4 24.5 129.6 251.7
Mean 25.6 128.1 252
Standard Dev. 1.1 3.3 8.4
%CV 4.4 2.6 3.3
Accuracy 102.5 102.5 100.8
QC1 F/T 2 QC2 F/T 2 QC3 F/T 2
Batch3 Expected Conc. (µg/L) 25.0 125.0 250.0
N = 4 of 4 4 of 4 4 of 4
Data Point #1 24.6 125.6 252
Data Point #2 24.8 124 243.4
Data Point #3 24.7 125.6 249.3
Data Point #4 25.7 126.2 243.8
Mean 24.9 125.4 247.1
Standard Dev. 0.5 0.9 4.2
%CV 2.1 0.7 1.7
Accuracy 99.8 100.3 98.9
QC1 F/T 3 QC2 F/T 3 QC3 F/T 3
Batch5 Expected Conc. (µg/L) 25.0 125.0 250.0
N = 4 of 4 4 of 4 4 of 4
Data Point #1 26.2 113.9 247.1
Data Point #2 24.7 114.5 244.8
Data Point #3 23.5 123.9 246.2
Data Point #4 22 121.1 240.3
Mean 24.1 118.3 244.6
Standard Dev. 1.8 4.9 3.0
%CV 7.4 4.2 1.2
Accuracy 96.5 94.7 97.8
t0, On the day of preparation. Rt, After 24 hours at ambient temperature. 4°C, After 24
hours at approximately 4°C. F/T1, Freeze-thaw cycle 1. F/T2, Freeze-thaw cycle 2. F/T3,
Freeze-thaw cycle 3.

Pharmacogenetic Associations with Prednisolone and Prednisone Exposure
Page 282 of 377
Table 62: Prednisone Short-Term Stability Data.
QC1 t0 QC2 t0 QC3 t0
Batch1 Expected Conc. (µg/L) 5.0 25.0 50.0
N = 6 of 6 6 of 6 6 of 6 Data Point #1 5.1 21.3 50.3 Data Point #2 5.3 26.1 48.1 Data Point #3 5.2 27.8 45.2 Data Point #4 4.9 27.2 47.7 Data Point #5 5.2 26.5 49.2 Data Point #6 5.1 27.3 47.8 Mean 5.1 26.0 48.0 Standard Dev. 0.1 2.4 1.7 %CV 2.7 9.3 3.5 Accuracy 102.5 104.1 96.1 QC1 Rt QC2 Rt QC3 Rt
Batch2 Expected Conc. (µg/L) 5.0 25.0 50.0
N = 4 of 4 4 of 4 4 of 4 Data Point #1 5.2 23.9 49.1 Data Point #2 5.0 23.3 49.3 Data Point #3 5.0 24.7 49.4 Data Point #4 5.1 24.7 49.1 Mean 5.1 24.1 49.2 Standard Dev. 0.1 0.7 0.1 %CV 1.9 2.9 0.2 Accuracy 101.9 96.6 98.4 QC1 4°C QC2 4°C QC3 4°C
Batch2 Expected Conc. (µg/L) 5.0 25.0 50.0
N = 4 of 4 4 of 4 4 of 4 Data Point #1 5.1 24.7 51.7 Data Point #2 4.7 25.6 51.9 Data Point #3 4.9 25.5 52.7 Data Point #4 5.1 25.1 53.5 Mean 5.0 25.2 52.4 Standard Dev. 0.2 0.4 0.8 %CV 4.3 1.7 1.5 Accuracy 99.2 100.9 104.9 QC1 F/T 1 QC2 F/T 1 QC3 F/T 1
Batch2 Expected Conc. (µg/L) 5.0 25.0 50.0
N = 4 of 4 4 of 4 4 of 4 Data Point #1 5.6 26.3 50.9 Data Point #2 5.3 26.3 45.6 Data Point #3 5.0 24.8 51.8 Data Point #4 4.9 26.3 49.0 Mean 5.2 25.9 49.3 Standard Dev. 0.3 0.7 2.7 %CV 5.8 2.9 5.5 Accuracy 103.7 103.7 98.6
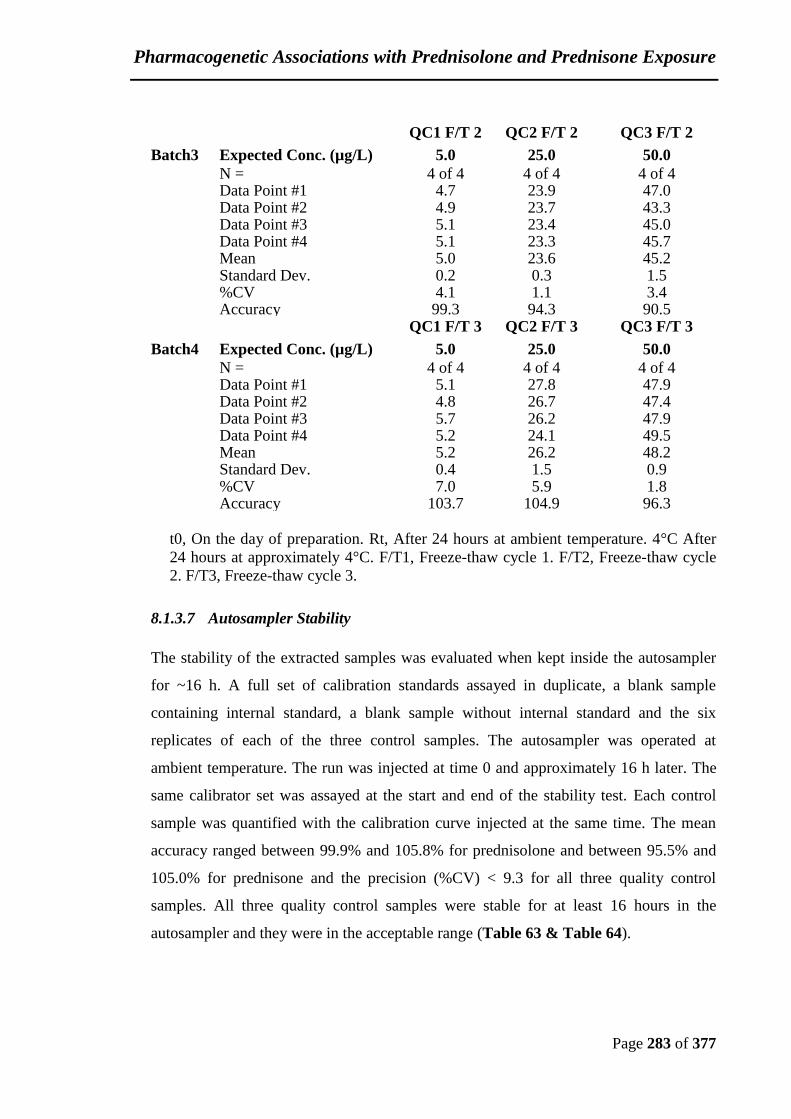
Pharmacogenetic Associations with Prednisolone and Prednisone Exposure
Page 283 of 377
QC1 F/T 2 QC2 F/T 2 QC3 F/T 2
Batch3 Expected Conc. (µg/L) 5.0 25.0 50.0
N = 4 of 4 4 of 4 4 of 4 Data Point #1 4.7 23.9 47.0 Data Point #2 4.9 23.7 43.3 Data Point #3 5.1 23.4 45.0 Data Point #4 5.1 23.3 45.7 Mean 5.0 23.6 45.2 Standard Dev. 0.2 0.3 1.5 %CV 4.1 1.1 3.4 Accuracy 99.3 94.3 90.5 QC1 F/T 3 QC2 F/T 3 QC3 F/T 3
Batch4 Expected Conc. (µg/L) 5.0 25.0 50.0
N = 4 of 4 4 of 4 4 of 4 Data Point #1 5.1 27.8 47.9 Data Point #2 4.8 26.7 47.4 Data Point #3 5.7 26.2 47.9 Data Point #4 5.2 24.1 49.5 Mean 5.2 26.2 48.2 Standard Dev. 0.4 1.5 0.9 %CV 7.0 5.9 1.8 Accuracy 103.7 104.9 96.3
t0, On the day of preparation. Rt, After 24 hours at ambient temperature. 4°C After
24 hours at approximately 4°C. F/T1, Freeze-thaw cycle 1. F/T2, Freeze-thaw cycle
2. F/T3, Freeze-thaw cycle 3.
8.1.3.7 Autosampler Stability
The stability of the extracted samples was evaluated when kept inside the autosampler
for ~16 h. A full set of calibration standards assayed in duplicate, a blank sample
containing internal standard, a blank sample without internal standard and the six
replicates of each of the three control samples. The autosampler was operated at
ambient temperature. The run was injected at time 0 and approximately 16 h later. The
same calibrator set was assayed at the start and end of the stability test. Each control
sample was quantified with the calibration curve injected at the same time. The mean
accuracy ranged between 99.9% and 105.8% for prednisolone and between 95.5% and
105.0% for prednisone and the precision (%CV) < 9.3 for all three quality control
samples. All three quality control samples were stable for at least 16 hours in the
autosampler and they were in the acceptable range (Table 63 & Table 64).

Pharmacogenetic Associations with Prednisolone and Prednisone Exposure
Page 284 of 377
Table 63: Prednisolone Autosampler Stability Data
Analytical Run: Batch1
Assay start date / time: 01/04/2013 18:56
QC1 QC2 QC3
Expected Conc. (µg/L) 25.0 125.0 250.0
N = 6 of 6 6 of 6 6 of 6
Data Point #1 24.8 110.1 260.1
Data Point #2 26.3 135.2 252.5
Data Point #3 25.1 140.8 232.5
Data Point #4 23.6 138.1 255.0
Data Point #5 26.0 132.1 258.3
Data Point #6 25.8 135.4 250.0
Mean 25.3 132.0 251.4
Standard Dev. 1.0 11.1 9.9
%CV 3.9 8.4 4.0
Accuracy 101.0 105.6 100.6
Analytical Run: Batch1R
Assay start date / time: 02/04/2013 11:18
QC1 QC2 QC3
Expected Conc. (µg/L) 25.0 125.0 250.0
N = 6 of 6 6 of 6 6 of 6
Data Point #1 24.7 111.7 256.7
Data Point #2 26.5 136.6 254.9
Data Point #3 24.6 141.4 231.9
Data Point #4 23.8 138.6 252.4
Data Point #5 26.1 130.8 253.5
Data Point #6 25.2 134.7 248.6
Mean 25.2 132.3 249.7
Standard Dev. 1.0 10.7 9.1
%CV 4.0 8.1 3.7
Accuracy 100.7 105.8 99.9
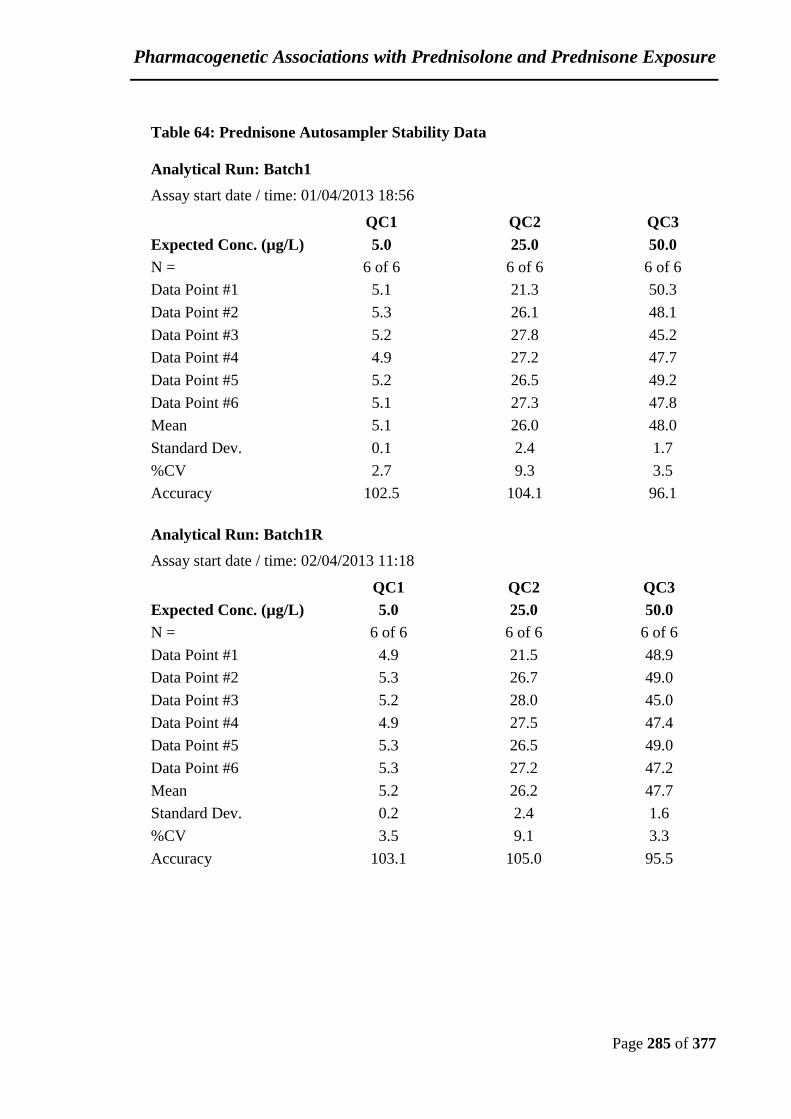
Pharmacogenetic Associations with Prednisolone and Prednisone Exposure
Page 285 of 377
Table 64: Prednisone Autosampler Stability Data
Analytical Run: Batch1
Assay start date / time: 01/04/2013 18:56
QC1 QC2 QC3
Expected Conc. (µg/L) 5.0 25.0 50.0
N = 6 of 6 6 of 6 6 of 6
Data Point #1 5.1 21.3 50.3
Data Point #2 5.3 26.1 48.1
Data Point #3 5.2 27.8 45.2
Data Point #4 4.9 27.2 47.7
Data Point #5 5.2 26.5 49.2
Data Point #6 5.1 27.3 47.8
Mean 5.1 26.0 48.0
Standard Dev. 0.1 2.4 1.7
%CV 2.7 9.3 3.5
Accuracy 102.5 104.1 96.1
Analytical Run: Batch1R
Assay start date / time: 02/04/2013 11:18
QC1 QC2 QC3
Expected Conc. (µg/L) 5.0 25.0 50.0
N = 6 of 6 6 of 6 6 of 6
Data Point #1 4.9 21.5 48.9
Data Point #2 5.3 26.7 49.0
Data Point #3 5.2 28.0 45.0
Data Point #4 4.9 27.5 47.4
Data Point #5 5.3 26.5 49.0
Data Point #6 5.3 27.2 47.2
Mean 5.2 26.2 47.7
Standard Dev. 0.2 2.4 1.6
%CV 3.5 9.1 3.3
Accuracy 103.1 105.0 95.5
Pharmacogenetic Associations with Prednisolone and Prednisone Exposure
Page 286 of 377
8.1.4 Discussion and Conclusion
All validation results obtained met the FDA guideline requirements. In this study, a very
simple liquid –liquid extraction method has been developed and validated. Cortisone
and prednisolone have molecular weights less than 1 amu apart and the same product
ion and this makes it difficult to separate them from each other. Hence, it was difficult
to measure prednisolone concentrations in renal transplant patients. This study showed
that there is no interference between cortisone with prednisolone and between
prednisone with hydrocortisone. However, we cannot separate cortisone from
hydrocortisone. In this method, all the analytes eluted at a very short retention time, run
time 3 min, which make it easy to run a large number of samples in a short period of
time. This method is a sensitive method and a very small amount of plasma (100 µL)
was used. HPLC–UV methods are not an adequate for analysing low concentrations of
simultaneous corticosteroids in biological fluids and require long retention time. The
sensitivity, accuracy and precision achieved by this method enable us to use it for
assessment of prednisolone and prednisone pharmacokinetics in renal transplant
patients’ samples.
In this study, we present a sensitive, simple and rapid method to be used to selectively
quantitate prednisolone and prednisone in plasma from stable post- transplant patients.
All the validation results met the international requirements as defined in the guideline
for analytical method validation (FDA., 2001). Previously published methods using
radioimmunoassay (Adachi et al., 1991) and detection by high-performance liquid
chromatography (HPLC)-ultraviolet (UV) (Majid et al., 2001) or gas chromatography–
mass spectrometry (GC–MS) (Shibasaki et al., 2008) have higher limits of
quantification and involve difficult extraction and derivatization steps. Several of the
previously reported LC–MS/MS methods do not or hardly achieve baseline separation
of prednisolone and cortisol (Frerichs and Tornatore, 2004, Ionita and Akhlaghi, 2010).
In this study, a simple liquid-liquid extraction which only needs 100µL of plasma has
been developed and validated. Prednisolone, its metabolite prednisone and the
endogenous cortisol and cortisone are very similar in structure (Figure 59). Most
reverse phase columns (C8, C18, etc.) would result in very long run times (Majid et al.,

Pharmacogenetic Associations with Prednisolone and Prednisone Exposure
Page 287 of 377
2001). The Hypercarb column used in this method offers the separation of highly polar
compounds with closely related structures. Using Hypercarb column, prednisolone and
prednisone were baseline separated from each other and from cortisol and cortisone;
however the latter two were only partially separated. Compared to previously published
methods, this method requires only 100µL volume of plasma, has a simple and short
extraction procedure and achieves suitable chromatographic separation of the
compounds of interest from each other and from endogenous corticosteroids in 3
minutes. The method developed is selective enough to distinguish between these
synthetic and endogenous corticosteroids.
In addition, this study demonstrated the validity of the analytical method developed for
the quantitative determination of prednisolone and prednisone in human plasma
samples. The developed method is a simple and rapid analytical method with
chromatographic separation in 3 minutes. Therefore, it enables us to assess prednisolone
and prednisone pharmacokinetics in renal transplant patients’ samples.
Pharmacogenetic Associations with Prednisolone and Prednisone Exposure
Page 288 of 377
8.2 The Genetic Association between CYP3A5*3, CYP3A4*22,
POR*28 and ABCB1 3435 and the Pharmacokinetics of
Prednisolone and Prednisone.
8.2.1 Introduction
Prednisolone is a known inducer of both CYP3A and P-glycoprotein (Anglicheau et al.,
2003a). It is also a substrate for both CYP3A4/3A5 and P-glycoprotein. Data obtained
from a study carried out on Japanese population, suggests that individuals with the
combined CYP3A5 expresser and wild-type (CC) ABCB1 3435 genotype have lower
maximum concentrations of prednisolone in the plasma (NTV, 2011).
8.2.2 Objective of the Study:
Measurement of prednisolone and prednisone concentration in samples collected for
tacrolimus measurement to explore the relationship between the CYP3A5, ABCB1 3435,
CYP3A4*22 and POR*28 genotypes and prednisolone- prednisone exposure.
8.2.3 Materials and Methods
8.2.3.1 Patients and Study Design
This study is part of a larger pharmacokinetic study; detailed information on the study
participants and procedure can be found in Chapter 4. The daily tacrolimus dose was
adjusted according to achieve whole trough blood concentrations of 8-12 µg/L during
the first three months after transplantation and 5-8 µg/L thereafter.
During once and twice daily tacrolimus sample collection, five mL of blood were
collected for prednisolone measurement at each time point into EDTA tubes. A series of
blood samples were collected at 0, 0.5, 1, 2, 4, 6, 8, 12, 16 and 24 hours post-dose with
twice daily tacrolimus samples and at 0, 1, 2, 3, 4, 6, 8, 10, 12 and 24 hours post-dose
with Advagraf® samples. Plasma was prepared by centrifugation for 10 minutes at 2500
g at room temperature. Plasma samples were stored frozen at approximately -20ºC until
the drug bioanalysis.
Pharmacogenetic Associations with Prednisolone and Prednisone Exposure
Page 289 of 377
8.2.3.2 Genotyping
DNA was extracted from a peripheral blood sample using a QIAamp DNA Blood Mini
Kit (Qiagen®, West Sussex, UK) and then was stored at −20◦C until analysis.
CYP3A5*3 allele was identified by performing Real-time polymerase chain reaction
(RT-PCR) method (Fredericks et al., 2005). The ABCB1 gene C and T alleles in exon
26 (C3435T) were identified using the RT-PCR method described by (Nauck et al.,
2000). The C and T alleles of POR*28 gene and in intron 6 of CYP3A4*22 gene were
identified by the new developed RT-PCR using LightCycler as described previously.
Full methodology is provided in Chapter 4 and Chapter 5.
8.2.3.3 Prednisolone and Prednisone Analysis in Plasma
Plasma concentration of prednisolone and its metabolite prednisone in the collected
samples was analysed using the liquid chromatography-mass spectrometry (LC-
MS/MS) method as described above.
8.2.3.4 Pharmacokinetic and Statistical Analysis
Prednisolone and prednisone individual pharmacokinetic parameters were determined
for each genotype group. The area under the plasma concentration-time curve (AUC)
was calculated using the linear trapezoidal method. The maximal plasma concentration
(Cmax) and time required to reach the peak (tmax) were directly obtained from the profile.
Statistical analysis was performed using Minitab statistical software (Minitab 17) to
assess the statistical significance of differences in prednisolone and prednisone kinetics
between different genotype groups. The log-transformed data was analysed using
analysis of variance (ANOVA). Data are expressed as mean ± standard deviation (SD).
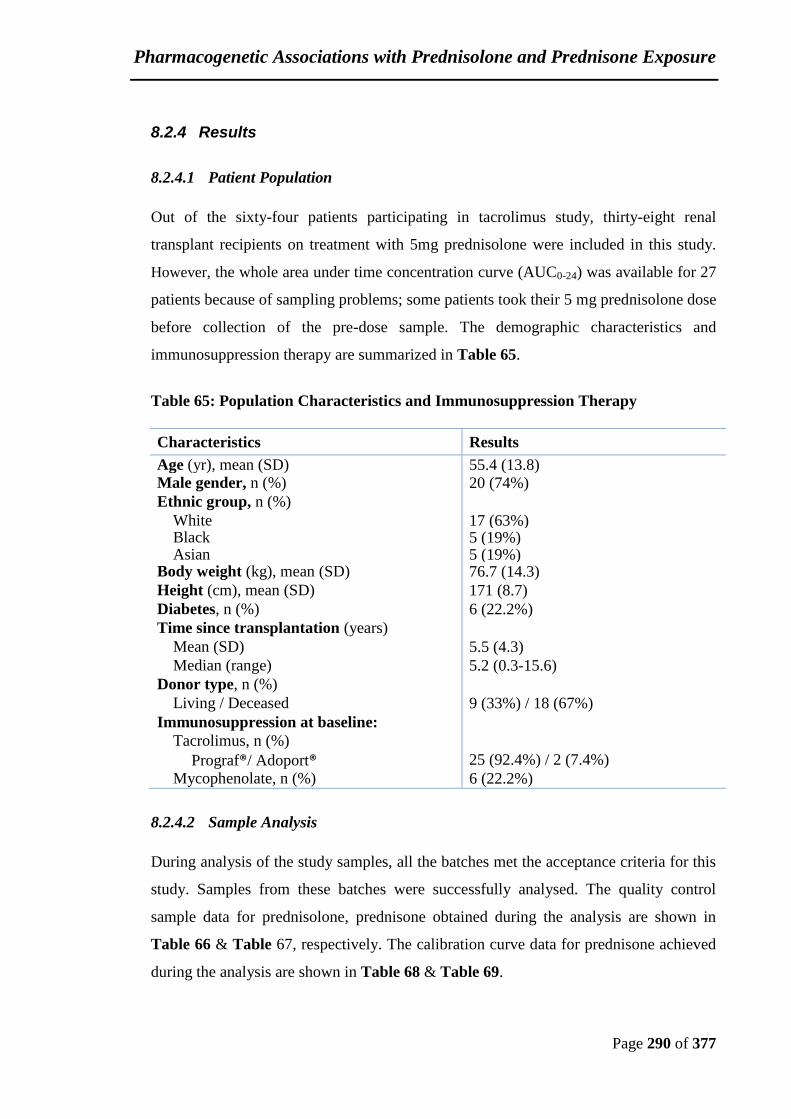
Pharmacogenetic Associations with Prednisolone and Prednisone Exposure
Page 290 of 377
8.2.4 Results
8.2.4.1 Patient Population
Out of the sixty-four patients participating in tacrolimus study, thirty-eight renal
transplant recipients on treatment with 5mg prednisolone were included in this study.
However, the whole area under time concentration curve (AUC0-24) was available for 27
patients because of sampling problems; some patients took their 5 mg prednisolone dose
before collection of the pre-dose sample. The demographic characteristics and
immunosuppression therapy are summarized in Table 65.
Table 65: Population Characteristics and Immunosuppression Therapy
Characteristics Results
Age (yr), mean (SD) 55.4 (13.8) Male gender, n (%) 20 (74%)
Ethnic group, n (%)
White 17 (63%) Black 5 (19%) Asian 5 (19%)
Body weight (kg), mean (SD) 76.7 (14.3)
Height (cm), mean (SD) 171 (8.7)
Diabetes, n (%) 6 (22.2%)
Time since transplantation (years)
Mean (SD) 5.5 (4.3)
Median (range) 5.2 (0.3-15.6)
Donor type, n (%)
Living / Deceased 9 (33%) / 18 (67%)
Immunosuppression at baseline:
Tacrolimus, n (%)
Prograf®/ Adoport® 25 (92.4%) / 2 (7.4%)
Mycophenolate, n (%) 6 (22.2%)
8.2.4.2 Sample Analysis
During analysis of the study samples, all the batches met the acceptance criteria for this
study. Samples from these batches were successfully analysed. The quality control
sample data for prednisolone, prednisone obtained during the analysis are shown in
Table 66 & Table 67, respectively. The calibration curve data for prednisone achieved
during the analysis are shown in Table 68 & Table 69.

Pharmacogenetic Associations with Prednisolone and Prednisone Exposure
Page 291 of 377
Table 66: Quality Control (QC) Samples Achieved During Prednisolone Analysis.
Quality Control Levels QC1 QC2 QC3
Prepared Concentrations (µg/L) 25.0 125.0 250.0
Batch ID Measured Concentration (µg/L)
Batch 1 23.6 119.9 239.3
24.3 122.7 242.1
24.9 116.5 224.3
24.9 116.2 228.4
Batch 2 25.1 126.7 247.8
26.9 124.3 244.1
25.6
25.9
Batch 3 24.3 121.0 241.9
24.8 119.3 249.7
23.3
23.3
Batch 3R 23.9 137.3 244.3
24.4 137.8 247.4
25.8
25.3
Batch 4 24.7 125.2 239.2
24.4 126.6 249.5
24.8 120.1 232.5
24.7 116.7 257.3
24.4 237.3
24.3 253.5
Batch 5 26.1 120.3 234.6
25.5 119.7 235.6
24.6 117.6 229.9
25.7 116.6 222.0
23.4 222.4
22.9 222.3
Batch 6 24.8 123.9 245.3
24.3 127.9 245.9
24.2 129.0 242.6
24.2 136.6 240.9
25.6
25.2
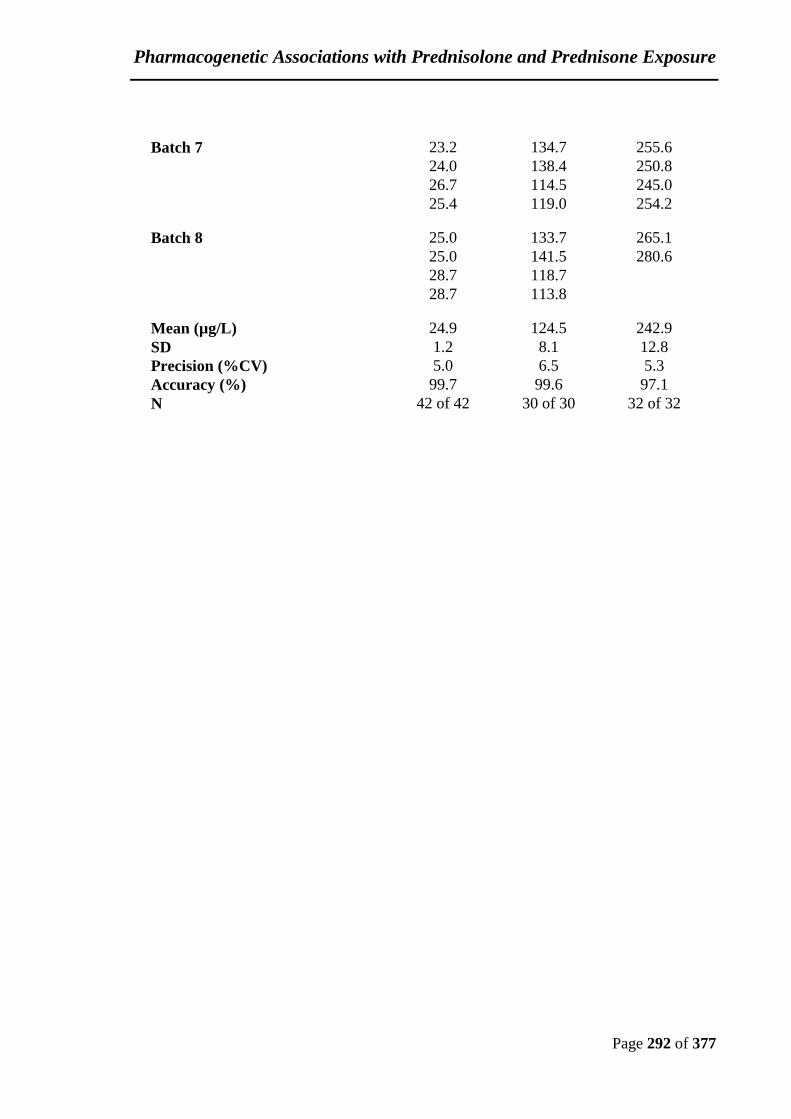
Pharmacogenetic Associations with Prednisolone and Prednisone Exposure
Page 292 of 377
Batch 7 23.2 134.7 255.6
24.0 138.4 250.8
26.7 114.5 245.0
25.4 119.0 254.2
Batch 8 25.0 133.7 265.1
25.0 141.5 280.6
28.7 118.7
28.7 113.8
Mean (µg/L) 24.9 124.5 242.9
SD 1.2 8.1 12.8
Precision (%CV) 5.0 6.5 5.3
Accuracy (%) 99.7 99.6 97.1
N 42 of 42 30 of 30 32 of 32

Pharmacogenetic Associations with Prednisolone and Prednisone Exposure
Page 293 of 377
Table 67: Quality Control (QC) Samples Achieved During Prednisone Analysis.
Quality Control Levels QC1 QC2 QC3
Prepared Concentrations (µg/L) 5.0 25.0 50.0
Batch ID Measured Concentration (µg/L)
Batch 1 5.0 22.8 44.6
4.9 23.5 43.3
4.9 22.4 43.7
5.1 23.6 44.6
Batch 2 4.8 22.5 43.5
5.0 22.4 44.5
5.0
5.0
Batch 3 5.0 24.3 48.4
4.9 24.1 49.7
4.3
4.3
Batch 3R 4.8 24.7 44.1
5.0 25.7 44.7
4.8
4.6
Batch 4 5.2 25.5 48.1
5.1 26.5 49.6
5.2 24.4 45.7
5.2 23.3 50.9
5.0 46.6
4.8 49.5
Batch 5 5.3 23.9 46.1
5.2 22.9 46.7
5.1 24.1 47.2
5.3 23.6 46.2
4.8 44.6
4.7 44.6
Batch 6 5.1 24.9 47.8
5.0 26.5 47.9
4.5 23.0 43.2
4.7 25.1 42.8
4.7
4.6

Pharmacogenetic Associations with Prednisolone and Prednisone Exposure
Page 294 of 377
Batch 7 4.9 27.9 52.5
4.9 28.7 51.8
#5.9 26.2 51.5
5.7 26.2 53.8
Batch 8 5.0 25.3 51.1
4.9 25.7 #60.5
#6.2 22.8
5.7 21.7
Mean (µg/L) 5.0 24.5 47.1
SD 0.3 1.7 3.1
Precision (%CV) 5.8 6.9 6.6
Accuracy (%) 99.1 97.9 94.1
N 40 of 42 30 of 30 31 of 32
#
#
#excluded from the quality controls used (>15% deviation from its actual concentration)

Pharmacogenetic Associations with Prednisolone and Prednisone Exposure
Page 295 of 377
Table 68: Calibration Curve Parameters Data Achieved During Prednisolone
Analysis.
Batch ID
Curve parameters (y=a2x2+a1x+a0)
a0 a1 a2 Correlation Coefficient (r)
Batch1 0.00018 0.00197 -7.84E-07 0.9996
Batch2 0.00249 0.00177 -5.25E-07 0.9954
Batch3 0.00079 0.00189 -8.44E-07 0.9989
Batch3R 0.00040 0.00176 -7.33E-07 0.9987
Batch4 0.00077 0.00188 -9.34E-07 0.9992
Batch5 0.00068 0.00184 -6.42E-07 0.9997
Batch6 0.00157 0.00180 -8.39E-07 0.9994
Batch7 0.00074 0.00185 -1.19E-06 0.9993
Batch8 0.00088 0.00116 -1.45E-07 0.9998
Table 69: Calibration Curve Parameters Data Achieved During Prednisone
Analysis.
Batch ID Curve parameters (y = A*x + B)
Slope (A) Intercept (B) Correlation Coefficient (r)
Batch1 0.00102 3.84E-05 0.9989
Batch2 0.00096 0.000188 0.9966
Batch3 0.00112 0.000113 0.9989
Batch3R 0.00109 0.000111 0.9989
Batch4 0.00101 0.000117 0.9993
Batch5 0.000999 5.9E-05 0.9995
Batch6 0.00101 0.000176 0.9982
Batch7 0.00092 0.000121 0.9964
Batch8 0.00069 0.000104 0.9989
The time–concentration profiles for prednisolone and prednisone mean blood
concentrations are shown in Figure 63. The individual time–concentration profiles of
the 27 patients are presented in Figure 64. The prednisolone and prednisone
pharmacokinetic parameters, Cmax, AUC0-24 and C0 are summarised in Table 70. The
between-patient coefficients of variation (CV%) of Cmax, AUC0-24 and C0 for
prednisolone were 24.4%, 23.2% and 55.6%, respectively. The between-patient
coefficients of variation (CV%) of Cmax, AUC0-24 and C0 for prednisone were 24.2%,
24.9% and 73.0%, respectively. Prednisolone and prednisone exposure AUC0–24, Cmax
and C0 of the individual patients are presented in Figure 65.

Pharmacogenetic Associations with Prednisolone and Prednisone Exposure
Page 296 of 377
Figure 63: Mean Blood Concentration-Time Profiles for Prednisolone (A) and
Prednisone (B) in 27 Stable Kidney Transplant Recipients.
(A)
(B)

Pharmacogenetic Associations with Prednisolone and Prednisone Exposure
Page 297 of 377
Figure 64: Whole-Blood Concentration-Time Profiles for Prednisolone (A) and
Prednisone (B) in 27 Stable Kidney Transplant Recipients.
(A)
(B)

Pharmacogenetic Associations with Prednisolone and Prednisone Exposure
Page 298 of 377
Table 70: Prednisolone-Prednisone Pharmacokinetic Parameters for Individual
Patients Treated with 5mg Prednisolone.
Patient Cmax (µg/L) AUC0-24 (µg∗h/L) C0 (µg/L)
Prednisolone Prednisone Prednisolone Prednisone Prednisolone Prednisone
1 150 11.9 844.5 112.2 1.0 0.1
2 115.6 9.3 1066.9 93.4 4.6 0.5
3 130.6 15.0 690.9 127.8 1.3 0.3
4 159.3 17.4 1396.6 180.4 4.5 0.8
5 159.1 17.3 1281.7 187.2 1.5 0.3
6 184 17.8 1183.9 146.6 2.7 0.4
7 116.8 12.7 683.5 93.2 1.2 0.1
8 143.9 15.0 1159.1 109.7 2.0 0.2
9 166.7 12.4 1068.5 116.3 3.2 0.3
10 136.7 16.6 1177.8 149.9 2.8 0.3
11 169.6 12.4 898.5 105.4 1.0 0.1
12 128.5 11.4 1130.0 96.0 2.7 0.2
13 210.8 11.4 1467.6 100.3 1.8 0.1
14 116.0 16.9 823.6 126.1 1.4 0.2
15 178.7 12.2 1332.1 102.9 2.7 0.1
16 98.7 10.7 909.1 102.9 1.8 0.2
17 194.5 14.8 1227.8 137.8 2.9 0.3
18 134.8 15.6 722.9 100.9 0.4 0.1
19 147.2 20.3 965.2 138.7 1.0 0.2
20 136.1 9.7 922.2 77.9 0.8 0.04
21 217.3 12.9 1398.1 111.3 2.9 0.3
22 195.1 16.1 1008.8 124.6 0.9 0.1
23 180.7 16.7 1275.9 154.3 4.3 0.7
24 143.7 20.3 1076.7 166.6 1.3 0.1
25 280.8 22.1 1722.1 195.5 4.5 0.6
26 142.6 8.3 1277.7 93.8 4.4 0.2
27 147.1 12.0 1428.3 126.6 4.1 0.2
Mean 160.5 14.5 1116.3 125.1 2.4 0.3
SD 39.1 3.5 259.1 31.1 1.3 0.2
CV% 24.4 24.2 23.2 24.9 55.6 73.0
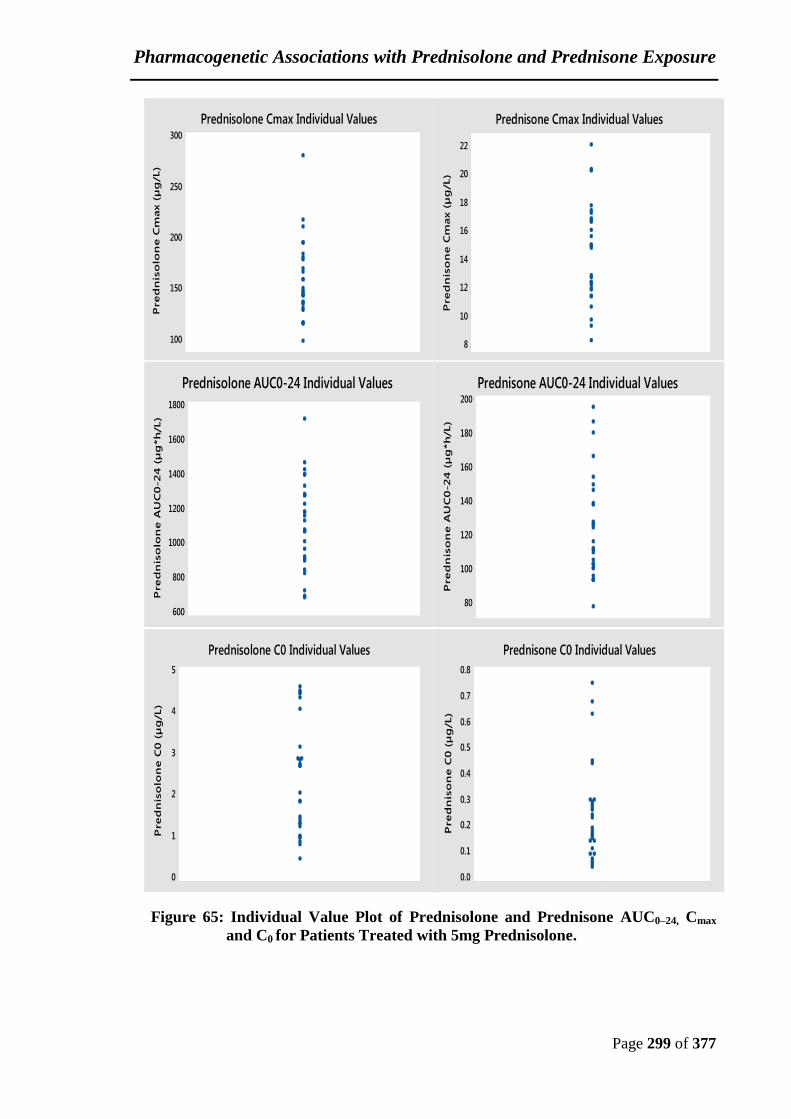
Pharmacogenetic Associations with Prednisolone and Prednisone Exposure
Page 299 of 377
Figure 65: Individual Value Plot of Prednisolone and Prednisone AUC0–24, Cmax
and C0 for Patients Treated with 5mg Prednisolone.
200
180
160
140
120
100
80
Pre
dn
iso
ne
AU
C0
-2
4 (
µg
*h
/L)
Prednisone AUC0-24 Individual Values
22
20
18
16
14
12
10
8
Pre
dn
iso
ne
Cm
ax (
µg
/L)
Prednisone Cmax Individual Values
0.8
0.7
0.6
0.5
0.4
0.3
0.2
0.1
0.0
Pre
dn
iso
ne
C0
(µ
g/L)
Prednisone C0 Individual Values
300
250
200
150
100
Pre
dn
iso
lon
e C
max (
µg
/L)
Prednisolone Cmax Individual Values
5
4
3
2
1
0
Pre
dn
iso
lon
e C
0 (
µg
/L)
Prednisolone C0 Individual Values
1800
1600
1400
1200
1000
800
600
Pre
dn
iso
lon
e A
UC
0-2
4 (
µg
*h
/L)
Prednisolone AUC0-24 Individual Values
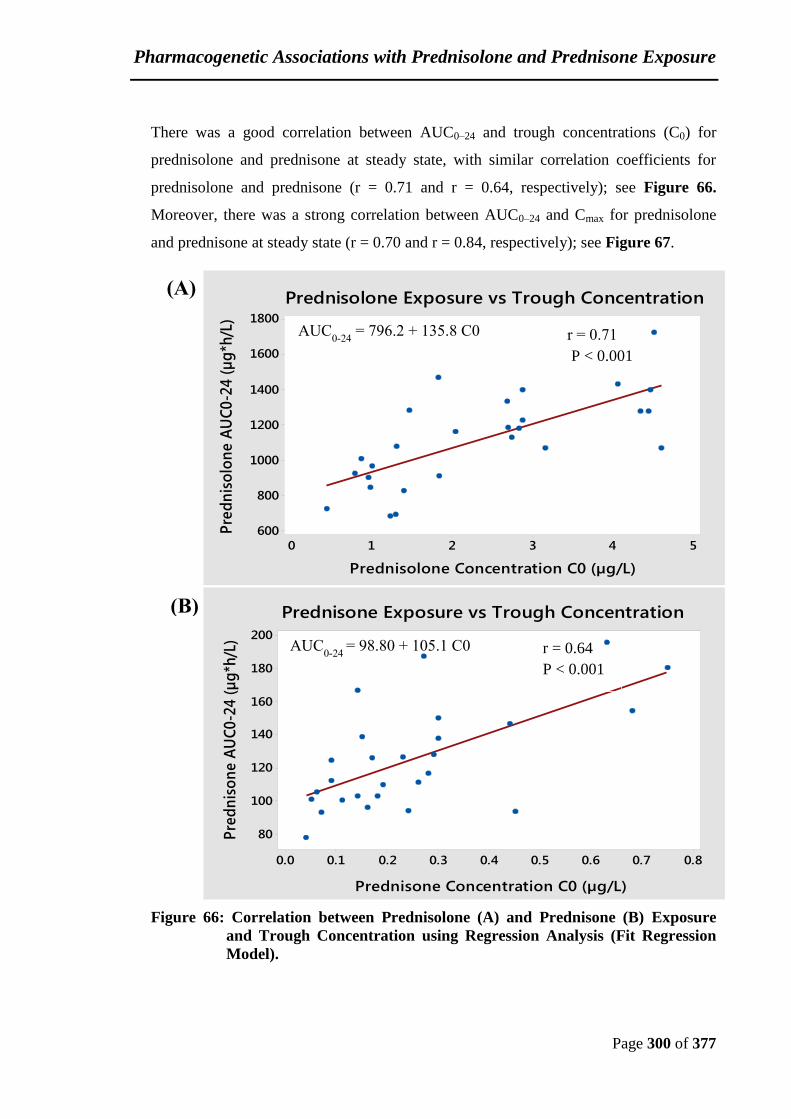
Pharmacogenetic Associations with Prednisolone and Prednisone Exposure
Page 300 of 377
There was a good correlation between AUC0–24 and trough concentrations (C0) for
prednisolone and prednisone at steady state, with similar correlation coefficients for
prednisolone and prednisone (r = 0.71 and r = 0.64, respectively); see Figure 66.
Moreover, there was a strong correlation between AUC0–24 and Cmax for prednisolone
and prednisone at steady state (r = 0.70 and r = 0.84, respectively); see Figure 67.
Figure 66: Correlation between Prednisolone (A) and Prednisone (B) Exposure
and Trough Concentration using Regression Analysis (Fit Regression
Model).
(A)
543210
1800
1600
1400
1200
1000
800
600
Prednisolone Concentration C0 (µg/L)
Pre
dn
iso
lon
e A
UC
0-2
4 (
µg
*h/L
)
Prednisolone Exposure vs Trough Concentration
AUC0-24
= 796.2 + 135.8 C0
(B)
0.80.70.60.50.40.30.20.10.0
200
180
160
140
120
100
80
Prednisone Concentration C0 (µg/L)
Pre
dn
iso
ne
AU
C0
-24
(µ
g*h
/L)
Prednisone Exposure vs Trough Concentration
AUC0-24
= 98.80 + 105.1 C0
r = 0.71
P < 0.001
r = 0.64
P < 0.001
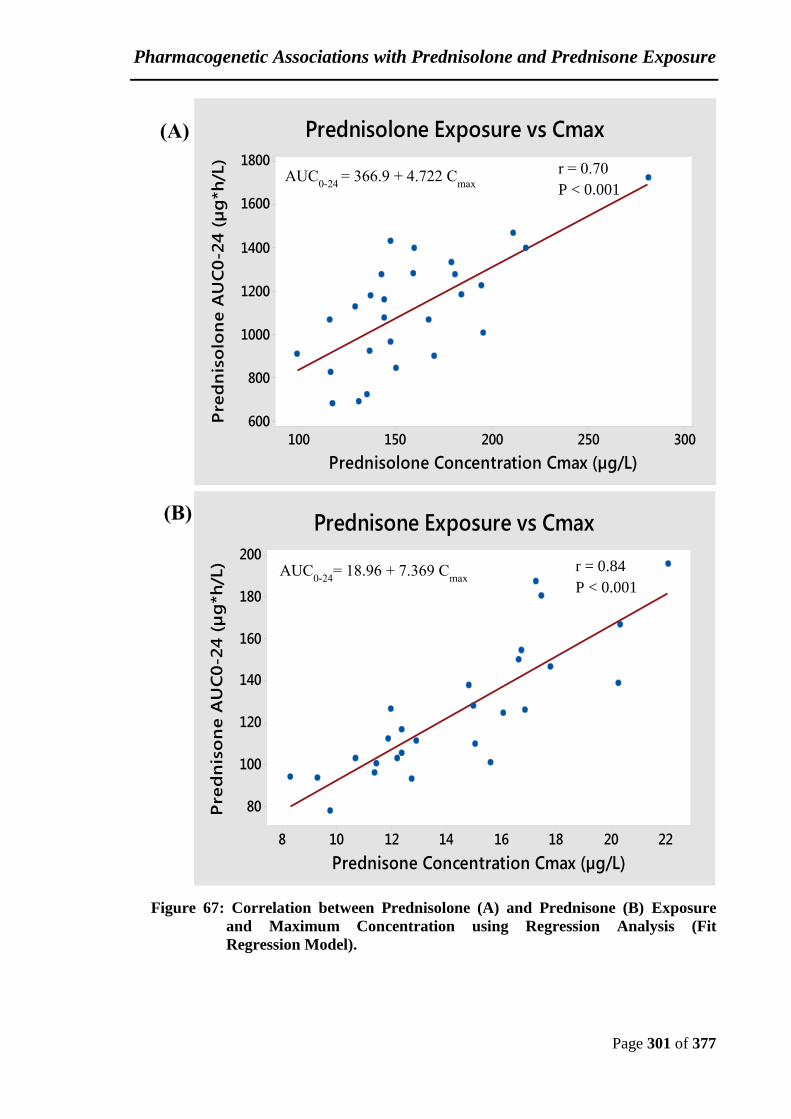
Pharmacogenetic Associations with Prednisolone and Prednisone Exposure
Page 301 of 377
Figure 67: Correlation between Prednisolone (A) and Prednisone (B) Exposure
and Maximum Concentration using Regression Analysis (Fit
Regression Model).
(A)
300250200150100
1800
1600
1400
1200
1000
800
600
Prednisolone Concentration Cmax (µg/L)
Pre
dn
iso
lon
e A
UC
0-2
4 (
µg
*h
/L)
Prednisolone Exposure vs Cmax
AUC0-24
= 366.9 + 4.722 Cmax
(B)
222018161412108
200
180
160
140
120
100
80
Prednisone Concentration Cmax (µg/L)
Pre
dn
iso
ne
AU
C0
-24
(µ
g*h
/L)
Prednisone Exposure vs Cmax
AUC0-24
= 18.96 + 7.369 Cmax
r = 0.70
P < 0.001
r = 0.84
P < 0.001
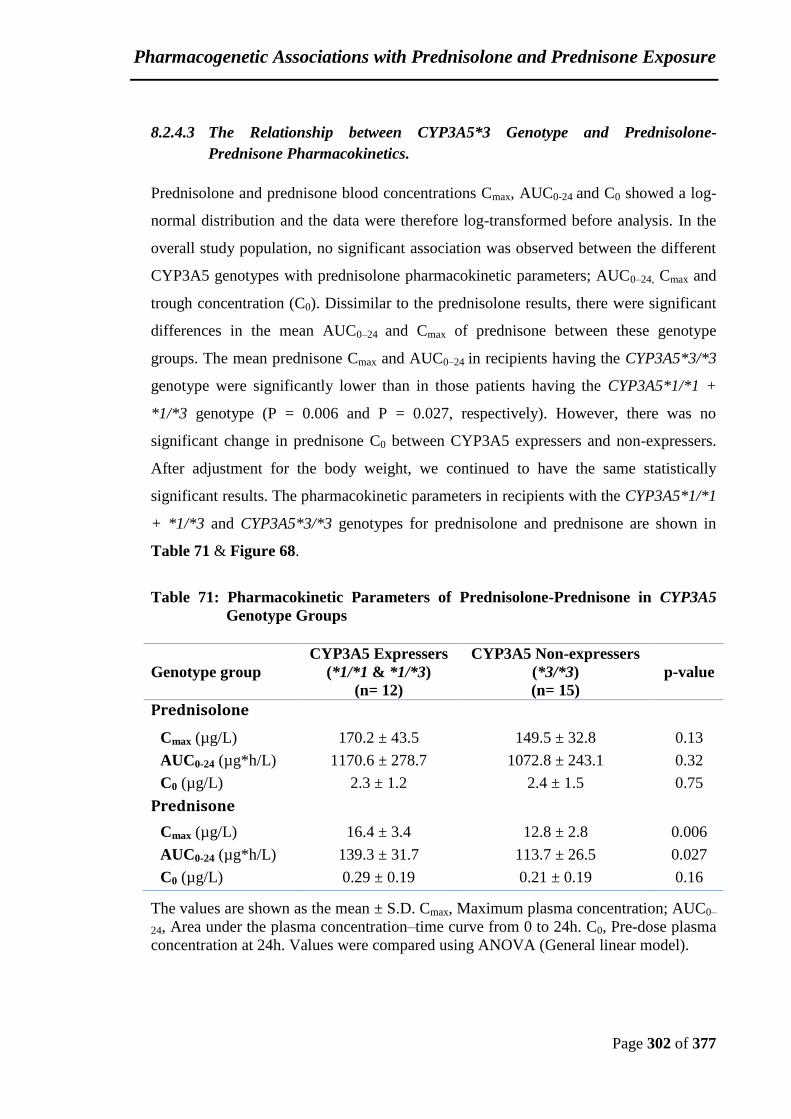
Pharmacogenetic Associations with Prednisolone and Prednisone Exposure
Page 302 of 377
8.2.4.3 The Relationship between CYP3A5*3 Genotype and Prednisolone-
Prednisone Pharmacokinetics.
Prednisolone and prednisone blood concentrations Cmax, AUC0-24 and C0 showed a log-
normal distribution and the data were therefore log-transformed before analysis. In the
overall study population, no significant association was observed between the different
CYP3A5 genotypes with prednisolone pharmacokinetic parameters; AUC0–24, Cmax and
trough concentration (C0). Dissimilar to the prednisolone results, there were significant
differences in the mean AUC0–24 and Cmax of prednisone between these genotype
groups. The mean prednisone Cmax and AUC0–24 in recipients having the CYP3A5*3/*3
genotype were significantly lower than in those patients having the CYP3A5*1/*1 +
*1/*3 genotype (P = 0.006 and P = 0.027, respectively). However, there was no
significant change in prednisone C0 between CYP3A5 expressers and non-expressers.
After adjustment for the body weight, we continued to have the same statistically
significant results. The pharmacokinetic parameters in recipients with the CYP3A5*1/*1
+ *1/*3 and CYP3A5*3/*3 genotypes for prednisolone and prednisone are shown in
Table 71 & Figure 68.
Table 71: Pharmacokinetic Parameters of Prednisolone-Prednisone in CYP3A5
Genotype Groups
Genotype group
CYP3A5 Expressers
(*1/*1 & *1/*3)
(n= 12)
CYP3A5 Non-expressers
(*3/*3)
(n= 15)
p-value
Prednisolone
Cmax (µg/L) 170.2 ± 43.5 149.5 ± 32.8 0.13
AUC0-24 (µg*h/L) 1170.6 ± 278.7 1072.8 ± 243.1 0.32
C0 (µg/L) 2.3 ± 1.2 2.4 ± 1.5 0.75
Prednisone
Cmax (µg/L) 16.4 ± 3.4 12.8 ± 2.8 0.006
AUC0-24 (µg*h/L) 139.3 ± 31.7 113.7 ± 26.5 0.027
C0 (µg/L) 0.29 ± 0.19 0.21 ± 0.19 0.16
The values are shown as the mean ± S.D. Cmax, Maximum plasma concentration; AUC0–
24, Area under the plasma concentration–time curve from 0 to 24h. C0, Pre-dose plasma
concentration at 24h. Values were compared using ANOVA (General linear model).
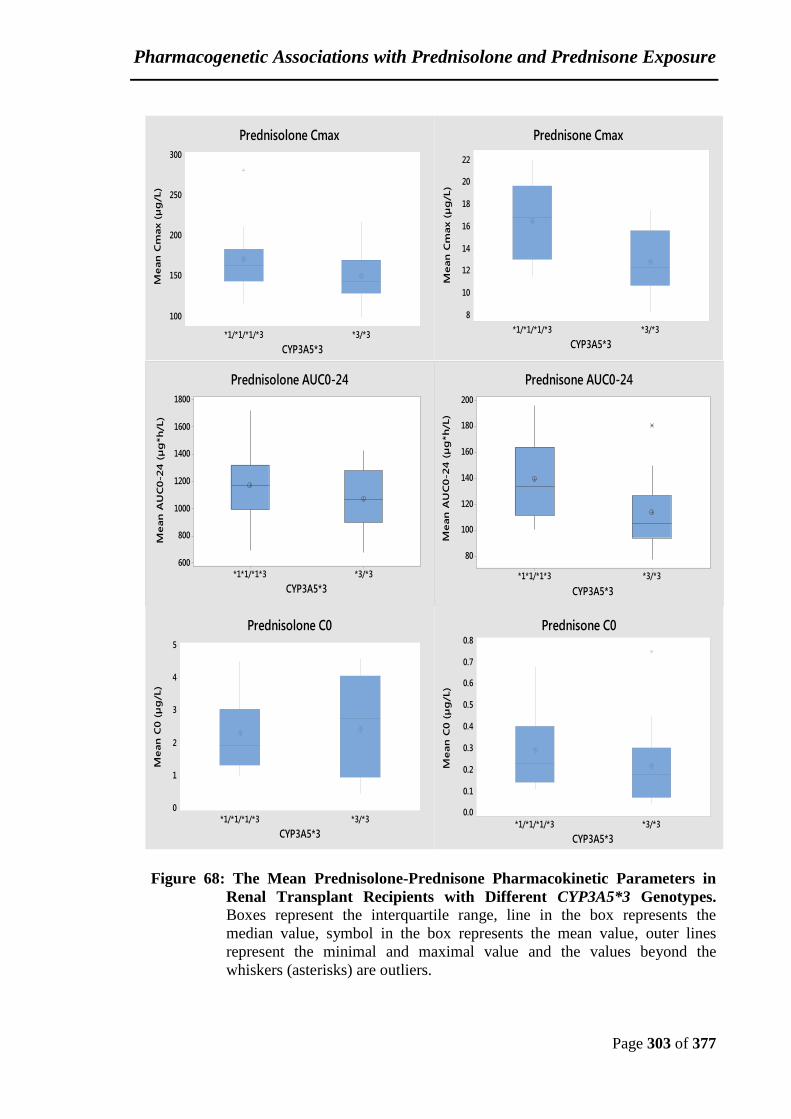
Pharmacogenetic Associations with Prednisolone and Prednisone Exposure
Page 303 of 377
Figure 68: The Mean Prednisolone-Prednisone Pharmacokinetic Parameters in
Renal Transplant Recipients with Different CYP3A5*3 Genotypes.
Boxes represent the interquartile range, line in the box represents the
median value, symbol in the box represents the mean value, outer lines
represent the minimal and maximal value and the values beyond the
whiskers (asterisks) are outliers.
*3/*3*1*1/*1*3
1800
1600
1400
1200
1000
800
600
CYP3A5*3
Me
an
AU
C0
-2
4 (
µg
*h
/L)
Prednisolone AUC0-24
*3/*3*1*1/*1*3
200
180
160
140
120
100
80
CYP3A5*3
Me
an
AU
C0
-2
4 (
µg
*h
/L)
Prednisone AUC0-24
*3/*3*1/*1/*1/*3
300
250
200
150
100
CYP3A5*3
Me
an
Cm
ax (
µg
/L)
Prednisolone Cmax
*3/*3*1/*1/*1/*3
22
20
18
16
14
12
10
8
CYP3A5*3
Me
an
Cm
ax (
µg
/L)
Prednisone Cmax
*3/*3*1/*1/*1/*3
5
4
3
2
1
0
CYP3A5*3
Me
an
C0
(µ
g/L)
Prednisolone C0
*3/*3*1/*1/*1/*3
0.8
0.7
0.6
0.5
0.4
0.3
0.2
0.1
0.0
CYP3A5*3
Me
an
C0
(µ
g/L)
Prednisone C0

Pharmacogenetic Associations with Prednisolone and Prednisone Exposure
Page 304 of 377
8.2.4.4 The Association between ABCB1 3435 Genotype and Prednisolone -
Prednisone Pharmacokinetics.
The prednisolone-prednisone pharmacokinetic parameters stratified by ABCB1 3435
polymorphisms are shown in Table 72. No significant difference was found in the
AUC0–24, Cmax and C0 of prednisolone between the different genotypes of ABCB1 3435
gene. However, a significant difference was observed in prednisone pharmacokinetic
parameters (Cmax, AUC0-24 and C0) between the ABCB1 CC and the CT/TT genotypes.
The mean prednisone Cmax for ABCB1 CC genotype was significantly higher than for
ABCB1 CT/TT genotype (16.8 µg/L versus 13.7 µg/L, P = 0.04). Moreover, ABCB1 CC
carriers had a significantly higher AUC0–24 compared to ABCB1 CT/TT carriers (153.9
µg*h/L versus 116.9 µg*h/L, P = 0.005). Likewise, the difference in prednisone C0
between ABCB1genotype groups was statistically. The mean prednisone C0 for
ABCB1CC carriers and for CT/TT patients were 0.37 ± 0.14 and 0.22 ± 0.19 µg/L,
respectively (Figure 69 & Table 72). After adjustment for the body weight, we
continued to have the same statistically significant results.
Table 72: Pharmacokinetic Parameters of Prednisolone- Prednisone in ABCB1
3435 Genotype Groups.
Study group ABCB1 CC Carriers
(n= 6)
ABCB1 CT/TT Carriers
(n= 21) p-value
Prednisolone
Cmax (µg/L) 176.3 ± 54.8 153.7 ± 32.6 0.08
AUC0-24 (µg*h/L) 1187.0 ± 333.0 1095.9 ± 239.9 0.22
C0 (µg/L) 2.7 ± 1.2 2.3 ± 1.4 0.30
Prednisone
Cmax (µg/L) 16.8 ± 3.2 13.7 ± 3.4 0.04
AUC0-24 (µg*h/L) 153.9 ± 31.6 116.9 ± 26.3 0.005
C0 (µg/L) 0.37 ± 0.14 0.22 ± 0.19 0.03
Values were compared using ANOVA (General linear model).

Pharmacogenetic Associations with Prednisolone and Prednisone Exposure
Page 305 of 377
Figure 69: The Mean Prednisolone-Prednisone Pharmacokinetic Parameters in
Renal Transplant Recipients with Different ABCB1 Genotypes. Boxes
represent the interquartile range, line in the box represents the median value,
symbol in the box represents the mean value, outer lines represent the
minimal and maximal value and values beyond the whiskers (asterisks) are
outliers.
CT/TTCC
1800
1600
1400
1200
1000
800
600
ABCB1
Me
an
AU
C0
-2
4 (
µg
*h
/L)
Prednisolone AUC0-24
CT/TTCC
200
180
160
140
120
100
80
ABCB1
Me
an
AU
C0
-2
4 (
µg
*h
/L)
Prednisone AUC0-24
CT/TTCC
300
250
200
150
100
ABCB1
Me
an
Cm
ax (
µg
/L)
Prednisolone Cmax
CT/TTCC
5
4
3
2
1
0
ABCB1
Me
an
C0
(µ
g/L)
Prednisolone C0
CT/TTCC
22
20
18
16
14
12
10
8
ABCB1
Me
an
Cm
ax (
µg
/L)
Prednisone Cmax
CT/TTCC
0.8
0.7
0.6
0.5
0.4
0.3
0.2
0.1
0.0
ABCB1
Me
an
C0
(µ
g/L)
Prednisone C0
Pharmacogenetic Associations with Prednisolone and Prednisone Exposure
Page 306 of 377
8.2.4.5 Association of CYP3A5*3 and ABCB1 3435 Combined Genotypes with
Prednisolone and Prednisone Pharmacokinetics.
Prednisolone and prednisone pharmacokinetic parameters in the two different CYP3A5
genotype groups in relation to ABCB1 3435 polymorphisms are shown in Table 73.
Because there was only one patient in CYP3A5 *3/*3 / ABCB1 CC group, it was
excluded from the analysis. Regarding prednisolone, no significant difference was
found in prednisolone Cmax, AUC0-24 and C0 between the three genotype groups.
However, the mean Cmax and AUC0-24 of prednisone in CYP3A5 *3/*3 patients having
the ABCB1 CT/TT genotype were lower than in CYP3A5 *1/*1&*1/*3 patients having
either ABCB1 CC or ABCB1 CT/TT genotypes. No significant difference was noted in
CYP3A5 expressers between ABCB1 CT/TT and ABCB1CC carriers for prednisolone
and prednisone Figure 70. After adjustment for the body weight, we continued to have
the same statistically significant results.

Pharmacogenetic Associations with Prednisolone and Prednisone Exposure
Page 307 of 377
Table 73: Pharmacokinetic Parameters of Prednisolone- Prednisone in CYP3A5-ABCB1 3435 Genotype Groups.
Study group CYP3A5 *1/*1 &*1/*3/
ABCB1 CC Carriers
(n= 5)
CYP3A5 *1/*1 &*1/*3/
ABCB1 CT/TT Carriers
(n= 7)
CYP3A5 *3/*3/
ABCB1 CT/TT Carriers
(n= 14)
p-value a p-value
b p-value
c
Prednisolone
Cmax (µg/L) 184.2 ± 57.3 160.1 ± 31.6 150.4 ± 33.8 0.37 0.12 0.52
AUC0-24 (µg*h/L) 1189 ± 373 1157 ± 222 1065 ± 250.5 0.99 0.48 0.43
C0 (µg/L) 2.6 ± 1.3 2.1 ± 1.1 2.4 ± 1.5 0.56 0.42 0.97
Prednisone
Cmax (µg/L) 16.9 ± 3.6 16.1 ± 3.5 12.5 ± 2.7 0.55 0.01 0.03
AUC0-24 (µg*h/L) 155 ± 35 128 ± 26 111 ± 25 0.10 0.004 0.17
C0 (µg/L) 0.4 ± 0.2 0.2 ± 0.2 0.2 ± 0.2 0.15 0.04 0.58
a p-values refer to comparisons between CYP3A5 *1/*1& *1/*3 (CYP3A5 Expressers) subgroups.
b p-values refer to comparisons between CYP3A5 *1/*1& *1/*3 / ABCB1 CC carriers and CYP3A5 *3/*3 (CYP3A5 Non-expresser) /ABCB1
CT/TT group. c
p-values refer to comparisons between CYP3A5 *1/*1& *1/*3 / ABCB1 CT/TT carriers and CYP3A5 *3/*3 /ABCB1 CT/TT group.
Values were compared using ANOVA (General linear model).

Pharmacogenetic Associations with Prednisolone and Prednisone Exposure
Page 308 of 377
Figure 70: The Mean Prednisolone-Prednisone Pharmacokinetic Parameters in
Renal Transplant Recipients with Combined CYP3A5*3-ABCB1
Genotypes. CYP exp is CYP3A5 expressers and CYP non-exp is
CYP3A5 non-expressers. Boxes represent the interquartile range, line in
the box represents the median value, symbol in the box represents the mean
value, outer lines represent the minimal and maximal value and values
beyond the whiskers (asterisks) are outliers.
CYP non-exp / ABCB1 CT/TT
CYP exp / ABCB1 CT/TT
CYP exp/ ABCB1 CC
200
180
160
140
120
100
80
Me
an
AU
C0
-24
(µ
g*h
/L)
Prednisone AUC0-24
CYP non-exp / ABCB1 CT/TT
CYP exp / ABCB1 CT/TT
CYP exp/ ABCB1 CC
1800
1600
1400
1200
1000
800
600
Me
an
AU
C0
-2
4 (
µg
*h
/L)
Prednisolone AUC0-24
CYP non-exp / ABCB1 CT/TT
CYP exp / ABCB1 CT/TT
CYP exp/ ABCB1 CC
300
250
200
150
100
Me
an
Cm
ax (
µg
/L)
Prednisolone Cmax
CYP non-exp / ABCB1 CT/TT
CYP exp / ABCB1 CT/TT
CYP exp/ ABCB1 CC
5
4
3
2
1
0
Me
an
C0
(µ
g/L)
Prednisolone C0
CYP non-exp / ABCB1 CT/TT
CYP exp / ABCB1 CT/TT
CYP exp/ ABCB1 CC
22
20
18
16
14
12
10
8
Me
an
Cm
ax (
µg
/L)
Prednisone Cmax
CYP non-exp / ABCB1 CT/TT
CYP exp / ABCB1 CT/TT
CYP exp/ ABCB1 CC
0.8
0.7
0.6
0.5
0.4
0.3
0.2
0.1
0.0
Me
an
C0
(µ
g/L
)
Prednisone C0
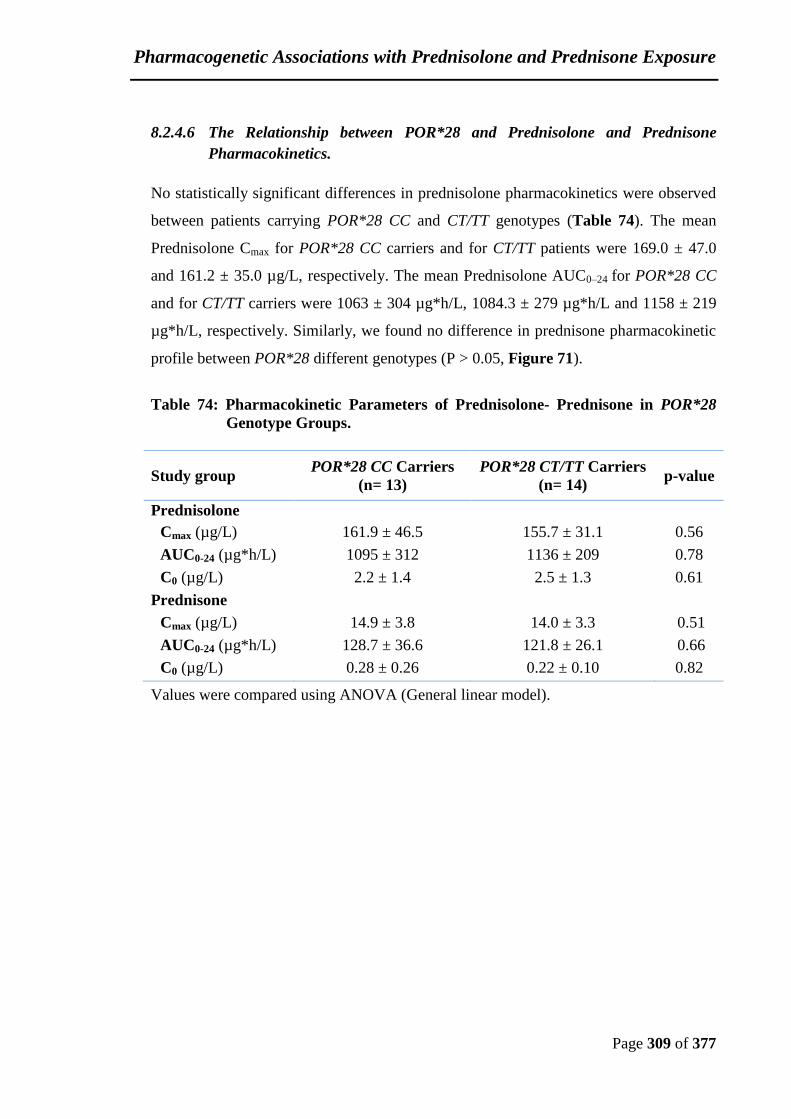
Pharmacogenetic Associations with Prednisolone and Prednisone Exposure
Page 309 of 377
8.2.4.6 The Relationship between POR*28 and Prednisolone and Prednisone
Pharmacokinetics.
No statistically significant differences in prednisolone pharmacokinetics were observed
between patients carrying POR*28 CC and CT/TT genotypes (Table 74). The mean
Prednisolone Cmax for POR*28 CC carriers and for CT/TT patients were 169.0 ± 47.0
and 161.2 ± 35.0 µg/L, respectively. The mean Prednisolone AUC0–24 for POR*28 CC
and for CT/TT carriers were 1063 ± 304 µg*h/L, 1084.3 ± 279 µg*h/L and 1158 ± 219
µg*h/L, respectively. Similarly, we found no difference in prednisone pharmacokinetic
profile between POR*28 different genotypes (P > 0.05, Figure 71).
Table 74: Pharmacokinetic Parameters of Prednisolone- Prednisone in POR*28
Genotype Groups.
Study group POR*28 CC Carriers
(n= 13)
POR*28 CT/TT Carriers
(n= 14) p-value
Prednisolone
Cmax (µg/L) 161.9 ± 46.5 155.7 ± 31.1 0.56
AUC0-24 (µg*h/L) 1095 ± 312 1136 ± 209 0.78
C0 (µg/L) 2.2 ± 1.4 2.5 ± 1.3 0.61
Prednisone
Cmax (µg/L) 14.9 ± 3.8 14.0 ± 3.3 0.51
AUC0-24 (µg*h/L) 128.7 ± 36.6 121.8 ± 26.1 0.66
C0 (µg/L) 0.28 ± 0.26 0.22 ± 0.10 0.82
Values were compared using ANOVA (General linear model).

Pharmacogenetic Associations with Prednisolone and Prednisone Exposure
Page 310 of 377
Figure 71: The Mean Prednisolone-Prednisone Pharmacokinetic Parameters in
Renal Transplant Recipients with POR*28 Different Genotypes. Boxes
represent the interquartile range, line in the box represents the median value,
symbol in the box represents the mean value, outer lines represent the
minimal and maximal value and values beyond the whiskers (asterisks) are
outliers.
CT/TTCC
1800
1600
1400
1200
1000
800
600
POR*28
Me
an
AU
C0
-2
4 (
µg
*h
/L)
Prednisolone AUC0-24
CT/TTCC
200
180
160
140
120
100
80
POR*28
Me
an
AU
C0
-2
4 (
µg
*h
/L)
Prednisone AUC0-24
CT/TTCC
300
250
200
150
100
POR*28
Me
an
Cm
ax (
µg
/L)
Prednisolone Cmax
CT/TTCC
5
4
3
2
1
0
POR*28
Me
an
C0
(µ
g/L)
Prednisolone C0
CT/TTCC
22
20
18
16
14
12
10
8
POR*28
Me
an
Cm
ax (
µg
/L)
Prednisone Cmax
CT/TTCC
0.8
0.7
0.6
0.5
0.4
0.3
0.2
0.1
0.0
POR*28
Me
an
C0
(µ
g/L)
Prednisone C0
Pharmacogenetic Associations with Prednisolone and Prednisone Exposure
Page 311 of 377
8.2.4.7 Non-genetic Factors Associated with Prednisolone and Prednisone Plasma
Concentrations.
No correlation was seen among different ethnic backgrounds for prednisolone or
prednisone blood concentrations. Moreover, patient sex was shown to influence
prednisolone Cmax, but have no effect on the AUC0-24 and the trough concentration
(Table 75). In the current study, twenty-seven patients were analysed; Twenty of them
were males, and they all had a significantly lower prednisolone Cmax compared to
females (p<0.05; Figure 72). After adjustment for the body weight, the statistically
significant difference vanished. In addition, there was no correlation between patient
age and prednisolone and prednisone blood concentrations. Multiple regression analysis
by stepwise selection; alpha to enter or remove, specified value to enter or remove
significance level, was 0.15; identified patient weight and tacrolimus dose, as
independent variables associated with prednisolone Cmax and identified tacrolimus dose
as independent variables associated with prednisolone AUC0-24. However, multiple
regression analysis for prednisone identified patient weight as an independent variable
associated with prednisone Cmax and patient age and weight for prednisone AUC0-24.
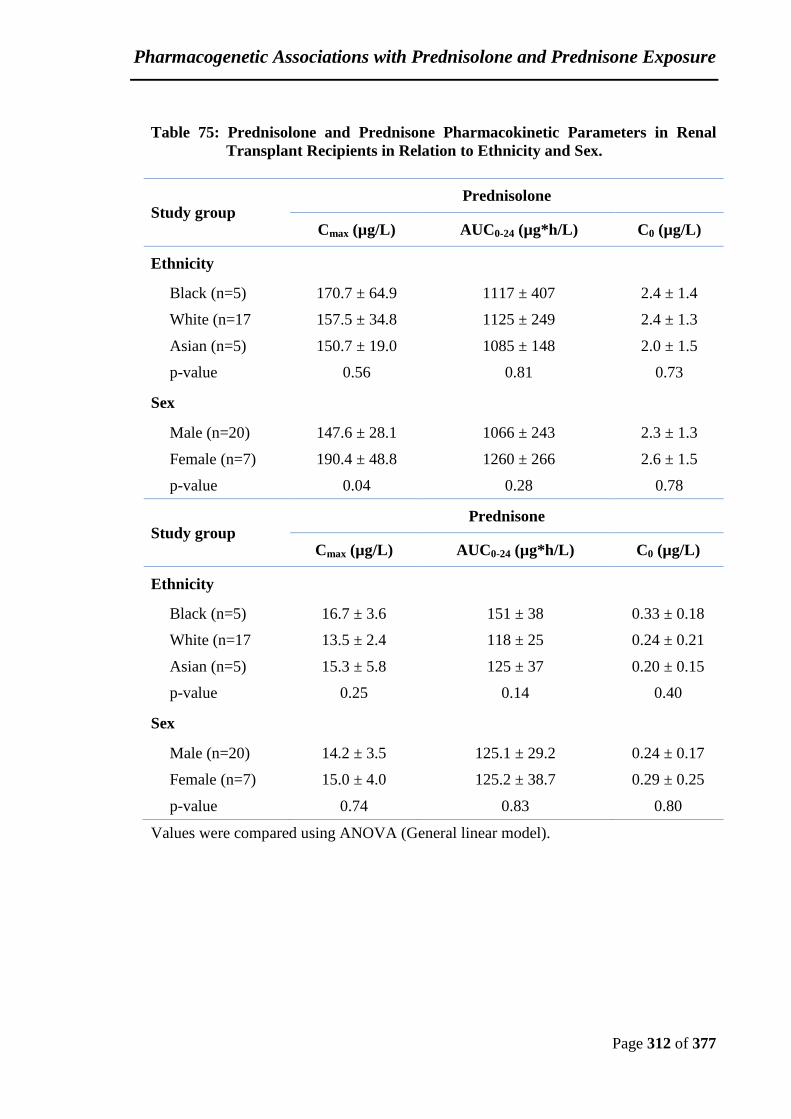
Pharmacogenetic Associations with Prednisolone and Prednisone Exposure
Page 312 of 377
Table 75: Prednisolone and Prednisone Pharmacokinetic Parameters in Renal
Transplant Recipients in Relation to Ethnicity and Sex.
Study group Prednisolone
Cmax (µg/L) AUC0-24 (µg*h/L) C0 (µg/L)
Ethnicity
Black (n=5) 170.7 ± 64.9 1117 ± 407 2.4 ± 1.4
White (n=17 157.5 ± 34.8 1125 ± 249 2.4 ± 1.3
Asian (n=5) 150.7 ± 19.0 1085 ± 148 2.0 ± 1.5
p-value 0.56 0.81 0.73
Sex
Male (n=20) 147.6 ± 28.1 1066 ± 243 2.3 ± 1.3
Female (n=7) 190.4 ± 48.8 1260 ± 266 2.6 ± 1.5
p-value 0.04 0.28 0.78
Study group Prednisone
Cmax (µg/L) AUC0-24 (µg*h/L) C0 (µg/L)
Ethnicity
Black (n=5) 16.7 ± 3.6 151 ± 38 0.33 ± 0.18
White (n=17 13.5 ± 2.4 118 ± 25 0.24 ± 0.21
Asian (n=5) 15.3 ± 5.8 125 ± 37 0.20 ± 0.15
p-value 0.25 0.14 0.40
Sex
Male (n=20) 14.2 ± 3.5 125.1 ± 29.2 0.24 ± 0.17
Female (n=7) 15.0 ± 4.0 125.2 ± 38.7 0.29 ± 0.25
p-value 0.74 0.83 0.80
Values were compared using ANOVA (General linear model).
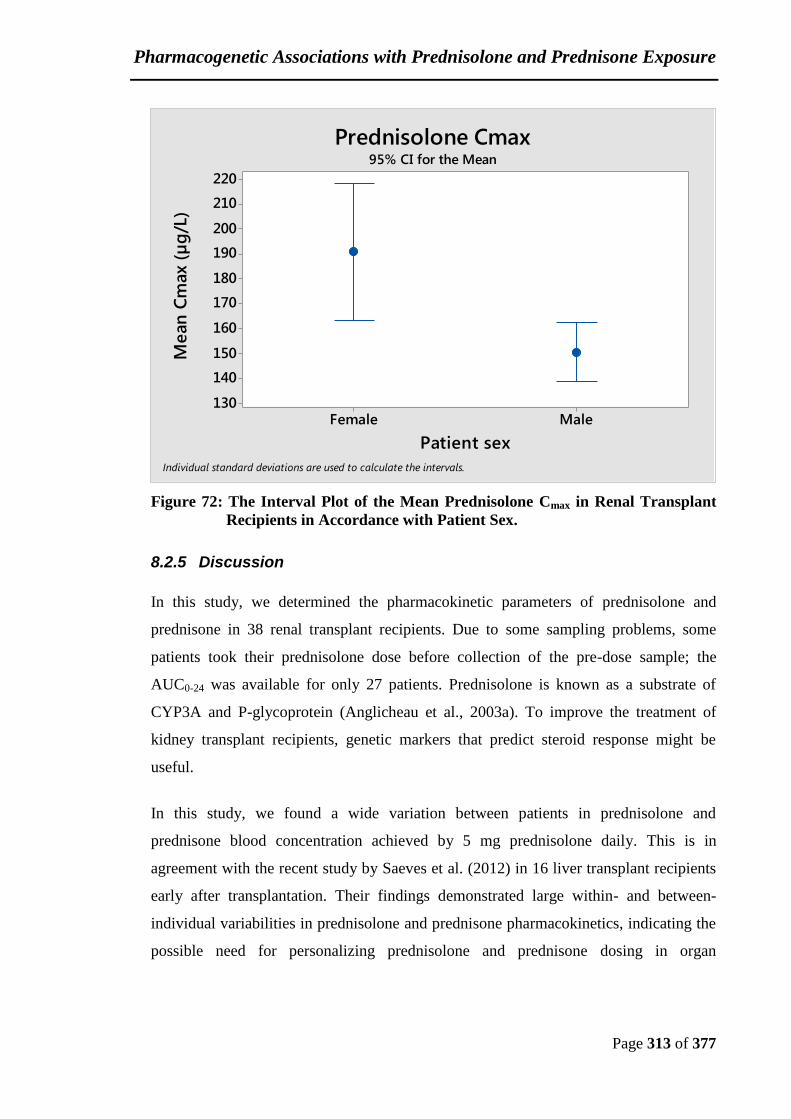
Pharmacogenetic Associations with Prednisolone and Prednisone Exposure
Page 313 of 377
Figure 72: The Interval Plot of the Mean Prednisolone Cmax in Renal Transplant
Recipients in Accordance with Patient Sex.
8.2.5 Discussion
In this study, we determined the pharmacokinetic parameters of prednisolone and
prednisone in 38 renal transplant recipients. Due to some sampling problems, some
patients took their prednisolone dose before collection of the pre-dose sample; the
AUC0-24 was available for only 27 patients. Prednisolone is known as a substrate of
CYP3A and P-glycoprotein (Anglicheau et al., 2003a). To improve the treatment of
kidney transplant recipients, genetic markers that predict steroid response might be
useful.
In this study, we found a wide variation between patients in prednisolone and
prednisone blood concentration achieved by 5 mg prednisolone daily. This is in
agreement with the recent study by Saeves et al. (2012) in 16 liver transplant recipients
early after transplantation. Their findings demonstrated large within- and between-
individual variabilities in prednisolone and prednisone pharmacokinetics, indicating the
possible need for personalizing prednisolone and prednisone dosing in organ
MaleFemale
220
210
200
190
180
170
160
150
140
130
Patient sex
Me
an
Cm
ax (
µg
/L)
95% CI for the Mean
Individual standard deviations are used to calculate the intervals.
Prednisolone Cmax

Pharmacogenetic Associations with Prednisolone and Prednisone Exposure
Page 314 of 377
transplantation. The same findings were obtained from pharmacokinetic study after
single dose administration of prednisone by showing high between-individual
variability in systemic exposure to prednisolone in systemic lupus erythematosus
patients (Sagcal-Gironella et al., 2011). Similarly, Morton et al. (2006) found a wide
between-individual variation in prednisolone pharmacokinetics among 52 lung
transplant recipients. The majority of the patients were overdosed on the conventional
protocols, suggesting the use of TDM to optimize prednisolone dosing and minimize
morbidity. Moreover, Barraclough et al. (2011b) reported wide between-subject
variability in prednisolone exposure in kidney transplant patients, justifying a role for
TDM and suggested the use of limiting sampling strategies (LSSs) for accurate
estimation of both total and free prednisolone AUC0-12. Hence, to achieve a balance
between toxicity and efficacy of prednisolone, therapeutic drug monitoring may be
useful and would be worthy of a clinical trial.
In our data, prednisolone and prednisone behaved differently. Although the CYP3A5
genotype plays an important role in drug metabolism, including prednisolone, no
association between CYP3A5 genetic polymorphisms and prednisolone
pharmacokinetics was observed. In addition, no significant differences were found in
prednisolone pharmacokinetics for ABCB1 3435 polymorphisms. This finding is in
agreement with the previous report by Miura et al. (2008), Miura et al. (2009) and
showed that prednisolone is unaffected by either the CYP3A5*3 or ABCB1 3435 genetic
polymorphisms. Moreover, POR*28 gene was not associated with prednisolone
pharmacokinetics.
In addition, the AUC0-24 and Cmax of prednisolone showed no significant difference
among CYP3A5 expressers having either ABCB1 3435 CC or CT/TT genotypes and
CYP3A5 non-expressers having ABCB1 3435 CT/TT genotype. This is in agreement
with Miura et al. (2008) who found no significant difference in prednisolone AUC0-24,
Cmax and C0 in CYP3A5 expressers having either ABCB1 3435 CC , CT or TT alleles.
They also found a significant increase in prednisolone Cmax in CYP3A5 non-expressers
having ABCB1 3435 CC allele compared to ABCB1 3435 TT carriers. They also
concluded that the intestinal CYP3A5 and P-glycoprotein may play important roles in
Pharmacogenetic Associations with Prednisolone and Prednisone Exposure
Page 315 of 377
prednisolone absorption but they have low contribution to prednisolone
pharmacokinetics. However, we could not make this comparison in our study cohort
because of the limited number of patients in the CYP3A5*3/*3 / ABCB1 3435 CC
group. Moreover, we found no correlation between the different ethnic backgrounds and
prednisolone blood concentrations. This indicates that neither the genetic factors nor
ethnicity can predict prednisolone plasma concentration. However, patient sex had a
significant effect on prednisolone Cmax.
Similar to prednisolone, prednisone is also known as a substrate and inducer of CYP3A
enzymes and P-glycoprotein (Anglicheau et al., 2003a); however, prednisone
pharmacokinetics differed significantly between CYP3A5 genotypes, suggesting
preferential generation of prednisone as a metabolite in CYP3A5 expressers. Like
prednisone, 20β- dihydroprednisolone was one of the main metabolites of prednisolone
in a recent study by Matabosch et al. (2015) who identified 20 metabolites of
prednisolone in urine samples of two healthy male Caucasian volunteers following
administration of 10 mg prednisolone. Interestingly, the maximum prednisolone
concentrations were similar in the excretion profiles of prednisolone metabolites in both
volunteers. However, 20β- dihydroprednisolone maximum concentration was similar to
prednisone maximum concentration in one volunteer and higher in the other one despite
that they are both males and Caucasians. This may explain prednisone low
concentration in CYP3A5 non-expressers, suggesting that 20β- dihydroprednisolone
could be produced more than prednisone in CYP3A5 non-expressers. Additionally, our
results showed that ABCB1 3435 gene was strongly associated with prednisone
pharmacokinetics. Conversely, POR*28 was not associated with prednisone PK. Our
results showed that patients carrying at least one CYP3A5*1 allele had a significantly
higher mean prednisone Cmax and AUC0-24 compared to CYP3A5*3 homozygotes.
Similarly, we found that ABCB1 3435 CC carriers achieved higher mean prednisone
Cmax and AUC0-24 than ABCB1 3435 CT/TT Carriers. This finding may be due to over-
representation of CYP3A5 expressers in the ABCB1 3435 CC group. When combining
CYP3A5 and ABCB1 3435 genotypes, we found a significantly lower prednisone C0 and
Cmax for CYP3A5 non-expresser patients having the ABCB1 3435 CT/TT genotype
compared to CYP3A5 expresser patients having ABCB1 3435 CC genotype. Similar

Pharmacogenetic Associations with Prednisolone and Prednisone Exposure
Page 316 of 377
results were found in prednisone AUC0-24 when compared to ABCB1 3435 CC carriers,
but not when compared to ABCB1 3435 CT/TT carriers. The difference in prednisone
C0, Cmax and AUC0-24 between CYP3A5 expressers subgroups (ABCB1 3435 CC or
ABCB1 3435 CT/TT carriers) was not statistically significant, confirming the
predominant influence of CYP3A5 in prednisone exposure.
With regard to CYP3A5 polymorphisms, we expected the prednisone Cmax and AUC0-24
to be unaffected like in prednisolone or to be lower in the CYP3A5 expressers than in
the CYP3A5 non-expressers, because CYP3A5 expressers should have high CYP3A5
expression and activity. Likewise, regarding ABCB1 polymorphisms, we expected the
prednisone Cmax and AUC0-24 to be unchanged like in prednisolone or to be lower in the
ABCB1 3435 CC Carriers than in the ABCB1 3435 CT/TT Carriers, because Pg-p
production and activity is higher in ABCB1 3435 CC Carriers. However, the results
were not as expected. The small sample size is likely to be a key limiting factor in the
current study. Hence, a larger number of patients need to be studied to confirm the
impact of CYP3A5 and ABCB1 3435 polymorphisms on prednisone pharmacokinetics.
To our knowledge, our data constitute the first report on the pharmacokinetics of
prednisone as an immunosuppressive agent describing the influence of CYP3A5,
ABCB1 3435 and POR*28 genetic polymorphisms. Further studies would be helpful to
understand the effects of these polymorphisms on prednisone plasma concentrations.
CYP3A4*22 gene polymorphisms were not included in this study because of the low
frequency of this genotype in our population. Ethnic factors and patients’ sex were
shown to have no influence on prednisone Cmax and AUC0-24.
Prednisone is a well-known substrate of CYP3A and/or P-gp. Effect of prednisone on
tacrolimus concentration in renal transplant patients should be taken into consideration.
Anglicheau et al. (2003a) found that tacrolimus dose requirement was greatly affected
by prednisone dose. The higher the prednisone dosage used, the higher the tacrolimus
dosage required to achieve target trough blood concentrations in these patients. The
interaction also occurs even with low prednisone dosage. This is due to enzymatic
induction of CYP3A and/or P-gp by glucocorticoid. These findings were confirmed by
Park et al. (2009) who found an inverse correlation between prednisone daily dose and
Pharmacogenetic Associations with Prednisolone and Prednisone Exposure
Page 317 of 377
tacrolimus exposures. Prednisone dose reduction was associated with an increase in
tacrolimus drug exposure. Similarly, a more recent study demonstrated that during the
first 6 months after transplantation, prednisone dose significantly influenced tacrolimus
blood concentration. Prednisone tacrolimus interaction has more effect on male than
female patients (Velickovic-Radovanovic et al., 2012). Differential generation of
prednisone in CYP3A5 expressers may influence the prednisolone/tacrolimus
interaction.

General Discussion
Page 318 of 377
9 Chapter 9. General Discussion & Conclusions
Tacrolimus has a narrow therapeutic window of blood concentration and wide variation
between individuals in blood concentration achieved by a given dose which is a matter
of concern in the clinical practice. Therefore, determination of the optimal tacrolimus
dose is necessary to minimize the undesired side effects of tacrolimus while maintaining
its efficacy, especially in the early period after transplantation. Different oral
formulations of tacrolimus are available and another once daily formulation, Envarsus
has recently been given marketing authorisation in the UK. Advagraf® is once-daily
tacrolimus with prolonged-release characteristics compared to the initially authorised
preparation, Prograf® which has immediate-release absorption profile (Soto et al.,
2015). Generic twice-daily tacrolimus preparations that are bioequivalent to Prograf®
are now available. A body-weight-based dose of tacrolimus results in a marked
variation between individuals in tacrolimus blood concentration. A number of factors
are considered to contribute to low and variable bioavailability of tacrolimus, including
extensive first pass metabolism and activity of the drug-efflux pump, p-glycoprotein.
Tacrolimus is a substrate of CYP3A4, CYP3A5, and Pg-p, which are proteins expressed
by CYP3A4, CYP3A5, and ABCB1 3435 genes (Hebert, 1997). Hence differences in the
level of expression and the bioactivity of these proteins may contribute to the individual
variations of tacrolimus pharmacokinetics.
In this study, Advagraf® showed a comparable pharmacokinetic profile to twice-daily
tacrolimus confirming that once-daily tacrolimus, Advagraf® is bioequivalent to twice-
daily tacrolimus preparations according to the FDA guidelines; 80-125% (FDA., 2003).
It also met the bioequivalence acceptance criteria of the European Medicines Agency
for tacrolimus; (90-111%) for AUC and (80-125%) for Cmax (EMA, 2015). We
confirmed the repeatedly reported strong correlation between AUC0–24 and C0 for
immediate and modified release tacrolimus indicating that measurement of C0 is
appropriate for therapeutic monitoring of Advagraf®. Our results are in accordance with
the previous findings in Phase II studies on Advagraf® showing that a given dose of
Advagraf® delivered 90% of the area under the concentration-time curve (AUC)
General Discussion
Page 319 of 377
obtained with Prograf® (EMEA, 2007) . However, the mean tacrolimus ratio for Cmax
following the administration of Advagraf was up to 20% less when compared with
Prograf®. They noted that the AUC0-24 may need to be monitored to ensure maintenance
of similar systemic exposure and they found a good correlation between AUC0-24 and C0
for Advagraf® and Prograf® at steady state, as found in the current study. They also
observed less between- and within-subject variability in exposure when compared
Advagraf® to Prograf®(EMEA, 2007).
Our data showed that switching from immediate to extended release tacrolimus has an
impact on between-patient variability of tacrolimus exposure in this cohort of patients.
Advagraf® has less between-individual differences in tacrolimus exposure when
compared to immediate release tacrolimus.
In addition, we demonstrated that the between-patient variability in tacrolimus daily
dose requirement was related to CYP3A5*3, CYP3A4*22 and ABCB1 3435 gene
polymorphisms in stable kidney transplant recipients, as reported previously, suggesting
that the pharmacogenetic assessment of CYP3A5*3, CYP3A4*22 and ABCB1 3435
genotypes may offer an effective tool for individualizing drug therapy by optimizing
tacrolimus dosage for both twice daily tacrolimus and Advagraf®.
It is becoming apparent that all individuals express CYP3A4 and CYP3A4 poor
metabolizers are rare. However, CYP3A5 expression varies between different
individuals. The CYP3A5*3 allele reduces CYP3A5 production and results in the loss of
hepatic CYP3A5 activity (Hustert et al., 2001, Kuehl et al., 2001). Thus, it has been
repeatedly reported that patients with the CYP3A5*3/*3 genotype (CYP3A5 non-
expressers) require lower doses to reach similar dose-normalized tacrolimus trough
concentrations than patients carrying at least one CYP3A5*1 allele (CYP3A5
expressers) (Macphee et al., 2005, Vannaprasaht et al., 2013, Ferraris et al., 2011). In
our study, we clearly could confirm this effect. Several studies have examined the effect
of P-gp on tacrolimus exposure, and conflicting results have been obtained. Some
studies reported no correlation between ABCB1 3435 genotypes and tacrolimus dose
and pharmacokinetics (Haufroid et al., 2004, Jun et al., 2009, Vannaprasaht et al.,
General Discussion
Page 320 of 377
2013). However, other studies displayed a significant influence of ABCB1 3435
genotypes on tacrolimus pharmacokinetics and dose requirements (Zheng et al., 2003,
Lopez-Montenegro Soria et al., 2010, Yu et al., 2011), which is in line with our
findings. In addition, upon evaluation of CYP3A5*3 and ABCB1 3435 genotypes in
combination, significant differences in tacrolimus pharmacokinetics were evident
between ABCB1 3435 polymorphisms in CYP3A5 expressers suggesting that ABCB1
3435 genotype is an important factor in tacrolimus pharmacokinetics particularly in the
case of CYP3A5 expressers. These findings support previous findings by Loh and
colleagues who reported the same outcome between ABCB1 3435 and CYP3A5*3
variants (Loh et al., 2008) and contrast with other studies demonstrating no significant
differences in tacrolimus bioavailability between the ABCB1 3435 polymorphisms in
both CYP3A5 expressers and non-expressers (Rong et al., 2010, Tada et al., 2005).
Additionally, our data showed the contribution between CYP3A4*22 polymorphisms
and tacrolimus pharmacokinetics confirming the findings of the recently published
studies (Elens et al., 2011a, Tavira et al., 2013, Kurzawski et al., 2014).
Interestingly, we found that the influence of CYP3A5, CYP3A4 and ABCB1 3435
genotypes on tacrolimus exposure was the same for once- and twice daily tacrolimus.
No significant difference was observed between these polymorphisms and tacrolimus
pharmacokinetics and dose requirements in both tacrolimus preparations.
It has been reported that CYP3A expression reduces progressively along the length of
the gut. However, the level of cellular expression of Pg-p increases continuously along
the gut length (Thorn et al., 2005). We hypothesised that the influence of these
genotypes would apply differently between tacrolimus formulations. Our assumption
was that CYP3A5 polymorphisms may have less effect on the oral bioavailability of
extended release tacrolimus formulation, Advagraf® which is mostly absorbed lower
down the gut than the immediate release preparations of tacrolimus such as Prograf®
and Adoport® that are absorbed in the upper part of the gastrointestinal tract (GIT),
mainly around the stomach and proximal small intestine (MacPhee, 2012). Our data
showed that the impact of CYP3A5, CYP3A4 and ABCB1 3435 polymorphisms and their
combinations had no clear difference between twice-daily tacrolimus and Advagraf®.
General Discussion
Page 321 of 377
This is in accordance with the recently published studies finding that tacrolimus
exposure was significantly higher in CYP3A5 non-expressers than in
CYP3A5expressers and the degree of difference was similar between Prograf® and
Advagraf® (Benkali et al., 2010, Glowacki et al., 2011b, Niioka et al., 2012, Wehland et
al., 2011). This may indicate a dominant effect of the liver CYP3A5 on the first-pass
metabolism of tacrolimus and a minor influence of intestinal enzymes in tacrolimus
metabolism. However, earlier studies in liver transplant recipients have revealed the
influence of the intestinal CYP3A5 on tacrolimus absorption. A study by Uesugi et al
indicates that intestinal CYP3A5, as well as hepatic CYP3A5, plays an essential role in
the first-pass metabolism of orally administered tacrolimus in liver transplantation
(Uesugi et al., 2006). Another study in liver transplantation recipients found that
tacrolimus pharmacokinetics is mainly influenced by the intestinal CYP3A5 and P-gp
expression during the first week; after that, it is mostly affected by the hepatic
metabolism (Goto et al., 2004). This can be explained by the minor effect of the
intestinal CYP3A5 on tacrolimus metabolism that only appears in the absence of the
liver CYP3A5 enzymes. It is also possible that the gradient of CYP3A5 and P-gp
expression along the length of the gut was over-estimated in previously published
reports (Thorn et al., 2005).
Moreover, this study showed that switching from immediate to extended release
tacrolimus formulations did not make any significant difference in WPV of dose-
normalized C0 in both tacrolimus preparations. Similar observations were made in other
conversion studies (van Hooff et al., 2012, Wehland et al., 2011, Shuker et al., 2014).
However, other studies showed that conversion from Prograf® to Advagraf® was associated
with a significantly lower WPV of Tac C0 (Wu et al., 2011, Alloway et al., 2005). Our
findings showed that neither patients treated with twice daily tacrolimus nor patients treated
with once- daily tacrolimus show any significant association between WPV of dose-
normalized Tac C0 and CYP3A5 genotype. This in line with previous published studies
(Pashaee et al., 2011, Ro et al., 2012, Wu et al., 2014). The balance of published evidence
suggests that conversion from twice daily tacrolimus to Advagraf® is unlikely to impact
significantly on WPV in routine renal transplantation.
General Discussion
Page 322 of 377
Additionally, in our data, we found that in spite of being a known substrate of CYP3A
and P-glycoprotein (Anglicheau et al., 2003a), prednisolone pharmacokinetics were not
associated with CYP3A5*3 and ABCB1 3435 polymorphisms. Prednisone behaved
differently and CYP3A5*3 and ABCB1 3435 genotypes were strongly associated with
prednisone pharmacokinetics. CYP3A5 expressers had higher concentrations of
prednisone, presumably reflecting preferential metabolism of prednisolone to
prednisone. It is worth noting that patient sex had a significant effect on prednisolone
Cmax. Ethnic factors and tacrolimus dose were shown to have no influence on the Cmax
and AUC0-24 of prednisolone and prednisone. This indicates that neither the genetic
factors nor ethnicity can predict prednisolone plasma concentration. Given the wide
variation between individuals in prednisolone blood concentration achieved by a dose of
5 mg prednisolone daily, it may actually be appropriate to consider using TDM, in
particular for patients with efficacy failure or toxicity.
Moreover, our study showed that 4β-OHC concentration increased significantly in
CYP3A5*1 allele carriers compared to recipients having CYP3A5*3*3 genotype
(Diczfalusy et al., 2008, Suzuki et al., 2014). The 4β-OHC/C ratio was significantly
correlated with tacrolimus exposure and dose requirement. 4β-OHC/C ratio may be a
useful biomarker for tacrolimus dosing in renal transplanted patients. While the effect of
CYP3A5*3 genotype and CYP3A activity measured by plasma 4β-OHC/C ratio on
tacrolimus exposure were closely linked, they were both found to be independent
predictors and would be additive in developing an algorithm for predicting optimal
initial tacrolimus dose.
Of note, tacrolimus dose requirement may be modified and its pharmacokinetics can be
affected by several parameters including genetic and non-genetic factors. In order to
secure the optimal tacrolimus administration, both genetic and non-genetic factors must
be taken into account. Most studies search for the genetic polymorphisms that affect the
response of individuals to tacrolimus. However, non-genetic factors may have an
influence in tacrolimus pharmacokinetics and dose requirements. Hence, we tried to
model tacrolimus kinetics based on both genetic and non-genetic factors.

General Discussion
Page 323 of 377
In the present study, we demonstrated that CYP3A5*3 genotype is a key factor in the
prediction of tacrolimus blood concentrations and dose requirement. Many studies
highlighted the influence of CYP3A5 in tacrolimus pharmacokinetics and dose
requirement and reported that CYP3A5 could be useful to predict the optimal
tacrolimus dose (Niioka et al., 2015, Thervet et al., 2008, Birdwell et al., 2015). In a
randomized controlled study, kidney transplant recipients receiving tacrolimus doses
according to the CYP3A5 genotype reached the target C0 significantly earlier than
recipients used a standard regimen. Although more patients were within the desired
tacrolimus target range early after transplantation, a considerable proportion of patients
still did not have tacrolimus C0 levels within the target range points (Thervet et al.,
2010) indicating that CYP3A5 genotype alone is unlikely to be sufficient for successful
individualisation of initial tacrolimus dose. Another study found no association between
pharmacogenetic adaptation of tacrolimus daily dose and earlier achievement of the
tacrolimus target exposure range. No improvement in the clinical outcome was observed
(Shuker et al., 2015). In addition to CYP3A5*3 genotype, our results also confirm a
minor role of the ABCB1 3435 variant allele. This supports previous studies showing a
weak association between ABCB1 3435 polymorphism and tacrolimus dose
requirements (Li et al., 2006a, MacPhee et al., 2002, Anglicheau et al., 2003b).
However, other studies failed to identify such an association (Tsuchiya et al., 2004,
Haufroid et al., 2004, Quteineh et al., 2008, Shi et al., 2013). The reason for the
discrepancies between these studies is unclear, but may be due to the food, the genetic
effect of other genes, or studies lacking sufficient statistical power.
Moreover, we studied some non-genetic factors, including age, sex, haematocrit,
ethnicity, diabetic status, steroid therapy, donor type, time since transplantation and
tacrolimus formulation. We found that the donor type, time since transplantation and
tacrolimus formulations had no significant effect. Although sex had a significant effect
on tacrolimus dose in univariate analysis, this effect was diminished in multivariate
regression analysis. Stratta et al reported that sex differences affect tacrolimus dose
requirements (Stratta et al., 2012).

General Discussion
Page 324 of 377
Furthermore, we demonstrated that the haematocrit value was strongly correlated with
tacrolimus dose, consistent with previous reports showing the influence of haematocrit
values in tacrolimus blood concentration (de Jonge et al., 2012, Stratta et al., 2012).
Tacrolimus is extensively bound to FK-binding proteins in red blood cells. Hence the
haematocrit plays an important role in tacrolimus pharmacokinetics and may need to be
considered in tacrolimus dosage regimens especially with significant changes in their
levels. In multivariate analysis, diabetic status was significantly associated with
tacrolimus dose requirements, confirming previous findings by Chitnis et al who found
that diabetic patients have significantly higher dose adjusted tacrolimus blood
concentrations compared to non-diabetic patients (Chitnis et al., 2013). Our findings
confirm the effect of age on tacrolimus dose requirement. Younger patients required
higher tacrolimus dose than older patients. This is in accordance with previous findings
indicating the strong correlation of age with tacrolimus dose in both adults (Kim et al.,
2012) and paediatric patients (Gijsen et al., 2011). We also demonstrated that ethnicity
had a significant effect on tacrolimus dose, black patients required higher tacrolimus
dose than white and Asian subjects, which is consistent with previous findings
(Macphee et al., 2005). However, the CYP3A5*3 polymorphism cannot be replaced by
ethnicity to predict the tacrolimus dose requirement, even though they are strongly
linked.
In this study, different tacrolimus formulation has no influence on tacrolimus dose
either in univariate or multivariate analysis. This means that factors were reported to
influence tacrolimus dose including age, sex, ethnicity, haematocrit, diabetic status,
corticosteroid treatment and CYP3A5*3/ ABCB1 3435 polymorphisms are the same for
both tacrolimus formulations. From our study prediction of tacrolimus dose can be
achieved from the following equation:
Dose (mg/kg) = 0.2199 - 0.000622 * Age - 0.1636 * Haematocrit - 0.0387 (if Asian) -
0.0217 (if White) - 0.02665 (if diabetic) + 0.01043 (if treated with
corticosteroids) + 0.00974 (if female) + 0.0017 (if CYP3A5*1/*1/*1/*3
/ABCB1CT/TT genotype) - 0.0457 (if CYP3A5*3/*3 /ABCB1CC
genotype) - 0.0534 (if CYP3A5*3/*3 /ABCB1CT/TT genotype).

General Discussion
Page 325 of 377
Our findings suggest that taking all these aforementioned factors into consideration may
account for 59.9% of the between-individual variability in tacrolimus dose
requirements. However, the impact of other factors, including different diet habits,
comorbidity and concomitant treatment schemes could not be estimated. These findings
may have potential clinical application for initiation and adjustment of tacrolimus
therapy. Given the modest impact, if any, of using CYP3A5 genotype to predict the
optimal initial dose of tacrolimus, it may now be appropriate to test algorithms
including genetic and non-genetic factors as described here. As a first step, it would be
useful to test the predictive value of this equation in an independent group of transplant
recipients. Demonstration of clinical utility of an algorithm would require a clinical
trial statistically powered to demonstrate improvement in hard clinical endpoints.
Conclusion
The findings of the studies presented have demonstrated that the between-patient
variability in tacrolimus daily dose requirement was related to CYP3A5*3, CYP3A4*22
and ABCB1 3435 gene polymorphisms and that CYP3A5 *3 genotype is a key factor in
the prediction of tacrolimus blood concentrations and dose requirement. Furthermore,
the influence of CYP3A5*3, CYP3A4*22 and ABCB1 3435 genotypes on tacrolimus
exposure was the same for once- and twice daily tacrolimus. CYP3A5*3 polymorphism
cannot be replaced by 4B-OHC to predict tacrolimus dose requirement, even though
they are strongly linked. Moreover, our data showed that switching from immediate to
extended release tacrolimus has an impact on between-patient variability of tacrolimus
exposure in this cohort of patients. On the other hand, conversion from immediate to
extended release tacrolimus did not make any significant difference in WPV of dose-
normalized C0 and CYP3A5*3 genotype had no impact on within-patient variability of
tacrolimus clearance in once- and twice-daily tacrolimus formulations. In addition to the
genetic factors associated with tacrolimus dose, some non-genetic factors, including
age, ethnicity, haematocrit, diabetic status and steroid treatment seems to have an
influence in tacrolimus dose. This can be applied for both tacrolimus formulations.

Future Options
Page 326 of 377
10 Chapter 10. Future Options
Based on the data presented in this thesis, I would propose the following follow-on
work.
Development of an algorithm to predict the optimal initial tacrolimus dose based on the
genetic polymorphisms and non-genetic factors is worthy of further investigation. To
test, this would require a large number of patients to deliver sufficient statistical power.
Proposed next steps include:
1) A retrospective study to validate a predictive equation for initial tacrolimus
dose in an independent cohort of renal transplant recipients
In an independent cohort of transplant patients, tacrolimus dose will be estimated based
on CYP3A5*3/ ABCB1 3435 polymorphisms, age, ethnicity, haematocrit, 4β-
hydroxycholesterol /cholesterol ratio, CYP3A4*22 and compared to the actual
tacrolimus dose that achieved target blood concentration. The relationship defined in
Chapter 6 page 228 will be used in this study.
2) Testing of a population pharmacokinetic model in a prospective clinical
trial
A population pharmacokinetic model for tacrolimus will be developed on basis of the
theoretical expectation of a relationship between tacrolimus dose and CYP3A5*3/
ABCB1 3435 polymorphisms, age, ethnicity, haematocrit, 4β-hydroxycholesterol
/cholesterol ratio, diabetic status and steroid therapy being the same for the prolonged
release preparation Advagraf® as for the immediate release preparation, Prograf® or
Adoport®. The clinical trial will need to show that the combination of genetic and non-
genetic factors to tacrolimus dose requirement would improve patient outcome based on
measurable clinical endpoints including incidence of acute rejection and NODAT.
The expectation following the identification of a number of gene polymorphisms
involved in tacrolimus metabolism is to achieve a better immunosuppressive therapy for

Future Options
Page 327 of 377
each individual patient with less rejections or adverse effects. However, even if patients
are genotyped for gene polymorphisms involved in tacrolimus absorption and
metabolism, still a large percentage of tacrolimus dose variability remains unclear. For
example, tacrolimus pharmacokinetics is strongly correlated with the expression and
activity of the metabolizing enzyme CYP3A5. CYP3A5 expressers required 2-fold
higher tacrolimus dose than non-expresser. Two recent clinical studies showed either no
association between CYP3A5 adaptation of tacrolimus daily dose and earlier
achievement of the target tacrolimus exposure range (Shuker et al., 2015) or some
improvement in the number of patients reaching the target concentration with a
considerable proportion of patients outside the target range (Thervet et al., 2010). The
Liver is the main site of metabolism of tacrolimus. Detection of CYP3A5 expression
helps to explain 30-35% of tacrolimus variability. It cannot give an accurate prediction
of tacrolimus trough concentration and dose requirement. While 4β-hydroxycholesterol
/cholesterol ratio provided a measure of systemic CYP3A activity, it adds relatively
little to the predictive value of CYP3A5 genotype. An alternative approach that has
been used to measure systemic CYP3A activity employed midazolam as a drug probe as
an adjunct to genotyping (de Jonge et al., 2012).
3) Individualisation of steroid therapy
In this study, we found variation between patients in prednisolone and prednisone blood
concentration achieved by 5 mg prednisolone daily, confirming the recent findings
demonstrating large within- and between-individual variabilities in prednisolone and
prednisone pharmacokinetics, indicating the need for personalizing dosing of
glucocorticoids (including prednisolone and prednisone) in organ transplantation
(Sagcal-Gironella et al., 2011, Saeves et al., 2012). Interestingly, this study showed a
significantly lower concentration of prednisolone metabolite, prednisone in CYP3A5
non-expressers, suggesting that the other main metabolite of prednisolone, 20β-
dihydroprednisolone could be produced more than prednisone in the case of CYP3A5
non-expresser. A clinical trial is needed to identify the pharmacodynamics of this
metabolite and to see if it is responsible for any of prednisolone adverse effects.
Furthermore a TDM clinical trial is also required to find the basis of a definable

Future Options
Page 328 of 377
relationship between prednisolone dose and plasma concentration and consequently
between plasma concentration and the therapeutic effect in order to optimize the clinical
outcomes in patients. Therefore, the dose can be adjusted to reach the target therapeutic
concentration.
4) Do the factors that predict pharmacokinetics for Advagraf® apply to
Envarsus®
Different oral formulations of tacrolimus are available. Generic once daily formulation,
Envarsus® has recently been given marketing authorisation in the UK. Each formulation
of tacrolimus has different excipients which are considered the inactive ingredients that
do not have therapeutic role. Some studies have revealed that excipients can cause
various side effects (Strauss and Greeff, 2015). Excipients can affect the
pharmacokinetics of drugs through their effects on drug absorption (Andrysek,
2006). Therefore, a clinical study is required to study the influence of the
pharmacogenetic differences in this new formulation and to study the effect of
switching stable renal transplant patients from a twice daily formulation of tacrolimus
(Prograf® or Adoport®) or once daily formulation (Advagraf®) to the new once daily
formulation (Envarsus®) on within patient variability in pre-dose blood tacrolimus
concentration.

References
Page 329 of 377
References
ABBOUDI, H. & MACPHEE, I. A. 2012. Individualized immunosuppression in transplant patients: potential role of pharmacogenetics. Pharmgenomics Pers Med, 5, 63-72.
ABOUZEID, H., YOUSSEF, M. A., BAYOUMI, N., ELSHAKANKIRI, N., MARZOUK, I., HAUSER, P. & SCHORDERET, D. F. 2012. RAX and anophthalmia in humans: evidence of brain anomalies. Mol Vis, 18, 1449-56.
ABUELO, J. G. 1995. Renal failure : diagnosis and treatment, Dordrecht, Kluwer Academic.
ADACHI, K., YASUDA, K., FUWA, Y., GOSHIMA, E., YAMAKITA, N. & MIURA, K. 1991. Measurement of plasma free steroids by direct radioimmunoassay of ultrafiltrate in association with the monitoring of free components with [14C]glucose. Clinica Chimica Acta, 200, 13-22.
ADCOCK, I. & ITO, K. 2000. Molecular mechanisms of corticosteroid actions. Monaldi archives for chest disease= Archivio Monaldi per le malattie del torace/Fondazione clinica del lavoro, IRCCS [and] Istituto di clinica tisiologica e malattie apparato respiratorio, Università di Napoli, Secondo ateneo, 55, 256.
AGRAWAL, V., CHOI, J. H., GIACOMINI, K. M. & MILLER, W. L. 2010. Substrate-specific modulation of CYP3A4 activity by genetic variants of cytochrome P450 oxidoreductase. Pharmacogenet Genomics, 20, 611-8.
ALBERTS, B., JOHNSON, A. & LEWIS, J. E. A. 2002. Molecular biology of the cell, New York, Garland Science.
ALIYU, S. 2014. Bacterial whole genome sequencing: The future of clinical bacteriology. Annals of Nigerian Medicine, 8, 51.
ALLISON, A. C. & EUGUI, E. M. 2000. Mycophenolate mofetil and its mechanisms of action. Immunopharmacology, 47, 85-118.
ALLOWAY, R., STEINBERG, S., KHALIL, K., GOURISHANKAR, S., MILLER, J., NORMAN, D., HARIHARAN, S., PIRSCH, J., MATAS, A., ZALTZMAN, J., WISEMANDLE, K., FITZSIMMONS, W. & FIRST, M. R. 2005. Conversion of stable kidney transplant recipients from a twice daily Prograf-based regimen to a once daily modified release tacrolimus-based regimen. Transplant Proc, 37, 867-70.
ALLOWAY, R., STEINBERG, S., KHALIL, K., GOURISHANKAR, S., MILLER, J., NORMAN, D., HARIHARAN, S., PIRSCH, J., MATAS, A., ZALTZMAN, J., WISEMANDLE, K., FITZSIMMONS, W. & FIRST, M. R. 2007. Two years postconversion from a prograf-based regimen to a once-daily tacrolimus extended-release formulation in stable kidney transplant recipients. Transplantation, 83, 1648-51.
ALLOWAY, R. R., SADAKA, B., TROFE-CLARK, J., WILAND, A. & BLOOM, R. D. 2012. A randomized pharmacokinetic study of generic tacrolimus versus reference tacrolimus in kidney transplant recipients. Am J Transplant, 12, 2825-31.
ALVINERIE, M., SUTRA, J. F., GALTIER, P., HOUIN, G. & TOUTAIN, P. L. 1990. Simultaneous measurement of prednisone, prednisolone and hydrocortisone in plasma by high performance liquid chromatography. Ann Biol Clin (Paris), 48, 87-90.

References
Page 330 of 377
AMUNDSEN, R., ASBERG, A., OHM, I. K. & CHRISTENSEN, H. 2012. Cyclosporine A- and tacrolimus-mediated inhibition of CYP3A4 and CYP3A5 in vitro. Drug Metab Dispos, 40, 655-61.
ANDRYSEK, T. 2006. Excipients and their role in absorption: Influencing bioavailability of cyclosporine by triglycerides and polyglycerol esters. Biomed Pap Med Fac Univ Palacky Olomouc Czech Repub, 150, 227-33.
ANGLICHEAU, D., FLAMANT, M., SCHLAGETER, M. H., MARTINEZ, F., CASSINAT, B., BEAUNE, P., LEGENDRE, C. & THERVET, E. 2003a. Pharmacokinetic interaction between corticosteroids and tacrolimus after renal transplantation. Nephrology dialysis transplantation, 18, 2409-2414.
ANGLICHEAU, D., VERSTUYFT, C., LAURENT-PUIG, P., BECQUEMONT, L., SCHLAGETER, M. H., CASSINAT, B., BEAUNE, P., LEGENDRE, C. & THERVET, E. 2003b. Association of the multidrug resistance-1 gene single-nucleotide polymorphisms with the tacrolimus dose requirements in renal transplant recipients. J Am Soc Nephrol, 14, 1889-96.
ARORA, P. 2013. Chronic Kidney Disease [Online]. Available:
emedicine.medscape.com/article/238798-overview [Accessed].
ATLURI, P., KARAKOUSIS, G. C., PORRETT, P. M. & KAISER, L. R. 2006. The surgical review : an integrated basic and clinical science study guide, Philadelphia, Pa. ; London, Lippincott Williams & Wilkins.
BARRACLOUGH, K. A., ISBEL, N. M., JOHNSON, D. W., CAMPBELL, S. B. & STAATZ, C. E. 2011a. Once- versus twice-daily tacrolimus: are the formulations truly equivalent? Drugs, 71, 1561-77.
BARRACLOUGH, K. A., ISBEL, N. M., MCWHINNEY, B. C., UNGERER, J. P., MEDLEY, G., JOHNSON, D. W., HAWLEY, C. M., LEARY, D. R., CAMPBELL, S. B. & STAATZ, C. E. 2011b. Evaluation of limited sampling strategies for total and free prednisolone in adult kidney transplant recipients. Eur J Clin Pharmacol, 67, 1243-52.
BEATRIZ, T., ELIECER, C., CARMEN, D.-C., VICTORIA, A., CARLOS, L.-L. & FRANCISCO, O. 2013. A search for new CYP3A4 variants as determinants of tacrolimus dose requirements in renal-transplanted patients. Pharmacogenet Genomics, 23, 445-448.
BECKEBAUM, S., IACOB, S., SWEID, D., SOTIROPOULOS, G. C., SANER, F., KAISER, G., RADTKE, A., KLEIN, C. G., ERIM, Y., DE GEEST, S., PAUL, A., GERKEN, G. & CICINNATI, V. R. 2011. Efficacy, safety, and immunosuppressant adherence in stable liver transplant patients converted from a twice-daily tacrolimus-based regimen to once-daily tacrolimus extended-release formulation. Transpl Int, 24, 666-75.
BEKERSKY, I., DRESSLER, D. & MEKKI, Q. 2001a. Effect of time of meal consumption on bioavailability of a single oral 5 mg tacrolimus dose. J Clin Pharmacol, 41, 289-97.
BEKERSKY, I., DRESSLER, D. & MEKKI, Q. A. 2001b. Effect of low- and high-fat meals on tacrolimus absorption following 5 mg single oral doses to healthy human subjects. J Clin Pharmacol, 41, 176-82.
BENKALI, K., PRÉMAUD, A., PICARD, N., RÉROLLE, J.-P., TOUPANCE, O., HOIZEY, G., TURCANT, A., VILLEMAIN, F., LE MEUR, Y., MARQUET, P. & ROUSSEAU, A. 2009. Tacrolimus Population Pharmacokinetic-Pharmacogenetic Analysis and Bayesian Estimation in Renal Transplant Recipients. Clinical Pharmacokinetics, 48, 805-816.

References
Page 331 of 377
BENKALI, K., ROSTAING, L., PREMAUD, A., WOILLARD, J.-B., SAINT-MARCOUX, F., URIEN, S., KAMAR, N., MARQUET, P. & ROUSSEAU, A. 2010. Population Pharmacokinetics and Bayesian Estimation of Tacrolimus Exposure in Renal Transplant Recipients on a New Once-Daily Formulation. Clinical Pharmacokinetics, 49, 683-692.
BERGMANN, T. K., BARRACLOUGH, K. A., LEE, K. J. & STAATZ, C. E. 2012. Clinical pharmacokinetics and pharmacodynamics of prednisolone and prednisone in solid organ transplantation. Clin Pharmacokinet, 51, 711-41.
BIRDWELL, K. A., DECKER, B., BARBARINO, J. M., PETERSON, J. F., STEIN, C. M., SADEE, W., WANG, D., VINKS, A. A., HE, Y., SWEN, J. J., LEEDER, J. S., VAN SCHAIK, R., THUMMEL, K. E., KLEIN, T. E., CAUDLE, K. E. & MACPHEE, I. A. 2015. Clinical Pharmacogenetics Implementation Consortium (CPIC) Guidelines for CYP3A5 Genotype and Tacrolimus Dosing. Clin Pharmacol Ther, 98, 19-24.
BIRKETT, D. J. 2003. Generics-equal or not? Australian Prescriber, 26, 85-86.
BORGHEINI, G. 2003. The bioequivalence and therapeutic efficacy of generic versus brand-name psychoactive drugs. Clin Ther, 25, 1578-92.
BORRA, L. C. P., ROODNAT, J. I., KAL, J. A., MATHOT, R. A. A., WEIMAR, W. & VAN GELDER, T. 2010. High within-patient variability in the clearance of tacrolimus is a risk factor for poor long-term outcome after kidney transplantation. Nephrology Dialysis Transplantation, 25, 2757-2763.
BROUDE, N. E. 2002. Stem-loop oligonucleotides: a robust tool for molecular biology and biotechnology. Trends Biotechnol, 20, 249-56.
BROWN, E., DALEY, C. & LAWRENCE, A. 2009. Oxford handbook of dialysis, Oxford University Press.
BRUCKMUELLER, H., WERK, A. N., RENDERS, L., FELDKAMP, T., TEPEL, M., BORST, C., CALIEBE, A., KUNZENDORF, U. & CASCORBI, I. 2014. Which genetic determinants should be considered for tacrolimus dose optimization in kidney transplantation? A combined analysis of genes affecting the CYP3A locus. Ther Drug Monit.
BURK, O., TEGUDE, H., KOCH, I., HUSTERT, E., WOLBOLD, R., GLAESER, H., KLEIN, K., FROMM, M. F., NUESSLER, A. K., NEUHAUS, P., ZANGER, U. M., EICHELBAUM, M. & WOJNOWSKI, L. 2002. Molecular mechanisms of polymorphic CYP3A7 expression in adult human liver and intestine. J Biol Chem, 277, 24280-8.
BURNS, M. 1999. Management of narrow therapeutic index drugs. J Thromb Thrombolysis, 7, 137-43.
BURTON, M. E. 2006. Applied pharmacokinetics & pharmacodynamics : principles of therapeutic drug monitoring, Philadelphia, Pa. ; London, Lippincott Williams & Wilkins.
CHADBAN, S. J., BRIGANTI, E. M., KERR, P. G., DUNSTAN, D. W., WELBORN, T. A., ZIMMET, P. Z. & ATKINS, R. C. 2003. Prevalence of kidney damage in Australian adults: The AusDiab kidney study. J Am Soc Nephrol, 14, S131-8.
CHANDRAKER, A., SAYEGH, M. H. & SINGH, A. K. 2011. Core Concepts in Renal Transplantation, Springer, Boston, US.
CHEN, S. Y., LI, J. L., MENG, F. H., WANG, X. D., LIU, T., LI, J., LIU, L. S., FU, Q., HUANG, M. & WANG, C. X. 2013. Individualization of tacrolimus dosage basing on cytochrome P450
References
Page 332 of 377
3A5 polymorphism--a prospective, randomized, controlled study. Clin Transplant, 27, E272-81.
CHEN, Y. K., HAN, L. Z., XUE, F., SHEN, C. H., LU, J., YANG, T. H., ZHANG, J. J. & XIA, Q. 2014. Personalized tacrolimus dose requirement by CYP3A5 but not ABCB1 or ACE genotyping in both recipient and donor after pediatric liver transplantation. PLoS One, 9, e109464.
CHENG, M. H., HUANG, W. Y. & LIPSEY, A. I. 1988. Simultaneous liquid-chromatographic determination of prednisone and prednisolone in plasma. Clin Chem, 34, 1897-9.
CHIEN, A., EDGAR, D. B. & TRELA, J. M. 1976. Deoxyribonucleic acid polymerase from the extreme thermophile Thermus aquaticus. J Bacteriol, 127, 1550-7.
CHITNIS, S. D., OGASAWARA, K., SCHNIEDEWIND, B., GOHH, R. Y., CHRISTIANS, U. & AKHLAGHI, F. 2013. Concentration of tacrolimus and major metabolites in kidney transplant recipients as a function of diabetes mellitus and cytochrome P450 3A gene polymorphism. Xenobiotica, 43, 641-9.
CHOI, J. H., LEE, Y. J., JANG, S. B., LEE, J. E., KIM, K. H. & PARK, K. 2007. Influence of the CYP3A5 and MDR1 genetic polymorphisms on the pharmacokinetics of tacrolimus in healthy Korean subjects. Br J Clin Pharmacol, 64, 185-91.
CLAXTON, A. J., CRAMER, J. & PIERCE, C. 2001. A systematic review of the associations between dose regimens and medication compliance. Clin Ther, 23, 1296-310.
CONSIDINE, A., TREDGER, J. M., HENEGHAN, M., AGARWAL, K., SAMYN, M., HEATON, N. D., O'GRADY, J. G. & ALUVIHARE, V. R. 2015. Performance of modified-release tacrolimus after conversion in liver transplant patients indicates potentially favorable outcomes in selected cohorts. Liver Transpl, 21, 29-37.
CUSINATO, D. A. C., LACCHINI, R., ROMAO, E. A., MOYSÉS-NETO, M. & COELHO, E. B. 2014. Relationship of CYP3A5 genotype and ABCB1 diplotype to tacrolimus disposition in Brazilian kidney transplant patients. British Journal of Clinical Pharmacology, 78, 364-372.
DAI, Y., HEBERT, M. F., ISOHERRANEN, N., DAVIS, C. L., MARSH, C., SHEN, D. D. & THUMMEL, K. E. 2006. Effect of CYP3A5 polymorphism on tacrolimus metabolic clearance in vitro. Drug Metab Dispos, 34, 836-47.
DALAL, P., SHAH, G., CHHABRA, D. & GALLON, L. 2010. Role of tacrolimus combination therapy with mycophenolate mofetil in the prevention of organ rejection in kidney transplant patients. International Journal of Nephrology and Renovascular Disease, 3, 107-115.
DANIELSON, P. B. 2002. The cytochrome P450 superfamily: biochemistry, evolution and drug metabolism in humans. Curr Drug Metab, 3, 561-97.
DE JONGE, H., DE LOOR, H., VERBEKE, K., VANRENTERGHEM, Y. & KUYPERS, D. R. 2012. In Vivo CYP3A4 Activity, CYP3A5 Genotype, and Hematocrit Predict Tacrolimus Dose Requirements and Clearance in Renal Transplant Patients. Clinical Pharmacology & Therapeutics, 92, 366-375.
DE JONGE, H., ELENS, L., DE LOOR, H., VAN SCHAIK, R. H. & KUYPERS, D. R. 2014. The CYP3A4*22 C>T single nucleotide polymorphism is associated with reduced midazolam and tacrolimus clearance in stable renal allograft recipients. Pharmacogenomics J.

References
Page 333 of 377
DE JONGE, H., METALIDIS, C., NAESENS, M., LAMBRECHTS, D. & KUYPERS, D. R. 2011. The P450 oxidoreductase *28 SNP is associated with low initial tacrolimus exposure and increased dose requirements in CYP3A5-expressing renal recipients. Pharmacogenomics, 12, 1281-91.
DEAN, L. 2012 Azathioprine Therapy and TPMT Genotype. In: Medical Genetics Summaries [Internet]. Bethesda (MD): National Center for Biotechnology Information (US). Available from: http://www.ncbi.nlm.nih.gov/books/NBK100661/. [accessed 10 November 2015].
DI MASI, A., MARINIS, E. D., ASCENZI, P. & MARINO, M. 2009. Nuclear receptors CAR and PXR: Molecular, functional, and biomedical aspects. Molecular Aspects of Medicine, 30, 297-343.
DIAZ-MOLINA, B., TAVIRA, B., LAMBERT, J. L., BERNARDO, M. J., ALVAREZ, V. & COTO, E. 2012. Effect of CYP3A5, CYP3A4, and ABCB1 genotypes as determinants of tacrolimus dose and clinical outcomes after heart transplantation. Transplant Proc, 44, 2635-8.
DICZFALUSY, U., KANEBRATT, K. P., BREDBERG, E., ANDERSSON, T. B., BOTTIGER, Y. & BERTILSSON, L. 2009. 4beta-hydroxycholesterol as an endogenous marker for CYP3A4/5 activity. Stability and half-life of elimination after induction with rifampicin. Br J Clin Pharmacol, 67, 38-43.
DICZFALUSY, U., MIURA, J., ROH, H. K., MIRGHANI, R. A., SAYI, J., LARSSON, H., BODIN, K. G., ALLQVIST, A., JANDE, M., KIM, J. W., AKLILLU, E., GUSTAFSSON, L. L. & BERTILSSON, L. 2008. 4Beta-hydroxycholesterol is a new endogenous CYP3A marker: relationship to CYP3A5 genotype, quinine 3-hydroxylation and sex in Koreans, Swedes and Tanzanians. Pharmacogenet Genomics, 18, 201-8.
DICZFALUSY, U., NYLEN, H., ELANDER, P. & BERTILSSON, L. 2011. 4beta-Hydroxycholesterol, an endogenous marker of CYP3A4/5 activity in humans. Br J Clin Pharmacol, 71, 183-9.
DOESCH, A. O., MUELLER, S., KONSTANDIN, M., CELIK, S., ERBEL, C., KRISTEN, A., FRANKENSTEIN, L., KOCH, A., DENGLER, T. J., EHLERMANN, P., ZUGCK, C., DE GEEST, S. & KATUS, H. A. 2010. Increased adherence after switch from twice daily calcineurin inhibitor based treatment to once daily modified released tacrolimus in heart transplantation: a pre-experimental study. Transplant Proc, 42, 4238-42.
DRANOFF, G. 2004. Cytokines in cancer pathogenesis and cancer therapy. Nat Rev Cancer, 4, 11-22.
EKBERG, H., MAMELOK, R. D., PEARSON, T. C., VINCENTI, F., TEDESCO-SILVA, H. & DALOZE, P. 2009. The challenge of achieving target drug concentrations in clinical trials: experience from the Symphony study. Transplantation, 87, 1360-6.
EKBERG, H., TEDESCO-SILVA, H., DEMIRBAS, A., VITKO, S., NASHAN, B., GURKAN, A., MARGREITER, R., HUGO, C., GRINYO, J. M., FREI, U., VANRENTERGHEM, Y., DALOZE, P., HALLORAN, P. F. & STUDY, E. L.-S. 2007. Reduced exposure to calcineurin inhibitors in renal transplantation. N Engl J Med, 357, 2562-75.
EL NAHAS, A. M. & BELLO, A. K. 2005. Chronic kidney disease: the global challenge. Lancet, 365, 331-40.
ELENS, L., BOUAMAR, R., HESSELINK, D. A., HAUFROID, V., VAN DER HEIDEN, I. P., VAN GELDER, T. & VAN SCHAIK, R. H. 2011a. A new functional CYP3A4 intron 6 polymorphism

References
Page 334 of 377
significantly affects tacrolimus pharmacokinetics in kidney transplant recipients. Clin Chem, 57, 1574-83.
ELENS, L., BOUAMAR, R., HESSELINK, D. A., HAUFROID, V., VAN GELDER, T. & VAN SCHAIK, R. H. 2012. The new CYP3A4 intron 6 C>T polymorphism (CYP3A4*22) is associated with an increased risk of delayed graft function and worse renal function in cyclosporine-treated kidney transplant patients. Pharmacogenet Genomics, 22, 373-80.
ELENS, L., HESSELINK, D. A., BOUAMAR, R., BUDDE, K., DE FIJTER, J. W., DE MEYER, M., MOURAD, M., KUYPERS, D. R., HAUFROID, V., VAN GELDER, T. & VAN SCHAIK, R. H. 2014. Impact of POR*28 on the pharmacokinetics of tacrolimus and cyclosporine A in renal transplant patients. Ther Drug Monit, 36, 71-9.
ELENS, L., NIEUWEBOER, A. J., CLARKE, S. J., CHARLES, K. A., DE GRAAN, A. J., HAUFROID, V., VAN GELDER, T., MATHIJSSEN, R. H. & VAN SCHAIK, R. H. 2013a. Impact of POR*28 on the clinical pharmacokinetics of CYP3A phenotyping probes midazolam and erythromycin. Pharmacogenet Genomics, 23, 148-55.
ELENS, L., VAN GELDER, T., HESSELINK, D. A., HAUFROID, V. & VAN SCHAIK, R. H. 2013b. CYP3A4*22: promising newly identified CYP3A4 variant allele for personalizing pharmacotherapy. Pharmacogenomics, 14, 47-62.
ELENS, L., VAN SCHAIK, R. H., PANIN, N., DE MEYER, M., WALLEMACQ, P., LISON, D., MOURAD, M. & HAUFROID, V. 2011b. Effect of a new functional CYP3A4 polymorphism on calcineurin inhibitors' dose requirements and trough blood levels in stable renal transplant patients. Pharmacogenomics, 12, 1383-96.
EMA 2010a. Guideline on the investigation of bioequivalence. . http://www.ema.europa.eu/docs/en_GB/document_library/Scientific_guideline/2010/01/WC500070039.pdf. [accessed 10 October 2011].
EMA 2010b. Guideline on the investigation of bioequivalence. http://www.ema.europa.eu/docs/en_GB/document_library/Scientific_guideline/2010/01/WC500070039.pdf. [accessed 10 October 2011].
EMA 2015. Questions & Answers: positions on specific questions addressed to the Pharmacokinetics Working Party (PKWP). London: European Medicines Agency, 2015 Contract No.: EMA/618604/2008 Rev.12. .
EMEA 2007. Advagraf. European Public Assessment Report H-C-712. Scientific Summary. http://www.ema.europa.eu/docs/en_GB/document_library/EPAR_-_Scientific_Discussion/human/000712/WC500022237.pdf.
FDA. 2001. Guidance for Industry Bioanalytical Method Validation. U.S. Department of Health and Human Services Food and Drug Administration Center for Drug Evaluation and Research (CDER) Center for Veterinary Medicine (CVM) [Online]. Available: http://www.fda.gov/downloads/Drugs/Guidances/ucm070107.pdf. [accessed 10 May 2011]. [Accessed].
FDA. 2003. Bioavailability and bioequivalence studies for orally administered drug products — general considerations. U.S. Department of Health and Human Services Food and Drug Administration Centre for Drug Evaluation and Research (CDER). [Online]. medscape. Available: http://www.fda.gov/downloads/Drugs/.../Guidances/ucm070124.pdf .[accessed 10 May 2011].
References
Page 335 of 377
[Accessed].
FEEST, T. G., MISTRY, C. D., GRIMES, D. S. & MALLICK, N. P. 1990. Incidence of advanced chronic renal failure and the need for end stage renal replacement treatment. Bmj, 301, 897-900.
FERRARESSO, M., TIRELLI, A., GHIO, L., GRILLO, P., MARTINA, V., TORRESANI, E. & EDEFONTI, A. 2007. Influence of the CYP3A5 genotype on tacrolimus pharmacokinetics and pharmacodynamics in young kidney transplant recipients. Pediatr Transplant, 11, 296-300.
FERRARIS, J. R., ARGIBAY, P. F., COSTA, L., JIMENEZ, G., COCCIA, P. A., GHEZZI, L. F., FERRARIS, V., BELLOSO, W. H., REDAL, M. A. & LARRIBA, J. M. 2011. Influence of CYP3A5 polymorphism on tacrolimus maintenance doses and serum levels after renal transplantation: age dependency and pharmacological interaction with steroids. Pediatr Transplant, 15, 525-32.
FINKEL, R., CLARK, M. A. & CUBEDDU, L. X. 2009. Pharmacology, Philadelphia, Lippincott Williams & Wilkins.
FLANAGAN, R. J., TAYLOR, A. A. & WATSON, I. D. 2007. Fundamentals of Analytical Toxicology, Wiley, West Sussex, England.
FLEISCHER, A. B., JR. 1999. Treatment of atopic dermatitis: role of tacrolimus ointment as a topical noncorticosteroidal therapy. J Allergy Clin Immunol, 104, S126-30.
FOGEL, B. S. E. & GREENBERG, D. B. E. 2015. Psychiatric care of the medical patient, Oxford University Press US.
FREDERICKS, S., MORETON, M., MACPHEE, I. A., MOHAMED, M., MARLOWE, S., JORGA, A., JOHNSTON, A., CARTER, N. D. & HOLT, D. W. 2005. Genotyping cytochrome P450 3A5 using the Light Cycler. Ann Clin Biochem, 42, 376-81.
FREDERICKS, S., MORETON, M., REBOUX, S., CARTER, N. D., GOLDBERG, L., HOLT, D. W. & MACPHEE, I. A. 2006. Multidrug resistance gene-1 (MDR-1) haplotypes have a minor influence on tacrolimus dose requirements. Transplantation, 82, 705-8.
FRERICHS, V. A. & TORNATORE, K. M. 2004. Determination of the glucocorticoids prednisone, prednisolone, dexamethasone, and cortisol in human serum using liquid chromatography coupled to tandem mass spectrometry. J Chromatogr B Analyt Technol Biomed Life Sci, 802, 329-38.
FUKUDO, M., YANO, I., YOSHIMURA, A., MASUDA, S., UESUGI, M., HOSOHATA, K., KATSURA, T., OGURA, Y., OIKE, F., TAKADA, Y., UEMOTO, S. & INUI, K. 2008. Impact of MDR1 and CYP3A5 on the oral clearance of tacrolimus and tacrolimus-related renal dysfunction in adult living-donor liver transplant patients. Pharmacogenet Genomics, 18, 413-23.
GAI, M. N., PINILLA, E., PAULOS, C., CHAVEZ, J., PUELLES, V. & ARANCIBIA, A. 2005. Determination of prednisolone and prednisone in plasma, whole blood, urine, and bound-to-plasma proteins by high-performance liquid chromatography. J Chromatogr Sci, 43, 201-6.
GARCIA-ROCA, P., MEDEIROS, M., REYES, H., RODRIGUEZ-ESPINO, B. A., ALBERU, J., ORTIZ, L., VASQUEZ-PERDOMO, M., ELIZONDO, G., MORALES-BUENROSTRO, L. E., MANCILLA URREA, E. & CASTANEDA-HERNANDEZ, G. 2012. CYP3A5 polymorphism in Mexican
References
Page 336 of 377
renal transplant recipients and its association with tacrolimus dosing. Arch Med Res, 43, 283-7.
GIJSEN, V., MITAL, S., VAN SCHAIK, R. H., SOLDIN, O. P., SOLDIN, S. J., VAN DER HEIDEN, I. P., NULMAN, I., KOREN, G. & DE WILDT, S. N. 2011. Age and CYP3A5 genotype affect tacrolimus dosing requirements after transplant in pediatric heart recipients. J Heart Lung Transplant, 30, 1352-9.
GIJSEN, V. M., VAN SCHAIK, R. H., ELENS, L., SOLDIN, O. P., SOLDIN, S. J., KOREN, G. & DE WILDT, S. N. 2013. CYP3A4*22 and CYP3A combined genotypes both correlate with tacrolimus disposition in pediatric heart transplant recipients. Pharmacogenomics, 14, 1027-36.
GIJSEN, V. M., VAN SCHAIK, R. H., SOLDIN, O. P., SOLDIN, S. J., NULMAN, I., KOREN, G. & DE WILDT, S. N. 2014. P450 oxidoreductase *28 (POR*28) and tacrolimus disposition in pediatric kidney transplant recipients--a pilot study. Ther Drug Monit, 36, 152-8.
GILG, J., PRUTHI, R. & FOGARTY, D. 2015. UK Renal Registry 17th Annual Report: Chapter 1 UK Renal Replacement Therapy Incidence in 2013: National and Centre-specific Analyses. Nephron, 129 Suppl 1, 1-29.
GLOWACKI, F., LIONET, A., BUOB, D., LABALETTE, M., ALLORGE, D., PROVOT, F., HAZZAN, M., NOEL, C., BROLY, F. & CAUFFIEZ, C. 2011a. CYP3A5 and ABCB1 polymorphisms in donor and recipient: impact on Tacrolimus dose requirements and clinical outcome after renal transplantation. Nephrol Dial Transplant, 26, 3046-50.
GLOWACKI, F., LIONET, A., HAMMELIN, J. P., LABALETTE, M., PROVOT, F., HAZZAN, M., BROLY, F., NOEL, C. & CAUFFIEZ, C. 2011b. Influence of cytochrome P450 3A5 (CYP3A5) genetic polymorphism on the pharmacokinetics of the prolonged-release, once-daily formulation of tacrolimus in stable renal transplant recipients. Clin Pharmacokinet, 50, 451-9.
GOODENOUGH, A. K., ONORATO, J. M., OUYANG, Z., CHANG, S., RODRIGUES, A. D., KASICHAYANULA, S., HUANG, S. P., TURLEY, W., BURRELL, R., BIFANO, M., JEMAL, M., LACRETA, F., TYMIAK, A. & WANG-IVERSON, D. 2011. Quantification of 4-beta-hydroxycholesterol in human plasma using automated sample preparation and LC-ESI-MS/MS analysis. Chem Res Toxicol, 24, 1575-85.
GOODMAN, L. S., GILMAN, A., BRUNTON, L. L., LAZO, J. S. & PARKER, K. L. 2006. Goodman & Gilman's the pharmacological basis of therapeutics, New York, McGraw-Hill.
GOTO, M., MASUDA, S., KIUCHI, T., OGURA, Y., OIKE, F., OKUDA, M., TANAKA, K. & INUI, K. 2004. CYP3A5*1-carrying graft liver reduces the concentration/oral dose ratio of tacrolimus in recipients of living-donor liver transplantation. Pharmacogenetics, 14, 471-8.
GOTO, M., MASUDA, S., SAITO, H., UEMOTO, S., KIUCHI, T., TANAKA, K. & INUI, K. 2002. C3435T polymorphism in the MDR1 gene affects the enterocyte expression level of CYP3A4 rather than Pgp in recipients of living-donor liver transplantation. Pharmacogenetics, 12, 451-7.
GUIRADO, L., CANTARELL, C., FRANCO, A., HUERTAS, E. G., FRUCTUOSO, A. S., FERNANDEZ, A., GENTIL, M. A., RODRIGUEZ, A., PAUL, J., TORREGROSSA, J. V., RODRIGUEZ, A., ALONSO, A., HERNANDEZ, D., BURGOS, D., JIMENEZ, C., JIMENO, L., LAUZURICA, R., MAZUECOS, A., OSUNA, A., PLUMED, J. S., RUIZ, J. C. & ZARRAGA, S. 2011. Efficacy and safety of

References
Page 337 of 377
conversion from twice-daily to once-daily tacrolimus in a large cohort of stable kidney transplant recipients. Am J Transplant, 11, 1965-71.
GUZMAN, F. 2014. Therapeutic index. http://pharmacologycorner.com/therapeutic-index/.
HALL, P. M. 2006. Prevention of progression in diabetic nephropathy. Diabetes spectrum, 19, 18-24.
HALLAN, S. I., CORESH, J., ASTOR, B. C., ASBERG, A., POWE, N. R., ROMUNDSTAD, S., HALLAN, H. A., LYDERSEN, S. & HOLMEN, J. 2006. International comparison of the relationship of chronic kidney disease prevalence and ESRD risk. J Am Soc Nephrol, 17, 2275-84.
HAMER, R. A. & EL NAHAS, A. M. 2006. The burden of chronic kidney disease : Is rising rapidly worldwide. BMJ, 332, 563-4.
HAROUN, M. K., JAAR, B. G., HOFFMAN, S. C., COMSTOCK, G. W., KLAG, M. J. & CORESH, J. 2003. Risk factors for chronic kidney disease: a prospective study of 23,534 men and women in Washington County, Maryland. J Am Soc Nephrol, 14, 2934-41.
HAUFROID, V., MOURAD, M., VAN KERCKHOVE, V., WAWRZYNIAK, J., DE MEYER, M., EDDOUR, D. C., MALAISE, J., LISON, D., SQUIFFLET, J. P. & WALLEMACQ, P. 2004. The effect of CYP3A5 and MDR1 (ABCB1) polymorphisms on cyclosporine and tacrolimus dose requirements and trough blood levels in stable renal transplant patients. Pharmacogenetics, 14, 147-54.
HAUFROID, V., WALLEMACQ, P., VANKERCKHOVE, V., ELENS, L., DE MEYER, M., EDDOUR, D. C., MALAISE, J., LISON, D. & MOURAD, M. 2006. CYP3A5 and ABCB1 polymorphisms and tacrolimus pharmacokinetics in renal transplant candidates: guidelines from an experimental study. Am J Transplant, 6, 2706-13.
HEBERT, M. F. 1997. Contributions of hepatic and intestinal metabolism and P-glycoprotein to cyclosporine and tacrolimus oral drug delivery. Advanced Drug Delivery Reviews, 27, 201-214.
HESSELINK, D. A., VAN SCHAIK, R. H., VAN DER HEIDEN, I. P., VAN DER WERF, M., GREGOOR, P. J., LINDEMANS, J., WEIMAR, W. & VAN GELDER, T. 2003. Genetic polymorphisms of the CYP3A4, CYP3A5, and MDR-1 genes and pharmacokinetics of the calcineurin inhibitors cyclosporine and tacrolimus. Clin Pharmacol Ther, 74, 245-54.
HIGUCHI, R., DOLLINGER, G., WALSH, P. S. & GRIFFITH, R. 1992. Simultaneous amplification and detection of specific DNA sequences. Biotechnology (N Y), 10, 413-7.
HIGUCHI, R., FOCKLER, C., DOLLINGER, G. & WATSON, R. 1993. Kinetic PCR analysis: real-time monitoring of DNA amplification reactions. Biotechnology (N Y), 11, 1026-30.
HIMMELFARB, J. & SAYEGH, M. H. 2010. Chronic kidney disease, dialysis, and transplantation : companion to Brenner & Rector's the kidney, Philadelphia, Saunders.
HIPPISLEY-COX, J. & COUPLAND, C. 2010. Predicting the risk of Chronic Kidney Disease in Men and Women in England and Wales: prospective derivation and external validation of the QKidney(® )Scores. BMC Fam Pract, 11, 49.
HOFFMEYER, S., BURK, O., VON RICHTER, O., ARNOLD, H. P., BROCKMOLLER, J., JOHNE, A., CASCORBI, I., GERLOFF, T., ROOTS, I., EICHELBAUM, M. & BRINKMANN, U. 2000. Functional polymorphisms of the human multidrug-resistance gene: multiple sequence
References
Page 338 of 377
variations and correlation of one allele with P-glycoprotein expression and activity in vivo. Proc Natl Acad Sci U S A, 97, 3473-8.
HUBER, F., WIEDEMANN, M., HEINRICH, G., SALAMA, Z. & JAEGER, H. 1990. Development of a high performance liquid chromatography method for the simultaneous measurement of prednisone and prednisolone. Arzneimittelforschung, 40, 926-31.
HUSTERT, E., HABERL, M., BURK, O., WOLBOLD, R., HE, Y. Q., KLEIN, K., NUESSLER, A. C., NEUHAUS, P., KLATTIG, J., EISELT, R., KOCH, I., ZIBAT, A., BROCKMOLLER, J., HALPERT, J. R., ZANGER, U. M. & WOJNOWSKI, L. 2001. The genetic determinants of the CYP3A5 polymorphism. Pharmacogenetics, 11, 773-9.
HUTCHISON, D. W., STRASBURG, J. L. & SHAFFER, C. 2005. Cleaning microsatellite PCR products with Sephadex in 96-well filtration plates enhances genotyping quality. Biotechniques, 38, 56-58.
ICHIMARU, N., KAKUTA, Y., ABE, T., OKUMI, M., IMAMURA, R., ISAKA, Y., NONOMURA, N., KOJIMA, Y., OKUYAMA, A. & TAKAHARA, S. 2008. Treatment adherence in renal transplant recipients: a questionnaire survey on immunosuppressants. Transplant Proc, 40, 1362-5.
IONITA, I. A. & AKHLAGHI, F. 2010. Quantification of unbound prednisolone, prednisone, cortisol and cortisone in human plasma by ultrafiltration and direct injection into liquid chromatrography tandem mass spectrometry. Ann Clin Biochem, 47, 350-7.
JENSEN, K. & MØLLER, B. L. 2010. Plant NADPH-cytochrome P450 oxidoreductases. Phytochemistry, 71, 132-141.
JI, E., CHOI, L., SUH, K. S., CHO, J. Y., HAN, N. & OH, J. M. 2012. Combinational effect of intestinal and hepatic CYP3A5 genotypes on tacrolimus pharmacokinetics in recipients of living donor liver transplantation. Transplantation, 94, 866-72.
JOHNSTON, A. & HOLT, D. W. 1999. Therapeutic drug monitoring of immunosuppressant drugs. British Journal of Clinical Pharmacology, 47, 339-350.
JORGA, A., HOLT, D. W. & JOHNSTON, A. 2004. Therapeutic drug monitoring of cyclosporine. Transplant Proc, 36, 396S-403S.
JORGA, A. & JOHNSTON, A. 2005. Novel therapies in transplantation. Expert Opin Investig Drugs, 14, 295-304.
JOSEPHSON, F., BERTILSSON, L., BOTTIGER, Y., FLAMHOLC, L., GISSLEN, M., ORMAASEN, V., SONNERBORG, A. & DICZFALUSY, U. 2008. CYP3A induction and inhibition by different antiretroviral regimens reflected by changes in plasma 4beta-hydroxycholesterol levels. Eur J Clin Pharmacol, 64, 775-81.
JUN, K. R., LEE, W., JANG, M. S., CHUN, S., SONG, G. W., PARK, K. T., LEE, S. G., HAN, D. J., KANG, C., CHO, D. Y., KIM, J. Q. & MIN, W. K. 2009. Tacrolimus concentrations in relation to CYP3A and ABCB1 polymorphisms among solid organ transplant recipients in Korea. Transplantation, 87, 1225-31.
JUNGERS, P., CHAUVEAU, P., DESCAMPS-LATSCHA, B., LABRUNIE, M., GIRAUD, E., MAN, N. K., GRUNFELD, J. P. & JACOBS, C. 1996. Age and gender-related incidence of chronic renal failure in a French urban area: a prospective epidemiologic study. Nephrol Dial Transplant, 11, 1542-6.
References
Page 339 of 377
KAMDEM, L. K., STREIT, F., ZANGER, U. M., BROCKMOLLER, J., OELLERICH, M., ARMSTRONG, V. W. & WOJNOWSKI, L. 2005. Contribution of CYP3A5 to the in vitro hepatic clearance of tacrolimus. Clin Chem, 51, 1374-81.
KANG, J. S. & LEE, M. H. 2009. Overview of Therapeutic Drug Monitoring. Korean J Intern Med, 24, 1-10.
KIM, I. W., MOON, Y. J., JI, E., KIM, K. I., HAN, N., KIM, S. J., SHIN, W. G., HA, J., YOON, J. H., LEE, H. S. & OH, J. M. 2012. Clinical and genetic factors affecting tacrolimus trough levels and drug-related outcomes in Korean kidney transplant recipients. Eur J Clin Pharmacol, 68, 657-69.
KNECHTLE, P. J. M. J. 2014. Kidney Transplantation–Principles and Practice (Seventh Edition)
In: KNECHTLE, P. J. M. J. (ed.) Kidney Transplantation–Principles and Practice (Seventh Edition). Philadelphia (PA): Content Repository Only!
KOBASHIGAWA, J. A. & PATEL, J. K. 2006. Immunosuppression for heart transplantation: where are we now? Nat Clin Pract Cardiovasc Med, 3, 203-212.
KUEHL, P., ZHANG, J., LIN, Y., LAMBA, J., ASSEM, M., SCHUETZ, J., WATKINS, P. B., DALY, A., WRIGHTON, S. A., HALL, S. D., MAUREL, P., RELLING, M., BRIMER, C., YASUDA, K., VENKATARAMANAN, R., STROM, S., THUMMEL, K., BOGUSKI, M. S. & SCHUETZ, E. 2001. Sequence diversity in CYP3A promoters and characterization of the genetic basis of polymorphic CYP3A5 expression. Nat Genet, 27, 383-91.
KURNATOWSKA, I., KRAWCZYK, J., OLEKSIK, T. & NOWICKI, M. 2011. Tacrolimus dose and blood concentration variability in kidney transplant recipients undergoing conversion from twice daily to once daily modified release tacrolimus. Transplant Proc, 43, 2954-6.
KURZAWSKI, M., DABROWSKA, J., DZIEWANOWSKI, K., DOMANSKI, L., PERUZYNSKA, M. & DROZDZIK, M. 2014. CYP3A5 and CYP3A4, but not ABCB1 polymorphisms affect tacrolimus dose-adjusted trough concentrations in kidney transplant recipients. Pharmacogenomics, 15, 179-88.
KUYPERS, D. R., DE LOOR, H., NAESENS, M., COOPMANS, T. & DE JONGE, H. 2014. Combined effects of CYP3A5*1, POR*28, and CYP3A4*22 single nucleotide polymorphisms on early concentration-controlled tacrolimus exposure in de-novo renal recipients. Pharmacogenet Genomics, 24, 597-606.
KUYPERS, D. R., PEETERS, P. C., SENNESAEL, J. J., KIANDA, M. N., VRIJENS, B., KRISTANTO, P., DOBBELS, F., VANRENTERGHEM, Y. & KANAAN, N. 2013. Improved adherence to tacrolimus once-daily formulation in renal recipients: a randomized controlled trial using electronic monitoring. Transplantation, 95, 333-40.
LAEDERACH-HOFMANN, K. & BUNZEL, B. 2000. Noncompliance in organ transplant recipients: a literature review. Gen Hosp Psychiatry, 22, 412-24.
LAMBA, J., HEBERT, J. M., SCHUETZ, E. G., KLEIN, T. E. & ALTMAN, R. B. 2012. PharmGKB summary: very important pharmacogene information for CYP3A5. Pharmacogenet Genomics, 22, 555-8.
LAPEYRAQUE, A. L., KASSIR, N., THEORET, Y., KRAJINOVIC, M., CLERMONT, M. J., LITALIEN, C. & PHAN, V. 2014. Conversion from twice- to once-daily tacrolimus in pediatric kidney recipients: a pharmacokinetic and bioequivalence study. Pediatr Nephrol, 29, 1081-8.

References
Page 340 of 377
LASIC, S., BOBAREVIC, N. & NIKOLIN, B. 1989. Simultaneous determination of prednisone, prednisolone, cortisol and dexamethasone in plasma by high-performance liquid chromatography. J Pharm Biomed Anal, 7, 777-82.
LEE, H. W., ARUNASALAM, P., LARATTA, W. P., SEETHARAMU, K. N. & AZID, I. A. 2007. Neuro-genetic optimization of temperature control for a continuous flow polymerase chain reaction microdevice. J Biomech Eng, 129, 540-7.
LESCHE, D., SIGURDARDOTTIR, V., SETOUD, R., OBERHANSLI, M., CARREL, T., FIEDLER, G. M., LARGIADER, C. R., MOHACSI, P. & SISTONEN, J. 2014. CYP3A5*3 and POR*28 genetic variants influence the required dose of tacrolimus in heart transplant recipients. Ther Drug Monit, 36, 710-5.
LEVEY, A. S., STEVENS, L. A., SCHMID, C. H., ZHANG, Y. L., CASTRO, A. F., 3RD, FELDMAN, H. I., KUSEK, J. W., EGGERS, P., VAN LENTE, F., GREENE, T. & CORESH, J. 2009. A new equation to estimate glomerular filtration rate. Ann Intern Med, 150, 604-12.
LI, C. J., LI, L., LIN, L., JIANG, H. X., ZHONG, Z. Y., LI, W. M., ZHANG, Y. J., ZHENG, P., TAN, X. H. & ZHOU, L. 2014. Impact of the CYP3A5, CYP3A4, COMT, IL-10 and POR genetic polymorphisms on tacrolimus metabolism in Chinese renal transplant recipients. PLoS One, 9, e86206.
LI, D., GUI, R., LI, J., HUANG, Z. & NIE, X. 2006a. Tacrolimus Dosing in Chinese Renal Transplant Patients Is Related to MDR1 Gene C3435T Polymorphisms. Transplantation Proceedings, 38, 2850-2852.
LI, D., ZHU, J. Y., GAO, J., WANG, X., LOU, Y. Q. & ZHANG, G. L. 2007. Polymorphisms of tumor necrosis factor-alpha, interleukin-10, cytochrome P450 3A5 and ABCB1 in Chinese liver transplant patients treated with immunosuppressant tacrolimus. Clin Chim Acta, 383, 133-9.
LI, Y.-H., WANG, Y.-H., LI, Y. & YANG, L. 2006b. MDR1 Gene Polymorphisms and Clinical Relevance. Acta Genetica Sinica, 33, 93-104.
LOH, P. T., LOU, H. X., ZHAO, Y., CHIN, Y. M. & VATHSALA, A. 2008. Significant impact of gene polymorphisms on tacrolimus but not cyclosporine dosing in Asian renal transplant recipients. Transplant Proc, 40, 1690-5.
LOPEZ-MONTENEGRO SORIA, M. A., KANTER BERGA, J., BELTRAN CATALAN, S., MILARA PAYA, J., PALLARDO MATEU, L. M. & JIMENEZ TORRES, N. V. 2010. Genetic polymorphisms and individualized tacrolimus dosing. Transplant Proc, 42, 3031-3.
LUNDE, I., BREMER, S., MIDTVEDT, K., MOHEBI, B., DAHL, M., BERGAN, S., ASBERG, A. & CHRISTENSEN, H. 2014. The influence of CYP3A, PPARA, and POR genetic variants on the pharmacokinetics of tacrolimus and cyclosporine in renal transplant recipients. Eur J Clin Pharmacol, 70, 685-93.
LUTJOHANN, D., MARINOVA, M., SCHNEIDER, B., OLDENBURG, J., VON BERGMANN, K., BIEBER, T., BJORKHEM, I. & DICZFALUSY, U. 2009. 4beta-hydroxycholesterol as a marker of CYP3A4 inhibition in vivo - effects of itraconazole in man. Int J Clin Pharmacol Ther, 47, 709-15.
MACPHEE, I. A. 2012. Pharmacogenetic biomarkers: cytochrome P450 3A5. Clin Chim Acta, 413, 1312-7.
References
Page 341 of 377
MACPHEE, I. A., FREDERICKS, S., MOHAMED, M., MORETON, M., CARTER, N. D., JOHNSTON, A., GOLDBERG, L. & HOLT, D. W. 2005. Tacrolimus pharmacogenetics: the CYP3A5*1 allele predicts low dose-normalized tacrolimus blood concentrations in whites and South Asians. Transplantation, 79, 499-502.
MACPHEE, I. A., FREDERICKS, S., TAI, T., SYRRIS, P., CARTER, N. D., JOHNSTON, A., GOLDBERG, L. & HOLT, D. W. 2002. Tacrolimus pharmacogenetics: polymorphisms associated with expression of cytochrome p4503A5 and P-glycoprotein correlate with dose requirement. Transplantation, 74, 1486-9.
MACPHEE, I. A., FREDERICKS, S., TAI, T., SYRRIS, P., CARTER, N. D., JOHNSTON, A., GOLDBERG, L. & HOLT, D. W. 2004. The influence of pharmacogenetics on the time to achieve target tacrolimus concentrations after kidney transplantation. Am J Transplant, 4, 914-9.
MAHMUD, N., KLIPA, D. & AHSAN, N. 2010. Antibody immunosuppressive therapy in solid-organ transplant: Part I. MAbs, 2, 148-56.
MAJID, O., AKHLAGHI, F., LEE, T., HOLT, D. W. & TRULL, A. 2001. Simultaneous determination of plasma prednisolone, prednisone, and cortisol levels by high-performance liquid chromatography. Ther Drug Monit, 23, 163-8.
MALE, D. K., BROSTOFF, J., ROTH, D. B. & ROITT, I. 2006. Immunology, Mosby Elsevier.
MALHOTRA, P., MALU, S. & KAPUR, S. 2013. Immunology of Transplant Rejection [Online]. medscape. Available: http://emedicine.medscape.com/article/432209-overview [Accessed].
MALTZMAN, J. S. & KORETZKY, G. A. 2003. Azathioprine: old drug, new actions. Journal of Clinical Investigation, 111, 1122-1124.
MANDAL, A. 2014. What are Genes? http://www.news-medical.net/health/What-are-Genes.aspx[accessed. 10 November 2015].
MARTINDALE, W. H. & REYNOLDS, J. E. F. 1996. Martindale: The Extra Pharmacopoeia, London, Royal Pharmaceutical Society of Great Britain, London.
MATABOSCH, X., POZO, O. J., PEREZ-MANA, C., PAPASEIT, E., SEGURA, J. & VENTURA, R. 2015. Detection and characterization of prednisolone metabolites in human urine by LC-MS/MS. J Mass Spectrom, 50, 633-42.
MATHEW, B. S., FLEMING, D. H., JEYASEELAN, V., CHANDY, S. J., ANNAPANDIAN, V. M., SUBBANNA, P. K. & JOHN, G. T. 2008. A limited sampling strategy for tacrolimus in renal transplant patients. Br J Clin Pharmacol, 66, 467-72.
MAYER, G. 2011. IMMUNOLOGY - CHAPTER ONE. INNATE (NON-SPECIFIC) IMMUNITY [Online]. medscape. Available: http://pathmicro.med.sc.edu/ghaffar/innate.htm [Accessed].
MEB 2012. PUBLIC ASSESSMENT REPORT of the Medicines Evaluation Board in the Netherlands_Tacrolimus Intas 5 mg capsules, hard Intas Pharmaceuticals Limited, United Kingdom. EU-procedure number: NL/H/1333/004/DC Available at: http://db.cbg-meb.nl/Pars/h108987.pdf (Accessed: November 2012).
MEIER-KRIESCHE, H. U., MERVILLE, P., TEDESCO-SILVA, H., HEEMANN, U., KES, P., HALLER, H., ROSTAING, L., GAFNER, N. & BERNASCONI, C. 2011. Mycophenolate mofetil initiation
References
Page 342 of 377
in renal transplant patients at different times posttransplantation: the TranCept Switch study. Transplantation, 91, 984-90.
MELVIN, G., SANDHIYA, S. & SUBRAJA, K. 2012. Belatacept: A worthy alternative to cyclosporine? Journal of Pharmacology & Pharmacotherapeutics, 3, 90-92.
METHLIE, P., HUSTAD, S. S., KELLMANN, R., ALMAS, B., ERICHSEN, M. M., HUSEBYE, E. & LOVAS, K. 2013. Multisteroid LC-MS/MS assay for glucocorticoids and androgens, and its application in Addison's disease. Endocr Connect.
MIN, S. I., HA, J., KANG, H. G., AHN, S., PARK, T., PARK, D. D., KIM, S. M., HONG, H. J., MIN, S. K., HA, I. S. & KIM, S. J. 2013. Conversion of twice-daily tacrolimus to once-daily tacrolimus formulation in stable pediatric kidney transplant recipients: pharmacokinetics and efficacy. Am J Transplant, 13, 2191-7.
MIURA, M., SATOH, S., INOUE, K., KAGAYA, H., SAITO, M., INOUE, T., HABUCHI, T. & SUZUKI, T. 2008. Influence of CYP3A5, ABCB1 and NR1I2 polymorphisms on prednisolone pharmacokinetics in renal transplant recipients. Steroids, 73, 1052-1059.
MIURA, M., SATOH, S., KAGAYA, H., SAITO, M., INOUE, T., TSUCHIYA, N., SUZUKI, T. & HABUCHI, T. 2009. No impact of age on dose-adjusted pharmacokinetics of tacrolimus, mycophenolic acid and prednisolone 1 month after renal transplantation. Eur J Clin Pharmacol, 65, 1047-53.
MORTON, J. M., WILLIAMSON, S., KEAR, L. M., MCWHINNEY, B. C., POTTER, J. & GLANVILLE, A. R. 2006. Therapeutic Drug Monitoring of Prednisolone After Lung Transplantation. The Journal of Heart and Lung Transplantation, 25, 557-563.
MURAKI, Y., USUI, M., ISAJI, S., MIZUNO, S., NAKATANI, K., YAMADA, T., IWAMOTO, T., UEMOTO, S., NOBORI, T. & OKUDA, M. 2011. Impact of CYP3A5 genotype of recipients as well as donors on the tacrolimus pharmacokinetics and infectious complications after living-donor liver transplantation for Japanese adult recipients. Ann Transplant, 16, 55-62.
NAGASE, K., IWASAKI, K., NOZAKI, K. & NODA, K. 1994. Distribution and protein binding of FK506, a potent immunosuppressive macrolide lactone, in human blood and its uptake by erythrocytes. J Pharm Pharmacol, 46, 113-7.
NAUCK, M., STEIN, U., VON KARGER, S., MARZ, W. & WIELAND, H. 2000. Rapid detection of the C3435T polymorphism of multidrug resistance gene 1 using fluorogenic hybridization probes. Clin Chem, 46, 1995-7.
NEW, J. P., MIDDLETON, R. J., KLEBE, B., FARMER, C. K. T., DE LUSIGNAN, S., STEVENS, P. E. & O'DONOGHUE, D. J. 2007. Assessing the prevalence, monitoring and management of chronic kidney disease in patients with diabetes compared with those without diabetes in general practice. Diabetic Medicine, 24, 364-369.
NHS 2010. Kidney Disease: Key Facts and Figures www.healthcheck.nhs.uk/document.php?o=81. [accessed 11 November 2015].
NIIOKA, T., KAGAYA, H., SAITO, M., INOUE, T., NUMAKURA, K., HABUCHI, T., SATOH, S. & MIURA, M. 2015. Capability of Utilizing CYP3A5 Polymorphisms to Predict Therapeutic Dosage of Tacrolimus at Early Stage Post-Renal Transplantation. International Journal of Molecular Sciences, 16, 1840-1854.

References
Page 343 of 377
NIIOKA, T., SATOH, S., KAGAYA, H., NUMAKURA, K., INOUE, T., SAITO, M., NARITA, S., TSUCHIYA, N., HABUCHI, T. & MIURA, M. 2012. Comparison of pharmacokinetics and pharmacogenetics of once- and twice-daily tacrolimus in the early stage after renal transplantation. Transplantation, 94, 1013-9.
NORMAN, D. & TURKA, L. 2001. Primer on Transplantation, Mt Laurel, United States, Wiley.
NTV. 2011. GUIDELINE ON GENERIC SUBSTITUTION OF IMMUNOSUPPRESSIVE DRUGS. 06.04.2011 ed.: Nederlandse Transplantatie Vereniging. [Online]. Available: http://www.transplantatievereniging.nl/uploads/82/330/NTV_doc_Generic_Substitution_April_7_2011.pdf. [accessed 15 November 2011]. [Accessed].
O'GRADY, J. G., ASDERAKIS, A., BRADLEY, R., BURNAPP, L., MCPAKE, D. M., PERRIN, M., RUSSELL, S., WATSON, A. R., WATSON, C. J., WRAY, J. & WILSON, L. C. 2010. Multidisciplinary insights into optimizing adherence after solid organ transplantation. Transplantation, 89, 627-32.
ONEDA, B., CRETTOL, S., JAQUENOUD SIROT, E., BOCHUD, M., ANSERMOT, N. & EAP, C. B. 2009. The P450 oxidoreductase genotype is associated with CYP3A activity in vivo as measured by the midazolam phenotyping test. Pharmacogenet Genomics, 19, 877-83.
OP DEN BUIJSCH, R. A., VAN DE PLAS, A., STOLK, L. M., CHRISTIAANS, M. H., VAN HOOFF, J. P., UNDRE, N. A., VAN DIEIJEN-VISSER, M. P. & BEKERS, O. 2007. Evaluation of limited sampling strategies for tacrolimus. Eur J Clin Pharmacol, 63, 1039-44.
PALLET, N., JANNOT, A. S., EL BAHRI, M., ETIENNE, I., BUCHLER, M., DE LIGNY, B. H., CHOUKROUN, G., COLOSIO, C., THIERRY, A., VIGNEAU, C., MOULIN, B., LE MEUR, Y., HENG, A. E., SUBRA, J. F., LEGENDRE, C., BEAUNE, P., ALBERTI, C., LORIOT, M. A. & THERVET, E. 2015. Kidney Transplant Recipients Carrying the CYP3A4*22 Allelic Variant Have Reduced Tacrolimus Clearance and Often Reach Supratherapeutic Tacrolimus Concentrations. Am J Transplant.
PARK, S. I., FELIPE, C. R., PINHEIRO-MACHADO, P. G., GARCIA, R., FERNANDES, F. B., CASARINI, D. E., TEDESCO-SILVA, H., JR. & MEDINA-PESTANA, J. O. 2009. Tacrolimus pharmacokinetic drug interactions: effect of prednisone, mycophenolic acid or sirolimus. Fundam Clin Pharmacol, 23, 137-45.
PARKIN, J. & COHEN, B. 2001. An overview of the immune system. The Lancet, 357, 1777-1789.
PASHAEE, N., BOUAMAR, R., HESSELINK, D. A., ROODNAT, J. I., VAN SCHAIK, R. H., WEIMAR, W. & VAN GELDER, T. 2011. CYP3A5 genotype is not related to the intrapatient variability of tacrolimus clearance. Ther Drug Monit, 33, 369-71.
PATEL, A. A., SWERLICK, R. A. & MCCALL, C. O. 2006. Azathioprine in dermatology: The past, the present, and the future. Journal of the American Academy of Dermatology, 55, 369-389.
PATEL, P., PATEL, H., PANCHAL, S. & MEHTA, T. 2012. Formulation strategies for drug delivery of tacrolimus: An overview. Int J Pharm Investig, 2, 169-75.
PENN, D. J. 2002. Major Histocompatibility Complex (MHC). ENCYCLOPEDIA OF LIFE SCIENCES Macmillan Publishers Ltd, Nature Publishing Group / www.els.net. [accessed 15 October 2013].
References
Page 344 of 377
PIRSCH, J. D., MILLER, J., DEIERHOI, M. H., VINCENTI, F. & FILO, R. S. 1997. A comparison of tacrolimus (FK506) and cyclosporine for immunosuppression after cadaveric renal transplantation. FK506 Kidney Transplant Study Group. Transplantation, 63, 977-83.
PRASAD, TATA, N. V., SUBBOTINA, N., BURCKART, G., SWAMINATHAN, A., GUSEV, A. I., HERCULES, D. M. & VENKATARAMANAN, R. 1997. Metabolism of tacrolimus (FK 506) in rat liver microsomes. Effect of rifampin and dexamethasone. Res Commun Mol Pathol Pharmacol, 96, 107-10.
PRESCILLA, R. P. 2013. Pediatric Immunosuppression [Online]. medscape. Available: http://emedicine.medscape.com/article/1013392-overview [Accessed].
PRESS, R. R., PLOEGER, B. A., DEN HARTIGH, J., VAN DER STRAATEN, T., VAN PELT, J., DANHOF, M., DE FIJTER, J. W. & GUCHELAAR, H. J. 2009. Explaining variability in tacrolimus pharmacokinetics to optimize early exposure in adult kidney transplant recipients. Ther Drug Monit, 31, 187-97.
PROVENZANI, A., NOTARBARTOLO, M., LABBOZZETTA, M., POMA, P., VIZZINI, G., SALIS, P., CACCAMO, C., BERTANI, T., PALAZZO, U., POLIDORI, P., GRIDELLI, B. & D'ALESSANDRO, N. 2011. Influence of CYP3A5 and ABCB1 gene polymorphisms and other factors on tacrolimus dosing in Caucasian liver and kidney transplant patients. Int J Mol Med, 28, 1093-102.
PROVENZANI, A., SANTEUSANIO, A., MATHIS, E., NOTARBARTOLO, M., LABBOZZETTA, M., POMA, P., PROVENZANI, A., POLIDORI, C., VIZZINI, G., POLIDORI, P. & D'ALESSANDRO, N. 2013. Pharmacogenetic considerations for optimizing tacrolimus dosing in liver and kidney transplant patients. World J Gastroenterol, 19, 9156-73.
PRYTULA, A. A., BOUTS, A. H., MATHOT, R. A., VAN GELDER, T., CROES, L. K., HOP, W. & CRANSBERG, K. 2012. Intra-patient variability in tacrolimus trough concentrations and renal function decline in pediatric renal transplant recipients. Pediatr Transplant, 16, 613-8.
QUTEINEH, L., VERSTUYFT, C., FURLAN, V., DURRBACH, A., LETIERCE, A., FERLICOT, S., TABURET, A. M., CHARPENTIER, B. & BECQUEMONT, L. 2008. Influence of CYP3A5 genetic polymorphism on tacrolimus daily dose requirements and acute rejection in renal graft recipients. Basic Clin Pharmacol Toxicol, 103, 546-52.
RAO, A., CASULA, A. & CASTLEDINE, C. 2015. UK Renal Registry 17th Annual Report: Chapter 2 UK Renal Replacement Therapy Prevalence in 2013: National and Centre-specific Analyses. Nephron, 129 Suppl 1, 31-56.
REUTER, M., KUPPER, Y., SCHMITZ, A., BREUER, J. P., WEND, U. & HENNIG, J. 2005. Detection of new single nucleotide polymorphisms by means of real time PCR. J Genet, 84, 341-5.
RO, H., MIN, S. I., YANG, J., MOON, K. C., KIM, Y. S., KIM, S. J., AHN, C. & HA, J. 2012. Impact of tacrolimus intraindividual variability and CYP3A5 genetic polymorphism on acute rejection in kidney transplantation. Ther Drug Monit, 34, 680-5.
RONG, G., JING, L., DENG-QING, L., HONG-SHAN, Z., SHAI-HONG, Z. & XIN-MIN, N. 2010. Influence of CYP3A5 and MDR1(ABCB1) polymorphisms on the pharmacokinetics of tacrolimus in Chinese renal transplant recipients. Transplant Proc, 42, 3455-8.

References
Page 345 of 377
ROY, J. N., BARAMA, A., POIRIER, C., VINET, B. & ROGER, M. 2006. Cyp3A4, Cyp3A5, and MDR-1 genetic influences on tacrolimus pharmacokinetics in renal transplant recipients. Pharmacogenet Genomics, 16, 659-65.
SAEVES, I., LINE, P. D. & BERGAN, S. 2012. The pharmacokinetics of prednisolone and prednisone in adult liver transplant recipients early after transplantation. Ther Drug Monit, 34, 452-9.
SAGCAL-GIRONELLA, A. C., SHERWIN, C. M., TIRONA, R. G., RIEDER, M. J., BRUNNER, H. I. & VINKS, A. A. 2011. Pharmacokinetics of prednisolone at steady state in young patients with systemic lupus erythematosus on prednisone therapy: an open-label, single-dose study. Clin Ther, 33, 1524-36.
SANTORO, A. B., STRUCHINER, C. J., FELIPE, C. R., TEDESCO-SILVA, H., MEDINA-PESTANA, J. O. & SUAREZ-KURTZ, G. 2013. CYP3A5 genotype, but not CYP3A4*1b, CYP3A4*22, or hematocrit, predicts tacrolimus dose requirements in Brazilian renal transplant patients. Clin Pharmacol Ther, 94, 201-2.
SARKAR, G., KAPELNER, S. & SOMMER, S. S. 1990. Formamide can dramatically improve the specificity of PCR. Nucleic Acids Res, 18, 7465.
SCHIFF, J., COLE, E. & CANTAROVICH, M. 2007. Therapeutic monitoring of calcineurin inhibitors for the nephrologist. Clin J Am Soc Nephrol, 2, 374-84.
SEHGAL, S. N. 2003. Sirolimus: its discovery, biological properties, and mechanism of action. Transplantation Proceedings, 35, S7-S14.
SELLARES, J., DE FREITAS, D., MENGEL, M., REEVE, J., EINECKE, G., SIS, B., HIDALGO, L., FAMULSKI, K., MATAS, A. & HALLORAN, P. 2012. Understanding the Causes of Kidney Transplant Failure: The Dominant Role of Antibody‐Mediated Rejection and Nonadherence. American Journal of Transplantation, 12, 388-399.
SHARKEY, D. J., SCALICE, E. R., CHRISTY, K. G., JR., ATWOOD, S. M. & DAISS, J. L. 1994. Antibodies as thermolabile switches: high temperature triggering for the polymerase chain reaction. Biotechnology (N Y), 12, 506-9.
SHERWOOD, L. 2008. Human physiology : from cells to systems, Melbourne ; London, Brooks/Cole.
SHI, Y., LI, Y., TANG, J., ZHANG, J., ZOU, Y., CAI, B. & WANG, L. 2013. Influence of CYP3A4, CYP3A5 and MDR-1 polymorphisms on tacrolimus pharmacokinetics and early renal dysfunction in liver transplant recipients. Gene, 512, 226-31.
SHIBASAKI, H., NAKAYAMA, H., FURUTA, T., KASUYA, Y., TSUCHIYA, M., SOEJIMA, A., YAMADA, A. & NAGASAWA, T. 2008. Simultaneous determination of prednisolone, prednisone, cortisol, and cortisone in plasma by GC-MS: estimating unbound prednisolone concentration in patients with nephrotic syndrome during oral prednisolone therapy. J Chromatogr B Analyt Technol Biomed Life Sci, 870, 164-9.
SHIMADA, T., TERADA, A., YOKOGAWA, K., KANEKO, H., NOMURA, M., KAJI, K., KANEKO, S., KOBAYASHI, K. & MIYAMOTO, K. 2002. Lowered blood concentration of tacrolimus and its recovery with changes in expression of CYP3A and P-glycoprotein after high-dose steroid therapy. Transplantation, 74, 1419-24.
SHUKER, N., BOUAMAR, R., VAN SCHAIK, R., CLAHSEN- VAN GRONINGEN, M., DAMMAN, J., BAAN, C., VAN DE WETERING, J., ROWSHANI, A., WEIMAR, W., VAN GELDER, T. &

References
Page 346 of 377
HESSELINK, D. 2015. A RANDOMISED-CONTROLLED TRIAL TO STUDY THE ADDITIVE VALUE OF CYP3A5 GENOTYPE-BASED TACROLIMUS DOSING IN LIVING-DONOR KIDNEY TRANSPLANTATION [Abstract]. In: 14th International Congress of Therapeutic Drug Monitoring & Clinical Toxicology (IATDMCT). Available:http://iatdmct2015.org/wp-content/uploads/2015/11/Abstractbook.pdf. [accessed 23 November 2015]. .
SHUKER, N., CADOGAN, M., VAN GELDER, T., ROODNAT, J. I., KHO, M. M., WEIMAR, W. & HESSELINK, D. A. 2014. Conversion from Twice-Daily to Once-Daily Tacrolimus Does Not Reduce Intra-Patient Variability in Tacrolimus Exposure. Ther Drug Monit.
SILVA, H. T., JR., YANG, H. C., ABOULJOUD, M., KUO, P. C., WISEMANDLE, K., BHATTACHARYA, P., DHADDA, S., HOLMAN, J., FITZSIMMONS, W. & FIRST, M. R. 2007. One-year results with extended-release tacrolimus/MMF, tacrolimus/MMF and cyclosporine/MMF in de novo kidney transplant recipients. Am J Transplant, 7, 595-608.
SINGH, P. & BHANDARI, M. 2004. Renal replacement therapy options from an Indian perspective: dialysis versus transplantation. Transplant Proc, 36, 2013-4.
SINGH, R., SRIVASTAVA, A., KAPOOR, R. & MITTAL, R. D. 2011. Do drug transporter (ABCB1) SNPs influence cyclosporine and tacrolimus dose requirements and renal allograft outcome in the posttransplantation period? J Clin Pharmacol, 51, 603-15.
SOTO, G., RUIZ-ANTORÁN, B., LAPORTA, R., SANCHO, A., LÁZARO, M., HERRERA, C., SALCEDO, I., COS, M., TORRES, F., USETTI, P. & AVENDAÑO-SOLA, C. 2015. Dose increase needed in most cystic fibrosis lung transplantation patients when changing from twice- to once-daily tacrolimus oral administration. European Journal of Clinical Pharmacology, 71, 715-722.
SPIERINGS, N., HOLT, D. W. & MACPHEE, I. A. 2013. CYP3A5 genotype had no impact on intrapatient variability of tacrolimus clearance in renal transplant recipients. Ther Drug Monit, 35, 328-31.
STAATZ, C. & TETT, S. 2007. Clinical Pharmacokinetics and Pharmacodynamics of Mycophenolate in Solid Organ Transplant Recipients. Clinical Pharmacokinetics, 46, 13-58.
STAATZ, C. E. & TETT, S. E. 2004. Clinical pharmacokinetics and pharmacodynamics of tacrolimus in solid organ transplantation. Clin Pharmacokinet, 43, 623-53.
STANBURY, R. M. & GRAHAM, E. M. 1998. Systemic corticosteroid therapy—side effects and their management. British journal of ophthalmology, 82, 704-708.
STEIN, A. & WILD, J. 2002. Kidney Failure Explained: Everything You Always Wanted to Know about Dialysis and Kidney Transplants But Were Afraid to Ask, London, Class Pub.
STEPKOWSKI, S. M. 2000. Molecular targets for existing and novel immunosuppressive drugs. Expert Rev Mol Med, 2, 1-23.
STRATTA, P., QUAGLIA, M., CENA, T., ANTONIOTTI, R., FENOGLIO, R., MENEGOTTO, A., FERRANTE, D., GENAZZANI, A., TERRAZZINO, S. & MAGNANI, C. 2012. The interactions of age, sex, body mass index, genetics, and steroid weight-based doses on tacrolimus dosing requirement after adult kidney transplantation. Eur J Clin Pharmacol, 68, 671-80.
STRAUSS, J. & GREEFF, O. B. W. 2015. Excipient-Related Adverse Drug Reactions: A Clinical Approach. Current Allergy & Clinical Immunology, 28, 24-27.
References
Page 347 of 377
SUZUKI, Y., HOMMA, M., DOKI, K., ITAGAKI, F. & KOHDA, Y. 2008. Impact of CYP3A5 genetic polymorphism on pharmacokinetics of tacrolimus in healthy Japanese subjects. Br J Clin Pharmacol, 66, 154-5.
SUZUKI, Y., ITOH, H., FUJIOKA, T., SATO, F., KAWASAKI, K., SATO, Y., SATO, Y., OHNO, K., MIMATA, H. & KISHINO, S. 2013a. Association of plasma concentration of 4beta-hydroxycholesterol with CYP3A5 polymorphism and plasma concentration of indoxyl sulfate in stable kidney transplant recipients. Drug Metab Dispos, 42, 105-10.
SUZUKI, Y., ITOH, H., FUJIOKA, T., SATO, F., KAWASAKI, K., SATO, Y., SATO, Y., OHNO, K., MIMATA, H. & KISHINO, S. 2014. Association of plasma concentration of 4beta-hydroxycholesterol with CYP3A5 polymorphism and plasma concentration of indoxyl sulfate in stable kidney transplant recipients. Drug Metab Dispos, 42, 105-10.
SUZUKI, Y., ITOH, H., SATO, F., KAWASAKI, K., SATO, Y., FUJIOKA, T., SATO, Y., OHNO, K., MIMATA, H. & KISHINO, S. 2013b. Significant increase in plasma 4 beta-hydroxycholesterol concentration in patients after kidney transplantation. Journal of Lipid Research, 54, 2568-2572.
TADA, H., TSUCHIYA, N., SATOH, S., KAGAYA, H., LI, Z., SATO, K., MIURA, M., SUZUKI, T., KATO, T. & HABUCHI, T. 2005. Impact of CYP3A5 and MDR1(ABCB1) C3435T polymorphisms on the pharmacokinetics of tacrolimus in renal transplant recipients. Transplant Proc, 37, 1730-2.
TAKEMOTO, S. K., PINSKY, B. W., SCHNITZLER, M. A., LENTINE, K. L., WILLOUGHBY, L. M., BURROUGHS, T. E. & BUNNAPRADIST, S. 2007. A retrospective analysis of immunosuppression compliance, dose reduction and discontinuation in kidney transplant recipients. Am J Transplant, 7, 2704-11.
TAVIRA, B., COTO, E., DIAZ-CORTE, C., ALVAREZ, V., LOPEZ-LARREA, C. & ORTEGA, F. 2013. A search for new CYP3A4 variants as determinants of tacrolimus dose requirements in renal-transplanted patients. Pharmacogenet Genomics, 23, 445-8.
TAYLOR, A. L., WATSON, C. J. & BRADLEY, J. A. 2005. Immunosuppressive agents in solid organ transplantation: Mechanisms of action and therapeutic efficacy. Crit Rev Oncol Hematol, 56, 23-46.
THERMO SCIENTIFIC. 2011. CEDIA Tacrolimus Immunoassay [Online]. Thermo Scientific. Available: https://static.thermoscientific.com/images/D01337~.pdf [Accessed 2016].
THERVET, E., ANGLICHEAU, D., KING, B., SCHLAGETER, M. H., CASSINAT, B., BEAUNE, P., LEGENDRE, C. & DALY, A. K. 2003. Impact of cytochrome p450 3A5 genetic polymorphism on tacrolimus doses and concentration-to-dose ratio in renal transplant recipients. Transplantation, 76, 1233-5.
THERVET, E., LORIOT, M. A., BARBIER, S., BUCHLER, M., FICHEUX, M., CHOUKROUN, G., TOUPANCE, O., TOUCHARD, G., ALBERTI, C., LE POGAMP, P., MOULIN, B., LE MEUR, Y., HENG, A. E., SUBRA, J. F., BEAUNE, P. & LEGENDRE, C. 2010. Optimization of initial tacrolimus dose using pharmacogenetic testing. Clin Pharmacol Ther, 87, 721-6.
THERVET, E., LORIOT, M. A., BARBIER, S., BUCHLER, M., HURAULT DE LIGNY, B., CHOUKROUN, G., LEGENDRE, C., ALBERTI, C. & BEAUNE, P. 2008. Prospective Randomized Study of Pharmacogenetic Adaptation of Tacrolimus Treatment After Renal Transplantation: 529. Transplantation, 86, 185

References
Page 348 of 377
THORN, M., FINNSTROM, N., LUNDGREN, S., RANE, A. & LOOF, L. 2005. Cytochromes P450 and MDR1 mRNA expression along the human gastrointestinal tract. Br J Clin Pharmacol, 60, 54-60.
TINTI, F., MECULE, A., POLI, L., BACHETONI, A., UMBRO, I., BRUNINI, F., BARILE, M., NOFRONI, I., BERLOCO, P. B. & MITTERHOFER, A. P. 2010. Improvement of graft function after conversion to once daily tacrolimus of stable kidney transplant patients. Transplant Proc, 42, 4047-8.
TSUCHIYA, N., SATOH, S., TADA, H., LI, Z., OHYAMA, C., SATO, K., SUZUKI, T., HABUCHI, T. & KATO, T. 2004. Influence of CYP3A5 and MDR1 (ABCB1) polymorphisms on the pharmacokinetics of tacrolimus in renal transplant recipients. Transplantation, 78, 1182-7.
TSUNODA, S. M. & AWEEKA, F. T. 2000. Drug concentration monitoring of immunosuppressive agents: focus on tacrolimus, mycophenolate mofetil and sirolimus. BioDrugs, 14, 355-69.
TUTEJA, S., ALLOWAY, R. R., JOHNSON, J. A. & GABER, A. O. 2001. The effect of gut metabolism on tacrolimus bioavailability in renal transplant recipients. Transplantation, 71, 1303-7.
UESUGI, M., MASUDA, S., KATSURA, T., OIKE, F., TAKADA, Y. & INUI, K. 2006. Effect of intestinal CYP3A5 on postoperative tacrolimus trough levels in living-donor liver transplant recipients. Pharmacogenet Genomics, 16, 119-27.
UNDRE, N. A. 2003. Pharmacokinetics of tacrolimus-based combination therapies. Nephrol Dial Transplant, 18 Suppl 1, i12-5.
USRDS 2014. Chapter 1: Incidence, Prevalence, Patient Characteristics, and Treatment Modalities. http://www.usrds.org/2014/download/V2_Ch_01_ESRD_Incidence_Prevalence_14.pdf. [accessed 15 December 2014].
VAN DUIJNHOVEN, E. M., BOOTS, J. M., CHRISTIAANS, M. H., STOLK, L. M., UNDRE, N. A. & VAN HOOFF, J. P. 2003. Increase in tacrolimus trough levels after steroid withdrawal. Transpl Int, 16, 721-5.
VAN HOOFF, J., VAN DER WALT, I., KALLMEYER, J., MILLER, D., DAWOOD, S., MOOSA, M. R., CHRISTIAANS, M., KARPF, C. & UNDRE, N. 2012. Pharmacokinetics in stable kidney transplant recipients after conversion from twice-daily to once-daily tacrolimus formulations. Ther Drug Monit, 34, 46-52.
VAN WATERSCHOOT, R. A. & SCHINKEL, A. H. 2011. A critical analysis of the interplay between cytochrome P450 3A and P-glycoprotein: recent insights from knockout and transgenic mice. Pharmacol Rev, 63, 390-410.
VANNAPRASAHT, S., REUNGJUI, S., SUPANYA, D., SIRIVONGS, D., PONGSKUL, C., AVIHINGSANON, Y. & TASSANEEYAKUL, W. 2013. Personalized tacrolimus doses determined by CYP3A5 genotype for induction and maintenance phases of kidney transplantation. Clin Ther, 35, 1762-9.
VELIA, J. P. 2005. Maine Medical Center Transplant Program Policies and Procedures Transplant immunosuppression policy. [Online]. Available: http://www.mmc.org/workfiles/mmc_services/nephrology/Transplant%20Immunosuppression.pdf [Accessed].

References
Page 349 of 377
VELICKOVIC-RADOVANOVIC, R., MIKOV, M., CATIC-DJORDJEVIC, A., STEFANOVIC, N., STOJANOVIC, M., JOKANOVIC, M. & CVETKOVIC, T. 2012. Tacrolimus as a part of immunosuppressive treatment in kidney transplantation patients: sex differences. Gend Med, 9, 471-80.
VENKATARAMANAN, R., SWAMINATHAN, A., PRASAD, T., JAIN, A., ZUCKERMAN, S., WARTY, V., MCMICHAEL, J., LEVER, J., BURCKART, G. & STARZL, T. 1995. Clinical pharmacokinetics of tacrolimus. Clin Pharmacokinet, 29, 404-30.
WANG, D. & BAKHAI, A. 2006. Clinical trials : a practical guide to design, analysis, and reporting, London, Remedica.
WANG, D., GUO, Y., WRIGHTON, S. A., COOKE, G. E. & SADEE, W. 2011. Intronic polymorphism in CYP3A4 affects hepatic expression and response to statin drugs. Pharmacogenomics J, 11, 274-86.
WEHLAND, M., BAUER, S., BRAKEMEIER, S., BURGWINKEL, P., GLANDER, P., KREUTZ, R., LORKOWSKI, C., SLOWINSKI, T., NEUMAYER, H. H. & BUDDE, K. 2011. Differential impact of the CYP3A5*1 and CYP3A5*3 alleles on pre-dose concentrations of two tacrolimus formulations. Pharmacogenet Genomics, 21, 179-84.
WEI-LIN, W., JING, J., SHU-SEN, Z., LI-HUA, W., TING-BO, L., SONG-FENG, Y. & SHENG, Y. 2006. Tacrolimus dose requirement in relation to donor and recipient ABCB1 and CYP3A5 gene polymorphisms in Chinese liver transplant patients. Liver Transpl, 12, 775-80.
WENG, F. L., ISRANI, A. K., JOFFE, M. M., HOY, T., GAUGHAN, C. A., NEWMAN, M., ABRAMS, J. D., KAMOUN, M., ROSAS, S. E., MANGE, K. C., STROM, B. L., BRAYMAN, K. L. & FELDMAN, H. I. 2005. Race and electronically measured adherence to immunosuppressive medications after deceased donor renal transplantation. J Am Soc Nephrol, 16, 1839-48.
WILKINSON, G. R. 1996. Cytochrome P4503A (CYP3A) metabolism: prediction of in vivo activity in humans. J Pharmacokinet Biopharm, 24, 475-90.
WILLIAMS, A., HUSSELL, T. & LLOYD, C. 2012. Immunology : mucosal and body surface defences, Chichester ; Hoboken, NJ, Wiley-Blackwell.
WOLFE, R. A., ASHBY, V. B., MILFORD, E. L., OJO, A. O., ETTENGER, R. E., AGODOA, L. Y. C., HELD, P. J. & PORT, F. K. 1999. Comparison of Mortality in All Patients on Dialysis, Patients on Dialysis Awaiting Transplantation, and Recipients of a First Cadaveric Transplant. New England Journal of Medicine, 341, 1725-1730.
WU, M. J., CHANG, C. H., CHENG, C. Y., SHU, K. H., CHEN, C. H., CHENG, C. H., YU, T. M., CHUANG, Y. W., HUANG, S. T., TSAI, S. F., HO, H. C., LI, J. R., SHIU, Y. N. & FU, Y. C. 2014. Reduced variability of tacrolimus trough level in once-daily tacrolimus-based Taiwanese kidney transplant recipients with high-expressive genotype of cytochrome P450 3A5. Transplant Proc, 46, 403-5.
WU, M. J., CHENG, C. Y., CHEN, C. H., WU, W. P., CHENG, C. H., YU, D. M., CHUANG, Y. W. & SHU, K. H. 2011. Lower variability of tacrolimus trough concentration after conversion from prograf to advagraf in stable kidney transplant recipients. Transplantation, 92, 648-52.
References
Page 350 of 377
XING, J., ZHANG, X., FAN, J., SHEN, B., MEN, T. & WANG, J. 2015. Association between interleukin-18 promoter variants and tacrolimus pharmacokinetics in Chinese renal transplant patients. Eur J Clin Pharmacol, 71, 191-8.
YONG CHUNG, J., JUNG LEE, Y., BOK JANG, S., AHYOUNG LIM, L., SOO PARK, M. & HWAN KIM, K. 2010. CYP3A5*3 genotype associated with intrasubject pharmacokinetic variation toward tacrolimus in bioequivalence study. Ther Drug Monit, 32, 67-72.
YU, X., XIE, H., WEI, B., ZHANG, M., WANG, W., WU, J., YAN, S., ZHENG, S. & ZHOU, L. 2011. Association of MDR1 gene SNPs and haplotypes with the tacrolimus dose requirements in Han Chinese liver transplant recipients. PLoS One, 6, e25933.
ZAZA, G., TOMEI, P., GRANATA, S., BOSCHIERO, L. & LUPO, A. 2014. Monoclonal antibody therapy and renal transplantation: focus on adverse effects. Toxins, 6, 869-891.
ZHANG, J. J., ZHANG, H., DING, X. L., MA, S. & MIAO, L. Y. 2013. Effect of the P450 oxidoreductase 28 polymorphism on the pharmacokinetics of tacrolimus in Chinese healthy male volunteers. Eur J Clin Pharmacol, 69, 807-12.
ZHANG, X., LIU, Z. H., ZHENG, J. M., CHEN, Z. H., TANG, Z., CHEN, J. S. & LI, L. S. 2005. Influence of CYP3A5 and MDR1 polymorphisms on tacrolimus concentration in the early stage after renal transplantation. Clin Transplant, 19, 638-43.
ZHANG, Y. & BENET, L. Z. 2001. The gut as a barrier to drug absorption. Clinical pharmacokinetics, 40, 159-168.
ZHAO, Y., SONG, M., GUAN, D., BI, S., MENG, J., LI, Q. & WANG, W. 2005. Genetic polymorphisms of CYP3A5 genes and concentration of the cyclosporine and tacrolimus. Transplant Proc, 37, 178-81.
ZHENG, H., WEBBER, S., ZEEVI, A., SCHUETZ, E., ZHANG, J., BOWMAN, P., BOYLE, G., LAW, Y., MILLER, S., LAMBA, J. & BURCKART, G. J. 2003. Tacrolimus Dosing in Pediatric Heart Transplant Patients is Related to CYP3A5 and MDR1 Gene Polymorphisms. American Journal of Transplantation, 3, 477-483.
Appendices
Page 351 of 377
Appendices
Appendix 1. Patient Information Sheet and Consent Form
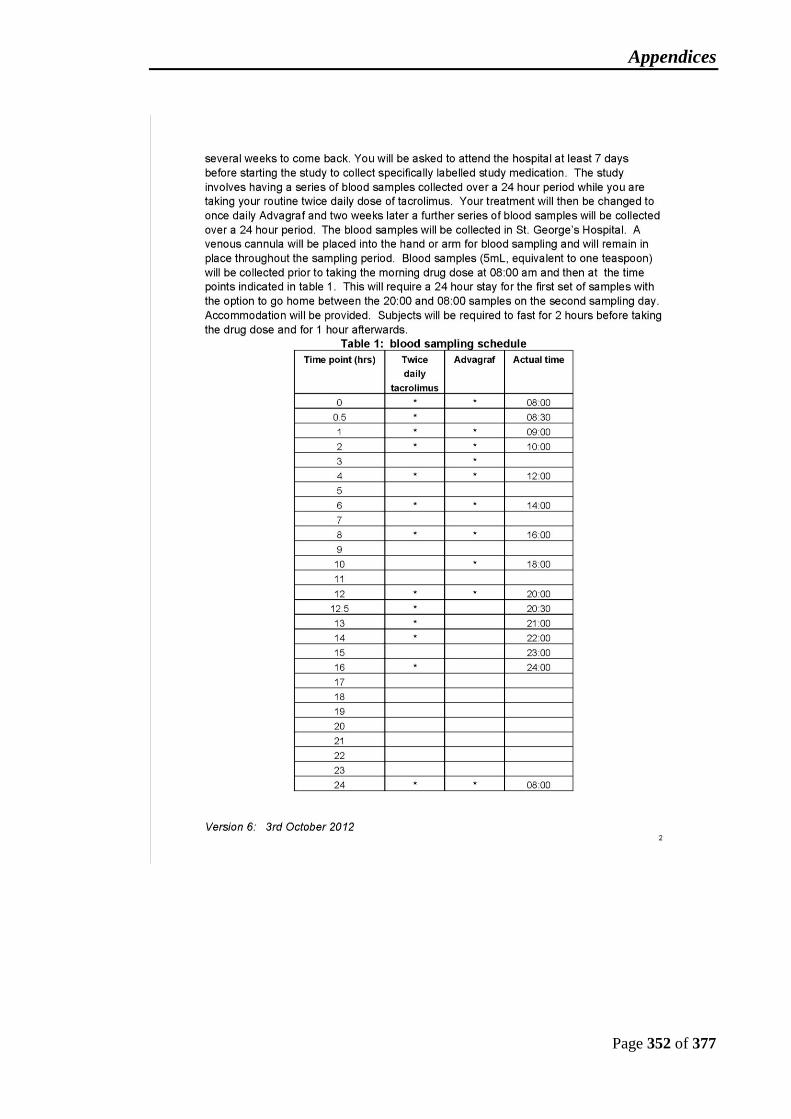
Appendices
Page 352 of 377

Appendices
Page 353 of 377

Appendices
Page 354 of 377

Appendices
Page 355 of 377

Appendices
Page 356 of 377

Appendices
Page 357 of 377
Appendix 2. Case Report Form
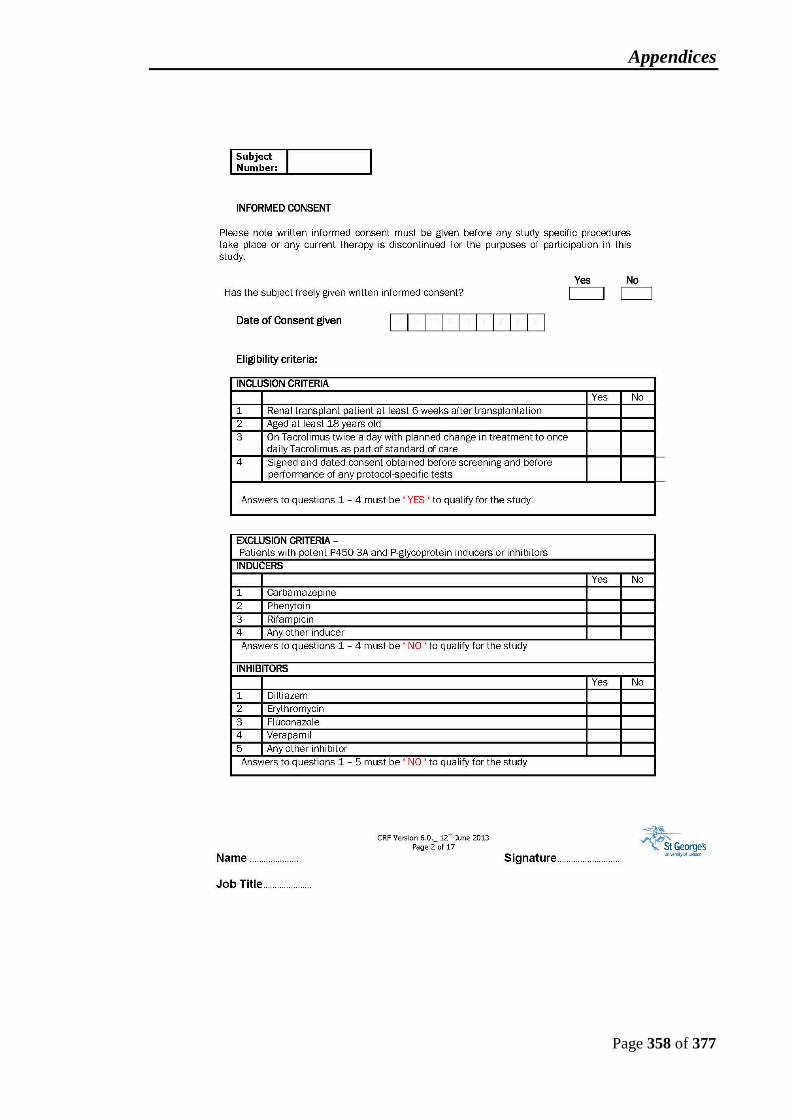
Appendices
Page 358 of 377

Appendices
Page 359 of 377
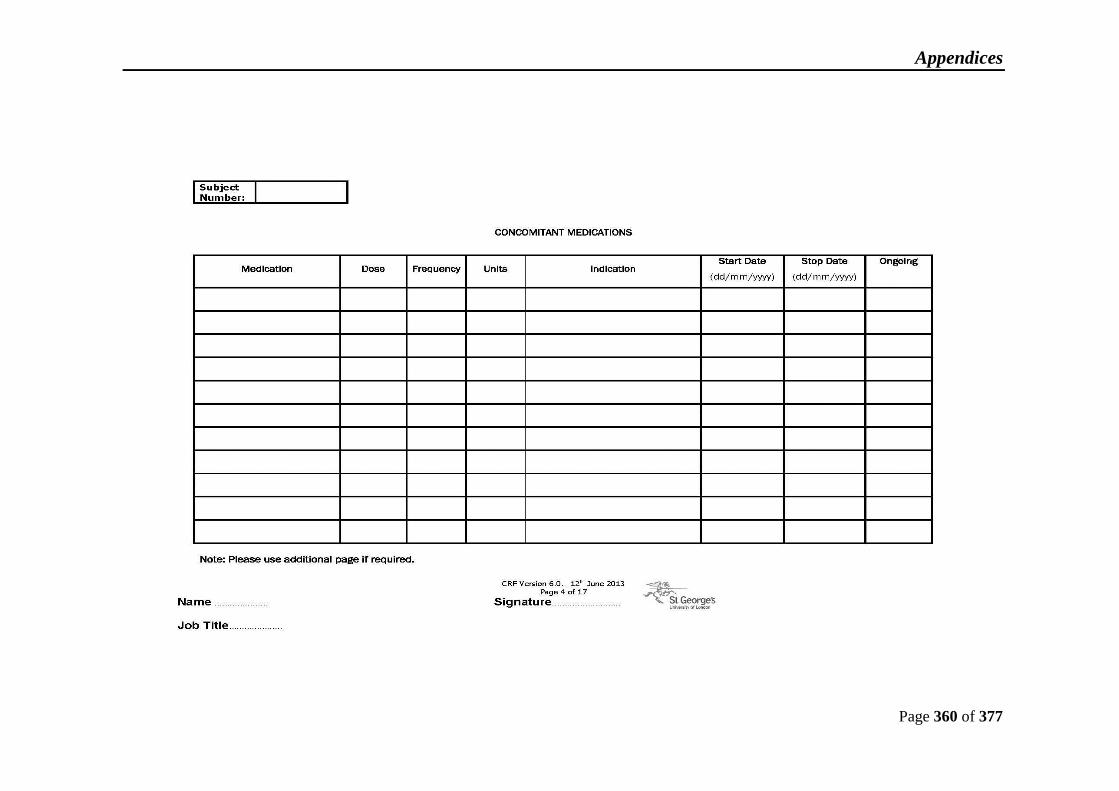
Appendices
Page 360 of 377

Appendices
Page 361 of 377
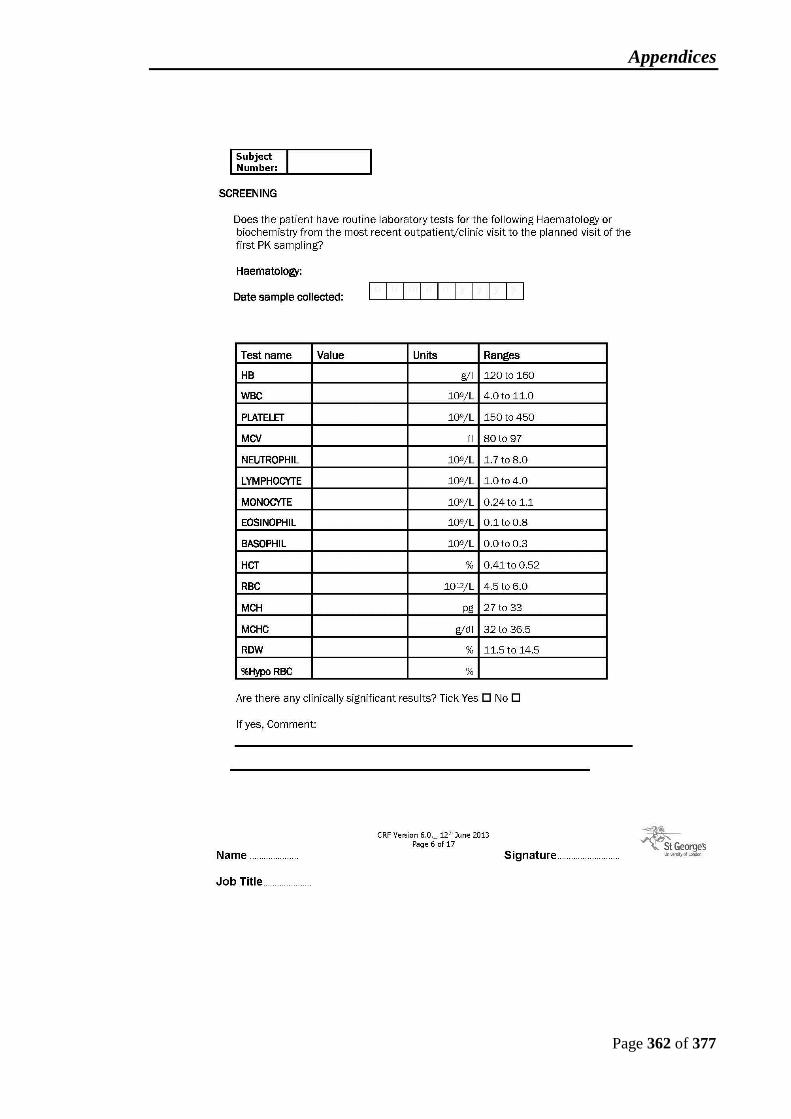
Appendices
Page 362 of 377

Appendices
Page 363 of 377

Appendices
Page 364 of 377
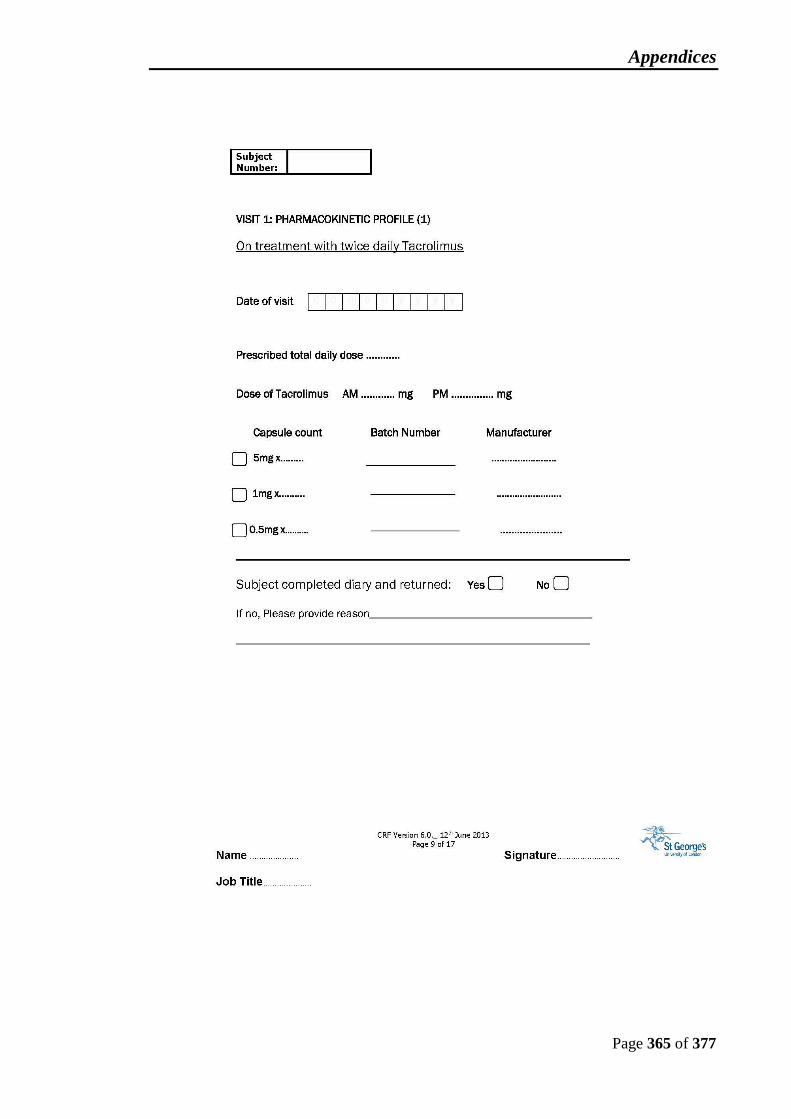
Appendices
Page 365 of 377

Appendices
Page 366 of 377

Appendices
Page 367 of 377

Appendices
Page 368 of 377

Appendices
Page 369 of 377

Appendices
Page 370 of 377

Appendices
Page 371 of 377
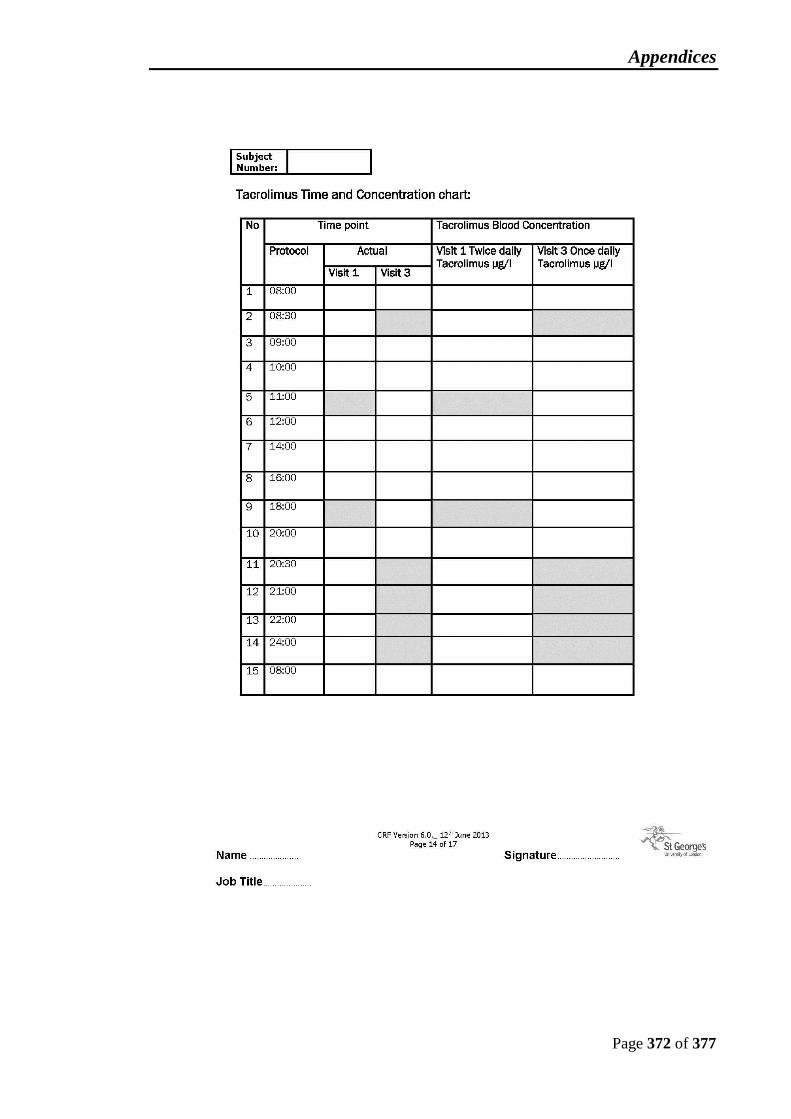
Appendices
Page 372 of 377
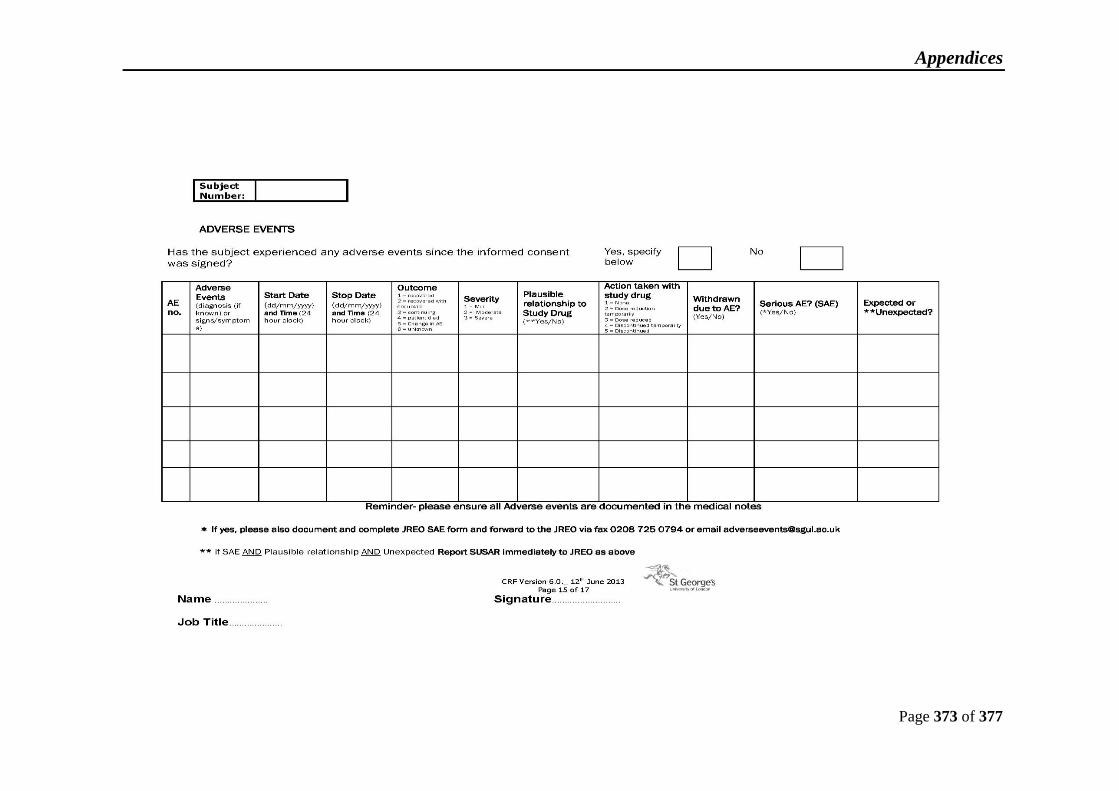
Appendices
Page 373 of 377
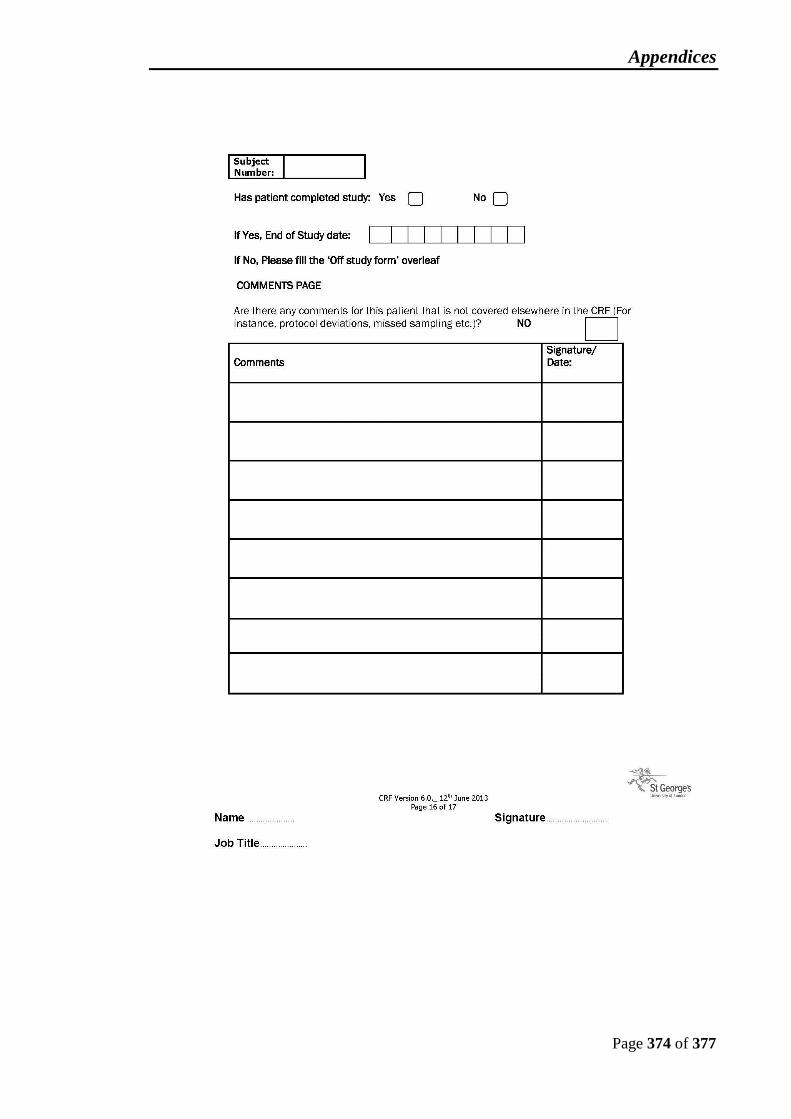
Appendices
Page 374 of 377

Appendices
Page 375 of 377

Appendices
Page 376 of 377
Appendix 3. List of the Concomitant Medications
Concomitant medication Patients
No. Concomitant medication Patients
No. Adalat La 2 Ismn 1
Alendronic Acid (As
Alendronate Sodium) 4 Lansoprazole 5
Alfacalcidol 35 Lantus Insulin 2
Alfuzosin 2 Levimir Insulin 1
Allopurinol 6 Losartan 2
Amlodipine 31 Metoprolol 13
Amoxicillin 2 Metronidazole (Metrotop) 1
Aspirin 19 Minoxidil 1
Atorvastatin 35 Mircera 1
Azathioprine 14 Moxonidine 1
Bendroflumethiazide
(Bendrofluazide) 5 Mycophenolate Mofetil 19
Bisoprolol 9 Nifedipine 7
Calcichew 1 Nitrofurantoin 1
Calcitriol 2 Normacol 1
Candesartan 12 Olanzapine 1
Carvedilol 2 Omacor 1
Cefalexin 1 Omeprazole 30
Cefuroxime 1 Paracetamol 1
Cinacalcet 6 Paroxetine 1
Ciprofloxacin 3 Pravastatin 3
Citalopram 1 Prednisolone 39
Co-Amoxiclav 3 Pregabalin 1
Colchicine 1 Pregaday 1
Co-Trimoxazole 4 Propranolol 1
Darbepoetin Alfa (Aranesp) 1 Pyridoxine 3
Dorzolamide Eye Drops 1 Ramipril 16
Doxazosin 20 Ranitidine 1
Esomeprazole 1 Risedronate 1
Ezetimibe 4 Salbutamol 1
Ferrous Sulphate 6 Sildenafil 1
Fluoxetine 1 Sodium Valproate 2
Folic Acid 2 Sotalol 2
Furosemide(Frusemide) 2 Tamsulosin 3
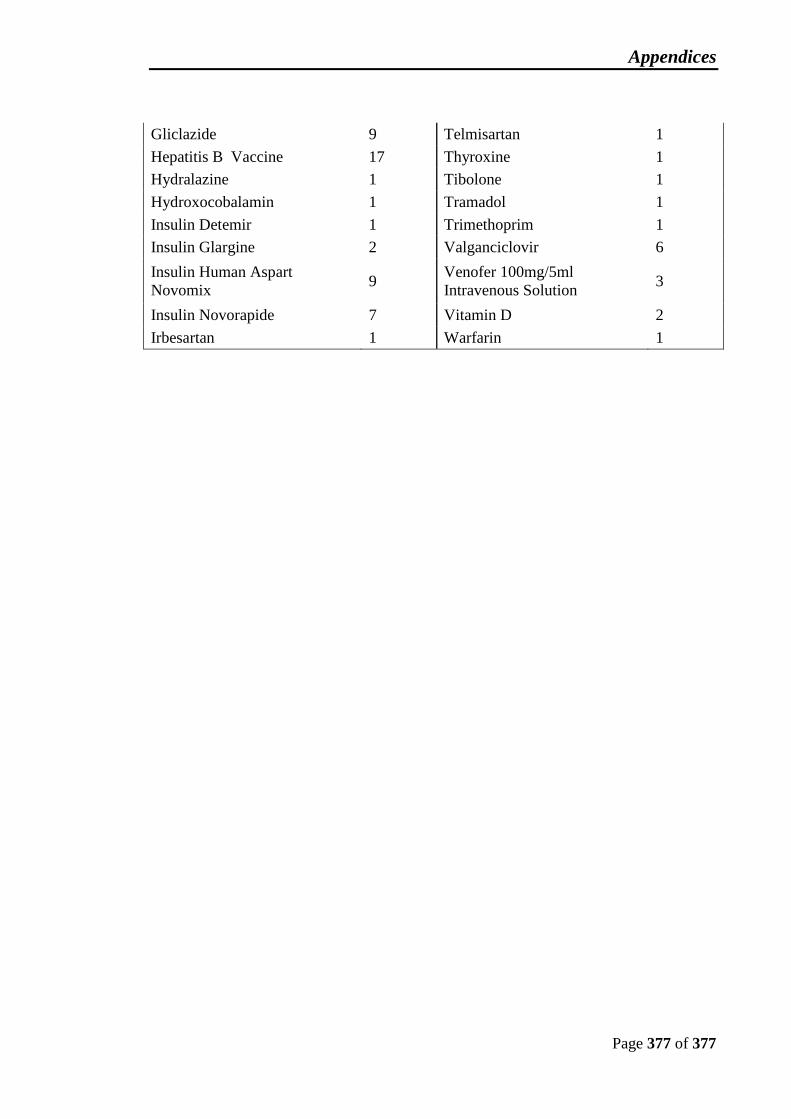
Appendices
Page 377 of 377
Gliclazide 9 Telmisartan 1
Hepatitis B Vaccine 17 Thyroxine 1
Hydralazine 1 Tibolone 1
Hydroxocobalamin 1 Tramadol 1
Insulin Detemir 1 Trimethoprim 1
Insulin Glargine 2 Valganciclovir 6
Insulin Human Aspart
Novomix 9
Venofer 100mg/5ml
Intravenous Solution 3
Insulin Novorapide 7 Vitamin D 2
Irbesartan 1 Warfarin 1