Relationships Between Selected Teacher Behaviors ... - ERIC
42
DOCUMENTBBSUHB^ ED 141 118 SB 022 622 IOTBOB McConnell, John W. TITLE Relationships Between Selected Teacher Behaviors and Attitudes/Achievements of Algebra Classes. BOB Bill Apr 77 BOTB U5p. ; Paper presented at the annual meeting of the* American Educational Besearch Association (lev"York, Ben lork. April 4-8, 1977) BDBS fBICB HF-10.83 HC-J2.C6 tins Postage. DBSCBIJTOBS Achievement; Algebra; cognitive Development; ^Educational Besearch; instruction; Hathematics Education; Secondary Education; * Secondary School Bathematics; *Student Attitudes; *Teacher Bfefcavior IDBBTIFIIBS Besearch Reports ABSTBACT This study, related high-inference teacher behaviors' to* measures cf pupil achievement and attitude in ninth-grade algebra classes. A sample of 50 classes came from 13 suburban high schools.' The most consistent results showed that pupil and observer assessments 'of clarity, enthusiasm, and task orientation were important for attitudes toward mathematics, teachers whose pupils rated them as emphasizing analysis had classes with lower attitudes on several scales. Achievement criteria* were not as productive;- Bevertbeless, teachers fated as higher on task orientation bad higher residuals on computation and comprehensive cognitive functioning levels. Teachers rated clearer bad higher resrduals on comprehension. Analysis correlated "with teacher behaviors of probing and enthusiasm. (Author/SB)
-
Upload
khangminh22 -
Category
Documents
-
view
2 -
download
0
Transcript of Relationships Between Selected Teacher Behaviors ... - ERIC
DOCUMENTBBSUHB^
ED 141 118 SB 022 622
IOTBOB McConnell, John W.TITLE Relationships Between Selected Teacher Behaviors and
Attitudes/Achievements of Algebra Classes. BOB Bill Apr 77 BOTB U5p. ; Paper presented at the annual meeting of the*
American Educational Besearch Association (lev"York, Ben lork. April 4-8, 1977)
BDBS fBICB HF-10.83 HC-J2.C6 tins Postage. DBSCBIJTOBS Achievement; Algebra; cognitive Development;
^Educational Besearch; instruction; Hathematics Education; Secondary Education; * Secondary School Bathematics; *Student Attitudes; *Teacher Bfefcavior
IDBBTIFIIBS Besearch Reports
ABSTBACT This study, related high-inference teacher behaviors'
to* measures cf pupil achievement and attitude in ninth-grade algebra classes. A sample of 50 classes came from 13 suburban high schools.' The most consistent results showed that pupil and observer assessments 'of clarity, enthusiasm, and task orientation were important for attitudes toward mathematics, teachers whose pupils rated them as emphasizing analysis had classes with lower attitudes on several scales. Achievement criteria* were not as productive;- Bevertbeless, teachers fated as higher on task orientation bad higher residuals on computation and comprehensive cognitive functioning levels. Teachers rated clearer bad higher resrduals on comprehension. Analysis correlated "with teacher behaviors of probing and enthusiasm. (Author/SB)
RELATIONSHIPS BETWEEN SELECTED TEACHER BEHAVIORS
AND ATTITUDES/ACHIEVEMENTS OF ALGEBRA CLASSES
John W. McConnell
Glenbrook South High School
Glenview, Illinois
Paper Presented at the
Annual Meeting of the American Educational Research Association
New York City, New York
April 4-8, 1977

This study relates high-inference teacher behaviors to"
measures of pupil achievement and attitude in ninth grade
algebra classes. The sample of fifty classes came from thirteen
suburban high schools. Pupil achievement 'and attitudes were measured with
scales from the National Longitudinal Study of
MathematicalAbilities in the fall and spring of 1971-72.
The posttest criterion measures were collapsed into three levels
of cognitive functioning: Analysis; Comprehension; Computation.
Students rated their teachers on level of cognitive processes
used in the classroom and on a questionnaire designed around the Rosenshine-Furst review (1971) of process-product studies. An
observer used Teacher Characteristic Study scales on four visits
to the classrooms. A rating sheet designed after the Rosenshine-
Furst categories was used on the last' two visits. Complete data
was obtained on 43 classes.
Class, means formed the unit of analysis. Posttest. criteria
were regressed against pretest aptitude, achievement, and attitude.
Residuals were correlated with teacher behavior measures.
The most consistent results showed that pupil and
observer assessments of clarity, enthusiasm, and task orientation
were important for attitudes towards mathematics. Teachers whose
pupils rated them as emphasizing analysis had classes with lower
attitudes on several, scales.
Achievement criteria were not as productive. Nevertheless,
teachers rated- as higher on task orientation had higher residuals
on Computation and Comprehension. Teachers rated clearer had
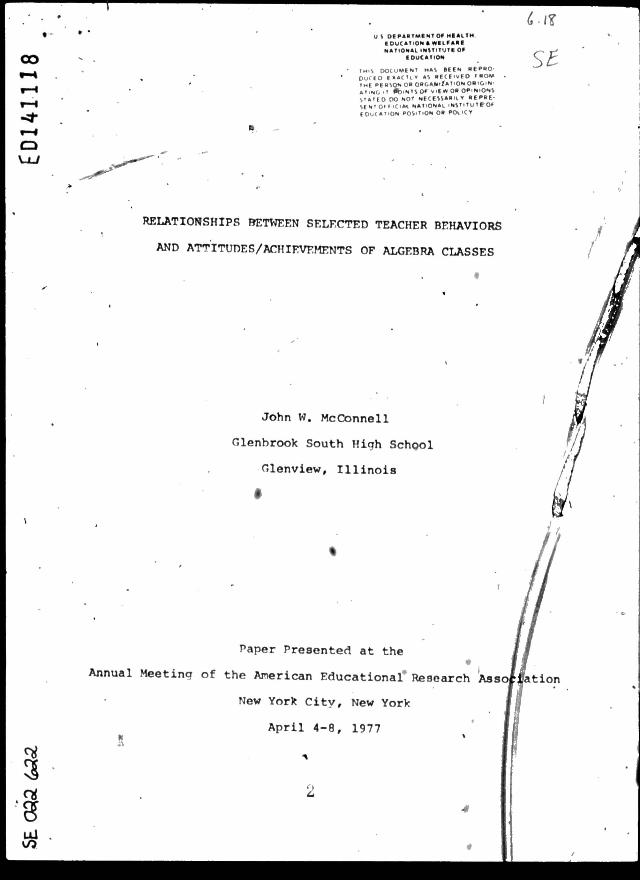
higher residuals on Comprehension. Analysis correlated with Probing
and Enthusiasm. Teachers who talked more had higher Analysis
residuals.
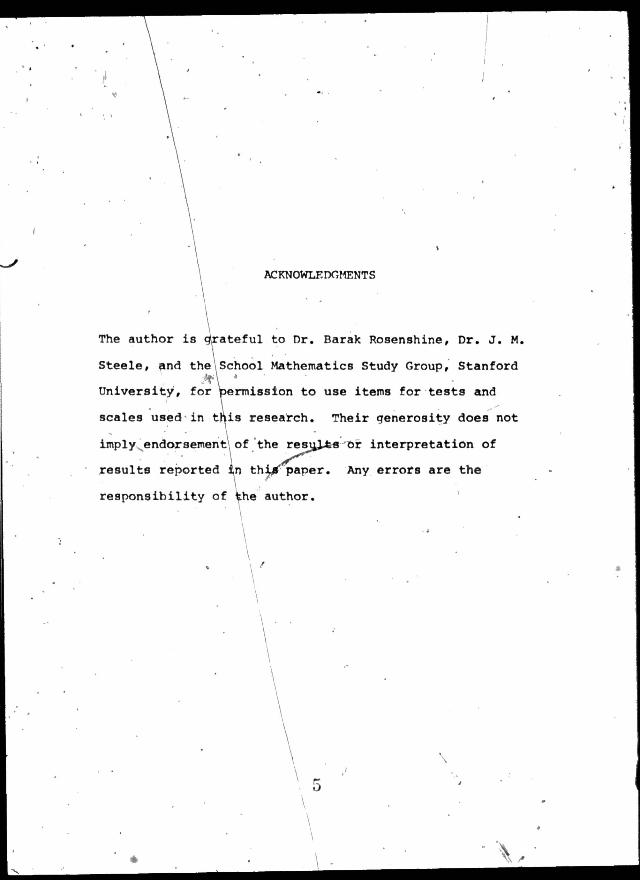
ACKNOWLEDGMENTS
The author is grateful to Dr. Barak Rosenshine, Dr. J. M.
Steele, and the School Mathematics Study Group, Stanford
University, for permission to use items for tests and
scales used-in this research. Their generosity does not
imply endorsement of the results or interpretation of
results reported in this paper. Any errors are the
responsibility of the author.

RELATIONSHIPS BETWEEN SELECTED TEACHER
BEHAVIORS AND ATTITUDES/ACHIEVEMENTS
OF ALGEBRA CLASSES
J. W. McConnell
THE PROBLEM
The purpose of this study was to relate teacher behavior'
measures to pupil achievement and attitude measures in ninth
grade algebra classes. Algebra classes were selected for the
study for several reasons. First, the content of algebra is
highly structured and contributes to teacher-pupil interaction.
Second, the content is fairly standard across classes throughout
the United States even though this country does not have a
national curriculum. Third, the researcher's work in mathematics
classrooms had convinced him that algebra is the key to later
work in mathematics. A successful experience in algebra promotes
enrollment in later mathematics courses. If teacher behaviors
important for pupil'achievement and positive attitude can be
identified, then these behaviors can be encouraged in the class
room to improve retention of students in secondary school
mathematics programs.
This study used both high and low inference measures of
teacher behavior. The model for relating the teacher behaviors-
to.outcome measures in this study are shown in Figure 1.
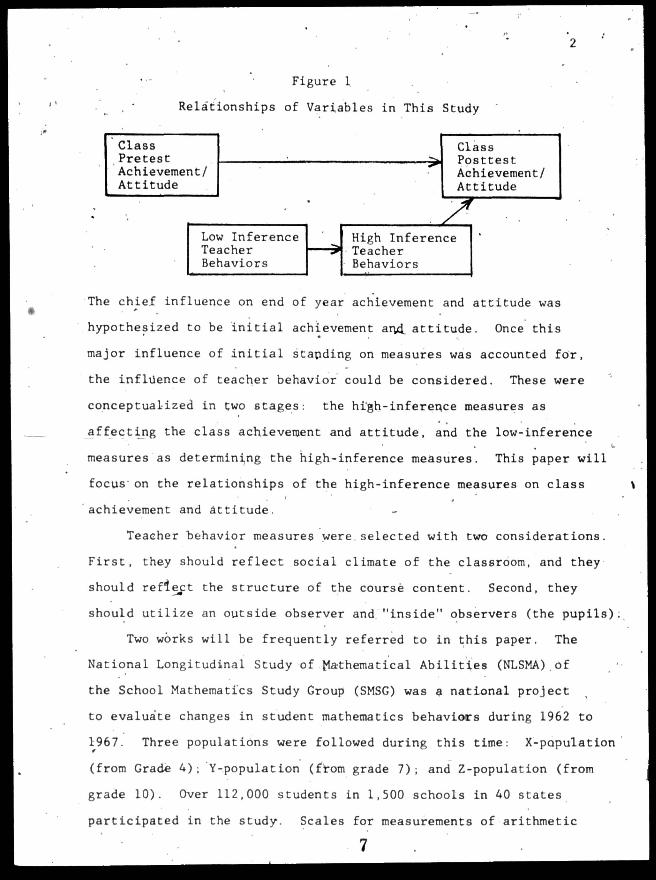
Figure 1
Relationships of Variables in This Study
Class Class Pretest Posttest Achievement/ Achievement/ Attitude Attitude
Low Inference High Inference Teacher Teacher Behaviors Behaviors
The chief influence on end of year achievement and attitude was
hypothesized to be initial achievement and attitude. Once this
major influence of initial stapding on measures was accounted for,
the influence of teacher behavior could be considered. These were
conceptualized in two stages: the high-inference measures as
affecting the class achievement and attitude, and the low-inference
measures as determining the high-inference measures. This paper will
focus' on the relationships of the high-inference measures on class
'achievement and attitude.
Teacher "behavior measures were.selected with two considerations.
First, they should reflect social climate of the classroom, and they
should reflect the structure of the course content. Second, they
should utilize an outside observer and "inside" observers (the pupils):
Two works will be frequently referred to in this paper. The
National Longitudinal Study of Mathematical Abilities (NLSMA).of
the School Mathematics Study Group (SMSG) was a national project
to evalua'te changes in student mathematics behaviors during 1962 to
1967. Three populations were followed during this time: X-papulation
(from Grade 4); Y-population (from grade 7); and Z-population (from
grade 10). Over 112,000 students in 1,500 schools in 40 states
participated in the study. Scales for measurements of arithmetic

skills, algebraic skills, and attitude towards mathematics were
carefully developed and tested by teams of mathematicians, math-
ematics educators, statisticians, and psychologists. By producing'
these scales, NLSMA was a major contributor to progress in research
on mathematics education.
The second work is the Rosenshine and Furst's .review of
process-product studies, "Research on Teacher Performance Criteria."
(1971) This review organized the results of fifty correlational
studies into high-inference variables which were supported in
several of the studies. Five of the variables which were most
conclusive-were Clarity, Variability, Enthusiasm, Task-Oriented
and/or Businesslike Behaviors, and Student Opportunity to Learn
Criterion Material. Six which were less conclusive were. Indirect
ness, Criticism, Structuring, Types of Questions, Probing, and
Difficulty of Instruction. The influence of these variables on
this study will be seen in the scales used to observe pupil behavior.
MEASURES OF PUPIL APTITUDE, ACHIEVEMENT AND ATTITUDE
Aptitude
Achievement in algebra is dependent uppn ability. Even though
the schools in this study have had procedures to select students
for a homogeneous grouping in algebra, the ability levels within
'the classes spanned a wide range and 'contributed to variability
in student performance at the end of the course. Further, in this
study, it was clear that the .schools involved had different selection
procedures for algebra. These differences alone would lead to -class
differences in achievement at the end of the year.

A measure of students' initial abilities was chosen to account
for these differences. The Short Test of Educational Ability, Level
5 CSRA, 1969) was selected because it could be administered in 30
minutes and provided scores in four areas: Verbal Meaning,
Arithmetic Reasoning, Letter Series, and Symbol. Manipulation. The
total score on the 55 items averaged 33.39 over the students who
were in both .the fall and spring testings. This is roughly equiva
lent, to an IQ of 116. Sinc6 class means were used for the analysis
of data in this study, separate scores on the four subscales were
used for the analysis. Means and standard deviations are reported
in Table 1.
TABLE I
MEANS, STANDARD DEVIATIONS, AND 'RELIABILITIES FOR 47 CLASSES ON SCALES FROM THE PRETESTING 'WITH THE SHORT TEST OF EDUCATIONAL ABILITY (STEA) LEVEL 5 (n-50 classes)
Items MEAN SD r1 r2
Verbal Meaning 15 9.14 l.f\2 .73 .87 10
Arithmetic Reasoning 156.41 .65 .69 .75
Letter Series 10.56 .94 .85 .88
Symbol Manipulation 15 8.18 .99 .78 .89
TOTAL 55 33.39 2.61 .89 .93
r1 -- Hovt reliability over students
r2 -- Hoyt reliability over classes

Achievement-
Both the fall testing and the spring testing included tests
which measured achievement in mathematics. The fall testing con-
centrated on arithmetic items, the spring, on algebra. This
research followed the National Longitudinal Study of Mathematical
Abilities (NLSMA) pattern of conceptualizing mathematical achieve-
ment as multidimensional (Romberg and Wilson, 1968). NLSMA
Y-population scales were used extensively. The NLSMA conception of
achievement items can best be described as concentrating on two
dimensions: Content and Cognitive Behavior (Romberg and Wilson,
1969, 39-42). The Content dimension contains three areas: Number
Systems, Geometry, and Algebra. The Cognitive Behavior dimension
has four categories: Computation, Comprehension, Application and
Analysis.
The selection of tiems from the NLSMA item pools is indicated
on Tables 2 and 3. The number of items falling in each cell of
the matrix for the pretesting and posttesting is shown. The items
are concentrated in Computation and Comprehension at both te'stings.
From fall to spring, the content clearly shifts from Number Systems
to Algebra. Few items are in the Applications. Category because the
NLSMA writing team found them practically impossible to write.
Tables 4 and 5 break down the items according to the NLSMA
classification and show means, standard deviations, .and reliabilities.
Data is from fifty classes from 'the fall testing and forty-six on
the spring testing. For the' forty-six classes with data on both
testings, only students who were in both 'testings were used 'in the
computation of means. The four extra classes are retained because
they provided data for other parts
of the study. The means and
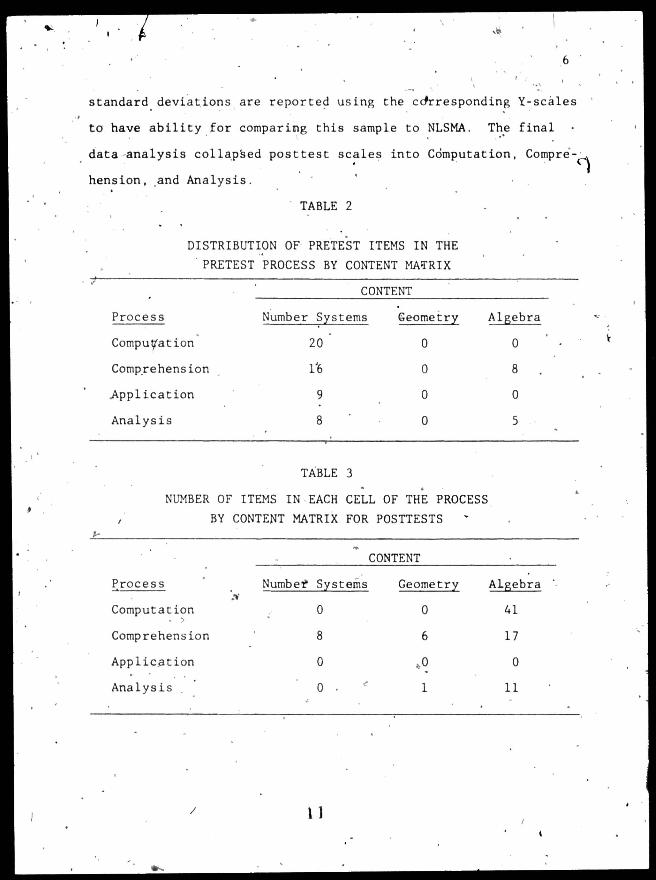
standard deviations are reported using the corresponding Y-scales
to have ability for comparing this sample to NLSMA. The final
data-analysis collapsed posttest scales into Computation, Compre-
hension, and Analysis.
TABLE 2
DISTRIBUTION OF PRETEST ITEMS IN THE PRETEST PROCESS BY CONTENT MATRIX
CONTENT
Process Number Systems Geometry Algebra 20
Computation 0 0
16Comprehension 0 8
Application 9 0 0
Analysis 8 0 5
TABLE 3
NUMBER OF ITEMS IN EACH CELL OF THE PROCESS BY CONTENT MATRIX FOR POSTTESTS
CONTENT
Process Number Systems Geometry Algebra
Computation 0 0 41
Comprehension 8 6 17
Application 0 0 0
Analysis 0 1 11

TABLE 4
MEANS, STANDARD DEVIATIONS, AND RELIABILITIES FOR SCALES IN THE FALL -TESTING (n=50 .classes)
n of NLSMA*_r_ SCALE items NLSMA.CODE MEAN SD r
Rationals
High Cognitive Problems
20
5
Y301-306
Y012
11.97
3.00
1.44
.47
.83
.60
.83
.69
.75
.66
Problem' Formulation 4 Y110 1.20 .39 .59 .34
Whole Numbers 5 Y307 2.84 .43 .44 .69
Ratl. Numbers 11 Y308 5.28 .70 .51 .63
Numbers -Problems 4 Y309 1.42 .35 .45 .44
Numbers -Logical Analysis
Algebra Number Props
Algebra Sentences
4
6
5
Y310
Y311
Y312
.91
3.48
,2.49
.32
.45
.48
.42
.43
•51
.31
.6'3
.67
Algebra- Translation 2, Y313 .81 .22 0 .38'
Numbers Combined 24 Y319 10.44 1.33 .73 .82
Algebra Combined 13 Y320 6.77 .91 .67 .80

TABLE 5
MEANS, STANDARD DEVIATIONS, AND RELIABILITIES FOR SCALES IN THE SPRING TESTING (n-46 classes)
-NLSMA SCALE ITEMS NLSMA CODE MEAN SD r r
Number s- 2 8 Y501 4.81 .60 .57 .56
Algebraic 'Expressions-3 20 Y502 10.27 1.65 .85 .82
AlgebraicEquations-4 15 Y503 6.54 1.05 .73 .74
Algebraic Inequalities 7 Y504 4.14 .70 .74 .54
Graphs 6 Y505 3.72 ..73 .67 .53
Informal Geometry 1 Y506 .46 .20 - '.55 Y507 Analysis-3 11 3.80 .64 .47 .49
Algebraic Sentences-2 6 Y515 3.34 .71 .75 .64
Algebra Translation 4 Y516 1.92 .46 .60 .34
AlgebraNumber Properties 6 Y517 4.30 .63 .61 .57
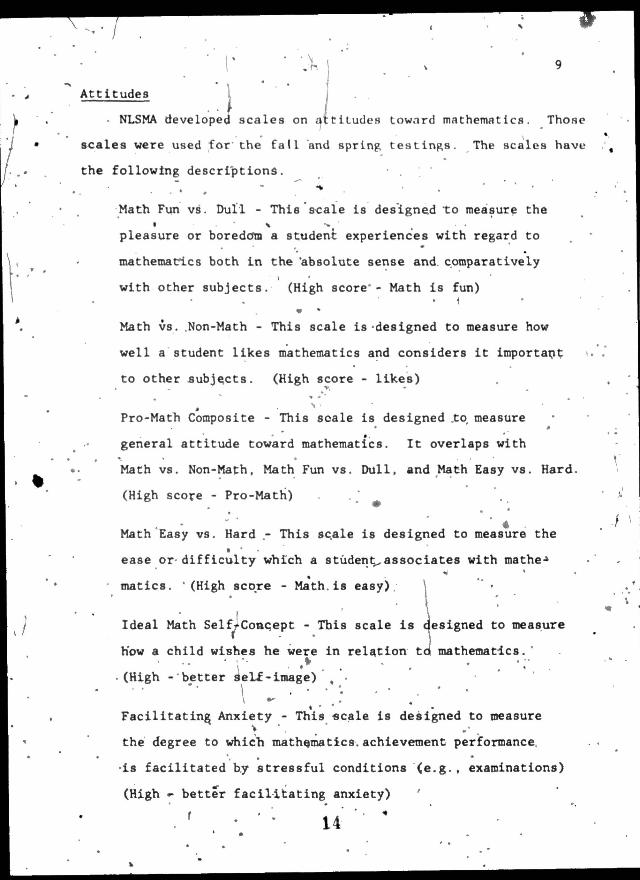
Attitudes
NLSMA devloped scales on attitudestoward mathematics. Those
scales were used for'the fall and spring testings. The scales have
the following descriptions.
•Math Fun vs. Dull - This'scale is designed to measure the
pleasure or boredom a student experiences with regard to
mathematics both in the absolute sense and. comparatively
with other subjects. (High score'- Math is fun)
Math vs. .Non-Math - This scale is designed to measure how
well a'student likes mathematics and considers it important
to other .subjects. (High score - likes)
Pro-Math Composite - This scale is designed to measure
general attitude toward mathematics. It overlaps with
Math vs. Non-Math, Math Fun vs. Dull, and Math Easy vs. Hard.
(High score - Pro-Math')
Math Easy vs. Hard .- This sc.ale is designed to measure the
ease or difficulty which a student associates with mathe-
matics. '(High score - Math is easy).
Ideal Math Self-Concept - This scale is designed to measure
h'ow a child wishes he were in relation to mathematics.
(High -'better self-image)
Facilitating Anxiety - This scale is designed to measure
the degree to which mathematics achievement performance,
•is facilitated by stressful conditions (e.g., examinations)
(High - better facilitating anxiety)

Debilitating Anxiety - This scale is designed to measure
the degree to which mathematics achievement performance
is harmed by stressful conditions (e.g.,, examinations)
(High '- lack .of debilitating anxiety*)
Actual 'Math Self-Concept - This scale is designed to
measure how a child sees himself in relation to mathe
matics. (High - Positive)
The development of the scales is described in Romberg and Wilson
(1968, pp 151-156).
As was done with the aptitude scales, two reliabilities can
be reported: r, the internal consistency based on students;
•r*. the internal consistency based on class means. These, along
with means and standard deviations are on Tables 6 and 7. All
means declined over the year.
*This is the reverse of NLSMA scoring.

TABLE 6
MEANS, STANDARD DEVIATIONS, AND RELIABILITIES FOR ATTITUDE SCALES, FALL TESTING (n-50 classes)
NLSMA N of NLSMA SCALE CODE items MEAN SD r1 r2 r
Math vs. Non-Math 8 20.88. 1.17 .66 ,74 .68
Math Fun vs. Dull 4 13.60 1.11 .81 .85 . 84
PromathComposite 11 33.05 1.56 .63 .76 .68
Math Easy vs. Hard 9 27.57 1.44 .73 .80 .7.8
Math Ideal Self-Concept 8 26.68 1.44 .76 .59 .76
Facilitating Anxiety 9 24.35 1.26 '.61 .74 .67
Debilitating Anxiety 10 33.8O l.88 .81 .88 .85
Actual Math Self-Concept 8 33.08 '1.58 .74 .69 .79
TABLE 7
MEANS, STANDARD DEVIATIONS, AND INTERNAL CONSISTENCY RELIABILITIES FOR ATTITUTE SCALES USED IN THE SPRING TESTING (n-46 classes)
SCALE Items Means SD r
Math vs. Non Math 8 19.75 1.69 .79
Math Fun vs. Dull 4 12.86 1.40 .80
Promath Composite 11 32.18 2.26 .78
Math Easy vs. Hard 9
Facilitating Anxiety 9
26.38
25.20
1.99
1.79
.79
.72
Debilitating Anxiety 10 31.42 1.67
.68
Actual Math Self Concept 8
28.93 1,96 .67

Assignment of Items to Students'
One of the problems in a multivariate study of pupil change
is measuring that change* without forcing the student to spend an
excessive amount of time in testing. The two days used at the
beginning of the algebra course and two days at the end were not
sufficient for every student to take the 149 items on the pretest
forms and 176 items on the posttest. With the exception of the
STEA and the attitude items on the pretesting, none of the other
items were administered to all-students within a class.. Instead,
most -of the items were on forms which were randomly assigned to
507. of the students in a class. On the pretest, the assignment
of forms was done by the teacher passing out presetted forms to his'
class. On the posttest, the researcher randomly assigned forms to
test packets which were labeled with the students' names. On the posttesting,, student answers to the multiple choice items were
recorded on mark-sense cards which had been prepunched with their
names and project identification codes.
The use of portions of a class for each scale determined that
the basic item data for this study would be in the form of class
item means, Scales were constructed from the item means. Reliability
estimates, were based on internal consistency formulas using a class
by item design.
MEASURES OF TEACHER BEHAVIOR
Observation Scales Used by Researcher
The researcher and a second observer visited the 47 teachers
four times during the year, twice each semester. Two low-inference
behavior observation instruments were used during the observation

period: the Wright-Proctor and OScAR 4V : At the end of the
observation period, the observer used scales developed from
Characteristics of Teachers (Ryans , 1961) . During the second
.semester, a second rating sheet based on the Rosenshine and Furst
review (1971) of process -product studies was added.
TCS Scales
Characteristics of Teachers (Ryans, 1960) produced scales
which were tested and validated over large samples of elementary
and secondary sch'ool classrooms. The scales which have been used
in several large-sdale mathematics studies are based
on items
formed by antonyms. The observer rates the teacher on a scale
from 1 to 7 depending on the work which is more appropriate. For
example: PARTIAL 1 3. 3 4 5 6 7 FAIR
Four items were added to the list from Characteristics of Teachers in an attempt to pick up* special characteristics of algebra
classrooms. These were: Practical - Theoretical,
Abstract - Concrete,
Vague - Clear,
Static - Active.
The full list of characteristics is on Table 8. Reliabilities
are based on differences between classes with observations not
matched within visits. Four observations were available on 43 of the classes; three, on four other classes.
TABLE 8
ITEMS USED FOR RATING CLASS RELIABILITIES OVER 4 VISITS
SESSIONS WITH
Item r
Partial-Fair .61
Practical-Theoretical .53
Autocratic-Democratic* .07
Aloof-Responsive
Restricted-Understanding
Harsh-Kindly
Dull Stimulating.
Stereotyped-Original
Apathetic-Alert
Unimpressive-Attractive
Evading-Responsible
Erratic-Steady
Excitable-Poised
Uncertain-Confident
.71
.70
.62
. 80
.73
.82
.71.65
.73
.68
.70
Disorganized-Systematic
Inflexible-Adaptable
Pessimistic-Optomistic
Immature-Integrated
Abstract-Concrete
.79
.62
.78
.39
.47
Narrow-Broad
Vague-Clear
Static-Active
-.52 .75
.69

Alpha Factor Analysis was used to reduce the mean scores on
the scales to four factors with eigenvalues greater than 1. These
were rotated to the-varimax criterion. The rotated factor loadings
were compared with those from the Ryans study (1960), p. 106). The
comparisons warranted labeling.the factor scores in this study
similar.to the Ryans on Table 9. Rather than using the Ryans set
of items, factor scores were generated for later analyses.
Table 9
IDENTIFICATION OF FACTORS IN THIS STUDYWITH CHARACTERISTICS OF TEACHERS SCALES
TCSY
TCSZ
TCSX
TCSC
This Study
Responsible, Steady, YPoised, Systematic
vs. Evading, Erratic. Excitable, Disorganized
Stimulating, Original, ZAlert, Broad vs. Dull , Stereotyped, Apathetic, Narrow
Democratic, Kindly C vs
Autocratic, Harsh
Concrete; Practical vs.
Abstract, Theoretical
Characteristics of Teachers
Responsible, systematic vs.
Evading, Disorganized
Stimulating, Original vs.
Dull, Stereotyped
Responsible, Understanding, Kindly, Democratic, Optimistic
vs. Aloof, Restricted, Harsh,Autocratic, Pessimistic
(No comparative scale)

Process Rating Sheet
A second rating scale was introduced for the last two observa
tions. Following the Rosenshine-Furst review of process-product
studies (1971), it has ten items to be rated on a 1 (low) to 5 (high)
scale. No formal glossary such as that available for the TCS scales were
used. It should be noted that one of the variables cited by
Rosenshine and.Furst does not appear on this sheet. That is
"Student Opportunity to Learn Criterion Material. " This variable
was not an appropriate one for rating a class session.
The ratings on five of the items were high for most teachers
despite the efforts of the observers to aim for a distribution of
ratings centering on three. The average of only three of the items
were close to three-.
The correlations between ratings on the third .and fourth visits
for the 43 classes on which full observations were completed are on
Table 10. "Difficulty of Lesson" was notably unstable across the
two visits. -The other nine were adequately correlated.

TABLE 10
CORRELATIONS BETWEEN ITEM SCORES ON THE PROCESS RATING SHEET ON CLASS VISITS 3 and 4 for 43 CLASSES
r Item
PR1
PR2
PR3
Clarity
Variability
Enthusiasm
.382*
.375*
.636**
PR4 Business-like .533**
PR5 Uses Student Ideas .398**
PR6 Criticism .565**
PR7 Structures Lesson .347*
PR8 Higher Cognitive Questions
PR9 Probing Questions
PR10 Difficulty of Lesson
.595**
.332*
-.147
* P < .01
**P < .05

Observation Scales Used by Students
Classroom Activities Questionnaire
'The Classroom Activities Questionnaire (CAQ) attempts to
provide a low-inference rating sheet which students may use to
fate their teacher. It is based on the Bloom taxonomy of Educa
tional Objectives (Bloom, 1956). It has been used with mathematics
classrooms for gifted students (Steele, et al, 1970) and was
.included in this study because it related, to the Wright-Proctor
observation scale.
The structure of the CAQ is indicated on Table 11. Further
information on'its development can be found in Steele, et al (1971).
The CAQ was administered to 507. of the students in each class at
the end of the first semester. Items were scored so that high
scores imply more of the construct implied in the scale title, with
•the exceptions of Test/Grade Stress and Lecture,

TABLE 11
Scales from Class* Activities Questionnaire
Identifier Description
CAQM Memory - - Recall and Recognition of information
CAQT Translation --- Paraphrasing or expressing information in different symbolic form
CAQI Interpretation ---- Recognition of relationships
CAQAP
CAQAN
Application — Selection of appropriate methods and performance of operations required by problem situation
'Analysis -- Recognition of structure of material, including conditions which affect the way it fits together
CAQSY Synthesis — Generation of new ideas and solutions
CAQEV Evaluation — "Development and application of a set of standards for judging worth
CAQDS Discussion -- Student 'opportunity for and involve ment in discussion
CAQTS .Test/Grade Stress — High pressure to produce teacher selected answers (High score,: low stress)
CAQL
CAQLO
Lecture •- Teacher role as information giver with students in passive, listening role (High score: less time on lecture)
Low Cognitive Composite — Memory, Translation,Interpretation
CAQHI High Cognitive Composite --- Application, Analysis, Synthesis, Evaluation
CAQCF
CAQCL
Classroom Focus — Discussion, Test/Grade Stress, Lecture
Classroom Climate — Enthusiasm, Independence, •Divergence, Humor, Teacher Talk, Homework
.From: Steele, et^ al (1971, p.451)

Classroom Proceas Questionnaire
The construct.s synthesized by Rosenshine and* Furst (1971)
can be measured by students. Rosenshine provided the researcher
with item sets he and his associates had been developing to
produce class measures on ten areas of behaviors. These were
adapted for algebra classes. A twenty-five item scale was
administered to 50% of the students in each class as part of the
spring testing. The scales and sample items are on Table 12.

TABLE 12
CLASSROOM PROCESS QTTESTIONNAIRE SAMPLE ITEMS
•Identifier Description and Example
RCLAR Clarity (4 items; r=.80)"My teacher makes his points clear and easy to understand"
RQUEST. Questioning (1 item) "My teacher asks questions in such a way -that you really have to think in order to answer them."
RVART Variability (6 items; r-.63)
"My teacher uses many different teaching methods."
RENTHUT Enthusiasm (4 items; r-.74)
"My teacher has high interest in teaching Mathematics."
RDIFFT Difficulty (3 items; r=.51) "My teacher spends too much, time on easy problems."
RCRITT Criticism (1 item)
"My teacher spends too much time criticizing or finding fault with the students in this class."
RUSET. Use of Ideas (2 items; r-.87) "This teacher respects the ideas of his students."
RSTRUCT Structuring (1 item) "This teacher gives a short sumary at the end of
the lesson."
ROPPT Opportunity to Learn (1 item) "This teacher really doesn't give students many opportunities to learn the things they should be learning in Algebra."
RTASKT Task Orientation (2 items; r-.31) "This teacher really makes you get down to work. in class."
SAMPLE
The original pool of schools used 'for the sample were located
within driving distance of Northwestern University. The researcher
contacted both city and suburban schools. Districts containing 25
high schools in Chicago and suburban areas were contacted*in the
Spring* of 1971. Three districts declined participation. In the
remaining districts', decisions-were left to the schools. Four of
the schools declined to participate, and four schools were not
contacted since unusual scheduling'of students, newness of school,
or prolonged teacher strikes would have interfered with the progress
of the research.
Forty-seven teachers in thirteen schools offered one algebra
class each for the project. Four of these .teachers also provided
a second classroom as well for extra testing. (*) '.'Regular" or
"average" algebra classes had been requested for the study, but
entrance requirements for the classes in the sample varied from
school to school.
The sample of schools in this study served students from above-
average suburban communities. On the basis of the 1971 ranking of
Chicago suburbs by the Chicago Regional Hospital Study, twenty of
the twenty-six communities served by the thirteen high schools are
in the top quartile in economic standing.
Class times of the fifty-one classes tested ranged from 40
minutes to 57 minutes per day. Twenty-five percent of the classes
net for 40-44 minutes each day, about one-third met for 45-49
minutes, and th* remainder, for 50 or more minutes per day.
(*) One class was dropped by the school at the end of October due
to insufficient enrollment.
Classes in the study started as early as 7:50 A.M. and as
•late as 2:40 P.M. Most of the classes started after 12:00 noon.
Several* schools, were still on split shifts with freshmen coining
to school later, and several schools had early release programs
which forced upper-level courses to be early in the day.
Although the United States has no national curriculum for
algebra, the most popular textbooks in algebra cover substantially
the same content. Five different textbooks are used in-the fifty-one
classrooms. Two of these, Houghton-Mifflin's Modern School Mathe
matics Algebra and Modern Algebra, were used in 38 of the classes.
One other text was used in more than one school, and the two
remaining texts were used in one school each.'
Neither variables of textbook nor time spent in class per
week had any relation to the pupil achievement and attitude measures
used in this study. Teacher Characteristics
Since most of the teachers in this study were volunteers, the
researcher felt it important to compare the sample with data avail
able on ninth grade math teachers. Two sources were available.
The National Longitudinal Study of Mathematical Abilities, NLSMA,
had studied a carefully selected,.but large sample of schools in
the United States during the 60's. Questions they had asked ninth
grade mathematics teachers were used in this study to see how this
sample of teachers compared to a more representative national-
sample (Wilson, et al. #9, 1968). In addition, Bell (1969) had
completed a study using Chicago area high school math teachers two
years before this study. His research had involved far more
teachers
and relied on less of a commitment from the teachers. Hence, his

sample is quite representative of math, teachers in the Chicago area.
He used some of the same questions from NLSMA.
Three-quarters of the teachers in this- sample were male. This
is typical of both the NLSMA statistics and Bell's suburban data,
The distribution of years of experience was typical of both the
NLSMA sample and Bell's: 40% were in the 1-6 year .range, 281 in
7-12, .the and the rest in 13 or more years. 65% of the teachers in
this sample had a master's degree or higher. This compares to Bell's
suburban data, but not to the figure from NLSMA of 48%. The teachers
in this sample tended to belong to more professional organizations
devoted to mathematics education than the NLSMA teachers did. On
a checklist of five ways'of preparing for mathematics teaching, the
number of items checked by the teachers in this sample was slightly
more than that checked by teachers in the NLSMA sample. Almost all
of the teachers had taught algebra before.
Teacher Opinions About Teaching
Teacher attitudes, were assessed with the Teacher Opinion
Inventory (TOI) of NLSMA (Wilson, et al, #9,' 1968, pp. 67-73).
Data on the scales in this inventory 'was compared with the much
larger NLSMA grade nine sample. Before presenting the results,
it should be pointed out that considerable anxiety was created
by the items on the questionnaire. Some teachers refused to com-
plete' it; some filled it out-by putting on extensive comments.
Usable results on all scales were available from only 41 of the 47
teachers.
A t-test for differences of the sample means in this study
against the means derived from the* NLSMA ninth grade data showed
that there were no differences between the scores on this sample of
teachers on the scales.
"Theoretical Orientation"
"Concern for Students"
"Involvement in Teaching"
"Like, (math) vs. dislike"
"Creative vs. Rote Orientation to Mathematics"
"Need for Approval".
A difference did show up on."Non-authoritarian Orientation" with
the sample teachers showing more democratic, non-authoritarian
views of mathematics teaching than the. NLSMA grade nine sample.
Attrition
In a praject spanning a year of school, attrition is a critical.
problem. It is even more of a problem in a course such as grade
nine algebra, because schools differ in their approach- to students
who do not have success in algebra. Most schools in this study had
a two-year algebra sequence to which low-achieving algebra students
•'were dropped. One school had different levels of one-year algebra.
Another school had a policy of pulling out all students who were
failing at the end of the first quarter and assigning them to a
section which would start the course all over. An attempt was made
at the end of the first semester to track down students who were no
longer in the .sections being studied, but the task was not successful.
The most consistent method of analyzing the data was to use only
students who were registered in the class, both in October, 1971, and
in May, 1972, for the computation of class mean scores.' About 25Z
of the students in the fall testing were not in the spring testing.
'Fifty classes completed the fall testing. 'Forty-six completed
the spring testing. Four observations were completed on forty-three

of the classes Where only student data is compared, the forty-six
classes will be used. Where observation data is reported, the sample
will be the forty-three classes with complete observations.
ANALYSIS OF DATA
The first step in the analysis was the computation of class
mean scores on all items administered to students. Scales were
constructed from these means. The posttest attitude and achievement
scores were regressed on all pretest scales. Many process-product
studies which have had pre- and post-measures have regressed posttests
only on corresponding pretests.. This may be an incomplete correction
in mathematics. As an example, consider the attitude scale,
"Facilitating Anxiety." The attitude measured by this scale may be
more a function, of ability than a function of the pretest score on
the same measure. By putting all pretest measures into a regression
program and selecting the ones which significantly predict posttest
scores, more variability from initial differences could be removed.
On the seven attitude measures-, one ("Math - Easy vs. Hard".)
was regressed against its pre-measure only. All others were
regressed against at least two premeasures. "Pro-Math Composite,"
for example, was significantly predicted by fall measures "Math -
Fun vs. Dull" and "Symbol Manipulation" from STEA.
The posttest achievement measures regressed against arithmetic
scales and STEA subscales.
After the regression sets were determined for each criterion
variable, the residuals were computed for each class. These residuals
were then correlated against the teacher behavior measures. One-
tailed significance tests were selected because the teacher behavior
measures, had been scaled so that higher scores on each behavior
measure should relate positively to attitude and achievement measures.

Hence, the alternates to the null hypotheses on correlations were 2
one-directional. Proportions of variance.accounted for (r ) were
also computed.' These were tested with an F-ratio, which, in effect,
is performing a two-tailed significance test.
RESULTS ACHIEVEMENT MEASURES
Correlations between achievement residuals and teacher behavior
measures are on Table 13. The computation scale had residuals
related to thfee measures distinguishing the task-oriented teacher.
The classes who rated their teachers as "making them ge't down to
work" and those classes who had teachers who were rated by the
observer higher on "businesslike" and "responsible, steady, poised,
systematic" behavior tended to have higher residual scores on
computation. This result indicates that systematic teacher behavior
has a positive effect on algebraic computation. On the other hand,
it should be noted that the. cognitive scales of the CAQ questionnaire
did not relate to the Computation residual. Task orientation is
different from concentration on lower cognitive skills in this regard.
It is striking that pupils'rate'd the asking of "thinking" questions
in such a way that teacher scores connected with Computation.
The Comprehension residual correlated with clarity as measured
by observer and pupils. Teachers rated as clearer had higher*
residual achievement. Task Orientation, as rated by pupils, cor
related with residuals.
The highest cognitive level, Analysis, had residuals which
correlated negatively with two CAQ scales, and positively with the
observer scale "Probing," and pupil rating scale, "Enthusiasm."
The negative correlations are due to lecture: the less time spent
on lecture, the lower the analysis residual. These results are not

contradictory. The teachers who are rated by the students as
enthusiastic and by the observer as asking probing questions are
probably spending most of the period talking. The title of the
CAQ variable may be deceiving in this regard. Teachers who asked
probing questions .were not lecturing but were accounting for a
high proportion of the talking.
None of the CAQ scales measuring levels of cognitive emphasis
correlated with the Analysis residual. Results for the Analysis'
scale are-therefore not as clear-cut as the Computation and Com-
prehension Scales.
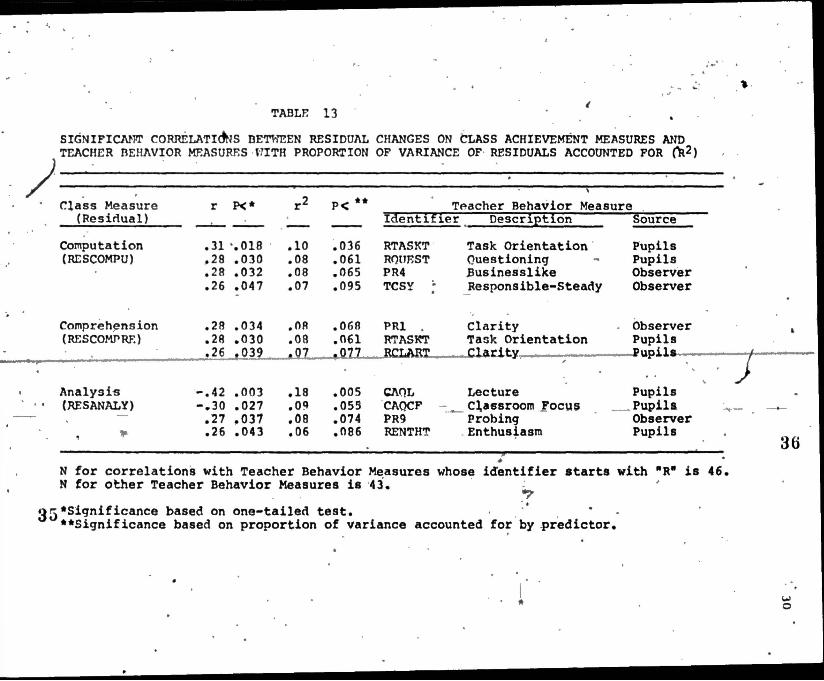
TABLE 13
SIGNIFICANT CORRELATIONS BETWEEN RESIDDAL CHANGES ON CLASS ACHIEVEMENT MEASURES AND TEACHER BEHAVIOR MEASURES WITH PROPORTION OP VARIANCE OF- RESIDUALS ACCOUNTED FOR (R2)
Class Measure (Residual)
Computation (RESCOMPU)
r
.31
.28
.28
.26
P<*
-.018 .030 .032 .047
r2
.10
.08
.08
.07
P<**
.036
.061
.065
.095
Teacher Behavior MeasIdentifier Description
RTASKT Task Orientation RQUEST Questioning PR4 Businesslike TCSY Responsible-Steady
ure Source
Pupils Pupils Observer Observer
Comprehens ion (RESCOMPRE)
Analysis (RESANALY)
.28
.28
.26
-.42 -»30 .27 .26
.034
.030 .039
.003
.027 ,037 .043
.OR
.08
.97
.18
.09
.08
.06
.068
.061 .077
.005
.053
.074
.086
PR1 Clarity RTASKT Task Orientation RCLART Clarity
CAQL Lecture CAQCP Classroom Focus PR9 Probing RENTHT Enthusiasm
Observer Pupils Pupils
Pupils PupilsObserver Pupils
N for correlations with Teacher Behavior Measures whose identifier starts with "R" is 46. N for other Teacher Behavior Measures is 43.
*Significance based on one-tailed test. **Significance based on proportion of variance accounted for by predictor.

ATTITUDE MEASURES
The results of correlating teacher behavior measures with
residuals on attitude measures provided many significant relation- ships. The significant correlations are on Table 14.
Math - Fun va. Dull
Residuals on this scale were positively, correlated with pupil
and observer measures of
Clarity (PR 1 and RCLART),
Enthusiasm (RENTHUT and TCSZ), and
Businesslike behavior (PR4 and RTASKT).
la addition, "Opportunity to Learn," as measured by the pupils,
correlated positively with this attitude residual. If a teacher
.was rated as providing students the "Opportunity to Learn" Algebra,
students had higher residuals on "Math Fun vs. Dull." A striking
contradiction occurs with the observer rating on "Higher Cognitive
Questions" relating positively to these attitude residuals, but the pupil ratings of teacher emphasis on "Analysis" correlating negatively.
This contradiction is consistent with the result on'the next variable.
Math vs. Non-Math
The residuals on this scale relate to teacher Clarity (PR1 and
RCLART) and teacher (enthusiasm . TCSZ and RENTHUS) as measured by
both observer and pupils. In addition,, teachers related as
"Businesslike" by the observer had higher class residuals on Math
vs. Non-Math. Teachers rated lower by their classes on analysis,
but higher classes with higher residuals.
Pro-Math Composite
Since this scale uses items from the previous two and the
following, many of the results are redundant and will not be
discussed.

TABLE 14
SIGNIFICANT CORRELATIONS BETWEEN'RESIDUAL CHANGES ON CLASS ACHIEVEMENT MEASURES ANDTEACHER BEHAVIOR MEASURES WITH PROPORTION OF VARIANCE OF RESIDUALS ACCOUNTED FOR (R2)
Class Measure (Residual)
r ** 2 .r P^** Tparher Behavior Measure
Identifier Description Source
Math Fun vs. Dull
(RESPUN)
Math vs. Nonnath
(RESMATH)
.36 .34 .31 .30 .28 .28 .28 .26
-.25
-.37 .35.35.31 .30 .26-.25
.009
.014
.018
.026
.029
.030.
.033
.039
.050
.008
.008
.011
.021
.023
.048
.050
.13 .017
.11 .027
.10 .037
.09 .053
.08 .057
.08 .061
.08 .066
.07 .079
.06 .100
-13 .024 .12 .016. .12 .021.10 .041.09 .045 .07 .095 .06 .099
PR1 PR4 RENTHT TCSZ ROPPT RCLART PR8 RTASKT CAQANCAQANRENTHT PR4 TCSZ RCLART PR8 PR1
Clarity Observer Businesslike Observer Enthusiasm PupilsExciting-Stimulating Observer Opportunity to Learn PupilsClarity PupilsHigh Cognitive Quest. Observer Task Orientation •PupilsAnalysis Pupils
Analysis PupilsEnthusiasm Pupils Businesslike Observer Exciting-Stimulating Observer Clarity Pupils High Cognitive Quest. Observer Clarity Observer
Pro-Math Composite
(RESPRO)
.38
.37
.32
.32
.007
.006
.016
.017
.14
.13
.10
.10
.013 .012 .032 .034
PR1 RCLART RENTHT PR4
ClarityClarityEnthusiasmBusinesslike
Observer PupilsPupilsObserver
.31
.31
.30
.29
.29-.27 .26 .26
.019
.022
.026
.024
.031
.042
.047
.047
.09
.10
.09
.09
.08
.07
.07.
.07
.039
.044
.052
.047
.062
.084
.093
.094
ROPPT CAQCLCAQAPRTASKT TCSZ CAOM PR8 PR7
Opportunity to Learn Classroom Climate ApplicationsTask Orientation Exciting-StimulatingMemoryHigh Cognitive Quest. Structures Lesson
Pupils PupilsPupilsPupilsObserver PupilsObserver Observer
(Continued)

Class- Measure (Residuals)
r P<
TABLE 2
r
14
P<
(Continued)
Teacher Behavior Measure Identifier Description Source
Math Easy vs. Hard
(RES EASY)
-.45 .27 .27
.001
.037
.040
.21
.08
.07
.002
.075
.081
CAQAN Analysis Pupils TC8I Exciting-Stimulating Observer PR1 Clarity Observer
Facilitating Anxiety
(RESPANX)
Debilitating Anxiety
(RZSDEDX)
Actual Math Self -Concept
(RE3ACT)
.31
.31 -.27
.27
.25
.46
.38
.35
.32 -.30 .30 .27
.018
.018
.038
.038
.050
.001
.005
.009
.019
.024
.024
.033
.10
.10
.07
.07
.06
.21
.14
.12
.10
.09
.09
.07
.036
.037
.076
.076
.100
.001
.009
.018
.037
.048
.049
.067
RCLART Clarity Pupils RTASKT Task Orientation Pupils CAQL Lecture Pupils
TCSI Exciting-Stimulating Observer PR6- Ctiticism Observer
RTASKT Task Orientation Pupils RCLART Clarity Pupils RENTHT Enthusiasm Pupil* TCSS Exciting-Stimulating Observer CAQLO Low Cognitive Composite Pupils •PR1 Clarity Observer ROPPT Opportunity to Learn Pupils
N for correlations with Teacher Behavior Measures whose identifier starts with "R" is 46. N for othor Teacher Behavior Measures is 43.
•Significance based on one-tailed test. ••Significance based on proportion of variance accounted for by predictor.

Math Easy vs. Hard
Observer ratings of the teacher on "Clarity" and "Exciting-
Stimulating" correlated positively with residuals. A striking
negative
result is the correlation of th« residuals with pupils' rating of their
teacher's emphasis on analysis.
Facilitating Anxiety
All variables which correlated with residuals on facilitating
anxiety were from pupils. Teachers rated higher orl clarity and
task-orientation had higher residuals. Teachers who spent more
time talking had classes with higher facilitating anxiety.
Debilitating Anxiety
Two observer measures correlated with residuals. Teachers
rated as more exciting and using more criticism of pupil statements
had higher residuals on debilitating anxiety. It should be recalled
that higher scores en this scale indicate absence of debilitating
anxiety.
Actual Hath Self-Concept
Clarity and teacher enthusiasm as measured by both pupils and
observer related positively to residuals on actual math self-concept.
Further, pupils', rating of teachers on "Task Orientation" and pro
viding an "Opportunity to Learn Algebra" were positively related
to residuals on this attitude scale. Finally, classes which rated
their teacher as giving more emphasis to lower cognitive skills
had lower residuals on this scale.
SUMMARY
DISCUSSION OF FINDINGS'
Factors synthesized by Rosenshine and Furst (1971) as teacher
behaviors relating to pupil achievement showed up in this study as
important for attitudes towards mathematics. The most consistent
results centered on teacher behavior's of clarity, enthusiasm, and
task orientation (businesslike) behaviors. Whether ratings were
completed by the classroom observer or by the pupils, teachers
who were rated as .clearer, as more enthusiastic, and as more
'businesslike had classes with higher residual attitudes.
The results for achievement differences .were not as productive.
Nevertheless, teachers rated as more businesslike had classes with
higher residuals on computation, and teachers rated as clearer had
classes with higher residuals on comprehension.
A surprising result occurred in the classification of teacher
behavior on a cognitive dimension. 'Teachers whose pupils rated
them as emphasizing analysis activities had no better achievement
than other teachers but did have classes with lower residual
attitudes towards mathematics on several scales. It appears that,
if pupils perceive their teacher as spending more time in analysis
questions and activities, they will view mathematics as being
harder, duller., and less attractive than non-math courses.
A second unexpected result centered about the pupils' perception
of the amount of time their teacher spent talking. Teachers who were
rated as talking more had classes which had higher residuals on the
analysis scale. It is possible that these teachers who spent more
time talking were actually having the students perform the analysis
of problems. This possibility is supported by the observer's ratings
of the teachers on the "Probing" measure relating positively with
the residuals on analysis. In fact, it was a notable characteristic
of the algebra classrooms in this study that, even though the
teachers accounted for the bulk of classroom talk, they rarely
talked for more than a minute without asking for a response from
the students.
SIGNIFICANCE OF THE STUDY
This study used high-inference teacher behaviors which were
synthesized from process-product studies. It was unusual in that
different sources were uaed for rating teacher behaviors—an
outside observer and the residents of the classroom, the pupils.
Outcome measures were multidimensional to permit a variety of teacher
influence to emerge.
The narrowing of this study to suburban schools and one subject,
ninth-grade algebra, did not severely impair the generalizability
of the results. On the other hand, this restriction makes the
reaults more valuable to mathematics education. Rating sheets for
student teachers in mathematics should emphasize some of the
behavior constellations found important in this study. High schools
should promote the teacher behavior* of clarity, businesslike
behavior, and enthusiasm in their freshmen algebra classes. These
behaviors will lead to a modest improvement in class attitudes
towards mathematics. An improvement in attitudes, however modest,
may substantially increase the number of students electing, mathe
matics courses beyond algebra.
FURTHER RESEARCH
The data collected in this study included low-inference teacher
behavior measures. The next question to be investigated is how low-
inference teacher behaviors relate to the high-inference behaviors
cited in this paper as important for pupil achievement and attitude.
REFERENCES
Ball, M.S. Studies with Respect to the Uses of Mathematics in Secondary School Curriculum" Ph.D. Dissertation, University of Michigan, 1969.
Bloom, B.S.(Ed). Taxonomy of Educational Objectives. Handbook I; Cognitive Domain. New York : David McKay, 1956.
Romberg, Thomas and Wilson, Janes W.' "The 'Development of Mathematics Achievement Tests for the National Longitudinal Study of Mathematics Achievement ."The Mathematics Teacher. May, 1968, 36, 489-495.
Romberg, Thomas A. and Wilson, James W. NLSMA Report 07; The Development of Tests. James W. Wilson, Leonard 5. Cahen, and Edward G. Begle (Eds). Stanford University, SMSG, 1969.
Rosenshine, Barak and Furst, Norma. "Research on Teacher Performance Criteria. " in Research inTeacher Education. B. Othanel Smith (Ed). Englewood Cliff, New Jersey:Prentice- Hall, 1971.
Ryans, David G. Characteristics of Teachers. Washington, D.C.:American Council on Education, 1960.
Steele, J.M.; House, E.R.; Lapan, S.; and Kerins, T. Instriietional Climate in Illinois Gi fted Classes. Illinois Gifted Program Evaluation, Urbana: Center for Instructional Research and Curriculum Evaluation, University of Illinois, August, 1970.
Steele, Joe Milan; House, Ernest R.j and Kerins, Thomas. "An Instrument for Assessing Instructional Climate through Low- Inference Student Judgments." American Educational Research Journal. May, 1971, vil, 447-466.
Wilson, James; Cahen, Leonard S.; Begle, Edward G.NLSMA Report *2, Part A; Y-Pepulatton Test Batteries'. Stanford University, SMSG, 1968.
Wilson, James W.; Cahen, Leonard; and Begle, Edward G. (Eds). KLSMA Report f5; Description and Statistical Properties of Y-PopuIatlon Scales. Stanford University, 5M5G, 196B.
Wilson, James W. ; Cahen, Leonard; and Begle, Edward G. (Eds). NLSMA Report #9: Non-Test Data. Stanford University: SMSG, 1968.