Relations of Production and Modes of Surplus Extraction in India
116
DEPARTMENT OF ECONOMICS Working Paper Relations of Production and Modes of Surplus Extraction in India By Amit Basole Deepankar Basu Working Paper 2011‐01 UNIVERSITY OF MASSACHUSETTS AMHERST
Transcript of Relations of Production and Modes of Surplus Extraction in India

DEPARTMENT OF ECONOMICS
Working Paper
Relations of Production and Modes of Surplus Extraction in India
By
Amit Basole Deepankar Basu
Working Paper 2011‐01
UNIVERSITY OF MASSACHUSETTS AMHERST

RELATIONS OF PRODUCTION AND
MODES OF SURPLUS EXTRACTION IN INDIA*
Amit Basole and Deepankar Basu
Department of Economics, University of Massachusetts, Amherst, MA, USA
(October 02, 2010)
Abstract: This paper uses aggregate-level data, as well as case-studies, to trace out the
evolution of some key structural features of the Indian economy, relating both to the
agricultural and the informal industrial sector. These aggregate trends are used to infer:
(a) the dominant relations of production under which the vast majority of the Indian
working people labour, and (b) the predominant ways in which the surplus labour of the
direct producers is appropriated by the dominant classes. This summary account is meant
to inform and link up with on-going attempts at radically restructuring Indian society.
Keywords: relations of production, forms of surplus extraction, mode of production,
India.
JEL Codes: B24, B51
* This is a substantially revised version of our earlier work “Relations of Production and Modes of Surplus
Extraction in India: An Aggregate Study” that appeared on Sanhati (www.sanhati.com) and was hosted as Working
Paper 2009-12, Department of Economics, University of Massachusetts, Amherst; the present version is
forthcoming in the Economic and Political Weekly. We would like to thank Debarshi Das, Gail Omvedt, Mohan
Rao, Sukla Sen, Abhay Shukla, Rahul Varman and the editorial staff of Economic and Political Weekly for very
helpful comments on the earlier version.

Men make their own history, but they do not make it as they please; they do not make it under
self-selected circumstances, but under circumstances existing already, given and transmitted
from the past.
The Eighteenth Brumaire of Louis Bonaparte, Karl Marx.
INTRODUCTION
Assessing the nature and direction of economic development in India is an important theoretical
and practical task with profound political and social implications. After all, any serious attempt
at a radical restructuring of Indian society, if it is not to fall prey to empty utopianism, will need
to base its long-term strategy on the historical trends in the evolution of the material conditions
of life of the vast majority of the population. Attempting to build on past debates and as part of
on-going attempts at radical transformation of Indian society, this paper tries to provide a
summary account of the evolution of some key structural features of the Indian economy over
the last few decades.
In providing this summary account, we connect with and speak to issues thrown up by earlier
work on characterizing Indian society. The primary, though implicit, reference point for this
paper is the “mode of production” debate that occupied scholars and activists in India during the
1970s and 1980s.i This paper is an attempt to revisit that debate in the light of new data that has
since become available; it is also an attempt to widen the analytical and empirical focus beyond
the agricultural sector, the sole concern of the “mode of production” debate. While it is true that
agriculture continues to “employ” the vast majority of the working people in India, the last few
decades have also witnessed the slow but steady growth of an industrial and services sector. A
large part of the working class now constantly shuttles between these sectors, as much as it
physically moves between regions and states. Hence it is important to include this growing non-
agricultural sector in any analysis of the evolution of the Indian economy, not least because the
availability of non-farm employment opportunities has profound implications for the material
and social lives of the vast majority of the rural poor.

The principal questions that motivate this study are: what types of production relations does the
vast majority of the working population in Indian agriculture and industry labor in? How is
economic surplus appropriated from the direct producers? The aim is to understand the material
conditions under which the working population labors, the manners in which it is exploited, the
relations into which they enter during the process of production, the conflicting interests that
arise among economic actors from contradictory locations that they occupy within the web of
production relations, and to indicate the possibilities of fruitful political mobilization that this
emerging set of class positions throw up.
This paper combines an analysis of aggregate-level trends as revealed by the successive rounds
of the National Sample Survey with micro-level studies (village-level studies for the agrarian
sector and industry-level studies for the informal manufacturing sector). While a study of the
structural evolution of the Indian economy is of interest in itself, this paper uses trends in the
structural evolution to make inferences about the mode of generation, appropriation and use of
the surplus product in Indian society.ii The focus on surplus appropriation, in turn, is motivated
by the idea that the form of extraction of unpaid surplus labour from the direct producers and the
manner of its distribution among the dominant classes provides the key to understanding the
structure and evolution of any class-divided society (Marx, 1993).
Accepting the centrality of the notion of economic surplus, this study attempts to identify the
evolution of the modes of appropriation of surplus labour in India indirectly by studying the
evolution of key structures of the Indian economy. The underlying assumption of the whole
study is that the evolution of the key economic structures, like ownership patterns in the agrarian
economy, the evolution of labour forms like tenancy, wage-labour, bonded labour, the size-
distribution of firms in the informal sector, the patterns of employment and migration, the
importance of merchant and finance capital, etc., can provide useful and reliable information
about the mode of surplus extraction. While it is possible to form a picture of the aggregate
evolution of the Indian economy using data available from sources like the National Sample
Survey Organization (NSSO), the Agricultural Census, the Census of India – and that is precisely
what we do in this study - we are fully aware of the limitations of such aggregate accounts. Many
micro-level variations are lost in the aggregate story and so, at every crucial point in the analysis

and subject to the availability of data, the aggregate picture is complemented with case studies. It
is hoped that the combination of aggregate-level trends with micro-level, often qualitative,
evidence will help in forming a comprehensive, historically grounded picture of the political
economy of India.
Apart from a concluding section that raises some philosophical and political questions for further
discussion, the paper is broadly divided into two parts, one dealing with the agrarian economy
and the other with what has come to be called the “informal” industrial sector. This twin focus is
motivated by the following considerations. First, the agrarian economy accounts for the largest
section of the country‟s workforce and population. Second, in the non-agrarian economy the
majority of the workforce is found in what has been called the “informal” sector. Third, to the
extent that an understanding of the relations of production (and forms of surplus extraction) is at
issue, most serious scholars and activists would agree that the “formal” sector is characterized by
capitalist relations of production. On the other hand, the informal sector is much more complex
and thus the focus of our study.
One final caveat is in order. Based largely on NSSO data and to some extent on commissioned
studies, the Sengupta Commission Reports (NCEUS 2007a and NCEUS 2009) have given a
comprehensive picture of the recent trends in informal employment, conditions of work, and
regional variations for all three sectors. It is not our intention here to reproduce the same data.
Rather we wish to offer some theoretical interpretations based on our as well as the Sengupta
Commission‟s analysis of the NSSO data.

PART I: AGRICULTURE
Framed in the backdrop of massive mobilization of the rural poor against intolerable conditions
of existence in the late 1960s, expressed politically in the eruption of the Naxalite movement and
its brutal suppression by the Indian state, the “mode of production” debate brought together some
of the most prominent Marxist social scientists in India in their attempt to characterize the
agrarian structure in India. Was it capitalist or was it semi-feudal? What were the main classes in
rural society? How should India‟s relationship with imperialism be factored into the
characterization of Indian society? What kind of revolutionary political strategy followed from
the political economic analysis? These were some of the main questions around which the debate
was organized.
The time is probably ripe for revisiting this debate, for going back and taking another look at the
issues raised and the questions asked. There are at least two reasons for this. First and foremost,
we are once again witnessing the mobilization of the rural poor, this time not only against the
continued poverty and misery that has become their lot under the post-colonial Indian state, but
also against dispossession by the State and by capital. The numerous peoples‟ movements,
ranging from anti-SEZ (Special Economic Zone) struggles, to movements against displacement
and for rights over common property resources to the Maoist movement, are political expressions
of this enormous rural churning. This provides a backdrop which is very similar to that provided
by the late 1960s in India; this backdrop, this objective reality of peoples‟ struggles, impels us to
once again ask fundamental questions about the structure and dynamics of Indian society.
Second, more than two decades have elapsed since the “mode of production” debate ended in the
early 1980s; these two and a half decades have seen several changes in the direction of policy of
the Indian state, the most notable being the wholesale adoption of the neoliberal economic
framework. Did this policy change impinge on the structure of the Indian economy? If so how?
With the passage of time, we also have access to more and possibly better quality data about the
Indian economy; this new data can be fruitfully used to empirically evaluate many of the claims
thrown up during the “mode of production” debate. It is for all these reasons, and with

motivations very similar to those of the participants in the previous debate, that we wish to
revisit the mode of production debate, starting with an analysis of the agricultural sector and then
moving on to the “informal” industrial sector.
In order to analyze the spatial and temporal patterns of rural class structure we compile all-India
data on land holding patterns, landlessness, forms of tenancy, credit, and sources of income and
supplement it with state-level data. Further we combine the aggregate data (drawn mostly from
NSSO reports and economic censuses) with village-level case studies from several major Indian
states.
A. Declining size of average holdings
According to the NCEUS (2007), as of January 2005 the total employment (principal plus
subsidiary) in the Indian economy was 458 million, of which the informal sector accounted for
395 million (86%).iii
Of the 395 million unorganised sector workers, agriculture accounted for
253 million (64%) and the rest 142 million were employed in the non-agriculture sector. While
the share of value added (GDP) coming from agriculture has declined sharply from around 39%
in 1980 to about 17% in 2007, the share of the total labour force engaged in agricultural activities
has displayed a much slower decline from 68% to 57% during the same period. As is well-
known, this has effectively trapped the largest section of the Indian workforce, for lack of
alternative employment opportunities, in a low productivity sphere of production, leading to
extremely low incomes and consumption expenditures. The continued reliance of a large
majority of the population on agriculture, which adds an ever-declining share to GDP, clearly
underlines the failure of any meaningful structural transformation of the Indian economy over
the last five decades since political independence. While this picture remains valid in aggregate
terms, as we discuss later on, several micro-level studies from all across India in the past 20
years point to a growing importance of non-farm wage labor in the rural economy.
With the majority of the working population in India engaged in agricultural activities, and with
land being one of the most important inputs in agricultural production, one is naturally led to

enquire into the evolution of average size of landholdings and other aspects related to ownership
of land in rural India. One of the key facts about the evolution of the agrarian structure in India
over the last five decades is the steadily declining size of agricultural holdings, as depicted in
Figure 1, with a value that is currently even less than half the corresponding value in the early
1960s. But this average decline hides interesting patterns across size-classes of ownership. To
discuss this and other important trends disaggregated by size of ownership holdings, we use a
size-class classification of the peasantry that is summarized in Table 1. Later in the paper we
offer some theoretical justifications for this classification based on sources of income data. The
category of “effectively landless” is discussed further in the next section.
Table 1: Size-Class Definition
Size-Class Area Owned
Effectively Landless =< 1 acre
Marginal 1.01 – 2.5 acres
Small 2.51 – 5 acres
Middle 5.01 – 10 acres
Large > 10.01 acres
The average size of holdings obtaining in India today also has important implications for the
agenda of redistributive land reforms, as traditionally envisaged within the left political tradition;
we will comment on this issue in a later section but here wish to focus on the differential changes
in the size of ownership holdings at the lower and upper ends of the landholding spectrum.
Average size of ownership holdings has declined over the last five decades at the upper end of
the ownership scale: average size of large, middle and even small holdings have declined, with
small holdings registering the largest proportional decline. While the average size of ownership
holding was 22.21 acres, 7.11 acres and 6.02 acres for large, middle and small category of
peasant households in 1962 respectively, the corresponding figures in 2003 were 18.12 acres,
6.65 acres and 3.44 acres. The picture of overall decline in the size of area owned at the upper
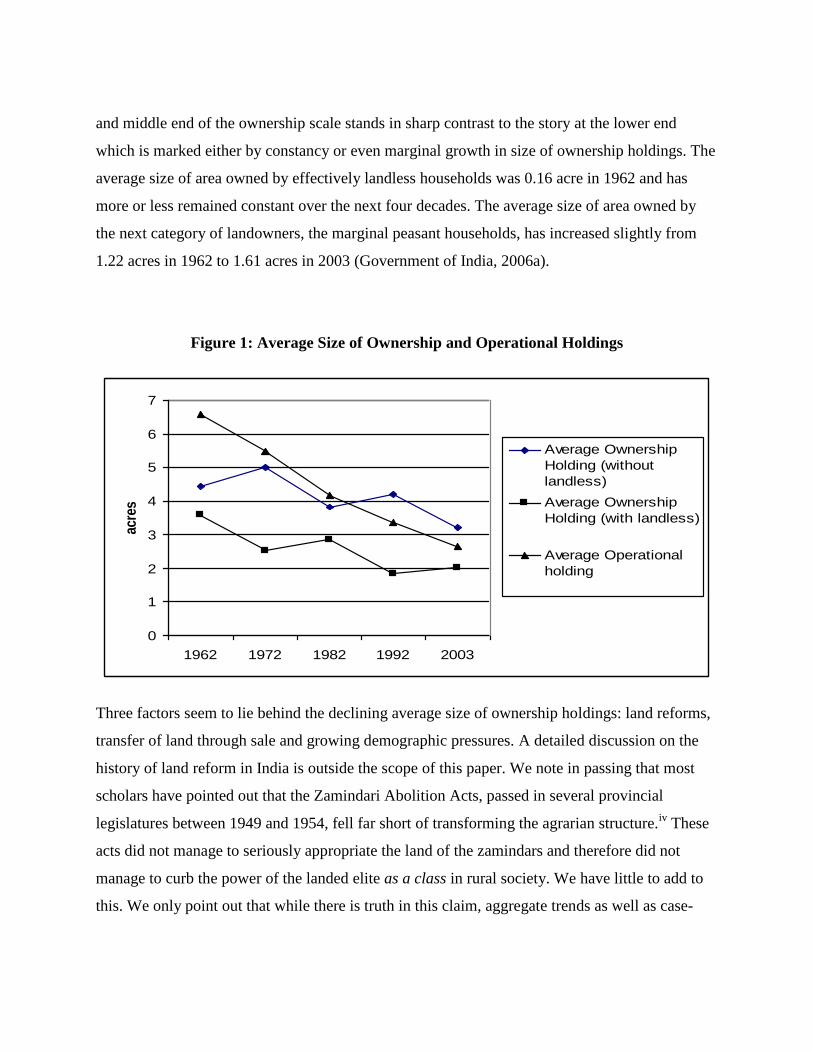
and middle end of the ownership scale stands in sharp contrast to the story at the lower end
which is marked either by constancy or even marginal growth in size of ownership holdings. The
average size of area owned by effectively landless households was 0.16 acre in 1962 and has
more or less remained constant over the next four decades. The average size of area owned by
the next category of landowners, the marginal peasant households, has increased slightly from
1.22 acres in 1962 to 1.61 acres in 2003 (Government of India, 2006a).
Figure 1: Average Size of Ownership and Operational Holdings
0
1
2
3
4
5
6
7
1962 1972 1982 1992 2003
acre
s
Average Ownership
Holding (without
landless)
Average Ownership
Holding (with landless)
Average Operational
holding
Three factors seem to lie behind the declining average size of ownership holdings: land reforms,
transfer of land through sale and growing demographic pressures. A detailed discussion on the
history of land reform in India is outside the scope of this paper. We note in passing that most
scholars have pointed out that the Zamindari Abolition Acts, passed in several provincial
legislatures between 1949 and 1954, fell far short of transforming the agrarian structure.iv
These
acts did not manage to seriously appropriate the land of the zamindars and therefore did not
manage to curb the power of the landed elite as a class in rural society. We have little to add to
this. We only point out that while there is truth in this claim, aggregate trends as well as case-

studies demonstrate that tenancy reform brought into existence a large class of small and middle
peasants, mostly belonging to the “intermediate castes” such as Yadavs in Bihar and Jats in
Haryana, who were erstwhile tenants on large estates owned by upper-caste (usually non-
cultivating) landlords. This is reflected in the decline in share of land held by the largest
landowning households as well as a decline in the percentage of large landholding households in
rural society.
Scaria (2010) in a study of Wadakkancherry village in Kerala notes that
As much as 85% of the landholdings are below one-acre size and these land- holdings
constitute 32% of the total area of the village. This is in complete contrast to the situation
in 1909, when the average size of landholdings was around 10 acres. Around 87% of the
landholdings were below 10 acres in size and constituted only 20% of the total area. (p.
193)
The author attributes these changes to “land reforms, commercialization of agriculture, the
Depression, the second world war, social reforms and demographic pressures.” (ibid)
Historically the problem of small holdings has been further exacerbated by the phenomenon of
fragmentation of plots. Here the aggregate evidence does suggest some mitigation of the
deleterious effects of declining size of contiguous farmed area. Average number of parcels per
operational holding has declined steadily from 5.7 in 1962 to 2.3 in 2003 (Government of India,
2006b). But even within the overall trend of consolidation, there are large regional variations as
highlighted by village-level studies. A recent study of 12 villages in Nalanda district highlights
the continuing, and perhaps worsening, problem of land fragmentation in Central Bihar:
"Another striking aspect of the landholding pattern in Chandkura [a village in Central
Bihar] is the extent of fragmentation of holdings. The average number of plots per
operated holding in 1995-96 was extremely high at 6.6, compared to an all-Bihar figure
of 2.8 in 1991-92 (Government of India, 1996a: A19). The average size of plots was
highest among those operating five acres and above, but even this group operates plots of
an average size of only 1.3 acres." (Wilson 1999, p. 326)
Fragmentation of holdings into multiple plots, as noted by Byres (1981), acts a major drag on the
adoption of technological improvements in agricultural production and thereby impedes the
growth of agricultural productivity, both of labour and of land.
In concluding this section we note that the declining size of ownership holdings suggest that land
concentration – through transfer of land from small to large landowners – is not occurring on any
significant scale in the country. This combined with the decline in share of land held by the
largest landholders, has altered the rural landscape significantly in the past few decades. We
return to this point in Section C.
B. Landlessness
Since land is one of the most important means of production in the agrarian economy, any
analysis of the pattern of land ownership in the rural economy must pay close attention to the
group of landless households. Since this group of households is totally divorced from ownership
of land, they might be expected to give us an accurate measure of the rural proletariat.
According to NSSO data, the extent of landlessness has stayed more or less constant over the last
five decades: in 1960-61, 11.7% of rural households were landless; the corresponding figure in
the 2002-03 survey came out to 10%. However this number is not very useful in understanding
the agrarian class structure for at least two reasons. First it hides tremendous regional variation
that is crucial is explaining local agrarian politics. Even at the state level, the percentage of
landless can vary from 18% (Maharashtra) to 4% (Uttar Pradesh) (Government of India 2006a).
Harris et al (2010) report for Iruvelpattu village in Tamil Nadu that the number of landless
households has apparently doubled since 1981. The authors report that in 2008, 49% of
households were landless compared with 29% reported in 1981.
But there is a more important reason why the category of “landless households” is inadequate
and does not reveal the growing numbers of rural wage laborers. This is because the NSSO
defines landless households as only those households which own less than 0.05 acres. However
data put out by the NSSO itself for 2002-03 show that households owning less than 1 acre use

more than 90% of their land as homestead (Government of India, 2006a, p. 25). Thus, if
landlessness is understood as pertaining to land that can be used for cultivation and that can
generate some income for the family, then a more realistic definition must consider all
households owning less than 1 acre as “effectively landless.” Two pieces of evidence can be
offered in support of this claim. First, NSSO data reveal (Table 2) that 62% of agricultural
laborers come from households that own more than 0.025 but less than 1 acre of land. These are
the very households that we have clubbed together with the pure landless in the category
“effectively landless.” Second, in keeping with the foregoing finding, households owning less
than 1 acre of land derive 60% of their income from wages (see Section E). One caveat that
should be added is that “effectively landless” households may still cultivate their small plots and
we present evidence in Section H that they even sell a substantial portion (44%) of their output
on the market.
Table 2: Composition of agricultural labor and farmer households in terms of size classes
Size Class Agricultural
Labour Household
Farmer
Household
All Rural
Households
Landless 19.7 0.6 13.1
Sub-Marginal 62.3 14.6 44.8
Marginal 12.9 30.7 18.7
Small 4.1 26.5 12.2
Medium-Large 1.0 27.5 11.2
All 100.0 100.0 100.0
Note: Landless (< 0.01), Sub-Marginal (0.01 - 0.40), Marginal (0.41 - 1.00), Small (1.01 - 2.00), Medium-Large (>
2.00) Hectares. Source: NCEUS 2007 (based on NSS61st Round 2004-2005,Employment-Unemployment Survey.)

In Figure 2 and Table A5 we see that the extent of effective landlessness has significantly
increased over the decades, from 44.2% in 1960-61 to 60.1% in 2002-03 for the country as a
whole. This also underscores the highly skewed distribution of landholding patterns in India even
today: as we see in detail in the next section, about 60 percent of the poorest rural households in
2003 owned only 6 percent of the land used for cultivation!
Figure 2: Proportion of Effectively Landless among All Rural Households
44.21 44.8748.21
51.36
60.15
0
10
20
30
40
50
60
70
1962 1972 1982 1992 2003
per
cen
tag
e o
f ru
ral
ho
use
ho
lds
Applying these categories to village-level data collected by Wilson (1999) in Central Bihar we
see that 50 percent of rural households were completely landless and another 21 percent owned
less than 1 acre. Therefore 71 percent of the rural households were effectively landless. The
countrywide trend of large and growing effective landlessness is also supported by data
emerging from the 1999-2000 resurvey of the 12 villages surveyed originally in 1981-82
(Sharma 2005).v In 1999-2000, 43 percent of the rural households in Bihar were completely
landless and another 43 percent owned less than 2.5 acres of land, giving an indication of large
scale landlessness. What we have termed effectively landless households, i.e., those owning less
than 1 acre, grew from 67 percent (of rural households) in 1981-82 to 73 percent in 1999-2000.

C. Patterns of land ownership across size classes
Understanding the class forces currently working in agriculture requires us to look not only at the
evolution of the average size of holdings and landlessness but also at the aggregate ownership
patterns of land in the rural economy across all size classes. The steady decline in average size of
holdings has been accompanied by some striking changes in the pattern of ownership of land in
rural India. The proportion of effectively landless and marginal farmer households (owning less
than 2.5 acres) has increased steadily over the last four decades, from about 66 percent in 1961 to
about 80 percent of all rural households in 2003. This rather large increase has been matched by
a steady decline of large farmer households (owning more than 10 acres): large farmer
households comprise a minuscule 3.6 percent of rural households in rural India today (and in
some states such as West Bengal they have completely disappeared from the scene); in 1961, on
the other hand, this category represented about 12 percent of all rural households. Between the
decline in the share of large landholding families and the increase in the share of effectively
landless and marginal farmer families, the small-to-medium farmer family (those owning
between 2.5 and 10 acres) has managed to more or less maintain its share constant over the past
five decades, decreasing marginally from 23 percent to 17 percent of all rural households
between 1961 and 2003. (Government of India, 2006a)
The pattern of ownership in terms of the share of total area owned more or less matches the
foregoing pattern observed with respect to the share of households in the rural areas, though the
pace of change is more rapid in case of the former. The share of total area held by farmer
families owning up to 2.5 acres has steadily increased from 8 percent of total area in 1961 to
about 23 percent of total area owned in 2003. Paralleling this is the steady decline in the share of
total area owned by large farmer households: the share of area owned by large farmer households
(those owning more than 10 acres) declined from 60 percent in 1961 to about 35 percent in 2003.
Caught between these two trends is the small-to-middle farmer family (those owning between
2.5 and 10 acres), which has marginally increased its share in the total area owned from 33

percent in 1962 to around 42 percent in 2003. The changing pattern of ownership of land is
depicted graphically in Figures 3 and 4 (see Table A2 for details).
Figure 3: Share of Households and Area Owned by Size-Class of Ownership Holdings,
1962
0
10
20
30
40
50
60
70
Eff LL Marginal Small Middle Large
perc
en
tag
e
% of hhlds
% of area
Has this changing pattern of land ownership made the distribution of this most important asset
more equitable? Perhaps counter-intuitively, the answer is no. Though the share of area owned
by large landholding families has declined substantially over the past few decades, driven by
demographic pressures and by some half-hearted attempts at land reforms, the resulting
distribution of land at the beginning of the twenty first century in India cannot be seen as more
equitable than it was five decades ago. This can be seen from the fact that the Gini coefficient of
ownership concentration was 0.73 in 1961-62, 0.71 thereafter till 1992 and then inched up to
0.74 in 2003 and that the Lorenz curve for the ownership distribution has also more or less
remained unchanged between 1961-62 and 2003 (Government of India, 2006; pp. 12-13).

Figure 4: Share of Households and Area Owned by Size-Class of Ownership Holdings,
2003
0
10
20
30
40
50
60
70
Eff LL Marginal Small Middle Large
perc
en
tag
e
% of hhlds
% of area
Continued inequality can also be seen clearly in the evolution of average size of ownership
holdings for all classes relative to the average size of holdings for the effectively landless
households (Figure 5). As reported earlier the average size of ownership holdings for large,
middle and small peasant households has declined over the last five decades, but it is still very
large relative to the average size of effectively landless holdings; average size of marginal
holdings has slightly increased, over the same period, relative to the effectively landless
holdings. While some land has moved from the upper to the lower spectrum of landownership,
the growth of households at the lower end has far outstripped this transfer of land; thus, the
degree of aggregate inequality in ownership has remained largely intact through these five
decades.
The picture of agrarian change painted above – in terms of patterns of land ownership and
average size of ownership holdings by size-class categories – for the whole country is
corroborated by the 1999-2000 resurvey of 12 villages (Sharma 2005). Since the stratified
random sample of roughly 600 households is spread across the plains of Bihar, a comparison of
the agrarian structure in 1981-82 (original survey) and 1999-2000 (resurvey) gives a fairly

accurate and comprehensive picture of the key aspects of agrarian change in Bihar, and possibly
in Eastern India as a whole. Changes in the distribution of landownership in Bihar, according to
the resurvey in 1999-2000, has been underlined by the loss of land, as measured by the average
size of ownership holding, from all categories of size-classes and all caste groups. The loss of
land was steepest for landlords, big peasants and agricultural labourers; the loss was lowest for
the middle category of peasants, with poor middle peasants even gaining some land between
1981-82 and 1999-2000. In terms of caste, the most interesting pattern seems to be the relatively
lower loss of land witnessed by the intermediate caste groups: Yadavs, Koeris and Kurmis.
Figure 5: Average Size of Ownership Holdings for different Size-Classes
0
20
40
60
80
100
120
140
160
1962 1972 1982 1992 2003
mu
ltip
le o
f eff
lan
dle
ss h
old
ing
Marginal Small Middle Large
Both these patterns have important implications for changes in the caste-class nexus in Bihar,
and possibly all over India. At the lower end of the social and economic ladder, there is hardly
any change over the decades: the scheduled caste households by and large continue to remain
landless or near-landless, and mired in unimaginable poverty. At the upper end of the social
ladder, there is a noticeable shift, though incomplete, in the ownership of land and social power
from upper-caste non-cultivating landlords to intermediate-caste cultivating peasants.

A note on size, surplus and class
The skewed distribution of land ownership of course in itself does not provide very useful
information about the dominant relations of production prevailing in the agrarian economy and
modes of surplus extraction most in use; a predominantly feudal mode of production can have a
skewed ownership distribution as much as a predominantly capitalist mode of production. Many
participants in the “mode of production” debate in India in the 1970s, and especially Patnaik
(1972a, 1972b, 1976, 1980, 1986), drew attention to the fact that the acreage or size of
agricultural holdings per se cannot be used to infer the class status, in the Marxist sense, of the
owner of the holding or the relations she/he enters into with other classes in rural society. The
same size of holdings can go with very different ways of organizing production, i.e., capitalist or
semi-feudal, depending on the availability of water, power, fertilizers, draught animals, other
tools and implements, etc. Hence, the same size-class of ownership or operational holding might
have members from very different classes.
While this argument is theoretically valid, we might nonetheless use the average size-class of
ownership holdings as a proxy, decidedly approximate, for the class position of the owner of the
holding. This is a purely empirical argument and follows from the following two observed facts:
(a) there is a very strong positive correlation between the size of land possessed and the
ownership of animals, minor tools and implements (like sickles, chaff-cutters, axes, spades and
choppers) and tractors (Statement 2, Government of India, 2005); and (b) if we define, following
Patnaik (1976), the rural classes as full-time labourer, poor peasant, middle peasant, rich peasant,
capitalist and landlord, then the proportion of the “upper classes” tend to increase as we move
from smaller to larger sizes of ownership holdings. The second assertion, which seems fairly
intuitive, is partly reflected in Patnaik (1980). In her sample of 236 households, of those owning
between 2.5 and 10 acres, the majority were small peasants; of those owning between 10 and 15
acres, the majority were middle peasants. Even though Patnaik (1980) did not use a random
sample and the sample size was small, we can probably still make the claim that size of holding
provides a good approximation of the class position of the owner.

But we do not want to attach more importance to acreage than to use it as a rough indicator of
class status. Hence, we supplement the above data on aggregate ownership patterns with the
following variables: (1) geographical variation of land ownership across Indian states, (2) the
extent of tenancy, both over time and across space, (3) evolution of the pattern of tenancy
relations, (4) the extent and growth of landlessness, (5) the major sources of income of rural
households, (6) the pattern of capital accumulation in the agricultural sector, and (7) sources of
credit in the rural economy. Taken together with the evolution of the pattern of land ownership,
these might help us construct a broad picture about the relations of production and the
predominant modes of surplus extraction in the agrarian economy.
The second problem with relying on aggregate acreage data is that large productivity
differentials may exist between irrigated and non-irrigated areas. The size of the agricultural unit
and surplus produced have a complex relationship co-determined by technological and
geographical variables. A small plot in a dry area will produce much less surplus than a small
plot in a well-irrigated area; a small fruit orchard will produce more by way of income than a
small subsistence plot. For example Vakulabharanam (2004) finds irrigated land to be equivalent
to twice the non-irrigated land in terms of yield per acre, in Telangana. A recent study of the wet
and dry areas of Tamil Nadu (Athreya et al 1986) offers a glimpse at how class structure is
influenced by geographical and technical variables. Family labor accounts for a bigger share of
total labor input in the dry areas as compared to the wet areas. A reflection of this fact is that the
middle peasantry forms a more significant part of the population in the dry area, accounting for
nearly half the agrarian population. We reproduce data from Athreya et al in Figure 6.
Further, the authors note that
…due to the high level of surplus production in the wet area, the surplus appropriating
classes constitute a bigger share of the total population (15 per cent), than in the dry area
where they make up a mere 4 per cent. (p. 9)

Figure 6: Estimated class structure of wet and dry area (percentage of agrarian
population) (Athreya et al., p.7)
0
510
15
2025
30
35
4045
50
Agr
i lab
orer
s
Poo
r peas
ants
Middle
Pea
sant
s
Rich
Peasant
s
Capi
talis
t Far
mers
Culti
vatin
g Lan
dlord
s
Pur
e landl
ords
Oth
ers
perc
en
tag
e
Wet
Dry
To the best of our knowledge such data is not available at the national level to the same extent
that data on land ownership distribution is; hence, even though we understand the importance of
the issue, we do not present detailed data on this in the paper. We hope that this issue will be
explored in future research. However, we do not think that productivity differentials between
irrigated and non-irrigated areas make state or national-level analysis useless. The appropriate
level of analysis depends on the questions that the analysis is meant to address. Our aim in this
study is to understand the broad patterns of evolution of the relations of production that the
majority of the working population in India labours in; that is why we have undertaken the
analysis at the aggregate level. We are aware of the fact that this necessarily forces us to ignore
several important variations, like the extent of irrigation, observable at lower levels of
aggregation; every aggregate level study would face this limitation. A more disaggregated
analysis is something we might take up in the future to complement our present study; but we
believe that this does not detract from the usefulness of aggregate-level studies, which can
inform national-level political strategy and action.

D. The declining importance of tenancy
Growing landlessness might not lead to the consolidation of capitalist relations of production and
growth of the rural proletariat and semi-proletariat if there is widespread and continuing
prevalence of tenant cultivation. There are after all, two different ways in which the surplus
labour of direct producers can be appropriated by the ruling classes in a rural context, directly as
wage-labour (with various degrees of un-freedom built into the wage contract) and indirectly as
land rent, with the latter referring to the rent paid as part of a tenancy contract. The first method
of appropriating surplus is associated with capitalist relations of production, while the second is
associated with semi-feudal methods of surplus extraction.
Tenant cultivation, with sharecropping as the form of the tenancy contract, especially allows
extraction of the surplus product in the form of land rent. Therefore, sharecropping tenant
cultivation has been historically identified as one of the most important semi-feudal forms of
surplus extraction in rural India. It is for this reason that the extent of its prevalence today can be
used as an important indicator of the continued strength of feudal and semi-feudal modes of
surplus extraction, and indirectly at the relative strength of the landed gentry in rural society.
Hence, it is important to complement the study of land ownership and landlessness patterns with
a close study of the evolution of tenancy, both the extent of its prevalence and the evolution of its
form, over time. What does the evidence on tenancy show?
Aggregate level data suggests that tenant cultivation as a form of organizing agricultural
production has witnessed a steady decline in rural India over the last four decades. According to
NSSO data, the percentage of households leasing in land has declined from 25% in 1971-72 to
12% in 2003; the percentage of area leased in to total area owned has declined from 12% in
1971-72 to 7% in 2003; and the percentage of area leased out to total area owned has also
decreased from 6% in 1971-72 to 3% in 2003 (Government of India, 2006a). The same declining
pattern is observed even with data on tenancy from the various Agricultural Censuses in India.
The sharp decline in the extent of tenancy is also observed for operational holdings. Whereas the
percentage of operational holdings with partly or wholly owned land has practically remained
unchanged at around 95%, the percentage of operational holdings with partly or wholly leased-in

land has fallen drastically from around 24% in 1960-61 to 10% in 2002-03. In terms of the total
area operated, the percentage share of area leased in has declined from 10.7% in 1960-61 to
6.5% in 2002-03. At the aggregate level, the gradual shift from tenant cultivation to self-
cultivation seems to be a persistent and unmistakable trend in the Indian agrarian economy.
It is true that aggregate figures about the decline of the extent of tenancy might not be very
helpful in drawing conclusions about the “tenancy problem”. For it is conceivable that the
decline in tenancy is largely restricted to larger holdings, i.e., those belonging to middle and rich
peasants, while there is a simultaneous increase in the incidence of tenancy for smaller holdings,
i.e., those belonging to poor peasant and effectively landless households (Patnaik, 1976). Since,
in any meaningful sense, the “tenancy problem” refers to the indirect extraction of surplus labour
of the landless and near-landless households, we need to supplement the aggregate picture about
the evolution of tenancy with a more disaggregated story, where the disaggregation runs along
size-classes.vi
The aggregate evidence on the evolution of tenancy by size-classes can be seen as emphasizing
five important points. First, as shown in Figure 7 (details in Table A7), other than for large
operational holding (i.e., operational holdings of 25 acres or more), the share of tenant holdings
(i.e., holdings with partly or fully leased-in land) has declined sharply in all the other categories
since 1960-61. In fact, the share of tenant cultivation has marginally increased for large
operational holdings over the last five decades (though there is a decline for this category
between 1991-92 and 2003).
Second, as shown in Figure 8, the share of area leased in by size-class of operational holdings
display the same pattern across size-class categories: the share of leased-in area (in total operated
area) has declined across the board, with the decline sharpest for the medium holdings. For large
operational holdings, the share of leased in land declined by the least proportional amount, with a
large decline recorded between 1991-92 and 2003.

Figure 7: Percentage of Tenant Holdings by Size-Class
0
5
10
15
20
25
30
Marginal Small Semi-
medium
Medium Large All sizes
pe
rce
nta
ge
of
ho
us
eh
old
s
1960-61
1970-71
1981-82
1991-92
2002-03
Third, as a culmination of the above two trends, a large proportion of the tenanted land was
operated by the relatively large holdings. In 2003, for instance, 70 percent of the total tenanted
land was operated by holdings that were larger than 2.5 acres, which accounted for only about 30
percent of all the operational holdings. Since only about 10 percent of such holdings were tenant
holdings, this implies that about 70 percent of the total tenanted land was operated by only 3
percent of all operational holdings. Thus, even though marginal holdings (i.e., holdings of less
than 2.5 acres) had a higher share of operated land as leased-in land, the relatively larger size-
class categories operated a preponderant majority of the tenanted area (Government of India,
2006b, page 30).
The fourth trend relates to the terms of tenancy, i.e., the specifics of the tenancy contract. The
NSSO landholding surveys classify contracts relating to leased-in land into the following
categories: (a) fixed money lease, (b) fixed produce lease, (c) share of produce lease, (d) service
contract lease, (e) share of produce along with other terms, (f) leased from relatives. Figure 9
displays the trend for the terms of the tenancy contract since 1960-61 where fixed money and
fixed produce rent has been clubbed together into the category of “fixed rent”. The data shows
two striking trends: (a) the fixed rent category of tenancy contracts, which includes both money
and produce rents, declined till the early 1980s and since then has grown continuously to become

the predominant form of tenancy arrangement in 2003; (b) sharecropping has maintained a
steady share at around 40 percent of all tenancy contracts so that the growth in the fixed rent
category has come at the cost of “other” forms of tenancyvii
(see Table A9 for more details).
Figure 8: Leased-in Area as a Share of Operated Area by Size-Class
0
2
4
6
8
10
12
14
16
18
20
Marginal Small Semi-
medium
Medium Large All sizes
perc
en
tag
e o
f o
pera
ted
are
a
1960-61
1970-71
1981-82
1991-92
2002-03
The fifth fact relates to the geographical variation in the extent and forms of tenancy in 2003 (for
details see Table A9). The states which report the highest share of leased-in area are Punjab,
Haryana and Orissa, two of which have the most “developed” agricultural production. Apart
from Orissa, Punjab and Haryana, all the other major states had leased-in area which was less
than 10 percent of the total operated area. Thus, states which are usually considered to be the
bastions of semi-feudal and pre-capitalist production relations are not the ones which have the
highest prevalence of tenancy, with the notable exception of Orissa. The inter-state variation in
the terms of lease (for details see Table A10) also provides useful information. Haryana and
Punjab, the states with the largest share of leased-in land, had fixed money lease contracts as the
predominant form of tenancy. Assam, Bihar, Orissa and Uttar Pradesh were the four major states
which had sharecropping as the predominant form of tenancy contract.

Figure 9: Forms of Tenancy Contracts
0
10
20
30
40
50
60
1960-61 1970-71 1981-82 1991-92 2002-03
pre
cen
tag
e o
f te
nan
cy c
on
tracts
fixed rent share of produce other
The micro-level evidence on tenancy from Bihar, Uttar Pradesh and Tamil Nadu is in agreement
with the aggregate trends. Wilson‟s (1999) study of Central Bihar hardly ever mentions tenancy
and Harris et al (2010) find very little tenancy in Iruvelpattu, Tamil Nadu. Sharma‟s (2005)
findings highlight a considerable decline in households leasing-in land across the plains of Bihar.
While the proportion of households leasing in land for cultivation has declined significantly from
36 percent in 1981-82 to 23 percent in 1999-2000, the proportion of leased in area in total
cultivated area has inched up marginally. This has resulted in an increase in the average size of
leased-in plots. There is an interesting pattern within the overall picture of declining tenancy:
larger sized holdings increased, while lower sized holdings decreased, leasing-in of land for
cultivation.
In the higher land size category, particularly [for] those with more than 10 acres of land,
there has been a phenomenal increase in proportion of households leasing in as well as
that of leased-in area. Earlier, no leasing in was reported by the households above 20
acres but during 1999-2000, the practice has started in this category also. (Sharma, 2005).

This implies that “reverse tenancy” has emerged as an important trend in Bihar since the early
1980s. In terms of the tenancy contract, fixed rent tenancy – both in cash and in kind – seems to
be replacing sharecropping arrangements, especially in the relatively dynamic regions. “Apart
from sharecropping, leasing in against labour services (labour tying tenancy) was one of the
important modes of tenancy during 1981-82, which seems to have almost vanished by 1999-
2000,” especially so in the Southern plains of Bihar (Sharma, 2005).
Based on village-level studies, Sidhu (2005) also points to the changing nature of tenancy in
North-Western India. In states like Punjab and Haryana, the majority of the tenant cultivators are
no longer the landless and poor peasants; it is rather the middle and rich peasants who lease-in
land to increase the size of their agricultural operations and reap some economies of scale on
their capital investments (Sidhu, 2005). Thus, the prevalence of the fixed money rent form of
tenancy, in Punjab for instance, is not an indicator of pre-capitalist relations of production, but
are rather very much part of the capitalist development in Indian agriculture; the land rent that is
earned by the lessor, in this case, can be considered capitalist rent. In states like Bihar and
Orissa, on the other hand, tenancy is still predominantly of the old form, where the largest group
of lessees is landless and near-landless peasants. In such a scenario, sharecropping operates as a
semi-feudal mode of surplus extraction, where land rent can be considered pre-capitalist rent. viii
Another example of “capitalist forms of tenancy” comes from Jaunpur district, in eastern UP.
Lerche (1999) offers an interesting example of a type of production relation that is neither
strictly sharecropping nor strictly wage labor. In a canonical sharecropping arrangement the
tenant provides all the inputs to production apart from land (even if he may have to borrow from
the landlord to do so) and part of the output is appropriated by the landowner as rent. In Jaunpur,
under the new system, the “sharecroppers” no longer supplies all the means of production
(always excepting land) rather they provide only simple tools. The landowner retains control
over the major inputs and over production itself while the tenant only provides his and his
family‟s labor-power. This appears to be a type of piece-rate system of wages cloaked in
sharecropping phraseology. Though the system has existed for a long time, it has since the 1980s
become a common way of cultivating paddy. In a variant of this, the tiseri system, “the
landowner supplied 2/3 of expenditure for fertilizer and seeds, and provided irrigation, while the

sharecropper provided all labor as well as the remaining share of inputs, and received one-third
of the harvest.” (p. 188) Sharma (2005) reports a similar practice in Bihar. Thus one can clearly
see degrees of dispossession or proletarianization at work here. The tiseri system became more
prevalent in the 1990s as agricultural wages increased. According to Lerche it has been adopted
by landowners as a strategy to handle labor conflict. Here we see the emergence of what appear
to be feudal relations of production (sharecropping in this case), which are really responses to
new conditions created by changes in technology as well as caste/class struggle. The controversy
over “unfree” labor in Haryana provides another example of seemingly pre-capitalist labor
relations (in this case bonded or attached labor) being created in part as a result of capitalist class
struggle (Brass 1990, 1994, Jodhka 1994).
The evidence on tenancy, thus, seems to suggest a sharply declining role of tenant cultivation at
the national level. What is interesting is that its continued prevalence is observed mainly in
contexts of capitalist agricultural production, where sharecropping is less important than money
rents, and not in the states with semi-feudal modes of surplus extraction; among the three states
with the largest reported share of tenant cultivation, the top two are Punjab and Haryana,
precisely the states where capitalist farming has developed the most. In the more pre-capitalist
settings, tenancy is relatively less prevalent today and has steadily declined over the decades but,
along expected lines, sharecropping continues to be the predominant form of the tenancy
contract. If, as mentioned earlier, the tenancy problem largely refers to semi-feudal modes of
exploitation of the landless and near-landless through tenant cultivation, then this problem seems
to have become less severe over the last five decades.
The decline of tenancy is a complex process often mediated by technological change and class
struggle. Chakravarti‟s (2001) study, based on fieldwork done between 1978 and 1980 in a
canal-irrigated village in Purnea district in Northeastern Bihar, though a little dated, offers a
vivid picture of agrarian change and the decline of tenancy in North Bihar, a well-known bastion
of feudalism. Two sets of factors, one social and the other technological, came together to affect
a change in the situation so that by the early 1980s, sharecropping arrangements had been largely
replaced by the use of wage labour. The social factors in question were those that were related to
the emergence and sharpening of class struggle between landlords and sharecroppers, and the

relevant set of technological factors were canal irrigation and tractorisation. Let us take up each
of these in turn.
The first phase of the struggle in the 1930s and 1940s was centered on the action of Santhal
bataidars (share-croppers) against the exploitation of the maliks (upper-caste, non-cultivating
landlords). Despite dogged resistance, the maliks managed to largely evict the Santhals – the
original tenant cultivators – and replace them with more pliant intermediate caste bataidars.
Within two decades, the intermediate caste bataidars, Yadavs in Purnea, managed to replicate the
struggle of the Santhal sharecroppers and fiercely fought to claim occupancy rights over the land
that they tilled. Maliks, once again, attempted to evict the tenants, which the latter resisted, at
times quite successfully. Successful resistance to forcible eviction by maliks meant, according to
the letter and spirit of the Bihar Tenancy Act of 1938, that tenants could buy the land, and often
that is what happened.
Around the time when the maliks were actively trying to reorient production relationships in
Purnea, some crucial technological factors kicked in. Canal irrigation from the Kosi river became
available from 1969, facilitating an enormous increase in the intensity and scale of cultivation.
The traditional agricultural cycle, with annual cultivation of a single crop on a given field, could
now be replaced with multiple cropping on the same piece of land. This led to the development
of a pattern of agricultural production that encouraged the cultivation of paddy, maize and wheat,
the last being a novelty in the area. Keeping pace with the strict requirements of cropping time in
the new agricultural cycle was greatly facilitated by the adoption of tractors. Thus, the tenant-
labour based plough teams were gradually replaced with wage-labour using tractors. “By and
large, the capacity of big landholders to organize production within the framework of the new
agricultural cycle was determined by the possession of tractors.” (pp. 96, Chakravarti, 2001).
The confluence of social and technological factors, thus, heralded the decline of sharecropping
and its replacement by the use of wage labour. But what emerged from the womb of tenancy was
not doubly free wage labour. Rather maliks attempted to work out arrangements so that
dependency and “unfreedom” could be continued even within the framework of wage labour.
The main mechanism through which agricultural workers could be constrained to work

exclusively for the same malik as his “unfree labour” (known as lagua jan) was debt. One can
surmise, based on field studies carried out in other parts of Bihar and in later years, that as
employment opportunities outside agriculture became accessible to agricultural workers and poor
peasants, their bargaining power increased, and elements of dependency and unfreedom
gradually became weaker over time (see, for instance, Wilson, 1999; and Sharma, 2005).
A caveat is in order before we conclude this section on tenancy. It is well known that reliable
data on the real extent and terms of tenancy is difficult to come by. Due to the possibility of legal
action securing the rights of tenants, there is always an incentive for landlords to understate the
extent of tenancy they actually participate in. Often times, this is done by replacing recorded
tenants with unrecorded tenants; if the extent of unrecorded tenant relationships are large, then
official data on the extent of tenancy would underestimate their true prevalence. It is difficult to
rule out the possibility that the NSSO data on tenancy suffers from such problems. What might
mitigate the problem is the fact that we have looked at data on tenancy over several decades and
not only at a point in time; hence, if the prevalence of unrecorded tenancies have remained more
or less stable over time, we might get a relatively correct picture of the trend. Additionally, since
we have supplemented aggregate level data with evidence from field-based studies and since
both seem to point in the same direction, our conclusions regarding the prevalence and forms of
tenancy are relatively robust.
E. Sources of income and the growing importance of non-farm employment
While information on patterns of land ownership, landlessness and tenancy provide very useful
clues about the agrarian structure of India, this needs to be complemented with data on the
sources of rural income to get a more complete picture of class relations. How does the vast
majority earn their incomes? Do they work mainly for wages or do they derive the lion‟s share of
their income from self or tenant cultivation? What portion of their income comes from petty
production? These are important questions to consider because they provide clues about the
necessary relations into which the majority of the rural population enter during the process of
production and income generation. A predominance of wage income would suggest the gradual

spread of the institution of wage-labour and therefore of capitalist relations; continued
dependence on income from cultivation (self or tenant) would suggest an opposite story.
Several caveats are in order before we proceed. First, a straightforward link between wage-labor
and capitalism on the one hand, and non-wage income and non-capitalism on the other hand is
problematic. As we will see in the section on industry, various types of self-employment income
can result from merchant and finance capitalist relations (mainly variations on the putting-out
system); hence non-wage income can often mask the underlying capitalist relations. Similarly,
wage income can often mask the fact of bondage, extra-economic coercion and other forms of
“unfree” labour restricting the domain of operation of capitalist relations. But, as has been
pointed out, for instance by Patnaik (1976) and Brass (1990), many of these “unfree” relations
are created by capitalism and are not relics of a pre-capitalist past. The second caveat is that the
same individual may participate in several types of economic activities, as we highlight below,
and thus the aggregate level distinctions that we make between wage and non-wage income
might need serious modifications when looking at more micro-level phenomena. With these
caveats in mind, we will proceed to study the sources of rural income because we feel the
aggregate level distinction between wage and non-wage income still has important clues to offer
about the dominant relations of production in India.
To start an analysis of the sources of rural income we need to revisit the issue, pointed out
earlier, of the continued fragmentation of land. Continuing fragmentation leads to a declining
average size of ownership and operational holdings, and this increasingly brings the question of
viability of small-holding cultivation to the fore. Of course the small size of the average holding
is not the only factor that needs to be reckoned with when looking at the issue of viability of
small-scale cultivation. Existence of the ground-rent barrier (Patnaik, 1986), lack of formal
credit, movement in the terms of trade vis-à-vis industry and services, dwindling rural public
investment and rapidly eroding irrigation facilities kick in too, and makes technological change
almost impossible to initiate and sustain at the farm level; the exploitation faced by farmers in
the input and output markets, combined with these other factors, force incomes from small
holdings to be extremely low. For instance, in 2002-03, the average return from cultivation per
hectare, i.e., value of output less value of paid out expenses (excluding value of family labour or

rent of owned land), was Rs. 6756 for Kharif and Rs. 9290 for the Rabi season (Mishra, 2007).
The low returns from cultivation implies that most rural families need to augment their incomes
through wage labour (in both the rural farm and non-farm sectors) and petty commodity
production (of both agricultural and non-agricultural commodities), and possibly also provide for
consumption needs of the family through subsistence farming.
Figure 10 shows the distribution of sources of income across all size-classes. The first thing to
notice is that across size-classes, cultivation now accounts for less than half (46%) while wages
and non-farm business together account for 50% of monthly income of a farmer household. As
might be expected, the dependence on wage income and income from petty production is
especially pronounced for the small farmers, marginal farmers and near landless households,
which together comprise about 85% of the rural population. Table 3 summarizes information
about the sources of rural income by the size-class of ownership holdings. Several important
facts emerge from this data.
First, most of the households have abysmally low incomes; the incomes do not cover even the
basic expenditures necessary for survival. It is only the rural families with more than 10 acres of
land whose total income exceeds their expenditures (Government of India, 2005; Mishra, 2007).
To put this in perspective, let us recall that in 2003, 96% of rural households owned less than 10
acres; thus, in 2003, 96% of rural households had lower total incomes – which includes income
from cultivation, wage labour, farm animals and petty production – than even what their
extremely low expenditures required. It is, therefore, not surprising that rural India should have
seen an explosion of debt over the last decade, leading in many cases to severe distress and even
suicides (Government of India, 2007). In keeping with this dismal agrarian scenario,
Vakulabharanam (2010) finds that increases in rural inequality between 1993-94 and 2004-05
were largely explained by rising inequality between the agrarian and non-agrarian rural classes,
not by higher inequality between agrarian classes. The particular non-agrarian classes who have
enriched themselves during this period are the rural professionals, moneylenders and the
absentee landlords.

Table 3: Monthly Income and Consumption Expenditure, 2003 (rupees)
wage
income
income
from
cultivation
income
from
animals
non-
farm
business
income
total
income
consumption
expenditure
Effective
Landless 999 223 86 260 1568 2366
Marginal 720 784 112 193 1809 2672
Small 635 1578 102 178 2493 3148
Middle 637 2685 57 210 3589 3685
Large 496 5195 26 531 6248 4881
Source: Table 6, Government of India, 2006c.
Figure 10: Sources of Rural Income in 2003 by Size-Class
0
10
20
30
40
50
60
70
80
90
Eff Landless Marginal Small Middle Large
perc
en
tag
e o
f in
co
me
wage cultivation animals non-farm business
Second, for a large majority of rural households, the primary source of income is wage income
(Figure 10). For all families with less than 1 acres, i.e., the effectively landless households as
defined above, wage income provided more than half of their total monthly income; in 2003, let
us recall that 60% of rural households belonged to this category. For completely landless
households, of course, this proportion would be much higher. Third, income from petty
commodity production accounts for a substantial portion – close to 20 percent – of the total
income of rural households; this is especially true for near landless and marginal farmer
households, who together comprised about 80% of rural households in 2003.
Thus aggregate level data seems to suggest that wage income has become a very important
source of income for the majority of the rural population. This implies that surplus extraction
through the institution of wage-labour has become one of the most important forms of extracting
the surplus product of direct producers. As is well-known, an important feature of wage-labor in
agriculture is that even small and marginal peasants employ wage-labor. This can be seen from
the fact that labor costs account for around 20% of expenses even for effectively landless and
marginal farmers. This number shows only a modest increase to 24.5% for the large farmers
(Government of India, 2006c, p. A-162). When we combine this information with that presented
earlier on sources of income, we see that the vast majority of farmers are routinely hiring in as
well as hiring out their labor power. This has prompted scholars to create class categories based
on “net hiring of labour-power.” While this method is analytically appropriate, it is equally
important, if not more so, to appreciate the political (class struggle and class alliance)
consequences of such complexity of production relations. For example, Marx‟s observation of
domestic industry that it entails the exploitation of labourer by labourer seems appropriate to this
context as well.
Since income from petty commodity production, which shows up as income from non-farm
business in Table 3 and Figure 10, is an important source of income for the effectively landless
households (17 percent of total income) and marginal farmers (11 percent of total income), this
suggests that exploitation by merchant capital through unequal exchange is also an important
form of surplus extraction in the rural setting.
To preempt any misunderstanding, the notion of unequal exchange and its relationship to surplus
extraction needs some elaboration. As long as commodities exchange in proportion to their
values, i.e., as long as prices reflect the underlying labour values congealed in commodities,

artisanal producers cannot be exploited, in the Marxist sense of the term, because they are not
separated from the means of production. But the formation of market prices is mediated through
monopoly and other forms of bargaining power; hence, market prices for individual and groups
of commodities can, in the presence of monopoly, deviate from the their labour values. If one
party to the exchange can systematically ensure this deviation, this is tantamount to systematic
unequal exchange, i.e., exchange which systematically deviates from the labour values congealed
in commodities. In such a situation, one party to the exchange appropriates part of the value that
is produced by the other party, and thereby appropriates a part of the surplus labour time of the
other party without giving anything in return. The markets where the commodities arising from
petty production by landless and marginal farmers are sold are typically controlled by merchants;
these merchants manage to systematically ensure deviation of prices (they pay to the artisan-
producers) from underlying labour values due to their monopoly position in these markets. This
is the sense in which merchant capital manages to appropriate a part of the value produced by
petty producers through unequal exchange. We defer further discussion on this to the section on
informal industry.
Growing importance of non-farm employment
A large majority of the village-level studies of agrarian change in India highlight the growing
importance of non-farm employment opportunities for the economic and social lives of the rural
poor. In a pioneering study of two villages in South Gujarat spanning a period of more than 30
years, Breman (1993) has indicated the crucial role of employment opportunities outside the
village and outside agriculture in eroding the basis for the system of labour bondage known as
halipratha. Wilson (1999) and Sharma (2005) highlight the importance of non-farm employment
for improving the material conditions of effectively landless and marginal farmers in Bihar.
Similarly Bhalla (1999) notes in her study of Haryana that
In India in recent decades, the factor which has mattered most in the determination of
farm wages is the availability of alternative, non-farm jobs as reflected in shifts in the

structure of a growing workforce in favor of industrial, trade, transport, communications
and service sector employment. (p. 26)
Already in the 1990s Haryana was one of 4 states where non-farm employment accounted for
more than half of all (principal status) jobs when rural and urban areas are taken together.
Harris et al (2010) in their resurvey of Iruvelpattu (Tamil Nadu) note that the earlier, 1981
survey found that 24% of the households could be described as “non-agricultural”. By 2008,
such households made up more than 40% of all households. They conclude that
In 2008, though cultivation still remained the most important single activity of
Iruvelpattu, and employed two-thirds of the village labour force, it was no longer so
essentially an “agricultural village”.
Harriss-White and Janakrajan (1997) in their study of North Arcot district in Tamil Nadu observe
that even though
“only 10 per cent of households give 'manufacturing' as their primary occupation,
apparently-rubbishing the idea that the non-farm economy has expanded, this figure
conceals what we believe to be a significant change over the previous decade. For 41 per
cent of male labor and 8 per cent of female labor are employed in the rural non-farm
economy, and half the landed agricultural households report at last one adult in non-
agricultural activity.” (p. 1474)
When they look at individuals rather than households they find a striking emergence of weaving
as a major form of rural livelihood and a massive increase in the miscellaneous category “other
sources of livelihood” from 20% in 1982-84 to 36% in 1993-94, which includes petty or
household manufacturing, construction, trade, transport, storage and “other services,” which
itself is a large and unspecified category.” The authors are led to conclude that “The non-
agricultural economy is no longer marginal, it is of central importance to the reproduction of
rural society.” P 1475

Village studies in Uttar Pradesh echo these findings. According to a study in Meerut district cited
by Lerche (1999, p. 193) between 59 and 70 per cent of income of landless households came
from non-agricultural employment. Srivastava (1999) in village studies conducted in west,
central and east UP also underlines the importance of non-agricultural employment. In four of
the six villages studies non-agricultrual employment accounted for more labor days of the year
than agricultural employment. However much of this employment is migrant. Only in one village
(Siswa in west UP) was there a substantial amount of local non-agricultural work available (66%
of total employment days).
Access to employment opportunities outside the village has at least three important consequences
for the rural poor. First, it directly augments their income by offering employment during off-
peak seasons of agricultural production. Second, it increases the bargaining position of the rural
poor vis-à-vis their employers within the village; this is one of the most important factor
contributing to higher real wages and better conditions of work in agriculture. Third, by offering
escape routes from the closed village milieu, it helps in countering the worst aspects of caste-
based oppression. Thus, non-farm employment opportunities have not only economic but also
social and political implications for the rural poor.
Before moving on to the next section, we would like to draw attention to the fact that the sources
of income data can be used to understand the rationale behind the definition of size-classes that
we have adopted in this paper (for details of the definitions see Table 1). There is a sharp
distinction between what we have termed effectively landless households, who comprised about
60 percent of rural Indian households in 2003, and the rest of the population: as can be seen in
Figure 10, effectively landless households derive only a small portion of their income from
cultivation, the largest share coming in the form of wages. For all the other households,
cultivation remains a significant source of income, starting at 43 percent for marginal and
increasing all the way to 83 percent for large farmer households. In a sense, therefore, all these
households could be categorized as farmers or peasants, with the differences between them
deriving from the differential mix of wage and income from cultivation.

F. Sources and terms of credit
Informal credit, often linked with product and labour markets, has historically played a very
important role in the perpetuation of semi-servile conditions of life and economic stagnation in
rural India. Since usurious capital, which operates through the mechanism of informal credit, is
never directly involved in the process of production in the sense in which industrial capital is, the
profits of the moneylender can only be understood as a claim on the surplus product produced
elsewhere. Usurious capital, therefore, gets a share of the total surplus production through the
process of redistribution of the surplus without having participated in its generation. That is the
sense in which usurious capital is understood to be necessarily parasitic.
During the “mode of production” debate, usurious capital and debt bondage played a key role in
defining “semi-feudalism”, which was understood as a semi-servile state of existence for the
majority of the working population in the agrarian economy. Low production by tenant
cultivators necessitated consumption loans; often these loans were made by the same landlord
who had hired out land to the tenant. The terms of these loans were so onerous that they could
never be possibly paid back by the tenant; as interest kept piling up on top of the original loan
amount, the tenants were eventually forced to “pay back” in labour services rendered to the
landlord. Thus, this mechanism of perpetual debt bondage drastically reduced the freedom of
labour to participate in the institution of wage-labour and created the semi-servile conditions
identified as “semi-feudalism” (Prasad, 1974). Note that in such a situation, a large part of the
surplus product of the direct producers was appropriated as direct “labour services”, a
characteristic feature of a feudal organization of production.
Equally important, informal credit was often the mechanism through which different markets,
like the labour market and the product markets, were linked together. This interlinked system of
markets then facilitated extraction of surplus through unequal exchange, in the sense we have
used this term above. Interest rates in these “informal” credit markets were often as high as 30%
per month and the main borrowers were the landless labourers, the marginal and small peasant
households whose total income remained perennially below their consumption expenditures.
Existence of usurious capital also acted as a depressant on the rural economy: very high rates of

return promised by money-lending activities created enormous disincentives for productive
investment, thereby perpetuating conditions of economic stagnation and social backwardness.
Furthermore, production relations were themselves important in shaping these unequal exchange
relations. It is precisely the small size of land holdings and absence of sufficient collateral due to
maldistribution of assets, that forces peasants to go to informal credit sources and as a result to
self-exploit themselves. Hence, for all these reasons, it is important to study the evolution of
informal credit in the rural economy of India. What does the evidence say?
While the share of total rural credit provided by moneylenders declined substantially between
1961 and 1981, the trend of rapid decline was halted in the early 1980s. Since then the
moneylender has made a spectacular comeback in rural India, as can be seen in Figure 11 (details
in Table A11). The new moneylenders, though, are quite different, in terms of social
composition, from the older ones. While the earlier brand of moneylenders had close links with
landed property, the new crop does not seem to have that connection. Over the last two decades,
various groups of the rural population, like traders, school teachers, government servants,
lawyers, rich farmers, and other members of the petty bourgeois class, have entered this lucrative
business, facilitated by the gradual but steady retreat of formal credit institutions (see
Vakulabharanam 2010 for resulting inequality in the rural sector).
Sources and uses of credit, disaggregated by size-classes in 2003, show two important
characteristics. First, the share of total credit coming from non-institutional sources, especially
moneylenders, falls secularly across the size-class spectrum: for effectively landless households
close to half of outstanding loans come from moneylenders; for middle and large farmer
households, the corresponding share is less than 20 percent. Second, the share of credit that is
used for financing consumption expenditures, as opposed to productive investment expenditure
(both capital and current expenditures), falls secularly as we move from the lower to the higher
size-class categories: about 57 percent of total outstanding loans is used by effectively landless
households to finance consumption expenditure; the corresponding figure for middle and large
farmer households hovers around 13 percent (Government of India, 2006d). The implication of
both these facts is that the problem of debt exploitation, even if lower at the aggregate level than

in the early 1960s, continues to be a serious issue for the majority of the rural poor, the
effectively landless and marginal farmers.
Figure 11: Major Sources of Credit for Rural Households
0
10
20
30
40
50
60
70
80
1951 1961 1971 1981 1991 2002
perc
en
tag
e o
f o
uts
tan
din
g l
oan
s
Coop Societies Commercial Banks Moneylenders
The inter-state variation of the prevalence of informal credit, as depicted in Figure 12, has
interesting features. First, most of the larger states have a larger share of the total rural credit
coming from formal than from informal sources; other than Punjab, Rajasthan, Assam, Bihar and
Andhra Pradesh, all the other states had a higher proportion of total credit attributable to formal
than to informal sources in 2003. Since the largest component of informal credit comes from
moneylenders, most states seem to have had relatively lower prevalence of moneylenders.
Second, some of the states with relatively well developed capitalist agriculture like Punjab,
Andhra Pradesh and Tamil Nadu also have a very high prevalence of informal credit. In Punjab,
for instance, one of the main players in the informal credit market is the trader-middleman
(arhatiya), who often provides credit, sells inputs and also procures the output from the farmer.
This typical pattern of interlinked markets allows the surplus product to be easily extracted from
the direct producer through unequal exchange whereby input prices are inflated and output prices

depressed. Interestingly, West Bengal, which has had some limited degree of land reforms in the
past, also shows a high percentage of non-institutional forms of rural credit.
G. Capital formation in agriculture
The foregoing data on the rural class structure, decline in tenancy, rise in proportion of wage-
labor etc. seem to suggest a growing trend towards capitalist relations of production in Indian
agriculture. We have not referred thus far, however, to capital accumulation or reinvestment of
surplus product, which is considered to be a historically important aspect of capitalist production.
Has there been any significant trend towards reinvestment of surplus and capital accumulation in
the agrarian economy? What does the aggregate level data suggest in this regard?
Figure 12: Institutional Versus Non-institutional Credit across Indian States, 2003
0
10
20
30
40
50
60
70
80
90
Mah
arash
tra
Ker
ala
Utta
ranch
al
Oris
sa
Chha
ttisg
arh
Gujara
t
Kar
nataka
Hary
anaJ&
K
Him
acha
l
Jhar
khan
d
Utta
r Pra
desh
West
Ben
gal
Mad
hya P
rade
sh
Tamil Nad
u
Pun
jab
Bihar
Ass
am
Raja
stha
n
And
hra
Prade
sh
pere
cn
tag
e o
f to
tal
cre
dit
Institutional Noninstitutional
From 1961 to 1999, gross capital formation in agriculture (GCFA) grew at about 3% per annum,
a significant rate of growth by developing country standards. Decomposed by decades, the
growth in gross capital formation displays significant differences. While the growth rate of

GCFA was 5.05% per annum in the decade of the 1960s, it accelerated to 8.7% per annum
during the 1970s; thereafter, the growth rate slowed down significantly. During the 1980s,
capital formation registered a negative growth rate of -0.33% per annum and picked up again to a
growth rate of 2.89% per annum during the 1990s. What is interesting is that the slowdown in
capital formation is largely accounted for by the deceleration of public sector capital
expenditures in agriculture. Private sector investments, though growing at a slower rate than in
the 1960s and 1970s never became negative even as public sector investment growth dipped
below zero; moreover, it has picked up steam during the 1990s despite poor performance of the
public sector (Table 1.2, Gulati and Bathla, 2002).
How does this growth in capital accumulation in the agricultural sector compare with the rest of
the Indian economy? To answer this question, we look at GCFA relative to the aggregate gross
domestic capital formation (GDCF) in the Indian economy. As can be seen from Figure 13
(details in Table A13), agriculture‟s share in GDCF was stable at around 15% till the early
1980s; in fact it even displayed a slight positive trend from the mid-1960s to the early 1980s.
Thereafter, capital formation in agriculture has declined drastically as a share of the total capital
formation in the economy, from about 18 % in 1980 to a little more than 6% in 1999.
Aggregate level data on capital formation in Indian agriculture, therefore, seem to suggest that
there was significant capital accumulation during the 1970s and 1980s. During this period,
capital formation in agriculture kept pace with capital formation in the rest of the Indian
economy. From the decade of the 1980s, driven largely by changes in central government policy,
agriculture has faced a state of relative neglect: capital formation in agriculture has not only
significantly slowed down but has also fallen relative to the rest of the economy. This can be
accounted for by the drastic fall in public investment in agriculture.
The aggregate picture seems to be corroborated by the village-level accounts from Bihar (Wilson
1999, Chakravarti 2001, Sharma 2005). Peasant capitalism led by intermediate caste cultivators
had emerged in parts of Bihar in the 1970s, generating surpluses and its reinvestment into the
agrarian sector. Tractorization and development of irrigation facilities were a direct result of this
development. The dynamic of peasant capitalism, though, seems to have completely stalled by

the mid-1980s. Diversion of agrarian surpluses of the 1970s away from productive investment
avenues into corruption and crime, and the decline (or even complete wiping out) of surpluses
since the mid-1980s due to increasing real costs of cultivation – caused by corruption as well as
by policy changes of the State in a neoliberal direction – have brought back stagnation into
agrarian Bihar and in much of Eastern India.
Figure 13: Capital Formation in Agriculture as a percentage of Gross Domestic Capital
Formation (Source: Gulati and Bathla, 2002)
0
2
4
6
8
10
12
14
16
18
20
1960
-61
1962
-63
1964
-65
1966
-67
1968
-69
1970
-71
1972
-73
1974
-75
1976
-77
1978
-79
1980
-81
1982
-83
1984
-85
1986
-87
1988
-89
1990
-91
1992
-93
1994
-95
1996
-97
1998
-99
perc
en
tag
e
H. Penetration of the market
Though the picture of village India as a self-contained economy with minimal links to the rest of
the world was always an exaggeration, it was not till forced commercialization took root under
the watchful eyes of British colonialism that local production got integrated into wider
production and distribution networks. Since the transfer of power in 1947, market penetration of
the rural economy has continuously increased driven both by the production of marketable

surpluses in agriculture and the re-fashioning of cropping patterns according to the needs of
Indian and global capital. What does the evidence on market penetration, as measured by
marketed surplus, show?
Table 4: Marketed Surplus Ratio (%)
1950-51 2001-02
Rice 30 63.5
Wheat 30 73.3
Maize 24 51.6
Jowar 24 54
Bajra 27 56.9
Arhar 50 77.2
Gram 35 81.3
Lentil 55 89.9
Sugarcane 100 91.8
Cotton 100 86.9
Jute 100 100
Onion NA 100
Potato NA 91.1
Source: Chand, 2006, p. 140.
Table 4 gives the marketed surplus ratio (MSR), i.e., the share of the output (in quantity terms)
that is sold in the market, for key crops at two points in time five decades apart. Comparing the
early 1950s to the early 2000s, we see a sharp increase in the marketed surplus ratio for all
important non-cash crops like rice, wheat and maize; cash crops like sugarcane, cotton and jute,
on the other hand, have always registered a high marketed surplus ratio and did not show much
change over the last five decades. The massive increase in the marketed surplus ratio for key
crops indicates an increasing penetration of the market over the last five decades. But this
aggregate figure for key crops might hide important variations across size-classes. It is possible
that most of the marketed surplus comes from large landholding families, while small
landholding families produce mainly for subsistence needs.

How is the market penetration spread out across size-class categories? Figure 14 plots the
marketed surplus ratio by size-class categories in 2003. Along expected lines, the MSR increases
secularly with the size of holding with the small and middle categories being almost
indistinguishable on the basis of MSR. However, just as the sources of income data indicates a
substantial contribution to household income of marginal and small farmers from cultivation and
wages, we see here that subsistence farming and production for the market both account for
substantial portions of output. Thus even if its true that in absolute terms most of the marketed
surplus is accounted for by large landholders, in relative terms even the smallest landholders sell
a non-negligible 44% of their output. Effectively landless and marginal farmers – who comprise
a little more than 60 percent of the rural households – keep around half of their produce for
family consumption and sell the other half.
Figure 14: Marketed Surplus Ratio by Size-Class, 2003 (Source: Government of India,
2006c)
44
54
65 6671
0
10
20
30
40
50
60
70
80
Eff Landless Marginal Small Middle Large
perc
en
tag
e
Combined with the data we presented earlier on labor costs as a percent of cultivation expenses,
as well as the well-known commercialization of other inputs to farming, such as seeds, electricity

and fertilizer, we are confronted with a picture of the peasantry that has been substantially
integrated into the market across size classes and hence is extremely sensitive to input and output
prices. This is one of the key characteristics of current Indian political economy and we will
return to this later in the paper.
I. Inter-State Variation
Students of Indian society have always been struck by its enormous diversity. It is therefore not
very surprising that the agrarian structure displays wide regional and state-level variations across
the country. Though we have indicated these state-level variations at several relevant locations in
the text, in this section, we would like to gather together some of these key findings and present a
coherent story about regional variation around themes of landownership patterns, landlessness,
sources of income and occupational patterns (cultivators versus agricultural workers).
To make sense of the geographical variation in the patterns of land ownership across Indian
states, we have divided all the states into two groups (Chart 15). The first group comprises of
states which had a relatively large share (more than 50 percent in 1972) of the total area owned
by large landholding families (i.e., those owning more than 10 acres); we call these the “large
landholding states” (LLS) and summarize information about these states in Table A3. The
second group consists of states where large landholding families owned a relatively small
proportion (less than 32 percent in 1972) of the total area; we call these the “small landholding
states” (SLS) and provide data about these states in Table A4. The following states belong to the
first group: Andhra Pradesh, Gujarat, Haryana, Karnataka, Madhya Pradesh, Maharashtra,
Punjab, and Rajasthan. The second group, i.e., the small landholding group has the following
members: Assam, Bihar, Himachal Pradesh, Jammu and Kashmir, Kerala, Orissa, Tamil Nadu,
Uttar Pradesh, and West Bengal.
A rather striking feature of the division into the two groups of states, LLS and SLS, is that the
former group of states continues to have large inequality in landholding in comparison to the
latter group. For example, in Haryana a “large land holding state” medium and large holdings
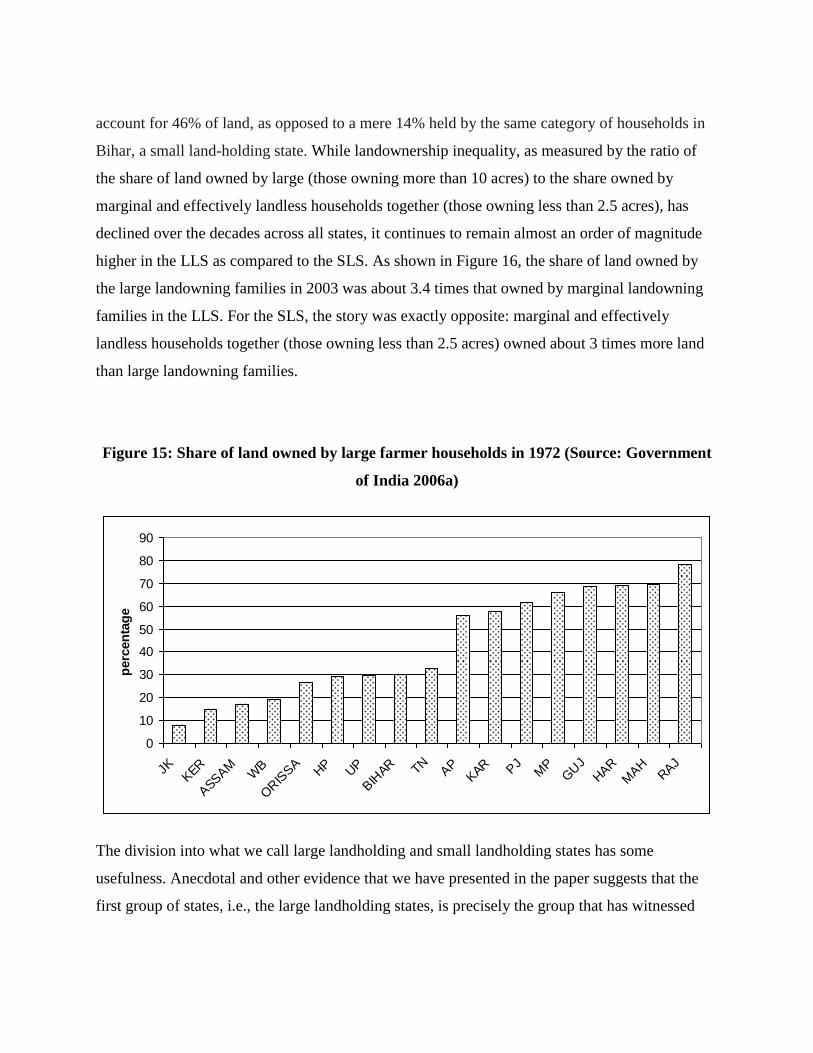
account for 46% of land, as opposed to a mere 14% held by the same category of households in
Bihar, a small land-holding state. While landownership inequality, as measured by the ratio of
the share of land owned by large (those owning more than 10 acres) to the share owned by
marginal and effectively landless households together (those owning less than 2.5 acres), has
declined over the decades across all states, it continues to remain almost an order of magnitude
higher in the LLS as compared to the SLS. As shown in Figure 16, the share of land owned by
the large landowning families in 2003 was about 3.4 times that owned by marginal landowning
families in the LLS. For the SLS, the story was exactly opposite: marginal and effectively
landless households together (those owning less than 2.5 acres) owned about 3 times more land
than large landowning families.
Figure 15: Share of land owned by large farmer households in 1972 (Source: Government
of India 2006a)
0
10
20
30
40
50
60
70
80
90
JKKER
ASS
AM
WB
ORIS
SA
HP
UP
BIH
AR TNAP
KAR P
JM
PGUJ
HAR
MAH
RAJ
perc
en
tag
e
The division into what we call large landholding and small landholding states has some
usefulness. Anecdotal and other evidence that we have presented in the paper suggests that the
first group of states, i.e., the large landholding states, is precisely the group that has witnessed

relatively robust growth of capitalist relations of production in agriculture;ix
the second group
largely consists of the states, which are still encumbered by remnants of pre-capitalist modes of
organizing production. The fact that the latter group of states is marked by lower inequality in
landownership and has also seen a relatively greater decline in the share of land owned by large
landholding families seems to suggest that the economic position of the “semi-feudal” landlords,
to the extent they derive their power solely from land ownership, has declined relative to the
middle and rich farmers and capitalist landlords at the national, state and regional level.
Figure 16: Ratio of Total Land Owned by Large to Marginal Farmer Households in 2003
(Source: Government of India 2006a)
3.4
0.3
0.0
0.5
1.0
1.5
2.0
2.5
3.0
3.5
4.0
Large Landholding States Small Landholding States
While the division into large and small landholding states has its use, other dimensions of
regional variation emerge when we focus on the temporal evolution of another key feature of the
agrarian structure: concentration of land ownership as measured by the share of land owned by
the large landowners. Figures 17 and 18 display the evolution of land concentration in the LLS
and SLS states. The measure plotted in the graphs is the share of total land owned by large
landholding families, i.e., families with more than 10 acres of owned land. The SLS display a

strong tendency towards de-concentration (with the exception of Tamil Nadu and J&K) while the
LLS display a much weaker de-concentration tendency. The key characteristic of the LLS states
is that they show either a reversal of the trend of de-concentration (Andhra Pradesh, Gujarat,
Haryana) or a significant slowing down of that process (Karnataka, Punjab, Rajasthan).
Figure 17: Share of total land owned by large landholding families in SLS (Source:
Government of India 2006a)
0
5
10
15
20
25
30
35
Uttar
Pradesh
Bihar Himachal
Pradesh
Orissa West
Bengal
Kerala Assam J&K Tamil
Nadu
perc
en
tag
e
1972 1982 1992 2003
The inter-state evidence on landownership inequality and land concentration seems to suggest
that semi-feudal landlords have been replaced by rich and middle peasants as the ruling bloc in
the agrarian structure of a large part of contemporary India. This, as we point out later, was not
so much the result of political conflict between a rising capitalist farming class and the feudal
oligarchy; rather, the latter have, aided by a pliant State, gradually transformed themselves into
capitalist farmers, among other things. We return to this important point in the concluding
section.

J. Concluding remarks
On the basis of the data presented in the foregoing sections, we are led to the following tentative
conclusions: over the past few decades, the relations of production in the Indian agrarian
economy have become increasingly “capitalist”; this conclusion emerges from the fact that the
predominant mode of surplus extraction seems to be working through the institution of wage-
labour, the defining feature of capitalism. Articulated to the global capitalist-imperialist system,
the development of capitalism in the periphery has of course not led to the growth of income and
living standards of the vast majority of the population. On the contrary, the agrarian economy
has continued to stagnate and the majority of the rural population has been consigned to a life of
poverty and misery.
Figure 18: Share of total land owned by large landholding families in LLS (Source:
Government of India 2006a)
0
10
20
30
40
50
60
70
80
Gujarat Haryana Punjab Karnataka Andhra
Pradesh
Madhya
Pradesh
Mhrstra
perc
en
tag
e
1972 1982 1992 2003
Aggregate level data suggests that the two main forms through which the surplus product of
direct producers is extracted are (a) surplus value through the institution of wage-labour (which
rests on equal exchange), and (b) surplus value through unequal exchange (which mainly affects
petty producers) where input prices are inflated and output prices deflated for the direct

producers due to the presence of monopoly, monopsony and interlinking of markets. Semi-feudal
forms of surplus product extraction, through the institution of tenant cultivation and share
cropping, has declined over time. Merchant and usurious capital continues to maintain a
substantial presence in the life of the rural populace, both of which manage to appropriate a part
of the surplus value created through wage-labour, apart from directly extracting surplus value
from petty producers through unequal exchange.
The process of class differentiation has been considerably slowed down and complicated due to
the steady incorporation of the Indian economy into the global capitalist system, which has
supported and even encouraged the growth of a large informal sector. This informal production
sector can be best understood as being involved in petty commodity production, both of
agricultural and nonagricultural commodities. Petty commodity production refers to the
organization of production where the producer owns the means of production and primarily uses
family and other forms of non-wage labour in the production process. Petty commodity
production is exploited mainly by merchant and usurious capital where the main form of surplus
extraction is through the mechanism of unequal exchange and not through the institution of
wage-labour; unequal exchange is often facilitated and maintained through interlinked product,
labour and credit markets. The coexistence of both wage-labour and petty commodity
production, whereby landless labourers, marginal farmers and small farmers participate in both,
in one as free labour and in the other as owner-producer, has complicated the task of
revolutionary politics. This is a point we return to in the concluding section but before that we
turn to a detailed study of petty commodity production in the non-agricultural sector.

PART II: INDUSTRYx
The classical concerns of economic development relating to the establishment of a capital-
intensive (“modern”) industrial sector, whether under State or market control, in societies
dominated by labour intensive industry and non-capitalist modes of production, are still alive
today. Witness the numerous sites of conflict between the peasants and the State (acting in the
interests of corporate capital) over acquisition of land and other resources in the name of
industry. India remains a dual society and a dual economy and the roots of this duality are to be
found in the colonial period. The colonial duality between the “modern” and the “traditional”
sectors continues today as the divide between the informal sector consisting of peasants, artisans,
small producers and retailers, and domestic workers and the formal sector consisting of large
capital, foreign and domestic, as well as the State itself. This divide is seen far more prominently
in the case of the manufacturing sector where a substantial large-scale, capital-intensive
component has developed, as compared to agriculture, which remains overwhelmingly small-
scale.
In terms of employment, the informal economy continues to dominate. Figure 19 shows the
relative proportions of the formal and informal economies in employment (as of 2008-09,
NCEUS 2009) for the three sectors. Across all three sectors a large portion of employment (93%
according to NCEUS 2009) is classified as “unorganized” (Govt. of India terminology) or
“informal” (academic and general policy usage). These workers work in informal enterprises or
are casually employed in formal enterprises. An informal enterprise typically employs less than
ten workers (and in many instances only works with family labour), is not registered with the
government and typically does not pay any taxes, nor is required to abide by labour and other
laws. Informal employment in formal sector enterprises means that work is not regular, secure,
or governed by formal/written contracts, and usually no benefits (health, retirement, other social
security) are paid.

Figure 19: Share of formal and informal employment in agriculture, industry and services
(Source: NCEUS 2009)
0%
20%
40%
60%
80%
100%
Agriculture Industry Serivces
Formal Informal
Total employment in industry is about 45 million (about 18 % of the labour force). The share of
industrial sector in employment has increased, albeit slowly, since the 1980s (14 to 18%).
According to the latest National Sample Survey Organization (NSSO) survey of the
“unorganized manufacturing sector” covering the period 2005-2006, 36.44 million of India‟s 45
million industrial workers are employed in the informal manufacturing sector (Government of
India, 2008a). Informal manufacturing firms account for 75% of manufacturing employment and
27% of Gross Value Added (GVA) in manufacturing. If mining and construction are included,
the contribution in GVA jumps to 40%. The informal manufacturing sector also has an extensive
scope, producing food products, beverages, cotton, wool, and silk textiles, wood and paper
products, leather and chemical products, metal and plastic products, electrical and transport
equipment and repair services of various kinds including repair of capital equipment. That said
employment is certainly concentrated in a few key industries that form the backbone of this
sector. The “top three,” food processing, textiles and garments alone account for nearly 50% of
informal manufacturing employment.

It is common knowledge that large-scale industry has not expanded as expected in India. The
share of large industry (factories of >100 workers) in manufacturing employment grew from
around 5% in 1900 to 30% in 1980 and thereafter has declined to around 25 % (Roy 2000).
Apart from well-known reasons of low employment elasticity of capital-intensive industry and
increasingly unproductive use of surplus in finance and speculation as opposed to accumulation,
the new phenomenon that has gained prominence in the post-reform period is the extensive use
of informal (casual and sub-contracted) employment by formal firms looking for “labour
flexibility” (NCEUS 2007).
While there has been no shortage of empirical studies on India‟s informal sector, many of these
have been motivated by a developmentalist or “poverty-centered” view rather than an
“exploitation-centered” view. Hence the range and quality of studies analyzing production
relations and modes of surplus extraction to be found for agriculture does not exist for the rest of
the informal sector (for some accounts see Breman 1996, De Neve 2005, Haynes 1999, Parry et
al 1999, Wilkinson-Weber 1997, Varman 2006). Marxist accounts of Indian industry have
tended to focus on large-scale or “modern” industry, since it was assumed that this sector was the
more dynamic one and would grow rapidly to accommodate all industrial employment. More
importantly, the “industrial proletariat” has been imagined as consisting of urban workers in
large industry. The workers and small producers in the “traditional” or small-scale industry,
though numerically strong, occupy an ambiguous position in Marxist theory, similar to the
peasantry. The revolutionary experiences of Russia and China had shown that peasants and other
small producers could, depending on the specific historical conditions, be antagonistic to or allies
of the modern industrial working class, or indeed a revolutionary force in their own right. Many
of the issues that have motivated controversies over the role of the peasantry in the socialist
revolution are relevant to the analysis of small-scale industrial production as well (see Sanyal
and Bhattacharya 2009 for a recent analysis).
The present study is motivated by a desire to understand the material conditions confronting the
vast majority of the industrial working class. To a first approximation, relations of production in
large formal sector firms may be termed “industrial capitalist.” We do not discuss these further.
This study limits itself to the informal manufacturing sector. As we will see relations of

production and modes of surplus extraction are more complex here than those prevailing in
formal industry. A large body of the self-employed exists alongside wage-labourers, unpaid
domestic workers are crucial, workers are free to change employers to varying degrees and are
“free” of the means of production to varying degrees. Wide and deep putting-out arrangements
are the norm.
We present macroeconomic data from five rounds of National Sample Survey (NSS) of the
unorganized manufacturing sector from 1984 to the present and we supplement this aggregate
data with micro case studies. These data show that the particular type of capitalism found in
Indian informal manufacturing is characterized by a large number of very small firms locked in
unequal exchange relationships with large industrial capital as well as merchant and finance
capital. Broadly speaking formal rather than real subsumption of labour to capital, and extraction
of absolute rather than relative surplus value characterizes many firms. Surplus extraction via the
“conventional” wage-labour route is compounded by unequal exchange, unpaid domestic labour,
labour bondage, contingent or casual labour, and gender and caste hierarchies. Towards the end
we present a framework for the diversity of production relations to be found in this sector.
B. Informal Industry: A Production Relations Perspective
The Sengupta Commission (NCEUS 2007) has adopted the following definition of the informal
sector:
The unorganised sector consists of all unincorporated private enterprises owned by
individuals or households engaged in the sale and production of goods and services
operated on a proprietary or partnership basis and with less than ten total workers. (p.2)
Thus three major criteria, legal status, participation in the market and firm size (number of
workers) are used to define an informal firm or enterprise. While the NSSO criteria differ
slightly, number of workers working in the enterprise remains a crucial aspect of any definition.
This is a good starting point but as Harris (1982) comments referring to categories based on firm
size or scale (such as number of employees, size of assets etc.).

For analytical purposes these categories are quite clearly of very limited value because
they mostly rest upon numerically defined classes and may subsume quite different forms
of the production process and of relations of production. (p. 945)
Beyond Firm Size
The purely statistical aspects of informality should be distinguished from more substantive issues
of production and exchange relations, type of labour processes etc, although naturally the two
interact in a complex way. For example, costs of conforming to government regulations
exceeding the gains of concentration and centralization of capital are often cited as a reason for
remaining small or undertaking “horizontal” as opposed to “vertical” expansion, or for
employing casual labour. Similarly firm size profoundly shapes the type of labour process,
modes of supervision and control, division of labour in the workshop and so on. Figure 20 offers
a schematic look at the various criteria that have been used to describe the dualism in the Indian
economy. In this schematic, the formal-informal distinction itself is restricted only to the
question of State regulation of economic activity (“registered” versus “unregistered”). The point
of the schematic is to draw attention to the more substantive aspects of the formal-informal
divide that relate to forms of exploitation (real versus formal subsumption of labour to capital),
relations of production (ownership of means of production versus wage labour) and the type of
circuit of capital (need versus accumulation). Qualities on the right half of the circle are usually
associated with formal sector firms, while those on the left are thought to belong to informal
firms. Though needless to say, no single enterprise in either sector may display all the features
typically associated with that sector.
Marx on Informal Industry
Even though Marx‟s writings on primitive accumulation and the transition from peasant to
capitalist farming are much more well-known, in fact he had a lot to say about the transition from
small-scale and cottage industry to capitalist factory production. In Chapters 14 and 15 of Capital
Vol. 1, he discusses at length the development of modern industry in England and parts of

Germany. The sheer diversity of production relations, including independent commodity
production, putting-out, and wage-labour described by Marx, calls to mind contemporary
conditions in Indian informal industry. In these pages Marx appears to be concerned about three
things. One, what are the specific ways in which workers are exploited in “so-called domestic
industry,” two how is small-scale and domestic industry transformed when it becomes articulated
within a dominant industrial capitalist mode of production, and three under what conditions do
modern large-scale factories emerge from existing decentralized workshops and domestic
production. All these questions are pertinent for us today. For example Marx notes that
“concentration of workers” (i.e. large-scale production) become profitable only under
“exceptional circumstances” because competition is intense between workers wanting to work at
home, and because by putting-out production to the workers‟ home the capitalist saves all
expenses on workshops, maintenance etc. (Marx 1992, pp. 462-463) Thus outsourcing to smaller
workshops and homes can, under some circumstance, be more convenient, from the capitalist‟s
point of view, than centralizing production in a factory, something we observe repeatedly in the
Indian experience, particularly in the neoliberal period.
This home-based artisan who works for capital, though he appears superficially similar to the
independent craftsman of yore, is also very different from him. Referring to “domestic industry”
Marx observes:
That kind of Industry has now been converted into an external department of the
factory…Besides the factory worker, the workers engaged in manufacture, and the
handicraftsmen, whom it concentrates in large masses at one spot, and directly
commands, capital also sets another army in motion, by means of invisible threads: the
outworkers in the domestic industries, who live in the large towns as well as being
scattered over the countryside. (Marx 1992, pp. 590-591, emphasis added)

Figure 20: Dualisms associated with the formal-informal divide
Capital thus organizes production in a familiar dual mode: large factories are articulated with
smaller workshops dependent upon the factory. Higher rates of exploitation are achieved not via
increased productivity of labour but via lowering the price of labour power or by increasing the
intensity of work made possible because “the workers‟ power of resistance declines with their
dispersal.” Further, unlike the direct relationship between the worker and employer in formal
industry,
in the so-called domestic industries… a whole series of plundering parasites insinuate
themselves between the actual employer and the worker he employs. (ibid, p. 591,
emphasis added)
Both the factors alluded to above remain relevant in Indian informal industry today. The
dispersal of the working class or, in some instances, the failure of the working class to aggregate
in the first place, results in the breaking of labour‟s resistance to exploitation by capital. And the
rising importance of middlemen creates channels for surplus extraction via unequal exchange.

Thus, in reading Marx on the evolution of modern industry one is often struck by the resonance
with Indian manufacturing today: the widespread prevalence of putting-out relations, the
preponderance of merchant capital and of formal subsumption of labour. However there are
important differences to be noted as well. Firstly, the transition from small (home and workshop)
to large (factory) production would have to occur in the context of dominant transnational
capital. Informal manufacturing today is inserted into global commodity chains in a way that did
not exist for European domestic industry. Second, the economies of scale achieved via large
industry owed an unacknowledged debt to colonial plunder. Similar plunder being attempted in
India today is meeting with fierce resistance from the peasantry and the adivasis. Third, due to
State policy as well as the logic of global capital accumulation, recent industrial history of India
offers evidence not only for a constant or increasing share of informal production but even for an
absolute decline of large industry in some sectors and its replacement with smaller workshops or
home-based production (the powerloom sector is a particularly well-studied sector where this has
occurred). As Roy (1999) notes rather than being annihilated, several types of traditional
industries survived with changes into the 20th
century, and even grew in size in some cases.
Surat at the turn of the century probably employed about 5-6,000 weavers in silk and
lace. Today, the direct descendant of weaving, the powerloom, provides employment to
about half a million. Moradabad brassware engaged 7-8,000 full-time workers in 1924. In
the 1990s, an estimate places the town's metal workers at 150,000. Not more than a few
thousands were found in the carpets in Mirzapur-Bhadohi area in the interwar period.
300,000 is the approximate figure in the 1990s.
(http://www.indialabourarchives.org/publications/ Tirthankar%20Roy.htm)
Marx's famous dictum "the country that is more developed industrially only shows, to the less
developed, the image of its own future," has often been read in teleological fashion as asserting
that the particular transition from petty commodity production to domestic industry articulated
with capitalism (putting-out) to large-scale factories will be repeated wherever capitalism
develops. Apart form the obvious fact that the period over which this transition occurs is around
300 years (from the 17th
century to the 19th
centuries), one important factor that Marx did not
incorporate in his analysis is imperialism; later Marxists drew attention to imperialism and the

uneven development that characterizes the world capitalist system. It has been argued that the
incorporation of the Indian economy into the global capitalist system creates conditions for the
perpetuation of the informal sector and other low-productivity activities. To this must be added
another caveat. Modern large-sale industry has in general displayed great capital intensity and a
corresponding failure to provide employment to a large fraction of society (even in China, the
new manufacturing powerhouse, the secondary sector currently employs only 23% of the labour
force). The persistence of small-scale production as “employer of last report” thus raises
important questions for the type of industrialization that should drive the development process.
We defer further comments on this issue until the concluding section.
C. Characteristics of the informal firm: An analysis of NSSO data
As mentioned earlier, one main cause of anxiety regarding the development of industry in India
has been that the formal sector has displayed low employment elasticities. Figure 21 shows that
formal manufacturing employment has been stagnant since the 1980s (NCEUS 2009). The share
of large industry (usually defined as composed of firms employing more than 100 workers) in
manufacturing employment grew from around 5% in 1900 to 30% in 1980 and thereafter has
declined to around 25 % (Figure 22). In particular the post-reform period has seen growing
informalization. Figure 23 plots the timeseries of the number of informal manufacturing firms as
well as the number of workers. We observe a clear though modest decline in informal
employment over the decade of the 1980s, from 37 million to 32.5 million, which reverses in the
1990s and is back to the 1984 level by the year 2000.xi
There is an even greater decrease in the
number of firms through the 1980s, which also reverses in the 1990s though it does not return to
the 1984 level. This is consistent with data we present later on an overall increase (albeit small)
in the size of the informal firm.
Forms and locations of informal labour:
We now take a closer look at the composition and structure of informal enterprises. 85% of firms
in informal manufacturing are own-account enterprises (employing no wage-workers), while

10% are firms employing less than 6 workers, and 5 % employed more than 6 but less than 20
workers (Government of India, 2008a). Depending on whether and how many wage-workers are
employed in the firm, the NSSO categorizes informal firms as follows (category labels are ours):
Figure 21: Total persons engaged in manufacturing industries (Source: NCEUS 2009, p.
12)
The persistence and even proliferation of small-scale and cottage industry on the one hand and
continued support for large-scale modern industry on the other hand have resulted in a firm size
distribution displaying what Mazumdar and Sarkar (2008) refer to as the “missing middle.” This
refers to the low proportion of firms employing more than 50 but less than 1000 or more workers
compared to very small firms (employing less than 9 workers) or very large ones (with more than
1000 workers. In part the explanation may be found in incentives to reduce small firm size in
order to avoid compliance with labour and other laws. Beyond a certain size, where non-
registration is not an option, economies of scale may result in large firm sizes.
1. Petty-proprietorship (PP): These are called “Own Account Manufacturing Enterprises”
(OAMEs) in the NSSO data. The defining feature is that no wage-workers are employed. Use of
family labour is common and many firms are situated on household premises. A typical PP firm
has one working owner and one unpaid (mostly family) worker.

Figure 22: Share of large-scale industry in total industrial employment (Source: Roy 2000)
Figure 23: Number (in millions) of informal firms and informal workes (Source: NSS
several rounds).
14
15
16
17
18
19
20
21
1984 1989 1994 2000 2005
firm
s (
mil
lio
n)
30
31
32
33
34
35
36
37
38
wo
rkers
(m
illi
on
)
informal firms (millions) informal workers (millions)
2. Marginal capitalist (MC): These are called “Non Directory Manufacturing Establishments”
(NDMEs) in the NSSO data. They have at least one wage-worker but no more than 5 wage and
family workers taken together. A typical MC firm has one working owner and two hired
workers.

3. Small Capitalist (SC): These are called “Directory Manufacturing Establishments” (DMEs) in
the NSSO data. These employ more than 5 but less than 20 workers (at which point they should
be included in the Annual Survey of Industries). A typical SC firm has one working owner, one
unpaid worker and eight hired workers.
Figure 24: Share of petty proprietorships, marginal capitalist and small capitalist firms in
rural and urban areas, 2005-06 (Source: Government of India 2008c)
0%
10%
20%
30%
40%
50%
60%
70%
80%
90%
100%
Rural Urban
Small Capitalist (6-20 workers)
Marginal Capitalist (< 6 workers)
Petty Proprietorship
The rural and urban percentage shares for the above three types of firms for 2005-2006 are
shown in Figure 24. Petty-proprietorships are by far the most common type in both rural and
urban areas, in terms of both number of firms and number of workers (Figure 25). However,
relatively more marginal and small capitalist firms are found in urban areas as compared to rural
areas. The all-India shares of firms and workers are shown for the past 25 years in Figure 25. It is
clear that the overall structure of informal manufacturing, at least as captured by size classes, has
remained more or less unchanged during this period. However, there has been a ten percentage-
point decline in the proportion of workers accounted for by PP firms, of which 2.5% have been
absorbed by the MC firms and the remaining by SC firms. Consistent with this observation
NSSO also reports that the ten year period from 1994 to 2005 saw a 4 percentage point increase

in proportion of hired workers in total informal workers, from 20 to 24% (Government of India
2008b).
Figure 25: Relative shares of petty prorpietorships, marginal and small capitalist firms and
relative share of workers in those firms (Source: NSS several rounds)
0%
20%
40%
60%
80%
100%
1984 1989 1994 2000 2005 1984 1989 1994 2000 2005
Share in firms Share in workers
SC (6-20 workers)
MC (< 6 workers)
PP
Despite these trends, direct exploitation of wage-labour still forms a minor part of the informal
manufacturing sector taken as a whole. Unpaid family members and other non-hired helpers
make up a very large part of the informal industrial working class. While 52% of all informal
workers are “working owners,” 24% are “other workers” (unpaid family workers) and the
remaining, 24% are “hired workers.” The majority of hired workers (85%) are male while the
majority of “other workers” (59%) are female (Government of India, 2008b). Thus, to reiterate,
fully 76% of the workers in informal manufacturing labour outside of the capital-wage labour
relation of production.
Further, in keeping with the epithet “cottage industry,” 73% of informal manufacturing firms,
across rural and urban areas, are located within the household premises of the proprietor. Home-
based production is particularly common for petty-proprietorships (81.1%), followed by

marginal capitalist (27.4) and small capitalist (17.2%) firms. Since petty-proprietorships still
account for the majority of workers we can conclude that for a very large proportion of India‟s
manufacturing workforce the home and the factory are one and the same. In keeping with this we
find that the workshop premise or home forms the single largest asset for informal firms,
accounting for 60-80% of assets (Government of India, 2008b, p. 29). Sanyal and Bhattacharya
(2009) have commented on the significance of home-based production:
Self-employed production units involve the contribution of family members as “helpers”,
the dwelling unit itself is used as the site of production, personal assets of family
members like bicycles act as assets of the enterprise, durable assets of households act as
fixed business investments and household expenditures and production expenditures
overlap… The location of production within the household explains how informal
production units with such low levels of fixed business investment manage to survive.
(pp. 40-41)
Putting-out Arrangements
Does this domestic industry resemble that described by Marx as an “external department of the
factory?” In other words is self-employment really disguised wage-labour? For example a
nominally independent own-account manufacturer may work exclusively for a larger merchant
or other type of capitalist firm on contract. The producer may possess part of the means of
production but may be dependent on a larger unit for key inputs such as raw materials and
design. Such type of sub-contracting or putting-out arrangements which are common, for
example in the handloom weaving sector, as also in other craft-based industries have been
described by the Sengupta Commission as “a living testimony of the exploitation of the home-
based rural enterprises by the master enterprise or the contractor, through contrived trade
devices.” (NCEUS 2007, p. 273) We offer some examples from case-studies in the next section.
But such arrangements, however prevalent they may be in certain industries, do not seem to be in
the majority at the aggregate level. NSSO data reveal that only 32% of informal manufacturing

enterprises had undertaken some work on contract basis during the reference period
(Government of India, 2008a). That is, fully 68% of enterprises had not worked on contract at
all. These proportions were very similar to those reported for the year 2000-01 (30.7 on contract,
69.3 with no contract, Government of India 2002). When we contemplate the 67.5% of petty-
proprietorships who did not work on contract (figure 26), we find a type of production regime
that is extensive is size but that neither employs wage labour not is inserted into any type of
putting out arrangements. These firms constitute the substantial non-capitalist sector (Sanyal and
Bhattacharya 2009).
Figure 26: Percentage of firms working on contract (light gray) versus not on contract
(dark gray) (Source: Government of India 2008a).
However for those firms that did undertake work on contract, the overwhelming majority (85%)
worked solely for the master unit or contractor. Moreover there was a 5 percentage-point rise in
the proportion of such firms between 2000 and 2005 (Government of India 2002 and 2008a)
indicating a rise in putting-out relationships at the all-India level. As one might expect, petty-
proprietorships tend to work exclusively for a contractor much more frequently (88%) as
compared to the marginal (63%) and small capitalist (70%) firms who sell more often to other
customers.

Figure 27: Percentage of firms who sell their output to a private enterprise, a
middleman/contractor or to private consumers (Source Government of India 2008c).
0
10
20
30
40
50
60
70
80
Rural Urban PP MC SC
Pvt Enterprise
Middleman/Contractor
Pvt Household
NSSO data offers yet another dimension along which the relationship of the informal firms to the
rest of the economy can be explored. Figure 27 shows the distribution of firms according to
destination of output: to private households (consumers), private enterprises (other
manufacturing or merchant firms) and middlemen/contractors. Less than 10% of firms who sell
to the government, to co-operative societies, and to miscellaneous other agents are not shown.
The relatively greater importance of the middleman in the rural sector is expected since many
urban firms put out work via middlemen to seasonally unemployed peasants and village artisans.
However despite this we can see that across rural and urban areas, 80% of the firms sell at least
some of their output on the market to other firms and consumers. Disaggregating by firm type we
see that PP firms are much more likely to sell to consumers while SC firms sell predominantly to
other firms. The importance of the middleman declines with firm size. Two caveats have to be
added here. First any given firm may sell to more than one destination resulting in overlap in the
figures quoted above. We do not know the extent of this overlap. Secondly, we do not know the
percentage of output that is sold to each of these destinations.
The “putting-out” mode of production is historically a result of the subordination of artisanal
production to merchant capital. Typically a merchant or his representative supplies raw materials

or working capital to the producer and collects the finished product at an agreed upon price or
piece-wage. One account of the contemporary small-scale industry describes the situation thus:
Under the new system capitalists exercise tight control in the market of raw material and
finished products. Production is organized through a supply of raw material to sites of
production spread out in houses and huts. A battery of middlemen and contractors
operates at several levels. In many cases these levels are so numerous that the producer
knows nothing about the master…This arrangement has spread quickly in textile, hosiery,
readymade clothes, electrical devices, small machines and leather works. Of late,
ironwork, clay-work, carpentry and stone-work has also been brought within the ambit of
this system. (Sahasrabudhey, 2001, p.3)
Today putting-out goes by the name of sub-contracting and is a widely discussed phenomenon in
mainstream international economics as global commodity chains become increasingly
elabourated. NSSO data presents a picture of subcontracting arrangements that is in close
agreement with classical putting out relations where a merchant (or a merchant‟s employee, the
middleman) puts out work (gives an order for some products) to an artisan or small producer.
Raw materials are provided by the merchant along with specifications on what type of product is
desired. The machine and tools typically belong to the worker. The finished product is collected
by the merchant and the worker is paid piece wages. Figure 28 shows that proportion of firms
operating under sub-contracting arrangements who obtain equipment, raw materials and design
specifications from the contractor. Over 90% of firms obtain their raw materials and design from
the contractor or master unit, while only 18% obtain equipment. However, disaggregating by
firm type we observe that almost twice as many PP firms (20%) as MC and SC firms (10-11%)
obtain equipment from the master unit. This finding is consistent with case-studies that find the
poorest artisans and producers often operating on equipment rented from merchants. In some
cases, such as handloom weaving, a master-weaver may also install a loom in the weaver‟s home
with the agreement that he weaves exclusively for that master-weaver.

Figure 28: Percentage of firms obtaining equipment, raw materials and design from
contractor or master-unit (Source: Government of India, 2008a).
0
10
20
30
40
50
60
70
80
90
100
PP MC SC All Firms
perc
en
tag
e
equipment
raw material
design
Wages, Profits and Value Added
It is a well-known fact that the informal sector is plagued with extremely low wages. In 2005,
hired workers in marginal and small capitalist firms earned on an average a monthly income of
Rs. 2134 (Government of India 2008b). Even today, five years later, daily incomes of Rs. 80-100
with work available for around 20-25 days of the month are observed. In some cases, such as the
handloom sector nominal wages have even fallen during the past five years, in parts of India.
Thus it is not surprising that households in this sector may have multiple sources of income in
order to survive. In the section on agriculture, we have seen the importance of multiple income
sources (such as cultivation, agricultural wage work and non-farm businesses) for rural
households. This pattern is also found in the manufacturing sector. NSSO reports that across firm
types 72% of enterprises had owners for whom this activity was the only source of income, while
11% had another minor source and for the remainder, 17% the major source of income was not
the surveyed enterprise. Agriculture forms the single most important “other income source.” Of
those working owners for whom the surveyed enterprise was not the major source of income,
77% relied on agriculture, 8.7% on manufacturing and 5.9% on trade. Taken together with the

data of income sources presented in the Agriculture section, the picture that suggests itself is one
of a rural countryside dominated by small and marginal peasants who hire in as well as hire out
labour, on and off farm and also participate in petty production of goods and services for sale,
largely in the local market (Government of India 2008a, p.35-36).
It is also well-known that informal economic activity is characterized by low value added. As
can be seen in Figure 29, GVA in the formal sector has grown at a much more rapid rate, going
from 5 times informal GVA in 1984 to nearly 10 times informal GVA in 2001. While, this is
expected, it is interesting to note that GVA has also been increasing rapidly in the past decade
across the informal sector. Coupled with the fact that total informal industrial employment has
not grown similarly over the same period, we can infer than labour productivity has been
increasing in this sector. Table 5 gives summary aggregate statistics for wage and profit shares as
well as average wages and profits per worker for 2005.
GVA per firm for the PP enterprises can essentially be taken as the household‟s income from that
enterprise and as can be seen, in 2005 it came to an abysmally low Rs. 19203 per year. For
marginal and small capitalist firms the profit share (working owner‟s income and profit of
enterprise) is a healthy 41 and 46 percent respectively. However, because the level of economic
activity is low in general, absolute values corresponding to those percentages only reach the level
of compensation paid to lower echelons of formal sector in case of the small capitalist firms (Rs.
21,500 per month).
We now come to a point of theoretical as well as practical importance that arises when
considering the value-added figures. To calculate the gross value added in manufacturing two
quantities are first defined:
1. Operating Expenses: “The total values of raw materials, electricity, fuel, lubricants and
auxiliary materials consumed; cost of maintenance, services purchased and other expenses
incurred during the reference period.” (Government of India 2008c, p. 14)
2. Receipts: “The sale value of products and by-products manufactured by the enterprise together
with the value of services rendered to other concerns…” (ibid)

Figure 29: Gross Value Added by type of firm (Source: Mazumdar and Sarkar 2008)
0
200
400
600
800
1000
1200
1400
1984 1989 1994 2000
rup
ees (
bil
lio
n)
PP
MC
SC
ASI (Organized)
TABLE 5: Gross Value Added and Wages Share for Informal Firms
PP MC SC
Aggregate GVA (Billions Rs) 280.61 211.20 384.05
Wage Share - 59% 54%
Profit Share - 41% 46%
No. of workers (millions) 23.69 5.78 6.98
GVA per firm (Rs) 19203 119302 558513
GVA per worker (Rs) 11846 36543 55052
Number of workers/firm 1.62 3.26 10.15
Annual emolument/worker (Rs) - 21576.00 29635.00
Profit/ worker (Rs) - 14967.00 25417.00
Source: Government of India 2008b and c

Then, Gross Value Added (GVA) = Total Receipts – Total Operating Expenses
But what happens if due to unfavorable position in the market, informal enterprises (like small
and marginal peasants) are forced to less cheap and buy dear? Such unfavorable terms of trade
will bias the value added figures downward. In fact what is happening in this hypothetical
situation is that surplus generated in informal firms is being pumped via unequal exchange into
the formal sector. While there are no comprehensive studies on the terms of trade facing the
informal manufacturing sector, case studies reveal that in situations where long supply chains
exist linking the producer with the final consumer, the sale price of the producer (the informal
firm) is only a small part of the retail price paid by the final consumer. This problem is
particularly accentuated when the value chain is global. As Chakrabarti and Varman (2009) note
in their study of the Kanpur leather cluster,
…almost 80 per cent of the final price of the shoe goes to the long chain of middlemen
who operate only in the post-production stage. Or in other words, four-fifths of the „value
addition‟ of shoes in the global value chain actually adds no value to the product.
http://rupe-india.org/47/leather.html (last accessed, August 2010).
Heintz (2006) has developed a model in the “unequal exchange tradition,” that attempts to
capture the unequal distributional consequences of a global production system where “large
retailers or brand-name corporations set up a decentralized system of production and
distribution.” Here
Actual production is subcontracted out to small producers who face extremely
competitive conditions…Retailers and brand-name multinationals enjoy some degree of
market power which they can use to keep prices low for the goods they purchase or to
earn rents through the development of monopolistic brand identities. (p.511)
Heintz points out that the international division of labour between exporters of primary products
and manufactured goods is being reproduced as the divide between manufacturing economies
(erstwhile primary producers) and the knowledge economies specializing in ideas, designs,
brands etc.

Credit
The preponderance of the self-employed and of employers who work alongside their workers
may suggest that the informal economy is characterized by a C-M-C type of circuit. The product
of labour produced by a producer united with the means of labour is brought to the market, sold
for money, which is exchanged for consumption goods as well as replacement for working
capital. But of course the presence of hired workers, even if in a minority, suggests that M-C-M
also equally characterizes this economy. This later conclusion is also strengthened when we note
the extent to which credit plays a role in informal production.
According to NSSO data in 2005-06 outstanding loans were 21.6% of total fixed assets owned,
at the all India level. While nearly 50% of the credit in rural and urban areas came from
government agencies, public sector and cooperative banks, or other institutional sources (such as
the Khadi and Village Industries Commission), private money-lenders along with other informal
sources such as friends and relatives accounted for 15% of outstanding loans at the all-India
level. Expectedly, formal sources of credit were more important for small capitalists as compared
to marginal capitalists and petty-proprietors. Petty-proprietors are the worst hit by money-
lenders. The percentage of loans from money-lenders to rural petty-proprietors has actually
increased substantially in the period from 1994-95 to 2005-06, while it has decreased for every
other category as seen in Figure 30. The figure of 25% can be compared to the proportion of
loans going to farmers from money-lenders reported in the section on agriculture. The usurious
nature of money-lender credit is apparent when we note that the “annual interest payable as a
percentage of loan amount outstanding” is on average ten percentage points higher (at 26%) than
formal sources of credit (around 15%).
Further, continuing on the theme of needing money to commence production, the informal sector
should not be thought of as a place where producers (except wage workers of course) are always
united with their means of production. Even for PP firms, a quarter of the fixed assets were
rented rather than owned. This proportion increased to 39% for MC and 29% for SC firms
(Figure 31). Thus rented assets form an important part of the operation of the informal
manufacturing economy. Across all three types of informal firms, 30% of total assets were hired.

Taken together with the data presented on use of credit, we note that money or credit forms an
essential first step to production everywhere in the informal sector.
Figure 30: Percentage of loans coming from moneylenders across firm type in rural and
urban areas in 1994-95 and 2005-06 (Source: Government of India 2008b).
0
5
10
15
20
25
30
PP MC SC PP MC SC
Rural Urban
% o
f lo
an
s f
rom
mo
ney l
en
ders
1994-95
2005-06
C5. Shortcomings of NSSO Data
In this study so far we have relied exclusively on aggregate-level data collected by the NSSO.
This approach is useful because it enables us to form a picture of production relations at the
national level. However, we have to also take into account the potential pitfalls of relying only
on aggregate data. Das (2003) has carried out a micro-level case study of the ceramic ware
manufacturing sub-sector in Gujarat specifically to uncover the shortcomings of national level
NSSO data, which result in part from problems with including/excluding specific sub-sectors
below the two-digit level National Industry Classification (NIC). The key points that emerge
from this study are:

Figure 31: Percent of hired versus owned assets in value of total assets (Source:
Government of India, 2008b)
1. At a greater level of disaggregation of industrial classification it is seen that NSSO data has
improved vastly over time to include more and more previously missed types of industries. For
example early NSSO data (1978-79) estimated no informal enterprises in manufacturing or
processing of cotton textiles, and in drugs, cosmetics and washing and cleaning preparations,
both of which consist of several informal units in Gujarat (and most likely elsewhere as well).
2. The National Sample Surveys are likely to underestimate, in some cases severely, the number
of informal enterprises and as a result the size of informal employment. For example, the
ceramic ware sub-sector had one surveyed unit and an estimated eight units in the informal
sector according to 1994-95 NSSO data. Das (2003) found at least 164 and possibly as many as
229 informal units. The corresponding employment estimates were 24 workers for ceramic ware
industry in Gujarat according to NSSO (1994-95) data and anywhere between 1,292-1,802
workers as per the Das (2003) study. Thus only about 3% of the total number of units surveyed
was reflected in the official statistics and similarly the official level of employment was less than
2% of the study‟s estimate.

3. Annual emoluments for non OAME‟s according to NSSO 2005-2006 is Rs. 26,682. Das
(2003) reveals wages around Rs. 18,000 (assuming regular year-long employment). The piece
rate system was widely prevalent though it does not feature prominently in the official statistics.
4. Only around 28% of informal enterprises had no hired workers while the NSSO data reports a
much larger percentage. This suggests that NSSO estimates of the number of wage-workers in
the informal sector may also be biased downwards.
Hence treating the NSSO data as a first pass on the types of production relations in the informal
sector, we now turn to case-studies of individual industries which offer more reliable data as well
as richer institutional detail. Using examples from different informal industries including Agra
footwear, Lucknow Chikan, Gujarat Ceramics, and UP and TN Handlooms, and a 1991 survey of
1500 artisan households involved in 15 different export-oriented handicraft industries, we offer a
schematic look at the principal ways in which surplus extraction is facilitated.
D. Modes of surplus extraction in informal manufacturing
As elaborated in the introduction, a “mode of surplus extraction” refers to the specific way in
which unpaid labour is extracted from the producers and appropriated by the dominant classes.
In advanced capitalist economies, the employer-employee relationship (the wage-labour/capital
relation) forms the single most important mode of surplus extraction although in the neoliberal
period unequal exchange between larger and smaller capitalists via sub-contracting has assumed
renewed importance. In contrast, developing economies such as India are characterized by a
much greater variety of modes. Broadly speaking we may distinguish between three principal
modes: wage-labour, unpaid work, and unequal exchange. In the first case surplus is pumped out
of direct producers by ensuring that workers produce greater value than is returned to them in the
form of wages. In the second case, one vital to both peasant production and artisanal production,
the labour of women and children is extracted in return for direct subsistence. In the third case,
the surplus produced in small-scale production, even if it be first appropriated by the direct
producer, is eventually transferred from the small producer to a larger one, or to a merchant

capitalist or rentier. Each of these modes interacts with other hierarchies prevalent in society,
such as caste and gender to accentuate the rate of exploitation.
We now consider some specific institutional ways in which surplus extraction is achieved in the
informal economy.
Piece wages
The NSSO does not gather data on whether wages paid in the informal sector are piece-wages or
time-wages but we know from several case-studies that piece-wages are widely prevalent in
small-scale manufacturing. In the Gujarat ceramic study cited earlier (Das 2003) 88% of
informal units and 47.5% of formal units followed the piece-rate system. In a 1991 survey of 365
handicraft artisan units, 96% paid piece-wages (Vijayagopalan 1993). Marx (1992) notes the
salient features of piece-wages, that it in this system it is “the personal interest of the labourer to
lengthen the working-day, since with it his daily or weekly wages rise.” (p. 695) Thus piece
wages achieve an increased rate of exploitation via increasing intensity of labour and a
lengthened working day. Further they obviate the need for control by the capitalist over the
labour process since “the quality and intensity of the work are here controlled by the form of
wage itself.” (ibid, p. 695). Hence Marx‟s conclusion “that piece-wage is the form of wages most
in harmony with the capitalist mode of production.” (ibid, pp. 697-98)
The two types of putting-out relations described by Marx, which give rise to a “hierarchically
organized system of exploitation and oppression,” are still applicable to informal manufacturing
in India:
On the one hand, piece-wages facilitate the interposition of parasites between the
capitalist and the wage-labourer, the “sub-letting of labour.” The gain of these middlemen
comes entirely from the difference between the labour-price which the capitalist pays,
and the part of that price which they actually allow to reach the labourer. (p. 695)
For example, in the Lucknow Chikan industry middlemen (beechwaale), also called agents,
perform the work of bringing cloth and other raw materials to the embroider at her home and

then carrying off the finished product. Social norms around gender make producers accessible
only to men who are the women‟s relatives and neighbors.
…while agents do not control embroiderers by directly overseeing their work, they do
impose a rudimentary discipline upon them by adjusting the flow of work according to
the relative productivity of each woman, and adjusting wages as a means of penalizing
deficient workers and rewarding good ones. In this way, agents effectively release the
mahajans from the need to intervene directly in the labour process (Wilkinson-Weber
1997, p. 59).
In the second type of putting-out arrangment,
…piece-wage allows the capitalist to make a contract for so much per piece with the head
labourer-in manufactures with the chief of some group… at a price for which the head
labourer himself undertakes the enlisting and payment of his assistant work people. The
exploitation of the labourer by capital is here effected through the exploitation of the
labourer by the labourer (p. 695, emphasis added)
This systems is found in the Agra footwear industry as well as the Banarasi Sari industry where
master artisans take responsibility for an order, execute part of the work themselves and recruit
additional artisans as needed to fulfill the order (Knorringa 1999, Varman and Chakrabarti,
2006). In general “exploitation of the labourer by the labourer” exactly characterizes production
relations in large parts of the informal economy.
Unequal exchange
The issue of unequal exchange and the "exploitation" of petty-producers and small capitalists by
merchant capital is ubiquitous in the literature on artisans (see Portes and Walton 1981, Roy
1994, Knorringa 1999, Wilkinson-Weber 1997). Yet few quantitative studies exist on the
aggregate amount of surplus that is siphoned off in this fashion. Asymmetric market power
needed for unequal exchange exists because typically many artisans must compete for the
business of one or a few traders. Vijayagopalan (1993) found that around 50% of the artisans
surveyed obtained their raw materials from traders (who placed the order) and around 90%

handed over the finished product to middlemen/traders. Knorringa (1999) provides institutional
detail in his study of the Agra shoe industry:
Because plenty of anonymous artisans must bargain with a limited number of identifiable
traders and because the small quantities allow for easy, quick, and accurate inspection,
the margins for artisans are pushed down…Moreover with all their working capital tied
up in one production cycle, artisans in a direct sales channel cannot postpone selling. (p.
314)
Traders, on the other hand, can wait for artisan profit margins to decline. Further, traders also
double as financiers extending credit in the form of leather raw material. Since these artisans are
owners of their home-based production units and working capital this is a typical example of
hidden dependency of self-employed artisans.
As mentioned earlier, depending on how prevalent such situations are, they cast doubt on
aggregate value-added numbers. Since value-added is calculated simply by subtracting raw
material costs from total receipts unequal exchange, by increasing input prices and decreasing
output prices and thereby squeezing margins, will result in low value-added estimates.
Apart from monopsonistic or monopolistic situations, extensive middlemen networks also serve
to reduce the price paid to the artisan per piece. In Mexico‟s garment industry, domestic women
workers work on piece wages using their own sewing machines.
A blouse which retails for 120 pesos costs the merchant 60 pesos, plus the cost of the
material which he has given ready-cut to the broker. The broker pays the seamstress 15-
20 pesos and keeps the rest for himself. (Lomnitz, quoted in Portes and Walton, 1981, p.
99)
To accomplish the production target the seamstress may require the help of her children, mother,
neighbors etc. This work is unpaid. Here we witness a common way of increasing absolute
surplus value, by engaging not only the artisan but his/her entire family for one person‟s wage.
Further, workers assume the costs of errors in production.

Wlkinson-Weber (1997) offers another detailed example from the Lucknow Chikan industry.
Agents are paid by the traders/merchants per piece and in turn pay the producer. For items
retailing at Rs. 60 to over Rs. 100 (1990 prices) piece wages for chikan embroidery
…were as low as a single rupee for kurta embroidery in the village, five to fifteen rupees
for salwar-kamiz embroidery in town, and up to 100 rupees for top-ticket items. In very
rare circumstances, a highly skilled embroiderer might collect more than 100 rupees for a
specially commissioned piece obtained directly from the trader. At the other extreme,
most women get their work through agents, who take a substantial cut from the piece
wage, so that the women get no more than a fraction of a rupee for embroidering the most
commonly sold item, a kurta. (p. 52)
Male agents admit to taking at least 50 percent and sometimes more of the piece wage for
themselves while female agents take less. (ibid, p. 60)
Here one could make the case that given the technical conditions of production, the middlemen
perform an essential function bringing together the components of the final commodity. But it
should be noted that their compensation can be far in excess of the labour they expend.
Middlemen wages may thus be seen as cut of the surplus rather than wages per se, being
proportional not to the labour expended but the scale of operation. This is analogous to Adam
Smith‟s observation that profit of enterprise should not be viewed as wages for supervision since
profits are proportional not to labour expended by the capitalist but rather to the stock of capital
employed.
A last point to note is that exchange relations manifested in these terms of trade act in concert
with production relations. Production relations (including but not limited to asset ownership
patterns) determine market power. Market power and resulting terms of trade determine current
income. Income determines future assets and production relations. It is important to emphasize
this dual nature because arguments that limit themselves to deteriorating terms of trade or non-
competitive market structures often do not question why the conditions of exchange are what
they are. Why are rates of return on capital reaching 30 or 40% demanded from small producers?
Perhaps because production is fragmented and volumes of loans are small, or purchase volumes

are small, and transactions costs are large. Relations of production thus underlie relations of
exchange. It is not only because intermediaries manipulate and monopolize that we get unequal
exchange, but rather production relations can create the conditions for unequal exchange, which
are exploited by intermediaries. Such an argument forms the rationale for the formation of
producer and peasant cooperatives.
Labour Bondage
Das (2003) in Gujarat Ceramics and De Neve (2005) in Tamil Nadu handlooms and powerlooms
describe the practice of “consumption advances” which are used to hold workers in bondage.
These advances (called “baki”) can amount to as much as one year‟s worth of wages for the
worker and binds him to the employer until the loan is paid off, which may never happen. This
system is analogous to the attached labour system in agriculture described by Brass (1990) and
Jodhka (1994). Consumption advances were viewed in the modes of production debate as a type
of feudal or semi-feudal arrangement which makes labour unfree. However the situation here is
more complex. It is true that these advances often function as a device to retain skilled labour
that reduces costs of replacement and training. However the resulting “rigidity” in the size of the
labour force is also cited by employers as a problem during lean times or in dealing with
“problem” workers. Further, in practice workers have been found to retain mobility by
transferring loans to new employers.
Gender and Caste
Exploitation of unpaid domestic labour especially of women and children is ubiquitous in
household enterprises. In addition to unpaid market work (to be distinguished from unpaid non-
market work performed by women), women‟s paid work is often devalued as well. The Lucknow
Chikan industry provides an archetypal example of surplus extraction achieved via devaluing of
women‟s paid work.
Women's embroidery, made in the home, is looked upon with far less respect than the
products of men, made in their workshops. Chikan embroidery is thus not regarded
seriously as an occupation in spite of the fact that many families depend upon the income

they derive from it. In fact, it is customarily referred to by mahajans as "free-time" work
to fill in the hours between cooking, cleaning, and caring for children…As one [mahajan]
put it, "They just sit around and they get work, and they get money. All in their spare
time! I'm the one with all the headaches." (Wilkinson-Weber, 1997, p. 62)
Another avenue for the devaluing of productive work is via caste. Agra‟s footwear industry
offers a typical example of a caste-based division between artisans who produce a commodity
and traders/merchants who sell it. Producers are chamars (an untouchable caste) while merchants
are upper-caste Hindus from Punjab. In general the “producer castes” (artisans and peasants) are
often shudras (OBCs) or dalits (SCs) while the traders and other non-productive workers belong
to the forward castes. However, even in instances where employers and workers belong to the
same caste, this may strengthen rather than undermine the regime of exploitation. For example
Engelshoven (1999) alludes to the Surat diamond cutting industry where both employers and
employees are Saurashtra Patels. While the caste monopoly helps workers retain some job
security, it also make it difficult for them to challenge exploitation since community bonds are
supposed to trump class contradictions. As a result there has been no strike in this industry.
Thus Gender and Caste hierarchies can serve to enhance surplus extraction occurring via wage-
labour or unequal exchange. This highlights the importance of understanding how exploitation is
produced at the intersection of several hierarchies. The intention is not to reduce Gender or Caste
oppression to class exploitation, but rather to elucidate how each of these may reinforce (and at
times undermine) the other.
Reversing the technical division of labour
We have commented on how piece-wages can eliminate the need for supervision on part of the
employer and enhance the production of absolute surplus value by intensification of the work
effort as well as lengthening of the working day. However there is yet another channel of
exploitation afforded by putting-out which depends not on intensification of the work effort for a
given type of task, but rather on increasing the type of tasks a worker is expected to perform at a

fraction of the cost of employing another worker to do the job. Sahasrabudhey (2001) notes that
in this system of production the management of production, the tasks of training, maintenance of
machinery, ensuring supply of electricity and water etc. have been shifted onto the labourer.
Each of these, which would represent an independent cost to the capitalist, are born by the
worker. Thus the capital-enforced division of labour between management and production is
collapsed to a certain extent and workers once again become managers, though ironically only to
exploit themselves all the more.
E. A framework for discussing production relations in the informal sector
The informal manufacturing sector displays a great variety of production relations in which the
producer retains or losses control over the means of production and the labour process as well as
product to varying degrees. The variety of production relations observed empirically can be
captured in a simple matrix (see Table 6) where the two axes are control over labour process and
product, and control over fixed and working capital.xii
By “self” or “other” labour process is
meant the absence or presence of supervision over the labourer respectively. “Self” labour
product refers to the producer‟s ability to dispose of the product of her labour according to her
will (i.e. on the market) while “other” labour product indicates another‟s (typically a merchant‟s)
control over the product. “Self” refers to the artisan household in other words, this scheme does
not consider unpaid household labour as a separate category.
Classical Artisan: The “classical artisan” mode consists of say a weaver, a metal-worker, or a
leather-worker who owns the means of production, works in own premises usually with the help
of household labour and produces for sale on the market. He (usually though not necessarily
male) also retains control over a self-directed labour process and commands unpaid household
labour. This is of course an ideal type and actually existing artisanal firms may deviate to
varying degrees. In fact, as capitalism undermines the conditions of existence of independent
commodity production and as merchant capital inserts itself between the market and the artisan,
the producer increasingly loses control over the process and product of labour and slides into a

putting-out arrangement. Going further, as she is completely alienated from capital, the classical
proletarian is born.
Table 6: A typology of production relations in the Indian informal manufacturing sector
Contemporary Artisan: Here the producer works on own premises, with own capital but loses
independence in the market and works either exclusively or partially on the order of a merchant
or industrial capitalist. Thus he or she is not always free to dispose off the product as desired.
He/she may also be dependent upon the same merchant for credit. This type of arrangement is
found among other places in the Agra footwear industry as well as in the Banaras handloom
industry. This captures the salient features of the contemporary artisan: control over capital and
labour process but little control over access to the market.
Putting-out variation I- The producer works on own premises with own equipment but with
working capital advanced by the merchant, in a self-directed labour-process and hands over
product to merchant capitalist or his representative. As the NSSO data discussed earlier suggest,
this is an extremely common type of contract arrangement.
Putting-out variation II- The producer works on own premises in a self-directed labour-process
but with equipment and working capital advanced by the contractor/merchant and hands product
over to merchant capitalist. NSSO data suggest that this is less common though weavers in rural

areas (sometimes called “dependent weavers”) often labour under such relations. In industries
such as embroidery where working capital forms the bulk of capital, this type of relation is
particularly frequent. Women are given cloth, thread and other materials on which they work at
home. The finished product is collected by male agents.
Classical wage labourer- The producer works in another‟s premises with no independent access
to capital or the market. Though these are in a minority as compared to the self-employed, they
still form an important part of the informal manufacturing working class.
Relating our typology to Roy‟s (1994) typology, we can say that the “classical artisan”
corresponds to Roy‟s “independent weavers” (sale of product not tied to one buyer, no
monopsony) and the putting-out variations correspond to the two types of “dependent weavers,”
those employed on piece contracts (“seller of cloth”) versus those on wage-employment (“seller
of labour”), the capitalist in the first instances being a merchant or money-lender and the second
case being a larger producer-cum-merchant. An example of putting out-II has been reported in
Mau, UP, where large producers lease out looms to weavers. “Workers work in their own house
but on someone else‟s looms.” (Roy, 1994, p. 207)
One point that emerges from the above discussion is that capitalist relations may show up first
not in the separation of the producer from the means of production but rather in a slow loss of
control first over the product and then over the process of labour. Conversely wage-labourers
may be united with the means of production if this is suited to the interest of capital. For example
in the Bhavani handloom industry in Tamil Nadu described by de Neve (2005) many capitalist
owners of workshops who previously employed weavers on piece-wages began to sell or lease
their looms to master-weavers to whom they provided yarn. The problems of managing the
looms and disciplining labour were thus transferred from the merchant capitalist to the master-
artisan. Lastly, it should be noted that the fluidity of production relations is also manifested at the
level of the individual worker who may work on piece-wages today, be a small contractor of
labourers tomorrow and work on a factory shop-floor on the third day.

F. Concluding remarks
In the foregoing pages we have attempted to take a broad look at the organization of informal
industry in India. In particular we have focused on the evolution of firm size, the types of
production relations and the modes of surplus extraction prevailing in informal industry. The
relations of production in informal industry are neither purely independent producer
(characterized by producer‟s control over the labour process and ownership of capital) nor only
industrial capitalist (characterized by a proletarian workforce and a real subsumption of labour to
capital). Rather a spectrum of putting-out relations based on formal subsumption of labour and a
reliance on extraction of absolute rather than relative surplus value is observed. In addition to
putting-out arrangements, nominally self-employed or independent producers are often locked
into a relation of dependency vis-à-vis merchant and finance capital. This situation is closely
analogous to the position of the peasant in the countryside with respect to intermediaries.
Relations of dependency and lack of resources as well as incentives for technical change keep
informal workers trapped in low productivity, low wage work. Surplus labour, low wages and
intense (self) exploitation in turn create disincentives for technical change. From the point of
view of the large or formal-sector capitalist (whether merchant or industrial) sub-contracting
arrangements retain advantages of economies of scale in purchase of means of production while
circumventing the costs associated with a formal labour force. Number of workers protected by
legislation is kept to a necessary minimum while much labour-intensive (skilled and unskilled)
work is contracted out to informal units. Through employment of unpaid family labour and
labour paid below official minimum wage, informal firms are able to survive and formal firms
are able to extract larger amounts of surplus value. The disintegration of the textile mills and
their conversion into powerloom sweat-shops is an example of this process.
Labour bondage, gender and caste hierarchies, unpaid domestic work and contingent and casual
labour can all be understood as attempts to increase absolute surplus value. This reinforces the
fact that in all these cases, there is formal rather than real subsumption of labour by capital. The
incentive to alter the methods of production or adopt new techniques of production comes, in
these circumstances, from the direct producer, who however, lacks the resources to undertake

this task. Capitalists in the formal sector do not have the incentive to undertake technical change
because under formal subsumption of labour there is no drive to increase relative surplus value.
Efforts to increase productivity and reduce work burdens are thus doubly undermined as
producers, who have the incentive do not control their own surplus while capitalists, given a
large labour force ready to work for extremely low wages, have resources but do not face
incentives for technical change. Naturally, we do not mean to imply that the above-stated reason
is the only factor in continued low labour productivities observed in informal manufacturing, but
it is nevertheless an important part of the story.
It is widely recognized that in the face of the failure of modern industry to expand satisfactorily,
the informal sector has acted as the “employer of last resort” for surplus labour in the agricultural
sector. However NSSO data also shows that employment in informal manufacturing has been
more of less constant since the 1980s. Thus it can be inferred that informal retail as well as
informal labour in construction have largely absorbed the increase in the labour force. Further
work is needed to explore the relations of production in these two important sectors of the Indian
economy.

CONCLUSION
Based upon the foregoing analysis, we would now like to raise some political and philosophical
questions for further discussion without in any way claiming to have arrived at conclusive
answers. Though both the authors agree as to the analysis presented above, we derive different
political and social implications from these trends. This is due to the different political and
philosophical perspectives that both of us see ourselves closest to. Rather than paper over our
differences and in the spirit of dialogue, we therefore, present our alternative viewpoints, which
might even be contradictory, for further discussion.
One of the striking features of contemporary Indian capitalism is the predominance, both in
agriculture and in industry, of small-scale production. In 2003, 70 percent of all operational
holdings in Indian agriculture were less than 2.5 acres in size, with another 16 percent between
2.5 and 5 acres (Government of India, 2006c); around half of the produce from these small
holdings is kept for family consumption while the other half is sold in the market. Similarly,
informal manufacturing is dominated by petty proprietorships, which typically has an owner-
employer and an unpaid worker (usually a family member); a large number of such firms neither
employ wage labour nor are part of a putting-out system. Thus, while production for subsistence
and for sale on small, unviable plots is a key characteristic of the agrarian scene (see Figure 14),
petty commodity production (or simple commodity production) marked by low productivity and
income seems to be a pronounced feature of the non-farm economy. The vast majority of the
Indian poor shuttle between these two. As a consequence of these relations, unequal exchange
must be counted alongside wage-labor as a preeminent mode of surplus extraction in the Indian
economy.
All the issues that we wish to raise in this concluding section relate to such an economic
structure, characterized by the persistence of small scale production: (a) the vicious cycle of the
interaction between small scale production in agriculture and industry, (b) the implication of
predominance of small scale production in India for the development of revolutionary class
consciousness, (c) the changed nature of the agrarian question and the relevance of redistributive

land reforms in resolving the agrarian question, and (d) the question of the appropriate model of
industrialization. Let us take each of these in turn.
The relation between small-scale production in agriculture and industry
Recall that the picture emerging from our study of the agrarian economy emphasizes the growth
of capitalist relations of production over the last few decades. The decline of tenancy, growth of
wage labour, decline of attached and bonded labour, growth of casual labour, replacement of
patronage by contractual arrangements, increase of migration to locations outside agriculture and
outside the village, modest accumulation and the adoption of new technologies – irrigation,
tractors and high yielding varieties of seeds – highlight the consolidation of capitalist forms of
surplus extraction. However some key trends associated with capitalism are completely missing.
Lack of concentration of land on any significant scale and the persistence of small-scale
cultivation are two such trends, which are often seen as signs of a lack of growth of capitalist
relations. Some political economists would probably argue that this warrants a characterization
of the contemporary political economy as semi-feudal. Does lack of land concentration, the
perpetuation of small-scale farming, and the resultant economic stagnation have anything in
common with the stagnation associated with semi-feudal relations of production observed in an
earlier period? We do not think so.
To understand the issue of land concentration, let us recall that by the process of concentration is
meant the transfer of land from smaller to larger landholders. A smallholding owner of land can
give up his/her ownership to the larger landholder in at least two different ways: he can be
forcibly driven off his land or he can sell it off. In India, both historically and today, the first
form of land transfer – so important in the development of capitalist agriculture in England – has
not been observed on any substantial scale. The recent attempts by the State to forcibly drive off
peasants from their land have been fiercely resisted all across India, from Nandigram to
Kalinganagar to Raigad and beyond. While forcible eviction of the peasantry, at least on a large
scale, has been absent, neither has sale of land by smallholders been observed on a large scale in

the post-1947 period. The refusal of smallholders to part with their land thus works against the
movement towards concentration. What lies behind this refusal?
As we have already seen in the section on agriculture, there is lot of evidence to support the
claim that small scale agricultural production has become economically unviable: small scale
agriculture does not generate a comfortable surplus in the present context of property relations
and state structure. Sources of income data show that only families with large landholdings (i.e.,
10 acres or more) can generate more income than their expenditures. Why do smallholders refuse
to give up ownership of their land if cultivation of their small plots, despite heavy self-
exploitation at the family level, has become seriously unviable? In part, the answer must be that
giving up ownership would mean a further worsening of the material conditions of their
existence compared to their current situation.
If we pay attention to the situation of employment options outside agriculture, we can understand
the dogged refusal of smallholders to part with their land. Employment outside agriculture in
India today is predominantly available in the unorganized or informal sector. As the Sengupta
Commission Report (NCEUS 2007, 2009) has made amply clear, employment in India's
informal economy is marked by low wages, abysmal conditions of work, self-exploitation, no
social security, and no job security. The alternative to agricultural production is, thus, low-
paying and precarious employment. In such a scenario, a small piece of land can very well mean
assurance of some subsistence needs in the face of extreme income uncertainty. The growth of
the informal sector, therefore, feeds on and reinforces the lack of land concentration. We suggest
that the logic of semi-feudalism – appropriation of the surplus labour predominantly through
direct labour services, bondage and attached labour; interlinked credit, labour and product
markets; prevalence of usurious credit; lack of incentives for productive investment both for the
direct producers (the tenant) and the owners of the land (non-cultivating landlords)– does not
seem to be at work here; what is relevant is the political economy of contemporary backward
capitalism resting on the vicious cycle of precarious non-farm employment and small-scale
agricultural production, both marked by low productivity and low incomes and one reinforcing
the other.

Multiple relations of production and class-consciousness
The second issue that we wish to put forward for discussion relates to the dynamics of class
differentiation in rural India. The persistence of petty production in agriculture, industry as well
as services has been interpreted as arrested class differentiation. However a closer look at the
evolving relations of production reveals that class differentiation is proceeding, albeit in a way
different from the European case. For example the differentiation that is taking place in rural
India is more between a heterogeneous rural gentry and a heterogeneous rural poor, than between
capitalist and worker. In industry too, the apparent preponderance of petty production hides the
extent of wage-labor, for example by making a piece-rate wage worker appear as an own-
account producer. Both in agriculture and in industry the actual extent of alienated labor is
hidden by a semblance of private property.
All this implies that a member of the working population participates in multiple production
relations and her consciousness is shaped by these multiple, and often drastically, different
objective positions in the production process. At one time a worker may be an agricultural
labourer, exploited through the institution of wage-labour; at another time, often within weeks or
months, a tenant cultivator, hiring in land from the local landlord and facing exploitation through
semi-feudal methods; on still another occasion he may even employ wage-labor during peak
season for his small plot of land, and finally as a petty producer he may operate as an owner of a
small business using family labour.
The political struggles that have mobilized large numbers in the past few decades are a testament
to this complexity. Rather than witnessing mass struggles of the proletariat against capital, or of
the landless against the landlords, we have seen a vast number of struggles over “jal, jungle,
zamin.” These are essentially struggles against dispossession, or in other words, struggles of
small property holders against confiscation of their property. Dispossession forms the
centerpiece of the adivasi struggle aided by CPI (Maoist) also. The agitations over input and
output prices which mobilized lakhs of farmers in the 1980s and 1990s are also struggles of
property-holders and can be explained by the evidence we have presented regarding the
penetration of the market up to the smallest producer. What does this imply for radical social

transformation? Can the absence of a clear-cut class-based political leadership of these resistance
movements account for the lack of serious challenge to the power of the Indian state?
If the class differentiation at the lower end of the social and economic hierarchy is masked by
participation of members of the working population in multiple relations of production, the rural
gentry at the other end of the spectrum is also a complex entity. How did this rural gentry come
into being? Land reforms, of a decidedly timid variety, “sliced off a bit of the old land-owning
classes, those that owned enormous estates, and incorporated a small upper section of the tenants
in the land-owning group, thus creating a broader strata of landowners…” (Desai, 1986: quoted
in Balagopal, 1986). Members of the rural gentry have, over the years, lost some of the
monopoly over land, as we have seen, but facing this decline, have nicely “diversified” their
portfolios into other areas of rural economic life, thereby maintaining their hold over rural
society (Metcalf, 1967). Facilitated by a pliable state, members of this class gradually got
involved in trade and usury, in government contracts for infrastructure works, in building and
maintaining hotels, cinema theatres, petrol pumps, newspapers, etc. They continue to rely
heavily on their relationship to the State to facilitate the reproduction of their capital; and without
exception, they are the local notables of mainstream political parties, often maintaining their own
militias to politically intimidate the local population, and garner the lion‟s share of development
funds.
It is difficult to differentiate, within the rural gentry, between feudal interests (which have
certainly seen a secular decline over the past five decades) and capitalist interests, as much as it
is difficult to differentiate between different varieties of capital: industrial, merchant, usurious.
Analogously, from the point of view of the working class, it is difficult to identify where surplus
extraction via unequal exchange stops and that via wage-labor begins. As feudal methods of
surplus extraction, like tenancy, declined and as their hold on the monopoly of land dwindled,
members of the rural gentry painlessly morphed into capitalist farmers and local merchants.
Some started industrial activities with the support of the State, while others ploughed their
capital into money-lending. It is worth noting that never in independent India have the class of
capitalist farmers taken up arms against the so-called feudal interests in land; the contradiction,

to the extent it ever existed between these fractions of the rural ruling classes, have been resolved
in the most amicable manner.
The question of land reform
The third issue worth considering is the continued centrality of the agrarian question to any
project for revolutionizing Indian society. This follows simply from the fact that the majority of
the working people in India are related, directly or indirectly, with the agricultural sector; this is
a direct result of the failure of the structural transformation of the Indian economy. Any attempt,
therefore, at radical reconstruction of Indian society will have to deal with the agrarian question
effectively. Dealing with the agrarian question will mean, among other things, rapidly increasing
the productivity of agricultural activity, the surest way to increase the income of the vast masses
of the working people involved in agriculture and thereby create a home market for domestic
industry.
The Marxist tradition has seen redistributive land reforms as essential to the project of dealing
with the agrarian question. The reasons have primarily been political, though some economic
arguments have also been developed.xiii
Politically, land reforms have been seen as a way to
decisively break the power of the parasitic class of feudal and semi-feudal landlords;
economically, it has been understood as creating conditions for the development of the
productive forces in rural society, increasing the productivity of labour, creating a surplus for
supporting industrialization and providing a market for domestic industry.
Using Lenin‟s distinction between the Prussian and the American paths for bourgeois
development in the rural economy lends credence to the call for redistributive land reforms
(Lenin, 1907). The three main communist streams in India, the Communist Party of India
(Marxist), the Communist Party of India (Marxist-Leninist) Liberation and the Communist Party
of India (Maoist) more or less accept this distinction, the first two explicitly and the last one
implicitly.xiv
Hence, for all the three streams the main task (or axis) of the current stage of the

Peoples (or New) Democratic Revolution is the agrarian revolution, with redistributive land
reforms being one of its main tasks.
While it is true that India, because it did not witness any serious efforts at land reforms on a
national scale, developed along the landlord path out of semi-feudalism, there are some
important differences that need to be considered. One pole of landlord capitalism, viz.,
landlessness has been growing over the years; the other pole of landlord capitalism, viz., the
continued dominance of a few “big peasants” seems to be at variance with the evidence.
Aggregate level data about India that we have seen in the course of this study seems to throw up
an unmistakable trend of the declining power of landlords (feudal or otherwise), not by any
revolutionary means but just by the sheer pressure of demographic developments and economic
stagnation. The total land owned by the large landholding families, the “big peasants” that Lenin
refers to, has halved over the last five decades and today they own only about 12 percent of the
total land. On the other hand, the land owned by medium-to-small landholding families has
increased to over 65 percent. Does this, along with other evidence on the decline of tenancy and
the increase of wage-labour, not indicate that the rural economy in India is inexorably being
pushed in the direction of peasant capitalism? How would this important trend of the increasing
dominance of peasant capitalism, and a gradual whittling down of landlord capitalism, change
the course of the agrarian revolution? If landlords, as a class, are dwindling in economic and
social power, is a programme aimed at breaking their political power still relevant? Is the
contradiction between feudalism and the broad masses of the people still the principal
contradiction in India today?
A crucial issue that will need to be addressed in the context of the slogan for redistributive land
reforms is to see whether the resulting farms will be viable in any meaningful economic sense.
Let us recall that the average size of ownership holding in India in 2003 was 0.81 hectares; so,
the most equitable redistribution will result in the average holding of this size. If instead land is
only taken from those owning more than 10 acres and all of it distributed among those currently
owning less than 1 acre, then the average size of holding for those receiving redistributed land
will roughly become 1.25 acres. If we juxtapose this with the cost of cultivation data, we can
easily see that agricultural units of approximately such sizes will not be economically viable in

the sense of being able to generate any substantial surplus product after sustaining a decent level
of consumption of the producers. It is extremely doubtful whether these small farms can generate
any economic surplus even after the onerous relations of unequal exchange have been removed
from the picture. Can they, therefore, help in the industrialization effort by generating surplus or
will they instead require a net resource flow in their direction with subsidized credit, power,
inputs, technology, etc. to continuously keep them viable? This question is extremely important
as can be seen from the concrete experiences of the Russian and Chinese revolutions.
The growth of capitalist relations in the Indian countryside, the continued fragmentation of the
land, the decline in tenancy, the unviability of small-scale production and other related factors
seem to suggest that collective forms of agricultural production are gradually being pushed on to
the historical agenda of the revolutionary movements in India. Collective, cooperative and
socialist forms of large-scale agriculture probably need to be seriously considered as an option
emerging out of the very evolution of the material conditions of the vast masses of the working
people. The agenda of redistributive land reforms creating bourgeois property in rural areas and
facilitating capitalist development needs to be seriously rethought, not because of some
ideological reasons but because the development of the agrarian structure seems to demand such
a re-evaluation.
It is not that redistributive land reform is, either economically or politically, not useful; it is
extremely useful at this stage of Indian development and thus finds pride of place in the
programme of all the communist streams. Land reforms will certainly help in increasing the
consumption levels of the vast masses of the peasantry from their current abysmally low levels;
it will democratize the ownership structure in rural society; it will help create an internal market
for the accumulation of capital; it will help break the stranglehold of the rural gentry over rural
social and political life. All these reasons undoubtedly make redistributive land reforms an
indispensable part of any strategy for the radical restructuring of Indian society.
Without in any way undermining the logic of land reforms in the present Indian context we
would also like to strike a cautionary note, following Paul Baran (1957), against treating land
reforms as a panacea for all economic problems of an underdeveloped society such as India. The

agrarian structure of rural India, with its extremely low land-man ratio, suggests that the limits of
the positive aspects of redistributive land reforms will be reached pretty quickly; it will need to
be positively transcended within a very short time. Hence, the transition from a focus on
redistributive land reforms and support for peasant capitalism to an emphasis on collective
ownership and production will need to be reckoned with from the very beginning; both the
agrarian structure and historical lessons suggest such an emphasis.
The mode of industrialization
The fourth large issue raised by our study concerns the mode of industrialization of the Indian
economy. It is relatively uncontroversial that a shift of the agricultural population into the
secondary and tertiary sectors will be required in order to raise real incomes of the vast majority.
How this transformation is to be achieved is the difficult question. The structural transformation
required to relieve above-mentioned pressures on agriculture cannot be left to the anarchy of the
global capitalist market. The “market-friendly” post-1991 period has been witness to a type of
growth that has resulted in rising inequality and increasing number of low-wage, contingent and
informal jobs. However the contradictions and problems of the pre-Reform, “planning period”
also need to be taken seriously. There is an urgent need to break out of certain simple binaries
and equations, which have been imposed upon us. The first binary is that between State-managed
capitalism and market-oriented capitalism. India‟s experience shows that the vast majority of the
working population has suffered greatly in both regimes. In our struggle against a particularly
predatory type of neoliberal capitalism (whose days may in any case be numbered given the
global crisis), we must not find ourselves unwittingly arguing for a return to the bureaucratic and
corrupt State. Rather the spectacular failure of the neoliberal model can be an opportunity to
demand greater decentralization and more autonomous development. The various people‟s
movements have been articulating precisely such a model of development.
The second simple equation is between rural areas and agriculture on the one hand, and cities
and industry on the other hand. The social and ecological contradictions of the large-scale,
capital-intensive model of industrialization must be taken seriously. Nowhere has this model
produced high levels of employment in an ecologically sustainable fashion while giving
producers a say in the running of the workplace. It is becoming increasingly clear that the
economic viability of such industrialization is obtained only by cost externalization. The Indian
experience points to the necessity for developing dispersed, low capital-intensity, sustainable
models of industry that nevertheless raise real incomes of the majority (see Datye 1997 for one
such model). This is not a utopian pipe-dream but rather a historical necessity if “development”
is not to remain an unfulfilled promise for the majority of Indians.
None of the above can be taken only as a demand for better or more enlightened development
policy. Rather it articulates what has already been emerging from social and political movements
and in turn seeks to ground the political demands in an empirical and theoretical context. There
is a need to extend revolutionary people‟s movements rooted in peasant agriculture and natural
resource struggles into the rural, semi-urban and urban industrial milieu. The urgent question
here is how can the dispersed industrial working class be effectively politically organized at a
national level? This working class does not always resemble the “classical” doubly-free, urban
industrial proletariat. Yet, our attempt here has shown that it remains exploited nonetheless and
can and should form an important component of left revolutionary politics. Is an artisan-peasant
alliance a possibility for the near future?
There is a difference of opinion between the two of us on the question of the model of
industrialization that might fruitfully accompany efforts at a radical restructuring of Indian
society. One of us (AB) believes, as has been stated in the above paragraphs, that a dispersed,
low capital-intensity, sustainable model of industrialization is the way forward. While we agree
that the scale and geographic dispersal of industrialization per se does not lead to its being more
democratic or ecologically sustainable, DB places more importance on the institutional setting
within which the industrialization effort is embedded. A small-scale industrialization effort in the
context of local level inequalities of class, caste and gender can reinforce those inequalities and
nullify all attempts at democratic control of the production process; on the other hand, a large-
scale, high capital intensity and centralized industrialization effort within a socialist context
might be amenable to democratic control if the institutions of workers‟ control are in place. DB
believes that the experience of the Russian and Chinese revolutions shows that petty production

of the artisanal variety cannot solve either the economic problems of the vast masses of an
underdeveloped country like India or the political problems of a society embarking on the
socialist path. Sustainability, for DB, seems to have more to do with proper cost-benefit analysis
rather than the scale of production as such. In a socialist context, where the surplus product of
society is democratically controlled, the pace and direction of technical change will be
determined in a rational and scientific manner and not left to the anarchy of capitalist production
and the imperatives of profit maximization. In such a setting, internalizing the environmental
costs of production would flow naturally from the imperatives of all round social development.
It has been our effort in the present study to arrive a macro understanding of Indian agriculture
and Industry from the Marxist perspective. As our differing positions advanced above indicate,
we do not intend to argue for any one right solution to the problems identified in the study.
Rather we hope that the data and the accompanying reflections and speculations will serve to
fuel further discussions and debate out of which visions for a future Indian society may emerge.
REFERENCES
Athreya, V.B., Boklin, G., Djurfeldt, G., and Lindberg, S. 1986. “Production Relations and
Agrarian Change: Some Findings from a Case Study in Tamil Nadu,” Social Scientist, Vol 14,
No. 5, pp. 3-14.
Balagopal, K. 1986. “Agrarian Struggles,” Economic and Political Weekly, Vol. 21, No. 32,
pp.1401-05.
Baran, P. 1957. The Political Economy of Growth. Monthly Review Press, New York.
Bhalla, S. 1999. “Liberalisation, Rural Labour Markets and the Mobilisation of Farm Workers:
The Haryana Story in an All-India Context,” in Byres, T.J., Kapadia, K., and Lerche, J. eds.
Rural Labour Relations in India, London: Frank Cass, pp. 25-70.
Brass, T. 1990. “Class Struggle and the Deproletarianisation of Agricultural Labour in Haryana
(India),” Journal of Peasant Studies, Vol. 18, Issue 1, pp. 36-67.
Brass, T. 1994. “Unfree Labour and Agrarian Change: A Different View,” Economic and
Political Weekly, Vol. 30, No. 13, pp. 697-699.

Breman, J. 1993. Beyond Patronage and Exploitation: Changing Agrarian Relations in South
Gujarat. Oxford, Oxford University Press.
Breman J, 1996. Footloose Labor: Working in India’s Informal Economy. Cambridge University
Press
Byres, T. J. 1981. “The New Technology, Class Formation and Class Action in the Indian
Countryside,” Journal of Peasant Studies, Vol. 8, No. 4, pp. 405-54.
Byres, T. J., K. Kapadia and J. Lerche (eds.). 1999. Rural Labour Relations in India. Frank Cass,
London.
Chakravarti, A. 2001. Social Power and Everyday Class Relations: Agrarian Transformation in
North Bihar. Sage Publications, New Delhi.
Chakrabarti, M and Varman, R 2009. Labour in Global Value Chains: A Study of the Leather
and Footwear Manufacturing Cluster of Kanpur, Aspects of India‟s Economy, No. 47, March
2009, http://rupe-india.org/47/leather.html (last accessed, August 2010).
Chand, R. 2006. “Agriculture Markets in India: Implications for Competition,” in Mehta, P. S.
(ed), A Functional Competition Policy for India. Academic Foundation, New Delhi.
CPI(Maoist)Party Programme:
http://www.satp.org/satporgtp/countries/india/maoist/documents/papers/partyprogram.htm
CPI(ML) Liberation Party Programme:
http://www.cpiml.org/8th_congress/partyprogramme.html
CPI(M) Party Programme: http://cpim.org/
Das K. 2003. “Income and Employment in Informal Manufacturing: A Case Study.” In R.
Jhabvala, R.M. Sudarshan and J. Unni wds. Informal Economy Centerstage: New Structures of
Employment. Sage Publication, New Delhi.
Datye K. R. 1997. “Banking on Biomass: A New Strategy for Sustainable Prosperity Based on
Renewable Energy and Dispersed Industrialization.” Center for Environmental Education,
Ahmedabad.
De Neve G, 2005. The Everyday Politics of Labor: Working Lives in India’s Informal Economy.
Social Science Press, New Delhi.
Desai, A. R., (ed.) 1986. Agrarian Struggles in India after Independence. Oxford University
Press, Bombay.
Engelshoven, M. 1999. “Diamonds and Patels,” in J. Parry, J. Breman and K. Kapadia eds. The
Worlds of Indian Industrial Labor. Sage Publications, New Delhi.

Forbes D. K. 1981. "Production, reproduction, and underdevelopment: petty commodity
producers in Ujung Pandang, Indonesia" Environment and Planning A 13(7) 841 – 856.
Frankel, F. 2005. India’s Political Economy, 1947-2004. Oxford University Press, New York.
Government of India, 2002. “Unorganized Manufacturing Sector in India 2000-2001:
Characteristics of Enterprises,” Report No. 478, NSS 56th
Round, July 2000- June 2001.
Government of India. 2006a. “Household Ownership Holdings in India, 2003,” Report No. 491,
NSS 59th
Round, January-December, 2003.
Government of India. 2006b. “Some Aspects of Operational Land Holdings in India, 2002-03,”
Report No. 492, NSS 59th
Round, January-December, 2003.
Government of India 2006c. “Income, Expenditure and Productive Assets of Farmer Households,
2003,” Report No. 497, NSS 59th
Round, January-December 2003.
Government of India. 2006d. “Indebtedness of Farmer Households, 2002-03,” Report No. 498,
NSS 59th
Round, January-December, 2003.
Government of India. 2007. “Report of the Expert Group on Agricultural Indebtedness,”
Ministry of Finance.
Government of India, 2008a. “Operational Characteristics of Unorganized Manufacturing
Enterprises in India,” Report No. 524, NSS 62nd
Round, July 2005- June 2006.
Government of India, 2008b. “Unorganized Manufacturing Sector in India: Employment, Assets
and Borrowings,” Report No. 525, NSS 62nd
Round, July 2005- June 2006.
Government of India, 2008c. “Unorganized Manufacturing Sector in India: Input, Output, and
Value Added,” Report No. 526, NSS 62nd
Round, July 2005- June 2006.
Gulati, A. and S. Bathla. 2002. “Capital Formation in Indian Agriculture: Trends, Composition
and Implications for Growth,” Occasional Paper 24, National Bank for Agriculture and Rural
Development.
Harriss J, 1982. Character of an Urban Economy: “Small-Scale” Production and Labor Markets
in Coimbatore.” Economic and Political Weekly, Vol 17. No. 23 and No. 24.
Harriss, J., Jeyaranjan, J., and Nagaraj, K. 2010. Land, Labour and Caste Politics in Rural Tamil
Nadu in the 20th
Century: Iruvelpattu (1916-2008), Economics and Political Weekly, Vol. 45,
No. 31, p. 47-61.
Harriss-White, B. and Janakrajan, S. 1997. “From Green Revolution to Rural Industrial
Revolution in South India,” Economic and Political Weekly, Vol. 32, No. 25, pp. 1469-1477.

Haynes, D. 1999. “Just Like a Family? Recalling the relations of production in the textile
industries of Surat and Bhiwandi, 1940-60,” Contributions to Indian Sociology, Vol. 33, No.1-2,
pp. 141-169.
Heintz, J. 2006. “Low-wage manufacturing and global commodity chains: a model in the
unequal exchange tradition,” Cambridge Journal of Economics, Vol.30, pp. 507-520.
Januzzi, F. T. 1974. Agrarian Crisis in India: The Case of Bihar. University of Texas Press,
Austin.
Jhabvala R, Sudarshan R.M, Unni, J. 2003. Informal Economy Centerstage: New Structures of
Employment. Sage Publication, New Delhi.
Jodhka, S.S. 1994. “Agrarian Changes and Attached Labour: Emerging Patterns in Haryana
Agriculture,” Economic and Political Weekly, Vol. 29, No. 39, pp. A102-A106.
Kahn, J. S. 1982. “From Peasants to Petty Commodity Production in Southeast Asia,” Bulletin of
Concerned Asian Scholars, Vol. 14.
Kapila U (ed), 2007. India’s Economic Development Since 1947, Academic Foundation, New
Delhi.
Knorringa, P. 1999. “Artisan Labor in the Agra Footwear Industry: Continued Informality and
Changing Threats.” In J. Parry, J. Breman and K. Kapadia eds. The Worlds of Indian Industrial
Labor. Sage Publications, New Delhi.
Lenin, V. I. 1907. “The Agrarian Programme of Social-Democracy in the First Russian
Revolution, 1905-07.” Available at:
http://www.marxists.org/archive/lenin/works/1907/agrprogr/index.htm
Lerche, J. 1999. “Politics of the Poor: Agricultural Laborers and Political Transformations in
Uttar Pradesh,” in Byres, T.J., Kapadia, K., and Lerche, J. eds. Rural Labour Relations in India,
London: Frank Cass, pp. 182-241.
Marx, Karl. 1992. Capital: A Critique of Political Economy, Volume 1. Penguin Classics,
London.
--- 1993. Capital: A Critique of Political Economy, Volume 2. Penguin Classics, London.
--- 1993. Capital: A Critique of Political Economy, Volume 3. Penguin Classics, London.
Mazumdar, D and Sarkar, S. 2008. Globalization, Labor Markets and Inequality in India, New
Delhi: Routledge.

Metcalf, T. R. 1967. “Landlords without Land: The U.P. Zamindars Today,” Pacific Affairs, Vol.
40, No. 1/2, pp. 5-18.
Middleton, A. 1989. “The Changing Structure of Petty Production in Ecuador,” World
Development, Vol. 17, Issue 1, pp. 139-155.
Mishra, S. 2007. “Agrarian Scenario in Post-reform India: A Story of Distress, Despair and
Death,” Working Paper, Indira Gandhi Institute of Development Research, Mumbai.
Morris S et al. 2001. “The Growth and Transformation of Small Firms in India.” Oxford
University Press, New Delhi.
NCEUS, 2007. Report on Conditions of Work and Promotion of Livelihoods in the Unorganised
Sector, National Commission for Enterprises in the Unorganized Sector, www.nceuis.nic.in
NCEUS 2009. The Challenge of Employment in India: An Informal Economy Perspective,
Volume 1, National Commission for Enterprises in the Unorganized Sector, www.nceuis.nic.in
J. Parry, J. Breman and K. Kapadia eds. The Worlds of Indian Industrial Labor. Sage
Publications, New Delhi.
Patnaik, U. 1972a. “Development of Capitalism in Agriculture-I,” Social Scientist, Vol. 1, No. 2,
pp. 15-31.
--- 1972b. “Development of Capitalism in Agriculture-II,” Social Scientist, Vol. 1, No. 3, pp. 3-
19.
--- 1976. “Class Diefferentiation iwithin the Peasantry: An Approach to Analysis of Indian
Agriculture,” Economic and Political Weekly, Vol. 11, No. 39, pp. A82-A85+A87-A101.
--- 1980. “Empirical Identification of Peasant Classes Revisited,” Economic and Political
Weekly, Vol. 15, No. 9, pp. 483-488.
--- 1986. “The Agrarian Question and Development of Capitalism in India,” Economic and
Political Weekly, Vol. 21, No. 18, pp. 781-793.
--- 1990. Agrarian Relations and Accumulation: The “Mode of Production” Debate in India,
Oxford University Press.
Portes, A and Walton, J. 1981. “Labor, Class and the International System,” Academic Press,
New York.
Roy T, 1994. Artisans and Industrialization: Indian Weaving in the Twentieth Century, Oxford
University Press.
Roy T, 1999. Outline of a History of Labour in Traditional Small-scale Industry in India.
Archives of Indian Labor, Online at http://www.indialabourarchives.org/publications/
Tirthankar%20Roy.htm

Roy, T. 2000. The Economic History of India, 1857-1947. Oxford University Press. New Delhi.
Sahasrabudhey C, 2001. Karigar Samaj (Artisanal Society), in Sahasrabudhey and Sashrabudhey
eds., Lokavidya Vichar, Vikalp, Varanasi.
Sanyal, K. and Bhattacharya, R. 2009. “Beyond the Factory: Globalisation, Informalisation of
Production and the New Locations of Labour,” Economic and Political Weekly, Vol. 44, No. 22,
pp. 35-44.
Scaria S, 2010. Changes in Land Relations: The Political Economy of Land Reforms in a Kerala
Village, Economic and Political Weekly, Vol 45, Nos. 26-27, p. 191-198.
Sharma, A. N. 2005. “Agrarian Relations and Socio-Economic Change in Bihar,” Economic and
Political Weekly, March 05, pp. 960-972.
Sidhu, H. S. 2005. “Production Conditions in Contemporary Punjab Agriculture,” Journal of
Punjab Studies, Volume 12, No. 2.
Thorner, A. 1982a. “Semi-Feudalism or Capitalism? Contemporary Debate on Classes and
Modes of Production in India,” Economic and Political Weekly, Vol. 17, No. 49, pp. 1961-68.
--- 1982b. “Semi-Feudalism or Capitalism? Contemporary Debate on Classes and Modes of
Production in India,” Economic and Political Weekly, Vol. 17, No. 50, pp. 1993-99.
--- 1982c. “Semi-Feudalism or Capitalism? Contemporary Debate on Classes and Modes of
Production in India,” Economic and Political Weekly, Vol. 17, No. 51, pp. 2061-66.
Thorner, D. and A. Thorner. 1962. Land and Labour in India. Asia Publishing House, New
York.
Vakulabharanam, V. 2004. Immiserising Growth: Globalisation and Agrarian Change in
Telangana, South India between 1985 and 2000. PhD Dissertation, University of Massachusetts,
Amherst.
Vakulabharanam, V. 2010. “Does Class Matter? Class Structure and Worsening Inequality in
India,” Economic and Political Weekly, Vol. 45, No. 29, pp. 67-76.
Varman, R, and Chakrabarti, M. 2006. Case Studies on Industrial Clusters: A Study of Kanpur
Leather and Footwear, Varanasi Silk Saree and Moradabad Brassware Clusters, Department of
Scientific and Industrial Research, GOI Report.
Vijayagopalan, S. 1993. Economic Status of Handicraft Artisans. NCAER, New Delhi.

Wilkinson-Weber, C. M. 1997. “Skill, Dependency and Differentiation: Artisans and Agents in
the Lucknow Embroidery Industry,” Ethnology, Vol. 36, No. 1, pp. 49-65.
Wilson, K. 1999. “Patterns of Accumulation and Struggles of Rural Labour: Some Aspects of
Agrarian Change in Central Bihar,” in Byres, T.J., Kapadia, K., and Lerche, J. eds. Rural Labour
Relations in India, London: Frank Cass, pp. 316-354.

1
0
3
K. Appendix
Table A1: Average Size of Ownership Holding in India
1961-62 1971-72 1982 1992 2003
Estimated Area Owned (million ha) 128.73 119.64 119.74 117.35 107.23
Average area owned (ha)
Including landless 1.78 1.53 1.28 1.01 0.73
Excluding landless 2.01 1.69 1.44 1.14 0.81
Area Operated (millon ha) 133.48 125.68 118.57 125.1 107.65
Average area operated (ha) 2.63 2.2 1.67 1.34 1.06
Source: Report No. 491, NSS 59th
Round, January-December, 2003.
Table A2: Land Ownership Structure in Rural India by Ownership Size-Class
marginal small semi-medium medium large
1961 % of households 66.06 9.16 12.86 9.07 2.85
% of area owned 7.59 12.39 20.54 31.23 28.25
1971 % of households 62.62 15.49 11.94 7.83 2.12
% of area owned 9.76 14.68 21.92 30.73 22.91
1982 % of households 66.64 14.70 10.78 6.45 1.42
% of area owned 12.22 16.49 23.58 29.83 18.07
1992 % of households 71.88 13.42 9.28 4.54 0.88
% of area owned 16.93 18.59 24.58 26.07 13.83
2003 % of households 79.60 10.80 6.00 3.00 0.60
% of area owned 23.05 20.38 21.98 23.08 11.55
Source: Report No. 491, NSS 59th
Round, January-December, 2003.

1
0
4
Table A3: Large Landholding States: Share of Area Owned by Ownership Size-
Class
marginal small
semi-
medium medium Large
ANDHRA PRADESH 2003 21.87 19.95 21.16 22.91 14.05
1992 21.30 22.44 24.15 24.06 8.06
1982 11.26 15.29 20.70 29.83 22.92
1971-72 9.92 13.16 21.19 30.15 25.58
GUJRAT 2003 13.60 16.05 18.96 39.12 12.28
1992 9.55 15.44 24.78 31.99 18.24
1982 6.66 10.78 22.63 39.45 20.49
1971-72 4.53 9.94 16.73 36.15 32.65
HARYANA 2003 13.15 15.83 24.62 34.14 12.26
1992 7.96 13.43 33.54 37.17 7.91
1982 5.04 13.44 21.58 44.90 15.05
1971-72 4.63 7.43 18.95 46.93 22.06
KARNATAKA 2003 16.65 19.45 23.18 29.52 11.20
1992 11.05 18.35 27.82 26.62 16.16
1982 6.21 13.56 25.40 31.45 23.38
1971-72 5.74 11.81 24.84 35.19 22.42
MADHYA
PRADESH 2003 11.61 19.07 25.80 31.25 12.29
1992 7.61 15.49 24.97 35.38 16.57
1982 4.99 11.08 24.30 37.93 21.72
1971-72 3.34 9.16 21.36 37.80 28.34
MAHARASHTRA 2003 12.38 17.57 30.88 27.35 11.78
1992 7.02 12.61 25.54 33.43 21.41
1982 4.65 10.90 20.82 36.23 27.40
1971-72 3.48 8.59 18.34 35.45 34.14
PUNJAB 2003 9.16 15.63 25.30 34.50 15.31

1
0
5
1992 7.18 12.35 30.21 38.04 12.22
1982 5.59 10.76 22.87 42.23 18.56
1971-72 4.47 8.87 25.06 37.96 23.64
RAJASTHAN 2003 9.26 11.19 18.61 28.40 32.52
1992 5.42 10.04 18.90 31.55 34.10
1982 3.63 7.29 17.29 35.19 36.59
1971-72 2.03 6.78 13.15 32.89 45.15
Source: Statement 5, Report No. 491, NSS 59th
Round, January-December, 2003.
Table A4: Small Landholding States: Share of Area Owned by Ownership Size-Class
marginal small
semi-
medium medium large
ASSAM 2003 44.42 34.87 16.36 4.32 0.00
1992 38.05 29.07 23.06 8.53 1.29
1982 24.53 34.81 27.67 11.50 1.48
1971-72 22.15 30.22 30.79 15.20 1.64
BIHAR 2003 42.07 25.29 18.53 9.56 4.63
1992 28.58 23.84 24.45 18.68 4.44
1982 23.96 22.91 27.02 20.22 5.90
1971-72 18.20 23.43 28.07 23.63 6.67
HIMACHAL
PRADESH 2003 43.80 28.02 19.77 6.45 2.03
1992 34.99 20.35 21.57 18.50 4.60
1982 20.94 23.09 26.04 27.82 2.11
1971-72 21.22 23.43 25.92 23.12 6.31
J&K 2003 36.26 25.49 19.54 11.12 7.58
1992 25.52 33.40 25.84 15.23 0.00
1982 28.13 30.29 28.70 12.56 0.32
1971-72 27.41 39.33 25.20 8.06 0.00
KERALA 2003 60.72 21.13 10.78 7.16 0.00

1
0
6
1992 54.51 24.19 14.32 6.33 0.66
1982 45.74 23.51 19.11 10.06 1.59
1971-72 40.88 24.32 19.95 11.89 2.96
ORISSA 2003 41.52 27.06 19.72 9.98 1.78
1992 26.37 27.16 25.99 18.08 2.40
1982 19.88 29.73 25.04 19.50 5.84
1971-72 20.45 26.95 25.88 20.72 6.00
TAMIL NADU 2003 33.21 23.10 22.09 20.57 1.23
1992 33.28 26.24 24.15 12.15 4.18
1982 23.57 27.24 23.53 20.94 4.71
1971-72 20.23 21.84 25.21 22.97 9.75
UTTAR
PRADESH 2003 34.89 27.38 20.74 14.65 2.34
1992 27.42 24.88 25.82 18.14 3.73
1982 20.36 24.08 28.11 22.25 5.18
1971-72 17.49 24.65 27.94 23.85 6.07
WEST BENGAL 2003 58.23 25.71 11.88 4.02 0.00
1992 41.29 28.11 22.98 7.62 0.00
1982 30.33 28.77 27.23 12.12 1.54
1971-72 27.28 25.69 27.72 18.61 0.70
Source: Statement 5, Report No. 491, NSS 59th
Round, January-December, 2003.

1
0
7
Table A5: Effective Landlessness in Rural India: Cumulative Distribution of
Land Ownership Patterns over Time
1961-62 1971-72 1982 1992 2003
Area
Owned
% of
hhlds
%
of
area
% of
hhlds
%
of
area
% of
hhlds
%
of
are
a
% of
hhlds
%
of
area
% of
hhlds
%
of
are
a
0 ha 11.68 0 9.64 0 11.33 0 11.25 0 10.04 0.01
< 0.21 ha 37.9 0.54 37.42 0.69 39.93 0.9 42.4 1.31 50.6 2.08
< 0.41 ha 44.21 1.59 44.87 2.07 48.21 2.75 51.36 3.8 60.15 5.83
Source: Report No. 491, NSS 59th
Round, January-December, 2003.
Table A6: Cultivators and Agricultural Workers in Rural India,
2001
Cultivators Ag Workers
Agwrkr/Cul
tiv
Andhra Pradesh 7757337 13384671 1.73
Arunachal Pradesh 275403 17634 0.06
Assam 3712769 1253451 0.34
Bihar 8075104 13145639 1.63
Goa 45885 31076 0.68
Gujarat 5697434 4983209 0.87
Haryana 2958215 1224403 0.41
Himachal Pradesh 1946890 92598 0.05
Jammu & Kashmir 1559633 227325 0.15
Jharkhand 3858788 2810671 0.73
Karnataka 6684521 5901934 0.88
Kerala 693986 1507081 2.17
Madhya Pradesh 10733516 7136391 0.66

1
0
8
Maharashtra 11569293 10314720 0.89
Orissa 4197912 4921925 1.17
Punjab 1998640 1394035 0.70
Rajasthan 12921374 2436566 0.19
Sikkim 131201 16952 0.13
Tamil Nadu 4773028 7533766 1.58
Tripura 310871 272712 0.88
Uttar Pradesh 21754799 12931317 0.59
Uttaranchal 1556202 244520 0.16
West Bengal 5585848 7240517 1.30
Total 118798649 99023113 0.83
Source: Census of India, 2001.
Table A7: Share of Tenant Holdings by Operational Size-Class
Percentage of tenant holdings
1960-61 1970-71 1981-82 1991-92 2002-03
Marginal 24.1 27 14.4 9.3 9.8
Small 25.1 27.8 17.9 14.9 10.7
Semi-medium 23.6 24.8 15.9 12.2 10.3
Medium 20.5 20 14.5 13.1 7.8
Large 9.5 15.9 11.5 16.7 13.8
All sizes 23.5 25.7 15.2 11 9.9
Source: Report No. 492, NSS 59th
Round, January-December, 2003.
Table A8: Tenancy in the Major Indian States
share of tenant holdings share of area leased in
1981-82 1991-92 2002-03 1981-82 1991-92 2002-03
ANDHRA
PRADESH 13.8 14.1 12.9 6.2 9.6 9.0

1
0
9
ASSAM 12.9 10.1 8.9 6.4 8.9 5.3
BIHAR 19.7 5.6 12.7 10.3 3.9 8.9
GUJARAT 4.8 3.7 5.3 2.0 3.3 5.1
HARYANA 25.9 17.1 10.7 18.2 33.7 14.4
KARNATAKA 10.7 8.0 4.6 6.0 7.4 3.6
KERALA 6.7 5.2 5.1 2.6 2.9 4.0
MADHYA
PRADESH 8.0 9.0 7.3 3.6 6.3 3.6
MAHARASHTRA 10.6 6.9 6.6 5.2 5.5 4.7
ORISSA 18.2 16.9 19.4 9.9 9.5 13.0
PUNJAB 21.3 15.9 13.1 16.1 18.8 16.8
RAJASTHAN 7.1 6.5 2.9 4.3 5.2 2.8
TAMIL NADU 24.7 15.3 9.4 10.9 10.9 6.0
UTTAR PRADESH 20.5 15.5 11.7 10.2 10.5 9.5
WEST BENGAL 23.1 14.4 14.1 12.3 10.4 9.3
Source: Report No. 492, NSS 59th
Round, January-December, 2003.
Table A9: Share of Leased-in Area by Terms of Lease
terms of lease 1960-61 1970-71 1981-82 1991-92 2002-03
incl
n.r.
excl
n.r.
incl
n.r.
excl
n.r.
fixed money 25.6 15.4 10.9 19 22.7 29.5 29.8
fixed produce 12.9 11.6 6.3 14.5 17.4 20.3 20.6
share of produce 38.2 47.9 41.9 34.4 41.1 40.3 40.8
Other 23.3 25.1 40.9 32.1 18.8 9.9 8.8
Source: Report No. 492, NSS 59th
Round, January-December, 2003; n.r.=not reported.

1
1
0
Table A10: Share of Area by Terms of Lease, Major Indian States: 2002-
03
fixed
money
fixed
produce
share of
produce
from
relatives other
ANDHRA
PRADESH 31.6 37.9 24.0 2.1 4.4
ASSAM 15.8 3.6 55.0 0.0 25.6
BIHAR 12.0 17.5 67.0 0.5 3.0
GUJARAT 10.7 46.3 37.9 3.5 1.6
HARYANA 71.2 9.8 15.8 0.1 3.1
KARNATAKA 32.4 41.1 24.8 0.0 1.7
KERALA 39.9 7.5 12.0 33.0 7.8
MADHYA
PRADESH 18.3 32.5 39.0 1.6 8.6
MAHARASHTRA 26.2 9.0 37.5 15.7 11.6
ORISSA 11.1 7.8 73.0 3.5 4.6
PUNJAB 79.2 1.5 15.3 3.1 0.9
RAJASTHAN 35.0 17.7 39.3 1.1 6.9
TAMIL NADU 32.0 30.0 22.9 7.3 7.8
UTTAR PRADESH 23.8 12.9 52.9 5.0 5.4
WEST BENGAL 23.7 28.5 34.9 4.1 8.8
INDIA 29.5 20.3 40.3 4.0 5.9
Source: Report No. 492, NSS 59th
Round, January-December, 2003.

1
1
1
Table A11: Share of Debt from Various Sources for Cultivator Households
(%)
1951 1961 1971 1981 1991 2002
Sources of Credit
Institutional 7.3 18.7 31.7 63.2 66.3 61.1
Cooperative Societies 3.3 2.6 22 29.8 30 30.2
Commercial Banks 0.9 0.6 2.4 28.8 35.2 26.3
Non-Institutional 92.7 81.3 66.3 36.8 30.6 38.9
Moneylenders 69.7 49.2 36.1 16.1 17.5 26.8
Unspecified - - - - 3.1 -
Source: Government of India, 2007.
Table A12: Gross Capital Formation in Agriculture at 1993-94 Prices
GFCFA CIS GCFA GFCFA CIS GCFA
1961 59.02 3.77 62.79 1981 137.21 5.12 142.33
1962 54.68 0.23 54.91 1982 134.07 6.72 140.79
1963 58.33 2.00 60.33 1983 137.66 7.63 145.29
1964 62.72 2.77 65.49 1984 139.26 7.99 147.25
1965 68.14 1.14 69.28 1985 138.46 11.02 149.48
1966 71.77 2.27 74.04 1986 130.61 10.71 141.32
1967 72.79 1.64 74.43 1987 127.89 9.19 137.08
1968 79.55 0.49 80.04 1988 133.75 9.19 142.94
1969 78.83 6.83 85.66 1989 143.35 4.27 147.62
1970 83.18 5.83 89.01 1990 127.28 6.96 134.24
1971 79.80 6.85 86.65 1991 158.05 6.11 164.16
1972 83.72 7.98 91.70 1992 145.46 4.19 149.65
1973 90.63 12.46 103.09 1993 156.10 5.31 161.41
1974 88.15 15.54 103.69 1994 147.49 5.00 152.49
1975 86.09 13.55 99.64 1995 160.12 8.31 168.43
1976 93.48 22.97 116.45 1996 170.14 8.70 178.84
1977 113.56 30.99 144.55 1997 174.72 12.91 187.63

1
1
2
1978 115.85 17.21 133.06 1998 174.99 11.81 186.80
1979 129.97 51.99 181.96 1999 179.79 10.33 190.12
1980 136.09 42.14 178.23
Source: Gulati and Bathla, 2002.
Table A13: GDCF, GDP and Shares in 1993-94 prices
Years
GDCF
(Rs
billion)
GDP (Rs
billion)
GFCA/G
DCF
GDPA/G
DP
GDCF/G
DP
1960-61 435.49 2221.61 14.42 40.53 19.6
1961-62 409.96 2305.72 13.39 39.61 17.78
1962-63 465.05 2375.2 12.97 37.61 19.58
1963-64 489.12 2519.79 13.39 38.52 19.41
1964-65 540.61 2707.27 12.82 40.36 19.97
1965-66 616.79 2638.64 12 38.14 23.38
1966-67 641.01 2634.41 11.61 39.21 24.33
1967-68 600.68 2839.76 13.32 41.92 21.15
1968-69 588.05 2938.17 14.58 40.79 20.01
1969-70 666.26 3130.39 13.36 40.51 21.28
1970-71 689.71 3292.27 12.56 39.09 20.95
1971-72 709.78 3348.42 12.92 37.28 21.2
1972-73 697.14 3329.12 14.79 37.19 20.94
1973-74 816.64 3434.73 12.7 40.3 23.78
1974-75 724.58 3475.53 13.75 37.39 20.85
1975-76 759.45 3794.04 15.33 34.48 20.02
1976-77 853.06 3858.69 16.94 32.69 22.11
1977-78 966 4137.81 13.77 34.18 23.35
1978-79 1112.5 4375.04 16.36 32.41 25.43
1979-80 981.59 4145.71 18.16 30.56 23.68
1980-81 981.91 4423.19 14.5 36.02 22.2

1
1
3
1981-82 991.98 4717.09 14.19 35.56 21.03
1982-83 991.99 4880.89 14.65 34.13 20.32
1983-84 1025.14 5216.87 14.36 34.98 19.65
1984-85 1112.26 5453.49 13.44 33.96 20.4
1985-86 1217.57 5766.54 11.61 32.35 21.11
1986-87 1219.78 6031.39 11.24 30.73 20.22
1987-88 1398.91 6265.59 10.22 29.19 22.33
1988-89 1584.54 6895.41 9.32 30.63 22.98
1989-90 1699.65 7325.78 7.9 29.25 23.2
1990-91 1956.5 7733.49 8.39 28.85 25.3
1991-92 1715.53 7815.75 8.72 28.1 21.95
1992-93 1874.77 8185.44 8.61 28.39 22.9
1993-94 1984.12 8592.2 7.69 28.16 23.09
1994-95 2421.13 9222.89 6.96 27.55 26.25
1995-96 2692.19 9928.77 6.64 25.37 27.12
1996-97 2638.83 10619.02 7.11 26 24.85
1997-98 2985.68 11103.84 6.25 24.39 26.89
1998-99 2975.18 11853.99 6.39 24.48 25.1
Source: Gulati and Bathla, 2002
i Thorner (1982a, 1982b, 1982c) summed up the debate and Patnaik (1990) contains a selection of the key articles.
ii For an incisive analysis of the use of the notion of surplus for economic analysis see Baran (1957).
iii The Sengupta Commission (NCEUS 2007) has adopted the following definition of the informal sector:
"The unorganised sector consists of all unincorporated private enterprises owned by individuals or
households engaged in the sale and production of goods and services operated on a proprietary or
partnership basis and with less than ten total workers." (p.2)
iv See Thorner and Thorner (1962), Januzzi (1974), and Frankel (2005) for details.
v The original survey was part of a comprehensive A N Sinha Institute of Social Sciences-International Labour
Organization study under the leadership of Pradhan H Prasad.

1
1
4
vi For the discussion on tenancy, we follow the definition of size-classes adopted by recent NSSO reports (see, e.g.,
Government of India, 2006a) where the category of marginal refers to holdings of less than 2.5 acres, small refers to
holdings between 2.5 and 5 acres, semi-medium to holdings between 5 and 10 acres, medium to holdings between
10 and 25 acres, and large refers to holdings larger than 25 acres. Note that these definitions are different from the
ones we have used in other sections of the paper (presented in Table 1). Our inability to use the same set of
definitions for the discussion on tenancy arises from the lack of historical data on the prevalence of tenancy by
sufficiently disaggregated size-class categories. Though the two sets of definitions are different in details,
nonetheless they convey similar sets of information in the sense of showing differential trends by the size of area
owned. Hence, they are approximately comparable and can be used, in the context of data limitations, one for the
other.
vii
“Other” forms of tenancy includes the following: (a) tenancy under service contract, (b) tenancy for share of
produce along with other terms, (c) tenancy under usufructary mortgage, and (d) tenancy from relatives under no
fixed terms.
viii
For a distinction between capitalist and pre-capitalist rent see Patnaik (1976).
ix
The fact that states like Punjab and Haryana have undergone robust capitalist growth has been widely noted and
commented on. Evidence that points in this direction are: relative consolidation of agricultural holdings, increased
mechanization of the production process, predominance of peasant-proprietors as opposed to parasitic landlords,
radical change in the pattern of tenancy (on which more below), accumulation of capital in the agricultural sector,
etc. For evidence on the growth of capitalist relations in Punjab agriculture, see Sidhu (2005) and the references
therein.
x In this study we use the term “Industry” to refer only to the manufacturing sector and exclude mining and
construction from our analysis.
xi
The 62nd
round of the National Sample Survey carried out in 2005-06 contains the most recent national-level data
on the informal manufacturing sector in India. Data is also available from previous rounds conducted in 2000-2001,
1994-1995, 1989-1990 and 1984-1985 giving a broad overview of the evolution of informal industry over the past
25 years. Before we present the data, it will be appropriate to discuss the problems that may arise in comparing data
from several different NSSO rounds. The general problem of underestimation of informal activity by sample surveys
such as the NSS is discussed separately. Report #524 (62nd
round) notes that there has been a change in which in
industries are covered and which are not between the 51st round (1994-95) and the 62
nd round. Repair and
maintenance of computers, motor vehicles, electrical appliances, TVs, radios etc., watches and clocks, and bicycles
were covered in the 51st round but were later dropped. While cotton ginning, cleaning and baling was included anew
in the 62nd
round, we note that this change would most likely reduce the number of enterprises counted as belonging
to the sector since these repair activities account for a greater percentage of enterprises and workers than cotton
ginning and baling. The fact that an increase is observed in the same period suggests that this change would not bias
results in our favor.
xii We thank Mohan Rao for the framework behind the typology depicted in Table 6.
xiii
Patnaik (1972) summarily rejects any economic rationale for land reforms and instead stresses the political logic;
but Patnaik (1976) and Patnaik (1986) develop an explicitly economic logic for land reforms in terms of overcoming
the ground rent barrier to capitalist development.
xiv
CPI(M) and CPI(ML) Liberation explicitly recognize the current rural scenario in India as being characterized by
landlord capitalism; this was most clearly formulated by Patnaik (1976, 1986) and finds its place in the CPI(M)
programme accordingly; it also appears explicitly in the agrarian programme of CPI(ML) Liberation, though there is
no mention of Patnaik (1976, 1986). The CPI (Maoist), on the other hand, largely discounts the development of

1
1
5
capitalist relations in rural India. Characterization of Indian society can be found in the programmes of the CPI(M),
CPI(ML) Liberation and CPI(Maoist); links for the programmes are provided in the references.