RELATIONAL LOGICS AND DIAGRAMS: NO-SCALE ...
39
S A J _ 2016 _ 8 _ 388 RELATIONAL LOGICS AND DIAGRAMS: NO-SCALE CONDITIONS Dragana Ćirić University of Belgrade - Faculty of Architecture original scientific article approval date 16 12 2016 UDK BROJEVI: 72.013 COBISS.SR-ID 236418828 KEY WORDS RELATIONAL THINKING DIAGRAMS CODES DIAGRAMMATICS TOPOLOGICAL THINKING INTENSIVE PROPERTIES AND DYNAMIC SYSTEMS DATA-SCAPES A B S T R A C T The paper investigates logics of relational thinking and connectivity, rendering particular correspondences between the elements of representation and the things represented in drawings, diagrams, maps, or notations, which either deny notions of scale, or work at all scales without belonging to any specific one of them. They include ratios and proportions (static and dynamic, geometric, arithmetic and harmonic progressions) expressing symmetry and self-similarity principles in spatial-metric terms, but also principles of nonlinearity and complexity by symmetry-breakings within non-metric systems. The first part explains geometric and numeric relational figures/sets as taken for “principles of beauty and primary aesthetic quality of all things” in classical philosophy, science, and architecture. These progressions are guided by certain rules or their combinations (codes and algorithms) based on principles of regularity, usually directly spatially reflected. Conversely, configurations representing the main subject of the following sections, could be spatially independent, transformable, and unpredictable, escaping regular extensive definitions. Their forms are presented through transitions from scalable to no-scale conditions showing initial symmetry breakings and abstractions, through complex forms of dynamic modulations and variations of matter, ending with some of the relational diagrammatic and topological ways of architectural data-processing outside of the spatial constraints and parameters – all through diagrams as ultimate tools of relational thinking and inference.
-
Upload
khangminh22 -
Category
Documents
-
view
0 -
download
0
Transcript of RELATIONAL LOGICS AND DIAGRAMS: NO-SCALE ...

S A J _ 2016 _ 8 _
388
RELATIONAL LOGICS AND DIAGRAMS: NO-SCALE CONDITIONS
Dragana Ćirić University of Belgrade - Faculty of Architecture
original scientific article
approval date 16 12 2016
UDK BROJEVI: 72.013
COBISS.SR-ID 236418828
key words
relational thinkingdiagrams
codesdiagrammatics
topological thinkingintensive properties and dynamic systems
data-scapes
A B S T R A C T
The paper investigates logics of relational thinking and connectivity, rendering particular correspondences between the elements of representation and the things represented in drawings, diagrams, maps, or notations, which either deny notions of scale, or work at all scales without belonging to any specific one of them. They include ratios and proportions (static and dynamic, geometric, arithmetic and harmonic progressions) expressing symmetry and self-similarity principles in spatial-metric terms, but also principles of nonlinearity and complexity by symmetry-breakings within non-metric systems.The first part explains geometric and numeric relational figures/sets as taken for “principles of beauty and primary aesthetic quality of all things” in classical philosophy, science, and architecture. These progressions are guided by certain rules or their combinations (codes and algorithms) based on principles of regularity, usually directly spatially reflected. Conversely, configurations representing the main subject of the following sections, could be spatially independent, transformable, and unpredictable, escaping regular extensive definitions. Their forms are presented through transitions from scalable to no-scale conditions showing initial symmetry breakings and abstractions, through complex forms of dynamic modulations and variations of matter, ending with some of the relational diagrammatic and topological ways of architectural data-processing outside of the spatial constraints and parameters – all through diagrams as ultimate tools of relational thinking and inference.

S A J _ 2016 _ 8 _
389
INTRODUCTION
Starting with the examples of relational thinking within the classical architectural theory, its tradition, continuity, and reinvention, we come to discussions about the new systems which operate beyond the established spatial properties. The code, the rule, and the regularities which were guiding spatial thinking and ordering throughout history became more complex with the advent of modern science. Arguments of the turn from symmetry (in and beyond the Vitruvian term) towards irregular complexity are based mostly on Klaus Mainzer’s research in nonlinear logics and principles1, widened by architectural interpretations of diagrammatics and diagrammatology2 summarized by Mark Garcia3 and followed by many other authorities within the field of diagrammatic thinking and representation in architecture and outside of it (Stan Allen, Antony Vidler, Robert Somol, Douglas Graf, Kenneth Knoespel, Frederick Stjernfelt, Alexander Gerner, and others). They are complemented with theories of intensity by Gilles Deleuze, recently refined by Manuel De Landa, as well as that of digitality and data-architecture. A correspondence between the representation and the object represented in these new relational forms is based on a certain rule, but more complex, transformable, unpredictable, or non-metric and non-spatial in itself, escaping thus familiar 3-dimensional explanation. Their dynamics cannot be assigned with numeric values of Cartesian space as the ratio between signifier and signified is not necessarily spatial dimension. Hence, the notion of scale between them is also altered, and it doesn’t have to be constant to establish the law of proportion. The complexity is not always based on self-similarity of the parts to whole, it doesn’t have one dominant rule of progression, but rather includes multiple agents as barriers of different logics that collide and interact among themselves producing different relational scapes.
OF DIVINE COMPLEXITYTHE IDEAL AND THE REAL – FROM CODES OF SELF-SIMILARITY TO NONLINEAR COMPLEXITY
Even in the ancient times, Plato’s and Euclid’s idealistic conceptions of formal spatiality represented by their regular geometric articulation, were encountering a significant critique. Against strictly mathematical idealization of the world were Archimedes’ arguments and critical inferences made from his physical point of view. The school of Alexandria had more complex, dynamic perspective on the contextual reality and the ways geometry and numeric control of space should be regarded4. This ancient dialogue between mathematical (ideal) and physical (real, immediate) system is going to take place throughout history as a main corrective element of both disciplines – mathematics providing calculus
Dra
gana
Ćiri
ć _
Relational Logics and Diagrams: No-Scale Conditions

S A J _ 2016 _ 8 _
390
for physical unpredictabilities, controlling therefore their unstable properties, and physics taking the alternative spatial-numeric articulation back to the real experiential environment, testing it, and frequently denying their idealistic assumptions.
As everything starts with the notions of ratio, proportion ( Greek symmetry – “static” or “simple”, and “continuous” or “dynamic”, and later Gothic commodulatio, or “harmonics”), scale, and commensurability,5 it is very important to properly distinguish their relational rules. They belong to numeric and geometric class of relational thinking developed under the laws of mathematics, clearly scalable and measurable. Hence being easily transferred to principles of spatial coordination, they represented the main code or a convention of the ancient and medieval architecture, bridging the scales from human to cosmic one. Golden Section (or Divine Proportion in Pacioli’s terms) here, represents the simplest and most ancient tool of the highly aesthetic spatial organization according to the criteria of the classical philosophy. Defined by (1+√5)/2=1,618, it marks a mysterious number whose algebraic qualities of endless progression became a key for spatial ordering, present at the same time in nature as well as in architecture and music. Within the concept of “self-similarity,” it produces fractal sets infinitely on multiple scales. It connects human proportions to the proportion of the system controlling and articulating physical environment (nature) by means of architecture, but also a spiritual one by the means of music.
De Divina Proportione by Luca Pacioli from 1509 (with Leonardo da Vinci’s illustrations, Figure 1) is based, as most renaissance works, on the antique traditions and knowledge of geometry within the Neoplatonic and Neopythagorean line of philosophy. It establishes classical continuity reviving its arithmetic and geometric ideals of the golden ratio. Besides these direct references, it is probably also based on the more recent mathematical studies by Pierro Della Francesca6 and Alberti7, summarizing their scientific and theoretical knowledge with the Christian one. Pacioli rediscovered the golden ratio assigning five divine attributes to it. He defined it as a singular proportion which appears in several forms, creating through its progression self-similar parts. In the fifth attribute, he related it to the “platonic quintessence“ – a celestial fifth element to which all the beings and other four elements are subjected. Therefore, according to Timaeus, this proportion is a “formal being” of the universe represented by dodecahedron (the body with twelve pentagons).8 The notion of “formal being” is constructed according to the proofs of golden ratio’s existence in the living world (directing and underlying morphogenetic processes), in order of celestial bodies, making it a superior law of nature and thus formative to its human spatial

S A J _ 2016 _ 8 _
391
Dra
gana
Ćiri
ć _
Relational Logics and Diagrams: No-Scale Conditions
interpretation – the architecture. Proportione defined relational instruments of earthly and architectural synchronization with celestial harmonic regularity and dynamics – an instrument of “harmonic” construction and division of the world and the universe. By its laws, the architecture became a “cosmic diagram”9. (Figure 1, 2, 3)
„An artist’s proper use of measurement and proportion to create forms and spaces (be they two-dimensional or three-dimensional) would reflect the macrocosm, and bring the observer into spiritual communion with it. Hence architects’ preoccupation with architectural “music“ ... “numbers, figures and reasons for movements concern thought more than the exterior senses; by studying them, the soul detaches itself not only from corporeal appetite but also from the senses and is turned toward interior reflection. Such is, in effect, the Platonic order in the perception of these objects: arithmetic leads to geometry, geometry to stereometry, stereometry to astronomy, this last to music.”10
It has been assumed that harmonic ratio represented the main relational code of architectural ordering of space. Contained in numeric sets of musical intervals (Figures 2, 3, 4), it reflected celestial measures and the laws of their terrestrial transpositions (whether speaking about their direct application in mathematical, geometric, spatial, or musical compositions, or social, political, cultural, or spiritual orders of certain communities11). Greek music scale represented a key for understanding the “mysteries of the universe” and their microcosmic reflections. Theological beliefs also supported the claim that universe has a mathematical structure and that “regular proportion and measures reflect mathematical harmony of the universe”12 applying these rules to spatial architectural coordination. The rules of harmonic ratios, Raskusin argues, were transferred and used also in Renaissance, as well as previously in Greek, Roman and Gothic architecture (for example Simonetta Valtieri’s investigations and analyses in architectural representations in paintings showed that architecture in Raphael’s “School of Athens” is based on harmonic ratios). In the more general theoretical sense, Alberti’s comparison of architecture to music was echoed by other theoreticians, such as Francesco di Giorgio Martini13 (Figure 2) whose diagrams explain these progressions14.
Boethius’ scholastic diagrammatic representations of harmonic progressions might have a bridging role between the antiquity and Renaissance. His diagrams are unique examples of didactic instruments of the early Christian, or late-classical education15. In this case, a common relational logic used to compose and construct musical structures and figures, or intervals, worked also as architectural design codes when converted to spatial orders. Direct conversions

S A J _ 2016 _ 8 _
392
Figure 1. Leonardo da Vinci, Illustrations in Luca Paccioli’s De Divina Proportione. a) Duodecedron abscisus elevatus vacuus, Codice della Biblioteca Ambrosiana di Milano (aus: Duilio Contin, Pierogiorgio Odifredd), b) Leonardo da Vinci, Septuaginta duarum basium vacuum, Codice della Biblioteca Ambrosiana di Milano (aus: Contin, Odifreddi und Pieretti 2010, Antologia, S. 243).Figure 2. Raphael Araujo. Fibonacci Dodecahedron and Icosahedron.Figure 3. Die Platonischen Körper mit ihren In- und Um-Kugeln, Abb. aus Kepler, Weltharmonik, V. Buch, Kap. III.
Figure 4. Diagrama de Francesco di Giorgo Martini, De Harmonia Mundi, 1525. Common geometrical and numeric progressions are therefore used both in musical and spatial/architectural structuring (for example 1+1/2 = 3/2 = una quinta o dia pente; 1+1/3 = 4/3 = una cuarta o dia pessaron; 1+1/8 = 9/8 = una segunda (tono mayor)). Harmonic and arithmetic progressions define spatial arrangements and relations (the first progression: 1 4/3 3/2 2 8/3 3 4 16/3 6 8, the second: 1 3/2 2 3 9/2 6 9 27/2 18 27, and the example of ratio 256/243 = geimma (semi tono menor) from a Francesco di Giorgio Martini’s diagram referring to platonic harmonic rules Carmen Bonell, La Divina Proporción: Las formas geométricas, Barcelona: Edicion UPC, 1999, fig. 49, p. 114.Figure 5. a) Chartres Cathedral, Musical intervals in vertical division of the architectural section.Figure 6. a) Cross-section of Milan Cathedral as built, left, compared with Stornaloco’s scheme, right (after Beltrami, ‘Il coronamento della fronte del Duomo di Milano’, 1900), in Giulia Ceriani Sebregondi and Richard Schofield, “First Principles: Gabriele Stornaloco and Milan Cathedral”, Architectural History, Volume 59, January 2016, pp. 63-122, b) Facade and Section of Milan Cathedral, Cesare Cesariano, from Vitruvius Pollio Cesariano, Cesare Ponte. Di Lucio Vitruvio Pollione de architectura libri dece, Liber Primus, XVI, v, Impressa nel ... citate de Como, nel anno ... 1521 mensis Iulii, Bibliothek Werner Oechslin, http://dx.doi.org/10.3931/e-rara-19393.
Figure 7. Musical ratios: a) Genesis of tetrachordes, 11th century, b) Musical intervals and proportions, 12th century, c) Musical arc diagrams for the monochord from Boethius’ De institutione musica (MS VadSlg. 296, fol. 96r, St. Gallen, Kantonsbibliothek, d) Vitruvius Pollio Cesariano, Cesare Ponte. Di Lucio Vitruvio Pollione de architectura libri dece, Liber Quintus, LXXVIII v, Impressa nel ... citate de Como, nel anno ... 1521 mensis Iulii, Bibliothek Werner Oechslin, http://dx.doi.org/10.3931/e-rara-19393.
Figure 8. Mathematical ratios and numeric sets, Boethius: a) Anicius Manlius Severinus Boethius. Divi Severini Boetii arithmetica, Paris: Colines, 1521, p.75, b) Anicius Manlius Severinus Boethius. Divi Severini Boetii arithmetica, Paris: Colines, 1521, pp.108-109, c) Aritmetic diagram from Boethius’ De Arithmetica (MS Cod. Sang. 248, fol. 10a, St. Gallen, Shiftsbibliothek), and in Anicius Manlius Severinus Boethius. Divi Severini Boetii arithmetica, Paris: Colines, 1521, Libro I, p.25.

S A J _ 2016 _ 8 _
393
between music and architecture existed only in philosophical statements not being graphically documented, but their transfers may be confirmed by analyzing the music-diagram’s presence in architectural orders (we recognize circles of thirds, quints, quarts, and other musical ratios in architectural compositions and structures; Figure 5). Musical theory represented a compulsory subject of the quadrivium within mathematical sciences (matheoseos disciplinae, not artes liberales as it will be the case later) and as such a discipline and research of numerical calculus and laws of sounds and tones16. Boethius’ numerical-musical analysis merged with Pythagorean quantitative-cosmological conception of the world provided mathematical outline of musical theory, and therefore its influences on all arts of proportion, all the way till Kepler’s and Leibniz’s new dynamic concepts. It defined theoretical basis for development of architectural relational coordination and logic.
As we saw, traces and proofs of architectural, or spatial coordination by means of numeric and geometric ratios, should be looked for elsewhere, outside of the architectural practice and discipline – in music and its arithmetic structure17, philosophy, astronomy and laws of movement of celestial bodies, or natural sciences and fractal patterns of morphogenetic and evolutionary processes of transformation. These are essential in understanding the position of the human individual in relation to universals of nature; architecture usually having the role of the mediator between these two.
Besides design strategies based on cosmological views and regular arithmetic and geometric progressions, particular architectural forms occurred, changing these concepts of spatial structuring. The examples could be irregular gothic fractal progression18 of its late period, aspiring towards emphasized verticality, or baroque fold which will become the main metric and non-metric rule, varying and modulating architectural matter19. Baroque will create a move from the renaissance ideal conception of space bringing in the instability and doubt provoked by intensive inconsistencies and uncertainties of nature. Scientific skepticism and rigorous methodological apparatus will reveal ideological and optical deceptions or misinterpretations of natural philosophy, having the role of their controlling mechanism. Pragmatic lines of engineering, astronomy, geography, and architecture were going to change the conditions of an ideal, imaginary world of renaissance theory.
Another turn will occur with the advent of new metric concepts of engineering science, moving principal notions from anthropomorphic towards machine-logic. In 1789 the meter was adopted as an universal metric unit continuing to coordinate new architectural typologies of impressive structural possibilities. Cosmological referents were lost and the idea of any external natural system
Dra
gana
Ćiri
ć _
Relational Logics and Diagrams: No-Scale Conditions

S A J _ 2016 _ 8 _
394
Table 1. Anthropomorphic Studies: Metric Systems – Historical Preview

S A J _ 2016 _ 8 _
395
Dra
gana
Ćiri
ć _
Relational Logics and Diagrams: No-Scale Conditions
which will regulate the events in spatial reality was subdued to economic, scientific, industrial, and social rationality. As space/cosmos lost its boundaries and finiteness, the overall system collapsed seeking for a new precise formula for its metric definition. This became the main task of the 18th and 19th-century mathematicians – the algebraic definition of the indefinite dynamic physical properties of nature – space and movement. A return to a human individual seen as a measure of all things will take hold again around 1920s with Le Corbusier’s return to golden ratio. But it could be argued that particular ratios worked on particular levels of architectural and urban practice, not always on all of them as in cosmological conceptions. At the scale of the city, region, or on the global-planetary scale, different laws were to be applied, such as theory of a system, of complexity, mobility, and machine, or chaos theory, which shaped some of the most influential architectural and urban theories. Buckminster Fuller’s concept of synergetics, architectural structuralism, and metabolism, were just some of the architectural ideologies which were able to span again the spatial issues from the atomic to cosmic scale through one comprehenxive system based on self-similarity principles.
DIAGRAMMATICS: RELATIONAL LOGICS AND DIAGRAMMATIC OPERATIONS
The diagram is a graphic presentation of the course of a phenomenon. It consists of lines, structure, form; it works with reduction, abstraction, and representation. As a medium the diagram performs a double role: it is a mode of notation, resuming, analytic and reflective; but it is also a model of thought, generating, synthetic and productive. Diagrams are a self-evident part of our everyday life with its continuously growing complexity of information-flows. … in architecture, the use of diagrams is diverse. The spectrum ranges from a programmatic interest to include non-architectonic data in the design-process to a fascination for the diagram as form, free of meaning. In contrast to related disciplines such as cartography or iconography there is very little research in this two-dimensional field of thinking. This issue would like to instigate such an investigation in which the diagram is sketched from a historic and theoretic point of view, as it is from the perspective of designers, for whom the diagram constitutes a form of visual thinking; a thought-image.20
As shown in the previous section, diagrams had an important role in a period when architectural knowledge wasn’t established as an independent discipline or a scientific field. Their relational nature generated an instrument which could be applied to different professions having the ability and properties of the transitory figure – an entity of translation, transposition, or conversion – working as a common ground for all the specified skills and knowledges. These features

S A J _ 2016 _ 8 _
396
enabled it to operate on a meta-disciplinary level, or as an interdisciplinary scape without being confined to any disciplinary system, including the metric and the spatial one as well. Here, new connectivity patterns could have been established as an entry to a new field of knowledge and a new thinking structure. Within the possibility of retaining metric properties, diagrammatic representations are brought closer to architectural problematics, but beyond these, they operate as no-scale conditions. They express invisible structures, their real networking principles, and logics in a non-metric environment. The space of logic, relationality, dependency, and connectivity, bears no extensive constraints. As an abstract machine (Deleuze, 1987), or/and “abstract instrument of thinking about the organization“ (Stan Allen, 1999), it shows rather how the things work, their mechanisms and activities, along with logics of clustering, networking, and mobility, than real distances and physical values (even though they could be rendering these as well); this kind of relationality represents their particular feature hardly realized by any other type of representation.
What, then, is a diagram?
The Oxford English Dictionary traces the word from the Old French, “diagramme”, out of the Greek “diagramma”, from “dia”, (“through”,”across”), or and “graphein”, something written, like a letter of the alphabet, which takes diagram from simply something “marked out by lines”, all the way through a geometrical figure, to a written list, a register, a gamut or scale in music. More precisely, and along the lines of its geometry, a diagram might be “a figure composed by lines”, an “illustrative figure”, a “set of lines, marks, or tracings”. But it is the function of these traces that is important: a diagram serves something else. It illustrates a definition, aids in the proof of a proposition, it represents the course or results of any action or process.
How might it do this?
First, it doesn’t, like a picture, represent the “exact appearance of an object”. Rather it represents “symbolically”. In this sense, it is an abstraction of what it represents, giving only “an outline or general scheme of it”; it exhibits “the shape and relations of its various parts” without imitating them. Through this abstraction it is able to signify variations, actions, or even mental processes. It is at once precise – giving form to a definition or statement – and vague – an outline or “general scheme”.21
Vidler argues against the focus on formal, figurative qualities of signs and traces used in diagrams. He extends its definition claiming that “function … is what is important … [a diagram] illustrates a definition… it represents a direction or

S A J _ 2016 _ 8 _
397
Dra
gana
Ćiri
ć _
Relational Logics and Diagrams: No-Scale Conditions
a movement towards the result of any action or a process”. Vidler’s definitions are derived from Pearce’s and Deleuze’s notions of an icon, or a sign, and connectivities which in specific ways define ‘relations between unformed, unorganized matter and unformalized, or unfinished functions’. It appears that Vidler adopts Deleuze’s notion of a diagram as a ‘spatio-temporal multiplicity’ which “rejects any formal distinction between the content and the expression”. He also distinguishes the ways by which diagrams differ from drawings as the means of symbolic representation of the abstraction.22
“Diagram … never functions in direction of the representation of constant, durable, real/actual world, but rather produces a new kind of reality, a new model of truth.”23
Considering the relation to spatial properties, the content, and the level of abstraction, a diagram could occupy several conditions: 1) it could neglect metric values and distances, scale and proportion, indicating different relational systems among the included elements, usually belonging or related to some other (inter)disciplinary authority, 2) it might retain spatial or proportional traces, but hardly visible as lifted to the highest levels of abstraction, implying, therefore the principles, not the actual spatial conditions while these serving just as a background and a pattern of higher meaning, 3) condition retaining numeric ratios but no scale, working as a self-similar entity, easily applied to any scale (a geometric principle, or a numeric set and the law of progression – an algorithm), and 4) a condition of a diagram-map directly constructed according to the existing situation in a specific scale, thus retaining all the spatial metric properties and values, or their ratios. However, it must be noted that these are supplemented with representations of dynamic conditions as a parallel category for each. They could have their own system of representation having no spatial metric references and ratios, or be superimposed to the existing ones where questions of congruence become more important for space-movement/performance/event dialogue and comparison.
The shift towards notational, diagrammatic and mapping practices emerged with the move from object-based towards process-based practices. Dynamic relational logics imply some kind of movement, mobility, transformation, or an action – a procedural operational logic and representation. A diagram in this sense must include temporal properties (duration) implying unfolding in time in a discrete sequential or smooth continuous manner. These diagrams are usually defined as notations (implying mostly temporal in comparison to spatial orientation)24, but number of hybrid diagram-notation-map forms are also constructed transversing the boundaries of strict typological definitions25. Notations describe a work that is yet to be realized. As a set of procedures, instructions, and guiding principles
S A J _ 2016 _ 8 _
398
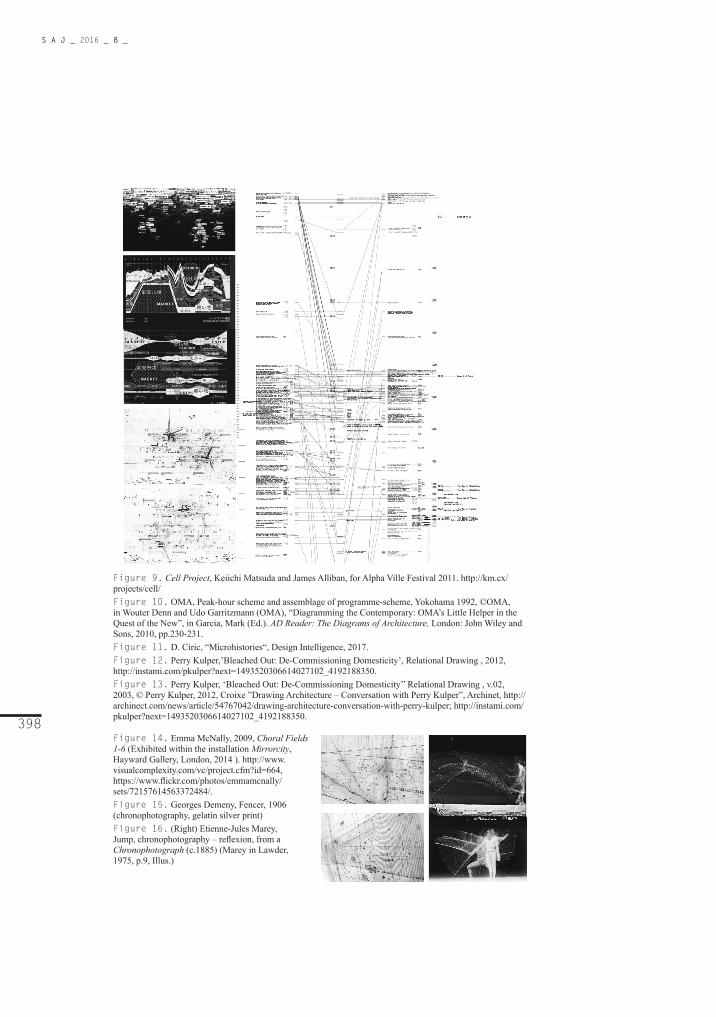
Figure 9. Cell Project, Keiichi Matsuda and James Alliban, for Alpha Ville Festival 2011. http://km.cx/projects/cell/Figure 10. OMA, Peak-hour scheme and assemblage of programme-scheme, Yokohama 1992, ©OMA, in Wouter Denn and Udo Garritzmann (OMA), “Diagramming the Contemporary: OMA’s Little Helper in the Quest of the New”, in Garcia, Mark (Ed.). AD Reader: The Diagrams of Architecture, London: John Wiley and Sons, 2010, pp.230-231.Figure 11. D. Ciric, “Microhistories“, Design Intelligence, 2017.Figure 12. Perry Kulper,’Bleached Out: De-Commissioning Domesticity’, Relational Drawing , 2012, http://instami.com/pkulper?next=1493520306614027102_4192188350. Figure 13. Perry Kulper, ‘Bleached Out: De-Commissioning Domesticity’’ Relational Drawing , v.02, 2003, © Perry Kulper, 2012, Croixe ”Drawing Architecture – Conversation with Perry Kulper”, Archinet, http://archinect.com/news/article/54767042/drawing-architecture-conversation-with-perry-kulper; http://instami.com/pkulper?next=1493520306614027102_4192188350.
Figure 14. Emma McNally, 2009, Choral Fields 1-6 (Exhibited within the installation Mirrorcity, Hayward Gallery, London, 2014 ). http://www.visualcomplexity.com/vc/project.cfm?id=664, https://www.flickr.com/photos/emmamcnally/sets/72157614563372484/.Figure 15. Georges Demeny, Fencer, 1906 (chronophotography, gelatin silver print)Figure 16. (Right) Etienne-Jules Marey, Jump, chronophotography – reflexion, from a Chronophotograph (c.1885) (Marey in Lawder, 1975, p.9, Illus.)

S A J _ 2016 _ 8 _
399
Dra
gana
Ćiri
ć _
Relational Logics and Diagrams: No-Scale Conditions
(scripts), they are always open to interpretation and future performances. Not supporting classical theories of mimesis, they do not trace the already existing, known, visible data, but anticipate new configurations. In his arguments about the notation theory, Allen defines two areas: “mathematics (that describe abstract quantities and relationships), and time-based art forms such as music and dance.”26 Some of the examples of notations would be musical scripts, dance notations, maps of movements, but we are also familiar with cinegrammatic notations as defined by Brian McGrath and Jean Gardner, and specifically applied as architectural design tools by Bernard Tschumi within his space-movement-event concept. In this sense, to paraphrase Allen’s notions, diagrams are not schemas, types, formal paradigms, or other kinds of regulatory devices, but simple procedures, instructions for action, or dependent, transformable, mobile descriptions of possible formal configurations. They function as abstract machines27 and they do not look alike anything they produce.28 Within this diagrammatic subcategory, they are defined, in Allen’s words, by “the shift from production toward the performance of space“, and their non-similarity to the object represented becomes an important argument in support of the no-scale theory. This kind of formlessness, or abstraction of operational mechanisms defines a type of no-scale condition – spatial in its essence (having spatial effect or containing instructions for some kind of spatial behaviour) but non-spatial/scalar in its appearance (not representing the existing world but the invisible one – a hidden structure which makes it function, which supports it, or the one yet to be developed as an anticipation of the future formal conditions). Thinking through diagrams engage higher abstract, relational components of intelligence and cognition, working with the complex environments of multiple data-configurations. Even though based on spatial figures, or having some kind of spatial appearance, it is not necessarily its direct trace or a document with actual physical values. It rather belongs to the virtual realm where it becomes possible to reveal connectivities unfamiliar to the existential, experiential space, as its parallel complementary system. A diagram creates an augmented reality – it informs the actuality with additional information where this one becomes unable to uncover the reasons or causes of the effects and phenomena by which it functions.
A notion that “Diagram is in itself an interpretant of a symbol and therefore it precedes the condition of its object, ...“29, will also indicate its objectlessness/formlessness. This kind of nonformal nature30 hardly belongs to the 3-dimensional space in a direct sense. It occupies more the intellectual space bridging the communication-gap between different systems, working as a phase of graphic conversion between broader spatial problems and social, cultural, political, economic issues. As Allen puts it “Nothing can enter the discourse

S A J _ 2016 _ 8 _
400
of architecture, or a communication by architectural terms, without previously being converted into a graphic form by which is further explored.“ Therefore, a diagrammatic graphic mechanism could represent this form that any architectural externality must pass through in order to communicate architecturally.31
Diagrammatic practice is positioned between the immateriality of ideas and information and materiality of objects. It deals with translation from drawing/writing to building/context and vice versa. Positioned between virtual/imaginary/conceptual/abstract/fictional and the real/actual/concrete/experiential world, diagrammatic and notational procedures establish the architecture as “transactional discipline”.32 A diagram represents the structure of transition between architecture’s interiority and exteriority (Eisenman). It communicates and synthesizes different disciplinary systems, allowing and initiating reconfigurations of their contents in order to reveal a hidden structure of the common “dynamic object“.
What is diagrammatic reasoning?
Diagrammatic reasoning involves use of diagrammatic representations to aid information processing, especially extracting new facts from the ones encoded in the representation.33
While diagrammatic (visual) representation or communication uses diagrams in mediating data and knowledge, diagrammatic reasoning uses them as tools of direct thought manipulation, guidance, and logic of their succession, and as a means of inference. A diagram represents a thinking based on its analogical properties - a direct knowledge representation compared with the propositional one.34 The main difference is made between 1) a direct correspondence between the structure of representation/reasoning and the structure of what is represented in diagram, or analogical representation (relative relations not necessarily based on any mimetic or naturalistic similarities, but abstract ones, and usually rendering different information compared to what they stand for), and 2) descriptive relation between representation and represented in propositional one, in which the elements or the structure of representation do not have to correspond directly to the thing represented. Analogical representation models or depicts the object using visual language or a specific system of visual (graphic) communication. The fact that many researchers distinguish logical thinking from diagrammatic, relating the first one with the propositional, axiomatic and theoretic reasoning, isn’t completely relevant. Diagrammatic thinking and reasoning might include the same logic (if not the one of their own) only represented, organized, and conducted differently – through visual means of inference – facilitating therefore thinking processes (within the hypothesis based on the idea that visual information is easier to handle in communication

S A J _ 2016 _ 8 _
401
Dra
gana
Ćiri
ć _
Relational Logics and Diagrams: No-Scale Conditions
and learning than sentential representation systems and algebraic notations35). One of the most influential theoreticians of a diagram is certainly Charles Sanders Peirce. A central corollary to Peirce‘s non-trivial iconicity definition is the ability of diagrammatical reasoning to make explicit aspects of the diagram which otherwise would remain implicit. This feature determines the wide extension of Peircean diagrams, comprising logic, algebra, reasoning with pictures and even aspects of linguistic grammar.
“The first things I found out were that all mathematical reasoning is diagrammatic and that all necessary reasoning is mathematical reasoning, no matter how simple it may be. By diagrammatic reasoning, I mean reasoning which constructs a diagram according to a precept expressed in general terms, performs experiments upon this diagram, notes their results, assures itself that similar experiments performed upon any diagram constructed according to the same precept would have the same results, and expresses this in general terms.” (Peirce NEM IV: 47-48)36
A notion that diagrammatic reasoning allows to depict the reasoning process in moving pictures of thought as Stjernfelt quotes Peirce’s arguments, suggests a dynamic property of a diagram contained in its temporal succession of thinking procedures (problem-solving. decision making, or conflict management) by means of its external representation37. In this sense, a diagram “…represents a course of thoughts”, as “…predominantly an icon of relations ...” (Peirce CP 4.418), or “… a visual means of representation of (not necessarily visual) information.“38
Finally, within the question of relational reasoning, several notions and functions of a diagram could be derived:
“A diagram has been defined as 1) intellectual, scientific, and rational thinking structure working through complex network of elements, discontinuous lines and fragments (even though the existence of intuitive diagram may be argued as possibility), 2) compressed information (formed by reduction to a single visual and verbal data-representation in order to ease communication and comprehension of the complex set of relations; the data-map: data compressed in a single image with several levels of signification;reductive machine for production of information”, 3) the way of thinking – the abstract machine (Deleuze) – or a specific mindset (Allen); the structure that supports, directs, and controls design thinking process; a cognitive tool, 4) the way of organization: notational, operational and performative map, 5) relational drawing, revealing all the hidden connections and dependences (Knoespel), 6) transitional figure – instrument of translation, transposition, transcoding
S A J _ 2016 _ 8 _
402
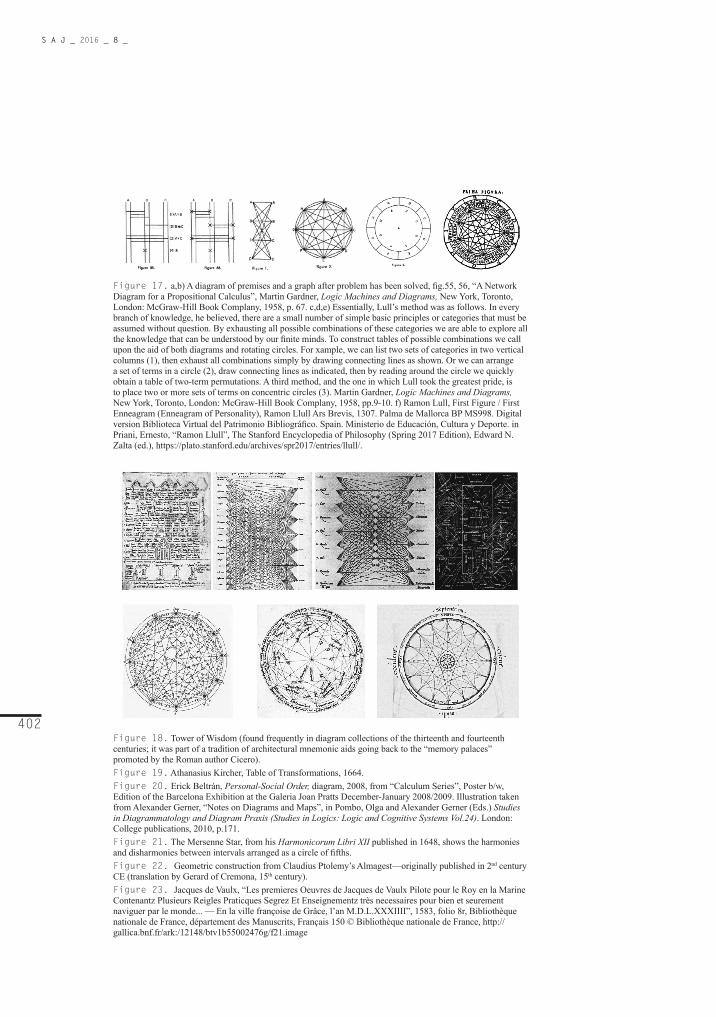
Figure 17. a,b) A diagram of premises and a graph after problem has been solved, fig.55, 56, “A Network Diagram for a Propositional Calculus”, Martin Gardner, Logic Machines and Diagrams, New York, Toronto, London: McGraw-Hill Book Complany, 1958, p. 67. c,d,e) Essentially, Lull’s method was as follows. In every branch of knowledge, he believed, there are a small number of simple basic principles or categories that must be assumed without question. By exhausting all possible combinations of these categories we are able to explore all the knowledge that can be understood by our finite minds. To construct tables of possible combinations we call upon the aid of both diagrams and rotating circles. For xample, we can list two sets of categories in two vertical columns (1), then exhaust all combinations simply by drawing connecting lines as shown. Or we can arrange a set of terms in a circle (2), draw connecting lines as indicated, then by reading around the circle we quickly obtain a table of two-term permutations. A third method, and the one in which Lull took the greatest pride, is to place two or more sets of terms on concentric circles (3). Martin Gardner, Logic Machines and Diagrams, New York, Toronto, London: McGraw-Hill Book Complany, 1958, pp.9-10. f) Ramon Lull, First Figure / First Enneagram (Enneagram of Personality), Ramon Llull Ars Brevis, 1307. Palma de Mallorca BP MS998. Digital version Biblioteca Virtual del Patrimonio Bibliográfico. Spain. Ministerio de Educación, Cultura y Deporte. in Priani, Ernesto, “Ramon Llull”, The Stanford Encyclopedia of Philosophy (Spring 2017 Edition), Edward N. Zalta (ed.), https://plato.stanford.edu/archives/spr2017/entries/llull/.
Figure 18. Tower of Wisdom (found frequently in diagram collections of the thirteenth and fourteenth centuries; it was part of a tradition of architectural mnemonic aids going back to the “memory palaces” promoted by the Roman author Cicero). Figure 19. Athanasius Kircher, Table of Transformations, 1664. Figure 20. Erick Beltrán, Personal-Social Order, diagram, 2008, from “Calculum Series”, Poster b/w, Edition of the Barcelona Exhibition at the Galeria Joan Pratts December-January 2008/2009. Illustration taken from Alexander Gerner, “Notes on Diagrams and Maps”, in Pombo, Olga and Alexander Gerner (Eds.) Studies in Diagrammatology and Diagram Praxis (Studies in Logics: Logic and Cognitive Systems Vol.24). London: College publications, 2010, p.171.Figure 21. The Mersenne Star, from his Harmonicorum Libri XII published in 1648, shows the harmonies and disharmonies between intervals arranged as a circle of fifths. Figure 22. Geometric construction from Claudius Ptolemy’s Almagest—originally published in 2nd century CE (translation by Gerard of Cremona, 15th century). Figure 23. Jacques de Vaulx, “Les premieres Oeuvres de Jacques de Vaulx Pilote pour le Roy en la Marine Contenantz Plusieurs Reigles Praticques Segrez Et Enseignementz très necessaires pour bien et seurement naviguer par le monde... — En la ville françoise de Grâce, l’an M.D.L.XXXIIII”, 1583, folio 8r, Bibliothèque nationale de France, département des Manuscrits, Français 150 © Bibliothèque nationale de France, http://gallica.bnf.fr/ark:/12148/btv1b55002476g/f21.image

S A J _ 2016 _ 8 _
403
Dra
gana
Ćiri
ć _
Relational Logics and Diagrams: No-Scale Conditions
between different fields and disciplines, or stages in a design process, 7) graphic representation of certain information – a map, an image diagram (Deleuze), 8) generative, transformative figure; an open structure escaping the recognition of legitimate and familiar type, form, leaving the space for the invention and change, 9) a tool for different operations and processes – analysis, synthesis, reduction, transformation, deconstruction, deprivation, erasure, transformation, abstraction, fragmentation – the active, generative, constructive and creative tool, 10) a form containing all the elements of space and time articulation, being legitimate for their representation and performance (spatial experiences through time), 11) the artifice, 12) the interpreter (Graff, 1986), 13) abstraction of an expression of cultural, political and organizational effects (Foucault); the narrative-diagram.”39
Diagrams are not usually naturalistic, realistic, mimetic depictions (even though they might contain some of these features). They frequently stay latent in a design process and, as Garcia states, are given the secondary status of the means of a programmatic, procedural and logical functioning, and abstract representation and reasoning. Standing for the immaterial aspects of a design process, they have been given a status of an intellectual and expert authority when used as pedagogic, scientific, and academic tools.40 Their methodological role in generating complex design environments, operating with multiple data-structures, effective use in processes of building management, their ability of symbolic representation and construction referring to historical examples of mystical-religious ideas, or representation of knowledge-structures, add to this kind of status which usually undermined their aesthetic possibilities. But always present hybridizations with the artistic methodologies and other representational techniques characteristic to architecture, alter the status of a diagram as an entity of multiple values and an aesthetic object.
No-scale Diagram
The correspondence between the diagrammatic representation and the structure of its referent in reality could be based on metrical, or topological understanding of a given spatial condition. Aaron Sloman will indicate these differences through utilization of different classes of transformations or inferences which enable us to view the same structure in multiple ways, making the equivalence between this multiplicity, or simultaneity of number of views of possible changes and situations with the notion of intelligence 41. A diagram could represent number of these levels, or could merge them in one composite complex picture. It also allows the mobility of their elements, and the mechanisms of their manipulation through inferences drawn by information retrieval from these multilevel, or

S A J _ 2016 _ 8 _
404
Figure 24. Barry Le Va, Plazas in Transition; Foundations in Fragmented Perspectives, New York, Parasol Press, 1979: a) Transition 1, b) Transition 3, http://www.parasolpress.com/parasol-editions/leva_barry/.Figure 25. Zaha Hadid, sketch for the MAXXI Museum of Art of the XXI Century, Rome, 2002. Figure 26. Zaha Hadid, Drawing, Competition for Parc de la Villette, Paris, 1982-83, Ink on tracing paper: d) Planetary Strip, e) Discovery Strip, f) Greenhouse Strip.
Figure 27. Enric Miralles, Eurhythmics Centre, Alicante, Spain, 1993–94, earth movements under entry ramps. The rise and spread of waveforms from A to G and from H to P can be felt through this ‘cinematic sectioning’.© Miralles Tagliabue EMBT Studio. Figure 28. FOA Diagram, Yokohama Port Terminal.

S A J _ 2016 _ 8 _
405
Dra
gana
Ćiri
ć _
Relational Logics and Diagrams: No-Scale Conditions
meta-level representations. Based on metric-nonmetric/topological opposition in relational logic, we distinguish classes of diagrams containing direct spatial references (including scale and proportion), and those spatially-altered in order to put forward different classes of information.
Sloman will question traditional spatial vs. logical polarity42, claiming that actually both approaches of problem-solving have much more in common than it is usually represented (a difference between Fregean/propositional and analogical are usually misdescribed). He criticizes other dichotomies as well, such as implicit/explicit, computational/non-computational, procedural/declarative representations, arguing that there are more different and also hybrid types which abolish this “black-and-white view” of the problem. Robert K. Lindsay also argues that conscious geometric reasoning with diagrams must employ propositional as well as pictorial manipulations, thus creating an in-between condition and a new representational class.43 This division may be even problematized based on the assumption that visual reasoning also has its logical basis – its internal logic – especially when speaking about relational such as the one used or integrated into diagrammatic reasoning. This point of view will actually argue for extension of notion of logical thinking beyond just verbal or algebraic towards diagrammatic and visual as well. Precisely in this gap between logical and visual (as they were traditionally divided) lays the category of a diagram as a result of integrated intelligence networking which as a paradigm transcends the theory of strict functional differentiation (multiple intelligence theory) involved in creation of hybrid entities. The common place for linguistic, verbal, logical, algebraic and visual thinking is that of a structure, a syntax, and semantics (1) the logic of configuration whether fixed or a mobile one – the structural properties, 2) the logic of connectivity, or relational logic, 03. the structure-manipulations possible in its dynamic condition, and 04. the logic of narrative content, or a description). Working with and manipulating this structure, a diagram becomes their shared entity enabling translation and dialogue, as well as transfer of categories from one to another field in a way that they cannot any longer stay strictly tied to any particular authority of a type of reasoning. The theory of diagrammatic reasoning is finally based on the interaction of linguistic and visual-structural logic, allowing architectural techniques of conceptualization to move more from the strict spatial representation, to leave out some of the spatial properties in order to reveal different influences and conditions of an architectural design task, thus producing a specific design knowledge.
Allan Blackwell and Yuri Engelhardt will, after explaining a meta-taxonomy for diagram research, based on nine aspects of diagram and diagram use, point to the example of The London Underground Diagram44. Besides its analysis

S A J _ 2016 _ 8 _
406
Figure 29. Models of data-branching and connectivity (arborescent and rhizomatic): a) Ramon Llull, The Tree of Knowledge (Arbor scientiae venerabilis et caelitus illuminati Patris Raymundi Lullii maioricensis Liber ad omnes scientias utilissimus), 1515 (also in Lima, M. fig. 11, p. 32); b) Tree of life – mimetic representation.Figure 30. Diagrams taken form Manuel Lima’s Visual Complexity, pages: (c) p. 66, (e) p. 58, (f) p. 68, (g) p. 142-143, (h) p. 180: c) Tree of Life, from Charles Darwin, The Origin of Species, 1859, (the only one illustration featured in the first edition of Darwin’s masterpiece), fig. 22, p. 66; d) Radial organization chart which highlights the centralized decision-making power structure of most companies, with the president at the very core, followed by successive degrees of dependency. From Smith, Graphic Statistics in Management.in Lima, M. fig. 15, p. 58; e) Radial 3-dimensional (spherical) diagram with arborescent branching along radial paths; f) A three-dimensional representation of the net of life – an alternative version to the common tree of life. Red lines, depicting horizontal gene transfer, tie individual bacteria and archaea, which all originate from a common root depicted in orange. From V. Kunin, L. Goldovsky, N. Darzentas, and C. A. Ouzounis, “The Net of Life: Reconstructing the Microbial Phylogenetic Network,” Genome Research 15, no. 7 ( July 2005): 954-59. In Manuel Lima, Visual Complexity: Mapping Patterns of Information, New York: Princeton Architectural Press, 2011, p. 68, fig. 24; g) Heath Bunting, A Map of Terrorism, 2008 (A map of global activities and affiliations associated with terrorism. Commissioned by the Tate (above), fig. , p. 142-143; h) Maurits de Bruijn and Jeanne van Heeswijk, Typologies and Capacities, 2006, in Manuel Lima, Visual Complexity: Mapping Patterns of Information, New York: Princeton Architectural Press, 2011, p. 180; i) Mandelbrot set.
Figure 31. “The World Government“ map, © Bureau d’Etudes, series of mapping projects, aiming at charting and exposing hidden structures of global power and domination “The World Government“ map is an attempt to understand how world governance behaves, by analyzing its major contributors, from independent states, financial institutions, industrial firms, foundations, schools, universities, NGO’s, international organizations, lobbyist groups, religious institutions, and others, in an endless network of influence. Icons represent each of these key players spread throughout the graph, while lines between them represent different types of ties.

S A J _ 2016 _ 8 _
407
by aspects they proposed, for the purposes of this paper, it becomes relevant to discuss the part referring to correspondence of diagrammatic representation to real spatial structure and distribution of elements interpreted by this class of visual reasoning.
Obviously diagrammatic representations of metro systems are non-scalar – they neglect real spatial dimensions, configurations, proportions, or distances showing logics of connectivity among locations-points on a map by a new geometric system differing from the real spatial one. Scalar and metric properties could be abolished in order to emphasize organizational principles. In this sense, notion of a diagram as an “abstract tool of thinking about organization”45, implying the complex web of relations among the elements of the represented structure, becomes highly relevant and accurate. This type of non-corresponding figurative representation, indicating the lack of extensive formal properties of the referent, makes logical distortion of real spatial quantities – distances, positions, and orientations – among the entities it represents. Its system of communication converts them into non-metric language of topological structures. The Underground diagram may be considered to be a representation of “spatial” and “ordinal” information, or it may be taken to represent a “sequence of actions” required to reach a particular destination46, but it doesn’t have to regard a scale – it may be scaleless, representing operative logic and point-sequences on a line of connectivity. If not fully liberated from spatial connections, it may represent a transitory, phase state leading towards more general principles and logic of spatial control.
Dealing more with relations than with the elements, with logics of continuity and movement more than that of a form, topological representations emerged as a consequence of the requirement of division from the 3-dimensional system of coordination not suggesting any relation to real locations or places (the points may be indicating some spatial referents but they are not spatially specified as they function to analyse and represent a general system, a topological rule or a principle of a dynamic condition; they may be spatially applied or recognized, but they actually aren’t spatial in themselves – they do not include dimensions, shapes or distances but parameters invariant under constant transformations).47
Considering previously mentioned status of a diagram as a dynamic system, or a system of information, two specific transitions could be made towards new types of unscaled, non-metric states – the one towards the intensive properties, and the other towards data-diagram – both slipping out of the Cartesian spatial logic – the first belonging to systems of thermodynamics and non-euclidean space, the second to the virtual realm of data-scapes.
Dra
gana
Ćiri
ć _
Relational Logics and Diagrams: No-Scale Conditions

S A J _ 2016 _ 8 _
408
DYNAMIC SYSTEMS: INTENSIVE PROPERTIESAT THE SCALE OF INVISIBLE NATURE
“Intensive differences, also known as gradients, are properties of matter with indivisible difference, such as weight, elasticity, pressure, heat, density, colour, and duration. Any intensive property that is halved maintains an equal property in each half… In contrast, extensive properties are properties of matter with divisible differences, such as measurement, constraint, limits, codes/rules, modulation, mass, total volume, and time.”48
Speaking about architecture, or architectural space, we usually have in mind measurable (commensurable) properties or extensive values of an architectural entity as a definite formal state. Formal stability implies finished processes of morphogenesis and static condition of an object. But considering dynamic systems and vectorial fields directing their constant transformation (movement, morphing, variation, or versioning), not having or always “slipping out” of any formal consistency, traditional systems of architectural space encountered a problem of a proper integration and explanation of “intensities”. This demanded adaptation and change of architectural paradigms in order to include new notions of intensive relativity, instability, state of transformation and morphogenesis. Dynamism always stood for a challenging concept in architecture. Belonging to different kind of order as a representative of change and unpredictability, it tended to be integrated, closed and controlled by different metric systems, specifically spatial one. But as such, it had to be altered from its initial continuity by discretization, devoid of its smooth nature. For this reason, architects were trying to incorporate a new intensive science and virtual philosophy, positioned by Gilles Deleuze, and refined recently by Manuel DeLanda49, into architectural metric restrictions, or to alter completely the notion of architecture as possible non-metric science. Intensive architecture would contain the logic of vector fields, their mobile structure, and variability, or versioning.
“Euclidean geometry couldn’t explain the shapes of the clouds, mountains, coasts or trees as they weren’t spheres, cones or circles.”
Architecture is traditionally being defined in relation to 1) nature – the real physical experiential space of irregularity, complexity, and unpredictability, and 2) abstract ideal mathematical space of perfect geometric figures, laws of scale and proportion, and their (de)finite values, regularities, and axiomatics. For a long period of time geometry relied on antique traditions of Greek mathematicians – Euclidean space and geometry – and by its means, all the aspects of the world were defined. This kind of calculus included reductions and aproximatizations constructing ideal concepts of space. Aristotelian sources

S A J _ 2016 _ 8 _
409
Dra
gana
Ćiri
ć _
Relational Logics and Diagrams: No-Scale Conditions
excluded a nonlinear world from the mathematics, and these traditions were transferred to later periods as ideal and perfect. But their dynamic states, or contextual distortions, on the other hand, brought regularities into a crisis – their adaptability was problematized introducing nonlinearity and the state of constant flux50, influenced by the theories of physics such as that of fluid dynamics or thermodynamics, and electro-magnetics.
Formal deformations and foldings rendering processes of morphogenesis, unfinished transitory states, and dynamic fluctuations demanded revisions of 3-dimensional space coordination. As their extensive properties were variables, they couldn’t be directly defined by their parameters. Invariants of dynamic states belonged to different calculus not having spatial properties by which they could be architecturally embedded, controlled, and comprehended in a traditional way. They implied different space-theory. Processual logic, or states of becoming, had to (re)invent their architectural syntax and tools of spatial translation in order to become methodologically justified and possible in architectural terms. The first historical period to introduce this new science of intensities in a more deliberate way was Baroque. The invisible forces (at that time simply marked as elements – fire, air, water, ground, but also tensions, performances, and events – in other words, processes instead of formal resolutions) were the ones to set the matter in motion and infinite foldings51 exceeding the boundaries of the representational frames, and bringing the instability into beliefs of the known world. Leibniz’s “vortex cosmology” and differential calculus, or Verignon’s calculus of motion established mathematical foundations of non-Euclidean geometry and space.52 Calculus of curvatures theoretically and practically contrasted new design currents to Cartesian logic. Starting from here, periods that followed could have generated more complex scientific approaches to dynamic systems, concepts of dynamism and transformation53 (reflected on problems of space through Gauss’ and Riemann’s manifolds54). Focillon will explain this continuity of dynamism as a “baroque trop”55 which will appear every time in history when questions of morphogenesis, intensive properties, and dynamic states start to dominate architectural and intellectual culture in general.
Extensive-intensive polarity is based on differences of spatial metric systems and formalization, finiteness and constancy on the one hand, and constant transformability, dynamic processual logic, formlessness, infinity, and unpredictability on the other. Equations of intensitites contain and define virtual attractors of a system – intrinsic singularities – to which trajectories express tendencies but never obtain, or retain their stable condition56. The predictions which one of the trajectories will be actualized is made impossible or insufficiently reliable, making the equation unsolvable. Virtuality of a problem (objectively defined structure) exists independently of its actuality (a solution)57. Therefore,

S A J _ 2016 _ 8 _
410
Figure 32. a) WV 2012-159 Ludwig van Beethoven/ Sonate Nr. 20 (Opus 49, Nr. 2) Allegro ma non troppo 2/2 – 122 Takte Tempo di Menuetto 3/4 – 120 Takte Himmelsrichtung N-S; Rotationsrichtung/ Rotationsgeschwindigkeit; 2 Interne Zentren; 4 Externe Zentren; Extract Intonation + Dynamic; Beat; Loop Jorinde Voigt Berlin 2012 86,5 x 140 cm Tinte, Bleistift auf Papier Unikat Signiert. http://jorindevoigt.com/blog/?cat=602. b) WV 2012-157 Ludwig van Beethoven/ Sonate Nr. 18 (Opus 31, Nr. 3) “The Hunt“ Allegro 3/4 – 253 Takte Scherzo Allegretto vivace 2/4 – 171 Takte Menuetto 3/4 – 62 Takte Presto con Fuoco 6/8 – 333 Takte Himmelsrichtung N-S; Rotationsrichtung/ Rotationsgeschwindigkeit; 2 Interne Zentren; 4 Externe Zentren; Extract Intonation + Dynamic; Beat; Loop Jorinde Voigt Berlin 2012 86,5 x 140 cm Tinte, Bleistift auf Papier Unikat Signiert. http://jorindevoigt.com/blog/?cat=602.
Figure 33. Bifurcation diagram for Mandelbrot set, http://www.math.harvard.edu/~ctm/gallery/Figure 34. a) Diagram of the physics of liquids. “Cinématique des fluides.” Archives des sciences physiques et naturelles. 1898. http://scientificillustration.tumblr.com/post/145134638487/nemfrog-fig-10-diagram-of-the-physics-of. b) Iannis Xenakis, Polytope, Montral, 1967.
Figure 35. Perry Culper, Winter, Graduate Drawing Seminar, ‘Drawing Speeds’, Arch 509, drawing from the students’ exhibition, http://archinect.com/blogs/gallery/73570777/12/drawing-speeds-with-perry-kulper. Figure 36. Barry Le Va. Study for Equal Wall Base Divisions Crossed. 1973, Moma collections, https://www.moma.org/collection/works/33497?locale=enFigure 37. Colibri in stream, Particle Image Velocimetry (PIV). Figure 38. A vector field drawn from PIV-images, Fig. 5 in Particle Image Velocimetry – PIV, Department of Biotechnology and Chemical Technology, Aalto University School of Chemical Engineering, http://chemtech.aalto.fi/en/research/chemical_engineering/equipment/particle_image_velocimetr

S A J _ 2016 _ 8 _
411
Dra
gana
Ćiri
ć _
Relational Logics and Diagrams: No-Scale Conditions
the tendencies of precise mathematical elaboration and scientific understanding of these conditions, have the aim at controlling their metamorphic adaptability – the state of constant flux. Depending on the discipline where they are applied or identified, these principles have divergent forms – intensities are vital for biological evolutive and morphogenetic processes, they are present and could be used for modelling indefinite physical systems like weather, meteorological fluctuations, they could be used for determining geo-logical processes, while on the psychological level they imply different personal states, and logics of collective entities and system behavior on the social one. Within the field of architecture, intensities are applied whenever some of these issues are brought to the forefront of the architectural problem or a design task. Here, Intensive properties brought into a crisis the status of an object as a stable formal, structural, programmatic or functional and operative condition. They demanded thinking in different terms – that of the event and duration, along with variability through time. We find these analyses in Reiser’s and Umemoto’s observations in Atlas of Novel Tectonics58. The new status of an object introduced earlier by Deleuze and Allen, more closely related to the notion of “objectile”, contrasts 1) the Cartesian spatial logic, or a “Cartesian method” as a search for the clear and distinct59 – for the object whose borders and metric properties represent invariant, extensive, quantitative (spatial) values, and 2) the logic of dynamic continuity of the vector field – the intensive (gradient), spatially non-dependent variety. These intensities cannot be explained by Cartesian spatial coordinates. Constant variation, in order to maintain the property of smoothness, cannot be divided into points with determined ordinate values as this will mean breakage of their continuity which is the primary feature of intensive phenomenon.
Within the architectural field, the notion of transformability and variability could have been interpreted on the level of conceptual thinking and virtual figurations related to design research process. In terms of spatial actualization, instabilities had to be fixed in order to obtain finite spatial form – they had to be regulated and geometrically stabilized replacing intensive gradients and differences (or possibilities) with their extensive resolution and discretization of the matter. Indivisible differences, such as weight, elasticity, pressure, heat, colour, or duration“60 whose properties cannot be explained by 3-dimensional geometric system, had to be converted into the spatial or architectural effects and manifestations in matter. This was achieved by 1) transposition to non-Euclidian space which enabled to “animate form”61 or matter towards otherwise unexplainable geometrical states, 2) construction of intensive values by their spatial control – providing intensive differences whose formal instability will eventually become formalized in a way that architect controls it (meteorological methodologies of Phillipe Rahm), 3) their application to abstract systems of ideas,
S A J _ 2016 _ 8 _
412
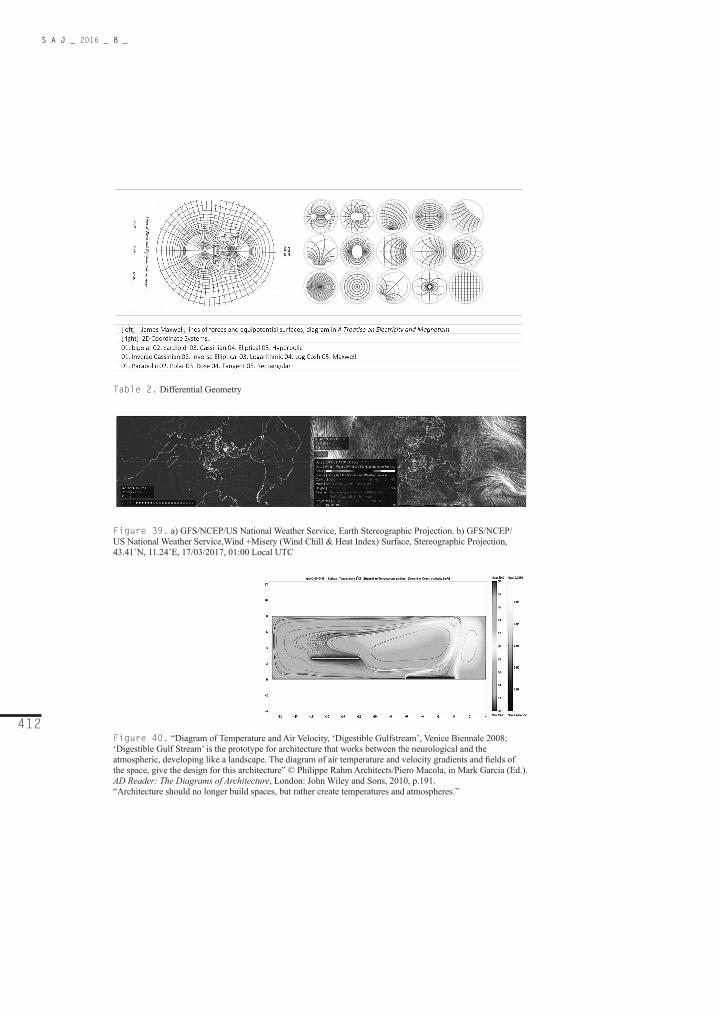
Table 2. Differential Geometry
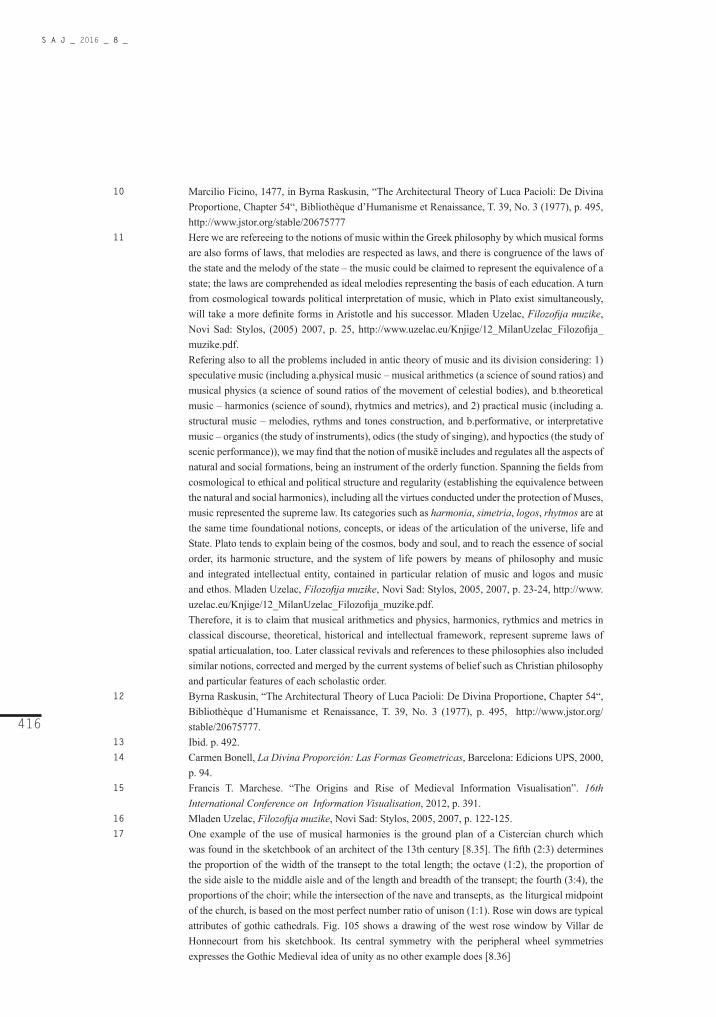
Figure 39. a) GFS/NCEP/US National Weather Service, Earth Stereographic Projection. b) GFS/NCEP/US National Weather Service,Wind +Misery (Wind Chill & Heat Index) Surface, Stereographic Projection, 43.41˚N, 11.24˚Е, 17/03/2017, 01:00 Local UTC
Figure 40. “Diagram of Temperature and Air Velocity, ‘Digestible Gulfstream’, Venice Biennale 2008; ‘Digestible Gulf Stream’ is the prototype for architecture that works between the neurological and the atmospheric, developing like a landscape. The diagram of air temperature and velocity gradients and fields ofthe space, give the design for this architecture” © Philippe Rahm Architects/Piero Macola, in Mark Garcia (Ed.).AD Reader: The Diagrams of Architecture, London: John Wiley and Sons, 2010, p.191.“Architecture should no longer build spaces, but rather create temperatures and atmospheres.”

S A J _ 2016 _ 8 _
413
Dra
gana
Ćiri
ć _
Relational Logics and Diagrams: No-Scale Conditions
4) their programmatic equations with the spatial category of the event, variable in its durability, 5) with introduction of new 2d, 3d, or n-dimensional systems. Still, this interpretation might not be completely accurate as it represents only the beginning of this kind of research. A transfer to higher theories of space, including those of multiple dimensions or theories of quantum physics, still aren’t fully developed for architectural application. Therefore we stay within the notions implying:
“Geometry derived from fields of intensive difference in matter can be used generatively. These gradient fields are understood as trans-scalar and flexible but in order to operate architecturally must be scaled precisely by being brought into relationship with extensive models.”62
“The most important distinction in our changed notion of architectural design is the shift from geometry as an abstract regulator of the materials of construction to a notion that matter and material behaviors must be implicated in geometry itself. In the older model, the sovereign role of geometry was to regulate or impress itself upon the irrational and accidental condition of matter, thus measurement, proportion and all of the elements of pure extension maintain a priority over that which they regulate. The new model must be understood not as a succession of measuring but as the interplay between intensive and extensive differences.”63
Geometric transformations and dynamics expressed by intensive processes have their own logics and systems of explanation. Within the architectural field, they imply scientific approach towards organic and inorganic processes of morphogenesis and modulation of matter, its structural effects and logics, as well as natural influences such as meteorological or climate properties, merging with the field of geo-sciences.
Topological thinking is also included in thinking about “intensities”. Its parameters are those invariant under continual transformation – they describe variability processes, not the object of this transformation as its morphing extensive properties no longer hold to stable definition. The properties that remain constant in regard to deformation, e.g. features that do not break the figure/motion and connections/continuity64, are of importance for topological definition. Topology is defined by a group of continual transformations; length, surface area, linearity, cross ratio and other concepts of metric, affine or projective geometry are not left invariant under these conditions65, and therefore inappropriate for the calculus. Additionally, figures of non-Euclidean spaces also cannot be defined by points and their coordinates in the 3d orthogonal system. Their smoothness, continuity, isomorphism and homogeneity is what

S A J _ 2016 _ 8 _
414
needs to be maintained in contrast to discretization (striatization), which can be achieved by using differential geometry (Table 2).
The control of intensive processes enables reproduction of artificial spatial environments and forms, approaching the attitude that “Architecture is a thermodynamic mediation between the macroscopic and the microscopic, between the body and space, between the visible and the invisible, between meteorological and physiological functions.”66 Articulation of vector fields of intensive forces spatially leads to Philippe Rahm’s argument that “Architecture should no longer build spaces, but rather create temperatures and atmospheres”.67
GRAPHIC CONCLUSION: TOWARDS THE SCALE OF DATADATA-SCAPES AND DYNAMICS [design intelligence project]68
[Diagram] … makes history by unmaking preceding realities and significations, constituting hundreds of points of emergence or creativity, unexpected conjunctions or improbable continuums. It doubles history with a sense of continual evolution”.69
… a diagram is a map, or rather several superimposed maps. And from one diagram to the next, new maps are drawn.70
Figure 41. Project Design Intelligence:Microhistoires, D. Ciric, 2016: a) Data-timeline, b) Data-scapes

S A J _ 2016 _ 8 _
415
Dra
gana
Ćiri
ć _
Relational Logics and Diagrams: No-Scale Conditions
Klaus, Mainzer, Symmetry and Complexity: The Sprirt and Beauty of Nonlinear Science, New Jersey, London, Singapore, Beijing, Shanhai, Hong Kong, Taipei, Bangalor: World Scientific, (World Scientific Series on Nonlinear Science, Editor: Leon O. Chua, Series A, Vol. 51), 2005.Stjernfelt, F. Diagrammatology, Dordrecht: Springer Verlag, 2007. Anderson, Michael, Meyer, Bernd, and Patrick Olivier (Eds.). Diagrammatic Representation and Reasoning. London: Springer-Verlag, 2002.Mark Garcia (Ed.),. AD Reader: The Diagrams of Architecture, London: John Wiley and Sons, 2010.Archimedean geometry is considered as the “operative” geometry in which “…the line was defined less as an essence than as a continuous process of “alignment,” the circle as a continuous process of “rounding,” the square as the process of “quadrature,” and so on.”Archimedes’ formulations are expressed in temporal terms – geometrical entities and their essences are defined by the processes of their formation, unlike static conditions of Euclidean geometry eliminating any reference to curvatures. Standard definition of a straight line as a shortest distance between two points, in Archimedean geometry is defined as dynamic process of becoming, an alignement in predifferential calculus – a straight line is represented as a specific “case of a curve/curvature”. In this sense, figures cannot be set aside of their variations, affections, and events.Daniel W. Smith, “Mathematics and the Theory of Multiplicities: Badiou and Deleuze Revisited”. The Southern Journal of Philosophy (2003) Vol. XLI , p. 416.Matila Ghyka, The Geomtry of Art and Life, New York: Dover Publications, (1946) 1977, pp. 1-19, and pp.124-154.De Prospectiva Pignendi (1472-1475). Pierro della Francesca is well-known as a mathematitian among the artists, a true scientific figure whose precise perspective constructions and investigations belong to eraly renaissance developments in spatial representation. His work and didactic material is presented and published in De Prospettiva Pignendi, one of the most influential books from that period, conceived as a didactic instrument important for intellectual, artistic, and scientific development of many renaissance and later historical period’s figures. Della Francesca constructs algebraic (numeric) system for geometric proportional relations, establishes foundation of renaissance projective geometry and develops a technique of mapping of 3-dimensional bodies, particularly interesting in the course of today’s digital facial representation techiques and other techniques of identity determination and recognition. Among other things, Francesca’s perspective depiction of dodecahedron on the page… was the first one of this kind ever to be published in a book. (paraphrased by the author, based on Baldasso, Renzo. “Portrait of Luca Pacioli and Disciple-A New, Mathematical Look” The Art Bulletin, Vol. 92, No. 1/2 (March–June 2010), pp. 83-102, Lauwers, L., and M. Willekens. “Five Hundred Years of Bookkeeping. A Portrait of Luca Paccioli”, Tijdschrift voor Economie en Management, Vol. XXXIX. 3. 1994, pp. 289-304, Rackusin, Byrna. “The Architectural Theory of Luca Pacioli: De Divina Proportione, Chapter 54”, Bibliothèque d’Humanisme et Renaissance, T. 39, No. 3 (1977), pp. 479-502, http://www.jstor.org/stable/20675777. The sources differ in their opinions whether Pierro della Francesca was actualy Pacioli’s teacher as they were both coming from the same school of Urbino, but it is rather reliable that Pacioli was familiar with the Francesca’s work and investigations. Field argues that in the Madonna dell’Ovo, now at the Brera in Milan, there is a portrait of Pacioli done by Piero.Emm, Michele. “ J. V. Field’’s „Piero della Francesca. A Mathematician’s Art “Book Review”, AMS, 2007, Vol. 54, No. 3, pp. 372-379.De pictura (1435), De statua (1438), De re aedificatoria libri decem (1442-1452).Luca Pacioli, De divina proportione (1509), George W. Hart. “Luca Pacioli’s Polyhedra”, in Götz Pfander and Isabel Wünsche, “Exploring infinity : number sequences in modern art”, p. 59. http://math.jacobs-university.de/pfander/pubs/numbersinarts.pdfByrna Raskusin, “The Architectural Theory of Luca Pacioli: De Divina Proportione, Chapter 54“, Bibliothèque d’Humanisme et Renaissance, T. 39, No. 3 (1977), p. 495, http://www.jstor.org/stable/20675777.
1
2
3
4
5
6
7
8
9
NOTES
S A J _ 2016 _ 8 _
416
Marcilio Ficino, 1477, in Byrna Raskusin, “The Architectural Theory of Luca Pacioli: De Divina Proportione, Chapter 54“, Bibliothèque d’Humanisme et Renaissance, T. 39, No. 3 (1977), p. 495, http://www.jstor.org/stable/20675777 Here we are refereeing to the notions of music within the Greek philosophy by which musical forms are also forms of laws, that melodies are respected as laws, and there is congruence of the laws of the state and the melody of the state – the music could be claimed to represent the equivalence of a state; the laws are comprehended as ideal melodies representing the basis of each education. A turn from cosmological towards political interpretation of music, which in Plato exist simultaneously, will take a more definite forms in Aristotle and his successor. Mladen Uzelac, Filozofija muzike, Novi Sad: Stylos, (2005) 2007, p. 25, http://www.uzelac.eu/Knjige/12_MilanUzelac_Filozofija_muzike.pdf.Refering also to all the problems included in antic theory of music and its division considering: 1) speculative music (including a.physical music – musical arithmetics (a science of sound ratios) and musical physics (a science of sound ratios of the movement of celestial bodies), and b.theoretical music – harmonics (science of sound), rhytmics and metrics), and 2) practical music (including a. structural music – melodies, rythms and tones construction, and b.performative, or interpretative music – organics (the study of instruments), odics (the study of singing), and hypoctics (the study of scenic performance)), we may find that the notion of musikē includes and regulates all the aspects of natural and social formations, being an instrument of the orderly function. Spanning the fields from cosmological to ethical and political structure and regularity (establishing the equivalence between the natural and social harmonics), including all the virtues conducted under the protection of Muses, music represented the supreme law. Its categories such as harmonia, simetria, logos, rhytmos are at the same time foundational notions, concepts, or ideas of the articulation of the universe, life and State. Plato tends to explain being of the cosmos, body and soul, and to reach the essence of social order, its harmonic structure, and the system of life powers by means of philosophy and music and integrated intellectual entity, contained in particular relation of music and logos and music and ethos. Mladen Uzelac, Filozofija muzike, Novi Sad: Stylos, 2005, 2007, p. 23-24, http://www.uzelac.eu/Knjige/12_MilanUzelac_Filozofija_muzike.pdf.Therefore, it is to claim that musical arithmetics and physics, harmonics, rythmics and metrics in classical discourse, theoretical, historical and intellectual framework, represent supreme laws of spatial articualation, too. Later classical revivals and references to these philosophies also included similar notions, corrected and merged by the current systems of belief such as Christian philosophy and particular features of each scholastic order. Byrna Raskusin, “The Architectural Theory of Luca Pacioli: De Divina Proportione, Chapter 54“, Bibliothèque d’Humanisme et Renaissance, T. 39, No. 3 (1977), p. 495, http://www.jstor.org/stable/20675777.Ibid. p. 492.Carmen Bonell, La Divina Proporción: Las Formas Geometricas, Barcelona: Edicions UPS, 2000, p. 94.Francis T. Marchese. “The Origins and Rise of Medieval Information Visualisation”. 16th International Conference on Information Visualisation, 2012, p. 391.Mladen Uzelac, Filozofija muzike, Novi Sad: Stylos, 2005, 2007, p. 122-125.One example of the use of musical harmonies is the ground plan of a Cistercian church which was found in the sketchbook of an architect of the 13th century [8.35]. The fifth (2:3) determines the proportion of the width of the transept to the total length; the octave (1:2), the proportion of the side aisle to the middle aisle and of the length and breadth of the transept; the fourth (3:4), the proportions of the choir; while the intersection of the nave and transepts, as the liturgical midpoint of the church, is based on the most perfect number ratio of unison (1:1). Rose win dows are typical attributes of gothic cathedrals. Fig. 105 shows a drawing of the west rose window by Villar de Honnecourt from his sketchbook. Its central symmetry with the peripheral wheel symmetries expresses the Gothic Medieval idea of unity as no other example does [8.36]
10
11
12
13
14
15
16
17

S A J _ 2016 _ 8 _
417
Dra
gana
Ćiri
ć _
Relational Logics and Diagrams: No-Scale Conditions
The regular pentagon also yielded the Golden Section and was occasionally used for the rosettes of the cathedrals (e.g. in the cathedral of Amiens). This proportion frequently appears in churches of the 12th and 13th century (e.g. Chartres) as an approximate number ratio, as in 5:8. The number ratio 5:8 is at the same time a musical harmony, namely the minor sixth. Augustine had already characterized music and architecture as “sisters of number,” in the Neoplatonic and Pythagorean tradition. Klaus Mainzer, Symmetry and Complexity: The Sprirt and Beauty of Nonlinear Science, New Jersey, London, Singapore, Beijing, Shanhai, Hong Kong, Taipei, Bangalor: World Scientific, (World Scientific Series on Nonlinear Science, Editor: Leon O. Chua, Series A, Vol. 51), 2005, pp. 365-366.A gothic use of fractals becomes highly interesting as they won’t be mathematicaly explained until B. B. Mandelbrot’s definition under the label of “new geometry” of nature formulated in order to describe these new shapes through computer technology. Mandelbrot defined “Mandelbrot set“ important for history of computer science mathematics, whose self-similarity may be illustrated only by means of computer graphics. Fractal geometry represents the first example of computer application. Klaus Mainzer, Symmetry and Complexity: The Sprirt and Beauty of Nonlinear Science, New Jersey, London, Singapore, Beijing, Shanhai, Hong Kong, Taipei, Bangalor: World Scientific, (World Scientific Series on Nonlinear Science, Editor: Leon O. Chua, Series A, Vol. 51), 2005, p. 5, pp.19-20, pp. 104-106. … as indicated in Deleuze’s The Fold: Leibniz and the Baroqque, implying a dynamic view of the world with the both “figure and the ground in movement in space” (Deleuze, 1997:136), where intensive properties of the elements (fire, air, ground, and water) direct movement of material bodies and are contained in their extensive form, or processes of morphogenesis evading the possibility of ever achieving stable condition just as the forces are constantly transforming, varying, or modulating the matter.Like Bijlsma, Wouter Deen, Udo Garritzmann (ed.), “Editorial”, OASE: tijdschrift voor architectuur = OASE: architectural journal, Rotterdam: NAi Publishers, no. 48 (1998).Antony Vidler, “What is a Diagram Anyway”, in Cassara, Silvio and Peter Eisenman (Eds.). Peter Eisenman: Feints. Milan: Skira, 2006 , p. 19.Mark Garcia, “Introduction: Histories and Theories of the Diagrams of the Architecture”, in Garcia, Mark (Ed.). AD Reader: The Diagrams of Architecture, Garcia, Mark (ed.), John Wiley and Sons, 2010, p. 24. Gilles Deleuze, Foucault, London, Minneapolis: University of Minnesota Press (Originally published in 1986 by Les Editions de Minuit.), (1988) 2006, p. 35.Foucault relates the concept of a diagram with that of the “Power” (as forces), and the concept of the strata or an archive with that of ‘Knowledge” (as forms) (Deleuze, 2006:96). It is an applied notion of a diagram in general terms contextualized within the field of power relations and general politics. Thus he forms at the same time a difference and a relation archive/stratum-diagram, or Knowledge-Power as a central question of his writings. deleuze additionaly explains them from the perspective of his defferential theory, theory of multiplicity, of intensivities, explaining through their mechnanisms the working (or functioning) logic of a diaram (the concept of an archive is obviously striated, divisible and categorized, and that of a diagram smooth, continual, inconsistent in itself). Moreover, diagram behaves as an unstable variation and web of multiple trajectories (or connectivity patterns), a relational formation whose temporary configuration cannot be easilz captured in comparison to historical archive (or knowledge) whose structure and compartments, form and figure of historical stratification is documented and organized in a way that it could be comprehended. A transformable, formless, relational nature of a diagram and its fluctuations around the points of the archive, are derived from the notion of intensive properties and their dynamic variation by analogy to differential theory and theory of movement and continuity. However, beyond this context of relations of power and applied concept of diagrammatics, certain universals could be abstracted as general diagrammatic notions – its relational, operative, konektivna, neoformljena (morfiraju’a) struktura, mechanisms of hidden networking, uncategorized, indivisible matter which as much as they enable invisibility and durability of invisible power relations (by their
18
19
20
21
22
23

S A J _ 2016 _ 8 _
418
24
25
26
27
28
29
30
31
32
33
34
35
inconsistency), enable also reconfigurations and new relational logic within their own or within structures of formalized archives.Stan Allen, “Mapping the Unmappable: On Notation” (“Notations and Diagrams: Mapping the Intangible”, Second Edition, London: Routledge, 2009), in Allen, Stan and Diana Agrest. Practice: Architecture Technique+Representation. New York: Routledge, Amsterdam: G+B Arts International, p. 42.“All notations are diagrammatic, but not all diagrams are notations.” Diagrammatic aspects underly and make possible functioning of notation. Notation is directed towards time inscription and duration, while diagram includes space, body/element-positions and organization (as well as other information beyond architectural discipline). Positions of bodies/objects and spatial indications might be present in notations, and they would be diagrammatic, and time and change over time might be implied in particular diagram, indicating notational character. Finaly, notation-diagram represents that in-between form contatining all the elements of space and time articulation (Allen, 2009:50). They imply movement, either in space, or in time, or both throught the space-time diagram.Notational system operates according to shared conventions of interpretation. It works as fixed set of operational and performing instruction, but leaving some space for the singularity of every interpretation performed. The diagram is, on the other hand, open to multiple interpretations. Ciric, Dragana. “Architectural Design Process: Diagrammatic Turn”, in Bogdanovic, Ruzica (Ed.). Facing the Future. Second International Conference and Exhibition. Conference Proceedings, Belgrade: STRAND, 2014, p. 162.Stan Allen, “Notations and Diagrams: Mapping the Intagible”. In Practice: Architecture Technique+Representation. London: Routledge, 2009, p. 42.“An abstract machine in itself is not physical or corporeal, any more than it is semiotic it is diagrammatic… It operates by matter, not by substance; by function, not by form … The diagrammatic or abstract machine does not function to represent, even something real, but rather construct a real that is yet to come, a new type of reality.” Gilles Deleuze and Felix Guattari, A Thousand Plateous:Capitalism and Schizophrenia (Translation and Forward by Brian Massumi), London, Minneapolis: University of Minnesota Press, 1987, pp. 141-142.Stan Allen, “Diagrams Matter”, ANY 23, 1998, p. 16.also in Allen, Stan. Points+Lines: Diagrams and Projects for the City. Princeton Architectural Press, 1999, p. 1.F. Stjernfelt, Diagrammatology, Dordrecht: Springer Verlag, 2007, p. 102.Somol E, Robert. “Dummy Text, or The Diagrammatic Basisof Contemporary Architecture”. In Eisenman, Pete., Diagram Diaries. pp. 6-23.Stan Allen, “Diagrams Matter”, ANY 23, 1998, p. 19also in Allen, Stan. Points+Lines: Diagrams and Projects for the City, Princeton Architectural Press, 1999, p. 4.Dragana Ciric, “Architectural Design Process: Diagrammatic Turn”, in Bogdanovic, Ruzica (Ed.). Facing the Future. Second International Conference and Exhibition. Conference Proceedings, Belgrade: STRAND, 2014, p. 164.Zenon Kulpa, “Diagrammatic Representation and Reasoning”, Machine Graphics & Vision, Vol. 3, no. 1/2, 1994, pp. 89. (13)Ibid. p. 77-78.Michael H. G. Hoffmann, “Cognitive Conditions of Diagrammatic Reasoning” (Working Paper #24), in Queiroz, Joao and Frederik Stjernfelt (Eds.). Semiotica: Special Issue on Peircean Diagrammatical Logic, February 2007, pp. 3-6.“In a short, the main idea to facilitate thinking processes by diagrammatic reasoning is that it should be possible to reduce the cognitive load in individual and collaborative problem solving, decision making, and conflict management by means of external representations (cf. van Bruggen et al. 2002; Hoffmann 2005b)Larkin and Simon in their seminal paper [31] tried to give a more precise answer to the question, from the point of view of cognitive science. Their main conclusion has been that diagrams allow effective control of the reasoning process, facilitating search for the elements

S A J _ 2016 _ 8 _
419
Dra
gana
Ćiri
ć _
Relational Logics and Diagrams: No-Scale Conditions
needed to make the next inference step, due to explicit proximity or adjacency relations between appropriate entities on the diagram. With propositional (e.g., predicate calculus) representation, to find an information needed to apply some inference rule one must search the entire data base to find the relevant entities and their properties. On the diagram, however, the relevant entities are usually placed just in the (topological or metrical) vicinity of the current “attention point” that has resulted from the previous reasoning step. The diagram, as an analogical representation of the structure of the problem, organizes the problem description in a way corresponding to the problem’s internal structure that should be followed in order to find the path to the solution.Zenon Kulpa, “Diagrammatic Representation and Reasoning”, Machine Graphics & Vision, Vol. 3, no. 1/2, 1994, pp. 90. (14)Charles Sanders Pierce, MS CSP L75 C, 1902, 91–92, in Stjernfelt, Frederik.Diagrammatology: An Investigation on the Borderlines of Phenomenology, Ontology, and Semiotics, Dordrecht: Springer Verlag, 2007, p. xiiiFrederik Stjernfelt, Diagrammatology: An Investigation on the Borderlines of Phenomenology, Ontology, and Semiotics, Dordrecht: Springer Verlag, 2007, pp. 89-116.Zenon Kulpa, “Diagrammatic Representation and Reasoning”, Machine Graphics & Vision, Vol. 3, no. 1/2, 1994, p. 83.Ciric, Dragana. “Architectural Design Process: Diagrammatic Turn”, in Bogdanovic, Ruzica (Ed.). Facing the Future. Second International Conference and Exhibition. Conference Proceedings, Belgrade: STRAND, 2014, pp. 155-156.Mark Garcia, “Introduction: Histories and Theories of the Diagrams of the Architecture”, in Garcia, Mark (ed.) AD Reader:The Diagrams of Architecture, London: John Wiley and Sons, 2010, pp. 26-27. Aaron Sloman, “Diagrams in the Mind?”, in Anderson, Michael, Meyer, Bernd, and Patrick Olivier (Eds.). Diagrammatic Representation and Reasoning. London: Springer-Verlag, 2002, p. 27.Ibid. pp. 25-26.Robert K. Lindsay, “Knowing About Diagrams”, in Anderson, Michael, Meyer, Bernd, and Patrick Olivier (Eds.). Diagrammatic Representation and Reasoning. London: Springer-Verlag, 2002, p. 31.Alan Blackwell and Yuri Engelhardt, “Meta-Taxonomy for Diagram Research” (ch 3), Diagrammatic Representation and Reasoning, pp. 48-53, and pp. 53-54.Stan Allen. “Diagrams Matter”, ANY 23, 1998, p. 16.also in Allen, Stan. Points+Lines: Diagrams and Projects for the City. Princeton Architectural Press, 1999, p. 1.Alan Blackwell and Yuri Engelhardt, “Meta-Taxonomy for Diagram Research” (ch 3), Diagrammatic Representation and Reasoning, p. 54.The origin of topology is related to Leonhard Euler’s paper from 1736. “The Bridges of Königsberg.” Trying to resolve popular mathematical problem of finding a path by which all the seven bridges in the town could be passed through just ones. Euler diagrammed the city as a set of flexible relations. This method marked a move from lienar geometry as Euler didn’t regard dimensions, shapes, and distances, but „qualitative parameters invariant under the group of continuous (topological) transformactions“. (Klaus Mainzer, Symmetry and Complexity: The Sprirt and Beauty of Nonlinear Science, 2005:74). Klein will suggest that each geometry is characterized by a unique family of transformations and deals with exctly those properties and relationships that are invariant under these transformations (the associated families of transformations may be roughly characterized as follows: 01. Topological transformations leave invariant the property of being a continuous region. 02. Projective transformations are topological transformations and leave invariant the property of being a line and the relations of pair separation on a line (e.g. hyperbolic geometry may also be presented as subgeometry of projective geometry) 03. Affine transformations are projective transformations and leave invariant the relation of being parallel. 04. Euclidean transformations are affine transformations and leave distances invariant) from Bas C. van Fraassen, An Introduction to the Philosophy of Time and Space, (Originaly published by random House 1970, Reprinted by Columbia University Press 1985, all the rights reverted to the author in 2013), PDF Edition by the Author, 2015, p. 138.).
36
37
38
39
40
41
42
43
44
45
46
47

S A J _ 2016 _ 8 _
420
48
49
50
51
52
Dealing more with relations than elements, continuity more than form, topological field has, since Euler’s experiments, produced mathematical curiosities such as Klein bottle, Mobius strip (Möbius published a description of a Möbius band in 1865, trying to describe the ‘one-sided’ property of the Möbius band in terms of non-orientability), or coffee-cup-to-donut transformation.A term topology isn’t found in literature since 1920s, and its more deliberate development id usually related to Henri Poencaré. Its scientific field emerges as a consequence of the need to step out of the 3-dimensional system of coordination, not suggesting any connections with real locations or places, and 3d orientation. Topological thinking deals with relations which doesn’t need or imply contextual, spatial properties (not having, or not taking into consideration distances, shapes nad forms). It constructs a relational structure. Daniel Smith will explain that its original naming geometria situs or analysis situs (literally analysis of positions) suggests closer relations with location (perhaps because of its urban origin) more than it is really justified by the content and the probelmatics of its scientific field. Therefore many misunderstandings and inconveniencies still occure within the modern notion of topology, which shouldn’t be taken for relevant. Daniel W. Smith, “Mathematics and the Theory of Multiplicities: Badiou and Deleuze Revisited.” The Southern Journal of Philosophy (2003) Vol. XLI , pp. 417.“Euler essentially reformulated the problem in abstract terms, isolating the seven bridges as a series of edges (links) connecting the different landmasses represented by vertices (nodes). Even though Euler did not use any of these modern terms, he did however deconstruct the problem in such a way that suggests a type of simplified scheme, commonly called a graph in mathematics. Euler’s ability to look at the problem from a topological perspective – by conceiving the bridges challenge as a graph – laid the foundation for graph theory (the study of graphs in mathematics and computer science) and, consequently, network science.”Manuel Lima, Visual Complexity: Mapping Patterns of Information, New York: Pirinceton Architectural Press, 2011, pp. 74-75.Reiser+Umemoto, Atlas of Novel Tectonics. New York: Princeton University Press, 2006, p. 73.Manuel De Landa, Intensive Science and Virtual Philosophy, London: Continuum, 2002.Comprehension of architecture as a construction of material world is radically altered with the notion of dynamism, transformation, unstable and interactive systems within the concepts of liquid architecture (Novak, 1999: 273). Set of conceptual tools were devised for thinking processes and processes of construction of territories in cyber-space. This enabled development of fluid imaginary scapes as an expression of fourth dimension with flexions, foldings, mutations and morphing through parametric control. Isomorphic polysurfaces defined the “copresence of movement and force in the moment of formal conceptualization” replacing the “logic of conflict and contradiction” with the “fluid logic of connectivity” (Lynn, 1998, Kolarevic). Architectural cyber-scapes represent thus “information territories in a constant flux”; in cyber-space, the concept of space is merged with that of the information.Analysis and inferences according to notions of Marcos Novak (in Novak, Markos.“Liquid Architectures in Cyberspace” (1991). in Michael Benedikt (Ed.). Cyberspace: First Steps. p. 273-274) and Greg Lynn (in Lynn, Greg. 1998, in Kolarevci, Branko (Ed.) Architecture in the Digital Age: Design and Manufacturing, New York: Spon Press, 2003).Dragana Ciric. “Disappearing Borders: Ethics of Power Invisibility”, in Bogdanovic, Ruzica (Ed.). Going Digital: Innovation in Art, Architecture, Science, and Technology. Conference ProceedingsI. ternational Conference and Exhibition. Conference Proceedings, Belgrade: STRAND, 2016, p. 100.Gilles Deleuze, The Fold: Leibniz and the Baroque, Minneapolis: University of Minnesota Press, 1993, pp. 122-123.Michael S. Mahoney ,“Varignon and the calculus of motion”, (Draft Paper) 1985, 1994, p. 12, Princetone University Online Articles Archive, https://www.princeton.edu/~hos/h593/varignon.rev.pdf.During the 18th century, Bernoulli, l’Hôpital, and Varignon were successfully using differential calculus for development of their own mathematical concepts. Through their researches –
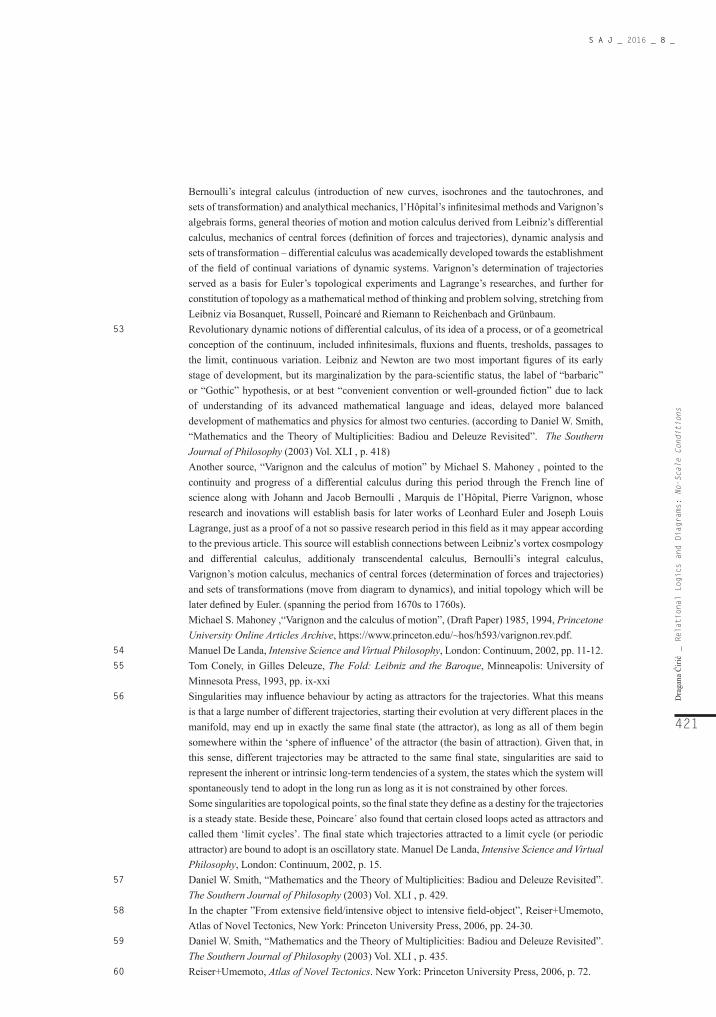
S A J _ 2016 _ 8 _
421
Dra
gana
Ćiri
ć _
Relational Logics and Diagrams: No-Scale Conditions
Bernoulli’s integral calculus (introduction of new curves, isochrones and the tautochrones, and sets of transformation) and analythical mechanics, l’Hôpital’s infinitesimal methods and Varignon’s algebrais forms, general theories of motion and motion calculus derived from Leibniz’s differential calculus, mechanics of central forces (definition of forces and trajectories), dynamic analysis and sets of transformation – differential calculus was academically developed towards the establishment of the field of continual variations of dynamic systems. Varignon’s determination of trajectories served as a basis for Euler’s topological experiments and Lagrange’s researches, and further for constitution of topology as a mathematical method of thinking and problem solving, stretching from Leibniz via Bosanquet, Russell, Poincaré and Riemann to Reichenbach and Grünbaum.Revolutionary dynamic notions of differential calculus, of its idea of a process, or of a geometrical conception of the continuum, included infinitesimals, fluxions and fluents, tresholds, passages to the limit, continuous variation. Leibniz and Newton are two most important figures of its early stage of development, but its marginalization by the para-scientific status, the label of “barbaric” or “Gothic” hypothesis, or at best “convenient convention or well-grounded fiction” due to lack of understanding of its advanced mathematical language and ideas, delayed more balanced development of mathematics and physics for almost two centuries. (according to Daniel W. Smith, “Mathematics and the Theory of Multiplicities: Badiou and Deleuze Revisited”. The Southern Journal of Philosophy (2003) Vol. XLI , p. 418)Another source, “Varignon and the calculus of motion” by Michael S. Mahoney , pointed to the continuity and progress of a differential calculus during this period through the French line of science along with Johann and Jacob Bernoulli , Marquis de l’Hôpital, Pierre Varignon, whose research and inovations will establish basis for later works of Leonhard Euler and Joseph Louis Lagrange, just as a proof of a not so passive research period in this field as it may appear according to the previous article. This source will establish connections between Leibniz’s vortex cosmpology and differential calculus, additionaly transcendental calculus, Bernoulli’s integral calculus, Varignon’s motion calculus, mechanics of central forces (determination of forces and trajectories) and sets of transformations (move from diagram to dynamics), and initial topology which will be later defined by Euler. (spanning the period from 1670s to 1760s). Michael S. Mahoney ,“Varignon and the calculus of motion”, (Draft Paper) 1985, 1994, Princetone University Online Articles Archive, https://www.princeton.edu/~hos/h593/varignon.rev.pdf.Manuel De Landa, Intensive Science and Virtual Philosophy, London: Continuum, 2002, pp. 11-12.Tom Conely, in Gilles Deleuze, The Fold: Leibniz and the Baroque, Minneapolis: University of Minnesota Press, 1993, pp. ix-xxiSingularities may influence behaviour by acting as attractors for the trajectories. What this means is that a large number of different trajectories, starting their evolution at very different places in the manifold, may end up in exactly the same final state (the attractor), as long as all of them begin somewhere within the ‘sphere of influence’ of the attractor (the basin of attraction). Given that, in this sense, different trajectories may be attracted to the same final state, singularities are said to represent the inherent or intrinsic long-term tendencies of a system, the states which the system will spontaneously tend to adopt in the long run as long as it is not constrained by other forces. Some singularities are topological points, so the final state they define as a destiny for the trajectories is a steady state. Beside these, Poincare´ also found that certain closed loops acted as attractors and called them ‘limit cycles’. The final state which trajectories attracted to a limit cycle (or periodic attractor) are bound to adopt is an oscillatory state. Manuel De Landa, Intensive Science and Virtual Philosophy, London: Continuum, 2002, p. 15.Daniel W. Smith, “Mathematics and the Theory of Multiplicities: Badiou and Deleuze Revisited”. The Southern Journal of Philosophy (2003) Vol. XLI , p. 429.In the chapter ”From extensive field/intensive object to intensive field-object”, Reiser+Umemoto, Atlas of Novel Tectonics, New York: Princeton University Press, 2006, pp. 24-30.Daniel W. Smith, “Mathematics and the Theory of Multiplicities: Badiou and Deleuze Revisited”. The Southern Journal of Philosophy (2003) Vol. XLI , p. 435.Reiser+Umemoto, Atlas of Novel Tectonics. New York: Princeton University Press, 2006, p. 72.
53
54
55
56
57
58
59
60

S A J _ 2016 _ 8 _
422
61
62
63
64
65
66
67
68
69
70
Digital narratives use terms like organic and dynamic analogies and algorithms, process, flow, emergence, fluidity, fold, flexion, topological geometry, motion kinematics, morphing and morphogenesis, polymorphism, keyshape animation (metamorphosis), interaction, etc., to define “co-presence and pervasion of motion and force in the process of formal conceptualization” Greg Lynn, 1998, in Ciric, D. “Disappearing Borders: Ethics of Power Invisibility”, in Bogdanovic, R. (Ed.) Going Digital: Innovation in Art, Architecture, Science, and Technology. Conference Proceedings, Belgrade: STRAND, 2016, p. 100.Reiser+Umemoto, Atlas of Novel Tectonics. New York: Princeton University Press, 2006, p. 80.Reiser+Umemoto, Atlas of Novel Tectonics. New York: Princeton University Press, 2006, p. 73. Bas. C. Van Fraassen, An Introduction to the Philosophy of Time and Space, (Originaly published by random House 1970, Reprinted by Columbia University Press 1985, all the rights reverted to the author in 2013), PDF Edition by the Author, 2015, pp. 68-69, https://www.princeton.edu/~fraassen/BvF%20-%20IPTS.pdfMainzer gives more deliberate explainations of absolute, affine, and projective geometry and topology. Klaus Mainzer, Symmetry and Complexity: The Sprirt and Beauty of Nonlinear Science, New Jersey, London, Singapore, Beijing, Shanhai, Hong Kong, Taipei, Bangalor: World Scientific, (World Scientific Series on Nonlinear Science, Editor: Leon O. Chua, Series A, Vol. 51), 2005, p. 5, pp.19-20, pp. 74-75.Philippe Rahm, “Meteorological Architecture”, in Lally Sean (Ed.). AD. Energies: New Material Boundaries , Vol.79, Issue 3, 2009, p. 35.Philippe Rahm, Thermodynamic Architecture”, in Kudless, A., Oxman, N., and Swackhamer, M. (Ed.) 48 ACADIA 08 Silicon + Skin: Biological Processes and Computation, Proceedings, pp.47-48Paul A. Bove, “Foreword. The Foucault Phenomenon: the Problematics of Style”, in Deleuze, Gilles. Foucault. (Paris: Les Editions de Minuit, 1986). London, Minneapolis: University of Minnesota Press,(1988) 2006, p. xxviGilles Deleuze,. Foucault. (Paris: Les Editions de Minuit, 1986). London, Minneapolis: University of Minnesota Press,(1988) 2006, p. 44 (Further definitions of a diagram can be found on the followinng pages: 72, 73, 81, 82, 84, 85, 86, 89, 96)Ibid p. 37 in Dragana Ciric, “Design-Data Intelligence: Microhistories and Diagrammatic Reasoning”, in Bogdanovic, Ruzica (Ed.). International Scientific Conference and Exhibition “Scale of Design: From Micro to Macro” Conference Proceedings, Belgrade: STRAND - Sustainable Urban Society Association, pp. 155-171.
Allen, Stan. “Diagrams Matter”, in Allen, Stan. Points+Lines: Diagrams and Projects for the City, Princeton Architectural Press, 1999.
Allen, Stan. “Diagrams Matter.” ANY 23, 1998, pp. 16-19.Allen, Stan. (2009) “Notations and Diagrams: Mapping the Intagible”. In Practice: Architecture
Technique+Representation. London: Routledge, pp. 40-69.Anderson, Michael, Meyer, Bernd, and Patrick Olivier (Eds.). Diagrammatic Representation and
Reasoning. London: Springer-Verlag, 2002.Bijlsma, Like, Deen, Wouter, and Udo Garritzmann (eds.), OASE: tijdschrift voor architectuur =
OASE:architectural journal, NAi Publishers (Rotterdam), no. 48, 1998.Blackwell, Alan and Yuri Engelhardt. “Meta-Taxonomy for Diagram Research”, in Anderson,
Michael, Meyer, Bernd, and Patrick Olivier (Eds.). Diagrammatic Representation and Reasoning. London: Springer-Verlag, 2002, pp. 47-64.
Bonell, Carmen. La Divina Proporción: Las Formas Geometricas, Barcelona: Edicions UPS, 2000. Boethius, Anicius Manlius Severinus. Divi Severini Boetii arithmetica, Paris: Colines, 1521.
ETH-Bibliothek Zürich, http://dx.doi.org/10.3931/e-rara-17077
BIBLIOGRAPHY

S A J _ 2016 _ 8 _
423
Dra
gana
Ćiri
ć _
Relational Logics and Diagrams: No-Scale Conditions
Carpo, Mario. The Digital Turn in Architecture, 1992-2012 (AD Primer). London: John Willey & Sons, 2013.
Ciric, Dragana. “Architectural Design Process: Diagrammatic Turn”, in Bogdanovic, Ruzica (Ed.). Facing the Future. Second International Conference and Exhibition. Conference Proceedings, Belgrade: STRAND, 2014, pp. 151-167.
Ciric, Dragana. “Disappearing Borders: Ethics of Power Invisibility”, in Bogdanovic, Ruzica (Ed.). Going Digital: Innovation in Art, Architecture, Science, and Technology. Conference ProceedingsI. ternational Conference and Exhibition. Conference Proceedings, Belgrade: STRAND, 2016, pp. 91-107.
Ciric, Dragana. “Design-Data Intelligence: Microhistories and Diagrammatic Reasoning”, in Bogdanovic, Ruzica (Ed.). International Scientific Conference and Exhibition “Scale of Design: From Micro to Macro” Conference Proceedings, Belgrade: STRAND – Sustainable Urban Society Association, pp. 155-171.
De Landa, Manuel. Intensive Science and Virtual Philosophy, London: Continuum, 2002.De Landa, Manuel. “Deleuze and the Use of Genetic Algorithm in Architecture”, Art and Technology
Lecture Series, Lecture given at the Columbia University,April 9, 2004.De Landa, Manuel. Intensive and Topological Thinking. European Graduate School Video Lecture,
2011, https://www.youtube.com/watch?v=0wW2l-nBIDgDeleuze, Gilles and Felix Guattari, A Thousand Plateaus: Capitalism and Schizophrenia (Translation
and Forward by Brian Massumi), London, Minneapolis: University of Minnesota Press, 1987.Deleuze, Gilles. Foucault. (Paris: Les Editions de Minuit, 1986). London, Minneapolis: University
of Minnesota Press,(1988) 2006.Deleuze, Gilles. The Fold: Leibniz and the Baroque. Minneapolis: University of Minnesota Press,
1993.Emm, Michele. “ J. V. Field’’s „Piero della Francesca. A Mathematician’s Art“ Book Reviewe”,
AMS, 2007, Vol. 54, No. 3, pp. 372-379.Garcia, Mark (Ed.). AD Reader: The Diagrams of Architecture. London: John Wiley and Sons,
2010.Gerner, Alexander. “Notes on Diagrams and Maps”, in Pombo, Olga and Alexander Gerner.
Studies in Diagrammatology and Diagram Praxis (D. Gabbay, J.Siekmann, J. van Benthem and J. Woods (Series Editors). Studies in Logic. Logic and Cognitive Systems, Vol. 24). London: College Publications, 2010, pp. 167-190.
Ghyka, Matila. The Geomtry of Art and Life. New York: Dover Publications, (1946) 1977.Graf, D. “Diagrams”, Perspecta, Paradigms of Architecture. Vol. 22, 1996, pp. 42-71. Stable URL:
http://links.jstor.org/sici?sici=0079-0958%281986%2922%3C42%3AD%3E2.0.CO%3B2-WHoffmann, H. G. Michael. “Cognitive Conditions of Diagrammatic Reasoning” (Working Paper
#24), in Queiroz, Joao and Frederik Stjernfelt (Eds.). Semiotica: Special Issue on Peircean Diagrammatical Logic, February 2007.
Knoespel, J. K. “Diagrammatic Transformation of Architectural Space“. Philosophica 70, 2002, pp. 11-36.
Kulpa, Zenon. “Diagrammatic Representation and Reasoning”, Machine Graphics & Vision, Vol. 3, nos. 1/2, 1994.
Lima, Manuel. Visual Complexity: Mapping Patterns of Information. New York: Pirinceton Architectural Press, 2011.
Lindsay, K. Robert. “Knowing About Diagrams”, in Anderson, Michael, Meyer, Bernd, and Patrick Olivier (Eds.). Diagrammatic Representation and Reasoning. London: Springer-Verlag, 2002, pp. 29-46.
Mainzer, Klaus. Symmetry and Complexity: The Sprirt and Beauty of Nonlinear Science, New Jersey, London,Singapore, Beijing, Shanhai, Hong Kong, Taipei, Bangalor: World Scientific, (World Scientific Series on Nonlinear Science, Editor: Leon O. Chua, Series A, Vol. 51), 2005.

S A J _ 2016 _ 8 _
424
Manesson Mallet, Allain. La Geometrie Pratique. Tome Second (Des Définitions, des Mesures, & des Inftrumens de la Géométrie Pratique; avec les Méthodes de tracer fltr le papier far le terrain des Lignes, des Angles, des Figures, copier les Plans, représenter en relief les Solides, & niveler toutes fortes de Terrains.), Paris: Chez Annison Directeur de l’Impremerie Royal, rue de la Harpe, 1702.
Manesson Mallet, Allain. La Geometrie Pratique. Tome Troissième (La Planîmétrie, ou la mesure des Superficies ( ce qu’on appelle l’Arpentage ) avec les Méthodes de transfigurer, d’augmenter, & de diviser toutes sortes de Terres, Bois, &c.). Paris: Chez Annison Directeur de l’Impremerie Royal, rue de la Harpe, 1702.
Marchese, T. Francis. “The Origins and Rise of Medieval Information Visualisation”. 16th International Conference on Information Visualisation, 2012, pp. 389-395.
Pfander, Götz and Isabel Wünsche. “Exploring infinity : number sequences in modern art”. http://math.jacobs-university.de/pfander/pubs/numbersinarts.pdf
Pombo, Olga and Alexander Gerner. Studies in Diagrammatology and Diagram Praxis (D. Gabbay, J.Siekmann, J. van Benthem and J. Woods (Series Editors). Studies in Logic. Logic and Cognitive Systems, Vol. 24). London: College Publications, 2010.
Rahm, Philippe.“Meteorological Architecture”, in Lally Sean (Ed.). AD. Energies: New Material Boundaries , Vol.79, Issue 3, (May/June) 2009, pp. 30-41.
Rahm. Philippe. “Thermodynamic Architecture”. in Kudless, A., Oxman, N., and Swackhamer, M. (Ed.) 48 ACADIA 08 Silicon + Skin: Biological Processes and Computation, Proceedings, pp. 46-51.
Raskusin, Byrna. “The Architectural Theory of Luca Pacioli: De Divina Proportione, Chapter 54“, Bibliothèque d’Humanisme et Renaissance, T. 39, No. 3 (1977), pp. 479-502, http://www.jstor.org/stable/20675777
Reiser J. and N. Umemoto, Atlas of Novel Tectonics. New York: Princeton University Press, 2006Reiser, J. and Umemoto, N. (2010) “ Atlas of Novel Tectonics”. In Garcia, M. (Ed.) AD Reader: The
Diagrams of Architecture. London: John Wiley and Sons, pp. 250-259.Shafik Ramzy, Nelly. “The Dual Language of Geometry in Gothic Architecture: The Symbolic
Message of Euclidian Geometry versus the Visual Dialogue of Fractal Geometry”, Peregrinations: Journal of Medieval Art & Architecture, 2015, Vol. V, No. 2, pp. 135- 172.
Sloman, Aaron. “Diagrams in the Mind?”, in Anderson, Michael, Meyer, Bernd, and Patrick Olivier (Eds.). Diagrammatic Representation and Reasoning. London: Springer-Verlag, 2002, pp. 7-28
Smith, W. Daniel. “Mathematics and the Theory of Multiplicities: Badiou and Deleuze Revisited”. The Southern Journal of Philosophy (2003) Vol. XLI , pp. 411-449.
Somol E, Robert. “Dummy Text, or The Diagrammatic Basisof Contemporary Architecture”. In Peter Eisenman, Diagram Diaries, New York: Universe Publishing, 1999, pp. 6-25, https://iitcoa3rdyr.files.wordpress.com/2013/03/somol_dummy-text.pdf
Stjernfelt, Frederik. Diagrammatology: An Investigation on the Borderlines of Phenomenology, Ontology, and Semiotics. Dordrecht: Springer Verlag, 2007.
Tschumi, B. (2010). Interviewd by Marc Garcia. “ The Diagrams of Bernard Tschumi”. In Garcia, Mark (Ed.). AD Reader: The Diagrams of Architecture. London: John Wiley and Sons, pp. 194-203.
Uzelac, Mladen. Filozofija muzike. Novi Sad: Stylos, (2005) 2007, http://www.uzelac.eu/Knjige/12_MilanUzelac_Filozofija_muzike.pdf
Van Berkel, B. and Boss, C. “Interactive Instrument in Operation. Diagrams”. ANY, no.23, 1998, pp. 79-88.
Van Berkel, B. and Boss, C. “Diagrams”. In Garcia, M. (Ed.). AD Reader: The Diagrams of Architecture. London: John Wiley and Sons, 2010, pp. 222-227.
Vidler, Antony. “What is a Diagram Anyway”, in Cassara, Silvio and Peter Eisenman (Eds.). Peter Eisenman: Feints. Milan: Skira, 2006, pp. 19-25.
Vidler, A. “Diagrams of Diagrams: Architectural Abstraction and Modern Representation”. In Garcia, Mark (Ed.). AD Reader: The Diagrams of Architecture. London: John Wiley and Sons,2010, pp. 54-63.

S A J _ 2016 _ 8 _
425
Dra
gana
Ćiri
ć _
Relational Logics and Diagrams: No-Scale Conditions
Van Fraassen, C. Bas. An Introduction to the Philosophy of Time and Space, (Originaly published by random House 1970, Reprinted by Columbia University Press 1985, all the rights reverted to the author in 2013), PDF Edition by the Author, 2015, https://www.princeton.edu/~fraassen/BvF%20-%20IPTS.pdf
Volk, C. Jacoby and Anat M. Messing. “Haptic Diagrams: From Cinematography to Architectural Performance.” Journal of Architectural Education, 2009, pp. 71–76.
Zaera-Polo, A. “Between Ideas and Matters: Icons, Indexes, Diagrams, Drawings and Graphs”. In Garcia, Mark (Ed.). AD Reader: The Diagrams of Architecture,. London: John Wiley and Sons, 2010, pp. 236-243.

S A J _ 2016 _ 8 _
Ž
Ž
promena na mikro-nivou (modeli transformacije neiskorišćenih prostornih resursa) kontekstom makro-nivoa (aktiviranje prostora u odnosu na aspekte održivog urbanog razvoja).
ključne reči: modeli transformacije, principi transformacije, neiskorišćeni prostorni resursi, urbana održivost, kulturni centar magacin, studentska radionica
RELACIONE LOGIKE I DIJAGRAMI: STANJA BEZ RAZMERE (NEMETRICKA STANJA)Dragana Ćirić
Studija razmatra logike relacionog mišlјenja i konektivnosti, prikazujući odnose između predmeta reprezentacije i načine njegovog predstavlјanja u crtežima, dijagramima, mapama i notacijama, koje ili negiraju razmeru i metrička svojstva, ili funkcionišu u svim razmerama ne pripadajući isklјučivo ni jednoj od njih. Obuhvataju korelacije i proporcije (statičke i dinamičke, geometrijske, aritmetičke, harmonijske) ispolјavajući principe samo-sličnosti u prostorno-metričkim progresijama, ali i principe kompleksnosti ili nelinearnosti zasnovane na prekidima simetrije u okviru nemetričkih sistema.
Prvi deo rada objašnjava geometrijske i numeričke relacione figure, ili nizove predstavlјajući „osnovne principe lepog i primarne esteske kvalitete svih stvari“ na način na koji ih definišu klasična filozofija, nauka i arhitektura. Ove progresije (njihovi kodovi i algoritmi) zasnovani su na principima regularnosti, najčešće i direktno prostorno reflektovane. Na drugoj strani, složenije relacije i transformacije kao primarni predmet sledećih tematskih jedinica, su transformabilne i nepredvidive, izmičući pravilnoj ekstenzivnoj definiciji. Nјihove forme predstavlјene su tranzicijama od skalarnih ka ne-metričkim stanjima prikazujući prekide simetrija i apstrakcije, preko složenijih formi dinamičkih modulacija i varijacija materije, zaklјučno sa nekim od primera digitalne relacione dijagramatike i topologije arhitektonske problematike izvan prostornih ograničenja i prostorne parametarske definicije – sve do dijagrama kao primarnog instrumenta relacionog mišlјenja.
ključne reči: relaciono mišlјenje, dijagram, kod, dijagramatika, topološko mišlјenje, intenzivnosti dinamičkih sistema, polјa informacija
IZVAN RAZMERE. UGRADNJA DRUŠTVENE SVAKODNEVICE U ARHITEKTONSKE I UMETNICKE FORMEVerica Krstić, Milena Kordić
Kao polazište istraživanja rad problematizuje aktuelizaciju pojma atmosfere u savremenim arhitektonskim i umetničkim istraživanjima u teoriji i praksi. Kroz pojam atmosfere ukazuje se na mogućnosti da arhitektonske i umetničke prakse direktno operacionalizuju svoj interes za probleme svakodnevnog života i kulturu svakodnevice. Arhitektonske i umetničke atmosfere realizuju se u razmeri 1:1, prevazilazeći tako razmere karakteristične za obe discipline pojedinačno. Korisnost primene razmere 1:1 je u potencijalu za odvijanje interdiskurzivne razmene, jer podrazumeva iskustvo fizičkog tela u prostoru i predstavlja medij kroz koji se društvena stvarnost utiskuje u
prostor. U ovom radu pokazuje se da je proizvodnja ambijenta mehanizam putem kog ambijentalne umetnosti i arhitektura prevode društvenu svakodnevicu u arhitektonske i umetničke forme u obliku real-size-multimediaworks.
ključne reči: arhitektura atmosfere, umetnost instalacija, interdiskurzivna razmena, razmera 1:1, društvena svakodnevica