(Re)insurance tools to support the resilience of economies ...
50
(Re)insurance tools to support resilience of economies and communities Vincent Foucart – Eric Le Mercier
-
Upload
khangminh22 -
Category
Documents
-
view
1 -
download
0
Transcript of (Re)insurance tools to support the resilience of economies ...
(Re)insurance tools to support resilience
of economies and communities
Vincent Foucart – Eric Le Mercier
2
Agenda
The Global Resilience Challenge
The Insurance Protection Gap
The role of (Re)insurance
The need for greater coordination and collaboration
3
Agenda
The Global Resilience Challenge
The Insurance Protection Gap
The role of (Re)insurance
The need for greater coordination and collaboration
4
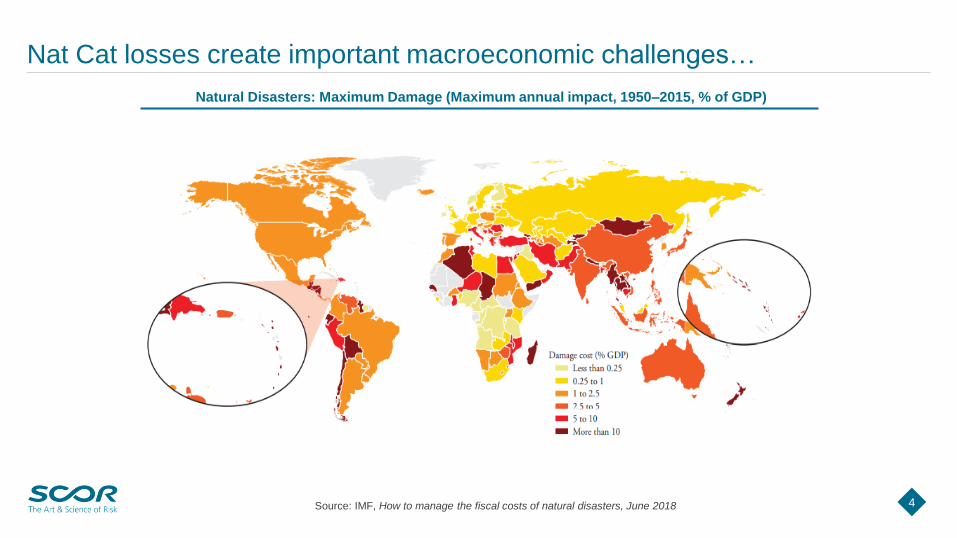
Nat Cat losses create important macroeconomic challenges…
Source: IMF, How to manage the fiscal costs of natural disasters, June 2018
Natural Disasters: Maximum Damage (Maximum annual impact, 1950–2015, % of GDP)
5
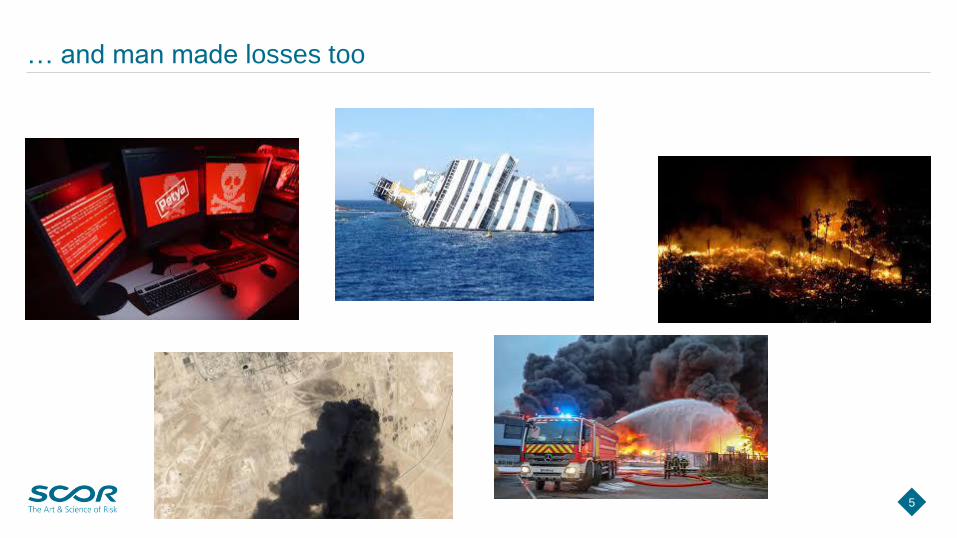
… and man made losses too
Source: …
6
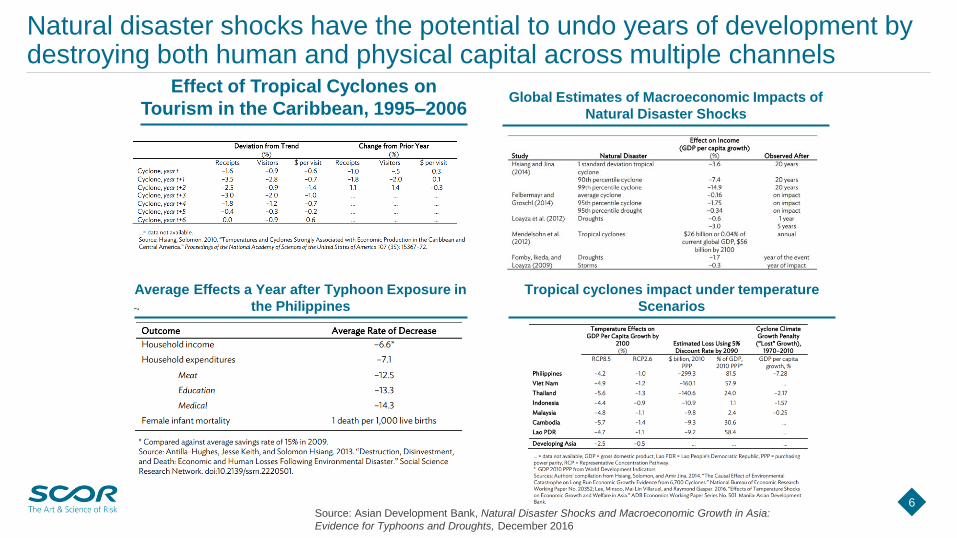
Natural disaster shocks have the potential to undo years of development by destroying both human and physical capital across multiple channels
Effect of Tropical Cyclones on
Tourism in the Caribbean, 1995–2006
Source: Asian Development Bank, Natural Disaster Shocks and Macroeconomic Growth in Asia:
Evidence for Typhoons and Droughts, December 2016
Average Effects a Year after Typhoon Exposure in
the Philippines
Global Estimates of Macroeconomic Impacts of
Natural Disaster Shocks
Tropical cyclones impact under temperature
Scenarios
7
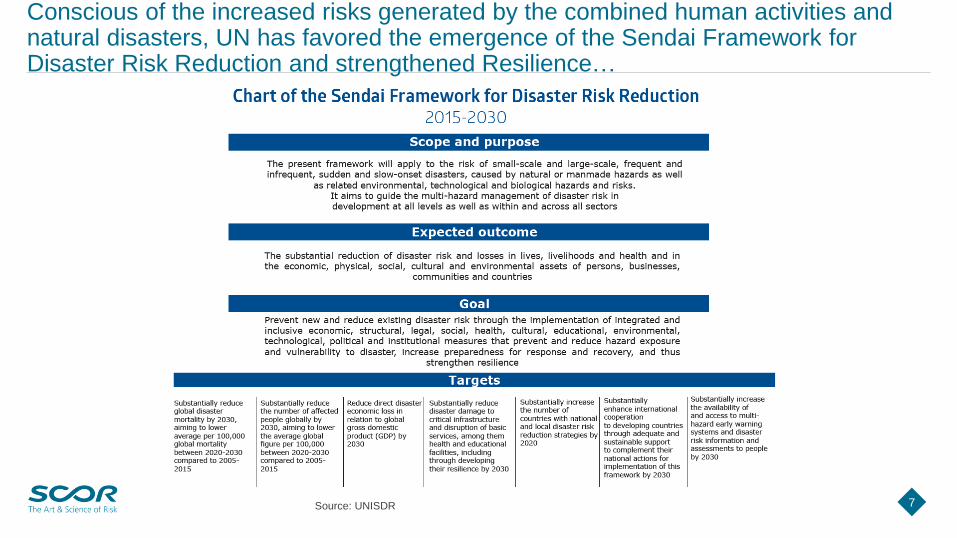
Conscious of the increased risks generated by the combined human activities and natural disasters, UN has favored the emergence of the Sendai Framework for Disaster Risk Reduction and strengthened Resilience…
Source: UNISDR
8
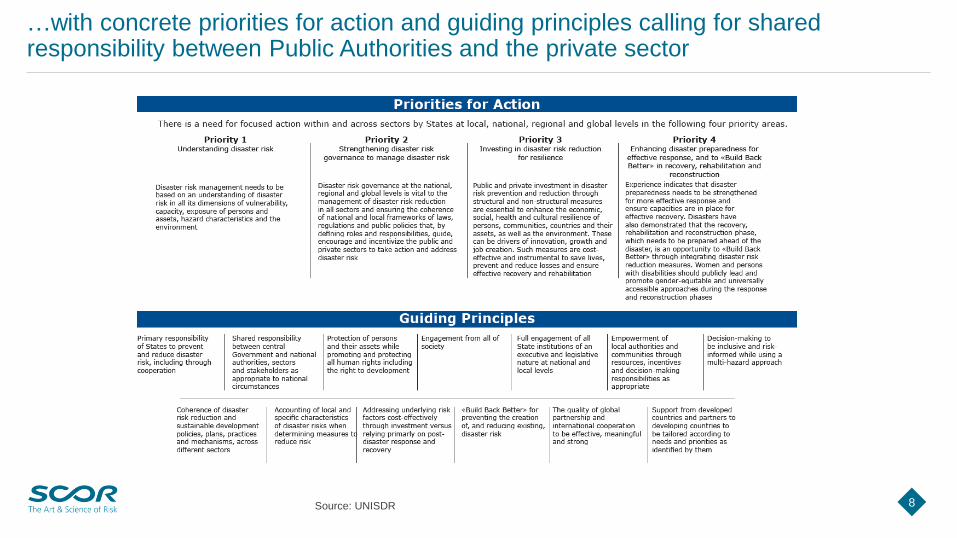
…with concrete priorities for action and guiding principles calling for sharedresponsibility between Public Authorities and the private sector
Source: UNISDR
9
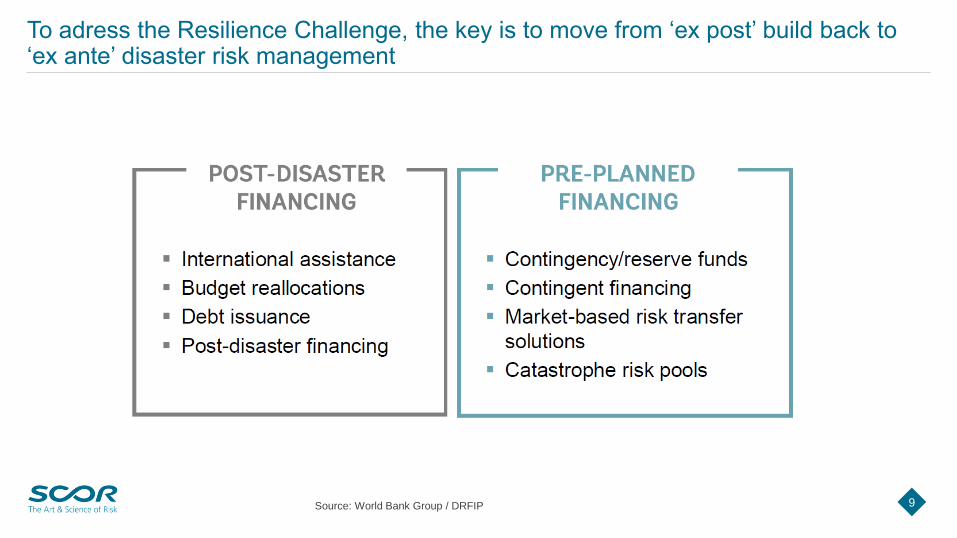
To adress the Resilience Challenge, the key is to move from ‘ex post’ build back to ‘ex ante’ disaster risk management
Source: World Bank Group / DRFIP
10
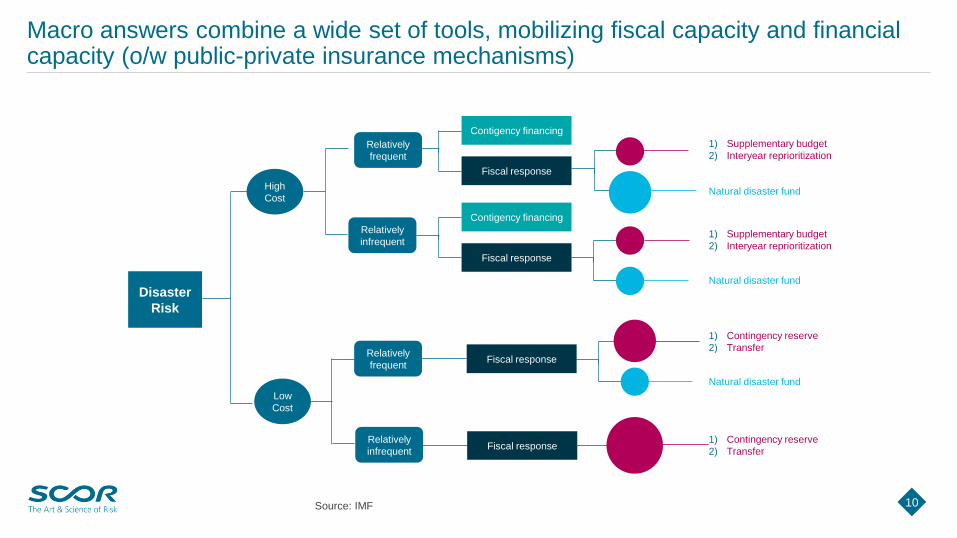
Macro answers combine a wide set of tools, mobilizing fiscal capacity and financialcapacity (o/w public-private insurance mechanisms)
Source: IMF
Disaster
Risk
Relatively
frequent
Low
Cost
Relatively
frequentFiscal response
Relatively
infrequentFiscal response
High
Cost
Contigency financing
Relatively
infrequent
Fiscal response
Contigency financing
Fiscal response
1) Supplementary budget
2) Interyear reprioritization
Natural disaster fund
1) Supplementary budget
2) Interyear reprioritization
Natural disaster fund
1) Contingency reserve
2) Transfer
Natural disaster fund
1) Contingency reserve
2) Transfer
11
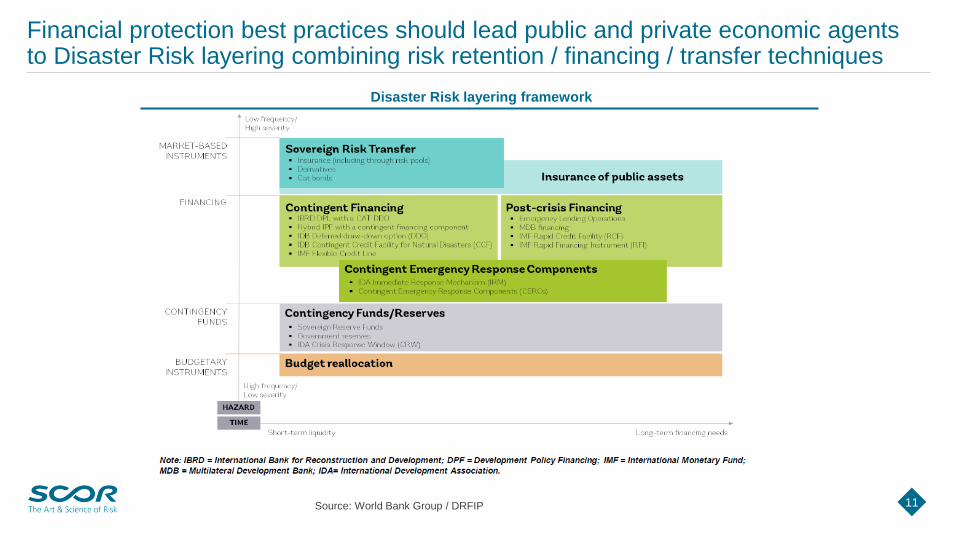
Financial protection best practices should lead public and private economic agents to Disaster Risk layering combining risk retention / financing / transfer techniques
Source: World Bank Group / DRFIP
Disaster Risk layering framework
12
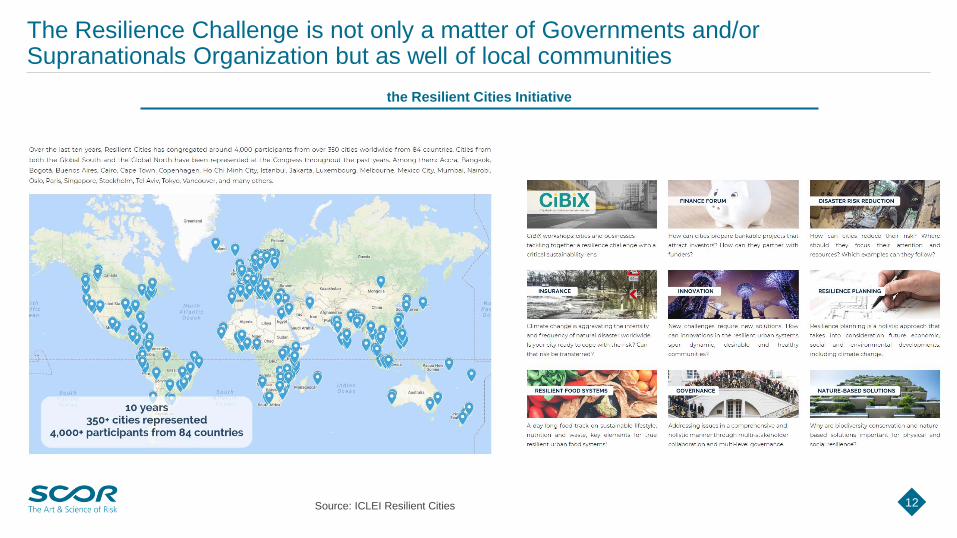
The Resilience Challenge is not only a matter of Governments and/or Supranationals Organization but as well of local communities
Source: ICLEI Resilient Cities
the Resilient Cities Initiative
13
Agenda
The Global Resilience Challenge
The Insurance Protection Gap
The role of (Re)insurance
The need for greater coordination and collaboration
14
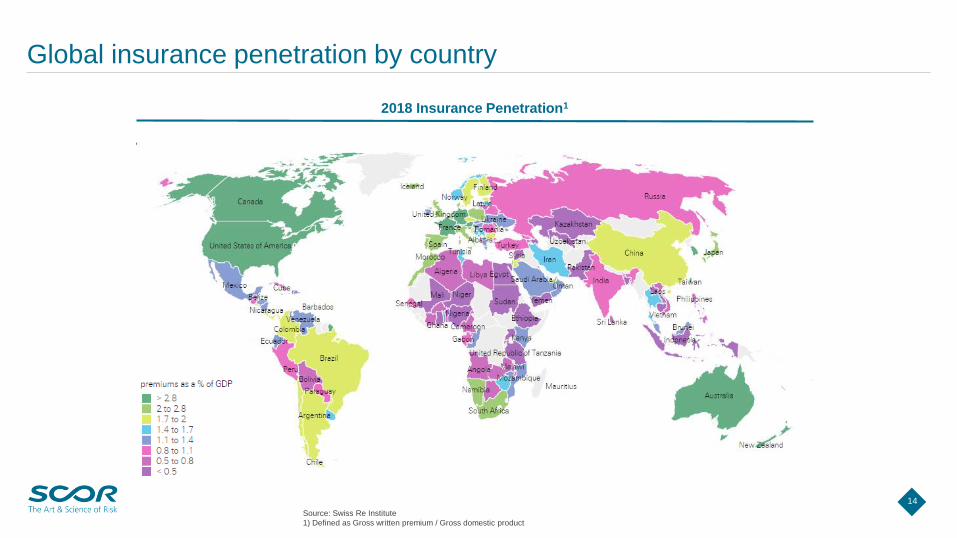
Global insurance penetration by country
2018 Insurance Penetration1
Source: Swiss Re Institute
1) Defined as Gross written premium / Gross domestic product
15
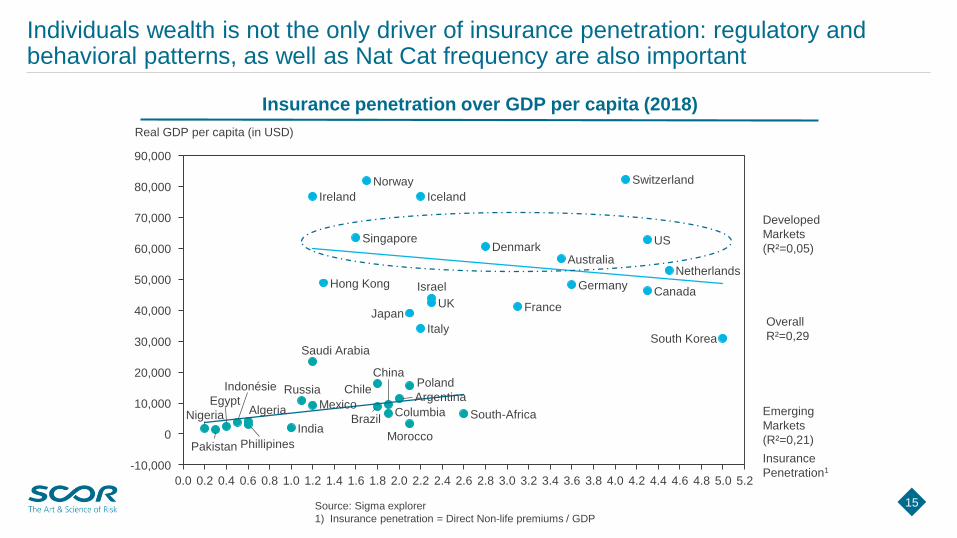
Individuals wealth is not the only driver of insurance penetration: regulatory and behavioral patterns, as well as Nat Cat frequency are also important
Source: Sigma explorer
1) Insurance penetration = Direct Non-life premiums / GDP
0.60.40.0
30,000
90,000
4.80.8 5.00.2
0
2.0
20,000
70,000
3.01.0 1.2 1.4 1.6
80,000
1.8
10,000
2.2 2.4 2.6
50,000
2.8 3.2 3.4
60,000
3.6 3.8
-10,000
40,000
4.0 4.2 4.4 5.24.6
Singapore
Israel
Real GDP per capita (in USD)
Norway
Denmark
France
Germany
Algeria
South Korea
JapanUK
Chile
MexicoArgentina
Morocco
Italy
Columbia
Netherlands
Insurance
Penetration1
China
BrazilNigeria
Egypt
Pakistan
PolandRussia
South-Africa
Canada
Indonésie
Saudi Arabia
Iceland
Phillipines
Australia
US
Switzerland
Hong Kong
Ireland
India
Developed
Markets
(R²=0,05)
Emerging
Markets
(R²=0,21)
Overall
R²=0,29
Insurance penetration over GDP per capita (2018)
16
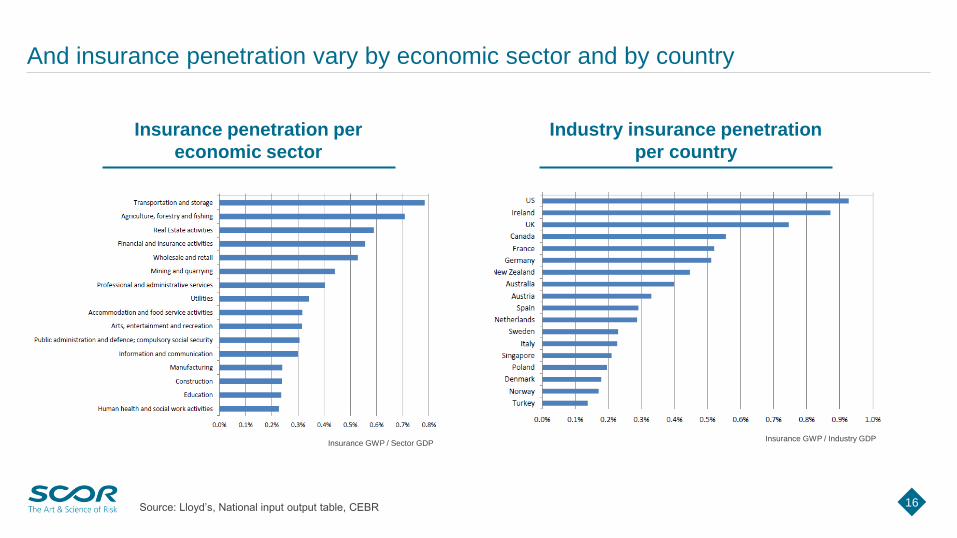
And insurance penetration vary by economic sector and by country
Source: Lloyd’s, National input output table, CEBR
Insurance penetration per
economic sector
Industry insurance penetration
per country
Insurance GWP / Sector GDPInsurance GWP / Industry GDP
17
17
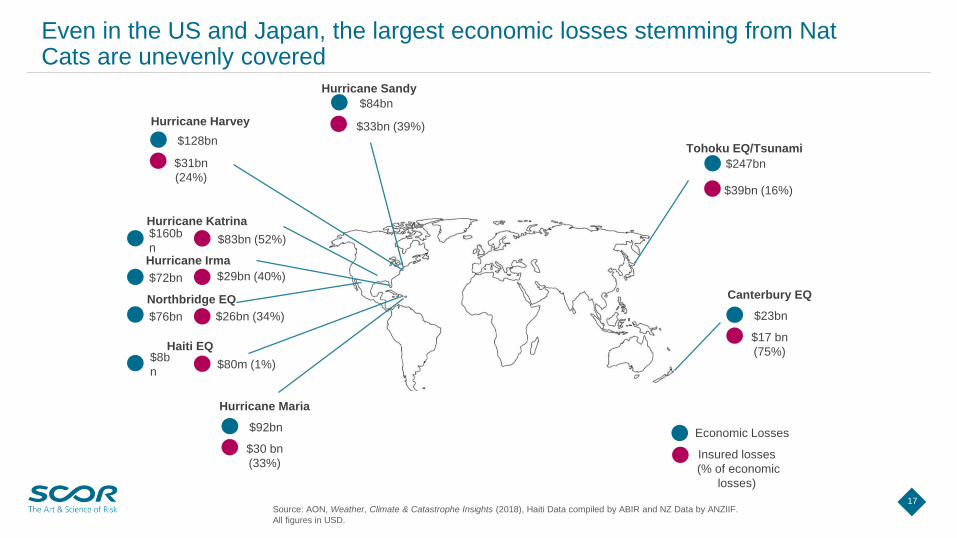
$247bn
$80m (1%)
Canterbury EQ
Economic Losses
Insured losses
(% of economic
losses)
Tohoku EQ/Tsunami
$23bn
$84bn
$33bn (39%)
$31bn
(24%)
Hurricane Harvey
$128bn
Even in the US and Japan, the largest economic losses stemming from Nat Cats are unevenly covered
Source: AON, Weather, Climate & Catastrophe Insights (2018), Haiti Data compiled by ABIR and NZ Data by ANZIIF.
All figures in USD.
Hurricane Sandy
$83bn (52%)
Hurricane Katrina$160b
n
$17 bn
(75%)
$39bn (16%)
Hurricane Maria
$92bn
$30 bn
(33%)
Northbridge EQ
$76bn $26bn (34%)
Haiti EQ$8b
n
$72bn $29bn (40%)
Hurricane Irma
18
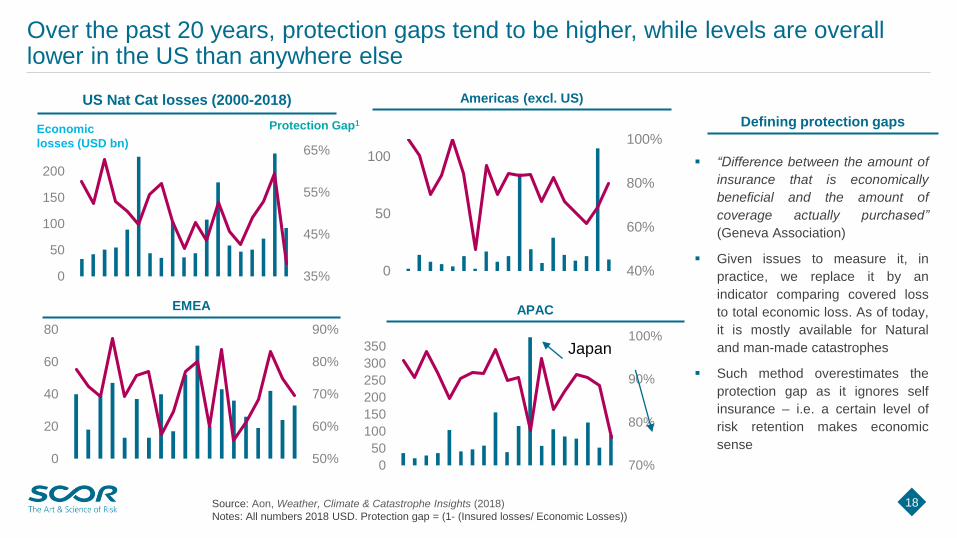
Over the past 20 years, protection gaps tend to be higher, while levels are overall lower in the US than anywhere else
US Nat Cat losses (2000-2018)
Source: Aon, Weather, Climate & Catastrophe Insights (2018)
Notes: All numbers 2018 USD. Protection gap = (1- (Insured losses/ Economic Losses))
35%
45%
55%
65%
0
50
100
150
200
Protection Gap1Economic
losses (USD bn)
40%
60%
80%
100%
0
50
100
Americas (excl. US)
50%
60%
70%
80%
90%
0
20
40
60
80
EMEA
70%
80%
90%
100%
0
50
100
150
200
250
300
350 Japan
APAC
▪ “Difference between the amount of
insurance that is economically
beneficial and the amount of
coverage actually purchased”
(Geneva Association)
▪ Given issues to measure it, in
practice, we replace it by an
indicator comparing covered loss
to total economic loss. As of today,
it is mostly available for Natural
and man-made catastrophes
▪ Such method overestimates the
protection gap as it ignores self
insurance – i.e. a certain level of
risk retention makes economic
sense
Defining protection gaps

19
Agenda
The Global Resilience Challenge
The Insurance Protection Gap
The role of (Re)insurance
The need for greater coordination and collaboration

(Re)insurers are in a unique position to protect societies and the economy against climate change-related risks
20
▪ (Re)insurers have a pivotal role to play in facilitating comprehension,
mitigation and protection with regard to the risks arising from climate
change for 2 reasons:
▪ their deep expertise in data analysis, risk modelling and risk
transfer solutions
▪ their shock-absorbing capability and fundamental function of
pooling risks to optimize diversification benefits
▪ We need to promote insurability and bridge the “protection gap”.
Addressing this global issue requires the combined efforts of
governments and the private (re)insurance industry in the form of
strong and innovative public-private partnerships. Pooling
mechanisms will likely develop globally to share the peak risks across
a wide pool of participants
Protecting the welfare of citizens and communities is an integral part of the (re)insurance industry’s corporate mission
21
▪ The (re)insurance industry has been committed to contribute to the
understanding of climate change and the protection against the associated
risks for a very long time
▪ It supported the Kyoto Declaration in May 2009, under the aegis of the
Geneva Association, stressing that the fight against the consequences of
climate change needs to be a global commitment requiring the combined
efforts of all (re)insurers as their fiduciary responsibility
▪ The 2012 UN Principles for Sustainable Insurance have led to the largest
collaborative initiative between the UN and the industry: the PSI Initiative
▪ The Insurance Development Forum was set up in 2016 by the industry,
the UN and the World Bank to foster modelling of extreme events and
increase (re)insurance penetration
22
22
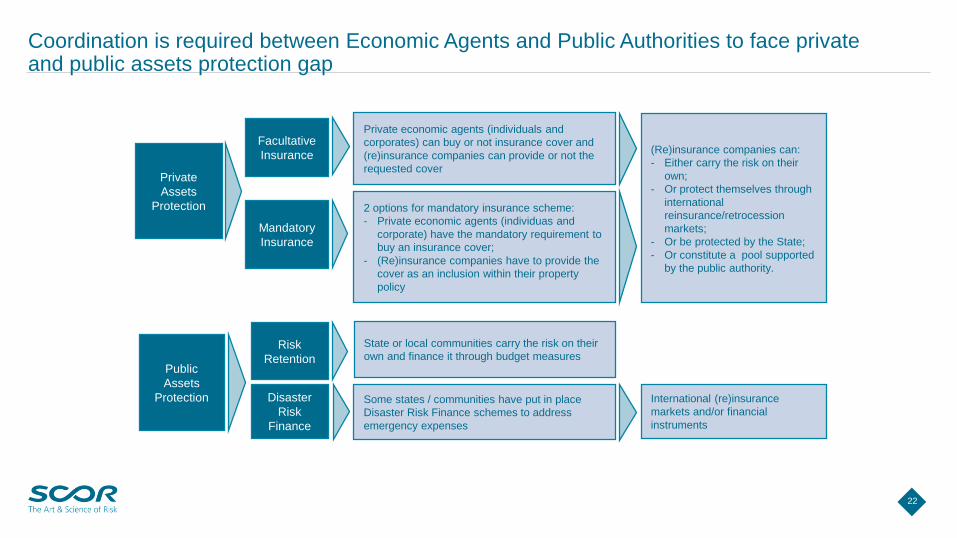
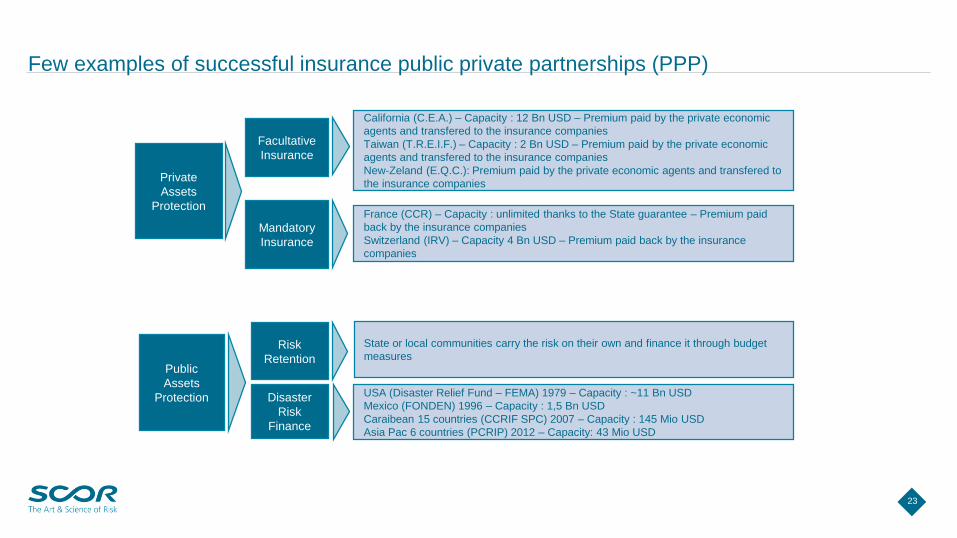
Facultative
Insurance
Private economic agents (individuals and
corporates) can buy or not insurance cover and
(re)insurance companies can provide or not the
requested cover
Mandatory
Insurance
2 options for mandatory insurance scheme:
- Private economic agents (individuas and
corporate) have the mandatory requirement to
buy an insurance cover;
- (Re)insurance companies have to provide the
cover as an inclusion within their property
policy
Disaster
Risk
Finance
Some states / communities have put in place
Disaster Risk Finance schemes to address
emergency expenses
Private
Assets
Protection
Public
Assets
Protection
Risk
Retention
(Re)insurance companies can:
- Either carry the risk on their
own;
- Or protect themselves through
international
reinsurance/retrocession
markets;
- Or be protected by the State;
- Or constitute a pool supported
by the public authority.
State or local communities carry the risk on their
own and finance it through budget measures
International (re)insurance
markets and/or financial
instruments
Coordination is required between Economic Agents and Public Authorities to face private and public assets protection gap
23
23
California (C.E.A.) – Capacity : 12 Bn USD – Premium paid by the private economic
agents and transfered to the insurance companies
Taiwan (T.R.E.I.F.) – Capacity : 2 Bn USD – Premium paid by the private economic
agents and transfered to the insurance companies
New-Zeland (E.Q.C.): Premium paid by the private economic agents and transfered to
the insurance companies
France (CCR) – Capacity : unlimited thanks to the State guarantee – Premium paid
back by the insurance companies
Switzerland (IRV) – Capacity 4 Bn USD – Premium paid back by the insurance
companies
USA (Disaster Relief Fund – FEMA) 1979 – Capacity : ~11 Bn USD
Mexico (FONDEN) 1996 – Capacity : 1,5 Bn USD
Caraibean 15 countries (CCRIF SPC) 2007 – Capacity : 145 Mio USD
Asia Pac 6 countries (PCRIP) 2012 – Capacity: 43 Mio USD
State or local communities carry the risk on their own and finance it through budget
measures
Facultative
Insurance
Mandatory
Insurance
Disaster
Risk
Finance
Private
Assets
Protection
Public
Assets
Protection
Risk
Retention
Few examples of successful insurance public private partnerships (PPP)
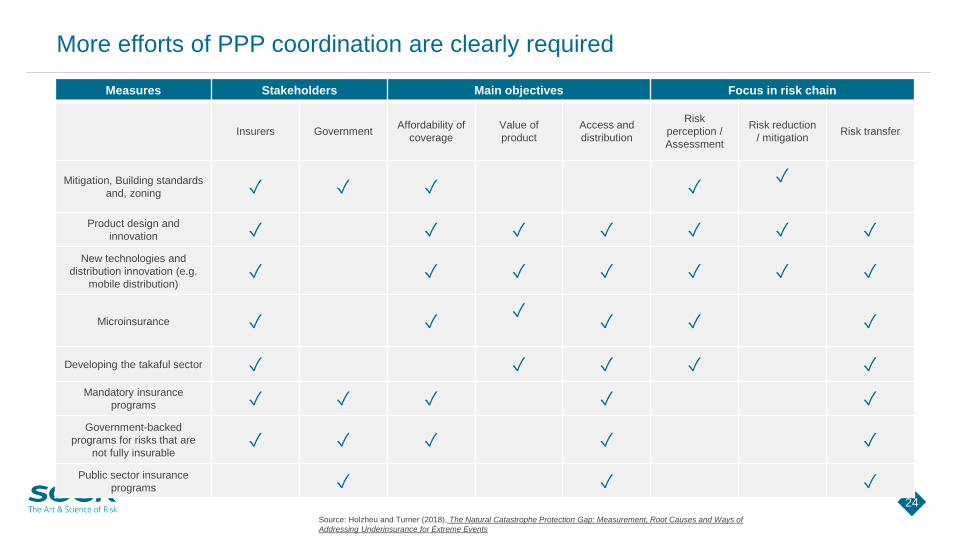
More efforts of PPP coordination are clearly required
24
Measures Stakeholders Main objectives Focus in risk chain
Insurers GovernmentAffordability of
coverage
Value of
product
Access and
distribution
Risk
perception /
Assessment
Risk reduction
/ mitigationRisk transfer
Mitigation, Building standards
and, zoning ✓ ✓ ✓ ✓✓
Product design and
innovation ✓ ✓ ✓ ✓ ✓ ✓ ✓
New technologies and
distribution innovation (e.g.
mobile distribution)✓ ✓ ✓ ✓ ✓ ✓ ✓
Microinsurance ✓ ✓✓
✓ ✓ ✓
Developing the takaful sector ✓ ✓ ✓ ✓ ✓
Mandatory insurance
programs ✓ ✓ ✓ ✓ ✓
Government-backed
programs for risks that are
not fully insurable✓ ✓ ✓ ✓ ✓
Public sector insurance
programs ✓ ✓ ✓
Source: Holzheu and Turner (2018), The Natural Catastrophe Protection Gap: Measurement, Root Causes and Ways of
Addressing Underinsurance for Extreme Events
25
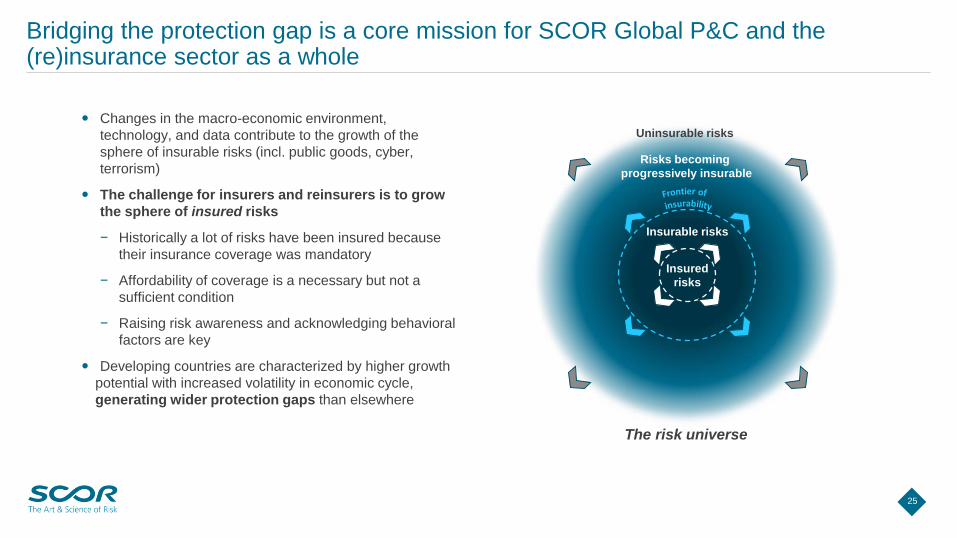
Bridging the protection gap is a core mission for SCOR Global P&C and the (re)insurance sector as a whole
Insurable risks
Risks becoming
progressively insurable
Uninsurable risks
The risk universe
Insured
risks
Changes in the macro-economic environment,
technology, and data contribute to the growth of the
sphere of insurable risks (incl. public goods, cyber,
terrorism)
The challenge for insurers and reinsurers is to grow
the sphere of insured risks
− Historically a lot of risks have been insured because
their insurance coverage was mandatory
− Affordability of coverage is a necessary but not a
sufficient condition
− Raising risk awareness and acknowledging behavioral
factors are key
Developing countries are characterized by higher growth
potential with increased volatility in economic cycle,
generating wider protection gaps than elsewhere
26
26
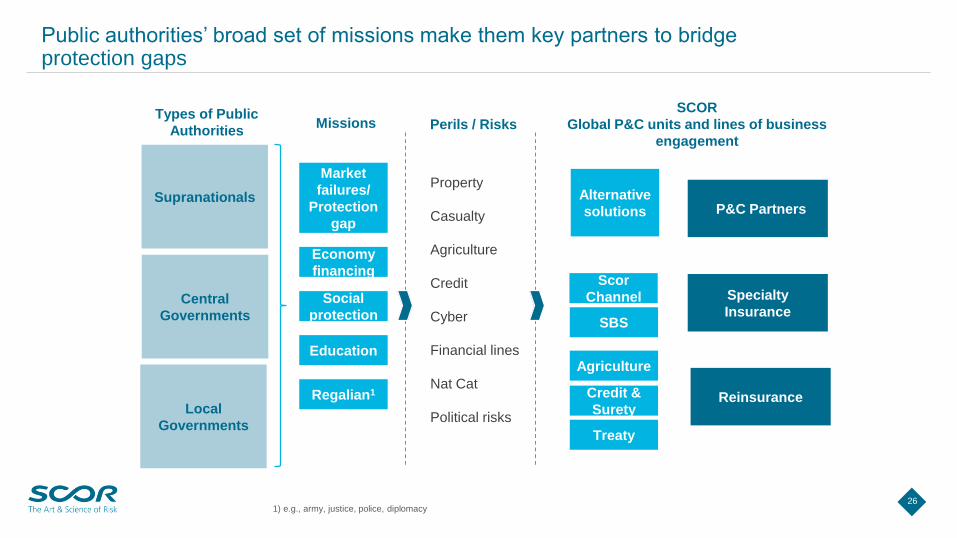
Public authorities’ broad set of missions make them key partners to bridge protection gaps
P&C Partners
SCOR
Global P&C units and lines of business
engagement
Types of Public
Authorities
Specialty
Insurance
Reinsurance
Alternative
solutions
Scor
Channel
SBS
Agriculture
Credit &
Surety
Treaty
Supranationals
Central
Governments
Local
Governments
Economy
financing
Perils / Risks
Property
Casualty
Agriculture
Credit
Cyber
Financial lines
Nat Cat
Political risks
Missions
Education
Regalian1
Social
protection
Market
failures/
Protection
gap
1) e.g., army, justice, police, diplomacy
27
27
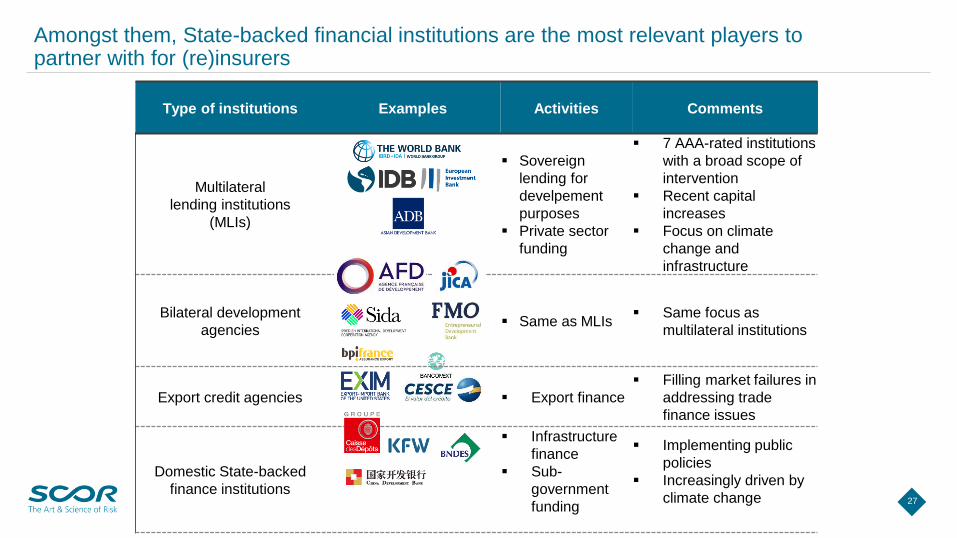
Type of institutions Examples Activities Comments
Multilateral
lending institutions
(MLIs)
▪ Sovereign
lending for
develpement
purposes
▪ Private sector
funding
▪ 7 AAA-rated institutions
with a broad scope of
intervention
▪ Recent capital
increases
▪ Focus on climate
change and
infrastructure
Bilateral development
agencies▪ Same as MLIs
▪ Same focus as
multilateral institutions
Export credit agencies ▪ Export finance
▪ Filling market failures in
addressing trade
finance issues
Domestic State-backed
finance institutions
▪ Infrastructure
finance
▪ Sub-
government
funding
▪ Implementing public
policies
▪ Increasingly driven by
climate change
Amongst them, State-backed financial institutions are the most relevant players to partner with for (re)insurers

28
(Re)insurers can cooperate with public authorities on multiple fronts, namely through climate and infrastructure finance
Direct interactions with (Re)insurers Indirect interactions
▪ Capital Optimization
▪ Earnings protection
▪ Crowding in private
capital1
▪ Protect investments
▪ Leverage reinsurers
expertise
▪ Crowd in longstanding
private capital to create
new markets
▪ Build quality and climate-
smart infrastructures
▪ Ensure best practices
from contractors,
compliance with domestic
laws
Guarantees
Equity investments
Loans / Project finance
Risk pooling -
Natural disasters, pandemics
Project finance
(namely infrastructure)
Activity
type
Generate insurance covers
through procurement
requirements
Originate and distribute
(re)insurance(Re)Insurance buyer
Resulting
needs
Interaction
type
29
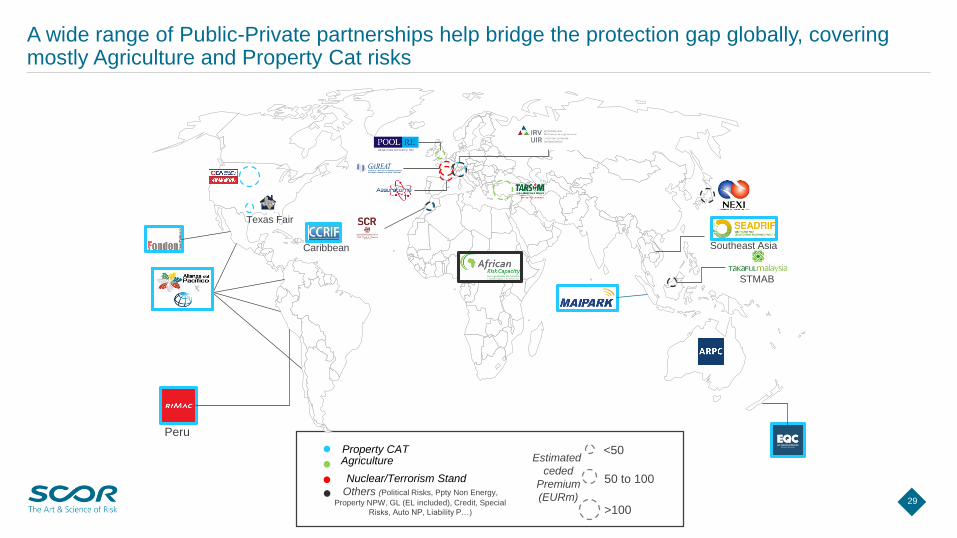
A wide range of Public-Private partnerships help bridge the protection gap globally, covering mostly Agriculture and Property Cat risks
AgricultureProperty CAT
Nuclear/Terrorism Stand
Others (Political Risks, Ppty Non Energy,
Property NPW, GL (EL included), Credit, Special
Risks, Auto NP, Liability P…)
Estimated
ceded
Premium
(EURm)
<50
>100
50 to 100
Texas Fair
STMAB
Caribbean
Peru
Southeast Asia
30
30
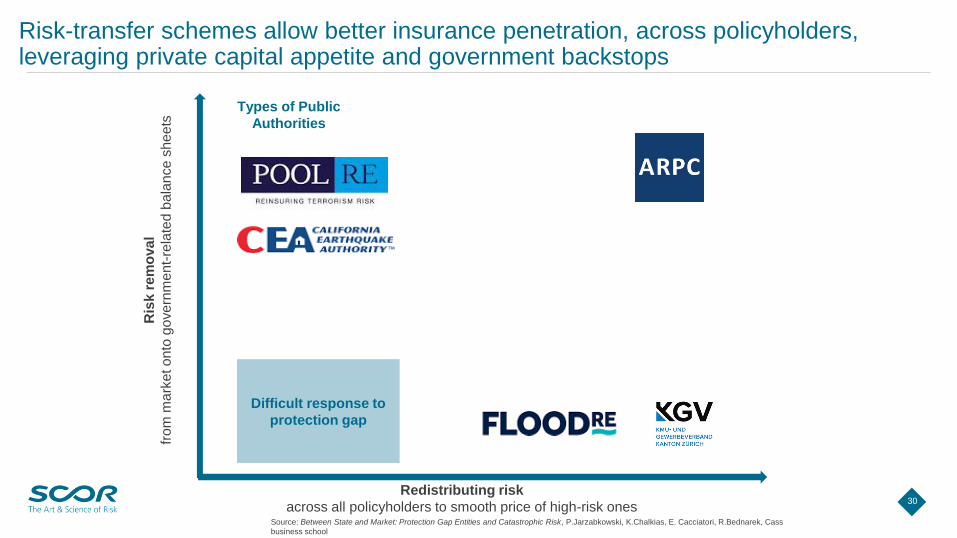
Risk-transfer schemes allow better insurance penetration, across policyholders, leveraging private capital appetite and government backstops
Types of Public
Authorities
Difficult response to
protection gap
Ris
k r
em
oval
fro
mm
ark
eto
nto
go
ve
rnm
en
t-re
late
db
ala
nce
sh
ee
ts
Redistributing risk
across all policyholders to smooth price of high-risk onesSource: Between State and Market: Protection Gap Entities and Catastrophic Risk, P.Jarzabkowski, K.Chalkias, E. Cacciatori, R.Bednarek, Cass
business school
31
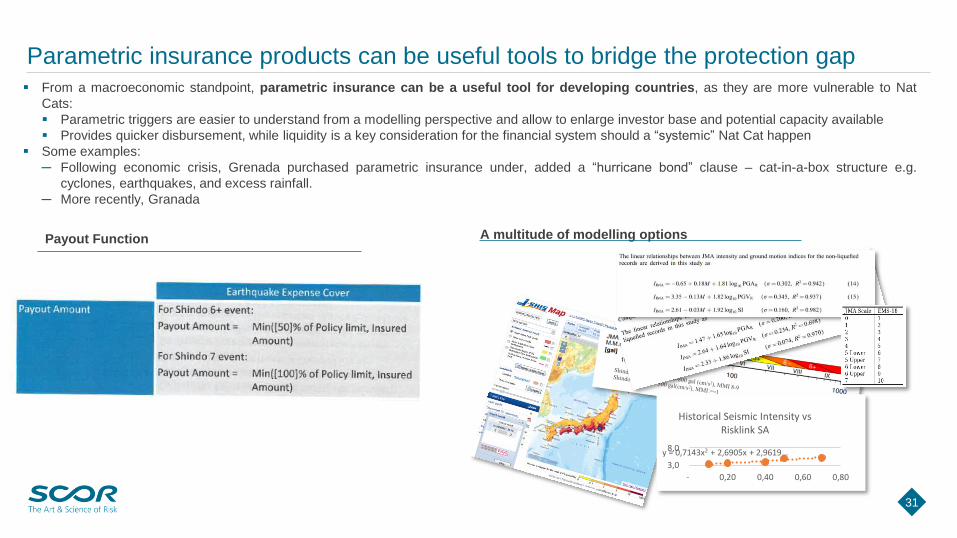
Parametric insurance products can be useful tools to bridge the protection gap ▪ From a macroeconomic standpoint, parametric insurance can be a useful tool for developing countries, as they are more vulnerable to Nat
Cats:
▪ Parametric triggers are easier to understand from a modelling perspective and allow to enlarge investor base and potential capacity available
▪ Provides quicker disbursement, while liquidity is a key consideration for the financial system should a “systemic” Nat Cat happen
▪ Some examples:
─ Following economic crisis, Grenada purchased parametric insurance under, added a “hurricane bond” clause – cat-in-a-box structure e.g.
cyclones, earthquakes, and excess rainfall.
─ More recently, Granada
y = 0,7143x2 + 2,6905x + 2,9619…
3,0
8,0
- 0,20 0,40 0,60 0,80
Historical Seismic Intensity vs Risklink SA
Payout Function A multitude of modelling options
32
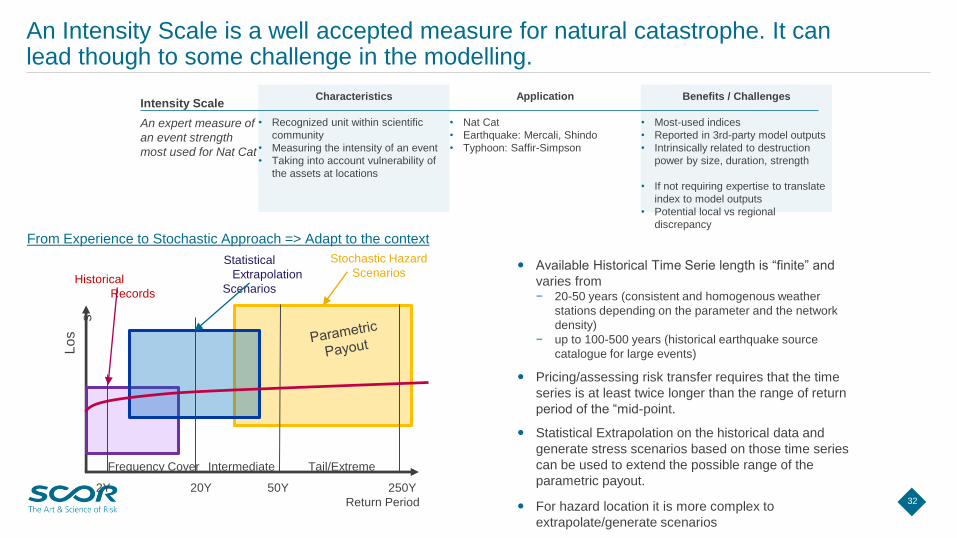
An Intensity Scale is a well accepted measure for natural catastrophe. It can lead though to some challenge in the modelling.
Benefits / Challenges
• Most-used indices
• Reported in 3rd-party model outputs
• Intrinsically related to destruction
power by size, duration, strength
• If not requiring expertise to translate
index to model outputs
• Potential local vs regional
discrepancy
Characteristics ApplicationIntensity Scale
• Recognized unit within scientific
community
• Measuring the intensity of an event
• Taking into account vulnerability of
the assets at locations
• Nat Cat
• Earthquake: Mercali, Shindo
• Typhoon: Saffir-Simpson
An expert measure of
an event strength
most used for Nat Cat
From Experience to Stochastic Approach => Adapt to the context
Tail/Extreme
50Y 250Y
Frequency Cover
2Y 20Y
Lo
s
s
Return Period
Stochastic Hazard
ScenariosStatistical
Extrapolation
Scenarios
Intermediate
Historical
Records
Available Historical Time Serie length is “finite” and
varies from− 20-50 years (consistent and homogenous weather
stations depending on the parameter and the network
density)
− up to 100-500 years (historical earthquake source
catalogue for large events)
Pricing/assessing risk transfer requires that the time
series is at least twice longer than the range of return
period of the “mid-point.
Statistical Extrapolation on the historical data and
generate stress scenarios based on those time series
can be used to extend the possible range of the
parametric payout.
For hazard location it is more complex to
extrapolate/generate scenarios
33
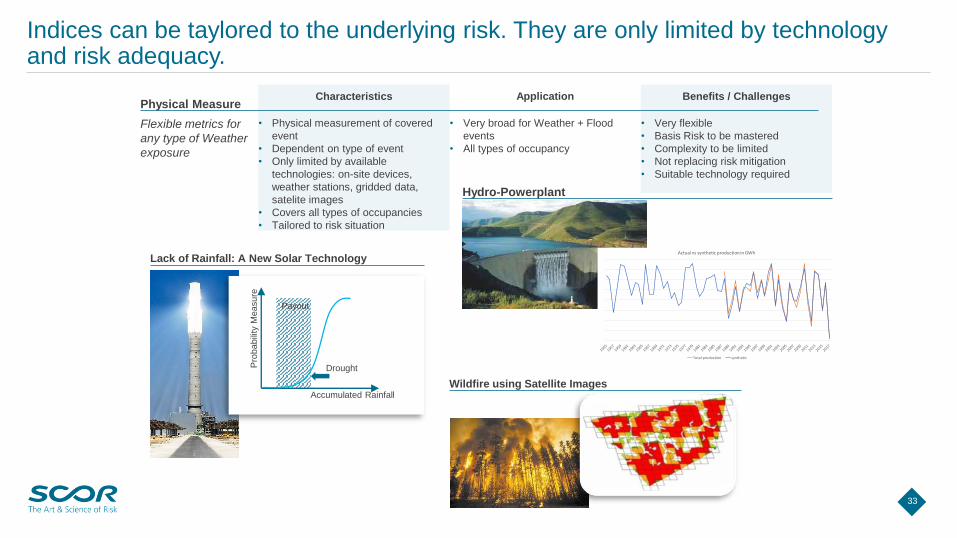
Indices can be taylored to the underlying risk. They are only limited by technology and risk adequacy.
Benefits / Challenges
• Very flexible
• Basis Risk to be mastered
• Complexity to be limited
• Not replacing risk mitigation
• Suitable technology required
Characteristics ApplicationPhysical Measure
• Physical measurement of covered
event
• Dependent on type of event
• Only limited by available
technologies: on-site devices,
weather stations, gridded data,
satelite images
• Covers all types of occupancies
• Tailored to risk situation
• Very broad for Weather + Flood
events
• All types of occupancy
Flexible metrics for
any type of Weather
exposure
Accumulated Rainfall
Payout
DroughtPro
ba
bili
tyM
easu
reActual vs synthetic production in GWh
Total production synthetic
Lack of Rainfall: A New Solar Technology
Hydro-Powerplant
Wildfire using Satellite Images
34
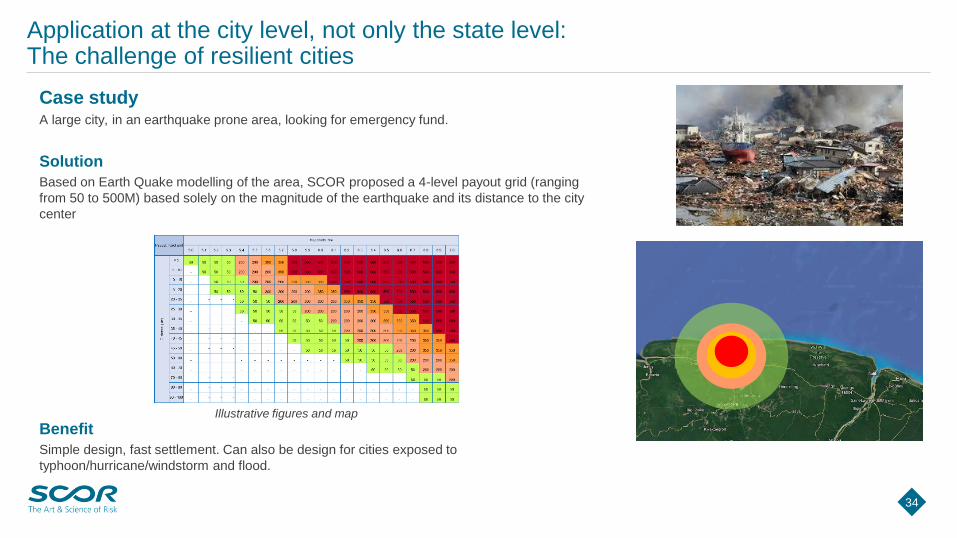
Application at the city level, not only the state level: The challenge of resilient cities
Case studyA large city, in an earthquake prone area, looking for emergency fund.
Solution
Based on Earth Quake modelling of the area, SCOR proposed a 4-level payout grid (ranging
from 50 to 500M) based solely on the magnitude of the earthquake and its distance to the city
center
Benefit
Simple design, fast settlement. Can also be design for cities exposed to
typhoon/hurricane/windstorm and flood.
Illustrative figures and map
35
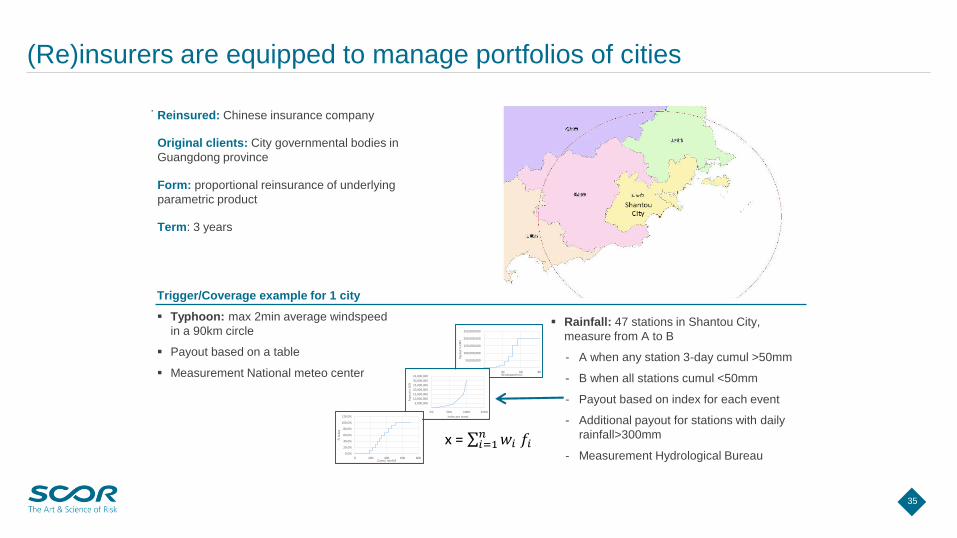
(Re)insurers are equipped to manage portfolios of cities
.Reinsured: Chinese insurance company
Original clients: City governmental bodies in
Guangdong province
Form: proportional reinsurance of underlying
parametric product
Term: 3 years
x =
-
50,000,000
100,000,000
150,000,000
200,000,000
250,000,000
20 40 60 80
Payo
ut
in C
NY
Windspeed m/s
-
5,000,000
10,000,000
15,000,000
20,000,000
25,000,000
30,000,000
35,000,000
0% 50% 100% 150%Pa
you
t in
CN
Y
Index per event
0.0%
20.0%
40.0%
60.0%
80.0%
100.0%
120.0%
0 200 400 600 800
Fi in
dex
Cumul rainfall
Trigger/Coverage example for 1 city
▪ Typhoon: max 2min average windspeed
in a 90km circle
▪ Payout based on a table
▪ Measurement National meteo center
▪ Rainfall: 47 stations in Shantou City,
measure from A to B
- A when any station 3-day cumul >50mm
- B when all stations cumul <50mm
- Payout based on index for each event
- Additional payout for stations with daily
rainfall>300mm
- Measurement Hydrological Bureau
36
Agenda
The Global Resilience Challenge
The Insurance Protection Gap
The role of (Re)insurance
The need for greater coordination and collaboration
37
To conclude
“There is no one group that can close the insurance gap on its own.It requires action from all parties that have the expertise and tools tomake a positive change ».
1) Source: Lloyd’s

38
APPENDICES
39
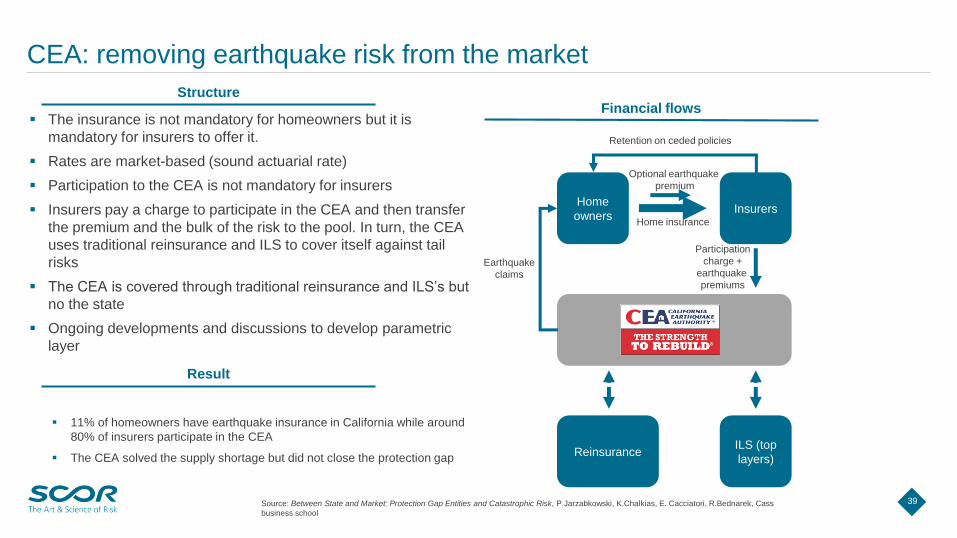
CEA: removing earthquake risk from the market
▪ The insurance is not mandatory for homeowners but it is
mandatory for insurers to offer it.
▪ Rates are market-based (sound actuarial rate)
▪ Participation to the CEA is not mandatory for insurers
▪ Insurers pay a charge to participate in the CEA and then transfer
the premium and the bulk of the risk to the pool. In turn, the CEA
uses traditional reinsurance and ILS to cover itself against tail
risks
▪ The CEA is covered through traditional reinsurance and ILS’s but
no the state
▪ Ongoing developments and discussions to develop parametric
layer
Result
Structure
▪ 11% of homeowners have earthquake insurance in California while around
80% of insurers participate in the CEA
▪ The CEA solved the supply shortage but did not close the protection gap
Home
ownersInsurers
ILS (top
layers)Reinsurance
Home insurance
Optional earthquake
premium
Participation
charge +
earthquake
premiums
Retention on ceded policies
Earthquake
claims
Financial flows
Source: Between State and Market: Protection Gap Entities and Catastrophic Risk, P.Jarzabkowski, K.Chalkias, E. Cacciatori, R.Bednarek, Cass
business school
40
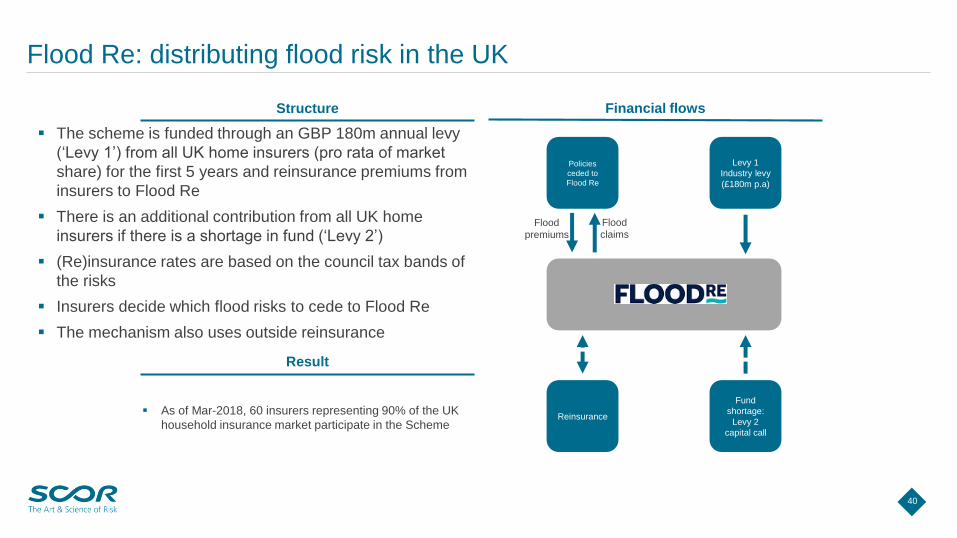
Flood Re: distributing flood risk in the UK
▪ The scheme is funded through an GBP 180m annual levy
(‘Levy 1’) from all UK home insurers (pro rata of market
share) for the first 5 years and reinsurance premiums from
insurers to Flood Re
▪ There is an additional contribution from all UK home
insurers if there is a shortage in fund (‘Levy 2’)
▪ (Re)insurance rates are based on the council tax bands of
the risks
▪ Insurers decide which flood risks to cede to Flood Re
▪ The mechanism also uses outside reinsurance
Result
Structure
▪ As of Mar-2018, 60 insurers representing 90% of the UK
household insurance market participate in the Scheme
Policies
ceded to
Flood Re
Levy 1
Industry levy
(£180m p.a)
Fund
shortage:
Levy 2
capital call
Reinsurance
Flood
premiums
Flood
claims
Financial flows
41
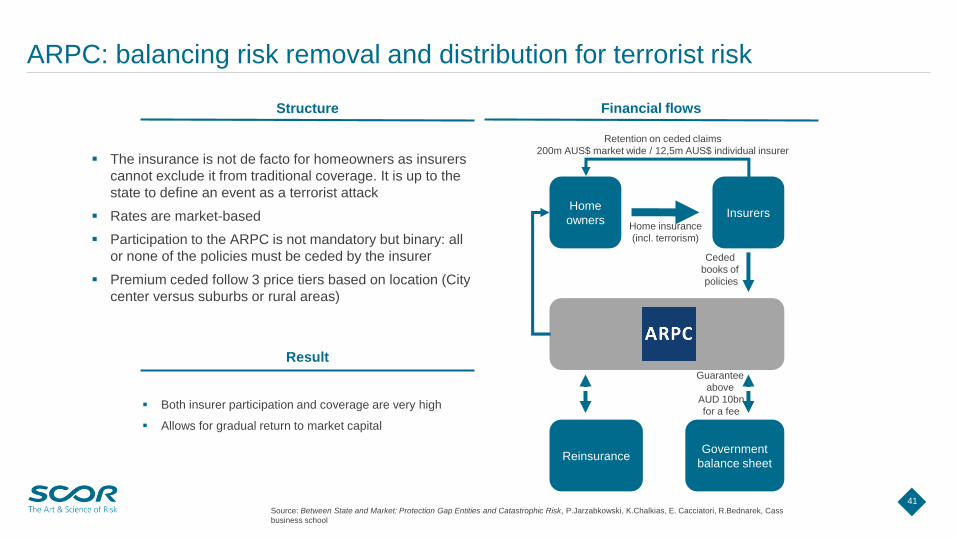
ARPC: balancing risk removal and distribution for terrorist risk
▪ The insurance is not de facto for homeowners as insurers
cannot exclude it from traditional coverage. It is up to the
state to define an event as a terrorist attack
▪ Rates are market-based
▪ Participation to the ARPC is not mandatory but binary: all
or none of the policies must be ceded by the insurer
▪ Premium ceded follow 3 price tiers based on location (City
center versus suburbs or rural areas)
Result
Structure
▪ Both insurer participation and coverage are very high
▪ Allows for gradual return to market capital
Home
ownersInsurers
Government
balance sheetReinsurance
Home insurance
(incl. terrorism)
Ceded
books of
policies
Retention on ceded claims
200m AUS$ market wide / 12,5m AUS$ individual insurer
Guarantee
above
AUD 10bn
for a fee
Financial flows
Source: Between State and Market: Protection Gap Entities and Catastrophic Risk, P.Jarzabkowski, K.Chalkias, E. Cacciatori, R.Bednarek, Cass
business school
42
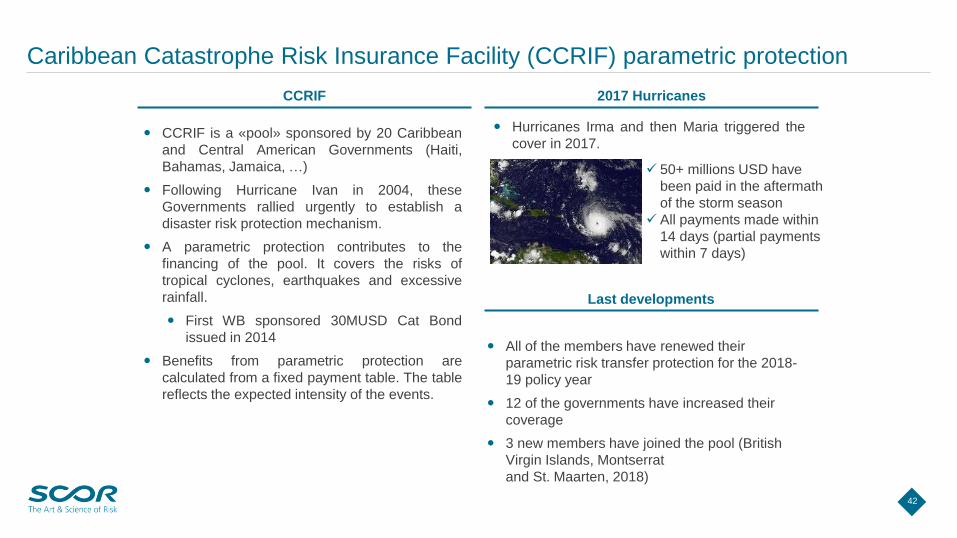
Caribbean Catastrophe Risk Insurance Facility (CCRIF) parametric protection
CCRIF is a «pool» sponsored by 20 Caribbean
and Central American Governments (Haiti,
Bahamas, Jamaica, …)
Following Hurricane Ivan in 2004, these
Governments rallied urgently to establish a
disaster risk protection mechanism.
A parametric protection contributes to the
financing of the pool. It covers the risks of
tropical cyclones, earthquakes and excessive
rainfall.
First WB sponsored 30MUSD Cat Bond
issued in 2014
Benefits from parametric protection are
calculated from a fixed payment table. The table
reflects the expected intensity of the events.
Hurricanes Irma and then Maria triggered the
cover in 2017.
✓ 50+ millions USD have
been paid in the aftermath
of the storm season
✓ All payments made within
14 days (partial payments
within 7 days)
All of the members have renewed their
parametric risk transfer protection for the 2018-
19 policy year
12 of the governments have increased their
coverage
3 new members have joined the pool (British
Virgin Islands, Montserrat
and St. Maarten, 2018)
2017 Hurricanes
Last developments
CCRIF
43
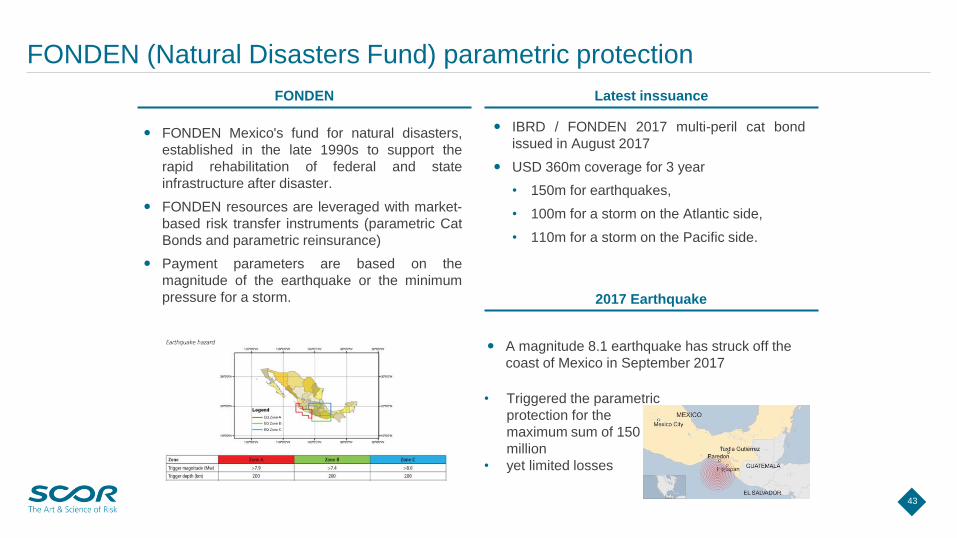
FONDEN (Natural Disasters Fund) parametric protection
FONDEN Mexico's fund for natural disasters,
established in the late 1990s to support the
rapid rehabilitation of federal and state
infrastructure after disaster.
FONDEN resources are leveraged with market-
based risk transfer instruments (parametric Cat
Bonds and parametric reinsurance)
Payment parameters are based on the
magnitude of the earthquake or the minimum
pressure for a storm.
IBRD / FONDEN 2017 multi-peril cat bond
issued in August 2017
USD 360m coverage for 3 year
• 150m for earthquakes,
• 100m for a storm on the Atlantic side,
• 110m for a storm on the Pacific side.
A magnitude 8.1 earthquake has struck off the
coast of Mexico in September 2017
Latest inssuance
2017 Earthquake
FONDEN
• Triggered the parametric
protection for the
maximum sum of 150
million
• yet limited losses
44
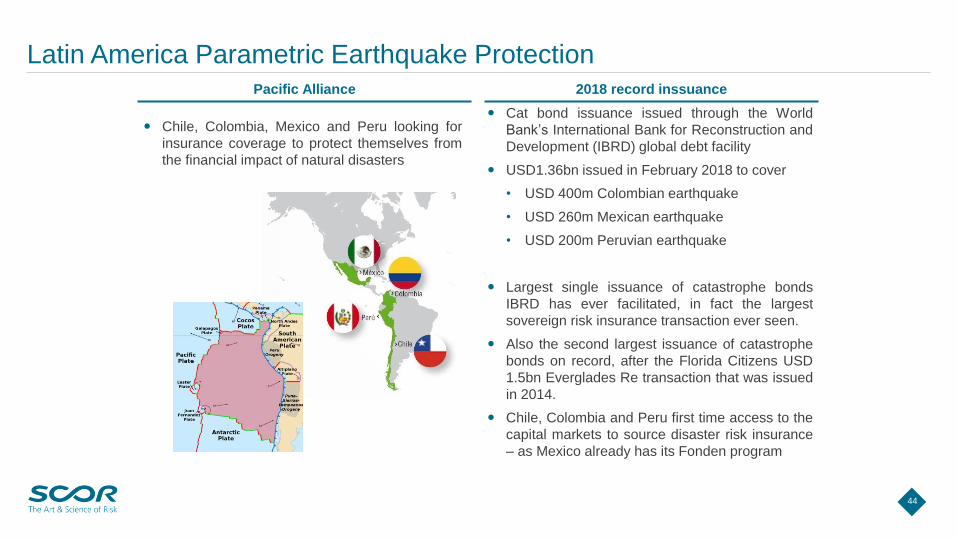
Latin America Parametric Earthquake Protection
Chile, Colombia, Mexico and Peru looking for
insurance coverage to protect themselves from
the financial impact of natural disasters
Cat bond issuance issued through the World
Bank’s International Bank for Reconstruction and
Development (IBRD) global debt facility
USD1.36bn issued in February 2018 to cover
• USD 400m Colombian earthquake
• USD 260m Mexican earthquake
• USD 200m Peruvian earthquake
Largest single issuance of catastrophe bonds
IBRD has ever facilitated, in fact the largest
sovereign risk insurance transaction ever seen.
Also the second largest issuance of catastrophe
bonds on record, after the Florida Citizens USD
1.5bn Everglades Re transaction that was issued
in 2014.
Chile, Colombia and Peru first time access to the
capital markets to source disaster risk insurance
– as Mexico already has its Fonden program
2018 record inssuancePacific Alliance
45
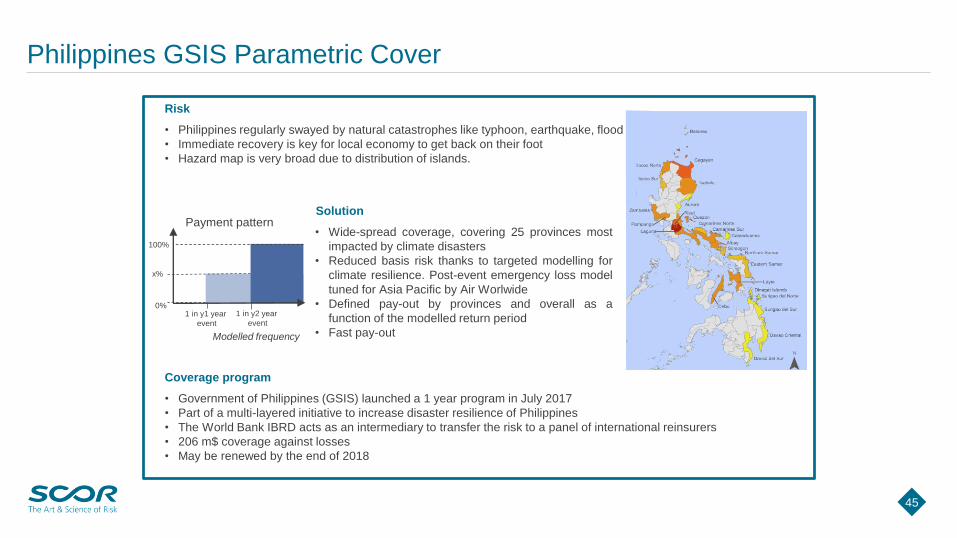
Philippines GSIS Parametric Cover
Risk
• Philippines regularly swayed by natural catastrophes like typhoon, earthquake, flood
• Immediate recovery is key for local economy to get back on their foot
• Hazard map is very broad due to distribution of islands.
Solution
• Wide-spread coverage, covering 25 provinces most
impacted by climate disasters
• Reduced basis risk thanks to targeted modelling for
climate resilience. Post-event emergency loss model
tuned for Asia Pacific by Air Worlwide
• Defined pay-out by provinces and overall as a
function of the modelled return period
• Fast pay-outModelled frequency
Payment pattern
Coverage program
• Government of Philippines (GSIS) launched a 1 year program in July 2017
• Part of a multi-layered initiative to increase disaster resilience of Philippines
• The World Bank IBRD acts as an intermediary to transfer the risk to a panel of international reinsurers
• 206 m$ coverage against losses
• May be renewed by the end of 2018
1 in y1 year
event
1 in y2 year
event
0%
100%
x%
46
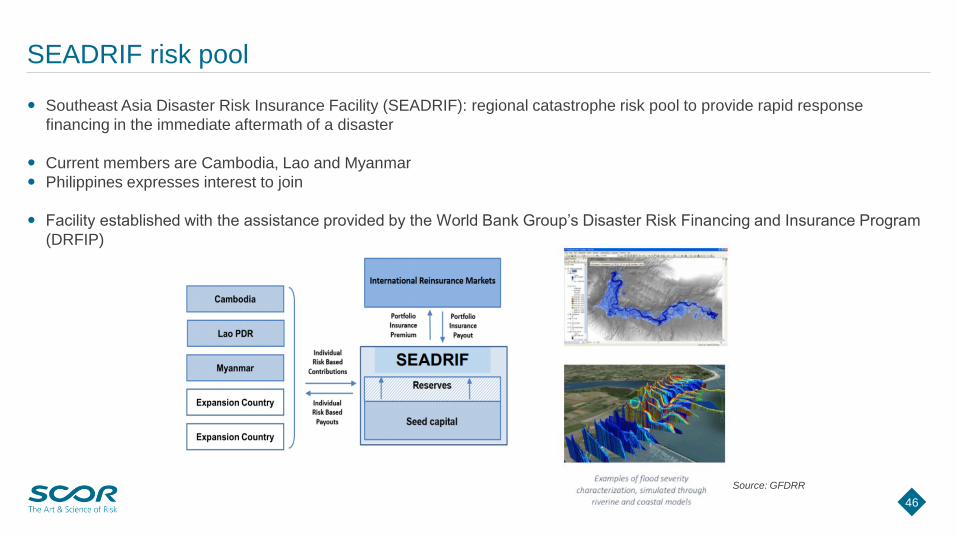
Southeast Asia Disaster Risk Insurance Facility (SEADRIF): regional catastrophe risk pool to provide rapid response
financing in the immediate aftermath of a disaster
Current members are Cambodia, Lao and Myanmar
Philippines expresses interest to join
Facility established with the assistance provided by the World Bank Group’s Disaster Risk Financing and Insurance Program
(DRFIP)
SEADRIF risk pool
Source: GFDRR
47
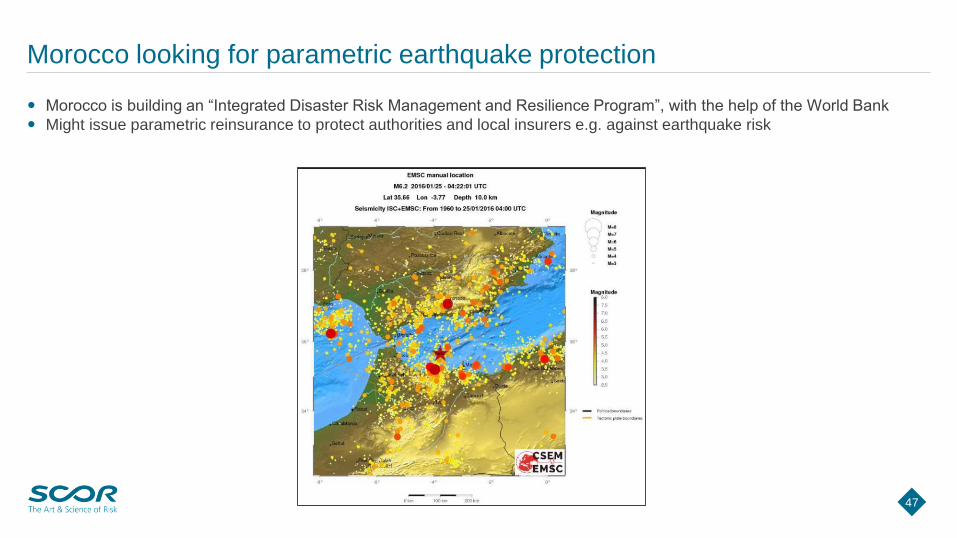
Morocco is building an “Integrated Disaster Risk Management and Resilience Program”, with the help of the World Bank
Might issue parametric reinsurance to protect authorities and local insurers e.g. against earthquake risk
Morocco looking for parametric earthquake protection
48
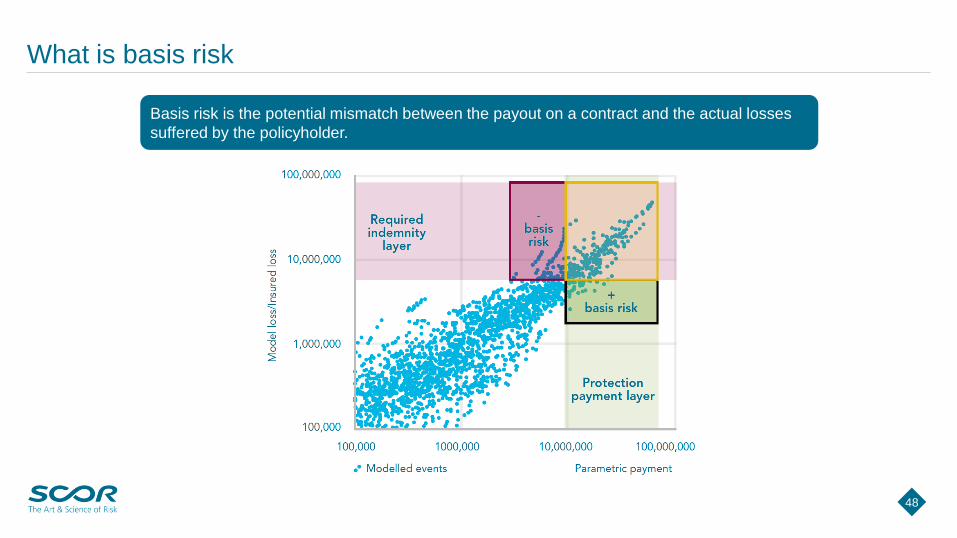
What is basis risk
Basis risk is the potential mismatch between the payout on a contract and the actual losses
suffered by the policyholder.
49
Regulatory Aspects of Parametric Products – Insurance vs Derivative
Nature of a product (derivative vs (re)insurance) will determine the applicable legal and regulatory framework.
Classification as (re)insurance or derivative, will determine:
Licensing Requirement
Provision of derivatives, direct insurance and reinsurance are each regulated activities, different licenses required and regulatory regimes
apply.
Carrier Management
Carriers are generally only licensed to offer specific products. Classification will determine which carrier may be used.
Accounting treatment
Accounting treatment will differ depending on classification as derivative or (re)insurance
Tax
Tax treatment may differ depending on classification as derivative or (re)insurance
50
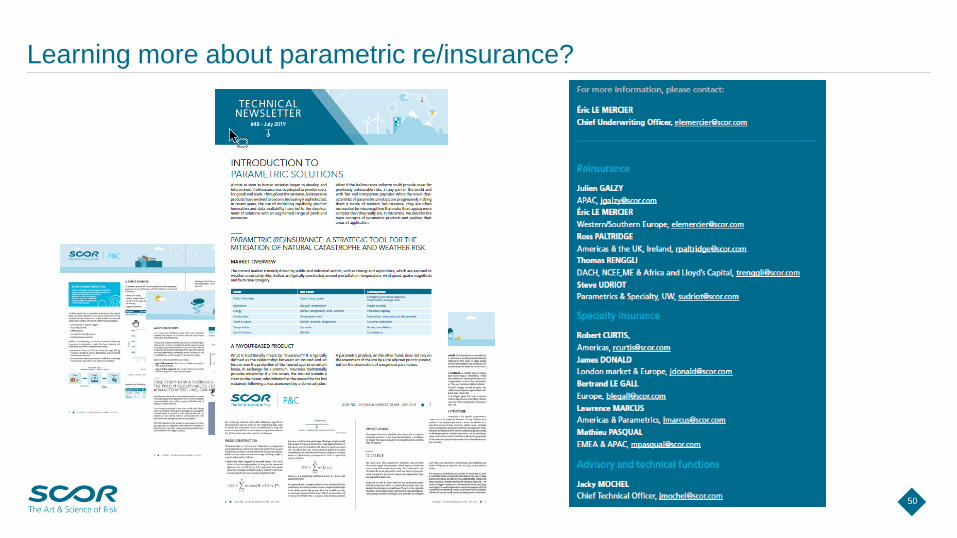
Learning more about parametric re/insurance?