Regulation of positive emotions: Measurement and individual ...
223
Regulation of positive emotions: Measurement and individual differences Thesis submitted for the degree of Doctor of Philosophy School of Psychology and Clinical Language Sciences Joanne Louise Bower October 2015
-
Upload
khangminh22 -
Category
Documents
-
view
3 -
download
0
Transcript of Regulation of positive emotions: Measurement and individual ...
Regulation of positive emotions: Measurement and individual differences
Thesis submitted for the degree of Doctor of Philosophy
School of Psychology and Clinical Language Sciences
Joanne Louise Bower
October 2015

Declaration
I confirm that this is my own work and the use of all materials from other sources has been properly
and fully acknowledged.
Joanne Louise Bower

Page | ii
Acknowledgements
I would like to thank my supervisors, Craig Steel and Anastasia Christakou, whose guidance, wisdom,
support and patience has been invaluable throughout the completion of this work. You have gone
above and beyond to make sure I not only completed this thesis, but maintained some semblance of
sanity in the process. I hope I’ve not cost you too much of yours...
Thank you to the University of Reading for funding my PhD, and to the Department of Psychology
and Clinical Language Sciences for providing such an engaging and supportive environment within
which to study. I also wish to thank the individuals who generously gave their time to participate in
my studies.
Thanks to my friends, who have supported me with humour, fun, and when all else fails, diet coke or
wine. Thank you for finding my loss of life competence endearing rather than infuriating; and for
forgiving me when my social skills became lost in requests for synonyms and obsessions with word
counts. I also owe particular thanks to those of you who generously provided me with places to stay
when I no longer had a local base. You turned a potentially stressful situation into a fun way to relax
with some of my favourite people.
Finally I want to thank my family, whose love and encouragement mean the world to me. You have
supported and believed in me, not just throughout the PhD, but during the whole of my life to date.
Thank you.

Page | iii
Abstract
Regulation of positive emotions is under-researched, despite evidence linking dysregulation to
mental health problems. Furthermore, studies often use clinical populations, with limited data from
healthy volunteers. The current thesis investigated individual differences in the regulation of positive
emotions, and developed and validated tools for the study of emotion regulation.
The State/Trait Emotion Regulation Questionnaires (STERQ) were created and validated, showing
good reliability, model fit and convergent validity. The project also examined the feasibility of online
emotion regulation experiments, showing these can be conducted via the internet, with comparable
results to those obtained within the laboratory, albeit eliciting smaller effect sizes.
Two studies investigated spontaneous and instructed regulation of positive emotions in healthy
participants, focusing on associations between emotion regulation and risk for hypomania and
depression. Emotional intrusion was positively associated with both increased hypomania and
depression traits. Additionally, hypomanic personality traits were associated with use of more
strategies to regulate positive emotions. Individuals with higher depression scores showed some
lowering of baseline positive emotions and increased dampening in response to positive emotions.
Finally, the thesis assessed the impact of positive emotions on subsequent emotion regulation
responses to negative stimuli, testing the hypothesis that positive emotions may have a protective
impact on the experience of negative emotion. Elicitation of positive emotions did not affect the
regulation strategies, emotional or physiological response to subsequent negative stimuli.
Various future directions arise from the current work. The creation of the STERQ provides additional
measures for investigating the temporal and contextual dynamics of emotion regulation. Research
into regulating positive emotions could be extended through the manipulation of emotional intensity
and types of emotion examined. Finally, studying how emotion regulation changes in response to
mixed valence states may better reflect real life, leading to a more nuanced understanding of
emotion regulation and its relationship with psychopathology.

Page | iv
Table of Contents
Declaration ............................................................................................................................................ i
Acknowledgements .............................................................................................................................. ii
Abstract ............................................................................................................................................... iii
Tables & Figures .................................................................................................................................. ix
CHAPTER 1: LITERATURE REVIEW ................................................................................................... 1 1.1 Overview .................................................................................................................................. 1
1.2 Emotion and Emotion Regulation ............................................................................................ 1
1.2.1 Definitions of emotion ..................................................................................................... 1
1.2.2 Concepts of emotion regulation ...................................................................................... 3
1.2.3 The process model of emotion regulation ....................................................................... 3
1.2.4 The dynamic nature of emotion regulation ..................................................................... 6
1.3 Regulation of Positive Emotions .............................................................................................. 8
1.3.1 Why study positive emotions? ......................................................................................... 8
1.3.2 Differences between positive and negative emotions .................................................. 10
1.3.3 Theories of positive emotion ......................................................................................... 10
1.4 Hypomania and positive emotions ........................................................................................ 11
1.4.1 Symptoms of hypomania ............................................................................................... 11
1.4.2 Models of hypomania .................................................................................................... 12
1.4.3 Hypomania and regulation of positive emotions ........................................................... 13
1.5 Depression and Positive Emotions ......................................................................................... 14
1.5.1 Symptoms of Depression ............................................................................................... 14
1.5.2 Depression, Positive Emotional Attenuation and Emotional Context Insensitivity ....... 15
1.5.3 Depression and the BIS/BAS hypothesis ........................................................................ 15
1.5.4 Depression and regulation of positive emotions ........................................................... 16
1.6 Measurement of emotion regulation .................................................................................... 16
1.6.1 Self-report measures of emotion regulation ................................................................. 16
1.6.2 Experimental assessment of emotion regulation .......................................................... 21
1.6.3 Emotion regulation research using the internet ............................................................ 22
1.6.4 Physiological measures of emotion regulation .............................................................. 23
1.7 The current thesis .................................................................................................................. 26
1.7.1 Aims of the current research ......................................................................................... 27
CHAPTER 2: DEVELOPMENT AND VALIDATION OF THE STATE/TRAIT EMOTION REGULATION QUESTIONNAIRES (STERQ) ................................................................................................................... 28
2.1 STERQ Chapter Summary ....................................................................................................... 29
2.2 STERQ Introduction ................................................................................................................ 30
2.2.1 Positive Emotions, Emotion Regulation and Mental Health .......................................... 30
2.2.2 State-based assessment of emotion regulation ............................................................ 32
2.2.3 The State/Trait Emotion Regulation Questionnaires (STERQ) ....................................... 33
2.3 Method: Phase One ............................................................................................................... 34

Page | v
2.3.1 Participants .................................................................................................................... 34
2.3.2 Materials ........................................................................................................................ 35
2.3.3 Procedure ....................................................................................................................... 36
2.3.4 Statistical Analysis .......................................................................................................... 36
2.4 Results: Phase One ................................................................................................................. 38
2.4.1 Preliminary analysis........................................................................................................ 38
2.4.2 Item Reduction ............................................................................................................... 39
2.5 STERQ Method: Phase Two .................................................................................................... 40
2.5.1 Participants .................................................................................................................... 40
2.5.2 Materials ........................................................................................................................ 41
2.5.3 Procedure ....................................................................................................................... 42
2.5.4 Statistical Analysis .......................................................................................................... 44
2.6 STERQ Results: Phase Two ..................................................................................................... 46
2.6.1 Pre-analysis .................................................................................................................... 46
2.6.2 Reliability Analysis .......................................................................................................... 47
2.6.3 Model Fit Analysis .......................................................................................................... 47
2.6.4 Trait and state associations, convergent validity and sensitivity to change analysis .... 49
2.6.5 Final STERQ Scales .......................................................................................................... 57
2.7 STERQ Discussion ................................................................................................................... 58
2.7.1 Trait Emotion Regulation Measures............................................................................... 59
2.7.2 Measures of Clinical Traits ............................................................................................. 60
2.7.3 Study limitations and future directions ......................................................................... 61
2.7.4 Conclusion ...................................................................................................................... 64
CHAPTER 3: SPONTANEOUS AND INSTRUCTED REGULATION OF POSITIVE EMOTIONS .......... 66 3.1 Introduction ........................................................................................................................... 67
3.1.1 Positive emotion dysregulation in bipolar disorder ....................................................... 67
3.1.2 Positive emotion dysregulation in depression ............................................................... 68
3.1.3 Types of Positive Emotion .............................................................................................. 69
3.2 Spontaneous Regulation of Positive Emotions ...................................................................... 70
3.3 Spontaneous Regulation Method .......................................................................................... 72
3.3.1 Participants .................................................................................................................... 72
3.3.2 Materials ........................................................................................................................ 72
3.3.3 Procedure ....................................................................................................................... 74
3.3.4 Statistical Analysis .......................................................................................................... 75
3.4 Spontaneous Regulation Results ............................................................................................ 75
3.4.1 Preliminary analysis........................................................................................................ 75
3.4.2 Efficacy of mood inductions ........................................................................................... 76
3.4.3 Hypomania, reactivity and regulation of positive emotions .......................................... 77
3.4.4 Anhedonic depression, reactivity and regulation of positive emotions ........................ 80
3.5 Spontaneous Regulation Discussion ...................................................................................... 82

Page | vi
3.5.1 Hypomania and positive emotional reactivity ............................................................... 83
3.5.2 Hypomania and the regulation of positive emotions .................................................... 83
3.5.3 Anhedonic depression, positivity and positive emotion reactivity ................................ 84
3.5.4 Anhedonic depression and regulation of positive emotions ......................................... 85
3.5.5 Trait and state emotion regulation styles and emotional reactivity .............................. 86
3.6 Instructed regulation of positive emotions............................................................................ 86
3.7 Instructed Regulation Method ............................................................................................... 87
3.7.1 Participants .................................................................................................................... 87
3.7.2 Materials ........................................................................................................................ 88
3.7.3 Procedure ....................................................................................................................... 89
3.7.4 Statistical Analysis .......................................................................................................... 90
3.8 Instructed Regulation Results ................................................................................................ 90
3.8.1 Preliminary analysis........................................................................................................ 90
3.8.2 Relationships between trait mood and instructions to regulate positive emotions ..... 93
3.9 Instructed Regulation Discussion ........................................................................................... 95
3.9.1 Hypomania and positive emotional reactivity and regulation ....................................... 95
3.9.2 Depression and positive emotional reactivity and regulation ....................................... 95
3.10 Discussion ............................................................................................................................... 96
3.10.1 Study limitations and future directions ......................................................................... 97
3.10.2 Future Directions .......................................................................................................... 100
3.10.3 Conclusion .................................................................................................................... 100
CHAPTER 4: STUDYING EMOTION REGULATION ONLINE ........................................................ 101 4.1 Introduction ......................................................................................................................... 102
4.1.1 Current Study ............................................................................................................... 104
4.2 Method ................................................................................................................................. 105
4.2.1 Participants .................................................................................................................. 105
4.2.2 Materials ...................................................................................................................... 107
4.2.3 Procedure ..................................................................................................................... 107
4.2.4 Statistical Analysis ........................................................................................................ 107
4.3 Results .................................................................................................................................. 108
4.3.1 Demographic, trait mood and emotion regulation measures ..................................... 108
4.3.2 Relationships between trait measures ........................................................................ 110
4.3.3 Effects of mood induction and emotion regulation instructions ................................. 111
4.4 Discussion ............................................................................................................................. 113
4.4.1 Implications of findings ................................................................................................ 113
4.4.2 Response rates, drop-outs and non-compliance ......................................................... 114
4.4.3 Limitations .................................................................................................................... 115
4.4.4 Conclusions .................................................................................................................. 115
CHAPTER 5: CAN POSITIVE EMOTIONS PROTECT AGAINST THE EMOTIONAL AND CARDIAC EFFECTS OF NEGATIVE EMOTIONS? .................................................................................................. 116

Page | vii
5.1 Introduction ......................................................................................................................... 117
5.1.1 The role of positive emotions in well-being ................................................................. 117
5.1.2 Individual differences in responses .............................................................................. 119
5.1.3 Relationship between cardiac measures and emotion ................................................ 119
5.1.4 Research questions and hypotheses ............................................................................ 120
5.2 Video validation ................................................................................................................... 121
5.2.1 Method ......................................................................................................................... 121
5.2.2 Results .......................................................................................................................... 122
5.3 Main Study Method ............................................................................................................. 123
5.3.1 Materials ...................................................................................................................... 123
5.3.2 Participants .................................................................................................................. 124
5.3.3 Procedure ..................................................................................................................... 124
5.3.4 Statistical Analysis ........................................................................................................ 125
5.4 Results .................................................................................................................................. 126
5.4.1 Preliminary analysis...................................................................................................... 126
5.4.2 Do positive stimuli buffer the effects of a negative mood induction (hypotheses 1-3)? 127
5.4.3 Individual differences in buffering responses .............................................................. 129
5.5 Discussion ............................................................................................................................. 130
5.5.1 Limitations .................................................................................................................... 131
5.5.2 Future Directions .......................................................................................................... 132
5.5.3 Conclusions .................................................................................................................. 133
CHAPTER 6: GENERAL DISCUSSION ............................................................................................ 134 6.1 Aims of the current thesis .................................................................................................... 135
6.2 Methodological contributions of the thesis ......................................................................... 135
6.2.1 State/Trait Emotion Regulation Questionnaire and Emotion Regulation Research .... 135
6.2.2 Online validation of experimental emotion regulation research ................................ 136
6.3 Theoretical contributions of the thesis ................................................................................ 137
6.3.1 Hypomania and responses to positive emotions ......................................................... 137
6.3.2 Depression and responses to positive emotions ......................................................... 138
6.3.3 Emotional intrusion as a transdiagnostic risk factor for mental health problems ...... 139
6.3.4 Potential implications for clinical interventions .......................................................... 140
6.3.5 Prototypical emotions versus valence ......................................................................... 140
6.3.6 Interaction between positive and negative emotions ................................................. 141
6.4 Strengths and limitations of the thesis ................................................................................ 142
6.4.1 Use of non-clinical samples .......................................................................................... 142
6.4.2 Experimental assessment of emotion regulation ........................................................ 143
6.4.3 Focus on hedonic regulation ........................................................................................ 144
6.4.4 Use of Self-Report Measures ....................................................................................... 145
6.5 Future Directions .................................................................................................................. 145

Page | viii
6.6 Conclusion ............................................................................................................................ 146
REFERENCES .................................................................................................................................. 147
Appendix 1: Cognitive Emotion Regulation Questionnaire .......................................................... 165
Appendix 2: Depression, Anxiety and Stress Scale (DASS) ........................................................... 166
Appendix 3: Difficulties in Emotion Regulation Scale (DERS) ....................................................... 167
Appendix 4: Emotion Regulation Questionnaire .......................................................................... 169
Appendix 5: Hypomanic Personality Scale ................................................................................... 170
Appendix 6: Hypomanic Personality Scale (20-Item) ................................................................... 172
Appendix 7: Mood and Anxiety Symptoms Questionnaire .......................................................... 173
Appendix 8: Responses of Positive Affect Scale ........................................................................... 174
Appendix 9: Participant information sheet – STERQ Positive (phase 1) ...................................... 175
Appendix 10: Participant information sheet – STERQ Negative (Phase 1) .................................... 176
Appendix 11: Participant information sheet – STERQ Positive (Phase 2) ...................................... 177
Appendix 12: Participant information sheet – STERQ Negative (phase 2) .................................... 178
Appendix 13: STERQ Positive Trait Items ....................................................................................... 179
Appendix 14: STERQ Positive State Items ...................................................................................... 181
Appendix 15: STERQ Negative Trait Items ..................................................................................... 182
Appendix 16: STERQ Negative State Items..................................................................................... 184
Appendix 17: Mood ratings scale and video memory questions ................................................... 185
Appendix 18: Phase 1 scree-plots for STERQ scales ....................................................................... 186
Appendix 19: STERQ Factor loadings for models retained in phase 1 ........................................... 188
Appendix 20: Memory questions for STERQ Phase 2 ..................................................................... 192
Appendix 21: Phase 2 path diagrams for final STERQ factor models ............................................. 194
Appendix 22: Competing model-fit statistics for STERQ scales ..................................................... 198
Appendix 23: Final STERQ Scales .................................................................................................... 199
Appendix 24: Participant Information Sheet – Spontaneous regulation study ............................. 203
Appendix 25: Participant Information Sheet – Instructed Regulation study ................................. 204
Appendix 26: Chapter 3 skew and kurtosis values ......................................................................... 205
Appendix 27: Chapter 3 Zero order and partial correlations (Spontaneous regulation study) ..... 207
Appendix 28: Participant Information Sheet – Buffering study video validation .......................... 208
Appendix 29: Participant Information Sheet – buffering study online phase ................................ 209
Appendix 30: Participant Information Sheet – Buffering study laboratory session ....................... 210
Appendix 31: Chapter 5 Skew and Kurtosis Values ........................................................................ 211

Page | ix
Tables & Figures
Table 1: Participant exclusions from phase 1 studies ................................................................................... 34
Table 2: Participant withdrawals from phase 1 studies ................................................................................ 34
Table 3: Mood ratings before and after phase 1 mood induction ................................................................ 38
Table 4: Number of factors identified for retention ...................................................................................... 39
Table 5: Model properties of each STERQ scale ............................................................................................ 40
Table 6: Participant exclusions from STERQ phase 2 .................................................................................... 40
Table 7: Participant withdrawals from STERQ phase 2 ................................................................................. 41
Table 8: Phase 2 baseline and mood induction videos.................................................................................. 41
Table 9: Mood ratings for the phase 2 videos ............................................................................................... 46
Table 10: Reliability and corrected item-total correlations for STERQ scales and subscales ........................ 47
Table 11: Model fit statistics for STERQ scales .............................................................................................. 48
Table 12: Subscale correlations between Video 1 and 2 ............................................................................... 49
Table 13: Relationship between trait and state STERQ positive measures ................................................... 50
Table 14: Relationship between trait and state STERQ negative measures ................................................. 50
Table 15: Correlations between STERQ trait positive subscales and the Responses to Positive Affect
questionnaire................................................................................................................................................. 52
Table 16: Correlations between STERQ state positive subscales and the Responses to Positive Affect
questionnaire................................................................................................................................................. 52
Table 17: Correlations between STERQ trait negative subscales, DERS and CERQ scales ............................ 54
Table 18: Correlations between STERQ state negative subscales, DERS and CERQ scales ........................... 55
Table 19: Correlations between STERQ trait positive subscales and measures of psychopathology ........... 56
Table 20: Correlations between STERQ state positive subscales and measures of psychopathology .......... 56
Table 21: Correlations between STERQ trait negative subscales and measures of psychopathology .......... 57
Table 22: Participant withdrawal information .............................................................................................. 72
Table 23: Items used to create composite scores of suppression, negative and positive reappraisal ......... 76
Table 24: Median levels of emotion before and after each video ................................................................ 77
Table 25: Condition specific instructions regarding mood induction ............................................................ 89
Table 26: Correlation coefficients for relationships between trait mood and emotion regulation style ..... 93
Table 27: Participant exclusions from online samples ................................................................................ 106
Table 28: Participant withdrawals from online samples ............................................................................. 107
Table 29: Demographic characteristics of participants across samples ...................................................... 108
Table 30: Comparison of measures of central tendency across samples.................................................... 109
Table 31: Regression coefficients, correlation and model fit ...................................................................... 110
Table 32: Comparison of coefficient values across samples ....................................................................... 110
Table 33: ANCOVA statistics for effects of instructions to regulate emotions on positive mood change .. 112
Table 34: Demographic data and mean emotion ratings for each video .................................................... 122
Table 35: Demographic data separated by group ....................................................................................... 124

Page | x
Figure 1: Process model of emotion regulation .............................................................................................. 4
Figure 2: Key study procedures ..................................................................................................................... 36
Figure 3: Phase 1 analysis .............................................................................................................................. 37
Figure 4: STERQ phase 2 study outline .......................................................................................................... 43
Figure 5: Analysis outline for STERQ phase 2 ................................................................................................ 45
Figure 6: Change in STERQ State Positive scores across videos .................................................................... 51
Figure 7: Change in STERQ Negative State scores across videos .................................................................. 51
Figure 8: Outline of study procedures ........................................................................................................... 74
Figure 9: Relationship between hypomania and number of trait emotion regulation strategies endorsed 78
Figure 10: Relationship between hypomania and number of state emotion regulation strategies endorsed
(low activation video) .................................................................................................................................... 78
Figure 11: Relationship between hypomania and trait emotional intrusion ................................................ 79
Figure 12: Relationship between hypomania and state emotional intrusion (Low activation video) .......... 79
Figure 13: Relationship between hypomania and state emotional intrusion (High activation video) .......... 80
Figure 14: Relationship between Anhedonic Depression and baseline High Activation positive emotions . 81
Figure 15: Relationship between Anhedonic Depression and baseline Low Activation positive emotions .. 81
Figure 16: Relationship between anhedonic depression and change in low activation emotions ............... 82
Figure 17: Instructed regulation study procedures ....................................................................................... 89
Figure 18: Level of change in positive emotions ........................................................................................... 91
Figure 19: Use of emotion regulation strategies across conditions. ............................................................. 92
Figure 20: Relationship between depression and suppression use in the minimise condition .................... 94
Figure 21: Relationship between trait dampening and suppression use in the minimise condition ............ 94
Figure 22: Mean positive emotion scores for each sample and condition ................................................. 111
Figure 23: Mean mood change across instruction conditions and data sets .............................................. 112
Figure 24: Key laboratory procedures ......................................................................................................... 125
Figure 25: Change in positive emotion scores across videos ...................................................................... 128
Figure 26: Change in negative emotion scores across videos ..................................................................... 128
Figure 27: Change in Respiratory Sinus Arrhythmia across video epochs ................................................... 129
Figure 28: Relationship between anhedonic depression and change in RSA in response to the positive
video ............................................................................................................................................................ 130

CHAPTER 1: LITERATURE REVIEW

Page | 1
1.1 Overview The current thesis investigates individual differences in the regulation of positive emotions. It is
concerned with both the assessment of such differences, and the relationships between positive
emotions, emotion regulation and risk of hypomania and depression. As such, the thesis draws on an
array of existing literature, with this chapter encompassing five main topics for review. First, the
chapter starts with a general definition of both emotion and emotion regulation, introducing
arguably the most influential model of emotion regulation, the process model (Gross & Thompson,
2009; Gross, 1998a). The section continues by discussing the progression of emotion regulation
research since the inception of the model, with particular focus on temporal and contextual
influences on the flexible and adaptive regulation of emotions. These factors were selected for
review as they are acknowledged to be fundamental to whether emotion regulation is healthy or
maladaptive, yet remain difficult to assess using current measures. Such literature was pivotal in the
decision to develop a state-based emotion regulation questionnaire.
The second section focuses specifically on the regulation of positive emotions. This highlights
important reasons for investigating positive emotions and their regulation, before outlining some of
the key differences between positive and negative emotions. Finally, the section concludes by
reviewing two pertinent theories relevant to positive emotions, the “broaden and build” theory
(Fredrickson, 2001) and the theory of Behavioural Inhibition and Activation Systems (Gray, 1990).
The individual differences of interest in the current thesis are risk for hypomania and depression,
which are discussed in sections three and four respectively. Both sections outline key symptoms,
moving on to discuss predominant models of each disorder. Finally, potential associations between
hypomania and depression, and the reactivity and regulation of positive emotions were explored.
Finally, section five considered the measurement of emotion regulation, reviewing both the
advantages and limitations of general methodologies and focusing on the specific experimental
designs, self-report and physiological measures used in the current work.
1.2 Emotion and Emotion Regulation
1.2.1 Definitions of emotion
Research into emotion is well established, however, definitions of what constitutes an emotion, and
how emotions differ from other affective processes remains disputed. Emotions can be perceived as
a subset of broader affective processes (Fredrickson, 2005). Unlike moods, which may be salient,
long-lasting and non-specific (Gendolla, 2000), emotions are transient, functional responses to
specific stimuli (Gross & Thompson, 2009; Gross, 1998b). They may have cognitive input, as they
arise from meaningful experiences (Frijda, 1988), give meaning to experiences (Cole, Martin, &
Dennis, 2004), and occur when an individual perceives a situation as relevant to their goals (Frijda,

Page | 2
Kuipers, & ter Schure, 1989; Gross & Thompson, 2009). This cognitive element of emotion comprises
of conscious and unconscious appraisals of a situation (e.g. is this situation relevant to me? Can I
cope with the demands of the situation?) and is not present in broader affective states. In addition to
their experiential component, emotions also promote an awareness of potential for action (Frijda,
1988) and may elicit specific behaviours associated with the emotion, referred to as action
tendencies (Frijda et al., 1989).
However, the action tendency theory proposes that emotions elicit specific and distinguishable
responses (Fredrickson, 1998). This is problematic for two reasons. First, current biological evidence
does not support the concept of basic or discrete emotions (Barrett, 2006), with several emotions
showing overlapping physiological or behavioural states. Furthermore, any emotion (e.g. fear) may
be experienced in various ways by different people or across different contexts (Russell, 2003). This
heterogeneity of emotional experience makes the mapping of emotions to specific action tendencies
problematic. Second, specific actions may be most relevant to negatively valenced emotions (e.g.
fear may lead to running away). Unlike their negative counterparts, positive emotions are thought to
have slower, more diverse properties that facilitate approach behaviour. However these diffuse
effects are non-specific and may incorporate components that unfold over time, thus cannot be
considered action tendencies (Fredrickson & Branigan, 2005; Fredrickson, 1998, 2001). Additionally,
approach facilitation is not unique to positive emotions. Non-positive emotions (e.g. anger) are also
associated with approach motivation (Mauss & Robinson, 2009), further undermining the concept of
emotions eliciting specific action tendencies.
According to the circumplex model of affect, the continua of valence and activation (also referred to
as arousal) are key features of core affect, which is a precursor to emotion (Posner, Russell, &
Peterson, 2005; Russell, 2003). Barrett (2006) argues that valence, rather than primary emotions, are
universally identifiable, basic emotional building blocks. She suggests that people vary in their ability
to differentiate and identify individual emotions such as “anger” or “sadness.” Furthermore, reported
experience of similarly valenced emotions is often highly correlated, suggesting overlap in the
activation of these emotional states (Posner et al., 2005). Therefore, it may be more appropriate to
consider the affective qualities across a valence dimension, as everyone is able to assess their
emotional landscape in terms of being “pleasant” or unpleasant” (Barratt, 2006). Arousal is the
second dimension that is key to the circumplex model of affect, and encompasses the subjective
experience of feeling activated or deactivated (Barrett, 1998). Subjective feelings of activation are
thought to be interpretations of physiological states of arousal and refer to a sense of being
energised or motivated (Russell & Barrett, 1999).
In contrast to the basic emotions approach (e.g. Izard, 1992), the circumplex model denotes
emotions as the output of various interacting features. These include interpretation and appraisal of
internal and external events, actions, emotional awareness; and interpretation and regulation of the
Page | 3
emotional state (Russell, 2003). As such, emotions are an emergent property of the perceiver, rather
than a specific state that can be identified and labelled. Therefore, it is not necessary for emotions to
have specific and differentiable profiles. Instead, individually labelled emotions can be considered
prototypes, each encompassing common, but not necessary, features (Gross & Thompson, 2009).
1.2.2 Concepts of emotion regulation
Theories of emotion regulation are necessarily derived from underlying assumptions regarding the
nature of emotions (Tamir, 2011) and are therefore also contested. In the current thesis, emotion
regulation is considered in terms of the regulatory processes acting upon emotions. It is
acknowledged that emotions can also be considered regulatory influences on other processes;
however this is beyond the scope of the current work. Emotion regulation can be conceptualised as
attempts, using a number of heterogeneous processes, to influence the nature, magnitude and
duration of our emotional responses (Gross & Thompson, 2009; Ochsner, Silvers, & Buhle, 2012).
For the purpose of the current work, the relationship between emotion and emotion regulation is
assumed to be bi-directional, originating from overlapping neural circuitry that is responsible for
both the emergence of emotion and its regulation (Gross & Barrett, 2011). Emotion regulation can
take many forms. Emotions can self-terminate (Kappas, 2011), regulation can be automatic or
voluntary (Goldsmith & Davidson, 2004; Phillips, Ladouceur, & Drevets, 2008), self-regulated or
regulated by others (Zeman, Cassano, Perry-Parrish, & Stegall, 2006). Furthermore, emotion
regulation may not be exclusively hedonic, but may instead fulfil a variety of goals (Tamir, 2011). In
these instances, the purpose of emotional regulation may not be to improve the pleasantness of the
emotional state. Instead, it may be engaged in the pursuit of higher-order or conflicting goals
(Campos, Walle, Dahl, & Main, 2011) or have a longer-term holistic focus, within which the overall
personality system is maintained (Koole, 2009).
Among numerous existing models, the process model of emotion regulation is arguably the most
influential (Webb, Miles, & Sheeran, 2012), and is described in more detail below.
1.2.3 The process model of emotion regulation
The process model of emotion regulation arises from the modal model of emotion, in which
emotions arise through the interaction of the person with a meaningful situation, which captures
attention, and elicits a flexible, co-ordinated response to such interactions (Gross & Barrett, 2011).
Emotion regulation is an intrinsic part of the co-ordinated emotional responding, which can arise at
several stages in the emotion generation process. The model highlights 5 key stages of emotion
regulation: Situation selection, situation modification, attentional deployment, cognitive change and
response modulation (Figure 1; Gross & Thompson, 2009; Gross & John 2003).

Page | 4
Figure 1: Process model of emotion regulation
Implicit within the model, is the assumption that different parts of the emotion regulation process
are temporally distinct. For example, the first four stages may precede the onset of the emotion, and
thus be intrinsically related to emotion generation. Conversely, the response modulation phase
typically follows, and potentially alters, the emotional response. However, the overall system is
dynamic; consequently, emotion regulation may not follow a linear progression through the emotion
regulation stages. The temporal features of emotion regulation are explored in more detail in the
next section.
Two key strategies for emotion regulation, suppression and reappraisal, have emerged from the
process model. These have been extensively studied, particularly in relation to negatively valenced
emotions. Suppression has been described as a response-focused regulation strategy and
predominantly refers to attempts to minimise the emotional expression (Gross, 1998a), subjective
experience, and physiological arousal that occur after the onset of an emotion (Liverant, Brown,
Barlow, & Roemer, 2008). Suppression is often considered maladaptive, with increased use being
associated with numerous mental health problems (Aldao, Nolen-Hoeksema, & Schweizer, 2010).
Furthermore, increased use of suppression has been related to increased overall mortality and
deaths due to cancer during a 12 year period (Chapman, Fiscella, Kawachi, Duberstein, & Muennig,
2013), increased physiological responding to negative stimuli (e.g. Gross, 1998a) and decreased social
functioning (Butler et al., 2003).
In contrast to suppression, reappraisal is considered an antecedent regulation strategy. Individuals
change the way they think about a situation, thus altering the emotional experience. Reappraisal can
take several forms, including reinterpretation, in which the meaning of the stimulus is changed, and
detachment, whereby participants cognitively distance themselves from the stimulus and the
emotions it evokes (Dörfel et al., 2014). Reappraisal is proposed to influence earlier stages in the
Figure reproduced from Gross & John (2003)

Page | 5
emotion generation process, therefore requiring less cognitive and physiological effort. Indeed,
instructed reappraisal of emotional stimuli reduces emotional change compared to uninstructed
conditions, with comparable behavioural and physiological responses (e.g. Gross, 1998a).
The process model has been widely influential in the study of emotion regulation. However, the
model is acknowledged to be a simplification of the nature of emotion regulation (Gross &
Thompson, 2009). One facet of regulation not addressed by the model is the intended function of the
regulatory processes. This may have important consequences when considering which processes can
be considered as mechanisms of emotion regulation. For example, Berking and Wupperman (2012)
argue that suppression cannot always be considered an emotion regulation strategy. Engagement in
suppression may be an attempt to avoid perceived negative social judgements associated with
emotional expression, rather than an attempt to modify the emotional experience (Berking &
Wupperman, 2012).
Furthermore, wider definitions of suppression (e.g. Liverant et al., 2008), which encompass the
inhibition of both physiological and subjective emotional experience, may be conflating regulatory
processes with regulatory goals. Consequently, there may be many mechanisms by which this
inhibition occurs. Indeed, when asked specifically how they suppressed their emotional experience,
participants in one study reported using a mixture of antecedent cognitive and response relevant
behavioural strategies (Demaree, Robinson, Pu, & Allen, 2006). This is important, as differentiation of
suppression mechanisms may help elucidate whether some are more detrimental to individual well-
being than others.
Finally, experimental studies based on the process model are often confounded by simultaneously
changing temporal and strategy variables (e.g. simply comparing suppression and reappraisal cannot
differentiate between when the strategies are engaged, and the mechanisms by which they work).
This makes it impossible to disentangle their relative importance in different situations (Koole, van
Dillen, & Sheppes, 2010).
Many of these considerations were addressed by a later expansion to the process model (Sheppes &
Gross, 2012). The model expansion incorporates three further factors regarding the potential success
of down-regulatory emotion regulation strategies. First, it proposes that effectiveness will depend on
the cognitive resources required to achieve the desired modulation. This is elucidated through the
comparison of regulation strategies that both occur in the same temporal dimension (e.g. distraction
and reappraisal, which are both predominantly antecedent). Second, emotional intensity is expected
to be a key factor differentiating between the relative successes of various strategies. Finally, the
extended model acknowledges that short- and long-term regulatory goals may be both different and
contradictory. Therefore, regulatory strategies may be more or less successful depending on their
target (Sheppes & Gross, 2012).

Page | 6
1.2.4 The dynamic nature of emotion regulation
1.2.4.1 Temporal dynamics in emotion regulation
Variation in the temporal features of emotion regulation strategies may be pivotal to their relative
success. The generic and process-specific timing hypotheses propose that emotions develop and
strengthen over time, thus making timing a proxy for emotional intensity. The later in the emotion
regulation process a strategy is deployed, the higher the proposed emotional intensity, therefore the
greater the resources required for its successful implementation (Sheppes & Gross, 2011).
However, emotion regulation is a dynamic process, whereby strategies are not necessarily deployed
during the same period of emotion generation across individuals and stimuli. Consequently, it is
important to consider how well a strategy performs at varying stages in the emotion regulation
process. Furthermore, strategies that are utilised early in the process may also have differing longer-
term implications. This was assessed in a study using EEG to measure the late positive potentials
(LPP) of distraction versus reappraisal (Thiruchselvam, Blechert, Sheppes, Rydstrom, & Gross, 2011).
In this study, distraction was associated with earlier LPP onset than reappraisal. It was further
hypothesised that the early disengagement from the emotional stimuli during the distraction trials
would mean that those trials were minimally processed compared with reappraisal trials, in which
information had to be first attended to, then reappraised. Therefore, when the stimuli were re-
experienced later in the experiment, it would be more intensely experienced when previously
regulated using distraction than using reappraisal. Thiruchselvam et al., (2011) found partial support
for this, with LPPs for the re-exposed images being larger for those previously seen in distraction
trials.
However, the assumption that the temporal dynamics of emotion regulation map onto the intensity
of emotional stimuli takes no account of the gradient of intensity increase. It is conceivable that the
sudden onset of a more severe emotional episode (for example being told of the unexpected death
of a loved one) may have different implications for regulatory success than an emotional episode
that fluctuates in intensity over time (e.g. fear in anticipation of failing an impending assessment).
1.2.4.2 Multiple strategy use in emotion regulation
Emerging evidence suggests that multiple emotion regulation strategies may be deployed in
response to the same stimulus (Aldao & Nolen-Hoeksema, 2013; Dixon-Gordon, Aldao, & De Los
Reyes, 2015; Gruber, Harvey, & Gross, 2012; Opitz, Cavanagh, & Urry, 2015). However, the majority
of current research investigating state emotion regulation uses an instructed regulation paradigm
whereby participants are required to use particular regulation strategies. The mechanisms of
regulation are examined only as evidence of successful experimental manipulation, with multiple
strategies disregarded if the strategy of interest was most endorsed (Aldao & Nolen-Hoeksema,
2013).

Page | 7
Measuring the engagement of multiple regulation strategies could be informative in various ways.
First, it can establish whether different strategies are employed simultaneously, or sequentially
depending on regulatory success. Second, the number of strategies engaged, and the extent of
endorsement of each, may vary systematically as a function of individual differences. For example,
participants with bipolar disorder have previously been shown to endorse more regulatory strategies
in response to emotional stimuli than healthy control participants (Gruber et al., 2012). Finally, the
mix of strategies adopted may provide insight into the extent to which individuals perceive emotion
regulation to be challenging, both as a function of stimulus properties (intensity and valence) as well
as their perceived skill in effectively managing the stimulus.
1.2.4.3 The role of context in emotion regulation
No individual emotion or emotion regulation strategy is universally adaptive or maladaptive (Aldao &
Nolen-Hoeksema, 2012; Aldao, 2013; Gross & Thompson, 2009; Kashdan, Young, & Machell, 2015).
Instead, the goal of emotion regulation is to flexibly invoke responses which influence the dynamics
of an emotion within the wider environment (Aldao, 2013; Sheppes et al., 2014). The influence of
context may underlie existing inconsistencies regarding the relative effectiveness of various emotion
regulation strategies (Aldao, 2013). Context can take many forms, including the temporal dynamics
explored above. Other key components of context include the characteristics of the individual
engaged in regulation, features of the stimuli, implementation of the regulatory process and the
types of regulatory outcome (Aldao & Tull, 2015).
Facets of each of these elements may already be incorporated into existing studies. For example, an
extensive literature examines individual differences in emotion regulation, from both developmental
and psychopathological perspectives. However, the individual difference variables studied in these
studies are often limited to one or two variables of interest (Aldao, 2013). Furthermore, many of
these studies rely on trait measurement, which neither differentiates between the emotions
targeted for regulation, nor captures information regarding the flexibility of regulatory responding.
Indeed, the initial instruction for many emotion regulation measures simply refers to feeling “bad” or
“good,” potentially resulting in different emotions being considered by individuals. This may be
exacerbated if participants have a mental health condition which makes some emotions more salient
(e.g. anxiety or depression). Therefore, the resulting strategy engagement may show artificial
differences in strategy selection by different groups, that are in fact a product of the emotion being
regulated, rather than the strategies used in response to the emotion (Berking & Wupperman, 2012).
Thus, the meaningful integration of multiple contextual variables in emotion regulation research
remains a significant challenge.

Page | 8
1.3 Regulation of Positive Emotions
1.3.1 Why study positive emotions?
Historically, the study of emotion has focused primarily on those that are negatively valenced.
However there are several pertinent reasons for conducting research into the regulation of positive
emotions.
Emotion regulation is not only concerned with the down-regulation of emotions, but is also
influential in maintaining or intensifying emotional states (Gross, 2002). Such regulatory mechanisms
may be of particular interest for positive emotions. Responses to positive emotions can be broadly
classified as either savouring or dampening (Feldman, Joormann, & Johnson, 2008; Quoidbach, Berry,
Hansenne, & Mikolajczak, 2010). Savouring responses serve to prolong and increase emotional
experiences. They can be achieved through a number of regulatory responses, including emotional
expression, attending to the experience, capitalising on the emotion and engaging in reflective or
ruminative positive thoughts. Conversely, dampening results in the down regulation of positive
emotions, and may occur through expressive suppression, fault finding, distraction and engaging in
negative rumination or reflection (Quoidbach et al., 2010).
Although predominantly studied in relation to negative emotions, rumination has also been shown to
influence positive emotions. Rumination is a cognitive, response-focused, emotion regulation
strategy (Feldman et al., 2008) that occurs after the onset of the emotional experience. It relates to a
preoccupation with the feelings elicited by an event or stimulus, and their possible causes and
consequences (Feldman et al., 2008; Nolen-Hoeksema, Wisco, & Lyubomirsky, 2008). When applied
to negative emotions, rumination may lead to increased and prolonged distress, and can be
associated with depression (Treynor, Gonzalez, & Nolen-Hoeksema, 2003). Ruminative regulation of
positive emotions can be separated using the savouring and dampening distinction outlined above,
and has been measured using the Responses to Positive Affect questionnaire (Feldman et al., 2008).
Increased ruminative savouring has been associated with hypomania and bipolar disorder (Feldman
et al., 2008; Gruber, Eidelman, Johnson, Smith, & Harvey, 2011), whilst increased dampening has
been related to depression (Feldman et al., 2008; Werner-Seidler, Banks, Dunn, & Moulds, 2013),
social phobia, panic disorder and generalised anxiety (Eisner, Johnson, & Carver, 2009).
However, whether savouring and dampening are adopted as strategies intended to change
emotional responding is currently unclear. It is equally plausible that these responses may have
unintended down-regulatory emotional consequences. For example, it is conceivable that individuals
deliberately focus on the savouring aspects of positive emotions, in an attempt to maximise positive
experience. On the other hand, thoughts which dampen positive emotions may arise as a result of
external factors (e.g. feeling like the emotion is not deserved may be a function of low self-esteem),
with decreased positive emotions being an unintended consequence of, rather than a goal for such

Page | 9
thought-processes. The extent to which savouring and dampening are deliberately adopted may also
alter across contexts. For example, it may be appropriate to focus on praise regarding your work
when going into a tough meeting that you are nervous about. Alternatively, it may be useful to
down-regulate the joy at getting positive feedback on a thesis chapter, when there are a further six
still to write.
Therefore, the notion that individuals only wish to increase positive emotions is unfounded (Kashdan
et al., 2015). Successful emotion regulation is predicated on flexible, contextually appropriate
responses to emotional stimuli, therefore it is essential that positive emotionality is reactive to
fluctuating contextual demands. Regulatory success in this context may depend on both the
strategies adopted and the purpose of the regulation. Quoidbach et al., (2010) investigated the
relationship between savouring and dampening strategies, positive affect and life satisfaction. They
found capitalising on positive emotions to be positively associated with increased life satisfaction,
whilst increased savouring rumination was related to greater positive affect. Conversely, distraction
was negatively associated with experience of positive affect; whilst fault finding and negative
rumination were both associated with decreased life satisfaction. Furthermore, the authors also
found that use of multiple savouring strategies was more positively associated with life satisfaction,
which they argue may result from being able to flexible apply savouring strategies depending on
situational demands (Quoidbach et al., 2010).
As alluded to above, regulation can be hedonic (i.e. focused on managing the affective state) or
instrumental (focused towards achieving longer term goals). This may be particularly salient to
positive emotions, where there may be a trade off between immediate and delayed gratification.
Therefore, emotion regulation goals may not always be focused towards short-term affective gain
(e.g. increase in positive mood). Indeed, when attempting to resolve conflict, participants may select
emotional stimuli that evoke anger, rather than happiness (Tamir & Ford, 2012b). Furthermore,
desire to experience context-appropriate, rather than universally positive emotion in a range of
situations was also associated with improved overall personal wellbeing (Tamir & Ford, 2012a).
The perception of positive emotions may also vary as a function of individual differences, leading to
differences in regulatory responses. For example, participants with lower self-esteem were reported
to feel less deserving of positive emotions (Wood, Heimpel, Manwell, & Whittington, 2009), and to
engage in dampening strategies towards positive affect (Wood, Heimpel, & Michela, 2003). Finally,
the dysregulation of positive emotions is a key component of several mental health problems,
including bipolar disorder (section 1.4) and depression (section 1.5), schizophrenia and addiction
(Carl, Soskin, Kerns, & Barlow, 2013; Stanton & Watson, 2014). Thus, research targeting the
regulation of positive emotions is of both theoretical and clinical interest.

Page | 10
1.3.2 Differences between positive and negative emotions
Neurological, clinical and behavioural evidence suggests that positive and negative emotions are not
simply opposite ends of the same continuum (Depue & Iacono, 1989). A comprehensive review of
the neurological differences between positive and negative emotions is beyond the scope of this
thesis. However, in brief summary, earlier studies of emotion in the brain suggested emotional
valence was associated with lateralisation of activation, with positive emotions activating left cortical
areas and negative showing activation in the right hemisphere (Ahern & Schwartz, 1979, 1985). A
later meta-analysis concluded that these effects were small, and limited to the amygdala, where left
activation was elicited for negative emotions, and basal ganglia, in which right activation was elicited
through positive emotions (Wager, Phan, Liberzon, & Taylor, 2003).
Support for the differentiation between positive and negative emotions also comes from studies of
dopamine across the brain. These have found an association between dopamine and positive, but
not negative, affect. For example, a reduction in dopamine can be associated with a loss of pleasure
(anhedonia) but not with an increase in negative emotions (Ashby, Isen, & Turken, 1999).
Positive and negative emotions have also been shown to differentially predict mental health
outcomes (Weiss, Gratz, & Lavender, 2015). Several mental health conditions may experience unique
dysregulation of positive emotions, for example heightened reward sensitivity in hypomania (section
1.4.2) and blunted responses to positive emotions in depression (section 1.5.2). Furthermore,
emotion regulation strategies may have differing impact on positive and negative emotions. The
relative paucity of studies investigating positive emotions means that many strategies have yet to be
assessed in positive emotions. However, suppression, which has been shown to be ineffective at
reducing negative affect, has been shown to successfully reduce positive affect (Nezlek & Kuppens,
2008). Whether this dissociation of effectiveness is robust or generalises to further emotion
regulation strategies is currently unanswered.
1.3.3 Theories of positive emotion
Prominent theories of emotion may be better suited to negative than positive emotions, due to the
comparatively larger extant literature addressing such emotions (Fredrickson, 1998). In light of this,
emotion theories should be considered and, where necessary, modified, to ensure their suitability for
the emotions under investigation (Fredrickson, 1998, 2001, 2005). For example, the notion of
emotions eliciting action tendencies is highly influential within emotion research, however, whilst it
may be useful as a description for negative emotions, positive emotions may be better explained by a
model emphasising their diffuse, non-specific properties. The “broaden and build” theory is one such
model, outlined in section 1.3.3.1. Additionally, it is useful to consider neuro-behavioural systems
that may contribute to the regulation of positive and negative affect. The Behavioural Inhibition and
Activation Systems are one such approach, explored in section 1.3.3.2.
Page | 11
1.3.3.1 “Broaden and Build” model of positive emotions
The “broaden and build” theory proposes that positive emotions broaden thought-action repertoires
through, for example, increased creativity, flexible thinking and pro-social behaviour. Repeated
exposures to these benefits of positive emotions are suggested to build resources over time, which in
turn, promotes resilience (Fredrickson, 2001, 2005). Chapter five investigates the effect of positive
emotions on subsequent responses to negative stimuli, exploring aspects of the “broaden and build”
model in a shorter, experimental time-scale.
Substantial support for the notion of increased flexibility of attention and cognition in response to
positive emotions has been garnered from both behavioural and neurobiological studies (e.g. Isen,
2008). Positive emotion is associated with greater dopamine release across the brain, which may
contribute to the cognitive changes seen, even after mild increases in positive emotion (Ashby et al.,
1999). This provides a plausible neural route for the proposed influence of positive emotions on
cognitive systems. However positive emotions do not lead to global cognitive improvements, with
benefits seen primarily for neutral or positive tasks (Isen, 2008). This suggests that positive emotions
may have differing regulatory impact, depending on the nature of subsequent stimuli.
1.3.3.2 Behavioural activation and inhibition systems (BAS/BIS)
Emotional valence is thought to be associated with the Behavioural Activation System (BAS) and
Behavioural Inhibition System (BIS). The BAS comprises of a neurobehavioural appetitive system that
is sensitive to both reward and absence of punishment, leading to approach or goal seeking
behaviour (Gray, 1990). It is activated by stimuli (e.g. food, novelty, social interaction), which initiates
both locomotor activity and reward motivation (Depue & Iacono, 1989). The BAS has been further
subdivided into reward responsiveness, drive and fun seeking (Carver & White, 1994), with all
aspects also thought to be associated with reward-related positive emotions including elation, hope
and happiness (Gray, 1990). Conversely, the BIS is sensitive to punishment and novelty, thus BIS
activation results in withdrawal or avoidance motivated behaviours (Carver & White, 1994).
Measurement of the BIS/BAS systems can be both psychological (for example the BIS/BAS scales) or
can involve measurement of the proposed underlying dopaminergic reward circuitry of the limbic
and pre-frontal cortex regions (Green, Cahill, & Malhi, 2007). The sensitivity of each system is subject
to individual differences and has been implicated in models of psychopathology (section 1.4 & 1.5).
1.4 Hypomania and positive emotions
1.4.1 Symptoms of hypomania
Hypomania can be defined as the presence of sub-threshold mania symptoms including elevated
mood and increased irritability. Diagnosis of hypomania broadly encompasses the same symptoms as
for mania, but with lower levels of intensity, functional and social impairment (Eckblad & Chapman,

Page | 12
1986; Goodwin, 2002). Both hypomania and mania can be features of bipolar spectrum disorders,
which are characterised by the presence of both manic (or hypomanic) and depressive episodes.
Some elements of hypomania, including cheerfulness, optimism, extraversion, recklessness and
irresponsibility, also exist as stable, trait-like personality features (Meyer, 2002). Such traits may
indicate a risk for subsequent manic or hypomanic episodes (Meyer, 2002) and can be measured
using the Hypomanic Personality Scale (Eckblad & Chapman, 1986). Hypomania and mania have both
been associated with dysregulation of positive emotions. However, it remains unclear whether all, or
just a subset of positive emotions (e.g. reward-based emotions), are affected within these individuals
(Gruber, Johnson, Oveis, & Keltner, 2008).
1.4.2 Models of hypomania
Dysregulation of the Behavioural Activation System (BAS), the Manic Defence Hypothesis and
Positive Emotional Persistence (PEP), are three key theories regarding the underlying mechanisms of
positive emotional dysregulation in bipolar disorder and are outlined below.
1.4.2.1 Hypomania and the BAS model
According to the BAS model, vulnerability to bipolar disorder arises through hypersensitivity of the
BAS system, which increases reactivity to goal or reward relevant cues (Alloy et al., 2013). The
presence of (hypo)manic and depressive symptoms can both be explained within the BAS model.
Reward or achievement may cause increased BAS activation, which is not sufficiently down-
regulated, leading to hypomanic responses including, for example, excessive goal-oriented
behaviours, euphoria, optimism and energy (Alloy et al., 2013). Conversely, experiences of failure or
loss may lead to an over-disengagement of the BAS, resulting in depressive symptoms such as lack of
goal-directed behaviour, decreased interest and hopelessness (Alloy & Abramson, 2010). Support for
the BAS model of hypomania comes from prospective high-risk studies, which show high BAS scores
on the BIS/BAS scales are predictive of onset of hypomanic episodes (Alloy et al., 2013).
Furthermore, high BAS sensitivity is predictive of increased symptoms of mania and decreased time
to relapse (Alloy & Abramson, 2010).
1.4.2.2 Hypomania and the manic defence hypothesis
The manic defence model proposes that (hypo)mania arises as a defence against depression (Thomas
& Bentall, 2002), or negative or threatening feelings towards the self (Carver & Johnson, 2009).
Individuals with increased hypomania traits (as measured by the HPS) were shown to have increased
rumination, distraction and extreme behaviours in response to negative mood states, even after
accounting for depression score (Thomas & Bentall, 2002). The authors argue that rumination may
be responsible for the development of depression, whilst mania may arise from the use of distraction
and extreme behaviours in order to avoid negative emotional states. However, relationships
between hypomania, depression and the valence of affect have also been shown to be distinct,

Page | 13
whereby hypomania was associated with reward sensitivity and intensity of positive affect, whilst
depression was associated with threat sensitivity and intensity of negative affect (Carver & Johnson,
2009). No significant interactions between the hypomanic and depressive risk factors were detected,
suggesting distinct profiles of emotional dysregulation (Carver & Johnson, 2009).
1.4.2.3 Hypomania and Positive Emotional Persistence
Gruber (2011) theorises that the increased positivity observed in (hypo)mania is indicative of
“Positive Emotional Persistence” (PEP), in which heightened positive responses are elicited in
response to reward- and achievement-centred positive emotions. However, evidence regarding the
reactivity of participants with BD to positive emotions and their regulatory responses is currently
mixed. Whilst many studies report the increased reactivity described above, an experience sampling
(ESM) study comparing emotional reactivity and regulation between healthy controls and patients
with BD or depression found that positivity did not differ between BD patients and healthy controls,
but was reduced in those with depression (Gruber, Kogan, Mennin, & Murray, 2013). This
incongruence may be a result of the type of positive emotion examined. ESM studies capture
responses to naturally occurring events, therefore cannot be guaranteed to capture specific types of
positive emotion. If, as theorised in the PEP approach, dysregulation is centred on reward and
achievement focused emotions, other forms of positivity may not show the same dysregulation.
Indeed, in a study of trait measures of positive emotions, those relating to joviality (e.g. happiness,
excitement and enthusiasm) were associated with well-being, whilst those relating to experience
seeking (e.g. fearlessness) were endorsed more by those with BD (Stanton & Watson, 2014).
Whilst PEP may provide a useful framework within which to consider emotional dysfunction in
bipolar disorder, the mechanisms by which PEP is maintained remain unclear. Gruber (2011) predicts
that PEP is associated with both top down and bottom up disturbances in emotional processing,
including increased attentional focus on positive events and rumination regarding positive emotions.
However, as with emotional reactivity, the evidence for disturbances in emotion regulation is also
mixed.
1.4.3 Hypomania and regulation of positive emotions
The relationship between hypomania and regulation of positive emotions is explored in more detail
in chapter three, with an overview presented here. Patients with bipolar disorder may experience
varying differences in regulation of positive emotions compared to healthy controls. These include
increased rumination over positive events (Johnson, McKenzie, & McMurrich, 2008) and increased
dampening of positive emotions (Edge et al., 2013). Increased trait self focused rumination may be
associated with frequency of manic episodes (Gruber, Eidelman, et al., 2011) and patients with
bipolar disorder showed a positive association between emotion focused rumination and elevated
positive affect after a neutral rumination manipulation, primed by thinking about future life goals.

Page | 14
Additionally, dampening was associated with increased negative affect and heart rate in these
participants (Gilbert, Nolen-Hoeksema, & Gruber, 2013). However with no healthy control group, it is
unclear whether this is a healthy response to the task, or a symptom of the bipolar disorder. Indeed,
level of emotion focused rumination was not predictive of future symptomatology.
Furthermore, evidence regarding the relationship between hypomania and regulation of positive
emotions is currently contradictory. Whilst some studies (e.g. Feldman et al., 2008; Raes, Daems,
Feldman, Johnson, & Van Gucht, 2009) report an association between hypomania and increases in
emotion- and self-focused rumination in response to positive stimuli; Edge, et al., (2013) detected no
such differences between participants with bipolar disorder and healthy controls. Furthermore,
whilst some studies report increased dampening in participants with bipolar disorder, others find
that this relationship disappears when controlling for depression, suggesting symptom
contamination is driving the association between dampening and hypomania (Raes et al, 2009).
1.5 Depression and Positive Emotions
1.5.1 Symptoms of Depression
Depression is characterised by low or irritable mood, with decreased interest or pleasure in
previously enjoyable activities (anhedonia). Secondary symptoms can include negative cognitions
(and suicidal ideation), decreased concentration, and somatic symptoms such as changes in sleep
and appetite.
Whilst much research has investigated the experience and regulation of negative emotions in
depression, the tripartite model of anxiety and depression (Clark & Watson, 1991; Watson & Clark,
1995) suggests that these may in fact be transdiagnostic symptoms of general distress. The model
posits that it is the anhedonic symptoms that are unique to depression (Clark & Watson, 1991).
Indeed, anhedonia uniquely predicts both protracted recovery and shorter time to relapse
(McMakin, Olino, & Porta, 2012).
However, anhedonia is currently poorly defined (Ho & Sommers, 2013). Treadway and Zald (2011)
argue for greater specificity in the definition of anhedonia, including the separation of hedonic and
motivational anhedonia, in order to better understand the underlying mechanisms. This is important
for two reasons. First, it guides decisions regarding which positive emotions to study in relation to
depression, as dysregulation is unlikely to be identical for all positive emotions. Second, it highlights
the need to consider both hedonic and instrumental emotion regulation when assessing
dysregulation of positive emotions.
Perhaps as a function of the non-specific definitions of anhedonia, the mechanisms underlying its
characteristic blunted response to positive emotions are also unclear. Decreased emotional
responding may be unique to positive emotions (positive emotional attenuation), or be part of a
Page | 15
wider profile of blunted emotional responding (Emotion Context Insensitivity). Furthermore,
anhedonia may arise from a lack of engagement of the behavioural approach system, or over-
engagement of the behavioural inhibition system. These possibilities are explored in more detail
below.
1.5.2 Depression, Positive Emotional Attenuation and Emotional Context Insensitivity
The deficits in engagement with approach related, positive stimuli has been well documented in
depression and forms the basis of both the positive attenuation and emotion context insensitivity
hypotheses (Rottenberg, Gross, & Gotlib, 2005; Rottenberg, 2005). Positive attenuation in depression
refers to a blunted response to positive stimuli, resulting in prolonged low mood. It is well
supported, with research showing reduced responding to positive stimuli (e.g. McFarland & Klein,
2009) and reduced sensitivity to reward (e.g. Kasch, Rottenberg, Arnow, & Gotlib, 2002; McFarland,
Shankman, Tenke, Bruder, & Klein, 2006). The emotion context insensitivity hypothesis incorporates
the concept of positive attenuation within a wider theory of both positive and negative emotions. It
posits that depression is characterised by disengagement with the environment, leading to reduced
emotional responding, regardless of valence (Rottenberg et al., 2005). Supportive evidence indicates
that when baseline mood is accounted for, reactivity to negative stimuli is, in fact, decreased for
depressed participants relative to healthy controls (e.g. Rottenberg, 2005), however such findings are
also mixed, with other researchers (e.g. McFarland & Klein, 2009) finding attenuated positive, but
not negative, emotional responding.
1.5.3 Depression and the BIS/BAS hypothesis
Mixed evidence has emerged regarding the relative impact of the behavioural inhibition and
activation systems on depression. Depression has been associated with increased BIS and decreased
BAS sensitivity, especially in the Reward responsiveness and drive subscales (e.g. Kasch et al., 2002).
However, these associations are not reliably replicated, with some studies finding depression related
to increased BIS activation but no impact of behavioural activation systems (Johnson, Turner, &
Iwata, 2003), and others finding associations between BAS subsystems (particularly reward
responsiveness and drive) but not BIS (e.g. Markarian, Pickett, Deveson, & Kanona, 2013; McFarland
et al., 2006).
There are a variety of possible explanations for these discrepancies. First, depression is considered to
be a heterogeneous disorder, with varying subtypes (e.g. anhedonic or anxious depression) and co-
morbidities (Goldberg, 2011). Thus, this differing profile of sensitivities may be related to variations
within the depressive phenotype. Second, BIS or BAS sensitivity may lead to behavioural avoidance of
situations which elicit uncomfortable system activation (e.g. someone with increased BIS sensitivity
may avoid anxiety inducing situations, therefore not showing symptoms of anxiety), thus sensitivity
may not directly relate to psychopathology (Carver & White, 1994).

Page | 16
Following from this, emotion regulation may be an important factor influencing the relationship
between BIS/BAS systems and depression (or indeed hypomania). Indirect support for this idea
comes from a study investigating the inter-relationships between depression, BIS/BAS activation,
emotion regulation strategies and sleep quality (Markarian et al., 2013). The study found the
relationship between depression and BAS activation to be entirely mediated by differences in
emotion regulation. However, the measure used only assessed regulation of negative emotions,
therefore whether regulation of positive emotions has a similar effect is yet to be determined.
1.5.4 Depression and regulation of positive emotions
Dysregulation of positive emotions in participants with depression may be a result of regulatory
engagement which, either directly or indirectly, reduces the intensity of positive emotions. Evidence
regarding the relationship between depression and regulation of positive emotions is currently
sparse. Of the strategies currently investigated, dampening rumination appears increased in
participants with depression (Feldman et al., 2008; Gilbert et al., 2013; Hudson, Harding, & Mezulis,
2015; Raes et al., 2009; Raes, Smets, Nelis, & Schoofs, 2012). There is also limited evidence
suggesting that depression is associated with reduced emotion-focused rumination, as measured by
the responses to positive affect scale (Werner-Seidler et al., 2013). However, the scale content for
the emotion-focused subscale (e.g. “think about how happy you feel”) may be confounded by
emotional awareness. Low awareness may result in a lack of acknowledgement of positive emotional
states, making emotion-focused savouring unlikely. Furthermore, the intentional regulation of
positive emotions may also depend on factors such as tolerability of the positive emotions (Gilbert,
McEwan, Catarino, Baião, & Palmeira, 2014) or commonly associated symptoms of depression such
as low self-esteem (Wood et al., 2003).
1.6 Measurement of emotion regulation The multi-component nature of emotion regulation presents several challenges in adopting optimal
assessment of these multiple systems (Adrian, Zeman, & Veits, 2011). Consequently, emotion
regulation has been operationalised using a vast array of measurement techniques. A full review of
all methodologies implemented when conducting emotion regulation research is beyond the scope
of the current work. However, key methodologies used in the thesis include self-report, experimental
manipulation of emotion regulation and physiological responding using heart rate variability. Such
measures will be explored in more detail below.
1.6.1 Self-report measures of emotion regulation
Self-report of emotion regulation can take many forms, including questionnaires, diaries and
experience sampling. However, diaries and experience sampling methodologies are not used in the
current work, thus will not be discussed further. This thesis uses several questionnaires to measure
the regulation of positive and negative emotions along with trait hypomania and depression.

Page | 17
Self-report is essential in the study of emotion. Asking people about their experiences provides a
direct measure of emotional responding, providing data that is not accessible through observational
and physiological responses (Kashdan, Biswas-Diener, & King, 2008). Therefore, alternate methods
such as collection of behavioural or physiological data should be considered complementary to,
rather than a replacement for, self-report measures.
There are multiple advantages to self-report measures. They are generally cheap, easy to administer
and score, and can be administered across a variety of mediums (e.g. in the laboratory, online, at
home). Furthermore, questionnaires addressing emotion regulation can provide a picture of
dispositional responding which may provide insight into factors associated with various repeating
emotional episodes (Aldao et al., 2010). However, such measures also have a range of limitations.
First, self-report data may be susceptible to demand characteristics and social desirability biases.
Arndt and Fujiwara (2014) argue that this may increase in participants with mental health problems,
due to the social stigma and prejudice potentially already experienced by these individuals. Non-
genuine responding (whether through demand characteristics or for other reasons) may require
some caution when interpreting self-report data. However social desirability is often measured
during scale construction (e.g. hypomanic personality scale, emotion regulation questionnaire), with
validation studies showing low reported correlation between measures of social desirability and
constructs of interest (e.g. Eckblad & Chapman, 1986; Gross & John, 2003). Furthermore, socially
desirable reporting can be diminished through self-administration of questionnaires, away from the
experimenter (Nederhof, 1985).
Second, accurate completion of measures of emotion regulation may require a level of emotional
awareness not available to all participants, thus leading to the under-reporting of implicit emotion
regulation strategies (Wirtz, Radkovsky, Ebert, & Berking, 2014). This may be particularly pertinent
when assessing emotion regulation skills before and after clinical interventions, as one of the
treatment goals may be to increase emotional awareness. Thus, any subsequent changes reported in
emotion regulation will need to be considered in light of this potentially increased awareness.
Related to this, some measures may have substantial overlap between scale items included to
measure emotion regulation and features of psychopathology (Aldao et al., 2010). Such measures
may also elicit responses which conflate emotion and it’s regulation (Cole et al., 2004).
Third, reflective of the overall research bias towards negative emotions, there are a lack of
instruments suitable for measuring the regulation of positive emotions (Carl et al., 2013).
Questionnaires that do address the regulation of positive emotions have typically been adapted from
equivalent negative scales (for example, the Responses to Positive Affect scale was based on the
response styles questionnaire, and the Difficulties in Regulating Positive Emotions, based on the
Difficulties in Regulating Emotions Scale), thus are limited in the number of strategies addressed.

Page | 18
Currently, only the Inventory of Responses to Positive Affective States (IRPAS; Wright & Armstrong,
2015) incorporates a wider array of emotional responding for positive emotions.
Finally, existing measures of emotion regulation are almost exclusively trait measures. Whilst this can
provide information about individual differences in overall approaches to emotion regulation, trait
measures are limited in the extent to which they can accurately reflect flexibility in emotion
regulation strategy use. Furthermore, they cannot detect subtleties in regulatory responding. For
example, trait measures cannot detect whether multiple strategies are adopted simultaneously, or
whether different strategies are adopted in response to different circumstances. Where state
emotion regulation data has been captured it has relied on questions based on face validity (Aldao &
Nolen-Hoeksema, 2013) or adaptations of the Emotion Regulation Questionnaire (Gross & John,
2003). These studies that have shown either limited state-trait correlation (Egloff, Schmukle, Burns,
& Schwerdtfeger, 2006), or have not reported validation of the state measures (e.g. Gruber et al.,
2012).
To address the lack of validated state-based measures of emotion regulation, and to widen the
variety of instruments available to measure regulation of positive emotions, chapter two focuses on
the development of a valence specific, state and trait measure of emotion regulation.
1.6.1.1 Self-report questionnaires included in the current project
Cognitive Emotion Regulation Questionnaire (Garnefski, Kraaij, & Spinhoven, 2001):
The Cognitive Emotion Regulation Questionnaire (CERQ; Appendix 1:) was developed to assess
cognitive emotion regulation strategies used in response to threatening or stressful life events
(Garnefski, Kraaij, & Spinhoven, 2001). The measure comprises of 9 subscales, including: self-blame,
other blame, rumination, catastrophising, positive refocusing, planning, positive reappraisal, putting
into perspective and acceptance. Scores on these subscales vary as a function of mental health
conditions (e.g. depression). Increased depression was associated with higher subscale scores for
rumination, self-blame and catastrophising and reduced positive reappraisal and refocusing
(Garnefski et al., 2001; Garnefski & Kraaij, 2006b; Kraaij, Pruymboom, & Garnefski, 2002). Elderly
participants with increased depression scores also showed increased acceptance scores compared
with those with lower depression scores (Kraaij et al., 2002). However, bipolar and depressed
samples may not differ in their responses to the CERQ subscales (Wolkenstein, Zwick, Hautzinger, &
Joormann, 2014). This may imply an inability of the measure to distinguish between these
populations. However, it may also reflect genuine similarities between patient groups, which would
be unsurprising given the established association between hypomania and depression. A shortened,
18 item version of the CERQ has also been created, which was used in the current project. This
version preserved the psychometric properties of the original scale and has been validated in a range
of adult and adolescent community and clinical populations (Garnefski & Kraaij, 2006a).
Page | 19
Depression, Anxiety and Stress Scale (Lovibond & Lovibond, 1995):
The original 42-item DASS was developed as a measure of low positive affect (depression),
physiological hyper-arousal (anxiety) and negative affect (stress) across general and clinical
populations (Lovibond & Lovibond, 1995). The DASS shares some similarities with the tripartite
model of anxiety and depression (Watson & Clark, 1995; Watson et al., 1995), used to form the
Mood and Anxiety Symptoms Questionnaire (MASQ; below). These include the characterisation of
autonomic arousal in anxiety, and anhedonia in depression. However, the DASS depression subscale
also includes items addressing hopelessness, whilst the MASQ depression subscale is more solely
focused anhedonic symptoms (Lovibond & Lovibond, 1995). The validation study reported that the
anxiety and depression subscales correlate well with the respective Beck Anxiety and Depression
Inventories, although there were still moderate correlations between the anxiety and depression
scales (Lovibond & Lovibond, 1995). The shortened 21-item scale (Henry & Crawford, 2005; Appendix
2) used in the current thesis, shows high reliability with the original scale (Henry & Crawford, 2005).
Difficulties in Emotion Regulation Scale (Gratz & Roemer, 2004):
The Difficulties in Emotion Regulation Scale (DERS; Appendix 3) was designed as a measure of
clinically relevant problems with emotion regulation. It comprises of six subscales assessing discrete
facets of emotional dysregulation, including non-acceptance of emotional responses, difficulties in
engaging in goal-directed behaviour, impulse control difficulties, lack of emotional awareness,
limited access to emotion regulation strategies and lack of emotional clarity (Gratz & Roemer, 2004).
The original scale focused exclusively on negative affect, and was found to correlate well with other
measures of emotion regulation (e.g. Negative Mood Regulation Scale), whilst accounting for
significant extra variance (Gratz & Roemer, 2004). Good convergent validity was reported both in the
original and subsequent validation papers. For example, increased overall scores were associated
with self-harm in men and women and partner abuse in men. Subsequent studies have, for example,
found subscale differences (limited strategy and goal directed behaviour subscales) between
recovered and never depressed samples (Ehring, Fischer, Schnulle, Bösterling, & Tuschen-Caffier,
2008) and internalising and externalising disorders in adolescents (Neumann, van Lier, Gratz, & Koot,
2010). In addition to the original scale, a revised DERS-positive has been recently published,
addressing responses to happiness (Weiss et al., 2015). The current project, however, only utilises
the original DERS questionnaire.
Emotion Regulation Questionnaire (Gross & John, 2003):
The Emotion Regulation Questionnaire (ERQ; Appendix 4) is based on the process model of emotion
regulation, explaining strategy use across a time-scale of antecedent and response focused actions
(Gross & Barrett, 2011; Gross & Thompson, 2009; John & Gross, 2004). The ERQ comprises of two
uncorrelated subscales, suppression and reappraisal. It is not valence specific, with items addressing

Page | 20
both positive and negative affect. It has been adapted for use as a state measure of emotion
regulation (Egloff et al., 2006; Gruber et al., 2012) but these adaptations have either not reported
scale validation (Gruber et al., 2012) or show modest relationships with the original ERQ scale (Egloff
et al., 2006).
Hypomanic Personality Scale (Eckblad & Chapman, 1986):
The Hypomanic Personality Scale (HPS; Appendices 5 & 6) was developed to assess hypomanic
personality traits, which may be indicative of risk for bipolar disorder (specifically mania or
hypomania). Initial and subsequent validation studies showed that the scale performed well at
differentiating those who met criteria for having hypomanic episodes (Eckblad & Chapman, 1986;
Meyer & Hautzinger, 2003), with high overall scores also predicting future onset of mood disorders,
including bipolar disorder and depression at 13 year follow-up (Kwapil et al., 2000). However, factor
analysis conducted after the initial validation suggested the HPS consisted of multiple subscales
(Rawlings, Barrantes-Vidal, Claridge, McCreery, & Galanos, 2000; Schalet, Durbin, & Revelle, 2011).
These showed distinct, opposing correlations with psychopathology measures. Increased mood
volatility was predictive of psychopathology whereas other subscales were indicative of healthy
emotional responding (Schalet et al., 2011). A reduction of the original 48-item scale was also
conducted using Rasch analysis, creating a unidimensional 20-item scale (Meads & Bentall, 2008).
Both the 20-item and original scales are used within the current research.
Mini Mood and Anxiety Symptoms Questionnaire (Casillas & Clark, 2000; Watson & Clark, 1995;
Watson et al., 1995):
The original Mood and Anxiety Symptoms Questionnaire (MASQ) was a 90 item scale based on the
tripartite model of anxiety and depression (Watson et al., 1995). This 3-factor model comprises of
general distress (common to both depression and anxiety), anhedonia (unique to depression) and
anxious arousal (unique to anxiety). Scale validation confirmed that the anxiety and depression
specific subscales elicited moderate correlations, accounting for considerably less shared variance
than with the general subscale. Convergent validity of specific subscales with the Beck Depression
and Anxiety Inventories remained good, despite the reduction in shared variance (Watson et al.,
1995). There are several existing adaptations providing shortened versions of the MASQ. The current
study uses the 26 item version (Appendix 7), which also demonstrated acceptable reliability and
convergent validity with other measures of depression and anxiety (Casillas & Clark, 2000).
Responses to Positive Affect Questionnaire (Feldman et al., 2008):
The Responses to Positive Affect Questionnaire (RPA; Appendix 8) is based on the rumination
component of the response styles questionnaire (Nolen-Hoeksema, 1991) and comprises of 3 sub-
scales designed to measure savouring and dampening ruminative responses to feeling good. The
savouring scale comprises of two subscales, emotion-focus, which reflects the extent to which

Page | 21
individuals focus on the mood and somatic experience, and self-focused, which captures the extent
to which individuals focused on their sense of self and pursuit of personally relevant goals. The initial
validation study showed increased dampening and decreased emotion focus scores were predictive
of depression, whilst higher scores on both savouring scales predicted mania and vulnerability for
mania (Feldman et al., 2008).
1.6.2 Experimental assessment of emotion regulation
Experimental manipulation of emotion regulation has typically relied upon giving participants
instructions to use a specific type of emotion regulation strategy in response to an induced
emotional state (e.g. Ehring, Tuschen-Caffier, Schnülle, Fischer, & Gross, 2010; Johnstone, van
Reekum, Urry, Kalin, & Davidson, 2007; Joormann, Cooney, Henry, & Gotlib, 2012). A range of
outcomes are considered, including the effects of the strategy on subjective and physiological
responses, as well as individual differences in engagement with the strategy under investigation.
These studies can provide valuable information regarding how participants may react to instructions
to regulate emotions in specific ways. This may be of particular interest where individual differences
in spontaneous emotion regulation emerge, as it can help to elucidate whether such differences are
the result of strategy selection, an inability to engage in particular types of regulation, or both.
However, evidence is emerging to suggest that even when instructed to use particular strategies,
participants may also engage in additional processes to achieve their regulatory goal (Demaree et al.,
2006; Opitz et al., 2015). Relatively few studies have investigated the spontaneous regulation of
emotion, or, as discussed above, the use of multiple regulation responses. Furthermore, in both
instructed and spontaneous regulation studies (Aldao & Nolen-Hoeksema, 2013; Egloff et al., 2006;
Ehring et al., 2010), investigators have typically focused on the regulation of negative emotions,
thereby neglecting the regulatory responses to positive stimuli. Study of spontaneous and instructed
regulation of positive emotions are considered by the author to be complementary approaches,
therefore both will be investigated in chapter 3 of the current thesis, with particular reference to
individual differences based on trait levels of hypomania and depression.
Emotional states are typically manipulated using varied techniques, for example video or auditory
stimuli, autobiographical memory tasks, vignettes or Velten procedures. A meta-analysis assessed
the relative effectiveness of many of these procedures, and found video or story presentations
elicited strongest emotional change, particularly for positive emotions (Westermann, Spies, Stahl, &
Hesse, 1996). These changes were evident in both self-report and physiological responses,
suggesting that they were not simply due to experimental demand characteristics. Additionally,
individual studies have validated video mood induction for a range of emotions (Gross & Levenson,
1995), demonstrating superiority over other methods (e.g. Isen & Gorgoglione, 1983). However, the

Page | 22
effect sizes of these inductions differ according to valence, with larger effect sizes for the elicitation
of negative emotions (Westermann et al., 1996).
1.6.2.1 Experimental manipulation of emotion regulation in the current project
Videos were selected throughout the current project to induce positive and negative emotions for
three reasons. As discussed above, videos effectively elicit emotions with larger effect sizes than
other induction methods. Therefore, they were selected over other forms of mood induction in order
to try and achieve the biggest emotional change from which to measure emotion regulation. Second,
the use of videos generated results that were comparable with several similar studies with results of
relevance to the current project (e.g. Gruber et al., 2008, 2011, 2012). Finally, the use of videos
enabled studies to be conducted both in the laboratory and online. Different video stimuli were used
for each of the studies, to avoid repeated exposure to the same stimuli for participants who took
part in more than one experiment.
1.6.3 Emotion regulation research using the internet
Online research comes with a variety of benefits including access to more diverse samples, decreased
cost and experimenter time, and reduced accidental non-responding (Birnbaum, 2004; Granello &
Wheaton, 2004; Kraut et al., 2004). Currently, online investigations of emotion regulation have
exclusively used self-report diaries and questionnaire measures. These have included daily measures
of self-esteem, emotional adjustment, positive and negative affect, emotion regulation (Nezlek &
Kuppens, 2008) and social anxiety, positive emotions, emotional expression and suppression
(Kashdan & Breen, 2008). Studies of similar phenomena (e.g. bereavement, relationships, anxiety,
panic, agoraphobia) have shown questionnaire measures administered online to elicit comparable
response properties to those obtained via pen and paper methods (Brock, Barry, Lawrence, Dey, &
Rolffs, 2012; Carlbring et al., 2007; Kashdan & Breen, 2008; Tolstikova & Chartier, 2010). This
suggests the internet has the potential to be a useful tool in emotion regulation research.
Thus far, experimental approaches to investigating emotion regulation have been conducted
predominantly in laboratory environments. However, a small number of mood induction procedures
have been tested online. Tests of the Velten procedure, photos, cartoons, jokes, written texts, and
emotive texts accompanied by pictures were used to elicit positive and negative emotions (Göritz &
Moser, 2006; Göritz, 2007; Verheyen & Goritz, 2009). Across the different methodologies, negative
mood was elicited more successfully than positive mood. Only cartoons and emotive texts
successfully elicited positive emotions (Göritz & Moser, 2006). However, to date, video mood
inductions are yet to be implemented via the internet, despite having the strongest laboratory effect
sizes (Westermann et al., 1996). Testing whether videos can elicit mood change online is a valuable
extension to current online mood induction methodologies. Furthermore, utilising video mood

Page | 23
induction within an emotion regulation paradigm would provide further validation of online
methodologies in emotion regulation research.
1.6.3.1 Internet research on emotion regulation and the current study
The current project assesses the feasibility of conducting an online instructed regulation experiment
using a video mood induction. This is discussed further in chapter four. The internet was also used for
data collection during the validation of the State/Trait Emotion Regulation Questionnaire, and to
assess spontaneous regulation of positive emotions (Chapter two and three respectively).
1.6.4 Physiological measures of emotion regulation
There are numerous well established physiological correlates of emotion regulation. Measurement of
such responses can include neuro-imaging techniques such as (f)MRI, EEG and PET and autonomic
nervous system measurements, for example, galvanic skin response and heart rate variability (HRV).
Collecting heart rate data is a cheap, minimally invasive technique that is widely used as an implicit
measure of emotional responding (e.g. Chang et al., 2012; Cohen et al., 2003; Kemp et al., 2010; Lane
et al., 2009). Heart rate variability (HRV) is used in chapter five as an implicit measure of emotional
reactivity and regulation. Therefore, the features and measurement of HRV in relation to emotional
responding are explored below.
1.6.4.1 Emotion regulation and heart rate variability
The most prominent determinant of cardiac functions such as heart rate is the autonomic nervous
system (ANS; Thayer, Loerbroks, & Sternberg, 2011). The ANS has two main components, the
sympathetic and parasympathetic nervous systems. The sympathetic nervous system is associated
with increased heart rate and physiological arousal in response to stress (Appelhans & Luecken,
2006) and takes effect over several seconds (Lane et al., 2009). Conversely, the parasympathetic
nervous system is referred to as the “rest and digest” system, as it dominates in periods of safety,
lowering heart rate and arousal (Appelhans & Luecken, 2006). The parasympathetic system takes
effect over milliseconds, thus is much faster than the sympathetic nervous system. Heart rate
variability can be conceptualised as a measure of the ongoing interplay between sympathetic and
parasympathetic nervous system regulation (Appelhans & Luecken, 2006). However, the rapid
alterations in inter-beat variability in heart rate indicate that heart rate variability (HRV) is primarily
under parasympathetic control (Thayer et al, 2011, Porges et al, 2007).
Heart rate variability can occur at several frequencies, each thought to result from co-varying
metabolic demands. Low frequency variation is proposed to arise from blood pressure regulation and
comprises of both sympathetic and parasympathetic influences (Porges, 2007). High frequency
variability is related to parasympathetic nervous system activation and is associated with respiration
(Porges, 2007). The high frequency variability associated with respiration is known as respiratory

Page | 24
sinus arrhythmia (RSA). There is currently disagreement amongst researchers regarding analysis of
RSA measures.
For example, whether respiration rate should be accounted for within measures of HRV and RSA, is
part of a wider debate regarding the relationship between respiration and cardiac function. Causal
models suggest that changes in respiration cause alterations in HRV, and therefore are an artefact
that should be controlled for during the analysis process (E.g. Butler, Wilhelm, & Gross, 2006).
However, there are several reasons to suggest that respiration should not be controlled for within
RSA analysis. Parallel models of respiratory and cardiac function (e.g. Porges, 2007) highlight the
shared neurological pathways from the nucleus ambiguus via the vagus nerve that influence both
respiration and HRV. This suggests that controlling for respiration should be avoided, as it would
eliminate valid shared variance in HRV arising through this central autonomic network, thus
potentially reducing variation in the key variable of interest (Denver, Reed, & Porges, 2007; Thayer et
al., 2011). Furthermore, respiration rate may only confound RSA data in specific methodological or
statistical circumstances. For example, the frequency of RSA has been shown to be highly correlated
with respiration frequency, however RSA amplitude was not correlated with spontaneous breathing
frequency (Denver et al., 2007).
1.6.4.2 Heart rate variability, emotion regulation and psychopathology
Respiratory Sinus Arrhythmia (RSA) has been reliably associated with emotional regulation during
both tonic (resting) and phasic (e.g. experimentally manipulated) periods (Lane et al., 2009; Thayer &
Lane, 2009). Tonic RSA is hypothesised to reflect autonomic flexibility, which is related to emotional
reactivity (Butler et al., 2006). Reduced tonic RSA is indicative of hyperactive sympathetic and
hypoactive parasympathetic activation (Thayer & Brosschot, 2005). This lack of parasympathetic
activation may result in an inability to respond flexibly and quickly to changing environmental
demands, thus making emotion regulation more difficult (Thayer & Lane, 2000). Indeed, low tonic
RSA is associated with increased negativity (Thayer & Brosschot, 2005), poor emotion regulation and
risk of psychiatric disorders (Porges, 2007), including depression, anxiety, schizophrenia and post-
traumatic stress disorder (Thayer & Lane, 2009). Conversely, increased tonic RSA has been associated
with greater positive mood (Kang & Gruber, 2013), positive emotional personality traits (extraversion
and agreeableness) and greater baseline positivity, but not increased reactivity to positive mood
manipulation (Oveis et al., 2009). Increased tonic RSA has also been associated with greater increases
in positivity and social connectedness over time (Kok & Fredrickson, 2010).
1.6.4.3 Heart rate variability, hypomania and bipolar disorder
Evidence relating heart rate variability (HRV) and bipolar disorder or hypomania is currently scarce
and contradictory. Euthymic and manic states in bipolar disorder have both been associated with
reductions in tonic respiratory sinus arrhythmia (Cohen et al., 2003; Henry, Minassian, & Paulus,
Page | 25
2010). Whilst medication was used by participants in both studies, there were no significant
differences in HRV detected as a function of medication type. The authors suggest that this implies
that the changes in HRV are associated with the disorder rather than medication. However, other
research has found no significant differences between patients with bipolar disorder and healthy
controls (Todder, Bersudsky, & Cohen, 2005). Yet further studies have shown that increased
hypomania is associated with increased tonic respiratory sinus arrhythmia (RSA), which remains
elevated across a variety of mood inductions (Gruber, et al., 2008). Furthermore, remitted patients
with bipolar disorder also showed elevated tonic RSA, and less reduction in RSA in response to mood
induction than healthy control participants (Gruber, Harvey, & Purcell, 2011). The limited available
evidence and confounding factors across studies (e.g. medication status, illness phase) make it
difficult to draw conclusions regarding whether, and how, HRV is associated with hypomania.
1.6.4.4 Heart rate variability and depression
Heart rate variability (HRV) has been extensively researched in relation to depression, with several
authors arguing that depression is associated with decreased HRV (e.g. Carney et al., 1995; Gorman
& Sloan, 2000; Kemp et al., 2010; Licht et al., 2008). However, many studies have predominantly
focused on patients with existing cardiac conditions, or have not controlled for medications or a
range of common co-morbid conditions which may impact on resting HRV (e.g. obesity). More recent
meta-analyses investigating RSA and depression found reductions in HRV were present in non-
medicated individuals (Kemp et al., 2010; Rottenberg, 2007), particularly in the high frequency
domain. No significant effects of medication on HRV were found (Kemp et al., 2010). However,
conflicting evidence was presented by a large cohort study, which found that anti-depressant
medication strongly attenuated the reduced RSA found in depressed individuals (Licht et al., 2008).
The evidence relating HRV to depression is further confused by contradictory findings suggesting that
increased RSA was predictive of increased sadness and decreased recovery from depression at six
month follow up (Rottenberg, Wilhelm, Gross, & Gotlib, 2002), studies showing no relationship
between HRV and depression (e.g. Lehofer et al., 1997) and studies showing HRV to be linked to
somatic, more than psychological symptoms of depression (Chang et al., 2012).
It is likely that some of the contradictions reported in the literature with regards to HRV and
depression arise through differences in measurement and analysis. As described in section 1.6.4.1,
such variations could include the addition of respiration as a covariate, or the use of paced breathing
(e.g. Rottenberg et al., 2002) in an attempt to control for respiration. Furthermore, most studies did
not differentiate between different subtypes of depression (e.g. melancholic or reactive depression),
which may further muddle the available evidence regarding depression and tonic HRV (Rottenberg,
2007).

Page | 26
Less research has been conducted in relation to phasic HRV and psychopathology. One of the often-
reported features of depression is flattened emotional reactivity (e.g. emotional context insensitivity
hypothesis; Rottenberg et al., 2005). However, physiological findings related to HRV are mixed. When
using a speech task, depressed participants showed greater reduction in HRV than healthy controls
(Hughes & Stoney, 2000). However, other research has shown depressed participants increased HRV
in response to stressors, whilst healthy controls showed the predicted reduction (Rottenberg, Clift,
Bolden, & Salomon, 2007). Furthermore, greater reduction in HRV in response to sad film clips was
predictive of improved recovery in depressed individuals (Rottenberg, Salomon, Gross, & Gotlib,
2005). It is possible to consider these findings in terms of the polyvagal theory (Porges, 2007), which
predicts reduced flexibility in cardiac responses due to lower parasympathetic control. Through this,
it becomes apparent there are at least two potential interpretations. First, if depressed patients
show reduced overall parasympathetic control, this could be indicative of reduced parasympathetic
responding (i.e. less overall change in HRV), which would account for the relationship between
recovery and decreased HRV (i.e. the change in HRV shown by those who recover indicates flexibility
in parasympathetic control not shown by those who remain depressed) and may be more apparent
in phasic than tonic HRV. Conversely, an overall lack of parasympathetic control experienced by
depressed participants, resulting in reduced tonic HRV, could lead to greater parasympathetic
withdrawal in response to stressors if phasic HRV is unaffected. This would account for the decreased
HRV shown by Hughes and Stoney (2000). However, whilst there is a growing body of evidence
relating both tonic and phasic HRV to depression, the nuances of such relationships remain unclear.
1.7 The current thesis This thesis focuses specifically on the measurement of, and individual differences in, the regulation of
positive emotions. The review of the extant literature has highlighted various considerations
pertinent to the current project. First, emotion regulation theorists have recently recognised the
importance of considering contextual variables as an integral part of emotion regulation. This shifts
research emphasis away from identifying “adaptive” and “maladaptive” emotion regulation
strategies, towards the notion that healthy emotion regulation is flexible and adaptable.
Parallel to this, research into the regulation of positive emotions has recently gained momentum as
an important consideration for emotional well-being. This has added unique explanatory and
discriminatory power to existing models of psychopathology. However, current knowledge regarding
how responding to positive emotions is associated with mental health conditions is still in its infancy.
Furthermore, emotion regulation research, particularly for positive emotions, is also hindered by a
lack of measurement tools which can adequately assess the dynamic and varied nature of such
regulation.

Page | 27
Finally, rapid advances in technology over recent decades have created opportunities to conduct
experimental emotion regulation research online. However, as yet, the feasibility of such research
has not been established.
1.7.1 Aims of the current research
The current project will contribute to existing research, addressing some of the issues outlined
above, through the following research aims:
1. To develop and validate, valence specific measures of state and trait emotion regulation
(chapter two). This will broaden the range of scales available to assess positive emotion
regulation, whilst also providing a measure of state-based emotion regulation.
2. To assess individual differences in the spontaneous and instructed regulation of positive
emotions (chapter three), contributing to the existing literature by assessing the relationship
between personality traits associated with risk for hypomania and depression.
3. To validate the use of online data collection in an experimental emotion regulation paradigm
(chapter four). Building on previous mood induction research, this also assesses the
effectiveness of online videos in eliciting changes in positive emotions.
4. To evaluate the effects of positive emotions on the subsequent regulation of responses to
negative stimuli (chapter five). This assesses whether the broadening of cognition and
attention hypothesised to be associated with positive emotions generalises to the
subsequent selection and effectiveness of emotion regulation strategies.
All studies conducted within the current thesis were approved by the University of Reading Research Ethics Committee.

Page | 28
CHAPTER 2:
DEVELOPMENT AND VALIDATION OF
THE STATE/TRAIT EMOTION
REGULATION QUESTIONNAIRES
(STERQ)

Page | 29
2.1 STERQ Chapter Summary There is growing evidence linking dysfunctional emotion regulation to psychopathology (e.g. Berking,
Wirtz, Svaldi, & Hofmann, 2014; Berking & Wupperman, 2012; Gross & John, 2003; Larsen et al.,
2012). However, emotion regulation assessment tools are limited, particularly in relation to positive
affect (Carl et al., 2013). Furthermore, validated self-report measures of emotion regulation are
almost exclusively trait-based (e.g. Cognitive Emotion Regulation Questionnaire (Garnefski & Kraaij,
2006a), Difficulties in Regulating Emotion Scale (Gratz & Roemer, 2004), Responses to Positive Affect
Scale (Feldman et al., 2008)).
The State/Trait Emotion Regulation Questionnaires (STERQ) provide valence specific, validated
measures of both state- and trait- based emotion regulation. Items were selected from existing
emotion regulation measures (regardless of valence)1. The resulting state and trait scales were
incorporated into two online mood induction studies (Positive: n = 307; Negative: n = 407) for item
reduction and subscale identification using Principal Axis Factoring. Item reduced STERQ scales from
phase 1 were used in two further online mood induction studies (Positive: n = 198; Negative: n = 210)
for maximum likelihood estimation of confirmatory factor analysis and assessment of convergent
validity and sensitivity to change (state scales).
After minor adjustments the four STERQ scales (State/Trait; Positive/Negative) had factor structures
with acceptable model fit and reliability and showed theoretically supported relationships with other
measures of mood and emotion regulation. Although not item matched, significant relationships
between associated state and trait subscales (e.g. state and trait intrusion) were also noted. These
scales broaden the emotion regulation strategies currently measured in response to positive
emotions. Furthermore, the state scales enable context specific measurements of emotion
regulation, which is crucial in defining adaptive and maladaptive strategies and their relationship to
wellbeing.
1 Item generation and recruitment for phase 1 was conducted in conjunction with another PhD student
Page | 30
2.2 STERQ Introduction The regulation of emotion is a dynamic system that can be both voluntary and automatic (Goldsmith
& Davidson, 2004; Phillips et al., 2008) and is implemented in the pursuit of short-term (hedonic) and
longer-term (goal directed) gain (Koole, 2009). Emotion regulation has been conceptualised as both a
process (e.g. Gross, 1998, 2009) and a skill (Berking, Wupperman, et al., 2008) and can be
contextually adaptive or maladaptive (e.g. Gross, 2009). Research on emotion regulation has
dramatically increased in recent decades (Gross, 2014). However, assessment of the regulation of
positive emotions has lagged behind their negative counterparts, in part due to a dearth of
appropriate assessment measures (Carl et al., 2013). Furthermore, questionnaire measures of
emotion regulation are almost exclusively trait-based. Given the context dependent nature of
successful emotion regulation, well-validated state measures must also be created to further our
understanding of the relationship between emotion regulation and well-being. To address these
current measurement deficits, the State/Trait Emotion Regulation Questionnaires (STERQ) were
developed.
2.2.1 Positive Emotions, Emotion Regulation and Mental Health
Positive emotions are strongly implicated in psychopathology, with differences in positive affect
being a predictive and differentiating factor for several disorders, including depression, anxiety and
schizophrenia (Watson & Naragon-Gainey, 2010). Positive and negative emotions can be considered
conceptually distinct but parallel constructs (Fredrickson, 2008; Watson, Clark, & Tellegen, 1988;
Watson & Naragon-Gainey, 2010). The “broaden and build” theory of positive affect (Fredrickson,
2001) posits that positive emotions elicit a broadened thought-action repertoire (e.g. widened
attention, increased flexible thinking and greater pro-social behaviour). Through such broadening, an
individual can build resources, fostering longer-term resilience (Fredrickson, Mancuso, Branigan, &
Tugade, 2000; Fredrickson, 2001; Tugade & Fredrickson, 2006). Indeed, the presence of positive
emotions have been shown to mitigate the effects of negative events (Wood & Tarrier, 2010) and
reverse cardiovascular arousal caused by stressors (Fredrickson et al., 2000). Conversely, an absence
of positive affect uniquely predicts future distress and negative outcomes, for example, longer time
to remission in depression (McMakin et al., 2012) and greater relapse after smoking cessation (Cook,
Spring, McChargue, & Doran, 2010).
However, to simply note the presence of negative or absence of positive emotions and infer
associated emotional dysregulation is insufficient when considering emotion regulation and
psychopathology (Berking & Wupperman, 2012). To be meaningful, two further issues must also be
considered. First, both emotion and its regulation must be contextually appropriate. Therefore the
presence of negative (or absence of positive) emotions is not necessarily indicative of
psychopathology and only problematic if they are incongruent with the current circumstance (Gross
Page | 31
& Thompson, 2009). Indeed, one challenge of successful regulation is to preserve the useful
functionality of emotions whilst limiting their destructive aspects (John & Gross, 2004). Following
from this, for emotion regulation to be a useful predictor of psychopathology, the mechanisms by
which such regulation functions, and its resulting impact on emotion, must also be specified and
examined (Berking & Wupperman, 2012).
The ability to modify, accept and tolerate emotions is an integral feature of mental health (Berking,
et al., 2008) and predicts subsequent mood and anxiety at 2 weeks follow up (Berking, Orth,
Wupperman, Meier, & Caspar, 2008). This was a unidirectional relationship, maintained even once
baseline mood and psychopathology was accounted for, further supporting the importance of
understanding emotion regulation as a mechanism underpinning mental health and well-being.
Furthermore, maladaptive emotion regulation is a key transdiagnostic feature of many mental
illnesses including depression (e.g. Gotlib & Joormann, 2010; Ehring, Fischer, Schnulle, Bösterling, &
Tuschen-Caffier, 2008; Ehring et al., 2010) and bipolar disorder (e.g. Thomas & Bentall, 2002; Gruber,
Eidelman, & Harvey, 2008; Gruber et al., 2012).
Investigation of the regulation of positive emotions has historically been neglected in favour of their
negative counterparts. Joseph and Wood (2010) argue that positive and negative emotions can be
assumed to lie on a continuum, thus allowing the reanalysis of existing datasets. However the limited
available evidence regarding the regulation of positive affect shows potential inaccuracies in
assuming regulation strategies will have the same effect on both positive and negative emotions. For
example, whilst suppression has been repeatedly shown to be ineffective, and often
counterproductive, in reducing negative emotions (e.g. Ehring et al., 2010), it may successfully
reduce positive affect (Nezlek & Kuppens, 2008). Furthermore, the regulation of positive emotions
has been shown to be a unique predictor of current and future psychopathology, even after
accounting for the impact of negative affect (Raes, Smets, Nelis, & Schoofs, 2012; Werner-Seidler,
Banks, Dunn, & Moulds, 2013; Wood & Tarrier, 2010; Wood, Heimpel, & Michela, 2003).
The difference in outcomes of the regulation of positive and negative emotions, and their
subsequent impact on mental health make the regulation of positive emotions an essential target for
future research. Such research is hindered by a lack of appropriate assessment tools (Carl et al.,
2013). Most commonly used scales assessing regulation in positive emotions are adaptations of
specific scales investigating the regulation of negative emotions. For example, the responses to
positive affect scale (RPA; Feldman et al., 2008) addresses 3 sub-types of rumination and was
developed from the ruminative responses scale (Treynor et al., 2003), whilst the Difficulties in the
Regulation of Positive Emotions (DERS-Positive; Weiss, Gratz, & Lavender, 2015) used the non-
acceptance, difficulties in goal engagement and difficulties in impulse control subscales from the
original Difficulties in Emotion Regulation Scale (DERS; Gratz & Roemer, 2004). To date, only the

Page | 32
Inventory of Responses to Positive Affective States (IRPAS; Wright & Armstrong, 2015) has
encompassed a broader range of both types of, and responses to, positive emotions.
In the current study, the potential inclusion of a wider variety of emotion regulation strategies was
achieved through considering items from a range of existing emotion regulation scales (irrespective
of scale valence).
2.2.2 State-based assessment of emotion regulation
Trait based measures provide valuable information about cumulative or longer term effects of
emotion regulation strategies. However, they have limited utility when investigating the interaction
between such strategies or the contexts of their use. For example, the widely cited process model of
emotion regulation (Gross, 1998b) depicts a series of dynamic stages which contribute to the
generation of emotions, thus providing potential for regulation (Gross, 1998b). Such regulation is
either antecedent (i.e. preceding the emotion onset) or response focused. Two of the most widely
researched strategies emerging from this model are reappraisal (antecedent) and suppression
(response focused), both measured by the Emotion Regulation Questionnaire (ERQ; Gross & John,
2003). Analysis of ERQ responses show no correlation between reappraisal and suppression use,
suggesting that they operate independently (Gross & John, 2003). However, they are conceptualised
as temporally distinct. Therefore trait based measures cannot inform us of potential interaction
between these strategies. For example, where a participant reports using high levels of both
suppression and reappraisal, they may use different strategies in different situations, or alternatively,
in some situations, may have unsuccessfully tried reappraisal, subsequently using suppression to
regulate their emotion.
This more nuanced understanding of the interaction between, and implementation of, emotion
regulation strategies is crucial given that the adaptiveness of such strategies is, in part, context
defined (Gross & Thompson, 2009; John & Gross, 2004). Therefore to fully understand how different
emotion regulation strategies are linked to psychopathology, the ability to measure emotion
regulation across multiple contexts is essential and not achievable through exclusive use of trait
measures.
State based studies of emotion regulation currently use either study instructions to prescribe specific
regulation strategies (e.g. Ehring, Tuschen-Caffier, Schnülle, Fischer, & Gross, 2010; Johnstone, van
Reekum, Urry, Kalin, & Davidson, 2007; Joormann, Cooney, Henry, & Gotlib, 2012) and observe the
resultant effects on emotion, or have used reduced conversions of the ERQ, that are limited to
measuring state suppression and reappraisal (e.g. Nezlek & Kuppens, 2008; Gruber et al., 2012). Both
approaches have significant limitations. Whilst instructed regulation experiments provide a useful
method for establishing short-term cause and effect, it is difficult to determine how such instructions
interact with personality traits and habitual regulation style to impact on current emotions.

Page | 33
Furthermore, it is also unclear whether the effects noticed in response to instructed regulation
strategies are a result of the strategy being tested, or the instruction which required a particular type
of regulation that may or may not be congruent with individuals natural responses (Egloff et al.,
2006).
Experimental studies investigating the spontaneous use of emotion regulation strategies tend to
exclusively rely on items adapted from the ERQ to create state-based measures. When assessing the
regulation of negative emotions, Egloff et al (2006) validated a shortened version of the ERQ,
showing good consistency and internal validity. However, the relationship between the state
suppression and reappraisal subscales and their ERQ counterparts were limited, with, at best, only
medium effect sizes. Without further research, it is unclear whether this limited state/trait
relationship is due to the scale modification, or is a genuine reflection of the difference between
state responding and trait reporting. To date, alternative reductions of the ERQ have not reported
validation of the state adapted scale (e.g. Gruber et al, 2012).
Therefore to gain a better understanding of the intricacies associated with emotion regulation and
improve research into the temporal dynamics of such regulation, a range of validated state-based
emotion regulation questionnaires are needed. Through such measures, we can begin to ascertain
whether the current similarities and differences between state and trait responding are genuine
features of emotion regulation, or whether they are the product of less than optimal assessment
tools.
2.2.3 The State/Trait Emotion Regulation Questionnaires (STERQ)
The current scales were designed to address an unmet need to provide valence specific, validated
measures of both state- and trait- based emotion regulation. Development occurred in two phases;
item generation and reduction (phase 1), and validity, reliability, sensitivity to change and
confirmatory factor analysis (phase 2). In both phases, separate studies were conducted for positive
and negative emotions, with each study comprising of both state and trait components.
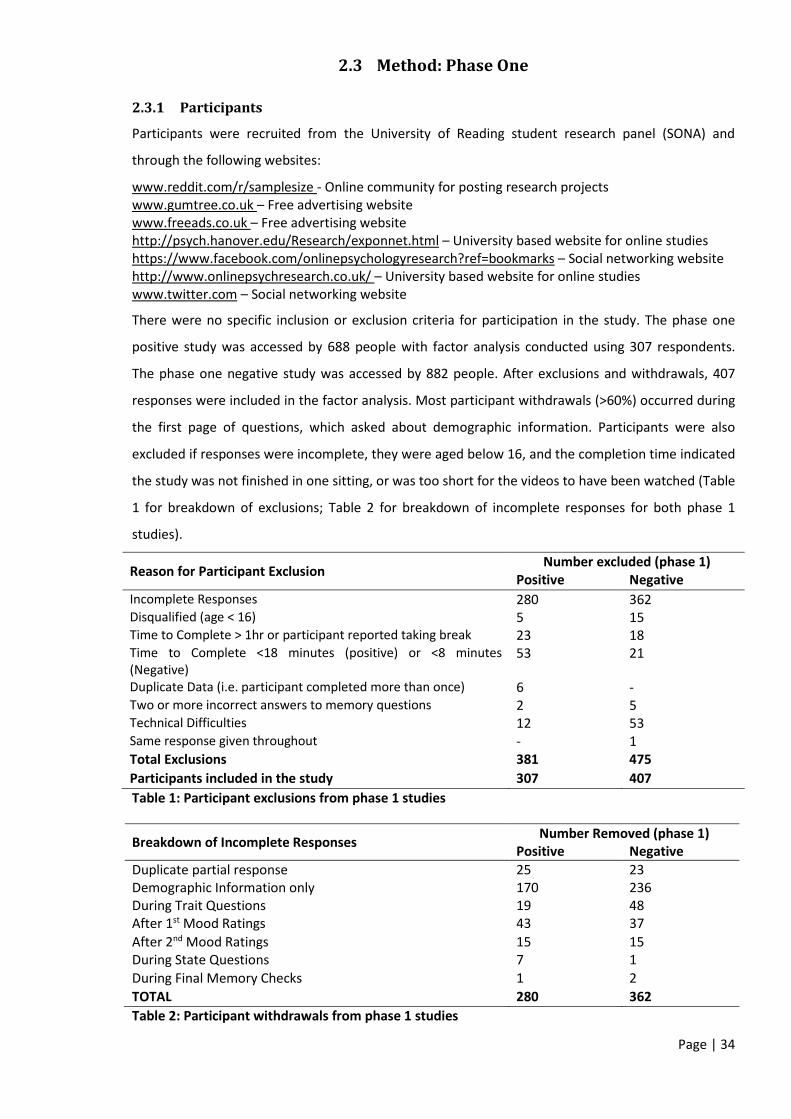
Page | 34
2.3 Method: Phase One
2.3.1 Participants
Participants were recruited from the University of Reading student research panel (SONA) and
through the following websites:
www.reddit.com/r/samplesize - Online community for posting research projects www.gumtree.co.uk – Free advertising website www.freeads.co.uk – Free advertising website http://psych.hanover.edu/Research/exponnet.html – University based website for online studies https://www.facebook.com/onlinepsychologyresearch?ref=bookmarks – Social networking website http://www.onlinepsychresearch.co.uk/ – University based website for online studies www.twitter.com – Social networking website
There were no specific inclusion or exclusion criteria for participation in the study. The phase one
positive study was accessed by 688 people with factor analysis conducted using 307 respondents.
The phase one negative study was accessed by 882 people. After exclusions and withdrawals, 407
responses were included in the factor analysis. Most participant withdrawals (>60%) occurred during
the first page of questions, which asked about demographic information. Participants were also
excluded if responses were incomplete, they were aged below 16, and the completion time indicated
the study was not finished in one sitting, or was too short for the videos to have been watched (Table
1 for breakdown of exclusions; Table 2 for breakdown of incomplete responses for both phase 1
studies).
Reason for Participant Exclusion Number excluded (phase 1)
Positive Negative Incomplete Responses 280 362 Disqualified (age < 16) 5 15 Time to Complete > 1hr or participant reported taking break 23 18 Time to Complete <18 minutes (positive) or <8 minutes (Negative)
53 21
Duplicate Data (i.e. participant completed more than once) 6 - Two or more incorrect answers to memory questions 2 5 Technical Difficulties 12 53 Same response given throughout - 1 Total Exclusions 381 475 Participants included in the study 307 407 Table 1: Participant exclusions from phase 1 studies
Breakdown of Incomplete Responses Number Removed (phase 1) Positive Negative
Duplicate partial response 25 23 Demographic Information only 170 236 During Trait Questions 19 48 After 1st Mood Ratings 43 37 After 2nd Mood Ratings 15 15 During State Questions 7 1 During Final Memory Checks 1 2 TOTAL 280 362 Table 2: Participant withdrawals from phase 1 studies
Page | 35
2.3.2 Materials
2.3.2.1 State/Trait Emotion Regulation Questionnaires (STERQ)
Items for the State/Trait Emotion Regulation Questionnaires were generated through collation and
modification of existing emotion regulation scale items for positive and negative affect. STERQ is
intended for use with older adolescents and adults, therefore scale items were only included if they
had previously been used with adolescent populations. To identify suitable scales, first measures of
emotion regulation discussed in the review by Adrian, Zeman, and Veits (2011) were considered for
inclusion. Next, the search terms “emotion regulation questionnaire”, “emotion regulation scale”,
“affect regulation scale”, “affect regulation questionnaire”, “positive emotion regulation scale” and
“positive emotion regulation questionnaire” were entered into Web of Knowledge and Google
Scholar, and existing measures of emotion regulation identified. Items were considered from the
following questionnaires: Cognitive Emotion Regulation Questionnaire (Garnefski, Kraaij, &
Spinhoven, 2001), Children’s Emotion Management Scale (Zeman et al 2001), Negative Mood
Regulation Scale (Catanzaro & Mearns, 1990), Difficulties in emotion regulation scale (Gratz &
Roemer, 2004), Emotion expression scale for children (Penz-Clyve & Zeman, 2002), Emotion
regulation questionnaire for children and adolescents (Gullone & Taffe, 2012), Emotion regulation
index for children and adolescents (MacDermott, Gullone, Allen, King & Tonge, 2010), Responses to
stress questionnaire (Connor-Smith, Compas, Wadsworth, Thomsen & Saltzman, 2000), Emotion
regulation of others and self (EROS) scale (Niven, Totterdell, Stride & Homan, 2011), Mindful
Attentional Awareness Scale (Brown & Ryan, 2003), Coping through Emotional Approach scale
(Stanton, Kirk, Cameron & Danoff-Burg, 2000), Emotion Amplification and Reduction scale (Hamilton
et al., 2009), COPE Scale (Carver, Scheier & Weintrub, 1989), Cognitive and affective mindfulness
scale (Feldman, Hayes, Kumar, Greeson & Laurenceau, 2006), Early Adolescent Temperament
Questionnaire (Ellis & Rothbart, 2001), Child Affect Questionnaire (factors only; Garber, Braafladt &
Weiss, 1995), Responses to Positive Affect Scale (Feldman et al., 2008), Dispositional positive
emotion scale (Shiota, Keltner & John, 2006). 491 items were identified and grouped into categories.
368 items were removed as they were either duplicates of other items, or only relevant to highly
specific situations. A selection of remaining items which best represented each category were
reworded so that they were valence neutral. The final scales comprised of 41 trait items and 32 state
items (See Appendices 13-16 for STERQ scale items).
2.3.2.2 Mood Induction Stimuli
In order for the STERQ state scale to refer to a specific event, participants underwent a mood
induction to provide a point of reference for completion of the scale. Phase 1 positive study
participants viewed an extract from “Mr Bean” lasting approximately 7 minutes, whilst phase 1
negative study participants watched an excerpt from “The Lion King” showing the sudden death of a
main character in a stampede, lasting approximately 3.5 minutes.
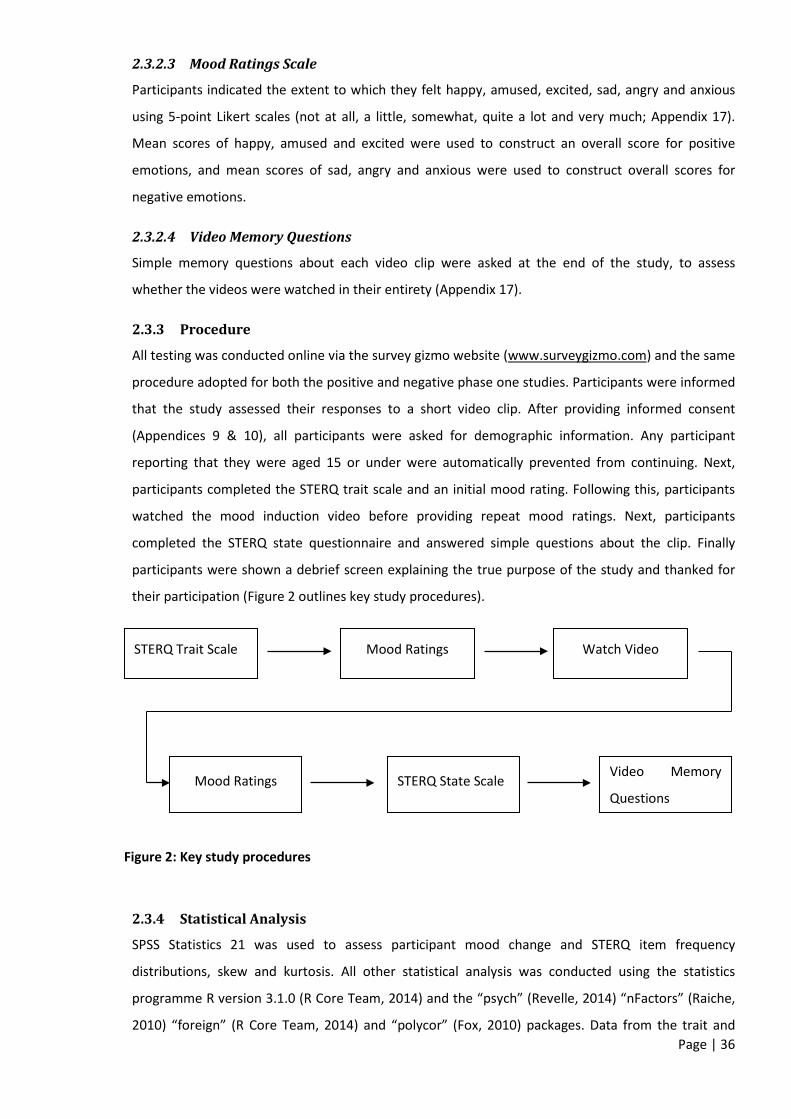
Page | 36
2.3.2.3 Mood Ratings Scale
Participants indicated the extent to which they felt happy, amused, excited, sad, angry and anxious
using 5-point Likert scales (not at all, a little, somewhat, quite a lot and very much; Appendix 17).
Mean scores of happy, amused and excited were used to construct an overall score for positive
emotions, and mean scores of sad, angry and anxious were used to construct overall scores for
negative emotions.
2.3.2.4 Video Memory Questions
Simple memory questions about each video clip were asked at the end of the study, to assess
whether the videos were watched in their entirety (Appendix 17).
2.3.3 Procedure
All testing was conducted online via the survey gizmo website (www.surveygizmo.com) and the same
procedure adopted for both the positive and negative phase one studies. Participants were informed
that the study assessed their responses to a short video clip. After providing informed consent
(Appendices 9 & 10), all participants were asked for demographic information. Any participant
reporting that they were aged 15 or under were automatically prevented from continuing. Next,
participants completed the STERQ trait scale and an initial mood rating. Following this, participants
watched the mood induction video before providing repeat mood ratings. Next, participants
completed the STERQ state questionnaire and answered simple questions about the clip. Finally
participants were shown a debrief screen explaining the true purpose of the study and thanked for
their participation (Figure 2 outlines key study procedures).
2.3.4 Statistical Analysis
SPSS Statistics 21 was used to assess participant mood change and STERQ item frequency
distributions, skew and kurtosis. All other statistical analysis was conducted using the statistics
programme R version 3.1.0 (R Core Team, 2014) and the “psych” (Revelle, 2014) “nFactors” (Raiche,
2010) “foreign” (R Core Team, 2014) and “polycor” (Fox, 2010) packages. Data from the trait and
Video Memory
Questions STERQ State Scale Mood Ratings
Mood Ratings STERQ Trait Scale Watch Video
Figure 2: Key study procedures

Page | 37
state questionnaires were analysed separately for each study (positive and negative) and exploratory
factor analysis conducted to reveal latent relationships between variables and perform item
reduction. As all questions have ordinal, Likert scale data, polychoric2 correlational matrices were
produced and used for subsequent factor analysis. Several items had non-normal distributions,
therefore Principal Axis Factoring was used as this approach does not make distributional
assumptions (Costello & Osborne, 2005; Fabrigar, Wegener, MacCallum, & Strahan, 1999). The
number of factors to be extracted was established through creating competing models, based on
parallel analysis, Velicer’s MAP and inspection of the scree plot3. Reliability analysis was conducted
using Cronbach’s alpha. As the questionnaire data was ordinal, Cronbach’s alpha was tested using
the polychoric matrix for each factor rather than the raw data. In addition to factor reliability, an
overall scale alpha was also computed to establish whether the scale could be used as an overall
measure of emotional dysfunction. Final models were selected based on the amount of variance
explained by the factor model, factor reliability, as measured by Cronbach’s alpha, and factor
interpretability. For key analysis procedures see Figure 3.
2 Polychoric correlations calculate Pearson’s coefficients for ordinal data. This can help correct severe skew/kurtosis by assuming normality in the projected underlying distribution, upon which the coefficients are calculated. 3 These are widely accepted to be more accurate than using Kaiser’s eigenvalues >1 criterion. For discussion of these methods, see Costello & Osborne (2005)
Figure 3: Phase 1 analysis
Conduct Reliability Analysis
Conduct Factor Analysis for item reduction
Identify number of factors to retain
Participant characteristics and item checks

Page | 38
2.4 Results: Phase One
2.4.1 Preliminary analysis
2.4.1.1 Participant Characteristics
STERQ positive phase 1 comprised of 307 participants aged 16-65 (median age 20; 58 male) from 7
countries (81% UK, 12% USA, 7% miscellaneous). Analysis of STERQ negative phase 1 included data
from 407 respondents aged 16-69 (median age 19; 78 male) from 12 countries (59% USA, 33% UK,
8% miscellaneous).
2.4.1.2 Mood Manipulation
Overall positive and negative mood ratings were constructed using the mean of the appropriate
mood scale items. As intended, the positive mood induction video elicited a small but significant
increase in positive (happy, amused and excited) emotions (t(306) = 4.721, p < .001, d = .54) and a
decrease in negative (sad, anxious and angry) emotions (t(306) = 10.863, p < .001, d = 1.24). The
negative mood induction video also worked as intended, eliciting a significant decrease in positive
emotions (t(406) = 22.257, p < .001, d = 2.21) and increase in negative emotions
(t(406) = 14.941, p < .001, d = 1.48). Table 3 shows mean ratings of positive and negative emotions
before and after each mood induction.
Pre-Positive Score (sd)
Post-Positive Score (sd)
Pre-Negative Score (sd)
Post-Negative Score (sd)
Phase 1 Positive 1.624 (.972) 1.862 (.939) .774 (.774) .385 (.594) Phase 1 Negative 1.511 (.957) .546 (.705) .909 (.866) 1.559 (.950) Table 3: Mood ratings before and after phase 1 mood induction
2.4.1.3 Item characteristics
All items in STERQ negative scales elicited responses across the full 5 point scale (not at all to very
much). In the STERQ positive scales, only 4 of the 5 scale points were used for trait item 2 and state
item 27. All other items in the STERQ positive scales also elicited answers across the entire scale.
Several items were identified with absolute skew values >2 and/or kurtosis values >7, indicating
severe departure from normality (Fabrigar et al., 1999).
2.4.1.4 Inter-item correlations, multi-collinearity and sampling adequacy
A high degree of multi-collinearity was indicated by the determinants of all polychoric matrices
(Positive: trait determinant = 0.8*e12; state determinant = 1.27*e9; Negative:
trait determinant = 6.65*e10; state determinant = 7.00*e10). Where two items were highly correlated
(r > .8) the item with the greatest further collinearity was removed. Remaining multi-collinearity
suggested the determinant was unduly influenced by individual items moderately correlating with
many other items (Field, 2009). This was addressed through a compromise between removing
questions with many moderate inter-item correlations and preserving at least 3 correlations for

Page | 39
items correlating with fewer other questions. For the state scales, preserving symmetry across the
trait and state scales was also influential when selecting items for removal. Finally, items that
correlated with fewer than 3 other items (threshold of r = ±.30) were removed to reduce noise in the
factor models (Field, 2012).
The Kaiser-Meyer-Olkin measure indicated a good sample size for analysis in all STERQ scales
(minimum .65), Bartlett’s test of sphericity was significant for all scales (p < .001) and examination of
the determinants indicated that the issue of multi-collinearity had been resolved (highest
determinant 1.86*e5).
2.4.2 Item Reduction
2.4.2.1 Method of analysis and number of factors for retention
To establish the appropriate level of factor retention the polychoric correlation matrices were
analysed using parallel analysis, Velicer’s MAP and examination of scree plots. Table 4 shows
recommended factor retention for each scale. Scree plots are displayed in Appendix 18.
Parallel Analysis Velicer’s MAP Scree Plot STERQ Positive Trait 5 4 4 STERQ Positive State 5 4 4 STERQ Negative Trait 5 3 4 STERQ Negative State 5 3 4 Table 4: Number of factors identified for retention
2.4.2.2 Factor Retention
The models suggested by Velicer’s MAP, parallel analysis and scree plots were created using Principal
Axis factor analysis. Overall scale and subscale reliability was good (α range > .70). However in the
state scales, automatic item reversal was not consistent with the factor structures and loadings,
indicating that the overall state scales may not be consistent with the constituent factors.
Within each scale high levels of overlap were observed between the factors. Selection of the final
model was a compromise between the variance explained by the model and interpretability and
reliability of the factors within it. In all STERQ scales, items were removed if they did not load onto
reliable factors (i.e. factors with 3 or more items and acceptable Cronbach’s alpha; Costello &
Osborne, 2005), had low item-total correlation (r <. 35), had a factor loading >.4 for more than one
factor (Costello & Osborne, 2005), or if removal improved the interpretability or reliability of a factor
(Appendices 13 – 16 provide detailed breakdown of item removal). The models retained for each
scales are outlined within Table 5. Factor loadings for the retained models are located in Appendix
19.

Page | 40
STERQ Scale Final Model Factors retained
Factor names (number of items)
Total Variance Explained
STERQ Positive Trait 4 factor 3 Intrusion (4) .42 Avoidance (3) Expression (4) STERQ Positive State 5 factor 4 Intrusion (4) .46 Avoidance (3) Awareness (3) Harnessing (3) STERQ Negative Trait 5 factor 4 Intrusion (4) .41 Avoidance (3) Expression (3) Harnessing (4) STERQ Negative State 5 factor 4 Intrusion (4) .47 Awareness (4) Harnessing (4) Perspective-Taking (3) Table 5: Model properties of each STERQ scale
2.5 STERQ Method: Phase Two The reduced STERQ trait and state scales were incorporated into two mood induction studies (one
positive, one negative) to confirm subscale factors and validate the scales against existing measures
of mood and emotion regulation. Sensitivity to change was also assessed within the state scales. To
adequately assess model fit, the study aimed to recruit 200 completed responses in both the positive
and negative validation studies, described as a “critical sample size” rule of thumb by Hoe (2008).
2.5.1 Participants
Participants were recruited from the University of Reading student research panel (SONA) and the
websites outlined in phase 1. There were no specific inclusion or exclusion criteria for participation in
the study. The STERQ positive phase two was accessed by 271 people, with further analysis
conducted using data from 198 respondents. The STERQ negative phase two was accessed by 350
people, with data from 210 respondents used. Most participant withdrawals (>60%) occurred prior to
the first STERQ state questionnaire. Participants were also excluded if responses were incomplete,
they were aged below 16, and the completion time indicated the study was not finished in one
sitting, or was too short for the videos to have been watched. Breakdown of exclusions and
incomplete responses for both phase 2 studies are shown in Table 6 and Table 7 respectively.
Reason for Participant Exclusion Number excluded
STERQ Positive STERQ Negative Incomplete Responses 60 108 Disqualified (age < 16) - 4 Time to Complete indicated study was not completed in one sitting
8 16
Duplicate Data (i.e. participant completed more than once) 1 - Two or more incorrect answers to memory questions 4 12 TOTAL 73 140 Table 6: Participant exclusions from STERQ phase 2

Page | 41
Breakdown of Incomplete Responses Number Removed STERQ Positive STERQ Negative
Demographic Information only 31 38 During STERQ Trait Questions 0 1 Before first video 1 1 After first video 10 30 During first STERQ State questionnaire 4 7 First video memory questions - 1 During trait mood and emotion regulation validation scales 7 15 During second video 6 14 Prior to second STERQ state questionnaire 1 1 TOTAL 60 108 Table 7: Participant withdrawals from STERQ phase 2
2.5.2 Materials
2.5.2.1 Mood induction stimuli
Two video mood inductions per study provided specific events prior to answering the state STERQ
scales. The first video was incorporated to provide a “baseline” event and was intended to be
valence neutral. The second was selected to elicit a positive or negative emotional response
(depending on the study). Two videos were used to enable sensitivity to change analysis for the
STERQ state scales to be conducted. The clips used for each study are shown in Table 8.
Study Baseline video Mood induction video Phase 2 Positive
Short documentary about penguins (approx. 2 minutes)
“Helping hands” comedy sketch (approx. 3 minutes)
Phase 2 Negative
Short documentary about wolves (approx. 3.5 minutes)
Beginning of the film “Up” (the death of one of the characters; approx. 9 minutes)
Table 8: Phase 2 baseline and mood induction videos
2.5.2.2 Mood and emotion regulation questionnaires
In addition to the STERQ scales created in phase 1, the state modified Emotion Regulation
Questionnaire (Gruber et al., 2012), Depression, Anxiety and Stress Scale (21 item version; Lovibond
& Lovibond, 1995), reduced 20 item version of the Hypomanic Personality Scale (Meads & Bentall,
2008), Responses to Positive affect scale (Phase 2 Positive only; Feldman, Joormann, & Johnson,
2008), Cognitive Emotion Regulation Questionnaire (18 item version; Phase 2 Negative only;
Garnefski & Kraaij, 2006), Difficulties in Regulating Emotions Scale (Phase 2 Negative only; Weiss,
Gratz, & Lavender, 2015) were used to assess convergent validity of the STERQ scales. For further
information on these scales, see section 1.6.1.1. The mood rating scale used in phase 1 (Section
2.3.2.3) was also used in phase 2.

Page | 42
2.5.3 Procedure
All testing was conducted online via the survey gizmo website (www.surveygizmo.com) and the same
procedure adopted for both positive and negative phase two studies. Participant information sheets
are shown in Appendices 11 and 12. Demographic information was used to automatically prevent
anyone aged below 16 from continuing. Participants completed the STERQ trait scale and initial
mood rating. Following this, participants watched the baseline video then completed a second mood
rating. Next participants completed the STERQ state scale and state-modified emotion regulation
questionnaire. Then participants answered simple questions about the video to ensure compliance
with watching the clip (Appendix 20). Following this, participants completed a range of trait mood
and emotion regulation scales. Finally, participants underwent a second mood induction, with mood
ratings taken before and after. As with the baseline video, participants also completed the state
STERQ, emotion regulation and video memory questions (Figure 4 for study outline).

Page | 43
Mood Induction
Baseline procedures
Trait Mood and Emotion Regulation Measures
Figure 4: STERQ phase 2 study outline
Mood Rating
Mood induction
video
Mood Rating
Memory questions
Emotion regulation
scales
Mood Rating
Baseline Video
Mood Rating
Memory questions
Emotion regulation
scales
STERQ Trait
Page | 44
2.5.4 Statistical Analysis
Data from the trait and state questionnaires were analysed separately for each study (positive and
negative). Confirmatory factor analysis (CFA) and reliability analysis were conducted using the
statistics programme R version 3.1.0 (R Core Team, 2014) and the “psych” (Revelle, 2014) “foreign”
(R Core Team, 2014) “polycor” (Fox, 2010) and “lavaan” (Rosseel, 2012) packages. Partial correlations
were conducted using the statistics programme R version 3.1.0 (R Core Team, 2014) and the “psych”
(Revelle, 2014), “foreign” (R Core Team, 2014) and “ppcor” (Kim & Yi, 2007) packages. All other
analyses were conducted using SPSS version 21. Path diagrams for CFA were recreated using SPSS
AMOS version 21 to improve clarity.
Reliability analysis for each subscale was conducted using Cronbach’s alpha. As with phase 1,
Cronbach’s alpha was tested using the polychoric matrix for each factor rather than the raw data,
due to the ordinal nature of the scale responses.
Next, competing CFA models were generated using Maximum-likelihood (ML) estimation, and model
fit determined using the comparative fit index (CFI, Bentler, 1990). In CFI the model in question is
compared with a “baseline model” which assumes no underlying relationships between items. CFI
values should not fall below .90 (Kenny, Kashy & Cook, 2006, p105). CFI was selected as this is less
sensitive to sample size than the traditionally used chi-square. Where the data was non-normally
distributed, ML estimates were conducted using the Satorra-Bentler correction and referred to as
robust ML estimates. The Standardised Root Mean Square Residuals (SRMR) will also be reported,
providing an alternative fit index whereby the overall difference in observed and predicted
correlations is recorded. Values below 0.08 are considered indicative of reasonable model fit
(Hooper, Coughlan, & Mullen, 2008).
The relationship between trait and state subscales of the STERQ positive and negative scales was
assessed using Spearman’s correlations to determine the relative similarity of trait and state scales. If
the trait and state subscales correlated significantly, and at a higher level than other trait-to-state
relationships (e.g. trait and state intrusion correlated more strongly than trait intrusion and state
avoidance) they were considered to be measuring similar constructs.
Convergent validity was examined using Spearman’s correlations between the STERQ subscales and
existing emotion regulation scales (Responses to positive affect questionnaire (RPA); Difficulties in
Emotion Regulation Scale (DERS); Cognitive Emotion Regulation Questionnaire (CERQ)). The following
relationships would be predicted for convergent validity to be assumed:
STERQ Positive
1. State and trait emotional intrusion (STERQ subscales) would be positively associated with
emotion focus (RPA Scale)

Page | 45
2. Emotional expression (STERQ Positive trait) and awareness (STERQ Positive state) would be
negatively associated with dampening of positive emotions (RPA Scale)
STERQ Negative
1. Positive associations between:
a. Trait and state emotional intrusion (STERQ subscales) and overall dysregulation of
emotion (DERS total and CERQ negative total)
b. Trait emotional avoidance (STERQ) and overall dysregulation of emotions (DERS total
and CERQ negative total) and non-acceptance of emotion (DERS subscale)
c. Trait emotional harnessing (STERQ) and CERQ positive total
2. Negative associations between:
a. Trait emotional harnessing (STERQ) and DERS total and difficulties in goal pursuit
(DERS)
b. Trait emotional expression and state emotional awareness (STERQ subscales) and
lack of emotional awareness and clarity (DERS subscales).
Further exploratory analysis was conducted to establish the relationship between the STERQ
subscales and the remaining subscales of the emotion regulation scales, plus measures of depression
and hypomania. Finally, sensitivity to change analysis was conducted on the state scales by
comparing subscale totals for each of the two videos (neutral and positive/negative) presented in the
study, using Wilcoxen-signed rank tests. Non parametric tests were selected due to the Likert-scale
(ordinal) data which was not always normally distributed. For an outline of phase 2 analysis, see
Figure 5.
Convergent validity and sensitivity to change analysis
Participant characteristics and item checks
Reliability analysis (scale and subscales)
Model Fit analysis (confirmatory factor analysis)
Figure 5: Analysis outline for STERQ phase 2
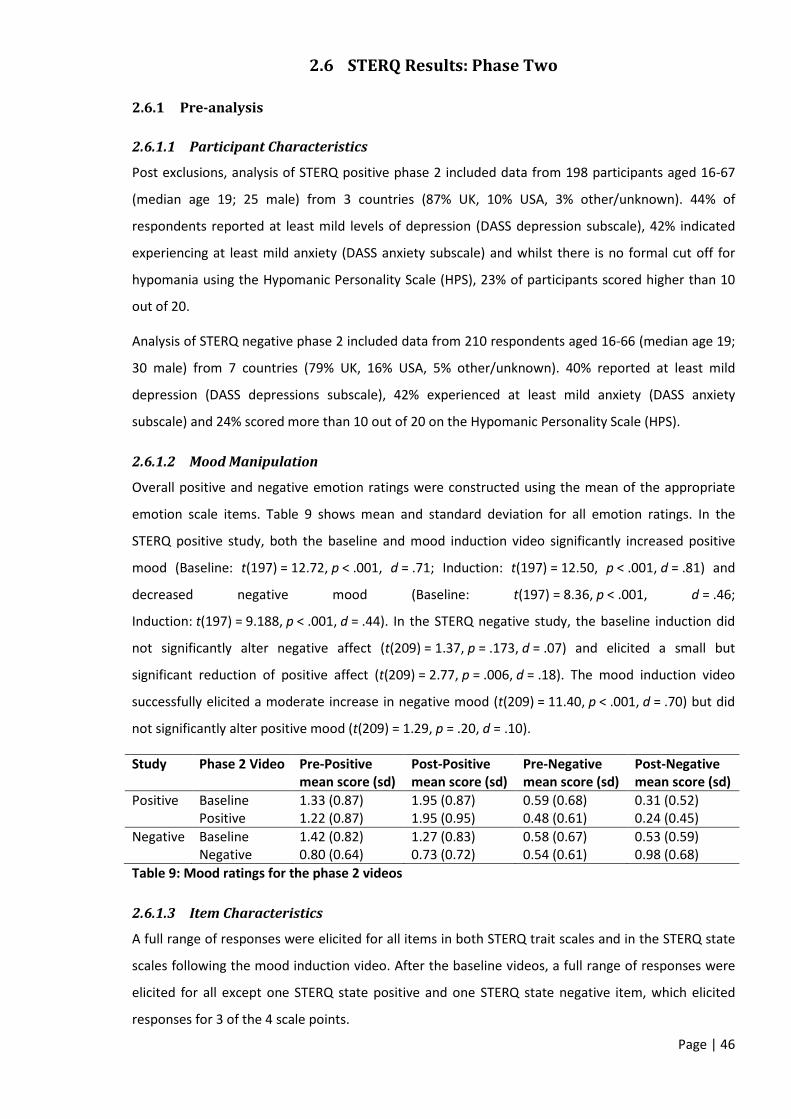
Page | 46
2.6 STERQ Results: Phase Two
2.6.1 Pre-analysis
2.6.1.1 Participant Characteristics
Post exclusions, analysis of STERQ positive phase 2 included data from 198 participants aged 16-67
(median age 19; 25 male) from 3 countries (87% UK, 10% USA, 3% other/unknown). 44% of
respondents reported at least mild levels of depression (DASS depression subscale), 42% indicated
experiencing at least mild anxiety (DASS anxiety subscale) and whilst there is no formal cut off for
hypomania using the Hypomanic Personality Scale (HPS), 23% of participants scored higher than 10
out of 20.
Analysis of STERQ negative phase 2 included data from 210 respondents aged 16-66 (median age 19;
30 male) from 7 countries (79% UK, 16% USA, 5% other/unknown). 40% reported at least mild
depression (DASS depressions subscale), 42% experienced at least mild anxiety (DASS anxiety
subscale) and 24% scored more than 10 out of 20 on the Hypomanic Personality Scale (HPS).
2.6.1.2 Mood Manipulation
Overall positive and negative emotion ratings were constructed using the mean of the appropriate
emotion scale items. Table 9 shows mean and standard deviation for all emotion ratings. In the
STERQ positive study, both the baseline and mood induction video significantly increased positive
mood (Baseline: t(197) = 12.72, p < .001, d = .71; Induction: t(197) = 12.50, p < .001, d = .81) and
decreased negative mood (Baseline: t(197) = 8.36, p < .001, d = .46;
Induction: t(197) = 9.188, p < .001, d = .44). In the STERQ negative study, the baseline induction did
not significantly alter negative affect (t(209) = 1.37, p = .173, d = .07) and elicited a small but
significant reduction of positive affect (t(209) = 2.77, p = .006, d = .18). The mood induction video
successfully elicited a moderate increase in negative mood (t(209) = 11.40, p < .001, d = .70) but did
not significantly alter positive mood (t(209) = 1.29, p = .20, d = .10).
Study Phase 2 Video Pre-Positive mean score (sd)
Post-Positive mean score (sd)
Pre-Negative mean score (sd)
Post-Negative mean score (sd)
Positive Baseline 1.33 (0.87) 1.95 (0.87) 0.59 (0.68) 0.31 (0.52) Positive 1.22 (0.87) 1.95 (0.95) 0.48 (0.61) 0.24 (0.45) Negative Baseline 1.42 (0.82) 1.27 (0.83) 0.58 (0.67) 0.53 (0.59) Negative 0.80 (0.64) 0.73 (0.72) 0.54 (0.61) 0.98 (0.68) Table 9: Mood ratings for the phase 2 videos
2.6.1.3 Item Characteristics
A full range of responses were elicited for all items in both STERQ trait scales and in the STERQ state
scales following the mood induction video. After the baseline videos, a full range of responses were
elicited for all except one STERQ state positive and one STERQ state negative item, which elicited
responses for 3 of the 4 scale points.

Page | 47
Skew and kurtosis were calculated for all items. None of the STERQ trait positive or negative items
showed severe departure from normality. The STERQ state positive scale showed severe departures
for all items in the avoidance subscale. The STERQ state negative scale had only one item (“I
reminded myself the situation was not real”) which showed severe departure from normality (first
video only).
2.6.2 Reliability Analysis
Table 10 shows overall and subscale reliability for each of the 4 STERQ scales. For the state scales,
values for the mood induction (2nd) videos were used. All scales and subscales showed good internal
consistency (α >. 70). However the item reversal required for computing the total negative state
scale reliability was different to that used in phase 1, raising questions about the reliability of the
scale across different datasets.
Scale Subscale Reliability (α) Item-total correlation range
STERQ Trait Positive N/A full scale1 .87 .51-.69 Emotional Intrusion .88 .69-.78 Emotional Avoidance .89 .66-.82 Emotional Expression .83 .52-.77
STERQ State Positive N/A full scale2 .80 .33-.71 Emotional Intrusion .83 .58-.71 Emotional Avoidance .88 .66-.86 Emotional Awareness .62 .35-.52 Emotional Harnessing .84 .69-.71
STERQ Trait Negative N/A full scale3 .82 .25-.69 Emotional Avoidance .74 .48-.68 Emotional Intrusion .79 .50-.67 Emotional Expression .84 .65-.74 Emotional Harnessing .71 .45-.56
STERQ State Negative N/A full scale4 .83 .00-.71 Emotional Intrusion .89 .57-.86 Emotional Awareness .84 .56-.79 Emotional Harnessing .67 .29-.64 Perspective-taking .74 .42-.64
Table 10: Reliability and corrected item-total correlations for STERQ scales and subscales 1Expression subscale reversed, 2Awareness & harnessing subscale reversed, 3Expression and harnessing subscale reversed, 4Item “I could accept my feelings about the situation” reversed.
2.6.3 Model Fit Analysis
Maximum Likelihood estimation (ML) was implemented for confirmatory factor analysis (CFA) of the
all scales except the STERQ Positive State scale, where the robust ML estimation was used, adjusting
for the detected departures in normality. Several competing models were assessed, including the
models predicted from phase 1 data, and single factor alternatives. As with the reliability analysis, for
the STERQ state scales, only data from the mood induction video (video 2) was included for model fit
analysis. Where Cronbach’s alpha indicated improved reliability upon removal of an item, additional
models reflecting this were also included. Additionally, for the STERQ Negative Trait scale, one item
was removed to improve model fit, however scale reliability remained unchanged. Table 11 shows

Page | 48
the optimal model fit for all STERQ scales. For model path diagrams see Appendix 21 and fit statistics
for competing models see Appendix 22.
STERQ Scale Best Model Chi-Square Statistic
Comparative Fit Index (CFI) Score
Standardised Root mean Square Residual (RMSR) score
Positive Trait 3-factor (TP4 removed)
120.84* .911 .073
Positive State1 4-factor 105.19* .913 .071 Negative Trait 4-factor
(TN2 removed) 145.61* .900 .073
Negative State 4-factor (SN10 removed)
145.61* .850 .093
Table 11: Model fit statistics for STERQ scales
Although Chi-square remained significant for all models, indicating a poorer model fit, it is commonly
reported as being overly sensitive due to the sample sizes required to conduct CFA. All scales except
the STERQ negative state scale had passable fit values from the CFI (>.9) and SRMR (<.08) indices
thus models for the STERQ Positive trait and state and STERQ Negative trait were considered
acceptable.
The STERQ Negative State factor structure proposed by phase 1 was not confirmed by the model fit
analysis. To verify whether an alternative factor structure was present, an exploratory factor analysis
was conducted using phase two data. As with the phase 1 procedure, polychoric correlations and
principal axis factoring with promax rotation were used. The Kaiser-Meyer-Olkin measure indicated a
good sample size (KMO = .73; Field, 2012), the level of multi-collinearity was acceptable
(determinant = .0001) and Bartlett’s test of sphericity indicated sufficient correlations for factor
analysis (χ2 (105, n = 210) = 1830.47, p < .001). Examination of Velicer’s MAP indicated a 3 factor
solution, whilst parallel analysis suggested a 4 factor model would be appropriate. Both models
showed good subscale reliability but poor model fit (3 factor: CFI = .806; SRMR = .101; 4 factor:
CFI = .814, SRMR = .100).
However, the final factor of both models had increased item numbers which can artificially improve
factor reliability (Gliem & Gliem, 2003). Therefore, model fit analysis was rerun excluding items from
the final factors. The resulting solution from the reduced 4-factor model showed acceptable model
fit when using only the first 3 factors (CFI = .915; SRMR = .073). The model chi square remained
significant (χ2 (32, n = 210) = 102.112, p < .001) however as with the previous models, this was
unsurprising given the sample size needed for analysis.
Due to the exploratory nature of the STERQ negative state analysis, once an acceptable model was
identified, the corresponding items from the phase 1 dataset were selected and used to confirm
model suitability. A robust version of the Maximum Likelihood estimation confirmed acceptable
model fit (CFI = .934; SRMR = .056), albeit with chi-square still significant (χ2 (32) = 82.997, p < .001).
*Significant p < .01. 1Satorra-Bentler ML correction used

Page | 49
2.6.4 Trait and state associations, convergent validity and sensitivity to change analysis
Due to the ordinal nature of the scale items, spearman’s correlations were conducted throughout
this section. Even modest correlations were significant due to the sample size, therefore significant
correlations have been highlighted but only those with at least a medium effect size (rs > .3; Cohen,
1992) are discussed.
2.6.4.1 Relationships between STERQ Subscales
In both STERQ positive and negative trait scales, intrusion and avoidance were positively correlated
(positive trait: rs = .327, p < .001; negative trait: rs = .570; p < .001). The STERQ positive trait
avoidance subscale was also negatively associated with trait expression (rs = -.348, p < .001), and
remained significant when partialling out the effect of trait intrusion (rs = -.327, p < .001). The STERQ
negative trait harnessing subscale was negatively associated with the intrusion (rs = -.463, p < .001)
and avoidance (rs = -.334, p < .001) subscales. However partial correlations controlling for the
relationship between intrusion and avoidance, showed an association between intrusion and
harnessing (rs = -.353, p < .001), but not harnessing and avoidance (rs = -.095, p = .169). Partial
correlations controlling for intrusion also revealed a significant negative association between STERQ
negative trait expression and avoidance (rs = -.352, p < .001).
No significant correlations were identified between the STERQ negative state scales. In the STERQ
positive state scale, the intrusion and avoidance subscales were positive correlated (video 2;
rs = .321, p < .001) and the harness subscale was also positively correlated with the awareness
subscale (video 2; rs = .338, p < .001).
All state subscale scores for baseline (video 1) and mood induction videos (video 2) were positively
correlated for both STERQ positive and negative scales (Table 12).
Scale STERQ State Subscale Video 1 - Video 2 Spearman coefficient
STERQ Positive Avoidance .327 Intrusion .634 Harnessing .624 Awareness (trait expression)
.531
STERQ Negative Intrusion .492 Perspective-taking .458 Awareness (trait expression)
.584
Table 12: Subscale correlations between Video 1 and 2
2.6.4.2 Relationships between trait and state subscales
State and trait subscales are not item matched, however moderate correlations between equivalent
state and trait subscales were noted. In the STERQ positive scales (Table 13), the trait and state
All coefficient values significant (p < .001)

Page | 50
intrusion subscale correlated to a greater extent than other trait/state intrusion correlations,
suggesting that both subscales may be measuring similar constructs. Additionally, there seems to be
association between trait expression and state awareness at a greater level than other trait/state
expression or awareness correlations. However, the correlation between state and trait avoidance,
although significant, is less than that between trait avoidance and state intrusion. This indicates that
there may be overlap between trait and state constructs.
STERQ Positive State Subscales
STERQ Positive Trait Subscales
Intrusion Avoidance Expression
Intrusion .456* .327* -.093 Avoidance .234* .314* -.064 Awareness -.158 -.187* .305* Harnessing .187* .138 .074 Table 13: Relationship between trait and state STERQ positive measures
In the STERQ negative scales (Table 14), there are also significant trait and state intrusion and trait
expression and state awareness correlations that are of much greater magnitude than other
state/trait associations. This suggests overlap between trait and state constructs for these subscales.
STERQ Negative State Subscales
STERQ Negative Trait Subscales
Intrusion Avoidance Expression Harnessing Intrusion .401* .307* -.026 -.071 Perspective-taking .038 .020 .062 .129 Awareness .060 -.084 .390* .117 Table 14: Relationship between trait and state STERQ negative measures
2.6.4.3 STERQ State Sensitivity to Change
For STERQ positive state scale, the intrusion and harnessing subscales both showed significant
differences between video scores (Intrusion: z = -4.38, p < .001; Harnessing: z = -5.831, p < .001;
Figure 6). There was no difference between video one and two scores for the avoidance or
awareness subscales (Avoidance: z = -.941, p = .352; Awareness: z = -.631, p = .529; Figure 6).
* p < .01
* p < .01

Page | 51
Figure 6: Change in STERQ State Positive scores across videos
Proportional response calculated as the mean of all individual totals divided by subscale totals enabling subscales with different numbers of items to be compared. * p < .05. Error bars indicate SEM As seen in Figure 7, subscales of the STERQ Negative State scale all showed significant differences
across videos one and two, indicating sensitivity to change (intrusion: z = -6.24; p < .001;
Awareness: z = -2.84, p < .01; Perspective taking: z = -3.84, p < .001).
Figure 7: Change in STERQ Negative State scores across videos
Proportional response calculated as the mean of all individual totals divided by subscale totals enabling subscales with different numbers of items to be compared.* p < .05. Error bars indicate SEM.
2.6.4.4 Convergent Validity: STERQ Positive
To assess the convergent validity of the STERQ positive subscales, Spearman’s correlations were
conducted with the subscales of the Responses to Positive Affect questionnaire (RPA). As predicted,
people with higher reported trait emotional intrusion (STERQ scale) also reported increased emotion
0
0.1
0.2
0.3
0.4
0.5
0.6
0.7
0.8
Intrusion Avoidance Harnessing Awareness
Aver
age
prop
ortio
n of
scal
e to
tal
Video 1
Video 2
0
0.1
0.2
0.3
0.4
0.5
0.6
0.7
Intrusion Awareness Perspective taking
Aver
age
prop
ortio
nal r
espo
nse
Video 1
Video 2
*
*

Page | 52
focus (RPA emotion focus). Additionally, increased trait and state emotion intrusion was associated
with higher levels of dampening of positive emotions (RPA dampening subscale). The prediction that
trait emotional expression (STERQ) and state emotional awareness (STERQ) were negatively
associated with dampening of positive emotions was also supported. Furthermore, trait emotional
expression (STERQ) was positively correlated with emotion focused responses to positive affect (RPA
emotion subscale). Zero order and partial correlations between the STERQ positive trait and state
scales and the Responses to Positive Affect questionnaire are reported in Table 15 and 16
respectively.
STERQ Positive Trait Subscales Intrusion Avoidance Expression Measure Zero order Partial1 Zero order Partial2 Zero order Partial1 STERQ Trait Expression -.127 -.015 -.348** -.327** - -
Responses to Positive Affect Scale (RPA) Emotion focus .261** .317** -.155 -.219* .410** .398** Dampening .437** .387** .255** .132 -.349** -.287** Self focus .158 .146 .061 .011 .254** .294** Table 15: Correlations between STERQ trait positive subscales and the Responses to Positive Affect questionnaire Bolded items represent medium or greater effect size (rs > .3) *Significant p < .01 **Significant p < .001. Partial Correlations: 1Partial correlate: avoidance; 2Partial correlate: Intrusion.
STERQ Positive State Subscales Intrusion Avoidance Awareness Harnessing
Measure Zero order Partial1 Zero
order Partial2 Zero order Partial3 Zero order Partial4
Responses to Positive Affect Scale (RPA) Emotion focus .155 .143 .062 .013 .150 .079 .229* .192*
Dampening .286** .244** .185 .102 -.277** -.289** -.015 .087 Self focus .071 .065 .029 .006 .092 .042 .156 .134
Table 16: Correlations between STERQ state positive subscales and the Responses to Positive Affect questionnaire Bolded items represent medium or greater effect size (rs > .3) **Significant p < .001 *Significant p < .01. Partial correlations: 1Partial correlate: Avoidance; 2Partial correlate Intrusion; 3Partial correlate: Harnessing; 4Partial correlate: Awareness
2.6.4.5 Convergent validity: STERQ Negative
To assess the convergent validity of the STERQ negative subscales, Spearman’s correlations were
conducted with overall and subscale totals of the Cognitive Emotion Regulation Questionnaire
(CERQ) and Difficulties in Emotion Regulation Scale (DERS).
As predicted, increased trait and state emotional intrusion was associated with greater emotional
dysregulation (DERS total and CERQ negative total). Trait emotional intrusion was also positively
correlated with increased rumination and catastrophising (CERQ subscales) and higher ratings on all
DERS subscales, except lack of emotional awareness and clarity. State emotional intrusion was also

Page | 53
positively associated with catastrophising (CERQ subscale), goal disruption, impulsiveness and lack of
emotion regulation strategies (DERS subscales).
Similarly increased trait emotional avoidance was associated with the predicted increase in emotion
dysregulation (DERS total and CERQ negative total) and increased ratings on all DERS subscales
(including the predicted non-acceptance of emotions), except lack of awareness. Emotional
avoidance was also positively associated with rumination, self-blame and catastrophising (CERQ
subscales).
Given the correlation between emotional intrusion and avoidance, partial correlations were also
conducted to control for the effect of this relationship on the association with other measures. The
relationships between emotional intrusion emotional dysregulation (DERS total), lack of goal pursuit
(DERS goal), impulsivity (DERS impulsivity) and lack of emotion regulation strategies (DERS strategy)
were preserved once avoidance was controlled for. After controlling for intrusion, only the
relationship between avoidance and emotional dysregulation (DERS total) remained.
The relationships between trait harnessing and expression (STERQ subscales) and other emotion
regulation measures were also examined. As predicted, there was an inverse relationship between
emotional harnessing (STERQ) and emotional dysregulation (DERS total), and a positive association
between harnessing (STERQ) and the overall CERQ positive total. Emotional harnessing was also
positively associated with emotional acceptance, positive reappraisal and refocusing, planning and
perspective taking (CERQ subscales) and negatively associated with decreased goal directed
behaviour and lack of emotion regulation strategies (DERS subscales). When using partial
correlations to control for the effects of emotional awareness (STERQ subscale), the negative
associations between harnessing and goal disruption and lack of emotion regulation strategies (DERS
subscales) and the positive association between positive emotion regulation strategies, reappraisal,
refocusing, planning and perspective taking (CERQ subscales) remained significant.
Emotional expression and awareness had fewer associations with other measures, but both state
awareness and trait expression scales showed the predicted negative relationship with emotional
awareness and clarity (DERS subscales). These associations were preserved on conducting partial
correlations, controlling for harnessing. Furthermore, increased state awareness was also positively
associated with increased emotional acceptance (CERQ acceptance subscale). All trait and state
correlations are shown in tables 17 and 18 respectively.

Page | 54
STERQ Negative Trait Subscales Intrusion Avoidance Expression Harnessing
Measure Zero order Partial Zero
order Partial Zero order Partial Zero
order Partial
Difficulties in Emotion Regulation Scale (DERS)
Total .532** .339** .515** .305** -.243** -.193* -.328** -.296** Non-acceptance .402** .199 .449** .292** -.210* -.193* -.113 -.076 Goal pursuit .574** .462** .396** .102 .021 .089 -.319** -.329** Impulsivity .526** .395** .401** .145 -.043 .005 -.250** -.247** Awareness -.196* -.257** .026 .171 -.475** -.463** -.132 -.046 Strategies .588** .421** .510** .263** -.048 .016 -.326** -.323** Clarity .272** .079 .371** .273** -.400** -.373** -.225** -.164
Cognitive Emotion Regulation Questionnaire (CERQ)
Positive Total -.146 -.065 -.164 -.099 .169 .077 .542** .527** Negative Total .497** .303** .490** .290** -.043 -.014 -.151 -.146 Acceptance -.120 -.039 -.154 -.105 .097 .041 .302* .290** Rumination .430* .274** .391** .197 -.011 .005 -.084 -.084 Reappraisal -.108 -.027 -.151 -.110 .142 .058 .478** .463** Self blame .258** .079 .345** .249** -.163 -.157 -.047 -.016 Refocusing -.129 -.117 -.059 .018 .111 .044 .366** .353** Catastrophising .534** .350** .500** .281** -.058 -.004 -.279** -.274** Other blame .128 .071 .124 .062 .100 .107 -.024 -.044 Planning -.036 .028 -.103 -.101 .123 .056 .370** .356** Perspective -.134 -.104 -.085 -.011 .113 .026 .464** .453**
Table 17: Correlations between STERQ trait negative subscales, DERS and CERQ scales Bolded items represent medium or greater effect size (rs > .3) *Significant p < .01 **Significant p < .001

Page | 55
STERQ Negative State Subscales Scale Intrusion Awareness Perspective Taking
Difficulties in Emotion Regulation Scale (DERS)
Total .442** -.290** .090 Non-acceptance .275** -.153 .143 Goal pursuit .427** -.055 -.056 Impulsivity .451** -.139 .168 Awareness -.083 -.455** .005 Strategies .472** -.173 .061 Clarity .296** -.366** .121
Cognitive Emotion Regulation Questionnaire (CERQ)
Positive Total -.008 .301** .243** Negative Total .321** .055 .189* Acceptance -.043 .322** .067 Rumination .230* .131 .165 Reappraisal -.069 .177 .278** Self blame .279** -.063 .109 Refocusing .017 .151 .164 Catastrophising .326** .016 .188* Other blame .059 .035 .045 Planning .047 .222* .184* Perspective .074 .185* .175
Table 18: Correlations between STERQ state negative subscales, DERS and CERQ scales Partial correlations not conducted as no significant correlations between subscales. Bolded items represent medium or greater effect size (rs > .3) *Significant p < .01 **Significant p < .001
2.6.4.6 Relationships between STERQ positive scales and clinical traits
To assess the relationships between the STERQ trait and state positive scales and clinical traits,
Spearman’s correlations were conducted with the Hypomanic Personality Scale (HPS) and overall and
subscale totals of the Depression, Anxiety and Stress Scale (DASS). Participants with higher self-
reported trait and state emotional intrusion also reported greater depression, anxiety and stress
(DASS subscales and total) and higher levels of hypomania (HPS scale). Additionally, the STERQ trait
emotional expression subscale was negatively associated with levels of overall distress (DASS total)
and depression (DASS depression subscale). Trait and state zero order and partial correlations are
shown in tables 19 and 20 respectively.
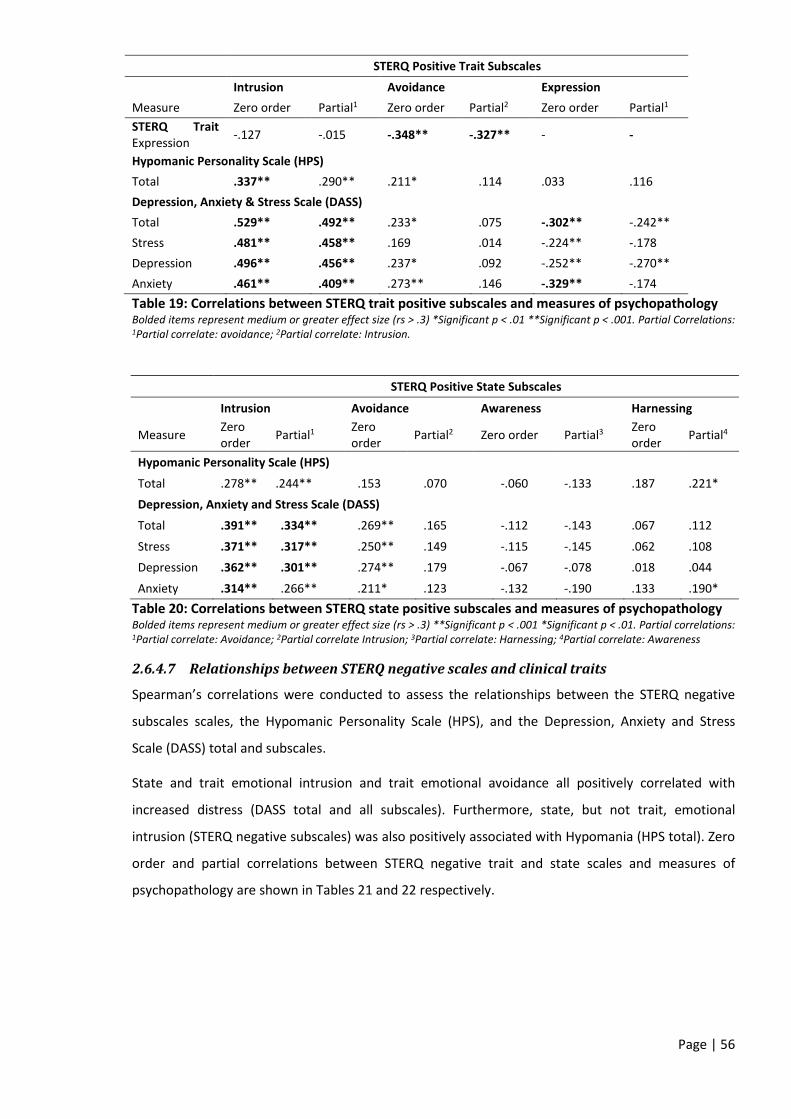
Page | 56
STERQ Positive Trait Subscales
Intrusion Avoidance Expression Measure Zero order Partial1 Zero order Partial2 Zero order Partial1 STERQ Trait Expression -.127 -.015 -.348** -.327** - -
Hypomanic Personality Scale (HPS) Total .337** .290** .211* .114 .033 .116 Depression, Anxiety & Stress Scale (DASS) Total .529** .492** .233* .075 -.302** -.242** Stress .481** .458** .169 .014 -.224** -.178 Depression .496** .456** .237* .092 -.252** -.270** Anxiety .461** .409** .273** .146 -.329** -.174 Table 19: Correlations between STERQ trait positive subscales and measures of psychopathology Bolded items represent medium or greater effect size (rs > .3) *Significant p < .01 **Significant p < .001. Partial Correlations: 1Partial correlate: avoidance; 2Partial correlate: Intrusion.
STERQ Positive State Subscales
Intrusion Avoidance Awareness Harnessing
Measure Zero order Partial1 Zero
order Partial2 Zero order Partial3 Zero order Partial4
Hypomanic Personality Scale (HPS)
Total .278** .244** .153 .070 -.060 -.133 .187 .221* Depression, Anxiety and Stress Scale (DASS)
Total .391** .334** .269** .165 -.112 -.143 .067 .112
Stress .371** .317** .250** .149 -.115 -.145 .062 .108 Depression .362** .301** .274** .179 -.067 -.078 .018 .044
Anxiety .314** .266** .211* .123 -.132 -.190 .133 .190* Table 20: Correlations between STERQ state positive subscales and measures of psychopathology Bolded items represent medium or greater effect size (rs > .3) **Significant p < .001 *Significant p < .01. Partial correlations: 1Partial correlate: Avoidance; 2Partial correlate Intrusion; 3Partial correlate: Harnessing; 4Partial correlate: Awareness
2.6.4.7 Relationships between STERQ negative scales and clinical traits
Spearman’s correlations were conducted to assess the relationships between the STERQ negative
subscales scales, the Hypomanic Personality Scale (HPS), and the Depression, Anxiety and Stress
Scale (DASS) total and subscales.
State and trait emotional intrusion and trait emotional avoidance all positively correlated with
increased distress (DASS total and all subscales). Furthermore, state, but not trait, emotional
intrusion (STERQ negative subscales) was also positively associated with Hypomania (HPS total). Zero
order and partial correlations between STERQ negative trait and state scales and measures of
psychopathology are shown in Tables 21 and 22 respectively.

Page | 57
STERQ Negative Trait Subscales Intrusion Avoidance Expression Harnessing
Measure Zero order Partial Zero
order Partial Zero order Partial Zero
order Partial
Hypomanic Personality Scale (HPS) Total .291** .240** .170 .005 .047 .033 .077 .069 Depression, Anxiety and Stress Scale (DASS) Total .479** .310** .439** .230** -.145 -.117 -.159 -.135 Stress .463** .348** .340** .105 -.073 -.046 -.149 -.137 Depression .414** .227** .431** .260** -.151 -.118 -.194* -.170 Anxiety .389** .223** .387** .218* -.136 -.127 -.060 -.035
Table 21: Correlations between STERQ trait negative subscales and measures of psychopathology Bolded items represent medium or greater effect size (rs > .3) *Significant p < .01 **Significant p < .001
STERQ Negative State Subscales Scale Intrusion Awareness Perspective Taking Hypomanic Personality Scale (HPS) Total .317** -.069 .120 Depression, Anxiety and Stress Scale (DASS) Total .413** -.087 .180* Stress .372** -.067 .204* Depression .361** -.119 .140 Anxiety .421** -.035 .163
Table 22: Correlations between STERQ state negative subscales and measures of psychopathology Partial correlations not conducted as no significant correlations between subscales. Bolded items represent medium or greater effect size (rs > .3) *Significant p < .01 **Significant p < .001
2.6.5 Final STERQ Scales
Overall, each of the subscales showed good reliability, model fit, convergent validity, and in the state
scales, sensitivity to change. For the final versions of each of the STERQ scales, see Appendix 23.
Page | 58
2.7 STERQ Discussion These studies aimed to construct and validate valence specific state and trait measures of emotion
regulation. This addressed two significant gaps in the literature. First, it added to the currently
narrow range of assessment tools available for measuring the regulation of positive affect. Second, it
provided the first state specific validated measure of emotion regulation. Four scales were devised,
each showing good internal consistency and theoretically supported relationships between a range
of mood and emotion regulation scales. This discussion section will explore in more detail the nature
of the relationships between the STERQ subscales and other trait measures of mood and emotion
regulation. Following this, the study limitations and future directions will be considered.
Throughout the phase 2 results section, small but significant correlations with other measures of
mood and emotion regulation were reported but not discussed. This was to avoid placing undue
importance on correlations that were only significant due to the relatively large sample size.
However, there are two disadvantages to such an approach. First, several existing scales report
relationships of a similar (small) magnitude to those not addressed in this study (E.g. Feldman et al,
2008; Egloff et al., 2006). Therefore, when assessing the utility of the STERQ scales in comparison to
other measures, not reporting such relationships may undervalue the STERQ as a predictive indicator
of psychopathology. Second, as noted by Aldao et al (2010), findings from community samples are
often replicated more strongly in clinical samples. Furthermore, even correlation coefficients as low
as 0.1 are described by Cohen (1992) as non-trivial. Therefore in community samples such as the
ones used here, it may be beneficial to consider these smaller correlations as useful indicators of
emotion regulation strategies to be explored further in clinical samples. Given these two
considerations, when discussing the relationships between the STERQ subscales and other measures
of mood and emotion regulation, smaller relationships reported but not explored in the results
section will be highlighted if they are of a similar magnitude to those published elsewhere.
The STERQ intrusion subscales had the most associations across all measures of trait mood and
emotion regulation. On closer inspection of the items within this subscale, it is important to note that
many of these (e.g. “my emotions made it difficult to concentrate”, “my feelings are out of control”)
may address the precursors to or outcomes of regulation, rather than the regulation process per se.
As such, this may widen the relevance of the STERQ intrusion subscales to other measures. It is also
an important consideration when examining the shared variance between STERQ intrusion and
avoidance, as the two may be temporally distinct and/or causally related. The nature of this and the
potential causal relationships with other measures of emotion regulation is of interest for future
studies.
Page | 59
2.7.1 Trait Emotion Regulation Measures
2.7.1.1 Responses to Positive Affect Scale (RPA)
Associations between the STERQ Positive scales and the Responses to Positive Affect Scale (RPA;
Feldman, Joorman & Johnson, 2008) were predominantly found in the dampening and emotion focus
subscales.
Dampening refers to ruminative reactions to positive affect that lead to a decrease in, or inability to
sustain the emotional experience (Feldman et al., 2008). The dampening subscale was positively
associated with the STERQ Positive trait and state intrusion subscales and negatively associated with
the STERQ expression (trait) and awareness (state) subscales. Both relationships have face validity. It
is intuitive that the greater the perceived negative consequences of positive emotions (e.g. being
overwhelmed by the emotion) the more they may be met with strategies that minimise such
emotions. Conversely, if a person habitually responds to positive emotions by telling themselves that
the situation won’t last, or they don’t deserve it (dampening subscale), then it follows that they
would find it harder to express, accept or manage such emotions.
The emotion focus subscale of the RPA addresses rumination that directly focuses on the emotion
being experienced, including items such as “Think about how happy you feel” or “Savour this
moment” (Feldman et al., 2008). Emotion focused savouring was positively associated with trait
intrusion and expression, and to a smaller extent, state harnessing. Additionally, when intrusion was
accounted for, a small but significant negative relationship also emerged between trait avoidance
and emotion focus. These also have good face validity.
Whilst it may seem contradictory that the STERQ intrusion scale was positively associated with both
dampening and emotion focus, the temporal nature of emotion focus and dampening remains
undefined. Given the dynamic nature of emotion regulation (Gross & Thompson, 2009), it is plausible
that emotion focus and dampening are temporally distinct; therefore emotional intrusion could be
both the result of increased emotion focus and a precursor to dampening. This may also explain why
the relationship with emotion focus emerges in the trait but not state scale, with most of the state
items referring to the period after the emotional stimuli, therefore emotion focus may have
diminished. Exploring potential inter-temporal dependencies between regulation strategies is an
important area for future research.
2.7.1.2 Cognitive Emotion Regulation Questionnaire (CERQ) and Difficulties in Emotion
Regulation Scale (DERS)
The STERQ negative scales were correlated with the 9 CERQ and 6 DERS subscales. All STERQ
subscales showed associations across several domains of emotion regulation.

Page | 60
As expected, overall difficulties in regulating negative emotions (DERS total and CERQ negative total)
were strongly associated with both the state and trait emotional intrusion and trait emotional
avoidance subscales. Furthermore, the state and trait emotional awareness and trait harnessing
were inversely related to difficulties in regulating emotions (DERS total) and positively associated
with positive emotion regulation strategies (CERQ positive total). Finally state perspective taking was
also positively associated with positive emotion regulation strategies (CERQ positive total). Individual
subscales with large overlap to CERQ or DERS subscales (e.g. STERQ awareness with DERS lack of
awareness) all correlated as expected, suggesting that the STERQ subscales are appropriately
labelled.
2.7.2 Measures of Clinical Traits
2.7.2.1 Hypomanic Personality Scale (HPS)
STERQ positive and negative scales were both compared with scores from the 20 item version of the
HPS (Meads & Bentall, 2008). Hypomanic personality traits (as measured by the HPS) refer to stable
and enduring characteristics of persistently elevated or irritable mood (Eckblad & Chapman, 1986).
Such traits have been demonstrated to predict the onset of mood disorders, particularly bipolar
disorder (Eckblad & Chapman, 1986; Kwapil et al., 2000; Meyer & Hautzinger, 2003).
Trait hypomania was positively associated with emotional intrusion, regardless of valence, at both
state and trait level. The association between intrusion and hypomania is smaller in the state positive
and trait negative scales, but remains significant and comparable with the previously reported
relationships between hypomania and emotion regulation (e.g. association between hypomania and
the RPA subscales; Feldman et al., 2008). Bipolar disorder is known to be associated with
experiencing greater affective reactivity and intensity (Gruber, Harvey, et al., 2011; Henry et al.,
2008; M’bailara et al., 2009), and several items in the HPS address this mood volatility. If emotions
are experienced more strongly and are more volatile than in the general population, it is unsurprising
that participants who score highly on the HPS may find such emotions more intrusive.
For positive emotions there was also a small but significant association between increased
hypomania and state emotional harnessing. This is also congruent with current theories of bipolar
disorder. For example, Mansell, Morrison, Reid, Lowens, and Tai (2007) propose that a change in
internal mood state is appraised as overly personally relevant or meaningful, leading to associated
changes in cognition and behaviour. An increased sense of being able to harness positive emotions
(as measured by the STERQ harnessing subscale) may be consistent with this theory, as the perceived
utility of such emotions may be increased if they are also experienced as more personally relevant.

Page | 61
2.7.2.2 Depression, Anxiety and Stress Scale (DASS)
The Depression, Anxiety and Stress Scale (DASS) is based on the tripartite model of negative affect,
comprising of general distress and unique symptoms associated with depression, anxiety and stress.
The relationships between the STERQ and DASS scores were generally mirrored across all DASS
subscales.
Increased state and trait intrusion scores were strongly associated with increased DASS totals and
subscale scores, regardless of valence. Previous findings indicate that depression can be linked with a
fear of positive emotions (e.g. Gilbert, McEwan, Catarino, Baião, & Palmeira, 2014), therefore it is
unsurprising that such emotions may be experienced as intrusive. Whilst this positive association
may seem incongruent with theories suggesting that depression is associated with a flattening of
emotional reactivity (e.g. context insensitivity hypothesis; Rottenberg, Gross, & Gotlib, 2005), it is
important to note that the level of reactivity is not necessarily associated with the experience of
emotional intrusion. Indeed, people with a higher sensitivity to emotional intrusion may be less
tolerant of emotional variability, leading to blunted responding.
2.7.3 Study limitations and future directions
2.7.3.1 Item selection and reduction
Item selection was initially guided by the desire to create a scale suitable for both adolescents and
adults. Therefore, items were only included for consideration if they had previously been tested in
adolescent populations. Whilst many commonly used measures (e.g. Cognitive Emotion Regulation
Questionnaire, Difficulties in Emotion Regulation Scale, Emotion Regulation Questionnaire) have
been subsequently validated for use in adolescent populations, it is acknowledged that this approach
may risk missing important facets of emotion regulation. Therefore, particular care was taken during
the item generation process, to ensure that key concepts within emotion regulation (e.g.
suppression, awareness, reappraisal) were represented within the current measure.
As is typical in item reduction studies, decisions concerning the discarding and preserving of items
were a compromise between statistical integrity and judgements regarding theoretical interest. This
is particularly pertinent to the current study, as the initial item selection was a-theoretical, based
instead on adaptation of other scales. The presence of multi-collinearity also dictated that much of
the item reduction be conducted prior to formal factor analysis, in order to achieve interpretable
factor structures.
The compromises required for item retention were also evident in the confirmatory studies. In the
negative state scale, several items were discarded to achieve adequate model fit, at the expense of
an entire subscale. Conversely, in the positive state scale, as acceptable model fit had already been
achieved, items in the avoidance subscale were retained, even though removal would further

Page | 62
improve the model fit. The scale was included to allow further investigation of potential relationships
between emotional avoidance and psychopathology that may emerge in clinical samples.
Although scale similarity was prioritised during item selection, the final STERQ scales (state/trait
positive/negative) contained substantial overlap, but were not item matched. Identical scales were
unachievable due to differences in the underlying factor structure of the 4 data sets. Since factor
analysis relies upon shared variance, it is not possible to group items whose values do not vary
(Spielberger & Reheiser, 2004, p72). Prior to item reduction, the questions that did not correlate with
other items (and were therefore removed), were different for each STERQ scale. This problem is not
unique to the current study. Authors of the State/Trait Anxiety Inventory also report that despite
initial attempts to maintain item symmetry across measures, differing item responses between scales
made this impossible (Spielberger and Reheiser, 2004, p72).
Valence specific scales are not necessarily problematic. Indeed, given the different mechanisms
underpinning positive and negative affect (e.g. Garland et al., 2010), it is reasonable to assume that
there will consequently be differences in their regulation. In the trait scales, individuals have the
freedom to make their own judgements about what they consider to be positive and negative
emotions, therefore having valence specific scales is less problematic. However, to appropriately
administer the state scales, a situation must first be pre-determined as either positive or negative.
Given the individual differences in responses to situations, and that in many instances situations will
not evoke purely positive or negative emotions; this is a limitation of the current STERQ state scales.
The steps required to overcome this will depend on the study context, but could include taking mood
ratings to ensure the situation is being experienced as expected, or, in the case of experience
sampling studies, using the mood rating of a particular event to trigger the administration of the
appropriate scale.
2.7.3.2 Sample population and question wording
Initially the STERQ scales were intended for use with both adults and adolescents. Although item
generation was conducted using questionnaires that had been previously validated with adolescents,
currently, the STERQ scales have only been validated for participants aged 16 and above. Establishing
the suitability of the STERQ scales for younger adolescents would be a useful future validation study.
The current validation was conducted using a predominantly student based online community
sample. Through using online methodology, this enabled recruitment of a wider population than
would have been possible in person. Indeed, in the first phase of developing the STERQ negative
scales, a majority of responses came from the USA, and in all studies responses came from a
minimum of 3 countries, improving the diversity of the sample. This diversity in responding
nationalities is one of the strengths of the current studies, enabling wider generalisation from the

Page | 63
validation sample. However, it is possible that the change in demographic between phase 1 and 2 for
the STERQ negative responses also contributed to the difficulties in finding an appropriate model fit,
especially in the STERQ state negative scale.
It is important to note that current validation did not target specific clinical populations. Whilst a full
range of responses were reported across measures of depression, anxiety and hypomania, only 18-
25% of the sample met the threshold for moderate or severe anxiety or depression in either phase 2
study. Similarly, although there is not a formal cut off for “high” hypomania when using the
Hypomanic Personality Scale (HPS), only 25% of respondents scored greater than 50% of the possible
total. Given the relatively large sample sizes of the validation studies, these proportions were
sufficient to enable meaningful analysis of the relationship between the STERQ subscales and
measures of psychopathology. Previous findings have shown strengthened relationships between
maladaptive emotion regulation strategies for negative emotions and psychopathology in clinical
compared to community samples (Aldao et al., 2010). However, it is essential that further validation
of the STERQ scales are conducted with clinical populations, to establish whether the currently
proposed subscales and their associations with mental health difficulties can be replicated.
When testing the STERQ trait questionnaires on clinical samples, it may also be beneficial to test
variations on the initial instruction. Berking and Wupperman (2012) note that by referring to general
emotional states (i.e. positive or negative) and not specifying the type of emotion targeted for
regulation (e.g. sadness, anxiety), it is impossible to ascertain whether differences between clinical
and healthy populations are the result of deficits in strategy use, or differences in the emotions
identified in the responses. This difficulty is mitigated somewhat in the state scales, as the STERQ
questionnaire asks for responses to a specific event. Such events can be selected based on the
emotions they elicit (and verified using mood ratings), therefore specifically targeting response
differences in different populations.
2.7.3.3 Full scale and subscale reliability
The validation of the STERQ scales included the calculation of both full and subscale reliability. To
obtain reasonable full scale reliability for the state scales, the item reversals were inconsistent with
the factor loadings. Furthermore, to obtain reasonable full scale reliability in the STERQ state
negative scale, different items were reversed in phases 1 and 2. Therefore, it is recommended that
only subscale scores be used when measuring emotion regulation. Whilst this cannot provide a
global measure, the use of subscale scores is not unique to the STERQ and are a feature of several
other emotion regulation measures (e.g. Emotion Regulation Questionnaire (Gross & John, 2003),
Cognitive Emotion Regulation Questionnaire (Garnefski & Kraaij, 2006)).

Page | 64
2.7.3.4 Sensitivity to change analysis
The STERQ state positive scales did not show sensitivity to change across all subscales. However,
both the neutral and positive videos within this study elicited an increase in positive emotions.
Therefore, limited conclusions can be drawn from the current data. Further investigation is required
to clarify whether these results show a genuine insensitivity to change within the awareness and
avoidance subscales, or whether the similarity in emotional response to each video resulted in
similar deployment of regulation strategies.
2.7.3.5 Mood induction methodology
The current STERQ studies relied solely on video mood inductions to validate the STERQ state scales.
Furthermore, some of the videos either did not, or only partially elicited, the intended responses.
Therefore it is important that future validation widens both the types of mood induction tasks, and
mood states induced. These could include using the questionnaire as part of experimental studies
with behavioural tasks (e.g. gambling tasks, reward-learning tasks, social interaction tasks) or
experience sampling methodologies, answering the scales in response to emotional contexts
identified by participants during the course of the study.
Widening the methodology used to assess the STERQ state scales will also be crucial in confirming
the sensitivity of the state positive scale. Currently two STERQ state positive subscales showed no
differences between the two phase 2 videos. Without further validation, it is unclear whether this is
because the two scales are not currently sensitive to change, or whether the two videos used elicited
the same reactions. Future validation could include studies in which the two subscales of interest are
experimentally manipulated (e.g. instructed regulation studies could be used to assess whether
awareness of emotions change when instructed to concentrate on them) and therefore expected to
elicit different subscale results.
2.7.4 Conclusion
The State/Trait Emotion Regulation Questionnaires comprise of four measures developed to assess
trait and state emotion regulation across positive and negative valences. These scales complement
existing measures by providing a broader assessment of emotion regulation strategies in positive
affect and validated measures of state based emotion regulation. Such measures are crucial to the
advancement of emotion regulation research, including investigation of the temporal and causal
dynamics of emotion regulation.
The STERQ scales show promising reliability and validity, demonstrating a range of theoretically
supported relationships with depression, hypomania and trait based emotion regulation. The scales
would benefit from further validation across a range of mood induction and research methods,
including comparison with indirect assessment of emotion regulation such as physiological measures

Page | 65
(e.g. heart rate variability). However, in their current form, the associations between the STERQ
scales and other measures have generated several testable hypotheses key to the field of emotion
regulation and psychopathology.

Page | 66
CHAPTER 3:
SPONTANEOUS AND INSTRUCTED
REGULATION OF POSITIVE
EMOTIONS

Page | 67
3.1 Introduction
Maladaptive emotion regulation has been linked with a variety of mental health problems including
depression, anxiety and bipolar disorder (e.g. Berking & Wupperman, 2012; Carl, Soskin, Kerns, &
Barlow, 2013; John & Gross, 2004; McLaughlin, Hatzenbuehler, Mennin, & Nolen-Hoeksema, 2011).
However, the majority of research into emotion regulation in mental health has focused almost
exclusively on negative emotions. Including positive emotions within emotion regulation and mental
health frameworks can enhance the predictive power of models of clinical dysregulation (Wood &
Tarrier, 2010). Positive emotions are strongly implicated in psychopathology, with differences in
positive affect being a predictive and differentiating factor for several disorders (Carl et al., 2013;
Watson & Naragon-Gainey, 2010).
The presence of positive emotions is not sufficient for emotional well-being. It is also essential that
emotions (whether positive or negative) are contextually appropriate (John & Gross, 2004).
Therefore the hallmark of adaptive responses are those which can allow for the up- and down-
regulation of positive, as well as negative, emotions, as needed. Dysregulation in response to positive
emotions has been associated with both bipolar disorder (BD) and depression.
3.1.1 Positive emotion dysregulation in bipolar disorder
Studies of participants with BD have shown increased responding to positive emotions across a
variety of contexts, using a number of methodologies. Such studies have demonstrated that,
compared to healthy controls, currently euthymic participants with BD show increased positivity and
startle reflex in response to neutral stimuli (M’bailara et al., 2009), increased emotional and
physiological reactivity to positive stimuli (Gruber et al., 2009) and increased emotional intensity and
lability (Henry et al., 2008). Furthermore, student participants with high levels of hypomania (as
measured by the Hypomanic Personality Scale (Eckblad & Chapman, 1986)), also demonstrated
increased emotional positivity and irritability in response to positive, neutral and negative mood
inductions (Gruber, Johnson, Oveis, & Keltner, 2008), suggesting that increased positivity is a risk
factor for BD.
Significant differences in regulation have been detected across several studies of patients with BD.
Patients with BD have shown increased rumination over positive events compared to patients with
depression and healthy controls (Johnson et al., 2008). However, different types of rumination may
lead to differing changes in positive emotions. For example, Feldman, Joormann and Johnson (2008)
report that hypomania is associated with increased self- and emotion-focused rumination in
response to positive emotions. Both of these ruminative responses are associated with increased
levels of positive emotion (Feldman et al., 2008). However, somewhat counter-intuitively, the same
study reported that increased self-reported hypomania was also associated with dampening styles of
rumination, which is thought to decrease experience of positive emotion. This utilisation of several,

Page | 68
potentially conflicting, emotion regulation strategies is a feature of BD that has emerged in several
studies. For example, patients with BD report increased use of both reappraisal and suppression,
making greater efforts to regulate and being less successful in their regulation of positive and
negative emotions (Gruber, Harvey, & Gross, 2012). These results were unaffected by self-reported
emotional reactivity.
However, recent work has detected no significant differences between patients with BD and healthy
controls, in instructed reappraisal after positive and negative mood inductions (Gruber, Hay, & Gross,
2014). Furthermore, patients with BD and healthy controls did not significantly differ in their choice
of using distraction or reappraisal in response to high and low activation positive images (Hay,
Sheppes, Gross, & Gruber, 2015). Therefore, the extent to which maladaptive emotion regulation
strategies are adopted in response to positive emotions and whether such regulation attempts can
be guided through instruction remains uncertain. Furthermore, it is also unclear whether regulatory
dysfunction is a pre-cursor to, or symptom of bipolar disorder.
3.1.2 Positive emotion dysregulation in depression
Emotion dysregulation is thought to be an important feature of depression, which persists during
both acute and remitted periods (Aldao, Nolen-Hoeksema, & Schweizer, 2010; Berking, Wirtz, Svaldi,
& Hofmann, 2014; Berking & Wupperman, 2012; Ehring, Fischer, Schnulle, Bösterling, & Tuschen-
Caffier, 2008; Ehring, Tuschen-Caffier, Schnülle, Fischer, & Gross, 2010). Use of maladaptive emotion
regulation strategies such as rumination, catastrophising and self-blame has been associated with
depression scores across several age groups (Garnefski & Kraaij, 2006b), and decreased use of
positive reappraisal and increased emotional acceptance is predictive of current depression in the
elderly, even after controlling for previous depressive episodes (Kraaij et al., 2002). However, as is
the case throughout emotion regulation and psychopathology research, there are currently limited
studies addressing the regulation of positive emotions in depression.
This is particularly problematic for depression, since anhedonia (i.e. a loss of pleasure) is a key
feature of the disorder (Werner-Seidler et al., 2013). Furthermore, heightened anhedonia is
associated with poorer treatment outcomes and increased rates of relapse (e.g. McMakin et al.,
2012). Therefore understanding the mechanisms by which anhedonia persists is a crucial target for
further research.
A recent study investigated the relationship between depression and reactivity to discrete positive
emotions. Increased depression was associated with greater reduction in emotional reactivity in
response to self-referential positive mood inductions (e.g. those targeting pride compared to mood
inductions eliciting happiness or amusement (Gruber, Oveis, Keltner, & Johnson, 2011)). However,
this is inconsistent with alternative literature, which reports decreased reactivity, compared to

Page | 69
healthy controls, in patients with depression when experiencing a mood induction eliciting
amusement (Rottenberg, Kasch, Gross, & Gotlib, 2002). This flattening of reactivity to a positive
mood induction was also predictive of poorer outcomes, including non-recovery at follow-up
(Rottenberg et al., 2002). Furthermore, in a study comparing trait-based measures of positive
emotion, joviality (which incorporates happiness) was strongly negatively correlated with symptoms
of dysphoria (Stanton & Watson, 2014). Therefore, further investigation incorporating a wider range
of positive emotions may help elucidate our understanding of anhedonia.
A second key component in understanding anhedonia is the investigation of emotion regulation in
response to positive emotions. Participants with depression may have individual differences in how
they tolerate different positive emotions (Gilbert et al., 2008; Gilbert, McEwan, Catarino, Baião, &
Palmeira, 2014). Indeed some findings suggest that depression may be accompanied by a fear of
positive emotions (Beblo et al., 2012; Gilbert et al., 2014) and may evoke reactions which minimise
the emotional experience (Beblo et al., 2012; Feldman et al., 2008; Quoidbach et al., 2010; Werner-
Seidler et al., 2013). Substantial evidence suggests that depression is associated with increased use of
rumination (e.g. Aldao, Nolen-Hoeksema, & Schweizer, 2010; Nolen-Hoeksema, 1991; Treynor,
Gonzalez, & Nolen-Hoeksema, 2003). Specifically, depression is associated with a dampening style of
rumination in response to positive emotions (Feldman et al., 2008). Further investigation at state
level detected decreased use of strategies which intensified positive emotions and increased use of
dampening strategies (Werner-Seidler et al., 2013). Together, these findings lend support to the
notion that patients with depression may engage with strategies which actively reduce reactivity to
positive emotions.
3.1.3 Types of Positive Emotion
As suggested above, the incongruence regarding the relationships between positivity, depression and
bipolar disorder may partially result from the inclusion of different types of positive emotions.
Therefore targeting more than one type of positive emotion is an important component of the
current studies. Positive emotions have been conceptualised in several ways. Some researchers have
focused on specific, discrete emotions (e.g. Gruber et al., 2011), whilst others have classified positive
emotions in terms of drive or motivation versus satisfaction or contentment (Depue & Morrone-
Strupinsky, 2005; Gilbert et al., 2009), joviality compared to experience seeking (Stanton & Watson,
2014) or with regards to their level of activation (e.g. Fredrickson, 2001). There is considerable
overlap between such conceptualisations. For example, joviality, experience seeking and
appetitive/motivating emotions can all be considered high activation positive emotions (Fredrickson,
2001; Gilbert et al., 2008). Conversely, low activation emotions include those suggested to be
associated with experiences of satisfaction/contentment. The current spontaneous regulation study
included two mood induction videos, to attempt to differentially elicit both high and low activation

Page | 70
emotions. Specifically, the high activation emotions (happy, amused, excited) were considered to
reflect joviality, the constituents of which have been associated with reduced emotional responding
in depression (Rottenberg et al., 2002). The low activation emotions (relaxed, peaceful, calm) were
considered to be associated with the satisfaction and contentment group of emotions, which
Fredrickson (1998) argues is when emotion regulation, such as savouring, occurs.
The two studies in this chapter complement existing research into the relationships between mental
health problems (depression and hypomania), positive emotionality and regulation of positive
emotions in two ways. First, the spontaneous regulation study includes mood inductions that elicit
both high and low activation positive emotions. This addresses the need for the assessment of
varying types of positive emotions, which may have different underlying regulatory mechanisms.
Second, the use of a student sample contributes to the evidence assessing whether disruptions in
positive emotional reactivity and regulation form a vulnerability or potential pre-cursor to BD and
depression, or whether they emerge during the illness trajectory.
3.2 Spontaneous Regulation of Positive Emotions This study assessed individual differences in the spontaneous reactivity and regulation of two classes
of positive emotions (high activation/joviality and low activation/contentment). Specifically, it
addressed the following questions:
1. Is increased hypomania associated with increased positivity and increased reactivity of positive
emotions?
Gruber et al., (2008) found hypomania in a student sample to be associated with increased positivity
across positive, neutral and negative mood inductions. However these were absolute, rather than
change from baseline values, indicating greater overall positivity, rather than increased positive
reactivity. Subsequent studies (e.g. Gruber et al., 2011) have linked bipolar disorder to both
increased positivity and increased positive reactivity. However, they did not contain measures of low
activation positive emotions. Furthermore, studies investigating trait responses to positive emotions
have found contentment to be negatively associated with cyclothymia and dysthymia but not
associated with hyperthymia (Gilbert et al., 2009).
Therefore hypothesis 1 predicts that higher scores on the Hypomanic Personality Scale (HPS) will be
positively associated with increased baseline positivity (assessed by initial emotions ratings) and
reactivity (difference between pre- and post- video emotion ratings) of high, but not low, activation
positive emotions.
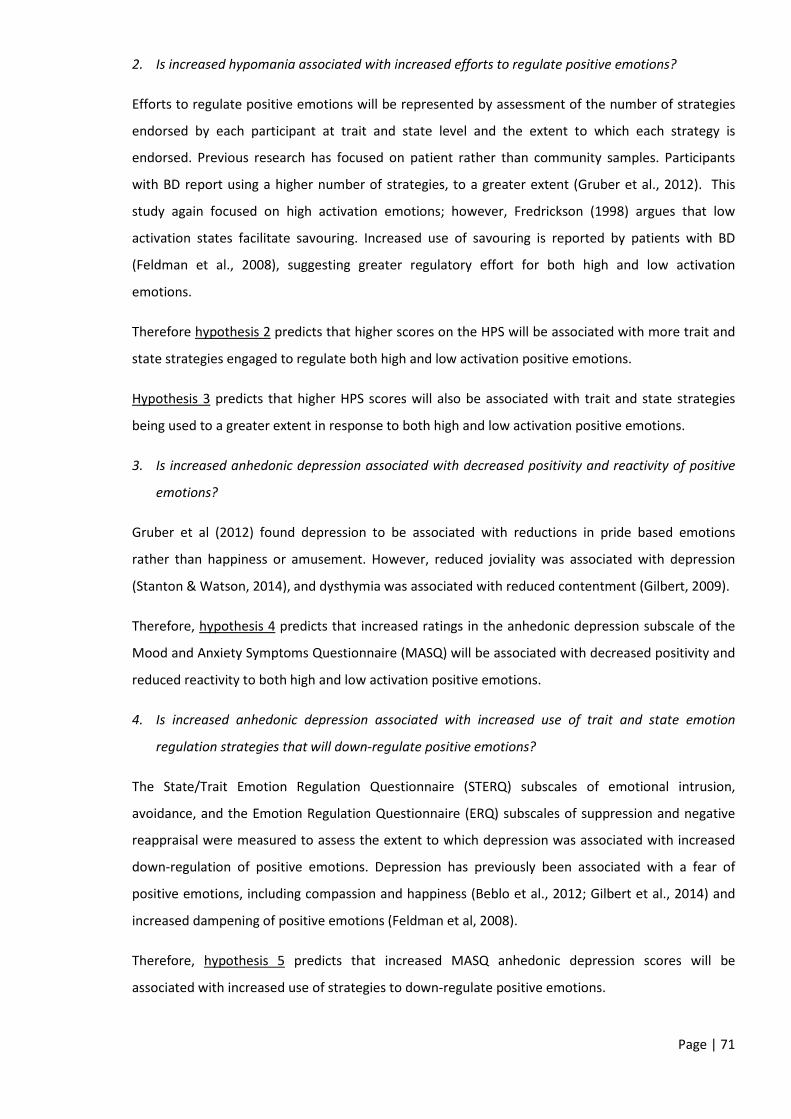
Page | 71
2. Is increased hypomania associated with increased efforts to regulate positive emotions?
Efforts to regulate positive emotions will be represented by assessment of the number of strategies
endorsed by each participant at trait and state level and the extent to which each strategy is
endorsed. Previous research has focused on patient rather than community samples. Participants
with BD report using a higher number of strategies, to a greater extent (Gruber et al., 2012). This
study again focused on high activation emotions; however, Fredrickson (1998) argues that low
activation states facilitate savouring. Increased use of savouring is reported by patients with BD
(Feldman et al., 2008), suggesting greater regulatory effort for both high and low activation
emotions.
Therefore hypothesis 2 predicts that higher scores on the HPS will be associated with more trait and
state strategies engaged to regulate both high and low activation positive emotions.
Hypothesis 3 predicts that higher HPS scores will also be associated with trait and state strategies
being used to a greater extent in response to both high and low activation positive emotions.
3. Is increased anhedonic depression associated with decreased positivity and reactivity of positive
emotions?
Gruber et al (2012) found depression to be associated with reductions in pride based emotions
rather than happiness or amusement. However, reduced joviality was associated with depression
(Stanton & Watson, 2014), and dysthymia was associated with reduced contentment (Gilbert, 2009).
Therefore, hypothesis 4 predicts that increased ratings in the anhedonic depression subscale of the
Mood and Anxiety Symptoms Questionnaire (MASQ) will be associated with decreased positivity and
reduced reactivity to both high and low activation positive emotions.
4. Is increased anhedonic depression associated with increased use of trait and state emotion
regulation strategies that will down-regulate positive emotions?
The State/Trait Emotion Regulation Questionnaire (STERQ) subscales of emotional intrusion,
avoidance, and the Emotion Regulation Questionnaire (ERQ) subscales of suppression and negative
reappraisal were measured to assess the extent to which depression was associated with increased
down-regulation of positive emotions. Depression has previously been associated with a fear of
positive emotions, including compassion and happiness (Beblo et al., 2012; Gilbert et al., 2014) and
increased dampening of positive emotions (Feldman et al, 2008).
Therefore, hypothesis 5 predicts that increased MASQ anhedonic depression scores will be
associated with increased use of strategies to down-regulate positive emotions.

Page | 72
5. Is increased anhedonic depression associated with decreased use of trait and state emotion
regulation strategies that up-regulate or maintain positive emotions?
The STERQ subscales of emotional expression and awareness and the ERQ subscale of positive
reappraisal were used to assess engagement with strategies that up-regulated or maintained positive
emotions. The current study extends previous findings which associated depression with lack of
engagement with up-regulatory strategies of positive emotions regulation (Werner-Seidler et al.,
2013) through the assessment of a wider range of emotion regulation strategies and positive
emotions.
Hypothesis 6 predicts that increased MASQ anhedonic depression ratings will be associated with
decreased use of trait and state emotion regulation strategies that up-regulate or maintain positive
emotions.
3.3 Spontaneous Regulation Method
3.3.1 Participants
Participants were recruited by the University of Reading undergraduate psychology SONA research
panel, Facebook (www.facebook.com) and Twitter (www.twitter.com). Power analysis indicated that
100 participants were required to detect moderate to strong correlations (r >=.35). Participation was
not subject to any specific inclusion or exclusion criteria.
The study was accessed by 139 participants, 110 of whom gave completed results (for details of
withdrawals see Table 22). A further 11 of the completed results were removed by the investigator
due to excessive time to complete the study (n = 7), 2 or more incorrect memory questions indicating
the clips had not been watched in their entirety (n = 3) and duplicate responses (n = 1). Further
analysis was conducted using 99 participants (9 male) aged 18-64 (M: 21.3; S.D: 8.42).
Time of withdrawal Number of participants After demographic data 12 During trait measures 6 During first mood induction 8 After first mood induction 1 Substantial missing data 2 TOTAL 29 Table 22: Participant withdrawal information
3.3.2 Materials
3.3.2.1 Questionnaires
The following measures were used to assess state and trait mood and emotion regulation. For more
details regarding all measures, except the State/Trait Emotion Regulation Questionnaire (STERQ), see
chapter 1. Further information regarding the STERQ scales is available in chapter 2.

Page | 73
Trait Emotion Regulation Measures:
1. State/Trait Emotion Regulation Questionnaires (STERQ): The STERQ Positive Trait scale
assesses trait regulation of positive emotions. The scale comprises of 12 items across 3
subscales: Emotional intrusion, avoidance and expression. Participants answer using a 5-
point Likert scale (Not at all to Very much).
2. Emotion Regulation Questionnaire (ERQ; Gross et al., 2003): This 10-item scale assesses the
extent to which participants typically use suppression and reappraisal in response to positive
and negative emotions. Participants responded using a scale from 1 (Strongly disagree) to 7
(strongly agree).
Trait Mood Measures:
1. Mini Mood and Anxiety Symptoms Questionnaire (MASQ; Casillas & Clark, 2000): This 26-
item scale measured current levels of general distress and anhedonia. The scale is based on
the tripartite model of anxiety and depression and consists of 3 subscales: General Distress;
Anxious Arousal (not analysed) and Anhedonic Depression. Participants provide answers
using a 5-point Likert scale (Not at all to Extremely). Scores on the General Distress and
Anhedonic Depression subscales range from 0-40.
2. Hypomanic Personality Scale (HPS; Meads & Bentall, 2008): The current study used the
unidimensional 20-item version of the HPS. The original and revised scales are a measure of
manic-like traits and have been shown to predict episodes of mania and diagnosis of bipolar
disorder (Eckblad & Chapman, 1986; Kwapil et al., 2000). Participants provide yes/no
answers to items, some of which are reverse coded.
Current Mood and Emotion Regulation Measures:
1. Current Mood: Participants rated the extent to which they felt Happy, Amused, Excited (high
activation), Calm, Peaceful and Relaxed (low activation) by marking a line between “not at
all” to “very much”. The resulting values were scaled between 0-100. Composite high and
low activation scores were created by taking the mean of the constituent emotion ratings.
High activation adjectives were consistent with those used in the instructed regulation study
(below), whilst low activation adjectives were chosen from the “Types of Positive Affect
Scale” (Gilbert et al., 2008).
2. State/Trait Emotion Regulation Questionnaires (STERQ): The STERQ Positive State
questionnaire assessed responses to emotions elicited by the mood inductions. The scale
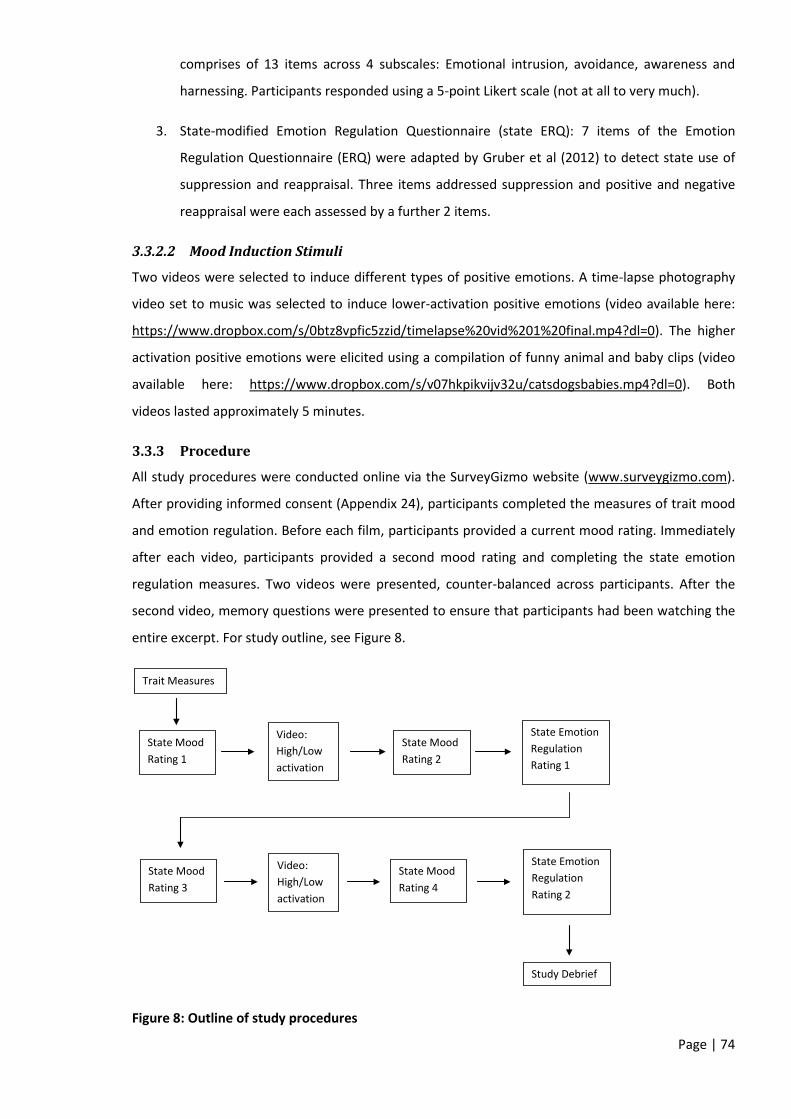
Page | 74
comprises of 13 items across 4 subscales: Emotional intrusion, avoidance, awareness and
harnessing. Participants responded using a 5-point Likert scale (not at all to very much).
3. State-modified Emotion Regulation Questionnaire (state ERQ): 7 items of the Emotion
Regulation Questionnaire (ERQ) were adapted by Gruber et al (2012) to detect state use of
suppression and reappraisal. Three items addressed suppression and positive and negative
reappraisal were each assessed by a further 2 items.
3.3.2.2 Mood Induction Stimuli
Two videos were selected to induce different types of positive emotions. A time-lapse photography
video set to music was selected to induce lower-activation positive emotions (video available here:
https://www.dropbox.com/s/0btz8vpfic5zzid/timelapse%20vid%201%20final.mp4?dl=0). The higher
activation positive emotions were elicited using a compilation of funny animal and baby clips (video
available here: https://www.dropbox.com/s/v07hkpikvijv32u/catsdogsbabies.mp4?dl=0). Both
videos lasted approximately 5 minutes.
3.3.3 Procedure
All study procedures were conducted online via the SurveyGizmo website (www.surveygizmo.com).
After providing informed consent (Appendix 24), participants completed the measures of trait mood
and emotion regulation. Before each film, participants provided a current mood rating. Immediately
after each video, participants provided a second mood rating and completing the state emotion
regulation measures. Two videos were presented, counter-balanced across participants. After the
second video, memory questions were presented to ensure that participants had been watching the
entire excerpt. For study outline, see Figure 8.
Figure 8: Outline of study procedures
Trait Measures
State Mood Rating 1
Video: High/Low activation
State Mood Rating 2
State Emotion Regulation Rating 1
State Mood Rating 3
Video: High/Low activation
State Mood Rating 4
State Emotion Regulation Rating 2
Study Debrief

Page | 75
3.3.4 Statistical Analysis
Analysis was conducted in two phases. First, preliminary analysis comprised of:
• Creation of composite scores of current mood and state emotion regulation ratings through
calculating the mean of relevant questionnaire items (Section 3.4.1.1).
• Assessment of normality of key measures using the Kolmogorov-Smirnov (K-S) statistic, and
skew and kurtosis values converted to z-scores (Section 3.4.1.2).
• Identification of missing values and consequences for analysis (Section 3.4.1.3).
• Assessment of mood induction efficacy using Wilcoxen-Signed Ranks test (Section 3.4.2).
In the second phase, bonferroni corrected Spearman’s Rho correlations (individual sections outline
level of bonferroni correction applied) were conducted to assess the following relationships:
• Hypomania, baseline positive emotions and positive emotional reactivity (Section 3.4.3.1).
• Hypomania, the number of trait and state emotion regulation strategies used and the extent
to which they are endorsed (Section 3.4.3.2).
• Anhedonic depression, baseline positive emotions and positive emotional reactivity (Section
3.4.4.1).
• Anhedonic depression and the use of trait and state strategies which down-regulate positive
emotions (intrusion, avoidance, suppression, negative reappraisal; Section 3.4.4.2).
• Anhedonic depression and the use of trait and state strategies which up-regulate or maintain
positive emotions (expression, awareness, positive reappraisal; Section 3.4.4.3).
To control for inter-relationships between trait measures, where two or more trait measures
correlated, these were added as covariates when both trait measures were significantly associated
with the variable of interest. When the pattern of significance is the same for zero-order and partial
correlations, zero order correlations were reported for clarity.
3.4 Spontaneous Regulation Results
3.4.1 Preliminary analysis
3.4.1.1 Composite scores
Composite high and low activation positive emotion scores were created by taking the mean of
Happy, Amused and Excited (High activation) and Calm, Peaceful and Relaxed (Low activation) from
each of the current emotion ratings. As per the study by Gruber et al, (2011) an emotion change
score for each type of emotion was also created by subtracting pre-mood induction score from post-
induction score.
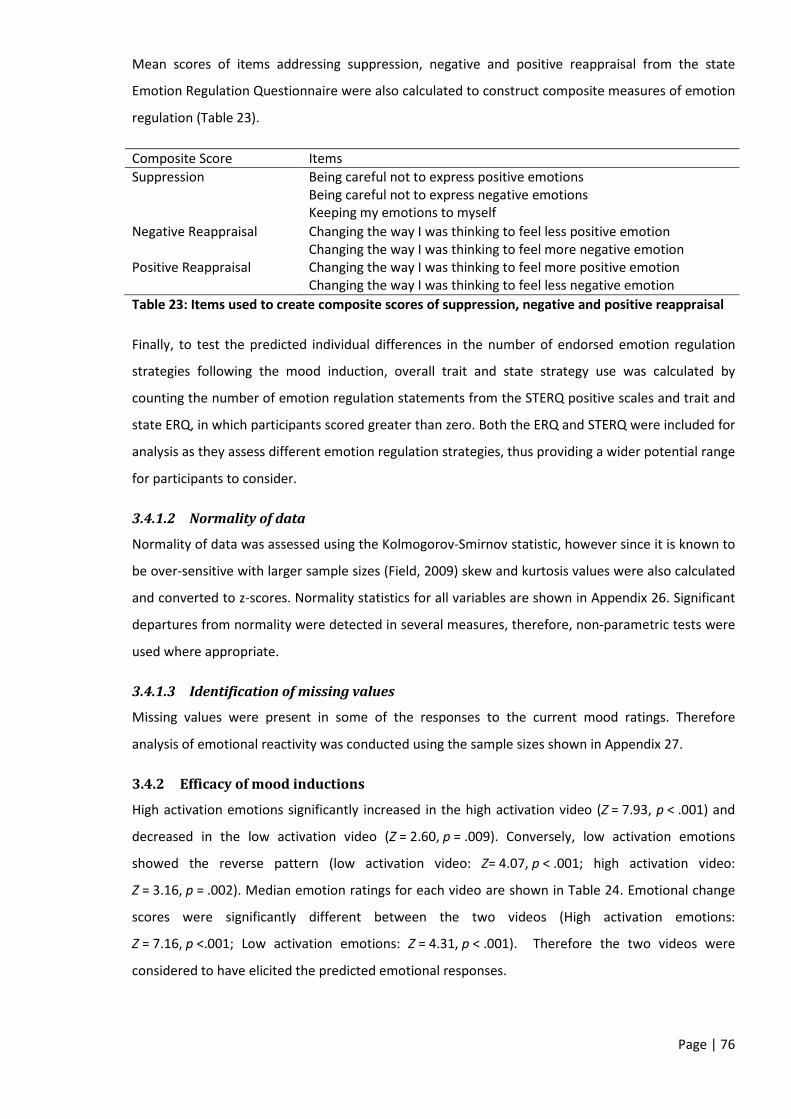
Page | 76
Mean scores of items addressing suppression, negative and positive reappraisal from the state
Emotion Regulation Questionnaire were also calculated to construct composite measures of emotion
regulation (Table 23).
Composite Score Items Suppression Being careful not to express positive emotions Being careful not to express negative emotions Keeping my emotions to myself Negative Reappraisal Changing the way I was thinking to feel less positive emotion Changing the way I was thinking to feel more negative emotion Positive Reappraisal Changing the way I was thinking to feel more positive emotion Changing the way I was thinking to feel less negative emotion Table 23: Items used to create composite scores of suppression, negative and positive reappraisal
Finally, to test the predicted individual differences in the number of endorsed emotion regulation
strategies following the mood induction, overall trait and state strategy use was calculated by
counting the number of emotion regulation statements from the STERQ positive scales and trait and
state ERQ, in which participants scored greater than zero. Both the ERQ and STERQ were included for
analysis as they assess different emotion regulation strategies, thus providing a wider potential range
for participants to consider.
3.4.1.2 Normality of data
Normality of data was assessed using the Kolmogorov-Smirnov statistic, however since it is known to
be over-sensitive with larger sample sizes (Field, 2009) skew and kurtosis values were also calculated
and converted to z-scores. Normality statistics for all variables are shown in Appendix 26. Significant
departures from normality were detected in several measures, therefore, non-parametric tests were
used where appropriate.
3.4.1.3 Identification of missing values
Missing values were present in some of the responses to the current mood ratings. Therefore
analysis of emotional reactivity was conducted using the sample sizes shown in Appendix 27.
3.4.2 Efficacy of mood inductions
High activation emotions significantly increased in the high activation video (Z = 7.93, p < .001) and
decreased in the low activation video (Z = 2.60, p = .009). Conversely, low activation emotions
showed the reverse pattern (low activation video: Z= 4.07, p < .001; high activation video:
Z = 3.16, p = .002). Median emotion ratings for each video are shown in Table 24. Emotional change
scores were significantly different between the two videos (High activation emotions:
Z = 7.16, p <.001; Low activation emotions: Z = 4.31, p < .001). Therefore the two videos were
considered to have elicited the predicted emotional responses.

Page | 77
Current Mood Score Low Activation Emotions High Activation Emotions Pre-induction
Median (IQR) Post-induction Median (IQR)
Pre-induction Median (IQR)
Post-induction Median (IQR)
Low Activation Video 63.33 (34.66) 69.67 (30.67) 50.67 (31.83) 41.67 (32.33)
High Activation Video 64.83 (31.50) 57.33 (37.67) 37.33 (27.34) 66.67 (26.67)
Table 24: Median levels of emotion before and after each video
3.4.3 Hypomania, reactivity and regulation of positive emotions
Spearman’s Rho correlations were used to detect associations between self-reported hypomania,
emotional reactivity, and trait and state emotion regulation strategy use. Hypomania was
significantly associated with the General Distress subscale of the MASQ (rs = .330, p = .001), however
there were no shared correlations with other measures, therefore this was not used as a covariate.
All significance thresholds are bonferroni adjusted for 28 multiple comparisons (p < .002). A full table
of correlations is available in Appendix 27.
3.4.3.1 Are increased hypomania scores associated with increased positivity and reactivity
of positive emotions?
Hypomania was not significantly associated with baseline measures of high (rs = .083, p = .441) or
low (rs = .026, p = .800) activation positive emotions. Furthermore, hypomania was not significantly
associated with change in high or low activation emotions in response to either mood induction
video (rs’s = -.014 to .204, p non-significant). Therefore the hypothesised relationship between
hypomania and increased positivity and reactivity of positive emotions (hypothesis 1) was not
supported.
3.4.3.2 Are increased hypomania scores associated with increased efforts to regulate
positive emotions?
Efforts to regulate positive emotions were assessed by measuring the number of strategies adopted
by participants, and the extent to which each strategy was endorsed. Participants who reported
higher levels of hypomania endorsed using more trait strategies to at least some extent (Figure 9;
rs = .448, p < .001) and more state strategies in the low (rs = .331, p < .001) but not the high
(rs = .118, p = .244) activation condition. This supports the prediction that hypomania would be
positively associated with increased number of strategies adopted in response to positive emotions
(hypothesis 2).

Page | 78
Figure 9: Relationship between hypomania and number of trait emotion regulation strategies endorsed
Figure 10: Relationship between hypomania and number of state emotion regulation strategies endorsed (low activation video)
When assessing the extent to which specific strategies were adopted, the prediction that hypomania
would be associated with increased engagement with emotion regulation strategies (hypothesis 3)
was partially supported. Hypomania was positively associated with trait emotional intrusion (Figure
11; rs = .459, p < .001) and state emotional intrusion in response to the low activation video (Figure
12; rs = .356, p < .001). Emotional intrusion in response to the high activation video was also
approaching significance (Figure 13; rs = .279, p = .005). However, trait emotional intrusion was
significantly related to both hypomania and state intrusion (low activation video: rs = .461,p < .001;
High activation video: rs = .588, p < .001), thus was added as covariate. The resulting relationships
0
2
4
6
8
10
12
0 5 10 15 20
Num
ber o
f tra
it em
otio
n re
gula
tion
stra
tegi
es e
ndor
sed
(>0)
Hypomanic Personality Scale Score
0
5
10
15
20
25
0 5 10 15 20 25
Num
ber o
f sta
te e
mot
ion
regu
latio
n st
rate
gies
end
orse
d (>
0)
Hypomanic Personality Scale Score

Page | 79
between hypomania and state emotional intrusion were no longer significant (Low activation video:
rs = .183, p = .069; High activation video: rs = .013, p = .898).
Figure 11: Relationship between hypomania and trait emotional intrusion
Figure 12: Relationship between hypomania and state emotional intrusion (Low activation video)
0
2
4
6
8
10
12
14
16
0 5 10 15 20 25
Trai
t lev
el o
f Em
otio
nal I
ntru
sion
(STE
RQ
subs
cale
)
Hypomanic Personality Scale Score
0
2
4
6
8
10
12
14
0 5 10 15 20 25
Stat
e Em
otio
nal I
ntru
sion
(STE
RQ s
ubsc
ale)
Hypomanic Personality Scale Score
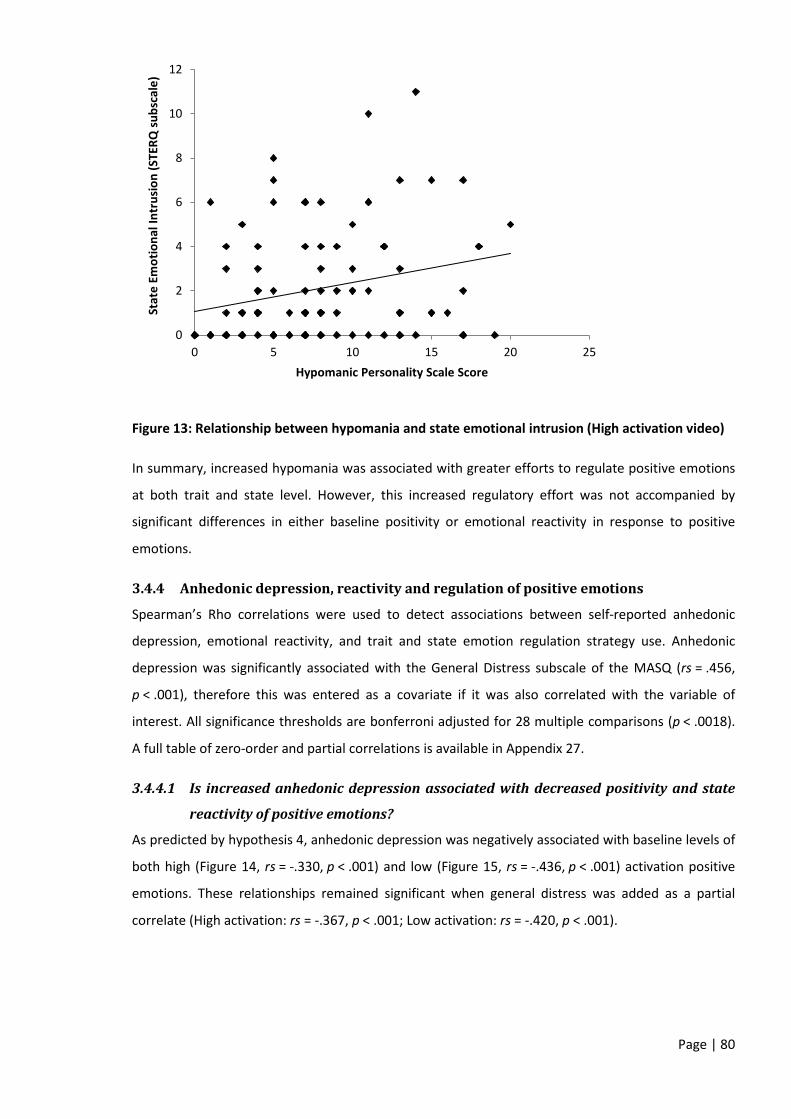
Page | 80
Figure 13: Relationship between hypomania and state emotional intrusion (High activation video)
In summary, increased hypomania was associated with greater efforts to regulate positive emotions
at both trait and state level. However, this increased regulatory effort was not accompanied by
significant differences in either baseline positivity or emotional reactivity in response to positive
emotions.
3.4.4 Anhedonic depression, reactivity and regulation of positive emotions
Spearman’s Rho correlations were used to detect associations between self-reported anhedonic
depression, emotional reactivity, and trait and state emotion regulation strategy use. Anhedonic
depression was significantly associated with the General Distress subscale of the MASQ (rs = .456,
p < .001), therefore this was entered as a covariate if it was also correlated with the variable of
interest. All significance thresholds are bonferroni adjusted for 28 multiple comparisons (p < .0018).
A full table of zero-order and partial correlations is available in Appendix 27.
3.4.4.1 Is increased anhedonic depression associated with decreased positivity and state
reactivity of positive emotions?
As predicted by hypothesis 4, anhedonic depression was negatively associated with baseline levels of
both high (Figure 14, rs = -.330, p < .001) and low (Figure 15, rs = -.436, p < .001) activation positive
emotions. These relationships remained significant when general distress was added as a partial
correlate (High activation: rs = -.367, p < .001; Low activation: rs = -.420, p < .001).
0
2
4
6
8
10
12
0 5 10 15 20 25
Stat
e Em
otio
nal I
ntru
sion
(STE
RQ s
ubsc
ale)
Hypomanic Personality Scale Score
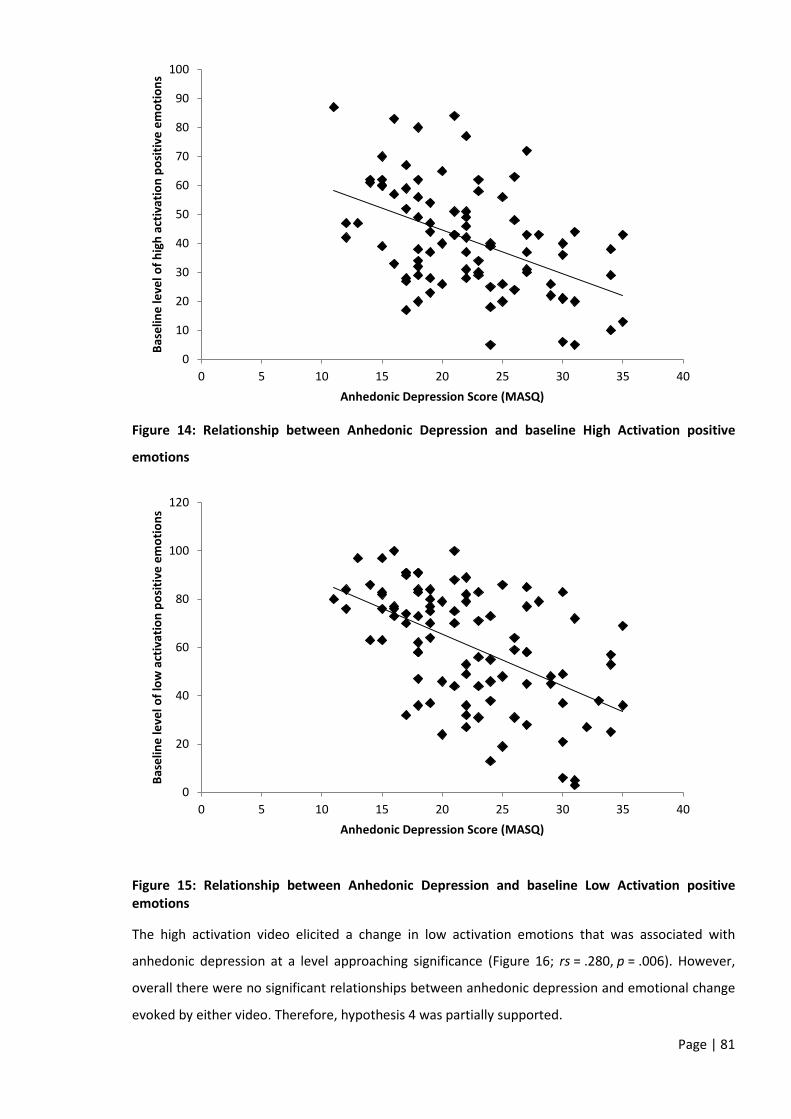
Page | 81
Figure 14: Relationship between Anhedonic Depression and baseline High Activation positive
emotions
Figure 15: Relationship between Anhedonic Depression and baseline Low Activation positive emotions
The high activation video elicited a change in low activation emotions that was associated with
anhedonic depression at a level approaching significance (Figure 16; rs = .280, p = .006). However,
overall there were no significant relationships between anhedonic depression and emotional change
evoked by either video. Therefore, hypothesis 4 was partially supported.
0
10
20
30
40
50
60
70
80
90
100
0 5 10 15 20 25 30 35 40
Base
line
leve
l of h
igh
activ
atio
n po
sitiv
e em
otio
ns
Anhedonic Depression Score (MASQ)
0
20
40
60
80
100
120
0 5 10 15 20 25 30 35 40
Base
line
leve
l of l
ow a
ctiv
atio
n po
sitiv
e em
otio
ns
Anhedonic Depression Score (MASQ)

Page | 82
Figure 16: Relationship between anhedonic depression and change in low activation emotions
3.4.4.2 Are increased levels of anhedonic depression associated with increased use of
down-regulatory emotion regulation strategies in response to positive emotions?
Contrary to the prediction that anhedonic depression would be associated with increased use of trait
and state emotional intrusion, avoidance, suppression or negative reappraisal (hypothesis 5), there
were no significant relationships between these variables and anhedonic depression.
3.4.4.3 Are increased levels of anhedonic depression associated with decreased use of up-
regulatory emotion regulation strategies in response to positive emotions?
As predicted by hypothesis 6, anhedonic depression and trait emotional expression were inversely
correlated (rs = -.439, p < .001), regardless of the level of General Distress (rs = -.416, p < .001).
Additionally, increased anhedonic depression was associated with decreased emotional awareness in
both low (rs = -.345, p <.001) and high (rs = -.322, p = .001) activation videos. However, when
accounting for trait emotional expression the relationship was no longer significant (low activation:
rs = -.150, p = .136; high activation: rs = -.140, p = .178).
3.5 Spontaneous Regulation Discussion This study investigated the relationship between state and trait emotion regulation style in response
to high and low activation positive emotions and individual differences in self-reported hypomania
and depression. Additionally, the study used the validated State/Trait Emotion Regulation
Questionnaires (STERQ) to establish the level of congruence between self-reported trait and state
emotion regulation strategy use.
-80
-60
-40
-20
0
20
40
0 5 10 15 20 25 30 35 40
Chan
ge in
low
act
ivat
ion
posi
tive
emot
ions
(h
igh
activ
atio
n vi
deo)
MASQ Anhedonic Depression Score

Page | 83
3.5.1 Hypomania and positive emotional reactivity
Hypomania was hypothesised to be associated with increased positive responding to positive mood
induction videos. However, this hypothesis was not supported. Self-reported hypomania was not
related to initial levels of high or low activation positive emotions; neither was it related to change in
positive emotions for either mood induction video. This does not replicate previous findings which
have shown increased emotional reactivity to positive mood inductions (Gruber, Harvey, & Purcell,
2011) and persistently elevated positive affect (PEP; Gruber, 2011) in patients with bipolar disorder
(BD).
There are several potential explanations for this. The current findings may indicate that PEP is a
product of, rather than precursor to, BD and thus was not detected within this student sample of
healthy participants. Alternatively, the nature of the stimuli used in the current study and the level of
detected change in positive emotions may have masked potential individual differences. Although
there was a large change in high activation positive emotions in the high activation video, it may be
that the emotional change elicited in the low activation video was not big enough to detect individual
differences in changes in positivity. The high activation video was selected to induce emotions of
happiness, excitement and amusement. Whilst Gruber et al (2011) suggest these are reward-based
emotions, they also have high overlap with emotions suggested to contribute to joviality, which has
been previously associated with well-being rather than psychopathology (Stanton & Watson, 2014).
Indeed previous studies using films to elicit positive emotions have centred more on emotions of
pride and achievement (e.g. Gruber et al., 2009, 2011, 2014) than of joy and amusement. Conversely,
the emotions elicited by the low activation video (calm, peaceful and relaxed) showed only small
increases following the low activation video. These emotions may be more pertinent to disruptions in
emotional positivity, as they provide an antithesis to the sensation, experience and reward-seeking
behaviour that reported in participants with BD (e.g. Stanton & Watson, 2014). Indeed Fredrickson
(1998) argues that it is during the experience of low activation positive emotions (e.g. contentment)
that savouring occurs, through the integration of positive events into the sense of self. Increased use
of this type of regulation (e.g. savouring or rumination of positive events) has been previously
associated with BD (e.g. Feldman et al., 2008). The relationship between hypomania and regulation
of positive emotions is explored in more detail in 3.5.2 below.
3.5.2 Hypomania and the regulation of positive emotions
The results showed partial support for the hypothesis that hypomania would be associated with
increased trait and state use of a greater range of emotion regulation strategies. Higher levels of self-
reported hypomania was associated with increased overall endorsement of a greater number of
emotion regulation strategies in response to positive emotions at a trait level, and following the low
activation video. Furthermore, feelings of emotional intrusion both at trait level, and after the low
activation video were also positively associated with hypomania. These findings support those

Page | 84
reported by Gruber et al (2012), in which participants with BD endorse using a wider range of
strategies, irrespective of the level of emotional reactivity.
Emotion generation and regulation is a dynamic process, therefore the potential relationships
between increased strategy endorsement and emotional positivity could be interpreted in at least
two ways. It may be that despite there being no overall difference in the level of positive emotion,
these emotions are less tolerable to individuals with higher levels of hypomania, leading to increased
attempts to regulate such emotions. Conversely, the initial experience of the positive emotion may
be amplified in participants with higher levels of hypomania, thus a wider number of strategies are
adopted, bringing the level of emotionality back to the same as those with low levels of hypomania.
Whilst we cannot be certain which interpretation accurately reflects the relationship between
hypomania, emotion regulation and positivity, there is some evidence both in the current study and
the wider literature, in support of the first interpretation.
In the current study, when examining the trait and state reported emotion regulation in more detail,
it is apparent that most of the emotion regulation statements endorsed belong to the “emotional
intrusion” category of the STERQ. This contains items such as “My feelings made it difficult to
concentrate” and “it was difficult to get the situation out of my mind” indicating higher levels of
hypomania may lead to positive emotions being perceived as more disruptive to ongoing functioning.
Furthermore, when assessing the perceived effort and success to regulate positive emotions, Gruber
et al (2012) reported that patients with BD reported making more effort and having less success in
emotional regulation, suggesting that the reported levels of emotional reactivity are likely to be an
initial response to the positive stimuli, rather than a post regulation modification of emotional
positivity.
3.5.3 Anhedonic depression, positivity and positive emotion reactivity
Anhedonic depression was hypothesised to be associated with decreased positivity and emotional
reactivity in response to positive mood induction. This hypothesis was only partially supported. As
predicted, overall levels of high and low activation positivity were negatively associated with
anhedonic depression. This provides experimental support for previous, questionnaire-based
research, which found depression to be associated with reduced joviality (Stanton & Watson, 2014)
and contentment (Gilbert et al., 2009).
The relationship between anhedonic depression and increase in low activation emotions (calm,
peaceful and relaxed) in response to the high activation video was approaching significance. This is
counter to the overall pattern of reactivity, which showed a decrease in low activation emotions
following the high activation video. Whilst anhedonic depression did not relate to levels of high
activation emotions (happiness, amusement, excitement), the relative lack of reactivity in reducing
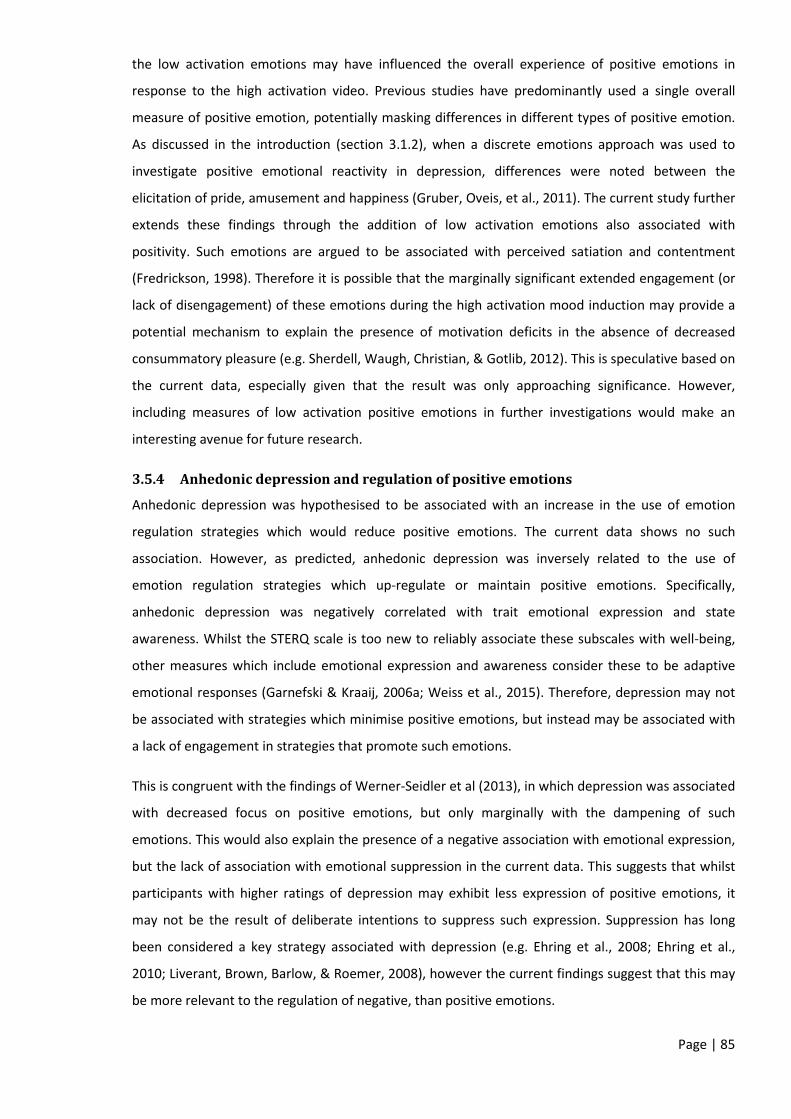
Page | 85
the low activation emotions may have influenced the overall experience of positive emotions in
response to the high activation video. Previous studies have predominantly used a single overall
measure of positive emotion, potentially masking differences in different types of positive emotion.
As discussed in the introduction (section 3.1.2), when a discrete emotions approach was used to
investigate positive emotional reactivity in depression, differences were noted between the
elicitation of pride, amusement and happiness (Gruber, Oveis, et al., 2011). The current study further
extends these findings through the addition of low activation emotions also associated with
positivity. Such emotions are argued to be associated with perceived satiation and contentment
(Fredrickson, 1998). Therefore it is possible that the marginally significant extended engagement (or
lack of disengagement) of these emotions during the high activation mood induction may provide a
potential mechanism to explain the presence of motivation deficits in the absence of decreased
consummatory pleasure (e.g. Sherdell, Waugh, Christian, & Gotlib, 2012). This is speculative based on
the current data, especially given that the result was only approaching significance. However,
including measures of low activation positive emotions in further investigations would make an
interesting avenue for future research.
3.5.4 Anhedonic depression and regulation of positive emotions
Anhedonic depression was hypothesised to be associated with an increase in the use of emotion
regulation strategies which would reduce positive emotions. The current data shows no such
association. However, as predicted, anhedonic depression was inversely related to the use of
emotion regulation strategies which up-regulate or maintain positive emotions. Specifically,
anhedonic depression was negatively correlated with trait emotional expression and state
awareness. Whilst the STERQ scale is too new to reliably associate these subscales with well-being,
other measures which include emotional expression and awareness consider these to be adaptive
emotional responses (Garnefski & Kraaij, 2006a; Weiss et al., 2015). Therefore, depression may not
be associated with strategies which minimise positive emotions, but instead may be associated with
a lack of engagement in strategies that promote such emotions.
This is congruent with the findings of Werner-Seidler et al (2013), in which depression was associated
with decreased focus on positive emotions, but only marginally with the dampening of such
emotions. This would also explain the presence of a negative association with emotional expression,
but the lack of association with emotional suppression in the current data. This suggests that whilst
participants with higher ratings of depression may exhibit less expression of positive emotions, it
may not be the result of deliberate intentions to suppress such expression. Suppression has long
been considered a key strategy associated with depression (e.g. Ehring et al., 2008; Ehring et al.,
2010; Liverant, Brown, Barlow, & Roemer, 2008), however the current findings suggest that this may
be more relevant to the regulation of negative, than positive emotions.

Page | 86
3.5.5 Trait and state emotion regulation styles and emotional reactivity
The relationships between trait hypomania and intrusion and trait anhedonia and
expression/awareness were present across trait and state measurements. That the state
relationships ceased to be significant when the relevant trait emotion regulation strategy was
controlled for, suggests that the same relationship between mood and emotion regulation may be
present at both state and trait level.
The current study also provides information regarding the relative strength of trait and state
correlations for emotion regulation subscales. Moderate to strong relationships were detected
between trait and state emotional intrusion, avoidance and trait expression/state awareness. These
relationships persisted for both low and high activation videos and are stronger than those between
state and trait suppression and reappraisal reported both in this study and for the situation specific
adaptation of the ERQ by Egloff, Schmukle, Burns and Schwerdtfeger (2006). There are at least two
possible explanations for this. First, by widening the potential emotion regulation strategies beyond
suppression and reappraisal, the study may provide a more comprehensive reflection of how
participants respond to positive emotions, thus improving the opportunity to detect such responses
at both state and trait level. Second, using a validated measure, specifically designed for assessing
state-based regulation of positive emotions, may have improved the concordance detected between
trait and state responses.
3.6 Instructed regulation of positive emotions The current study investigated individual differences in the ability of participants to successfully
follow instructions to up- or down- regulate positive emotions in response to a mood induction. The
ability to follow emotion regulation instruction will be inferred from the level of emotional change in
response to the mood induction video. Additionally, the way in which participants engage with
instructions will be assessed through number of strategies they adopt and extent of endorsement in
response to the instructions.
Specifically, the study addressed the following questions:
1. How does hypomania interact with instructions to up- or down- regulate positive emotions?
The widely reported association between hypomania and increased overall positivity and reactivity
to positive stimuli (Gruber, 2011) may lead difficulties following instructions to down-regulate
positive emotions. Conversely, following instructions to up-regulate positive emotions may be easier
to follow for those with increased levels of hypomania as it may be more congruent with their
natural emotion regulation style. Bipolar disorder (BD) has been associated with increased use of
multiple strategies to regulate positive emotions in previous studies using either questionnaire
measures (Feldman et al., 2008) or experiments addressing spontaneous regulation (Gruber et al.,

Page | 87
2012). It is not clear whether these differences are also present in community samples with
increased levels of hypomania. Nor is it clear whether these differences remain upon instruction to
regulate positive emotions.
However, based on available evidence outlined above, hypothesis 1 predicts that higher scores on
the Hypomanic Personality Scale (HPS) will be associated with increased use of multiple strategies in
response to instructions to regulate positive emotions.
Hypothesis 2 predicts increased scores on the HPS will be associated with greater emotional change,
regardless of instruction conditions. This would be indicative of greater success in up-regulating
positive emotions, and reduced success in down-regulating positive emotions.
2. How does depression interact with instructions to up- or down- regulate positive emotions?
The Emotional Context Insensitivity and Positivity Attenuation hypotheses argue that depression is
associated with decreased responding to positive emotions (Rottenberg, 2005). Existing literature
also suggests that depression is associated with increased use of strategies which minimise positive
emotions (Werner-Seidler et al., 2013) and decreased engagement in strategies which up-regulate
positive emotions.
Therefore hypothesis 3 predicts that increased scores on the depression subscale of the Depression,
Anxiety and Stress Scale (DASS) will be associated with greater success in minimising positive
emotions and reduced success in maximising these emotions.
Hypothesis 4 predicts that higher scores on the depression subscale of the DASS will be associated
with increased use of suppression and negative reappraisal across all conditions.
3.7 Instructed Regulation Method
3.7.1 Participants
Sample size calculation, based on moderate to large mood induction effects previously shown
elsewhere (e.g. Joorman et al., 2011), indicated a minimum of 39 participants were required. 77
participants were recruited via the University of Reading undergraduate psychology SONA research
panel. There were no specific inclusion or exclusion criteria for participation, however one
participant was excluded due to self-disclosed autism and difficulty understanding questionnaire
items. Therefore, data was analysed from 76 undergraduate participants (84% female) aged 18 to 47
(Mean: 20.72; S.D: 4.84). The age and ratio of male to female participants was equivalent across
conditions. Two further online samples were also recruited to online mood induction studies
assessing emotion regulation. For details see chapter 4.

Page | 88
3.7.2 Materials
3.7.2.1 Questionnaires
Hypomanic Personality Scale (HPS) – 20 item version (Meads & Bentall, 2008): See section 3.3.2.1
above.
Responses to Positive Affect Questionnaire (RPA) – 17 item (Feldman et al., 2008): This scale was
designed to measure how individuals typically respond when they are feeling good. The RPA
comprises of 3 sub-scales. The dampening subscale reflects the extent to which individuals react in
ways which may minimise the intensity and duration of the positive affect. The emotion-focused
subscale reflects the extent to which individuals focus on the mood and somatic experience. Finally,
the self-focused subscale captures the extent to which individuals focused on their sense of self and
pursuit of personally relevant goals. For all items, participants answer on a Likert scale from 1 (almost
never respond in this way) to 4 (almost always respond in this way). The full questionnaire was
administered for this study, however only the dampening and emotion-focused rumination scales
were analysed.
Depression, Anxiety and Stress Scale (DASS) – 21 item version (Henry & Crawford, 2005): The original
42-item DASS was developed as a measure of low positive affect (depression), physiological hyper-
arousal (anxiety) and negative affect (stress) across general and clinical populations (Lovibond &
Lovibond, 1995). The 21-item version has been shown to have improved discriminant validity
between the depression, anxiety and stress factors, and when results are doubled, give values that
closely match those obtained by the full 42-item scale (Henry & Crawford, 2005). Participants
responded using a 4-point Likert scale from 0 (Did not apply to me at all) to 4 (Applied to me very
much or most of the time). The current study used the full scale, however only the depression
subscale was analysed.
Current Mood Ratings: Participants were required to rate the extent to which they felt happy,
amused, sad, anxious, excited and angry immediately pre and post mood induction. Ratings for each
emotion were given on a 5-point Likert scale of not at all or very little, a little, somewhat, quite a lot,
very much. Composite scores for positive (happy, amused, excited) and negative (sad, anxious and
angry) emotions were created through calculating the mean of the constituent emotions.
State Emotion Regulation Questions: State emotion regulation measured using the state-modified
emotion regulation questionnaire (Gruber et al., 2012), see section 3.3.2.1 for details.
3.7.2.2 Mood Induction Stimuli
Positive emotions were elicited using a video containing Mr Bean at the Swimming Pool followed by
the Muppets singing Mahna Mahnam. The total video length was approximately 7 minutes (video
link: https://www.dropbox.com/s/3g1wyewen96t6l2/muppets%20and%20bean.mp4?dl=0).

Page | 89
3.7.3 Procedure
After obtaining informed consent (Appendix 25), the experiment was conducted using the
SurveyGizmo website (www.surveygizmo.com). Participants provided demographic information and
completed the trait mood and emotion regulation measures before providing a current mood rating.
Next, all participants were given condition-specific instructions (Table 25) prior to watching the mood
induction video. Immediately after the video, participants provided a second mood rating and
answered a series of questions regarding the emotion regulation strategies they adopted during the
video. Finally participants completed memory questions regarding the stimuli to ensure they had
been paying attention throughout the task. Figure 17 outlines the key study procedures.
Condition Instruction
Minimise Prior to video: We will now be showing you a short video. It is important that you pay close attention to the clip, and watch all the way to the end. Whilst watching the clip, please try to KEEP YOUR EXPRESSION NEUTRAL and NOT SHOW YOUR FEELINGS. Try to SUPPRESS ANY FEELINGS you have in response to the video as much as you can.
Above video: Please watch carefully and KEEP YOUR EXPRESSION NEUTRAL. Try NOT TO FEEL ANYTHING in response to the clip.
Maximise Prior to video: We will now be showing you a short film clip. It is important that you pay close attention to the clip, and watch all the way to the end. Whilst watching the clip, try to REALLY NOTICE ANY FEELINGS YOU HAVE. Try to HOLD ON TO THESE FEELINGS as much as you can.
Above video: Please watch carefully and REALLY NOTICE ANY FEELINGS THAT YOU HAVE. Try to HOLD ONTO ANY FEELINGS you have in response to the clip
Watch Prior to video: We will now be showing you a short film clip. It is important that you pay close attention to the clip, and watch all the way to the end.
Above video: Please watch carefully and all the way to the end.
Table 25: Condition specific instructions regarding mood induction
1. Trait Mood and Emotion Regulation Measures
2. Current Mood Measure
Minimise Feelings Maximise Feelings Watch Carefully
Watch Video
1. Current Mood Measure 2. Emotion Regulation
Figure 17: Instructed regulation study procedures

Page | 90
3.7.4 Statistical Analysis
Analysis occurred in two phases. First, preliminary analysis was conducted to address the following:
• Creation of composite scores (Section 3.8.1.1): Mean values of happy, amused and excited
(positive) items and sad, anxious and angry (negative) were calculated to create overall
measures of positive and negative emotions. The mean of items addressing suppression,
positive and negative reappraisal were also calculated to give overall measures of state
emotion regulations.
• Assessment of data normality (Section 3.8.1.2) was conducted as described in the
spontaneous regulation study above (Section 3.4.1.2).
• Evaluation of the mood induction (Section 3.8.1.3) was measured using an independent
measures ANOVA to assess overall change in positives in response to the mood induction
video.
• Evaluation of the effectiveness of the instructions to regulate emotions (Section 3.8.1.4) was
measured through the assessment of differences in emotional reactivity and emotion
regulation strategies adopted in response to the mood induction. ANOVAs and Kruskall-
Wallis ANOVAs were conducted depending on the normality of the data.
• Interactions between trait measures of mood and emotion regulation were assessed using
Spearman’s Rho correlations (Section 3.8.1.5). This enabled the clarification of whether
individual differences in responses to instructions to regulate positive emotions are
associated with trait mood, trait emotion regulation style or an interaction of the two.
In the second phase, Spearman’s Rho correlations were conducted to assess the following
relationships:
• Level of emotional change in response to the video, hypomania (section 3.8.2.1) and
depression (Section 3.8.2.2)
• Emotion regulation strategies engaged in response to the instructions by participants
with increased hypomania (Section 3.8.2.1) and depression (Section 3.8.2.2)
Where two or more trait measures correlated, these were added as covariates when they were
significantly associated with the variable of interest.
3.8 Instructed Regulation Results
3.8.1 Preliminary analysis
3.8.1.1 Composite scores
Overall levels of positive emotions were calculated from the current mood ratings by calculating the
mean ratings from happy, excited and amused scores. Participant change scores were also calculated

Page | 91
.25 .63 .860.00
0.20
0.40
0.60
0.80
1.00
1.20
Minimise (n=25) Watch (n=25) Maximise (n=26)
Chan
ge in
Pos
itive
Em
otio
ns
(val
ues
0-4)
Condition
for positive emotions by subtracting the baseline from the post-induction score (Gruber et al., 2011).
Mean state suppression and reappraisal scores were created as per section 3.4.1.1.
3.8.1.2 Normality of data
As in section 3.4.1.2, kolmogorov-smirnov (K-S) statistics and skew and kurtosis Z scores were
calculated. Normality statistics for all variables are shown in Appendix 26. Significant departures from
normality were detected in several measures, therefore, non-parametric tests were used where
appropriate.
3.8.1.3 Efficacy of Mood Induction
A significant increase in positive emotions (F(1,73) = 48.536, p < .001, η2 = 0.339) indicated that the
video was successful at improving mood.
3.8.1.4 Effectiveness of Instructions
Emotional reactivity:
The impact of instructions on change in positive emotions (PE change) was assessed using an
ANCOVA, with baseline levels of positive emotions (Baseline PE) entered as a covariate. Both
Baseline PE and Instructions significantly influenced PE change (Baseline PE:
F(1,72) = 14.02, p < .001, η2 = 0.16); Instructions: F(2,72) = 6.03, p = .004, η2 = 0.14). Bonferroni
corrected one-tailed post hoc analysis (adjusted significance threshold p < .017) found significantly
smaller increases in positive emotions in the Minimise, compared to Maximise (p = .001) and Watch
conditions (p = .014). The Maximise and Watch conditions did not elicit significantly different levels
of emotional change (p = .792). Figure 18 shows changes in positive emotions.
Figure 18: Level of change in positive emotions Error bars indicate SEM asignificant change from baseline, *Significant p < .05
Emotion Regulation:
Kruskal-Wallis ANOVAs identified significant effects of emotion regulation instructions on the use of
all strategies (suppression: X2(2) = 31.155, p <.001; negative reappraisal X2(2) = 37.445, p <.001;
positive reappraisal: X2(2) = 15.319, p <.001). As illustrated by Figure 19, participants in the Minimise
*
a

Page | 92
condition reported using suppression and negative reappraisal significantly more, and positive
reappraisal significantly less than those in the Watch condition (suppression U = 96.0 p < .001;
negative reappraisal U = 91.5, p < .001; positive reappraisal U = 148.0, p = .001). The Maximise and
Watch conditions did not significantly differ in strategy use (suppression U = 234.5, p = .0405;
negative reappraisal U = 311.0, p = .305; positive reappraisal U = 308.5, p = .377).
Figure 19: Use of emotion regulation strategies across conditions.
Self-reported use of negative reappraisal in the Watch condition, and positive reappraisal in the
Minimise condition was predominantly zero (n = 22/25 and n = 15/25 respectively). Therefore
subsequent analysis of positive reappraisal use was only conducted in the Watch condition. Similarly,
use of negative reappraisal was only conducted in the Minimise condition.
Overall, the emotion regulation instructions were partially effective, with significant differences
detected between the Watch and Minimise conditions with regards to emotional reactivity and use
of emotion regulation strategies reported. However, no significant differences were detected across
instruction conditions in changes to negative emotions or in the Enhance condition compared to the
Watch condition. Therefore only data relating to positive emotions and to the Watch and Minimise
conditions was investigated further.
3.8.1.5 Inter-relationships between trait measures
Spearman’s rho correlations were used to detect relationships between self-reported hypomania
(HPS), depression (DASS) and habitual use of dampening and savouring (RPA dampening and emotion
focused subscales). One-tailed significance levels bonferroni corrected for multiple comparisons
(adjusted significance p < .006) were used for all correlations.
1.95
1.36
.54.55 .10
1.52
.85.14
1.62
0.00
0.50
1.00
1.50
2.00
Suppression Negativereappraisal
Positive reappraisal
Leve
l of s
trat
egy
use
(0-4
)
Emotion Regulation Strategy
Minimise
Maximise
Watch
Error bars represent SEM

Page | 93
Hypomania and depression were significantly correlated (rs = .407, p < .001), thus zero order and
partial correlations were conducted to establish the relationship between trait mood and trait
emotion regulation measures. Correlation coefficients (Spearman’s rho) are reported in Table 26.
Measure Hypomania (HPS-20) Depression (DASS-21) Zero-order Partial1 Zero-order Partial2 Dampening (RPA) .356* .178 .536* .459* Emotion Focus (RPA) .348* .407* -.058 -.233
Table 26: Correlation coefficients for relationships between trait mood and emotion regulation style
Significant relationships were identified between hypomania and dampening and hypomania and
emotion focus. However, only the relationship between hypomania and emotion focus remained
after accounting for depression. Depression and dampening were also related, and remained
significantly correlated upon accounting for hypomania.
Given the significant inter-relationships between trait mood and emotion regulation, subsequent
analysis will include both zero-order and partial correlations as appropriate.
3.8.2 Relationships between trait mood and instructions to regulate positive emotions
Spearman’s Rho correlations were used to detect associations between hypomania and level of
emotional reactivity and regulation across different instruction conditions. All significance thresholds
are bonferroni adjusted for 6 multiple comparisons (p < .008).
3.8.2.1 How does hypomania interact with instructions to up- or down- regulate positive
emotions?
Contrary to hypotheses 1 and 2, hypomania was not significantly associated with level of emotion
change (minimise: rs = .235, p = .258; watch: rs = -.190, p = .363), number of strategies endorsed
(minimise: rs = .186, p =.372; Watch: rs = .261, p = .207) or extent of use of any strategy (p’s > .05).
3.8.2.2 How does depression interact with instructions to up- or down- regulate positive
emotions?
Depression was associated with hypomania (rs = .407, p < .001) and dampening (rs = .536, p < .01)
therefore these were included as partial correlates when they were also associated with the variable
of interest.
Depression was not associated with level of emotional change in either the minimise
(rs = -.050, p = .811) or watch (rs = -.134, p =.523) conditions. Therefore the prediction of decreased
emotional responding with increased depression (hypothesis 3) was not supported.
In the minimise condition, depression was positively associated with use of suppression (Figure 20;
rs = .506, p = .005). However dampening was significantly associated with both depression and
1DASS-depression added as partial correlate; 2HPS score added as partial correlate * p < .01
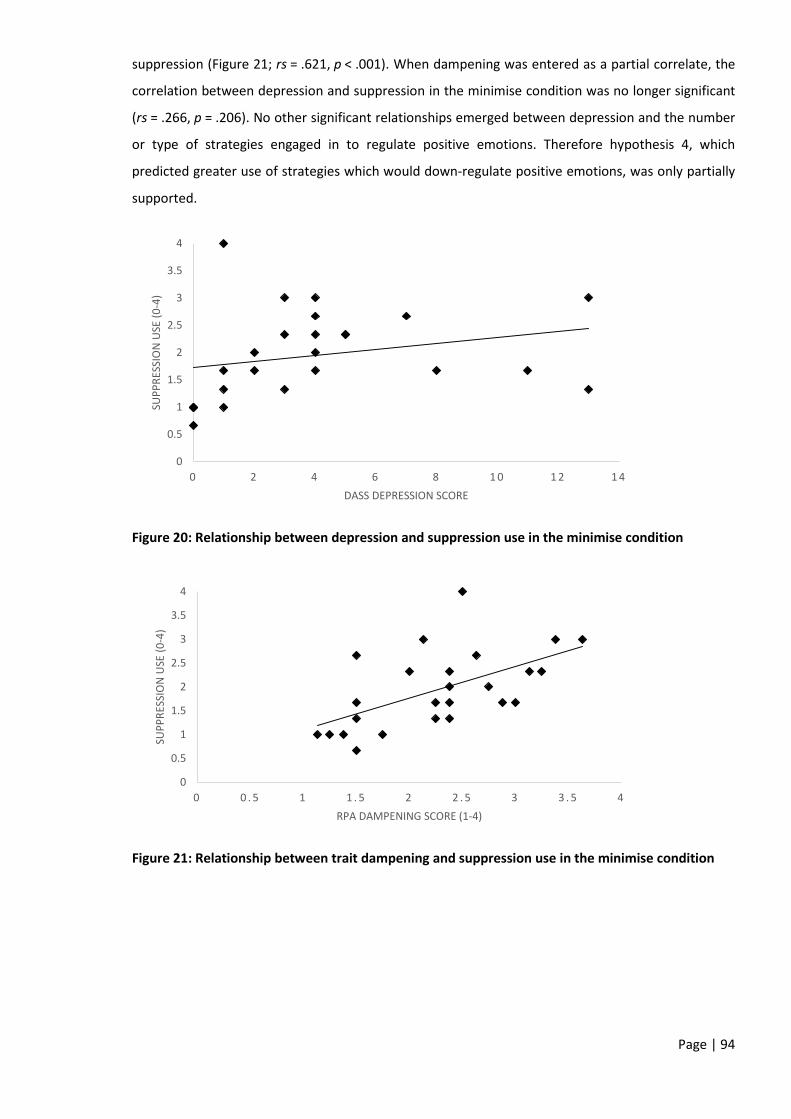
Page | 94
0
0.5
1
1.5
2
2.5
3
3.5
4
0 0 . 5 1 1 . 5 2 2 . 5 3 3 . 5 4
SUPP
RESS
ION
USE
(0-4
)
RPA DAMPENING SCORE (1-4)
suppression (Figure 21; rs = .621, p < .001). When dampening was entered as a partial correlate, the
correlation between depression and suppression in the minimise condition was no longer significant
(rs = .266, p = .206). No other significant relationships emerged between depression and the number
or type of strategies engaged in to regulate positive emotions. Therefore hypothesis 4, which
predicted greater use of strategies which would down-regulate positive emotions, was only partially
supported.
Figure 20: Relationship between depression and suppression use in the minimise condition
Figure 21: Relationship between trait dampening and suppression use in the minimise condition
0
0.5
1
1.5
2
2.5
3
3.5
4
0 2 4 6 8 1 0 1 2 1 4
SUPP
RESS
ION
USE
(0-4
)
DASS DEPRESSION SCORE

Page | 95
3.9 Instructed Regulation Discussion The current study evaluated individual differences in engagement with instructions to up- or down-
regulate positive emotions.
3.9.1 Hypomania and positive emotional reactivity and regulation
Contrary to our hypotheses, there were no significant associations detected between self-reported
hypomania and positive emotional reactivity or regulation of positive emotions, regardless of the
instruction condition of participants. This suggests that all participants were equally successful at
regulating their emotions as instructed, and that there were no differences in the number or type of
strategies they employed to do so. Whilst this does not support our original hypothesis, it is
congruent with further research published after the completion of the current study. This showed
that participants with bipolar disorder were able to effectively use reappraisal to modify both
positive and negative emotional responses when instructed (Gruber et al., 2014). The current study
did not give specific instructions regarding which emotion regulation strategies to adopt. However
this did not elicit a relationship between hypomania and the ways in which people attempted to
regulate positive emotions. This suggests that when the regulatory goal is clear, increased hypomania
is not associated with differences in emotion regulation.
3.9.2 Depression and positive emotional reactivity and regulation
Depression was not significantly associated with level of emotional reactivity in any of the instructed
regulation conditions. This refutes the hypothesis predicting depression would be associated with
decreased emotional reactivity. There are several potential explanations for this. First, as discussed in
relation to hypomania, the emotions targeted in the video may be different to those disrupted by
depression, and may thus remain unaffected. This notion is supported by evidence from Gruber et al
(2012), which suggests that happiness and amusement are less disrupted in depression than other
emotions. However, these emotions have previously been successfully associated with depression,
but in a clinical population (Rottenberg, 2002). Therefore disruption of such emotions may be linked
to increased depression severity, therefore not affected in a student sample. Alternatively, since the
current study employed a between-subjects design, it may have simply been underpowered for
detection of smaller associations between depression and reactivity to positive emotions.
Unlike the relationships between depression and emotion regulation in the spontaneous regulation
study, the current study found partial support for the hypothesis that depression would be
associated with greater use of strategies that reduce positive emotions. Increased depression was
associate with greater trait dampening of positive emotion, and state use of suppression in the
minimise condition. This may suggest that participants who have higher depression scores also utilise
less adaptive strategies when specifically asked to down-regulate positive emotions. This finding is in
line with robust findings from research investigating the regulation of negative emotions, whereby

Page | 96
suppression is associated with increased depression (Aldao et al., 2010). However, the use of
suppression was also associated with trait endorsement of dampening of positive emotions. Partial
correlations indicated that the association between depression and suppression became non-
significant upon controlling for trait dampening. This may suggest that the association between
depression and suppression is merely a side-effect of both variables being related to dampening.
Alternatively, it could also indicate that an increase in depression scores is associated with the
endorsement of multiple maladaptive emotion regulation strategies in response to positive
emotions.
3.10 Discussion This chapter investigated individual differences in spontaneous and instructed regulation of positive
emotions. The two studies sought to increase understanding of how hypomania and depression in a
student sample are associated with the dysregulation of positive emotions.
Neither study found an association between hypomania and increased emotional reactivity. This can
be interpreted in two ways. Given that hypomania is a known risk factor for bipolar disorder (BD; e.g.
Kwapil et al., 2000), a lack of association between this and increased emotional responding to
positive stimuli may indicate that exacerbated positive reactivity is a product of, rather than a pre-
cursor to, BD. However, this contradicts previous studies showing increased positive reactivity in
participants with high hypomania scores (Gruber et al., 2008). In the study by Gruber et al (2008), the
stimuli used depicted scenes selected to elicit pride-based emotions, rather than the joviality and
contentment emotions targeted in the current studies. Therefore, the current results may instead
suggest that increased positivity in BD is not universally associated with all types of positive emotion.
Indeed, Stanton and Watson (2014) note that greater endorsement of experience-seeking positive
emotions may be a risk factor for mania, whereas those related to joviality are associated with well-
being. Both studies included a video eliciting emotions associated with joviality (amusement,
happiness, excitement), providing support for the notion that such emotions are not associated with
risk of mania.
Mixed results were obtained regarding the relationship between hypomania and regulation of
positive emotions. Increased hypomania was associated with greater trait-based use of emotion
focus (instructed regulation study) and greater trait emotional intrusion (spontaneous regulation
study). These relationships were detected in separate studies; therefore it is not possible to establish
whether emotion-focus is related to emotional intrusion. However, it is plausible that increased
focus on emotions may lead to a greater sense of emotional intrusion, regardless of whether there is
an associated change in emotional reactivity.

Page | 97
Similarly mixed results were obtained for the relationships between depression and positive
emotional reactivity and regulation. No association was detected between depression and high
activation emotions in either study. However, in the spontaneous regulation study, low activation
emotions were increased in response to the high activation video, going against the overall
emotional response to this video. Some dysregulation in response to positive emotions was also
detected across the two studies. In the spontaneous regulation study trait measures indicated a lack
of engagement in adaptive regulation, whilst in the instructed regulation study, increased
endorsement of engagement in rumination that dampens positive emotions was noted. This subtle
difference in the way the dysregulation presented may be accounted for by the different measures of
depression and emotion regulation used in the different studies. Alternatively, this pattern of
responses could arise if the dysregulation is not a product of direct attempts to reduce positive
emotions (e.g. through suppression or avoidance), but instead is a by-product of maladaptive
engagement with such emotions. Such engagement could either be through processes which
inadvertently minimise the impact of such emotions (e.g. thinking “this will never last”) or through a
lack of engagement with strategies that maintain or amplify positive emotions (e.g. emotional
expression).
The inclusion of the State/Trait Emotion Regulation Questionnaire (STERQ) in the spontaneous
regulation study enabled a more thorough investigation of the relationship between trait and state
based regulation of positive emotions than has previously been achieved. This had several benefits. It
widened the scope of the investigation of relationships between emotion regulation, hypomania and
anhedonic depression, enabling improved understanding of how reactions to positive emotions are
related to both emotional reactivity and psychopathology. This widened scope also provides further
insight regarding better-researched strategies, such as suppression and reappraisal. Indeed this was
exemplified by the significant negative relationship between anhedonic depression and expression,
but lack of relationship to suppression noted in the spontaneous regulation study (section 3.5.4).
Using a purpose-designed measure of both trait and state emotion regulation also enabled
comparisons to be made between trait and state strategy use. As discussed in the spontaneous
regulation discussion (Section 3.5.5), there was generally a moderate to strong correlation between
trait and state measures, with similar patterns of association with hypomania and depression.
Further exploration of the stability of such relationships is an important area for future study.
3.10.1 Study limitations and future directions
3.10.1.1 Video stimuli
Video mood induction was chosen for the current study, as it has been previously demonstrated to
elicit the strongest change in positive emotions (Westermann & Spies, 1996) and can be successfully
implemented both in the laboratory (instructed regulation study) and online (spontaneous regulation

Page | 98
study). However, this approach had several limitations. First, hypomania and depression may affect
different types of positive emotions. Therefore, one video may not effectively show dysregulation for
both conditions. Although originally chosen to try and assess responses to high activation positive
emotions, the amusement videos in the spontaneous and instructed regulation studies may have
been most relevant to emotions linked to joviality, which, as previously discussed, is negatively
associated with depression, but not related to hypomania. However, Stanton and Watson (2014)
proposed these potential relationships on the basis of trait emotion measures. Indeed, baseline
ratings of both high and low activation positive emotions were negatively associated with depression
in the spontaneous regulation study. However, neither study found a relationship between
depression and reactivity of these emotions in response to the mood induction. Therefore replication
and further research utilising alternative methodologies (e.g. Diary or Experience sampling) would be
useful in elucidating the state relationship between joviality and depression.
Second, watching a video is a relatively passive process with limited personal involvement from the
participant. This may not allow access to a full range of positive emotions, for example those linked
to reward or social feedback. Third, the use of video mood induction elicits a transient, short-term
change in emotion, which may not be sufficient to detect subtle individual differences in positive
emotional reactivity and regulation. This is further compounded in the instructed regulation study, as
the between-subjects design resulted in relatively small groups for each instruction condition.
3.10.1.2 State emotion regulation measures for the instructed regulation study
The State/Trait Emotion Regulation Questionnaires were not developed in time for the instructed
regulation study, therefore different trait and state measures were used when assessing the
relationship between regulation of positive emotions and psychopathology. Detection of individual
differences in state emotion regulation across conditions was limited to the assessment of
suppression and reappraisal, using the state-modified Emotion Regulation Questionnaire (Gruber et
al, 2012), as this was the only state-based measure which had previously been validated (Egloff et al.,
2006). However, in order to assess a wider range of emotion regulation strategies, ruminative
responses to positive emotions were assessed at the trait level using the Responses to Positive Affect
Scale (Feldman et al., 2008). Although this provided interesting data regarding how different state
and trait regulation strategies interact, it precluded the comparison of trait and state responding for
each emotion regulation strategy.
The inclusion of the State/Trait Emotion Regulation Questionnaires in the spontaneous regulation
study helped to mitigate against this limitation, by providing a wider range of strategies with both
state and trait components. However, it is important to note that whilst there is substantial overlap
between state and trait STERQ scales, no subscale has complete trait and state overlap.
Page | 99
3.10.1.3 Effectiveness of instructions in the instructed regulation study
The instructions designed to elicit increased positive emotional responding in response to the mood
induction were not successful, with participants showing no difference to those in the uninstructed
(watch) condition. Consequently, it was not possible to conduct further analysis regarding individual
differences in response to instructions to maximise emotional responses. This problem may have
arisen for two reasons. First, the mood induction or instructions may not have been specific or
powerful enough to elicit heightened positive emotional responding. Second, the instructions may
reflect what participants naturally do anyway in response to positive emotions. Therefore there were
no significant differences between the maximise and watch conditions. Future studies could adopt
matched state and trait measures as discussed above. This would enable them to identify whether
changes from trait responses occurred as a function of instructions to regulate positive emotions.
3.10.1.4 Power to detect effects in the instructed regulation study
Power analysis for the instructed regulation study was based on the number of participants required
to detect an emotional response to the mood induction stimuli. As such, this was effective, with a
change in positive emotions detected across the uninstructed and “maximise” groups. The study was
also sufficiently powered to detect differences in emotional response and regulation strategy use
across groups, with the minimise condition showing less emotional change, and increased use of
suppression and negative reappraisal than other groups. However, further correlational analysis
within each group to assess the relationships between traits of hypomania and depression were
underpowered, with power calculations indicating a minimum of 38 required to detect even large
(r>.5) effects. As discussed in section 3.9.2, it is therefore not possible to discern whether the lack of
association between hypomania, depression and reactivity was a genuine experimental effect, or was
simply a product of the study being underpowered.
3.10.1.5 Self-report measures of emotional reactivity and regulation
It is well acknowledged that self-report measures of emotional reactivity and regulation are
subjective, may be influenced by demand characteristics, and rely on emotional awareness and
insight from the individual. Such ratings may therefore provide an incomplete account of emotional
processes occurring within individuals. Furthermore, the issue of missing data in the spontaneous
regulation study resulted in some data loss from up to 11% of respondents. Whilst self-report would
ideally be accompanied by objective data (e.g. physiological measures), this was not possible in the
present chapter, as data collection for the spontaneous regulation study occurred via the internet.
Although the instructed regulation study was conducted in the laboratory, a secondary aim of the
study was to conduct online replication to validate the use of internet data collection in mood
induction studies (chapter 4). Therefore, to enable a like-for-like comparison between laboratory and
internet data collection, no physiological measures were used.
Page | 100
3.10.2 Future Directions
Several potential future studies can add to the current work investigating the spontaneous and
instructed regulation of positive emotions. The measurement of both high and low activation
positive emotions in the spontaneous regulation study, is a strength of the current research, and
would benefit from further refinement and inclusion in future studies. This would ensure that
positive emotions across a range of activation states, hedonic and eudemonic categories are
captured when assessing emotional reactivity and regulation. Furthermore, the inclusion of low
activation emotions in studies investigating positive emotional reactivity to a range of different
stimuli may yield important information regarding how the different types of positive emotions
interact in different psychopathologies.
Replication of the current results including physiological measures would also help to improve our
understanding of how different positive emotional states may interact to change subjective
experience. For example, inclusion of physiological measures may have identified associations in
overall arousal which would clarify the impact of the current finding, relating decreased
disengagement of low activation emotions in response to high activation stimuli with increased
depression score.
Future work could also extend the current findings relating state and trait emotion regulation use.
Whilst the current study found reasonable agreement between trait and state emotion regulation
and their relationships with hypomania and depression, considerably more evidence across a range
of methodologies is needed before firm conclusions regarding the relationship between trait and
state regulation of positive emotions can be drawn.
3.10.3 Conclusion
Regulation of positive emotions is an under-researched topic with key relevance to both bipolar
disorder and depression. This chapter includes two studies assessing individual differences in the
spontaneous and instructed regulation of positive emotions in student samples. Increased
hypomania was associated with increased use of multiple emotion regulation strategies, both at trait
and state level, and increased use of emotion focus and experience of emotional intrusion. Higher
self-reported depression was also associated with disrupted regulation of positive emotions. This was
seen in both the endorsement of strategies which minimise such emotions, and through lack of
engagement with strategies that amplify or maintain positive emotions.

Page | 101
CHAPTER 4:
STUDYING EMOTION
REGULATION ONLINE

Page | 102
4.1 Introduction Mood induction has long been used as a method for identifying individual differences in the
regulation of emotional responses. Traditionally, such experiments have been conducted in the
laboratory, under tightly controlled conditions. Improvements in technology and a rise in internet
use means there may be alternatives to exclusively conducting such studies in the laboratory.
Internet-based research widens potential participation as the laboratory no longer needs to be
accessible to those taking part. This reduces the burden of recruitment (Kraut et al., 2004) whilst also
enabling more diverse sampling, with increased accessibility allowing participation across several
countries. Internet administration also reduces the time burden (Granello & Wheaton, 2004) and
costs (Birnbaum, 2004; Kraut et al., 2004) for experimenters, making studies quicker and more
economic to conduct. Furthermore, the computerised administration of questionnaires ensures
responses for every item, reducing accidental non-responses and eliminating un-codable replies
(Pettit, 2002). Coding and scoring of questionnaires can also be automated, reducing both coding
errors, and time required by the experimenter.
There have been several proposed concerns regarding internet data collection. However, many
concerns have either not materialised in practice, or have been mitigated by improvements in
technology and increasingly ubiquitous internet use. Such concerns include:
1. Internet sampling leads to lowered response and increased drop-out rates (e.g. Reips, 2002; Sohn,
2001)
Varying response and drop-out rates have been reported across online studies (Sohn, 2001). In many
instances, online response rates may also be impossible to determine, as it is unclear how many
people accessed the website but did not continue into the study. However, although response rates
may be lower, recruitment is quicker and cheaper than for both laboratory and paper-based non-
laboratory studies. Therefore, in practical terms, reduced responding may not be problematic. Whilst
the resulting samples will be self-selecting, the bias inherent within this is not necessarily
exacerbated through online recruitment (discussed further in section 2).
Drop-out rates are also higher for online samples, however this may be potentially informative in
several ways. First, in non-laboratory studies using pen and paper measures, several participants may
have started but not finished or returned the questionnaires. It is impossible to distinguish between
these and genuine non-responders, thus losing valuable information about the tolerability of
individual measures. Second, computerised responding enables the encoding of several completion
variables, for example, when drop-out occurs, how long participants take to respond and whether
participants navigated back to change previous responses. This may provide information regarding
the tolerability of particular measures or study conditions, key to assessing the validity and efficacy
of the study. Finally, the absence of interaction with an experimenter may have either beneficial or
Page | 103
detrimental effects on response rates and integrity (Brock et al., 2012). Internet completion enables
greater anonymity through the lack of interaction with study personnel, and standardisation of
administration (Rhodes, Bowie, & Hergenrather, 2003). This may encourage more honest and
complete reporting from participants, especially if the study requires divulging personal or sensitive
information. Conversely, through gaining rapport with the experimenter, participants may be
encouraged to continue where they may otherwise withdraw, and feel more comfortable in
disclosing sensitive information if required (Brock et al., 2012).
2. Differing internet accessibility and response rates may lead to the over- or under- representation
of particular populations, resulting in sample bias (e.g. Granello et al, 2004)
Previous research has reported a predominance of younger respondents, with higher levels of
education, when recruiting for internet research (Pettit, 1999). However, internet usage increased by
37% in the decade from 2003-2013, with 83% of UK households having internet access by 2013
(Office of National Statistics (ONS), 2013). 73% of UK people aged 16 or over report daily internet use
(ONS, 2013), making the internet more ubiquitous than ever before. Therefore, whilst some
sampling bias is inherent within all self-selected samples, the bias from internet recruitment is likely
to be lower than previously reported, due to the increased prevalence and usage of the internet in
daily life. Furthermore, opportunity sampling over the internet provides access to a more diverse
population than the undergraduate sample often used in laboratory research (Kraut et al., 2004) and
targeted recruitment can aid participation in populations that are historically difficult to access
(Rhodes et al., 2003).
3. Complex experimental logic cannot be programmed for administration via the internet (e.g. Kraut
et al., 2004)
Early research highlighted the technical knowledge and time required to develop and programme
online research (e.g. Kraut et al., 2004). However, a growth in commercial websites (e.g.
SurveyMonkey, SurveyGizmo) has allowed the relatively simple creation and dynamic administration
of questionnaires and experiments. This includes automatic randomisation of participants into
groups, “if-then” criteria in question responding, and randomisation of question order, permitting
greater flexibility in experimental administration than previously possible.
4. The study environment is uncontrolled increasing potential study confounds (e.g. Brock et al.,
2012).
Internet data collection does not provide the same controlled environment that is present in
laboratory studies. This introduces several confounds, for example, differing levels of privacy during
completion, interruptions during the study, and prioritisation of speed over accuracy (Brock et al.,
2012). Although these cannot be completely eliminated, measures such as completion time and time

Page | 104
spent on each page provide some indication as to whether the study was completed genuinely, and
without interruption. Additionally, an uncontrolled, non-laboratory environment may provide useful
data regarding the generalisation of results obtained in highly controlled laboratory contexts.
5. Technological differences between participants (e.g. screen size, processing speed) may affect
completion of study measures (e.g. Brock et al, 2012)
Brock et al (2012) highlight several ways in which the presentation of questionnaires may be non-
standard, thus potentially influencing respondents. However, the validity of online administration for
several measures has been tested (e.g. Carlbring et al., 2007; Pettit, 1999; Pettit, 2002) and no
differences in the reliability or validity of the measures detected. Carlbring et al (2007) note that
response values for several measures of psychopathology (e.g. Beck Depression Inventory and Beck
Anxiety Inventory) differed slightly online, however the effect sizes were small, thus potentially
indicative of statistical but not clinical significance (Carlbring et al., 2007). Furthermore, if genuine
differences in normative values do emerge, it cannot be concluded that the internet values are less
accurate. Indeed, they could simply represent differences in sample diversity, or as discussed above,
be reflective of increased rather than decreased honesty due to greater anonymity.
Birnbaum (2004) cites several experimental cognitive studies that have reached the same
conclusions online that have been achieved in the lab, despite extra noise in the data from
technological differences (e.g. timing differences for stimuli). They argue that the increased power
resulting from larger sample sizes is enough to overcome the noise created through differences in
experimental presentation. Furthermore, they note that an absence of replication across laboratory
and online experiments may not indicate that one is better than the other, but as with questionnaire
measures, may simply reflect differences in the recruited sample.
To date, only one study has investigated whether mood induction can be successfully implemented
online. Göritz and Moser (2006) suggest that to be considered successful, online mood induction
studies need to demonstrate efficacy and genuine responding, participant compliance and economic
viability. They used emotive photos, autobiographical memory tasks and the Velten procedures in
online mood inductions to compare mood response and effect sizes to traditional laboratory studies
reported elsewhere. Overall completion rates were 68%, with similar compliance and completion
rates across mood induction techniques. Negative but not positive emotions were successfully
induced, with similar response patterns to previously reported offline results, however with smaller
effect sizes.
4.1.1 Current Study
The current study extends previous findings in two ways. First, building on the work of Goritz and
Moser (2006), it assesses the effectiveness of videos as a method for inducing positive mood online.
Offline, videos are reported to induce changes in emotions with the largest effect sizes (Westermann
Page | 105
et al., 1996) thus may be powerful enough to elicit even positive mood change online, which, in
contrast to negative mood, was not seen using other techniques. Second, whilst one previous
validation of online mood induction has been published, using the Internet to measure
experimentally induced emotion regulation is currently untested. Given the potential benefits of
online research, the current study investigates whether the often subtle, experimental effects found
in laboratory studies of emotion regulation can be replicated via the Internet.
Specifically, the current study assesses the following:
1. Reliability and response properties of questionnaires assessing trait mood and emotion regulation
will not differ significantly as a function of data collection method.
Thus far, studies investigating the online administration of questionnaire measures have not
reported differences in scale reliability, and have shown little, if any, changes in score distributions.
In addition to these reliability assessments, the stability of the inter-relationships between
questionnaires will also be examined. This provides previously unreported, additional validation of
using the Internet to administer such measures.
2. A video mood induction will elicit a significant increase in positive emotions when conducted as
part of an online emotion regulation experiment.
In the laboratory, video mood induction elicited the largest effect size for both positive and negative
emotions, particularly when accompanied by instructions to enter a specified mood state
(Westermann et al., 1996). Therefore it is hypothesised that the use of video mood induction in the
current study will successfully elicit mood change, obtaining stronger effects than those reported by
Goritz and Moser (2006).
3. Will experimental instructions to up- or down- regulate emotional responding alter emotional
responding and use of emotion regulation strategies in the same way across online and laboratory
data sets?
There is currently no evidence regarding the effectiveness of emotion regulation instructions
administered via the internet. However, if, as reported by Goritz and Moser (2006), the effect size
from online mood induction is smaller than in the laboratory, the emotional change elicited by the
online mood induction may not be sufficient to detect differences across instructed regulation
conditions. Therefore, we are agnostic regarding whether the effects of instructions to regulate
emotional responses will differ across data sets.
4.2 Method 4.2.1 Participants Two online samples (student and community) were obtained for comparison with data from
laboratory participants in the instructed regulation study (chapter 3). Both were opportunity

Page | 106
samples, with no inclusion or exclusion criteria. The online student sample was recruited from the
same University of Reading undergraduate psychology research panel as laboratory participants. The
online community sample was self-selecting and recruited from the following internet sites:
www.reddit.com/r/samplesize - a general interest site that has a specific section for participation in online studies. http://psych.hanover.edu/Research/exponnet.html - a study participation site linked to a university psychology department. https://www.facebook.com - social networking site which includes personal and special interest pages. www.twitter.com - social networking site.
Student participants were given course credit for study completion, whilst the community sample
received no reward for participation.
Goritz and Moser (2006) highlight the increased need to assess compliance when testing via the
internet, due to the remote nature of the data collection and absence of experimenter. The current
study addressed this through setting minimum (14 minutes) and maximum (45 minutes) completion
times. These times were selected to ensure participants watched the entire mood induction with
time for all experimental measures, whilst minimising the likelihood of external distractions.
Additionally, simple memory questions were used to ensure participants had paid attention to the
mood induction video. Participants who made more than one error in these questions were also
excluded.
In the online student sample, 148 participants accessed the study, with 118 providing completed
responses. There were 39 exclusions for non-compliance resulting in a final sample of 79 participants
(8 male). The community study was accessed by 184 participants (86 withdrawals, 2 disqualified as
aged below 16). Of the 96 participants who completed the study, a further 19 were excluded,
therefore data from 77 participants (23 male) were analysed. For a full breakdown of withdrawals
and exclusions, see Table 27 and Table 28. In both samples the majority of withdrawals came prior to
randomisation (student: 73.3%; community: 82.5%). Of those excluded, in both samples
approximately half were due to short response times indicating inadequate study completion.
Reason for exclusion Number of participants excluded
Total Excluded Minimise condition
Enhance condition
Watch condition
Student Sample: Time to complete <14 minutes 5 8 10 23 Time to complete >45 minutes 2 5 0 7 2 or more incorrect memory questions 3 4 2 9 TOTAL: 10 17 12 39 Community Sample: Time to complete <14 minutes 2 6 2 10 Time to complete >45 minutes 1 2 4 7 2 or more incorrect memory questions 2 0 0 2 TOTAL: 5 8 6 19 Table 27: Participant exclusions from online samples

Page | 107
Time of Withdrawal Number of participants withdrawn Total
Withdrawn Minimise condition
Enhance condition
Watch condition
Student Sample: No data N/A N/A N/A 5 Pre-randomisation questions N/A N/A N/A 17 Post-randomisation video 3 2 1 6 Post-randomisation questions 1 0 1 2 Total: 4 2 2 30 Community Sample: No data N/A N/A N/A 28 Pre-randomisation questions N/A N/A N/A 43 Post-randomisation video 4 7 2 13 Post-randomisation questions 0 2 0 2 Total: 4 9 2 86 Table 28: Participant withdrawals from online samples
4.2.2 Materials Trait mood and regulation of positive emotions were assessed using the following measures:
1. Depression, Anxiety and Stress Scale (21 item version; DASS; Lovibond & Lovibond., 1995)
2. Hypomanic Personality Scale (20 item version; HPS; Meads & Bentall., 2008)
3. Responses to Positive Affect Scale (RPA; Feldman et al., 2008).
Responses to the mood induction were measured as follows:
1. 5 point likert scale (not at all to very much) assessed extent to which participants felt
Happy, Amused, Excited, Anxious, Sad and Angry. Composite averaged scores for positive
and negative valence were created by using the mean of relevant items (Positive: Happy,
amused and excited; Negative: Anxious, sad angry).
2. State-modified Emotion Regulation Questionnaire (state ERQ) adapted by (Gruber et al.,
2012).
4.2.3 Procedure All data was collected online via the www.surveygizmo.com website, following the same method
used for the instructed regulation study in chapter 3.
4.2.4 Statistical Analysis Data analysis was conducted in three phases. First, demographic data (age, gender, country of
residence) and trait mood and emotion regulation scores (DASS, HPS, RPA) were compared across
online and laboratory samples using chi-square and ANOVA (Kruskal-Wallis where appropriate). The
reliability of each measure was also assessed using Cronbach’s alpha, and where possible, trait mood
and emotion regulation scores compared with data norms. As a large sample size discrepancy existed
between the data norms and values from this study, the published data norms were treated as
population data, thus 1 sample t tests were conducted (with bonferroni adjustment) to compare
each measure against previously published data.

Page | 108
Next, the coefficients of correlations between trait measures of mood and emotion regulation were
compared across samples. To do this, Fisher’s r to z transformation was computed using the online
calculator at http://vassarstats.net/rdiff.html, which also gives the significance value of resulting z
statistics. The r to z transformation relies on Pearson’s correlation coefficients. Study data was
ordinal and therefore initially analysed using Spearman’s coefficients. Prior to conducting the r to z
transformation, the data was reanalysed using Pearson’s coefficients. To ensure that the Spearman’s
and Pearson’s coefficients were comparable, a regression was conducted using the Pearson’s value
to predict the Spearman’s coefficient (Norman, 2010). Finally, mixed and univariate ANOVAS were
conducted to assess the effects of the mood induction and instructions across different samples.
4.3 Results
4.3.1 Demographic, trait mood and emotion regulation measures
4.3.1.1 Participant characteristics The characteristics of the laboratory and online student samples were closely matched, with no
significant differences in any of the demographic variables (p’s > .05; Table 29). Two 2x3 chi squares
comparing gender and country of residence across the 3 sample groups were significant
(gender: χ2(2, N = 232) = 10.63, p < .01; country: χ2(2, N = 232) = 57.49, p < .01). Across all samples
there were significantly more women than men, with respondents predominantly from the UK. There
was a significant difference in the gender balance between the online community and the online
student samples, with a greater proportion of men in the community sample (p < .05)4. The online
community sample also had a higher average age (U = 813, p < .001) and greater number of countries
from which the survey was accessed (p < .05) than the laboratory study.
Demographic Characteristics Laboratory Online Community
Online Student
Gender (% female) 84 70 90 Mean age (S.D.) 20.29 (3.88) 34.45 (13.46) 19.62 (2.65) Median age 19 30 19 Ethnicity (% Caucasian) 81.6 88.3 84 Country (% UK) 100 62 99 Table 29: Demographic characteristics of participants across samples
4.3.1.2 Reliability of trait measures Cronbach’s alpha was calculated to assess the reliability of scales administered over the internet. All
subscales of the Responses to Positive Affect Scale (RPA), the Depression, Anxiety and Stress Scale
(DASS) and the Hypomanic Personality Scale (HPS) showed at least acceptable reliability (α > .65)
across all data sets.
4 SPSS conducted z score analysis and indicated bonferroni corrected significant differences between columns, however no z scores were provided in the SPSS output
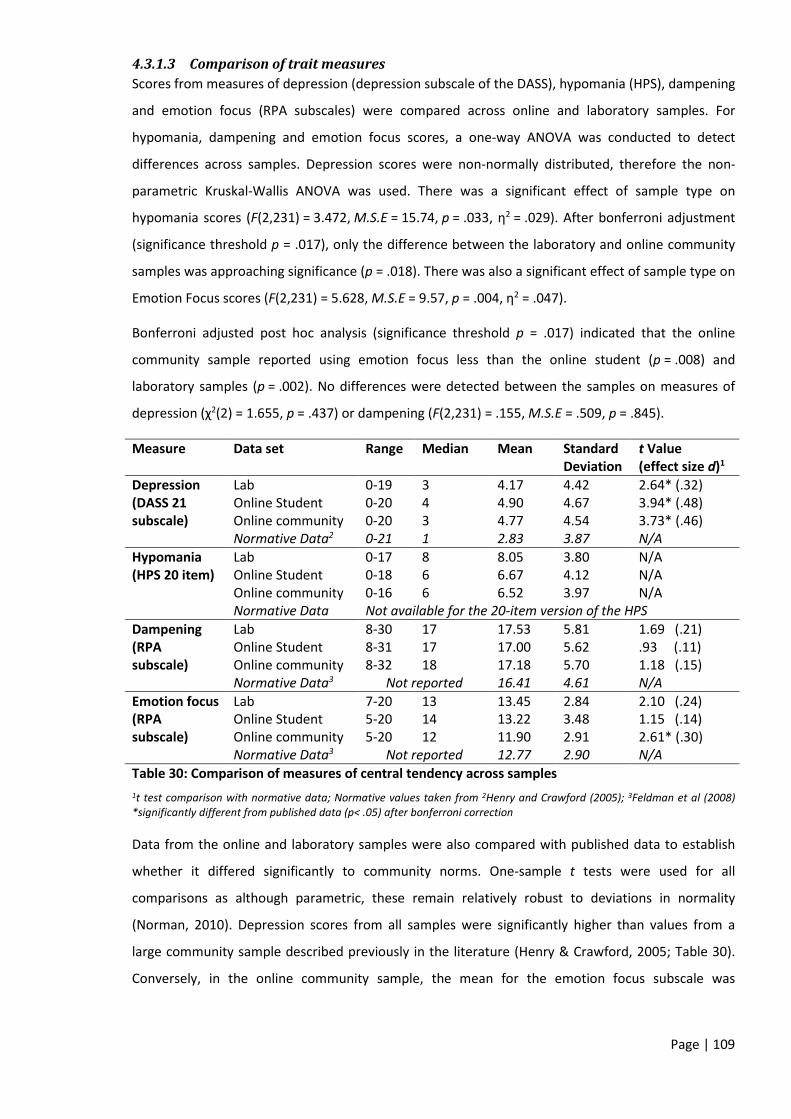
Page | 109
4.3.1.3 Comparison of trait measures Scores from measures of depression (depression subscale of the DASS), hypomania (HPS), dampening
and emotion focus (RPA subscales) were compared across online and laboratory samples. For
hypomania, dampening and emotion focus scores, a one-way ANOVA was conducted to detect
differences across samples. Depression scores were non-normally distributed, therefore the non-
parametric Kruskal-Wallis ANOVA was used. There was a significant effect of sample type on
hypomania scores (F(2,231) = 3.472, M.S.E = 15.74, p = .033, η2 = .029). After bonferroni adjustment
(significance threshold p = .017), only the difference between the laboratory and online community
samples was approaching significance (p = .018). There was also a significant effect of sample type on
Emotion Focus scores (F(2,231) = 5.628, M.S.E = 9.57, p = .004, η2 = .047).
Bonferroni adjusted post hoc analysis (significance threshold p = .017) indicated that the online
community sample reported using emotion focus less than the online student (p = .008) and
laboratory samples (p = .002). No differences were detected between the samples on measures of
depression (χ2(2) = 1.655, p = .437) or dampening (F(2,231) = .155, M.S.E = .509, p = .845).
Measure Data set Range Median Mean Standard Deviation
t Value (effect size d)1
Depression (DASS 21 subscale)
Lab 0-19 3 4.17 4.42 2.64* (.32) Online Student 0-20 4 4.90 4.67 3.94* (.48) Online community 0-20 3 4.77 4.54 3.73* (.46) Normative Data2 0-21 1 2.83 3.87 N/A
Hypomania (HPS 20 item)
Lab 0-17 8 8.05 3.80 N/A Online Student 0-18 6 6.67 4.12 N/A Online community 0-16 6 6.52 3.97 N/A Normative Data Not available for the 20-item version of the HPS
Dampening (RPA subscale)
Lab 8-30 17 17.53 5.81 1.69 (.21) Online Student 8-31 17 17.00 5.62 .93 (.11) Online community 8-32 18 17.18 5.70 1.18 (.15)
Normative Data3 Not reported 16.41 4.61 N/A Emotion focus (RPA subscale)
Lab 7-20 13 13.45 2.84 2.10 (.24) Online Student 5-20 14 13.22 3.48 1.15 (.14) Online community 5-20 12 11.90 2.91 2.61* (.30) Normative Data3 Not reported 12.77 2.90 N/A
Table 30: Comparison of measures of central tendency across samples 1t test comparison with normative data; Normative values taken from 2Henry and Crawford (2005); 3Feldman et al (2008) *significantly different from published data (p< .05) after bonferroni correction
Data from the online and laboratory samples were also compared with published data to establish
whether it differed significantly to community norms. One-sample t tests were used for all
comparisons as although parametric, these remain relatively robust to deviations in normality
(Norman, 2010). Depression scores from all samples were significantly higher than values from a
large community sample described previously in the literature (Henry & Crawford, 2005; Table 30).
Conversely, in the online community sample, the mean for the emotion focus subscale was

Page | 110
significantly lower than previously published data by Feldman et al (2008). No significant differences
in self-reported dampening were detected and data for the 20 item HPS was not available.
4.3.2 Relationships between trait measures
4.3.2.1 Validation of Pearson Coefficients To compare correlation coefficients across online and laboratory samples using the r to z
transformation, the relationships between trait depression, hypomania and emotion regulation were
first reanalysed to create Pearson’s correlation coefficients. The pairs of Pearson’s and Spearman’s
coefficients (n = 45) were treated as raw data. A regression was conducted, using Pearson’s
coefficients to predict the original Spearman’s values. The Spearman’s and Pearson’s coefficients
were highly correlated, with a slope close to 1 and intercept not significantly different from zero
(Table 31 shows correlation, model fit and beta values). This indicates a strong relationship between
the Pearson and Spearman values, thus further analysis was computed using Pearson coefficients.
R R2 Beta Standard Error of Beta Pearson’s coefficient .973* .945* .965* .035 Intercept N/A N/A .011 .006 Table 31: Regression coefficients, correlation and model fit Dependent variable = Spearman’s coefficient. * p < .001
4.3.2.2 Comparison of coefficients across samples Fisher’s r to z transformations were computed, and for each correlation, comparisons made between
the two samples whose coefficients differed most. No significant differences in correlation
magnitude were detected between the online and laboratory samples (Table 32).
Correlation Pearson Coefficient Difference between coefficients
Variable 1 Variable 2 Lab Online
Student Online
Community
z-value largest
difference
p-value largest
difference Hypomania Depression .352 .273 .136 1.41 .162 Dampening .339 .260 .297 .532 .596
Emotion Focus .416 .365 .225 1.31 .194
Depression Dampening .490 .422 .269 1.581 .114
Emotion Focus -.015 -.081 -.286 1.691 .091
Dampening Emotion Focus .034 -.114 -.019 .912 .363
Sample Size 76 79 77 N/A N/A Table 32: Comparison of coefficient values across samples
For each correlation, the largest and smallest coefficients were compared. Comparisons: 1Lab and online community samples 2Lab and online student samples

Page | 111
4.3.3 Effects of mood induction and emotion regulation instructions
4.3.3.1 Change in mood in response to mood induction A mixed ANOVA (within subjects factor positive mood score before and after; between subjects
factor sample type), confirmed that overall, the mood induction successfully increased positive mood
(Figure 22; F(1,229) = 104.21, p < .001, η2 = .31). There was no main effect of collection method
(F(2,229) = 1.27, MSE = 1.348, p = .284, η2 = .01) and no interaction between change in positive mood
score and sample type (F(2,229) = 1.07, p > .05, , η2 = .009). This indicates that the mood induction
successfully improved positive mood, regardless of data collection method.
Figure 22: Mean positive emotion scores for each sample and condition
4.3.3.2 Effects of instructions to regulate emotions across samples For analysis of the effect of instructions on positive mood, a positive mood change score was created
by subtracting the baseline positive mood score from the post mood induction positive mood score.
This enabled baseline mood to be entered into subsequent analyses as a covariate.
The ANCOVA conducted in chapter 3 was repeated, examining the effects of instructions to regulate
emotions on level of mood change. Neither of the online samples showed the significant effect of
instructions on mood change seen in the laboratory sample (Table 33). However, this may be a
consequence of the reduced effect size in the online samples, leading to a lack of power.
Furthermore, although the significant effects of the laboratory study were not replicated in the
online samples, it is unclear whether the means from each instruction condition (minimise,
maximise, watch) are significantly different across sample types.
0.00
0.50
1.00
1.50
2.00
2.50
Min
imise
Max
imise
Wat
ch
Min
imise
Max
imise
Wat
ch
Min
imise
Max
imise
Wat
chLaboratory Online Student Online Community
Mea
n Po
sitiv
e Em
otio
n Sc
ore
(0-4
)
Sample and Condition
Baseline Score
Post Video Score
* * **
* **
Error bars indicate SEM; *p < .05

Page | 112
Sample F MSE η2 Power Laboratory 6.03* 0.446 0.14 0.88 Online Student 1.96 0.545 0.05 0.41 Online Community 0.84 0.486 0.02 0.20
Table 33: ANCOVA statistics for effects of instructions to regulate emotions on positive mood change
Initial positive mood used as a covariate (statistics not reported) *p < .05.
To address this, a 3*3 Univariate ANCOVA was conducted investigating the effects of instructions
(Minimise, Maximise or Watch) and sample types (lab, online student and online community) on
positive mood change score. Baseline positive mood was entered as a covariate. This found a small
but significant main effect of instructions (F(2,222) = 6.04, MSE = .492, p < .01, η2 = .05) and the
baseline positive mood covariate (F(1,222) = 18.846, MSE = .492, p < .001, η2 = .08). There was no
significant effect of sample type (F(2,222) = 1.22, MSE = .492, p = .29, η2 = .01) or interaction between
sample type and instructions to participants (F(4,222) = 1.16, MSE = .492, p = .33, η2 = .02). This
indicates that the mean level of mood change for each of the instruction conditions did not differ
across data sets (Figure 23). As with the laboratory only sample, overall, participants in the Minimise
condition reported a significantly smaller mood change than those in the Maximise (p = .003) and
Watch (p = .049) conditions.
Figure 23: Mean mood change across instruction conditions and data sets Error bars indicate SEM.
4.3.3.3 Use of regulation strategies across conditions and samples Scores for the use of suppression, negative and positive reappraisal in response to the video all
showed non-normality that could not be resolved through transformations. Therefore, 2 Kruskal-
Wallis ANOVAs were conducted. The first separated the file by instruction condition and investigated
the effect of sample type on emotion regulation strategy use. The second split the file by sample type
to investigate the effect of emotion regulation instruction on strategy use.
0
0.2
0.4
0.6
0.8
1
1.2
Minimise Maximise Watch
Leve
l of P
ositi
ve M
ood
Chan
ge
Instruction Condition
Laboratory
Online Student
Online Community

Page | 113
No significant effect of sample type was found in any of the instruction conditions (all p > .05). All
sample types showed significant differences in the use of suppression, negative and positive
reappraisal dependent on the emotion regulation instructions given.
4.4 Discussion
4.4.1 Implications of findings This study tested the feasibility of conducting mood induction experiments via the internet. Overall,
very few differences were noted between the online and laboratory results. Specifically, the study
addressed the following:
1. Reliability and response properties of questionnaires assessing trait mood and emotion regulation
will not differ significantly as a function of data collection method.
As hypothesised, the questionnaire measures showed acceptable full and subscale reliability online.
No differences were present in the inter-relationships between questionnaire measures. Average
scores for each measure showed few differences between data sets, or to previously published
normative data. Where significant differences between the data sets were detected (hypomania and
emotion focus scales) the overall effect sizes were very small. Similarly, when comparing to published
norms, although significant differences were detected, sometimes with moderate effect sizes (e.g.
depression scores) the scores remained within the healthy range. This supports previous research
using similar measures, which proposes that the differences may reflect statistical, rather than
clinical significance (Carlbring et al., 2007).
2. A video mood induction will elicit a significant increase in positive emotions when conducted as
part of an online emotion regulation experiment.
Unlike Goritz and Moser (2006), the current study successfully induced positive affect in both
laboratory and online samples. This may have resulted from the use of video mood inductions, not
considered by Goritz and Moser (2006), despite evidence previously indicating that videos can induce
larger effect sizes than other methods (Westerman et al., 1996).
3. Will experimental instructions to up- or down- regulate emotional responding alter emotional
responding and use of emotion regulation strategies in the same way across online and laboratory
data sets?
All datasets showed the same pattern of emotion regulation across instruction conditions. This
suggests that the instructions had the same impact on choice of emotion regulation strategy,
regardless of whether the experiment was administered in the laboratory or online. Only the
laboratory data showed significant differences in emotional change between instruction conditions.
However the mean emotional change in each condition did not differ significantly across data sets.
The effect sizes in the online samples are less than half of those obtained in the laboratory.

Page | 114
The minimal effect size found in the online community sample could simply reflect the absence of
replication in non-student samples. Alternatively, the smaller effect sizes could also indicate that the
lack of significant results arose from a lack of power in the online studies. Indeed post-hoc power
analysis indicated a power of approximately 20% (online community sample) and 40% (online
student sample) compared to the 88% achieved in the laboratory. This dramatic reduction of power
for the online studies is important to consider when calculating the sample sizes needed to conduct
research online. The variation of effect size between online samples is also important to note. These
may have arisen through many extraneous factors that should be considered when conducting a
priori power analysis (e.g. greater heterogeneity and absence of reward in the community sample).
4.4.2 Response rates, drop-outs and non-compliance The current online samples had response rates of 71% (community sample) and 97% (student
sample). The completion rates were reduced to 54% and 80% (community and student sample
respectively). Compliance was measured through time to complete and answers to simple memory
questions to ensure that participants had watched the mood induction video as requested.
Responses were also examined for non-genuine (e.g. giving the same response throughout) and
duplicate responses. This led to the removal of several further responses for non-compliance or
duplicate responding, leaving usable data from 52% (community) and 53% (student) responses. This
is far below the level of usable data obtained in the laboratory study, in which only 1 participant was
excluded.
Whilst this relatively low usable response rate may give cause for concern, there are several factors
that may have increased the rate of withdrawal. The videos were relatively long, which may have led
to technical problems loading and watching them, resulting in participant withdrawal. Additionally,
the total study duration was also relatively long, which, in the absence of an experimenter, may have
led to greater dropout in the online studies. Indeed, Matzat and Snijders (2010) found that online
participants showed increased likelihood to answer in time-saving ways, indicating a lower tolerance
for longer online studies and Brock et al (2012) suggest that the presence of an experimenter may
encourage participants to continue where they otherwise may withdraw. The timing of participant
withdrawals may also be informative regarding the tolerability of specific conditions with the study
(Goritz & Moser, 2006). The majority of withdrawals in the current online samples occurred prior to
randomisation, suggesting that all conditions were equally tolerable.
Higher non-compliance was also evident in the current online samples, however with care, this can
be detected and responses removed. Furthermore, additional measures not used in the current
study (e.g. forced pacing of responses) may assist in improving compliance.

Page | 115
4.4.3 Limitations The primary focus of the study was to establish the feasibility of conducting mood induction
experiments online. As such, only limited demographic information was collected. Therefore
information regarding the extent to which the online and laboratory samples differ is limited. These
differences may exacerbate the effects of increased noise already identified in online data collection.
4.4.4 Conclusions The current study has successfully implemented an online mood induction experiment with
comparable results across laboratory and online samples. Our findings further supports existing
evidence suggesting that questionnaire measures elicit compatible responses online to those
obtained in the laboratory. The use of video mood induction in the current study has also
successfully changed reported levels of positive emotions, something which has not previous been
achieved experimentally via the Internet. Finally, although significant differences between emotion
regulation conditions were not achieved online, each condition was not significantly different to its
laboratory equivalent. This suggests that online studies of emotion regulation are feasible, however
power calculations must take into account the reduced effect sizes obtained outside of the highly
controlled laboratory environment. This, combined with the increased drop-out rates will require the
recruitment of considerably larger samples than for laboratory studies. Furthermore, care should be
taken to specify strategies for the identification and removal of non-compliant responses prior to
data analysis. However, the reduced time and financial burden of conducting online research can
easily compensate for the extra time and care required to ensure the quality of the data collected.

Page | 116
CHAPTER 5: CAN POSITIVE EMOTIONS PROTECT
AGAINST THE EMOTIONAL AND CARDIAC EFFECTS OF NEGATIVE
EMOTIONS?
Page | 117
5.1 Introduction Emotions can be considered to be a subset of broader affective processes (Fredrickson, 2005) which
encompass a range of subjective, expressive and physiological responses (Gross & Barrett, 2011). The
term “emotion regulation” encompasses both the way in which emotions provide regulation, and the
way in which emotions are regulated. This study investigates whether the experience of positive
emotions can alter the regulation of subsequent negative emotions, thus incorporating both types of
emotion regulation.
Positive and negative emotions have a number of known differences. They have asymmetrical effects
on memory and cognition, with even mild positive affect leading to improved recall of positive
events, without hindering access to negative memories when appropriate (Isen, 2008). Unlike
negative emotions, positive emotions are problematic for the specific action tendencies theory of
emotions, as they typically elicit general, rather than specific, responses (Fredrickson & Branigan,
2005). Thus, whilst negative emotions may generate a narrower range of outcomes, upon which
action tendencies were proposed, the features of positive emotions do not fit this conceptualisation
of emotion. The differences between positive and negative emotions are also more than simply a
dichotomy between approach (positive emotions) and avoidance (negative emotions) cues
(Fredrickson & Branigan, 2005; Fredrickson, 1998; Fredrickson, 2001). Approach behaviour is present
in several other affective and biological states (e.g. seeking out food to satisfy hunger), and can be
associated with negatively valenced emotions (e.g. anger). Rather than being unique to positive
emotions, the elicitation of approach behaviour could simply address the lowest common
denominator of affective states (Fredrickson & Branigan, 2005; Fredrickson, 1998; Fredrickson,
2001). The features of positive emotions and their impact on wellbeing are explored below, enabling
prediction of how positive experiences may affect the regulation of subsequent negative emotions.
5.1.1 The role of positive emotions in well-being
The “broaden and build” theory (Fredrickson, 1998) suggests that emotional valence can instead be
characterised by the psychological consequences of an emotion. As such, negative emotions serve to
narrow thought-action repertoires, characterised by quick, decisive actions with immediate, direct
benefits. Conversely, positive emotions broaden these thought-action repertoires, with a variety of
proposed slower-acting, longer-term benefits (Fredrickson, 1998). For example, positive emotions
have been associated with increased creativity and innovation in problem solving (Isen, Daubman, &
Nowicki, 1987), improved attention to peripheral stimuli, increased pro-social behaviour and greater
flexibility of thought (Isen, 2001). However, whilst the broadened thinking elicited by positive
emotions does not promote specificity, it maintains attentional focus, for example, level of recalled
detail to specific events (Isen, 2008). Therefore Isen (2001, 2008) argues that even mild, transient,
positive affect may promote flexible, rather than globally broadened attention.

Page | 118
Positive emotions can have positive effects beyond the transient nature of the emotional experience,
building longer term personal resources and resilience (Folkman, 2008; Garland et al., 2010; Tugade
& Fredrickson, 2006). The hedonic contingency hypothesis predicts that people engage most in
mood management whilst in a positive mood, as they are motivated to sustain it for as long as
possible (Wegener & Petty, 1994). The theory posits that when in a negative mood state, most
options will improve mood to some extent, therefore there is less motivation to select an optimal
strategy. Conversely, in a positive mood state, the options that will maintain or further improve
mood are limited. Therefore, it is those who most frequently experience positive emotions that are
most motivated and able to learn which strategies are most adaptive in promoting positive mood.
Day to day experience of positive emotions has also been identified as a predictor of ego-protection
(ability to adapt to changing and stressful circumstances) and life satisfaction (Cohn, Fredrickson,
Brown, Mikels, & Conway, 2009), and positive affect was associated with increased use of
reappraisal, problem solving and creation of positive events (Folkman & Moskowitz, 2000). Folkman
and Moskowitz (2000) assert no claims regarding the causality of positivity or choice of emotion
regulation strategy. Some subsequent citations of the paper argue that it shows that the experience
of positivity that “may function as a resource, as individuals manage stress and threat” (Fredrickson
et al., 2000, p240). This seems to imply that it is through the experience of positivity that adaptive
strategy use arises. However, the reverse is equally plausible. Indeed, the stress and coping model
(Folkman, 2008) suggests an interaction in which positive emotions are both an outcome of, and
precursor to, effective coping styles.
The revised stress and coping model (Folkman, 2008) predicts that positive emotions are influential
in several facets of the coping process. They are an outcome of successful problem- and emotion-
focused coping, and of meaning-focused coping during unfavourable conditions. Positive emotions in
the face of adversity also promote meaning-focused coping, sustain ongoing coping efforts and
restore resources for dealing with ongoing challenges (Folkman, 2008).
The “undoing hypothesis” also predicts that positive emotion acts to regulate preceding negative
emotions (Fredrickson, Mancuso, Branigan, & Tugade, 2000). Two experimental studies have
reported a cardiac “undoing effect” of positive emotions in response to negative stimuli (Fredrickson
& Levenson, 1998; Fredrickson et al., 2000). These used a negative mood induction followed by an
amusing, contentment inducing, sad or neutral short video. Both papers found that participants who
watched videos eliciting amusement or contentment showed faster cardiac recovery than those who
watched a neutral or sad video. Further studies confirmed that when shown alone, positive videos do
not elicit cardiac signatures that are different to neutral videos, suggesting that the positive videos
were promoting recovery from the negative induction, rather than replacing the negative cardiac
events with those aligned to the subsequent film (Fredrickson et al., 2000).

Page | 119
Positive emotions have been demonstrated to “undo” the cardiac and emotional effects of preceding
negative emotions. However, it is currently unclear whether, in the short term, positive emotions can
also protect or “buffer” against future negative experiences. Both the hedonic contingency
hypothesis (Wegener & Petty, 1994) and stress and coping model (Folkman, 2008) would suggest
that a positive experience would, even in the short term, promote use of optimal emotion regulation
strategies, in order to preserve the positive emotional experience. Most of the data reported to
support these hypotheses have currently relied on non-laboratory studies, for example use of
emotion diaries or qualitative techniques (e.g. Cohn et al., 2009; Fredrickson, Cohn, Coffey, Pek, &
Finkel, 2008). Conversely, experimental studies have generally focused on cognitive or pro-social
benefits associated with positive mood (e.g. Isen, 2008). Therefore, it is currently unclear whether
the benefits of positive mood are a culmination of repeated experience of, and appropriate
responses to, positive emotions, or whether such benefits in the face of negative stimuli can also be
elicited experimentally.
5.1.2 Individual differences in emotional responses Hypomania and anhedonic depression are both associated with dysregulation of positive and
negative emotions (see chapters 1 and 3). Previous research has indicated that depression is linked
to a blunting of positivity (e.g. Rottenberg, 2005) and increased use of maladaptive strategies in
response to positive and negative events (e.g. Feldman, et al., 2008; Hudson et al., 2015).
Furthermore, according to the hedonic contingency hypothesis, prolonged lower mood makes
individuals less able to select the most effective strategies in response to negative stimuli (Wegener
& Petty, 1994). This suggests that depression will result in the reduction of the protective influence
of positive stimuli. Conversely, hypomania has been associated with increased positive responding to
positive, neutral and negative stimuli (Gruber, Harvey, & Purcell, 2011). However it is currently
unclear whether individuals with higher hypomania score are better able to harness emotional
benefits from positive stimuli, in order to protect themselves from effects of negative stimuli. Indeed,
the manic defence hypothesis (chapter 1) predicts that (hypo)mania arises through attempts to avoid
negative emotionality, thus individuals with high hypomania scores may respond to positive stimuli
in a way that magnifies and maintains the positive emotional response (Feldman et al., 2008; Raes et
al., 2009).
5.1.3 Relationship between cardiac measures and emotion
Cardiac measures, in particular heart rate variability (HRV) and respiratory sinus arrhythmia (RSA) are
a cheap, minimally invasive technique, widely used as an implicit measure of emotional responding
(e.g. Chang et al., 2012; Cohen et al., 2003; Kemp et al., 2010; Lane et al., 2009). HRV refers to the
inter-beat variability in heart-rate and is proposed to reflect parasympathetic activity in the
autonomic nervous system (Appelhans & Luecken, 2006). HRV encompasses both high and low
Page | 120
frequency data, however it is data from the high frequency spectrum that represents RSA, and is
thought to most cleanly reflect parasympathetic activity (Porges, 2007).
Individual differences in HRV and RSA have been reliably associated with emotional reactivity and
regulation during both tonic (resting) and phasic (e.g. experimentally manipulated) periods (e.g. Lane
et al., 2009). Reduced tonic RSA indicates decreased parasympathetic activation, and has been
associated with less flexible responding to changing environmental stimuli. Consequently, this may
make emotion regulation harder (Thayer & Lane, 2000). Indeed, lower tonic RSA has been associated
with poorer emotion regulation (Porges, 2007) and increased negativity (Thayer & Brosschot, 2005).
Conversely, increased tonic RSA has been associated with greater positive mood (Kang & Gruber,
2013) and baseline positivity (but not change in positive emotions), during mood manipulation (Oveis
et al., 2009).
Differences in tonic and phasic HRV have also been associated with various psychiatric disorders
(Porges, 2007). However, as discussed in the main introduction (section 1.6.4), there is contradictory
evidence regarding the relationship between heart rate, hypomania and depression. These disorders
have been associated with both increased and decreased tonic heart rate variability (e.g. Cohen et
al., 2003; Gruber et al., 2008; Gorman & Sloan, 2000; Licht et al., 2008; Rottenberg et al., 2002). The
evidence regarding phasic heart rate variability in hypomania and depression is similarly mixed (e.g.
Rottenberg et al., 2005; Rottenberg et al., 2007; Gruber et al., 2011).
5.1.4 Research questions and hypotheses The current study investigated the potential protective effect of elicited positive emotions on
reactions to a subsequent negative mood induction. In a between-subjects design, participants saw
either a positive or neutral video immediately preceding a negative mood induction in order to
address the following questions:
1. Does the viewing of positive stimuli immediately prior to negative stimuli reduce emotional and cardiac change in response to the negative stimuli?
Congruent with the hedonic contingency theory, hypothesis 1 predicts participants in the positive
video condition will experience a smaller increase in negative mood in response to the negative
mood induction than those in the neutral video condition.
Hypothesis 2 predicts participants in the positive video condition will experience smaller decreases in
RSA in response to the negative mood induction than those in the neutral video condition.
The impact of neutral and positive stimuli on RSA is currently unclear. Fredrickson, et al., (2000)
found no difference between the cardiac profiles of neutral and positive stimuli, however others
have noted higher heart rate variability in neutral, compared to emotional, video mood inductions
(Lane et al., 2009). Therefore no prediction is made regarding the heart rate variability in the neutral
and positive conditions.

Page | 121
2. Does the viewing of a positive video prior to negative stimuli broaden the number and type of
emotion regulation strategies adopted in response to the negative stimuli?
Hypothesis 3 predicts participants in the positive video condition will show greater use of adaptive
regulation strategies (STERQ Perspective-taking and Awareness) in response to the negative mood
induction than those in the neutral video condition. This is congruent with previous research
indicated that induced positive mood is associated with improved problem solving and greater
flexible thinking.
3. Are there individual differences in the potential protective effects of a positive video immediately
prior to a negative mood induction?
Exploratory analysis will use correlations to assess whether there are associations between trait
mood (levels of hypomania and anhedonic depression) and:
• Baseline emotional and cardiac measures,
• Emotional and cardiac responses to the positive/neutral and negative videos.
Hypothesis 4 predicts that participants with higher scores on the hypomanic personality scale will
experience greater positivity in response to both the positive and neutral videos, thus showing less
overall difference across conditions in response to the negative video.
Hypothesis 5 predicts that those who score more highly on the MASQ anhedonic depression subscale
will respond less to the positive stimuli, congruent with the attenuated positive responding
associated with depression. This reduced positive responding is also predicted to result in smaller
benefits during the negative video.
5.2 Video validation
5.2.1 Method
5.2.1.1 Materials
5.2.1.1.1.1 Mood Induction Videos Three videos were tested to establish their effect on participants’ positive and negative emotions.
The neutral video depicted a person making a bow available here:
https://www.dropbox.com/s/gsyvl8svgmiepm6/how%20to%20make%20a%20bow2.mp4?dl=0, the
positive video was a compilation of comedy clips including “the minions” and stand-up comedy
available here: https://www.dropbox.com/s/bltyfzsl0e93o8k/positive%20buffering.mp4?dl=0 and
the negative video was the suicide scene from “The Shawshank Redemption” available here:
https://www.dropbox.com/s/dkppp2wspm39qt2/shawshank%20redemption.mp4?dl=0. All videos
lasted approximately 5 minutes.

Page | 122
5.2.1.1.1.2 Mood ratings scale Participants rated the extent to which they felt Happy, Amused, Excited (positive emotions), Sad,
Angry and Anxious (negative emotions) by marking a line between not at all to very much. The
resulting value ranged between 0-100. Overall positive and negative emotion scores were computed
through calculating a mean of the relevant emotions.
5.2.1.1.1.3 Participants 81 participants (20 male) were recruited via the University of Reading undergraduate psychology
SONA research panel, and online via Facebook, Twitter and “Psychological Research on the Net”
website (University based website for recruiting volunteers). A breakdown of demographic
information for each video is displayed in Table 34.
Video Mean Age (s.d.)
Gender (%female)
Mean Pre-video positive emotion (sd)
Mean Post-video positive emotion (sd)
Mean Pre-video positive emotion (sd)
Mean Post-video negative emotion (sd)
Negative 24.85 (7.19)
77.8 40.40 (12.52) 15.79 (14.93) 20.67 (16.23) 35.94 (18.77)
Neutral 24.44 (8.26)
77.8 36.85 (19.62) 31.60 (19.71) 28.19 (20.39) 24.88 (20.96)
Positive 28.14 (11.10)
70.4 42.57 (18.62) 58.01 (17.20) 18.75 (16.06) 11.54 (12.54)
Table 34: Demographic data and mean emotion ratings for each video
5.2.1.2 Procedure Participants were directed to the www.surveygizmo.com website, where they viewed the participant
information sheet (Appendix 28). After completing demographic information and initial ratings,
participants were randomly assigned to watch one of the three mood induction videos (neutral,
positive negative) used in the main study. Following the video the mood ratings were repeated and
the participants debriefed.
5.2.2 Results Composite scores of positive and negative emotions were computed by taking the mean of happy,
amused and excited (positive emotions) and sad, angry and anxious (negative emotions; Table 34
shows mean emotion scores). Repeated measures t-tests showed that all videos elicited the
predicted response. The positive video elicited a significant increase in positive emotions
(t(26) = 3.89, p = .001, d = 1.53) and decrease in negative emotions (t(26) = 3.91, p = .001, d = 1.53).
The negative video elicited a significant increase in negative emotions
(t(26) = 5.37, p < .001, d = 2.11) and decrease in positive emotions (t(26) = 11.85, p < .001, d = 4.65).
The neutral video elicited no significant change in positive (t(26) = 1.58, p = .126, d = .62) or negative
(t(26) = 1.66, p = .110, d = .65) emotions.

Page | 123
5.3 Main Study Method
5.3.1 Materials
5.3.1.1 Questionnaire Measures
Prior to coming to the laboratory, participants completed the following questionnaires online:
• Trait positive and negative versions of the State/Trait Emotion Regulation Questionnaires
(STERQ trait positive and negative)1,
• Responses to Positive Affect Questionnaire5 (RPA; Feldman, Joormann, & Johnson, 2008),
• Cognitive Emotion Regulation Questionnaire1, 18 item (CERQ; Garnefski & Kraaij, 2006),
• Mini Mood and Symptoms Questionnaire (26 items; MASQ)
• Hypomanic Personality Scale (48 items; HPS)
In the laboratory session the state-modified Emotion Regulation Questionnaire (ERQ; Gruber, 2012)
and state negative version of the STERQ (STERQ state negative) were also completed.
5.3.1.2 Mood Induction Videos Five videos were used throughout the course of the study. The baseline and recovery videos were
both time-lapse photography of coastal scenes set to music (Baseline video:
https://www.dropbox.com/s/7sby0oir85htbl1/baseline1.mp4?dl=0; recovery video:
https://www.dropbox.com/s/4eswj4ir6r0zfkg/baseline2.mp4?dl=0). The neutral, positive and
negative videos were as described in the video validation (Section 5.2). All videos lasted
approximately 5 minutes.
5.3.1.3 Cardiovascular measures Heartrate and Interbeat Intervals (IBIs) were measured throughout the laboratory session using
Actiheart monitors and software (Version 4, Cambridge Neurotechnology, Cambridge, UK). These
measures were converted using CMetX Cardiac Metric Software (Allen, 2002; Allen, Chambers &
Towers, 2007) to provide estimates of Respiratory Sinus Arrhythmia (RSA).
The Actiheart monitor was attached using 2 standard ECG electrodes, below the sternum in the
center and at the same level towards the left of the torso. After recording, manual artifact detection
was conducted and identified artifacts removed. To ensure accuracy of removal, 20% of all data files
were double scored with another Actiheart user. Correlations were conducted for all double scored
files. Correlations ranged from r = .981 to r = 1, indicating good reliability between scorers. Edited IBI
data from each of the video periods were exported into CMetX for further analysis. In order to detect
heart rate variability in the high frequency domain (representing vagal tone influences), IBI data was
converted into a time series through sampling at 10Hz and the appropriate (.12-.40Hz) CMetX filter
5 Data collected but not analysed

Page | 124
was applied (241-point optimal finite impulse response digital filter using FWTGEN V3.8 Cook &
Miller (1992)). This provided the natural log of the variance of the filtered waveform, which was used
as an estimate of RSA. Movement was also detected using the internal accelerometer in the
Actiheart.
5.3.2 Participants
Participants were an opportunity sample, recruited from the University of Reading student research
panel (SONA) and word of mouth. There were no specific inclusion or exclusion criteria for
completing the study. Required sample size was estimated from previous studies using mood
induction and physiological measures. Such studies recruited approximately 30 participants per
condition (e.g. Gruber et al., 2009; Hughes et al., 2000). 64 participants (56 female) completed the
online measures prior to coming into the laboratory. One participant withdrew prior to the
laboratory session therefore completed data was analysed from 63 participants. One further
participant was withdrawn from the RSA analysis due to technical difficulties with the Actiheart
recording. Demographic data for each group is shown in Table 35.
Video shown prior to negative mood induction Positive (n = 31) Neutral (n = 32) Overall (n = 63)
Percentage Female 90.2% 84.4% 85.9% Mean Age (standard deviation) 23.84 (6.62) 23.57 (5.32) 23.71 (5.98) Table 35: Demographic data separated by group
5.3.3 Procedure
Prior to laboratory testing, participants were directed to www.surveygizmo.com where they
completed the questionnaire measures outlined in section 5.3.1.1 and watched either the neutral or
positive mood induction video (For Participant Information Sheet see Appendix 29). Ratings of
positive and negative emotions were obtained before and after the video. This provided verification
of the emotional effects of the neutral and positive videos for the current sample, without
interrupting the transition into the negative video in the laboratory study (see below).
Upon arrival at the laboratory, participant height and weight were measured, and the Actiheart
attached (see Appendix 30 for Participant Information sheet). Next participants watched the 5
minute neutral baseline video (section 5.3.1.2), providing mood ratings before and after. Then
participants were shown either the neutral or positive video (whichever they did not see prior to the
laboratory session) immediately followed by a negative mood induction video6. Following this,
participants provided further ratings of positive and negative emotions and completed measures of
emotion regulation (State negative STERQ and modified ERQ). Finally participants watched the 5
6 No measure of emotional change was taken immediately after the positive/neutral video, prior to the negative video, to avoid disrupting and potentially losing the mood induction effects. It is acknowledged that this means the effects of the positive/neutral videos cannot be definitively verified. To compensate for this, the video validation pilot and pre-lab testing assessed average responses to each video.

Page | 125
minute neutral recovery video (section 5.3.1.2), providing mood ratings afterwards. Heart-rate was
recorded for the duration of the session. For full testing outline see Figure 24.
Figure 24: Key laboratory procedures
5.3.4 Statistical Analysis
Preliminary analysis comprised of creating composite scores using mean emotion and emotion
regulation ratings (section 5.4.1.1) and normality assessment of trait and state measures (section
5.4.1.2). The emotional change elicited by the videos in the pre-laboratory session (for current
participants), was also calculated to validate that the videos elicited the predicted responses (section
5.4.1.3). Level of participant movement, recorded in the Respiratory Sinus Arrhythmia (RSA) data
was calculated for all videos, with t tests used to detect any differences between videos or groups
(section 5.4.1.4). Finally, Spearman’s rho correlation was used to measure the relationship between
emotion and Respiratory Sinus Arrhythmia (RSA).
Next emotional change and RSA change from baseline was calculated for the post-baseline, post-
negative and post-recovery videos and ANOVAs were used to assess for differences between
conditions. Due to the potential for heart rate artefacts, change score values greater than 2 standard
deviations away from the mean were identified as outliers and excluded from heart rate analysis.
Following this, the number and type of emotion regulation strategies adopted (as measured by the
STERQ state negative and state ERQ) following the negative video was compared between groups.
Finally, secondary analysis assessed individual differences in responses to the positive/neutral and
negative videos. Spearman’s Rho correlations were conducted between trait mood (hypomania and
anhedonic depression) and baseline emotion ratings and RSA for all participants. Next, further
correlations assessed the relationship between trait mood and emotional reactivity and regulation
and change in RSA separated by condition.

Page | 126
5.4 Results
5.4.1 Preliminary analysis
5.4.1.1 Composite scores
As in previous chapters, composite scores for positive and negative emotions were obtained through
obtaining the mean ratings for happy, amused and excited (positive) and sad, anxious and angry
(negative) emotions. Composite ratings of suppression, positive and negative reappraisal were also
constructed by taking the mean of the relevant items from the state-modified ERQ (Gruber et al.,
2012).
5.4.1.2 Normality of data Kolmogorov-Smirnov tests were used to assess the distribution of all variables. For complete outline
of normality statistics, see Appendix 31.
Mood (trait) and state Emotion regulation measures: Hypomania scores (HPS) showed significant
departures from normality, as did the majority of the state emotion regulation measures. Therefore,
non-parametric analyses were conducted when using these measures.
State emotion measures: Ratings of positive emotions were normally distributed for all except the
final measurement, which showed significant departures from normality. Ratings of negative
emotions were positively skewed at all times of measurement (p’s < .05) therefore non-parametric
analyses were conducted when negative emotions were included.
5.4.1.3 Emotional change elicited by videos
The following analysis was conducted to ensure that the videos elicited the predicted emotional
responses:
Neutral and positive videos: Data from the online (pre-laboratory) presentation of the neutral and
positive videos were used to assess the change elicited in positive and negative emotions. The
neutral video elicited a significant decrease in positive emotions (t(29) = 4.55, p < .001, d = 1.69) but
no significant change in negative emotions (Z = -1.87, p = .06). This suggests that the video may have
been slightly more negative than intended. As predicted, the positive video elicited both an increase
in positive (t(31) = 4.57, p < .001, d = 1.70) and decrease in negative emotions (Z = -4.56, p < .001).
Baseline and recovery videos: The emotion ratings taken immediately before and after both the
baseline and recovery videos were compared using Wilcoxen Signed Ranks tests. The baseline video
showed a reduction in both positive (Z = -5.32, p < .001) and negative emotions (Z = -2.93, p = .003).
The recovery video showed a reduction in negative emotions (Z = -5.83, p < .001) but no significant
difference in positive emotions (Z = -1.40, p = .162).

Page | 127
5.4.1.4 Level of movement recorded across groups To ensure that Respiratory Sinus Arrhythmia (RSA) analysis was not confounded by participant
movement, mean movement scores were calculated for each participant and video using the data
recorded by the internal Actiheart accelerometer. Mean movement scores were compared both
within- and between- groups for each video using the appropriate t tests. No significant differences
between groups or videos were detected (p’s > .05) therefore movement was not included in further
analysis.
5.4.1.5 Relationship between self-reported emotion and Respiratory Sinus Arrhythmia To provide like-for-like measures of emotional and RSA responding, a mean of emotion ratings one
and two (pre and post baseline) and three and four (pre and post recovery) were created for the
composite positive and negative emotions. Spearman’s rho correlations were used to assess the
relationship between these emotion scores with mean RSA for the same epochs. There were no
significant relationships between RSA and positive or negative emotions for either the baseline or
recovery period.
5.4.2 Do positive stimuli buffer the effects of a negative mood induction (hypotheses 1-3)?
5.4.2.1 Does the viewing of positive stimuli immediately prior to negative stimuli reduce
emotional and cardiac change in response to the negative stimuli?
Explicit and implicit emotional reactivity and recovery were measured using self-report emotion
ratings (explicit) and respiratory sinus arrhythmia values (RSA; implicit). Emotional reactivity was
computed as change from baseline after mood induction for composite positive and negative
emotion ratings (rating 3 – rating 1) and RSA average (RSA 2 – RSA 1; RSA 3 – RSA 1). Emotional
recovery was computed as change from baseline after recovery video for emotion ratings and RSA
(rating or RSA 4 – rating or RSA 1).
Self-report emotion measures
Contrary to hypothesis 1, the video seen prior to the negative mood induction did not significantly
influence emotional change (positive emotions: U = 399.0, p = .182, r = .168; Negative emotions:
U = 429.5, p = .360, r = .115) or emotional recovery (positive emotions: U = 417.0, p = .277, r = .137;
Negative emotions: U = .716, p = .474, r = .09). Figure 25 and Figure 26 respectively show the change
in positive and negative emotions compared to the initial scores.

Page | 128
Figure 25: Change in positive emotion scores across videos
Figure 26: Change in negative emotion scores across videos
Cardiac measures
One participant from the positive condition had RSA change score greater than twice the standard
deviation above the mean. Therefore this participant was excluded from RSA analysis (n = 62).
Hypothesis 2 predicted a smaller decrease in RSA during the negative video for those in the positive
compared to the neutral video condition. Analysis showed an approaching significant group
difference in change scores for the second video epoch (positive or neutral; Mann Whitney test:
U = 332.5, p = .059, r = .262) but not for the negative (U = 405.0, p = .291, r = .133) or recovery
(U = 437.5, p = .549, r = .08) videos. Therefore this hypothesis was not supported.
Figure 27 shows the change in RSA from baseline for each video epoch.
-6.96 -15.86 -17.31
-9.61
-21.01 -21.40
-30.00
-25.00
-20.00
-15.00
-10.00
-5.00
0.00Baseline (2-1) Reactivity (3-1) Recovery (4-1)
Chan
ge in
Pos
itive
Em
otio
n Ra
tings
Video Viewing Period
Positive Condition
Neutral Condition
-2.30 7.04 -1.80
-.96
10.64
.65
-6.00
-4.00
-2.00
0.00
2.00
4.00
6.00
8.00
10.00
12.00
14.00Baseline (2-1) Reactivity (3-1) Recovery (4-1)
Chan
ge in
Neg
ativ
e Em
otio
n Ra
tings
Video Viewing Period
Positive Condition
Neutral Condition
(Error bars indicate SEM)
(Error bars indicate SEM)

Page | 129
Figure 27: Change in Respiratory Sinus Arrhythmia across video epochs
5.4.2.2 Does the viewing of positive stimuli prior to negative stimuli broaden the number and type of emotion regulation strategies adopted in response to the negative stimuli?
The total number of strategies adopted in response to the negative video was calculated by counting
the number of statements in the STERQ state negative and state ERQ that were endorsed to any
extent. Mann-Whitney tests were conducted to assess group differences in the total number of
strategies adopted and each of the subscales from the STERQ state negative and state ERQ. Contrary
to hypothesis 3, no significant group differences were detected in the number or type of strategies
engaged in response to the negative stimuli.
5.4.3 Individual differences in buffering responses For both hypomania and depression, Spearman’s Rho correlations were conducted using bonferroni
adjustment for 10 multiple comparisons (p < .005).
5.4.3.1 Hypomania, emotional activity and cardiac response to buffering conditions Contrary to hypothesis 4, no significant relationships were detected between hypomania and
baseline measures of emotion or RSA. Furthermore, no relationships were detected between
hypomania, emotional reactivity, regulation or RSA in either condition.
5.4.3.2 Anhedonic Depression, emotional activity and cardiac response to buffering conditions
No significant relationships were detected between anhedonic depression and baseline measures of
emotion or RSA. During the positive video, increased anhedonic depression was associated with a
decrease in RSA which was approaching significance (Figure 28; rs = -.502, p = .005). This was
opposite to the prediction made by hypothesis 5. No further relationships were detected between
anhedonic depression and emotional or cardiac responding in either condition.
.06 .06-.01
-.26
-.15
-.02
-0.40
-0.30
-0.20
-0.10
0.00
0.10
0.20
0.30Ch
ange
in R
SA
Video Epoch
Positive Condition
Neutral Condition
(Error bars indicate SEM)

Page | 130
Figure 28: Relationship between anhedonic depression and change in RSA in response to the
positive video
5.5 Discussion
Contrary to all hypotheses, exposure to a positive video immediately prior to a negative mood
induction elicited no significant effects on emotional change, emotion regulation or cardiac measures
in response to the negative mood induction.
The study was founded on a body of research which suggested that positive mood broadened
thought-action repertoires (Fredrickson & Branigan, 2005; Fredrickson, 2008; Fredrickson, 1998;
Fredrickson, 2001). Experimental evidence for this mostly addressed attention, cognition and pro-
social behaviours (e.g. Isen, 2001, 2008). Therefore, it is possible that such benefits may, in turn,
have longer term effects on coping and resilience. However, the current study suggests that positive
emotions do not appear to elicit direct, immediate, benefits in the regulation of subsequent negative
emotions.
This is contrary to the hedonic contingency hypothesis, which predicts participants in a positive
emotional state will select responses that will maintain their positive mood. However, Isen (2008)
argues that maintenance of hedonic well-being is only prioritised when circumstances remain stable.
Additionally, Cohn (2009) suggests that individuals will move flexibly between self-preservation (in
this case a narrowing of the thought-action repertoire) and long-term investment (broadening
responses), adapting to circumstances. Therefore the dissipation of positive mood may in fact, have
been, an adaptive response to the negative stimuli. Indeed, sustained positive mood, even when
encountering negative stimuli, is a feature of dysregulated positive emotion, linked to bipolar
disorder (Gruber, 2011).
Literature regarding the relative cardiac effects of mood inductions versus baseline videos currently
yields mixed evidence. Consequently, no predictions were made regarding the relative cardiac
reactivity of the positive and neutral stimuli. The current study found that the positive stimuli did not
-1
-0.5
0
0.5
1
1.5
0 10 20 30 40Chan
ge in
RSA
Anhedonic Depression Score (MASQ)
Page | 131
evoke RSA values that differed significantly from baseline. However the neutral condition showed a
significant reduction in RSA variability. This is difficult to interpret, due to the lack of emotion rating
immediately after the neutral/positive video (discussed in more detail in section 5.5.1).
There are two reasons to suspect that the RSA reduction is in fact a product of the neutral video
being experienced negatively. First, pre-laboratory ratings (conducted on the opposite experimental
group) showed a reduction in positive mood in response to the neutral video. This would be
congruent with previously published evidence suggesting that RSA is associated with variations in
positivity, albeit at tonic, rather than phasic, level (Oveis et al., 2009). Second, the RSA reduction in
the neutral condition differed significantly from the positive condition, but not for the within-
subjects comparison with the negative video. Therefore, this suggests similarity between how the
neutral and negative videos were experienced by participants.
Exploratory analysis revealed that in the positive video, there was a marginally significant association
between greater reduction in RSA and increased anhedonic depression scores. As discussed above,
reduced tonic RSA has been previously associated with lower positivity (Oveis et al., 2009) and
reduced tonic and phasic RSA have been associated with increased negative responding (e.g.
Demaree, Robinson, Everhart, & Schmeichel, 2004). This suggests that depressed participants may
have been less responsive to the positive video. However, this interpretation should be adopted
cautiously as it is cannot be verified due to the absence of a corresponding self-report emotion
rating.
5.5.1 Limitations
The measures of RSA in the current study did not correlate with emotion, which may be interpreted
in at least two ways. The simplest suggests that RSA was unrelated to emotion in the current study
and therefore was not a valid measure of emotional responding. However, when considering the
different phases of the experiment, it becomes apparent that the recorded lack of relationship may
be a reflection of the experimental design, rather than a true lack of association between RSA and
emotion. If, during the baseline video (where no emotional change was detected), we consider the
measure of RSA to be tonic RSA (i.e. unrelated to a particular stimulus), the relationship of interest
may be with trait measures of mood (e.g. depression and hypomania), rather than baseline emotion.
Conversely, when considering subsequent epochs, the analysis is focused on phasic RSA (i.e. the RSA
response to stimuli). Unfortunately, the decision to omit a rating between the two videos,
immediately prior to the negative mood induction, means that the video specific RSA measures do
not have a direct comparison within the self-report emotion rating. Additionally, because the effects
on emotion regulation were the primary outcome of interest, the final video was presented after the
emotion regulation questions were answered. However, given the transient nature of the emotional
change, although included to capture emotional recovery, this may already have been completed

Page | 132
during the answering of the emotion regulation questions. Therefore it is unclear whether the
corresponding RSA epoch is reflective of tonic (having already returned to baseline) or phasic (still
undergoing recovery) RSA.
The lack of emotion measure immediately prior to the negative mood induction video means we can
only infer the emotional impact of the preceding positive or neutral video. This compromise in design
was accepted to avoid disrupting the transient potential mood response prior to the negative
induction video. Two steps were taken to try to validate that the positive, neutral and negative
videos were eliciting the expected results. The three videos were piloted using participants that were
not part of the main study. This verified that all videos elicited the predicted responses. Additionally,
to verify the video effects using the current sample, participants each watched the video they did not
experience in the main study as part of the pre-laboratory procedures. This indicated that the
positive video elicited the expected emotional reaction. The neutral video elicited a reduction in
positive emotions, which may indicate it was perceived more negatively than intended. However,
even if this was also the case for participants who viewed it immediately prior to the negative video,
it is reasonable, from the two validation processes, to assume that those participants will have had a
different emotional experience to those in the positive condition. Therefore, the lack of significant
difference between the conditions is unlikely to be due to a similarity in positive and neutral videos,
thus is more likely to reflect a genuine lack of effect of positive emotions on subsequent responses to
negative experiences.
5.5.2 Future Directions The current study could be improved and extended in the following ways. First, the study design
could be reversed so that the negative mood induction was elicited first, in line with previous
“cardiac undoing” studies (Fredrickson & Levenson, 1998; Fredrickson, Mancuso, Branigan, &
Tugade, 2000). The regulatory strategies adopted in response to the negative mood induction could
then be assessed retrospectively, alongside measures of emotional and cardiac recovery. This
approach was not adopted in the current study, as the effects of positive versus neutral videos after
the negative induction could only be expected to influence post stimuli (rather than concurrent)
regulation. However, given that emotion regulation is a continuous process, this post-stimulus
regulation focus would still be of interest, particularly in association with emotional recovery.
Second, the type of stimuli could be altered, particularly for eliciting negative mood, to include more
dynamic tasks than the current video mood inductions. This may engage a wider range of emotion
regulation responses and thus be more informative when measuring concepts such as emotional
resilience. Such studies would provide an interesting addition to current literature showing
broadening of cognition and attention in response to positive emotions. It would also bridge the gap
between the experimental studies of cognition and attention, and the longitudinal and qualitative
studies inferring positivity related differences in emotion regulation.

Page | 133
5.5.3 Conclusions The current study tested whether a positive emotional experience would broaden the emotion
regulation strategies adopted in response to a negative mood induction. Measures of emotion,
emotion regulation and respiratory sinus arrhythmia all showed no significant effects of the initial
video (positive or neutral) on responses to the subsequent negative induction. This suggests that the
improved longer-term coping and psychological resilience as a result exposure to positivity does not
arise through state emotion regulation. Instead, this may be a cumulative effect of several short-
term processes previously shown to be enhanced through exposure to positive mood.
Page | 134
CHAPTER 6:
GENERAL DISCUSSION

Page | 135
6.1 Aims of the current thesis This work advanced existing knowledge of individual differences in the regulation of positive
emotions. It encompassed two parallel avenues for research. The project contributed to
methodological tools available for assessing state based emotion regulation, and the regulation of
positive emotions. Chapter 2 focused on the development and validation of the State/Trait Emotion
Regulation Questionnaire (STERQ). This was created and validated for the study of positive emotion
regulation, and for the study of state-based emotion regulation (chapter 2). The scales showed good
reliability, model fit and convergent validity. Chapter 4 validated online methodology for conducting
emotion regulation research. The study was designed to validate the administration of emotion
regulation experiments online, and established that such research is feasible, with comparable
results to those obtained within the laboratory, but eliciting smaller effect sizes.
The project also had a theoretical focus on the regulation of positive emotions in healthy volunteers.
Chapter 3 investigated the spontaneous and instructed regulation of positive emotions in healthy
participants. Various individual differences were described in the regulation of positive emotions:
emotional intrusion was positively associated with both increased hypomania and depression traits
(chapter 2 and 3). Additionally, hypomanic personality traits were associated with use of more
strategies to regulate positive emotions, whilst individuals with higher depression scores showed
lower baseline positive emotions and increased dampening in response to positive emotions (chapter
3). Following this, chapter 5 assessed the impact of positive emotions on the subsequent emotion
regulation responses to negative stimuli. The elicitation of positive emotions prior to a negative
stimulus had no effect on either the choice of regulation strategies, or the emotional or physiological
response to the negative stimuli.
6.2 Methodological contributions of the thesis Existing self-report measures of emotion regulation were subject to two key limitations: A lack of
validated assessments of state emotional responding; and limited variation in measures assessing the
regulation of positive emotions. Furthermore, experimental assessment of emotion regulation has
previously been predominantly conducted in laboratory environments. Both issues were addressed
in the current work, through the creation of a state/trait emotion regulation questionnaire, and the
validation of an emotion regulation experiment using video mood induction online.
6.2.1 State/Trait Emotion Regulation Questionnaire and Emotion Regulation Research
Theories addressing the regulation of emotions have developed to emphasize the dynamic nature of
such regulation. For example, although the process model depicts transition through temporally
distinct regulatory phases, the authors note that such stages may not occur in a linear progression
(Gross & Thompson, 2009). Furthermore, recent research has highlighted the importance of
disentangling the relative impact of the nature of the selected regulation strategy, from the time at
Page | 136
which it is deployed (Koole et al., 2010). Following from this, the success of emotion regulation may
be an interaction between such variables (Sheppes & Gross, 2012). Moreover, it is unlikely that
individuals adopt only one strategy in response to emotional stimuli (Aldao & Nolen-Hoeksema,
2013). It is more realistic to expect multiple strategies to be engaged, either simultaneously, or
differentially, in response to varying stimulus demands. Finally, emotion regulation research has
moved beyond the notion that individual emotions or regulation strategies are inherently adaptive or
mal-adaptive. Instead, healthy emotional responding is conceived as being contextually appropriate
(Aldao, 2013; Dixon-Gordon, Aldao, & De Los Reyes, 2015). This may include accepting unpleasant
emotions, if they are congruent with the wider situation or are necessary to achieve longer-term
goals (Tamir & Ford, 2012b). Conversely, this also highlights the importance of considering positive
emotions in terms of their wider context. For example, it is inaccurate to assume that all individuals
embrace and seek to maintain positive emotions (Kashdan et al., 2015). Indeed, healthy emotional
responding requires the same flexible reactions to positive emotions as it does to negative.
Furthermore, disruption of positive emotions can be a key diagnostic feature of several mental
health conditions (Gilbert, 2012).
Current self-report measures of emotion regulation are ill-equipped to capture these contextual
variations in regulatory responding. Additionally, there is a particularly sparse selection of available
measures which address trait or state responses to positive emotions. The State/Trait Emotion
Regulation Questionnaire (STERQ) provides a measure which has been validated for use in
experimental emotion regulation studies. In addition to providing a trait measure for positive
emotions, the STERQ also enables state-based measurement of emotion regulation. Testing of
higher-level theories of emotion regulation (e.g. the process model) may be enriched through use of
the STERQ, providing opportunity to assess the dynamic temporal nature of the regulatory responses
outlined above. This may also be a useful first step in providing more nuanced information regarding
how and when such regulation may be adaptive and mal-adaptive, elucidating its association with
psychopathologies.
The development of the STERQ also opens several avenues for further research. Theoretically, it is of
interest to ascertain how trait and state emotion regulation interact, including the strength of
relationships between trait and state responding. Clinically, it may also be important to establish the
relative impact of habitual versus situational emotion regulation on mental health and wellbeing.
Finally, continuing development of scales validated to measure state-based emotional responding is
needed, to satisfactorily encompass a range of contexts and regulation techniques.
6.2.2 Online validation of experimental emotion regulation research
The growth of technology and ubiquitous nature of the internet makes online data collection easier
than ever before. However previous online emotion regulation research has been limited to

Page | 137
questionnaire or diary measures (Kashdan & Breen, 2008; Nezlek & Kuppens, 2008). Chapter 4
provided validation of the online experimental induction of positive mood using a video mood
induction. Additionally, it supplied evidence that an instructed regulation paradigm can be
successfully implemented via the internet, showing comparable results albeit with reduced power.
This allows emotion researchers to take advantage of the many benefits associated with online
research. These benefits include access to wider participant populations, reduced costs and
experimenter time, and lower rates of incomplete responses. However, the current study also
highlighted the greatly increased drop-out rates associated with online responding, the increase in
non-genuine responses, and the reduced power, which may arise through using a less controlled,
non-laboratory setting. These findings support similar concerns previously highlighted in the
literature (e.g. Göritz & Moser, 2006; Göritz, 2007). Therefore it is important that researchers are
aware of such issues, and plan accordingly to adequately detect non-genuine or incomplete
responses, and to recruit samples that provide sufficient power for the variables of interest.
6.3 Theoretical contributions of the thesis Across the current studies, several findings relating to regulation of positive emotions in participants
with increased trait hypomania and depression emerged. Furthermore, the influence of positive
emotions on the subsequent regulation in response to negative stimuli also contributed to the
understanding of how positive and negative emotions interact.
6.3.1 Hypomania and responses to positive emotions
Contrary to previous findings, risk for hypomania was not associated with either increased baseline
positive emotions, or increased reactivity to positive stimuli in any of the studies within the current
thesis. Furthermore, increased risk of hypomania was also not associated with altered heart rate
responses to positive emotions (chapter 5). There may be several reasons for the disparity between
the current findings and the wider literature. First, our studies used healthy individuals with varying
scores in trait risk of hypomania. However existing literature includes both healthy volunteers and
euthymic patients with bipolar disorder. Therefore, the elevated positivity reported previously may
be an emergent feature of the disorder rather than a feature of hypomanic vulnerability.
Alternatively, elevated positivity may be limited to specific emotions or stimuli not addressed in the
current studies. Indeed, the theories of Behavioural Activation System (BAS) dysregulation and
positive emotional persistence (Gruber, 2011) predict that it is the positive emotions associated with
reward that become heightened in participants with bipolar disorder (Gruber, 2011). However,
previous research using participants at risk for mania, found positive emotions to be elevated across
all assessed emotions, albeit with no association between hypomania and reactivity to positive
stimuli (Gruber et al., 2008).

Page | 138
Various relationships between hypomania and emotion regulation were detected in the current
work, which partially reflected those reported in the wider literature. Higher trait hypomania was
associated with the adoption of greater numbers of regulation strategy items in response to positive
emotions. This may suggest that the increased multiple strategy use shown in patients with bipolar
disorder (Gruber, Harvey, & Gross, 2012) is a trait feature of hypomanic personality rather than
arising as a consequence of the disorder. However, it is important to note that the majority of the
items endorsed in the current spontaneous regulation study belonged to the intrusion subscale.
Therefore, this finding may instead be more reflective of the experience of positive emotions than
efforts to change such emotions. This alternative would therefore potentially suggest that the
increased use of multiple strategies shown by Gruber et al., (2012) may develop in response to a
sense of emotional intrusion elicited by both positive and negative emotions.
In addition to supporting the notion that hypomania is associated with increased use of multiple
strategies, the spontaneous and instructed regulation studies (chapter 3) also found risk of
hypomania to influence the use of specific regulatory strategies. The proposed association between
increased hypomania and greater emotion focused rumination (e.g. Feldman et al, 2009; Gruber et
al., 2012) was supported by the current instructed regulation study. The current studies also found
hypomania to be associated with increased levels of trait intrusion of positive emotions and state
intrusion of low activation positive emotions. As suggested above, this may be indicative of positive
emotions having a greater overall impact on individuals with higher hypomania scores. Therefore,
rather than experiencing higher levels of positive emotions, participants with higher risk for
hypomania may instead, experience the same level of positivity but be less tolerant of such feelings.
6.3.2 Depression and responses to positive emotions
Studies within the current project showed a mixed impact of depression scores on responses to
positive emotions. Only the spontaneous regulation study (chapter 3) showed increased depression
scores to be associated with reduced initial positivity across all assessed emotions. However, no
association between depression score and initial positive emotions was demonstrated in either the
instructed regulation study (chapter 3) or the investigation of the interaction between positive and
negative emotions (chapter 5).
Furthermore, none of the studies showed the diminished emotional reactivity predicted by the
positive attenuation or context insensitivity hypotheses (Rottenberg et al., 2005). Indeed the only
relationship that approached significance suggested that increased depression score was associated
with increased low activation emotions in response to a video eliciting high activation emotion
(chapter 3). Therefore, it appears that decreased positivity and emotional reactivity may not be
universal features of low mood, but may instead emerge under specific circumstances or in response
to particular emotions. Alternatively, decreased positivity and emotional reactivity may be present in
Page | 139
clinically diagnosed depression, as a function of more than simply low mood. Following from this,
depression may not simply exist as an extreme case on a low mood continuum, but may instead have
unique distinguishing features (e.g. diminished emotional reactivity). Such features may
consequently be a product of, rather than a risk factor for, depression.
Extant literature reports mixed findings regarding whether depression is associated with increased
use of regulation which diminishes positive emotion (e.g. Feldman et al., 2008) or decreased
engagement with strategies which maintain and enhance positivity (e.g. Werner-Seidler et al., 2013).
The current work found evidence suggesting both may occur. Chapter 3 showed that increased self-
reported depression was associated with greater use of ruminative dampening but was unrelated to
levels of ruminative focusing on positive emotions after accounting for hypomania.
When different measures of emotional responding and depression were adopted, depression scores
were associated with reduced expression of positive emotions (chapter 2 and 3), reduced state
awareness of positive emotions and increased feelings of emotional intrusion for both positive
(chapter 2 & 3) and negative (chapter 2) emotions. This suggests ruminative responses (e.g.
dampening) may, intentionally or otherwise, serve to decrease emotional responding, whilst non-
facilitation of maintaining positive emotions may have a non-ruminative basis, for example lack of
expression. It is interesting to note, that depression score was only associated with suppression
when individuals were specifically instructed to down-regulate positive emotions. Given the recorded
relationship between reduced emotional expression and depression, this may indicate that
suppression constitutes more than simply reducing the expression of positive emotions. The precise
nature of suppression and the relationships between suppression, expression and depression make
an interesting avenue for future research.
Unlike the wider field, studies in the current thesis controlled for trait risk of hypomania when
investigating depression scores. Definitions of depression, and in particular, anhedonia, have been
criticised for being overly inclusive (Ho & Sommers, 2013; Treadway & Zald, 2011). Therefore the use
of a wider range of potentially co-morbid measures (in this case hypomania) may aid our
understanding of the factors that contribute to emotion regulation and are specific to depression,
representing one strength of the current work.
6.3.3 Emotional intrusion as a transdiagnostic risk factor for mental health problems
The current studies consistently showed emotional intrusion, in relation to positive and negative
emotions, to be related to increased depression and hypomania scores. This suggests that
experiencing emotions as intrusive or overwhelming may be a common feature contributing to a
range of mental health conditions. Indeed, this would be congruent with literature reporting an
association between depression and fear of intense or positive emotions (e.g. Gilbert, McEwan,
Catarino, Baião, & Palmeira, 2014; Werner-Seidler, Banks, Dunn, & Moulds, 2013), and evidence

Page | 140
suggesting participants with bipolar disorder avoid rewarding experiences in an effort to avoid onset
of mania (Edge et al., 2013). The preliminary evidence from the current work could be usefully
followed up across a range of disorders, to establish whether or not emotional intrusion plays a role
in generating avoidant, or minimising, emotional regulation; in response to positive and negative
emotions.
6.3.4 Potential implications for clinical interventions
Reflective of a wider theoretical and empirical focus on negative emotions, clinical psychology has
also predominantly targeted the reduction of distress, rather than the building of resilience (Joseph
& Wood, 2010). However, decreased positivity is a significant risk factor for mental health problems
(e.g. Wood & Joseph, 2010) but current interventions show limited effectiveness when targeting
reduced positivity, such as anhedonia in depression (e.g. Werner-Seidler et al., 2013). Furthermore,
current interventions which aim to increase exposure to positive situations (e.g. behavioural
activation interventions) do not currently address how positive emotions are experienced by the
individual (Werner-Seidler et al., 2013). As discussed above, the current studies show both risk of
hypomania and depression score was linked to an increased sense of emotional intrusion, in
response to both positive and negative emotions. Additionally, increased depression scores were
associated with increased dampening and reduced expression of positive emotions. Conversely,
increased risk of hypomania was associated with increased focus on emotions and implementation of
greater numbers of strategies to regulate such emotions. Each of these findings could be targeted in
interventions designed to either prevent onset of mental health problems or when treating
conditions such as hypomania and depression. For example, this could include challenging the
thoughts related to dampening of positive emotions, or modelling and practice in emotional
expression for clients with depression.
6.3.5 Prototypical emotions versus valence
Throughout the current project, results have suggested that depression and hypomania may
influence responses to specific emotions rather than generally across the positive valence. This has
wider theoretical implications for how emotions are conceptualised and measured. Barrett (2006)
argues for valence and arousal to be considered as the basic emotional building blocks. She suggests
that individuals vary in their ability to distinguish between similarly valenced emotions, but can
identify feelings as positive or negative. Therefore it may be more useful to consider emotions in
terms of their valence and arousal, rather than study discrete emotions. The reduced emotional
awareness reported by participants with increased depression may support the assertion that people
vary in their ability to identify emotional states. However, this does not necessarily indicate that
emotion should be considered predominantly in terms of valence and arousal. Such an approach
would encounter multiple difficulties, particularly when assessing clinical populations. First, the
ability to identify different emotional states may be an important indicator of emotional wellbeing.

Page | 141
Indeed, a lack of emotional awareness has been associated with several mental health problems (e.g.
Berking et al., 2009; Rieffe & De Rooij, 2012) and is a treatment target in emotion regulation based
therapies (e.g. Berking & Lukas, 2015). Second, conflating specific emotions across each valence
potentially masks many of the interactions between mental health conditions and different subsets
of emotions. Therefore increased specificity both in terms of defining and measuring emotions
provides valuable detail when assessing emotional disruption in psychopathology. Third, whilst
research investigating associations between emotion and mental health often measures discrete
emotions, research in emotion regulation relies predominantly on asking for responses for valence
specific classes of emotions (e.g. when you feel bad...). This results in ambiguity regarding similarities
and differences in how emotions are regulated in various mental health problems. Differences arising
across psychopathologies may represent differences in strategy adoption, or differences in the
emotion being regulated (Berking & Wupperman, 2012), or both. Thus, in order to obtain an accurate
reflection of emotion regulation and its relationship with mental health, increased specificity is
required regarding the emotions targeted by such regulatory efforts.
6.3.6 Interaction between positive and negative emotions
The final experimental chapter investigated whether experiencing positive emotions could influence
how participants responded to subsequent negative stimuli. This tested predictions arising from the
“broaden and build” hypothesis (Fredrickson, 2001), which posit that even transient increases in
positive emotions can result in more flexible attentional focus and broadened cognitions. Specifically
the current study extended previous research to investigate whether these gains were also seen
when investigating selection of emotion regulation strategies. Contrary to all predictions, there was
no evidence to support the notion that experiencing positive emotions could, in the short term,
protect against the influence of negative stimuli. Furthermore, this remained the case regardless of
current level or depression or hypomania. This adds to evidence from the instructed and
spontaneous regulation chapter suggesting that the increased positivity in people with hypomania
predicted by the positive emotional persistence theory (Gruber, 2011), may only arise in specific
circumstances, not elicited in any of the current studies.
Although not explicitly tested in the current work, the interaction of positive and negative emotions
may have important theoretical implications for more general models of emotion regulation. For
example, whilst the process model of emotion regulation (Gross & Thompson, 2009; Gross, 1998b) is
valence neutral, investigations based on the model predominantly focus on a single valence.
However, in everyday life, individuals experience a complex interaction of emotions, with potentially
simultaneous or overlapping valence states. Given the possible difference in strategy selection and
effectiveness in response to differently valenced emotions, this interaction between valences may
influence regulation but remain undetected by traditional emotion regulation paradigms. Thus

Page | 142
through conducting experiments measuring a range of emotions, research can start to provide more
nuanced understanding based on broader emotion regulation theories.
6.4 Strengths and limitations of the thesis
6.4.1 Use of non-clinical samples
The current project used healthy volunteers to investigate the regulation of positive emotions, taking
measures of trait hypomania and depression. Since the regulation of positive emotions is a relatively
new area of research, there is limited evidence to currently suggest how “adaptive” regulation of
these emotions is characterised in this population. Therefore, research using student and community
samples can provide a valuable bench-mark from which variations associated with psychopathologies
can be measured.
Research using non-clinical samples can also inform clinical studies. The current project uses trait
measures to establish whether particular styles of responding to positive emotions can be associated
with vulnerabilities for depression or hypomania. Assessing trait vulnerabilities in healthy, rather
than clinical, populations mitigates some of the potentially confounding variables in clinical samples,
including current illness status (e.g. unwell/remitted/inter-episode), medication and psychological
treatment. This may be particularly useful when comparing results across participants with bipolar
disorder and depression. Most studies of emotion regulation recruit euthymic patients with BD,
reducing the potential confound of mood-state. However there is greater variation in whether
depressed patients are recruited when currently depressed or currently asymptomatic. Therefore,
studies using healthy participants with a spectrum of depression and hypomania scores can help
elucidate whether emotion regulation findings are disorder specific, or whether differences are a
feature of confounding current illness status.
Studies using healthy volunteers may also provide valuable information that can be compared with
remitted or recovered clinical samples. Treatment effects may be problematic when disentangling
emotion regulation differences between currently symptomatic and remitted samples. Therefore,
increased knowledge from healthy participants can be used as a comparator for data from recovered
clinical samples, to establish relative similarities and differences between healthy, currently unwell
and recovered populations.
However, using non-clinical samples to inform clinical research is not problem-free. Trait measures of
depression and hypomania have shown good predictive validity, so can be considered indicators of
clinical risk (e.g. Lovibond & Lovibond, 1995; Meyer & Hautzinger, 2003). However, the sample in this
PhD were all aged 16 and above. A substantial proportion of people who suffer with mental health
problems develop first onset during adolescence (e.g. Patel, Flisher, Hetrick, & McGorry, 2007).
Therefore, it is plausible that individuals with high hypomania or depression scores may in fact be a

Page | 143
mixed sample: Some people identified as at risk may well go on to develop psychopathology.
However, there may be a subset of individuals who, despite the risk factors, are actually showing
resilience, preventing them from becoming unwell. The cross-sectional nature of the current work
makes it unable to distinguish between these possibilities.
Furthermore, the extent to which the measures in the current work assess risk for psychopathology
rather than current symptomatology may differ across questionnaires and mental health conditions.
For example, the hypomanic personality scale may capture personality traits which are risk factors
for mania, whilst the depression, anxiety and stress scale may target symptoms of those conditions.
6.4.2 Experimental assessment of emotion regulation
6.4.2.1 Mood induction across experiments
Throughout the current project, videos were used as a mood induction tool for eliciting emotional
change. This method was selected because it has previously been shown to have the largest effect
size, especially for eliciting positive emotions (Westermann & Spies, 1996). Furthermore, the use of
videos generated results that were comparable with several similar studies with results of relevance
to the current project (e.g. Gruber et al., 2008, 2011, 2012). Finally, the use of videos enabled the
project to be conducted both in the laboratory and online.
However, there are several limitations to using exclusively video stimuli. The use of videos generally
elicits small and transient emotional effects. Therefore, given the importance of context in the
regulatory process, regulation strategies adopted in response to such emotions may be different to
those elicited in other settings. This may challenge the ecological validity of exclusively using video
inductions. Furthermore, video scenes may be relatively explicit in the emotions depicted, and thus
the emotions expected to be elicited for participants. This may increase the potential for demand
characteristics to affect responses relative to other techniques. Furthermore, videos may introduce
an element of cognitive priming through the use of language that may not be present with other
methods (e.g. musical mood induction). However, despite these limitations, there is reason to
believe that videos can elicit genuine emotional states (Westerman & Spies, 1996). For example, in
both the final experimental chapter of the current work, and elsewhere, videos elicited changes in
physiological states associated with emotional responding (e.g. changes in heart rate variability).
Importantly, in the current work, the videos did not always elicit the expected results. For example,
one video expected to be neutral in the second phase of STERQ validation, in fact, elicited increased
positive emotions in participants. Conversely, an intended neutral video in the final study decreased
both positive and negative emotions when seen by participants. Beyond complicating the
interpretability of the findings, this observation suggests that the current work was not unduly
influenced by demand characteristics.

Page | 144
6.4.2.2 Instructed regulation protocols
When instructing individuals to regulate their emotions using a particular technique, the instruction
may inadvertently introduce a regulatory goal, rather than a method for regulation. For example,
participants who are instructed not to show any emotions (i.e. expressive suppression) may achieve
this in a variety of ways, including uninstructed strategies such as reappraisal or distraction. In this
instance, not showing emotion has become an outcome, rather than a strategy for emotional
regulation. This introduces two consequences for consideration. First, the strategies adopted may
differ from those intended, in a bid to successfully achieve the regulatory goal. Indeed, previous
findings have indicated that when asked to suppress emotional responses, participants report using
both antecedent (e.g. reappraisal) and response-focused regulatory strategies (Demaree et al.,
2006). Second, it may change the nature of the regulation attempted. The introduction of a goal (e.g.
to consider emotional stimuli as if directing a film) may have features closer to instrumental
regulation, whereby regulatory efforts are focused on wider, rather than immediate hedonic goals.
Consequently, it is important to assess the ways in which individuals achieve compliance with
instructions to regulate emotional responding.
Finally, the instructed regulation paradigm used here and elsewhere also provides the regulatory
instruction prior to the onset of emotional stimuli. This may inadvertently alter the timing of the
regulation, as participants are primed to begin emotional regulation before onset of emotions.
Therefore, strategies such as suppression, which are hypothesised to be response-focused (occurring
late in the emotion generation process) may be elicited earlier than when occurring naturally,
potentially changing the overall impact and effectiveness of the strategy.
6.4.3 Focus on hedonic regulation
The level of analysis in the current project has focused on the intentional regulation of emotions for
hedonic purposes. This may not reflect real world instrumental regulation of emotion, in which
individuals sacrifice short-term pleasure for long-term gain (Sheppes et al., 2014). In addition to the
potential loss of ecological validity, it is important to consider the potential confound of participant
motivations during participation. For example, in an experimental manipulation during which a sad
video is shown, participants may use information about their situation to guide their regulation (e.g.
it’s only a short clip and I’ll get credit for participating). Such motivations may inherently alter the
emotional experience, and form part of their regulatory responses, however were not measured
during the studies conducted here. However, this may be a greater concern for negative stimuli, in
which the shorter term hedonic (I want this to stop) may be less congruent with the longer-term
instrumental regulation goals. Furthermore, the State/Trait Emotion Regulation Questionnaires
(STERQ) incorporates a harnessing subscale, including items such as “I felt something good would
come of it” and “I could use what I was feeling to my advantage” which may incorporate both
hedonic and instrumental regulation.

Page | 145
6.4.4 Use of Self-Report Measures
As with the use of videos in emotion regulation research, self-report scales have several project
specific and general advantages and limitations. Self-report provides a direct measure of emotional
responding, providing data that is not accessible through observational and physiological responses
(Kashdan et al., 2008). Therefore such measures are an integral component of emotion regulation
research. Self-report scales were particularly suitable for the current research, as they provided well-
validated measures that were cheap, easy to administer and implementable in both laboratory and
internet studies. However, as considered for the use of videos, self-report measures may be at risk of
capturing socially desirable responses or demand characteristics. Furthermore, they may require a
level of insight regarding ones emotional responses that is not achievable for all participants (Wirtz et
al., 2014). Finally it is important to consider how the different measures may inter-relate when
providing evidence regarding emotion regulation. For example, the responses to positive affect (RPA)
questionnaire describes ruminative responses that are suggested to up- or down- regulate positive
emotions. The scale has been shown to relate to measures of both hypomania and depression (e.g.
Feldman et al., 2008). However, none of the studies in the current project have shown any of the
subscales within the RPA to be associated with emotional reactivity. This suggests that whilst
individuals may engage in such rumination strategies, their effects on state emotion appear
negligible. Therefore, the contributory impact of such strategies on depression and hypomania, as
well as the mechanisms by which such impact is generated remain unclear.
6.5 Future Directions The research presented in the current thesis opens several potential avenues for future research. As
discussed above, creation of the State/Trait Emotion Regulation Questionnaires has generated
several testable hypotheses regarding the regulation of state and trait emotions. These include
investigation of how trait and state strategy use interact across a range of contexts and emotions;
additional validation of the scale using clinical and adolescent populations and variations on the
initial instruction wording and elucidating the relationship between state emotion regulation style
and mental wellbeing.
Despite recent advances, research into the role of emotion regulation in the management of positive
emotions is still in its infancy. The current project has highlighted several areas of interest which
could further develop such research. The investigation of multiple positive emotions enabled
identification of a range of emotions that may be dysregulated in response to increased risk of
depression or hypomania. Future work could extend this by refining the specific emotions examined,
and manipulating more general emotional intensity, valence and arousal states and measuring the
emergent regulatory efforts. Furthermore, a wider range of methodologies could be incorporated
into the assessment of emotion regulation. This could include the combination of self-report with
physiological measures, collecting diary or experience sampling data and comparing more

Page | 146
ecologically valid assessments of emotion regulation with measures obtained using experimental
protocols.
Several wider theoretical implications were considered, but only briefly addressed in the current
project. For example, only the latter stages of the process model of emotion regulation (Gross &
Thompson, 2009) were targeted in the current studies. However, the earlier stages of the model
(situation selection and modification) are currently neglected in emotion regulation research, and
may be particularly pertinent to positive emotions (Aldao & Tull, 2015). Additionally, several further
predictions regarding emotion regulation based on the “broaden and build” model of positive
emotions (Fredrickson, 2001) could be tested, including assessing the restorative effects of positive
emotions after negative stimuli.
6.6 Conclusion The current project was conducted to make theoretical and methodological contributions to the field
of emotion regulation research. This was achieved in several ways. Methodologically, evidence was
provided to indicate that emotion regulation research can be conducted via the internet, using self-
report and experimental measures. Furthermore, the creation of the State/Trait Emotion Regulation
Questionnaires provides a measure of state-based regulation providing a new option for addressing
theoretical questions regarding the temporal and contextual dynamics of emotion regulation.
Theoretically, the current study has found no evidence of increased overall positivity or reactivity to
positive stimuli in individuals with higher self-reported hypomania, and mixed evidence for reduced
baseline positivity in depression. This suggests further research is required to better understand how,
when and which positive emotions are implicated in mental health problems. Similarly the current
project has highlighted conflicting evidence regarding how the regulation of positive emotions may
be disrupted in depression and hypomania. However, common to increased risk of both disorders
was a greater sense of emotional intrusion in response to positive (and negative) emotions. Future
research could investigate this further to establish whether intrusion plays a role in efforts to
regulate positive emotions. This work may provide an explanation for why emotion regulation, but
not reactivity, was shown in the current study to be related to reduced emotional wellbeing.

Page | 147
REFERENCES Adrian, M., Zeman, J., & Veits, G. (2011). Methodological implications of the affect revolution: a 35-
year review of emotion regulation assessment in children. Journal of Experimental Child Psychology, 110(2), 171–97. doi:10.1016/j.jecp.2011.03.009
Ahern, G. L., & Schwartz, G. E. (1979). Differential lateralization for positive versus negative emotion. Neuropsychologia, 17(6), 693–698. doi:10.1016/0028-3932(79)90045-9
Ahern, G. L., & Schwartz, G. E. (1985). Differential lateralization for positive and negative emotion in the human brain: EEG spectral analysis. Neuropsychologia, 23(6), 745–755. doi:10.1016/0028-3932(85)90081-8
Aldao, A. (2013). The future of emotion regulation research: Capturing context. Perspectives on Psychological Science, 8(2), 155–172. doi:10.1177/1745691612459518
Aldao, A., & Nolen-Hoeksema, S. (2012). The influence of context on the implementation of adaptive emotion regulation strategies. Behaviour Research and Therapy, 50(7-8), 493–501. doi:10.1016/j.brat.2012.04.004
Aldao, A., & Nolen-Hoeksema, S. (2013). One versus many: capturing the use of multiple emotion regulation strategies in response to an emotion-eliciting stimulus. Cognition & Emotion, 27(4), 753–60. doi:10.1080/02699931.2012.739998
Aldao, A., Nolen-Hoeksema, S., & Schweizer, S. (2010). Emotion-regulation strategies across psychopathology: A meta-analytic review. Clinical Psychology Review, 30(2), 217–237. doi:10.1016/j.cpr.2009.11.004
Aldao, A., & Tull, M. T. (2015). Putting Emotion Regulation in Context. Current Opinion in Psychology, 3, 100–107. doi:10.1016/j.copsyc.2015.03.022
Allen, J. J., Chambers, A. S., & Towers, D. N. (2007). The many metrics of cardiac chronotropy: A pragmatic primer and a brief comparison of metrics. Biological psychology, 74(2), 243-262.
Allen, J. J. (2002). Calculating metrics of cardiac chronotropy: A pragmatic overview. Psychophysiology, 39, S18.
Alloy, L. B., & Abramson, L. (2010). The Role of the Behavioral Approach System (BAS) in Bipolar Spectrum Disorders. Current Directions in Psychological Science, 19(3), 189–194. doi:10.1177/0963721410370292.The
Alloy, L. B., Bender, R. E., Whitehouse, W. G., Wagner, C. A, Liu, R. T., Grant, D. A, … Abramson, L. (2013). High Behavioral Approach System (BAS) Sensitivity, Reward Responsiveness, and Goal-Striving Predict First Onset of Bipolar Spectrum Disorders: A Prospective Behavioral High-Risk Design, 121(2), 339–351. doi:10.1037/a0025877.High
Appelhans, B. M., & Luecken, L. J. (2006). Heart rate variability as an index of regulated emotional responding. Review of General Psychology, 10(3), 229–240. doi:10.1037/1089-2680.10.3.229
Arndt, J., & Fujiwara, E. (2014). Interactions Between Emotion Regulation and Mental Health. Austin Journal of Psychiatr and Behavioral Science, 1(5), 1–8.

Page | 148
Ashby, F. G., Isen, A. M., & Turken, A. U. (1999). A neuropsychological theory of positive affect and its influence on cognition. Psychological Review, 106(3), 529–50. Retrieved from http://www.ncbi.nlm.nih.gov/pubmed/10467897
Barrett, L. F. (1998). Discrete Emotions or Dimensions? The Role of Valence Focus and Arousal Focus. Cognition & Emotion, 12(4), 579–599. doi:10.1080/026999398379574
Barrett, L. F. (2006). Valence is a basic building block of emotional life. Journal of Research in Personality, 40(1), 35–55. doi:10.1016/j.jrp.2005.08.006
Beblo, T., Fernando, S., Klocke, S., Griepenstroh, J., Aschenbrenner, S., & Driessen, M. (2012). Increased suppression of negative and positive emotions in major depression. Journal of Affective Disorders, 141(2-3), 474–479. doi:10.1016/j.jad.2012.03.019
Bentler, P. M. (1990). Comparative fit indexes in structural models. Psychological bulletin, 107(2), 238.
Berking, M., & Lukas, C. A. (2015). The Affect Regulation Training (ART): A Transdiagnostic Approach to the Prevention and Treatment of Mental Disorders. Current Opinion in Psychology, 3(Figure 1), 64–69. doi:10.1016/j.copsyc.2015.02.002
Berking, M., Orth, U., Wupperman, P., Meier, L. L., & Caspar, F. (2008). Prospective effects of emotion-regulation skills on emotional adjustment. Journal of Counseling Psychology, 55(4), 485–494. doi:10.1037/a0013589
Berking, M., Wirtz, C. M., Svaldi, J., & Hofmann, S. G. (2014). Emotion regulation predicts symptoms of depression over five years. Behaviour Research and Therapy, 57(1), 13–20. doi:10.1016/j.brat.2014.03.003
Berking, M., & Wupperman, P. (2012). Emotion regulation and mental health. Current Opinion in Psychiatry, 25(2), 128–134. doi:10.1097/YCO.0b013e3283503669
Berking, M., Wupperman, P., Reichardt, A., Pejic, T., Dippel, A., & Znoj, H. (2008). Emotion-regulation skills as a treatment target in psychotherapy. Behaviour Research and Therapy, 46(11), 1230–1237. doi:10.1016/j.brat.2008.08.005
Birnbaum, M. H. (2004). Human research and data collection via the internet. Annual Review of Psychology, 55, 803–832. doi:10.1146/annurev.psych.55.090902.141601
Brock, R. L., Barry, R. A., Lawrence, E., Dey, J., & Rolffs, J. (2012). Internet Administration of Paper-and-Pencil Questionnaires Used in Couple Research: Assessing Psychometric Equivalence. Assessment, 19(2), 226–242. doi:10.1177/1073191110382850
Brown, K. W., & Ryan, R. M. (2003). The benefits of being present: mindfulness and its role in psychological well-being. Journal of personality and social psychology, 84(4), 822.
Butler, E. A, Egloff, B., Wilhelm, F. H., Smith, N. C., Erickson, E. A, & Gross, J. J. (2003). The social consequences of expressive suppression. Emotion (Washington, D.C.), 3(1), 48–67. doi:10.1037/1528-3542.3.1.48
Butler, E. A., Wilhelm, F. H., & Gross, J. J. (2006). Respiratory sinus arrhythmia, emotion, and emotion regulation during social interaction. Psychophysiology, 43(6), 612–622. doi:10.1111/j.1469-8986.2006.00467.x

Page | 149
Campos, J. J., Walle, E. A., Dahl, A., & Main, A. (2011). Reconceptualizing Emotion Regulation. Emotion Review, 3(1), 26–35. doi:10.1177/1754073910380975
Capaldi, D. M., & Rothbart, M. K. (1992). Development and validation of an early adolescent temperament measure. The Journal of Early Adolescence, 12(2), 153-173.
Carl, J. R., Soskin, D. P., Kerns, C., & Barlow, D. H. (2013). Positive emotion regulation in emotional disorders: A theoretical review. Clinical Psychology Review, 33(3), 343–360. doi:10.1016/j.cpr.2013.01.003
Carlbring, P., Brunt, S., Bohman, S., Austin, D., Richards, J., Öst, L. G., & Andersson, G. (2007). Internet vs. paper and pencil administration of questionnaires commonly used in panic/agoraphobia research. Computers in Human Behavior, 23(3), 1421–1434. doi:10.1016/j.chb.2005.05.002
Carney, R. M., Saunders, R. D., Freedland, K. E., Stein, P., Rich, M. W., & Jaffe, A. S. (1995). Association of depression with reduced heart rate variability in coronary artery disease. The American Journal of Cardiology, 76(8), 562–564.
Carver, C. S., & Johnson, S. L. (2009). Tendencies Toward Mania and Tendencies Toward Depression Have Distinct Motivational, Affective, and Cognitive Correlates. Cognitive Therapy and Research, 33(6), 552–569. doi:10.1007/s10608-008-9213-y
Carver, C. S., Scheier, M. F., & Weintraub, J. K. (1989). Assessing coping strategies: a theoretically based approach. Journal of personality and social psychology, 56(2), 267.
Carver, C. S., & White, T. L. (1994). Behavioral inhibition, behavioral activation, and affective responses to impending reward and punishment: The BIS/BAS Scales. Journal of Personality and Social Psychology, 67(2), 319–333. doi:10.1037//0022-3514.67.2.319
Casillas, A., & Clark, L. A. (2000). The Mini Mood and Anxiety Symptom Questionnaire (Mini-MASQ). In 72nd Annual Meeting of the Midwestern Psychological Association (pp. 1–4). Chicago, IL.
Catanzaro, S. J., & Mearns, J. (1990). Measuring generalized expectancies for negative mood regulation: Initial scale development and implications. Journal of Personality Assessment, 54(3-4), 546-563.
Chang, H., Chang, C. C., Chen, C. L., Kuo, T. B. J., Lu, R. B., & Huang, S. Y. (2012). Major depression is associated with cardiac autonomic dysregulation. Acta Neuropsychiatrica, 24(6), 318–327. doi:10.1111/j.1601-5215.2011.00647.x
Chapman, B. P., Fiscella, K., Kawachi, I., Duberstein, P., & Muennig, P. (2013). Emotion suppression and mortality risk over a 12-year follow-up. Journal of Psychosomatic Research, 75(4), 381–385. doi:10.1016/j.jpsychores.2013.07.014
Clark, L. A, & Watson, D. (1991). Tripartite model of anxiety and depression: psychometric evidence and taxonomic implications. Journal of Abnormal Psychology, 100(3), 316–336. doi:10.1037/0021-843X.100.3.316
Cohen, H., Kaplan, Z., Kotler, M., Mittelman, I., Osher, Y., & Bersudsky, Y. (2003). Impaired heart rate variability in euthymic bipolar patients. Bipolar Disorders, 5(2), 138–143. doi:10.1034/j.1399-5618.2003.00027.x
Cohen, J. (1992). Quantitative Methods in Psychology. Psychological Bulletin, 112(1), 155–159.

Page | 150
doi:10.1037/0033-2909.112.1.155
Cohn, M. A, Fredrickson, B., Brown, S. L., Mikels, J. A, & Conway, A. M. (2009). Happiness unpacked: positive emotions increase life satisfaction by building resilience. Emotion (Washington, D.C.), 9(3), 361–368. doi:10.1037/a0015952
Cole, P. M., Martin, S. E., & Dennis, T. A. (2004). Emotion regulation as a scientific construct: methodological challenges and directions for child development research. Child Development, 75(2), 317–33. doi:10.1111/j.1467-8624.2004.00673.x
Cook, J., Spring, B., McChargue, D., & Doran, N. (2010). Effects of anhedonia on days to relapse among smokers with a history of depression: a brief report. Nicotine & Tobacco Research : Official Journal of the Society for Research on Nicotine and Tobacco, 12(9), 978–82. doi:10.1093/ntr/ntq118
Connor-Smith, J. K., Compas, B. E., Wadsworth, M. E., Thomsen, A. H., & Saltzman, H. (2000). Responses to stress in adolescence: measurement of coping and involuntary stress responses. Journal of consulting and clinical psychology, 68(6), 976.
Costello, A., & Osborne, J. (2005). Best practices in exploratory factor analysis: four recommendations for getting the most from your analysis. 2005. Practical Assessment, Research & Evaluation 10(7). Retrieved from http://pareonline.net/pdf/v10n7.pdf
Demaree, H. A., Robinson, J. L., Everhart, D., & Schmeichel, B. J. (2004). Resting RSA is associated with natural and self-regulated responses to negative emotional stimuli. Brain and Cognition, 56(1), 14–23. doi:10.1016/j.bandc.2004.05.001
Demaree, H. A., Robinson, J. L., Pu, J., & Allen, J. J. B. (2006). Strategies actually employed during response-focused emotion regulation research: Affective and physiological consequences. Cognition & Emotion, 20(8), 1248–1260. doi:10.1080/02699930500405303
Denver, J., Reed, S., & Porges, S. W. (2007). Methodological Issues in the Quantification of Respiratory Sinus Arrhythmia. Biological Psychology, 74(2), 286–294. doi:10.1016/j.biotechadv.2011.08.021.Secreted
Depue, R. A., & Iacono, W. G. (1989). Neurobehavioral Apsects of Affective Disorders. Annual Review of Psychology, 40, 457–492.
Depue, R. A., & Morrone-Strupinsky, J. V. (2005). A neurobehavioral model of affiliative bonding: implications for conceptualizing a human trait of affiliation. The Behavioral and Brain Sciences, 28(3), 313–350; discussion 350–395. doi:10.1017/S0140525X05000063
Dixon-Gordon, K. L., Aldao, A., & De Los Reyes, A. (2015). Emotion regulation in context: Examining the spontaneous use of strategies across emotional intensity and type of emotion. Personality and Individual Differences, 86, 271–276. doi:10.1016/j.paid.2015.06.011
Dörfel, D., Lamke, J. P., Hummel, F., Wagner, U., Erk, S., & Walter, H. (2014). Common and differential neural networks of emotion regulation by detachment, reinterpretation, distraction, and expressive suppression: A comparative fMRI investigation. NeuroImage, 101, 298–309. doi:10.1016/j.neuroimage.2014.06.051
Eckblad, M., & Chapman, L. J. (1986). Development and validation of a scale for hypomanic personality. Journal of Abnormal Psychology, 95(3), 214–222. doi:10.1037/0021-843X.95.3.214

Page | 151
Edge, M. D., Miller, C. J., Muhtadie, L., Johnson, S. L., Carver, C. S., Marquinez, N., & Gotlib, I. H. (2013). People with bipolar I disorder report avoiding rewarding activities and dampening positive emotion. Journal of Affective Disorders, 146(3), 407–413. doi:10.1016/j.jad.2012.07.027
Egloff, B., Schmukle, S. C., Burns, L. R., & Schwerdtfeger, A. (2006). Spontaneous emotion regulation during evaluated speaking tasks: associations with negative affect, anxiety expression, memory, and physiological responding. Emotion (Washington, D.C.), 6(3), 356–366. doi:10.1037/1528-3542.6.3.356
Ehring, T., Fischer, S., Schnulle, J., Bösterling, A., & Tuschen-Caffier, B. (2008). Characteristics of emotion regulation in recovered depressed versus never depressed individuals. Personality and Individual Differences, 44, 1574–1584.
Ehring, T., Tuschen-Caffier, B., Schnülle, J., Fischer, S., & Gross, J. J. (2010). Emotion regulation and vulnerability to depression: spontaneous versus instructed use of emotion suppression and reappraisal. Emotion (Washington, D.C.), 10(4), 563–72. doi:10.1037/a0019010
Eisner, L. R., Johnson, S. L., & Carver, C. S. (2009). Positive affect regulation in anxiety disorders. Journal of Anxiety Disorders, 23(5), 645–649. doi:10.1016/j.janxdis.2009.02.001
Fabrigar, L. R., Wegener, D. T., MacCallum, R. C., & Strahan, E. J. (1999). Evaluating the use of exploratory factor analysis in psychological research. Psychological Methods, 4(3), 272–299. doi:10.1037//1082-989X.4.3.272
Feldman, G., Hayes, A., Kumar, S., Greeson, J., & Laurenceau, J. P. (2007). Mindfulness and emotion regulation: The development and initial validation of the Cognitive and Affective Mindfulness Scale-Revised (CAMS-R). Journal of Psychopathology and Behavioral Assessment, 29(3), 177-190.
Feldman, G., Joormann, J., & Johnson, S. (2008). Responses to positive affect: A self-report measure of rumination and dampening. Cognitive Therapy and Research, 32(4), 507–525. doi:10.1007/s10608-006-9083-0.Responses
Field, A. (2009). Discovering Statistics Using SPSS (3rd ed.). London: Sage Publications.
Field, A., Miles, J., & Field., Z. (2012). Discovering Statistics Using R. London: Sage Publications.
Folkman, S. (2008). The case for positive emotions in the stress process. Anxiety, Stress, and Coping, 21(1), 3–14. doi:10.1080/10615800701740457
Folkman, S., & Moskowitz, J. T. (2000). Stress, Positive Emotion, and Coping. Current Directions in Psychological Science, 9(4), 115–118. doi:10.1111/1467-8721.00073
Fox, J., (2010). polycor: Polychoric and Polyserial Correlations. R package version 0.7-8. http://CRAN.R-project.org/package=polycor
Fredrickson, B. (1998). What good are positive emotions? Review of General Psychology, 2(3), 300–319. doi:10.1037/1089-2680.2.3.300
Fredrickson, B. (2001). The role of positive emotions in positive psychology: The broaden-and-build theory of positive emotions. The American Psychologist, 56(3), 218–226. Retrieved from http://www.ncbi.nlm.nih.gov/pmc/articles/PMC3122271/

Page | 152
Fredrickson, B. (2008). Handbook of Emotions. in M. Lewis, M. Haviland-Jones, Jeannette, & L. Feldman Barrett, Eds. (3rd ed., Vol. 24). New York: The Guildford Press. doi:10.2307/2076468
Fredrickson, B., & Branigan, C. (2005). Positive emotions broaden the scope of attention and thought-action repertoires. Cognition & Emotion, 19(3), 313–332. doi:10.1080/02699930441000238
Fredrickson, B., Cohn, M. A, Coffey, K. A, Pek, J., & Finkel, S. M. (2008). Open Hearts Build Lives: Positive Emotions, Induced Through Loving-Kindness Meditation, Build Consequential Personal Resources. Journal of Personality and Social Psychology, 95(5), 1045–1062. doi:10.1037/a0013262.Open
Fredrickson, B., & Levenson, R. W. (1998). Positive Emotions Speed Recovery from the Cardiovascular Sequelae of Negative Emotions. Cognition & Emotion, 12(2), 191–220. doi:10.1080/026999398379718.Positive
Fredrickson, B., Mancuso, R. A, Branigan, C., & Tugade, M. M. (2000). The Undoing Effect of Positive Emotions. Motivation and Emotion, 24(4), 237–258. Retrieved from http://www.pubmedcentral.nih.gov/articlerender.fcgi?artid=3128334&tool=pmcentrez&rendertype=abstract
Frijda, N. H. (1988). The laws of emotion. American Psychologist, 43(5), 349–358. doi:10.1037//0003-066X.43.5.349
Frijda, N. H., Kuipers, P., & ter Schure, E. (1989). Relations among emotion, appraisal, and emotional action readiness. Journal of Personality and Social Psychology, 57(2), 212–228. doi:10.1037/0022-3514.57.2.212
Garber, J., Braafladt, N., & Weiss, B. (1995). Affect regulation in depressed and nondepressed children and young adolescents. Development and Psychopathology, 7(01), 93-115.
Garland, E. L., Fredrickson, B., Kring, A. M., Johnson, D. P., Meyer, P. S., & Penn, D. L. (2010). Upward spirals of positive emotions counter downward spirals of negativity: Insights from the broaden-and-build theory and affective neuroscience on the treatment of emotion dysfunctions and deficits in psychopathology. Clinical Psychology Review, 30(7), 849–864. doi:10.1016/j.cpr.2010.03.002
Garnefski, N., & Kraaij, V. (2006a). Cognitive emotion regulation questionnaire – development of a short 18-item version (CERQ-short). Personality and Individual Differences, 41(6), 1045–1053. doi:10.1016/j.paid.2006.04.010
Garnefski, N., & Kraaij, V. (2006b). Relationships between cognitive emotion regulation strategies and depressive symptoms: A comparative study of five specific samples. Personality and Individual Differences, 40(8), 1659–1669. doi:10.1016/j.paid.2005.12.009
Garnefski, N., Kraaij, V., & Spinhoven, P. (2001). Negative life events, cognitive emotion regulation and emotional problems. Personality and Individual Differences, 30(8), 1311–1327. doi:10.1016/S0191-8869(00)00113-6
Gendolla, G. H. E. (2000). On the impact of mood on behavior: An integrative theory and a review. Review of General Psychology, 4(4), 378–408. doi:10.1037//1089-2680.4.4.378
Gilbert, K. E. (2012). The neglected role of positive emotion in adolescent psychopathology. Clinical

Page | 153
Psychology Review, 32(6), 467–81. doi:10.1016/j.cpr.2012.05.005
Gilbert, K. E., Nolen-Hoeksema, S., & Gruber, J. (2013). Positive Emotion Dysregulation across Mood Disorders: How Amplifying versus Dampening Predicts Emotional Reactivity and Illness Course. Behaviour Research and Therapy, 51(11), 736–741. doi:10.1016/j.brat.2013.08.004
Gilbert, McEwan, K., Mitra, R., Richter, A., Franks, L., Mills, A., … Gale, C. (2009). An Exploration of Different Types of Positive Affect in Students and Patients with a Bipolar Disorder. Clinical Neuropsychiatry, 6(4), 135–143.
Gilbert, P., McEwan, K., Catarino, F., Baião, R., & Palmeira, L. (2014). Fears of happiness and compassion in relationship with depression, alexithymia, and attachment security in a depressed sample. British Journal of Clinical Psychology, 53(2), 228–244. doi:10.1111/bjc.12037
Gilbert, P., McEwan, K., Mitra, R., Franks, L., Richter, A., & Rockliff, H. (2008). Feeling safe and content: A specific affect regulation system? Relationship to depression, anxiety, stress, and self-criticism. The Journal of Positive Psychology, 3(3), 182–191. doi:10.1080/17439760801999461
Gliem, J. A, & Gliem, R. R. (2003). Calculating, Interpreting, and Reporting Cronbach’s Alpha Reliability Coefficient for Likert-Type Scales,. In Midwest Research to Practice Conference in Adult, Continuing, and Community Education (pp. 82–88). doi:10.1109/PROC.1975.9792
Goldberg, D. (2011). The heterogeneity of “major depression.” World Psychiatry, 10(October), 226–228. doi:10.1002/j.2051-5545.2011.tb00061.x
Goldsmith, H. H., & Davidson, R. J. (2004). Disambiguating the components of emotion regulation. Child Development, 75(2), 361–5. doi:10.1111/j.1467-8624.2004.00678.x
Goodwin, G. M. (2002). Hypomania : what’s in a name ? British Journal of Psychiatry, 181, 94–95.
Göritz, A. S. (2007). The induction of mood via the WWW. Motivation and Emotion, 31(1), 35–47. doi:10.1007/s11031-006-9047-4
Göritz, A. S., & Moser, K. (2006). Web-based mood induction. Cognition & Emotion, 20(6), 887–896. doi:10.1080/02699930500405386
Gorman, J. M., & Sloan, R. P. (2000). Heart rate variability in depressive and anxiety disorders. American Heart Journal, 140(4), S77–S83. doi:10.1067/mhj.2000.109981
Gotlib, I., & Joormann, J. (2010). Cognition and depression: current status and future directions. Annual Review of Clinical Psychology, 27(6), 285–312. doi:10.1146/annurev.clinpsy.121208.131305.Cognition
Granello, D. H., & Wheaton, J. E. (2004). Online Data Collection: Strategies for Research. Journal of Counseling and Development, 82(4), 387–394. Retrieved from http://imet.csus.edu/imet9/250/docs/Online_Survey.pdf
Gratz, K. L., & Roemer, L. (2004). Multidimensional Assessment of Emotion Regulation and Dysregulation: Development, Factor Structure, and Initial Validation of the Difficulties in Emotion Regulation Scale. Journal of Psychopathology and Behavioral Assessment, 26(1), 41–54. doi:10.1023/B:JOBA.0000007455.08539.94
Gray, J. A. (1990). Brain Systems that Mediate both Emotion and Cognition. Cognition & Emotion,

Page | 154
4(3), 269–288. doi:10.1080/02699939008410799
Green, M. J., Cahill, C. M., & Malhi, G. S. (2007). The cognitive and neurophysiological basis of emotion dysregulation in bipolar disorder. Journal of Affective Disorders, 103(1-3), 29–42. doi:10.1016/j.jad.2007.01.024
Gross, J. J. (1998a). Antecedent- and response-focused emotion regulation: divergent consequences for experience, expression, and physiology. Journal of Personality and Social Psychology, 74(1), 224–37. Retrieved from http://www.ncbi.nlm.nih.gov/pubmed/9457784
Gross, J. J. (1998b). The Emerging Field of Emotion Regulation : An Integrative Review. Review of General Psychology, 2(3), 271–299.
Gross, J. J. (2002). Emotion regulation: Affective, cognitive, and social consequences. Psychophysiology, 39, 281–291. doi:10.1017.S0048577201393198
Gross, J. J., & Barrett, L. F. (2011). Emotion Generation and Emotion Regulation: One or Two Depends on Your Point of View. Emotion Review, 3(1), 8–16. doi:10.1177/1754073910380974
Gross, J. J., & John, O. P. (2003). Individual differences in two emotion regulation processes: Implications for affect, relationships, and well-being. Journal of Personality and Social Psychology, 85(2), 348–362. doi:10.1037/0022-3514.85.2.348
Gross, J. J., & Levenson, R. W. (1995). Emotion elicitation using films. Cognition & Emotion, 9(1), 87–108. doi:10.1080/02699939508408966
Gross, J. J., & Thompson, R. A. (2009). Gross, J.J., & Thompson, R.A. (2009). Emotion regulation: Conceptual foundations. In J.J. Gross (Ed.), Handbook of emotion regulation. New York: Guilford Press.
Gruber, J. (2011a). A review and synthesis of positive emotion and reward disturbance in bipolar disorder. Clinical Psychology & Psychotherapy, 18(5), 356–65. doi:10.1002/cpp.776
Gruber, J. (2011b). Can Feeling Too Good Be Bad?: Positive Emotion Persistence (PEP) in Bipolar Disorder. Current Directions in Psychological Science, 20(4), 217–221. doi:10.1177/0963721411414632
Gruber, J., Culver, J. L., Johnson, S. L., Nam, J. Y., Keller, K. L., & Ketter, T. A. (2009). Do positive emotions predict symptomatic change in bipolar disorder? Bipolar Disorders, 11(3), 330–6. doi:10.1111/j.1399-5618.2009.00679.x
Gruber, J., Eidelman, P., & Harvey, A. G. (2008). Transdiagnostic emotion regulation processes in bipolar disorder and insomnia. Behaviour Research and Therapy, 46(9), 1096–100. doi:10.1016/j.brat.2008.05.004
Gruber, J., Eidelman, P., Johnson, S. L., Smith, B., & Harvey, A. G. (2011). Hooked on a feeling: rumination about positive and negative emotion in inter-episode bipolar disorder. Journal of Abnormal Psychology, 120(4), 956–61. doi:10.1037/a0023667
Gruber, J., Harvey, A. G., & Gross, J. J. (2012). When trying is not enough: emotion regulation and the effort-success gap in bipolar disorder. Emotion (Washington, D.C.), 12(5), 997–1003. doi:10.1037/a0026822
Gruber, J., Harvey, A. G., & Purcell, A. (2011). What goes up can come down? A preliminary

Page | 155
investigation of emotion reactivity and emotion recovery in bipolar disorder. Journal of Affective Disorders, 133(3), 457–66. doi:10.1016/j.jad.2011.05.009
Gruber, J., Hay, A. C., & Gross, J. J. (2014). Rethinking emotion: cognitive reappraisal is an effective positive and negative emotion regulation strategy in bipolar disorder. Emotion (Washington, D.C.), 14(2), 388–96. doi:10.1037/a0035249
Gruber, J., Johnson, S. L., Oveis, C., & Keltner, D. (2008). Risk for mania and positive emotional responding: too much of a good thing? Emotion (Washington, D.C.), 8(1), 23–33. doi:10.1037/1528-3542.8.1.23
Gruber, J., Kogan, A., Mennin, D., & Murray, G. (2013). Real-World Emotion? An Experience Sampling Approach to Emotion Experience and Regulation in Bipolar I Disorder. Journal of Abnormal Psychology. Retrieved from http://yalepeplab.com/pdf/INPRESS_GruberKoganMenninMurray_ESM.pdf
Gruber, J., Oveis, C., Keltner, D., & Johnson, S. L. (2011). A discrete emotions approach to positive emotion disturbance in depression. Cognition & Emotion, 25(1), 40–52. doi:10.1080/02699931003615984
Gullone, E., & Taffe, J. (2012). The Emotion Regulation Questionnaire for Children and Adolescents (ERQ–CA): A psychometric evaluation. Psychological assessment, 24(2), 409.
Hamilton, N. A., Karoly, P., Gallagher, M., Stevens, N., Karlson, C., & McCurdy, D. (2009). The assessment of emotion regulation in cognitive context: The emotion amplification and reduction scales. Cognitive therapy and research, 33(3), 255-263.
Hay, A. C., Sheppes, G., Gross, J. J., & Gruber, J. (2015). Choosing How to Feel : Emotion Regulation Choice in Bipolar Disorder. Emotion, 15(2), 139–145.
Henry, B., Minassian, A., & Paulus, M. (2010). Heart rate variability in bipolar mania and schizophrenia. Journal of Psychiatric …, 44(3), 1–19. doi:10.1016/j.jpsychires.2009.07.011.Heart
Henry, C., Van den Bulke, D., Bellivier, F., Roy, I., Swendsen, J., M’Baïlara, K., … Leboyer, M. (2008). Affective lability and affect intensity as core dimensions of bipolar disorders during euthymic period. Psychiatry Research, 159(1-2), 1–6. doi:10.1016/j.psychres.2005.11.016
Henry, J. D., & Crawford, J. R. (2005). The short-form version of the Depression Anxiety Stress Scales (DASS-21): construct validity and normative data in a large non-clinical sample. The British Journal of Clinical Psychology / the British Psychological Society, 44(Pt 2), 227–39. doi:10.1348/014466505X29657
Ho, N., & Sommers, M. (2013). Anhedonia: A Concept Analysis. Archives of Psychiatric Nursing, 27(3), 121–129. doi:10.1016/j.biotechadv.2011.08.021.Secreted
Hoe, S. L. (2008). Issues and procedures in adopting structural equation modeling technique. Journal of applied quantitative methods, 3(1), 76-83.
Hooper, D., Coughlan, J., & Mullen, M. (2008). Structural Equation Modelling : Guidelines for Determining Model Fit Structural equation modelling : guidelines for determining model fit. Electronic Journal of Business Research Methods, 6(1), 53–60.
Hudson, M. R., Harding, K. A., & Mezulis, A. (2015). Dampening and brooding jointly link

Page | 156
temperament with depressive symptoms: A prospective study. Personality and Individual Differences, 83, 249–254. doi:10.1016/j.paid.2015.04.025
Hughes, J. W., & Stoney, C. M. (2000). Depressed mood is related to high-frequency heart rate variability during stressors. Psychosomatic Medicine, 62(6), 796–803. doi:0033-3174/00/6206-0796
Isen, A. M. (2001). An Influence of Positive Affect on Decision Making in Complex Situations: Theoretical Issues With Practical Implications. Journal of Consumer Psychology, 11(2), 75–85. doi:10.1207/S15327663JCP1102_01
Isen, A. M. (2008). Some Ways in Which Positive Affect Influences Decision Making and Problem Soliving. In Lewis, M., Haviland-Jones, J., & Feldman Barrett, L., (Eds.), Handbook of emotions (3rd ed., pp. 548–573). London: The Guilford Press. doi:10.2307/2076468
Isen, A. M., Daubman, K. A., & Nowicki, G. P. (1987). Positive affect facilitates creative problem solving. Journal of Personality and Social Psychology, 52(6), 1122–1131. doi:10.1037/0022-3514.52.6.1122
Isen, A. M., & Gorgoglione, J. (1983). Some Specific Effects of Four Affect-Induction Procedures. Personality and Social Psychology Bulletin, 9(1), 136–143. doi:0803973233
Izard, C. E. (1992). Basic emotions, relations among emotions, and emotion-cognition relations. Psychological Review, 99(3), 561–565. doi:10.1037//0033-295X.99.3.561
John, O., & Gross, J. J. (2004). Healthy and Unhealthy Emotion Regulation: Personality Processes, Individual Differences, and Life Span Development. Journal of Personality, 72(6), 1301–1334. Retrieved from http://www.peetransito.com/pdf/healthyemotionregulation.pdf
Johnson, S., McKenzie, G., & McMurrich, S. (2008). Ruminative responses to negative and positive affect among students diagnosed with bipolar disorder and major depressive disorder. Cognitive Therapy and Research, 32(5), 702–713. doi:10.1007/s10608-007-9158-6.Ruminative
Johnson, S., Turner, R., & Iwata, N. (2003). BIS/BAS Levels and Psychiatric Disorder: An Epidemiological Study. Journal of Psychopathology and Behavioral Assessment, 25(1), 25–36. doi:10.1023/A
Johnstone, T., van Reekum, C. M., Urry, H. L., Kalin, N. H., & Davidson, R. J. (2007). Failure to regulate: counterproductive recruitment of top-down prefrontal-subcortical circuitry in major depression. The Journal of Neuroscience : The Official Journal of the Society for Neuroscience, 27(33), 8877–84. doi:10.1523/JNEUROSCI.2063-07.2007
Joormann, J., Cooney, R. E., Henry, M. L., & Gotlib, I. H. (2012). Neural correlates of automatic mood regulation in girls at high risk for depression. Journal of Abnormal Psychology, 121(1), 61–72. doi:10.1037/a0025294
Joseph, S., & Wood, A. (2010). Assessment of positive functioning in clinical psychology: Theoretical and practical issues. Clinical Psychology Review, 30(7), 830–838. doi:10.1016/j.cpr.2010.01.002
Kang, Y., & Gruber, J. (2013). Harnessing happiness? Uncontrollable positive emotion in bipolar disorder, major depression, and healthy adults. Emotion (Washington, D.C.), 13(2), 290–301. doi:10.1037/a0030780

Page | 157
Kappas, A. (2011). Emotion and Regulation are One! Emotion Review, 3(1), 17–25. doi:10.1177/1754073910380971
Kasch, K. L., Rottenberg, J., Arnow, B. a., & Gotlib, I. H. (2002). Behavioral activation and inhibition systems and the severity and course of depression. Journal of Abnormal Psychology, 111(4), 589–597. doi:10.1037//0021-843X.111.4.589
Kashdan, T. B., Biswas-Diener, R., & King, L. A. (2008). Reconsidering happiness: the costs of distinguishing between hedonics and eudaimonia. The Journal of Positive Psychology, 3(4), 219–233. doi:10.1080/17439760802303044
Kashdan, T. B., & Breen, W. E. (2008). Social Anxiety and Positive Emotions : A Prospective Examination of a Self-Regulatory Model With Tendencies to Suppress or Express Emotions as a Moderating Variable. Behavior Therapy, 39, 1–12.
Kashdan, T. B., Young, K. C., & Machell, K. A. (2015). Positive emotion regulation: addressing two myths. Current Opinion in Psychology, 3(2), 117–121. doi:10.1016/j.copsyc.2014.12.012
Kemp, A. H., Quintana, D. S., Gray, M. A., Felmingham, K. L., Brown, K., & Gatt, J. M. (2010). Impact of Depression and Antidepressant Treatment on Heart Rate Variability: A Review and Meta-Analysis. Biological Psychiatry, 67(11), 1067–1074. doi:10.1016/j.biopsych.2009.12.012
Kenny, D. A., Kashy, D. A., & Cook, W. L. (2006). Dyadic data analysis. London: Guilford Press. p105.
Kim, S.H. (2012). ppcor: Partial and Semi-partial (Part) correlation. R package version 1.0. http://CRAN.R-project.org/package=ppcor
Kok, B. E., & Fredrickson, B. (2010). Upward spirals of the heart: Autonomic flexibility, as indexed by vagal tone, reciprocally and prospectively predicts positive emotions and social connectedness. Biological Psychology, 85(3), 432–436. doi:10.1016/j.biopsycho.2010.09.005
Koole, S. L. (2009). The psychology of emotion regulation: An integrative review. Cognition & Emotion, 23(1), 4–41. doi:10.1080/02699930802619031
Koole, S. L., van Dillen, L. F., & Sheppes, G. (2010). The self-regulation of emotion. In K. D. Vohs & R. F. Baumeister (Eds.), Handbook of Self-Regulation. New York: Guilford Press.
Kraaij, V., Pruymboom, E., & Garnefski, N. (2002). Cognitive coping and depressive symptoms in the elderly: a longitudinal study. Aging & Mental Health, 6(3), 275–281. doi:10.1080/13607860220142387
Kraut, R., Olson, J., Banaji, M., Bruckman, A., Cohen, J., & Couper, M. (2004). Psychological research online: report of Board of Scientific Affairs’ Advisory Group on the Conduct of Research on the Internet. The American Psychologist, 59(2), 105–117. doi:10.1037/0003-066X.59.2.105
Kwapil, T. R., Miller, M. B., Zinser, M. C., Chapman, L. J., Chapman, J., & Eckblad, M. (2000). A longitudinal study of high scorers on the Hypomanic Personality Scale. Journal of Abnormal Psychology, 109(2), 222–226. doi:10.1037//0021-843X.109.2.222
Lane, R. D., McRae, K., Reiman, E. M., Chen, K., Ahern, G. L., & Thayer, J. F. (2009). Neural correlates of heart rate variability during emotion. NeuroImage, 44(1), 213–22. doi:10.1016/j.neuroimage.2008.07.056
Larsen, J. K., Vermulst, A. A., Geenen, R., van Middendorp, H., English, T., Gross, J. J., … Engels, R. C.
Page | 158
M. E. (2012). Emotion Regulation in Adolescence: A Prospective Study of Expressive Suppression and Depressive Symptoms. The Journal of Early Adolescence, 33(2), 184–200. doi:10.1177/0272431611432712
Lehofer, M., Moser, M., Hoehn-Saric, R., McLeod, D., Liebmann, P., Drnovsek, B., … Zapotoczky, H. G. (1997). Major depression and cardiac autonomic control. Biological Psychiatry, 42(10), 914–919. doi:10.1016/S0006-3223(96)00494-5
Licht, C., de Geus, E. J., Zitman, F. G., Hoogendijk, W. J., van Dyck, R., & Penninx, B. W. (2008). Association between major depressive disorder and heart rate variability in the Netherlands Study of Depression and Anxiety (NESDA). Archives of …, 65(12), 1358–1367. Retrieved from http://archneur.jamanetwork.com/article.aspx?articleid=482917
Liverant, G. I., Brown, T. A., Barlow, D. H., & Roemer, L. (2008). Emotion regulation in unipolar depression: The effects of acceptance and suppression of subjective emotional experience on the intensity and duration of sadness and negative affect. Behaviour Research and Therapy, 46(11), 1201–1209. doi:10.1016/j.brat.2008.08.001
Lovibond, P. F., & Lovibond, S. H. (1995). The structure of negative emotional states: Comparison of the Depression Anxiety Stress Scales (DASS) with the Beck Depression and Anxiety Inventories. Behaviour Research and Therapy, 33(3), 335–343. Retrieved from http://www.sciencedirect.com/science/article/pii/000579679400075U
Lovibond, S. H., & Lovibond, P. F. (1995). Manual for the Depression Anxiety Stress Scales (2nd ed.). Sydney: Psychology Foundation.
M’bailara, K., Demotes-Mainard, J., Swendsen, J., Mathieu, F., Leboyer, M., & Henry, C. (2009). Emotional hyper-reactivity in normothymic bipolar patients. Bipolar Disorders, 11(1), 63–9. doi:10.1111/j.1399-5618.2008.00656.x
Mansell, W., Morrison, A. P., Reid, G., Lowens, I., & Tai, S. (2007). The Interpretation of, and Responses to, Changes in Internal States: An Integrative Cognitive Model of Mood Swings and Bipolar Disorders. Behavioural and Cognitive Psychotherapy, 35(05), 515–539. doi:10.1017/S1352465807003827
Markarian, S. A., Pickett, S. M., Deveson, D. F., & Kanona, B. B. (2013). A model of BIS/BAS sensitivity, emotion regulation difficulties, and depression, anxiety, and stress symptoms in relation to sleep quality. Psychiatry Research, 210(1), 281–286. doi:10.1016/j.psychres.2013.06.004
Matzat, U., & Snijders, C. (2010). Does the online collection of ego-centered network data reduce data quality? An experimental comparison. Social Networks, 32, 105–111. doi:10.1016/j.socnet.2009.08.002
Mauss, I., & Robinson, M. D. (2009). Measures of emotion: A review. Cognition & Emotion, 23(2), 209–237. doi:10.1080/02699930802204677.Measures
MacDermott, S. T., Gullone, E., Allen, J. S., King, N. J., & Tonge, B. (2010). The emotion regulation index for children and adolescents (ERICA): a psychometric investigation. Journal of Psychopathology and Behavioral Assessment, 32(3), 301-314.
McFarland, B. R., & Klein, D. N. (2009). Emotional reactivity in depression: diminished responsiveness to anticipated reward but not to anticipated punishment or to nonreward or avoidance.

Page | 159
Depression and Anxiety, 26(2), 117–22. doi:10.1002/da.20513
McFarland, B. R., Shankman, S. A, Tenke, C. E., Bruder, G. E., & Klein, D. N. (2006). Behavioral activation system deficits predict the six-month course of depression. Journal of Affective Disorders, 91(2-3), 229–34. doi:10.1016/j.jad.2006.01.012
McLaughlin, K. A, Hatzenbuehler, M. L., Mennin, D. S., & Nolen-Hoeksema, S. (2011). Emotion dysregulation and adolescent psychopathology: a prospective study. Behaviour Research and Therapy, 49(9), 544–54. doi:10.1016/j.brat.2011.06.003
McMakin, D. L., Olino, T. M., Porta, G., Dietz, L. J., Emslie, G., Clarke, G., … Brent, D. A. (2012). Anhedonia predicts poorer recovery among youth with selective serotonin reuptake inhibitor treatment-resistant depression. Journal of the American Academy of Child and Adolescent Psychiatry, 51(4), 404–11. doi:10.1016/j.jaac.2012.01.011
Meads, D. M., & Bentall, R. P. (2008). Rasch analysis and item reduction of the hypomanic personality scale. Personality and Individual Differences, 44(8), 1772–1783. doi:10.1016/j.paid.2008.02.009
Meyer, T. D. (2002). The Hypomanic Personality Scale, the Big Five, and their relationship to depression and mania. Personality and Individual Differences, 32(4), 649–660. doi:10.1016/S0191-8869(01)00067-8
Meyer, T. D., & Hautzinger, M. (2003). Screening for bipolar disorders using the Hypomanic Personality Scale. Journal of Affective Disorders, 75(2), 149–154. Retrieved from http://www.sciencedirect.com/science/article/pii/S0165032702000423
Nederhof, A. J. (1985). Methods of coping with social desirability bias: a review. European Journal of Social Psychology, 15(3), 263–280. doi:10.1002/ejsp.2420150303
Neumann, A., van Lier, P. A. C., Gratz, K. L., & Koot, H. M. (2010). Multidimensional Assessment of Emotion Regulation Difficulties in Adolescents Using the Difficulties in Emotion Regulation Scale. Assessment, 17(1), 138–149. doi:10.1177/1073191109349579
Nezlek, J. B., & Kuppens, P. (2008). Regulating positive and negative emotions in daily life. Journal of Personality, 76(3), 561–80. doi:10.1111/j.1467-6494.2008.00496.x
Niven, K., Totterdell, P., Stride, C. B., & Holman, D. (2011). Emotion Regulation of Others and Self (EROS): The development and validation of a new individual difference measure. Current Psychology, 30(1), 53-73.
Nolen-Hoeksema, S. (1991). Responses to depression and their effects on the duration of depressive episodes. Journal of Abnormal Psychology, 100(4), 569–582. doi:10.1037/0021-843X.100.4.569
Nolen-Hoeksema, S., Wisco, B. E., & Lyubomirsky, S. (2008). Rethinking Rumination. Perspectives on Psychological Science, 3(5), 400–424. doi:10.1111/j.1745-6924.2008.00088.x
Norman, G. (2010). Likert scales, levels of measurement and the “laws” of statistics. Advances in Health Sciences Education, 15(5), 625–632. doi:10.1007/s10459-010-9222-y
Ochsner, K. N., Silvers, J. A, & Buhle, J. T. (2012). Functional imaging studies of emotion regulation: a synthetic review and evolving model of the cognitive control of emotion. Annals of the New York Academy of Sciences, 1251, E1–24. doi:10.1111/j.1749-6632.2012.06751.x
Opitz, P. C., Cavanagh, S. R., & Urry, H. L. (2015). Uninstructed emotion regulation choice in four

Page | 160
studies of cognitive reappraisal. Personality and Individual Differences, 86, 455–464. doi:10.1016/j.paid.2015.06.048
Oveis, C., Cohen, A. B., Gruber, J., Shiota, M. N., Haidt, J., & Keltner, D. (2009). Resting respiratory sinus arrhythmia is associated with tonic positive emotionality. Emotion (Washington, D.C.), 9(2), 265–270. doi:10.1037/a0015383
Patel, V., Flisher, A. J., Hetrick, S., & McGorry, P. (2007). Mental health of young people: a global public-health challenge. The Lancet, 369(9569), 1302–1313. doi:10.1016/S0140-6736(07)60368-7
Penza-Clyve, S., & Zeman, J. (2002). Initial validation of the emotion expression scale for children (EESC). Journal of Clinical Child and Adolescent Psychology, 31(4), 540-547.
Pettit, F. A. (1999). Exploring the use of the World Wide Web as a psychology data collection tool. Computers in Human Behavior, 15(1), 67–71. doi:10.1016/S0747-5632(98)00033-8
Pettit, F. A. (2002). A comparison of World-Wide Web and paper-and-pencil personality questionnaires. Behavior Research Methods, Instruments, & Computers : A Journal of the Psychonomic Society, Inc, 34(1), 50–54. doi:10.3758/BF03195423
Phillips, M., Ladouceur, C., & Drevets, W. (2008). A neural model of voluntary and automatic emotion regulation: implications for understanding the pathophysiology and neurodevelopment of bipolar disorder. Molecular Psychiatry, 13(9), 829–857. doi:10.1038/mp.2008.65.A
Posner, J., Russell, J. A., & Peterson, B. S. (2005). The circumplex model of affect: an integrative approach to affective neuroscience, cognitive development, and psychopathology. Development and Psychopathology, 17(3), 715–734. doi:10.1017/S0954579405050340
Quoidbach, J., Berry, E. V., Hansenne, M., & Mikolajczak, M. (2010). Positive emotion regulation and well-being: Comparing the impact of eight savoring and dampening strategies. Personality and Individual Differences, 49(5), 368–373. doi:10.1016/j.paid.2010.03.048
R Core Team (2014). R: A language and environment for statistical computing. R Foundation for Statistical Computing, Vienna, Austria. URL http://www.R-project.org/.
R Core Team (2014). foreign: Read Data Stored by Minitab, S, SAS, SPSS, Stata, Systat, Weka, dBase,.... R package version 0.8-61. http://CRAN.R-project.org/package=foreign
Raes, F., Daems, K., Feldman, G. C., Johnson, S. L., & Van Gucht, D. (2009). A psychometric evaluation of the Dutch version of The Responses to Positive Affect Questionnaire. Psychologica Belgica, 49(4), 293–310. doi:10.5334/pb-49-4-293
Raes, F., Smets, J., Nelis, S., & Schoofs, H. (2012). Dampening of positive affect prospectively predicts depressive symptoms in non-clinical samples. Cognition & Emotion, 26(1), 75–82. doi:10.1080/02699931.2011.555474
Raiche, G. (2010). nFactors: an R package for parallel analysis and non graphical solutions to the Cattell scree test. R package version 2.3.3.
Rawlings, D., Barrantes-Vidal, N., Claridge, G., McCreery, C., & Galanos, G. (2000). A factor analytic study of the Hypomanic Personality Scale in British, Spanish and Australian samples. Personality and Individual Differences, 28(1), 73–84. doi:10.1016/S0191-8869(99)00081-1

Page | 161
Reips, U.-D. (2002). Standards for Internet-Based Experimenting. Experimental Psychology (formerly Zeitschrift Für Experimentelle Psychologie), 49(4), 243–256. doi:10.1027//1618-3169.49.4.243
Revelle, W. (2014). psych: Procedures for Personality and Psychological Research, Northwestern University, Evanston, Illinois, USA, http://CRAN.R-project.org/package=psych Version = 1.4.8.
Rhodes, S. D., Bowie, D. A., & Hergenrather, K. C. (2003). Collecting behavioural data using the world wide web: considerations for researchers. Journal of Epidemiology and Community Health, 57(1), 68–73. doi:10.1136/jech.57.1.68
Rieffe, C., & De Rooij, M. (2012). The longitudinal relationship between emotion awareness and internalising symptoms during late childhood. European Child & Adolescent Psychiatry, 21(6), 349–56. doi:10.1007/s00787-012-0267-8
Rosseel, Y (2012). lavaan: An R Package for Structural Equation Modeling. Journal of Statistical Software, 48(2), 1-36.URL http://www.jstatsoft.org/v48/i02/.
Rottenberg, J. (2005). Mood and Emotion in Major Depression. Current Directions in Psychological Science, 14(3), 167–170. doi:10.1111/j.0963-7214.2005.00354.x
Rottenberg, J. (2007). Cardiac vagal control in depression: A critical analysis. Biological Psychology, 74(2), 200–211. doi:10.1016/j.biopsycho.2005.08.010
Rottenberg, J., Clift, A., Bolden, S., & Salomon, K. (2007). RSA fluctuation in major depressive disorder. Psychophysiology, 44(3), 450–458. doi:10.1111/j.1469-8986.2007.00509.x
Rottenberg, J., Gross, J. J., & Gotlib, I. H. (2005). Emotion context insensitivity in major depressive disorder. Journal of Abnormal Psychology, 114(4), 627–39. doi:10.1037/0021-843X.114.4.627
Rottenberg, J., Kasch, K., Gross, J., & Gotlib, I. (2002). Sadness and Amusement Reactivity Differentially Predict Concurrent and Prospective Functioning in Major Depressive Disorder. Emotion, 2(2), 135–146. Retrieved from http://www.stanford.edu/group/mood/gotlib_pdfs/rottenberg_gotlib_2002.pdf
Rottenberg, J., Salomon, K., Gross, J. J., & Gotlib, I. H. (2005). Vagal withdrawal to a sad film predicts subsequent recovery from depression. Psychophysiology, 42(3), 277–281. doi:10.1111/j.1469-8986.2005.00289.x
Rottenberg, J., Wilhelm, F. H., Gross, J. J., & Gotlib, I. H. (2002). Respiratory sinus arrhythmia as a predictor of outcome in major depressive disorder. Journal of Affective Disorders, 71(1-3), 265–272. doi:10.1016/S0165-0327(01)00406-2
Russell, J. A, & Barrett, L. F. (1999). Core affect, prototypical emotional episodes, and other things called emotion: dissecting the elephant. Journal of Personality and Social Psychology, 76(5), 805–819. doi:10.1037/0022-3514.76.5.805
Russell, J. A. (2003). Core affect and the psychological construction of emotion. Psychological Review, 110(1), 145–172. doi:10.1037/0033-295X.110.1.145
Schalet, B. D., Durbin, C. E., & Revelle, W. (2011). Multidimensional structure of the Hypomanic Personality Scale. Psychological Assessment, 23(2), 504–522. doi:10.1037/a0022301
Sheppes, G., & Gross, J. J. (2011). Is Timing Everything? Temporal Considerations in Emotion Regulation. Personality and Social Psychology Review, 15(4), 319–331.

Page | 162
doi:10.1177/1088868310395778
Sheppes, G., & Gross, J. J. (2012). Emotion regulation effectiveness: what works when. In Handbook of Psychology, (pp. 391–406). Retrieved from http://scholar.google.com/scholar?hl=en&btnG=Search&q=intitle:Emotion+regulation+effectiveness:+What+works+when#4
Sheppes, G., Scheibe, S., Suri, G., Radu, P., Blechert, J., & Gross, J. J. (2014). Emotion regulation choice: A conceptual framework and supporting evidence. Journal of Experimental Psychology. General, 143(1), 163–81. doi:10.1037/a0030831
Sherdell, L., Waugh, Christian, E., & Gotlib, I. H. (2012). Anticipatory Pleasure Predicts Motivation for Reward in Major Depression. Journal of Abnormal Psychology, 121(1), 51–60. doi:10.1037/a0024945.Anticipatory
Shiota, M. N., Keltner, D., & John, O. P. (2006). Positive emotion dispositions differentially associated with Big Five personality and attachment style. The Journal of Positive Psychology, 1(2), 61-71.
Sohn, C. (2001). Validity of Web-based Survey in IS Related Research as an Alternative to Mail Survey. In AMCIS proceedings, Paper 318.
Stanton, A. L., Kirk, S. B., Cameron, C. L., & Danoff-Burg, S. (2000). Coping through emotional approach: Scale construction and validation. Journal of personality and social psychology, 78(6), 1150.
Stanton, K., & Watson, D. (2014). Replicable Facets of Positive Emotionality and Their Relations to Psychopathology. Assessment, 1–16. doi:10.1177/1073191114552471
Tamir, M. (2011). The Maturing Field of Emotion Regulation. Emotion Review, 3(1), 3–7. doi:10.1177/1754073910388685
Tamir, M., & Ford, B. Q. (2012a). Should people pursue feelings that feel good or feelings that do good? Emotional preferences and well-being. Emotion, 12(5), 1061–1070. doi:10.1037/a0027223
Tamir, M., & Ford, B. Q. (2012b). When feeling bad is expected to be good: Emotion regulation and outcome expectancies in social conflicts. Emotion, 12(4), 807–816. doi:10.1037/a0024443
Thayer, J. F., & Brosschot, J. F. (2005). Psychosomatics and psychopathology: Looking up and down from the brain. Psychoneuroendocrinology, 30(10), 1050–1058. doi:10.1016/j.psyneuen.2005.04.014
Thayer, J. F., & Lane, R. D. (2000). A model of neurovisceral integration in ER and dysregulation. Journal of Affective Disorders, 61(201-216), 201–216.
Thayer, J. F., & Lane, R. D. (2009). Claude Bernard and the heart-brain connection: Further elaboration of a model of neurovisceral integration. Neuroscience and Biobehavioral Reviews, 33(2), 81–88. doi:10.1016/j.neubiorev.2008.08.004
Thayer, J. F., Loerbroks, A., & Sternberg, E. M. (2011). Inflammation and cardiorespiratory control: The role of the vagus nerve. Respiratory Physiology and Neurobiology, 178(3), 387–394. doi:10.1016/j.resp.2011.05.016
Thiruchselvam, R., Blechert, J., Sheppes, G., Rydstrom, A., & Gross, J. J. (2011). The temporal

Page | 163
dynamics of emotion regulation: An EEG study of distraction and reappraisal. Biological Psychology, 87(1), 84–92. doi:10.1016/j.biopsycho.2011.02.009
Thomas, J., & Bentall, R. P. (2002). Brief report Hypomanic traits and response styles to depression. British Journal of Clinical Psychology, 41, 309–313.
Todder, D., Bersudsky, Y., & Cohen, H. (2005). Nonlinear analysis of RR interval in euthymic bipolar disorder. Autonomic Neuroscience: Basic and Clinical, 117(2), 127–131. doi:10.1016/j.autneu.2004.11.006
Tolstikova, K., & Chartier, B. (2010). Internet method in bereavement research: comparison of online and offline surveys. Omega, 60(4), 327–349. doi:10.2190/OM.60.4.b
Treadway, M. T., & Zald, D. H. (2011). Reconsidering anhedonia in depression: lessons from translational neuroscience. Neuroscience and Biobehavioral Reviews, 35(3), 537–55. doi:10.1016/j.neubiorev.2010.06.006
Treynor, W., Gonzalez, R., & Nolen-Hoeksema, S. (2003). Rumination reconsidered: A psychometric analysis. Cognitive Therapy and Research, 27(3), 247–259. doi:10.1023/A:1023910315561
Tugade, M. M., & Fredrickson, B. (2006). Regulation of Positive Emotions: Emotion Regulation Strategies that Promote Resilience. Journal of Happiness Studies, 8(3), 311–333. doi:10.1007/s10902-006-9015-4
Verheyen, C., & Goritz, A. S. (2009). Plain texts as an online mood-induction procedure. Social Psychology, 40(1), 6–15. doi:10.1027/1864-9335.40.1.6
Wager, T. D., Phan, K. L., Liberzon, I., & Taylor, S. F. (2003). Valence, gender, and lateralization of functional brain anatomy in emotion: a meta-analysis of findings from neuroimaging. NeuroImage, 19(3), 513–531. doi:10.1016/S1053-8119(03)00078-8
Watson, D., & Clark, L.A. (1995). Testing a Tripartite Model: II. Exploring the Symptom Structure of Anxiety and Depression in Student, Adult, and Patient Samples. Journal of Abnormal Psychology, 104(1), 15–25. Retrieved from http://facstaff.bloomu.edu/jleitzel/classes/sem/Watson1995_01.pdf
Watson, D., Clark, L. A, & Tellegen, A. (1988). Development and validation of brief measures of positive and negative affect: the PANAS scales. Journal of Personality and Social Psychology, 54(6), 1063–70. Retrieved from http://www.ncbi.nlm.nih.gov/pubmed/3397865
Watson, D., & Naragon-Gainey, K. (2010). On the specificity of positive emotional dysfunction in psychopathology: Evidence from the mood and anxiety disorders and schizophrenia/schizotypy. Clinical Psychology Review, 30(7), 839–848. doi:10.1016/j.cpr.2009.11.002
Watson, D., Weber, K., Assenheimer, J. S., Clark, L. A, Strauss, M. E., & McCormick, R. A. (1995). Testing a tripartite model: I. Evaluating the convergent and discriminant validity of anxiety and depression symptom scales. Journal of Abnormal Psychology, 104(1), 3–14. Retrieved from http://www.ncbi.nlm.nih.gov/pubmed/7897050
Webb, T. L., Miles, E., & Sheeran, P. (2012). Dealing with feeling: A meta-analysis of the effectiveness of strategies derived from the process model of emotion regulation. Psychological Bulletin, 138(4), 775–808. doi:10.1037/a0027600

Page | 164
Wegener, D. T., & Petty, R. E. (1994). Mood management across affective states: the hedonic contingency hypothesis. Journal of Personality and Social Psychology, 66(6), 1034–1048. doi:10.1037/0022-3514.66.6.1034
Weiss, N. H., Gratz, K. L., & Lavender, J. M. (2015). Factor Structure and Initial Validation of a Multidimensional Measure of Difficulties in the Regulation of Positive Emotions: The DERS-Positive. Behavior Modification. doi:10.1177/0145445514566504
Werner-Seidler, A., Banks, R., Dunn, B. D., & Moulds, M. L. (2013). An investigation of the relationship between positive affect regulation and depression. Behaviour Research and Therapy, 51(1), 46–56. Retrieved from http://www.sciencedirect.com/science/article/pii/S0005796712001623
Westermann, R., Spies, K., Stahl, G., & Hesse, F. W. (1996). Relative effectiveness and validity of mood induction procedures: a meta-analysis. European Journal of Social Psychology, 26(4), 557-580.
Wirtz, C. M., Radkovsky, A., Ebert, D. D., & Berking, M. (2014). Successful Application of Adaptive Emotion Regulation Skills Predicts the Subsequent Reduction of Depressive Symptom Severity but neither the Reduction of Anxiety nor the Reduction of General Distress during the Treatment of Major Depressive Disorder. PLoS ONE, 9(10), e108288. doi:10.1371/journal.pone.0108288
Wolkenstein, L., Zwick, J. C., Hautzinger, M., & Joormann, J. (2014). Cognitive emotion regulation in euthymic bipolar disorder. Journal of Affective Disorders, 160, 92–97. doi:10.1016/j.jad.2013.12.022
Wood, A. M., & Joseph, S. (2010). The absence of positive psychological (eudemonic) well-being as a risk factor for depression: A ten year cohort study. Journal of Affective Disorders, 122(3), 213–217. doi:10.1016/j.jad.2009.06.032
Wood, A. M., & Tarrier, N. (2010). Positive Clinical Psychology: a new vision and strategy for integrated research and practice. Clinical Psychology Review, 30(7), 819–29. doi:10.1016/j.cpr.2010.06.003
Wood, J. V, Heimpel, S. A, & Michela, J. L. (2003). Savoring versus dampening: self-esteem differences in regulating positive affect. Journal of Personality and Social Psychology, 85(3), 566–580. doi:10.1037/0022-3514.85.3.566
Wood, J. V., Heimpel, S. A., Manwell, L. A., & Whittington, E. J. (2009). This mood is familiar and I don’t deserve to feel better anyway: Mechanisms underlying self-esteem differences in motivation to repair sad moods. Journal of Personality and Social Psychology, 96(2), 363–380. doi:10.1037/a0012881
Wright, K., & Armstrong, A. (2015) The construction of an inventory of responses to positive affective states (IRPAS). Manuscript submitted for publication.
Zeman, J., Cassano, M., Perry-Parrish, C., & Stegall, S. (2006). Emotion regulation in children and adolescents. Journal of Developmental and Behavioral Pediatrics JDBP, 27(2), 155–168. Retrieved from http://doi.apa.org/getdoi.cfm?doi=10.1037/a0026299
Zeman, J., Shipman, K., & Penza-Clyve, S. (2001). Development and initial validation of the Children's Sadness Management Scale. Journal of Nonverbal Behavior, 25(3), 187-205.

Page | 165
Appendix 1: Cognitive Emotion Regulation Questionnaire
Reference:
Garnefski, N & Kraaij, V (2006) Cognitive emotion regulation questionnaire – development of a short 18-item version (CERQ-short). Personality and Individual Differences 41(6), 1045-1053.
Instructions and Items
How do you cope with events?
Everyone gets confronted with negative or unpleasant events now and then and everyone responds to them in his
or her own way. By the following questions you are asked to indicate what you generally think, when you
experience negative or unpleasant events.
(almost)
never
Some-
times
Regularly often (almost)
always
1. I think that I have to accept that this has happened 1 2 3 4 5
2. I often think about how I feel about what I have
experienced
1 2 3 4 5
3. I think I can learn something from the situation 1 2 3 4 5
4. I feel that I am the one who is responsible for what has
happened
1 2 3 4 5
5. I think that I have to accept the situation 1 2 3 4 5
6. I am preoccupied with what I think and feel about what I
have experienced
1 2 3 4 5
7. I think of pleasant things that have nothing to do with it 1 2 3 4 5
8. I think that I can become a stronger person as a result of
what has happened
1 2 3 4 5
9. I keep thinking about how terrible it is what I have
experienced
1 2 3 4 5
10. I feel that others are responsible for what has happened 1 2 3 4 5
11. I think of something nice instead of what has happened 1 2 3 4 5
12. I think about how to change the situation 1 2 3 4 5
13. I think that it hasn’t been too bad compared to other things 1 2 3 4 5
14. I think that basically the cause must lie within myself 1 2 3 4 5
15. I think about a plan of what I can do best 1 2 3 4 5
16. I tell myself that there are worse things in life 1 2 3 4 5
17. I continually think how horrible the situation has been 1 2 3 4 5
18. I feel that basically the cause lies with others 1 2 3 4 5

Page | 166
Appendix 2: Depression, Anxiety and Stress Scale (DASS)
Reference
Lovibond, S.H. & Lovibond, P.F. (1995). Manual for the Depression Anxiety Stress Scales. (2nd. Ed.) Sydney: Psychology Foundation.
Instructions and Items
Please read each statement and circle a number 0, 1, 2 or 3 which indicates how much the statement applied to you over the past week. There are no right or wrong answers. Do not spend too much time on any statement.
The rating scale is as follows: 0 Did not apply to me at all 1 Applied to me to some degree, or some of the time 2 Applied to me to a considerable degree, or a good part of time 3 Applied to me very much, or most of the time
1 I found it hard to wind down 0 1 2 3
2 I was aware of dryness of my mouth 0 1 2 3 3 I couldn't seem to experience any positive feeling at all 0 1 2 3
4 I experienced breathing difficulty (eg, excessively rapid breathing, breathlessness in the absence of physical exertion)
0 1 2 3
5 I found it difficult to work up the initiative to do things 0 1 2 3
6 I tended to over-react to situations 0 1 2 3
7 I experienced trembling (eg, in the hands) 0 1 2 3
8 I felt that I was using a lot of nervous energy 0 1 2 3
9 I was worried about situations in which I might panic and make a fool of myself
0 1 2 3
10 I felt that I had nothing to look forward to 0 1 2 3
11 I found myself getting agitated 0 1 2 3
12 I found it difficult to relax 0 1 2 3
13 I felt down-hearted and blue 0 1 2 3
14 I was intolerant of anything that kept me from getting on with what I was doing
0 1 2 3
15 I felt I was close to panic 0 1 2 3
16 I was unable to become enthusiastic about anything 0 1 2 3
17 I felt I wasn't worth much as a person 0 1 2 3
18 I felt that I was rather touchy 0 1 2 3 19 I was aware of the action of my heart in the absence of physical
exertion (e.g., sense of heart rate increase, heart missing a beat) 0 1 2 3
20 I felt scared without any good reason 0 1 2 3 21 I felt that life was meaningless 0 1 2 3

Page | 167
Appendix 3: Difficulties in Emotion Regulation Scale (DERS)
Reference
Gratz, K & Roemer, L (2004) Multidimensional Assessment of Emotion Regulation and Dysregulation: Development, Factor Structure, and Initial Validation of the Difficulties in Emotion Regulation Scale. Journal of Psychopathology and Behavioral Assessment 26(1), 41-54.
Instructions and items
Please indicate how often the following statements apply to you by writing the appropriate number from the scale below on the line beside each item.
1---------------------------2---------------------------3---------------------------4---------------------------5
almost never sometimes about half the time most of the time almost always
(0-10%) (11-35%) (36-65%) (66-90%) (91-100%)
_____ 1) I am clear about my feelings.
_____ 2) I pay attention to how I feel.
_____ 3) I experience my emotions as overwhelming and out of control.
_____ 4) I have no idea how I am feeling.
_____ 5) I have difficulty making sense out of my feelings.
_____ 6) I am attentive to my feelings.
_____ 7) I know exactly how I am feeling.
_____ 8) I care about what I am feeling.
_____ 9) I am confused about how I feel.
_____ 10) When I’m upset, I acknowledge my emotions.
_____ 11) When I’m upset, I become angry with myself for feeling that way.
_____ 12) When I’m upset, I become embarrassed for feeling that way.
_____ 13) When I’m upset, I have difficulty getting work done.
_____ 14) When I’m upset, I become out of control.
_____ 15) When I’m upset, I believe that I will remain that way for a long time.
_____ 16) When I’m upset, I believe that I will end up feeling very depressed.
_____ 17) When I’m upset, I believe that my feelings are valid and important.
_____ 18) When I’m upset, I have difficulty focusing on other things.
_____ 19) When I’m upset, I feel out of control.

Page | 168
1---------------------------2---------------------------3---------------------------4---------------------------5
almost never sometimes about half the time most of the time almost always
(0-10%) (11-35%) (36-65%) (66-90%) (91-100%)
_____ 20) When I’m upset, I can still get things done.
_____ 21) When I’m upset, I feel ashamed at myself for feeling that way.
_____ 22) When I’m upset, I know that I can find a way to eventually feel better.
_____ 23) When I’m upset, I feel like I am weak.
_____ 24) When I’m upset, I feel like I can remain in control of my behaviors.
_____ 25) When I’m upset, I feel guilty for feeling that way.
_____ 26) When I’m upset, I have difficulty concentrating.
_____ 27) When I’m upset, I have difficulty controlling my behaviors.
_____ 28) When I’m upset, I believe there is nothing I can do to make myself feel better.
_____ 29) When I’m upset, I become irritated at myself for feeling that way.
_____ 30) When I’m upset, I start to feel very bad about myself.
_____ 31) When I’m upset, I believe that wallowing in it is all I can do.
_____ 32) When I’m upset, I lose control over my behavior.
_____ 33) When I’m upset, I have difficulty thinking about anything else.
_____ 34) When I’m upset I take time to figure out what I’m really feeling.
_____ 35) When I’m upset, it takes me a long time to feel better.
_____ 36) When I’m upset, my emotions feel overwhelming.
SUBSCALE SCORING**:
1. Nonacceptance of emotional responses (NONACCEPT): 11, 12, 21, 23, 25, 29
2. Difficulty engaging in Goal-directed behavior (GOALS): 13, 18, 20R, 26, 33
3. Impulse control difficulties (IMPULSE): 3, 14, 19, 24R, 27, 32
4. Lack of emotional awareness (AWARENESS): 2R, 6R, 8R, 10R, 17R, 34R
5. Limited access to emotion regulation strategies (STRATEGIES): 15, 16, 22R, 28, 30, 31, 35, 36
6. Lack of emotional clarity (CLARITY): 1R, 4, 5, 7R, 9
Total score: sum of all subscales
**”R” indicates reverse scored item

Page | 169
Appendix 4: Emotion Regulation Questionnaire
Gross & John (2003) Individual differences in two emotion regulation processes: Implications for affect, relationships, and well-being. Journal of Personality and Social Psychology 85(2), 348-362. Instructions and Items
We would like to ask you some questions about your emotional life, in particular, how you control (that is, regulate and manage) your emotions. The questions below involve two distinct aspects of your emotional life. One is your emotional experience, or what you feel like inside. The other is your emotional expression, or how you show your emotions in the way you talk, gesture, or behave. Although some of the following questions may seem similar to one another, they differ in important ways. For each item, please answer using the following scale:
1-----------------2------------------3------------------4------------------5------------------6------------------7
strongly neutral strongly
disagree agree
1. ____ When I want to feel more positive emotion (such as joy or amusement), I change what I’m thinking about.
2. ____ I keep my emotions to myself.
3. ____ When I want to feel less negative emotion (such as sadness or anger), I change what I’m thinking about.
4. ____ When I am feeling positive emotions, I am careful not to express them.
5. ____ When I’m faced with a stressful situation, I make myself think about it in a way that helps me stay calm.
6. ____ I control my emotions by not expressing them.
7. ____ When I want to feel more positive emotion, I change the way I’m thinking about the situation.
8. ____ I control my emotions by changing the way I think about the situation I’m in.
9. ____ When I am feeling negative emotions, I make sure not to express them.
10. ____ When I want to feel less negative emotion, I change the way I’m thinking about the situation

Page | 170
Appendix 5: Hypomanic Personality Scale
Eckblad, M., & Chapman, L.J., (1986) Development and validation of a scale for hypomanic personality. Journal of Abnormal Psychology 95(3), 214-222.
Instructions and Items
Please answer whether the following descriptions are true of you or not:
True of you
Not true of you
1. I consider myself to be pretty much an average kind of person. 2. It would make me nervous to play the clown in front of other people. 3. I am frequently so “hyper” that my friends kiddingly ask me what drug I’m taking.
4. I think I would make a good nightclub comedian. 5. Sometimes ideas and insights come to me so fast that I cannot express them all.
6. When with groups of people, I usually prefer to let someone else be the centre of attention.
7. In unfamiliar surroundings, I am often so assertive and sociable that I surprise myself.
8. There are often times when I am so restless that it is impossible for me to sit still.
9. Many people consider me to be amusing but kind of eccentric. 10. When I feel an emotion, I usually feel it with extreme intensity. 11. I am frequently in such high spirits that I can’t concentrate on any one thing for too long.
12. I sometimes have felt that nothing can happen to me until I do what I am meant to do in life.
13. People often come to me when they have a clever idea. 14. I am no more self-aware than the majority of people. 15. Often feel excited and happy for no apparent reason. 16. I can’t imagine that anyone would ever write a book about my life. 17. I am usually in an average sort of mood, not too high and not too low. 18. I often have moods where I feel so energetic and optimistic that I feel I could outperform almost anyone at anything.
19. I have such a wide range of interests that I often don’t know what to do next.
20. There have often been times when I had such an excess of energy that I felt little need to sleep at night.
21. My moods do not seem to fluctuate any more than most people’s do. 22. I very frequently get into moods where I wish I could be everywhere and do everything at once.
23. I expect that someday I will succeed in several different professions. 24. When I feel very excited and happy, I almost always know the reason why.
25. When I go to a gathering where I don’t know anyone, it usually takes me a while to feel comfortable.
26. I think I would make a good actor, because I can play many roles convincingly.
27. I like to have others think of me as a normal kind of person.
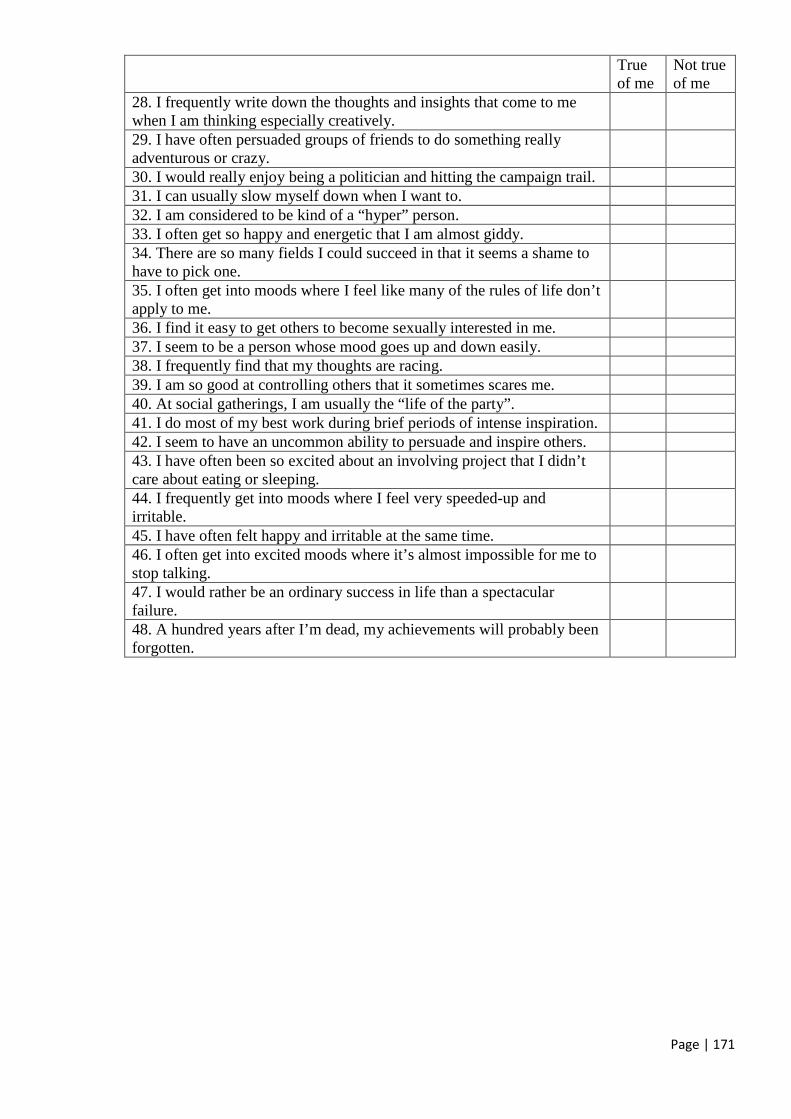
Page | 171
True of me
Not true of me
28. I frequently write down the thoughts and insights that come to me when I am thinking especially creatively.
29. I have often persuaded groups of friends to do something really adventurous or crazy.
30. I would really enjoy being a politician and hitting the campaign trail. 31. I can usually slow myself down when I want to. 32. I am considered to be kind of a “hyper” person. 33. I often get so happy and energetic that I am almost giddy. 34. There are so many fields I could succeed in that it seems a shame to have to pick one.
35. I often get into moods where I feel like many of the rules of life don’t apply to me.
36. I find it easy to get others to become sexually interested in me. 37. I seem to be a person whose mood goes up and down easily. 38. I frequently find that my thoughts are racing. 39. I am so good at controlling others that it sometimes scares me. 40. At social gatherings, I am usually the “life of the party”. 41. I do most of my best work during brief periods of intense inspiration. 42. I seem to have an uncommon ability to persuade and inspire others. 43. I have often been so excited about an involving project that I didn’t care about eating or sleeping.
44. I frequently get into moods where I feel very speeded-up and irritable.
45. I have often felt happy and irritable at the same time. 46. I often get into excited moods where it’s almost impossible for me to stop talking.
47. I would rather be an ordinary success in life than a spectacular failure.
48. A hundred years after I’m dead, my achievements will probably been forgotten.

Page | 172
Appendix 6: Hypomanic Personality Scale (20-Item)
Meads, D.M., & Bentall, R.P., (2008) Rasch analysis and item reduction of the hypomanic personality scale. Personality and Individual Differences 44, 1772-1783.
Instructions and items:
Please answer whether the following descriptions are true of you or not:
True of you
Not True of you
A hundred years after I’m dead, my achievements will probably have been forgotten
I am so good at controlling others that sometimes it scares me
I am frequently in such high spirits that I can’t concentrate on any one thing for too long
I am considered to be a kind of ‘Hyper’ person
I often have moods where I feel so energetic and optimistic that I feel I could out-perform almost anyone at anything
In unfamiliar surroundings I am often so assertive and sociable that I surprise myself
I like to have others think of me as a normal kind of person
I am usually in an average sort of mood, not too high and not too low
I often get into moods where I feel like many of the rules of life don’t apply to me
I very frequently get into moods where I wish I could be everywhere and do everything at once
I have often felt happy and irritable at the same time
Sometime ideas and insights come to me so fast I cannot express them all
I seem to have an uncommon ability to persuade and inspire others
I frequently find that my thoughts are racing
There are times when I am so restless that it impossible for me to sit still
When I feel an emotion, I usually feel it with extreme intensity
Many people would consider me to be amusing but kind of eccentric
I seem to be a person whose mood goes up and down easily
I often feel excited and happy for no apparent reason
I do most of my work during brief periods of intense inspiration

Page | 173
Appendix 7: Mood and Anxiety Symptoms Questionnaire
Casillas, A. & Clark, L. A. (2000, May). The Mini Mood and Anxiety Symptom Questionnaire (Mini- MASQ). Poster presented at the 72nd Annual Meeting of the Midwestern Psychological Association,
Chicago, IL.
Instructions and items
Below is a list of feelings, sensations, problems and experiences that people sometimes have. Read
each item and then fill in the blank with the number that best describes how much you have felt or
experienced things this way DURING THE PAST WEEK, including today:
Not at All A little Bit
Moderately Quite a bit
Extremely
1. Felt really happy 2. Felt tense or “high strung” 3. Felt depressed 4. Was short of breath 5. Felt withdrawn from other people
6. Felt dizzy or lightheaded 7. Felt hopeless 8. Hands were cold or sweaty 9. Felt like I had a lot to look forward to
10. Hands were shaky 11. Felt like nothing was very enjoyable
12. Felt keyed up, “on edge” 13. Felt worthless 14. Had trouble swallowing 15. Felt like I had a lot of interesting things to do
16. Had hot or cold spells 17. Felt like a failure 18. Felt like I was choking 19. Felt really lively, “up” 20. Felt uneasy 21. Felt discouraged 22. Muscles twitched or trembled 23. Felt like I had a lot of energy 24. Was trembling or shaking 25. Felt like I was having a lot of fun 26. Had a very dry mouth
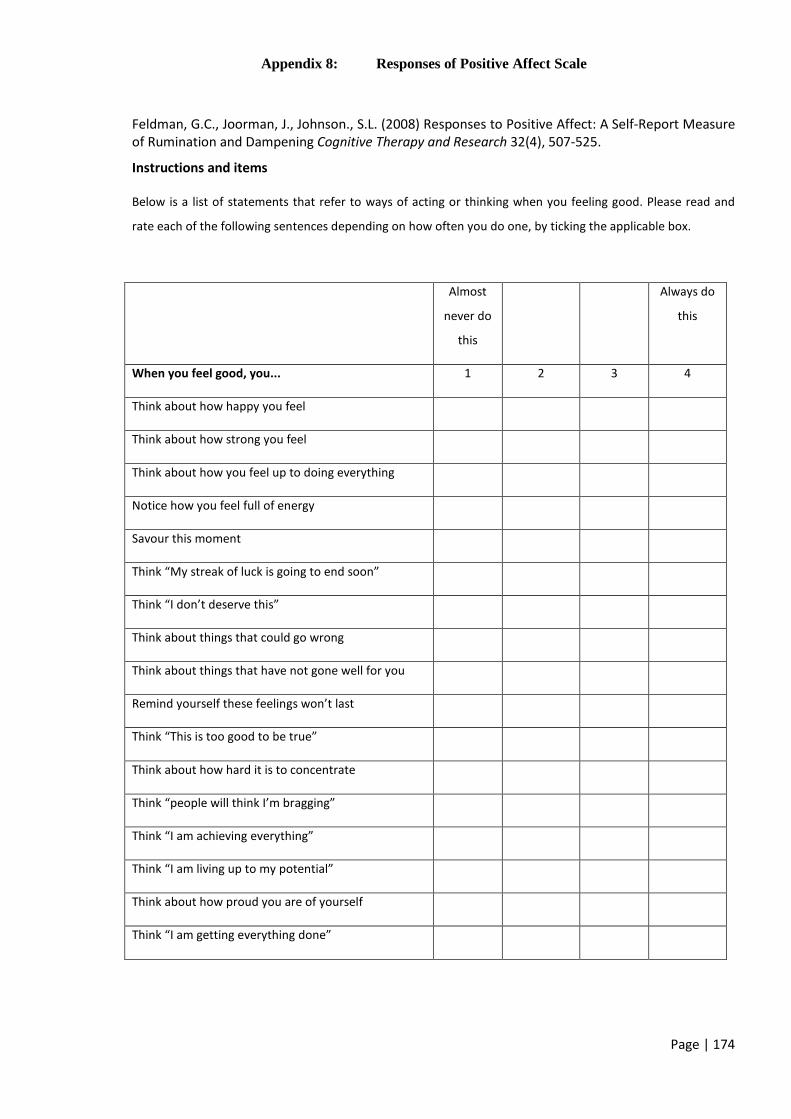
Page | 174
Appendix 8: Responses of Positive Affect Scale
Feldman, G.C., Joorman, J., Johnson., S.L. (2008) Responses to Positive Affect: A Self-Report Measure of Rumination and Dampening Cognitive Therapy and Research 32(4), 507-525.
Instructions and items
Below is a list of statements that refer to ways of acting or thinking when you feeling good. Please read and
rate each of the following sentences depending on how often you do one, by ticking the applicable box.
Almost
never do
this
Always do
this
When you feel good, you... 1 2 3 4
Think about how happy you feel
Think about how strong you feel
Think about how you feel up to doing everything
Notice how you feel full of energy
Savour this moment
Think “My streak of luck is going to end soon”
Think “I don’t deserve this”
Think about things that could go wrong
Think about things that have not gone well for you
Remind yourself these feelings won’t last
Think “This is too good to be true”
Think about how hard it is to concentrate
Think “people will think I’m bragging”
Think “I am achieving everything”
Think “I am living up to my potential”
Think about how proud you are of yourself
Think “I am getting everything done”

Page | 175
School of Psychology and Clinical
Language Sciences
University of Reading
Whiteknights
Reading RG6 6AL
Appendix 9: Participant information sheet – STERQ Positive (phase 1)
Supervisors: Email: Phone: Dr Craig Steel [email protected] 0118 378 7550 Experimenters: Joanne Bower [email protected] 0118 378 7937 David Angell [email protected] 0118 378 7937
What is the study about?
This is a study to investigate your responses to a short video clip
What do I have to do?
First you will complete some questions about yourself, after which you will view a short video clip.
After this, we will ask you some more questions about the video clip, and your responses to it. We
ask that whilst you are participating in the study, you do so in a quiet environment, away from your
mobile phone and other distractions.
How long will it take?
We anticipate the whole study taking no more than 30 minutes.
What will happen to my data if I take part?
All of your data will be stored anonymously within our database for the duration of the study.
What if I want to withdraw my consent?
Participating in the study is completely optional, and you are free to withdraw at any time. If during
the study you decide you no longer want to take part, you can withdraw by closing your internet
browser. If you do this then none of the data collected will be used within any of our analysis.
By clicking “continue” to enter into the study, we will assume that you have given your consent to
participate.

Page | 176
School of Psychology and Clinical
Language Sciences
University of Reading
Whiteknights
Reading RG6 6AL
Appendix 10: Participant information sheet – STERQ Negative (Phase 1)
Supervisors: Email: Phone: Dr Craig Steel [email protected] 0118 378 7550 Experimenters: Joanne Bower [email protected] 0118 378 7937 David Angell [email protected] 0118 378 7937
Title: Personality and Memory
What is the study about?
This is a study to investigate your responses to short video clips containing emotional stimuli.
What do I have to do?
First you will complete some questions about yourself, after which you will view 2 short video clips.
You may find the second of these slightly distressing. We will also ask you some more questions
about the video clips, and your responses to it. We ask that whilst you are participating in the study,
you do so in a quiet environment, away from your mobile phone and other distractions.
How long will it take?
We anticipate the whole study taking no more than 30 minutes.
What will happen to my data if I take part?
All of your data will be stored anonymously within our database for the duration of the study.
What if I want to withdraw my consent?
Participating in the study is completely optional, and you are free to withdraw at any time. If during
the study you decide you no longer want to take part, you can withdraw by closing your internet
browser. If you do this then none of the data collected will be used within any of our analysis.
By clicking “continue” to enter into the study, we will assume that you have given your consent to
participate.

Page | 177
School of Psychology and Clinical
Language Sciences
University of Reading
Whiteknights
Reading RG6 6AL
Appendix 11: Participant information sheet – STERQ Positive (Phase 2)
Supervisors: Email: Phone: Dr Craig Steel [email protected] 0118 378 7550 Experimenters: Joanne Bower [email protected] 0118 378 7937 David Angell [email protected] 0118 378 7937 What is the study about?
This is a study to investigate your responses to short video clips
What do I have to do?
You will complete some questions about yourself, watch 2 short video clips and answer some more
questions about the videos and your responses to it. We ask that whilst you are participating in the
study, you do so in a quiet environment, away from your mobile phone and other distractions.
How long will it take?
We anticipate the whole study taking no more than 30 minutes.
What will happen to my data if I take part?
All of your data will be stored anonymously within our database for the duration of the study.
What if I want to withdraw my consent?
Participating in the study is completely optional, and you are free to withdraw at any time. If during
the study you decide you no longer want to take part, you can withdraw by closing your internet
browser.
By clicking “continue” to enter into the study, we will assume that you have given your consent to
participate.

Page | 178
School of Psychology and Clinical
Language Sciences
University of Reading
Whiteknights
Reading RG6 6AL
Appendix 12: Participant information sheet – STERQ Negative (phase 2)
Supervisors: Email: Phone: Dr Craig Steel [email protected] 0118 378 7550 Experimenters: Joanne Bower [email protected] 0118 378 7937 David Angell [email protected] 0118 378 7937
Title: Personality and Memory
What is the study about?
This is a study to investigate your responses to short video clips containing emotional stimuli.
What do I have to do?
First you will complete some questions about yourself, after which you will view 2 short video clips.
You may find the second of these slightly distressing. We will also ask you some more questions
about the video clips, and your responses to it. We ask that whilst you are participating in the study,
you do so in a quiet environment, away from your mobile phone and other distractions.
How long will it take?
We anticipate the whole study taking no more than 30 minutes.
What will happen to my data if I take part?
All of your data will be stored anonymously within our database for the duration of the study.
What if I want to withdraw my consent?
Participating in the study is completely optional, and you are free to withdraw at any time. If during
the study you decide you no longer want to take part, you can withdraw by closing your internet
browser. If you do this then none of the data collected will be used within any of our analysis.
By clicking “continue” to enter into the study, we will assume that you have given your consent to
participate.

Page | 179
Appendix 13: STERQ Positive Trait Items
STERQ: Positive Trait Removed Retained Item Number
Item Before Factor Analysis
During Factor Analysis
During phase 2
TP1 I could use my feelings about the experience to my advantage4
X
TP2 I want to avoid the situation by trying to escape X
TP3 I think about ways in which I can change the experience2
X
TP4 The situation had such a big impact on me I wished it would just go away
X
TP5 I can stay calm and not be affected by the situation1
X
TP6 It is difficult to get the experience out of my mind4 X
TP7 I avoid the experience because I know it will be emotional2
X
TP8 I try to change the situation so I can change how I feel
X
TP9 When I know in advance about the experience, I can choose to stay calm4
X
TP10 I feel like this is not going to last3 X
TP11 I use substances (e.g. alcohol or drugs) to change how I am feeling4
X
TP12 My feelings interfere with my ability to carry on with daily life2
X
TP13 I try to see the funny side of the experience1 X TP14 I can hold on to the emotions I felt in the situation1 X TP15 I control my feelings by not showing them5 X
TP16 I experience emotion but am not aware of it until sometime later2
X
TP17 I feel like the same things were going round and round in my head2
X
TP18 I seek out information related to the event to understand or change how I am feeling2
X
TP19 It is easy for me to show my feelings X
TP20 I do not generally pay much attention to how I feel1
X
TP21 I think about something different to change how I am feeling
X
TP22 I try to avoid feeling anything2 X TP23 I feel that I am responsible for what has happened4 X
TP24 Sharing the experience with someone I trust changes the intensity of the experience1
X
TP25 My feelings were out of control X
TP26 My feelings impacted on how I interpreted the situation1
X
TP27 I find it easy to describe how I’m feeling X
TP28 My faith influenced how I felt about the experience1
X
TP29 I analyse the experience to try to understand why I feel the way I did4
X
TP30 I find it easy to talk to other people about the experience
X
TP31 I seek out the experience because I know it will be emotional3
X
TP32 The experience had a big impact on my mood2 X

Page | 180
STERQ: Positive Trait Removed Retained Item Number
Item Before Factor Analysis
During Factor Analysis
During phase 2
TP33 My feelings were overwhelming X
TP34 I am tempted to use extreme behaviours to change the intensity of what I’m feeling2
X
TP35 I change the way I think about the experience to alter how I am feeling2
X
TP36 I try to hide how I was feeling2 X TP37 My feelings made it difficult to concentrate X
TP38 It is difficult for me to make sense of what I am feeling, whilst I am feeling it2
X
TP39 It was easy to manage what I was feeling3 X
TP40 My feelings make it difficult to focus on other things
X
TP41 I feel that something good will come of it4 X
TP42 I believe the cause of the experience is outside of my control3
X
Bolded items retained for final scale. Reasons for removals: 1Lack of correlation with other items, 2Multicollinearity, 3Low item-total correlation, 4Item failed to load onto a reliable factor, 5Removal improved model fit (phase 2)
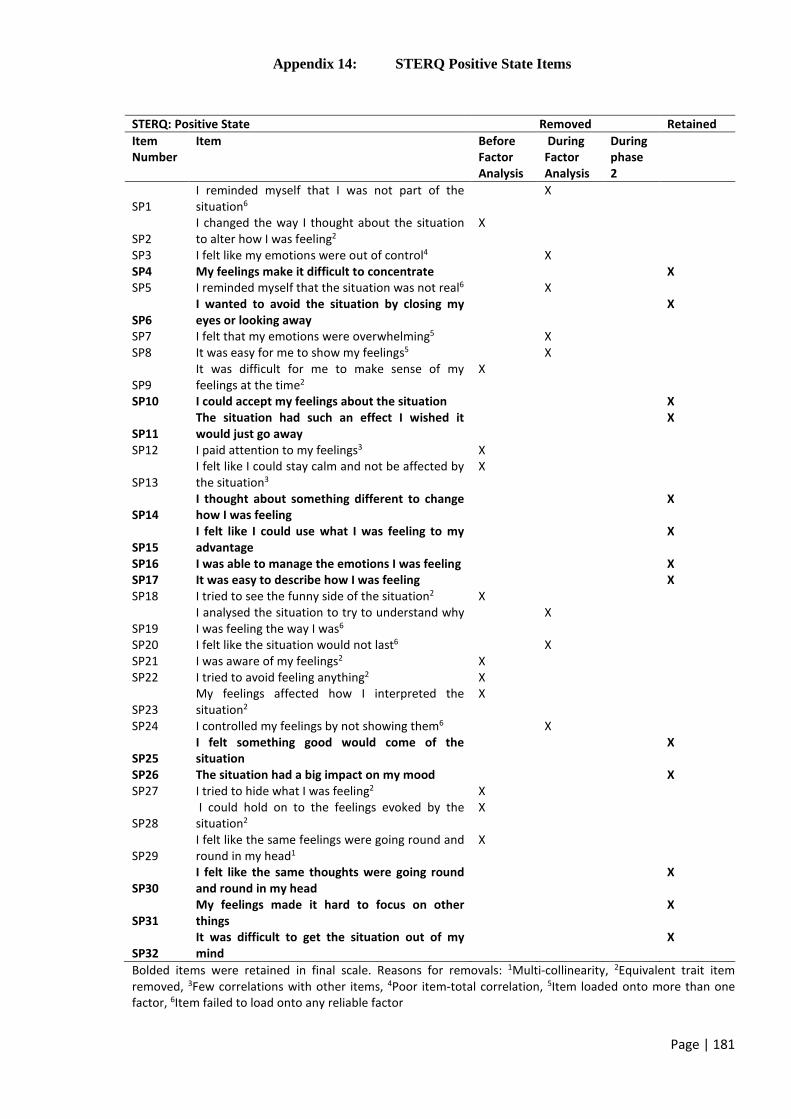
Page | 181
Appendix 14: STERQ Positive State Items
STERQ: Positive State Removed Retained Item Number
Item Before Factor Analysis
During Factor Analysis
During phase 2
SP1 I reminded myself that I was not part of the situation6
X
SP2 I changed the way I thought about the situation to alter how I was feeling2
X
SP3 I felt like my emotions were out of control4 X SP4 My feelings make it difficult to concentrate X SP5 I reminded myself that the situation was not real6 X
SP6 I wanted to avoid the situation by closing my eyes or looking away
X
SP7 I felt that my emotions were overwhelming5 X SP8 It was easy for me to show my feelings5 X
SP9 It was difficult for me to make sense of my feelings at the time2
X
SP10 I could accept my feelings about the situation X
SP11 The situation had such an effect I wished it would just go away
X
SP12 I paid attention to my feelings3 X
SP13 I felt like I could stay calm and not be affected by the situation3
X
SP14 I thought about something different to change how I was feeling
X
SP15 I felt like I could use what I was feeling to my advantage
X
SP16 I was able to manage the emotions I was feeling X SP17 It was easy to describe how I was feeling X SP18 I tried to see the funny side of the situation2 X
SP19 I analysed the situation to try to understand why I was feeling the way I was6
X
SP20 I felt like the situation would not last6 X SP21 I was aware of my feelings2 X SP22 I tried to avoid feeling anything2 X
SP23 My feelings affected how I interpreted the situation2
X
SP24 I controlled my feelings by not showing them6 X
SP25 I felt something good would come of the situation
X
SP26 The situation had a big impact on my mood X SP27 I tried to hide what I was feeling2 X
SP28 I could hold on to the feelings evoked by the situation2
X
SP29 I felt like the same feelings were going round and round in my head1
X
SP30 I felt like the same thoughts were going round and round in my head
X
SP31 My feelings made it hard to focus on other things
X
SP32 It was difficult to get the situation out of my mind
X
Bolded items were retained in final scale. Reasons for removals: 1Multi-collinearity, 2Equivalent trait item removed, 3Few correlations with other items, 4Poor item-total correlation, 5Item loaded onto more than one factor, 6Item failed to load onto any reliable factor
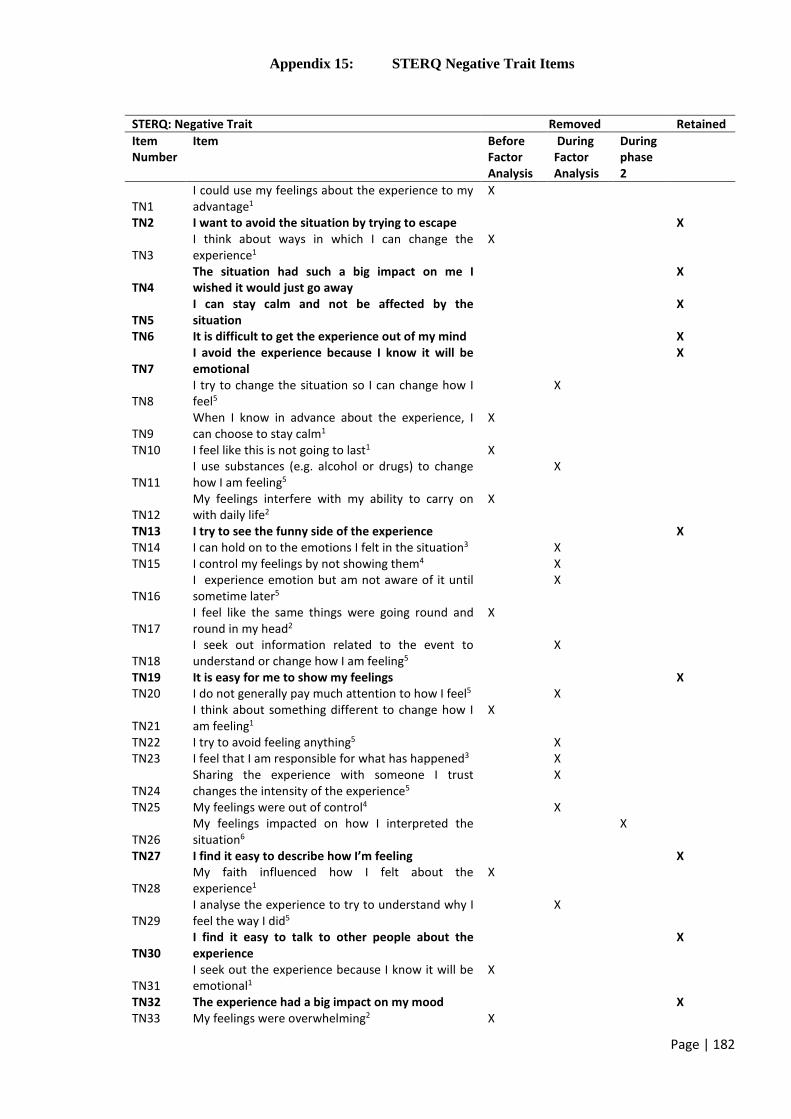
Page | 182
Appendix 15: STERQ Negative Trait Items
STERQ: Negative Trait Removed Retained Item Number
Item Before Factor Analysis
During Factor Analysis
During phase 2
TN1 I could use my feelings about the experience to my advantage1
X
TN2 I want to avoid the situation by trying to escape X
TN3 I think about ways in which I can change the experience1
X
TN4 The situation had such a big impact on me I wished it would just go away
X
TN5 I can stay calm and not be affected by the situation
X
TN6 It is difficult to get the experience out of my mind X
TN7 I avoid the experience because I know it will be emotional
X
TN8 I try to change the situation so I can change how I feel5
X
TN9 When I know in advance about the experience, I can choose to stay calm1
X
TN10 I feel like this is not going to last1 X
TN11 I use substances (e.g. alcohol or drugs) to change how I am feeling5
X
TN12 My feelings interfere with my ability to carry on with daily life2
X
TN13 I try to see the funny side of the experience X TN14 I can hold on to the emotions I felt in the situation3 X TN15 I control my feelings by not showing them4 X
TN16 I experience emotion but am not aware of it until sometime later5
X
TN17 I feel like the same things were going round and round in my head2
X
TN18 I seek out information related to the event to understand or change how I am feeling5
X
TN19 It is easy for me to show my feelings X TN20 I do not generally pay much attention to how I feel5 X
TN21 I think about something different to change how I am feeling1
X
TN22 I try to avoid feeling anything5 X TN23 I feel that I am responsible for what has happened3 X
TN24 Sharing the experience with someone I trust changes the intensity of the experience5
X
TN25 My feelings were out of control4 X
TN26 My feelings impacted on how I interpreted the situation6
X
TN27 I find it easy to describe how I’m feeling X
TN28 My faith influenced how I felt about the experience1
X
TN29 I analyse the experience to try to understand why I feel the way I did5
X
TN30 I find it easy to talk to other people about the experience
X
TN31 I seek out the experience because I know it will be emotional1
X
TN32 The experience had a big impact on my mood X TN33 My feelings were overwhelming2 X

Page | 183
STERQ: Negative Trait Removed Retained Item Number
Item Before Factor Analysis
During Factor Analysis
During phase 2
TN34 I am tempted to use extreme behaviours to change the intensity of what I’m feeling5
X
TN35 I change the way I think about the experience to alter how I am feeling1
X
TN36 I try to hide how I was feeling2 X TN37 My feelings made it difficult to concentrate2 X
TN38 It is difficult for me to make sense of what I am feeling, whilst I am feeling it5
X
TN39 It was easy to manage what I was feeling X
TN40 My feelings make it difficult to focus on other things
X
TN41 I feel that something good will come of it X
TN42 I believe the cause of the experience is outside of my control1
X
Bolded items were retained in the final scale. Reason for removals: 1Lack of correlation with other items, 2Multi-collinearity, 3Aided factor interpretability, 4Item loaded onto more than one factor, 5Item did not load
onto any reliable factor, 6Improved model fit (phase 2)

Page | 184
Appendix 16: STERQ Negative State Items
STERQ: Negative State Removed Retained Item Number
Item Before Factor Analysis
During Factor Analysis
During phase 2
SN1 I reminded myself that I was not part of the situation
X
SN2 I changed the way I thought about the situation to alter how I was feeling6
X
SN3 I felt like my emotions were out of control2 X SN4 My feelings make it difficult to concentrate2 X SN5 I reminded myself that the situation was not real X SN6 I wanted to avoid the situation by closing my eyes
or looking away3 X
SN7 I felt that my emotions were overwhelming2 X SN8 It was easy for me to show my feelings4 X SN9 It was difficult for me to make sense of my feelings
at the time5 X
SN10 I could accept my feelings about the situation X SN11 The situation had such an effect I wished it would
just go away2 X
SN12 I paid attention to my feelings6 X SN13 I felt like I could stay calm and not be affected by
the situation3 X
SN14 I thought about something different to change how I was feeling5
X
SN15 I felt like I could use what I was feeling to my advantage6
X
SN16 I was able to manage the emotions I was feeling3 X SN17 It was easy to describe how I was feeling X SN18 I tried to see the funny side of the situation X SN19 I analysed the situation to try to understand why I
was feeling the way I was6 X
SN20 I felt like the situation would not last1 X SN21 I was aware of my feelings X SN22 I tried to avoid feeling anything5 X SN23 My feelings affected how I interpreted the
situation2 X
SN24 I controlled my feelings by not showing them5 X SN25 I felt something good would come of the situation X SN26 The situation had a big impact on my mood6 X SN27 I tried to hide what I was feeling2 X SN28 I could hold on to the feelings evoked by the
situation3 X
SN29 I felt like the same feelings were going round and round in my head
X
SN30 I felt like the same thoughts were going round and round in my head2
X
SN31 My feelings made it hard to focus on other things X SN32 It was difficult to get the situation out of my mind X Bolded items were retained in final scale. Reason for removals: 1Few correlations with other items, 2Multi-
collinearity, 3Aided factor interpretation, 4Loaded onto more than one factor, 5Failed to load onto any reliable
factor, 6Removal improved model fit (phase 2)

Page | 185
Appendix 17: Mood ratings scale and video memory questions
Mood Ratings:
To what extent do you currently feel the following?
STERQ Positive Phase 1 Memory Questions
In the film clip you have just viewed, you watched the main character, Mr Bean, encounter a range of
situations. Please answer the following questions about the film clip:
1. What comic did he want to read?
a) Superman
b) Spiderman
c) Batman
d) Ironman
2. Who did he visit?
a) A friend
b) A dentist
c) A doctor
d) An optician
3. What does he go looking for in his attic?
a) Christmas decorations
b) Antiques
c) Comics
d) A coat
4. What does he try to cook?
a) A lobster
b) A turkey
c) A fish
d) Some mince
STERQ Negative Phase 1 Memory Questions
What is the lion cub being rescued from?
a) A flood
b) A fire
c) A stampede
Where did the father put the lion cub for safety?
a) A tree branch
b) A ledge
c) A side pathway
How did the older lion die?
a) He fell when the lion holding him let go
b) He slipped and fell
c) He was crushed in a stampede
Not at all A little Somewhat Quite a lot Very much Happy Amused Sad Anxious Excited Angry

Page | 186
Appendix 18: Phase 1 scree-plots for STERQ scales
STERQ Positive: Trait
STERQ Positive: State
Inflexion Point
Inflexion Point

Page | 187
STERQ Negative: Trait
STERQ Negative: State
Inflexion Point
Inflexion Point

Page | 188
Appendix 19: STERQ Factor loadings for models retained in phase 1
Trait Positive 4 factor solution
Item Item Description Factor 1 Factor 2 Factor 3 Factor 4 TP25 My feelings are out of control 0.77 TP40 My feelings make it difficult to focus on
other things 0.75
TP37 My feelings make it difficult to concentrate 0.75 TP33 My feelings were overwhelming 0.69 TP39 It is easy to manage what I was feeling -0.68 0.49 TP42 I believe the cause of the experience is
outside of my control 0.51
TP31 I seek out the experience because I know it will be emotional
0.40
TP10 I feel like this is not going to last 0.40 TP30 I find it easy to talk to other people about
the experience 0.89
TP19 It is easy for me to show my feelings 0.86 TP27 I find it easy to describe how I'm feeling 0.85 TP15 I control my feelings by not showing them -0.62 TP4 The situation has such a big impact on me I
wish it would just go away 0.87
TP8 I try to change the situation so I can change how I feel
0.84
TP2 I want to avoid the situation by trying to escape
0.80
TP21 I think about something different to change how I am feeling
0.61
TP9 When I know in advance about the experience, I can choose to stay calm
0.51
TP23 I feel that I am responsible for what has happened
0.46
TP41 I feel that something good will come of it 0.41 Proportion of variance explained .15 .14 .13 .06 Cronbach’s Alpha (polychoric matrices) .81 .87 .88 .37 Corrected item-total correlation range .42-.76 .61-.87 .65-.86 .22-.41 Items TP1, TP6, TP11 and TP29 did not load onto any factor (>.4)

Page | 189
State Positive 5 factor solution
Item Factor 1 Factor 2 Factor 3 Factor 4 Factor 5 SP11 The situation had such an effect I
wished it would just go away 1.04
SP6 I wanted to avoid the situation by closing my eyes or looking away
0.89
SP14 I thought about something different to change how I was feeling
0.62
SP7 I felt that my emotions were overwhelming
0.59 0.46
SP15 I felt like I could use what I was feeling to my advantage
0.68
SP26 The situation had a big impact on my mood
0.64
SP25 I felt something good would come of the situation
0.61
SP3 I felt like my emotions were out of control
0.47
SP5 I reminded myself that the situation was not real
1.00
SP1 I reminded myself that I was not part of the situation
0.87
SP31 My feelings made it hard to focus on other things
0.82
SP32 It was difficult to get the situation out of my mind
0.66
SP30 I felt like the same thoughts were going round and round in my head
0.66
SP4 My feelings make it difficult to concentrate
0.53
SP17 It was easy to describe how I was feeling
0.83
SP10 I could accept my feelings about the situation
0.62
SP16 I was able to manage the emotions I was feeling
0.62
SP8 It was easy for me to show my feelings 0.49 0.51 Proportion of variance explained .15 .12 .11 .10 .09 Cronbach’s Alpha (polychoric matrices) .84 .77 .86 .80 .75 Corrected item-total correlation range .56-.88 .62-.66 .82 .58-.81 .49-.85 SP19, SP20 and SP24 did not load onto any factors (>.4)

Page | 190
Trait Negative 5 factor solution
Item Item Description Intrude Express Harness Extreme Avoid TN40 I find that my feelings make it
difficult to focus on other things 0.76
TN23 I feel that I am responsible for what has happened
0.72
TN32 The experience had a big impact on my mood
0.67
TN26 My feelings impacted on how I interpreted the situation
0.65
TN25 My feelings were out of control 0.65 0.43 TN14 I can hold on to the emotions I felt
in the situation 0.53
TN6 It is difficult to get the experience out of my mind
0.46
TN27 I find it easy to describe how I’m feeling
0.78
TN19 It is easy for me to show my feelings 0.76 TN30 I find it easy to talk to other people
about the experience 0.74
TN15 I control my feelings by not showing them
-0.57 0.41
TN13 I try to see the funny side of the experience
0.64
TN41 I feel that something good will come of it
0.61
TN5 I can stay calm and not be affected by the situation
0.55
TN39 It was easy to manage what I was feeling
0.44
TN34 I am tempted to use extreme behaviours to change the intensity of what I’m feeling
0.65
TN11 I use substances (e.g. alcohol or drugs) to change how I am feeling
0.54
TN22 I try to avoid feeling anything 0.50 TN7 I avoid the experience because I
know it will be emotional 0.83
TN4 The situation had such a big impact on me I wished it would just go away
0.58
TN2 I want to avoid the situation by trying to escape
0.54
Proportion of Variance Explained .15 .10 .09 .07 .07 Cronbach’s Alpha (α) .84 .78 .68 .72 .75
Corrected item-total correlation range .50-.70 .44-.70 .46-.60 .25-.59 .55-.59

Page | 191
State Negative 5 factor solution
Item Intrude Aware Harness Perspective Suppress SN32 It was difficult to get the situation
out of my mind 0.89
SN31 My feelings made it hard to focus on other things
0.85
SN29 I felt like the same feelings were going round and round in my head
0.78
SN26 The situation had a big impact on my mood
0.77
SN16 I was able to manage the emotions I was feeling
-0.60
SN6 I wanted to avoid the situation by closing my eyes or looking away
0.60
SN13 I felt like I could stay calm and not be affected by the situation
-0.56
SN28 I could hold on to the feelings evoked by the situation
0.48
SN21 I was aware of my feelings 0.76 SN17 It was easy to describe how I was
feeling 0.73
SN12 I paid attention to my feelings 0.69 SN10 I could accept my feelings about
the situation 0.63
SN15 I felt like I could use what I was feeling to my advantage
0.74
SN18 I tried to see the funny side of the situation
0.74
SN25 I felt something good would come of the situation
0.68
SN19 I analysed the situation to try to understand why I was feeling the way I was
0.43
SN5 I reminded myself that the situation was not real
0.82
SN1 I reminded myself that I was not part of the situation
0.71
SN2 I changed the way I thought about the situation to alter how I was feeling
0.46
SN24 I controlled my feelings by not showing them
0.74
SN8 It was easy for me to show my feelings
0.45 -0.50
SN22 I tried to avoid feeling anything 0.41 Proportion of variance explained .19 .11 .09 .08 .06
Cronbach’s alpha .86 .79 .70 .75 .63 Corrected item-total correlation .38-.79 .54-.66 .38-.57 .52-.61 .35-.58

Page | 192
Appendix 20: Memory questions for STERQ Phase 2 STERQ Positive Memory Questions:
Video 1:
1. What is the first bird seen in the video?
a. Magpie b. Penguin c. Finch d. Eagle
2. What group of animals walk in front of a rainbow?
a. Dogs b. Gazelle c. Lions d. Elephants
3. At the end of the video, what type of animal is the presenter surrounded by?
a. Chimps b. Lions c. Zebra d. Wolves
4. In the video clip, what were the two hippos doing?
a. Fighting b. Drinking c. Swimming d. Running
Video 2:
1. What was the name of the mini-game? a. Dirty dancers b. Helping hands c. Wrestle Hypomania d. Foot ‘n’ Mouth
2. What character was Ryan playing? a. A drunken Irish chocolatier b. An angry German dancer c. A claustrophobic Japanese ninja d. A lovesick Italian pizza maker
3. What gimmick was Ryan wearing? a. A moustache b. A ninja outfit c. A booze stained vest d. A tutu
4. What does Ryan use? a. A screwdriver b. A cane c. A ladle d. A rolling pin
5. What does Ryan eat at the end of the clip?
a. Parmesan Cheese b. Pickle c. Pepperoni d. Pineapple

Page | 193
STERQ Negative Memory Questions:
Video 1:
1. What animal was the focus of this clip? a. Wild dogs b. Bears c. Wolves d. Eagles
2. What does David Attenborough do at the
start of the clip? a. Feed the animals himself b. Watch the animals feeding their
young c. Pet the animals d. Try to communicate with the
animals
3. What other animal is featured in the video clip?
a. Elk b. Bison c. Deer d. Vampire bats
4. As stated in the clip, how often are hunts
like the ones shown successful? a. 1 in 5 b. 1 in 10 c. 1 in 15 d. 1 in 20
Video 2:
1. What colour balloon is the main male character holding at the start?
a. Blue b. Red c. Purple d. White
2. While still children, what present did the
girl give the boy? a. An orange juice b. A bumblebee yoyo c. A silent rabbit d. A bottle cap badge
3. When in the field together what are the
characters doing? a. Watching the clouds b. Talking c. Exploring d. Dancing in the rain
4. What was the name of the scrapbook?
a. Cloudwatcher Extraordinaire b. Superfluous Vocabulary c. Scrappy the Book d. My Adventure Book
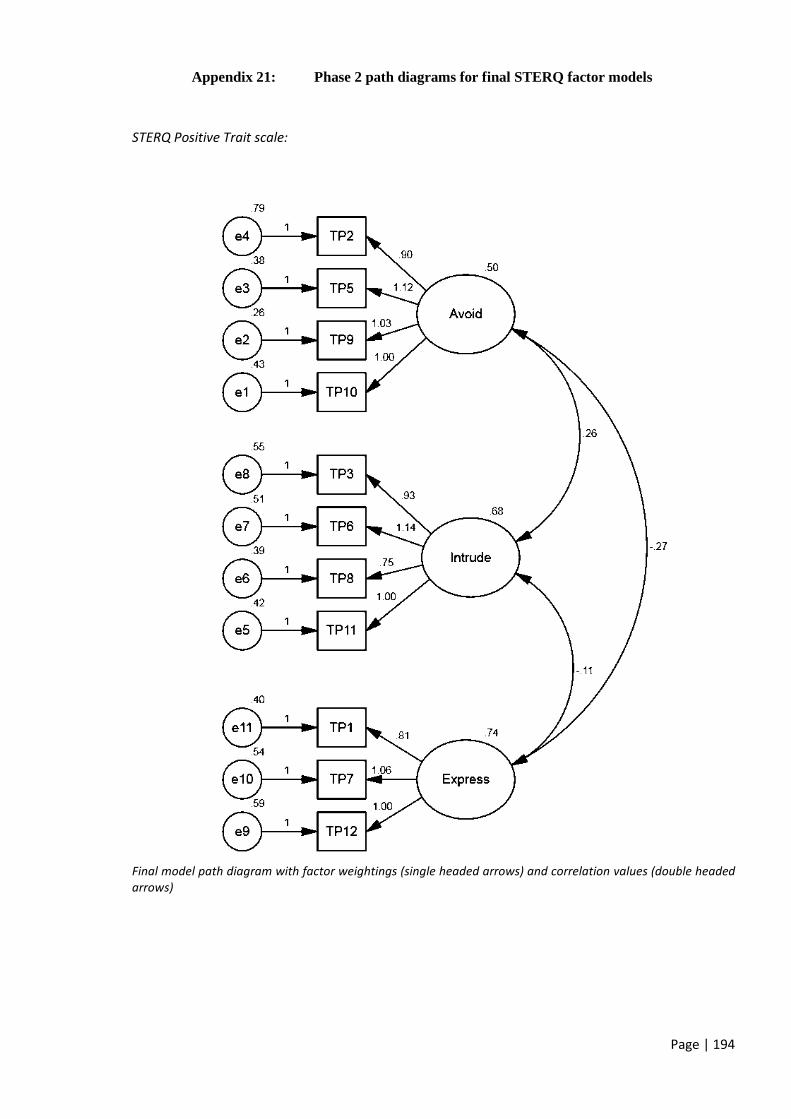
Page | 194
Appendix 21: Phase 2 path diagrams for final STERQ factor models
STERQ Positive Trait scale:
Final model path diagram with factor weightings (single headed arrows) and correlation values (double headed arrows)

Page | 195
STERQ Positive State scale:
Final model path diagram with factor weightings (single headed arrows) and correlation values (double headed arrows)

Page | 196
STERQ Negative Trait scale:
Final model path diagram with factor weightings (single headed arrows) and correlation values (double headed arrows)

Page | 197
STERQ Negative State scale:
Final model path diagram with factor weightings (single headed arrows) and correlation values (double headed
arrows)

Page | 198
Appendix 22: Competing model-fit statistics for STERQ scales
Positive Trait Models
Model Chi-Square statistic
Comparative Fit Index (CFI)
Standardised Root Mean Square Residual (SRMR)
3-factor 155.87* .893 .084 3-factor (TP4 removed) 120.84* .911 .073 2-factor 368.09* .680 .133 1-factor 514.32* .532 .158 Table X: Model fit summary statistics for competing models of STERQ Positive Trait data. * p <.05.
Positive State Models
Model Chi-Square statistic
Comparative Fit Index (CFI)
Standardised Root Mean Square Residual (SRMR)
4-factor 105.19* .913a .071 2-factor 586.39 .722 .118 1-factor 397.29 .365 .186 Table X: STERQ Positive State model fit statistics. * p < .05.
Negative Trait Models
Model Chi-Square statistic
Comparative Fit Index (CFI)
Standardised Root Mean Square Residual (SRMR)
4-factor 178.00* .887 .080 4-factor TN2 removed 145.61* .900 .073 2-factor 387.79* .67 .154 1-factor 493.3* .559 .133 Table X: Model fit statistics for STERQ Trait Negative. * p < .05.
Negative State Models:
Model Chi-Square statistic
Comparative Fit Index (CFI)
Standardised Root Mean Square Residual (SRMR)
4-factor 285.60* .834 .102 4-factor SN10 removed 145.61* .850 .093 3-factor 210.53* .791 .109 1-factor 462.505* .598 .112 Table X: Model fit statistics for STERQ Negative State Models. * p < .05.
Revised Negative State Models (phase 1 data):
Model Chi-Square statistic Comparative Fit Index (CFI)
Standardised Root Mean Square Residual (SRMR)
3-factor 322.86* .806 .101 4-factor 310.40* .814 .100 3-factor (factor 4 removed) 102.11* .915 .073 3-factor (phase 1 data) 82.997* .934 .056 Table X: Model fit statistics for revised STERQ negative state structures *p < .05

Page | 199
Appendix 23: Final STERQ Scales
STERQ Trait Positive Final Questionnaire
When you have a POSITIVE experience to what extent do the following apply to you?
Not at all
A little Some-what
Quite a lot
Very Much
1. I find it easy to describe how I'm feeling
2. I try to change the situation so I can change how I feel
3. My feelings make it difficult to concentrate
4. I want to avoid the situation by trying to escape
5. My feelings are overwhelming
6. It is easy for me to show my feelings
7. My feelings are out of control
8. The situation has such a big impact on me I wish it would just go away
9. I think about something different to change how I am feeling
10. My feelings make it difficult to focus on other things
11. I find it easy to talk to other people about the experience
Scoring:
Subscale scores are created as follows:
Emotional Intrusion: Sum items 3, 5, 7, 10 Total: ______ (range 0-16)
Emotional Avoidance: Sum items 2, 4, 8, 9 Total: ______ (range 0-16)
Emotional Expression: Sum items 1, 6, 11 Total: ______ (range 0-12)

Page | 200
STERQ State Positive Final Questionnaire
Whilst you were [insert activity] to what extent did the following statements apply to you?
Not at all
A little Somewhat
Quite a lot
Very Much
1. It was easy to describe how I was feeling
2. My feelings made it difficult to concentrate
3. I was able to manage the emotions I was feeling
4. The situation had such an effect I wished it would just go away
5. I felt something good would come of the situation
6. I thought about something different to change how I was feeling
7. I could accept my feelings about the situation
8. I wanted to avoid the situation by closing my eyes or looking away
9. I felt like I could use what I was feeling to my advantage
10. The situation had a big impact on my mood
After you [insert activity] to what extent did the following statements apply to you?
Not at all
A little Some-what
Quite a lot
Very Much
11. My feelings made it hard to focus on other things
12. I felt like the same thoughts were going round and round in my head
13. It was difficult to get the situation out of my mind
Scoring:
Subscale scores are created as follows:
Emotional Intrusion: Sum items 2, 11, 12, 13, Total: ______ (range 0-16)
Emotional Avoidance: Sum items 4, 6, 8 Total: ______ (range 0-12)
Emotional Awareness: Sum items 1, 3, 7 Total: ______ (range 0-12)
Emotional Harnessing: Sum items 5, 9, 10 Total: ______ (range 0-12)

Page | 201
STERQ Trait Negative Final Questionnaire
When you have a NEGATIVE experience to what extent do the following apply to you?
Not at all
A little Some-what
Quite a lot
Very Much
1. I find it easy to describe how I'm feeling
2. I can stay calm and not be affected by the situation
3. I want to avoid the situation by trying to escape
4. The experience has a big impact on my mood
5. It is easy for me to show my feelings
6. I feel that something good will come of it
7. The situation has such a big impact on me I wish it would just go away
8. It is easy to manage what I was feeling
9. My feelings make it difficult to focus on other things
10. I find it easy to talk to other people about the experience
11. It is difficult to get the experience out of my mind
12. I try to see the funny side of the experience
13. I avoid the experience because I know it will be emotional
Scoring:
Subscale scores are created as follows:
Emotional Intrusion: Sum items 4, 9, 11 Total: ______ (range 0-12)
Emotional Avoidance: Sum items 3, 7, 13 Total: ______ (range 0-12)
Emotional Expression: Sum items 1, 5, 10 Total: ______ (range 0-12)
Emotional Harnessing: Sum items 2, 6, 8, 12 Total: ______ (range 0-16)
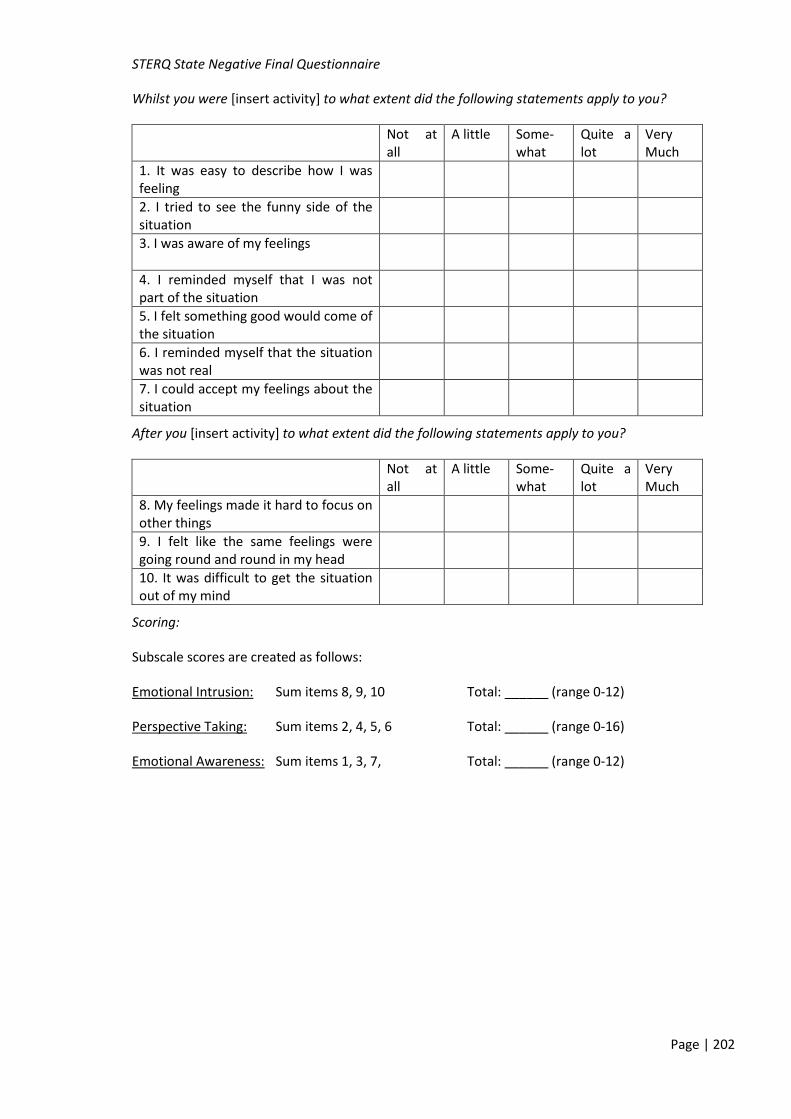
Page | 202
STERQ State Negative Final Questionnaire
Whilst you were [insert activity] to what extent did the following statements apply to you?
Not at all
A little Some-what
Quite a lot
Very Much
1. It was easy to describe how I was feeling
2. I tried to see the funny side of the situation
3. I was aware of my feelings
4. I reminded myself that I was not part of the situation
5. I felt something good would come of the situation
6. I reminded myself that the situation was not real
7. I could accept my feelings about the situation
After you [insert activity] to what extent did the following statements apply to you?
Not at all
A little Some-what
Quite a lot
Very Much
8. My feelings made it hard to focus on other things
9. I felt like the same feelings were going round and round in my head
10. It was difficult to get the situation out of my mind
Scoring:
Subscale scores are created as follows:
Emotional Intrusion: Sum items 8, 9, 10 Total: ______ (range 0-12)
Perspective Taking: Sum items 2, 4, 5, 6 Total: ______ (range 0-16)
Emotional Awareness: Sum items 1, 3, 7, Total: ______ (range 0-12)

Page | 203
School of Psychology and Clinical
Language Sciences
University of Reading
Whiteknights
Reading RG6 6AL
Appendix 24: Participant Information Sheet – Spontaneous regulation study
Supervisors: Email: Phone: Dr Craig Steel [email protected] 0118 378 7550 Dr Anastasia Christakou [email protected] 0118 378 6298 Experimenters: Joanne Bower [email protected] 0118 378 6210
What is the study about?
This is a study to investigate how individual differences affect responses to short film clips
What do I have to do?
First you will complete some questions about yourself, then you will view a short video clip. After this, we will ask you some more questions about the video clip, and your responses to it. Next you will answer some more questions about yourself, before watching another video. Finally you will be asked some more questions about the second video and your responses to it. We ask that whilst you are participating in the study, you do so in a quiet environment, away from your mobile phone and other distractions.
How long will it take?
We anticipate the whole study taking no more than 45 minutes.
What will happen to my data if I take part?
All of your data will be stored anonymously within our database for the duration of the study and subsequent data analysis.
Are there any risks associated with participating in the study?
We do not foresee any risks associated with participation in this study.
What if I want to withdraw my consent?
Participating in the study is completely optional, and you are free to withdraw at any time. If during the study you decide you no longer want to take part, you can withdraw by closing your internet browser.
This application has been reviewed by the University Research Ethics Committee and has been given a favourable ethical opinion for conduct
By clicking “next” to enter into the study, we will assume that you have given your consent to participate.

Page | 204
School of Psychology and Clinical
Language Sciences
University of Reading
Whiteknights
Reading RG6 6AL
Appendix 25: Participant Information Sheet – Instructed Regulation study
Supervisors: Email: Phone: Dr Craig Steel [email protected] 0118 378 7550 Dr Anastasia Christakou [email protected] 0118 378 6298 Experimenters: Joanne Bower [email protected] 0118 378 7937
What is the study about?
This is a study to investigate how individual differences affect recall of short film excerpts
What do I have to do?
First you will complete some questions about yourself, after which you will view a short video clip. After this, we will ask you some more questions about the video clip, and your responses to it.
How long will it take?
We anticipate the study taking approximately 30 minutes.
What will happen to my data if I take part?
We will keep your consent forms securely for 5 years, and all of your data will be stored anonymously within our database for the duration of the study and subsequent analysis.
Will I get anything for taking part?
You will receive 0.5 credits for participation in the study.
Are there any risks associated with participating in the study?
We do not foresee any risks associated with participation in this study.
What if I want to withdraw my consent?
Participating in the study is completely optional, and you are free to withdraw at any time by informing the experimenter.
Thank-you for reading this information sheet. Please let the experimenter know if you have any questions.
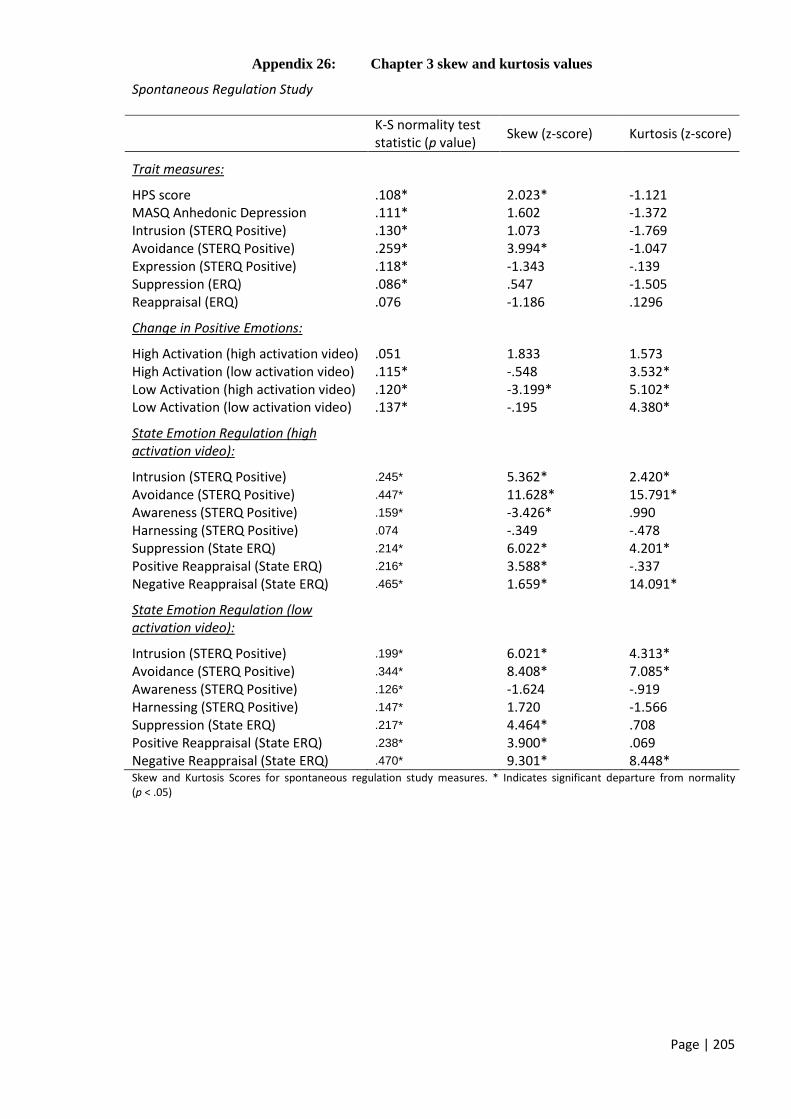
Page | 205
Appendix 26: Chapter 3 skew and kurtosis values
Spontaneous Regulation Study
K-S normality test statistic (p value) Skew (z-score) Kurtosis (z-score)
Trait measures:
HPS score .108* 2.023* -1.121 MASQ Anhedonic Depression .111* 1.602 -1.372 Intrusion (STERQ Positive) .130* 1.073 -1.769 Avoidance (STERQ Positive) .259* 3.994* -1.047 Expression (STERQ Positive) .118* -1.343 -.139 Suppression (ERQ) .086* .547 -1.505 Reappraisal (ERQ) .076 -1.186 .1296
Change in Positive Emotions:
High Activation (high activation video) .051 1.833 1.573 High Activation (low activation video) .115* -.548 3.532* Low Activation (high activation video) .120* -3.199* 5.102* Low Activation (low activation video) .137* -.195 4.380*
State Emotion Regulation (high activation video):
Intrusion (STERQ Positive) .245* 5.362* 2.420* Avoidance (STERQ Positive) .447* 11.628* 15.791* Awareness (STERQ Positive) .159* -3.426* .990 Harnessing (STERQ Positive) .074 -.349 -.478 Suppression (State ERQ) .214* 6.022* 4.201* Positive Reappraisal (State ERQ) .216* 3.588* -.337 Negative Reappraisal (State ERQ) .465* 1.659* 14.091*
State Emotion Regulation (low activation video):
Intrusion (STERQ Positive) .199* 6.021* 4.313* Avoidance (STERQ Positive) .344* 8.408* 7.085* Awareness (STERQ Positive) .126* -1.624 -.919 Harnessing (STERQ Positive) .147* 1.720 -1.566 Suppression (State ERQ) .217* 4.464* .708 Positive Reappraisal (State ERQ) .238* 3.900* .069 Negative Reappraisal (State ERQ) .470* 9.301* 8.448* Skew and Kurtosis Scores for spontaneous regulation study measures. * Indicates significant departure from normality (p < .05)

Page | 206
Instructed Regulation Study
K-S normality test statistic
Skew z-score Kurtosis z-score
Trait measures:
HPS score .083 .578 -.716 DASS Depression Score .200* 5.201* 2.91* RPA Dampening Score .105* 1.098 -1.503 RPA Emotion Score .095 .585 .215
Change in Affect:
Pre Mood Induction Positive Affect .153* 1.95 1.02 Post Mood Induction Positive Affect .093 .05 .77 Positive Affect Change Score .167* .67 2.40* Pre Mood Induction Negative Affect .273* 6.58* 6.01* Post Mood Induction Negative Affect
.382* 3.46* 14.80*
Negative Affect Change Score .306* 3.42* 1.81
Emotion regulation strategies used:
Suppression .163* 2.82* -.48 Negative Reappraisal .379* 7.67* -1.90 Positive Reappraisal .181* 1.47 7.52* Skew and Kurtosis Scores for instructed regulation study measures. * Indicates significant departure from normality (p < .05)

Page | 207
Appendix 27: Chapter 3 Zero order and partial correlations (Spontaneous regulation study)
Hypomania (HPS) Anhedonic Depression (MASQ) Video Measure Zero-order Partial Zero-order Partial Baseline Emotion N/A Low Activation Emotions (n = 95) .026 -.436* -.420*
High Activation Emotions (n = 88) .083 -.330* -.367* Trait emotion regulation measures
N/A Overall Strategy Use .448* .369* -.150 STERQ Intrusion .459* .364* .147 STERQ Avoidance .260 .113
STERQ Expression -.015 .127 ERQ Suppression .013 -.439* -.416*
ERQ Reappraisal -.112 .240 Emotional Change
High Activation Low Activation Emotions (n = 95) .204 .280 .222 High Activation Emotions (n = 85) -.020 .175 Low Activation Low Activation Emotions (n = 94) -.014 .134 High Activation Emotions (n = 85) .109 .022
State emotion regulation measures
High Activation Overall Strategy Use .118 .203 STERQ Intrusion .279 .197 STERQ Avoidance .076 .089
STERQ Awareness -.012 -.322* STERQ Harnessing .216 -.028 ERQ Suppression -.024 .110
ERQ Positive Reappraisal .115 .144 ERQ Negative Reappraisal .016 .194 Low Activation
Overall Strategy Use .331* .190 STERQ Intrusion .356* .122 STERQ Avoidance .187 .145
STERQ Awareness -.129 -.345 STERQ Harnessing .250 -.082 ERQ Suppression .069 .185
ERQ Positive Reappraisal .256 .101 ERQ Negative Reappraisal .207 .183
* p < .002 1Partial correlate: General distress.

Page | 208
School of Psychology and Clinical
Language Sciences
University of Reading
Whiteknights
Reading RG6 6AL
Appendix 28: Participant Information Sheet – Buffering study video validation
Supervisors: Email: Phone: Dr Craig Steel [email protected] 0118 378 7550 Dr Anastasia Christakou [email protected] 0118 378 6298 Experimenters: Joanne Bower [email protected] 0118 378 6210 What is the study about?
This study is to find out how people respond to various video clips. You must be aged 18 or over to participate.
What do I have to do?
After providing us with some initial information about yourself, you will be asked to rate your current mood then carefully watch a short video. After the video we will ask you to rate your current mood again.
How long will it take?
We anticipate it taking less than 10 minutes to complete this study.
What will happen to my data if I take part?
All of your data will be stored anonymously within our database for the duration of the study and subsequent data analysis.
Are there any risks associated with participating in the study?
One of the videos may be upsetting. If you watch this video, you may feel temporarily distressed, however we anticipate this being transient and for you to experience no lasting effects as a result of participating.
What if I want to withdraw my consent?
Participating in the study is completely optional, and you are free to withdraw at any time. If during the questionnaires you decide you no longer want to take part, you can withdraw by closing your internet browser. If during the lab session you no longer wish to participate, please inform the experimenter
This application has been reviewed by the University Research Ethics Committee and has been given a favourable ethical opinion for conduct
By clicking “next” to enter into the study, we will assume that you have given your consent to participate.
Page | 209
School of Psychology and Clinical
Language Sciences
University of Reading
Whiteknights
Reading RG6 6AL
Appendix 29: Participant Information Sheet – buffering study online phase
Supervisors: Email: Phone: Dr Craig Steel [email protected] 0118 378 7550 Dr Anastasia Christakou [email protected] 0118 378 6298 Experimenters: Joanne Bower [email protected] 0118 378 6210 What is the study about?
This is a study to investigate how individual differences affect responses to different film clips
What do I have to do?
In this session you will answer a series of questionnaires about yourself. Some of the information may be quite personal but your responses will be confidential and anonymous. We will also ask you to watch a short video and will ask about your responses to it.
After you have completed this session, you will also participate in a laboratory session. Within this your height and weight will be measured and you will wear two ECG pads which will collect heart rate data for the duration of the session. Once connected to the ECG pads, you will watch four short videos, one of which may make you feel temporarily distressed. However we do not anticipate you will experience any lasting effects from this. After you have seen the videos we will ask you some questions about your responses to them.
How long will it take?
We anticipate the questionnaire completion to take no longer than 20 minutes and the laboratory session to take approximately 40 minutes.
What will happen to my data if I take part?
All of your data will be stored anonymously within our database for the duration of the study and subsequent data analysis.
Are there any risks associated with participating in the study?
You may feel temporarily distressed after watching one of the videos, however we anticipate this being transient and for you to experience no lasting effects as a result of participating.
What if I want to withdraw my consent?
Participating in the study is completely optional, and you are free to withdraw at any time. If during the questionnaires you decide you no longer want to take part, you can withdraw by closing your internet browser. If during the lab session you no longer wish to participate, please inform the experimenter
This application has been reviewed by the University Research Ethics Committee and has been given a favourable ethical opinion for conduct
By clicking “next” to enter into the study, we will assume that you have given your consent to
participate.

Page | 210
School of Psychology and Clinical
Language Sciences
University of Reading
Whiteknights
Reading RG6 6AL
Appendix 30: Participant Information Sheet – Buffering study laboratory session
Supervisors: Email: Phone: Dr Craig Steel [email protected] 0118 378 7550 Dr Anastasia Christakou [email protected] 0118 378 6298 Experimenters: Joanne Bower [email protected] 0118 378 6210 What is the study about?
This is a study to investigate how individual differences affect responses to different film clips
What do I have to do?
In this session we will measure your height and weight and then attach two ECG pads which will
collect heart rate data for the duration of the study. After collecting some baseline data, you will
watch four videos, one of which may make you feel temporarily distressed. However we do not
anticipate you will experience any lasting effects from this. After you have seen the videos we will ask
you some questions about your responses to them.
How long will it take?
We anticipate this session to take approximately 40 minutes.
What will happen to my data if I take part?
All of your data from this session will be combined with your questionnaire responses, and will be
stored anonymously within our database for the duration of the study and subsequent data analysis.
Are there any risks associated with participating in the study?
You may feel temporarily distressed after watching one of the videos, however we anticipate this
being transient and for you to experience no lasting effects as a result of participating.
What if I want to withdraw my consent?
Participating in the study is completely optional, and you are free to withdraw at any time. If you no
longer wish to participate, please inform the experimenter.
This application has been reviewed by the University Research Ethics Committee and has been given
a favourable ethical opinion for conduct

Page | 211
Appendix 31: Chapter 5 Skew and Kurtosis Values
Scale Kolmogorov-Smirnov statistic Skew Z scores Kurtosis Z scores
HPS total .127* 2.942688* 0.598634 MASQ Anhedonic depression .079 1.802098 0.655732 State Positive Emotions
Rating 1 .073 0.211409 -1.12177 Rating 2 .070 0.447856 -0.80042
Rating 3 .082 2.37917* 1.355628 Rating 4 .134* 3.76172* 2.730059* State Negative Emotions
Rating 1 .238* 7.155017* 8.348039* Rating 2 .261* 8.215589* 11.93731*
Rating 3 .119* 4.577325* 5.700386* Rating 4 .272* 6.228485* 5.59796* Skew and Kurtosis statistics for chapter 5 variables *Significant p < .05