Regulation of mitochondrial gene expression by energy demand in neural cells
11
Regulation of mitochondrial gene expression by energy demand in neural cells Zara Mehrabian,* Li-Ing Liu, Gary Fiskum,* Stanley I. Rapoport and Krish Chandrasekaran* *Department of Anesthesiology, University of Maryland School of Medicine, Baltimore, Maryland, USA Section on Brain Physiology and Metabolism, National Institute on Aging, National Institutes of Health, Bethesda, Maryland, USA Abstract Mitochondrial DNA (mtDNA) encodes critical subunit proteins of the oxidative phosphorylation (OXPHOS) complex that gener- ates ATP. This study tested the hypothesis that mitochondrial gene expression in neural cells is regulated by energy demand, as modified via stimulation of cellular sodium transport. Expo- sure of PC12S cells to the sodium ionophore monensin (250 nM) for 1–6 h caused a 13–60% decrease in cellular ATP (from 15 to 5 nmol per mg protein at 6 h). Levels of mitoch- ondrial DNA-encoded mRNAs (mt-mRNAs) increased signifi- cantly (150%) within the first hour of exposure to monensin, and then decreased significantly (50%) at 3–4 h. Levels of mtDNA- encoded 12S rRNA and nuclear DNA-encoded OXPHOS subunit mRNAs were not significantly affected. Exposure of primary cerebellar neuronal cultures to the excitatory amino acid glutamate caused a similar rapid and significant increase followed by a significant decrease in cell mt-mRNA levels. The monensin-induced initial increase in mt-mRNA levels was abolished by pretreatment with actinomycin D or by reducing extracellular sodium ion concentration. The monensin-induced delayed reduction in mt-mRNA levels was accelerated in the presence of actinomycin D, and was accompanied by a 67% reduction in the half-life (from 3.6 to 1.2 h). Exposure of PC12S cells to 2-deoxy-D-glucose significantly decreased cellular ATP levels (from 14.2 to 7.1 nmol per mg protein at 8 h), and in- creased mt-mRNA levels. These results suggest a physiologi- cal transcriptional mechanism of regulation of mitochondrial gene expression by energy demand and a post-transcriptional regulation that is independent of energy status of the cell. Keywords: mitochondrial DNA, monensin, mRNA half-life, post-transcription, RNase-L, transcription. J. Neurochem. (2005) 93, 850–860. The mammalian brain is characterized by a high rate of glucose consumption, high content of carriers and enzymes for glucose transport and metabolism, a high rate of oxidative phosphorylation (OXPHOS) in mitochondria, and a high ATP consumption (Erecinska and Silver 1989; Wong-Riley 1989). Furthermore, the rates of glucose utilization and activities of the OXPHOS enzymes that generate ATP correlate with neuronal activity (Hevner et al. 1995). ATP is the energy source for active ion pumping to maintain resting membrane potential, fast axoplasmic transport, membrane phospholipid turnover, synthesis of macromole- cules and neurotransmitters, and other cellular processes (Erecinska and Silver 1989; Wong-Riley 1989; Purdon et al. 2002). Active ion pumping at synapses and dendrites by far consumes the most ATP (Erecinska and Silver 1989). The mitochondrial respiratory chain responsible for gen- eration of cellular ATP consists of five multisubunit OXPHOS enzyme complexes. Four of these, Complexes I, III, IV and V, are bipartite and consist of subunits derived from both mitochondrial DNA (mtDNA) and nuclear DNA (nDNA). MtDNA encodes 13 polypeptides, all of which are necessary for electron transport and OXPHOS. The remain- ing subunits are specified by the nuclear genome. Both mtDNA and nDNA-encoded subunits are required to form active enzyme complexes (Attardi and Schatz 1988). Received September 27, 2004; revised manuscript received December 17, 2004; accepted December 23, 2004. Address correspondence and reprint requests to Dr Krish Chand- rasekaran, Department of Anesthesiology, University of Maryland School of Medicine, Medical School Teaching Facility 5–34, 685 West Baltimore Street, Baltimore, MD 21201, USA. E-mail: [email protected] Abbreviations used: [Ca 2+ ] i , intracellular calcium concentration; COX, cytochrome oxidase; cyt, cytochrome; DMEM, Dulbecco’s modified Eagle’s medium; DPBS, Dulbecco’s phosphate-buffered saline; mtDNA, mitochondrial DNA, mt-mRNA, mitochondrial DNA-encoded mRNA; [Na + ] e , extracellular sodium concentration; [Na + ] i , intracellular sodium concentration; ND, NADH dehydrogenase; nDNA, nuclear DNA; NRF, nuclear respiratory factor; OXPHOS, oxidative phosphorylation; SDH, succinate dehydrogenase. Journal of Neurochemistry , 2005, 93, 850–860 doi:10.1111/j.1471-4159.2005.03066.x 850 ȑ 2005 International Society for Neurochemistry, J. Neurochem. (2005) 93, 850–860
-
Upload
independent -
Category
Documents
-
view
4 -
download
0
Transcript of Regulation of mitochondrial gene expression by energy demand in neural cells
Regulation of mitochondrial gene expression by energy demandin neural cells
Zara Mehrabian,* Li-Ing Liu,� Gary Fiskum,* Stanley I. Rapoport� and Krish Chandrasekaran*
*Department of Anesthesiology, University of Maryland School of Medicine, Baltimore, Maryland, USA
�Section on Brain Physiology and Metabolism, National Institute on Aging, National Institutes of Health, Bethesda, Maryland, USA
Abstract
Mitochondrial DNA (mtDNA) encodes critical subunit proteins of
the oxidative phosphorylation (OXPHOS) complex that gener-
ates ATP. This study tested the hypothesis that mitochondrial
gene expression in neural cells is regulated by energy demand,
as modified via stimulation of cellular sodium transport. Expo-
sure of PC12S cells to the sodium ionophore monensin
(250 nM) for 1–6 h caused a 13–60% decrease in cellular ATP
(from 15 to 5 nmol per mg protein at 6 h). Levels of mitoch-
ondrial DNA-encoded mRNAs (mt-mRNAs) increased signifi-
cantly (150%) within the first hour of exposure tomonensin, and
then decreased significantly (50%) at 3–4 h. Levels of mtDNA-
encoded 12S rRNA and nuclear DNA-encoded OXPHOS
subunit mRNAs were not significantly affected. Exposure of
primary cerebellar neuronal cultures to the excitatory amino
acid glutamate caused a similar rapid and significant increase
followed by a significant decrease in cell mt-mRNA levels. The
monensin-induced initial increase in mt-mRNA levels was
abolished by pretreatment with actinomycin D or by reducing
extracellular sodium ion concentration. The monensin-induced
delayed reduction in mt-mRNA levels was accelerated in the
presence of actinomycin D, and was accompanied by a 67%
reduction in the half-life (from 3.6 to 1.2 h). Exposure of PC12S
cells to 2-deoxy-D-glucose significantly decreased cellular ATP
levels (from 14.2 to 7.1 nmol per mg protein at 8 h), and in-
creased mt-mRNA levels. These results suggest a physiologi-
cal transcriptional mechanism of regulation of mitochondrial
gene expression by energy demand and a post-transcriptional
regulation that is independent of energy status of the cell.
Keywords: mitochondrial DNA, monensin, mRNA half-life,
post-transcription, RNase-L, transcription.
J. Neurochem. (2005) 93, 850–860.
The mammalian brain is characterized by a high rate ofglucose consumption, high content of carriers and enzymesfor glucose transport and metabolism, a high rate of oxidativephosphorylation (OXPHOS) in mitochondria, and a highATP consumption (Erecinska and Silver 1989; Wong-Riley1989). Furthermore, the rates of glucose utilization andactivities of the OXPHOS enzymes that generate ATPcorrelate with neuronal activity (Hevner et al. 1995). ATPis the energy source for active ion pumping to maintainresting membrane potential, fast axoplasmic transport,membrane phospholipid turnover, synthesis of macromole-cules and neurotransmitters, and other cellular processes(Erecinska and Silver 1989; Wong-Riley 1989; Purdon et al.2002). Active ion pumping at synapses and dendrites by farconsumes the most ATP (Erecinska and Silver 1989).
The mitochondrial respiratory chain responsible for gen-eration of cellular ATP consists of five multisubunitOXPHOS enzyme complexes. Four of these, Complexes I,III, IV and V, are bipartite and consist of subunits derivedfrom both mitochondrial DNA (mtDNA) and nuclear DNA
(nDNA). MtDNA encodes 13 polypeptides, all of which arenecessary for electron transport and OXPHOS. The remain-ing subunits are specified by the nuclear genome. BothmtDNA and nDNA-encoded subunits are required to formactive enzyme complexes (Attardi and Schatz 1988).
Received September 27, 2004; revised manuscript received December17, 2004; accepted December 23, 2004.Address correspondence and reprint requests to Dr Krish Chand-
rasekaran, Department of Anesthesiology, University of MarylandSchool of Medicine, Medical School Teaching Facility 5–34, 685 WestBaltimore Street, Baltimore, MD 21201, USA.E-mail: [email protected] used: [Ca2+]i, intracellular calcium concentration; COX,
cytochrome oxidase; cyt, cytochrome; DMEM, Dulbecco’s modifiedEagle’s medium; DPBS, Dulbecco’s phosphate-buffered saline; mtDNA,mitochondrial DNA, mt-mRNA, mitochondrial DNA-encoded mRNA;[Na+]e, extracellular sodium concentration; [Na+]i, intracellular sodiumconcentration; ND, NADH dehydrogenase; nDNA, nuclear DNA; NRF,nuclear respiratory factor; OXPHOS, oxidative phosphorylation; SDH,succinate dehydrogenase.
Journal of Neurochemistry, 2005, 93, 850–860 doi:10.1111/j.1471-4159.2005.03066.x
850 � 2005 International Society for Neurochemistry, J. Neurochem. (2005) 93, 850–860
Changes in levels of mtDNA-encoded mRNA (mt-mRNA)occur rapidly in response to changes in energy requirementof the cell. Decreased neuronal activity, induced by afferentimpulse blockade, decreases neuronal mt-mRNA (Wong-Riley et al. 1997), whereas removal of the afferent impulseblockade restores basal mRNA levels (Hevner and Wong-Riley 1993), suggesting feedback regulation of mitochondrialgene expression by energy demand (Wong-Riley et al.1997). Consistent with this reasoning, an in organellomethod demonstrated that high intramitochondrial ATPlevels suppress transcription of mtDNA, suggesting howenergy demand can regulate mtDNA transcription (Gainesand Attardi 1984; Enriquez et al. 1996; DasGupta et al.2001). Apart from transcriptional control, mitochondrial geneexpression depends on differences in RNA stability (Gelfandand Attardi 1981; Attardi et al. 1990). Although mitochond-rial gene expression is a major component in the regulationof energy metabolism of the cell, the contributions oftranscriptional and post-transcriptional mechanisms to thisregulation are not known (Kagawa and Ohta 1990).
The aim of our present study was to investigate themechanism(s) of regulation of mitochondrial gene expressionunder conditions of increasing energy demand. Cellularenergy demand was increased by exposing rat pheochrom-ocytoma PC12 cultures to the Na+ ionophore monensin(Pressman and Fahim 1982), or by exposing primaryneuronal cultures to the excitatory amino acid glutamate(Ankarcrona et al. 1995), then measuring ATP and levels ofmtDNA-encoded and nDNA-encoded OXPHOS mRNAs.Our results indicate a selective initial increase and asubsequent decrease in mt-mRNA in both monensin- andglutamate-treated cells. The initial increase is due totranscriptional regulation dependent on the energy status ofthe cell, whereas the subsequent decrease is due to post-transcriptional regulation that is independent of the cell’senergy status. Part of this work has been published as anabstract (Liu et al. 1999).
Materials and methods
Chemicals
Reagents and chemicals were of the highest grade available from
Sigma Chemical Co. (St Louis, MO, USA). Stock solutions of
ouabain and actinomycin D were prepared in water, whereas
monensin and ionomycin were dissolved in 95% ethanol. When
ethanol was used as a solvent, appropriate control experiments were
conducted using the vehicle alone. Ethanol concentrations were
always < 0.1%.
Culture of PC12S cells
A morphological variant of rat pheochromocytoma PC12 cells
(PC12S) that has the ability to grow in tissue culture dishes without
polylysine treatment was used in the experiments (Fukuyama et al.1993). The PC12S cells were maintained in Dulbecco’s modified
Eagle’s medium (DMEM) containing 2 mM glutamine, 7.5% heat-
inactivated fetal calf serum, 7.5% heat-inactivated horse serum and
penicillin–streptomycin.
Primary rat cerebellar cultures
Procedures involving animals and their care were conducted in
conformity with institutional guidelines that are in compliance with
national and international laws and policies (National Institutes of
Health (NIH) Guide for the Care and Use of Laboratory Animals,
NIH publication no. 85–23, 1985).
Cerebellar granule neurons were prepared from brains of 7-day-
old Sprague–Dawley rats using a standard method (Schousboe et al.1989). Neurons were plated at a density of 2 · 105 cells/cm2 in six-
well tissue culture chambers coated with poly-L-lysine (MW
30 000–700 000) and were cultured in Eagle’s basal medium
supplemented with Earle’s salts, 10% inactivated fetal calf serum,
25 mM KCl and gentamicin (50 ng/mL). Neuronal cultures were
incubated at 37�C in a humidified atmosphere containing 5% CO2/
95% air. Twenty-four hours after plating, cytosine arabinoside
(10 lM) was added to the cultures to prevent growth of glial cells.
To ensure sensitivity to glutamate, we routinely used 8-day-old
cerebellar neuronal cultures.
Exposure to monensin, ouabain, ionomycin or 2-deoxy-D-
glucose
PC12S cells grown in 100 · 15 mm dishes were treated with
vehicle, monensin (final concentration 250 nM), ouabain (final
concentration 1 mM) or ionomycin (final concentration 3 lM). Attimed points over a 6–8-h period, cells were washed with
Dulbecco’s phosphate-buffered saline (DPBS) without calcium
and magnesium, and total RNA was isolated using RNA-Bee
reagent as recommended by the manufacturer (TEL-TEST Inc.,
Friendswood, TX, USA). Total RNA was subjected to northern blot
analysis as described below.
For experiments with 2-deoxy-D-glucose, this reagent was added
at a concentration of 4.5 g/L to glucose-free DMEM containing
pyruvate (110 mg/L). At timed points over an 8-h period, the cells
were exposed to this medium and total RNA was isolated.
The effect of extracellular sodium ([Na+]e) on monensin-induced
changes in mt-mRNA levels was studied by changing [Na+]e from
125 mM to 62.5 mM or 31.25 mM. Briefly, the amount of sodium
chloride in constituted culture medium was decreased and replaced
with a corresponding concentration of choline chloride (Choi 1987).
The effect of monensin on the stability of mtDNA- and nDNA-
encoded transcripts was determined by adding the transcriptional
inhibitor actinomycin D to the cultures at a final concentration of
5 lg/mL. After 1 h, either vehicle or monensin was added. Total
RNAwas isolated at various times over timed periods and processed
for northern blot analysis.
Exposure of neurons to glutamate
On day 8 in culture, the cell culture medium was removed and
stored. Neuronal cultures were washed once with prewarmed (37�C)Locke solution (134 mM NaCl, 5 mM KCl, 4 mM NaHCO3, 5 mM
HEPES, pH 7.4, 2.3 mM CaCl2 and 5 mM glucose) and incubated
for 15 min. Immediately thereafter, L-glutamate (100 lM) and
glycine (10 lM) were added, and the cells were further incubated
for 30 min at room temperature (24�C). The cells then were washed
Neuronal regulation of mitochondrial gene expression 851
� 2005 International Society for Neurochemistry, J. Neurochem. (2005) 93, 850–860
and kept in the old culture medium without glutamate for up to 24 h.
Control cultures were treated with vehicle over the same time period
as that of glutamate-treated cells. At timed points over an 8-h period,
neuronal cultures were washed with DPBS; total RNA was isolated
and subjected to northern blot analysis.
Cell viability
Cell viability was determined using a two-color fluorescence assay
based on the simultaneous determination of live and dead cells. Two
probes were employed that measure two recognized parameters of
cell viability: intracellular esterase activity and plasma membrane
integrity. Viable cells were quantified after staining of cells with
cell-permeant dye calcein AM (2 lM). Non-viable cells were
quantified with cell-impermeant propidium iodide (10 lg/mL).
The ratio of the number of cells that displayed propidium iodide
fluorescence (non-viable) to the total number of cells in a field was
determined.
RNA analysis
Some 2–10 lg total RNA was run on a 1.2% formaldehyde agarose
gel, stained with ethidium bromide. 28S rRNA and 18S rRNAwere
imaged and quantified to confirm equal loading of RNA, and the gel
was then transferred on to a GeneScreen Plus membrane as described
by the manufacturer (Dupont, New England Nuclear, MA, USA).
Prehybridization and hybridization were done with Hybridizol
reagent (Hybridizol I and II in a ratio of 3 : 2; Serologicals
Corporation, Norcross, GA, USA). The blots were prehybridized at
37�C for 16 h and hybridized with 32P-labeled mtDNA- and nDNA-
encoded gene probes at 37�C for 48 h (Chandrasekaran et al. 1994).The blots were washed with increasing stringency and the final wash
was performed at 65�C with 0.2 · SSC (1 · SSC contains 150 mM
sodium chloride and 15 mM sodium citrate) and 1% sodium dodecyl
sulfate. The blots were exposed to X-ray film (Bio-max MS, Kodak,
Rochester, NY, USA) with an intensifying screen for 45 min to
2 days at ) 70�C. The probes were removed from the blots by placing
them in boiling Diethyl Pyrocarbonate (DEPC)-treated water for
10 min. The blots were then rehybridized with a 32P-labeled control
b-actin probe as described above. Finally the blots were hybridized
with 12S rRNA probe. The level of RNA hybridized was quantified
using an image analysis program. To maintain measured intensities
within the linear range, the blots hybridized with different probes
were exposed for different periods of time. The level of RNA was
quantified from autoradiograms of lower exposure than was used for
photography. Ratios of mt-mRNA to b-actin mRNA or 12S rRNA to
b-actin mRNA were calculated (Chandrasekaran et al. 1994).
Probe preparation and labeling
Mitochondrial DNA probes that simultaneously detect several mt-
mRNAs were used (Murdock et al. 1999). The probes were createdby amplifying nucleotides (nt) 3351–7570 of mtDNA (probe 1) and
nt 8861–14 549 of mtDNA (probe 2). Probe 1 hybridized to
mtDNA-encoded NADH dehydrogenase (ND) subunit 1 (ND1),
ND2, cytochrome oxidase (COX) subunit I (COX I) and COX II
mRNAs. Probe 2 hybridized to ND5, ND4 and ND4L, cytochrome
b (cyt b) and COX III mRNAs. cDNA inserts of b-actin cDNA and
12S rRNA clones were used as probes. In the case of nDNA-
encoded cytochrome c (cyt c), COX IV and succinate dehydroge-
nase (SDH) subunit B (SDH B), probes were prepared by RT–PCR
using gene-specific primers and were confirmed by sequencing. The
probes were radiolabeled by the random primer method.
Estimation of half-lives of mt-mRNAs, 12S rRNA and b-actinmRNA
Some 2–10 lg total RNA from cells treated with either vehicle or
monensin in the presence of actinomycin D was subjected to
northern blot analysis. The blots were hybridized with mtDNA
probe 2, 12S rRNA, b-actin, COX IVand COX VIII probes, and the
levels of respective RNA species quantified. Levels of b-actinmRNA are expressed as a percentage of the b-actin mRNA
remaining at each experimental time compared with time zero.
Levels of mt-mRNA, 12S rRNA, COX IV mRNA and COX VIII
mRNA were calculated as the ratio of the respective species to the
level of b-actin mRNA. At each experimental time, the RNA ratios
are expressed as a percentage of the ratio at time zero. The half-lives
were determined from the equation t1/2 ¼ 0.301/slope of the best fit
line (log10 remaining RNA vs. time).
Measurement of ATP and intracellular sodium ([Na+]i)
Cellular ATP levels were determined luminometrically (Victor3,
Shelton, CT, USA); Perkin-Elmer Instruments using an ATP
Bioluminescence Assay Kit (Boehringer Ingelheim, Ridgefield,
CT, USA) according to the protocol provided. Briefly, after exposing
PC12S cells to vehicle, monensin or 2-deoxy-D-glucose, the
medium was withdrawn, the cells were exposed to lysis buffer
mixed with dilution buffer for 5 min and were then harvested by
scraping. Aliquots of cellular extracts were assayed for ATP content
using the ATP dependency of the light-emitting luciferase/luciferin
reagent. ATP concentration was determined from a standard curve.
Results were normalized with respect to cell protein concentration.
The culture medium was replaced with medium containing 22Na
(5 lCi or 185 KBq per ml). Measurement of intracellular 22Na
showed that equilibration between added radioactive label and
’cold’ sodium in the medium was achieved within 24 h. The cells
were then treated for various time periods with either the vehicle or
monensin (250 nM). The reaction was terminated by aspiration of
the medium, and the cells were quickly washed twice with ice-cold
DPBS and digested for 1 h in 0.2 mL 1 M NaOH at room
temperature. Cell digests were assayed for 22Na content by
scintillation counting.
Statistical analysis and replication of results
The results presented are representative of at least three to five
independent experiments. Where indicated, statistical analysis was
carried out using one-way ANOVA followed by Tukey’s test for
multiple comparisons. Mean ± SEM values are presented. Differ-
ences were considered significant when p < 0.05.
Results
Treatment of PC12S cells with monensin reduces cellular
ATP levels
Exposure of PC12S cell cultures to monensin (250 nM)caused a sustained 13–60% decrease in total cellular ATPlevels, from 15 ± 2 nmol per mg protein at time zero, to
852 Z. Mehrabian et al.
� 2005 International Society for Neurochemistry, J. Neurochem. (2005) 93, 850–860
13 ± 1.5, 10 ± 1, 8 ± 0.7 and 5 ± 0.5 nmol per mg protein at0.5, 1, 3 and 6 h respectively. Exposure of PC12S cells tomonensin for 6 h resulted in a 500% increase in intracellular22Na ([Na+]i) from 30 ± 5 to 150 ± 12 pmol per lg protein.Determination of cell viability using calcein AM andpropidium iodide showed no decrease in viability (> 95%propidium iodide negative) with exposure to monensin for upto 6 h. Our interpretation of these results is that exposure tomonensin in PC12S cells causes an influx of Na+, which inturn activates Na/K-ATPase, leading to increased consump-tion of ATP and decreased cellular ATP levels.
Biphasic changes in expression of mt-mRNAs induced
by exposure of PC12S cells to monensin
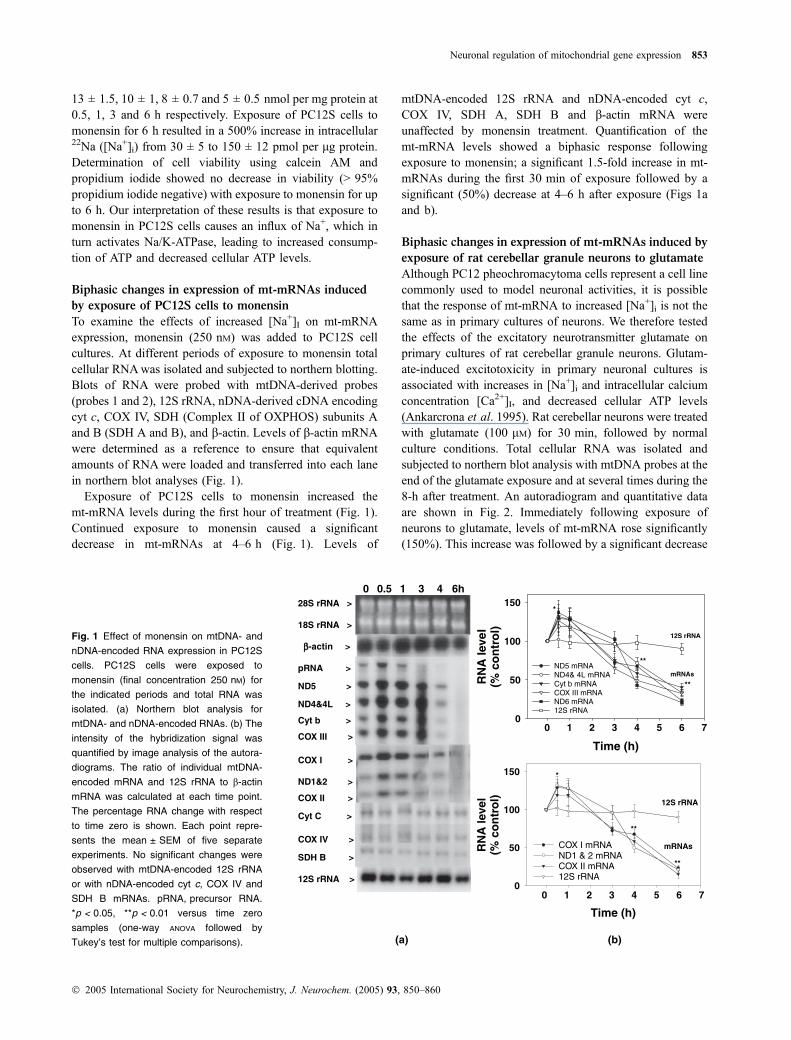
To examine the effects of increased [Na+]I on mt-mRNAexpression, monensin (250 nM) was added to PC12S cellcultures. At different periods of exposure to monensin totalcellular RNAwas isolated and subjected to northern blotting.Blots of RNA were probed with mtDNA-derived probes(probes 1 and 2), 12S rRNA, nDNA-derived cDNA encodingcyt c, COX IV, SDH (Complex II of OXPHOS) subunits Aand B (SDH A and B), and b-actin. Levels of b-actin mRNAwere determined as a reference to ensure that equivalentamounts of RNA were loaded and transferred into each lanein northern blot analyses (Fig. 1).
Exposure of PC12S cells to monensin increased themt-mRNA levels during the first hour of treatment (Fig. 1).Continued exposure to monensin caused a significantdecrease in mt-mRNAs at 4–6 h (Fig. 1). Levels of
mtDNA-encoded 12S rRNA and nDNA-encoded cyt c,COX IV, SDH A, SDH B and b-actin mRNA wereunaffected by monensin treatment. Quantification of themt-mRNA levels showed a biphasic response followingexposure to monensin; a significant 1.5-fold increase in mt-mRNAs during the first 30 min of exposure followed by asignificant (50%) decrease at 4–6 h after exposure (Figs 1aand b).
Biphasic changes in expression of mt-mRNAs induced by
exposure of rat cerebellar granule neurons to glutamate
Although PC12 pheochromacytoma cells represent a cell linecommonly used to model neuronal activities, it is possiblethat the response of mt-mRNA to increased [Na+]i is not thesame as in primary cultures of neurons. We therefore testedthe effects of the excitatory neurotransmitter glutamate onprimary cultures of rat cerebellar granule neurons. Glutam-ate-induced excitotoxicity in primary neuronal cultures isassociated with increases in [Na+]i and intracellular calciumconcentration [Ca2+]I, and decreased cellular ATP levels(Ankarcrona et al. 1995). Rat cerebellar neurons were treatedwith glutamate (100 lM) for 30 min, followed by normalculture conditions. Total cellular RNA was isolated andsubjected to northern blot analysis with mtDNA probes at theend of the glutamate exposure and at several times during the8-h after treatment. An autoradiogram and quantitative dataare shown in Fig. 2. Immediately following exposure ofneurons to glutamate, levels of mt-mRNA rose significantly(150%). This increase was followed by a significant decrease
28S rRNA >
18S rRNA >
ββ-actin >
pRNA >
ND5 >
ND4&4L >
Cyt b >
COX III >
COX I >
ND1&2 >
COX II >
Cyt C >
COX IV >
SDH B >
12S rRNA >
0 0.5 1 3 4 6h
Time (h)
0 1 2 3 4 5 6 7
0 1 2 3 4 5 6 7
RN
A le
vel
(% c
on
tro
l)
0
50
100
150
ND5 mRNAND4& 4L mRNA Cyt b mRNACOX III mRNAND6 mRNA12S rRNA
12S rRNA
mRNAs
**
**
*
Time (h
(a) (b)
)
RN
A le
vel
(% c
on
tro
l)
0
50
100
150
COX I mRNAND1 & 2 mRNACOX II mRNA12S rRNA
12S rRNA
mRNAs
**
**
*
Fig. 1 Effect of monensin on mtDNA- and
nDNA-encoded RNA expression in PC12S
cells. PC12S cells were exposed to
monensin (final concentration 250 nM) for
the indicated periods and total RNA was
isolated. (a) Northern blot analysis for
mtDNA- and nDNA-encoded RNAs. (b) The
intensity of the hybridization signal was
quantified by image analysis of the autora-
diograms. The ratio of individual mtDNA-
encoded mRNA and 12S rRNA to b-actin
mRNA was calculated at each time point.
The percentage RNA change with respect
to time zero is shown. Each point repre-
sents the mean ± SEM of five separate
experiments. No significant changes were
observed with mtDNA-encoded 12S rRNA
or with nDNA-encoded cyt c, COX IV and
SDH B mRNAs. pRNA, precursor RNA.
*p < 0.05, **p < 0.01 versus time zero
samples (one-way ANOVA followed by
Tukey’s test for multiple comparisons).
Neuronal regulation of mitochondrial gene expression 853
� 2005 International Society for Neurochemistry, J. Neurochem. (2005) 93, 850–860
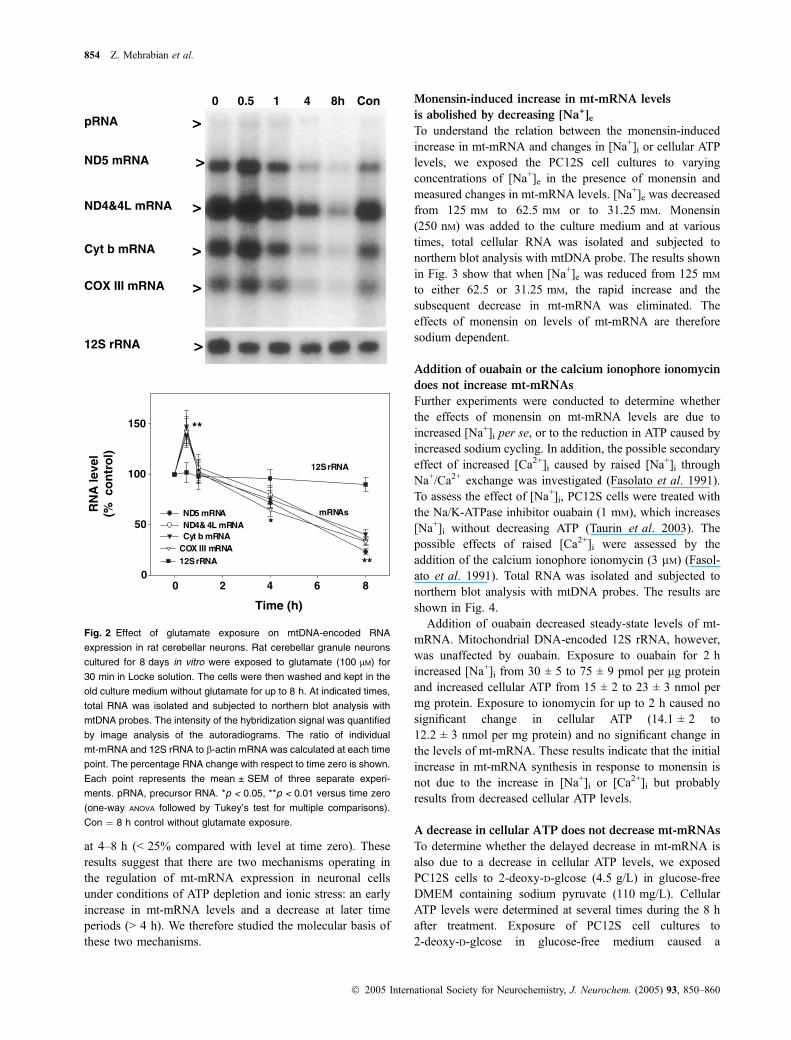
at 4–8 h (< 25% compared with level at time zero). Theseresults suggest that there are two mechanisms operating inthe regulation of mt-mRNA expression in neuronal cellsunder conditions of ATP depletion and ionic stress: an earlyincrease in mt-mRNA levels and a decrease at later timeperiods (> 4 h). We therefore studied the molecular basis ofthese two mechanisms.
Monensin-induced increase in mt-mRNA levels
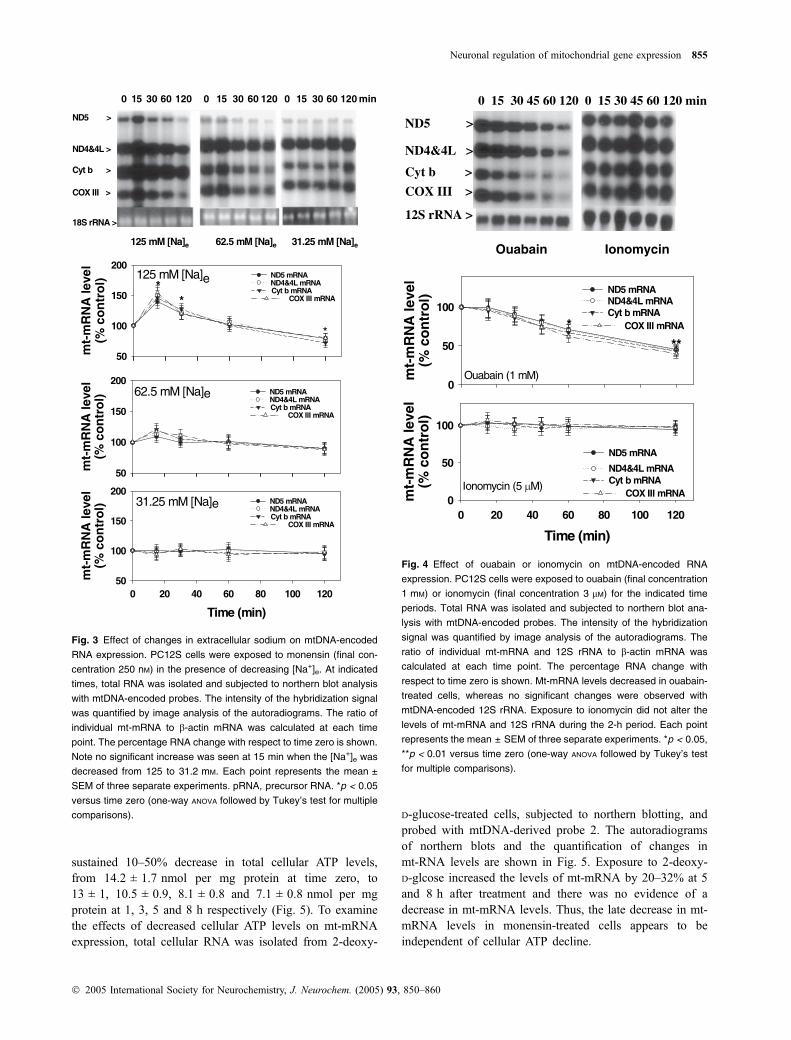
is abolished by decreasing [Na+]eTo understand the relation between the monensin-inducedincrease in mt-mRNA and changes in [Na+]i or cellular ATPlevels, we exposed the PC12S cell cultures to varyingconcentrations of [Na+]e in the presence of monensin andmeasured changes in mt-mRNA levels. [Na+]e was decreasedfrom 125 mM to 62.5 mM or to 31.25 mM. Monensin(250 nM) was added to the culture medium and at varioustimes, total cellular RNA was isolated and subjected tonorthern blot analysis with mtDNA probe. The results shownin Fig. 3 show that when [Na+]e was reduced from 125 mM
to either 62.5 or 31.25 mM, the rapid increase and thesubsequent decrease in mt-mRNA was eliminated. Theeffects of monensin on levels of mt-mRNA are thereforesodium dependent.
Addition of ouabain or the calcium ionophore ionomycin
does not increase mt-mRNAs
Further experiments were conducted to determine whetherthe effects of monensin on mt-mRNA levels are due toincreased [Na+]i per se, or to the reduction in ATP caused byincreased sodium cycling. In addition, the possible secondaryeffect of increased [Ca2+]i caused by raised [Na+]i throughNa+/Ca2+ exchange was investigated (Fasolato et al. 1991).To assess the effect of [Na+]i, PC12S cells were treated withthe Na/K-ATPase inhibitor ouabain (1 mM), which increases[Na+]i without decreasing ATP (Taurin et al. 2003). Thepossible effects of raised [Ca2+]i were assessed by theaddition of the calcium ionophore ionomycin (3 lM) (Fasol-ato et al. 1991). Total RNA was isolated and subjected tonorthern blot analysis with mtDNA probes. The results areshown in Fig. 4.
Addition of ouabain decreased steady-state levels of mt-mRNA. Mitochondrial DNA-encoded 12S rRNA, however,was unaffected by ouabain. Exposure to ouabain for 2 hincreased [Na+]i from 30 ± 5 to 75 ± 9 pmol per lg proteinand increased cellular ATP from 15 ± 2 to 23 ± 3 nmol permg protein. Exposure to ionomycin for up to 2 h caused nosignificant change in cellular ATP (14.1 ± 2 to12.2 ± 3 nmol per mg protein) and no significant change inthe levels of mt-mRNA. These results indicate that the initialincrease in mt-mRNA synthesis in response to monensin isnot due to the increase in [Na+]i or [Ca2+]i but probablyresults from decreased cellular ATP levels.
A decrease in cellular ATP does not decrease mt-mRNAs
To determine whether the delayed decrease in mt-mRNA isalso due to a decrease in cellular ATP levels, we exposedPC12S cells to 2-deoxy-D-glcose (4.5 g/L) in glucose-freeDMEM containing sodium pyruvate (110 mg/L). CellularATP levels were determined at several times during the 8 hafter treatment. Exposure of PC12S cell cultures to2-deoxy-D-glcose in glucose-free medium caused a
0 0.5 1 4 8h Con
pRNA >
ND5 mRNA >
ND4&4L mRNA >
Cyt b mRNA >
COX III mRNA >
12S rRNA >
Time (h)
RN
A le
vel
(% c
on
tro
l)
0
50
100
150
12S rRNA
mRNAsND5 mRNAND4& 4L mRNA Cyt b mRNA
COX III mRNA12S rRNA
**
*
**
0 2 4 6 8
Fig. 2 Effect of glutamate exposure on mtDNA-encoded RNA
expression in rat cerebellar neurons. Rat cerebellar granule neurons
cultured for 8 days in vitro were exposed to glutamate (100 lM) for
30 min in Locke solution. The cells were then washed and kept in the
old culture medium without glutamate for up to 8 h. At indicated times,
total RNA was isolated and subjected to northern blot analysis with
mtDNA probes. The intensity of the hybridization signal was quantified
by image analysis of the autoradiograms. The ratio of individual
mt-mRNA and 12S rRNA to b-actin mRNA was calculated at each time
point. The percentage RNA change with respect to time zero is shown.
Each point represents the mean ± SEM of three separate experi-
ments. pRNA, precursor RNA. *p < 0.05, **p < 0.01 versus time zero
(one-way ANOVA followed by Tukey’s test for multiple comparisons).
Con ¼ 8 h control without glutamate exposure.
854 Z. Mehrabian et al.
� 2005 International Society for Neurochemistry, J. Neurochem. (2005) 93, 850–860
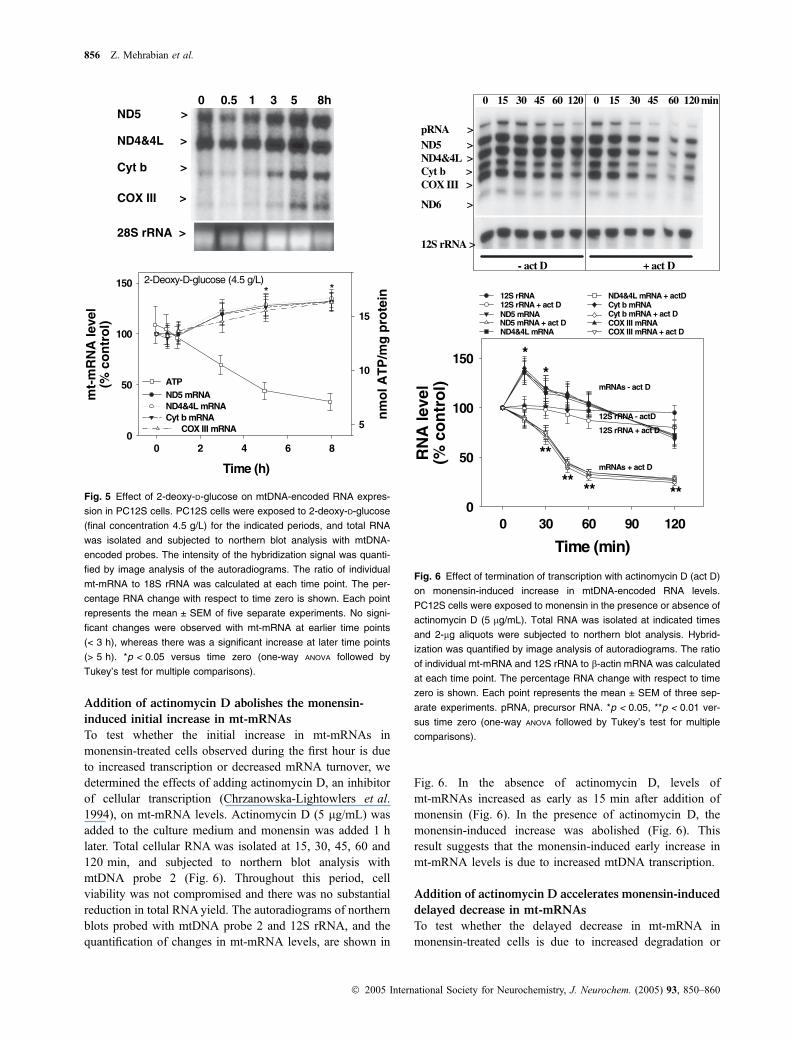
sustained 10–50% decrease in total cellular ATP levels,from 14.2 ± 1.7 nmol per mg protein at time zero, to13 ± 1, 10.5 ± 0.9, 8.1 ± 0.8 and 7.1 ± 0.8 nmol per mgprotein at 1, 3, 5 and 8 h respectively (Fig. 5). To examinethe effects of decreased cellular ATP levels on mt-mRNAexpression, total cellular RNA was isolated from 2-deoxy-
D-glucose-treated cells, subjected to northern blotting, andprobed with mtDNA-derived probe 2. The autoradiogramsof northern blots and the quantification of changes inmt-RNA levels are shown in Fig. 5. Exposure to 2-deoxy-D-glcose increased the levels of mt-mRNA by 20–32% at 5and 8 h after treatment and there was no evidence of adecrease in mt-mRNA levels. Thus, the late decrease in mt-mRNA levels in monensin-treated cells appears to beindependent of cellular ATP decline.
ND5 >
ND4&4L >
Cyt b >
COX III >
18S rRNA >
125 mM [Na]e 62.5 mM [Na]e 31.25 mM [Na]e
0 15 30 60 120 0 15 30 60 120 0 15 30 60 120 minm
t-m
RN
A le
vel
(% c
on
tro
l)
50
100
150
200ND5 mRNAND4&4L mRNACyt b mRNA
COX III mRNA
62.5 mM [Na]e
Time (min)
0 20 40 60 80 100 120
mt-
mR
NA
leve
l(%
co
ntr
ol)
50
100
150
200ND5 mRNAND4&4L mRNACyt b mRNA
COX III mRNA
31.25 mM [Na]e
**
mt-
mR
NA
leve
l(%
co
ntr
ol)
50
100
150
200ND5 mRNAND4&4L mRNACyt b mRNA
COX III mRNA
125 mM [Na]e**
*
Fig. 3 Effect of changes in extracellular sodium on mtDNA-encoded
RNA expression. PC12S cells were exposed to monensin (final con-
centration 250 nM) in the presence of decreasing [Na+]e. At indicated
times, total RNA was isolated and subjected to northern blot analysis
with mtDNA-encoded probes. The intensity of the hybridization signal
was quantified by image analysis of the autoradiograms. The ratio of
individual mt-mRNA to b-actin mRNA was calculated at each time
point. The percentage RNA change with respect to time zero is shown.
Note no significant increase was seen at 15 min when the [Na+]e was
decreased from 125 to 31.2 mM. Each point represents the mean ±
SEM of three separate experiments. pRNA, precursor RNA. *p < 0.05
versus time zero (one-way ANOVA followed by Tukey’s test for multiple
comparisons).
0 15 30 45 60 120 0 15 30 45 60 120 min
ND5 >
ND4&4L >
Cyt b >
COX III >
12S rRNA >
Ouabain Ionomycin
Time (min)
0 20 40 60 80 100 120
mt-
mR
NA
leve
l(%
co
ntr
ol)
0
50
100
ND5 mRNA
ND4&4L mRNACyt b mRNA
COX III mRNAIonomycin (5 M)
mt-
mR
NA
leve
l(%
co
ntr
ol)
0
50
100
Ouabain (1 mM)
***
ND5 mRNAND4&4L mRNACyt b mRNA
COX III mRNA
Fig. 4 Effect of ouabain or ionomycin on mtDNA-encoded RNA
expression. PC12S cells were exposed to ouabain (final concentration
1 mM) or ionomycin (final concentration 3 lM) for the indicated time
periods. Total RNA was isolated and subjected to northern blot ana-
lysis with mtDNA-encoded probes. The intensity of the hybridization
signal was quantified by image analysis of the autoradiograms. The
ratio of individual mt-mRNA and 12S rRNA to b-actin mRNA was
calculated at each time point. The percentage RNA change with
respect to time zero is shown. Mt-mRNA levels decreased in ouabain-
treated cells, whereas no significant changes were observed with
mtDNA-encoded 12S rRNA. Exposure to ionomycin did not alter the
levels of mt-mRNA and 12S rRNA during the 2-h period. Each point
represents the mean ± SEM of three separate experiments. *p < 0.05,
**p < 0.01 versus time zero (one-way ANOVA followed by Tukey’s test
for multiple comparisons).
Neuronal regulation of mitochondrial gene expression 855
� 2005 International Society for Neurochemistry, J. Neurochem. (2005) 93, 850–860
Addition of actinomycin D abolishes the monensin-
induced initial increase in mt-mRNAs
To test whether the initial increase in mt-mRNAs inmonensin-treated cells observed during the first hour is dueto increased transcription or decreased mRNA turnover, wedetermined the effects of adding actinomycin D, an inhibitorof cellular transcription (Chrzanowska-Lightowlers et al.1994), on mt-mRNA levels. Actinomycin D (5 lg/mL) wasadded to the culture medium and monensin was added 1 hlater. Total cellular RNA was isolated at 15, 30, 45, 60 and120 min, and subjected to northern blot analysis withmtDNA probe 2 (Fig. 6). Throughout this period, cellviability was not compromised and there was no substantialreduction in total RNAyield. The autoradiograms of northernblots probed with mtDNA probe 2 and 12S rRNA, and thequantification of changes in mt-mRNA levels, are shown in
Fig. 6. In the absence of actinomycin D, levels ofmt-mRNAs increased as early as 15 min after addition ofmonensin (Fig. 6). In the presence of actinomycin D, themonensin-induced increase was abolished (Fig. 6). Thisresult suggests that the monensin-induced early increase inmt-mRNA levels is due to increased mtDNA transcription.
Addition of actinomycin D accelerates monensin-induced
delayed decrease in mt-mRNAs
To test whether the delayed decrease in mt-mRNA inmonensin-treated cells is due to increased degradation or
ND5 >
ND4&4L >
Cyt b >
COX III >
28S rRNA >
Time (h)
mt-
mR
NA
leve
l(%
co
ntr
ol)
0
50
100
150 2-Deoxy-D-glucose (4.5 g/L) * *
ND5 mRNAND4&4L mRNACyt b mRNA
COX III mRNA
ATPn
mo
l AT
P/m
gp
rote
in
5
10
15
0 2 4 6 8
0 0.5 1 53 8h
Fig. 5 Effect of 2-deoxy-D-glucose on mtDNA-encoded RNA expres-
sion in PC12S cells. PC12S cells were exposed to 2-deoxy-D-glucose
(final concentration 4.5 g/L) for the indicated periods, and total RNA
was isolated and subjected to northern blot analysis with mtDNA-
encoded probes. The intensity of the hybridization signal was quanti-
fied by image analysis of the autoradiograms. The ratio of individual
mt-mRNA to 18S rRNA was calculated at each time point. The per-
centage RNA change with respect to time zero is shown. Each point
represents the mean ± SEM of five separate experiments. No signi-
ficant changes were observed with mt-mRNA at earlier time points
(< 3 h), whereas there was a significant increase at later time points
(> 5 h). *p < 0.05 versus time zero (one-way ANOVA followed by
Tukey’s test for multiple comparisons).
0 15 30 45 60 120 0 15 30 45 60 120 min
pRNA >ND5 >ND4&4L >Cyt b >COX III >
ND6 >
12S rRNA >
- + act D
- act D
Time (min)0 30 60 90 120
RN
A le
vel
(% c
on
tro
l)
0
50
100
150
mRNAs - act D
12S rRNA - actD
12S rRNA + act D
mRNAs + act D
*
**
** ** **
*
12S rRNA 12S rRNA + act D ND5 mRNA ND5 mRNA + act D ND4&4L mRNA
ND4&4L mRNA + actD Cyt b mRNA Cyt b mRNA + act D COX III mRNA COX III mRNA + act D
Fig. 6 Effect of termination of transcription with actinomycin D (act D)
on monensin-induced increase in mtDNA-encoded RNA levels.
PC12S cells were exposed to monensin in the presence or absence of
actinomycin D (5 lg/mL). Total RNA was isolated at indicated times
and 2-lg aliquots were subjected to northern blot analysis. Hybrid-
ization was quantified by image analysis of autoradiograms. The ratio
of individual mt-mRNA and 12S rRNA to b-actin mRNA was calculated
at each time point. The percentage RNA change with respect to time
zero is shown. Each point represents the mean ± SEM of three sep-
arate experiments. pRNA, precursor RNA. *p < 0.05, **p < 0.01 ver-
sus time zero (one-way ANOVA followed by Tukey’s test for multiple
comparisons).
856 Z. Mehrabian et al.
� 2005 International Society for Neurochemistry, J. Neurochem. (2005) 93, 850–860
decreased synthesis, we determined the half-lives ofmt-mRNA, mtDNA-encoded 12S rRNA, nDNA-encodedCOX IV, COX VIII and b-actin mRNA in control and
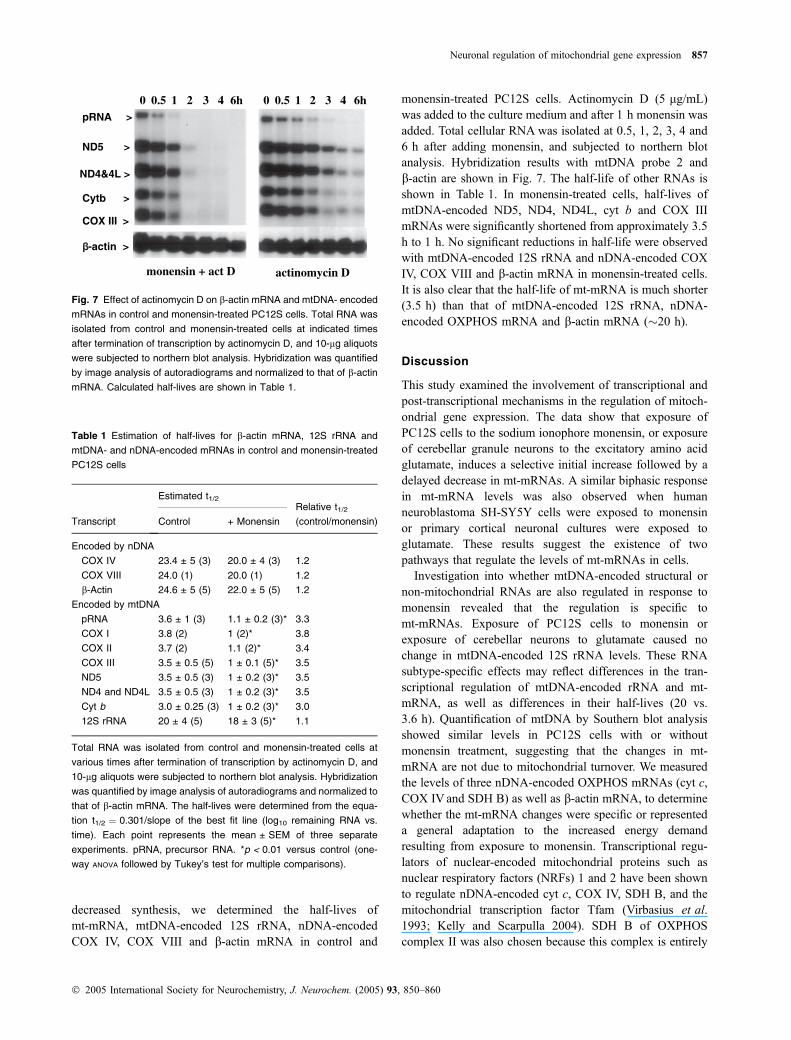
monensin-treated PC12S cells. Actinomycin D (5 lg/mL)was added to the culture medium and after 1 h monensin wasadded. Total cellular RNA was isolated at 0.5, 1, 2, 3, 4 and6 h after adding monensin, and subjected to northern blotanalysis. Hybridization results with mtDNA probe 2 andb-actin are shown in Fig. 7. The half-life of other RNAs isshown in Table 1. In monensin-treated cells, half-lives ofmtDNA-encoded ND5, ND4, ND4L, cyt b and COX IIImRNAs were significantly shortened from approximately 3.5h to 1 h. No significant reductions in half-life were observedwith mtDNA-encoded 12S rRNA and nDNA-encoded COXIV, COX VIII and b-actin mRNA in monensin-treated cells.It is also clear that the half-life of mt-mRNA is much shorter(3.5 h) than that of mtDNA-encoded 12S rRNA, nDNA-encoded OXPHOS mRNA and b-actin mRNA (�20 h).
Discussion
This study examined the involvement of transcriptional andpost-transcriptional mechanisms in the regulation of mitoch-ondrial gene expression. The data show that exposure ofPC12S cells to the sodium ionophore monensin, or exposureof cerebellar granule neurons to the excitatory amino acidglutamate, induces a selective initial increase followed by adelayed decrease in mt-mRNAs. A similar biphasic responsein mt-mRNA levels was also observed when humanneuroblastoma SH-SY5Y cells were exposed to monensinor primary cortical neuronal cultures were exposed toglutamate. These results suggest the existence of twopathways that regulate the levels of mt-mRNAs in cells.
Investigation into whether mtDNA-encoded structural ornon-mitochondrial RNAs are also regulated in response tomonensin revealed that the regulation is specific tomt-mRNAs. Exposure of PC12S cells to monensin orexposure of cerebellar neurons to glutamate caused nochange in mtDNA-encoded 12S rRNA levels. These RNAsubtype-specific effects may reflect differences in the tran-scriptional regulation of mtDNA-encoded rRNA and mt-mRNA, as well as differences in their half-lives (20 vs.3.6 h). Quantification of mtDNA by Southern blot analysisshowed similar levels in PC12S cells with or withoutmonensin treatment, suggesting that the changes in mt-mRNA are not due to mitochondrial turnover. We measuredthe levels of three nDNA-encoded OXPHOS mRNAs (cyt c,COX IV and SDH B) as well as b-actin mRNA, to determinewhether the mt-mRNA changes were specific or representeda general adaptation to the increased energy demandresulting from exposure to monensin. Transcriptional regu-lators of nuclear-encoded mitochondrial proteins such asnuclear respiratory factors (NRFs) 1 and 2 have been shownto regulate nDNA-encoded cyt c, COX IV, SDH B, and themitochondrial transcription factor Tfam (Virbasius et al.1993; Kelly and Scarpulla 2004). SDH B of OXPHOScomplex II was also chosen because this complex is entirely
2 1 0.5 0 3 4 6h 2 1 0.5 0 3 4 6h
monensin + act D actinomycin D
pRNA >
ND5 >
ND4&4L >
Cytb >
COX III >
-actin >
Fig. 7 Effect of actinomycin D on b-actin mRNA and mtDNA- encoded
mRNAs in control and monensin-treated PC12S cells. Total RNA was
isolated from control and monensin-treated cells at indicated times
after termination of transcription by actinomycin D, and 10-lg aliquots
were subjected to northern blot analysis. Hybridization was quantified
by image analysis of autoradiograms and normalized to that of b-actin
mRNA. Calculated half-lives are shown in Table 1.
Table 1 Estimation of half-lives for b-actin mRNA, 12S rRNA and
mtDNA- and nDNA-encoded mRNAs in control and monensin-treated
PC12S cells
Transcript
Estimated t1/2Relative t1/2
(control/monensin)Control + Monensin
Encoded by nDNA
COX IV 23.4 ± 5 (3) 20.0 ± 4 (3) 1.2
COX VIII 24.0 (1) 20.0 (1) 1.2
b-Actin 24.6 ± 5 (5) 22.0 ± 5 (5) 1.2
Encoded by mtDNA
pRNA 3.6 ± 1 (3) 1.1 ± 0.2 (3)* 3.3
COX I 3.8 (2) 1 (2)* 3.8
COX II 3.7 (2) 1.1 (2)* 3.4
COX III 3.5 ± 0.5 (5) 1 ± 0.1 (5)* 3.5
ND5 3.5 ± 0.5 (3) 1 ± 0.2 (3)* 3.5
ND4 and ND4L 3.5 ± 0.5 (3) 1 ± 0.2 (3)* 3.5
Cyt b 3.0 ± 0.25 (3) 1 ± 0.2 (3)* 3.0
12S rRNA 20 ± 4 (5) 18 ± 3 (5)* 1.1
Total RNA was isolated from control and monensin-treated cells at
various times after termination of transcription by actinomycin D, and
10-lg aliquots were subjected to northern blot analysis. Hybridization
was quantified by image analysis of autoradiograms and normalized to
that of b-actin mRNA. The half-lives were determined from the equa-
tion t1/2 ¼ 0.301/slope of the best fit line (log10 remaining RNA vs.
time). Each point represents the mean ± SEM of three separate
experiments. pRNA, precursor RNA. *p < 0.01 versus control (one-
way ANOVA followed by Tukey’s test for multiple comparisons).
Neuronal regulation of mitochondrial gene expression 857
� 2005 International Society for Neurochemistry, J. Neurochem. (2005) 93, 850–860
coded by nDNA, whereas other OXPHOS complexes (I, III,IV and V) consist of subunits encoded by both mtDNA andnDNA (Attardi and Schatz 1988). Our northern blot resultsshowed no significant changes in the levels of nDNA-encoded OXPHOS and non-OXPHOS mRNAs (b-actin)after exposure to monensin. They suggest that the monensin-induced response is specific to mt-mRNAs. Levels of all mt-mRNAs were altered in a similar manner in both monensin-and glutamate-treated cells. This similarity may reflect thetranscriptional mechanism by which each strand of mtDNAis transcribed as a single polycistronic message, followingwhich the message is processed to individual mRNAs bypost-transcriptional mechanisms (Attardi et al. 1990).
Increasing or decreasing energy demand has been shown,respectively, to up-regulate or down-regulate both mtDNA-and nDNA-encoded OXPHOS genes (Hevner and Wong-Riley 1993; Heddi et al. 1999; Murdock et al. 1999; Wiesneret al. 1999; Zhang and Wong-Riley 2000). For example,under conditions of decreased neuronal activity induced byafferent impulse blockade with monocular tetrodotoxininjection in monkeys, mRNA levels of OXPHOS subunitgenes encoded by mtDNA and nDNA were decreased inlateral geniculate nucleus and primary visual cortex withindays (Hevner and Wong-Riley 1993; Wong-Riley et al.1997). Removal of the blockade restored basal mRNA levelswithin days (Hevner and Wong-Riley 1993; Wong-Rileyet al. 1997). However, in these studies the changes in mt-mRNA were disproportionately larger and occurred earlierthan changes in mRNA encoded by nDNA, suggesting thatchanges in mt-mRNA are more tightly regulated by neuronalactivity and energy demand (Hevner and Wong-Riley 1993;Wong-Riley et al. 1997). On the other hand, the changes innDNA-encoded OXPHOS mRNA probably represent com-pensatory mechanisms that operate more slowly. Because wemeasured changes over a period of 6 h, we interpret theimmediate increase in mt-mRNA in response to monensin orglutamate as representing a mechanism that couples increas-ing energy demand directly with up-regulated mitochondrialgene expression. Consistent with this interpretation are theresults that show increased levels of mtDNA- and nDNA-encoded COX subunit mRNA in primary neuronal culturesin response to KCl-induced depolarization (Zhang andWong-Riley 2000). It would appear that both NRF-2a andNRF-2b respond to increased neuronal activity by translo-cating from the cytoplasm to the nucleus, where they engagein transcriptional activation of target genes such as Tfam(Zhang and Wong-Riley 2000; Yang et al. 2004).
Investigations into the molecular component of this rapidcoupling suggested that the monensin-induced decrease incellular ATP level is probably responsible for the stimulationof mitochondrial transcription. In organello transcriptionexperiments with isolated mitochondria show that mitoch-ondrial RNA synthesis is regulated in response to changes inintramitochondrial ATP levels (Gaines et al. 1987; Enriquez
et al. 1996; DasGupta et al. 2001). A low level of intramit-ochondrial ATP stimulates mtDNA transcription, whereas ahigh level suppresses mtDNA transcription, possibly byinhibiting mitochondrial RNA polymerase. This sensitivity toATP levels represents a mechanism by which energy demandcould regulate mtDNA transcription (Enriquez et al. 1996;DasGupta et al. 2001). Moreover, in organello studies using[a-32P]UTP showed that at low intramitochondrial ATPlevels, mRNA species are labeled to a substantial extent,whereas there is minimal labeling of the rRNA species(Gaines et al. 1987). This observation may explain ourfinding of an increase in mt-mRNA levels but not 12S rRNAin monensin-treated cells. The results demonstrating areduction in mt-mRNA levels associated with increasedATP levels in ouabain-treated cells are also consistent withthis mechanism of gene regulation. Thus, the initial increasein mt-mRNA in monensin-treated cells may represent aphysiological coupling mechanism that operates at thetranscriptional level, allowing mtDNA to generate optimallevels of mRNA in response to energy demands.
Our results demonstrating a rapid positive effect ofmonensin on transcription of mt-mRNAs and a negativeeffect of ouabain suggest that the metabolic pathways areuniquely organized in mammalian brain so that dynamiclocal energy demand can be met rapidly by increasedOXPHOS (Rapoport 1970; Kato and Lowry 1973; Sokoloff1991; Wong-Riley et al. 1998). At sites of high energydemand, such as at postsynaptic dendrites and axon terminalswhere Na/K-ATPase and mitochondria are enriched, in-creased electrical activity causes an increase in [Na+]i whichin turn stimulates Na/K-ATPase to consume ATP. ReducedATP and increased ADP and AMP level can be sensed bymitochondria to stimulate the transcription and translation ofmtDNA-encoded subunits. These changes provide a frame-work for the import and integration of nuclear-encodedsubunits, which are entirely synthesized in cell bodies.Dynamic local energy demand can be met when mtDNA-and nDNA-encoded subunits are assembled to form func-tional OXPHOS complexes.
The decrease inmt-mRNAat 4–6 h of exposure tomonensinsuggests the presence of a slower-acting mechanism forinhibiting mitochondrial gene expression, which is independ-ent of the cell energy status and overrides the normalrapid regulation by energy demand. The independence of thedecrease in mt-mRNA levels with cellular ATP decline wassubstantiated by the observation that exposure to 2-deoxy-D-glucose decreased cellular ATP levels with no evidence ofany mt-mRNA decrease. Decreases in mt-mRNA levels underpathological conditions have been observed. For example, thelevel of mtDNA-encoded COX I mRNA decreases withinhours in CA1 neurons of gerbils after transient forebrainischemia (Abe et al. 1993). This decrease occurs in theabsence of a decrease in mtDNA, suggesting impairedtranscription and/or turnover of mt-mRNA (Abe et al. 1993).
858 Z. Mehrabian et al.
� 2005 International Society for Neurochemistry, J. Neurochem. (2005) 93, 850–860
In this model, the decrease in COX I mRNA occurs whenenergy demand is high on these cells to restore ionic gradientsto resting levels and to maintain neuronal activity (Arai et al.1986; Abe et al. 1993). A disproportionate decrease inmtDNA-encoded COX subunit mRNA in the absence of achange in mtDNA-encoded 12S rRNA has also been noted inbrains of patients with Alzheimer’s disease (Chandrasekaranet al. 1994, 1998; Hatanpaa et al. 1996).
Our actinomycin D experiments suggest that a post-transcriptional mechanism is responsible for the observeddecrease in mt-mRNA in monensin-treated cells. Half-livesof mt-mRNA, 12S rRNA, COX IV, COX VIII and b-actinmRNA in the presence and absence of monensin werecalculated after inhibition of de novo mitochondrial andnuclear transcription by actinomycin D. The estimated half-life of mt-mRNAs in control cells was �3.6 h, whereas thatof mtDNA-encoded 12S rRNA and of nDNA-encodedCOX IV, COX VIII and b-actin mRNA was greater than20 h. The half-lives of mt-mRNAs in PC12S cells aresimilar to those reported in other cell culture systems(Gelfand and Attardi 1981; Chrzanowska-Lightowlers et al.1994). In monensin-treated cells, the estimated half-life ofmt-mRNA decreased from 3.6 to �1 h, representing a 3.5-fold decrease in the stability of mt-mRNA in monensin-treated cells. This post-transcriptional mechanism involvingRnase(s) probably accounts for the accelerated degradationof mt-mRNA.
Although we have not identified a specific Rnaseresponsible for the accelerated degradation of mt-mRNAin PC12S cells, an Rnase-L has been reported to degrade anumber of mitochondrial mRNAs in human H9 cells inresponse to interferon-a treatment (Le Roy et al. 2001).This Rnase-L pathway is activated in models of ischemia–reperfusion injury (Paschen et al. 1999). A comparison ofthe half-life of mt-mRNA in monensin-treated mouseembryo fibroblasts showed greater stability in Rnase-L–/–cells compared with Rnase-L+/+ cells (Chandrasekaranet al. 2004). Thus, activation of Rnase-L may be respon-sible for the accelerated degradation of mt-mRNA inmonensin-treated cells.
In summary, our results suggest a physiological transcrip-tional mechanism of regulation of mitochondrial geneexpression by energy demand and a pathological post-transcriptional regulation that is independent of energy statusof the cell. The post-transcriptional mechanism is likely to bepathological because it overrides the normal regulation byenergy demand, causes accelerated degradation of transcriptsand undermines the actual energy demand of the cell.
Acknowledgements
This work was supported by grants from the NIH (NS045081) to
KC, American Heart Association (AHA) (0256383U) to KC and the
US Army (DAMD17-99-1-9483) to GF.
References
Abe K., Kawagoe J. and Kogure K. (1993) Early disturbance of a mit-ochondrial DNA expression in gerbil hippocampus after transientforebrain ischemia. Neurosci. Lett. 153, 173–176.
Ankarcrona M., Dypbukt J. M., Bonfoco E., Zhivotovsky B., OrreniusS., Lipton S. A. and Nicotera P. (1995) Glutamate-induced neur-onal death: a succession of necrosis or apoptosis depending onmitochondrial function. Neuron 15, 961–973.
Arai H., Passonneau J. V. and Lust W. D. (1986) Energy metabolism indelayed neuronal death of CA1 neurons of the hippocampus fol-lowing transient ischemia in the gerbil. Metab. Brain Dis. 1, 263–278.
Attardi G. and Schatz G. (1988) Biogenesis of mitochondria. Annu. Rev.Cell Biol. 4, 289–333.
Attardi G., Chomyn A., King M. P., Kruse B., Polosa P. L. and MurdterN. N. (1990) Regulation of mitochondrial gene expression inmammalian cells. Biochem. Soc. Trans. 18, 509–513.
Chandrasekaran K., Giordano T., Brady D. R., Stoll J., Martin L. J. andRapoport S. I. (1994) Impairment in mitochondrial cytochromeoxidase gene expression in Alzheimer disease. Brain Res. Mol.Brain Res. 24, 336–340.
Chandrasekaran K., Hatanpaa K., Brady D. R., Stoll J. and Rapoport S. I.(1998) Downregulation of oxidative phosphorylation in Alzheimerdisease: loss of cytochrome oxidase subunit mRNA in the hippo-campus and entorhinal cortex. Brain Res. 796, 13–19.
Chandrasekaran K., Mehrabian Z., Li X. L. and Hassel B. (2004) RNase-L regulates the stability of mitochondrial DNA-encoded mRNAs inmouse embryo fibroblasts. Biochem. Biophys. Res. Commun. 325,18–23.
Choi D. W. (1987) Ionic dependence of glutamate neurotoxicity.J. Neurosci. 7, 369–379.
Chrzanowska-Lightowlers Z. M., Preiss T. and Lightowlers R. N. (1994)Inhibition of mitochondrial protein synthesis promotes increasedstability of nuclear-encoded respiratory gene transcripts. J. Biol.Chem. 269, 27 322–27 328.
DasGupta S. F., Rapoport S. I., Gerschenson M., Murphy E., Fiskum G.,Russell S. J. and Chandrasekaran K. (2001) ATP synthesis iscoupled to rat liver mitochondrial RNA synthesis. Mol. Cell.Biochem. 221, 3–10.
Enriquez J. A., Fernandez-Silva P., Perez-Martos A., Lopez-PereZ. M. J.and Montoya J. (1996) The synthesis of mRNA in isolated mito-chondria can be maintained for several hours and is inhibited byhigh levels of ATP. Eur. J. Biochem. 237, 601–610.
Erecinska M. and Silver I. A. (1989) ATP and brain function. J. Cereb.Blood Flow Metab. 9, 2–19.
Fasolato C., Zottini M., Clementi E., Zacchetti D., Meldolesi J. andPozzan T. (1991) Intracellular Ca2+ pools in PC12 cells.Three intracellular pools are distinguished by their turnover andmechanisms of Ca2+ accumulation, storage, and release. J. Biol.Chem. 266, 20 159–20 167.
Fukuyama R., Chandrasekaran K. and Rapoport S. I. (1993) Nervegrowth factor-induced neuronal differentiation is accompanied bydifferential induction and localization of the amyloid precursorprotein (APP) in PC12 cells and variant PC12S cells. Brain Res.Mol. Brain Res. 17, 17–22.
Gaines G. and Attardi G. (1984) Highly efficient RNA-synthesizingsystem that uses isolated human mitochondria: new initiationevents and in vivo-like processing patterns. Mol. Cell. Biol. 4,1605–1617.
Gaines G., Rossi C. and Attardi G. (1987) Markedly different ATPrequirements for rRNA synthesis and mtDNA light strand tran-scription versus mRNA synthesis in isolated human mitochondria.J. Biol. Chem. 262, 1907–1915.
Neuronal regulation of mitochondrial gene expression 859
� 2005 International Society for Neurochemistry, J. Neurochem. (2005) 93, 850–860
Gelfand R. and Attardi G. (1981) Synthesis and turnover of mitoch-ondrial ribonucleic acid in HeLa cells: the mature ribosomal andmessenger ribonucleic acid species are metabolically unstable.Mol. Cell. Biol. 1, 497–511.
Hatanpaa K., Brady D. R., Stoll J., Rapoport S. I. and Chandrasekaran K.(1996) Neuronal activity and early neurofibrillary tangles in Alz-heimer’s disease. Ann. Neurol. 40, 411–420.
Heddi A., Stepien G., Benke P. J. and Wallace D. C. (1999) Coordinateinduction of energy gene expression in tissues of mitochondrialdisease patients. J. Biol. Chem. 274, 22 968–22 976.
Hevner R. F. and Wong-Riley M. T. (1993) Mitochondrial and nucleargene expression for cytochrome oxidase subunits are dispropor-tionately regulated by functional activity in neurons. J. Neurosci.13, 1805–1819.
Hevner R. F., Liu S. and Wong-Riley M. T. (1995) A metabolic map ofcytochrome oxidase in the rat brain: histochemical, densitometricand biochemical studies. Neuroscience 65, 313–342.
Kagawa Y. and Ohta S. (1990) Regulation of mitochondrial ATP syn-thesis in mammalian cells by transcriptional control. Int. J. Bio-chem. 22, 219–229.
Kato T. and Lowry O. H. (1973) Enzymes of energy-converting systemsin individual mammalian nerve cell bodies. J. Neurochem. 20,151–163.
Kelly D. P. and Scarpulla R. C. (2004) Transcriptional regulatory circuitscontrolling mitochondrial biogenesis and function. Genes Dev. 18,357–368.
Le Roy F., Bisbal C., Silhol M., Martinand C., Lebleu B. and SalehzadaT. (2001) The 2–5A/RNase L/RNase L Inhibitor (RLI) pathwayregulates mitochondrial mRNAs stability in interferon alpha-trea-ted H9 cells. J. Biol. Chem. 276, 48 473–48 482.
Liu L. I., Rapoport S. I. and Chandrasekaran K. (1999) Regulation ofmitochondrial gene expression in differentiated PC12 cells. Ann. N.Y. Acad. Sci. 893, 341–344.
Murdock D. G., Boone B. E., Esposito L. A. and Wallace D. C. (1999)Up-regulation of nuclear and mitochondrial genes in the skeletalmuscle of mice lacking the heart/muscle isoform of the adeninenucleotide translocator. J. Biol. Chem. 274, 14 429–14 433.
Paschen W., Althausen S. and Doutheil J. (1999) Ischemia-inducedchanges in 2¢-5¢-oligoadenylate synthethase mRNA levels in ratbrain: comparison with changes produced by perturbations ofendoplasmic reticulum calcium homeostasis in neuronal cell cul-tures. Neurosci. Lett. 263, 109–112.
Pressman B. C. and Fahim M. (1982) Pharmacology and toxicology ofthe monovalent carboxylic ionophores. Annu. Rev. Pharmacol.Toxicol. 22, 465–490.
Purdon A. D., Rosenberger T. A., Shetty H. U. and Rapoport S. I. (2002)Energy consumption by phospholipid metabolism in mammalianbrain. Neurochem. Res. 27, 1641–1647.
Rapoport S. I. (1970) The sodium–potassium exchange pump: relation ofmetabolism to electrical properties of the cell. I. Theory. Biophys.J. 10, 246–259.
Schousboe A., Meier E., Drejer J. and Hertz L. (1989) Preparation ofprimary cultures of mouse (rat) cerebellar granule cells, in A Dis-section and Tissue Culture Manual of the Nervous System (ShaharA., de Vellis J., Vernadakis A. and Haber B., eds), pp. 203–206.Alan R. Liss, Inc., New York.
Sokoloff L. (1991) Measurement of local cerebral glucose utilization andits relation to local functional activity in the brain. Adv. Exp. Med.Biol. 291, 21–42.
Taurin S., Hamet P. and Orlov S. N. (2003) Na/K pump and intracellularmonovalent cations: novel mechanism of excitation–transcriptioncoupling involved in inhibition of apoptosis.Mol. Biol. (Mosk.) 37,371–381.
Virbasius C. A., Virbasius J. V. and Scarpulla R. C. (1993) NRF-1, anactivator involved in nuclear–mitochondrial interactions, utilizes anew DNA-binding domain conserved in a family of developmentalregulators. Genes Dev. 7, 2431–2445.
Wiesner R. J., Hornung T. V., Garman J. D., Clayton D. A., O’GormanE. and Wallimann T. (1999) Stimulation of mitochondrial geneexpression and proliferation of mitochondria following impairmentof cellular energy transfer by inhibition of the phosphocreatinecircuit in rat hearts. J. Bioenerg. Biomembr. 31, 559–567.
Wong-Riley M. T. (1989) Cytochrome oxidase: an endogenous meta-bolic marker for neuronal activity. Trends Neurosci. 12, 94–101.
Wong-Riley M. T., Mullen M. A., Huang Z. and Guyer C. (1997) Braincytochrome oxidase subunit complementary DNAs: isolation,subcloning, sequencing, light and electron microscopic in situhybridization of transcripts, and regulation by neuronal activity.Neuroscience 76, 1035–1055.
Wong-Riley M., Anderson B., Liebl W. and Huang Z. (1998) Neuro-chemical organization of the macaque striate cortex: correlation ofcytochrome oxidase with Na+K+ATPase, NADPH-diaphorase, ni-tric oxide synthase, and N-methyl-D-aspartate receptor subunit 1.Neuroscience 83, 1025–1045.
Yang S. J., Liang H. L., Ning G. and Wong-Riley M. T. (2004) Ultra-structural study of depolarization-induced translocation of NRF-2transcription factor in cultured rat visual cortical neurons. Eur. J.Neurosci. 19, 1153–1162.
Zhang C. and Wong-Riley M. T. (2000) Synthesis and degradation ofcytochrome oxidase subunit mRNAs in neurons: differentialbigenomic regulation by neuronal activity. J. Neurosci. Res. 60,338–344.
860 Z. Mehrabian et al.
� 2005 International Society for Neurochemistry, J. Neurochem. (2005) 93, 850–860