
Regulation of glycolysis in Lactococcus lactis: an unfinished systems biological case study
13
Regulation of glycolysis in Lactococcus lactis: an unfinished systems biological case study E.O. Voit, J. Almeida, S. Marino, R. Lall, G. Goel, A.R. Neves and H. Santos Abstract: The unexpectedly long, and still unfinished, path towards a reliable mathematical model of glycolysis and its regulation in Lactococcus lactis is described. The model of this comparatively simple pathway was to be deduced from in vivo nuclear magnetic resonance time-series measure- ments of the key glycolytic metabolites. As to be expected from any nonlinear inverse problem, computational challenges were encountered in the numerical determination of parameter values of the model. Some of these were successfully solved, whereas others are still awaiting improved techniques of analysis. In addition, rethinking of the model formulation became necessary, because some generally accepted assumptions during model design are not necessarily valid for in vivo models. Examples include precursor –product relationships and the homogeneity of cells and their responses. Finally, it turned out to be useful to model only some of the metabolites, while using time courses of ubiquitous compounds such as adenosine triphosphate, inorganic phosphate, nicotinamide adenine dinucleotide (oxidised) and nicotinamide adenine dinucleotide (reduced) as unmodelled input functions. With respect to our specific application, the modelling process has come a long way, but it is not yet completed. Nonetheless, the model analysis has led to interesting insights into the design of the pathway and into the principles that govern its operation. Specifically, the widely observed feedforward activation of pyruvate kinase by fructose 1,6-bisphosphate is shown to provide a crucial mechanism for positioning the starving organism in a holding pattern that allows immediate uptake of glucose, as soon as it becomes available. 1 Introduction Modern techniques of biology permit high-density in vivo assessments of genes, proteins and metabolites. If the exper- iments follow entire time courses after stimulation of the system, the resulting data are an enormous amount of information on the structure and regulation of the observed system. However, this information is mostly implicit and requires methods of analysis and interpretation that must combine biological with mathematical and computational techniques. At first, this task of inferring information from time-series data may seem to consist of a rather straight- forward ‘inverse problem’, where a mathematical model is regressed or otherwise matched against the observed data in some optimal fashion. In practice, the task is riddled with large and small challenges, some of which are readily anticipated, whereas others are surprising and puzzling. The task of model identification from in vivo time-series data can be subdivided into three problem areas. First, data are seldom complete and they typically contain noise that consists of a mixture of natural variability among cells, uncertainties about the particular experimental conditions at the time of observation and possibly a number of other biases; none of these sources of variation is truly and a priori quantifiable at this point. Second, the inverse problem requires a mathematical model that captures the dynamics of the data in a suitable fashion. In contrast to linear models, which are seldom ideal for the representation of biological phenomena, there is an infinite variety of non- linear structures and mathematical formulations that could be potential candidates for the optimal data representation. In physics, mechanistic laws describe most processes with an accuracy that is sufficient for replicable experimentation, manipulation and optimisation, so that applied physics seamlessly transits into successful engineering. Biology does not have such a rich repertoire of first-principle laws, and the best-suited functions for describing higher-level bio- logical phenomena are simply unknown. Beyond physical principles, biology must therefore resort to approximations that are locally anchored in mathematical theory, but whose global appropriateness is supported primarily by experience. The spectrum of possible approximations is in some sense unlimited, and today’s modeller has to choose mathematical models based on criteria such as data fit, inter- pretability and mathematical tractability, rather than on deep theory. It is clear that this selection is supported by rational considerations but it also involves abstractions, # The Institution of Engineering and Technology 2006 IEE Proceedings online no. 20050087 doi:10.1049/ip-syb:20050087 Paper first received 28th November 2005 and in revised form 10th February 2006 E.O. Voit and G. Goel are with The Wallace H. Coulter Department of Biomedical Engineering, Georgia Tech and Emory University, 313 Ferst Drive, Suite 4103, Atlanta, GA 30332-0535, USA J. Almeida is with the Department of Biostatistics and Applied Mathematics, University of Texas, M.D. Anderson Cancer Center – Unit 447, 1515 Holcombe Blvd, Houston, TX 077030-4009, USA S. Marino is with the Department of Microbiology and Immunology, University of Michigan Medical School, 6730 Medical Science Building II, Ann Arbor, MI 48109-0620, USA R. Lall is with the BACTER Institute, Room 6630 Biochemistry Addition, University of Wisconsin at Madison, 433 Babcock Drive, Madison, WI 53706, USA A.R. Neves and H. Santos are with the Instituto de Tecnologia Quı ´mica e Biolo ´gica, Universidade Nova de Lisboa, Rua da Quinta Grande 6, Apartado 127, Oeiras 2780-156, Portugal E-mail: [email protected] IEE Proc.-Syst. Biol., Vol. 153, No. 4, July 2006 286
-
Upload
independent -
Category
Documents
-
view
0 -
download
0
Transcript of Regulation of glycolysis in Lactococcus lactis: an unfinished systems biological case study
Regulation of glycolysis in Lactococcus lactis:an unfinished systems biological case study
E.O. Voit, J. Almeida, S. Marino, R. Lall, G. Goel, A.R. Neves and H. Santos
Abstract: The unexpectedly long, and still unfinished, path towards a reliable mathematical modelof glycolysis and its regulation in Lactococcus lactis is described. The model of this comparativelysimple pathway was to be deduced from in vivo nuclear magnetic resonance time-series measure-ments of the key glycolytic metabolites. As to be expected from any nonlinear inverse problem,computational challenges were encountered in the numerical determination of parameter valuesof the model. Some of these were successfully solved, whereas others are still awaiting improvedtechniques of analysis. In addition, rethinking of the model formulation became necessary, becausesome generally accepted assumptions during model design are not necessarily valid for in vivomodels. Examples include precursor–product relationships and the homogeneity of cells andtheir responses. Finally, it turned out to be useful to model only some of the metabolites, whileusing time courses of ubiquitous compounds such as adenosine triphosphate, inorganic phosphate,nicotinamide adenine dinucleotide (oxidised) and nicotinamide adenine dinucleotide (reduced) asunmodelled input functions. With respect to our specific application, the modelling process hascome a long way, but it is not yet completed. Nonetheless, the model analysis has led to interestinginsights into the design of the pathway and into the principles that govern its operation.Specifically, the widely observed feedforward activation of pyruvate kinase by fructose1,6-bisphosphate is shown to provide a crucial mechanism for positioning the starving organismin a holding pattern that allows immediate uptake of glucose, as soon as it becomes available.
1 Introduction
Modern techniques of biology permit high-density in vivoassessments of genes, proteins and metabolites. If the exper-iments follow entire time courses after stimulation of thesystem, the resulting data are an enormous amount ofinformation on the structure and regulation of the observedsystem. However, this information is mostly implicit andrequires methods of analysis and interpretation that mustcombine biological with mathematical and computationaltechniques. At first, this task of inferring information fromtime-series data may seem to consist of a rather straight-forward ‘inverse problem’, where a mathematical modelis regressed or otherwise matched against the observed
data in some optimal fashion. In practice, the task isriddled with large and small challenges, some of whichare readily anticipated, whereas others are surprising andpuzzling.
The task of model identification from in vivo time-seriesdata can be subdivided into three problem areas. First, dataare seldom complete and they typically contain noise thatconsists of a mixture of natural variability among cells,uncertainties about the particular experimental conditionsat the time of observation and possibly a number of otherbiases; none of these sources of variation is truly anda priori quantifiable at this point. Second, the inverseproblem requires a mathematical model that captures thedynamics of the data in a suitable fashion. In contrast tolinear models, which are seldom ideal for the representationof biological phenomena, there is an infinite variety of non-linear structures and mathematical formulations that couldbe potential candidates for the optimal data representation.In physics, mechanistic laws describe most processes withan accuracy that is sufficient for replicable experimentation,manipulation and optimisation, so that applied physicsseamlessly transits into successful engineering. Biologydoes not have such a rich repertoire of first-principle laws,and the best-suited functions for describing higher-level bio-logical phenomena are simply unknown. Beyond physicalprinciples, biology must therefore resort to approximationsthat are locally anchored in mathematical theory, butwhose global appropriateness is supported primarily byexperience. The spectrum of possible approximations is insome sense unlimited, and today’s modeller has to choosemathematical models based on criteria such as data fit, inter-pretability and mathematical tractability, rather than ondeep theory. It is clear that this selection is supported byrational considerations but it also involves abstractions,
# The Institution of Engineering and Technology 2006
IEE Proceedings online no. 20050087
doi:10.1049/ip-syb:20050087
Paper first received 28th November 2005 and in revised form 10th February2006
E.O. Voit and G. Goel are with The Wallace H. Coulter Department ofBiomedical Engineering, Georgia Tech and Emory University, 313 FerstDrive, Suite 4103, Atlanta, GA 30332-0535, USA
J. Almeida is with the Department of Biostatistics and Applied Mathematics,University of Texas, M.D. Anderson Cancer Center – Unit 447, 1515Holcombe Blvd, Houston, TX 077030-4009, USA
S. Marino is with the Department of Microbiology and Immunology, Universityof Michigan Medical School, 6730 Medical Science Building II, Ann Arbor, MI48109-0620, USA
R. Lall is with the BACTER Institute, Room 6630 Biochemistry Addition,University of Wisconsin at Madison, 433 Babcock Drive, Madison, WI53706, USA
A.R. Neves and H. Santos are with the Instituto de Tecnologia Quımica eBiologica, Universidade Nova de Lisboa, Rua da Quinta Grande 6, Apartado127, Oeiras 2780-156, Portugal
E-mail: [email protected]
IEE Proc.-Syst. Biol., Vol. 153, No. 4, July 2006286

assumptions, arbitrariness and, to some degree, personaltaste. The third problem area of model identification is of atechnical nature. Because the describing models are non-linear and typically formulated as systems of differentialequations, the optimisation of their parameters is farmore complex than in linear regression, where a fastand unique solution is guaranteed in essentially allcases. Corresponding nonlinear methods, such as nonlinearregression, genetic algorithms, simulated annealing ordynamic programming, are not straightforward and leadto very challenging issues of lacking convergence orconvergence to local minima, as soon as a model becomesmoderately large.
In spite of these challenges, the analysis of in vivo time-series data is certainly worthwhile, because these data havenot undergone artificial isolation and purification steps.They are the most accurate reflections of what cells andorganisms really do, how they receive, transduce andhandle signals and stimuli, and how they coordinate machin-ery that spans several levels of organisation, from geneexpression and regulation to dynamic changes in proteinprevalence, to adaptive changes in metabolic profiles andto physiologically adequate responses. Driven by the pro-spect of understanding the functionality of these intracellu-lar mechanisms, biologists are increasingly forming teamswith mathematicians and computer scientists and therebypropelling the emerging field of systems biology forward.
Some might say that unfinished work like the followingshould probably have been completed before being sub-mitted for publishing. At the same time, however, nonlinearparameter estimation is a topic of great current interest andconsiderable difficulty with many researchers at or near thesame stage of method development as ourselves. It wouldtherefore seem to be a waste of time and effort if eachgroup had to stumble through the same pitfalls that wehave so far encountered in our analysis. It is hoped that, byopenly acknowledging and describing these pitfalls, thescientific community as a whole will be able to focus more
crisply on the generic problems and solve them morequickly. As for the definite model of the regulation ofglycolysis in L. lactis, it still requires significantly more work.
2 Glycolysis and lactate production in L. lactis
Lactic acid bacteria have a long tradition in industrial fer-mentations, in which they are used as starters in the manu-facture of fermented foods and beverages, such asbuttermilk, cheese and yogurt, sausages, bread, picklesand olives, and wine. In particular, L. lactis is widelyused in the dairy industry for the production of cheeseand buttermilk, mainly because of its capacity to convertabout 95% of the milk sugar lactose to lactic acid. Thelow pH generated by this activity, as well as the action ofother fermentation products, inhibits the spoilage andgrowth of pathogenic bacteria, and consequently extendsthe shelf-life of the fermented products. The relative simpli-city of L. lactis metabolism that converts sugars via theEmbden–Meyerhof–Parnas pathway to pyruvate (Fig. 1)and generates energy mainly through substrate-level phos-phorylation, together with a small genome with limitedredundancy [1] and a large number of applicable tools ofmolecular biology [2], makes this organism a very attractivemodel for biological systems approaches.
Regulation of glycolysis in L. lactis has been the subject ofintensive research over the past three decades. Key enzymesin the homofermentative pathway, phosphofructokinase [3],fructose 1,6-bisphosphate (FBP) aldolase [4], glyceralde-hyde 3-phosphate dehydrogenase (GAPDH) [5], pyruvatekinase (PK) [6, 7] and lactate dehydrogenase (LDH) [8, 9]were characterised, and concentrations of several glycolyticintermediates in cell extracts had been obtained already inthe 1980s (refer to Thompson [10] for a review on earlystudies). However, despite the wealth of metabolic infor-mation collected, a comprehensive understanding of sugarmetabolism and regulatory pathways in this model organismhas not yet been achieved.
Fig. 1 Relative simplicity of L. lactis metabolism
Left panel: simplified representation of glycolysis and lactate production in L. lactisBlack arrows: flow of material; grey arrows: signals; double arrow: reaction products that are not part of the current modelSubscripted X’s designate dependent variables in the model equationsMetabolites without symbolic names were used as offline variablesRight panel: symbolic power-law equations used to model the pathway (see text for explanation and Supplements for software implementations)
IEE Proc.-Syst. Biol., Vol. 153, No. 4, July 2006 287

Nuclear magnetic resonance (NMR) is probably the onlycurrent analytical technique allowing online measurementsof the kinetics of intracellular metabolite pools in livingcells. We used this method to monitor the pools of labelledintermediates and end products, with a time resolution of30 s, in non-growing L. lactis cell suspensions following apulse of 13C-labelled glucose [11] (Fig. 2 for one of thesets of time courses measured). Cells were grown in chemi-cally defined medium supplemented with glucose (10%, w/v),harvested at the mid-exponential growth phase, washedtwice with 5 mM potassium phosphate (KPi) and suspendedin 50 mM KPi buffer, pH 6.5, to a protein concentration inthe range 13–15 mg of protein/ml. In vivo NMR exper-iments were performed using a circulating system alreadydescribed by Neves et al. [12]. [6-13C]glucose (20 mM)was supplied to the cell suspension, and the time coursesfor substrate consumption, product formation and intra-cellular metabolite pools were monitored in vivo. After sub-strate exhaustion, and when no changes in the resonancesdue to end products and intracellular metabolites wereobserved, a 10-ml aliquot was passed through a Frenchpress and an NMR-sample extract was prepared as reportedpreviously [11]. The end products (lactate, acetoin, acetateand formate) were quantified in the NMR-sample extractby 1H-NMR [12]. Because of the fast pulsing conditionsused for acquiring in vivo 13C spectra, quantification ofthe intracellular metabolites required the use of correctionfactors that allow the conversion of resonance areas intoconcentrations [12]. Intracellular metabolite concentrationswere calculated using a value of 2.9 ml/mg of protein forthe intracellular volume [13]. The concentration limit fordetection of intracellular metabolites under the conditionsused to acquire in vivo spectra (30 s total acquisition timefor each spectrum) was approximately 3 mM. Furtherdetails are available in Neves et al. [11].
3 Qualitative and semi-quantitative pathwayanalysis
The data obtained with the in vivo NMR methods describedin the previous section (Fig. 2) are as good as a modeller can
presently hope for. They are more or less complete, showclear trends and exhibit experimental noise that is quitereasonable in most cases.
Our strategy for analysing the data is a combinedbottom-up and top-down approach [14]. In the classicalbottom-up approach, rate laws for every step wereintegrated into a dynamical model and instantiated withparameter values from the literature. An example of sucha model, although with much coarser resolution, waspresented by Hoefnagel et al. [15], who described someof the major pathways in Lactococcus. If the model struc-ture and the parameter values turned out to be inconsistentwith the observed data, the parameter values were itera-tively adjusted to make the model fit the data better. Inthe top-down approach, the biochemical network topologyand parameter values were inferred directly from observedtime-series data [16]. Ideally, this information is sufficientto determine the underlying pathway structure and regu-lation. In the present case, the network topology is allegedlyknown, so that the top-down strategy is greatly simplified toa constrained parameter-estimation task.
Before a numerical model from the given data is inferredand its specific features analysed, it is useful to scrutinisethe data qualitatively and to check the logic of theassumed pathway.
3.1 Observed dynamics of metabolite pools
Most aspects of the observed time courses (Fig. 2) makeintuitive sense. The bolus of external glucose is graduallyused up, during which time glucose 6-phosphate (G6P)and all subsequent metabolites increase in concentration.With the external glucose pool becoming depleted, theimmediately subsequent pools (G6P and FBP) alsodecrease. In contrast, the trioses approach high levels thatdo not decrease appreciably during the hour-long exper-iment. This is quite interesting, because a straightforwardpathway model without regulation (i.e. a purely stoichio-metric analysis) would predict that all materials would ulti-mately flow into the final pools, such as lactate and possiblyacetate and acetoin, thereby emptying all intermediate
Fig. 2 Dynamics of metabolite pools in L. lactis strain MG1363, derived from 20 mM [6-13C]glucose metabolised under aerobic con-ditions at pH 6.5 [11] and used for our systems biological investigation
Data were obtained with in vivo NMR techniques using 13C for glycolytic metabolites and 31P for ATP and Pi (see text)Under the experimental conditions used, the detection limit for Pi or ATP was 1 mM and, for other phosphorylated metabolites, it was 3 mM
IEE Proc.-Syst. Biol., Vol. 153, No. 4, July 2006288

pools, such as 3-phosphoglycerate (3-PGA) and phospho-enolpyrurate (PEP). As this is not the case, special attentionmust be paid to the dynamics of the trioses and to thecontrol mechanisms that prevent the triose pools fromdepleting.
3.1.1 Closer look at glucose: The data describingglucose consumption are nearly error-free, which impliesthat there are essentially no degrees of freedom or ‘fudgefactors’ in modelling the process. Very clearly, glucoseconsumption exhibits a sigmoid pattern, with a very slowdecrease in concentration at the beginning, a maximaldecrease after a few minutes and a quasi-negative-exponential tail towards zero at the end.
Glucose uptake and consumption are primarily driven bythe PEP : carbohydrate phosphotransferase (PTS) system,which requires PEP [10, 17]. As a typical bisubstrate reac-tion, the speed of reaction should be proportional to the sub-strate concentrations, and because these are maximal at thebeginning of the experiment, the time course for glucoseshould be decreasing with maximal slope at the beginning.It is imaginable that G6P could have an inhibiting effect onglucose utilisation, as suggested by Galazzo and Bailey [18]for yeast, even though such inhibition has not been reportedfor Lactococcus. Even if such inhibition were in place, itseffect would be minimal initially, because the G6P concen-tration at the beginning of the experiment is close to zero.The most rapid decrease predicted at the beginning of theexperiment is thus inconsistent with the observed data,which unambiguously show a sigmoid trend. The logic ofthe pathway structure cannot explain this discrepancy, andone can only resort to speculation about possible causes.For instance, it could be that the cells in the observedculture initiate glucose uptake with speeds that slightlydiffer from cell to cell. These differences could be explainedby genuine variability or by slightly differing delaysbetween adding glucose to the medium, complete mixingand each cell’s ability to access it. Simulations confirmthat a distributed rate of initiating uptake converts thequasi-exponential trend in glucose consumption into a sig-moidal trend [19].
An alternative explanation of the sigmoid glucose uptaketrend could be that the glucose concentration in themedium is so high that the uptake process is initially notconcentration-dependent. Whether either alternative cap-tures the true mechanism or the sigmoidal uptake trend iscaused by something else cannot be decided from thegiven data. In general experimental data may soonbecome so good that biophysical details such as diffusionand transport through the cell membrane are reflected inthem. For purely metabolic models, this data quality mayrequire a type of abstraction that was hitherto not needed.
3.1.2 Dynamics of PEP: To the observer unfamiliar withthe subtleties of the NMR techniques used to generate thedata, the experimental results suggest that there is no PEPat the beginning of the experiment. This appears reasonable,because PEP is a downstream metabolite of glycolysis, andwithout substrate before the beginning of the experiment, allsuch intermediates should be assumed to be depleted.However, a total lack of PEP under starvation wouldcreate a severe problem. Namely, glycolysis could noteven be started effectively, because the phosphorylationof glucose depends on a phosphate which in Lactococcusis primarily provided by PEP, and only to a much lesserdegree by adenosine triphosphate (ATP) [10, 17]. Arevised interpretation of the data suggests that the initialconcentration of PEP is not zero, but merely below the
experimental detection limit. For the labelled metabolite,this limit is 3 mM with the NMR technique used here, butthe detection limit in this case of unlabelled PEP wouldbe much higher, because the natural isotopic abundanceof 13C is only about 1%. At any rate, even such smallinitial quantities would not be explainable in a linearpathway without substrate.
Further analysis, combined with additional experimentsand literature information, however, suggests a differentsolution. Studying the entire time course of the pathway,PEP and 3-PGA are at high concentration levels at theend of the experiment, and these levels apparently decreaseonly very slowly. Thus, one might surmise high levels alsoduring the time of glucose starvation before the presentexperiment, resulting from the last time glucose was avail-able and then used up. Indeed, Mason et al. [20] andThompson [10] reported high levels of trioses duringglucose starvation. Furthermore, a second experiment inour laboratory, following the present experiment after 1 h,showed high, rapidly decreasing pools of 3-PGA and PEP,strongly suggesting that the initial conditions of the firstexperiment should mirror those at the end of the exper-iment. Then how is it possible to make these deductionsconsistent with the observed data? The answer lies in thefeatures of the NMR method. This method only measureslabelled metabolites, so that any pre-existing, unlabelledmetabolite pools are not recorded. These considerationsencouraged us to supplement the observed NMR datawith initial 3-PGA and PEP concentrations at levels com-mensurate with those at the end of the experiment and todeplete these pools at the rate of G6P formation, becauseglucose and PEP form a bisubstrate reaction generatingG6P and pyruvate, and because PEP and 3-PGA are infast equilibrium.
4 Specific model selection
All the above considerations were largely independent of aparticular model structure. For more detailed analyses, it isnecessary to select such a structure. In principle, unlimitedpossibilities are available for the choice of a model, andthere are no specific guidelines for what type of modelwould be optimal in a given situation. One constraintresults from the discussion above. Namely, it seems clearthat purely linear models, or nonlinear models without regu-lation, would be inappropriate, because they would notfacilitate the mandatory accumulation of PEP underglucose starvation.
For reasons that have been discussed in the literaturemany times [21–24], the oncepts of biochemical systemstheory (BST) [25, 26] are used. In this modelling frame-work, which was designed for investigating metabolic andgene-regulatory systems, all processes are represented asproducts of power-law functions. These can be biologicallymotivated [27] and are mathematically derived fromTaylor’s theorem of numerical analysis, which is appliedto variables in logarithmic space. As a consequence, eachstep Vi involving at most n dependent (state) variables andm independent variables (including control variables andconstant enzyme activities) takes the format
Vi ¼ gi
Ynþm
j¼1
Xfijj
Here gi is the rate constant, which describes the turnoverrate of the process, and the exponent fij is the kineticorder that quantifies the direct effect of variable Xj on Vi.Specifically, given measurements of Vi in an experiment
IEE Proc.-Syst. Biol., Vol. 153, No. 4, July 2006 289

where Xj is altered and all other Xi are kept constant, fij is theslope of log(Vi) plotted against log(Xj). The interpretation ofkinetic orders is easy: A positive kinetic order indicates anactivating or otherwise augmenting effect, with the magni-tude reflecting the strength of the effect, whereas a negativekinetic order reflects inhibition. A kinetic order of 0 corre-sponds to no direct effect. In this case, the variable, raised to0, automatically drops out of the term.
Kinetic orders may also be compared with parametersin Michaelis–Menten or other rate laws. A value of 0.5for fij corresponds to an enzymatic process operating atKM, values between 0.5 and 1 correspond to operationbelow KM and values between 0 and 0.5 correspond tooperation above KM. Values outside [0, 1] correspondto non-Michaelis–Menten processes. A more detaileddiscussion is given in Voit [23].
BST offers several alternative representations. The mostuseful are the generalised mass action (GMA) and theS-system representations. GMA models focus on processesand therefore represent each reaction by a product of power-law functions of the type above that include all variablesthat have a direct effect on this process. Thus, the dynamicsof each variable is given as a sum of power-law termsdescribing all influxes and effluxes, and the generic GMAstructure is
_X i ¼XPi
p¼1
+gip
Yn
j¼1
Xfipj
j
!; i ¼ 1; . . . ; n
The S-system form focuses on metabolite pools and rep-resents the collection of all influxes into a given pool witha single power-law term and the collection of all effluxesfrom this pool with a second power-law term. Thus, thegeneric S-system structure is
_X i ¼ ai
Yn
j¼1
Xgij
j � bi
Yn
j¼1
Xhij
j ; i ¼ 1; . . . ; n
As in the GMA form, the coefficients a and b are non-negative rate constants and the exponents g and h are real-valued kinetic orders. Further details on model constructionand analysis are readily available in the literature [23, 24].
4.1 Ubiquitous metabolites
The identification of variables to be included in the modelappears to be a trivial matter. Although this is typically acorrect assumption, there are exceptions. Probably themost difficult metabolites to model are those that are mostprevalent. Outside water, which is seldom considered inmetabolic models, ATP, inorganic phosphate (Pi), nicotin-amide adenine dinucleotide (oxidised) (NADþ) and nicotin-amide adenine dinucleotide (reduced) (NADH) are in thetop tier of the list. The problem with these metabolites isthat they are associated with a wide array of reactionsthroughout the entire metabolic network, and not just inthose reactions that happen to be included in the pathwaydiagram of interest. As a consequence, their dynamics is,at least in part, controlled by forces outside the systemunder study.
Several strategies have been proposed in the past to dealwith this situation. The simplest is to ignore the troublesomemetabolites altogether, which obviously runs the risk ofmisrepresentation of some reactions. Alternately, themetabolites could be considered constant, which wouldessentially be equivalent to ignoring them, because theycould be subsumed with the rate constants. A somewhatmore appropriate strategy has been to assume the pools of
ATPþ adenosine diphosphateþ adenosine monophosphate(AMP) and of NADþ NADH to be constant and to attemptto model internal fluctuations, retaining the constant sumsas constraints [28]. This reduces the number of dynamicvariables, but does not circumvent the complexity causedby reactions outside the considered pathway. Another strat-egy, gleaned from experimental biochemistry, has been todefine ‘mathematical buffers’ that absorb excess metab-olites and replenish the metabolite pools within thepathway in times of demand [29].
As a new strategy, we propose not to model these metab-olites explicitly as dependent system variables, but to usetheir time courses as input functions, quasi ‘off-line’. Thisis possible in the form of raw data, which directly enterthe system in observed concentrations and typically leadto correspondingly jagged model output. As a variation,the raw data may first be smoothed with a filter or spline[30–32], which corresponds to a reduction of unwantednoise and consequently smoothes the model output aswell. The rationale for this offline strategy is that the obser-vations are believed to be true reflections of the internalfunctioning of the cell under the exact conditions of interest.As such, they are considered important modulators of thesystem. At the same time, this strategy acknowledges thatwe are unable to explain the dynamics of these variablesin sufficient detail to formulate representative equations.
An immediate question is which variables should bemodelled in this offline fashion and which as regular depen-dent state variables. There is no single best answer, and thedecision needs to be made case by case. In fact, the analysisof different scenarios of this type offers new modellingstrategies. At one extreme, one may keep a single ‘trouble-some’ variable off-line and test whether the remainder ofthe system is able to fit the data. At the other extreme,one may use all variables except one as offline variablesand test to what degree the equation describing the remain-ing dependent variable is valid. If the observed input of‘true’ values of all other variables does not lead to a satis-factory fit of the remaining time course, then it is verylikely that this time course is not represented well in themodel. In this fashion, each equation and each combinationof equations can be tested for validity or at least for accu-racy of fit (see later). One must note that even if eachequation fits well, if all other variables are consideredoffline, one cannot necessarily expect the system of allequations to provide a good fit. This is so because evenslight deviations between the raw and smoothed data onone hand and the describing model equation on the otherhand may derail the complete system onto undesiredtrajectories.
The use of different combinations of offline variablescould also form the basis for an incremental parameterisa-tion scheme. Beginning with a preliminary exploration ofthe domain of solutions, one could use the extremeoffline scenario and estimate parameters for each equationindividually. In subsequent steps, one would then estimatepairs or larger subsets of equations, now taking constraintsinto account. This incremental strategy would also haveimplications for the choice of objective function for errorminimisation. During the first complete offline estimation,one could simply minimise the sum of squared deviations.As the reverse engineering gets closer to mechanistic infer-ence, this objective function would gradually incorporatenot only constraints imposed by kinetic limits but alsoby design principles postulated for the functioning ofthe investigated biological network. Initial steps havebeen taken in this regard; for instance, in the softwareWebmetabol [16].
IEE Proc.-Syst. Biol., Vol. 153, No. 4, July 2006290

5 Numerical model implementation
5.1 Appropriateness of the power-lawrepresentation
As a first task, it has to be established that the power-lawrepresentation is a suitable format. In comparison to someof the rate laws used in traditional kinetic modelling [33],power-law functions are rather simple, which leads to thesuspicion that they per se might preclude satisfactory fits.
We tested the appropriateness of the functional form ofpower-laws by modelling each equation Xi separately,using smoothed raw data for all other involved variablesas input. The rationale for this procedure is the following:If it is possible to obtain a good fit for this one equation(for Xi) under the condition that all other variables (Xj,i = j) are ‘correct’, then the functional form of thisequation is deemed adequate. On the other hand, if one isnot able to fit the data corresponding to Xi with acceptableresidual error, even though the remaining components ofthe system are ‘correct’, then the lack of fit is to be attribu-ted to the form of the equation for Xi.
The results of this modular fitting demonstrated that allvariables were modelled very well with this procedure(Fig. 3).
As a specific challenge, we had to infer the initial data for3-PGA and PEP, because the measurements only accountedfor labelled metabolites, while ignoring unlabelled materialpresent at the beginning of the experiment, as discussedbefore. As to be expected, these inferred data were import-ant, because they forced the search algorithm to determinefits that started at high values, dipped down close to zero,where all unlabelled material is used up and no labelledmaterial has formed, and then showed the observeddynamics. The inferred data points are documented inFig. 3 as light diamonds.
It is noted that similar good fits may be obtainable withother model equations. For instance, Hoefnagel et al. [15]proposed a model of Lactococcus focusing on thedistribution of carbon at the pyruvate branch point.Overlapping with our model, they represented the hexo-kinase reaction between glucose and G6P with a rate lawin the tradition of Michaelis and Menten. This rate represen-tation has the form
v½1� ¼Vmax1 Gluc PEP½t�
Km1Gluc Km1PEP
ð1þ ðGluc=Km1GlucÞ þ ðG6P½t�=Km1G6PÞÞ
ð1þ ðPEP½t�=Km1PEPÞ þ ðPYR½t�=Km1PYRÞÞ
0B@
1CA
and fits the observed glucose uptake data as well as a power-law function [19], but is more complex in structure. It is
interesting to note that the optimised parameter valueswere distinctly different from those found in the literature.
One should also note that the so-called log–lin andlin–log models, which some authors prefer over power-lawmodels [34, 35], may fail for this particular system, becauseof two reasons. First, these approaches are based on a for-mulation that expresses all system variables in relation toa reference state, which is typically taken as the nominalsteady state. These ratios are then logarithmically trans-formed. Because the Lactococcus system has a referencestate that is zero in several variables, this set-up is proble-matic. This issue could potentially be circumvented byselecting a different, yet quite arbitrary reference state. Ofgreater concern would probably be that the approximationunderlying the log–lin and lin–log models fails for smallconcentration values, where the rate of the reactionbecomes negative and approaches 21 for concentrationsapproaching 0.
5.2 Global fitting
5.2.1 General problems: Given the time course data anda model in GMA or S-system format, the estimation of par-ameter values constitutes an inverse problem that is typi-cally solved through nonlinear regression [23, 32, 36], agenetic algorithm [16, 37–40] or simulated annealing[41]. In contrast to linear regression, nonlinear regressionsare far from trivial and hampered by multiple technicalobstacles. For instance, it is well known that gradient-basednonlinear searches tend to get stuck in local minima or maynot converge because they search in irrelevant parts of theparameter space. Furthermore, searches with systems ofdifferential equations require many numerical integrations,which easily use in excess of 95% of the entire searchtime. The problem becomes worse if the equations arestiff. But even if the true solution is not stiff, search algor-ithms often select parameter combinations that artificiallymake the system stiff, thereby dramatically slowing downthe solution [16].
In our specific case, the algorithms usually did not con-verge, even though there were occasional cases where, forinstance, the nonlinear regression (using lsqcurvefit inMATLAB) did find a good solution. Then again, other,and sometimes, similar combinations, of initial values didnot lead to convergence, leading us to suspect that thebasins of attraction are complicated. This might not be sur-prising, because even the simple Newton algorithm exhibitsfractal basins of attraction for some root finding tasks [42].We have begun a more comprehensive analysis to illumi-nate the error surface of GMA models as well as thebasins of attraction of several search algorithms.
Fig. 3 Data fits to all relevant variables
Each fit (line) was obtained by considering all other variables as offline input in the form of smoothed raw dataDark diamonds: measured concentrations; light diamonds: concentrations inferred from the logic of the pathway (see text)
IEE Proc.-Syst. Biol., Vol. 153, No. 4, July 2006 291

5.2.2 Case-specific problems: Global-fitting attemptsran into additional difficulties that were due to thepeculiarities of our data. For instance, the shapes of thetime courses of 3-PGA and PEP are somewhat ‘treacher-ous’, because they dip down very quickly, then recover,overshoot and slowly degrade. Although it is possible tomodel these dynamics with power-laws (see Fig. 3 andlater figures), it is difficult for search algorithms based ondifferential equations to avoid parameter combinationscausing the time courses to cross over into the negativedomain, in which case non-integer kinetic orders force theintegration to stop or to produce results with imaginaryvalues. Furthermore, several variables towards the end ofthe experiment approach zero, thereby risking negativevalues caused by numerical inaccuracies.
An additional issue with the time course of 3-PGA andPEP is that the initial phase was inferred from secondaryinformation, as described before. Specifically, no reliabledata were available for the crucial first few minutes.Attempting global fits without these points clearly wouldlet the search algorithm settle on solutions starting withlow 3-PGA and PEP, which are known to be incorrect.Thus, we inferred ‘data points’ based on the production ofG6P, which is concurrent with the degradation of PEP. Towhat degree these artificial data are ‘true’ is an unansweredquestion, except that the general trend of these data is prob-ably correct.
The failure of the search algorithms to converge led us todevelop various strategies for ameliorating the situation.Even using the parameter values from the individual fits(Fig. 3), as described in the previous paragraph, did nothelp identify a globally satisfactory fit. Moreover, as theabove procedure focused on one equation at a time, con-straints among terms in different equations were ignored.
5.2.3 Choice of constraints and algorithmic conse-quences: If all parameter values are allowed to vary, thesearch has a high degree of freedom, which often causesproblems with convergence. It is, therefore, sometimeshelpful to impose constraints on parameters, if they areavailable. In the case of BST models, experience hasshown that kinetic orders are usually within a range ofabout [21, þ3], which may be used as boundaries in thesearch. Furthermore, as negative kinetic orders correspondto inhibition, it is a priori possible to determine for mostparameters whether they would fall within [21, 0] or[0, þ3]. Caution is needed, because exceptions to theseranges are possible. For instance, Savageau [43] argued,based on a theoretical analysis, that kinetic orders may bemuch higher if the processes occur on surfaces or in chan-nels. Of greater important is our following finding:Although it is often beneficial to constrain the search andto relax constraints later if it is deemed necessary, this strat-egy does not seem to apply in general. Some search algor-ithms seem to be too confined and converge dramaticallybetter without hard constraints.
The tradition of bottom-up modelling mandates that pre-cursor–product relationships are satisfied. For instance, inan unbranched, irreversible reaction step, such as betweenG6P and FBP (Fig. 1), all material leaving the precursor(G6P) enters the product pool (FBP), so that the degradationterm of the former equals the production term of the latter.Although this appears to be perfectly reasonable, one has tobe careful with such constraints in estimations from in vivotime series. The reason is that the assumed pathway ismerely one component of the true network in the naturalcell. Thus, G6P is not solely produced from glucose andconverted, via F6P, into FBP, even if these may be the
major routes. Instead, some amounts of G6P may befunnelled into the pentose phosphate cycle or convertedinto G1P. Similarly, the intermediate, F6P, is omitted inthe simplified pathway representation, even though it con-stitutes a branch point. On one hand, the back fluxthrough the aldolase reaction in gluconeogenesis constitutesan additional source of F6P. On the other hand, Lactococcususes F6P for the synthesis of glucosamine-1P, which is theprecursor of all the sugar components in the cell wall of thisgram-positive organism, and constitutes a branch point withthe mannose and sorbitol pathways. As a consequence, it ispossible that not all material leaving G6P becomes FBP. Ifso, it might be too restrictive to force the mathematicalterms describing G6P consumption and FBP generation tobe numerically equal. Again, it might be helpful to startthe parameter search in the constrained parameter space.If the constrained system allows for a good solution, thesecondary branches may be negligible.
Searches constrained too loosely may run into problemsas well. The most obvious problem, of course, is thatrelaxed constraints enlarge the parameter space in combina-torial fashion. If an unnecessarily expanded space must besearched, it is very likely that the number of undesiredlocal minima increases and that convergence slows down.Related to the size of the search space is also the probabilitythat some combination of parameter values will make thesystem of equations stiff, thereby challenging any presentintegrator and increasing search time immensely (see dis-cussion in Voit and Almeida [16]).
A secondary problem encountered was not anticipated:A lacking constraint may make the system extremely sensi-tive to parameter variations. This sensitivity in turn maycause havoc for the search algorithm, which is likely toderail, because small steps during the search push the algor-ithm farther away from the true solution with every step. Asa demonstration, consider first a simple flip-flop cyclebetween two variables of the form
_X 1 ¼ aX2 � bX1; X1 ¼ 1
_X 2 ¼ bX1 � aX2; X2 ¼ 1
with typical parameters a ¼ 1 and b ¼ 2. It is widelyknown that this type of system has zero real eigenvalues,with the consequence that the initial conditions deter-mine the steady-state solution. For instance, starting at(X1, X2) ¼ (1, 1), the system converges quickly toX1 ¼ 0.6666667 and X2 ¼ 1.333333, whereas startingat (X1, X2) ¼ (2, 1) causes the system to converge towards(1, 2).
These closed cycles are not very realistic, but a relatedproblem occurs if the system contains a reversible stepwith high flux and relatively smaller influxes and effluxes.Indeed, this situation resembles the step between 3-PGAand PEP in the glycolytic pathway of Lactococcus. Tomodel this extension, suppose the above system is augmen-ted with a small influx and a small efflux, so that it reads
_X 1 ¼ 0:1þ aX2 � bX1; X1 ¼ 1
_X 2 ¼ bX1 � aX2 � 0:1X 0:52 ; X2 ¼ 1
The steady state at (X1 ¼ 0.55, X2 ¼ 1.0) is now stable withtwo negative real eigenvalues. Thus, one would expect asearch algorithm to find parameter values in the inverseproblem. However, the system is very sensitive. Supposeone considers it too restrictive to force parameter a tohave exactly the same value in both equations, and allowsthe value in the second equation to be within [a 2 1,
IEE Proc.-Syst. Biol., Vol. 153, No. 4, July 2006292
aþ 1], with a small 1 such as 0.1. During the search, if theparameter in the second equation assumes the value aþ 0.1,the steady state decreases sharply to (X1 ¼ 0.240983,X2 ¼ 0.3819661) and the residual error in the objectivefunction is unduly exacerbated. Much worse, if the par-ameter is lowered by as little as 3%, that is, if a is replacedwith a 2 0.03, the system very quickly grows withoutbound, causing enormous residual errors when the predictedtime course is compared with observed data and leading tothe faulty conclusion that the present set of parametervalues is to be discarded. The corresponding outcomeshappen for changes in b. Thus, bad things may happen ifconstraints are not satisfied precisely, for instance,because one does not want to exclude secondary branches.More generically speaking, in addition to insufficient algo-rithmic robustness of the search method, a fractionated errorsurface and the crucial dependence on appropriate initialguesses, convergence problems may also be due tomodules within the model that are structurally sensitive.To some degree, it might be possible to analyse suchmodules beforehand and to guard the algorithm a prioriagainst undesirable variations within them, for instance,by enforcing the right constraints.
In the Lactococcus pathway, it is easy to mimic the aboveproblem by not exactly matching the forward or reverse fluxbetween 3-PGA and PEP (results not shown). Making theLactococcus case even worse is that both 3PGA and PEPare highly noisy in their ‘steady-state’ phase towards theend of the experiment, which might reflect observationalsnapshots of a system with a high degree of forward andreverse fluxes between the two pools. The noise, combinedwith the system’s sensitivity if fluxes are not precisely con-strained, causes algorithmic searches to fail, unless cautionis used.
5.3 Alternative estimation methods
Because all direct global-fitting attempts with the system ofdifferential equation failed miserably, the estimation task isdivided into two steps, namely decoupling of the differentialsystem, which allows preliminary parameter estimationbased on algebraic equations, and secondly using the esti-mates as start values in a nonlinear regression with thesystem of differential equations.
Thus, in the first step the differentials on the left-handsides of the differential equations were replaced with esti-mated slopes [16, 36]. In addition to circumventing the inte-gration of differential equations, this method decouples thesystem into subsets requiring purely algebraic regression.Furthermore, in the present case, some of these regressiontasks become linear in logarithmic space, thereby makingthem very efficient [19]. In the present case, we did nottake advantage of the decoupling though and instead esti-mated all equations simultaneously, which permitted us to
account for precursor–product constraints in an unbiasedfashion.
The effectiveness of this method depends significantly onthe accuracy of the measured or estimated slopes. If the dataare smooth, as in the case of glucose, simple linear interp-olation between points would probably be sufficient, butfor time courses that are noisy, as is the case for PEP and3-PGA, the estimated slopes would not be very reliable.An alternative is the three-point method, but again thismethod is rather sensitive to noise [39]. Instead of thesesimple methods, we first used an artificial neural network,which is known to be a universal function generator andwhich had earlier implemented in the softwareWebmetabol [16]. This software not only smoothes thedata, but also computes slopes from the smoothed timecourses, and subsequently estimates parameters from thealgebraic form of the system equations. Although functionaland rather effective in principle, the neural network createsfitting functions as weighted sums of sigmoids. This has theundesired side effect that fits tend to plateau at the begin-ning and the end of the time series. Therefore the datawere fitted with simple cubic splines, which also allowedus to compute slopes very easily.
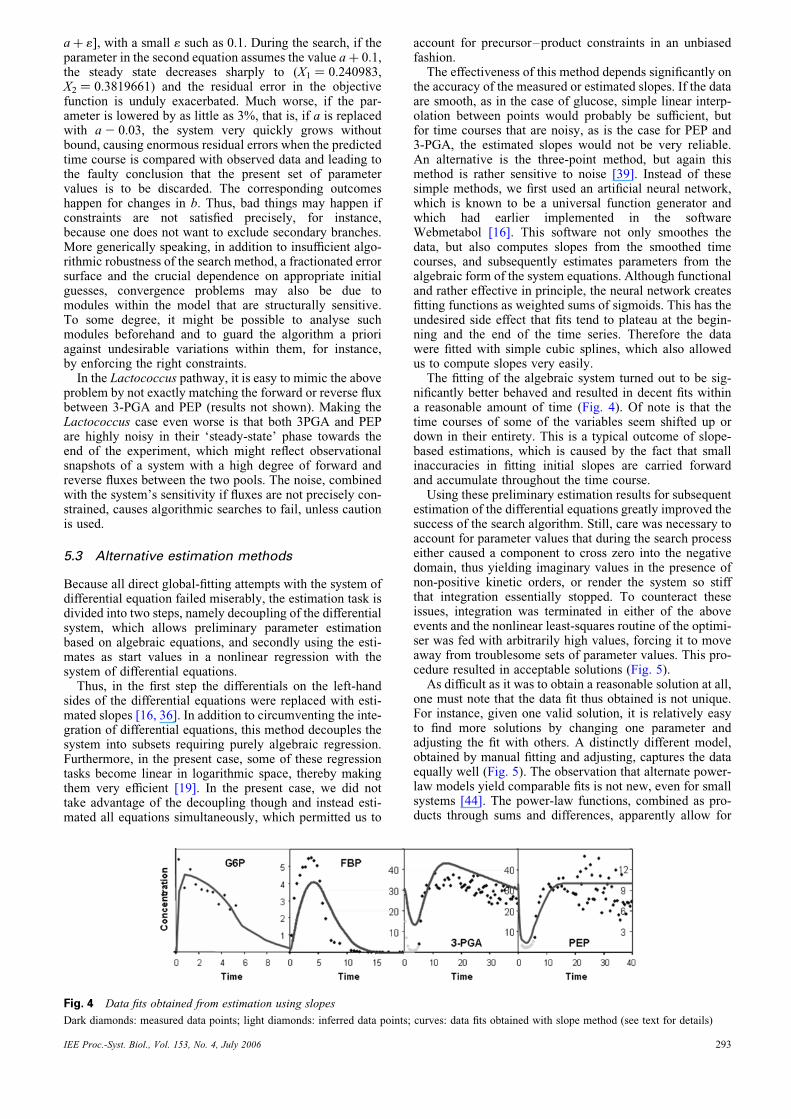
The fitting of the algebraic system turned out to be sig-nificantly better behaved and resulted in decent fits withina reasonable amount of time (Fig. 4). Of note is that thetime courses of some of the variables seem shifted up ordown in their entirety. This is a typical outcome of slope-based estimations, which is caused by the fact that smallinaccuracies in fitting initial slopes are carried forwardand accumulate throughout the time course.
Using these preliminary estimation results for subsequentestimation of the differential equations greatly improved thesuccess of the search algorithm. Still, care was necessary toaccount for parameter values that during the search processeither caused a component to cross zero into the negativedomain, thus yielding imaginary values in the presence ofnon-positive kinetic orders, or render the system so stiffthat integration essentially stopped. To counteract theseissues, integration was terminated in either of the aboveevents and the nonlinear least-squares routine of the optimi-ser was fed with arbitrarily high values, forcing it to moveaway from troublesome sets of parameter values. This pro-cedure resulted in acceptable solutions (Fig. 5).
As difficult as it was to obtain a reasonable solution at all,one must note that the data fit thus obtained is not unique.For instance, given one valid solution, it is relatively easyto find more solutions by changing one parameter andadjusting the fit with others. A distinctly different model,obtained by manual fitting and adjusting, captures the dataequally well (Fig. 5). The observation that alternate power-law models yield comparable fits is not new, even for smallsystems [44]. The power-law functions, combined as pro-ducts through sums and differences, apparently allow for
Fig. 4 Data fits obtained from estimation using slopes
Dark diamonds: measured data points; light diamonds: inferred data points; curves: data fits obtained with slope method (see text for details)
IEE Proc.-Syst. Biol., Vol. 153, No. 4, July 2006 293

a lot of flexibility, and it seems that only additional infor-mation, either on some of the processes within the systemor in the form of additional time series, can distinguishbetween these alternative representations.
6 Model analysis
6.1 Diagnostics and simulations
Typical diagnostics of the model do not reveal particularproblems. The model is moderately sensitive andsimulations with slightly altered input conditions appearto be reasonable.
The model may be used for various purposes. Forinstance, one may make predictions of its responses to sofar untested inputs or perturbations or test the consistencywith other data sets, such as increased glucose concen-trations (results not shown). One could also use methodsof optimisation [24] to manipulate lactose production.
As an example, the effect of changing the experimentalconditions from aerobic to anaerobic was studied. Thischange affects the balance between NADþ and NADH.Specifically, under aerobic conditions, both NADþ andNADH are essentially constant. In contrast, when glucoseis provided after starvation, NADþ dips down under anaero-bic conditions, before returning to its former level, whereasNADH shows the opposite trend. In the correspondingexperiments (data not shown), glucose uptake and G6P areunaffected, whereas FBP degrades more slowly, 3-PGAand PEP accumulate at lower levels and the final concen-tration of lactate increases. Using NADH as an additionaloffline variable, the simulation results are qualitatively andquantitatively consistent with these observations (Fig. 6).
6.2 Design principles
In addition to exploring the model in this fashion, we set outto analyse some of the design principles governing the
control structure of the pathway. A typical question addres-sing design principles is: Why is the system regulated in theobserved fashion and not in an alternate fashion. The strat-egy for such assessments is the method of controlled math-ematical comparisons [45–49]. According to this method,two models are compared by making them as similar aspossible, except for one distinguishing feature of interest.The two models are then analysed and differing resultsare attributed to the one distinguishing feature. The differ-ences in results are measured against objective criteria ofquality (such as robustness or response time) and interpretedin terms of biological functionality.
The insights gained from such an analysis may be used indifferent ways. In clear-cut cases, where one alternative isbetter than the other with respect to all criteria tested, theresults provide rationale for the selection of one designover another. If no specific observations are available, thetheoretical results subsequently become hypotheses to be
Fig. 5 Two data fits with a complete differential equation model (Fig. 1) satisfying all biologically motivated constraints
Diamonds: data points (data of 3-PGA and PEP at t ¼ 0 inferred; see text); light curves: results of two-phase estimation; dark curves: data fitsobtained with a combination of methods and significant manual fitting; equations and parameters are found in the supplements
Fig. 6 Under anaerobic conditions, FBP decreases more slowly
The final levels of 3-PGA and PEP decrease, whereas the lactateconcentration is increasedThese simulation results are consistent with observations (data notshown)
IEE Proc.-Syst. Biol., Vol. 153, No. 4, July 2006294

tested with biological experiments. In less obvious cases, theresults can suggest decisive experiments that would eitherconfirm nature’s preference for one of the designs orenhance our understanding by revealing in greater detailsituations in which one or the other design would be superior.
6.2.1 Regulation of pyruvate kinase activity: In ourcase, we used the model to explore the role of the regulationof PK by FBP and Pi was used. In particular, the feedfor-ward activation by FBP is of interest, because this mechan-ism is very rare in metabolic systems. In the tradition ofcontrolled mathematical experiments, we thus executedcomparative simulations with alternative system designslacking FBP activation, Pi inhibition or both. By keepingall else in the system equal and analysing responses of thedifferent implementation, it is possible to discern thespecific roles of signals, such as the activation by FBP incomparison to the inhibition by Pi.
It is customary in the method of controlled comparisonsto adjust the alternative systems so that they exhibitresponse features that are as similar as possible to theobserved design. This is typically accomplished by equatingthe steady states and/or some steady-state gains of the com-peting systems [46]. In our case, this form of external equiv-alence is a problem, because the pathway does not have aregular steady state where none of the system variables iszero. Instead, we used the entire dynamic time course ofFBP as standard for equating the alternative systems,because this metabolite is better characterised in the exper-imental data than G6P and drives all steps downstream. Thesignals of interest for the comparisons are found in theequation for PEP (X5) in the right panel of Fig. 1.Specifically, the term describing the pyruvate kinase stepin this equation is b51X3
h513X5h515Pi
h51,Pi. To explore the dis-tinguishing features in the alternative modes of regulation,we ran analyses with either h513, h51,Pi or both set equalto zero, which eliminated the corresponding regulatorysignal(s). To obtain external equivalence, the rate constantb51 was readjusted so that the observed dynamics of FBPwas as similar as possible to the corresponding dynamicsin the reference pathway. Everything else in the equationremained symbolically and numerically unaltered. As a sec-ondary analysis, we extended these comparisons by also
exploring different strengths of the inhibition by Pi, wherethe value of h51,Pi was altered and again adjusted b51.
The results of the comparisons are quite interesting. Ifboth regulatory signals are removed, the system essentiallybecomes a linear pathway, except that PEP is recycled inthe PTS step. Using the same glucose input as in theobserved data, and starting with high PEP and 3-PGAlevels, the substrate is quickly converted into G6P, FBPand trioses, as observed. However, as soon as the externalglucose is depleted, all internal pools vanish and onlylactate accumulates at a high level. In particular, PEP and3-PGA are no longer available, and a second bolus ofglucose cannot be utilised (Fig. 7a). In reality, the organismwould switch to a less effective ATP-driven system, but theprimary mechanism of glucose consumption would nolonger be functional.
In the second series of experiments, we removed the feed-forward activation by FBP, subjecting PK exclusively to thecontrol by Pi inhibition (Fig. 7b). As in the unregulated case,3-PGA and PEP first drop quickly, because they are used bythe PTS system. They then rise, which is a consequence ofglycolysis, but as soon as FBP is used up, the levels falland approach zero. Finally, the feedforward inhibition byPi was removed, leaving as control only the activation byFBP. The simulation results now show that the system isessentially working as in the fully regulated case (Fig. 7c).
The results suggest that FBP is the main controller of pyr-uvate kinase and, therewith, of glycolysis in Lactococcus.This is in contrast to Mason et al. [20], who came to the con-clusion that Pi was the dominant controller of glycolysis.They based this conclusion primarily on in vitro experimentsshowing that PK depends strongly on the concentration of Pi,but can be active in the absence of FBP. Closer inspection ofthe authors’ data reveals that PK is only active forlow-to-moderate FBP levels if Pi is below about 4 mM.The same data also show that PK runs at about two-thirdsof maximal activity if FBP is present at a physiologicallevel of 30 mM, even if Pi is at a relatively highconcentration (20 mM). In our case, the Pi concentration isrelatively high at most times (Fig. 2), so that Mason’sdata do not contradict our results. One explanation for therole of Pi may be that low Pi values increase the Ka forFBP, thereby further increasing its regulating effect asactivator [6].
a b c
Fig. 7 Comparison of the dynamics of PEP and 3-PGA in alternative system designs with no regulation of PK (a), exclusive inhibition byPi (b), or exclusive activation by FBP (c)
Although c is very similar to the fully regulated system (Figs. 2 and 5), the designs in a and b fail to generate and hold enough PEP to restartglycolysis after a period of starvationThe somewhat jagged appearance is due to the fact that Pi enters the system as an offline variable, which is given in the form of raw data (see Fig. 2)
IEE Proc.-Syst. Biol., Vol. 153, No. 4, July 2006 295

6.2.2 G6P inhibition of glucose utilisation: Galazzoand Bailey [18] found that glucose uptake and utilisationin yeast is rather strongly inhibited by G6P. Because suchinhibition has not been reported for Lactococcus, weimplemented alternative models either with or withoutG6P inhibition. With slight adjustments in the uptaketerm, the model fit by the two models was essentially indis-tinguishable (results not shown). Thus, the data set is notsufficient to distinguish between the two alternatives. Athorough controlled comparison could further investigatethis signal, for instance, by assessing stability and sensi-tivity of the model or questions of transients and responsetimes. We did not explore these features.
7 Conclusions
The estimation of parameter values from time-series datamay seem to be an almost trivial problem of nonlinearregression. A variety of algorithms are available, of whichsome are based on gradient searches combined withleast-squares minimisation, some on variations of geneticalgorithms and others on simulated annealing. Even withthis rich repertoire of tools at hand, the estimation is farfrom trivial. The main reason is likely the structure of theerror surface associated with the large parameter searchspace, which seems to be quite rugged and may even befractal, as it was observed in basins of attraction of thesimple Newton algorithm [42]. The error surface surelycontains numerous local minima, which in many cases pre-vents search algorithms from finding the global optimum.For small systems, a branch-and-reduce method seems ade-quate [50], but this method has not been applied to noisydata obtained from systems of moderate size.
We have shown here that estimation problems are severeeven if the time-series data are quite dense and show onlymodest noise. Barring major breakthroughs in estimationmethods, it is therefore advisable to split the global esti-mation task into smaller tasks that lead at least to decentstarting conditions for an overall search. In this casestudy, we pursued a divide-and-conquer strategy. First, itis useful to employ a mathematical model with a generallyapplicable, yet homogeneous structure. We used for thispurpose a power-law representation in the form of a gener-alised mass action (GMA) system. We chose this formwithin BST rather than an S-system model, which is oftenused for structure identification tasks [16, 23, 36–38, 40].S-system models are used for these purposes, becausethey do not require a priori structural information on theunderlying pathway. In the present case, we had this infor-mation at hand, and chose the GMA form, because it simpli-fies the association of terms in the estimation task withbiochemical processes.
The symbolic form of the GMA representation isimmediately deducible from the topology and regulationof the pathway. This is in contrast to kinetic models in thetradition of Michaelis and Menten, where it is a prioriunclear what exact type and rate law would best character-ise a particular reaction, and whether all implicitly under-lying assumptions are satisfied. The mathematicalfoundation of the power-law formalism lies in Taylor’stheorem, which guarantees correctness at the operatingpoint and high quality close to it. The range of validity ofthis formalism is unknown in specific cases, and this motiv-ated us to test whether the power-law format is structurallyappropriate and rich enough to capture the dynamics of thepathway at hand. For this purpose, a modelling strategy wasproposed where only one variable at a time is modelled,whereas the dynamics of all other variables was taken
directly as input from the measured time-series data. Theconsideration of one variable at a time, using other variablesas raw input, has been proposed before for purposes ofparameter estimation [16, 23, 36–38, 40], but not for theassessment of the quality of a model. In the present case,one variable at a time was selected and formulated a differ-ential equation for just this variable. All other variableswere considered offline forcing functions that were notaffected by the dynamics of the system but taken at facevalue. As a slight variation, the offline data may first besmoothed with some filter, a spline function, a piecewiseapproximation or a neural network.
The fits of these individual fits were quite good, confirm-ing that the power-law structure is indeed able to capture alldynamical features of the Lactococcus pathway. This is animportant finding, because the power-law formulation is alocal representation, and general assessments of qualityare difficult to execute in specific cases.
Interestingly, and quite disturbingly, the collection ofindividual fits does not necessarily yield a good dynamicdescription of the entire pathway. Two reasons dominatethis issue. First, because each individual fit typicallyincurs some residual error, the fitted time course differslocally from the raw data. This difference is often sufficientto force the integrated system onto a different trajectory,which may derail the solution over any extended timeperiod. Second, the individual fits, by their very nature,ignore constraints between the dynamics of the system vari-ables. Thus, precursor–product and branch point relation-ships are usually violated, which creates issues ofinterpretability of the integrated system. One way toenforce precursor–product and branch point relationshipsis hierarchical fitting, which is particularly straightforwardin unbranched systems [19]. Beginning with the initial sub-strate of the pathway, one fits the first variable by estimatingits production and degradation terms. The degradation termis retained as production term in the second equation, whereonly the degradation term is to be estimated. Through con-venient sorting of equations to be estimated, it is even poss-ible to extend this method to many branch points. Wepursued this strategy previously upon the replacement ofdifferentials with estimated slopes. Here, we employed sim-ultaneous fitting with slopes, as opposed to differentials,which already led to reasonable fits. We then used thesuch estimated parameter values as starting values for non-linear searches, which produced a global fit satisfying alltopological constraints within the pathway.
The issue of constraints emerged in our analysis as morecomplex than expected. On one hand, the time-series datadescribe just a small part of the real biological system, sothat the idealised pathway reflected in the model may beoverly simplified. For instance, an obvious precursor–product relationship in the model may not strictly exist inreality, where smaller amounts of material leave or enterthe pathway. Mathematically, one may deal with thisissue by relaxing the constraints, arguing that the optimisedsolution would show to what degree the constraints are sat-isfied. However, any relaxation of constraints increases thesearch space, further complicating already difficult issues ofconvergence. Furthermore, we have shown here that evenslightly relaxed constraints may have significant negativeconsequences for the search process and its solution. Inthe example shown here, deviations of a few percent in areversible reaction were enough to let some of the systemvariables grow to infinity or to vanish. Thus, constraintsneed to be subjected to very careful scrutiny.
The natural regulatory design of the glucose pathway inLactococcus is very interesting. It involves a forward
IEE Proc.-Syst. Biol., Vol. 153, No. 4, July 2006296

activation signal, which is otherwise very rare in metabolicsystems, but is here very effective for the task to be accom-plished. The mechanism allows the organism to enter aholding pattern during periods of glucose starvation.Without regulation, the glycolytic intermediates wouldeventually be depleted, but through the feedforward acti-vation by FBP and the feedforward inhibition by organicphosphate, the last available glucose is successfully chan-nelled into 3-PGA and PEP, where the material accumulatesand apparently remains for an extended period of time.Although the accumulation of intermediates is usually con-sidered disadvantageous [21, 51, 52], it constitutes here aperfect mechanism for restarting glycolysis as soon asnew glucose becomes available. Because PEP is availablein a rather high concentration, the glycolytic machinery isimmediately able to start. The PEP level subsequentlyfalls rapidly, but the pool is soon replenished through denovo synthesis. The mechanism has the added benefit thatmuch of the de novo glycolytic pathway is initially short-circuited through the PEP : PTS, so that the organism usesthe first available glucose directly to produce pyruvateand then lactate, thereby souring the medium for potentialcompetitor species.
It is not entirely clear at this point why the key enzymepyruvate kinase is both activated by FBP and inhibited byPi. To distinguish the relative importance of each, themethod of controlled mathematical comparisons to testalternative system designs was employed, with both, oneor no regulator of PK. The results clearly demonstratedthat FBP alone would be sufficient to control PK, whereasthe opposite is not true. This numerical result is furthersupported by a strategic argument. Namely, if Pi were themain regulator, then fluctuations in its concentrationanywhere in the cell would have the potential of affectingthe PK flux, which could lead to undesirable consequences.For instance, even short-term scarcity of Pi due to someother metabolic process during glucose starvation wouldrelease the inhibition of PK, thereby depleting the PEPpool. As a consequence, any later glucose availabilitywould be difficult to utilise, because the PTS systemcould not be initiated without PEP, and Lactococcuswould have to resort to a secondary, ATP-basedphosphorylation system. In contrast, fluctuations in FBPwould almost exclusively be associated with the pathwayof interest, glycolysis. In particular, low levels of FBPwould prevent any remaining PEP to be used for pyruvateand lactate production, whereas high levels would allowflux through PK, with immediate reduction during decreasesin FBP. Although FBP seems sufficient to control theglycolytic flux, Pi may be involved in the process becauseof its ability to affect the association between FBP and PK.
The incomplete case study presented here demonstratesthat even the combination of excellent data and techniquesfor all computational aspects is currently not sufficient tomake the estimation of parameter values a trivial matter.As this investigation unfolded, computational and concep-tual hurdles were detected, some of which were overcome,whereas others still await improved solutions. Most import-ant for future successful analyses appears to be the develop-ment of improved methods supporting and automatinginverse tasks based on time series of dynamic biologicalmodels. These should include a comparative assessmentof smoothers and of the various types of search algorithms.Directly related is the need for good initial guesses that startthe nonlinear searches in the right basin of attraction.Independent of algorithmic improvements, explicit andimplicit assumptions associated with model choice anddesign must be revisited and validated. Finally, there is an
ongoing need to evaluate the mathematical structure ofmodels that we choose to describe the dynamics of biologi-cal systems.
8 Acknowledgments
This work was supported in part by a National Heart, Lungand Blood Institute Proteomics Initiative (ContractN01-HV-28181; D. Knapp, PI), a grant from theFundacao para a Ciencia e a Tecnologia, projects POCTI/BIO/48333/02 and FEDER (H. Santos, PI) and an endow-ment from the Georgia Research Alliance (E.O. Voit, PI).Any opinions, findings, and conclusions or recommen-dations expressed in this material are those of the authorsand do not necessarily reflect the views of the sponsoringinstitutions.
9 References
1 Bolotin, A., Wincker, P., Mauger, S., Jaillon, O., Malarme, K.,Weissenbach, J., Ehrlich, S. D., and Sorokin, A.: ‘The completegenome sequence of lactic acid bacterium Lactococcus lactis ssp.lactis IL1403’, Genome Res., 2001, 11, pp. 731–753
2 de Vos, W.M.: ‘Safe and sustainable systems for food-gradefermentations by genetically modified lactic acid bacteria’, Int.Dairy J., 1999, 9, pp. 3–10
3 Fordyce, A.M., Moore, C.H., and Pritchard, G.G.:‘Phosphofructokinase from Streptococcus lactis’, Methods Enzymol.,1982, 90, pp. 77–82
4 Crow, V.L., and Thomas, T.D.: ‘D-tagatose 1,6-diphosphate aldolasefrom lactic streptococci: purification, properties, and use in measuringintracellular tagatose 1,6-diphosphate’, J. Bacteriol., 1982, 151,pp. 600–608
5 Even, S., Garrigues, C., Loubiere, P., Lindley, N.D., andCocaign-Bousquet, M.: ‘Pyruvate metabolism in Lactococcus lactisis dependent upon glyceraldehyde-3-phosphate dehydrogenaseactivity’, Metab. Eng., 1999, 1, pp. 198–205
6 Crow, V.L., and Pritchard, G.G.: ‘Purification and properties ofpyruvate kinase from Streptococcus lactis’, Biochim. Biophys. Acta,1976, 438, pp. 90–101
7 Thomas, T.D.: ‘Activator specificity of pyruvate kinase from lacticstreptococci’, J. Bacteriol., 1976, 125, pp. 1240–1242
8 Crow, V.L., and Pritchard, G.G.: ‘Fructose 1,6-diphosphate-activatedL lactate dehydrogenase from Streptococcus lactis: kinetic propertiesand factors affecting activation’, J. Bacteriol., 1977, 131, pp. 82–91
9 Jonas, H.A., Anders, R.F., and Jago, G.R.: ‘Factors affecting theactivity of the lactate dehydrogenase of Streptococcus cremoris’, J.Bacteriol., 1972, 111, pp. 397–403
10 Thompson, J.: ‘Regulation of sugar transport and metabolism in lacticacid bacteria’, FEMS Microbiol. Rev., 1987, 46, pp. 221–231
11 Neves, A.R., Ramos, A., Costa, H., van Swam, I.I., Hugenholtz, J.,Kleerebezem, M., de Vos, V.W., and Santos, H.: ‘Effect of differentNADH oxidase levels on glucose metabolism by Lactococcus lactis:kinetics of intracellular metabolite pools determined by in vivonuclear magnetic resonance’, Appl. Environ. Microbiol., 2002, 68,pp. 6332–6342
12 Neves, A.R., Ramos, A., Nunes, M.C., Kleerebezem, M., Hugenholtz,J., de Vos, W.M., Almeida, J.S., and Santos, H.: ‘In vivo nuclearmagnetic resonance studies of glycolytic kinetics in Lactococcuslactis’, Biotechnol. Bioeng., 1999, 64, pp. 200–212
13 Poolman, B., Smid, E.J., Veldkamp, H., and Konings, W.N.:‘Bioenergetic consequences of lactose starvation for continuouslycultured Streptococcus cremoris’, J. Bacteriol., 1987, 169,pp. 1460–1468
14 Voit, E.O.: ‘The dawn of a new era of metabolic systems analysis’,Drug Discovery Today: BioSilico, 2004, 2, (5), pp. 182–189
15 Hoefnagel, M.H., van der Burgt, A., Martens, D.E., Hugenholtz, J.,and Snoep, J.L.: ‘Time dependent responses of glycolyticintermediates in a detailed glycolytic model of Lactococcus lactisduring glucose run-out experiments’, Mol. Biol. Rep., 2002, 29,(1–2), pp. 157–161
16 Voit, E.O., and Almeida, J.: ‘Decoupling dynamical systems forpathway identification from metabolic profiles’, Bioinformatics,2004, 20, (11), pp. 1670–1681
17 Poolman, B.: ‘Transporters and their roles in LAB cell physiology’,Antonie Van Leeuwenhoek, 2002, 82, (1–4), pp. 147–164
18 Galazzo, J.L., and Bailey, J.E.: ‘Fermentation pathway kinetics andmetabolic flux control in suspended and immobilized Saccharomycescerevisiae’, Enzyme Microb. Technol., 1990, 12, pp. 162–172
IEE Proc.-Syst. Biol., Vol. 153, No. 4, July 2006 297

19 Lall, R., and Voit, E.O.: ‘Parameter estimation in modulated,unbranched reaction chains within biochemical systems’, Comput.Biol. Chem., 2005, 29, (5), pp. 309–318
20 Mason, P.W., Carbone, D.P., Cushman, R.A., and Waggoner, A.S.:‘The importance of inorganic phosphate in regulation of energymetabolism in Streptococcus lactis’, J. Biol. Chem., 1981, 256,pp. 1861–1866
21 Savageau, M.A.: ‘Biochemical systems analysis: a study of functionand design in molecular biology’ (Addison-Wesley Pub. Co.Advanced Book Program, Reading, MA, USA, 1976), pp. xvii, 379
22 Voit, E.O.: ‘Canonical nonlinear modeling: S-system approach tounderstanding complexity’ (Van Nostrand Reinhold, New York,1991), pp. xii, 365
23 Voit, E.O.: ‘Computational analysis of biochemical systems:a practical guide for biochemists and molecular biologists’(Cambridge University Press, New York, 2000)
24 Torres, N.V., and Voit, E.O.: ‘Pathway analysis and optimization inmetabolic engineering’ (Cambridge University Press, New York,2002), pp. xiv, 305
25 Savageau, M.A.: ‘Biochemical systems analysis. I. Somemathematical properties of the rate law for the componentenzymatic reactions’, J. Theor. Biol., 1969, 25, (3), pp. 365–369
26 Savageau, M.A.: ‘Biochemical systems analysis. II. The steady-statesolutions for an n-pool system using a power-law approximation’, J.Theor. Biol., 1969, 25, (3), pp. 370–379
27 Voit, E.O., and Savageau, M.A.: ‘Accuracy of alternativerepresentations for integrated biochemical systems’, Biochemistry,1987, 26, pp. 6869–6880
28 Curto, R., Sorribas, A., and Cascante, M.: ‘Comparative characterizationof the fermentation pathway of Saccharomyces cerevisiae usingbiochemical systems theory and metabolic control analysis: modeldefinition and nomenclature’, Math. Biosci., 1995, 130, pp. 25–50
29 Voit, E.O., and Ferreira, A.E.N.: ‘Buffering in models of integratedbiochemical systems’, J. Theor. Biol., 1998, 191, pp. 429–438
30 Seatzu, C.: ‘A fitting based method for parameter estimation inS-systems’, Dyn. Syst. Appl., 2000, 9, (1), pp. 77–98
31 Tsai, K.Y., and Wang, F.S.: ‘Evolutionary optimization with datacollocation for reverse engineering of biological networks’,Bioinformatics, 2005, 21, (7), pp. 1180–1188
32 Marino, S., and Voit, E.O.: ‘An automated procedure for theextraction of metabolic network information from time series data’,in press
33 Schultz, A.R.: ‘Enzyme kinetics: from diastase to multi-enzymesystems’ (Cambridge University Press, Cambridge, 1994), pp. x, 246
34 Hatzimanikatis, V., and Bailey, J.E.: ‘MCA has more to say’, J. Theor.Biol., 1996, 182, pp. 233–242
35 Heijnen, J.J.: ‘Approximative kinetic formats used in metabolicnetwork modeling’, Biotechnol. Bioeng., 2005, 91, (5), pp. 534–545
36 Voit, E.O., and Savageau, M.A.: ‘Power-law approach to modelingbiological systems. 3. Methods of analysis’, J. FermentationTechnol., 1982, 60, (3), pp. 233–241
37 Maki, Y., Ueda, T., Okamoto, M., Uematsu, N., Inamura, Y., andEguchi, Y.: ‘Inference of genetic network using the expressionprofile time course data of mouse P19 cells’, Genome Inform., 2002,13, pp. 382–383
38 Kikuchi, S., Tominaga, D., Arita, M., Takahashi, K., and Tomita, M.:‘Dynamic modeling of genetic networks using genetic algorithm andS-system’, Bioinformatics, 2003, 19, (5), pp. 643–650
39 Almeida, J., and Voit, E.O.: ‘Neural-network based parameterestimation in complex biomedical system’, Genome Inform., 2003,14, pp. 114–123
40 Kimura, S., Ide, K., Kashihara, A., Kano, M., Hatakeyama, M., Masui,R., Nakagawa, N., Yokoyama, S., Kuramitsu, S., and Konagaya, A.:‘Inference of S-system models of genetic networks using acooperative coevolutionary algorithm’, Bioinformatics, 2005, 21,(7), pp. 1154–1163
41 Naval, P.C., Gonzales, O.R., Mendoza, E., and Sison, L.G.: ‘Heuristicparameter estimation methods for S-system models of biochemicalnetworks’. IEEE Conf. HNICEM 2005, Manila, Philippines, 2005
42 Epureanu, B.I., and Greenside, H.S.: ‘Fractal basins of attractionassociated with a damped Newton’s method’, SIAM Rev., 1998, 40,(1), pp. 102–109
43 Savageau, M.A.: ‘Michaelis–Menten mechanism reconsidered:implications of fractal kinetics’, J. Theor. Biol., 1995, 176,pp. 115–124
44 Sands, P.J., and Voit, E.O.: ‘Flux-based estimation of parameters inS-systems’, Ecol. Model., 1996, 93, pp. 75–88
45 Savageau, M.A.: ‘A theory of alternative designs forbiochemical control systems’, Biomed. Biochim. Acta, 1985, 44, (6),pp. 875–880
46 Irvine, D.H., and Savageau, M.A.: ‘Network regulation of theimmune response: alternative control points for suppressormodulation of effector lymphocytes’, J. Immunol., 1985, 134, (4),pp. 2100–2116
47 Hlavacek, W.S., and Savageau, M.A.: ‘Completely uncoupled andperfectly coupled gene expression in repressible systems’, J. Mol.Biol., 1997, 266, (3), pp. 538–558
48 Schwacke, J.H., and Voit, E.O.: ‘Improved methods for themathematically controlled comparison of biochemical systems’,BMC Theor. Biol. Med. Model., 2004, 1, p. 1
49 Wall, M.E., Hlavacek, W.S., and Savageau, M.A.: ‘Design of genecircuits: lessons from bacteria’, Nat. Rev. Genet., 2004, 5, (1),pp. 34–42
50 Polisetty, P.K., Voit, E.O., and Gatzke, E.P.: ‘Identification ofmetabolic system parameters using global optimization methods’,BMC Theor. Bio. and Med. Model., 2006, 3, (1)
51 Koch, A.L.: ‘Metabolic control through reflexive enzyme action’,J. Theor. Biol., 1967, 15, pp. 75–102
52 Atkinson, D.E.: ‘Limitation of metabolite concentrations and theconservation of solvent capacity in the living cell’, Curr. Top. Cell.Reg., 1969, 1, pp. 29–43
IEE Proc.-Syst. Biol., Vol. 153, No. 4, July 2006298